UNITED STATES
SECURITIES AND EXCHANGE COMMISSION
Washington, D.C. 20549
FORM N-CSR
CERTIFIED SHAREHOLDER REPORT OF REGISTERED
MANAGEMENT INVESTMENT COMPANIES
Investment Company Act file number 811-10263
GuideStone Funds
(Exact name of registrant as specified in charter)
5005 Lyndon B. Johnson Freeway, Suite 2200
Dallas, TX 75244-6152
(Address of principal executive offices) (Zip code)
Matthew A. Wolfe, Esq.
GuideStone Financial Resources of the Southern Baptist Convention
5005 Lyndon B. Johnson Freeway, Suite 2200
Dallas, TX 75244-6152
(Name and address of agent for service)
Registrant’s telephone number, including area code: 214-720-4640
Date of fiscal year end: December 31
Date of reporting period: December 31, 2021
Item 1. Reports to Stockholders.
| | (a) | The following is a copy of the report transmitted to shareholders pursuant to Rule 30e-1 under the Investment Company Act of 1940 (17 CFR 270.30e-1) |
GuideStone Funds
Privacy Notice
NOTICE CONCERNING OUR PRIVACY PRACTICES
This notice provides you with information concerning our policies with respect to non-public personal information that we collect about you in connection with the following financial products and services provided and/or serviced by the entities listed below: Individual Retirement Accounts (“IRAs”), personal mutual fund accounts and/or GuideStone Personal Advisory Services.
The confidentiality of your information is important to us, as we recognize that you depend on us to keep your information confidential, as described in this notice.
We collect non-public personal information about you with regard to the products and services listed above from the following sources:
| • | Information we receive from you on applications or other forms |
| • | Information about your transactions with us, our affiliates or others (including our third-party service providers) |
| • | Information we receive from others, such as service providers, broker-dealers and your personal agents or representatives |
| • | Information you and others provide to us in correspondence sent to us, whether written, electronic or by telephone |
We may disclose such non-public personal financial information about you to one or more of our affiliates as permitted by law. An affiliate of an organization means any entity that controls, is controlled by or is under common control with that organization. GuideStone Funds, GuideStone Financial Resources of the Southern Baptist Convention, GuideStone Capital Management, LLC, GuideStone Resource Management, Inc., GuideStone Investment Services, GuideStone Trust Services, GuideStone Financial Services, GuideStone Advisors and GuideStone Advisors, LLC (collectively “GuideStone”) are affiliates of one another. GuideStone does not sell your personal information to non-affiliated third parties.
We may also disclose any of the personal information that we collect about you to non-affiliated third parties as permitted by law. For example, we may provide your information to non-affiliated companies that provide account services or that perform marketing services on our behalf. We restrict access to non-public personal information about you to those of our employees who need to know that information in order for us to provide products and services to you. We also maintain physical, electronic and procedural safeguards to guard your personal information.
We may continue to maintain and disclose non-public personal information about you after you cease to receive financial products and services from us.
If you have any questions concerning our customer information policy, please contact a customer solutions specialist at 1-888-GS-FUNDS (1-888-473-8637).
This report has been prepared for shareholders of GuideStone Funds. It is not authorized for distribution to prospective investors unless accompanied or preceded by a current prospectus, which contains more complete information about the Funds. Investors are reminded to read the prospectus carefully before investing. The performance data quoted represents past performance and does not guarantee future results. Current performance may be lower or higher than the performance quoted. Performance data current to the most recent month-end may be obtained at www.GuideStoneFunds.com. The investment return and principal value of an investment will fluctuate so that shares, when redeemed, may be worth more or less than their original cost. Fund shares are distributed by Foreside Funds Distributors LLC.
LETTER FROM THE PRESIDENT
Dear Shareholder:
We are pleased to present you with the 2021 GuideStone Funds Annual Report. This report reflects our unwavering commitment to integrity in financial reporting so you may stay fully informed of your investments. We trust that you will find this information valuable when making investment decisions.
2021 offered many opportunities for the GuideStone Funds team to demonstrate its commitment to work on behalf of the investors who entrust us with their hard-earned resources. Despite the challenges brought on by the COVID-19 pandemic’s second year, all of the people who make up GuideStone Funds worked diligently, as we have since 2001, to continue to earn your trust each day.
We invite you to learn more about GuideStone Funds and all of the various investment options available by visiting our website, GuideStoneFunds.com/Disclosures/Fund-Literature, or contacting us at 1-888-GS-FUNDS (1-888-473-8637).
Thank you for choosing to invest in GuideStone Funds.
Sincerely,
John R. Jones, CFA
President
FROM THE CHIEF INVESTMENT OFFICER
Market Recap
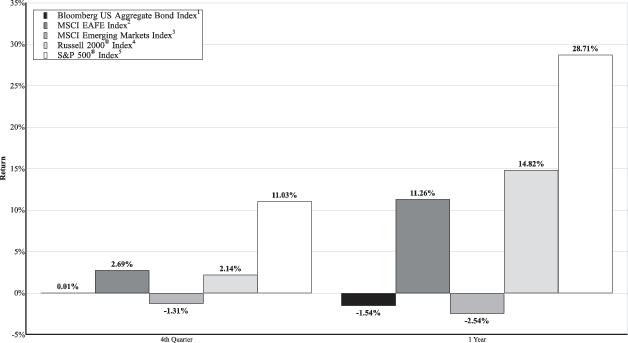
Despite the presence of multiple potential headwinds — most prominently skyrocketing inflation, pronounced supply chain shortages and renewed coronavirus pandemic (“COVID-19”) concerns with the appearance of the Delta and Omicron variants — the S&P 500® Index had a strong year overall, producing four consecutive quarters of gains and delivering a return of 28.71% for the 12-month period ending December 31, 2021. Amazingly, the S&P 500® hit 70 all-time highs in 2021 — the second-most ever in a calendar year. U.S. equities were driven higher during the year by the sustainment of a stimulus-rich environment by both the federal government and Federal Reserve (“the Fed”) and by robust corporate earnings growth.
International equity markets were mixed for the year. Despite an overall strengthening of the U.S. dollar, the MSCI EAFE Index ended 2021 up 11.26% amidst strength in financials and outperformance of value stocks. Conversely, the MSCI Emerging Markets Index finished the year down -2.54%, driven in large part by China’s struggles in the face of property market uncertainty and increasing regulatory pressures on its largest technology companies.
The U.S. 10-year Treasury yield increased over the course of the year, moving higher as concerns grew about inflation and the end of the Fed’s easy money monetary policy. The Bloomberg US Aggregate Index finished 2021 down -1.54% as rising short- and long-term interest rates impacted bond prices while fixed income investors generally became more risk averse amidst an increasingly likely environment of tighter monetary policy. The Bloomberg Global Aggregate Bond Index also ended the year in negative territory, closing the most recent 12-month period down -4.71% as the U.S. dollar strengthened and interest rates were broadly up across the globe. Emerging markets economies were particularly challenged, as they faced very different market conditions — such as tightening monetary policies — well ahead of developed markets.
The following table summarizes the calendar year 2021 returns for each major broad-based market index, or market indicator.
| Index | 3 rd Quarter
2021 Return | 4 th Quarter
2021 Return | YTD Returns as of December 31, 2021 |
| U.S. Equities |
| S&P 500® | 0.58% | 11.03% | 28.71% |
| Russell 2000® | -4.36% | 2.14% | 14.82% |
| International Equities |
| MSCI EAFE | -0.45% | 2.69% | 11.26% |
| MSCI Emerging Markets | -8.09% | -1.31% | -2.54% |
| U.S. Fixed Income |
| Bloomberg US Aggregate Bond | 0.05% | 0.01% | -1.54% |
| Bloomberg US High Yield Corporate | 0.89% | 0.71% | 5.28% |
| Global Fixed Income |
| Bloomberg Global Aggregate Bond | -0.88% | -0.67% | -4.71% |
Monetary Policy
Fed officials became increasingly hawkish during the second half of the year. While the central bank maintained its accommodative approach to monetary policy throughout the third quarter, continued inflationary pressures prompted the Fed in November to begin the process of pulling back on its pandemic-era easy money policies. Its first action was to start winding down purchases of Treasury and mortgage-backed securities (i.e., quantitative easing (QE) tapering). Shortly after beginning this process, the Fed announced it was doubling the pace of tapering — with an expected end date of March 2022 — in a more concerted effort to tame inflation. This move also served to suggest that Fed officials will move up the timeline in which increases
to the federal funds rate are likely to commence. To that effect, the central bank released revised projections after its December meeting that showed an expected three rate hikes in 2022.
As we have previously stated, tighter monetary policy presents a significant risk to lofty equity valuations. In fact, Fed tightening — in concert with stubborn inflation — is the primary risk we see in 2022, especially as financial markets have become highly dependent on monetary stimulus and ample liquidity over the past several years.
Economic Growth
The U.S. economy added jobs each month in 2021, sending the unemployment rate down from 6.7% at the beginning of the year to 3.9% at the end of the year. The pace of hiring, however, was inconsistent, as only five months — February, March, June, July and October — saw job growth come in above consensus expectations. Despite net employment gains of nearly six million over the past 12 months, the U.S. economy remains four million jobs shy of pre-pandemic employment. This is a key reason the Fed remained accommodative under increasing inflationary pressures. However, this narrative has shifted, with Fed Chairman Powell now stating that the United States “is making rapid progress toward maximum employment.” This sentiment appears to be supported by recent unemployment data. According to a report released in late December by the Bureau of Labor Statistics, unemployment rates were lower on a year-over-year basis in all 389 metropolitan areas across the United States, with 139 of them having a jobless rate of less than 3%.
Of key importance to financial markets are the challenges employers continue to face in finding and retaining employees. At present, there are ample job openings across the country to fully employ everyone that wants a job. Moreover, workers are quitting their jobs for new opportunities — many for higher-paying roles — at the highest rate ever. This has added stress to a job market already hampered by COVID-19 and could serve to slow the employment recovery. This is something we will be watching closely, as the nation’s state of employment will have a measurable impact on future Fed actions, fiscal policy decisions and other important drivers of market directionality.
Conclusion
Looking forward, we expect higher market volatility and lower market returns in 2022 as economic and market tailwinds turn into headwinds. These anticipated headwinds include tighter monetary policy, lower fiscal stimulus and less robust earnings and economic growth, with each of these challenges potentially having a negative impact on investor sentiment. Together, a combination of these and other catalysts, including sticky inflationary pressures and potentially higher taxes, could create a difficult environment for returns next year.
Thank you for your continued confidence in GuideStone Funds, and for allowing us the privilege of managing your hard-earned assets. Please feel free to reach out to us if you have any comments, questions or concerns. For additional information on GuideStone Funds, we invite you to visit our website at GuideStoneFunds.com.
Sincerely,
David S. Spika, CFA
President and Chief Investment Officer
GuideStone Capital Management, LLC
Past performance does not guarantee future results and the Funds may experience negative performance. There can be no guarantee that any strategy (risk management or otherwise) will be successful. All investing involves risk, including potential loss of principal. You cannot invest directly into an index.
Asset Class Performance Comparison
The following graph illustrates the performance of the major assets classes during 2021.
1The Bloomberg US Aggregate Bond Index is a broad-based flagship benchmark that measures the investment grade, US dollar-denominated, fixed-rate taxable bond market. The index includes Treasuries, government-related and corporate securities, MBS (agency fixed-rate and hybrid ARM pass-throughs), ABS and CMBS (agency and non-agency).
2The MSCI EAFE Index (Europe, Australasia, Far East) is a free float-adjusted market capitalization index that is designed to measure equity market performance of developed markets, excluding the United States & Canada. The index consists of the following 21 developed market country indices: Australia, Austria, Belgium, Denmark, Finland, France, Germany, Hong Kong, Ireland, Israel, Italy, Japan, the Netherlands, New Zealand, Norway, Portugal, Singapore, Spain, Sweden, Switzerland and the United Kingdom.
3The MSCI Emerging Markets Index is a free float-adjusted market capitalization index that is designed to measure equity market performance of emerging markets. The index consists of the following 25 emerging market country indices: Brazil, Chile, China, Colombia, Czech Republic, Egypt, Greece, Hungary, India, Indonesia, Korea, Kuwait, Malaysia, Mexico, Peru, Philippines, Poland, Qatar, Russia, Saudi Arabia, South Africa, Taiwan, Thailand, Turkey, and United Arab Emirates.
4The Russell 2000® Index measures the performance of the small-cap segment of the U.S. equity universe. The Russell 2000® Index is a subset of the Russell 3000® Index representing approximately 10% of the total market capitalization of that index. It includes approximately 2,000 of the smallest securities based on a combination of their market cap and current index membership. The Russell 2000® Index is constructed to provide a comprehensive and unbiased small-cap barometer and is completely reconstituted annually to ensure that larger stocks do not distort the performance and characteristics of the actual small-cap opportunity set.
5The S&P 500® Index is a market capitalization-weighted equity index composed of approximately 500 U.S. companies, representing all major industries and captures approximately 80% coverage of available market capitalization. The index is designed to measure performance of the broad domestic economy through changes in the aggregate market value of its constituents.
S&P 500® Index Returns
The U.S. large-cap equity market, as measured by the S&P 500® Index, finished the year up 28.71%. With nearly nine trillion dollars on the Fed’s balance sheet, an effective Covid-19 vaccine, and a rebound in corporate earnings, the markets continued to propel forward in 2021. The index posted positive performance for nine of the twelve months, hitting 70 all-time highs — the second-most ever in a calendar year, despite several headwinds including: Covid-19 restrictions, labor shortages, supply chain backlogs, higher inflation, and fears of waning monetary and fiscal support. All sectors in the index posted double-digit returns. The energy (54.64%) and real estate (46.19%) sectors led the way in the market, benefitting from elevated inflation, after being beat down in 2020. The industrials (21.12%), consumer staples (18.63%) and utilities (17.67%) sectors were the laggards in an incredibly hot market.
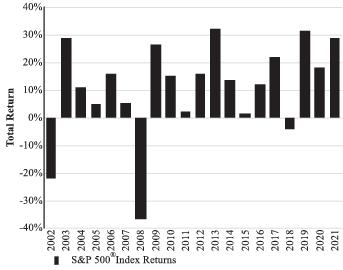
The S&P 500® Index is a market capitalization-weighted equity index composed of approximately 500 U.S. companies, representing all major industries and captures approximately 80% coverage of available market capitalization. The index is designed to measure performance of the broad domestic economy through changes in the aggregate market value of its constituents.
Data Source: Dow Jones Indices LLC
Russell 2000® Index Returns
The U.S. small cap equity market, as measured by the Russell 2000® Index, rose by 14.82% in 2021. The index rose by 12.70% during the first quarter as small caps fared better than their large cap counterparts that only rose 6.17%. However, the roles reversed in the fourth quarter as large caps outperformed small caps by approximately 8.89%. The Russell 2000® Index finished roughly -13.89% below the S&P 500® Index for the year. Small capitalization stocks underperformed large capitalization stocks materially, but still posted meaningful double-digit gains during a period where the market rewarded stocks with higher sensitivity to the index, lower valuations and higher dividend yields within the index. For the year, all sectors were positive except for healthcare (-17.56%), a sector that performed exceedingly well in 2020 on the back of high demand due to the Coronavirus Pandemic. The energy (38.23%), financials (29.95%) and consumer discretionary (28.41%) sectors rebounded strongly during the year and were the largest positive performers for the index in 2021.

The Russell 2000® Index measures the performance of the small capitalization segment of the U.S. equity universe. The Russell 2000® Index is a subset of the Russell 3000® Index representing approximately 10% of the total market capitalization of that index. It includes approximately 2,000 of the smallest securities based on a combination of their market cap and current index membership. The Russell 2000® Index is constructed to provide a comprehensive and unbiased small capitalization barometer and is completely reconstituted annually to ensure that larger stocks do not distort the performance and characteristics of the actual small capitalization opportunity set.
Data Source: Russell Investments, Bloomberg
MSCI EAFE Index Returns
With an annual return of 11.26%, developed non-U.S. markets (represented by the MSCI EAFE Index) saw strong performance in 2021, yet underperformed their U.S. counterparts. Unlike the prior year, where growth and value investment styles saw historically high spreads in performance, equity style factors in 2021 had relatively lower impact on performance. Far more material to 2021 returns was the strength of the U.S. dollar, which detracted more than 7% from U.S. dollar-denominated returns, partially offsetting market strength. Among major foreign developed markets, U.K. stocks strongly outperformed and were followed closely by continental European shares. Sector performance was generally positive, with energy posting the highest returns and financials contributing the most to index performance.
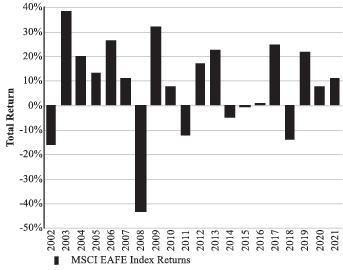
The MSCI EAFE Index (Europe, Australasia, Far East) is a free float-adjusted market capitalization index that is designed to measure equity market performance of developed markets, excluding the U.S. & Canada. The index consists of the following 21 developed market country indices: Australia, Austria, Belgium, Denmark, Finland, France, Germany, Hong Kong, Ireland, Israel, Italy, Japan, the Netherlands, New Zealand, Norway, Portugal, Singapore, Spain, Sweden, Switzerland and the United Kingdom
Data Source: FactSet
MSCI Emerging Markets Index Returns
Emerging markets stocks declined in 2021, with the MSCI Emerging Markets Index posting a return of -2.54% compared to 28.71% for the S&P 500® Index. China, the largest regional component of the index, was the primary drag on index returns for the year, as regulators checked the power of the country’s leading tech firms and concerns arose about a potential collapse in the country’s debt-laden real estate industry. Despite marking all-time highs early in the year, China’s stock market (defined as the MSCI China Index) declined by 21.72% in 2021. Although there was a small spread between the returns of growth and value stocks globally, within emerging markets, value stocks outperformed growth stocks by more than 12% for the year. This outsized return gap in emerging markets was due mostly to the decline of Chinese tech shares. Helping to partially offset China’s weakness were strong returns from Taiwan and India, as well as the financial and energy sectors.
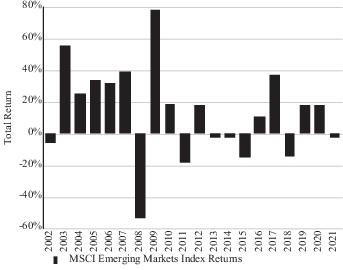
The MSCI Emerging Markets Index is a free float-adjusted market capitalization index that is designed to measure equity market performance of emerging markets. The index consists of the following 25 emerging market country indices: Brazil, Chile, China, Colombia, Czech Republic, Egypt, Greece, Hungary, India, Indonesia, Korea, Kuwait, Malaysia, Mexico, Peru, Philippines, Poland, Qatar, Russia, Saudi Arabia, South Africa, Taiwan, Thailand, Turkey, and United Arab Emirates.
Data Source: FactSet
Bloomberg US Aggregate Bond Index Returns
The broad U.S. bond market, as measured by the Bloomberg US Aggregate Bond Index, was down -1.54% for 2021 following a strong 2020, where the index was up by 7.51%. Rates were higher this year as the Fed and markets grappled with higher inflation expectations as pent-up demand combined with unprecedented fiscal and monetary stimulus drove prices higher in a range of sectors. This was the first time since 2013 that the index posted a negative absolute return. Rates rose this year as inflation picked up, but spreads remained relatively tight. However, the interest rate sensitivity of investment grade credit reached all-time highs and the duration component weighed heavily on absolute returns. Within the corporate bond segment, lower quality BBB-rated issues outperformed other higher quality tiers and the Industrials sector outperformed both Utilities and Financials. Mortgages outperformed other sectors as the Fed remained a price insensitive buyer under the terms of quantitative easing.
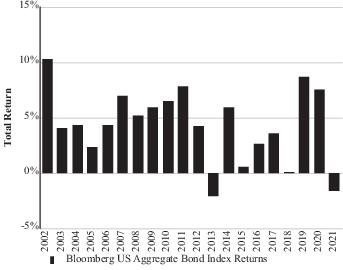
The Bloomberg US Aggregate Bond Index is a broad-based flagship benchmark that measures the investment grade, U.S. dollar-denominated, fixed-rate taxable bond market. The index includes Treasuries, government-related and corporate securities, mortgage-backed securities (agency fixed-rate and hybrid adjustable-rate mortgage pass-throughs), asset-backed securities and commercial mortgage-backed securities (agency and non-agency).
Data Source: FactSet
Federal Reserve
The Fed maintained its extremely accommodative policies throughout 2021 leaving the target Fed Funds rate at 0.00% - 0.25% and continued to purchase $120 billion in assets ($80 billion in treasury bonds and $40 billion in mortgage-backed securities) throughout most of the calendar year. Near the end of the year, the Fed started to signal the next steps in unwinding the historic level of monetary stimulus as inflation remained elevated.
In his post-meeting press conference on November 3, 2021, Fed Chairman Powell indicated that the Federal Open Markets Committee (“FOMC”) would start to reduce the pace of asset purchases by $15 billion per month. Persistent levels of inflation throughout November prompted the FOMC to accelerate tapering further in December and they increased the reduction of new purchases to $30 billion per month.
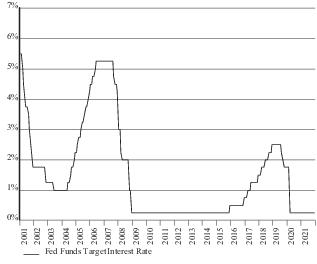
The Fed is the central bank of the United States. It was created by Congress to provide the nation with a safer, more flexible and more stable monetary and financial system. The federal funds rate is the interest rate at which depository institutions lend balances at the Fed to other depository institutions overnight. The rate is one tool the Fed can use in their efforts of controlling the supply of money. Changes in the federal funds rate trigger a chain of events that affect other short-term interest rates, foreign exchange rates, long-term interest rates, the amount of money and credit and, ultimately, a range of economic variables, including employment, output and prices of goods and services.
Data Source: Bloomberg, Federal Reserve
U.S. Treasury Yield Curve
The Fed started the process of policy normalization by signaling the beginning of the end of monetary stimulus and ultimately tapering new asset purchases in the fourth quarter. In the first part of the year, the U.S. Treasury yield curve steepened with long end rates rising faster than shorter before reversing course and flattening significantly in the fourth quarter. The benchmark 10-year U.S. Treasury began the year at 0.92% and ended 0.59% higher at 1.51% peaking at 1.74 % in March.
Inflation concerns were prevalent for most of the year and the Fed’s characterization of it as transitory only fueled fears that they were too slow in policy normalization. Acknowledging that inflation was more persistent than initially expected after the November meeting sent the curve flatter as the market priced in slower growth coming after a more hawkish than expected Fed.
The Treasury yield curve illustrates the relationship between yields on short-term, intermediate-term and long-term Treasury securities. Normally, the shape of the yield curve is upward sloping with rates increasing from the short end of the curve moving higher to the long end. The short end of the curve is impacted more by monetary policy (demand for money) while inflationary expectations and market forces impact the long end of the curve.
Data Source: Bloomberg
About Your Expenses (Unaudited)
As a shareholder of the Funds, you incur ongoing costs, including advisory fees and to the extent applicable, shareholder services fees, as well as other Fund expenses. This example is intended to help you to understand your ongoing costs (in dollars) of investing in the Funds and to compare these costs with the ongoing costs of investing in other mutual funds. It is based on an investment of $1,000 invested at the beginning of the period and held for the entire period from July 1, 2021, to December 31, 2021. The Annualized Expense Ratio may be different from the expense ratio in the Financial Highlights which is for the fiscal year ended December 31, 2021.
Actual Expenses
The first section of the table below provides information about actual account values and actual expenses. You may use the information in this section, together with the amount you invested, to estimate the expenses that you incurred over the period. Simply divide your account value by $1,000 (for example, an $8,600 account value divided by $1,000 = 8.6), then multiply the result by the number in the first section under the heading entitled “Expenses Paid During Period” to estimate the expenses attributable to your investment during this period.
Hypothetical Example for Comparison Purposes
The second section of the table below provides information about hypothetical account values and hypothetical expenses based on the Fund’s actual expense ratio and an assumed rate of return of 5% per year before expenses, which is not the Fund’s actual return. Thus, you should not use the hypothetical account values and expenses to estimate the actual ending account balance or your expenses for the period. Rather, these figures are provided to enable you to compare the ongoing costs of investing in the Fund and other funds. To do so, compare this 5% hypothetical example with the 5% hypothetical examples that appear in the shareholder reports of the other funds. Please note that the expenses shown in the table are meant to highlight your ongoing costs only. Therefore, the second section of the table is useful in comparing ongoing costs only and will not help you determine the relative total costs of owning different funds.
| Actual |
| Fund | | Class | | Beginning
Account Value
07/01/21 | | Ending
Account Value
12/31/21 | | Annualized
Expense
Ratio (1) | | Expenses
Paid During
Period (2) |
MyDestination 2015
| | Institutional | | $1,000.00 | | $1,026.70 | | 0.13% | | $0.64 |
| | | Investor | | 1,000.00 | | 1,026.00 | | 0.38 | | 1.92 |
MyDestination 2025
| | Institutional | | 1,000.00 | | 1,031.30 | | 0.12 | | 0.62 |
| | | Investor | | 1,000.00 | | 1,030.70 | | 0.37 | | 1.90 |
MyDestination 2035
| | Institutional | | 1,000.00 | | 1,042.50 | | 0.12 | | 0.63 |
| | | Investor | | 1,000.00 | | 1,041.90 | | 0.38 | | 1.93 |
MyDestination 2045
| | Institutional | | 1,000.00 | | 1,051.10 | | 0.13 | | 0.65 |
| | | Investor | | 1,000.00 | | 1,050.50 | | 0.38 | | 1.96 |
MyDestination 2055
| | Institutional | | 1,000.00 | | 1,053.90 | | 0.17 | | 0.89 |
| | | Investor | | 1,000.00 | | 1,052.40 | | 0.42 | | 2.16 |
Conservative Allocation
| | Institutional | | 1,000.00 | | 1,009.50 | | 0.15 | | 0.76 |
| | | Investor | | 1,000.00 | | 1,008.60 | | 0.40 | | 2.02 |
Balanced Allocation
| | Institutional | | 1,000.00 | | 1,018.80 | | 0.12 | | 0.63 |
| | | Investor | | 1,000.00 | | 1,017.70 | | 0.37 | | 1.91 |
Growth Allocation
| | Institutional | | 1,000.00 | | 1,024.60 | | 0.13 | | 0.64 |
| | | Investor | | 1,000.00 | | 1,023.60 | | 0.38 | | 1.92 |
Aggressive Allocation
| | Institutional | | 1,000.00 | | 1,025.30 | | 0.13 | | 0.65 |
| Actual |
| Fund | | Class | | Beginning
Account Value
07/01/21 | | Ending
Account Value
12/31/21 | | Annualized
Expense
Ratio (1) | | Expenses
Paid During
Period (2) |
| | | Investor | | $1,000.00 | | $1,024.40 | | 0.38% | | $1.92 |
Money Market
| | Institutional | | 1,000.00 | | 1,000.00 | | 0.07 | | 0.36 |
| | | Investor | | 1,000.00 | | 1,000.00 | | 0.07 | | 0.36 |
Low-Duration Bond
| | Institutional | | 1,000.00 | | 994.60 | | 0.34 | | 1.71 |
| | | Investor | | 1,000.00 | | 992.80 | | 0.61 | | 3.08 |
Medium-Duration Bond
| | Institutional | | 1,000.00 | | 999.20 | | 0.35 | | 1.78 |
| | | Investor | | 1,000.00 | | 998.40 | | 0.62 | | 3.13 |
Global Bond
| | Institutional | | 1,000.00 | | 986.30 | | 0.55 | | 2.76 |
| | | Investor | | 1,000.00 | | 984.90 | | 0.84 | | 4.23 |
Defensive Market Strategies®
| | Institutional | | 1,000.00 | | 1,047.50 | | 0.64 | | 3.33 |
| | | Investor | | 1,000.00 | | 1,045.30 | | 0.91 | | 4.69 |
Global Impact
| | Institutional | | 1,000.00 | | 1,041.70 | | 0.80 | | 4.11 |
| | | Investor | | 1,000.00 | | 1,038.30 | | 1.26 | | 6.47 |
Equity Index
| | Institutional | | 1,000.00 | | 1,113.20 | | 0.12 | | 0.65 |
| | | Investor | | 1,000.00 | | 1,111.60 | | 0.38 | | 2.05 |
Value Equity
| | Institutional | | 1,000.00 | | 1,069.40 | | 0.63 | | 3.29 |
| | | Investor | | 1,000.00 | | 1,068.10 | | 0.89 | | 4.65 |
Growth Equity
| | Institutional | | 1,000.00 | | 1,051.30 | | 0.67 | | 3.46 |
| | | Investor | | 1,000.00 | | 1,050.10 | | 0.93 | | 4.79 |
Small Cap Equity
| | Institutional | | 1,000.00 | | 1,029.10 | | 0.90 | | 4.58 |
| | | Investor | | 1,000.00 | | 1,027.80 | | 1.16 | | 5.93 |
International Equity Index
| | Institutional | | 1,000.00 | | 1,017.80 | | 0.22 | | 1.12 |
International Equity (3)
| | Institutional | | 1,000.00 | | 1,010.20 | | 0.86 | | 4.35 |
| | | Investor | | 1,000.00 | | 1,009.00 | | 1.12 | | 5.69 |
Emerging Markets Equity
| | Institutional | | 1,000.00 | | 901.10 | | 1.08 | | 5.17 |
| | | Investor | | 1,000.00 | | 899.70 | | 1.38 | | 6.59 |
Global Real Estate Securities
| | Institutional | | 1,000.00 | | 1,108.10 | | 0.78 | | 4.13 |
| | | Investor | | 1,000.00 | | 1,106.00 | | 1.06 | | 5.63 |
Strategic Alternatives (3)
| | Institutional | | 1,000.00 | | 1,042.30 | | 1.14 | | 5.87 |
| | | Investor | | 1,000.00 | | 1,040.50 | | 1.45 | | 7.48 |
| Hypothetical (assuming a 5% return before expenses) |
| Fund | | Class | | Beginning
Account Value
07/01/21 | | Ending
Account Value
12/31/21 | | Annualized
Expense
Ratio (1) | | Expenses
Paid During
Period (2) |
MyDestination 2015
| | Institutional | | $1,000.00 | | $ 1,024.57 | | 0.13% | | $0.64 |
| | | Investor | | 1,000.00 | | 1,023.31 | | 0.38 | | 1.92 |
MyDestination 2025
| | Institutional | | 1,000.00 | | 1,024.59 | | 0.12 | | 0.62 |
| | | Investor | | 1,000.00 | | 1,023.33 | | 0.37 | | 1.90 |
MyDestination 2035
| | Institutional | | 1,000.00 | | 1,024.58 | | 0.12 | | 0.63 |
| | | Investor | | 1,000.00 | | 1,023.31 | | 0.38 | | 1.91 |
MyDestination 2045
| | Institutional | | 1,000.00 | | 1,024.57 | | 0.13 | | 0.64 |
| | | Investor | | 1,000.00 | | 1,023.30 | | 0.38 | | 1.93 |
MyDestination 2055
| | Institutional | | 1,000.00 | | 1,024.34 | | 0.17 | | 0.88 |
About Your Expenses (Unaudited) (Continued)
| Hypothetical (assuming a 5% return before expenses) |
| Fund | | Class | | Beginning
Account Value
07/01/21 | | Ending
Account Value
12/31/21 | | Annualized
Expense
Ratio (1) | | Expenses
Paid During
Period (2) |
| | | Investor | | $1,000.00 | | $1,023.10 | | 0.42% | | $2.13 |
Conservative Allocation
| | Institutional | | 1,000.00 | | 1,024.45 | | 0.15 | | 0.76 |
| | | Investor | | 1,000.00 | | 1,023.20 | | 0.40 | | 2.03 |
Balanced Allocation
| | Institutional | | 1,000.00 | | 1,024.58 | | 0.12 | | 0.63 |
| | | Investor | | 1,000.00 | | 1,023.32 | | 0.37 | | 1.91 |
Growth Allocation
| | Institutional | | 1,000.00 | | 1,024.57 | | 0.13 | | 0.64 |
| | | Investor | | 1,000.00 | | 1,023.31 | | 0.38 | | 1.92 |
Aggressive Allocation
| | Institutional | | 1,000.00 | | 1,024.56 | | 0.13 | | 0.65 |
| | | Investor | | 1,000.00 | | 1,023.31 | | 0.38 | | 1.92 |
Money Market
| | Institutional | | 1,000.00 | | 1,024.85 | | 0.07 | | 0.36 |
| | | Investor | | 1,000.00 | | 1,024.85 | | 0.07 | | 0.36 |
Low-Duration Bond
| | Institutional | | 1,000.00 | | 1,023.49 | | 0.34 | | 1.73 |
| | | Investor | | 1,000.00 | | 1,022.12 | | 0.61 | | 3.12 |
Medium-Duration Bond
| | Institutional | | 1,000.00 | | 1,023.43 | | 0.35 | | 1.80 |
| | | Investor | | 1,000.00 | | 1,022.07 | | 0.62 | | 3.17 |
Global Bond
| | Institutional | | 1,000.00 | | 1,022.43 | | 0.55 | | 2.81 |
| | | Investor | | 1,000.00 | | 1,020.95 | | 0.84 | | 4.30 |
Defensive Market Strategies®
| | Institutional | | 1,000.00 | | 1,021.95 | | 0.64 | | 3.29 |
| | | Investor | | 1,000.00 | | 1,020.61 | | 0.91 | | 4.64 |
Global Impact
| | Institutional | | 1,000.00 | | 1,021.18 | | 0.80 | | 4.07 |
| | | Investor | | 1,000.00 | | 1,018.86 | | 1.26 | | 6.41 |
Equity Index
| | Institutional | | 1,000.00 | | 1,024.59 | | 0.12 | | 0.62 |
| | | Investor | | 1,000.00 | | 1,023.27 | | 0.38 | | 1.96 |
Value Equity
| | Institutional | | 1,000.00 | | 1,022.03 | | 0.63 | | 3.21 |
| | | Investor | | 1,000.00 | | 1,020.71 | | 0.89 | | 4.54 |
Growth Equity
| | Institutional | | 1,000.00 | | 1,021.83 | | 0.67 | | 3.41 |
| | | Investor | | 1,000.00 | | 1,020.53 | | 0.93 | | 4.72 |
Small Cap Equity
| | Institutional | | 1,000.00 | | 1,020.69 | | 0.90 | | 4.56 |
| | | Investor | | 1,000.00 | | 1,019.36 | | 1.16 | | 5.90 |
International Equity Index
| | Institutional | | 1,000.00 | | 1,024.10 | | 0.22 | | 1.12 |
International Equity (3)
| | Institutional | | 1,000.00 | | 1,020.87 | | 0.86 | | 4.38 |
| | | Investor | | 1,000.00 | | 1,019.54 | | 1.12 | | 5.72 |
Emerging Markets Equity
| | Institutional | | 1,000.00 | | 1,019.77 | | 1.08 | | 5.49 |
| | | Investor | | 1,000.00 | | 1,018.27 | | 1.38 | | 7.00 |
Global Real Estate Securities
| | Institutional | | 1,000.00 | | 1,021.29 | | 0.78 | | 3.96 |
| | | Investor | | 1,000.00 | | 1,019.86 | | 1.06 | | 5.40 |
Strategic Alternatives (3)
| | Institutional | | 1,000.00 | | 1,019.45 | | 1.14 | | 5.81 |
| | | Investor | | 1,000.00 | | 1,017.88 | | 1.45 | | 7.39 |
(1) Expenses include the effect of contractual waivers by GuideStone Capital Management, LLC. The Target Date Funds’ and the Target Risk Funds’ proportionate share of the operating expenses of the Select Funds is not reflected in the tables above.
(2) Expenses are equal to the Fund’s annualized expense ratios for the period July 1, 2021, through December 31, 2021, multiplied by the average account value over the period, multiplied by 184/365 (to reflect the one-half year period).
(3) The expense ratios for the International Equity Fund and the Strategic Alternatives Fund include the impact of dividend or interest expense on securities sold short.
ABBREVIATIONS, FOOTNOTES AND INDEX DEFINITIONS
| INVESTMENT ABBREVIATIONS: |
| 10Y | — | 10 Year |
| 12Y | — | 12 Year |
| 1M | — | 1 Month |
| 1Y | — | 1 Year |
| 2M | — | 2 Month |
| 3M | — | 3 Month |
| 5Y | — | 5 Year |
| 6M | — | 6 Month |
| ABS | — | Asset-Backed Security |
| ACES | — | Alternative Credit Enhancement Securities |
| ADR | — | American Depositary Receipt |
| AEX | — | Amsterdam Exchange |
| AGM | — | Assured Guarantee Municipal Corporation |
| ARM | — | Adjustable Rate Mortgage |
| ASX | — | Australian Securities Exchange |
| BAM | — | Build America Mutual |
| BBR | — | Bank Bill Rate |
| BBSW | — | Bank Bill Swap Rate |
| Bobl | — | Bundesobligation ("federal government bond") |
| BUBOR | — | Budapest Interbank Offered Rate |
| Bund | — | Bundesanleihe ("federal bond") |
| CDI | — | Crest Depository Interest |
| CDO | — | Collateralized Debt Obligation |
| CDOR | — | Canadian Dollar Offered Rate |
| CDX | — | A series of indexes that track North American and emerging market credit derivative indexes. |
| Cetip | — | Central of Custody and Financial Settlement of Securities |
| CFETS | — | China Foreign Exchange Trade System |
| CLP-TNA | — | Chilean Pesos Floating Rate Index |
| CLO | — | Collateralized Loan Obligation |
| CME | — | Chicago Mercantile Exchange |
| CMT | — | Constant Maturity |
| COF | — | Cost of Funds |
| CONV | — | Convertible |
| COP-IBR-OIS | — | Certificate of Participation - Income-based Repayment - Overnight Indexed Swap |
| COPS | — | Certificates of Participation |
| CVA | — | Dutch Certificate |
| DAC | — | Designated Activity Company |
| DAX | — | Deutscher Aktien Index |
| ESTR | — | Euro Short-Term Rate |
| ETF | — | Exchange Traded Fund |
| EURIBOR | — | Euro Interbank Offered Rate |
| Fannie Mae | — | Federal National Mortgage Association |
| FHA | — | Federal Housing Administration |
| FHLMC | — | Federal Home Loan Mortgage Corporation |
| FRA | — | Forward Rate Agreements |
| FTSE | — | Financial Times Stock Exchange |
| GDR | — | Global Depositary Receipt |
| Gtd. | — | Guaranteed |
| HIBOR | — | Hong Kong Interbank Offered Rate |
| HTS | — | Harmonized Tariff Schedule |
| HUD | — | Housing and Urban Development |
| HY | — | High Yield |
| IBEX | — | Iberia Index |
| ICE | — | Intercontinental Exchange |
| IG | — | Investment Grade |
| IO | — | Interest Only (Principal amount shown is notional) |
| JIBAR | — | Johannesburg Interbank Average Rate |
| JSC | — | Joint Stock Company |
| KLCI | — | Kuala Lumpur Composite Index |
| KOSPI | — | Korea Composite Stock Price Index |
| KWCDC | — | Korean Won Certificate of Deposit |
| LIBOR | — | London Interbank Offered Rate |
| LLC | — | Limited Liability Company |
| LP | — | Limited Partnership |
| MIBOR | — | Mumbai Inter-Bank Overnight Rate |
| MSCI | — | Morgan Stanley Capital International |
| NA | — | North American |
| NIBOR | — | Norwegian Interbank Offered Rate |
| NVDR | — | Non-Voting Depository Receipt |
| OAT | — | Obligations Assimilables du Trésor |
| OMX | — | Stockholm Stock Exchange |
| PCL | — | Public Company Limited |
| PIK | — | Payment-in-Kind Bonds |
| PJSC | — | Public Joint Stock Company |
| PLC | — | Public Limited Company |
| PRIBOR | — | Prague Inter-bank Offered Rate |
| PSF | — | Permanent School Fund |
| Q-SBLF | — | Qualified School Bond Loan Fund |
| QPSC | — | Qualified Personal Service Corporation |
| QSC | — | Qatar Shareholder Company |
| REIT | — | Real Estate Investment Trust |
| REMIC | — | Real Estate Mortgage Investment Conduit |
| SA | — | Societe Anonyme |
| SAE | — | Societe Anonyme Egyptienne |
| SBA | — | Small Business Administration |
| SGX | — | Singapore Stock Exchange |
| SOFR | — | Secured Overnight Financing Rate |
| SONIA | — | Sterling Overnight Index Average Rate |
| SonyMA | — | State of New York Mortgage Agency |
| STACR | — | Structured Agency Credit Risk |
| STEP | — | Stepped Coupon Bonds: Interest rates shown reflect the rates currently in effect. |
| STIBOR | — | Stockholm Interbank Offered Rate |
| STRIP | — | Stripped Security |
| TBA | — | To be announced |
| Tbk | — | Terbuka |
| TELBOR | — | Tel Aviv Inter-Bank Offered Rate |
| THBFIX | — | Thai Baht Interest Rate Fixing |
| TIIE | — | The Equilibrium Interbank Interest Rate |
| TSX | — | Toronto Stock Exchange |
| WIBOR | — | Warsaw Interbank Offered Rate |
| 144A | — | Security was purchased pursuant to Rule 144A under the Securities Act of 1933 and may not be resold subject to that rule except to qualified institutional buyers. As of December 31, 2021, the total market values and percentages of net assets for 144A securities by fund were as follows: |
| Fund | | Value of
144A Securities | | Percentage of
Net Assets |
| Low-Duration Bond | | $393,711,448 | | 36.70% |
| Medium-Duration Bond | | 460,233,034 | | 19.10 |
| Global Bond | | 104,588,815 | | 16.79 |
| Defensive Market Strategies® | | 113,315,330 | | 7.53 |
| Global Impact Fund | | 4,717,056 | | 2.68 |
| International Equity Index | | 14,119,791 | | 1.69 |
| International Equity | | 29,360,538 | | 2.18 |
| Emerging Markets Equity | | 26,903,526 | | 3.26 |
| Global Real Estate Securities | | 1,300,901 | | 0.39 |
| Strategic Alternatives | | 21,087,503 | | 6.00 |
ABBREVIATIONS, FOOTNOTES AND INDEX DEFINITIONS
| INVESTMENT FOOTNOTES: |
| π | — | Century bond maturing in 2115. |
| ‡‡ | — | All or a portion of the security was held as collateral for open futures, options, securities sold short and/or swap agreements. |
| * | — | Non-income producing security. |
| # | — | Security in default. |
| § | — | Security purchased with the cash proceeds from securities loaned. |
| ^ | — | Variable rate security. Security issued at a fixed coupon rate, which converts to a variable rate at a specified date. Rate shown is the rate in effect as of year end. |
| † | — | Variable rate security. Rate shown reflects the rate in effect as of December 31, 2021. |
| γ | — | Variable or floating rate security, the interest rate of which adjusts periodically based on changes in current interest rates and prepayments on the underlying pool of assets. |
| Ω | — | Rate shown reflects the effective yield as of December 31, 2021. |
| ∞ | — | Affiliated fund. |
| Δ | — | Security either partially or fully on loan. |
| Σ | — | All or a portion of this position has not settled. Full contract rates do not take effect until settlement date. |
| ††† | — | Security is a Level 3 investment (see Note 2 in Notes to Financial Statements). |
| Ø | — | 7-day current yield as of December 31, 2021 is disclosed. |
| ρ | — | Perpetual bond. Maturity date represents the next call date. |
| ~ | — | Century bond maturing in 2121. |
| « | — | Century bond maturing in 2110. |
| ◊ | — | Current yield is disclosed. Dividends are calculated based on a percentage of the issuer’s net income. |
| € | — | Rounds to less than 1 share. |
| Ψ | — | Security is valued at fair value by the Valuation Committee (see Note 2 in Notes to Financial Statements). As of December 31, 2021, the total market values and percentages of net assets for Fair Valued securities by fund were as follows: |
| Fund | | Value of
Fair
Valued
Securities | | Percentage of
Net Assets |
| Medium-Duration Bond | | $ — | | 0.00% |
| Global Bond | | — | | 0.00 |
| International Equity | | — | | 0.00 |
| Emerging Markets Equity | | 966,150 | | 0.12 |
| | | | | |
| FOREIGN BOND FOOTNOTES: |
| (A) | — | Par is denominated in Australian Dollars (AUD). |
| (B) | — | Par is denominated in Brazilian Reals (BRL). |
| (C) | — | Par is denominated in Canadian Dollars (CAD). |
| (D) | — | Par is denominated in Danish Krone (DKK). |
| (E) | — | Par is denominated in Euro (EUR). |
| (I) | — | Par is denominated in Indonesian Rupiahs (IDR). |
| (J) | — | Par is denominated in Japanese Yen (JPY). |
| (M) | — | Par is denominated in Mexican Pesos (MXN). |
| (P) | — | Par is denominated in Polish Zloty (PLN). |
| (Q) | — | Par is denominated in Russian Rubles (RUB). |
| (S) | — | Par is denominated in South African Rand (ZAR). |
| (U) | — | Par is denominated in British Pounds (GBP). |
| (Y) | — | Par is denominated in Chinese Yuan (CNY). |
| (Z) | — | Par is denominated in New Zealand Dollars (NZD). |
| (ZB) | — | Par is denominated in Peruvian Sol (PEN). |
| (ZC) | — | Par is denominated in Israeli Shekels (ILS). |
| (ZE) | — | Par is denominated in Czech Koruna (CZK). |
| | | |
| COUNTERPARTY ABBREVIATIONS: |
| BAR | — | Counterparty to contract is Barclays Capital. |
| BNP | — | Counterparty to contract is BNP Paribas. |
| BOA | — | Counterparty to contract is Bank of America. |
| CITI | — | Counterparty to contract is Citibank NA London. |
| CS | — | Counterparty to contract is Credit Suisse International. |
| DEUT | — | Counterparty to contract is Deutsche Bank AG. |
| Evercore | — | Counterparty to contract is Evercore Inc. |
| GSC | — | Counterparty to contract is Goldman Sachs Capital Markets, LP. |
| HSBC | — | Counterparty to contract is HSBC Securities. |
| JPM | — | Counterparty to contract is JPMorgan Chase Bank. |
| MSCS | — | Counterparty to contract is Morgan Stanley Capital Services. |
| NT | — | Counterparty to contract is Northern Trust. |
| RBC | — | Counterparty to contract is Royal Bank of Canada. |
| RBS | — | Counterparty to contract is Royal Bank of Scotland. |
| SC | — | Counterparty to contract is Standard Chartered PLC. |
| SS | — | Counterparty to contract is State Street Global Markets. |
| UBS | — | Counterparty to contract is UBS AG. |
ABBREVIATIONS, FOOTNOTES AND INDEX DEFINITIONS
INDEX DEFINITIONS:
The Bloomberg Global Aggregate Bond Index is a flagship measure of global investment grade debt from 24 local currency markets. This multi-currency benchmark includes treasury, government-related, corporate and securitized fixed-rate bonds from both developed and emerging markets issuers.
The Bloomberg US Aggregate Bond Index is a broad-based flagship benchmark that measures the investment grade, U.S. dollar-denominated, fixed-rate taxable bond market. The index includes Treasuries, government-related and corporate securities, mortgage-backed securities (agency fixed-rate and hybrid adjustable-rate mortgage pass-throughs), asset-backed securities and commercial mortgage-backed securities (agency and non-agency).
The Bloomberg US Corporate High Yield 2% Issuer Capped Bond Index is an issuer-constrained version of the flagship US Corporate High Yield Index, which measures the U.S. dollar-denominated, high yield, fixed-rate corporate bond market. The index follows the same rules as the uncapped version but limits the exposure of each issuer to 2% of the total market value and redistributes any excess market value index-wide on a pro rata basis.
The FTSE EPRA/NAREIT Developed Index is designed to track the performance of listed real estate companies and REITs worldwide. By making the index constituents free-float adjusted, liquidity, size and revenue screened, the series is suitable for use as the basis for investment products.
The Bloomberg US Treasury 1-3 Year Index measures U.S. dollar-denominated, fixed-rate, nominal debt issued by the U.S. Treasury with one to 2.999 years to maturity. Treasury bills are excluded by the maturity constraint but are part of a separate short Treasury index. Separate Trading of Registered Interest and Principal of Securities (STRIPS) are excluded from the index because their inclusion would result in double-counting.
The Bloomberg 1-3 Month US Treasury Bill Index tracks the market for Treasury bills with one to 2.9999 months to maturity issued by the U.S. government. U.S. Treasury bills are issued in fixed maturity terms of 4-, 13-, 26- and 52-weeks.
The J.P. Morgan Emerging Markets Bond Index (EMBI) Plus is a traditional, market-capitalization weighted index comprised of U.S. dollar denominated Brady bonds, Eurobonds and traded loans issued by sovereign entities.
The MSCI ACWI (All Country World Index) ex USA Index is a free float-adjusted market capitalization index that is designed to measure equity market performance in the global developed (excluding the United States) and emerging markets.
The MSCI EAFE Index is a free float-adjusted market capitalization index that is designed to measure equity market performance of developed markets, excluding the United States and Canada. The index consists of the following 21 developed market country indices: Australia, Austria, Belgium, Denmark, Finland, France, Germany, Hong Kong, Ireland, Israel, Italy, Japan, the Netherlands, New Zealand, Norway, Portugal, Singapore, Spain, Sweden, Switzerland and the United Kingdom.
The MSCI Emerging Markets Index is a free float-adjusted market capitalization index that is designed to measure equity market performance of emerging markets. The index consists of the following 25 emerging market country indices: Brazil, Chile, China, Colombia, Czech Republic, Egypt, Greece, Hungary, India, Indonesia, Korea, Kuwait, Malaysia, Mexico, Peru, Philippines, Poland, Qatar, Russia, Saudi Arabia, South Africa, Taiwan, Thailand, Turkey and United Arab Emirates.
The Russell 1000® Growth Index is a large-cap index consisting of those Russell 1000® Index securities with greater-than-average growth orientation. Companies in this index tend to exhibit higher price-to-book and price-to-earnings-ratios, lower dividend yields and higher forecasted growth values than the value universe.
The Russell 1000® Value Index is a large-cap index consisting of those Russell 1000® Index securities with a less-than-average growth orientation. Companies in this index tend to exhibit lower price-to-book and price-to-earnings ratios, higher dividend yields and lower forecasted growth values than the growth universe.
The Russell 2000® Index measures the performance of the small-cap segment of the U.S. equity universe. The Russell 2000® Index is a subset of the Russell 3000® Index representing approximately 10% of the total market capitalization of that index. It includes approximately 2,000 of the smallest securities based on a combination of their market cap and current index membership. The Russell 2000® Index is constructed to provide a comprehensive and unbiased small-cap barometer and is completely reconstituted annually to ensure that larger stocks do not distort the performance and characteristics of the actual small-cap opportunity set.
The Russell 3000® Index is composed of approximately 3,000 large U.S. companies. This portfolio of securities represents approximately 98% of the investable U.S. equity market.
ABBREVIATIONS, FOOTNOTES AND INDEX DEFINITIONS
The S&P 500® Index is a market capitalization-weighted equity index composed of approximately 500 U.S. companies representing all major industries. The index is designed to measure performance of the broad domestic economy through changes in the aggregate market value of its constituents.
“Bloomberg®”, Bloomberg Global Aggregate Bond Index, Bloomberg US Aggregate Bond Index, Bloomberg US Corporate High Yield 2% Issuer Capped Bond Index, Bloomberg Global Aggregate Bond Index (USD-Hedged), Bloomberg US Treasury 1-3 Year Index, and Bloomberg 1-3 Month US Treasury Bill Index are service marks of Bloomberg Finance L.P. and its affiliates, including Bloomberg Index Services Limited (“BISL”), the administrator of the index (collectively, “Bloomberg”) and have been licensed for use for certain purposes by GuideStone Funds. Bloomberg is not affiliated with GuideStone Funds, and Bloomberg does not approve, endorse, review, or recommend GuideStone Funds. Bloomberg does not guarantee the timeliness, accurateness, or completeness of any data or information relating to GuideStone Funds.
GuideStone Funds are not in any way connected to or sponsored, endorsed, sold or promoted by the London Stock Exchange Group plc and its group undertakings, including FTSE International Limited (collectively, the “LSE Group”), European Public Real Estate Association (“EPRA”), or the National Association of Real Estate Investments Trusts (Nareit) (and together the “Licensor Parties”). FTSE Russell is a trading name of certain of the LSE Group Companies. All rights in the FTSE Russell Indexes vest in the Licensor Parties. “FTSE®” and “FTSE Russell®” are a trademark(s) of the relevant LSE Group company and are used by any other LSE Group company under license. “Nareit®” is a trademark of Nareit, “EPRA®” is a trademark of EPRA and all are used by the LSE Group under license. The FTSE Russell Indexes are calculated by or on behalf of FTSE International Limited or its affiliate, agent or partner. The Licensor Parties do not accept any liability whatsoever to any person arising out of (a) the use of, reliance on or any error in the FTSE Russell Indexes or (b) investment in or operation of the GuideStone Funds. The Licensor Parties make no claim, prediction, warranty or representation either as to the results to be obtained from the GuideStone Funds or the suitability of the FTSE Russell Indexes for the purpose to which it is being put by GuideStone Funds.
The funds or securities referred to herein are not sponsored, endorsed, or promoted by MSCI, and MSCI bears no liability with respect to any such funds or securities or any index on which such funds or securities are based. The prospectus contains a more detailed description of the limited relationship MSCI has with GuideStone Funds. Neither MSCI nor any other party involved in or related to compiling, computing or creating the MSCI data makes any express or implied warranties or representations with respect to such data (or the results to be obtained by the use thereof), and all such parties hereby expressly disclaim all warranties of originality, accuracy, completeness, merchantability or fitness for a particular purpose with respect to any of such data. Without limiting any of the foregoing, in no event shall MSCI, any of its affiliates or any third party involved in or related to compiling, computing or creating the data have any liability for any direct, indirect, special, punitive, consequential or any other damages (including lost profits) even if notified of the possibility of such damages. No further distribution or dissemination of the MSCI data is permitted without MSCI’s express written consent.
“Standard & Poor’s®”, “S&P®”, and “S&P 500®” are trademarks of The McGraw-Hill Companies, Inc. and have been licensed for use by GuideStone Funds. The Funds are not sponsored, endorsed, sold or promoted by Standard & Poor’s and Standard & Poor’s makes no representation regarding the advisability of investing in the Funds.
MyDestination 2015 Fund (Unaudited)
The Fund, through investments primarily in the Select Funds, combined a greater percentage of exposure to fixed income securities with smaller percentages allocated to equity securities and alternative investments. The Fund followed an allocation glide path designed to become more conservative over time, and the targeted allocations were approximately 51.00% fixed income securities, 46.00% equity securities and 3.00% alternative investments as of December 31, 2021.
As a fund of funds, the Fund’s performance was based on the performance of its underlying investments. The Investor Class of the Fund generated a return of 6.72% for the one-year period ended December 31, 2021. Contribution to absolute performance from each major asset class was positive, except for a slight drag from the Fund’s fixed income exposure. Exposure to U.S. equity securities produced relatively stronger performance than funds with primarily non-U.S. equity securities exposure. During the year, concerns over the spread of COVID-19 continued, and as a result, associated lockdowns, fluctuating global economic growth patterns and idiosyncratic circumstances (e.g., Chinese government interventions, general emerging market weakness and supply chain slowdowns) contributed to additional performance headwinds faced by companies outside of the United States. The Equity Index Fund was the largest equity contributor to Fund performance due to its broad exposure to the strength of stocks in the S&P 500® Index. Broadly, fixed income markets experienced one of their weakest years, as the Bloomberg US Aggregate Bond Index returned its first negative annual return since 2013. As such, the contribution to performance emanating from the fixed income Funds was the weakest. The contribution to absolute performance by the Fund’s exposure to real assets was positive, via exposure to the Global Real Estate Securities Fund as well as Treasury Inflation Protected Securities (TIPS). Exposure to the Strategic Alternatives Fund was a positive contributor to Fund performance as well, particularly when viewed through the lens of the Fund’s role in augmenting traditional fixed income. For more information on a Select Fund’s performance, please refer to that Select Fund’s section in this Annual Report.
Certain derivatives were utilized to provide market exposure for the cash positions held in the Fund. These derivative positions primarily included stock index futures and fixed income futures. Overall, derivative exposure had a positive impact on Fund performance for the year.
The Fund attempted to achieve its objective by investing in a diversified portfolio of primarily the Select Funds that represent various asset classes. The Fund is managed to the specific year included in its name (“Target Date”) and assumes a retirement age of 65. The Target Date refers to the approximate year an investor in the Fund would plan to retire and likely stop making any new investments in the Fund. The Fund is designed for an investor who anticipates retiring at or near the Target Date and who plans to withdraw the value of the account in the Fund gradually after retirement. Over time, the allocation to asset classes will change according to a predetermined “glide path,” which adjusts the percentage of fixed income securities and equity securities to become more conservative each year until 15 years after Target Date. The Fund’s value will fluctuate due to changes in interest rates. There is a risk that the issuer of a fixed income investment may fail to pay interest or even principal due in a timely manner or at all. The Fund’s value will fluctuate due to business developments concerning a particular issuer, industry or country, as well as general market and economic conditions. Securities of foreign issuers may be negatively impacted by political events, economic conditions or inefficient, illiquid or unregulated markets in foreign countries, and they also may be subject to inadequate regulatory or accounting standards, which may increase investment risk. By investing in this Fund, you will incur the expenses of the Fund in addition to those of the underlying Select Funds. You may directly invest in the Select Funds. The Fund’s value will go up and down in response to changes in the share prices of the investments that it owns. The amount invested in the Fund is not guaranteed to increase, is not guaranteed against loss nor is the amount of the original investment guaranteed at the Target Date. It is possible to lose money by investing in the Fund.
At December 31, 2021, the portfolio holdings of the Fund, as a percentage of net assets, is shown in the following table. Portfolio holdings are subject to risk and may change at any time.
| | % |
| Fixed Income Select Funds | 44.5 |
| U.S. Equity Select Funds | 32.2 |
| Non-U.S. Equity Select Funds | 11.3 |
| U.S. Treasury Obligations | 6.8 |
| Alternative Select Funds | 3.0 |
| Money Market Funds | 1.3 |
| Real Assets Select Funds | 0.9 |
| | 100.0 |
MyDestination 2015 Fund (Unaudited)
| Average Annual Total Returns as of 12/31/21 | |
| | | Institutional Class* | | Investor Class* | |
| One Year | | 6.98% | | 6.72% | |
| Five Year | | N/A | | 7.60% | |
| Ten Year | | N/A | | 6.81% | |
| Since Inception | | 7.40% | | 5.12% | |
| Inception Date | | 05/01/17 | | 12/29/02 | |
| Total Fund Operating Expenses (May 1, 2021 Prospectus)(1) | | 0.59% | | 0.84% | |
(1)The Fund’s shareholders indirectly bear the expenses of the Institutional Class shares of the Select Funds in which the Fund invests. Current information regarding the Fund’s Operating Expenses can be found in the Financial Highlights.
The performance data quoted represents past performance and does not guarantee future results. Current performance may be lower or higher. Performance data current to the most recent month-end may be obtained at GuideStoneFunds.com. The investment return and principal value of an investment will fluctuate so that shares, when redeemed, may be worth more or less than their original cost.
The Adviser has agreed to waive fees and/or reimburse expenses to the extent needed to limit total annual operating expenses to 0.50% for the Institutional Class and 0.75% for the Investor Class. This contractual waiver and reimbursement applies to Fund operating expenses only and will remain in place until April 30, 2022. Institutional Class Net Expense Ratio - 0.50% and Investor Class Net Expense Ratio - 0.75%.
The graph illustrates the results of a hypothetical $10,000 investment in the Investor Class of the Fund for the 10-year period from December 31, 2011 to December 31, 2021, with all dividends and capital gains reinvested.
*These returns reflect investment advisory and shareholder servicing fee waivers, if applicable, during the reported time periods.
Unlike a mutual fund, the performance of an index assumes no taxes, transaction costs, management fees or other expenses.
| | | Shares | | Value |
| MUTUAL FUNDS — 91.9% |
GuideStone Low-Duration Bond Fund
(Institutional Class)∞ | 8,542,721 | | $114,643,312 |
GuideStone Medium-Duration Bond Fund
(Institutional Class)∞ | 11,960,847 | | 179,891,135 |
GuideStone Global Bond Fund
(Institutional Class)∞ | 3,922,280 | | 38,320,680 |
GuideStone Defensive Market Strategies® Fund
(Institutional Class)∞ | 5,918,833 | | 84,639,309 |
GuideStone Equity Index Fund
(Institutional Class)∞ | 2,738,909 | | 138,561,428 |
GuideStone Small Cap Equity Fund
(Institutional Class)∞ | 896,090 | | 17,509,605 |
GuideStone International Equity Index Fund
(Institutional Class)∞ | 4,929,009 | | 59,443,848 |
GuideStone Emerging Markets Equity Fund
(Institutional Class)∞ | 2,281,938 | | 24,348,279 |
GuideStone Global Real Estate Securities Fund
(Institutional Class)∞ | 589,197 | | 6,793,438 |
GuideStone Strategic Alternatives Fund
(Institutional Class)∞ | 2,149,046 | | 22,113,678 |
Total Mutual Funds
(Cost $621,655,963) | | 686,264,712 |
| MONEY MARKET FUNDS — 1.3% |
GuideStone Money Market Fund, 0.00%
(Institutional Class)Ø∞ | 9,410,133 | | 9,410,133 |
| | | Shares | | Value |
| Northern Institutional U.S. Government Portfolio (Shares), 0.00%Ø | 40,525 | | $ 40,525 |
Total Money Market Funds
(Cost $9,450,658) | | 9,450,658 |
| | | Par | |
| U.S. TREASURY OBLIGATIONS — 6.8% |
| U.S. Treasury Inflationary Index Bonds | | | |
| 0.63%, 04/15/23 | $ 2,210,910 | 2,317,128 |
| 0.13%, 07/15/24 | 12,685,216 | 13,527,678 |
| 0.13%, 07/15/26 | 6,773,334 | 7,357,511 |
| 0.38%, 07/15/27 | 2,645,838 | 2,937,014 |
| 3.88%, 04/15/29 | 8,849,845 | 12,333,070 |
| 3.38%, 04/15/32 | 2,758,103 | 4,105,099 |
| 0.63%, 02/15/43 | 3,194,045 | 3,973,598 |
| 1.00%, 02/15/48 | 2,546,100 | 3,573,363 |
| 0.13%, 02/15/51 | 626,798 | 743,036 |
Total U.S. Treasury Obligations
(Cost $49,797,569) | 50,867,497 |
TOTAL INVESTMENTS — 100.0%
(Cost $680,904,190) | | 746,582,867 |
Other Assets in Excess of
Liabilities — 0.0% | | 117,683 |
| NET ASSETS — 100.0% | | $746,700,550 |
Futures Contracts outstanding at December 31, 2021:
| Future Type | | Expiration Date | | Open Long
(Short) Contracts | | Notional
Market Value
of Contracts | | Value and
Unrealized
Appreciation
(Depreciation) |
| MSCI EAFE Index | | 03/2022 | | 8 | | $ 928,720 | | $14,239 |
| MSCI Emerging Markets | | 03/2022 | | 4 | | 245,260 | | (942) |
| S&P 500® E-Mini | | 03/2022 | | 9 | | 2,141,325 | | 31,989 |
| 10-Year U.S. Treasury Note | | 03/2022 | | 32 | | 4,175,000 | | 29,748 |
| Total Futures Contracts outstanding at December 31, 2021 | | | | | | $7,490,305 | | $75,034 |
See Notes to Financial Statements.
VALUATION HIERARCHY
The following is a summary of the inputs used, as of December 31, 2021, in valuing the Fund’s investments carried at fair value:
| | Total
Value | | Level 1
Quoted Prices | | Level 2
Other Significant
Observable Inputs | | Level 3
Significant
Unobservable Inputs |
| Assets: | | | | | | | |
| Investments in Securities: | | | | | | | |
| Money Market Funds | $ 9,450,658 | | $ 9,450,658 | | $ — | | $ — |
| Mutual Funds | 686,264,712 | | 686,264,712 | | — | | — |
| U.S. Treasury Obligations | 50,867,497 | | — | | 50,867,497 | | — |
| Total Assets - Investments in Securities | $746,582,867 | | $695,715,370 | | $50,867,497 | | $ — |
| Other Financial Instruments*** | | | | | | | |
| Futures Contracts | $ 75,976 | | $ 75,976 | | $ — | | $ — |
| Total Assets - Other Financial Instruments | $ 75,976 | | $ 75,976 | | $ — | | $ — |
| Liabilities: | | | | | | | |
| Other Financial Instruments*** | | | | | | | |
| Futures Contracts | $ (942) | | $ (942) | | $ — | | $ — |
| Total Liabilities - Other Financial Instruments | $ (942) | | $ (942) | | $ — | | $ — |
| *** | Other financial instruments are derivative instruments, such as futures contracts, which are valued at the unrealized appreciation (depreciation) on the investment. Further details regarding the value of these investments can be found in the preceding "Futures Contracts outstanding" disclosure. |
See Notes to Financial Statements.
MyDestination 2025 Fund (Unaudited)
The Fund, through investments primarily in the Select Funds, combined a greater percentage of exposure to equity securities with smaller percentages allocated to fixed income securities, real assets and alternative investments. The Fund followed an allocation glide path designed to become more conservative over time, and the targeted allocations were approximately 41.00% fixed income securities, 56.00% equity securities, 1.00% real assets and 2.00% alternative investments as of December 31, 2021.
As a fund of funds, the Fund’s performance was based on the performance of its underlying investments. The Investor Class of the Fund generated a return of 8.91% for the one-year period ended December 31, 2021. Contribution to absolute performance from all major asset classes was positive, except for a slight drag on performance from the Fund’s fixed income exposure. Exposure to U.S. equity securities produced relatively stronger performance than funds with primarily non-U.S. equity securities exposure. During the year, concerns over the spread of COVID-19 continued, and as a result, associated lockdowns, fluctuating global economic growth patterns and idiosyncratic circumstances (e.g., Chinese government interventions, general emerging market weakness and supply chain slowdowns) contributed to additional performance headwinds faced by companies outside of the United States. The Equity Index Fund was the largest equity contributor to Fund performance due to its broad exposure to the strength of stocks in the S&P 500® Index. Broadly, fixed income markets experienced one of their weakest years, as the Bloomberg US Aggregate Bond Index returned its first negative annual return since 2013. As such, the contribution to performance emanating from the fixed income Funds was the weakest. The contribution to absolute performance by the Fund’s exposure to real assets was positive, via exposure to the Global Real Estate Securities Fund as well as Treasury Inflation Protected Securities (TIPS). Exposure to the Strategic Alternatives Fund exposure was a positive contributor to Fund performance, particularly when viewed through the lens of the Fund’s role in augmenting traditional fixed income. For more information on a Select Fund’s performance, please refer to that Select Fund’s section in this Annual Report.
Certain derivatives were utilized to provide market exposure for the cash positions held in the Fund. These derivative positions primarily included stock index futures and fixed income futures. Overall, derivative exposure had a positive impact on Fund performance for the year.
The Fund attempted to achieve its objective by investing in a diversified portfolio of primarily the Select Funds that represent various asset classes. The Fund is managed to the specific year included in its name (“Target Date”) and assumes a retirement age of 65. The Target Date refers to the approximate year an investor in the Fund would plan to retire and likely stop making any new investments in the Fund. The Fund is designed for an investor who anticipates retiring at or near the Target Date and who plans to withdraw the value of the account in the Fund gradually after retirement. Over time, the allocation to asset classes will change according to a predetermined “glide path,” which adjusts the percentage of fixed income securities and equity securities to become more conservative each year until 15 years after Target Date. The Fund’s value will fluctuate due to changes in interest rates. There is a risk that the issuer of a fixed income investment may fail to pay interest or even principal due in a timely manner or at all. The Fund’s value will fluctuate due to business developments concerning a particular issuer, industry or country, as well as general market and economic conditions. Securities of foreign issuers may be negatively impacted by political events, economic conditions or inefficient, illiquid or unregulated markets in foreign countries, and they also may be subject to inadequate regulatory or accounting standards, which may increase investment risk. By investing in this Fund, you will incur the expenses of the Fund in addition to those of the underlying Select Funds. You may directly invest in the Select Funds. The Fund’s value will go up and down in response to changes in the share prices of the investments that it owns. The amount invested in the Fund is not guaranteed to increase, is not guaranteed against loss nor is the amount of the original investment guaranteed at the Target Date. It is possible to lose money by investing in the Fund.
At December 31, 2021, the portfolio holdings of the Fund, as a percentage of net assets, is shown in the following table. Portfolio holdings are subject to risk and may change at any time.
| | % |
| U.S. Equity Select Funds | 39.9 |
| Fixed Income Select Funds | 37.6 |
| Non-U.S. Equity Select Funds | 15.0 |
| U.S. Treasury Obligations | 3.0 |
| Alternative Select Funds | 1.9 |
| Money Market Funds | 1.4 |
| Real Assets Select Funds | 1.2 |
| | 100.0 |
See Notes to Financial Statements.
MyDestination 2025 Fund (Unaudited)
| Average Annual Total Returns as of 12/31/21 | |
| | | Institutional Class* | | Investor Class* | |
| One Year | | 9.17% | | 8.91% | |
| Five Year | | N/A | | 9.27% | |
| Ten Year | | N/A | | 8.33% | |
| Since Inception | | 8.94% | | 5.66% | |
| Inception Date | | 05/01/17 | | 12/29/06 | |
| Total Fund Operating Expenses (May 1, 2021 Prospectus)(1) | | 0.53% | | 0.79% | |
(1)The Fund’s shareholders indirectly bear the expenses of the Institutional Class shares of the Select Funds in which the Fund invests. Current information regarding the Fund’s Operating Expenses can be found in the Financial Highlights.
The performance data quoted represents past performance and does not guarantee future results. Current performance may be lower or higher. Performance data current to the most recent month-end may be obtained at GuideStoneFunds.com. The investment return and principal value of an investment will fluctuate so that shares, when redeemed, may be worth more or less than their original cost.
The Adviser has agreed to waive fees and/or reimburse expenses to the extent needed to limit total annual operating expenses to 0.50% for the Institutional Class and 0.75% for the Investor Class. This contractual waiver and reimbursement applies to Fund operating expenses only and will remain in place until April 30, 2022. Institutional Class Net Expense Ratio - 0.50% and Investor Class Net Expense Ratio - 0.75%.
The graph illustrates the results of a hypothetical $10,000 investment in the Investor Class of the Fund for the 10-year period from December 31, 2011 to December 31, 2021, with all dividends and capital gains reinvested.
*These returns reflect investment advisory and shareholder servicing fee waivers, if applicable, during the reported time periods.
Unlike a mutual fund, the performance of an index assumes no taxes, transaction costs, management fees or other expenses.
See Notes to Financial Statements.
| | | Shares | | Value |
| MUTUAL FUNDS — 95.6% |
GuideStone Low-Duration Bond Fund
(Institutional Class)∞ | 11,106,359 | | $ 149,047,337 |
GuideStone Medium-Duration Bond Fund
(Institutional Class)∞ | 28,287,069 | | 425,437,514 |
GuideStone Global Bond Fund
(Institutional Class)∞ | 9,844,124 | | 96,177,095 |
GuideStone Defensive Market Strategies® Fund
(Institutional Class)∞ | 15,211,020 | | 217,517,587 |
GuideStone Equity Index Fund
(Institutional Class)∞ | 8,733,223 | | 441,813,728 |
GuideStone Small Cap Equity Fund
(Institutional Class)∞ | 2,777,940 | | 54,280,956 |
GuideStone International Equity Index Fund
(Institutional Class)∞ | 15,631,860 | | 188,520,232 |
GuideStone Emerging Markets Equity Fund
(Institutional Class)∞ | 7,420,543 | | 79,177,199 |
GuideStone Global Real Estate Securities Fund
(Institutional Class)∞ | 1,803,138 | | 20,790,179 |
GuideStone Strategic Alternatives Fund
(Institutional Class)∞ | 3,368,573 | | 34,662,616 |
Total Mutual Funds
(Cost $1,498,800,889) | | 1,707,424,443 |
| MONEY MARKET FUNDS — 1.4% |
GuideStone Money Market Fund, 0.00%
(Institutional Class)Ø∞ | 25,164,442 | | 25,164,442 |
| | | Shares | | Value |
| Northern Institutional U.S. Government Portfolio (Shares), 0.00%Ø | 11,878 | | $ 11,878 |
Total Money Market Funds
(Cost $25,176,320) | | 25,176,320 |
| | | Par | |
| U.S. TREASURY OBLIGATIONS — 3.0% |
| U.S. Treasury Inflationary Index Bonds | | | |
| 0.63%, 04/15/23 | $ 2,333,121 | 2,445,210 |
| 0.13%, 07/15/24 | 13,430,720 | 14,322,693 |
| 0.13%, 07/15/26 | 7,084,885 | 7,695,932 |
| 0.38%, 07/15/27 | 2,781,522 | 3,087,630 |
| 3.88%, 04/15/29 | 9,371,414 | 13,059,924 |
| 3.38%, 04/15/32 | 2,882,762 | 4,290,640 |
| 0.63%, 02/15/43 | 3,398,560 | 4,228,028 |
| 1.00%, 02/15/48 | 2,697,520 | 3,785,875 |
| 0.13%, 02/15/51 | 690,541 | 818,599 |
Total U.S. Treasury Obligations
(Cost $52,592,231) | 53,734,531 |
TOTAL INVESTMENTS — 100.0%
(Cost $1,576,569,440) | | 1,786,335,294 |
Other Assets in Excess of
Liabilities — 0.0% | | 356,616 |
| NET ASSETS — 100.0% | | $1,786,691,910 |
Futures Contracts outstanding at December 31, 2021:
| Future Type | | Expiration Date | | Open Long
(Short) Contracts | | Notional
Market Value
of Contracts | | Value and
Unrealized
Appreciation
(Depreciation) |
| MSCI EAFE Index | | 03/2022 | | 34 | | $ 3,947,060 | | $ 49,827 |
| MSCI Emerging Markets | | 03/2022 | | 16 | | 981,040 | | (2,615) |
| S&P 500® E-Mini | | 03/2022 | | 31 | | 7,375,675 | | 124,526 |
| 10-Year U.S. Treasury Note | | 03/2022 | | 78 | | 10,176,563 | | 95,746 |
| Total Futures Contracts outstanding at December 31, 2021 | | | | | | $22,480,338 | | $267,484 |
See Notes to Financial Statements.
VALUATION HIERARCHY
The following is a summary of the inputs used, as of December 31, 2021, in valuing the Fund’s investments carried at fair value:
| | Total
Value | | Level 1
Quoted Prices | | Level 2
Other Significant
Observable Inputs | | Level 3
Significant
Unobservable Inputs |
| Assets: | | | | | | | |
| Investments in Securities: | | | | | | | |
| Money Market Funds | $ 25,176,320 | | $ 25,176,320 | | $ — | | $ — |
| Mutual Funds | 1,707,424,443 | | 1,707,424,443 | | — | | — |
| U.S. Treasury Obligations | 53,734,531 | | — | | 53,734,531 | | — |
| Total Assets - Investments in Securities | $1,786,335,294 | | $1,732,600,763 | | $53,734,531 | | $ — |
| Other Financial Instruments*** | | | | | | | |
| Futures Contracts | $ 270,099 | | $ 270,099 | | $ — | | $ — |
| Total Assets - Other Financial Instruments | $ 270,099 | | $ 270,099 | | $ — | | $ — |
| Liabilities: | | | | | | | |
| Other Financial Instruments*** | | | | | | | |
| Futures Contracts | $ (2,615) | | $ (2,615) | | $ — | | $ — |
| Total Liabilities - Other Financial Instruments | $ (2,615) | | $ (2,615) | | $ — | | $ — |
| *** | Other financial instruments are derivative instruments, such as futures contracts, which are valued at the unrealized appreciation (depreciation) on the investment. Further details regarding the value of these investments can be found in the preceding "Futures Contracts outstanding" disclosure. |
See Notes to Financial Statements.
MyDestination 2035 Fund (Unaudited)
The Fund, through investments primarily in the Select Funds, combined a greater percentage of exposure to equity securities with smaller percentages allocated to fixed income securities and real assets. The Fund followed an allocation glide path designed to become more conservative over time, and the targeted allocations were approximately 24.00% fixed income securities, 74.00% equity securities and 2.00% real assets as of December 31, 2021.
As a fund of funds, the Fund’s performance was based on the performance of its underlying investments. The Investor Class of the Fund generated a return of 13.04% for the one-year period ended December 31, 2021. Contribution to absolute performance from all major asset classes was positive, except for a slight drag on performance from the Fund’s fixed income exposure. Exposure to U.S. equity securities produced relatively stronger performance than funds with primarily non-U.S. equity securities exposure. During the year, concerns over the spread of COVID-19 continued, and as a result, associated lockdowns, fluctuating global economic growth patterns and idiosyncratic circumstances (e.g., Chinese government interventions, general emerging market weakness and supply chain slowdowns) contributed to additional performance headwinds faced by companies outside of the United States. The Equity Index Fund was the largest equity contributor to Fund performance due to its broad exposure to the strength of stocks in the S&P 500® Index. Broadly, fixed income markets experienced one of their weakest years, as the Bloomberg US Aggregate Bond Index returned its first negative annual return since 2013. As such, the contribution to performance emanating from the fixed income Funds was the weakest. The contribution to absolute performance by the Fund’s exposure to real assets was positive, via exposure to the Global Real Estate Securities Fund. For more information on a Select Fund’s performance, please refer to that Select Fund’s section in this Annual Report.
Certain derivatives were utilized to provide market exposure for the cash positions held in the Fund. These derivative positions primarily included stock index futures and fixed income futures. Overall, derivative exposure had a positive impact on Fund performance for the year.
The Fund attempted to achieve its objective by investing in a diversified portfolio of primarily the Select Funds that represent various asset classes. The Fund is managed to the specific year included in its name (“Target Date”) and assumes a retirement age of 65. The Target Date refers to the approximate year an investor in the Fund would plan to retire and likely stop making any new investments in the Fund. The Fund is designed for an investor who anticipates retiring at or near the Target Date and who plans to withdraw the value of the account in the Fund gradually after retirement. Over time, the allocation to asset classes will change according to a predetermined “glide path,” which adjusts the percentage of fixed income securities and equity securities to become more conservative each year until 15 years after Target Date. The Fund’s value will fluctuate due to changes in interest rates. There is a risk that the issuer of a fixed income investment may fail to pay interest or even principal due in a timely manner or at all. The Fund’s value will fluctuate due to business developments concerning a particular issuer, industry or country, as well as general market and economic conditions. Securities of foreign issuers may be negatively impacted by political events, economic conditions or inefficient, illiquid or unregulated markets in foreign countries, and they also may be subject to inadequate regulatory or accounting standards, which may increase investment risk. By investing in this Fund, you will incur the expenses of the Fund in addition to those of the underlying Select Funds. You may directly invest in the Select Funds. The Fund’s value will go up and down in response to changes in the share prices of the investments that it owns. The amount invested in the Fund is not guaranteed to increase, is not guaranteed against loss nor is the amount of the original investment guaranteed at the Target Date. It is possible to lose money by investing in the Fund.
At December 31, 2021, the portfolio holdings of the Fund, as a percentage of net assets, is shown in the following table. Portfolio holdings are subject to risk and may change at any time.
| | % |
| U.S. Equity Select Funds | 50.2 |
| Fixed Income Select Funds | 23.0 |
| Non-U.S. Equity Select Funds | 22.7 |
| Money Market Funds | 2.2 |
| Real Assets Select Funds | 1.5 |
| Alternative Select Funds | 0.4 |
| | 100.0 |
See Notes to Financial Statements.
MyDestination 2035 Fund (Unaudited)
| Average Annual Total Returns as of 12/31/21 | |
| | | Institutional Class* | | Investor Class* | |
| One Year | | 13.29% | | 13.04% | |
| Five Year | | N/A | | 11.49% | |
| Ten Year | | N/A | | 9.99% | |
| Since Inception | | 11.09% | | 6.17% | |
| Inception Date | | 05/01/17 | | 12/29/06 | |
| Total Fund Operating Expenses (May 1, 2021 Prospectus)(1) | | 0.50% | | 0.75% | |
(1)The Fund’s shareholders indirectly bear the expenses of the Institutional Class shares of the Select Funds in which the Fund invests. Current information regarding the Fund’s Operating Expenses can be found in the Financial Highlights.
The performance data quoted represents past performance and does not guarantee future results. Current performance may be lower or higher. Performance data current to the most recent month-end may be obtained at GuideStoneFunds.com. The investment return and principal value of an investment will fluctuate so that shares, when redeemed, may be worth more or less than their original cost.
The graph illustrates the results of a hypothetical $10,000 investment in the Investor Class of the Fund for the 10-year period from December 31, 2011 to December 31, 2021, with all dividends and capital gains reinvested.
*These returns reflect investment advisory and shareholder servicing fee waivers, if applicable, during the reported time periods.
Unlike a mutual fund, the performance of an index assumes no taxes, transaction costs, management fees or other expenses.
See Notes to Financial Statements.
| | | Shares | | Value |
| MUTUAL FUNDS — 97.8% |
GuideStone Medium-Duration Bond Fund
(Institutional Class)∞ | 17,422,956 | | $262,041,259 |
GuideStone Global Bond Fund
(Institutional Class)∞ | 6,786,777 | | 66,306,811 |
GuideStone Defensive Market Strategies® Fund
(Institutional Class)∞ | 7,787,891 | | 111,366,843 |
GuideStone Equity Index Fund
(Institutional Class)∞ | 10,698,742 | | 541,249,356 |
GuideStone Small Cap Equity Fund
(Institutional Class)∞ | 3,304,902 | | 64,577,777 |
GuideStone International Equity Index Fund
(Institutional Class)∞ | 18,954,201 | | 228,587,658 |
GuideStone Emerging Markets Equity Fund
(Institutional Class)∞ | 9,022,535 | | 96,270,451 |
GuideStone Global Real Estate Securities Fund
(Institutional Class)∞ | 1,896,102 | | 21,862,058 |
| | | Shares | | Value |
GuideStone Strategic Alternatives Fund
(Institutional Class)∞ | 501,381 | | $ 5,159,214 |
Total Mutual Funds
(Cost $1,177,147,062) | | 1,397,421,427 |
| MONEY MARKET FUNDS — 2.2% |
GuideStone Money Market Fund, 0.00%
(Institutional Class)Ø∞
(Cost $31,482,822) | 31,482,822 | | 31,482,822 |
TOTAL INVESTMENTS — 100.0%
(Cost $1,208,629,884) | | | 1,428,904,249 |
Other Assets in Excess of
Liabilities — 0.0% | | | 703,814 |
| NET ASSETS — 100.0% | | | $1,429,608,063 |
Futures Contracts outstanding at December 31, 2021:
| Future Type | | Expiration Date | | Open Long
(Short) Contracts | | Notional
Market Value
of Contracts | | Value and
Unrealized
Appreciation
(Depreciation) |
| MSCI EAFE Index | | 03/2022 | | 60 | | $ 6,965,400 | | $108,166 |
| MSCI Emerging Markets | | 03/2022 | | 29 | | 1,778,135 | | (10,065) |
| S&P 500® E-Mini | | 03/2022 | | 55 | | 13,085,875 | | 271,508 |
| 10-Year U.S. Treasury Note | | 03/2022 | | 63 | | 8,219,531 | | 83,295 |
| Total Futures Contracts outstanding at December 31, 2021 | | | | | | $30,048,941 | | $452,904 |
See Notes to Financial Statements.
VALUATION HIERARCHY
The following is a summary of the inputs used, as of December 31, 2021, in valuing the Fund’s investments carried at fair value:
| | Total
Value | | Level 1
Quoted Prices | | Level 2
Other Significant
Observable Inputs | | Level 3
Significant
Unobservable Inputs |
| Assets: | | | | | | | |
| Investments in Securities: | | | | | | | |
| Money Market Funds | $ 31,482,822 | | $ 31,482,822 | | $ — | | $ — |
| Mutual Funds | 1,397,421,427 | | 1,397,421,427 | | — | | — |
| Total Assets - Investments in Securities | $1,428,904,249 | | $1,428,904,249 | | $ — | | $ — |
| Other Financial Instruments*** | | | | | | | |
| Futures Contracts | $ 462,969 | | $ 462,969 | | $ — | | $ — |
| Total Assets - Other Financial Instruments | $ 462,969 | | $ 462,969 | | $ — | | $ — |
| Liabilities: | | | | | | | |
| Other Financial Instruments*** | | | | | | | |
| Futures Contracts | $ (10,065) | | $ (10,065) | | $ — | | $ — |
| Total Liabilities - Other Financial Instruments | $ (10,065) | | $ (10,065) | | $ — | | $ — |
| *** | Other financial instruments are derivative instruments, such as futures contracts, which are valued at the unrealized appreciation (depreciation) on the investment. Further details regarding the value of these investments can be found in the preceding "Futures Contracts outstanding" disclosure. |
See Notes to Financial Statements.
MyDestination 2045 Fund (Unaudited)
The Fund, through investments primarily in the Select Funds, combined a high percentage of exposure to equity securities with only modest percentages allocated to fixed income securities and real assets. The Fund followed an allocation glide path designed to become more conservative over time, and the targeted allocations were approximately 9.00% fixed income securities, 89.00% equity securities and 2.00% real assets as of December 31, 2021.
As a fund of funds, the Fund’s performance was based on the performance of its underlying investments. The Investor Class of the Fund generated a return of 16.26% for the one-year period ended December 31, 2021. Contribution to absolute performance from all major asset classes was positive, except for a slight drag on performance from the Fund’s fixed income exposure. Exposure to U.S. equity securities produced relatively stronger performance than funds with primarily non-U.S. equity securities exposure. During the year, concerns over the spread of COVID-19 continued, and as a result, associated lockdowns, fluctuating global economic growth patterns and idiosyncratic circumstances (e.g., Chinese government interventions, general emerging market weakness and supply chain slowdowns) contributed to additional performance headwinds faced by companies outside of the United States. The Equity Index Fund was the largest equity contributor to Fund performance due to its broad exposure to the strength of stocks in the S&P 500® Index. Broadly, fixed income markets experienced one of their weakest years, as the Bloomberg US Aggregate Bond Index returned its first negative annual return since 2013. As such, the contribution to performance emanating from the fixed income Funds was the weakest. The contribution to absolute performance by the Fund’s exposure to real assets was positive, via exposure to the Global Real Estate Securities Fund. For more information on a Select Fund’s performance, please refer to that Select Fund’s section in this Annual Report.
Certain derivatives were utilized to provide market exposure for the cash positions held in the Fund. These derivative positions primarily included stock index futures and fixed income futures. Overall, derivative exposure had a positive impact on Fund performance for the year.
The Fund attempted to achieve its objective by investing in a diversified portfolio of primarily the Select Funds that represent various asset classes. The Fund is managed to the specific year included in its name (“Target Date”) and assumes a retirement age of 65. The Target Date refers to the approximate year an investor in the Fund would plan to retire and likely stop making any new investments in the Fund. The Fund is designed for an investor who anticipates retiring at or near the Target Date and who plans to withdraw the value of the account in the Fund gradually after retirement. Over time, the allocation to asset classes will change according to a predetermined “glide path,” which adjusts the percentage of fixed income securities and equity securities to become more conservative each year until 15 years after Target Date. The Fund’s value will fluctuate due to changes in interest rates. There is a risk that the issuer of a fixed income investment may fail to pay interest or even principal due in a timely manner or at all. The Fund’s value will fluctuate due to business developments concerning a particular issuer, industry or country, as well as general market and economic conditions. Securities of foreign issuers may be negatively impacted by political events, economic conditions or inefficient, illiquid or unregulated markets in foreign countries, and they also may be subject to inadequate regulatory or accounting standards, which may increase investment risk. By investing in this Fund, you will incur the expenses of the Fund in addition to those of the underlying Select Funds. You may directly invest in the Select Funds. The Fund’s value will go up and down in response to changes in the share prices of the investments that it owns. The amount invested in the Fund is not guaranteed to increase, is not guaranteed against loss nor is the amount of the original investment guaranteed at the Target Date. It is possible to lose money by investing in the Fund.
At December 31, 2021, the portfolio holdings of the Fund, as a percentage of net assets, is shown in the following table. Portfolio holdings are subject to risk and may change at any time.
| | % |
| U.S. Equity Select Funds | 57.8 |
| Non-U.S. Equity Select Funds | 28.1 |
| Fixed Income Select Funds | 9.9 |
| Money Market Funds | 2.3 |
| Real Assets Select Funds | 1.8 |
| | 99.9 |
See Notes to Financial Statements.
MyDestination 2045 Fund (Unaudited)
| Average Annual Total Returns as of 12/31/21 | |
| | | Institutional Class* | | Investor Class* | |
| One Year | | 16.61% | | 16.26% | |
| Five Year | | N/A | | 12.89% | |
| Ten Year | | N/A | | 10.83% | |
| Since Inception | | 12.43% | | 6.48% | |
| Inception Date | | 05/01/17 | | 12/29/06 | |
| Total Fund Operating Expenses (May 1, 2021 Prospectus)(1) | | 0.48% | | 0.75% | |
(1)The Fund’s shareholders indirectly bear the expenses of the Institutional Class shares of the Select Funds in which the Fund invests. Current information regarding the Fund’s Operating Expenses can be found in the Financial Highlights.
The performance data quoted represents past performance and does not guarantee future results. Current performance may be lower or higher. Performance data current to the most recent month-end may be obtained at GuideStoneFunds.com. The investment return and principal value of an investment will fluctuate so that shares, when redeemed, may be worth more or less than their original cost.
The graph illustrates the results of a hypothetical $10,000 investment in the Investor Class of the Fund for the 10-year period from December 31, 2011 to December 31, 2021, with all dividends and capital gains reinvested.
*These returns reflect investment advisory and shareholder servicing fee waivers, if applicable, during the reported time periods.
Unlike a mutual fund, the performance of an index assumes no taxes, transaction costs, management fees or other expenses.
See Notes to Financial Statements.
| | | Shares | | Value |
| MUTUAL FUNDS — 97.6% |
GuideStone Medium-Duration Bond Fund
(Institutional Class)∞ | 5,843,914 | | $ 87,892,463 |
GuideStone Global Bond Fund
(Institutional Class)∞ | 2,228,364 | | 21,771,112 |
GuideStone Defensive Market Strategies® Fund
(Institutional Class)∞ | 3,909,600 | | 55,907,284 |
GuideStone Equity Index Fund
(Institutional Class)∞ | 10,359,571 | | 524,090,684 |
GuideStone Small Cap Equity Fund
(Institutional Class)∞ | 3,294,854 | | 64,381,441 |
GuideStone International Equity Index Fund
(Institutional Class)∞ | 18,301,418 | | 220,715,102 |
GuideStone Emerging Markets Equity Fund
(Institutional Class)∞ | 8,689,570 | | 92,717,720 |
| | | Shares | | Value |
GuideStone Global Real Estate Securities Fund
(Institutional Class)∞ | 1,739,968 | | $ 20,061,829 |
Total Mutual Funds
(Cost $875,227,353) | | 1,087,537,635 |
| MONEY MARKET FUNDS — 2.3% |
GuideStone Money Market Fund, 0.00%
(Institutional Class)Ø∞
(Cost $26,132,248) | 26,132,248 | | 26,132,248 |
TOTAL INVESTMENTS — 99.9%
(Cost $901,359,601) | | | 1,113,669,883 |
Other Assets in Excess of
Liabilities — 0.1% | | | 1,042,489 |
| NET ASSETS — 100.0% | | | $1,114,712,372 |
Futures Contracts outstanding at December 31, 2021:
| Future Type | | Expiration Date | | Open Long
(Short) Contracts | | Notional
Market Value
of Contracts | | Value and
Unrealized
Appreciation
(Depreciation) |
| MSCI EAFE Index | | 03/2022 | | 59 | | $ 6,849,310 | | $106,680 |
| MSCI Emerging Markets | | 03/2022 | | 28 | | 1,716,820 | | (10,196) |
| S&P 500® E-Mini | | 03/2022 | | 53 | | 12,610,025 | | 261,635 |
| 10-Year U.S. Treasury Note | | 03/2022 | | 26 | | 3,392,188 | | 37,243 |
| Total Futures Contracts outstanding at December 31, 2021 | | | | | | $24,568,343 | | $395,362 |
See Notes to Financial Statements.
VALUATION HIERARCHY
The following is a summary of the inputs used, as of December 31, 2021, in valuing the Fund’s investments carried at fair value:
| | Total
Value | | Level 1
Quoted Prices | | Level 2
Other Significant
Observable Inputs | | Level 3
Significant
Unobservable Inputs |
| Assets: | | | | | | | |
| Investments in Securities: | | | | | | | |
| Money Market Funds | $ 26,132,248 | | $ 26,132,248 | | $ — | | $ — |
| Mutual Funds | 1,087,537,635 | | 1,087,537,635 | | — | | — |
| Total Assets - Investments in Securities | $1,113,669,883 | | $1,113,669,883 | | $ — | | $ — |
| Other Financial Instruments*** | | | | | | | |
| Futures Contracts | $ 405,558 | | $ 405,558 | | $ — | | $ — |
| Total Assets - Other Financial Instruments | $ 405,558 | | $ 405,558 | | $ — | | $ — |
| Liabilities: | | | | | | | |
| Other Financial Instruments*** | | | | | | | |
| Futures Contracts | $ (10,196) | | $ (10,196) | | $ — | | $ — |
| Total Liabilities - Other Financial Instruments | $ (10,196) | | $ (10,196) | | $ — | | $ — |
| *** | Other financial instruments are derivative instruments, such as futures contracts, which are valued at the unrealized appreciation (depreciation) on the investment. Further details regarding the value of these investments can be found in the preceding "Futures Contracts outstanding" disclosure. |
See Notes to Financial Statements.
MyDestination 2055 Fund (Unaudited)
The Fund, through investments primarily in the Select Funds, combined a high percentage of exposure to equity securities with only modest percentages allocated to fixed income securities and real assets. The Fund followed an allocation glide path designed to become more conservative over time, and the targeted allocations were approximately 5.00% fixed income securities, 93.00% equity securities and 2.00% real assets as of December 31, 2021.
As a fund of funds, the Fund’s performance was based on the performance of its underlying investments. The Investor Class of the Fund generated a return of 17.11%* for the one-year period ended December 31, 2021. Contribution to absolute performance from all major asset classes was positive, except for a slight drag on performance from the Fund’s fixed income exposure. Exposure to U.S. equity securities produced relatively stronger performance than funds with primarily non-U.S. equity securities exposure. During the year, concerns over the spread of COVID-19 continued, and as a result, associated lockdowns, fluctuating global economic growth patterns and idiosyncratic circumstances (e.g., Chinese government interventions, general emerging market weakness and supply chain slowdowns) contributed to additional performance headwinds faced by companies outside of the United States. The Equity Index Fund was the largest equity contributor to Fund performance due to its broad exposure to the strength of stocks in the S&P 500® Index. Broadly, fixed income markets experienced one of their weakest years, as the Bloomberg U. Aggregate Bond Index returned its first negative annual return since 2013. As such, the contribution to performance emanating from the fixed income Funds was the weakest. The contribution to absolute performance by the Fund’s exposure to real assets was positive, via exposure to the Global Real Estate Securities Fund. For more information on a Select Fund’s performance, please refer to that Select Fund’s section in this Annual Report.
Certain derivatives were utilized to provide market exposure for the cash positions held in the Fund. These derivative positions primarily included stock index futures and fixed income futures. Overall, derivative exposure had a positive impact on Fund performance for the year.
The Fund attempted to achieve its objective by investing in a diversified portfolio of primarily the Select Funds that represent various asset classes. The Fund is managed to the specific year included in its name (“Target Date”) and assumes a retirement age of 65. The Target Date refers to the approximate year an investor in the Fund would plan to retire and likely stop making any new investments in the Fund. The Fund is designed for an investor who anticipates retiring at or near the Target Date and who plans to withdraw the value of the account in the Fund gradually after retirement. Over time, the allocation to asset classes will change according to a predetermined “glide path,” which adjusts the percentage of fixed income securities and equity securities to become more conservative each year until 15 years after Target Date. The Fund’s value will fluctuate due to changes in interest rates. There is a risk that the issuer of a fixed income investment may fail to pay interest or even principal due in a timely manner or at all. The Fund’s value will fluctuate due to business developments concerning a particular issuer, industry or country, as well as general market and economic conditions. Securities of foreign issuers may be negatively impacted by political events, economic conditions or inefficient, illiquid or unregulated markets in foreign countries, and they also may be subject to inadequate regulatory or accounting standards, which may increase investment risk. By investing in this Fund, you will incur the expenses of the Fund in addition to those of the underlying Select Funds. You may directly invest in the Select Funds. The Fund’s value will go up and down in response to changes in the share prices of the investments that it owns. The amount invested in the Fund is not guaranteed to increase, is not guaranteed against loss nor is the amount of the original investment guaranteed at the Target Date. It is possible to lose money by investing in the Fund.
*Total returns may differ from the financial highlights due to adjustments required by U.S. GAAP.
At December 31, 2021, the portfolio holdings of the Fund, as a percentage of net assets, is shown in the following table. Portfolio holdings are subject to risk and may change at any time.
| | % |
| U.S. Equity Select Funds | 60.7 |
| Non-U.S. Equity Select Funds | 30.0 |
| Fixed Income Select Funds | 5.2 |
| Money Market Funds | 2.1 |
| Real Assets Select Funds | 1.9 |
| | 99.9 |
See Notes to Financial Statements.
MyDestination 2055 Fund (Unaudited)
| Average Annual Total Returns as of 12/31/21 | |
| | | Institutional Class* | | Investor Class* | |
| One Year | | 17.46% | | 17.11%** | |
| Five Year | | N/A | | 13.29% | |
| Ten Year | | N/A | | N/A | |
| Since Inception | | 12.78% | | 10.83% | |
| Inception Date | | 05/01/17 | | 01/01/12 | |
| Total Fund Operating Expenses (May 1, 2021 Prospectus)(1) | | 0.51% | | 0.77% | |
(1)The Fund’s shareholders indirectly bear the expenses of the Institutional Class shares of the Select Funds in which the Fund invests. Current information regarding the Fund’s Operating Expenses can be found in the Financial Highlights.
The performance data quoted represents past performance and does not guarantee future results. Current performance may be lower or higher. Performance data current to the most recent month-end may be obtained at GuideStoneFunds.com. The investment return and principal value of an investment will fluctuate so that shares, when redeemed, may be worth more or less than their original cost.
The Adviser has agreed to waive fees and/or reimburse expenses to the extent needed to limit total annual operating expenses to 0.50% for the Institutional Class and 0.75% for the Investor Class. This contractual waiver and reimbursement applies to Fund operating expenses only and will remain in place until April 30, 2022. Institutional Class Net Expense Ratio - 0.50% and Investor Class Net Expense Ratio - 0.75%.
The graph illustrates the results of a hypothetical $10,000 investment in the Investor Class of the Fund since January 1, 2012 (commencement of operations), with all dividends and capital gains reinvested.
*These returns reflect investment advisory and shareholder servicing fee waivers, if applicable, during the reported time periods.
**Total returns may differ from the financial highlights due to adjustments required by U.S. GAAP.
Unlike a mutual fund, the performance of an index assumes no taxes, transaction costs, management fees or other expenses.
See Notes to Financial Statements.
| | | Shares | | Value |
| MUTUAL FUNDS — 97.8% |
GuideStone Medium-Duration Bond Fund
(Institutional Class)∞ | 1,227,686 | | $ 18,464,403 |
GuideStone Global Bond Fund
(Institutional Class)∞ | 472,829 | | 4,619,540 |
GuideStone Defensive Market Strategies® Fund
(Institutional Class)∞ | 1,538,314 | | 21,997,883 |
GuideStone Equity Index Fund
(Institutional Class)∞ | 4,326,549 | | 218,880,115 |
GuideStone Small Cap Equity Fund
(Institutional Class)∞ | 1,381,730 | | 26,998,998 |
GuideStone International Equity Index Fund
(Institutional Class)∞ | 7,678,311 | | 92,600,424 |
GuideStone Emerging Markets Equity Fund
(Institutional Class)∞ | 3,736,563 | | 39,869,129 |
| | | Shares | | Value |
GuideStone Global Real Estate Securities Fund
(Institutional Class)∞ | 723,946 | | $ 8,347,101 |
Total Mutual Funds
(Cost $354,404,166) | | 431,777,593 |
| MONEY MARKET FUNDS — 2.1% |
GuideStone Money Market Fund, 0.00%
(Institutional Class)Ø∞
(Cost $9,115,968) | 9,115,968 | | 9,115,968 |
TOTAL INVESTMENTS — 99.9%
(Cost $363,520,134) | | | 440,893,561 |
Other Assets in Excess of
Liabilities — 0.1% | | | 418,688 |
| NET ASSETS — 100.0% | | | $441,312,249 |
Futures Contracts outstanding at December 31, 2021:
| Future Type | | Expiration Date | | Open Long
(Short) Contracts | | Notional
Market Value
of Contracts | | Value and
Unrealized
Appreciation
(Depreciation) |
| MSCI EAFE Index | | 03/2022 | | 21 | | $2,437,890 | | $ 36,343 |
| MSCI Emerging Markets | | 03/2022 | | 11 | | 674,465 | | 1,499 |
| S&P 500® E-Mini | | 03/2022 | | 20 | | 4,758,500 | | 94,499 |
| 10-Year U.S. Treasury Note | | 03/2022 | | 6 | | 782,813 | | 5,208 |
| Total Futures Contracts outstanding at December 31, 2021 | | | | | | $8,653,668 | | $137,549 |
See Notes to Financial Statements.
VALUATION HIERARCHY
The following is a summary of the inputs used, as of December 31, 2021, in valuing the Fund’s investments carried at fair value:
| | Total
Value | | Level 1
Quoted Prices | | Level 2
Other Significant
Observable Inputs | | Level 3
Significant
Unobservable Inputs |
| Assets: | | | | | | | |
| Investments in Securities: | | | | | | | |
| Money Market Funds | $ 9,115,968 | | $ 9,115,968 | | $ — | | $ — |
| Mutual Funds | 431,777,593 | | 431,777,593 | | — | | — |
| Total Assets - Investments in Securities | $440,893,561 | | $440,893,561 | | $ — | | $ — |
| Other Financial Instruments*** | | | | | | | |
| Futures Contracts | $ 137,549 | | $ 137,549 | | $ — | | $ — |
| Total Assets - Other Financial Instruments | $ 137,549 | | $ 137,549 | | $ — | | $ — |
| *** | Other financial instruments are derivative instruments, such as futures contracts, which are valued at the unrealized appreciation (depreciation) on the investment. Further details regarding the value of these investments can be found in the preceding "Futures Contracts outstanding" disclosure. |
See Notes to Financial Statements.
| STATEMENTS OF ASSETS AND LIABILITIES | December 31, 2021 |
| | MyDestination
2015 Fund | | MyDestination
2025 Fund |
| Assets | | | |
| Investments in securities of unaffiliated issuers, at value | $ 50,908,022 | | $ 53,746,409 |
| Investments in securities of affiliated issuers, at value | 695,674,845 | | 1,732,588,885 |
| Total investments, at value(1) | 746,582,867 | | 1,786,335,294 |
| Deposits with broker for futures contracts | 225,000 | | 775,000 |
| Receivables: | | | |
| Interest | 129,666 | | 136,993 |
| Fund shares sold | 134,592 | | 91,648 |
| Prepaid expenses and other assets | 16,330 | | 21,866 |
| Total Assets | 747,088,455 | | 1,787,360,801 |
| Liabilities | | | |
| Payables: | | | |
| Fund shares redeemed | 169,298 | | 165,415 |
| Variation margin on futures contracts | 6,107 | | 24,248 |
| Accrued expenses: | | | |
| Investment advisory fees | 52,156 | | 140,995 |
| Shareholder servicing fees | 113,400 | | 263,860 |
| Trustee fees | 684 | | 1,178 |
| Other expenses | 46,260 | | 73,195 |
| Total Liabilities | 387,905 | | 668,891 |
| Net Assets | $746,700,550 | | $1,786,691,910 |
| Net Assets Consist of: | | | |
| Paid-in-capital | $670,202,884 | | $1,546,329,489 |
| Distributable earnings (loss) | 76,497,666 | | 240,362,421 |
| Net Assets | $746,700,550 | | $1,786,691,910 |
| Net Asset Value: | | | |
| $0.001 par value, unlimited shares authorized | | | |
| Net assets applicable to the Institutional Class | $207,506,211 | | $ 524,603,550 |
| Institutional shares outstanding | 18,712,631 | | 45,479,892 |
| Net asset value, offering and redemption price per Institutional share | $ 11.09 | | $ 11.53 |
| Net assets applicable to the Investor Class | $539,194,339 | | $1,262,088,360 |
| Investor shares outstanding | 48,641,526 | | 109,358,188 |
| Net asset value, offering and redemption price per Investor share | $ 11.09 | | $ 11.54 |
| | | |
| (1)Investments in securities of unaffiliated issuers, at cost | $ 49,838,094 | | $ 52,604,109 |
| Investments in securities of affiliated issuers, at cost | 631,066,096 | | 1,523,965,331 |
| Total investments, at cost | $680,904,190 | | $1,576,569,440 |
See Notes to Financial Statements.
MyDestination
2035 Fund | | MyDestination
2045 Fund | | MyDestination
2055 Fund |
| | | | | |
| $ — | | $ — | | $ — |
| 1,428,904,249 | | 1,113,669,883 | | 440,893,561 |
| 1,428,904,249 | | 1,113,669,883 | | 440,893,561 |
| 1,257,000 | | 1,200,000 | | 427,007 |
| | | | | |
| — | | — | | — |
| 248,505 | | 266,445 | | 138,035 |
| 18,332 | | 16,439 | | 26,246 |
| 1,430,428,086 | | 1,115,152,767 | | 441,484,849 |
| | | | | |
| | | | | |
| 392,573 | | 99,831 | | 7,192 |
| 47,925 | | 48,447 | | 18,590 |
| | | | | |
| 119,057 | | 92,281 | | 46,723 |
| 195,526 | | 143,118 | | 53,953 |
| 853 | | 740 | | 452 |
| 64,089 | | 55,978 | | 45,690 |
| 820,023 | | 440,395 | | 172,600 |
| $1,429,608,063 | | $1,114,712,372 | | $441,312,249 |
| | | | | |
| $1,177,904,410 | | $ 874,609,388 | | $353,950,962 |
| 251,703,653 | | 240,102,984 | | 87,361,287 |
| $1,429,608,063 | | $1,114,712,372 | | $441,312,249 |
| | | | | |
| | | | | |
| $ 488,920,566 | | $ 422,302,974 | | $178,971,493 |
| 40,745,652 | | 34,899,339 | | 10,462,456 |
| $ 12.00 | | $ 12.10 | | $ 17.11 |
| $ 940,687,497 | | $ 692,409,398 | | $262,340,756 |
| 78,418,543 | | 57,277,663 | | 15,369,026 |
| $ 12.00 | | $ 12.09 | | $ 17.07 |
| | | | | |
| $ — | | $ — | | $ — |
| 1,208,629,884 | | 901,359,601 | | 363,520,134 |
| $1,208,629,884 | | $ 901,359,601 | | $363,520,134 |
See Notes to Financial Statements.
| STATEMENTS OF OPERATIONS | For the Year Ended December 31, 2021 |
| | MyDestination
2015 Fund |
| Investment Income | |
| Income distributions received from affiliated funds | $ 9,578,531 |
| Interest | 1,840,631 |
| Total Investment Income | 11,419,162 |
| Expenses | |
| Investment advisory fees | 787,950 |
| Transfer agent fees: | |
| Institutional shares | 3,876 |
| Investor shares | 20,077 |
| Custodian fees | 25,821 |
| Shareholder servicing fees: | |
| Investor shares | 1,363,702 |
| Accounting and administration fees | 30,792 |
| Professional fees | 77,294 |
| Shareholder reporting fees: | |
| Institutional shares | 768 |
| Investor shares | 7,318 |
| Trustees expenses | 4,739 |
| Line of credit facility fees | 3,201 |
| Other expenses | 75,237 |
| Recoupment of prior expenses reduced by the Advisor | 9,939 |
| Total Expenses | 2,410,714 |
| Expenses waived/reimbursed(1) | (155,283) |
| Net Expenses | 2,255,431 |
| Net Investment Income | 9,163,731 |
| Realized and Unrealized Gain (Loss) | |
| Capital gain distributions received from affiliated funds | 18,856,113 |
| Net realized gain on investment securities of affiliated issuers | 16,225,920 |
| Net realized gain on investment securities of unaffiliated issuers | 180,601 |
| Net realized gain on futures transactions | 418,829 |
| Net realized gain | 35,681,463 |
| Change in unrealized appreciation (depreciation) on investment securities of affiliated issuers | 2,596,311 |
| Change in unrealized appreciation (depreciation) on investment securities of unaffiliated issuers | 921,725 |
| Change in unrealized appreciation (depreciation) on futures | 23,379 |
| Net change in unrealized appreciation (depreciation) | 3,541,415 |
| Net Realized and Unrealized Gain | 39,222,878 |
| Net Increase in Net Assets Resulting from Operations | $48,386,609 |
| |
| (1) | See Note 3c in Notes to Financial Statements. |
See Notes to Financial Statements.
MyDestination
2025 Fund | | MyDestination
2035 Fund | | MyDestination
2045 Fund | | MyDestination
2055 Fund |
| | | | | | | |
| $ 24,036,123 | | $ 20,256,569 | | $ 15,424,537 | | $ 6,000,419 |
| 1,867,022 | | — | | — | | — |
| 25,903,145 | | 20,256,569 | | 15,424,537 | | 6,000,419 |
| | | | | | | |
| 1,751,379 | | 1,311,260 | | 1,007,752 | | 383,549 |
| | | | | | | |
| 4,204 | | 4,298 | | 4,181 | | 4,111 |
| 31,804 | | 22,715 | | 19,890 | | 17,762 |
| 34,060 | | 35,765 | | 32,157 | | 27,026 |
| | | | | | | |
| 3,019,790 | | 2,175,047 | | 1,575,943 | | 570,510 |
| 69,395 | | 52,998 | | 40,816 | | 15,636 |
| 78,840 | | 77,728 | | 77,266 | | 76,593 |
| | | | | | | |
| 804 | | 850 | | 748 | | 776 |
| 8,952 | | 7,725 | | 6,934 | | 6,452 |
| 8,304 | | 6,120 | | 5,046 | | 3,593 |
| 5,551 | | 4,447 | | 3,714 | | 2,410 |
| 121,178 | | 107,270 | | 91,680 | | 64,780 |
| 39,284 | | 34,019 | | 3,044 | | 46,426 |
| 5,173,545 | | 3,840,242 | | 2,869,171 | | 1,219,624 |
| (164,151) | | — | | — | | (13,082) |
| 5,009,394 | | 3,840,242 | | 2,869,171 | | 1,206,542 |
| 20,893,751 | | 16,416,327 | | 12,555,366 | | 4,793,877 |
| | | | | | | |
| 53,376,992 | | 48,638,421 | | 41,379,627 | | 17,069,050 |
| 27,575,239 | | 29,051,218 | | 23,545,860 | | 8,192,212 |
| 129,500 | | — | | — | | — |
| 1,895,997 | | 3,247,579 | | 3,029,003 | | 1,262,293 |
| 82,977,728 | | 80,937,218 | | 67,954,490 | | 26,523,555 |
| 40,262,401 | | 61,137,800 | | 69,162,929 | | 28,065,951 |
| 980,747 | | — | | — | | — |
| 44,841 | | 134,771 | | 117,207 | | 23,329 |
| 41,287,989 | | 61,272,571 | | 69,280,136 | | 28,089,280 |
| 124,265,717 | | 142,209,789 | | 137,234,626 | | 54,612,835 |
| $145,159,468 | | $158,626,116 | | $149,789,992 | | $59,406,712 |
See Notes to Financial Statements.
| STATEMENTS OF CHANGES IN NET ASSETS |
| | MyDestination 2015 Fund | | MyDestination 2025 Fund |
| | For the Year Ended | | For the Year Ended |
| | 12/31/21 | | 12/31/20 | | 12/31/21 | | 12/31/20 |
| | | | | | | | |
| Operations: | | | | | | | |
| Net investment income | $ 9,163,731 | | $ 8,841,489 | | $ 20,893,751 | | $ 19,606,645 |
| Net realized gain on investment securities and futures transactions | 35,681,463 | | 15,908,913 | | 82,977,728 | | 41,895,796 |
| Net change in unrealized appreciation (depreciation) on investment securities and futures | 3,541,415 | | 32,809,077 | | 41,287,989 | | 87,944,530 |
| Net increase in net assets resulting from operations | 48,386,609 | | 57,559,479 | | 145,159,468 | | 149,446,971 |
| Distributions to Shareholders: | | | | | | | |
| Institutional shares | (11,212,826) | | (6,408,437) | | (25,822,026) | | (17,903,630) |
| Investor shares | (27,805,081) | | (18,764,203) | | (58,826,598) | | (42,018,908) |
| Total distributions | (39,017,907) | | (25,172,640) | | (84,648,624) | | (59,922,538) |
| Capital Share Transactions: | | | | | | | |
| Proceeds from shares sold | | | | | | | |
| Institutional shares | 54,762,341 | | 41,045,766 | | 89,820,222 | | 97,587,137 |
| Investor shares | 58,612,402 | | 60,915,701 | | 137,601,889 | | 106,704,232 |
| Reinvestment of dividends and distributions | | | | | | | |
| Institutional shares | 11,212,826 | | 6,408,437 | | 25,822,025 | | 17,903,630 |
| Investor shares | 27,798,484 | | 18,759,541 | | 58,817,400 | | 42,015,796 |
| Total proceeds from shares sold and reinvested | 152,386,053 | | 127,129,445 | | 312,061,536 | | 264,210,795 |
| Value of shares redeemed | | | | | | | |
| Institutional shares | (30,077,650) | | (28,757,117) | | (58,008,101) | | (53,695,788) |
| Investor shares | (82,876,873) | | (100,454,578) | | (96,067,512) | | (141,392,507) |
| Total value of shares redeemed | (112,954,523) | | (129,211,695) | | (154,075,613) | | (195,088,295) |
| Net increase (decrease) from capital share transactions(1) | 39,431,530 | | (2,082,250) | | 157,985,923 | | 69,122,500 |
| Total increase in net assets | 48,800,232 | | 30,304,589 | | 218,496,767 | | 158,646,933 |
| Net Assets: | | | | | | | |
| Beginning of Year | 697,900,318 | | 667,595,729 | | 1,568,195,143 | | 1,409,548,210 |
| End of Year | $ 746,700,550 | | $ 697,900,318 | | $1,786,691,910 | | $1,568,195,143 |
| |
| (1) | See Note 6 in Notes to Financial Statements. |
See Notes to Financial Statements.
| MyDestination 2035 Fund | | MyDestination 2045 Fund | | MyDestination 2055 Fund |
| For the Year Ended | | For the Year Ended | | For the Year Ended |
| 12/31/21 | | 12/31/20 | | 12/31/21 | | 12/31/20 | | 12/31/21 | | 12/31/20 |
| | | | | | | | | | | |
| | | | | | | | | | | |
| $ 16,416,327 | | $ 13,446,206 | | $ 12,555,366 | | $ 9,964,337 | | $ 4,793,877 | | $ 3,486,476 |
| 80,937,218 | | 25,928,586 | | 67,954,490 | | 14,316,641 | | 26,523,555 | | 3,630,316 |
| 61,272,571 | | 90,280,776 | | 69,280,136 | | 84,113,480 | | 28,089,280 | | 33,501,116 |
| 158,626,116 | | 129,655,568 | | 149,789,992 | | 108,394,458 | | 59,406,712 | | 40,617,908 |
| | | | | | | | | | | |
| (26,474,371) | | (12,154,818) | | (23,036,550) | | (8,196,290) | | (9,426,520) | | (2,929,834) |
| (48,557,555) | | (22,913,162) | | (36,147,395) | | (12,765,470) | | (13,213,188) | | (3,887,403) |
| (75,031,926) | | (35,067,980) | | (59,183,945) | | (20,961,760) | | (22,639,708) | | (6,817,237) |
| | | | | | | | | | | |
| | | | | | | | | | | |
| 88,740,477 | | 93,832,021 | | 62,655,462 | | 69,124,988 | | 38,018,347 | | 43,068,497 |
| 113,685,881 | | 78,771,395 | | 73,883,374 | | 52,552,692 | | 49,961,631 | | 39,537,765 |
| | | | | | | | | | | |
| 26,474,370 | | 12,154,818 | | 23,036,551 | | 8,196,290 | | 9,426,520 | | 2,929,834 |
| 48,549,290 | | 22,911,118 | | 36,147,394 | | 12,765,324 | | 13,212,942 | | 3,887,416 |
| 277,450,018 | | 207,669,352 | | 195,722,781 | | 142,639,294 | | 110,619,440 | | 89,423,512 |
| | | | | | | | | | | |
| (33,544,937) | | (23,785,558) | | (20,402,162) | | (17,569,090) | | (13,472,797) | | (7,189,755) |
| (43,751,182) | | (61,433,706) | | (28,092,752) | | (36,714,974) | | (12,028,307) | | (17,236,823) |
| (77,296,119) | | (85,219,264) | | (48,494,914) | | (54,284,064) | | (25,501,104) | | (24,426,578) |
| 200,153,899 | | 122,450,088 | | 147,227,867 | | 88,355,230 | | 85,118,336 | | 64,996,934 |
| 283,748,089 | | 217,037,676 | | 237,833,914 | | 175,787,928 | | 121,885,340 | | 98,797,605 |
| | | | | | | | | | | |
| 1,145,859,974 | | 928,822,298 | | 876,878,458 | | 701,090,530 | | 319,426,909 | | 220,629,304 |
| $1,429,608,063 | | $1,145,859,974 | | $1,114,712,372 | | $876,878,458 | | $441,312,249 | | $319,426,909 |
See Notes to Financial Statements.
| For a Share Outstanding For the Years Ending December 31, unless otherwise indicated | | | | | | Ratios to Average Net Assets | |
| | Net Asset
Value,
Beginning
of Year | Net Investment
Income#(1) | Realized
and
Unrealized
Gain
(Loss) on
Investments | Total Income
From Investment
Operations | Dividends
from Net
Investment
Income | Distributions
from Net
Realized
Capital
Gains | Total
Distributions
Paid | Net Asset
Value,
End of
Year | Total
Return | Net Assets,
End of Year
(000) | Expenses,
Net(2) | Expenses,
Gross(2) | Investment
Income,
Net
(1) | Portfolio
Turnover
Rate |
| MyDestination 2015 Fund |
| Institutional Class |
| 2021 | $10.95 | $0.17 | $ 0.59 | $ 0.76 | $(0.26) | $(0.36) | $(0.62) | $11.09 | 6.98% | $ 207,506 | 0.12% | 0.14% | 1.46% | 17% |
| 2020 | 10.40 | 0.16 | 0.82 | 0.98 | (0.22) | (0.21) | (0.43) | 10.95 | 9.41 | 169,812 | 0.06 | 0.14 | 1.58 | 23 |
| 2019 | 9.40 | 0.25 | 1.19 | 1.44 | (0.28) | (0.16) | (0.44) | 10.40 | 15.32 | 142,900 | 0.06 | 0.13 | 2.48 | 7 |
| 2018 | 10.37 | 0.20 | (0.54) | (0.34) | (0.38) | (0.25) | (0.63) | 9.40 | (3.33) | 104,300 | 0.13 | 0.15 | 1.91 | 32 |
| 2017(3) | 9.97 | 0.12 | 0.58 | 0.70 | (0.06) | (0.24) | (0.30) | 10.37 | 6.99 | 108,975 | 0.16 | 0.16 | 1.78 | 17 |
| Investor Class |
| 2021 | $10.95 | $0.13 | $ 0.60 | $ 0.73 | $(0.23) | $(0.36) | $(0.59) | $11.09 | 6.72% | $ 539,194 | 0.37% | 0.39% | 1.15% | 17% |
| 2020 | 10.40 | 0.13 | 0.82 | 0.95 | (0.19) | (0.21) | (0.40) | 10.95 | 9.16 | 528,088 | 0.31 | 0.39 | 1.29 | 23 |
| 2019 | 9.40 | 0.21 | 1.21 | 1.42 | (0.26) | (0.16) | (0.42) | 10.40 | 15.09 | 524,696 | 0.31 | 0.38 | 2.09 | 7 |
| 2018 | 10.38 | 0.17 | (0.55) | (0.38) | (0.35) | (0.25) | (0.60) | 9.40 | (3.66) | 496,209 | 0.37 | 0.39 | 1.67 | 32 |
| 2017 | 9.54 | 0.12 | 1.00 | 1.12 | (0.04) | (0.24) | (0.28) | 10.38 | 11.67 | 521,339 | 0.38 | 0.39 | 1.21 | 17 |
| |
| MyDestination 2025 Fund |
| Institutional Class |
| 2021 | $11.10 | $0.16 | $ 0.85 | $ 1.01 | $(0.28) | $(0.30) | $(0.58) | $11.53 | 9.17% | $ 524,604 | 0.12% | 0.13% | 1.41% | 9% |
| 2020 | 10.42 | 0.17 | 0.97 | 1.14 | (0.22) | (0.24) | (0.46) | 11.10 | 10.95 | 449,798 | 0.08 | 0.12 | 1.60 | 19 |
| 2019 | 9.15 | 0.25 | 1.44 | 1.69 | (0.27) | (0.15) | (0.42) | 10.42 | 18.45 | 361,408 | 0.09 | 0.12 | 2.43 | 5 |
| 2018 | 10.25 | 0.18 | (0.66) | (0.48) | (0.28) | (0.34) | (0.62) | 9.15 | (4.64) | 250,202 | 0.12 | 0.13 | 1.80 | 37 |
| 2017(3) | 9.79 | 0.13 | 0.75 | 0.88 | (0.12) | (0.30) | (0.42) | 10.25 | 9.08 | 222,031 | 0.14 | 0.14 | 1.82 | 15 |
| Investor Class |
| 2021 | $11.11 | $0.13 | $ 0.85 | $ 0.98 | $(0.25) | $(0.30) | $(0.55) | $11.54 | 8.91% | $1,262,088 | 0.37% | 0.38% | 1.15% | 9% |
| 2020 | 10.43 | 0.14 | 0.97 | 1.11 | (0.19) | (0.24) | (0.43) | 11.11 | 10.69 | 1,118,397 | 0.34 | 0.38 | 1.31 | 19 |
| 2019 | 9.16 | 0.21 | 1.45 | 1.66 | (0.24) | (0.15) | (0.39) | 10.43 | 18.18 | 1,048,140 | 0.34 | 0.37 | 2.06 | 5 |
| 2018 | 10.26 | 0.15 | (0.65) | (0.50) | (0.26) | (0.34) | (0.60) | 9.16 | (4.87) | 888,153 | 0.36 | 0.38 | 1.51 | 37 |
| 2017 | 9.28 | 0.11 | 1.27 | 1.38 | (0.10) | (0.30) | (0.40) | 10.26 | 14.92 | 878,579 | 0.38 | 0.38 | 1.12 | 15 |
| |
| MyDestination 2035 Fund |
| Institutional Class |
| 2021 | $11.19 | $0.17 | $ 1.32 | $ 1.49 | $(0.30) | $(0.38) | $(0.68) | $12.00 | 13.29% | $ 488,921 | 0.12% | 0.12% | 1.43% | 10% |
| 2020 | 10.22 | 0.16 | 1.18 | 1.34 | (0.19) | (0.18) | (0.37) | 11.19 | 13.15 | 379,986 | 0.14 | 0.14 | 1.61 | 11 |
| 2019 | 8.65 | 0.24 | 1.70 | 1.94 | (0.24) | (0.13) | (0.37) | 10.22 | 22.47 | 266,012 | 0.13 | 0.13 | 2.41 | 4 |
| 2018 | 9.95 | 0.15 | (0.80) | (0.65) | (0.29) | (0.36) | (0.65) | 8.65 | (6.56) | 173,573 | 0.13 | 0.14 | 1.54 | 50 |
| 2017(3) | 9.29 | 0.13 | 0.93 | 1.06 | (0.07) | (0.33) | (0.40) | 9.95 | 11.51 | 152,421 | 0.15 | 0.15 | 1.99 | 35 |
| Investor Class |
| 2021 | $11.19 | $0.14 | $ 1.32 | $ 1.46 | $(0.27) | $(0.38) | $(0.65) | $12.00 | 13.04% | $ 940,687 | 0.38% | 0.38% | 1.16% | 10% |
| 2020 | 10.22 | 0.13 | 1.19 | 1.32 | (0.17) | (0.18) | (0.35) | 11.19 | 12.90 | 765,874 | 0.39 | 0.39 | 1.29 | 11 |
| 2019 | 8.65 | 0.20 | 1.72 | 1.92 | (0.22) | (0.13) | (0.35) | 10.22 | 22.16 | 662,810 | 0.39 | 0.39 | 2.01 | 4 |
| 2018 | 9.96 | 0.12 | (0.80) | (0.68) | (0.27) | (0.36) | (0.63) | 8.65 | (6.89) | 514,670 | 0.38 | 0.39 | 1.25 | 50 |
| 2017 | 8.72 | 0.11 | 1.51 | 1.62 | (0.05) | (0.33) | (0.38) | 9.96 | 18.66 | 498,807 | 0.38 | 0.39 | 1.16 | 35 |
| | | | | | | | | | | | | | | |
| # | Calculated using the average shares outstanding method. |
| (1) | Recognition of net investment income by the Fund is affected by the timing of the declaration of dividends by the underlying investment companies in which the Fund invests. |
| (2) | Does not include expenses of the investment companies in which the Fund invests. Acquired fund fees and expenses (i.e., the fees and expenses incurred by the underlying funds) for the MyDestination 2015 Fund, MyDestination 2025 Fund, MyDestination 2035 Fund, MyDestination 2045 Fund and MyDestination 2055 Fund were 0.38%, 0.38%, 0.36%, 0.34% and 0.33%, respectively for 2021. These acquired fund fees and expenses impact the net asset value of the underlying funds in which each Fund invests, and therefore the effect of the acquired fund fees and expenses are reflected in each Fund's total return. |
| (3) | Inception date was May 1, 2017. All ratios for the period have been annualized. Total return and portfolio turnover for the period have not been annualized. |
See Notes to Financial Statements.
| For a Share Outstanding For the Years Ending December 31, unless otherwise indicated | | | | | | Ratios to Average Net Assets | |
| | Net Asset
Value,
Beginning
of Year | Net Investment
Income#(1) | Realized
and
Unrealized
Gain
(Loss) on
Investments | Total Income
From Investment
Operations | Dividends
from Net
Investment
Income | Distributions
from Net
Realized
Capital
Gains | Total
Distributions
Paid | Net Asset
Value,
End of
Year | Total
Return | Net Assets,
End of Year
(000) | Expenses,
Net(2) | Expenses,
Gross(2) | Investment
Income,
Net
(1) | Portfolio
Turnover
Rate |
| MyDestination 2045 Fund |
| Institutional Class |
| 2021 | $10.97 | $0.17 | $ 1.65 | $ 1.82 | $(0.30) | $(0.39) | $(0.69) | $12.10 | 16.61% | $422,303 | 0.13% | 0.13% | 1.41% | 10% |
| 2020 | 9.87 | 0.15 | 1.24 | 1.39 | (0.17) | (0.12) | (0.29) | 10.97 | 14.06 | 323,697 | 0.14 | 0.14 | 1.58 | 7 |
| 2019 | 8.21 | 0.22 | 1.79 | 2.01 | (0.22) | (0.13) | (0.35) | 9.87 | 24.56 | 230,295 | 0.13 | 0.13 | 2.31 | 4 |
| 2018 | 9.60 | 0.13 | (0.84) | (0.71) | (0.26) | (0.42) | (0.68) | 8.21 | (7.50) | 160,533 | 0.14 | 0.15 | 1.36 | 58 |
| 2017(3) | 8.90 | 0.13 | 1.01 | 1.14 | (0.07) | (0.37) | (0.44) | 9.60 | 12.85 | 145,343 | 0.16 | 0.16 | 1.99 | 10 |
| Investor Class |
| 2021 | $10.97 | $0.14 | $ 1.64 | $ 1.78 | $(0.27) | $(0.39) | $(0.66) | $12.09 | 16.26% | $692,409 | 0.38% | 0.38% | 1.15% | 10% |
| 2020 | 9.87 | 0.12 | 1.24 | 1.36 | (0.14) | (0.12) | (0.26) | 10.97 | 13.80 | 553,181 | 0.41 | 0.41 | 1.26 | 7 |
| 2019 | 8.21 | 0.18 | 1.80 | 1.98 | (0.19) | (0.13) | (0.32) | 9.87 | 24.24 | 470,796 | 0.41 | 0.41 | 1.94 | 4 |
| 2018 | 9.60 | 0.10 | (0.83) | (0.73) | (0.24) | (0.42) | (0.66) | 8.21 | (7.73) | 357,044 | 0.39 | 0.40 | 1.08 | 58 |
| 2017 | 8.29 | 0.10 | 1.63 | 1.73 | (0.05) | (0.37) | (0.42) | 9.60 | 20.90 | 344,147 | 0.38 | 0.40 | 1.06 | 10 |
| |
| MyDestination 2055 Fund |
| Institutional Class |
| 2021 | $15.37 | $0.24 | $ 2.44 | $ 2.68 | $(0.42) | $(0.52) | $(0.94) | $17.11 | 17.46% | $178,971 | 0.17% | 0.17% | 1.39% | 11% |
| 2020 | 13.77 | 0.21 | 1.74 | 1.95 | (0.22) | (0.13) | (0.35) | 15.37 | 14.23 | 130,214 | 0.16 | 0.18 | 1.58 | 12 |
| 2019 | 11.48 | 0.30 | 2.58 | 2.88 | (0.30) | (0.29) | (0.59) | 13.77 | 25.15 | 77,156 | 0.16 | 0.20 | 2.26 | 10 |
| 2018 | 13.45 | 0.19 | (1.23) | (1.04) | (0.31) | (0.62) | (0.93) | 11.48 | (7.77) | 54,326 | 0.18 | 0.24 | 1.40 | 62 |
| 2017(3) | 12.43 | 0.18 | 1.47 | 1.65 | (0.02) | (0.61) | (0.63) | 13.45 | 13.33 | 38,161 | 0.20 | 0.33 | 2.04 | 9 |
| Investor Class |
| 2021 | $15.34 | $0.19 | $ 2.44 | $ 2.63 | $(0.38) | $(0.52) | $(0.90) | $17.07 | 17.18% | $262,341 | 0.42% | 0.42% | 1.15% | 11% |
| 2020 | 13.76 | 0.17 | 1.73 | 1.90 | (0.19) | (0.13) | (0.32) | 15.34 | 13.85 | 189,213 | 0.42 | 0.44 | 1.27 | 12 |
| 2019 | 11.47 | 0.27 | 2.58 | 2.85 | (0.27) | (0.29) | (0.56) | 13.76 | 24.92 | 143,473 | 0.41 | 0.44 | 2.03 | 10 |
| 2018 | 13.45 | 0.15 | (1.22) | (1.07) | (0.29) | (0.62) | (0.91) | 11.47 | (8.02) | 94,392 | 0.39 | 0.49 | 1.08 | 62 |
| 2017 | 11.56 | 0.14 | 2.37 | 2.51 | (0.01) | (0.61) | (0.62) | 13.45 | 21.73 | 78,024 | 0.38 | 0.55 | 1.12 | 9 |
| | | | | | | | | | | | | | | |
| # | Calculated using the average shares outstanding method. |
| (1) | Recognition of net investment income by the Fund is affected by the timing of the declaration of dividends by the underlying investment companies in which the Fund invests. |
| (2) | Does not include expenses of the investment companies in which the Fund invests. Acquired fund fees and expenses (i.e., the fees and expenses incurred by the underlying funds) for the MyDestination 2015 Fund, MyDestination 2025 Fund, MyDestination 2035 Fund, MyDestination 2045 Fund and MyDestination 2055 Fund were 0.38%, 0.38%, 0.36%, 0.34% and 0.33%, respectively for 2021. These acquired fund fees and expenses impact the net asset value of the underlying funds in which each Fund invests, and therefore the effect of the acquired fund fees and expenses are reflected in each Fund's total return. |
| (3) | Inception date was May 1, 2017. All ratios for the period have been annualized. Total return and portfolio turnover for the period have not been annualized. |
See Notes to Financial Statements.
Conservative Allocation Fund (Unaudited)
The Fund, through investments primarily in the Select Funds, combined a greater percentage of exposure to fixed income securities with a smaller percentage to equity securities, real assets, impact and alternative investments. The Fund had an approximate target asset allocation of 64.00% fixed income securities, 27.00% equity securities, 1.00% real assets, 3.00% impact and 5.00% alternative investments as of December 31, 2021.
As a fund of funds, the Fund’s performance was based on the performance of its underlying investments. The Investor Class of the Fund generated a return of 3.81% for the one-year period ended December 31, 2021. All major asset class groupings experienced positive performance contribution, except for a drag on performance from the Fund’s fixed income exposure, with equity outperforming fixed income and U.S. equity exposure outperforming non-U.S. equity exposure. The Fund’s largest fixed income exposure, the Low-Duration Bond Fund, weighed on Fund performance. Broadly, fixed income markets experienced one of their weakest years, as the Bloomberg US Aggregate Bond Index returned its first negative annual return since 2013. As such, the contribution to performance emanating from the fixed income Funds was the weakest. Both the Growth Equity Fund and Value Equity Fund contributed positively to performance, as U.S. stocks rebounded strongly from the pandemic-era lows due to a resurgence of economic activity and broad consumer demand. The Fund’s allocation to the International Equity Fund also proved to be a solidly positive driver of Fund performance. The contribution to absolute performance by the Fund’s exposure to real assets was additive, via exposure to the Global Real Estate Securities Fund. Exposure to the Strategic Alternatives Fund was a positive contributor to the Fund’s relative performance, particularly when viewed through the lens of the Fund’s role in augmenting traditional fixed income, and the Global Impact Fund was additive to Fund-level performance.
The Investor Class of the Fund underperformed its composite benchmark in 2021 (3.81% versus 5.38%). The performance difference between the Fund and the composite benchmark was due to the performance differences of the underlying Select Funds versus their respective benchmarks in addition to exposure differences between the Select Funds’ benchmarks and the Fund’s composite benchmark. For more information on a Select Fund’s performance, please refer to that Select Fund’s section in this Annual Report.
Certain derivatives were utilized to provide market exposure for the cash positions held in the Fund. These derivative positions primarily included stock index futures and fixed income futures. Overall, derivative exposure had a positive impact on Fund performance for the year.
The Fund attempted to achieve its objective, through investments primarily in the Select Funds, by combining a greater percentage of fixed income securities with a smaller percentage of equity securities. By investing in the Fund, you will also incur the expenses and risks of the underlying Select Funds. You may directly invest in the Select Funds. The Fund’s value will go up and down in response to changes in the share prices of the investments that it owns. The Fund may be suitable for investors who have a short- to medium-term investment horizon, possess a relatively low tolerance for risk and want some exposure to the growth potential of the equity market tempered by a larger allocation to short-term, fixed income securities. This Fund is subject to interest rate risk. Meaning, when interest rates rise, the value of the existing bonds decrease and vice versa. Changes in interest rates have a bigger impact on long duration holdings than on short duration holdings. It is possible to lose money by investing in the Fund.
At December 31, 2021, the portfolio holdings of the Fund, as a percentage of net assets, is shown in the following table. Portfolio holdings are subject to risk and may change at any time.
| | % |
| Fixed Income Select Funds | 62.8 |
| U.S. Equity Select Funds | 19.2 |
| Non-U.S. Equity Select Funds | 7.6 |
| Alternative Select Funds | 5.0 |
| Impact Select Funds | 3.1 |
| Real Assets Select Funds | 1.2 |
| Money Market Funds | 1.1 |
| | 100.0 |
Conservative Allocation Fund (Unaudited)
| Average Annual Total Returns as of 12/31/21 | |
| | | Institutional Class* | | Investor Class* | | Benchmark** | |
| One Year | | 4.07% | | 3.81% | | 5.38% | |
| Five Year | | 5.45% | | 5.20% | | 6.14% | |
| Ten Year | | N/A | | 4.09% | | 4.78% | |
| Since Inception(1) | | 5.12% | | 3.94% | | 4.43% | |
| Inception Date | | 11/23/15 | | 08/27/01 | | | |
| Total Fund Operating Expenses (May 1, 2021 Prospectus)(2) | | 0.69% | | 0.94% | | | |
| (1) | The Since Inception benchmark performance is based on the start date of August 27, 2001, which corresponds with the inception date of the Investor Class, the longest operating class of the Fund. |
| (2) | The Fund’s shareholders indirectly bear the expenses of the Institutional Class shares of the Select Funds in which the Fund invests. Current information regarding the Fund’s Operating Expenses can be found in the Financial Highlights. |
The performance data quoted represents past performance and does not guarantee future results. Current performance may be lower or higher. Performance data current to the most recent month-end may be obtained at GuideStoneFunds.com. The investment return and principal value of an investment will fluctuate so that shares, when redeemed, may be worth more or less than their original cost.
The graph illustrates the results of a hypothetical $10,000 investment in the Investor Class of the Fund for the 10-year period from December 31, 2011 to December 31, 2021, with all dividends and capital gains reinvested, with the Fund's composite benchmark index.
*These returns reflect investment advisory and shareholder servicing fee waivers, if applicable, during the reported time periods.
**The Benchmark Index shows how the Fund’s performance compares with the returns of an index constructed by the Adviser as a composite of various broad-based market indexes to reflect the market sectors in which the Fund invests. The percentage allocations to the broad-based market indexes comprising the Benchmark Index are intended to correspond to the Fund’s investment allocation, as represented by the Fund’s investment in the Select Funds. The Benchmark Index is 49.00% Bloomberg US Treasury 1-3 Year Index, 5.00% Bloomberg 1-3 Month US Treasury Bill Index, 16.00% Bloomberg US Aggregate Bond Index, 21.00% Russell 3000® Index, 1.00% FTSE EPRA/NAREIT Developed Index and 8.00% MSCI ACWI (All Country World Index) ex USA Index. The weightings of the Benchmark Index were modified effective November 30, 2020, and therefore, the weightings of the underlying indexes were different than the current benchmark weightings prior to that date. Benchmark Index performance represents the Fund’s current benchmark linked with its previous benchmark.
Unlike a mutual fund, the performance of an index assumes no taxes, transaction costs, management fees or other expenses.
CONSERVATIVE ALLOCATION FUND
| | | Shares | | Value |
| MUTUAL FUNDS — 98.9% |
GuideStone Low-Duration Bond Fund
(Institutional Class)∞ | 20,000,087 | | $268,401,165 |
GuideStone Medium-Duration Bond Fund
(Institutional Class)∞ | 4,764,881 | | 71,663,806 |
GuideStone Global Bond Fund
(Institutional Class)∞ | 1,809,027 | | 17,674,192 |
GuideStone Defensive Market Strategies® Fund
(Institutional Class)∞ | 3,008,528 | | 43,021,947 |
GuideStone Global Impact Fund
(Institutional Class)∞ | 1,611,899 | | 17,650,296 |
GuideStone Value Equity Fund
(Institutional Class)∞ | 1,438,930 | | 30,749,938 |
GuideStone Growth Equity Fund
(Institutional Class)∞ | 1,004,611 | | 30,057,947 |
GuideStone Small Cap Equity Fund
(Institutional Class)∞ | 293,922 | | 5,743,242 |
GuideStone International Equity Fund
(Institutional Class)∞ | 2,059,135 | | 30,578,150 |
GuideStone Emerging Markets Equity Fund
(Institutional Class)∞ | 1,192,731 | | 12,726,442 |
| | | Shares | | Value |
GuideStone Global Real Estate Securities Fund
(Institutional Class)∞ | 619,265 | | $ 7,140,129 |
GuideStone Strategic Alternatives Fund
(Institutional Class)∞ | 2,749,863 | | 28,296,093 |
Total Mutual Funds
(Cost $541,088,819) | | 563,703,347 |
| MONEY MARKET FUNDS — 1.1% |
GuideStone Money Market Fund, 0.00%
(Institutional Class)Ø∞
(Cost $6,247,394) | 6,247,394 | | 6,247,394 |
TOTAL INVESTMENTS — 100.0%
(Cost $547,336,213) | | | 569,950,741 |
Other Assets in Excess of
Liabilities — 0.0% | | | 55,930 |
| NET ASSETS — 100.0% | | | $570,006,671 |
Futures Contracts outstanding at December 31, 2021:
| Future Type | | Expiration Date | | Open Long
(Short) Contracts | | Notional
Market Value
of Contracts | | Value and
Unrealized
Appreciation
(Depreciation) |
| MSCI EAFE Index | | 03/2022 | | 3 | | $ 347,270 | | $ 4,859 |
| MSCI Emerging Markets | | 03/2022 | | 4 | | 245,260 | | (943) |
| S&P 500® E-Mini | | 03/2022 | | 5 | | 1,189,625 | | 24,683 |
| 2-Year U.S. Treasury Note | | 04/2022 | | 28 | | 6,108,813 | | (5,731) |
| Total Futures Contracts outstanding at December 31, 2021 | | | | | | $7,890,968 | | $22,868 |
See Notes to Financial Statements.
VALUATION HIERARCHY
The following is a summary of the inputs used, as of December 31, 2021, in valuing the Fund’s investments carried at fair value:
| | Total
Value | | Level 1
Quoted Prices | | Level 2
Other Significant
Observable Inputs | | Level 3
Significant
Unobservable Inputs |
| Assets: | | | | | | | |
| Investments in Securities: | | | | | | | |
| Money Market Funds | $ 6,247,394 | | $ 6,247,394 | | $ — | | $ — |
| Mutual Funds | 563,703,347 | | 563,703,347 | | — | | — |
| Total Assets - Investments in Securities | $569,950,741 | | $569,950,741 | | $ — | | $ — |
| Other Financial Instruments*** | | | | | | | |
| Futures Contracts | $ 29,542 | | $ 29,542 | | $ — | | $ — |
| Total Assets - Other Financial Instruments | $ 29,542 | | $ 29,542 | | $ — | | $ — |
| Liabilities: | | | | | | | |
| Other Financial Instruments*** | | | | | | | |
| Futures Contracts | $ (6,674) | | $ (6,674) | | $ — | | $ — |
| Total Liabilities - Other Financial Instruments | $ (6,674) | | $ (6,674) | | $ — | | $ — |
| *** | Other financial instruments are derivative instruments, such as futures contracts, which are valued at the unrealized appreciation (depreciation) on the investment. Further details regarding the value of these investments can be found in the preceding "Futures Contracts outstanding" disclosure. |
See Notes to Financial Statements.
Balanced Allocation Fund (Unaudited)
The Fund, through investments primarily in the Select Funds, combined approximately equal percentages of exposure to equity securities and fixed income securities in addition to smaller allocations to real assets, impact and alternative investments. The Fund had an approximate target asset allocation of 42.00% fixed income securities, 48.00% equity securities, 2.00% real assets, 4.00% impact and 4.00% alternative investments as of December 31, 2021.
As a fund of funds, the Fund’s performance was based on the performance of its underlying investments. The Investor Class of the Fund generated a return of 6.92% for the one-year period ended December 31, 2021. All major asset class groupings experienced positive performance contribution, except for a drag on performance from the Fund’s fixed income exposure, with equity outperforming fixed income and U.S. equity exposure outperforming non-U.S. equity exposure. Broadly, fixed income markets experienced one of their weakest years, as the Bloomberg US Aggregate Bond Index returned its first negative annual return since 2013. As such, the contribution to performance emanating from the fixed income Funds was the weakest. Both the Growth Equity Fund and Value Equity Fund contributed positively to performance, as U.S. stocks rebounded strongly from the pandemic-era lows due to a resurgence of economic activity and broad consumer demand. The Fund’s allocation to the International Equity Fund also proved to be a solidly positive driver of Fund performance. The contribution to absolute performance by the Fund’s exposure to real assets was additive, via exposure to the Global Real Estate Securities Fund. Exposure to the Strategic Alternatives Fund was a positive contributor to the Fund’s relative performance, and the Global Impact Fund was additive to Fund-level performance.
The Investor Class of the Fund underperformed its composite benchmark in 2021 (6.92% versus 9.49%). The performance difference between the Fund and the composite benchmark was due to the performance differences of the underlying Select Funds versus their respective benchmarks in addition to exposure differences between the Select Funds’ benchmarks and the Fund’s composite benchmark. For more information on a Select Fund’s performance, please refer to that Select Fund’s section in this Annual Report.
Certain derivatives were utilized to provide market exposure for the cash positions held in the Fund. These derivative positions primarily included stock index futures and fixed income futures. Overall, derivative exposure had a positive impact on Fund performance for the year.
The Fund attempted to achieve its objective, through investments primarily in the Select Funds, by combining approximately equal percentages of fixed income securities and equity securities. By investing in the Fund, you will also incur the expenses and risks of the underlying Select Funds. You may directly invest in the Select Funds. The Fund’s value will go up and down in response to changes in the share prices of the investments that it owns. This Fund may be suitable for investors who have a medium- to long-term investment horizon, possess a moderate tolerance for risk and seek to participate in the return potential of equities but want to achieve this result more slowly and with less volatility through a balanced allocation of fixed income and equity investments. This Fund is subject to interest rate risk. Meaning, when interest rates rise, the value of the existing bonds decrease and vice versa. Changes in interest rates have a bigger impact on long duration holdings than on short duration holdings. It is possible to lose money by investing in the Fund.
At December 31, 2021, the portfolio holdings of the Fund, as a percentage of net assets, is shown in the following table. Portfolio holdings are subject to risk and may change at any time.
| | % |
| Fixed Income Select Funds | 40.6 |
| U.S. Equity Select Funds | 32.6 |
| Non-U.S. Equity Select Funds | 14.6 |
| Impact Select Funds | 4.1 |
| Alternative Select Funds | 4.0 |
| Real Assets Select Funds | 2.1 |
| Money Market Funds | 2.0 |
| | 100.0 |
See Notes to Financial Statements.
Balanced Allocation Fund (Unaudited)
| Average Annual Total Returns as of 12/31/21 | |
| | | Institutional Class* | | Investor Class* | | Benchmark** | |
| One Year | | 7.17% | | 6.92% | | 9.49% | |
| Five Year | | 8.48% | | 8.20% | | 9.49% | |
| Ten Year | | N/A | | 6.92% | | 7.96% | |
| Since Inception(1) | | 7.82% | | 5.80% | | 6.53% | |
| Inception Date | | 11/23/15 | | 08/27/01 | | | |
| Total Fund Operating Expenses (May 1, 2021 Prospectus)(2) | | 0.77% | | 1.02% | | | |
| (1) | The Since Inception benchmark performance is based on the start date of August 27, 2001, which corresponds with the inception date of the Investor Class, the longest operating class of the Fund. |
| (2) | The Fund’s shareholders indirectly bear the expenses of the Institutional Class shares of the Select Funds in which the Fund invests. Current information regarding the Fund’s Operating Expenses can be found in the Financial Highlights. |
The performance data quoted represents past performance and does not guarantee future results. Current performance may be lower or higher. Performance data current to the most recent month-end may be obtained at GuideStoneFunds.com. The investment return and principal value of an investment will fluctuate so that shares, when redeemed, may be worth more or less than their original cost.
The graph illustrates the results of a hypothetical $10,000 investment in the Investor Class of the Fund for the 10-year period from December 31, 2011 to December 31, 2021, with all dividends and capital gains reinvested, with the Fund's composite benchmark index.
*These returns reflect investment advisory and shareholder servicing fee waivers, if applicable, during the reported time periods.
**The Benchmark Index shows how the Fund’s performance compares with the returns of an index constructed by the Adviser as a composite of various broad-based market indexes to reflect the market sectors in which the Fund invests. The percentage allocations to the broad-based market indexes comprising the Benchmark Index are intended to correspond to the Fund’s investment allocation, as represented by the Fund’s investment in the Select Funds. The Benchmark Index is 4.00% Bloomberg 1-3 Month US Treasury Bill Index, 43.50% Bloomberg US Aggregate Bond Index, 34.50% Russell 3000® Index, 2.00% FTSE EPRA/NAREIT Developed Index and 16.00% MSCI ACWI (All Country World Index) ex USA Index. The weightings of the Benchmark Index were modified effective November 30, 2020, and therefore, the weightings of the underlying indexes were different than the current benchmark weightings prior to that date. Benchmark Index performance represents the Fund’s current benchmark linked with its previous benchmark.
Unlike a mutual fund, the performance of an index assumes no taxes, transaction costs, management fees or other expenses.
See Notes to Financial Statements.
| | | Shares | | Value |
| MUTUAL FUNDS — 98.0% |
GuideStone Low-Duration Bond Fund
(Institutional Class)∞ | 5,200,786 | | $ 69,794,550 |
GuideStone Medium-Duration Bond Fund
(Institutional Class)∞ | 32,159,528 | | 483,679,303 |
GuideStone Global Bond Fund
(Institutional Class)∞ | 14,308,327 | | 139,792,357 |
GuideStone Defensive Market Strategies® Fund
(Institutional Class)∞ | 12,482,187 | | 178,495,275 |
GuideStone Global Impact Fund
(Institutional Class)∞ | 6,462,522 | | 70,764,613 |
GuideStone Value Equity Fund
(Institutional Class)∞ | 8,316,434 | | 177,722,188 |
GuideStone Growth Equity Fund
(Institutional Class)∞ | 5,626,207 | | 168,336,122 |
GuideStone Small Cap Equity Fund
(Institutional Class)∞ | 1,751,367 | | 34,221,704 |
GuideStone International Equity Fund
(Institutional Class)∞ | 11,917,337 | | 176,972,454 |
GuideStone Emerging Markets Equity Fund
(Institutional Class)∞ | 6,832,927 | | 72,907,330 |
| | | Shares | | Value |
GuideStone Global Real Estate Securities Fund
(Institutional Class)∞ | 3,111,543 | | $ 35,876,092 |
GuideStone Strategic Alternatives Fund
(Institutional Class)∞ | 6,695,589 | | 68,897,610 |
Total Mutual Funds
(Cost $1,577,733,203) | | 1,677,459,598 |
| MONEY MARKET FUNDS — 2.0% |
GuideStone Money Market Fund, 0.00%
(Institutional Class)Ø∞
(Cost $33,958,770) | 33,958,770 | | 33,958,770 |
TOTAL INVESTMENTS — 100.0%
(Cost $1,611,691,973) | | | 1,711,418,368 |
Other Assets in Excess of
Liabilities — 0.0% | | | 454,474 |
| NET ASSETS — 100.0% | | | $1,711,872,842 |
Futures Contracts outstanding at December 31, 2021:
| Future Type | | Expiration Date | | Open Long
(Short) Contracts | | Notional
Market Value
of Contracts | | Value and
Unrealized
Appreciation
(Depreciation) |
| MSCI EAFE Index | | 03/2022 | | 41 | | $ 4,759,690 | | $ 74,392 |
| MSCI Emerging Markets | | 03/2022 | | 30 | | 1,839,450 | | (9,568) |
| S&P 500® E-Mini | | 03/2022 | | 43 | | 10,230,775 | | 212,270 |
| 10-Year U.S. Treasury Note | | 03/2022 | | 17 | | 2,217,969 | | 21,790 |
| U.S. Treasury Long Bond | | 03/2022 | | 8 | | 1,283,500 | | 2,767 |
| Ultra 10-Year U.S. Treasury Note | | 03/2022 | | 7 | | 1,025,063 | | 18,251 |
| Ultra Long U.S. Treasury Bond | | 03/2022 | | 10 | | 1,971,250 | | 23,634 |
| 2-Year U.S. Treasury Note | | 04/2022 | | 22 | | 4,799,781 | | (4,902) |
| 5-Year U.S. Treasury Note | | 04/2022 | | 33 | | 3,992,227 | | 5,602 |
| Total Futures Contracts outstanding at December 31, 2021 | | | | | | $32,119,705 | | $344,236 |
See Notes to Financial Statements.
VALUATION HIERARCHY
The following is a summary of the inputs used, as of December 31, 2021, in valuing the Fund’s investments carried at fair value:
| | Total
Value | | Level 1
Quoted Prices | | Level 2
Other Significant
Observable Inputs | | Level 3
Significant
Unobservable Inputs |
| Assets: | | | | | | | |
| Investments in Securities: | | | | | | | |
| Money Market Funds | $ 33,958,770 | | $ 33,958,770 | | $ — | | $ — |
| Mutual Funds | 1,677,459,598 | | 1,677,459,598 | | — | | — |
| Total Assets - Investments in Securities | $1,711,418,368 | | $1,711,418,368 | | $ — | | $ — |
| Other Financial Instruments*** | | | | | | | |
| Futures Contracts | $ 358,706 | | $ 358,706 | | $ — | | $ — |
| Total Assets - Other Financial Instruments | $ 358,706 | | $ 358,706 | | $ — | | $ — |
| Liabilities: | | | | | | | |
| Other Financial Instruments*** | | | | | | | |
| Futures Contracts | $ (14,470) | | $ (14,470) | | $ — | | $ — |
| Total Liabilities - Other Financial Instruments | $ (14,470) | | $ (14,470) | | $ — | | $ — |
| *** | Other financial instruments are derivative instruments, such as futures contracts, which are valued at the unrealized appreciation (depreciation) on the investment. Further details regarding the value of these investments can be found in the preceding "Futures Contracts outstanding" disclosure. |
See Notes to Financial Statements.
Growth Allocation Fund (Unaudited)
The Fund, through investments primarily in the Select Funds, combined a greater percentage of exposure to equity securities with a smaller percentage to fixed income securities, real assets, impact and alternatives investments. The Fund had an approximate target asset allocation of 18.00% fixed income securities, 73.00% equity securities, 3.00% real assets, 4.00% impact and 2.00% alternative investments as of December 31, 2021.
As a fund of funds, the Fund’s performance was based on the performance of its underlying investments. The Investor Class of the Fund generated a return of 11.56% for the one-year period ended December 31, 2021. All major asset class groupings experienced positive performance contribution, except for a slight drag on performance from the Fund’s fixed income exposure, with equity outperforming fixed income and U.S. equity exposure outperforming non-U.S. equity exposure. Broadly, fixed income markets experienced one of their weakest years, as the Bloomberg US Aggregate Bond Index returned its first negative annual return since 2013. As such, the contribution to performance emanating from the fixed income Funds was the weakest. Both the Growth Equity Fund and Value Equity Fund contributed positively to performance, as U.S. stocks rebounded strongly from the pandemic-era lows due to a resurgence of economic activity and broad consumer demand. The Fund’s allocation to the International Equity Fund also proved to be a solidly positive driver of Fund performance. The contribution to absolute performance by the Fund’s exposure to real assets was positive, via exposure to the Global Real Estate Securities Fund. Exposure to the Strategic Alternatives Fund exposure was essentially a flat contributor to the Fund’s relative performance, and the Global Impact Fund was additive to Fund-level performance.
The Investor Class of the Fund underperformed its composite benchmark in 2021 (11.56% versus 14.34%). The performance difference between the Fund and the composite benchmark was due to the performance differences of the underlying Select Funds versus their respective benchmarks in addition to exposure differences between the Select Funds’ benchmarks and the Fund’s composite benchmark. For more information on a Select Fund’s performance, please refer to the section of that Select Fund in this Annual Report.
Certain derivatives were utilized to provide market exposure for the cash positions held in the Fund. These derivative positions primarily included stock index futures and fixed income futures. Overall, derivative exposure had a positive impact on Fund performance for the year.
The Fund attempted to achieve its objective, through investments primarily in the Select Funds, by combining a greater percentage of equity securities with a small percentage of fixed income securities. By investing in the Fund, you will also incur the expenses and risks of the underlying Select Funds. The Fund’s value will go up and down in response to changes in the share prices of the investments that it owns. This Fund may be suitable for investors who have a long-term investment horizon, possess a relatively high tolerance for risk and seek to participate in the return potential of stocks at a slightly lower risk level than an all-stock portfolio. Securities of foreign issuers may be negatively impacted by political events, economic conditions or inefficient, illiquid or unregulated markets in foreign countries, and they also may be subject to inadequate regulatory or accounting standards, which may increase investment risk. Small company stocks are subject to greater risk than large company stocks due to more volatility and less liquidity. This Fund is subject to interest rate risk. Meaning, when interest rates rise, the value of the existing bonds decrease and vice versa. Changes in interest rates have a bigger impact on long duration holdings than on short duration holdings. It is possible to lose money by investing in the Fund.
At December 31, 2021, the portfolio holdings of the Fund, as a percentage of net assets, is shown in the following table. Portfolio holdings are subject to risk and may change at any time.
| | % |
| U.S. Equity Select Funds | 44.6 |
| Non-U.S. Equity Select Funds | 26.1 |
| Fixed Income Select Funds | 17.2 |
| Impact Select Funds | 4.0 |
| Real Assets Select Funds | 3.2 |
| Alternative Select Funds | 2.5 |
| Money Market Funds | 2.3 |
| | 99.9 |
See Notes to Financial Statements.
Growth Allocation Fund (Unaudited)
| Average Annual Total Returns as of 12/31/21 | |
| | | Institutional Class* | | Investor Class* | | Benchmark** | |
| One Year | | 11.82% | | 11.56% | | 14.34% | |
| Five Year | | 11.36% | | 11.08% | | 12.04% | |
| Ten Year | | N/A | | 9.33% | | 10.17% | |
| Since Inception(1) | | 10.05% | | 6.49% | | 7.25% | |
| Inception Date | | 11/23/15 | | 08/27/01 | | | |
| Total Fund Operating Expenses (May 1, 2021 Prospectus)(2) | | 0.88% | | 1.13% | | | |
| (1) | The Since Inception benchmark performance is based on the start date of August 27, 2001, which corresponds with the inception date of the Investor Class, the longest operating class of the Fund. |
| (2) | The Fund’s shareholders indirectly bear the expenses of the Institutional Class shares of the Select Funds in which the Fund invests. Current information regarding the Fund’s Operating Expenses can be found in the Financial Highlights. |
The performance data quoted represents past performance and does not guarantee future results. Current performance may be lower or higher. Performance data current to the most recent month-end may be obtained at GuideStoneFunds.com. The investment return and principal value of an investment will fluctuate so that shares, when redeemed, may be worth more or less than their original cost.
The graph illustrates the results of a hypothetical $10,000 investment in the Investor Class of the Fund for the 10-year period from December 31, 2011 to December 31, 2021, with all dividends and capital gains reinvested, with the Fund’s composite benchmark index.
*These returns reflect investment advisory and shareholder servicing fee waivers, if applicable, during the reported time periods.
**The Benchmark Index shows how the Fund’s performance compares with the returns of an index constructed by the Adviser as a composite of various broad-based market indexes to reflect the market sectors in which the Fund invests. The percentage allocations to the broad-based market indexes comprising the Benchmark Index are intended to correspond to the Fund’s investment allocation, as represented by the Fund’s investment in the Select Funds. The Benchmark Index is 2.50% Bloomberg 1-3 Month US Treasury Bill Index, 19.50% Bloomberg US Aggregate Bond Index, 47.00% Russell 3000® Index, 3.00% FTSE EPRA/NAREIT Developed Index and 28.00% MSCI ACWI (All Country World Index) ex USA Index. The weightings of the Benchmark Index were modified effective November 30, 2020, and therefore, the weightings of the underlying indexes were different than the current benchmark weightings prior to that date. Benchmark Index performance represents the Fund’s current benchmark linked with its previous benchmark.
Unlike a mutual fund, the performance of an index assumes no taxes, transaction costs, management fees or other expenses.
See Notes to Financial Statements.
| | | Shares | | Value |
| MUTUAL FUNDS — 97.6% |
GuideStone Low-Duration Bond Fund
(Institutional Class)∞ | 1,839,273 | | $ 24,683,048 |
GuideStone Medium-Duration Bond Fund
(Institutional Class)∞ | 11,186,495 | | 168,244,877 |
GuideStone Global Bond Fund
(Institutional Class)∞ | 4,983,379 | | 48,687,613 |
GuideStone Defensive Market Strategies® Fund
(Institutional Class)∞ | 4,583,092 | | 65,538,212 |
GuideStone Global Impact Fund
(Institutional Class)∞ | 5,119,454 | | 56,058,016 |
GuideStone Value Equity Fund
(Institutional Class)∞ | 12,244,361 | | 261,662,004 |
GuideStone Growth Equity Fund
(Institutional Class)∞ | 8,376,750 | | 250,632,367 |
GuideStone Small Cap Equity Fund
(Institutional Class)∞ | 2,586,048 | | 50,531,375 |
GuideStone International Equity Fund
(Institutional Class)∞ | 17,559,516 | | 260,758,806 |
GuideStone Emerging Markets Equity Fund
(Institutional Class)∞ | 10,075,131 | | 107,501,644 |
| | | Shares | | Value |
GuideStone Global Real Estate Securities Fund
(Institutional Class)∞ | 3,928,034 | | $ 45,290,234 |
GuideStone Strategic Alternatives Fund
(Institutional Class)∞ | 3,449,482 | | 35,495,174 |
Total Mutual Funds
(Cost $1,281,020,739) | | 1,375,083,370 |
| MONEY MARKET FUNDS — 2.3% |
GuideStone Money Market Fund, 0.00%
(Institutional Class)Ø∞
(Cost $32,981,432) | 32,981,432 | | 32,981,432 |
TOTAL INVESTMENTS — 99.9%
(Cost $1,314,002,171) | | | 1,408,064,802 |
Other Assets in Excess of
Liabilities — 0.1% | | | 1,164,272 |
| NET ASSETS — 100.0% | | | $1,409,229,074 |
Futures Contracts outstanding at December 31, 2021:
| Future Type | | Expiration Date | | Open Long
(Short) Contracts | | Notional
Market Value
of Contracts | | Value and
Unrealized
Appreciation
(Depreciation) |
| MSCI EAFE Index | | 03/2022 | | 65 | | $ 7,545,850 | | $117,491 |
| MSCI Emerging Markets | | 03/2022 | | 50 | | 3,065,750 | | (18,254) |
| S&P 500® E-Mini | | 03/2022 | | 67 | | 15,940,975 | | 330,746 |
| 10-Year U.S. Treasury Note | | 03/2022 | | 8 | | 1,043,750 | | 9,220 |
| U.S. Treasury Long Bond | | 03/2022 | | 4 | | 641,750 | | 7,743 |
| Ultra 10-Year U.S. Treasury Note | | 03/2022 | | 3 | | 439,313 | | 5,838 |
| Ultra Long U.S. Treasury Bond | | 03/2022 | | 5 | | 985,625 | | 14,703 |
| 2-Year U.S. Treasury Note | | 04/2022 | | 11 | | 2,399,891 | | (3,470) |
| 5-Year U.S. Treasury Note | | 04/2022 | | 16 | | 1,935,625 | | 5,771 |
| Total Futures Contracts outstanding at December 31, 2021 | | | | | | $33,998,529 | | $469,788 |
See Notes to Financial Statements.
VALUATION HIERARCHY
The following is a summary of the inputs used, as of December 31, 2021, in valuing the Fund’s investments carried at fair value:
| | Total
Value | | Level 1
Quoted Prices | | Level 2
Other Significant
Observable Inputs | | Level 3
Significant
Unobservable Inputs |
| Assets: | | | | | | | |
| Investments in Securities: | | | | | | | |
| Money Market Funds | $ 32,981,432 | | $ 32,981,432 | | $ — | | $ — |
| Mutual Funds | 1,375,083,370 | | 1,375,083,370 | | — | | — |
| Total Assets - Investments in Securities | $1,408,064,802 | | $1,408,064,802 | | $ — | | $ — |
| Other Financial Instruments*** | | | | | | | |
| Futures Contracts | $ 491,512 | | $ 491,512 | | $ — | | $ — |
| Total Assets - Other Financial Instruments | $ 491,512 | | $ 491,512 | | $ — | | $ — |
| Liabilities: | | | | | | | |
| Other Financial Instruments*** | | | | | | | |
| Futures Contracts | $ (21,724) | | $ (21,724) | | $ — | | $ — |
| Total Liabilities - Other Financial Instruments | $ (21,724) | | $ (21,724) | | $ — | | $ — |
| *** | Other financial instruments are derivative instruments, such as futures contracts, which are valued at the unrealized appreciation (depreciation) on the investment. Further details regarding the value of these investments can be found in the preceding "Futures Contracts outstanding" disclosure. |
See Notes to Financial Statements.
Aggressive Allocation Fund (Unaudited)
The Fund, through investments primarily in the Select Funds, combined a greater percentage of exposure to U.S. equity securities with a smaller percentage to non-U.S. equity securities. The Fund had a target asset allocation of 100.00% equity securities as of December 31, 2021.
As a fund of funds, its performance was based on the performance of its underlying investments. The Investor Class of the Fund generated a return of 14.89% for the one-year period ended December 31, 2021. The allocations to both U.S. equities and non-U.S. equities generated positive performance, with the underlying Equity Select Funds positively contributing to absolute performance, with the exception of the Emerging Markets Equity Fund. The largest positive contributor was the Value Equity Fund, as U.S. stocks rebounded strongly from the pandemic-era lows due to a resurgence of economic activity and broad consumer demand. The Fund’s allocated weight to the International Equity Fund also proved to be a positive driver to absolute return.
The Investor Class of the Fund underperformed its composite benchmark in 2021 (14.89% versus 18.29%). The performance difference between the Fund and the composite benchmark was due to the performance differences of the underlying Select Funds versus their respective benchmarks in addition to exposure differences between the Select Funds’ benchmarks and the Fund’s composite benchmark. For more information on a Select Fund’s performance, please refer to that Select Fund’s section in this Annual Report.
Certain derivatives were utilized to provide market exposure for the cash positions held in the Fund. These derivative positions primarily included stock index futures. Overall, derivative exposure had a positive impact on Fund performance for the year.
The Fund attempted to achieve its objective, through investments primarily in the Select Funds, by combining a greater percentage of U.S. equity securities with a smaller percentage of non-U.S. equity securities. By investing in the Fund, you will also incur the expenses and risks of the underlying Select Funds. You may directly invest in the Select Funds. The Fund’s value will go up and down in response to changes in the share prices of the investments that it owns. This Fund may be suitable for investors who have a long-term investment horizon, possess a relatively high tolerance for risk and want to diversify by adding an aggressive investment option that combines U.S. and non-U.S. equity securities. Securities of foreign issuers may be negatively impacted by political events, economic conditions or inefficient, illiquid or unregulated markets in foreign countries, and they also may be subject to inadequate regulatory or accounting standards, which may increase investment risk. Small company stocks are subject to greater risk than large company stocks due to more volatility and less liquidity. It is possible to lose money by investing in the Fund.
At December 31, 2021, the portfolio holdings of the Fund, as a percentage of net assets, is shown in the following table. Portfolio holdings are subject to risk and may change at any time.
| | % |
| U.S. Equity Select Funds | 58.6 |
| Non-U.S. Equity Select Funds | 39.1 |
| Money Market Funds | 2.2 |
| | 99.9 |
See Notes to Financial Statements.
Aggressive Allocation Fund (Unaudited)
| Average Annual Total Returns as of 12/31/21 | |
| | | Institutional Class* | | Investor Class* | | Benchmark** | |
| One Year | | 15.09% | | 14.89% | | 18.29% | |
| Five Year | | 13.95% | | 13.67% | | 14.62% | |
| Ten Year | | N/A | | 11.77% | | 12.69% | |
| Since Inception(1) | | 11.92% | | 7.10% | | 8.00% | |
| Inception Date | | 11/23/15 | | 08/27/01 | | | |
| Total Fund Operating Expenses (May 1, 2021 Prospectus)(2) | | 0.97% | | 1.22% | | | |
| (1) | The Since Inception benchmark performance is based on the start date of August 27, 2001, which corresponds with the inception date of the Investor Class, the longest operating class of the Fund. |
| (2) | The Fund’s shareholders indirectly bear the expenses of the Institutional Class shares of the Select Funds in which the Fund invests. Current information regarding the Fund’s Operating Expenses can be found in the Financial Highlights. |
The performance data quoted represents past performance and does not guarantee future results. Current performance may be lower or higher. Performance data current to the most recent month-end may be obtained at GuideStoneFunds.com. The investment return and principal value of an investment will fluctuate so that shares, when redeemed, may be worth more or less than their original cost.
The graph illustrates the results of a hypothetical $10,000 investment in the Investor Class of the Fund for the 10-year period from December 31, 2011 to December 31, 2021, with all dividends and capital gains reinvested, with the Fund’s composite benchmark index.
*These returns reflect investment advisory and shareholder servicing fee waivers, if applicable, during the reported time periods.
**The Benchmark Index shows how the Fund’s performance compares with the returns of an index constructed by the Adviser as a composite of various broad-based market indexes to reflect the market sectors in which the Fund invests. The percentage allocations to the broad-based market indexes comprising the Benchmark Index are intended to correspond to the Fund’s investment allocation, as represented by the Fund’s investment in the Select Funds. The Benchmark Index is 60% Russell 3000® Index and 40% MSCI ACWI (All Country World Index) ex USA Index. The weightings of the Benchmark Index were modified effective December 1, 2012, and therefore, the weightings of the underlying indexes were different than the current benchmark weightings prior to that date. Benchmark Index performance represents the Fund’s current benchmark linked with its previous benchmark.
Unlike a mutual fund, the performance of an index assumes no taxes, transaction costs, management fees or other expenses.
See Notes to Financial Statements.
AGGRESSIVE ALLOCATION FUND
| | | Shares | | Value |
| MUTUAL FUNDS — 97.7% |
GuideStone Value Equity Fund
(Institutional Class)∞ | 15,762,271 | | $ 336,839,734 |
GuideStone Growth Equity Fund
(Institutional Class)∞ | 10,762,806 | | 322,023,156 |
GuideStone Small Cap Equity Fund
(Institutional Class)∞ | 3,313,857 | | 64,752,772 |
GuideStone International Equity Fund
(Institutional Class)∞ | 23,128,752 | | 343,461,964 |
GuideStone Emerging Markets Equity Fund
(Institutional Class)∞ | 13,141,801 | | 140,223,016 |
Total Mutual Funds
(Cost $1,119,128,590) | | 1,207,300,642 |
| | | Shares | | Value |
| MONEY MARKET FUNDS — 2.2% |
GuideStone Money Market Fund, 0.00%
(Institutional Class)Ø∞
(Cost $27,722,464) | 27,722,464 | | $ 27,722,464 |
TOTAL INVESTMENTS — 99.9%
(Cost $1,146,851,054) | | | 1,235,023,106 |
Other Assets in Excess of
Liabilities — 0.1% | | | 1,139,809 |
| NET ASSETS — 100.0% | | | $1,236,162,915 |
Futures Contracts outstanding at December 31, 2021:
| Future Type | | Expiration Date | | Open Long
(Short) Contracts | | Notional
Market Value
of Contracts | | Value and
Unrealized
Appreciation
(Depreciation) |
| MSCI EAFE Index | | 03/2022 | | 66 | | $ 7,661,940 | | $118,880 |
| MSCI Emerging Markets | | 03/2022 | | 55 | | 3,372,325 | | (20,597) |
| S&P 500® E-Mini | | 03/2022 | | 69 | | 16,416,825 | | 340,620 |
| Total Futures Contracts outstanding at December 31, 2021 | | | | | | $27,451,090 | | $438,903 |
See Notes to Financial Statements.
VALUATION HIERARCHY
The following is a summary of the inputs used, as of December 31, 2021, in valuing the Fund’s investments carried at fair value:
| | Total
Value | | Level 1
Quoted Prices | | Level 2
Other Significant
Observable Inputs | | Level 3
Significant
Unobservable Inputs |
| Assets: | | | | | | | |
| Investments in Securities: | | | | | | | |
| Money Market Funds | $ 27,722,464 | | $ 27,722,464 | | $ — | | $ — |
| Mutual Funds | 1,207,300,642 | | 1,207,300,642 | | — | | — |
| Total Assets - Investments in Securities | $1,235,023,106 | | $1,235,023,106 | | $ — | | $ — |
| Other Financial Instruments*** | | | | | | | |
| Futures Contracts | $ 459,500 | | $ 459,500 | | $ — | | $ — |
| Total Assets - Other Financial Instruments | $ 459,500 | | $ 459,500 | | $ — | | $ — |
| Liabilities: | | | | | | | |
| Other Financial Instruments*** | | | | | | | |
| Futures Contracts | $ (20,597) | | $ (20,597) | | $ — | | $ — |
| Total Liabilities - Other Financial Instruments | $ (20,597) | | $ (20,597) | | $ — | | $ — |
| *** | Other financial instruments are derivative instruments, such as futures contracts, which are valued at the unrealized appreciation (depreciation) on the investment. Further details regarding the value of these investments can be found in the preceding "Futures Contracts outstanding" disclosure. |
See Notes to Financial Statements.
| STATEMENTS OF ASSETS AND LIABILITIES | December 31, 2021 |
| | Conservative
Allocation Fund | | Balanced
Allocation Fund | | Growth
Allocation Fund | | Aggressive
Allocation Fund |
| Assets | | | | | | | |
| Investments in securities of affiliated issuers, at value | $569,950,741 | | $1,711,418,368 | | $1,408,064,802 | | $1,235,023,106 |
| Total investments, at value(1) | 569,950,741 | | 1,711,418,368 | | 1,408,064,802 | | 1,235,023,106 |
| Deposits with broker for futures contracts | 110,000 | | 1,083,000 | | 1,575,000 | | 1,520,000 |
| Receivables: | | | | | | | |
| Fund shares sold | 172,552 | | 32,757 | | 71,147 | | 55,298 |
| Prepaid expenses and other assets | 21,437 | | 27,775 | | 23,478 | | 21,802 |
| Total Assets | 570,254,730 | | 1,712,561,900 | | 1,409,734,427 | | 1,236,620,206 |
| Liabilities | | | | | | | |
| Payables: | | | | | | | |
| Fund shares redeemed | 62,773 | | 209,901 | | 75,204 | | 43,221 |
| Variation margin on futures contracts | 3,721 | | 16,329 | | 54,787 | | 70,977 |
| Accrued expenses: | | | | | | | |
| Investment advisory fees | 48,106 | | 143,668 | | 117,402 | | 102,646 |
| Shareholder servicing fees | 89,379 | | 258,119 | | 201,744 | | 187,654 |
| Trustee fees | 1,111 | | 1,829 | | 1,357 | | 1,116 |
| Other expenses | 42,969 | | 59,212 | | 54,859 | | 51,677 |
| Total Liabilities | 248,059 | | 689,058 | | 505,353 | | 457,291 |
| Net Assets | $570,006,671 | | $1,711,872,842 | | $1,409,229,074 | | $1,236,162,915 |
| Net Assets Consist of: | | | | | | | |
| Paid-in-capital | $539,696,889 | | $1,575,085,524 | | $1,249,280,576 | | $1,064,314,260 |
| Distributable earnings (loss) | 30,309,782 | | 136,787,318 | | 159,948,498 | | 171,848,655 |
| Net Assets | $570,006,671 | | $1,711,872,842 | | $1,409,229,074 | | $1,236,162,915 |
| Net Asset Value: | | | | | | | |
| $0.001 par value, unlimited shares authorized | | | | | | | |
| Net assets applicable to the Institutional Class | $146,436,040 | | $ 481,117,731 | | $ 440,337,942 | | $ 331,641,501 |
| Institutional shares outstanding | 12,212,417 | | 36,934,878 | | 31,836,668 | | 23,816,817 |
| Net asset value, offering and redemption price per Institutional share | $ 11.99 | | $ 13.03 | | $ 13.83 | | $ 13.92 |
| Net assets applicable to the Investor Class | $423,570,631 | | $1,230,755,111 | | $ 968,891,132 | | $ 904,521,414 |
| Investor shares outstanding | 35,335,948 | | 94,534,883 | | 70,130,894 | | 65,283,714 |
| Net asset value, offering and redemption price per Investor share | $ 11.99 | | $ 13.02 | | $ 13.82 | | $ 13.86 |
| | | | | | | |
| (1)Investments in securities of affiliated issuers, at cost | 547,336,213 | | 1,611,691,973 | | 1,314,002,171 | | 1,146,851,054 |
| Total investments, at cost | $547,336,213 | | $1,611,691,973 | | $1,314,002,171 | | $1,146,851,054 |
See Notes to Financial Statements.
| STATEMENTS OF OPERATIONS | For the Year Ended December 31, 2021 |
| | Conservative
Allocation Fund | | Balanced
Allocation Fund | | Growth
Allocation Fund | | Aggressive
Allocation Fund |
| Investment Income | | | | | | | |
| Income distributions received from affiliated funds | $ 5,991,769 | | $ 20,999,190 | | $ 15,051,532 | | $ 11,216,793 |
| Interest | 53 | | — | | 683 | | 19 |
| Total Investment Income | 5,991,822 | | 20,999,190 | | 15,052,215 | | 11,216,812 |
| Expenses | | | | | | | |
| Investment advisory fees | 569,350 | | 1,705,065 | | 1,388,965 | | 1,215,426 |
| Transfer agent fees: | | | | | | | |
| Institutional shares | 3,895 | | 4,027 | | 3,849 | | 3,760 |
| Investor shares | 29,998 | | 48,612 | | 37,286 | | 33,020 |
| Custodian fees | 22,375 | | 39,682 | | 37,811 | | 29,981 |
| Shareholder servicing fees: | | | | | | | |
| Investor shares | 1,065,494 | | 3,089,520 | | 2,400,830 | | 2,243,465 |
| Accounting and administration fees | 21,204 | | 63,134 | | 51,180 | | 44,708 |
| Professional fees | 79,473 | | 81,669 | | 80,211 | | 79,761 |
| Shareholder reporting fees: | | | | | | | |
| Institutional shares | 821 | | 838 | | 807 | | 752 |
| Investor shares | 9,676 | | 12,707 | | 11,289 | | 9,075 |
| Trustees expenses | 7,246 | | 11,975 | | 9,184 | | 7,974 |
| Line of credit facility fees | 3,344 | | 6,263 | | 5,194 | | 4,695 |
| Other expenses | 86,565 | | 129,219 | | 112,091 | | 99,466 |
| Total Expenses | 1,899,441 | | 5,192,711 | | 4,138,697 | | 3,772,083 |
| Net Investment Income | 4,092,381 | | 15,806,479 | | 10,913,518 | | 7,444,729 |
| Realized and Unrealized Gain (Loss) | | | | | | | |
| Capital gain distributions received from affiliated funds | 17,650,800 | | 92,778,191 | | 114,013,677 | | 135,721,453 |
| Net realized gain on investment securities of affiliated issuers | 5,472,061 | | 24,967,183 | | 15,950,753 | | 11,998,713 |
| Net realized gain on futures transactions | 383,973 | | 2,160,363 | | 3,396,829 | | 4,523,657 |
| Net realized gain | 23,506,834 | | 119,905,737 | | 133,361,259 | | 152,243,823 |
| Change in unrealized appreciation (depreciation) on investment securities of affiliated issuers | (5,954,297) | | (21,070,051) | | 6,915,090 | | 6,553,159 |
| Change in unrealized appreciation (depreciation) on futures | (17,601) | | (11,600) | | 94,018 | | 106,659 |
| Net change in unrealized appreciation (depreciation) | (5,971,898) | | (21,081,651) | | 7,009,108 | | 6,659,818 |
| Net Realized and Unrealized Gain | 17,534,936 | | 98,824,086 | | 140,370,367 | | 158,903,641 |
| Net Increase in Net Assets Resulting from Operations | $21,627,317 | | $114,630,565 | | $151,283,885 | | $166,348,370 |
See Notes to Financial Statements.
| STATEMENTS OF CHANGES IN NET ASSETS |
| | Conservative Allocation Fund | | Balanced Allocation Fund |
| | For the Year Ended | | For the Year Ended |
| | 12/31/21 | | 12/31/20 | | 12/31/21 | | 12/31/20 |
| | | | | | | | |
| Operations: | | | | | | | |
| Net investment income | $ 4,092,381 | | $ 5,934,526 | | $ 15,806,479 | | $ 15,563,615 |
| Net realized gain on investment securities and futures transactions | 23,506,834 | | 6,610,683 | | 119,905,737 | | 33,903,584 |
| Net change in unrealized appreciation (depreciation) on investment securities and futures | (5,971,898) | | 21,981,171 | | (21,081,651) | | 108,766,612 |
| Net increase in net assets resulting from operations | 21,627,317 | | 34,526,380 | | 114,630,565 | | 158,233,811 |
| Distributions to Shareholders: | | | | | | | |
| Institutional shares | (5,541,335) | | (4,154,503) | | (27,359,647) | | (21,700,422) |
| Investor shares | (15,001,787) | | (11,680,125) | | (66,938,989) | | (56,015,985) |
| Total distributions | (20,543,122) | | (15,834,628) | | (94,298,636) | | (77,716,407) |
| Capital Share Transactions: | | | | | | | |
| Proceeds from shares sold | | | | | | | |
| Institutional shares | 21,965,761 | | 35,450,549 | | 41,748,442 | | 70,877,243 |
| Investor shares | 54,732,442 | | 69,843,790 | | 49,371,634 | | 45,976,253 |
| Reinvestment of dividends and distributions | | | | | | | |
| Institutional shares | 5,516,854 | | 4,141,914 | | 27,265,118 | | 21,623,071 |
| Investor shares | 14,960,820 | | 11,659,641 | | 66,890,632 | | 55,973,918 |
| Total proceeds from shares sold and reinvested | 97,175,877 | | 121,095,894 | | 185,275,826 | | 194,450,485 |
| Value of shares redeemed | | | | | | | |
| Institutional shares | (16,821,639) | | (20,798,028) | | (42,703,474) | | (45,174,857) |
| Investor shares | (62,286,281) | | (95,489,389) | | (120,774,383) | | (175,636,915) |
| Total value of shares redeemed | (79,107,920) | | (116,287,417) | | (163,477,857) | | (220,811,772) |
| Net increase (decrease) from capital share transactions(1) | 18,067,957 | | 4,808,477 | | 21,797,969 | | (26,361,287) |
| Total increase in net assets | 19,152,152 | | 23,500,229 | | 42,129,898 | | 54,156,117 |
| Net Assets: | | | | | | | |
| Beginning of Year | 550,854,519 | | 527,354,290 | | 1,669,742,944 | | 1,615,586,827 |
| End of Year | $570,006,671 | | $ 550,854,519 | | $1,711,872,842 | | $1,669,742,944 |
| |
| (1) | See Note 6 in Notes to Financial Statements. |
See Notes to Financial Statements.
| Growth Allocation Fund | | Aggressive Allocation Fund |
| For the Year Ended | | For the Year Ended |
| 12/31/21 | | 12/31/20 | | 12/31/21 | | 12/31/20 |
| | | | | | | |
| | | | | | | |
| $ 10,913,518 | | $ 8,233,085 | | $ 7,444,729 | | $ 3,702,495 |
| 133,361,259 | | 32,621,376 | | 152,243,823 | | 28,183,804 |
| 7,009,108 | | 107,653,899 | | 6,659,818 | | 118,311,745 |
| 151,283,885 | | 148,508,360 | | 166,348,370 | | 150,198,044 |
| | | | | | | |
| (29,681,445) | | (20,043,664) | | (24,946,452) | | (17,131,829) |
| (63,097,520) | | (43,626,556) | | (66,098,585) | | (48,458,271) |
| (92,778,965) | | (63,670,220) | | (91,045,037) | | (65,590,100) |
| | | | | | | |
| | | | | | | |
| 24,402,267 | | 80,608,445 | | 22,637,067 | | 39,151,104 |
| 35,000,220 | | 30,062,722 | | 24,902,131 | | 22,528,095 |
| | | | | | | |
| 29,656,423 | | 20,021,280 | | 24,928,211 | | 17,124,877 |
| 63,050,192 | | 43,613,649 | | 66,089,225 | | 48,453,699 |
| 152,109,102 | | 174,306,096 | | 138,556,634 | | 127,257,775 |
| | | | | | | |
| (35,615,928) | | (39,461,439) | | (25,412,801) | | (31,600,752) |
| (90,074,062) | | (142,809,402) | | (93,175,612) | | (119,347,827) |
| (125,689,990) | | (182,270,841) | | (118,588,413) | | (150,948,579) |
| 26,419,112 | | (7,964,745) | | 19,968,221 | | (23,690,804) |
| 84,924,032 | | 76,873,395 | | 95,271,554 | | 60,917,140 |
| | | | | | | |
| 1,324,305,042 | | 1,247,431,647 | | 1,140,891,361 | | 1,079,974,221 |
| $1,409,229,074 | | $1,324,305,042 | | $1,236,162,915 | | $1,140,891,361 |
See Notes to Financial Statements.
| For a Share Outstanding For the Years Ending December 31, unless otherwise indicated | | | | | | Ratios to Average Net Assets | |
| | Net Asset
Value,
Beginning
of Year | Net Investment
Income#(1) | Realized
and
Unrealized
Gain
(Loss) on
Investments | Total Income
From Investment
Operations | Dividends
from Net
Investment
Income | Distributions
from Net
Realized
Capital
Gains | Total
Distributions
Paid | Net Asset
Value,
End of
Year | Total
Return | Net Assets,
End of Year
(000) | Expenses,
Net(2) | Expenses,
Gross(2) | Investment
Income,
Net
(1) | Portfolio
Turnover
Rate |
| Conservative Allocation Fund |
| Institutional Class |
| 2021 | $11.97 | $0.11 | $ 0.38 | $ 0.49 | $(0.22) | $(0.25) | $(0.47) | $11.99 | 4.07% | $ 146,436 | 0.15% | 0.15% | 0.92% | 6% |
| 2020 | 11.52 | 0.16 | 0.67 | 0.83 | (0.20) | (0.18) | (0.38) | 11.97 | 7.17 | 135,681 | 0.15 | 0.15 | 1.35 | 15 |
| 2019 | 10.87 | 0.25 | 0.95 | 1.20 | (0.27) | (0.28) | (0.55) | 11.52 | 11.01 | 111,611 | 0.13 | 0.13 | 2.19 | 7 |
| 2018 | 11.47 | 0.23 | (0.45) | (0.22) | (0.37) | (0.01) | (0.38) | 10.87 | (1.90) | 87,409 | 0.17 | 0.17 | 2.01 | 12 |
| 2017 | 10.88 | 0.16 | 0.64 | 0.80 | (0.05) | (0.16) | (0.21) | 11.47 | 7.33 | 85,482 | 0.19 | 0.19 | 1.40 | 19 |
| Investor Class |
| 2021 | $11.97 | $0.08 | $ 0.38 | $ 0.46 | $(0.19) | $(0.25) | $(0.44) | $11.99 | 3.81% | $ 423,571 | 0.40% | 0.40% | 0.65% | 6% |
| 2020 | 11.52 | 0.13 | 0.67 | 0.80 | (0.17) | (0.18) | (0.35) | 11.97 | 6.92 | 415,174 | 0.40 | 0.40 | 1.09 | 15 |
| 2019 | 10.87 | 0.21 | 0.96 | 1.17 | (0.24) | (0.28) | (0.52) | 11.52 | 10.73 | 415,743 | 0.39 | 0.39 | 1.86 | 7 |
| 2018 | 11.47 | 0.20 | (0.44) | (0.24) | (0.35) | (0.01) | (0.36) | 10.87 | (2.13) | 405,512 | 0.40 | 0.40 | 1.76 | 12 |
| 2017 | 10.88 | 0.13 | 0.64 | 0.77 | (0.02) | (0.16) | (0.18) | 11.47 | 7.11 | 427,485 | 0.42 | 0.42 | 1.19 | 19 |
| |
| Balanced Allocation Fund |
| Institutional Class |
| 2021 | $12.88 | $0.15 | $ 0.77 | $ 0.92 | $(0.34) | $(0.43) | $(0.77) | $13.03 | 7.17% | $ 481,118 | 0.12% | 0.12% | 1.12% | 19% |
| 2020 | 12.19 | 0.15 | 1.18 | 1.33 | (0.23) | (0.41) | (0.64) | 12.88 | 11.00 | 450,122 | 0.12 | 0.12 | 1.21 | 15 |
| 2019 | 11.07 | 0.26 | 1.69 | 1.95 | (0.29) | (0.54) | (0.83) | 12.19 | 17.62 | 377,832 | 0.12 | 0.12 | 2.12 | 9 |
| 2018 | 12.16 | 0.23 | (0.80) | (0.57) | (0.49) | (0.03) | (0.52) | 11.07 | (4.63) | 296,530 | 0.13 | 0.13 | 1.93 | 13 |
| 2017 | 11.09 | 0.19 | 1.20 | 1.39 | (0.16) | (0.16) | (0.32) | 12.16 | 12.57 | 334,114 | 0.12 | 0.13 | 1.57 | 19 |
| Investor Class |
| 2021 | $12.87 | $0.11 | $ 0.78 | $ 0.89 | $(0.31) | $(0.43) | $(0.74) | $13.02 | 6.92% | $1,230,755 | 0.37% | 0.37% | 0.85% | 19% |
| 2020 | 12.19 | 0.11 | 1.18 | 1.29 | (0.20) | (0.41) | (0.61) | 12.87 | 10.66 | 1,219,621 | 0.37 | 0.37 | 0.93 | 15 |
| 2019 | 11.07 | 0.22 | 1.70 | 1.92 | (0.26) | (0.54) | (0.80) | 12.19 | 17.33 | 1,237,755 | 0.38 | 0.38 | 1.79 | 9 |
| 2018 | 12.16 | 0.20 | (0.80) | (0.60) | (0.46) | (0.03) | (0.49) | 11.07 | (4.89) | 1,164,939 | 0.38 | 0.38 | 1.68 | 13 |
| 2017 | 11.09 | 0.16 | 1.20 | 1.36 | (0.13) | (0.16) | (0.29) | 12.16 | 12.30 | 1,280,286 | 0.37 | 0.38 | 1.34 | 19 |
| | | | | | | | | | | | | | | |
| # | Calculated using the average shares outstanding method. |
| (1) | Recognition of net investment income by the Fund is affected by the timing of the declaration of dividends by the underlying investment companies in which the Fund invests. |
| (2) | Does not include expenses of the investment companies in which the Fund invests. Acquired fund fees and expenses (i.e., the fees and expenses incurred by the underlying funds) for the Conservative Allocation Fund, Balanced Allocation Fund, Growth Allocation Fund and Aggressive Allocation Fund were 0.51%, 0.61%, 0.70% and 0.76%, respectively for 2021. These acquired fund fees and expenses impact the net asset value of the underlying funds in which each Fund invests, and therefore the effect of the acquired fund fees and expenses are reflected in each Fund's total return. |
See Notes to Financial Statements.
| For a Share Outstanding For the Years Ending December 31, unless otherwise indicated | | | | | | Ratios to Average Net Assets | |
| | Net Asset
Value,
Beginning
of Year | Net Investment
Income#(1) | Realized
and
Unrealized
Gain
(Loss) on
Investments | Total Income
From Investment
Operations | Dividends
from Net
Investment
Income | Distributions
from Net
Realized
Capital
Gains | Total
Distributions
Paid | Net Asset
Value,
End of
Year | Total
Return | Net Assets,
End of Year
(000) | Expenses,
Net(2) | Expenses,
Gross(2) | Investment
Income,
Net
(1) | Portfolio
Turnover
Rate |
| Growth Allocation Fund |
| Institutional Class |
| 2021 | $13.25 | $0.14 | $ 1.42 | $ 1.56 | $(0.40) | $(0.58) | $(0.98) | $13.83 | 11.82% | $440,338 | 0.12% | 0.12% | 0.96% | 17% |
| 2020 | 12.31 | 0.11 | 1.51 | 1.62 | (0.18) | (0.50) | (0.68) | 13.25 | 13.30 | 404,479 | 0.13 | 0.13 | 0.90 | 15 |
| 2019 | 11.02 | 0.23 | 2.25 | 2.48 | (0.22) | (0.97) | (1.19) | 12.31 | 22.62 | 312,347 | 0.12 | 0.12 | 1.86 | 10 |
| 2018 | 12.43 | 0.20 | (1.11) | (0.91) | (0.46) | (0.04) | (0.50) | 11.02 | (7.32) | 244,900 | 0.13 | 0.13 | 1.60 | 9 |
| 2017 | 10.97 | 0.17 | 1.90 | 2.07 | (0.11) | (0.50) | (0.61) | 12.43 | 18.94 | 279,148 | 0.13 | 0.13 | 1.38 | 17 |
| Investor Class |
| 2021 | $13.24 | $0.10 | $ 1.43 | $ 1.53 | $(0.37) | $(0.58) | $(0.95) | $13.82 | 11.56% | $968,891 | 0.38% | 0.38% | 0.71% | 17% |
| 2020 | 12.31 | 0.07 | 1.51 | 1.58 | (0.15) | (0.50) | (0.65) | 13.24 | 12.96 | 919,826 | 0.38 | 0.38 | 0.61 | 15 |
| 2019 | 11.02 | 0.19 | 2.26 | 2.45 | (0.19) | (0.97) | (1.16) | 12.31 | 22.33 | 935,085 | 0.38 | 0.38 | 1.51 | 10 |
| 2018 | 12.42 | 0.17 | (1.10) | (0.93) | (0.43) | (0.04) | (0.47) | 11.02 | (7.50) | 852,723 | 0.38 | 0.38 | 1.35 | 9 |
| 2017 | 10.97 | 0.14 | 1.89 | 2.03 | (0.08) | (0.50) | (0.58) | 12.42 | 18.59 | 973,237 | 0.37 | 0.37 | 1.14 | 17 |
| |
| Aggressive Allocation Fund |
| Institutional Class |
| 2021 | $13.06 | $0.12 | $ 1.85 | $ 1.97 | $(0.46) | $(0.65) | $(1.11) | $13.92 | 15.09% | $331,642 | 0.13% | 0.13% | 0.81% | 12% |
| 2020 | 12.00 | 0.07 | 1.80 | 1.87 | (0.11) | (0.70) | (0.81) | 13.06 | 15.75 | 290,969 | 0.13 | 0.13 | 0.59 | 13 |
| 2019 | 10.61 | 0.18 | 2.69 | 2.87 | (0.15) | (1.33) | (1.48) | 12.00 | 27.25 | 239,577 | 0.12 | 0.12 | 1.48 | 9 |
| 2018 | 12.28 | 0.15 | (1.37) | (1.22) | (0.40) | (0.05) | (0.45) | 10.61 | (9.95) | 167,013 | 0.14 | 0.14 | 1.18 | 9 |
| 2017 | 10.48 | 0.12 | 2.58 | 2.70 | (0.13) | (0.77) | (0.90) | 12.28 | 25.88 | 195,991 | 0.14 | 0.14 | 0.98 | 7 |
| Investor Class |
| 2021 | $13.00 | $0.08 | $ 1.85 | $ 1.93 | $(0.42) | $(0.65) | $(1.07) | $13.86 | 14.89% | $904,521 | 0.38% | 0.38% | 0.54% | 12% |
| 2020 | 11.95 | 0.03 | 1.80 | 1.83 | (0.08) | (0.70) | (0.78) | 13.00 | 15.49 | 849,922 | 0.38 | 0.38 | 0.30 | 13 |
| 2019 | 10.58 | 0.14 | 2.68 | 2.82 | (0.12) | (1.33) | (1.45) | 11.95 | 26.86 | 840,397 | 0.38 | 0.38 | 1.12 | 9 |
| 2018 | 12.24 | 0.12 | (1.36) | (1.24) | (0.37) | (0.05) | (0.42) | 10.58 | (10.15) | 742,412 | 0.38 | 0.38 | 0.94 | 9 |
| 2017 | 10.46 | 0.09 | 2.57 | 2.66 | (0.11) | (0.77) | (0.88) | 12.24 | 25.49 | 864,508 | 0.38 | 0.38 | 0.75 | 7 |
| | | | | | | | | | | | | | | |
| # | Calculated using the average shares outstanding method. |
| (1) | Recognition of net investment income by the Fund is affected by the timing of the declaration of dividends by the underlying investment companies in which the Fund invests. |
| (2) | Does not include expenses of the investment companies in which the Fund invests. Acquired fund fees and expenses (i.e., the fees and expenses incurred by the underlying funds) for the Conservative Allocation Fund, Balanced Allocation Fund, Growth Allocation Fund and Aggressive Allocation Fund were 0.51%, 0.61%, 0.70% and 0.76%, respectively for 2021. These acquired fund fees and expenses impact the net asset value of the underlying funds in which each Fund invests, and therefore the effect of the acquired fund fees and expenses are reflected in each Fund's total return. |
See Notes to Financial Statements.
Money Market Fund (Unaudited)
The Federal Reserve kept the federal funds rate at 0.00% to 0.25% for the entirety of 2021. Money market fund investors were generally able to preserve capital for the year with rates locked at the lower bound with many funds waiving fees and expenses.
Easy monetary policy and excess liquidity flowing into money market funds in 2021 kept rates low and returns muted. At the end of 2021, the three-month US Treasury Bill was yielding 0.04%.
The Fund is a government money market fund and invested no less than 99.5% of its total assets in eligible government money market fund securities. The Fund maintained a stable per share price of $1.00, while declaring dividends daily and paying them monthly based on its daily value. The Investor Class of the Fund returned 0.00% for the one-year period ended December 31, 2021, as compared to a 0.04% return for its benchmark, the Bloomberg 1-3 Month US Treasury Bill Index. Income opportunities continue to be scarce and stretching for yield in this environment produced an asymmetrical payoff, providing little upside while increasing the potential for a material negative return event. At year end, the Fund’s weighted average maturity was 44 days, compared to 56 days at the end of 2020. In a low-rate environment, the management of the Fund remained true and steadfast to its investment objective to maximize current income to the extent consistent with the preservation of capital and liquidity, and the maintenance of a stable per share price of $1.00.
This Fund may be suitable for investors who have a short-term investment horizon, seek to maintain a stable dollar value for their investment and can accept a long-term rate of return that may be lower than other fixed income and equity investments.
At December 31, 2021, the portfolio holdings of the Fund, as a percentage of net assets, is shown in the following table. Portfolio holdings are subject to risk and may change at any time.
| | % |
| Agency Obligations | 41.2 |
| Repurchase Agreements | 30.9 |
| U.S. Treasury Obligations | 30.3 |
| Money Market Funds | —** |
| | 102.4 |
| **Rounds to less than 0.05% | |
Money Market Fund (Unaudited)
| Average Annual Total Returns as of 12/31/21 | |
| | | Institutional Class* | | Investor Class* | | Benchmark** | |
| One Year | | 0.00% | | 0.00% | | 0.04% | |
| Five Year | | 1.01% | | 0.82% | | 1.08% | |
| Ten Year | | 0.55% | | 0.42% | | 0.58% | |
| Since Inception | | 1.32% | | 1.19% | | 1.25% | |
| Inception Date | | 08/27/01 | | 08/27/01 | | | |
| Total Fund Operating Expenses (May 1, 2021 Prospectus)(1) | | 0.15% | | 0.42% | | | |
| Yield as of 12/31/21(2) | |
| | | Institutional Class* | | Investor Class* | |
| 7-Day Annualized Yield (Net) | | 0.00% | | 0.00% | |
| 7-Day Annualized Yield (Gross) | | 0.00% | | 0.00% | |
| (1) | Current information regarding the Fund’s Operating Expenses can be found in the Financial Highlights. |
| (2) | Yield for the Money Market Fund represents the annualization of the Fund’s declared dividends over the period indicated, excluding capital gains distributions. The yield more closely reflects the current earnings of the Fund than the total return. Gross Yield reflects the yield without expenses. |
The performance data quoted represents past performance and does not guarantee future results. Current performance may be lower or higher. Performance data current to the most recent month-end may be obtained at GuideStoneFunds.com. The investment return and principal value of an investment will fluctuate so that shares, when redeemed, may be worth more or less than their original cost. The yield for the Money Market Fund represents annualization of the Fund’s declared dividends over the period indicated, excluding capital gains distributions. The 7-day annualized yield more closely reflects the current earnings of the Fund than the total return.
The graph illustrates the results of a hypothetical $10,000 investment in the Investor Class of the Fund for the 10-year period from December 31, 2011 to December 31, 2021, with all dividends and capital gains reinvested, with the Bloomberg 1-3 Month US Treasury Bill Index.
*These returns reflect investment advisory and shareholder servicing fee waivers, if applicable, during the reported time periods.
**Unlike a mutual fund, the performance of an index assumes no taxes, transaction costs, management fees or other expenses.
| | | Par | | Value |
| AGENCY OBLIGATIONS — 41.2% |
| Federal Farm Credit Bank Discount Notes | | | | |
| 0.05%, 01/07/22 | $ 3,165,000 | | $ 3,164,974 |
| 0.00%, 01/19/22 | 5,300,000 | | 5,299,788 |
| 0.08%, 01/28/22 | 4,640,000 | | 4,639,721 |
| 0.05%, 01/31/22 | 5,480,000 | | 5,479,772 |
| 0.05%, 03/03/22 | 16,000,000 | | 15,998,644 |
| 0.05%, 04/19/22 | 11,940,000 | | 11,938,209 |
| 0.06%, 06/21/22 | 8,075,000 | | 8,072,699 |
| Federal Farm Credit Banks Funding Corporation | | | | |
| (Floating, U.S. SOFR + 0.18%), 0.23%, 01/14/22† | 6,170,000 | | 6,170,000 |
| (Floating, U.S. Treasury 3M Bill MMY + 0.12%), 0.21%, 05/02/22† | 2,100,000 | | 2,099,958 |
| (Floating, U.S. SOFR + 0.19%), 0.24%, 07/14/22† | 4,580,000 | | 4,580,000 |
| (Floating, U.S. Federal Funds + 0.18%), 0.26%, 07/20/22† | 16,000,000 | | 15,999,132 |
| 0.07%, 08/10/22 | 22,505,000 | | 22,504,318 |
| (Floating, U.S. SOFR + 0.05%), 0.10%, 09/08/22† | 9,530,000 | | 9,530,990 |
| (Floating, U.S. SOFR + 0.06%), 0.11%, 10/21/22† | 13,335,000 | | 13,335,000 |
| (Floating, U.S. SOFR + 0.08%), 0.13%, 11/03/22† | 7,810,000 | | 7,810,000 |
| (Floating, U.S. SOFR + 0.03%), 0.08%, 01/12/23† | 15,770,000 | | 15,769,178 |
| (Floating, U.S. SOFR + 0.05%), 0.10%, 02/17/23† | 7,350,000 | | 7,350,000 |
| (Floating, U.S. SOFR + 0.05%), 0.10%, 08/22/23† | 9,040,000 | | 9,040,000 |
| (Floating, U.S. SOFR + 0.05%), 0.10%, 09/28/23† | 6,010,000 | | 6,010,000 |
| (Floating, U.S. SOFR + 0.06%), 0.11%, 11/22/23† | 11,060,000 | | 11,060,000 |
| Federal Home Loan Bank | | | | |
| 0.04%, 01/12/22 | 16,035,000 | | 16,034,947 |
| (Floating, U.S. SOFR + 0.02%), 0.07%, 01/12/22† | 40,000,000 | | 40,000,000 |
| 0.04%, 01/28/22 | 23,190,000 | | 23,189,812 |
| 0.05%, 01/28/22 | 8,535,000 | | 8,534,995 |
| 0.04%, 02/01/22 | 14,850,000 | | 14,849,859 |
| 0.05%, 02/07/22 | 4,150,000 | | 4,149,995 |
| (Floating, U.S. SOFR + 0.12%), 0.17%, 02/28/22† | 8,240,000 | | 8,240,000 |
| 0.06%, 03/22/22 | 15,455,000 | | 15,454,914 |
| (Floating, U.S. SOFR + 0.01%), 0.06%, 03/28/22† | 1,310,000 | | 1,310,000 |
| (Floating, U.S. SOFR + 0.01%), 0.06%, 03/30/22† | 2,090,000 | | 2,090,000 |
| (Floating, U.S. SOFR + 0.07%), 0.12%, 04/28/22† | 2,565,000 | | 2,565,000 |
| 0.06%, 05/23/22 | 7,640,000 | | 7,639,836 |
| (Floating, U.S. SOFR + 0.01%), 0.06%, 09/06/22† | 9,525,000 | | 9,525,000 |
| | | Par | | Value |
| (Floating, U.S. SOFR + 0.02%), 0.07%, 12/16/22† | $ 19,240,000 | | $ 19,240,000 |
| Federal Home Loan Bank Discount Notes | | | | |
| 0.04%, 01/12/22 | 17,290,000 | | 17,289,789 |
| 0.04%, 01/14/22 | 4,990,000 | | 4,989,919 |
| 0.05%, 02/08/22 | 4,165,000 | | 4,164,780 |
| 0.05%, 02/14/22 | 31,585,000 | | 31,582,969 |
| 0.00%, 02/15/22 | 12,590,000 | | 12,589,292 |
| 0.05%, 02/16/22 | 28,770,000 | | 28,768,346 |
| 0.05%, 02/18/22 | 11,715,000 | | 11,714,219 |
| 0.05%, 03/02/22 | 24,205,000 | | 24,203,023 |
| 0.04%, 03/08/22 | 37,065,000 | | 37,062,155 |
| 0.04%, 03/11/22 | 1,380,000 | | 1,379,881 |
| 0.04%, 03/15/22 | 22,015,000 | | 22,013,214 |
| 0.05%, 03/18/22 | 31,015,000 | | 31,012,119 |
| 0.04%, 04/01/22 | 5,925,000 | | 5,924,348 |
| 0.06%, 04/22/22 | 18,965,000 | | 18,961,725 |
| Federal Home Loan Mortgage Corporation | | | | |
| (Floating, U.S. SOFR + 0.20%), 0.25%, 03/11/22† | 5,330,000 | | 5,330,000 |
| (Floating, U.S. SOFR + 0.19%), 0.24%, 06/02/22† | 8,900,000 | | 8,900,000 |
| 0.13%, 07/25/22 | 6,835,000 | | 6,836,696 |
| (Floating, U.S. SOFR + 0.07%), 0.12%, 11/10/22† | 5,065,000 | | 5,065,000 |
| Federal National Mortgage Association | | | | |
| (Floating, U.S. SOFR + 0.35%), 0.40%, 04/07/22† | 7,655,000 | | 7,655,000 |
| (Floating, U.S. SOFR + 0.39%), 0.44%, 04/15/22† | 8,775,000 | | 8,775,000 |
| Federal National Mortgage Association Discount Note | | | | |
| 0.05%, 03/02/22 | 7,695,000 | | 7,694,359 |
Total Agency Obligations
(Cost $660,588,575) | | | 660,588,575 |
| U.S. TREASURY OBLIGATIONS — 30.3% |
| U.S. Cash Management Bill | | | | |
| 0.07%, 04/05/22 | 2,760,000 | | 2,759,472 |
| 0.10%, 04/26/22 | 18,540,000 | | 18,533,485 |
| 0.12%, 05/03/22 | 37,995,000 | | 37,979,320 |
| | | | | 59,272,277 |
| U.S. Treasury Bills | | | | |
| 0.05%, 02/08/22Ω | 2,225,000 | | 2,224,894 |
| 0.05%, 03/01/22Ω | 15,881,100 | | 15,879,741 |
| 0.04%, 03/03/22Ω | 105,610,000 | | 105,601,053 |
| 0.05%, 03/10/22Ω | 98,090,700 | | 98,079,689 |
| 0.05%, 03/24/22Ω | 12,760,000 | | 12,757,820 |
| 0.08%, 03/31/22Ω | 35,500,000 | | 35,492,540 |
| 0.12%, 06/16/22Ω | 32,335,000 | | 32,315,617 |
See Notes to Financial Statements.
| | | Par | | Value |
| 0.15%, 06/23/22Ω | $28,860,000 | | $ 28,839,149 |
| 0.21%, 06/30/22Ω | 15,035,000 | | 15,019,213 |
| 0.07%, 09/08/22Ω | 6,810,000 | | 6,806,453 |
| 0.39%, 12/29/22Ω | 3,295,000 | | 3,282,078 |
| | | | | 356,298,247 |
| U.S. Treasury Floating Rate Notes | | | | |
| (Floating, U.S. Treasury 3M Bill MMY + 0.06%), 0.15%, 07/31/22† | 19,672,100 | | 19,672,100 |
| (Floating, U.S. Treasury 3M Bill MMY + 0.05%), 0.14%, 01/31/23† | 17,000,000 | | 17,001,211 |
| (Floating, U.S. Treasury 3M Bill MMY + 0.04%), 0.13%, 10/31/23† | 10,000,000 | | 10,000,000 |
| | | | | 46,673,311 |
| U.S. Treasury Notes | | | | |
| 1.38%, 01/31/22 | 18,285,000 | | 18,304,691 |
| 1.75%, 02/28/22 | 420,000 | | 421,107 |
| 0.38%, 03/31/22 | 420,000 | | 420,288 |
| 2.13%, 05/15/22 | 3,040,000 | | 3,062,921 |
| 1.75%, 06/15/22 | 360,000 | | 362,731 |
| 0.13%, 06/30/22 | 1,350,000 | | 1,350,360 |
| | | | | 23,922,098 |
Total U.S. Treasury Obligations
(Cost $486,165,933) | | | 486,165,933 |
| | | Shares | |
| MONEY MARKET FUNDS — 0.0% |
Northern Institutional Funds - U.S. Government Select Portfolio (Shares), 0.01%Ø
(Cost $231,311) | 231,311 | 231,311 |
| | | Par | |
| REPURCHASE AGREEMENTS — 30.9% |
| Bank of Nova Scotia | | |
| 0.05% (dated 12/31/2021, due 01/03/2022, repurchase price $65,000,271, collateralized by U.S. Treasury Bonds and U.S. Treasury Notes, 0.125% to 2.750%, due 11/15/2023 to 02/15/2050, total market value$66,300,341) | $65,000,000 | 65,000,000 |
| BNP Paribas | | |
| 0.05% (dated 12/31/2021, due 01/03/2022, repurchase price $18,000,075, collateralized by Federal National Mortgage Association, Government National Mortgage Association, U.S. Treasury Bonds and U.S. Treasury Notes, 0.000% to 4.500%, due 03/15/2022 to 04/01/2051, total market value $18,360,150) | 18,000,000 | 18,000,000 |
| | | Par | | Value |
| | | | |
| 0.05% (dated 12/31/2021, due 01/03/2022, repurchase price $50,000,208, collateralized by U.S. Treasury Bills, U.S. Treasury Bonds and U.S. Treasury Notes, 0.000% to 2.750%, due 01/27/2022 to 11/15/2037, total market value $51,000,067) | $50,000,000 | | $50,000,000 |
| Citigroup Global Markets, Inc. | | | |
| 0.06% (dated 12/31/2021, due 01/03/2022, repurchase price $58,000,290, collateralized by Government National Mortgage Association, 2.500% to 4.000%, due 11/20/2050 to 12/20/2050, total market value $59,160,614) | 58,000,000 | | 58,000,000 |
| Goldman Sachs & Co. | | | |
| 0.05% (dated 12/31/2021, due 01/03/2022, repurchase price $50,000,208, collateralized by Government National Mortgage Association, 2.000% to 6.000%, due 02/20/2034 to 11/15/2056, total market value $51,000,000) | 50,000,000 | | 50,000,000 |
| Mitsubishi UFJ Securities USA, Inc. | | | |
| 0.06% (dated 12/31/2021, due 01/03/2022, repurchase price $70,000,321, collateralized by Government National Mortgage Association, 2.500% to 5.500%, due 10/15/2039 to 06/20/2051, total market value $71,400,000) | 70,000,000 | | 70,000,000 |
| Mizuho Securities USA, Inc. | | | |
| 0.05% (dated 12/31/2021, due 01/03/2022, repurchase price $65,000,271, collateralized by U.S. Treasury Notes, 0.750% to 2.875%, due 01/31/2023 to 05/15/2028, total market value $66,300,003) | 65,000,000 | | 65,000,000 |
| Natixis S.A. | | | |
| 0.05% (dated 12/31/2021, due 01/03/2022, repurchase price $70,000,292, collateralized by U.S. Treasury Bonds and U.S. Treasury Notes, 0.125% to 2.875%, due 06/30/2022 to 02/15/2041, total market value $71,400,089) | 70,000,000 | | 70,000,000 |
See Notes to Financial Statements.
SCHEDULE OF INVESTMENTS (Continued)
| | | Par | | Value |
| TD Securities USA LLC | | | |
| 0.05% (dated 12/31/2021, due 01/03/2022, repurchase price $50,000,208, collateralized by U.S. Treasury Notes, 2.000%, due 06/30/2024, total market value $51,000,028) | $50,000,000 | | $ 50,000,000 |
Total Repurchase Agreements
(Cost $496,000,000) | | | 496,000,000 |
TOTAL INVESTMENTS —102.4%
(Cost $1,642,985,819) | | | 1,642,985,819 |
Liabilities in Excess of Other
Assets — (2.4)% | | | (39,124,036) |
| NET ASSETS — 100.0% | | | $1,603,861,783 |
VALUATION HIERARCHY
The following is a summary of the inputs used, as of December 31, 2021, in valuing the Fund’s investments carried at fair value:
| | Total
Value | | Level 1
Quoted Prices | | Level 2
Other Significant
Observable Inputs | | Level 3
Significant
Unobservable Inputs |
| Assets: | | | | | | | |
| Investments in Securities: | | | | | | | |
| Agency Obligations | $ 660,588,575 | | $ — | | $ 660,588,575 | | $ — |
| Money Market Funds | 231,311 | | 231,311 | | — | | — |
| Repurchase Agreements | 496,000,000 | | — | | 496,000,000 | | — |
| U.S. Treasury Obligations | 486,165,933 | | — | | 486,165,933 | | — |
| Total Assets - Investments in Securities | $1,642,985,819 | | $231,311 | | $1,642,754,508 | | $ — |
See Notes to Financial Statements.
Low-Duration Bond Fund (Unaudited)
The Fund invested in a diversified portfolio composed primarily of investment grade fixed income securities with a dollar-weighted effective duration (a calculation that measures the price sensitivity of a bond or bond fund to changes in interest rates taking into account embedded options and floating interest rates) normally between one to three years. The average dollar-weighted effective duration at the end of the reporting period was 1.54 years. The Investor Class of the Fund lagged its all U.S. Treasury benchmark, the Bloomberg US Treasury 1-3 Year Index, for the one-year period ended December 31, 2021 (-0.65% versus -0.60%). In an effort to outpace its benchmark, the Fund tactically utilized spread sectors (such as high yield and investment grade corporates, mortgage-backed securities, U.S. dollar denominated emerging markets securities and asset-backed securities) that traded at a yield premium relative to U.S. Treasuries. The strategy of overweighting non-U.S. Treasury sectors was additive for the year but not enough to fully compensate for fees in the Investor Class.
Other strategies involving derivatives were utilized during the year, resulting in an overall positive impact to performance. U.S. Treasury futures and swap contracts were used for both duration management and yield curve positioning strategies. Over the course of 2021, these positions contributed to relative outperformance. Options strategies used for duration management were positive contributors for the year. Credit default swaps were purchased and added to the Fund’s relative performance during the year. In an effort to gain exposure to U.S. and non-U.S. interest rates and duration, interest rate swaps were utilized and added to performance. Currency forward contracts were used to hedge certain non-U.S. dollar positions and to express views on the relative value of differing currencies. In aggregate the exposure detracted from relative performance.
During the year, the Fund remained true to its overall objective of seeking current income consistent with preservation of capital.
This Fund may be suitable for investors who have a short-term investment horizon, seek an investment return that is relatively stable and want to diversify their portfolio with a fixed income investment option. This Fund is subject to interest rate risk, meaning, when interest rates rise, the value of the existing fixed income securities decrease and vice versa. Changes in interest rates have a bigger impact on long duration holdings than on short duration holdings. To the extent that the investment adviser or sub-adviser misjudge current market conditions, the Fund’s volatility may be amplified by its use of derivatives and by its ability to select sub-advisers to allocate assets. Derivatives involve different risks from, and in some respects greater risks than, those associated with investing directly in securities, currencies or other instruments. Derivatives may be illiquid or less liquid, volatile, difficult to price and leveraged, so small changes in the value of the underlying instruments may produce disproportionate losses to the Fund. It is possible to lose money by investing in the Fund.
At December 31, 2021, the portfolio holdings of the Fund, as a percentage of net assets, is shown in the following table. Portfolio holdings are subject to risk and may change at any time.
| | % |
| U.S. Treasury Obligations | 27.4 |
| Corporate Bonds | 19.5 |
| Asset-Backed Securities | 17.0 |
| Foreign Bonds | 16.5 |
| Mortgage-Backed Securities | 15.9 |
| Money Market Funds | 3.5 |
| Agency Obligations | 2.6 |
| Municipal Bonds | 0.1 |
| Written Options | —** |
| | 102.5 |
| **Rounds to less than 0.05% | |
See Notes to Financial Statements.
Low-Duration Bond Fund (Unaudited)
| Average Annual Total Returns as of 12/31/21 | |
| | | Institutional Class* | | Investor Class* | | Benchmark** | |
| One Year | | (0.40%) | | (0.65%) | | (0.60%) | |
| Five Year | | 2.00% | | 1.74% | | 1.60% | |
| Ten Year | | 1.80% | | 1.55% | | 1.08% | |
| Since Inception | | 2.76% | | 2.58% | | 2.26% | |
| Inception Date | | 08/27/01 | | 08/27/01 | | | |
| Total Fund Operating Expenses (May 1, 2021 Prospectus)(1) | | 0.36% | | 0.63% | | | |
| (1) | Current information regarding the Fund’s Operating Expenses can be found in the Financial Highlights. |
The performance data quoted represents past performance and does not guarantee future results. Current performance may be lower or higher. Performance data current to the most recent month-end may be obtained at GuideStoneFunds.com. The investment return and principal value of an investment will fluctuate so that shares, when redeemed, may be worth more or less than their original cost.
The graph illustrates the results of a hypothetical $10,000 investment in the Investor Class of the Fund for the 10-year period from December 31, 2011 to December 31, 2021, with all dividends and capital gains reinvested, with the Bloomberg US Treasury 1-3 Year Index.
*These returns reflect investment advisory and shareholder servicing fee waivers, if applicable, during the reported time periods.
**Unlike a mutual fund, the performance of an index assumes no taxes, transaction costs, management fees or other expenses.
See Notes to Financial Statements.
| | | Par | | Value |
| AGENCY OBLIGATIONS — 2.6% |
| Federal Home Loan Bank | | | | |
| 0.90%, 02/26/27 | $3,300,000 | | $ 3,217,678 |
| 0.92%, 02/26/27 | 3,300,000 | | 3,227,762 |
| Federal Home Loan Mortgage Corporation | | | | |
| 0.80%, 10/27/26 | 3,000,000 | | 2,925,018 |
| 0.80%, 10/28/26 | 4,000,000 | | 3,903,934 |
| Federal National Mortgage Association | | | | |
| 0.70%, 07/30/25 | 6,000,000 | | 5,908,443 |
| 0.88%, 12/18/26 | 8,700,000 | | 8,509,556 |
Total Agency Obligations
(Cost $28,297,315) | | | 27,692,391 |
| ASSET-BACKED SECURITIES — 17.0% |
| ACRES Commercial Realty, Ltd., Series 2021-FL2, Class A | | | |
| (Floating, ICE LIBOR USD 1M + 1.40%, 1.40% Floor), 1.49%, 01/15/37 144A † | 240,000 | | 240,965 |
| AIMCO CLO, Series 2017-AA, Class AR | | | |
| (Floating, ICE LIBOR USD 3M + 1.05%, 1.05% Floor), 1.18%, 04/20/34 144A † | 1,000,000 | | 996,698 |
| Ally Auto Receivables Trust, Series 2019-3, Class A3 | | | |
| 1.93%, 05/15/24 | 494,952 | | 497,827 |
| American Express Credit Account Master Trust, Series 2021-1, Class A | | | |
| 0.90%, 11/15/26 | 3,220,000 | | 3,206,585 |
| AmeriCredit Automobile Receivables Trust, Series 2020-2, Class B | | | |
| 0.97%, 02/18/26 | 180,000 | | 180,340 |
| AMMC CLO XIII, Ltd., Series 2013-13A, Class A1R2 | | | |
| (Floating, ICE LIBOR USD 3M + 1.05%), 1.17%, 07/24/29 144A † | 2,000,000 | | 1,999,442 |
| AMSR Trust, Series 2020-SFR5, Class A | | | |
| 1.38%, 11/17/37 144A | 1,350,000 | | 1,323,197 |
| Anchorage Capital CLO 7, Ltd., Series 2015-7A, Class CR2 | | | |
| (Floating, ICE LIBOR USD 3M + 2.20%, 2.20% Floor), 2.34%, 01/28/31 144A † | 450,000 | | 450,030 |
| Apidos CLO XXI, Series 2015-21A, Class A1R | | | |
| (Floating, ICE LIBOR USD 3M + 0.93%, 0.93% Floor), 1.05%, 07/18/27 144A † | 1,323,400 | | 1,324,063 |
| Apidos CLO XXII, Series 2015-22A, Class A2R | | | |
| (Floating, ICE LIBOR USD 3M + 1.50%), 1.63%, 04/20/31 144A † | 250,000 | | 249,087 |
| | | Par | | Value |
| Arbor Realty Commercial Real Estate Notes, Ltd., Series 2021-FL2, Class A | | | |
| (Floating, ICE LIBOR USD 1M + 1.10%, 1.10% Floor), 1.21%, 05/15/36 144A † | $2,350,000 | | $2,353,819 |
| Arbor Realty Commercial Real Estate Notes, Ltd., Series 2021-FL4, Class A | | | |
| (Floating, ICE LIBOR USD 1M + 1.35%, 1.35% Floor), 1.44%, 11/15/36 144A † | 580,000 | | 581,856 |
| Ares LVI CLO, Ltd., Series 2020-56A, Class AR | | | |
| (Floating, ICE LIBOR USD 3M + 1.16%, 1.16% Floor), 1.29%, 10/25/34 144A † | 250,000 | | 250,125 |
| Barings CLO, Ltd., Series 2013-IA, Class AR | | | |
| (Floating, ICE LIBOR USD 3M + 0.80%, 0.80% Floor), 0.93%, 01/20/28 144A † | 957,826 | | 957,448 |
| BDS, Ltd., Series 2020-FL5, Class A | | | |
| (Floating, U.S. 30-Day Average SOFR + 1.26%, 1.15% Floor), 1.31%, 02/16/37 144A † | 750,000 | | 751,133 |
| BDS, Ltd., Series 2021-FL10, Class A | | | |
| (Floating, ICE LIBOR USD 1M + 1.35%, 1.35% Floor), 1.45%, 12/18/36 144A † | 585,000 | | 586,868 |
| BDS, Ltd., Series 2021-FL7, Class A | | | |
| (Floating, ICE LIBOR USD 1M + 1.07%, 1.07% Floor), 1.18%, 06/16/36 144A † | 1,450,000 | | 1,446,979 |
| Bear Stearns Asset Backed Securities I Trust, Series 2007-HE7, Class 1A1 | | | |
| (Floating, ICE LIBOR USD 1M + 1.00%, 1.00% Floor), 1.10%, 10/25/37† | 69,343 | | 69,418 |
| Bear Stearns Asset Backed Securities Trust, Series 2004-SD1, Class A2 | | | |
| (Floating, ICE LIBOR USD 1M + 0.90%, 0.90% Floor, 11.00% Cap), 1.00%, 12/25/42† | 8,555 | | 8,551 |
| Benefit Street Partners CLO II, Ltd., Series 2013-IIA, Class A2R2 | | | |
| (Floating, ICE LIBOR USD 3M + 1.45%, 1.45% Floor), 1.57%, 07/15/29 144A † | 300,000 | | 299,839 |
| BMW Canada Auto Trust, Series 2021-1A, Class A2 | | | |
| 0.50%, 07/20/24(C) 144A | 1,500,000 | | 1,176,408 |
| BRSP, Ltd., Series 2021-FL1, Class A | | | |
| (Floating, ICE LIBOR USD 1M + 1.15%, 1.15% Floor), 1.25%, 08/19/38 144A † | 2,600,000 | | 2,595,705 |
| BSPRT Issuer, Ltd., Series 2018-FL4 , Class AS | | | |
| (Floating, ICE LIBOR USD 1M + 1.30%, 1.30% Floor), 1.41%, 09/15/35 144A † | 1,520,000 | | 1,521,736 |
See Notes to Financial Statements.
SCHEDULE OF INVESTMENTS (Continued)
| | | Par | | Value |
| BSPRT Issuer, Ltd., Series 2021-FL7, Class A | | | |
| (Floating, ICE LIBOR USD 1M + 1.32%, 1.32% Floor), 1.42%, 12/15/38 144A † | $ 290,000 | | $ 290,415 |
| CARS-DB4 LP, Series 2020-1A, Class A1 | | | |
| 2.69%, 02/15/50 144A | 314,629 | | 318,822 |
| CARS-DB5 LP, Series 2021-1A, Class A1 | | | |
| 1.44%, 08/15/51 144A | 1,995,599 | | 1,968,151 |
| Cedar Funding VI CLO, Ltd., Series 2016-6A, Class ARR | | | |
| (Floating, ICE LIBOR USD 3M + 1.05%, 1.05% Floor), 1.18%, 04/20/34 144A † | 1,490,000 | | 1,488,513 |
| Chesapeake Funding II LLC, Series 2019-1A, Class B | | | |
| 3.11%, 04/15/31 144A | 240,000 | | 241,691 |
| Chesapeake Funding II LLC, Series 2019-1A, Class C | | | |
| 3.36%, 04/15/31 144A | 230,000 | | 231,722 |
| Chesapeake Funding II LLC, Series 2019-1A, Class D | | | |
| 3.80%, 04/15/31 144A | 370,000 | | 373,209 |
| Chesapeake Funding II LLC, Series 2020-1A, Class B | | | |
| 1.24%, 08/16/32 144A | 100,000 | | 100,289 |
| CIFC Funding 2015-II, Ltd., Series 2015-2A, Class AR2 | | | |
| (Floating, ICE LIBOR USD 3M + 1.01%, 1.01% Floor), 1.13%, 04/15/30 144A † | 1,000,000 | | 999,750 |
| CIFC Funding, Ltd., Series 2018-3A, Class A | | | |
| (Floating, ICE LIBOR USD 3M + 1.10%), 1.22%, 07/18/31 144A † | 500,000 | | 499,224 |
| CIFC Funding, Ltd., Series 2021-5A, Class A | | | |
| (Floating, ICE LIBOR USD 3M + 1.14%, 1.14% Floor), 1.26%, 07/15/34 144A † | 250,000 | | 249,986 |
| CLNC, Ltd., Series 2019-FL1, Class A | | | |
| (Floating, U.S. 30-Day Average SOFR + 1.36%, 1.25% Floor), 1.41%, 08/20/35 144A † | 1,290,000 | | 1,294,087 |
| CNH Capital Canada Receivables Trust, Series 2021-1A, Class A1 | | | |
| 0.39%, 03/15/24(C) 144A | 579,182 | | 457,778 |
| CNH Equipment Trust, Series 2018-B, Class A3 | | | |
| 3.19%, 11/15/23 | 196,404 | | 198,065 |
| College Ave Student Loans LLC, Series 2021-B, Class A1 | | | |
| (Floating, ICE LIBOR USD 1M + 0.80%, 0.80% Floor), 0.90%, 06/25/52 144A † | 243,197 | | 243,785 |
| College Ave Student Loans LLC, Series 2021-C, Class B | | | |
| 2.72%, 07/26/55 144A | 100,000 | | 100,582 |
| | | Par | | Value |
| Credit Acceptance Auto Loan Trust, Series 2019-3A, Class A | | | |
| 2.38%, 11/15/28 144A | $ 512,131 | | $ 516,747 |
| Credit Acceptance Auto Loan Trust, Series 2020-1A, Class A | | | |
| 2.01%, 02/15/29 144A | 1,290,000 | | 1,300,463 |
| Credit Acceptance Auto Loan Trust, Series 2020-2A, Class A | | | |
| 1.37%, 07/16/29 144A | 300,000 | | 301,084 |
| Credit Acceptance Auto Loan Trust, Series 2021-2A, Class A | | | |
| 0.96%, 02/15/30 144A | 800,000 | | 795,689 |
| CSAB Mortgage-Backed Trust, Series 2006-2, Class A6A | | | |
| (Step to 6.22% on 02/25/36), 6.22%, 09/25/36 STEP | 256,353 | | 119,907 |
| CWABS, Inc. Asset-Backed Certificates Trust, Series 2004-6, Class 1A1 | | | |
| (Floating, ICE LIBOR USD 1M + 0.54%, 0.54% Floor), 0.64%, 12/25/34† | 663,185 | | 651,007 |
| DataBank Issuer, Series 2021-1A, Class A2 | | | |
| 2.06%, 02/27/51 144A | 650,000 | | 639,000 |
| DataBank Issuer, Series 2021-2A, Class A2 | | | |
| 2.40%, 10/25/51 144A | 1,200,000 | | 1,190,869 |
| Dewolf Park CLO, Ltd., Series 2017-1A, Class AR | | | |
| (Floating, ICE LIBOR USD 3M + 0.92%, 0.90% Floor), 1.04%, 10/15/30 144A † | 2,950,000 | | 2,946,918 |
| Diamond Infrastructure Funding LLC, Series 2021-1A, Class A | | | |
| 1.76%, 04/15/49 144A | 1,650,000 | | 1,613,747 |
| Diamond Issuer, Series 2021-1A, Class A | | | |
| 2.31%, 11/20/51 144A | 1,750,000 | | 1,731,915 |
| Drive Auto Receivables Trust, Series 2020-1, Class C | | | |
| 2.36%, 03/16/26 | 850,000 | | 856,879 |
| Drive Auto Receivables Trust, Series 2020-2, Class B | | | |
| 1.42%, 03/17/25 | 400,000 | | 401,042 |
| Drive Auto Receivables Trust, Series 2021-1, Class B | | | |
| 0.65%, 07/15/25 | 1,650,000 | | 1,648,016 |
| Drive Auto Receivables Trust, Series 2021-3, Class B | | | |
| 1.11%, 05/15/26 | 1,350,000 | | 1,332,330 |
| Dryden 43 Senior Loan Fund, Series 2016-43A, Class AR2 | | | |
| (Floating, ICE LIBOR USD 3M + 1.04%, 1.04% Floor), 1.17%, 04/20/34 144A † | 1,000,000 | | 995,720 |
| Dryden XXVI Senior Loan Fund, Series 2013-26A, Class AR | | | |
| (Floating, ICE LIBOR USD 3M + 0.90%), 1.02%, 04/15/29 144A † | 969,662 | | 970,001 |
See Notes to Financial Statements.
| | | Par | | Value |
| EDvestinU Private Education Loan Issue No. 1 LLC, Series 2019-A, Class A | | | |
| 3.58%, 11/25/38 144A | $ 248,332 | | $ 254,428 |
| EDvestinU Private Education Loan Issue No. 3 LLC, Series 2021-A, Class A | | | |
| 1.80%, 11/25/45 144A | 84,108 | | 82,884 |
| Elevation CLO, Ltd., Series 2017-7A, Class A | | | |
| (Floating, ICE LIBOR USD 3M + 1.22%), 1.34%, 07/15/30 144A † | 1,500,000 | | 1,501,607 |
| ELFI Graduate Loan Program LLC, Series 2021-A, Class A | | | |
| 1.53%, 12/26/46 144A | 4,583,877 | | 4,557,139 |
| Elmwood CLO II, Ltd., Series 2019-2A, Class AR | | | |
| (Floating, ICE LIBOR USD 3M + 1.15%, 1.15% Floor), 1.28%, 04/20/34 144A † | 1,700,000 | | 1,700,847 |
| Fairstone Financial Issuance Trust I, Series 2020-1A, Class A | | | |
| 2.51%, 10/20/39(C) 144A | 460,000 | | 363,953 |
| FHLMC Structured Pass-Through Certificates, Series T-32, Class A1 | | | |
| (Floating, ICE LIBOR USD 1M + 0.26%, 0.26% Floor), 0.36%, 08/25/31† | 179,598 | | 175,821 |
| FirstKey Homes Trust, Series 2020-SFR2, Class A | | | |
| 1.27%, 10/19/37 144A | 4,686,630 | | 4,574,032 |
| Flexential Issuer, Series 2021-1A, Class A2 | | | |
| 3.25%, 11/27/51 144A | 1,250,000 | | 1,250,774 |
| Ford Auto Securitization Trust, Series 2020-AA, Class A2 | | | |
| 0.89%, 08/15/24(C) 144A | 2,668,982 | | 2,112,008 |
| Ford Credit Auto Lease Trust, Series 2020-A, Class B | | | |
| 2.05%, 06/15/23 | 1,010,000 | | 1,017,470 |
| FS RIALTO, Series 2021-FL2, Class A | | | |
| (Floating, ICE LIBOR USD 1M + 1.22%, 1.22% Floor), 1.33%, 04/16/28 144A † | 270,000 | | 269,884 |
| FS Rialto, Series 2021-FL3, Class A | | | |
| (Floating, ICE LIBOR USD 1M + 1.25%, 1.25% Floor), 1.36%, 11/16/36 144A † | 515,000 | | 515,511 |
| GM Financial Automobile Leasing Trust, Series 2020-1, Class A3 | | | |
| 1.67%, 12/20/22 | 1,584,224 | | 1,587,528 |
| GM Financial Consumer Automobile Receivables Trust, Series 2020-1, Class B | | | |
| 2.03%, 04/16/25 | 390,000 | | 395,613 |
| GM Financial Consumer Automobile Receivables Trust, Series 2020-1, Class C | | | |
| 2.18%, 05/16/25 | 300,000 | | 304,541 |
| | | Par | | Value |
| GMF Canada Leasing Trust, Series 2020-1A, Class A2 | | | |
| 0.91%, 07/20/23(C) 144A | $1,954,312 | | $1,546,725 |
| GMF Canada Leasing Trust, Series 2020-1A, Class A3 | | | |
| 1.05%, 11/20/25(C) 144A | 1,690,000 | | 1,337,137 |
| GMF Canada Leasing Trust, Series 2021-1A, Class A2 | | | |
| 0.64%, 03/20/24(C) 144A | 2,000,000 | | 1,576,711 |
| GMF Floorplan Owner Revolving Trust, Series 2019-2, Class A | | | |
| 2.90%, 04/15/26 144A | 2,000,000 | | 2,074,177 |
| Goldentree Loan Management U.S. CLO 1, Ltd., Series 2017-1A, Class A1R2 | | | |
| (Floating, ICE LIBOR USD 3M + 1.02%, 1.02% Floor), 1.15%, 04/20/34 144A † | 348,000 | | 346,086 |
| GoodLeap Sustainable Home Solutions Trust, Series 2021-4GS, Class A | | | |
| 1.93%, 07/20/48 144A | 208,330 | | 205,850 |
| GPMT, Ltd., Series 2021-FL4, Class A | | | |
| (Floating, ICE LIBOR USD 1M + 1.35%, 1.35% Floor), 1.45%, 12/15/36 144A † | 500,000 | | 500,419 |
| GreatAmerica Leasing Receivables Funding LLC, Series 2019-1, Class A3 | | | |
| 3.05%, 09/15/22 144A | 143,456 | | 143,806 |
| GreatAmerica Leasing Receivables Funding LLC, Series 2021-1, Class A3 | | | |
| 0.34%, 08/15/24 144A | 1,100,000 | | 1,090,879 |
| Greystone CRE Notes, Ltd., Series 2019-FL2, Class A | | | |
| (Floating, ICE LIBOR USD 1M + 1.18%, 1.18% Floor), 1.29%, 09/15/37 144A † | 1,770,000 | | 1,774,380 |
| Gulf Stream Meridian 4, Ltd., Series 2021-4A, Class A1 | | | |
| (Floating, ICE LIBOR USD 3M + 1.20%, 1.20% Floor), 1.32%, 07/15/34 144A † | 900,000 | | 900,603 |
| Harley-Davidson Motorcycle Trust, Series 2020-A, Class A3 | | | |
| 1.87%, 10/15/24 | 430,410 | | 433,084 |
| Hertz Vehicle Financing LLC, Series 2021-1A, Class A | | | |
| 1.21%, 12/26/25 144A | 1,700,000 | | 1,685,794 |
| Honda Auto Receivables Owner Trust, Series 2021-4, Class A3 | | | |
| 0.88%, 01/21/26 | 520,000 | | 520,991 |
| Hyundai Auto Receivables Trust, Series 2021-C, Class A3 | | | |
| 0.74%, 05/15/26 | 610,000 | | 606,823 |
| ITE Rail Fund Levered LP, Series 2021-3, Class A | | | |
| 2.21%, 06/28/51 144A | 1,562,470 | | 1,568,173 |
See Notes to Financial Statements.
SCHEDULE OF INVESTMENTS (Continued)
| | | Par | | Value |
| Kubota Credit Owner Trust, Series 2020-2A, Class A3 | | | |
| 0.59%, 10/15/24 144A | $1,520,000 | | $1,515,945 |
| LCCM Trust, Series 2021-FL2, Class A | | | |
| (Floating, ICE LIBOR USD 1M + 1.20%, 1.20% Floor), 1.31%, 12/13/38 144A † | 1,600,000 | | 1,596,931 |
| LCM XX LP, Series 20A, Class AR | | | |
| (Floating, ICE LIBOR USD 3M + 1.04%), 1.17%, 10/20/27 144A † | 630,096 | | 630,084 |
| Lendmark Funding Trust, Series 2019-2A, Class A | | | |
| 2.78%, 04/20/28 144A | 350,000 | | 355,028 |
| Lendmark Funding Trust, Series 2021-1A, Class A | | | |
| 1.90%, 11/20/31 144A | 280,000 | | 277,699 |
| LoanCore Issuer, Ltd., Series 2018-CRE1, Class A | | | |
| (Floating, ICE LIBOR USD 1M + 1.13%, 1.13% Floor), 1.24%, 05/15/28 144A † | 131,923 | | 131,923 |
| LoanCore Issuer, Ltd., Series 2021-CRE5, Class A | | | |
| (Floating, ICE LIBOR USD 1M + 1.30%, 1.30% Floor), 1.41%, 07/15/36 144A † | 2,490,000 | | 2,489,741 |
| LoanCore Issuer, Ltd., Series 2021-CRE6, Class A | | | |
| (Floating, ICE LIBOR USD 1M + 1.30%, 1.30% Floor), 1.41%, 11/15/38 144A † | 300,000 | | 301,135 |
| Madison Park Funding XIII, Ltd., Series 2014-13A, Class CR2 | | | |
| (Floating, ICE LIBOR USD 3M + 1.90%), 2.02%, 04/19/30 144A † | 400,000 | | 399,558 |
| Madison Park Funding XIX, Ltd., Series 2015-19A, Class A2R2 | | | |
| (Floating, ICE LIBOR USD 3M + 1.50%, 1.50% Floor), 1.63%, 01/22/28 144A † | 600,000 | | 597,772 |
| Madison Park Funding XVII, Ltd., Series 2015-17A, Class AR2 | | | |
| (Floating, ICE LIBOR USD 3M + 1.00%), 1.13%, 07/21/30 144A † | 4,300,000 | | 4,295,939 |
| Magnetite VII, Ltd., Series 2012-7A, Class A1R2 | | | |
| (Floating, ICE LIBOR USD 3M + 0.80%), 0.92%, 01/15/28 144A † | 2,833,823 | | 2,831,852 |
| Magnetite VIII, Ltd., Series 2014-8A, Class AR2 | | | |
| (Floating, ICE LIBOR USD 3M + 0.98%, 0.98% Floor), 1.10%, 04/15/31 144A † | 530,000 | | 530,313 |
| Mariner Finance Issuance Trust, Series 2019-AA, Class A | | | |
| 2.96%, 07/20/32 144A | 308,000 | | 311,798 |
| | | Par | | Value |
| Mariner Finance Issuance Trust, Series 2020-AA, Class A | | | |
| 2.19%, 08/21/34 144A | $ 140,000 | | $ 141,006 |
| Mariner Finance Issuance Trust, Series 2021-AA, Class A | | | |
| 1.86%, 03/20/36 144A | 110,000 | | 108,326 |
| MBarc Credit Canada, Inc., Series 2021-AA, Class A2 | | | |
| 0.63%, 05/15/24(C) 144A | 1,700,000 | | 1,335,272 |
| MF1, Ltd., Series 2021-FL6, Class A | | | |
| (Floating, ICE LIBOR USD 1M + 1.10%, 1.10% Floor), 1.21%, 07/16/36 144A † | 1,300,000 | | 1,296,460 |
| Mill City Mortgage Loan Trust, Series 2016-1, Class A1 | | | |
| 2.50%, 04/25/57 144A | 27,601 | | 27,617 |
| MMAF Equipment Finance LLC, Series 2020-BA, Class A3 | | | |
| 0.49%, 08/14/25 144A | 1,360,000 | | 1,346,978 |
| Navient Private Education Loan Trust, Series 2020-IA, Class A1B | | | |
| (Floating, ICE LIBOR USD 1M + 1.00%, 1.00% Floor), 1.11%, 04/15/69 144A † | 1,849,498 | | 1,861,998 |
| Navient Private Education Refinancing Loan Trust, Series 2019-CA, Class A2 | | | |
| 3.13%, 02/15/68 144A | 253,650 | | 258,699 |
| Navient Private Education Refinancing Loan Trust, Series 2019-EA, Class A2B | | | |
| (Floating, ICE LIBOR USD 1M + 0.92%), 1.03%, 05/15/68 144A † | 469,542 | | 472,200 |
| Navient Private Education Refinancing Loan Trust, Series 2020-A, Class A2A | | | |
| 2.46%, 11/15/68 144A | 587,964 | | 599,841 |
| Navient Private Education Refinancing Loan Trust, Series 2020-A, Class A2B | | | |
| (Floating, ICE LIBOR USD 1M + 0.90%), 1.01%, 11/15/68 144A † | 97,994 | | 98,748 |
| Navient Private Education Refinancing Loan Trust, Series 2020-DA, Class A | | | |
| 1.69%, 05/15/69 144A | 912,991 | | 914,046 |
| Navient Private Education Refinancing Loan Trust, Series 2020-FA, Class A | | | |
| 1.22%, 07/15/69 144A | 411,200 | | 410,493 |
| Navient Private Education Refinancing Loan Trust, Series 2020-HA, Class A | | | |
| 1.31%, 01/15/69 144A | 1,425,174 | | 1,420,055 |
| Navient Private Education Refinancing Loan Trust, Series 2021-A, Class A | | | |
| 0.84%, 05/15/69 144A | 574,662 | | 567,906 |
See Notes to Financial Statements.
| | | Par | | Value |
| Navient Private Education Refinancing Loan Trust, Series 2021-CA, Class A | | | |
| 1.06%, 10/15/69 144A | $1,529,257 | | $1,507,914 |
| Navient Private Education Refinancing Loan Trust, Series 2021-DA, Class A | | | |
| (Floating, Prime Rate U.S. - 1.99%), 1.26%, 04/15/60 144A † | 550,226 | | 550,162 |
| Navient Private Education Refinancing Loan Trust, Series 2021-FA, Class A | | | |
| 1.11%, 02/18/70 144A | 1,637,522 | | 1,622,928 |
| Navient Student Loan Trust, Series 2016-6A, Class A2 | | | |
| (Floating, ICE LIBOR USD 1M + 0.75%), 0.85%, 03/25/66 144A † | 511,658 | | 512,672 |
| Navient Student Loan Trust, Series 2017-2A, Class A | | | |
| (Floating, ICE LIBOR USD 1M + 1.05%), 1.15%, 12/27/66 144A † | 839,585 | | 847,183 |
| Navient Student Loan Trust, Series 2017-5A, Class A | | | |
| (Floating, ICE LIBOR USD 1M + 0.80%), 0.90%, 07/26/66 144A † | 850,750 | | 855,289 |
| Navient Student Loan Trust, Series 2018-EA, Class A2 | | | |
| 4.00%, 12/15/59 144A | 69,434 | | 71,163 |
| Navient Student Loan Trust, Series 2019-BA, Class A2A | | | |
| 3.39%, 12/15/59 144A | 310,928 | | 320,564 |
| Nelnet Student Loan Trust, Series 2016-1A, Class A | | | |
| (Floating, ICE LIBOR USD 1M + 0.80%), 0.90%, 09/25/65 144A † | 804,872 | | 804,181 |
| Nelnet Student Loan Trust, Series 2021-A, Class APT2 | | | |
| 1.36%, 04/20/62 144A | 801,575 | | 787,292 |
| Nelnet Student Loan Trust, Series 2021-BA, Class AFX | | | |
| 1.42%, 04/20/62 144A | 755,314 | | 745,405 |
| Nelnet Student Loan Trust, Series 2021-CA, Class AFL | | | |
| (Floating, ICE LIBOR USD 1M + 0.74%), 0.84%, 04/20/62 144A † | 607,407 | | 609,594 |
| Nelnet Student Loan Trust, Series 2021-DA, Class AFX | | | |
| 1.63%, 04/20/62 144A | 650,983 | | 648,710 |
| Neuberger Berman CLO XVI-S, Ltd., Series 2017-16SA, Class AR | | | |
| (Floating, ICE LIBOR USD 3M + 1.04%, 1.04% Floor), 1.16%, 04/15/34 144A † | 1,145,000 | | 1,143,020 |
| | | Par | | Value |
| Neuberger Berman Loan Advisers CLO, Ltd., Series 2017-26A, Class AR | | | |
| (Floating, ICE LIBOR USD 3M + 0.92%, 0.92% Floor), 1.07%, 10/18/30 144A † | $ 680,000 | | $ 680,340 |
| Neuberger Berman Loan Advisers CLO, Ltd., Series 2019-33A, Class AR | | | |
| (Floating, ICE LIBOR USD 3M + 1.08%, 1.08% Floor), 1.20%, 10/16/33 144A † | 3,450,000 | | 3,450,307 |
| NLY Commercial Mortgage Trust, Series 2019-FL2, Class A | | | |
| (Floating, ICE LIBOR USD 1M + 1.30%, 1.30% Floor), 1.41%, 02/15/36 144A † | 202,346 | | 202,458 |
| OCP CLO, Ltd., Series 2017-13A, Class A2R | | | |
| (Floating, ICE LIBOR USD 3M + 1.55%, 1.55% Floor), 1.67%, 07/15/30 144A † | 900,000 | | 900,544 |
| OCP CLO, Ltd., Series 2020-19A, Class BR | | | |
| (Floating, ICE LIBOR USD 3M + 1.70%, 1.70% Floor), 1.83%, 10/20/34 144A † | 250,000 | | 249,957 |
| Octagon Investment Partners 36, Ltd., Series 2018-1A, Class A1 | | | |
| (Floating, ICE LIBOR USD 3M + 0.97%), 1.09%, 04/15/31 144A † | 500,000 | | 497,824 |
| OHA Credit Funding 2, Ltd., Series 2019-2A , Class AR | | | |
| (Floating, ICE LIBOR USD 3M + 1.15%, 1.15% Floor), 1.28%, 04/21/34 144A † | 750,000 | | 750,031 |
| OneMain Direct Auto Receivables Trust, Series 2018-1A, Class A | | | |
| 3.43%, 12/16/24 144A | 34,056 | | 34,065 |
| Onemain Financial Issuance Trust, Series 2018-1A, Class A | | | |
| 3.30%, 03/14/29 144A | 61,483 | | 61,531 |
| OZLM Funding IV, Ltd., Series 2013-4A, Class A1R | | | |
| (Floating, ICE LIBOR USD 3M + 1.25%), 1.38%, 10/22/30 144A † | 981,167 | | 981,178 |
| Palmer Square CLO, Ltd., Series 2013-2A, Class A1A3 | | | |
| (Floating, ICE LIBOR USD 3M + 1.00%, 1.00% Floor), 1.12%, 10/17/31 144A † | 250,000 | | 249,701 |
| Palmer Square CLO, Ltd., Series 2018-1A, Class A1 | | | |
| (Floating, ICE LIBOR USD 3M + 1.03%, 1.03% Floor), 1.15%, 04/18/31 144A † | 1,550,000 | | 1,550,347 |
See Notes to Financial Statements.
SCHEDULE OF INVESTMENTS (Continued)
| | | Par | | Value |
| Palmer Square Loan Funding, Ltd., Series 2020-1A, Class A1 | | | |
| (Floating, ICE LIBOR USD 3M + 0.80%, 0.80% Floor), 0.96%, 02/20/28 144A † | $ 560,835 | | $ 560,565 |
| PFS Financing Corp, Series 2020-B, Class A | | | |
| 1.21%, 06/15/24 144A | 1,500,000 | | 1,504,911 |
| PFS Financing Corporation, Series 2019-A, Class A1 | | | |
| (Floating, ICE LIBOR USD 1M + 0.55%), 0.66%, 04/15/24 144A † | 390,000 | | 390,414 |
| PFS Financing Corporation, Series 2019-A, Class A2 | | | |
| 2.86%, 04/15/24 144A | 1,500,000 | | 1,510,124 |
| PFS Financing Corporation, Series 2020-F, Class A | | | |
| 0.93%, 08/15/24 144A | 684,000 | | 685,650 |
| PFS Financing Corporation, Series 2020-G, Class A | | | |
| 0.97%, 02/15/26 144A | 330,000 | | 328,341 |
| PFS Financing Corporation, Series 2021-A, Class A | | | |
| 0.71%, 04/15/26 144A | 230,000 | | 226,957 |
| Prodigy Finance CM DAC, Series 2021-1A, Class A | | | |
| (Floating, ICE LIBOR USD 1M + 1.25%), 1.35%, 07/25/51 144A † | 198,674 | | 198,761 |
| Progress Residential Trust, Series 2021-SFR10, Class A | | | |
| 2.39%, 12/17/38 144A | 152,000 | | 153,236 |
| Regional Management Issuance Trust, Series 2020-1, Class A | | | |
| 2.34%, 10/15/30 144A | 110,000 | | 110,850 |
| Regional Management Issuance Trust, Series 2021-2, Class A | | | |
| 1.90%, 08/15/33 144A | 221,000 | | 216,872 |
| Santander Bank NA, Series 2021-1A, Class B | | | |
| 1.83%, 12/15/31 144A | 600,000 | | 600,227 |
| Santander Drive Auto Receivables Trust, Series 2020-2, Class B | | | |
| 0.96%, 11/15/24 | 122,844 | | 122,956 |
| Santander Drive Auto Receivables Trust, Series 2020-2, Class C | | | |
| 1.46%, 09/15/25 | 440,000 | | 442,126 |
| Securitized Term Auto Receivables Trust, Series 2019-1A, Class A3 | | | |
| 2.99%, 02/27/23 144A | 63,471 | | 63,626 |
| Signal Peak CLO 5, Ltd., Series 2018-5A, Class A | | | |
| (Floating, ICE LIBOR USD 3M + 1.11%, 1.11% Floor), 1.23%, 04/25/31 144A † | 400,000 | | 400,091 |
| Sixth Street CLO XIX, Ltd., Series 2021-19A, Class A | | | |
| (Floating, ICE LIBOR USD 3M + 1.10%, 1.10% Floor), 1.24%, 07/20/34 144A † | 1,300,000 | | 1,300,648 |
| | | Par | | Value |
| SLM Private Credit Student Loan Trust, Series 2004-A, Class A3 | | | |
| (Floating, ICE LIBOR USD 3M + 0.40%), 0.60%, 06/15/33† | $ 271,595 | | $ 269,546 |
| SLM Private Credit Student Loan Trust, Series 2007-A, Class A4A | | | |
| (Floating, ICE LIBOR USD 3M + 0.24%), 0.44%, 12/16/41† | 206,157 | | 203,375 |
| SMB Private Education Loan Trust, Series 2015-C, Class A2A | | | |
| 2.75%, 07/15/27 144A | 29,797 | | 29,885 |
| SMB Private Education Loan Trust, Series 2016-A, Class A2B | | | |
| (Floating, ICE LIBOR USD 1M + 1.50%), 1.61%, 05/15/31 144A † | 430,749 | | 434,734 |
| SMB Private Education Loan Trust, Series 2018-B, Class A2B | | | |
| (Floating, ICE LIBOR USD 1M + 0.72%), 0.83%, 01/15/37 144A † | 408,231 | | 409,888 |
| SMB Private Education Loan Trust, Series 2020-A, Class A2A | | | |
| 2.23%, 09/15/37 144A | 943,796 | | 955,845 |
| SMB Private Education Loan Trust, Series 2020-A, Class A2B | | | |
| (Floating, ICE LIBOR USD 1M + 0.83%), 0.94%, 09/15/37 144A † | 94,380 | | 94,720 |
| SMB Private Education Loan Trust, Series 2020-PTA, Class A2B | | | |
| (Floating, ICE LIBOR USD 1M + 0.85%), 0.95%, 09/15/54 144A † | 2,676,128 | | 2,709,283 |
| SMB Private Education Loan Trust, Series 2021-A, Class APL | | | |
| 0.00%, 01/15/53 144A | 869,253 | | 870,085 |
| SMB Private Education Loan Trust, Series 2021-A, Class B | | | |
| 2.31%, 01/15/53 144A | 160,000 | | 158,929 |
| SMB Private Education Loan Trust, Series 2021-B, Class A | | | |
| 1.31%, 07/17/51 144A | 585,719 | | 581,702 |
| SoFi Professional Loan Program LLC, Series 2015-D, Class A2 | | | |
| 2.72%, 10/27/36 144A | 255,858 | | 256,671 |
| SoFi Professional Loan Program LLC, Series 2016-A, Class A2 | | | |
| 2.76%, 12/26/36 144A | 81,481 | | 81,785 |
| SoFi Professional Loan Program LLC, Series 2016-C, Class A2B | | | |
| 2.36%, 12/27/32 144A | 17,764 | | 17,856 |
| SoFi Professional Loan Program LLC, Series 2016-D, Class A2B | | | |
| 2.34%, 04/25/33 144A | 31,344 | | 31,688 |
| SoFi Professional Loan Program LLC, Series 2016-F, Class A2 | | | |
| 3.02%, 02/25/40 144A | 381,176 | | 389,532 |
| SoFi Professional Loan Program LLC, Series 2019-B, Class A2FX | | | |
| 3.09%, 08/17/48 144A | 126,975 | | 129,641 |
See Notes to Financial Statements.
| | | Par | | Value |
| SoFi Professional Loan Program Trust, Series 2018-C, Class A2FX | | | |
| 3.59%, 01/25/48 144A | $ 131,282 | | $ 134,569 |
| SoFi Professional Loan Program Trust, Series 2020-A, Class A2FX | | | |
| 2.54%, 05/15/46 144A | 485,301 | | 494,253 |
| SoFi Professional Loan Program Trust, Series 2021-B, Class AFX | | | |
| 1.14%, 02/15/47 144A | 1,943,674 | | 1,911,785 |
| SoFi Professional Loan Program, Series 2018-B, Class A2FX | | | |
| 3.34%, 08/25/47 144A | 357,304 | | 363,632 |
| Stack Infrastructure Issuer LLC, Series 2021-1A, Class A2 | | | |
| 1.88%, 03/26/46 144A | 1,600,000 | | 1,575,596 |
| Structured Asset Securities Corporation Mortgage Loan Trust, Series 2005-7XS, Class 2A1A | | | |
| (Floating, ICE LIBOR USD 1M + 1.50%, 1.50% Floor), 1.60%, 04/25/35† | 108,053 | | 109,125 |
| STWD, Ltd., Series 2019-FL1, Class A | | | |
| (Floating, U.S. 30-Day Average SOFR + 1.19%, 1.08% Floor), 1.24%, 07/15/38 144A † | 1,330,000 | | 1,330,814 |
| TCI-Symphony CLO, Ltd., Series 2017-1A, Class AR | | | |
| (Floating, ICE LIBOR USD 3M + 0.93%, 0.93% Floor), 1.05%, 07/15/30 144A † | 3,100,000 | | 3,098,514 |
| THL Credit Wind River CLO, Ltd., Series 2019-3A, Class AR | | | |
| (Floating, ICE LIBOR USD 3M + 1.08%, 1.08% Floor), 1.20%, 04/15/31 144A † | 2,950,000 | | 2,944,437 |
| TICP CLO VI, Ltd., Series 2016-6A, Class AR2 | | | |
| (Floating, ICE LIBOR USD 3M + 1.12%, 1.12% Floor), 1.24%, 01/15/34 144A † | 1,000,000 | | 1,000,955 |
| Towd Point Mortgage Trust, Series 2016-3, Class A1 | | | |
| 2.25%, 04/25/56 144A | 25,238 | | 25,270 |
| Towd Point Mortgage Trust, Series 2019-MH1, Class A1 | | | |
| 3.00%, 11/25/58 144A | 365,161 | | 369,726 |
| Towd Point Mortgage Trust, Series 2020-1, Class A1 | | | |
| 2.71%, 01/25/60 144A † γ | 724,074 | | 735,927 |
| Towd Point Mortgage Trust, Series 2020-2, Class A1A | | | |
| 1.64%, 04/25/60 144A | 2,085,839 | | 2,074,169 |
| Transportation Finance Equipment Trust, Series 2019-1, Class A3 | | | |
| 1.85%, 04/24/23 144A | 319,151 | | 320,809 |
| TRESTLES CLO, Ltd., Series 2017-1A, Class A1R | | | |
| (Floating, ICE LIBOR USD 3M + 0.99%, 0.99% Floor), 1.11%, 04/25/32 144A † | 550,000 | | 549,725 |
| | | Par | | Value |
| TRP - TRIP Rail Master Funding LLC, Series 2021-2, Class A | | | |
| 2.15%, 06/19/51 144A | $1,720,807 | | $ 1,715,395 |
| TRTX Issuer, Ltd., Series 2019-FL3, Class A | | | |
| (Floating, U.S. 30-Day Average SOFR + 1.26%, 1.15% Floor), 1.31%, 10/15/34 144A † | 1,505,311 | | 1,510,110 |
| Tryon Park CLO, Ltd., Series 2013-1A, Class A1SR | | | |
| (Floating, ICE LIBOR USD 3M + 0.89%), 1.01%, 04/15/29 144A † | 2,532,520 | | 2,531,888 |
| VB-S1 Issuer LLC, Series 2020-1A, Class C2 | | | |
| 3.03%, 06/15/50 144A | 670,000 | | 689,140 |
| Venture XVII CLO, Ltd., Series 2014-17A, Class ARR | | | |
| (Floating, ICE LIBOR USD 3M + 0.88%), 1.00%, 04/15/27 144A † | 281,507 | | 281,425 |
| Verizon Owner Trust, Series 2020-A, Class A1A | | | |
| 1.85%, 07/22/24 | 420,000 | | 423,225 |
| Volkswagen Auto Loan Enhanced Trust, Series 2021-1, Class A3 | | | |
| 1.02%, 06/22/26 | 1,062,000 | | 1,067,795 |
| Volvo Financial Equipment LLC, Series 2019-1A, Class A3 | | | |
| 3.00%, 03/15/23 144A | 152,719 | | 153,060 |
| Westlake Automobile Receivables Trust, Series 2018-3A, Class D | | | |
| 4.00%, 10/16/23 144A | 164,042 | | 165,100 |
| Westlake Automobile Receivables Trust, Series 2020-1A, Class C | | | |
| 2.52%, 04/15/25 144A | 620,000 | | 628,867 |
| Westlake Automobile Receivables Trust, Series 2020-2A, Class B | | | |
| 1.32%, 07/15/25 144A | 910,000 | | 913,268 |
| Wingstop Funding LLC, Series 2020-1A, Class A2 | | | |
| 2.84%, 12/05/50 144A | 1,044,750 | | 1,048,104 |
| World Omni Select Auto Trust, Series 2021-A, Class A3 | | | |
| 0.53%, 03/15/27 | 3,150,000 | | 3,119,017 |
Total Asset-Backed Securities
(Cost $182,844,073) | | | 182,598,143 |
| CORPORATE BONDS — 19.5% |
| 3M Co. | | | |
| 2.65%, 04/15/25Δ | 80,000 | | 83,595 |
| 7-Eleven, Inc. | | | |
| 0.95%, 02/10/26 144A Δ | 1,600,000 | | 1,551,560 |
| ADT Security Corporation (The) | | | |
| 4.13%, 06/15/23Δ | 180,000 | | 187,146 |
| AES Corporation (The) | | | |
| 1.38%, 01/15/26 | 1,700,000 | | 1,652,889 |
| Air Lease Corporation | | | |
| 2.63%, 07/01/22 | 150,000 | | 151,221 |
See Notes to Financial Statements.
SCHEDULE OF INVESTMENTS (Continued)
| | | Par | | Value |
| 2.25%, 01/15/23 | $1,355,000 | | $1,372,276 |
| 2.75%, 01/15/23 | 175,000 | | 177,736 |
| 0.80%, 08/18/24 | 490,000 | | 480,396 |
| 1.88%, 08/15/26 | 200,000 | | 197,009 |
| Alexander Funding Trust | | | |
| 1.84%, 11/15/23 144A | 1,355,000 | | 1,360,511 |
| Ally Financial, Inc. | | | |
| 4.13%, 02/13/22 | 1,700,000 | | 1,706,758 |
| 1.45%, 10/02/23 | 2,135,000 | | 2,142,599 |
| 3.88%, 05/21/24 | 400,000 | | 421,840 |
| Ameren Corporation | | | |
| 2.50%, 09/15/24 | 610,000 | | 626,935 |
| American Electric Power Co., Inc. | | | |
| 0.75%, 11/01/23 | 180,000 | | 178,859 |
| American Tower Corporation REIT | | | |
| 0.60%, 01/15/24Δ | 1,300,000 | | 1,287,063 |
| 2.40%, 03/15/25 | 215,000 | | 221,012 |
| 1.60%, 04/15/26Δ | 570,000 | | 565,038 |
| 0.45%, 01/15/27(E) | 205,000 | | 230,877 |
| 0.40%, 02/15/27(E) | 100,000 | | 112,171 |
| AT&T, Inc. | | | |
| 1.05%, 09/05/23(E) | 290,000 | | 336,631 |
| (Floating, Australian BBSW 3M + 1.25%), 1.32%, 09/19/23(A) † | 1,240,000 | | 912,298 |
| 0.90%, 03/25/24 | 1,295,000 | | 1,290,022 |
| Athene Global Funding | | | |
| 2.80%, 05/26/23 144A | 820,000 | | 841,160 |
| 1.20%, 10/13/23 144A | 725,000 | | 726,393 |
| Aviation Capital Group LLC | | | |
| 4.38%, 01/30/24 144A | 1,000,000 | | 1,049,586 |
| 1.95%, 01/30/26 144A | 285,000 | | 278,407 |
| 1.95%, 09/20/26 144A | 345,000 | | 335,662 |
| Bank of America Corporation | | | |
| (Variable, CAD Offered Rate 3M + 0.82%), 3.30%, 04/24/24(C) ^ | 2,000,000 | | 1,620,032 |
| (Variable, U.S. SOFR + 0.74%), 0.81%, 10/24/24^ | 1,850,000 | | 1,838,645 |
| (Variable, U.S. SOFR + 0.69%), 0.98%, 04/22/25^ | 1,555,000 | | 1,543,606 |
| (Variable, U.S. SOFR + 0.65%), 1.53%, 12/06/25^ | 1,860,000 | | 1,865,642 |
| (Variable, U.S. SOFR + 0.91%), 1.66%, 03/11/27^ | 1,000,000 | | 993,842 |
| (Variable, U.S. SOFR + 0.96%), 1.73%, 07/22/27^ | 725,000 | | 720,532 |
| Baxter International, Inc. | | | |
| 1.32%, 11/29/24 144A | 2,075,000 | | 2,073,841 |
| Becton Dickinson Euro Finance S.a.r.l. | | | |
| 0.63%, 06/04/23(E) | 900,000 | | 1,034,738 |
| 1.21%, 06/04/26(E) | 120,000 | | 141,427 |
| Becton, Dickinson and Co. | | | |
| 0.03%, 08/13/25(E) | 100,000 | | 113,194 |
| Berry Global, Inc. | | | |
| 0.95%, 02/15/24 | 1,035,000 | | 1,026,968 |
| 1.57%, 01/15/26 | 1,600,000 | | 1,567,440 |
| Blackstone Private Credit Fund | | | |
| 3.25%, 03/15/27 144A | 700,000 | | 708,096 |
| | | Par | | Value |
| Blackstone Secured Lending Fund | | | |
| 3.65%, 07/14/23 | $ 985,000 | | $1,015,754 |
| Boeing Co. (The) | | | |
| 4.51%, 05/01/23 | 3,000,000 | | 3,134,525 |
| 1.43%, 02/04/24 | 1,970,000 | | 1,968,230 |
| 2.20%, 02/04/26 | 200,000 | | 200,052 |
| Booking Holdings, Inc. | | | |
| 0.10%, 03/08/25(E) | 160,000 | | 182,355 |
| Brighthouse Financial Global Funding | | | |
| 1.00%, 04/12/24 144A | 330,000 | | 327,401 |
| Broadcom, Inc. | | | |
| 4.70%, 04/15/25 | 690,000 | | 755,313 |
| 3.15%, 11/15/25 | 750,000 | | 786,304 |
| Brunswick Corporation | | | |
| 0.85%, 08/18/24Δ | 1,045,000 | | 1,030,896 |
| Calpine Corporation | | | |
| 5.25%, 06/01/26 144A Δ | 67,000 | | 68,823 |
| Cantor Fitzgerald LP | | | |
| 6.50%, 06/17/22 144A | 750,000 | | 768,674 |
| Capital One Financial Corporation | | | |
| 0.80%, 06/12/24(E) | 900,000 | | 1,043,346 |
| (Variable, U.S. SOFR + 0.69%), 1.34%, 12/06/24^ | 1,480,000 | | 1,489,759 |
| CCO Holdings LLC | | | |
| 5.13%, 05/01/27 144A | 400,000 | | 412,490 |
| CDK Global, Inc. | | | |
| 4.88%, 06/01/27 | 125,000 | | 129,516 |
| CDW LLC | | | |
| 5.50%, 12/01/24 | 275,000 | | 301,617 |
| CenterPoint Energy Resources Corporation | | | |
| (Floating, ICE LIBOR USD 3M + 0.50%), 0.67%, 03/02/23† | 300,000 | | 299,385 |
| 0.70%, 03/02/23 | 805,000 | | 801,564 |
| Charter Communications Operating LLC | | | |
| 4.46%, 07/23/22 | 500,000 | | 507,431 |
| 4.50%, 02/01/24Δ | 2,700,000 | | 2,873,199 |
| Cheniere Corpus Christi Holdings LLC | | | |
| 5.88%, 03/31/25 | 630,000 | | 698,934 |
| CIT Bank NA | | | |
| (Variable, U.S. SOFR + 1.72%), 2.97%, 09/27/25^ | 440,000 | | 454,964 |
| CIT Group, Inc. | | | |
| 5.00%, 08/15/22 | 750,000 | | 767,693 |
| Citigroup, Inc. | | | |
| (Variable, ICE LIBOR USD 3M + 0.72%), 3.14%, 01/24/23^ | 910,000 | | 911,165 |
| (Floating, ICE LIBOR USD 3M + 1.02%), 1.19%, 06/01/24† | 1,000,000 | | 1,009,703 |
| (Variable, U.S. SOFR + 0.69%), 0.78%, 10/30/24^ | 1,775,000 | | 1,764,503 |
| (Variable, U.S. SOFR + 0.67%), 0.98%, 05/01/25^ | 1,645,000 | | 1,633,173 |
| (Variable, U.S. SOFR + 0.53%), 1.28%, 11/03/25^ | 480,000 | | 479,117 |
| (Variable, U.S. SOFR + 2.84%), 3.11%, 04/08/26^ | 525,000 | | 550,959 |
See Notes to Financial Statements.
| | | Par | | Value |
| (Variable, U.S. SOFR + 0.77%), 1.46%, 06/09/27^ | $ 465,000 | | $ 457,229 |
| Citrix Systems, Inc. | | | |
| 1.25%, 03/01/26 | 600,000 | | 585,209 |
| CNH Industrial Capital LLC | | | |
| 1.95%, 07/02/23 | 590,000 | | 597,949 |
| CommonSpirit Health | | | |
| 1.55%, 10/01/25 | 800,000 | | 793,522 |
| Crown Americas LLC | | | |
| 4.75%, 02/01/26 | 150,000 | | 153,947 |
| Crown Castle International Corporation REIT | | | |
| 1.35%, 07/15/25Δ | 335,000 | | 330,909 |
| CrownRock LP | | | |
| 5.63%, 10/15/25 144A | 500,000 | | 511,835 |
| Daimler Finance North America LLC | | | |
| (Floating, ICE LIBOR USD 3M + 0.90%), 1.06%, 02/15/22 144A † | 1,000,000 | | 1,000,904 |
| 2.55%, 08/15/22 144A Δ | 1,000,000 | | 1,011,481 |
| 0.75%, 03/01/24 144A | 1,790,000 | | 1,774,484 |
| Daimler Trucks Finance North America LLC | | | |
| 1.13%, 12/14/23 144A | 1,640,000 | | 1,641,371 |
| 1.63%, 12/13/24 144A | 590,000 | | 594,955 |
| 2.00%, 12/14/26 144A | 150,000 | | 150,823 |
| Dell International LLC | | | |
| 5.45%, 06/15/23 | 316,000 | | 333,483 |
| Devon Energy Corporation | | | |
| 5.25%, 09/15/24 144A | 915,000 | | 990,698 |
| Diamondback Energy, Inc. | | | |
| 4.75%, 05/31/25 | 700,000 | | 767,734 |
| Discover Bank | | | |
| 3.35%, 02/06/23 | 1,590,000 | | 1,628,532 |
| Endeavor Energy Resources LP | | | |
| 6.63%, 07/15/25 144A | 150,000 | | 158,882 |
| Energy Transfer LP | | | |
| 3.60%, 02/01/23 | 105,000 | | 107,066 |
| 4.25%, 03/15/23 | 1,880,000 | | 1,932,432 |
| 2.90%, 05/15/25 | 260,000 | | 268,600 |
| Entergy Louisiana LLC | | | |
| 0.95%, 10/01/24 | 1,030,000 | | 1,019,506 |
| EQM Midstream Partners LP | | | |
| 6.50%, 07/01/27 144A | 330,000 | | 370,016 |
| Equinix, Inc. REIT | | | |
| 2.63%, 11/18/24 | 985,000 | | 1,015,807 |
| 1.25%, 07/15/25Δ | 345,000 | | 338,805 |
| Equitable Financial Life Global Funding | | | |
| 1.00%, 01/09/26 144A | 1,600,000 | | 1,553,592 |
| Evergy, Inc. | | | |
| 2.45%, 09/15/24 | 1,020,000 | | 1,047,099 |
| F&G Global Funding | | | |
| 0.90%, 09/20/24 144A | 1,860,000 | | 1,833,863 |
| Fidelity National Information Services, Inc. | | | |
| 0.13%, 12/03/22(E) | 300,000 | | 342,722 |
| 0.75%, 05/21/23(E) | 1,050,000 | | 1,209,017 |
| 0.60%, 03/01/24 | 445,000 | | 438,345 |
| | | Par | | Value |
| FirstEnergy Corporation | | | |
| 3.35%, 07/15/22 | $2,357,000 | | $2,367,253 |
| 4.75%, 03/15/23 | 570,000 | | 593,513 |
| Fiserv, Inc. | | | |
| 1.13%, 07/01/27(E) | 180,000 | | 211,983 |
| Ford Motor Credit Co. LLC | | | |
| 5.60%, 01/07/22 | 1,800,000 | | 1,803,582 |
| 4.14%, 02/15/23 | 345,000 | | 353,642 |
| 3.37%, 11/17/23 | 750,000 | | 774,375 |
| 5.58%, 03/18/24 | 300,000 | | 323,627 |
| 5.13%, 06/16/25 | 640,000 | | 696,832 |
| FS KKR Capital Corporation | | | |
| 4.75%, 05/15/22 | 1,000,000 | | 1,010,521 |
| 4.25%, 02/14/25 144A | 880,000 | | 922,026 |
| GA Global Funding Trust | | | |
| 1.63%, 01/15/26 144A | 400,000 | | 397,288 |
| General Mills, Inc. | | | |
| 0.45%, 01/15/26(E) | 100,000 | | 114,713 |
| General Motors Co. | | | |
| 5.40%, 10/02/23 | 230,000 | | 246,311 |
| General Motors Financial Co., Inc. | | | |
| 1.05%, 03/08/24 | 675,000 | | 671,931 |
| 3.95%, 04/13/24 | 925,000 | | 973,997 |
| 1.20%, 10/15/24 | 900,000 | | 894,132 |
| Glencore Funding LLC | | | |
| 4.63%, 04/29/24 144A | 1,800,000 | | 1,923,774 |
| Global Payments, Inc. | | | |
| 1.50%, 11/15/24 | 700,000 | | 700,684 |
| 1.20%, 03/01/26 | 1,000,000 | | 972,111 |
| Goldman Sachs Group, Inc. (The) | | | |
| 1.38%, 07/26/22(E) | 220,000 | | 253,075 |
| (Floating, 0.55% - Euribor 3M), 0.00%, 04/21/23(E) † | 210,000 | | 239,346 |
| (Floating, Australian BBSW 3M + 1.20%), 1.24%, 05/16/23(A) † | 2,000,000 | | 1,469,884 |
| (Variable, ICE LIBOR USD 3M + 1.05%), 2.91%, 06/05/23^ | 920,000 | | 927,784 |
| (Variable, U.S. SOFR + 0.54%), 0.63%, 11/17/23^ | 1,250,000 | | 1,247,081 |
| (Variable, U.S. SOFR + 0.57%), 0.67%, 03/08/24^ | 1,830,000 | | 1,822,345 |
| (Variable, U.S. SOFR + 0.49%), 0.93%, 10/21/24^ | 1,900,000 | | 1,892,794 |
| 3.50%, 04/01/25 | 380,000 | | 402,236 |
| (Variable, U.S. SOFR + 0.61%), 0.86%, 02/12/26Δ ^ | 810,000 | | 795,000 |
| Golub Capital BDC, Inc. | | | |
| 3.38%, 04/15/24 | 575,000 | | 591,217 |
| Graphic Packaging International LLC | | | |
| 0.82%, 04/15/24 144A | 735,000 | | 723,907 |
| Gray Oak Pipeline LLC | | | |
| 2.00%, 09/15/23 144A | 905,000 | | 915,215 |
| HCA, Inc. | | | |
| 5.38%, 02/01/25 | 525,000 | | 577,658 |
| 5.88%, 02/15/26 | 295,000 | | 333,359 |
| Healthpeak Properties, Inc. REIT | | | |
| 1.35%, 02/01/27 | 145,000 | | 141,286 |
| Hilton Domestic Operating Co., Inc. | | | |
| 5.38%, 05/01/25 144A | 500,000 | | 520,818 |
See Notes to Financial Statements.
SCHEDULE OF INVESTMENTS (Continued)
| | | Par | | Value |
| Humana, Inc. | | | |
| 2.90%, 12/15/22 | $1,700,000 | | $1,733,868 |
| Huntington Ingalls Industries, Inc. | | | |
| 0.67%, 08/16/23 144A Δ | 510,000 | | 505,762 |
| Hyundai Capital America | | | |
| 1.15%, 11/10/22 144A Δ | 3,840,000 | | 3,850,546 |
| 1.25%, 09/18/23 144A | 900,000 | | 899,721 |
| 1.00%, 09/17/24 144A | 855,000 | | 840,910 |
| 1.65%, 09/17/26 144A | 360,000 | | 353,431 |
| Illinois Tool Works, Inc. | | | |
| 0.25%, 12/05/24(E) | 180,000 | | 206,401 |
| Infor, Inc. | | | |
| 1.45%, 07/15/23 144A | 365,000 | | 366,393 |
| International Flavors & Fragrances, Inc. | | | |
| 1.23%, 10/01/25 144A | 1,500,000 | | 1,468,850 |
| International Lease Finance Corporation | | | |
| 5.88%, 08/15/22 | 500,000 | | 515,512 |
| IQVIA, Inc. | | | |
| 5.00%, 05/15/27 144A | 200,000 | | 207,270 |
| iStar, Inc. REIT | | | |
| 4.75%, 10/01/24 | 150,000 | | 155,811 |
| Jackson Financial, Inc. | | | |
| 1.13%, 11/22/23 144A | 595,000 | | 594,207 |
| JPMorgan Chase & Co. | | | |
| (Variable, ICE LIBOR USD 3M + 0.89%), 3.80%, 07/23/24^ | 374,000 | | 389,950 |
| 1.50%, 01/27/25(E) | 120,000 | | 142,828 |
| (Variable, U.S. SOFR + 0.42%), 0.56%, 02/16/25^ | 790,000 | | 779,060 |
| (Variable, U.S. SOFR + 1.16%), 2.30%, 10/15/25^ | 290,000 | | 296,839 |
| (Variable, U.S. SOFR + 1.85%), 2.08%, 04/22/26^ | 376,000 | | 382,075 |
| (Variable, U.S. SOFR + 0.89%), 1.58%, 04/22/27^ | 600,000 | | 593,564 |
| Kinder Morgan, Inc. | | | |
| (Floating, ICE LIBOR USD 3M + 1.28%), 1.40%, 01/15/23† | 660,000 | | 665,616 |
| Kraft Heinz Foods Co. | | | |
| (Floating, ICE LIBOR USD 3M + 0.82%), 0.97%, 08/10/22† | 400,000 | | 399,574 |
| 3.88%, 05/15/27 | 650,000 | | 703,293 |
| Lehman Brothers Holdings, Inc. | | | |
| 6.63%, 01/18/12# | 600,000 | | 3,300 |
| Lennar Corporation | | | |
| 4.50%, 04/30/24 | 1,000,000 | | 1,063,540 |
| Level 3 Financing, Inc. | | | |
| 5.25%, 03/15/26 | 250,000 | | 255,891 |
| Live Nation Entertainment, Inc. | | | |
| 6.50%, 05/15/27 144A | 125,000 | | 136,869 |
| Lumen Technologies, Inc. | | | |
| 5.13%, 12/15/26 144A Δ | 615,000 | | 640,916 |
| 4.00%, 02/15/27 144A | 300,000 | | 304,740 |
| Marathon Petroleum Corporation | | | |
| 4.70%, 05/01/25 | 130,000 | | 141,987 |
| Marsh & McLennan Cos., Inc. | | | |
| 1.35%, 09/21/26(E) | 145,000 | | 172,460 |
| | | Par | | Value |
| McCormick & Co., Inc. | | | |
| 2.70%, 08/15/22 | $ 200,000 | | $ 202,100 |
| McDonald’s Corporation | | | |
| 3.30%, 07/01/25 | 155,000 | | 164,514 |
| Medtronic Global Holdings SCA | | | |
| 0.00%, 12/02/22(E) | 255,000 | | 291,289 |
| 0.00%, 10/15/25(E) | 100,000 | | 113,497 |
| Metropolitan Life Global Funding I | | | |
| 0.70%, 09/27/24 144A | 3,000,000 | | 2,957,905 |
| Microchip Technology, Inc. | | | |
| 2.67%, 09/01/23 | 745,000 | | 761,222 |
| 0.97%, 02/15/24 | 1,380,000 | | 1,368,795 |
| 0.98%, 09/01/24 144A | 370,000 | | 363,495 |
| 4.25%, 09/01/25 | 250,000 | | 259,706 |
| MMS U.S.A. Holdings, Inc. | | | |
| 0.63%, 06/13/25(E) | 100,000 | | 115,143 |
| Morgan Stanley | | | |
| (Floating, CAD Offered Rate 3M + 0.30%), 0.78%, 02/03/23(C) † | 1,500,000 | | 1,186,333 |
| (Variable, U.S. SOFR + 0.46%), 0.53%, 01/25/24^ | 1,320,000 | | 1,315,846 |
| 1.75%, 03/11/24(E) | 205,000 | | 242,630 |
| (Variable, ICE LIBOR USD 3M + 0.85%), 3.74%, 04/24/24^ | 750,000 | | 776,202 |
| (Variable, U.S. SOFR + 0.51%), 0.79%, 01/22/25^ | 1,015,000 | | 1,005,303 |
| (Variable, U.S. SOFR + 1.15%), 2.72%, 07/22/25^ | 790,000 | | 814,727 |
| (Variable, U.S. SOFR + 0.75%), 0.86%, 10/21/25^ | 525,000 | | 517,987 |
| (Variable, U.S. SOFR + 0.56%), 1.16%, 10/21/25^ | 3,060,000 | | 3,038,381 |
| MUFG Union Bank NA | | | |
| 2.10%, 12/09/22 | 1,000,000 | | 1,012,989 |
| Mylan, Inc. | | | |
| 3.13%, 01/15/23 144A | 1,700,000 | | 1,735,915 |
| NextEra Energy Capital Holdings, Inc. | | | |
| 1.88%, 01/15/27Δ | 710,000 | | 714,645 |
| NextEra Energy Operating Partners LP | | | |
| 4.25%, 07/15/24 144A | 405,000 | | 421,194 |
| NIKE, Inc. | | | |
| 2.40%, 03/27/25 | 105,000 | | 108,825 |
| Nissan Motor Acceptance Co. LLC | | | |
| (Floating, ICE LIBOR USD 3M + 0.69%), 0.91%, 09/28/22 144A † | 300,000 | | 300,326 |
| 3.45%, 03/15/23 144A | 1,350,000 | | 1,385,970 |
| 1.13%, 09/16/24 144A | 675,000 | | 663,763 |
| Nordstrom, Inc. | | | |
| 2.30%, 04/08/24Δ | 250,000 | | 250,264 |
| NRG Energy, Inc. | | | |
| 6.63%, 01/15/27 | 44,000 | | 45,795 |
| Nuance Communications, Inc. | | | |
| 5.63%, 12/15/26 | 125,000 | | 129,106 |
| OGE Energy Corporation | | | |
| 0.70%, 05/26/23 | 380,000 | | 378,416 |
See Notes to Financial Statements.
| | | Par | | Value |
| Oklahoma Gas and Electric Co. | | | |
| 0.55%, 05/26/23 | $ 550,000 | | $ 546,598 |
| ONE Gas, Inc. | | | |
| 0.85%, 03/11/23Δ | 780,000 | | 779,358 |
| 1.10%, 03/11/24 | 1,835,000 | | 1,826,216 |
| OneMain Finance Corporation | | | |
| 5.63%, 03/15/23Δ | 435,000 | | 454,849 |
| Owl Rock Capital Corporation | | | |
| 4.25%, 01/15/26 | 510,000 | | 537,067 |
| Owl Rock Technology Finance Corporation | | | |
| 3.75%, 06/17/26 144A | 345,000 | | 355,934 |
| Pacific Gas and Electric Co. | | | |
| (Floating, ICE LIBOR USD 3M + 1.48%), 1.69%, 06/16/22† | 1,100,000 | | 1,100,370 |
| 1.75%, 06/16/22 | 3,000,000 | | 3,000,021 |
| 1.37%, 03/10/23 | 1,835,000 | | 1,824,159 |
| 3.25%, 06/15/23 | 100,000 | | 101,863 |
| 4.25%, 08/01/23 | 200,000 | | 207,059 |
| 3.85%, 11/15/23 | 100,000 | | 103,294 |
| 3.75%, 02/15/24 | 200,000 | | 207,422 |
| 3.45%, 07/01/25 | 146,000 | | 151,499 |
| 2.10%, 08/01/27 | 600,000 | | 580,137 |
| Pacific Life Global Funding II | | | |
| (Floating, U.S. SOFR + 0.62%), 0.67%, 06/04/26 144A † Δ | 3,400,000 | | 3,424,138 |
| PeaceHealth Obligated Group | | | |
| 1.38%, 11/15/25 | 104,000 | | 103,475 |
| Penske Truck Leasing Co. LP | | | |
| 3.45%, 07/01/24 144A | 1,500,000 | | 1,573,036 |
| 2.70%, 11/01/24 144A | 1,105,000 | | 1,139,628 |
| 1.20%, 11/15/25 144A | 295,000 | | 287,840 |
| 1.70%, 06/15/26 144A | 430,000 | | 425,723 |
| PerkinElmer, Inc. | | | |
| 0.55%, 09/15/23Δ | 385,000 | | 381,935 |
| 0.85%, 09/15/24 | 690,000 | | 680,742 |
| Phillips 66 | | | |
| 0.90%, 02/15/24 | 585,000 | | 581,044 |
| Pioneer Natural Resources Co. | | | |
| 0.55%, 05/15/23 | 385,000 | | 383,680 |
| 0.75%, 01/15/24 | 455,000 | | 449,109 |
| 1.13%, 01/15/26 | 280,000 | | 272,331 |
| Prime Security Services Borrower LLC | | | |
| 5.25%, 04/15/24 144A | 250,000 | | 266,295 |
| PulteGroup, Inc. | | | |
| 5.00%, 01/15/27Δ | 64,000 | | 72,766 |
| Qorvo, Inc. | | | |
| 1.75%, 12/15/24 144A | 620,000 | | 621,053 |
| Quanta Services, Inc. | | | |
| 0.95%, 10/01/24 | 385,000 | | 381,140 |
| Reliance Standard Life Global Funding II | | | |
| 2.15%, 01/21/23 144A | 465,000 | | 471,472 |
| Sabine Pass Liquefaction LLC | | | |
| 5.75%, 05/15/24 | 1,048,000 | | 1,140,537 |
| Santander Holdings U.S.A., Inc. | | | |
| 3.70%, 03/28/22 | 510,000 | | 512,203 |
| | | Par | | Value |
| SBA Tower Trust REIT | | | |
| 2.84%, 01/15/25 144A | $3,225,000 | | $3,312,291 |
| 1.88%, 01/15/26 144A | 680,000 | | 679,668 |
| 1.63%, 11/15/26 144A | 800,000 | | 788,023 |
| Simon International Finance SCA REIT | | | |
| 1.38%, 11/18/22(E) | 105,000 | | 120,917 |
| Sirius XM Radio, Inc. | | | |
| 3.13%, 09/01/26 144A Δ | 600,000 | | 600,963 |
| SK Battery America, Inc. | | | |
| 2.13%, 01/26/26 | 200,000 | | 195,988 |
| Skyworks Solutions, Inc. | | | |
| 0.90%, 06/01/23Δ | 125,000 | | 124,406 |
| Southern California Edison Co. | | | |
| 1.85%, 02/01/22 | 107,143 | | 107,229 |
| Southwest Airlines Co. | | | |
| 4.75%, 05/04/23 | 675,000 | | 707,173 |
| Sprint Corporation | | | |
| 7.88%, 09/15/23 | 665,000 | | 733,312 |
| Sprint Spectrum Co. LLC | | | |
| 4.74%, 03/20/25 144A | 361,563 | | 378,742 |
| Steel Dynamics, Inc. | | | |
| 2.40%, 06/15/25Δ | 35,000 | | 35,852 |
| Stellantis Finance U.S., Inc. | | | |
| 1.71%, 01/29/27 144A | 1,000,000 | | 984,116 |
| Stryker Corporation | | | |
| 0.60%, 12/01/23 | 265,000 | | 263,713 |
| Synchrony Financial | | | |
| 2.85%, 07/25/22 | 232,000 | | 234,390 |
| 4.50%, 07/23/25 | 410,000 | | 443,528 |
| Target Corporation | | | |
| 2.25%, 04/15/25 | 135,000 | | 139,281 |
| TerraForm Power Operating LLC | | | |
| 4.25%, 01/31/23 144A Δ | 150,000 | | 153,533 |
| T-Mobile U.S.A., Inc. | | | |
| 1.50%, 02/15/26 | 2,492,000 | | 2,465,238 |
| 2.25%, 02/15/26 | 205,000 | | 205,825 |
| 2.63%, 04/15/26 | 84,000 | | 84,530 |
| Toll Brothers Finance Corporation | | | |
| 4.38%, 04/15/23 | 200,000 | | 206,711 |
| Truist Financial Corporation | | | |
| 2.20%, 03/16/23 | 1,185,000 | | 1,205,320 |
| United Airlines Pass-Through Trust, Series 2020-1, Class A | | | |
| 5.88%, 10/15/27 | 212,275 | | 232,970 |
| United Airlines Pass-Through Trust, Series 2020-1, Class B | | | |
| 4.88%, 01/15/26 | 40,410 | | 42,425 |
| Ventas Realty LP REIT | | | |
| 2.65%, 01/15/25 | 695,000 | | 716,842 |
| Verizon Communications, Inc. | | | |
| (Floating, ICE LIBOR USD 3M + 1.10%), 1.26%, 05/15/25† | 1,000,000 | | 1,020,036 |
| 1.75%, 01/20/31 | 220,000 | | 208,722 |
| Viasat, Inc. | | | |
| 5.63%, 04/15/27 144A | 475,000 | | 489,763 |
See Notes to Financial Statements.
SCHEDULE OF INVESTMENTS (Continued)
| | | Par | | Value |
| Vistra Operations Co. LLC | | | |
| 3.55%, 07/15/24 144A | $ 900,000 | | $ 927,532 |
| 5.63%, 02/15/27 144A | 250,000 | | 257,816 |
| VMware, Inc. | | | |
| 1.00%, 08/15/24 | 770,000 | | 763,170 |
| 1.40%, 08/15/26 | 430,000 | | 423,292 |
| Volkswagen Group of America Finance LLC | | | |
| 2.90%, 05/13/22 144A | 230,000 | | 231,896 |
| 2.70%, 09/26/22 144A | 2,000,000 | | 2,029,204 |
| 0.88%, 11/22/23 144A | 1,305,000 | | 1,297,003 |
| Wells Fargo & Co. | | | |
| (Variable, U.S. SOFR + 0.51%), 0.81%, 05/19/25^ | 405,000 | | 400,680 |
| WESCO Distribution, Inc. | | | |
| 7.13%, 06/15/25 144A | 520,000 | | 551,863 |
| Western Midstream Operating LP | | | |
| 4.65%, 07/01/26 | 325,000 | | 354,070 |
| Westinghouse Air Brake Technologies Corporation | | | |
| 4.40%, 03/15/24 | 800,000 | | 846,835 |
| 3.20%, 06/15/25 | 325,000 | | 338,665 |
| Yum! Brands, Inc. | | | |
| 7.75%, 04/01/25 144A | 430,000 | | 453,622 |
| Zimmer Biomet Holdings, Inc. | | | |
| 1.45%, 11/22/24 | 1,075,000 | | 1,072,852 |
Total Corporate Bonds
(Cost $209,089,913) | | | 209,046,082 |
| FOREIGN BONDS — 16.5% |
| Australia — 0.4% | | |
| Macquarie Group, Ltd. | | | |
| (Variable, U.S. SOFR + 0.69%), 1.20%, 10/14/25 144A ^ | 800,000 | | 793,637 |
| NBN Co., Ltd. | | | |
| 0.88%, 10/08/24 144A | 880,000 | | 868,258 |
| Santos Finance, Ltd. | | | |
| 4.13%, 09/14/27 | 200,000 | | 211,380 |
| Westpac Banking Corporation | | | |
| 3.15%, 01/16/24 144A | 1,275,000 | | 1,331,457 |
| Woodside Finance, Ltd. | | | |
| 3.70%, 09/15/26 144A | 400,000 | | 426,313 |
| | | | | 3,631,045 |
| Austria — 0.0% | | |
| Klabin Austria GmbH | | | |
| 3.20%, 01/12/31 144A | 200,000 | | 185,547 |
| Suzano Austria GmbH | | | |
| 3.13%, 01/15/32 | 45,000 | | 43,616 |
| | | | | 229,163 |
| Belgium — 0.0% | | |
| KBC Group NV | | | |
| 1.13%, 01/25/24(E) | 200,000 | | 233,644 |
| Bermuda — 0.1% | | |
| Triton Container International, Ltd. | | | |
| 0.80%, 08/01/23 144A | 630,000 | | 624,074 |
| | | Par | | Value |
| Brazil — 0.3% | | |
| Banco Bradesco SA | | | |
| 2.85%, 01/27/23 144A | $1,495,000 | | $ 1,512,275 |
| Brazilian Government International Bond | | | |
| 3.88%, 06/12/30Δ | 288,000 | | 279,864 |
| Itau Unibanco Holding SA | | | |
| 2.90%, 01/24/23 144A | 920,000 | | 930,810 |
| Nexa Resources SA | | | |
| 5.38%, 05/04/27 144A | 200,000 | | 212,452 |
| | | | | 2,935,401 |
| Canada — 1.3% | | |
| 1011778 BC ULC | | | |
| 5.75%, 04/15/25 144A | 200,000 | | 207,737 |
| Bank of Nova Scotia (The) | | | |
| (Floating, U.S. SOFR + 0.61%), 0.66%, 09/15/26† | 1,500,000 | | 1,501,054 |
| Canadian Pacific Railway Co. | | | |
| 1.35%, 12/02/24 | 1,070,000 | | 1,071,584 |
| 1.75%, 12/02/26 | 205,000 | | 206,156 |
| CDP Financial, Inc. | | | |
| 1.00%, 05/26/26 144A | 520,000 | | 512,473 |
| CPPIB Capital, Inc. | | | |
| 0.50%, 09/16/24 144A Δ | 1,265,000 | | 1,247,537 |
| Element Fleet Management Corporation | | | |
| 1.60%, 04/06/24 144A Δ | 315,000 | | 315,489 |
| GFL Environmental, Inc. | | | |
| 5.13%, 12/15/26 144A | 400,000 | | 416,490 |
| National Bank of Canada | | | |
| 0.75%, 08/06/24Δ | 1,485,000 | | 1,465,954 |
| OMERS Finance Trust | | | |
| 1.13%, 04/14/23 144A | 1,770,000 | | 1,780,923 |
| 1.10%, 03/26/26 144A | 675,000 | | 667,578 |
| Royal Bank of Canada | | | |
| (Floating, U.S. SOFR + 0.53%), 0.57%, 01/20/26† | 2,000,000 | | 2,000,352 |
| Toronto-Dominion Bank (The) | | | |
| 0.38%, 04/25/24(E) | 305,000 | | 350,650 |
| TransCanada PipeLines, Ltd. | | | |
| 1.00%, 10/12/24 | 1,755,000 | | 1,740,984 |
| | | | | 13,484,961 |
| Chile — 0.0% | | |
| Chile Government International Bond | | | |
| 2.45%, 01/31/31 | 237,000 | | 235,815 |
| China — 0.5% | | |
| AAC Technologies Holdings, Inc. | | | |
| 2.63%, 06/02/26 | 200,000 | | 196,561 |
| Avolon Holdings Funding, Ltd. | | | |
| 5.50%, 01/15/23 144A | 900,000 | | 933,749 |
| Azure Nova International Finance, Ltd. | | | |
| 4.25%, 03/21/27 | 200,000 | | 216,498 |
See Notes to Financial Statements.
| | | Par | | Value |
| Baidu, Inc. | | | |
| 2.88%, 07/06/22 | $ 235,000 | | $ 237,066 |
| CDBL Funding 1 | | | |
| 3.50%, 10/24/27 | 200,000 | | 208,866 |
| China Life Insurance Overseas Co., Ltd. | | | |
| (Variable, U.S. Treasury Yield Curve Rate CMT 5Y + 2.53%), 3.35%, 07/27/27^ | 200,000 | | 201,388 |
| China Mengniu Dairy Co., Ltd. | | | |
| 1.88%, 06/17/25 | 200,000 | | 199,012 |
| CICC Hong Kong Finance 2016 MTN, Ltd. | | | |
| 2.00%, 01/26/26 | 200,000 | | 199,396 |
| Country Garden Holdings Co., Ltd. | | | |
| 5.63%, 12/15/26 | 200,000 | | 189,447 |
| Haitong International Securities Group, Ltd. | | | |
| 3.13%, 05/18/25 | 200,000 | | 205,050 |
| Longfor Group Holdings, Ltd. | | | |
| 3.90%, 04/16/23 | 200,000 | | 203,512 |
| Park Aerospace Holdings, Ltd. | | | |
| 5.25%, 08/15/22 144A | 700,000 | | 715,477 |
| 4.50%, 03/15/23 144A | 1,000,000 | | 1,032,464 |
| Sino-Ocean Land Treasure Finance II, Ltd. | | | |
| 5.95%, 02/04/27 | 200,000 | | 194,077 |
| Sinopec Group Overseas Development 2017, Ltd. | | | |
| 3.63%, 04/12/27 | 200,000 | | 216,026 |
| Weibo Corporation | | | |
| 3.50%, 07/05/24 | 200,000 | | 206,079 |
| | | | | 5,354,668 |
| Colombia — 0.1% | | |
| Colombia Government International Bond | | | |
| 3.88%, 04/25/27 | 270,000 | | 272,565 |
| 4.50%, 03/15/29 | 259,000 | | 264,185 |
| Ecopetrol SA | | | |
| 5.38%, 06/26/26 | 200,000 | | 211,020 |
| 4.63%, 11/02/31 | 60,000 | | 58,441 |
| Millicom International Cellular SA | | | |
| 4.50%, 04/27/31 144A | 200,000 | | 201,805 |
| SURA Asset Management SA | | | |
| 4.88%, 04/17/24 144A | 100,000 | | 105,553 |
| | | | | 1,113,569 |
| Denmark — 0.4% | | |
| Danske Bank A/S | | | |
| 3.88%, 09/12/23 144A | 400,000 | | 416,264 |
| (Variable, U.S. Treasury Yield Curve Rate CMT 1Y + 1.03%), 1.17%, 12/08/23 144A ^ | 2,400,000 | | 2,400,102 |
| 5.38%, 01/12/24 144A | 600,000 | | 646,271 |
| (Variable, U.S. Treasury Yield Curve Rate CMT 1Y + 0.55%), 0.98%, 09/10/25 144A ^ | 200,000 | | 197,078 |
| | | Par | | Value |
| (Variable, U.S. Treasury Yield Curve Rate CMT 1Y + 1.35%), 1.62%, 09/11/26 144A ^ | $ 540,000 | | $ 532,731 |
| | | | | 4,192,446 |
| Dominican Republic — 0.0% | | |
| Dominican Republic International Bond | | | |
| 4.88%, 09/23/32 144A | 150,000 | | 152,813 |
| 6.40%, 06/05/49 | 150,000 | | 157,876 |
| | | | | 310,689 |
| Finland — 0.1% | | |
| CRH Finland Services OYJ | | | |
| 0.88%, 11/05/23(E) | 180,000 | | 208,507 |
| Nordea Bank Abp | | | |
| 1.50%, 09/30/26 144A | 700,000 | | 688,730 |
| | | | | 897,237 |
| France — 0.5% | | |
| Banque Federative du Credit Mutuel SA | | | |
| 0.75%, 06/15/23(E) | 100,000 | | 115,546 |
| 0.65%, 02/27/24 144A | 1,140,000 | | 1,126,630 |
| 1.00%, 02/04/25 144A | 1,865,000 | | 1,836,639 |
| 0.75%, 06/08/26(E) | 100,000 | | 116,302 |
| BNP Paribas SA | | | |
| (Variable, 0.70% - Euribor 3M), 0.25%, 04/13/27(E) ^ | 300,000 | | 337,899 |
| BPCE SA | | | |
| 0.63%, 04/28/25(E) | 100,000 | | 115,745 |
| Capgemini SE | | | |
| 0.63%, 06/23/25(E) | 200,000 | | 231,796 |
| Credit Agricole SA | | | |
| (Variable, U.S. SOFR + 0.89%), 1.25%, 01/26/27 144A ^ | 250,000 | | 243,514 |
| Engie SA | | | |
| 0.38%, 02/28/23(E) | 200,000 | | 229,215 |
| PSA Banque France SA | | | |
| 0.00%, 01/22/25(E) | 100,000 | | 113,206 |
| RCI Banque SA | | | |
| 0.75%, 04/10/23(E) | 425,000 | | 487,320 |
| Societe Generale SA | | | |
| (Variable, U.S. Treasury Yield Curve Rate CMT 1Y + 1.10%), 1.49%, 12/14/26 144A ^ | 200,000 | | 194,996 |
| Veolia Environnement SA | | | |
| 0.67%, 03/30/22(E) | 200,000 | | 227,795 |
| | | | | 5,376,603 |
| Germany — 0.3% | | |
| Amphenol Technologies Holding GmbH | | | |
| 0.75%, 05/04/26(E) | 120,000 | | 139,564 |
| Commerzbank AG | | | |
| (Variable, 1.30% - Euribor 3M), 0.75%, 03/24/26(E) ^ | 100,000 | | 115,569 |
See Notes to Financial Statements.
SCHEDULE OF INVESTMENTS (Continued)
| | | Par | | Value |
| Deutsche Bank AG | | | |
| (Variable, U.S. SOFR + 1.13%), 1.45%, 04/01/25^ | $150,000 | | $ 149,171 |
| (Variable, 1.60% - Euribor 3M), 1.00%, 11/19/25(E) ^ | 100,000 | | 115,898 |
| E.ON SE | | | |
| 0.00%, 10/24/22(E) | 240,000 | | 273,983 |
| KION Group AG | | | |
| 1.63%, 09/24/25(E) | 100,000 | | 119,804 |
| Traton Finance Luxembourg SA | | | |
| 0.00%, 06/14/24(E) | 100,000 | | 113,593 |
| 0.13%, 11/10/24(E) | 100,000 | | 113,668 |
| 0.13%, 03/24/25(E) | 200,000 | | 226,544 |
| Volkswagen Bank GmbH | | | |
| 0.38%, 07/05/22(E) | 300,000 | | 342,859 |
| 1.88%, 01/31/24(E) | 300,000 | | 354,615 |
| Volkswagen Leasing GmbH | | | |
| 1.00%, 02/16/23(E) | 260,000 | | 300,082 |
| 0.38%, 07/20/26(E) | 60,000 | | 68,212 |
| Vonovia SE | | | |
| 0.00%, 09/16/24(E) Δ | 100,000 | | 113,486 |
| | | | | 2,547,048 |
| Guatemala — 0.0% | | |
| Central American Bottling Corporation | | | |
| 5.75%, 01/31/27 144A | 200,000 | | 205,718 |
| Hong Kong — 0.1% | | |
| CMB International Leasing Management, Ltd. | | | |
| 1.25%, 09/16/24 | 200,000 | | 197,244 |
| CMB Wing Lung Bank, Ltd. | | | |
| (Variable, U.S. Treasury Yield Curve Rate CMT 5Y + 1.75%), 3.75%, 11/22/27^ | 200,000 | | 202,891 |
| | | | | 400,135 |
| India — 0.2% | | |
| Adani Transmission, Ltd. | | | |
| 4.00%, 08/03/26 | 200,000 | | 210,463 |
| ICICI Bank, Ltd. | | | |
| 3.80%, 12/14/27 | 200,000 | | 212,897 |
| Indian Railway Finance Corporation, Ltd. | | | |
| 3.73%, 03/29/24 | 200,000 | | 208,439 |
| NTPC, Ltd. | | | |
| 3.75%, 04/03/24 | 200,000 | | 207,807 |
| Oil India, Ltd. | | | |
| 5.38%, 04/17/24 | 200,000 | | 215,551 |
| REC, Ltd. | | | |
| 3.88%, 07/07/27 | 200,000 | | 209,338 |
| Shriram Transport Finance Co., Ltd. | | | |
| 5.10%, 07/16/23 144A | 275,000 | | 280,830 |
| | | | | 1,545,325 |
| Indonesia — 0.2% | | |
| Indonesia Government International Bond | | | |
| 4.75%, 02/11/29 | 246,000 | | 286,738 |
| | | Par | | Value |
| Pelabuhan Indonesia II PT | | | |
| 4.25%, 05/05/25 | $ 200,000 | | $ 214,377 |
| Pelabuhan Indonesia III Persero PT | | | |
| 4.50%, 05/02/23 144A | 1,175,000 | | 1,223,580 |
| Pertamina Persero PT | | | |
| 1.40%, 02/09/26Δ | 200,000 | | 194,471 |
| 3.10%, 08/27/30 | 200,000 | | 204,749 |
| Perusahaan Perseroan Persero PT Perusahaan Listrik Negara | | | |
| 4.13%, 05/15/27Δ | 200,000 | | 213,658 |
| | | | | 2,337,573 |
| Ireland — 1.0% | | |
| Abbott Ireland Financing DAC | | | |
| 0.88%, 09/27/23(E) | 200,000 | | 232,119 |
| 0.10%, 11/19/24(E) | 170,000 | | 194,768 |
| AerCap Ireland Capital DAC | | | |
| 3.50%, 05/26/22 | 400,000 | | 403,567 |
| 3.30%, 01/23/23 | 155,000 | | 158,307 |
| 4.50%, 09/15/23 | 1,000,000 | | 1,049,360 |
| 1.15%, 10/29/23 | 1,330,000 | | 1,324,902 |
| 2.88%, 08/14/24 | 150,000 | | 154,422 |
| 1.65%, 10/29/24 | 2,585,000 | | 2,582,208 |
| 3.50%, 01/15/25 | 350,000 | | 365,708 |
| 2.45%, 10/29/26 | 405,000 | | 408,823 |
| Ardagh Packaging Finance PLC | | | |
| 5.25%, 04/30/25 144A | 250,000 | | 258,384 |
| ESB Finance DAC | | | |
| 3.49%, 01/12/24(E) | 100,000 | | 122,087 |
| Fresenius Finance Ireland PLC | | | |
| 0.00%, 10/01/25(E) | 100,000 | | 112,582 |
| SMBC Aviation Capital Finance DAC | | | |
| 3.00%, 07/15/22 144A | 540,000 | | 545,625 |
| 4.13%, 07/15/23 144A | 1,800,000 | | 1,876,304 |
| 3.55%, 04/15/24 144A | 800,000 | | 835,810 |
| Smurfit Kappa Treasury ULC | | | |
| 1.50%, 09/15/27(E) | 100,000 | | 119,565 |
| | | | | 10,744,541 |
| Italy — 0.2% | | |
| ACEA SpA | | | |
| 0.00%, 09/28/25(E) | 100,000 | | 113,352 |
| ASTM SpA | | | |
| 1.00%, 11/25/26(E) | 170,000 | | 194,264 |
| FCA Bank SpA | | | |
| 0.50%, 09/18/23(E) | 1,010,000 | | 1,158,690 |
| 0.00%, 04/16/24(E) | 100,000 | | 113,605 |
| Snam SpA | | | |
| 0.00%, 08/15/25(E) | 100,000 | | 113,182 |
| Telecom Italia SpA | | | |
| 5.30%, 05/30/24 144A | 200,000 | | 210,750 |
| UniCredit SpA | | | |
| 6.95%, 10/31/22(E) | 225,000 | | 270,493 |
| | | | | 2,174,336 |
| Japan — 3.8% | | |
| Central Nippon Expressway Co., Ltd. | | | |
| 2.85%, 03/03/22 | 2,000,000 | | 2,007,100 |
See Notes to Financial Statements.
| | | Par | | Value |
| Denso Corporation | | | |
| 1.24%, 09/16/26 | $ 200,000 | | $ 196,202 |
| Japan Treasury Discount Bills | | | |
| 0.00%, 02/14/22(J) Ω | 1,485,000,000 | | 12,911,296 |
| Mitsubishi UFJ Financial Group, Inc. | | | |
| (Variable, U.S. Treasury Yield Curve Rate CMT 1Y + 0.68%), 0.85%, 09/15/24^ | 1,745,000 | | 1,737,259 |
| (Variable, U.S. Treasury Yield Curve Rate CMT 1Y + 0.55%), 0.95%, 07/19/25^ | 1,880,000 | | 1,858,366 |
| (Variable, U.S. Treasury Yield Curve Rate CMT 1Y + 0.45%), 0.96%, 10/11/25^ | 3,185,000 | | 3,142,305 |
| Mizuho Financial Group, Inc. | | | |
| (Variable, ICE LIBOR USD 3M + 0.84%), 2.72%, 07/16/23^ | 640,000 | | 646,312 |
| (Floating, Australian BBSW 3M + 1.40%), 1.44%, 07/19/23(A) † | 3,100,000 | | 2,286,571 |
| 0.52%, 06/10/24(E) | 100,000 | | 115,418 |
| (Floating, ICE LIBOR USD 3M + 0.99%), 1.11%, 07/10/24† | 1,000,000 | | 1,009,027 |
| (Variable, 1.25% - U.S. SOFR), 1.24%, 07/10/24^ | 520,000 | | 521,487 |
| Nissan Motor Co., Ltd. | | | |
| 3.04%, 09/15/23 144A | 3,485,000 | | 3,577,729 |
| 3.52%, 09/17/25 144A | 600,000 | | 629,740 |
| 2.65%, 03/17/26(E) | 110,000 | | 134,418 |
| 4.35%, 09/17/27 144A | 215,000 | | 232,429 |
| Nomura Holdings, Inc. | | | |
| 2.65%, 01/16/25 | 600,000 | | 617,708 |
| 1.85%, 07/16/25 | 2,700,000 | | 2,701,825 |
| ORIX Corporation | | | |
| 3.20%, 01/19/22 | 700,000 | | 700,788 |
| Renesas Electronics Corporation | | | |
| 1.54%, 11/26/24 144A | 1,245,000 | | 1,237,873 |
| Sumitomo Mitsui Financial Group, Inc. | | | |
| 0.51%, 01/12/24 | 1,600,000 | | 1,582,702 |
| 1.47%, 07/08/25 | 1,100,000 | | 1,095,655 |
| Sumitomo Mitsui Trust Bank, Ltd. | | | |
| 0.85%, 03/25/24 144A | 960,000 | | 951,417 |
| 0.80%, 09/16/24 144A | 1,000,000 | | 984,131 |
| | | | | 40,877,758 |
| Jersey — 0.0% | | |
| Heathrow Funding, Ltd. | | | |
| 1.50%, 10/12/25(E) | 185,000 | | 218,358 |
| Mexico — 0.1% | | |
| Industrias Penoles SAB de CV | | | |
| 4.75%, 08/06/50 144A | 200,000 | | 218,839 |
| Mexico City Airport Trust | | | |
| 4.25%, 10/31/26 144A | 200,000 | | 211,961 |
| Mexico Government International Bond | | | |
| 4.75%, 04/27/32 | 295,000 | | 334,235 |
| Petroleos Mexicanos | | | |
| 6.88%, 08/04/26 | 119,000 | | 131,001 |
| | | Par | | Value |
| 5.95%, 01/28/31 | $ 174,000 | | $ 169,424 |
| 6.70%, 02/16/32 144A | 185,000 | | 187,215 |
| | | | | 1,252,675 |
| Morocco & Antilles — 0.0% | | |
| Morocco Government International Bond | | | |
| 3.00%, 12/15/32 144A | 200,000 | | 191,434 |
| 4.00%, 12/15/50 144A | 200,000 | | 182,000 |
| | | | | 373,434 |
| Netherlands — 0.9% | | |
| BMW Finance NV | | | |
| 0.00%, 04/14/23(E) | 290,000 | | 331,581 |
| Conti-Gummi Finance BV | | | |
| 1.13%, 09/25/24(E) | 110,000 | | 128,475 |
| Cooperatieve Rabobank UA | | | |
| (Variable, U.S. Treasury Yield Curve Rate CMT 1Y + 0.73%), 1.98%, 12/15/27 144A Δ ^ | 1,000,000 | | 1,001,487 |
| Daimler International Finance BV | | | |
| 0.25%, 11/06/23(E) | 90,000 | | 103,271 |
| Digital Dutch Finco BV REIT | | | |
| 0.63%, 07/15/25(E) | 300,000 | | 345,627 |
| E.ON International Finance BV | | | |
| 0.75%, 11/30/22(E) | 50,000 | | 57,352 |
| Enel Finance International NV | | | |
| 0.00%, 06/17/24(E) | 200,000 | | 227,734 |
| 2.65%, 09/10/24Δ | 500,000 | | 515,328 |
| 1.38%, 07/12/26 144A | 370,000 | | 360,895 |
| Equate Petrochemical BV | | | |
| 4.25%, 11/03/26 | 200,000 | | 217,842 |
| Heimstaden Bostad Treasury BV | | | |
| 0.25%, 10/13/24(E) | 110,000 | | 125,453 |
| ING Bank NV | | | |
| (Floating, 0.40% - Euribor 3M), 0.00%, 04/08/22(E) † | 200,000 | | 228,032 |
| ING Groep NV | | | |
| 1.00%, 09/20/23(E) | 200,000 | | 232,334 |
| (Variable, 0.60% - Euribor 3M), 0.10%, 09/03/25(E) ^ | 100,000 | | 113,828 |
| JDE Peet's NV | | | |
| 0.80%, 09/24/24 144A | 430,000 | | 421,681 |
| LeasePlan Corporation NV | | | |
| 2.88%, 10/24/24 144A | 1,900,000 | | 1,960,766 |
| NXP BV | | | |
| 2.70%, 05/01/25 144A | 50,000 | | 51,738 |
| 3.88%, 06/18/26 144A | 300,000 | | 324,246 |
| PACCAR Financial Europe BV | | | |
| 0.00%, 03/01/26(E) | 300,000 | | 339,170 |
| Redexis Gas Finance BV | | | |
| 1.88%, 05/28/25(E) | 100,000 | | 119,494 |
| Sensata Technologies BV | | | |
| 5.00%, 10/01/25 144A | 200,000 | | 217,210 |
See Notes to Financial Statements.
SCHEDULE OF INVESTMENTS (Continued)
| | | Par | | Value |
| Siemens Financieringsmaatschappij NV | | | |
| 0.38%, 09/06/23(E) | $ 235,000 | | $ 270,910 |
| Stellantis NV | | | |
| 5.25%, 04/15/23 | 1,000,000 | | 1,050,150 |
| 3.38%, 07/07/23(E) | 145,000 | | 172,165 |
| Toyota Motor Finance Netherlands BV | | | |
| 0.00%, 10/27/25(E) | 100,000 | | 113,181 |
| Upjohn Finance BV | | | |
| 0.82%, 06/23/22(E) | 220,000 | | 251,804 |
| VEON Holdings BV | | | |
| 3.38%, 11/25/27 144A | 200,000 | | 195,562 |
| Viterra Finance BV | | | |
| 0.38%, 09/24/25(E) | 160,000 | | 181,236 |
| Vonovia Finance BV | | | |
| 0.13%, 04/06/23(E) | 200,000 | | 228,589 |
| 1.63%, 04/07/24(E) Δ | 100,000 | | 117,655 |
| | | | | 10,004,796 |
| Norway — 0.1% | | |
| Aker BP ASA | | | |
| 2.88%, 01/15/26 144A | 895,000 | | 928,980 |
| Panama — 0.0% | | |
| Panama Government International Bond | | | |
| 2.25%, 09/29/32Δ | 225,000 | | 213,919 |
| Paraguay — 0.0% | | |
| Paraguay Government International Bond | | | |
| 2.74%, 01/29/33 144A | 344,000 | | 332,390 |
| Peru — 0.1% | | |
| Fondo MIVIVIENDA SA | | | |
| 3.50%, 01/31/23 144A | 690,000 | | 703,966 |
| Kallpa Generacion SA | | | |
| 4.88%, 05/24/26 | 200,000 | | 211,960 |
| Peruvian Government International Bond | | | |
| 1.86%, 12/01/32 | 197,000 | | 180,257 |
| | | | | 1,096,183 |
| Philippines — 0.0% | | |
| Philippine Government International Bond | | | |
| 3.75%, 01/14/29 | 200,000 | | 225,633 |
| Qatar — 0.4% | | |
| ABQ Finance, Ltd. | | | |
| 1.88%, 09/08/25 | 200,000 | | 198,587 |
| Qatar Government International Bond | | | |
| 4.50%, 04/23/28 | 200,000 | | 230,050 |
| 4.00%, 03/14/29 144A | 200,000 | | 225,783 |
| QNB Finance, Ltd. | | | |
| (Floating, ICE LIBOR USD 3M + 1.00%), 1.13%, 05/02/22† | 3,000,000 | | 3,005,676 |
| | | | | 3,660,096 |
| | | Par | | Value |
| Romania — 0.0% | | |
| Romanian Government International Bond | | | |
| 3.00%, 02/14/31 144A Δ | $ 138,000 | | $ 140,484 |
| Russia — 0.0% | | |
| Russian Foreign Bond - Eurobond | | | |
| 4.25%, 06/23/27 | 200,000 | | 216,587 |
| Saudi Arabia — 0.1% | | |
| Samba Funding, Ltd. | | | |
| 2.90%, 01/29/27 | 200,000 | | 207,855 |
| Saudi Arabian Oil Co. | | | |
| 1.25%, 11/24/23 144A | 490,000 | | 490,549 |
| Saudi Government International Bond | | | |
| 3.63%, 03/04/28 | 200,000 | | 218,176 |
| 4.38%, 04/16/29 144A | 200,000 | | 229,940 |
| | | | | 1,146,520 |
| Singapore — 0.3% | | |
| BOC Aviation, Ltd. | | | |
| 3.00%, 05/23/22 | 700,000 | | 703,609 |
| 2.75%, 12/02/23 | 1,800,000 | | 1,842,556 |
| 3.50%, 09/18/27 | 200,000 | | 211,023 |
| BPRL International Singapore Pte., Ltd. | | | |
| 4.38%, 01/18/27 | 200,000 | | 210,282 |
| Continuum Energy Levanter Pte., Ltd. | | | |
| 4.50%, 02/09/27 144A | 198,500 | | 203,214 |
| | | | | 3,170,684 |
| South Korea — 0.8% | | |
| Export-Import Bank of Korea | | | |
| (Floating, Australian BBSW 3M + 1.07%), 1.12%, 05/29/23(A) † | 1,000,000 | | 735,429 |
| (Floating, Australian BBSW 3M + 0.95%), 1.02%, 10/30/23(A) † | 2,000,000 | | 1,471,004 |
| Hana Bank | | | |
| (Floating, ICE LIBOR USD 3M + 0.88%), 1.07%, 09/14/22† | 1,000,000 | | 1,004,334 |
| (Floating, ICE LIBOR USD 3M + 0.80%), 1.00%, 03/13/23† | 500,000 | | 502,770 |
| Hyundai Capital Services, Inc. | | | |
| 3.63%, 08/29/27 | 200,000 | | 215,106 |
| Industrial Bank of Korea | | | |
| 2.13%, 10/23/24 144A | 3,100,000 | | 3,183,881 |
| Kia Corporation | | | |
| 3.00%, 04/25/23 | 510,000 | | 524,178 |
| 1.75%, 10/16/26 | 200,000 | | 197,791 |
| SK Telecom Co., Ltd. | | | |
| 3.75%, 04/16/23 | 900,000 | | 930,364 |
| | | | | 8,764,857 |
| Spain — 0.3% | | |
| Amadeus IT Group SA | | | |
| (Floating, 0.65% - Euribor 3M), 0.08%, 02/09/23(E) † | 700,000 | | 797,140 |
| 2.50%, 05/20/24(E) | 200,000 | | 239,426 |
See Notes to Financial Statements.
| | | Par | | Value |
| Banco de Sabadell SA | | | |
| (Variable, 0.97% - EUR Swap Rate 1Y), 0.63%, 11/07/25(E) ^ | $ 100,000 | | $ 114,306 |
| (Variable, 1.55% - EUR Swap Rate 1Y), 1.13%, 03/11/27(E) ^ | 100,000 | | 115,980 |
| Banco Santander SA | | | |
| (Variable, U.S. Treasury Yield Curve Rate CMT 1Y + 0.45%), 0.70%, 06/30/24^ | 1,200,000 | | 1,194,110 |
| 2.75%, 05/28/25 | 400,000 | | 413,945 |
| 1.85%, 03/25/26 | 400,000 | | 398,390 |
| (Variable, U.S. Treasury Yield Curve Rate CMT 1Y + 0.90%), 1.72%, 09/14/27^ | 200,000 | | 196,590 |
| | | | | 3,469,887 |
| Sweden — 0.3% | | |
| Akelius Residential Property AB | | | |
| 1.13%, 03/14/24(E) | 1,100,000 | | 1,279,088 |
| Stadshypotek AB | | | |
| 2.50%, 04/05/22 144A Δ | 1,000,000 | | 1,005,591 |
| Volvo Treasury AB | | | |
| 0.00%, 05/09/24(E) | 310,000 | | 353,447 |
| | | | | 2,638,126 |
| Switzerland — 0.8% | | |
| Credit Suisse Group AG | | | |
| 3.57%, 01/09/23 144A | 750,000 | | 750,214 |
| (Variable, U.S. SOFR + 0.98%), 1.31%, 02/02/27 144A ^ | 700,000 | | 677,013 |
| Credit Suisse Group Funding Guernsey, Ltd. | | | |
| 3.80%, 09/15/22 | 450,000 | | 459,793 |
| SIG Combibloc PurchaseCo S.a.r.l. | | | |
| 1.88%, 06/18/23(E) Δ | 300,000 | | 350,855 |
| 2.13%, 06/18/25(E) | 100,000 | | 119,671 |
| UBS AG | | | |
| (Floating, U.S. SOFR + 0.36%), 0.41%, 02/09/24 144A † | 3,000,000 | | 2,998,972 |
| UBS Group AG | | | |
| 3.49%, 05/23/23 144A | 1,800,000 | | 1,818,435 |
| (Variable, U.S. Treasury Yield Curve Rate CMT 1Y + 0.83%), 1.01%, 07/30/24 144A ^ | 690,000 | | 688,116 |
| (Variable, 0.55% - EUR Swap Rate 1Y), 0.25%, 01/29/26(E) ^ | 200,000 | | 228,126 |
| (Variable, U.S. Treasury Yield Curve Rate CMT 1Y + 0.85%), 1.49%, 08/10/27 144A ^ | 600,000 | | 585,962 |
| | | | | 8,677,157 |
| Thailand — 0.0% | | |
| PTTEP Treasury Center Co., Ltd. | | | |
| 2.59%, 06/10/27 | 200,000 | | 204,089 |
| United Arab Emirates — 0.2% | | |
| First Abu Dhabi Bank PJSC | | | |
| 1.38%, 02/19/23(U) | 1,666,000 | | 2,260,650 |
| | | Par | | Value |
| Sharjah Sukuk Program, Ltd. | | | |
| 2.94%, 06/10/27 | $ 200,000 | | $ 201,270 |
| | | | | 2,461,920 |
| United Kingdom — 2.6% | | |
| Barclays PLC | | | |
| (Variable, ICE LIBOR USD 3M + 1.40%), 4.61%, 02/15/23^ | 600,000 | | 602,587 |
| (Floating, Australian BBSW 3M + 1.80%), 1.86%, 06/15/23(A) † | 1,000,000 | | 741,410 |
| (Variable, ICE LIBOR USD 3M + 1.36%), 4.34%, 05/16/24^ | 900,000 | | 937,251 |
| (Variable, U.S. Treasury Yield Curve Rate CMT 1Y + 0.80%), 1.01%, 12/10/24^ | 1,545,000 | | 1,534,600 |
| (Variable, 3.70% - EUR Swap Rate 1Y), 3.38%, 04/02/25(E) ^ | 100,000 | | 122,142 |
| (Variable, U.S. SOFR + 2.71%), 2.85%, 05/07/26^ | 1,000,000 | | 1,032,600 |
| HSBC Holdings PLC | | | |
| (Floating, Australian BBSW 3M + 1.10%), 1.14%, 02/16/24(A) † | 1,300,000 | | 952,743 |
| (Floating, ICE LIBOR USD 3M + 1.23%), 1.43%, 03/11/25† | 3,000,000 | | 3,047,751 |
| (Variable, U.S. SOFR + 1.40%), 2.63%, 11/07/25^ | 300,000 | | 307,973 |
| Informa PLC | | | |
| 1.50%, 07/05/23(E) | 200,000 | | 232,453 |
| 2.13%, 10/06/25(E) | 485,000 | | 579,044 |
| Lloyds Banking Group PLC | | | |
| (Variable, ICE LIBOR USD 3M + 1.25%), 2.86%, 03/17/23^ | 2,500,000 | | 2,509,833 |
| LSEGA Financing PLC | | | |
| 0.65%, 04/06/24 144A | 200,000 | | 197,263 |
| National Grid Electricity Transmission PLC | | | |
| 0.19%, 01/20/25(E) | 100,000 | | 114,215 |
| Nationwide Building Society | | | |
| 2.00%, 01/27/23 144A | 900,000 | | 911,875 |
| 1.70%, 02/13/23 144A | 2,900,000 | | 2,931,543 |
| (Variable, ICE LIBOR USD 3M + 1.18%), 3.62%, 04/26/23 144A ^ | 1,500,000 | | 1,512,343 |
| 0.55%, 01/22/24 144A | 1,845,000 | | 1,821,457 |
| NatWest Group PLC | | | |
| (Floating, ICE LIBOR USD 3M + 1.47%), 1.63%, 05/15/23† | 1,000,000 | | 1,004,299 |
| NatWest Markets PLC | | | |
| 2.38%, 05/21/23 144A | 1,800,000 | | 1,834,869 |
| 1.60%, 09/29/26 144A Δ | 545,000 | | 536,711 |
| Royalty Pharma PLC | | | |
| 0.75%, 09/02/23 | 920,000 | | 914,641 |
| Santander UK Group Holdings PLC | | | |
| 3.57%, 01/10/23 | 350,000 | | 350,150 |
| (Variable, ICE LIBOR USD 3M + 1.08%), 3.37%, 01/05/24^ | 215,000 | | 219,723 |
| Santander UK PLC | | | |
| 1.63%, 02/12/23 144A | 2,100,000 | | 2,122,638 |
See Notes to Financial Statements.
SCHEDULE OF INVESTMENTS (Continued)
| | | Par | | Value |
| Standard Chartered PLC | | | |
| (Variable, U.S. Treasury Yield Curve Rate CMT 1Y + 1.17%), 1.32%, 10/14/23 144A ^ | $ 200,000 | | $ 200,209 |
| (Variable, U.S. Treasury Yield Curve Rate CMT 1Y + 0.78%), 0.99%, 01/12/25 144A ^ | 440,000 | | 435,495 |
| Virgin Money UK PLC | | | |
| (Variable, 0.85% - EUR Swap Rate 1Y), 0.38%, 05/27/24(E) ^ | 110,000 | | 125,760 |
| WPP Finance 2013 | | | |
| 3.00%, 11/20/23(E) | 200,000 | | 241,226 |
| | | | | 28,074,804 |
| Uruguay — 0.0% | | |
| Uruguay Government International Bond | | | |
| 4.38%, 10/27/27 | 84,713 | | 95,409 |
Total Foreign Bonds
(Cost $177,678,652) | | 176,818,737 |
| MORTGAGE-BACKED SECURITIES — 15.9% |
| Alen Mortgage Trust, Series 2021-ACEN, Class A | | | |
| (Floating, ICE LIBOR USD 1M + 1.15%, 1.15% Floor), 1.26%, 04/15/34 144A † | 350,000 | | 350,122 |
| American Home Mortgage Assets Trust, Series 2006-5, Class A1 | | | |
| (Floating, Federal Reserve U.S. 12 1Y CMT + 0.92%, 0.92% Floor), 1.00%, 11/25/46† | 571,804 | | 232,628 |
| Avon Finance No. 2 PLC, Class A | | | |
| (Floating, SONIA Interest Rate + 0.90%), 0.95%, 09/20/48(U) 144A † | 1,242,024 | | 1,684,341 |
| Banc of America Mortgage Trust, Series 2003-L, Class 3A1 | | | |
| 2.37%, 01/25/34† γ | 22,786 | | 22,473 |
| BANK, Series 2019-BNK18, Class A2 | | | |
| 3.47%, 05/15/62 | 610,000 | | 634,186 |
| Bear Stearns ARM Trust, Series 2003-8, Class 4A1 | | | |
| 2.48%, 01/25/34† γ | 64,734 | | 66,939 |
| Bear Stearns ARM Trust, Series 2004-5, Class 2A | | | |
| 2.94%, 07/25/34† γ | 65,792 | | 67,863 |
| Bear Stearns Commercial Mortgage Securities Trust, Series 2007-T26, Class AM | | | |
| 5.43%, 01/12/45† γ | 115,225 | | 114,603 |
| Bellemeade RE, Ltd., Series 2021-3A, Class M1A | | | |
| (Floating, U.S. 30-Day Average SOFR + 1.00%, 1.00% Floor), 1.05%, 09/25/31 144A † | 900,000 | | 896,118 |
| Brass No. 8 PLC, Class A1 | | | |
| (Floating, ICE LIBOR USD 3M + 0.70%), 0.86%, 11/16/66 144A † | 98,430 | | 98,779 |
| | | Par | | Value |
| BX Commercial Mortgage Trust, Series 2019-XL, Class A | | | |
| (Floating, ICE LIBOR USD 1M + 0.92%, 0.92% Floor), 1.03%, 10/15/36 144A † | $1,493,285 | | $1,495,058 |
| BX Commercial Mortgage Trust, Series 2019-XL, Class B | | | |
| (Floating, ICE LIBOR USD 1M + 1.08%, 1.08% Floor), 1.19%, 10/15/36 144A † | 569,500 | | 569,359 |
| BX Commercial Mortgage Trust, Series 2019-XL, Class D | | | |
| (Floating, ICE LIBOR USD 1M + 1.45%, 1.45% Floor), 1.56%, 10/15/36 144A † | 667,250 | | 666,766 |
| BX Commercial Mortgage Trust, Series 2020-BXLP, Class A | | | |
| (Floating, ICE LIBOR USD 1M + 0.80%, 0.80% Floor), 0.91%, 12/15/36 144A † | 722,310 | | 722,554 |
| BX Commercial Mortgage Trust, Series 2020-BXLP, Class E | | | |
| (Floating, ICE LIBOR USD 1M + 1.60%, 1.60% Floor), 1.71%, 12/15/36 144A † | 292,264 | | 291,376 |
| BX Commercial Mortgage Trust, Series 2020-VKNG, Class B | | | |
| (Floating, ICE LIBOR USD 1M + 1.13%, 1.13% Floor), 1.24%, 10/15/37 144A † | 1,167,848 | | 1,168,715 |
| BX Commercial Mortgage Trust, Series 2021-SOAR, Class A | | | |
| (Floating, ICE LIBOR USD 1M + 0.67%, 0.67% Floor), 0.78%, 06/15/38 144A † | 2,310,000 | | 2,300,111 |
| BX Commercial Mortgage Trust, Series 2021-VINO, Class A | | | |
| (Floating, ICE LIBOR USD 1M + 0.65%, 0.65% Floor), 0.76%, 05/15/38 144A † | 280,000 | | 279,134 |
| BX Commercial Mortgage Trust, Series 2021-XL2, Class A | | | |
| (Floating, ICE LIBOR USD 1M + 0.69%, 0.69% Floor), 0.80%, 10/15/38 144A † | 685,000 | | 681,741 |
| BX Trust, Series 2018-BILT, Class D | | | |
| (Floating, ICE LIBOR USD 1M + 1.77%, 1.77% Floor), 1.88%, 05/15/30 144A † | 235,000 | | 233,158 |
| BX Trust, Series 2021-LBA, Class AJV | | | |
| (Floating, ICE LIBOR USD 1M + 0.80%, 0.80% Floor), 0.91%, 02/15/36 144A † | 240,000 | | 239,563 |
| BX Trust, Series 2021-LBA, Class AV | | | |
| (Floating, ICE LIBOR USD 1M + 0.80%, 0.80% Floor), 0.91%, 02/15/36 144A † | 330,000 | | 329,399 |
| BX Trust, Series 2021-VIEW, Class A | | | |
| (Floating, ICE LIBOR USD 1M + 1.28%, 1.28% Floor), 1.39%, 06/15/23 144A † | 150,000 | | 150,123 |
See Notes to Financial Statements.
| | | Par | | Value |
| Canterbury Finance PLC, No. 1, Class A2 | | | |
| (Floating, SONIA Interest Rate + 1.35%), 1.40%, 05/16/56(U) † | $ 885,245 | | $1,205,560 |
| CFCRE Commercial Mortgage Trust, Series 2017-C8, Class ASB | | | |
| 3.37%, 06/15/50 | 1,500,000 | | 1,572,394 |
| Chase Home Lending Mortgage Trust, Series 2019-ATR2, Class A11 | | | |
| (Floating, ICE LIBOR USD 1M + 0.90%, 6.50% Cap), 1.00%, 07/25/49 144A † | 51,657 | | 51,918 |
| Chase Home Lending Mortgage Trust, Series 2019-ATR2, Class A3 | | | |
| 3.50%, 07/25/49 144A † γ | 105,522 | | 107,173 |
| CHC Commercial Mortgage Trust, Series 2019-CHC, Class D | | | |
| (Floating, ICE LIBOR USD 1M + 2.05%, 2.05% Floor), 2.16%, 06/15/34 144A † | 2,124,493 | | 2,095,751 |
| CHL Mortgage Pass-Through Trust, Series 2004-29, Class 1A1 | | | |
| (Floating, ICE LIBOR USD 1M + 0.54%, 0.54% Floor, 11.50% Cap), 0.64%, 02/25/35† | 43,276 | | 42,563 |
| Citigroup Commercial Mortgage Trust, Series 2016-P4, Class A4 | | | |
| 2.90%, 07/10/49 | 641,000 | | 668,361 |
| Citigroup Commercial Mortgage Trust, Series 2016-P5, Class AAB | | | |
| 2.84%, 10/10/49 | 972,543 | | 1,002,035 |
| Cold Storage Trust, Series 2020-ICE5, Class A | | | |
| (Floating, ICE LIBOR USD 1M + 0.90%, 0.90% Floor), 1.01%, 11/15/37 144A † | 4,865,803 | | 4,867,524 |
| COMM Mortgage Trust, Series 2012-CR4, Class ASB | | | |
| 2.44%, 10/15/45 | 234,777 | | 236,121 |
| COMM Mortgage Trust, Series 2013-CR8, Class A5 | | | |
| 3.61%, 06/10/46 | 750,000 | | 772,143 |
| COMM Mortgage Trust, Series 2013-SFS, Class A1 | | | |
| 1.87%, 04/12/35 144A | 118,090 | | 118,308 |
| COMM Mortgage Trust, Series 2014-CR21, Class A3 | | | |
| 3.53%, 12/10/47 | 566,458 | | 589,026 |
| COMM Mortgage Trust, Series 2014-UBS5, Class ASB | | | |
| 3.55%, 09/10/47 | 199,855 | | 205,450 |
| COMM Mortgage Trust, Series 2015-CR24, Class ASB | | | |
| 3.45%, 08/10/48 | 122,427 | | 126,619 |
| COMM Mortgage Trust, Series 2015-PC1, Class A4 | | | |
| 3.62%, 07/10/50 | 450,342 | | 462,626 |
| COMM Mortgage Trust, Series 2021-LBA, Class A | | | |
| (Floating, ICE LIBOR USD 1M + 0.69%, 0.69% Floor), 0.80%, 03/15/38 144A † | 1,800,000 | | 1,787,755 |
| | | Par | | Value |
| Connecticut Avenue Securities Trust, Series 2021-R01, Class 1M2 | | | |
| (Floating, U.S. 30-Day Average SOFR + 1.55%), 1.60%, 10/25/41 144A † | $1,050,000 | | $1,053,284 |
| CSAIL Commercial Mortgage Trust, Series 2016-C6, Class XA | | | |
| 1.87%, 01/15/49† IO γ | 628,926 | | 42,193 |
| CSMC, Series 2020-NET, Class A | | | |
| 2.26%, 08/15/37 144A | 315,000 | | 317,895 |
| CSMC, Series 2021-980M, Class C | | | |
| 3.20%, 07/15/31 144A | 150,000 | | 150,290 |
| CSMC, Series 2021-BHAR, Class A | | | |
| (Floating, ICE LIBOR USD 1M + 1.15%, 1.15% Floor), 1.26%, 11/15/38 144A † | 770,000 | | 771,107 |
| Deutsche Alt-B Securities Mortgage Loan Trust, Series 2006-AB4, Class A6A1 | | | |
| (Step to 5.36% on 03/25/22), 6.37%, 10/25/36 STEP | 114,566 | | 115,041 |
| Deutsche Alt-B Securities Mortgage Loan Trust, Series 2006-AB4, Class A6A2 | | | |
| (Step to 5.36% on 03/25/22), 6.39%, 10/25/36 STEP | 114,566 | | 115,039 |
| Eagle RE, Ltd., Series 2021-2, Class M1A | | | |
| (Floating, U.S. 30-Day Average SOFR + 1.55%, 1.55% Floor), 1.60%, 04/25/34 144A † | 800,000 | | 800,606 |
| Extended Stay America Trust, Series 2021-ESH, Class A | | | |
| (Floating, ICE LIBOR USD 1M + 1.08%, 1.08% Floor), 1.19%, 07/15/38 144A † | 2,238,355 | | 2,244,789 |
| Fannie Mae Connecticut Avenue Securities, Series 2018-C01, Class 1M2 | | | |
| (Floating, ICE LIBOR USD 1M + 2.25%, 2.25% Floor), 2.35%, 07/25/30† | 774,696 | | 784,219 |
| Fannie Mae Connecticut Avenue Securities, Series 2021-R02, Class 2M2 | | | |
| (Floating, U.S. 30-Day Average SOFR + 2.00%), 2.05%, 11/25/41 144A † | 3,000,000 | | 3,003,750 |
| Federal Home Loan Mortgage Corporation | | | |
| (Floating, U.S. Treasury Yield Curve Rate CMT 1Y + 2.36%, 2.36% Floor, 13.19% Cap), 2.40%, 07/01/27† | 1,346 | | 1,351 |
| (Floating, U.S. Treasury Yield Curve Rate CMT 1Y + 2.25%, 2.25% Floor, 11.15% Cap), 2.35%, 11/01/31† | 10,143 | | 10,190 |
| (Floating, U.S. Treasury Yield Curve Rate CMT 1Y + 2.25%, 2.25% Floor, 10.86% Cap), 2.38%, 04/01/32† | 2,935 | | 2,954 |
See Notes to Financial Statements.
SCHEDULE OF INVESTMENTS (Continued)
| | | Par | | Value |
| (Floating, U.S. Treasury Yield Curve Rate CMT 1Y + 2.04%, 2.04% Floor, 9.78% Cap), 2.16%, 06/01/33† | $ 206,080 | | $ 218,485 |
| (Floating, ICE LIBOR USD 1Y + 1.75%, 1.75% Floor, 10.84% Cap), 2.00%, 08/01/35† | 48,425 | | 49,984 |
| (Floating, ICE LIBOR USD 1Y + 1.35%, 1.35% Floor, 10.35% Cap), 1.60%, 09/01/35† | 66,020 | | 68,584 |
| (Floating, ICE LIBOR USD 1Y + 1.63%, 1.63% Floor, 10.80% Cap), 1.88%, 10/01/35† | 87,657 | | 91,924 |
| 3.00%, 02/01/36 | 52,500 | | 55,533 |
| 4.00%, 11/01/36 | 6,583 | | 7,166 |
| 4.00%, 06/01/37 | 78,457 | | 85,164 |
| 4.50%, 07/01/47 | 45,341 | | 49,761 |
| 4.50%, 03/01/49 | 2,134,553 | | 2,364,214 |
| Federal Home Loan Mortgage Corporation REMIC, Series 3228 | | | |
| (Floating, ICE LIBOR USD 1M + 0.50%, 0.50% Floor, 6.50% Cap), 0.61%, 10/15/36† | 811,713 | | 821,607 |
| Federal Home Loan Mortgage Corporation REMIC, Series 3710 | | | |
| 4.00%, 08/15/25 STEP | 39,867 | | 42,395 |
| Federal Home Loan Mortgage Corporation REMIC, Series 3959 | | | |
| 4.50%, 11/15/41 | 143,169 | | 155,091 |
| Federal Home Loan Mortgage Corporation REMIC, Series 3986 | | | |
| 4.50%, 09/15/41 | 91,831 | | 95,094 |
| Federal Home Loan Mortgage Corporation REMIC, Series 4459 | | | |
| 3.00%, 08/15/43 | 284,901 | | 298,467 |
| Federal Home Loan Mortgage Corporation REMIC, Series 4494 | | | |
| 3.75%, 10/15/42 | 166,062 | | 170,333 |
| Federal Home Loan Mortgage Corporation REMIC, Series 4752 | | | |
| 3.00%, 09/15/46 | 325,660 | | 332,443 |
| Federal Home Loan Mortgage Corporation REMIC, Series 4777 | | | |
| 3.50%, 10/15/45 | 671,940 | | 693,669 |
| Federal Home Loan Mortgage Corporation REMIC, Series 4904 | | | |
| (Floating, ICE LIBOR USD 1M + 0.45%, 0.45% Floor, 6.50% Cap), 0.56%, 06/15/49† | 537,020 | | 541,295 |
| Federal Home Loan Mortgage Corporation REMIC, Series 4941 | | | |
| 3.00%, 07/25/49 | 241,268 | | 248,660 |
| Federal Home Loan Mortgage Corporation REMIC, Series 4948 | | | |
| 2.50%, 10/25/48 | 143,868 | | 146,359 |
| Federal Home Loan Mortgage Corporation REMIC, Series 5000 | | | |
| 2.00%, 06/25/44 | 176,290 | | 178,525 |
| | | Par | | Value |
| Federal Home Loan Mortgage Corporation REMIC, Series 5006 | | | |
| 2.00%, 06/25/45 | $ 490,975 | | $ 499,351 |
| Federal Home Loan Mortgage Corporation REMIC, Series 5047 | | | |
| 0.75%, 10/15/28 | 3,221,951 | | 3,183,127 |
| Federal Home Loan Mortgage Corporation REMIC, Series 5057 | | | |
| 1.00%, 04/15/54 | 2,374,110 | | 2,373,544 |
| Federal Home Loan Mortgage Corporation REMIC, Series 5105 | | | |
| 1.50%, 04/15/44 | 1,356,156 | | 1,366,798 |
| Federal Home Loan Mortgage Corporation REMIC, Series 5115 | | | |
| 1.00%, 02/25/42 | 2,715,721 | | 2,658,812 |
| Federal Home Loan Mortgage Corporation STACR REMIC Trust, Series 2020-DNA1, Class M2 | | | |
| (Floating, ICE LIBOR USD 1M + 1.70%), 1.80%, 01/25/50 144A † | 198,092 | | 198,607 |
| Federal Home Loan Mortgage Corporation STACR REMIC Trust, Series 2020-DNA2, Class M2 | | | |
| (Floating, ICE LIBOR USD 1M + 1.85%, 1.85% Floor), 1.95%, 02/25/50 144A † | 160,687 | | 161,379 |
| Federal Home Loan Mortgage Corporation STACR REMIC Trust, Series 2021-DNA1, Class M1 | | | |
| (Floating, U.S. 30-Day Average SOFR + 0.65%), 0.70%, 01/25/51 144A † | 292,161 | | 292,107 |
| Federal Home Loan Mortgage Corporation STACR REMIC Trust, Series 2021-DNA5, Class M2 | | | |
| (Floating, U.S. 30-Day Average SOFR + 1.65%), 1.70%, 01/25/34 144A † | 1,100,000 | | 1,104,817 |
| Federal Home Loan Mortgage Corporation STACR REMIC Trust, Series 2021-DNA6 Class M2 | | | |
| (Floating, U.S. 30-Day Average SOFR + 1.50%), 1.55%, 10/25/41 144A † | 1,850,000 | | 1,849,997 |
| Federal Home Loan Mortgage Corporation STACR REMIC Trust, Series 2021-HQA4, Class M2 | | | |
| (Floating, U.S. 30-Day Average SOFR + 2.35%), 2.40%, 12/25/41 144A † | 2,200,000 | | 2,208,995 |
See Notes to Financial Statements.
| | | Par | | Value |
| Federal Home Loan Mortgage Corporation STACR Trust, Series 2018-DNA2, Class M1 | | | |
| (Floating, ICE LIBOR USD 1M + 0.80%), 0.90%, 12/25/30 144A † | $ 179,966 | | $ 179,981 |
| Federal Home Loan Mortgage Corporation STACR Trust, Series 2019-DNA4, Class M2 | | | |
| (Floating, ICE LIBOR USD 1M + 1.95%), 2.05%, 10/25/49 144A † | 193,728 | | 194,405 |
| Federal National Mortgage Association | | | |
| (Floating, Federal Reserve U.S. 12 1Y CMT + 2.00%, 2.00% Floor, 10.80% Cap), 2.20%, 12/01/24 CONV † | 1,762 | | 1,766 |
| 2.50%, 12/01/27 | 341,751 | | 355,139 |
| 3.00%, 09/01/30 | 170,262 | | 179,315 |
| 3.00%, 02/01/31 | 924,129 | | 971,762 |
| 3.00%, 04/01/31 | 15,285 | | 16,083 |
| (Floating, U.S. Treasury Yield Curve Rate CMT 1Y + 2.22%, 2.22% Floor, 11.63% Cap), 2.32%, 09/01/31† | 24,949 | | 24,959 |
| 2.50%, 10/01/31 | 372,511 | | 387,154 |
| 2.50%, 11/01/31 | 846,113 | | 880,888 |
| 2.50%, 01/01/32 | 6,194 | | 6,447 |
| 3.00%, 03/01/32 | 568,103 | | 599,269 |
| (Floating, ICE LIBOR USD 1M + 1.31%, 1.31% Floor, 11.27% Cap), 1.43%, 08/01/32† | 154,959 | | 155,630 |
| 3.00%, 11/01/32 | 51,154 | | 53,790 |
| (Floating, U.S. Treasury Yield Curve Rate CMT 1Y + 2.24%, 2.24% Floor, 9.73% Cap), 2.37%, 12/01/32† | 231,998 | | 233,440 |
| 3.00%, 12/01/32 | 656,990 | | 690,431 |
| (Floating, U.S. Treasury Yield Curve Rate CMT 1Y + 2.41%, 2.41% Floor, 9.35% Cap), 2.48%, 06/01/33† | 8,026 | | 8,057 |
| 4.00%, 09/01/33 | 1,175,970 | | 1,239,943 |
| 4.00%, 03/01/34 | 41,237 | | 43,759 |
| 4.00%, 05/01/34 | 558,258 | | 603,919 |
| (Floating, ICE LIBOR USD 1Y + 1.66%, 1.66% Floor, 10.01% Cap), 2.01%, 02/01/35† | 73,175 | | 76,232 |
| 3.00%, 09/01/35 | 91,000 | | 95,231 |
| 4.00%, 07/01/37 | 30,961 | | 33,541 |
| 4.00%, 09/01/37 | 36,769 | | 39,832 |
| 4.00%, 03/01/38 | 27,317 | | 29,283 |
| (Floating, ICE LIBOR USD 1Y + 1.73%, 1.73% Floor, 9.50% Cap), 2.02%, 05/01/38† | 591,650 | | 621,792 |
| 1.28%, 08/01/42† | 162,294 | | 165,690 |
| (Floating, ICE LIBOR USD 1Y + 1.74%, 1.74% Floor, 8.50% Cap), 2.63%, 09/01/42† | 209,348 | | 220,426 |
| (Floating, ICE LIBOR USD 1Y + 1.69%, 1.69% Floor, 7.75% Cap), 2.74%, 07/01/43† | 329,156 | | 346,809 |
| | | Par | | Value |
| (Floating, Federal Reserve U.S. 12 1Y CMT + 1.20%, 1.20% Floor, 8.52% Cap), 1.28%, 07/01/44† | $ 66,680 | | $ 68,161 |
| (Floating, Federal Reserve U.S. 12 1Y CMT + 1.20%, 1.20% Floor, 9.38% Cap), 1.28%, 10/01/44† | 42,620 | | 43,610 |
| (Floating, ICE LIBOR USD 1Y + 1.59%, 1.59% Floor, 7.84% Cap), 2.84%, 06/01/45† | 288,399 | | 300,406 |
| 4.50%, 03/01/47 | 135,218 | | 147,359 |
| 4.50%, 05/01/47 | 420,789 | | 457,693 |
| 4.50%, 07/01/47 | 54,453 | | 59,612 |
| 4.50%, 11/01/47 | 464,350 | | 506,952 |
| 4.50%, 06/01/48 | 68,681 | | 76,214 |
| 4.50%, 11/01/48 | 212,397 | | 233,530 |
| 4.50%, 02/01/49 | 681,106 | | 762,047 |
| 4.50%, 04/01/49 | 187,511 | | 209,797 |
| Federal National Mortgage Association REMIC, Series 2006-98 | | | |
| (Floating, ICE LIBOR USD 1M + 0.43%, 0.43% Floor, 7.00% Cap), 0.53%, 10/25/36† | 135,346 | | 137,552 |
| Federal National Mortgage Association REMIC, Series 2007-100 | | | |
| (Floating, ICE LIBOR USD 1M + 0.55%, 0.55% Floor, 7.00% Cap), 0.65%, 10/25/37† | 177,575 | | 181,022 |
| Federal National Mortgage Association REMIC, Series 2011-48 | | | |
| 4.00%, 06/25/26 STEP | 71,940 | | 76,392 |
| Federal National Mortgage Association REMIC, Series 2012-79 | | | |
| (Floating, ICE LIBOR USD 1M + 0.45%, 0.45% Floor, 6.50% Cap), 0.55%, 07/25/42† | 140,382 | | 141,581 |
| Federal National Mortgage Association REMIC, Series 2015-38 | | | |
| (Floating, ICE LIBOR USD 1M + 0.31%, 0.31% Floor), 0.40%, 06/25/55† | 167,856 | | 168,524 |
| Federal National Mortgage Association REMIC, Series 2016-11 | | | |
| (Floating, ICE LIBOR USD 1M + 0.50%, 0.50% Floor), 0.59%, 03/25/46† | 805,735 | | 806,079 |
| Federal National Mortgage Association REMIC, Series 2016-40 | | | |
| (Floating, ICE LIBOR USD 1M + 0.45%, 0.45% Floor), 0.54%, 07/25/46† | 983,158 | | 982,388 |
| Federal National Mortgage Association REMIC, Series 2018-21 | | | |
| 3.50%, 04/25/45 | 242,452 | | 246,280 |
See Notes to Financial Statements.
SCHEDULE OF INVESTMENTS (Continued)
| | | Par | | Value |
| Federal National Mortgage Association REMIC, Series 2019-30 | | | |
| (Floating, ICE LIBOR USD 1M + 0.50%, 0.50% Floor, 6.50% Cap), 0.60%, 07/25/49† | $ 604,207 | | $ 608,628 |
| Federal National Mortgage Association REMIC, Series 2019-53 | | | |
| (Floating, ICE LIBOR USD 1M + 0.40%, 0.40% Floor), 0.49%, 09/25/49† | 1,140,494 | | 1,140,983 |
| Federal National Mortgage Association REMIC, Series 2019-60 | | | |
| (Floating, ICE LIBOR USD 1M + 0.40%, 0.40% Floor), 0.49%, 10/25/59† | 1,185,381 | | 1,185,219 |
| Federal National Mortgage Association REMIC, Series 2019-9 | | | |
| 3.50%, 06/25/48 | 1,037,685 | | 1,076,496 |
| FHLMC Multifamily Structured Pass-Through Certificates, Series K121 | | | |
| 1.03%, 10/25/30† IO γ | 598,876 | | 45,824 |
| FHLMC Multifamily Structured Pass-Through Certificates, Series K727 | | | |
| 2.95%, 07/25/24 | 3,750,000 | | 3,898,087 |
| FHLMC Multifamily Structured Pass-Through Certificates, Series KIR2 | | | |
| 2.75%, 03/25/27 | 297,301 | | 309,692 |
| FHLMC Multifamily Structured Pass-Through Certificates, Series KJ18 | | | |
| 3.07%, 08/25/22 | 152,325 | | 153,157 |
| FHLMC Structured Agency Credit Risk Debt Notes, Series 2021-DNA2, Class M1 | | | |
| (Floating, U.S. 30-Day Average SOFR + 0.80%), 0.85%, 08/25/33 144A † | 1,245,874 | | 1,245,402 |
| FHLMC Structured Pass-Through Certificates, Series T-56, Class 3AF | | | |
| (Floating, ICE LIBOR USD 1M + 1.00%, 1.00% Floor, 8.50% Cap), 1.10%, 05/25/43† | 361,976 | | 368,127 |
| FHLMC Structured Pass-Through Certificates, Series T-61, Class 1A1 | | | |
| (Floating, Federal Reserve U.S. 12 1Y CMT + 1.40%, 1.40% Floor), 1.48%, 07/25/44† | 313,693 | | 323,037 |
| Finsbury Square PLC, Series 2020-2A, Class A | | | |
| (Floating, SONIA Interest Rate + 1.30%), 1.35%, 06/16/70(U) 144A † | 955,255 | | 1,302,299 |
| First Horizon Alternative Mortgage Securities Trust, Series 2004-AA1, Class A1 | | | |
| 2.08%, 06/25/34† γ | 98,428 | | 101,013 |
| | | Par | | Value |
| FREMF Mortgage Trust, Series 2012-K18, Class B | | | |
| 4.17%, 01/25/45 144A † γ | $ 240,000 | | $ 239,898 |
| FREMF Mortgage Trust, Series 2012-K19, Class B | | | |
| 4.01%, 05/25/45 144A † γ | 145,000 | | 145,252 |
| FREMF Mortgage Trust, Series 2012-K20, Class B | | | |
| 3.87%, 05/25/45 144A † γ | 135,000 | | 136,262 |
| FREMF Mortgage Trust, Series 2013-K27, Class B | | | |
| 3.50%, 01/25/46 144A † γ | 130,000 | | 133,073 |
| FREMF Mortgage Trust, Series 2013-K31, Class B | | | |
| 3.63%, 07/25/46 144A † γ | 105,000 | | 108,255 |
| FREMF Mortgage Trust, Series 2015-K45, Class B | | | |
| 3.59%, 04/25/48 144A † γ | 250,000 | | 261,487 |
| FREMF Mortgage Trust, Series 2015-K720, Class B | | | |
| 3.39%, 07/25/22 144A † γ | 455,000 | | 460,143 |
| GCAT Trust, Series 2021-NQM7, Class A1 | | | |
| 1.92%, 08/25/66 144A † γ | 340,000 | | 341,762 |
| Gemgarto PLC, Series 2021-1A, Class A | | | |
| (Floating, SONIA Interest Rate + 0.59%), 0.64%, 12/16/67(U) 144A † | 1,878,134 | | 2,549,833 |
| Gosforth Funding PLC, Series 2018-1A, Class A1 | | | |
| (Floating, ICE LIBOR USD 3M + 0.45%), 0.63%, 08/25/60 144A † | 125,216 | | 125,338 |
| Government National Mortgage Association | | | |
| 2.00%, 03/20/22† | 1,037 | | 1,038 |
| (Floating, U.S. Treasury Yield Curve Rate CMT 1Y + 1.50%, 1.50% Floor, 11.50% Cap), 2.00%, 01/20/23† | 1,030 | | 1,034 |
| (Floating, U.S. Treasury Yield Curve Rate CMT 1Y + 1.50%, 1.50% Floor, 10.00% Cap), 1.88%, 05/20/24† | 5,945 | | 6,021 |
| (Floating, U.S. Treasury Yield Curve Rate CMT 1Y + 1.50%, 1.50% Floor, 11.50% Cap), 1.63%, 07/20/25† | 12,165 | | 12,456 |
| (Floating, U.S. Treasury Yield Curve Rate CMT 1Y + 1.50%, 1.50% Floor, 11.00% Cap), 1.63%, 08/20/25† | 3,326 | | 3,411 |
| (Floating, U.S. Treasury Yield Curve Rate CMT 1Y + 1.50%, 1.50% Floor, 11.00% Cap), 2.13%, 11/20/25† | 10,822 | | 11,034 |
| (Floating, U.S. Treasury Yield Curve Rate CMT 1Y + 1.50%, 1.50% Floor, 11.50% Cap), 2.13%, 12/20/26† | 21,054 | | 21,762 |
See Notes to Financial Statements.
| | | Par | | Value |
| (Floating, U.S. Treasury Yield Curve Rate CMT 1Y + 1.50%, 1.50% Floor, 11.00% Cap), 1.63%, 07/20/27† | $ 474 | | $ 486 |
| (Floating, U.S. Treasury Yield Curve Rate CMT 1Y + 1.50%, 1.50% Floor, 10.00% Cap), 2.13%, 10/20/27† | 7,816 | | 8,013 |
| 8.50%, 10/15/29 | 16,424 | | 16,667 |
| 8.50%, 04/15/30 | 1,921 | | 1,928 |
| 8.50%, 05/15/30 | 45,928 | | 47,624 |
| (Floating, U.S. Treasury Yield Curve Rate CMT 1Y + 1.50%, 1.50% Floor, 11.50% Cap), 1.88%, 05/20/30† | 12,047 | | 12,473 |
| 8.50%, 07/15/30 | 18,852 | | 19,358 |
| 8.50%, 08/15/30 | 3,013 | | 3,053 |
| 8.50%, 11/15/30 | 3,113 | | 3,128 |
| 8.50%, 12/15/30 | 2,457 | | 2,467 |
| 8.50%, 02/15/31 | 12,460 | | 12,933 |
| Government National Mortgage Association, Series 2007-30 | | | |
| (Floating, ICE LIBOR USD 1M + 0.30%, 0.30% Floor, 6.50% Cap), 0.40%, 05/20/37† | 61,321 | | 61,489 |
| Government National Mortgage Association, Series 2011-H08 | | | |
| (Floating, ICE LIBOR USD 1M + 0.60%, 0.60% Floor, 10.50% Cap), 0.68%, 02/20/61† | 471,204 | | 473,148 |
| Government National Mortgage Association, Series 2013-H13 | | | |
| (Floating, U.S. Treasury Yield Curve Rate CMT 1Y + 0.45%, 0.45% Floor, 15.00% Cap), 0.59%, 05/20/63† | 1,021,634 | | 1,014,380 |
| Government National Mortgage Association, Series 2016-H07 | | | |
| (Floating, ICE LIBOR USD 1M + 0.77%, 0.77% Floor), 0.85%, 02/20/66† | 13,346 | | 13,399 |
| Government National Mortgage Association, Series 2016-H22 | | | |
| (Floating, ICE LIBOR USD 1M + 0.77%, 0.77% Floor, 7.50% Cap), 0.85%, 10/20/66† | 1,495,714 | | 1,514,214 |
| Government National Mortgage Association, Series 2017-136 | | | |
| 3.00%, 03/20/47 | 144,560 | | 146,924 |
| Government National Mortgage Association, Series 2017-H09 | | | |
| (Floating, ICE LIBOR USD 1Y + 0.75%, 0.75% Floor, 7.50% Cap), 1.03%, 04/20/67† | 1,966,737 | | 1,981,514 |
| Government National Mortgage Association, Series 2017-H10 | | | |
| (Floating, ICE LIBOR USD 1Y + 0.75%, 0.75% Floor, 7.50% Cap), 1.03%, 04/20/67† | 2,253,385 | | 2,271,413 |
| Government National Mortgage Association, Series 2020-17 | | | |
| 2.50%, 10/20/49 | 111,500 | | 114,847 |
| | | Par | | Value |
| GreenPoint Mortgage Funding Trust, Series 2005-AR5, Class 1A1 | | | |
| (Floating, ICE LIBOR USD 1M + 0.54%, 0.54% Floor, 10.50% Cap), 0.64%, 11/25/45† | $ 91,152 | | $ 83,522 |
| GreenPoint Mortgage Funding Trust, Series 2006-OH1, Class A1 | | | |
| (Floating, ICE LIBOR USD 1M + 0.18%, 0.18% Floor), 0.28%, 01/25/37† | 258,044 | | 251,387 |
| GS Mortgage Securities Corporation Trust, Series 2012-ALOH, Class A | | | |
| 3.55%, 04/10/34 144A | 680,000 | | 680,106 |
| GS Mortgage Securities Corporation Trust, Series 2020-TWN3, Class A | | | |
| (Floating, ICE LIBOR USD 1M + 2.00%, 2.00% Floor), 2.11%, 11/15/37 144A † | 560,000 | | 563,081 |
| GS Mortgage Securities Trust, Series 2011-GC5, Class AS | | | |
| 5.16%, 08/10/44 144A † γ | 315,981 | | 317,551 |
| GS Mortgage Securities Trust, Series 2013-GC12, Class A3 | | | |
| 2.86%, 06/10/46 | 1,342,000 | | 1,361,783 |
| GS Mortgage Securities Trust, Series 2019-GC38, Class A2 | | | |
| 3.87%, 02/10/52 | 373,644 | | 388,406 |
| GS Mortgage-Backed Securities Corporation Trust, Series 2020-PJ4, Class A2 | | | |
| 3.00%, 01/25/51 144A † γ | 216,641 | | 220,168 |
| GSR Mortgage Loan Trust, Series 2004-11, Class 5A1 | | | |
| 2.25%, 09/25/34† γ | 93,733 | | 96,360 |
| GSR Mortgage Loan Trust, Series 2005-AR6, Class 2A1 | | | |
| 2.85%, 09/25/35† γ | 44,383 | | 45,430 |
| Hawaii Hotel Trust, Series 2019-MAUI, Class A | | | |
| (Floating, ICE LIBOR USD 1M + 1.15%, 1.15% Floor), 1.26%, 05/15/38 144A † | 429,000 | | 429,594 |
| Hawksmoor Mortgage Funding PLC, Series 2019-1X, Class A | | | |
| (Floating, SONIA Interest Rate + 1.05%), 1.10%, 05/25/53(U) † | 786,373 | | 1,067,463 |
| Hawksmoor Mortgages, Series 2019-1A, Class A | | | |
| (Floating, SONIA Interest Rate + 1.05%), 1.10%, 05/25/53(U) 144A † | 1,000,838 | | 1,358,589 |
| IndyMac INDX Mortgage Loan Trust, Series 2006-AR12, Class A1 | | | |
| (Floating, ICE LIBOR USD 1M + 0.19%, 0.19% Floor), 0.29%, 09/25/46† | 310,660 | | 293,083 |
| IndyMac INDX Mortgage Loan Trust, Series 2007-FLX3, Class A2 | | | |
| (Floating, ICE LIBOR USD 1M + 0.27%, 0.27% Floor), 0.37%, 06/25/37† | 120,886 | | 160,679 |
See Notes to Financial Statements.
SCHEDULE OF INVESTMENTS (Continued)
| | | Par | | Value |
| JP Morgan Chase Commercial Mortgage Securities Trust, Series 2012-CBX, Class A4 | | | |
| 3.48%, 06/15/45 | $ 217,933 | | $ 219,203 |
| JP Morgan Chase Commercial Mortgage Securities Trust, Series 2012-CBX, Class A4FX | | | |
| 3.48%, 06/15/45 144A | 133,089 | | 133,778 |
| JP Morgan Chase Commercial Mortgage Securities Trust, Series 2012-HSBC, Class D | | | |
| 4.52%, 07/05/32 144A † γ | 610,000 | | 616,059 |
| JP Morgan Chase Commercial Mortgage Securities Trust, Series 2013-LC11, Class ASB | | | |
| 2.55%, 04/15/46 | 342,750 | | 346,239 |
| JP Morgan Chase Commercial Mortgage Securities Trust, Series 2018-WPT, Class AFX | | | |
| 4.25%, 07/05/33 144A | 190,000 | | 197,231 |
| JP Morgan Chase Commercial Mortgage Securities Trust, Series 2019-MFP, Class A | | | |
| (Floating, ICE LIBOR USD 1M + 0.96%, 0.96% Floor), 1.07%, 07/15/36 144A † | 1,710,000 | | 1,708,721 |
| JP Morgan Chase Commercial Mortgage Securities Trust, Series 2021-MHC, Class A | | | |
| (Floating, ICE LIBOR USD 1M + 0.80%, 0.80% Floor), 0.91%, 04/15/38 144A † | 141,735 | | 141,667 |
| JP Morgan Chase Commercial Mortgage Securities Trust, Series 2021-NYAH, Class A | | | |
| (Floating, ICE LIBOR USD 1M + 0.76%, 0.76% Floor), 0.87%, 06/15/38 144A † | 560,000 | | 559,398 |
| JP Morgan Mortgage Trust, Series 2005-A1, Class 6T1 | | | |
| 2.58%, 02/25/35† γ | 10,272 | | 10,332 |
| JP Morgan Mortgage Trust, Series 2016-2, Class A1 | | | |
| 2.35%, 06/25/46 144A † γ | 247,318 | | 244,699 |
| JP Morgan Mortgage Trust, Series 2020-7, Class A3 | | | |
| 3.00%, 01/25/51 144A † γ | 165,880 | | 167,447 |
| JP Morgan Mortgage Trust, Series 2020-LTV1, Class A11 | | | |
| (Floating, ICE LIBOR USD 1M + 1.00%, 6.00% Cap), 1.09%, 06/25/50 144A † | 63,539 | | 63,740 |
| JP Morgan Mortgage Trust, Series 2021-12, Class A11 | | | |
| (Floating, U.S. 30-Day Average SOFR + 0.85%, 5.00% Cap), 0.90%, 02/25/52 144A † | 191,962 | | 193,734 |
| JPMBB Commercial Mortgage Securities Trust, Series 2014-C23, Class ASB | | | |
| 3.66%, 09/15/47 | 199,183 | | 206,115 |
| | | Par | | Value |
| JPMBB Commercial Mortgage Securities Trust, Series 2015-C33, Class A3 | | | |
| 3.50%, 12/15/48 | $ 325,618 | | $ 339,711 |
| JPMCC Commercial Mortgage Securities Trust, Series 2017-JP7, Class A3 | | | |
| 3.38%, 09/15/50 | 1,500,000 | | 1,546,631 |
| KNDL Mortgage Trust, Series 2019-KNSQ, Class A | | | |
| (Floating, ICE LIBOR USD 1M + 0.80%, 0.80% Floor), 0.91%, 05/15/36 144A † | 409,000 | | 408,943 |
| KNDL Mortgage Trust, Series 2019-KNSQ, Class D | | | |
| (Floating, ICE LIBOR USD 1M + 1.35%, 1.35% Floor), 1.46%, 05/15/36 144A † | 136,000 | | 135,711 |
| Life Mortgage Trust, Series 2021-BMR, Class A | | | |
| (Floating, ICE LIBOR USD 1M + 0.70%, 0.70% Floor), 0.81%, 03/15/38 144A † | 1,000,000 | | 999,052 |
| Luminent Mortgage Trust, Series 2006-7, Class 2A1 | | | |
| (Floating, ICE LIBOR USD 1M + 0.17%, 0.17% Floor, 10.50% Cap), 0.27%, 12/25/36† | 306,624 | | 294,764 |
| LUXE Trust, Series 2021-TRIP, Class A | | | |
| (Floating, ICE LIBOR USD 1M + 1.05%, 1.05% Floor), 1.16%, 10/15/38 144A † | 1,500,000 | | 1,501,776 |
| MASTR Adjustable Rate Mortgages Trust, Series 2003-6, Class 3A1 | | | |
| 2.24%, 12/25/33† γ | 40,976 | | 42,535 |
| MF1 Multifamily Housing Mortgage Loan Trust, Series 2020-FL3, Class AS | | | |
| (Floating, U.S. 30-Day Average SOFR + 2.96%, 2.85% Floor), 3.01%, 07/15/35 144A † | 260,000 | | 264,224 |
| MF1, Series 2021-W10, Class A | | | |
| (Floating, U.S. 30-Day Average SOFR + 1.07%, 1.07% Floor), 1.12%, 12/15/34 144A † | 110,000 | | 110,924 |
| MF1, Series 2021-W10, Class B | | | |
| (Floating, U.S. 30-Day Average SOFR + 1.37%, 1.37% Floor), 1.42%, 12/15/34 144A † | 100,000 | | 100,431 |
| MFA Trust, Series 2021-INV2, Class A1 | | | |
| 1.91%, 11/25/56 144A | 307,185 | | 304,519 |
| MFA Trust, Series 2021-RPL1, Class A1 | | | |
| 1.13%, 07/25/60 144A | 1,055,921 | | 1,039,787 |
| MHC Commercial Mortgage Trust, Series 2021-MHC, Class A | | | |
| (Floating, ICE LIBOR USD 1M + 0.80%, 0.80% Floor), 0.91%, 04/15/38 144A † | 480,000 | | 479,721 |
See Notes to Financial Statements.
| | | Par | | Value |
| Morgan Stanley Bank of America Merrill Lynch Trust, Series 2013-C12, Class ASB | | | |
| 3.82%, 10/15/46 | $ 477,258 | | $ 486,870 |
| Morgan Stanley Bank of America Merrill Lynch Trust, Series 2013-C13, Class A3 | | | |
| 3.77%, 11/15/46 | 484,630 | | 498,459 |
| Morgan Stanley Bank of America Merrill Lynch Trust, Series 2013-C9, Class AAB | | | |
| 2.66%, 05/15/46 | 74,927 | | 75,623 |
| Morgan Stanley Bank of America Merrill Lynch Trust, Series 2014-C15, Class A4 | | | |
| 4.05%, 04/15/47 | 285,000 | | 299,296 |
| Morgan Stanley Bank of America Merrill Lynch Trust, Series 2014-C18, Class ASB | | | |
| 3.62%, 10/15/47 | 252,251 | | 259,778 |
| Morgan Stanley Bank of America Merrill Lynch Trust, Series 2015-C22, Class ASB | | | |
| 3.04%, 04/15/48 | 1,381,055 | | 1,414,495 |
| Morgan Stanley Bank of America Merrill Lynch Trust, Series 2015-C24, Class A4 | | | |
| 3.73%, 05/15/48 | 955,000 | | 1,019,215 |
| Morgan Stanley Bank of America Merrill Lynch Trust, Series 2015-C25, Class A5 | | | |
| 3.64%, 10/15/48 | 535,000 | | 570,760 |
| Morgan Stanley Bank of America Merrill Lynch Trust, Series 2016-C32, Class XA | | | |
| 0.66%, 12/15/49† IO γ | 1,828,748 | | 51,461 |
| Morgan Stanley Capital I Trust, Series 2018-H4, Class A4 | | | |
| 4.31%, 12/15/51 | 249,000 | | 283,778 |
| Morgan Stanley Capital I Trust, Series 2021-230P, Class A | | | |
| (Floating, ICE LIBOR USD 1M + 1.17%, 1.17% Floor), 1.28%, 12/15/23 144A † | 1,000,000 | | 1,001,250 |
| New Residential Mortgage Loan Trust, Series 2017-3A, Class A1 | | | |
| 4.00%, 04/25/57 144A | 857,471 | | 901,208 |
| New Residential Mortgage Loan Trust, Series 2017-4A, Class A1 | | | |
| 4.00%, 05/25/57 144A | 757,764 | | 796,761 |
| New Residential Mortgage Loan Trust, Series 2018-1A, Class A1A | | | |
| 4.00%, 12/25/57 144A † γ | 1,108,889 | | 1,170,462 |
| New Residential Mortgage Loan Trust, Series 2019-RPL3, Class A1 | | | |
| 2.75%, 07/25/59 144A | 1,251,653 | | 1,276,626 |
| | | Par | | Value |
| New Residential Mortgage Loan Trust, Series 2020-1A, Class A1B | | | |
| 3.50%, 10/25/59 144A † γ | $ 543,583 | | $ 565,029 |
| New Residential Mortgage Loan Trust, Series 2020-RPL1, Class A1 | | | |
| 2.75%, 11/25/59 144A | 1,527,175 | | 1,555,139 |
| Oaktown Re VII, Ltd., Series 2021-2, Class M1A | | | |
| (Floating, U.S. 30-Day Average SOFR + 1.60%, 1.60% Floor), 1.65%, 04/25/34 144A † | 700,000 | | 700,796 |
| OBX Trust, Series 2020-EXP3, Class 2A1B | | | |
| (Floating, ICE LIBOR USD 1M + 0.90%), 1.00%, 01/25/60 144A † | 450,000 | | 451,745 |
| ONE Mortgage Trust, Series 2021-PARK, Class A | | | |
| (Floating, ICE LIBOR USD 1M + 0.70%, 0.70% Floor), 0.81%, 03/15/36 144A † | 1,900,000 | | 1,888,773 |
| One New York Plaza Trust, Series 2020-1NYP, Class A | | | |
| (Floating, ICE LIBOR USD 1M + 0.95%, 0.95% Floor), 1.06%, 01/15/36 144A † | 240,000 | | 239,856 |
| PFP, Ltd., Series 2019-5, Class A | | | |
| (Floating, ICE LIBOR USD 1M + 0.97%, 0.97% Floor), 1.08%, 04/14/36 144A † | 59,243 | | 59,271 |
| PFP, Ltd., Series 2019-6, Class A | | | |
| (Floating, ICE LIBOR USD 1M + 1.05%, 1.05% Floor), 1.16%, 04/14/37 144A † | 623,408 | | 622,169 |
| PFP, Ltd., Series 2021-8, Class A | | | |
| (Floating, ICE LIBOR USD 1M + 1.00%, 1.00% Floor), 1.11%, 08/09/37 144A † | 1,700,000 | | 1,692,886 |
| PKHL Commercial Mortgage Trust, Series 2021-MF, Class A | | | |
| (Floating, ICE LIBOR USD 1M + 0.88%, 0.88% Floor), 0.99%, 07/15/38 144A † | 678,000 | | 678,568 |
| Pretium Mortgage Credit Partners LLC, Series 2021-RN1, Class A1 | | | |
| (Step to 4.99% on 07/25/24), 1.99%, 02/25/61 144A STEP | 719,088 | | 710,842 |
| PRKCM Trust, Series 2021-AFC2, Class A1 | | | |
| 2.07%, 11/25/56 144A | 350,990 | | 352,939 |
| Radnor RE, Ltd., Series 2021-2, Class M1A | | | |
| (Floating, U.S. 30-Day Average SOFR + 1.85%, 1.85% Floor), 1.90%, 11/25/31 144A † | 400,000 | | 400,768 |
See Notes to Financial Statements.
SCHEDULE OF INVESTMENTS (Continued)
| | | Par | | Value |
| Ready Capital Mortgage Financing LLC, Series 2021-FL6, Class A | | | |
| (Floating, ICE LIBOR USD 1M + 0.95%, 0.95% Floor), 1.04%, 07/25/36 144A † | $1,500,000 | | $1,488,815 |
| Residential Mortgage Securities 32 PLC, Class A | | | |
| (Floating, SONIA Interest Rate + 1.25%), 1.30%, 06/20/70(U) 144A † | 807,789 | | 1,103,279 |
| Resimac Bastille Trust, Series 2021-2NCA, Class A1A | | | |
| (Floating, ICE LIBOR USD 1M + 0.65%), 0.75%, 02/03/53 144A † | 1,249,059 | | 1,252,215 |
| RFMSI Trust, Series 2003-S9, Class A1 | | | |
| 6.50%, 03/25/32 | 4,460 | | 4,695 |
| Ripon Mortgages PLC, Series 1X, Class A2 | | | |
| (Floating, ICE LIBOR GBP 3M + 0.80%), 0.91%, 08/20/56(U) † | 673,021 | | 911,543 |
| Seasoned Credit Risk Transfer Trust Series, Series 2019-4, Class MA | | | |
| 3.00%, 02/25/59 | 707,611 | | 731,129 |
| Seasoned Credit Risk Transfer Trust, Series 2018-2, Class MA | | | |
| 3.50%, 11/25/57 | 290,601 | | 301,206 |
| Seasoned Credit Risk Transfer Trust, Series 2018-3, Class MA | | | |
| 3.50%, 08/25/57 | 336,807 | | 349,579 |
| Sequoia Mortgage Trust, Series 2017-CH1, Class A2 | | | |
| 3.50%, 08/25/47 144A | 75,205 | | 75,705 |
| STACR Trust, Series 2018-HRP1, Class M2 | | | |
| (Floating, ICE LIBOR USD 1M + 1.65%), 1.75%, 04/25/43 144A † | 1,986,587 | | 1,987,854 |
| STACR Trust, Series 2018-HRP2, Class M2 | | | |
| (Floating, ICE LIBOR USD 1M + 1.25%), 1.35%, 02/25/47 144A † | 1,465,014 | | 1,465,821 |
| Starwood Mortgage Residential Trust, Series 2020-3, Class A1 | | | |
| 1.49%, 04/25/65 144A | 342,207 | | 342,719 |
| Starwood Mortgage Residential Trust, Series 2020-INV1, Class A1 | | | |
| 1.03%, 11/25/55 144A | 218,517 | | 217,378 |
| Stratton Mortgage Funding, Series 2021-2A, Class A | | | |
| (Floating, SONIA Interest Rate + 0.90%), 0.95%, 07/20/60(U) 144A † | 265,820 | | 361,200 |
| Structured Adjustable Rate Mortgage Loan Trust, Series 2004-13, Class A2 | | | |
| (Floating, ICE LIBOR USD 1M + 0.30%, 0.30% Floor), 0.40%, 09/25/34† | 47,415 | | 45,561 |
| | | Par | | Value |
| Structured Asset Mortgage Investments II Trust, Series 2005-AR5, Class A1 | | | |
| (Floating, ICE LIBOR USD 1M + 0.50%, 0.50% Floor, 11.00% Cap), 0.60%, 07/19/35† | $ 27,562 | | $ 26,903 |
| Structured Asset Mortgage Investments II Trust, Series 2005-AR8, Class A1A | | | |
| (Floating, ICE LIBOR USD 1M + 0.56%, 0.56% Floor, 10.50% Cap), 0.66%, 02/25/36† | 247,622 | | 238,476 |
| STWD Mortgage Trust, Series 2021-HTS, Class A | | | |
| (Floating, ICE LIBOR USD 1M + 1.05%, 1.05% Floor), 1.16%, 04/15/34 144A † | 1,700,000 | | 1,705,419 |
| STWD Trust, Series 2021-FLWR, Class A | | | |
| (Floating, ICE LIBOR USD 1M + 0.58%, 0.58% Floor), 0.69%, 07/15/36 144A † | 2,100,000 | | 2,077,832 |
| TBW Mortgage-Backed Trust, Series 2007-2, Class A6A | | | |
| (Step to 4.36% on 03/25/22), 6.51%, 07/25/37 STEP | 190,839 | | 105,705 |
| TORRENS Trust, Series 2013-1, Class A | | | |
| (Floating, Australian BBSW 1M + 0.95%), 0.97%, 04/12/44(A) † | 345,136 | | 251,450 |
| Towd Point Mortgage Funding PLC, Series 2019-GR4A, Class A1 | | | |
| (Floating, ICE LIBOR GBP 3M + 1.03%), 1.24%, 10/20/51(U) 144A † | 1,129,310 | | 1,539,938 |
| Towd Point Mortgage Funding, Series 2019-A13A, Class A1 | | | |
| (Floating, SONIA Interest Rate + 0.90%), 0.95%, 07/20/45(U) 144A † | 2,098,278 | | 2,846,665 |
| Towd Point Mortgage Trust, Series 2021-SJ2, Class A1A | | | |
| 2.25%, 03/25/59 144A | 1,300,000 | | 1,314,901 |
| TPGI Trust, Series 2021-DGWD, Class A | | | |
| (Floating, ICE LIBOR USD 1M + 0.70%, 0.70% Floor), 0.81%, 06/15/26 144A † | 450,000 | | 448,614 |
| Trinity Square PLC, Series 2021-1A, Class A | | | |
| (Floating, SONIA Interest Rate + 0.85%), 0.90%, 07/15/59(U) 144A † | 1,237,451 | | 1,677,226 |
| TTAN, Series 2021-MHC, Class A | | | |
| (Floating, ICE LIBOR USD 1M + 0.85%, 0.85% Floor), 0.96%, 03/15/38 144A † | 299,861 | | 299,710 |
| UBS Commercial Mortgage Trust, Series 2017-C1, Class A4 | | | |
| 3.46%, 06/15/50 | 500,000 | | 533,132 |
See Notes to Financial Statements.
| | | Par | | Value |
| UBS Commercial Mortgage Trust, Series 2019-C16, Class ASB | | | |
| 3.46%, 04/15/52 | $ 540,000 | | $ 579,337 |
| UBS Commercial Mortgage Trust, Series 2019-C18, Class A4 | | | |
| 3.04%, 12/15/52 | 330,000 | | 349,443 |
| Verus Securitization Trust, Series 2021-6, Class A1 | | | |
| 1.63%, 10/25/66 144A | 1,251,547 | | 1,247,226 |
| Washington Mutual Mortgage Pass-Through Certificates Trust, Series 2002-AR6, Class A | | | |
| (Floating, Federal Reserve U.S. 12 1Y CMT + 1.40%, 1.40% Floor), 1.48%, 06/25/42† | 3,232 | | 3,230 |
| Washington Mutual Mortgage Pass-Through Certificates Trust, Series 2003-AR8, Class A | | | |
| 2.68%, 08/25/33† γ | 82,099 | | 85,035 |
| Washington Mutual Mortgage Pass-Through Certificates Trust, Series 2005-AR2, Class 2A1A | | | |
| (Floating, ICE LIBOR USD 1M + 0.62%, 0.62% Floor, 10.50% Cap), 0.72%, 01/25/45† | 149,528 | | 149,533 |
| Washington Mutual Mortgage Pass-Through Certificates Trust, Series 2006-AR19, Class 1A | | | |
| (Floating, Federal Reserve U.S. 12 1Y CMT + 0.74%, 0.74% Floor), 0.82%, 01/25/47† | 181,284 | | 175,875 |
| Washington Mutual Mortgage Pass-Through Certificates Trust, Series 2006-AR5, Class A12A | | | |
| (Floating, Federal Reserve U.S. 12 1Y CMT + 0.98%, 0.98% Floor), 1.06%, 06/25/46† | 365,196 | | 370,365 |
| Washington Mutual Mortgage Pass-Through Certificates Trust, Series 2007-HY1, Class 1A1 | | | |
| 2.88%, 02/25/37† γ | 125,507 | | 119,231 |
| Washington Mutual Mortgage Pass-Through Certificates Trust, Series 2007-HY5, Class 2A1 | | | |
| 3.29%, 05/25/37† γ | 173,415 | | 153,027 |
| Washington Mutual Mortgage Pass-Through Certificates Trust, Series 2007-OA5, Class A1B | | | |
| (Floating, Federal Reserve U.S. 12 1Y CMT + 0.84%, 0.84% Floor), 0.92%, 05/25/47† | 34,309 | | 3,873 |
| Wells Fargo Commercial Mortgage Trust, Series 2015-C26, Class A4 | | | |
| 3.17%, 02/15/48 | 500,000 | | 522,546 |
| Wells Fargo Commercial Mortgage Trust, Series 2015-C27, Class A5 | | | |
| 3.45%, 02/15/48 | 435,000 | | 458,356 |
| | | Par | | Value |
| Wells Fargo Commercial Mortgage Trust, Series 2016-NXS5, Class A6FL | | | |
| (Floating, ICE LIBOR USD 1M + 1.55%, 1.55% Floor), 1.66%, 01/15/59 144A † | $ 2,000,000 | | $ 2,054,319 |
| Wells Fargo Commercial Mortgage Trust, Series 2017-C39, Class A5 | | | |
| 3.42%, 09/15/50 | 1,096,000 | | 1,181,180 |
| Wells Fargo Mortgage Backed Securities Trust, Series 2020-RR1, Class A1 | | | |
| 3.00%, 05/25/50 144A † γ | 103,420 | | 104,888 |
| WFRBS Commercial Mortgage Trust, Series 2014-C21, Class ASB | | | |
| 3.39%, 08/15/47 | 364,835 | | 373,817 |
| WFRBS Commercial Mortgage Trust, Series 2014-LC14, Class ASB | | | |
| 3.52%, 03/15/47 | 289,297 | | 295,817 |
Total Mortgage-Backed Securities
(Cost $169,636,285) | | | 170,977,969 |
| MUNICIPAL BONDS — 0.1% |
| California State Earthquake Authority, Revenue Bond, Series B | | | |
| 1.48%, 07/01/23 | 315,000 | | 317,846 |
| Hawaii State, General Obligation, Series GB | | | |
| 0.80%, 10/01/24 | 1,000,000 | | 992,781 |
Total Municipal Bonds
(Cost $1,315,000) | | | 1,310,627 |
| U.S. TREASURY OBLIGATIONS — 27.4% |
| U.S. Treasury Bonds | | | | |
| 1.75%, 08/15/41 | 4,300,000 | | 4,183,765 |
| U.S. Treasury Notes | | | | |
| 0.13%, 12/31/22 | 15,400,000 | | 15,353,236 |
| 0.38%, 10/31/23 | 43,017,000 | | 42,774,189 |
| 0.75%, 12/31/23 | 10,130,000 | | 10,133,957 |
| 0.13%, 02/15/24‡‡ | 16,272,300 | | 16,065,400 |
| 0.25%, 03/15/24 | 21,060,000 | | 20,814,026 |
| 0.38%, 04/15/24 | 8,470,000 | | 8,387,616 |
| 0.25%, 05/15/24 | 6,300,000 | | 6,216,082 |
| 0.25%, 06/15/24 | 15,860,000 | | 15,631,393 |
| 0.38%, 07/15/24 | 1,620,000 | | 1,600,509 |
| 0.38%, 08/15/24 | 12,495,000 | | 12,334,420 |
| 0.38%, 09/15/24 | 10,600,000 | | 10,453,836 |
| 0.75%, 11/15/24 | 100,655,000 | | 100,128,135 |
| 1.00%, 12/15/24‡‡ | 29,685,000 | | 29,725,585 |
| | | | | 289,618,384 |
Total U.S. Treasury Obligations
(Cost $294,908,870) | | | 293,802,149 |
See Notes to Financial Statements.
SCHEDULE OF INVESTMENTS (Continued)
| | | Shares | | Value |
| MONEY MARKET FUNDS — 3.5% |
GuideStone Money Market Fund, 0.00%
(Institutional Class)Ø ∞ | 28,508,385 | | $ 28,508,385 |
| Northern Institutional Liquid Assets Portfolio (Shares), 0.04%Ø § | 8,092,328 | | 8,092,328 |
| Northern Institutional U.S. Government Portfolio (Shares), 0.00%Ø | 1,018,453 | | 1,018,453 |
Total Money Market Funds
(Cost $37,619,166) | | | 37,619,166 |
TOTAL INVESTMENTS —102.5%
(Cost $1,101,389,274) | | | 1,099,865,264 |
| | Number of
Contracts | | Notional
Amount | |
| WRITTEN OPTIONS — (0.0)% |
| Call Option — (0.0)% |
| FNCL 3.00% expiration date 3/2022, Strike Price $103.75, Expires 03/07/22 (JPM) | 1 | | $ (622,523) | (1,380) |
| Call Swaptions — (0.0)% |
Sell Protection on Markit CDX.NA.IG.37 Index; Receive 1.00% (Quarterly); Credit Default Swap Maturing 12/20/2026 USD, Strike Price
$80.00, Expires
01/19/22 (MSCS) | 1 | | (2,800,000) | (112) |
Sell Protection on Markit CDX.NA.IG.37 Index; Receive 1.00% (Quarterly); Credit Default Swap Maturing 12/20/2026 USD, Strike Price
$80.00, Expires
01/19/22 (DEUT) | 1 | | (14,200,000) | (571) |
Sell Protection on Markit CDX.NA.IG.37 Index; Receive 1.00% (Quarterly); Credit Default Swap Maturing 12/20/2026 USD, Strike Price
$90.00, Expires
03/16/22 (DEUT) | 1 | | (17,000,000) | (5,454) |
| | Number of
Contracts | | Notional
Amount | | Value |
Sell Protection on Markit CDX.NA.IG.37 Index; Receive 1.00% (Quarterly); Credit Default Swap Maturing 12/20/2026 USD, Strike Price
$95.00, Expires
03/16/22 (BAR) | 1 | | $(13,700,000) | | $ (3,711) |
Sell Protection on Markit CDX.NA.IG.37 Index; Receive 1.00% (Quarterly); Credit Default Swap Maturing 12/20/2026 USD, Strike Price
$100.00, Expires
03/16/22 (GSC) | 1 | | (11,800,000) | | (2,758) |
Sell Protection on Markit CDX.NA.IG.37 Index; Receive 1.00% (Quarterly); Credit Default Swap Maturing 12/20/2026 USD, Strike Price
$100.00, Expires
03/16/22 (MSCS) | 1 | | (26,600,000) | | (6,216) |
| | | | | | (18,822) |
| Put Option — (0.0)% |
| FNCL 3.00% expiration date 1/2022, Strike Price $104.06, Expires 01/06/22 (JPM) | 1 | | (2,497,500) | | (9,704) |
Total Written Options
(Premiums received $ (105,645)) | | | | (29,906) |
Liabilities in Excess of Other
Assets — (2.5)% | | | | (26,936,084) |
| NET ASSETS — 100.0% | | | | $1,072,899,274 |
See Notes to Financial Statements.
Futures Contracts outstanding at December 31, 2021:
| Future Type | | Expiration Date | | Open Long
(Short) Contracts | | Notional
Market Value
of Contracts | | Value and
Unrealized
Appreciation
(Depreciation) |
| Euro-Bobl | | 03/2022 | | (51) | | $ (7,736,381) | | $ 46,587 |
| Euro-Bund | | 03/2022 | | (1) | | (195,105) | | 2,771 |
| Euro-Schatz | | 03/2022 | | (34) | | (4,336,569) | | 5,209 |
| 10-Year U.S. Treasury Note | | 03/2022 | | (75) | | (9,785,156) | | (53,955) |
| Ultra 10-Year U.S. Treasury Note | | 03/2022 | | (162) | | (23,722,875) | | (375,197) |
| Ultra Long U.S. Treasury Bond | | 03/2022 | | (16) | | (3,154,000) | | (65,887) |
| 2-Year U.S. Treasury Note | | 04/2022 | | 1,422 | | 310,240,406 | | (386,792) |
| 5-Year U.S. Treasury Note | | 04/2022 | | (1,101) | | (133,195,195) | | (202,487) |
| 90-Day Bank Acceptance | | 12/2022 | | 302 | | 58,635,677 | | (493,749) |
| 90-Day Bank Acceptance | | 03/2023 | | 413 | | 80,048,441 | | (482,099) |
| Total Futures Contracts outstanding at December 31, 2021 | | | | | | $ 266,799,243 | | $(2,005,599) |
Forward Foreign Currency Contracts outstanding at December 31, 2021:
| Expiration Date | | Currency
Purchased | | Amount
of Currency
Purchased | | Currency
Sold | | Amount
of Currency
Sold | | Counter-
party | | Net Unrealized
Appreciation
(Depreciation) |
| 03/17/22 | | U.S. Dollars | | 5,854,506 | | Euro | | 4,958,000 | | HSBC | | $ 200,920 |
| 02/14/22 | | U.S. Dollars | | 13,091,313 | | Japanese Yen | | 1,485,000,000 | | UBS | | 177,149 |
| 02/02/22 | | U.S. Dollars | | 20,277,474 | | British Pounds | | 14,972,000 | | BNP | | 13,976 |
| 03/17/22 | | Canadian Dollars | | 85,000 | | U.S. Dollars | | 65,892 | | HSBC | | 1,293 |
| Subtotal Appreciation | | | | | | | | | | $ 393,338 |
| 03/17/22 | | Euro | | 4,000 | | U.S. Dollars | | 4,655 | | HSBC | | $ (94) |
| 03/17/22 | | Canadian Dollars | | 143,000 | | U.S. Dollars | | 114,756 | | HSBC | | (1,727) |
| 03/16/22 | | U.S. Dollars | | 282,531 | | Canadian Dollars | | 361,000 | | MSCS | | (2,810) |
| 03/16/22 | | U.S. Dollars | | 232,559 | | Australian Dollars | | 326,000 | | MSCS | | (4,668) |
| 03/17/22 | | U.S. Dollars | | 1,985,499 | | Canadian Dollars | | 2,518,000 | | HSBC | | (4,761) |
| 02/02/22 | | U.S. Dollars | | 6,707,625 | | Euro | | 5,895,000 | | BAR | | (8,378) |
| 01/07/22 | | U.S. Dollars | | 1,112,241 | | Canadian Dollars | | 1,419,847 | | UBS | | (10,204) |
| 01/07/22 | | Japanese Yen | | 194,100,000 | | U.S. Dollars | | 1,709,872 | | JPM | | (22,390) |
| 01/07/22 | | U.S. Dollars | | 6,630,507 | | Canadian Dollars | | 8,418,160 | | JPM | | (24,379) |
| 01/07/22 | | U.S. Dollars | | 1,572,796 | | Australian Dollars | | 2,197,000 | | JPM | | (25,668) |
| 01/07/22 | | U.S. Dollars | | 3,568,984 | | Canadian Dollars | | 4,561,037 | | HSBC | | (36,694) |
| 01/07/22 | | U.S. Dollars | | 6,881,159 | | Australian Dollars | | 9,532,078 | | MSCS | | (54,062) |
| 01/04/22 | | U.S. Dollars | | 6,645,221 | | Euro | | 5,895,000 | | BAR | | (66,793) |
| 03/16/22 | | U.S. Dollars | | 18,354,678 | | Euro | | 16,211,000 | | RBS | | (130,199) |
| 01/05/22 | | U.S. Dollars | | 19,824,981 | | British Pounds | | 14,972,000 | | BNP | | (440,125) |
| Subtotal Depreciation | | | | | | | | | | $(832,952) |
| Total Forward Foreign Currency Contracts outstanding at December 31, 2021 | | | | $(439,614) |
See Notes to Financial Statements.
SCHEDULE OF INVESTMENTS (Continued)
Swap Agreements outstanding at December 31, 2021:
| Reference Obligation | | Fixed
Deal
(Pay) Rate | | Maturity
Date | | Counterparty | | Currency | | Notional
Amount | | Market Value | | Upfront
Premiums
Paid/
(Received) | | Unrealized
Appreciation
(Depreciation) |
| Credit Default Swaps on Sovereign Issuers—Buy Protection | | | | | | | | | | | | | | | | |
| Peoples Republic of China, 7.5% due 10/28/27 (Pay Quarterly) | | (1.00)% | | 6/20/2024 | | MSCS | | USD | | 1,600,000 | | $(32,954) | | $(35,993) | | $3,039 |
| | | $(32,954) | | $(35,993) | | $3,039 |
| Reference Obligation | | Fixed
Deal
(Pay) Rate | | Maturity
Date | | Currency | | Notional
Amount | | Market Value | | Upfront
Premiums
Paid/
(Received) | | Unrealized
Appreciation
(Depreciation) |
| Centrally Cleared Credit Default Swaps on Credit Indexes—Buy Protection | | | | | | | | | | | | | | |
| Markit CDX.NA.IG.37 Index (Pay Quarterly) | | (1.00)% | | 12/20/2026 | | USD | | 40,700,000 | | $(1,008,030) | | $(1,002,279) | | $(5,751) |
| | | $(1,008,030) | | $(1,002,279) | | $(5,751) |
| Pay Rate Index/Pay Rate | | Receive
Rate/Receive
Rate Index | | Maturity
Date | | Currency | | Notional
Amount | | Market Value | | Upfront
Premiums
Paid/
(Received) | | Unrealized
Appreciation
(Depreciation) |
| Centrally Cleared Interest Rate Swaps | | | | | | | | | | | | | | |
| 1-Month LIBOR + .098% (Quarterly) | | 3-Month LIBOR (Quarterly) | | 1/13/2023 | | USD | | 25,000,000 | | $(9,877) | | $ — | | $(9,877) |
| | | $(9,877) | | $ — | | $(9,877) |
VALUATION HIERARCHY
The following is a summary of the inputs used, as of December 31, 2021, in valuing the Fund’s investments carried at fair value:
| | Total
Value | | Level 1
Quoted Prices | | Level 2
Other Significant
Observable Inputs | | Level 3
Significant
Unobservable Inputs |
| Assets: | | | | | | | |
| Investments in Securities: | | | | | | | |
| Agency Obligations | $ 27,692,391 | | $ — | | $ 27,692,391 | | $ — |
| Asset-Backed Securities | 182,598,143 | | — | | 182,598,143 | | — |
| Corporate Bonds | 209,046,082 | | — | | 209,046,082 | | — |
| Foreign Bonds | 176,818,737 | | — | | 176,818,737 | | — |
| Money Market Funds | 37,619,166 | | 37,619,166 | | — | | — |
| Mortgage-Backed Securities | 170,977,969 | | — | | 170,977,969 | | — |
| Municipal Bonds | 1,310,627 | | — | | 1,310,627 | | — |
| U.S. Treasury Obligations | 293,802,149 | | — | | 293,802,149 | | — |
| Total Assets - Investments in Securities | $1,099,865,264 | | $37,619,166 | | $1,062,246,098 | | $ — |
| Other Financial Instruments*** | | | | | | | |
| Forward Foreign Currency Contracts | $ 393,338 | | $ — | | $ 393,338 | | $ — |
| Futures Contracts | 54,567 | | 54,567 | | — | | — |
| Swap Agreements | 3,039 | | — | | 3,039 | | — |
| Total Assets - Other Financial Instruments | $ 450,944 | | $ 54,567 | | $ 396,377 | | $ — |
See Notes to Financial Statements.
| | Total
Value | | Level 1
Quoted Prices | | Level 2
Other Significant
Observable Inputs | | Level 3
Significant
Unobservable Inputs |
| Liabilities: | | | | | | | |
| Investments in Securities: | | | | | | | |
| Written Options: | | | | | | | |
| Call Option | $ (1,380) | | $ (1,380) | | $ — | | $ — |
| Call Swaptions | (18,822) | | (18,822) | | — | | — |
| Put Option | (9,704) | | (9,704) | | — | | — |
| Total Written Options | (29,906) | | (29,906) | | — | | — |
| Total Liabilities - Investments in Securities | $ (29,906) | | $ (29,906) | | $ — | | $ — |
| Other Financial Instruments*** | | | | | | | |
| Forward Foreign Currency Contracts | $ (832,952) | | $ — | | $(832,952) | | $ — |
| Futures Contracts | (2,060,166) | | (2,060,166) | | — | | — |
| Swap Agreements | (15,628) | | — | | (15,628) | | — |
| Total Liabilities - Other Financial Instruments | $(2,908,746) | | $(2,060,166) | | $(848,580) | | $ — |
| *** | Other financial instruments are derivative instruments, such as futures contracts, forward contracts and swap agreements, which are valued at the unrealized appreciation (depreciation) on the investment. Further details regarding the value of these investments can be found in the preceding "Futures Contracts outstanding", "Forward Foreign Currency Contracts outstanding" and "Swap Agreements outstanding" disclosures. |
See Notes to Financial Statements.
Medium-Duration Bond Fund (Unaudited)
The Fund invested in a diversified portfolio composed primarily of investment grade fixed income securities with a dollar-weighted effective duration (a calculation that measures the sensitivity of a bond or bond fund to changes in interest rates taking into account embedded options and floating interest rates) that normally varies, in years, between +/- 30% of the duration of the Fund’s benchmark index, the Bloomberg U.S. Aggregate Bond Index. The average dollar-weighted effective duration at the end of the reporting period was 6.14 years. The Investor Class of the Fund underperformed its benchmark for the one-year period ended December 31, 2021 (-2.27% versus -1.54%).
The Fund maintained an overweight to credit, both high yield and investment grade and local currency emerging markets debt throughout the year. While credit was additive, local currency emerging markets debt detracted from performance. Credit spreads narrowed slightly after robust tightening in 2021, but the interest rate sensitivity of high-quality bonds reached record highs and the sector posted negative absolute returns for the year as rates rose. Emerging markets debt and currencies lagged for the year as inflation and growth fears sparked underperformance in relative terms. Tactical U.S. yield curve positioning was a detractor as well with the Fund maintaining a longer duration than the benchmark for the first part of the year, when rates rose significantly.
Other strategies involving derivatives were utilized during 2021. U.S. Treasury futures contracts, options on U.S. Treasuries and interest rate swaps were used for the common purposes of managing both U.S. and non-U.S. duration, implementing yield curve positioning strategies and expressing cross-sector views. Overall, on a net basis, these positions had a positive impact on performance. In an effort to better manage credit risks from a synthetic perspective, credit default swaps were utilized on a very modest basis and were a detractor from performance. Currency forward and futures contracts were included in the Fund to hedge foreign currency risk and to express active currency views, and both added to performance. Interest futures were used to express interest rate views during the year and were a detractor to the performance of the Fund. Swaptions were also used to manage portfolio duration along with credit risk and contributed to relative performance.
During the year, the Fund remained focused on its objective of seeking maximum total return consistent with preservation of capital.
This Fund may be suitable for investors who have a short- to medium-term investment horizon, seek higher returns than those offered by a shorter maturity bond fund, can accept some short-term fluctuations in account value and want to diversify their portfolio with a fixed income investment option. This Fund is subject to interest rate risk, meaning, when interest rates rise, the value of the existing fixed income securities decrease and vice versa. Changes in interest rates have a bigger impact on long duration holdings than on short duration holdings. To the extent that the investment adviser or sub-advisers misjudge current market conditions, the Fund’s volatility may be amplified by its use of derivatives and by its ability to select sub-advisers to allocate assets. Derivatives involve different risks from, and in some respects greater risks than, those associated with investing directly in securities, currencies or other instruments. Derivatives may be illiquid or less liquid, volatile, difficult to price and leveraged, so small changes in value of the underlying instruments may produce disproportionate losses to the Fund. It is possible to lose money by investing in the Fund.
See Notes to Financial Statements.
Medium-Duration Bond Fund (Unaudited)
At December 31, 2021, the portfolio holdings of the Fund, as a percentage of net assets, is shown in the following table. Portfolio holdings are subject to risk and may change at any time.
| | % |
| Corporate Bonds | 28.4 |
| Mortgage-Backed Securities | 24.2 |
| U.S. Treasury Obligations | 22.3 |
| Foreign Bonds | 12.5 |
| Repurchase Agreements | 6.9 |
| Money Market Funds | 6.8 |
| Asset-Backed Securities | 4.8 |
| Agency Obligations | 1.3 |
| Commercial Paper | 0.7 |
| Municipal Bonds | 0.5 |
| Loan Agreements | 0.4 |
| Certificates Of Deposit | 0.3 |
| Purchased Options | —** |
| Written Options | —** |
| TBA Sale Commitments | (2.7) |
| | 106.4 |
| **Rounds to less than 0.05% | |
See Notes to Financial Statements.
Medium-Duration Bond Fund (Unaudited)
| Average Annual Total Returns as of 12/31/21 | |
| | | Institutional Class* | | Investor Class* | | Benchmark** | |
| One Year | | (2.07%)*** | | (2.27%) | | (1.54%) | |
| Five Year | | 4.02% | | 3.76% | | 3.57% | |
| Ten Year | | 3.51% | | 3.27% | | 2.90% | |
| Since Inception | | 4.83% | | 4.68% | | 4.34% | |
| Inception Date | | 08/27/01 | | 08/27/01 | | | |
| Total Fund Operating Expenses (May 1, 2021 Prospectus)(1) | | 0.39% | | 0.66% | | | |
| (1) | Current information regarding the Fund’s Operating Expenses can be found in the Financial Highlights. |
The performance data quoted represents past performance and does not guarantee future results. Current performance may be lower or higher. Performance data current to the most recent month-end may be obtained at GuideStoneFunds.com. The investment return and principal value of an investment will fluctuate so that shares, when redeemed, may be worth more or less than their original cost.
The graph illustrates the results of a hypothetical $10,000 investment in the Investor Class of the Fund for the 10-year period from December 31, 2011 to December 31, 2021, with all dividends and capital gains reinvested, with the Bloomberg US Aggregate Bond Index.
*These returns reflect investment advisory and shareholder servicing fee waivers, if applicable, during the reported time periods.
**Unlike a mutual fund, the performance of an index assumes no taxes, transaction costs, management fees or other expenses.
***Total returns may differ from the financial highlights due to adjustments required by U.S. GAAP.
See Notes to Financial Statements.
MEDIUM-DURATION BOND FUND
| | | Par | | Value |
| AGENCY OBLIGATIONS — 1.3% |
| Federal Farm Credit Banks Funding Corporation | | | | |
| 1.70%, 04/23/35 | $3,800,000 | | $ 3,703,021 |
| Federal Home Loan Bank Discount Notes | | | | |
| 0.05%, 03/09/22Ω | 1,230,000 | | 1,229,911 |
| 0.05%, 03/18/22Ω | 3,630,000 | | 3,629,702 |
| Federal Home Loan Mortgage Corporation | | | | |
| 0.00%, | 300,001 | | 312,709 |
| 0.65%, 10/22/25 | 7,100,000 | | 6,948,106 |
| 0.65%, 10/27/25 | 7,200,000 | | 7,055,019 |
| 0.80%, 10/28/26 | 7,200,000 | | 7,027,081 |
| Federal National Mortgage Association | | | | |
| 6.63%, 11/15/30 | 670,000 | | 944,992 |
Total Agency Obligations
(Cost $31,103,745) | | | 30,850,541 |
| ASSET-BACKED SECURITIES — 4.8% |
| 522 Funding CLO, Ltd., Series 2020-6A, Class A1R | | | |
| (Floating, ICE LIBOR USD 3M + 1.15%, 1.15% Floor), 1.28%, 10/23/34 144A † | 1,110,000 | | 1,110,555 |
| A10 Bridge Asset Financing LLC, Series 2020-C, Class A | | | |
| 2.02%, 08/15/40 144A | 947,095 | | 949,197 |
| ABPCI Direct Lending Fund CLO X LP, Series 2020-10A, Class A1A | | | |
| (Floating, ICE LIBOR USD 3M + 1.95%, 1.95% Floor), 2.08%, 01/20/32 144A † | 970,000 | | 971,515 |
| Allegro CLO XI, Ltd., Series 2019-2A, Class A1A | | | |
| (Floating, ICE LIBOR USD 3M + 1.39%, 1.39% Floor), 1.51%, 01/19/33 144A † | 500,000 | | 500,945 |
| Ameriquest Mortgage Securities, Inc. Asset-Backed Pass-Through Certificates, Series 2005-R10, Class M3 | | | |
| (Floating, ICE LIBOR USD 1M + 0.68%, 0.68% Floor), 0.78%, 01/25/36† | 2,900,000 | | 2,885,899 |
| AMMC CLO XI, Ltd., Series 2012-11A, Class A1R2 | | | |
| (Floating, ICE LIBOR USD 3M + 1.01%), 1.14%, 04/30/31 144A † | 710,000 | | 709,587 |
| Apidos CLO XXIII, Series 2015-23A, Class AR | | | |
| (Floating, ICE LIBOR USD 3M + 1.22%, 1.22% Floor), 1.34%, 04/15/33 144A † | 1,500,000 | | 1,501,090 |
| | | Par | | Value |
| Apidos CLO XXXV, Series 2021-35A, Class A | | | |
| (Floating, ICE LIBOR USD 3M + 1.05%, 1.05% Floor), 1.18%, 04/20/34 144A † | $ 540,000 | | $ 538,764 |
| Ballyrock CLO, Ltd., Series 2018-1A, Class C | | | |
| (Floating, ICE LIBOR USD 3M + 3.15%), 3.28%, 04/20/31 144A † | 750,000 | | 750,502 |
| Ballyrock CLO, Ltd., Series 2019-2A, Class A1BR | | | |
| (Floating, ICE LIBOR USD 3M + 1.20%, 1.20% Floor), 1.36%, 11/20/30 144A † | 490,000 | | 489,899 |
| Basswood Park CLO, Ltd., Series 2021-1A, Class A | | | |
| (Floating, ICE LIBOR USD 3M + 1.00%, 1.00% Floor), 1.13%, 04/20/34 144A † | 1,500,000 | | 1,497,754 |
| Bear Stearns Asset Backed Securities Trust, Series 2007-SD1, Class 1A2A | | | |
| 6.00%, 10/25/36 | 848,543 | | 551,691 |
| Bear Stearns Asset Backed Securities Trust, Series 2007-SD1, Class 1A3A | | | |
| 6.50%, 10/25/36 | 2,063,900 | | 1,352,740 |
| BlueMountain CLO XXVIII, Ltd., Series 2021-28A, Class A | | | |
| (Floating, ICE LIBOR USD 3M + 1.26%, 1.26% Floor), 1.38%, 04/15/34 144A † | 400,000 | | 400,484 |
| BlueMountain CLO, Ltd., Series 2013-2A, Class A1R | | | |
| (Floating, ICE LIBOR USD 3M + 1.18%), 1.31%, 10/22/30 144A † | 490,193 | | 490,344 |
| BSPRT Issuer, Ltd., Series 2018-FL4, Class A | | | |
| (Floating, ICE LIBOR USD 1M + 1.05%, 1.05% Floor), 1.16%, 09/15/35 144A † | 469,460 | | 469,815 |
| Carlyle Global Market Strategies CLO, Ltd., Series 2014-3RA, Class A1A | | | |
| (Floating, ICE LIBOR USD 3M + 1.05%), 1.18%, 07/27/31 144A † | 317,386 | | 317,326 |
| Carrington Mortgage Loan Trust, Series 2005-OPT2, Class M4 | | | |
| (Floating, ICE LIBOR USD 1M + 0.98%, 0.98% Floor), 1.08%, 05/25/35† | 1,002,434 | | 1,003,552 |
| Cayuga Park CLO, Ltd., Series 2020-1A, Class AR | | | |
| (Floating, ICE LIBOR USD 3M + 1.12%, 1.12% Floor), 1.24%, 07/17/34 144A † | 790,000 | | 789,956 |
See Notes to Financial Statements.
MEDIUM-DURATION BOND FUND
SCHEDULE OF INVESTMENTS (Continued)
| | | Par | | Value |
| Cedar Funding V CLO, Ltd., Series 2016-5A, Class AFRR | | | |
| 1.94%, 07/17/31 144A | $ 560,000 | | $ 561,091 |
| Credit Suisse European Mortgage Capital, Ltd., Series 2019-1OTF, Class A | | | |
| (Floating, ICE LIBOR USD 3M + 2.90%), 3.03%, 08/09/24 144A † | 960,000 | | 931,428 |
| CWABS, Inc. Asset-Backed Certificates, Series 2004-1, Class M1 | | | |
| (Floating, ICE LIBOR USD 1M + 0.75%, 0.75% Floor), 0.85%, 03/25/34† | 79,677 | | 79,518 |
| CWHEQ Revolving Home Equity Loan Trust, Series 2005-F, Class 2A | | | |
| (Floating, ICE LIBOR USD 1M + 0.24%, 0.24% Floor, 16.00% Cap), 0.35%, 12/15/35† | 26,000 | | 25,286 |
| Dryden 75 CLO, Ltd., Series 2019-75A, Class AR2 | | | |
| (Floating, ICE LIBOR USD 3M + 1.04%, 1.04% Floor), 1.16%, 04/15/34 144A † | 250,000 | | 250,222 |
| Dryden 77 CLO, Ltd., Series 2020-77A, Class AR | | | |
| (Floating, ICE LIBOR USD 3M + 1.12%, 1.12% Floor), 1.28%, 05/20/34 144A † | 6,500,000 | | 6,503,240 |
| Dryden 87 CLO, Ltd., Series 2021-87A, Class A1 | | | |
| (Floating, ICE LIBOR USD 3M + 1.10%, 1.10% Floor), 1.26%, 05/20/34 144A † | 1,440,000 | | 1,440,007 |
| ECMC Group Student Loan Trust, Series 2017-1A, Class A | | | |
| (Floating, ICE LIBOR USD 1M + 1.20%), 1.30%, 12/27/66 144A † | 795,609 | | 810,241 |
| Elmwood CLO IV, Ltd., Series 2020-1A, Class A | | | |
| (Floating, ICE LIBOR USD 3M + 1.24%, 1.24% Floor), 1.36%, 04/15/33 144A † | 3,800,000 | | 3,800,146 |
| Federal National Mortgage Association Grantor Trust, Series 2017-T1 | | | |
| 2.90%, 06/25/27 | 99,538 | | 105,355 |
| Financial Asset Securities Corporation AAA Trust, Series 2005-1A, Class 1A3B | | | |
| (Floating, ICE LIBOR USD 1M + 0.41%, 0.41% Floor), 0.51%, 02/27/35 144A † | 359,314 | | 334,582 |
| Flagship Credit Auto Trust, Series 2019-3, Class A | | | |
| 2.33%, 02/15/24 144A | 115,070 | | 115,251 |
| Fortress Credit Bsl X, Ltd., Series 2021-1A, Class A | | | |
| (Floating, ICE LIBOR USD 3M + 1.47%, 1.47% Floor), 1.60%, 04/20/33 144A † | 2,190,000 | | 2,197,849 |
| | | Par | | Value |
| GMACM Home Equity Loan Trust, Series 2007-HE3, Class 2A1 | | | |
| 7.00%, 09/25/37† γ | $ 32,161 | | $ 31,396 |
| GoldenTree Loan Opportunities IX, Ltd., Series 2014-9A, Class AR2 | | | |
| (Floating, ICE LIBOR USD 3M + 1.11%, 1.11% Floor), 1.24%, 10/29/29 144A † | 1,000,000 | | 1,000,310 |
| Golub Capital Partners CLO 45M, Ltd., Series 2019-45A, Class A | | | |
| (Floating, ICE LIBOR USD 3M + 1.72%, 1.72% Floor), 1.85%, 10/20/31 144A † | 250,000 | | 250,159 |
| GoodLeap Sustainable Home Solutions Trust, Series 2021-3CS, Class A | | | |
| 2.10%, 05/20/48 144A | 2,226,428 | | 2,195,055 |
| Greywolf CLO V, Ltd., Series 2015-1A, Class A1R | | | |
| (Floating, ICE LIBOR USD 3M + 1.16%, 1.16% Floor), 1.28%, 01/27/31 144A † | 500,000 | | 500,366 |
| Halcyon Loan Advisors Funding, Ltd., Series 2015-2A, Class AR | | | |
| (Floating, ICE LIBOR USD 3M + 1.08%, 1.08% Floor), 1.20%, 07/25/27 144A † | 18,821 | | 18,830 |
| HalseyPoint CLO, Ltd., Series 2020-3A, Class A1A | | | |
| (Floating, ICE LIBOR USD 3M + 1.45%, 1.45% Floor), 1.58%, 11/30/32 144A † | 530,000 | | 531,840 |
| Higher Education Funding I, Series 2014-1, Class A | | | |
| (Floating, ICE LIBOR USD 3M + 1.05%), 1.23%, 05/25/34 144A † | 474,653 | | 476,325 |
| Hildene Community Funding CDO, Ltd., Series 2015-1A, Class ARR | | | |
| 2.60%, 11/01/35 144A | 750,000 | | 750,349 |
| HPS Loan Management, Ltd., Series 2021-16A, Class A1 | | | |
| (Floating, ICE LIBOR USD 3M + 1.14%, 1.14% Floor), 1.40%, 01/23/35 144A † | 640,000 | | 640,000 |
| ICG U.S. CLO, Ltd., Series 2017-1A, Class ARR | | | |
| (Floating, ICE LIBOR USD 3M + 1.17%, 1.17% Floor), 1.31%, 07/28/34 144A † | 1,500,000 | | 1,496,500 |
| InStar Leasing III LLC, Series 2021-1A, Class A | | | |
| 2.30%, 02/15/54 144A | 966,076 | | 961,780 |
| KKR CLO, Ltd., Series 32A, Class A1 | | | |
| (Floating, ICE LIBOR USD 3M + 1.32%, 1.32% Floor), 1.44%, 01/15/32 144A † | 340,000 | | 340,253 |
| KREF, Ltd., Series 2021-FL2, Class A | | | |
| (Floating, ICE LIBOR USD 1M + 1.07%, 1.07% Floor), 1.18%, 02/15/39 144A † | 1,560,000 | | 1,559,276 |
See Notes to Financial Statements.
| | | Par | | Value |
| LCCM Trust, Series 2021-FL2, Class A | | | |
| (Floating, ICE LIBOR USD 1M + 1.20%, 1.20% Floor), 1.31%, 12/13/38 144A † | $ 750,000 | | $ 748,561 |
| LCM XVIII LP, Series 19A, Class AR | | | |
| (Floating, ICE LIBOR USD 3M + 1.24%, 1.24% Floor), 1.36%, 07/15/27 144A † | 116,188 | | 116,225 |
| Loanpal Solar Loan, Ltd., Series 2021-1GS, Class A | | | |
| 2.29%, 01/20/48 144A | 725,498 | | 727,388 |
| LP Credit Card ABS Master Trust, Series 2018-1, Class A | | | |
| (Floating, ICE LIBOR USD 1M + 1.55%), 1.64%, 08/20/24 144A † | 385,552 | | 386,608 |
| Madison Park Funding XXX, Ltd., Series 2018-30A, Class A | | | |
| (Floating, ICE LIBOR USD 3M + 0.75%, 0.75% Floor), 0.87%, 04/15/29 144A † | 2,735,383 | | 2,735,895 |
| Magnetite VIII, Ltd., Series 2014-8A, Class CR2 | | | |
| (Floating, ICE LIBOR USD 3M + 1.85%, 1.85% Floor), 1.97%, 04/15/31 144A † | 500,000 | | 500,109 |
| MF1, Ltd., Series 2021-FL6, Class A | | | |
| (Floating, ICE LIBOR USD 1M + 1.10%, 1.10% Floor), 1.21%, 07/16/36 144A † | 900,000 | | 897,550 |
| Mill City Mortgage Loan Trust, Series 2017-2, Class A3 | | | |
| 3.01%, 07/25/59 144A † γ | 190,106 | | 194,247 |
| Mississippi Higher Education Assistance Corporation, Series 2014-1, Class A1 | | �� | |
| (Floating, ICE LIBOR USD 1M + 0.68%, 0.68% Floor), 0.78%, 10/25/35† | 349,364 | | 350,517 |
| NADG NNN Operating LP, Series 2019-1, Class A | | | |
| 3.37%, 12/28/49 144A | 881,100 | | 894,734 |
| Navient Private Education Loan Trust, Series 2015-BA, Class A3 | | | |
| (Floating, ICE LIBOR USD 1M + 1.45%), 1.56%, 07/16/40 144A † | 2,207,949 | | 2,218,942 |
| Navient Student Loan Trust, Series 2016-3A, Class A3 | | | |
| (Floating, ICE LIBOR USD 1M + 1.35%), 1.45%, 06/25/65 144A † | 1,301,188 | | 1,341,566 |
| Navient Student Loan Trust, Series 2016-6A, Class A3 | | | |
| (Floating, ICE LIBOR USD 1M + 1.30%), 1.40%, 03/25/66 144A † | 3,176,000 | | 3,297,760 |
| Navient Student Loan Trust, Series 2017-2A, Class A | | | |
| (Floating, ICE LIBOR USD 1M + 1.05%), 1.15%, 12/27/66 144A † | 1,259,377 | | 1,270,774 |
| | | Par | | Value |
| Navient Student Loan Trust, Series 2020-1A, Class A1B | | | |
| (Floating, ICE LIBOR USD 1M + 1.05%, 1.05% Floor), 1.15%, 06/25/69 144A † | $2,014,963 | | $2,070,833 |
| Neuberger Berman Loan Advisers CLO, Ltd., Series 2018-29A, Class A1 | | | |
| (Floating, ICE LIBOR USD 3M + 1.13%, 1.13% Floor), 1.25%, 10/19/31 144A † | 750,000 | | 750,144 |
| Oak Street Investment Grade Net Lease Fund, Series 2020-1A, Class A1 | | | |
| 1.85%, 11/20/50 144A | 667,153 | | 661,717 |
| Octagon Investment Partners 36, Ltd., Series 2018-1A, Class A1 | | | |
| (Floating, ICE LIBOR USD 3M + 0.97%), 1.09%, 04/15/31 144A † | 700,000 | | 696,954 |
| Octagon Investment Partners 45, Ltd., Series 2019-1A, Class A | | | |
| (Floating, ICE LIBOR USD 3M + 1.33%, 1.33% Floor), 1.45%, 10/15/32 144A † | 750,000 | | 750,478 |
| Octagon Investment Partners XXI, Ltd., Series 2014-1A, Class AAR3 | | | |
| (Floating, ICE LIBOR USD 3M + 1.00%, 1.00% Floor), 1.16%, 02/14/31 144A † | 530,000 | | 527,555 |
| OHA Credit Funding 7, Ltd., Series 2020-7A, Class A | | | |
| (Floating, ICE LIBOR USD 3M + 1.25%, 1.25% Floor), 1.37%, 10/19/32 144A † | 270,000 | | 270,193 |
| Owl Rock CLO III, Ltd., Series 2020-3A, Class A1L | | | |
| (Floating, ICE LIBOR USD 3M + 1.80%), 1.93%, 04/20/32 144A † | 600,000 | | 601,624 |
| Palmer Square CLO, Ltd., Series 2019-1A, Class A1R | | | |
| (Floating, ICE LIBOR USD 3M + 1.15%, 1.15% Floor), 1.30%, 11/14/34 144A † | 900,000 | | 900,449 |
| PHEAA Student Loan Trust, Series 2012-1A, Class A1 | | | |
| (Floating, ICE LIBOR USD 1M + 0.55%), 0.65%, 05/25/57 144A † | 410,533 | | 405,014 |
| PHEAA Student Loan Trust, Series 2016-1A, Class A | | | |
| (Floating, ICE LIBOR USD 1M + 1.15%, 1.15% Floor), 1.25%, 09/25/65 144A † | 385,249 | | 392,472 |
| PHEAA Student Loan Trust, Series 2016-2A, Class A | | | |
| (Floating, ICE LIBOR USD 1M + 0.95%), 1.05%, 11/25/65 144A † | 348,397 | | 348,082 |
See Notes to Financial Statements.
MEDIUM-DURATION BOND FUND
SCHEDULE OF INVESTMENTS (Continued)
| | | Par | | Value |
| Point Au Roche Park CLO, Ltd., Series 2021-1A, Class A | | | |
| (Floating, ICE LIBOR USD 3M + 1.08%, 1.08% Floor), 1.26%, 07/20/34 144A † | $1,170,000 | | $1,167,324 |
| RAMP Trust, Series 2005-EFC6, Class M2 | | | |
| (Floating, ICE LIBOR USD 1M + 0.43%, 0.65% Floor, 14.00% Cap), 0.75%, 11/25/35† | 137,726 | | 137,823 |
| Recette CLO, Ltd., Series 2015-1A, Class ARR | | | |
| (Floating, ICE LIBOR USD 3M + 1.08%), 1.21%, 04/20/34 144A † | 340,000 | | 339,234 |
| REESE PARK CLO, Ltd., Series 2020-1A, Class AR | | | |
| (Floating, ICE LIBOR USD 3M + 1.13%, 1.13% Floor), 1.25%, 10/15/34 144A † | 1,350,000 | | 1,349,228 |
| Saxon Asset Securities Trust, Series 2004-1, Class M1 | | | |
| (Floating, ICE LIBOR USD 1M + 0.80%, 0.80% Floor, 10.28% Cap), 0.89%, 03/25/35† | 92,265 | | 90,398 |
| SBA Small Business Investment Cos., Series 2018-10B, Class 1 | | | |
| 3.55%, 09/10/28 | 136,923 | | 145,140 |
| Shackleton CLO, Ltd., Series 2014-6RA, Class A | | | |
| (Floating, ICE LIBOR USD 3M + 1.02%, 1.02% Floor), 1.14%, 07/17/28 144A † | 357,990 | | 358,229 |
| Shackleton CLO, Ltd., Series 2019-14A, Class A1R | | | |
| (Floating, ICE LIBOR USD 3M + 1.20%, 1.20% Floor), 1.33%, 07/20/34 144A † | 8,700,000 | | 8,704,333 |
| SLC Student Loan Trust, Series 2005-3, Class A3 | | | |
| (Floating, ICE LIBOR USD 3M + 0.12%), 0.32%, 06/15/29† | 232,893 | | 232,432 |
| SLM Student Loan Trust, Series 2003-10A, Class A3 | | | |
| (Floating, ICE LIBOR USD 3M + 0.47%), 0.67%, 12/15/27 144A † | 312,431 | | 312,475 |
| SLM Student Loan Trust, Series 2005-4, Class A3 | | | |
| (Floating, ICE LIBOR USD 3M + 0.12%), 0.24%, 01/25/27† | 44,822 | | 44,731 |
| SLM Student Loan Trust, Series 2005-5, Class A4 | | | |
| (Floating, ICE LIBOR USD 3M + 0.14%, 0.14% Floor), 0.26%, 10/25/28† | 337,266 | | 336,322 |
| SMB Private Education Loan Trust, Series 2020-BA, Class A1A | | | |
| 1.29%, 07/15/53 144A | 429,188 | | 424,811 |
| | | Par | | Value |
| SMB Private Education Loan Trust, Series 2021-A, Class A2B | | | |
| 1.59%, 01/15/53 144A | $1,530,000 | | $1,517,742 |
| SMB Private Education Loan Trust, Series 2021-A, Class B | | | |
| 2.31%, 01/15/53 144A | 660,000 | | 655,584 |
| SMB Private Education Loan Trust, Series 2021-C, Class B | | | |
| 2.30%, 01/15/53 144A | 580,000 | | 582,497 |
| Sonic Capital LLC, Series 2020-1A, Class A2I | | | |
| 3.85%, 01/20/50 144A | 661,067 | | 687,447 |
| Sound Point CLO XX, Ltd., Series 2018-2A, Class A | | | |
| (Floating, ICE LIBOR USD 3M + 1.10%), 1.22%, 07/26/31 144A † | 500,000 | | 499,252 |
| Stonepeak, Series 2021-1A, Class AA | | | |
| 2.30%, 02/28/33 144A | 2,172,847 | | 2,154,706 |
| Structured Asset Investment Loan Trust, Series 2005-1, Class M3 | | | |
| (Floating, ICE LIBOR USD 1M + 0.78%, 0.78% Floor), 0.88%, 02/25/35 144A † | 2,700,000 | | 2,722,842 |
| Sunrun Demeter Issuer, Series 2021-2A, Class A | | | |
| 2.27%, 01/30/57 144A | 2,300,000 | | 2,296,513 |
| Tryon Park CLO, Ltd., Series 2013-1A, Class A1SR | | | |
| (Floating, ICE LIBOR USD 3M + 0.89%), 1.01%, 04/15/29 144A † | 2,012,817 | | 2,012,315 |
| Trysail CLO, Ltd., Series 2021-1A, Class A1 | | | |
| (Floating, ICE LIBOR USD 3M + 1.32%, 1.32% Floor), 1.45%, 07/20/32 144A † | 2,900,000 | | 2,898,878 |
| United States Small Business Administration, Series 2019-20D, Class 1 | | | |
| 2.98%, 04/01/39 | 106,140 | | 113,501 |
| United States Small Business Administration, Series 2019-25G, Class 1 | | | |
| 2.69%, 07/01/44 | 193,203 | | 202,499 |
| Utah State Board of Regents, Series 2015-1, Class A | | | |
| (Floating, ICE LIBOR USD 1M + 0.60%, 0.60% Floor), 0.69%, 02/25/43† | 275,979 | | 274,473 |
| Venture 39 CLO, Ltd., Series 2020-39A, Class A1 | | | |
| (Floating, ICE LIBOR USD 3M + 1.28%, 1.28% Floor), 1.40%, 04/15/33 144A † | 2,525,000 | | 2,527,529 |
See Notes to Financial Statements.
| | | Par | | Value |
| Voya CLO, Ltd., Series 2016-3A, Class A1R | | | |
| (Floating, ICE LIBOR USD 3M + 1.19%), 1.31%, 10/18/31 144A † | $ 500,000 | | $ 500,267 |
| Voya CLO, Ltd., Series 2017-3A, Class A1R | | | |
| (Floating, ICE LIBOR USD 3M + 1.04%), 1.17%, 04/20/34 144A † | 490,000 | | 487,323 |
| Voya CLO, Ltd., Series 2018-3A, Class A1A | | | |
| (Floating, ICE LIBOR USD 3M + 1.15%, 1.15% Floor), 1.27%, 10/15/31 144A † | 1,250,000 | | 1,250,623 |
| Voya CLO, Ltd., Series 2019-1A, Class AR | | | |
| (Floating, ICE LIBOR USD 3M + 1.06%, 1.06% Floor), 1.18%, 04/15/31 144A † | 1,700,000 | | 1,696,580 |
| Wellfleet CLO X, Ltd., Series 2019-XA, Class A1R | | | |
| (Floating, ICE LIBOR USD 3M + 1.17%), 1.30%, 07/20/32 144A † | 6,900,000 | | 6,906,988 |
| Whitebox CLO II, Ltd., Series 2020-2A, Class A1R | | | |
| (Floating, ICE LIBOR USD 3M + 1.22%, 1.22% Floor), 1.38%, 10/24/34 144A † | 650,000 | | 650,325 |
| Whitebox CLO III, Ltd., Series 2021-3A, Class A1 | | | |
| (Floating, ICE LIBOR USD 3M + 1.22%, 1.22% Floor), 1.34%, 10/15/34 144A † | 780,000 | | 780,753 |
| Whitehorse XII, Ltd., Series 2018-12A, Class D | | | |
| (Floating, ICE LIBOR USD 3M + 3.65%, 3.65% Floor), 3.77%, 10/15/31 144A † | 750,000 | | 731,007 |
Total Asset-Backed Securities
(Cost $115,683,680) | | | 115,036,785 |
| CERTIFICATES OF DEPOSIT — 0.3% |
| Sumitomo Mitsui Banking Corporation | | | |
0.18%, 01/31/22
(Cost $6,000,000) | 6,000,000 | | 6,000,382 |
| COMMERCIAL PAPER — 0.7% |
| AT&T, Inc. | | | |
| 0.18%, 02/14/22Ω | 3,500,000 | | 3,498,731 |
| Australia & New Zealand Banking Group Ltd. | | | |
| 0.12%, 02/01/22Ω | 5,000,000 | | 4,999,698 |
| Entergy Corp. | | | |
| 0.15%, 01/12/22Ω | 2,000,000 | | 1,999,905 |
| Fidelity National Information Services, Inc. | | | |
| 0.25%, 01/05/22Ω | 3,300,000 | | 3,299,930 |
| VW Credit, Inc. | | | |
| 0.20%, 01/06/22Ω | 2,900,000 | | 2,899,926 |
Total Commercial Paper
(Cost $16,698,446) | | | 16,698,190 |
| | | Par | | Value |
| CORPORATE BONDS — 28.4% |
| 3M Co. | | | |
| 2.38%, 08/26/29 | $ 210,000 | | $ 215,835 |
| 3.05%, 04/15/30Δ | 50,000 | | 53,723 |
| 3.70%, 04/15/50Δ | 790,000 | | 931,928 |
| 7-Eleven, Inc. | | | |
| 1.30%, 02/10/28 144A | 725,000 | | 691,596 |
| Abbott Laboratories | | | |
| 3.75%, 11/30/26 | 148,000 | | 163,744 |
| 4.75%, 11/30/36 | 205,000 | | 262,433 |
| 4.90%, 11/30/46 | 210,000 | | 288,731 |
| Adobe, Inc. | | | |
| 2.30%, 02/01/30Δ | 650,000 | | 665,690 |
| Adventist Health System | | | |
| 2.95%, 03/01/29 | 160,000 | | 167,588 |
| Aetna, Inc. | | | |
| 2.80%, 06/15/23 | 50,000 | | 51,252 |
| Air Lease Corporation | | | |
| 3.38%, 07/01/25 | 1,430,000 | | 1,493,967 |
| 2.88%, 01/15/26 | 1,600,000 | | 1,652,711 |
| 3.75%, 06/01/26Δ | 875,000 | | 929,041 |
| (Variable, U.S. Treasury Yield Curve Rate CMT 5Y + 3.15%), 4.13%, 12/15/26ρ Δ ^ | 600,000 | | 597,000 |
| 3.25%, 10/01/29 | 45,000 | | 46,163 |
| 3.00%, 02/01/30 | 40,000 | | 40,008 |
| Alaska Airlines Pass-Through Trust, Series 2020-1, Class A | | | |
| 4.80%, 08/15/27 144A | 1,566,740 | | 1,715,829 |
| Alexandria Real Estate Equities, Inc. REIT | | | |
| 3.80%, 04/15/26 | 900,000 | | 975,288 |
| 2.75%, 12/15/29 | 1,400,000 | | 1,446,866 |
| 3.38%, 08/15/31 | 325,000 | | 350,709 |
| Allegion U.S. Holding Co., Inc. | | | |
| 3.20%, 10/01/24 | 400,000 | | 416,329 |
| Alliant Energy Finance LLC | | | |
| 3.75%, 06/15/23 144A | 275,000 | | 284,968 |
| 4.25%, 06/15/28 144A | 75,000 | | 82,951 |
| Ally Financial, Inc. | | | |
| 1.45%, 10/02/23 | 250,000 | | 250,890 |
| Alphabet, Inc. | | | |
| 0.45%, 08/15/25Δ | 60,000 | | 58,695 |
| 0.80%, 08/15/27Δ | 130,000 | | 126,042 |
| 1.10%, 08/15/30Δ | 150,000 | | 142,152 |
| 2.05%, 08/15/50 | 230,000 | | 206,775 |
| Amazon.com, Inc. | | | |
| 0.80%, 06/03/25 | 310,000 | | 306,815 |
| 1.20%, 06/03/27 | 390,000 | | 385,046 |
| 3.15%, 08/22/27 | 270,000 | | 291,989 |
| 1.50%, 06/03/30Δ | 190,000 | | 184,532 |
| 2.10%, 05/12/31Δ | 170,000 | | 172,611 |
| 4.80%, 12/05/34 | 75,000 | | 96,055 |
| 3.88%, 08/22/37 | 2,620,000 | | 3,088,572 |
| 4.95%, 12/05/44 | 220,000 | | 301,842 |
| 4.05%, 08/22/47 | 290,000 | | 353,665 |
| 2.50%, 06/03/50 | 310,000 | | 297,234 |
| 3.10%, 05/12/51 | 140,000 | | 150,486 |
See Notes to Financial Statements.
MEDIUM-DURATION BOND FUND
SCHEDULE OF INVESTMENTS (Continued)
| | | Par | | Value |
| 4.25%, 08/22/57 | $ 160,000 | | $ 206,317 |
| Amdocs, Ltd. | | | |
| 2.54%, 06/15/30 | 1,975,000 | | 1,961,687 |
| American Airlines Pass-Through Trust, Series 2013-1, Class A | | | |
| 4.00%, 07/15/25 | 712,064 | | 688,962 |
| American Airlines Pass-Through Trust, Series 2017-2, Class AA | | | |
| 3.35%, 10/15/29Δ | 1,702,202 | | 1,736,749 |
| American Airlines Pass-Through Trust, Series 2021-1, Class A | | | |
| 2.88%, 07/11/34 | 2,300,000 | | 2,269,431 |
| American Campus Communities Operating Partnership LP REIT | | | |
| 3.75%, 04/15/23 | 525,000 | | 539,431 |
| 2.85%, 02/01/30 | 40,000 | | 40,893 |
| American Express Co. | | | |
| 2.50%, 07/30/24 | 1,995,000 | | 2,062,667 |
| American Homes 4 Rent LP REIT | | | |
| 4.90%, 02/15/29 | 309,000 | | 357,774 |
| 2.38%, 07/15/31 | 205,000 | | 201,505 |
| American International Group, Inc. | | | |
| 4.13%, 02/15/24 | 75,000 | | 79,691 |
| 2.50%, 06/30/25 | 150,000 | | 154,856 |
| 3.90%, 04/01/26 | 825,000 | | 895,458 |
| 4.20%, 04/01/28 | 1,850,000 | | 2,067,002 |
| 3.40%, 06/30/30 | 250,000 | | 270,909 |
| 4.38%, 01/15/55 | 25,000 | | 30,872 |
| American Tower Corporation REIT | | | |
| 3.38%, 05/15/24 | 825,000 | | 862,138 |
| 3.38%, 10/15/26Δ | 1,500,000 | | 1,595,702 |
| American Transmission Systems, Inc. | | | |
| 2.65%, 01/15/32 144A | 160,000 | | 161,855 |
| Amgen, Inc. | | | |
| 3.63%, 05/22/24 | 50,000 | | 52,697 |
| 4.66%, 06/15/51 | 34,000 | | 43,772 |
| Anthem, Inc. | | | |
| 2.95%, 12/01/22 | 390,000 | | 397,669 |
| 3.35%, 12/01/24 | 130,000 | | 137,443 |
| 3.65%, 12/01/27 | 250,000 | | 274,654 |
| 2.55%, 03/15/31Δ | 2,100,000 | | 2,148,625 |
| Aon Corporation | | | |
| 2.90%, 08/23/51 | 35,000 | | 33,914 |
| Apache Corporation | | | |
| 3.25%, 04/15/22 | 24,000 | | 24,031 |
| 4.38%, 10/15/28Δ | 20,000 | | 21,817 |
| 4.25%, 01/15/30Δ | 60,000 | | 65,198 |
| 5.10%, 09/01/40Δ | 180,000 | | 203,684 |
| 5.25%, 02/01/42Δ | 30,000 | | 34,694 |
| 4.75%, 04/15/43Δ | 40,000 | | 44,059 |
| 4.25%, 01/15/44Δ | 300,000 | | 304,554 |
| 5.35%, 07/01/49Δ | 140,000 | | 160,159 |
| Appalachian Power Co. | | | |
| 2.70%, 04/01/31 | 2,200,000 | | 2,243,385 |
| Apple, Inc. | | | |
| 1.13%, 05/11/25 | 630,000 | | 628,779 |
| 3.25%, 02/23/26 | 30,000 | | 32,114 |
| 2.45%, 08/04/26 | 595,000 | | 622,323 |
| | | Par | | Value |
| 3.35%, 02/09/27 | $ 40,000 | | $ 43,467 |
| 3.00%, 06/20/27 | 20,000 | | 21,457 |
| 4.50%, 02/23/36Δ | 55,000 | | 69,216 |
| Arch Capital Finance LLC | | | |
| 4.01%, 12/15/26 | 600,000 | | 659,167 |
| Arch Capital Group, Ltd. | | | |
| 7.35%, 05/01/34 | 175,000 | | 252,276 |
| Archer-Daniels-Midland Co. | | | |
| 3.25%, 03/27/30 | 150,000 | | 163,374 |
| Arrow Electronics, Inc. | | | |
| 4.50%, 03/01/23 | 1,200,000 | | 1,235,090 |
| Ashtead Capital, Inc. | | | |
| 1.50%, 08/12/26 144A Δ | 350,000 | | 344,147 |
| AT&T, Inc. | | | |
| 4.45%, 04/01/24 | 725,000 | | 774,360 |
| 2.30%, 06/01/27 | 430,000 | | 438,075 |
| 1.65%, 02/01/28 | 540,000 | | 529,463 |
| 2.75%, 06/01/31 | 175,000 | | 178,933 |
| 2.25%, 02/01/32Δ | 1,700,000 | | 1,646,571 |
| 2.55%, 12/01/33Δ | 2,794,000 | | 2,739,736 |
| 5.25%, 03/01/37 | 225,000 | | 279,375 |
| 4.90%, 08/15/37 | 200,000 | | 242,793 |
| 5.35%, 09/01/40 | 80,000 | | 101,972 |
| 6.38%, 03/01/41 | 325,000 | | 462,072 |
| 3.50%, 06/01/41 | 400,000 | | 413,101 |
| 5.55%, 08/15/41 | 40,000 | | 52,771 |
| 3.10%, 02/01/43 | 1,110,000 | | 1,084,638 |
| 4.35%, 06/15/45Δ | 94,000 | | 106,537 |
| 5.15%, 11/15/46 | 125,000 | | 159,358 |
| 5.45%, 03/01/47 | 575,000 | | 754,935 |
| 4.50%, 03/09/48 | 197,000 | | 231,019 |
| 5.15%, 02/15/50 | 200,000 | | 256,680 |
| 3.65%, 06/01/51 | 325,000 | | 338,571 |
| 3.30%, 02/01/52 | 80,000 | | 78,875 |
| 3.50%, 09/15/53 | 2,143,000 | | 2,174,558 |
| 3.55%, 09/15/55 | 301,000 | | 303,812 |
| 3.80%, 12/01/57 | 90,000 | | 94,291 |
| 3.65%, 09/15/59 | 127,000 | | 129,044 |
| AutoNation, Inc. | | | |
| 1.95%, 08/01/28Δ | 150,000 | | 146,919 |
| 4.75%, 06/01/30 | 225,000 | | 257,535 |
| AvalonBay Communities, Inc. REIT | | | |
| 2.05%, 01/15/32Δ | 2,400,000 | | 2,378,482 |
| Avangrid, Inc. | | | |
| 3.20%, 04/15/25 | 275,000 | | 289,336 |
| Aviation Capital Group LLC | | | |
| 5.50%, 12/15/24 144A | 2,000,000 | | 2,190,156 |
| 1.95%, 01/30/26 144A | 400,000 | | 390,747 |
| Baker Hughes Holdings LLC | | | |
| 4.49%, 05/01/30 | 60,000 | | 68,963 |
| Bank of America Corporation | | | |
| 3.30%, 01/11/23 | 120,000 | | 123,324 |
| (Variable, ICE LIBOR USD 3M + 0.79%), 3.00%, 12/20/23^ | 329,000 | | 335,896 |
| (Variable, ICE LIBOR USD 3M + 0.78%), 3.55%, 03/05/24^ | 530,000 | | 545,912 |
| 4.00%, 04/01/24 | 420,000 | | 446,803 |
See Notes to Financial Statements.
| | | Par | | Value |
| (Floating, ICE LIBOR USD 3M + 0.96%), 1.08%, 07/23/24† | $ 900,000 | | $ 907,990 |
| (Variable, ICE LIBOR USD 3M + 0.94%), 3.86%, 07/23/24^ | 225,000 | | 234,524 |
| 4.20%, 08/26/24 | 1,295,000 | | 1,389,277 |
| (Variable, ICE LIBOR USD 3M + 3.71%), 6.25%, 09/05/24ρ ^ | 300,000 | | 323,063 |
| (Variable, ICE LIBOR USD 3M + 4.17%), 6.50%, 10/23/24ρ ^ | 150,000 | | 164,621 |
| 4.00%, 01/22/25 | 440,000 | | 470,406 |
| (Variable, ICE LIBOR USD 3M + 0.97%), 3.46%, 03/15/25^ | 60,000 | | 62,791 |
| (Variable, ICE LIBOR USD 3M + 1.09%), 3.09%, 10/01/25^ | 2,240,000 | | 2,332,646 |
| (Variable, U.S. SOFR + 0.65%), 1.53%, 12/06/25^ | 2,300,000 | | 2,306,977 |
| (Variable, ICE LIBOR USD 3M + 0.81%), 3.37%, 01/23/26^ | 55,000 | | 57,922 |
| 4.45%, 03/03/26 | 420,000 | | 463,082 |
| 3.50%, 04/19/26 | 1,260,000 | | 1,359,353 |
| (Variable, U.S. SOFR + 1.15%), 1.32%, 06/19/26^ | 60,000 | | 59,436 |
| 4.25%, 10/22/26 | 480,000 | | 530,297 |
| (Variable, U.S. SOFR + 1.01%), 1.20%, 10/24/26Δ ^ | 2,200,000 | | 2,158,246 |
| 3.25%, 10/21/27 | 875,000 | | 932,525 |
| 4.18%, 11/25/27 | 825,000 | | 903,803 |
| (Variable, ICE LIBOR USD 3M + 1.37%), 3.59%, 07/21/28^ | 860,000 | | 926,920 |
| (Variable, ICE LIBOR USD 3M + 1.04%), 3.42%, 12/20/28^ | 694,000 | | 741,960 |
| (Variable, ICE LIBOR USD 3M + 1.07%), 3.97%, 03/05/29^ | 300,000 | | 328,974 |
| (Variable, ICE LIBOR USD 3M + 1.31%), 4.27%, 07/23/29^ | 525,000 | | 586,186 |
| (Variable, ICE LIBOR USD 3M + 1.19%), 2.88%, 10/22/30^ | 500,000 | | 517,289 |
| (Variable, ICE LIBOR USD 3M + 0.99%), 2.50%, 02/13/31^ | 75,000 | | 75,346 |
| (Variable, U.S. SOFR + 2.15%), 2.59%, 04/29/31^ | 1,010,000 | | 1,022,418 |
| (Variable, U.S. SOFR + 1.53%), 1.90%, 07/23/31^ | 1,150,000 | | 1,103,061 |
| (Variable, U.S. SOFR + 1.22%), 2.30%, 07/21/32^ | 755,000 | | 744,002 |
| (Variable, U.S. SOFR + 1.21%), 2.57%, 10/20/32^ | 1,550,000 | | 1,560,425 |
| 6.11%, 01/29/37 | 500,000 | | 675,019 |
| (Variable, ICE LIBOR USD 3M + 1.81%), 4.24%, 04/24/38^ | 20,000 | | 23,562 |
| 5.00%, 01/21/44 | 790,000 | | 1,042,677 |
| (Variable, ICE LIBOR USD 3M + 1.19%), 3.95%, 01/23/49^ | 270,000 | | 317,074 |
| (Variable, ICE LIBOR USD 3M + 1.52%), 4.33%, 03/15/50^ | 170,000 | | 211,574 |
| (Variable, ICE LIBOR USD 3M + 3.15%), 4.08%, 03/20/51^ | 990,000 | | 1,196,661 |
| (Variable, U.S. SOFR + 1.88%), 2.83%, 10/24/51^ | 750,000 | | 741,438 |
| Banner Health | | | |
| 2.34%, 01/01/30 | 865,000 | | 877,918 |
| | | Par | | Value |
| Barrick North America Finance LLC | | | |
| 5.70%, 05/30/41 | $ 150,000 | | $ 204,882 |
| Bausch Health Americas, Inc. | | | |
| 9.25%, 04/01/26 144A | 200,000 | | 211,497 |
| Baxter International, Inc. | | | |
| 1.92%, 02/01/27 144A Δ | 600,000 | | 602,943 |
| 2.54%, 02/01/32 144A | 600,000 | | 607,531 |
| Baylor Scott & White Holdings | | | |
| 1.78%, 11/15/30 | 305,000 | | 295,000 |
| Becton, Dickinson and Co. | | | |
| 3.36%, 06/06/24 | 377,000 | | 394,971 |
| 3.73%, 12/15/24Δ | 47,000 | | 50,000 |
| 3.70%, 06/06/27Δ | 1,685,000 | | 1,838,805 |
| 2.82%, 05/20/30 | 650,000 | | 674,235 |
| 4.69%, 12/15/44 | 94,000 | | 118,588 |
| Berkshire Hathaway Energy Co. | | | |
| 3.25%, 04/15/28 | 400,000 | | 428,620 |
| 3.70%, 07/15/30 | 400,000 | | 442,597 |
| Berkshire Hathaway Finance Corporation | | | |
| 1.85%, 03/12/30 | 725,000 | | 719,806 |
| 4.25%, 01/15/49 | 460,000 | | 568,192 |
| Berry Global, Inc. | | | |
| 1.57%, 01/15/26 | 2,475,000 | | 2,424,634 |
| Block Financial LLC | | | |
| 3.88%, 08/15/30Δ | 1,600,000 | | 1,715,485 |
| Boeing Co. (The) | | | |
| 1.17%, 02/04/23 | 2,000,000 | | 2,000,288 |
| 1.43%, 02/04/24 | 2,920,000 | | 2,917,376 |
| 4.88%, 05/01/25 | 850,000 | | 931,053 |
| 2.20%, 02/04/26 | 430,000 | | 430,112 |
| 2.70%, 02/01/27Δ | 70,000 | | 71,269 |
| 2.80%, 03/01/27 | 110,000 | | 112,383 |
| 5.15%, 05/01/30 | 1,200,000 | | 1,400,564 |
| 3.25%, 02/01/35Δ | 1,575,000 | | 1,591,933 |
| 6.63%, 02/15/38 | 210,000 | | 284,114 |
| 3.55%, 03/01/38 | 70,000 | | 71,638 |
| 5.71%, 05/01/40 | 340,000 | | 438,373 |
| 3.85%, 11/01/48 | 25,000 | | 26,190 |
| 3.75%, 02/01/50Δ | 200,000 | | 209,165 |
| 5.81%, 05/01/50Δ | 1,400,000 | | 1,905,541 |
| 5.93%, 05/01/60 | 10,000 | | 13,967 |
| Booking Holdings, Inc. | | | |
| 4.63%, 04/13/30 | 60,000 | | 70,098 |
| Boston Properties LP REIT | | | |
| 4.50%, 12/01/28 | 900,000 | | 1,016,019 |
| 2.55%, 04/01/32Δ | 2,200,000 | | 2,188,843 |
| Boston Scientific Corporation | | | |
| 2.65%, 06/01/30 | 1,900,000 | | 1,941,010 |
| BP Capital Markets America, Inc. | | | |
| 3.79%, 02/06/24 | 50,000 | | 52,667 |
| 3.12%, 05/04/26 | 570,000 | | 603,490 |
| 3.54%, 04/06/27 | 50,000 | | 54,069 |
| 4.23%, 11/06/28 | 1,550,000 | | 1,752,055 |
| 3.63%, 04/06/30Δ | 490,000 | | 542,192 |
| 3.06%, 06/17/41 | 35,000 | | 35,587 |
See Notes to Financial Statements.
MEDIUM-DURATION BOND FUND
SCHEDULE OF INVESTMENTS (Continued)
| | | Par | | Value |
| 3.00%, 02/24/50 | $ 735,000 | | $ 721,119 |
| Broadcom, Inc. | | | |
| 2.45%, 02/15/31 144A | 2,000,000 | | 1,965,276 |
| 4.30%, 11/15/32 | 2,000,000 | | 2,253,208 |
| 3.42%, 04/15/33 144A | 900,000 | | 945,590 |
| 3.47%, 04/15/34 144A | 2,090,000 | | 2,191,764 |
| 3.14%, 11/15/35 144A | 6,814,000 | | 6,872,368 |
| 3.19%, 11/15/36 144A | 28,000 | | 28,039 |
| 3.50%, 02/15/41 144A | 325,000 | | 333,731 |
| Burlington Northern Santa Fe LLC | | | |
| 2.88%, 06/15/52 | 70,000 | | 70,484 |
| Calpine Corporation | | | |
| 4.50%, 02/15/28 144A | 495,000 | | 513,181 |
| Camden Property Trust REIT | | | |
| 3.15%, 07/01/29 | 65,000 | | 69,255 |
| Cameron LNG LLC | | | |
| 2.90%, 07/15/31 144A | 70,000 | | 73,050 |
| 3.30%, 01/15/35 144A | 460,000 | | 481,791 |
| Capital One Financial Corporation | | | |
| 3.50%, 06/15/23 | 325,000 | | 336,946 |
| 3.30%, 10/30/24 | 345,000 | | 363,411 |
| Cargill, Inc. | | | |
| 2.13%, 04/23/30 144A | 70,000 | | 69,374 |
| Carrier Global Corporation | | | |
| 2.49%, 02/15/27 | 1,225,000 | | 1,260,144 |
| 2.72%, 02/15/30 | 650,000 | | 665,170 |
| 3.58%, 04/05/50 | 20,000 | | 21,401 |
| CenterPoint Energy Resources Corporation | | | |
| (Floating, ICE LIBOR USD 3M + 0.50%), 0.67%, 03/02/23† | 2,100,000 | | 2,095,694 |
| CenterPoint Energy, Inc. | | | |
| 4.25%, 11/01/28 | 700,000 | | 779,052 |
| CH Robinson Worldwide, Inc. | | | |
| 4.20%, 04/15/28 | 1,500,000 | | 1,692,386 |
| Charles Schwab Corporation (The) | | | |
| 4.20%, 03/24/25 | 60,000 | | 65,310 |
| 3.30%, 04/01/27 | 65,000 | | 69,741 |
| 3.25%, 05/22/29 | 10,000 | | 10,763 |
| Charter Communications Operating LLC | | | |
| 4.46%, 07/23/22 | 1,700,000 | | 1,725,265 |
| 4.91%, 07/23/25 | 7,190,000 | | 7,919,052 |
| 4.20%, 03/15/28 | 510,000 | | 559,094 |
| 2.25%, 01/15/29 | 2,300,000 | | 2,247,961 |
| 5.05%, 03/30/29 | 460,000 | | 527,527 |
| 6.38%, 10/23/35 | 530,000 | | 685,007 |
| 5.38%, 04/01/38 | 215,000 | | 256,919 |
| 3.50%, 03/01/42 | 450,000 | | 438,492 |
| 6.48%, 10/23/45 | 90,000 | | 123,517 |
| 4.80%, 03/01/50 | 360,000 | | 405,385 |
| Cheniere Energy Partners LP | | | |
| 4.00%, 03/01/31 | 60,000 | | 63,086 |
| 3.25%, 01/31/32 144A | 80,000 | | 80,960 |
| Chevron Corporation | | | |
| 1.55%, 05/11/25 | 310,000 | | 312,950 |
| 2.95%, 05/16/26 | 350,000 | | 371,103 |
| 2.00%, 05/11/27 | 170,000 | | 172,772 |
| | | Par | | Value |
| Chevron U.S.A., Inc. | | | |
| 3.85%, 01/15/28 | $ 550,000 | | $ 609,811 |
| Choice Hotels International, Inc. | | | |
| 3.70%, 12/01/29 | 1,500,000 | | 1,597,530 |
| Chubb INA Holdings, Inc. | | | |
| 3.35%, 05/03/26 | 120,000 | | 128,846 |
| Cigna Corporation | | | |
| 3.75%, 07/15/23 | 293,000 | | 304,827 |
| 4.13%, 11/15/25 | 180,000 | | 197,086 |
| 4.38%, 10/15/28 | 460,000 | | 523,560 |
| 2.40%, 03/15/30 | 1,250,000 | | 1,262,787 |
| 4.80%, 08/15/38 | 955,000 | | 1,179,510 |
| 3.20%, 03/15/40 | 675,000 | | 700,244 |
| 4.90%, 12/15/48 | 1,000,000 | | 1,299,681 |
| Cintas Corporation No. 2 | | | |
| 2.90%, 04/01/22 | 180,000 | | 180,731 |
| 3.70%, 04/01/27 | 190,000 | | 208,129 |
| Cisco Systems, Inc. | | | |
| 5.50%, 01/15/40 | 75,000 | | 104,887 |
| CIT Bank NA | | | |
| (Variable, U.S. SOFR + 1.72%), 2.97%, 09/27/25^ | 550,000 | | 568,706 |
| Citigroup, Inc. | | | |
| (Variable, ICE LIBOR USD 3M + 4.07%), 5.95%, 01/30/23ρ ^ | 170,000 | | 175,525 |
| 3.50%, 05/15/23 | 220,000 | | 227,525 |
| (Variable, U.S. SOFR + 1.67%), 1.68%, 05/15/24^ | 2,190,000 | | 2,215,175 |
| (Variable, ICE LIBOR USD 3M + 0.90%), 3.35%, 04/24/25^ | 65,000 | | 67,918 |
| (Variable, ICE LIBOR USD 3M + 3.91%), 5.95%, 05/15/25ρ ^ | 430,000 | | 461,175 |
| 4.40%, 06/10/25 | 450,000 | | 490,643 |
| 5.50%, 09/13/25 | 490,000 | | 554,848 |
| (Variable, U.S. SOFR + 2.84%), 3.11%, 04/08/26^ | 190,000 | | 199,395 |
| 3.40%, 05/01/26 | 2,075,000 | | 2,228,457 |
| (Variable, ICE LIBOR USD 3M + 4.52%), 6.25%, 08/15/26ρ Δ ^ | 150,000 | | 169,545 |
| 3.20%, 10/21/26 | 500,000 | | 530,477 |
| 4.30%, 11/20/26 | 1,675,000 | | 1,855,583 |
| 4.45%, 09/29/27 | 2,305,000 | | 2,573,602 |
| (Variable, ICE LIBOR USD 3M + 1.56%), 3.89%, 01/10/28^ | 30,000 | | 32,562 |
| (Variable, ICE LIBOR USD 3M + 1.39%), 3.67%, 07/24/28^ | 150,000 | | 162,012 |
| 4.13%, 07/25/28 | 1,750,000 | | 1,923,609 |
| (Variable, U.S. SOFR + 3.91%), 4.41%, 03/31/31^ | 340,000 | | 389,067 |
| (Variable, U.S. SOFR + 2.11%), 2.57%, 06/03/31^ | 790,000 | | 798,522 |
| 6.63%, 06/15/32 | 50,000 | | 66,541 |
| (Variable, U.S. SOFR + 1.18%), 2.52%, 11/03/32^ | 860,000 | | 860,957 |
| 8.13%, 07/15/39 | 260,000 | | 441,325 |
| 6.68%, 09/13/43 | 10,000 | | 15,141 |
| 5.30%, 05/06/44 | 24,000 | | 31,482 |
| 4.65%, 07/30/45 | 894,000 | | 1,133,535 |
| 4.75%, 05/18/46 | 40,000 | | 49,465 |
See Notes to Financial Statements.
| | | Par | | Value |
| 4.65%, 07/23/48 | $ 160,000 | | $ 206,642 |
| Citizens Financial Group, Inc. | | | |
| 2.85%, 07/27/26 | 65,000 | | 67,847 |
| Citrix Systems, Inc. | | | |
| 1.25%, 03/01/26 | 2,100,000 | | 2,048,232 |
| 4.50%, 12/01/27 | 40,000 | | 43,479 |
| CME Group, Inc. | | | |
| 3.00%, 03/15/25 | 65,000 | | 68,309 |
| Coca-Cola Co. (The) | | | |
| 3.38%, 03/25/27 | 120,000 | | 129,776 |
| 1.45%, 06/01/27Δ | 265,000 | | 263,810 |
| 2.50%, 06/01/40 | 20,000 | | 20,177 |
| 2.60%, 06/01/50 | 130,000 | | 127,814 |
| Comcast Corporation | | | |
| 3.38%, 08/15/25 | 275,000 | | 294,270 |
| 3.95%, 10/15/25 | 477,000 | | 521,406 |
| 3.15%, 03/01/26 | 130,000 | | 138,799 |
| 3.30%, 02/01/27 | 344,000 | | 370,009 |
| 3.30%, 04/01/27 | 1,710,000 | | 1,840,244 |
| 4.15%, 10/15/28Δ | 1,180,000 | | 1,341,491 |
| 3.40%, 04/01/30 | 450,000 | | 492,105 |
| 4.25%, 10/15/30 | 410,000 | | 474,139 |
| 5.65%, 06/15/35 | 420,000 | | 558,083 |
| 6.50%, 11/15/35 | 7,000 | | 10,102 |
| 3.90%, 03/01/38 | 30,000 | | 34,082 |
| 3.25%, 11/01/39 | 400,000 | | 423,944 |
| 3.75%, 04/01/40 | 165,000 | | 185,558 |
| 3.40%, 07/15/46 | 50,000 | | 53,280 |
| 4.00%, 03/01/48 | 40,000 | | 46,348 |
| 4.70%, 10/15/48 | 100,000 | | 128,067 |
| 2.80%, 01/15/51Δ | 270,000 | | 261,930 |
| 2.89%, 11/01/51 144A | 300,000 | | 291,838 |
| 2.94%, 11/01/56 144A | 135,000 | | 129,512 |
| CommonSpirit Health | | | |
| 4.35%, 11/01/42 | 40,000 | | 46,127 |
| Commonwealth Edison Co. | | | |
| 3.80%, 10/01/42 | 300,000 | | 340,259 |
| ConocoPhillips | | | |
| 3.75%, 10/01/27 144A | 170,000 | | 186,593 |
| 4.30%, 08/15/28 144A Δ | 480,000 | | 539,892 |
| ConocoPhillips Co. | | | |
| 6.95%, 04/15/29 | 220,000 | | 289,937 |
| Consolidated Edison Co. of New York, Inc. | | | |
| 3.35%, 04/01/30 | 130,000 | | 140,093 |
| 3.95%, 04/01/50 | 140,000 | | 160,956 |
| Continental Resources, Inc. | | | |
| 4.50%, 04/15/23 | 556,000 | | 573,631 |
| 2.27%, 11/15/26 144A | 140,000 | | 139,098 |
| 4.38%, 01/15/28 | 320,000 | | 346,490 |
| 5.75%, 01/15/31 144A Δ | 210,000 | | 247,653 |
| 4.90%, 06/01/44 | 180,000 | | 199,778 |
| CoStar Group, Inc. | | | |
| 2.80%, 07/15/30 144A | 625,000 | | 626,509 |
| Costco Wholesale Corporation | | | |
| 1.38%, 06/20/27 | 70,000 | | 69,557 |
| 1.60%, 04/20/30 | 550,000 | | 533,979 |
| | | Par | | Value |
| Coterra Energy, Inc. | | | |
| 3.90%, 05/15/27 144A | $ 660,000 | | $ 710,167 |
| 4.38%, 03/15/29 144A | 650,000 | | 727,487 |
| Cox Communications, Inc. | | | |
| 3.35%, 09/15/26 144A | 45,000 | | 47,838 |
| CRH America Finance, Inc. | | | |
| 3.40%, 05/09/27 144A | 2,100,000 | | 2,244,474 |
| 3.95%, 04/04/28 144A | 500,000 | | 551,875 |
| Crown Castle International Corporation REIT | | | |
| 3.15%, 07/15/23 | 2,325,000 | | 2,396,182 |
| 3.10%, 11/15/29 | 70,000 | | 73,202 |
| CSC Holdings LLC | | | |
| 3.38%, 02/15/31 144A Δ | 780,000 | | 731,539 |
| CSX Corporation | | | |
| 3.80%, 04/15/50 | 300,000 | | 343,631 |
| CubeSmart LP REIT | | | |
| 2.50%, 02/15/32 | 650,000 | | 648,678 |
| CVS Health Corporation | | | |
| 2.75%, 12/01/22 | 210,000 | | 212,950 |
| 2.63%, 08/15/24Δ | 205,000 | | 212,430 |
| 3.88%, 07/20/25 | 788,000 | | 847,895 |
| 3.63%, 04/01/27 | 200,000 | | 217,313 |
| 4.30%, 03/25/28 | 576,000 | | 647,381 |
| 3.75%, 04/01/30Δ | 1,090,000 | | 1,197,443 |
| 2.13%, 09/15/31Δ | 2,740,000 | | 2,689,442 |
| 4.13%, 04/01/40 | 80,000 | | 92,270 |
| 2.70%, 08/21/40Δ | 360,000 | | 348,507 |
| 5.13%, 07/20/45 | 250,000 | | 326,720 |
| 5.05%, 03/25/48 | 1,480,000 | | 1,944,745 |
| 4.25%, 04/01/50Δ | 80,000 | | 97,300 |
| CVS Pass-Through Trust | | | |
| 6.94%, 01/10/30 | 487,593 | | 578,302 |
| CyrusOne LP REIT | | | |
| 2.90%, 11/15/24 | 1,500,000 | | 1,549,897 |
| D.R. Horton, Inc. | | | |
| 4.38%, 09/15/22Δ | 800,000 | | 812,979 |
| Daimler Finance North America LLC | | | |
| 2.55%, 08/15/22 144A | 1,700,000 | | 1,719,518 |
| 2.70%, 06/14/24 144A | 1,900,000 | | 1,965,442 |
| 8.50%, 01/18/31 | 25,000 | | 37,248 |
| Daimler Trucks Finance North America LLC | | | |
| (Floating, U.S. SOFR + 0.50%), 0.55%, 06/14/23 144A † | 2,300,000 | | 2,302,185 |
| Deere & Co. | | | |
| 2.75%, 04/15/25 | 65,000 | | 67,978 |
| 3.10%, 04/15/30 | 50,000 | | 53,997 |
| 3.75%, 04/15/50 | 760,000 | | 903,408 |
| Dell International LLC | | | |
| 5.45%, 06/15/23 | 735,000 | | 775,663 |
| 5.85%, 07/15/25 | 25,000 | | 28,371 |
| 6.02%, 06/15/26 | 1,025,000 | | 1,186,512 |
| 8.35%, 07/15/46 | 19,000 | | 31,742 |
| Delta Air Lines, Inc. | | | |
| 7.00%, 05/01/25 144A | 2,460,000 | | 2,816,079 |
| 4.50%, 10/20/25 144A | 700,000 | | 736,365 |
See Notes to Financial Statements.
MEDIUM-DURATION BOND FUND
SCHEDULE OF INVESTMENTS (Continued)
| | | Par | | Value |
| 4.75%, 10/20/28 144A | $ 350,000 | | $ 382,716 |
| Deutsche Bank AG | | | |
| 3.95%, 02/27/23 | 1,900,000 | | 1,959,785 |
| Devon Energy Corporation | | | |
| 5.85%, 12/15/25 | 792,000 | | 906,771 |
| 5.25%, 10/15/27 144A | 38,000 | | 40,092 |
| 4.50%, 01/15/30 144A | 32,000 | | 34,388 |
| 5.60%, 07/15/41 | 477,000 | | 601,000 |
| 4.75%, 05/15/42Δ | 710,000 | | 826,039 |
| 5.00%, 06/15/45Δ | 1,240,000 | | 1,506,853 |
| DH Europe Finance II S.a.r.l. | | | |
| 2.20%, 11/15/24 | 2,275,000 | | 2,326,823 |
| 2.60%, 11/15/29 | 225,000 | | 232,941 |
| Diamondback Energy, Inc. | | | |
| 3.25%, 12/01/26 | 90,000 | | 95,037 |
| 3.50%, 12/01/29 | 160,000 | | 169,840 |
| Discover Financial Services | | | |
| 3.75%, 03/04/25 | 450,000 | | 476,693 |
| Discovery Communications LLC | | | |
| 3.63%, 05/15/30Δ | 1,800,000 | | 1,928,274 |
| DISH DBS Corporation | | | |
| 5.88%, 11/15/24 | 170,000 | | 174,699 |
| 7.75%, 07/01/26 | 150,000 | | 158,445 |
| 5.25%, 12/01/26 144A | 120,000 | | 122,073 |
| 5.13%, 06/01/29 | 140,000 | | 127,627 |
| Dollar Tree, Inc. | | | |
| 4.00%, 05/15/25 | 325,000 | | 349,535 |
| 4.20%, 05/15/28 | 400,000 | | 446,483 |
| Dominion Energy, Inc. | | | |
| (Step to 0.00% on 08/15/24), 3.07%, 08/15/24 STEP | 675,000 | | 699,269 |
| 3.38%, 04/01/30 | 225,000 | | 239,255 |
| 2.25%, 08/15/31 | 2,300,000 | | 2,251,164 |
| Duke Energy Corporation | | | |
| 3.75%, 04/15/24 | 200,000 | | 210,169 |
| 3.15%, 08/15/27Δ | 550,000 | | 579,349 |
| 2.45%, 06/01/30Δ | 1,800,000 | | 1,791,149 |
| Duke Energy Ohio, Inc. | | | |
| 3.65%, 02/01/29 | 350,000 | | 379,268 |
| Duke Realty LP REIT | | | |
| 2.25%, 01/15/32 | 2,300,000 | | 2,261,060 |
| DuPont de Nemours, Inc. | | | |
| 4.21%, 11/15/23 | 175,000 | | 185,143 |
| 4.49%, 11/15/25 | 350,000 | | 387,221 |
| 4.73%, 11/15/28 | 350,000 | | 406,063 |
| East Ohio Gas Co. (The) | | | |
| 2.00%, 06/15/30 144A | 125,000 | | 121,135 |
| Eaton Corporation | | | |
| 2.75%, 11/02/22 | 410,000 | | 417,742 |
| 4.15%, 11/02/42 | 200,000 | | 235,017 |
| eBay, Inc. | | | |
| 4.00%, 07/15/42 | 30,000 | | 33,605 |
| Ecolab, Inc. | | | |
| 4.80%, 03/24/30 | 60,000 | | 72,203 |
| 2.75%, 08/18/55 | 68,000 | | 67,227 |
| Emory University | | | |
| 1.57%, 09/01/25 | 1,600,000 | | 1,594,466 |
| | | Par | | Value |
| 2.14%, 09/01/30 | $1,170,000 | | $1,188,800 |
| Energy Transfer LP | | | |
| 4.20%, 09/15/23 | 625,000 | | 652,997 |
| 4.50%, 11/01/23 | 310,000 | | 324,894 |
| 4.25%, 04/01/24 | 100,000 | | 105,053 |
| 4.50%, 04/15/24 | 230,000 | | 243,940 |
| (Variable, U.S. Treasury Yield Curve Rate CMT 5Y + 5.13%), 6.75%, 05/15/25ρ ^ | 260,000 | | 260,975 |
| 5.95%, 12/01/25 | 300,000 | | 341,990 |
| 5.50%, 06/01/27 | 1,175,000 | | 1,341,339 |
| 4.95%, 05/15/28 | 900,000 | | 999,758 |
| 4.95%, 06/15/28 | 110,000 | | 123,937 |
| 5.25%, 04/15/29 | 1,410,000 | | 1,617,813 |
| 3.75%, 05/15/30Δ | 1,090,000 | | 1,157,381 |
| 5.30%, 04/01/44 | 20,000 | | 23,016 |
| 5.30%, 04/15/47 | 125,000 | | 145,631 |
| 5.40%, 10/01/47 | 50,000 | | 58,985 |
| 6.00%, 06/15/48 | 50,000 | | 62,442 |
| 6.25%, 04/15/49Δ | 590,000 | | 774,499 |
| Entergy Louisiana LLC | | | |
| 5.40%, 11/01/24 | 1,200,000 | | 1,331,074 |
| 2.35%, 06/15/32 | 2,200,000 | | 2,198,862 |
| Enterprise Products Operating LLC | | | |
| 4.15%, 10/16/28 | 600,000 | | 674,721 |
| 3.13%, 07/31/29 | 100,000 | | 106,393 |
| 2.80%, 01/31/30Δ | 890,000 | | 929,853 |
| 7.55%, 04/15/38 | 50,000 | | 74,967 |
| 5.70%, 02/15/42 | 60,000 | | 78,386 |
| 4.85%, 03/15/44 | 50,000 | | 60,503 |
| 4.80%, 02/01/49 | 30,000 | | 36,722 |
| 4.20%, 01/31/50 | 680,000 | | 766,985 |
| 3.70%, 01/31/51Δ | 970,000 | | 1,024,259 |
| 3.95%, 01/31/60 | 120,000 | | 130,504 |
| EOG Resources, Inc. | | | |
| 4.15%, 01/15/26 | 160,000 | | 175,017 |
| 4.38%, 04/15/30Δ | 40,000 | | 46,313 |
| 3.90%, 04/01/35 | 260,000 | | 295,648 |
| 4.95%, 04/15/50Δ | 490,000 | | 665,907 |
| EPR Properties REIT | | | |
| 4.75%, 12/15/26 | 1,265,000 | | 1,353,541 |
| 3.60%, 11/15/31 | 2,300,000 | | 2,280,556 |
| EQM Midstream Partners LP | | | |
| 4.13%, 12/01/26 | 1,800,000 | | 1,846,899 |
| EQT Corporation | | | |
| 3.00%, 10/01/22Δ | 20,000 | | 20,228 |
| 6.63%, 02/01/25 | 20,000 | | 22,575 |
| 3.13%, 05/15/26 144A Δ | 10,000 | | 10,278 |
| 3.90%, 10/01/27Δ | 440,000 | | 473,000 |
| 5.00%, 01/15/29 | 100,000 | | 110,893 |
| 3.63%, 05/15/31 144A Δ | 210,000 | | 218,202 |
| Equinix, Inc. REIT | | | |
| 2.63%, 11/18/24 | 1,700,000 | | 1,753,170 |
| 1.55%, 03/15/28 | 2,200,000 | | 2,119,794 |
| 3.00%, 07/15/50 | 10,000 | | 9,610 |
| Equitable Holdings, Inc. | | | |
| 4.35%, 04/20/28 | 2,600,000 | | 2,919,186 |
See Notes to Financial Statements.
| | | Par | | Value |
| Exelon Corporation | | | |
| 4.05%, 04/15/30 | $ 325,000 | | $ 361,822 |
| 5.63%, 06/15/35 | 415,000 | | 529,991 |
| 4.70%, 04/15/50 | 25,000 | | 31,576 |
| Exelon Generation Co. LLC | | | |
| 3.25%, 06/01/25 | 1,665,000 | | 1,746,566 |
| Expedia Group, Inc. | | | |
| 3.60%, 12/15/23 | 300,000 | | 311,894 |
| 6.25%, 05/01/25 144A | 1,054,000 | | 1,190,396 |
| 4.63%, 08/01/27 | 150,000 | | 167,243 |
| 3.80%, 02/15/28 | 300,000 | | 321,242 |
| 3.25%, 02/15/30 | 70,000 | | 71,579 |
| 2.95%, 03/15/31 | 2,350,000 | | 2,351,688 |
| Exxon Mobil Corporation | | | |
| 1.57%, 04/15/23 | 30,000 | | 30,350 |
| 2.99%, 03/19/25 | 660,000 | | 694,370 |
| 3.04%, 03/01/26 | 730,000 | | 773,369 |
| 3.48%, 03/19/30 | 540,000 | | 592,531 |
| 4.23%, 03/19/40 | 50,000 | | 59,383 |
| 4.11%, 03/01/46 | 230,000 | | 270,342 |
| 3.10%, 08/16/49 | 45,000 | | 45,902 |
| 4.33%, 03/19/50Δ | 190,000 | | 234,708 |
| 3.45%, 04/15/51 | 250,000 | | 272,547 |
| Federal Realty Investment Trust REIT | | | |
| 3.50%, 06/01/30 | 1,900,000 | | 2,031,448 |
| FedEx Corporation | | | |
| 4.05%, 02/15/48 | 375,000 | | 423,518 |
| Fidelity National Information Services, Inc. | | | |
| 1.15%, 03/01/26 | 2,200,000 | | 2,146,167 |
| Fifth Third Bancorp | | | |
| 2.38%, 01/28/25 | 375,000 | | 385,390 |
| Fiserv, Inc. | | | |
| 2.75%, 07/01/24 | 1,075,000 | | 1,112,745 |
| 3.20%, 07/01/26 | 725,000 | | 767,781 |
| 4.20%, 10/01/28Δ | 375,000 | | 421,182 |
| 2.65%, 06/01/30 | 2,300,000 | | 2,338,824 |
| Florida Power & Light Co. | | | |
| 3.80%, 12/15/42 | 425,000 | | 485,529 |
| Ford Motor Co. | | | |
| 3.25%, 02/12/32 | 590,000 | | 605,340 |
| Ford Motor Credit Co. LLC | | | |
| 2.98%, 08/03/22 | 1,800,000 | | 1,811,493 |
| (Floating, ICE LIBOR USD 3M + 1.24%), 1.39%, 02/15/23† | 2,200,000 | | 2,196,517 |
| 3.37%, 11/17/23 | 1,900,000 | | 1,961,750 |
| 2.90%, 02/16/28 | 380,000 | | 381,495 |
| 4.00%, 11/13/30 | 940,000 | | 1,012,878 |
| Fox Corporation | | | |
| 4.03%, 01/25/24 | 480,000 | | 507,240 |
| 4.71%, 01/25/29 | 250,000 | | 285,840 |
| 3.50%, 04/08/30Δ | 125,000 | | 134,803 |
| 5.48%, 01/25/39 | 525,000 | | 679,848 |
| Freeport-McMoRan, Inc. | | | |
| 3.88%, 03/15/23Δ | 10,000 | | 10,361 |
| 4.55%, 11/14/24 | 10,000 | | 10,727 |
| | | Par | | Value |
| 5.45%, 03/15/43 | $ 192,000 | | $ 241,736 |
| GA Global Funding Trust | | | |
| 1.25%, 12/08/23 144A | 2,300,000 | | 2,299,936 |
| General Dynamics Corporation | | | |
| 3.25%, 04/01/25 | 40,000 | | 42,327 |
| 3.50%, 05/15/25 | 40,000 | | 42,691 |
| 4.25%, 04/01/40 | 60,000 | | 73,595 |
| 4.25%, 04/01/50 | 180,000 | | 230,979 |
| General Electric Co. | | | |
| 6.75%, 03/15/32 | 44,000 | | 60,145 |
| 5.88%, 01/14/38 | 45,000 | | 61,465 |
| General Mills, Inc. | | | |
| 4.20%, 04/17/28 | 600,000 | | 670,975 |
| General Motors Co. | | | |
| 5.40%, 10/02/23 | 535,000 | | 572,940 |
| 4.00%, 04/01/25 | 200,000 | | 214,223 |
| 6.13%, 10/01/25 | 190,000 | | 218,541 |
| 4.20%, 10/01/27 | 65,000 | | 71,234 |
| 6.60%, 04/01/36 | 25,000 | | 33,912 |
| 5.15%, 04/01/38 | 50,000 | | 60,507 |
| 5.95%, 04/01/49 | 300,000 | | 412,896 |
| General Motors Financial Co., Inc. | | | |
| 3.45%, 04/10/22 | 230,000 | | 230,709 |
| 4.30%, 07/13/25 | 300,000 | | 323,772 |
| 4.35%, 01/17/27 | 560,000 | | 617,678 |
| 5.65%, 01/17/29 | 100,000 | | 118,883 |
| 2.70%, 06/10/31Δ | 575,000 | | 574,218 |
| Gilead Sciences, Inc. | | | |
| 3.70%, 04/01/24 | 230,000 | | 241,928 |
| 4.60%, 09/01/35 | 55,000 | | 66,747 |
| 4.50%, 02/01/45 | 275,000 | | 337,045 |
| 4.75%, 03/01/46 | 20,000 | | 25,481 |
| Glencore Funding LLC | | | |
| 3.00%, 10/27/22 144A Δ | 10,000 | | 10,159 |
| 4.13%, 05/30/23 144A | 20,000 | | 20,825 |
| 4.13%, 03/12/24 144A | 1,155,000 | | 1,215,291 |
| 4.63%, 04/29/24 144A | 658,000 | | 703,246 |
| 1.63%, 04/27/26 144A | 525,000 | | 515,873 |
| 4.00%, 03/27/27 144A Δ | 480,000 | | 518,529 |
| 3.88%, 10/27/27 144A | 520,000 | | 560,109 |
| 2.63%, 09/23/31 144A | 875,000 | | 852,216 |
| Global Payments, Inc. | | | |
| 2.65%, 02/15/25 | 400,000 | | 411,524 |
| 2.90%, 05/15/30Δ | 1,600,000 | | 1,632,466 |
| Goldman Sachs Capital II | | | |
| (Variable, ICE LIBOR USD 3M + 0.77%), 4.00%, 02/10/22† ρ | 3,000 | | 2,948 |
| Goldman Sachs Group, Inc. (The) | | | |
| 3.20%, 02/23/23 | 250,000 | | 256,473 |
| 3.85%, 07/08/24 | 150,000 | | 158,652 |
| 3.50%, 04/01/25 | 320,000 | | 338,725 |
| 4.25%, 10/21/25 | 1,170,000 | | 1,277,663 |
| 3.50%, 11/16/26 | 700,000 | | 746,737 |
| (Floating, ICE LIBOR USD 3M + 1.75%), 1.89%, 10/28/27† | 1,800,000 | | 1,886,107 |
See Notes to Financial Statements.
MEDIUM-DURATION BOND FUND
SCHEDULE OF INVESTMENTS (Continued)
| | | Par | | Value |
| (Variable, ICE LIBOR USD 3M + 1.16%), 3.81%, 04/23/29^ | $1,140,000 | | $1,242,004 |
| (Variable, ICE LIBOR USD 3M + 1.30%), 4.22%, 05/01/29^ | 990,000 | | 1,101,451 |
| (Variable, U.S. SOFR + 1.26%), 2.65%, 10/21/32^ | 1,450,000 | | 1,462,256 |
| 6.75%, 10/01/37 | 110,000 | | 156,552 |
| 6.25%, 02/01/41 | 750,000 | | 1,095,106 |
| (Variable, U.S. SOFR + 1.51%), 3.21%, 04/22/42^ | 60,000 | | 62,519 |
| (Variable, U.S. SOFR + 1.47%), 2.91%, 07/21/42^ | 150,000 | | 149,854 |
| 5.15%, 05/22/45 | 550,000 | | 718,706 |
| 4.75%, 10/21/45 | 220,000 | | 284,699 |
| Goodman U.S. Finance Three LLC REIT | | | |
| 3.70%, 03/15/28 144A | 1,000,000 | | 1,081,467 |
| Great-West Lifeco Finance 2018 LP | | | |
| 4.05%, 05/17/28 144A | 175,000 | | 198,221 |
| Guardian Life Global Funding | | | |
| 1.10%, 06/23/25 144A | 100,000 | | 99,183 |
| 1.25%, 11/19/27 144A | 1,800,000 | | 1,732,401 |
| H&E Equipment Services, Inc. | | | |
| 3.88%, 12/15/28 144A | 325,000 | | 323,139 |
| Halliburton Co. | | | |
| 3.80%, 11/15/25Δ | 40,000 | | 43,059 |
| 6.70%, 09/15/38 | 50,000 | | 69,021 |
| 5.00%, 11/15/45 | 190,000 | | 228,209 |
| HCA, Inc. | | | |
| 5.25%, 04/15/25 | 120,000 | | 132,904 |
| 5.25%, 06/15/26 | 10,000 | | 11,262 |
| 5.38%, 09/01/26Δ | 1,600,000 | | 1,800,080 |
| 5.50%, 06/15/47 | 50,000 | | 65,787 |
| Healthcare Realty Trust, Inc. REIT | | | |
| 2.05%, 03/15/31 | 175,000 | | 167,768 |
| Healthcare Trust of America Holdings LP REIT | | | |
| 3.10%, 02/15/30 | 1,500,000 | | 1,551,515 |
| Healthpeak Properties, Inc. REIT | | | |
| 3.50%, 07/15/29 | 65,000 | | 70,616 |
| Hewlett Packard Enterprise Co. | | | |
| 2.25%, 04/01/23 | 1,000,000 | | 1,015,550 |
| 4.45%, 10/02/23 | 1,350,000 | | 1,425,228 |
| 4.90%, 10/15/25 | 915,000 | | 1,016,058 |
| 6.35%, 10/15/45 | 155,000 | | 208,639 |
| Hilton Domestic Operating Co., Inc. | | | |
| 4.00%, 05/01/31 144A Δ | 986,000 | | 1,010,887 |
| 3.63%, 02/15/32 144A | 407,000 | | 405,537 |
| Home Depot, Inc. (The) | | | |
| 2.50%, 04/15/27 | 150,000 | | 156,630 |
| 3.90%, 12/06/28 | 270,000 | | 304,554 |
| 2.70%, 04/15/30 | 170,000 | | 178,735 |
| 3.30%, 04/15/40 | 450,000 | | 490,153 |
| 4.50%, 12/06/48 | 35,000 | | 45,519 |
| 3.35%, 04/15/50 | 830,000 | | 911,026 |
| 3.50%, 09/15/56 | 55,000 | | 62,499 |
| Honeywell International, Inc. | | | |
| 1.35%, 06/01/25 | 180,000 | | 180,920 |
| | | Par | | Value |
| Host Hotels & Resorts LP REIT | | | |
| 2.90%, 12/15/31 | $ 475,000 | | $ 459,321 |
| Humana, Inc. | | | |
| 3.15%, 12/01/22 | 70,000 | | 71,170 |
| 4.50%, 04/01/25 | 40,000 | | 43,641 |
| 3.95%, 03/15/27Δ | 150,000 | | 164,145 |
| 4.63%, 12/01/42 | 60,000 | | 74,417 |
| 4.95%, 10/01/44 | 70,000 | | 90,505 |
| 4.80%, 03/15/47 | 10,000 | | 12,785 |
| Huntington Bancshares, Inc. | | | |
| 4.00%, 05/15/25 | 550,000 | | 592,250 |
| Huntington Ingalls Industries, Inc. | | | |
| 0.67%, 08/16/23 144A | 2,500,000 | | 2,479,223 |
| Huntsman International LLC | | | |
| 4.50%, 05/01/29 | 325,000 | | 359,896 |
| 2.95%, 06/15/31 | 250,000 | | 254,058 |
| Hyatt Hotels Corporation | | | |
| 1.80%, 10/01/24 | 2,875,000 | | 2,875,960 |
| Hyundai Capital America | | | |
| 1.00%, 09/17/24 144A | 2,300,000 | | 2,262,096 |
| 1.65%, 09/17/26 144A | 2,300,000 | | 2,258,031 |
| 2.75%, 09/27/26 | 70,000 | | 71,575 |
| IHS Markit, Ltd. | | | |
| 4.00%, 03/01/26 144A | 631,000 | | 683,578 |
| Intel Corporation | | | |
| 3.40%, 03/25/25Δ | 65,000 | | 69,168 |
| 3.70%, 07/29/25 | 80,000 | | 86,427 |
| 1.60%, 08/12/28 | 250,000 | | 247,388 |
| 4.60%, 03/25/40 | 15,000 | | 18,760 |
| 3.73%, 12/08/47 | 76,000 | | 87,080 |
| 4.75%, 03/25/50 | 210,000 | | 281,331 |
| 3.05%, 08/12/51 | 120,000 | | 123,463 |
| Intercontinental Exchange, Inc. | | | |
| 3.00%, 06/15/50 | 1,500,000 | | 1,506,966 |
| International Business Machines Corporation | | | |
| 3.00%, 05/15/24 | 720,000 | | 752,662 |
| International Flavors & Fragrances, Inc. | | | |
| 1.83%, 10/15/27 144A | 650,000 | | 639,042 |
| 4.38%, 06/01/47 | 1,000,000 | | 1,168,141 |
| 5.00%, 09/26/48 | 55,000 | | 71,106 |
| Intuit, Inc. | | | |
| 1.35%, 07/15/27Δ | 175,000 | | 171,388 |
| Invitation Homes Operating Partnership LP REIT | | | |
| 2.30%, 11/15/28 | 375,000 | | 371,559 |
| IPALCO Enterprises, Inc. | | | |
| 4.25%, 05/01/30 | 1,800,000 | | 1,981,611 |
| ITC Holdings Corporation | | | |
| 2.95%, 05/14/30 144A | 1,900,000 | | 1,944,574 |
| JetBlue Pass-Through Trust, Series 2019-1, Class AA | | | |
| 2.75%, 05/15/32 | 1,920,765 | | 1,942,903 |
| JPMorgan Chase & Co. | | | |
| (Variable, ICE LIBOR USD 3M + 3.80%), 3.93%, 02/01/22† ρ | 1,260,000 | | 1,268,298 |
See Notes to Financial Statements.
| | | Par | | Value |
| (Variable, ICE LIBOR USD 3M + 0.73%), 3.56%, 04/23/24^ | $ 800,000 | | $ 827,026 |
| (Variable, U.S. SOFR + 1.46%), 1.51%, 06/01/24^ | 770,000 | | 776,167 |
| (Variable, ICE LIBOR USD 3M + 0.89%), 3.80%, 07/23/24^ | 1,775,000 | | 1,850,698 |
| 3.88%, 09/10/24Δ | 860,000 | | 912,976 |
| (Variable, ICE LIBOR USD 3M + 1.00%), 4.02%, 12/05/24^ | 1,425,000 | | 1,503,306 |
| (Variable, U.S. SOFR + 3.13%), 4.60%, 02/01/25ρ ^ | 875,000 | | 899,063 |
| (Variable, ICE LIBOR USD 3M + 1.16%), 3.22%, 03/01/25^ | 65,000 | | 67,619 |
| (Variable, U.S. SOFR + 1.16%), 2.30%, 10/15/25^ | 685,000 | | 701,153 |
| (Variable, U.S. SOFR + 1.85%), 2.08%, 04/22/26^ | 460,000 | | 467,432 |
| 2.95%, 10/01/26 | 700,000 | | 739,828 |
| (Variable, ICE LIBOR USD 3M + 1.25%), 3.96%, 01/29/27^ | 875,000 | | 946,394 |
| (Variable, U.S. SOFR + 0.77%), 1.47%, 09/22/27^ | 2,500,000 | | 2,453,139 |
| 4.25%, 10/01/27 | 780,000 | | 876,254 |
| 3.63%, 12/01/27 | 900,000 | | 970,976 |
| (Variable, ICE LIBOR USD 3M + 0.95%), 3.51%, 01/23/29^ | 1,720,000 | | 1,845,375 |
| (Variable, ICE LIBOR USD 3M + 1.26%), 4.20%, 07/23/29^ | 380,000 | | 425,773 |
| (Variable, ICE LIBOR USD 3M + 1.33%), 4.45%, 12/05/29^ | 170,000 | | 193,260 |
| (Variable, U.S. SOFR + 3.79%), 4.49%, 03/24/31^ | 75,000 | | 86,961 |
| (Variable, U.S. SOFR + 2.04%), 2.52%, 04/22/31^ | 575,000 | | 582,392 |
| (Variable, U.S. SOFR + 2.52%), 2.96%, 05/13/31^ | 300,000 | | 311,258 |
| (Variable, U.S. SOFR + 1.18%), 2.55%, 11/08/32^ | 880,000 | | 888,132 |
| 4.95%, 06/01/45 | 400,000 | | 523,392 |
| (Variable, U.S. SOFR + 2.44%), 3.11%, 04/22/51^ | 320,000 | | 332,808 |
| Keurig Dr. Pepper, Inc. | | | |
| 4.60%, 05/25/28 | 50,000 | | 56,953 |
| Keysight Technologies, Inc. | | | |
| 3.00%, 10/30/29 | 475,000 | | 494,064 |
| Kilroy Realty LP REIT | | | |
| 4.75%, 12/15/28 | 1,750,000 | | 2,004,834 |
| Kimberly-Clark Corporation | | | |
| 2.88%, 02/07/50 | 5,000 | | 5,160 |
| Kimco Realty Corporation REIT | | | |
| 2.25%, 12/01/31 | 75,000 | | 73,252 |
| Kinder Morgan Energy Partners LP | | | |
| 3.95%, 09/01/22Δ | 520,000 | | 527,028 |
| 3.50%, 09/01/23 | 2,250,000 | | 2,327,598 |
| 4.25%, 09/01/24 | 980,000 | | 1,045,749 |
| Kinder Morgan, Inc. | | | |
| 4.30%, 03/01/28 | 60,000 | | 66,774 |
| 5.20%, 03/01/48 | 10,000 | | 12,420 |
| KKR Group Finance Co. II LLC | | | |
| 5.50%, 02/01/43 144A | 30,000 | | 40,246 |
| | | Par | | Value |
| Kyndryl Holdings, Inc. | | | |
| 2.05%, 10/15/26 144A | $ 550,000 | | $ 536,155 |
| L3Harris Technologies, Inc. | | | |
| 5.05%, 04/27/45 | 50,000 | | 66,019 |
| Lear Corporation | | | |
| 5.25%, 05/15/49 | 35,000 | | 44,442 |
| Lehman Escrow Bonds | | | |
| 0.00%, 01/18/12# | 200,000 | | 1,100 |
| 0.00%, 01/24/13# | 2,300,000 | | 12,650 |
| 0.00%, 07/19/17Ψ ††† # | 150,000 | | — |
| 0.00%, 12/28/17Ψ ††† # | 3,340,000 | | — |
| 0.00%, 02/10/22Ψ ††† ρ # | 2,330,000 | | — |
| Level 3 Financing, Inc. | | | |
| 3.40%, 03/01/27 144A | 1,600,000 | | 1,653,928 |
| Life Storage LP REIT | | | |
| 3.88%, 12/15/27 | 900,000 | | 988,795 |
| Lincoln National Corporation | | | |
| 3.05%, 01/15/30 | 20,000 | | 20,840 |
| Lockheed Martin Corporation | | | |
| 3.10%, 01/15/23 | 40,000 | | 40,741 |
| 3.55%, 01/15/26Δ | 310,000 | | 336,034 |
| 4.50%, 05/15/36 | 50,000 | | 61,283 |
| Louisville Gas and Electric Co. | | | |
| 4.25%, 04/01/49 | 50,000 | | 61,396 |
| Lowe's Cos., Inc. | | | |
| 1.70%, 09/15/28 | 500,000 | | 490,772 |
| 4.50%, 04/15/30 | 110,000 | | 127,943 |
| 1.70%, 10/15/30 | 675,000 | | 642,821 |
| 3.00%, 10/15/50 | 150,000 | | 148,919 |
| Marathon Petroleum Corporation | | | |
| 3.80%, 04/01/28 | 125,000 | | 134,201 |
| 6.50%, 03/01/41 | 25,000 | | 34,520 |
| Marriott International, Inc. | | | |
| 2.13%, 10/03/22 | 1,500,000 | | 1,513,617 |
| Mars, Inc. | | | |
| 2.70%, 04/01/25 144A | 400,000 | | 416,413 |
| 3.20%, 04/01/30 144A | 475,000 | | 512,543 |
| 2.38%, 07/16/40 144A | 150,000 | | 143,535 |
| Marsh & McLennan Cos., Inc. | | | |
| 3.75%, 03/14/26 | 1,100,000 | | 1,195,377 |
| 4.38%, 03/15/29 | 500,000 | | 570,953 |
| Martin Marietta Materials, Inc. | | | |
| 3.20%, 07/15/51 | 1,225,000 | | 1,247,145 |
| Masco Corporation | | | |
| 1.50%, 02/15/28Δ | 2,575,000 | | 2,496,367 |
| Mastercard, Inc. | | | |
| 3.30%, 03/26/27 | 250,000 | | 270,499 |
| 3.85%, 03/26/50 | 310,000 | | 374,917 |
| McDonald’s Corporation | | | |
| 3.30%, 07/01/25 | 170,000 | | 180,434 |
| 1.45%, 09/01/25 | 40,000 | | 40,410 |
| 3.70%, 01/30/26 | 250,000 | | 269,352 |
| 3.50%, 03/01/27 | 360,000 | | 389,350 |
| 3.50%, 07/01/27 | 390,000 | | 423,527 |
| 3.80%, 04/01/28 | 90,000 | | 99,037 |
| 3.60%, 07/01/30Δ | 160,000 | | 177,140 |
See Notes to Financial Statements.
MEDIUM-DURATION BOND FUND
SCHEDULE OF INVESTMENTS (Continued)
| | | Par | | Value |
| 6.30%, 03/01/38 | $ 50,000 | | $ 71,315 |
| 3.63%, 09/01/49 | 130,000 | | 144,380 |
| 4.20%, 04/01/50 | 1,230,000 | | 1,498,131 |
| Medtronic, Inc. | | | |
| 3.50%, 03/15/25 | 10,000 | | 10,659 |
| 4.63%, 03/15/45 | 36,000 | | 47,407 |
| MetLife Capital Trust IV | | | |
| 7.88%, 12/15/37 144A | 300,000 | | 410,250 |
| MetLife, Inc. | | | |
| 6.40%, 12/15/36 | 50,000 | | 61,589 |
| Metropolitan Life Global Funding I | | | |
| 3.45%, 12/18/26 144A | 1,700,000 | | 1,835,794 |
| Microchip Technology, Inc. | | | |
| 2.67%, 09/01/23 | 675,000 | | 689,698 |
| Microsoft Corporation | | | |
| 2.88%, 02/06/24 | 470,000 | | 489,492 |
| 2.70%, 02/12/25 | 120,000 | | 125,767 |
| 3.13%, 11/03/25 | 60,000 | | 64,088 |
| 2.40%, 08/08/26 | 1,540,000 | | 1,614,085 |
| 3.30%, 02/06/27 | 800,000 | | 872,916 |
| 3.45%, 08/08/36 | 5,000 | | 5,777 |
| 2.53%, 06/01/50 | 18,000 | | 17,674 |
| 2.92%, 03/17/52 | 37,000 | | 39,546 |
| 2.68%, 06/01/60 | 22,000 | | 22,106 |
| 3.04%, 03/17/62 | 108,000 | | 116,424 |
| MidAmerican Energy Co. | | | |
| 3.65%, 04/15/29 | 350,000 | | 386,371 |
| Mileage Plus Holdings LLC | | | |
| 6.50%, 06/20/27 144A | 290,000 | | 310,011 |
| Mondelez International, Inc. | | | |
| 1.50%, 05/04/25 | 670,000 | | 671,426 |
| 2.75%, 04/13/30 | 55,000 | | 56,796 |
| Morgan Stanley | | | |
| 3.70%, 10/23/24 | 1,150,000 | | 1,225,786 |
| (Variable, U.S. SOFR + 1.15%), 2.72%, 07/22/25^ | 755,000 | | 778,632 |
| (Variable, U.S. SOFR + 1.99%), 2.19%, 04/28/26^ | 750,000 | | 765,612 |
| 3.63%, 01/20/27 | 1,475,000 | | 1,601,219 |
| 3.95%, 04/23/27 | 1,375,000 | | 1,513,985 |
| (Variable, ICE LIBOR USD 3M + 1.14%), 3.77%, 01/24/29^ | 220,000 | | 239,765 |
| (Variable, ICE LIBOR USD 3M + 1.63%), 4.43%, 01/23/30^ | 195,000 | | 222,597 |
| (Variable, U.S. SOFR + 1.14%), 2.70%, 01/22/31^ | 1,895,000 | | 1,942,684 |
| (Variable, U.S. SOFR + 3.12%), 3.62%, 04/01/31^ | 1,000,000 | | 1,091,889 |
| (Variable, U.S. SOFR + 1.03%), 1.79%, 02/13/32^ | 725,000 | | 687,856 |
| (Variable, U.S. SOFR + 1.20%), 2.51%, 10/20/32^ | 830,000 | | 831,151 |
| (Variable, U.S. SOFR + 1.36%), 2.48%, 09/16/36^ | 1,055,000 | | 1,016,924 |
| MPLX LP | | | |
| 4.88%, 12/01/24 | 230,000 | | 249,858 |
| 4.88%, 06/01/25 | 100,000 | | 109,544 |
| 4.00%, 03/15/28 | 50,000 | | 54,268 |
| 4.80%, 02/15/29 | 250,000 | | 285,973 |
| | | Par | | Value |
| 4.50%, 04/15/38Δ | $ 470,000 | | $ 528,471 |
| 4.70%, 04/15/48 | 1,020,000 | | 1,183,570 |
| 5.50%, 02/15/49 | 595,000 | | 764,033 |
| MPT Operating Partnership LP REIT | | | |
| 4.63%, 08/01/29 | 435,000 | | 459,678 |
| National Retail Properties, Inc. REIT | | | |
| 3.90%, 06/15/24 | 255,000 | | 269,524 |
| 3.60%, 12/15/26 | 250,000 | | 266,582 |
| National Securities Clearing Corporation | | | |
| 1.50%, 04/23/25 144A | 400,000 | | 402,871 |
| Nature Conservancy (The) | | | |
| 0.94%, 07/01/26 | 25,000 | | 24,385 |
| 1.30%, 07/01/28 | 25,000 | | 24,441 |
| NetApp, Inc. | | | |
| 1.88%, 06/22/25 | 1,700,000 | | 1,714,940 |
| 2.38%, 06/22/27 | 45,000 | | 46,244 |
| New York Life Global Funding | | | |
| 0.95%, 06/24/25 144A | 200,000 | | 197,336 |
| NextEra Energy Capital Holdings, Inc. | | | |
| 1.90%, 06/15/28 | 590,000 | | 584,737 |
| 2.25%, 06/01/30Δ | 1,900,000 | | 1,892,605 |
| Niagara Mohawk Power Corporation | | | |
| 4.28%, 12/15/28 144A | 2,000,000 | | 2,204,943 |
| Nielsen Finance LLC | | | |
| 5.88%, 10/01/30 144A | 83,000 | | 87,756 |
| NIKE, Inc. | | | |
| 2.40%, 03/27/25 | 140,000 | | 145,100 |
| 2.75%, 03/27/27Δ | 220,000 | | 233,362 |
| 3.25%, 03/27/40 | 140,000 | | 153,017 |
| 3.38%, 03/27/50 | 520,000 | | 591,374 |
| NiSource, Inc. | | | |
| 3.49%, 05/15/27 | 925,000 | | 994,298 |
| 3.60%, 05/01/30 | 100,000 | | 108,003 |
| 3.95%, 03/30/48 | 450,000 | | 508,490 |
| Nissan Motor Acceptance Co. LLC | | | |
| (Floating, ICE LIBOR USD 3M + 0.89%), 1.01%, 01/13/22 144A † | 1,900,000 | | 1,900,179 |
| 2.75%, 03/09/28 144A | 2,200,000 | | 2,187,965 |
| Northrop Grumman Corporation | | | |
| 2.93%, 01/15/25 | 870,000 | | 907,220 |
| 3.25%, 01/15/28 | 900,000 | | 964,741 |
| 5.25%, 05/01/50 | 180,000 | | 253,645 |
| Northwell Healthcare, Inc. | | | |
| 6.15%, 11/01/43 | 375,000 | | 552,166 |
| Northwestern Mutual Life Insurance Co. (The) | | | |
| 6.06%, 03/30/40 144A | 300,000 | | 426,445 |
| 3.85%, 09/30/47 144A | 250,000 | | 283,967 |
| NRG Energy, Inc. | | | |
| 3.75%, 06/15/24 144A | 625,000 | | 652,626 |
| 3.38%, 02/15/29 144A | 318,000 | | 312,065 |
| 3.63%, 02/15/31 144A | 850,000 | | 830,203 |
| NVIDIA Corporation | | | |
| 2.85%, 04/01/30 | 350,000 | | 372,501 |
| 3.50%, 04/01/40 | 880,000 | | 993,563 |
See Notes to Financial Statements.
| | | Par | | Value |
| 3.50%, 04/01/50 | $1,120,000 | | $1,284,653 |
| 3.70%, 04/01/60 | 460,000 | | 554,004 |
| Occidental Petroleum Corporation | | | |
| 6.95%, 07/01/24 | 290,000 | | 321,942 |
| 5.55%, 03/15/26 | 435,000 | | 484,755 |
| 3.40%, 04/15/26 | 500,000 | | 513,028 |
| 3.20%, 08/15/26 | 260,000 | | 268,208 |
| 3.00%, 02/15/27 | 150,000 | | 152,408 |
| 7.88%, 09/15/31Δ | 280,000 | | 374,186 |
| 6.45%, 09/15/36 | 205,000 | | 261,784 |
| 4.63%, 06/15/45 | 130,000 | | 135,072 |
| 6.60%, 03/15/46 | 220,000 | | 285,795 |
| 4.40%, 04/15/46 | 60,000 | | 61,613 |
| 4.10%, 02/15/47 | 260,000 | | 255,194 |
| 4.20%, 03/15/48 | 80,000 | | 80,130 |
| Omega Healthcare Investors, Inc. REIT | | | |
| 3.63%, 10/01/29 | 1,600,000 | | 1,663,880 |
| ONEOK, Inc. | | | |
| 6.35%, 01/15/31 | 1,600,000 | | 2,013,020 |
| Oracle Corporation | | | |
| 3.80%, 11/15/37 | 65,000 | | 68,144 |
| 3.60%, 04/01/40 | 400,000 | | 403,428 |
| 5.38%, 07/15/40 | 55,000 | | 67,460 |
| 4.00%, 07/15/46 | 375,000 | | 391,438 |
| Otis Worldwide Corporation | | | |
| 2.06%, 04/05/25 | 130,000 | | 132,315 |
| 2.29%, 04/05/27 | 200,000 | | 204,076 |
| 2.57%, 02/15/30 | 25,000 | | 25,408 |
| Owl Rock Capital Corporation | | | |
| 2.88%, 06/11/28Δ | 2,200,000 | | 2,162,938 |
| Pacific Gas and Electric Co. | | | |
| 1.75%, 06/16/22Δ | 2,900,000 | | 2,900,020 |
| 1.70%, 11/15/23 | 2,200,000 | | 2,205,660 |
| 3.40%, 08/15/24 | 600,000 | | 620,648 |
| 3.15%, 01/01/26 | 1,300,000 | | 1,330,707 |
| 2.95%, 03/01/26Δ | 800,000 | | 814,186 |
| 2.10%, 08/01/27 | 370,000 | | 357,751 |
| 4.55%, 07/01/30 | 1,800,000 | | 1,949,817 |
| 2.50%, 02/01/31 | 610,000 | | 582,089 |
| 3.30%, 08/01/40 | 165,000 | | 153,704 |
| 3.50%, 08/01/50Δ | 70,000 | | 65,243 |
| Pacific Life Global Funding II | | | |
| 1.20%, 06/24/25 144A | 1,700,000 | | 1,680,950 |
| PacifiCorp | | | |
| 4.15%, 02/15/50 | 60,000 | | 71,418 |
| Parsley Energy LLC | | | |
| 4.13%, 02/15/28 144A | 30,000 | | 30,326 |
| PayPal Holdings, Inc. | | | |
| 1.35%, 06/01/23 | 220,000 | | 221,879 |
| 1.65%, 06/01/25 | 1,380,000 | | 1,398,526 |
| 2.65%, 10/01/26 | 2,775,000 | | 2,916,361 |
| 2.30%, 06/01/30 | 300,000 | | 305,333 |
| PepsiCo, Inc. | | | |
| 0.75%, 05/01/23 | 300,000 | | 300,501 |
| 2.25%, 03/19/25 | 20,000 | | 20,689 |
| 2.63%, 03/19/27Δ | 30,000 | | 31,452 |
| | | Par | | Value |
| 2.63%, 07/29/29 | $ 65,000 | | $ 68,498 |
| 1.63%, 05/01/30 | 250,000 | | 242,976 |
| 2.88%, 10/15/49Δ | 100,000 | | 105,558 |
| PerkinElmer, Inc. | | | |
| 3.30%, 09/15/29 | 65,000 | | 68,930 |
| Phillips 66 | | | |
| 3.70%, 04/06/23 | 400,000 | | 413,658 |
| 3.85%, 04/09/25 | 100,000 | | 106,736 |
| 1.30%, 02/15/26 | 175,000 | | 171,468 |
| Physicians Realty LP REIT | | | |
| 3.95%, 01/15/28 | 2,400,000 | | 2,626,039 |
| Pioneer Natural Resources Co. | | | |
| 1.13%, 01/15/26 | 70,000 | | 68,083 |
| 2.15%, 01/15/31 | 290,000 | | 279,272 |
| Plains All American Pipeline LP | | | |
| 3.65%, 06/01/22 | 200,000 | | 200,989 |
| 3.85%, 10/15/23 | 725,000 | | 752,309 |
| Post Holdings, Inc. | | | |
| 5.50%, 12/15/29 144A | 350,000 | | 368,169 |
| Prime Security Services Borrower LLC | | | |
| 3.38%, 08/31/27 144A | 770,000 | | 743,639 |
| Principal Life Global Funding II | | | |
| 1.25%, 06/23/25 144A | 90,000 | | 89,041 |
| Procter & Gamble Co. (The) | | | |
| 2.80%, 03/25/27 | 75,000 | | 79,414 |
| 2.85%, 08/11/27Δ | 45,000 | | 48,216 |
| 3.00%, 03/25/30 | 130,000 | | 141,552 |
| Progress Energy, Inc. | | | |
| 7.75%, 03/01/31 | 350,000 | | 488,594 |
| Public Storage REIT | | | |
| 0.50%, 09/09/30(E) | 2,000,000 | | 2,206,953 |
| QUALCOMM, Inc. | | | |
| 4.65%, 05/20/35 | 55,000 | | 68,586 |
| 4.80%, 05/20/45 | 10,000 | | 13,327 |
| Quanta Services, Inc. | | | |
| 2.90%, 10/01/30 | 25,000 | | 25,480 |
| Range Resources Corporation | | | |
| 5.00%, 03/15/23 | 322,000 | | 329,586 |
| 4.88%, 05/15/25 | 10,000 | | 10,338 |
| Raymond James Financial, Inc. | | | |
| 4.65%, 04/01/30 | 75,000 | | 87,141 |
| Raytheon Technologies Corporation | | | |
| 3.15%, 12/15/24 | 120,000 | | 126,137 |
| 3.95%, 08/16/25 | 530,000 | | 575,323 |
| 3.50%, 03/15/27 | 550,000 | | 589,895 |
| 4.13%, 11/16/28 | 665,000 | | 745,094 |
| 2.25%, 07/01/30 | 540,000 | | 539,685 |
| 4.50%, 06/01/42Δ | 90,000 | | 112,419 |
| 4.05%, 05/04/47 | 375,000 | | 436,314 |
| Realty Income Corporation REIT | | | |
| 4.63%, 11/01/25 | 600,000 | | 665,837 |
| 3.95%, 08/15/27 | 150,000 | | 166,529 |
| 3.40%, 01/15/28 | 200,000 | | 216,008 |
| 3.25%, 01/15/31 | 1,800,000 | | 1,939,712 |
| 2.85%, 12/15/32 | 800,000 | | 832,228 |
See Notes to Financial Statements.
MEDIUM-DURATION BOND FUND
SCHEDULE OF INVESTMENTS (Continued)
| | | Par | | Value |
| Regency Centers LP REIT | | | |
| 2.95%, 09/15/29 | $ 775,000 | | $ 805,939 |
| Regeneron Pharmaceuticals, Inc. | | | |
| 1.75%, 09/15/30Δ | 1,500,000 | | 1,421,777 |
| Reinsurance Group of America, Inc. | | | |
| 3.90%, 05/15/29 | 65,000 | | 71,277 |
| RELX Capital, Inc. | | | |
| 3.50%, 03/16/23 | 300,000 | | 308,913 |
| Republic Services, Inc. | | | |
| 2.50%, 08/15/24 | 190,000 | | 195,680 |
| Roche Holdings, Inc. | | | |
| 2.61%, 12/13/51 144A | 820,000 | | 804,811 |
| Roper Technologies, Inc. | | | |
| 4.20%, 09/15/28 | 500,000 | | 562,234 |
| Ross Stores, Inc. | | | |
| 4.60%, 04/15/25 | 65,000 | | 71,293 |
| Rush Obligated Group | | | |
| 3.92%, 11/15/29 | 400,000 | | 447,835 |
| Sabine Pass Liquefaction LLC | | | |
| 5.63%, 04/15/23 | 400,000 | | 418,509 |
| 5.63%, 03/01/25 | 450,000 | | 500,135 |
| 5.00%, 03/15/27 | 425,000 | | 477,940 |
| 4.20%, 03/15/28 | 300,000 | | 329,110 |
| 4.50%, 05/15/30 | 1,600,000 | | 1,808,055 |
| Sabra Health Care LP REIT | | | |
| 3.90%, 10/15/29 | 1,500,000 | | 1,573,680 |
| salesforce.com, Inc. | | | |
| 3.25%, 04/11/23 | 300,000 | | 309,548 |
| San Diego Gas & Electric Co. | | | |
| 2.95%, 08/15/51 | 2,300,000 | | 2,299,506 |
| Santander Holdings U.S.A., Inc. | | | |
| 4.50%, 07/17/25 | 60,000 | | 65,031 |
| 3.24%, 10/05/26 | 1,100,000 | | 1,149,532 |
| SBA Communications Corporation REIT | | | |
| 3.13%, 02/01/29 144A | 598,000 | | 575,001 |
| SBA Tower Trust REIT | | | |
| 2.84%, 01/15/25 144A | 2,200,000 | | 2,259,548 |
| 2.33%, 01/15/28 144A | 2,300,000 | | 2,350,410 |
| Schlumberger Holdings Corporation | | | |
| 4.00%, 12/21/25 144A | 190,000 | | 204,923 |
| 3.90%, 05/17/28 144A | 292,000 | | 315,907 |
| Schlumberger Investment SA | | | |
| 2.65%, 06/26/30Δ | 35,000 | | 35,939 |
| Sempra Energy | | | |
| 3.40%, 02/01/28 | 275,000 | | 293,198 |
| ServiceNow, Inc. | | | |
| 1.40%, 09/01/30 | 675,000 | | 629,770 |
| Sherwin-Williams Co. (The) | | | |
| 3.13%, 06/01/24Δ | 75,000 | | 78,344 |
| 3.45%, 06/01/27 | 350,000 | | 379,181 |
| 2.95%, 08/15/29 | 475,000 | | 500,676 |
| Simon Property Group LP REIT | | | |
| 2.45%, 09/13/29 | 1,670,000 | | 1,684,577 |
| Skyworks Solutions, Inc. | | | |
| 1.80%, 06/01/26Δ | 2,200,000 | | 2,181,195 |
| Southern California Edison Co. | | | |
| 3.70%, 08/01/25 | 2,800,000 | | 2,993,004 |
| | | Par | | Value |
| 4.20%, 03/01/29 | $ 400,000 | | $ 446,822 |
| 4.88%, 03/01/49 | 55,000 | | 67,531 |
| Southern Co. (The) | | | |
| 3.25%, 07/01/26 | 1,400,000 | | 1,483,297 |
| Southern Co. Gas Capital Corporation | | | |
| 3.25%, 06/15/26 | 300,000 | | 318,974 |
| Southern Copper Corporation | | | |
| 5.25%, 11/08/42 | 2,710,000 | | 3,415,670 |
| 5.88%, 04/23/45 | 200,000 | | 275,027 |
| Southern Natural Gas Co. LLC | | | |
| 8.00%, 03/01/32 | 400,000 | | 557,691 |
| Southern Power Co. | | | |
| 4.95%, 12/15/46Δ | 50,000 | | 61,138 |
| Southwestern Electric Power Co. | | | |
| 2.75%, 10/01/26 | 65,000 | | 67,310 |
| Southwestern Energy Co. | | | |
| 5.38%, 02/01/29 | 10,000 | | 10,589 |
| 5.38%, 03/15/30Δ | 40,000 | | 42,930 |
| 4.75%, 02/01/32 | 90,000 | | 94,919 |
| Spectra Energy Partners LP | | | |
| 3.50%, 03/15/25 | 65,000 | | 68,427 |
| Spirit AeroSystems, Inc. | | | |
| 3.95%, 06/15/23 | 1,500,000 | | 1,513,440 |
| Spirit Airlines Pass-Through Trust, Series 2015-1, Class A | | | |
| 4.10%, 04/01/28 | 989,707 | | 1,022,991 |
| Spirit Realty LP REIT | | | |
| 4.45%, 09/15/26 | 1,200,000 | | 1,322,314 |
| 4.00%, 07/15/29 | 750,000 | | 825,562 |
| Sprint Spectrum Co. LLC | | | |
| 5.15%, 03/20/28 144A | 1,100,000 | | 1,214,372 |
| Starbucks Corporation | | | |
| 3.80%, 08/15/25 | 625,000 | | 675,111 |
| 2.55%, 11/15/30 | 1,900,000 | | 1,942,073 |
| State Street Corporation | | | |
| (Variable, ICE LIBOR USD 3M + 1.03%), 4.14%, 12/03/29^ | 60,000 | | 68,260 |
| (Variable, U.S. SOFR + 2.65%), 3.15%, 03/30/31^ | 240,000 | | 260,395 |
| Steel Dynamics, Inc. | | | |
| 2.40%, 06/15/25 | 140,000 | | 143,410 |
| 1.65%, 10/15/27Δ | 275,000 | | 269,478 |
| Stifel Financial Corporation | | | |
| 4.00%, 05/15/30 | 1,900,000 | | 2,087,863 |
| Sutter Health | | | |
| 2.29%, 08/15/30 | 215,000 | | 215,165 |
| Sysco Corporation | | | |
| 6.60%, 04/01/40 | 675,000 | | 983,640 |
| Targa Resources Partners LP | | | |
| 5.88%, 04/15/26 | 350,000 | | 365,656 |
| 6.50%, 07/15/27 | 355,000 | | 380,943 |
| 5.00%, 01/15/28 | 70,000 | | 73,872 |
| 5.50%, 03/01/30 | 120,000 | | 131,302 |
| 4.88%, 02/01/31 | 70,000 | | 76,138 |
| 4.00%, 01/15/32 144A | 30,000 | | 31,402 |
| Teachers Insurance & Annuity Association of America | | | |
| 6.85%, 12/16/39 144A | 46,000 | | 69,037 |
See Notes to Financial Statements.
| | | Par | | Value |
| 4.90%, 09/15/44 144A | $ 520,000 | | $ 671,616 |
| Tennessee Gas Pipeline Co. LLC | | | |
| 2.90%, 03/01/30 144A | 1,430,000 | | 1,455,529 |
| Texas Instruments, Inc. | | | |
| 1.75%, 05/04/30 | 370,000 | | 363,636 |
| Textron, Inc. | | | |
| 2.45%, 03/15/31 | 1,700,000 | | 1,674,800 |
| Time Warner Cable LLC | | | |
| 7.30%, 07/01/38 | 880,000 | | 1,250,284 |
| 5.88%, 11/15/40 | 300,000 | | 375,989 |
| Time Warner Entertainment Co. LP | | | |
| 8.38%, 03/15/23 | 975,000 | | 1,057,635 |
| 8.38%, 07/15/33 | 390,000 | | 569,249 |
| TJX Cos., Inc. (The) | | | |
| 2.25%, 09/15/26Δ | 40,000 | | 41,368 |
| T-Mobile U.S.A., Inc. | | | |
| 3.50%, 04/15/25 | 1,495,000 | | 1,585,638 |
| 1.50%, 02/15/26 | 400,000 | | 395,704 |
| 2.25%, 02/15/26Δ | 70,000 | | 70,282 |
| 3.75%, 04/15/27 | 2,325,000 | | 2,520,459 |
| 2.05%, 02/15/28 | 1,085,000 | | 1,078,649 |
| 2.63%, 02/15/29 | 320,000 | | 315,754 |
| 3.88%, 04/15/30 | 1,985,000 | | 2,175,758 |
| 2.55%, 02/15/31 | 1,570,000 | | 1,565,101 |
| 2.88%, 02/15/31Δ | 160,000 | | 158,293 |
| 3.50%, 04/15/31 | 260,000 | | 270,850 |
| 3.50%, 04/15/31 144A | 190,000 | | 197,929 |
| 2.70%, 03/15/32 144A | 610,000 | | 615,277 |
| 4.38%, 04/15/40 | 60,000 | | 68,876 |
| 3.00%, 02/15/41 | 365,000 | | 358,034 |
| 3.40%, 10/15/52 144A | 380,000 | | 380,276 |
| Transcontinental Gas Pipe Line Co. LLC | | | |
| 7.85%, 02/01/26 | 880,000 | | 1,075,605 |
| 3.25%, 05/15/30 | 870,000 | | 918,933 |
| TransDigm, Inc. | | | |
| 6.38%, 06/15/26 | 350,000 | | 360,008 |
| 7.50%, 03/15/27 | 300,000 | | 313,800 |
| 4.63%, 01/15/29 | 130,000 | | 129,804 |
| Tronox, Inc. | | | |
| 4.63%, 03/15/29 144A | 1,225,000 | | 1,225,686 |
| Truist Financial Corporation | | | |
| (Variable, U.S. SOFR + 0.61%), 1.27%, 03/02/27^ | 35,000 | | 34,377 |
| (Variable, U.S. SOFR + 0.86%), 1.89%, 06/07/29^ | 55,000 | | 54,247 |
| U.S. Bancorp | | | |
| 1.45%, 05/12/25 | 2,380,000 | | 2,392,610 |
| (Variable, U.S. Treasury Yield Curve Rate CMT 5Y + 2.54%), 3.70%, 01/15/27ρ ^ | 775,000 | | 776,782 |
| UDR, Inc. REIT | | | |
| 3.20%, 01/15/30 | 1,200,000 | | 1,263,647 |
| 2.10%, 08/01/32 | 150,000 | | 143,160 |
| Union Pacific Corporation | | | |
| 3.75%, 07/15/25Δ | 210,000 | | 227,122 |
| 2.89%, 04/06/36 | 670,000 | | 704,317 |
| 3.84%, 03/20/60 | 480,000 | | 569,462 |
| 3.75%, 02/05/70 | 80,000 | | 91,407 |
| | | Par | | Value |
| United Airlines Pass-Through Trust, Series 2016-2, Class A | | | |
| 3.10%, 10/07/28 | $ 630,842 | | $ 625,988 |
| United Airlines Pass-Through Trust, Series 2016-2, Class AA | | | |
| 2.88%, 10/07/28 | 630,842 | | 644,320 |
| United Airlines Pass-Through Trust, Series 2020-1, Class A | | | |
| 5.88%, 10/15/27 | 1,987,260 | | 2,180,999 |
| United Airlines, Inc. | | | |
| 4.38%, 04/15/26 144A | 20,000 | | 20,881 |
| 4.63%, 04/15/29 144A | 250,000 | | 258,333 |
| United Parcel Service, Inc. | | | |
| 3.90%, 04/01/25 | 15,000 | | 16,205 |
| 5.30%, 04/01/50 | 45,000 | | 66,870 |
| UnitedHealth Group, Inc. | | | |
| 2.38%, 10/15/22Δ | 40,000 | | 40,575 |
| 3.50%, 06/15/23 | 90,000 | | 93,641 |
| 3.75%, 07/15/25Δ | 230,000 | | 249,701 |
| 1.25%, 01/15/26 | 90,000 | | 89,786 |
| 3.45%, 01/15/27 | 45,000 | | 49,032 |
| 2.00%, 05/15/30 | 690,000 | | 686,441 |
| 2.75%, 05/15/40 | 700,000 | | 714,146 |
| 4.25%, 06/15/48 | 215,000 | | 267,828 |
| 4.45%, 12/15/48 | 50,000 | | 64,185 |
| 3.70%, 08/15/49 | 170,000 | | 196,841 |
| 2.90%, 05/15/50 | 290,000 | | 297,386 |
| 3.88%, 08/15/59 | 190,000 | | 229,070 |
| 3.13%, 05/15/60 | 30,000 | | 31,197 |
| University of Chicago (The) | | | |
| 5.42%, 10/01/30 | 100,000 | | 119,619 |
| Utah Acquisition Sub, Inc. | | | |
| 2.25%, 11/22/24(E) | 1,500,000 | | 1,805,570 |
| 3.95%, 06/15/26Δ | 1,700,000 | | 1,835,733 |
| Valero Energy Corporation | | | |
| 2.85%, 04/15/25 | 600,000 | | 622,002 |
| Vanguard Group, Inc. (The) | | | |
| 3.05%, 08/22/50††† | 390,000 | | 381,378 |
| Ventas Realty LP REIT | | | |
| 3.00%, 01/15/30Δ | 1,700,000 | | 1,758,073 |
| Verizon Communications, Inc. | | | |
| 2.63%, 08/15/26 | 280,000 | | 291,981 |
| 3.00%, 03/22/27 | 70,000 | | 74,022 |
| 2.10%, 03/22/28 | 405,000 | | 406,394 |
| 4.33%, 09/21/28 | 2,018,000 | | 2,296,285 |
| 3.88%, 02/08/29 | 360,000 | | 399,655 |
| 3.15%, 03/22/30 | 1,465,000 | | 1,553,324 |
| 1.75%, 01/20/31 | 250,000 | | 237,184 |
| 2.55%, 03/21/31Δ | 4,360,000 | | 4,408,218 |
| 2.36%, 03/15/32 144A | 5,416,000 | | 5,349,294 |
| 4.50%, 08/10/33 | 430,000 | | 506,922 |
| 5.25%, 03/16/37 | 530,000 | | 691,286 |
| 2.65%, 11/20/40 | 1,250,000 | | 1,193,360 |
| 3.85%, 11/01/42 | 40,000 | | 44,943 |
| 4.13%, 08/15/46 | 380,000 | | 443,292 |
| 4.86%, 08/21/46 | 290,000 | | 375,369 |
| 5.50%, 03/16/47 | 40,000 | | 56,115 |
| 4.00%, 03/22/50 | 190,000 | | 221,391 |
See Notes to Financial Statements.
MEDIUM-DURATION BOND FUND
SCHEDULE OF INVESTMENTS (Continued)
| | | Par | | Value |
| 2.88%, 11/20/50 | $1,250,000 | | $1,194,334 |
| 2.99%, 10/30/56 | 746,000 | | 710,902 |
| ViacomCBS, Inc. | | | |
| 4.38%, 03/15/43 | 60,000 | | 68,611 |
| Visa, Inc. | | | |
| 3.15%, 12/14/25 | 450,000 | | 480,268 |
| 2.05%, 04/15/30 | 270,000 | | 273,941 |
| 4.15%, 12/14/35 | 60,000 | | 72,024 |
| 2.70%, 04/15/40 | 270,000 | | 277,244 |
| 4.30%, 12/14/45 | 460,000 | | 581,980 |
| Vistra Operations Co. LLC | | | |
| 3.55%, 07/15/24 144A | 1,150,000 | | 1,185,180 |
| VMware, Inc. | | | |
| 2.95%, 08/21/22 | 1,800,000 | | 1,821,393 |
| 4.65%, 05/15/27 | 700,000 | | 788,300 |
| 3.90%, 08/21/27 | 500,000 | | 545,110 |
| 1.80%, 08/15/28 | 225,000 | | 219,329 |
| 2.20%, 08/15/31 | 600,000 | | 589,746 |
| Volkswagen Group of America Finance LLC | | | |
| 3.13%, 05/12/23 144A | 1,600,000 | | 1,645,498 |
| Voya Financial, Inc. | | | |
| 5.70%, 07/15/43Δ | 170,000 | | 232,923 |
| Walgreens Boots Alliance, Inc. | | | |
| 4.10%, 04/15/50Δ | 65,000 | | 73,314 |
| Walmart, Inc. | | | |
| 1.50%, 09/22/28Δ | 150,000 | | 149,319 |
| 1.80%, 09/22/31 | 80,000 | | 79,385 |
| Walt Disney Co. (The) | | | |
| 3.70%, 09/15/24 | 625,000 | | 664,653 |
| 2.20%, 01/13/28Δ | 1,300,000 | | 1,326,289 |
| 2.65%, 01/13/31 | 400,000 | | 417,029 |
| 6.65%, 11/15/37 | 150,000 | | 223,135 |
| Waste Management, Inc. | | | |
| 1.15%, 03/15/28Δ | 250,000 | | 239,012 |
| WEA Finance LLC REIT | | | |
| 3.75%, 09/17/24 144A | 770,000 | | 808,341 |
| Wells Fargo & Co. | | | |
| 3.45%, 02/13/23 | 200,000 | | 205,844 |
| (Floating, ICE LIBOR USD 3M + 1.23%), 1.36%, 10/31/23† | 600,000 | | 604,913 |
| 4.48%, 01/16/24 | 396,000 | | 420,911 |
| 3.75%, 01/24/24 | 1,325,000 | | 1,392,957 |
| 3.55%, 09/29/25 | 2,000,000 | | 2,134,044 |
| 3.00%, 04/22/26Δ | 900,000 | | 946,808 |
| (Variable, U.S. SOFR + 2.00%), 2.19%, 04/30/26^ | 1,540,000 | | 1,569,043 |
| 4.10%, 06/03/26 | 440,000 | | 480,281 |
| 3.00%, 10/23/26 | 2,210,000 | | 2,324,737 |
| 4.30%, 07/22/27 | 1,780,000 | | 1,985,836 |
| 4.15%, 01/24/29 | 645,000 | | 723,234 |
| (Variable, U.S. SOFR + 1.43%), 2.88%, 10/30/30^ | 410,000 | | 427,069 |
| (Variable, U.S. SOFR + 4.03%), 4.48%, 04/04/31^ | 1,240,000 | | 1,443,229 |
| 5.38%, 11/02/43 | 190,000 | | 252,354 |
| 4.65%, 11/04/44 | 70,000 | | 85,189 |
| | | Par | | Value |
| 4.90%, 11/17/45Δ | $ 370,000 | | $ 467,790 |
| 4.40%, 06/14/46 | 370,000 | | 440,961 |
| 4.75%, 12/07/46 | 260,000 | | 326,310 |
| (Variable, U.S. SOFR + 4.50%), 5.01%, 04/04/51^ | 3,475,000 | | 4,771,538 |
| Welltower, Inc. REIT | | | |
| 4.25%, 04/01/26 | 898,000 | | 985,168 |
| 3.10%, 01/15/30 | 65,000 | | 68,234 |
| Western Midstream Operating LP | | | |
| (Floating, ICE LIBOR USD 3M + 1.85%), 1.97%, 01/13/23† Δ | 80,000 | | 79,895 |
| 4.35%, 02/01/25 | 220,000 | | 230,177 |
| 4.50%, 03/01/28 | 60,000 | | 65,432 |
| 5.30%, 02/01/30Δ | 780,000 | | 860,344 |
| 5.45%, 04/01/44 | 75,000 | | 89,732 |
| 5.30%, 03/01/48Δ | 65,000 | | 78,420 |
| 5.50%, 08/15/48 | 160,000 | | 191,590 |
| 6.50%, 02/01/50 | 130,000 | | 153,922 |
| Westinghouse Air Brake Technologies Corporation | | | |
| 4.95%, 09/15/28 | 60,000 | | 68,314 |
| Westlake Chemical Corporation | | | |
| 3.60%, 08/15/26 | 55,000 | | 59,061 |
| WestRock RKT LLC | | | |
| 4.00%, 03/01/23 | 30,000 | | 30,815 |
| Williams Cos., Inc. (The) | | | |
| 3.90%, 01/15/25 | 300,000 | | 319,122 |
| 7.50%, 01/15/31 | 100,000 | | 135,810 |
| 7.75%, 06/15/31 | 585,000 | | 795,202 |
| 8.75%, 03/15/32 | 181,000 | | 269,091 |
| 5.75%, 06/24/44 | 160,000 | | 208,878 |
| WP Carey, Inc. REIT | | | |
| 4.60%, 04/01/24 | 160,000 | | 169,985 |
| 4.00%, 02/01/25 | 105,000 | | 111,815 |
| 3.85%, 07/15/29 | 900,000 | | 992,814 |
| WR Grace Holdings LLC | | | |
| 4.88%, 06/15/27 144A Δ | 730,000 | | 750,717 |
| WRKCo, Inc. | | | |
| 3.75%, 03/15/25 | 500,000 | | 533,351 |
| 4.00%, 03/15/28 | 1,100,000 | | 1,217,623 |
| Xerox Holdings Corporation | | | |
| 5.00%, 08/15/25 144A | 1,240,000 | | 1,315,702 |
| Zoetis, Inc. | | | |
| 2.00%, 05/15/30 | 1,900,000 | | 1,877,166 |
Total Corporate Bonds
(Cost $659,567,438) | | | 684,139,561 |
| FOREIGN BONDS — 12.5% |
| Argentina — 0.0% | | |
| Argentine Republic Government International Bond | | | |
| 1.00%, 07/09/29 | 93,932 | | 34,286 |
| (Step to 0.75% on 07/09/23), 0.50%, 07/09/30 STEP | 1,614,303 | | 569,058 |
| (Step to 1.50% on 07/09/22), 1.13%, 07/09/35 STEP | 451,796 | | 145,144 |
See Notes to Financial Statements.
| | | Par | | Value |
| (Step to 3.50% on 07/09/22), 2.50%, 07/09/41 STEP | $ 810,000 | | $ 287,145 |
| | | | | 1,035,633 |
| Australia — 0.1% | | |
| APT Pipelines, Ltd. | | | |
| 4.20%, 03/23/25 144A | 60,000 | | 64,233 |
| BHP Billiton Finance U.S.A., Ltd. | | | |
| 2.88%, 02/24/22 | 20,000 | | 20,058 |
| 5.00%, 09/30/43 | 170,000 | | 225,948 |
| Commonwealth Bank of Australia | | | |
| 3.90%, 07/12/47 144A Δ | 110,000 | | 133,014 |
| Macquarie Bank, Ltd. | | | |
| (Variable, U.S. Treasury Yield Curve Rate CMT 5Y + 1.70%), 3.05%, 03/03/36 144A ^ | 750,000 | | 741,091 |
| Macquarie Group, Ltd. | | | |
| (Variable, U.S. SOFR + 1.07%), 1.34%, 01/12/27 144A ^ | 500,000 | | 486,984 |
| Newcrest Finance Pty, Ltd. | | | |
| 3.25%, 05/13/30 144A | 175,000 | | 183,666 |
| Westpac Banking Corporation | | | |
| 2.35%, 02/19/25 | 70,000 | | 72,355 |
| (Variable, USD ICE Swap Rate 5Y + 2.24%), 4.32%, 11/23/31Δ ^ | 175,000 | | 189,499 |
| (Variable, U.S. Treasury Yield Curve Rate CMT 5Y + 2.00%), 4.11%, 07/24/34^ | 275,000 | | 297,399 |
| | | | | 2,414,247 |
| Austria — 0.0% | | |
| Suzano Austria GmbH | | | |
| 3.75%, 01/15/31 | 660,000 | | 671,873 |
| 3.13%, 01/15/32 | 320,000 | | 310,157 |
| | | | | 982,030 |
| Brazil — 0.2% | | |
| Brazil Notas do Tesouro Nacional Serie F | | | |
| 10.00%, 01/01/23(B) | 8,338,000 | | 1,468,639 |
| 10.00%, 01/01/27(B) | 1,013,000 | | 177,742 |
| Brazilian Government International Bond | | | |
| 4.63%, 01/13/28Δ | 480,000 | | 502,054 |
| 5.63%, 01/07/41 | 340,000 | | 348,004 |
| 5.00%, 01/27/45 | 1,650,000 | | 1,551,825 |
| BRF SA | | | |
| 4.88%, 01/24/30Δ | 200,000 | | 202,853 |
| Vale Overseas, Ltd. | | | |
| 6.25%, 08/10/26 | 105,000 | | 121,693 |
| 6.88%, 11/21/36 | 484,000 | | 643,952 |
| | | | | 5,016,762 |
| Canada — 0.6% | | |
| 1011778 BC ULC | | | |
| 4.00%, 10/15/30 144A | 446,000 | | 439,123 |
| | | Par | | Value |
| Alimentation Couche-Tard, Inc. | | | |
| 3.55%, 07/26/27 144A | $ 75,000 | | $ 80,468 |
| Bank of Montreal | | | |
| 1.85%, 05/01/25Δ | 500,000 | | 507,983 |
| (Variable, U.S. SOFR + 0.60%), 0.95%, 01/22/27^ | 75,000 | | 72,634 |
| (Variable, USD Swap 5Y + 1.43%), 3.80%, 12/15/32^ | 100,000 | | 107,417 |
| Bank of Nova Scotia (The) | | | |
| 2.20%, 02/03/25 | 70,000 | | 71,689 |
| 1.30%, 06/11/25Δ | 270,000 | | 268,765 |
| Barrick Gold Corporation | | | |
| 5.25%, 04/01/42Δ | 560,000 | | 729,835 |
| Bausch Health Cos., Inc. | | | |
| 9.00%, 12/15/25 144A | 600,000 | | 632,688 |
| Canadian Imperial Bank of Commerce | | | |
| 0.95%, 06/23/23 | 270,000 | | 270,431 |
| Canadian National Railway Co. | | | |
| 2.45%, 05/01/50 | 35,000 | | 32,794 |
| Canadian Natural Resources, Ltd. | | | |
| 3.85%, 06/01/27 | 65,000 | | 69,733 |
| Canadian Pacific Railway Co. | | | |
| 2.45%, 12/02/31 | 400,000 | | 408,119 |
| 3.00%, 12/02/41 | 30,000 | | 30,825 |
| 3.10%, 12/02/51 | 370,000 | | 379,607 |
| Cenovus Energy, Inc. | | | |
| 4.40%, 04/15/29 | 65,000 | | 72,046 |
| CGI, Inc. | | | |
| 1.45%, 09/14/26 144A | 2,300,000 | | 2,252,871 |
| Enbridge, Inc. | | | |
| (Floating, U.S. SOFR + 0.40%), 0.45%, 02/17/23† Δ | 1,800,000 | | 1,800,547 |
| 2.50%, 08/01/33 | 850,000 | | 836,476 |
| Ford Credit Canada Co. | | | |
| (Floating, CAD Offered Rate 3M + 3.03%), 3.49%, 01/10/22(C) † | 2,400,000 | | 1,897,801 |
| GFL Environmental, Inc. | | | |
| 3.75%, 08/01/25 144A | 1,025,000 | | 1,036,521 |
| Royal Bank of Canada | | | |
| 1.60%, 04/17/23 | 430,000 | | 434,990 |
| 1.15%, 06/10/25 | 260,000 | | 258,071 |
| Suncor Energy, Inc. | | | |
| 2.80%, 05/15/23 | 225,000 | | 230,278 |
| 3.10%, 05/15/25 | 475,000 | | 496,982 |
| Teck Resources, Ltd. | | | |
| 3.90%, 07/15/30Δ | 275,000 | | 296,067 |
| 6.00%, 08/15/40 | 10,000 | | 12,860 |
| Toronto-Dominion Bank (The) | | | |
| 0.75%, 06/12/23 | 500,000 | | 500,213 |
| 1.15%, 06/12/25 | 260,000 | | 258,132 |
| 1.25%, 09/10/26 | 70,000 | | 68,875 |
| TransCanada PipeLines, Ltd. | | | |
| 7.63%, 01/15/39 | 30,000 | | 46,870 |
| | | | | 14,601,711 |
See Notes to Financial Statements.
MEDIUM-DURATION BOND FUND
SCHEDULE OF INVESTMENTS (Continued)
| | | Par | | Value |
| Chile — 0.1% | | |
| Chile Government International Bond | | | |
| 2.45%, 01/31/31Δ | $ 1,800,000 | | $1,791,000 |
| China — 0.3% | | |
| Avolon Holdings Funding, Ltd. | | | |
| 3.95%, 07/01/24 144A | 400,000 | | 419,475 |
| 2.88%, 02/15/25 144A | 800,000 | | 818,128 |
| 2.13%, 02/21/26 144A | 2,500,000 | | 2,457,296 |
| 4.25%, 04/15/26 144A | 125,000 | | 132,660 |
| Baidu, Inc. | | | |
| 3.43%, 04/07/30 | 400,000 | | 420,410 |
| China Government Bond | | | |
| 3.31%, 11/30/25(Y) | 1,000,000 | | 161,754 |
| Huarong Finance II Co., Ltd. | | | |
| 4.88%, 11/22/26 | 200,000 | | 207,802 |
| Park Aerospace Holdings, Ltd. | | | |
| 5.25%, 08/15/22 144A | 15,000 | | 15,332 |
| 4.50%, 03/15/23 144A | 20,000 | | 20,649 |
| 5.50%, 02/15/24 144A | 60,000 | | 64,383 |
| Sinopec Group Overseas Development 2014, Ltd. | | | |
| 4.38%, 04/10/24 144A | 390,000 | | 416,856 |
| Tencent Holdings, Ltd. | | | |
| 3.68%, 04/22/41 144A | 420,000 | | 437,621 |
| 3.84%, 04/22/51 144A | 910,000 | | 960,739 |
| | | | | 6,533,105 |
| Colombia — 0.2% | | |
| Colombia Government International Bond | | | |
| 3.00%, 01/30/30Δ | 200,000 | | 183,175 |
| 3.13%, 04/15/31Δ | 460,000 | | 413,761 |
| 3.25%, 04/22/32 | 450,000 | | 405,563 |
| 4.13%, 02/22/42 | 650,000 | | 544,375 |
| 5.63%, 02/26/44 | 1,080,000 | | 1,050,937 |
| 4.13%, 05/15/51Δ | 240,000 | | 195,600 |
| 3.88%, 02/15/61Δ | 200,000 | | 154,752 |
| Ecopetrol SA | | | |
| 5.88%, 05/28/45Δ | 1,360,000 | | 1,302,832 |
| | | | | 4,250,995 |
| Denmark — 0.2% | | |
| Danske Bank A/S | | | |
| 5.00%, 01/12/22 144A | 540,000 | | 540,481 |
| 5.38%, 01/12/24 144A | 340,000 | | 366,220 |
| 1.23%, 06/22/24 144A | 280,000 | | 279,795 |
| (Variable, ICE LIBOR USD 3M + 1.59%), 3.24%, 12/20/25 144A ^ | 220,000 | | 228,787 |
| (Variable, U.S. Treasury Yield Curve Rate CMT 1Y + 1.35%), 1.62%, 09/11/26 144A ^ | 1,800,000 | | 1,775,772 |
| Jyske Realkredit A/S | | | |
| 1.50%, 10/01/53(D) | 10,000,000 | | 1,487,282 |
| Realkredit Danmark A/S | | | |
| 1.50%, 10/01/53(D) ††† | 6,000,000 | | 900,111 |
| | | | | 5,578,448 |
| | | Par | | Value |
| Dominican Republic — 0.0% | | |
| Dominican Republic International Bond | | | |
| 6.40%, 06/05/49 144A | $ 170,000 | | $ 178,927 |
| Finland — 0.0% | | |
| Nokia OYJ | | | |
| 4.38%, 06/12/27 | 9,000 | | 9,731 |
| France — 0.8% | | |
| BNP Paribas SA | | | |
| 3.50%, 03/01/23 144A | 925,000 | | 953,271 |
| (Variable, USD Swap 5Y + 4.15%), 6.63%, 03/25/24 144A ρ Δ ^ | 200,000 | | 216,010 |
| 3.38%, 01/09/25 144A | 450,000 | | 472,969 |
| (Variable, ICE LIBOR USD 3M + 2.24%), 4.71%, 01/10/25 144A ^ | 450,000 | | 479,369 |
| (Variable, U.S. SOFR + 2.07%), 2.22%, 06/09/26 144A ^ | 1,790,000 | | 1,808,902 |
| (Variable, U.S. SOFR + 1.00%), 1.32%, 01/13/27 144A ^ | 775,000 | | 754,916 |
| 4.40%, 08/14/28 144A | 1,340,000 | | 1,504,225 |
| (Variable, U.S. SOFR + 1.61%), 1.90%, 09/30/28 144A ^ | 1,800,000 | | 1,759,738 |
| (Variable, USD Swap 5Y + 1.48%), 4.38%, 03/01/33 144A ^ | 440,000 | | 478,005 |
| BPCE SA | | | |
| 4.00%, 09/12/23 144A | 750,000 | | 785,731 |
| 4.63%, 09/12/28 144A | 375,000 | | 427,652 |
| (Variable, U.S. SOFR + 1.31%), 2.28%, 01/20/32 144A ^ | 375,000 | | 362,109 |
| (Variable, U.S. SOFR + 1.73%), 3.12%, 10/19/32 144A ^ | 875,000 | | 879,763 |
| Credit Agricole SA | | | |
| (Variable, USD Swap 5Y + 4.32%), 6.88%, 09/23/24 144A ρ ^ | 300,000 | | 327,900 |
| 4.38%, 03/17/25 | 275,000 | | 295,758 |
| (Variable, U.S. SOFR + 1.68%), 1.91%, 06/16/26 144A ^ | 2,025,000 | | 2,031,452 |
| 4.13%, 01/10/27 144A | 450,000 | | 494,692 |
| (Variable, USD Swap 5Y + 1.64%), 4.00%, 01/10/33 144A ^ | 250,000 | | 266,818 |
| Danone SA | | | |
| 2.59%, 11/02/23 144A | 2,350,000 | | 2,410,540 |
| 2.95%, 11/02/26 144A Δ | 310,000 | | 326,585 |
| Societe Generale SA | | | |
| (Variable, U.S. Treasury Yield Curve Rate CMT 1Y + 1.10%), 1.49%, 12/14/26 144A ^ | 1,700,000 | | 1,657,468 |
| XLIT, Ltd. | | | |
| 4.45%, 03/31/25 | 349,000 | | 378,823 |
| | | | | 19,072,696 |
See Notes to Financial Statements.
| | | Par | | Value |
| Germany — 0.6% | | |
| Commerzbank AG | | | |
| (Variable, 6.36% - EUR Swap Rate 5Y), 6.13%, 10/09/25(E) ρ ^ | $ 400,000 | | $ 496,955 |
| Deutsche Bank AG | | | |
| 5.00%, 02/14/22 | 1,400,000 | | 1,406,387 |
| (Variable, U.S. SOFR + 2.16%), 2.22%, 09/18/24^ | 2,100,000 | | 2,128,110 |
| (Variable, U.S. SOFR + 2.58%), 3.96%, 11/26/25^ | 2,500,000 | | 2,642,316 |
| 4.10%, 01/13/26 | 65,000 | | 69,880 |
| (Variable, 1.85% - Euribor 3M), 1.38%, 09/03/26(E) ^ | 1,500,000 | | 1,756,967 |
| (Variable, U.S. SOFR + 1.87%), 2.13%, 11/24/26^ | 450,000 | | 449,660 |
| (Variable, 2.05% - Euribor 3M), 1.75%, 11/19/30(E) ^ | 1,700,000 | | 2,013,801 |
| (Variable, U.S. SOFR + 3.04%), 3.55%, 09/18/31^ | 1,900,000 | | 2,004,050 |
| (Variable, U.S. SOFR + 1.72%), 3.04%, 05/28/32^ | 560,000 | | 565,416 |
| Volkswagen Bank GmbH | | | |
| 1.88%, 01/31/24(E) | 1,500,000 | | 1,773,073 |
| | | | | 15,306,615 |
| Hong Kong — 0.0% | | |
| AIA Group, Ltd. | | | |
| 3.90%, 04/06/28 144A | 200,000 | | 221,183 |
| Indonesia — 0.2% | | |
| Indonesia Government International Bond | | | |
| 3.85%, 07/18/27 144A | 500,000 | | 548,310 |
| 3.50%, 01/11/28 | 450,000 | | 486,441 |
| 5.25%, 01/08/47 144A | 200,000 | | 256,891 |
| 4.35%, 01/11/48 | 1,000,000 | | 1,147,726 |
| 3.70%, 10/30/49 | 1,180,000 | | 1,250,760 |
| 3.05%, 03/12/51 | 700,000 | | 692,657 |
| 3.35%, 03/12/71 | 240,000 | | 233,402 |
| Perusahaan Penerbit SBSN Indonesia III | | | |
| 2.55%, 06/09/31 144A | 590,000 | | 597,988 |
| | | | | 5,214,175 |
| Ireland — 0.4% | | |
| AerCap Ireland Capital DAC | | | |
| 4.63%, 07/01/22 | 550,000 | | 560,798 |
| 3.30%, 01/23/23 | 525,000 | | 536,202 |
| 4.88%, 01/16/24 | 350,000 | | 372,432 |
| 3.15%, 02/15/24 | 330,000 | | 340,562 |
| 6.50%, 07/15/25 | 290,000 | | 331,763 |
| 2.45%, 10/29/26 | 1,785,000 | | 1,801,849 |
| 3.00%, 10/29/28 | 1,480,000 | | 1,503,367 |
| 3.30%, 01/30/32 | 1,375,000 | | 1,404,761 |
| AIB Group PLC | | | |
| 4.75%, 10/12/23 144A | 950,000 | | 1,005,369 |
| GE Capital International Funding Co. Unlimited Co. | | | |
| 4.42%, 11/15/35 | 250,000 | | 299,192 |
| | | Par | | Value |
| SMBC Aviation Capital Finance DAC | | | |
| 4.13%, 07/15/23 144A | $ 900,000 | | $ 938,152 |
| STERIS Irish FinCo Unlimited Co. | | | |
| 2.70%, 03/15/31 | 625,000 | | 631,715 |
| | | | | 9,726,162 |
| Isle of Man — 0.0% | | |
| Sasol Financing International, Ltd. | | | |
| 4.50%, 11/14/22 | 370,000 | | 374,866 |
| Israel — 0.7% | | |
| Bank of Israel Bill - Makam | | | |
| 0.01%, 04/06/22(ZC) Ω | 7,000,000 | | 2,256,067 |
| 0.00%, 09/07/22(ZC) Ω | 5,700,000 | | 1,836,717 |
| 0.00%, 10/07/22(ZC) Ω | 15,800,000 | | 5,094,299 |
| Israel Government Bond - Fixed | | | |
| 5.50%, 01/31/22(ZC) | 6,900,000 | | 2,229,432 |
| Israel Government International Bond | | | |
| 3.25%, 01/17/28 | 1,500,000 | | 1,629,613 |
| 2.75%, 07/03/30 | 2,060,000 | | 2,194,250 |
| 3.38%, 01/15/50 | 430,000 | | 466,049 |
| | | | | 15,706,427 |
| Italy — 0.3% | | |
| Intesa Sanpaolo SpA | | | |
| 3.13%, 07/14/22 144A | 580,000 | | 586,683 |
| 3.38%, 01/12/23 144A | 220,000 | | 224,854 |
| 5.02%, 06/26/24 144A | 1,310,000 | | 1,404,833 |
| 3.25%, 09/23/24 144A | 1,400,000 | | 1,458,685 |
| 5.71%, 01/15/26 144A Δ | 200,000 | | 221,504 |
| UniCredit SpA | | | |
| 6.57%, 01/14/22 144A | 530,000 | | 530,772 |
| 7.83%, 12/04/23 144A | 3,100,000 | | 3,457,831 |
| | | | | 7,885,162 |
| Japan — 1.0% | | |
| Aircastle, Ltd. | | | |
| 5.25%, 08/11/25 144A | 10,000 | | 11,009 |
| 4.25%, 06/15/26 | 60,000 | | 64,368 |
| Japan Finance Organization for Municipalities | | | |
| 2.13%, 10/25/23 144A | 2,200,000 | | 2,251,250 |
| Mitsubishi HC Capital, Inc. | | | |
| 3.41%, 02/28/22 144A | 1,500,000 | | 1,502,730 |
| Mitsubishi UFJ Financial Group, Inc. | | | |
| 3.00%, 02/22/22 | 180,000 | | 180,647 |
| 1.41%, 07/17/25 | 2,100,000 | | 2,090,854 |
| 3.74%, 03/07/29 | 35,000 | | 38,326 |
| 4.29%, 07/26/38 | 30,000 | | 36,127 |
| Mizuho Financial Group, Inc. | | | |
| (Floating, ICE LIBOR USD 3M + 0.99%), 1.11%, 07/10/24† | 1,700,000 | | 1,715,346 |
| (Variable, ICE LIBOR USD 3M + 0.83%), 2.23%, 05/25/26^ | 1,600,000 | | 1,625,678 |
| Nissan Motor Co., Ltd. | | | |
| 3.04%, 09/15/23 144A | 330,000 | | 338,781 |
| 3.52%, 09/17/25 144A | 3,210,000 | | 3,369,111 |
| 4.35%, 09/17/27 144A | 770,000 | | 832,421 |
See Notes to Financial Statements.
MEDIUM-DURATION BOND FUND
SCHEDULE OF INVESTMENTS (Continued)
| | | Par | | Value |
| 4.81%, 09/17/30 144A | $ 2,200,000 | | $ 2,465,416 |
| Nomura Holdings, Inc. | | | |
| 2.61%, 07/14/31 | 270,000 | | 267,038 |
| Panasonic Corporation | | | |
| 2.54%, 07/19/22 144A | 1,302,000 | | 1,312,474 |
| Sumitomo Mitsui Financial Group, Inc. | | | |
| 4.44%, 04/02/24 144A | 1,450,000 | | 1,539,322 |
| 2.45%, 09/27/24 | 1,600,000 | | 1,647,056 |
| 1.90%, 09/17/28 | 2,300,000 | | 2,258,583 |
| Takeda Pharmaceutical Co., Ltd. | | | |
| 2.05%, 03/31/30 | 700,000 | | 687,021 |
| | | | | 24,233,558 |
| Jersey — 0.0% | | |
| Galaxy Pipeline Assets Bidco, Ltd. | | | |
| 2.63%, 03/31/36 144A | 200,000 | | 195,899 |
| 2.94%, 09/30/40 | 940,000 | | 937,784 |
| | | | | 1,133,683 |
| Kazakhstan — 0.0% | | |
| KazMunayGas National Co. JSC | | | |
| 5.38%, 04/24/30 144A | 200,000 | | 233,625 |
| 5.38%, 04/24/30 | 260,000 | | 303,713 |
| | | | | 537,338 |
| Kuwait — 0.1% | | |
| Kuwait International Government Bond | | | |
| 3.50%, 03/20/27 144A | 1,190,000 | | 1,298,236 |
| Luxembourg — 0.0% | | |
| ArcelorMittal SA | | | |
| 7.00%, 10/15/39 | 70,000 | | 96,537 |
| Mexico — 1.0% | | |
| Mexican Bonos | | | |
| 10.00%, 12/05/24(M) | 25,130,000 | | 1,315,218 |
| 7.75%, 11/13/42(M) | 245,995,200 | | 11,670,760 |
| 8.00%, 11/07/47(M) | 78,860,000 | | 3,822,955 |
| Mexico City Airport Trust | | | |
| 3.88%, 04/30/28 144A | 360,000 | | 373,545 |
| 5.50%, 07/31/47 | 200,000 | | 200,597 |
| 5.50%, 07/31/47 144A | 270,000 | | 270,806 |
| Mexico Government International Bond | | | |
| 4.50%, 04/22/29 | 200,000 | | 223,131 |
| 2.66%, 05/24/31Δ | 760,000 | | 743,288 |
| 4.75%, 04/27/32 | 2,300,000 | | 2,605,900 |
| 6.05%, 01/11/40 | 330,000 | | 411,266 |
| 3.77%, 05/24/61 | 702,000 | | 648,118 |
| Orbia Advance Corporation SAB de CV | | | |
| 1.88%, 05/11/26 144A | 550,000 | | 542,545 |
| 2.88%, 05/11/31 144A | 520,000 | | 509,374 |
| Petroleos Mexicanos | | | |
| 6.88%, 08/04/26 | 200,000 | | 220,169 |
| 6.63%, 06/15/35 | 19,000 | | 18,287 |
| 5.50%, 06/27/44 | 170,000 | | 143,011 |
| 6.38%, 01/23/45 | 370,000 | | 322,005 |
| | | | | 24,040,975 |
| | | Par | | Value |
| Morocco & Antilles — 0.0% | | |
| OCP SA | | | |
| 5.13%, 06/23/51 144A | $ 200,000 | | $ 189,453 |
| Netherlands — 1.1% | | |
| ABN AMRO Bank NV | | | |
| 4.75%, 07/28/25 144A | 200,000 | | 218,144 |
| (Variable, 4.67% - EUR Swap Rate 5Y), 4.38%, 09/22/25(E) ρ Δ ^ | 400,000 | | 488,701 |
| Cooperatieve Rabobank UA | | | |
| 4.38%, 08/04/25 | 670,000 | | 726,683 |
| (Variable, U.S. Treasury Yield Curve Rate CMT 1Y + 1.00%), 1.34%, 06/24/26 144A ^ | 810,000 | | 799,364 |
| Enel Finance International NV | | | |
| 1.88%, 07/12/28 144A | 1,150,000 | | 1,123,097 |
| 2.88%, 07/12/41 144A Δ | 2,300,000 | | 2,215,950 |
| Equate Petrochemical BV | | | |
| 4.25%, 11/03/26 144A | 520,000 | | 566,390 |
| ING Groep NV | | | |
| 4.63%, 01/06/26 144A | 1,600,000 | | 1,780,295 |
| (Variable, U.S. Treasury Yield Curve Rate CMT 1Y + 1.10%), 1.40%, 07/01/26 144A ^ | 1,000,000 | | 990,682 |
| JDE Peet's NV | | | |
| 1.38%, 01/15/27 144A | 475,000 | | 459,258 |
| Lukoil Securities BV | | | |
| 3.88%, 05/06/30 144A | 210,000 | | 214,206 |
| 3.88%, 05/06/30 | 1,240,000 | | 1,264,837 |
| Lundin Energy Finance BV | | | |
| 2.00%, 07/15/26 144A | 650,000 | | 646,476 |
| NXP BV | | | |
| 2.70%, 05/01/25 144A Δ | 1,870,000 | | 1,934,982 |
| 3.88%, 06/18/26 144A | 1,500,000 | | 1,621,228 |
| 3.40%, 05/01/30 144A | 250,000 | | 266,983 |
| 2.50%, 05/11/31 144A | 900,000 | | 907,584 |
| Petrobras Global Finance BV | | | |
| 5.30%, 01/27/25 | 356,000 | | 383,074 |
| 7.38%, 01/17/27Δ | 120,000 | | 139,811 |
| 6.00%, 01/27/28 | 1,290,000 | | 1,408,390 |
| 6.85%, 06/05/15π | 550,000 | | 546,961 |
| Prosus NV | | | |
| 3.68%, 01/21/30 144A | 200,000 | | 206,237 |
| 3.06%, 07/13/31 144A | 1,430,000 | | 1,396,977 |
| 4.03%, 08/03/50 144A | 220,000 | | 212,543 |
| 4.03%, 08/03/50 | 200,000 | | 193,221 |
| 3.83%, 02/08/51 144A | 420,000 | | 394,116 |
| Shell International Finance BV | | | |
| 2.88%, 05/10/26 | 660,000 | | 701,101 |
| 2.75%, 04/06/30 | 1,600,000 | | 1,674,588 |
| 6.38%, 12/15/38 | 20,000 | | 29,242 |
| 4.55%, 08/12/43 | 120,000 | | 150,411 |
| 4.38%, 05/11/45 | 660,000 | | 806,304 |
| 4.00%, 05/10/46 | 330,000 | | 385,993 |
| 3.25%, 04/06/50 | 310,000 | | 331,965 |
See Notes to Financial Statements.
| | | Par | | Value |
| Syngenta Finance NV | | | |
| 5.18%, 04/24/28 144A | $ 200,000 | | $ 224,883 |
| | | | | 25,410,677 |
| Nigeria — 0.1% | | |
| Nigeria Government International Bond | | | |
| 7.14%, 02/23/30 | 690,000 | | 680,064 |
| 8.75%, 01/21/31 | 210,000 | | 221,015 |
| 7.88%, 02/16/32 | 520,000 | | 513,890 |
| | | | | 1,414,969 |
| Norway — 0.1% | | |
| Equinor ASA | | | |
| 2.88%, 04/06/25 | 60,000 | | 62,687 |
| Yara International ASA | | | |
| 4.75%, 06/01/28 144A | 1,100,000 | | 1,251,099 |
| | | | | 1,313,786 |
| Panama — 0.0% | | |
| Panama Government International Bond | | | |
| 2.25%, 09/29/32Δ | 590,000 | | 560,942 |
| 4.50%, 04/16/50 | 250,000 | | 276,003 |
| 4.50%, 04/01/56 | 280,000 | | 309,473 |
| | | | | 1,146,418 |
| Peru — 0.2% | | |
| Peruvian Government International Bond | | | |
| 8.20%, 08/12/26 | 7,000,000 | | 2,000,468 |
| 6.35%, 08/12/28(ZB) | 6,100,000 | | 1,609,211 |
| 2.78%, 01/23/31 | 1,330,000 | | 1,326,688 |
| 5.63%, 11/18/50Δ | 330,000 | | 465,138 |
| 2.78%, 12/01/60 | 10,000 | | 8,800 |
| 3.23%, 07/28/21~ | 50,000 | | 43,063 |
| | | | | 5,453,368 |
| Poland — 0.1% | | |
| Republic of Poland Government International Bond | | | |
| 4.00%, 01/22/24 | 1,380,000 | | 1,461,860 |
| Qatar — 0.4% | | |
| Qatar Energy | | | |
| 2.25%, 07/12/31 144A | 680,000 | | 675,307 |
| 3.13%, 07/12/41 144A | 630,000 | | 638,353 |
| 3.30%, 07/12/51 144A | 640,000 | | 661,137 |
| Qatar Government International Bond | | | |
| 3.38%, 03/14/24 144A | 560,000 | | 587,042 |
| 3.38%, 03/14/24 | 1,700,000 | | 1,782,093 |
| 4.00%, 03/14/29 144A | 660,000 | | 745,084 |
| 5.10%, 04/23/48Δ | 1,000,000 | | 1,355,674 |
| 4.82%, 03/14/49 144A | 1,720,000 | | 2,260,029 |
| | | | | 8,704,719 |
| Romania — 0.1% | | |
| Romanian Government International Bond | | | |
| 3.62%, 05/26/30(E) 144A | 510,000 | | 630,847 |
| | | Par | | Value |
| 3.00%, 02/14/31 144A Δ | $ 130,000 | | $ 132,340 |
| 2.00%, 01/28/32(E) 144A | 70,000 | | 74,209 |
| 3.38%, 01/28/50(E) 144A | 60,000 | | 64,536 |
| 3.38%, 01/28/50(E) | 70,000 | | 75,292 |
| 4.00%, 02/14/51 144A | 280,000 | | 280,870 |
| | | | | 1,258,094 |
| Russia — 0.5% | | |
| Gazprom PJSC Via Gaz Capital SA | | | |
| 5.15%, 02/11/26 144A | 340,000 | | 364,425 |
| 7.29%, 08/16/37 | 100,000 | | 133,241 |
| Russian Federal Bond - OFZ | | | |
| 7.00%, 01/25/23(Q) | 34,070,000 | | 448,516 |
| 7.00%, 08/16/23(Q) | 52,440,000 | | 685,782 |
| 7.75%, 09/16/26(Q) | 9,710,000 | | 126,897 |
| 8.15%, 02/03/27(Q) | 87,410,000 | | 1,159,018 |
| 7.05%, 01/19/28(Q) | 110,471,000 | | 1,384,493 |
| 6.90%, 05/23/29(Q) | 455,677,000 | | 5,616,074 |
| 7.25%, 05/10/34(Q) | 48,570,000 | | 598,969 |
| 7.70%, 03/16/39(Q) | 135,260,000 | | 1,714,150 |
| | | | | 12,231,565 |
| Saudi Arabia — 0.1% | | |
| Saudi Arabian Oil Co. | | | |
| 2.75%, 04/16/22 144A | 1,800,000 | | 1,812,825 |
| Singapore — 0.0% | | |
| Greenko Power II, Ltd. | | | |
| 4.30%, 12/13/28 144A | 200,000 | | 203,750 |
| South Africa — 0.0% | | |
| Republic of South Africa Government International Bond | | | |
| 4.30%, 10/12/28 | 280,000 | | 284,788 |
| South Korea — 0.0% | | |
| Export-Import Bank of Korea | | | |
| 5.00%, 04/11/22 | 900,000 | | 910,103 |
| Spain — 0.3% | | |
| Banco Santander SA | | | |
| (Floating, ICE LIBOR USD 3M + 1.12%), 1.24%, 04/12/23† | 200,000 | | 202,064 |
| 3.85%, 04/12/23 | 400,000 | | 413,914 |
| 2.75%, 05/28/25 | 4,500,000 | | 4,656,884 |
| 3.31%, 06/27/29 | 400,000 | | 423,563 |
| 2.75%, 12/03/30 | 200,000 | | 196,157 |
| Cellnex Finance Co. SA | | | |
| 1.25%, 01/15/29(E) | 500,000 | | 543,717 |
| Telefonica Emisiones SA | | | |
| 5.21%, 03/08/47 | 400,000 | | 499,367 |
| | | | | 6,935,666 |
| Supranational — 0.0% | | |
| African Export-Import Bank (The) | | | |
| 3.80%, 05/17/31 144A | 250,000 | | 256,018 |
| Sweden — 0.0% | | |
| Swedbank AB | | | |
| 1.30%, 06/02/23 144A | 330,000 | | 332,203 |
See Notes to Financial Statements.
MEDIUM-DURATION BOND FUND
SCHEDULE OF INVESTMENTS (Continued)
| | | Par | | Value |
| Switzerland — 0.8% | | |
| Credit Suisse AG | | | |
| 6.50%, 08/08/23 144A | $ 225,000 | | $ 242,697 |
| 2.95%, 04/09/25 | 665,000 | | 696,878 |
| Credit Suisse Group AG | | | |
| (Variable, ICE LIBOR USD 3M + 1.24%), 4.21%, 06/12/24 144A ^ | 2,100,000 | | 2,185,933 |
| (Variable, U.S. SOFR + 1.56%), 2.59%, 09/11/25 144A ^ | 250,000 | | 255,512 |
| (Variable, USD ICE Swap Rate 5Y + 4.33%), 7.25%, 09/12/25 144A ρ ^ | 400,000 | | 439,612 |
| 4.55%, 04/17/26 | 1,140,000 | | 1,257,936 |
| (Variable, U.S. SOFR + 2.04%), 2.19%, 06/05/26 144A ^ | 610,000 | | 614,194 |
| 4.28%, 01/09/28 144A | 1,800,000 | | 1,956,485 |
| (Variable, ICE LIBOR USD 3M + 1.41%), 3.87%, 01/12/29 144A ^ | 2,525,000 | | 2,707,048 |
| (Variable, U.S. SOFR + 3.73%), 4.19%, 04/01/31 144A ^ | 955,000 | | 1,055,361 |
| (Variable, U.S. SOFR + 1.73%), 3.09%, 05/14/32 144A ^ | 755,000 | | 769,907 |
| Credit Suisse Group Funding Guernsey, Ltd. | | | |
| 3.80%, 09/15/22 | 1,300,000 | | 1,328,290 |
| UBS AG | | | |
| 1.75%, 04/21/22 144A | 470,000 | | 471,498 |
| 4.50%, 06/26/48 144A | 280,000 | | 367,744 |
| UBS Group AG | | | |
| 3.49%, 05/23/23 144A | 2,480,000 | | 2,505,399 |
| (Variable, ICE LIBOR USD 3M + 0.95%), 2.86%, 08/15/23 144A ^ | 200,000 | | 202,435 |
| (Variable, USD Swap 5Y + 4.34%), 7.00%, 01/31/24 144A ρ Δ ^ | 840,000 | | 906,314 |
| 4.13%, 09/24/25 144A | 440,000 | | 475,684 |
| 4.25%, 03/23/28 144A | 760,000 | | 842,784 |
| | | | | 19,281,711 |
| Taiwan — 0.0% | | |
| TSMC Global, Ltd. | | | |
| 2.25%, 04/23/31 144A | 200,000 | | 198,539 |
| Turkey — 0.1% | | |
| Turkey Government International Bond | | | |
| 5.25%, 03/13/30 | 200,000 | | 172,633 |
| 5.95%, 01/15/31 | 200,000 | | 179,478 |
| 5.88%, 06/26/31 | 200,000 | | 178,060 |
| Turkish Airlines Pass-Through Trust, Series 2015-1, Class A | | | |
| 4.20%, 03/15/27 144A | 974,269 | | 902,536 |
| Turkiye Vakiflar Bankasi TAO | | | |
| 8.13%, 03/28/24 | 200,000 | | 201,614 |
| 6.50%, 01/08/26 144A | 200,000 | | 188,123 |
| | | | | 1,822,444 |
| | | Par | | Value |
| United Arab Emirates — 0.3% | | |
| Abu Dhabi Government International Bond | | | |
| 2.50%, 10/11/22 144A | $ 810,000 | | $ 822,554 |
| 3.13%, 10/11/27 144A | 500,000 | | 537,851 |
| 3.13%, 04/16/30 144A | 1,500,000 | | 1,627,692 |
| 3.88%, 04/16/50 144A | 2,500,000 | | 2,918,485 |
| DP World, Ltd. | | | |
| 5.63%, 09/25/48 144A | 620,000 | | 763,531 |
| | | | | 6,670,113 |
| United Kingdom — 1.5% | | |
| Anglo American Capital PLC | | | |
| 3.63%, 09/11/24 144A | 700,000 | | 735,412 |
| 4.00%, 09/11/27 144A | 220,000 | | 236,883 |
| Barclays Bank PLC | | | |
| 1.70%, 05/12/22 | 200,000 | | 200,691 |
| 7.63%, 11/21/22 | 415,000 | | 437,931 |
| Barclays PLC | | | |
| (Variable, ICE LIBOR USD 3M + 1.40%), 4.61%, 02/15/23^ | 950,000 | | 954,097 |
| (Variable, U.S. SOFR + 2.71%), 2.85%, 05/07/26^ | 800,000 | | 826,080 |
| 3.25%, 02/12/27(U) | 1,100,000 | | 1,573,188 |
| (Variable, ICE LIBOR USD 3M + 1.90%), 4.97%, 05/16/29^ | 1,760,000 | | 2,010,622 |
| (Variable, ICE LIBOR USD 3M + 3.05%), 5.09%, 06/20/30^ | 1,450,000 | | 1,647,794 |
| BP Capital Markets PLC | | | |
| 3.81%, 02/10/24 | 330,000 | | 347,955 |
| 3.54%, 11/04/24Δ | 60,000 | | 63,920 |
| 3.51%, 03/17/25 | 330,000 | | 351,611 |
| British Telecommunications PLC | | | |
| 9.63%, 12/15/30 | 45,000 | | 66,026 |
| CK Hutchison International 21, Ltd. | | | |
| 2.50%, 04/15/31 144A Δ | 200,000 | | 202,748 |
| Gazprom PJSC via Gaz Finance PLC | | | |
| 3.25%, 02/25/30 144A | 470,000 | | 455,056 |
| Hammerson PLC REIT | | | |
| 3.50%, 10/27/25(U) | 100,000 | | 137,607 |
| HSBC Holdings PLC | | | |
| (Variable, ICE LIBOR USD 3M + 1.06%), 3.26%, 03/13/23^ | 300,000 | | 301,434 |
| (Floating, ICE LIBOR USD 3M + 1.00%), 1.16%, 05/18/24† | 300,000 | | 302,903 |
| (Variable, ICE LIBOR USD 3M + 1.21%), 3.80%, 03/11/25^ | 625,000 | | 656,296 |
| 4.25%, 08/18/25 | 220,000 | | 236,855 |
| (Variable, U.S. SOFR + 1.54%), 1.65%, 04/18/26^ | 1,050,000 | | 1,042,554 |
| (Variable, U.S. SOFR + 1.93%), 2.10%, 06/04/26^ | 370,000 | | 372,843 |
| (Variable, ICE LIBOR USD 3M + 1.55%), 4.04%, 03/13/28^ | 300,000 | | 324,713 |
| (Variable, ICE LIBOR USD 3M + 1.53%), 4.58%, 06/19/29^ | 310,000 | | 347,828 |
| 4.95%, 03/31/30 | 400,000 | | 470,273 |
See Notes to Financial Statements.
| | | Par | | Value |
| (Variable, U.S. SOFR + 1.41%), 2.87%, 11/22/32^ | $ 330,000 | | $ 333,495 |
| 6.50%, 09/15/37 | 120,000 | | 166,669 |
| Lloyds Bank PLC | | | |
| (Step to 0.00% on 02/25/24), 7.50%, 04/02/32 STEP | 2,000,000 | | 1,599,963 |
| Lloyds Banking Group PLC | | | |
| (Variable, ICE LIBOR USD 3M + 1.25%), 2.86%, 03/17/23^ | 1,900,000 | | 1,907,473 |
| 3.90%, 03/12/24 | 210,000 | | 221,974 |
| 4.38%, 03/22/28 | 2,400,000 | | 2,696,547 |
| 4.55%, 08/16/28 | 230,000 | | 262,014 |
| NatWest Group PLC | | | |
| 2.50%, 03/22/23(E) | 1,400,000 | | 1,645,933 |
| (Floating, ICE LIBOR USD 3M + 1.47%), 1.63%, 05/15/23† | 1,300,000 | | 1,305,588 |
| (Variable, ICE LIBOR USD 3M + 1.48%), 3.50%, 05/15/23^ | 429,000 | | 432,798 |
| 3.88%, 09/12/23 | 579,000 | | 604,063 |
| (Variable, ICE LIBOR USD 3M + 1.55%), 4.52%, 06/25/24^ | 2,205,000 | | 2,307,886 |
| (Variable, ICE LIBOR USD 3M + 1.76%), 4.27%, 03/22/25^ | 1,215,000 | | 1,287,571 |
| (Variable, U.S. Treasury Yield Curve Rate CMT 5Y + 2.10%), 3.75%, 11/01/29^ | 200,000 | | 208,671 |
| Reckitt Benckiser Treasury Services PLC | | | |
| 2.75%, 06/26/24 144A | 600,000 | | 620,432 |
| Royalty Pharma PLC | | | |
| 1.20%, 09/02/25 | 1,700,000 | | 1,666,453 |
| Santander UK Group Holdings PLC | | | |
| (Variable, U.S. SOFR + 1.48%), 2.90%, 03/15/32^ | 1,200,000 | | 1,214,489 |
| Severn Trent Utilities Finance PLC | | | |
| 6.25%, 06/07/29(U) | 100,000 | | 178,452 |
| Society of Lloyd's | | | |
| 4.75%, 10/30/24(U) | 100,000 | | 145,174 |
| Standard Chartered PLC | | | |
| (Variable, ICE LIBOR USD 3M + 1.15%), 4.25%, 01/20/23 144A ^ | 1,000,000 | | 1,001,446 |
| (Variable, U.S. Treasury Yield Curve Rate CMT 1Y + 0.78%), 0.99%, 01/12/25 144A ^ | 1,900,000 | | 1,880,548 |
| Vedanta Resources Finance II PLC | | | |
| 8.95%, 03/11/25 144A | 200,000 | | 195,250 |
| Vodafone Group PLC | | | |
| 4.38%, 05/30/28 | 340,000 | | 383,192 |
| 6.15%, 02/27/37 | 10,000 | | 13,606 |
| | | | | 36,583,007 |
| Uruguay — 0.0% | | |
| Uruguay Government International Bond | | | |
| 4.38%, 01/23/31Δ | 410,000 | | 473,042 |
Total Foreign Bonds
(Cost $302,746,162) | | 301,589,320 |
| | | Par | | Value |
| LOAN AGREEMENTS — 0.4% |
| 1011778 B.C. Unlimited Liability Co. Term B-4 Loan | | | |
| (Floating, ICE LIBOR USD 1M + 1.75%), 1.85%, 11/19/26† | $117,600 | | $116,203 |
| Ali Group S.R.L. Term Loan B | | | |
| 0.00%, 10/13/28† Σ | 150,000 | | 149,271 |
| Allied Universal Holdco LLC Initial U.S. Dollar Term Loan | | | |
| (Floating, ICE LIBOR USD 3M + 3.75%, 0.50% Floor), 4.25%, 05/12/28† | 196,978 | | 196,586 |
| APi Group DE, Inc. Initial Term Loan | | | |
| (Floating, ICE LIBOR USD 1M + 2.50%), 2.60%, 10/01/26† | 218,500 | | 218,445 |
| Asurion LLC New B-7 Term Loan | | | |
| (Floating, ICE LIBOR USD 1M + 3.00%), 3.10%, 11/03/24† | 262,472 | | 261,605 |
| Asurion LLC New B-9 Term Loan | | | |
| (Floating, ICE LIBOR USD 1M + 3.25%), 3.35%, 07/31/27† | 238,800 | | 237,636 |
| athenahealth, Inc. Term B-1 Loan | | | |
| (Floating, ICE LIBOR USD 3M + 4.25%), 4.40%, 02/11/26† | 81,199 | | 81,310 |
| Avolon TLB Borrower 1 LLC Term B-5 Loan | | | |
| (Floating, ICE LIBOR USD 1M + 2.25%, 0.50% Floor), 2.75%, 12/01/27† | 178,200 | | 178,660 |
| Brookfield WEC Holdings, Inc. Initial Term Loan | | | |
| (Floating, ICE LIBOR USD 1M + 2.75%, 0.50% Floor), 3.25%, 08/01/25† | 138,600 | | 137,762 |
| Brown Group Holdings LLC Initial Term Loan | | | |
| (Floating, ICE LIBOR USD 3M + 2.50%, 0.50% Floor), 3.00%, 06/07/28† | 319,144 | | 318,944 |
| Castlelake Aviation One Designated Activity Co. Initial Term Loan | | | |
| (Floating, ICE LIBOR USD 3M + 2.75%, 0.50% Floor), 3.25%, 10/22/26† | 309,225 | | 308,308 |
| Charter Communications Operating LLC Term B-1 Loan | | | |
| (Floating, ICE LIBOR USD 1M + 1.75%), 1.86%, 04/30/25† | 152,697 | | 152,535 |
| Charter Communications Operating LLC Term B-2 Loan | | | |
| (Floating, ICE LIBOR USD 1M + 1.75%), 1.86%, 02/01/27† | 128,359 | | 127,295 |
| Clarios Global LP Amendment No. 1 Dollar Term Loan | | | |
| (Floating, ICE LIBOR USD 1M + 3.25%), 3.35%, 04/30/26† | 608,332 | | 605,975 |
| Cloudera, Inc. Initial Term Loan | | | |
| (Floating, ICE LIBOR USD 1M + 3.75%, 0.50% Floor), 4.25%, 10/08/28† | 220,000 | | 219,691 |
See Notes to Financial Statements.
MEDIUM-DURATION BOND FUND
SCHEDULE OF INVESTMENTS (Continued)
| | | Par | | Value |
| CSC Holdings LLC October 2018 Incremental Term Loan | | | |
| (Floating, ICE LIBOR USD 1M + 2.25%), 2.36%, 01/15/26† | $129,335 | | $127,848 |
| DCert Buyer, Inc. Initial Term Loan | | | |
| (Floating, ICE LIBOR USD 1M + 4.00%), 4.10%, 10/16/26† | 432,300 | | 432,030 |
| Delta Topco, Inc. Initial Term Loan | | | |
| (Floating, ICE LIBOR USD 3M + 3.75%, 0.75% Floor), 4.50%, 12/01/27† | 497,500 | | 498,657 |
| Energizer Holdings, Inc. 2020 Term Loan | | | |
| (Floating, ICE LIBOR USD 1M + 2.25%, 0.50% Floor), 2.75%, 12/22/27† | 138,950 | | 138,820 |
| EyeCare Partners LLC Initial Term Loan | | | |
| (Floating, ICE LIBOR USD 3M + 3.75%), 3.97%, 02/18/27† | 403,432 | | 401,794 |
| Focus Financial Partners LLC Tranche B-3 Term Loan | | | |
| (Floating, ICE LIBOR USD 1M + 2.00%), 2.10%, 07/03/24† | 85,624 | | 85,041 |
| Four Seasons Holdings, Inc. Term Loan 2013 | | | |
| (Floating, ICE LIBOR USD 1M + 2.00%), 2.10%, 11/30/23† | 98,322 | | 98,077 |
| Froneri International, Ltd. Facility B2 | | | |
| (Floating, ICE LIBOR USD 1M + 2.25%), 2.35%, 01/29/27† | 265,950 | | 262,989 |
| Genesee & Wyoming, Inc. Initial Term Loan | | | |
| (Floating, ICE LIBOR USD 3M + 2.00%), 2.22%, 12/30/26† | 58,950 | | 58,655 |
| Global Medical Response, Inc. 2021 Refinancing Term Loan | | | |
| (Floating, ICE LIBOR USD 3M + 4.25%, 1.00% Floor), 5.25%, 10/02/25† | 599,881 | | 598,231 |
| Hilton Worldwide Finance LLC Refinanced Series B-2 Term Loan | | | |
| (Floating, ICE LIBOR USD 1M + 1.75%), 1.85%, 06/22/26† | 68,355 | | 67,869 |
| Hudson River Trading LLC Term Loan | | | |
| (Floating, ICE LIBOR USD 1M + 3.00%), 3.10%, 03/20/28† | 327,525 | | 325,537 |
| iHeartCommunications, Inc. New Term Loan | | | |
| (Floating, ICE LIBOR USD 1M + 3.00%), 3.10%, 05/01/26† | 167,519 | | 166,592 |
| II-VI, Inc. Term Loan B | | | |
| 0.00%, 12/08/28† Σ | 520,000 | | 520,109 |
| INEOS Styrolution Group GmbH 2026 Tranche B Dollar Term Loan | | | |
| (Floating, ICE LIBOR USD 1M + 2.75%, 0.50% Floor), 3.25%, 01/29/26† | 159,200 | | 158,935 |
| Jane Street Group LLC Dollar Term Loan | | | |
| (Floating, ICE LIBOR USD 1M + 2.75%), 2.85%, 01/26/28† | 44,055 | | 43,775 |
| | | Par | | Value |
| Level 3 Financing, Inc. Tranche B 2027 Term Loan | | | |
| (Floating, ICE LIBOR USD 1M + 1.75%), 1.85%, 03/01/27† | $ 227,945 | | $ 225,380 |
| LifePoint Health, Inc. Term B Loan | | | |
| (Floating, ICE LIBOR USD 1M + 3.75%), 3.85%, 11/16/25† | 137,463 | | 137,531 |
| Nexstar Media, Inc. Term B-4 Loan | | | |
| (Floating, ICE LIBOR USD 1M + 2.50%), 2.60%, 09/18/26† | 427,600 | | 427,335 |
| Rackspace Technology Global, Inc. 2021 Term B Loan | | | |
| (Floating, ICE LIBOR USD 3M + 2.75%, 0.75% Floor), 3.50%, 02/15/28† | 178,650 | | 177,550 |
| Reynolds Consumer Products LLC Initial Term Loan | | | |
| (Floating, ICE LIBOR USD 1M + 1.75%), 1.85%, 02/04/27† | 19,869 | | 19,789 |
| Setanta Aircraft Leasing DAC Loan | | | |
| (Floating, ICE LIBOR USD 6M + 2.00%), 2.14%, 11/05/28† | 680,000 | | 680,425 |
| TransDigm, Inc. Tranche F Refinancing Term Loan | | | |
| (Floating, ICE LIBOR USD 1M + 2.25%), 2.35%, 12/09/25† | 39,596 | | 39,109 |
| UFC Holdings LLC Term B-3 Loan | | | |
| (Floating, ICE LIBOR USD 3M + 2.75%, 0.75% Floor), 3.50%, 04/29/26† | 348,218 | | 347,285 |
| Univision Communications, Inc. 2021 Replacement Converted First-Lien Term Loan | | | |
| (Floating, ICE LIBOR USD 1M + 3.25%, 0.75% Floor), 4.00%, 03/15/26† | 109,423 | | 109,807 |
| Verscend Holding Corporation Term B-1 Loan | | | |
| (Floating, ICE LIBOR USD 1M + 4.00%), 4.10%, 08/27/25† | 207,884 | | 208,092 |
| VFH Parent LLC Initial Term Loan | | | |
| (Floating, ICE LIBOR USD 1M + 3.00%), 3.10%, 03/01/26† | 268,130 | | 267,814 |
Total Loan Agreements
(Cost $9,931,783) | | | 9,935,302 |
| MORTGAGE-BACKED SECURITIES — 24.2% |
| 280 Park Avenue Mortgage Trust, Series 2017-280P, Class A | | | |
| (Floating, ICE LIBOR USD 1M + 0.88%, 0.88% Floor), 0.99%, 09/15/34 144A † | 1,200,000 | | 1,200,079 |
| 3650R Commercial Mortgage Trust, Series 2021-PF1, Class AS | | | |
| 2.78%, 11/15/54 | 750,000 | | 766,416 |
| Alba PLC, Series 2007-1, Class A3 | | | |
| (Floating, ICE LIBOR GBP 3M + 0.17%), 0.39%, 03/17/39(U) † | 547,228 | | 717,278 |
| Alternative Loan Trust, Series 2006-OA11, Class A1B | | | |
| (Floating, ICE LIBOR USD 1M + 0.38%, 0.38% Floor), 0.48%, 09/25/46† | 207,694 | | 204,456 |
See Notes to Financial Statements.
| | | Par | | Value |
| American Home Mortgage Investment Trust, Series 2005-2, Class 4A1 | | | |
| (Floating, ICE LIBOR USD 6M + 1.50%, 1.50% Floor, 11.00% Cap), 1.75%, 09/25/45† | $ 54,405 | | $ 54,545 |
| Arbor Multifamily Mortgage Securities Trust, Series 2020-MF1, Class A5 | | | |
| 2.76%, 05/15/53 144A | 1,300,000 | | 1,356,254 |
| AREIT Trust, Series 2020-CRE4, Class A | | | |
| (Floating, U.S. 30-Day Average SOFR + 2.73%, 2.62% Floor), 2.78%, 04/15/37 144A † | 351,147 | | 351,615 |
| AREIT Trust, Series 2021-CRE5, Class A | | | |
| (Floating, ICE LIBOR USD 1M + 1.08%, 1.08% Floor), 1.19%, 07/17/26 144A † | 2,800,000 | | 2,803,004 |
| BAMLL Commercial Mortgage Securities Trust, Series 2021-JACX, Class A | | | |
| (Floating, ICE LIBOR USD 1M + 1.05%, 1.05% Floor), 1.16%, 09/15/38 144A † | 2,300,000 | | 2,302,988 |
| Banc of America Funding Trust, Series 2005-D, Class A1 | | | |
| 2.79%, 05/25/35† γ | 239,075 | | 246,959 |
| Banc of America Mortgage Trust, Series 2004-F, Class 1A1 | | | |
| 2.45%, 07/25/34† γ | 25,501 | | 26,114 |
| BANK, Series 2017-BNK9, Class XA | | | |
| 0.79%, 11/15/54† IO γ | 9,551,531 | | 363,219 |
| BANK, Series 2018-BNK10, Class D | | | |
| 2.60%, 02/15/61 144A | 200,000 | | 173,560 |
| BANK, Series 2018-BNK14, Class D | | | |
| 3.00%, 09/15/60 144A | 250,000 | | 223,437 |
| BANK, Series 2019-BNK19, Class D | | | |
| 3.00%, 08/15/61 144A | 100,000 | | 91,086 |
| BANK, Series 2021-BN32, Class A5 | | | |
| 2.64%, 04/15/54 | 1,200,000 | | 1,247,354 |
| BANK, Series 2021-BN32, Class C | | | |
| 3.37%, 04/15/54 | 300,000 | | 305,324 |
| BANK, Series 2021-BN34, Class A5 | | | |
| 2.44%, 06/15/63 | 1,500,000 | | 1,533,652 |
| BANK, Series 2021-BN37, Class A5 | | | |
| 2.62%, 11/15/64 | 1,150,000 | | 1,193,699 |
| Barclays Commercial Mortgage Trust, Series 2019-C4, Class D | | | |
| 3.25%, 08/15/52 144A | 250,000 | | 231,933 |
| BBCCRE Trust, Series 2015-GTP, Class A | | | |
| 3.97%, 08/10/33 144A | 1,600,000 | | 1,701,098 |
| BBCCRE Trust, Series 2015-GTP, Class D | | | |
| 4.56%, 08/10/33 144A † γ | 390,000 | | 390,073 |
| BBCMS Mortgage Trust, Series 2017-C1, Class D | | | |
| 3.49%, 02/15/50 144A † γ | 200,000 | | 183,229 |
| BBCMS Mortgage Trust, Series 2018-C2, Class A5 | | | |
| 4.31%, 12/15/51 | 1,700,000 | | 1,934,024 |
| | | Par | | Value |
| BBCMS Mortgage Trust, Series 2020-C6, Class ASB | | | |
| 2.60%, 02/15/53 | $1,800,000 | | $1,873,884 |
| BBCMS Mortgage Trust, Series 2021-C12, Class A5 | | | |
| 2.69%, 11/15/54 | 1,900,000 | | 1,975,951 |
| BBCMS Mortgage Trust, Series 2021-C9, Class A5 | | | |
| 2.30%, 02/15/54 | 600,000 | | 601,985 |
| BBCMS Mortgage Trust, Series 2021-C9, Class C | | | |
| 3.19%, 02/15/54 | 300,000 | | 301,898 |
| Bear Stearns ALT-A Trust, Series 2005-4, Class 23A2 | | | |
| 2.60%, 05/25/35† γ | 86,428 | | 87,223 |
| Bear Stearns ARM Trust, Series 2002-11, Class 1A1 | | | |
| 2.50%, 02/25/33† γ | 4,223 | | 4,388 |
| Bear Stearns Structured Products, Inc. Trust, Series 2007-R6, Class 1A1 | | | |
| 2.70%, 01/26/36† γ | 273,275 | | 234,753 |
| Bellemeade Re, Ltd., Series 2021-2A, Class M1B | | | |
| (Floating, U.S. 30-Day Average SOFR + 1.50%, 1.50% Floor), 1.55%, 06/25/31 144A † | 310,000 | | 309,810 |
| Benchmark Mortgage Trust, Series 2019-B9, Class A5 | | | |
| 4.02%, 03/15/52 | 1,800,000 | | 2,024,363 |
| Benchmark Mortgage Trust, Series 2020-B20, Class XA | | | |
| 1.62%, 10/15/53† IO γ | 3,497,096 | | 356,568 |
| Benchmark Mortgage Trust, Series 2021-B28, Class XA | | | |
| 1.29%, 08/15/54† IO γ | 3,873,381 | | 364,799 |
| Benchmark Mortgage Trust, Series 2021-B31, Class A5 | | | |
| 2.67%, 12/15/54 | 1,640,000 | | 1,705,611 |
| BWAY Mortgage Trust, Series 2021-1450, Class A | | | |
| (Floating, ICE LIBOR USD 1M + 1.25%, 1.25% Floor), 1.36%, 09/15/36 144A † | 2,300,000 | | 2,302,875 |
| BX Commercial Mortgage Trust, Series 2019-XL, Class F | | | |
| (Floating, ICE LIBOR USD 1M + 2.00%, 2.00% Floor), 2.11%, 10/15/36 144A † | 1,249,500 | | 1,244,306 |
| BX Commercial Mortgage Trust, Series 2021-21M, Class A | | | |
| (Floating, ICE LIBOR USD 1M + 0.73%, 0.73% Floor), 0.84%, 10/15/36 144A † | 2,300,000 | | 2,287,445 |
| Cantor Commercial Real Estate Lending, Series 2019-CF2, Class E | | | |
| 2.50%, 11/15/52 144A | 550,000 | | 463,273 |
| CHL Mortgage Pass-Through Trust, Series 2003-58, Class 2A2 | | | |
| 2.46%, 02/19/34† γ | 142,308 | | 148,023 |
See Notes to Financial Statements.
MEDIUM-DURATION BOND FUND
SCHEDULE OF INVESTMENTS (Continued)
| | | Par | | Value |
| CHL Mortgage Pass-Through Trust, Series 2004-HYB5, Class 2A1 | | | |
| 2.57%, 04/20/35† γ | $ 3,151 | | $ 3,153 |
| CHT Mortgage Trust, Series 2017-CSMO, Class A | | | |
| (Floating, ICE LIBOR USD 1M + 0.93%, 0.93% Floor), 1.04%, 11/15/36 144A † | 310,000 | | 310,227 |
| CIM Retail Portfolio Trust, Series 2021-RETL, Class A | | | |
| (Floating, ICE LIBOR USD 1M + 1.40%, 1.40% Floor), 1.51%, 08/15/36 144A † | 1,300,000 | | 1,299,187 |
| Citigroup Commercial Mortgage Trust, Series 2014-GC23, Class B | | | |
| 4.18%, 07/10/47 | 370,000 | | 388,728 |
| Citigroup Commercial Mortgage Trust, Series 2015-GC29, Class D | | | |
| 3.11%, 04/10/48 144A | 550,000 | | 530,398 |
| Citigroup Commercial Mortgage Trust, Series 2017-P7, Class D | | | |
| 3.25%, 04/14/50 144A | 150,000 | | 127,275 |
| Citigroup Commercial Mortgage Trust, Series 2019-C7, Class E | | | |
| 2.75%, 12/15/72 144A | 330,000 | | 296,038 |
| Citigroup Commercial Mortgage Trust, Series 2019-GC41, Class A5 | | | |
| 2.87%, 08/10/56 | 1,450,000 | | 1,524,704 |
| Citigroup Commercial Mortgage Trust, Series 2021-KEYS, Class A | | | |
| (Floating, ICE LIBOR USD 1M + 1.18%, 1.18% Floor), 1.29%, 10/15/36 144A † | 2,300,000 | | 2,302,847 |
| Cold Storage Trust, Series 2020-ICE5, Class A | | | |
| (Floating, ICE LIBOR USD 1M + 0.90%, 0.90% Floor), 1.01%, 11/15/37 144A † | 648,774 | | 649,003 |
| COMM Mortgage Trust, Series 2013-CR12, Class AM | | | |
| 4.30%, 10/10/46 | 50,000 | | 51,676 |
| COMM Mortgage Trust, Series 2013-CR12, Class B | | | |
| 4.76%, 10/10/46 | 40,000 | | 41,376 |
| COMM Mortgage Trust, Series 2013-CR12, Class C | | | |
| 5.07%, 10/10/46† γ | 20,000 | | 19,833 |
| COMM Mortgage Trust, Series 2013-CR6, Class B | | | |
| 3.40%, 03/10/46 144A | 390,000 | | 395,044 |
| COMM Mortgage Trust, Series 2014-277P, Class A | | | |
| 3.61%, 08/10/49 144A † γ | 160,000 | | 167,457 |
| COMM Mortgage Trust, Series 2014-UBS6, Class A5 | | | |
| 3.64%, 12/10/47 | 2,400,000 | | 2,530,319 |
| COMM Mortgage Trust, Series 2015-DC1, Class C | | | |
| 4.31%, 02/10/48† γ | 80,000 | | 80,331 |
| COMM Mortgage Trust, Series 2017-COR2, Class C | | | |
| 4.56%, 09/10/50† γ | 500,000 | | 535,178 |
| | | Par | | Value |
| COMM Mortgage Trust, Series 2019-GC44, Class D | | | |
| 2.50%, 08/15/57 144A | $ 450,000 | | $ 400,771 |
| COMM Mortgage Trust, Series 2020-CX, Class B | | | |
| 2.45%, 11/10/46 144A | 1,060,000 | | 1,048,067 |
| Connecticut Avenue Securities Trust, Series 2018-R07, Class 1M2 | | | |
| (Floating, ICE LIBOR USD 1M + 2.40%), 2.50%, 04/25/31 144A † | 108,150 | | 108,652 |
| Connecticut Avenue Securities Trust, Series 2019-R02, Class 1M2 | | | |
| (Floating, ICE LIBOR USD 1M + 2.30%, 2.30% Floor), 2.40%, 08/25/31 144A † | 113,508 | | 114,028 |
| Connecticut Avenue Securities Trust, Series 2021-R01, Class 1M2 | | | |
| (Floating, U.S. 30-Day Average SOFR + 1.55%), 1.60%, 10/25/41 144A † | 279,000 | | 279,873 |
| Connecticut Avenue Securities Trust, Series 2021-R03, Class 1M2 | | | |
| (Floating, U.S. 30-Day Average SOFR + 1.65%, 1.65% Floor), 1.70%, 12/25/41 144A † | 245,000 | | 245,625 |
| CRSNT Trust, Series 2021-MOON, Class A | | | |
| (Floating, ICE LIBOR USD 1M + 0.82%, 0.82% Floor), 0.93%, 04/15/36 144A † | 2,500,000 | | 2,495,598 |
| CSAIL Commercial Mortgage Trust, Series 2018-C14, Class D | | | |
| 4.92%, 11/15/51 144A † γ | 300,000 | | 311,582 |
| CSAIL Commercial Mortgage Trust, Series 2021-C20, Class A3 | | | |
| 2.80%, 03/15/54 | 800,000 | | 834,076 |
| CSAIL Commercial Mortgage Trust, Series 2021-C20, Class C | | | |
| 3.73%, 03/15/54† γ | 300,000 | | 314,655 |
| CSMC Trust, Series 2010-16, Class B9 | | | |
| 3.84%, 06/25/50 144A † γ | 2,123,618 | | 1,895,647 |
| CSMC Trust, Series 2018-J1, Class A2 | | | |
| 3.50%, 02/25/48 144A † γ | 1,204,496 | | 1,224,541 |
| CSMC Trust, Series 2021-JR2, Class A1 | | | |
| 2.22%, 11/25/61 144A | 1,878,136 | | 1,879,349 |
| CSMC, Series 2017-TIME, Class A | | | |
| 3.65%, 11/13/39 144A | 530,000 | | 533,939 |
| CSMC, Series 2020-FACT, Class D | | | |
| (Floating, ICE LIBOR USD 1M + 3.71%, 3.71% Floor), 3.82%, 10/15/37 144A † | 670,000 | | 677,410 |
| CSMC, Series 2020-NET, Class A | | | |
| 2.26%, 08/15/37 144A | 2,000,000 | | 2,018,380 |
| CSMC, Series 2020-NET, Class B | | | |
| 2.82%, 08/15/37 144A | 650,000 | | 658,274 |
| CSMC, Series 2021-ADV, Class A | | | |
| (Floating, ICE LIBOR USD 1M + 1.40%, 1.40% Floor), 1.51%, 07/15/38 144A † | 2,600,000 | | 2,599,021 |
See Notes to Financial Statements.
| | | Par | | Value |
| CSMC, Series 2021-NQM8, Class A1 | | | |
| 1.84%, 10/25/66 144A † γ | $ 200,000 | | $ 200,971 |
| CSWF, Series 2021-SOP2, Class A | | | |
| (Floating, ICE LIBOR USD 1M + 0.97%, 0.97% Floor), 1.08%, 06/15/34 144A † | 2,300,000 | | 2,293,364 |
| DBJPM Mortgage Trust, Series 2016-C1, Class D | | | |
| 3.33%, 05/10/49 144A † γ | 500,000 | | 387,058 |
| Deutsche Alt-A Securities, Inc. Mortgage Loan Trust, Series 2006-AR1, Class 3A1 | | | |
| 3.06%, 02/25/36† γ | 527,379 | | 444,035 |
| DOLP Trust, Series 2021-NYC, Class A | | | |
| 2.96%, 05/10/41 144A | 3,400,000 | | 3,566,476 |
| ELP Commercial Mortgage Trust, Series 2021-ELP, Class A | | | |
| (Floating, ICE LIBOR USD 1M + 0.70%, 0.70% Floor), 0.81%, 11/15/38 144A † | 840,000 | | 836,269 |
| EQUS Mortgage Trust, Series 2021-EQAZ, Class A | | | |
| (Floating, ICE LIBOR USD 1M + 0.75%, 0.76% Floor), 0.86%, 10/15/38 144A † | 1,100,000 | | 1,096,507 |
| Eurohome UK Mortgages PLC, Series 2007-1, Class A | | | |
| (Floating, ICE LIBOR GBP 3M + 0.15%), 0.25%, 06/15/44(U) † | 1,275,125 | | 1,691,362 |
| Extended Stay America Trust, Series 2021-ESH, Class A | | | |
| (Floating, ICE LIBOR USD 1M + 1.08%, 1.08% Floor), 1.19%, 07/15/38 144A † | 7,411,443 | | 7,432,746 |
| Fannie Mae Connecticut Avenue Securities, Series 2017-C04, Class 2M2 | | | |
| (Floating, ICE LIBOR USD 1M + 2.85%), 2.95%, 11/25/29† | 583,816 | | 599,081 |
| Fannie Mae Connecticut Avenue Securities, Series 2018-C01, Class 1M2 | | | |
| (Floating, ICE LIBOR USD 1M + 2.25%, 2.25% Floor), 2.35%, 07/25/30† | 140,854 | | 142,585 |
| Fannie Mae Connecticut Avenue Securities, Series 2018-C03, Class 1M2 | | | |
| (Floating, ICE LIBOR USD 1M + 2.15%, 2.15% Floor), 2.25%, 10/25/30† | 135,840 | | 137,613 |
| Federal Home Loan Mortgage Corporation | | | |
| 8.00%, 08/01/24 | 225 | | 239 |
| 5.50%, 02/01/27 | 11,233 | | 12,316 |
| 4.50%, 10/01/29 | 910 | | 975 |
| 7.50%, 11/01/29 | 1,746 | | 2,011 |
| 7.50%, 12/01/29 | 1,997 | | 2,297 |
| (Floating, 2.23% - U.S. Treasury Yield Curve Rate CMT 1Y, 2.23% Floor, 11.36% Cap), 2.23%, 07/01/31† | 2,281 | | 2,286 |
| | | Par | | Value |
| 7.50%, 11/01/31 | $ 6,691 | | $ 6,717 |
| (Floating, ICE LIBOR USD 1Y + 1.98%, 1.98% Floor, 10.60% Cap), 2.23%, 04/01/32† | 231 | | 232 |
| 3.00%, 10/01/32 | 60,020 | | 63,110 |
| 3.50%, 08/01/33 | 367,630 | | 388,303 |
| 5.00%, 08/01/33 | 2,331 | | 2,633 |
| 5.00%, 09/01/33 | 383 | | 433 |
| 5.00%, 10/01/33 | 1,204 | | 1,363 |
| (Floating, U.S. Treasury Yield Curve Rate CMT 1Y + 2.37%, 2.37% Floor, 9.23% Cap), 2.49%, 03/01/34† | 599 | | 603 |
| 5.00%, 12/01/34 | 28,441 | | 31,963 |
| 5.50%, 05/01/35 | 118,469 | | 130,364 |
| 5.00%, 07/01/35 | 1,858 | | 2,104 |
| 5.00%, 11/01/35 | 62,468 | | 70,767 |
| 5.50%, 11/01/35 | 11,463 | | 12,796 |
| 5.00%, 12/01/35 | 5,608 | | 6,244 |
| 6.00%, 02/01/36 | 174,198 | | 192,012 |
| 5.00%, 02/01/37 | 5,214 | | 5,920 |
| 5.50%, 07/01/37 | 14,083 | | 16,139 |
| 3.50%, 01/01/38 | 295,478 | | 317,337 |
| 3.00%, 04/01/38 | 55,865 | | 58,281 |
| 5.50%, 04/01/38 | 3,327 | | 3,814 |
| 7.00%, 03/01/39 | 8,290 | | 9,774 |
| 6.50%, 09/01/39 | 16,228 | | 18,276 |
| 4.00%, 02/01/41 | 21,083 | | 23,173 |
| 2.50%, 04/01/41 | 92,114 | | 94,962 |
| 5.00%, 06/01/41 | 958 | | 1,069 |
| 2.00%, 09/01/41 | 1,173,286 | | 1,193,133 |
| 3.50%, 10/01/42 | 61,202 | | 65,893 |
| 4.00%, 10/01/42 | 21,356 | | 23,342 |
| 3.50%, 11/01/42 | 125,726 | | 135,313 |
| 3.50%, 12/01/42 | 13,131 | | 14,099 |
| 3.50%, 01/01/43 | 19,572 | | 20,946 |
| 3.50%, 02/01/43 | 106,723 | | 114,549 |
| 4.00%, 04/01/43 | 63,842 | | 69,780 |
| 3.50%, 05/01/43 | 211,488 | | 228,637 |
| 4.00%, 05/01/43 | 27,691 | | 30,476 |
| 4.00%, 06/01/43 | 34,216 | | 38,063 |
| 4.00%, 07/01/43 | 120,790 | | 133,708 |
| 4.00%, 08/01/43 | 53,926 | | 59,120 |
| 4.50%, 12/01/43 | 407,571 | | 453,250 |
| 3.50%, 02/01/44 | 29,673 | | 31,948 |
| 4.50%, 02/01/44 | 313,547 | | 346,433 |
| 4.50%, 03/01/44 | 86,317 | | 95,402 |
| 3.50%, 03/01/45 | 289,425 | | 311,608 |
| 4.00%, 12/01/45 | 163,116 | | 177,406 |
| 3.50%, 06/01/46 | 32,099 | | 34,435 |
| 4.00%, 09/01/46 | 174,685 | | 188,169 |
| 4.50%, 01/01/47 | 51,140 | | 54,809 |
| (Floating, U.S. Treasury Yield Curve Rate CMT 5Y + 1.29%, 1.29% Floor, 7.20% Cap), 2.08%, 03/01/47† | 424,981 | | 435,331 |
| 3.50%, 04/01/47 | 4,694,783 | | 5,037,691 |
| 3.50%, 06/01/47 | 29,841 | | 31,919 |
See Notes to Financial Statements.
MEDIUM-DURATION BOND FUND
SCHEDULE OF INVESTMENTS (Continued)
| | | Par | | Value |
| 4.00%, 07/01/47 | $ 220,901 | | $ 237,535 |
| 4.00%, 08/01/47 | 57,853 | | 62,929 |
| 3.00%, 09/01/47 | 684,202 | | 725,276 |
| 3.50%, 09/01/47 | 339,556 | | 360,262 |
| (Floating, ICE LIBOR USD 1Y + 1.62%, 1.62% Floor, 7.88% Cap), 2.88%, 11/01/47† | 348,659 | | 360,290 |
| 3.50%, 01/01/48 | 914 | | 970 |
| 3.50%, 03/01/48 | 60,203 | | 63,822 |
| 4.00%, 03/01/48 | 37,797 | | 40,830 |
| 3.50%, 06/01/48 | 181,609 | | 193,285 |
| 4.00%, 06/01/48 | 1,422,298 | | 1,545,869 |
| 4.50%, 08/01/48 | 716,270 | | 787,629 |
| 5.00%, 08/01/48 | 101,882 | | 111,414 |
| 3.00%, 09/01/48 | 98,093 | | 103,492 |
| (Floating, ICE LIBOR USD 1Y + 1.63%, 1.63% Floor, 8.02% Cap), 3.02%, 11/01/48† | 1,260,639 | | 1,302,758 |
| 4.00%, 04/01/49 | 196,006 | | 212,026 |
| 3.00%, 09/01/49 | 2,595,008 | | 2,735,550 |
| 4.50%, 09/01/49 | 415,972 | | 446,265 |
| 3.50%, 12/01/49 | 331,784 | | 349,867 |
| 4.50%, 12/01/49 | 632,038 | | 678,045 |
| 3.00%, 01/01/50 | 57,562 | | 61,013 |
| (Floating, ICE LIBOR USD 1Y + 1.62%, 1.62% Floor, 8.09% Cap), 3.09%, 02/01/50† | 179,298 | | 185,396 |
| 4.00%, 03/01/50 | 74,675 | | 80,101 |
| 4.50%, 05/01/50 | 297,181 | | 318,739 |
| 2.00%, 11/01/50 | 451,318 | | 451,529 |
| 2.50%, 12/01/50 | 619,481 | | 637,326 |
| 3.00%, 12/01/50 | 3,179,072 | | 3,353,680 |
| 2.50%, 01/01/51 | 527,520 | | 541,742 |
| 2.00%, 02/01/51 | 1,293,853 | | 1,294,559 |
| 2.50%, 02/01/51 | 178,456 | | 183,229 |
| 2.00%, 03/01/51 | 1,616,259 | | 1,617,304 |
| 2.00%, 04/01/51 | 567,818 | | 570,658 |
| 2.00%, 05/01/51 | 2,590,399 | | 2,592,766 |
| 2.50%, 05/01/51 | 93,952 | | 97,620 |
| 2.50%, 07/01/51 | 2,141,879 | | 2,202,065 |
| 2.50%, 08/01/51 | 479,841 | | 492,809 |
| 2.50%, 09/01/51 | 5,000,686 | | 5,139,853 |
| 2.00%, 11/01/51 | 399,241 | | 398,955 |
| 2.50%, 01/01/52 | 200,000 | | 204,453 |
| Federal Home Loan Mortgage Corporation Reference REMIC, Series R007 | | | |
| 6.00%, 05/15/36 | 85,799 | | 98,554 |
| Federal Home Loan Mortgage Corporation REMIC, Series 3325 | | | |
| (Floating, ICE LIBOR USD 1M + 0.50%, 0.50% Floor, 6.75% Cap), 0.61%, 06/15/37† | 56,676 | | 57,644 |
| Federal Home Loan Mortgage Corporation REMIC, Series 3621 | | | |
| (Floating, 6.23% - ICE LIBOR USD 1M, 6.23% Cap), 6.12%, 01/15/40† IO | 119,528 | | 20,538 |
| | | Par | | Value |
| Federal Home Loan Mortgage Corporation REMIC, Series 3947 | | | |
| (Floating, 5.95% - ICE LIBOR USD 1M, 5.95% Cap), 5.84%, 10/15/41† IO | $ 53,670 | | $ 8,157 |
| Federal Home Loan Mortgage Corporation REMIC, Series 3973 | | | |
| (Floating, 6.49% - ICE LIBOR USD 1M, 6.49% Cap), 6.38%, 12/15/41† IO | 148,818 | | 28,400 |
| Federal Home Loan Mortgage Corporation REMIC, Series 4099 | | | |
| (Floating, 6.00% - ICE LIBOR USD 1M, 6.00% Cap), 5.89%, 08/15/42† IO | 94,154 | | 15,180 |
| Federal Home Loan Mortgage Corporation REMIC, Series 4194 | | | |
| 3.50%, 04/15/43 IO | 130,928 | | 15,261 |
| Federal Home Loan Mortgage Corporation REMIC, Series 4210 | | | |
| 3.00%, 05/15/43 | 109,115 | | 113,451 |
| Federal Home Loan Mortgage Corporation REMIC, Series 4239 | | | |
| 3.50%, 06/15/27 IO | 110,407 | | 5,038 |
| Federal Home Loan Mortgage Corporation REMIC, Series 4298 | | | |
| 4.00%, 04/15/43 IO | 47,287 | | 1,209 |
| Federal Home Loan Mortgage Corporation REMIC, Series 4310 | | | |
| (Floating, 5.95% - ICE LIBOR USD 1M, 5.95% Cap), 5.84%, 02/15/44† IO | 53,387 | | 8,244 |
| Federal Home Loan Mortgage Corporation REMIC, Series 4335 | | | |
| (Floating, 6.00% - ICE LIBOR USD 1M, 6.00% Cap), 5.89%, 05/15/44† IO | 51,970 | | 8,370 |
| Federal Home Loan Mortgage Corporation REMIC, Series 4415 | | | |
| 1.59%, 04/15/41† IO γ | 64,969 | | 3,606 |
| Federal Home Loan Mortgage Corporation REMIC, Series 4638 | | | |
| (Floating, ICE LIBOR USD 1M + 0.44%), 0.53%, 07/15/40† | 179,948 | | 182,223 |
| Federal Home Loan Mortgage Corporation REMIC, Series 4793 | | | |
| 3.00%, 05/15/48 | 318,429 | | 329,225 |
| 3.00%, 06/15/48 | 208,797 | | 215,885 |
| Federal Home Loan Mortgage Corporation REMIC, Series 4813 | | | |
| 3.00%, 08/15/48 | 147,069 | | 151,790 |
| Federal Home Loan Mortgage Corporation REMIC, Series 4989 | | | |
| (Floating, ICE LIBOR USD 1M + 0.35%), 0.44%, 08/15/40† | 714,131 | | 717,397 |
| (Floating, ICE LIBOR USD 1M + 0.35%), 0.44%, 10/15/40† | 655,744 | | 658,741 |
| Federal Home Loan Mortgage Corporation REMIC, Series 5010 | | | |
| 2.50%, 09/25/50 IO | 594,943 | | 83,765 |
See Notes to Financial Statements.
| | | Par | | Value |
| Federal Home Loan Mortgage Corporation REMIC, Series 5013 | | | |
| 2.50%, 09/25/50 IO | $186,361 | | $ 27,296 |
| Federal Home Loan Mortgage Corporation REMIC, Series 5018 | | | |
| 2.00%, 10/25/50 IO | 369,310 | | 47,034 |
| Federal Home Loan Mortgage Corporation REMIC, Series 5040 | | | |
| 2.50%, 11/25/50 IO | 85,244 | | 10,050 |
| Federal Home Loan Mortgage Corporation REMIC, Series 5059 | | | |
| 2.50%, 01/25/51 IO | 377,514 | | 59,089 |
| Federal Home Loan Mortgage Corporation REMIC, Series 5140 | | | |
| 2.50%, 05/25/49 IO | 688,765 | | 93,312 |
| Federal Home Loan Mortgage Corporation STACR REMIC Trust, Series 2020-DNA3, Class B1 | | | |
| (Floating, ICE LIBOR USD 1M + 5.10%), 5.20%, 06/25/50 144A † | 170,000 | | 175,696 |
| Federal Home Loan Mortgage Corporation STACR REMIC Trust, Series 2020-DNA4, Class B1 | | | |
| (Floating, ICE LIBOR USD 1M + 6.00%), 6.10%, 08/25/50 144A † | 176,000 | | 185,687 |
| Federal Home Loan Mortgage Corporation STACR REMIC Trust, Series 2020-DNA5, Class B1 | | | |
| (Floating, U.S. 30-Day Average SOFR + 4.80%), 4.85%, 10/25/50 144A † | 720,000 | | 763,948 |
| Federal Home Loan Mortgage Corporation STACR REMIC Trust, Series 2021-DNA5, Class M2 | | | |
| (Floating, U.S. 30-Day Average SOFR + 1.65%), 1.70%, 01/25/34 144A † | 200,000 | | 200,876 |
| Federal Home Loan Mortgage Corporation STACR REMIC Trust, Series 2021-HQA1, Class B1 | | | |
| (Floating, U.S. 30-Day Average SOFR + 3.00%), 3.05%, 08/25/33 144A † | 970,000 | | 974,712 |
| Federal Home Loan Mortgage Corporation STRIP, Series 353 | | | |
| (Floating, 6.00% - ICE LIBOR USD 1M, 6.00% Cap), 5.89%, 12/15/46† IO | 214,698 | | 35,095 |
| Federal National Mortgage Association | | | |
| (Floating, COF 11th District San Francisco + 1.25%, 1.25% Floor, 12.75% Cap), 1.51%, 07/01/22† | 41 | | 41 |
| 5.50%, 09/01/23 | 1,764 | | 1,790 |
| 5.50%, 10/01/23 | 497 | | 504 |
| 2.81%, 04/01/25 | 50,000 | | 52,220 |
| | | Par | | Value |
| 5.50%, 05/01/25 | $ 56 | | $ 56 |
| (Floating, COF 11th District San Francisco + 1.25%, 1.25% Floor, 12.05% Cap), 1.48%, 07/01/27† | 3,228 | | 3,238 |
| (Floating, U.S. Treasury Yield Curve Rate CMT 1Y + 2.13%, 2.13% Floor, 11.79% Cap), 2.26%, 08/01/27† | 3,870 | | 3,888 |
| (Floating, COF 11th District San Francisco + 1.25%, 1.25% Floor, 10.61% Cap), 1.48%, 11/01/27 CONV † | 6,034 | | 6,059 |
| 3.08%, 01/01/28 | 140,000 | | 149,926 |
| 3.16%, 05/01/29 | 144,954 | | 158,594 |
| 2.79%, 08/01/29 | 500,000 | | 536,735 |
| 2.26%, 04/01/30 | 386,694 | | 403,685 |
| (Floating, 2.38% - U.S. Treasury Yield Curve Rate CMT 1Y, 2.38% Floor, 10.65% Cap), 2.38%, 06/01/30 CONV † | 8,730 | | 8,758 |
| 8.00%, 10/01/30 | 5,598 | | 6,451 |
| (Floating, U.S. Treasury Yield Curve Rate CMT 1Y + 2.51%, 2.51% Floor, 12.62% Cap), 2.63%, 12/01/30 CONV † | 1,369 | | 1,373 |
| 4.50%, 04/01/31 | 20,049 | | 21,732 |
| 4.50%, 05/01/31 | 78,084 | | 84,453 |
| 4.50%, 06/01/31 | 23,932 | | 25,886 |
| 4.50%, 11/01/31 | 34,440 | | 37,258 |
| 6.00%, 11/01/31 | 1,465 | | 1,678 |
| 4.50%, 12/01/31 | 51,208 | | 55,394 |
| 6.00%, 01/01/32 | 45,017 | | 49,598 |
| 6.00%, 03/01/32 | 1,687 | | 1,859 |
| 6.00%, 04/01/32 | 81,825 | | 90,293 |
| (Floating, COF 11th District San Francisco + 1.25%, 1.25% Floor, 10.95% Cap), 1.48%, 06/01/32† | 5,424 | | 5,447 |
| (Floating, COF 11th District San Francisco + 1.25%, 1.25% Floor, 12.21% Cap), 1.51%, 08/01/32† | 5,520 | | 5,544 |
| (Floating, U.S. Treasury Yield Curve Rate CMT 1Y + 2.13%, 2.13% Floor, 9.75% Cap), 2.25%, 02/01/33† | 759 | | 762 |
| (Floating, COF 11th District San Francisco + 1.25%, 1.25% Floor, 11.98% Cap), 1.51%, 05/01/33† | 5,738 | | 5,762 |
| 5.00%, 07/01/33 | 10,827 | | 12,215 |
| 5.00%, 09/01/33 | 13,498 | | 15,210 |
| 3.50%, 05/01/34 | 81,040 | | 87,059 |
| 6.00%, 10/01/34 | 22,853 | | 25,157 |
| (Floating, ICE LIBOR USD 1Y + 1.55%, 1.55% Floor, 9.67% Cap), 1.92%, 12/01/34† | 11,315 | | 11,376 |
| 3.50%, 12/01/34 | 18,880 | | 20,204 |
| 3.50%, 01/01/35 | 19,373 | | 20,732 |
| 6.00%, 05/01/35 | 122,090 | | 135,010 |
| 3.00%, 07/01/35 | 24,711 | | 26,102 |
See Notes to Financial Statements.
MEDIUM-DURATION BOND FUND
SCHEDULE OF INVESTMENTS (Continued)
| | | Par | | Value |
| 6.00%, 07/01/35 | $ 33,285 | | $ 36,771 |
| 5.50%, 09/01/35 | 23,121 | | 25,329 |
| 5.00%, 10/01/35 | 37,636 | | 42,458 |
| 6.00%, 10/01/35 | 12,049 | | 13,856 |
| (Floating, COF 11th District San Francisco + 1.25%, 1.25% Floor, 10.54% Cap), 1.48%, 11/01/35† | 2,311 | | 2,313 |
| (Floating, Federal Reserve U.S. 12 1Y CMT + 1.79%, 1.79% Floor, 8.93% Cap), 1.88%, 11/01/35† | 12,012 | | 12,523 |
| 6.00%, 11/01/35 | 75,703 | | 84,047 |
| 1.50%, 12/01/35 | 91,179 | | 91,600 |
| 3.00%, 02/01/36 | 358,517 | | 379,070 |
| 3.00%, 04/01/36 | 289,362 | | 305,661 |
| 5.50%, 04/01/36 | 1,516 | | 1,629 |
| (Floating, COF 11th District San Francisco + 1.25%, 3.95% Floor, 12.88% Cap), 3.99%, 05/01/36† | 16,035 | | 17,266 |
| 3.00%, 07/01/36 | 546,423 | | 574,080 |
| 3.00%, 08/01/36 | 216,215 | | 227,399 |
| 2.50%, 09/01/36 | 128,182 | | 132,075 |
| 3.00%, 10/01/36 | 1,092,628 | | 1,150,475 |
| 5.50%, 11/01/36 | 30,839 | | 35,165 |
| 3.00%, 12/01/36 | 461,819 | | 485,839 |
| 3.50%, 02/01/37 | 82,887 | | 88,672 |
| 3.50%, 03/01/37 | 67,147 | | 71,518 |
| 5.50%, 03/01/37 | 1,851 | | 2,076 |
| 6.00%, 07/01/37 | 330,379 | | 383,075 |
| 6.50%, 10/01/37 | 37,488 | | 41,594 |
| 7.00%, 10/01/37 | 545 | | 562 |
| 7.00%, 11/01/37 | 3,228 | | 3,454 |
| (Floating, COF 11th District San Francisco + 1.25%, 1.25% Floor, 10.69% Cap), 1.48%, 12/01/37† | 10,824 | | 10,876 |
| 3.00%, 12/01/37 | 63,599 | | 66,515 |
| 3.50%, 12/01/37 | 98,009 | | 105,794 |
| 7.00%, 12/01/37 | 2,093 | | 2,307 |
| (Floating, COF 11th District San Francisco + 1.25%, 1.25% Floor, 10.54% Cap), 1.48%, 01/01/38† | 4,365 | | 4,387 |
| 2.50%, 03/01/38 | 453,415 | | 467,191 |
| 4.50%, 03/01/38 | 3,190 | | 3,458 |
| 4.50%, 04/01/38 | 25,352 | | 28,019 |
| 5.00%, 04/01/38 | 36,108 | | 40,955 |
| 3.00%, 06/01/38 | 264,110 | | 277,456 |
| 5.00%, 06/01/38 | 34,318 | | 38,706 |
| 5.50%, 08/01/38 | 21,566 | | 24,731 |
| 7.00%, 11/01/38 | 10,751 | | 12,527 |
| 7.00%, 02/01/39 | 3,754 | | 4,441 |
| 3.50%, 08/01/39 | 66,605 | | 70,840 |
| 6.00%, 12/01/39 | 141,290 | | 164,018 |
| 3.50%, 02/01/40 | 177,831 | | 191,515 |
| 3.00%, 03/01/40 | 262,077 | | 275,371 |
| | | Par | | Value |
| (Floating, Federal Reserve U.S. 12 1Y CMT + 1.40%, 1.40% Floor, 9.70% Cap), 1.48%, 06/01/40† | $ 14,450 | | $ 14,942 |
| 1.48%, 10/01/40† | 41,916 | | 42,306 |
| (Floating, COF 11th District San Francisco + 1.25%, 1.25% Floor, 10.25% Cap), 1.48%, 11/01/40† | 5,886 | | 5,911 |
| 2.50%, 03/01/41 | 93,191 | | 97,220 |
| 2.50%, 04/01/41 | 660,377 | | 687,009 |
| 4.50%, 04/01/41 | 56,780 | | 62,800 |
| 2.50%, 05/01/41 | 755,458 | | 780,591 |
| 6.00%, 07/01/41 | 119,020 | | 137,514 |
| 4.50%, 08/01/41 | 23,460 | | 25,878 |
| 2.00%, 10/01/41 | 992,171 | | 1,011,411 |
| 4.50%, 11/01/41 | 90,637 | | 100,172 |
| 4.00%, 06/01/42 | 20,385 | | 21,890 |
| 3.50%, 09/01/42 | 21,532 | | 23,173 |
| 4.00%, 10/01/42 | 79,079 | | 86,082 |
| 2.50%, 11/01/42 | 12,182 | | 12,558 |
| 4.00%, 11/01/42 | 858,544 | | 943,045 |
| 2.50%, 12/01/42 | 6,191 | | 6,369 |
| 3.00%, 12/01/42 | 10,056 | | 10,718 |
| 3.50%, 12/01/42 | 39,521 | | 42,679 |
| 4.00%, 12/01/42 | 49,575 | | 54,042 |
| 2.50%, 01/01/43 | 8,596 | | 8,865 |
| 3.00%, 01/01/43 | 174,790 | | 185,516 |
| 3.50%, 01/01/43 | 676,421 | | 727,825 |
| 2.50%, 02/01/43 | 11,408 | | 11,724 |
| 2.50%, 03/01/43 | 761,694 | | 783,961 |
| 3.00%, 03/01/43 | 124,744 | | 132,870 |
| 3.50%, 03/01/43 | 313,087 | | 338,225 |
| 2.50%, 04/01/43 | 892,898 | | 916,869 |
| 3.00%, 04/01/43 | 188,855 | | 201,296 |
| 4.00%, 04/01/43 | 29,483 | | 32,437 |
| 2.50%, 05/01/43 | 13,962 | | 14,297 |
| 3.00%, 05/01/43 | 113,829 | | 121,328 |
| 2.50%, 06/01/43 | 17,534 | | 18,047 |
| 3.00%, 06/01/43 | 35,575 | | 37,917 |
| 4.00%, 06/01/43 | 268,035 | | 295,423 |
| 3.00%, 07/01/43 | 307,256 | | 327,485 |
| 4.00%, 07/01/43 | 288,102 | | 317,182 |
| 2.50%, 08/01/43 | 448,318 | | 459,351 |
| 4.00%, 08/01/43 | 80,109 | | 87,312 |
| 4.50%, 09/01/43 | 257,547 | | 284,494 |
| 2.50%, 10/01/43 | 23,803 | | 24,537 |
| 4.50%, 10/01/43 | 79,151 | | 87,423 |
| 4.50%, 11/01/43 | 52,551 | | 57,706 |
| 4.50%, 12/01/43 | 83,071 | | 91,381 |
| 4.50%, 01/01/44 | 47,437 | | 52,032 |
| 4.50%, 02/01/44 | 191,392 | | 206,957 |
| 3.50%, 08/01/44 | 89,015 | | 95,274 |
| 4.50%, 10/01/44 | 188,488 | | 208,297 |
| 4.00%, 01/01/45 | 74,606 | | 81,972 |
| 4.50%, 02/01/45 | 639,805 | | 717,084 |
See Notes to Financial Statements.
| | | Par | | Value |
| 4.50%, 04/01/45 | $ 315,959 | | $ 351,031 |
| 4.50%, 05/01/45 | 38,829 | | 43,140 |
| 4.50%, 06/01/45 | 290,322 | | 318,618 |
| 3.00%, 11/01/45 | 601,657 | | 632,578 |
| 3.50%, 01/01/46 | 196,721 | | 211,493 |
| 3.00%, 05/01/46 | 285,150 | | 302,144 |
| 3.00%, 07/01/46 | 311,290 | | 328,398 |
| 3.00%, 08/01/46 | 471,914 | | 499,776 |
| 3.00%, 09/01/46 | 76,076 | | 79,971 |
| 3.00%, 10/01/46 | 40,519 | | 42,600 |
| 3.00%, 11/01/46 | 982,104 | | 1,035,743 |
| 3.50%, 11/01/46 | 27,387 | | 29,213 |
| 4.50%, 11/01/46 | 278,601 | | 301,695 |
| 5.00%, 11/01/46 | 468,280 | | 524,177 |
| 3.50%, 12/01/46 | 163,471 | | 174,951 |
| 4.00%, 01/01/47 | 656,381 | | 712,331 |
| 3.50%, 02/01/47 | 1,756,609 | | 1,867,063 |
| 4.00%, 02/01/47 | 72,091 | | 78,006 |
| 3.50%, 03/01/47 | 289,489 | | 308,387 |
| 4.50%, 03/01/47 | 388,719 | | 423,896 |
| 4.00%, 04/01/47 | 54,255 | | 58,636 |
| 3.50%, 05/01/47 | 245,215 | | 260,121 |
| 4.00%, 05/01/47 | 56,687 | | 61,243 |
| 4.50%, 06/01/47 | 557,584 | | 612,609 |
| 3.50%, 07/01/47 | 77,977 | | 82,906 |
| 4.50%, 07/01/47 | 539,982 | | 586,779 |
| 4.00%, 08/01/47 | 459,549 | | 498,468 |
| 3.00%, 09/01/47 | 742,018 | | 782,433 |
| 3.50%, 09/01/47 | 10,201,840 | | 10,995,587 |
| 3.50%, 10/01/47 | 11,118,794 | | 11,986,767 |
| 3.50%, 11/01/47 | 14,559,160 | | 15,697,301 |
| 4.50%, 11/01/47 | 141,726 | | 154,437 |
| 3.50%, 12/01/47 | 14,138,520 | | 15,244,582 |
| 4.00%, 12/01/47 | 268,417 | | 292,726 |
| 4.00%, 01/01/48 | 322,652 | | 351,683 |
| 3.50%, 02/01/48 | 770,832 | | 818,922 |
| 4.00%, 02/01/48 | 887,862 | | 966,320 |
| 4.00%, 03/01/48 | 647,742 | | 704,451 |
| 4.00%, 06/01/48 | 411,878 | | 449,913 |
| 4.00%, 07/01/48 | 733,707 | | 798,917 |
| 4.50%, 07/01/48 | 202,223 | | 221,012 |
| 3.50%, 08/01/48 | 3,482,949 | | 3,730,128 |
| 4.00%, 08/01/48 | 1,969,119 | | 2,125,758 |
| 4.50%, 09/01/48 | 389,952 | | 428,655 |
| 5.00%, 09/01/48 | 790,974 | | 882,351 |
| 4.00%, 10/01/48 | 77,683 | | 83,467 |
| 3.50%, 11/01/48 | 336,875 | | 358,842 |
| 4.00%, 11/01/48 | 98,855 | | 107,319 |
| 5.00%, 11/01/48 | 1,881,477 | | 2,104,642 |
| 4.00%, 01/01/49 | 30,168 | | 32,148 |
| 4.50%, 01/01/49 | 373,073 | | 400,384 |
| 4.00%, 05/01/49 | 49,400 | | 53,355 |
| 3.50%, 06/01/49 | 318,690 | | 339,004 |
| 4.50%, 06/01/49 | 798,470 | | 854,449 |
| 4.50%, 07/01/49 | 497,694 | | 534,340 |
| 3.00%, 09/01/49 | 767,502 | | 813,278 |
| | | Par | | Value |
| 4.00%, 10/01/49 | $ 42,199 | | $ 45,464 |
| 3.00%, 12/01/49 | 734,811 | | 772,577 |
| 4.00%, 12/01/49 | 153,051 | | 165,252 |
| 3.00%, 02/01/50 | 2,303,127 | | 2,415,427 |
| 3.00%, 03/01/50 | 293,297 | | 310,867 |
| 3.00%, 04/01/50 | 1,412,323 | | 1,476,506 |
| 3.00%, 06/01/50 | 783,812 | | 817,947 |
| 4.50%, 07/01/50 | 47,076 | | 50,376 |
| 2.00%, 08/01/50 | 81,661 | | 81,719 |
| 3.00%, 08/01/50 | 136,997 | | 142,780 |
| 3.50%, 08/01/50 | 80,716 | | 85,785 |
| 2.00%, 09/01/50 | 81,875 | | 81,933 |
| 2.50%, 09/01/50 | 94,094 | | 97,230 |
| 2.50%, 11/01/50 | 282,875 | | 291,643 |
| 3.00%, 11/01/50 | 131,099 | | 137,198 |
| 2.50%, 12/01/50 | 89,247 | | 91,559 |
| 4.00%, 12/01/50 | 66,227 | | 71,157 |
| 4.50%, 12/01/50 | 713,086 | | 763,078 |
| 2.00%, 01/01/51 | 461,908 | | 461,606 |
| 2.50%, 01/01/51 | 88,937 | | 91,496 |
| 2.00%, 02/01/51 | 1,391,486 | | 1,392,723 |
| 2.50%, 02/01/51 | 801,935 | | 824,234 |
| 2.00%, 03/01/51 | 4,906,501 | | 4,908,623 |
| 2.50%, 03/01/51 | 187,223 | | 193,290 |
| 2.00%, 04/01/51 | 935,924 | | 938,543 |
| 2.50%, 04/01/51 | 190,761 | | 196,844 |
| 2.50%, 05/01/51 | 282,382 | | 290,862 |
| 2.50%, 06/01/51 | 757,844 | | 780,704 |
| 2.50%, 07/01/51 | 875,273 | | 900,453 |
| 2.50%, 08/01/51 | 394,665 | | 405,094 |
| 2.50%, 09/01/51 | 4,134,077 | | 4,250,998 |
| 3.00%, 09/01/51 | 96,813 | | 101,510 |
| 2.00%, 10/01/51 | 298,709 | | 299,033 |
| 2.50%, 10/01/51 | 691,708 | | 711,299 |
| 3.00%, 10/01/51 | 200,000 | | 208,458 |
| 2.00%, 11/01/51 | 99,751 | | 99,842 |
| 4.00%, 02/01/56 | 329,142 | | 365,085 |
| 5.50%, 09/01/56 | 480,785 | | 562,170 |
| 4.00%, 01/01/57 | 210,627 | | 233,629 |
| 4.00%, 06/01/57 | 329,461 | | 362,544 |
| 4.50%, 09/01/57 | 534,022 | | 593,674 |
| 4.50%, 08/01/58 | 150,799 | | 168,690 |
| Federal National Mortgage Association ACES, Series 2015-M1 | | | |
| 0.49%, 09/25/24† IO γ | 2,662,218 | | 34,910 |
| Federal National Mortgage Association ACES, Series 2016-M11 | | | |
| 2.94%, 07/25/39 | 60,193 | | 61,666 |
| Federal National Mortgage Association ACES, Series 2017-M8 | | | |
| 3.06%, 05/25/27 | 99,830 | | 107,097 |
See Notes to Financial Statements.
MEDIUM-DURATION BOND FUND
SCHEDULE OF INVESTMENTS (Continued)
| | | Par | | Value |
| Federal National Mortgage Association ACES, Series 2019-M23 | | | |
| 2.72%, 10/25/31 | $ 299,686 | | $321,281 |
| Federal National Mortgage Association ACES, Series 2020-M33 | | | |
| 2.25%, 01/25/31† IO γ | 7,100,000 | | 926,177 |
| Federal National Mortgage Association ACES, Series 2020-M6 | | | |
| 2.50%, 10/25/37 | 92,121 | | 95,593 |
| Federal National Mortgage Association Interest STRIP, Series 409 | | | |
| 3.00%, 04/25/27 IO | 95,298 | | 4,668 |
| 4.50%, 11/25/39 IO | 18,343 | | 2,560 |
| 3.50%, 11/25/41 IO | 63,404 | | 6,232 |
| 4.00%, 11/25/41 IO | 84,339 | | 11,422 |
| 4.00%, 04/25/42 IO | 155,267 | | 21,704 |
| Federal National Mortgage Association REMIC, Series 2000-32 | | | |
| (Floating, ICE LIBOR USD 1M + 0.45%, 0.45% Floor, 9.00% Cap), 0.55%, 10/18/30† | 3,903 | | 3,921 |
| Federal National Mortgage Association REMIC, Series 2005-29 | | | |
| 5.50%, 04/25/35 | 244,229 | | 277,172 |
| Federal National Mortgage Association REMIC, Series 2007-24 | | | |
| (Floating, 6.75% - ICE LIBOR USD 1M, 6.75% Cap), 6.65%, 03/25/37† IO | 266,670 | | 48,145 |
| Federal National Mortgage Association REMIC, Series 2011-52 | | | |
| 5.00%, 06/25/41 | 152,467 | | 170,964 |
| Federal National Mortgage Association REMIC, Series 2011-59 | | | |
| 5.50%, 07/25/41 | 510,293 | | 580,314 |
| Federal National Mortgage Association REMIC, Series 2011-96 | | | |
| (Floating, 6.55% - ICE LIBOR USD 1M, 6.55% Cap), 6.45%, 10/25/41† IO | 209,256 | | 33,097 |
| Federal National Mortgage Association REMIC, Series 2012-101 | | | |
| 4.00%, 09/25/27 IO | 43,293 | | 1,805 |
| Federal National Mortgage Association REMIC, Series 2012-111 | | | |
| 7.00%, 10/25/42 | 13,686 | | 16,246 |
| Federal National Mortgage Association REMIC, Series 2012-133 | | | |
| (Floating, 6.15% - ICE LIBOR USD 1M, 6.15% Cap), 6.05%, 12/25/42† IO | 60,246 | | 10,718 |
| | | Par | | Value |
| Federal National Mortgage Association REMIC, Series 2012-153 | | | |
| 7.00%, 07/25/42 | $ 46,242 | | $ 55,267 |
| Federal National Mortgage Association REMIC, Series 2012-28 | | | |
| 6.50%, 06/25/39 | 2,642 | | 2,863 |
| Federal National Mortgage Association REMIC, Series 2012-35 | | | |
| (Floating, 6.50% - ICE LIBOR USD 1M, 6.50% Cap), 6.40%, 04/25/42† IO | 62,351 | | 12,004 |
| Federal National Mortgage Association REMIC, Series 2012-46 | | | |
| 6.00%, 05/25/42 | 66,171 | | 76,323 |
| Federal National Mortgage Association REMIC, Series 2012-70 | | | |
| (Floating, 6.65% - ICE LIBOR USD 1M, 6.65% Cap), 6.55%, 02/25/41† IO | 1,243 | | 11 |
| Federal National Mortgage Association REMIC, Series 2012-74 | | | |
| (Floating, 6.65% - ICE LIBOR USD 1M, 6.65% Cap), 6.55%, 03/25/42† IO | 83,235 | | 11,646 |
| Federal National Mortgage Association REMIC, Series 2012-75 | | | |
| (Floating, 6.60% - ICE LIBOR USD 1M, 6.60% Cap), 6.50%, 07/25/42† IO | 15,606 | | 2,584 |
| Federal National Mortgage Association REMIC, Series 2013-124 | | | |
| (Floating, 5.95% - ICE LIBOR USD 1M, 5.95% Cap), 5.85%, 12/25/43† IO | 236,712 | | 41,541 |
| Federal National Mortgage Association REMIC, Series 2013-14 | | | |
| 4.00%, 03/25/43 IO | 63,290 | | 6,968 |
| Federal National Mortgage Association REMIC, Series 2013-17 | | | |
| 3.00%, 03/25/28 IO | 399,865 | | 25,338 |
| Federal National Mortgage Association REMIC, Series 2013-29 | | | |
| 4.00%, 04/25/43 IO | 159,653 | | 16,332 |
| Federal National Mortgage Association REMIC, Series 2013-54 | | | |
| (Floating, 6.15% - ICE LIBOR USD 1M, 6.15% Cap), 6.05%, 06/25/43† IO | 104,520 | | 18,449 |
| Federal National Mortgage Association REMIC, Series 2013-9 | | | |
| 5.50%, 04/25/42 | 293,982 | | 331,118 |
See Notes to Financial Statements.
| | | Par | | Value |
| 6.50%, 07/25/42 | $ 122,000 | | $143,302 |
| Federal National Mortgage Association REMIC, Series 2014-47 | | | |
| 1.63%, 08/25/44† IO γ | 196,241 | | 10,510 |
| Federal National Mortgage Association REMIC, Series 2015-55 | | | |
| 1.42%, 08/25/55† IO γ | 74,694 | | 2,976 |
| Federal National Mortgage Association REMIC, Series 2015-56 | | | |
| (Floating, 6.15% - ICE LIBOR USD 1M, 6.15% Cap), 6.05%, 08/25/45† IO | 37,542 | | 7,516 |
| Federal National Mortgage Association REMIC, Series 2017-76 | | | |
| (Floating, 6.10% - ICE LIBOR USD 1M, 6.10% Cap), 6.00%, 10/25/57† IO | 474,633 | | 86,817 |
| Federal National Mortgage Association REMIC, Series 2017-85 | | | |
| (Floating, 6.20% - ICE LIBOR USD 1M, 6.20% Cap), 6.10%, 11/25/47† IO | 160,890 | | 27,658 |
| Federal National Mortgage Association REMIC, Series 2020-47 | | | |
| 2.00%, 07/25/50 | 309,129 | | 286,307 |
| Federal National Mortgage Association REMIC, Series 2020-56 | | | |
| 2.50%, 08/25/50 IO | 347,647 | | 51,483 |
| Federal National Mortgage Association REMIC, Series 2020-74 | | | |
| 2.50%, 10/25/50 IO | 174,049 | | 25,244 |
| Federal National Mortgage Association REMIC, Series 2020-89 | | | |
| 2.50%, 12/25/50 IO | 859,829 | | 111,715 |
| Federal National Mortgage Association REMIC, Series 2021-1 | | | |
| 2.50%, 02/25/51 IO | 660,744 | | 92,795 |
| Federal National Mortgage Association REMIC, Series 2021-3 | | | |
| 2.50%, 02/25/51 IO | 816,388 | | 110,514 |
| FHLMC Multifamily Structured Pass-Through Certificates, Series K068 | | | |
| 0.43%, 08/25/27† IO γ | 2,381,943 | | 53,469 |
| FHLMC Multifamily Structured Pass-Through Certificates, Series K091 | | | |
| 0.56%, 03/25/29† IO γ | 1,412,693 | | 53,375 |
| FHLMC Multifamily Structured Pass-Through Certificates, Series K093 | | | |
| 0.95%, 05/25/29† IO γ | 1,990,409 | | 122,864 |
| | | Par | | Value |
| FHLMC Multifamily Structured Pass-Through Certificates, Series K094 | | | |
| 0.88%, 06/25/29† IO γ | $ 997,325 | | $ 58,411 |
| FHLMC Multifamily Structured Pass-Through Certificates, Series K-1519 | | | |
| 0.61%, 12/25/35† IO γ | 6,050,481 | | 386,180 |
| FHLMC Multifamily Structured Pass-Through Certificates, Series K723 | | | |
| 0.91%, 08/25/23† IO γ | 2,818,123 | | 35,101 |
| FHLMC Multifamily Structured Pass-Through Certificates, Series K736 | | | |
| 1.31%, 07/25/26† IO γ | 1,037,330 | | 50,345 |
| FHLMC Multifamily Structured Pass-Through Certificates, Series K741 | | | |
| 0.57%, 12/25/27† IO γ | 2,998,779 | | 92,969 |
| FHLMC Structured Agency Credit Risk Debt Notes, Series 2016-DNA4, Class M3 | | | |
| (Floating, ICE LIBOR USD 1M + 3.80%, 3.80% Floor), 3.90%, 03/25/29† | 186,492 | | 192,353 |
| FHLMC Structured Pass-Through Certificates, Series T-61, Class 1A1 | | | |
| (Floating, Federal Reserve U.S. 12 1Y CMT + 1.40%, 1.40% Floor), 1.48%, 07/25/44† | 316,494 | | 325,921 |
| Finsbury Square PLC, Series 2020-2A, Class A | | | |
| (Floating, SONIA Interest Rate + 1.30%), 1.35%, 06/16/70(U) 144A † | 1,114,464 | | 1,519,349 |
| First Horizon Alternative Mortgage Securities Trust, Series 2004-AA1, Class A1 | | | |
| 2.08%, 06/25/34† γ | 131,237 | | 134,684 |
| FREMF Mortgage Trust, Series 2012-K20, Class X2A | | | |
| 0.20%, 05/25/45 144A IO | 4,516,529 | | 1,282 |
| Government National Mortgage Association | | | |
| 7.00%, 01/15/26 | 1,612 | | 1,715 |
| 7.00%, 07/15/27 | 11,186 | | 12,249 |
| 7.00%, 01/15/28 | 8,757 | | 8,851 |
| 7.00%, 03/15/28 | 15,933 | | 17,717 |
| 7.00%, 07/15/28 | 1,524 | | 1,557 |
| 6.50%, 08/15/28 | 1,122 | | 1,232 |
| 7.00%, 08/15/28 | 1,573 | | 1,688 |
| 7.50%, 08/15/28 | 4,990 | | 5,486 |
| 6.50%, 09/15/28 | 2,460 | | 2,712 |
| 7.00%, 10/15/28 | 9,034 | | 9,068 |
| 7.50%, 03/15/29 | 6,243 | | 7,002 |
| (Floating, U.S. Treasury Yield Curve Rate CMT 1Y + 1.50%, 1.50% Floor, 11.00% Cap), 2.13%, 11/20/29† | 11,919 | | 12,332 |
See Notes to Financial Statements.
MEDIUM-DURATION BOND FUND
SCHEDULE OF INVESTMENTS (Continued)
| | | Par | | Value |
| 8.50%, 08/15/30 | $ 208 | | $ 209 |
| 8.50%, 11/20/30 | 4,268 | | 4,887 |
| 6.50%, 08/15/31 | 16,702 | | 18,344 |
| 7.50%, 08/15/31 | 5,540 | | 5,968 |
| 6.50%, 10/15/31 | 19,607 | | 21,751 |
| 6.00%, 11/15/31 | 64,538 | | 72,319 |
| 6.50%, 11/15/31 | 12,814 | | 14,061 |
| 6.00%, 12/15/31 | 8,495 | | 9,542 |
| 6.00%, 01/15/32 | 47,741 | | 53,066 |
| 6.00%, 02/15/32 | 57,820 | | 63,753 |
| 6.50%, 02/15/32 | 22,277 | | 24,527 |
| 6.00%, 04/15/32 | 31,838 | | 35,059 |
| 6.50%, 06/15/32 | 36,251 | | 39,870 |
| 6.50%, 08/15/32 | 48,331 | | 53,353 |
| 6.50%, 09/15/32 | 38,650 | | 43,549 |
| 6.00%, 10/15/32 | 45,296 | | 52,677 |
| 5.50%, 11/15/32 | 7,014 | | 7,784 |
| 6.00%, 11/15/32 | 35,148 | | 39,044 |
| 6.00%, 12/15/32 | 21,619 | | 24,286 |
| 6.50%, 12/15/32 | 4,344 | | 4,769 |
| 5.50%, 01/15/33 | 3,409 | | 3,757 |
| 6.00%, 01/15/33 | 13,034 | | 14,434 |
| 5.50%, 02/15/33 | 7,780 | | 8,730 |
| 6.00%, 02/15/33 | 14,728 | | 17,104 |
| 5.50%, 03/15/33 | 8,424 | | 9,511 |
| 6.50%, 04/15/33 | 80,494 | | 92,374 |
| 6.00%, 06/15/33 | 15,954 | | 17,565 |
| 5.50%, 07/15/33 | 8,689 | | 9,713 |
| 5.50%, 08/15/33 | 2,842 | | 3,130 |
| 5.50%, 09/15/33 | 2,269 | | 2,510 |
| 6.00%, 10/15/33 | 29,801 | | 32,852 |
| 6.50%, 10/15/33 | 45,301 | | 50,068 |
| 5.50%, 04/15/34 | 3,283 | | 3,611 |
| 5.50%, 05/15/34 | 2,293 | | 2,523 |
| 6.50%, 08/15/34 | 51,655 | | 58,606 |
| 5.50%, 09/15/34 | 35,517 | | 40,700 |
| 5.50%, 12/15/34 | 37,897 | | 43,661 |
| 5.50%, 01/15/35 | 24,053 | | 27,666 |
| 6.00%, 09/20/38 | 73,687 | | 83,475 |
| 5.00%, 07/20/40 | 5,542 | | 6,246 |
| 5.00%, 09/20/40 | 26,054 | | 29,459 |
| 4.00%, 10/20/40 | 2,989 | | 3,240 |
| 6.00%, 10/20/40 | 9,908 | | 11,325 |
| 6.00%, 01/20/41 | 9,934 | | 11,448 |
| 4.50%, 04/20/41 | 103,377 | | 114,076 |
| 3.00%, 09/15/42 | 237,239 | | 249,007 |
| 3.00%, 10/15/42 | 108,539 | | 113,695 |
| 3.00%, 11/15/42 | 48,078 | | 50,376 |
| 4.00%, 08/20/43 | 179,421 | | 194,473 |
| 3.50%, 06/20/44 | 62,734 | | 66,925 |
| 3.00%, 01/15/45 | 1,204,715 | | 1,254,346 |
| 3.50%, 03/20/45 | 27,115 | | 28,707 |
| 3.50%, 04/15/45 | 263,042 | | 279,275 |
| 4.00%, 05/20/45 | 15,379 | | 16,617 |
| 4.00%, 10/20/45 | 112,694 | | 119,814 |
| 3.50%, 01/20/46 | 71,766 | | 76,123 |
| 3.50%, 04/20/46 | 155,226 | | 164,088 |
| 3.50%, 05/20/46 | 78,894 | | 83,100 |
| | | Par | | Value |
| 3.50%, 06/20/46 | $ 162,840 | | $ 171,600 |
| 3.50%, 07/20/46 | 81,832 | | 86,229 |
| 3.00%, 08/20/46 | 206,033 | | 215,203 |
| 3.50%, 09/20/46 | 727,323 | | 764,116 |
| 3.00%, 11/20/46 | 50,044 | | 52,274 |
| 3.50%, 04/20/47 | 1,720,852 | | 1,808,730 |
| 3.50%, 05/20/47 | 95,643 | | 100,525 |
| 4.00%, 06/20/47 | 704,520 | | 750,400 |
| 4.50%, 08/20/47 | 33,237 | | 35,695 |
| 3.00%, 09/20/47 | 13,852 | | 14,460 |
| 4.00%, 09/20/47 | 454,474 | | 483,503 |
| 3.50%, 10/20/47 | 439,335 | | 464,680 |
| 4.00%, 11/20/47 | 277,002 | | 295,417 |
| 3.50%, 12/20/47 | 1,640,872 | | 1,723,927 |
| 4.00%, 12/20/47 | 124,266 | | 132,525 |
| 3.00%, 02/20/48 | 65,813 | | 68,398 |
| 4.00%, 02/20/48 | 79,887 | | 85,192 |
| 4.00%, 03/20/48 | 126,424 | | 134,490 |
| 4.00%, 04/20/48 | 79,883 | | 84,882 |
| 4.50%, 04/20/48 | 217,614 | | 231,994 |
| 4.50%, 05/20/48 | 746,431 | | 794,402 |
| 3.50%, 06/15/48 | 124,134 | | 132,469 |
| 4.50%, 06/20/48 | 217,216 | | 231,171 |
| 4.50%, 07/20/48 | 14,963 | | 15,924 |
| 5.00%, 07/20/48 | 175,872 | | 188,526 |
| 4.50%, 08/20/48 | 1,842,549 | | 1,952,608 |
| 5.00%, 08/20/48 | 211,453 | | 227,055 |
| 4.50%, 09/20/48 | 1,275,379 | | 1,354,624 |
| 4.50%, 10/20/48 | 202,284 | | 214,006 |
| 5.00%, 10/20/48 | 847,121 | | 906,505 |
| 5.00%, 11/20/48 | 1,558,135 | | 1,667,261 |
| 4.50%, 12/20/48 | 817,675 | | 865,579 |
| 5.00%, 12/20/48 | 899,723 | | 960,950 |
| 4.50%, 01/20/49 | 3,218,300 | | 3,405,914 |
| 5.00%, 01/20/49 | 2,757,084 | | 2,936,754 |
| 4.00%, 02/20/49 | 1,437,806 | | 1,521,432 |
| 4.50%, 02/20/49 | 303,750 | | 321,157 |
| 5.00%, 02/20/49 | 63,707 | | 68,045 |
| 4.00%, 03/20/49 | 1,534,996 | | 1,626,456 |
| 4.50%, 03/20/49 | 221,967 | | 234,902 |
| 5.00%, 03/20/49 | 273,375 | | 291,996 |
| 4.00%, 05/20/49 | 869,036 | | 916,013 |
| 3.50%, 07/20/49 | 263,023 | | 274,296 |
| 3.00%, 08/20/49 | 1,896,187 | | 1,964,582 |
| 5.00%, 08/20/49 | 4,513,759 | | 4,829,744 |
| 3.50%, 10/20/49 | 72,509 | | 74,838 |
| 4.00%, 10/20/49 | 50,695 | | 54,263 |
| 4.50%, 10/20/49 | 271,482 | | 287,266 |
| 4.00%, 11/20/49 | 60,439 | | 63,131 |
| 5.00%, 11/20/49 | 345,423 | | 369,745 |
| 3.00%, 01/20/50 | 218,386 | | 226,354 |
| 4.00%, 01/20/50 | 61,372 | | 66,512 |
| 3.50%, 02/20/50 | 1,025,104 | | 1,069,457 |
| 4.00%, 02/20/50 | 57,037 | | 61,553 |
| 3.00%, 03/20/50 | 7,902,994 | | 8,185,339 |
| 4.00%, 03/20/50 | 50,609 | | 55,017 |
| 4.00%, 04/20/50 | 224,122 | | 241,570 |
| 3.50%, 05/15/50 | 134,904 | | 143,119 |
See Notes to Financial Statements.
| | | Par | | Value |
| 4.50%, 05/20/50 | $ 599,022 | | $ 633,983 |
| 3.50%, 07/20/50 | 103,066 | | 107,587 |
| 4.50%, 12/20/50 | 410,521 | | 436,155 |
| 3.00%, 01/01/51 TBA | 12,100,000 | | 12,524,918 |
| 3.50%, 01/01/51 TBA | 3,300,000 | | 3,437,156 |
| 4.50%, 01/01/51 TBA | 1,000,000 | | 1,056,445 |
| 3.00%, 02/01/51 TBA | 6,000,000 | | 6,199,687 |
| 2.50%, 07/20/51 | 6,000,003 | | 6,155,527 |
| 3.00%, 07/20/51 | 171,359 | | 177,638 |
| 3.00%, 09/20/51 | 293,820 | | 304,967 |
| 3.00%, 11/20/51 | 995,389 | | 1,033,801 |
| 3.00%, 12/20/51 | 1,000,000 | | 1,039,762 |
| 2.50%, 01/01/52 TBA | 16,000,000 | | 16,395,625 |
| 2.50%, 01/20/52 | 1,999,800 | | 2,047,686 |
| Government National Mortgage Association, Series 2007-30 | | | |
| (Floating, ICE LIBOR USD 1M + 0.30%, 0.30% Floor, 6.50% Cap), 0.40%, 05/20/37† | 63,299 | | 63,472 |
| Government National Mortgage Association, Series 2007-51 | | | |
| (Floating, 6.58% - ICE LIBOR USD 1M, 6.58% Cap), 6.48%, 08/20/37† IO | 578,103 | | 73,058 |
| Government National Mortgage Association, Series 2010-85 | | | |
| (Floating, 6.65% - ICE LIBOR USD 1M, 6.65% Cap), 6.55%, 01/20/40† IO | 7,804 | | 331 |
| Government National Mortgage Association, Series 2010-H28 | | | |
| (Floating, ICE LIBOR USD 1M + 0.40%, 0.40% Floor, 10.50% Cap), 0.48%, 12/20/60† | 140,902 | | 141,005 |
| Government National Mortgage Association, Series 2011-H08 | | | |
| (Floating, ICE LIBOR USD 1M + 0.48%, 0.48% Floor, 10.50% Cap), 0.56%, 03/20/61† | 154,620 | | 155,013 |
| Government National Mortgage Association, Series 2011-H09 | | | |
| (Floating, ICE LIBOR USD 1M + 0.50%, 0.50% Floor, 10.50% Cap), 0.58%, 03/20/61† | 113,389 | | 113,677 |
| Government National Mortgage Association, Series 2012-144 | | | |
| 0.35%, 01/16/53† IO γ | 2,940,581 | | 33,433 |
| Government National Mortgage Association, Series 2012-34 | | | |
| (Floating, 6.05% - ICE LIBOR USD 1M, 6.05% Cap), 5.95%, 03/20/42† IO | 21,650 | | 4,164 |
| Government National Mortgage Association, Series 2012-66 | | | |
| 3.50%, 02/20/38 IO | 4,066 | | 5 |
| Government National Mortgage Association, Series 2012-H27 | | | |
| 1.76%, 10/20/62† IO γ | 379,572 | | 16,777 |
| Government National Mortgage Association, Series 2012-H30 | | | |
| (Floating, ICE LIBOR USD 1M + 0.35%, 0.35% Floor, 10.50% Cap), 0.43%, 12/20/62† | 586,871 | | 586,699 |
| | | Par | | Value |
| Government National Mortgage Association, Series 2013-107 | | | |
| 2.77%, 11/16/47† γ | $ 154,635 | | $ 158,304 |
| Government National Mortgage Association, Series 2013-53 | | | |
| 3.50%, 04/20/43 IO | 51,384 | | 4,942 |
| Government National Mortgage Association, Series 2014-118 | | | |
| (Floating, 6.20% - ICE LIBOR USD 1M, 6.20% Cap), 6.10%, 08/20/44† IO | 116,514 | | 24,963 |
| Government National Mortgage Association, Series 2014-17 | | | |
| 3.37%, 06/16/48† γ | 6,091 | | 6,399 |
| Government National Mortgage Association, Series 2014-93 | | | |
| 0.51%, 11/16/55† IO γ | 1,267,569 | | 32,727 |
| Government National Mortgage Association, Series 2015-167 | | | |
| 4.00%, 04/16/45 IO | 57,152 | | 9,000 |
| Government National Mortgage Association, Series 2015-H11 | | | |
| (Floating, ICE LIBOR USD 1M + 0.55%, 0.55% Floor, 7.50% Cap), 0.63%, 05/20/65† | 1,685,895 | | 1,694,598 |
| Government National Mortgage Association, Series 2015-H14 | | | |
| (Floating, ICE LIBOR USD 1M + 0.43%, 0.43% Floor, 11.00% Cap), 0.51%, 05/20/65† | 1,606,750 | | 1,608,451 |
| (Floating, ICE LIBOR USD 1M + 0.57%, 0.57% Floor, 7.50% Cap), 0.65%, 06/20/65† | 2,864,151 | | 2,880,222 |
| Government National Mortgage Association, Series 2015-H15 | | | |
| (Floating, ICE LIBOR USD 1M + 0.58%, 0.58% Floor, 7.50% Cap), 0.66%, 06/20/65† | 1,099,947 | | 1,107,224 |
| (Floating, ICE LIBOR USD 1M + 0.60%, 0.60% Floor, 7.50% Cap), 0.68%, 06/20/65† | 2,784,445 | | 2,802,708 |
| Government National Mortgage Association, Series 2015-H16 | | | |
| (Floating, ICE LIBOR USD 1M + 0.60%, 0.60% Floor), 0.68%, 07/20/65† | 2,638,475 | | 2,657,126 |
| Government National Mortgage Association, Series 2015-H17 | | | |
| (Floating, ICE LIBOR USD 1M + 0.46%, 0.46% Floor), 0.54%, 06/20/65† | 385,407 | | 386,080 |
| Government National Mortgage Association, Series 2015-H18 | | | |
| (Floating, ICE LIBOR USD 1M + 0.60%, 0.60% Floor, 7.50% Cap), 0.68%, 07/20/65† | 382,120 | | 384,700 |
| Government National Mortgage Association, Series 2015-H19 | | | |
| (Floating, ICE LIBOR USD 1M + 0.60%, 0.60% Floor), 0.68%, 08/20/65† | 428,892 | | 431,730 |
See Notes to Financial Statements.
MEDIUM-DURATION BOND FUND
SCHEDULE OF INVESTMENTS (Continued)
| | | Par | | Value |
| Government National Mortgage Association, Series 2015-H22 | | | |
| (Floating, ICE LIBOR USD 1M + 0.60%, 0.60% Floor, 7.50% Cap), 0.68%, 09/20/65† | $ 457,604 | | $ 460,839 |
| Government National Mortgage Association, Series 2015-H23 | | | |
| (Floating, ICE LIBOR USD 1M + 0.62%, 0.62% Floor, 7.50% Cap), 0.70%, 09/20/65† | 490,006 | | 493,806 |
| Government National Mortgage Association, Series 2015-H26 | | | |
| (Floating, ICE LIBOR USD 1M + 0.52%, 0.52% Floor, 11.00% Cap), 0.60%, 10/20/65† | 1,059,019 | | 1,064,498 |
| Government National Mortgage Association, Series 2015-H30 | | | |
| (Floating, ICE LIBOR USD 1M + 0.68%, 0.68% Floor), 0.76%, 08/20/61† | 1,819 | | 1,838 |
| Government National Mortgage Association, Series 2016-152 | | | |
| 0.73%, 08/15/58† IO γ | 2,973,691 | | 139,299 |
| Government National Mortgage Association, Series 2017-190 | | | |
| 0.54%, 03/16/60† IO γ | 3,887,696 | | 167,161 |
| Government National Mortgage Association, Series 2017-H15 | | | |
| (Floating, ICE LIBOR USD 1Y + 0.80%, 0.80% Floor, 7.50% Cap), 1.05%, 07/20/67† | 1,298,747 | | 1,311,808 |
| 2.20%, 07/20/67† IO γ | 398,893 | | 40,711 |
| Government National Mortgage Association, Series 2017-H18 | | | |
| 1.61%, 09/20/67† IO γ | 3,114,723 | | 183,359 |
| Government National Mortgage Association, Series 2017-H20 | | | |
| 2.03%, 10/20/67† IO γ | 140,336 | | 11,375 |
| Government National Mortgage Association, Series 2017-H22 | | | |
| 2.36%, 11/20/67† IO γ | 1,132,579 | | 78,080 |
| Government National Mortgage Association, Series 2018-H07 | | | |
| (Floating, ICE LIBOR USD 1M + 0.30%, 0.30% Floor, 11.00% Cap), 0.38%, 05/20/68† | 677,120 | | 676,204 |
| Government National Mortgage Association, Series 2019-28 | | | |
| 3.15%, 06/16/60 | 22,570 | | 22,766 |
| Government National Mortgage Association, Series 2020-123 | | | |
| 2.50%, 08/20/50 IO | 638,751 | | 81,458 |
| Government National Mortgage Association, Series 2020-127 | | | |
| 2.50%, 08/20/50 IO | 180,927 | | 24,174 |
| Government National Mortgage Association, Series 2020-129 | | | |
| 2.50%, 09/20/50 IO | 185,388 | | 25,578 |
| Government National Mortgage Association, Series 2020-160 | | | |
| 2.50%, 10/20/50 IO | 833,771 | | 109,915 |
| | | Par | | Value |
| Government National Mortgage Association, Series 2020-179 | | | |
| 1.00%, 09/16/62† IO γ | $7,243,872 | | $ 602,491 |
| Government National Mortgage Association, Series 2020-181 | | | |
| 2.00%, 12/20/50 IO | 1,457,851 | | 148,692 |
| Government National Mortgage Association, Series 2020-47 | | | |
| 3.50%, 04/20/50 IO | 424,837 | | 57,887 |
| Government National Mortgage Association, Series 2020-H09 | | | |
| (Floating, ICE LIBOR USD 1M + 1.25%, 1.25% Floor, 11.00% Cap), 1.35%, 04/20/70† | 147,435 | | 151,670 |
| (Floating, ICE LIBOR USD 1M + 1.15%, 1.15% Floor), 1.25%, 05/20/70† | 413,845 | | 432,818 |
| Government National Mortgage Association, Series 2020-H13 | | | |
| (Floating, ICE LIBOR USD 1M + 0.45%, 0.45% Floor, 7.50% Cap), 0.55%, 07/20/70† | 163,232 | | 164,394 |
| Government National Mortgage Association, Series 2021-29 | | | |
| 2.50%, 02/20/51 IO | 488,592 | | 90,604 |
| GPMT, Ltd., Series 2021-FL3, Class A | | | |
| (Floating, ICE LIBOR USD 1M + 1.25%, 1.25% Floor), 1.35%, 07/16/35 144A † | 1,830,615 | | 1,832,137 |
| GreenPoint Mortgage Funding Trust, Series 2006-OH1, Class A1 | | | |
| (Floating, ICE LIBOR USD 1M + 0.18%, 0.18% Floor), 0.28%, 01/25/37† | 326,856 | | 318,423 |
| GS Mortgage Securities Corporation II, Series 2018-SRP5, Class A | | | |
| (Floating, ICE LIBOR USD 1M + 1.55%, 1.30% Floor), 1.66%, 09/15/31 144A † | 1,467,300 | | 1,338,730 |
| GS Mortgage Securities Corporation Trust, Series 2021-DM, Class A | | | |
| (Floating, ICE LIBOR USD 1M + 0.89%, 0.89% Floor), 0.99%, 11/15/36 144A † | 1,570,000 | | 1,571,583 |
| GS Mortgage Securities Corporation Trust, Series 2021-DM, Class AS | | | |
| (Floating, ICE LIBOR USD 1M + 1.39%, 1.39% Floor), 1.49%, 11/15/36 144A † | 1,370,000 | | 1,371,385 |
| GS Mortgage Securities Corporation Trust, Series 2021-RENT, Class B | | | |
| (Floating, ICE LIBOR USD 1M + 1.10%, 1.10% Floor), 1.20%, 11/21/35 144A † | 670,000 | | 667,135 |
| GS Mortgage Securities Trust, Series 2013-GC16, Class B | | | |
| 5.16%, 11/10/46 | 130,000 | | 135,261 |
| GS Mortgage Securities Trust, Series 2015-GC30, Class AS | | | |
| 3.78%, 05/10/50 | 370,000 | | 388,884 |
See Notes to Financial Statements.
| | | Par | | Value |
| GSR Mortgage Loan Trust, Series 2005-AR6, Class 2A1 | | | |
| 2.85%, 09/25/35† γ | $ 214,082 | | $ 219,134 |
| Harben Finance PLC, Series 2017-1X, Class A | | | |
| (Floating, ICE LIBOR GBP 3M + 0.80%), 0.91%, 08/20/56(U) † | 405,447 | | 549,252 |
| Hawksmoor Mortgages, Series 2019-1A, Class A | | | |
| (Floating, SONIA Interest Rate + 1.05%), 1.10%, 05/25/53(U) 144A † | 5,218,657 | | 7,084,071 |
| Impac CMB Trust, Series 2004-8, Class 1A | | | |
| (Floating, ICE LIBOR USD 1M + 0.72%, 0.72% Floor, 11.00% Cap), 0.82%, 10/25/34† | 13,551 | | 13,328 |
| IndyMac ARM Trust, Series 2001-H2, Class A1 | | | |
| 1.66%, 01/25/32† γ | 3,291 | | 3,219 |
| JP Morgan Chase Commercial Mortgage Securities Trust, Series 2012-C6, Class D | | | |
| 5.12%, 05/15/45† γ | 280,000 | | 273,985 |
| JP Morgan Mortgage Trust, Series 2005-A1, Class 6T1 | | | |
| 2.58%, 02/25/35† γ | 13,481 | | 13,561 |
| JP Morgan Mortgage Trust, Series 2018-3, Class A1 | | | |
| 3.50%, 09/25/48 144A † γ | 484,015 | | 490,811 |
| JP Morgan Mortgage Trust, Series 2018-4, Class A1 | | | |
| 3.50%, 10/25/48 144A † γ | 161,399 | | 162,657 |
| JP Morgan Mortgage Trust, Series 2021-14, Class A11 | | | |
| (Floating, U.S. 30-Day Average SOFR + 0.95%, 5.00% Cap), 1.00%, 05/25/52 144A † | 2,275,993 | | 2,280,953 |
| JP Morgan Mortgage Trust, Series 2021-6, Class A3 | | | |
| 2.50%, 10/25/51 144A † γ | 801,587 | | 802,765 |
| JP Morgan Mortgage Trust, Series 2021-LTV2, Class A1 | | | |
| 2.52%, 05/25/52 144A | 1,138,000 | | 1,140,799 |
| JP Morgan Mortgage Trust, Series 2022 - INV1 | | | |
| 3.00%, 02/25/52 | 2,200,000 | | 2,263,594 |
| JPMBB Commercial Mortgage Securities Trust, Series 2013-C17, Class B | | | |
| 4.89%, 01/15/47† γ | 50,000 | | 52,557 |
| JPMBB Commercial Mortgage Securities Trust, Series 2014-C25, Class ASB | | | |
| 3.41%, 11/15/47 | 487,110 | | 502,751 |
| JPMBB Commercial Mortgage Securities Trust, Series 2015-C32, Class ASB | | | |
| 3.36%, 11/15/48 | 551,734 | | 572,077 |
| JPMDB Commercial Mortgage Securities Trust, Series 2017-C5, Class B | | | |
| 4.01%, 03/15/50 | 630,000 | | 654,910 |
| | | Par | | Value |
| JPMDB Commercial Mortgage Securities Trust, Series 2017-C7, Class D | | | |
| 3.00%, 10/15/50 144A | $ 300,000 | | $ 278,626 |
| KREST Commercial Mortgage Securities Trust, Series 2021-CHIP, Class A | | | |
| 2.56%, 11/05/44 144A | 2,300,000 | | 2,330,545 |
| London Wall Mortgage Capital PLC, Series 2017-FL1, Class A | | | |
| (Floating, ICE LIBOR GBP 3M + 0.85%), 0.95%, 11/15/49(U) † | 202,057 | | 273,699 |
| Ludgate Funding PLC, Series 2007-1, Class A2A | | | |
| (Floating, ICE LIBOR GBP 3M + 0.16%), 0.24%, 01/01/61(U) † | 600,249 | | 780,302 |
| Ludgate Funding PLC, Series 2008-W1X, Class A1 | | | |
| (Floating, ICE LIBOR GBP 3M + 0.60%), 0.68%, 01/01/61(U) † | 473,661 | | 631,647 |
| LUXE Trust, Series 2021-TRIP, Class A | | | |
| (Floating, ICE LIBOR USD 1M + 1.05%, 1.05% Floor), 1.16%, 10/15/38 144A † | 2,300,000 | | 2,302,724 |
| Manhattan West Mortgage Trust, Series 2020-OMW, Class A | | | |
| 2.13%, 09/10/39 144A | 1,700,000 | | 1,697,245 |
| Mansard Mortgages PLC, Series 2007-1X, Class A2 | | | |
| (Floating, ICE LIBOR GBP 3M + 0.18%), 0.31%, 04/15/47(U) † | 562,895 | | 734,929 |
| MASTR Adjustable Rate Mortgages Trust, Series 2004-13, Class 3A7 | | | |
| 2.73%, 11/21/34† γ | 108,604 | | 109,964 |
| MASTR Adjustable Rate Mortgages Trust, Series 2004-4, Class 4A1 | | | |
| 2.62%, 05/25/34† γ | 52,157 | | 52,307 |
| MF1 Multifamily Housing Mortgage Loan Trust, Series 2021-FL5, Class A | | | |
| (Floating, U.S. 30-Day Average SOFR + 0.96%, 0.85% Floor), 1.01%, 07/15/36 144A † | 2,005,577 | | 2,006,858 |
| Mill City Mortgage Loan Trust, Series 2019-GS2, Class M1 | | | |
| 3.00%, 08/25/59 144A | 870,000 | | 896,910 |
| Morgan Stanley Bank of America Merrill Lynch Trust, Series 2013-C9, Class AS | | | |
| 3.46%, 05/15/46 | 140,000 | | 142,996 |
| Morgan Stanley Bank of America Merrill Lynch Trust, Series 2014-C19, Class B | | | |
| 4.00%, 12/15/47 | 370,000 | | 389,140 |
| Morgan Stanley Bank of America Merrill Lynch Trust, Series 2015-C22, Class AS | | | |
| 3.56%, 04/15/48 | 480,000 | | 496,088 |
| Morgan Stanley Bank of America Merrill Lynch Trust, Series 2015-C24, Class A4 | | | |
| 3.73%, 05/15/48 | 850,000 | | 907,155 |
See Notes to Financial Statements.
MEDIUM-DURATION BOND FUND
SCHEDULE OF INVESTMENTS (Continued)
| | | Par | | Value |
| Morgan Stanley Bank of America Merrill Lynch Trust, Series 2015-C25, Class A4 | | | |
| 3.37%, 10/15/48 | $1,400,000 | | $1,471,647 |
| Morgan Stanley Bank of America Merrill Lynch Trust, Series 2015-C27, Class ASB | | | |
| 3.56%, 12/15/47 | 614,579 | | 638,020 |
| Morgan Stanley Bank of America Merrill Lynch Trust, Series 2017-C34, Class D | | | |
| 2.70%, 11/15/52 144A | 500,000 | | 438,083 |
| Morgan Stanley Capital I Trust, Series 2019-BPR, Class A | | | |
| (Floating, ICE LIBOR USD 1M + 1.40%, 1.40% Floor), 1.51%, 05/15/36 144A † | 1,050,000 | | 1,038,497 |
| Morgan Stanley Capital I Trust, Series 2020-CNP, Class A | | | |
| 2.43%, 04/05/42 144A † γ | 1,600,000 | | 1,612,414 |
| Morgan Stanley Capital I, Series 2017-HR2, Class A4 | | | |
| 3.59%, 12/15/50 | 550,000 | | 597,478 |
| MortgageIT Trust, Series 2005-4, Class A1 | | | |
| (Floating, ICE LIBOR USD 1M + 0.56%, 0.56% Floor, 11.50% Cap), 0.66%, 10/25/35† | 100,539 | | 101,064 |
| MSCG Trust, Series 2015-ALDR, Class A2 | | | |
| 3.46%, 06/07/35 144A † γ | 580,000 | | 602,154 |
| NYO Commercial Mortgage Trust, Series 2021-1290, Class A | | | |
| (Floating, ICE LIBOR USD 1M + 1.10%, 1.10% Floor), 1.21%, 11/15/38 144A † | 2,300,000 | | 2,293,212 |
| OBX Trust, Series 2018-1, Class A2 | | | |
| (Floating, ICE LIBOR USD 1M + 0.65%), 0.75%, 06/25/57 144A † | 1,200,031 | | 1,202,392 |
| PFP, Ltd., Series 2021-8, Class A | | | |
| (Floating, ICE LIBOR USD 1M + 1.00%, 1.00% Floor), 1.11%, 08/09/37 144A † | 2,300,000 | | 2,290,375 |
| Ready Capital Mortgage Financing LLC, Series 2021-FL6, Class A | | | |
| (Floating, ICE LIBOR USD 1M + 0.95%, 0.95% Floor), 1.04%, 07/25/36 144A † | 2,300,000 | | 2,282,850 |
| Ready Capital Mortgage Financing LLC, Series 2021-FL7, Class A | | | |
| (Floating, ICE LIBOR USD 1M + 1.20%, 1.20% Floor), 1.28%, 11/25/36 144A † | 3,599,806 | | 3,600,904 |
| Resloc UK PLC, Series 2007-1X, Class A3A | | | |
| (Floating, 0.16% - Euribor 3M), 0.00%, 12/15/43(E) † | 792,075 | | 873,224 |
| | | Par | | Value |
| Resloc UK PLC, Series 2007-1X, Class A3B | | | |
| (Floating, ICE LIBOR GBP 3M + 0.16%), 0.26%, 12/15/43(U) † | $ 198,019 | | $ 258,658 |
| Ripon Mortgages PLC, Series 1A, Class A1 | | | |
| (Floating, ICE LIBOR GBP 3M + 0.80%), 0.91%, 08/20/56(U) 144A † | 1,626,468 | | 2,202,895 |
| Ripon Mortgages PLC, Series 1X, Class A1 | | | |
| (Floating, ICE LIBOR GBP 3M + 0.80%), 0.91%, 08/20/56(U) † | 117,779 | | 159,520 |
| Ripon Mortgages PLC, Series 1X, Class A2 | | | |
| (Floating, ICE LIBOR GBP 3M + 0.80%), 0.91%, 08/20/56(U) † | 2,120,017 | | 2,871,360 |
| Sequoia Mortgage Trust, Series 6, Class A | | | |
| (Floating, ICE LIBOR USD 1M + 0.64%, 0.64% Floor, 11.00% Cap), 0.74%, 04/19/27† | 100,766 | | 99,175 |
| SFO Commercial Mortgage Trust, Series 2021-555, Class D | | | |
| (Floating, ICE LIBOR USD 1M + 2.40%, 2.40% Floor), 2.51%, 05/15/38 144A † | 970,000 | | 973,409 |
| Shops at Crystals Trust, Series 2016-CSTL, Class A | | | |
| 3.13%, 07/05/36 144A | 340,000 | | 350,084 |
| SLG Office Trust, Series 2021-OVA, Class A | | | |
| 2.59%, 07/15/41 144A | 430,000 | | 441,476 |
| SREIT Trust, Series 2021-IND, Class A | | | |
| (Floating, ICE LIBOR USD 1M + 0.70%, 0.70% Floor), 0.81%, 10/15/38 144A † | 2,300,000 | | 2,271,726 |
| SREIT Trust, Series 2021-MFP2, Class A | | | |
| (Floating, ICE LIBOR USD 1M + 0.82%, 0.82% Floor), 0.92%, 11/15/36 144A † | 450,000 | | 448,450 |
| Stratton Mortgage Funding PLC, Series 2019-1, Class A | | | |
| (Floating, SONIA Interest Rate + 1.20%), 1.25%, 05/25/51(U) † | 1,274,412 | | 1,730,135 |
| Structured Adjustable Rate Mortgage Loan Trust, Series 2005-19XS, Class 2A1 | | | |
| (Floating, ICE LIBOR USD 1M + 0.30%, 0.30% Floor), 0.40%, 10/25/35† | 126,003 | | 126,766 |
| Structured Asset Mortgage Investments II Trust, Series 2005-AR5, Class A1 | | | |
| (Floating, ICE LIBOR USD 1M + 0.50%, 0.50% Floor, 11.00% Cap), 0.60%, 07/19/35† | 36,175 | | 35,310 |
See Notes to Financial Statements.
| | | Par | | Value |
| STWD Mortgage Trust, Series 2021-HTS, Class A | | | |
| (Floating, ICE LIBOR USD 1M + 1.05%, 1.05% Floor), 1.16%, 04/15/34 144A † | $ 1,959,000 | | $ 1,965,244 |
| Thornburg Mortgage Securities Trust, Series 2003-4, Class A1 | | | |
| (Floating, ICE LIBOR USD 1M + 0.64%, 0.64% Floor, 11.50% Cap), 0.74%, 09/25/43† | 3,559 | | 3,633 |
| Thornburg Mortgage Securities Trust, Series 2005-1, Class A3 | | | |
| 2.14%, 04/25/45† γ | 20,770 | | 21,193 |
| Towd Point Mortgage Funding PLC, Series 2019-GR4A, Class A1 | | | |
| (Floating, ICE LIBOR GBP 3M + 1.03%), 1.24%, 10/20/51(U) 144A † | 1,129,310 | | 1,539,938 |
| Towd Point Mortgage Funding PLC, Series 2020-A14X, Class A | | | |
| (Floating, SONIA Interest Rate + 0.90%), 0.95%, 05/20/45(U) † | 3,383,292 | | 4,593,327 |
| UBS-Barclays Commercial Mortgage Trust, Series 2012-C4, Class D | | | |
| 4.46%, 12/10/45 144A † γ | 320,000 | | 289,411 |
| Uniform Mortgage Backed Securities | | | |
| 4.00%, 01/01/51 TBA | 500,000 | | 531,992 |
| 4.50%, 01/01/51 TBA | 4,000,000 | | 4,286,250 |
| 2.00%, 02/01/51 TBA | 53,200,000 | | 52,961,266 |
| 3.00%, 02/01/51 TBA | 800,000 | | 828,070 |
| 2.00%, 01/01/52 TBA | 300,000 | | 299,250 |
| 2.50%, 01/01/52 TBA | 11,000,000 | | 11,229,023 |
| 3.00%, 01/01/52 TBA | 13,200,000 | | 13,682,109 |
| 2.50%, 02/01/52 TBA | 6,700,000 | | 6,824,086 |
| 3.50%, 02/01/52 TBA | 2,400,000 | | 2,524,683 |
| UWM Mortgage Trust, Series 2021-INV2, Class A9 | | | |
| (Floating, U.S. 30-Day Average SOFR + 1.00%, 5.00% Cap), 1.05%, 09/25/51 144A † | 2,273,476 | | 2,273,696 |
| UWM Mortgage Trust, Series 2021-INV3, Class A3 | | | |
| 2.50%, 11/25/51 144A † γ | 3,166,974 | | 3,167,668 |
| UWM Mortgage Trust, Series 2021-INV3, Class A9 | | | |
| (Floating, U.S. 30-Day Average SOFR + 0.95%, 5.00% Cap), 1.00%, 11/25/51 144A † | 2,276,263 | | 2,272,474 |
| UWM Mortgage Trust, Series 2021-INV4, Class A3 | | | |
| 2.50%, 12/25/51 144A † γ | 2,189,773 | | 2,190,143 |
| VASA Trust, Series 2021-VASA, Class A | | | |
| (Floating, ICE LIBOR USD 1M + 0.90%, 0.90% Floor), 1.01%, 07/15/39 144A † | 390,000 | | 388,939 |
| Verus Securitization Trust, Series 2021-8, Class A1 | | | |
| 1.82%, 11/25/66 144A † γ | 147,000 | | 147,188 |
| VLS Commercial Mortgage Trust, Series 2020-LAB, Class A | | | |
| 2.13%, 10/10/42 144A | 1,610,000 | | 1,595,364 |
| | | Par | | Value |
| VLS Commercial Mortgage Trust, Series 2020-LAB, Class B | | | |
| 2.45%, 10/10/42 144A | $1,610,000 | | $1,598,169 |
| VNDO Mortgage Trust, Series 2012-6AVE, Class A | | | |
| 3.00%, 11/15/30 144A | 100,000 | | 101,389 |
| Washington Mutual Mortgage Pass-Through Certificates Trust, Series 2002-AR19, Class A7 | | | |
| 2.61%, 02/25/33† γ | 2,042 | | 2,148 |
| Washington Mutual Mortgage Pass-Through Certificates Trust, Series 2002-AR6, Class A | | | |
| (Floating, Federal Reserve U.S. 12 1Y CMT + 1.40%, 1.40% Floor), 1.48%, 06/25/42† | 3,838 | | 3,836 |
| Washington Mutual Mortgage Pass-Through Certificates Trust, Series 2005-AR1, Class A1B | | | |
| (Floating, ICE LIBOR USD 1M + 0.78%, 0.78% Floor, 10.50% Cap), 0.88%, 01/25/45† | 603,729 | | 596,397 |
| Washington Mutual Mortgage Pass-Through Certificates Trust, Series 2005-AR13, Class A1A1 | | | |
| (Floating, ICE LIBOR USD 1M + 0.58%, 0.58% Floor, 10.50% Cap), 0.68%, 10/25/45† | 405,709 | | 406,946 |
| Washington Mutual Mortgage Pass-Through Certificates Trust, Series 2007-HY1, Class 1A1 | | | |
| 2.88%, 02/25/37† γ | 125,652 | | 119,369 |
| Washington Mutual Mortgage Pass-Through Certificates Trust, Series 2007-HY1, Class 2A3 | | | |
| 3.05%, 02/25/37† γ | 83,359 | | 84,676 |
| Washington Mutual Mortgage Pass-Through Certificates Trust, Series 2007-OA3, Class 2A1A | | | |
| (Floating, Federal Reserve U.S. 12 1Y CMT + 0.76%, 0.76% Floor), 0.84%, 04/25/47† | 324,932 | | 313,917 |
| Washington Mutual Mortgage Pass-Through Certificates, Series 2005-AR8, Class 1A1A | | | |
| (Floating, ICE LIBOR USD 1M + 0.54%, 0.54% Floor, 10.50% Cap), 0.64%, 07/25/45† | 302,501 | | 299,853 |
| Washington Mutual Mortgage Pass-Through Certificates, Series 2005-AR8, Class 2A1A | | | |
| (Floating, ICE LIBOR USD 1M + 0.58%, 0.58% Floor, 10.50% Cap), 0.68%, 07/25/45† | 71,955 | | 71,319 |
| Waterfall Commercial Mortgage Trust, Series 2015-SBC5, Class A | | | |
| 4.10%, 09/14/22 144A | 62,456 | | 63,355 |
| Wells Fargo Alternative Loan Trust, Series 2007-PA6, Class A1 | | | |
| 2.69%, 12/28/37† γ | 204,353 | | 201,498 |
| Wells Fargo Commercial Mortgage Trust, Series 2013-LC12, Class B | | | |
| 4.31%, 07/15/46† γ | 20,000 | | 19,881 |
See Notes to Financial Statements.
MEDIUM-DURATION BOND FUND
SCHEDULE OF INVESTMENTS (Continued)
| | | Par | | Value |
| Wells Fargo Commercial Mortgage Trust, Series 2016-LC25, Class D | | | |
| 3.04%, 12/15/59 144A † γ | $ 532,000 | | $ 484,009 |
| Wells Fargo Commercial Mortgage Trust, Series 2017-C42, Class D | | | |
| 2.80%, 12/15/50 144A | 650,000 | | 580,428 |
| Wells Fargo Commercial Mortgage Trust, Series 2017-RC1, Class D | | | |
| 3.25%, 01/15/60 144A | 150,000 | | 139,066 |
| Wells Fargo Commercial Mortgage Trust, Series 2019-C51, Class ASB | | | |
| 3.16%, 06/15/52 | 300,000 | | 318,616 |
| Wells Fargo Commercial Mortgage Trust, Series 2021-C59, Class A5 | | | |
| 2.63%, 04/15/54 | 950,000 | | 983,159 |
| Wells Fargo Mortgage Backed Securities Trust, Series 2019-3, Class A1 | | | |
| 3.50%, 07/25/49 144A † γ | 54,053 | | 54,511 |
| WFRBS Commercial Mortgage Trust, Series 2012-C7, Class XA | | | |
| 1.28%, 06/15/45 144A † IO γ | 180,502 | | 173 |
| WFRBS Commercial Mortgage Trust, Series 2013-C13, Class XA | | | |
| 1.18%, 05/15/45 144A �� IO γ | 2,115,653 | | 23,608 |
| WFRBS Commercial Mortgage Trust, Series 2014-C19, Class XA | | | |
| 1.01%, 03/15/47† IO γ | 831,158 | | 13,337 |
| WFRBS Commercial Mortgage Trust, Series 2014-C21, Class XA | | | |
| 1.02%, 08/15/47† IO γ | 2,580,679 | | 54,627 |
| WFRBS Commercial Mortgage Trust, Series 2014-C24, Class AS | | | |
| 3.93%, 11/15/47 | 290,000 | | 302,188 |
| WFRBS Commercial Mortgage Trust, Series 2014-C24, Class C | | | |
| 4.29%, 11/15/47 | 300,000 | | 278,513 |
| Worldwide Plaza Trust, Series 2017-WWP, Class A | | | |
| 3.53%, 11/10/36 144A | 1,900,000 | | 2,025,269 |
Total Mortgage-Backed Securities
(Cost $575,993,370) | | | 583,449,900 |
| MUNICIPAL BONDS — 0.5% |
| American Municipal Power, Inc., Hydroelectric Projects, Revenue Bond, Series B | | | |
| 8.08%, 02/15/50 | 600,000 | | 1,138,159 |
| American Municipal Power, Inc., Revenue Bond, Series E | | | |
| 6.27%, 02/15/50 | 245,000 | | 350,530 |
| Bay Area Toll Authority, Revenue Bond, Series F-1 | | | |
| 1.63%, 04/01/28 | 300,000 | | 296,117 |
| California Statewide Communities Development Authority, Revenue Bond | | | |
| 1.81%, 02/01/30 | 25,000 | | 24,630 |
| | | Par | | Value |
| 1.88%, 02/01/31 | $150,000 | | $ 147,205 |
| Chicago Transit Authority Sales & Transfer Tax Receipts Revenue, Revenue Bond, Series A | | | |
| 6.90%, 12/01/40 | 700,000 | | 986,760 |
| Chicago Transit Authority Sales & Transfer Tax Receipts Revenue, Revenue Bond, Series B | | | |
| 6.90%, 12/01/40 | 300,000 | | 422,897 |
| City of Houston Texas Airport System Revenue, Revenue Bond, Subseries C | | | |
| 2.24%, 07/01/29 | 110,000 | | 110,506 |
| City of New Orleans Louisiana Sewerage Service Revenue, Revenue Bond (AGM Insured) | | | |
| 0.96%, 06/01/26 | 25,000 | | 24,333 |
| 1.41%, 06/01/28 | 65,000 | | 63,096 |
| City of New Orleans Louisiana Water System Revenue, Revenue Bond (AGM Insured) | | | |
| 1.01%, 12/01/26 | 30,000 | | 28,904 |
| 1.46%, 12/01/28 | 65,000 | | 62,617 |
| City of Tucson Arizona COPS, Series A (AGM Insured) | | | |
| 1.93%, 07/01/31 | 205,000 | | 201,541 |
| Commonwealth Financing Authority, Revenue Bond, Series C | | | |
| 2.76%, 06/01/30 | 50,000 | | 52,236 |
| Louisiana State Transportation Authority, Revenue Bond, Series A | | | |
| 2.00%, 02/15/30 | 50,000 | | 48,967 |
| Metropolitan Transportation Authority, Revenue Bond, Series A-2 | | | |
| 5.99%, 11/15/30 | 115,000 | | 143,217 |
| Metropolitan Transportation Authority, Revenue Bond, Series C-2 | | | |
| 5.18%, 11/15/49 | 825,000 | | 1,134,935 |
| Municipal Improvement Corporation of Los Angeles, Revenue Bond, Series A | | | |
| 1.65%, 11/01/28 | 225,000 | | 220,880 |
| 2.07%, 11/01/30 | 670,000 | | 664,852 |
| Municipal Improvement Corporation of Los Angeles, Revenue Bond, Series C | | | |
| 1.83%, 11/01/29 | 70,000 | | 68,749 |
| Port Authority of New York & New Jersey, Revenue Bond, Series 192 | | | |
| 4.81%, 10/15/65 | 300,000 | | 412,383 |
| Port of Oakland, Senior Lien Revenue Bond, Series R | | | |
| 1.95%, 05/01/28 | 90,000 | | 90,261 |
| 2.10%, 05/01/30 | 25,000 | | 24,900 |
| 2.20%, 05/01/31 | 135,000 | | 134,232 |
See Notes to Financial Statements.
| | | Par | | Value |
| San Francisco Municipal Transportation Agency, Revenue Bond, Series A | | | |
| 1.30%, 03/01/28 | $ 155,000 | | $ 151,173 |
| San Jose Financing Authority, Revenue Bond | | | |
| 1.81%, 06/01/29 | 100,000 | | 99,018 |
| 1.86%, 06/01/30 | 55,000 | | 53,941 |
| State Board of Administration Finance Corporation, Revenue Bond, Series A | | | |
| 2.15%, 07/01/30 | 235,000 | | 234,626 |
| State of California, General Obligation | | | |
| 7.55%, 04/01/39 | 410,000 | | 685,017 |
| State of Illinois, General Obligation | | | |
| 5.10%, 06/01/33 | 405,000 | | 468,437 |
| 6.63%, 02/01/35 | 495,000 | | 605,121 |
| 7.35%, 07/01/35 | 465,000 | | 585,674 |
| State of Louisiana, Revenue Bond, I-49 North Project | | | |
| 1.06%, 09/01/26 | 15,000 | | 14,698 |
| State of Louisiana, Revenue Bond, I-49 South Project | | | |
| 1.54%, 09/01/28 | 70,000 | | 68,509 |
| University of California, Revenue Bond, Series BG | | | |
| 1.61%, 05/15/30 | 1,600,000 | | 1,553,573 |
| University of North Carolina at Charlotte (The), Revenue Bond | | | |
| 1.71%, 04/01/28 | 5,000 | | 4,961 |
Total Municipal Bonds
(Cost $10,189,951) | | | 11,377,655 |
| | Number of
Contracts | | Notional
Amount | |
| PURCHASED OPTIONS — 0.0% |
| Call Options — 0.0% |
10-Year U.S. Treasury Note Future expiration date 01/2022, Strike Price
$130.50, Expires
01/07/22 (GSC) | 37 | | $4,827,344 | 13,297 |
10-Year U.S. Treasury Note Future expiration date 02/2022, Strike Price
$131.00, Expires
01/21/22 (GSC) | 35 | | 4,566,406 | 12,031 |
5-Year U.S. Treasury Note Future expiration date 02/2022, Strike Price
$130.50, Expires
01/21/22 (GSC) | 35 | | 4,566,406 | 20,234 |
| | Number of
Contracts | | Notional
Amount | | Value |
Long U.S. Treasury Bond Future expiration date 02/2022, Strike Price
$159.50, Expires
01/21/22 (GSC) | 19 | | $3,048,312 | | $ 36,516 |
Long U.S. Treasury Bond Future expiration date 02/2022, Strike Price
$161.50, Expires
01/21/22 (GSC) | 38 | �� | 6,096,625 | | 33,844 |
Long U.S. Treasury Bond Future expiration date 02/2022, Strike Price
$162.00, Expires
01/21/22 (GSC) | 13 | | 2,085,688 | | 9,344 |
| | | | | | 125,266 |
| Put Options — 0.0% |
10-Year U.S. Treasury Note Future expiration date 02/2022, Strike Price
$130.00, Expires
01/21/22 (GSC) | 44 | | 5,740,625 | | 17,188 |
10-Year U.S. Treasury Note Future expiration date 02/2022, Strike Price
$130.50, Expires
01/21/22 (GSC) | 37 | | 4,827,344 | | 22,547 |
10-Year U.S. Treasury Note Future expiration date 03/2022, Strike Price
$129.50, Expires
02/18/22 (GSC) | 31 | | 4,044,531 | | 16,953 |
5-Year U.S. Treasury Note Future expiration date 02/2022, Strike Price
$120.75, Expires
01/21/22 (GSC) | 66 | | 7,984,456 | | 17,531 |
Long U.S. Treasury Bond Future expiration date 02/2022, Strike Price
$160.00, Expires
01/21/22 (GSC) | 21 | | 3,369,187 | | 24,938 |
See Notes to Financial Statements.
MEDIUM-DURATION BOND FUND
SCHEDULE OF INVESTMENTS (Continued)
| | Number of
Contracts | | Notional
Amount | | Value |
Long U.S. Treasury Bond Future expiration date 02/2022, Strike Price
$162.00, Expires
01/21/22 (GSC) | 13 | | $2,085,688 | | $ 29,656 |
| | | | | | 128,813 |
Total Purchased Options
(Premiums paid $273,728) | | | | 254,079 |
| | | Par | |
| U.S. TREASURY OBLIGATIONS — 22.3% |
| U.S. Treasury Bills | | | |
| 0.05%, 03/10/22Ω ‡‡ | $ 6,100,000 | 6,099,581 |
| 0.05%, 03/24/22Ω ‡‡ | 108,000 | 107,988 |
| | | | 6,207,569 |
| U.S. Treasury Bonds | | | |
| 4.38%, 02/15/38 | 10,000 | 13,814 |
| 4.25%, 05/15/39 | 4,300,000 | 5,911,324 |
| 4.38%, 11/15/39 | 200,000 | 279,523 |
| 1.13%, 08/15/40 | 6,750,000 | 5,917,060 |
| 1.38%, 11/15/40 | 45,370,000 | 41,494,055 |
| 1.88%, 02/15/41 | 14,190,000 | 14,095,770 |
| 2.25%, 05/15/41 | 4,150,000 | 4,374,684 |
| 1.75%, 08/15/41 | 4,350,000 | 4,232,414 |
| 2.00%, 11/15/41 | 6,590,000 | 6,688,335 |
| 2.75%, 08/15/42 | 600,000 | 686,086 |
| 2.75%, 11/15/42 | 700,000 | 800,680 |
| 2.88%, 05/15/43 | 3,200,000 | 3,732,250 |
| 3.63%, 02/15/44‡‡ | 6,460,000 | 8,437,366 |
| 3.38%, 05/15/44‡‡ | 3,200,000 | 4,043,625 |
| 3.13%, 08/15/44 | 4,800,000 | 5,851,125 |
| 3.00%, 11/15/44 | 3,100,000 | 3,711,160 |
| 2.50%, 02/15/45 | 950,000 | 1,048,971 |
| 2.88%, 08/15/45 | 4,340,000 | 5,116,114 |
| 2.75%, 08/15/47 | 7,940,000 | 9,279,255 |
| 3.00%, 02/15/48 | 6,170,000 | 7,562,829 |
| 2.88%, 05/15/49 | 6,200,000 | 7,501,758 |
| 2.38%, 11/15/49‡‡ | 4,080,000 | 4,502,822 |
| 2.00%, 02/15/50‡‡ | 24,070,000 | 24,567,384 |
| 1.25%, 05/15/50 | 28,750,000 | 24,543,066 |
| 1.38%, 08/15/50 | 34,060,000 | 29,991,427 |
| 1.63%, 11/15/50‡‡ | 16,570,000 | 15,515,604 |
| 1.88%, 02/15/51 | 17,070,000 | 16,971,314 |
| 2.38%, 05/15/51 | 4,670,000 | 5,182,241 |
| 2.00%, 08/15/51 | 2,980,000 | 3,052,637 |
| 1.88%, 11/15/51 | 3,580,000 | 3,569,092 |
| | | | 268,673,785 |
| U.S. Treasury Notes | | | |
| 1.88%, 03/31/22‡‡ | 1,900,000 | 1,908,121 |
| 1.88%, 09/30/22‡‡ | 3,000,000 | 3,034,682 |
| 2.00%, 10/31/22‡‡ | 2,700,000 | 2,736,499 |
| 0.13%, 03/31/23‡‡ | 1,000,000 | 995,547 |
| | | Par | | Value |
| 0.25%, 09/30/23 | $ 160,000 | | $ 158,900 |
| 0.25%, 11/15/23 | 60,000 | | 59,517 |
| 0.25%, 05/31/25 | 6,170,000 | | 6,004,663 |
| 2.88%, 07/31/25 | 2,330,000 | | 2,477,354 |
| 0.25%, 08/31/25 | 170,000 | | 164,761 |
| 0.25%, 09/30/25 | 2,800,000 | | 2,712,719 |
| 0.25%, 10/31/25 | 500,000 | | 483,535 |
| 2.25%, 11/15/25 | 1,480,000 | | 1,542,611 |
| 0.38%, 11/30/25 | 20,000 | | 19,408 |
| 0.38%, 01/31/26 | 600,000 | | 580,875 |
| 2.63%, 01/31/26 | 3,120,000 | | 3,300,984 |
| 0.75%, 03/31/26 | 2,850,000 | | 2,797,564 |
| 2.25%, 03/31/26 | 1,500,000 | | 1,565,156 |
| 2.13%, 05/31/26 | 6,320,000 | | 6,568,850 |
| 0.88%, 09/30/26 | 1,050,000 | | 1,032,117 |
| 1.25%, 11/30/26 | 27,170,000 | | 27,174,245 |
| 1.25%, 12/31/26 | 15,530,000 | | 15,525,147 |
| 2.25%, 02/15/27 | 3,518,000 | | 3,688,541 |
| 0.63%, 12/31/27 | 4,415,700 | | 4,229,585 |
| 0.75%, 01/31/28 | 33,530,000 | | 32,323,706 |
| 2.75%, 02/15/28‡‡ | 1,400,000 | | 1,514,625 |
| 1.25%, 03/31/28‡‡ | 25,060,000 | | 24,863,240 |
| 1.25%, 04/30/28 | 34,790,000 | | 34,510,049 |
| 2.88%, 05/15/28‡‡ | 800,000 | | 872,469 |
| 1.25%, 05/31/28 | 6,590,000 | | 6,531,823 |
| 1.25%, 06/30/28 | 15,080,000 | | 14,941,570 |
| 1.00%, 07/31/28 | 2,180,000 | | 2,124,563 |
| 1.13%, 08/31/28 | 12,330,000 | | 12,104,111 |
| 1.25%, 09/30/28 | 6,350,000 | | 6,282,035 |
| 1.38%, 10/31/28 | 750,000 | | 747,832 |
| 1.38%, 12/31/28 | 18,070,000 | | 18,006,473 |
| 2.63%, 02/15/29 | 1,000,000 | | 1,082,227 |
| 1.63%, 05/15/31 | 6,330,000 | | 6,418,521 |
| 1.25%, 08/15/31 | 7,530,000 | | 7,372,929 |
| 1.38%, 11/15/31 | 2,400,000 | | 2,372,812 |
| | | | | 260,830,366 |
| U.S. Treasury Strips | | | | |
| 2.22%, 02/15/40Ω ‡‡ | 2,790,000 | | 1,940,627 |
| 2.18%, 08/15/41Ω ‡‡ | 1,080,000 | | 720,054 |
| | | | | 2,660,681 |
Total U.S. Treasury Obligations
(Cost $544,049,200) | | | 538,372,401 |
| | | Shares | |
| MONEY MARKET FUNDS — 6.8% |
GuideStone Money Market Fund, 0.00%
(Institutional Class)Ø ∞ | 133,664,253 | 133,664,253 |
| Northern Institutional Liquid Assets Portfolio (Shares), 0.04%Ø § | 27,825,685 | 27,825,685 |
See Notes to Financial Statements.
| | | Shares | | Value |
| Northern Institutional U.S. Government Portfolio (Shares), 0.00%Ø | 1,667,976 | | $ 1,667,976 |
Total Money Market Funds
(Cost $163,157,914) | | | 163,157,914 |
| | | Par | |
| REPURCHASE AGREEMENTS — 6.9% |
| Deutsche Bank Securities, Inc. | | |
| 0.04% (dated 12/31/21, due 01/03/22, repurchase price $83,418,533, collateralized by U.S. Treasury Bond, 1.13%, due 05/15/2040, total market value $85,451,279) | $83,400,000 | 83,400,000 |
| | | |
| 0.04% (dated 12/31/21, due 01/04/22, repurchase price $83,518,556, collateralized by U.S. Treasury Bond, 1.13%, due 05/15/2040, total market value $83,492,668) | 83,500,000 | 83,500,000 |
Total Repurchase Agreements
(Cost $166,900,000) | | 166,900,000 |
TOTAL INVESTMENTS —109.1%
(Cost $2,602,295,417) | | 2,627,762,030 |
| | Number of
Contracts | | Notional
Amount | |
| WRITTEN OPTIONS — (0.0)% |
| Call Options — (0.0)% |
10-Year U.S. Treasury Note Future expiration date 02/2022, Strike Price
$131.50, Expires
01/21/22 (GSC) | (64) | | $ (8,350,000) | (12,000) |
10-Year U.S. Treasury Note Future expiration date 02/2022, Strike Price
$132.00, Expires
01/21/22 (GSC) | (137) | | (17,874,219) | (14,985) |
10-Year U.S. Treasury Note Future expiration date 03/2022, Strike Price
$132.00, Expires
02/18/22 (GSC) | (35) | | (4,566,406) | (10,938) |
| | Number of
Contracts | | Notional
Amount | | Value |
5-Year U.S. Treasury Note Future expiration date 02/2022, Strike Price
$121.50, Expires
01/21/22 (GSC) | (117) | | $(14,154,262) | | $ (17,367) |
5-Year U.S. Treasury Note Future expiration date 02/2022, Strike Price
$121.50, Expires
01/21/22 (GSC) | (150) | | (18,146,490) | | (35,156) |
5-Year U.S. Treasury Note Future expiration date 02/2022, Strike Price
$122.00, Expires
01/21/22 (GSC) | (49) | | (5,927,854) | | (2,297) |
FNCL 2.00% expiration date 02/2022, Strike Price
$22.20, Expires
02/07/22 (JPM) | 1 | | (2,322,281) | | (2,625) |
FNCL 3.00% expiration date 03/2022, Strike Price
$32.20, Expires
03/07/22 (JPM) | 1 | | (2,075,078) | | (4,600) |
Long U.S. Treasury Bond Future expiration date 02/2022, Strike Price
$164.50, Expires
01/21/22 (GSC) | (36) | | (5,775,750) | | (8,438) |
| | | | | | (108,406) |
| Call Swaptions — (0.0)% |
Pay 0.02% (Annually); Receive 6-Month EURIBOR (Semiannually); Interest Rate Swap Maturing 12/13/2027 EUR, Strike Price
$0.02, Expires
12/09/22 (CITI) | 1 | | (2,410,000) | | (20,017) |
See Notes to Financial Statements.
MEDIUM-DURATION BOND FUND
SCHEDULE OF INVESTMENTS (Continued)
| | Number of
Contracts | | Notional
Amount | | Value |
Pay 0.02% (Annually); Receive 6-Month EURIBOR (Semiannually); Interest Rate Swap Maturing 12/13/2027 EUR, Strike Price
$0.02, Expires
12/09/22 (CITI) | 1 | | $ (2,360,000) | | $(19,602) |
Pay 0.87% (Semiannually); Receive 3-Month LIBOR (Quarterly); Interest Rate Swap Maturing 11/04/2023 USD, Strike Price
$0.87, Expires
11/02/22 (GSC) | 1 | | (25,000,000) | | (26,473) |
Pay 0.87% (Semiannually); Receive 3-Month LIBOR (Quarterly); Interest Rate Swap Maturing 11/04/2023 USD, Strike Price
$0.87, Expires
11/02/22 (GSC) | 1 | | (10,200,000) | | (10,801) |
Pay 0.87% (Semiannually); Receive 3-Month LIBOR (Quarterly); Interest Rate Swap Maturing 11/04/2023 USD, Strike Price
$0.87, Expires
11/02/22 (GSC) | 1 | | (25,300,000) | | (26,790) |
Pay 0.87% (Semiannually); Receive 3-Month LIBOR (Quarterly); Interest Rate Swap Maturing 11/04/2023 USD, Strike Price
$0.87, Expires
11/02/22 (GSC) | 1 | | (14,800,000) | | (15,672) |
Pay 1.25% (Semiannually); Receive 3-Month LIBOR (Quarterly); Interest Rate Swap Maturing 12/15/2023 USD, Strike Price
$1.25, Expires
12/13/22 (CITI) | 1 | | (16,400,000) | | (42,679) |
| | Number of
Contracts | | Notional
Amount | | Value |
Pay 1.26% (Semiannually); Receive 3-Month LIBOR (Quarterly); Interest Rate Swap Maturing 12/15/2023 USD, Strike Price
$1.26, Expires
12/13/22 (CITI) | 1 | | $(11,400,000) | | $ (29,853) |
Pay 1.29% (Semiannually); Receive 3-Month LIBOR (Quarterly); Interest Rate Swap Maturing 12/14/2023 USD, Strike Price
$1.29, Expires
12/12/22 (CITI) | 1 | | (13,600,000) | | (38,311) |
Pay 1.29% (Semiannually); Receive 3-Month LIBOR (Quarterly); Interest Rate Swap Maturing 12/14/2023 USD, Strike Price
$1.29, Expires
12/12/22 (CITI) | 1 | | (13,600,000) | | (38,311) |
| | | | | | (268,509) |
| Put Options — (0.0)% |
10-Year U.S. Treasury Note Future expiration date 03/2022, Strike Price
$127.50, Expires
02/18/22 (GSC) | (62) | | (8,089,063) | | (9,688) |
10-Year U.S. Treasury Note Future expiration date 03/2022, Strike Price
$128.00, Expires
02/18/22 (GSC) | (88) | | (11,481,250) | | (19,250) |
5-Year U.S. Treasury Note Future expiration date 02/2022, Strike Price
$120.50, Expires
01/21/22 (GSC) | (66) | | (7,984,456) | | (11,859) |
5-Year U.S. Treasury Note Future expiration date 03/2022, Strike Price
$119.50, Expires
02/18/22 (GSC) | (132) | | (15,968,911) | | (18,562) |
See Notes to Financial Statements.
| | Number of
Contracts | | Notional
Amount | | Value |
FNCL 2.00% expiration date 02/2022, Strike Price
$98.97, Expires
02/07/22 (JPM) | 1 | | $ (2,276,281) | | $ (8,752) |
Long U.S. Treasury Bond Future expiration date 02/2022, Strike Price
$157.00, Expires
01/21/22 (GSC) | (42) | | (6,738,375) | | (14,438) |
| | | | | | (82,549) |
| Put Swaptions — (0.0)% |
Pay 3-Month LIBOR (Quarterly); Receive 1.25% (Semiannually); Interest Rate Swap Maturing 12/15/2023 USD, Strike Price
$1.25, Expires
12/13/22 (CITI) | 1 | | (16,400,000) | | (51,181) |
Pay 3-Month LIBOR (Quarterly); Receive 1.26% (Semiannually); Interest Rate Swap Maturing 12/15/2023 USD, Strike Price
$1.26, Expires
12/13/22 (CITI) | 1 | | (11,400,000) | | (35,424) |
Pay 3-Month LIBOR (Quarterly); Receive 1.27% (Semiannually); Interest Rate Swap Maturing 11/04/2023 USD, Strike Price
$1.27, Expires
11/02/22 (GSC) | 1 | | (25,000,000) | | (62,378) |
Pay 3-Month LIBOR (Quarterly); Receive 1.27% (Semiannually); Interest Rate Swap Maturing 11/04/2023 USD, Strike Price
$1.27, Expires
11/02/22 (GSC) | 1 | | (10,200,000) | | (25,450) |
| | Number of
Contracts | | Notional
Amount | | Value |
Pay 3-Month LIBOR (Quarterly); Receive 1.27% (Semiannually); Interest Rate Swap Maturing 11/04/2023 USD, Strike Price
$1.27, Expires
11/02/22 (GSC) | 1 | | $(25,300,000) | | $(63,126) |
Pay 3-Month LIBOR (Quarterly); Receive 1.27% (Semiannually); Interest Rate Swap Maturing 11/04/2023 USD, Strike Price
$1.27, Expires
11/02/22 (GSC) | 1 | | (14,800,000) | | (36,927) |
Pay 3-Month LIBOR (Quarterly); Receive 1.29% (Semiannually); Interest Rate Swap Maturing 12/14/2023 USD, Strike Price
$1.29, Expires
12/12/22 (CITI) | 1 | | (13,600,000) | | (40,013) |
Pay 3-Month LIBOR (Quarterly); Receive 1.29% (Semiannually); Interest Rate Swap Maturing 12/14/2023 USD, Strike Price
$1.29, Expires
12/12/22 (CITI) | 1 | | (13,600,000) | | (40,013) |
Pay 3-Month LIBOR (Quarterly); Receive 1.30% (Semiannually); Interest Rate Swap Maturing 5/04/2024 USD, Strike Price
$1.30, Expires
04/29/22 (CITI) | 1 | | (12,460,000) | | (30,344) |
See Notes to Financial Statements.
MEDIUM-DURATION BOND FUND
SCHEDULE OF INVESTMENTS (Continued)
| | Number of
Contracts | | Notional
Amount | | Value |
Pay 6-Month EURIBOR (Semiannually); Receive 0.02% (Annually); Interest Rate Swap Maturing 12/13/2027 EUR, Strike Price
$0.02, Expires
12/09/22 (CITI) | 1 | | $(2,410,000) | | $ (42,432) |
Pay 6-Month EURIBOR (Semiannually); Receive 0.02% (Annually); Interest Rate Swap Maturing 12/13/2027 EUR, Strike Price
$0.02, Expires
12/09/22 (CITI) | 1 | | (2,360,000) | | (41,552) |
| | | | | | (468,840) |
Total Written Options
(Premiums received $ (1,096,829)) | | | | (928,304) |
| | | Par | | Value |
| TBA SALE COMMITMENTS — (2.7)% |
Uniform Mortgage Backed Securities
4.00%, 01/01/51 TBA | $ (3,000,000) | | $ (3,191,953) |
Government National Mortgage Association
3.00%, 01/01/51 TBA | (1,000,000) | | (1,031,016) |
Government National Mortgage Association
4.00%, 01/01/51 TBA | (2,000,000) | | (2,106,562) |
Uniform Mortgage Backed Securities
3.50%, 03/01/52 TBA | (52,800,000) | | (55,475,811) |
JP Morgan Mortgage Trust
2.50%, 02/14/52 TBA | (2,200,000) | | (2,264,969) |
Total TBA Sale Commitments
(Proceeds $(63,990,125)) | | | (64,070,311) |
Liabilities in Excess of Other
Assets — (6.4)% | | | (153,796,105) |
| NET ASSETS — 100.0% | | | $2,408,967,310 |
Futures Contracts outstanding at December 31, 2021:
| Future Type | | Expiration Date | | Open Long
(Short) Contracts | | Notional
Market Value
of Contracts | | Value and
Unrealized
Appreciation
(Depreciation) |
| 30-Year Euro Buxl | | 03/2022 | | (19) | | $ (4,472,096) | | $ 171,123 |
| Euro-Bund | | 03/2022 | | (117) | | (22,827,255) | | 294,140 |
| Euro-OAT | | 03/2022 | | 40 | | 7,429,851 | | (129,909) |
| 90-Day Eurodollar | | 03/2022 | | (147) | | (36,623,213) | | 31,822 |
| 10-Year Commonwealth Treasury Bond | | 03/2022 | | 91 | | 9,213,859 | | 3,512 |
| 10-Year Japanese Treasury Bond | | 03/2022 | | (9) | | (11,860,471) | | 41,643 |
| 10-Year U.S. Treasury Note | | 03/2022 | | 931 | | 121,466,406 | | 445,674 |
| Long GILT | | 03/2022 | | (70) | | (11,834,089) | | (18,407) |
| U.S. Treasury Long Bond | | 03/2022 | | (535) | | (85,834,063) | | 272,993 |
| Ultra 10-Year U.S. Treasury Note | | 03/2022 | | (226) | | (33,094,875) | | (490,648) |
| Ultra Long U.S. Treasury Bond | | 03/2022 | | 238 | | 46,915,750 | | 680,197 |
| 2-Year U.S. Treasury Note | | 04/2022 | | 803 | | 175,192,016 | | (141,297) |
| 5-Year U.S. Treasury Note | | 04/2022 | | 2,540 | | 307,280,469 | | 297,623 |
| 90-Day Eurodollar | | 12/2022 | | 572 | | 141,505,650 | | (406,175) |
| 90-Day Eurodollar | | 06/2023 | | 156 | | 38,465,700 | | (238,352) |
| 90-Day Eurodollar | | 09/2023 | | 37 | | 9,110,325 | | (54,800) |
| 90-Day Eurodollar | | 12/2023 | | 1,232 | | 303,102,800 | | (1,243,825) |
| Total Futures Contracts outstanding at December 31, 2021 | | | | | | $953,136,764 | | $ (484,686) |
Forward Foreign Currency Contracts outstanding at December 31, 2021:
| Expiration Date | | Currency
Purchased | | Amount
of Currency
Purchased | | Currency
Sold | | Amount
of Currency
Sold | | Counter-
party | | Net Unrealized
Appreciation
(Depreciation) |
| 02/02/22 | | Brazilian Reals | | 23,710,527 | | U.S. Dollars | | 4,124,502 | | MSCS | | $98,430 |
| 01/21/22 | | U.S. Dollars | | 5,012,055 | | British Pounds | | 3,642,019 | | DEUT | | 82,653 |
See Notes to Financial Statements.
| Expiration Date | | Currency
Purchased | | Amount
of Currency
Purchased | | Currency
Sold | | Amount
of Currency
Sold | | Counter-
party | | Net Unrealized
Appreciation
(Depreciation) |
| 01/07/22 | | Australian Dollars | | 12,761,525 | | U.S. Dollars | | 9,212,481 | | MSCS | | $ 72,379 |
| 01/18/22 | | Indonesian Rupiahs | | 56,877,253,622 | | U.S. Dollars | | 3,939,632 | | CITI | | 55,085 |
| 01/04/22 | | Brazilian Reals | | 23,710,527 | | U.S. Dollars | | 4,209,667 | | MSCS | | 43,023 |
| 04/01/22 | | U.S. Dollars | | 2,421,054 | | Danish Kroner | | 15,525,000 | | GSC | | 39,576 |
| 01/07/22 | | Australian Dollars | | 2,958,000 | | U.S. Dollars | | 2,117,584 | | JPM | | 34,558 |
| 03/16/22 | | Australian Dollars | | 970,775 | | U.S. Dollars | | 682,377 | | UBS | | 24,048 |
| 02/02/22 | | U.S. Dollars | | 27,715,618 | | British Pounds | | 20,464,000 | | BNP | | 19,103 |
| 03/16/22 | | Norwegian Kroner | | 6,735,214 | | U.S. Dollars | | 744,673 | | DEUT | | 19,056 |
| 01/18/22 | | Brazilian Reals | | 15,244,857 | | U.S. Dollars | | 2,706,059 | | CITI | | 18,928 |
| 01/18/22 | | U.S. Dollars | | 1,066,575 | | Euro | | 919,896 | | CITI | | 18,882 |
| 01/07/22 | | British Pounds | | 815,000 | | U.S. Dollars | | 1,085,160 | | MSCS | | 17,965 |
| 01/18/22 | | Canadian Dollars | | 4,630,025 | | U.S. Dollars | | 3,649,048 | | CITI | | 11,126 |
| 03/16/22 | | Swiss Francs | | 719,356 | | U.S. Dollars | | 782,664 | | CITI | | 8,345 |
| 01/31/22 | | U.S. Dollars | | 414,203 | | Canadian Dollars | | 515,436 | | MSCS | | 6,741 |
| 03/16/22 | | Euro | | 690,000 | | U.S. Dollars | | 782,928 | | DEUT | | 3,857 |
| 02/17/22 | | U.S. Dollars | | 384,714 | | Japanese Yen | | 43,900,000 | | GSC | | 2,934 |
| 01/18/22 | | U.S. Dollars | | 257,138 | | British Pounds | | 188,429 | | GSC | | 2,101 |
| 01/18/22 | | U.S. Dollars | | 62,110 | | Canadian Dollars | | 77,000 | | CITI | | 1,240 |
| Subtotal Appreciation | | | | | | | | | | $ 580,030 |
| 01/21/22 | | U.S. Dollars | | 253,286 | | British Pounds | | 187,559 | | MSCS | | $ (571) |
| 01/18/22 | | U.S. Dollars | | 1,044,695 | | Peruvian Nuevo Soles | | 4,177,734 | | BNP | | (1,099) |
| 01/18/22 | | U.S. Dollars | | 80,690 | | Mexican Pesos | | 1,688,846 | | GSC | | (1,535) |
| 03/16/22 | | Japanese Yen | | 12,235,149 | | U.S. Dollars | | 108,249 | | MSCS | | (1,816) |
| 01/18/22 | | U.S. Dollars | | 395,770 | | Euro | | 350,000 | | CITI | | (2,854) |
| 03/16/22 | | Japanese Yen | | 44,503,836 | | U.S. Dollars | | 390,000 | | UBS | | (2,862) |
| 01/18/22 | | Australian Dollars | | 2,211,180 | | U.S. Dollars | | 1,612,554 | | CITI | | (3,716) |
| 03/16/22 | | U.S. Dollars | | 361,903 | | British Pounds | | 271,000 | | UBS | | (4,787) |
| 03/16/22 | | U.S. Dollars | | 2,539,633 | | Euro | | 2,231,450 | | UBS | | (4,817) |
| 02/10/22 | | U.S. Dollars | | 551,421 | | Euro | | 488,558 | | UBS | | (5,263) |
| 02/17/22 | | Norwegian Kroner | | 21,815,000 | | U.S. Dollars | | 2,484,983 | | DEUT | | (10,011) |
| 02/10/22 | | U.S. Dollars | | 1,141,839 | | Peruvian Nuevo Soles | | 4,609,488 | | GSC | | (10,738) |
| 01/18/22 | | U.S. Dollars | | 453,293 | | Chinese Offshore Yuan | | 2,958,374 | | GSC | | (11,451) |
| 01/07/22 | | U.S. Dollars | | 1,857,036 | | Canadian Dollars | | 2,366,000 | | GSC | | (13,380) |
| 02/10/22 | | U.S. Dollars | | 1,705,628 | | Euro | | 1,509,119 | | DEUT | | (13,926) |
| 02/02/22 | | U.S. Dollars | | 13,273,019 | | Euro | | 11,665,000 | | BAR | | (16,579) |
| 01/07/22 | | U.S. Dollars | | 1,025,432 | | British Pounds | | 773,000 | | DEUT | | (20,844) |
| 03/16/22 | | U.S. Dollars | | 1,554,543 | | New Zealand Dollars | | 2,303,000 | | UBS | | (20,862) |
| 01/18/22 | | Canadian Dollars | | 3,995,065 | | U.S. Dollars | | 3,180,658 | | CITI | | (22,438) |
| 03/02/22 | | Chilean Pesos | | 1,891,114,500 | | U.S. Dollars | | 2,227,506 | | BNP | | (28,268) |
| 01/24/22 | | U.S. Dollars | | 2,172,000 | | Chilean Pesos | | 1,885,404,600 | | BNP | | (33,437) |
| 02/17/22 | | Japanese Yen | | 444,800,000 | | U.S. Dollars | | 3,919,875 | | GSC | | (51,633) |
| 02/17/22 | | Norwegian Kroner | | 37,365,000 | | U.S. Dollars | | 4,291,160 | | GSC | | (51,998) |
| 09/07/22 | | U.S. Dollars | | 1,786,732 | | Israeli Shekels | | 5,700,570 | | JPM | | (57,170) |
| 10/07/22 | | U.S. Dollars | | 2,302,621 | | Israeli Shekels | | 7,300,000 | | HSBC | | (61,026) |
| 01/18/22 | | U.S. Dollars | | 1,702,055 | | Peruvian Nuevo Soles | | 7,052,466 | | HSBC | | (63,357) |
| 10/07/22 | | U.S. Dollars | | 2,664,135 | | Israeli Shekels | | 8,499,500 | | DEUT | | (87,894) |
| 01/07/22 | | U.S. Dollars | | 2,637,926 | | Australian Dollars | | 3,753,000 | | DEUT | | (92,632) |
| 01/04/22 | | U.S. Dollars | | 4,152,457 | | Brazilian Reals | | 23,710,527 | | MSCS | | (100,233) |
| 01/18/22 | | Japanese Yen | | 917,179,528 | | U.S. Dollars | | 8,079,980 | | CITI | | (105,421) |
| 02/17/22 | | Japanese Yen | | 805,900,000 | | U.S. Dollars | | 7,125,611 | | BAR | | (117,031) |
| 01/18/22 | | Russian Rubles | | 572,480,971 | | U.S. Dollars | | 7,729,376 | | GSC | | (117,056) |
| 04/06/22 | | U.S. Dollars | | 2,131,981 | | Israeli Shekels | | 6,999,294 | | GSC | | (121,811) |
| 01/31/22 | | U.S. Dollars | | 2,219,614 | | Israeli Shekels | | 7,282,000 | | HSBC | | (122,957) |
| 01/04/22 | | U.S. Dollars | | 13,149,533 | | Euro | | 11,665,000 | | BAR | | (132,169) |
| 01/07/22 | | U.S. Dollars | | 8,413,694 | | Australian Dollars | | 11,923,000 | | BAR | | (261,083) |
See Notes to Financial Statements.
MEDIUM-DURATION BOND FUND
SCHEDULE OF INVESTMENTS (Continued)
| Expiration Date | | Currency
Purchased | | Amount
of Currency
Purchased | | Currency
Sold | | Amount
of Currency
Sold | | Counter-
party | | Net Unrealized
Appreciation
(Depreciation) |
| 01/05/22 | | U.S. Dollars | | 27,097,141 | | British Pounds | | 20,464,000 | | BNP | | $ (601,571) |
| Subtotal Depreciation | | | | | | | | | | $(2,376,296) |
| Total Forward Foreign Currency Contracts outstanding at December 31, 2021 | | | | $(1,796,266) |
Swap Agreements outstanding at December 31, 2021:
| Reference Obligation | | Fixed
Deal
(Pay) Rate | | Maturity
Date | | Counterparty | | Currency | | Notional
Amount | | Market Value | | Upfront
Premiums
Paid/
(Received) | | Unrealized
Appreciation
(Depreciation) |
| Credit Default Swaps on Sovereign Issuers—Buy Protection | | | | | | | | | | | | | | | | |
| Peoples Republic of China, 7.50% due 10/28/27 (Pay Quarterly) | | (1.00)% | | 6/20/2022 | | JPM | | USD | | 630,000 | | $(2,976) | | $(6,835) | | $3,859 |
| Peoples Republic of China, 7.50% due 10/28/27 (Pay Quarterly) | | (1.00)% | | 6/20/2022 | | CITI | | USD | | 70,000 | | (331) | | (1,226) | | 895 |
| | | $(3,307) | | $(8,061) | | $4,754 |
| Reference Obligation | | Implied
Credit
Spread | | Fixed
Deal
Receive Rate | | Maturity
Date | | Currency | | Notional
Amount | | Market Value | | Upfront
Premiums
Paid/
(Received) | | Unrealized
Appreciation
(Depreciation) |
| Centrally Cleared Credit Default Swaps on Corporate and Sovereign Issuers—Sell Protection | | | | | | | | | | | | | | | | |
| Citigroup, Inc., 2.88% due 7/24/23 (Receive Quarterly) | | 0.29% | | 1.00% | | 12/20/2022 | | USD | | 2,200,000 | | $ 15,992 | | $ 15,971 | | $ 21 |
| The Boeing Co., 2.60% due 10/30/25 (Receive Quarterly) | | 0.59% | | 1.00% | | 6/20/2023 | | USD | | 2,200,000 | | 13,931 | | 5,839 | | 8,092 |
| General Electric Co., 2.70% due 10/9/22 (Receive Quarterly) | | 0.30% | | 1.00% | | 12/20/2023 | | USD | | 600,000 | | 8,512 | | (25,420) | | 33,932 |
| General Electric Co., 2.70% due 10/9/22 (Receive Quarterly) | | 0.36% | | 1.00% | | 6/20/2024 | | USD | | 1,000,000 | | 16,143 | | (20,253) | | 36,396 |
| Republic of Indonesia, 5.88% due 3/13/20 (Receive Quarterly) | | 0.35% | | 1.00% | | 6/20/2024 | | USD | | 3,470,000 | | 56,780 | | 13,562 | | 43,218 |
| Rolls-Royce Holdings PLC, 2.13% due 6/18/21 (Receive Quarterly) | | 1.37% | | 1.00% | | 6/20/2025 | | EUR | | 1,700,000 | | (23,705) | | (263,901) | | 240,196 |
| Devon Energy Corporation, 7.95% due 4/15/32 (Receive Quarterly) | | 0.93% | | 1.00% | | 6/20/2026 | | USD | | 2,800,000 | | 9,728 | | (26,054) | | 35,782 |
| General Electric Co., 2.70% due 10/9/22 (Receive Quarterly) | | 0.61% | | 1.00% | | 6/20/2026 | | USD | | 2,100,000 | | 36,138 | | 11,126 | | 25,012 |
| General Electric Co., 2.70% due 10/9/22 (Receive Quarterly) | | 0.61% | | 1.00% | | 6/20/2026 | | USD | | 1,100,000 | | 18,930 | | 17,602 | | 1,328 |
| The Boeing Co., 2.60% due 10/30/25 (Receive Quarterly) | | 0.97% | | 1.00% | | 6/20/2026 | | USD | | 2,400,000 | | 3,479 | | (17,161) | | 20,640 |
| General Electric Co., 2.70% due 10/9/22 (Receive Quarterly) | | 0.67% | | 1.00% | | 12/20/2026 | | USD | | 2,600,000 | | 41,650 | | 29,130 | | 12,520 |
| Subtotal Appreciation | | | | | | | | | | | | $197,578 | | $(259,559) | | $457,137 |
| Prudential Financial, Inc., 3.50% due 5/15/24 (Receive Quarterly) | | 0.27% | | 1.00% | | 6/20/2024 | | USD | | 1,075,000 | | $ 19,752 | | $ 19,844 | | $ (92) |
| The Boeing Co., 8.75% due 8/15/21 (Receive Quarterly) | | 0.73% | | 1.00% | | 6/20/2024 | | USD | | 475,000 | | 3,291 | | 11,966 | | (8,675) |
| Republic of Peru, 8.75% due 11/21/33 (Receive Quarterly) | | 0.38% | | 1.00% | | 12/20/2024 | | USD | | 290,000 | | 5,461 | | 6,739 | | (1,278) |
See Notes to Financial Statements.
| Reference Obligation | | Implied
Credit
Spread | | Fixed
Deal
Receive Rate | | Maturity
Date | | Currency | | Notional
Amount | | Market Value | | Upfront
Premiums
Paid/
(Received) | | Unrealized
Appreciation
(Depreciation) |
| General Motors Co., 4.88% due 10/2/23 (Pay Quarterly) | | 0.97% | | 5.00% | | 12/20/2026 | | USD | | 2,200,000 | | $426,467 | | $443,519 | | $ (17,052) |
| Russian Federation, 7.50% due 3/31/30 (Receive Quarterly) | | 1.25% | | 1.00% | | 12/20/2026 | | USD | | 220,000 | | (2,513) | | 1,521 | | (4,034) |
| Stellantis NV, 5.25% due 4/15/23 (Receive Quarterly) | | 1.07% | | 5.00% | | 12/20/2026 | | EUR | | 1,700,000 | | 377,788 | | 391,652 | | (13,864) |
| Verizon Communications, Inc, 4.13% due 3/16/27 (Receive Quarterly) | | 0.58% | | 1.00% | | 12/20/2026 | | USD | | 2,100,000 | | 43,071 | | 51,189 | | (8,118) |
| British Telecommunications, 5.75% due 12/7/28 (Receive Quarterly) | | 1.50% | | 1.00% | | 6/20/2028 | | EUR | | 2,000,000 | | (71,151) | | (11,393) | | (59,758) |
| British Telecommunications, 5.75% due 12/7/28 (Receive Quarterly) | | 1.59% | | 1.00% | | 12/20/2028 | | EUR | | 2,000,000 | | (88,834) | | (23,988) | | (64,846) |
| Subtotal Depreciation | | | | | | | | | | | | $713,332 | | $891,049 | | $(177,717) |
Net Centrally Cleared Credit Default Swaps on Corporate and Sovereign Issuers—Sell Protection outstanding at
December 31, 2021 | | $910,910 | | $631,490 | | $ 279,420 |
| Reference Obligation | | Fixed
Deal
(Pay) Rate | | Maturity
Date | | Currency | | Notional
Amount | | Market Value | | Upfront
Premiums
Paid/
(Received) | | Unrealized
Appreciation
(Depreciation) |
| Centrally Cleared Credit Default Swaps on Credit Indexes—Buy Protection | | | | | | | | | | | | | | |
| CDX.NA.HY.37 (Pay Quarterly) | | (5.00)% | | 12/20/2026 | | USD | | 1,020,000 | | $(95,505) | | $(97,955) | | $2,450 |
| | | $(95,505) | | $(97,955) | | $2,450 |
| Reference Obligation | | Implied
Credit
Spread | | Fixed
Deal
Receive Rate | | Maturity
Date | | Currency | | Notional
Amount | | Market Value | | Upfront
Premiums
Paid/
(Received) | | Unrealized
Appreciation
(Depreciation) |
| Centrally Cleared Credit Default Swaps on Credit Indexes—Sell Protection | | | | | | | | | | | | | | | | |
| Markit CDX.NA.IG.34 Index (Receive Quarterly) | | 0.45% | | 1.00% | | 6/20/2025 | | USD | | 22,475,000 | | $ 434,373 | | $ 232,086 | | $202,287 |
| Markit CDX.NA.IG.36 Index (Receive Quarterly) | | 0.44% | | 1.00% | | 6/20/2026 | | USD | | 18,000,000 | | 445,695 | | 442,845 | | 2,850 |
| Markit CDX.NA.IG.37 Index (Receive Quarterly) | | 0.49% | | 1.00% | | 12/20/2026 | | USD | | 77,559,000 | | 1,920,928 | | 1,869,531 | | 51,397 |
| Subtotal Appreciation | | | | | | | | | | | | $2,800,996 | | $2,544,462 | | $256,534 |
| iTraxx Europe & Crossover Series 36 (Receive Quarterly) | | 2.42% | | 5.00% | | 12/20/2026 | | EUR | | 11,300,000 | | $1,546,563 | | $1,573,888 | | $ (27,325) |
| Subtotal Depreciation | | | | | | | | | | | | $1,546,563 | | $1,573,888 | | $ (27,325) |
| Net Centrally Cleared Credit Default Swaps on Credit Indexes—Sell Protection outstanding at December 31, 2021 | | $4,347,559 | | $4,118,350 | | $229,209 |
See Notes to Financial Statements.
MEDIUM-DURATION BOND FUND
SCHEDULE OF INVESTMENTS (Continued)
| Pay Rate Index/Pay Rate | | Receive
Rate/Receive
Rate Index | | Maturity
Date | | Counterparty | | Currency | | Notional
Amount | | Market Value | | Upfront
Premiums
Paid/
(Received) | | Unrealized
Appreciation
(Depreciation) |
| Interest Rate Swaps | | | | | | | | | | | | | | | | |
| 1-Day Brazil Cetip DI Interbank Deposit Rate (Upon termination) | | 7.02% (Upon termination) | | 1/4/2027 | | CITI | | BRL | | 15,744,748 | | $(254,382) | | $9,244 | | $(263,626) |
| | | | | | | | | | | $(254,382) | | $9,244 | | $(263,626) |
| Pay Rate Index/Pay Rate | | Receive
Rate/Receive
Rate Index | | Maturity
Date | | Currency | | Notional
Amount | | Market Value | | Upfront
Premiums
Paid/
(Received) | | Unrealized
Appreciation
(Depreciation) |
| Centrally Cleared Interest Rate Swaps | | | | | | | | | | | | |
| 2.85% (Upon termination) | | 1-Day Brazil Cetip DI Interbank Deposit Rate (Upon termination) | | 1/3/2022 | | BRL | | 12,735,575 | | $ 36,049 | | $ (83) | | $ 36,132 |
| 2.86% (Upon termination) | | 1-Day Brazil Cetip DI Interbank Deposit Rate (Upon termination) | | 1/3/2022 | | BRL | | 22,364,364 | | 63,280 | | (495) | | 63,775 |
| Bank of Japan Unsecured Overnight Call Rate (Semiannually) | | 0.00% (Semiannually) | | 3/15/2022 | | JPY | | 360,000,000 | | 493 | | (188) | | 681 |
| Bank of Japan Unsecured Overnight Call Rate (Semiannually) | | 0.00% (Semiannually) | | 3/17/2022 | | JPY | | 111,000,000 | | 153 | | (56) | | 209 |
| Bank of Japan Unsecured Overnight Call Rate (Semiannually) | | 0.00% (Semiannually) | | 3/19/2022 | | JPY | | 106,000,000 | | 148 | | (50) | | 198 |
| Bank of Japan Unsecured Overnight Call Rate (Semiannually) | | 0.00% (Semiannually) | | 3/20/2022 | | JPY | | 489,200,000 | | 683 | | (231) | | 914 |
| Bank of Japan Unsecured Overnight Call Rate (Semiannually) | | 0.00% (Semiannually) | | 4/7/2022 | | JPY | | 48,000,000 | | 70 | | (16) | | 86 |
| 1-Day Brazil Cetip DI Interbank Deposit Rate (Upon termination) | | 12.40% (Upon termination) | | 1/2/2023 | | BRL | | 3,804,163 | | 8,440 | | (270) | | 8,710 |
| 5.80% (Upon termination) | | 1-Day Brazil Cetip DI Interbank Deposit Rate (Upon termination) | | 1/2/2023 | | BRL | | 10,262,470 | | 89,681 | | — | | 89,681 |
| 7-Day CFETS Repo Rate (Quarterly) | | 2.50% (Quarterly) | | 9/15/2023 | | CNY | | 40,686,015 | | 33,338 | | 26,478 | | 6,860 |
| 3.97% (Upon termination) | | U.S. CPI Urban Consumers (Upon termination) | | 11/18/2023 | | USD | | 7,830,000 | | (38,577) | | (43,299) | | 4,722 |
| 1-Day Brazil Cetip DI Interbank Deposit Rate (Upon termination) | | 12.30% (Upon termination) | | 1/2/2024 | | BRL | | 6,716,621 | | 37,918 | | 4,446 | | 33,472 |
| 1-Day Brazil Cetip DI Interbank Deposit Rate (Upon termination) | | 9.20% (Upon termination) | | 1/2/2024 | | BRL | | 6,468,748 | | (27,962) | | (28,018) | | 56 |
| 7.20% (Lunar) | | 28-Day Mexico Interbank TIIE (Lunar) | | 3/13/2024 | | MXN | | 90,910,000 | | 28,562 | | 1,286 | | 27,276 |
| 1.50% (Quarterly) | | 3-Month KWCDC (Quarterly) | | 3/16/2024 | | KRW | | 2,647,119,417 | | 14,781 | | 7,206 | | 7,575 |
| 1-Day SOFR (Annually) | | 0.25% (Annually) | | 3/16/2024 | | USD | | 5,470,000 | | 67,019 | | 52,743 | | 14,276 |
| 3.15% (Annually) | | 6-Month WIBOR (Semiannually) | | 3/16/2024 | | PLN | | 4,849,069 | | 21,052 | | 881 | | 20,171 |
| 3-Month STIBOR (Quarterly) | | 0.50% (Annually) | | 3/16/2024 | | SEK | | 78,110,000 | | 21,404 | | 18,730 | | 2,674 |
| 1-Month LIBOR + 0.09% (Quarterly) | | 3-Month LIBOR (Quarterly) | | 7/25/2024 | | USD | | 41,780,000 | | 11,355 | | — | | 11,355 |
| 6.32% (Upon termination) | | 1-Day Brazil Cetip DI Interbank Deposit Rate (Upon termination) | | 1/2/2025 | | BRL | | 5,365,429 | | 96,351 | | — | | 96,351 |
| 7-Day CFETS Repo Rate (Quarterly) | | 2.75% (Quarterly) | | 9/15/2026 | | CNY | | 11,648,207 | | 31,905 | | 11,937 | | 19,968 |
| 2.95% (Upon termination) | | U.S. CPI Urban Consumers (Upon termination) | | 10/20/2026 | | USD | | 7,090,000 | | 75,841 | | (3,705) | | 79,546 |
| (0.18)% (Annually) | | 1-Day ESTR (Annually) | | 12/9/2026 | | EUR | | 24,160,000 | | 106,369 | | (2,127) | | 108,496 |
| 7-Day CFETS Repo Rate (Quarterly) | | 2.50% (Quarterly) | | 12/15/2026 | | CNY | | 4,040,000 | | 3,995 | | (4,074) | | 8,069 |
| 7.40% (Lunar) | | 28-Day Mexico Interbank TIIE (Lunar) | | 3/10/2027 | | MXN | | 25,340,000 | | 4,970 | | (6,096) | | 11,066 |
| (0.25)% (Annually) | | 6-Month EURIBOR (Semiannually) | | 3/16/2027 | | EUR | | 1,920,000 | | 33,093 | | 17,199 | | 15,894 |
| 1.00% (Annually) | | 1-Day SOFR (Annually) | | 3/16/2027 | | USD | | 12,620,000 | | 105,585 | | 85,417 | | 20,168 |
| 1-Day SONIA (Annually) | | 0.50% (Annually) | | 3/16/2027 | | GBP | | 3,240,000 | | 121,418 | | 83,253 | | 38,165 |
See Notes to Financial Statements.
| Pay Rate Index/Pay Rate | | Receive
Rate/Receive
Rate Index | | Maturity
Date | | Currency | | Notional
Amount | | Market Value | | Upfront
Premiums
Paid/
(Received) | | Unrealized
Appreciation
(Depreciation) |
| 3.25% (Annually) | | 6-Month WIBOR (Semiannually) | | 3/16/2027 | | PLN | | 5,175,000 | | $ 31,222 | | $ 17,001 | | $ 14,221 |
| 0.71% (Annually) | | 1-Day SOFR (Annually) | | 5/15/2027 | | USD | | 22,990,000 | | 418,968 | | 24,706 | | 394,262 |
| 0.02% (Annually) | | 6-Month EURIBOR (Semiannually) | | 12/13/2027 | | EUR | | 1,060,000 | | 9,867 | | 6,257 | | 3,610 |
| 1.68% (Semiannually) | | 3-Month CDOR (Semiannually) | | 8/22/2028 | | CAD | | 11,720,000 | | 134,944 | | (12,022) | | 146,966 |
| 3-Month New Zealand BBR FRA (Quarterly) | | 3.00% (Semiannually) | | 9/16/2031 | | NZD | | 2,830,000 | | 20,923 | | 17,904 | | 3,019 |
| 1-Day SOFR (Annually) | | 1.53% (Annually) | | 9/22/2031 | | USD | | 9,100,000 | | 5,019 | | 1,015 | | 4,004 |
| 3-Month CDOR (Semiannually) | | 2.50% (Semiannually) | | 10/14/2031 | | CAD | | 4,390,000 | | 59,765 | | 20,356 | | 39,409 |
| 7.40% (Lunar) | | 28-Day Mexico Interbank TIIE (Lunar) | | 3/3/2032 | | MXN | | 7,720,000 | | 4,984 | | (1,059) | | 6,043 |
| 0.00% (Annually) | | Bank of Japan Unsecured Overnight Call Rate (Annually) | | 3/16/2032 | | JPY | | 248,890,000 | | 17,681 | | 9,733 | | 7,948 |
| 0.25% (Annually) | | Swiss Average Overnight Rate (Annually) | | 3/16/2032 | | CHF | | 2,840,000 | | 41,584 | | 41,190 | | 394 |
| 0.75% (Annually) | | 1-Day SONIA (Annually) | | 3/16/2032 | | GBP | | 6,200,000 | | 168,996 | | (47,814) | | 216,810 |
| 1-Day SONIA (Annually) | | 0.75% (Annually) | | 3/16/2032 | | GBP | | 6,990,000 | | 190,529 | | (2,999) | | 193,528 |
| 2.75% (Semiannually) | | 3-Month New Zealand BBR FRA (Quarterly) | | 3/16/2032 | | NZD | | 3,190,000 | | (13,353) | | (24,799) | | 11,446 |
| 3.10% (Annually) | | 6-Month WIBOR (Semiannually) | | 3/16/2032 | | PLN | | 3,200,000 | | 31,285 | | (1,558) | | 32,843 |
| 3-Month JIBAR (Quarterly) | | 7.60% (Quarterly) | | 3/16/2032 | | ZAR | | 8,700,000 | | 1,644 | | 400 | | 1,244 |
| 1.00% (Annually) | | 1-Day SONIA (Annually) | | 3/17/2032 | | GBP | | 3,170,000 | | (30,086) | | (58,740) | | 28,654 |
| 1.50% (Annually) | | 1-Day SOFR (Annually) | | 3/17/2032 | | USD | | 5,390,000 | | 9,221 | | 3,934 | | 5,287 |
| 2.00% (Semiannually) | | 3-Month CDOR (Semiannually) | | 3/17/2032 | | CAD | | 2,230,000 | | 12,099 | | 9,789 | | 2,310 |
| 6-Month ASX BBSW (Semiannually) | | 2.00% (Semiannually) | | 3/17/2032 | | AUD | | 1,220,000 | | (13,909) | | (15,487) | | 1,578 |
| 1.63% (Annually) | | 1-Day SOFR (Annually) | | 9/22/2036 | | USD | | 10,960,000 | | 23,411 | | 3,371 | | 20,040 |
| 0.75% (Annually) | | 6-Month EURIBOR (Semiannually) | | 11/26/2041 | | EUR | | 7,680,000 | | 47,190 | | (152,109) | | 199,299 |
| 0.50% (Annually) | | 6-Month EURIBOR (Semiannually) | | 3/16/2042 | | EUR | | 130,000 | | 1,623 | | (4,820) | | 6,443 |
| 0.56% (Annually) | | 1-Day SOFR (Annually) | | 7/20/2045 | | USD | | 5,310,000 | | 976,958 | | 70,079 | | 906,879 |
| 0.74% (Annually) | | 1-Day SOFR (Annually) | | 8/19/2045 | | USD | | 3,610,000 | | 533,614 | | — | | 533,614 |
| 1.00% (Semiannually) | | 3-Month LIBOR (Quarterly) | | 2/15/2047 | | USD | | 2,807,000 | | 436,561 | | 24,617 | | 411,944 |
| 1.20% (Semiannually) | | 3-Month LIBOR (Quarterly) | | 2/15/2047 | | USD | | 1,621,000 | | 182,558 | | 8,929 | | 173,629 |
| 1.23% (Semiannually) | | 3-Month LIBOR (Quarterly) | | 2/15/2047 | | USD | | 905,000 | | 97,113 | | 1,039 | | 96,074 |
| 1.52% (Annually) | | 1-Day SOFR (Annually) | | 2/15/2047 | | USD | | 3,222,000 | | (41,012) | | (44,743) | | 3,731 |
| 1.60% (Semiannually) | | 3-Month LIBOR (Quarterly) | | 2/15/2047 | | USD | | 1,769,000 | | 47,682 | | 9,710 | | 37,972 |
| 1.63% (Semiannually) | | 3-Month LIBOR (Quarterly) | | 2/15/2047 | | USD | | 4,153,000 | | 93,523 | | 23,910 | | 69,613 |
| 1.67% (Semiannually) | | 3-Month LIBOR (Quarterly) | | 7/9/2051 | | USD | | 2,945,000 | | 23,468 | | (13,125) | | 36,593 |
| 2.25% (Semiannually) | | 3-Month CDOR (Semiannually) | | 12/15/2051 | | CAD | | 2,230,000 | | 65,852 | | 21,657 | | 44,195 |
| 0.75% (Annually) | | 1-Day SONIA (Annually) | | 3/16/2052 | | GBP | | 8,200,000 | | 248,911 | | (143,996) | | 392,907 |
| 1-Day SOFR (Annually) | | 1.75% (Annually) | | 3/16/2052 | | USD | | 1,260,000 | | (87,581) | | (108,128) | | 20,547 |
| Subtotal Appreciation | | | | | | | | | | $4,698,668 | | $ (94,934) | | $4,793,602 |
| 1-Day Brazil Cetip DI Interbank Deposit Rate (Upon termination) | | 3.36% (Upon termination) | | 1/3/2022 | | BRL | | 286,224,050 | | $ (377,738) | | $ 102,156 | | $ (479,894) |
| 1-Day Brazil Cetip DI Interbank Deposit Rate (Upon termination) | | 3.35% (Upon termination) | | 1/3/2022 | | BRL | | 94,028,297 | | (195,954) | | 287 | | (196,241) |
| 1-Day Brazil Cetip DI Interbank Deposit Rate (Upon termination) | | 3.70% (Upon termination) | | 1/3/2022 | | BRL | | 88,138,258 | | (158,444) | | (17,065) | | (141,379) |
| 1-Day Brazil Cetip DI Interbank Deposit Rate (Upon termination) | | 3.98% (Upon termination) | | 1/3/2022 | | BRL | | 31,092,652 | | (46,489) | | — | | (46,489) |
| 0.00% (Semiannually) | | 6-Month LIBOR (Semiannually) | | 3/15/2022 | | JPY | | 360,000,000 | | (1,292) | | (572) | | (720) |
| 0.00% (Semiannually) | | 6-Month LIBOR (Semiannually) | | 3/17/2022 | | JPY | | 111,000,000 | | (317) | | (137) | | (180) |
| 0.00% (Semiannually) | | 6-Month LIBOR (Semiannually) | | 3/19/2022 | | JPY | | 106,000,000 | | (295) | | (118) | | (177) |
| 0.00% (Semiannually) | | 6-Month LIBOR (Semiannually) | | 3/20/2022 | | JPY | | 489,200,000 | | (1,350) | | (547) | | (803) |
| 0.00% (Semiannually) | | 6-Month LIBOR (Semiannually) | | 4/7/2022 | | JPY | | 48,000,000 | | (109) | | (29) | | (80) |
| 3-Month LIBOR (Quarterly) | | 0.19% (Semiannually) | | 6/15/2022 | | USD | | 21,256,000 | | (9,302) | | (96) | | (9,206) |
See Notes to Financial Statements.
MEDIUM-DURATION BOND FUND
SCHEDULE OF INVESTMENTS (Continued)
| Pay Rate Index/Pay Rate | | Receive
Rate/Receive
Rate Index | | Maturity
Date | | Currency | | Notional
Amount | | Market Value | | Upfront
Premiums
Paid/
(Received) | | Unrealized
Appreciation
(Depreciation) |
| 3-Month New Zealand BBR FRA (Quarterly) | | 1.25% (Semiannually) | | 12/15/2022 | | NZD | | 9,510,000 | | $ (24,228) | | $ (10,537) | | $ (13,691) |
| 1-Day Brazil Cetip DI Interbank Deposit Rate (Upon termination) | | 7.20% (Upon termination) | | 1/2/2023 | | BRL | | 11,043,254 | | (76,691) | | 1,084 | | (77,775) |
| 1-Day Brazil Cetip DI Interbank Deposit Rate (Upon termination) | | 10.57% (Upon termination) | | 1/2/2023 | | BRL | | 4,354,944 | | (4,847) | | — | | (4,847) |
| 0.19% (Quarterly) | | 3-Month ASX BBSW (Quarterly) | | 2/22/2023 | | AUD | | 86,990,000 | | (204,652) | | — | | (204,652) |
| 11.81% (Upon termination) | | 1-Day Brazil Cetip DI Interbank Deposit Rate (Upon termination) | | 1/2/2024 | | BRL | | 651,161 | | (2,380) | | — | | (2,380) |
| 11.91% (Upon termination) | | 1-Day Brazil Cetip DI Interbank Deposit Rate (Upon termination) | | 1/2/2024 | | BRL | | 671,833 | | (2,532) | | — | | (2,532) |
| 12.19% (Upon termination) | | 1-Day Brazil Cetip DI Interbank Deposit Rate (Upon termination) | | 1/2/2024 | | BRL | | 902,976 | | (4,372) | | — | | (4,372) |
| 3-Month JIBAR (Quarterly) | | 5.65% (Quarterly) | | 3/16/2024 | | ZAR | | 950,000 | | (6) | | 143 | | (149) |
| Bank of Japan Unsecured Overnight Call Rate (Annually) | | 0.00% (Annually) | | 3/17/2024 | | JPY | | 750,000,000 | | 6,345 | | 11,605 | | (5,260) |
| 1-Day ESTR (Annually) | | (0.30)% (Annually) | | 12/9/2024 | | EUR | | 10,990,000 | | (26,296) | | 5,985 | | (32,281) |
| 1.56% (Semiannually) | | 3-Month CDOR (Semiannually) | | 8/22/2025 | | CAD | | 14,710,000 | | (122,362) | | 6,882 | | (129,244) |
| U.S. CPI Urban Consumers (Upon termination) | | 3.37% (Upon termination) | | 11/18/2026 | | USD | | 7,830,000 | | 95,243 | | 122,847 | | (27,604) |
| 1.52% (Annually) | | 1-Day SOFR (Annually) | | 11/20/2026 | | USD | | 8,910,000 | | (38,483) | | (21,341) | | (17,142) |
| 1.75% (Semiannually) | | 3-Month CDOR (Semiannually) | | 3/16/2027 | | CAD | | 7,980,000 | | 35,591 | | 55,988 | | (20,397) |
| 2.00% (Annually) | | 6-Month NIBOR (Semiannually) | | 3/16/2027 | | NOK | | 34,420,000 | | (17,554) | | (13,145) | | (4,409) |
| 3-Month STIBOR (Quarterly) | | 0.75% (Annually) | | 3/16/2027 | | SEK | | 15,520,000 | | 388 | | 10,702 | | (10,314) |
| 6-Month ASX BBSW (Semiannually) | | 1.25% (Semiannually) | | 3/16/2027 | | AUD | | 27,580,000 | | (484,568) | | (473,285) | | (11,283) |
| 1.35% (Semiannually) | | 3-Month LIBOR (Quarterly) | | 2/15/2028 | | USD | | 22,903,000 | | (3,440) | | 18,658 | | (22,098) |
| 1.13% (Annually) | | 1-Day SOFR (Annually) | | 8/15/2028 | | USD | | 13,722,000 | | 55,978 | | 99,593 | | (43,615) |
| 1.22% (Annually) | | 1-Day SOFR (Annually) | | 8/15/2028 | | USD | | 5,885,000 | | (10,186) | | (380) | | (9,806) |
| 1.20% (Annually) | | 1-Day SOFR (Annually) | | 11/1/2028 | | USD | | 4,580,000 | | (7,957) | | (267) | | (7,690) |
| 28-Day Mexico Interbank TIIE (Lunar) | | 7.45% (Lunar) | | 7/18/2029 | | MXN | | 165,770,000 | | 667 | | 68,837 | | (68,170) |
| 2.13% (Annually) | | 6-Month NIBOR (Semiannually) | | 5/11/2031 | | NOK | | 32,920,000 | | (29,972) | | (28,398) | | (1,574) |
| 3-Month KWCDC (Quarterly) | | 1.75% (Quarterly) | | 9/15/2031 | | KRW | | 755,700,000 | | 5,852 | | 20,560 | | (14,708) |
| 1.73% (Annually) | | 1-Day SOFR (Annually) | | 10/20/2031 | | USD | | 7,100,000 | | (69,381) | | 27,966 | | (97,347) |
| U.S. CPI Urban Consumers (Upon termination) | | 2.77% (Upon termination) | | 10/20/2031 | | USD | | 7,090,000 | | (66,881) | | 6,104 | | (72,985) |
| 6-Month EURIBOR (Semiannually) | | 0.50% (Annually) | | 11/26/2031 | | EUR | | 15,050,000 | | (64,195) | | 109,770 | | (173,965) |
| 1-Day ESTR (Annually) | | 0.14% (Annually) | | 12/9/2031 | | EUR | | 4,330,000 | | (52,320) | | 3,138 | | (55,458) |
| 0.25% (Annually) | | 6-Month EURIBOR (Semiannually) | | 3/16/2032 | | EUR | | 3,070,000 | | (27,095) | | 24,553 | | (51,648) |
| 1-Day SOFR (Annually) | | 1.50% (Annually) | | 3/16/2032 | | USD | | 3,160,000 | | 45,826 | | 61,684 | | (15,858) |
| 3-Month CDOR (Semiannually) | | 2.00% (Semiannually) | | 3/16/2032 | | CAD | | 5,390,000 | | 2,068 | | 7,992 | | (5,924) |
| 3-Month STIBOR (Quarterly) | | 1.00% (Annually) | | 3/16/2032 | | SEK | | 43,590,000 | | 4,151 | | 76,770 | | (72,619) |
| 6-Month ASX BBSW (Semiannually) | | 2.00% (Semiannually) | | 3/16/2032 | | AUD | | 4,960,000 | | (12,769) | | 3,607 | | (16,376) |
| 6-Month NIBOR (Semiannually) | | 2.00% (Annually) | | 3/16/2032 | | NOK | | 9,150,000 | | 8,216 | | 27,273 | | (19,057) |
| 3-Month STIBOR (Quarterly) | | 1.00% (Annually) | | 3/17/2032 | | SEK | | 11,010,000 | | (14,322) | | (8,768) | | (5,554) |
| 6-Month EURIBOR (Semiannually) | | 0.50% (Annually) | | 3/17/2032 | | EUR | | 8,890,000 | | (54,016) | | 12,732 | | (66,748) |
| 3-Month CDOR (Semiannually) | | 2.10% (Semiannually) | | 12/18/2033 | | CAD | | 3,260,000 | | (10,553) | | 16,282 | | (26,835) |
| 0.75% (Semiannually) | | Bank of Japan Unsecured Overnight Call Rate (Semiannually) | | 3/20/2038 | | JPY | | 489,200,000 | | (361,589) | | 39,965 | | (401,554) |
| 1.73% (Annually) | | 1-Day SOFR (Annually) | | 2/15/2047 | | USD | | 2,706,000 | | (167,702) | | — | | (167,702) |
| 2.00% (Semiannually) | | 3-Month LIBOR (Quarterly) | | 2/15/2047 | | USD | | 1,226,000 | | (71,974) | | 17,824 | | (89,798) |
| 0.54% (Semiannually) | | Bank of Japan Unsecured Overnight Call Rate (Semiannually) | | 3/15/2051 | | JPY | | 138,000,000 | | (15,021) | | (4,284) | | (10,737) |
| 0.56% (Semiannually) | | Bank of Japan Unsecured Overnight Call Rate (Semiannually) | | 3/15/2051 | | JPY | | 222,000,000 | | (34,245) | | (2,942) | | (31,303) |
See Notes to Financial Statements.
| Pay Rate Index/Pay Rate | | Receive
Rate/Receive
Rate Index | | Maturity
Date | | Currency | | Notional
Amount | | Market Value | | Upfront
Premiums
Paid/
(Received) | | Unrealized
Appreciation
(Depreciation) |
| 0.35% (Semiannually) | | Bank of Japan Unsecured Overnight Call Rate (Semiannually) | | 3/17/2051 | | JPY | | 111,000,000 | | $ 39,053 | | $ 58,150 | | $ (19,097) |
| 0.57% (Semiannually) | | Bank of Japan Unsecured Overnight Call Rate (Semiannually) | | 3/19/2051 | | JPY | | 106,000,000 | | (19,951) | | (1,022) | | (18,929) |
| 0.57% (Semiannually) | | Bank of Japan Unsecured Overnight Call Rate (Semiannually) | | 4/7/2051 | | JPY | | 48,000,000 | | (9,055) | | (364) | | (8,691) |
| 2.00% (Semiannually) | | 3-Month LIBOR (Quarterly) | | 6/3/2051 | | USD | | 1,164,000 | | (74,837) | | 10,952 | | (85,789) |
| 0.75% (Annually) | | 1-Day SONIA (Annually) | | 9/21/2052 | | GBP | | 2,000,000 | | 59,047 | | 130,340 | | (71,293) |
| Subtotal Depreciation | | | | | | | | | | $(2,619,297) | | $577,132 | | $(3,196,429) |
| Net Centrally Cleared Interest Rate Swaps outstanding at December 31, 2021 | | $ 2,079,371 | | $482,198 | | $ 1,597,173 |
VALUATION HIERARCHY
The following is a summary of the inputs used, as of December 31, 2021, in valuing the Fund’s investments carried at fair value:
| | Total
Value | | Level 1
Quoted Prices | | Level 2
Other Significant
Observable Inputs | | Level 3
Significant
Unobservable Inputs |
| Assets: | | | | | | | |
| Investments in Securities: | | | | | | | |
| Agency Obligations | $ 30,850,541 | | $ — | | $ 30,850,541 | | $ — |
| Asset-Backed Securities | 115,036,785 | | — | | 115,036,785 | | — |
| Certificates Of Deposit | 6,000,382 | | — | | 6,000,382 | | — |
| Commercial Paper | 16,698,190 | | — | | 16,698,190 | | — |
| Corporate Bonds | 684,139,561 | | — | | 683,758,183 | | 381,378 |
| Foreign Bonds | | | | | | | |
| Denmark | 5,578,448 | | — | | 4,678,337 | | 900,111 |
| Other | 296,010,872 | | — | | 296,010,872 | | — |
| Total Foreign Bonds | 301,589,320 | | — | | 300,689,209 | | 900,111 |
| Loan Agreements | 9,935,302 | | — | | 9,935,302 | | — |
| Money Market Funds | 163,157,914 | | 163,157,914 | | — | | — |
| Mortgage-Backed Securities | 583,449,900 | | — | | 583,449,900 | | — |
| Municipal Bonds | 11,377,655 | | — | | 11,377,655 | | — |
| Purchased Options: | | | | | | | |
| Call Options | 125,266 | | 125,266 | | — | | — |
| Put Options | 128,813 | | 128,813 | | — | | — |
| Total Purchased Options | 254,079 | | 254,079 | | — | | — |
| Repurchase Agreements | 166,900,000 | | — | | 166,900,000 | | — |
| U.S. Treasury Obligations | 538,372,401 | | — | | 538,372,401 | | — |
| Total Assets - Investments in Securities | $2,627,762,030 | | $163,411,993 | | $2,463,068,548 | | $1,281,489 |
| Other Financial Instruments*** | | | | | | | |
| Forward Foreign Currency Contracts | $ 580,030 | | $ — | | $ 580,030 | | $ — |
| Futures Contracts | 2,238,727 | | 2,238,727 | | — | | — |
| Swap Agreements | 5,514,477 | | — | | 5,514,477 | | — |
| Total Assets - Other Financial Instruments | $ 8,333,234 | | $ 2,238,727 | | $ 6,094,507 | | $ — |
See Notes to Financial Statements.
MEDIUM-DURATION BOND FUND
SCHEDULE OF INVESTMENTS (Continued)
| | Total
Value | | Level 1
Quoted Prices | | Level 2
Other Significant
Observable Inputs | | Level 3
Significant
Unobservable Inputs |
| Liabilities: | | | | | | | |
| Investments in Securities: | | | | | | | |
| TBA Sale Commitments | $(64,070,311) | | $ — | | $(64,070,311) | | $ — |
| Written Options: | | | | | | | |
| Call Options | (108,406) | | (101,181) | | (7,225) | | — |
| Call Swaptions | (268,509) | | — | | (268,509) | | — |
| Put Options | (82,549) | | (73,797) | | (8,752) | | — |
| Put Swaptions | (468,840) | | — | | (468,840) | | — |
| Total Written Options | (928,304) | | (174,978) | | (753,326) | | — |
| Total Liabilities - Investments in Securities | $(64,998,615) | | $ (174,978) | | $(64,823,637) | | $ — |
| Other Financial Instruments*** | | | | | | | |
| Forward Foreign Currency Contracts | $ (2,376,296) | | $ — | | $ (2,376,296) | | $ — |
| Futures Contracts | (2,723,413) | | (2,723,413) | | — | | — |
| Swap Agreements | (3,665,097) | | — | | (3,665,097) | | — |
| Total Liabilities - Other Financial Instruments | $ (8,764,806) | | $(2,723,413) | | $ (6,041,393) | | $ — |
| *** | Other financial instruments are derivative instruments, such as futures contracts, forward contracts and swap agreements, which are valued at the unrealized appreciation (depreciation) on the investment. Further details regarding the value of these investments can be found in the preceding "Futures Contracts outstanding", "Forward Foreign Currency Contracts outstanding" and "Swap Agreements outstanding" disclosures. |
Management has determined that the amount of transfers between Level 3 and Level 2 compared to total net assets is not material; therefore, the amount of transfers between Level 3 and Level 2 is not shown for the year ended December 31, 2021.
Management has determined that the amount of Level 3 securities compared to total net assets is not material; therefore, the reconciliation of Level 3 securities and assumptions is not shown for the year ended December 31, 2021.
See Notes to Financial Statements.
Global Bond Fund (Unaudited)
The Fund is actively managed and invests in a diversified portfolio composed of global fixed income securities with a dollar-weighted effective duration (a calculation that measures the sensitivity of a bond or bond fund to changes in interest rates taking into account embedded options and floating interest rates) normally between three to 10 years. The Fund maintained its global focus, seeking investment opportunities across a wide array of economies, credits, yield curves and currencies. For the one-year period ended December 31, 2021, the Investor Class of the Fund outperformed its composite benchmark, 70% Bloomberg Global Aggregate Bond Index, 15% J.P. Morgan Emerging Markets Bond Index (EMBI) Plus and 15% Bloomberg US Corporate High Yield 2% Issuer Capped Bond Index (-2.53% versus -3.22%).
Outperformance within the Fund was driven by several factors. An underweight to broad duration relative to the benchmark was additive as rates rose across the globe in response to inflation expectations. An overweight to lower quality sectors was additive as well.
Government bond futures, interest rate futures and options were used for the common purpose of implementing yield curve positioning strategies and managing duration within the Fund and added to relative performance. Currency options and forward contracts were used to adjust exposure to various currency markets and/or to hedge against foreign currency fluctuations. In aggregate, currency derivatives were a detractor from performance.
Credit default swaps, purchased to tactically adjust credit exposure, detracted from the Fund’s relative performance during the year.
During the year, the Fund remained focused on its objective of seeking to maximize total return through capital gains and current income while preserving principal value.
This Fund may be suitable for investors who have a medium- to long-term investment horizon, seek higher returns than those offered by a shorter maturity fixed income fund, can accept short-term fluctuations in account value and want to diversify their portfolio with a globally diversified fixed income investment option. This Fund may invest, to a large extent, in below-investment grade securities (i.e., high yield securities and junk bonds). These securities involve greater risks of default, are more volatile than fixed income securities rated investment grade and are inherently speculative. Obligations of foreign issuers may be negatively impacted by political events, economic conditions or inefficient, illiquid or unregulated markets in foreign countries, and they also may be subject to inadequate regulatory or accounting standards, which may increase investment risk. Investing in emerging markets may involve greater risks than investing in more developed foreign markets because, among other things, emerging markets often have more political and economic instability.
This Fund is subject to interest rate risk, meaning, when interest rates rise, the value of the existing fixed income securities decrease and vice versa. Changes in interest rates have a bigger impact on long duration holdings than on short duration holdings. To the extent that the investment adviser or sub-advisers misjudge current market conditions, the Fund’s volatility may be amplified by its use of derivatives and by its ability to select sub-advisers to allocate assets. Derivatives involve different risks from, and in some respects greater risks than, those associated with investing directly in securities, currencies or other instruments. Derivatives may be illiquid or less liquid, volatile, difficult to price and leveraged, so small changes in value of the underlying instruments may produce disproportionate losses to the Fund. It is possible to lose money by investing in the Fund.
See Notes to Financial Statements.
Global Bond Fund (Unaudited)
At December 31, 2021, the portfolio holdings of the Fund, as a percentage of net assets, is shown in the following table. Portfolio holdings are subject to risk and may change at any time.
| | % |
| Foreign Bonds | 39.7 |
| U.S. Treasury Obligations | 23.2 |
| Corporate Bonds | 19.9 |
| Money Market Funds | 7.4 |
| Mortgage-Backed Securities | 5.2 |
| Loan Agreements | 2.5 |
| Asset-Backed Securities | 2.3 |
| Mutual Funds | 1.1 |
| Communication Services | 0.1 |
| Financials | 0.1 |
| Information Technology | 0.1 |
| Industrials | —** |
| Energy | —** |
| Consumer Staples | —** |
| Health Care | —** |
| Utilities | —** |
| Consumer Discretionary | —** |
| Materials | —** |
| Real Estate | —** |
| Purchased Options | —** |
| | 101.6 |
| **Rounds to less than 0.05% | |
See Notes to Financial Statements.
Global Bond Fund (Unaudited)
| Average Annual Total Returns as of 12/31/21 | |
| | | Institutional Class* | | Investor Class* | | Benchmark** | |
| One Year | | (2.31%) | | (2.53%) | | (3.22%) | |
| Five Year | | 3.37% | | 3.10% | | 3.59% | |
| Ten Year | | N/A | | 3.50% | | 3.40% | |
| Since Inception(1) | | 2.96% | | 4.44% | | 4.71% | |
| Inception Date | | 05/01/15 | | 12/29/06 | | | |
| Total Fund Operating Expenses (May 1, 2021 Prospectus)(2) | | 0.57% | | 0.86% | | | |
| (1) | The Since Inception benchmark performance is based on the start date of December 29, 2006, which corresponds with the inception date of the Investor Class, the longest operating class of the Fund. |
| (2) | Current information regarding the Fund’s Operating Expenses can be found in the Financial Highlights. |
The performance data quoted represents past performance and does not guarantee future results. Current performance may be lower or higher. Performance data current to the most recent month-end may be obtained at GuideStoneFunds.com. The investment return and principal value of an investment will fluctuate so that shares, when redeemed, may be worth more or less than their original cost.
The graph illustrates the results of a hypothetical $10,000 investment in the Investor Class of the Fund for the 10-year period from December 31, 2011 to December 31, 2021, with all dividends and capital gains reinvested, with the Fund’s composite benchmark index.
*These returns reflect investment advisory and shareholder servicing fee waivers, if applicable, during the reported time periods.
**The Benchmark Index shows how the Fund’s performance compares with the returns of an index constructed by the Adviser as a composite of various broad-based market indexes to reflect the market sectors in which the Fund invests. The Benchmark Index is 15% J.P. Morgan Emerging Markets Bond Index (EMBI) Plus, 70% Bloomberg Global Aggregate Bond Index and 15% Bloomberg US Corporate High Yield 2% Issuer Capped Bond Index. The weightings of the Benchmark Index were modified effective May 1, 2020, and therefore, the weightings of the underlying indexes were different than the current benchmark weightings prior to that date. Benchmark Index performance represents the Fund’s current benchmark linked with its previous benchmark.
Unlike a mutual fund, the performance of an index assumes no taxes, transaction costs, management fees or other expenses.
See Notes to Financial Statements.
| | | Par | | Value |
| ASSET-BACKED SECURITIES — 2.3% |
| Aaset Trust, Series 2021-2A, Class A | | | |
| 2.80%, 01/15/47 144A | $ 250,000 | | $ 249,122 |
| AIMCO CLO 10, Ltd., Series 2019-10A, Class DR | | | |
| (Floating, ICE LIBOR USD 3M + 2.90%, 2.90% Floor), 3.03%, 07/22/32 144A † | 1,000,000 | | 1,003,634 |
| American Credit Acceptance Receivables Trust, Series 2021-3, Class D | | | |
| 1.34%, 11/15/27 144A | 80,000 | | 78,986 |
| American Credit Acceptance Receivables Trust, Series 2021-4, Class D | | | |
| 1.82%, 02/14/28 144A | 105,000 | | 103,723 |
| AmeriCredit Automobile Receivables Trust, Series 2021-1, Class D | | | |
| 1.21%, 12/18/26 | 55,000 | | 54,322 |
| Annisa CLO, Ltd., Series 2016-2A, Class DR | | | |
| (Floating, ICE LIBOR USD 3M + 3.00%), 3.13%, 07/20/31 144A † | 500,000 | | 494,665 |
| Avis Budget Rental Car Funding AESOP LLC, Series 2019-3A, Class A | | | |
| 2.36%, 03/20/26 144A | 145,000 | | 148,464 |
| Avis Budget Rental Car Funding AESOP LLC, Series 2021-1A, Class A | | | |
| 1.38%, 08/20/27 144A | 770,000 | | 757,980 |
| Bravo Mortgage Asset Trust, Series 2006-1A, Class M1 | | | |
| (Floating, ICE LIBOR USD 1M + 0.40%, 0.40% Floor), 0.50%, 07/25/36 144A † | 630,000 | | 607,068 |
| Carvana Auto Receivables Trust, Series 2021-N3, Class C | | | |
| 1.02%, 06/12/28 | 55,000 | | 54,305 |
| Carvana Auto Receivables Trust, Series 2021-N4, Class C | | | |
| 1.72%, 09/11/28 | 20,000 | | 20,044 |
| Carvana Auto Receivables Trust, Series 2021-N4, Class D | | | |
| 2.30%, 09/11/28 | 50,000 | | 50,099 |
| Carvana Auto Receivables Trust, Series 2021-P3, Class C | | | |
| 1.93%, 10/12/27 | 50,000 | | 49,289 |
| Carvana Auto Receivables Trust, Series 2021-P4, Class C | | | |
| 2.33%, 02/10/28 | 25,000 | | 25,054 |
| CIFC Funding, Ltd., Series 2018-1A, Class D | | | |
| (Floating, ICE LIBOR USD 3M + 2.65%), 2.77%, 04/18/31 144A † | 1,050,000 | | 1,033,635 |
| CIFC Funding, Ltd., Series 2018-2A, Class C | | | |
| (Floating, ICE LIBOR USD 3M + 2.85%), 2.98%, 04/20/31 144A † | 250,000 | | 248,799 |
| | | Par | | Value |
| CLI Funding VIII LLC, Series 2021-1A, Class A | | | |
| 1.64%, 02/18/46 144A | $114,610 | | $112,188 |
| DB Master Finance LLC, Series 2021-1A, Class A2II | | | |
| 2.49%, 11/20/51 144A | 90,000 | | 90,056 |
| Domino's Pizza Master Issuer LLC, Series 2021-1A, Class A2I | | | |
| 2.66%, 04/25/51 144A | 139,300 | | 140,411 |
| Drive Auto Receivables Trust, Series 2021-2, Class D | | | |
| 1.39%, 03/15/29 | 170,000 | | 166,880 |
| DT Auto Owner Trust, Series 2020-3A, Class C | | | |
| 1.47%, 06/15/26 144A | 210,000 | | 210,612 |
| DT Auto Owner Trust, Series 2021-2A, Class D | | | |
| 1.50%, 02/16/27 144A | 25,000 | | 24,753 |
| DT Auto Owner Trust, Series 2021-3A, Class D | | | |
| 1.31%, 05/17/27 144A | 165,000 | | 161,481 |
| DT Auto Owner Trust, Series 2021-4A, Class D | | | |
| 1.99%, 09/15/27 144A | 65,000 | | 64,637 |
| Exeter Automobile Receivables Trust, Series 2021-1A, Class D | | | |
| 1.08%, 11/16/26 | 70,000 | | 69,194 |
| Exeter Automobile Receivables Trust, Series 2021-3A, Class D | | | |
| 1.55%, 06/15/27 | 120,000 | | 118,160 |
| Flagship Credit Auto Trust, Series 2021-2, Class D | | | |
| 1.59%, 06/15/27 144A | 40,000 | | 39,467 |
| Flagship Credit Auto Trust, Series 2021-3, Class D | | | |
| 1.65%, 09/15/27 144A | 50,000 | | 49,147 |
| Ford Credit Auto Owner Trust, Series 2021-A, Class A3 | | | |
| 0.30%, 08/15/25 | 260,000 | | 258,343 |
| GLS Auto Receivables Issuer Trust, Series 2021-1A, Class D | | | |
| 1.68%, 01/15/27 144A | 175,000 | | 174,095 |
| GLS Auto Receivables Issuer Trust, Series 2021-3A, Class D | | | |
| 1.48%, 07/15/27 144A | 80,000 | | 78,720 |
| GLS Auto Receivables Issuer Trust, Series 2021-4A, Class D | | | |
| 2.48%, 10/15/27 144A | 135,000 | | 135,669 |
| GLS Auto Receivables Trust, Series 2021-2A, Class D | | | |
| 1.42%, 04/15/27 144A | 65,000 | | 64,000 |
| GM Financial Consumer Automobile Receivables Trust, Series 2021-1, Class A3 | | | |
| 0.35%, 10/16/25 | 95,000 | | 94,426 |
| GM Financial Consumer Automobile Receivables Trust, Series 2021-2, Class A3 | | | |
| 0.51%, 04/16/26 | 195,000 | | 193,702 |
See Notes to Financial Statements.
| | | Par | | Value |
| Honda Auto Receivables Owner Trust, Series 2021-1, Class A3 | | | |
| 0.27%, 04/21/25 | $155,000 | | $154,197 |
| Legacy Mortgage Asset Trust, Series 2019-GS4, Class A1 | | | |
| (Step to 6.44% on 06/27/22), 3.44%, 05/25/59 144A STEP | 66,274 | | 66,376 |
| MVW LLC, Series 2021-2A, Class C | | | |
| 2.23%, 05/20/39 144A | 130,000 | | 129,531 |
| Navient Private Education Refinancing Loan Trust, Series 2021-FA, Class B | | | |
| 2.12%, 02/18/70 144A | 100,000 | | 98,444 |
| Navient Student Loan Trust, Series 2018-EA, Class B | | | |
| 4.44%, 12/15/59 144A | 560,000 | | 579,356 |
| New Century Home Equity Loan Trust, Series 2003-6, Class M1 | | | |
| (Floating, ICE LIBOR USD 1M + 1.08%, 1.08% Floor, 12.50% Cap), 1.18%, 01/25/34† | 244,356 | | 244,358 |
| Octagon Investment Partners 35, Ltd., Series 2018-1A, Class C | | | |
| (Floating, ICE LIBOR USD 3M + 2.60%, 2.60% Floor), 2.73%, 01/20/31 144A † | 250,000 | | 247,064 |
| PFCA Home Equity Investment Trust, Series 2003-IFC5, Class A | | | |
| 4.35%, 01/22/35 144A † γ | 399,734 | | 408,239 |
| Progress Residential, Series 2021-SFR3, Class E1 | | | |
| 2.54%, 05/17/26 144A | 20,000 | | 19,720 |
| Santander Drive Auto Receivables Trust, Series 2021-1, Class D | | | |
| 1.13%, 11/16/26 | 70,000 | | 69,629 |
| Santander Drive Auto Receivables Trust, Series 2021-2, Class D | | | |
| 1.35%, 07/15/27 | 85,000 | | 84,572 |
| Santander Drive Auto Receivables Trust, Series 2021-3, Class D | | | |
| 1.33%, 09/15/27 | 115,000 | | 113,635 |
| Santander Drive Auto Receivables Trust, Series 2021-4, Class D | | | |
| 1.67%, 10/15/27 | 75,000 | | 74,582 |
| Saxon Asset Securities Trust, Series 2006-3, Class A4 | | | |
| (Floating, ICE LIBOR USD 1M + 0.24%, 0.24% Floor, 12.25% Cap), 0.34%, 10/25/46† | 600,000 | | 556,827 |
| Sierra Timeshare Receivables Funding LLC, Series 2019-2A, Class C | | | |
| 3.12%, 05/20/36 144A | 30,570 | | 30,885 |
| S-Jets, Ltd., Series 2017-1, Class A | | | |
| 3.97%, 08/15/42 144A | 177,093 | | 172,782 |
| SLM Student Loan Trust, Series 2003-10A, Class A4 | | | |
| (Floating, ICE LIBOR USD 3M + 0.67%), 0.87%, 12/17/68 144A † | 640,000 | | 640,195 |
| | | Par | | Value |
| SLM Student Loan Trust, Series 2003-4, Class A5E | | | |
| (Floating, ICE LIBOR USD 3M + 0.75%), 0.95%, 03/15/33 144A † | $ 123,134 | | $ 121,885 |
| SLM Student Loan Trust, Series 2006-10, Class A6 | | | |
| (Floating, ICE LIBOR USD 3M + 0.15%), 0.27%, 03/25/44† | 121,021 | | 119,151 |
| SMB Private Education Loan Trust, Seres 2021-A, Class A2A2 | | | |
| (Floating, ICE LIBOR USD 1M + 0.73%), 0.84%, 01/15/53 144A † | 100,000 | | 100,545 |
| SMB Private Education Loan Trust, Series 2021-A, Class A2B | | | |
| 1.59%, 01/15/53 144A | 240,000 | | 238,077 |
| SMB Private Education Loan Trust, Series 2021-E, Class B | | | |
| 2.49%, 02/15/51 144A | 100,000 | | 100,260 |
| Taco Bell Funding LLC, Series 2021-1A, Class A2II | | | |
| 2.29%, 08/25/51 144A | 110,000 | | 109,166 |
| Textainer Marine Containers VII, Ltd., Series 2021-1A, Class A | | | |
| 1.68%, 02/20/46 144A | 93,333 | | 90,991 |
| TIF Funding II LLC, Series 2021-1A, Class A | | | |
| 1.65%, 02/20/46 144A | 92,896 | | 90,246 |
| Towd Point Mortgage Trust, Series 2019-4, Class A1 | | | |
| 2.90%, 10/25/59 144A | 78,587 | | 80,219 |
| Toyota Auto Receivables Owner Trust, Series 2021-A, Class A2 | | | |
| 0.16%, 07/17/23 | 44,083 | | 44,067 |
| Trinitas CLO XII, Ltd., Series 2020-12A, Class D | | | |
| (Floating, ICE LIBOR USD 3M + 4.00%, 4.00% Floor), 4.12%, 04/25/33 144A † | 1,250,000 | | 1,259,145 |
| Triton Container Finance VIII LLC, Series 2021-1A, Class A | | | |
| 1.86%, 03/20/46 144A | 121,712 | | 119,508 |
| VCAT LLC, Series 2021-NPL5, Class A1 | | | |
| (Step to 5.87% on 09/25/25), 1.87%, 08/25/51 144A STEP | 96,887 | | 95,627 |
| VCAT LLC, Series 2021-NPL6, Class A1 | | | |
| (Step to 4.92% on 10/25/24), 1.92%, 09/25/51 144A STEP | 150,358 | | 150,045 |
| VOLT XCIII LLC, Series 2021-NPL2, Class A1 | | | |
| (Step to 4.89% on 02/25/24), 1.89%, 02/27/51 144A STEP | 76,308 | | 75,775 |
| VOLT XCIV LLC, Series 2021-NPL3, Class A1 | | | |
| (Step to 5.24% on 02/25/24), 2.24%, 02/27/51 144A STEP | 64,839 | | 64,557 |
See Notes to Financial Statements.
SCHEDULE OF INVESTMENTS (Continued)
| | | Par | | Value |
| VOLT XCVII LLC, Series 2021-NPL6, Class A1 | | | |
| (Step to 5.24% on 04/25/24), 2.24%, 04/25/51 144A STEP | $ 95,890 | | $ 95,411 |
| Wendy's Funding LLC, Series 2021-1A, Class A2I | | | |
| 2.37%, 06/15/51 144A | 59,700 | | 58,564 |
| Westlake Automobile Receivables Trust, Series 2021-1A, Class D | | | |
| 1.23%, 04/15/26 144A | 140,000 | | 138,491 |
| Westlake Automobile Receivables Trust, Series 2021-2A, Class D | | | |
| 1.23%, 12/15/26 144A | 65,000 | | 64,018 |
Total Asset-Backed Securities
(Cost $14,149,603) | | | 14,131,270 |
| CORPORATE BONDS — 19.9% |
| Air Lease Corporation | | | |
| 0.70%, 02/15/24 | 380,000 | | 374,223 |
| 2.30%, 02/01/25 | 305,000 | | 309,543 |
| (Variable, U.S. Treasury Yield Curve Rate CMT 5Y + 4.08%), 4.65%, 06/15/26ρ Δ ^ | 120,000 | | 124,650 |
| 4.63%, 10/01/28 | 50,000 | | 55,257 |
| 3.00%, 02/01/30 | 30,000 | | 30,006 |
| 3.13%, 12/01/30 | 25,000 | | 25,566 |
| Allied Universal Holdco LLC | | | |
| 6.00%, 06/01/29 144A Δ | 270,000 | | 262,984 |
| Ally Financial, Inc. | | | |
| 5.13%, 09/30/24 | 465,000 | | 508,524 |
| (Variable, U.S. Treasury Yield Curve Rate CMT 5Y + 3.87%), 4.70%, 05/15/26ρ ^ | 140,000 | | 145,688 |
| (Variable, U.S. Treasury Yield Curve Rate CMT 7Y + 3.48%), 4.70%, 05/15/28ρ Δ ^ | 125,000 | | 129,163 |
| 2.20%, 11/02/28 | 50,000 | | 49,752 |
| 8.00%, 11/01/31 | 175,000 | | 248,268 |
| Amazon.com, Inc. | | | |
| 0.45%, 05/12/24 | 595,000 | | 589,588 |
| 3.88%, 08/22/37 | 620,000 | | 730,883 |
| 4.25%, 08/22/57 | 190,000 | | 245,001 |
| AMC Networks, Inc. | | | |
| 4.25%, 02/15/29 | 55,000 | | 54,756 |
| American Airlines Group, Inc. | | | |
| 5.00%, 06/01/22 144A Δ | 90,000 | | 90,300 |
| 3.75%, 03/01/25 144A Δ | 5,000 | | 4,680 |
| American Airlines Pass-Through Trust, Series 2016-3, Class B | | | |
| 3.75%, 10/15/25 | 193,940 | | 186,209 |
| American Airlines Pass-Through Trust, Series 2017-2, Class B | | | |
| 3.70%, 10/15/25 | 77,535 | | 74,917 |
| American Airlines, Inc. | | | |
| 5.50%, 04/20/26 144A | 810,000 | | 843,558 |
| 5.75%, 04/20/29 144A | 780,000 | | 834,307 |
| American Homes 4 Rent LP REIT | | | |
| 2.38%, 07/15/31 | 20,000 | | 19,659 |
| | | Par | | Value |
| Apple, Inc. | | | |
| 4.65%, 02/23/46 | $ 145,000 | | $ 191,254 |
| Aramark International Finance S.a.r.l. | | | |
| 3.13%, 04/01/25(E) | 284,000 | | 326,581 |
| Ares Capital Corporation | | | |
| 2.88%, 06/15/28 | 365,000 | | 364,599 |
| 3.20%, 11/15/31 | 155,000 | | 152,739 |
| AT&T, Inc. | | | |
| 0.25%, 03/04/26(E) | 650,000 | | 738,597 |
| 3.65%, 06/01/51 | 315,000 | | 328,153 |
| Athene Global Funding | | | |
| 1.61%, 06/29/26 144A | 110,000 | | 108,146 |
| Avantor Funding, Inc. | | | |
| 3.88%, 11/01/29 144A Δ | 60,000 | | 60,741 |
| Aviation Capital Group LLC | | | |
| 1.95%, 01/30/26 144A | 50,000 | | 48,843 |
| Avon Products, Inc. | | | |
| 8.45%, 03/15/43 | 60,000 | | 73,884 |
| Bank of America Corporation | | | |
| 1.38%, 03/26/25(E) | 595,000 | | 705,934 |
| 4.25%, 10/22/26 | 55,000 | | 60,763 |
| (Variable, ICE LIBOR USD 3M + 1.51%), 3.71%, 04/24/28^ | 250,000 | | 271,679 |
| (Variable, ICE LIBOR USD 3M + 1.04%), 3.42%, 12/20/28^ | 435,000 | | 465,061 |
| (Variable, ICE LIBOR USD 3M + 0.99%), 2.50%, 02/13/31^ | 155,000 | | 155,715 |
| (Variable, U.S. SOFR + 1.37%), 1.92%, 10/24/31^ | 360,000 | | 345,998 |
| (Variable, U.S. SOFR + 1.58%), 3.31%, 04/22/42^ | 1,860,000 | | 1,964,080 |
| (Variable, ICE LIBOR USD 3M + 3.15%), 4.08%, 03/20/51^ | 170,000 | | 205,487 |
| Barings BDC, Inc. | | | |
| 3.30%, 11/23/26 144A | 75,000 | | 74,265 |
| Bausch Health Americas, Inc. | | | |
| 9.25%, 04/01/26 144A | 500,000 | | 528,742 |
| 8.50%, 01/31/27 144A | 50,000 | | 52,572 |
| BioMarin Pharmaceutical, Inc. | | | |
| 0.60%, 08/01/24 CONV | 80,000 | | 83,848 |
| 1.25%, 05/15/27 CONV | 235,000 | | 246,303 |
| Blackstone Secured Lending Fund | | | |
| 2.13%, 02/15/27 144A | 190,000 | | 185,167 |
| Block, Inc. | | | |
| 3.50%, 06/01/31 144A | 65,000 | | 66,737 |
| Boeing Co. (The) | | | |
| 4.88%, 05/01/25 | 690,000 | | 755,796 |
| 2.20%, 02/04/26 | 280,000 | | 280,073 |
| 3.10%, 05/01/26 | 30,000 | | 31,305 |
| 3.63%, 03/01/48 | 5,000 | | 4,994 |
| 3.85%, 11/01/48 | 35,000 | | 36,666 |
| 3.75%, 02/01/50Δ | 425,000 | | 444,476 |
| 5.81%, 05/01/50 | 365,000 | | 496,802 |
| 3.83%, 03/01/59 | 185,000 | | 187,661 |
| Braskem America Finance Co. | | | |
| 7.13%, 07/22/41 | 2,440,000 | | 3,159,178 |
See Notes to Financial Statements.
| | | Par | | Value |
| Brighthouse Financial, Inc. | | | |
| 5.63%, 05/15/30 | $375,000 | | $ 448,347 |
| Brixmor Operating Partnership LP REIT | | | |
| 2.25%, 04/01/28 | 15,000 | | 14,957 |
| Broadcom, Inc. | | | |
| 2.60%, 02/15/33 144A | 385,000 | | 376,337 |
| Carnival Corporation | | | |
| 5.75%, 03/01/27 144A | 120,000 | | 120,180 |
| 6.00%, 05/01/29 144A Δ | 45,000 | | 44,864 |
| Carvana Co. | | | |
| 5.63%, 10/01/25 144A | 35,000 | | 35,044 |
| 5.50%, 04/15/27 144A | 50,000 | | 49,553 |
| 5.88%, 10/01/28 144A | 55,000 | | 54,871 |
| Caterpillar Financial Services Corporation | | | |
| 0.45%, 05/17/24Δ | 595,000 | | 588,055 |
| CCO Holdings LLC | | | |
| 4.50%, 08/15/30 144A | 650,000 | | 666,403 |
| 4.25%, 01/15/34 144A | 405,000 | | 399,183 |
| CDW LLC | | | |
| 3.57%, 12/01/31 | 220,000 | | 229,212 |
| Centene Corporation | | | |
| 4.63%, 12/15/29 | 700,000 | | 756,133 |
| 3.00%, 10/15/30 | 25,000 | | 25,456 |
| 2.50%, 03/01/31 | 215,000 | | 209,664 |
| 2.63%, 08/01/31 | 100,000 | | 98,167 |
| Charter Communications Operating LLC | | | |
| 3.50%, 06/01/41 | 370,000 | | 362,391 |
| 6.48%, 10/23/45 | 210,000 | | 288,205 |
| 5.75%, 04/01/48 | 890,000 | | 1,115,755 |
| 4.80%, 03/01/50 | 335,000 | | 377,233 |
| 3.70%, 04/01/51 | 150,000 | | 145,936 |
| 3.90%, 06/01/52 | 135,000 | | 136,127 |
| 3.85%, 04/01/61 | 270,000 | | 256,413 |
| 4.40%, 12/01/61 | 260,000 | | 270,686 |
| 3.95%, 06/30/62 | 245,000 | | 237,595 |
| Cigna Corporation | | | |
| 4.80%, 08/15/38 | 280,000 | | 345,825 |
| 3.20%, 03/15/40 | 150,000 | | 155,610 |
| 3.40%, 03/15/50 | 260,000 | | 272,530 |
| CIT Group, Inc. | | | |
| 5.25%, 03/07/25 | 540,000 | | 595,504 |
| Citigroup, Inc. | | | |
| 3.50%, 05/15/23 | 655,000 | | 677,404 |
| (Variable, ICE LIBOR USD 3M + 3.42%), 6.30%, 05/15/24ρ ^ | 690,000 | | 724,935 |
| (Variable, ICE LIBOR USD 3M + 0.90%), 3.35%, 04/24/25^ | 350,000 | | 365,710 |
| (Variable, ICE LIBOR USD 3M + 3.91%), 5.95%, 05/15/25ρ ^ | 100,000 | | 107,250 |
| (Variable, ICE LIBOR USD 3M + 1.56%), 3.89%, 01/10/28^ | 135,000 | | 146,530 |
| (Variable, ICE LIBOR USD 3M + 1.15%), 3.52%, 10/27/28^ | 200,000 | | 214,848 |
| (Variable, U.S. SOFR + 1.42%), 2.98%, 11/05/30^ | 210,000 | | 218,504 |
| | | Par | | Value |
| CME Group, Inc. | | | |
| 5.30%, 09/15/43 | $ 620,000 | | $ 866,024 |
| Comcast Corporation | | | |
| 2.94%, 11/01/56 144A | 801,000 | | 768,436 |
| 2.99%, 11/01/63 144A | 307,000 | | 293,432 |
| CommScope, Inc. | | | |
| 4.75%, 09/01/29 144A | 240,000 | | 238,933 |
| Comstock Resources, Inc. | | | |
| 7.50%, 05/15/25 144A | 93,000 | | 96,322 |
| ConocoPhillips | | | |
| 6.50%, 02/01/39 | 10,000 | | 14,585 |
| Continental Resources, Inc. | | | |
| 5.75%, 01/15/31 144A | 190,000 | | 224,067 |
| 2.88%, 04/01/32 144A Δ | 25,000 | | 24,492 |
| 4.90%, 06/01/44 | 270,000 | | 299,668 |
| Corporate Office Properties LP REIT | | | |
| 2.75%, 04/15/31 | 20,000 | | 19,929 |
| Crown Castle International Corporation REIT | | | |
| 1.05%, 07/15/26 | 385,000 | | 372,407 |
| 2.50%, 07/15/31 | 185,000 | | 184,046 |
| CVS Health Corporation | | | |
| 4.13%, 04/01/40 | 105,000 | | 121,104 |
| 5.05%, 03/25/48 | 295,000 | | 387,635 |
| 4.25%, 04/01/50Δ | 210,000 | | 255,412 |
| DCP Midstream Operating LP | | | |
| 5.13%, 05/15/29 | 20,000 | | 22,628 |
| 3.25%, 02/15/32Δ | 135,000 | | 136,231 |
| 6.75%, 09/15/37 144A Δ | 500,000 | | 669,512 |
| Dell International LLC | | | |
| 5.45%, 06/15/23 | 153,000 | | 161,465 |
| 5.30%, 10/01/29 | 365,000 | | 428,644 |
| 8.10%, 07/15/36 | 122,000 | | 186,167 |
| 8.35%, 07/15/46 | 31,000 | | 51,789 |
| Delta Air Lines, Inc. | | | |
| 2.90%, 10/28/24Δ | 30,000 | | 30,613 |
| 7.00%, 05/01/25 144A | 50,000 | | 57,237 |
| 4.50%, 10/20/25 144A | 350,000 | | 368,183 |
| 7.38%, 01/15/26Δ | 330,000 | | 388,813 |
| 4.75%, 10/20/28 144A | 1,300,000 | | 1,421,516 |
| Devon Energy Corporation | | | |
| 5.88%, 06/15/28 144A | 384,000 | | 416,063 |
| Diamondback Energy, Inc. | | | |
| 3.13%, 03/24/31 | 45,000 | | 46,476 |
| Digital Euro Finco LLC REIT | | | |
| 1.13%, 04/09/28(E) | 305,000 | | 352,634 |
| Dillard's, Inc. | | | |
| 7.75%, 07/15/26 | 450,000 | | 537,855 |
| Directv Financing LLC | | | |
| 5.88%, 08/15/27 144A | 1,370,000 | | 1,404,003 |
| Discovery Communications LLC | | | |
| 3.63%, 05/15/30 | 125,000 | | 133,908 |
| DISH DBS Corporation | | | |
| 5.88%, 11/15/24 | 1,065,000 | | 1,094,437 |
| 7.75%, 07/01/26 | 1,545,000 | | 1,631,983 |
| 5.75%, 12/01/28 144A | 770,000 | | 779,144 |
See Notes to Financial Statements.
SCHEDULE OF INVESTMENTS (Continued)
| | | Par | | Value |
| 5.13%, 06/01/29 | $ 90,000 | | $ 82,046 |
| DISH Network Corporation | | | |
| 2.38%, 03/15/24 CONV | 900,000 | | 865,125 |
| 3.38%, 08/15/26 CONV | 565,000 | | 536,215 |
| DTE Energy Co. | | | |
| 3.40%, 06/15/29 | 142,000 | | 150,471 |
| Duke Energy Corporation | | | |
| 2.55%, 06/15/31 | 295,000 | | 295,928 |
| Edison International | | | |
| 4.95%, 04/15/25 | 35,000 | | 38,110 |
| El Paso Natural Gas Co. LLC | | | |
| 8.63%, 01/15/22 | 60,000 | | 60,146 |
| 8.38%, 06/15/32 | 50,000 | | 71,882 |
| Encore Capital Group, Inc. | | | |
| 4.88%, 10/15/25(E) | 500,000 | | 595,023 |
| Endeavor Energy Resources LP | | | |
| 5.75%, 01/30/28 144A | 230,000 | | 244,004 |
| Energy Transfer LP | | | |
| 5.00%, 10/01/22 | 60,000 | | 61,201 |
| 4.50%, 11/01/23 | 500,000 | | 524,022 |
| 7.60%, 02/01/24 | 220,000 | | 242,012 |
| Enterprise Products Operating LLC | | | |
| 5.10%, 02/15/45 | 600,000 | | 743,720 |
| 4.80%, 02/01/49 | 290,000 | | 354,977 |
| EOG Resources, Inc. | | | |
| 4.38%, 04/15/30Δ | 100,000 | | 115,782 |
| EPR Properties REIT | | | |
| 3.75%, 08/15/29 | 230,000 | | 232,563 |
| 3.60%, 11/15/31 | 340,000 | | 337,126 |
| EQT Corporation | | | |
| 3.13%, 05/15/26 144A | 10,000 | | 10,278 |
| 3.90%, 10/01/27 | 30,000 | | 32,250 |
| 5.00%, 01/15/29 | 850,000 | | 942,586 |
| 3.63%, 05/15/31 144A Δ | 105,000 | | 109,101 |
| ERAC U.S.A. Finance LLC | | | |
| 7.00%, 10/15/37 144A | 535,000 | | 791,213 |
| Expedia Group, Inc. | | | |
| 0.00%, 02/15/26 144A Ω CONV Δ | 5,000 | | 5,778 |
| 2.95%, 03/15/31 | 440,000 | | 440,316 |
| Exxon Mobil Corporation | | | |
| 4.33%, 03/19/50 | 300,000 | | 370,591 |
| 3.45%, 04/15/51 | 340,000 | | 370,664 |
| Fidelity & Guaranty Life Holdings, Inc. | | | |
| 5.50%, 05/01/25 144A | 430,000 | | 480,831 |
| Fidelity National Information Services, Inc. | | | |
| 1.00%, 12/03/28(E) | 300,000 | | 347,872 |
| FirstEnergy Corporation | | | |
| 7.38%, 11/15/31 | 630,000 | | 851,697 |
| Fiserv, Inc. | | | |
| 1.63%, 07/01/30(E) | 290,000 | | 349,769 |
| Ford Motor Co. | | | |
| 6.63%, 10/01/28 | 75,000 | | 90,291 |
| 3.25%, 02/12/32 | 1,050,000 | | 1,077,300 |
| 4.75%, 01/15/43 | 190,000 | | 210,050 |
| | | Par | | Value |
| Ford Motor Credit Co. LLC | | | |
| 2.75%, 06/14/24(U) | $ 460,000 | | $ 627,619 |
| 3.82%, 11/02/27 | 400,000 | | 423,498 |
| 4.00%, 11/13/30 | 850,000 | | 915,900 |
| Fox Corporation | | | |
| 5.58%, 01/25/49 | 215,000 | | 295,109 |
| Freeport-McMoRan, Inc. | | | |
| 5.40%, 11/14/34Δ | 230,000 | | 280,349 |
| Fresenius Medical Care U.S. Finance II, Inc. | | | |
| 5.88%, 01/31/22 144A | 540,000 | | 541,932 |
| FS KKR Capital Corporation | | | |
| 3.40%, 01/15/26 | 75,000 | | 76,271 |
| 3.13%, 10/12/28 | 100,000 | | 99,658 |
| GE Capital Funding LLC | | | |
| 4.55%, 05/15/32 | 1,390,000 | | 1,647,431 |
| General Dynamics Corporation | | | |
| 4.25%, 04/01/40 | 190,000 | | 233,051 |
| 4.25%, 04/01/50 | 460,000 | | 590,281 |
| General Electric Co. | | | |
| 6.75%, 03/15/32 | 11,000 | | 15,036 |
| General Motors Co. | | | |
| 5.40%, 10/02/23 | 360,000 | | 385,530 |
| 6.13%, 10/01/25 | 250,000 | | 287,554 |
| 6.25%, 10/02/43 | 85,000 | | 116,875 |
| 5.20%, 04/01/45 | 255,000 | | 317,172 |
| General Motors Financial Co., Inc. | | | |
| 0.96%, 09/07/23(E) | 415,000 | | 480,034 |
| 1.05%, 03/08/24 | 75,000 | | 74,659 |
| 5.25%, 03/01/26 | 315,000 | | 353,738 |
| (Variable, ICE LIBOR USD 3M + 3.60%), 5.75%, 09/30/27ρ ^ | 5,000 | | 5,363 |
| 3.60%, 06/21/30 | 275,000 | | 293,891 |
| (Variable, U.S. Treasury Yield Curve Rate CMT 5Y + 5.00%), 5.70%, 09/30/30ρ ^ | 10,000 | | 11,438 |
| GEO Group, Inc. (The) REIT | | | |
| 5.88%, 10/15/24 | 290,000 | | 256,734 |
| Georgia-Pacific LLC | | | |
| 8.88%, 05/15/31 | 305,000 | | 473,019 |
| Gilead Sciences, Inc. | | | |
| 4.00%, 09/01/36 | 670,000 | | 773,121 |
| Glencore Funding LLC | | | |
| 2.85%, 04/27/31 144A | 450,000 | | 445,781 |
| Go Daddy Operating Co. LLC | | | |
| 3.50%, 03/01/29 144A | 105,000 | | 104,307 |
| Goldman Sachs Capital II | | | |
| (Variable, ICE LIBOR USD 3M + 0.77%), 4.00%, 02/10/22† ρ | 40,000 | | 39,300 |
| Goldman Sachs Group, Inc. (The) | | | |
| (Variable, ICE LIBOR USD 3M + 1.20%), 3.27%, 09/29/25^ | 420,000 | | 441,049 |
| (Variable, U.S. SOFR + 0.79%), 1.09%, 12/09/26Δ ^ | 360,000 | | 351,169 |
| (Variable, ICE LIBOR USD 3M + 1.51%), 3.69%, 06/05/28^ | 225,000 | | 242,627 |
| (Variable, ICE LIBOR USD 3M + 1.16%), 3.81%, 04/23/29^ | 265,000 | | 288,711 |
See Notes to Financial Statements.
| | | Par | | Value |
| (Variable, U.S. SOFR + 1.28%), 2.62%, 04/22/32^ | $220,000 | | $222,064 |
| 6.75%, 10/01/37 | 180,000 | | 256,175 |
| (Variable, ICE LIBOR USD 3M + 1.37%), 4.02%, 10/31/38^ | 160,000 | | 183,749 |
| 5.15%, 05/22/45 | 580,000 | | 757,908 |
| Hanesbrands, Inc. | | | |
| 4.63%, 05/15/24 144A | 110,000 | | 115,310 |
| 4.88%, 05/15/26 144A | 560,000 | | 599,197 |
| HCA, Inc. | | | |
| 5.38%, 02/01/25 | 20,000 | | 22,006 |
| 5.38%, 09/01/26 | 18,000 | | 20,251 |
| 3.50%, 09/01/30 | 50,000 | | 52,944 |
| 5.25%, 06/15/49 | 170,000 | | 219,462 |
| Hercules LLC | | | |
| 6.50%, 06/30/29 | 130,000 | | 146,239 |
| Hess Midstream Operations LP | | | |
| 4.25%, 02/15/30 144A | 30,000 | | 29,826 |
| Hilton Domestic Operating Co., Inc. | | | |
| 3.63%, 02/15/32 144A | 75,000 | | 74,730 |
| Hilton Grand Vacations Borrower Escrow LLC | | | |
| 5.00%, 06/01/29 144A | 60,000 | | 61,593 |
| 4.88%, 07/01/31 144A | 20,000 | | 20,030 |
| Hilton Worldwide Finance LLC | | | |
| 4.88%, 04/01/27 | 520,000 | | 536,120 |
| Icahn Enterprises LP | | | |
| 5.25%, 05/15/27 | 5,000 | | 5,144 |
| 4.38%, 02/01/29 | 280,000 | | 273,424 |
| Ideal Standard International SA | | | |
| 6.38%, 07/30/26(E) 144A | 840,000 | | 858,315 |
| Ionis Pharmaceuticals, Inc. | | | |
| 0.00%, 04/01/26 144A Ω CONV | 55,000 | | 48,642 |
| Jabil, Inc. | | | |
| 1.70%, 04/15/26 | 85,000 | | 84,893 |
| JBS U.S.A. LUX SA | | | |
| 3.75%, 12/01/31 144A | 50,000 | | 50,822 |
| Jefferies Group LLC | | | |
| 6.25%, 01/15/36 | 570,000 | | 757,873 |
| 6.50%, 01/20/43 | 260,000 | | 360,723 |
| JELD-WEN, Inc. | | | |
| 4.88%, 12/15/27 144A Δ | 380,000 | | 390,078 |
| JetBlue Airways Corporation | | | |
| 0.50%, 04/01/26 144A CONV | 40,000 | | 37,489 |
| JPMorgan Chase & Co. | | | |
| (Variable, ICE LIBOR USD 3M + 3.33%), 6.13%, 04/30/24ρ ^ | 190,000 | | 202,825 |
| (Variable, U.S. SOFR + 0.89%), 1.58%, 04/22/27^ | 110,000 | | 108,820 |
| (Variable, Euribor 3M + 0.84%), 1.64%, 05/18/28(E) ^ | 250,000 | | 301,567 |
| (Variable, U.S. SOFR + 2.04%), 2.52%, 04/22/31^ | 510,000 | | 516,556 |
| (Variable, U.S. SOFR + 2.52%), 2.96%, 05/13/31^ | 285,000 | | 295,695 |
| (Variable, U.S. SOFR + 2.46%), 3.11%, 04/22/41^ | 250,000 | | 260,154 |
| (Variable, U.S. SOFR + 2.44%), 3.11%, 04/22/51^ | 460,000 | | 478,412 |
| | | Par | | Value |
| (Variable, U.S. SOFR + 1.58%), 3.33%, 04/22/52^ | $1,880,000 | | $2,024,473 |
| Kinder Morgan Energy Partners LP | | | |
| 6.50%, 02/01/37 | 40,000 | | 53,099 |
| 6.95%, 01/15/38 | 50,000 | | 69,445 |
| Kinder Morgan, Inc. | | | |
| 7.75%, 01/15/32 | 560,000 | | 788,445 |
| 5.55%, 06/01/45 | 310,000 | | 393,963 |
| Kraft Heinz Foods Co. | | | |
| 4.38%, 06/01/46 | 515,000 | | 605,231 |
| Legacy LifePoint Health LLC | | | |
| 4.38%, 02/15/27 144A | 230,000 | | 231,971 |
| Lennar Corporation | | | |
| 4.75%, 11/29/27Δ | 1,045,000 | | 1,185,166 |
| Lithia Motors, Inc. | | | |
| 3.88%, 06/01/29 144A | 45,000 | | 46,014 |
| Livongo Health, Inc. | | | |
| 0.88%, 06/01/25 CONV | 35,000 | | 40,065 |
| Lumen Technologies, Inc. | | | |
| 5.63%, 04/01/25 | 50,000 | | 52,945 |
| Marathon Petroleum Corporation | | | |
| 4.70%, 05/01/25 | 380,000 | | 415,039 |
| Marriott International, Inc. | | | |
| 2.85%, 04/15/31 | 75,000 | | 74,932 |
| Marriott Ownership Resorts, Inc. | | | |
| 4.50%, 06/15/29 144A | 45,000 | | 45,367 |
| Marvell Technology, Inc. | | | |
| 2.45%, 04/15/28 | 70,000 | | 71,106 |
| 2.95%, 04/15/31 | 60,000 | | 61,267 |
| Masco Corporation | | | |
| 7.75%, 08/01/29 | 62,000 | | 83,086 |
| 6.50%, 08/15/32 | 27,000 | | 35,861 |
| Match Group Holdings II LLC | | | |
| 5.00%, 12/15/27 144A | 560,000 | | 583,198 |
| MBIA Insurance Corporation | | | |
| 11.38%, 01/15/33 144A # | 215,000 | | 26,338 |
| McDonald’s Corporation | | | |
| 4.20%, 04/01/50 | 300,000 | | 365,398 |
| Microchip Technology, Inc. | | | |
| 0.98%, 09/01/24 144A | 105,000 | | 103,154 |
| Micron Technology, Inc. | | | |
| 2.70%, 04/15/32 | 215,000 | | 215,615 |
| Mileage Plus Holdings LLC | | | |
| 6.50%, 06/20/27 144A | 375,000 | | 400,877 |
| MMS U.S.A. Holdings, Inc. | | | |
| 1.75%, 06/13/31(E) Δ | 500,000 | | 610,159 |
| Molina Healthcare, Inc. | | | |
| 3.88%, 05/15/32 144A | 50,000 | | 50,394 |
| Morgan Stanley | | | |
| 4.10%, 05/22/23 | 190,000 | | 197,939 |
| (Variable, U.S. SOFR + 0.51%), 0.79%, 01/22/25^ | 510,000 | | 505,127 |
| 6.25%, 08/09/26 | 205,000 | | 244,662 |
| 4.35%, 09/08/26 | 475,000 | | 525,318 |
| 3.63%, 01/20/27 | 250,000 | | 271,393 |
| 3.95%, 04/23/27 | 65,000 | | 71,570 |
See Notes to Financial Statements.
SCHEDULE OF INVESTMENTS (Continued)
| | | Par | | Value |
| (Variable, U.S. SOFR + 1.14%), 2.70%, 01/22/31^ | $ 315,000 | | $ 322,926 |
| (Variable, U.S. SOFR + 4.84%), 5.60%, 03/24/51^ | 230,000 | | 345,575 |
| MPLX LP | | | |
| 4.50%, 07/15/23Δ | 20,000 | | 20,829 |
| 4.88%, 06/01/25 | 40,000 | | 43,818 |
| 4.70%, 04/15/48 | 105,000 | | 121,838 |
| MPT Operating Partnership LP REIT | | | |
| 2.55%, 12/05/23(U) | 350,000 | | 480,047 |
| 4.63%, 08/01/29 | 240,000 | | 253,615 |
| 3.50%, 03/15/31 | 1,000,000 | | 1,012,790 |
| Murphy Oil U.S.A., Inc. | | | |
| 3.75%, 02/15/31 144A | 25,000 | | 24,880 |
| Mutual of Omaha Insurance Co. | | | |
| 6.80%, 06/15/36 144A | 605,000 | | 817,481 |
| Mylan, Inc. | | | |
| 4.55%, 04/15/28 | 225,000 | | 252,244 |
| Navient Corporation | | | |
| 6.75%, 06/15/26Δ | 150,000 | | 165,965 |
| 5.00%, 03/15/27 | 5,000 | | 5,101 |
| 5.63%, 08/01/33 | 10,000 | | 9,539 |
| NCL Corporation, Ltd. | | | |
| 5.88%, 03/15/26 144A | 65,000 | | 64,797 |
| 1.13%, 02/15/27 144A CONV | 155,000 | | 145,902 |
| NCL Finance, Ltd. | | | |
| 6.13%, 03/15/28 144A | 25,000 | | 24,667 |
| Netflix, Inc. | | | |
| 4.88%, 04/15/28 | 20,000 | | 22,835 |
| 5.88%, 11/15/28 | 60,000 | | 72,251 |
| 6.38%, 05/15/29 | 75,000 | | 93,305 |
| 5.38%, 11/15/29 144A | 5,000 | | 5,946 |
| 4.88%, 06/15/30 144A | 105,000 | | 122,637 |
| Newell Brands, Inc. | | | |
| 4.35%, 04/01/23 | 320,000 | | 330,000 |
| NGPL PipeCo LLC | | | |
| 7.77%, 12/15/37 144A | 200,000 | | 281,507 |
| NVIDIA Corporation | | | |
| 3.70%, 04/01/60 | 280,000 | | 337,220 |
| Occidental Petroleum Corporation | | | |
| 3.20%, 08/15/26 | 275,000 | | 283,682 |
| 3.50%, 08/15/29Δ | 280,000 | | 287,750 |
| 4.50%, 07/15/44 | 110,000 | | 113,467 |
| 4.63%, 06/15/45 | 5,000 | | 5,195 |
| 4.10%, 02/15/47 | 15,000 | | 14,723 |
| 4.20%, 03/15/48 | 20,000 | | 20,032 |
| OneMain Finance Corporation | | | |
| 6.88%, 03/15/25 | 125,000 | | 139,221 |
| ONEOK Partners LP | | | |
| 4.90%, 03/15/25 | 35,000 | | 38,166 |
| Open Text Holdings, Inc. | | | |
| 4.13%, 02/15/30 144A | 300,000 | | 309,462 |
| Oracle Corporation | | | |
| 4.00%, 07/15/46 | 205,000 | | 213,986 |
| 3.95%, 03/25/51 | 70,000 | | 73,062 |
| Ovintiv, Inc. | | | |
| 8.13%, 09/15/30 | 15,000 | | 19,986 |
| | | Par | | Value |
| 7.20%, 11/01/31 | $ 5,000 | | $ 6,499 |
| 7.38%, 11/01/31 | 5,000 | | 6,532 |
| 6.50%, 08/15/34Δ | 90,000 | | 116,115 |
| 6.63%, 08/15/37 | 30,000 | | 39,404 |
| 6.50%, 02/01/38 | 5,000 | | 6,509 |
| Owens Corning | | | |
| 7.00%, 12/01/36 | 523,000 | | 740,785 |
| Owl Rock Capital Corporation | | | |
| 4.25%, 01/15/26 | 265,000 | | 279,064 |
| 2.88%, 06/11/28 | 120,000 | | 117,978 |
| Owl Rock Technology Finance Corporation | | | |
| 4.75%, 12/15/25 144A | 265,000 | | 282,436 |
| Pacific Gas and Electric Co. | | | |
| 3.25%, 06/01/31 | 160,000 | | 160,870 |
| 3.30%, 08/01/40 | 120,000 | | 111,785 |
| 4.30%, 03/15/45 | 255,000 | | 259,185 |
| Palo Alto Networks, Inc. | | | |
| 0.38%, 06/01/25 CONV | 120,000 | | 227,928 |
| Peloton Interactive, Inc. | | | |
| 0.62%, 02/15/26 144A Ω CONV | 60,000 | | 51,150 |
| Penn Mutual Life Insurance Co. (The) | | | |
| 7.63%, 06/15/40 144A | 345,000 | | 509,021 |
| Pilgrim's Pride Corporation | | | |
| 4.25%, 04/15/31 144A | 10,000 | | 10,515 |
| 3.50%, 03/01/32 144A Δ | 140,000 | | 141,632 |
| Plains All American Pipeline LP | | | |
| 4.65%, 10/15/25 | 230,000 | | 251,187 |
| 3.55%, 12/15/29 | 200,000 | | 207,595 |
| PLT VII Finance S.a.r.l. | | | |
| 4.63%, 01/05/26(E) | 265,000 | | 308,850 |
| Prime Security Services Borrower LLC | | | |
| 5.25%, 04/15/24 144A | 610,000 | | 649,760 |
| PulteGroup, Inc. | | | |
| 6.00%, 02/15/35 | 95,000 | | 122,346 |
| Radiology Partners, Inc. | | | |
| 9.25%, 02/01/28 144A | 440,000 | | 462,675 |
| Range Resources Corporation | | | |
| 5.00%, 03/15/23 | 53,000 | | 54,249 |
| 4.88%, 05/15/25 | 120,000 | | 124,055 |
| Rocket Mortgage LLC | | | |
| 2.88%, 10/15/26 144A | 230,000 | | 228,583 |
| 3.63%, 03/01/29 144A | 130,000 | | 130,674 |
| 3.88%, 03/01/31 144A | 320,000 | | 325,293 |
| 4.00%, 10/15/33 144A | 155,000 | | 157,172 |
| Royal Caribbean Cruises, Ltd. | | | |
| 4.25%, 07/01/26 144A | 10,000 | | 9,697 |
| 5.50%, 04/01/28 144A Δ | 130,000 | | 131,726 |
| Sasol Financing U.S.A. LLC | | | |
| 5.50%, 03/18/31 | 1,470,000 | | 1,484,612 |
| SBA Communications Corporation REIT | | | |
| 3.13%, 02/01/29 144A | 155,000 | | 149,039 |
| Sensata Technologies, Inc. | | | |
| 4.38%, 02/15/30 144A | 720,000 | | 757,033 |
See Notes to Financial Statements.
| | | Par | | Value |
| Skyworks Solutions, Inc. | | | |
| 1.80%, 06/01/26 | $ 15,000 | | $ 14,872 |
| Southern Co. (The) | | | |
| (Variable, U.S. Treasury Yield Curve Rate CMT 5Y + 3.73%), 4.00%, 01/15/51^ | 200,000 | | 205,000 |
| Southern Copper Corporation | | | |
| 5.25%, 11/08/42 | 870,000 | | 1,096,544 |
| Southwest Airlines Co. | | | |
| 1.25%, 05/01/25 CONV | 150,000 | | 200,513 |
| Southwestern Energy Co. | | | |
| 6.45%, 01/23/25 | 20,000 | | 22,004 |
| 4.75%, 02/01/32 | 5,000 | | 5,273 |
| Spectrum Brands, Inc. | | | |
| 5.75%, 07/15/25 | 35,000 | | 35,780 |
| 5.00%, 10/01/29 144A | 90,000 | | 94,520 |
| Splunk, Inc. | | | |
| 1.13%, 06/15/27 CONV | 65,000 | | 60,938 |
| Sprint Capital Corporation | | | |
| 8.75%, 03/15/32 | 550,000 | | 825,924 |
| Sprint Corporation | | | |
| 7.88%, 09/15/23 | 490,000 | | 540,335 |
| Stewart Information Services Corporation | | | |
| 3.60%, 11/15/31 | 135,000 | | 136,996 |
| Synchrony Financial | | | |
| 2.88%, 10/28/31 | 215,000 | | 215,044 |
| Sysco Corporation | | | |
| 6.60%, 04/01/50 | 142,000 | | 221,831 |
| Tapestry, Inc. | | | |
| 3.05%, 03/15/32 | 30,000 | | 30,246 |
| Targa Resources Partners LP | | | |
| 5.88%, 04/15/26 | 620,000 | | 647,733 |
| 5.38%, 02/01/27 | 40,000 | | 41,272 |
| 5.50%, 03/01/30 | 280,000 | | 306,370 |
| 4.00%, 01/15/32 144A | 35,000 | | 36,636 |
| TD SYNNEX Corporation | | | |
| 1.75%, 08/09/26 144A | 135,000 | | 131,779 |
| Teladoc Health, Inc. | | | |
| 1.25%, 06/01/27 CONV | 235,000 | | 215,172 |
| Tennessee Gas Pipeline Co. LLC | | | |
| 2.90%, 03/01/30 144A | 340,000 | | 346,070 |
| Terminix Co. LLC (The) | | | |
| 7.45%, 08/15/27 | 120,000 | | 150,149 |
| Teva Pharmaceutical Finance Co. LLC | | | |
| 6.15%, 02/01/36Δ | 75,000 | | 78,728 |
| Time Warner Cable LLC | | | |
| 5.50%, 09/01/41 | 35,000 | | 42,625 |
| 4.50%, 09/15/42 | 55,000 | | 60,253 |
| T-Mobile U.S.A., Inc. | | | |
| 2.40%, 03/15/29 144A | 25,000 | | 25,286 |
| 3.88%, 04/15/30 | 675,000 | | 739,867 |
| 2.70%, 03/15/32 144A | 485,000 | | 489,196 |
| 4.50%, 04/15/50 | 360,000 | | 423,407 |
| Toyota Motor Credit Corporation | | | |
| 0.50%, 06/18/24 | 595,000 | | 586,661 |
| | | Par | | Value |
| Transcontinental Gas Pipe Line Co. LLC | | | |
| 3.25%, 05/15/30 | $320,000 | | $337,999 |
| 4.45%, 08/01/42 | 750,000 | | 883,080 |
| TransDigm, Inc. | | | |
| 4.63%, 01/15/29 | 35,000 | | 34,947 |
| Travel + Leisure Co. | | | |
| 6.63%, 07/31/26 144A | 10,000 | | 11,100 |
| 6.00%, 04/01/27 | 10,000 | | 10,905 |
| 4.50%, 12/01/29 144A | 110,000 | | 111,100 |
| 4.63%, 03/01/30 144A | 75,000 | | 75,600 |
| TriNet Group, Inc. | | | |
| 3.50%, 03/01/29 144A | 95,000 | | 94,780 |
| Twitter, Inc. | | | |
| 0.00%, 03/15/26 144A Ω CONV | 85,000 | | 76,551 |
| U.S. Airways Pass-Through Trust, Series 2012-1, Class A | | | |
| 5.90%, 10/01/24 | 75,153 | | 78,865 |
| U.S. Airways Pass-Through Trust, Series 2012-2, Class A | | | |
| 4.63%, 06/03/25 | 63,962 | | 63,779 |
| Uber Technologies, Inc. | | | |
| 0.00%, 12/15/25Ω CONV Δ | 60,000 | | 59,190 |
| 7.50%, 09/15/27 144A | 260,000 | | 283,270 |
| 6.25%, 01/15/28 144A Δ | 120,000 | | 128,987 |
| 4.50%, 08/15/29 144A | 345,000 | | 351,974 |
| United Airlines Pass-Through Trust, Series 2014-1, Class A | | | |
| 4.00%, 04/11/26 | 80,314 | | 84,226 |
| United Airlines Pass-Through Trust, Series 2016-2, Class B | | | |
| 3.65%, 10/07/25 | 65,741 | | 65,083 |
| United Airlines Pass-Through Trust, Series 2020-1, Class A | | | |
| 5.88%, 10/15/27 | 338,737 | | 371,761 |
| United Airlines, Inc. | | | |
| 4.38%, 04/15/26 144A | 25,000 | | 26,101 |
| 4.63%, 04/15/29 144A | 35,000 | | 36,167 |
| United Rentals North America, Inc. | | | |
| 5.25%, 01/15/30 | 410,000 | | 444,405 |
| Verizon Communications, Inc. | | | |
| 1.13%, 11/03/28(U) | 290,000 | | 376,355 |
| 2.36%, 03/15/32 144A | 940,000 | | 928,423 |
| 0.75%, 03/22/32(E) Δ | 185,000 | | 206,082 |
| 3.40%, 03/22/41 | 620,000 | | 652,058 |
| 4.00%, 03/22/50 | 720,000 | | 838,956 |
| 3.55%, 03/22/51Δ | 150,000 | | 162,522 |
| 3.70%, 03/22/61 | 350,000 | | 381,923 |
| Viatris, Inc. | | | |
| 3.85%, 06/22/40 | 280,000 | | 297,821 |
| Viking Cruises, Ltd. | | | |
| 5.88%, 09/15/27 144A Δ | 90,000 | | 85,788 |
| Viking Ocean Cruises Ship VII, Ltd. | | | |
| 5.63%, 02/15/29 144A | 900,000 | | 900,139 |
| VOC Escrow, Ltd. | | | |
| 5.00%, 02/15/28 144A | 280,000 | | 277,606 |
See Notes to Financial Statements.
SCHEDULE OF INVESTMENTS (Continued)
| | | Par | | Value |
| Wells Fargo & Co. | | | |
| (Variable, ICE LIBOR USD 3M + 3.99%), 5.88%, 06/15/25ρ ^ | $ 170,000 | | $ 186,150 |
| 1.00%, 02/02/27(E) | 400,000 | | 464,383 |
| (Variable, U.S. SOFR + 1.26%), 2.57%, 02/11/31^ | 230,000 | | 235,280 |
| (Variable, U.S. SOFR + 2.53%), 3.07%, 04/30/41^ | 220,000 | | 226,700 |
| (Variable, U.S. SOFR + 4.50%), 5.01%, 04/04/51^ | 840,000 | | 1,153,408 |
| Western Digital Corporation | | | |
| 2.85%, 02/01/29 | 15,000 | | 15,169 |
| 3.10%, 02/01/32 | 10,000 | | 10,092 |
| Western Midstream Operating LP | | | |
| 4.35%, 02/01/25 | 850,000 | | 889,321 |
| 5.30%, 02/01/30Δ | 20,000 | | 22,060 |
| 5.45%, 04/01/44 | 10,000 | | 11,964 |
| 5.30%, 03/01/48Δ | 35,000 | | 42,226 |
| 5.50%, 08/15/48 | 5,000 | | 5,987 |
| 6.50%, 02/01/50 | 25,000 | | 29,600 |
| Westlake Chemical Corporation | | | |
| 3.13%, 08/15/51 | 205,000 | | 198,706 |
| WestRock MWV LLC | | | |
| 8.20%, 01/15/30 | 75,000 | | 104,249 |
| 7.95%, 02/15/31 | 25,000 | | 35,321 |
| Weyerhaeuser Co. REIT | | | |
| 8.50%, 01/15/25 | 205,000 | | 247,095 |
| 6.95%, 10/01/27 | 30,000 | | 37,981 |
| 6.88%, 12/15/33 | 250,000 | | 342,260 |
| Williams Cos., Inc. (The) | | | |
| 7.50%, 01/15/31 | 40,000 | | 54,324 |
| 5.75%, 06/24/44 | 320,000 | | 417,756 |
| Yum! Brands, Inc. | | | |
| 4.63%, 01/31/32 | 195,000 | | 207,565 |
Total Corporate Bonds
(Cost $116,649,160) | | | 124,294,896 |
| FOREIGN BONDS — 39.7% |
| Angola — 0.1% | | |
| Angolan Government International Bond | | | |
| 9.50%, 11/12/25 | 200,000 | | 214,690 |
| 9.38%, 05/08/48 | 200,000 | | 196,388 |
| | | | | 411,078 |
| Argentina — 0.3% | | |
| Argentine Republic Government International Bond | | | |
| 1.00%, 07/09/29 | 136,957 | | 49,991 |
| (Step to 0.75% on 07/09/23), 0.50%, 07/09/30 STEP | 828,157 | | 291,933 |
| (Step to 1.50% on 07/09/22), 1.13%, 07/09/35 STEP | 1,625,941 | | 522,350 |
| Pampa Energia SA | | | |
| 7.50%, 01/24/27 144A | 750,000 | | 648,600 |
| Provincia de Buenos Aires | | | |
| (Step to 5.25% on 09/01/22), 3.90%, 09/01/37 144A STEP | 623,391 | | 268,228 |
| | | | | 1,781,102 |
| | | Par | | Value |
| Australia — 0.2% | | |
| Australia Government Bond | | | |
| 1.75%, 06/21/51(A) | $ 2,000,000 | | $1,264,249 |
| FMG Resources August 2006 Pty, Ltd. | | | |
| 4.38%, 04/01/31 144A Δ | 100,000 | | 105,173 |
| | | | | 1,369,422 |
| Austria — 0.4% | | |
| Suzano Austria GmbH | | | |
| 5.75%, 07/14/26 144A | 370,000 | | 422,823 |
| 5.00%, 01/15/30 | 730,000 | | 801,482 |
| 3.75%, 01/15/31 | 1,450,000 | | 1,476,085 |
| | | | | 2,700,390 |
| Azerbaijan — 0.1% | | |
| Southern Gas Corridor CJSC | | | |
| 6.88%, 03/24/26 | 510,000 | | 587,275 |
| State Oil Co. of the Azerbaijan Republic | | | |
| 6.95%, 03/18/30 | 200,000 | | 242,092 |
| | | | | 829,367 |
| Belgium — 0.2% | | |
| Elia Transmission Belgium SA | | | |
| 0.88%, 04/28/30(E) | 500,000 | | 581,688 |
| House of Finance NV (The) | | | |
| 4.38%, 07/15/26(E) | 150,000 | | 173,651 |
| Kingdom of Belgium Government Bond | | | |
| 3.75%, 06/22/45(E) | 18,000 | | 33,610 |
| Ontex Group NV | | | |
| 3.50%, 07/15/26(E) Δ | 400,000 | | 434,953 |
| | | | | 1,223,902 |
| Bermuda — 0.1% | | |
| Bermuda Government International Bond | | | |
| 3.72%, 01/25/27Δ | 200,000 | | 215,000 |
| 4.75%, 02/15/29 | 200,000 | | 230,250 |
| | | | | 445,250 |
| Brazil — 1.9% | | |
| Brazil Minas SPE via State of Minas Gerais | | | |
| 5.33%, 02/15/28 | 140,000 | | 146,292 |
| Brazil Notas do Tesouro Nacional Serie F | | | |
| 10.00%, 01/01/23(B) | 9,213,000 | | 1,622,760 |
| 10.00%, 01/01/25(B) | 17,777,000 | | 3,129,170 |
| 10.00%, 01/01/27(B) | 8,227,000 | | 1,443,518 |
| Brazilian Government International Bond | | | |
| 10.25%, 01/10/28(B) | 2,630,000 | | 460,968 |
| 5.63%, 01/07/41Δ | 230,000 | | 235,414 |
| Itau Unibanco Holding SA | | | |
| (Variable, U.S. Treasury Yield Curve Rate CMT 5Y + 3.98%), 6.13%, 12/12/22 144A ρ ^ | 760,000 | | 765,920 |
See Notes to Financial Statements.
| | | Par | | Value |
| (Variable, U.S. Treasury Yield Curve Rate CMT 5Y + 3.98%), 6.13%, 12/12/22ρ ^ | $ 1,110,000 | | $ 1,118,647 |
| Ultrapar International SA | | | |
| 5.25%, 10/06/26 144A | 1,300,000 | | 1,376,629 |
| Vale Overseas, Ltd. | | | |
| 6.88%, 11/21/36 | 900,000 | | 1,197,432 |
| | | | | 11,496,750 |
| Canada — 1.2% | | |
| 1011778 BC ULC | | | |
| 3.88%, 01/15/28 144A | 720,000 | | 730,433 |
| Air Canada Pass-Through Trust, Series 2020-2, Class A | | | |
| 5.25%, 04/01/29 144A | 459,006 | | 500,694 |
| Bausch Health Cos., Inc. | | | |
| 5.00%, 01/30/28 144A | 15,000 | | 13,824 |
| 5.25%, 01/30/30 144A | 20,000 | | 17,631 |
| 5.25%, 02/15/31 144A Δ | 65,000 | | 57,220 |
| Canadian Government Bond | | | |
| 1.00%, 06/01/27(C) | 3,265,000 | | 2,548,143 |
| Clarios Global LP | | | |
| 4.38%, 05/15/26(E) | 291,000 | | 340,741 |
| Element Fleet Management Corporation | | | |
| 1.60%, 04/06/24 144A Δ | 25,000 | | 25,039 |
| First Quantum Minerals, Ltd. | | | |
| 6.50%, 03/01/24 144A | 300,000 | | 304,080 |
| 7.50%, 04/01/25 144A Δ | 350,000 | | 360,491 |
| 6.88%, 10/15/27 144A | 200,000 | | 215,469 |
| Glencore Finance Canada, Ltd. | | | |
| 6.00%, 11/15/41 | 340,000 | | 449,199 |
| MEG Energy Corporation | | | |
| 7.13%, 02/01/27 144A | 1,310,000 | | 1,397,023 |
| Open Text Corporation | | | |
| 3.88%, 02/15/28 144A | 190,000 | | 193,950 |
| | | | | 7,153,937 |
| Chile — 0.1% | | |
| Corporation Nacional del Cobre de Chile | | | |
| 3.63%, 08/01/27 144A | 220,000 | | 235,168 |
| Empresa de los Ferrocarriles del Estado | | | |
| 3.83%, 09/14/61 | 400,000 | | 384,724 |
| | | | | 619,892 |
| China — 5.3% | | |
| Avolon Holdings Funding, Ltd. | | | |
| 4.25%, 04/15/26 144A | 680,000 | | 721,672 |
| China Government Bond | | | |
| 2.20%, 07/27/25(Y) | 49,500,000 | | 7,697,785 |
| 3.85%, 12/12/26(Y) | 26,000,000 | | 4,334,220 |
| 3.48%, 06/29/27(Y) | 47,500,000 | | 7,765,932 |
| 4.15%, 12/04/27(Y) | 19,000,000 | | 3,228,954 |
| 4.29%, 05/22/29(Y) | 24,000,000 | | 4,156,068 |
| 3.60%, 05/21/30(Y) | 10,000,000 | | 1,666,056 |
| 3.95%, 06/29/43(Y) | 6,000,000 | | 1,057,208 |
| | | Par | | Value |
| 4.10%, 05/21/45(Y) | $ 1,500,000 | | $ 269,698 |
| China Minmetals Corporation | | | |
| (Variable, 4.72% - U.S. Treasury Yield Curve Rate CMT 5Y), 3.75%, 11/13/22ρ ^ | 250,000 | | 255,874 |
| Dianjian International Finance, Ltd. | | | |
| (Variable, 6.93% - U.S. Treasury Yield Curve Rate CMT 5Y), 4.60%, 03/13/23ρ ^ | 200,000 | | 206,130 |
| Park Aerospace Holdings, Ltd. | | | |
| 5.25%, 08/15/22 144A | 15,000 | | 15,332 |
| 4.50%, 03/15/23 144A | 190,000 | | 196,168 |
| 5.50%, 02/15/24 144A | 830,000 | | 890,630 |
| Sinopec Group Overseas Development 2015, Ltd. | | | |
| 3.25%, 04/28/25 | 250,000 | | 263,031 |
| Times China Holdings, Ltd. | | | |
| 6.75%, 07/08/25 | 200,000 | | 138,200 |
| Yuzhou Group Holdings Co., Ltd. | | | |
| 7.70%, 02/20/25 | 495,000 | | 146,025 |
| | | | | 33,008,983 |
| Colombia — 0.7% | | |
| Colombia Government International Bond | | | |
| 3.00%, 01/30/30 | 315,000 | | 288,501 |
| 6.13%, 01/18/41 | 100,000 | | 103,189 |
| 5.63%, 02/26/44 | 3,170,000 | | 3,084,695 |
| 5.00%, 06/15/45 | 200,000 | | 181,250 |
| 5.20%, 05/15/49 | 200,000 | | 184,448 |
| Ecopetrol SA | | | |
| 5.88%, 09/18/23 | 140,000 | | 148,578 |
| Millicom International Cellular SA | | | |
| 5.13%, 01/15/28 144A | 540,000 | | 560,582 |
| | | | | 4,551,243 |
| Costa Rica — 0.1% | | |
| Costa Rica Government International Bond | | | |
| 7.16%, 03/12/45Δ | 340,000 | | 337,453 |
| Croatia — 0.0% | | |
| Croatia Government International Bond | | | |
| 1.50%, 06/17/31(E) | 200,000 | | 236,192 |
| Cyprus — 0.0% | | |
| Cyprus Government International Bond | | | |
| 0.00%, 02/09/26(E) | 34,000 | | 38,501 |
| Czech Republic — 0.1% | | |
| Czech Republic Government Bond | | | |
| 0.95%, 05/15/30(ZE) | 17,870,000 | | 698,508 |
| Denmark — 0.0% | | |
| DKT Finance ApS | | | |
| 7.00%, 06/17/23(E) | 204,000 | | 235,842 |
See Notes to Financial Statements.
SCHEDULE OF INVESTMENTS (Continued)
| | | Par | | Value |
| Dominican Republic — 0.1% | | |
| Dominican Republic International Bond | | | |
| 4.88%, 09/23/32 | $ 260,000 | | $ 264,875 |
| 6.85%, 01/27/45Δ | 220,000 | | 243,100 |
| | | | | 507,975 |
| Ecuador — 0.1% | | |
| Ecuador Government International Bond | | | |
| 4.72%, 07/31/30Ω | 16,866 | | 9,572 |
| (Step to 5.50% on 07/31/22), 5.00%, 07/31/30 STEP | 69,140 | | 57,473 |
| (Step to 2.50% on 07/31/22), 1.00%, 07/31/35 STEP | 488,778 | | 323,204 |
| (Step to 1.50% on 07/31/22), 0.50%, 07/31/40 STEP | 59,020 | | 34,711 |
| | | | | 424,960 |
| Egypt — 0.3% | | |
| Egypt Government International Bond | | | |
| 7.60%, 03/01/29 | 400,000 | | 397,727 |
| 6.38%, 04/11/31(E) | 1,200,000 | | 1,264,953 |
| 7.63%, 05/29/32 | 200,000 | | 190,019 |
| 7.90%, 02/21/48 | 200,000 | | 168,337 |
| | | | | 2,021,036 |
| El Salvador — 0.0% | | |
| El Salvador Government International Bond | | | |
| 7.12%, 01/20/50 | 150,000 | | 82,501 |
| France — 1.5% | | |
| Accor SA | | | |
| (Variable, 3.25% - EUR Swap Rate 5Y), 2.63%, 01/30/25(E) ρ ^ | 400,000 | | 434,074 |
| Altice France SA | | | |
| 3.38%, 01/15/28(E) | 500,000 | | 555,144 |
| Banijay Group SAS | | | |
| 6.50%, 03/01/26(E) | 122,000 | | 144,787 |
| BNP Paribas SA | | | |
| (Variable, USD Swap 5Y + 5.15%), 7.38%, 08/19/25 144A ρ Δ ^ | 740,000 | | 841,339 |
| (Variable, Euribor 3M + 1.80%), 2.13%, 01/23/27(E) ^ | 300,000 | | 364,374 |
| (Variable, U.S. SOFR + 0.91%), 1.68%, 06/30/27 144A ^ | 210,000 | | 206,693 |
| (Variable, USD Swap 5Y + 3.98%), 7.00%, 08/16/28 144A ρ ^ | 300,000 | | 351,323 |
| Burger King France SAS | | | |
| (Floating, 4.75% - Euribor 3M), 4.75%, 11/01/26(E) 144A † | 360,000 | | 416,718 |
| CAB SELAS | | | |
| 3.38%, 02/01/28(E) 144A | 600,000 | | 684,659 |
| Constellium SE | | | |
| 4.25%, 02/15/26(E) | 285,000 | | 328,155 |
| | | Par | | Value |
| Electricite de France SA | | | |
| (Variable, GBP Swap Rate 13Y + 3.96%), 6.00%, 01/29/26(U) ρ ^ | $ 700,000 | | $1,032,520 |
| Faurecia SE | | | |
| 2.38%, 06/15/27(E) | 365,000 | | 417,859 |
| French Republic Government Bond OAT | | | |
| 2.10%, 07/25/23(E) 144A | 252,283 | | 308,207 |
| 0.11%, 03/01/25(E) | 159,833 | | 194,844 |
| 1.00%, 05/25/27(E) | 27,925 | | 34,014 |
| 0.10%, 03/01/28(E) | 190,155 | | 244,129 |
| 1.50%, 05/25/31(E) | 136,073 | | 174,833 |
| 0.00%, 11/25/31(E) | 158,000 | | 176,456 |
| 0.10%, 03/01/32(E) | 50,710 | | 67,923 |
| Kapla Holding SAS | | | |
| 3.38%, 12/15/26(E) | 200,000 | | 227,922 |
| La Financiere Atalian SASU | | | |
| 4.00%, 05/15/24(E) | 200,000 | | 224,524 |
| Loxam SAS | | | |
| 3.75%, 07/15/26(E) | 650,000 | | 753,901 |
| 5.75%, 07/15/27(E) | 530,000 | | 624,524 |
| Orange SA | | | |
| 0.50%, 09/04/32(E) | 400,000 | | 445,454 |
| Paprec Holding SA | | | |
| 4.00%, 03/31/25(E) | 255,000 | | 295,536 |
| | | | | 9,549,912 |
| Gabon — 0.2% | | |
| Gabo Government International Bond | | | |
| 7.00%, 11/24/31 144A Δ | 1,020,000 | | 1,002,150 |
| Germany — 3.2% | | |
| Allianz SE | | | |
| (Variable, U.S. Treasury Yield Curve Rate CMT 5Y + 2.17%), 3.20%, 10/30/27 144A ρ ^ | 3,200,000 | | 3,068,000 |
| APCOA Parking Holdings GmbH | | | |
| 4.63%, 01/15/27(E) 144A | 100,000 | | 113,161 |
| Bundesrepublik Deutschland Bundesanleihe | | | |
| 1.00%, 08/15/24(E) | 2,400,000 | | 2,851,623 |
| 0.00%, 08/15/30(E) | 46,241 | | 54,183 |
| 0.00%, 02/15/31(E) | 5,423,255 | | 6,301,228 |
| 0.00%, 08/15/31(E) | 57,400 | | 66,533 |
| 0.00%, 05/15/36(E) | 11,865 | | 13,496 |
| 1.25%, 08/15/48(E) | 17,000 | | 25,085 |
| Bundesschatzanweisungen | | | |
| 0.00%, 12/15/22(E) | 1,350,000 | | 1,546,632 |
| CeramTec BondCo GmbH | | | |
| 5.25%, 12/15/25(E) | 300,000 | | 346,656 |
| Cheplapharm Arzneimittel GmbH | | | |
| 4.38%, 01/15/28(E) 144A | 680,000 | | 809,442 |
| Deutsche Bank AG | | | |
| (Variable, U.S. SOFR + 2.76%), 3.73%, 01/14/32^ | 201,000 | | 205,944 |
See Notes to Financial Statements.
| | | Par | | Value |
| EnBW Energie Baden-Wuerttemberg AG | | | |
| (Variable, 3.63% - EUR Swap Rate 5Y), 3.38%, 04/05/77(E) ^ | $135,000 | | $ 153,819 |
| IHO Verwaltungs GmbH | | | |
| PIK 4.63%, 3.88%, 05/15/27(E) | 215,000 | | 250,132 |
| Infineon Technologies AG | | | |
| (Variable, 4.00% - EUR Swap Rate 5Y), 3.63%, 01/01/28(E) ρ ^ | 100,000 | | 124,364 |
| Kreditanstalt fuer Wiederaufbau | | | |
| 0.00%, 09/15/31(E) | 33,000 | | 37,134 |
| PCF GmbH | | | |
| 4.75%, 04/15/26(E) | 395,000 | | 465,447 |
| Renk AG | | | |
| 5.75%, 07/15/25(E) 144A | 210,000 | | 248,708 |
| Schenck Process Holding GmbH | | | |
| 5.38%, 06/15/23(E) 144A | 340,000 | | 387,715 |
| 5.38%, 06/15/23(E) | 200,000 | | 228,068 |
| SGL Carbon SE | | | |
| 4.63%, 09/30/24(E) | 480,000 | | 556,726 |
| TK Elevator Holdco GmbH | | | |
| 6.63%, 07/15/28(E) Δ | 238,500 | | 287,281 |
| 6.63%, 07/15/28(E) 144A | 243,000 | | 292,701 |
| TK Elevator Midco GmbH | | | |
| 4.38%, 07/15/27(E) 144A | 350,000 | | 413,037 |
| TUI Cruises GmbH | | | |
| 6.50%, 05/15/26(E) 144A | 120,000 | | 136,364 |
| Volkswagen Bank GmbH | | | |
| 1.25%, 12/15/25(E) | 782,000 | | 921,746 |
| | | | | 19,905,225 |
| Ghana — 0.2% | | |
| Ghana Government International Bond | | | |
| 7.63%, 05/16/29 144A | 640,000 | | 535,376 |
| 7.63%, 05/16/29 | 200,000 | | 167,305 |
| 10.75%, 10/14/30 | 200,000 | | 224,546 |
| 10.75%, 10/14/30 144A | 340,000 | | 381,728 |
| 7.88%, 02/11/35 | 200,000 | | 157,500 |
| | | | | 1,466,455 |
| Hong Kong — 0.0% | | |
| Shimao Group Holdings, Ltd. | | | |
| 6.13%, 02/21/24 | 200,000 | | 129,700 |
| Hungary — 0.0% | | |
| Hungary Government International Bond | | | |
| 1.75%, 06/05/35(E) | 19,000 | | 22,553 |
| India — 0.0% | | |
| Indian Railway Finance Corporation, Ltd. | | | |
| 2.80%, 02/10/31 144A | 200,000 | | 194,809 |
| Indonesia — 2.8% | | |
| Indonesia Government International Bond | | | |
| 0.90%, 02/14/27(E) | 120,000 | | 137,038 |
| 1.40%, 10/30/31(E) | 220,000 | | 251,674 |
| | | Par | | Value |
| 5.25%, 01/17/42 144A | $ 1,940,000 | | $ 2,438,478 |
| 5.25%, 01/17/42 | 630,000 | | 791,877 |
| 4.20%, 10/15/50Δ | 3,480,000 | | 3,977,108 |
| Indonesia Treasury Bond | | | |
| 7.00%, 05/15/27(I) | 48,282,000,000 | | 3,638,184 |
| 8.25%, 05/15/29(I) | 76,029,000,000 | | 5,957,025 |
| Perusahaan Perseroan Persero PT Perusahaan Listrik Negara | | | |
| 5.45%, 05/21/28 | 200,000 | | 229,436 |
| | | | | 17,420,820 |
| Ireland — 0.5% | | |
| AerCap Ireland Capital DAC | | | |
| 4.45%, 10/01/25 | 400,000 | | 431,058 |
| 1.75%, 01/30/26 | 540,000 | | 530,445 |
| 3.30%, 01/30/32 | 660,000 | | 674,285 |
| Ardagh Packaging Finance PLC | | | |
| 5.25%, 08/15/27 144A Δ | 300,000 | | 302,213 |
| GE Capital International Funding Co. Unlimited Co. | | | |
| 4.42%, 11/15/35 | 448,000 | | 536,151 |
| Ireland Government Bond | | | |
| 0.20%, 10/18/30(E) | 20,000 | | 22,942 |
| 0.40%, 05/15/35(E) | 81,000 | | 91,071 |
| 0.55%, 04/22/41(E) | 36,000 | | 39,997 |
| Motion Bondco DAC | | | |
| 4.50%, 11/15/27(E) | 330,000 | | 360,824 |
| | | | | 2,988,986 |
| Israel — 0.1% | | |
| Energean Israel Finance, Ltd. | | | |
| 5.38%, 03/30/28 144A | 65,000 | | 64,269 |
| 5.88%, 03/30/31 144A | 90,000 | | 88,616 |
| Israel Government International Bond | | | |
| 3.38%, 01/15/50 | 200,000 | | 216,767 |
| Summit Properties, Ltd. | | | |
| 2.00%, 01/31/25(E) | 265,000 | | 296,293 |
| | | | | 665,945 |
| Italy — 2.0% | | |
| Autostrade per l'Italia SpA | | | |
| 1.88%, 09/26/29(E) | 487,000 | | 570,321 |
| Centurion Bidco SpA | | | |
| 5.88%, 09/30/26(E) | 230,000 | | 270,365 |
| doValue SpA | | | |
| 5.00%, 08/04/25(E) | 320,000 | | 379,111 |
| Guala Closures SpA | | | |
| 3.25%, 06/15/28(E) | 100,000 | | 112,143 |
| International Design Group SpA | | | |
| (Floating, 4.25% - Euribor 3M), 4.25%, 05/15/26(E) 144A † | 250,000 | | 286,610 |
| Italy Buoni Poliennali Del Tesoro | | | |
| 1.45%, 05/15/25(E) | 81,000 | | 96,237 |
| 1.41%, 05/26/25(E) 144A | 497,936 | | 604,030 |
| 1.60%, 06/01/26(E) | 87,000 | | 104,516 |
| 3.10%, 09/15/26(E) 144A | 21,917 | | 30,411 |
| 2.05%, 08/01/27(E) | 4,240,000 | | 5,228,251 |
| 1.35%, 04/01/30(E) | 2,145,000 | | 2,524,053 |
| 0.60%, 08/01/31(E) 144A | 1,301,000 | | 1,410,959 |
See Notes to Financial Statements.
SCHEDULE OF INVESTMENTS (Continued)
| | | Par | | Value |
| 0.95%, 12/01/31(E) 144A | $ 55,000 | | $ 61,390 |
| 0.95%, 06/01/32(E) | 35,000 | | 38,745 |
| 1.50%, 04/30/45(E) 144A | 7,000 | | 7,491 |
| Mooney Group SpA | | | |
| (Floating, 3.88% - Euribor 3M), 3.88%, 12/17/26(E) † | 300,000 | | 342,783 |
| Telecom Italia Capital SA | | | |
| 6.38%, 11/15/33 | 255,000 | | 274,970 |
| Telecom Italia SpA | | | |
| 3.63%, 05/25/26(E) Δ | 255,000 | | 306,356 |
| | | | | 12,648,742 |
| Ivory Coast — 0.3% | | |
| Ivory Coast Government International Bond | | | |
| 5.25%, 03/22/30(E) | 460,000 | | 536,200 |
| 5.88%, 10/17/31(E) | 200,000 | | 234,467 |
| 4.88%, 01/30/32(E) 144A | 340,000 | | 373,368 |
| 4.88%, 01/30/32(E) | 110,000 | | 120,795 |
| 5.75%, 12/31/32 144A STEP | 321,903 | | 324,208 |
| | | | | 1,589,038 |
| Japan — 0.3% | | |
| Japan Government Ten Year Bond | | | |
| 0.10%, 12/20/28(J) | 140,000,000 | | 1,230,523 |
| Japan Government Thirty Year Bond | | | |
| 0.70%, 12/20/48(J) | 30,000,000 | | 264,548 |
| SoftBank Group Corporation | | | |
| 5.00%, 04/15/28(E) | 245,000 | | 287,700 |
| 4.63%, 07/06/28 | 200,000 | | 195,407 |
| | | | | 1,978,178 |
| Jersey — 0.1% | | |
| AA Bond Co., Ltd. | | | |
| 6.50%, 01/31/26(U) | 300,000 | | 413,840 |
| Avis Budget Finance PLC | | | |
| 4.75%, 01/30/26(E) | 100,000 | | 116,434 |
| CPUK Finance, Ltd. | | | |
| 6.50%, 08/28/26(U) | 100,000 | | 141,344 |
| | | | | 671,618 |
| Kazakhstan — 0.3% | | |
| Kazakhstan Government International Bond | | | |
| 2.38%, 11/09/28(E) | 300,000 | | 373,927 |
| KazMunayGas National Co. JSC | | | |
| 5.38%, 04/24/30 144A | 500,000 | | 584,063 |
| 5.38%, 04/24/30 | 300,000 | | 350,438 |
| KazTransGas JSC | | | |
| 4.38%, 09/26/27 144A | 630,000 | | 686,590 |
| | | | | 1,995,018 |
| Luxembourg — 0.3% | | |
| Altice Finco SA | | | |
| 4.75%, 01/15/28(E) | 679,000 | | 737,939 |
| Altice France Holding SA | | | |
| 8.00%, 05/15/27(E) | 300,000 | | 361,886 |
| | | Par | | Value |
| Vivion Investments S.a.r.l. | | | |
| 3.00%, 08/08/24(E) Δ | $ 300,000 | | $ 335,402 |
| 3.50%, 11/01/25(E) | 200,000 | | 223,806 |
| | | | | 1,659,033 |
| Mexico — 3.0% | | |
| Banco Mercantil del Norte SA | | | |
| (Variable, U.S. Treasury Yield Curve Rate CMT 5Y + 5.04%), 6.88%, 07/06/22 144A ρ ^ | 260,000 | | 263,307 |
| (Variable, U.S. Treasury Yield Curve Rate CMT 10Y + 5.47%), 7.50%, 06/27/29 144A ρ ^ | 1,125,000 | | 1,198,592 |
| Banco Santander Mexico SA Institucion de Banca Multiple Grupo Financiero Santand | | | |
| 5.38%, 04/17/25 144A | 580,000 | | 633,685 |
| BBVA Bancomer SA | | | |
| (Variable, U.S. Treasury Yield Curve Rate CMT 5Y + 2.65%), 5.13%, 01/18/33 144A Δ ^ | 630,000 | | 647,555 |
| Cemex SAB de CV | | | |
| 3.88%, 07/11/31 144A | 400,000 | | 399,166 |
| Mexican Bonos | | | |
| 8.00%, 12/07/23(M) | 5,818,600 | | 288,141 |
| 7.50%, 06/03/27(M) | 151,900,000 | | 7,444,740 |
| 8.50%, 11/18/38(M) | 3,089,400 | | 158,985 |
| 7.75%, 11/13/42(M) | 76,750,000 | | 3,641,254 |
| Mexico Government International Bond | | | |
| 2.88%, 04/08/39(E) | 700,000 | | 805,805 |
| 5.75%, 10/12/10« | 320,000 | | 370,003 |
| Orbia Advance Corp SAB de CV | | | |
| 5.88%, 09/17/44 144A | 1,100,000 | | 1,353,011 |
| Orbia Advance Corporation SAB de CV | | | |
| 2.88%, 05/11/31 144A | 200,000 | | 195,913 |
| Petroleos Mexicanos | | | |
| 4.75%, 02/26/29(E) | 400,000 | | 450,176 |
| 5.95%, 01/28/31 | 140,000 | | 136,318 |
| 7.69%, 01/23/50 | 390,000 | | 377,120 |
| | | | | 18,363,771 |
| Mongolia — 0.0% | | |
| Mongolia Government International Bond | | | |
| 8.75%, 03/09/24 | 200,000 | | 221,010 |
| Morocco & Antilles — 0.1% | | |
| OCP SA | | | |
| 5.63%, 04/25/24 144A | 350,000 | | 375,601 |
| 4.50%, 10/22/25 144A | 320,000 | | 338,628 |
| | | | | 714,229 |
See Notes to Financial Statements.
| | | Par | | Value |
| Netherlands — 2.5% | | |
| Abertis Infraestructuras Finance BV | | | |
| (Variable, 3.69% - EUR Swap Rate 5Y), 3.25%, 11/24/25(E) ρ ^ | $ 100,000 | | $ 116,295 |
| ABN AMRO Bank NV | | | |
| 7.13%, 07/06/22(E) | 540,000 | | 637,270 |
| Cooperatieve Rabobank UA | | | |
| 5.75%, 12/01/43 | 630,000 | | 883,355 |
| Dufry One BV | | | |
| 2.00%, 02/15/27(E) | 345,000 | | 365,553 |
| E.ON International Finance BV | | | |
| 6.38%, 06/07/32(U) | 155,000 | | 293,823 |
| Embraer Netherlands Finance BV | | | |
| 5.40%, 02/01/27 | 130,000 | | 135,769 |
| Equate Petrochemical BV | | | |
| 4.25%, 11/03/26 144A | 380,000 | | 413,900 |
| IPD 3 BV | | | |
| 5.50%, 12/01/25(E) 144A | 560,000 | | 657,229 |
| 5.50%, 12/01/25(E) | 417,000 | | 489,401 |
| Lincoln Financing S.a.r.l. | | | |
| 3.63%, 04/01/24(E) | 215,000 | | 247,170 |
| (Floating, 3.88% - Euribor 3M), 3.88%, 04/01/24(E) † | 118,000 | | 134,679 |
| Maxeda DIY Holding BV | | | |
| 5.88%, 10/01/26(E) | 200,000 | | 233,046 |
| Petrobras Global Finance BV | | | |
| 6.25%, 03/17/24Δ | 2,110,000 | | 2,281,195 |
| 6.88%, 01/20/40Δ | 80,000 | | 87,807 |
| 6.90%, 03/19/49 | 880,000 | | 938,533 |
| Prosus NV | | | |
| 3.83%, 02/08/51 | 1,020,000 | | 957,138 |
| Repsol International Finance BV | | | |
| (Variable, EUR Swap Rate 10Y + 4.20%), 4.50%, 03/25/75(E) ^ | 530,000 | | 648,654 |
| Summer BidCo BV | | | |
| Cash Coupon 9.00% or PIK 9.75%, 9.00%, 11/15/25(E) | 446,768 | | 521,018 |
| Syngenta Finance NV | | | |
| 4.44%, 04/24/23 144A | 460,000 | | 475,702 |
| Teva Pharmaceutical Finance Netherlands II BV | | | |
| 4.50%, 03/01/25(E) | 635,000 | | 751,576 |
| 1.88%, 03/31/27(E) | 200,000 | | 210,053 |
| Teva Pharmaceutical Finance Netherlands III BV | | | |
| 4.75%, 05/09/27Δ | 200,000 | | 198,250 |
| 4.10%, 10/01/46Δ | 175,000 | | 148,149 |
| Trivium Packaging Finance BV | | | |
| 3.75%, 08/15/26(E) | 250,000 | | 289,150 |
| United Group BV | | | |
| 3.13%, 02/15/26(E) Δ | 200,000 | | 221,700 |
| UPC Holding BV | | | |
| 5.50%, 01/15/28 144A | 310,000 | | 322,056 |
| 3.88%, 06/15/29(E) | 300,000 | | 349,303 |
| Volkswagen International Finance NV | | | |
| (Variable, 3.96% - EUR Swap Rate 9Y), 3.88%, 06/17/29(E) ρ ^ | 300,000 | | 371,905 |
| | | Par | | Value |
| Wintershall Dea Finance 2 BV | | | |
| (Variable, 3.32% - EUR Swap Rate 5Y), 3.00%, 07/20/28(E) ρ ^ | $ 200,000 | | $ 221,908 |
| WP/AP Telecom Holdings IV BV | | | |
| 3.75%, 01/15/29(E) 144A | 480,000 | | 553,377 |
| ZF Europe Finance BV | | | |
| 3.00%, 10/23/29(E) Δ | 700,000 | | 825,313 |
| Ziggo BV | | | |
| 4.25%, 01/15/27(E) | 320,800 | | 373,648 |
| | | | | 15,353,925 |
| New Zealand — 0.7% | | |
| New Zealand Government Bond | | | |
| 3.50%, 04/14/33(Z) | 5,374,000 | | 4,064,766 |
| Nigeria — 0.2% | | |
| Nigeria Government International Bond | | | |
| 7.14%, 02/23/30 144A | 440,000 | | 433,664 |
| 7.88%, 02/16/32 | 200,000 | | 197,650 |
| 7.63%, 11/28/47 144A | 940,000 | | 843,960 |
| | | | | 1,475,274 |
| Norway — 0.2% | | |
| Adevinta ASA | | | |
| 3.00%, 11/15/27(E) 144A | 540,000 | | 631,856 |
| 3.00%, 11/15/27(E) Δ | 150,000 | | 175,515 |
| Aker BP ASA | | | |
| 3.75%, 01/15/30 144A | 150,000 | | 159,150 |
| 4.00%, 01/15/31 144A | 150,000 | | 162,545 |
| | | | | 1,129,066 |
| Oman — 0.0% | | |
| Oman Government International Bond | | | |
| 6.75%, 01/17/48 | 200,000 | | 203,943 |
| Panama — 0.4% | | |
| Panama Government International Bond | | | |
| 3.75%, 03/16/25 | 860,000 | | 912,039 |
| 6.70%, 01/26/36 | 202,000 | | 271,043 |
| 4.50%, 04/01/56 | 1,140,000 | | 1,259,996 |
| | | | | 2,443,078 |
| Paraguay — 0.0% | | |
| Paraguay Government International Bond | | | |
| 6.10%, 08/11/44 | 200,000 | | 246,750 |
| Peru — 0.8% | | |
| Peruvian Government International Bond | | | |
| 2.39%, 01/23/26 | 1,370,000 | | 1,393,304 |
| 1.25%, 03/11/33(E) | 200,000 | | 218,349 |
| 1.95%, 11/17/36(E) | 100,000 | | 112,234 |
| 6.55%, 03/14/37 | 640,000 | | 874,755 |
| Petroleos del Peru SA | | | |
| 5.63%, 06/19/47 144A | 750,000 | | 743,835 |
| Transportadora de Gas del Peru SA | | | |
| 4.25%, 04/30/28 144A | 1,670,000 | | 1,770,584 |
See Notes to Financial Statements.
SCHEDULE OF INVESTMENTS (Continued)
| | | Par | | Value |
| Volcan Cia Minera SAA, Class B | | | |
| 4.38%, 02/11/26 144A | $ 20,000 | | $ 19,525 |
| | | | | 5,132,586 |
| Philippines — 0.0% | | |
| Philippine Government International Bond | | | |
| 1.75%, 04/28/41(E) Δ | 100,000 | | 113,373 |
| Poland — 0.3% | | |
| Republic of Poland Government Bond | | | |
| 2.75%, 04/25/28(P) | 5,370,000 | | 1,256,953 |
| 1.25%, 10/25/30(P) | 3,060,000 | | 626,829 |
| | | | | 1,883,782 |
| Qatar — 0.0% | | |
| Qatar Government International Bond | | | |
| 4.82%, 03/14/49 | 200,000 | | 262,794 |
| Romania — 0.2% | | |
| RCS & RDS SA | | | |
| 3.25%, 02/05/28(E) | 200,000 | | 223,715 |
| Romanian Government International Bond | | | |
| 3.62%, 05/26/30(E) | 42,000 | | 51,952 |
| 1.75%, 07/13/30(E) | 41,000 | | 43,663 |
| 2.00%, 04/14/33(E) 144A | 560,000 | | 582,623 |
| 3.88%, 10/29/35(E) | 248,000 | | 306,691 |
| 2.88%, 04/13/42(E) | 18,000 | | 18,418 |
| 4.63%, 04/03/49(E) | 100,000 | | 128,856 |
| 3.38%, 01/28/50(E) | 84,000 | | 90,350 |
| | | | | 1,446,268 |
| Russia — 1.8% | | |
| Russian Federal Bond - OFZ | | | |
| 7.05%, 01/19/28(Q) | 423,153,000 | | 5,303,223 |
| 6.90%, 05/23/29(Q) | 205,550,000 | | 2,533,338 |
| 7.25%, 05/10/34(Q) | 262,547,000 | | 3,237,749 |
| Russian Foreign Bond - Eurobond | | | |
| 5.10%, 03/28/35 | 200,000 | | 236,250 |
| | | | | 11,310,560 |
| Senegal — 0.0% | | |
| Senegal Government International Bond | | | |
| 4.75%, 03/13/28(E) | 100,000 | | 115,767 |
| Serbia — 0.0% | | |
| Serbia International Bond | | | |
| 1.50%, 06/26/29(E) | 190,000 | | 209,699 |
| Slovakia — 0.0% | | |
| Slovakia Government Bond | | | |
| 0.38%, 04/21/36(E) | 18,400 | | 20,573 |
| South Africa — 1.2% | | |
| Republic of South Africa Government Bond | | | |
| 6.25%, 03/31/36(S) | 2,140,000 | | 93,966 |
| 6.50%, 02/28/41(S) | 56,596,000 | | 2,353,189 |
| | | Par | | Value |
| Republic of South Africa Government International Bond | | | |
| 4.88%, 04/14/26Δ | $ 200,000 | | $ 213,588 |
| 4.85%, 09/27/27Δ | 200,000 | | 211,244 |
| 4.85%, 09/30/29Δ | 2,190,000 | | 2,267,307 |
| 5.88%, 06/22/30Δ | 200,000 | | 223,405 |
| 5.75%, 09/30/49 | 2,420,000 | | 2,333,485 |
| | | | | 7,696,184 |
| South Korea — 0.1% | | |
| Export-Import Bank of Korea | | | |
| 6.75%, 08/09/22(I) | 4,500,000 | | 61,058 |
| 4.89%, 08/09/23 144A ††† | 24,800,000 | | 330,217 |
| | | | | 391,275 |
| Spain — 0.7% | | |
| Banco Santander SA | | | |
| (Variable, U.S. Treasury Yield Curve Rate CMT 1Y + 0.45%), 0.70%, 06/30/24^ | 200,000 | | 199,018 |
| Iberdrola Finanzas SA | | | |
| 7.38%, 01/29/24(U) | 100,000 | | 152,300 |
| Lorca Telecom Bondco SA | | | |
| 4.00%, 09/18/27(E) Δ | 680,000 | | 788,728 |
| 4.00%, 09/18/27(E) 144A | 400,000 | | 463,958 |
| Spain Government Bond | | | |
| 0.80%, 07/30/27(E) 144A | 26,000 | | 30,893 |
| 1.40%, 07/30/28(E) 144A | 73,000 | | 90,157 |
| 0.50%, 10/31/31(E) 144A | 1,271,000 | | 1,439,272 |
| 1.00%, 07/30/42(E) 144A | 29,000 | | 32,174 |
| Spain Government Inflation Linked Bond | | | |
| 0.65%, 11/30/27(E) 144A | 75,893 | | 99,268 |
| Tendam Brands SAU | | | |
| 5.00%, 09/15/24(E) 144A | 510,000 | | 576,607 |
| (Floating, 5.25% - Euribor 3M), 5.25%, 09/15/24(E) 144A † | 160,000 | | 181,822 |
| (Floating, 5.25% - Euribor 3M), 5.25%, 09/15/24(E) † | 160,000 | | 181,822 |
| | | | | 4,236,019 |
| Sri Lanka — 0.1% | | |
| Sri Lanka Government International Bond | | | |
| 6.85%, 11/03/25 | 200,000 | | 104,036 |
| 6.75%, 04/18/28 | 500,000 | | 254,730 |
| | | | | 358,766 |
| Supranational — 0.1% | | |
| Banque Ouest Africaine de Developpement | | | |
| 5.00%, 07/27/27 | 200,000 | | 221,456 |
| European Union | | | |
| 0.00%, 07/06/26(E) | 68,000 | | 78,563 |
| 0.00%, 10/04/28(E) | 46,000 | | 52,847 |
| 0.00%, 04/22/31(E) | 32,000 | | 36,210 |
| 0.40%, 02/04/37(E) | 43,000 | | 49,504 |
See Notes to Financial Statements.
| | | Par | | Value |
| International Finance Corporation | | | |
| 5.85%, 11/25/22(I) | $5,190,000 | | $ 70,299 |
| | | | | 508,879 |
| Sweden — 0.3% | | |
| Intrum AB | | | |
| 3.50%, 07/15/26(E) | 495,000 | | 571,646 |
| Samhallsbyggnadsbolaget i Norden AB | | | |
| (Variable, 2.81% - EUR Swap Rate 5Y), 2.62%, 01/30/25(E) ρ ^ | 321,000 | | 359,024 |
| Unilabs Subholding AB | | | |
| 5.75%, 05/15/25(E) | 299,000 | | 343,814 |
| Verisure Midholding AB | | | |
| 5.25%, 02/15/29(E) 144A | 240,000 | | 277,926 |
| | | | | 1,552,410 |
| Switzerland — 0.7% | | |
| Cidron Aida Finco S.a.r.l. | | | |
| 6.25%, 04/01/28(U) 144A | 580,000 | | 779,171 |
| Credit Suisse Group AG | | | |
| (Variable, USD Swap 5Y + 4.60%), 7.50%, 07/17/23 144A ρ ^ | 330,000 | | 349,552 |
| (Variable, EUR Swap Rate 1Y + 0.75%), 1.25%, 07/17/25(E) ^ | 500,000 | | 582,135 |
| (Variable, U.S. SOFR + 1.73%), 3.09%, 05/14/32 144A ^ | 335,000 | | 341,614 |
| UBS Group AG | | | |
| (Variable, USD Swap 5Y + 4.34%), 7.00%, 01/31/24 144A ρ ^ | 1,420,000 | | 1,532,102 |
| (Variable, EUR Swap Rate 1Y + 0.75%), 1.25%, 04/17/25(E) ^ | 400,000 | | 467,708 |
| | | | | 4,052,282 |
| Turkey — 0.4% | | |
| Turkey Government International Bond | | | |
| 6.38%, 10/14/25 | 200,000 | | 195,763 |
| 6.00%, 03/25/27 | 1,570,000 | | 1,484,262 |
| 4.88%, 04/16/43 | 500,000 | | 384,425 |
| Turkiye Ihracat Kredi Bankasi AS | | | |
| 5.38%, 10/24/23 | 200,000 | | 193,968 |
| | | | | 2,258,418 |
| Ukraine — 0.1% | | |
| Ukraine Government International Bond | | | |
| 7.75%, 09/01/25 | 100,000 | | 96,335 |
| 6.75%, 06/20/26(E) | 200,000 | | 217,383 |
| 9.75%, 11/01/28 | 250,000 | | 253,647 |
| 0.00%, 05/31/401 | 43,000 | | 39,301 |
| | | | | 606,666 |
| United Arab Emirates — 0.4% | | |
| Abu Dhabi Crude Oil Pipeline LLC | | | |
| 4.60%, 11/02/47 | 200,000 | | 237,130 |
| | | Par | | Value |
| DP World Crescent, Ltd. | | | |
| 3.88%, 07/18/29 | $200,000 | | $ 213,650 |
| DP World, Ltd. | | | |
| 5.63%, 09/25/48 144A | 970,000 | | 1,194,557 |
| 5.63%, 09/25/48 | 600,000 | | 738,901 |
| | | | | 2,384,238 |
| United Kingdom — 2.3% | | |
| Anglo American Capital PLC | | | |
| 4.75%, 04/10/27 144A | 200,000 | | 222,738 |
| 3.38%, 03/11/29(U) | 250,000 | | 362,066 |
| 2.88%, 03/17/31 144A Δ | 200,000 | | 199,489 |
| Antofagasta PLC | | | |
| 2.38%, 10/14/30 144A Δ | 300,000 | | 285,430 |
| Aviva PLC | | | |
| (Variable, UK Gilts 5Y + 2.40%), 6.13%, 09/29/22(U) ρ ^ | 490,000 | | 685,313 |
| Barclays Bank PLC | | | |
| 7.63%, 11/21/22 | 291,000 | | 307,080 |
| Barclays PLC | | | |
| (Variable, EUR Swap Rate 1Y + 0.78%), 1.38%, 01/24/26(E) ^ | 300,000 | | 352,732 |
| (Variable, U.S. SOFR + 2.71%), 2.85%, 05/07/26^ | 380,000 | | 392,388 |
| (Variable, U.S. Treasury Yield Curve Rate CMT 1Y + 1.05%), 2.28%, 11/24/27^ | 235,000 | | 235,682 |
| (Variable, U.S. Treasury Yield Curve Rate CMT 5Y + 3.41%), 4.38%, 03/15/28ρ ^ | 200,000 | | 196,400 |
| Bellis Acquisition Co. PLC | | | |
| 4.50%, 02/16/26(U) 144A | 260,000 | | 352,451 |
| Bellis Finco PLC | | | |
| 4.00%, 02/16/27(U) | 213,000 | | 273,487 |
| Constellation Automotive Financing PLC | | | |
| 4.88%, 07/15/27(U) | 100,000 | | 133,660 |
| eG Global Finance PLC | | | |
| 4.38%, 02/07/25(E) Δ | 440,000 | | 504,384 |
| HSBC Holdings PLC | | | |
| (Variable, USD ICE Swap Rate 5Y + 4.37%), 6.38%, 03/30/25ρ ^ | 400,000 | | 432,262 |
| (Variable, USD ICE Swap Rate 5Y + 3.75%), 6.00%, 05/22/27ρ ^ | 400,000 | | 431,500 |
| Iceland Bondco PLC | | | |
| 4.63%, 03/15/25(U) Δ | 230,000 | | 293,442 |
| INEOS Finance PLC | | | |
| 3.38%, 03/31/26(E) | 200,000 | | 233,107 |
| 2.88%, 05/01/26(E) | 250,000 | | 287,720 |
| INEOS Quattro Finance 1 PLC | | | |
| 3.75%, 07/15/26(E) 144A | 110,000 | | 126,215 |
| Jaguar Land Rover Automotive PLC | | | |
| 5.88%, 11/15/24(E) | 215,000 | | 265,017 |
| 4.50%, 01/15/26(E) Δ | 245,000 | | 290,412 |
See Notes to Financial Statements.
SCHEDULE OF INVESTMENTS (Continued)
| | | Par | | Value |
| Lloyds Banking Group PLC | | | |
| (Variable, U.S. Treasury Yield Curve Rate CMT 1Y + 1.10%), 1.33%, 06/15/23^ | $310,000 | | $ 310,562 |
| Miller Homes Group Holdings PLC | | | |
| 5.50%, 10/15/24(U) | 530,000 | | 727,540 |
| National Express Group PLC | | | |
| (Variable, UK Gilts 5Y + 4.14%), 4.25%, 11/26/25(U) ρ ^ | 200,000 | | 276,667 |
| National Grid Electricity Transmission PLC | | | |
| 0.19%, 01/20/25(E) | 154,000 | | 175,890 |
| NatWest Group PLC | | | |
| (Variable, U.S. Treasury Yield Curve Rate CMT 1Y + 0.90%), 1.64%, 06/14/27^ | 200,000 | | 197,476 |
| (Variable, U.S. Treasury Yield Curve Rate CMT 1Y + 2.55%), 3.07%, 05/22/28^ | 545,000 | | 567,633 |
| (Variable, U.S. Treasury Yield Curve Rate CMT 5Y + 2.35%), 3.03%, 11/28/35^ | 200,000 | | 197,788 |
| NGG Finance PLC | | | |
| (Variable, GBP Swap Rate 12Y + 3.48%), 5.63%, 06/18/73(U) ^ | 296,000 | | 435,958 |
| Pinnacle Bidco PLC | | | |
| 6.38%, 02/15/25(U) | 310,000 | | 425,509 |
| Santander UK Group Holdings PLC | | | |
| (Variable, GBP Swap Rate 5Y + 5.54%), 7.38%, 06/24/22(U) ρ ^ | 820,000 | | 1,136,965 |
| SSE PLC | | | |
| 1.75%, 04/16/30(E) | 350,000 | | 430,110 |
| Tesco Property Finance 6 PLC | | | |
| 5.41%, 07/13/44(U) | 380,665 | | 655,367 |
| United Kingdom Gilt | | | |
| 4.50%, 09/07/34(U) | 220,000 | | 419,276 |
| Virgin Media Secured Finance PLC | | | |
| 4.25%, 01/15/30(U) | 890,000 | | 1,196,574 |
| Vodafone Group PLC | | | |
| 5.25%, 05/30/48 | 190,000 | | 248,881 |
| | | | | 14,265,171 |
Total Foreign Bonds
(Cost $253,788,922) | | 247,083,988 |
| LOAN AGREEMENTS — 2.5% |
| 1011778 B.C. Unlimited Liability Company Term B-4 Loan | | | |
| (Floating, ICE LIBOR USD 1M + 1.75%), 1.85%, 11/19/26† | 453,065 | | 447,685 |
| Allied Universal Holdco LLC Initial U.S. Dollar Term Loan | | | |
| (Floating, ICE LIBOR USD 3M + 3.75%, 0.50% Floor), 4.25%, 05/12/28† | 492,516 | | 491,533 |
| Apollo Commercial Real Estate Finance, Inc. Initial Term Loan | | | |
| (Floating, ICE LIBOR USD 1M + 2.75%), 2.85%, 05/15/26† | 494,923 | | 489,974 |
| | | Par | | Value |
| Asurion LLC New B-7 Term Loan | | | |
| (Floating, ICE LIBOR USD 1M + 3.00%), 3.10%, 11/03/24† | $517,924 | | $516,212 |
| Asurion LLC New B-9 Term Loan | | | |
| 0.00%, 07/31/27Σ | 797,990 | | 794,100 |
| Asurion LLC Replacement B-6 Term Loan | | | |
| (Floating, ICE LIBOR USD 1M + 3.13%), 3.23%, 11/03/23† | 250,395 | | 250,082 |
| Asurion LLC Replacement B-8 Term Loan | | | |
| (Floating, ICE LIBOR USD 1M + 3.25%), 3.35%, 12/23/26† | 158,400 | | 157,542 |
| Bausch Health Companies, Inc. Initial Term Loan | | | |
| (Floating, ICE LIBOR USD 1M + 3.00%), 3.10%, 06/02/25† | 221,534 | | 220,786 |
| Berry Global, Inc. Term Z Loan | | | |
| (Floating, ICE LIBOR USD 2M + 1.75%), 1.86%, 07/01/26† | 446,802 | | 444,456 |
| Brookfield WEC Holdings, Inc. Initial Term Loan | | | |
| (Floating, ICE LIBOR USD 1M + 2.75%, 0.50% Floor), 3.25%, 08/01/25† | 85,436 | | 84,920 |
| Charter Communications Operating LLC Term B-2 Loan | | | |
| 0.00%, 02/01/27Σ | 28 | | 27 |
| (Floating, ICE LIBOR USD 1M + 1.75%), 1.86%, 02/01/27† | 494,909 | | 490,809 |
| CWGS Group LLC Term Loan | | | |
| (Floating, ICE LIBOR USD 1M + 2.50%, 0.75% Floor), 3.25%, 06/03/28† | 137,870 | | 136,991 |
| Energizer Holdings, Inc. 2020 Term Loan | | | |
| (Floating, ICE LIBOR USD 1M + 2.25%, 0.50% Floor), 2.75%, 12/22/27† | 893,250 | | 892,415 |
| Entercom Media Corporation Term B-2 Loan | | | |
| (Floating, ICE LIBOR USD 1M + 2.50%), 2.60%, 11/18/24† | 150,083 | | 148,563 |
| Focus Financial Partners LLC Tranche B-3 Term Loan | | | |
| (Floating, ICE LIBOR USD 1M + 2.00%), 2.10%, 07/03/24† | 273,620 | | 271,757 |
| Four Seasons Holdings, Inc. Term Loan 2013 | | | |
| (Floating, ICE LIBOR USD 1M + 2.00%), 2.10%, 11/30/23† | 224,679 | | 224,117 |
| Froneri International Limited Facility B1 | | | |
| (Floating, ICE EURIBOR USD 6M + 2.38%), 2.38%, 01/29/27† | 380,000 | | 424,456 |
| Garda World Security Corporation Term B-2 Loan | | | |
| (Floating, ICE LIBOR USD 1M + 4.25%), 4.36%, 10/30/26† | 405,369 | | 405,328 |
See Notes to Financial Statements.
| | | Par | | Value |
| Genesee & Wyoming, Inc. Initial Term Loan | | | |
| (Floating, ICE LIBOR USD 3M + 2.00%), 2.22%, 12/30/26† | $176,850 | | $175,966 |
| Global Medical Response, Inc. 2020 Refinancing Term Loan | | | |
| (Floating, ICE LIBOR USD 3M + 4.25%, 1.00% Floor), 5.25%, 10/02/25† | 354,487 | | 353,513 |
| INEOS Styrolution Group GmbH 2026 Tranche B Euro Term Loan | | | |
| (Floating, ICE EURIBOR USD 1M + 2.75%), 2.75%, 01/29/26† | 450,000 | | 509,202 |
| IU Finance Management GmbH Facility B | | | |
| (Floating, ICE EURIBOR USD 3M + 5.00%), 5.00%, 12/08/28† | 690,000 | | 781,637 |
| Lakeshore Learning Materials LLC Initial Term loan | | | |
| (Floating, ICE LIBOR USD 3M + 3.50%, 0.50% Floor), 4.00%, 09/29/28† | 800,000 | | 798,752 |
| Leslie's Poolmart, Inc. Initial Term Loan | | | |
| (Floating, ICE LIBOR USD 3M + 2.50%, 0.50% Floor), 3.00%, 03/09/28† | 797,990 | | 796,354 |
| Level 3 Financing, Inc. Tranche B 2027 Term Loan | | | |
| (Floating, ICE LIBOR USD 1M + 1.75%), 1.85%, 03/01/27† | 574,212 | | 567,752 |
| Mister Car Wash Holdings, Inc. Initial Term Loan | | | |
| (Floating, ICE LIBOR USD 1M + 3.00%), 3.10%, 05/14/26† | 370,269 | | 368,741 |
| Nexstar Broadcasting, Inc. Term B-4 Loan | | | |
| (Floating, ICE LIBOR USD 1M + 2.50%), 2.60%, 09/18/26† | 103,529 | | 103,465 |
| Pilot Travel Centers LLC Initial Tranche B Term Loan | | | |
| 0.00%, 08/04/28Σ | 798,000 | | 794,293 |
| Prime Security Services Borrower LLC 2021 Refinancing Term B-1 Loan | | | |
| (Floating, ICE LIBOR USD 1M + 2.75%, 0.75% Floor), 3.50%, 09/23/26† | 403,842 | | 403,933 |
| Reynolds Consumer Products LLC Initial Term Loan | | | |
| (Floating, ICE LIBOR USD 1M + 1.75%), 1.85%, 02/04/27† | 71,265 | | 70,979 |
| Sedgwick Claims Management Services, Inc. Initial Term Loan | | | |
| (Floating, ICE LIBOR USD 1M + 3.25%), 3.35%, 12/31/25† | 254,106 | | 252,439 |
| TransDigm, Inc. Tranche F Refinancing Term Loan | | | |
| (Floating, ICE LIBOR USD 1M + 2.25%), 2.35%, 12/09/25† | 797,964 | | 788,141 |
| | | Par | | Value |
| U.S. Renal Care, Inc. Initial Term Loan | | | |
| (Floating, ICE LIBOR USD 1M + 5.00%), 5.08%, 06/26/26† | $296,962 | | $ 289,577 |
| UFC Holdings LLC Term B-3 Loan | | | |
| (Floating, ICE LIBOR USD 3M + 2.75%, 0.75% Floor), 3.50%, 04/29/26† | 108,547 | | 108,256 |
| Univision Communications, Inc. 2020 Replacement First-Lien Term Loan | | | |
| (Floating, ICE LIBOR USD 1M + 3.25%, 0.75% Floor), 4.00%, 03/15/26† | 529,878 | | 531,741 |
| Virgin Media Bristol LLC N Facility | | | |
| (Floating, ICE LIBOR USD 1M + 2.50%), 2.61%, 01/31/28† | 370,000 | | 367,149 |
| Whatabrands LLC Initial Term B Loan | | | |
| (Floating, ICE LIBOR USD 1M + 3.25%, 0.50% Floor), 3.75%, 08/03/28† | 510,000 | | 508,927 |
Total Loan Agreements
(Cost $15,510,374) | | | 15,462,570 |
| MORTGAGE-BACKED SECURITIES — 5.2% |
| 510 Asset Backed Trust, Series 2021-NPL1, Class A1 | | | |
| (Step to 5.24% on 07/25/24), 2.24%, 06/25/61 144A STEP | 108,467 | | 107,746 |
| BANK, Series 2018-BNK15, Class B | | | |
| 4.65%, 11/15/61† γ | 260,000 | | 290,141 |
| BANK, Series 2021-BN35, Class AS | | | |
| 2.46%, 06/15/64 | 85,000 | | 85,344 |
| BPR Trust, Series 2021-NRD, Class B | | | |
| (Floating, U.S. 30-Day Average SOFR + 2.12%, 2.12% Floor), 2.22%, 12/15/23 144A † | 25,000 | | 25,001 |
| BPR Trust, Series 2021-NRD, Class C | | | |
| (Floating, U.S. 30-Day Average SOFR + 2.42%, 2.42% Floor), 2.52%, 12/15/23 144A † | 25,000 | | 25,009 |
| BPR Trust, Series 2021-NRD, Class D | | | |
| (Floating, U.S. 30-Day Average SOFR + 3.72%, 3.72% Floor), 3.82%, 12/15/23 144A † | 15,000 | | 15,025 |
| CAFL Issuer LLC, Series 2021-RTL1, Class A1 | | | |
| (Step to 4.24% on 04/30/25), 2.24%, 03/28/29 144A STEP | 105,000 | | 104,751 |
| CIM Trust, Series 2021-NR2, Class A1 | | | |
| (Step to 5.57% on 04/25/24), 2.57%, 07/25/59 144A STEP | 119,234 | | 119,054 |
| COMM Mortgage Trust, Series 2012-CR3, Class AM | | | |
| 3.42%, 10/15/45 144A | 20,000 | | 20,004 |
| COMM Mortgage Trust, Series 2012-LC4, Class B | | | |
| 4.93%, 12/10/44 | 35,000 | | 34,982 |
See Notes to Financial Statements.
SCHEDULE OF INVESTMENTS (Continued)
| | | Par | | Value |
| Connecticut Avenue Securities Trust, Series 2019-R07, Class 1M2 | | | |
| (Floating, ICE LIBOR USD 1M + 2.10%), 2.20%, 10/25/39 144A † | $ 158,044 | | $ 158,485 |
| Connecticut Avenue Securities Trust, Series 2020-R01, Class 1M2 | | | |
| (Floating, ICE LIBOR USD 1M + 2.05%, 2.05% Floor), 2.15%, 01/25/40 144A † | 279,791 | | 281,111 |
| Connecticut Avenue Securities Trust, Series 2021-R01, Class 1B1 | | | |
| (Floating, U.S. 30-Day Average SOFR + 3.10%), 3.15%, 10/25/41 144A † | 790,000 | | 795,925 |
| Connecticut Avenue Securities Trust, Series 2021-R03, Class 1M2 | | | |
| (Floating, U.S. 30-Day Average SOFR + 1.65%, 1.65% Floor), 1.70%, 12/25/41 144A † | 424,000 | | 425,082 |
| CSMC OA LLC, Series 2014-USA, Class F | | | |
| 4.37%, 09/15/37 144A | 1,610,000 | | 1,257,085 |
| CSMC Trust, Series 2021-RPL1, Class A1 | | | |
| 1.67%, 09/27/60 144A † γ | 83,380 | | 82,763 |
| CSMC Trust, Series 2021-RPL3, Class M2 | | | |
| 3.75%, 01/25/60 144A | 100,000 | | 107,564 |
| CSMC Trust, Series 2021-RPL4, Class A1 | | | |
| 1.80%, 12/27/60 144A † γ | 132,544 | | 132,653 |
| CSMC, Series 2019-RIO, Class B | | | |
| (Floating, ICE LIBOR USD 1M + 7.00%, 8.00% Floor), 8.00%, 12/15/22 144A † | 1,120,000 | | 1,090,195 |
| Fannie Mae Connecticut Avenue Securities, Series 2017-C04, Class 2M2 | | | |
| (Floating, ICE LIBOR USD 1M + 2.85%), 2.95%, 11/25/29† | 396,161 | | 406,519 |
| Fannie Mae Connecticut Avenue Securities, Series 2018-C01, Class 1M2 | | | |
| (Floating, ICE LIBOR USD 1M + 2.25%, 2.25% Floor), 2.35%, 07/25/30† | 1,873,355 | | 1,896,385 |
| Fannie Mae Connecticut Avenue Securities, Series 2018-C04, Class 2M2 | | | |
| (Floating, ICE LIBOR USD 1M + 2.55%, 2.55% Floor), 2.65%, 12/25/30† | 1,186,197 | | 1,209,247 |
| Fannie Mae Connecticut Avenue Securities, Series 2018-C05, Class 1B1 | | | |
| (Floating, ICE LIBOR USD 1M + 4.25%, 4.25% Floor), 4.35%, 01/25/31† | 270,000 | | 283,569 |
| Federal Home Loan Mortgage Corporation | | | |
| 3.00%, 03/01/50 | 84,921 | | 88,641 |
| 3.50%, 04/01/50 | 65,608 | | 69,232 |
| 3.00%, 07/01/50 | 91,287 | | 94,978 |
| | | Par | | Value |
| Federal Home Loan Mortgage Corporation STACR REMIC Trust, Series 2020-DNA1, Class B1 | | | |
| (Floating, ICE LIBOR USD 1M + 2.30%), 2.40%, 01/25/50 144A † | $ 770,000 | | $ 770,952 |
| Federal Home Loan Mortgage Corporation STACR REMIC Trust, Series 2020-DNA2, Class M2 | | | |
| (Floating, ICE LIBOR USD 1M + 1.85%, 1.85% Floor), 1.95%, 02/25/50 144A † | 510,008 | | 512,204 |
| Federal Home Loan Mortgage Corporation STACR REMIC Trust, Series 2020-DNA6, Class M2 | | | |
| (Floating, U.S. 30-Day Average SOFR + 2.00%), 2.05%, 12/25/50 144A † | 310,000 | | 311,929 |
| Federal Home Loan Mortgage Corporation STACR REMIC Trust, Series 2021-DNA3, Class B1 | | | |
| (Floating, U.S. 30-Day Average SOFR + 3.50%), 3.55%, 10/25/33 144A † | 610,000 | | 633,341 |
| Federal Home Loan Mortgage Corporation STACR Trust, Series 2018-HQA2, Class M2 | | | |
| (Floating, ICE LIBOR USD 1M + 2.30%), 2.40%, 10/25/48 144A † | 1,110,000 | | 1,124,140 |
| Federal National Mortgage Association | | | |
| 3.00%, 08/01/46 | 95,083 | | 99,736 |
| 3.00%, 12/01/47 | 297,939 | | 311,558 |
| 3.50%, 08/01/49 | 150,524 | | 158,532 |
| 4.00%, 08/01/49 | 144,758 | | 154,050 |
| 3.50%, 09/01/49 | 256,331 | | 270,420 |
| 4.00%, 10/01/49 | 207,587 | | 220,914 |
| 3.00%, 03/01/50 | 147,161 | | 153,692 |
| 3.00%, 05/01/50 | 170,150 | | 176,818 |
| 3.50%, 06/01/50 | 48,053 | | 50,683 |
| 3.00%, 07/01/50 | 49,781 | | 51,772 |
| FHLMC Structured Agency Credit Risk Debt Notes, Series 2017-DNA1, Class B1 | | | |
| (Floating, ICE LIBOR USD 1M + 4.95%, 4.95% Floor), 5.05%, 07/25/29† | 760,000 | | 822,199 |
| FHLMC Structured Agency Credit Risk Debt Notes, Series 2017-HQA2, Class M2 | | | |
| (Floating, ICE LIBOR USD 1M + 2.65%), 2.75%, 12/25/29† | 1,117,256 | | 1,146,754 |
| GCAT Trust, Series 2019-RPL1, Class A1 | | | |
| 2.65%, 10/25/68 144A | 58,452 | | 59,366 |
| Government National Mortgage Association | | | |
| 4.50%, 08/20/48 | 95,611 | | 101,322 |
| 3.00%, 01/01/51 TBA | 1,210,000 | | 1,252,492 |
See Notes to Financial Statements.
| | | Par | | Value |
| 2.50%, 01/01/52 TBA | $ 575,000 | | $589,218 |
| GS Mortgage Securities Corporation II, Series 2018-SRP5, Class C | | | |
| (Floating, ICE LIBOR USD 1M + 4.00%, 3.75% Floor), 4.11%, 09/15/31 144A † | 1,524,842 | | 491,615 |
| GS Mortgage Securities Trust, Series 2014-GC18, Class AS | | | |
| 4.38%, 01/10/47 | 45,000 | | 46,436 |
| GS Mortgage Securities Trust, Series 2014-GC18, Class B | | | |
| 4.89%, 01/10/47 | 25,000 | | 24,841 |
| Hawaii Hotel Trust, Series 2019-MAUI, Class F | | | |
| (Floating, ICE LIBOR USD 1M + 2.75%, 2.75% Floor), 2.86%, 05/15/38 144A † | 780,000 | | 774,524 |
| Hilton U.S.A. Trust, Series 2016-HHV, Class D | | | |
| 4.19%, 11/05/38 144A † γ | 540,000 | | 564,147 |
| Impac Secured Assets Trust, Series 2006-2, Class 2M3 | | | |
| (Floating, ICE LIBOR USD 1M + 1.65%, 1.65% Floor, 11.50% Cap), 1.75%, 08/25/36† | 254,137 | | 257,739 |
| JP Morgan Chase Commercial Mortgage Securities Trust, Series 2007-LD12, Class AJ | | | |
| 6.50%, 02/15/51† γ | 2,437 | | 2,253 |
| JP Morgan Chase Commercial Mortgage Securities Trust, Series 2018-PHMZ, Class M | | | |
| (Floating, ICE LIBOR USD 1M + 8.36%, 8.21% Floor), 8.47%, 06/15/35 144A † | 1,500,000 | | 120,150 |
| Legacy Mortgage Asset Trust, Series 2020-RPL1, Class A2 | | | |
| 3.25%, 09/25/59 144A | 120,000 | | 126,393 |
| PMT Credit Risk Transfer Trust, Series 2021-1R, Class A | | | |
| (Floating, ICE LIBOR USD 1M + 2.90%, 2.90% Floor), 3.00%, 02/27/24 144A † | 132,933 | | 134,851 |
| PRPM LLC, Series 2021-1, Class A1 | | | |
| 2.12%, 01/25/26 144A † γ | 102,865 | | 102,323 |
| PRPM LLC, Series 2021-3, Class A1 | | | |
| (Step to 4.87% on 05/25/24), 1.87%, 04/25/26 144A STEP | 88,403 | | 87,953 |
| PRPM LLC, Series 2021-5, Class A1 | | | |
| (Step to 4.79% on 07/25/24), 1.79%, 06/25/26 144A STEP | 93,523 | | 92,713 |
| PRPM LLC, Series 2021-8, Class A1 | | | |
| 1.74%, 09/25/26 144A † γ | 91,401 | | 91,152 |
| Radnor RE, Ltd., Series 2021-1, Class M1C | | | |
| (Floating, U.S. 30-Day Average SOFR + 2.70%, 2.70% Floor), 2.75%, 12/27/33 144A † | 790,000 | | 780,726 |
| | | Par | | Value |
| RBS Commercial Funding, Inc. Trust, Series 2013-GSP, Class A | | | |
| 3.83%, 01/15/32 144A † γ | $ 100,000 | | $ 103,627 |
| Seasoned Credit Risk Transfer Trust, Series 2017-2, Class M1 | | | |
| 4.00%, 08/25/56 144A | 440,000 | | 443,833 |
| Seasoned Credit Risk Transfer Trust, Series 2017-2, Class M2 | | | |
| 4.00%, 08/25/56 144A | 570,000 | | 581,757 |
| Seasoned Credit Risk Transfer Trust, Series 2020-2, Class M | | | |
| 4.25%, 11/25/59 144A | 1,170,000 | | 1,197,753 |
| SFO Commercial Mortgage Trust, Series 2021-555, Class D | | | |
| (Floating, ICE LIBOR USD 1M + 2.40%, 2.40% Floor), 2.51%, 05/15/38 144A † | 760,000 | | 762,671 |
| Toorak Mortgage Corporation, Ltd., Series 2021-1, Class A1 | | | |
| (Step to 3.24% on 01/25/24), 2.24%, 06/25/24 144A STEP | 100,000 | | 99,734 |
| UBS Commercial Mortgage Trust, Series 2017-C3, Class C | | | |
| 4.31%, 08/15/50† γ | 410,000 | | 412,922 |
| UBS Commercial Mortgage Trust, Series 2018-C13, Class B | | | |
| 4.79%, 10/15/51 | 270,000 | | 296,256 |
| UBS-Barclays Commercial Mortgage Trust, Series 2012-C2, Class BEC | | | |
| 4.81%, 05/10/63 144A † γ | 123,000 | | 118,247 |
| Uniform Mortgage Backed Securities | | | |
| 2.00%, 01/01/52 TBA | 675,000 | | 673,312 |
| 2.50%, 01/01/52 TBA | 3,925,000 | | 4,006,720 |
| 3.00%, 01/01/52 TBA | 1,320,000 | | 1,368,211 |
| Wells Fargo Commercial Mortgage Trust, Series 2013-LC12, Class B | | | |
| 4.31%, 07/15/46† γ | 25,000 | | 24,852 |
| Wells Fargo Commercial Mortgage Trust, Series 2016-C36, Class B | | | |
| 3.67%, 11/15/59 | 25,000 | | 24,458 |
| WFRBS Commercial Mortgage Trust, Series 2012-C7, Class AS | | | |
| 4.09%, 06/15/45 | 45,000 | | 45,049 |
| WFRBS Commercial Mortgage Trust, Series 2012-C7, Class C | | | |
| 4.79%, 06/15/45† γ | 40,000 | | 30,979 |
| WFRBS Commercial Mortgage Trust, Series 2013-C15, Class B | | | |
| 4.50%, 08/15/46† γ | 35,000 | | 34,682 |
| WFRBS Commercial Mortgage Trust, Series 2014-C20, Class B | | | |
| 4.38%, 05/15/47 | 35,000 | | 35,624 |
Total Mortgage-Backed Securities
(Cost $34,513,938) | | | 32,137,086 |
See Notes to Financial Statements.
SCHEDULE OF INVESTMENTS (Continued)
| | Number of
Contracts | | Notional
Amount | | Value |
| PURCHASED OPTIONS — 0.0% |
| Put Options — 0.0% |
Euro Bund 2/2022, Strike Price
$171.00, Expires
01/21/22 (CITI) | 3 | | $514,110 | | $2,528 |
Euro Bund 2/2022, Strike Price
$172.00, Expires
01/21/22 (CITI) | 2 | | 342,740 | | 2,869 |
Total Purchased Options
(Premiums paid $2,262) | | | | 5,397 |
| | | Par | |
| U.S. TREASURY OBLIGATIONS — 23.2% |
| U.S. Treasury Bonds | | | |
| 3.50%, 02/15/39 | $ 3,540,000 | 4,453,348 |
| 4.25%, 05/15/39 | 30,000 | 41,242 |
| 3.88%, 08/15/40 | 20,000 | 26,443 |
| 1.75%, 08/15/41 | 1,321,000 | 1,285,292 |
| 2.00%, 11/15/41 | 40,000 | 40,597 |
| 2.75%, 08/15/42 | 90,000 | 102,913 |
| 2.88%, 05/15/43 | 2,045,000 | 2,385,141 |
| 3.00%, 05/15/45 | 250,000 | 300,195 |
| 3.00%, 11/15/45 | 920,000 | 1,109,678 |
| 2.50%, 05/15/46 | 820,000 | 910,072 |
| 2.25%, 08/15/46 | 960,000 | 1,019,437 |
| 2.88%, 11/15/46 | 1,520,000 | 1,805,297 |
| 3.00%, 05/15/47 | 60,000 | 73,125 |
| 2.75%, 08/15/47 | 90,000 | 105,180 |
| 3.13%, 05/15/48 | 40,000 | 50,200 |
| 3.00%, 08/15/48 | 630,000 | 774,211 |
| 3.38%, 11/15/48 | 770,000 | 1,011,738 |
| 1.25%, 05/15/50 | 50,000 | 42,684 |
| 1.38%, 08/15/50 | 3,730,000 | 3,284,440 |
| 2.38%, 05/15/51 | 870,000 | 965,428 |
| 2.00%, 08/15/51 | 4,716,000 | 4,830,952 |
| | | | 24,617,613 |
| U.S. Treasury Notes | | | |
| 1.88%, 01/31/22 | 710,000 | 710,980 |
| 2.00%, 02/15/22 | 90,000 | 90,205 |
| 1.63%, 08/15/22 | 23,540,000 | 23,742,109 |
| 1.38%, 10/15/22 | 5,859,000 | 5,906,376 |
| 0.13%, 12/31/22 | 2,310,000 | 2,302,985 |
| 0.13%, 02/28/23 | 1,795,000 | 1,787,953 |
| 0.13%, 06/30/23 | 615,000 | 610,916 |
| 2.88%, 09/30/23 | 9,510,000 | 9,874,426 |
| 2.88%, 10/31/23 | 2,975,000 | 3,092,954 |
| 0.50%, 11/30/23Δ | 610,000 | 607,784 |
| 2.75%, 02/15/24 | 5,655,000 | 5,891,361 |
| 2.38%, 02/29/24 | 10,000 | 10,342 |
| 1.50%, 10/31/24 | 570,000 | 579,129 |
| 2.25%, 11/15/24 | 20,520,000 | 21,281,484 |
| 2.00%, 02/15/25 | 70,000 | 72,133 |
| 2.88%, 05/31/25 | 315,000 | 334,146 |
| 0.38%, 11/30/25 | 26,242,000 | 25,464,991 |
| 1.63%, 02/15/26 | 6,460,000 | 6,575,069 |
| | | Par | | Value |
| 1.63%, 05/15/26 | $ 340,000 | | $ 345,937 |
| 2.00%, 11/15/26 | 870,000 | | 900,654 |
| 1.25%, 11/30/26Δ | 200,000 | | 200,031 |
| 0.88%, 11/15/30 | 8,550,000 | | 8,139,867 |
| 1.25%, 08/15/31 | 730,000 | | 714,773 |
| 1.38%, 11/15/31Δ | 550,000 | | 543,770 |
| | | | | 119,780,375 |
Total U.S. Treasury Obligations
(Cost $142,164,221) | | | 144,397,988 |
| | | Shares | |
| COMMON STOCKS — 0.2% |
| Communication Services — 0.1% | |
| Altice U.S.A., Inc. Class A* | 10,645 | 172,236 |
| Comcast Corporation Class A | 473 | 23,806 |
| T-Mobile US, Inc.* | 5,206 | 603,792 |
| | | | 799,834 |
| Consumer Discretionary — 0.0% | |
| Home Depot, Inc. (The) | 37 | 15,355 |
| Starbucks Corporation | 184 | 21,523 |
| | | | 36,878 |
| Consumer Staples — 0.0% | |
| Coca-Cola Co. (The) | 390 | 23,092 |
| Procter & Gamble Co. (The) | 141 | 23,065 |
| Walmart, Inc. | 140 | 20,256 |
| | | | 66,413 |
| Energy — 0.0% | |
| Berry Corporation | 2,492 | 20,983 |
| Chevron Corporation | 194 | 22,766 |
| Hercules Offshore, Inc.Ψ ††† Δ * | 46,644 | — |
| Whiting Petroleum Corporation* | 255 | 16,493 |
| Williams Cos., Inc. (The) | 562 | 14,635 |
| | | | 74,877 |
| Financials — 0.0% | |
| BlackRock, Inc. | 21 | 19,227 |
| Morgan Stanley | 203 | 19,926 |
| | | | 39,153 |
| Health Care — 0.0% | |
| Abbott Laboratories | 147 | 20,689 |
| Anthem, Inc. | 43 | 19,932 |
| UnitedHealth Group, Inc. | 28 | 14,060 |
| | | | 54,681 |
| Industrials — 0.0% | |
| Cummins, Inc. | 87 | 18,978 |
| Deere & Co. | 57 | 19,545 |
| Lockheed Martin Corporation | 65 | 23,102 |
| Union Pacific Corporation | 85 | 21,414 |
| United Parcel Service, Inc. Class B | 96 | 20,576 |
| | | | 103,615 |
| Information Technology — 0.1% | |
| Apple, Inc. | 144 | 25,570 |
| Automatic Data Processing, Inc. | 44 | 10,849 |
See Notes to Financial Statements.
| | | Shares | | Value |
| Broadcom, Inc. | 19 | | $ 12,643 |
| Cisco Systems, Inc. | 367 | | 23,257 |
| Corning, Inc. | 3,787 | | 140,990 |
| Microsoft Corporation | 61 | | 20,515 |
| Texas Instruments, Inc. | 63 | | 11,874 |
| | | | | 245,698 |
| Materials — 0.0% | | |
| Newmont Corporation | 389 | | 24,126 |
| Real Estate — 0.0% | | |
| American Tower Corporation REIT | 75 | | 21,938 |
| Utilities — 0.0% | | |
| Duke Energy Corporation | 205 | | 21,504 |
| NextEra Energy, Inc. | 241 | | 22,500 |
| | | | | 44,004 |
Total Common Stocks
(Cost $4,203,977) | | | 1,511,217 |
| FOREIGN COMMON STOCKS — 0.0% |
| Ireland — 0.0% | | |
| Accenture PLC Class A | 55 | | 22,800 |
| Jersey — 0.0% | | |
| Clarivate PLC* | 59 | | 1,388 |
Total Foreign Common Stocks
(Cost $16,244) | | | 24,188 |
| PREFERRED STOCKS — 0.1% |
| Bank of America Corporation | | | |
| 7.25% CONV | 387 | | 559,370 |
| El Paso Energy Capital Trust I | | | |
| 4.75%, 03/31/28 CONV | 2,799 | | 141,601 |
| | | Shares | | Value |
| Wells Fargo & Co. | | | |
| 7.50%, 02/27/20 CONV | 69 | | $ 102,847 |
Total Preferred Stocks
(Cost $592,008) | | | 803,818 |
| FOREIGN PREFERRED STOCK — 0.0% |
| Jersey — 0.0% | | |
| Clarivate PLC | | | |
5.25%, 06/01/24 CONV Δ
(Cost $128,000) | 1,280 | | 116,301 |
| MUTUAL FUNDS — 1.1% |
VanEck Vectors J.P. Morgan EM Local Currency Bond ETF
(Cost $7,572,406) | 238,000 | | 6,806,800 |
| MONEY MARKET FUNDS — 7.4% |
GuideStone Money Market Fund, 0.00%
(Institutional Class)Ø ∞ | 33,009,006 | | 33,009,006 |
| Northern Institutional Liquid Assets Portfolio (Shares), 0.04%Ø § | 12,778,817 | | 12,778,817 |
| Northern Institutional U.S. Government Portfolio (Shares), 0.00%Ø | 217,087 | | 217,087 |
Total Money Market Funds
(Cost $46,004,910) | | | 46,004,910 |
TOTAL INVESTMENTS —101.6%
(Cost $635,296,025) | | | 632,780,429 |
Liabilities in Excess of Other
Assets — (1.6)% | | | (9,786,657) |
| NET ASSETS — 100.0% | | | $622,993,772 |
Futures Contracts outstanding at December 31, 2021:
| Future Type | | Expiration Date | | Open Long
(Short) Contracts | | Notional
Market Value
of Contracts | | Value and
Unrealized
Appreciation
(Depreciation) |
| 30-Year Euro Buxl | | 03/2022 | | 13 | | $ 3,059,855 | | $(166,531) |
| Euro-Bobl | | 03/2022 | | (30) | | (4,550,812) | | 38,029 |
| Euro-BTP Italian Government Bond | | 03/2022 | | (1) | | (167,371) | | 3,543 |
| Euro-Bund | | 03/2022 | | (16) | | (3,121,676) | | 59,698 |
| Euro-Schatz | | 03/2022 | | 70 | | 8,928,231 | | (15,190) |
| 10-Year Japanese E-Mini | | 03/2022 | | 184 | | 24,251,274 | | (98,891) |
| 10-Year Commonwealth Treasury Bond | | 03/2022 | | 19 | | 1,923,773 | | 1,853 |
| 3-Year Commonwealth Treasury Bond | | 03/2022 | | 170 | | 14,118,487 | | 15,552 |
| 10-Year Bond | | 03/2022 | | 18 | | 2,029,456 | | 50,347 |
| 10-Year U.S. Treasury Note | | 03/2022 | | 58 | | 7,567,188 | | 86,357 |
| Long GILT | | 03/2022 | | 31 | | 5,240,811 | | 4,935 |
| U.S. Treasury Long Bond | | 03/2022 | | (42) | | (6,738,375) | | 71,614 |
| Ultra 10-Year U.S. Treasury Note | | 03/2022 | | (87) | | (12,740,063) | | (117,482) |
| Ultra Long U.S. Treasury Bond | | 03/2022 | | (57) | | (11,236,125) | | (235,325) |
| 2-Year U.S. Treasury Note | | 04/2022 | | 209 | | 45,597,922 | | (38,187) |
| 5-Year U.S. Treasury Note | | 04/2022 | | (375) | | (45,366,211) | | 13,505 |
| 3-Month Euribor | | 12/2022 | | 3 | | 856,565 | | 779 |
| 90-Day Eurodollar | | 12/2022 | | 157 | | 38,839,838 | | (94,200) |
See Notes to Financial Statements.
SCHEDULE OF INVESTMENTS (Continued)
| Future Type | | Expiration Date | | Open Long
(Short) Contracts | | Notional
Market Value
of Contracts | | Value and
Unrealized
Appreciation
(Depreciation) |
| 90-Day Eurodollar | | 12/2023 | | 146 | | $ 35,919,650 | | $(344,925) |
| Total Futures Contracts outstanding at December 31, 2021 | | | | | | $104,412,417 | | $(764,519) |
Forward Foreign Currency Contracts outstanding at December 31, 2021:
| Expiration Date | | Currency
Purchased | | Amount
of Currency
Purchased | | Currency
Sold | | Amount
of Currency
Sold | | Counter-
party | | Net Unrealized
Appreciation
(Depreciation) |
| 01/19/22 | | U.S. Dollars | | 255,648,538 | | Euro | | 220,893,694 | | SS | | $4,062,140 |
| 01/19/22 | | U.S. Dollars | | 1,258,808 | | Turkish Lira | | 11,970,755 | | RBC | | 369,164 |
| 01/19/22 | | U.S. Dollars | | 16,886,594 | | Euro | | 14,564,810 | | CITI | | 298,034 |
| 01/19/22 | | U.S. Dollars | | 15,669,996 | | Euro | | 13,535,373 | | UBS | | 253,911 |
| 01/19/22 | | U.S. Dollars | | 6,473,104 | | Norwegian Kroner | | 55,320,604 | | SS | | 193,523 |
| 01/19/22 | | U.S. Dollars | | 11,502,519 | | Canadian Dollars | | 14,339,064 | | SS | | 167,070 |
| 01/19/22 | | U.S. Dollars | | 11,653,971 | | Japanese Yen | | 1,321,688,511 | | SS | | 162,253 |
| 01/19/22 | | U.S. Dollars | | 4,520,240 | | Swedish Kronor | | 39,552,963 | | SC | | 142,414 |
| 01/19/22 | | U.S. Dollars | | 18,583,923 | | British Pounds | | 13,639,192 | | SS | | 123,449 |
| 01/18/22 | | U.S. Dollars | | 2,368,949 | | Russian Rubles | | 169,920,000 | | CITI | | 109,511 |
| 01/19/22 | | U.S. Dollars | | 8,494,449 | | Australian Dollars | | 11,537,099 | | SC | | 100,113 |
| 01/19/22 | | U.S. Dollars | | 4,037,615 | | Euro | | 3,458,476 | | BNP | | 98,592 |
| 01/19/22 | | U.S. Dollars | | 4,957,754 | | Euro | | 4,280,587 | | RBC | | 82,390 |
| 01/19/22 | | U.S. Dollars | | 1,620,089 | | Swedish Kronor | | 13,900,307 | | CITI | | 81,567 |
| 01/18/22 | | U.S. Dollars | | 2,357,668 | | South African Rand | | 36,380,000 | | CITI | | 80,693 |
| 01/19/22 | | U.S. Dollars | | 4,562,180 | | New Zealand Dollars | | 6,557,852 | | CITI | | 71,836 |
| 01/19/22 | | U.S. Dollars | | 5,488,084 | | New Zealand Dollars | | 7,910,548 | | SC | | 71,512 |
| 01/19/22 | | U.S. Dollars | | 2,233,112 | | Swedish Kronor | | 19,532,304 | | BNP | | 71,225 |
| 01/18/22 | | U.S. Dollars | | 5,836,422 | | Russian Rubles | | 434,043,000 | | GSC | | 64,920 |
| 01/19/22 | | U.S. Dollars | | 1,470,512 | | Australian Dollars | | 1,953,017 | | BNP | | 49,507 |
| 01/19/22 | | U.S. Dollars | | 4,617,483 | | Japanese Yen | | 525,590,556 | | BNP | | 47,618 |
| 01/19/22 | | Swiss Francs | | 2,181,897 | | U.S. Dollars | | 2,354,785 | | SS | | 40,945 |
| 01/19/22 | | U.S. Dollars | | 694,905 | | South African Rand | | 10,538,726 | | SS | | 35,398 |
| 01/18/22 | | Mexican Pesos | | 25,706,691 | | U.S. Dollars | | 1,216,868 | | CITI | | 34,702 |
| 01/19/22 | | U.S. Dollars | | 2,233,968 | | Australian Dollars | | 3,025,782 | | RBC | | 32,424 |
| 01/18/22 | | U.S. Dollars | | 2,308,915 | | Euro | | 2,000,000 | | CITI | | 31,066 |
| 01/19/22 | | U.S. Dollars | | 1,043,217 | | Norwegian Kroner | | 8,916,706 | | UBS | | 31,060 |
| 01/19/22 | | U.S. Dollars | | 1,543,785 | | Russian Rubles | | 113,882,449 | | SC | | 29,613 |
| 01/19/22 | | U.S. Dollars | | 751,396 | | Hungarian Forint | | 234,839,935 | | UBS | | 28,924 |
| 01/18/22 | | Indian Rupees | | 301,423,535 | | U.S. Dollars | | 4,013,095 | | CITI | | 28,528 |
| 01/19/22 | | U.S. Dollars | | 2,433,022 | | Japanese Yen | | 276,846,790 | | CITI | | 25,915 |
| 01/19/22 | | U.S. Dollars | | 567,125 | | Norwegian Kroner | | 4,775,489 | | BNP | | 25,047 |
| 01/19/22 | | U.S. Dollars | | 1,627,684 | | Canadian Dollars | | 2,028,920 | | BNP | | 23,764 |
| 01/19/22 | | U.S. Dollars | | 1,477,921 | | Canadian Dollars | | 1,841,039 | | CITI | | 22,526 |
| 01/19/22 | | Mexican Pesos | | 17,444,985 | | U.S. Dollars | | 826,997 | | BNP | | 22,191 |
| 01/19/22 | | Swiss Francs | | 1,824,717 | | U.S. Dollars | | 1,982,255 | | CITI | | 21,291 |
| 01/19/22 | | U.S. Dollars | | 985,327 | | Australian Dollars | | 1,325,987 | | CITI | | 20,546 |
| 01/19/22 | | U.S. Dollars | | 546,389 | | Hungarian Forint | | 170,955,840 | | SC | | 20,453 |
| 01/18/22 | | Hungarian Forint | | 639,305,000 | | U.S. Dollars | | 1,946,785 | | CITI | | 20,190 |
| 01/19/22 | | U.S. Dollars | | 2,116,715 | | British Pounds | | 1,550,589 | | BNP | | 18,011 |
| 01/18/22 | | U.S. Dollars | | 599,060 | | Australian Dollars | | 800,000 | | CITI | | 16,986 |
| 01/19/22 | | British Pounds | | 603,440 | | U.S. Dollars | | 799,808 | | SC | | 16,940 |
| 01/19/22 | | U.S. Dollars | | 1,069,100 | | Polish Zloty | | 4,248,028 | | SS | | 16,168 |
| 01/19/22 | | Mexican Pesos | | 11,128,938 | | U.S. Dollars | | 527,666 | | RBC | | 14,070 |
See Notes to Financial Statements.
| Expiration Date | | Currency
Purchased | | Amount
of Currency
Purchased | | Currency
Sold | | Amount
of Currency
Sold | | Counter-
party | | Net Unrealized
Appreciation
(Depreciation) |
| 01/19/22 | | U.S. Dollars | | 457,374 | | Australian Dollars | | 609,385 | | UBS | | $ 13,988 |
| 01/19/22 | | U.S. Dollars | | 1,639,803 | | British Pounds | | 1,202,559 | | RBC | | 12,155 |
| 01/19/22 | | U.S. Dollars | | 753,736 | | Canadian Dollars | | 938,880 | | RBC | | 11,524 |
| 01/19/22 | | U.S. Dollars | | 288,290 | | Russian Rubles | | 20,871,183 | | BNP | | 10,789 |
| 01/19/22 | | Canadian Dollars | | 977,109 | | U.S. Dollars | | 763,764 | | CITI | | 8,669 |
| 01/18/22 | | U.S. Dollars | | 3,991,475 | | Taiwan Dollars | | 110,204,629 | | CITI | | 8,353 |
| 01/19/22 | | New Zealand Dollars | | 1,134,996 | | U.S. Dollars | | 769,014 | | CITI | | 8,150 |
| 01/19/22 | | Euro | | 765,567 | | U.S. Dollars | | 864,611 | | CITI | | 7,329 |
| 01/19/22 | | Euro | | 582,366 | | U.S. Dollars | | 656,072 | | BNP | | 7,213 |
| 01/19/22 | | Brazilian Reals | | 4,521,270 | | U.S. Dollars | | 801,257 | | SC | | 6,714 |
| 01/19/22 | | Swedish Kronor | | 7,319,859 | | U.S. Dollars | | 803,629 | | SS | | 6,552 |
| 01/19/22 | | U.S. Dollars | | 359,144 | | New Zealand Dollars | | 516,418 | | RBC | | 5,538 |
| 01/19/22 | | Euro | | 674,626 | | U.S. Dollars | | 763,000 | | SC | | 5,365 |
| 01/19/22 | | U.S. Dollars | | 156,326 | | Swedish Kronor | | 1,365,893 | | RBC | | 5,145 |
| 01/19/22 | | Czech Republic Koruna | | 16,304,593 | | U.S. Dollars | | 740,774 | | CITI | | 4,117 |
| 01/19/22 | | Czech Republic Koruna | | 9,393,086 | | U.S. Dollars | | 425,203 | | SC | | 3,929 |
| 01/19/22 | | Polish Zloty | | 417,611 | | U.S. Dollars | | 99,769 | | SC | | 3,742 |
| 01/19/22 | | Swedish Kronor | | 10,434,759 | | U.S. Dollars | | 1,151,438 | | CITI | | 3,508 |
| 01/19/22 | | Australian Dollars | | 137,992 | | U.S. Dollars | | 97,275 | | SC | | 3,128 |
| 01/19/22 | | U.S. Dollars | | 146,151 | | Euro | | 125,897 | | SC | | 2,761 |
| 01/19/22 | | Norwegian Kroner | | 728,807 | | U.S. Dollars | | 79,990 | | SC | | 2,738 |
| 01/19/22 | | U.S. Dollars | | 907,387 | | Canadian Dollars | | 1,144,552 | | SC | | 2,585 |
| 01/19/22 | | Mexican Pesos | | 2,140,706 | | U.S. Dollars | | 101,647 | | CITI | | 2,559 |
| 01/19/22 | | Brazilian Reals | | 1,467,624 | | U.S. Dollars | | 260,140 | | CITI | | 2,131 |
| 01/19/22 | | U.S. Dollars | | 75,601 | | Polish Zloty | | 300,000 | | UBS | | 1,241 |
| 01/19/22 | | U.S. Dollars | | 154,441 | | British Pounds | | 113,248 | | CITI | | 1,161 |
| 01/19/22 | | Swiss Francs | | 142,513 | | U.S. Dollars | | 155,487 | | SC | | 993 |
| 01/19/22 | | Swiss Francs | | 48,044 | | U.S. Dollars | | 51,815 | | BNP | | 937 |
| 01/19/22 | | U.S. Dollars | | 95,526 | | Japanese Yen | | 10,879,284 | | SC | | 934 |
| 01/18/22 | | Brazilian Reals | | 593,000 | | U.S. Dollars | | 105,261 | | CITI | | 736 |
| 01/19/22 | | Czech Republic Koruna | | 2,300,136 | | U.S. Dollars | | 104,441 | | RBC | | 643 |
| 01/19/22 | | U.S. Dollars | | 35,458 | | Polish Zloty | | 140,864 | | BNP | | 543 |
| 01/19/22 | | British Pounds | | 69,049 | | U.S. Dollars | | 93,408 | | SS | | 49 |
| 01/19/22 | | U.S. Dollars | | 10 | | Chilean Pesos | | 7,984 | | CITI | | —* |
| Subtotal Appreciation | | | | | | | | | | $7,434,119 |
| 01/19/22 | | U.S. Dollars | | 240 | | South Korean Won | | 288,311 | | SC | | $ (2) |
| 01/19/22 | | South African Rand | | 1,403 | | U.S. Dollars | | 93 | | RBC | | (5) |
| 01/19/22 | | U.S. Dollars | | 521 | | Mexican Pesos | | 10,990 | | SS | | (14) |
| 01/19/22 | | U.S. Dollars | | 20,452 | | Czech Republic Koruna | | 450,000 | | UBS | | (106) |
| 01/19/22 | | U.S. Dollars | | 101,308 | | British Pounds | | 75,066 | | SS | | (292) |
| 01/19/22 | | U.S. Dollars | | 95,142 | | New Zealand Dollars | | 140,145 | | SS | | (820) |
| 01/19/22 | | U.S. Dollars | | 139,133 | | Euro | | 123,313 | | SS | | (1,314) |
| 01/19/22 | | South African Rand | | 435,791 | | U.S. Dollars | | 28,743 | | BNP | | (1,472) |
| 01/18/22 | | U.S. Dollars | | 79,665 | | Mexican Pesos | | 1,667,393 | | GSC | | (1,515) |
| 01/19/22 | | Polish Zloty | | 388,709 | | U.S. Dollars | | 97,866 | | CITI | | (1,519) |
| 01/19/22 | | Japanese Yen | | 10,972,867 | | U.S. Dollars | | 96,946 | | SS | | (1,540) |
| 01/19/22 | | Euro | | 433,855 | | British Pounds | | 366,387 | | SC | | (1,762) |
| 01/19/22 | | U.S. Dollars | | 99,798 | | Swiss Francs | | 92,618 | | SS | | (1,897) |
| 01/19/22 | | Polish Zloty | | 544,827 | | U.S. Dollars | | 137,001 | | SC | | (1,959) |
| 01/19/22 | | U.S. Dollars | | 99,451 | | British Pounds | | 75,112 | | SC | | (2,212) |
| 01/19/22 | | U.S. Dollars | | 435,892 | | Euro | | 385,133 | | SC | | (2,755) |
| 01/19/22 | | New Zealand Dollars | | 112,256 | | U.S. Dollars | | 80,412 | | SC | | (3,547) |
| 01/19/22 | | U.S. Dollars | | 135,444 | | Mexican Pesos | | 2,858,984 | | BNP | | (3,726) |
| 01/19/22 | | Euro | | 200,000 | | U.S. Dollars | | 231,639 | | RBC | | (3,849) |
| 01/19/22 | | U.S. Dollars | | 119,456 | | Brazilian Reals | | 690,429 | | BNP | | (3,926) |
See Notes to Financial Statements.
SCHEDULE OF INVESTMENTS (Continued)
| Expiration Date | | Currency
Purchased | | Amount
of Currency
Purchased | | Currency
Sold | | Amount
of Currency
Sold | | Counter-
party | | Net Unrealized
Appreciation
(Depreciation) |
| 01/19/22 | | Australian Dollars | | 275,151 | | U.S. Dollars | | 204,364 | | SC | | $ (4,165) |
| 01/19/22 | | Hungarian Forint | | 36,669,187 | | U.S. Dollars | | 117,244 | | RBC | | (4,433) |
| 01/19/22 | | British Pounds | | 500,000 | | U.S. Dollars | | 681,798 | | RBC | | (5,054) |
| 01/18/22 | | Australian Dollars | | 3,163,635 | | U.S. Dollars | | 2,307,153 | | CITI | | (5,316) |
| 01/19/22 | | British Pounds | | 588,908 | | U.S. Dollars | | 802,405 | | UBS | | (5,325) |
| 01/19/22 | | British Pounds | | 612,588 | | U.S. Dollars | | 834,529 | | SS | | (5,398) |
| 01/18/22 | | Euro | | 782,670 | | Polish Zloty | | 3,620,000 | | CITI | | (5,928) |
| 01/19/22 | | U.S. Dollars | | 412,756 | | Swiss Francs | | 382,246 | | CITI | | (6,952) |
| 01/19/22 | | Canadian Dollars | | 500,526 | | U.S. Dollars | | 404,868 | | UBS | | (9,187) |
| 01/19/22 | | U.S. Dollars | | 1,199,103 | | Euro | | 1,060,918 | | CITI | | (9,227) |
| 01/19/22 | | Norwegian Kroner | | 3,096,314 | | U.S. Dollars | | 362,281 | | BNP | | (10,810) |
| 01/19/22 | | Polish Zloty | | 3,151,405 | | U.S. Dollars | | 793,114 | | SS | | (11,994) |
| 01/19/22 | | Canadian Dollars | | 738,857 | | U.S. Dollars | | 598,048 | | BNP | | (13,960) |
| 01/19/22 | | Japanese Yen | | 115,825,811 | | U.S. Dollars | | 1,021,229 | | UBS | | (14,155) |
| 01/19/22 | | Canadian Dollars | | 1,080,875 | | U.S. Dollars | | 868,755 | | SS | | (14,292) |
| 01/19/22 | | Polish Zloty | | 3,706,086 | | U.S. Dollars | | 933,191 | | RBC | | (14,587) |
| 01/19/22 | | U.S. Dollars | | 742,525 | | British Pounds | | 559,805 | | CITI | | (15,164) |
| 01/19/22 | | Euro | | 684,073 | | U.S. Dollars | | 794,656 | | CITI | | (15,532) |
| 01/19/22 | | Swiss Francs | | 6,078,943 | | U.S. Dollars | | 6,690,609 | | BNP | | (15,909) |
| 01/19/22 | | U.S. Dollars | | 837,849 | | Australian Dollars | | 1,174,977 | | BNP | | (17,058) |
| 01/18/22 | | South Korean Won | | 3,422,044,000 | | U.S. Dollars | | 2,893,759 | | CITI | | (17,172) |
| 01/19/22 | | British Pounds | | 895,932 | | U.S. Dollars | | 1,230,151 | | CITI | | (17,519) |
| 01/19/22 | | New Zealand Dollars | | 929,524 | | U.S. Dollars | | 655,919 | | CITI | | (19,448) |
| 01/19/22 | | U.S. Dollars | | 1,146,396 | | Swiss Francs | | 1,062,973 | | UBS | | (20,752) |
| 01/18/22 | | Russian Rubles | | 105,720,000 | | U.S. Dollars | | 1,427,383 | | GSC | | (21,616) |
| 01/18/22 | | Hungarian Forint | | 629,506,000 | | Euro | | 1,721,421 | | CITI | | (23,742) |
| 01/18/22 | | U.S. Dollars | | 5,868,246 | | Chinese Offshore Yuan | | 37,511,000 | | CITI | | (24,530) |
| 01/19/22 | | U.S. Dollars | | 2,070,489 | | Czech Republic Koruna | | 45,900,141 | | BNP | | (26,501) |
| 01/19/22 | | U.S. Dollars | | 1,065,811 | | Mexican Pesos | | 22,528,873 | | SC | | (30,851) |
| 01/19/22 | | Canadian Dollars | | 1,649,951 | | U.S. Dollars | | 1,335,388 | | CITI | | (31,053) |
| 01/19/22 | | Swedish Kronor | | 6,913,838 | | U.S. Dollars | | 804,922 | | UBS | | (39,680) |
| 01/19/22 | | South African Rand | | 11,639,916 | | U.S. Dollars | | 768,669 | | SC | | (40,250) |
| 01/19/22 | | U.S. Dollars | | 4,067,400 | | New Zealand Dollars | | 6,000,000 | | UBS | | (40,966) |
| 01/18/22 | | British Pounds | | 3,769,249 | | U.S. Dollars | | 5,143,676 | | GSC | | (42,032) |
| 01/19/22 | | Australian Dollars | | 4,202,672 | | U.S. Dollars | | 3,101,433 | | BNP | | (43,590) |
| 01/19/22 | | Hungarian Forint | | 373,386,382 | | U.S. Dollars | | 1,192,872 | | SS | | (44,169) |
| 01/19/22 | | U.S. Dollars | | 2,266,568 | | Chinese Yuan | | 14,763,741 | | SS | | (49,729) |
| 01/19/22 | | Norwegian Kroner | | 15,996,502 | | U.S. Dollars | | 1,867,108 | | SC | | (51,305) |
| 01/19/22 | | Norwegian Kroner | | 14,916,230 | | U.S. Dollars | | 1,745,813 | | CITI | | (52,635) |
| 01/18/22 | | Canadian Dollars | | 9,608,964 | | U.S. Dollars | | 7,650,145 | | CITI | | (53,969) |
| 01/19/22 | | Russian Rubles | | 173,934,394 | | U.S. Dollars | | 2,375,660 | | SC | | (63,039) |
| 01/19/22 | | New Zealand Dollars | | 2,498,746 | | U.S. Dollars | | 1,775,305 | | BNP | | (64,345) |
| 01/19/22 | | Australian Dollars | | 5,867,449 | | U.S. Dollars | | 4,334,613 | | CITI | | (65,487) |
| 01/19/22 | | British Pounds | | 10,512,411 | | U.S. Dollars | | 14,302,648 | | SC | | (74,232) |
| 01/19/22 | | Japanese Yen | | 637,956,674 | | U.S. Dollars | | 5,629,207 | | CITI | | (82,349) |
| 01/19/22 | | Japanese Yen | | 660,162,753 | | U.S. Dollars | | 5,827,590 | | RBC | | (87,656) |
| 01/19/22 | | New Zealand Dollars | | 8,324,722 | | U.S. Dollars | | 5,788,029 | | SS | | (87,861) |
| 01/19/22 | | Euro | | 4,922,992 | | U.S. Dollars | | 5,696,926 | | BNP | | (89,895) |
| 01/19/22 | | U.S. Dollars | | 6,061,199 | | Swiss Francs | | 5,612,131 | | RBC | | (100,940) |
| 01/19/22 | | Swedish Kronor | | 27,790,863 | | U.S. Dollars | | 3,177,120 | | SS | | (101,154) |
| 01/18/22 | | U.S. Dollars | | 11,430,449 | | Euro | | 10,132,000 | | CITI | | (109,132) |
| 01/19/22 | | Canadian Dollars | | 10,543,869 | | U.S. Dollars | | 8,453,609 | | SC | | (118,371) |
| 01/19/22 | | Japanese Yen | | 1,118,624,798 | | U.S. Dollars | | 9,847,437 | | SC | | (121,302) |
| 01/19/22 | | Australian Dollars | | 11,902,147 | | U.S. Dollars | | 8,783,547 | | SS | | (123,604) |
| 01/19/22 | | Swedish Kronor | | 33,209,674 | | U.S. Dollars | | 3,801,129 | | CITI | | (125,395) |
| 01/19/22 | | Norwegian Kroner | | 43,623,989 | | U.S. Dollars | | 5,106,112 | | RBC | | (154,244) |
See Notes to Financial Statements.
| Expiration Date | | Currency
Purchased | | Amount
of Currency
Purchased | | Currency
Sold | | Amount
of Currency
Sold | | Counter-
party | | Net Unrealized
Appreciation
(Depreciation) |
| 01/19/22 | | U.S. Dollars | | 9,648,760 | | Swiss Francs | | 8,949,976 | | SC | | $ (178,345) |
| 01/18/22 | | Japanese Yen | | 3,079,952,000 | | U.S. Dollars | | 27,133,129 | | CITI | | (354,012) |
| 01/19/22 | | Turkish Lira | | 11,918,698 | | U.S. Dollars | | 1,260,272 | | SS | | (374,496) |
| 01/19/22 | | Euro | | 26,860,624 | | U.S. Dollars | | 31,087,817 | | SS | | (494,967) |
| 01/18/22 | | Euro | | 40,566,940 | | U.S. Dollars | | 47,026,110 | | CITI | | (823,437) |
| 01/19/22 | | Euro | | 47,514,435 | | U.S. Dollars | | 54,990,831 | | UBS | | (874,368) |
| 01/19/22 | | Euro | | 138,800,104 | | U.S. Dollars | | 160,640,602 | | SC | | (2,554,524) |
| Subtotal Depreciation | | | | | | | | | | $(8,153,342) |
| Total Forward Foreign Currency Contracts outstanding at December 31, 2021 | | | | $ (719,223) |
* Amount rounds to less than one dollar.
Swap Agreements outstanding at December 31, 2021:
| Reference Obligation | | Fixed
Deal
(Pay) Rate | | Maturity
Date | | Currency | | Notional
Amount | | Market Value | | Upfront
Premiums
Paid/
(Received) | | Unrealized
Appreciation
(Depreciation) |
| Centrally Cleared Credit Default Swaps on Credit Indexes—Buy Protection | | | | | | | | | | | | | | |
| iTraxx Europe & Crossover Series 35 (Pay Quarterly) | | (5.00)% | | 12/20/2026 | | EUR | | 14,077,000 | | $(1,926,633) | | $(1,909,386) | | $(17,247) |
| | | $(1,926,633) | | $(1,909,386) | | $(17,247) |
| Pay Rate Index/Pay Rate | | Receive
Rate/Receive
Rate Index | | Maturity
Date | | Currency | | Notional
Amount | | Market Value | | Upfront
Premiums
Paid/
(Received) | | Unrealized
Appreciation
(Depreciation) |
| Centrally Cleared Interest Rate Swaps | | | | | | | | | | | | | | |
| US CPI Urban Consumers (Upon termination) | | 2.50%
(Upon
termination) | | 4/28/2026 | | USD | | 3,690,000 | | $(225,429) | | $(263,537) | | $38,108 |
| | | $(225,429) | | $(263,537) | | $38,108 |
See Notes to Financial Statements.
SCHEDULE OF INVESTMENTS (Continued)
VALUATION HIERARCHY
The following is a summary of the inputs used, as of December 31, 2021, in valuing the Fund’s investments carried at fair value:
| | Total
Value | | Level 1
Quoted Prices | | Level 2
Other Significant
Observable Inputs | | Level 3
Significant
Unobservable Inputs |
| Assets: | | | | | | | |
| Investments in Securities: | | | | | | | |
| Asset-Backed Securities | $ 14,131,270 | | $ — | | $ 14,131,270 | | $ — |
| Common Stocks | 1,511,217 | | 1,511,217 | | — | | — |
| Corporate Bonds | 124,294,896 | | — | | 124,294,896 | | — |
| Foreign Bonds: | | | | | | | |
| South Korea | 391,275 | | — | | 61,058 | | 330,217 |
| Other ^^ | 246,692,713 | | — | | 246,692,713 | | — |
| Total Foreign Bonds | 247,083,988 | | — | | 246,753,771 | | 330,217 |
| Foreign Common Stocks | 24,188 | | 24,188 | | — | | — |
| Foreign Preferred Stock | 116,301 | | 116,301 | | — | | — |
| Loan Agreements | 15,462,570 | | — | | 15,462,570 | | — |
| Money Market Funds | 46,004,910 | | 46,004,910 | | — | | — |
| Mortgage-Backed Securities | 32,137,086 | | — | | 32,137,086 | | — |
| Mutual Funds | 6,806,800 | | 6,806,800 | | — | | — |
| Preferred Stocks | 803,818 | | 803,818 | | — | | — |
| Purchased Options: | | | | | | | |
| Put Options | 5,397 | | 5,397 | | — | | — |
| U.S. Treasury Obligations | 144,397,988 | | — | | 144,397,988 | | — |
| Total Assets - Investments in Securities | $632,780,429 | | $55,272,631 | | $577,177,581 | | $330,217 |
| Other Financial Instruments*** | | | | | | | |
| Forward Foreign Currency Contracts | $ 7,434,119 | | $ — | | $ 7,434,119 | | $ — |
| Futures Contracts | 346,212 | | 346,212 | | — | | — |
| Swap Agreements | 38,108 | | — | | 38,108 | | — |
| Total Assets - Other Financial Instruments | $ 7,818,439 | | $ 346,212 | | $ 7,472,227 | | $ — |
| Liabilities: | | | | | | | |
| Other Financial Instruments*** | | | | | | | |
| Forward Foreign Currency Contracts | $ (8,153,342) | | $ — | | $ (8,153,342) | | $ — |
| Futures Contracts | (1,110,731) | | (1,110,731) | | — | | — |
| Swap Agreements | (17,247) | | — | | (17,247) | | — |
| Total Liabilities - Other Financial Instruments | $ (9,281,320) | | $ (1,110,731) | | $ (8,170,589) | | $ — |
| ^^ | Classifications as defined in the Schedule of Investments. |
| *** | Other financial instruments are derivative instruments, such as futures contracts, forward contracts and swap agreements, which are valued at the unrealized appreciation (depreciation) on the investment. Further details regarding the value of these investments can be found in the preceding "Futures Contracts outstanding", "Forward Foreign Currency Contracts outstanding" and "Swap Agreements outstanding" disclosures. |
Management has determined that the amount of transfers between Level 3 and Level 2 compared to total net assets is not material; therefore, the amount of transfers between Level 3 and Level 2 is not shown for the year ended December 31, 2021.
Management has determined that the amount of Level 3 securities compared to total net assets is not material; therefore, the reconciliation of Level 3 securities and assumptions is not shown for the year ended December 31, 2021.
See Notes to Financial Statements.
(This page intentionally left blank)
| STATEMENTS OF ASSETS AND LIABILITIES | December 31, 2021 |
| | Money
Market Fund | | Low-Duration
Bond Fund |
| Assets | | | |
| Investments in securities of unaffiliated issuers, at value | $1,146,985,819 | | $1,071,356,879 |
| Investments in repurchase agreements, at value | 496,000,000 | | — |
| Investments in securities of affiliated issuers, at value | — | | 28,508,385 |
| Total investments, at value(1), (2) | 1,642,985,819 | | 1,099,865,264 |
| Cash | — | | 4,524 |
| Cash collateral for derivatives | — | | 1,694,766 |
| Deposits with broker for futures contracts | — | | 2,188,232 |
| Foreign currency(3) | — | | 1,093,112 |
| Upfront premiums paid from swap agreements | — | | — |
| Receivables: | | | |
| Dividends and reclaims | — | | 1,055 |
| Interest | 196,128 | | 2,880,844 |
| Securities lending | — | | 5,544 |
| From advisor | 44,218 | | — |
| Investment securities sold | — | | 7,153,360 |
| Fund shares sold | 20,451,813 | | 148,856 |
| Variation margin on centrally cleared swaps | — | | — |
| Variation margin on futures contracts | — | | — |
| Unrealized appreciation on foreign currency exchange contracts | — | | 393,338 |
| Unrealized appreciation on swap agreements | — | | 3,039 |
| Prepaid expenses and other assets | 28,907 | | 21,455 |
| Total Assets | 1,663,706,885 | | 1,115,453,389 |
| Liabilities | | | |
| TBA sale commitments, at value(4) | — | | — |
| Options written, at value(5) | — | | 29,906 |
| Upfront premiums received from swap agreements | — | | 1,038,272 |
| Unrealized depreciation on foreign currency exchange contracts | — | | 832,952 |
| Unrealized depreciation on swap agreements | — | | — |
| Collateral held for securities on loan, at value | — | | 8,092,328 |
| Collateral from counterparty | — | | 176,296 |
| Payables: | | | |
| Investment securities purchased | 53,859,061 | | 31,802,452 |
| Fund shares redeemed | 5,754,525 | | 31,571 |
| Variation margin on centrally cleared swaps | — | | 9,332 |
| Variation margin on futures contracts | — | | 57,576 |
| Accrued expenses: | | | |
| Investment advisory fees | — | | 264,136 |
| Shareholder servicing fees | 96,774 | | 50,580 |
| Trustee fees | 1,941 | | 616 |
| Other expenses | 132,801 | | 168,098 |
| Total Liabilities | 59,845,102 | | 42,554,115 |
| Net Assets | $1,603,861,783 | | $1,072,899,274 |
| Net Assets Consist of: | | | |
| Paid-in-capital | $1,603,852,602 | | $1,078,603,286 |
| Distributable earnings (loss) | 9,181 | | (5,704,012) |
| Net Assets | $1,603,861,783 | | $1,072,899,274 |
| Net Asset Value: | | | |
| $0.001 par value, unlimited shares authorized | | | |
| Net assets applicable to the Institutional Class | $1,154,219,213 | | $ 835,297,137 |
| Institutional shares outstanding | 1,154,180,997 | | 62,222,671 |
| Net asset value, offering and redemption price per Institutional share | $ 1.00 | | $ 13.42 |
| Net assets applicable to the Investor Class | $ 449,642,570 | | $ 237,602,137 |
| Investor shares outstanding | 449,583,791 | | 17,685,327 |
| Net asset value, offering and redemption price per Investor share | $ 1.00 | | $ 13.43 |
| | | |
| (1)Investments in securities of unaffiliated issuers, at cost | $1,146,985,819 | | $1,072,880,889 |
| Investments in repurchase agreements, at cost | 496,000,000 | | — |
| Investments in securities of affiliated issuers, at cost | — | | 28,508,385 |
| Total investments, at cost | $1,642,985,819 | | $1,101,389,274 |
| (2)Includes securities loaned of: | $ — | | $ 10,974,907 |
| (3)Foreign currency, at cost | $ — | | $ 1,080,366 |
| (4)TBA sale commitments, at cost | $ — | | $ — |
| (5)Premiums received on options written | $ — | | $ 105,645 |
See Notes to Financial Statements.
Medium-Duration
Bond Fund | | Global
Bond Fund |
| | | |
| $2,327,197,777 | | $599,771,423 |
| 166,900,000 | | — |
| 133,664,253 | | 33,009,006 |
| 2,627,762,030 | | 632,780,429 |
| — | | 199,457 |
| 20,370,514 | | 7,478,985 |
| 5,775,382 | | 1,825,869 |
| 7,542,522 | | 7,704,275 |
| 6,932,856 | | — |
| | | |
| 129,097 | | 48,283 |
| 11,695,409 | | 4,976,248 |
| 10,311 | | 2,841 |
| — | | — |
| 279,935,948 | | — |
| 231,524 | | 233,384 |
| — | | 5,331 |
| 311,199 | | — |
| 580,030 | | 7,434,119 |
| 4,754 | | — |
| 33,795 | | 14,004 |
| 2,961,315,371 | | 662,703,225 |
| | | |
| 64,070,311 | | — |
| 928,304 | | — |
| 1,797,590 | | 2,172,924 |
| 2,376,296 | | 8,153,342 |
| 263,626 | | — |
| 27,825,685 | | 12,778,817 |
| 9,419,392 | | 5,830,000 |
| | | |
| 443,527,200 | | 10,136,660 |
| 721,605 | | 43,603 |
| 333,855 | | — |
| — | | 175,882 |
| | | |
| 645,155 | | 248,131 |
| 97,448 | | 25,576 |
| 883 | | 338 |
| 340,711 | | 144,180 |
| 552,348,061 | | 39,709,453 |
| $2,408,967,310 | | $622,993,772 |
| | | |
| $2,398,206,139 | | $633,794,439 |
| 10,761,171 | | (10,800,667) |
| $2,408,967,310 | | $622,993,772 |
| | | |
| | | |
| $1,950,665,531 | | $502,292,045 |
| 129,670,832 | | 51,425,088 |
| $ 15.04 | | $ 9.77 |
| $ 458,301,779 | | $120,701,727 |
| 30,455,884 | | 12,410,557 |
| $ 15.05 | | $ 9.73 |
| | | |
| $2,301,731,164 | | $602,287,019 |
| 166,900,000 | | — |
| 133,664,253 | | 33,009,006 |
| $2,602,295,417 | | $635,296,025 |
| $ 56,108,216 | | $ 20,294,920 |
| $ 7,596,950 | | $ 7,846,299 |
| $ 63,990,125 | | $ — |
| $ 1,096,830 | | $ — |
See Notes to Financial Statements.
| STATEMENTS OF OPERATIONS | For the Year Ended December 31, 2021 |
| | Money
Market Fund | | Low-Duration
Bond Fund |
| Investment Income | | | |
| Dividends | $ — | | $ — |
| Interest | 1,298,157 | | 12,663,066 |
| Securities lending, net | — | | 98,668 |
| Less foreign taxes withheld | — | | (8,800) |
| Total Investment Income | 1,298,157 | | 12,752,934 |
| Expenses | | | |
| Investment advisory fees | 1,906,920 | | 3,112,327 |
| Transfer agent fees: | | | |
| Institutional shares | 4,552 | | 5,019 |
| Investor shares | 39,533 | | 20,063 |
| Custodian fees | 19,542 | | 128,173 |
| Shareholder servicing fees: | | | |
| Investor shares | 1,169,500 | | 600,946 |
| Accounting and administration fees | 304,832 | | 155,199 |
| Professional fees | 92,982 | | 130,984 |
| Shareholder reporting fees: | | | |
| Institutional shares | — | | 2,153 |
| Investor shares | — | | 15,404 |
| Trustees expenses | 11,133 | | 4,401 |
| Line of credit facility fees | 6,245 | | 3,892 |
| Other expenses | 118,924 | | 110,059 |
| Total Expenses | 3,674,163 | | 4,288,620 |
| Expenses waived/reimbursed(1) | (2,376,006) | | — |
| Net Expenses | 1,298,157 | | 4,288,620 |
| Net Investment Income | — | | 8,464,314 |
| Realized and Unrealized Gain (Loss) | | | |
| Net realized gain (loss) from: | | | |
| Investment securities | 20,629 | | 1,661,521 |
| Investment securities sold short | — | | — |
| Futures transactions | — | | 1,507,865 |
| Swap agreements | — | | (1,327,157) |
| Option contracts written | — | | 214,115 |
| Option contracts purchased | — | | (8,539) |
| Forward foreign currency contracts | — | | 1,588,941 |
| Foreign currency | — | | 137,265 |
| Net realized gain (loss) | 20,629 | | 3,774,011 |
| Net change in unrealized appreciation (depreciation) on: | | | |
| Investment securities | — | | (17,263,413) |
| Investment securities sold short | — | | — |
| Futures | — | | (2,231,095) |
| Swap agreements | — | | 1,033,875 |
| Option contracts written | — | | 57,046 |
| Option contracts purchased | — | | 1,458 |
| Forward foreign currency contracts | — | | 1,618,670 |
| Foreign currency | — | | 7,241 |
| Net change in unrealized appreciation (depreciation) | — | | (16,776,218) |
| Net Realized and Unrealized Gain (Loss) | 20,629 | | (13,002,207) |
| Net Increase (Decrease) in Net Assets Resulting from Operations | $ 20,629 | | $ (4,537,893) |
| |
| (1) | See Note 3c in Notes to Financial Statements. |
See Notes to Financial Statements.
Medium-Duration
Bond Fund | | Global
Bond Fund |
| | | |
| $ — | | $ 308,631 |
| 46,490,800 | | 19,525,232 |
| 145,156 | | 86,437 |
| (5,532) | | (70,257) |
| 46,630,424 | | 19,850,043 |
| | | |
| 7,486,411 | | 2,882,185 |
| | | |
| 5,278 | | 4,846 |
| 46,560 | | 28,565 |
| 335,001 | | 177,127 |
| | | |
| 1,136,899 | | 297,424 |
| 377,636 | | 95,580 |
| 116,636 | | 122,516 |
| | | |
| 1,517 | | 1,483 |
| 6,394 | | 4,896 |
| 5,947 | | 2,499 |
| 6,540 | | 2,682 |
| 206,354 | | 129,397 |
| 9,731,173 | | 3,749,200 |
| — | | — |
| 9,731,173 | | 3,749,200 |
| 36,899,251 | | 16,100,843 |
| | | |
| | | |
| (656,772) | | 6,128,089 |
| 1,190,090 | | — |
| (9,902,557) | | 3,997,426 |
| 320,479 | | (817,277) |
| 3,852,411 | | — |
| (3,848,072) | | (209,494) |
| 2,472,569 | | (5,852,985) |
| 180,297 | | (419,820) |
| (6,391,555) | | 2,825,939 |
| | | |
| (74,345,915) | | (33,682,849) |
| (4,443) | | — |
| 343,810 | | (968,762) |
| (1,961,832) | | 20,861 |
| (33,984) | | — |
| (21,609) | | 3,134 |
| (387,054) | | 1,725,567 |
| (201,618) | | (230,638) |
| (76,612,645) | | (33,132,687) |
| (83,004,200) | | (30,306,748) |
| $(46,104,949) | | $(14,205,905) |
See Notes to Financial Statements.
| STATEMENTS OF CHANGES IN NET ASSETS |
| | Money Market Fund |
| | For the Year Ended |
| | 12/31/21 | | 12/31/20 |
| | | | |
| Operations: | | | |
| Net investment income | $ — | | $ 5,470,866 |
| Net realized gain (loss) on investment securities, foreign currency and derivatives | 20,629 | | 14,329 |
| Net change in unrealized appreciation (depreciation) on investment securities, foreign currency and derivatives | — | | — |
| Net increase (decrease) in net assets resulting from operations | 20,629 | | 5,485,195 |
| Distributions to Shareholders: | | | |
| Institutional shares | — | | (4,317,024) |
| Investor shares | — | | (1,153,842) |
| Total distributions | — | | (5,470,866) |
| Capital Share Transactions: | | | |
| Proceeds from shares sold | | | |
| Institutional shares | 6,595,566,663 | | 6,163,830,444 |
| Investor shares | 478,461,978 | | 592,641,013 |
| Reinvestment of dividends and distributions | | | |
| Institutional shares | — | | 956,522 |
| Investor shares | — | | 1,146,594 |
| Total proceeds from shares sold and reinvested | 7,074,028,641 | | 6,758,574,573 |
| Value of shares redeemed | | | |
| Institutional shares | (6,609,506,460) | | (5,900,852,959) |
| Investor shares | (503,905,897) | | (510,679,541) |
| Total value of shares redeemed | (7,113,412,357) | | (6,411,532,500) |
| Net increase (decrease) from capital share transactions(1) | (39,383,716) | | 347,042,073 |
| Total increase (decrease) in net assets | (39,363,087) | | 347,056,402 |
| Net Assets: | | | |
| Beginning of Year | 1,643,224,870 | | 1,296,168,468 |
| End of Year | $ 1,603,861,783 | | $ 1,643,224,870 |
| |
| (1) | See Note 6 in Notes to Financial Statements. |
See Notes to Financial Statements.
| Low-Duration Bond Fund | | Medium-Duration Bond Fund |
| For the Year Ended | | For the Year Ended |
| 12/31/21 | | 12/31/20 | | 12/31/21 | | 12/31/20 |
| | | | | | | |
| | | | | | | |
| $ 8,464,314 | | $ 13,748,439 | | $ 36,899,251 | | $ 38,500,778 |
| 3,774,011 | | 11,196,237 | | (6,391,555) | | 68,842,443 |
| (16,776,218) | | 7,711,659 | | (76,612,645) | | 52,899,798 |
| (4,537,893) | | 32,656,335 | | (46,104,949) | | 160,243,019 |
| | | | | | | |
| (8,959,518) | | (13,268,366) | | (38,009,278) | | (75,595,690) |
| (1,796,689) | | (3,506,890) | | (7,677,777) | | (17,458,099) |
| (10,756,207) | | (16,775,256) | | (45,687,055) | | (93,053,789) |
| | | | | | | |
| | | | | | | |
| 167,502,457 | | 176,339,136 | | 459,996,914 | | 364,783,068 |
| 56,105,985 | | 89,879,934 | | 136,555,002 | | 178,590,044 |
| | | | | | | |
| 8,907,777 | | 13,190,460 | | 37,771,638 | | 75,272,959 |
| 1,796,053 | | 3,502,365 | | 7,443,560 | | 17,182,553 |
| 234,312,272 | | 282,911,895 | | 641,767,114 | | 635,828,624 |
| | | | | | | |
| (151,204,553) | | (141,363,518) | | (168,105,314) | | (277,633,544) |
| (57,675,217) | | (89,372,346) | | (88,866,964) | | (93,617,926) |
| (208,879,770) | | (230,735,864) | | (256,972,278) | | (371,251,470) |
| 25,432,502 | | 52,176,031 | | 384,794,836 | | 264,577,154 |
| 10,138,402 | | 68,057,110 | | 293,002,832 | | 331,766,384 |
| | | | | | | |
| 1,062,760,872 | | 994,703,762 | | 2,115,964,478 | | 1,784,198,094 |
| $1,072,899,274 | | $1,062,760,872 | | $2,408,967,310 | | $2,115,964,478 |
See Notes to Financial Statements.
| STATEMENTS OF CHANGES IN NET ASSETS |
| | Global Bond Fund |
| | For the Year Ended |
| | 12/31/21 | | 12/31/20 |
| | | | |
| Operations: | | | |
| Net investment income | $ 16,100,843 | | $ 17,127,875 |
| Net realized gain (loss) on investment securities, foreign currency and derivatives | 2,825,939 | | (6,807,750) |
| Net change in unrealized appreciation (depreciation) on investment securities, foreign currency and derivatives | (33,132,687) | | 20,298,840 |
| Net increase (decrease) in net assets resulting from operations | (14,205,905) | | 30,618,965 |
| Distributions to Shareholders: | | | |
| Institutional shares | (18,325,938) | | (7,088,527) |
| Investor shares | (4,199,565) | | (1,604,868) |
| Total distributions | (22,525,503) | | (8,693,395) |
| Capital Share Transactions: | | | |
| Proceeds from shares sold | | | |
| Institutional shares | 81,970,787 | | 46,411,542 |
| Investor shares | 32,131,805 | | 36,929,960 |
| Reinvestment of dividends and distributions | | | |
| Institutional shares | 18,310,684 | | 7,083,831 |
| Investor shares | 4,112,049 | | 1,575,516 |
| Total proceeds from shares sold and reinvested | 136,525,325 | | 92,000,849 |
| Value of shares redeemed | | | |
| Institutional shares | (29,454,921) | | (98,572,205) |
| Investor shares | (26,144,322) | | (46,644,841) |
| Total value of shares redeemed | (55,599,243) | | (145,217,046) |
| Net increase (decrease) from capital share transactions(1) | 80,926,082 | | (53,216,197) |
| Total increase (decrease) in net assets | 44,194,674 | | (31,290,627) |
| Net Assets: | | | |
| Beginning of Year | 578,799,098 | | 610,089,725 |
| End of Year | $622,993,772 | | $ 578,799,098 |
| |
| (1) | See Note 6 in Notes to Financial Statements. |
See Notes to Financial Statements.
| For a Share Outstanding For the Years Ending December 31, unless otherwise indicated | | | | | | Ratios to Average Net Assets | |
| | Net Asset
Value,
Beginning
of Year | Net Investment
Income# | Realized
and
Unrealized
Gain
(Loss) on
Investments | Total Income
From Investment
Operations | Dividends
from Net
Investment
Income | Distributions
from Net
Realized
Capital
Gains | Total
Distributions
Paid | Net Asset
Value,
End of
Year | Total
Return | Net Assets,
End of Year
(000) | Expenses,
Net | Expenses,
Gross | Investment
Income,
Net
| Portfolio
Turnover
Rate |
| Money Market Fund |
| Institutional Class |
| 2021 | $ 1.00 | $ — | $ —† | $ —† | $ — | $ — | $ — | $ 1.00 | —% | $1,154,219 | 0.07% | 0.14% | —% | N/A |
| 2020 | 1.00 | —† | —† | —† | —† | — | —† | 1.00 | 0.43 | 1,168,144 | 0.14 | 0.15 | 0.39 | N/A |
| 2019 | 1.00 | 0.02 | —† | 0.02 | (0.02) | — | (0.02) | 1.00 | 2.13 | 904,202 | 0.14 | 0.14 | 2.10 | N/A |
| 2018 | 1.00 | 0.02 | —† | 0.02 | (0.02) | — | (0.02) | 1.00 | 1.74 | 841,532 | 0.15 | 0.15 | 1.74 | N/A |
| 2017 | 1.00 | 0.01 | —† | 0.01 | (0.01) | —† | (0.01) | 1.00 | 0.76 | 268,948 | 0.17 | 0.17 | 0.77 | N/A |
| Investor Class |
| 2021 | $ 1.00 | $ — | $ —† | $ —† | $ — | $ — | $ — | $ 1.00 | —% | $ 449,643 | 0.08% | 0.41% | —% | N/A |
| 2020 | 1.00 | —† | —† | —† | —† | — | —† | 1.00 | 0.28 | 475,081 | 0.29 | 0.42 | 0.25 | N/A |
| 2019 | 1.00 | 0.02 | —† | 0.02 | (0.02) | — | (0.02) | 1.00 | 1.85 | 391,966 | 0.42 | 0.42 | 1.83 | N/A |
| 2018 | 1.00 | 0.01 | —† | 0.01 | (0.01) | — | (0.01) | 1.00 | 1.48 | 408,231 | 0.40 | 0.40 | 1.47 | N/A |
| 2017 | 1.00 | 0.01 | —† | 0.01 | (0.01) | —† | (0.01) | 1.00 | 0.51 | 894,563 | 0.42 | 0.42 | 0.52 | N/A |
| |
| Low-Duration Bond Fund |
| Institutional Class |
| 2021 | $13.62 | $0.12 | $(0.17) | $(0.05) | $(0.14) | $(0.01) | $(0.15) | $13.42 | (0.40)% | $ 835,297 | 0.34% | 0.34% | 0.85% | 304% |
| 2020 | 13.40 | 0.19 | 0.26 | 0.45 | (0.23) | — | (0.23) | 13.62 | 3.42 | 822,079 | 0.35 | 0.35 | 1.44 | 220 |
| 2019 | 13.21 | 0.32 | 0.20 | 0.52 | (0.33) | — | (0.33) | 13.40 | 3.99 | 761,737 | 0.35 | 0.35 | 2.39 | 525 |
| 2018 | 13.35 | 0.30 | (0.12) | 0.18 | (0.32) | — | (0.32) | 13.21 | 1.36 | 602,968 | 0.35 | 0.35 | 2.30 | 513 |
| 2017 | 13.34 | 0.21 | 0.01 | 0.22 | (0.21) | — | (0.21) | 13.35 | 1.69 | 592,325 | 0.35 | 0.36 | 1.60 | 102 |
| Investor Class |
| 2021 | $13.62 | $0.08 | $(0.17) | $(0.09) | $(0.09) | $(0.01) | $(0.10) | $13.43 | (0.65)% | $ 237,602 | 0.61% | 0.61% | 0.58% | 304% |
| 2020 | 13.40 | 0.16 | 0.26 | 0.42 | (0.20) | — | (0.20) | 13.62 | 3.16 | 240,682 | 0.62 | 0.62 | 1.17 | 220 |
| 2019 | 13.21 | 0.29 | 0.20 | 0.49 | (0.30) | — | (0.30) | 13.40 | 3.71 | 232,967 | 0.62 | 0.62 | 2.16 | 525 |
| 2018 | 13.35 | 0.27 | (0.13) | 0.14 | (0.28) | — | (0.28) | 13.21 | 1.10 | 305,475 | 0.61 | 0.61 | 2.03 | 513 |
| 2017 | 13.34 | 0.18 | 0.01 | 0.19 | (0.18) | — | (0.18) | 13.35 | 1.42 | 310,208 | 0.62 | 0.63 | 1.33 | 102 |
| |
| Medium-Duration Bond Fund |
| Institutional Class |
| 2021 | $15.65 | $0.24 | $(0.56) | $(0.32) | $(0.27) | $(0.02) | $(0.29) | $15.04 | (2.01)% | $1,950,666 | 0.36% | 0.36% | 1.60% | 347% |
| 2020 | 15.05 | 0.33 | 1.03 | 1.36 | (0.37) | (0.39) | (0.76) | 15.65 | 9.13 | 1,694,858 | 0.38 | 0.38 | 2.12 | 444 |
| 2019 | 14.28 | 0.43 | 0.96 | 1.39 | (0.42) | (0.20) | (0.62) | 15.05 | 9.81 | 1,476,286 | 0.39 | 0.39 | 2.90 | 433 |
| 2018 | 14.75 | 0.40 | (0.47) | (0.07) | (0.40) | — | (0.40) | 14.28 | (0.46) | 1,240,967 | 0.37 | 0.38 | 2.76 | 431 |
| 2017 | 14.46 | 0.34 | 0.26 | 0.60 | (0.31) | — | (0.31) | 14.75 | 4.13 | 1,138,597 | 0.39 | 0.40 | 2.32 | 387 |
| Investor Class |
| 2021 | $15.66 | $0.20 | $(0.56) | $(0.36) | $(0.23) | $(0.02) | $(0.25) | $15.05 | (2.27)% | $ 458,302 | 0.62% | 0.62% | 1.33% | 347% |
| 2020 | 15.06 | 0.29 | 1.02 | 1.31 | (0.32) | (0.39) | (0.71) | 15.66 | 8.84 | 421,106 | 0.65 | 0.65 | 1.84 | 444 |
| 2019 | 14.28 | 0.39 | 0.97 | 1.36 | (0.38) | (0.20) | (0.58) | 15.06 | 9.58 | 307,912 | 0.65 | 0.65 | 2.63 | 433 |
| 2018 | 14.75 | 0.36 | (0.47) | (0.11) | (0.36) | — | (0.36) | 14.28 | (0.72) | 270,107 | 0.64 | 0.65 | 2.49 | 431 |
| 2017 | 14.46 | 0.30 | 0.26 | 0.56 | (0.27) | — | (0.27) | 14.75 | 3.93 | 269,362 | 0.66 | 0.67 | 2.05 | 387 |
| |
| Global Bond Fund |
| Institutional Class |
| 2021 | $10.38 | $0.27 | $(0.51) | $(0.24) | $(0.21) | $(0.16) | $(0.37) | $ 9.77 | (2.31)% | $ 502,292 | 0.56% | 0.56% | 2.69% | 57% |
| 2020 | 10.01 | 0.29 | 0.23 | 0.52 | (0.07) | (0.08) | (0.15) | 10.38 | 5.28 | 460,852 | 0.56 | 0.56 | 2.91 | 95 |
| 2019 | 9.32 | 0.42 | 0.62 | 1.04 | (0.35) | — | (0.35) | 10.01 | 11.31 | 486,865 | 0.54 | 0.54 | 4.30 | 59 |
| 2018 | 10.08 | 0.43 | (0.88) | (0.45) | (0.31) | — | (0.31) | 9.32 | (4.51) | 409,257 | 0.53 | 0.55 | 4.50 | 23 |
| 2017 | 9.68 | 0.42 | 0.35 | 0.77 | (0.37) | — | (0.37) | 10.08 | 8.09 | 405,411 | 0.56 | 0.58 | 4.18 | 31 |
| Investor Class |
| 2021 | $10.34 | $0.24 | $(0.50) | $(0.26) | $(0.19) | $(0.16) | $(0.35) | $ 9.73 | (2.53)% | $ 120,702 | 0.85% | 0.85% | 2.40% | 57% |
| 2020 | 10.00 | 0.26 | 0.22 | 0.48 | (0.06) | (0.08) | (0.14) | 10.34 | 4.93 | 117,947 | 0.85 | 0.85 | 2.64 | 95 |
| 2019 | 9.31 | 0.40 | 0.62 | 1.02 | (0.33) | — | (0.33) | 10.00 | 11.03 | 123,225 | 0.82 | 0.82 | 4.02 | 59 |
| 2018 | 10.07 | 0.41 | (0.88) | (0.47) | (0.29) | — | (0.29) | 9.31 | (4.73) | 114,418 | 0.80 | 0.82 | 4.22 | 23 |
| 2017 | 9.68 | 0.39 | 0.35 | 0.74 | (0.35) | — | (0.35) | 10.07 | 7.69 | 123,120 | 0.83 | 0.85 | 3.89 | 31 |
| | | | | | | | | | | | | | | |
| # | Calculated using the average shares outstanding method. |
| † | Amount represents less than $0.005 per share. |
See Notes to Financial Statements.
Defensive Market Strategies® Fund (Unaudited)
The Fund combines multiple investment strategies that in aggregate seek to provide long-term capital appreciation with reduced volatility compared to the U.S. equity markets.
For 2021, the Investor Class of the Fund underperformed its composite benchmark of 50% S&P 500® Index and 50% Bloomberg 1-3 Month US Treasury Bill Index (11.79% versus 13.70%). In a banner year for U.S. equities, the Fund underperformed the S&P 500® Index by 16.92%, net of fees. The Fund’s relative underperformance to the S&P 500® Index was due to the Fund’s materially lower market sensitivity and volatility, as by design, compared to the S&P 500® Index.
The Fund allocated its assets among three of its four principal investment strategies – long-only equity, options equity and convertible bond. For the calendar year of 2021, all three of these investment strategies contributed positively to Fund returns. The Fund did not allocate assets to the long-short equity strategy during the year.
The long-only equity strategy was the largest positive contributor to benchmark-relative performance, but generally underperformed broader equity indexes due to its lower-risk orientation.
The convertible bond strategy detracted from the Fund’s benchmark-relative performance, as the broader convertibles market took a pause after a fierce rally in the prior year.
During 2021, the Fund sold equity options to generate income. The selling of equity options contributed to performance. In addition, currency forwards were used to hedge foreign currency exposure back to the U.S. dollar and were slightly additive to the Fund’s absolute performance.
This Fund may be suitable for investors who have a medium- to long-term investment horizon, possess a moderate tolerance for risk and seek to participate in the return potential of equities at a slightly lower risk level than an all equity portfolio. In addition to the interest and credit rate risks associated with fixed income securities, a convertible security’s market value also tends to reflect the market price of the common stock of the issuing company when that stock price approaches or is greater than the convertible security’s “conversion price.” This Fund is subject to interest rate risk, meaning, when interest rates rise, the value of the existing fixed income securities decrease and vice versa. Securities of foreign issuers may be negatively impacted by political events, economic conditions or inefficient, illiquid or unregulated markets in foreign countries, and they also may be subject to inadequate regulatory or accounting standards, which may increase investment risk. To the extent that the investment adviser or sub-adviser misjudge current market conditions, the Fund’s volatility may be amplified by its use of short sales and derivatives and by its ability to select sub-advisers to allocate assets. Derivatives involve different risks from, and in some respects greater risks than, those associated with investing directly in securities, currencies or other instruments. Derivatives may be illiquid or less liquid, volatile, difficult to price and leveraged, so small changes in the value of the underlying instruments may produce disproportionate losses to the Fund. Short sales involve selling a security the Fund does not own in anticipation that the security will decline in price. Short sales expose the Fund to the risk that it will be required to buy the security sold short (also known as “covering” the short position) at a time when the security has appreciated in value, thus resulting in a loss to the Fund. The Fund’s potential loss on a short position is limited only by the maximum attainable price of the security, less the price at which the security was sold by the Fund. Therefore, in theory, stocks sold short have unlimited risk. The Fund’s use of short sales in effect leverages the Fund. The use of leverage may magnify the Fund’s gains or losses, and leverage also creates interest expense that may lower the Fund’s overall returns. It is possible to lose money by investing in the Fund.
Defensive Market Strategies® Fund (Unaudited)
At December 31, 2021, the portfolio holdings of the Fund, as a percentage of net assets, is shown in the following table. Portfolio holdings are subject to risk and may change at any time.
| | % |
| U.S. Treasury Obligations | 32.4 |
| Money Market Funds | 22.2 |
| Corporate Bonds | 20.7 |
| Purchased Options | 6.1 |
| Health Care | 3.3 |
| Consumer Staples | 3.3 |
| Financials | 3.2 |
| Information Technology | 2.0 |
| Foreign Bonds | 1.9 |
| Industrials | 1.8 |
| Utilities | 1.7 |
| Materials | 1.1 |
| Energy | 1.0 |
| Communication Services | 0.7 |
| Equity-Linked Securities | 0.6 |
| Consumer Discretionary | 0.2 |
| Mutual Funds | 0.1 |
| Real Estate | 0.1 |
| Written Options | (0.2) |
| | 102.2 |
Defensive Market Strategies® Fund (Unaudited)
| Average Annual Total Returns as of 12/31/21 | |
| | | Institutional Class* | | Investor Class* | | Benchmark** | |
| One Year | | 12.15% | | 11.79% | | 13.70% | |
| Five Year | | 10.43% | | 10.12% | | 9.79% | |
| Ten Year | | 10.37% | | 10.08% | | 8.53% | |
| Since Inception | | 10.28% | | 9.99% | | 8.47% | |
| Inception Date | | 09/01/11 | | 09/01/11 | | | |
| Total Fund Operating Expenses (May 1, 2021 Prospectus)(1) | | 0.68% | | 0.95% | | | |
| (1) | Current information regarding the Fund’s Operating Expenses can be found in the Financial Highlights. |
The performance data quoted represents past performance and does not guarantee future results. Current performance may be lower or higher. Performance data current to the most recent month-end may be obtained at GuideStoneFunds.com. The investment return and principal value of an investment will fluctuate so that shares, when redeemed, may be worth more or less than their original cost.
The graph illustrates the results of a hypothetical $10,000 investment in the Investor Class of the Fund from December 31, 2011 to December 31, 2021, with all dividends and capital gains reinvested, with the Fund's composite benchmark index.
*These returns reflect investment advisory and shareholder servicing fee waivers, if applicable, during the reported time periods.
**The Benchmark Index shows how the Fund’s performance compares with the returns of an index constructed by the Adviser as a composite of various broad-based market indexes to reflect the market sectors in which the Fund invests. The Benchmark Index is 50% S&P 500® Index and 50% Bloomberg 1-3 Month US Treasury Bill Index. The weightings of the Benchmark Index were modified effective November 30, 2020, and therefore, the weightings of the underlying indexes were different than the current benchmark weightings prior to that date. Benchmark Index performance represents the Fund’s current benchmark linked with its previous benchmark.
Unlike a mutual fund, the performance of an index assumes no taxes, transaction costs, management fees or other expenses.
DEFENSIVE MARKET STRATEGIES® FUND
| | | Shares | | Value |
| COMMON STOCKS — 13.1% |
| Communication Services — 0.6% | | |
| Comcast Corporation Class A | 10,300 | | $ 518,399 |
| Verizon Communications, Inc. | 158,200 | | 8,220,072 |
| | | | | 8,738,471 |
| Consumer Staples — 2.2% | | |
| Colgate-Palmolive Co. | 77,800 | | 6,639,452 |
| Hershey Co. (The) | 25,200 | | 4,875,444 |
| Mondelez International, Inc. Class A | 67,300 | | 4,462,663 |
| PepsiCo, Inc. | 36,100 | | 6,270,931 |
| Procter & Gamble Co. (The) | 19,300 | | 3,157,094 |
| Walmart, Inc. | 51,805 | | 7,495,666 |
| | | | | 32,901,250 |
| Energy — 0.8% | | |
| Baker Hughes Co. | 101,000 | | 2,430,060 |
| Chevron Corporation | 60,400 | | 7,087,940 |
| Exxon Mobil Corporation | 45,000 | | 2,753,550 |
| | | | | 12,271,550 |
| Financials — 2.7% | | |
| Aflac, Inc. | 34,774 | | 2,030,454 |
| Allstate Corporation (The) | 10,200 | | 1,200,030 |
| Ameriprise Financial, Inc. | 8,602 | | 2,594,879 |
| Bank of New York Mellon Corporation (The) | 78,500 | | 4,559,280 |
| BlackRock, Inc. | 746 | | 683,008 |
| Capitol Federal Financial, Inc. | 222,500 | | 2,520,925 |
| Commerce Bancshares, Inc. | 22,143 | | 1,522,068 |
| Hartford Financial Services Group, Inc. (The) | 24,200 | | 1,670,768 |
| JPMorgan Chase & Co. | 37,856 | | 5,994,498 |
| Marsh & McLennan Cos., Inc. | 49,561 | | 8,614,693 |
| MetLife, Inc. | 20,900 | | 1,306,041 |
| Northern Trust Corporation | 28,600 | | 3,420,846 |
| PNC Financial Services Group, Inc. (The) | 8,700 | | 1,744,524 |
| T. Rowe Price Group, Inc. | 4,100 | | 806,224 |
| U.S. Bancorp | 44,600 | | 2,505,182 |
| | | | | 41,173,420 |
| Health Care — 1.0% | | |
| Amgen, Inc. | 13,600 | | 3,059,592 |
| Cardinal Health, Inc. | 22,500 | | 1,158,525 |
| Cerner Corporation | 69,700 | | 6,473,039 |
| Eli Lilly and Co. | 2,700 | | 745,794 |
| Quest Diagnostics, Inc. | 6,830 | | 1,181,659 |
| UnitedHealth Group, Inc. | 3,500 | | 1,757,490 |
| | | | | 14,376,099 |
| Industrials — 1.8% | | |
| Emerson Electric Co. | 76,410 | | 7,103,838 |
| Hubbell, Inc. | 23,889 | | 4,975,362 |
| Norfolk Southern Corporation | 15,114 | | 4,499,589 |
| PACCAR, Inc. | 3,700 | | 326,562 |
| Raytheon Technologies Corporation | 76,178 | | 6,555,878 |
| Republic Services, Inc. | 19,233 | | 2,682,042 |
| United Parcel Service, Inc. Class B | 4,700 | | 1,007,398 |
| | | | | 27,150,669 |
| | | Shares | | Value |
| Information Technology — 2.0% | | |
| Automatic Data Processing, Inc. | 24,533 | | $ 6,049,347 |
| Cisco Systems, Inc. | 127,278 | | 8,065,607 |
| Corning, Inc. | 116,400 | | 4,333,572 |
| Microsoft Corporation | 17,400 | | 5,851,968 |
| Oracle Corporation | 17,800 | | 1,552,338 |
| Texas Instruments, Inc. | 24,600 | | 4,636,362 |
| | | | | 30,489,194 |
| Materials — 0.2% | | |
| Packaging Corporation of America | 19,400 | | 2,641,310 |
| Real Estate — 0.1% | | |
| American Tower Corporation REIT | 1,462 | | 427,635 |
| Equinix, Inc. REITΔ | 414 | | 350,178 |
| Orion Office REIT, Inc.* | 0 € | | 3 |
| Welltower, Inc. REIT | 13,800 | | 1,183,626 |
| | | | | 1,961,442 |
| Utilities — 1.7% | | |
| Atmos Energy CorporationΔ | 48,085 | | 5,037,865 |
| Duke Energy Corporation | 29,484 | | 3,092,872 |
| Evergy, Inc. | 16,300 | | 1,118,343 |
| Eversource EnergyΔ | 33,743 | | 3,069,938 |
| ONE Gas, Inc. | 90,602 | | 7,029,809 |
| Spire, Inc. | 97,640 | | 6,368,081 |
| | | | | 25,716,908 |
Total Common Stocks
(Cost $160,278,266) | | 197,420,313 |
| FOREIGN COMMON STOCKS — 4.6% |
| France — 0.2% | | |
| TotalEnergies SEΔ | 64,623 | | 3,283,576 |
| Germany — 0.1% | | |
| Deutsche Telekom AG | 82,000 | | 1,515,155 |
| Ireland — 1.4% | | |
| Linde PLC | 21,400 | | 7,413,602 |
| Medtronic PLC | 128,591 | | 13,302,739 |
| | | | | 20,716,341 |
| Japan — 0.2% | | |
| Bridgestone CorporationΔ | 33,100 | | 1,421,071 |
| Toyota Motor Corporation | 61,600 | | 1,138,528 |
| | | | | 2,559,599 |
| Jersey — 0.2% | | |
| Amcor PLC | 205,500 | | 2,468,055 |
| Netherlands — 0.5% | | |
| Akzo Nobel NV | 35,500 | | 3,900,216 |
| Koninklijke Ahold Delhaize NV | 122,553 | | 4,204,634 |
| | | | | 8,104,850 |
| Switzerland — 1.6% | | |
| Chubb, Ltd. | 25,017 | | 4,836,036 |
| Nestle SA | 37,100 | | 5,179,803 |
| Novartis AG | 52,000 | | 4,569,345 |
| Roche Holding AG | 22,100 | | 9,168,434 |
| | | | | 23,753,618 |
See Notes to Financial Statements.
DEFENSIVE MARKET STRATEGIES® FUND
SCHEDULE OF INVESTMENTS (Continued)
| | | Shares | | Value |
| United Kingdom — 0.4% | | |
| Unilever PLC | 112,200 | | $ 6,010,792 |
Total Foreign Common Stocks
(Cost $60,887,463) | | 68,411,986 |
| PREFERRED STOCKS — 0.7% |
| Bank of America Corporation | | | | |
| 7.25% CONV | 1,700 | | 2,457,180 |
| Becton Dickinson and Co. | | | | |
| 6.00% 06/01/23 CONV | 138,928 | | 7,328,452 |
Total Preferred Stocks
(Cost $9,684,998) | | 9,785,632 |
| MUTUAL FUNDS — 0.1% |
iShares Russell 1000 Value ETF
(Cost $1,925,250) | 11,900 | | 1,998,367 |
| | | Par | |
| CORPORATE BONDS — 20.7% |
| Affirm Holdings, Inc. | | | |
| 0.00%, 11/15/26 144AΩ CONV | $ 974,000 | 880,496 |
| Airbnb, Inc. | | | |
| 0.00%, 03/15/26 144AΩ CONV | 2,241,000 | 2,198,421 |
| Akamai Technologies, Inc. | | | |
| 0.13%, 05/01/25 CONV | 493,000 | 647,703 |
| 0.38%, 09/01/27 CONV | 1,836,000 | 2,156,198 |
| Alarm.com Holdings, Inc. | | | |
| 0.43%, 01/15/26 144AΩ CONV | 2,216,000 | 2,005,480 |
| Allscripts Healthcare Solutions, Inc. | | | |
| 0.88%, 01/01/27 CONV | 2,007,000 | 2,979,091 |
| Altair Engineering, Inc. | | | |
| 0.25%, 06/01/24 CONV | 625,000 | 1,065,250 |
| Alteryx, Inc. | | | |
| 1.00%, 08/01/26 CONVΔ | 706,000 | 634,518 |
| Ares Capital Corporation | | | |
| 4.63%, 03/01/24 CONV | 505,000 | 580,144 |
| Avalara, Inc. | | | |
| 0.25%, 08/01/26 144A CONV | 1,920,000 | 1,781,760 |
| Bank of America Corporation | | | |
| (Variable, ICE LIBOR USD 3M + 2.66%), 4.30%, 01/28/25ρ^ | 1,034,000 | 1,046,925 |
| (Variable, ICE LIBOR USD 3M + 2.93%), 5.88%, 03/15/28ρ^ | 3,011,000 | 3,353,501 |
| Bank of New York Mellon Corporation (The) | | | |
| (Variable, U.S. Treasury Yield Curve Rate CMT 5Y + 4.36%), 4.70%, 09/20/25ρ^ | 268,000 | 286,559 |
| Bentley Systems, Inc. | | | |
| 0.13%, 01/15/26 144A CONV | 951,000 | 983,144 |
| 0.38%, 07/01/27 144A CONV | 1,491,000 | 1,379,175 |
| | | Par | | Value |
| Beyond Meat, Inc. | | | | |
| 0.37%, 03/15/27 144AΩ CONV | $3,062,000 | | $2,137,582 |
| BioMarin Pharmaceutical, Inc. | | | | |
| 0.60%, 08/01/24 CONV | 4,310,000 | | 4,517,311 |
| Blackline, Inc. | | | | |
| 0.00%, 03/15/26 144AΩ CONV | 2,907,000 | | 2,715,138 |
| Blackstone Mortgage Trust, Inc. REIT | | | | |
| 4.75%, 03/15/23 CONV | 2,245,000 | | 2,313,697 |
| Block, Inc. | | | | |
| 0.25%, 11/01/27 CONVΔ | 2,084,000 | | 2,220,762 |
| BofA Finance LLC | | | | |
| 0.25%, 05/01/23 CONV | 1,496,000 | | 1,638,868 |
| Booking Holdings, Inc. | | | | |
| 0.75%, 05/01/25 CONVΔ | 1,562,000 | | 2,301,607 |
| Box, Inc. | | | | |
| 0.00%, 01/15/26 144AΩ CONV | 2,457,000 | | 2,963,879 |
| Burlington Stores, Inc. | | | | |
| 2.25%, 04/15/25 CONV | 1,965,000 | | 2,929,078 |
| Cable One, Inc. | | | | |
| 0.00%, 03/15/26 144AΩ CONV | 1,559,000 | | 1,498,199 |
| Ceridian HCM Holding, Inc. | | | | |
| 0.25%, 03/15/26 144A CONV | 1,784,000 | | 1,872,486 |
| Charles Schwab Corporation (The) | | | | |
| (Variable, U.S. Treasury Yield Curve Rate CMT 5Y + 4.97%), 5.38%, 06/01/25ρΔ^ | 974,000 | | 1,064,095 |
| (Variable, U.S. Treasury Yield Curve Rate CMT 5Y + 3.17%), 4.00%, 06/01/26ρ^ | 3,860,000 | | 3,942,025 |
| (Variable, ICE LIBOR USD 3M + 2.58%), 5.00%, 12/01/27ρΔ^ | 1,119,000 | | 1,163,395 |
| Cheesecake Factory, Inc. (The) | | | | |
| 0.38%, 06/15/26 CONV | 2,226,000 | | 2,004,791 |
| Chegg, Inc. | | | | |
| 0.00%, 09/01/26Ω CONV | 3,908,000 | | 3,253,410 |
| Citigroup, Inc. | | | | |
| (Variable, ICE LIBOR USD 3M + 4.07%), 5.95%, 01/30/23ρ^ | 1,792,000 | | 1,850,240 |
| Coherus Biosciences, Inc. | | | | |
| 1.50%, 04/15/26 CONV | 1,260,000 | | 1,393,088 |
| CONMED Corporation | | | | |
| 2.63%, 02/01/24 CONV | 967,000 | | 1,612,473 |
| Coupa Software, Inc. | | | | |
| 0.38%, 06/15/26 CONV | 1,601,000 | | 1,520,950 |
| Cracker Barrel Old Country Store, Inc. | | | | |
| 0.63%, 06/15/26 144A CONV | 2,417,000 | | 2,327,873 |
| Datadog, Inc. | | | | |
| 0.13%, 06/15/25 CONV | 920,000 | | 1,848,280 |
| Dexcom, Inc. | | | | |
| 0.25%, 11/15/25 CONV | 2,444,000 | | 2,912,942 |
See Notes to Financial Statements.
| | | Par | | Value |
| DigitalOcean Holdings, Inc. | | | | |
| 0.00%, 12/01/26 144AΩ CONV | $1,823,000 | | $1,621,376 |
| DISH Network Corporation | | | | |
| 0.00%, 12/15/25Ω CONV | 1,209,000 | | 1,221,090 |
| 3.38%, 08/15/26 CONV | 5,486,000 | | 5,206,505 |
| DocuSign, Inc. | | | | |
| 0.00%, 01/15/24 144AΩ CONVΔ | 1,946,000 | | 1,885,674 |
| Dominion Energy, Inc. | | | | |
| (Variable, U.S. Treasury Yield Curve Rate CMT 5Y + 2.99%), 4.65%, 12/15/24ρ^ | 2,125,000 | | 2,220,625 |
| Dropbox, Inc. | | | | |
| 0.00%, 03/01/26 144AΩ CONV | 1,707,000 | | 1,668,593 |
| 0.00%, 03/01/28 144AΩ CONV | 1,707,000 | | 1,684,596 |
| Duke Energy Corporation | | | | |
| (Variable, U.S. Treasury Yield Curve Rate CMT 5Y + 3.39%), 4.88%, 09/16/24ρΔ^ | 2,407,000 | | 2,503,280 |
| Enphase Energy, Inc. | | | | |
| 0.00%, 03/01/26 144AΩ CONV | 1,862,000 | | 1,873,172 |
| 1.86%, 03/01/28 144AΩ CONVΔ | 1,809,000 | | 1,875,029 |
| Envestnet, Inc. | | | | |
| 0.75%, 08/15/25 144A CONV | 2,227,000 | | 2,245,094 |
| EQT Corporation | | | | |
| 1.75%, 05/01/26 CONV | 1,331,000 | | 2,224,766 |
| Etsy, Inc. | | | | |
| 0.13%, 09/01/27 CONVΔ | 1,095,000 | | 1,474,418 |
| 0.25%, 06/15/28 144A CONV | 1,892,000 | | 2,233,695 |
| Euronet Worldwide, Inc. | | | | |
| 0.75%, 03/15/49 CONVΔ | 2,663,000 | | 2,902,670 |
| Exact Sciences Corporation | | | | |
| 0.38%, 03/15/27 CONV | 1,840,000 | | 1,881,400 |
| Expedia Group, Inc. | | | | |
| 0.00%, 02/15/26 144AΩ CONVΔ | 2,271,000 | | 2,624,140 |
| Five9, Inc. | | | | |
| 0.50%, 06/01/25 CONV | 542,000 | | 666,985 |
| Ford Motor Co. | | | | |
| 0.00%, 03/15/26 144AΩ CONVΔ | 1,892,000 | | 2,612,142 |
| FTI Consulting, Inc. | | | | |
| 2.00%, 08/15/23 CONV | 1,261,000 | | 1,958,333 |
| Greenbrier Cos., Inc. (The) | | | | |
| 2.88%, 04/15/28 144A CONV | 2,776,000 | | 3,032,780 |
| Guardant Health, Inc. | | | | |
| 0.00%, 11/15/27Ω CONV | 1,569,000 | | 1,595,045 |
| Haemonetics Corporation | | | | |
| 3.70%, 03/01/26 144AΩ CONVΔ | 1,004,000 | | 844,489 |
| Halozyme Therapeutics, Inc. | | | | |
| 0.25%, 03/01/27 144A CONV | 1,736,000 | | 1,554,805 |
| Herbalife Nutrition, Ltd. | | | | |
| 2.63%, 03/15/24 CONV | 89,000 | | 89,392 |
| | | Par | | Value |
| II-VI, Inc. | | | | |
| 0.25%, 09/01/22 CONV | $1,002,000 | | $1,485,465 |
| Illumina, Inc. | | | | |
| 0.00%, 08/15/23Ω CONVΔ | 2,349,000 | | 2,691,073 |
| Insight Enterprises, Inc. | | | | |
| 0.75%, 02/15/25 CONV | 2,137,000 | | 3,429,885 |
| Insulet Corporation | | | | |
| 0.38%, 09/01/26 CONV | 1,611,000 | | 2,139,213 |
| Integra LifeSciences Holdings Corporation | | | | |
| 0.50%, 08/15/25 CONV | 1,738,000 | | 1,891,118 |
| InterDigital, Inc. | | | | |
| 2.00%, 06/01/24 CONV | 1,042,000 | | 1,148,805 |
| Ionis Pharmaceuticals, Inc. | | | | |
| 0.13%, 12/15/24 CONV | 1,179,000 | | 1,059,626 |
| Ironwood Pharmaceuticals, Inc. | | | | |
| 0.75%, 06/15/24 CONV | 1,001,000 | | 1,121,746 |
| 1.50%, 06/15/26 CONV | 746,000 | | 854,170 |
| Itron, Inc. | | | | |
| 0.00%, 03/15/26 144AΩ CONV | 1,969,000 | | 1,797,688 |
| Jamf Holding Corporation | | | | |
| 0.13%, 09/01/26 144A CONV | 2,206,000 | | 2,298,376 |
| Jazz Investments I, Ltd. | | | | |
| 1.50%, 08/15/24 CONVΔ | 282,000 | | 283,234 |
| 2.00%, 06/15/26 CONVΔ | 1,648,000 | | 1,868,420 |
| JetBlue Airways Corporation | | | | |
| 0.50%, 04/01/26 144A CONV | 2,602,000 | | 2,438,640 |
| John Bean Technologies Corporation | | | | |
| 0.25%, 05/15/26 144A CONV | 685,000 | | 756,240 |
| JPMorgan Chase & Co. | | | | |
| (Variable, ICE LIBOR USD 3M + 3.47%), 3.60%, 04/30/22†ρΔ | 2,686,000 | | 2,699,449 |
| (Variable, U.S. SOFR + 3.38%), 5.00%, 08/01/24ρ^ | 5,266,000 | | 5,414,106 |
| (Variable, U.S. SOFR + 3.13%), 4.60%, 02/01/25ρ^ | 1,083,000 | | 1,112,783 |
| KBR, Inc. | | | | |
| 2.50%, 11/01/23 CONV | 865,000 | | 1,649,192 |
| LCI Industries | | | | |
| 1.13%, 05/15/26 CONV | 1,203,000 | | 1,326,909 |
| LendingTree, Inc. | | | | |
| 0.50%, 07/15/25 CONVΔ | 195,000 | | 162,581 |
| Liberty Broadband Corporation | | | | |
| 1.25%, 09/30/50 144A CONV | 1,080,000 | | 1,070,280 |
| 2.75%, 09/30/50 144A CONV | 1,915,000 | | 1,944,654 |
| Liberty Media Corp-Liberty Formula One | | | | |
| 1.00%, 01/30/23 CONV | 1,231,000 | | 2,127,535 |
See Notes to Financial Statements.
DEFENSIVE MARKET STRATEGIES® FUND
SCHEDULE OF INVESTMENTS (Continued)
| | | Par | | Value |
| Liberty Media Corporation | | | | |
| 1.38%, 10/15/23 CONV | $ 636,000 | | $ 960,226 |
| 2.13%, 03/31/48 144A CONV | 3,665,000 | | 3,800,605 |
| Liberty TripAdvisor Holdings, Inc. | | | | |
| 0.50%, 06/30/51 144A CONV | 1,896,000 | | 1,546,378 |
| Live Nation Entertainment, Inc. | | | | |
| 2.00%, 02/15/25 CONV | 2,623,000 | | 3,459,737 |
| Lumentum Holdings, Inc. | | | | |
| 0.50%, 12/15/26 CONV | 1,996,000 | | 2,492,505 |
| MACOM Technology Solutions Holdings, Inc. | | | | |
| 0.25%, 03/15/26 144A CONV | 1,666,000 | | 1,958,591 |
| Mandiant, Inc. | | | | |
| 0.88%, 06/01/24 CONV | 1,025,000 | | 1,071,125 |
| Marriott Vacations Worldwide Corporation | | | | |
| 1.50%, 09/15/22 CONV | 1,000 | | 1,221 |
| 0.00%, 01/15/26 144AΩ CONV | 2,707,000 | | 3,181,376 |
| Match Group Financeco 3, Inc. | | | | |
| 2.00%, 01/15/30 144A CONV | 675,000 | | 1,190,970 |
| Meritor, Inc. | | | | |
| 3.25%, 10/15/37 CONV | 1,981,000 | | 2,161,865 |
| Microchip Technology, Inc. | | | | |
| 0.13%, 11/15/24 CONVΔ | 5,410,000 | | 6,721,925 |
| National Vision Holdings, Inc. | | | | |
| 2.50%, 05/15/25 CONV | 434,000 | | 727,764 |
| NCL Corporation, Ltd. | | | | |
| 1.13%, 02/15/27 144A CONV | 2,152,000 | | 2,025,678 |
| Neurocrine Biosciences, Inc. | | | | |
| 2.25%, 05/15/24 CONV | 838,000 | | 1,053,261 |
| New Relic, Inc. | | | | |
| 0.50%, 05/01/23 CONV | 1,051,000 | | 1,254,684 |
| NextEra Energy Partners LP | | | | |
| 0.00%, 11/15/25 144AΩ CONV | 1,921,000 | | 2,198,584 |
| NuVasive, Inc. | | | | |
| 0.38%, 03/15/25 CONV | 1,990,000 | | 1,917,863 |
| Okta, Inc. | | | | |
| 0.38%, 06/15/26 CONV | 2,162,000 | | 2,583,590 |
| ON Semiconductor Corporation | | | | |
| 0.00%, 05/01/27 144AΩ CONVΔ | 1,812,000 | | 2,645,520 |
| Opendoor Technologies, Inc. | | | | |
| 0.25%, 08/15/26 144A CONV | 1,776,000 | | 1,849,260 |
| Palo Alto Networks, Inc. | | | | |
| 0.75%, 07/01/23 CONV | 971,000 | | 2,037,935 |
| Pandora Media LLC | | | | |
| 1.75%, 12/01/23 CONV | 1,378,000 | | 1,569,041 |
| | | Par | | Value |
| Parsons Corporation | | | | |
| 0.25%, 08/15/25 CONV | $1,822,000 | | $1,815,987 |
| Patrick Industries, Inc. | | | | |
| 1.75%, 12/01/28 144A CONV | 331,000 | | 344,986 |
| Pegasystems, Inc. | | | | |
| 0.75%, 03/01/25 CONV | 2,396,000 | | 2,542,875 |
| Peloton Interactive, Inc. | | | | |
| 3.63%, 02/15/26 144AΩ CONV | 2,265,000 | | 1,930,912 |
| Perficient, Inc. | | | | |
| 0.13%, 11/15/26 144A CONV | 355,000 | | 337,715 |
| Pioneer Natural Resources Co. | | | | |
| 0.25%, 05/15/25 CONV | 1,216,000 | | 2,172,840 |
| Progressive Corporation (The) | | | | |
| (Variable, ICE LIBOR USD 3M + 2.54%), 5.38%, 03/15/23ρ^ | 1,321,000 | | 1,354,025 |
| Pure Storage, Inc. | | | | |
| 0.13%, 04/15/23 CONV | 2,376,000 | | 3,177,900 |
| Q2 Holdings, Inc. | | | | |
| 0.13%, 11/15/25 CONV | 1,445,000 | | 1,331,137 |
| 0.75%, 06/01/26 CONV | 1,051,000 | | 1,183,398 |
| Rapid7, Inc. | | | | |
| 2.25%, 05/01/25 CONV | 679,000 | | 1,362,882 |
| 0.25%, 03/15/27 144A CONV | 1,832,000 | | 2,370,242 |
| Realogy Group LLC | | | | |
| 0.25%, 06/15/26 144A CONV | 1,597,000 | | 1,580,156 |
| Redfin Corporation | | | | |
| 0.00%, 10/15/25Ω CONV | 1,761,000 | | 1,577,196 |
| 0.50%, 04/01/27 144A CONV | 1,747,000 | | 1,425,727 |
| Repligen Corporation | | | | |
| 0.38%, 07/15/24 CONV | 473,000 | | 1,107,707 |
| RingCentral, Inc. | | | | |
| 0.00%, 03/01/25Ω CONV | 3,273,000 | | 3,091,218 |
| 0.00%, 03/15/26Ω CONV | 1,298,000 | | 1,155,829 |
| Royal Caribbean Cruises, Ltd. | | | | |
| 2.88%, 11/15/23 CONV | 1,400,000 | | 1,656,200 |
| Shake Shack, Inc. | | | | |
| 0.23%, 03/01/28 144AΩ CONV | 2,174,000 | | 1,809,855 |
| Shift4 Payments, Inc. | | | | |
| 0.00%, 12/15/25 144AΩ CONV | 1,055,000 | | 1,117,667 |
| 0.50%, 08/01/27 144A CONV | 221,000 | | 195,165 |
| Silicon Laboratories, Inc. | | | | |
| 0.63%, 06/15/25 CONV | 1,233,000 | | 2,167,737 |
| Snap, Inc. | | | | |
| 0.00%, 05/01/27 144AΩ CONV | 2,523,000 | | 2,452,459 |
| SoFi Technologies, Inc. | | | | |
| 0.00%, 10/15/26 144AΩ CONV | 714,000 | | 740,811 |
| SolarEdge Technologies, Inc. | | | | |
| 0.00%, 09/15/25Ω CONV | 1,622,000 | | 2,063,995 |
| Southwest Airlines Co. | | | | |
| 1.25%, 05/01/25 CONV | 1,660,000 | | 2,219,005 |
| Spirit Airlines, Inc. | | | | |
| 1.00%, 05/15/26 CONVΔ | 2,252,000 | | 1,952,575 |
See Notes to Financial Statements.
| | | Par | | Value |
| Splunk, Inc. | | | | |
| 0.50%, 09/15/23 CONV | $1,762,000 | | $1,888,578 |
| 1.13%, 06/15/27 CONV | 3,898,000 | | 3,654,375 |
| Spotify U.S.A., Inc. | | | | |
| 2.01%, 03/15/26 144AΩ CONV | 2,171,000 | | 1,968,880 |
| Stride, Inc. | | | | |
| 1.13%, 09/01/27 CONV | 2,322,000 | | 2,270,619 |
| Sunrun, Inc. | | | | |
| 0.00%, 02/01/26 144AΩ CONV | 1,301,000 | | 1,019,688 |
| Supernus Pharmaceuticals, Inc. | | | | |
| 0.63%, 04/01/23 CONV | 1,007,000 | | 997,559 |
| Tandem Diabetes Care, Inc. | | | | |
| 1.50%, 05/01/25 144A CONV | 1,209,000 | | 1,798,388 |
| Teladoc Health, Inc. | | | | |
| 1.25%, 06/01/27 CONV | 2,343,000 | | 2,145,309 |
| TripAdvisor, Inc. | | | | |
| 0.25%, 04/01/26 144A CONV | 1,498,000 | | 1,321,985 |
| Twitter, Inc. | | | | |
| 0.25%, 06/15/24 CONV | 1,174,000 | | 1,282,041 |
| 0.00%, 03/15/26 144AΩ CONV | 2,780,000 | | 2,503,668 |
| U.S. Bancorp | | | | |
| (Variable, ICE LIBOR USD 3M + 2.91%), 5.30%, 04/15/27ρ^ | 2,949,000 | | 3,193,384 |
| Uber Technologies, Inc. | | | | |
| 0.00%, 12/15/25Ω CONVΔ | 2,112,000 | | 2,083,488 |
| Unity Software, Inc. | | | | |
| 0.00%, 11/15/26 144AΩ CONV | 1,226,000 | | 1,124,855 |
| Upstart Holdings, Inc. | | | | |
| 0.25%, 08/15/26 144A CONV | 1,081,000 | | 1,037,760 |
| Vail Resorts, Inc. | | | | |
| 0.00%, 01/01/26Ω CONVΔ | 3,486,000 | | 3,732,726 |
| Verint Systems, Inc. | | | | |
| 0.25%, 04/15/26 144A CONV | 1,161,000 | | 1,241,573 |
| Vonage Holdings Corporation | | | | |
| 1.75%, 06/01/24 CONV | 653,000 | | 875,347 |
| Wayfair, Inc. | | | | |
| 0.63%, 10/01/25 CONVΔ | 2,208,000 | | 2,018,608 |
| Wells Fargo & Co. | | | | |
| (Variable, U.S. Treasury Yield Curve Rate CMT 5Y + 3.45%), 3.90%, 03/15/26ρ^ | 1,291,000 | | 1,327,309 |
| Western Digital Corporation | | | | |
| 1.50%, 02/01/24 CONV | 236,000 | | 239,393 |
| Winnebago Industries, Inc. | | | | |
| 1.50%, 04/01/25 CONV | 1,762,000 | | 2,359,156 |
| Workiva, Inc. | | | | |
| 1.13%, 08/15/26 CONV | 52,000 | | 92,032 |
| Zendesk, Inc. | | | | |
| 0.63%, 06/15/25 CONV | 2,450,000 | | 2,935,345 |
| Ziff Davis, Inc. | | | | |
| 1.75%, 11/01/26 144A CONV | 1,153,000 | | 1,430,598 |
| Zillow Group, Inc. | | | | |
| 2.75%, 05/15/25 CONV | 1,191,000 | | 1,538,892 |
| | | Par | | Value |
| Zscaler, Inc. | | | | |
| 0.13%, 07/01/25 CONV | $ 863,000 | | $ 1,890,411 |
| Zynga, Inc. | | | | |
| 0.25%, 06/01/24 CONV | 1,399,000 | | 1,517,076 |
| 0.00%, 12/15/26Ω CONV | 1,347,000 | | 1,235,995 |
Total Corporate Bonds
(Cost $290,190,702) | | 311,824,759 |
| FOREIGN BONDS — 1.9% |
| Canada — 0.4% | | |
| IMAX Corporation | | | | |
| 0.50%, 04/01/26 144A CONV | 3,538,000 | | 3,420,133 |
| Shopify, Inc. | | | | |
| 0.13%, 11/01/25 CONVΔ | 1,522,000 | | 1,906,305 |
| | | | | 5,326,438 |
| France — 0.2% | | |
| TotalEnergies SE | | | | |
| 0.50%, 12/02/22 CONV | 3,000,000 | | 3,065,246 |
| Israel — 0.7% | | |
| CyberArk Software, Ltd. | | | | |
| 0.05%, 11/15/24Ω CONV | 2,729,000 | | 3,452,185 |
| Fiverr International, Ltd. | | | | |
| 0.00%, 11/01/25Ω CONVΔ | 2,063,000 | | 1,925,810 |
| Nice, Ltd. | | | | |
| 0.00%, 09/15/25Ω CONVΔ | 2,509,000 | | 3,059,412 |
| Wix.com, Ltd. | | | | |
| 0.00%, 08/15/25Ω CONVΔ | 2,735,000 | | 2,455,702 |
| | | | | 10,893,109 |
| Jersey — 0.1% | | |
| Novocure, Ltd. | | | | |
| 0.00%, 11/01/25Ω CONV | 1,258,000 | | 1,155,850 |
| Netherlands — 0.5% | | |
| QIAGEN NV | | | | |
| 0.00%, 12/17/27Ω CONV | 2,800,000 | | 3,000,138 |
| STMicroelectronics NV | | | | |
| 0.00%, 08/04/25Ω CONVΔ | 3,200,000 | | 4,206,722 |
| | | | | 7,206,860 |
Total Foreign Bonds
(Cost $26,271,569) | | 27,647,503 |
| | | Shares | |
| EQUITY-LINKED SECURITIES — 0.6% |
| Berkshire Hathaway, Inc., Issued by Credit Suisse AG, Maturity Date 06/28/22††† | 8,600 | 2,465,792 |
| Berkshire Hathaway, Inc., Issued by JPMorgan Chase Bank, Maturity Date 05/24/22††† | 3,200 | 908,002 |
| Berkshire Hathaway, Inc., Issued by Merrill Lynch International & Co. CV, Maturity Date 01/24/22††† | 4,300 | 1,189,853 |
| Berkshire Hathaway, Inc., Issued by Merrill Lynch International & Co. CV, Maturity Date 03/24/22††† | 5,100 | 1,407,753 |
See Notes to Financial Statements.
DEFENSIVE MARKET STRATEGIES® FUND
SCHEDULE OF INVESTMENTS (Continued)
| | | Shares | | Value |
| Berkshire Hathaway, Inc., Issued by Royal Bank of Canada, Maturity Date 06/01/22 144A††† | 5,100 | | $ 1,462,629 |
| Emerson Electric Co., Issued by Royal Bank of Canada, Maturity Date 04/19/22 144A††† | 9,300 | | 871,596 |
| Martin Marietta Materials, Inc., Issued by Citigroup Global Markets Holdings Inc., Maturity Date 02/02/22 144A††† | 1,600 | | 605,824 |
Total Equity-Linked Securities
(Cost $8,833,113) | | 8,911,449 |
| MONEY MARKET FUNDS — 22.2% |
GuideStone Money Market Fund, 0.00%
(Institutional Class)Ø∞ | 39,220,393 | | 39,220,393 |
| Northern Institutional Liquid Assets Portfolio (Shares), 0.04%ا | 34,282,159 | | 34,282,159 |
| Northern Institutional U.S. Government Portfolio (Shares), 0.00%Ø | 260,174,152 | | 260,174,152 |
Total Money Market Funds
(Cost $333,676,704) | | 333,676,704 |
| | | Par | |
| U.S. TREASURY OBLIGATIONS — 32.4% |
| U.S. Treasury Bill | | | |
| 0.03%, 03/17/22Ω | $ 5,500,000 | 5,499,439 |
| U.S. Treasury Notes | | | |
| 1.75%, 06/15/22 | 50,000,000 | 50,362,456 |
| 1.50%, 09/15/22 | 50,000,000 | 50,429,486 |
| 1.63%, 12/15/22 | 41,900,000 | 42,396,288 |
| 0.50%, 03/15/23 | 41,900,000 | 41,919,641 |
| 0.25%, 06/15/23 | 50,000,000 | 49,775,390 |
| 0.13%, 09/15/23 | 50,000,000 | 49,552,735 |
| 0.13%, 12/15/23 | 26,900,000 | 26,598,951 |
| 1.13%, 02/28/27 | 86,000,000 | 85,402,031 |
| 0.75%, 01/31/28 | 89,000,000 | 85,798,086 |
Total U.S. Treasury Obligations
(Cost $488,385,677) | 487,734,503 |
| | Number of
Contracts | | Notional
Amount | |
| PURCHASED OPTIONS — 6.1% |
| Call Options — 6.1% | | |
| S&P 500®, Strike Price $4,590.00, Expires 11/30/26 (MSCS) | 440 | | $209,711,920 | 43,317,248 |
| S&P 500®, Strike Price $4,650.00, Expires 11/30/27 (MSCS) | 460 | | 219,244,280 | 48,302,562 |
Total Purchased Options
(Premiums paid $79,843,114) | 91,619,810 | |
TOTAL INVESTMENTS — 102.4%
(Cost $1,459,976,856) | | | 1,539,031,026 |
| | Number ofContracts | | NotionalAmount | | Value |
| WRITTEN OPTIONS — (0.2)% |
| Put Options — (0.2)% | | |
| S&P 500®, Strike Price $4,535.00, Expires 01/21/22 (MSCS) | (2) | | $ (953,236) | | $ (2,620) |
| S&P 500®, Strike Price $4,605.00, Expires 01/07/22 (MSCS) | (17) | | (8,102,506) | | (3,400) |
| S&P 500®, Strike Price $4,605.00, Expires 01/14/22 (MSCS) | (7) | | (3,336,326) | | (7,665) |
| S&P 500®, Strike Price $4,610.00, Expires 01/14/22 (MSCS) | (1) | | (476,618) | | (1,135) |
| S&P 500®, Strike Price $4,645.00, Expires 01/14/22 (MSCS) | (140) | | (66,726,520) | | (208,600) |
| S&P 500®, Strike Price $4,645.00, Expires 01/21/22 (MSCS) | (15) | | (7,149,270) | | (35,475) |
| S&P 500®, Strike Price $4,680.00, Expires 01/21/22 (MSCS) | (3) | | (1,429,854) | | (8,715) |
| S&P 500®, Strike Price $4,685.00, Expires 01/07/22 (MSCS) | (8) | | (3,812,944) | | (5,200) |
| S&P 500®, Strike Price $4,685.00, Expires 01/14/22 (MSCS) | (17) | | (8,102,506) | | (34,255) |
| S&P 500®, Strike Price $4,695.00, Expires 01/07/22 (MSCS) | (8) | | (3,812,944) | | (6,160) |
| S&P 500®, Strike Price $4,695.00, Expires 01/14/22 (MSCS) | (16) | | (7,625,888) | | (35,200) |
| S&P 500®, Strike Price $4,730.00, Expires 01/21/22 (MSCS) | (159) | | (75,782,262) | | (632,820) |
| S&P 500®, Strike Price $4,760.00, Expires 01/07/22 (MSCS) | (16) | | (7,625,888) | | (36,560) |
| S&P 500®, Strike Price $4,765.00, Expires 01/07/22 (MSCS) | (93) | | (44,325,474) | | (230,175) |
| S&P 500®, Strike Price $4,775.00, Expires 01/28/22 (MSCS) | (80) | | (38,129,440) | | (542,000) |
| S&P 500®, Strike Price $4,780.00, Expires 01/07/22 (MSCS) | (34) | | (16,205,012) | | (106,080) |
| S&P 500®, Strike Price $4,780.00, Expires 01/28/22 (MSCS) | (10) | | (4,766,180) | | (69,750) |
| S&P 500®, Strike Price $4,780.00, Expires 02/04/22 (MSCS) | (4) | | (1,906,472) | | (32,180) |
| S&P 500®, Strike Price $4,785.00, Expires 01/28/22 (MSCS) | (72) | | (34,316,496) | | (516,600) |
See Notes to Financial Statements.
| | Number ofContracts | | NotionalAmount | | Value |
| S&P 500®, Strike Price $4,795.00, Expires 01/28/22 (MSCS) | (15) | | $(7,149,270) | | $ (114,000) |
Total Written Options
(Premiums received $(4,851,262)) | | | | (2,628,590) |
Liabilities in Excess of Other
Assets — (2.2)% | | | | (32,545,999) |
| NET ASSETS — 100.0% | | | | $1,503,856,437 |
Futures Contracts outstanding at December 31, 2021:
| Future Type | | Expiration Date | | Open Long
(Short) Contracts | | Notional
Market Value
of Contracts | | Value and
Unrealized
Appreciation
(Depreciation) |
| S&P 500® E-Mini | | 03/2022 | | 154 | | $ 36,640,450 | | $ 628,226 |
| 10-Year U.S. Treasury Note | | 03/2022 | | 90 | | 11,742,187 | | (15,469) |
| U.S. Treasury Long Bond | | 03/2022 | | 33 | | 5,294,438 | | (43,313) |
| 2-Year U.S. Treasury Note | | 04/2022 | | 450 | | 98,177,344 | | (129,594) |
| 5-Year U.S. Treasury Note | | 04/2022 | | 605 | | 73,190,820 | | (100,545) |
| Total Futures Contracts outstanding at December 31, 2021 | | | | | | $225,045,239 | | $ 339,305 |
Forward Foreign Currency Contracts outstanding at December 31, 2021:
| Expiration Date | | Currency
Purchased | | Amount
of Currency
Purchased | | Currency
Sold | | Amount
of Currency
Sold | | Counter-
party | | Net Unrealized
Appreciation
(Depreciation) |
| 03/31/22 | | U.S. Dollars | | 2,437,965 | | Japanese Yen | | 276,699,780 | | BOA | | $ 30,499 |
| Subtotal Appreciation | | | | | | | | | | $ 30,499 |
| 03/31/22 | | Japanese Yen | | 11,609,190 | | U.S. Dollars | | 102,205 | | BOA | | $ (1,198) |
| 03/31/22 | | U.S. Dollars | | 16,821,433 | | Euro | | 14,865,504 | | GSC | | (135,469) |
| 03/31/22 | | U.S. Dollars | | 17,167,896 | | Swiss Francs | | 15,782,447 | | MSCS | | (194,398) |
| Subtotal Depreciation | | | | | | | | | | $(331,065) |
| Total Forward Foreign Currency Contracts outstanding at December 31, 2021 | | | | $(300,566) |
See Notes to Financial Statements.
DEFENSIVE MARKET STRATEGIES® FUND
SCHEDULE OF INVESTMENTS (Continued)
VALUATION HIERARCHY
The following is a summary of the inputs used, as of December 31, 2021, in valuing the Fund’s investments carried at fair value:
| | Total
Value | | Level 1
Quoted Prices | | Level 2
Other Significant
Observable Inputs | | Level 3
Significant
Unobservable Inputs |
| Assets: | | | | | | | |
| Investments in Securities: | | | | | | | |
| Common Stocks | $ 197,420,313 | | $197,420,313 | | $ — | | $ — |
| Corporate Bonds | 311,824,759 | | — | | 311,824,759 | | — |
| Equity-Linked Securities | 8,911,449 | | — | | — | | 8,911,449 |
| Foreign Bonds | 27,647,503 | | — | | 27,647,503 | | — |
| Foreign Common Stocks: | | | | | | | |
| Germany | 1,515,155 | | — | | 1,515,155 | | — |
| Japan | 2,559,599 | | — | | 2,559,599 | | — |
| Switzerland | 23,753,618 | | 4,836,036 | | 18,917,582 | | — |
| Other ^^ | 40,583,614 | | 40,583,614 | | — | | — |
| Total Foreign Common Stocks | 68,411,986 | | 45,419,650 | | 22,992,336 | | — |
| Money Market Funds | 333,676,704 | | 333,676,704 | | — | | — |
| Mutual Funds | 1,998,367 | | 1,998,367 | | — | | — |
| Preferred Stocks | 9,785,632 | | 9,785,632 | | — | | — |
| Purchased Options: | | | | | | | |
| Call Options | 91,619,810 | | — | | 91,619,810 | | — |
| U.S. Treasury Obligations | 487,734,503 | | — | | 487,734,503 | | — |
| Total Assets - Investments in Securities | $1,539,031,026 | | $588,300,666 | | $941,818,911 | | $8,911,449 |
| Other Financial Instruments*** | | | | | | | |
| Forward Foreign Currency Contracts | $ 30,499 | | $ — | | $ 30,499 | | $ — |
| Futures Contracts | 628,226 | | 628,226 | | — | | — |
| Total Assets - Other Financial Instruments | $ 658,725 | | $ 628,226 | | $ 30,499 | | $ — |
| Liabilities: | | | | | | | |
| Investments in Securities: | | | | | | | |
| Written Options: | | | | | | | |
| Put Options | $ (2,628,590) | | $ (2,628,590) | | $ — | | $ — |
| Total Liabilities - Investments in Securities | $ (2,628,590) | | $ (2,628,590) | | $ — | | $ — |
| Other Financial Instruments*** | | | | | | | |
| Forward Foreign Currency Contracts | $ (331,065) | | $ — | | $ (331,065) | | $ — |
| Futures Contracts | (288,921) | | (288,921) | | — | | — |
| Total Liabilities - Other Financial Instruments | $ (619,986) | | $ (288,921) | | $ (331,065) | | $ — |
| ^^ | Classifications as defined in the Schedule of Investments. |
| *** | Other financial instruments are derivative instruments, such as futures contracts and forward contracts, which are valued at the unrealized appreciation (depreciation) on the investment. Further details regarding the value of these investments can be found in the preceding "Futures Contracts outstanding" and "Forward Foreign Currency Contracts outstanding" disclosures. |
There were no transfers to or from Level 3 during the year ended December 31, 2021.
Management has determined that the amount of Level 3 securities compared to total net assets is not material; therefore, the reconciliation of Level 3 securities and assumptions is not shown for the year ended December 31, 2021.
See Notes to Financial Statements.
Global Impact Fund (Unaudited)
The Fund is actively managed and invests in a diversified portfolio of equity and fixed income securities and is benchmarked to a composite of 60% MSCI ACWI (All Country World Index) Index and 40% Bloomberg US Aggregate Bond Index. Please note that the Fund commenced operations on January 29, 2021, and therefore, the commentary only discusses the factors that contributed to performance from the commencement of operations through the end of 2021. For this period, the Investor Class of the Fund underperformed its composite benchmark (9.85% versus 10.84%).
Both equity and fixed income asset classes detracted from relative-to-benchmark performance. Stock selection within the equity account was the primary drag. Renewable energy related businesses within the utilities sector and software companies within the technology sector weighed on relative returns. Implementation within the fixed income sleeve was also a drag with U.S. Treasuries held to mitigate duration basis risk during the portfolio buildout in the months following the Fund’s commencement of operations. Underperformance of the fixed income account was partially curtailed by an overweight to municipal bonds, which outperformed.
Derivatives were utilized in the Fund to provide market exposure for the cash positions and to manage interest rate risk. These derivative positions primarily included stock index futures and fixed income futures. Overall, derivative exposure had a negative impact on Fund performance in 2021.
During the year, the Fund remained focused on its objective of capital appreciation with modest current income by investing in a mix of equity and fixed income assets with the intent of generating positive impact in line with the Adviser’s Christian values.
This Fund may be suitable for investors who have a long-term investment horizon, possess a relatively high tolerance for risk and seek to participate in the return potential of stocks at a slightly lower risk level than an all-stock portfolio. Securities of foreign issuers may be negatively impacted by political events, economic conditions or inefficient, illiquid or unregulated markets in foreign countries, and they also may be subject to inadequate regulatory or accounting standards, which may increase investment risk. Small company stocks are subject to greater risk than large company stocks due to more volatility and less liquidity. This Fund is subject to interest rate risk. Meaning, when interest rates rise, the value of the existing bonds decrease and vice versa. Changes in interest rates have a bigger impact on long duration holdings than on short duration holdings. It is possible to lose money by investing in the Fund.
At December 31, 2021, the portfolio holdings of the Fund, as a percentage of net assets, is shown in the following table. Portfolio holdings are subject to risk and may change at any time.
| | % |
| Information Technology | 27.9 |
| Mortgage-Backed Securities | 12.3 |
| Industrials | 10.6 |
| Municipal Bonds | 10.4 |
| Financials | 8.2 |
| Corporate Bonds | 5.4 |
| Consumer Discretionary | 4.8 |
| Health Care | 4.5 |
| Money Market Funds | 3.0 |
| Real Estate | 2.8 |
| Asset-Backed Securities | 2.5 |
| Utilities | 2.4 |
| Communication Services | 1.1 |
| Foreign Bonds | 1.0 |
| Materials | 0.9 |
| Private Investment | 0.6 |
| Agency Obligations | 0.6 |
| Consumer Staples | 0.3 |
| Loan Agreements | 0.1 |
| | 99.4 |
See Notes to Financial Statements.
| | | Par | | Value |
| AGENCY OBLIGATIONS — 0.6% |
| United States International Development Finance Corporation | | | | |
| 1.44%, 04/15/28 | $500,000 | | $ 494,603 |
| 1.65%, 04/15/28 | 500,000 | | 500,129 |
Total Agency Obligations
(Cost $1,000,000) | | | 994,732 |
| ASSET-BACKED SECURITIES — 2.5% |
| Loanpal Solar Loan, Ltd., Series 2021-2GS, Class A | | | |
| 2.22%, 03/20/48 144A | 494,903 | | 492,377 |
| Sunnova Helios II Issuer LLC, Series 2019-AA, Class A | | | |
| 3.75%, 06/20/46 144A | 554,776 | | 577,009 |
| Sunnova Helios II Issuer LLC, Series 2021-A, Class A | | | |
| 1.80%, 02/20/48 144A | 368,055 | | 363,062 |
| Sunnova Helios II Issuer LLC, Series 2021-B, Class A | | | |
| 1.62%, 07/20/48 144A | 334,143 | | 326,580 |
| Sunnova Helios VII Issuer LLC, Series 2021-C, Class A | | | |
| 2.03%, 10/20/48 144A | 494,182 | | 490,296 |
| Sunrun Vulcan Issuer LLC, Series 2021-1A, Class A | | | |
| 2.46%, 01/30/52 144A | 663,584 | | 657,710 |
| Tesla Auto Lease Trust, Series 2021-A, Class D | | | |
| 1.34%, 03/20/25 144A | 890,000 | | 884,558 |
| Tesla Auto Lease Trust, Series 2021-B, Class D | | | |
| 1.32%, 09/22/25 144A | 500,000 | | 492,113 |
Total Asset-Backed Securities
(Cost $4,322,020) | | | 4,283,705 |
| CORPORATE BONDS — 5.4% |
| Agilent Technologies, Inc. | | | |
| 2.30%, 03/12/31 | 250,000 | | 248,109 |
| Amgen, Inc. | | | |
| 2.80%, 08/15/41 | 100,000 | | 96,635 |
| 4.40%, 05/01/45 | 197,000 | | 236,396 |
| 3.00%, 01/15/52 | 75,000 | | 73,245 |
| Avangrid, Inc. | | | |
| 3.15%, 12/01/24 | 850,000 | | 890,648 |
| 3.80%, 06/01/29 | 250,000 | | 272,311 |
| Becton, Dickinson and Co. | | | |
| 3.73%, 12/15/24 | 274,000 | | 291,489 |
| 1.96%, 02/11/31 | 165,000 | | 158,968 |
| 4.69%, 12/15/44 | 150,000 | | 189,236 |
| BlueHub Loan Fund, Inc. | | | |
| 3.10%, 01/01/30 | 625,000 | | 647,911 |
| Bridge Housing Corporation | | | |
| 3.25%, 07/15/30 | 300,000 | | 321,167 |
| DH Europe Finance II S.a.r.l. | | | |
| 2.60%, 11/15/29 | 300,000 | | 310,588 |
| | | Par | | Value |
| Gilead Sciences, Inc. | | | |
| 3.65%, 03/01/26 | $ 392,000 | | $ 422,867 |
| 1.20%, 10/01/27 | 200,000 | | 193,605 |
| 5.65%, 12/01/41 | 238,000 | | 329,070 |
| Low Income Investment Fund | | | |
| 3.39%, 07/01/26 | 600,000 | | 624,104 |
| Mary Free Bed Rehabilitation Hospital | | | |
| 3.79%, 04/01/51 | 300,000 | | 327,735 |
| Mead Johnson Nutrition Co. | | | |
| 4.13%, 11/15/25 | 650,000 | | 709,258 |
| Medtronic, Inc. | | | |
| 3.50%, 03/15/25 | 448,000 | | 477,512 |
| NextEra Energy Capital Holdings, Inc. | | | |
| 3.55%, 05/01/27 | 500,000 | | 542,269 |
| 1.90%, 06/15/28 | 475,000 | | 470,762 |
| 2.44%, 01/15/32 | 580,000 | | 582,465 |
| PerkinElmer, Inc. | | | |
| 1.90%, 09/15/28 | 60,000 | | 58,708 |
| 2.25%, 09/15/31 | 175,000 | | 170,560 |
| Reinvestment Fund, Inc. (The) | | | |
| 3.93%, 02/15/28 | 500,000 | | 554,330 |
| Verizon Communications, Inc. | | | |
| 3.88%, 02/08/29 | 300,000 | | 333,046 |
Total Corporate Bonds
(Cost $9,643,797) | | | 9,532,994 |
| FOREIGN BONDS — 1.0% |
| Ireland — 0.3% | | |
| Shire Acquisitions Investments Ireland DAC | | | |
| 3.20%, 09/23/26 | 500,000 | | 531,220 |
| Japan — 0.4% | | |
| Takeda Pharmaceutical Co., Ltd. | | | |
| 5.00%, 11/26/28 | 600,000 | | 706,038 |
| United Kingdom — 0.3% | | |
| Vodafone Group PLC | | | |
| 5.25%, 05/30/48 | 400,000 | | 523,959 |
Total Foreign Bonds
(Cost $1,778,321) | | 1,761,217 |
| LOAN AGREEMENTS — 0.1% |
| Ciello Supermarket, Inc. STRIP, SBA Loan | | | |
| 0.23%, 09/15/31 IO ††† | 1,875,000 | | 13,047 |
| Georgia Act and Healthcare Services, Inc. STRIP, SBA Loan | | | |
| 1.28%, 03/15/46 IO ††† | 285,734 | | 14,622 |
| Ideal Therapy Rehabilitative Services II LLC STRIP, SBA Loan | | | |
| 0.48%, 01/15/46 IO ††† | 484,457 | | 9,297 |
| JILS Corporation STRIP, SBA Loan | | | |
| 1.23%, 08/15/31 IO ††† | 446,862 | | 17,484 |
| MBT Industries LLC STRIP, SBA Loan | | | |
| 0.53%, 08/15/31 IO ††† | 522,000 | | 8,370 |
See Notes to Financial Statements.
| | | Par | | Value |
| MCJT Phamaceutical Care, Inc. STRIP, SBA Loan | | | |
| 1.28%, 08/15/46 IO ††† | $ 363,600 | | $ 18,606 |
| N&K Market, Inc. STRIP, SBA Loan | | | |
| 0.73%, 02/15/31 IO ††† | 310,910 | | 6,109 |
| Southwest Technologies, Inc. STRIP, SBA Loan | | | |
| 1.23%, 06/15/31 IO ††† | 432,677 | | 16,929 |
Total Loan Agreements
(Cost $118,318) | | | 104,464 |
| MORTGAGE-BACKED SECURITIES — 12.3% |
| Federal Home Loan Mortgage Corporation | | | |
| 2.00%, 02/01/51 | 7,747,385 | | 7,736,706 |
| 2.00%, 03/01/51 | 2,260,960 | | 2,257,843 |
| Federal National Mortgage Association | | | |
| 1.19%, 03/01/26 | 500,000 | | 497,417 |
| 1.59%, 03/01/31 | 500,000 | | 492,282 |
| 1.61%, 03/01/31 | 492,396 | | 487,558 |
| 1.62%, 03/01/31 | 500,000 | | 493,567 |
| 2.03%, 04/01/31 | 250,000 | | 254,317 |
| 1.65%, 03/01/33 | 500,000 | | 489,023 |
| 2.01%, 03/01/33 | 100,000 | | 101,064 |
| 2.00%, 02/01/51 | 2,941,709 | | 2,937,654 |
| 2.00%, 03/01/51 | 2,235,358 | | 2,232,276 |
| FRESB Mortgage Trust, Series 2021-SB87, Class A5H | | | |
| 0.78%, 04/25/41 | 596,637 | | 585,953 |
| Small Business Administration | | | |
| (Floating, Prime Rate U.S. + 1.07%), 4.32%, 06/25/30† | 80,361 | | 87,501 |
| (Floating, Prime Rate U.S. + 0.92%), 4.17%, 12/25/30† | 174,204 | | 194,381 |
| (Floating, Prime Rate U.S. + 2.33%), 5.58%, 01/25/31† | 125,176 | | 142,921 |
| (Floating, Prime Rate U.S. + 1.03%), 4.28%, 02/25/31† | 220,176 | | 245,950 |
| (Floating, Prime Rate U.S. + 0.33%), 3.58%, 07/25/31† | 359,412 | | 390,394 |
| (Floating, Prime Rate U.S. + 0.85%), 4.10%, 08/25/31† | 334,571 | | 378,495 |
| (Floating, Prime Rate U.S. - 0.36%), 2.89%, 12/25/45† | 241,466 | | 267,863 |
| (Floating, Prime Rate U.S. + 0.54%), 3.79%, 12/25/45† | 244,393 | | 282,368 |
| (Floating, Prime Rate U.S. + 0.12%), 3.37%, 01/25/46† | 184,801 | | 211,122 |
| (Floating, Prime Rate U.S. + 0.33%), 3.58%, 04/25/46† | 244,316 | | 283,820 |
| (Floating, Prime Rate U.S. + 0.38%), 3.63%, 08/25/46† | 498,958 | | 557,852 |
Total Mortgage-Backed Securities
(Cost $22,224,605) | | | 21,608,327 |
| MUNICIPAL BONDS — 10.4% |
| Arlington Higher Education Finance Corporation, Revenue Bond (PSF-Gtd.) | | | |
| 0.50%, 08/15/23 | 410,000 | | 408,510 |
| | | Par | | Value |
| Boston Water & Sewer Commission, Revenue Bond | | | |
| 0.97%, 11/01/25 | $200,000 | | $197,689 |
| California State Health Facilities Financing Authority, Revenue Bond | | | |
| 1.98%, 06/01/30 | 600,000 | | 592,456 |
| Carroll County Water Authority, Revenue Bond, Series B | | | |
| 1.08%, 07/01/25 | 290,000 | | 288,403 |
| 1.96%, 07/01/29 | 150,000 | | 151,800 |
| City & County of San Francisco, General Obligation, Series A | | | |
| 1.78%, 06/15/29 | 600,000 | | 598,645 |
| City of Bossier Utilities, Revenue Bond (BAM Insured) | | | |
| 1.00%, 10/01/25 | 370,000 | | 366,596 |
| City of Columbia Waterworks & Sewer System, Revenue Bond, Series B | | | |
| 0.78%, 02/01/25 | 400,000 | | 394,824 |
| 1.29%, 02/01/27 | 165,000 | | 163,344 |
| City of Deltona Utility System, Revenue Bond (BAM Insured) | | | |
| 1.54%, 10/01/29 | 250,000 | | 244,010 |
| City of Phoenix Civic Improvement Corporation, Junior Lien Revenue Bond, Series C | | | |
| 1.84%, 07/01/29 | 640,000 | | 641,826 |
| City of Tacoma Washington Electric System Revenue, Revenue Bond | | | |
| 5.64%, 01/01/27 | 600,000 | | 719,435 |
| Connecticut Green Bank, Revenue Bond | | | |
| 2.15%, 11/15/29 | 207,000 | | 208,485 |
| Connecticut Housing Finance Authority, Revenue Bond, Series 29 | | | |
| 1.20%, 06/15/25 | 400,000 | | 396,587 |
| County of Hernando Water & Sewer, Revenue Bond, Series A | | | |
| 1.01%, 06/01/25 | 300,000 | | 299,063 |
| Coweta County Water & Sewage Authority, Revenue Bond, Series A | | | |
| 2.00%, 06/01/25 | 200,000 | | 204,600 |
| Cucamonga Valley Water District Financing Authority, Revenue Bond, Series A | | | |
| 0.99%, 09/01/25 | 150,000 | | 148,719 |
| Cucamonga Valley Water District Financing Authority, Revenue Bond, Series B | | | |
| 3.86%, 09/01/30 | 140,000 | | 157,200 |
| Denver City & County Housing Authority, Revenue Bond (HUD Sector 8 Program) | | | |
| 0.84%, 08/01/24 | 500,000 | | 493,519 |
| District of Columbia Housing Finance Agency, Revenue Bond, Series A-2 (FHA Insured) | | | |
| 1.90%, 03/01/29 | 140,000 | | 136,924 |
See Notes to Financial Statements.
SCHEDULE OF INVESTMENTS (Continued)
| | | Par | | Value |
| 2.05%, 03/01/30 | $420,000 | | $411,060 |
| Economy Borough Municipal Authority, Revenue Bond, Series A (BAM Insured) | | | |
| 0.42%, 12/15/22 | 660,000 | | 659,665 |
| Honolulu City & County Board of Water Supply, Revenue Bond, Series B | | | |
| 1.16%, 07/01/26 | 580,000 | | 574,026 |
| Iowa State Finance Authority, Revenue Bond, Series B | | | |
| 0.47%, 08/01/24 | 350,000 | | 345,412 |
| Lancaster Power Authority, Revenue Bond (AGM Insured) | | | |
| 2.56%, 11/01/33 | 275,000 | | 276,117 |
| 2.68%, 11/01/34 | 275,000 | | 276,801 |
| Metropolitan Water District of Salt Lake & Sandy, Revenue Bond, Series B | | | |
| 0.82%, 07/01/25 | 475,000 | | 468,178 |
| 1.52%, 07/01/28 | 200,000 | | 198,738 |
| Monterey Regional Waste Management Authority, Revenue Bond | | | |
| 2.31%, 04/01/32 | 700,000 | | 695,377 |
| Montgomery Water Works & Sanitary Sewer Board, Revenue Bond | | | |
| 2.00%, 09/01/26 | 400,000 | | 410,627 |
| Narragansett Bay Commission, Revenue Bond | | | |
| 2.09%, 09/01/30 | 500,000 | | 507,808 |
| New York City Housing Development Corporation, Revenue Bond, Series B | | | |
| 0.82%, 05/01/25 | 150,000 | | 147,280 |
| 0.92%, 11/01/25 | 200,000 | | 195,612 |
| 1.02%, 05/01/26 | 250,000 | | 243,936 |
| New York State Housing Finance Agency, Revenue Bond (SonyMA Insured) | | | |
| 1.13%, 11/01/25 | 165,000 | | 162,675 |
| North Carolina Capital Facilities Finance Agency, Revenue Bond, Series B | | | |
| 1.05%, 10/01/23 | 150,000 | | 148,966 |
| 1.43%, 10/01/24 | 100,000 | | 98,697 |
| Redevelopment Authority of the City of Philadelphia, Revenue Bond, Series A | | | |
| 1.93%, 09/01/27 | 500,000 | | 495,926 |
| Regional Transportation District Sales Tax, Revenue Bond, Series A | | | |
| 0.70%, 11/01/25 | 600,000 | | 586,048 |
| Riverside Community College District, General Obligation | | | |
| 0.82%, 08/01/25 | 195,000 | | 191,797 |
| Romulus Community Schools, General Obligation, Series B (Q-SBLF Insured) | | | |
| 1.00%, 05/01/25 | 200,000 | | 197,648 |
| | | Par | | Value |
| Rowland Water District, Revenue Bond, Series A | | | |
| 2.56%, 12/01/36 | $ 590,000 | | $ 596,733 |
| San Antonio Education Facilities Corporation, Revenue Bond | | | |
| 1.74%, 04/01/25 | 250,000 | | 246,897 |
| San Diego Public Facilities Financing Authority, Revenue Bond, Series A | | | |
| 2.13%, 08/01/29 | 290,000 | | 296,575 |
| Santa Clara Valley Water District COPS, Series D | | | |
| 1.78%, 06/01/31 | 440,000 | | 435,316 |
| Silicon Valley Clean Water, Revenue Bond, Series A | | | |
| 1.38%, 08/01/27 | 240,000 | | 238,189 |
| Somerset County Improvement Authority, Revenue Bond (County Gtd.) | | | |
| 0.97%, 04/15/25 | 530,000 | | 526,014 |
| Spartanburg Sanitary Sewer District, Revenue Bond | | | |
| 1.19%, 03/01/26 | 300,000 | | 296,946 |
| State of California Department of Water Resources, Revenue Bond | | | |
| 0.51%, 12/01/24 | 750,000 | | 737,229 |
| Tift County Hospital Authority, Revenue Bond (County Gtd.) | | | |
| 1.05%, 12/01/25 | 325,000 | | 321,095 |
| United Independent School District, General Obligation (PSF-Gtd.) | | | |
| 5.00%, 08/15/25 | 160,000 | | 181,121 |
| Upper Santa Clara Valley Joint Powers Authority, Revenue Bond, Series B | | | |
| 1.18%, 08/01/26 | 360,000 | | 357,085 |
Total Municipal Bonds
(Cost $18,511,214) | | | 18,338,229 |
| PRIVATE INVESTMENT — 0.6% |
Calvert Impact Capital, Inc.
(Cost $1,000,000) | 1,000,000 | | 1,000,000 |
| | | Shares | |
| COMMON STOCKS — 36.0% |
| Consumer Discretionary — 1.4% | |
| Home Depot, Inc. (The) | 3,053 | 1,267,025 |
| NIKE, Inc. Class B | 7,583 | 1,263,859 |
| | | | 2,530,884 |
| Consumer Staples — 0.3% | |
| McCormick & Co., Inc. (Non-Voting Shares) | 5,417 | 523,337 |
| Financials — 4.0% | |
| Marsh & McLennan Cos., Inc. | 15,067 | 2,618,946 |
| Progressive Corporation (The) | 15,559 | 1,597,131 |
| Walker & Dunlop, Inc. | 19,104 | 2,882,412 |
| | | | 7,098,489 |
See Notes to Financial Statements.
| | | Shares | | Value |
| Health Care — 2.8% | | |
| Accolade, Inc.* | 12,015 | | $ 316,715 |
| Encompass Health Corporation | 24,423 | | 1,593,845 |
| Humana, Inc. | 6,401 | | 2,969,168 |
| | | | | 4,879,728 |
| Industrials — 5.0% | | |
| Advanced Drainage Systems, Inc. | 8,900 | | 1,211,557 |
| Evoqua Water Technologies Corporation* | 81,738 | | 3,821,251 |
| Westinghouse Air Brake Technologies Corporation | 22,714 | | 2,092,187 |
| Xylem, Inc. | 13,689 | | 1,641,585 |
| | | | | 8,766,580 |
| Information Technology — 19.7% | | |
| Adobe, Inc.* | 6,106 | | 3,462,468 |
| Autodesk, Inc.* | 12,113 | | 3,406,054 |
| Avalara, Inc.Δ * | 12,655 | | 1,633,887 |
| Bill.com Holdings, Inc.* | 4,708 | | 1,172,998 |
| Cadence Design Systems, Inc.* | 9,750 | | 1,816,912 |
| IPG Photonics Corporation* | 11,627 | | 2,001,472 |
| Lam Research Corporation | 3,940 | | 2,833,451 |
| Mastercard, Inc. Class A | 5,102 | | 1,833,251 |
| Microchip Technology, Inc. | 25,112 | | 2,186,251 |
| Microsoft Corporation | 19,695 | | 6,623,822 |
| NVIDIA Corporation | 14,969 | | 4,402,533 |
| Texas Instruments, Inc. | 9,651 | | 1,818,924 |
| Zendesk, Inc.* | 13,885 | | 1,448,067 |
| | | | | 34,640,090 |
| Real Estate — 2.8% | | |
| Crown Castle International Corporation REIT | 8,076 | | 1,685,784 |
| Equinix, Inc. REIT | 2,035 | | 1,721,285 |
| Prologis, Inc. REIT | 8,765 | | 1,475,675 |
| | | | | 4,882,744 |
Total Common Stocks
(Cost $50,271,404) | | | 63,321,852 |
| FOREIGN COMMON STOCKS — 27.5% |
| Australia — 0.3% | | |
| Nanosonics, Ltd.* | 97,002 | | 445,321 |
| Canada — 2.7% | | |
| Boralex, Inc. Class AΔ | 44,020 | | 1,206,857 |
| Innergex Renewable Energy, Inc. | 82,919 | | 1,219,253 |
| Intact Financial Corporation | 17,529 | | 2,278,444 |
| | | | | 4,704,554 |
| France — 2.7% | | |
| Legrand SA | 15,559 | | 1,822,762 |
| Schneider Electric SE | 14,575 | | 2,861,739 |
| | | | | 4,684,501 |
| Germany — 1.7% | | |
| adidas AG | 5,121 | | 1,474,568 |
| | | Shares | | Value |
| Knorr-Bremse AG | 16,219 | | $ 1,601,862 |
| | | | | 3,076,430 |
| Hong Kong — 1.3% | | |
| AIA Group, Ltd. | 186,000 | | 1,874,896 |
| Linklogis, Inc. Class B 144A * | 462,887 | | 433,351 |
| | | | | 2,308,247 |
| Ireland — 3.2% | | |
| Aon PLC Class A | 10,625 | | 3,193,450 |
| ICON PLC* | 8,100 | | 2,508,570 |
| | | | | 5,702,020 |
| Japan — 5.5% | | |
| Murata Manufacturing Co., Ltd. | 23,700 | | 1,890,371 |
| Nidec Corporation | 14,500 | | 1,715,269 |
| Nintendo Co., Ltd. | 4,300 | | 2,011,787 |
| Shimadzu Corporation | 48,000 | | 2,027,424 |
| Shimano, Inc. | 7,700 | | 2,050,659 |
| | | | | 9,695,510 |
| Jersey — 1.4% | | |
| Aptiv PLC* | 14,870 | | 2,452,806 |
| Netherlands — 2.3% | | |
| ASML Holding NV | 2,856 | | 2,297,875 |
| Wolters Kluwer NV | 14,969 | | 1,765,572 |
| | | | | 4,063,447 |
| Switzerland — 1.6% | | |
| TE Connectivity, Ltd. | 17,037 | | 2,748,750 |
| Taiwan — 1.8% | | |
| Taiwan Semiconductor Manufacturing Co., Ltd. ADR | 26,800 | | 3,224,308 |
| United Kingdom — 3.0% | | |
| Atlassian Corporation PLC Class A* | 5,121 | | 1,952,586 |
| DS Smith PLC | 295,734 | | 1,536,316 |
| SSE PLC | 81,047 | | 1,808,973 |
| | | | | 5,297,875 |
Total Foreign Common Stocks
(Cost $45,514,357) | | | 48,403,769 |
| MONEY MARKET FUNDS — 3.0% |
GuideStone Money Market Fund, 0.00%
(Institutional Class)Ø ∞
(Cost $5,291,910) | 5,291,910 | | 5,291,910 |
TOTAL INVESTMENTS —99.4%
(Cost $159,675,946) | | | 174,641,199 |
Other Assets in Excess of
Liabilities — 0.6% | | | 1,138,470 |
| NET ASSETS — 100.0% | | | $175,779,669 |
See Notes to Financial Statements.
SCHEDULE OF INVESTMENTS (Continued)
Futures Contracts outstanding at December 31, 2021:
| Future Type | | Expiration Date | | Open Long
(Short) Contracts | | Notional
Market Value
of Contracts | | Value and
Unrealized
Appreciation
(Depreciation) |
| Canadian Dollars/U.S. Dollars | | 03/2022 | | 3 | | $ 237,150 | | $ 113 |
| MSCI EAFE Index | | 03/2022 | | 27 | | 3,134,430 | | 40,598 |
| MSCI Emerging Markets | | 03/2022 | | 25 | | 1,532,875 | | (6,230) |
| S&P/TSX 60 Index | | 03/2022 | | 1 | | 202,522 | | 3,374 |
| 10-Year U.S. Treasury Note | | 03/2022 | | (40) | | (5,218,750) | | (48,125) |
| Ultra 10-Year U.S. Treasury Note | | 03/2022 | | (21) | | (3,075,188) | | (21,844) |
| Ultra Long U.S. Treasury Bond | | 03/2022 | | 31 | | 6,110,875 | | 90,094 |
| 2-Year U.S. Treasury Note | | 04/2022 | | 22 | | 4,799,781 | | (2,750) |
| Total Futures Contracts outstanding at December 31, 2021 | | | | | | $ 7,723,695 | | $ 55,230 |
See Notes to Financial Statements.
VALUATION HIERARCHY
The following is a summary of the inputs used, as of December 31, 2021, in valuing the Fund’s investments carried at fair value:
| | Total
Value | | Level 1
Quoted Prices | | Level 2
Other Significant
Observable Inputs | | Level 3
Significant
Unobservable Inputs |
| Assets: | | | | | | | |
| Investments in Securities: | | | | | | | |
| Agency Obligations | $ 994,732 | | $ — | | $ 994,732 | | $ — |
| Asset-Backed Securities | 4,283,705 | | — | | 4,283,705 | | — |
| Common Stocks | 63,321,852 | | 63,321,852 | | — | | — |
| Corporate Bonds | 9,532,994 | | — | | 9,532,994 | | — |
| Foreign Bonds | 1,761,217 | | — | | 1,761,217 | | — |
| Foreign Common Stocks: | | | | | | | |
| Germany | 3,076,430 | | — | | 3,076,430 | | — |
| Japan | 9,695,510 | | — | | 9,695,510 | | — |
| Other ^^ | 35,631,829 | | 35,631,829 | | — | | — |
| Total Foreign Common Stocks | 48,403,769 | | 35,631,829 | | 12,771,940 | | — |
| Loan Agreements | 104,464 | | — | | — | | 104,464 |
| Money Market Funds | 5,291,910 | | 5,291,910 | | — | | — |
| Mortgage-Backed Securities | 21,608,327 | | — | | 21,608,327 | | — |
| Municipal Bonds | 18,338,229 | | — | | 18,338,229 | | — |
| Private Investment | 1,000,000 | | — | | 1,000,000 | | — |
| Total Assets - Investments in Securities | $174,641,199 | | $104,245,591 | | $70,291,144 | | $104,464 |
| Other Financial Instruments*** | | | | | | | |
| Futures Contracts | $ 134,179 | | $ 134,179 | | $ — | | $ — |
| Total Assets - Other Financial Instruments | $ 134,179 | | $ 134,179 | | $ — | | $ — |
| Liabilities: | | | | | | | |
| Other Financial Instruments*** | | | | | | | |
| Futures Contracts | $ (78,949) | | $ (78,949) | | $ — | | $ — |
| Total Liabilities - Other Financial Instruments | $ (78,949) | | $ (78,949) | | $ — | | $ — |
| ^^ | Classifications as defined in the Schedule of Investments. |
| *** | Other financial instruments are derivative instruments, such as futures contracts, which are valued at the unrealized appreciation (depreciation) on the investment. Further details regarding the value of these investments can be found in the preceding "Futures Contracts outstanding" disclosure. |
There were no transfers to or from Level 3 during the year ended December 31, 2021.
Management has determined that the amount of Level 3 securities compared to total net assets is not material; therefore, the reconciliation of Level 3 securities and assumptions is not shown for the year ended December 31, 2021.
See Notes to Financial Statements.
Equity Index Fund (Unaudited)
The Fund was passively managed and attempted to replicate the performance of its benchmark, the S&P 500® Index. The Fund was comprised of domestic, large-cap equity stocks with both value- and growth-style orientations. The objective of the Fund is to provide investment results approximating the aggregate price and dividend performance of the securities included in the S&P 500® Index. However, the Fund’s returns relative to its benchmark could be lower in certain market environments and also due to the exclusion of certain securities from the Fund’s portfolio because of the Fund’s faith-based investment policies and restrictions.
The Investor Class of the Fund returned 27.95% for the one-year period ended December 31, 2021, as compared to a return of 28.71% for the S&P 500® Index. The return differential was primarily a result of faith-based investment restrictions and expenses of the Fund.
In 2021, exchange-listed equity index futures contracts were utilized to provide market exposure to the cash positions held in the Fund. Overall, derivative exposure had a positive impact on Fund performance for the year.
This Fund may be suitable for investors who seek higher, long-term rates of return, can accept significant short-term fluctuations in account value and want to diversify their portfolio by adding a potentially higher return, higher risk option of equity securities. It is possible to lose money by investing in the Fund.
At December 31, 2021, the portfolio holdings of the Fund, as a percentage of net assets, is shown in the following table. Portfolio holdings are subject to risk and may change at any time.
| | % |
| Information Technology | 28.7 |
| Health Care | 12.0 |
| Consumer Discretionary | 11.9 |
| Financials | 10.7 |
| Communication Services | 10.2 |
| Industrials | 7.7 |
| Consumer Staples | 6.2 |
| Real Estate | 2.8 |
| Energy | 2.6 |
| Materials | 2.6 |
| Utilities | 2.6 |
| Money Market Funds | 1.9 |
| | 99.9 |
See Notes to Financial Statements.
Equity Index Fund (Unaudited)
| Average Annual Total Returns as of 12/31/21 | |
| | | Institutional Class* | | Investor Class* | | Benchmark** | |
| One Year | | 28.28% | | 27.95% | | 28.71% | |
| Five Year | | 18.44% | | 18.13% | | 18.46% | |
| Ten Year | | 16.45% | | 16.19% | | 16.54% | |
| Since Inception | | 9.03% | | 8.86% | | 9.20% | |
| Inception Date | | 08/27/01 | | 08/27/01 | | | |
| Total Fund Operating Expenses (May 1, 2021 Prospectus)(1) | | 0.13% | | 0.40% | | | |
| (1) | Current information regarding the Fund’s Operating Expenses can be found in the Financial Highlights. |
The performance data quoted represents past performance and does not guarantee future results. Current performance may be lower or higher. Performance data current to the most recent month-end may be obtained at GuideStoneFunds.com. The investment return and principal value of an investment will fluctuate so that shares, when redeemed, may be worth more or less than their original cost.
The graph illustrates the results of a hypothetical $10,000 investment in the Investor Class of the Fund for the 10-year period from December 31, 2011 to December 31, 2021, with all dividends and capital gains reinvested, with the S&P 500® Index.
*These returns reflect investment advisory and shareholder servicing fee waivers, if applicable, during the reported time periods.
**Unlike a mutual fund, the performance of an index assumes no taxes, transaction costs, management fees or other expenses.
See Notes to Financial Statements.
| | | Shares | | Value |
| COMMON STOCKS — 94.8% |
| Communication Services — 10.2% | | |
| Activision Blizzard, Inc. | 67,691 | | $ 4,503,482 |
| Alphabet, Inc. Class A* | 24,283 | | 70,348,822 |
| Alphabet, Inc. Class C* | 22,760 | | 65,858,108 |
| AT&T, Inc. | 621,024 | | 15,277,190 |
| Charter Communications, Inc. Class AΔ* | 11,090 | | 7,230,347 |
| Comcast Corporation Class A | 376,227 | | 18,935,505 |
| Discovery, Inc. Class AΔ* | 27,796 | | 654,318 |
| Discovery, Inc. Class CΔ* | 15,921 | | 364,591 |
| DISH Network Corporation Class A* | 18,408 | | 597,156 |
| Electronic Arts, Inc. | 25,211 | | 3,325,331 |
| Fox Corporation Class A | 31,129 | | 1,148,660 |
| Fox Corporation Class B | 9,099 | | 311,823 |
| Interpublic Group of Cos., Inc. (The) | 47,139 | | 1,765,356 |
| Live Nation Entertainment, Inc.Δ* | 10,940 | | 1,309,409 |
| Lumen Technologies, Inc.Δ | 121,774 | | 1,528,264 |
| Match Group, Inc.Δ* | 21,213 | | 2,805,419 |
| Meta Platforms, Inc. Class A* | 193,191 | | 64,979,793 |
| Netflix, Inc.* | 35,817 | | 21,577,593 |
| News Corporation Class A | 13,865 | | 309,328 |
| News Corporation Class B | 13,984 | | 314,640 |
| Omnicom Group, Inc. | 24,095 | | 1,765,441 |
| Take-Two Interactive Software, Inc.* | 10,102 | | 1,795,327 |
| T-Mobile US, Inc.* | 47,662 | | 5,527,839 |
| Twitter, Inc.* | 60,429 | | 2,611,741 |
| Verizon Communications, Inc. | 435,557 | | 22,631,542 |
| ViacomCBS, Inc. Class B | 52,671 | | 1,589,611 |
| Walt Disney Co. (The)* | 146,419 | | 22,678,839 |
| | | | | 341,745,475 |
| Consumer Discretionary — 11.8% | | |
| Advance Auto Parts, Inc. | 6,948 | | 1,666,686 |
| Amazon.com, Inc.* | 35,432 | | 118,142,335 |
| AutoZone, Inc.* | 2,011 | | 4,215,840 |
| Bath & Body Works, Inc. | 13,836 | | 965,614 |
| Best Buy Co., Inc. | 15,833 | | 1,608,633 |
| Booking Holdings, Inc.* | 3,294 | | 7,903,064 |
| BorgWarner, Inc. | 6,279 | | 282,995 |
| CarMax, Inc.Δ* | 12,596 | | 1,640,377 |
| Carnival CorporationΔ* | 84,836 | | 1,706,900 |
| Chipotle Mexican Grill, Inc.* | 2,169 | | 3,791,954 |
| D.R. Horton, Inc. | 16,760 | | 1,817,622 |
| Darden Restaurants, Inc. | 9,727 | | 1,465,275 |
| Dollar General Corporation | 18,720 | | 4,414,738 |
| Dollar Tree, Inc.* | 18,243 | | 2,563,506 |
| Domino’s Pizza, Inc.Δ | 3,030 | | 1,709,920 |
| eBay, Inc. | 57,037 | | 3,792,960 |
| Etsy, Inc.* | 9,267 | | 2,028,917 |
| Expedia Group, Inc.* | 10,462 | | 1,890,693 |
| Ford Motor Co. | 308,985 | | 6,417,618 |
| Gap, Inc. (The)Δ | 12,531 | | 221,172 |
| General Motors Co.* | 106,950 | | 6,270,478 |
| Genuine Parts Co. | 12,313 | | 1,726,283 |
| Hasbro, Inc. | 10,784 | | 1,097,596 |
| Hilton Worldwide Holdings, Inc.* | 23,098 | | 3,603,057 |
| Home Depot, Inc. (The) | 84,598 | | 35,109,016 |
| | | Shares | | Value |
| Lennar Corporation Class A | 14,886 | | $ 1,729,158 |
| LKQ Corporation | 18,658 | | 1,120,040 |
| Lowe’s Cos., Inc. | 57,516 | | 14,866,736 |
| Marriott International, Inc. Class A* | 21,380 | | 3,532,831 |
| McDonald’s Corporation | 63,693 | | 17,074,183 |
| Mohawk Industries, Inc.Δ* | 2,387 | | 434,864 |
| Newell Brands, Inc.Δ | 39,118 | | 854,337 |
| NIKE, Inc. Class B | 104,453 | | 17,409,182 |
| Norwegian Cruise Line Holdings, Ltd.* | 41,279 | | 856,126 |
| NVR, Inc.* | 171 | | 1,010,417 |
| O’Reilly Automotive, Inc.* | 5,716 | | 4,036,811 |
| Pool Corporation | 3,147 | | 1,781,202 |
| PulteGroup, Inc.Δ | 5,415 | | 309,521 |
| PVH Corporation | 2,959 | | 315,577 |
| Ralph Lauren Corporation | 2,058 | | 244,614 |
| Ross Stores, Inc. | 25,592 | | 2,924,654 |
| Royal Caribbean Cruises, Ltd.* | 22,682 | | 1,744,246 |
| Starbucks Corporation | 98,522 | | 11,524,118 |
| Tapestry, Inc. | 24,199 | | 982,479 |
| Target Corporation | 41,380 | | 9,576,987 |
| Tesla, Inc.* | 65,435 | | 69,150,399 |
| TJX Cos., Inc. (The) | 90,590 | | 6,877,593 |
| Tractor Supply Co. | 7,490 | | 1,787,114 |
| Ulta Beauty, Inc.* | 3,840 | | 1,583,386 |
| Under Armour, Inc. Class AΔ* | 20,379 | | 431,831 |
| Under Armour, Inc. Class C* | 9,410 | | 169,756 |
| VF Corporation | 27,573 | | 2,018,895 |
| Whirlpool Corporation | 4,600 | | 1,079,436 |
| Yum! Brands, Inc. | 24,402 | | 3,388,462 |
| | | | | 394,868,204 |
| Consumer Staples — 6.2% | | |
| Archer-Daniels-Midland Co. | 58,262 | | 3,937,929 |
| Campbell Soup Co. | 28,952 | | 1,258,254 |
| Church & Dwight Co., Inc. | 27,416 | | 2,810,140 |
| Clorox Co. (The) | 12,213 | | 2,129,459 |
| Coca-Cola Co. (The) | 374,142 | | 22,152,948 |
| Colgate-Palmolive Co. | 83,433 | | 7,120,172 |
| Conagra Brands, Inc. | 80,687 | | 2,755,461 |
| Costco Wholesale Corporation | 36,347 | | 20,634,192 |
| Estee Lauder Cos., Inc. (The) Class A | 19,563 | | 7,242,223 |
| General Mills, Inc. | 82,355 | | 5,549,080 |
| Hershey Co. (The) | 19,352 | | 3,744,031 |
| Hormel Foods CorporationΔ | 43,964 | | 2,145,883 |
| J.M. Smucker Co. (The)Δ | 15,075 | | 2,047,487 |
| Kellogg Co. | 42,353 | | 2,728,380 |
| Kimberly-Clark Corporation | 31,736 | | 4,535,709 |
| Kraft Heinz Co. (The) | 63,648 | | 2,284,963 |
| Kroger Co. (The) | 81,475 | | 3,687,558 |
| Lamb Weston Holdings, Inc. | 17,029 | | 1,079,298 |
| McCormick & Co., Inc. (Non-Voting Shares)Δ | 25,400 | | 2,453,894 |
| Mondelez International, Inc. Class A | 158,472 | | 10,508,278 |
| Monster Beverage Corporation* | 36,278 | | 3,484,139 |
| PepsiCo, Inc. | 145,366 | | 25,251,528 |
| Procter & Gamble Co. (The) | 235,667 | | 38,550,408 |
| Sysco Corporation | 37,870 | | 2,974,689 |
See Notes to Financial Statements.
| | | Shares | | Value |
| Tyson Foods, Inc. Class A | 27,409 | | $ 2,388,968 |
| Walgreens Boots Alliance, Inc. | 61,239 | | 3,194,226 |
| Walmart, Inc. | 131,003 | | 18,954,824 |
| | | | | 205,604,121 |
| Energy — 2.5% | | |
| APA CorporationΔ | 18,290 | | 491,818 |
| Archrock, Inc. | 13 | | 97 |
| Baker Hughes Co. | 60,056 | | 1,444,947 |
| Chevron Corporation | 161,435 | | 18,944,397 |
| ConocoPhillips | 112,555 | | 8,124,220 |
| Coterra Energy, Inc. | 73,032 | | 1,387,608 |
| Devon Energy CorporationΔ | 49,912 | | 2,198,624 |
| Diamondback Energy, Inc. | 10,890 | | 1,174,487 |
| EOG Resources, Inc. | 47,427 | | 4,212,940 |
| Exterran Corporation* | 6 | | 18 |
| Exxon Mobil Corporation | 355,827 | | 21,773,054 |
| Halliburton Co. | 68,091 | | 1,557,241 |
| Hess Corporation | 18,891 | | 1,398,501 |
| Kinder Morgan, Inc.Δ | 146,006 | | 2,315,655 |
| Marathon Oil Corporation | 59,299 | | 973,690 |
| Marathon Petroleum Corporation | 50,234 | | 3,214,474 |
| Occidental Petroleum Corporation | 65,681 | | 1,904,092 |
| ONEOK, Inc. | 35,809 | | 2,104,137 |
| Phillips 66 | 31,961 | | 2,315,894 |
| Pioneer Natural Resources Co. | 18,667 | | 3,395,154 |
| Valero Energy Corporation | 31,110 | | 2,336,672 |
| Williams Cos., Inc. (The) | 96,309 | | 2,507,886 |
| | | | | 83,775,606 |
| Financials — 10.2% | | |
| Aflac, Inc. | 55,516 | | 3,241,578 |
| Allstate Corporation (The) | 28,840 | | 3,393,026 |
| American Express Co. | 56,945 | | 9,316,202 |
| American International Group, Inc. | 67,569 | | 3,841,973 |
| Ameriprise Financial, Inc. | 10,345 | | 3,120,673 |
| Arthur J. Gallagher & Co. | 15,093 | | 2,560,829 |
| Assurant, Inc. | 2,341 | | 364,868 |
| Bank of America Corporation | 621,241 | | 27,639,012 |
| Bank of New York Mellon Corporation (The) | 72,967 | | 4,237,923 |
| Berkshire Hathaway, Inc. Class B* | 155,715 | | 46,558,785 |
| BlackRock, Inc. | 12,151 | | 11,124,970 |
| Brown & Brown, Inc.Δ | 18,702 | | 1,314,377 |
| Capital One Financial Corporation | 34,907 | | 5,064,657 |
| Cboe Global Markets, Inc. | 8,664 | | 1,129,786 |
| Charles Schwab Corporation (The) | 124,970 | | 10,509,977 |
| Cincinnati Financial Corporation | 10,988 | | 1,251,863 |
| Citigroup, Inc. | 170,029 | | 10,268,051 |
| Citizens Financial Group, Inc. | 18,464 | | 872,424 |
| CME Group, Inc. | 28,081 | | 6,415,385 |
| Comerica, Inc. | 10,547 | | 917,589 |
| Discover Financial Services | 22,685 | | 2,621,479 |
| Everest Re Group, Ltd. | 3,173 | | 869,148 |
| FactSet Research Systems, Inc. | 3,042 | | 1,478,442 |
| Fifth Third BancorpΔ | 52,084 | | 2,268,258 |
| First Republic Bank | 11,885 | | 2,454,371 |
| Franklin Resources, Inc. | 23,495 | | 786,848 |
| Globe Life, Inc. | 4,186 | | 392,312 |
| | | Shares | | Value |
| Goldman Sachs Group, Inc. (The) | 27,330 | | $ 10,455,092 |
| Hartford Financial Services Group, Inc. (The) | 28,747 | | 1,984,693 |
| Huntington Bancshares, Inc.Δ | 118,830 | | 1,832,359 |
| Intercontinental Exchange, Inc. | 43,068 | | 5,890,410 |
| Invesco, Ltd. | 17,740 | | 408,375 |
| JPMorgan Chase & Co. | 249,235 | | 39,466,362 |
| KeyCorp | 64,549 | | 1,493,018 |
| Lincoln National Corporation | 16,646 | | 1,136,256 |
| Loews Corporation | 3,079 | | 177,843 |
| M&T Bank Corporation | 10,059 | | 1,544,861 |
| MarketAxess Holdings, Inc. | 2,840 | | 1,168,007 |
| Marsh & McLennan Cos., Inc. | 39,915 | | 6,938,025 |
| MetLife, Inc. | 64,005 | | 3,999,672 |
| Moody’s Corporation | 11,483 | | 4,485,030 |
| Morgan Stanley | 122,245 | | 11,999,569 |
| MSCI, Inc. | 6,284 | | 3,850,144 |
| Nasdaq, Inc. | 9,140 | | 1,919,491 |
| Northern Trust Corporation | 16,617 | | 1,987,559 |
| People’s United Financial, Inc. | 11,480 | | 204,574 |
| PNC Financial Services Group, Inc. (The) | 34,137 | | 6,845,151 |
| Principal Financial Group, Inc. | 22,421 | | 1,621,711 |
| Progressive Corporation (The) | 45,104 | | 4,629,926 |
| Prudential Financial, Inc. | 36,128 | | 3,910,495 |
| Raymond James Financial, Inc. | 13,842 | | 1,389,737 |
| Regions Financial Corporation | 40,587 | | 884,797 |
| S&P Global, Inc. | 18,528 | | 8,743,919 |
| Signature Bank | 4,900 | | 1,585,003 |
| State Street Corporation | 30,870 | | 2,870,910 |
| SVB Financial Group* | 4,898 | | 3,322,020 |
| Synchrony Financial | 55,655 | | 2,581,835 |
| T. Rowe Price Group, Inc. | 22,044 | | 4,334,732 |
| Travelers Cos., Inc. (The) | 21,004 | | 3,285,656 |
| Truist Financial Corporation | 104,234 | | 6,102,901 |
| U.S. Bancorp | 117,801 | | 6,616,882 |
| W.R. Berkley Corporation | 11,267 | | 928,288 |
| Wells Fargo & Co. | 334,461 | | 16,047,439 |
| Zions Bancorp NA | 7,446 | | 470,289 |
| | | | | 341,127,837 |
| Health Care — 11.6% | | |
| Abbott Laboratories | 164,886 | | 23,206,056 |
| ABIOMED, Inc.* | 4,950 | | 1,777,891 |
| Agilent Technologies, Inc. | 45,567 | | 7,274,771 |
| Align Technology, Inc.* | 6,636 | | 4,361,046 |
| AmerisourceBergen CorporationΔ | 17,971 | | 2,388,166 |
| Amgen, Inc. | 77,723 | | 17,485,343 |
| Anthem, Inc. | 21,194 | | 9,824,267 |
| Baxter International, Inc. | 49,046 | | 4,210,109 |
| Becton, Dickinson and Co. | 34,256 | | 8,614,699 |
| Biogen, Inc.* | 17,530 | | 4,205,798 |
| Bio-Rad Laboratories, Inc. Class A* | 4,307 | | 3,254,240 |
| Boston Scientific Corporation* | 120,221 | | 5,106,988 |
| Cardinal Health, Inc. | 27,527 | | 1,417,365 |
| Catalent, Inc.Δ* | 45,285 | | 5,797,838 |
| Centene Corporation* | 48,859 | | 4,025,982 |
| Cerner Corporation | 28,126 | | 2,612,062 |
See Notes to Financial Statements.
SCHEDULE OF INVESTMENTS (Continued)
| | | Shares | | Value |
| Charles River Laboratories International, Inc.* | 10,283 | | $ 3,874,429 |
| Cigna Corporation | 29,323 | | 6,733,440 |
| CVS Health Corporation | 111,494 | | 11,501,721 |
| Danaher Corporation | 58,941 | | 19,392,178 |
| DaVita, Inc.* | 13,768 | | 1,566,248 |
| DENTSPLY SIRONA, Inc. | 26,241 | | 1,463,985 |
| DexCom, Inc.Δ* | 8,564 | | 4,598,440 |
| Edwards Lifesciences Corporation* | 57,327 | | 7,426,713 |
| Eli Lilly and Co. | 85,714 | | 23,675,921 |
| Gilead Sciences, Inc. | 235,975 | | 17,134,145 |
| HCA Healthcare, Inc. | 23,088 | | 5,931,769 |
| Henry Schein, Inc.* | 11,738 | | 910,047 |
| Hologic, Inc.* | 29,305 | | 2,243,591 |
| Humana, Inc. | 10,676 | | 4,952,169 |
| IDEXX Laboratories, Inc.* | 7,551 | | 4,972,031 |
| Illumina, Inc.* | 14,975 | | 5,697,089 |
| Incyte Corporation* | 41,125 | | 3,018,575 |
| Intuitive Surgical, Inc.* | 30,693 | | 11,027,995 |
| IQVIA Holdings, Inc.* | 33,184 | | 9,362,534 |
| Laboratory Corporation of America Holdings* | 7,436 | | 2,336,466 |
| McKesson Corporation | 13,291 | | 3,303,744 |
| Mettler-Toledo International, Inc.* | 2,979 | | 5,055,989 |
| Moderna, Inc.* | 30,751 | | 7,810,139 |
| Organon & Co. | 54,009 | | 1,644,574 |
| PerkinElmer, Inc.Δ | 16,506 | | 3,318,696 |
| Quest Diagnostics, Inc. | 16,017 | | 2,771,101 |
| Regeneron Pharmaceuticals, Inc.* | 12,710 | | 8,026,619 |
| ResMed, Inc. | 11,820 | | 3,078,874 |
| Stryker Corporation | 27,962 | | 7,477,598 |
| Teleflex, Inc. | 4,060 | | 1,333,629 |
| UnitedHealth Group, Inc. | 82,292 | | 41,322,105 |
| Universal Health Services, Inc. Class B | 6,340 | | 822,044 |
| Vertex Pharmaceuticals, Inc.* | 40,955 | | 8,993,718 |
| Viatris, Inc. | 339,730 | | 4,596,547 |
| Waters Corporation* | 8,175 | | 3,046,005 |
| West Pharmaceutical Services, Inc. | 12,656 | | 5,935,791 |
| Zimmer Biomet Holdings, Inc. | 21,341 | | 2,711,161 |
| Zoetis, Inc. | 94,276 | | 23,006,172 |
| | | | | 387,636,613 |
| Industrials — 7.2% | | |
| 3M Co. | 52,910 | | 9,398,403 |
| A.O. Smith Corporation | 16,217 | | 1,392,229 |
| Alaska Air Group, Inc.* | 10,021 | | 522,094 |
| American Airlines Group, Inc.Δ* | 66,936 | | 1,202,171 |
| AMETEK, Inc. | 16,745 | | 2,462,185 |
| Boeing Co. (The)Δ* | 45,776 | | 9,215,624 |
| C.H. Robinson Worldwide, Inc. | 12,459 | | 1,340,962 |
| Carrier Global Corporation | 63,362 | | 3,436,755 |
| Caterpillar, Inc. | 44,540 | | 9,208,200 |
| Cintas Corporation | 6,438 | | 2,853,128 |
| Copart, Inc.* | 11,178 | | 1,694,808 |
| CSX Corporation | 195,759 | | 7,360,538 |
| Cummins, Inc. | 10,680 | | 2,329,735 |
| Deere & Co. | 24,563 | | 8,422,407 |
| Delta Air Lines, Inc.* | 64,874 | | 2,535,276 |
| | | Shares | | Value |
| Dover Corporation | 13,712 | | $ 2,490,099 |
| Emerson Electric Co. | 55,944 | | 5,201,114 |
| Equifax, Inc. | 11,124 | | 3,256,996 |
| Expeditors International of Washington, Inc. | 6,818 | | 915,589 |
| Fastenal Co. | 36,004 | | 2,306,416 |
| FedEx Corporation | 19,831 | | 5,129,090 |
| Fortive Corporation | 28,093 | | 2,143,215 |
| Fortune Brands Home & Security, Inc. | 13,017 | | 1,391,517 |
| Generac Holdings, Inc.* | 4,876 | | 1,715,962 |
| General Dynamics Corporation | 20,407 | | 4,254,247 |
| General Electric Co. | 90,769 | | 8,574,947 |
| Honeywell International, Inc. | 55,553 | | 11,583,356 |
| Howmet Aerospace, Inc. | 32,372 | | 1,030,401 |
| Huntington Ingalls Industries, Inc. | 2,805 | | 523,806 |
| IDEX Corporation | 5,716 | | 1,350,805 |
| IHS Markit, Ltd. | 29,494 | | 3,920,343 |
| Illinois ToolWorks, Inc. | 25,469 | | 6,285,749 |
| Ingersoll-Rand, Inc. | 30,890 | | 1,911,164 |
| J.B. Hunt Transport Services, Inc. | 9,677 | | 1,977,979 |
| Jacobs Engineering Group, Inc. | 12,155 | | 1,692,341 |
| L3Harris Technologies, Inc. | 16,801 | | 3,582,645 |
| Leidos Holdings, Inc. | 10,893 | | 968,388 |
| Lockheed Martin Corporation | 22,033 | | 7,830,749 |
| Masco Corporation | 23,878 | | 1,676,713 |
| Norfolk Southern Corporation | 19,839 | | 5,906,269 |
| Northrop Grumman Corporation | 12,728 | | 4,926,627 |
| Old Dominion Freight Line, Inc. | 7,428 | | 2,662,047 |
| Otis Worldwide Corporation | 31,681 | | 2,758,465 |
| PACCAR, Inc. | 22,794 | | 2,011,798 |
| Parker-Hannifin Corporation | 8,815 | | 2,804,228 |
| Quanta Services, Inc. | 5,431 | | 622,718 |
| Raytheon Technologies Corporation | 126,686 | | 10,902,597 |
| Republic Services, Inc. | 19,655 | | 2,740,890 |
| Robert Half International, Inc. | 4,920 | | 548,678 |
| Rockwell Automation, Inc.Δ | 11,922 | | 4,158,990 |
| Rollins, Inc. | 21,375 | | 731,239 |
| Roper Technologies, Inc. | 8,524 | | 4,192,615 |
| Snap-on, Inc. | 5,899 | | 1,270,527 |
| Southwest Airlines Co.* | 54,434 | | 2,331,953 |
| Stanley Black & Decker, Inc. | 10,352 | | 1,952,594 |
| Textron, Inc. | 19,700 | | 1,520,840 |
| TransDigm Group, Inc.* | 3,870 | | 2,462,404 |
| Union Pacific Corporation | 55,813 | | 14,060,969 |
| United Airlines Holdings, Inc.Δ* | 19,397 | | 849,201 |
| United Parcel Service, Inc. Class B | 59,797 | | 12,816,889 |
| United Rentals, Inc.* | 4,677 | | 1,554,120 |
| Verisk Analytics, Inc. | 12,729 | | 2,911,504 |
| W.W. Grainger, Inc. | 3,321 | | 1,721,075 |
| Waste Management, Inc. | 33,085 | | 5,521,887 |
| Westinghouse Air Brake Technologies CorporationΔ | 11,295 | | 1,040,382 |
| Xylem, Inc. | 9,669 | | 1,159,506 |
| | | | | 241,229,158 |
| Information Technology — 27.7% | | |
| Adobe, Inc.* | 38,494 | | 21,828,408 |
| Advanced Micro Devices, Inc.* | 97,492 | | 14,029,099 |
See Notes to Financial Statements.
| | | Shares | | Value |
| Akamai Technologies, Inc.* | 12,022 | | $ 1,407,055 |
| Amphenol Corporation Class A | 53,795 | | 4,704,911 |
| Analog Devices, Inc. | 49,747 | | 8,744,030 |
| ANSYS, Inc.* | 6,671 | | 2,675,872 |
| Apple, Inc. | 1,270,282 | | 225,563,975 |
| Applied Materials, Inc. | 71,724 | | 11,286,489 |
| Arista Networks, Inc.* | 18,552 | | 2,666,850 |
| Autodesk, Inc.Δ* | 18,555 | | 5,217,480 |
| Automatic Data Processing, Inc. | 36,726 | | 9,055,897 |
| Broadcom, Inc. | 34,492 | | 22,951,322 |
| Broadridge Financial Solutions, Inc. | 6,807 | | 1,244,456 |
| Cadence Design Systems, Inc.Δ* | 18,580 | | 3,462,383 |
| CDW Corporation | 11,000 | | 2,252,580 |
| Ceridian HCM Holding, Inc.Δ* | 10,792 | | 1,127,332 |
| Cisco Systems, Inc. | 350,235 | | 22,194,392 |
| Citrix Systems, Inc. | 9,508 | | 899,362 |
| Cognizant Technology Solutions Corporation Class A | 43,559 | | 3,864,554 |
| Corning, Inc. | 59,799 | | 2,226,317 |
| DXC Technology Co.* | 18,725 | | 602,758 |
| Enphase Energy, Inc.* | 10,555 | | 1,930,932 |
| EPAM Systems, Inc.* | 4,569 | | 3,054,148 |
| F5, Inc.* | 6,504 | | 1,591,594 |
| Fidelity National Information Services, Inc. | 47,995 | | 5,238,654 |
| Fiserv, Inc.Δ* | 43,328 | | 4,497,013 |
| FleetCor Technologies, Inc.* | 6,254 | | 1,399,895 |
| Fortinet, Inc.* | 11,550 | | 4,151,070 |
| Gartner, Inc.* | 5,295 | | 1,770,224 |
| Global Payments, Inc. | 22,769 | | 3,077,913 |
| Hewlett Packard Enterprise Co. | 113,804 | | 1,794,689 |
| HP, Inc.Δ | 103,716 | | 3,906,982 |
| Intel Corporation | 328,598 | | 16,922,797 |
| International Business Machines Corporation | 75,798 | | 10,131,161 |
| Intuit, Inc. | 22,108 | | 14,220,308 |
| IPG Photonics Corporation* | 2,807 | | 483,197 |
| Jack Henry & Associates, Inc. | 5,530 | | 923,455 |
| Juniper Networks, Inc. | 50,500 | | 1,803,355 |
| Keysight Technologies, Inc.* | 13,420 | | 2,771,364 |
| KLA Corporation | 11,211 | | 4,821,963 |
| Lam Research Corporation | 10,705 | | 7,698,501 |
| Mastercard, Inc. Class A | 71,135 | | 25,560,228 |
| Microchip Technology, Inc. | 41,030 | | 3,572,072 |
| Micron Technology, Inc. | 84,017 | | 7,826,184 |
| Microsoft Corporation | 611,985 | | 205,822,795 |
| Monolithic Power Systems, Inc. | 3,300 | | 1,627,989 |
| Motorola Solutions, Inc.Δ | 13,048 | | 3,545,142 |
| NetApp, Inc. | 18,482 | | 1,700,159 |
| NortonLifeLock, Inc. | 47,298 | | 1,228,802 |
| NVIDIA Corporation | 201,327 | | 59,212,284 |
| Oracle Corporation | 144,267 | | 12,581,525 |
| Paychex, Inc. | 27,668 | | 3,776,682 |
| Paycom Software, Inc.* | 3,850 | | 1,598,481 |
| PayPal Holdings, Inc.* | 93,571 | | 17,645,619 |
| PTC, Inc.* | 6,734 | | 815,824 |
| Qorvo, Inc.* | 8,118 | | 1,269,574 |
| QUALCOMM, Inc. | 91,816 | | 16,790,392 |
| | | Shares | | Value |
| salesforce.com, Inc.* | 80,450 | | $ 20,444,758 |
| ServiceNow, Inc.* | 16,274 | | 10,563,616 |
| Skyworks Solutions, Inc. | 14,117 | | 2,190,111 |
| SolarEdge Technologies, Inc.* | 4,244 | | 1,190,739 |
| Synopsys, Inc.* | 12,360 | | 4,554,660 |
| Teledyne Technologies, Inc.* | 3,268 | | 1,427,757 |
| Teradyne, Inc.Δ | 9,806 | | 1,603,575 |
| Texas Instruments, Inc. | 78,134 | | 14,725,915 |
| Trimble, Inc.Δ* | 19,275 | | 1,680,587 |
| Tyler Technologies, Inc.* | 3,141 | | 1,689,701 |
| VeriSign, Inc.* | 7,867 | | 1,996,802 |
| Visa, Inc. Class AΔ | 135,771 | | 29,422,933 |
| Western Digital Corporation* | 22,012 | | 1,435,403 |
| Xilinx, Inc. | 18,364 | | 3,893,719 |
| Zebra Technologies Corporation Class A* | 4,187 | | 2,492,102 |
| | | | | 924,080,867 |
| Materials — 2.0% | | |
| Air Products and Chemicals, Inc. | 18,561 | | 5,647,370 |
| Albemarle Corporation | 8,321 | | 1,945,200 |
| Avery Dennison Corporation | 3,272 | | 708,617 |
| Ball Corporation | 26,240 | | 2,526,125 |
| Celanese Corporation | 9,582 | | 1,610,351 |
| CF Industries Holdings, Inc. | 17,082 | | 1,209,064 |
| Corteva, Inc. | 55,219 | | 2,610,754 |
| Dow, Inc. | 72,331 | | 4,102,614 |
| DuPont de Nemours, Inc. | 47,302 | | 3,821,056 |
| Eastman Chemical Co. | 14,389 | | 1,739,774 |
| Ecolab, Inc. | 16,680 | | 3,912,961 |
| FMC CorporationΔ | 5,397 | | 593,076 |
| Freeport-McMoRan, Inc. | 112,863 | | 4,709,773 |
| International Flavors & Fragrances, Inc. | 19,185 | | 2,890,220 |
| International Paper Co. | 43,581 | | 2,047,435 |
| Martin Marietta Materials, Inc. | 5,969 | | 2,629,464 |
| Mosaic Co. (The) | 26,057 | | 1,023,780 |
| Newmont Corporation | 67,991 | | 4,216,802 |
| Nucor Corporation | 32,443 | | 3,703,368 |
| Packaging Corporation of America | 6,567 | | 894,097 |
| PPG Industries, Inc.Δ | 18,443 | | 3,180,311 |
| Sealed Air Corporation | 10,710 | | 722,604 |
| Sherwin-Williams Co. (The) | 19,044 | | 6,706,535 |
| Vulcan Materials Co. | 11,222 | | 2,329,463 |
| Westrock Co. | 21,818 | | 967,847 |
| | | | | 66,448,661 |
| Real Estate — 2.8% | | |
| Alexandria Real Estate Equities, Inc. REIT | 11,494 | | 2,562,702 |
| American Tower Corporation REIT | 37,022 | | 10,828,935 |
| AvalonBay Communities, Inc. REIT | 11,730 | | 2,962,881 |
| Boston Properties, Inc. REITΔ | 11,272 | | 1,298,309 |
| CBRE Group, Inc. Class A* | 35,708 | | 3,874,675 |
| Crown Castle International Corporation REIT | 35,778 | | 7,468,300 |
| Digital Realty Trust, Inc. REITΔ | 25,560 | | 4,520,797 |
| Duke Realty Corporation REIT | 32,547 | | 2,136,385 |
See Notes to Financial Statements.
SCHEDULE OF INVESTMENTS (Continued)
| | | Shares | | Value |
| Equinix, Inc. REIT | 8,002 | | $ 6,768,412 |
| Equity Residential REIT | 36,341 | | 3,288,860 |
| Essex Property Trust, Inc. REIT | 5,627 | | 1,981,998 |
| Extra Space Storage, Inc. REIT | 8,534 | | 1,934,914 |
| Federal Realty Investment Trust REIT | 2,600 | | 354,432 |
| Healthpeak Properties, Inc. REITΔ | 46,597 | | 1,681,686 |
| Host Hotels & Resorts, Inc. REIT* | 47,435 | | 824,895 |
| Iron Mountain, Inc. REITΔ | 32,755 | | 1,714,069 |
| Kimco Realty Corporation REIT | 56,971 | | 1,404,335 |
| Mid-America Apartment Communities, Inc. REIT | 7,607 | | 1,745,350 |
| Prologis, Inc. REIT | 61,392 | | 10,335,957 |
| Public Storage REIT | 13,141 | | 4,922,093 |
| Realty Income Corporation REIT | 28,647 | | 2,050,839 |
| Regency Centers Corporation REITΔ | 15,104 | | 1,138,086 |
| SBA Communications Corporation REIT | 9,082 | | 3,533,080 |
| Simon Property Group, Inc. REIT | 25,427 | | 4,062,472 |
| UDR, Inc. REITΔ | 16,995 | | 1,019,530 |
| Ventas, Inc. REIT | 33,547 | | 1,714,923 |
| Vornado Realty Trust REITΔ | 15,993 | | 669,467 |
| Welltower, Inc. REIT | 31,626 | | 2,712,562 |
| Weyerhaeuser Co. REIT | 57,740 | | 2,377,733 |
| | | | | 91,888,677 |
| Utilities — 2.6% | | |
| AES Corporation (The) | 56,201 | | 1,365,684 |
| Alliant Energy Corporation | 22,632 | | 1,391,189 |
| Ameren Corporation | 19,884 | | 1,769,875 |
| American Electric Power Co., Inc. | 43,060 | | 3,831,048 |
| American Water Works Co., Inc.Δ | 16,760 | | 3,165,294 |
| Atmos Energy CorporationΔ | 8,640 | | 905,213 |
| CenterPoint Energy, Inc.Δ | 50,231 | | 1,401,947 |
| CMS Energy Corporation | 24,417 | | 1,588,326 |
| Consolidated Edison, Inc.Δ | 33,879 | | 2,890,556 |
| Dominion Energy, Inc. | 72,926 | | 5,729,067 |
| DTE Energy Co. | 16,224 | | 1,939,417 |
| Duke Energy Corporation | 81,288 | | 8,527,111 |
| Edison International | 40,240 | | 2,746,380 |
| Entergy Corporation | 21,410 | | 2,411,836 |
| Evergy, Inc. | 17,247 | | 1,183,317 |
| Eversource Energy | 30,559 | | 2,780,258 |
| Exelon Corporation | 65,931 | | 3,808,175 |
| FirstEnergy Corporation | 51,603 | | 2,146,169 |
| NextEra Energy, Inc. | 152,587 | | 14,245,522 |
| NiSource, Inc. | 23,079 | | 637,211 |
| NRG Energy, Inc.Δ | 19,377 | | 834,761 |
| Pinnacle West Capital Corporation | 4,108 | | 289,984 |
| PPL Corporation | 73,784 | | 2,217,947 |
| Public Service Enterprise Group, Inc. | 46,751 | | 3,119,694 |
| Sempra Energy | 20,984 | | 2,775,763 |
| Southern Co. (The) | 92,202 | | 6,323,213 |
| WEC Energy Group, Inc. | 26,694 | | 2,591,187 |
| Xcel Energy, Inc. | 35,982 | | 2,435,981 |
| | | | | 85,052,125 |
Total Common Stocks
(Cost $1,634,987,290) | | 3,163,457,344 |
| | | Shares | | Value |
| FOREIGN COMMON STOCKS — 3.2% |
| Curacao — 0.1% | | |
| Schlumberger NV | 110,484 | | $ 3,308,996 |
| Ireland — 2.3% | | |
| Accenture PLC Class A | 50,763 | | 21,043,802 |
| Allegion PLC | 11,277 | | 1,493,526 |
| Aon PLC Class A | 19,060 | | 5,728,674 |
| Eaton Corporation PLC | 34,612 | | 5,981,646 |
| Johnson Controls International PLC | 75,803 | | 6,163,542 |
| Linde PLC | 42,397 | | 14,687,593 |
| Medtronic PLC | 114,412 | | 11,835,921 |
| Pentair PLC | 6,692 | | 488,717 |
| Seagate Technology Holdings PLCΔ | 20,280 | | 2,291,234 |
| STERIS PLC | 7,533 | | 1,833,607 |
| Trane Technologies PLC | 16,206 | | 3,274,098 |
| Willis Towers Watson PLC | 12,561 | | 2,983,112 |
| | | | | 77,805,472 |
| Jersey — 0.2% | | |
| Amcor PLC | 120,129 | | 1,442,749 |
| Aptiv PLC* | 21,684 | | 3,576,776 |
| | | | | 5,019,525 |
| Netherlands — 0.2% | | |
| LyondellBasell Industries NV Class A | 27,312 | | 2,518,986 |
| NXP Semiconductor NV | 19,939 | | 4,541,706 |
| | | | | 7,060,692 |
| Switzerland — 0.4% | | |
| Chubb, Ltd. | 35,583 | | 6,878,550 |
| Garmin, Ltd. | 8,253 | | 1,123,811 |
| TE Connectivity, Ltd. | 28,610 | | 4,615,937 |
| | | | | 12,618,298 |
| United Kingdom — 0.0% | | |
| Nielsen Holdings PLC | 40,749 | | 835,762 |
Total Foreign Common Stocks
(Cost $62,614,483) | | 106,648,745 |
| MONEY MARKET FUNDS — 1.9% |
GuideStone Money Market Fund, 0.00%
(Institutional Class)Ø∞ | 62,134,618 | | 62,134,618 |
| Northern Institutional Liquid Assets Portfolio (Shares), 0.04%ا | 1,227,216 | | 1,227,216 |
Total Money Market Funds
(Cost $63,361,834) | | 63,361,834 |
TOTAL INVESTMENTS — 99.9%
(Cost $1,760,963,607) | | | 3,333,467,923 |
Other Assets in Excess of
Liabilities — 0.1% | | | 3,083,823 |
| NET ASSETS — 100.0% | | | $3,336,551,746 |
See Notes to Financial Statements.
Futures Contracts outstanding at December 31, 2021:
| Future Type | | Expiration Date | | Open Long
(Short) Contracts | | Notional
Market Value
of Contracts | | Value and
Unrealized
Appreciation
(Depreciation) |
| S&P 500® E-Mini | | 03/2022 | | 264 | | $62,812,200 | | $1,295,866 |
VALUATION HIERARCHY
The following is a summary of the inputs used, as of December 31, 2021, in valuing the Fund’s investments carried at fair value:
| | Total
Value | | Level 1
Quoted Prices | | Level 2
Other Significant
Observable Inputs | | Level 3
Significant
Unobservable Inputs |
| Assets: | | | | | | | |
| Investments in Securities: | | | | | | | |
| Common Stocks | $3,163,457,344 | | $3,163,457,344 | | $ — | | $ — |
| Foreign Common Stocks | 106,648,745 | | 106,648,745 | | — | | — |
| Money Market Funds | 63,361,834 | | 63,361,834 | | — | | — |
| Total Assets - Investments in Securities | $3,333,467,923 | | $3,333,467,923 | | $ — | | $ — |
| Other Financial Instruments*** | | | | | | | |
| Futures Contracts | $ 1,295,866 | | $ 1,295,866 | | $ — | | $ — |
| Total Assets - Other Financial Instruments | $ 1,295,866 | | $ 1,295,866 | | $ — | | $ — |
| *** | Other financial instruments are derivative instruments, such as futures contracts, which are valued at the unrealized appreciation (depreciation) on the investment. Further details regarding the value of these investments can be found in the preceding "Futures Contracts outstanding" disclosure. |
See Notes to Financial Statements.
Value Equity Fund (Unaudited)
The Fund invested in a diversified portfolio of large- and medium-sized U.S. companies whose stocks were considered to be attractive from a valuation perspective. The Investor Class of the Fund underperformed its benchmark, the Russell 1000® Value Index, for the one-year period ended December 31, 2021 (24.27% versus 25.16%). The Fund underperformed in the first three quarters but experienced outperformance in the final quarter of the year. Large capitalization value stocks underperformed large capitalization growth stocks but still posted strong double-digit positive returns across most sectors in 2021. The Fund remained diversified, with a modest underweight to the financial services and health care sectors and a modest overweight to the consumer discretionary sector. Security selection within the energy and health care sectors were the primary detractors from benchmark-relative returns, while security selection within the producer durables and technology sectors contributed to benchmark-relative returns during the year.
In 2021, exchange-listed equity index futures contracts were utilized to provide market exposure to the cash positions held in the Fund. In addition, currency forwards were used to hedge modest foreign currency exposure back to the U.S. dollar. Overall, derivative exposure had a positive impact on Fund performance for the year.
This Fund may be suitable for investors who seek higher, long-term rates of return, can accept significant short-term fluctuations in account value and want to diversify their portfolio by adding a potentially higher return, higher risk option of value equity securities. This Fund is subject to value investing risk. This involves the risk that an investment in companies whose securities are believed to be undervalued, relative to their underlying profitability, will not appreciate in value as anticipated. It is possible to lose money by investing in the Fund.
At December 31, 2021, the portfolio holdings of the Fund, as a percentage of net assets, is shown in the following table. Portfolio holdings are subject to risk and may change at any time.
| | % |
| Financials | 20.3 |
| Health Care | 13.9 |
| Information Technology | 11.7 |
| Industrials | 10.9 |
| Consumer Discretionary | 10.3 |
| Consumer Staples | 6.2 |
| Communication Services | 6.0 |
| Materials | 5.9 |
| Energy | 5.4 |
| Utilities | 3.7 |
| Money Market Funds | 3.3 |
| Real Estate | 2.0 |
| Mutual Funds | 0.4 |
| | 100.0 |
See Notes to Financial Statements.
Value Equity Fund (Unaudited)
| Average Annual Total Returns as of 12/31/21 | |
| | | Institutional Class* | | Investor Class* | | Benchmark** | |
| One Year | | 24.61% | | 24.27% | | 25.16% | |
| Five Year | | 11.17% | | 10.87% | | 11.16% | |
| Ten Year | | 12.69% | | 12.40% | | 12.96% | |
| Since Inception | | 7.73% | | 7.45% | | 8.01% | |
| Inception Date | | 08/27/01 | | 08/27/01 | | | |
| Total Fund Operating Expenses (May 1, 2021 Prospectus)(1) | | 0.69% | | 0.95% | | | |
| (1) | Current information regarding the Fund’s Operating Expenses can be found in the Financial Highlights. |
The performance data quoted represents past performance and does not guarantee future results. Current performance may be lower or higher. Performance data current to the most recent month-end may be obtained at GuideStoneFunds.com. The investment return and principal value of an investment will fluctuate so that shares, when redeemed, may be worth more or less than their original cost.
The graph illustrates the results of a hypothetical $10,000 investment in the Investor Class of the Fund for the 10-year period from December 31, 2011 to December 31, 2021, with all dividends and capital gains reinvested, with the Russell 1000® Value Index.
*These returns reflect investment advisory and shareholder servicing fee waivers, if applicable, during the reported time periods.
**Unlike a mutual fund, the performance of an index assumes no taxes, transaction costs, management fees or other expenses.
See Notes to Financial Statements.
| | | Shares | | Value |
| COMMON STOCKS — 84.7% |
| Communication Services — 5.7% | | |
| Altice U.S.A., Inc. Class A* | 682,878 | | $ 11,048,966 |
| AT&T, Inc. | 187,264 | | 4,606,694 |
| Comcast Corporation Class A | 469,819 | | 23,645,990 |
| Discovery, Inc. Class AΔ* | 148,389 | | 3,493,077 |
| Fox Corporation Class A | 128,654 | | 4,747,333 |
| T-Mobile US, Inc.* | 74,794 | | 8,674,608 |
| Verizon Communications, Inc. | 377,527 | | 19,616,303 |
| ViacomCBS, Inc. Class B | 155,710 | | 4,699,328 |
| | | | | 80,532,299 |
| Consumer Discretionary — 9.9% | | |
| Advance Auto Parts, Inc. | 94,065 | | 22,564,312 |
| Aramark | 311,434 | | 11,476,343 |
| Darden Restaurants, Inc. | 39,925 | | 6,014,302 |
| Dick's Sporting Goods, Inc.Δ | 32,695 | | 3,759,598 |
| Dollar General Corporation | 62,759 | | 14,800,455 |
| Lennar Corporation Class A | 151,803 | | 17,633,437 |
| Lithia Motors, Inc. | 24,779 | | 7,358,124 |
| Lowe’s Cos., Inc. | 113,688 | | 29,386,074 |
| Ralph Lauren Corporation | 105,297 | | 12,515,601 |
| Target Corporation | 60,927 | | 14,100,945 |
| | | | | 139,609,191 |
| Consumer Staples — 4.6% | | |
| Church & Dwight Co., Inc. | 64,417 | | 6,602,742 |
| Colgate-Palmolive Co. | 104,047 | | 8,879,371 |
| Conagra Brands, Inc. | 351,963 | | 12,019,536 |
| Kimberly-Clark Corporation | 44,079 | | 6,299,771 |
| Lamb Weston Holdings, Inc. | 91,527 | | 5,800,981 |
| Mondelez International, Inc. Class A | 125,800 | | 8,341,798 |
| PepsiCo, Inc. | 63,000 | | 10,943,730 |
| Walmart, Inc. | 46,242 | | 6,690,755 |
| | | | | 65,578,684 |
| Energy — 4.6% | | |
| Baker Hughes Co. | 212,735 | | 5,118,404 |
| Chevron Corporation | 157,370 | | 18,467,370 |
| Exxon Mobil Corporation | 75,685 | | 4,631,165 |
| Hess Corporation | 175,260 | | 12,974,498 |
| Phillips 66 | 189,037 | | 13,697,621 |
| Pioneer Natural Resources Co. | 28,399 | | 5,165,210 |
| Valero Energy Corporation | 64,384 | | 4,835,882 |
| | | | | 64,890,150 |
| Financials — 18.6% | | |
| Aflac, Inc. | 116,238 | | 6,787,137 |
| Allstate Corporation (The) | 186,058 | | 21,889,724 |
| American Express Co. | 39,804 | | 6,511,934 |
| American International Group, Inc. | 218,900 | | 12,446,654 |
| Ameriprise Financial, Inc. | 23,878 | | 7,203,037 |
| Apollo Asset Management, Inc.Δ | 14,000 | | 1,014,020 |
| Bank of New York Mellon Corporation (The) | 188,492 | | 10,947,615 |
| Berkshire Hathaway, Inc. Class B* | 78,667 | | 23,521,433 |
| BlackRock, Inc. | 10,625 | | 9,727,825 |
| Blackstone, Inc. | 33,100 | | 4,282,809 |
| Cincinnati Financial Corporation | 37,810 | | 4,307,693 |
| | | Shares | | Value |
| Citigroup, Inc. | 178,891 | | $ 10,803,228 |
| Franklin Resources, Inc. | 84,825 | | 2,840,789 |
| Goldman Sachs Group, Inc. (The) | 14,160 | | 5,416,908 |
| Intercontinental Exchange, Inc. | 66,374 | | 9,077,972 |
| JPMorgan Chase & Co. | 199,519 | | 31,593,834 |
| Marsh & McLennan Cos., Inc. | 31,994 | | 5,561,197 |
| MetLife, Inc. | 121,951 | | 7,620,718 |
| Morgan Stanley | 59,900 | | 5,879,784 |
| Northern Trust Corporation | 84,561 | | 10,114,341 |
| Progressive Corporation (The) | 67,840 | | 6,963,776 |
| Reinsurance Group of America, Inc. | 90,071 | | 9,861,874 |
| Signature Bank | 24,022 | | 7,770,396 |
| Truist Financial Corporation | 129,248 | | 7,567,470 |
| U.S. Bancorp | 207,874 | | 11,676,283 |
| Wells Fargo & Co. | 426,424 | | 20,459,824 |
| | | | | 261,848,275 |
| Health Care — 9.3% | | |
| Anthem, Inc. | 35,233 | | 16,331,905 |
| Becton, Dickinson and Co. | 35,342 | | 8,887,806 |
| Centene Corporation* | 115,343 | | 9,504,263 |
| Cerner Corporation | 140,288 | | 13,028,547 |
| CVS Health Corporation | 146,965 | | 15,160,910 |
| Gilead Sciences, Inc. | 71,040 | | 5,158,215 |
| Humana, Inc. | 23,776 | | 11,028,735 |
| McKesson Corporation | 34,135 | | 8,484,937 |
| Molina Healthcare, Inc.* | 33,025 | | 10,504,592 |
| UnitedHealth Group, Inc. | 36,695 | | 18,426,027 |
| Zimmer Biomet Holdings, Inc. | 111,032 | | 14,105,505 |
| | | | | 130,621,442 |
| Industrials — 9.5% | | |
| AECOM* | 75,201 | | 5,816,797 |
| Deere & Co. | 45,598 | | 15,635,098 |
| Emerson Electric Co. | 82,905 | | 7,707,678 |
| Fastenal Co. | 93,741 | | 6,005,049 |
| General Electric Co. | 75,766 | | 7,157,614 |
| Hubbell, Inc. | 8,963 | | 1,866,724 |
| J.B. Hunt Transport Services, Inc. | 98,248 | | 20,081,891 |
| Norfolk Southern Corporation | 27,085 | | 8,063,475 |
| Raytheon Technologies Corporation | 178,317 | | 15,345,961 |
| Southwest Airlines Co.* | 105,052 | | 4,500,428 |
| Stanley Black & Decker, Inc. | 45,044 | | 8,496,199 |
| Textron, Inc. | 110,657 | | 8,542,720 |
| United Parcel Service, Inc. Class B | 76,114 | | 16,314,275 |
| Vertiv Holdings Co. | 313,919 | | 7,838,558 |
| | | | | 133,372,467 |
| Information Technology — 10.9% | | |
| Apple, Inc. | 67,302 | | 11,950,816 |
| Broadcom, Inc. | 37,123 | | 24,702,015 |
| Cisco Systems, Inc. | 345,422 | | 21,889,392 |
| Cognizant Technology Solutions Corporation Class A | 166,316 | | 14,755,556 |
| Corning, Inc. | 85,002 | | 3,164,625 |
| F5, Inc.* | 17,470 | | 4,275,084 |
| Fiserv, Inc.Δ* | 49,950 | | 5,184,311 |
| HP, Inc.Δ | 103,003 | | 3,880,123 |
See Notes to Financial Statements.
| | | Shares | | Value |
| Intel Corporation | 92,630 | | $ 4,770,445 |
| International Business Machines Corporation | 50,928 | | 6,807,037 |
| Juniper Networks, Inc. | 95,065 | | 3,394,771 |
| Microsoft Corporation | 21,694 | | 7,296,126 |
| ON Semiconductor Corporation* | 143,872 | | 9,771,786 |
| Oracle Corporation | 65,311 | | 5,695,772 |
| Paychex, Inc. | 47,472 | | 6,479,928 |
| QUALCOMM, Inc. | 35,830 | | 6,552,232 |
| Texas Instruments, Inc. | 68,537 | | 12,917,168 |
| | | | | 153,487,187 |
| Materials — 5.9% | | |
| Air Products and Chemicals, Inc. | 50,110 | | 15,246,469 |
| Axalta Coating Systems, Ltd.* | 316,368 | | 10,478,108 |
| Corteva, Inc. | 304,796 | | 14,410,755 |
| DuPont de Nemours, Inc. | 125,469 | | 10,135,386 |
| Freeport-McMoRan, Inc. | 182,406 | | 7,611,802 |
| International Flavors & Fragrances, Inc. | 128,006 | | 19,284,104 |
| Sonoco Products Co. | 98,154 | | 5,682,135 |
| | | | | 82,848,759 |
| Real Estate — 2.0% | | |
| American Tower Corporation REIT | 20,357 | | 5,954,423 |
| Crown Castle International Corporation REIT | 40,676 | | 8,490,708 |
| Jones Lang LaSalle, Inc.* | 16,025 | | 4,316,173 |
| STORE Capital Corporation REIT | 161,949 | | 5,571,046 |
| Weyerhaeuser Co. REITΔ | 100,873 | | 4,153,950 |
| | | | | 28,486,300 |
| Utilities — 3.7% | | |
| AES Corporation (The) | 257,310 | | 6,252,633 |
| Atmos Energy CorporationΔ | 116,962 | | 12,254,109 |
| Dominion Energy, Inc. | 82,084 | | 6,448,519 |
| Duke Energy Corporation | 62,517 | | 6,558,033 |
| Edison International | 84,741 | | 5,783,573 |
| Exelon Corporation | 149,669 | | 8,644,882 |
| Pinnacle West Capital Corporation | 95,258 | | 6,724,262 |
| | | | | 52,666,011 |
Total Common Stocks
(Cost $896,083,703) | | 1,193,940,765 |
| FOREIGN COMMON STOCKS — 11.6% |
| Canada — 0.4% | | |
| Open Text Corporation | 123,915 | | 5,883,484 |
| France — 1.2% | | |
| Sodexo SAΔ | 64,525 | | 5,660,959 |
| | | Shares | | Value |
| TotalEnergies SE ADRΔ | 223,260 | | $ 11,042,440 |
| | | | | 16,703,399 |
| Germany — 0.6% | | |
| Siemens AG | 48,645 | | 8,425,455 |
| Ireland — 4.8% | | |
| Johnson Controls International PLC | 147,351 | | 11,981,110 |
| Medtronic PLC | 299,217 | | 30,953,999 |
| STERIS PLC | 32,684 | | 7,955,612 |
| Willis Towers Watson PLC | 70,879 | | 16,833,054 |
| | | | | 67,723,775 |
| Japan — 0.3% | | |
| Nintendo Co., Ltd. ADRΔ | 67,345 | | 3,930,928 |
| Singapore — 0.4% | | |
| Flex, Ltd.* | 283,418 | | 5,195,052 |
| Switzerland — 2.8% | | |
| Chubb, Ltd. | 32,858 | | 6,351,780 |
| Nestle SA ADR | 54,119 | | 7,596,684 |
| Novartis AG | 106,286 | | 9,339,566 |
| Roche Holding AG | 38,040 | | 15,781,322 |
| | | | | 39,069,352 |
| United Kingdom — 1.1% | | |
| Unilever PLC ADR | 304,138 | | 16,359,583 |
Total Foreign Common Stocks
(Cost $144,172,208) | | 163,291,028 |
| MUTUAL FUNDS — 0.4% |
iShares Russell 1000 Value ETFΔ
(Cost $5,288,654) | 32,408 | | 5,442,276 |
| MONEY MARKET FUNDS — 3.3% |
GuideStone Money Market Fund, 0.00%
(Institutional Class)Ø∞ | 44,330,279 | | 44,330,279 |
| Northern Institutional Liquid Assets Portfolio (Shares), 0.04%ا | 1,685,880 | | 1,685,880 |
| Northern Institutional U.S. Government Portfolio (Shares), 0.00%Ø | 69,988 | | 69,988 |
Total Money Market Funds
(Cost $46,086,147) | | 46,086,147 |
TOTAL INVESTMENTS — 100.0%
(Cost $1,091,630,712) | | | 1,408,760,216 |
Liabilities in Excess of Other
Assets — (0.0)% | | | (107,581) |
| NET ASSETS — 100.0% | | | $1,408,652,635 |
Futures Contracts outstanding at December 31, 2021:
| Future Type | | Expiration Date | | Open Long
(Short) Contracts | | Notional
Market Value
of Contracts | | Value and
Unrealized
Appreciation
(Depreciation) |
| S&P 500® E-Mini | | 03/2022 | | 192 | | $45,681,600 | | $947,811 |
See Notes to Financial Statements.
SCHEDULE OF INVESTMENTS (Continued)
Forward Foreign Currency Contracts outstanding at December 31, 2021:
| Expiration Date | | Currency
Purchased | | Amount
of Currency
Purchased | | Currency
Sold | | Amount
of Currency
Sold | | Counter-
party | | Net Unrealized
Appreciation
(Depreciation) |
| 03/31/22 | | U.S. Dollars | | 24,221,558 | | Euro | | 21,390,522 | | CS | | $(178,354) |
| 03/31/22 | | U.S. Dollars | | 24,331,282 | | Swiss Francs | | 22,367,748 | | MSCS | | (275,512) |
| 03/31/22 | | U.S. Dollars | | 15,361,641 | | British Pounds | | 11,618,155 | | JPM | | (357,689) |
| Total Forward Foreign Currency Contracts outstanding at December 31, 2021 | | | | $(811,555) |
VALUATION HIERARCHY
The following is a summary of the inputs used, as of December 31, 2021, in valuing the Fund’s investments carried at fair value:
| | Total
Value | | Level 1
Quoted Prices | | Level 2
Other Significant
Observable Inputs | | Level 3
Significant
Unobservable Inputs |
| Assets: | | | | | | | |
| Investments in Securities: | | | | | | | |
| Common Stocks | $1,193,940,765 | | $1,193,940,765 | | $ — | | $ — |
| Foreign Common Stocks: | | | | | | | |
| Germany | 8,425,455 | | — | | 8,425,455 | | — |
| Switzerland | 39,069,352 | | 13,948,464 | | 25,120,888 | | — |
| Other ^^ | 115,796,221 | | 115,796,221 | | — | | — |
| Total Foreign Common Stocks | 163,291,028 | | 129,744,685 | | 33,546,343 | | — |
| Money Market Funds | 46,086,147 | | 46,086,147 | | — | | — |
| Mutual Funds | 5,442,276 | | 5,442,276 | | — | | — |
| Total Assets - Investments in Securities | $1,408,760,216 | | $1,375,213,873 | | $33,546,343 | | $ — |
| Other Financial Instruments*** | | | | | | | |
| Futures Contracts | $ 947,811 | | $ 947,811 | | $ — | | $ — |
| Total Assets - Other Financial Instruments | $ 947,811 | | $ 947,811 | | $ — | | $ — |
| Liabilities: | | | | | | | |
| Other Financial Instruments*** | | | | | | | |
| Forward Foreign Currency Contracts | $ (811,555) | | $ — | | $ (811,555) | | $ — |
| Total Liabilities - Other Financial Instruments | $ (811,555) | | $ — | | $ (811,555) | | $ — |
| ^^ | Classifications as defined in the Schedule of Investments. |
| *** | Other financial instruments are derivative instruments, such as futures contracts and forward contracts, which are valued at the unrealized appreciation (depreciation) on the investment. Further details regarding the value of these investments can be found in the preceding "Futures Contracts outstanding" and "Forward Foreign Currency Contracts outstanding" disclosures. |
See Notes to Financial Statements.
Growth Equity Fund (Unaudited)
The Fund invested in a diversified portfolio of large- and medium-sized U.S. companies whose stocks were considered to have above average potential for growth in revenue and earnings. The Investor Class of the Fund underperformed its benchmark, the Russell 1000® Growth Index, for the one-year period ended December 31, 2021 (17.41% versus 27.60%). The Fund experienced underperformance in all four quarters of the year. Large capitalization growth stocks outperformed large capitalization value stocks during 2021, as the market favored a handful of mega cap technology stocks, which accounted for a large portion of the performance of the benchmark index. This created a significant hurdle for active management as growth managers that were underweight in these particular technology stocks most likely experienced underperformance for the year. The Fund remained diversified, with a modest underweight to the technology and consumer discretionary sectors and a modest overweight to the health care sector. Security selection within the technology and consumer discretionary sectors were the primary detractors from benchmark-relative performance, while security selection within the health care sector benefited benchmark-relative returns during the year.
In 2021, exchange-listed equity index futures contracts were utilized to provide market exposure to the cash positions held in the Fund. Overall, derivative exposure had a positive impact on Fund performance for the year.
This Fund may be suitable for investors who seek high, long-term rates of return, can accept significant short-term fluctuations in account value, want to invest in growth-oriented equities and would like to diversify their portfolio by adding a potentially higher return, higher risk option of equity securities. The Fund will not concentrate in any particular industry, but at times, it may be heavily invested in a particular economic sector. This may result in greater short-term price volatility. It is possible to lose money by investing in the Fund.
At December 31, 2021, the portfolio holdings of the Fund, as a percentage of net assets, is shown in the following table. Portfolio holdings are subject to risk and may change at any time.
| | % |
| Information Technology | 40.7 |
| Consumer Discretionary | 14.0 |
| Communication Services | 13.9 |
| Health Care | 12.8 |
| Industrials | 9.1 |
| Money Market Funds | 4.1 |
| Consumer Staples | 2.8 |
| Real Estate | 1.3 |
| Materials | 0.8 |
| Financials | 0.6 |
| Energy | 0.3 |
| | 100.4 |
See Notes to Financial Statements.
Growth Equity Fund (Unaudited)
| Average Annual Total Returns as of 12/31/21 | |
| | | Institutional Class* | | Investor Class* | | Benchmark** | |
| One Year | | 17.68% | | 17.41% | | 27.60% | |
| Five Year | | 23.62% | | 23.30% | | 25.30% | |
| Ten Year | | 18.07% | | 17.79% | | 19.77% | |
| Since Inception | | 9.43% | | 9.26% | | 10.56% | |
| Inception Date | | 08/27/01 | | 08/27/01 | | | |
| Total Fund Operating Expenses (May 1, 2021 Prospectus)(1) | | 0.70% | | 0.96% | | | |
| (1) | Current information regarding the Fund’s Operating Expenses can be found in the Financial Highlights. |
The performance data quoted represents past performance and does not guarantee future results. Current performance may be lower or higher. Performance data current to the most recent month-end may be obtained at GuideStoneFunds.com. The investment return and principal value of an investment will fluctuate so that shares, when redeemed, may be worth more or less than their original cost.
The graph illustrates the results of a hypothetical $10,000 investment in the Investor Class of the Fund for the 10-year period from December 31, 2011 to December 31, 2021, with all dividends and capital gains reinvested, with the Russell 1000® Growth Index.
*These returns reflect investment advisory and shareholder servicing fee waivers, if applicable, during the reported time periods.
**Unlike a mutual fund, the performance of an index assumes no taxes, transaction costs, management fees or other expenses.
See Notes to Financial Statements.
| | | Shares | | Value |
| COMMON STOCKS — 88.2% |
| Communication Services — 13.9% | | |
| Alphabet, Inc. Class A* | 5,462 | | $ 15,823,632 |
| Alphabet, Inc. Class C* | 12,944 | | 37,454,629 |
| Charter Communications, Inc. Class AΔ* | 14,237 | | 9,282,097 |
| Match Group, Inc.Δ* | 197,517 | | 26,121,623 |
| Meta Platforms, Inc. Class A* | 248,117 | | 83,454,153 |
| Netflix, Inc.* | 73,456 | | 44,252,833 |
| Pinterest, Inc. Class A* | 192,265 | | 6,988,833 |
| Sea, Ltd. ADRΔ* | 151,244 | | 33,834,795 |
| Walt Disney Co. (The)* | 162,600 | | 25,185,114 |
| Warner Music Group Corporation Class A | 180,777 | | 7,805,951 |
| | | | | 290,203,660 |
| Consumer Discretionary — 12.7% | | |
| Advance Auto Parts, Inc. | 46,347 | | 11,117,718 |
| Airbnb, Inc. Class A* | 39,225 | | 6,530,570 |
| Amazon.com, Inc.* | 37,043 | | 123,513,957 |
| Booking Holdings, Inc.* | 3,989 | | 9,570,529 |
| Carvana Co.* | 18,736 | | 4,342,817 |
| Chewy, Inc. Class AΔ* | 146,239 | | 8,623,714 |
| DoorDash, Inc. Class A* | 51,307 | | 7,639,612 |
| Floor & Decor Holdings, Inc. Class A* | 67,424 | | 8,765,794 |
| Home Depot, Inc. (The) | 47,932 | | 19,892,259 |
| Lululemon Athletica, Inc.* | 23,956 | | 9,377,576 |
| NIKE, Inc. Class B | 78,800 | | 13,133,596 |
| Starbucks Corporation | 84,241 | | 9,853,670 |
| Tractor Supply Co. | 46,760 | | 11,156,936 |
| Ulta Beauty, Inc.* | 32,975 | | 13,596,912 |
| Yum China Holdings, Inc. | 55,597 | | 2,770,955 |
| Yum! Brands, Inc. | 41,109 | | 5,708,396 |
| | | | | 265,595,011 |
| Consumer Staples — 2.8% | | |
| Colgate-Palmolive Co. | 61,196 | | 5,222,467 |
| Costco Wholesale Corporation | 22,685 | | 12,878,274 |
| Estee Lauder Cos., Inc. (The) Class A | 42,867 | | 15,869,363 |
| Monster Beverage Corporation* | 258,470 | | 24,823,459 |
| | | | | 58,793,563 |
| Financials — 0.6% | | |
| FactSet Research Systems, Inc. | 15,621 | | 7,591,962 |
| SEI Investments Co. | 88,163 | | 5,372,653 |
| | | | | 12,964,615 |
| Health Care — 11.3% | | |
| 10X Genomics, Inc. Class AΔ* | 26,550 | | 3,954,888 |
| Align Technology, Inc.* | 18,565 | | 12,200,547 |
| BioMarin Pharmaceutical, Inc.* | 65,073 | | 5,749,200 |
| DexCom, Inc.Δ* | 46,651 | | 25,049,254 |
| Edwards Lifesciences Corporation* | 190,262 | | 24,648,442 |
| Illumina, Inc.* | 23,680 | | 9,008,819 |
| Intuitive Surgical, Inc.* | 103,329 | | 37,126,110 |
| Regeneron Pharmaceuticals, Inc.* | 18,245 | | 11,522,082 |
| | | Shares | | Value |
| Sarepta Therapeutics, Inc.* | 83,558 | | $ 7,524,398 |
| UnitedHealth Group, Inc. | 53,377 | | 26,802,727 |
| Veeva Systems, Inc. Class A* | 49,774 | | 12,716,262 |
| Vertex Pharmaceuticals, Inc.* | 47,095 | | 10,342,062 |
| Zoetis, Inc. | 200,843 | | 49,011,717 |
| | | | | 235,656,508 |
| Industrials — 8.6% | | |
| Boeing Co. (The)* | 87,835 | | 17,682,942 |
| Cintas Corporation | 34,293 | | 15,197,629 |
| CoStar Group, Inc.* | 130,976 | | 10,351,033 |
| Deere & Co. | 29,911 | | 10,256,183 |
| Expeditors International of Washington, Inc. | 70,494 | | 9,466,639 |
| IDEX Corporation | 44,918 | | 10,615,022 |
| IHS Markit, Ltd. | 118,733 | | 15,781,990 |
| L3Harris Technologies, Inc. | 47,830 | | 10,199,269 |
| Raytheon Technologies Corporation | 123,454 | | 10,624,451 |
| Roper Technologies, Inc. | 23,341 | | 11,480,504 |
| Uber Technologies, Inc.* | 596,531 | | 25,012,545 |
| United Parcel Service, Inc. Class B | 84,407 | | 18,091,797 |
| W.W. Grainger, Inc. | 27,127 | | 14,058,297 |
| | | | | 178,818,301 |
| Information Technology — 36.2% | | |
| Adobe, Inc.* | 66,056 | | 37,457,715 |
| Apple, Inc. | 810,626 | | 143,942,859 |
| Autodesk, Inc.Δ* | 112,873 | | 31,738,759 |
| Automatic Data Processing, Inc. | 14,031 | | 3,459,764 |
| Block, Inc.* | 114,971 | | 18,568,966 |
| Cisco Systems, Inc. | 129,767 | | 8,223,335 |
| Cloudflare, Inc. Class A* | 31,557 | | 4,149,746 |
| Coupa Software, Inc.* | 41,406 | | 6,544,218 |
| Fidelity National Information Services, Inc. | 71,229 | | 7,774,645 |
| Intuit, Inc. | 57,674 | | 37,097,070 |
| Mastercard, Inc. Class A | 42,169 | | 15,152,165 |
| Microsoft Corporation | 261,138 | | 87,825,932 |
| NVIDIA Corporation | 217,105 | | 63,852,752 |
| Oracle Corporation | 206,926 | | 18,046,017 |
| Palo Alto Networks, Inc.Δ* | 39,413 | | 21,943,582 |
| PayPal Holdings, Inc.* | 116,536 | | 21,976,359 |
| QUALCOMM, Inc. | 57,714 | | 10,554,159 |
| salesforce.com, Inc.* | 166,901 | | 42,414,551 |
| ServiceNow, Inc.* | 70,288 | | 45,624,644 |
| Snowflake, Inc. Class A* | 25,339 | | 8,583,586 |
| Splunk, Inc.* | 70,328 | | 8,138,356 |
| Twilio, Inc. Class A* | 54,242 | | 14,284,088 |
| UiPath, Inc. Class AΔ* | 103,138 | | 4,448,342 |
| Visa, Inc. Class AΔ | 348,268 | | 75,473,158 |
| Workday, Inc. Class A* | 65,822 | | 17,981,254 |
| Xperi Holding Corporation | 3 | | 57 |
| | | | | 755,256,079 |
| Materials — 0.8% | | |
| Sherwin-Williams Co. (The) | 43,646 | | 15,370,375 |
See Notes to Financial Statements.
SCHEDULE OF INVESTMENTS (Continued)
| | | Shares | | Value |
| Real Estate — 1.3% | | |
| Equinix, Inc. REIT | 13,443 | | $ 11,370,627 |
| SBA Communications Corporation REIT | 41,390 | | 16,101,538 |
| | | | | 27,472,165 |
Total Common Stocks
(Cost $1,116,052,066) | | 1,840,130,277 |
| FOREIGN COMMON STOCKS — 8.1% |
| Canada — 1.3% | | |
| Shopify, Inc. Class A* | 19,105 | | 26,315,036 |
| China — 0.6% | | |
| Alibaba Group Holding, Ltd. ADR* | 106,262 | | 12,622,863 |
| Curacao — 0.3% | | |
| Schlumberger NV | 180,826 | | 5,415,739 |
| Ireland — 0.5% | | |
| Eaton Corporation PLC | 65,810 | | 11,373,284 |
| Israel — 0.1% | | |
| Fiverr International, Ltd.* | 25,348 | | 2,882,068 |
| Jersey — 0.6% | | |
| Aptiv PLC* | 77,117 | | 12,720,449 |
| Netherlands — 1.8% | | |
| ASML Holding NV (NASDAQ Exchange) | 12,700 | | 10,110,978 |
| NXP Semiconductor NV | 116,270 | | 26,483,980 |
| | | | | 36,594,958 |
| | | Shares | | Value |
| Switzerland — 1.5% | | |
| Alcon, Inc.Δ | 128,230 | | $ 11,171,398 |
| Novartis AG ADR | 121,352 | | 10,614,659 |
| Roche Holding AG ADR | 201,897 | | 10,436,056 |
| | | | | 32,222,113 |
| United Kingdom — 1.4% | | |
| Atlassian Corporation PLC Class A* | 75,934 | | 28,952,875 |
Total Foreign Common Stocks
(Cost $131,186,613) | | 169,099,385 |
| MONEY MARKET FUNDS — 4.1% |
GuideStone Money Market Fund, 0.00%
(Institutional Class)Ø∞ | 76,063,715 | | 76,063,715 |
| Northern Institutional Liquid Assets Portfolio (Shares), 0.04%ا | 10,176,712 | | 10,176,712 |
Total Money Market Funds
(Cost $86,240,427) | | 86,240,427 |
TOTAL INVESTMENTS — 100.4%
(Cost $1,333,479,106) | | | 2,095,470,089 |
Liabilities in Excess of Other
Assets — (0.4)% | | | (7,838,873) |
| NET ASSETS — 100.0% | | | $2,087,631,216 |
Futures Contracts outstanding at December 31, 2021:
| Future Type | | Expiration Date | | Open Long
(Short) Contracts | | Notional
Market Value
of Contracts | | Value and
Unrealized
Appreciation
(Depreciation) |
| S&P 500® E-Mini | | 03/2022 | | 326 | | $77,563,550 | | $1,659,661 |
See Notes to Financial Statements.
VALUATION HIERARCHY
The following is a summary of the inputs used, as of December 31, 2021, in valuing the Fund’s investments carried at fair value:
| | Total
Value | | Level 1
Quoted Prices | | Level 2
Other Significant
Observable Inputs | | Level 3
Significant
Unobservable Inputs |
| Assets: | | | | | | | |
| Investments in Securities: | | | | | | | |
| Common Stocks | $1,840,130,277 | | $1,840,130,277 | | $ — | | $ — |
| Foreign Common Stocks | 169,099,385 | | 169,099,385 | | — | | — |
| Money Market Funds | 86,240,427 | | 86,240,427 | | — | | — |
| Total Assets - Investments in Securities | $2,095,470,089 | | $2,095,470,089 | | $ — | | $ — |
| Other Financial Instruments*** | | | | | | | |
| Futures Contracts | $ 1,659,661 | | $ 1,659,661 | | $ — | | $ — |
| Total Assets - Other Financial Instruments | $ 1,659,661 | | $ 1,659,661 | | $ — | | $ — |
| *** | Other financial instruments are derivative instruments, such as futures contracts, which are valued at the unrealized appreciation (depreciation) on the investment. Further details regarding the value of these investments can be found in the preceding "Futures Contracts outstanding" disclosure. |
See Notes to Financial Statements.
Small Cap Equity Fund (Unaudited)
The Fund invested in a diversified portfolio of domestic, small capitalization stocks with both value- and growth-style orientations. The Investor Class of the Fund significantly outperformed its benchmark, the Russell 2000® Index, for the one-year period ended December 31, 2021 (21.79% versus 14.82%). The Fund outperformed in all four quarters of the year. Small capitalization stocks underperformed large capitalization stocks but still posted meaningful double-digit gains during a period where the market rewarded higher beta, lower price-to-earnings (P/E) and higher dividend yielding names within the benchmark index. The Fund maintained an allocation across all sectors, with a modest overweight to the producer durables sector and modest underweights to the health care and energy sectors. Security selection across most sectors was additive during the year. Underweight exposure and security selection within the health care sector was the primary contributor to benchmark-relative returns, while security selection within the financial services sector slightly distracted from benchmark-relative returns for the one-year period.
In 2021, exchange-listed equity index futures contracts were utilized to provide market exposure to the cash positions held in the Fund. In addition, currency forwards were used to hedge modest foreign currency exposure back to the U.S. dollar. Overall, derivative exposure had a positive impact on Fund performance for the year.
This Fund may be suitable for investors who seek higher, long-term rates of return, can accept significant short-term fluctuations in account value, want to invest in stocks of small- to medium-sized U.S. companies and would like to diversify their portfolio by adding a potentially higher return, higher risk option of equity securities. Small capitalization stocks are subject to greater risk than large capitalization stocks due to more volatility and less liquidity. It is possible to lose money by investing in the Fund.
At December 31, 2021, the portfolio holdings of the Fund, as a percentage of net assets, is shown in the following table. Portfolio holdings are subject to risk and may change at any time.
| | % |
| Industrials | 18.2 |
| Information Technology | 16.7 |
| Financials | 16.5 |
| Health Care | 15.8 |
| Consumer Discretionary | 11.8 |
| Money Market Funds | 5.6 |
| Real Estate | 5.2 |
| Materials | 3.4 |
| Consumer Staples | 2.9 |
| Energy | 2.5 |
| Communication Services | 1.8 |
| Utilities | 1.7 |
| Rights | —** |
| | 102.1 |
| **Rounds to less than 0.05% | |
See Notes to Financial Statements.
Small Cap Equity Fund (Unaudited)
| Average Annual Total Returns as of 12/31/21 | |
| | | Institutional Class* | | Investor Class* | | Benchmark** | |
| One Year | | 22.09% | | 21.79% | | 14.82% | |
| Five Year | | 12.80% | | 12.51% | | 12.01% | |
| Ten Year | | 12.88% | | 12.60% | | 13.22% | |
| Since Inception | | 8.81% | | 8.59% | | 9.30% | |
| Inception Date | | 08/27/01 | | 08/27/01 | | | |
| Total Fund Operating Expenses (May 1, 2021 Prospectus)(1) | | 1.00% | | 1.26% | | | |
| (1) | Current information regarding the Fund’s Operating Expenses can be found in the Financial Highlights. |
The performance data quoted represents past performance and does not guarantee future results. Current performance may be lower or higher. Performance data current to the most recent month-end may be obtained at GuideStoneFunds.com. The investment return and principal value of an investment will fluctuate so that shares, when redeemed, may be worth more or less than their original cost.
The graph illustrates the results of a hypothetical $10,000 investment in the Investor Class of the Fund for the 10-year period from December 31, 2011 to December 31, 2021, with all dividends and capital gains reinvested, with the Russell 2000® Index.
*These returns reflect investment advisory and shareholder servicing fee waivers, if applicable, during the reported time periods.
**Unlike a mutual fund, the performance of an index assumes no taxes, transaction costs, management fees or other expenses.
See Notes to Financial Statements.
| | | Shares | | Value |
| COMMON STOCKS — 94.1% |
| Communication Services — 1.8% | | |
| ATN International, Inc. | 20,753 | | $ 829,082 |
| Bandwidth, Inc. Class A* | 24,314 | | 1,744,773 |
| Cinemark Holdings, Inc.Δ* | 62,680 | | 1,010,402 |
| comScore, Inc.* | 42,720 | | 142,685 |
| Consolidated Communications Holdings, Inc.* | 33,400 | | 249,832 |
| Cumulus Media, Inc. Class A* | 4,213 | | 47,396 |
| CuriosityStream, Inc.Δ* | 119,720 | | 709,940 |
| DHI Group, Inc.* | 14,410 | | 89,918 |
| Entravision Communications Corporation Class AΔ | 201,226 | | 1,364,312 |
| Integral Ad Science Holding CorporationΔ* | 115,400 | | 2,563,034 |
| Nexstar Media Group, Inc. Class AΔ | 7,922 | | 1,196,064 |
| Telephone & Data Systems, Inc.Δ | 78,725 | | 1,586,309 |
| Townsquare Media, Inc. Class A* | 18,671 | | 248,884 |
| TrueCar, Inc.* | 53,602 | | 182,247 |
| United States Cellular Corporation* | 15,570 | | 490,766 |
| Yelp, Inc.* | 80,428 | | 2,914,711 |
| | | | | 15,370,355 |
| Consumer Discretionary — 11.4% | | |
| Aaron's Co, Inc. (The) | 31,102 | | 766,664 |
| Academy Sports & Outdoors, Inc.* | 44,709 | | 1,962,725 |
| Adtalem Global Education, Inc.* | 27,923 | | 825,404 |
| American Axle & Manufacturing Holdings, Inc.* | 122,558 | | 1,143,466 |
| American Eagle Outfitters, Inc.Δ | 137,552 | | 3,482,817 |
| American Outdoor Brands, Inc.Δ* | 11,336 | | 225,926 |
| American Public Education, Inc.* | 14,768 | | 328,588 |
| Barnes & Noble Education, Inc.* | 33,450 | | 227,795 |
| Bassett Furniture Industries, Inc. | 9,223 | | 154,670 |
| Beazer Homes U.S.A., Inc.* | 46,805 | | 1,086,812 |
| Boot Barn Holdings, Inc.* | 14,300 | | 1,759,615 |
| Brinker International, Inc.* | 44,275 | | 1,620,022 |
| Brunswick Corporation | 26,123 | | 2,631,370 |
| Callaway Golf Co.* | 99,500 | | 2,730,280 |
| Children's Place, Inc. (The)* | 12,890 | | 1,022,048 |
| Chuy's Holdings, Inc.* | 27,149 | | 817,728 |
| Container Store Group, Inc. (The)* | 10,800 | | 107,784 |
| Cooper-Standard Holdings, Inc.* | 16,176 | | 362,504 |
| Cracker Barrel Old Country Store, Inc. | 14,280 | | 1,836,979 |
| Dana, Inc.Δ | 94,689 | | 2,160,803 |
| Dave & Buster's Entertainment, Inc.* | 54,295 | | 2,084,928 |
| Dillard's, Inc. Class AΔ | 1,407 | | 344,743 |
| F45 Training Holdings, Inc.Δ* | 66,000 | | 718,740 |
| Genesco, Inc.* | 8,992 | | 577,017 |
| Goodyear Tire & Rubber Co. (The)* | 72,145 | | 1,538,131 |
| Helen of Troy, Ltd.Δ* | 8,551 | | 2,090,463 |
| Hibbett, Inc.Δ | 15,193 | | 1,092,833 |
| Hilton Grand Vacations, Inc.* | 49,500 | | 2,579,445 |
| Hooker Furnishings Corporation | 2,792 | | 64,998 |
| Jack in the Box, Inc.Δ | 22,878 | | 2,001,367 |
| KB HomeΔ | 56,974 | | 2,548,447 |
| La-Z-Boy, Inc. | 32,393 | | 1,176,190 |
| Leslie's, Inc.* | 134,100 | | 3,172,806 |
| | | Shares | | Value |
| Lifetime Brands, Inc. | 2,450 | | $ 39,127 |
| LL Flooring Holdings, Inc.* | 3,359 | | 57,338 |
| Malibu Boats, Inc. Class A* | 81,674 | | 5,613,454 |
| MarineMax, Inc.* | 55,527 | | 3,278,314 |
| Modine Manufacturing Co.Δ* | 39,494 | | 398,494 |
| Mohawk Industries, Inc.Δ* | 4,871 | | 887,399 |
| National Vision Holdings, Inc.* | 77,100 | | 3,700,029 |
| ODP Corporation (The)Δ* | 17,103 | | 671,806 |
| OneSpaWorld Holdings, Ltd.Δ* | 154,100 | | 1,544,082 |
| OneWater Marine, Inc. Class AΔ | 30,212 | | 1,842,026 |
| Penske Automotive Group, Inc.Δ | 30,887 | | 3,311,704 |
| Perdoceo Education Corporation* | 46,693 | | 549,110 |
| Planet Fitness, Inc. Class A* | 31,300 | | 2,835,154 |
| PowerSchool Holdings, Inc. Class AΔ* | 92,300 | | 1,520,181 |
| RealReal, Inc. (The)Δ* | 148,100 | | 1,719,441 |
| Red Robin Gourmet Burgers, Inc.* | 47,091 | | 778,414 |
| Signet Jewelers, Ltd. | 10,438 | | 908,419 |
| Skyline Champion Corporation* | 25,290 | | 1,997,404 |
| Solo Brands, Inc. Class AΔ* | 21,704 | | 339,234 |
| Sonic Automotive, Inc. Class A | 15,258 | | 754,508 |
| Standard Motor Products, Inc. | 2,940 | | 154,027 |
| Steven Madden, Ltd. | 74,589 | | 3,466,151 |
| Tapestry, Inc. | 62,319 | | 2,530,151 |
| Taylor Morrison Home Corporation Class AΔ* | 86,158 | | 3,012,084 |
| Tenneco, Inc. Class A* | 68,291 | | 771,688 |
| Texas Roadhouse, Inc. | 33,363 | | 2,978,649 |
| Tilly's, Inc. Class A | 22,359 | | 360,203 |
| Unifi, Inc.* | 11,316 | | 261,965 |
| Universal Electronics, Inc.* | 6,855 | | 279,341 |
| Universal Technical Institute, Inc.* | 7,811 | | 61,082 |
| Vera Bradley, Inc.* | 21,100 | | 179,561 |
| Vista Outdoor, Inc.* | 25,952 | | 1,195,609 |
| Visteon Corporation* | 20,200 | | 2,245,028 |
| Wendy's Co. (The) | 60,087 | | 1,433,075 |
| Wingstop, Inc. | 11,000 | | 1,900,800 |
| | | | | 98,819,160 |
| Consumer Staples — 2.8% | | |
| Albertsons Cos., Inc. Class AΔ | 18,043 | | 544,718 |
| Andersons, Inc. (The) | 16,449 | | 636,741 |
| BJ's Wholesale Club Holdings, Inc.* | 101,045 | | 6,766,984 |
| Edgewell Personal Care Co.Δ | 102,271 | | 4,674,807 |
| Fresh Del Monte Produce, Inc. | 16,001 | | 441,628 |
| Honest Co., Inc. (The)Δ* | 18,957 | | 153,362 |
| J&J Snack Foods Corporation | 16,395 | | 2,589,754 |
| Landec Corporation* | 11,463 | | 127,239 |
| Nature's Sunshine Products, Inc. | 7,293 | | 134,921 |
| Simply Good Foods Co. (The)Δ* | 70,100 | | 2,914,057 |
| SpartanNash Co.Δ | 23,725 | | 611,156 |
| Spectrum Brands Holdings, Inc. | 39,753 | | 4,043,675 |
| Vita Coco Co., Inc. (The)Δ* | 44,700 | | 499,299 |
| | | | | 24,138,341 |
| Energy — 2.5% | | |
| Arch Resources, Inc.Δ | 7,583 | | 692,480 |
| ChampionX Corporation* | 70,589 | | 1,426,604 |
See Notes to Financial Statements.
| | | Shares | | Value |
| CVR Energy, Inc. | 71,528 | | $ 1,202,386 |
| Delek U.S. Holdings, Inc.* | 88,897 | | 1,332,566 |
| DHT Holdings, Inc.Δ | 211,770 | | 1,099,086 |
| Dorian LPG, Ltd. | 26,950 | | 341,995 |
| Dril-Quip, Inc.* | 9,160 | | 180,269 |
| Earthstone Energy, Inc. Class A* | 89,483 | | 978,944 |
| Enviva Partners LP | 16,152 | | 1,137,424 |
| HollyFrontier Corporation | 15,639 | | 512,646 |
| Nabors Industries, Ltd.* | 2,205 | | 178,803 |
| NCS Multistage Holdings, Inc.Δ* | 1,539 | | 44,631 |
| Newpark Resources, Inc.* | 2,464 | | 7,244 |
| Oil States International, Inc.* | 88,180 | | 438,255 |
| Ovintiv, Inc. | 20,797 | | 700,859 |
| Patterson-UTI Energy, Inc.Δ | 365,569 | | 3,089,058 |
| PDC Energy, Inc. | 82,791 | | 4,038,545 |
| Plains GP Holdings LP Class A* | 18,685 | | 189,466 |
| REX American Resources Corporation* | 3,600 | | 345,600 |
| SFL Corporation, Ltd. | 113,541 | | 925,359 |
| Southwestern Energy Co.* | 335,468 | | 1,563,281 |
| W&T Offshore, Inc.Δ* | 1,000 | | 3,230 |
| Whiting Petroleum Corporation* | 7,694 | | 497,648 |
| World Fuel Services Corporation | 35,867 | | 949,399 |
| | | | | 21,875,778 |
| Financials — 16.5% | | |
| 1st Source Corporation | 2,553 | | 126,629 |
| Alerus Financial Corporation | 802 | | 23,483 |
| Amalgamated Financial CorporationΔ | 7,301 | | 122,438 |
| A-Mark Precious Metals, Inc. | 10,144 | | 619,798 |
| American Equity Investment Life Holding Co. | 46,757 | | 1,819,782 |
| American National Bankshares, Inc.Δ | 996 | | 37,529 |
| Ameris Bancorp | 32,578 | | 1,618,475 |
| Argo Group International Holdings, Ltd. | 17,098 | | 993,565 |
| Associated Banc-Corp | 61,859 | | 1,397,395 |
| Axis Capital Holdings, Ltd. | 45,117 | | 2,457,523 |
| Bakkt Holdings, Inc.* | 58,100 | | 494,431 |
| Banc of California, Inc. | 28,553 | | 560,210 |
| Bank First CorporationΔ | 790 | | 57,070 |
| Bank of Marin Bancorp | 3,903 | | 145,309 |
| Bank of Princeton (The) | 700 | | 20,531 |
| BankUnited, Inc. | 49,281 | | 2,085,079 |
| Bankwell Financial Group, Inc. | 2,224 | | 73,036 |
| Banner Corporation | 5,563 | | 337,507 |
| Bar Harbor Bankshares | 900 | | 26,037 |
| BayCom Corporation* | 1,431 | | 26,846 |
| BCB Bancorp, Inc. | 4,310 | | 66,503 |
| Berkshire Hills Bancorp, Inc. | 23,390 | | 664,978 |
| Blucora, Inc.* | 32,593 | | 564,511 |
| Bridgewater Bancshares, Inc.* | 7,186 | | 127,120 |
| Bryn Mawr Bank Corporation | 20,273 | | 912,488 |
| Business First Bancshares, Inc. | 4,303 | | 121,818 |
| Byline Bancorp, Inc. | 8,086 | | 221,152 |
| Camden National Corporation | 3,260 | | 157,002 |
| Capital Bancorp, Inc. | 2,033 | | 53,265 |
| Capital City Bank Group, Inc. | 3,249 | | 85,774 |
| Capstar Financial Holdings, Inc. | 7,586 | | 159,534 |
| | | Shares | | Value |
| Carter Bankshares, Inc.* | 4,771 | | $ 73,426 |
| CBTX, Inc. | 6,076 | | 176,204 |
| Central Pacific Financial Corporation | 20,523 | | 578,133 |
| Central Valley Community Bancorp | 3,819 | | 79,321 |
| Chemung Financial CorporationΔ | 841 | | 38,501 |
| City Holding Co. | 18,825 | | 1,539,697 |
| CNB Financial Corporation | 2,452 | | 64,978 |
| CNO Financial Group, Inc. | 72,911 | | 1,738,198 |
| Community Trust Bancorp, Inc. | 4,965 | | 216,524 |
| Compass Diversified Holdings | 105,074 | | 3,213,163 |
| Cowen, Inc. Class A | 29,359 | | 1,059,860 |
| CVB Financial Corporation | 35,400 | | 757,914 |
| Donegal Group, Inc. Class A | 4,457 | | 63,691 |
| Donnelley Financial Solutions, Inc.* | 43,437 | | 2,047,620 |
| Eagle Bancorp, Inc. | 23,084 | | 1,346,721 |
| Employers Holdings, Inc. | 17,350 | | 717,943 |
| Enact Holdings, Inc.Δ | 27,319 | | 564,684 |
| Enova International, Inc.* | 21,308 | | 872,776 |
| Enstar Group, Ltd.Δ* | 1,460 | | 361,481 |
| Enterprise Financial Services Corporation | 22,772 | | 1,072,333 |
| Essent Group, Ltd. | 49,058 | | 2,233,611 |
| Evans Bancorp, Inc. | 119 | | 4,796 |
| Evercore, Inc. Class A | 11,700 | | 1,589,445 |
| EZCORP, Inc. Class A* | 33,756 | | 248,782 |
| FB Financial Corporation | 5,204 | | 228,039 |
| Financial Institutions, Inc. | 7,086 | | 225,335 |
| First American Financial Corporation | 8,703 | | 680,836 |
| First Bancorp | 37,307 | | 1,705,676 |
| First BanCorp | 208,514 | | 2,873,323 |
| First Business Financial Services, Inc. | 1,700 | | 49,589 |
| First Commonwealth Financial Corporation | 19,467 | | 313,224 |
| First Financial Bancorp | 79,535 | | 1,939,063 |
| First Financial Corporation | 5,060 | | 229,167 |
| First Foundation, Inc. | 35,080 | | 872,089 |
| First Hawaiian, Inc. | 18,628 | | 509,103 |
| First Internet Bancorp | 2,863 | | 134,675 |
| First Interstate BancSystem, Inc. Class A | 41,130 | | 1,672,757 |
| First Mid Bancshares, Inc. | 7,366 | | 315,191 |
| First Savings Financial Group, Inc. | 900 | | 23,760 |
| First Western Financial, Inc.* | 980 | | 29,753 |
| FNB Corporation | 174,118 | | 2,112,051 |
| Focus Financial Partners, Inc. Class A* | 56,000 | | 3,344,320 |
| FS Bancorp, Inc. | 1,380 | | 46,409 |
| Genworth Financial, Inc. Class A* | 314,862 | | 1,275,191 |
| Global Indemnity Group LLC Class AΔ | 1,048 | | 26,336 |
| Great Southern Bancorp, Inc. | 3,097 | | 183,497 |
| Great Western Bancorp, Inc. | 38,793 | | 1,317,410 |
| Greenlight Capital Re, Ltd. Class AΔ* | 14,919 | | 116,965 |
| Guaranty Bancshares, Inc. | 1,775 | | 66,704 |
| Hamilton Lane, Inc. Class A | 42,231 | | 4,375,976 |
| Hanmi Financial Corporation | 23,041 | | 545,611 |
| HarborOne Bancorp, Inc. | 25,066 | | 371,979 |
| HBT Financial, Inc.Δ | 5,253 | | 98,389 |
| Heartland Financial U.S.A., Inc. | 4,209 | | 213,017 |
See Notes to Financial Statements.
SCHEDULE OF INVESTMENTS (Continued)
| | | Shares | | Value |
| Heritage Commerce Corporation | 2,100 | | $ 25,074 |
| Heritage Financial Corporation | 4,368 | | 106,754 |
| Heritage Insurance Holdings, Inc. | 9,217 | | 54,196 |
| Hilltop Holdings, Inc. | 14,793 | | 519,826 |
| Home Bancorp, Inc. | 799 | | 33,166 |
| Home BancShares, Inc. | 66,245 | | 1,613,066 |
| HomeStreet, Inc. | 14,388 | | 748,176 |
| HomeTrust Bancshares, Inc. | 5,932 | | 183,773 |
| Horace Mann Educators Corporation | 2,040 | | 78,948 |
| Independent Bank CorporationΔ | 44,001 | | 3,136,270 |
| Independent Bank Group, Inc. | 57,400 | | 4,141,410 |
| Investar Holding CorporationΔ | 1,835 | | 33,782 |
| James River Group Holdings, Ltd. | 32,616 | | 939,667 |
| Kearny Financial Corporation | 5,401 | | 71,563 |
| Kemper CorporationΔ | 25,392 | | 1,492,796 |
| Lakeland Bancorp, Inc. | 15,918 | | 302,283 |
| Lakeland Financial Corporation | 5,651 | | 452,871 |
| Luther Burbank Corporation | 1,800 | | 25,272 |
| Macatawa Bank Corporation | 5,951 | | 52,488 |
| Merchants Bancorp | 6,722 | | 318,152 |
| Metropolitan Bank Holding Corporation* | 1,806 | | 192,393 |
| Midland States Bancorp, Inc. | 5,833 | | 144,600 |
| MidWestOne Financial Group, Inc. | 2,974 | | 96,268 |
| Mr Cooper Group, Inc.* | 34,081 | | 1,418,110 |
| MVB Financial Corporation | 61,000 | | 2,532,720 |
| NBT Bancorp, Inc. | 4,980 | | 191,830 |
| Nicolet Bankshares, Inc.* | 4,151 | | 355,948 |
| NMI Holdings, Inc. Class A* | 77,988 | | 1,704,038 |
| Northeast Bank | 2,400 | | 85,752 |
| Northfield Bancorp, Inc. | 2,850 | | 46,056 |
| Northrim BanCorp, Inc. | 2,640 | | 114,734 |
| OceanFirst Financial Corporation | 26,356 | | 585,103 |
| Ocwen Financial Corporation* | 2,357 | | 94,209 |
| OFG Bancorp | 29,975 | | 796,136 |
| Old National Bancorp | 258,936 | | 4,691,920 |
| Old Second Bancorp, Inc. | 8,304 | | 104,547 |
| Origin Bancorp, Inc. | 17,742 | | 761,487 |
| Pacific Premier Bancorp, Inc. | 106,164 | | 4,249,745 |
| Patria Investments, Ltd. Class A | 17,347 | | 281,021 |
| PCSB Financial Corporation | 5,554 | | 105,748 |
| Peapack-Gladstone Financial Corporation | 8,906 | | 315,272 |
| PennyMac Financial Services, Inc. | 26,707 | | 1,863,614 |
| Preferred Bank | 1,617 | | 116,084 |
| Premier Financial Corporation | 17,386 | | 537,401 |
| Primis Financial Corporation | 8,221 | | 123,644 |
| ProAssurance Corporation | 61,019 | | 1,543,781 |
| Professional Holding Corporation Class A* | 1,233 | | 23,624 |
| Provident Financial Services, Inc. | 26,198 | | 634,516 |
| QCR Holdings, Inc. | 12,849 | | 719,544 |
| RBB Bancorp | 6,004 | | 157,305 |
| Reinsurance Group of America, Inc. | 6,036 | | 660,882 |
| Renasant Corporation | 9,464 | | 359,159 |
| RLI Corporation | 11,337 | | 1,270,878 |
| S&T Bancorp, Inc. | 1,340 | | 42,237 |
| Selective Insurance Group, Inc.Δ | 28,852 | | 2,364,133 |
| | | Shares | | Value |
| Shore Bancshares, Inc. | 1,456 | | $ 30,358 |
| Sierra Bancorp | 3,346 | | 90,844 |
| Silvergate Capital Corporation Class A* | 16,300 | | 2,415,660 |
| SLM Corporation | 12,808 | | 251,933 |
| SmartFinancial, Inc. | 2,579 | | 70,561 |
| South Plains Financial, Inc. | 506 | | 14,072 |
| Southern First Bancshares, Inc.* | 1,003 | | 62,677 |
| SouthState Corporation | 62,901 | | 5,038,999 |
| Stewart Information Services Corporation | 17,534 | | 1,397,986 |
| Stifel Financial Corporation | 37,699 | | 2,654,764 |
| StoneX Group, Inc.* | 4,875 | | 298,594 |
| Towne Bank/Portsmouth VA | 18,441 | | 582,551 |
| Trean Insurance Group, Inc.* | 2,650 | | 23,611 |
| TriCo Bancshares | 6,844 | | 294,018 |
| UMB Financial Corporation | 35,026 | | 3,716,609 |
| Umpqua Holdings Corporation | 98,186 | | 1,889,099 |
| United Community Banks, Inc. | 73,844 | | 2,653,953 |
| United Fire Group, Inc. | 9,225 | | 213,928 |
| United Insurance Holdings Corporation | 11,143 | | 48,361 |
| Universal Insurance Holdings, Inc. | 12,829 | | 218,093 |
| Unum Group | 51,676 | | 1,269,679 |
| Valley National Bancorp | 375,233 | | 5,159,454 |
| Veritex Holdings, Inc. | 20,945 | | 833,192 |
| Victory Capital Holdings, Inc. Class A | 83,400 | | 3,046,602 |
| Washington Federal, Inc. | 17,692 | | 590,559 |
| Waterstone Financial, Inc. | 10,189 | | 222,732 |
| WesBanco, Inc. | 52,020 | | 1,820,180 |
| Western New England Bancorp, Inc. | 2,800 | | 24,528 |
| WSFS Financial Corporation | 48,707 | | 2,441,195 |
| | | | | 143,720,819 |
| Health Care — 15.6% | | |
| 2seventy bio, Inc.* | 6,560 | | 168,133 |
| 4D Molecular Therapeutics, Inc.Δ* | 2,837 | | 62,244 |
| Aadi Bioscience, Inc.Δ* | 1,019 | | 24,609 |
| ACADIA Pharmaceuticals, Inc.* | 8,964 | | 209,220 |
| Adagio Therapeutics, Inc.Δ* | 4,288 | | 31,131 |
| Adaptive Biotechnologies CorporationΔ* | 30,000 | | 841,800 |
| Addus HomeCare CorporationΔ* | 15,300 | | 1,430,703 |
| Adverum Biotechnologies, Inc.* | 21,300 | | 37,488 |
| Aeglea BioTherapeutics, Inc.* | 2,600 | | 12,350 |
| Agenus, Inc.* | 59,319 | | 191,007 |
| Agios Pharmaceuticals, Inc.* | 50,363 | | 1,655,432 |
| Akebia Therapeutics, Inc.* | 28,079 | | 63,459 |
| Akero Therapeutics, Inc.Δ* | 2,234 | | 47,249 |
| Albireo Pharma, Inc.* | 2,653 | | 61,788 |
| Aldeyra Therapeutics, Inc.* | 7,972 | | 31,888 |
| Alector, Inc.* | 6,828 | | 140,998 |
| Allakos, Inc.* | 2,551 | | 24,974 |
| Allogene Therapeutics, Inc.Δ* | 10,369 | | 154,705 |
| Allovir, Inc.Δ* | 2,664 | | 34,472 |
| Allscripts Healthcare Solutions, Inc.Δ* | 87,898 | | 1,621,718 |
| Alnylam Pharmaceuticals, Inc.* | 1,142 | | 193,660 |
See Notes to Financial Statements.
| | | Shares | | Value |
| Altimmune, Inc.Δ* | 12,826 | | $ 117,486 |
| ALX Oncology Holdings, Inc.Δ* | 3,942 | | 84,714 |
| Amgen, Inc. | 1,076 | | 242,068 |
| Amicus Therapeutics, Inc.Δ* | 204,025 | | 2,356,489 |
| AMN Healthcare Services, Inc.* | 6,067 | | 742,176 |
| AnaptysBio, Inc.Δ* | 4,159 | | 144,525 |
| Anavex Life Sciences CorporationΔ* | 8,792 | | 152,453 |
| AngioDynamics, Inc.* | 19,655 | | 542,085 |
| Anika Therapeutics, Inc.* | 997 | | 35,723 |
| Annexon, Inc.Δ* | 2,609 | | 29,977 |
| Apellis Pharmaceuticals, Inc.* | 45,018 | | 2,128,451 |
| Apria, Inc.* | 43,253 | | 1,410,048 |
| Arcturus Therapeutics Holdings, Inc.Δ* | 5,526 | | 204,517 |
| Arcus Biosciences, Inc.* | 45,989 | | 1,861,175 |
| Arcutis Biotherapeutics, Inc.* | 2,142 | | 44,425 |
| Arena Pharmaceuticals, Inc.* | 3,804 | | 353,544 |
| Arrowhead Pharmaceuticals, Inc.Δ* | 2,767 | | 183,452 |
| Atara Biotherapeutics, Inc.* | 8,897 | | 140,217 |
| Athenex, Inc.Δ* | 75,452 | | 102,615 |
| Atreca, Inc. Class AΔ* | 3,700 | | 11,211 |
| AtriCure, Inc.Δ* | 65,514 | | 4,555,188 |
| Avanos Medical, Inc.* | 2,700 | | 93,609 |
| Aveanna Healthcare Holdings, Inc.Δ* | 132,900 | | 983,460 |
| Avid Bioservices, Inc.Δ* | 6,502 | | 189,728 |
| Avidity Biosciences, Inc.Δ* | 2,508 | | 59,615 |
| Avita Medical, Inc.Δ* | 1,611 | | 19,300 |
| Beam Therapeutics, Inc.Δ* | 2,581 | | 205,680 |
| BioAtla, Inc.Δ* | 2,848 | | 55,906 |
| BioCryst Pharmaceuticals, Inc.Δ* | 16,525 | | 228,871 |
| Biogen, Inc.* | 825 | | 197,934 |
| Biohaven Pharmaceutical Holding Co., Ltd.Δ* | 22,185 | | 3,057,315 |
| BioLife Solutions, Inc.* | 29,200 | | 1,088,284 |
| BioMarin Pharmaceutical, Inc.* | 2,471 | | 218,313 |
| Bioxcel Therapeutics, Inc.Δ* | 3,574 | | 72,659 |
| Bluebird Bio, Inc.Δ* | 22,495 | | 224,725 |
| Blueprint Medicines Corporation* | 69,635 | | 7,458,605 |
| Bridgebio Pharma, Inc.Δ* | 5,362 | | 89,438 |
| C4 Therapeutics, Inc.Δ* | 3,573 | | 115,051 |
| Cara Therapeutics, Inc.* | 47,350 | | 576,723 |
| CareDx, Inc.* | 4,411 | | 200,612 |
| Castlight Health, Inc. Class B* | 97,730 | | 150,504 |
| Catalyst Pharmaceuticals, Inc.* | 67,119 | | 454,396 |
| Celldex Therapeutics, Inc.* | 5,244 | | 202,628 |
| CEL-SCI CorporationΔ* | 9,117 | | 64,731 |
| Cerevel Therapeutics Holdings, Inc.Δ* | 4,899 | | 158,826 |
| Certara, Inc.Δ* | 19,300 | | 548,506 |
| ChemoCentryx, Inc.Δ* | 5,691 | | 207,209 |
| Chimerix, Inc.* | 8,968 | | 57,664 |
| Chinook Therapeutics, Inc.* | 2,368 | | 38,622 |
| Clovis Oncology, Inc.Δ* | 50,093 | | 135,752 |
| Codex DNA, Inc.Δ* | 34,400 | | 371,520 |
| Coherus Biosciences, Inc.* | 7,190 | | 114,752 |
| Computer Programs and Systems, Inc.Δ* | 11,878 | | 348,025 |
| CONMED CorporationΔ | 22,240 | | 3,152,742 |
| Crinetics Pharmaceuticals, Inc.* | 2,094 | | 59,491 |
| | | Shares | | Value |
| CryoLife, Inc.* | 70,276 | | $1,430,117 |
| Cue Biopharma, Inc.* | 3,151 | | 35,638 |
| Cullinan Oncology, Inc.Δ* | 2,477 | | 38,220 |
| Curis, Inc.* | 21,702 | | 103,302 |
| Cytokinetics, Inc.Δ* | 5,281 | | 240,708 |
| CytomX Therapeutics, Inc.* | 27,087 | | 117,287 |
| Deciphera Pharmaceuticals, Inc.* | 19,690 | | 192,371 |
| Denali Therapeutics, Inc.* | 4,425 | | 197,355 |
| DermTech, Inc.Δ* | 8,079 | | 127,648 |
| Dynavax Technologies CorporationΔ* | 14,427 | | 202,988 |
| Eagle Pharmaceuticals, Inc.* | 1,404 | | 71,492 |
| Editas Medicine, Inc.* | 6,493 | | 172,389 |
| Emergent BioSolutions, Inc.* | 4,883 | | 212,264 |
| Enanta Pharmaceuticals, Inc.Δ* | 13,446 | | 1,005,492 |
| Exact Sciences Corporation* | 2,388 | | 185,858 |
| Exelixis, Inc.* | 33,749 | | 616,932 |
| Fate Therapeutics, Inc.Δ* | 3,825 | | 223,801 |
| FibroGen, Inc.Δ* | 25,070 | | 353,487 |
| Forma Therapeutics Holdings, Inc.* | 4,092 | | 58,188 |
| Frequency Therapeutics, Inc.Δ* | 9,894 | | 50,756 |
| G1 Therapeutics, Inc.Δ* | 12,938 | | 132,097 |
| Generation Bio Co.Δ* | 3,849 | | 27,251 |
| Geron CorporationΔ* | 23,027 | | 28,093 |
| Gilead Sciences, Inc. | 3,244 | | 235,547 |
| Global Blood Therapeutics, Inc.* | 7,187 | | 210,363 |
| Gossamer Bio, Inc.Δ* | 54,283 | | 613,941 |
| Gritstone bio, Inc.Δ* | 9,708 | | 124,845 |
| Halozyme Therapeutics, Inc.Δ* | 72,137 | | 2,900,629 |
| HealthStream, Inc.* | 11,096 | | 292,491 |
| Heron Therapeutics, Inc.Δ* | 20,338 | | 185,686 |
| Homology Medicines, Inc.Δ* | 69,900 | | 254,436 |
| Hookipa Pharma, Inc.Δ* | 7,400 | | 17,242 |
| Ideaya Biosciences, Inc.Δ* | 3,959 | | 93,591 |
| IGM Biosciences, Inc.Δ* | 1,964 | | 57,604 |
| ImmunityBio, Inc.Δ* | 16,422 | | 99,846 |
| ImmunoGen, Inc.* | 15,109 | | 112,109 |
| Immunovant, Inc.Δ* | 7,236 | | 61,651 |
| Incyte Corporation* | 3,138 | | 230,329 |
| Inhibrx, Inc.Δ* | 1,417 | | 61,880 |
| Inovio Pharmaceuticals, Inc.Δ* | 31,892 | | 159,141 |
| Insmed, Inc.Δ* | 80,695 | | 2,198,132 |
| Inspire Medical Systems, Inc.* | 20,813 | | 4,788,239 |
| Intellia Therapeutics, Inc.* | 1,664 | | 196,751 |
| Intercept Pharmaceuticals, Inc.Δ* | 30,535 | | 497,415 |
| Intra-Cellular Therapies, Inc.Δ* | 53,000 | | 2,774,020 |
| Invacare CorporationΔ* | 53,326 | | 145,047 |
| Invitae CorporationΔ* | 11,909 | | 181,850 |
| Ionis Pharmaceuticals, Inc.* | 9,830 | | 299,127 |
| Iovance Biotherapeutics, Inc.* | 10,337 | | 197,333 |
| Ironwood Pharmaceuticals, Inc.Δ* | 17,720 | | 206,615 |
| iTeos Therapeutics, Inc.* | 1,462 | | 68,071 |
| IVERIC bio, Inc.* | 13,260 | | 221,707 |
| Jounce Therapeutics, Inc.* | 9,900 | | 82,665 |
| KalVista Pharmaceuticals, Inc.* | 2,448 | | 32,387 |
| Karuna Therapeutics, Inc.Δ* | 1,542 | | 202,002 |
| Karyopharm Therapeutics, Inc.Δ* | 14,262 | | 91,705 |
| Keros Therapeutics, Inc.* | 1,329 | | 77,760 |
See Notes to Financial Statements.
SCHEDULE OF INVESTMENTS (Continued)
| | | Shares | | Value |
| Kezar Life Sciences, Inc.* | 2,468 | | $ 41,265 |
| Kiniksa Pharmaceuticals, Ltd. Class AΔ* | 3,397 | | 39,983 |
| Kodiak Sciences, Inc.* | 2,274 | | 192,790 |
| Kronos Bio, Inc.Δ* | 2,477 | | 33,662 |
| Krystal Biotech, Inc.Δ* | 1,282 | | 89,676 |
| Kura Oncology, Inc.* | 7,700 | | 107,800 |
| Kymera Therapeutics, Inc.Δ* | 3,513 | | 223,040 |
| LHC Group, Inc.* | 14,300 | | 1,962,389 |
| Ligand Pharmaceuticals, Inc.Δ* | 19,439 | | 3,002,548 |
| MacroGenics, Inc.* | 6,328 | | 101,564 |
| Madrigal Pharmaceuticals, Inc.Δ* | 1,304 | | 110,501 |
| MannKind CorporationΔ* | 29,702 | | 129,798 |
| Merit Medical Systems, Inc.* | 46,286 | | 2,883,618 |
| Mersana Therapeutics, Inc.* | 10,101 | | 62,828 |
| MiMedx Group, Inc.Δ* | 7,678 | | 46,375 |
| Mirati Therapeutics, Inc.* | 1,467 | | 215,194 |
| Mirum Pharmaceuticals, Inc.* | 17,397 | | 277,482 |
| Moderna, Inc.* | 754 | | 191,501 |
| Molina Healthcare, Inc.* | 4,137 | | 1,315,897 |
| Morphic Holding, Inc.Δ* | 2,051 | | 97,176 |
| Myovant Sciences, Ltd.Δ* | 8,917 | | 138,838 |
| Myriad Genetics, Inc.Δ* | 6,426 | | 177,358 |
| NanoString Technologies, Inc.Δ* | 32,400 | | 1,368,252 |
| Natera, Inc.* | 2,138 | | 199,668 |
| National HealthCare CorporationΔ | 7,988 | | 542,705 |
| NeoGenomics, Inc.* | 41,004 | | 1,399,056 |
| Neurocrine Biosciences, Inc.* | 2,409 | | 205,175 |
| NexImmune, Inc.Δ* | 13,197 | | 60,838 |
| NextCure, Inc.* | 4,665 | | 27,990 |
| NextGen Healthcare, Inc.* | 7,250 | | 128,977 |
| NGM Biopharmaceuticals, Inc.* | 21,387 | | 378,764 |
| Novavax, Inc.Δ* | 1,135 | | 162,384 |
| Nurix Therapeutics, Inc.* | 3,286 | | 95,130 |
| NuVasive, Inc.* | 37,618 | | 1,974,193 |
| Ocugen, Inc.Δ* | 36,245 | | 164,915 |
| Omnicell, Inc.* | 17,366 | | 3,133,521 |
| OPKO Health, Inc.Δ* | 31,727 | | 152,607 |
| Organogenesis Holdings, Inc.Δ* | 13,597 | | 125,636 |
| ORIC Pharmaceuticals, Inc.Δ* | 2,442 | | 35,897 |
| Orthofix Medical, Inc.* | 6,653 | | 206,842 |
| Outset Medical, Inc.* | 33,000 | | 1,520,970 |
| Pacific Biosciences of California, Inc.* | 54,962 | | 1,124,523 |
| Patterson Cos., Inc. | 53,338 | | 1,565,470 |
| Phreesia, Inc.* | 54,200 | | 2,257,972 |
| PMV Pharmaceuticals, Inc.* | 4,664 | | 107,738 |
| Poseida Therapeutics, Inc.Δ* | 10,819 | | 73,677 |
| Praxis Precision Medicines, Inc.* | 2,395 | | 47,181 |
| Precigen, Inc.Δ* | 16,965 | | 62,940 |
| Precision BioSciences, Inc.* | 5,728 | | 42,387 |
| Prestige Consumer Healthcare, Inc.Δ* | 57,683 | | 3,498,474 |
| Protagonist Therapeutics, Inc.Δ* | 5,907 | | 202,019 |
| PTC Therapeutics, Inc.Δ* | 80,232 | | 3,195,641 |
| Pulmonx CorporationΔ* | 46,100 | | 1,478,427 |
| Radius Health, Inc.Δ* | 11,505 | | 79,615 |
| | | Shares | | Value |
| RAPT Therapeutics, Inc.* | 2,967 | | $ 108,978 |
| Recursion Pharmaceuticals, Inc. Class AΔ* | 10,271 | | 175,942 |
| Regeneron Pharmaceuticals, Inc.* | 291 | | 183,772 |
| REGENXBIO, Inc.* | 4,445 | | 145,351 |
| Relay Therapeutics, Inc.* | 6,785 | | 208,367 |
| Replimune Group, Inc.* | 2,573 | | 69,728 |
| REVOLUTION Medicines, Inc.Δ* | 5,872 | | 147,798 |
| Rhythm Pharmaceuticals, Inc.* | 4,223 | | 42,146 |
| Rigel Pharmaceuticals, Inc.Δ* | 18,771 | | 49,743 |
| Rocket Pharmaceuticals, Inc.Δ* | 5,571 | | 121,615 |
| Rubius Therapeutics, Inc.Δ* | 4,473 | | 43,299 |
| Sage Therapeutics, Inc.* | 4,883 | | 207,723 |
| Sangamo Therapeutics, Inc.Δ* | 13,855 | | 103,912 |
| Sarepta Therapeutics, Inc.* | 2,325 | | 209,366 |
| Scholar Rock Holding CorporationΔ* | 2,330 | | 57,877 |
| Seagen, Inc.* | 1,373 | | 212,266 |
| Selecta Biosciences, Inc.* | 66,738 | | 217,566 |
| Seres Therapeutics, Inc.Δ* | 11,881 | | 98,969 |
| Shockwave Medical, Inc.* | 25,045 | | 4,466,275 |
| Silk Road Medical, Inc.Δ* | 36,800 | | 1,568,048 |
| Sorrento Therapeutics, Inc.Δ* | 30,424 | | 141,472 |
| Spero Therapeutics, Inc.Δ* | 1,021 | | 16,346 |
| SpringWorks Therapeutics, Inc.* | 2,836 | | 175,775 |
| STAAR Surgical Co.* | 15,900 | | 1,451,670 |
| Stoke Therapeutics, Inc.* | 1,736 | | 41,647 |
| Supernus Pharmaceuticals, Inc.* | 65,490 | | 1,909,688 |
| Sutro Biopharma, Inc.* | 3,209 | | 47,750 |
| Syndax Pharmaceuticals, Inc.* | 5,725 | | 125,320 |
| Tabula Rasa HealthCare, Inc.Δ* | 42,810 | | 642,150 |
| Tandem Diabetes Care, Inc.Δ* | 14,800 | | 2,227,696 |
| Tarsus Pharmaceuticals, Inc.Δ* | 39,100 | | 879,750 |
| Taysha Gene Therapies, Inc.Δ* | 36,400 | | 424,060 |
| TG Therapeutics, Inc.* | 11,484 | | 218,196 |
| TransMedics Group, Inc.* | 51,965 | | 995,649 |
| Travere Therapeutics, Inc.* | 166,785 | | 5,177,006 |
| Treace Medical Concepts, Inc.Δ* | 53,600 | | 999,104 |
| Turning Point Therapeutics, Inc.* | 4,754 | | 226,766 |
| Twist Bioscience Corporation* | 2,271 | | 175,753 |
| Ultragenyx Pharmaceutical, Inc.* | 27,077 | | 2,276,905 |
| United Therapeutics Corporation* | 1,075 | | 232,286 |
| Vanda Pharmaceuticals, Inc.* | 96,168 | | 1,508,876 |
| Varex Imaging Corporation* | 48,942 | | 1,544,120 |
| Vaxart, Inc.Δ* | 30,557 | | 191,592 |
| Vaxcyte, Inc.Δ* | 1,988 | | 47,295 |
| Veracyte, Inc.* | 4,814 | | 198,337 |
| Verastem, Inc.* | 21,247 | | 43,556 |
| Vericel CorporationΔ* | 4,620 | | 181,566 |
| Vertex Pharmaceuticals, Inc.* | 940 | | 206,424 |
| Verve Therapeutics, Inc.Δ* | 5,218 | | 192,388 |
| Viking Therapeutics, Inc.Δ* | 8,300 | | 38,180 |
| Vir Biotechnology, Inc.* | 4,357 | | 182,428 |
| VistaGen Therapeutics, Inc.Δ* | 17,758 | | 34,628 |
| Xencor, Inc.* | 2,905 | | 116,549 |
| Y-mAbs Therapeutics, Inc.* | 2,666 | | 43,216 |
See Notes to Financial Statements.
| | | Shares | | Value |
| Zentalis Pharmaceuticals, Inc.Δ* | 2,361 | | $ 198,466 |
| ZIOPHARM Oncology, Inc.Δ* | 30,350 | | 33,082 |
| | | | | 136,123,954 |
| Industrials — 17.9% | | |
| ABM Industries, Inc. | 45,497 | | 1,858,553 |
| Acacia Research Corporation* | 43,913 | | 225,274 |
| ACCO Brands Corporation | 63,854 | | 527,434 |
| ACV Auctions, Inc. Class AΔ* | 69,800 | | 1,315,032 |
| AGCO Corporation | 7,270 | | 843,465 |
| Albany International Corporation Class A | 8,136 | | 719,629 |
| Allegiant Travel Co.Δ* | 12,111 | | 2,265,241 |
| Ameresco, Inc. Class AΔ* | 31,118 | | 2,534,250 |
| Apogee Enterprises, Inc.Δ | 16,769 | | 807,427 |
| Applied Industrial Technologies, Inc. | 26,372 | | 2,708,404 |
| ArcBest Corporation | 17,062 | | 2,044,881 |
| Arcosa, Inc. | 17,287 | | 911,025 |
| Argan, Inc. | 5,066 | | 196,004 |
| ASGN, Inc.* | 69,294 | | 8,550,880 |
| Astec Industries, Inc. | 8,518 | | 590,042 |
| Astronics CorporationΔ* | 17,730 | | 212,760 |
| AZEK Co., Inc. (The)* | 89,600 | | 4,143,104 |
| Barnes Group, Inc. | 19,554 | | 911,021 |
| Barrett Business Services, Inc. | 12,243 | | 845,502 |
| Beacon Roofing Supply, Inc.Δ* | 41,281 | | 2,367,465 |
| Boise Cascade Co. | 80,156 | | 5,707,107 |
| BrightView Holdings, Inc.* | 94,845 | | 1,335,418 |
| Brink's Co. (The) | 41,141 | | 2,697,615 |
| Cadre Holdings, Inc.Δ | 8,008 | | 203,563 |
| Casella Waste Systems, Inc. Class A* | 59,367 | | 5,071,129 |
| CECO Environmental Corporation* | 52,463 | | 326,845 |
| Charah Solutions, Inc.Δ* | 51,311 | | 242,701 |
| Colfax Corporation* | 46,981 | | 2,159,717 |
| Columbus McKinnon Corporation | 43,767 | | 2,024,661 |
| Commercial Vehicle Group, Inc.* | 18,680 | | 150,561 |
| CoreCivic, Inc. REIT* | 112,472 | | 1,121,346 |
| Cornerstone Building Brands, Inc.* | 95,241 | | 1,661,003 |
| Covenant Logistics Group, Inc.* | 18,785 | | 496,488 |
| Deluxe Corporation | 55,365 | | 1,777,770 |
| Driven Brands Holdings, Inc.* | 84,500 | | 2,840,890 |
| DXP Enterprises, Inc.* | 29,242 | | 750,642 |
| Dycom Industries, Inc.* | 21,275 | | 1,994,744 |
| EMCOR Group, Inc. | 38,463 | | 4,899,802 |
| Encore Wire Corporation | 12,552 | | 1,796,191 |
| EnPro Industries, Inc. | 5,903 | | 649,743 |
| ESCO Technologies, Inc. | 11,306 | | 1,017,427 |
| Exponent, Inc. | 17,600 | | 2,054,448 |
| Federal Signal Corporation | 62,074 | | 2,690,287 |
| First Advantage Corporation* | 31,300 | | 595,952 |
| Fluor CorporationΔ* | 83,168 | | 2,060,071 |
| Genco Shipping & Trading, Ltd. | 52,680 | | 842,880 |
| GMS, Inc.* | 21,631 | | 1,300,239 |
| Graham CorporationΔ | 19,662 | | 244,595 |
| Healthcare Services Group, Inc. | 31,577 | | 561,755 |
| Heidrick & Struggles International, Inc. | 5,420 | | 237,017 |
| | | Shares | | Value |
| Hexcel Corporation* | 49,200 | | $2,548,560 |
| Hub Group, Inc. Class A* | 36,674 | | 3,089,418 |
| Hyster-Yale Materials Handling, Inc. | 8,039 | | 330,403 |
| Kadant, Inc.Δ | 11,393 | | 2,625,859 |
| KAR Auction Services, Inc.Δ* | 104,276 | | 1,628,791 |
| Karat Packaging, Inc.* | 9,433 | | 190,641 |
| KBR, Inc. | 82,149 | | 3,911,935 |
| Kelly Services, Inc. Class A | 13,315 | | 223,293 |
| Kimball International, Inc. Class B | 23,385 | | 239,229 |
| Korn Ferry | 25,825 | | 1,955,727 |
| LSI Industries, Inc. | 7,105 | | 48,740 |
| Manitowoc Co., Inc. (The)* | 21,409 | | 397,993 |
| ManpowerGroup, Inc. | 3,974 | | 386,789 |
| Matrix Service Co.* | 1,033 | | 7,768 |
| Mistras Group, Inc.* | 2,172 | | 16,138 |
| MRC Global, Inc.* | 67,988 | | 467,757 |
| MYR Group, Inc.Δ* | 36,995 | | 4,089,797 |
| NN, Inc.* | 8,200 | | 33,620 |
| NOW, Inc.* | 121,502 | | 1,037,627 |
| Park-Ohio Holdings CorporationΔ | 3,996 | | 84,595 |
| Parsons Corporation* | 14,798 | | 497,953 |
| Powell Industries, Inc. | 4,776 | | 140,844 |
| Primoris Services Corporation | 23,834 | | 571,539 |
| Quanex Building Products Corporation | 12,296 | | 304,695 |
| Radiant Logistics, Inc.* | 18,667 | | 136,082 |
| RBC Bearings, Inc.Δ* | 10,200 | | 2,060,094 |
| Regal Beloit Corporation | 32,313 | | 5,499,026 |
| Resources Connection, Inc. | 11,908 | | 212,439 |
| REV Group, Inc. | 13,650 | | 193,148 |
| Rush Enterprises, Inc. Class A | 2,258 | | 125,635 |
| Ryder System, Inc. | 1,990 | | 164,036 |
| Saia, Inc.* | 3,300 | | 1,112,199 |
| Steelcase, Inc. Class A | 70,772 | | 829,448 |
| Sterling Check CorporationΔ* | 41,600 | | 853,216 |
| Sun Country Airlines Holdings, Inc.* | 55,500 | | 1,512,375 |
| Tecnoglass, Inc.Δ | 43,665 | | 1,143,586 |
| Tetra Tech, Inc. | 40,052 | | 6,800,830 |
| Textainer Group Holdings, Ltd. | 23,428 | | 836,614 |
| Timken Co. (The) | 45,716 | | 3,167,662 |
| Titan International, Inc.* | 7,300 | | 80,008 |
| Titan Machinery, Inc.* | 1,080 | | 36,385 |
| TrueBlue, Inc.* | 20,564 | | 569,006 |
| Tutor Perini Corporation* | 38,716 | | 478,917 |
| U.S. Ecology, Inc.Δ* | 23,743 | | 758,351 |
| U.S. Xpress Enterprises, Inc. Class A* | 27,477 | | 161,290 |
| Upwork, Inc.* | 29,062 | | 992,758 |
| Vectrus, Inc.* | 7,595 | | 347,623 |
| Veritiv Corporation* | 6,759 | | 828,451 |
| Wabash National CorporationΔ | 32,601 | | 636,372 |
| Werner Enterprises, Inc. | 38,367 | | 1,828,571 |
| WESCO International, Inc.* | 34,534 | | 4,544,329 |
| WillScot Mobile Mini Holdings Corporation* | 151,155 | | 6,173,170 |
| Yellow Corporation* | 17,691 | | 222,730 |
See Notes to Financial Statements.
SCHEDULE OF INVESTMENTS (Continued)
| | | Shares | | Value |
| Zurn Water Solutions Corporation | 118,490 | | $ 4,313,036 |
| | | | | 155,537,098 |
| Information Technology — 15.3% | | |
| 908 Devices, Inc.Δ* | 23,400 | | 605,358 |
| ADTRAN, Inc. | 14,899 | | 340,144 |
| Advanced Energy Industries, Inc.Δ | 6,935 | | 631,501 |
| Allegro MicroSystems, Inc.Δ* | 86,300 | | 3,122,334 |
| Applied Optoelectronics, Inc.Δ* | 36,133 | | 185,724 |
| Avaya Holdings Corporation* | 92,395 | | 1,829,421 |
| Aviat Networks, Inc.* | 9,060 | | 290,645 |
| Avnet, Inc. | 72,674 | | 2,996,349 |
| Azenta, Inc. | 39,470 | | 4,069,752 |
| Belden, Inc. | 25,319 | | 1,664,218 |
| Benchmark Electronics, Inc. | 20,994 | | 568,937 |
| Blackline, Inc.* | 9,108 | | 943,042 |
| Box, Inc. Class AΔ* | 43,931 | | 1,150,553 |
| BTRS Holdings, Inc.* | 287,100 | | 2,245,122 |
| Coherent, Inc.* | 8,844 | | 2,357,280 |
| Cohu, Inc.* | 15,482 | | 589,709 |
| Comtech Telecommunications Corporation | 22,931 | | 543,235 |
| Conduent, Inc.* | 99,940 | | 533,680 |
| Consensus Cloud Solutions, Inc.Δ* | 8,746 | | 506,131 |
| DZS, Inc.Δ* | 5,273 | | 85,528 |
| EMCORE Corporation* | 21,867 | | 152,632 |
| Enfusion, Inc. Class AΔ* | 91,900 | | 1,924,386 |
| Envestnet, Inc.* | 31,300 | | 2,483,342 |
| Euronet Worldwide, Inc.* | 11,850 | | 1,412,164 |
| EVERTEC, Inc. | 67,388 | | 3,368,052 |
| Evo Payments, Inc. Class A* | 69,500 | | 1,779,200 |
| ExlService Holdings, Inc.* | 50,140 | | 7,258,768 |
| IBEX Holdings, Ltd.* | 22,249 | | 286,790 |
| Ichor Holdings, Ltd.* | 18,989 | | 874,064 |
| II-VI, Inc.Δ* | 91,804 | | 6,272,967 |
| Juniper Networks, Inc. | 50,395 | | 1,799,605 |
| Kimball Electronics, Inc.Δ* | 4,378 | | 95,265 |
| Kulicke & Soffa Industries, Inc.Δ | 31,806 | | 1,925,535 |
| KVH Industries, Inc.* | 4,620 | | 42,458 |
| Limelight Networks, Inc.Δ* | 30,450 | | 104,444 |
| Littelfuse, Inc.Δ | 5,300 | | 1,667,804 |
| MACOM Technology Solutions Holdings, Inc.* | 38,335 | | 3,001,630 |
| MaxLinear, Inc.* | 53,125 | | 4,005,094 |
| NETGEAR, Inc.* | 57,796 | | 1,688,221 |
| NetScout Systems, Inc.* | 29,957 | | 990,978 |
| New Relic, Inc.* | 34,600 | | 3,804,616 |
| nLight, Inc.* | 97,000 | | 2,323,150 |
| Onto Innovation, Inc.* | 42,600 | | 4,312,398 |
| Paycor HCM, Inc.Δ* | 104,600 | | 3,013,526 |
| PC Connection, Inc. | 4,130 | | 178,127 |
| Ping Identity Holding Corporation* | 21,334 | | 488,122 |
| Plantronics, Inc.* | 23,368 | | 685,617 |
| Priority Technology Holdings, Inc.Δ* | 121,700 | | 861,636 |
| Q2 Holdings, Inc.* | 50,889 | | 4,042,622 |
| Quantum Corporation* | 32,568 | | 179,775 |
| Rapid7, Inc.* | 33,148 | | 3,901,188 |
| Repay Holdings CorporationΔ* | 77,400 | | 1,414,098 |
| | | Shares | | Value |
| Ribbon Communications, Inc.* | 42,290 | | $ 255,854 |
| Sailpoint Technologies Holdings, Inc.Δ* | 85,400 | | 4,128,236 |
| ScanSource, Inc.* | 8,261 | | 289,796 |
| SecureWorks Corporation Class AΔ* | 12,451 | | 198,842 |
| SEMrush Holdings, Inc. Class A* | 27,800 | | 579,630 |
| Semtech Corporation* | 26,668 | | 2,371,585 |
| Silicon Laboratories, Inc.* | 12,465 | | 2,573,025 |
| Smartsheet, Inc. Class A* | 40,500 | | 3,136,725 |
| Sprout Social, Inc. Class A* | 34,127 | | 3,094,978 |
| Super Micro Computer, Inc.* | 9,183 | | 403,593 |
| Synaptics, Inc.Δ* | 13,700 | | 3,966,287 |
| Synchronoss Technologies, Inc.* | 29,166 | | 71,165 |
| Teradata Corporation* | 55,488 | | 2,356,575 |
| Unisys Corporation* | 19,156 | | 394,039 |
| Varonis Systems, Inc.* | 41,414 | | 2,020,175 |
| Veeco Instruments, Inc.Δ* | 26,729 | | 760,975 |
| Vertex, Inc. Class AΔ* | 58,600 | | 929,982 |
| Vonage Holdings Corporation* | 264,100 | | 5,490,639 |
| Vontier Corporation | 21,661 | | 665,643 |
| Workiva, Inc.* | 22,400 | | 2,922,976 |
| Xerox Holdings Corporation | 73,656 | | 1,667,572 |
| Ziff Davis, Inc.Δ* | 26,238 | | 2,908,745 |
| | | | | 132,783,974 |
| Materials — 3.4% | | |
| AdvanSix, Inc. | 20,519 | | 969,523 |
| American Vanguard Corporation | 2,290 | | 37,533 |
| Balchem CorporationΔ | 5,959 | | 1,004,687 |
| Clearwater Paper CorporationΔ* | 14,816 | | 543,303 |
| Coeur Mining, Inc.* | 114,834 | | 578,763 |
| Ecovyst, Inc. | 25,811 | | 264,305 |
| Ferro Corporation* | 19,963 | | 435,792 |
| Graphic Packaging Holding Co. | 173,102 | | 3,375,489 |
| Huntsman Corporation | 30,011 | | 1,046,784 |
| Kaiser Aluminum CorporationΔ | 22,837 | | 2,145,308 |
| Koppers Holdings, Inc.Δ* | 1,620 | | 50,706 |
| Minerals Technologies, Inc. | 60,949 | | 4,458,419 |
| Neenah, Inc. | 37,154 | | 1,719,487 |
| Olin Corporation | 14,413 | | 829,036 |
| Olympic Steel, Inc. | 7,364 | | 173,054 |
| Pactiv Evergreen, Inc.Δ | 133,239 | | 1,689,470 |
| Quaker Chemical CorporationΔ | 8,234 | | 1,900,242 |
| Rayonier Advanced Materials, Inc.* | 24,700 | | 141,037 |
| Schnitzer Steel Industries, Inc. Class A | 26,836 | | 1,393,325 |
| Stepan Co. | 2,637 | | 327,753 |
| Summit Materials, Inc. Class A* | 64,954 | | 2,607,254 |
| SunCoke Energy, Inc. | 101,398 | | 668,213 |
| TimkenSteel Corporation* | 54,314 | | 896,181 |
| Verso Corporation Class A | 4,279 | | 115,619 |
| Worthington Industries, Inc. | 46,600 | | 2,547,156 |
| | | | | 29,918,439 |
| Real Estate — 5.2% | | |
| American Assets Trust, Inc. REITΔ | 45,051 | | 1,690,764 |
| Apple Hospitality REIT, Inc. | 116,965 | | 1,888,985 |
| Armada Hoffler Properties, Inc. REIT | 113,103 | | 1,721,428 |
See Notes to Financial Statements.
| | | Shares | | Value |
| Brandywine Realty Trust REIT | 104,785 | | $ 1,406,215 |
| CareTrust REIT, Inc.Δ | 38,860 | | 887,174 |
| CatchMark Timber Trust, Inc. Class A REIT | 19,797 | | 172,432 |
| Cedar Realty Trust, Inc. REIT | 3,502 | | 87,935 |
| Centerspace REIT | 8,889 | | 985,790 |
| Cousins Properties, Inc. REIT | 26,056 | | 1,049,536 |
| CTO Realty Growth, Inc. REITΔ | 4,739 | | 291,069 |
| DiamondRock Hospitality Co. REIT* | 130,459 | | 1,253,711 |
| Diversified Healthcare Trust REIT | 119,574 | | 369,484 |
| Easterly Government Properties, Inc. REITΔ | 25,243 | | 578,570 |
| EastGroup Properties, Inc. REIT | 13,623 | | 3,104,001 |
| Equity Commonwealth REITΔ* | 64,280 | | 1,664,852 |
| Farmland Partners, Inc. REIT | 23,010 | | 274,969 |
| Forestar Group, Inc.Δ* | 9,962 | | 216,673 |
| Four Corners Property Trust, Inc. REIT | 41,540 | | 1,221,691 |
| Franklin Street Properties Corporation REITΔ | 37,165 | | 221,132 |
| GEO Group, Inc. (The) REITΔ | 142,943 | | 1,107,808 |
| Getty Realty Corporation REIT | 19,168 | | 615,101 |
| Healthcare Realty Trust, Inc. REITΔ | 13,732 | | 434,480 |
| Highwoods Properties, Inc. REIT | 12,073 | | 538,335 |
| Industrial Logistics Properties Trust REIT | 9,258 | | 231,913 |
| Kennedy-Wilson Holdings, Inc. | 164,511 | | 3,928,523 |
| Kite Realty Group Trust REITΔ | 119,253 | | 2,597,330 |
| LXP Industrial Trust REIT | 121,230 | | 1,893,613 |
| National Health Investors, Inc. REITΔ | 16,802 | | 965,611 |
| National Storage Affiliates Trust REIT | 34,188 | | 2,365,810 |
| NETSTREIT Corporation | 1,864 | | 42,686 |
| Office Properties Income Trust REIT | 22,397 | | 556,341 |
| Pebblebrook Hotel Trust REITΔ | 65,011 | | 1,454,296 |
| Physicians Realty Trust REITΔ | 135,765 | | 2,556,455 |
| Piedmont Office Realty Trust, Inc. Class A REIT | 57,951 | | 1,065,139 |
| Realogy Holdings Corporation* | 79,973 | | 1,344,346 |
| RLJ Lodging Trust REIT | 123,358 | | 1,718,377 |
| RPT Realty REIT | 112,147 | | 1,500,527 |
| Sabra Health Care REIT, Inc.Δ | 23,417 | | 317,066 |
| Spirit Realty Capital, Inc. REIT | 2,243 | | 108,090 |
| Summit Hotel Properties, Inc. REIT* | 32,820 | | 320,323 |
| Whitestone REIT | 33,354 | | 337,876 |
| | | | | 45,086,457 |
| Utilities — 1.7% | | |
| Black Hills Corporation | 23,731 | | 1,674,697 |
| Northwest Natural Holding Co. | 14,607 | | 712,530 |
| NorthWestern CorporationΔ | 31,577 | | 1,804,941 |
| NRG Energy, Inc.Δ | 16,328 | | 703,410 |
| Pinnacle West Capital CorporationΔ | 7,266 | | 512,907 |
| Portland General Electric Co. | 37,740 | | 1,997,201 |
| South Jersey Industries, Inc.Δ | 105,753 | | 2,762,268 |
| Southwest Gas Holdings, Inc. | 25,567 | | 1,790,968 |
| | | Shares | | Value |
| Spire, Inc. | 27,917 | | $ 1,820,747 |
| Sunnova Energy International, Inc.Δ* | 46,900 | | 1,309,448 |
| | | | | 15,089,117 |
Total Common Stocks
(Cost $649,403,737) | | 818,463,492 |
| FOREIGN COMMON STOCKS — 2.4% |
| Canada — 0.1% | | |
| DIRTT Environmental SolutionsΔ* | 96,127 | | 209,557 |
| Primo Water Corporation | 51,574 | | 909,249 |
| VBI Vaccines, Inc.Δ* | 30,129 | | 70,502 |
| | | | | 1,189,308 |
| Germany — 0.0% | | |
| SiriusPoint, Ltd.* | 33,622 | | 273,347 |
| Ireland — 0.2% | | |
| Alkermes PLC* | 8,789 | | 204,432 |
| GH Research PLCΔ* | 28,500 | | 664,905 |
| Horizon Therapeutics PLC* | 1,939 | | 208,947 |
| Prothena Corporation PLC* | 4,373 | | 216,026 |
| | | | | 1,294,310 |
| Israel — 0.5% | | |
| Caesarstone, Ltd. | 5,236 | | 59,376 |
| Global-e Online, Ltd.Δ* | 30,600 | | 1,939,734 |
| JFrog, Ltd.* | 45,800 | | 1,360,260 |
| Tufin Software Technologies, Ltd.Δ* | 72,300 | | 762,765 |
| | | | | 4,122,135 |
| Jersey — 1.1% | | |
| Mimecast, Ltd.* | 31,429 | | 2,500,806 |
| Quotient, Ltd.Δ* | 168,100 | | 435,379 |
| WNS Holdings, Ltd. ADR* | 77,822 | | 6,865,457 |
| | | | | 9,801,642 |
| Netherlands — 0.2% | | |
| MYT Netherlands Parent BV ADRΔ* | 64,700 | | 1,372,287 |
| uniQure NVΔ* | 5,091 | | 105,587 |
| | | | | 1,477,874 |
| Sweden — 0.1% | | |
| Loomis AB | 38,958 | | 1,037,736 |
| United Kingdom — 0.2% | | |
| Gates Industrial Corporation PLC* | 111,556 | | 1,774,856 |
| Luxfer Holdings PLC | 17,494 | | 337,809 |
| | | | | 2,112,665 |
Total Foreign Common Stocks
(Cost $19,871,458) | | 21,309,017 |
| RIGHTS — 0.0% |
Aduro Biotech, Inc.†††Δ*
(Cost $—) | 2,713 | | — |
| MONEY MARKET FUNDS — 5.6% |
GuideStone Money Market Fund, 0.00%
(Institutional Class)Ø∞ | 30,899,191 | | 30,899,191 |
See Notes to Financial Statements.
SCHEDULE OF INVESTMENTS (Continued)
| | | Shares | | Value |
| Northern Institutional Liquid Assets Portfolio (Shares), 0.04%ا | 17,934,148 | | $ 17,934,148 |
| Northern Institutional U.S. Government Portfolio (Shares), 0.00%Ø | 36,436 | | 36,436 |
Total Money Market Funds
(Cost $48,869,775) | | 48,869,775 |
TOTAL INVESTMENTS — 102.1%
(Cost $718,144,970) | | | 888,642,284 |
Liabilities in Excess of Other
Assets — (2.1)% | | | (18,401,915) |
| NET ASSETS — 100.0% | | | $870,240,369 |
See Notes to Financial Statements.
Futures Contracts outstanding at December 31, 2021:
| Future Type | | Expiration Date | | Open Long
(Short) Contracts | | Notional
Market Value
of Contracts | | Value and
Unrealized
Appreciation
(Depreciation) |
| CME Russell 2000 Index E-Mini | | 03/2022 | | 281 | | $31,511,340 | | $476,169 |
Forward Foreign Currency Contracts outstanding at December 31, 2021:
| Expiration Date | | Currency
Purchased | | Amount
of Currency
Purchased | | Currency
Sold | | Amount
of Currency
Sold | | Counter-
party | | Net Unrealized
Appreciation
(Depreciation) |
| 03/31/22 | | U.S. Dollars | | 993,817 | | Swedish Kronor | | 9,061,865 | | UBS | | $(9,816) |
| Total Forward Foreign Currency Contracts outstanding at December 31, 2021 | | | | $(9,816) |
VALUATION HIERARCHY
The following is a summary of the inputs used, as of December 31, 2021, in valuing the Fund’s investments carried at fair value:
| | Total
Value | | Level 1
Quoted Prices | | Level 2
Other Significant
Observable Inputs | | Level 3
Significant
Unobservable Inputs |
| Assets: | | | | | | | |
| Investments in Securities: | | | | | | | |
| Common Stocks | $818,463,492 | | $818,463,492 | | $ — | | $ — |
| Foreign Common Stocks | 21,309,017 | | 21,309,017 | | — | | — |
| Money Market Funds | 48,869,775 | | 48,869,775 | | — | | — |
| Rights | — | | — | | — | | —** |
| Total Assets - Investments in Securities | $888,642,284 | | $888,642,284 | | $ — | | $ — |
| Other Financial Instruments*** | | | | | | | |
| Futures Contracts | $ 476,169 | | $ 476,169 | | $ — | | $ — |
| Total Assets - Other Financial Instruments | $ 476,169 | | $ 476,169 | | $ — | | $ — |
| Liabilities: | | | | | | | |
| Other Financial Instruments*** | | | | | | | |
| Forward Foreign Currency Contracts | $ (9,816) | | $ — | | $ (9,816) | | $ — |
| Total Liabilities - Other Financial Instruments | $ (9,816) | | $ — | | $ (9,816) | | $ — |
| ** | Level 3 security has zero value. |
| *** | Other financial instruments are derivative instruments, such as futures contracts and forward contracts, which are valued at the unrealized appreciation (depreciation) on the investment. Further details regarding the value of these investments can be found in the preceding "Futures Contracts outstanding" and "Forward Foreign Currency Contracts outstanding" disclosures. |
There were no transfers to or from Level 3 during the year ended December 31, 2021.
Management has determined that the amount of Level 3 securities compared to total net assets is not material; therefore, the reconciliation of Level 3 securities and assumptions is not shown for the year ended December 31, 2021.
See Notes to Financial Statements.
International Equity Index Fund (Unaudited)
With an annual return of 11.26%, developed non-U.S. markets (represented by the MSCI EAFE Index) saw strong performance in 2021, yet underperformed their U.S. counterparts. Unlike the prior year, where growth and value investment styles saw historically high spreads in performance, equity style factors in 2021 had relatively lower impact on performance. Far more material to 2021 returns was the strength of the U.S. dollar, which detracted more than 7% from U.S. dollar-denominated returns, partially offsetting market strength. Among major foreign developed markets, U.K. stocks strongly outperformed and were followed closely by continental European shares. Sector performance was generally positive, with energy posting the highest returns and financials contributing the most to index performance.
The Fund was passively managed and attempted to replicate the performance of its benchmark, the MSCI EAFE Index. The objective of the Fund is to provide investment results approximating the aggregate price and dividend performance of the securities included in the MSCI EAFE Index. (The MSCI EAFE Index is a free-float-adjusted market capitalization index that is designed to measure the equity market performance of developed markets, excluding the United States and Canada.) The correlation between the Fund’s performance and the MSCI EAFE Index is expected to be greater than 98%. However, it could be lower in certain market environments and also due to the exclusion of certain securities from the Fund’s portfolio because of the Fund’s faith-based investment policies and restrictions (100% would indicate a perfect correlation). For the one-year period ended December 31, 2021, the Institutional Class of the Fund returned 10.43%, while the target index returned 11.26%. The return differential was primarily a result of the faith-based restrictions of the Fund, but also as a result of Fund expenses.
In 2021, exchange-listed equity index futures contracts were utilized to provide market exposure to the cash positions held in the Fund. Overall, derivative exposure had a slight positive impact on Fund performance for the year.
This Fund may be suitable to investors who seek higher, long-term rates of return, can accept significant short-term fluctuations in account value and want to diversify their portfolio with international equity securities. Securities of foreign issuers may be negatively impacted by political events, economic conditions or inefficient, illiquid or unregulated markets in foreign countries, and they also may be subject to inadequate regulatory or accounting standards, which may increase investment risk. Derivatives involve different risks from, and in some respects greater than, those risks associated with investing directly in securities, currencies or other instruments. The derivatives may be illiquid or less liquid, volatile, difficult to price and leveraged, so that small changes in the value of the underlying instruments may produce disproportionate losses to the Fund. It is possible to lose money by investing in the Fund.
At December 31, 2021, the portfolio holdings of the Fund, as a percentage of net assets, is shown in the following table. Portfolio holdings are subject to risk and may change at any time.
| | % |
| Financials | 16.1 |
| Industrials | 15.7 |
| Consumer Discretionary | 11.5 |
| Health Care | 10.8 |
| Information Technology | 9.3 |
| Consumer Staples | 8.6 |
| Materials | 7.1 |
| Money Market Funds | 6.6 |
| Communication Services | 4.4 |
| Utilities | 3.8 |
| Energy | 3.1 |
| Real Estate | 3.0 |
| | 100.0 |
See Notes to Financial Statements.
International Equity Index Fund (Unaudited)
| Average Annual Total Returns as of 12/31/21 | |
| | | Institutional Class* | | Benchmark** | |
| One Year | | 10.43% | | 11.26% | |
| Five Year | | 9.48% | | 9.54% | |
| Ten Year | | N/A | | N/A | |
| Since Inception | | 5.70% | | 5.86% | |
| Inception Date | | 06/01/15 | | | |
| Total Fund Operating Expenses (May 1, 2021 Prospectus)(1) | | 0.23% | | | |
| (1) | Current information regarding the Fund’s Operating Expenses can be found in the Financial Highlights. |
The performance data quoted represents past performance and does not guarantee future results. Current performance may be lower or higher. Performance data current to the most recent month-end may be obtained at GuideStoneFunds.com. The investment return and principal value of an investment will fluctuate so that shares, when redeemed, may be worth more or less than their original cost.
The Adviser has agreed to waive fees and/or reimburse expenses to the extent needed to limit total annual operating expenses (before expense payments by broker-dealers and excluding interest, taxes, brokerage commissions, extraordinary expenses, acquired fund fees and expenses and expenses incurred in connection with the short sales of securities) to 0.22% for the Institutional Class. This contractual waiver and reimbursement applies to Fund operating expenses only and will remain in place until April 30, 2022. Institutional Net Expense Ratio - 0.23%.
The graph illustrates the results of a hypothetical $10,000 investment in the Institutional Class of the Fund since June 1, 2015 (commencement of operations), with all dividends and capital gains reinvested, with the MSCI EAFE Index.
*These returns reflect investment advisory and shareholder servicing fee waivers, if applicable, during the reported time periods.
**Unlike a mutual fund, the performance of an index assumes no taxes, transaction costs, management fees or other expenses.
See Notes to Financial Statements.
INTERNATIONAL EQUITY INDEX FUND
| | | Shares | | Value |
| COMMON STOCKS — 0.2% |
| Communication Services — 0.2% | | |
| Sea, Ltd. ADR* | 6,309 | | $1,411,386 |
| Financials — 0.0% | | |
| Futu Holdings, Ltd. ADRΔ* | 2,522 | | 109,203 |
Total Common Stocks
(Cost $2,323,040) | | 1,520,589 |
| FOREIGN COMMON STOCKS — 92.7% |
| Australia — 6.5% | | |
| Afterpay, Ltd.* | 11,107 | | 670,795 |
| Ampol, Ltd. | 12,404 | | 267,668 |
| APA Group | 56,822 | | 415,889 |
| ASX, Ltd. | 9,397 | | 635,138 |
| Aurizon Holdings, Ltd. | 144,275 | | 366,336 |
| Australia & New Zealand Banking Group, Ltd. | 133,614 | | 2,674,271 |
| BHP Group, Ltd.Δ | 135,994 | | 4,106,111 |
| BlueScope Steel, Ltd. | 21,263 | | 323,321 |
| Brambles, Ltd. | 72,678 | | 562,081 |
| Cochlear, Ltd. | 3,288 | | 516,999 |
| Coles Group, Ltd. | 79,057 | | 1,031,872 |
| Commonwealth Bank of Australia | 82,859 | | 6,088,691 |
| Computershare, Ltd. | 24,948 | | 363,018 |
| CSL, Ltd. | 23,068 | | 4,879,190 |
| Dexus REITΔ | 65,896 | | 533,122 |
| Domino’s Pizza Enterprises, Ltd. | 4,484 | | 385,053 |
| Fortescue Metals Group, Ltd. | 86,232 | | 1,205,199 |
| Goodman Group REIT | 96,925 | | 1,868,721 |
| GPT Group (The) REIT (Athens Exchange) | 137,876 | | 543,689 |
| IDP Education, Ltd.Δ | 17,951 | | 452,538 |
| Insurance Australia Group, Ltd. | 115,449 | | 357,818 |
| Lendlease Corporation, Ltd.Δ | 36,784 | | 286,088 |
| Macquarie Group, Ltd. | 18,802 | | 2,809,748 |
| Magellan Financial Group, Ltd. | 5,400 | | 83,447 |
| Medibank Pvt., Ltd. | 94,662 | | 230,719 |
| Mirvac Group REIT | 260,355 | | 551,216 |
| National Australia Bank, Ltd. | 161,573 | | 3,390,212 |
| Newcrest Mining, Ltd. | 38,206 | | 680,465 |
| Northern Star Resources, Ltd. | 45,766 | | 313,325 |
| Orica, Ltd. | 7,637 | | 76,066 |
| Origin Energy, Ltd. | 62,971 | | 240,068 |
| Qantas Airways, Ltd.* | 66,392 | | 242,001 |
| QBE Insurance Group, Ltd. | 75,406 | | 622,680 |
| REA Group, Ltd. | 4,130 | | 503,722 |
| Reece, Ltd. | 18,888 | | 371,445 |
| Rio Tinto, Ltd. | 12,648 | | 921,218 |
| Santos, Ltd. | 177,590 | | 815,287 |
| Scentre Group REIT | 265,947 | | 611,428 |
| SEEK, Ltd.Δ | 16,462 | | 392,604 |
| Sonic Healthcare, Ltd. | 26,549 | | 900,692 |
| South32, Ltd. | 212,814 | | 620,880 |
| Stockland REIT | 133,688 | | 412,402 |
| Suncorp Group, Ltd. | 68,156 | | 548,927 |
| Sydney Airport* | 25,788 | | 162,855 |
| Telstra Corporation, Ltd. | 188,332 | | 572,748 |
| | | Shares | | Value |
| Transurban Group (Athen Exchange) | 138,068 | | $ 1,388,238 |
| Vicinity Centres REIT | 137,781 | | 169,410 |
| Washington H Soul Pattinson & Co., Ltd. | 6,495 | | 139,920 |
| Wesfarmers, Ltd. | 63,489 | | 2,739,151 |
| Westpac Banking Corporation | 164,250 | | 2,551,327 |
| WiseTech Global, Ltd. | 3,675 | | 156,628 |
| Woodside Petroleum, Ltd. | 45,699 | | 729,135 |
| Woolworths Group, Ltd. | 57,600 | | 1,592,881 |
| | | | | 54,074,453 |
| Austria — 0.3% | | |
| Erste Group Bank AG | 15,407 | | 722,286 |
| OMV AG | 10,806 | | 611,109 |
| Raiffeisen Bank International AG | 5,232 | | 153,667 |
| Verbund AGΔ | 5,255 | | 590,580 |
| voestalpine AG | 4,506 | | 163,492 |
| | | | | 2,241,134 |
| Belgium — 0.7% | | |
| Ageas SA/NV | 4,155 | | 215,473 |
| Etablissements Franz Colruyt NV | 5,111 | | 216,811 |
| Groupe Bruxelles Lambert SA | 11,620 | | 1,298,595 |
| KBC Group NV | 13,105 | | 1,125,866 |
| Proximus SADP | 7,723 | | 150,706 |
| Sofina SA | 865 | | 425,435 |
| Solvay SA | 4,910 | | 571,302 |
| UCB SA | 14,083 | | 1,608,961 |
| Umicore SA | 9,507 | | 386,948 |
| | | | | 6,000,097 |
| Denmark — 2.2% | | |
| Ambu A/S Class BΔ | 12,493 | | 329,738 |
| AP Moeller - Maersk A/S Class A | 549 | | 1,821,342 |
| AP Moeller - Maersk A/S Class B | 60 | | 214,159 |
| Chr. Hansen Holding A/S | 9,414 | | 742,298 |
| Coloplast A/S Class B | 9,701 | | 1,708,106 |
| Danske Bank A/SΔ | 52,273 | | 902,441 |
| Demant A/SΔ* | 13,113 | | 671,466 |
| DSV A/S | 11,994 | | 2,794,941 |
| Genmab A/S* | 4,030 | | 1,608,587 |
| GN Store Nord A/S | 5,764 | | 361,667 |
| Novozymes A/S, B Shares | 15,803 | | 1,297,581 |
| Orsted A/S 144A | 10,730 | | 1,374,160 |
| Pandora A/S | 9,048 | | 1,125,489 |
| ROCKWOOL International A/S, B Shares | 1,073 | | 468,556 |
| Tryg A/S | 43,880 | | 1,082,854 |
| Vestas Wind Systems A/S | 61,690 | | 1,878,778 |
| | | | | 18,382,163 |
| Finland — 1.2% | | |
| Elisa OYJ | 7,229 | | 445,133 |
| Fortum OYJ | 22,487 | | 689,686 |
| Kesko OYJ, B Shares | 12,949 | | 431,601 |
| Kone OYJ Class B | 11,915 | | 855,006 |
| Neste OYJ | 18,827 | | 926,586 |
| Nokia OYJ* | 251,591 | | 1,593,499 |
See Notes to Financial Statements.
| | | Shares | | Value |
| Nordea Bank Abp | 1,819 | | $ 22,287 |
| Nordea Bank Abp (NASDAQ Exchange) | 155,036 | | 1,891,214 |
| Orion OYJ Class B | 19,705 | | 818,522 |
| Sampo OYJ, A Shares | 19,367 | | 969,281 |
| Stora Enso OYJ, R Shares | 22,882 | | 419,962 |
| UPM-Kymmene OYJ | 27,891 | | 1,061,214 |
| Wartsila OYJ Abp | 14,669 | | 205,744 |
| | | | | 10,329,735 |
| France — 10.0% | | |
| Accor SA* | 16,778 | | 543,445 |
| Air Liquide SA | 24,343 | | 4,249,188 |
| Alstom SAΔ | 13,522 | | 480,626 |
| Amundi SA 144A | 3,229 | | 266,710 |
| Arkema SA | 2,715 | | 382,824 |
| AXA SA | 94,288 | | 2,810,878 |
| BioMerieux | 1,757 | | 249,843 |
| BNP Paribas SA | 51,911 | | 3,591,548 |
| Bollore SA | 53,876 | | 301,782 |
| Bouygues SA | 11,283 | | 404,511 |
| Bureau Veritas SA | 15,449 | | 513,238 |
| Capgemini SE | 7,893 | | 1,936,522 |
| Carrefour SA | 29,587 | | 542,494 |
| Cie de St-Gobain | 26,241 | | 1,848,390 |
| Cie Generale des Etablissements Michelin SCA | 8,634 | | 1,416,967 |
| CNP Assurances | 6,718 | | 166,354 |
| Credit Agricole SA | 66,291 | | 947,177 |
| Danone SA | 36,549 | | 2,271,546 |
| Dassault Systemes SE | 37,571 | | 2,237,538 |
| Edenred | 13,754 | | 635,283 |
| Eiffage SA | 4,139 | | 426,270 |
| Electricite de France SA | 32,416 | | 381,235 |
| Engie SA | 92,715 | | 1,373,706 |
| EssilorLuxottica SA | 18,021 | | 3,841,586 |
| Eurazeo SE | 3,083 | | 269,568 |
| Eurofins Scientific SE | 7,098 | | 879,221 |
| Faurecia SE | 977 | | 45,694 |
| Faurecia SE (Euronext Paris Exchange) | 5,122 | | 243,927 |
| Gecina SA REIT | 2,894 | | 404,933 |
| Getlink SE | 33,090 | | 548,518 |
| Hermes International | 1,835 | | 3,208,931 |
| Ipsen SA | 3,144 | | 288,145 |
| Kering SA | 4,361 | | 3,509,757 |
| Klepierre REITΔ* | 14,221 | | 337,574 |
| L’Oreal SA | 12,212 | | 5,797,007 |
| Legrand SA | 15,118 | | 1,771,099 |
| Orange SA | 111,352 | | 1,193,326 |
| Orpea SA | 3,616 | | 362,691 |
| Publicis Groupe SA | 15,647 | | 1,054,595 |
| Renault SA* | 7,966 | | 277,021 |
| Safran SA | 14,290 | | 1,751,538 |
| Sanofi | 72,120 | | 7,273,182 |
| Sartorius Stedim Biotech | 2,225 | | 1,221,998 |
| Schneider Electric SE | 24,838 | | 4,876,835 |
| SEB SA | 1,871 | | 291,615 |
| Societe Generale SA | 43,102 | | 1,482,209 |
| | | Shares | | Value |
| Sodexo SA | 2,396 | | $ 210,208 |
| Suez SA | 19,394 | | 437,406 |
| Teleperformance | 2,675 | | 1,193,831 |
| Thales SA | 4,648 | | 395,823 |
| TotalEnergies SE | 112,755 | | 5,729,223 |
| Ubisoft Entertainment SA* | 5,285 | | 259,151 |
| Unibail-Rodamco-Westfield CDI* | 10,140 | | 35,190 |
| Unibail-Rodamco-Westfield REIT* | 6,095 | | 427,591 |
| Valeo | 12,169 | | 368,250 |
| Veolia Environnement SA | 22,865 | | 839,786 |
| Vinci SA | 28,384 | | 3,002,404 |
| Vivendi SEΔ | 34,973 | | 473,421 |
| Wendel SE | 1,720 | | 206,396 |
| Worldline SA 144A* | 13,200 | | 736,532 |
| | | | | 83,224,257 |
| Germany — 7.8% | | |
| adidas AG | 11,373 | | 3,274,803 |
| Allianz SE | 19,260 | | 4,542,642 |
| Aroundtown SA | 49,132 | | 296,382 |
| BASF SE | 41,014 | | 2,878,583 |
| Bayerische Motoren Werke AG | 15,493 | | 1,549,955 |
| Bechtle AG | 3,882 | | 276,242 |
| Beiersdorf AG | 7,547 | | 773,606 |
| Brenntag SE | 7,869 | | 710,601 |
| Carl Zeiss Meditec AG | 1,414 | | 296,624 |
| Commerzbank AG* | 39,511 | | 298,924 |
| Continental AG* | 4,960 | | 521,125 |
| Covestro AG 144A | 8,920 | | 549,009 |
| Daimler AG | 39,166 | | 2,992,447 |
| Daimler Truck Holding AG* | 19,583 | | 719,913 |
| Delivery Hero SE 144A* | 6,459 | | 714,950 |
| Deutsche Bank AG* | 96,500 | | 1,201,909 |
| Deutsche Boerse AG | 8,824 | | 1,473,382 |
| Deutsche Post AG | 48,326 | | 3,108,367 |
| Deutsche Telekom AG | 179,440 | | 3,315,603 |
| E.ON SE | 119,140 | | 1,655,742 |
| Evonik Industries AG | 13,302 | | 429,728 |
| Fresenius Medical Care AG & Co. KGaA | 8,805 | | 570,812 |
| Fresenius SE & Co. KGaA | 22,478 | | 903,468 |
| GEA Group AG | 7,555 | | 412,649 |
| Hannover Rueck SE | 3,483 | | 660,365 |
| HeidelbergCement AG | 2,223 | | 150,446 |
| HelloFresh SE* | 7,006 | | 536,927 |
| Henkel AG & Co. KGaA | 8,746 | | 681,761 |
| Infineon Technologies AG | 57,165 | | 2,631,789 |
| KION Group AG | 3,513 | | 383,710 |
| Knorr-Bremse AG | 3,578 | | 353,380 |
| LANXESS AG | 3,845 | | 237,770 |
| LEG Immobilien SE | 2,998 | | 417,990 |
| MTU Aero Engines AG | 2,932 | | 595,325 |
| Muenchener Rueckversicherungs-Gesellschaft AG | 6,780 | | 2,001,516 |
| Nemetschek SE | 2,312 | | 295,622 |
| Puma SE | 17,232 | | 2,104,447 |
| Rational AG | 243 | | 248,532 |
| RWE AG | 29,703 | | 1,203,464 |
See Notes to Financial Statements.
INTERNATIONAL EQUITY INDEX FUND
SCHEDULE OF INVESTMENTS (Continued)
| | | Shares | | Value |
| SAP SE | 50,683 | | $ 7,133,103 |
| Siemens AG | 34,686 | | 6,007,715 |
| Siemens Energy AG* | 18,963 | | 483,828 |
| Siemens Healthineers AG 144A | 17,555 | | 1,308,887 |
| Symrise AG | 6,729 | | 995,184 |
| Telefonica Deutschland Holding AG | 56,298 | | 156,159 |
| Volkswagen AG | 247 | | 72,206 |
| Vonovia SE | 37,687 | | 2,076,636 |
| Zalando SE 144A* | 10,454 | | 842,138 |
| | | | | 65,046,366 |
| Hong Kong — 2.6% | | |
| AIA Group, Ltd. | 555,600 | | 5,600,498 |
| BOC Hong Kong Holdings, Ltd. | 214,500 | | 702,846 |
| Chow Tai Fook Jewellery Group, Ltd.* | 180,800 | | 325,078 |
| CK Asset Holdings, Ltd. | 102,557 | | 646,444 |
| CK Hutchison Holdings, Ltd. | 157,000 | | 1,012,767 |
| CK Infrastructure Holdings, Ltd. | 35,000 | | 222,858 |
| CLP Holdings, Ltd. | 96,000 | | 969,535 |
| ESR Cayman, Ltd. 144A* | 115,800 | | 391,319 |
| Hang Lung Properties, Ltd.Δ | 117,000 | | 240,676 |
| Hang Seng Bank, Ltd. | 46,300 | | 847,319 |
| Henderson Land Development Co., Ltd. | 71,275 | | 303,471 |
| HKT Trust & HKT, Ltd. | 266,000 | | 357,507 |
| Hong Kong & China Gas Co., Ltd. | 394,138 | | 613,633 |
| Hong Kong Exchanges and Clearing, Ltd. | 60,197 | | 3,515,683 |
| Link REITΔ | 79,111 | | 696,497 |
| MTR Corporation, Ltd.Δ | 98,963 | | 531,141 |
| New World Development Co., Ltd. | 83,466 | | 330,222 |
| Power Assets Holdings, Ltd. | 81,000 | | 504,851 |
| Sino Land Co., Ltd.Δ | 330,331 | | 411,349 |
| Sun Hung Kai Properties, Ltd. | 68,000 | | 824,977 |
| Swire Pacific, Ltd. Class A | 22,500 | | 127,973 |
| Swire Properties, Ltd. | 63,800 | | 159,877 |
| Techtronic Industries Co., Ltd. | 71,500 | | 1,423,114 |
| WH Group, Ltd. 144A | 585,591 | | 367,236 |
| Wharf Real Estate Investment Co., Ltd. | 115,000 | | 584,030 |
| Xinyi Glass Holdings, Ltd. | 96,000 | | 240,075 |
| | | | | 21,950,976 |
| Ireland — 0.7% | | |
| CRH PLC | 29,482 | | 1,561,456 |
| DCC PLC | 5,616 | | 459,893 |
| James Hardie Industries PLC CDI | 25,315 | | 1,018,511 |
| Kerry Group PLC Class A | 8,753 | | 1,128,569 |
| Kingspan Group PLC | 7,807 | | 933,268 |
| Smurfit Kappa Group PLC | 17,166 | | 946,687 |
| | | | | 6,048,384 |
| Israel — 0.7% | | |
| Azrieli Group, Ltd. | 1,239 | | 118,214 |
| Bank Hapoalim BM | 48,532 | | 499,490 |
| Bank Leumi Le-Israel BM | 65,831 | | 706,105 |
| Check Point Software Technologies, Ltd.* | 4,629 | | 539,556 |
| CyberArk Software, Ltd.* | 2,381 | | 412,580 |
| | | Shares | | Value |
| Elbit Systems, Ltd. | 1,618 | | $ 279,679 |
| ICL Group, Ltd. | 53,933 | | 519,489 |
| Israel Discount Bank, Ltd. Class A | 52,953 | | 355,540 |
| Kornit Digital, Ltd.* | 2,834 | | 431,476 |
| Nice, Ltd.* | 2,756 | | 835,773 |
| Teva Pharmaceutical Industries, Ltd. ADR* | 51,301 | | 410,921 |
| Wix.com, Ltd.* | 2,346 | | 370,175 |
| | | | | 5,478,998 |
| Italy — 2.0% | | |
| Amplifon SpA | 5,903 | | 317,630 |
| Assicurazioni Generali SpA | 54,201 | | 1,145,524 |
| Atlantia SpA* | 29,878 | | 592,833 |
| DiaSorin SpAΔ | 692 | | 131,650 |
| Enel SpA | 375,358 | | 3,001,395 |
| Eni SpA | 112,690 | | 1,566,142 |
| FinecoBank Banca Fineco SpA | 27,715 | | 485,360 |
| Infrastrutture Wireless Italiane SpA 144A | 26,318 | | 319,133 |
| Intesa Sanpaolo SpA | 830,817 | | 2,145,938 |
| Mediobanca Banca di Credito Finanziario SpA | 21,353 | | 245,143 |
| Moncler SpA | 19,299 | | 1,394,706 |
| Nexi SpA 144A* | 24,702 | | 391,438 |
| Poste Italiane SpA 144A | 25,999 | | 340,594 |
| Prysmian SpA | 8,844 | | 332,678 |
| Recordati Industria Chimica e Farmaceutica SpA | 20,453 | | 1,313,372 |
| Snam SpA | 106,584 | | 641,974 |
| Terna - Rete Elettrica Nazionale | 90,920 | | 735,511 |
| UniCredit SpA | 99,177 | | 1,524,485 |
| | | | | 16,625,506 |
| Japan — 21.2% | | |
| Advantest Corporation | 6,200 | | 587,135 |
| Aeon Co., Ltd. | 32,800 | | 772,971 |
| AGC, Inc. | 7,200 | | 343,966 |
| Aisin Corporation | 5,800 | | 222,532 |
| Ajinomoto Co., Inc. | 17,300 | | 526,649 |
| ANA Holdings, Inc.* | 7,400 | | 154,696 |
| Asahi Intecc Co., Ltd. | 7,400 | | 158,979 |
| Asahi Kasei Corporation | 78,000 | | 734,788 |
| Bandai Namco Holdings, Inc. | 9,100 | | 711,515 |
| Bridgestone Corporation | 21,000 | | 901,586 |
| Canon, Inc.Δ | 50,800 | | 1,239,198 |
| Capcom Co., Ltd. | 8,400 | | 197,831 |
| Central Japan Railway Co. | 7,300 | | 971,426 |
| Chubu Electric Power Co., Inc. | 40,800 | | 430,951 |
| Chugai Pharmaceutical Co., Ltd. | 43,000 | | 1,401,629 |
| Concordia Financial Group, Ltd. | 10,800 | | 39,221 |
| CyberAgent, Inc. | 23,800 | | 396,742 |
| Dai Nippon Printing Co., Ltd. | 11,500 | | 289,418 |
| Daifuku Co., Ltd. | 4,700 | | 384,342 |
| Dai-ichi Life Holdings, Inc. | 49,600 | | 1,000,431 |
| Daiichi Sankyo Co., Ltd. | 92,700 | | 2,359,348 |
| Daikin Industries, Ltd. | 10,700 | | 2,423,757 |
| Daito Trust Construction Co., Ltd. | 3,500 | | 401,524 |
| Daiwa House Industry Co., Ltd. | 25,600 | | 735,720 |
See Notes to Financial Statements.
| | | Shares | | Value |
| Daiwa House REIT Investment CorporationΔ | 101 | | $ 305,968 |
| Daiwa Securities Group, Inc. | 52,000 | | 293,436 |
| Denso Corporation | 22,400 | | 1,856,308 |
| Dentsu Group, Inc. | 11,700 | | 416,441 |
| East Japan Railway Co. | 17,300 | | 1,063,526 |
| Eisai Co., Ltd. | 11,100 | | 630,123 |
| ENEOS Holdings, Inc. | 144,150 | | 538,517 |
| FANUC Corporation | 8,900 | | 1,891,802 |
| Fast Retailing Co., Ltd. | 2,900 | | 1,648,490 |
| Fuji Electric Co., Ltd. | 2,700 | | 147,496 |
| FUJIFILM Holdings Corporation | 15,300 | | 1,134,255 |
| Fujitsu, Ltd. | 8,800 | | 1,512,074 |
| GLP J-REITΔ | 117 | | 202,237 |
| GMO Payment Gateway, Inc. | 1,900 | | 236,601 |
| Hakuhodo DY Holdings, Inc. | 7,900 | | 131,456 |
| Hamamatsu Photonics KK | 6,400 | | 408,767 |
| Hankyu Hanshin Holdings, Inc. | 14,100 | | 400,705 |
| Hikari Tsushin, Inc. | 1,200 | | 184,809 |
| Hirose Electric Co., Ltd. | 605 | | 101,676 |
| Hitachi Metals, Ltd.* | 2,000 | | 37,058 |
| Hitachi, Ltd. | 45,400 | | 2,459,469 |
| Honda Motor Co., Ltd. | 70,900 | | 2,017,158 |
| Hoya Corporation | 16,500 | | 2,448,465 |
| Hulic Co., Ltd. | 4,000 | | 38,038 |
| Ibiden Co., Ltd. | 1,800 | | 106,894 |
| Idemitsu Kosan Co., Ltd. | 8,736 | | 222,941 |
| Iida Group Holdings Co., Ltd. | 2,500 | | 58,144 |
| Inpex CorporationΔ | 45,600 | | 396,520 |
| Isuzu Motors, Ltd. | 18,100 | | 225,281 |
| Ito En, Ltd. | 15,500 | | 814,406 |
| ITOCHU Corporation | 58,600 | | 1,792,803 |
| Japan Airlines Co., Ltd.* | 6,100 | | 115,798 |
| Japan Exchange Group, Inc. | 25,800 | | 565,262 |
| Japan Metropolitan Fund Invest REIT | 228 | | 196,421 |
| Japan Post Holdings Co., Ltd.* | 110,700 | | 862,384 |
| Japan Real Estate Investment Corporation REITΔ | 46 | | 261,125 |
| JFE Holdings, Inc. | 24,900 | | 317,675 |
| JSR Corporation | 2,200 | | 83,608 |
| Kajima Corporation | 17,500 | | 201,119 |
| Kakaku.com, Inc. | 3,900 | | 104,260 |
| Kansai Electric Power Co., Inc. (The) | 36,300 | | 339,296 |
| Kansai Paint Co., Ltd. | 1,400 | | 30,444 |
| Kao Corporation | 25,200 | | 1,319,833 |
| KDDI Corporation | 66,900 | | 1,956,405 |
| Keio Corporation | 7,300 | | 322,092 |
| Keisei Electric Railway Co., Ltd. | 5,400 | | 146,084 |
| Keyence Corporation | 9,200 | | 5,784,576 |
| Kikkoman Corporation | 9,000 | | 757,899 |
| Kobayashi Pharmaceutical Co., Ltd. | 2,300 | | 180,912 |
| Koito Manufacturing Co., Ltd. | 4,300 | | 227,745 |
| Komatsu, Ltd. | 29,500 | | 689,887 |
| Konami Holdings CorporationΔ | 5,500 | | 263,997 |
| Kose CorporationΔ | 1,400 | | 158,819 |
| Kubota Corporation | 52,500 | | 1,167,393 |
| KuritaWater Industries, Ltd. | 900 | | 42,668 |
| Kyocera Corporation | 17,300 | | 1,081,700 |
| | | Shares | | Value |
| Kyowa Kirin Co., Ltd. | 19,400 | | $ 528,955 |
| Lasertec Corporation | 4,200 | | 1,286,467 |
| Lion Corporation | 12,600 | | 168,437 |
| Lixil Corporation | 12,900 | | 344,133 |
| M3, Inc. | 21,000 | | 1,058,849 |
| Makita Corporation | 7,900 | | 335,353 |
| Marubeni Corporation | 67,200 | | 654,729 |
| Mazda Motor Corporation* | 20,700 | | 158,829 |
| McDonald’s Holdings Co. Japan, Ltd.Δ | 8,800 | | 389,453 |
| Medipal Holdings Corporation | 4,500 | | 84,352 |
| MEIJI Holdings Co., Ltd. | 8,000 | | 477,550 |
| Mercari, Inc.Δ* | 6,500 | | 330,703 |
| MINEBEA MITSUMI, Inc. | 14,700 | | 417,680 |
| MISUMI Group, Inc. | 10,900 | | 447,794 |
| Mitsubishi Chemical Holdings Corporation | 63,200 | | 468,778 |
| Mitsubishi Corporation | 52,400 | | 1,663,863 |
| Mitsubishi Electric Corporation | 86,100 | | 1,092,871 |
| Mitsubishi Estate Co., Ltd. | 66,800 | | 926,683 |
| Mitsubishi HC Capital, Inc. | 38,900 | | 192,459 |
| Mitsubishi Heavy Industries, Ltd. | 14,700 | | 339,870 |
| Mitsubishi UFJ Financial Group, Inc. | 552,300 | | 3,005,770 |
| Mitsui & Co., Ltd. | 64,200 | | 1,521,404 |
| Mitsui Chemicals, Inc. | 9,400 | | 252,674 |
| Mitsui Fudosan Co., Ltd. | 36,200 | | 717,512 |
| Mizuho Financial Group, Inc. | 85,790 | | 1,089,641 |
| MonotaRO Co., Ltd. | 8,000 | | 143,888 |
| MS&AD Insurance Group Holdings, Inc. | 24,200 | | 745,174 |
| Murata Manufacturing Co., Ltd. | 29,000 | | 2,313,111 |
| NEC Corporation | 9,300 | | 430,029 |
| Nexon Co., Ltd. | 24,400 | | 471,804 |
| Nidec Corporation | 21,800 | | 2,578,818 |
| Nihon M&A Center, Inc. | 11,800 | | 289,444 |
| Nintendo Co., Ltd. | 5,400 | | 2,526,430 |
| Nippon Building Fund, Inc. REIT | 69 | | 401,901 |
| Nippon Express Co., Ltd. | 4,000 | | 239,379 |
| Nippon Paint Holdings Co., Ltd.Δ | 31,500 | | 344,005 |
| Nippon Prologis REIT, Inc. | 121 | | 427,703 |
| Nippon Sanso Holdings Corporation | 8,800 | | 192,479 |
| Nippon Shinyaku Co., Ltd. | 9,600 | | 668,498 |
| Nippon Steel Corporation | 37,900 | | 619,136 |
| Nippon Telegraph & Telephone Corporation | 64,300 | | 1,758,494 |
| Nippon Yusen KK | 8,500 | | 648,150 |
| Nissan Chemical Corporation | 5,900 | | 343,144 |
| Nissan Motor Co., Ltd.* | 112,800 | | 543,307 |
| Nisshin Seifun Group, Inc. | 16,300 | | 235,150 |
| Nissin Foods Holdings Co., Ltd. | 4,300 | | 313,829 |
| Nitori Holdings Co., Ltd. | 4,000 | | 598,286 |
| Nitto Denko Corporation | 7,100 | | 548,493 |
| Nomura Holdings, Inc. | 168,800 | | 735,234 |
| Nomura Real Estate Master Fund, Inc. REIT | 184 | | 258,950 |
| Nomura Research Institute, Ltd. | 18,157 | | 776,226 |
| NTT Data Corporation | 31,300 | | 671,423 |
| Obayashi Corporation | 26,400 | | 204,319 |
See Notes to Financial Statements.
INTERNATIONAL EQUITY INDEX FUND
SCHEDULE OF INVESTMENTS (Continued)
| | | Shares | | Value |
| Obic Co., Ltd. | 3,600 | | $ 673,737 |
| Odakyu Electric Railway Co., Ltd.Δ | 16,900 | | 314,196 |
| Oji Holdings Corporation | 31,000 | | 150,197 |
| Olympus Corporation | 57,000 | | 1,312,553 |
| Omron Corporation | 8,300 | | 827,073 |
| Ono Pharmaceutical Co., Ltd. | 65,400 | | 1,625,543 |
| Oracle Corporation | 700 | | 53,181 |
| Oriental Land Co., Ltd. | 9,500 | | 1,601,958 |
| ORIX Corporation | 63,200 | | 1,289,797 |
| Orix JREIT, Inc. | 119 | | 186,026 |
| Osaka Gas Co., Ltd. | 15,000 | | 248,089 |
| Otsuka Corporation | 6,900 | | 329,010 |
| Otsuka Holdings Co., Ltd. | 41,900 | | 1,524,361 |
| Pan Pacific International Holdings Corporation | 27,100 | | 373,542 |
| Panasonic Corporation | 118,600 | | 1,303,745 |
| Pola Orbis Holdings, Inc. | 7,300 | | 121,660 |
| Rakuten Group, Inc. | 37,400 | | 375,244 |
| Recruit Holdings Co., Ltd. | 65,200 | | 3,967,793 |
| Renesas Electronics Corporation* | 63,600 | | 789,957 |
| Ricoh Co., Ltd. | 26,200 | | 244,213 |
| Rohm Co., Ltd. | 3,100 | | 282,005 |
| Ryohin Keikaku Co., Ltd. | 12,000 | | 182,976 |
| Santen Pharmaceutical Co., Ltd. | 55,200 | | 673,923 |
| SBI Holdings, Inc. | 9,400 | | 256,390 |
| Secom Co., Ltd. | 12,500 | | 868,578 |
| Seiko Epson Corporation | 18,200 | | 327,790 |
| Sekisui House, Ltd. | 33,600 | | 722,929 |
| Seven & i Holdings Co., Ltd. | 31,000 | | 1,363,629 |
| SG Holdings Co., Ltd. | 8,800 | | 206,346 |
| Sharp Corporation | 9,500 | | 109,103 |
| Shimadzu Corporation | 12,300 | | 519,528 |
| Shimano, Inc. | 3,200 | | 852,222 |
| Shimizu Corporation | 26,800 | | 166,169 |
| Shin-Etsu Chemical Co., Ltd. | 14,800 | | 2,568,916 |
| Shionogi & Co., Ltd. | 19,200 | | 1,350,650 |
| Shiseido Co., Ltd. | 21,800 | | 1,216,146 |
| SMC Corporation | 2,700 | | 1,824,817 |
| SoftBank Corporation | 137,600 | | 1,737,967 |
| SoftBank Group Corporation | 55,500 | | 2,660,679 |
| Sohgo Security Services Co., Ltd. | 600 | | 23,842 |
| Sompo Holdings, Inc. | 14,400 | | 607,301 |
| Sony Group Corporation | 57,100 | | 7,210,489 |
| Subaru Corporation | 32,200 | | 575,344 |
| SUMCO Corporation | 15,200 | | 309,515 |
| Sumitomo Corporation | 54,900 | | 812,487 |
| Sumitomo Dainippon Pharma Co., Ltd. | 13,500 | | 155,755 |
| Sumitomo Electric Industries, Ltd. | 36,000 | | 469,835 |
| Sumitomo Metal Mining Co., Ltd. | 10,900 | | 412,832 |
| Sumitomo Mitsui Financial Group, Inc. | 58,300 | | 1,990,788 |
| Sumitomo Mitsui Trust Holdings, Inc. | 14,800 | | 494,888 |
| Sumitomo Realty & Development Co., Ltd. | 21,100 | | 622,046 |
| Suntory Beverage & Food, Ltd. | 24,900 | | 901,703 |
| Suzuki Motor Corporation | 11,100 | | 428,047 |
| Sysmex Corporation | 7,300 | | 985,365 |
| | | Shares | | Value |
| T&D Holdings, Inc. | 22,500 | | $ 287,455 |
| Taisho Pharmaceutical Holdings Co., Ltd. | 15,300 | | 706,248 |
| Takeda Pharmaceutical Co., Ltd. | 99,536 | | 2,718,160 |
| TDK Corporation | 19,900 | | 776,615 |
| Terumo Corporation | 35,100 | | 1,482,645 |
| TIS, Inc. | 8,000 | | 237,888 |
| Tobu Railway Co., Ltd. | 11,900 | | 271,558 |
| Toho Co., Ltd. | 2,900 | | 124,098 |
| Tokio Marine Holdings, Inc. | 31,100 | | 1,731,326 |
| Tokyo Electric Power Co. Holdings, Inc.* | 56,100 | | 145,030 |
| Tokyo Electron, Ltd. | 7,000 | | 4,029,010 |
| Tokyo Gas Co., Ltd. | 21,300 | | 382,343 |
| Tokyu Corporation | 16,400 | | 218,016 |
| TOPPAN, Inc. | 15,000 | | 281,486 |
| Toray Industries, Inc. | 89,700 | | 531,440 |
| Toshiba Corporation | 17,900 | | 736,557 |
| Toyo Suisan Kaisha, Ltd. | 4,200 | | 178,073 |
| Toyota Industries Corporation | 8,800 | | 703,939 |
| Toyota Motor Corporation | 483,580 | | 8,937,812 |
| Toyota Tsusho Corporation | 7,800 | | 359,555 |
| Trend Micro, Inc. | 4,300 | | 238,719 |
| Tsuruha Holdings, Inc. | 1,900 | | 182,436 |
| Unicharm Corporation | 25,000 | | 1,087,680 |
| Welcia Holdings Co., Ltd. | 4,600 | | 143,672 |
| West Japan Railway Co. | 9,300 | | 388,953 |
| Yakult Honsha Co., Ltd.Δ | 11,500 | | 599,946 |
| Yamaha Corporation | 5,400 | | 266,411 |
| Yamaha Motor Co., Ltd. | 14,300 | | 343,473 |
| Yamato Holdings Co., Ltd. | 11,600 | | 272,502 |
| Yaskawa Electric Corporation | 9,000 | | 441,591 |
| Z Holdings Corporation | 129,000 | | 744,329 |
| ZOZO, Inc. | 5,700 | | 177,727 |
| | | | | 177,196,802 |
| Jersey — 1.0% | | |
| Experian PLC | 53,919 | | 2,650,709 |
| Ferguson PLC | 12,836 | | 2,276,885 |
| Glencore PLC* | 458,703 | | 2,327,980 |
| WPP PLC | 75,700 | | 1,147,082 |
| | | | | 8,402,656 |
| Netherlands — 5.9% | | |
| Adyen NV 144A* | 927 | | 2,439,533 |
| Aegon NV | 97,467 | | 487,474 |
| Airbus SE* | 27,433 | | 3,509,280 |
| Akzo Nobel NV | 7,083 | | 778,176 |
| ArcelorMittal SA | 34,529 | | 1,106,416 |
| Argenx SE* | 2,200 | | 789,732 |
| ASM International NV | 2,234 | | 988,623 |
| ASML Holding NV | 18,835 | | 15,154,226 |
| CNH Industrial NV | 43,467 | | 840,400 |
| Euronext NV 144A | 4,841 | | 502,922 |
| EXOR NV | 3,560 | | 318,683 |
| Ferrari NV | 5,605 | | 1,442,762 |
| IMCD NV | 2,480 | | 549,732 |
| ING Groep NV | 182,403 | | 2,542,245 |
See Notes to Financial Statements.
| | | Shares | | Value |
| InPost SA* | 16,419 | | $ 198,109 |
| JDE Peet's NVΔ | 8,224 | | 253,738 |
| Just Eat Takeaway.com NV 144A* | 6,526 | | 360,125 |
| Koninklijke Ahold Delhaize NV | 58,297 | | 2,000,094 |
| Koninklijke DSM NV | 6,940 | | 1,564,436 |
| Koninklijke KPN NV | 184,467 | | 573,343 |
| Koninklijke Philips NV | 45,034 | | 1,679,901 |
| NN Group NVΔ | 4,404 | | 238,714 |
| Prosus NV* | 43,666 | | 3,655,451 |
| QIAGEN NVΔ* | 24,023 | | 1,332,090 |
| Randstad NV | 7,963 | | 544,315 |
| Stellantis NV | 98,407 | | 1,857,786 |
| STMicroelectronics NV | 30,860 | | 1,523,766 |
| Universal Music Group NV | 34,973 | | 986,659 |
| Wolters Kluwer NV | 10,268 | | 1,211,096 |
| | | | | 49,429,827 |
| New Zealand — 0.2% | | |
| Auckland International Airport, Ltd.Δ* | 11,623 | | 61,296 |
| Fisher & Paykel Healthcare Corporation, Ltd. | 28,390 | | 636,996 |
| Ryman Healthcare, Ltd. | 22,949 | | 192,543 |
| Xero, Ltd.* | 5,756 | | 592,319 |
| | | | | 1,483,154 |
| Norway — 0.7% | | |
| Adevinta ASA* | 16,796 | | 223,119 |
| DNB Bank ASA | 42,506 | | 972,271 |
| Equinor ASA | 43,834 | | 1,160,694 |
| Gjensidige Forsikring ASA | 8,027 | | 194,743 |
| Mowi ASA | 26,051 | | 616,543 |
| Norsk Hydro ASA | 56,215 | | 442,333 |
| Orkla ASA | 60,619 | | 607,618 |
| Schibsted ASA Class A | 9,647 | | 371,937 |
| Telenor ASA | 36,667 | | 576,371 |
| Yara International ASA | 10,434 | | 526,063 |
| | | | | 5,691,692 |
| Portugal — 0.2% | | |
| EDP - Energias de Portugal SA | 154,225 | | 848,428 |
| Galp Energia SGPS SA | 27,004 | | 261,939 |
| Jeronimo Martins SGPS SA | 14,871 | | 340,306 |
| | | | | 1,450,673 |
| Singapore — 0.9% | | |
| Ascendas REIT | 157,957 | | 345,780 |
| CapitaLand Integrated Commercial Trust REITΔ | 154,203 | | 233,433 |
| Capitaland Investment, Ltd.* | 42,360 | | 107,189 |
| DBS Group Holdings, Ltd. | 71,260 | | 1,727,034 |
| Jardine Matheson Holdings, Ltd. | 13,200 | | 726,132 |
| Mapletree Logistics Trust REIT | 7,947 | | 11,205 |
| Oversea-Chinese Banking Corporation, Ltd. | 124,940 | | 1,056,928 |
| Singapore Airlines, Ltd.Δ* | 134,450 | | 497,852 |
| Singapore Telecommunications, Ltd. | 454,500 | | 782,458 |
| United Overseas Bank, Ltd. | 56,959 | | 1,136,982 |
| UOL Group, Ltd.Δ | 7,561 | | 39,780 |
| | | Shares | | Value |
| Wilmar International, Ltd. | 198,000 | | $ 608,281 |
| | | | | 7,273,054 |
| Spain — 2.3% | | |
| ACS Actividades de Construccion y Servicios SAΔ | 18,362 | | 489,550 |
| Aena SME SA 144AΔ* | 3,930 | | 618,912 |
| Amadeus IT Group SA* | 22,411 | | 1,516,424 |
| Banco Bilbao Vizcaya Argentaria SA | 319,952 | | 1,897,630 |
| Banco Santander SA | 789,110 | | 2,620,696 |
| CaixaBank SA | 185,397 | | 506,438 |
| Cellnex Telecom SA 144AΔ* | 23,609 | | 1,367,613 |
| EDP Renovaveis SA | 12,583 | | 313,734 |
| Enagas SAΔ | 17,674 | | 410,591 |
| Endesa SA | 13,556 | | 312,079 |
| Ferrovial SA | 28,612 | | 894,803 |
| Grifols SA | 15,393 | | 296,202 |
| Iberdrola SA | 270,908 | | 3,207,546 |
| Industria de Diseno Textil SA | 56,903 | | 1,835,124 |
| Naturgy Energy Group SAΔ | 9,244 | | 300,663 |
| Red Electrica Corporation SAΔ | 23,715 | | 512,823 |
| Repsol SA | 42,415 | | 502,326 |
| Siemens Gamesa Renewable Energy SAΔ* | 6,866 | | 163,053 |
| Telefonica SAΔ | 281,234 | | 1,219,490 |
| | | | | 18,985,697 |
| Sweden — 3.5% | | |
| Alfa Laval AB | 14,717 | | 591,175 |
| Assa Abloy AB, B Shares | 39,827 | | 1,213,966 |
| Atlas Copco AB, A Shares | 28,714 | | 1,984,162 |
| Atlas Copco AB, B Shares | 19,228 | | 1,129,458 |
| Boliden AB | 9,794 | | 377,654 |
| Electrolux AB, B Shares | 13,970 | | 338,349 |
| Embracer Group ABΔ* | 27,006 | | 286,507 |
| Epiroc AB, A Shares | 31,158 | | 787,855 |
| Epiroc AB, B Shares | 20,075 | | 424,530 |
| EQT AB | 12,795 | | 693,617 |
| Essity AB, B SharesΔ | 36,031 | | 1,175,504 |
| Fastighets AB Balder, B Shares* | 4,801 | | 345,499 |
| Getinge AB, B Shares | 12,152 | | 529,610 |
| H & M Hennes & Mauritz AB, B SharesΔ | 42,435 | | 832,664 |
| Hexagon AB, B Shares | 97,566 | | 1,545,499 |
| Husqvarna AB, B Shares | 23,565 | | 376,779 |
| Industrivarden AB, A Shares | 1,009 | | 32,060 |
| Industrivarden AB, C Shares | 18,571 | | 581,842 |
| Investment AB Latour, B Shares | 9,171 | | 372,604 |
| Investor AB, B Shares | 120,422 | | 3,021,786 |
| Kinnevik AB, B Shares* | 10,870 | | 386,468 |
| L E Lundbergforetagen AB, B Shares | 5,888 | | 329,879 |
| Lifco AB, B Shares | 16,505 | | 492,982 |
| Lundin Energy AB | 8,084 | | 289,268 |
| Nibe Industrier AB, B Shares | 74,413 | | 1,124,376 |
| Sagax AB, B Shares | 11,741 | | 394,938 |
| Sandvik AB | 51,379 | | 1,432,115 |
| Securitas AB, B Shares | 14,981 | | 206,086 |
| Sinch AB 144A* | 22,610 | | 285,301 |
See Notes to Financial Statements.
INTERNATIONAL EQUITY INDEX FUND
SCHEDULE OF INVESTMENTS (Continued)
| | | Shares | | Value |
| Skandinaviska Enskilda Banken AB, A Shares | 79,780 | | $ 1,107,630 |
| Skanska AB, B Shares | 13,311 | | 343,971 |
| SKF AB, B Shares | 13,321 | | 315,038 |
| Svenska Cellulosa AB SCA, B Shares | 26,301 | | 466,693 |
| Svenska Handelsbanken AB, A SharesΔ | 65,615 | | 709,164 |
| Swedbank AB, A Shares | 41,659 | | 837,173 |
| Tele2 AB, B Shares | 19,177 | | 273,573 |
| Telefonaktiebolaget LM Ericsson, B Shares | 138,995 | | 1,529,368 |
| Telia Co ABΔ | 126,527 | | 494,843 |
| Volvo AB, B Shares | 76,978 | | 1,780,232 |
| | | | | 29,440,218 |
| Switzerland — 10.0% | | |
| ABB, Ltd. | 68,606 | | 2,614,767 |
| Adecco Group AG | 8,557 | | 436,042 |
| Alcon, Inc. | 23,311 | | 2,056,156 |
| Bachem Holding AG | 662 | | 518,377 |
| Barry Callebaut AG | 219 | | 531,656 |
| Chocoladefabriken Lindt & Spruengli AG | 12 | | 1,609,306 |
| Cie Financiere Richemont SA Class A | 26,655 | | 3,983,187 |
| Coca-Cola HBC AG* | 53,299 | | 1,843,250 |
| Credit Suisse Group AGΔ | 104,613 | | 1,014,288 |
| EMS-Chemie Holding AG | 154 | | 172,107 |
| Geberit AG | 1,584 | | 1,291,172 |
| Givaudan SA | 437 | | 2,292,767 |
| Holcim, Ltd.* | 1,494 | | 76,116 |
| Holcim, Ltd. (Swiss Exchange)* | 13,262 | | 674,493 |
| Julius Baer Group, Ltd. | 11,052 | | 739,073 |
| Kuehne + Nagel International AG | 2,592 | | 834,773 |
| Logitech International SA | 9,124 | | 765,391 |
| Nestle SA | 134,853 | | 18,827,814 |
| Novartis AG | 112,422 | | 9,878,749 |
| Partners Group Holding AG | 915 | | 1,510,491 |
| Roche Holding AG (Swiss Exchange) | 33,516 | | 13,904,490 |
| Schindler Holding AG (Swiss Exchange) | 2,186 | | 586,788 |
| SGS SA | 175 | | 583,397 |
| Sika AG | 6,515 | | 2,707,748 |
| Sonova Holding AG | 2,443 | | 954,717 |
| Straumann Holding AG | 637 | | 1,346,995 |
| Swatch Group AG (The) (Swiss Exchange)Δ | 3,611 | | 1,099,680 |
| Swiss Life Holding AG | 1,166 | | 712,399 |
| Swiss Re AG | 8,814 | | 870,061 |
| Swisscom AG | 1,391 | | 784,697 |
| Temenos AG | 3,832 | | 528,208 |
| UBS Group AG | 170,452 | | 3,059,494 |
| VAT Group AG 144A | 1,112 | | 551,022 |
| Vifor Pharma AGΔ | 6,734 | | 1,196,280 |
| Zurich Insurance Group AG | 7,211 | | 3,158,988 |
| | | | | 83,714,939 |
| United Kingdom — 12.1% | | |
| 3i Group PLC | 69,134 | | 1,355,921 |
| Abrdn PLC | 114,480 | | 373,285 |
| | | Shares | | Value |
| Admiral Group PLC | 9,123 | | $ 389,840 |
| Anglo American PLC | 61,836 | | 2,524,336 |
| Antofagasta PLC | 23,560 | | 426,842 |
| Ashtead Group PLC | 24,479 | | 1,968,796 |
| Associated British Foods PLC | 22,791 | | 619,443 |
| Auto Trader Group PLC 144AΔ | 39,162 | | 392,257 |
| AVEVA Group PLC | 8,238 | | 379,565 |
| Aviva PLC | 204,349 | | 1,135,153 |
| BAE Systems PLC | 224,084 | | 1,667,593 |
| Barclays PLC | 828,179 | | 2,096,236 |
| Barratt Developments PLC | 50,118 | | 507,423 |
| Berkeley Group Holdings PLC | 6,217 | | 401,817 |
| BHP Group PLC | 108,550 | | 3,231,678 |
| BP PLC | 1,002,493 | | 4,484,636 |
| British Land Co. PLC (The) REIT | 31,612 | | 227,207 |
| BT Group PLCΔ | 453,308 | | 1,040,317 |
| Bunzl PLC | 26,142 | | 1,020,843 |
| Burberry Group PLC | 30,456 | | 749,241 |
| Coca-Cola Europacific Partners PLC | 21,997 | | 1,230,292 |
| Compass Group PLC* | 98,923 | | 2,210,643 |
| Croda International PLC | 8,431 | | 1,154,872 |
| Evraz PLC | 31,936 | | 260,054 |
| Halma PLC | 23,059 | | 998,768 |
| Hargreaves Lansdown PLC | 13,678 | | 250,863 |
| Hikma Pharmaceuticals PLC | 34,178 | | 1,026,546 |
| HSBC Holdings PLC | 1,023,312 | | 6,214,270 |
| Informa PLC* | 87,112 | | 609,125 |
| InterContinental Hotels Group PLCΔ* | 14,742 | | 954,002 |
| Intertek Group PLC | 8,134 | | 619,850 |
| J Sainsbury PLCΔ | 118,172 | | 441,147 |
| JD Sports Fashion PLC | 99,615 | | 293,668 |
| Johnson Matthey PLCΔ | 13,222 | | 366,165 |
| Kingfisher PLC | 108,273 | | 495,789 |
| Land Securities Group PLC REIT | 42,490 | | 446,526 |
| Legal & General Group PLC | 335,080 | | 1,349,304 |
| Lloyds Banking Group PLC | 4,171,424 | | 2,698,899 |
| London Stock Exchange Group PLC | 19,997 | | 1,875,739 |
| M&G PLC | 308,841 | | 833,973 |
| Melrose Industries PLC | 238,315 | | 515,792 |
| Mondi PLC | 49,454 | | 1,222,296 |
| National Grid PLC | 211,420 | | 3,032,804 |
| Natwest Group PLC | 383,851 | | 1,172,651 |
| Next PLC | 7,706 | | 850,082 |
| Ocado Group PLCΔ* | 22,804 | | 517,937 |
| Pearson PLCΔ | 41,042 | | 340,647 |
| Persimmon PLC | 15,563 | | 601,625 |
| Phoenix Group Holdings PLC | 26,052 | | 230,336 |
| Prudential PLC | 141,564 | | 2,442,120 |
| Reckitt Benckiser Group PLC | 35,666 | | 3,061,646 |
| RELX PLC | 107,525 | | 3,495,882 |
| Rentokil Initial PLC | 101,023 | | 798,560 |
| Rio Tinto PLC | 52,168 | | 3,454,339 |
| Rolls-Royce Holdings PLCΔ* | 419,124 | | 697,105 |
| Royal Dutch Shell PLC, A Shares | 196,480 | | 4,313,105 |
| Royal Dutch Shell PLC, B Shares | 154,577 | | 3,394,511 |
| Sage Group PLC (The) | 68,811 | | 794,104 |
| Schroders PLC | 6,913 | | 333,112 |
See Notes to Financial Statements.
| | | Shares | | Value |
| Segro PLC REIT | 73,703 | | $ 1,433,063 |
| Severn Trent PLC | 25,238 | | 1,006,722 |
| Smith & Nephew PLCΔ | 46,538 | | 814,795 |
| Smiths Group PLCΔ | 26,226 | | 560,694 |
| Spirax-Sarco Engineering PLC | 3,343 | | 726,249 |
| SSE PLC | 59,270 | | 1,322,909 |
| St. James’s Place PLC | 37,454 | | 853,465 |
| Standard Chartered PLC | 131,722 | | 799,463 |
| Taylor Wimpey PLC | 203,676 | | 483,828 |
| Tesco PLC | 510,319 | | 2,002,462 |
| Unilever PLC | 128,803 | | 6,878,637 |
| United Utilities Group PLC | 48,952 | | 721,560 |
| Vodafone Group PLC | 1,476,417 | | 2,243,409 |
| Whitbread PLCΔ* | 15,331 | | 621,501 |
| | | | | 101,060,335 |
Total Foreign Common Stocks
(Cost $646,799,910) | | 773,531,116 |
| FOREIGN PREFERRED STOCKS — 0.5% |
| Germany — 0.5% | | |
| Henkel AG & Co. KGaA | | | | |
| 2.52%◊ | 8,912 | | 719,119 |
| Porsche Automobil Holding SE | | | | |
| 2.45%◊ | 6,508 | | 614,439 |
| | | Shares | | Value |
| Sartorius AG | | | | |
| 0.13%◊ | 1,199 | | $ 810,933 |
| Volkswagen AG | | | | |
| 2.59%◊ | 11,005 | | 2,210,721 |
| | | | | 4,355,212 |
Total Foreign Preferred Stocks
(Cost $3,524,310) | | 4,355,212 |
| MONEY MARKET FUNDS — 6.6% |
GuideStone Money Market Fund, 0.00%
(Institutional Class)Ø∞ | 46,086,919 | | 46,086,919 |
| Northern Institutional Liquid Assets Portfolio (Shares), 0.04%ا | 8,717,861 | | 8,717,861 |
Total Money Market Funds
(Cost $54,804,780) | | 54,804,780 |
TOTAL INVESTMENTS — 100.0%
(Cost $707,452,040) | | | 834,211,697 |
Liabilities in Excess of Other
Assets — (0.0)% | | | (317,650) |
| NET ASSETS — 100.0% | | | $833,894,047 |
Futures Contracts outstanding at December 31, 2021:
| Future Type | | Expiration Date | | Open Long
(Short) Contracts | | Notional
Market Value
of Contracts | | Value and
Unrealized
Appreciation
(Depreciation) |
| MSCI EAFE Index | | 03/2022 | | 457 | | $53,053,130 | | $867,855 |
See Notes to Financial Statements.
INTERNATIONAL EQUITY INDEX FUND
SCHEDULE OF INVESTMENTS (Continued)
VALUATION HIERARCHY
The following is a summary of the inputs used, as of December 31, 2021, in valuing the Fund’s investments carried at fair value:
| | Total
Value | | Level 1
Quoted Prices | | Level 2
Other Significant
Observable Inputs | | Level 3
Significant
Unobservable Inputs |
| Assets: | | | | | | | |
| Investments in Securities: | | | | | | | |
| Common Stocks | $ 1,520,589 | | $ 1,520,589 | | $ — | | $ — |
| Foreign Common Stocks: | | | | | | | |
| Austria | 2,241,134 | | — | | 2,241,134 | | — |
| Denmark | 18,382,163 | | — | | 18,382,163 | | — |
| Finland | 10,329,735 | | — | | 10,329,735 | | — |
| Germany | 65,046,366 | | 719,913 | | 64,326,453 | | — |
| Israel | 5,478,998 | | 2,164,708 | | 3,314,290 | | — |
| Italy | 16,625,506 | | — | | 16,625,506 | | — |
| Japan | 177,196,802 | | — | | 177,196,802 | | — |
| Netherlands | 49,429,827 | | 43,638,106 | | 5,791,721 | | — |
| Norway | 5,691,692 | | — | | 5,691,692 | | — |
| Spain | 18,985,697 | | 313,734 | | 18,671,963 | | — |
| Sweden | 29,440,218 | | — | | 29,440,218 | | — |
| Switzerland | 83,714,939 | | 3,528,672 | | 80,186,267 | | — |
| Other ^^ | 290,968,039 | | 290,968,039 | | — | | — |
| Total Foreign Common Stocks | 773,531,116 | | 341,333,172 | | 432,197,944 | | — |
| Foreign Preferred Stocks | 4,355,212 | | — | | 4,355,212 | | — |
| Money Market Funds | 54,804,780 | | 54,804,780 | | — | | — |
| Total Assets - Investments in Securities | $834,211,697 | | $397,658,541 | | $436,553,156 | | $ — |
| Other Financial Instruments*** | | | | | | | |
| Futures Contracts | $ 867,855 | | $ 867,855 | | $ — | | $ — |
| Total Assets - Other Financial Instruments | $ 867,855 | | $ 867,855 | | $ — | | $ — |
| ^^ | Classifications as defined in the Schedule of Investments. |
| *** | Other financial instruments are derivative instruments, such as futures contracts, which are valued at the unrealized appreciation (depreciation) on the investment. Further details regarding the value of these investments can be found in the preceding "Futures Contracts outstanding" disclosure. |
See Notes to Financial Statements.
International Equity Fund (Unaudited)
With an annual return of 11.26%, developed non-U.S. markets (represented by the MSCI EAFE Index) saw strong performance in 2021, yet underperformed their U.S. counterparts. Unlike the prior year, where growth and value investment styles saw historically high spreads in performance, equity style factors in 2021 had relatively lower impact on performance. Far more material to 2021 returns was the strength of the U.S. dollar, which detracted more than 7% from U.S. dollar-denominated returns, partially offsetting market strength. Among major foreign developed markets, U.K. stocks strongly outperformed and were followed closely by continental European shares. Sector performance was generally positive, with energy posting the highest returns and financials contributing the most to index performance.
The Fund primarily invests in equity securities of foreign companies in countries having economies and markets generally considered to be developed but may also invest in equity securities of foreign companies located in emerging markets. The Fund’s portfolio is diversified among a large number of companies across different industries, economic sectors and countries. The Investor Class of the Fund underperformed its benchmark, the MSCI EAFE Index, for the one-year period ended December 31, 2021 (9.35 % versus 11.26%). On a country basis, stock selection within Japan, Italy and the United Kingdom benefited the Fund’s relative performance and off-benchmark exposure to Chinese stocks detracted. On a sector basis, industrial holdings benefited relative performance, while the consumer discretionary sector detracted.
Within the Fund, certain derivatives were utilized to express active views in currency and country selection. These derivative positions primarily included currency forward contracts, stock index futures and total return swaps. Overall, derivative exposure had a slight negative impact on Fund performance over the course of the year.
This Fund may be suitable to investors who seek higher, long-term rates of return, can accept significant short-term fluctuations in account value and want to diversify their portfolio with international equity securities. Securities of foreign issuers may be negatively impacted by political events, economic conditions or inefficient, illiquid or unregulated markets in foreign countries, and they also may be subject to inadequate regulatory or accounting standards, which may increase investment risk. Investing in emerging markets may involve greater risks than investing in more developed foreign markets because, among other things, emerging markets often have more political and economic instability. To the extent that the investment adviser misjudges current market conditions, the Fund’s volatility may be amplified by its use of short sales and derivatives and by its ability to select sub-advisers to allocate assets. Derivatives involve different risks from, and in some respects greater than, those risks associated with investing directly in securities, currencies or other instruments. Derivatives may be illiquid or less liquid, volatile, difficult to price and leveraged, so that small changes in the value of the underlying instruments may produce disproportionate losses to the Fund. Short sales involve selling a security the Fund does not own in anticipation that the security will decline in price. Short sales expose the Fund to the risk that it will be required to buy the security sold short (also known as “covering” the short position) at a time when the security has appreciated in value, thus resulting in a loss to the Fund. The Fund’s potential loss on a short position is limited only by the maximum attainable price of the security, less the price at which the security was sold by the Fund. Therefore, in theory, stocks sold short have unlimited risk. The Fund’s use of short sales in effect “leverages” the Fund. The use of leverage may magnify the Fund’s gains or losses, and leverage also creates interest expense that may lower the Fund’s overall returns. It is possible to lose money by investing in the Fund.
See Notes to Financial Statements.
International Equity Fund (Unaudited)
At December 31, 2021, the portfolio holdings of the Fund, as a percentage of net assets, is shown in the following table. Portfolio holdings are subject to risk and may change at any time.
| | % |
| Financials | 18.8 |
| Industrials | 15.6 |
| Information Technology | 13.7 |
| Health Care | 12.1 |
| Consumer Discretionary | 11.1 |
| Consumer Staples | 6.9 |
| Money Market Funds | 6.4 |
| Materials | 5.6 |
| Communication Services | 4.2 |
| Energy | 1.3 |
| Real Estate | 1.2 |
| Utilities | 0.7 |
| Foreign Common Stocks Sold Short | (0.1) |
| | 97.5 |
See Notes to Financial Statements.
International Equity Fund (Unaudited)
| Average Annual Total Returns as of 12/31/21 | |
| | | Institutional Class* | | Investor Class* | | Benchmark** | |
| One Year | | 9.61% | | 9.35% | | 11.26% | |
| Five Year | | 10.02% | | 9.75% | | 9.54% | |
| Ten Year | | 7.87% | | 7.60% | | 7.43% | |
| Since Inception | | 6.22% | | 6.00% | | 6.45% | |
| Inception Date | | 08/27/01 | | 08/27/01 | | | |
| Total Fund Operating Expenses (May 1, 2021 Prospectus)(1) | | 0.95% | | 1.22% | | | |
| (1) | Current information regarding the Fund’s Operating Expenses can be found in the Financial Highlights. |
The performance data quoted represents past performance and does not guarantee future results. Current performance may be lower or higher. Performance data current to the most recent month-end may be obtained at GuideStoneFunds.com. The investment return and principal value of an investment will fluctuate so that shares, when redeemed, may be worth more or less than their original cost.
The graph illustrates the results of a hypothetical $10,000 investment in the Investor Class of the Fund for the 10-year period from December 31, 2011 to December 31, 2021, with all dividends and capital gains reinvested, with the MSCI EAFE Index.
*These returns reflect investment advisory and shareholder servicing fee waivers, if applicable, during the reported time periods.
**Unlike a mutual fund, the performance of an index assumes no taxes, transaction costs, management fees or other expenses.
See Notes to Financial Statements.
INTERNATIONAL EQUITY FUND
| | | Shares | | Value |
| COMMON STOCKS — 3.5% |
| Communication Services — 0.0% | | |
| Universal Music Group NV | 9,145 | | $ 257,999 |
| Consumer Discretionary — 1.1% | | |
| Booking Holdings, Inc.* | 1,898 | | 4,553,739 |
| Lululemon Athletica, Inc.* | 15,530 | | 6,079,218 |
| Trip.com Group, Ltd. ADR* | 160,082 | | 3,941,219 |
| | | | | 14,574,176 |
| Financials — 0.6% | | |
| Everest Re Group, Ltd. | 27,696 | | 7,586,488 |
| Health Care — 1.1% | | |
| Mettler-Toledo International, Inc.* | 3,930 | | 6,670,035 |
| ResMed, Inc. | 29,550 | | 7,697,184 |
| | | | | 14,367,219 |
| Information Technology — 0.7% | | |
| Cognizant Technology Solutions Corporation Class A | 37,063 | | 3,288,230 |
| EPAM Systems, Inc.* | 9,220 | | 6,163,109 |
| | | | | 9,451,339 |
Total Common Stocks
(Cost $33,438,400) | | 46,237,221 |
| FOREIGN COMMON STOCKS — 87.0% |
| Australia — 2.3% | | |
| Afterpay, Ltd.* | 2,670 | | 161,252 |
| AMP, Ltd.* | 844,647 | | 620,668 |
| Ampol, Ltd. | 43,629 | | 941,476 |
| Ansell, Ltd. | 7,496 | | 171,846 |
| ASX, Ltd.‡‡ | 2,303 | | 155,658 |
| Aurizon Holdings, Ltd. | 481,126 | | 1,221,651 |
| Australia & New Zealand Banking Group, Ltd. | 46,976 | | 940,220 |
| BHP Group, Ltd.‡‡ | 37,978 | | 1,146,682 |
| BlueScope Steel, Ltd.‡‡ | 149,008 | | 2,265,785 |
| Brambles, Ltd. | 223,109 | | 1,725,493 |
| carsales.com, Ltd. | 15,155 | | 276,643 |
| Coles Group, Ltd. | 35,308 | | 460,849 |
| Computershare, Ltd. | 12,190 | | 177,377 |
| CSL, Ltd. | 32,693 | | 6,915,006 |
| Dexus REIT‡‡ | 55,775 | | 451,240 |
| Fortescue Metals Group, Ltd. | 11,628 | | 162,516 |
| Goodman Group REIT‡‡ | 50,048 | | 964,929 |
| GPT Group (The) REITΨ†††* | 63,198 | | — |
| GPT Group (The) REIT (Athens Exchange) | 104,984 | | 413,986 |
| Harvey Norman Holdings, Ltd. | 365,388 | | 1,313,240 |
| Incitec Pivot, Ltd. | 29,002 | | 68,365 |
| JB Hi-Fi, Ltd. | 47,241 | | 1,660,768 |
| Mineral Resources, Ltd. | 6,340 | | 258,309 |
| Mirvac Group REIT‡‡ | 355,598 | | 752,862 |
| NEXTDC, Ltd.* | 7,655 | | 71,233 |
| Orica, Ltd. | 257,918 | | 2,568,905 |
| Rio Tinto, Ltd.‡‡ | 4,796 | | 349,317 |
| Santos, Ltd. | 15,116 | | 69,395 |
| Scentre Group REIT‡‡ | 186,809 | | 429,485 |
| Seven Group Holdings, Ltd. | 9,416 | | 147,973 |
| Sonic Healthcare, Ltd. | 25,444 | | 863,204 |
| | | Shares | | Value |
| South32, Ltd. | 278,436 | | $ 812,330 |
| Stockland REIT‡‡ | 206,720 | | 637,692 |
| Suncorp Group, Ltd. | 116,868 | | 941,252 |
| Telstra Corporation, Ltd. | 28,813 | | 87,625 |
| Vicinity Centres REIT‡‡ | 336,787 | | 414,100 |
| Westpac Banking Corporation | 28,678 | | 445,461 |
| WiseTech Global, Ltd. | 5,486 | | 233,813 |
| Woodside Petroleum, Ltd. | 6,369 | | 101,618 |
| | | | | 31,400,224 |
| Belgium — 0.2% | | |
| Ageas SA/NV | 5,301 | | 274,903 |
| Etablissements Franz Colruyt NV | 10,545 | | 447,324 |
| Groupe Bruxelles Lambert SA‡‡ | 415 | | 46,379 |
| KBC Group NV | 3,973 | | 341,325 |
| Proximus SADP | 43,796 | | 854,630 |
| Telenet Group Holding NV | 6,362 | | 232,215 |
| | | | | 2,196,776 |
| Canada — 3.2% | | |
| Agnico Eagle Mines, Ltd. | 39,278 | | 2,087,233 |
| Canadian National Railway Co. | 78,714 | | 9,670,802 |
| Canadian Pacific Railway, Ltd. | 103,620 | | 7,454,423 |
| Kinross Gold Corporation | 536,066 | | 3,110,577 |
| Open Text Corporation | 41,800 | | 1,984,009 |
| Restaurant Brands International, Inc.Δ | 31,010 | | 1,881,687 |
| Shopify, Inc. Class A* | 4,950 | | 6,818,080 |
| Toronto-Dominion Bank (The) | 123,469 | | 9,466,005 |
| | | | | 42,472,816 |
| China — 1.0% | | |
| Tencent Holdings, Ltd. | 204,700 | | 11,991,839 |
| Vipshop Holdings, Ltd. ADR* | 196,000 | | 1,646,400 |
| | | | | 13,638,239 |
| Denmark — 1.1% | | |
| AP Moeller - Maersk A/S Class B | 1,057 | | 3,772,765 |
| Danske Bank A/S | 12,095 | | 208,808 |
| DSV A/S | 33,640 | | 7,839,072 |
| Genmab A/S* | 642 | | 256,256 |
| GN Store Nord A/S | 10,945 | | 686,753 |
| H Lundbeck A/S | 10,608 | | 273,130 |
| Pandora A/S‡‡ | 9,870 | | 1,227,738 |
| | | | | 14,264,522 |
| Finland — 0.4% | | |
| Huhtamaki OYJ | 9,348 | | 413,472 |
| Kone OYJ Class B | 29,819 | | 2,139,774 |
| Nokian Renkaat OYJ | 10,972 | | 414,584 |
| UPM-Kymmene OYJ | 46,511 | | 1,769,680 |
| Valmet OYJ | 4,661 | | 199,843 |
| | | | | 4,937,353 |
| France — 10.9% | | |
| Accor SA* | 231,253 | | 7,490,360 |
| Air Liquide SA | 55,467 | | 9,682,032 |
| AXA SA | 236,036 | | 7,036,616 |
| BNP Paribas SA | 101,892 | | 7,049,566 |
| Bureau Veritas SA | 228,257 | | 7,583,024 |
| Capgemini SE | 68,687 | | 16,852,132 |
See Notes to Financial Statements.
| | | Shares | | Value |
| Danone SA | 119,409 | | $ 7,421,355 |
| Engie SA | 335,445 | | 4,970,100 |
| Hermes International | 7,285 | | 12,739,542 |
| L’Oreal SA | 34,197 | | 16,233,233 |
| Publicis Groupe SA | 45,956 | | 3,097,398 |
| Sanofi | 90,819 | | 9,158,945 |
| Schneider Electric SE | 106,142 | | 20,840,527 |
| SCOR SE | 48,487 | | 1,514,755 |
| TotalEnergies SEΔ | 146,646 | | 7,451,267 |
| Valeo | 108,461 | | 3,282,174 |
| Worldline SA 144A* | 75,000 | | 4,184,841 |
| | | | | 146,587,867 |
| Germany — 9.6% | | |
| adidas AG | 14,067 | | 4,050,528 |
| Allianz SE | 32,635 | | 7,697,254 |
| Aurubis AG | 13,702 | | 1,369,679 |
| BASF SE | 6,088 | | 427,289 |
| Bayerische Motoren Werke AG | 81,971 | | 8,200,565 |
| Beiersdorf AG | 93,277 | | 9,561,366 |
| Brenntag SE | 9,121 | | 823,662 |
| Continental AG* | 84,187 | | 8,845,147 |
| Covestro AG 144A | 6,692 | | 411,880 |
| Daimler AG | 78,921 | | 6,029,896 |
| Daimler Truck Holding AG* | 47,761 | | 1,755,779 |
| Deutsche Bank AG* | 161,606 | | 2,012,806 |
| Deutsche Boerse AG | 75,138 | | 12,546,126 |
| Deutsche Post AG | 53,613 | | 3,448,431 |
| Freenet AG | 21,875 | | 578,113 |
| Fresenius Medical Care AG & Co. KGaA | 130,170 | | 8,438,689 |
| Fresenius SE & Co. KGaA‡‡ | 76,433 | | 3,072,104 |
| GEA Group AG | 7,576 | | 413,797 |
| HelloFresh SE* | 10,186 | | 780,636 |
| Henkel AG & Co. KGaA | 31,000 | | 2,416,487 |
| HOCHTIEF AG | 4,372 | | 352,103 |
| Infineon Technologies AG‡‡ | 21,813 | | 1,004,237 |
| LANXESS AG | 1,068 | | 66,044 |
| METRO AG | 70,956 | | 744,359 |
| ProSiebenSat.1 Media SE | 15,298 | | 243,023 |
| Rheinmetall AG | 8,469 | | 797,019 |
| RWE AG‡‡ | 4,397 | | 178,151 |
| SAP SE | 175,966 | | 24,765,376 |
| Siemens AG | 54,523 | | 9,443,541 |
| Siemens Energy AG* | 74,311 | | 1,895,993 |
| Software AG | 1,456 | | 58,008 |
| Telefonica Deutschland Holding AG | 180,754 | | 501,374 |
| thyssenkrupp AG* | 329,984 | | 3,615,172 |
| Uniper SE | 17,475 | | 829,716 |
| United Internet AG | 2,292 | | 90,869 |
| Vitesco Technologies Group AG* | 9,253 | | 453,776 |
| Vonovia SE | 8,154 | | 449,303 |
| Wacker Chemie AG | 2,045 | | 304,013 |
| | | | | 128,672,311 |
| Hong Kong — 3.0% | | |
| AIA Group, Ltd. | 1,629,326 | | 16,423,752 |
| Alibaba Group Holding, Ltd.* | 477,259 | | 7,277,426 |
| Baidu, Inc. Class A* | 223,107 | | 4,137,360 |
| | | Shares | | Value |
| Li Ning Co., Ltd. | 367,000 | | $ 4,017,089 |
| Shenzhou International Group Holdings, Ltd. | 188,900 | | 3,631,411 |
| Trip.com Group, Ltd.* | 17,700 | | 433,105 |
| Wuxi Biologics Cayman, Inc. 144A* | 336,275 | | 3,991,286 |
| | | | | 39,911,429 |
| India — 0.8% | | |
| Axis Bank, Ltd.* | 216,718 | | 1,978,243 |
| HDFC Bank, Ltd. | 435,878 | | 8,674,679 |
| | | | | 10,652,922 |
| Indonesia — 0.1% | | |
| PT Bank Mandiri Persero Tbk | 2,663,300 | | 1,315,082 |
| Ireland — 3.9% | | |
| Accenture PLC Class A | 19,800 | | 8,208,090 |
| Aon PLC Class A | 31,024 | | 9,324,573 |
| ICON PLC* | 23,050 | | 7,138,585 |
| Linde PLC | 5,045 | | 1,750,654 |
| Medtronic PLC | 82,665 | | 8,551,694 |
| Ryanair Holdings PLC* | 7,800 | | 135,425 |
| Ryanair Holdings PLC ADR* | 28,610 | | 2,927,661 |
| STERIS PLC | 21,770 | | 5,299,036 |
| Willis Towers Watson PLC | 36,275 | | 8,614,950 |
| | | | | 51,950,668 |
| Israel — 0.6% | | |
| Check Point Software Technologies, Ltd.* | 65,608 | | 7,647,269 |
| Italy — 0.8% | | |
| Assicurazioni Generali SpA | 18,699 | | 395,198 |
| Atlantia SpA* | 3,435 | | 68,157 |
| Azimut Holding SpA | 3,677 | | 102,795 |
| Banco BPM SpA | 71,752 | | 214,833 |
| Brembo SpA | 14,267 | | 202,952 |
| Buzzi Unicem SpA | 60,245 | | 1,298,033 |
| Hera SpA | 27,467 | | 114,163 |
| Intesa Sanpaolo SpA | 2,344,337 | | 6,055,246 |
| Italgas SpA | 63,499 | | 436,484 |
| Prysmian SpA | 10,942 | | 411,596 |
| Telecom Italia SpA | 121,188 | | 59,622 |
| UniCredit SpA | 53,655 | | 824,750 |
| Unipol Gruppo SpA | 121,643 | | 658,742 |
| | | | | 10,842,571 |
| Japan — 14.9% | | |
| Advantest Corporation | 8,500 | | 804,943 |
| Aeon Co., Ltd. | 13,000 | | 306,361 |
| AEON Financial Service Co., Ltd. | 49,800 | | 537,170 |
| Aisin Corporation | 20,900 | | 801,882 |
| Ajinomoto Co., Inc. | 12,400 | | 377,482 |
| Alfresa Holdings Corporation | 13,700 | | 182,564 |
| Amada Co., Ltd. | 19,300 | | 191,106 |
| Bandai Namco Holdings, Inc. | 4,500 | | 351,848 |
| Bridgestone CorporationΔ | 9,900 | | 425,034 |
| Brother Industries, Ltd.‡‡ | 56,100 | | 1,081,301 |
| Canon, Inc.Δ | 10,000 | | 243,937 |
| Central Japan Railway Co. | 1,300 | | 172,994 |
| Chugai Pharmaceutical Co., Ltd. | 5,800 | | 189,057 |
See Notes to Financial Statements.
INTERNATIONAL EQUITY FUND
SCHEDULE OF INVESTMENTS (Continued)
| | | Shares | | Value |
| Concordia Financial Group, Ltd. | 60,800 | | $ 220,798 |
| Dai Nippon Printing Co., Ltd. | 2,800 | | 70,467 |
| Dai-ichi Life Holdings, Inc. | 51,500 | | 1,038,754 |
| Daiichi Sankyo Co., Ltd. | 20,700 | | 526,845 |
| Daikin Industries, Ltd. | 55,300 | | 12,526,519 |
| Daito Trust Construction Co., Ltd.‡‡ | 73,633 | | 8,447,258 |
| Daiwa House Industry Co., Ltd.‡‡ | 21,100 | | 606,395 |
| DeNA Co., Ltd. | 58,800 | | 905,452 |
| Denso Corporation | 7,200 | | 596,670 |
| Disco Corporation | 1,900 | | 580,740 |
| East Japan Railway Co. | 4,300 | | 264,345 |
| Eisai Co., Ltd. | 5,400 | | 306,546 |
| Electric Power Development Co., Ltd. | 45,800 | | 608,664 |
| ENEOS Holdings, Inc. | 124,000 | | 463,241 |
| FANUC Corporation | 1,800 | | 382,612 |
| Fast Retailing Co., Ltd. | 700 | | 397,911 |
| Food & Life Cos., Ltd. | 11,400 | | 430,449 |
| Fuji Electric Co., Ltd. | 5,200 | | 284,066 |
| FUJIFILM Holdings Corporation | 4,600 | | 341,018 |
| Fujitsu General, Ltd. | 7,300 | | 173,478 |
| Fujitsu, Ltd.‡‡ | 6,800 | | 1,168,421 |
| Fukuoka Financial Group, Inc. | 10,900 | | 186,660 |
| GMO Payment Gateway, Inc. | 500 | | 62,263 |
| Hakuhodo DY Holdings, Inc. | 14,100 | | 234,623 |
| Hankyu Hanshin Holdings, Inc. | 8,300 | | 235,876 |
| Haseko Corporation‡‡ | 29,300 | | 363,444 |
| Hirose Electric Co., Ltd. | 400 | | 67,224 |
| Hitachi Transport System, Ltd. | 10,000 | | 470,128 |
| Hitachi, Ltd.‡‡ | 13,000 | | 704,253 |
| Honda Motor Co., Ltd. | 45,300 | | 1,288,819 |
| Hoya Corporation‡‡ | 90,100 | | 13,370,103 |
| Ibiden Co., Ltd. | 4,700 | | 279,112 |
| Iida Group Holdings Co., Ltd. | 19,000 | | 441,892 |
| Inpex CorporationΔ | 15,600 | | 135,651 |
| Ito En, Ltd. | 3,800 | | 199,661 |
| ITOCHU Corporation | 12,700 | | 388,543 |
| Japan Airlines Co., Ltd.* | 4,800 | | 91,120 |
| Japan Exchange Group, Inc. | 226,421 | | 4,960,748 |
| Japan Metropolitan Fund Invest REIT | 166 | | 143,008 |
| Japan Post Holdings Co., Ltd.* | 46,500 | | 362,248 |
| Japan Post Insurance Co., Ltd. | 46,400 | | 745,363 |
| Japan Real Estate Investment Corporation REITΔ | 64 | | 363,304 |
| JSR Corporation | 8,400 | | 319,229 |
| JTEKT Corporation | 20,800 | | 181,909 |
| Kajima Corporation | 82,400 | | 946,984 |
| Kamigumi Co., Ltd. | 63,400 | | 1,200,527 |
| Kaneka Corporation | 5,400 | | 177,300 |
| Kao CorporationΔ | 3,900 | | 204,260 |
| KDDI Corporation | 20,600 | | 602,421 |
| Keyence Corporation | 12,600 | | 7,922,353 |
| Kinden Corporation | 67,100 | | 1,008,914 |
| Kintetsu Group Holdings Co., Ltd.* | 8,200 | | 229,228 |
| Komatsu, Ltd. | 67,200 | | 1,571,539 |
| Kubota CorporationΔ | 171,797 | | 3,820,087 |
| KuritaWater Industries, Ltd. | 4,900 | | 232,302 |
| Kyocera Corporation | 9,600 | | 600,250 |
| Kyowa Exeo Corporation | 11,700 | | 246,702 |
| | | Shares | | Value |
| Kyushu Electric Power Co., Inc. | 23,600 | | $ 176,200 |
| Lasertec Corporation | 27,200 | | 8,331,403 |
| Lixil Corporation | 9,700 | | 258,766 |
| M3, Inc. | 4,600 | | 231,938 |
| Mabuchi Motor Co., Ltd. | 27,800 | | 919,514 |
| Makita Corporation | 133,373 | | 5,661,643 |
| Marubeni Corporation | 164,500 | | 1,602,723 |
| Medipal Holdings Corporation | 4,200 | | 78,729 |
| MISUMI Group, Inc. | 8,300 | | 340,981 |
| Mitsubishi Chemical Holdings Corporation | 35,500 | | 263,317 |
| Mitsubishi Corporation | 17,300 | | 549,329 |
| Mitsubishi Electric Corporation | 52,500 | | 666,385 |
| Mitsubishi Estate Co., Ltd.‡‡ | 45,500 | | 631,198 |
| Mitsubishi HC Capital, Inc. | 30,300 | | 149,910 |
| Mitsubishi Heavy Industries, Ltd. | 19,400 | | 448,536 |
| Mitsubishi UFJ Financial Group, Inc. | 153,200 | | 833,757 |
| Mitsui & Co., Ltd. | 41,000 | | 971,613 |
| Mitsui Chemicals, Inc. | 10,400 | | 279,554 |
| Mitsui Fudosan Co., Ltd.‡‡ | 33,300 | | 660,032 |
| Mizuho Financial Group, Inc. | 257,000 | | 3,264,223 |
| Murata Manufacturing Co., Ltd. | 12,300 | | 981,078 |
| Nabtesco Corporation | 6,600 | | 195,558 |
| NEC Corporation | 5,600 | | 258,942 |
| NET One Systems Co., Ltd. | 18,000 | | 484,341 |
| Nexon Co., Ltd. | 8,900 | | 172,093 |
| NGK Insulators, Ltd. | 6,400 | | 108,320 |
| NGK Spark Plug Co., Ltd. | 54,900 | | 955,934 |
| NH Foods, Ltd. | 7,200 | | 259,603 |
| Nidec Corporation | 4,900 | | 579,643 |
| Nifco, Inc. | 2,200 | | 69,178 |
| Nihon Kohden Corporation | 4,000 | | 109,659 |
| Nihon M&A Center, Inc. | 10,600 | | 260,009 |
| Nihon Unisys, Ltd. | 40,900 | | 1,147,800 |
| Nikon Corporation | 10,100 | | 108,799 |
| Nintendo Co., Ltd. | 9,024 | | 4,221,946 |
| Nippo Corporation | 31,900 | | 1,107,439 |
| Nippon Building Fund, Inc. REIT | 16 | | 93,194 |
| Nippon Steel Corporation | 33,600 | | 548,891 |
| Nippon Telegraph & Telephone Corporation | 59,400 | | 1,624,487 |
| Nisshin Seifun Group, Inc. | 15,800 | | 227,937 |
| Nitori Holdings Co., Ltd. | 1,400 | | 209,400 |
| Nitto Denko Corporation‡‡ | 14,200 | | 1,096,985 |
| NOF Corporation | 1,300 | | 65,734 |
| Nomura Holdings, Inc. | 249,400 | | 1,086,299 |
| NS Solutions Corporation | 23,800 | | 733,882 |
| Obayashi Corporation | 144,900 | | 1,121,431 |
| Obic Co., Ltd. | 1,600 | | 299,439 |
| Olympus Corporation | 12,300 | | 283,235 |
| Omron Corporation | 4,000 | | 398,590 |
| Ono Pharmaceutical Co., Ltd. | 17,600 | | 437,455 |
| Oriental Land Co., Ltd. | 2,100 | | 354,117 |
| ORIX Corporation | 44,700 | | 912,246 |
| Osaka Gas Co., Ltd. | 15,300 | | 253,051 |
| Otsuka Holdings Co., Ltd. | 8,200 | | 298,324 |
| Panasonic Corporation | 102,900 | | 1,131,158 |
| Rakus Co., Ltd. | 3,100 | | 83,191 |
See Notes to Financial Statements.
| | | Shares | | Value |
| Recruit Holdings Co., Ltd. | 13,200 | | $ 803,296 |
| Renesas Electronics Corporation* | 82,200 | | 1,020,982 |
| Resona Holdings, Inc.‡‡ | 349,800 | | 1,359,385 |
| Ricoh Co., Ltd. | 31,400 | | 292,683 |
| Rohm Co., Ltd. | 2,700 | | 245,617 |
| Rohto Pharmaceutical Co., Ltd. | 8,400 | | 253,972 |
| Sankyu, Inc. | 22,700 | | 941,961 |
| Santen Pharmaceutical Co., Ltd. | 18,400 | | 224,641 |
| SCREEN Holdings Co., Ltd. | 14,300 | | 1,536,580 |
| SCSK Corporation | 13,500 | | 268,680 |
| Secom Co., Ltd. | 2,900 | | 201,510 |
| Seino Holdings Co., Ltd. | 31,500 | | 319,242 |
| Sekisui Chemical Co., Ltd. | 14,700 | | 245,845 |
| Sekisui House, Ltd. | 47,700 | | 1,026,301 |
| Seria Co., Ltd. | 3,800 | | 110,068 |
| Seven & i Holdings Co., Ltd. | 31,700 | | 1,394,420 |
| Shimamura Co., Ltd. | 18,200 | | 1,527,354 |
| Shimano, Inc. | 1,200 | | 319,583 |
| Shimizu Corporation | 92,200 | | 571,672 |
| Shin-Etsu Chemical Co., Ltd. | 3,600 | | 624,871 |
| Shiseido Co., Ltd. | 5,600 | | 312,404 |
| SMC Corporation | 15,000 | | 10,137,872 |
| SoftBank Corporation | 32,100 | | 405,441 |
| SoftBank Group Corporation | 13,200 | | 632,810 |
| Sojitz Corporation‡‡ | 61,760 | | 927,993 |
| Sony Group Corporation | 14,800 | | 1,868,918 |
| Stanley Electric Co., Ltd. | 7,600 | | 190,814 |
| Subaru Corporation | 47,900 | | 855,868 |
| Sumitomo Corporation | 44,100 | | 652,653 |
| Sumitomo Electric Industries, Ltd. | 20,100 | | 262,325 |
| Sumitomo Forestry Co., Ltd. | 23,800 | | 460,086 |
| Sumitomo Heavy Industries, Ltd. | 18,200 | | 441,765 |
| Sumitomo Metal Mining Co., Ltd. | 3,500 | | 132,561 |
| Sumitomo Mitsui Financial Group, Inc. | 34,000 | | 1,161,008 |
| Sumitomo Mitsui Trust Holdings, Inc. | 188,500 | | 6,303,130 |
| Sumitomo Realty & Development Co., Ltd.‡‡ | 6,000 | | 176,885 |
| Sumitomo Rubber Industries, Ltd. | 53,700 | | 547,750 |
| Sundrug Co., Ltd. | 7,200 | | 188,233 |
| Suzuken Co., Ltd. | 11,800 | | 340,522 |
| Suzuki Motor Corporation | 4,900 | | 188,958 |
| Sysmex Corporation | 2,900 | | 391,447 |
| T&D Holdings, Inc. | 21,100 | | 269,569 |
| Taiheiyo Cement Corporation | 61,800 | | 1,220,398 |
| Taisei Corporation | 24,200 | | 735,924 |
| Takeda Pharmaceutical Co., Ltd. | 23,400 | | 639,015 |
| TDK Corporation | 8,000 | | 312,207 |
| Teijin, Ltd. | 9,800 | | 120,622 |
| Terumo Corporation | 171,800 | | 7,256,935 |
| Tokio Marine Holdings, Inc. | 153,037 | | 8,519,515 |
| Tokyo Electric Power Co. Holdings, Inc.* | 201,300 | | 520,403 |
| Tokyo Electron, Ltd.‡‡ | 3,000 | | 1,726,718 |
| Tokyu Corporation | 18,500 | | 245,933 |
| Toshiba Corporation | 5,600 | | 230,431 |
| Tosoh Corporation | 17,600 | | 261,475 |
| | | Shares | | Value |
| Toyo Suisan Kaisha, Ltd. | 10,000 | | $ 423,984 |
| Toyoda Gosei Co., Ltd. | 32,300 | | 702,554 |
| Toyota Boshoku Corporation | 54,800 | | 1,075,198 |
| Toyota Motor Corporation | 237,700 | | 4,393,312 |
| Toyota Tsusho Corporation | 11,700 | | 539,332 |
| Trend Micro, Inc. | 6,100 | | 338,648 |
| Unicharm Corporation | 7,600 | | 330,655 |
| USS Co., Ltd. | 12,900 | | 201,546 |
| Yakult Honsha Co., Ltd. | 2,100 | | 109,555 |
| Yamada Holdings Co., Ltd. | 335,900 | | 1,148,343 |
| Yamaha Motor Co., Ltd. | 6,700 | | 160,928 |
| Yamato Holdings Co., Ltd. | 11,400 | | 267,803 |
| Yokohama Rubber Co., Ltd. (The) | 26,600 | | 426,626 |
| Z Holdings Corporation | 29,600 | | 170,792 |
| | | | | 201,180,042 |
| Jersey — 2.2% | | |
| Experian PLC | 437,902 | | 21,527,674 |
| Glencore PLC* | 1,173,465 | | 5,955,495 |
| WPP PLC | 145,998 | | 2,212,307 |
| | | | | 29,695,476 |
| Mexico — 0.2% | | |
| Grupo Televisa SAB SA ADR | 233,300 | | 2,186,021 |
| Netherlands — 5.3% | | |
| Adyen NV 144A* | 2,000 | | 5,263,286 |
| Aegon NV | 315 | | 1,575 |
| Akzo Nobel NV | 53,369 | | 5,863,399 |
| ASML Holding NV‡‡ | 8,684 | | 6,986,955 |
| ASML Holding NV (NASDAQ Exchange) | 10,630 | | 8,462,968 |
| ASR Nederland NV‡‡ | 12,165 | | 560,919 |
| CNH Industrial NV | 294,105 | | 5,686,287 |
| Euronext NV 144A | 85,039 | | 8,834,542 |
| EXOR NV | 46,023 | | 4,119,875 |
| Ferrari NV | 25,800 | | 6,641,079 |
| ING Groep NV‡‡ | 48,701 | | 678,771 |
| Just Eat Takeaway.com NV 144A* | 2,119 | | 116,933 |
| Koninklijke Ahold Delhaize NV‡‡ | 115,230 | | 3,953,391 |
| Koninklijke Philips NV | 179,752 | | 6,705,280 |
| Koninklijke Vopak NV | 3,559 | | 124,799 |
| NN Group NV | 3,978 | | 215,623 |
| Prosus NV* | 49,022 | | 4,103,823 |
| QIAGEN NV* | 7,121 | | 394,864 |
| Signify NV 144A‡‡ | 18,484 | | 858,176 |
| Stellantis NV | 78,129 | | 1,474,966 |
| | | | | 71,047,511 |
| Nigeria — 0.0% | | |
| Afriland Properties PLCΨ††† | 364,373 | | — |
| Norway — 0.2% | | |
| DNB Bank ASA | 15,435 | | 353,056 |
| Equinor ASA | 18,702 | | 495,216 |
| Leroy Seafood Group ASA | 38,539 | | 301,178 |
| Orkla ASA | 59,890 | | 600,311 |
| Telenor ASA | 32,965 | | 518,179 |
See Notes to Financial Statements.
INTERNATIONAL EQUITY FUND
SCHEDULE OF INVESTMENTS (Continued)
| | | Shares | | Value |
| Yara International ASA | 22,189 | | $ 1,118,729 |
| | | | | 3,386,669 |
| Peru — 0.2% | | |
| Credicorp, Ltd. | 19,654 | | 2,399,164 |
| Portugal — 0.3% | | |
| Galp Energia SGPS SA | 448,879 | | 4,354,135 |
| Singapore — 0.5% | | |
| Ascendas REIT‡‡ | 158,700 | | 347,406 |
| CapitaLand Integrated Commercial Trust REIT‡‡ | 233,640 | | 353,685 |
| Mapletree Commercial Trust REIT | 136,500 | | 202,582 |
| Singapore Exchange, Ltd.‡‡ | 930,232 | | 6,419,678 |
| | | | | 7,323,351 |
| South Africa — 0.1% | | |
| Naspers, Ltd. N Shares | 8,241 | | 1,278,428 |
| South Korea — 0.9% | | |
| KB Financial Group, Inc. | 150,484 | | 6,959,029 |
| NAVER Corporation | 8,175 | | 2,594,920 |
| Samsung Electronics Co., Ltd. GDR Class S | 1,899 | | 3,131,451 |
| | | | | 12,685,400 |
| Spain — 1.4% | | |
| Aena SME SA 144AΔ* | 32,905 | | 5,182,011 |
| Amadeus IT Group SA* | 209,488 | | 14,174,849 |
| | | | | 19,356,860 |
| Sweden — 2.5% | | |
| Assa Abloy AB, B Shares | 111,940 | | 3,412,041 |
| Atlas Copco AB, A Shares | 85,550 | | 5,911,577 |
| Atlas Copco AB, B Shares | 6,930 | | 407,070 |
| Electrolux AB, B Shares | 76,864 | | 1,861,622 |
| Getinge AB, B Shares‡‡ | 24,531 | | 1,069,114 |
| H & M Hennes & Mauritz AB, B SharesΔ | 194,233 | | 3,811,261 |
| Husqvarna AB, B Shares | 75,682 | | 1,210,073 |
| Investor AB, B Shares | 22,531 | | 565,377 |
| Saab AB, B Shares | 49,705 | | 1,262,492 |
| Skanska AB, B Shares | 11,709 | | 302,574 |
| SKF AB, B Shares | 139,477 | | 3,298,593 |
| Svenska Handelsbanken AB, A Shares | 265,190 | | 2,866,160 |
| Swedbank AB, A Shares | 37,171 | | 746,982 |
| Swedish Orphan Biovitrum AB‡���* | 17,165 | | 351,017 |
| Tele2 AB, B Shares | 19,205 | | 273,972 |
| Telefonaktiebolaget LM Ericsson, B Shares‡‡ | 346,611 | | 3,813,775 |
| Trelleborg AB, B Shares | 20,232 | | 530,835 |
| Volvo AB, B Shares | 115,611 | | 2,673,679 |
| | | | | 34,368,214 |
| Switzerland — 13.1% | | |
| ABB, Ltd. | 3,345 | | 127,487 |
| Adecco Group AG‡‡ | 31,256 | | 1,592,724 |
| Alcon, Inc. | 71,870 | | 6,339,321 |
| Baloise Holding AG | 6,266 | | 1,022,692 |
| BKW AG | 8,890 | | 1,154,320 |
| | | Shares | | Value |
| Bucher Industries AG | 279 | | $ 137,483 |
| Chubb, Ltd. | 60,190 | | 11,635,329 |
| Cie Financiere Richemont SA Class A | 6,007 | | 897,655 |
| Credit Suisse Group AGΔ | 667,861 | | 6,475,326 |
| DKSH Holding AG | 12,992 | | 1,070,869 |
| dormakaba Holding AG | 317 | | 209,364 |
| Galenica AG 144A | 6,892 | | 517,583 |
| Georg Fischer AG | 57 | | 86,242 |
| Holcim, Ltd. (Swiss Exchange)‡‡* | 117,852 | | 5,993,844 |
| Julius Baer Group, Ltd. | 95,661 | | 6,397,072 |
| Kuehne + Nagel International AG | 652 | | 209,981 |
| Nestle SA‡‡ | 244,110 | | 34,081,983 |
| Novartis AG‡‡ | 294,719 | | 25,897,556 |
| OC Oerlikon Corporation AG | 62,835 | | 642,619 |
| Roche Holding AG (Swiss Exchange)‡‡ | 68,150 | | 28,272,794 |
| Sika AG | 42,556 | | 17,687,016 |
| Swatch Group AG (The) (Swiss Exchange)Δ | 7,922 | | 2,412,534 |
| Swiss Life Holding AG | 456 | | 278,606 |
| Swiss Re AG | 5,901 | | 582,509 |
| Temenos AG | 2,892 | | 398,637 |
| UBS Group AG | 695,545 | | 12,484,545 |
| Zurich Insurance Group AG | 21,943 | | 9,612,767 |
| | | | | 176,218,858 |
| Taiwan — 1.8% | | |
| Taiwan Semiconductor Manufacturing Co., Ltd. ADR | 197,541 | | 23,766,158 |
| Turkey — 0.0% | | |
| Yapi ve Kredi Bankasi AS | 1 | | — |
| United Kingdom — 5.5% | | |
| Atlassian Corporation PLC Class A* | 12,150 | | 4,632,674 |
| BP PLC ADR | 159,196 | | 4,239,389 |
| BT Group PLC | 747,844 | | 1,716,260 |
| Compass Group PLC* | 518,023 | | 11,576,318 |
| Informa PLC* | 203,500 | | 1,422,962 |
| Liberty Global PLC Class A* | 350,845 | | 9,732,440 |
| Lloyds Banking Group PLC‡‡ | 17,205,779 | | 11,132,087 |
| Natwest Group PLC | 774,350 | | 2,365,610 |
| Prudential PLC | 110,100 | | 1,899,335 |
| Reckitt Benckiser Group PLC | 87,529 | | 7,513,678 |
| Rolls-Royce Holdings PLCΔ* | 2,833,497 | | 4,712,792 |
| Schroders PLC | 64,418 | | 3,104,071 |
| Smiths Group PLC | 231,704 | | 4,953,675 |
| Vodafone Group PLC ADRΔ | 369,156 | | 5,511,499 |
| | | | | 74,512,790 |
Total Foreign Common Stocks
(Cost $975,508,857) | | 1,170,249,126 |
| FOREIGN PREFERRED STOCKS — 0.7% |
| Germany — 0.5% | | |
| FUCHS PETROLUB SE | | | | |
| 2.46%◊ | 1,913 | | 86,447 |
See Notes to Financial Statements.
| | | Shares | | Value |
| Henkel AG & Co. KGaA | | | | |
| 2.52%◊ | 71,285 | | $ 5,752,068 |
| Porsche Automobil Holding SE | | | | |
| 2.45%‡‡◊ | 2,638 | | 249,061 |
| Volkswagen AG | | | | |
| 2.59%◊ | 5,599 | | 1,124,746 |
| | | | | 7,212,322 |
| South Korea — 0.2% | | |
| Samsung Electronics Co., Ltd. | | | | |
| 2.02% 03/29/18◊ | 44,100 | | 2,636,548 |
Total Foreign Preferred Stocks
(Cost $11,453,360) | | 9,848,870 |
| MONEY MARKET FUNDS — 6.4% |
GuideStone Money Market Fund, 0.00%
(Institutional Class)Ø∞ | 85,821,408 | | 85,821,408 |
| Northern Institutional Liquid Assets Portfolio (Shares), 0.04%ا | 40,586 | | 40,586 |
| | | Shares | | Value |
| Northern Institutional U.S. Government Portfolio (Shares), 0.00%Ø | 350,061 | | $ 350,061 |
Total Money Market Funds
(Cost $86,212,055) | | 86,212,055 |
TOTAL INVESTMENTS — 97.6%
(Cost $1,106,612,672) | | | 1,312,547,272 |
| FOREIGN COMMON STOCKS SOLD SHORT — (0.1)% |
| United Kingdom — (0.1)% | | |
Ocado Group PLC*
(Proceeds $(803,636)) | (47,886) | | (1,087,614) |
TOTAL SECURITIES SOLD SHORT — (0.1)%
(Proceeds $(803,636)) | | (1,087,614) |
Other Assets in Excess of
Liabilities — 2.5% | | | 34,195,177 |
| NET ASSETS — 100.0% | | | $1,345,654,835 |
Futures Contracts outstanding at December 31, 2021:
| Future Type | | Expiration Date | | Open Long
(Short) Contracts | | Notional
Market Value
of Contracts | | Value and
Unrealized
Appreciation
(Depreciation) |
| AEX Index | | 01/2022 | | 41 | | $ 7,446,995 | | $ 145,814 |
| CAC40 10 Euro | | 01/2022 | | 301 | | 24,478,240 | | 583,136 |
| IBEX 35 Index | | 01/2022 | | (72) | | (7,118,776) | | (297,794) |
| OMXS30 Index | | 01/2022 | | (27) | | (722,868) | | (27,413) |
| Hang Seng Index | | 01/2022 | | (38) | | (5,714,218) | | (67,666) |
| MSCI Singapore Index | | 01/2022 | | 84 | | 2,120,258 | | 12,968 |
| Topix Index® | | 03/2022 | | 171 | | 29,612,449 | | 249,084 |
| ASX SPI 200 Index | | 03/2022 | | (94) | | (12,561,479) | | (152,529) |
| DAX Index | | 03/2022 | | 5 | | 2,256,507 | | 38,352 |
| FTSE 100 Index | | 03/2022 | | (257) | | (25,477,441) | | (331,793) |
| FTSE/MIB Index | | 03/2022 | | 84 | | 13,029,176 | | 297,507 |
| MSCI EAFE Index | | 03/2022 | | 472 | | 54,794,480 | | 742,218 |
| S&P/TSX 60 Index | | 03/2022 | | (43) | | (8,708,439) | | (145,521) |
| Total Futures Contracts outstanding at December 31, 2021 | | | | | | $ 73,434,884 | | $1,046,363 |
Forward Foreign Currency Contracts outstanding at December 31, 2021:
| Expiration Date | | Currency
Purchased | | Amount
of Currency
Purchased | | Currency
Sold | | Amount
of Currency
Sold | | Counter-
party | | Net Unrealized
Appreciation
(Depreciation) |
| 03/16/22 | | Euro | | 44,919,000 | | U.S. Dollars | | 50,780,883 | | CITI | | $438,791 |
| 03/16/22 | | Canadian Dollars | | 53,272,000 | | U.S. Dollars | | 41,736,577 | | CITI | | 370,500 |
| 03/16/22 | | Australian Dollars | | 28,402,750 | | U.S. Dollars | | 20,344,679 | | CITI | | 323,777 |
| 03/16/22 | | Swiss Francs | | 26,383,000 | | U.S. Dollars | | 28,717,984 | | CITI | | 292,964 |
| 03/16/22 | | British Pounds | | 9,852,000 | | U.S. Dollars | | 13,150,854 | | CITI | | 179,888 |
| 03/16/22 | | Norwegian Kroner | | 108,131,000 | | U.S. Dollars | | 12,143,159 | | CITI | | 118,191 |
| 03/16/22 | | U.S. Dollars | | 8,668,192 | | Japanese Yen | | 988,111,000 | | CITI | | 72,639 |
| 03/16/22 | | Swedish Kronor | | 66,051,853 | | U.S. Dollars | | 7,268,260 | | CITI | | 45,991 |
See Notes to Financial Statements.
INTERNATIONAL EQUITY FUND
SCHEDULE OF INVESTMENTS (Continued)
| Expiration Date | | Currency
Purchased | | Amount
of Currency
Purchased | | Currency
Sold | | Amount
of Currency
Sold | | Counter-
party | | Net Unrealized
Appreciation
(Depreciation) |
| 03/16/22 | | Singapore Dollars | | 3,144,000 | | U.S. Dollars | | 2,304,818 | | CITI | | $ 27,326 |
| 03/16/22 | | Danish Kroner | | 8,854,000 | | U.S. Dollars | | 1,346,298 | | CITI | | 11,330 |
| 03/16/22 | | U.S. Dollars | | 4,379,721 | | Swedish Kronor | | 39,490,000 | | CITI | | 6,795 |
| 03/16/22 | | Israeli Shekels | | 1,008,000 | | U.S. Dollars | | 320,550 | | CITI | | 3,891 |
| 03/16/22 | | Japanese Yen | | 991,450,500 | | U.S. Dollars | | 8,622,312 | | CITI | | 2,291 |
| 03/16/22 | | Hong Kong Dollars | | 31,023,994 | | U.S. Dollars | | 3,978,404 | | CITI | | 812 |
| 03/16/22 | | U.S. Dollars | | 125,260 | | Israeli Shekels | | 387,000 | | CITI | | 699 |
| 03/16/22 | | U.S. Dollars | | 57,511 | | Hong Kong Dollars | | 448,000 | | CITI | | 50 |
| Subtotal Appreciation | | | | | | | | | | $ 1,895,935 |
| 03/16/22 | | U.S. Dollars | | 765,356 | | Hong Kong Dollars | | 5,969,000 | | CITI | | $ (241) |
| 03/16/22 | | U.S. Dollars | | 2,736,960 | | Japanese Yen | | 314,704,000 | | CITI | | (642) |
| 03/16/22 | | Australian Dollars | | 9,205,250 | | U.S. Dollars | | 6,699,481 | | CITI | | (894) |
| 03/16/22 | | U.S. Dollars | | 106,478 | | Israeli Shekels | | 335,000 | | CITI | | (1,347) |
| 03/16/22 | | Hong Kong Dollars | | 29,277,993 | | U.S. Dollars | | 3,759,014 | | CITI | | (3,745) |
| 03/16/22 | | U.S. Dollars | | 323,424 | | Singapore Dollars | | 442,000 | | CITI | | (4,441) |
| 03/16/22 | | U.S. Dollars | | 1,106,034 | | Danish Kroner | | 7,265,000 | | CITI | | (7,944) |
| 03/16/22 | | Israeli Shekels | | 5,286,000 | | U.S. Dollars | | 1,709,948 | | CITI | | (8,568) |
| 06/15/22 | | U.S. Dollars | | 2,881,418 | | Swiss Francs | | 2,646,000 | | NT | | (37,005) |
| 03/16/22 | | Swedish Kronor | | 173,548,147 | | U.S. Dollars | | 19,332,573 | | CITI | | (114,721) |
| 03/16/22 | | Japanese Yen | | 1,606,420,500 | | U.S. Dollars | | 14,146,589 | | CITI | | (172,377) |
| 03/16/22 | | U.S. Dollars | | 23,463,573 | | Swedish Kronor | | 213,582,000 | | CITI | | (187,427) |
| 03/16/22 | | New Zealand Dollars | | 14,539,000 | | U.S. Dollars | | 10,142,792 | | CITI | | (197,149) |
| 03/16/22 | | U.S. Dollars | | 16,540,750 | | British Pounds | | 12,383,000 | | CITI | | (214,690) |
| 03/16/22 | | U.S. Dollars | | 33,970,687 | | Euro | | 30,022,000 | | CITI | | (262,423) |
| 03/16/22 | | U.S. Dollars | | 14,019,315 | | Norwegian Kroner | | 126,684,000 | | CITI | | (345,825) |
| 03/16/22 | | U.S. Dollars | | 18,838,248 | | Australian Dollars | | 26,499,000 | | CITI | | (444,865) |
| 03/16/22 | | U.S. Dollars | | 62,098,154 | | Swiss Francs | | 57,230,000 | | CITI | | (832,389) |
| Subtotal Depreciation | | | | | | | | | | $(2,836,693) |
| Total Forward Foreign Currency Contracts outstanding at December 31, 2021 | | | | $ (940,758) |
Swap Agreements outstanding at December 31, 2021:
| Pay Rate Index/Pay Rate | | Receive
Rate/Receive
Rate Index | | Maturity
Date | | Counterparty | | Currency | | Notional
Amount | | Market Value | | Upfront
Premiums
Paid/
(Received) | | Unrealized
Appreciation
(Depreciation) |
| Total Return Swaps | | | | | | | | | | | | | | | | |
| Decrease in total return of Tel Aviv 35 Index (At Termination) | | Increase in total return of Tel Aviv 35 Index (At Termination) | | 1/28/2022 | | GSC | | ILS | | 5,538,568 | | $ 15,370 | | $ — | | $ 15,370 |
| Financing Index: Euro Short Term Rate - 0.01% | | MSCI Italy Net Return EUR Index (Monthly) | | 3/16/2022 | | GSC | | EUR | | 2,899,638 | | 76,906 | | — | | 76,906 |
| Financing Index: Euro Short Term Rate + 0.10% | | MSCI Netherlands Net Return EUR Index (Monthly) | | 3/16/2022 | | GSC | | EUR | | 100,976 | | 215 | | — | | 215 |
| Financing Index: Overnight Bank Funding Rate - 0.30% | | MSCI Daily TR Net Israel Index (Monthly) | | 3/16/2022 | | JPM | | USD | | 51,759 | | 624 | | — | | 624 |
| Financing Index: Swiss Average Rate Overnight + 0.025% | | MSCI Switzerland Net Return CHF Index (Monthly) | | 3/16/2022 | | GSC | | CHF | | 2,414,963 | | 59,383 | | — | | 59,383 |
| Decrease in total return of Swiss Market Index (At Termination) | | Increase in total return of Swiss Market Index (At Termination) | | 3/18/2022 | | CITI | | CHF | | 9,207,360 | | 312,289 | | — | | 312,289 |
| Subtotal Appreciation | | | | | | | | | | | | $464,787 | | $ — | | $464,787 |
| Financing Index: Bank of Japan Unsecured Overnight Call Rate + 0.00% | | MSCI Japan Net Return JPY Index (Monthly) | | 3/16/2022 | | GSC | | JPY | | 55,631,956 | | $ (964) | | $ — | | $ (964) |
See Notes to Financial Statements.
| Pay Rate Index/Pay Rate | | Receive
Rate/Receive
Rate Index | | Maturity
Date | | Counterparty | | Currency | | Notional
Amount | | Market Value | | Upfront
Premiums
Paid/
(Received) | | Unrealized
Appreciation
(Depreciation) |
| MSCI Australia Net Return AUD Index (Monthly) | | Financing Index: 1-Month ASX BBSW + 0.07% | | 3/16/2022 | | GSC | | AUD | | 918,758 | | $ (21) | | $ — | | $ (21) |
| MSCI Spain Net Return EUR Index (Monthly) | | Financing Index: Euro Short Term Rate - 0.22% | | 3/16/2022 | | GSC | | EUR | | 7,369,720 | | (248,873) | | — | | (248,873) |
| Subtotal Depreciation | | | | | | | | | | | | $(249,858) | | $ — | | $(249,858) |
| Net Total Return Swaps outstanding at December 31, 2021 | | $ 214,929 | | $ — | | $ 214,929 |
Total Return Basket Swap Agreements outstanding at December 31, 2021:
| Description | | Maturity
Date | | Counterparty | | Notional
Amount | | Market Value | | Upfront
Premiums
Paid/
(Received) | | Unrealized
Appreciation
(Depreciation) |
| The Fund receives the total return on a portfolio of short equity positions and receives the DETNT/N minus a specified spread (-0.35%), which is denominated in DKK based on the local currencies of the positions within the swap. | | 44-58 months maturity ranging from 08/08/2025 - 10/21/2026 | | GSC | | $ 11,764,537 | | $ 81,551 | | $ — | | $ 81,551 |
| The Fund receives the total return on a portfolio of long and short equity positions and pays or receives the EONIA plus or minus a specified spread(-.85% to 0.25%), which is denominated in EUR based on the local currencies of the positions within the swap (Monthly).* | | 44-60 months maturity ranging from 08/08/2025 - 12/16/2026 | | GSC | | 53,047,447 | | 215,665 | | — | | 215,665 |
| The Fund receives the total return on a portfolio of long and short equity positions and pays or receives the SONIA plus or minus a specified spread(-0.25% to 0.25%), which is denominated in GBP based on the local currencies of the positions within the swap (Monthly).** | | 44-60 months maturity ranging from 08/08/2025 - 12/16/2026 | | GSC | | 36,912,420 | | 761,352 | | — | | 761,352 |
| The Fund receives the total return on a portfolio of short equity positions and receives the MUTSCALM minus a specified spread(-0.60% to -0.33%), which is denominated in JPY based on the local currencies of the positions within the swap (Monthly).*** | | 44-60 months maturity ranging from 08/08/2025 - 12/16/2026 | | GSC | | 1,587,194,988 | | 396,407 | | — | | 396,407 |
| The Fund receives the total return on a portfolio of short equity positions and receives the NOWA minus a specified spread (-0.35%), which is denominated in NOK based on the local currencies of the positions within the swap (Monthly). | | 44-53 months maturity ranging from 08/08/2025 - 05/11/2026 | | GSC | | 7,908,284 | | 36,944 | | — | | 36,944 |
| The Fund receives the total return on a portfolio of short equity positions and receives the SORA minus a specified spread (-0.40%), which is denominated in SGD based on the local currencies of the positions within the swap (Monthly). | | 55 months to maturity 07/27/2026 | | GSC | | 146,207 | | 1,728 | | — | | 1,728 |
| Subtotal Appreciation | | | | | | | | $1,493,647 | | $ — | | $1,493,647 |
| | | | | | | | | | | | | |
See Notes to Financial Statements.
INTERNATIONAL EQUITY FUND
SCHEDULE OF INVESTMENTS (Continued)
| * The following table represents disclosures associated with the underlying components of the total return basket swap as of year end. |
| Common Stocks | | Shares | | Notional | | Unrealized
Appreciation
(Depreciation) | | Percentage of
Swap Value |
| SEB SA | | 18,648 | | $ 2,552,911 | | $ 51,411 | | 23.84% |
| STMicroelectronics NV | | 57,583 | | 2,497,375 | | 36,607 | | 16.97 |
| Orange SA | | 226,054 | | 2,127,846 | | 130,096 | | 60.32 |
| Unibail-Rodamco-Westfield REIT | | (33,054) | �� | 2,036,788 | | (43,277) | | (20.07) |
| Carrefour SA | | 114,683 | | 1,846,970 | | 125,667 | | 58.27 |
| Cie de St-Gobain | | 28,583 | | 1,768,430 | | 21,803 | | 10.11 |
| Publicis Groupe SA | | 29,056 | | 1,720,115 | | 36,702 | | 17.02 |
| Delivery Hero SE | | (17,553) | | 1,706,589 | | 193,221 | | 89.59 |
| Aeroports de Paris | | (12,986) | | 1,471,314 | | (102,703) | | (47.62) |
| Argenx SE | | (4,526) | | 1,427,048 | | (230,463) | | (106.86) |
| Prosus NV | | (19,227) | | 1,413,761 | | (5,997) | | (2.78) |
| Amadeus IT Group SA | | (22,440) | | 1,333,672 | | (46,959) | | (21.77) |
| Telefonica SA | | 323,932 | | 1,233,761 | | 41,972 | | 19.46 |
| Rexel SA | | 68,022 | | 1,212,832 | | 612 | | 0.28 |
| Iberdrola SA | | 112,716 | | 1,172,205 | | 68,686 | | 31.85 |
| Cie Generale des Etablissements Michelin SCA | | 7,778 | | 1,121,199 | | 24,556 | | 11.39 |
| Electricite de France SA | | 107,976 | | 1,115,392 | | (271,425) | | (125.85) |
| Repsol SA | | 105,897 | | 1,101,583 | | 32,317 | | 14.99 |
| Eutelsat Communications SA | | 93,837 | | 1,007,340 | | (43,607) | | (20.22) |
| Fluidra SA | | 27,160 | | 951,429 | | 41,312 | | 19.16 |
| Sanofi | | 10,559 | | 935,316 | | 54,141 | | 25.10 |
| TotalEnergies SE | | 20,503 | | 915,049 | | 15,924 | | 7.38 |
| BNP Paribas SA | | 13,946 | | 847,498 | | 53,338 | | 24.73 |
| Atos SE | | 22,524 | | 842,172 | | 26,565 | | 12.32 |
| Casino Guichard Perrachon SA | | 35,356 | | 818,491 | | 27,120 | | 12.58 |
| Endesa SA | | 39,611 | | 800,968 | | 40,320 | | 18.70 |
| CaixaBank SA | | 327,870 | | 786,670 | | 27,889 | | 12.93 |
| Ferrovial SA | | (25,976) | | 713,540 | | (52,064) | | (24.14) |
| Sodexo SA | | 8,931 | | 688,223 | | 22,903 | | 10.62 |
| Rubis | | 25,720 | | 675,407 | | 30,284 | | 14.04 |
| Societe BIC SA | | 14,115 | | 667,922 | | 7,515 | | 3.48 |
| Rational AG | | (738) | | 662,978 | | (32,410) | | (15.03) |
| Mapfre SA | | 366,008 | | 657,292 | | (3,486) | | (1.62) |
| thyssenkrupp AG | | (68,252) | | 656,778 | | (22,296) | | (10.34) |
| Alstom SA | | (20,719) | | 646,847 | | 4,393 | | 2.04 |
| Thales SA | | 8,504 | | 636,099 | | 19,667 | | 9.12 |
| Bouygues SA | | 19,899 | | 626,620 | | 27,524 | | 12.76 |
| CTS Eventim AG & Co. KGaA | | (9,635) | | 618,578 | | (27,733) | | (12.86) |
| Enagas SA | | 30,225 | | 616,748 | | 14,803 | | 6.86 |
| Eurofins Scientific SE | | 5,574 | | 606,451 | | 10,011 | | 4.64 |
| Ipsen SA | | 6,595 | | 530,898 | | (86,234) | | (39.98) |
| Fraport AG Frankfurt Airport Services Worldwide | | (8,816) | | 518,479 | | (19,031) | | (8.82) |
| Red Electrica Corporation SA | | 25,063 | | 476,041 | | 5,046 | | 2.34 |
| ACS Actividades de Construccion y Servicios SA | | (19,385) | | 453,952 | | (44,517) | | (20.64) |
| BioMerieux | | 3,415 | | 426,534 | | 11,352 | | 5.26 |
| Accor SA | | (14,842) | | 422,255 | | (24,533) | | (11.38) |
| Nexi SpA | | (29,329) | | 408,221 | | 17,352 | | 8.05 |
| EssilorLuxottica SA | | 2,024 | | 378,974 | | 4,680 | | 2.17 |
| Societe Generale SA | | 12,207 | | 368,712 | | 13,616 | | 6.31 |
| SES SA | | 48,451 | | 337,800 | | 173 | | 0.08 |
| Other | | 84,291 | | 3,487,374 | | 32,822 | | 15.22 |
| | | | | $53,047,447 | | $ 215,665 | | 100.00% |
See Notes to Financial Statements.
| ** The following table represents disclosures associated with the underlying components of the total return basket swap as of year end. |
| Common Stocks | | Shares | | Notional | | Unrealized
Appreciation
(Depreciation) | | Percentage of
Swap Value |
| Rio Tinto PLC | | 66,970 | | $ 3,276,172 | | $105,193 | | 13.82% |
| BHP Group PLC | | 108,537 | | 2,387,271 | | 97,804 | | 12.85 |
| Evraz PLC | | 327,644 | | 1,971,106 | | 68,533 | | 9.00 |
| Royal Dutch Shell PLC, A Shares | | 102,256 | | 1,658,388 | | (27,960) | | (3.67) |
| Man Group PLC | | 709,250 | | 1,612,834 | | 45,654 | | 6.00 |
| Barclays PLC | | 832,126 | | 1,556,076 | | 46,444 | | 6.10 |
| Rolls-Royce Holdings PLC | | (1,194,933) | | 1,468,334 | | 22,873 | | 3.00 |
| HSBC Holdings PLC | | 319,624 | | 1,433,993 | | 35,095 | | 4.61 |
| Ocado Group PLC | | (83,939) | | 1,408,496 | | (51,214) | | (6.73) |
| BP PLC | | 417,733 | | 1,380,608 | | (44,074) | | (5.79) |
| Inchcape PLC | | 126,466 | | 1,150,208 | | 42,492 | | 5.58 |
| Kingfisher PLC | | 298,495 | | 1,009,809 | | (12,800) | | (1.68) |
| Barratt Developments PLC | | 133,239 | | 996,628 | | 13,440 | | 1.77 |
| Anglo American PLC | | 32,095 | | 967,985 | | 18,422 | | 2.42 |
| Aviva PLC | | 235,201 | | 965,265 | | 53,552 | | 7.03 |
| Sage Group PLC (The) | | 108,055 | | 921,277 | | 49,489 | | 6.50 |
| Royal Dutch Shell PLC, B Shares | | 46,826 | | 759,705 | | (16,272) | | (2.14) |
| Tate & Lyle PLC | | 113,730 | | 752,210 | | 44,261 | | 5.81 |
| BT Group PLC | | (441,897) | | 749,236 | | 28,604 | | 3.76 |
| M&G PLC | | 372,321 | | 742,780 | | 19,206 | | 2.52 |
| Carnival PLC | | (49,559) | | 685,698 | | (57,844) | | (7.60) |
| Royal Mail PLC | | 133,918 | | 677,625 | | 91,955 | | 12.08 |
| Ashtead Group PLC | | 11,350 | | 674,417 | | (59,495) | | (7.81) |
| easyJet PLC | | (107,413) | | 597,216 | | (28,824) | | (3.79) |
| Persimmon PLC | | 19,437 | | 555,121 | | 6,071 | | 0.80 |
| DCC PLC | | 8,353 | | 505,357 | | 38,086 | | 5.00 |
| ASOS PLC | | (20,586) | | 492,211 | | 36,469 | | 4.79 |
| Smith & Nephew PLC | | 36,321 | | 469,812 | | 28,147 | | 3.70 |
| Standard Life Aberdeen PLC | | 182,733 | | 440,204 | | 5,818 | | 0.76 |
| Standard Chartered PLC | | 77,560 | | 347,779 | | 18,807 | | 2.47 |
| Lloyds Banking Group PLC | | 707,129 | | 338,008 | | 21,442 | | 2.82 |
| Burberry Group PLC | | 18,075 | | 328,513 | | 5,739 | | 0.75 |
| Vodafone Group PLC | | 284,685 | | 319,587 | | 10,866 | | 1.43 |
| BAE Systems PLC | | 49,090 | | 269,897 | | (206) | | (0.03) |
| London Stock Exchange Group PLC | | 3,641 | | 252,321 | | 14,128 | | 1.86 |
| Informa PLC | | (43,389) | | 224,148 | | (6,122) | | (0.80) |
| 3i Group PLC | | 15,222 | | 220,567 | | 14,108 | | 1.85 |
| WH Smith PLC | | (14,256) | | 210,989 | | (9,179) | | (1.21) |
| Mondi PLC | | 10,775 | | 196,752 | | (2,095) | | (0.27) |
| boohoo Group PLC | | (153,219) | | 188,766 | | 78,170 | | 10.27 |
| Investec PLC | | 42,542 | | 171,232 | | 15,100 | | 1.98 |
| Unilever PLC | | 4,294 | | 169,420 | | (2,168) | | (0.28) |
| Natwest Group PLC | | 74,558 | | 168,277 | | 6,617 | | 0.87 |
| Dunelm Group PLC | | 12,159 | | 167,916 | | (539) | | (0.07) |
| Spirax-Sarco Engineering PLC | | 998 | | 160,179 | | (584) | | (0.08) |
| Howden Joinery Group PLC | | 16,137 | | 145,427 | | 5,930 | | 0.78 |
| Intertek Group PLC | | 2,548 | | 143,452 | | (3,902) | | (0.51) |
| Intermediate Capital Group PLC | | 5,844 | | 128,217 | | 574 | | 0.08 |
| Berkeley Group Holdings PLC | | 2,445 | | 116,749 | | 1,729 | | 0.23 |
| ABCAM PLC | | (5,486) | | 95,072 | | (1,640) | | (0.22) |
| Other | | 31,969 | | 283,110 | | (4,548) | | (0.61) |
| | | | | $36,912,420 | | $761,352 | | 100.00% |
See Notes to Financial Statements.
INTERNATIONAL EQUITY FUND
SCHEDULE OF INVESTMENTS (Continued)
| *** The following table represents disclosures associated with the underlying components of the total return basket swap as of year end. |
| Common Stocks | | Shares | | Notional | | Unrealized
Appreciation
(Depreciation) | | Percentage of
Swap Value |
| East Japan Railway Co. | | (19,600) | | $ 138,601,965 | | $ 9,073 | | 2.29% |
| Nippon Paint Holdings Co., Ltd. | | (101,700) | | 127,757,442 | | 39,212 | | 9.89 |
| Rakuten, Inc. | | (110,600) | | 127,646,350 | | 11,847 | | 2.99 |
| Mercari, Inc. | | (18,000) | | 105,343,804 | | 123,060 | | 31.04 |
| West Japan Railway Co. | | (21,700) | | 104,396,310 | | 57,581 | | 14.53 |
| Japan Airlines Co., Ltd. | | (47,600) | | 103,941,746 | | 7,901 | | 1.99 |
| Harmonic Drive Systems, Inc. | | (21,000) | | 101,867,321 | | (30,296) | | (7.64) |
| ANA Holdings, Inc. | | (39,800) | | 95,706,612 | | (2,630) | | (0.66) |
| Central Japan Railway Co. | | (4,900) | | 75,005,659 | | 32,584 | | 8.22 |
| Japan Airport Terminal Co., Ltd. | | (12,400) | | 59,490,085 | | 34,660 | | 8.74 |
| Sysmex Corporation | | (3,600) | | 55,896,948 | | (32,687) | | (8.25) |
| Park24 Co., Ltd. | | (34,600) | | 54,557,454 | | 48,998 | | 12.36 |
| Toho Gas Co., Ltd. | | (16,000) | | 46,881,274 | | 14,520 | | 3.66 |
| Odakyu Electric Railway Co., Ltd. | | (21,700) | | 46,407,151 | | 7,932 | | 2.00 |
| Seibu Holdings, Inc. | | (42,400) | | 45,607,249 | | 21,807 | | 5.50 |
| Nexon Co., Ltd. | | (19,900) | | 44,262,539 | | 6,156 | | 1.55 |
| Koei Tecmo Holdings Co., Ltd. | | (7,000) | | 31,616,316 | | 18,289 | | 4.61 |
| Showa Denko KK | | (12,300) | | 29,750,705 | | 9,900 | | 2.50 |
| MonotaRO Co., Ltd. | | (14,000) | | 28,965,024 | | 17,387 | | 4.39 |
| Yaskawa Electric Corporation | | (3,900) | | 22,011,690 | | (847) | | (0.21) |
| Kikkoman Corporation | | (2,200) | | 21,310,953 | | (13,356) | | (3.37) |
| Keisei Electric Railway Co., Ltd. | | (6,600) | | 20,538,217 | | 3,879 | | 0.98 |
| Kobe Bussan Co., Ltd. | | (4,600) | | 20,486,895 | | (18,829) | | (4.75) |
| Z Holdings Corporation | | (26,500) | | 17,588,639 | | 14,710 | | 3.71 |
| Keikyu Corporation | | (11,500) | | 13,232,858 | | (2,360) | | (0.59) |
| Kakaku.com, Inc. | | (3,400) | | 10,455,439 | | 8,403 | | 2.12 |
| Aeon Co., Ltd. | | (3,100) | | 8,403,542 | | 3,077 | | 0.78 |
| Oriental Land Co., Ltd. | | (400) | | 7,758,872 | | (1,466) | | (0.37) |
| M3, Inc. | | (1,300) | | 7,539,963 | | 876 | | 0.22 |
| Daifuku Co., Ltd. | | (800) | | 7,525,255 | | 2,112 | | 0.53 |
| PeptiDream, Inc. | | (2,600) | | 6,640,711 | | 4,914 | | 1.24 |
| | | | | $1,587,194,988 | | $396,407 | | 100.00% |
| Description | | Maturity
Date | | Counterparty | | Notional
Amount | | Market Value | | Upfront
Premiums
Paid/
(Received) | | Unrealized
Appreciation
(Depreciation) |
| The Fund receives the total return on a portfolio of short equity positions and receives the RBA minus a specified spread(-0.40%), which is denominated in AUD based on the local currencies of the positions within the swap (Monthly). | | 44-59 months maturity ranging from 08/08/2025 - 11/16/2026 | | GSC | | $10,401,876 | | $(126,364) | | $— | | $(126,364) |
| The Fund receives the total return on a portfolio of short equity positions and receives the SSARON minus a specified spread(-0.35%), which is denominated in CHF based on the local currencies of the positions within the swap (Monthly). | | 44-54 months maturity ranging from 08/08/2025 - 06/12/2026 | | GSC | | 4,891,938 | | (216,994) | | — | | (216,994) |
See Notes to Financial Statements.
| Description | | Maturity
Date | | Counterparty | | Notional
Amount | | Market Value | | Upfront
Premiums
Paid/
(Received) | | Unrealized
Appreciation
(Depreciation) |
| The Fund receives the total return on a portfolio of long equity positions and pays HIBOR plus a specified spread (.33%), which is denominated in HKD based on the local currencies of the positions within the swap (Monthly). | | 44-60 months maturity ranging from 08/08/2025 - 12/16/2026 | | GSC | | $63,565,226 | | $ (84,521) | | $ — | | $ (84,521) |
| The Fund receives the total return on a portfolio of short equity positions and receives the STIBOR minus a specified spread(-0.35%), which is denominated in SEK based on the local currencies of the positions within the swap (Monthly). | | 46-58 months maturity ranging from 10/15/2025 - 10/21/2026 | | GSC | | 31,104,469 | | (9,457) | | — | | (9,457) |
| Subtotal Depreciation | | | | | | | | $ (437,336) | | $ — | | $ (437,336) |
| Net Total Return Basket Swaps | | | | | | | | $1,056,311 | | $ — | | $1,056,311 |
See Notes to Financial Statements.
INTERNATIONAL EQUITY FUND
SCHEDULE OF INVESTMENTS (Continued)
VALUATION HIERARCHY
The following is a summary of the inputs used, as of December 31, 2021, in valuing the Fund’s investments carried at fair value:
| | Total
Value | | Level 1
Quoted Prices | | Level 2
Other Significant
Observable Inputs | | Level 3
Significant
Unobservable Inputs |
| Assets: | | | | | | | |
| Investments in Securities: | | | | | | | |
| Common Stocks | $ 46,237,221 | | $ 46,237,221 | | $ — | | $ — |
| Foreign Common Stocks: | | | | | | | |
| Denmark | 14,264,522 | | — | | 14,264,522 | | — |
| Finland | 4,937,353 | | — | | 4,937,353 | | — |
| Germany | 128,672,311 | | 1,755,779 | | 126,916,532 | | — |
| Indonesia | 1,315,082 | | — | | 1,315,082 | | — |
| Ireland | 51,950,668 | | 50,200,014 | | 1,750,654 | | — |
| Italy | 10,842,571 | | — | | 10,842,571 | | — |
| Japan | 201,180,042 | | — | | 201,180,042 | | — |
| Netherlands | 71,047,511 | | 52,730,440 | | 18,317,071 | | — |
| Norway | 3,386,669 | | — | | 3,386,669 | | — |
| Singapore | 7,323,351 | | 7,120,769 | | 202,582 | | — |
| South Korea | 12,685,400 | | 3,131,451 | | 9,553,949 | | — |
| Spain | 19,356,860 | | — | | 19,356,860 | | — |
| Sweden | 34,368,214 | | — | | 34,368,214 | | — |
| Switzerland | 176,218,858 | | 11,635,329 | | 164,583,529 | | — |
| Other ^^ | 432,699,714 | | 432,699,714 | | — | | —** |
| Total Foreign Common Stocks | 1,170,249,126 | | 559,273,496 | | 610,975,630 | | — |
| Foreign Preferred Stocks | 9,848,870 | | — | | 9,848,870 | | — |
| Money Market Funds | 86,212,055 | | 86,212,055 | | — | | — |
| Total Assets - Investments in Securities | $1,312,547,272 | | $691,722,772 | | $620,824,500 | | $ — |
| Other Financial Instruments*** | | | | | | | |
| Forward Foreign Currency Contracts | $ 1,895,935 | | $ — | | $ 1,895,935 | | $ — |
| Futures Contracts | 2,069,079 | | 2,069,079 | | — | | — |
| Swap Agreements | 1,958,434 | | — | | 1,958,434 | | — |
| Total Assets - Other Financial Instruments | $ 5,923,448 | | $ 2,069,079 | | $ 3,854,369 | | $ — |
| | | | | | | | |
See Notes to Financial Statements.
| | Total
Value | | Level 1
Quoted Prices | | Level 2
Other Significant
Observable Inputs | | Level 3
Significant
Unobservable Inputs |
| Liabilities: | | | | | | | |
| Investments in Securities: | | | | | | | |
| Foreign Common Stocks Sold Short | $(1,087,614) | | $(1,087,614) | | $ — | | $ — |
| Total Liabilities - Investments in Securities | $(1,087,614) | | $(1,087,614) | | $ — | | $ — |
| Other Financial Instruments*** | | | | | | | |
| Forward Foreign Currency Contracts | $(2,836,693) | | $ — | | $(2,836,693) | | $ — |
| Futures Contracts | (1,022,716) | | (1,022,716) | | — | | — |
| Swap Agreements | (687,194) | | — | | (687,194) | | — |
| Total Liabilities - Other Financial Instruments | $(4,546,603) | | $(1,022,716) | | $(3,523,887) | | $ — |
| ** | Level 3 security has zero value. |
| ^^ | Classifications as defined in the Schedule of Investments. |
| *** | Other financial instruments are derivative instruments, such as futures contracts, forward contracts and swap agreements, which are valued at the unrealized appreciation (depreciation) on the investment. Further details regarding the value of these investments can be found in the preceding "Futures Contracts outstanding", "Forward Foreign Currency Contracts outstanding" and "Swap Agreements outstanding" disclosures. |
There were no transfers to or from Level 3 during the year ended December 31, 2021.
Management has determined that the amount of Level 3 securities compared to total net assets is not material; therefore, the reconciliation of Level 3 securities and assumptions is not shown for the year ended December 31, 2021.
See Notes to Financial Statements.
Emerging Markets Equity Fund (Unaudited)
Emerging markets stocks declined in 2021, with the MSCI Emerging Markets Index posting a return of -2.54% compared to 28.71% for the S&P 500® Index. China, the largest regional component of the index, was the primary drag on index returns for the year, as regulators checked the power of the country’s leading tech firms and concerns arose about a potential collapse in the country’s debt-laden real estate industry. Despite marking all-time highs early in the year, China’s stock market (defined as the MSCI China Index) declined by 21.72% in 2021. Although there was a small spread between the returns of growth and value stocks globally, within emerging markets, value stocks outperformed growth stocks by more than 12% for the year. This outsized return gap in emerging markets was due mostly to the decline of Chinese tech shares. Helping to partially offset China’s weakness were strong returns from Taiwan and India, as well as the financial and energy sectors.
The Fund is actively managed and invests mainly in equity securities that are economically tied to emerging markets. In addition, the Fund’s portfolio is diversified among a large number of companies across different industries and economic sectors. The Investor Class of the Fund outperformed its benchmark, the MSCI Emerging Markets Index, for the one-year period ended December 31, 2021 (-2.12% versus -2.54%). On a country basis, China was the strongest contributor to relative returns due to the Fund’s underweight to the region versus the benchmark, as well as strong underlying stock selection. Technology was by far the strongest contributor to relative performance at the sector level, driven by an overweight to the semiconductor industry. On the detractors’ front, financials was the worst sector, primarily as result of carrying less exposure to banks than the benchmark.
Within the Fund, certain derivatives were utilized to express active views in currency and country selection. These derivative positions primarily included currency forward contracts, stock index futures and total return swaps. Overall, derivative exposure had a slight positive impact on Fund performance over the course of the year.
This Fund may be suitable to investors who seek higher, long-term rates of return, can accept significant short-term fluctuations in account value and want to diversify their portfolio with emerging markets equity securities. Securities of foreign issuers may be negatively impacted by political events, economic conditions or inefficient, illiquid or unregulated markets in foreign countries, and they also may be subject to inadequate regulatory or accounting standards, which may increase investment risk. Investing in emerging markets may involve greater risks than investing in more developed foreign markets because, among other things, emerging markets often have more political and economic instability. Medium- and small-sized companies’ stocks have historically been subject to more investment risk and more volatile and less liquid than large company stocks, respectively. To the extent that the investment adviser misjudges current market conditions, the Fund’s volatility may be amplified by its use of derivatives and by its ability to select sub-advisers to allocate assets. Derivatives involve different risks from, and in some respects greater risks than, those associated with investing directly in securities, currencies or other instruments. Derivatives may be illiquid or less liquid, volatile, difficult to price and leveraged, so that small changes in the value of the underlying instruments may produce disproportionate losses to the Fund. It is possible to lose money by investing in the Fund.
At December 31, 2021, the portfolio holdings of the Fund, as a percentage of net assets, is shown in the following table. Portfolio holdings are subject to risk and may change at any time.
| | % |
| Information Technology | 25.1 |
| Financials | 16.2 |
| Consumer Discretionary | 12.7 |
| Communication Services | 9.2 |
| Money Market Funds | 9.1 |
| Consumer Staples | 7.5 |
| Materials | 6.0 |
| Industrials | 5.6 |
| Energy | 3.3 |
| Health Care | 2.0 |
| Real Estate | 1.2 |
| Utilities | 1.1 |
| | 99.0 |
See Notes to Financial Statements.
Emerging Markets Equity Fund (Unaudited)
| Average Annual Total Returns as of 12/31/21 | |
| | | Institutional Class* | | Investor Class* | | Benchmark** | |
| One Year | | (1.85%) | | (2.12%) | | (2.54%) | |
| Five Year | | 9.28% | | 8.91% | | 9.87% | |
| Ten Year | | N/A | | N/A | | N/A | |
| Since Inception | | 3.65% | | 3.34% | | 4.55% | |
| Inception Date | | 10/31/13 | | 10/31/13 | | | |
| Total Fund Operating Expenses (May 1, 2021 Prospectus)(1) | | 1.12% | | 1.52% | | | |
| (1) | Current information regarding the Fund’s Operating Expenses can be found in the Financial Highlights. |
The performance data quoted represents past performance and does not guarantee future results. Current performance may be lower or higher. Performance data current to the most recent month-end may be obtained at GuideStoneFunds.com. The investment return and principal value of an investment will fluctuate so that shares, when redeemed, may be worth more or less than their original cost.
The graph illustrates the results of a hypothetical $10,000 investment in the Investor Class of the Fund since October 31, 2013 (commencement of operations), with all dividends and capital gains reinvested, with the MSCI Emerging Markets Index.
*These returns reflect investment advisory and shareholder servicing fee waivers, if applicable, during the reported time periods.
**Unlike a mutual fund, the performance of an index assumes no taxes, transaction costs, management fees or other expenses.
See Notes to Financial Statements.
EMERGING MARKETS EQUITY FUND
| | | Shares | | Value |
| COMMON STOCKS — 4.0% |
| Communication Services — 0.5% | | |
| Bilibili, Inc. ADRΔ* | 3,322 | | $ 154,141 |
| Kanzhun, Ltd. ADRΔ* | 36,764 | | 1,282,328 |
| Sea, Ltd. ADR* | 8,241 | | 1,843,594 |
| Tencent Music Entertainment Group ADR* | 10,477 | | 71,767 |
| VTEX Class AΔ* | 36,862 | | 395,161 |
| | | | | 3,746,991 |
| Consumer Discretionary — 2.3% | | |
| Arco Platform, Ltd. Class AΔ* | 43,040 | | 899,106 |
| Coupang, Inc.Δ* | 36,967 | | 1,086,090 |
| Huazhu Group, Ltd. ADR* | 3,029 | | 113,103 |
| Li Auto, Inc. ADR* | 13,378 | | 429,434 |
| MercadoLibre, Inc.* | 4,742 | | 6,394,113 |
| NIO, Inc. ADR* | 36,022 | | 1,141,177 |
| Ozon Holdings PLC ADRΔ* | 32,420 | | 959,956 |
| Pinduoduo, Inc. ADR* | 10,227 | | 596,234 |
| Trip.com Group, Ltd. ADR* | 83,437 | | 2,054,219 |
| XPeng, Inc. ADR* | 11,092 | | 558,260 |
| Yum China Holdings, Inc. | 96,320 | | 4,800,589 |
| | | | | 19,032,281 |
| Financials — 0.2% | | |
| NU Holdings, Ltd. Class AΔ* | 51,396 | | 482,094 |
| Patria Investments, Ltd. Class A | 90,960 | | 1,473,552 |
| | | | | 1,955,646 |
| Health Care — 0.2% | | |
| BeiGene, Ltd. ADR* | 1,264 | | 342,456 |
| Zai Lab, Ltd. ADR* | 17,459 | | 1,097,298 |
| | | | | 1,439,754 |
| Industrials — 0.4% | | |
| Full Truck Alliance Co., Ltd. ADRΔ* | 37,426 | | 313,256 |
| ZTO Express Cayman, Inc. ADR | 99,746 | | 2,814,832 |
| | | | | 3,128,088 |
| Information Technology — 0.4% | | |
| Dlocal, Ltd.* | 10,490 | | 374,388 |
| EPAM Systems, Inc.* | 850 | | 568,183 |
| GDS Holdings, Ltd. ADRΔ* | 2,167 | | 102,196 |
| Globant SA* | 5,171 | | 1,624,159 |
| Pagseguro Digital, Ltd. Class AΔ* | 10,247 | | 268,676 |
| TDCX, Inc. ADRΔ* | 22,048 | | 422,219 |
| Zepp Health Corporation ADRΔ* | 8,091 | | 40,860 |
| | | | | 3,400,681 |
| Materials — 0.0% | | |
| Southern Copper Corporation | 2,441 | | 150,634 |
| Real Estate — 0.0% | | |
| KE Holdings, Inc. ADR* | 14,003 | | 281,740 |
Total Common Stocks
(Cost $33,961,783) | | 33,135,815 |
| FOREIGN COMMON STOCKS — 85.2% |
| Brazil — 2.8% | | |
| Aeris Industria E Comercio De Equipamentos Para Geracao De Energia SA* | 325,541 | | 382,360 |
| | | Shares | | Value |
| B3 SA - Brasil Bolsa Balcao | 1,850,400 | | $ 3,684,858 |
| Banco BTG Pactual SA* | 272,200 | | 1,022,407 |
| Banco do Brasil SA | 356,200 | | 1,840,981 |
| Blau Farmaceutica SA* | 45,978 | | 299,871 |
| Boa Vista Servicos SA | 173,393 | | 186,779 |
| Caixa Seguridade Participacoes S/A | 850,321 | | 1,270,116 |
| CCR SA | 119,800 | | 248,717 |
| Hapvida Participacoes e Investimentos SA 144A | 249,900 | | 463,880 |
| JBS SA | 218,300 | | 1,489,471 |
| Localiza Rent a Car SA | 97,600 | | 926,005 |
| Locaweb Servicos de Internet SA 144A* | 290,300 | | 673,504 |
| Magazine Luiza SA* | 591,600 | | 762,563 |
| Notre Dame Intermedica Participacoes SA | 14,300 | | 154,379 |
| Qualicorp Consultoria e Corretora de Seguros SA | 1,652 | | 4,998 |
| Raia Drogasil SA | 915,400 | | 3,985,389 |
| Rede D'Or Sao Luiz SA 144A | 69,871 | | 561,200 |
| Telefonica Brasil SA | 66,500 | | 577,290 |
| Vale SA ADR | 250,292 | | 3,509,094 |
| Vibra Energia SA | 300,223 | | 1,151,132 |
| | | | | 23,194,994 |
| Canada — 0.2% | | |
| Parex Resources, Inc. | 111,651 | | 1,907,410 |
| Chile — 0.8% | | |
| Banco de Chile ADRΔ | 7,668 | | 120,464 |
| Banco de Credito e Inversiones SA | 2,008 | | 58,652 |
| Banco Santander Chile ADR | 3,609 | | 58,791 |
| Cencosud SA | 819,586 | | 1,370,786 |
| Empresas CMPC SA | 130,129 | | 218,104 |
| Empresas COPEC SA | 35,154 | | 271,742 |
| Falabella SA | 1,343,766 | | 4,383,011 |
| | | | | 6,481,550 |
| China — 16.5% | | |
| Agricultural Bank of China, Ltd. Class A | 252,800 | | 116,906 |
| Agricultural Bank of China, Ltd. Class H | 7,548,000 | | 2,594,230 |
| Alibaba Group Holding, Ltd. ADR* | 48,300 | | 5,737,557 |
| Amoy Diagnostics Co., Ltd. Class A | 96,900 | | 1,150,911 |
| Anhui Conch Cement Co., Ltd. Class A | 40,100 | | 254,193 |
| Anhui Conch Cement Co., Ltd. Class H | 34,500 | | 172,333 |
| Baidu, Inc. ADR* | 7,509 | | 1,117,264 |
| Bank of Beijing Co., Ltd. Class A | 149,800 | | 104,619 |
| Bank of China, Ltd. Class A | 203,500 | | 97,629 |
| Bank of China, Ltd. Class H | 4,683,000 | | 1,687,611 |
| Bank of Communications Co., Ltd. Class A | 110,200 | | 79,909 |
| Bank of Ningbo Co., Ltd. Class A | 29,700 | | 178,831 |
| Bank of Shanghai Co., Ltd. Class A | 85,980 | | 96,427 |
| Baoshan Iron & Steel Co., Ltd. Class A | 212,500 | | 239,324 |
| Beijing Easpring Material Technology Co., Ltd. Class A | 40,300 | | 550,666 |
See Notes to Financial Statements.
| | | Shares | | Value |
| BOE Technology Group Co., Ltd. Class A | 620,900 | | $ 493,204 |
| BYD Co., Ltd. Class A | 15,500 | | 653,694 |
| China Cinda Asset Management Co., Ltd. Class H | 3,325,000 | | 605,511 |
| China CITIC Bank Corporation, Ltd. Class H | 3,832,000 | | 1,661,055 |
| China Construction Bank Corporation Class H | 1,477,000 | | 1,022,860 |
| China Everbright Bank Co., Ltd. Class A | 131,700 | | 68,776 |
| China Everbright Bank Co., Ltd. Class H | 1,777,000 | | 628,982 |
| China Mengniu Dairy Co., Ltd.* | 351,730 | | 1,993,763 |
| China Merchants Bank Co., Ltd. Class A | 37,756 | | 289,280 |
| China Merchants Bank Co., Ltd. Class H | 465,000 | | 3,610,846 |
| China Merchants Securities Co., Ltd. Class A | 80,400 | | 223,210 |
| China Minsheng Banking Corporation, Ltd. Class A | 139,200 | | 85,392 |
| China National Building Material Co., Ltd. Class H | 766,000 | | 939,136 |
| China Pacific Insurance Group Co., Ltd. Class A | 21,100 | | 90,009 |
| China Petroleum & Chemical Corporation Class A | 424,000 | | 282,111 |
| China Petroleum & Chemical Corporation Class H | 906,000 | | 421,771 |
| China Railway Group, Ltd. Class H | 510,000 | | 269,469 |
| China State Construction Engineering Corporation, Ltd. Class A | 394,700 | | 310,421 |
| China Tourism Group Duty Free Corporation, Ltd. Class A | 16,712 | | 576,764 |
| China Tower Corporation, Ltd. Class H 144A | 3,756,000 | | 414,253 |
| China Vanke Co., Ltd. Class H | 99,950 | | 232,521 |
| CITIC Securities Co., Ltd. Class A | 48,700 | | 202,307 |
| Contemporary Amperex Technology Co., Ltd. Class A | 12,899 | | 1,193,018 |
| Country Garden Holdings Co., Ltd. | 360,632 | | 320,046 |
| CSC Financial Co., Ltd. Class H 144AΔ | 640,500 | | 700,664 |
| Dongfeng Motor Group Co., Ltd. Class H | 2,814,000 | | 2,338,519 |
| East Money Information Co., Ltd. Class A | 384,000 | | 2,241,485 |
| Ecovacs Robotics Co., Ltd. Class A | 26,200 | | 622,083 |
| Foshan Haitian Flavouring & Food Co., Ltd. Class A | 32,301 | | 534,040 |
| Guotai Junan Securities Co., Ltd. Class A | 45,900 | | 129,163 |
| Haier Smart Home Co., Ltd. Class A | 104,200 | | 489,900 |
| Haitian International Holdings, Ltd. | 520,000 | | 1,443,787 |
| Haitong Securities Co., Ltd. Class A | 60,600 | | 116,863 |
| Haitong Securities Co., Ltd. Class H | 380,000 | | 336,747 |
| Hangzhou Robam Appliances Co., Ltd. Class A | 147,032 | | 833,046 |
| Huatai Securities Co., Ltd. Class A | 39,636 | | 110,725 |
| | | Shares | | Value |
| Huaxia Bank Co., Ltd. Class A | 113,607 | | $ 100,071 |
| Industrial & Commercial Bank of China, Ltd. Class A | 169,700 | | 123,588 |
| Industrial Bank Co., Ltd. Class A | 40,800 | | 122,191 |
| Inner Mongolia Yili Industrial Group Co., Ltd. Class A | 124,762 | | 813,627 |
| Jiangsu Hengli Hydraulic Co., Ltd. Class A | 157,800 | | 2,030,364 |
| Jiangsu Hengrui Medicine Co., Ltd. Class A | 80,775 | | 644,299 |
| LONGi Green Energy Technology Co., Ltd. Class A | 90,200 | | 1,223,003 |
| Luxshare Precision Industry Co., Ltd. Class A | 226,212 | | 1,750,630 |
| Midea Group Co., Ltd. Class A | 190,300 | | 2,209,366 |
| NARI Technology Co., Ltd. Class A | 775,441 | | 4,882,563 |
| NetEase, Inc. ADR | 31,981 | | 3,255,026 |
| New China Life Insurance Co., Ltd. Class A | 21,100 | | 129,039 |
| PetroChina Co., Ltd. Class A | 148,700 | | 114,843 |
| PetroChina Co., Ltd. Class H | 440,000 | | 195,805 |
| PICC Property & Casualty Co., Ltd. Class H | 77,803 | | 63,559 |
| Ping An Bank Co., Ltd. Class A | 50,900 | | 131,944 |
| Ping An Insurance Group Co. of China, Ltd. Class A | 20,100 | | 159,377 |
| Ping An Insurance Group Co. of China, Ltd. Class H | 1,074,996 | | 7,741,025 |
| Qingdao Haier Biomedical Co., Ltd. Class A | 33,550 | | 479,278 |
| SAIC Motor Corporation, Ltd. Class A | 81,900 | | 265,764 |
| Sany Heavy Industry Co., Ltd. Class A | 561,500 | | 2,013,716 |
| SF Holding Co., Ltd. Class A | 70,599 | | 765,345 |
| Shandong Sinocera Functional Material Co., Ltd. Class A | 316,800 | | 2,121,302 |
| Shanghai International Airport Co., Ltd. Class A* | 219,800 | | 1,614,229 |
| Shanghai Pudong Development Bank Co., Ltd. Class A | 60,200 | | 80,772 |
| Shenwan Hongyuan Group Co., Ltd. Class A | 160,100 | | 128,936 |
| Shenzhen Inovance Technology Co., Ltd. Class A | 233,427 | | 2,518,777 |
| Shenzhen Mindray Bio-Medical Electronics Co., Ltd. Class A | 31,800 | | 1,904,749 |
| Sinopharm Group Co., Ltd. Class H | 297,200 | | 646,423 |
| Sunac China Holdings, Ltd. | 142,859 | | 215,822 |
| Suning.com Co., Ltd. Class A* | 202,175 | | 131,020 |
| Sunny Optical Technology Group Co., Ltd. | 260,576 | | 8,240,799 |
| Tencent Holdings, Ltd. | 599,430 | | 35,116,110 |
| Vipshop Holdings, Ltd. ADR* | 8,678 | | 72,895 |
| Will Semiconductor Co., Ltd. Class A | 55,958 | | 2,735,363 |
| WuXi AppTec Co., Ltd. Class H 144A | 56,502 | | 978,220 |
| Yifeng Pharmacy Chain Co., Ltd. Class A | 335,026 | | 2,904,172 |
| Yonghui Superstores Co., Ltd. Class A | 364,632 | | 232,286 |
See Notes to Financial Statements.
EMERGING MARKETS EQUITY FUND
SCHEDULE OF INVESTMENTS (Continued)
| | | Shares | | Value |
| YTO Express Group Co., Ltd. Class A | 326,000 | | $ 855,317 |
| Yunnan Aluminium Co., Ltd. Class A* | 343,749 | | 603,960 |
| Yunnan Energy New Material Co., Ltd. Class A | 67,200 | | 2,646,776 |
| Zhejiang Sanhua Intelligent Controls Co., Ltd. Class A | 240,430 | | 956,804 |
| Zoomlion Heavy Industry Science and Technology Co., Ltd. Class H | 780,200 | | 491,280 |
| ZTE Corporation Class H | 448,200 | | 1,227,189 |
| | | | | 136,301,455 |
| Egypt — 0.3% | | |
| Commercial International Bank Egypt SAE* | 652,960 | | 2,197,594 |
| E-Finance for Digital & Financial Investments* | 271,463 | | 350,604 |
| | | | | 2,548,198 |
| Greece — 0.2% | | |
| Hellenic Exchanges - Athens Stock Exchange SA | 54,765 | | 231,318 |
| JUMBO SA | 38,114 | | 546,749 |
| Sarantis SA | 51,117 | | 517,951 |
| | | | | 1,296,018 |
| Hong Kong — 9.6% | | |
| 3SBio, Inc. 144A* | 671,000 | | 559,342 |
| AIA Group, Ltd. | 1,043,625 | | 10,519,833 |
| Akeso, Inc. 144A* | 235,000 | | 1,024,681 |
| Alibaba Group Holding, Ltd.* | 637,340 | | 9,718,402 |
| ANTA Sports Products, Ltd. | 89,000 | | 1,334,278 |
| Beijing Enterprises Holdings, Ltd. | 54,000 | | 186,289 |
| Bilibili, Inc. Class ZΔ* | 35,525 | | 1,633,752 |
| Brilliance China Automotive Holdings, Ltd.Ψ†††* | 2,064,000 | | 966,150 |
| China Everbright Environment Group, Ltd. | 158,000 | | 126,845 |
| China Feihe, Ltd. 144A | 464,000 | | 622,431 |
| China Hongqiao Group, Ltd. | 2,186,000 | | 2,307,235 |
| China Medical System Holdings, Ltd. | 707,000 | | 1,180,517 |
| China Merchants Port Holdings Co., Ltd. | 250,000 | | 455,271 |
| China Overseas Land & Investment, Ltd. | 121,500 | | 287,640 |
| China Resources Cement Holdings, Ltd. | 614,398 | | 464,095 |
| China Resources Land, Ltd.Δ | 1,359,987 | | 5,720,717 |
| China Taiping Insurance Holdings Co., Ltd. | 527,400 | | 723,712 |
| China Traditional Chinese Medicine Holdings Co., Ltd. | 702,000 | | 465,446 |
| China Yuhua Education Corporation, Ltd. 144A | 1,088,000 | | 389,292 |
| CITIC, Ltd. | 713,000 | | 704,080 |
| COSCO SHIPPING Ports, Ltd. | 290,000 | | 251,784 |
| Country Garden Services Holdings Co., Ltd. | 33,000 | | 197,639 |
| CSPC Pharmaceutical Group, Ltd. | 2,756,000 | | 2,993,674 |
| ENN Energy Holdings, Ltd. | 201,300 | | 3,789,760 |
| Hong Kong Exchanges and Clearing, Ltd. | 119,362 | | 6,971,094 |
| | | Shares | | Value |
| Hua Hong Semiconductor, Ltd. 144A* | 85,000 | | $ 468,737 |
| JD.com, Inc. Class AΔ* | 46,906 | | 1,648,241 |
| Jiumaojiu International Holdings, Ltd. 144A | 236,000 | | 414,643 |
| Kingboard Holdings, Ltd. | 295,500 | | 1,438,173 |
| Kingdee International Software Group Co., Ltd.* | 409,000 | | 1,258,857 |
| Kingsoft Corporation, Ltd. | 195,800 | | 860,033 |
| Kunlun Energy Co., Ltd. | 1,036,000 | | 971,223 |
| Lenovo Group, Ltd. | 60,000 | | 68,945 |
| Longfor Group Holdings, Ltd. 144A | 71,384 | | 335,976 |
| Meituan Class B 144A* | 299,821 | | 8,666,780 |
| Minth Group, Ltd. | 236,000 | | 1,039,634 |
| NetEase, Inc. | 107,700 | | 2,175,395 |
| Samsonite International SA 144A* | 327,000 | | 664,270 |
| Shenzhen International Holdings, Ltd. | 93,500 | | 97,127 |
| Sino Biopharmaceutical, Ltd. | 1,541,000 | | 1,079,039 |
| Sinotruk Hong Kong, Ltd. | 686,000 | | 1,055,716 |
| Techtronic Industries Co., Ltd. | 49,000 | | 975,281 |
| Topsports International Holdings, Ltd. 144A | 535,000 | | 541,343 |
| Uni-President China Holdings, Ltd. | 112,000 | | 108,588 |
| Wharf Holdings, Ltd. (The) | 58,000 | | 178,146 |
| Zhongsheng Group Holdings, Ltd. | 174,000 | | 1,356,734 |
| ZTO Express Cayman, Inc. | 18,600 | | 516,193 |
| | | | | 79,513,033 |
| Hungary — 0.5% | | |
| OTP Bank Nyrt PLC* | 81,964 | | 4,179,454 |
| India — 11.9% | | |
| Amber Enterprises India, Ltd.* | 19,905 | | 887,985 |
| Atul, Ltd. | 3,082 | | 374,766 |
| Avenue Supermarts, Ltd. 144A* | 17,304 | | 1,087,429 |
| Axis Bank, Ltd.* | 130,648 | | 1,192,580 |
| Bharat Electronics, Ltd. | 586,049 | | 1,655,208 |
| Bharat Petroleum Corporation, Ltd. | 93,521 | | 484,931 |
| Bharti Airtel, Ltd.* | 549,152 | | 5,051,549 |
| Bharti Airtel, Ltd. (Partly Paid)* | 27,702 | | 131,419 |
| Cartrade Tech, Ltd.* | 17,215 | | 196,453 |
| Coal India, Ltd. | 250,574 | | 492,312 |
| Computer Age Management Services, Ltd. | 19,308 | | 692,495 |
| Container Corporation Of India, Ltd. | 13,279 | | 109,781 |
| Crompton Greaves Consumer Electricals, Ltd. | 106,768 | | 628,308 |
| FSN E-Commerce Ventures, Ltd.* | 14,662 | | 414,511 |
| Godrej Properties, Ltd.* | 49,541 | | 1,247,461 |
| HCL Technologies, Ltd. | 458,203 | | 8,130,898 |
| Hero MotoCorp, Ltd. | 64,301 | | 2,129,739 |
| Hindustan Petroleum Corporation, Ltd. | 28,273 | | 111,193 |
| Housing Development Finance Corporation, Ltd. | 441,704 | | 15,368,741 |
| ICICI Bank, Ltd. | 417,059 | | 4,152,600 |
| ICICI Lombard General Insurance Co., Ltd. 144A | 42,519 | | 801,496 |
| Indian Oil Corporation, Ltd. | 732,041 | | 1,098,027 |
| Info Edge India, Ltd. | 12,231 | | 917,576 |
See Notes to Financial Statements.
| | | Shares | | Value |
| Infosys, Ltd. | 90,518 | | $ 2,298,700 |
| Infosys, Ltd. ADR | 141,202 | | 3,573,823 |
| Kotak Mahindra Bank, Ltd. | 40,987 | | 990,329 |
| Larsen & Toubro, Ltd. | 24,980 | | 637,105 |
| Macrotech Developers, Ltd. 144A* | 50,025 | | 830,131 |
| Mahindra & Mahindra, Ltd. | 583,435 | | 6,570,503 |
| Marico, Ltd. | 961,692 | | 6,632,234 |
| MRF, Ltd. | 353 | | 348,262 |
| Navin Fluorine International, Ltd. | 25,365 | | 1,429,211 |
| NTPC, Ltd. | 1,573,417 | | 2,633,098 |
| Page Industries, Ltd. | 1,307 | | 710,708 |
| Petronet LNG, Ltd. | 209,549 | | 610,022 |
| Power Grid Corporation of India, Ltd. | 173,584 | | 477,302 |
| REC, Ltd. | 540,412 | | 972,711 |
| Route Mobile, Ltd. | 30,711 | | 736,793 |
| SBI Life Insurance Co., Ltd. 144A | 46,329 | | 745,396 |
| Sona Blw Precision Forgings, Ltd. 144A* | 91,204 | | 912,277 |
| Tata Consultancy Services, Ltd. | 202,623 | | 10,189,938 |
| Tata Consumer Products, Ltd. | 82,317 | | 823,274 |
| Tata Steel, Ltd. | 28,647 | | 428,324 |
| TeamLease Services, Ltd.* | 13,419 | | 751,735 |
| Tech Mahindra, Ltd. | 144,780 | | 3,487,369 |
| Vedanta, Ltd. | 107,515 | | 493,493 |
| Wipro, Ltd. | 244,851 | | 2,356,261 |
| Zomato, Ltd.* | 615,325 | | 1,137,350 |
| | | | | 98,133,807 |
| Indonesia — 2.4% | | |
| PT Astra International Tbk | 3,119,400 | | 1,248,547 |
| PT Bank BTPN Syariah Tbk | 2,177,400 | | 546,838 |
| PT Bank Central Asia Tbk | 14,627,200 | | 7,491,331 |
| PT Bank Mandiri Persero Tbk | 3,307,100 | | 1,632,977 |
| PT Bank Rakyat Indonesia Persero Tbk | 4,454,000 | | 1,282,423 |
| PT BFI Finance Indonesia Tbk | 7,874,800 | | 649,212 |
| PT Cisarua Mountain Dairy TBK* | 1,308,400 | | 312,125 |
| PT Dayamitra Telekomunikasi Tbk* | 11,848,600 | | 690,008 |
| PT Indah Kiat Pulp & Paper Tbk | 125,000 | | 68,663 |
| PT Indofood Sukses Makmur Tbk | 154,400 | | 68,558 |
| PT Kalbe Farma Tbk | 2,346,100 | | 265,845 |
| PT Map Aktif Adiperkasa* | 977,200 | | 174,151 |
| PT Pakuwon Jati Tbk* | 8,454,300 | | 274,738 |
| PT Semen Indonesia Persero Tbk | 505,152 | | 256,835 |
| PT Telkom Indonesia Persero Tbk | 10,305,700 | | 2,941,269 |
| PT Unilever Indonesia Tbk | 774,100 | | 223,236 |
| PT United Tractors Tbk | 1,278,560 | | 1,985,064 |
| | | | | 20,111,820 |
| Kazakhstan — 0.1% | | |
| Kaspi.KZ JSC GDR 144A | 3,113 | | 369,762 |
| Kaspi.KZ JSC GDR (London Exchange) | 4,799 | | 556,684 |
| | | | | 926,446 |
| Malaysia — 0.1% | | |
| Kossan Rubber Industries | 44,000 | | 20,278 |
| RHB Bank Bhd | 59,600 | | 76,825 |
| | | Shares | | Value |
| Sime Darby Bhd | 965,400 | | $ 537,621 |
| Sime Darby Plantation Bhd | 247,400 | | 223,289 |
| | | | | 858,013 |
| Mexico — 2.7% | | |
| Alpek SAB de CV | 1,534,300 | | 1,667,270 |
| America Movil SAB de CV, Series L | 3,815,300 | | 4,039,740 |
| America Movil SAB de CV, Series L ADR | 11,811 | | 249,330 |
| Arca Continental SAB de CV | 212,421 | | 1,348,879 |
| Cemex SAB de CV ADR* | 160,855 | | 1,090,597 |
| Coca-Cola Femsa SAB de CV ADR | 10,684 | | 585,376 |
| Fomento Economico Mexicano SAB de CV ADR | 95,200 | | 7,397,992 |
| Gentera SAB de CV* | 330,350 | | 212,968 |
| Gruma SAB de CV Series B | 8,225 | | 105,121 |
| Grupo Aeroportuario del Sureste SAB de CV ADR | 546 | | 112,563 |
| Grupo Bimbo SAB de CV Series A | 200,900 | | 619,022 |
| Grupo Financiero Banorte SAB de CV Series O | 69,310 | | 450,783 |
| Grupo Televisa SAB SA ADR | 25,585 | | 239,732 |
| Industrias Penoles SAB de CV | 34,800 | | 401,155 |
| Kimberly-Clark de Mexico SAB de CV Series A | 337,801 | | 513,247 |
| Orbia Advance Corporation SAB de CV | 544,400 | | 1,389,482 |
| Prologis Property Mexico SA de CV REIT | 126,005 | | 348,928 |
| Promotora y Operadora de Infraestructura SAB de CV | 58,870 | | 459,333 |
| Wal-Mart de Mexico SAB de CV | 379,600 | | 1,413,060 |
| | | | | 22,644,578 |
| Netherlands — 0.2% | | |
| InPost SA* | 57,197 | | 690,129 |
| Yandex NV Class A* | 17,169 | | 1,038,724 |
| | | | | 1,728,853 |
| Peru — 0.3% | | |
| Credicorp, Ltd. | 23,217 | | 2,834,099 |
| Philippines — 0.5% | | |
| Ayala Land, Inc. | 2,749,100 | | 1,978,565 |
| BDO Unibank, Inc. | 34,770 | | 82,301 |
| International Container Terminal Services, Inc. | 95,860 | | 375,977 |
| Jollibee Foods Corporation | 108,620 | | 460,957 |
| Monde Nissin Corporation 144A* | 3,088,200 | | 981,102 |
| PLDT, Inc. | 4,180 | | 148,535 |
| SM Prime Holdings, Inc. | 381,000 | | 253,290 |
| | | | | 4,280,727 |
| Poland — 1.4% | | |
| Allegro.eu SA 144A* | 102,499 | | 986,720 |
| Bank Polska Kasa Opieki SA | 100,319 | | 3,027,997 |
| Cyfrowy Polsat SA | 8,219 | | 70,825 |
| Dino Polska SA 144A* | 11,869 | | 1,081,986 |
| Grupa Lotos SA* | 190,854 | | 2,884,631 |
| PGE Polska Grupa Energetyczna SA* | 348,677 | | 695,760 |
See Notes to Financial Statements.
EMERGING MARKETS EQUITY FUND
SCHEDULE OF INVESTMENTS (Continued)
| | | Shares | | Value |
| Polskie Gornictwo Naftowe i Gazownictwo SA | 726,670 | | $ 1,136,431 |
| Powszechna Kasa Oszczednosci Bank Polski SA* | 113,631 | | 1,260,362 |
| | | | | 11,144,712 |
| Qatar — 0.1% | | |
| Industries Qatar QSC | 17,530 | | 74,563 |
| Qatar Islamic Bank SAQ | 6,620 | | 33,320 |
| Qatar National Bank QPSC | 108,220 | | 599,976 |
| | | | | 707,859 |
| Russia — 1.9% | | |
| Gazprom PJSC ADR | 262,446 | | 2,411,879 |
| Gazprom PJSC ADR (London Exchange) | 170,565 | | 1,576,021 |
| LUKOIL PJSC ADR | 43,247 | | 3,870,606 |
| Magnit PJSC GDR | 26,957 | | 404,355 |
| MMC Norilsk Nickel PJSC ADR | 52,463 | | 1,622,681 |
| Novatek PJSC GDR | 1,991 | | 466,292 |
| Novolipetsk Steel PJSC GDR | 7,762 | | 229,134 |
| Rosneft Oil Co. PJSC GDR | 16,843 | | 135,451 |
| Sberbank of Russia PJSC ADR | 29,379 | | 462,719 |
| Sberbank of Russia PJSC ADR (London Exchange) | 182,426 | | 2,927,937 |
| Severstal PAO GDR | 19,892 | | 428,474 |
| Surgutneftegas PJSC ADR | 19,506 | | 104,260 |
| Tatneft PJSC ADR | 15,007 | | 622,941 |
| | | | | 15,262,750 |
| Saudi Arabia — 0.8% | | |
| Abdullah Al Othaim Markets Co. | 4,970 | | 143,233 |
| Almarai Co. JSC | 14,810 | | 192,525 |
| Arab National Bank | 94,170 | | 573,511 |
| Bank Al-Jazira | 12,790 | | 65,613 |
| Banque Saudi Fransi | 21,896 | | 275,093 |
| Etihad Etisalat Co. | 24,130 | | 200,146 |
| Jarir Marketing Co. | 10,125 | | 529,839 |
| Mobile Telecommunications Co.* | 192,865 | | 617,331 |
| Saudi Arabian Mining Co.* | 8,575 | | 178,958 |
| Saudi Basic Industries Corporation | 25,575 | | 788,718 |
| Saudi National Bank (The) | 68,142 | | 1,168,854 |
| Saudi Tadawul Group Holding Co.* | 14,960 | | 501,270 |
| Saudi Telecom Co. | 50,918 | | 1,523,024 |
| Savola Group (The) | 11,168 | | 95,065 |
| Yanbu National Petrochemical Co. | 5,657 | | 103,286 |
| | | | | 6,956,466 |
| Singapore — 0.1% | | |
| Del Monte Pacific, Ltd. | 250,300 | | 75,224 |
| Nanofilm Technologies International, Ltd. | 235,806 | | 668,432 |
| | | | | 743,656 |
| Slovenia — 0.1% | | |
| Nova Ljubljanska Banka dd GDR | 29,269 | | 501,508 |
| South Africa — 2.4% | | |
| African Rainbow Minerals, Ltd. | 14,120 | | 204,884 |
| Anglo American Platinum, Ltd. | 5,307 | | 605,058 |
| AngloGold Ashanti, Ltd. ADRΔ | 69,271 | | 1,453,306 |
| | | Shares | | Value |
| Bid Corporation, Ltd. | 3,218 | | $ 65,921 |
| Clicks Group, Ltd. | 100,688 | | 1,993,730 |
| Exxaro Resources, Ltd. | 62,898 | | 603,402 |
| Gold Fields, Ltd. ADRΔ | 160,149 | | 1,760,038 |
| Impala Platinum Holdings, Ltd. | 16,628 | | 234,785 |
| JSE, Ltd. | 64,435 | | 452,885 |
| Kumba Iron Ore, Ltd. | 14,307 | | 413,085 |
| Mr Price Group, Ltd. | 69,051 | | 864,492 |
| MultiChoice Group, Ltd. | 174,360 | | 1,335,246 |
| Naspers, Ltd. N Shares | 28,017 | | 4,346,283 |
| Nedbank Group, Ltd.Δ | 6,009 | | 65,999 |
| Rand Merchant Investment Holdings, Ltd. | 348,370 | | 987,504 |
| Santam, Ltd. | 15,690 | | 264,864 |
| Sasol, Ltd.* | 120,378 | | 1,956,567 |
| Shoprite Holdings, Ltd. | 55,560 | | 728,295 |
| SPAR Group, Ltd. (The) | 32,780 | | 343,784 |
| Standard Bank Group, Ltd. | 48,734 | | 428,192 |
| Tiger Brands, Ltd. | 12,975 | | 147,378 |
| Transaction Capital, Ltd. | 284,070 | | 802,741 |
| | | | | 20,058,439 |
| South Korea — 11.1% | | |
| BGF retail Co., Ltd. | 6,171 | | 754,029 |
| CJ ENM Co., Ltd. | 5,785 | | 674,415 |
| CJ Logistics Corporation* | 6,537 | | 692,296 |
| DB Insurance Co., Ltd. | 6,809 | | 309,147 |
| Doosan Bobcat, Inc.* | 3,699 | | 126,590 |
| E-MART, Inc. | 7,358 | | 932,785 |
| Fila Holdings Corporation | 12,238 | | 368,806 |
| Hana Financial Group, Inc. | 48,367 | | 1,708,762 |
| Hankook Tire & Technology Co., Ltd. | 17,499 | | 584,594 |
| HMM Co., Ltd.* | 19,665 | | 444,833 |
| Hyundai Heavy Industries Co., Ltd.* | 9,258 | | 735,911 |
| Hyundai Mobis Co., Ltd. | 478 | | 102,176 |
| Industrial Bank of Korea | 197,834 | | 1,711,413 |
| KB Financial Group, Inc. | 21,662 | | 1,001,744 |
| Kia Corporation | 53,340 | | 3,681,159 |
| Korea Investment Holdings Co., Ltd. | 8,900 | | 602,980 |
| Krafton, Inc.* | 1,533 | | 592,495 |
| LG Corporation* | 39,393 | | 2,681,379 |
| LG Electronic, Inc. | 28,121 | | 3,255,868 |
| LG Household & Health Care, Ltd. | 1,137 | | 1,049,412 |
| LG Uplus Corporation | 13,101 | | 149,487 |
| Lotte Chemical Corporation | 1,127 | | 205,588 |
| NAVER Corporation | 5,112 | | 1,622,658 |
| NCSoft Corporation | 5,885 | | 3,178,657 |
| NH Investment & Securities Co., Ltd. | 29,024 | | 304,841 |
| NHN KCP Corporation* | 16,132 | | 411,334 |
| Orion Corporation | 8,607 | | 749,248 |
| POSCO | 10,873 | | 2,521,306 |
| Samsung Electro-Mechanics Co., Ltd. | 12,232 | | 2,028,692 |
| Samsung Electronics Co., Ltd. | 413,160 | | 27,134,271 |
| Samsung Fire & Marine Insurance Co., Ltd. | 30,940 | | 5,255,958 |
| Samsung Life Insurance Co., Ltd. | 3,598 | | 193,742 |
| Samsung SDS Co., Ltd. | 2,855 | | 375,023 |
| Shinhan Financial Group Co., Ltd. | 7,496 | | 231,619 |
See Notes to Financial Statements.
| | | Shares | | Value |
| SK Hynix, Inc. | 201,877 | | $ 22,172,677 |
| SK Telecom Co., Ltd. | 24,448 | | 1,188,085 |
| Woori Financial Group, Inc. | 216,215 | | 2,305,787 |
| | | | | 92,039,767 |
| Taiwan — 14.2% | | |
| Advantech Co., Ltd. | 128,087 | | 1,831,041 |
| ASE Technology Holding Co., Ltd. | 93,000 | | 359,372 |
| ASMedia Technology, Inc. | 13,000 | | 852,484 |
| AU Optronics Corporation | 2,379,000 | | 1,966,626 |
| Catcher Technology Co., Ltd. | 100,000 | | 565,319 |
| Cathay Financial Holding Co., Ltd. | 1,379,000 | | 3,106,683 |
| Chailease Holding Co., Ltd. | 99,578 | | 947,168 |
| Cheng Shin Rubber Industry Co., Ltd. | 729,000 | | 950,036 |
| China Development Financial Holding Corporation | 116,548 | | 73,611 |
| China Steel Corporation | 1,210,000 | | 1,544,040 |
| CTBC Financial Holding Co., Ltd. | 650,000 | | 608,920 |
| Delta Electronics, Inc. | 410,982 | | 4,077,840 |
| Formosa Chemicals & Fibre Corporation | 32,000 | | 93,331 |
| Formosa Plastics Corporation | 142,000 | | 532,965 |
| Globalwafers Co., Ltd. | 85,000 | | 2,723,077 |
| Hon Hai Precision Industry Co., Ltd. | 357,000 | | 1,338,801 |
| Innolux Corporation | 1,553,000 | | 1,097,429 |
| Lite-On Technology Corporation | 316,000 | | 727,668 |
| MediaTek, Inc. | 277,396 | | 11,902,931 |
| momo.com, Inc. | 13,200 | | 772,805 |
| Nan Ya Plastics Corporation | 68,000 | | 209,491 |
| Nanya Technology Corporation | 886,000 | | 2,495,523 |
| Nien Made Enterprise Co., Ltd. | 40,000 | | 595,591 |
| Novatek Microelectronics Corporation | 34,000 | | 660,223 |
| Pou Chen Corporation | 1,211,000 | | 1,448,752 |
| Powertech Technology, Inc. | 439,763 | | 1,549,742 |
| President Chain Store Corporation | 594,000 | | 5,865,199 |
| Realtek Semiconductor Corporation | 107,000 | | 2,235,583 |
| Silergy Corporation | 23,800 | | 4,307,712 |
| Taiwan Semiconductor Manufacturing Co., Ltd. | 1,815,986 | | 40,171,424 |
| Taiwan Semiconductor Manufacturing Co., Ltd. ADR | 130,552 | | 15,706,711 |
| Tong Hsing Electronic Industries, Ltd. | 65,720 | | 703,741 |
| United Microelectronics Corporation | 799,000 | | 1,871,874 |
| Voltronic Power Technology Corporation | 52,000 | | 2,900,976 |
| Win Semiconductors Corporation | 36,000 | | 485,760 |
| | | | | 117,280,449 |
| Thailand — 1.3% | | |
| Advanced Info Service PCL NVDR | 10,100 | | 69,477 |
| Airports of Thailand PCL* | 1,290,200 | | 2,356,001 |
| Berli Jucker PCL NVDR | 241,900 | | 224,301 |
| Central Retail Corporation PCL | 1,281,400 | | 1,227,505 |
| | | Shares | | Value |
| Charoen Pokphand Foods PCL NVDR | 2,644,100 | | $ 2,020,274 |
| CP ALL PCL NVDR | 83,700 | | 147,724 |
| Kasikornbank PCL | 252,600 | | 1,071,163 |
| PTT Exploration & Production PCL | 275,200 | | 972,118 |
| PTT Global Chemical PCL NVDR | 1,222,100 | | 2,147,984 |
| PTT PCL NVDR | 95,900 | | 108,830 |
| | | | | 10,345,377 |
| United Arab Emirates — 0.1% | | |
| Abu Dhabi Commercial Bank PJSC | 361,205 | | 838,027 |
| United Kingdom — 2.6% | | |
| Anglo American PLC | 86,113 | | 3,515,397 |
| Antofagasta PLC | 408,681 | | 7,404,183 |
| Fix Price Group, Ltd. GDR | 96,790 | | 730,764 |
| Network International Holdings PLC 144A* | 411,626 | | 1,628,011 |
| TCS Group Holding PLC GDR | 21,683 | | 1,828,311 |
| Unilever PLC | 115,860 | | 6,187,425 |
| | | | | 21,294,091 |
Total Foreign Common Stocks
(Cost $629,264,954) | | 704,113,556 |
| FOREIGN PREFERRED STOCKS — 0.7% |
| Brazil — 0.5% | | |
| Banco Bradesco SA | | | | |
| 1.09%◊ | 185,371 | | 642,646 |
| Braskem SA Class A | | | | |
| 13.35%◊ | 17,700 | | 187,060 |
| Cia Energetica de Minas Gerais | | | | |
| 4.26%◊ | 1 | | 2 |
| Petroleo Brasileiro SA | | | | |
| 7.52%◊ | 430,200 | | 2,185,480 |
| Raizen SA | | | | |
| 0.00%* | 1,095,000 | | 1,261,000 |
| | | | | 4,276,188 |
| Chile — 0.2% | | |
| Embotelladora Andina SA Class B | | | | |
| 5.05%◊ | 551,512 | | 1,197,532 |
| Taiwan — 0.0% | | |
| China Development Financial Holding Corporation | | | | |
| 0.00%* | 106,350 | | 36,863 |
Total Foreign Preferred Stocks
(Cost $5,891,032) | | 5,510,583 |
| MONEY MARKET FUNDS — 9.1% |
GuideStone Money Market Fund, 0.00%
(Institutional Class)Ø∞ | 48,866,558 | | 48,866,558 |
See Notes to Financial Statements.
EMERGING MARKETS EQUITY FUND
SCHEDULE OF INVESTMENTS (Continued)
| | | Shares | | Value |
| Northern Institutional Liquid Assets Portfolio (Shares), 0.04%ا | 4,026,413 | | $ 4,026,413 |
| Northern Institutional U.S. Government Portfolio (Shares), 0.00%Ø | 22,218,973 | | 22,218,973 |
Total Money Market Funds
(Cost $75,111,944) | | 75,111,944 |
TOTAL INVESTMENTS — 99.0%
(Cost $744,229,713) | | | 817,871,898 |
Other Assets in Excess of
Liabilities — 1.0% | | | 8,371,216 |
| NET ASSETS — 100.0% | | | $826,243,114 |
Futures Contracts outstanding at December 31, 2021:
| Future Type | | Expiration Date | | Open Long
(Short) Contracts | | Notional
Market Value
of Contracts | | Value and
Unrealized
Appreciation
(Depreciation) |
| FTSE Taiwan Index | | 01/2022 | | 263 | | $ 16,868,820 | | $ 31,552 |
| SGX Nifty 50 Index | | 01/2022 | | 142 | | 4,952,818 | | 74,955 |
| Hang Seng China Enterprises Index | | 01/2022 | | (110) | | (5,831,126) | | (70,768) |
| FTSE KLCI | | 01/2022 | | 114 | | 2,132,369 | | 26,942 |
| KOSPI2 Index | | 03/2022 | | 331 | | 27,444,111 | | 134,865 |
| Mexican Bolsa Index | | 03/2022 | | 2 | | 52,513 | | 2,154 |
| MSCI Emerging Markets | | 03/2022 | | 1,195 | | 73,271,425 | | (177,723) |
| Total Futures Contracts outstanding at December 31, 2021 | | | | | | $118,890,930 | | $ 21,977 |
Forward Foreign Currency Contracts outstanding at December 31, 2021:
| Expiration Date | | Currency
Purchased | | Amount
of Currency
Purchased | | Currency
Sold | | Amount
of Currency
Sold | | Counter-
party | | Net Unrealized
Appreciation
(Depreciation) |
| 03/16/22 | | Mexican Pesos | | 665,424,479 | | U.S. Dollars | | (30,728,484) | | CITI | | $1,341,756 |
| 03/16/22 | | U.S. Dollars | | 21,758,692 | | Philippine Pesos | | (1,105,458,000) | | CITI | | 379,591 |
| 03/16/22 | | Polish Zloty | | 65,728,000 | | U.S. Dollars | | (15,903,671) | | CITI | | 317,359 |
| 03/16/22 | | Brazilian Reals | | 116,034,000 | | U.S. Dollars | | (20,217,869) | | CITI | | 231,038 |
| 03/16/22 | | Chinese Offshore Yuan | | 143,236,079 | | U.S. Dollars | | (22,276,397) | | CITI | | 144,828 |
| 03/16/22 | | U.S. Dollars | | 29,388,266 | | South Korean Won | | (34,862,149,000) | | CITI | | 123,096 |
| 03/16/22 | | Russian Rubles | | 1,041,564,500 | | U.S. Dollars | | (13,591,203) | | CITI | | 105,686 |
| 03/16/22 | | U.S. Dollars | | 8,297,120 | | Russian Rubles | | (623,000,000) | | CITI | | 104,481 |
| 03/16/22 | | Indian Rupees | | 1,048,062,125 | | U.S. Dollars | | (13,838,301) | | CITI | | 101,072 |
| 03/16/22 | | U.S. Dollars | | 4,024,053 | | Colombian Pesos | | (16,100,000,000) | | CITI | | 97,424 |
| 03/16/22 | | Singapore Dollars | | 10,330,000 | | U.S. Dollars | | (7,571,859) | | CITI | | 90,689 |
| 03/16/22 | | Czech Republic Koruna | | 83,000,000 | | U.S. Dollars | | (3,691,388) | | CITI | | 80,103 |
| 03/16/22 | | U.S. Dollars | | 4,461,617 | | Chilean Pesos | | (3,792,030,000) | | CITI | | 61,861 |
| 03/16/22 | | Thai Baht | | 205,513,375 | | U.S. Dollars | | (6,093,609) | | CITI | | 56,839 |
| 03/16/22 | | U.S. Dollars | | 8,584,782 | | Israeli Shekels | | (26,514,000) | | CITI | | 50,845 |
| 03/16/22 | | South African Rand | | 52,134,875 | | U.S. Dollars | | (3,199,239) | | CITI | | 37,822 |
| 03/16/22 | | Indonesian Rupiahs | | 36,861,457,000 | | U.S. Dollars | | (2,543,597) | | CITI | | 27,121 |
| 03/16/22 | | U.S. Dollars | | 4,548,965 | | South African Rand | | (72,880,000) | | CITI | | 23,836 |
| 03/16/22 | | U.S. Dollars | | 1,328,635 | | Thai Baht | | (43,727,999) | | CITI | | 19,976 |
| 03/16/22 | | Hungarian Forint | | 880,000,000 | | U.S. Dollars | | (2,672,401) | | CITI | | 19,077 |
| 03/16/22 | | Israeli Shekels | | 4,325,000 | | U.S. Dollars | | (1,375,660) | | CITI | | 16,407 |
| 03/16/22 | | Euro | | 543,000 | | U.S. Dollars | | (614,305) | | CITI | | 4,861 |
See Notes to Financial Statements.
| Expiration Date | | Currency
Purchased | | Amount
of Currency
Purchased | | Currency
Sold | | Amount
of Currency
Sold | | Counter-
party | | Net Unrealized
Appreciation
(Depreciation) |
| 03/16/22 | | U.S. Dollars | | 2,853,658 | | Taiwan Dollars | | (78,536,167) | | CITI | | $ 4,631 |
| 03/16/22 | | Peruvian Nuevo Soles | | 829,874 | | U.S. Dollars | | (204,554) | | CITI | | 2,522 |
| 03/16/22 | | South Korean Won | | 2,306,548,000 | | U.S. Dollars | | (1,933,915) | | CITI | | 2,326 |
| 03/16/22 | | U.S. Dollars | | 4,128,296 | | Hong Kong Dollars | | (32,169,000) | | CITI | | 2,219 |
| 03/16/22 | | Hong Kong Dollars | | 73,026,000 | | U.S. Dollars | | (9,364,477) | | CITI | | 2,021 |
| 03/16/22 | | Taiwan Dollars | | 28,732,000 | | U.S. Dollars | | (1,040,279) | | CITI | | 2,021 |
| 03/16/22 | | U.S. Dollars | | 961,129 | | Saudi Riyal | | (3,607,000) | | CITI | | 531 |
| Subtotal Appreciation | | | | | | | | | | $ 3,452,039 |
| 03/16/22 | | U.S. Dollars | | 5,158 | | South Korean Won | | (6,145,000) | | CITI | | $ — |
| 03/16/22 | | Taiwan Dollars | | 44,000 | | U.S. Dollars | | (1,599) | | CITI | | (3) |
| 03/16/22 | | Hungarian Forint | | 510,000,000 | | U.S. Dollars | | (1,560,102) | | CITI | | (268) |
| 03/16/22 | | Chinese Offshore Yuan | | 6,396,000 | | U.S. Dollars | | (1,001,570) | | CITI | | (383) |
| 03/16/22 | | U.S. Dollars | | 90,408 | | Euro | | (80,000) | | CITI | | (813) |
| 03/16/22 | | Indian Rupees | | 118,957,875 | | U.S. Dollars | | (1,583,003) | | CITI | | (847) |
| 03/16/22 | | U.S. Dollars | | 73,700 | | Peruvian Nuevo Soles | | (300,000) | | CITI | | (1,158) |
| 03/16/22 | | U.S. Dollars | | 5,064,977 | | Hong Kong Dollars | | (39,500,000) | | CITI | | (1,392) |
| 03/16/22 | | Saudi Riyal | | 15,314,000 | | U.S. Dollars | | (4,081,027) | | CITI | | (2,677) |
| 03/16/22 | | U.S. Dollars | | 3,812,907 | | Taiwan Dollars | | (105,246,943) | | CITI | | (5,097) |
| 03/16/22 | | U.S. Dollars | | 393,470 | | Hungarian Forint | | (130,344,000) | | CITI | | (5,187) |
| 03/16/22 | | Israeli Shekels | | 7,560,000 | | U.S. Dollars | | (2,440,689) | | CITI | | (7,387) |
| 03/16/22 | | Hong Kong Dollars | | 68,703,000 | | U.S. Dollars | | (8,819,569) | | CITI | | (7,549) |
| 03/16/22 | | U.S. Dollars | | 499,659 | | Polish Zloty | | (2,089,000) | | CITI | | (15,886) |
| 03/16/22 | | U.S. Dollars | | 1,283,388 | | South African Rand | | (20,932,000) | | CITI | | (16,283) |
| 03/16/22 | | U.S. Dollars | | 2,137,636 | | Thai Baht | | (72,076,001) | | CITI | | (19,400) |
| 03/16/22 | | U.S. Dollars | | 2,783,558 | | Indonesian Rupiahs | | (40,275,718,212) | | CITI | | (25,270) |
| 03/16/22 | | U.S. Dollars | | 4,502,844 | | Chinese Offshore Yuan | | (28,944,000) | | CITI | | (27,857) |
| 03/16/22 | | U.S. Dollars | | 7,720,954 | | Russian Rubles | | (590,078,000) | | CITI | | (38,751) |
| 03/16/22 | | U.S. Dollars | | 2,732,999 | | Chilean Pesos | | (2,400,000,000) | | CITI | | (51,635) |
| 03/16/22 | | South Korean Won | | 12,779,483,000 | | U.S. Dollars | | (10,798,546) | | CITI | | (70,758) |
| 03/16/22 | | South African Rand | | 179,534,125 | | U.S. Dollars | | (11,227,882) | | CITI | | (80,584) |
| 03/16/22 | | U.S. Dollars | | 5,992,267 | | Israeli Shekels | | (18,871,000) | | CITI | | (81,653) |
| 03/16/22 | | U.S. Dollars | | 1,196,266 | | Chinese Offshore Yuan | | (8,649,000) | | SC | | (116,826) |
| 03/16/22 | | Thai Baht | | 345,820,625 | | U.S. Dollars | | (10,506,486) | | CITI | | (157,029) |
| 03/16/22 | | U.S. Dollars | | 14,075,528 | | Singapore Dollars | | (19,190,000) | | CITI | | (159,157) |
| 03/16/22 | | Russian Rubles | | 1,313,743,500 | | U.S. Dollars | | (17,435,650) | | CITI | | (159,525) |
| 03/16/22 | | Colombian Pesos | | 31,700,000,000 | | U.S. Dollars | | (7,955,883) | | CITI | | (224,570) |
| 03/16/22 | | U.S. Dollars | | 16,257,217 | | Indian Rupees | | (1,242,686,000) | | CITI | | (270,681) |
| 03/16/22 | | U.S. Dollars | | 10,425,598 | | Brazilian Reals | | (60,699,000) | | CITI | | (271,509) |
| 03/16/22 | | Philippine Pesos | | 602,000,000 | | U.S. Dollars | | (11,978,591) | | CITI | | (336,160) |
| 03/16/22 | | U.S. Dollars | | 9,106,153 | | Mexican Pesos | | (196,883,000) | | CITI | | (382,655) |
| 03/16/22 | | Chilean Pesos | | 10,620,937,890 | | U.S. Dollars | | (12,725,966) | | CITI | | (402,874) |
| 03/16/22 | | U.S. Dollars | | 3,253,457 | | Chinese Offshore Yuan | | (24,819,000) | | MSCS | | (446,677) |
| 03/16/22 | | U.S. Dollars | | 18,350,631 | | Czech Republic Koruna | | (415,500,000) | | CITI | | (529,543) |
| Subtotal Depreciation | | | | | | | | | | $(3,918,044) |
| Total Forward Foreign Currency Contracts outstanding at December 31, 2021 | | | | $ (466,005) |
See Notes to Financial Statements.
EMERGING MARKETS EQUITY FUND
SCHEDULE OF INVESTMENTS (Continued)
Swap Agreements outstanding at December 31, 2021:
| Pay Rate Index/Pay Rate | | Receive
Rate/Receive
Rate Index | | Maturity
Date | | Counterparty | | Currency | | Notional
Amount | | Market Value | | Upfront
Premiums
Paid/
(Received) | | Unrealized
Appreciation
(Depreciation) |
| Total Return Swaps | | | | | | | | | | | | | | | | |
| Decrease in total return of Tel Aviv 35 Index (At Termination) | | Increase in total return of Tel Aviv 35 Index (At Termination) | | 1/28/2022 | | GSC | | ILS | | 3,956,120 | | $ 10,978 | | $ — | | $ 10,978 |
| Increase in total return of Bovespa Index (At Termination) | | Decrease in total return of Bovespa Index (At Termination) | | 2/16/2022 | | GSC | | BRL | | 11,639,650 | | 69,215 | | — | | 69,215 |
| Financing Index: 1-Month WIBOR + 1.4% | | MSCI Poland Net Return PLN Index (Monthly) | | 3/16/2022 | | GSC | | PLN | | 1,856,395 | | 9,828 | | — | | 9,828 |
| Financing Index: 1-Month WIBOR + 1.4% | | MSCI Poland Net Return PLN Index (Monthly) | | 3/16/2022 | | GSC | | PLN | | 1,222,580 | | 9,199 | | — | | 9,199 |
| Financing Index: 28-Day Mexico Interbank TIIE + 0.15% | | MSCI Mexico Net MXN Index (Monthly) | | 3/16/2022 | | GSC | | MXN | | 60,942,407 | | 128,382 | | — | | 128,382 |
| MSCI Brazil Net Return BRL Index (Monthly) | | Financing Index: Brazil Cetip Di Interbank Deposit Rate - 0.45% | | 3/16/2022 | | GSC | | BRL | | 4,165,455 | | 25,531 | | — | | 25,531 |
| MSCI Singapore Net Return SGD Index (Monthly) | | Financing Index: Singapore Overnight Rate + 0.2% | | 3/16/2022 | | GSC | | SGD | | 1,363,499 | | 26,921 | | — | | 26,921 |
| Decrease in total return of WIG20 Index (At Termination) | | Increase in total return of WIG20 Index (At Termination) | | 3/18/2022 | | GSC | | PLN | | 4,649,160 | | 26,237 | | — | | 26,237 |
| Subtotal Appreciation | | | | | | | | | | | | $ 306,291 | | $ — | | $ 306,291 |
| Decrease in total return of SGX Nifty 50 Index (At Termination) | | Increase in total return of SGX Nifty 50 Index (At Termination) | | 1/27/2022 | | GSC | | USD | | 1,983,300 | | $ (8,281) | | $ — | | $ (8,281) |
| Increase in total return of HSCEI Index (At Termination) | | Decrease in total return of HSCEI Index (At Termination) | | 1/28/2022 | | CITI | | HKD | | 24,387,650 | | (46,535) | | — | | (46,535) |
| Increase in total return of HSCEI Index (At Termination) | | Decrease in total return of HSCEI Index (At Termination) | | 1/28/2022 | | GSC | | HKD | | 11,160,450 | | (16,086) | | — | | (16,086) |
| Financing Index: Overnight Bank Funding Rate + 0% | | MSCI Daily Total Return Net Emerging Markets USD Index (Monthly) | | 3/16/2022 | | GSC | | USD | | 345,679 | | (3,828) | | — | | (3,828) |
| MSCI Emerging Markets Thailand Net Total Return USD Index (Monthly) | | Financing Index: Overnight Bank Funding Rate - 0.25% | | 3/16/2022 | | GSC | | USD | | 13,421,458 | | (343,748) | | — | | (343,748) |
| MSCI South Africa Net Return ZAR Index (Monthly) | | Financing Index: 1-Month SAFE South Africa JIBAR + 0.28% | | 3/16/2022 | | GSC | | ZAR | | 20,455,855 | | (15,844) | | — | | (15,844) |
| Subtotal Depreciation | | | | | | | | | | | | $(434,322) | | $ — | | $(434,322) |
| Net Total Return Swaps outstanding at December 31, 2021 | | $(128,031) | | $ — | | $(128,031) |
See Notes to Financial Statements.
VALUATION HIERARCHY
The following is a summary of the inputs used, as of December 31, 2021, in valuing the Fund’s investments carried at fair value:
| | Total
Value | | Level 1
Quoted Prices | | Level 2
Other Significant
Observable Inputs | | Level 3
Significant
Unobservable Inputs |
| Assets: | | | | | | | |
| Investments in Securities: | | | | | | | |
| Common Stocks | $ 33,135,815 | | $ 33,135,815 | | $ — | | $ — |
| Foreign Common Stocks: | | | | | | | |
| Brazil | 23,194,994 | | 3,695,873 | | 19,499,121 | | — |
| Egypt | 2,548,198 | | 350,604 | | 2,197,594 | | — |
| Hong Kong | 79,513,033 | | 78,546,883 | | — | | 966,150 |
| Hungary | 4,179,454 | | — | | 4,179,454 | | — |
| Indonesia | 20,111,820 | | 2,091,341 | | 18,020,479 | | — |
| Poland | 11,144,712 | | 1,152,811 | | 9,991,901 | | — |
| Saudi Arabia | 6,956,466 | | 1,813,357 | | 5,143,109 | | — |
| South Korea | 92,039,767 | | — | | 92,039,767 | | — |
| Taiwan ^^ | 117,280,449 | | 15,706,711 | | 101,573,738 | | — |
| Thailand | 10,345,377 | | — | | 10,345,377 | | — |
| United Arab Emirates | 838,027 | | — | | 838,027 | | — |
| Other ^^ | 335,961,259 | | 335,961,259 | | — | | — |
| Total Foreign Common Stocks | 704,113,556 | | 439,318,839 | | 263,828,567 | | 966,150 |
| Foreign Preferred Stocks: | | | | | | | |
| Brazil | 4,276,188 | | — | | 4,276,188 | | — |
| Other ^^ | 1,234,395 | | 1,234,395 | | — | | — |
| Total Foreign Preferred Stocks | 5,510,583 | | 1,234,395 | | 4,276,188 | | — |
| Money Market Funds | 75,111,944 | | 75,111,944 | | — | | — |
| Total Assets - Investments in Securities | $817,871,898 | | $548,800,993 | | $268,104,755 | | $966,150 |
| Other Financial Instruments*** | | | | | | | |
| Forward Foreign Currency Contracts | $ 3,452,039 | | $ — | | $ 3,452,039 | | $ — |
| Futures Contracts | 270,468 | | 270,468 | | — | | — |
| Swap Agreements | 306,291 | | — | | 306,291 | | — |
| Total Assets - Other Financial Instruments | $ 4,028,798 | | $ 270,468 | | $ 3,758,330 | | $ — |
| Liabilities: | | | | | | | |
| Other Financial Instruments*** | | | | | | | |
| Forward Foreign Currency Contracts | $ (3,918,044) | | $ — | | $ (3,918,044) | | $ — |
| Futures Contracts | (248,491) | | (248,491) | | — | | — |
| Swap Agreements | (434,322) | | — | | (434,322) | | — |
| Total Liabilities - Other Financial Instruments | $ (4,600,857) | | $ (248,491) | | $ (4,352,366) | | $ — |
| ^^ | Classifications as defined in the Schedule of Investments. |
| *** | Other financial instruments are derivative instruments, such as futures contracts, forward contracts and swap agreements, which are valued at the unrealized appreciation (depreciation) on the investment. Further details regarding the value of these investments can be found in the preceding "Futures Contracts outstanding", "Forward Foreign Currency Contracts outstanding" and "Swap Agreements outstanding" disclosures. |
Management has determined that the amount of transfers between Level 3 and Level 2 compared to total net assets is not material; therefore, the amount of transfers between Level 3 and Level 2 is not shown for the year ended December 31, 2021.
Management has determined that the amount of Level 3 securities compared to total net assets is not material; therefore, the reconciliation of Level 3 securities and assumptions is not shown for the year ended December 31, 2021.
See Notes to Financial Statements.
| STATEMENTS OF ASSETS AND LIABILITIES | December 31, 2021 |
| | Defensive Market
Strategies® Fund | | Global Impact Fund | | Equity Index
Fund |
| Assets | | | | | |
| Investments in securities of unaffiliated issuers, at value | $1,499,810,633 | | $169,349,289 | | $3,271,333,305 |
| Investments in securities of affiliated issuers, at value | 39,220,393 | | 5,291,910 | | 62,134,618 |
| Total investments, at value(1), (2) | 1,539,031,026 | | 174,641,199 | | 3,333,467,923 |
| Cash | 717,912 | | 5,576 | | — |
| Cash collateral for derivatives | — | | — | | — |
| Deposits with broker for futures contracts | — | | 930,173 | | 3,146,206 |
| Foreign currency(3) | — | | 9,458 | | — |
| Receivables: | | | | | |
| Dividends and reclaims | 796,540 | | 56,501 | | 1,588,853 |
| Interest | 1,774,028 | | 243,891 | | — |
| Securities lending | 20,354 | | 196 | | 27,157 |
| From broker | — | | — | | — |
| Investment securities sold | 215,427 | | — | | — |
| Fund shares sold | 346,447 | | 10,000 | | 719,370 |
| Variation margin on futures contracts | — | | 31,834 | | — |
| Unrealized appreciation on foreign currency exchange contracts | 30,499 | | — | | — |
| Unrealized appreciation on swap agreements | — | | — | | — |
| Prepaid expenses and other assets | 15,268 | | 26,686 | | 21,518 |
| Total Assets | 1,542,947,501 | | 175,955,514 | | 3,338,971,027 |
| Liabilities | | | | | |
| Cash Overdraft | — | | — | | — |
| Securities sold short, at value(4) | — | | — | | — |
| Options written, at value(5) | 2,628,590 | | — | | — |
| Unrealized depreciation on foreign currency exchange contracts | 331,065 | | — | | — |
| Unrealized depreciation on swap agreements | — | | — | | — |
| Collateral held for securities on loan, at value | 34,282,159 | | — | | 1,227,216 |
| Collateral from counterparty | — | | — | | — |
| Payables: | | | | | |
| Investment securities purchased | 573,882 | | — | | — |
| Fund shares redeemed | 199,402 | | 3,651 | | 191,238 |
| Variation margin on futures contracts | 18,055 | | — | | 181,500 |
| Foreign capital gains taxes | — | | — | | — |
| Accrued expenses: | | | | | |
| Investment advisory fees | 766,633 | | 94,821 | | 240,141 |
| Shareholder servicing fees | 94,787 | | 6,371 | | 193,018 |
| Trustee fees | 783 | | 6 | | 1,461 |
| Other expenses | 195,708 | | 70,996 | | 384,707 |
| Total Liabilities | 39,091,064 | | 175,845 | | 2,419,281 |
| Net Assets | $1,503,856,437 | | $175,779,669 | | $3,336,551,746 |
| Net Assets Consist of: | | | | | |
| Paid-in-capital | $1,238,072,496 | | $160,495,690 | | $1,745,929,012 |
| Distributable earnings (loss) | 265,783,941 | | 15,283,979 | | 1,590,622,734 |
| Net Assets | $1,503,856,437 | | $175,779,669 | | $3,336,551,746 |
| Net Asset Value: | | | | | |
| $0.001 par value, unlimited shares authorized | | | | | |
| Net assets applicable to the Institutional Class | $1,049,002,675 | | $145,392,904 | | $2,403,000,490 |
| Institutional shares outstanding | 73,381,915 | | 13,281,289 | | 47,498,514 |
| Net asset value, offering and redemption price per Institutional share | $ 14.30 | | $ 10.95 | | $ 50.59 |
| Net assets applicable to the Investor Class | $ 454,853,762 | | $ 30,386,765 | | $ 933,551,256 |
| Investor shares outstanding | 31,812,136 | | 2,779,075 | | 18,445,836 |
| Net asset value, offering and redemption price per Investor share | $ 14.30 | | $ 10.93 | | $ 50.61 |
| | | | | |
| (1)Investments in securities of unaffiliated issuers, at cost | $1,420,756,463 | | $154,384,036 | | $1,698,828,989 |
| Investments in securities of affiliated issuers, at cost | 39,220,393 | | 5,291,910 | | 62,134,618 |
| Total investments, at cost | $1,459,976,856 | | $159,675,946 | | $1,760,963,607 |
| (2)Includes securities loaned of: | $ 50,672,747 | | $ 1,702,427 | | $ 93,675,896 |
| (3)Foreign currency, at cost | $ — | | $ 9,458 | | $ — |
| (4)Proceeds from securities sold short | $ — | | $ — | | $ — |
| (5)Premiums received on options written | $ 4,851,262 | | $ — | | $ — |
| (6)Net of $(144,598) and $(3,097,752) accrued foreign capital gains taxed on appreciated securities for International Equity Fund and Emerging Markets Equity Fund, respectively. |
See Notes to Financial Statements.
Value Equity
Fund | | Growth Equity
Fund | | Small Cap
Equity Fund | | International Equity
Index Fund | | International
Equity Fund | | Emerging Markets
Equity Fund |
| | | | | | | | | | | |
| $1,364,429,937 | | $2,019,406,374 | | $857,743,093 | | $788,124,778 | | $1,226,725,864 | | $769,005,340 |
| 44,330,279 | | 76,063,715 | | 30,899,191 | | 46,086,919 | | 85,821,408 | | 48,866,558 |
| 1,408,760,216 | | 2,095,470,089 | | 888,642,284 | | 834,211,697 | | 1,312,547,272 | | 817,871,898 |
| 2,682 | | — | | 11,071 | | 1,327 | | — | | — |
| — | | — | | — | | — | | 17,270,000 | | 10,200,000 |
| 2,319,008 | | 4,015,468 | | 1,853,000 | | 2,912,376 | | 12,930,132 | | 8,678,182 |
| — | | — | | — | | 2,970,291 | | 4,408,753 | | 1,592,935 |
| | | | | | | | | | | |
| 1,662,466 | | 448,025 | | 542,670 | | 2,632,650 | | 5,955,647 | | 1,556,897 |
| — | | — | | — | | — | | — | | — |
| 17,708 | | 15,461 | | 21,330 | | 4,743 | | 2,968 | | 906 |
| — | | — | | — | | — | | — | | 447,007 |
| 112,929 | | 73,006 | | 483,161 | | — | | 10,966 | | 2,282,871 |
| 346,730 | | 31,225 | | 163,038 | | 256,577 | | 136,081 | | 67,918 |
| — | | — | | — | | — | | 124,255 | | — |
| — | | — | | — | | — | | 1,895,935 | | 3,452,039 |
| — | | — | | — | | — | | 1,958,434 | | 306,291 |
| 16,969 | | 24,548 | | 19,712 | | 4,486 | | 12,118 | | 23,004 |
| 1,413,238,708 | | 2,100,077,822 | | 891,736,266 | | 842,994,147 | | 1,357,252,561 | | 846,479,948 |
| | | | | | | | | | | |
| — | | — | | — | | — | | 4,143,120 | | 3,393,610 |
| — | | — | | — | | — | | 1,087,614 | | — |
| — | | — | | — | | — | | — | | — |
| 811,555 | | — | | 9,816 | | — | | 2,836,693 | | 3,918,044 |
| — | | — | | — | | — | | 687,194 | | 434,322 |
| 1,685,880 | | 10,176,712 | | 17,934,148 | | 8,717,861 | | 40,586 | | 4,026,413 |
| — | | — | | — | | — | | 1,195,944 | | 489,480 |
| | | | | | | | | | | |
| 911,304 | | — | | 2,468,092 | | — | | 20,708 | | 2,759,730 |
| 89,335 | | 481,866 | | 201,898 | | 54,867 | | 91,707 | | 707,697 |
| 132,000 | | 224,125 | | 57,605 | | 29,705 | | — | | 471,375 |
| — | | — | | — | | — | | 144,598 | | 3,097,752 |
| | | | | | | | | | | |
| 693,915 | | 1,119,488 | | 611,039 | | 85,916 | | 867,122 | | 577,544 |
| 88,903 | | 203,896 | | 72,111 | | — | | 73,949 | | 23,186 |
| 596 | | 1,421 | | 877 | | — | | 933 | | 516 |
| 172,585 | | 239,098 | | 140,311 | | 211,751 | | 407,558 | | 337,165 |
| 4,586,073 | | 12,446,606 | | 21,495,897 | | 9,100,100 | | 11,597,726 | | 20,236,834 |
| $1,408,652,635 | | $2,087,631,216 | | $870,240,369 | | $833,894,047 | | $1,345,654,835 | | $826,243,114 |
| | | | | | | | | | | |
| $1,092,982,151 | | $1,265,608,006 | | $692,838,010 | | $706,877,415 | | $1,161,928,205 | | $769,035,410 |
| 315,670,484 | | 822,023,210 | | 177,402,359 | | 127,016,632 | | 183,726,630 (6) | | 57,207,704 (6) |
| $1,408,652,635 | | $2,087,631,216 | | $870,240,369 | | $833,894,047 | | $1,345,654,835 | | $826,243,114 |
| | | | | | | | | | | |
| | | | | | | | | | | |
| $ 971,585,662 | | $1,108,030,609 | | $519,549,203 | | $833,894,047 | | $ 987,438,664 | | $714,817,906 |
| 45,465,309 | | 37,027,596 | | 26,584,658 | | 69,122,186 | | 66,500,731 | | 67,005,245 |
| $ 21.37 | | $ 29.92 | | $ 19.54 | | $ 12.06 | | $ 14.85 | | $ 10.67 |
| $ 437,066,973 | | $ 979,600,607 | | $350,691,166 | | N/A | | $ 358,216,171 | | $111,425,208 |
| 20,469,451 | | 33,275,322 | | 18,124,971 | | N/A | | 24,146,188 | | 10,482,361 |
| $ 21.35 | | $ 29.44 | | $ 19.35 | | N/A | | $ 14.84 | | $ 10.63 |
| | | | | | | | | | | |
| $1,047,300,433 | | $1,257,415,391 | | $687,245,779 | | $661,365,121 | | $1,020,791,264 | | $695,363,155 |
| 44,330,279 | | 76,063,715 | | 30,899,191 | | 46,086,919 | | 85,821,408 | | 48,866,558 |
| $1,091,630,712 | | $1,333,479,106 | | $718,144,970 | | $707,452,040 | | $1,106,612,672 | | $744,229,713 |
| $ 29,420,706 | | $ 167,628,183 | | $ 93,396,584 | | $ 23,787,825 | | $ 21,147,390 | | $ 11,370,117 |
| $ — | | $ — | | $ — | | $ 2,946,047 | | $ 4,466,040 | | $ 1,587,325 |
| $ — | | $ — | | $ — | | $ — | | $ 803,636 | | $ — |
| $ — | | $ — | | $ — | | $ — | | $ — | | $ — |
| | | | | | | | | | | |
See Notes to Financial Statements.
| STATEMENTS OF OPERATIONS | For the Year Ended December 31, 2021 |
| | Defensive Market
Strategies® Fund | | Global Impact Fund(1) | | Equity Index
Fund |
| Investment Income | | | | | |
| Dividends | $ 13,530,790 | | $ 1,084,821 | | $ 38,400,524 |
| Non Cash Dividends | — | | — | | — |
| Interest | 2,368,261 | | 718,324 | | 163 |
| Securities lending, net | 189,782 | | 4,277 | | 246,186 |
| Less foreign taxes withheld | (27,120) | | (77,030) | | (206,716) |
| Total Investment Income | 16,061,713 | | 1,730,392 | | 38,440,157 |
| Expenses | | | | | |
| Investment advisory fees | 8,739,328 | | 1,003,694 | | 2,524,137 |
| Transfer agent fees: | | | | | |
| Institutional shares | 5,146 | | 3,346 | | 5,212 |
| Investor shares | 36,896 | | 11,271 | | 71,220 |
| Custodian fees | 80,409 | | 29,693 | | 49,704 |
| Shareholder servicing fees: | | | | | |
| Investor shares | 1,084,789 | | 65,559 | | 2,061,464 |
| Accounting and administration fees | 223,384 | | 23,214 | | 458,096 |
| Professional fees | 47,881 | | 131,133 | | 98,062 |
| Shareholder reporting fees: | | | | | |
| Institutional shares | 2,452 | | 1,589 | | 1,568 |
| Investor shares | 12,640 | | 7,918 | | 13,769 |
| Trustees expenses | 5,386 | | 162 | | 10,686 |
| Line of credit facility fees | 4,600 | | 642 | | 8,083 |
| S&P license fees | — | | — | | 302,177 |
| MSCI license fees | — | | — | | — |
| Dividends on securities sold short | — | | — | | — |
| Other expenses | 179,708 | | 105,947 | | 184,548 |
| Recoupment of prior expenses reduced by the Advisor | — | | — | | — |
| Total Expenses | 10,422,619 | | 1,384,168 | | 5,788,726 |
| Expenses waived/reimbursed(2) | — | | — | | — |
| Fees paid indirectly | — | | — | | — |
| Net Expenses | 10,422,619 | | 1,384,168 | | 5,788,726 |
| Net Investment Income (Loss) | 5,639,094 | | 346,224 | | 32,651,431 |
| Realized and Unrealized Gain (Loss) | | | | | |
| Net realized gain (loss) from: | | | | | |
Investment securities
(net of capital gains taxes of $(1,393,231) and $(1,113,888) for International Equity Fund and Emerging Markets Equity Fund, respectively) | 276,000,185 | | 364,431 | | 48,166,976 |
| Investment securities sold short | — | | — | | — |
| Futures transactions | (286,846) | | 774,734 | | 16,050,263 |
| Swap agreements | — | | — | | — |
| Option contracts written | 26,986,233 | | — | | — |
| Forward foreign currency contracts | 2,343,713 | | — | | — |
| Foreign currency | (24,407) | | (4,151) | | — |
| Net realized gain | 305,018,878 | | 1,135,014 | | 64,217,239 |
| Net change in unrealized appreciation (depreciation) on: | | | | | |
Investment securities
(net of estimated capital gains taxes of $(144,598) and $(3,097,752) for International Equity Fund and Emerging Markets Fund, respectively) | (163,946,178) | | 14,965,253 | | 618,141,856 |
| Investment securities sold short | — | | — | | — |
| Futures | 339,305 | | 55,230 | | 316,156 |
| Swap agreements | — | | — | | — |
| Option contracts written | 1,631,848 | | — | | — |
| Option contracts purchased | 11,776,696 | | — | | — |
| Forward foreign currency contracts | (326,563) | | — | | — |
| Foreign currency | (15,635) | | 15 | | — |
| Net change in unrealized appreciation (depreciation) | (150,540,527) | | 15,020,498 | | 618,458,012 |
| Net Realized and Unrealized Gain (Loss) | 154,478,351 | | 16,155,512 | | 682,675,251 |
| Net Increase (Decrease) in Net Assets Resulting from Operations | $ 160,117,445 | | $16,501,736 | | $715,326,682 |
| |
| (1) | For the period January 29, 2021 (commencement of operations) through December 31, 2021. |
| (2) | See Note 3c in Notes to Financial Statements. |
See Notes to Financial Statements.
Value Equity
Fund | | Growth Equity
Fund | | Small Cap
Equity Fund | | International Equity
Index Fund | | International
Equity Fund | | Emerging Markets
Equity Fund |
| | | | | | | | | | | |
| $ 27,034,365 | | $ 10,218,572 | | $ 7,436,461 | | $20,868,843 | | $ 24,019,245 | | $ 17,688,480 |
| — | | — | | — | | 2,825,576 | | 1,823,454 | | — |
| — | | 2 | | 74,397 | | — | | 11,580 | | — |
| 160,487 | | 353,469 | | 533,172 | | 224,223 | | 122,371 | | 60,013 |
| (544,266) | | (215,567) | | (6,111) | | (1,537,817) | | (2,443,765) | | (2,127,461) |
| 26,650,586 | | 10,356,476 | | 8,037,919 | | 22,380,825 | | 23,532,885 | | 15,621,032 |
| | | | | | | | | | | |
| 8,067,541 | | 13,318,385 | | 6,977,126 | | 910,208 | | 10,233,032 | | 6,931,176 |
| | | | | | | | | | | |
| 4,837 | | 5,139 | | 5,062 | | 4,121 | | 5,197 | | 4,990 |
| 21,859 | | 49,013 | | 25,884 | | — | | 34,618 | | 17,997 |
| 37,927 | | 46,816 | | 77,339 | | 191,330 | | 724,028 | | 1,162,826 |
| | | | | | | | | | | |
| 1,014,847 | | 2,399,783 | | 851,643 | | — | | 885,157 | | 282,807 |
| 209,665 | | 323,443 | | 136,444 | | 128,992 | | 207,687 | | 130,938 |
| 99,983 | | 97,951 | | 111,279 | | 109,223 | | 108,809 | | 112,120 |
| | | | | | | | | | | |
| 1,478 | | 1,666 | | 1,629 | | 5,051 | | 652 | | 1,641 |
| 10,771 | | 13,150 | | 10,623 | | — | | 9,124 | | 7,693 |
| 5,392 | | 10,111 | | 6,425 | | 252 | | 5,391 | | 3,650 |
| 4,460 | | 6,825 | | 3,779 | | 2,630 | | 4,545 | | 3,328 |
| — | | — | | — | | — | | — | | — |
| — | | — | | — | | 260,240 | | — | | — |
| — | | — | | — | | — | | 34,466 | | — |
| 134,324 | | 187,480 | | 114,856 | | 120,813 | | 277,540 | | 210,151 |
| — | | — | | — | | 86,299 | | — | | — |
| 9,613,084 | | 16,459,762 | | 8,322,089 | | 1,819,159 | | 12,530,246 | | 8,869,317 |
| — | | — | | — | | (4,928) | | — | | — |
| (20,498) | | (43,997) | | (57,447) | | — | | — | | (1,963) |
| 9,592,586 | | 16,415,765 | | 8,264,642 | | 1,814,231 | | 12,530,246 | | 8,867,354 |
| 17,058,000 | | (6,059,289) | | (226,723) | | 20,566,594 | | 11,002,639 | | 6,753,678 |
| | | | | | | | | | | |
| | | | | | | | | | | |
| 145,125,611 | | 381,816,729 | | 131,332,798 | | 26,018,194 | | 101,536,723 | | 68,365,892 |
| — | | — | | — | | — | | (2,025,963) | | — |
| 10,091,869 | | 14,525,795 | | 3,063,481 | | 5,507,743 | | 11,422,115 | | 1,842,239 |
| — | | — | | — | | — | | 6,801,048 | | 4,186,171 |
| — | | — | | — | | — | | — | | — |
| 2,757,551 | | — | | 103,558 | | — | | (7,855,214) | | (1,104,514) |
| 2,400 | | — | | 2,194 | | (117,608) | | (645,431) | | (560,401) |
| 157,977,431 | | 396,342,524 | | 134,502,031 | | 31,408,329 | | 109,233,278 | | 72,729,387 |
| | | | | | | | | | | |
| 113,201,859 | | (56,695,959) | | 19,566,655 | | 31,975,042 | | (668,362) | | (89,346,109) |
| — | | — | | — | | — | | 1,814,107 | | — |
| 514,976 | | 284,589 | | (118,290) | | 404,213 | | (1,392,531) | | (2,380,566) |
| — | | — | | — | | — | | 3,650,429 | | (1,537,325) |
| — | | — | | — | | — | | — | | — |
| — | | — | | — | | — | | — | | — |
| (575,964) | | — | | (9,816) | | — | | (2,597,095) | | (478,289) |
| — | | — | | — | | (125,209) | | (377,908) | | 79,123 |
| 113,140,871 | | (56,411,370) | | 19,438,549 | | 32,254,046 | | 428,640 | | (93,663,166) |
| 271,118,302 | | 339,931,154 | | 153,940,580 | | 63,662,375 | | 109,661,918 | | (20,933,779) |
| $288,176,302 | | $333,871,865 | | $153,713,857 | | $84,228,969 | | $120,664,557 | | $(14,180,101) |
See Notes to Financial Statements.
| STATEMENTS OF CHANGES IN NET ASSETS |
| | Defensive Market Strategies® Fund |
| | For the Year Ended |
| | 12/31/21 | | 12/31/20 |
| | | | |
| Operations: | | | |
| Net investment income | $ 5,639,094 | | $ 10,012,122 |
| Net realized gain (loss) on investment securities, foreign currency and derivatives | 305,018,878 | | 48,320,242 |
| Net change in unrealized appreciation (depreciation) on investment securities, foreign currency and derivatives | (150,540,527) | | 58,324,843 |
| Net increase in net assets resulting from operations | 160,117,445 | | 116,657,207 |
| Distributions to Shareholders: | | | |
| Institutional shares | (102,492,352) | | (28,360,215) |
| Investor shares | (43,892,585) | | (11,880,888) |
| Total distributions | (146,384,937) | | (40,241,103) |
| Capital Share Transactions: | | | |
| Proceeds from shares sold | | | |
| Institutional shares | 101,913,277 | | 113,480,463 |
| Investor shares | 77,253,297 | | 109,047,446 |
| Reinvestment of dividends and distributions | | | |
| Institutional shares | 102,410,835 | | 28,332,976 |
| Investor shares | 43,392,557 | | 11,614,320 |
| Total proceeds from shares sold and reinvested | 324,969,966 | | 262,475,205 |
| Value of shares redeemed | | | |
| Institutional shares | (92,325,267) | | (77,994,633) |
| Investor shares | (79,559,985) | | (186,378,333) |
| Total value of shares redeemed | (171,885,252) | | (264,372,966) |
| Net increase (decrease) from capital share transactions(2) | 153,084,714 | | (1,897,761) |
| Total increase in net assets | 166,817,222 | | 74,518,343 |
| Net Assets: | | | |
| Beginning of Year | 1,337,039,215 | | 1,262,520,872 |
| End of Year | $1,503,856,437 | | $1,337,039,215 |
| |
| (2) | See Note 6 in Notes to Financial Statements. |
See Notes to Financial Statements.
| Global Impact Fund(1) | | Equity Index Fund | | Value Equity Fund |
| For the Period Ended | | For the Year Ended | | For the Year Ended |
| 12/31/21 | | 12/31/21 | | 12/31/20 | | 12/31/21 | | 12/31/20 |
| | | | | | | | | |
| | | | | | | | | |
| $ 346,224 | | $ 32,651,431 | | $ 32,674,137 | | $ 17,058,000 | | $ 19,065,258 |
| 1,135,014 | | 64,217,239 | | 47,322,749 | | 157,977,431 | | (5,835,474) |
| 15,020,498 | | 618,458,012 | | 308,888,250 | | 113,140,871 | | 39,259,823 |
| 16,501,736 | | 715,326,682 | | 388,885,136 | | 288,176,302 | | 52,489,607 |
| | | | | | | | | |
| (1,065,554) | | (75,568,513) | | (41,880,879) | | (110,145,870) | | (17,764,971) |
| (152,203) | | (27,787,525) | | (15,314,572) | | (48,291,794) | | (6,799,021) |
| (1,217,757) | | (103,356,038) | | (57,195,451) | | (158,437,664) | | (24,563,992) |
| | | | | | | | | |
| | | | | | | | | |
| 139,196,191 | | 300,877,960 | | 245,735,231 | | 53,440,513 | | 125,871,724 |
| 28,726,035 | | 125,608,438 | | 141,664,866 | | 72,355,582 | | 29,220,026 |
| | | | | | | | | |
| 1,065,554 | | 73,903,137 | | 40,937,745 | | 110,083,989 | | 17,755,900 |
| 152,203 | | 27,665,076 | | 15,249,001 | | 48,224,945 | | 6,781,640 |
| 169,139,983 | | 528,054,611 | | 443,586,843 | | 284,105,029 | | 179,629,290 |
| | | | | | | | | |
| (7,676,291) | | (181,914,711) | | (256,623,744) | | (181,628,402) | | (107,218,689) |
| (968,002) | | (110,582,572) | | (165,282,938) | | (62,099,803) | | (76,694,657) |
| (8,644,293) | | (292,497,283) | | (421,906,682) | | (243,728,205) | | (183,913,346) |
| 160,495,690 | | 235,557,328 | | 21,680,161 | | 40,376,824 | | (4,284,056) |
| 175,779,669 | | 847,527,972 | | 353,369,846 | | 170,115,462 | | 23,641,559 |
| | | | | | | | | |
| — | | 2,489,023,774 | | 2,135,653,928 | | 1,238,537,173 | | 1,214,895,614 |
| $175,779,669 | | $3,336,551,746 | | $2,489,023,774 | | $1,408,652,635 | | $1,238,537,173 |
| |
| (1) | For the period January 29, 2021 (commencement of operations) through December 31, 2021. |
See Notes to Financial Statements.
| STATEMENTS OF CHANGES IN NET ASSETS |
| | Growth Equity Fund | | Small Cap Equity Fund |
| | For the Year Ended | | For the Year Ended |
| | 12/31/21 | | 12/31/20 | | 12/31/21 | | 12/31/20 |
| | | | | | | | |
| Operations: | | | | | | | |
| Net investment income (loss) | $ (6,059,289) | | $ (892,507) | | $ (226,723) | | $ 66,077 |
| Net realized gain (loss) on investment securities, foreign currency and derivatives | 396,342,524 | | 288,812,882 | | 134,502,031 | | (1,140,081) |
| Net change in unrealized appreciation (depreciation) on investment securities, foreign currency and derivatives | (56,411,370) | | 255,761,652 | | 19,438,549 | | 114,909,817 |
| Net increase (decrease) in net assets resulting from operations | 333,871,865 | | 543,682,027 | | 153,713,857 | | 113,835,813 |
| Distributions to Shareholders: | | | | | | | |
| Institutional shares | (192,668,583) | | (144,758,996) | | (72,575,649) | | (4,586,466) |
| Investor shares | (172,602,822) | | (130,715,878) | | (49,546,274) | | (2,914,331) |
| Total distributions | (365,271,405) | | (275,474,874) | | (122,121,923) | | (7,500,797) |
| Capital Share Transactions: | | | | | | | |
| Proceeds from shares sold | | | | | | | |
| Institutional shares | 90,705,263 | | 119,129,235 | | 80,586,854 | | 82,357,232 |
| Investor shares | 73,022,150 | | 157,705,761 | | 80,131,997 | | 28,232,380 |
| Reinvestment of dividends and distributions | | | | | | | |
| Institutional shares | 192,563,028 | | 144,705,800 | | 72,378,323 | | 4,574,145 |
| Investor shares | 172,275,100 | | 130,472,321 | | 49,454,914 | | 2,908,010 |
| Total proceeds from shares sold and reinvested | 528,565,541 | | 552,013,117 | | 282,552,088 | | 118,071,767 |
| Value of shares redeemed | | | | | | | |
| Institutional shares | (229,277,241) | | (278,950,981) | | (81,879,444) | | (66,161,278) |
| Investor shares | (202,669,619) | | (217,006,766) | | (58,839,422) | | (57,888,097) |
| Total value of shares redeemed | (431,946,860) | | (495,957,747) | | (140,718,866) | | (124,049,375) |
| Net increase (decrease) from capital share transactions(1) | 96,618,681 | | 56,055,370 | | 141,833,222 | | (5,977,608) |
| Total increase in net assets | 65,219,141 | | 324,262,523 | | 173,425,156 | | 100,357,408 |
| Net Assets: | | | | | | | |
| Beginning of Year | 2,022,412,075 | | 1,698,149,552 | | 696,815,213 | | 596,457,805 |
| End of Year | $2,087,631,216 | | $2,022,412,075 | | $ 870,240,369 | | $ 696,815,213 |
| |
| (1) | See Note 6 in Notes to Financial Statements. |
See Notes to Financial Statements.
| International Equity Index Fund | | International Equity Fund | | Emerging Markets Equity Fund |
| For the Year Ended | | For the Year Ended | | For the Year Ended |
| 12/31/21 | | 12/31/20 | | 12/31/21 | | 12/31/20 | | 12/31/21 | | 12/31/20 |
| | | | | | | | | | | |
| | | | | | | | | | | |
| $ 20,566,594 | | $ 15,157,530 | | $ 11,002,639 | | $ 12,376,126 | | $ 6,753,678 | | $ 3,652,842 |
| 31,408,329 | | (4,430,596) | | 109,233,278 | | (16,830,329) | | 72,729,387 | | 22,991,721 |
| 32,254,046 | | 51,948,096 | | 428,640 | | 104,788,164 | | (93,663,166) | | 114,479,212 |
| 84,228,969 | | 62,675,030 | | 120,664,557 | | 100,333,961 | | (14,180,101) | | 141,123,775 |
| | | | | | | | | | | |
| (43,509,882) | | (14,997,073) | | (77,005,074) | | (10,269,203) | | (84,909,583) | | (6,348,367) |
| — | | — | | (27,107,306) | | (3,636,168) | | (13,090,539) | | (847,376) |
| (43,509,882) | | (14,997,073) | | (104,112,380) | | (13,905,371) | | (98,000,122) | | (7,195,743) |
| | | | | | | | | | | |
| | | | | | | | | | | |
| 123,432,374 | | 122,470,218 | | 55,330,718 | | 87,698,895 | | 167,423,077 | | 154,100,342 |
| — | | — | | 38,974,229 | | 54,503,766 | | 49,270,743 | | 34,698,746 |
| | | | | | | | | | | |
| 42,924,287 | | 14,797,848 | | 75,977,628 | | 10,156,580 | | 84,887,665 | | 6,345,885 |
| — | | — | | 27,023,555 | | 3,607,389 | | 13,032,918 | | 843,033 |
| 166,356,661 | | 137,268,066 | | 197,306,130 | | 155,966,630 | | 314,614,403 | | 195,988,006 |
| | | | | | | | | | | |
| (152,511,004) | | (119,480,679) | | (129,428,176) | | (153,711,495) | | (127,087,014) | | (51,696,785) |
| — | | — | | (57,247,307) | | (84,381,452) | | (30,712,692) | | (29,550,228) |
| (152,511,004) | | (119,480,679) | | (186,675,483) | | (238,092,947) | | (157,799,706) | | (81,247,013) |
| 13,845,657 | | 17,787,387 | | 10,630,647 | | (82,126,317) | | 156,814,697 | | 114,740,993 |
| 54,564,744 | | 65,465,344 | | 27,182,824 | | 4,302,273 | | 44,634,474 | | 248,669,025 |
| | | | | | | | | | | |
| 779,329,303 | | 713,863,959 | | 1,318,472,011 | | 1,314,169,738 | | 781,608,640 | | 532,939,615 |
| $ 833,894,047 | | $ 779,329,303 | | $1,345,654,835 | | $1,318,472,011 | | $ 826,243,114 | | $781,608,640 |
See Notes to Financial Statements.
| For a Share Outstanding For the Years Ending December 31, unless otherwise indicated | | | | | | Ratios to Average Net Assets | |
| | Net Asset
Value,
Beginning
of Year | Net Investment
Income/ (Loss)# | Realized
and
Unrealized
Gain
(Loss) on
Investments | Total Income
From Investment
Operations | Dividends
from Net
Investment
Income | Distributions
from Net
Realized
Capital
Gains | Total
Distributions
Paid | Net Asset
Value,
End of
Year | Total
Return | Net Assets,
End of Year
(000) | Expenses,
Net | Expenses,
Gross | Investment
Income/
(Loss),
Net | Portfolio
Turnover
Rate |
| Defensive Market Strategies® Fund |
| Institutional Class |
| 2021 | $14.14 | $ 0.07 | $ 1.62 | $ 1.69 | $(0.11) | $(1.42) | $(1.53) | $14.30 | 12.15% | $1,049,002 | 0.65% | 0.65% | 0.48% | 79% |
| 2020 | 13.27 | 0.12 | 1.19 | 1.31 | (0.16) | (0.28) | (0.44) | 14.14 | 10.08 | 927,539 | 0.67 | 0.67 | 0.90 | 67 |
| 2019 | 11.73 | 0.17 | 2.13 | 2.30 | (0.17) | (0.59) | (0.76) | 13.27 | 19.78 | 803,696 | 0.67 | 0.67 | 1.29 | 55 |
| 2018 | 12.68 | 0.15 | (0.32) | (0.17) | (0.17) | (0.61) | (0.78) | 11.73 | (1.51) | 653,481 | 0.67 | 0.67 | 1.17 | 65 |
| 2017 | 11.90 | 0.09 | 1.42 | 1.51 | (0.08) | (0.65) | (0.73) | 12.68 | 12.74 | 602,011 | 0.67(1) | 0.68 | 0.70 | 60 |
| Investor Class |
| 2021 | $14.15 | $ 0.03 | $ 1.61 | $ 1.64 | $(0.07) | $(1.42) | $(1.49) | $14.30 | 11.79% | $ 454,854 | 0.92% | 0.92% | 0.21% | 79% |
| 2020 | 13.27 | 0.08 | 1.20 | 1.28 | (0.12) | (0.28) | (0.40) | 14.15 | 9.86 | 409,500 | 0.94 | 0.94 | 0.64 | 67 |
| 2019 | 11.74 | 0.13 | 2.13 | 2.26 | (0.14) | (0.59) | (0.73) | 13.27 | 19.38 | 458,825 | 0.93 | 0.93 | 1.02 | 55 |
| 2018 | 12.68 | 0.12 | (0.32) | (0.20) | (0.13) | (0.61) | (0.74) | 11.74 | (1.69) | 358,777 | 0.93 | 0.93 | 0.90 | 65 |
| 2017 | 11.91 | 0.05 | 1.41 | 1.46 | (0.04) | (0.65) | (0.69) | 12.68 | 12.35 | 360,533 | 0.95(1) | 0.96 | 0.43 | 60 |
| |
| Global Impact Fund |
| Institutional Class |
| 2021(2) | $10.00 | $ 0.03 | $ 1.01 | $ 1.04 | $(0.03) | $(0.06) | $(0.09) | $10.95 | 10.31% | $ 145,393 | 0.81% | 0.81% | 0.28% | 56% |
| Investor Class |
| 2021(2) | $10.00 | $(0.01) | $ 1.00 | $ 0.99 | $ — | $(0.06) | $(0.06) | $10.93 | 9.85% | $ 30,387 | 1.20% | 1.20% | (0.11)% | 56% |
| |
| Equity Index Fund |
| Institutional Class |
| 2021 | $40.83 | $ 0.56 | $10.86 | $11.42 | $(0.54) | $(1.12) | $(1.66) | $50.59 | 28.28% | $2,403,001 | 0.12% | 0.12% | 1.21% | 4% |
| 2020 | 35.45 | 0.57 | 5.78 | 6.35 | (0.57) | (0.40) | (0.97) | 40.83 | 18.19 | 1,772,397 | 0.13 | 0.13 | 1.60 | 3 |
| 2019 | 27.56 | 0.59 | 8.11 | 8.70 | (0.58) | (0.23) | (0.81) | 35.45 | 31.68 | 1,501,076 | 0.13 | 0.13 | 1.82 | 2 |
| 2018 | 29.43 | 0.55 | (1.79) | (1.24) | (0.48) | (0.15) | (0.63) | 27.56 | (4.29) | 1,107,944 | 0.12 | 0.13 | 1.81 | 3 |
| 2017 | 24.68 | 0.47 | 4.92 | 5.39 | (0.46) | (0.18) | (0.64) | 29.43 | 21.97 | 483,275 | 0.19 | 0.20 | 1.72 | 2 |
| Investor Class |
| 2021 | $40.85 | $ 0.44 | $10.86 | $11.30 | $(0.42) | $(1.12) | $(1.54) | $50.61 | 27.95% | $ 933,551 | 0.39% | 0.39% | 0.95% | 4% |
| 2020 | 35.47 | 0.47 | 5.79 | 6.26 | (0.48) | (0.40) | (0.88) | 40.85 | 17.89 | 716,627 | 0.40 | 0.40 | 1.34 | 3 |
| 2019 | 27.58 | 0.50 | 8.11 | 8.61 | (0.49) | (0.23) | (0.72) | 35.47 | 31.33 | 634,578 | 0.39 | 0.39 | 1.56 | 2 |
| 2018 | 29.44 | 0.47 | (1.78) | (1.31) | (0.40) | (0.15) | (0.55) | 27.58 | (4.55) | 490,513 | 0.37 | 0.38 | 1.56 | 3 |
| 2017 | 24.70 | 0.40 | 4.91 | 5.31 | (0.39) | (0.18) | (0.57) | 29.44 | 21.65 | 494,771 | 0.45 | 0.46 | 1.46 | 2 |
| | | | | | | | | | | | | | | |
| # | Calculated using the average shares outstanding method. |
| (1) | The ratio for the Defensive Market Strategies® Fund includes the effect of fees paid indirectly which decreased the ratio by 0.00% for the year 2017. |
| (2) | For the period January 29, 2021 (commencement of operations) through December 31, 2021. All ratios for the period have been annualized with the exception of total return and portfolio turnover which have not been annualized. |
See Notes to Financial Statements.
| For a Share Outstanding For the Years Ending December 31, unless otherwise indicated | | | | | | Ratios to Average Net Assets | |
| | Net Asset
Value,
Beginning
of Year | Net Investment
Income/ (Loss)# | Realized
and
Unrealized
Gain
(Loss) on
Investments | Total Income
From Investment
Operations | Dividends
from Net
Investment
Income | Distributions
from Net
Realized
Capital
Gains | Total
Distributions
Paid | Net Asset
Value,
End of
Year | Total
Return | Net Assets,
End of Year
(000) | Expenses,
Net | Expenses,
Gross | Investment
Income/
(Loss),
Net | Portfolio
Turnover
Rate |
| Value Equity Fund |
| Institutional Class |
| 2021 | $19.35 | $ 0.30 | $ 4.38 | $ 4.68 | $(0.40) | $(2.26) | $(2.66) | $21.37 | 24.61% | $ 971,586 | 0.64%(1) | 0.64% | 1.35% | 38% |
| 2020 | 19.02 | 0.30 | 0.42 | 0.72 | (0.15) | (0.24) | (0.39) | 19.35 | 4.19 | 896,523 | 0.64(1) | 0.64 | 1.80 | 97 |
| 2019 | 16.79 | 0.35 | 4.16 | 4.51 | (0.34) | (1.94) | (2.28) | 19.02 | 27.14 | 831,854 | 0.62(1) | 0.62 | 1.81 | 92 |
| 2018 | 22.76 | 0.39 | (2.75) | (2.36) | (0.40) | (3.21) | (3.61) | 16.79 | (10.97) | 703,135 | 0.56(1) | 0.57 | 1.75 | 38 |
| 2017 | 21.18 | 0.39 | 2.85 | 3.24 | (0.37) | (1.29) | (1.66) | 22.76 | 15.54 | 1,128,445 | 0.57(1) | 0.58 | 1.78 | 38 |
| Investor Class |
| 2021 | $19.34 | $ 0.24 | $ 4.37 | $ 4.61 | $(0.34) | $(2.26) | $(2.60) | $21.35 | 24.27% | $ 437,067 | 0.90%(1) | 0.90% | 1.09% | 38% |
| 2020 | 19.04 | 0.26 | 0.40 | 0.66 | (0.12) | (0.24) | (0.36) | 19.34 | 3.89 | 342,014 | 0.90(1) | 0.90 | 1.54 | 97 |
| 2019 | 16.81 | 0.30 | 4.16 | 4.46 | (0.29) | (1.94) | (2.23) | 19.04 | 26.80 | 383,041 | 0.89(1) | 0.89 | 1.55 | 92 |
| 2018 | 22.78 | 0.34 | (2.75) | (2.41) | (0.35) | (3.21) | (3.56) | 16.81 | (11.19) | 335,568 | 0.83(1) | 0.84 | 1.50 | 38 |
| 2017 | 21.20 | 0.34 | 2.85 | 3.19 | (0.32) | (1.29) | (1.61) | 22.78 | 15.25 | 397,231 | 0.83(1) | 0.84 | 1.52 | 38 |
| |
| Growth Equity Fund |
| Institutional Class |
| 2021 | $30.63 | $(0.06) | $ 5.44 | $ 5.38 | $ — | $(6.09) | $(6.09) | $29.92 | 17.68% | $1,108,031 | 0.68%(2) | 0.68% | (0.17)% | 25% |
| 2020 | 26.23 | 0.02 | 9.11 | 9.13 | (0.05) | (4.68) | (4.73) | 30.63 | 35.75 | 1,064,559 | 0.69(2) | 0.69 | 0.08 | 40 |
| 2019 | 21.47 | 0.03 | 7.36 | 7.39 | (0.03) | (2.60) | (2.63) | 26.23 | 34.79 | 934,297 | 0.71(2) | 0.71 | 0.13 | 21 |
| 2018 | 25.18 | 0.05 | 0.41 | 0.46 | (0.01) | (4.16) | (4.17) | 21.47 | 1.22 | 765,738 | 0.70(2) | 0.71 | 0.18 | 19 |
| 2017 | 21.08 | 0.03 | 6.80 | 6.83 | (0.02) | (2.71) | (2.73) | 25.18 | 32.43 | 1,150,773 | 0.72(2) | 0.73 | 0.12 | 41 |
| Investor Class |
| 2021 | $30.29 | $(0.14) | $ 5.38 | $ 5.24 | $ — | $(6.09) | $(6.09) | $29.44 | 17.41% | $ 979,600 | 0.94%(2) | 0.94% | (0.43)% | 25% |
| 2020 | 26.02 | (0.05) | 9.02 | 8.97 | (0.02) | (4.68) | (4.70) | 30.29 | 35.39 | 957,853 | 0.95(2) | 0.95 | (0.19) | 40 |
| 2019 | 21.35 | (0.03) | 7.30 | 7.27 | — | (2.60) | (2.60) | 26.02 | 34.42 | 763,853 | 0.96(2) | 0.96 | (0.13) | 21 |
| 2018 | 25.11 | (0.02) | 0.42 | 0.40 | — | (4.16) | (4.16) | 21.35 | 0.99 | 622,379 | 0.96(2) | 0.97 | (0.06) | 19 |
| 2017 | 21.07 | (0.04) | 6.79 | 6.75 | — | (2.71) | (2.71) | 25.11 | 32.06 | 584,764 | 0.98(2) | 0.99 | (0.14) | 41 |
| | | | | | | | | | | | | | | |
| # | Calculated using the average shares outstanding method. |
| (1) | The ratio for the Value Equity Fund includes the effect of fees paid indirectly which decreased the ratio by 0.00% for the years 2017, 2018, 2019, 2020 and for 2021. |
| (2) | The ratio for the Growth Equity Fund includes the effect of fees paid indirectly which decreased the ratio by 0.00% for the years 2017, 2018, 2019, 2020 and 2021. |
See Notes to Financial Statements.
FINANCIAL HIGHLIGHTS (Continued)
| For a Share Outstanding For the Years Ending December 31, unless otherwise indicated | | | | | | Ratios to Average Net Assets | |
| | Net Asset
Value,
Beginning
of Year | Net Investment
Income/ (Loss)# | Realized
and
Unrealized
Gain
(Loss) on
Investments | Total Income
From Investment
Operations | Dividends
from Net
Investment
Income | Distributions
from Net
Realized
Capital
Gains | Total
Distributions
Paid | Net Asset
Value,
End of
Year | Total
Return | Net Assets,
End of Year
(000) | Expenses,
Net | Expenses,
Gross | Investment
Income/
(Loss),
Net | Portfolio
Turnover
Rate |
| Small Cap Equity Fund |
| Institutional Class |
| 2021 | $18.67 | $ 0.02 | $ 4.03 | $ 4.05 | $(0.02) | $(3.16) | $(3.18) | $19.54 | 22.09% | $519,549 | 0.90%(1) | 0.91% | 0.08% | 54% |
| 2020 | 15.72 | 0.02 | 3.13 | 3.15 | (—)† | (0.20) | (0.20) | 18.67 | 20.07 | 428,451 | 0.98(1) | 0.99 | 0.12 | 90 |
| 2019 | 13.04 | 0.03 | 3.26 | 3.29 | (0.02) | (0.59) | (0.61) | 15.72 | 25.29 | 338,440 | 1.00(1) | 1.01 | 0.20 | 84 |
| 2018 | 18.36 | 0.04 | (2.13) | (2.09) | — | (3.23) | (3.23) | 13.04 | (12.01) | 256,242 | 0.98(1) | 0.99 | 0.20 | 172 |
| 2017 | 17.53 | 0.02 | 2.24 | 2.26 | (0.03) | (1.40) | (1.43) | 18.36 | 12.98 | 293,953 | 0.98(1) | 1.00 | 0.09 | 80 |
| Investor Class |
| 2021 | $18.54 | $(0.04) | $ 4.01 | $ 3.97 | $ — | $(3.16) | $(3.16) | $19.35 | 21.79% | $350,691 | 1.16%(1) | 1.17% | (0.18)% | 54% |
| 2020 | 15.66 | (0.02) | 3.11 | 3.09 | (0.01) | (0.20) | (0.21) | 18.54 | 19.75 | 268,364 | 1.24(1) | 1.25 | (0.15) | 90 |
| 2019 | 13.01 | (0.01) | 3.25 | 3.24 | — | (0.59) | (0.59) | 15.66 | 24.97 | 258,018 | 1.26(1) | 1.27 | (0.06) | 84 |
| 2018 | 18.37 | (0.01) | (2.12) | (2.13) | — | (3.23) | (3.23) | 13.01 | (12.22) | 231,456 | 1.24(1) | 1.25 | (0.06) | 172 |
| 2017 | 17.56 | (0.03) | 2.24 | 2.21 | — | (1.40) | (1.40) | 18.37 | 12.67 | 261,943 | 1.25(1) | 1.27 | (0.17) | 80 |
| |
| International Equity Index Fund |
| Institutional Class |
| 2021 | $11.53 | $ 0.31 | $ 0.88 | $ 1.19 | $(0.35) | $(0.31) | $(0.66) | $12.06 | 10.43% | $833,894 | 0.22% | 0.22% | 2.52% | 18% |
| 2020 | 10.87 | 0.22 | 0.67 | 0.89 | (0.23) | — | (0.23) | 11.53 | 8.17 | 779,329 | 0.22 | 0.22 | 2.16 | 12 |
| 2019 | 9.24 | 0.31 | 1.65 | 1.96 | (0.33) | — | (0.33) | 10.87 | 21.21 | 713,864 | 0.22 | 0.23 | 3.05 | 5 |
| 2018 | 10.76 | 0.27 | (1.66) | (1.39) | (0.13) | — | (0.13) | 9.24 | (12.86) | 545,427 | 0.27 | 0.27 | 2.64 | 4 |
| 2017 | 8.86 | 0.25 | 1.93 | 2.18 | (0.25) | (0.03) | (0.28) | 10.76 | 24.69 | 188,122 | 0.41 | 0.35 | 2.45 | 4 |
| | | | | | | | | | | | | | | |
| # | Calculated using the average shares outstanding method. |
| † | Amount represents less than $0.005 per share. |
| (1) | The ratio for the Small Cap Equity Fund includes the effect of fees paid indirectly which decreased the ratio by 0.01% for the year 2017. For the year ended December 31, 2018, the effect of fees paid indirectly decreased the ratio by 0.00% and 0.01% for the Institutional and Investor Class, respectively. For the years ended 2019, 2020 and 2021, the effect of fees paid indirectly decreased the ratio by 0.01%, 0.01% and 0.01%, respectively. |
See Notes to Financial Statements.
| For a Share Outstanding For the Years Ending December 31, unless otherwise indicated | | | | | | Ratios to Average Net Assets | |
| | Net Asset
Value,
Beginning
of Year | Net Investment
Income# | Realized
and
Unrealized
Gain
(Loss) on
Investments | Total Income
From Investment
Operations | Dividends
from Net
Investment
Income | Distributions
from Net
Realized
Capital
Gains | Total
Distributions
Paid | Net Asset
Value,
End of
Year | Total
Return | Net Assets,
End of Year
(000) | Expenses,
Net | Expenses,
Gross | Investment
Income,
Net
| Portfolio
Turnover
Rate |
| International Equity Fund |
| Institutional Class |
| 2021 | $14.70 | $0.14 | $ 1.25 | $ 1.39 | $(0.18) | $(1.06) | $(1.24) | $14.85 | 9.61% | $ 987,439 | 0.87%(1) | 0.87%(1) | 0.90% | 37% |
| 2020 | 13.78 | 0.14 | 0.93 | 1.07 | (0.13) | (0.02) | (0.15) | 14.70 | 7.81(2) | 973,352 | 0.93(1) | 0.93(1) | 1.10 | 90 |
| 2019 | 11.74 | 0.31(3) | 2.44 | 2.75 | (0.31) | (0.40) | (0.71) | 13.78 | 23.45 | 963,046 | 1.07(1) | 1.07(1) | 2.31(3) | 54 |
| 2018 | 15.72 | 0.32 | (2.65) | (2.33) | (0.32) | (1.33) | (1.65) | 11.74 | (14.90) | 795,484 | 1.07(1) | 1.08(1) | 2.08 | 73 |
| 2017 | 13.16 | 0.25 | 3.65 | 3.90 | (0.25) | (1.09) | (1.34) | 15.72 | 29.85 | 1,279,089 | 0.92(1)(4) | 0.93(1) | 1.63 | 42 |
| Investor Class |
| 2021 | $14.69 | $0.10 | $ 1.25 | $ 1.35 | $(0.14) | $(1.06) | $(1.20) | $14.84 | 9.35% | $ 358,216 | 1.14%(1) | 1.14%(1) | 0.64% | 37% |
| 2020 | 13.81 | 0.11 | 0.93 | 1.04 | (0.14) | (0.02) | (0.16) | 14.69 | 7.52(2) | 345,120 | 1.20(1) | 1.20(1) | 0.84 | 90 |
| 2019 | 11.77 | 0.27(3) | 2.45 | 2.72 | (0.28) | (0.40) | (0.68) | 13.81 | 23.10 | 351,124 | 1.35(1) | 1.34(1) | 2.05(3) | 54 |
| 2018 | 15.74 | 0.27 | (2.63) | (2.36) | (0.28) | (1.33) | (1.61) | 11.77 | (15.06) | 285,252 | 1.33(1) | 1.35(1) | 1.76 | 73 |
| 2017 | 13.18 | 0.21 | 3.66 | 3.87 | (0.22) | (1.09) | (1.31) | 15.74 | 29.50 | 345,545 | 1.18(1)(4) | 1.19(1) | 1.37 | 42 |
| |
| Emerging Markets Equity Fund |
| Institutional Class |
| 2021 | $12.33 | $0.11 | $(0.34) | $(0.23) | $(0.08) | $(1.35) | $(1.43) | $10.67 | (1.85)% | $ 714,818 | 1.04%(5) | 1.04% | 0.86% | 62% |
| 2020 | 10.19 | 0.07 | 2.19 | 2.26 | (0.12) | — | (0.12) | 12.33 | 22.15 | 685,246 | 1.11(5) | 1.11 | 0.70 | 67 |
| 2019 | 8.71 | 0.18(6) | 1.57 | 1.75 | (0.27) | — | (0.27) | 10.19 | 20.06 | 457,074 | 1.19(5) | 1.19 | 1.92(6) | 92 |
| 2018 | 11.00 | 0.13 | (2.36) | (2.23) | (0.06) | — | (0.06) | 8.71 | (20.26) | 359,815 | 1.30(5) | 1.21 | 1.26 | 155 |
| 2017 | 8.18 | 0.08 | 2.85 | 2.93 | (0.11) | — | (0.11) | 11.00 | 35.80 | 404,641 | 1.30(5) | 1.31 | 0.83 | 56 |
| Investor Class |
| 2021 | $12.29 | $0.08 | $(0.34) | $(0.26) | $(0.05) | $(1.35) | $(1.40) | $10.63 | (2.12)% | $ 111,425 | 1.33%(5) | 1.33% | 0.60% | 62% |
| 2020 | 10.20 | 0.03 | 2.17 | 2.20 | (0.11) | — | (0.11) | 12.29 | 21.60 | 96,362 | 1.51(5) | 1.51 | 0.30 | 67 |
| 2019 | 8.72 | 0.14(6) | 1.57 | 1.71 | (0.23) | — | (0.23) | 10.20 | 19.64 | 75,866 | 1.57(5) | 1.57 | 1.48(6) | 92 |
| 2018 | 11.00 | 0.10 | (2.35) | (2.25) | (0.03) | — | (0.03) | 8.72 | (20.49) | 65,354 | 1.56(5) | 1.52 | 0.96 | 155 |
| 2017 | 8.19 | 0.06 | 2.84 | 2.90 | (0.09) | — | (0.09) | 11.00 | 35.37 | 94,346 | 1.57(5) | 1.66 | 0.57 | 56 |
| | | | | | | | | | | | | | | |
| # | Calculated using the average shares outstanding method. |
| (1) | The ratio for the International Equity Fund includes the effect of dividend expense on securities sold short which increased the ratio by 0.08% for the year ended December 31, 2017. For the year ended December 31, 2018, the effect of dividend expense on securities sold short increased the ratio by 0.23% and 0.29% for Institutional Class and Investor Class, respectively. For the years ended December 31, 2019, 2020 and 2021, the effect of dividend expense on securities sold short increased the ratio by 0.19%, 0.06% and 0.00%, respectively. |
| (2) | Amount includes the effect of the Adviser pay-in for an economic loss. Had the pay-in not been made, the net asset value total return would have been 7.77% and 7.46% for the Institutional Class and Investor Class, respectively. In addition, the portfolio turnover calculation includes the value of securities purchased and sold related to this transaction. |
| (3) | Net investment income per share and the ratio of net investment income to average net assets include $0.01 and 0.09% for the Institutional Class and $0.01 and 0.09% for the Investor Class, respectively, resulting from a special dividend from Naspers Ltd. in September 2019. |
| (4) | The ratio for the International Equity Fund includes the effect of fees paid indirectly which decreased the ratio by 0.00% for the year 2017. |
| (5) | The ratio for the Emerging Markets Equity Fund includes the effect of fees paid indirectly which decreased the ratio by 0.00% for the years 2017, 2018, 2019, 2020 and 2021. |
| (6) | Net investment income per share and the ratio of net investment income to average net assets include $0.06 and 0.68% for the Institutional Class and $0.06 and 0.62% for the Investor Class, respectively, resulting from a special dividend from Naspers Ltd. in September 2019. |
See Notes to Financial Statements.
Global Real Estate Securities Fund (Unaudited)
The Fund provides exposure to real estate by investing in equity securities of real estate investment trusts (“REITs”) and other real estate related companies. The Fund was diversified among property sectors and geographical locations. Global real estate securities outperformed their global equity counterparts during the year. The Investor Class of the Fund outperformed its benchmark, the FTSE EPRA/NAREIT Developed Index, for the one-year period ended December 31, 2021 (29.61% versus 26.09%). Overweight exposure and stock selection within the United States was the primary contributor to benchmark-relative returns, particularly in the industrial and residential property sectors.
In 2021, exchange-listed equity index futures contracts were utilized to provide market exposure to the cash positions held in the Fund. Overall, derivative exposure had a slightly positive impact on Fund performance for the year.
This Fund may be suitable for investors who seek the potential for current income and long-term capital appreciation. Investors should be willing to accept significant short-term fluctuations in account value and want to diversify their portfolio through exposure to publicly traded global real estate securities. This Fund invests substantial assets in REITs that involve equity market risks as well as risks linked directly to the real estate market. Risks include declines in the value of real estate, general and economic conditions, changes in the value of the underlying property and defaults by borrowers. The value of assets in the real estate industry may go through cycles of relative underperformance and outperformance in comparison to equity securities markets in general. Securities of foreign issuers may be negatively impacted by political events, economic conditions or inefficient, illiquid or unregulated markets in foreign countries, and they also may be subject to inadequate regulatory or accounting standards, which may increase investment risk. Investing in emerging markets may involve greater risks than investing in more developed foreign markets because, among other things, emerging markets often have more political and economic instability. It is possible to lose money by investing in the Fund.
At December 31, 2021, the portfolio holdings of the Fund, as a percentage of net assets, is shown in the following table. Portfolio holdings are subject to risk and may change at any time.
| | % |
| Real Estate | 96.1 |
| Money Market Funds | 3.0 |
| Health Care | 0.5 |
| | 99.6 |
Global Real Estate Securities Fund (Unaudited)
| Average Annual Total Returns as of 12/31/21 | |
| | | Institutional Class* | | Investor Class* | | Benchmark** | |
| One Year | | 29.97% | | 29.61% | | 26.09% | |
| Five Year | | 10.39% | | 10.09% | | 7.80% | |
| Ten Year | | N/A | | 8.80% | | 7.49% | |
| Since Inception | | 8.03% | | 5.19% | | 4.15% | |
| Inception Date | | 05/01/15 | | 12/29/06 | | | |
| Total Fund Operating Expenses (May 1, 2021 Prospectus)(1) | | 0.87% | | 1.14% | | | |
| (1) | Current information regarding the Fund’s Operating Expenses can be found in the Financial Highlights. |
The performance data quoted represents past performance and does not guarantee future results. Current performance may be lower or higher. Performance data current to the most recent month-end may be obtained at GuideStoneFunds.com. The investment return and principal value of an investment will fluctuate so that shares, when redeemed, may be worth more or less than their original cost.
The graph illustrates the results of a hypothetical $10,000 investment in the Investor Class of the Fund for the 10-year period from December 31, 2011 to December 31, 2021, with all dividends and capital gains reinvested, with the FTSE EPRA/NAREIT Developed Index.
*These returns reflect investment advisory and shareholder servicing fee waivers, if applicable, during the reported time periods.
**Unlike a mutual fund, the performance of an index assumes no taxes, transaction costs, management fees or other expenses.
GLOBAL REAL ESTATE SECURITIES FUND
| | | Shares | | Value |
| COMMON STOCKS — 59.2% |
| Real Estate — 59.2% | | |
| Agree Realty Corporation REITΔ | 64,777 | | $ 4,622,487 |
| Alexandria Real Estate Equities, Inc. REIT | 5,267 | | 1,174,330 |
| American Homes 4 Rent Class A REIT | 69,031 | | 3,010,442 |
| Americold Realty Trust REITΔ | 48,395 | | 1,586,872 |
| Apartment Income REIT Corporation | 72,186 | | 3,946,409 |
| AvalonBay Communities, Inc. REIT | 53,241 | | 13,448,144 |
| Boston Properties, Inc. REIT | 29,159 | | 3,358,534 |
| Camden Property Trust REIT | 8,191 | | 1,463,568 |
| CareTrust REIT, Inc. | 29,223 | | 667,161 |
| Centerspace REIT | 7,221 | | 800,809 |
| DiamondRock Hospitality Co. REIT* | 186,674 | | 1,793,937 |
| Digital Realty Trust, Inc. REITΔ | 61,895 | | 10,947,369 |
| Duke Realty Corporation REIT | 65,223 | | 4,281,238 |
| EastGroup Properties, Inc. REIT | 18,927 | | 4,312,517 |
| Empire State Realty Trust, Inc. Class A REIT | 104,228 | | 927,629 |
| Equinix, Inc. REIT | 8,888 | | 7,517,826 |
| Essential Properties Realty Trust, Inc. REIT | 100,424 | | 2,895,224 |
| Extra Space Storage, Inc. REIT | 32,536 | | 7,376,887 |
| Federal Realty Investment Trust REIT | 14,214 | | 1,937,652 |
| First Industrial Realty Trust, Inc. REIT | 41,991 | | 2,779,804 |
| Independence Realty Trust, Inc. REIT | 124,507 | | 3,216,016 |
| Kilroy Realty Corporation REIT | 26,500 | | 1,761,190 |
| Kimco Realty Corporation REIT | 335,710 | | 8,275,252 |
| Kite Realty Group Trust REIT | 115,161 | | 2,508,206 |
| Lamar Advertising Co. Class A REIT | 15,854 | | 1,923,090 |
| Life Storage, Inc. REIT | 51,154 | | 7,835,770 |
| Medical Properties Trust, Inc. REIT | 143,959 | | 3,401,751 |
| Mid-America Apartment Communities, Inc. REIT | 25,836 | | 5,927,812 |
| NETSTREIT Corporation | 91,549 | | 2,096,472 |
| Omega Healthcare Investors, Inc. REITΔ | 31,765 | | 939,926 |
| Pebblebrook Hotel Trust REIT | 58,892 | | 1,317,414 |
| Physicians Realty Trust REIT | 78,381 | | 1,475,914 |
| Piedmont Office Realty Trust, Inc. Class A REIT | 91,266 | | 1,677,469 |
| Postal Realty Trust, Inc. Class A REITΔ | 56,666 | | 1,121,987 |
| Prologis, Inc. REIT | 116,187 | | 19,561,243 |
| Public Storage REIT | 11,653 | | 4,364,748 |
| Realty Income Corporation REIT | 31,761 | | 2,273,770 |
| Regency Centers Corporation REIT | 35,362 | | 2,664,527 |
| Rexford Industrial Realty, Inc. REITΔ | 43,540 | | 3,531,529 |
| Ryman Hospitality Properties, Inc. REITΔ* | 35,348 | | 3,250,602 |
| SBA Communications Corporation REIT | 11,474 | | 4,463,616 |
| Simon Property Group, Inc. REIT | 62,660 | | 10,011,188 |
| STAG Industrial, Inc. REITΔ | 60,917 | | 2,921,579 |
| Sun Communities, Inc. REIT | 47,907 | | 10,059,033 |
| UDR, Inc. REIT | 33,723 | | 2,023,043 |
| Ventas, Inc. REIT | 52,657 | | 2,691,826 |
| | | Shares | | Value |
| Welltower, Inc. REIT | 112,121 | | $ 9,616,618 |
| | | | | 199,760,430 |
Total Common Stocks
(Cost $152,870,012) | | 199,760,430 |
| FOREIGN COMMON STOCKS — 37.4% |
| Australia — 3.9% | | |
| Dexus REIT | 324,034 | | 2,621,551 |
| GPT Group (The) REIT | 523,216 | | 2,063,209 |
| Mirvac Group REIT | 1,112,391 | | 2,355,121 |
| Scentre Group REIT | 1,535,500 | | 3,530,204 |
| Shopping Centres Australasia Property Group REIT | 429,589 | | 928,266 |
| Stockland REIT | 325,972 | | 1,005,562 |
| Waypoint REIT | 283,811 | | 584,358 |
| | | | | 13,088,271 |
| Belgium — 1.0% | | |
| Aedifica SA REITΔ | 6,326 | | 827,527 |
| Cofinimmo SA REIT | 3,384 | | 541,302 |
| VGP NV | 3,624 | | 1,056,237 |
| Warehouses De Pauw CVA REIT | 17,440 | | 837,502 |
| | | | | 3,262,568 |
| Canada — 3.8% | | |
| Canadian Apartment Properties REIT | 55,866 | | 2,648,109 |
| Chartwell Retirement Residences | 189,297 | | 1,768,837 |
| Granite REIT | 17,948 | | 1,495,489 |
| RioCan REIT | 62,747 | | 1,137,924 |
| Summit Industrial Income REIT | 65,903 | | 1,224,333 |
| Tricon Residential, Inc. | 287,084 | | 4,388,714 |
| | | | | 12,663,406 |
| Finland — 0.1% | | |
| Kojamo OYJ | 19,165 | | 463,443 |
| France — 1.7% | | |
| Gecina SA REIT | 10,108 | | 1,414,328 |
| ICADE REIT | 12,116 | | 870,405 |
| Klepierre REITΔ* | 22,347 | | 530,467 |
| Unibail-Rodamco-Westfield REIT* | 39,702 | | 2,785,269 |
| | | | | 5,600,469 |
| Germany — 3.2% | | |
| Aroundtown SA | 125,980 | | 759,958 |
| LEG Immobilien SE | 1,959 | | 273,130 |
| Vonovia SE | 179,521 | | 9,892,000 |
| | | | | 10,925,088 |
| Hong Kong — 3.8% | | |
| CK Asset Holdings, Ltd. | 512,855 | | 3,232,659 |
| Hang Lung Properties, Ltd. | 242,961 | | 499,785 |
| Hysan Development Co., Ltd. | 156,466 | | 483,592 |
| Link REIT | 361,773 | | 3,185,067 |
| Sun Hung Kai Properties, Ltd. | 271,459 | | 3,293,345 |
| Swire Properties, Ltd. | 503,688 | | 1,262,199 |
| Wharf Real Estate Investment Co., Ltd. | 159,000 | | 807,484 |
| | | | | 12,764,131 |
See Notes to Financial Statements.
| | | Shares | | Value |
| Japan — 8.1% | | |
| Activia Properties, Inc. REITΔ | 662 | | $ 2,393,373 |
| Daibiru Corporation | 37,300 | | 718,959 |
| Global One Real Estate Investment Corporation REIT | 853 | | 892,342 |
| GLP J-REITΔ | 347 | | 599,796 |
| Heiwa Real Estate Co., Ltd. | 13,013 | | 438,596 |
| Hulic Reit, Inc. | 899 | | 1,352,647 |
| Ichigo Office REIT Investment Corporation | 845 | | 609,140 |
| Japan Excellent, Inc. REIT | 245 | | 283,979 |
| Japan Hotel REIT Investment Corporation | 1,395 | | 681,555 |
| Japan Metropolitan Fund Invest REIT | 728 | | 627,169 |
| Japan Real Estate Investment Corporation REITΔ | 90 | | 510,897 |
| Keihanshin Building Co., Ltd. | 39,700 | | 539,312 |
| Kenedix Retail REIT Corporation | 798 | | 1,963,593 |
| LaSalle Logiport REIT | 783 | | 1,379,315 |
| Mitsubishi Estate Co., Ltd. | 233,605 | | 3,240,684 |
| Mitsubishi Estate Logistics REIT Investment Corporation | 88 | | 400,998 |
| Mitsui Fudosan Co., Ltd. | 159,380 | | 3,159,034 |
| Mori Trust Hotel Reit, Inc. | 1,095 | | 1,182,209 |
| Mori Trust Sogo REIT, Inc. | 1,089 | | 1,370,922 |
| Nippon Prologis REIT, Inc. | 166 | | 586,766 |
| Nomura Real Estate Holdings, Inc. | 10,734 | | 247,332 |
| Nomura Real Estate Master Fund, Inc. REIT | 471 | | 662,856 |
| One REIT, Inc. | 206 | | 540,868 |
| Samty Residential Investment Corporation REIT | 775 | | 867,825 |
| TOC Co., Ltd. | 8,800 | | 50,832 |
| Tokaido REIT, Inc.* | 346 | | 334,442 |
| Tokyu Fudosan Holdings Corporation | 191,048 | | 1,070,331 |
| United Urban Investment Corporation REIT | 609 | | 715,756 |
| | | | | 27,421,528 |
| Netherlands — 0.2% | | |
| CTP NV 144A | 30,640 | | 652,324 |
| Singapore — 2.9% | | |
| Ascott Residence Trust | 566,500 | | 432,988 |
| CapitaLand China Trust REIT | 253,978 | | 224,275 |
| CapitaLand Integrated Commercial Trust REIT | 1,261,936 | | 1,910,322 |
| Capitaland Investment, Ltd.Δ* | 818,645 | | 2,071,519 |
| City Developments, Ltd.Δ | 236,218 | | 1,193,711 |
| Daiwa House Logistics Trust REIT* | 708,044 | | 420,329 |
| Digital Core REIT Management Pte, Ltd.* | 1,163,898 | | 1,350,122 |
| Hongkong Land Holdings, Ltd. | 137,300 | | 713,960 |
| Mapletree Industrial Trust REIT | 332,600 | | 668,853 |
| Mapletree Logistics Trust REITΔ | 486,762 | | 686,292 |
| | | | | 9,672,371 |
| Spain — 0.7% | | |
| Arima Real Estate SOCIMI SA REITΔ* | 42,485 | | 444,029 |
| | | Shares | | Value |
| Inmobiliaria Colonial Socimi SA REIT* | 103,807 | | $ 971,293 |
| Merlin Properties Socimi SA REIT | 80,237 | | 869,324 |
| | | | | 2,284,646 |
| Sweden — 2.3% | | |
| Castellum ABΔ | 67,438 | | 1,813,423 |
| Fabege AB | 165,649 | | 2,772,407 |
| Fastighets AB Balder, B Shares* | 31,517 | | 2,268,090 |
| Nyfosa AB | 49,417 | | 850,546 |
| Sagax AB, B Shares | 7,018 | | 236,068 |
| | | | | 7,940,534 |
| Switzerland — 0.2% | | |
| PSP Swiss Property AG | 5,742 | | 715,540 |
| United Kingdom — 5.5% | | |
| Big Yellow Group PLC REIT | 53,921 | | 1,245,850 |
| British Land Co. PLC (The) REIT | 511,699 | | 3,677,760 |
| Derwent London PLC REIT | 32,829 | | 1,517,479 |
| Grainger PLC | 537,296 | | 2,290,860 |
| Hammerson PLC REIT | 667,878 | | 296,514 |
| Life Science Reit PLC REIT* | 230,500 | | 315,893 |
| PRS REIT PLC (The) | 252,691 | | 376,233 |
| Safestore Holdings PLC REIT | 25,891 | | 493,781 |
| Segro PLC REIT | 196,623 | | 3,823,088 |
| Sirius Real Estate, Ltd. | 226,567 | | 433,631 |
| Target Healthcare REIT PLC | 203,541 | | 325,094 |
| Tritax Big Box REIT PLC | 303,390 | | 1,022,527 |
| Tritax EuroBox PLC 144A | 411,616 | | 648,577 |
| UNITE Group PLC (The) REIT | 104,115 | | 1,564,971 |
| Urban Logistics REIT PLC | 220,591 | | 555,361 |
| | | | | 18,587,619 |
Total Foreign Common Stocks
(Cost $116,907,860) | | 126,041,938 |
| MONEY MARKET FUNDS — 3.0% |
GuideStone Money Market Fund, 0.00%
(Institutional Class)Ø∞ | 9,831,569 | | 9,831,569 |
| Northern Institutional Liquid Assets Portfolio (Shares), 0.04%ا | 67,622 | | 67,622 |
| Northern Institutional U.S. Government Portfolio (Shares), 0.00%Ø | 17,660 | | 17,660 |
Total Money Market Funds
(Cost $9,916,851) | | 9,916,851 |
TOTAL INVESTMENTS — 99.6%
(Cost $279,694,723) | | | 335,719,219 |
Other Assets in Excess of
Liabilities — 0.4% | | | 1,515,352 |
| NET ASSETS — 100.0% | | | $337,234,571 |
See Notes to Financial Statements.
GLOBAL REAL ESTATE SECURITIES FUND
SCHEDULE OF INVESTMENTS (Continued)
Futures Contracts outstanding at December 31, 2021:
| Future Type | | Expiration Date | | Open Long
(Short) Contracts | | Notional
Market Value
of Contracts | | Value and
Unrealized
Appreciation
(Depreciation) |
| S&P MidCap 400 Index E-Mini | | 03/2022 | | 41 | | $11,634,570 | | $229,185 |
VALUATION HIERARCHY
The following is a summary of the inputs used, as of December 31, 2021, in valuing the Fund’s investments carried at fair value:
| | Total
Value | | Level 1
Quoted Prices | | Level 2
Other Significant
Observable Inputs | | Level 3
Significant
Unobservable Inputs |
| Assets: | | | | | | | |
| Investments in Securities: | | | | | | | |
| Common Stocks | $199,760,430 | | $199,760,430 | | $ — | | $ — |
| Foreign Common Stocks: | | | | | | | |
| Germany | 10,925,088 | | — | | 10,925,088 | | — |
| Japan | 27,421,528 | | — | | 27,421,528 | | — |
| Spain | 2,284,646 | | 444,029 | | 1,840,617 | | — |
| Sweden | 7,940,534 | | — | | 7,940,534 | | — |
| Switzerland | 715,540 | | — | | 715,540 | | — |
| Other ^^ | 76,754,602 | | 76,754,602 | | — | | — |
| Total Foreign Common Stocks | 126,041,938 | | 77,198,631 | | 48,843,307 | | — |
| Money Market Funds | 9,916,851 | | 9,916,851 | | — | | — |
| Total Assets - Investments in Securities | $335,719,219 | | $286,875,912 | | $48,843,307 | | $ — |
| Other Financial Instruments*** | | | | | | | |
| Futures Contracts | $ 229,185 | | $ 229,185 | | $ — | | $ — |
| Total Assets - Other Financial Instruments | $ 229,185 | | $ 229,185 | | $ — | | $ — |
| ^^ | Classifications as defined in the Schedule of Investments. |
| *** | Other financial instruments are derivative instruments, such as futures contracts, which are valued at the unrealized appreciation (depreciation) on the investment. Further details regarding the value of these investments can be found in the preceding "Futures Contracts outstanding" disclosure. |
See Notes to Financial Statements.
| STATEMENTS OF ASSETS AND LIABILITIES | December 31, 2021 |
| | Global
Real Estate
Securities Fund |
| Assets | |
| Investments in securities of unaffiliated issuers, at value | $325,887,650 |
| Investments in securities of affiliated issuers, at value | 9,831,569 |
| Total investments, at value(1), (2) | 335,719,219 |
| Deposits with broker for futures contracts | 508,999 |
| Foreign currency(3) | 287,688 |
| Receivables: | |
| Dividends and reclaims | 1,019,101 |
| Securities lending | 3,503 |
| Investment securities sold | 995,856 |
| Fund shares sold | 287,277 |
| Prepaid expenses and other assets | 10,810 |
| Total Assets | 338,832,453 |
| Liabilities | |
| Collateral held for securities on loan, at value | 67,622 |
| Payables: | |
| Investment securities purchased | 955,033 |
| Fund shares redeemed | 275,089 |
| Accrued expenses: | |
| Investment advisory fees | 186,007 |
| Shareholder servicing fees | 23,785 |
| Trustee fees | 413 |
| Other expenses | 89,933 |
| Total Liabilities | 1,597,882 |
| Net Assets | $337,234,571 |
| Net Assets Consist of: | |
| Paid-in-capital | $285,910,589 |
| Distributable earnings (loss) | 51,323,982 |
| Net Assets | $337,234,571 |
| Net Asset Value: | |
| $0.001 par value, unlimited shares authorized | |
| Net assets applicable to the Institutional Class | $218,704,581 |
| Institutional shares outstanding | 18,967,834 |
| Net asset value, offering and redemption price per Institutional share | $ 11.53 |
| Net assets applicable to the Investor Class | $118,529,990 |
| Investor shares outstanding | 10,237,273 |
| Net asset value, offering and redemption price per Investor share | $ 11.58 |
| |
| (1)Investments in securities of unaffiliated issuers, at cost | $269,863,154 |
| Investments in securities of affiliated issuers, at cost | 9,831,569 |
| Total investments, at cost | $279,694,723 |
| (2)Includes securities loaned of: | $ 24,651,876 |
| (3)Foreign currency, at cost | $ 286,589 |
See Notes to Financial Statements.
| STATEMENTS OF OPERATIONS | For the Year Ended December 31, 2021 |
| | Global
Real Estate
Securities Fund |
| Investment Income | |
| Dividends | $ 7,426,420 |
| Securities lending, net | 54,074 |
| Less foreign taxes withheld | (338,446) |
| Total Investment Income | 7,142,048 |
| Expenses | |
| Investment advisory fees | 2,024,950 |
| Transfer agent fees: | |
| Institutional shares | 4,732 |
| Investor shares | 18,745 |
| Custodian fees | 116,972 |
| Shareholder servicing fees: | |
| Investor shares | 247,061 |
| Accounting and administration fees | 47,591 |
| Professional fees | 100,199 |
| Shareholder reporting fees: | |
| Institutional shares | 1,932 |
| Investor shares | 7,474 |
| Trustees expenses | 3,287 |
| Line of credit facility fees | 2,183 |
| Other expenses | 97,337 |
| Total Expenses | 2,672,463 |
| Fees paid indirectly | (14,188) |
| Net Expenses | 2,658,275 |
| Net Investment Income | 4,483,773 |
| Realized and Unrealized Gain (Loss) | |
| Net realized gain (loss) from: | |
| Investment securities | 38,583,247 |
| Futures transactions | 1,823,778 |
| Foreign currency | (21,452) |
| Net realized gain | 40,385,573 |
| Net change in unrealized appreciation (depreciation) on: | |
| Investment securities | 32,562,785 |
| Futures | 128,267 |
| Foreign currency | (9,413) |
| Net change in unrealized appreciation (depreciation) | 32,681,639 |
| Net Realized and Unrealized Gain | 73,067,212 |
| Net Increase in Net Assets Resulting from Operations | $77,550,985 |
See Notes to Financial Statements.
| STATEMENTS OF CHANGES IN NET ASSETS |
| | Global Real Estate Securities Fund |
| | For the Year Ended |
| | 12/31/21 | | 12/31/20 |
| | | | |
| Operations: | | | |
| Net investment income | $ 4,483,773 | | $ 4,368,630 |
| Net realized gain (loss) on investment securities, foreign currency and derivatives | 40,385,573 | | (17,765,105) |
| Net change in unrealized appreciation (depreciation) on investment securities, foreign currency and derivatives | 32,681,639 | | 1,257,093 |
| Net increase (decrease) in net assets resulting from operations | 77,550,985 | | (12,139,382) |
| Distributions to Shareholders: | | | |
| Institutional shares | (13,454,207) | | (4,221,953) |
| Investor shares | (6,736,082) | | (2,121,821) |
| Total distributions | (20,190,289) | | (6,343,774) |
| Capital Share Transactions: | | | |
| Proceeds from shares sold | | | |
| Institutional shares | 23,655,678 | | 30,682,021 |
| Investor shares | 28,230,636 | | 17,283,750 |
| Reinvestment of dividends and distributions | | | |
| Institutional shares | 13,303,961 | | 4,189,261 |
| Investor shares | 6,696,269 | | 2,106,503 |
| Total proceeds from shares sold and reinvested | 71,886,544 | | 54,261,535 |
| Value of shares redeemed | | | |
| Institutional shares | (32,747,061) | | (9,850,171) |
| Investor shares | (15,702,833) | | (33,326,479) |
| Total value of shares redeemed | (48,449,894) | | (43,176,650) |
| Net increase from capital share transactions(1) | 23,436,650 | | 11,084,885 |
| Total increase (decrease) in net assets | 80,797,346 | | (7,398,271) |
| Net Assets: | | | |
| Beginning of Year | 256,437,225 | | 263,835,496 |
| End of Year | $337,234,571 | | $256,437,225 |
| |
| (1) | See Note 6 in Notes to Financial Statements. |
See Notes to Financial Statements.
| For a Share Outstanding For the Years Ending December 31, unless otherwise indicated | | | | | | Ratios to Average Net Assets | |
| | Net Asset
Value,
Beginning
of Year | Net Investment
Income# | Realized
and
Unrealized
Gain
(Loss) on
Investments | Total Income
From Investment
Operations | Dividends
from Net
Investment
Income | Distributions
from Net
Realized
Capital
Gains | Total
Distributions
Paid | Net Asset
Value,
End of
Year | Total
Return | Net Assets,
End of Year
(000) | Expenses,
Net | Expenses,
Gross | Investment
Income,
Net
| Portfolio
Turnover
Rate |
| Global Real Estate Securities Fund |
| Institutional Class |
| 2021 | $ 9.47 | $0.17 | $ 2.63 | $ 2.80 | $(0.40) | $(0.34) | $(0.74) | $11.53 | 29.97% | $218,705 | 0.79%(1) | 0.80% | 1.59% | 105% |
| 2020 | 10.21 | 0.18 | (0.67) | (0.49) | (0.18) | (0.07) | (0.25) | 9.47 | (4.54) | 175,384 | 0.86(1) | 0.87 | 1.98 | 141 |
| 2019 | 8.83 | 0.22 | 1.95 | 2.17 | (0.61) | (0.18) | (0.79) | 10.21 | 24.87 | 159,523 | 0.82(1) | 0.83 | 2.13 | 118 |
| 2018 | 9.69 | 0.21 | (0.65) | (0.44) | (0.42) | — | (0.42) | 8.83 | (4.70) | 133,341 | 0.86(1) | 0.87 | 2.26 | 128 |
| 2017 | 9.10 | 0.27 | 0.73 | 1.00 | (0.41) | — | (0.41) | 9.69 | 11.05 | 133,656 | 0.87(1) | 0.88 | 2.86 | 138 |
| Investor Class |
| 2021 | $ 9.51 | $0.14 | $ 2.64 | $ 2.78 | $(0.37) | $(0.34) | $(0.71) | $11.58 | 29.61% | $118,530 | 1.07%(1) | 1.08% | 1.31% | 105% |
| 2020 | 10.25 | 0.15 | (0.67) | (0.52) | (0.15) | (0.07) | (0.22) | 9.51 | (4.79) | 81,053 | 1.13(1) | 1.14 | 1.68 | 141 |
| 2019 | 8.87 | 0.19 | 1.95 | 2.14 | (0.58) | (0.18) | (0.76) | 10.25 | 24.42 | 104,312 | 1.09(1) | 1.10 | 1.87 | 118 |
| 2018 | 9.72 | 0.19 | (0.65) | (0.46) | (0.39) | — | (0.39) | 8.87 | (4.86) | 82,133 | 1.14(1) | 1.15 | 1.97 | 128 |
| 2017 | 9.13 | 0.24 | 0.73 | 0.97 | (0.38) | — | (0.38) | 9.72 | 10.72 | 97,741 | 1.12(1) | 1.13 | 2.56 | 138 |
| | | | | | | | | | | | | | | |
| # | Calculated using the average shares outstanding method. |
| (1) | The ratio for the Global Real Estate Securities Fund includes the effect of fees paid indirectly which decreased the ratio by 0.01% for the years 2017, 2018, 2019, 2020 and 2021. |
See Notes to Financial Statements.
Strategic Alternatives Fund (Unaudited)
The Fund combines multiple strategies that, in aggregate, seek to provide absolute returns with both lower volatility than and low correlation to traditional equity and fixed income markets. The Investor Class of the Fund outperformed its benchmark, the Bloomberg 1-3 Month US Treasury Bill Index, for the one-year period ended December 31, 2021 (4.57% versus 0.04%).
During the year, the Fund allocated its assets among five principal investment strategies –long-short equity, options equity, currency trading, relative value and global macro – but suspended activity, including selling all positions, in the options equity strategy in the second quarter. For 2021, all strategies except for global macro contributed to performance.
The most additive investment strategy to the Fund’s performance during the year was the long-short equity strategy. The strategy benefitted from the retreat of high-beta stocks, which had been bid up during the “vaccine rally” of late 2020.
The currency strategy was also additive, primarily due to its high-conviction long position in the U.S. dollar against the euro and Canadian dollar.
This Fund may be suitable for investors who have a short- to medium-term investment horizon, can accept short-term fluctuations in account value and would like to diversify their portfolio with an alternatives investment option. The alternative investment strategies that the Fund pursues are complex and may involve greater risk than traditional investments (stocks, bonds and cash). The performance of alternative investments is not expected to correlate closely with more traditional investments; however, it is possible that alternative investments will decline in value along with equity or fixed income markets, or both, or that they may not otherwise perform in accordance with expectations. Alternative investments can be highly volatile, are often less liquid, particularly in periods of stress, are generally more complex and less transparent and may have more complicated tax profiles than traditional investments. In addition, the performance of alternative investments may be more dependent on a sub-adviser’s experience and skill than traditional investments. The use of alternative investments may not achieve the desired effect. Securities of foreign issuers may be negatively impacted by political events, economic conditions or inefficient, illiquid or unregulated markets in foreign countries, and they also may be subject to inadequate regulatory or accounting standards, which may increase investment risk. Derivatives involve different risks from, and in some respects greater risks than, those associated with investing directly in securities, currencies or other instruments. Derivatives may be illiquid or less liquid, volatile, difficult to price and leveraged, so that small changes in the value of the underlying instruments may produce disproportionate losses to the Fund. Short sales involve selling a security the Fund does not own in anticipation that the security will decline in price. Short sales expose the Fund to the risk that it will required to buy the security sold short (also known as “covering” the short position) at a time when the security has appreciated in value, thus resulting in a loss to the Fund. The Fund’s potential loss on a short position is limited only by the maximum attainable price of the security less the price at which the security was sold by the Fund. Therefore, in theory, stocks sold short have unlimited risk. The Fund’s use of short sales in effect “leverages” the Fund. The use of leverage may magnify the Fund’s gains or losses, and leverage also creates interest expense that may lower the Fund’s overall returns. The Fund’s currency investment strategy may be impacted by currency exchange rates, which can fluctuate significantly over short or extended periods of time. These changes may be caused by governmental or political factors that affect the value of what the Fund owns and its share price. It is possible to lose money by investing in the Fund.
Strategic Alternatives Fund (Unaudited)
At December 31, 2021, the portfolio holdings of the Fund, as a percentage of net assets, is shown in the following table. Portfolio holdings are subject to risk and may change at any time.
| | % |
| Money Market Funds | 38.0 |
| U.S. Treasury Obligations | 29.0 |
| Corporate Bonds | 14.3 |
| Financials | 2.6 |
| Materials | 1.9 |
| Information Technology | 1.4 |
| Consumer Discretionary | 1.4 |
| Mortgage-Backed Securities | 1.0 |
| Consumer Staples | 0.9 |
| Foreign Bonds | 0.4 |
| Industrials | 0.3 |
| Utilities | 0.1 |
| Mutual Funds | 0.1 |
| Purchased Options | —** |
| Communication Services | —** |
| Rights | —** |
| Foreign Common Stocks Sold Short | (0.2) |
| Written Options | (0.3) |
| Common Stocks Sold Short | (5.0) |
| | 85.9 |
| **Rounds to less than 0.05% | |
Strategic Alternatives Fund (Unaudited)
| Average Annual Total Returns as of 12/31/21 | |
| | | Institutional Class* | | Investor Class* | | Benchmark** | |
| One Year | | 4.96% | | 4.57% | | 0.04% | |
| Five Year | | N/A | | N/A | | N/A | |
| Ten Year | | N/A | | N/A | | N/A | |
| Since Inception | | 2.47% | | 2.16% | | 1.20% | |
| Inception Date | | 06/30/17 | | 06/30/17 | | | |
| Total Fund Operating Expenses (May 1, 2021 Prospectus)(1) | | 1.30% | | 1.56% | | | |
| (1) | Current information regarding the Fund’s Operating Expenses can be found in the Financial Highlights. |
The performance data quoted represents past performance and does not guarantee future results. Current performance may be lower or higher. Performance data current to the most recent month-end may be obtained at GuideStoneFunds.com. The investment return and principal value of an investment will fluctuate so that shares, when redeemed, may be worth more or less than their original cost.
The graph illustrates the results of a hypothetical $10,000 investment in the Investor Class of the Fund since June 30, 2017 (commencement of operations), with all dividends and capital gains reinvested, with the Bloomberg 1-3 Month US Treasury Bill Index.
*These returns reflect investment advisory and shareholder servicing fee waivers, if applicable, during the reported time periods.
**Unlike a mutual fund, the performance of an index assumes no taxes, transaction costs, management fees or other expenses.
STRATEGIC ALTERNATIVES FUND
| | | Par | | Value |
| CORPORATE BONDS — 14.3% |
| 2U, Inc. | | | |
| 2.25%, 05/01/25‡‡ CONV | $314,000 | | $333,566 |
| 8x8, Inc. | | | |
| 0.50%, 02/01/24‡‡ CONV | 250,000 | | 249,855 |
| Affirm Holdings, Inc. | | | |
| 0.00%, 11/15/26 144A Ω CONV | 270,000 | | 244,080 |
| Air Transport Services Group, Inc. | | | |
| 1.13%, 10/15/24‡‡ CONV | 500,000 | | 558,750 |
| Alphatec Holdings, Inc. | | | |
| 0.75%, 08/01/26 144A ‡‡ CONV | 210,000 | | 204,488 |
| Apollo Commercial Real Estate Finance, Inc. REIT | | | |
| 5.38%, 10/15/23 CONV | 920,000 | | 940,700 |
| Array Technologies, Inc. | | | |
| 1.00%, 12/01/28 144A CONV | 108,000 | | 102,654 |
| Avaya Holdings Corporation | | | |
| 2.25%, 06/15/23‡‡ CONV | 393,000 | | 415,990 |
| Avid SPV LLC | | | |
| 1.25%, 03/15/26 144A ‡‡ CONV | 225,000 | | 352,125 |
| Bentley Systems, Inc. | | | |
| 0.38%, 07/01/27 144A ‡‡ CONV | 313,000 | | 289,525 |
| Beyond Meat, Inc. | | | |
| 0.37%, 03/15/27 144A Ω ‡‡ CONV | 289,000 | | 201,751 |
| BigCommerce Holdings, Inc. | | | |
| 0.25%, 10/01/26 144A ‡‡ CONV | 354,000 | | 316,157 |
| Bloom Energy Corporation | | | |
| 2.50%, 08/15/25 CONV | 242,000 | | 376,644 |
| Burlington Stores, Inc. | | | |
| 2.25%, 04/15/25‡‡ CONV | 400,000 | | 596,250 |
| Cable One, Inc. | | | |
| 1.13%, 03/15/28 144A ‡‡ CONV | 503,000 | | 500,397 |
| Callaway Golf Co. | | | |
| 2.75%, 05/01/26‡‡ CONV | 264,000 | | 456,225 |
| Centennial Resource Production LLC | | | |
| 3.25%, 04/01/28‡‡ CONV | 500,000 | | 624,687 |
| Ceridian HCM Holding, Inc. | | | |
| 0.25%, 03/15/26 144A ‡‡ CONV | 428,000 | | 449,229 |
| Cheesecake Factory, Inc. (The) | | | |
| 0.38%, 06/15/26‡‡ CONV | 285,000 | | 256,678 |
| Chefs' Warehouse, Inc. (The) | | | |
| 1.88%, 12/01/24‡‡ CONV | 500,000 | | 534,687 |
| Chegg, Inc. | | | |
| 0.00%, 09/01/26Ω CONV | 498,000 | | 414,585 |
| Cheniere Energy, Inc. | | | |
| 4.25%, 03/15/45‡‡ CONV | 604,000 | | 511,316 |
| Coherus Biosciences, Inc. | | | |
| 1.50%, 04/15/26‡‡ CONV | 512,000 | | 566,080 |
| Coinbase Global, Inc. | | | |
| 0.50%, 06/01/26 144A ‡‡ CONV | 314,000 | | 337,707 |
| Confluent, Inc. | | | |
| 0.00%, 01/15/27 144A Ω CONV | 200,000 | | 217,750 |
| CryoPort, Inc. | | | |
| 0.75%, 12/01/26 144A CONV | 108,000 | | 99,790 |
| Danimer Scientific, Inc. | | | |
| 3.25%, 12/15/26 144A CONV | 301,000 | | 318,488 |
| | | Par | | Value |
| DigitalOcean Holdings, Inc. | | | |
| 0.00%, 12/01/26 144A Ω CONV | $ 216,000 | | $ 192,110 |
| DISH Network Corporation | | | |
| 3.38%, 08/15/26‡‡ CONV | 600,000 | | 569,432 |
| Enphase Energy, Inc. | | | |
| 1.86%, 03/01/28 144A Ω ‡‡ CONV | 707,000 | | 732,805 |
| Envestnet, Inc. | | | |
| 1.75%, 06/01/23‡‡ CONV | 250,000 | | 315,313 |
| Everbridge, Inc. | | | |
| 0.13%, 12/15/24‡‡ CONV | 250,000 | | 243,906 |
| Exact Sciences Corporation | | | |
| 0.38%, 03/15/27‡‡ CONV | 500,000 | | 511,250 |
| Fastly, Inc. | | | |
| 2.64%, 03/15/26 144A Ω ‡‡ CONV | 712,000 | | 585,620 |
| Flexion Therapeutics, Inc. | | | |
| 3.38%, 05/01/24 CONV | 98,000 | | 98,494 |
| FTI Consulting, Inc. | | | |
| 2.00%, 08/15/23‡‡ CONV | 325,000 | | 504,725 |
| fuboTV, Inc. | | | |
| 3.25%, 02/15/26 144A ‡‡ CONV | 629,000 | | 512,242 |
| GoPro, Inc. | | | |
| 1.25%, 11/15/25 144A ‡‡ CONV | 220,000 | | 289,232 |
| Gossamer Bio, Inc. | | | |
| 5.00%, 06/01/27‡‡ CONV | 510,000 | | 499,800 |
| Granite Point Mortgage Trust, Inc. REIT | | | |
| 6.38%, 10/01/23‡‡ CONV | 1,425,000 | | 1,459,770 |
| Greenbrier Cos., Inc. (The) | | | |
| 2.88%, 04/15/28 144A ‡‡ CONV | 519,000 | | 567,007 |
| Groupon, Inc. | | | |
| 1.13%, 03/15/26 144A ‡‡ CONV | 493,000 | | 390,702 |
| Haemonetics Corporation | | | |
| 3.70%, 03/01/26 144A Ω CONV | 430,000 | | 361,684 |
| Halozyme Therapeutics, Inc. | | | |
| 0.25%, 03/01/27 144A ‡‡ CONV | 697,000 | | 624,251 |
| Helix Energy Solutions Group, Inc. | | | |
| 4.13%, 09/15/23 CONV | 193,000 | | 185,763 |
| 6.75%, 02/15/26‡‡ CONV | 250,000 | | 249,375 |
| i3 Verticals LLC | | | |
| 1.00%, 02/15/25‡‡ CONV | 593,000 | | 552,261 |
| II-VI, Inc. | | | |
| 0.25%, 09/01/22‡‡ CONV | 250,000 | | 370,625 |
| Impinj, Inc. | | | |
| 1.13%, 05/15/27 144A CONV | 32,000 | | 35,082 |
| Infinera Corporation | | | |
| 2.13%, 09/01/24‡‡ CONV | 400,000 | | 475,600 |
| Innoviva, Inc. | | | |
| 2.13%, 01/15/23‡‡ CONV | 520,000 | | 568,100 |
| Insmed, Inc. | | | |
| 0.75%, 06/01/28‡‡ CONV | 613,000 | | 667,250 |
| Ionis Pharmaceuticals, Inc. | | | |
| 0.13%, 12/15/24‡‡ CONV | 500,000 | | 449,375 |
| iStar, Inc. REIT | | | |
| 3.13%, 09/15/22‡‡ CONV | 300,000 | | 564,930 |
See Notes to Financial Statements.
| | | Par | | Value |
| Jamf Holding Corporation | | | |
| 0.13%, 09/01/26 144A ‡‡ CONV | $ 316,000 | | $ 329,233 |
| Jazz Investments I, Ltd. | | | |
| 2.00%, 06/15/26 CONV | 500,000 | | 566,875 |
| Kaman Corporation | | | |
| 3.25%, 05/01/24‡‡ CONV | 365,000 | | 378,505 |
| Liberty TripAdvisor Holdings, Inc. | | | |
| 0.50%, 06/30/51 144A ‡‡ CONV | 500,000 | | 407,800 |
| Ligand Pharmaceuticals, Inc. | | | |
| 0.75%, 05/15/23‡‡ CONV | 500,000 | | 500,312 |
| LivePerson, Inc. | | | |
| 2.95%, 12/15/26Ω CONV | 370,000 | | 313,797 |
| Lucid Group, Inc. | | | |
| 1.25%, 12/15/26 144A CONV | 325,000 | | 321,653 |
| Lumentum Holdings, Inc. | | | |
| 0.50%, 12/15/26‡‡ CONV | 204,000 | | 254,745 |
| MACOM Technology Solutions Holdings, Inc. | | | |
| 0.25%, 03/15/26 144A ‡‡ CONV | 350,000 | | 411,469 |
| Magnite, Inc. | | | |
| 0.25%, 03/15/26 144A ‡‡ CONV | 962,000 | | 755,170 |
| Marathon Digital Holdings, Inc. | | | |
| 1.00%, 12/01/26 144A CONV | 323,000 | | 260,847 |
| Meritor, Inc. | | | |
| 3.25%, 10/15/37‡‡ CONV | 315,000 | | 343,760 |
| MFA Financial, Inc. REIT | | | |
| 6.25%, 06/15/24‡‡ CONV | 1,154,000 | | 1,200,160 |
| MGIC Investment Corporation | | | |
| 9.00%, 04/01/63 144A ‡‡ CONV | 602,000 | | 809,690 |
| MicroStrategy, Inc. | | | |
| 4.54%, 02/15/27 144A Ω ‡‡ CONV | 667,000 | | 484,442 |
| Mitek Systems, Inc. | | | |
| 0.75%, 02/01/26 144A ‡‡ CONV | 360,000 | | 395,732 |
| NCL Corporation, Ltd. | | | |
| 1.13%, 02/15/27 144A CONV | 264,000 | | 248,503 |
| New Relic, Inc. | | | |
| 0.50%, 05/01/23‡‡ CONV | 483,000 | | 576,605 |
| NRG Energy, Inc. | | | |
| 2.75%, 06/01/48‡‡ CONV | 600,000 | | 714,780 |
| OSI Systems, Inc. | | | |
| 1.25%, 09/01/22‡‡ CONV | 445,000 | | 456,994 |
| Patrick Industries, Inc. | | | |
| 1.75%, 12/01/28 144A CONV | 217,000 | | 226,169 |
| Pebblebrook Hotel Trust REIT | | | |
| 1.75%, 12/15/26‡‡ CONV | 587,000 | | 649,310 |
| Peloton Interactive, Inc. | | | |
| 3.63%, 02/15/26 144A Ω CONV | 377,000 | | 321,393 |
| PennyMac Corporation REIT | | | |
| 5.50%, 11/01/24‡‡ CONV | 500,000 | | 501,875 |
| 5.50%, 03/15/26 144A CONV | 1,000,000 | | 980,000 |
| Perficient, Inc. | | | |
| 0.13%, 11/15/26 144A CONV | 53,000 | | 50,419 |
| Porch Group, Inc. | | | |
| 0.75%, 09/15/26 144A ‡‡ CONV | 322,000 | | 308,734 |
| | | Par | | Value |
| PRA Group, Inc. | | | |
| 3.50%, 06/01/23‡‡ CONV | $500,000 | | $584,687 |
| Progress Software Corporation | | | |
| 1.00%, 04/15/26 144A ‡‡ CONV | 376,000 | | 391,805 |
| Q2 Holdings, Inc. | | | |
| 0.75%, 06/01/26‡‡ CONV | 274,000 | | 308,517 |
| Realogy Group LLC | | | |
| 0.25%, 06/15/26 144A ‡‡ CONV | 424,000 | | 419,528 |
| RealReal, Inc. (The) | | | |
| 1.00%, 03/01/28 144A ‡‡ CONV | 494,000 | | 407,007 |
| Redfin Corporation | | | |
| 0.50%, 04/01/27 144A ‡‡ CONV | 589,000 | | 480,683 |
| Redwood Trust, Inc. REIT | | | |
| 5.63%, 07/15/24‡‡ CONV | 228,000 | | 231,135 |
| Royal Caribbean Cruises, Ltd. | | | |
| 4.25%, 06/15/23 CONV | 467,000 | | 596,592 |
| RWT Holdings, Inc. | | | |
| 5.75%, 10/01/25‡‡ CONV | 890,000 | | 914,475 |
| Sabre GLBL, Inc. | | | |
| 4.00%, 04/15/25‡‡ CONV | 350,000 | | 479,278 |
| SoFi Technologies, Inc. | | | |
| 0.00%, 10/15/26 144A Ω CONV | 322,000 | | 334,091 |
| Spirit Airlines, Inc. | | | |
| 1.00%, 05/15/26‡‡ CONV | 324,000 | | 280,921 |
| Splunk, Inc. | | | |
| 1.13%, 06/15/27‡‡ CONV | 322,000 | | 301,875 |
| Spotify U.S.A., Inc. | | | |
| 2.01%, 03/15/26 144A Ω ‡‡ CONV | 524,000 | | 475,216 |
| Stride, Inc. | | | |
| 1.13%, 09/01/27 CONV | 536,000 | | 524,139 |
| Summit Hotel Properties, Inc. REIT | | | |
| 1.50%, 02/15/26‡‡ CONV | 500,000 | | 524,000 |
| Sunnova Energy International, Inc. | | | |
| 0.25%, 12/01/26 144A ‡‡ CONV | 419,000 | | 435,781 |
| Sunrun, Inc. | | | |
| 0.00%, 02/01/26 144A Ω ‡‡ CONV | 608,000 | | 476,534 |
| Travere Therapeutics, Inc. | | | |
| 2.50%, 09/15/25‡‡ CONV | 524,000 | | 578,706 |
| Two Harbors Investment Corporation REIT | | | |
| 6.25%, 01/15/26‡‡ CONV | 480,000 | | 486,000 |
| Unity Software, Inc. | | | |
| 0.00%, 11/15/26 144A Ω CONV | 271,000 | | 248,643 |
| Upwork, Inc. | | | |
| 0.25%, 08/15/26 144A ‡‡ CONV | 322,000 | | 296,561 |
| Verint Systems, Inc. | | | |
| 0.25%, 04/15/26 144A ‡‡ CONV | 524,000 | | 560,366 |
| Vocera Communications, Inc. | | | |
| 0.50%, 09/15/26 144A ‡‡ CONV | 673,000 | | 856,465 |
| Vroom, Inc. | | | |
| 0.75%, 07/01/26 144A ‡‡ CONV | 375,000 | | 236,250 |
| Winnebago Industries, Inc. | | | |
| 1.50%, 04/01/25‡‡ CONV | 375,000 | | 502,091 |
See Notes to Financial Statements.
STRATEGIC ALTERNATIVES FUND
SCHEDULE OF INVESTMENTS (Continued)
| | | Par | | Value |
| WisdomTree Investments, Inc. | | | |
| 4.25%, 06/15/23 CONV | $ 450,000 | | $ 541,687 |
| 3.25%, 06/15/26 144A CONV | 104,000 | | 100,817 |
| Workiva, Inc. | | | |
| 1.13%, 08/15/26‡‡ CONV | 500,000 | | 884,924 |
| Ziff Davis, Inc. | | | |
| 1.75%, 11/01/26 144A CONV | 300,000 | | 372,228 |
| Zillow Group, Inc. | | | |
| 2.75%, 05/15/25‡‡ CONV | 325,000 | | 419,933 |
| Zogenix, Inc. | | | |
| 2.75%, 10/01/27 CONV | 350,000 | | 346,605 |
Total Corporate Bonds
(Cost $50,161,315) | | | 50,413,370 |
| FOREIGN BONDS — 0.4% |
| Cameroon — 0.1% | | |
| Golar LNG, Ltd. | | | |
| 2.75%, 02/15/22‡‡ CONV | 300,000 | | 300,912 |
| Jersey — 0.2% | | |
| Encore Capital Europe Finance, Ltd. | | | |
| 4.50%, 09/01/23‡‡ CONV | 366,000 | | 542,595 |
| Norway — 0.1% | | |
| SFL Corporation, Ltd. | | | |
| 4.88%, 05/01/23‡‡ CONV | 427,000 | | 435,044 |
| Turkey — 0.0% | | |
| Turkey Government Bond | | | |
| 12.20%, 01/18/23(T) | 10,000 | | 693 |
Total Foreign Bonds
(Cost $1,150,229) | | 1,279,244 |
| MORTGAGE-BACKED SECURITIES — 1.0% |
| Federal Home Loan Mortgage Corporation REMIC, Series 4248 | | | |
| (Floating, 6.00% - ICE LIBOR USD 1M, 6.00% Cap), 5.89%, 09/15/43† IO | 279,598 | | 46,960 |
| Federal Home Loan Mortgage Corporation REMIC, Series 4468 | | | |
| (Floating, 6.10% - ICE LIBOR USD 1M, 6.10% Cap), 5.99%, 05/15/45† IO | 291,801 | | 52,855 |
| Federal Home Loan Mortgage Corporation REMIC, Series 4583 | | | |
| (Floating, 6.00% - ICE LIBOR USD 1M, 6.00% Cap), 5.89%, 05/15/46† IO | 714,029 | | 117,966 |
| Federal Home Loan Mortgage Corporation REMIC, Series 4905 | | | |
| (Floating, 6.10% - ICE LIBOR USD 1M, 6.10% Cap), 6.00%, 08/25/49† IO | 452,794 | | 77,473 |
| Federal Home Loan Mortgage Corporation REMIC, Series 4991 | | | |
| 5.00%, 07/25/50 IO | 1,273,377 | | 215,823 |
| Federal Home Loan Mortgage Corporation REMIC, Series 5009 | | | |
| 2.00%, 09/25/50 IO | 956,859 | | 112,022 |
| | | Par | | Value |
| Federal Home Loan Mortgage Corporation REMIC, Series 5012 | | | |
| 4.00%, 09/25/50 IO | $ 205,567 | | $ 33,433 |
| Federal Home Loan Mortgage Corporation REMIC, Series 5020 | | | |
| 3.00%, 08/25/50 IO | 371,931 | | 57,942 |
| Federal National Mortgage Association REMIC, Series 2012-115 | | | |
| (Floating, 6.10% - ICE LIBOR USD 1M, 6.10% Cap), 6.00%, 10/25/42† IO | 300,503 | | 49,876 |
| Federal National Mortgage Association REMIC, Series 2017-31 | | | |
| (Floating, 6.10% - ICE LIBOR USD 1M, 6.10% Cap), 6.00%, 05/25/47† IO | 408,690 | | 72,525 |
| Federal National Mortgage Association REMIC, Series 2017-86 | | | |
| (Floating, 6.15% - ICE LIBOR USD 1M, 6.15% Cap), 6.05%, 11/25/47† IO | 531,812 | | 96,676 |
| Federal National Mortgage Association REMIC, Series 2018-17 | | | |
| (Floating, 3.45% - ICE LIBOR USD 1M, 2.50% Cap), 2.50%, 03/25/48† IO | 2,307,828 | | 173,848 |
| Federal National Mortgage Association REMIC, Series 2018-8 | | | |
| (Floating, 6.15% - ICE LIBOR USD 1M, 6.15% Cap), 6.05%, 02/25/48† IO | 255,719 | | 38,466 |
| Federal National Mortgage Association REMIC, Series 2020-38 | | | |
| 4.00%, 06/25/50 IO | 1,092,115 | | 164,073 |
| Federal National Mortgage Association REMIC, Series 2020-49 | | | |
| 4.00%, 07/25/50 IO | 476,855 | | 76,754 |
| (Floating, 6.10% - ICE LIBOR USD 1M, 6.10% Cap), 6.00%, 07/25/50† IO | 582,208 | | 126,985 |
| Federal National Mortgage Association REMIC, Series 2020-60 | | | |
| 4.00%, 09/25/50 IO | 190,912 | | 29,072 |
| Federal National Mortgage Association REMIC, Series 2020-62 | | | |
| 4.00%, 06/25/48 IO | 633,763 | | 115,031 |
| Federal National Mortgage Association STRIP, Series 405 | | | |
| (Floating, 5.05% - ICE LIBOR USD 1M, 5.05% Cap), 4.95%, 10/25/40† IO | 684,244 | | 112,841 |
See Notes to Financial Statements.
| | | Par | | Value |
| Government National Mortgage Association, Series 2015-110 | | | |
| (Floating, 5.70% - ICE LIBOR USD 1M, 5.70% Cap), 5.60%, 08/20/45† IO | $ 160,316 | | $ 25,960 |
| Government National Mortgage Association, Series 2016-109 | | | |
| 4.00%, 10/20/45 IO | 128,156 | | 12,964 |
| Government National Mortgage Association, Series 2018-124 | | | |
| (Floating, 6.20% - ICE LIBOR USD 1M, 6.20% Cap), 6.10%, 09/20/48† IO | 473,941 | | 85,644 |
| Government National Mortgage Association, Series 2018-139 | | | |
| (Floating, 6.15% - ICE LIBOR USD 1M, 6.15% Cap), 6.05%, 10/20/48† IO | 198,794 | | 26,642 |
| Government National Mortgage Association, Series 2018-7 | | | |
| (Floating, 5.70% - ICE LIBOR USD 1M, 5.70% Cap), 5.60%, 01/20/48† IO | 403,784 | | 71,290 |
| Government National Mortgage Association, Series 2019-1 | | | |
| (Floating, 6.05% - ICE LIBOR USD 1M, 6.05% Cap), 5.95%, 01/20/49† IO | 221,464 | | 29,740 |
| Government National Mortgage Association, Series 2019-110 | | | |
| 6.00%, 09/20/49† IO | 714,931 | | 99,416 |
| Government National Mortgage Association, Series 2019-111 | | | |
| (Floating, 6.15% - ICE LIBOR USD 1M, 6.15% Cap), 6.05%, 01/20/49† IO | 612,939 | | 97,055 |
| Government National Mortgage Association, Series 2019-151 | | | |
| 3.50%, 10/20/49 IO | 969,577 | | 80,445 |
| 3.50%, 12/20/49 IO | 544,018 | | 58,985 |
| Government National Mortgage Association, Series 2019-153 | | | |
| 4.00%, 12/20/49 IO | 2,808,440 | | 372,300 |
| Government National Mortgage Association, Series 2019-20 | | | |
| (Floating, 3.79% - ICE LIBOR USD 1M, 3.79% Cap), 3.69%, 02/20/49† IO | 524,895 | | 36,000 |
| Government National Mortgage Association, Series 2019-6 | | | |
| (Floating, 6.05% - ICE LIBOR USD 1M, 6.05% Cap), 5.95%, 01/20/49† IO | 185,803 | | 28,297 |
| Government National Mortgage Association, Series 2019-69 | | | |
| (Floating, 3.27% - ICE LIBOR USD 1M, 3.27% Cap), 3.17%, 06/20/49† IO | 208,006 | | 17,315 |
| | | Par | | Value |
| Government National Mortgage Association, Series 2019-97 | | | |
| (Floating, 6.10% - ICE LIBOR USD 1M, 6.10% Cap), 6.00%, 08/20/49† IO | $297,486 | | $ 36,841 |
| Government National Mortgage Association, Series 2020-146 | | | |
| 2.50%, 10/20/50 IO | 386,682 | | 48,751 |
| Government National Mortgage Association, Series 2020-21 | | | |
| (Floating, 6.05% - ICE LIBOR USD 1M, 6.05% Cap), 5.95%, 02/20/50† IO | 405,804 | | 63,844 |
| Government National Mortgage Association, Series 2020-55 | | | |
| 3.50%, 04/20/50 IO | 385,178 | | 46,441 |
| (Floating, 6.05% - ICE LIBOR USD 1M, 6.05% Cap), 5.95%, 04/20/50† IO | 627,903 | | 110,637 |
| Government National Mortgage Association, Series 2020-61 | | | |
| (Floating, 6.44% - ICE LIBOR USD 1M, 6.44% Cap), 6.34%, 07/20/43† IO | 626,071 | | 111,470 |
| (Floating, 6.05% - ICE LIBOR USD 1M, 6.05% Cap), 5.95%, 08/20/49† IO | 949,745 | | 127,456 |
| Government National Mortgage Association, Series 2020-78 | | | |
| 4.00%, 06/20/50 IO | 743,299 | | 77,529 |
| (Floating, 6.15% - ICE LIBOR USD 1M, 6.15% Cap), 6.05%, 06/20/50† IO | 953,986 | | 153,782 |
| Government National Mortgage Association, Series 2020-79 | | | |
| 4.00%, 06/20/50 IO | 199,105 | | 23,839 |
Total Mortgage-Backed Securities
(Cost $4,164,889) | | | 3,613,264 |
| | Number of
Contracts | | Notional
Amount | |
| PURCHASED OPTIONS — 0.0% |
| Call Swaptions — 0.0% |
Pay 1-Day SONIA (Annually); Receive 0.42% (Annually); Interest Rate Swap Maturing 10/10/2023 GBP, Strike Price
$0.42, Expires
10/10/22 (CITI) | 1 | | $8,270,000 | 3,114 |
See Notes to Financial Statements.
STRATEGIC ALTERNATIVES FUND
SCHEDULE OF INVESTMENTS (Continued)
| | Number of
Contracts | | Notional
Amount | | Value |
Pay 1-Day SONIA (Annually); Receive 0.46% (Annually); Interest Rate Swap Maturing 10/10/2023 GBP, Strike Price
$0.46, Expires
10/10/22 (CITI) | 1 | | $ 7,550,000 | | $ 3,236 |
Pay 1-Day SONIA (Annually); Receive 0.52% (Annually); Interest Rate Swap Maturing 11/15/2023 GBP, Strike Price
$0.52, Expires
11/15/22 (CITI) | 1 | | 8,700,000 | | 5,171 |
Pay 1-Day SONIA (Annually); Receive 0.54% (Annually); Interest Rate Swap Maturing 11/16/2023 GBP, Strike Price
$0.54, Expires
11/16/22 (MSCS) | 1 | | 7,920,000 | | 5,149 |
Pay 3-Month LIBOR (Quarterly); Receive 0.47% (Semiannually); Interest Rate Swap Maturing 2/24/2025 USD, Strike Price
$0.47, Expires
02/22/22 (CITI) | 1 | | 7,540,000 | | 115 |
Pay 3-Month LIBOR (Quarterly); Receive 0.61% (Semiannually); Interest Rate Swap Maturing 1/11/2025 USD, Strike Price
$0.61, Expires
01/07/22 (CITI) | 1 | | 7,340,000 | | — |
| | | | | | 16,785 |
| Put Swaption — 0.0% |
| Pay 0.37% (Annually); Receive 1-Month IBOR (Annually); Interest Rate Swap Maturing 5/30/2042 JPY, Strike Price $0.37, Expires 05/26/22 (BAR) | 1 | | 195,390,000 | | 15,092 |
Total Purchased Options
(Premiums paid $115,308) | | | | 31,877 |
| | | Par | | Value |
| U.S. TREASURY OBLIGATIONS — 29.0% |
| U.S. Treasury Bills | | | | |
| 0.02%, 01/13/22Ω | $ 4,300,000 | | $ 4,299,988 |
| 0.03%, 01/20/22Ω | 4,300,000 | | 4,299,985 |
| 0.04%, 01/27/22Ω | 4,300,000 | | 4,299,935 |
| 0.04%, 02/10/22Ω | 4,300,000 | | 4,299,875 |
| 0.04%, 02/17/22Ω | 4,300,000 | | 4,299,866 |
| 0.04%, 03/03/22Ω | 4,300,000 | | 4,299,700 |
| 0.05%, 03/10/22Ω | 4,300,000 | | 4,299,704 |
| 0.03%, 03/17/22Ω | 4,300,000 | | 4,299,562 |
| 0.05%, 03/24/22Ω | 4,300,000 | | 4,299,513 |
| 0.03%, 04/07/22Ω | 4,300,000 | | 4,299,237 |
| 0.07%, 04/28/22Ω | 29,500,000 | | 29,493,286 |
| 0.12%, 06/16/22Ω | 29,500,000 | | 29,483,033 |
Total U.S. Treasury Obligations
(Cost $101,974,063) | | | 101,973,684 |
| | | Shares | |
| COMMON STOCKS — 6.5% |
| Communication Services — 0.0% | |
| Escrow NII Holdings, Inc.††† * | 76,167 | 19,803 |
| Consumer Discretionary — 1.4% | |
| Advance Auto Parts, Inc. | 584 | 140,090 |
| Amazon.com, Inc.* | 70 | 233,404 |
| American Eagle Outfitters, Inc. | 9,998 | 253,149 |
| AutoNation, Inc.* | 639 | 74,667 |
| AutoZone, Inc.* | 151 | 316,555 |
| Best Buy Co., Inc. | 4,107 | 417,271 |
| Chewy, Inc. Class A* | 2,662 | 156,978 |
| Dick's Sporting Goods, Inc. | 2,331 | 268,042 |
| Etsy, Inc.* | 677 | 148,222 |
| Floor & Decor Holdings, Inc. Class A* | 286 | 37,183 |
| Foot Locker, Inc. | 5,118 | 223,298 |
| Genuine Parts Co. | 379 | 53,136 |
| Home Depot, Inc. (The) | 117 | 48,556 |
| Kohl’s Corporation | 508 | 25,090 |
| Lithia Motors, Inc. | 521 | 154,711 |
| Lowe’s Cos., Inc. | 756 | 195,411 |
| Murphy U.S.A., Inc. | 447 | 89,060 |
| O’Reilly Automotive, Inc.* | 489 | 345,347 |
| Ollie's Bargain Outlet Holdings, Inc.* | 669 | 34,246 |
| Penske Automotive Group, Inc. | 1,049 | 112,474 |
| Pool Corporation | 366 | 207,156 |
| Target Corporation | 3,002 | 694,783 |
| Tractor Supply Co. | 538 | 128,367 |
| Ulta Beauty, Inc.* | 431 | 177,719 |
| Williams-Sonoma, Inc. | 2,055 | 347,562 |
| | | | 4,882,477 |
| Consumer Staples — 0.8% | |
| Albertsons Cos., Inc. Class A | 4,537 | 136,972 |
| BJ's Wholesale Club Holdings, Inc.* | 696 | 46,611 |
| Casey’s General Stores, Inc. | 1,162 | 229,321 |
| Church & Dwight Co., Inc. | 1,736 | 177,940 |
See Notes to Financial Statements.
| | | Shares | | Value |
| Colgate-Palmolive Co. | 4,853 | | $ 414,155 |
| Costco Wholesale Corporation | 481 | | 273,064 |
| Estee Lauder Cos., Inc. (The) Class A | 121 | | 44,794 |
| Nu Skin Enterprises, Inc. Class A | 1,299 | | 65,924 |
| Procter & Gamble Co. (The) | 3,192 | | 522,147 |
| Sprouts Farmers Market, Inc.* | 6,821 | | 202,447 |
| Walmart, Inc. | 4,911 | | 710,573 |
| | | | | 2,823,948 |
| Financials — 1.1% | | |
| Aflac, Inc. | 4,441 | | 259,310 |
| Alleghany Corporation* | 149 | | 99,471 |
| Allstate Corporation (The) | 7,489 | | 881,081 |
| Arch Capital Group, Ltd.* | 1,765 | | 78,454 |
| Brighthouse Financial, Inc.* | 532 | | 27,558 |
| Brown & Brown, Inc. | 876 | | 61,565 |
| Cincinnati Financial Corporation | 2,088 | | 237,886 |
| CNA Financial Corporation | 1,815 | | 80,005 |
| CNO Financial Group, Inc. | 2,794 | | 66,609 |
| Erie Indemnity Co. Class A | 1,022 | | 196,898 |
| Fidelity National Financial, Inc. | 2,473 | | 129,041 |
| First American Financial Corporation | 2,112 | | 165,222 |
| Globe Life, Inc. | 2,511 | | 235,331 |
| Hanover Insurance Group, Inc. (The) | 919 | | 120,444 |
| Kinsale Capital Group, Inc. | 535 | | 127,271 |
| Markel Corporation* | 159 | | 196,206 |
| Mercury General Corporation | 5,587 | | 296,446 |
| Old Republic International Corporation | 3,638 | | 89,422 |
| Primerica, Inc. | 1,244 | | 190,668 |
| Selective Insurance Group, Inc. | 1,040 | | 85,218 |
| Travelers Cos., Inc. (The) | 912 | | 142,664 |
| W.R. Berkley Corporation | 536 | | 44,161 |
| | | | | 3,810,931 |
| Information Technology — 1.3% | | |
| Amphenol Corporation Class A | 520 | | 45,479 |
| Apple, Inc. | 2,971 | | 527,561 |
| Arista Networks, Inc.* | 1,246 | | 179,113 |
| Arrow Electronics, Inc.* | 2,091 | | 280,759 |
| CDW Corporation | 3,851 | | 788,608 |
| Ciena Corporation* | 1,830 | | 140,855 |
| Cisco Systems, Inc. | 8,875 | | 562,409 |
| Cognex Corporation | 712 | | 55,365 |
| Dell Technologies, Inc. Class C* | 488 | | 27,411 |
| F5, Inc.* | 47 | | 11,501 |
| HP, Inc. | 15,817 | | 595,826 |
| IPG Photonics Corporation* | 629 | | 108,276 |
| Keysight Technologies, Inc.* | 967 | | 199,695 |
| Motorola Solutions, Inc. | 206 | | 55,970 |
| National Instruments Corporation | 1,951 | | 85,200 |
| NetApp, Inc. | 1,032 | | 94,934 |
| Trimble, Inc.* | 689 | | 60,074 |
| Ubiquiti, Inc. | 993 | | 304,553 |
| | | Shares | | Value |
| Vishay Intertechnology, Inc. | 11,098 | | $ 242,713 |
| VMware, Inc. Class A | 215 | | 24,914 |
| Zebra Technologies Corporation Class A* | 242 | | 144,038 |
| | | | | 4,535,254 |
| Materials — 1.9% | | |
| AptarGroup, Inc. | 1,423 | | 174,289 |
| Axalta Coating Systems, Ltd.* | 1,616 | | 53,522 |
| Ball Corporation | 5,852 | | 563,372 |
| Berry Global Group, Inc.* | 148 | | 10,920 |
| Celanese Corporation | 1,352 | | 227,217 |
| Corteva, Inc. | 1,149 | | 54,325 |
| Eagle Materials, Inc. | 278 | | 46,276 |
| Ecolab, Inc. | 830 | | 194,710 |
| Element Solutions, Inc. | 18,311 | | 444,591 |
| FMC Corporation‡‡ | 540 | | 59,341 |
| Huntsman Corporation | 1,371 | | 47,821 |
| Ingevity Corporation* | 382 | | 27,389 |
| Louisiana-Pacific Corporation | 1,084 | | 84,931 |
| Mosaic Co. (The) | 15,373 | | 604,005 |
| NewMarket Corporation | 745 | | 255,326 |
| Newmont Corporation | 1,750 | | 108,535 |
| Nucor Corporation | 2,936 | | 335,144 |
| Packaging Corporation of America | 4,479 | | 609,816 |
| Reliance Steel & Aluminum Co. | 2,488 | | 403,603 |
| Royal Gold, Inc. | 2,423 | | 254,924 |
| RPM International, Inc. | 1,279 | | 129,179 |
| Sealed Air Corporation | 5,507 | | 371,557 |
| Sensient Technologies Corporation | 2,288 | | 228,937 |
| Sherwin-Williams Co. (The) | 1,894 | | 666,991 |
| Silgan Holdings, Inc. | 596 | | 25,533 |
| Steel Dynamics, Inc. | 3,908 | | 242,570 |
| United States Steel Corporation | 10,372 | | 246,957 |
| Valvoline, Inc. | 2,636 | | 98,297 |
| Westlake Chemical Corporation | 1,264 | | 122,772 |
| | | | | 6,692,850 |
Total Common Stocks
(Cost $21,345,097) | | | 22,765,263 |
| FOREIGN COMMON STOCKS — 0.1% |
| Ireland — 0.1% | | |
| Seagate Technology Holdings PLC | 668 | | 75,471 |
| Willis Towers Watson PLC | 502 | | 119,220 |
| | | | | 194,691 |
| Jersey — 0.0% | | |
| Amcor PLC | 2,092 | | 25,125 |
| Netherlands — 0.0% | | |
| LyondellBasell Industries NV Class A | 1,071 | | 98,778 |
See Notes to Financial Statements.
STRATEGIC ALTERNATIVES FUND
SCHEDULE OF INVESTMENTS (Continued)
| | | Shares | | Value |
| Switzerland — 0.0% | | |
| Chubb, Ltd. | 546 | | $ 105,547 |
Total Foreign Common Stocks
(Cost $381,771) | | | 424,141 |
| PREFERRED STOCKS — 1.8% |
| AGNC Investment Corporation | | | |
| (Variable, ICE LIBOR USD 3M + 4.70%), 6.13% † | 11,804 | | 298,169 |
| AMG Capital Trust II | | | |
| 5.15%, 10/15/37 CONV | 13,938 | | 817,986 |
| Arbor Realty Trust, Inc. | | | |
| (Variable, U.S. SOFR + 5.44%), 0.00% * | 11,512 | | 292,980 |
| Bunge, Ltd. | | | |
| 4.88% CONV | 3,500 | | 443,590 |
| Cowen, Inc. | | | |
| 5.63% CONV | 320 | | 460,337 |
| Fluor Corporation | | | |
| 6.50% 144A CONV | 576 | | 759,398 |
| Granite Point Mortgage Trust, Inc. | | | |
| (Variable, U.S. SOFR + 5.83%), 7.00% † | 7,798 | | 199,239 |
| MFA Financial, Inc. | | | |
| (Variable, ICE LIBOR USD 3M + 5.35%), 6.50% † | 20,886 | | 493,745 |
| NCR Corporation | | | |
| PIK, 5.50% CONV | 250 | | 371,925 |
| New Residential Investment Corporation | | | |
| (Variable, ICE LIBOR USD 3M + 4.97%), 6.38% † | 20,512 | | 475,058 |
| (Variable, U.S. Treasury Yield Curve Rate CMT 5Y + 6.22%), 7.00% † | 7,755 | | 198,838 |
| New York Community Capital Trust V | | | |
| 6.00%, 11/01/51 CONV | 15,402 | | 814,823 |
| New York Mortgage Trust, Inc. | | | |
| (Variable, U.S. SOFR + 6.13%), 6.88% † | 11,165 | | 274,101 |
| RBC Bearings, Inc. | | | |
| 5.00%, 10/15/24 CONV | 1,916 | | 200,912 |
| Ready Capital Corporation | | | |
| 7.00%, 08/15/23 CONV | 11,500 | | 309,235 |
Total Preferred Stocks
(Cost $6,220,603) | | | 6,410,336 |
| FOREIGN PREFERRED STOCKS — 0.2% |
| Canada — 0.1% | | |
| Algonquin Power & Utilities Corporation | | | |
| 7.75%, 06/15/24 CONV | 6,766 | | 319,626 |
| Jersey — 0.1% | | |
| Clarivate PLC | | | |
| 5.25%, 06/01/24 CONV | 2,815 | | 255,771 |
Total Foreign Preferred Stocks
(Cost $620,160) | | | 575,397 |
| | | Shares | | Value |
| RIGHTS — 0.0% |
Alder Biopharmaceuticals, Inc.
††† *
(Cost $3,155) | 3,505 | | $ 7,010 |
| MUTUAL FUNDS — 0.1% |
ProShares Short
20+ Year Treasury*
(Cost $296,408) | 17,007 | | 271,942 |
| MONEY MARKET FUNDS — 38.0% |
GuideStone Money Market Fund, 0.00%
(Institutional Class)Ø ∞ | 13,188,960 | | 13,188,960 |
| Northern Institutional U.S. Government Portfolio (Shares), 0.00%Ø | 120,507,337 | | 120,507,337 |
Total Money Market Funds
(Cost $133,696,297) | | | 133,696,297 |
TOTAL INVESTMENTS —91.4%
(Cost $320,129,295) | | | 321,461,825 |
| COMMON STOCKS SOLD SHORT — (5.0)% |
| Communication Services — (0.2)% | | |
| Cable One, Inc. | (133) | | (234,539) |
| DISH Network Corporation Class A * | (3,871) | | (125,575) |
| fuboTV, Inc. * | (3,932) | | (61,025) |
| Magnite, Inc. * | (3,848) | | (67,340) |
| Spotify Technology SA * | (377) | | (88,229) |
| TripAdvisor, Inc. * | (1,575) | | (42,934) |
| Zillow Group, Inc. Class C * | (2,336) | | (149,154) |
| | | | | (768,796) |
| Consumer Discretionary — (0.7)% | | |
| 2U, Inc. * | (4,843) | | (97,199) |
| Burlington Stores, Inc. * | (1,122) | | (327,074) |
| Callaway Golf Co. * | (10,414) | | (285,760) |
| Cheesecake Factory, Inc. (The) * | (1,444) | | (56,533) |
| Chegg, Inc. * | (916) | | (28,121) |
| GoPro, Inc. Class A * | (18,150) | | (187,127) |
| Groupon, Inc. * | (1,831) | | (42,406) |
| Lucid Group, Inc. * | (3,467) | | (131,919) |
Norwegian Cruise Line
Holdings, Ltd. * | (3,907) | | (81,031) |
| Patrick Industries, Inc. | (1,193) | | (96,263) |
| Peloton Interactive, Inc. Class A * | (323) | | (11,550) |
| Porch Group, Inc. * | (7,084) | | (110,440) |
| RealReal, Inc. (The) * | (7,060) | | (81,967) |
| Royal Caribbean Cruises, Ltd. * | (3,944) | | (303,294) |
| Stride, Inc. * | (5,789) | | (192,947) |
| Vroom, Inc. * | (2,014) | | (21,731) |
| Winnebago Industries, Inc. | (3,496) | | (261,920) |
| | | | | (2,317,282) |
| Consumer Staples — (0.1)% | | |
| Beyond Meat, Inc. * | (511) | | (33,297) |
| Bunge, Ltd. | (1,969) | | (183,826) |
See Notes to Financial Statements.
| | | Shares | | Value |
| Chefs' Warehouse, Inc. (The) * | (6,100) | | $ (203,130) |
| | | | | (420,253) |
| Energy — (0.1)% | | |
| Centennial Resource Development, Inc. Class A * | (61,818) | | (369,671) |
| Helix Energy Solutions Group, Inc. * | (18,597) | | (58,023) |
| SFL Corporation, Ltd. | (6,100) | | (49,715) |
| | | | | (477,409) |
| Financials — (0.4)% | | |
| Affiliated Managers Group, Inc. | (721) | | (118,612) |
| Coinbase Global, Inc. Class A * | (391) | | (98,676) |
| Cowen, Inc. Class A | (9,208) | | (332,409) |
| Encore Capital Group, Inc. * | (6,149) | | (381,914) |
| PRA Group, Inc. * | (5,100) | | (256,071) |
| SoFi Technologies, Inc. * | (6,942) | | (109,753) |
| WisdomTree Investments, Inc. | (45,565) | | (278,858) |
| | | | | (1,576,293) |
| Health Care — (0.8)% | | |
| Alphatec Holdings, Inc. * | (6,300) | | (72,009) |
| Avid Bioservices, Inc. * | (7,545) | | (220,163) |
| Coherus Biosciences, Inc. * | (18,509) | | (295,404) |
| CryoPort, Inc. * | (432) | | (25,561) |
| Exact Sciences Corporation * | (2,173) | | (169,125) |
| Gossamer Bio, Inc. * | (22,996) | | (260,085) |
| Haemonetics Corporation * | (494) | | (26,202) |
| Halozyme Therapeutics, Inc. * | (3,646) | | (146,606) |
| Innoviva, Inc. * | (12,785) | | (220,541) |
| Insmed, Inc. * | (13,241) | | (360,685) |
| Ionis Pharmaceuticals, Inc. * | (1,229) | | (37,398) |
| Ligand Pharmaceuticals, Inc. * | (400) | | (61,784) |
| Travere Therapeutics, Inc. * | (6,097) | | (189,251) |
| Vocera Communications, Inc. * | (7,869) | | (510,226) |
| Zogenix, Inc. * | (7,933) | | (128,911) |
| | | | | (2,723,951) |
| Industrials — (0.6)% | | |
| Air Transport Services Group, Inc. * | (8,750) | | (257,075) |
| Array Technologies, Inc. * | (2,851) | | (44,732) |
| Bloom Energy Corporation Class A * | (12,003) | | (263,226) |
| Fluor Corporation * | (17,804) | | (441,005) |
| FTI Consulting, Inc. * | (2,724) | | (417,916) |
| Greenbrier Cos., Inc. (The) | (5,605) | | (257,214) |
| Kaman Corporation | (1,707) | | (73,657) |
| Meritor, Inc. * | (3,150) | | (78,057) |
| RBC Bearings, Inc. * | (707) | | (142,793) |
| Spirit Airlines, Inc. * | (2,651) | | (57,924) |
| Sunrun, Inc. * | (1,115) | | (38,245) |
| Upwork, Inc. * | (2,333) | | (79,695) |
| | | | | (2,151,539) |
| Information Technology — (1.5)% | | |
| 8x8, Inc. * | (3,500) | | (58,660) |
| Affirm Holdings, Inc. * | (562) | | (56,515) |
| Avaya Holdings Corporation * | (5,659) | | (112,048) |
| Bentley Systems, Inc. Class B | (1,878) | | (90,764) |
| | | Shares | | Value |
| BigCommerce Holdings, Inc. Series 1 * | (2,183) | | $ (77,213) |
| Ceridian HCM Holding, Inc. * | (1,957) | | (204,428) |
| Confluent, Inc. Class A * | (1,081) | | (82,415) |
| DigitalOcean Holdings, Inc. * | (540) | | (43,378) |
| Enphase Energy, Inc. * | (1,458) | | (266,727) |
| Envestnet, Inc. * | (2,270) | | (180,102) |
| Everbridge, Inc. * | (940) | | (63,290) |
| Fastly, Inc. Class A * | (2,095) | | (74,268) |
| I3 Verticals, Inc. Class A * | (4,341) | | (98,931) |
| II-VI, Inc. * | (4,052) | | (276,873) |
| Impinj, Inc. * | (181) | | (16,055) |
| Infinera Corporation * | (16,254) | | (155,876) |
| Jamf Holding Corporation * | (3,476) | | (132,123) |
| LivePerson, Inc. * | (1,961) | | (70,047) |
| Lumentum Holdings, Inc. * | (1,546) | | (163,520) |
| MACOM Technology Solutions Holdings, Inc. * | (2,683) | | (210,079) |
| Marathon Digital Holdings, Inc. * | (2,476) | | (81,361) |
| MicroStrategy, Inc. Class A * | (236) | | (128,500) |
| Mitek Systems, Inc. * | (11,592) | | (205,758) |
| NCR Corporation * | (5,464) | | (219,653) |
| New Relic, Inc. * | (1,987) | | (218,491) |
| OSI Systems, Inc. * | (1,246) | | (116,127) |
| Perficient, Inc. * | (148) | | (19,135) |
| Progress Software Corporation | (3,631) | | (175,268) |
| Q2 Holdings, Inc. * | (2,014) | | (159,992) |
| Sabre Corporation * | (28,204) | | (242,272) |
| Splunk, Inc. * | (504) | | (58,323) |
| Unity Software, Inc. * | (369) | | (52,763) |
| Verint Systems, Inc. * | (4,899) | | (257,247) |
| Workiva, Inc. * | (5,072) | | (661,845) |
| Ziff Davis, Inc. * | (2,000) | | (221,720) |
| | | | | (5,251,767) |
| Materials — (0.0)% | | |
| Danimer Scientific, Inc. * | (16,736) | | (142,591) |
| Real Estate — (0.4)% | | |
| iStar, Inc. REIT | (19,615) | | (506,655) |
| Pebblebrook Hotel Trust REIT | (15,458) | | (345,796) |
| Realogy Holdings Corporation * | (9,611) | | (161,561) |
| Redfin Corporation * | (1,993) | | (76,511) |
| Summit Hotel Properties, Inc. REIT * | (25,240) | | (246,342) |
| | | | | (1,336,865) |
| Utilities — (0.2)% | | |
| NRG Energy, Inc. | (6,947) | | (299,277) |
| Sunnova Energy International, Inc. * | (7,957) | | (222,159) |
| | | | | (521,436) |
Total Common Stocks Sold Short
(Proceeds $(17,839,523)) | | | (17,688,182) |
| FOREIGN COMMON STOCKS SOLD SHORT — (0.2)% |
| Canada — (0.1)% | | |
| Algonquin Power & Utilities Corporation | (13,918) | | (201,115) |
See Notes to Financial Statements.
STRATEGIC ALTERNATIVES FUND
SCHEDULE OF INVESTMENTS (Continued)
| | | Shares | | Value |
| Ireland — (0.1)% | | |
| Jazz Pharmaceuticals PLC * | (1,767) | | $ (225,116) |
| Jersey — (0.0)% | | |
| Clarivate PLC * | (7,770) | | (182,750) |
Total Foreign Common Stocks Sold Short
(Proceeds $(722,343)) | | | (608,981) |
TOTAL SECURITIES SOLD SHORT —(5.2)%
(Proceeds $(18,561,866)) | | | (18,297,163) |
| | Number of
Contracts | | Notional
Amount | |
| WRITTEN OPTIONS — (0.3)% |
| Call Options — (0.0)% |
2U, Inc., Strike Price
$20.00, Expires
01/21/22 (Evercore) | (22) | | $ (44,154) | (2,365) |
Avid Bioservices, Inc., Strike Price
$30.00, Expires
01/21/22 (Evercore) | (21) | | (61,278) | (2,520) |
BigCommerce, Inc., Strike Price
$55.00, Expires
01/21/22 (Evercore) | (6) | | (21,222) | (54) |
Burlington Stores, Inc., Strike Price
$280.00, Expires
03/18/22 (Evercore) | (4) | | (116,604) | (10,580) |
Callaway Golf Co., Strike Price
$29.00, Expires
02/18/22 (Evercore) | (30) | | (82,320) | (3,450) |
Enphase Energy, Inc., Strike Price
$250.00, Expires
02/18/22 (Evercore) | (5) | | (91,470) | (1,307) |
Exact Sciences, Inc., Strike Price
$85.00, Expires
01/21/22 (Evercore) | (9) | | (70,047) | (1,989) |
fuboTV Inc., Strike Price
$30.00, Expires
01/21/22 (Evercore) | (22) | | (34,144) | (176) |
II-VI, Inc., Strike Price
$70.00, Expires
01/21/22 (Evercore) | (11) | | (75,163) | (1,683) |
| | Number of
Contracts | | Notional
Amount | | Value |
Infinera Corp., Strike Price
$9.00, Expires
01/21/22 (Evercore) | (81) | | $ (77,679) | | $ (5,670) |
New Relic, Inc., Strike Price
$105.00, Expires
02/18/22 (Evercore) | (9) | | (98,964) | | (11,205) |
Realreal, Inc., Strike Price
$15.00, Expires
01/21/22 (Evercore) | (31) | | (35,991) | | (434) |
Redfin Corp., Strike Price
$40.00, Expires
02/18/22 (Evercore) | (13) | | (49,907) | | (3,510) |
Sabre Corp., Strike Price
$9.00, Expires
01/21/22 (Evercore) | (89) | | (76,451) | | (3,204) |
SoFi Technologies, Inc., Strike Price
$15.00, Expires
02/18/22 (Evercore) | (29) | | (45,849) | | (6,293) |
Sunnova Energy Intl., Strike Price
$40.00, Expires
01/21/22 (Evercore) | (24) | | (67,008) | | (240) |
Winnebago Industries, Inc., Strike Price
$70.00, Expires
01/21/22 (Evercore) | (12) | | (89,904) | | (6,600) |
Zillow Group, Inc., Strike Price
$60.00, Expires
02/18/22 (Evercore) | (10) | | (63,850) | | (7,800) |
| | | | | | (69,080) |
| Call Swaptions — (0.1)% |
Pay 0.02% (Annually); Receive 6-Month EURIBOR (Semiannually); Interest Rate Swap Maturing 12/13/2027 EUR, Strike Price
$0.02, Expires
12/09/22 (CITI) | (2) | | (7,440,000) | | (61,796) |
See Notes to Financial Statements.
| | Number of
Contracts | | Notional
Amount | | Value |
Pay -0.08% (Annually); Receive 6-Month EURIBOR (Semiannually); Interest Rate Swap Maturing 3/18/2027 EUR, Strike Price
$0.08, Expires
03/16/22 (BNP) | (2) | | $(15,740,000) | | $(38,815) |
Pay 0.38% (Annually); Receive 1-Day SONIA (Annually); Interest Rate Swap Maturing 10/10/2032 GBP, Strike Price
$0.38, Expires
10/10/22 (CITI) | (1) | | (850,000) | | (8,321) |
Pay 0.43% (Annually); Receive 1-Day SONIA (Annually); Interest Rate Swap Maturing 10/10/2032 GBP, Strike Price
$0.42, Expires
10/10/22 (CITI) | (1) | | (780,000) | | (8,562) |
Pay 0.55% (Annually); Receive 1-Day SONIA (Annually); Interest Rate Swap Maturing 11/15/2032 GBP, Strike Price
$0.55, Expires
11/15/22 (CITI) | (1) | | (900,000) | | (15,404) |
Pay 0.60% (Annually); Receive 1-Day SONIA (Annually); Interest Rate Swap Maturing 11/16/2032 GBP, Strike Price
$0.60, Expires
11/16/22 (MSCS) | (1) | | (820,000) | | (15,169) |
Pay 0.85% (Semiannually); Receive 3-Month LIBOR (Quarterly); Interest Rate Swap Maturing 2/24/2032 USD, Strike Price
$0.85, Expires
02/22/22 (CITI) | (1) | | (2,380,000) | | (190) |
| | Number of
Contracts | | Notional
Amount | | Value |
Pay 1.12% (Semiannually); Receive 3-Month LIBOR (Quarterly); Interest Rate Swap Maturing 1/11/2032 USD, Strike Price
$1.12, Expires
01/07/22 (CITI) | (1) | | $ (2,380,000) | | $ — |
Pay 1.25% (Semiannually); Receive 3-Month LIBOR (Quarterly); Interest Rate Swap Maturing 12/15/2023 USD, Strike Price
$1.25, Expires
12/13/22 (CITI) | (1) | | (12,400,000) | | (32,270) |
Pay 1.26% (Semiannually); Receive 3-Month LIBOR (Quarterly); Interest Rate Swap Maturing 12/15/2023 USD, Strike Price
$1.26, Expires
12/13/22 (CITI) | (1) | | (17,800,000) | | (46,613) |
Pay 1.29% (Semiannually); Receive 3-Month LIBOR (Quarterly); Interest Rate Swap Maturing 12/14/2023 USD, Strike Price
$1.29, Expires
12/12/22 (CITI) | (2) | | (42,400,000) | | (119,441) |
Pay 1.30% (Semiannually); Receive 3-Month LIBOR (Quarterly); Interest Rate Swap Maturing 12/19/2023 USD, Strike Price
$1.30, Expires
12/15/22 (CITI) | (1) | | (13,100,000) | | (36,913) |
| | | | | | (383,494) |
See Notes to Financial Statements.
STRATEGIC ALTERNATIVES FUND
SCHEDULE OF INVESTMENTS (Continued)
| | Number of
Contracts | | Notional
Amount | | Value |
| Put Swaptions — (0.2)% |
Pay 3-Month LIBOR (Quarterly); Receive 1.25% (Semiannually); Interest Rate Swap Maturing 12/15/2023 USD, Strike Price
$1.25, Expires
12/13/22 (CITI) | (1) | | $(12,400,000) | | $ (38,698) |
Pay 3-Month LIBOR (Quarterly); Receive 1.26% (Semiannually); Interest Rate Swap Maturing 12/15/2023 USD, Strike Price
$1.26, Expires
12/13/22 (CITI) | (1) | | (17,800,000) | | (55,312) |
Pay 3-Month LIBOR (Quarterly); Receive 1.29% (Semiannually); Interest Rate Swap Maturing 12/14/2023 USD, Strike Price
$1.29, Expires
12/12/22 (CITI) | (2) | | (42,400,000) | | (124,745) |
Pay 3-Month LIBOR (Quarterly); Receive 1.30% (Semiannually); Interest Rate Swap Maturing 12/19/2023 USD, Strike Price
$1.30, Expires
12/15/22 (CITI) | (1) | | (13,100,000) | | (38,942) |
Pay 6-Month EURIBOR (Semiannually); Receive 0.02% (Annually); Interest Rate Swap Maturing 12/13/2027 EUR, Strike Price
$0.02, Expires
12/09/22 (CITI) | (2) | | (7,440,000) | | (130,995) |
| | Number of
Contracts | | Notional
Amount | | Value |
Pay 6-Month EURIBOR (Semiannually); Receive -0.08% (Annually); Interest Rate Swap Maturing 3/18/2027 EUR, Strike Price
$0.08, Expires
03/16/22 (BNP) | (2) | | $(15,740,000) | | $ (159,230) |
Pay 6-Month EURIBOR (Semiannually); Receive -0.11% (Annually); Interest Rate Swap Maturing 5/30/2027 EUR, Strike Price
$0.11, Expires
05/26/22 (BNP) | (1) | | (3,450,000) | | (49,870) |
| | | | | | (597,792) |
Total Written Options
(Premiums received $ (1,199,864)) | | | | (1,050,366) |
Other Assets in Excess of
Liabilities — 14.1% | | | | 49,566,216 |
| NET ASSETS — 100.0% | | | | $351,680,512 |
Futures Contracts outstanding at December 31, 2021:
| Future Type | | Expiration Date | | Open Long
(Short) Contracts | | Notional
Market Value
of Contracts | | Value and
Unrealized
Appreciation
(Depreciation) |
| Euro-Bund | | 03/2022 | | (1) | | $ (195,105) | | $ 3,154 |
| Euro-OAT | | 03/2022 | | (1) | | (185,746) | | 3,190 |
| Australian Dollars/U.S. Dollars | | 03/2022 | | (277) | | (20,160,060) | | (374,050) |
| British Pounds/U.S. Dollars | | 03/2022 | | (13) | | (1,099,394) | | (27,219) |
| Mexican Pesos/U.S. Dollars | | 03/2022 | | (8) | | (193,040) | | (5,480) |
| New Zealand Dollars/U.S. Dollars | | 03/2022 | | (2) | | (136,870) | | (1,550) |
| South African Rand/U.S. Dollars | | 03/2022 | | (15) | | (465,563) | | 2,813 |
See Notes to Financial Statements.
| Future Type | | Expiration Date | | Open Long
(Short) Contracts | | Notional
Market Value
of Contracts | | Value and
Unrealized
Appreciation
(Depreciation) |
| Swiss Francs/U.S. Dollars | | 03/2022 | | (1) | | $ (137,400) | | $ (1,800) |
| U.S. Dollars/Czech Republic Koruna | | 03/2022 | | 1 | | 100,669 | | (3,343) |
| U.S. Dollars/Norwegian Kroner | | 03/2022 | | 1 | | 100,143 | | (1,874) |
| U.S. Dollars/Swedish Kroner | | 03/2022 | | 7 | | 699,721 | | (2,931) |
| Canadian Dollars/U.S. Dollars | | 03/2022 | | (3) | | (237,150) | | 441 |
| Euro/U.S. Dollars | | 03/2022 | | (210) | | (29,931,563) | | (194,825) |
| Japanese Yen/U.S. Dollars | | 03/2022 | | (6) | | (652,350) | | 7,275 |
| S&P 500® E-Mini | | 03/2022 | | 100 | | 23,792,500 | | 332,000 |
| 10-Year Bond | | 03/2022 | | (16) | | (1,803,961) | | (46,218) |
| 10-Year U.S. Treasury Note | | 03/2022 | | 450 | | 58,710,938 | | 455,350 |
| Long GILT | | 03/2022 | | (8) | | (1,352,467) | | (314) |
| U.S. Treasury Long Bond | | 03/2022 | | 12 | | 1,925,250 | | 21,945 |
| Ultra 10-Year U.S. Treasury Note | | 03/2022 | | (184) | | (26,944,500) | | (347,833) |
| Ultra Long U.S. Treasury Bond | | 03/2022 | | (1) | | (197,125) | | (899) |
| 2-Year U.S. Treasury Note | | 04/2022 | | 10 | | 2,181,719 | | (813) |
| 5-Year U.S. Treasury Note | | 04/2022 | | (294) | | (35,567,109) | | (51,597) |
| Total Futures Contracts outstanding at December 31, 2021 | | | | | | $(31,748,463) | | $(234,578) |
Forward Foreign Currency Contracts outstanding at December 31, 2021:
| Expiration Date | | Currency
Purchased | | Amount
of Currency
Purchased | | Currency
Sold | | Amount
of Currency
Sold | | Counter-
party | | Net Unrealized
Appreciation
(Depreciation) |
| 06/14/22 | | U.S. Dollars | | 979,000 | | Turkish Lira | | 9,446,860 | | MSCS | | $354,336 |
| 03/16/22 | | Australian Dollars | | 7,881,082 | | U.S. Dollars | | 5,587,237 | | MSCS | | 147,763 |
| 01/20/22 | | U.S. Dollars | | 1,962,573 | | Swedish Kronor | | 16,821,732 | | MSCS | | 100,685 |
| 01/25/22 | | U.S. Dollars | | 1,372,063 | | Norwegian Kroner | | 11,443,377 | | MSCS | | 73,239 |
| 02/10/22 | | Euro | | 4,190,111 | | U.S. Dollars | | 4,734,907 | | MSCS | | 39,481 |
| 01/31/22 | | U.S. Dollars | | 1,826,484 | | Australian Dollars | | 2,466,715 | | MSCS | | 31,648 |
| 03/16/22 | | Norwegian Kroner | | 9,862,509 | | U.S. Dollars | | 1,090,315 | | MSCS | | 28,031 |
| 03/16/22 | | Swiss Francs | | 2,412,505 | | U.S. Dollars | | 2,624,829 | | MSCS | | 27,979 |
| 03/16/22 | | Czech Republic Koruna | | 21,657,232 | | U.S. Dollars | | 956,245 | | MSCS | | 27,852 |
| 03/16/22 | | Turkish Lira | | 5,885,020 | | U.S. Dollars | | 389,815 | | MSCS | | 27,250 |
| 03/16/22 | | U.S. Dollars | | 1,674,391 | | Japanese Yen | | 189,667,091 | | MSCS | | 24,481 |
| 01/31/22 | | U.S. Dollars | | 1,477,083 | | Canadian Dollars | | 1,838,053 | | MSCS | | 24,069 |
| 01/26/22 | | U.S. Dollars | | 395,810 | | Hungarian Forint | | 123,964,000 | | MSCS | | 14,696 |
| 02/03/22 | | U.S. Dollars | | 389,653 | | South African Rand | | 6,009,000 | | MSCS | | 14,417 |
| 02/07/22 | | U.S. Dollars | | 355,677 | | Chilean Pesos | | 292,739,678 | | MSCS | | 13,977 |
| 01/21/22 | | U.S. Dollars | | 762,752 | | British Pounds | | 553,893 | | MSCS | | 13,067 |
| 03/16/22 | | Euro | | 1,693,510 | | U.S. Dollars | | 1,918,064 | | MSCS | | 12,992 |
| 02/10/22 | | U.S. Dollars | | 729,265 | | Russian Rubles | | 54,101,734 | | MSCS | | 12,245 |
| 03/16/22 | | Canadian Dollars | | 726,730 | | U.S. Dollars | | 563,319 | | MSCS | | 11,101 |
| 03/16/22 | | Mexican Pesos | | 10,355,259 | | U.S. Dollars | | 488,618 | | MSCS | | 10,456 |
| 03/16/22 | | Chinese Offshore Yuan | | 11,499,744 | | U.S. Dollars | | 1,790,438 | | MSCS | | 9,655 |
| 06/14/22 | | Turkish Lira | | 4,310,191 | | U.S. Dollars | | 276,020 | | MSCS | | 8,987 |
| 02/10/22 | | U.S. Dollars | | 1,471,709 | | South Korean Won | | 1,741,594,001 | | MSCS | | 8,768 |
| 03/16/22 | | New Zealand Dollars | | 3,087,130 | | U.S. Dollars | | 2,105,257 | | MSCS | | 6,545 |
| 03/16/22 | | Swedish Kronor | | 9,629,455 | | U.S. Dollars | | 1,059,971 | | MSCS | | 6,346 |
| 03/16/22 | | Israeli Shekels | | 1,548,367 | | U.S. Dollars | | 492,278 | | MSCS | | 6,088 |
| 02/16/22 | | U.S. Dollars | | 351,421 | | New Zealand Dollars | | 504,613 | | MSCS | | 6,047 |
| 02/16/22 | | U.S. Dollars | | 469,808 | | Japanese Yen | | 53,421,888 | | MSCS | | 5,223 |
| 01/24/22 | | Mexican Pesos | | 6,907,669 | | U.S. Dollars | | 330,859 | | MSCS | | 5,100 |
See Notes to Financial Statements.
STRATEGIC ALTERNATIVES FUND
SCHEDULE OF INVESTMENTS (Continued)
| Expiration Date | | Currency
Purchased | | Amount
of Currency
Purchased | | Currency
Sold | | Amount
of Currency
Sold | | Counter-
party | | Net Unrealized
Appreciation
(Depreciation) |
| 03/16/22 | | Polish Zloty | | 1,702,501 | | U.S. Dollars | | 415,198 | | MSCS | | $ 4,962 |
| 02/10/22 | | Indonesian Rupiahs | | 6,907,536,267 | | U.S. Dollars | | 479,790 | | MSCS | | 4,615 |
| 03/16/22 | | U.S. Dollars | | 1,180,438 | | Swedish Kronor | | 10,624,406 | | MSCS | | 3,945 |
| 03/16/22 | | British Pounds | | 369,909 | | Euro | | 435,536 | | MSCS | | 3,897 |
| 02/10/22 | | Polish Zloty | | 2,039,000 | | U.S. Dollars | | 500,923 | | MSCS | | 3,669 |
| 01/24/22 | | U.S. Dollars | | 411,933 | | Mexican Pesos | | 8,425,043 | | MSCS | | 2,174 |
| 03/16/22 | | U.S. Dollars | | 392,697 | | Hungarian Forint | | 127,686,316 | | MSCS | | 2,169 |
| 03/16/22 | | British Pounds | | 115,890 | | U.S. Dollars | | 154,754 | | MSCS | | 2,056 |
| 01/19/22 | | Taiwan Dollars | | 13,647,920 | | U.S. Dollars | | 491,392 | | MSCS | | 1,883 |
| 03/16/22 | | Hungarian Forint | | 79,898,400 | | U.S. Dollars | | 243,000 | | MSCS | | 1,369 |
| 01/19/22 | | U.S. Dollars | | 2,464,845 | | Taiwan Dollars | | 68,159,706 | | MSCS | | 1,355 |
| 03/16/22 | | New Zealand Dollars | | 362,786 | | Euro | | 216,899 | | MSCS | | 846 |
| 03/16/22 | | South African Rand | | 6,942,409 | | U.S. Dollars | | 430,321 | | MSCS | | 734 |
| 01/21/22 | | British Pounds | | 203,533 | | U.S. Dollars | | 275,019 | | MSCS | | 459 |
| 01/25/22 | | Swiss Francs | | 207,059 | | U.S. Dollars | | 226,969 | | MSCS | | 418 |
| 03/16/22 | | Swiss Francs | | 225,387 | | Euro | | 217,000 | | MSCS | | 400 |
| 01/31/22 | | U.S. Dollars | | 84,364 | | Czech Republic Koruna | | 1,841,000 | | MSCS | | 352 |
| 03/16/22 | | U.S. Dollars | | 48,811 | | South African Rand | | 784,135 | | MSCS | | 124 |
| 02/07/22 | | Singapore Dollars | | 103,302 | | U.S. Dollars | | 76,538 | | MSCS | | 99 |
| 03/16/22 | | Thai Baht | | 3,241,708 | | U.S. Dollars | | 96,944 | | MSCS | | 71 |
| 02/10/22 | | U.S. Dollars | | 74,135 | | Hong Kong Dollars | | 577,594 | | MSCS | | 56 |
| Subtotal Appreciation | | | | | | | | | | $1,108,177 |
| 03/16/22 | | U.S. Dollars | | 78,793 | | Thai Baht | | 2,639,574 | | MSCS | | $ (202) |
| 03/16/22 | | U.S. Dollars | | 429,046 | | South African Rand | | 6,916,760 | | MSCS | | (417) |
| 01/25/22 | | U.S. Dollars | | 233,482 | | Swiss Francs | | 213,000 | | MSCS | | (430) |
| 03/16/22 | | U.S. Dollars | | 60,956 | | Swiss Francs | | 55,868 | | MSCS | | (477) |
| 03/16/22 | | Euro | | 433,261 | | Chinese Offshore Yuan | | 3,159,559 | | MSCS | | (542) |
| 01/31/22 | | Czech Republic Koruna | | 3,295,307 | | U.S. Dollars | | 151,008 | | MSCS | | (630) |
| 01/19/22 | | Taiwan Dollars | | 27,121,246 | | U.S. Dollars | | 980,985 | | MSCS | | (745) |
| 03/16/22 | | Australian Dollars | | 344,405 | | British Pounds | | 186,008 | | MSCS | | (1,067) |
| 03/16/22 | | Swedish Kronor | | 2,340,555 | | Euro | | 228,244 | | MSCS | | (1,078) |
| 01/21/22 | | U.S. Dollars | | 163,025 | | British Pounds | | 121,479 | | MSCS | | (1,394) |
| 02/10/22 | | South Korean Won | | 876,059,390 | | U.S. Dollars | | 737,697 | | MSCS | | (1,806) |
| 03/16/22 | | Swedish Kronor | | 6,070,881 | | U.S. Dollars | | 674,513 | | MSCS | | (2,254) |
| 02/16/22 | | Japanese Yen | | 25,938,328 | | U.S. Dollars | | 227,867 | | MSCS | | (2,294) |
| 02/10/22 | | U.S. Dollars | | 483,154 | | Russian Rubles | | 36,631,143 | | MSCS | | (2,325) |
| 03/16/22 | | U.S. Dollars | | 243,215 | | Polish Zloty | | 997,594 | | MSCS | | (2,982) |
| 01/24/22 | | Mexican Pesos | | 12,421,871 | | U.S. Dollars | | 607,353 | | MSCS | | (3,206) |
| 01/26/22 | | U.S. Dollars | | 512,085 | | Hungarian Forint | | 167,670,843 | | MSCS | | (3,401) |
| 01/19/22 | | U.S. Dollars | | 492,840 | | Taiwan Dollars | | 13,731,995 | | MSCS | | (3,474) |
| 03/16/22 | | Euro | | 215,747 | | Czech Republic Koruna | | 5,492,166 | | MSCS | | (3,553) |
| 03/16/22 | | U.S. Dollars | | 981,872 | | Chinese Offshore Yuan | | 6,299,222 | | MSCS | | (4,166) |
| 03/16/22 | | U.S. Dollars | | 874,698 | | Swedish Kronor | | 7,939,125 | | MSCS | | (4,440) |
| 03/16/22 | | Euro | | 214,922 | | British Pounds | | 184,610 | | MSCS | | (4,727) |
| 02/03/22 | | South African Rand | | 2,269,389 | | U.S. Dollars | | 147,158 | | MSCS | | (5,445) |
| 02/10/22 | | U.S. Dollars | | 837,912 | | Polish Zloty | | 3,410,710 | | MSCS | | (6,137) |
| 03/16/22 | | Euro | | 871,749 | | Swiss Francs | | 911,366 | | MSCS | | (8,118) |
| 03/15/22 | | U.S. Dollars | | 390,000 | | South African Rand | | 6,413,711 | | MSCS | | (8,291) |
| 01/21/22 | | British Pounds | | 368,662 | | U.S. Dollars | | 507,676 | | MSCS | | (8,698) |
| 03/16/22 | | U.S. Dollars | | 5,676,680 | | Euro | | 4,986,962 | | MSCS | | (9,791) |
| 03/16/22 | | Japanese Yen | | 86,126,951 | | U.S. Dollars | | 759,867 | | MSCS | | (10,650) |
| 01/24/22 | | U.S. Dollars | | 392,095 | | Mexican Pesos | | 8,289,000 | | MSCS | | (11,047) |
| 03/16/22 | | U.S. Dollars | | 795,000 | | Israeli Shekels | | 2,514,505 | | MSCS | | (14,332) |
| 03/16/22 | | U.S. Dollars | | 1,671,352 | | New Zealand Dollars | | 2,464,254 | | MSCS | | (14,361) |
| 03/16/22 | | U.S. Dollars | | 557,137 | | Norwegian Kroner | | 5,049,372 | | MSCS | | (15,429) |
See Notes to Financial Statements.
| Expiration Date | | Currency
Purchased | | Amount
of Currency
Purchased | | Currency
Sold | | Amount
of Currency
Sold | | Counter-
party | | Net Unrealized
Appreciation
(Depreciation) |
| 03/16/22 | | U.S. Dollars | | 717,056 | | Australian Dollars | | 1,006,810 | | MSCS | | $ (15,592) |
| 01/18/22 | | U.S. Dollars | | 733,882 | | Indian Rupees | | 55,980,040 | | MSCS | | (16,723) |
| 03/16/22 | | U.S. Dollars | | 447,365 | | Mexican Pesos | | 9,652,485 | | MSCS | | (17,838) |
| 03/16/22 | | U.S. Dollars | | 1,645,006 | | Canadian Dollars | | 2,104,379 | | MSCS | | (18,332) |
| 01/26/22 | | Hungarian Forint | | 163,348,569 | | U.S. Dollars | | 521,562 | | MSCS | | (19,365) |
| 01/31/22 | | Canadian Dollars | | 1,844,128 | | U.S. Dollars | | 1,481,965 | | MSCS | | (24,148) |
| 02/07/22 | | Chilean Pesos | | 388,046,202 | | U.S. Dollars | | 480,806 | | MSCS | | (27,861) |
| 03/16/22 | | Turkish Lira | | 5,400,027 | | U.S. Dollars | | 413,231 | | MSCS | | (30,537) |
| 01/31/22 | | Australian Dollars | | 2,561,666 | | U.S. Dollars | | 1,896,790 | | MSCS | | (32,866) |
| 02/10/22 | | U.S. Dollars | | 4,254,812 | | Euro | | 3,765,293 | | MSCS | | (35,520) |
| 02/10/22 | | Russian Rubles | | 75,915,292 | | U.S. Dollars | | 1,052,814 | | MSCS | | (46,696) |
| 03/16/22 | | U.S. Dollars | | 3,448,134 | | British Pounds | | 2,587,034 | | MSCS | | (52,381) |
| 01/25/22 | | Norwegian Kroner | | 9,606,767 | | U.S. Dollars | | 1,146,761 | | MSCS | | (56,391) |
| 03/16/22 | | U.S. Dollars | | 1,173,609 | | Turkish Lira | | 17,652,226 | | MSCS | | (77,386) |
| 01/20/22 | | Swedish Kronor | | 14,285,000 | | U.S. Dollars | | 1,666,362 | | MSCS | | (85,248) |
| 06/14/22 | | Turkish Lira | | 5,136,670 | | U.S. Dollars | | 490,000 | | MSCS | | (150,343) |
| Subtotal Depreciation | | | | | | | | | | $(865,136) |
| Total Forward Foreign Currency Contracts outstanding at December 31, 2021 | | | | $ 243,041 |
Swap Agreements outstanding at December 31, 2021:
| Pay Rate Index/Pay Rate | | Receive
Rate/Receive
Rate Index | | Maturity
Date | | Currency | | Notional
Amount | | Market Value | | Upfront
Premiums
Paid/
(Received) | | Unrealized
Appreciation
(Depreciation) |
| Centrally Cleared Interest Rate Swaps | | | | | | | | | | | | |
| 1-Day Brazil Cetip DI Interbank Deposit Rate (Upon termination) | | 12.40% (Upon termination) | | 1/2/2023 | | BRL | | 3,175,953 | | $ 7,047 | | $ (298) | | $ 7,345 |
| 5.80% (Upon termination) | | 1-Day Brazil Cetip DI Interbank Deposit Rate (Upon termination) | | 1/2/2023 | | BRL | | 11,831,600 | | 103,394 | | 7,701 | | 95,693 |
| 2.50% (Quarterly) | | 7-Day CFETS Repo Rate (Quarterly) | | 9/15/2023 | | CNY | | 87,203,057 | | 71,454 | | 56,867 | | 14,587 |
| 1-Day SOFR (Annually) | | 0.50% (Annually) | | 12/15/2023 | | USD | | 7,470,000 | | 29,964 | | 21,128 | | 8,836 |
| 3-Month CDOR (Semiannually) | | 1.00% (Semiannually) | | 12/15/2023 | | CAD | | 4,910,000 | | 37,937 | | 6,346 | | 31,591 |
| 12.30% (Upon termination) | | 1-Day Brazil Cetip DI Interbank Deposit Rate (Upon termination) | | 1/2/2024 | | BRL | | 7,176,343 | | 40,513 | | 8,106 | | 32,407 |
| 7.20% (Lunar) | | 28-Day Mexico Interbank TIIE (Lunar) | | 3/13/2024 | | MXN | | 92,270,000 | | 28,989 | | 1,305 | | 27,684 |
| 0.25% (Annually) | | 1-Day SOFR (Annually) | | 3/16/2024 | | USD | | 5,360,000 | | 65,671 | | 51,552 | | 14,119 |
| 3.15% (Annually) | | 6-Month WIBOR (Semiannually) | | 3/16/2024 | | PLN | | 12,139,408 | | 52,704 | | 1,374 | | 51,330 |
| 3-Month KWCDC (Quarterly) | | 1.50% (Quarterly) | | 3/16/2024 | | KRW | | 3,908,240,000 | | 21,823 | | 10,936 | | 10,887 |
| 3-Month STIBOR (Quarterly) | | 0.50% (Annually) | | 3/16/2024 | | SEK | | 77,230,000 | | 21,163 | | 18,519 | | 2,644 |
| 4.00% (Annually) | | 6-Month PRIBOR (Semiannually) | | 3/16/2024 | | CZK | | 142,775,000 | | 61,276 | | 12,612 | | 48,664 |
| 5.30% (Semiannually) | | 1-Day CLP-TNA (Semiannually) | | 3/16/2024 | | CLP | | 5,330,090,000 | | 16,895 | | 3,750 | | 13,145 |
| 6-Month BUBOR (Semiannually) | | 4.60% (Annually) | | 3/16/2024 | | HUF | | 1,982,444,968 | | 82,184 | | 306 | | 81,878 |
| 1-Day Brazil Cetip DI Interbank Deposit Rate (Upon termination) | | 6.32% (Upon termination) | | 1/2/2025 | | BRL | | 9,063,249 | | 162,755 | | 24,417 | | 138,338 |
| 0.27% (Annually) | | 1-Day SONIA (Annually) | | 6/17/2025 | | GBP | | 10,000 | | 355 | | (174) | | 529 |
| 1-Day MIBOR (Semiannually) | | 5.50% (Semiannually) | | 9/15/2026 | | INR | | 170,050,000 | | 29,561 | | (7,803) | | 37,364 |
| (0.18)% (Annually) | | 1-Day ESTR (Annually) | | 12/9/2026 | | EUR | | 46,610,000 | | 205,209 | | 9,011 | | 196,198 |
| 7-Day CFETS Repo Rate (Quarterly) | | 2.50% (Quarterly) | | 12/15/2026 | | CNY | | 20,600,000 | | 20,373 | | (22,835) | | 43,208 |
| 11.23% (Upon termination) | | 1-Day Brazil Cetip DI Interbank Deposit Rate (Upon termination) | | 1/4/2027 | | BRL | | 6,682,183 | | 55,290 | | (21,296) | | 76,586 |
| 8.50% (Upon termination) | | 1-Day Brazil Cetip DI Interbank Deposit Rate (Upon termination) | | 1/4/2027 | | BRL | | 6,939,535 | | 85,435 | | (24,999) | | 110,434 |
| 7.40% (Lunar) | | 28-Day Mexico Interbank TIIE (Lunar) | | 3/10/2027 | | MXN | | 85,570,000 | | 16,782 | | (16,936) | | 33,718 |
See Notes to Financial Statements.
STRATEGIC ALTERNATIVES FUND
SCHEDULE OF INVESTMENTS (Continued)
| Pay Rate Index/Pay Rate | | Receive
Rate/Receive
Rate Index | | Maturity
Date | | Currency | | Notional
Amount | | Market Value | | Upfront
Premiums
Paid/
(Received) | | Unrealized
Appreciation
(Depreciation) |
| (0.25)% (Annually) | | 1-Day ESTR (Annually) | | 3/16/2027 | | EUR | | 4,530,000 | | $ 27,189 | | $ (4,770) | | $ 31,959 |
| 0.00% (Annually) | | Bank of Japan Unsecured Overnight Call Rate (Annually) | | 3/16/2027 | | JPY | | 1,862,700,000 | | (8,615) | | (26,562) | | 17,947 |
| 1.00% (Annually) | | 1-Day SOFR (Annually) | | 3/16/2027 | | USD | | 13,000,000 | | 108,764 | | 87,777 | | 20,987 |
| 1-Day SONIA (Annually) | | 0.50% (Annually) | | 3/16/2027 | | GBP | | 9,620,000 | | 360,503 | | 244,640 | | 115,863 |
| 3.25% (Annually) | | 6-Month WIBOR (Semiannually) | | 3/16/2027 | | PLN | | 11,075,000 | | 66,819 | | 36,445 | | 30,374 |
| 6-Month EURIBOR (Semiannually) | | (0.25)% (Annually) | | 3/16/2027 | | EUR | | 6,390,000 | | 110,138 | | 90,428 | | 19,710 |
| 6-Month NIBOR (Semiannually) | | 2.00% (Annually) | | 3/16/2027 | | NOK | | 29,660,000 | | (15,127) | | (21,509) | | 6,382 |
| 0.02% (Annually) | | 6-Month EURIBOR (Semiannually) | | 12/13/2027 | | EUR | | 1,290,000 | | 12,008 | | 8,366 | | 3,642 |
| 1.68% (Semiannually) | | 3-Month CDOR (Semiannually) | | 8/22/2028 | | CAD | | 17,030,000 | | 196,083 | | (17,478) | | 213,561 |
| 3-Month HIBOR (Quarterly) | | 1.50% (Quarterly) | | 9/15/2031 | | HKD | | 15,128,144 | | (2,689) | | (11,751) | | 9,062 |
| 3-Month New Zealand BBR FRA (Quarterly) | | 3.00% (Semiannually) | | 9/16/2031 | | NZD | | 2,640,000 | | 19,519 | | 16,816 | | 2,703 |
| 1-Day SOFR (Annually) | | 1.53% (Annually) | | 9/22/2031 | | USD | | 13,790,000 | | 7,607 | | 1,501 | | 6,106 |
| 3-Month CDOR (Semiannually) | | 2.50% (Semiannually) | | 10/14/2031 | | CAD | | 4,460,000 | | 60,717 | | 21,380 | | 39,337 |
| 3-Month JIBAR (Quarterly) | | 7.40% (Quarterly) | | 12/15/2031 | | ZAR | | 5,960,000 | | 108 | | (2,636) | | 2,744 |
| 7.40% (Lunar) | | 28-Day Mexico Interbank TIIE (Lunar) | | 3/3/2032 | | MXN | | 30,070,000 | | 19,415 | | (4,124) | | 23,539 |
| 0.00% (Annually) | | Bank of Japan Unsecured Overnight Call Rate (Annually) | | 3/16/2032 | | JPY | | 247,390,000 | | 17,575 | | 9,675 | | 7,900 |
| 0.25% (Annually) | | Swiss Average Overnight Rate (Annually) | | 3/16/2032 | | CHF | | 2,740,000 | | 40,120 | | 39,740 | | 380 |
| 1-Day SONIA (Annually) | | 0.75% (Annually) | | 3/16/2032 | | GBP | | 6,940,000 | | 189,166 | | (2,977) | | 192,143 |
| 2.75% (Semiannually) | | 3-Month New Zealand BBR FRA (Quarterly) | | 3/16/2032 | | NZD | | 3,180,000 | | (13,311) | | (24,724) | | 11,413 |
| 2.80% (Annually) | | 6-Month PRIBOR (Semiannually) | | 3/16/2032 | | CZK | | 35,800,000 | | 61,192 | | — | | 61,192 |
| 3.10% (Annually) | | 6-Month WIBOR (Semiannually) | | 3/16/2032 | | PLN | | 5,675,000 | | 55,482 | | (2,818) | | 58,300 |
| 3-Month JIBAR (Quarterly) | | 7.60% (Quarterly) | | 3/16/2032 | | ZAR | | 11,225,000 | | 2,121 | | 516 | | 1,605 |
| 3-Month TELBOR (Quarterly) | | 1.25% (Annually) | | 3/16/2032 | | ILS | | 6,311,083 | | 3,517 | | 2,917 | | 600 |
| 4.30% (Annually) | | 6-Month BUBOR (Semiannually) | | 3/16/2032 | | HUF | | 456,097,782 | | 23,342 | | 1,860 | | 21,482 |
| 1.50% (Annually) | | 1-Day SOFR (Annually) | | 3/17/2032 | | USD | | 5,470,000 | | 9,357 | | 3,828 | | 5,529 |
| 1-Day SONIA (Annually) | | 1.00% (Annually) | | 3/17/2032 | | GBP | | 3,260,000 | | (30,941) | | (61,769) | | 30,828 |
| 2.00% (Semiannually) | | 3-Month CDOR (Semiannually) | | 3/17/2032 | | CAD | | 2,280,000 | | 12,371 | | 9,643 | | 2,728 |
| 2.00% (Semiannually) | | 6-Month ASX BBSW (Semiannually) | | 3/17/2032 | | AUD | | 1,210,000 | | (13,795) | | (15,360) | | 1,565 |
| 1.63% (Annually) | | 1-Day SOFR (Annually) | | 9/22/2036 | | USD | | 16,630,000 | | 35,523 | | 5,100 | | 30,423 |
| 0.75% (Annually) | | 6-Month EURIBOR (Semiannually) | | 11/26/2041 | | EUR | | 12,070,000 | | 74,164 | | (237,155) | | 311,319 |
| 2.25% (Semiannually) | | 3-Month CDOR (Semiannually) | | 12/15/2051 | | CAD | | 2,060,000 | | 60,832 | | 1,121 | | 59,711 |
| 1-Day SOFR (Annually) | | 1.75% (Annually) | | 3/16/2052 | | USD | | 1,270,000 | | (88,275) | | (108,876) | | 20,601 |
| Subtotal Appreciation | | | | | | | | | | $2,617,653 | | $ 178,833 | | $2,438,820 |
| 0.50% (Semiannually) | | 3-Month New Zealand BBR FRA (Quarterly) | | 9/15/2022 | | NZD | | 91,250,000 | | $ (339,221) | | (296,390) | | $ (42,831) |
| 3-Month New Zealand BBR FRA (Quarterly) | | 1.25% (Semiannually) | | 12/15/2022 | | NZD | | 3,850,000 | | (9,809) | | (4,266) | | (5,543) |
| 1-Day Brazil Cetip DI Interbank Deposit Rate (Upon termination) | | 7.20% (Upon termination) | | 1/2/2023 | | BRL | | 22,194,952 | | (154,134) | | 2,179 | | (156,313) |
| 1-Day Brazil Cetip DI Interbank Deposit Rate (Upon termination) | | 10.57% (Upon termination) | | 1/2/2023 | | BRL | | 1,667,474 | | (1,856) | | — | | (1,856) |
| 3-Month ASX BBSW (Quarterly) | | 0.19% (Quarterly) | | 2/22/2023 | | AUD | | 37,480,000 | | (88,175) | | (22,765) | | (65,410) |
| 11.81% (Upon termination) | | 1-Day Brazil Cetip DI Interbank Deposit Rate (Upon termination) | | 1/2/2024 | | BRL | | 966,875 | | (3,535) | | — | | (3,535) |
| 11.91% (Upon termination) | | 1-Day Brazil Cetip DI Interbank Deposit Rate (Upon termination) | | 1/2/2024 | | BRL | | 1,027,510 | | (3,872) | | — | | (3,872) |
| 12.19% (Upon termination) | | 1-Day Brazil Cetip DI Interbank Deposit Rate (Upon termination) | | 1/2/2024 | | BRL | | 1,315,204 | | (6,368) | | — | | (6,368) |
| 3-Month JIBAR (Quarterly) | | 5.65% (Quarterly) | | 3/16/2024 | | ZAR | | 53,805,000 | | (388) | | 4,588 | | (4,976) |
See Notes to Financial Statements.
| Pay Rate Index/Pay Rate | | Receive
Rate/Receive
Rate Index | | Maturity
Date | | Currency | | Notional
Amount | | Market Value | | Upfront
Premiums
Paid/
(Received) | | Unrealized
Appreciation
(Depreciation) |
| 6.25% (Quarterly) | | 1-Day COP-IBR-OIS (Quarterly) | | 3/16/2024 | | COP | | 8,120,328,748 | | $ (6,759) | | $ (642) | | $ (6,117) |
| 6-Month PRIBOR (Semiannually) | | 3.70% (Annually) | | 3/16/2024 | | CZK | | 44,850,000 | | (31,005) | | (14,662) | | (16,343) |
| 1-Month LIBOR + .09% (Quarterly) | | 3-Month LIBOR (Quarterly) | | 7/25/2024 | | USD | | 68,000,000 | | 18,481 | | 22,829 | | (4,348) |
| 1-Day ESTR (Annually) | | (0.30)% (Annually) | | 12/9/2024 | | EUR | | 21,210,000 | | (50,748) | | 5,860 | | (56,608) |
| 1.56% (Semiannually) | | 3-Month CDOR (Semiannually) | | 8/22/2025 | | CAD | | 21,350,000 | | (177,595) | | 9,989 | | (187,584) |
| 6-Month THBFIX (Semiannually) | | 1.00% (Semiannually) | | 9/15/2026 | | THB | | 80,505,000 | | (12,265) | | (1,421) | | (10,844) |
| 1.75% (Semiannually) | | 3-Month CDOR (Semiannually) | | 3/16/2027 | | CAD | | 8,880,000 | | 39,604 | | 56,655 | | (17,051) |
| 3-Month New Zealand BBR FRA (Quarterly) | | 2.75% (Semiannually) | | 3/16/2027 | | NZD | | 9,870,000 | | 40,102 | | 45,120 | | (5,018) |
| 3-Month STIBOR (Quarterly) | | 0.75% (Annually) | | 3/16/2027 | | SEK | | 62,390,000 | | 1,560 | | 41,496 | | (39,936) |
| 6-Month ASX BBSW (Semiannually) | | 1.25% (Semiannually) | | 3/16/2027 | | AUD | | 39,300,000 | | (690,483) | | (677,844) | | (12,639) |
| 6-Month THBFIX (Semiannually) | | 1.00% (Semiannually) | | 3/16/2027 | | THB | | 60,420,000 | | (22,202) | | (8,624) | | (13,578) |
| Swiss Average Overnight Rate (Annually) | | (0.25)% (Annually) | | 3/16/2027 | | CHF | | 1,110,000 | | (3,681) | | (2,201) | | (1,480) |
| 1-Day SONIA (Annually) | | 0.31% (Annually) | | 6/17/2030 | | GBP | | 10,000 | | (695) | | 307 | | (1,002) |
| 2.13% (Annually) | | 6-Month NIBOR (Semiannually) | | 5/11/2031 | | NOK | | 37,680,000 | | (34,306) | | (33,728) | | (578) |
| 1.75% (Quarterly) | | 3-Month KWCDC (Quarterly) | | 9/15/2031 | | KRW | | 3,258,080,000 | | 25,229 | | 44,166 | | (18,937) |
| 6-Month EURIBOR (Semiannually) | | 0.50% (Annually) | | 11/26/2031 | | EUR | | 23,600,000 | | (100,666) | | 170,782 | | (271,448) |
| 1-Day ESTR (Annually) | | 0.14% (Annually) | | 12/9/2031 | | EUR | | 8,330,000 | | (100,652) | | (2,455) | | (98,197) |
| 1.50% (Annually) | | 1-Day SOFR (Annually) | | 3/16/2032 | | USD | | 2,130,000 | | 30,889 | | 41,578 | | (10,689) |
| 2.00% (Semiannually) | | 3-Month CDOR (Semiannually) | | 3/16/2032 | | CAD | | 5,520,000 | | 2,118 | | 8,185 | | (6,067) |
| 3-Month STIBOR (Quarterly) | | 1.00% (Annually) | | 3/16/2032 | | SEK | | 43,330,000 | | 4,126 | | 76,312 | | (72,186) |
| 5.40% (Semiannually) | | 1-Day CLP-TNA (Semiannually) | | 3/16/2032 | | CLP | | 270,700,000 | | (733) | | (377) | | (356) |
| 6.60% (Quarterly) | | 1-Day COP-IBR-OIS (Quarterly) | | 3/16/2032 | | COP | | 4,683,740,000 | | (9,294) | | 1,315 | | (10,609) |
| 6-Month ASX BBSW (Semiannually) | | 2.00% (Semiannually) | | 3/16/2032 | | AUD | | 5,300,000 | | (13,644) | | 3,854 | | (17,498) |
| 6-Month EURIBOR (Semiannually) | | 0.25% (Annually) | | 3/16/2032 | | EUR | | 4,180,000 | | (36,891) | | 38,533 | | (75,424) |
| 6-Month NIBOR (Semiannually) | | 2.00% (Annually) | | 3/16/2032 | | NOK | | 9,400,000 | | 8,440 | | 28,140 | | (19,700) |
| 3-Month STIBOR (Quarterly) | | 1.00% (Annually) | | 3/17/2032 | | SEK | | 11,860,000 | | (15,427) | | (9,445) | | (5,982) |
| 6-Month EURIBOR (Semiannually) | | 0.50% (Annually) | | 3/17/2032 | | EUR | | 8,990,000 | | (54,623) | | 11,439 | | (66,062) |
| 3-Month CDOR (Semiannually) | | 2.10% (Semiannually) | | 12/18/2033 | | CAD | | 4,720,000 | | (15,279) | | 23,574 | | (38,853) |
| 1-Day SONIA (Annually) | | 0.40% (Annually) | | 6/17/2040 | | GBP | | 10,000 | | (1,105) | | 512 | | (1,617) |
| Subtotal Depreciation | | | | | | | | | | $(1,814,862) | | $(437,407) | | $(1,377,455) |
| Net Centrally Cleared Interest Rate Swaps outstanding at December 31, 2021 | | $ 802,791 | | $(258,574) | | $ 1,061,365 |
Total Return Basket Swap Agreements outstanding at December 31, 2021:
| Description | | Maturity
Date | | Counterparty | | Notional
Amount | | Market Value | | Upfront
Premiums
Paid/
(Received) | | Unrealized
Appreciation
(Depreciation) |
| The Fund receives the total return on a portfolio of long and short equity positions and pays or receives the USFFE or plus or minus a specified spread (-6.45% to 0.15%), which is denominated in USD based on the local currencies of the positions within the swap (Monthly).* | | 53-60 months maturity ranging from 05/26/2026 - 12/18/2026 | | GSC | | $176,323,405 | | $1,326,194 | | $— | | $1,326,194 |
| * The following table represents disclosures associated with the underlying components of the total return basket swap as of year end. |
| Common Stocks | | Shares | | Notional | | Unrealized
Appreciation
(Depreciation) | | Percentage of
Swap Value |
| Cerner Corporation | | 13,455 | | $1,249,566 | | $241,939 | | 18.24% |
| General Electric Co. | | (11,206) | | 1,058,631 | | 37,609 | | 2.84 |
See Notes to Financial Statements.
STRATEGIC ALTERNATIVES FUND
SCHEDULE OF INVESTMENTS (Continued)
| Common Stocks | | Shares | | Notional | | Unrealized
Appreciation
(Depreciation) | | Percentage of
Swap Value |
| Microsoft Corporation | | 3,027 | | $ 1,018,041 | | $ 9,631 | | 0.73% |
| Abbott Laboratories | | 7,031 | | 989,543 | | 57,617 | | 4.34 |
| Facebook, Inc. Class A | | 2,595 | | 872,828 | | 16,847 | | 1.27 |
| Charles Schwab Corporation (The) | | (8,941) | | 751,938 | | (30,784) | | (2.32) |
| American Express Co. | | (4,586) | | 750,270 | | 20,236 | | 1.53 |
| Crown Holdings, Inc. | | (6,677) | | 738,610 | | (45,294) | | (3.42) |
| Fortive Corporation | | (9,117) | | 695,536 | | (11,172) | | (0.84) |
| Westinghouse Air Brake Technologies Corporation | | (7,439) | | 685,206 | | (3,967) | | (0.30) |
| Boeing Co. (The) | | (3,330) | | 670,396 | | 20,746 | | 1.56 |
| Gentex Corporation | | 18,853 | | 657,027 | | (3,847) | | (0.29) |
| Nordson Corporation | | 2,531 | | 646,088 | | (26,526) | | (2.00) |
| Loews Corporation | | (10,970) | | 633,627 | | (12,317) | | (0.93) |
| Aramark | | (17,022) | | 627,261 | | (13,641) | | (1.03) |
| National Retail Properties, Inc. REIT | | 12,877 | | 618,997 | | 31,739 | | 2.39 |
| SYNNEX Corporation | | (5,316) | | 607,938 | | (35,332) | | (2.66) |
| Lockheed Martin Corporation | | 1,710 | | 607,751 | | 24,916 | | 1.88 |
| NXP Semiconductor NV | | 2,647 | | 602,934 | | 8,543 | | 0.64 |
| Universal Display Corporation | | 3,649 | | 602,194 | | 28,535 | | 2.15 |
| Old Dominion Freight Line, Inc. | | 1,659 | | 594,552 | | 6,353 | | 0.48 |
| EOG Resources, Inc. | | 6,684 | | 593,740 | | 12,821 | | 0.97 |
| American International Group, Inc. | | (10,385) | | 590,491 | | (24,614) | | (1.86) |
| Marvell Technology, Inc. | | (6,689) | | 585,221 | | 16,969 | | 1.28 |
| Public Service Enterprise Group, Inc. | | (8,768) | | 585,089 | | (30,703) | | (2.32) |
| NextEra Energy, Inc. | | (6,224) | | 581,073 | | (23,615) | | (1.78) |
| Hershey Co. (The) | | 2,997 | | 579,830 | | 32,517 | | 2.45 |
| Adobe, Inc. | | 1,019 | | 577,834 | | (66,829) | | (5.04) |
| Signature Bank | | (1,769) | | 572,218 | | (14,387) | | (1.08) |
| Ventas, Inc. REIT | | (11,068) | | 565,796 | | (20,144) | | (1.52) |
| Chemed Corporation | | 1,043 | | 551,789 | | 29,718 | | 2.24 |
| SEI Investments Co. | | 8,942 | | 544,925 | | 3,425 | | 0.26 |
| Regal Rexnord Corporation | | 3,152 | | 536,407 | | 23,013 | | 1.74 |
| 3M Co. | | 2,994 | | 531,824 | | 4,999 | | 0.38 |
| CMS Energy Corporation | | 8,038 | | 522,872 | | 23,253 | | 1.75 |
| Coupa Software, Inc. | | (3,237) | | 511,608 | | 10,277 | | 0.77 |
| PS Business Parks, Inc. REIT | | 2,774 | | 510,888 | | 36,649 | | 2.76 |
| Ross Stores, Inc. | | (4,446) | | 508,089 | | (9,114) | | (0.69) |
| Zoetis, Inc. | | 2,066 | | 504,166 | | 28,601 | | 2.16 |
| Gap, Inc. (The) | | (28,503) | | 503,078 | | (13,141) | | (0.99) |
| DuPont de Nemours, Inc. | | (6,227) | | 503,017 | | (13,337) | | (1.01) |
| Visa, Inc. Class A | | 2,291 | | 496,483 | | 12,132 | | 0.91 |
| Domino’s Pizza, Inc. | | 878 | | 495,482 | | 30,788 | | 2.32 |
| Alphabet, Inc. Class A | | 171 | | 495,394 | | (9,588) | | (0.72) |
| Sirius XM Holdings, Inc. | | 76,157 | | 483,597 | | 14,416 | | 1.09 |
| BorgWarner, Inc. | | (10,719) | | 483,105 | | 10,447 | | 0.79 |
| Wells Fargo & Co. | | 10,026 | | 481,047 | | (17,202) | | (1.30) |
| Ingersoll-Rand, Inc. | | (7,771) | | 480,792 | | (15,330) | | (1.16) |
| International Flavors & Fragrances, Inc. | | (3,176) | | 478,464 | | (12,586) | | (0.95) |
| LPL Financial Holdings, Inc. | | (2,978) | | 476,748 | | 3,795 | | 0.29 |
| Other | | (553,189) | | 145,313,404 | | 981,133 | | 74.00 |
| | | | | $176,323,405 | | $1,326,194 | | 100.00% |
See Notes to Financial Statements.
VALUATION HIERARCHY
The following is a summary of the inputs used, as of December 31, 2021, in valuing the Fund’s investments carried at fair value:
| | Total
Value | | Level 1
Quoted Prices | | Level 2
Other Significant
Observable Inputs | | Level 3
Significant
Unobservable Inputs |
| Assets: | | | | | | | |
| Investments in Securities: | | | | | | | |
| Common Stocks: | | | | | | | |
| Communication Services | $ 19,803 | | $ — | | $ — | | $ 19,803 |
| Other ^^ | 22,745,460 | | 22,745,460 | | — | | — |
| Total Common Stocks | 22,765,263 | | 22,745,460 | | — | | 19,803 |
| Corporate Bonds | 50,413,370 | | — | | 50,413,370 | | — |
| Foreign Bonds | 1,279,244 | | — | | 1,279,244 | | — |
| Foreign Common Stocks | 424,141 | | 424,141 | | — | | — |
| Foreign Preferred Stocks | 575,397 | | 575,397 | | — | | — |
| Money Market Funds | 133,696,297 | | 133,696,297 | | — | | — |
| Mortgage-Backed Securities | 3,613,264 | | — | | 3,613,264 | | — |
| Mutual Funds | 271,942 | | 271,942 | | — | | — |
| Preferred Stocks: | | | | | | | |
| Consumer Staples | 443,590 | | 443,590 | | — | | — |
| Financials | 4,835,423 | | 3,560,263 | | 1,275,160 | | — |
| Other ^^ | 1,131,323 | | — | | 1,131,323 | | — |
| Total Preferred Stocks | 6,410,336 | | 4,003,853 | | 2,406,483 | | — |
| Purchased Options: | | | | | | | |
| Call Swaptions | 16,785 | | 16,785 | | — | | — |
| Put Swaption | 15,092 | | 15,092 | | — | | — |
| Total Purchased Options | 31,877 | | 31,877 | | — | | — |
| Rights | 7,010 | | — | | — | | 7,010 |
| U.S. Treasury Obligations | 101,973,684 | | — | | 101,973,684 | | — |
| Total Assets - Investments in Securities | $321,461,825 | | $161,748,967 | | $159,686,045 | | $ 26,813 |
| Other Financial Instruments*** | | | | | | | |
| Forward Foreign Currency Contracts | $ 1,108,177 | | $ — | | $ 1,108,177 | | $ — |
| Futures Contracts | 826,168 | | 826,168 | | — | | — |
| Swap Agreements | 3,765,014 | | — | | 3,765,014 | | — |
| Total Assets - Other Financial Instruments | $ 5,699,359 | | $ 826,168 | | $ 4,873,191 | | $ — |
See Notes to Financial Statements.
STRATEGIC ALTERNATIVES FUND
SCHEDULE OF INVESTMENTS (Continued)
| | Total
Value | | Level 1
Quoted Prices | | Level 2
Other Significant
Observable Inputs | | Level 3
Significant
Unobservable Inputs |
| Liabilities: | | | | | | | |
| Investments in Securities: | | | | | | | |
| Common Stocks Sold Short | $(17,688,182) | | $(17,688,182) | | $ — | | $ — |
| Foreign Common Stocks Sold Short | (608,981) | | (608,981) | | — | | — |
| Written Options: | | | | | | | |
| Call Options | (69,080) | | (69,080) | | — | | — |
| Call Swaptions | (383,494) | | (383,494) | | — | | — |
| Put Swaptions | (597,792) | | (597,792) | | — | | — |
| Total Written Options | (1,050,366) | | (1,050,366) | | — | | — |
| Total Liabilities - Investments in Securities | $(19,347,529) | | $(19,347,529) | | $ — | | $ — |
| Other Financial Instruments*** | | | | | | | |
| Forward Foreign Currency Contracts | $ (865,136) | | $ — | | $ (865,136) | | $ — |
| Futures Contracts | (1,060,746) | | (1,060,746) | | — | | — |
| Swap Agreements | (1,377,455) | | — | | (1,377,455) | | — |
| Total Liabilities - Other Financial Instruments | $ (3,303,337) | | $ (1,060,746) | | $(2,242,591) | | $ — |
| ^^ | Classifications as defined in the Schedule of Investments. |
| *** | Other financial instruments are derivative instruments, such as futures contracts, forward contracts and swap agreements, which are valued at the unrealized appreciation (depreciation) on the investment. Further details regarding the value of these investments can be found in the preceding "Futures Contracts outstanding", "Forward Foreign Currency Contracts outstanding" and "Swap Agreements outstanding" disclosures. |
There were no transfers to or from Level 3 during the year ended December 31, 2021.
Management has determined that the amount of Level 3 securities compared to total net assets is not material; therefore, the reconciliation of Level 3 securities and assumptions is not shown for the year ended December 31, 2021.
See Notes to Financial Statements.
| STATEMENTS OF ASSETS AND LIABILITIES | December 31, 2021 |
| | Strategic Alternatives Fund |
| Assets | |
| Investments in securities of unaffiliated issuers, at value | $308,272,865 |
| Investments in securities of affiliated issuers, at value | 13,188,960 |
| Total investments, at value(1) | 321,461,825 |
| Cash | 18,688,431 |
| Cash collateral for derivatives | 14,342,701 |
| Deposits with broker for futures contracts | 10,218,858 |
| Foreign currency(2) | 4,513 |
| Upfront premiums paid from swap agreements | 1,453,096 |
| Receivables: | |
| Dividends and reclaims | 50,549 |
| Interest | 295,071 |
| Investment securities sold | 140,928 |
| Fund shares sold | 8,621,145 |
| Variation margin on centrally cleared swaps | 144,067 |
| Unrealized appreciation on foreign currency exchange contracts | 1,108,177 |
| Unrealized appreciation on swap agreements | 1,326,194 |
| Prepaid expenses and other assets | 1,967 |
| Total Assets | 377,857,522 |
| Liabilities | |
| Securities sold short, at value(3) | 18,297,163 |
| Options written, at value(4) | 1,050,366 |
| Upfront premiums received from swap agreements | 1,711,670 |
| Unrealized depreciation on foreign currency exchange contracts | 865,136 |
| Collateral from counterparty | 2,717,192 |
| Payables: | |
| Investment securities purchased | 887,621 |
| Dividends on short sales | 2,870 |
| Fund shares redeemed | 4,727 |
| Variation margin on futures contracts | 303,840 |
| Accrued expenses: | |
| Investment advisory fees | 163,361 |
| Shareholder servicing fees | 8,227 |
| Trustee fees | 227 |
| Other expenses | 164,610 |
| Total Liabilities | 26,177,010 |
| Net Assets | $351,680,512 |
| Net Assets Consist of: | |
| Paid-in-capital | $344,373,219 |
| Distributable earnings (loss) | 7,307,293 |
| Net Assets | $351,680,512 |
| Net Asset Value: | |
| $0.001 par value, unlimited shares authorized | |
| Net assets applicable to the Institutional Class | $312,466,033 |
| Institutional shares outstanding | 30,378,863 |
| Net asset value, offering and redemption price per Institutional share | $ 10.29 |
| Net assets applicable to the Investor Class | $ 39,214,479 |
| Investor shares outstanding | 3,833,362 |
| Net asset value, offering and redemption price per Investor share | $ 10.23 |
| |
| (1)Investments in securities of unaffiliated issuers, at cost | $306,940,335 |
| Investments in securities of affiliated issuers, at cost | 13,188,960 |
| Total investments, at cost | $320,129,295 |
| (2)Foreign currency, at cost | $ 4,513 |
| (3)Proceeds from securities sold short | $ 18,561,866 |
| (3)Premiums received on options written | $ 1,199,864 |
See Notes to Financial Statements.
| STATEMENTS OF OPERATIONS | For the Year Ended December 31, 2021 |
| | Strategic Alternatives Fund |
| Investment Income | |
| Dividends | $ 412,725 |
| Income distributions received from affiliated funds | 1,063 |
| Interest | 1,679,942 |
| Less foreign taxes withheld | (1,281) |
| Total Investment Income | 2,092,449 |
| Expenses | |
| Investment advisory fees | 3,007,309 |
| Transfer agent fees: | |
| Institutional shares | 4,482 |
| Investor shares | 14,102 |
| Custodian fees | 453,614 |
| Shareholder servicing fees: | |
| Investor shares | 94,878 |
| Accounting and administration fees | 52,893 |
| Professional fees | 129,930 |
| Shareholder reporting fees: | |
| Institutional shares | 2,744 |
| Investor shares | 10,136 |
| Trustees expenses | 1,672 |
| Line of credit facility fees | 1,978 |
| Dividends on securities sold short | 131,561 |
| Other expenses | 99,866 |
| Total Expenses | 4,005,165 |
| Expenses waived/reimbursed | (289,263) |
| Net Expenses | 3,715,902 |
| Net Investment Loss | (1,623,453) |
| Realized and Unrealized Gain (Loss) | |
| Net realized gain (loss) from: | |
| Investment securities | 2,653,009 |
| Investment securities sold short | 209,451 |
| Futures transactions | 6,536,350 |
| Swap agreements | 4,676,945 |
| Option contracts written | 2,262,224 |
| Option contracts purchased | (114,642) |
| Forward foreign currency contracts | 109,941 |
| Non-deliverable bond forward contracts | (133,950) |
| Foreign currency | 266,263 |
| Net realized gain | 16,465,591 |
| Net change in unrealized appreciation (depreciation) on: | |
| Investment securities | (1,401,025) |
| Investment securities sold short | 264,703 |
| Futures | 114,093 |
| Swap agreements | 2,127,582 |
| Option contracts written | (42,942) |
| Option contracts purchased | (83,431) |
| Forward foreign currency contracts | 185,699 |
| Non-deliverable bond forward contracts | (29,258) |
| Foreign currency | (1,387) |
| Net change in unrealized appreciation (depreciation) | 1,134,034 |
| Net Realized and Unrealized Gain | 17,599,625 |
| Net Increase in Net Assets Resulting from Operations | $15,976,172 |
See Notes to Financial Statements.
| STATEMENTS OF CHANGES IN NET ASSETS |
| | Strategic Alternatives Fund |
| | For the Year Ended |
| | 12/31/21 | | 12/31/20 |
| | | | |
| Operations: | | | |
| Net investment income (loss) | $ (1,623,453) | | $ 2,905,432 |
| Net realized gain (loss) on investment securities, foreign currency and derivatives | 16,465,591 | | (3,833,145) |
| Net change in unrealized appreciation (depreciation) on investment securities, foreign currency and derivatives | 1,134,034 | | (533,047) |
| Net increase (decrease) in net assets resulting from operations | 15,976,172 | | (1,460,760) |
| Distributions to Shareholders: | | | |
| Institutional shares | (4,703,936) | | (4,362,601) |
| Investor shares | (537,123) | | (710,735) |
| Total distributions | (5,241,059) | | (5,073,336) |
| Capital Share Transactions: | | | |
| Proceeds from shares sold | | | |
| Institutional shares | 49,942,634 | | 34,762,066 |
| Investor shares | 7,143,417 | | 13,672,247 |
| Reinvestment of dividends and distributions | | | |
| Institutional shares | 4,701,917 | | 4,362,239 |
| Investor shares | 536,950 | | 710,466 |
| Total proceeds from shares sold and reinvested | 62,324,918 | | 53,507,018 |
| Value of shares redeemed | | | |
| Institutional shares | (38,806,306) | | (76,935,331) |
| Investor shares | (15,350,178) | | (23,353,274) |
| Total value of shares redeemed | (54,156,484) | | (100,288,605) |
| Net increase (decrease) from capital share transactions(1) | 8,168,434 | | (46,781,587) |
| Total increase (decrease) in net assets | 18,903,547 | | (53,315,683) |
| Net Assets: | | | |
| Beginning of Year | 332,776,965 | | 386,092,648 |
| End of Year | $351,680,512 | | $ 332,776,965 |
| |
| (1) | See Note 6 in Notes to Financial Statements. |
See Notes to Financial Statements.
| For a Share Outstanding For the Years Ending December 31, unless otherwise indicated | | | | | | Ratios to Average Net Assets | |
| | Net Asset
Value,
Beginning
of Year | Net Investment
Income/ (Loss)# | Realized
and
Unrealized
Gain
(Loss) on
Investments | Total Income
From Investment
Operations | Dividends
from Net
Investment
Income | Distributions
from Net
Realized
Capital
Gains | Total
Distributions
Paid | Net Asset
Value,
End of
Year | Total
Return | Net Assets,
End of Year
(000) | Expenses,
Net | Expenses,
Gross | Investment
Income/
(Loss),
Net | Portfolio
Turnover
Rate |
| Strategic Alternatives Fund |
| Institutional Class |
| 2021 | $ 9.96 | $(0.05) | $ 0.54 | $ 0.49 | $(0.02) | $(0.14) | $(0.16) | $10.29 | 4.96% | $312,466 | 1.09%(1) | 1.17%(1) | (0.46)% | 377% |
| 2020 | 10.13 | 0.08 | (0.10) | (0.02) | (0.14) | (0.01) | (0.15) | 9.96 | (0.20) | 287,088 | 1.10(1) | 1.10(1) | 0.82 | 483 |
| 2019 | 9.87 | 0.13 | 0.36 | 0.49 | (0.19) | (0.04) | (0.23) | 10.13 | 4.93 | 330,017 | 1.12(1) | 1.12(1) | 1.32 | 364 |
| 2018 | 10.07 | 0.20 | (0.19) | 0.01 | (0.18) | (0.03) | (0.21) | 9.87 | 0.15 | 320,404 | 1.01(1) | 1.02(1) | 1.96 | 172 |
| 2017(2) | 10.00 | 0.04 | 0.10 | 0.14 | (0.05) | (0.02) | (0.07) | 10.07 | 1.40 | 302,592 | 1.26(1) | 1.28(1) | 0.69 | 88 |
| Investor Class |
| 2021 | $ 9.92 | $(0.08) | $ 0.53 | $ 0.45 | $ — | $(0.14) | $(0.14) | $10.23 | 4.57% | $ 39,214 | 1.41%(1) | 1.52%(1) | (0.76)% | 377% |
| 2020 | 10.13 | 0.06 | (0.11) | (0.05) | (0.15) | (0.01) | (0.16) | 9.92 | (0.51) | 45,689 | 1.36(1) | 1.36(1) | 0.59 | 483 |
| 2019 | 9.87 | 0.10 | 0.36 | 0.46 | (0.16) | (0.04) | (0.20) | 10.13 | 4.62 | 56,076 | 1.46(1) | 1.46(1) | 0.99 | 364 |
| 2018 | 10.07 | 0.17 | (0.19) | (0.02) | (0.15) | (0.03) | (0.18) | 9.87 | (0.17) | 66,652 | 1.36(1) | 1.37(1) | 1.65 | 172 |
| 2017(2) | 10.00 | 0.01 | 0.12 | 0.13 | (0.04) | (0.02) | (0.06) | 10.07 | 1.31 | 58,599 | 1.63(1) | 1.65(1) | 0.25 | 88 |
| | | | | | | | | | | | | | | |
| # | Calculated using the average shares outstanding method. |
| (1) | The ratio for the Strategic Alternatives Fund includes the effect of dividend expense on securities sold short which increased the ratio by 0.11%, 0.14%, 0.10%, 0.11% and 0.04% for the period ended December 31, 2017 and for the years 2018, 2019, 2020 and 2021. |
| (2) | Inception date was June 30, 2017. All ratios for the period have been annualized with the exception of total return and portfolio turnover which have not been annualized. |
See Notes to Financial Statements.
NOTES TO FINANCIAL STATEMENTS
1. DESCRIPTION OF THE FUNDS
GuideStone Funds (the “Trust”) was organized as a Delaware statutory trust on March 2, 2000. The Trust has established 24 series (each, a “Fund” and together, the “Funds”). Each Fund is a diversified, open-end management investment company, registered under the Investment Company Act of 1940, as amended (the “1940 Act”).
The MyDestination 2015 Fund, MyDestination 2025 Fund, MyDestination 2035 Fund, MyDestination 2045 Fund and MyDestination 2055 Fund are each referred to as a “Target Date Fund” and together as the “Target Date Funds.”
The Conservative Allocation Fund, Balanced Allocation Fund, Growth Allocation Fund and Aggressive Allocation Fund are each referred to as a “Target Risk Fund” and together as the “Target Risk Funds.”
The remaining Funds are each referred to as a “Select Fund” and are together referred to as the “Select Funds.” The Money Market Fund is referred to as the “Money Market Fund.” The Low-Duration Bond Fund, Medium-Duration Bond Fund and Global Bond Fund are together referred to as the “Fixed Income Funds.”
The Defensive Market Strategies® Fund, Equity Index Fund, Value Equity Fund, Growth Equity Fund, Small Cap Equity Fund, International Equity Index Fund, International Equity Fund and Emerging Markets Equity Fund are together referred to as the “Equity Funds.”
The Global Impact Fund commenced operations on January 29, 2021, and is referred to as the "Impact Fund."
The Global Real Estate Securities Fund is referred to as the “Real Assets Fund.”
The Strategic Alternatives Fund is referred to as the “Strategic Alternatives Fund.”
There are two classes of shares issued by the Funds — the Institutional Class and the Investor Class (each, a “Class” and together the “Classes”). The International Equity Index Fund issues the Institutional Class only. All Classes of shares have identical voting, dividend and liquidation rights. Income, expenses (other than class specific expenses) and realized and unrealized gains or losses on investments are allocated to each Class of shares based upon its relative net assets.
Each Fund is a separate mutual fund with its own investment objective, strategies and risks. The Select Funds invest directly in particular types of fixed-income obligations, stocks and other investments. The Target Date and Target Risk Funds primarily invest in a different mix of the Select Funds to meet a specified investment strategy. The Target Date and Target Risk Funds are commonly referred to as “Fund of Funds.”
2. SUMMARY OF SIGNIFICANT ACCOUNTING POLICIES
The following is a summary of significant accounting policies followed by the Funds in the accounting and the preparation of their financial statements. The Funds are investment companies and follow accounting and reporting guidance in the Financial Accounting Standards Board ("FASB") Accounting Standards Codification Topic 946 (“ASC 946”). The policies are in conformity with accounting principles generally accepted in the United States of America (“U.S. GAAP”), including but not limited to ASC 946. The preparation of financial statements requires the Funds’ management to make estimates and assumptions that affect the reported amounts of assets and liabilities, the disclosure of contingent assets and liabilities at the date of the financial statements, and the reported amounts of income and expenses for the period. The Funds utilize various methods to measure the value of their investments on a recurring basis. Amounts received upon the sale of such investments could differ from estimated values and those differences could be significant.
a. Valuation of Securities
Each Fund, except the Money Market Fund, values securities traded on national securities exchanges or included in national market systems at the last quoted sale price, or official close price, on the principal exchange on which they were traded, or, in the absence of any sale or official close price, at the closing bid price. Non-exchange traded securities for which an over-the-counter quotation is readily available are valued at the last quoted bid price.
Debt securities, excluding asset-backed and mortgage-backed securities, are valued at the mean of the last bid and ask prices available, which approximates fair value. Asset-backed and mortgage-backed securities are generally valued at the last bid price, if available.
Short-term securities maturing in more than 60 days from the valuation date are valued at the mean of the last bid and ask prices; those maturing in 60 days or less are generally valued at amortized cost which approximates current market value.
Forward foreign currency contracts are valued based upon closing exchange rates from each respective foreign market.
Futures contracts are valued at the closing settlement price on the exchange on which they are primarily traded.
Options, rights and warrants for which the primary market is a national securities exchange are valued at the last sale price on the exchange on which they are traded, or, in the absence of any sale, at the closing bid price. Options, rights and warrants not traded on a national securities exchange are valued at the last quoted bid price.
Swap agreements are valued daily based upon the terms specific to each agreement with its counterparty. (Please see Note 2.i., “Derivative Financial Instruments” for additional information regarding the valuation of swap agreements).
Non-deliverable bond forward contracts are valued daily based upon the terms specific to each agreement with its counterparty. (Please see Note 2.i., “Derivative Financial Instruments” for additional information regarding the valuation of non-deliverable bond forward contracts).
To the extent available, valuations of portfolio securities are provided by independent pricing services approved by the Board of Trustees. Securities for which market quotations are not readily available are valued at fair value according to methods established in good faith by the Board of Trustees. Due to the potential excessive volatility at the time valuations are developed, pricing may materially vary from the actual amounts realized upon sale of the securities.
For securities that principally trade on a foreign market or exchange, a significant gap in time can exist between the time of a particular security’s last trade and the time at which a Fund calculates its Net Asset Value (“NAV”). The closing prices of such securities may no longer reflect their market value at the time the Fund calculates its NAV if an event that could materially affect the value of those securities (a “Significant Event”) has occurred between the time of the security’s last close and the time that the Fund calculates its NAV. A Significant Event may relate to a single issuer or to an entire market sector. If management becomes aware of a Significant Event that has occurred with respect to a security or group of securities after the closing of the exchange or market on which the security or securities principally trade, but before the time at which the Fund calculates its NAV, a Valuation Committee meeting may be called. The Funds use Intercontinental Exchange (“ICE”) as a third party fair valuation vendor. ICE provides a fair value for foreign equity securities held by the Funds based on certain factors and methodologies applied by ICE in the event that there is movement in the U.S. market that exceeds a specific threshold established by the Valuation Committee in consultation with, and approved by, the Board of Trustees. Such methodologies generally involve tracking valuation correlations between the U.S. market and each non-U.S. security. As part of the valuation procedures, a “confidence interval” is used, when the threshold is exceeded, to determine the level of correlation between the value of a foreign equity security and movements in the U.S. market before a particular security will be fair valued. In the event that the threshold established by the valuation procedures is exceeded on a specific day, the Funds will typically value non-U.S. equity securities in its portfolio that exceed the applicable confidence interval based upon the fair values provided by ICE.
Each Fund values their investments in underlying Funds daily at the closing NAV of each respective Fund.
The Financial Accounting Standards Board’s “Fair Value Measurements and Disclosures” defines fair value as the price that a fund would receive to sell an asset or pay to transfer a liability in an orderly transaction between market participants at the measurement date. It establishes and requires disclosure of a fair value hierarchy, separately for each major category of assets and liabilities, that segregates fair value measurements into levels (Levels 1, 2, and 3). Categorizations of fair value measurements, and the criteria used to determine each categorization, are as follows:
Level 1 – quoted prices in active markets for identical securities
Level 2 – prices determined using other significant observable inputs (including quoted prices for similar securities, interest rates, prepayment speeds, credit risk, etc.)
Level 3 – prices determined using significant unobservable inputs (including the valuation committee’s own assumptions in determining the fair value of investments)
Valuation levels are not necessarily an indication of the risk associated with investing in those securities. Changes in valuation techniques may result in transfers into or out of an assigned level within the disclosure hierarchy. In accordance with the requirements of U.S. GAAP, the amounts of transfers in and out of level 3, if material, are disclosed in the Note to Schedule of Investments for each respective fund.
b. Fixed Income Securities
The Fixed Income Funds, the Impact Fund and the Strategic Alternatives Fund may invest in mortgage-related and other asset-backed securities. These securities include mortgage pass-through securities, collateralized mortgage obligations, commercial mortgage-backed securities, stripped mortgage-backed securities, asset-backed securities, collateralized debt obligations and/or other securities that directly or indirectly represent a participation in, or are secured by and payable from, mortgage loans on real property. Mortgage-related and other asset-backed securities are interests in pools of loans or other receivables. Mortgage-related securities are created from pools of residential or commercial mortgage loans, including mortgage loans made by savings and loan institutions, mortgage bankers, commercial banks and others. Asset-backed securities are created from many types of assets, including auto loans, credit card receivables, home equity loans and student loans. These securities provide a monthly payment which consists of both interest and principal payments. Interest payments may be determined by fixed or adjustable rates. The rate of pre-payments on underlying mortgages will affect the price and volatility of a mortgage-related security and may have the effect of shortening or extending the effective duration of the security relative to what was anticipated at the time of purchase. The timely payment of principal and interest of certain mortgage-related securities is guaranteed with the full faith and credit of the U.S. government. Pools created and guaranteed by non-governmental issuers, including government-sponsored corporations, may be supported by various forms of insurance or guarantees, but there can be no assurance that the private insurers or guarantors can meet their obligations under the insurance policies or guarantee arrangements.
Collateralized Mortgage Obligations (“CMOs”) are debt obligations of a legal entity that are collateralized by mortgages and divided into classes. CMOs are structured into multiple classes, often referred to as “tranches,” with each class bearing a different stated maturity and entitled to a different schedule for payments of principal and interest, including pre-payments. Commercial Mortgage-Backed Securities (“CMBS”) include securities that reflect an interest in, and are secured by, mortgage loans on commercial real property. Many of the risks of investing in CMBS reflect the risks of investing in the real estate securing the underlying mortgage loans. These risks reflect the effects of local and other economic conditions on real estate markets, the ability
of tenants to make loan payments and the ability of a property to attract and retain tenants. CMOs and CMBS may be less liquid and may exhibit greater price volatility than other types of mortgage- or asset-backed securities.
Stripped Mortgage-Backed Securities (“SMBS”) are derivative multi-class mortgage securities. SMBS are usually structured with two classes that receive different proportions of the interest and principal distributions on a pool of mortgage assets. A common type of SMBS will have one class receiving some of the interest and most of the principal from the mortgage assets, while the other class will receive most of the interest and the remainder of the principal. In the most extreme case, one class will receive all of the interest (the interest-only or “IO” class), while the other class will receive the entire principal (the principal-only or “PO” class). Payments received for IOs are included in interest income on the Statements of Operations. Because little to no principal will be received at the maturity of an IO, adjustments are made to the book value of the security on a monthly basis until maturity. These adjustments are included in interest income on the Statements of Operations. Payments received for POs are treated as reductions to the cost and par value of the securities.
Inflation-indexed bonds are fixed-income securities whose principal value is periodically adjusted to the rate of inflation. The interest rate on these bonds is generally fixed at issuance at a rate lower than typical bonds. Over the life of an inflation-indexed bond, however, interest will be paid based on a principal value, which is adjusted for inflation. Any increase or decrease in the principal amount of an inflation-indexed bond will be included as interest income on the Statements of Operations, even though investors do not receive their principal until maturity.
“TBA” (to be announced) commitments are commitments to purchase or sell mortgage-backed securities for a fixed price at a future date, typically not exceeding 45 days. TBAs may be considered securities in themselves and involve a risk of loss if the value of the security to be purchased declines prior to settlement date. This risk is in addition to the risk of decline in each Fund’s other assets. Unsettled TBAs are valued at the current market value of the underlying securities, according to the procedures described in the section entitled “Valuation of Securities.”
The Fixed Income Funds may enter into dollar roll transactions, pursuant to which they sell a mortgage-backed TBA or security and simultaneously purchase a similar, but not identical, TBA with the same issuer, rate and terms. The Funds may execute a “roll” to obtain better underlying mortgage securities or to increase yield. The Funds account for dollar roll transactions as purchases and sales, which has the effect of increasing their portfolio turnover rates. Risks associated with dollar rolls are that actual mortgages received by the Funds may be less favorable than those anticipated or that counterparties may fail to perform under the terms of the contracts.
U.S. government securities are obligations of and, in certain cases, guaranteed by, the U.S. government, its agencies or instrumentalities. The U.S. government does not guarantee the NAV of the Funds’ shares. Some U.S. government securities, such as Treasury bills, notes and bonds and securities guaranteed by the Government National Mortgage Association (“GNMA” or “Ginnie Mae”), are supported by the full faith and credit of the U.S. government; others, such as those of the Federal Home Loan Bank, are supported by the right of the issuer to borrow from the U.S. Department of the Treasury (the “U.S. Treasury”); others, such as those of the Federal National Mortgage Association (“FNMA” or “Fannie Mae”), are supported by the discretionary authority of the U.S. government to purchase the agency’s obligations; and still others, such as those of the Student Loan Marketing Association, are supported only by the credit of the instrumentality. U.S. government securities may include zero coupon securities, which do not distribute interest on a current basis and tend to be subject to greater risk than interest-paying securities of similar maturities.
Government-related guarantors (i.e., not backed by the full faith and credit of the U.S. government) include FNMA and the Federal Home Loan Mortgage Corporation (“FHLMC” or “Freddie Mac”). FNMA is a government-sponsored corporation, the common stock of which is owned entirely by private stockholders. FNMA purchases conventional (i.e., not insured or guaranteed by any government agency) residential mortgages from a list of approved seller/servicers which include state and federally chartered savings and loan associations, mutual savings banks, commercial banks and credit unions and mortgage bankers.
Pass-through securities issued by FNMA are guaranteed as to timely payment of principal and interest by FNMA, but are not backed by the full faith and credit of the U.S. government. FHLMC issues Participation Certificates (“PCs”), which are pass-through securities, each representing an undivided interest in a pool of residential mortgages. FHLMC guarantees the timely payment of interest and ultimate collection of principal, but PCs are not backed by the full faith and credit of the U.S. government.
c. Foreign Currency Translations
Investment securities and other assets and liabilities denominated in foreign currencies are translated into U.S. dollar amounts at the date of valuation. Purchases and sales of investment securities and income and expense items denominated in foreign currencies are translated into U.S. dollar amounts on the respective dates of such transactions.
The Funds isolate that portion of the results of operations resulting from changes in foreign exchange rates on investments from the fluctuations arising from changes in market prices of securities held.
Reported net realized foreign exchange gains or losses arise from sales of portfolio securities, sales and maturities of short-term securities, sales of foreign currencies, currency gains or losses realized between the trade and settlement dates on securities transactions and the difference between the amounts of dividends, interest, and foreign withholding taxes recorded on the Fund’s books and the U.S. dollar equivalent of the amounts actually received or paid. Net unrealized foreign exchange gains and losses arise from changes in the values of assets and liabilities, including investments in securities at fiscal year-end, resulting from changes in the exchange rate.
d. Loan Participations
The Fixed Income Funds, Defensive Market Strategies® Fund, Strategic Alternatives Fund, and Impact Fund may invest in direct debt instruments which are interests in amounts owed to lenders or lending syndicates by corporate borrowers. Investments in loans may be in the form of participations in loans. A loan is often administered by a bank or other financial institution (the “lender”) that acts as agent for all holders. The agent administers the terms of the loan, as specified in the loan agreement. The holder may invest in multiple series of a loan, which may have varying terms and carry different associated risks. The holder generally has no right to enforce compliance with the terms of the loan agreement with the borrower. As a result, these instruments may be subject to the credit risk of both the borrower and the lender that is selling the loan agreement. When investing in a loan participation, the holder has the right to receive payments of principal, interest and any fees to which it is entitled only from the lender selling the loan agreement and only upon receipt of payments by the lender from the borrower.
The Fixed Income Funds, Defensive Market Strategies® Fund, Strategic Alternatives Fund and Impact Fund may invest in floating rate loans, some of which may be unfunded corporate loan commitments (“commitments”). Commitments may obligate the holder to furnish temporary financing to a borrower until permanent financing can be arranged. The holder may receive a commitment fee based on the undrawn portion of the underlying line of credit portion of a floating rate loan. In certain circumstances, the holder may receive a prepayment penalty fee upon the prepayment of a floating rate loan by a borrower. Fees earned or paid are recorded as a component of interest income or interest expense on the Statements of Operations.
e. REITs
The Fixed Income Funds, Real Assets Fund, the Impact Fund and the Equity Funds may invest in real estate investment trusts (“REITs”) that involve risks not associated with investing in stocks. Risks include declines in the value of real estate, general and economic conditions, changes in the value of the underlying property and defaults by borrowers. The value of assets in the real estate industry may go through cycles of relative underperformance and outperformance in comparison to equity securities markets in general.
Dividend income from REITs is recorded using management’s estimate of the income included in distributions received from REIT investments. The actual amounts of income, return of capital and capital gains are only determined by each REIT after its fiscal year-end and may differ from the estimated amount. Estimates of income are adjusted in the Funds to the actual amounts when the amounts are determined.
f. Repurchase Agreements
Each Fund may agree to purchase securities from financial institutions subject to the seller’s agreement to repurchase them at a mutually agreed upon date and price. It is the Fund’s policy that repurchase agreements are fully collateralized by U.S. Treasury and Government Agency securities, or by other securities sufficiently guaranteed and liquid in accordance with Rule 5b-3 under the 1940 Act. Any repurchase agreement entered into by a Fund will be collateralized by at least 100% of the repurchase price (including accrued interest) for repurchase agreements collateralized by U.S. Government securities or cash, and at least 102% of the repurchase price (including accrued interest) for other types of collateral. All collateral is held by the Fund’s custodian bank or a bank with which the custodian bank has entered into a subcustodian agreement, or is segregated in the Federal Reserve Book Entry System. In connection with transactions in repurchase agreements, if the seller defaults and the value of the collateral declines, or if the seller enters an insolvency proceeding, realization of the collateral by the Fund may be delayed or limited.
Repurchase transactions are entered into by the Funds under Master Repurchase Agreements (“MRA”) which permit the Funds, under certain circumstances including an event of default (such as bankruptcy or insolvency), to offset payables and/or receivables under the MRA with collateral held and/or posted to the counterparty and create one single net payment due to or from the Fund.
At December 31, 2021, the open repurchase agreements by counterparty which are subject to an MRA on a net payment basis are as follows:
| Fund/Counterparty | | Repurchase
Agreements | | Fair Value of
Non-cash
Collateral
Received(1) | | Cash
Collateral
Received | | Net Amount(2) |
| Money Market | | | | | | | | |
| Bank of Nova Scotia | | $ 65,000,000 | | $ (65,000,000) | | $ — | | $ — |
| BNP Paribas | | 68,000,000 | | (68,000,000) | | — | | — |
| Citigroup Global Markets, Inc. | | 58,000,000 | | (58,000,000) | | — | | — |
| Goldman Sachs & Co. | | 50,000,000 | | (50,000,000) | | — | | — |
| Mitsubishi UFJ Securities USA, Inc. | | 70,000,000 | | (70,000,000) | | — | | — |
| Mizuho Securities USA, Inc. | | 65,000,000 | | (65,000,000) | | — | | — |
| Natixis S.A. | | 70,000,000 | | (70,000,000) | | — | | — |
| TD Securities USA LLC | | 50,000,000 | | (50,000,000) | | — | | — |
| Total Repurchase Agreements | | $ 496,000,000 | | $ (496,000,000) | | $ — | | $ — |
| Medium-Duration Bond | | | | | | | | |
| Deutsche Bank Securities, Inc. | | $ 166,900,000 | | $ (166,900,000) | | $ — | | $ — |
(1) The value of the related collateral received exceeded the value of the repurchase agreement as of December 31, 2021.
(2) Net amount represents the net amount of receivable due from (payable to) the counterparty in the event of a default.
Additional information about netting arrangements under the Master Agreements can be found in the Derivative Financial Instruments and Securities Lending sections of the Notes to Financial Statements.
g. Short Sales
A short sale is a transaction in which a Fund sells a security it does not own. The Fund’s obligation to replace the security borrowed and sold short will be collateralized by cash equivalents maintained in a segregated account with the broker. Cash deposited with the broker is recorded as an asset on the Statements of Assets and Liabilities. If the price of the security sold short
increases between the time of the short sale and the time the Fund replaces the borrowed security, the Fund will realize a loss; and if the price declines during the period, the Fund will realize a gain. Any realized gain will be decreased, and any realized loss increased, by the amount of transaction costs.
The Fixed Income Funds, Strategic Alternatives Fund, and Impact Fund may sell short U.S. Treasury securities and derivatives such as, but not limited to, swaps, futures contracts and currency forwards to manage risk (e.g., duration, currency, credit, etc.). The Fixed Income Funds may occasionally enter into a short sale to initiate a dollar roll transaction. The Low-Duration Bond Fund may be involved in dollar roll transactions with U.S. Treasury securities throughout the year. The Strategic Alternatives Fund may establish short positions in stocks of companies with a market value of up to 40% of the Fund's assets. The Defensive Market Strategies® Fund may establish short positions in stocks of companies with a market value of up to 30% of the Fund’s assets. The International Equity Fund may establish short positions in stocks of foreign companies with a market value of up to 10% of the Fund’s assets.
At December 31, 2021, the values of securities sold short in the International Equity Fund and the Strategic Alternatives Fund amounted to $1,087,614 and $18,297,163, respectively.
h. Synthetic Convertible Instruments
The Defensive Market Strategies® Fund establishes synthetic convertible instruments. Synthetic convertible instruments combine fixed-income securities (which may be convertible or non-convertible) with the right to acquire equity securities. In establishing a synthetic instrument, a basket of fixed-income securities are pooled with a basket of options or warrants that produce the characteristics similar to a convertible security. The risks of investing in synthetic convertible instruments include unfavorable price movements in the underlying security and the credit risk of the issuing financial institution. There may be no guarantee of a return of principal with synthetic convertible instruments and the appreciation potential may be limited. Synthetic convertible instruments may be more volatile and less liquid than other investments held by the Fund.
i. Derivative Financial Instruments
The Funds may engage in various portfolio strategies to seek to increase their return by hedging their portfolios against adverse movements in the equity, debt and currency markets. Losses may arise due to changes in the value of the contract if the counterparty does not perform under the contract. The Funds, in their normal course of business, may enter into contracts that contain a variety of representations and warranties and which provide general indemnifications. The Funds’ exposure may include future claims that may be made against the Funds that have not yet occurred.
FASB “Derivatives and Hedging” includes required disclosure for (i) the nature and terms of the derivative, reasons for entering into the derivative, the events or circumstances that would require the seller to perform under the derivative, and the current status of the payment/performance risk of the derivative, (ii) the maximum potential amount of future payments (undiscounted) the seller could be required to make under the derivative, (iii) the fair value of the derivative and (iv) the nature of any recourse provisions and assets held either as collateral or by third parties. FASB “Guarantees” require additional disclosures about the current status of the payment/performance risk of a guarantee. All of this information has been incorporated for the current period as part of the Schedules of Investments within the Swap agreements outstanding disclosure and in the Notes to Financial Statements.
Financial Futures Contracts — The Funds (except the Money Market Fund) may purchase or sell financial futures contracts and the options on such futures contracts for the purpose of hedging risk on existing securities, demonstrating purchase of securities or gaining market exposure on cash balances. Financial futures contracts are contracts for the delivery of securities at a specified future date at an agreed upon price or yield. Upon entering into a contract, the Funds deposit and maintain as collateral such initial margin as required by the exchange on which the transaction is effected.
Pursuant to the contract, the Funds agree to pay to or receive from the broker an amount of cash equal to the daily fluctuation in the value of the contract. Such payments or receipts are known as variation margin and are recorded by the Funds as unrealized gains or losses until the contract is closed or settled.
Risks of entering into futures contracts include the possibility that there will be an imperfect price correlation between the futures and the underlying securities. Second, it is possible that a lack of liquidity for futures contracts could exist in the secondary market, resulting in an inability to close a futures position prior to its maturity date. Third, the purchase of a futures contract involves the risk that a Fund could lose more than the original margin deposit required to initiate a futures transaction. Futures contracts involve, to varying degrees, risk of loss in excess of the variation margin disclosed on the Statements of Assets and Liabilities.
Foreign Currency Options and Futures — The Fixed Income Funds, the Impact Fund, the Strategic Alternatives Fund and the Defensive Market Strategies® Fund may also enter into futures contracts on foreign currencies and related options on transactions as a short or long hedge against possible variations in foreign exchange rates.
Forward Foreign Currency Contracts — Certain Funds may enter into forward foreign currency contracts to hedge against adverse exchange rate fluctuation to the U.S. dollar or between different foreign currencies in connection with either specific security transactions or portfolio positions. Each contract is valued daily and the change in value is recorded as an unrealized gain or loss. When the contract is closed, a realized gain or loss is recorded equal to the difference between the opening value and the closing value of the contract. These contracts may involve market risk in excess of the unrealized gain or loss reflected on the Statements of Assets and Liabilities. The Funds could be exposed to risk if the counterparties to the contracts are unable to meet the terms of the contract and from unanticipated movements in the value of a foreign currency relative to the U.S. dollar.
Non-Deliverable Bond Forward Contracts — A non-deliverable bond forward is a short term forward contract between two parties to buy or sell a bond denominated in a non-deliverable foreign currency at a specified future time and price. Non-deliverable bond forwards are marked-to-market daily using market quotations. Unrealized gains or losses on non-deliverable bond forwards are recorded by the Fund on a daily basis, and realized gains or losses are recorded on the termination date or sale of a contract
Options — Certain Funds are authorized to write and purchase put and call options. The risk in writing a call option is that the Funds give up the opportunity for profit if the market price of the security increases. The risk in writing a put option is that the Funds may incur a loss if the market price of the security decreases and the option is exercised. The risk in purchasing an option is that the Funds pay a premium whether or not the option is exercised. The Funds also have the additional risk of being unable to enter into a closing transaction at an acceptable price if a liquid secondary market does not exist. The Funds also may write over-the-counter options where completing the obligation depends upon the credit standing of the other party and that party’s ability to perform. Option contracts also involve the risk that they may not work as intended due to unanticipated developments in market conditions or other causes.
Options purchased are recorded as an asset and written options are recorded as liabilities to the extent of premiums paid or received. Each Fund will realize a gain or loss when the option transaction expires or closes. When an option is exercised, the proceeds on sales for a written call option, the purchase cost for a written put option or the cost of a security for a purchased put or call option is adjusted by the amount of the premium received or paid.
When a Fund writes a call or put option, an amount equal to the premium received is recorded as a liability and subsequently marked to market to reflect the current value of the option written. These liabilities are reflected as written options on the Statements of Assets and Liabilities.
Certain Funds may write swaption contracts to manage exposure to fluctuations in interest rates and to enhance portfolio yield. Swaption contracts written by the Funds represent an option that gives the purchaser the right, but not the obligation, to enter into a previously agreed upon swap agreement on a future date. If a written call swaption is exercised, the writer will enter a swap and is obligated to pay the fixed-rate and receive a floating rate in exchange. If a written put swaption is exercised, the writer will enter a swap and is obligated to pay the floating rate and receive a fixed rate in exchange. Swaptions are marked-to-market daily based upon quotations from market makers. When a Fund writes a swaption, the premium received is recorded as a liability and is subsequently adjusted to the current market value of the swaption.
Entering into a swaption contract involves, to varying degrees, the elements of credit, market and interest rate risk in excess of the associated option and swap agreement amounts reported in the Statements of Assets and Liabilities. The Funds bear the market risk arising from any change in index values or interest rates.
Swap Agreements — Each Select Fund, except the Money Market Fund, may enter into swap agreements, such as total return swaps. The Equity Funds may enter into equity swap agreements, and the International Equity Fund and Emerging Markets Equity Fund may also enter into cross-currency swap agreements. The Fixed Income Funds may enter into interest rate, credit default, and cross-currency swap agreements. The Strategic Alternatives Fund may enter into equity and interest rate swap agreements.
Swap agreements are privately negotiated agreements between a Fund and a counterparty to exchange or swap investment cash flows, assets, foreign currencies or market-linked returns at specified, future intervals. A swap may be entered into in order to, among other things, change the maturity of a Fund’s portfolio, to protect a Fund’s value from changes in interest rates, to expose a Fund to a different security or market or to help a Fund achieve a strategy relative to an index or other benchmark. By entering into a swap agreement, a Fund is exposed to the risk of unanticipated movements in interest rates or in the value of an underlying security or index (or the risk that the counterparty will not fulfill its obligation under the agreement).
Swaps are marked-to-market daily based upon values from third party vendors or quotations from market makers to the extent available; and the change in value, if any, is recorded as an unrealized gain or loss on the Statements of Assets and Liabilities. In the event that market quotations are not readily available or deemed reliable, certain swap agreements may be valued pursuant to guidelines established by the Board of Trustees. In the event that market quotes are not readily available and the swap cannot be valued pursuant to one of the valuation methods, the value of the swap will be determined in good faith by the Valuation Committee, generally based upon recommendations provided by the Fund’s sub-adviser.
Payments received or made at the beginning of the measurement period are reflected as such on the Statements of Assets and Liabilities and represent payments made or received upon entering into the swap agreement to compensate for differences between the stated terms of the swap agreement and prevailing market conditions (credit spreads, currency exchange rates, interest rates, and other relevant factors). These upfront payments are recorded as realized gains or losses on the Statements of Operations upon termination or maturity of the swap. A liquidation payment received or made at the termination of the swap is recorded as realized gain or loss on the Statements of Operations. Net periodic payments received or paid by a Fund are included as part of realized gains or losses on the Statements of Operations.
Certain Funds’ derivative agreements contain provisions that require a Fund to maintain a predetermined level of net assets, and/or provide limits regarding the decline of the Fund’s NAV over one-month, three-month and 12-month periods. If a Fund were to violate such provisions, the counterparties to the derivative instruments could request immediate payment or demand immediate collateralization on derivative instruments in net liability positions. For the year ended December 31,
2021, all of the Funds maintained the required level of net assets and/or the NAVs of the Funds did not decline below the limits set forth in the derivative agreements.
Entering into these agreements involves, to varying degrees, elements of credit, market and documentation risk in excess of the amounts recognized on the Statements of Assets and Liabilities. Such risks involve the possibility that there will be no liquid market for these agreements, that the counterparty to the agreements may default on its obligation to perform or disagree as to the meaning of contractual terms in the agreements and that there may be unfavorable changes in interest rates.
Credit Default Swaps — Credit default swap (“CDS”) agreements involve one party making a stream of payments (referred to as the buyer of protection) to another party (the seller of protection) in exchange for the right to receive a specified return in the event of a default or other credit event for the referenced entity, obligation or index. As a seller of protection on CDS agreements, a Fund will generally receive from the buyer of protection a fixed rate of income throughout the term of the swap provided that there is no credit event. As the seller, a Fund would effectively add leverage to its portfolio because, in addition to its total net assets, a Fund would be subject to investment exposure on the notional amount of the swap. In connection with these agreements, securities are set aside as collateral by the Fund’s custodian.
Upfront payments made or received in connection with CDS agreements are amortized over the expected life of the CDS agreements as unrealized gains or losses on swap agreements. The change in value of the CDS agreements is recorded daily as unrealized appreciation or depreciation. A realized gain or loss is recorded upon a credit event (as defined in the CDS agreement) or the maturity or termination of the agreement.
The sub-advisers monitor a variety of factors including cash flow assumptions, market activity, market sentiment and valuation as part of their ongoing process of assessing payment and performance risk. As payment and performance risk increases, the value of a CDS increases, resulting in recognition of unrealized gains for long positions and unrealized losses for short positions. Conversely, as payment and performance risk decreases, unrealized gains are recognized for short positions and unrealized losses are recognized for long positions. Any current or future declines in the fair value of the swap may be partially offset by upfront payments received by the Fund as a seller of protection if applicable. The change in value is recorded within unrealized appreciation (depreciation) until the occurrence of a credit event or the termination of the swap, at which time a realized gain (loss) is recorded.
If a Fund is a seller of protection and a credit event occurs, as defined under the terms of that particular swap agreement, a Fund will either (i) pay to the buyer of protection an amount equal to the notional amount of the swap and take delivery of the referenced obligation, other deliverable obligations or underlying securities comprising the referenced index or (ii) pay a net settlement amount in the form of cash or securities equal to the notional amount of the swap less the recovery value of the referenced obligation or underlying securities comprising the referenced index. If a Fund is a buyer of protection and a credit event occurs, as defined under the terms of that particular swap agreement, a Fund will either (i) receive from the seller of protection an amount equal to the notional amount of the swap and deliver the referenced obligation, other deliverable obligations or underlying securities comprising the referenced index or (ii) receive a net settlement amount in the form of cash or securities equal to the notional amount of the swap less the recovery value of the referenced obligation or underlying securities comprising the referenced index. Recovery values are assumed by market makers considering either industry standard recovery rates or entity specific factors and considerations until a credit event occurs. If a credit event has occurred, the recovery value is determined by a facilitated auction whereby a minimum number of allowable broker bids, together with a specified valuation method, are used to calculate the settlement value.
CDS agreements on corporate issues or sovereign issues of an emerging country involve one party making a stream of payments to another party in exchange for the right to receive a specified return in the event of a default or other credit event. If a credit event occurs and cash settlement is not elected, a variety of other deliverable obligations may be delivered in lieu of the specific referenced obligation. The ability to deliver other obligations may result in a cheapest-to-deliver option (the buyer of protection’s right to choose the deliverable obligation with the lowest value following a credit event). A Fund may use CDS on corporate issues or sovereign issues of an emerging country to provide a measure of protection against defaults of the issuers (i.e., to reduce risk where a Fund owns or has exposure to the referenced obligation) or to take an active long or short position with respect to the likelihood of a particular issuer’s default.
CDS agreements on asset-backed securities involve one party making a stream of payments to another party in exchange for the right to receive a specified return in the event of a default or other credit event. Unlike CDS on corporate issues or sovereign issues of an emerging country, deliverable obligations in most instances would be limited to the specific referenced obligation as performance for asset-backed securities can vary across deals. Prepayments, principal paydowns, and other write down or loss events on the underlying loans will reduce the outstanding principal balance of the referenced obligation. These reductions may be temporary or permanent as defined under the terms of the swap agreement and the notional amount for the swap agreement will be adjusted by corresponding amounts. A Fund may use CDS on asset-backed securities to provide a measure of protection against defaults of the referenced obligation or to take an active long or short position with respect to the likelihood of a particular referenced obligation's default.
CDS agreements on credit indexes involve one party making a stream of payments to another party in exchange for the right to receive a specified return in the event of a write-down, principal shortfall, interest shortfall or default of all or part of the referenced entities comprising the credit index. A credit index is a list of a basket of credit instruments or exposures designed to be representative of some part of the credit market as a whole. These indexes are made up of reference credits that are judged by a poll of dealers to be the most liquid entities in the CDS market based on the sector of the index. Components of the indexes may include, but are not limited to, investment grade securities, high yield securities, asset-backed securities, emerging markets, and/or various credit ratings within each sector. Credit indexes are traded using CDS with standardized terms including a fixed spread and standard maturity dates. An index CDS references all the names in the index, and if there is a default, the credit event is settled based on that name’s weight in the index. The composition of the indexes changes periodically, usually every six months, and for most indexes, each name has an equal weight in the index. A Fund may use CDS on credit indexes to hedge a portfolio of CDS or bonds with a CDS on indexes which is less expensive than it would be to buy many CDS to achieve a similar effect. CDS on indexes are benchmarks for protecting investors owning bonds against default, and traders use them to speculate on changes in credit quality.
Implied credit spreads, represented in absolute terms, utilized in determining the market value of CDS agreements on corporate issues or sovereign issues of an emerging country as of year-end are disclosed in the Schedules of Investments and serve as an indicator of the current status of the payment/performance risk and represent the likelihood or risk of default for the credit derivative. The implied credit spread of a particular referenced entity reflects the cost of buying/selling protection and may include upfront payments required to be made to enter into the agreement. For CDS agreements on asset-backed securities and credit indexes, the quoted market prices and resulting values serve as the indicator of the current status of the payment/performance risk. Wider credit spreads and increasing market values, in absolute terms when compared to the notional amount of the swap, represent a deterioration of the referenced entity’s credit soundness and a greater likelihood or risk of default or other credit event occurring as defined under the terms of the agreement.
The maximum potential amount of future payments (undiscounted) that a Fund as a seller of protection could be required to make under a CDS agreement would be an amount equal to the notional amount of the agreement. These potential amounts would be partially offset by any recovery values of the respective referenced obligations, upfront payments received upon
entering into the agreement, or net amounts received from the settlement of buy protection CDS agreements entered into by a Fund for the same referenced entity or entities.
CDS involve greater risks than if the Funds had invested in the referenced obligation directly. In addition to general market risks, CDS are subject to liquidity risk and counterparty credit risk. The Funds enter into CDS with counterparties meeting defined criteria for financial strength. A buyer also may lose its investment and recover nothing should a credit event not occur. If a credit event did occur, the value of the referenced obligation received by the seller, coupled with the periodic payments previously received, may be less than the full notional value it pays to the buyer, resulting in a loss of value.
The maximum potential amount of future payments (undiscounted) that a Fund as a seller of protection could be required to make under a CDS agreement equals the notional amount of the agreement. Notional amounts of each individual CDS agreement outstanding as of year-end for which a Fund is the seller of protection are disclosed in the Schedules of Investments. These potential amounts would be partially offset by any recovery values of the respective referenced obligations, upfront payments received upon entering into the agreement or net amounts received from the settlement of buy protection CDS agreements entered into by a Fund for the same referenced entity or entities.
Centrally Cleared Swap Agreements — Centrally cleared swaps are either interest rate or CDS agreements brokered by the Chicago Mercantile Exchange, London Clearing House or the Intercontinental Exchange (the “Exchanges”) where the Exchanges are the counterparty to both the buyer and seller of protection. Centrally cleared swaps involve a lesser degree of risk because the Exchanges, as counterparties, monitor risk factors for the involved parties. Centrally cleared swaps are subject to general market risks and to liquidity risk. Pursuant to the agreement, the Funds agree to pay to or receive from the broker an amount of cash equal to the daily fluctuation in the value of the contract (the “margin”) and daily interest on the margin. In the case of centrally cleared interest rate swaps, the daily settlement also includes the daily portion of interest. Such payments are recorded by the Funds as unrealized gains or losses until the contract is closed or settled.
Centrally cleared swaps require no payments at the beginning of the measurement period nor are there liquidation payments at the termination of the swap.
Cross-Currency Swap Agreements — Cross-currency swap agreements involve two parties exchanging two different currencies with an agreement to reverse the exchange at a later date at specified exchange rates. The exchange of currencies at the inception date of the contract takes place at the current spot rate. The re-exchange at maturity may take place at the same exchange rate, a specified rate, or the then current spot rate. Interest payments, if applicable, are made between the parties based on interest rates available in the two currencies at the inception of the contract. The terms of cross-currency swap agreements may extend for many years. Cross-currency swaps are usually negotiated with commercial and investment banks. Some cross-currency swaps may not provide for exchanging principal cash flows but only for exchanging interest cash flows.
Interest Rate Swap Agreements — Interest rate swap agreements involve the exchange by a Fund with another party of their respective commitments to pay or receive interest with respect to the notional amount of principal. Certain forms of interest rate swap agreements may include: (i) interest rate caps, under which, in return for a premium, one party agrees to make payments to the other to the extent that interest rates exceed a specified rate, or “cap”, (ii) interest rate floors, under which, in return for a premium, one party agrees to make payments to the other to the extent that interest rates fall below a specified rate, or “floor”, (iii) interest rate collars, under which a party sells a cap and purchases a floor or vice versa in an attempt to protect itself against interest rate movements exceeding given minimum or maximum levels, (iv) callable interest rate swaps, under which the counterparty may terminate the swap transaction in whole at zero cost by a predetermined date and time prior to the maturity date, (v) spread locks, which allow the interest rate swap users to lock in the forward
differential (or spread) between the interest rate swap rate and a specified benchmark or (vi) basis swap, under which two parties can exchange variable interest rates based on different money markets.
Total Return Swap Agreements — Total return swap agreements on commodities involve commitments where exchanged cash flows are based on the price of a commodity and in return a Fund receives either fixed or determined by floating price rate. One party would receive payments based on the market value of the commodity involved and pay a fixed amount. Total return swap agreements on indexes involve commitments to pay interest in exchange for a market-linked return. One counterparty pays out the total return of a specific reference asset, which may be an equity, index or bond, and in return receives a regular stream of payments. To the extent the total return of the security or index underlying the transaction exceeds or falls short of the offsetting interest rate obligation, a Fund will receive a payment from or make a payment to the counterparty.
Forward Rate Agreements — Forward rate agreements represent an agreement between counterparties to exchange cash flows based on the difference between two interest rates, applied to a notional principal amount on a fixed future date. The Funds enter into forward rate agreements to gain yield exposure based on anticipated market conditions at the specified termination date of the agreement.
Variance Swap Agreements — Variance swap agreements involve two parties exchanging cash payments based on the difference between the stated level of variance (“Variance Strike Price”) and the actual variance realized on an underlying asset or index. As a receiver of the realized price variance, a Fund would receive the payoff amount when the realized price variance of the underlying asset is greater than the strike price and would owe the payoff amount when the variance is less than the strike price. As a payer of the realized price variance, a Fund would owe the payoff amount when the realized price variance of the underlying asset is greater than the strike price and would receive the payoff amount when the variance is less than the strike. A Fund may enter into variance swaps in an attempt to hedge market risk or adjust exposure to the markets.
Offsetting of Financial and Derivative Assets and Liabilities
Certain Funds are parties to International Swap and Derivatives Association, Inc. (“ISDA”) Master Agreements (“MA”) with various counterparties that govern over-the-counter derivative and foreign exchange contracts entered into from time to time. The ISDA MA may contain provisions regarding, among other things, the parties’ general obligations, representations, agreements, collateral requirements, events of default and early termination. With respect to certain counterparties, in accordance with the terms of the ISDA MA, collateral posted to the Fund is held in a segregated account by the Fund’s custodian and with respect to those amounts which can be sold or repledged, are presented in the Fund’s portfolio or Statements of Assets and Liabilities. For financial reporting purposes, the Funds do not offset derivative assets and derivative liabilities that are subject to an ISDA MA in the Statements of Assets and Liabilities.
At December 31, 2021, derivative assets and liabilities (by type) held by the Funds are as follows:
| Fund | | Assets | | Liabilities |
| MyDestination 2015 | | | | |
| Derivative Financial Instruments: | | | | |
| Futures contracts | | $ — | | $ 6,107 |
| Total derivative assets and liabilities in the Statements of Assets and Liabilities | | — | | 6,107 |
| Derivatives not subject to an ISDA MA or similar agreement | | — | | 6,107 |
| Total assets and liabilities subject to an ISDA MA | | $ — | | $ — |
| MyDestination 2025 | | | | |
| Derivative Financial Instruments: | | | | |
| Futures contracts | | $ — | | $ 24,248 |
| Total derivative assets and liabilities in the Statements of Assets and Liabilities | | — | | 24,248 |
| Derivatives not subject to an ISDA MA or similar agreement | | — | | 24,248 |
| Total assets and liabilities subject to an ISDA MA | | $ — | | $ — |
| MyDestination 2035 | | | | |
| Derivative Financial Instruments: | | | | |
| Futures contracts | | $ — | | $ 47,925 |
| Total derivative assets and liabilities in the Statements of Assets and Liabilities | | — | | 47,925 |
| Derivatives not subject to an ISDA MA or similar agreement | | — | | 47,925 |
| Total assets and liabilities subject to an ISDA MA | | $ — | | $ — |
| MyDestination 2045 | | | | |
| Derivative Financial Instruments: | | | | |
| Futures contracts | | $ — | | $ 48,447 |
| Total derivative assets and liabilities in the Statements of Assets and Liabilities | | — | | 48,447 |
| Derivatives not subject to an ISDA MA or similar agreement | | — | | 48,447 |
| Total assets and liabilities subject to an ISDA MA | | $ — | | $ — |
| MyDestination 2055 | | | | |
| Derivative Financial Instruments: | | | | |
| Futures contracts | | $ — | | $ 18,590 |
| Total derivative assets and liabilities in the Statements of Assets and Liabilities | | — | | 18,590 |
| Derivatives not subject to an ISDA MA or similar agreement | | — | | 18,590 |
| Total assets and liabilities subject to an ISDA MA | | $ — | | $ — |
| Conservative Allocation | | | | |
| Derivative Financial Instruments: | | | | |
| Futures contracts | | $ — | | $ 3,721 |
| Total derivative assets and liabilities in the Statements of Assets and Liabilities | | — | | 3,721 |
| Derivatives not subject to an ISDA MA or similar agreement | | — | | 3,721 |
| Total assets and liabilities subject to an ISDA MA | | $ — | | $ — |
| Fund | | Assets | | Liabilities |
| Balanced Allocation | | | | |
| Derivative Financial Instruments: | | | | |
| Futures contracts | | $ — | | $ 16,329 |
| Total derivative assets and liabilities in the Statements of Assets and Liabilities | | — | | 16,329 |
| Derivatives not subject to an ISDA MA or similar agreement | | — | | 16,329 |
| Total assets and liabilities subject to an ISDA MA | | $ — | | $ — |
| Growth Allocation | | | | |
| Derivative Financial Instruments: | | | | |
| Futures contracts | | $ — | | $ 54,787 |
| Total derivative assets and liabilities in the Statements of Assets and Liabilities | | — | | 54,787 |
| Derivatives not subject to an ISDA MA or similar agreement | | — | | 54,787 |
| Total assets and liabilities subject to an ISDA MA | | $ — | | $ — |
| Aggressive Allocation | | | | |
| Derivative Financial Instruments: | | | | |
| Futures contracts | | $ — | | $ 70,977 |
| Total derivative assets and liabilities in the Statements of Assets and Liabilities | | — | | 70,977 |
| Derivatives not subject to an ISDA MA or similar agreement | | — | | 70,977 |
| Total assets and liabilities subject to an ISDA MA | | $ — | | $ — |
| Low-Duration Bond | | | | |
| Derivative Financial Instruments: | | | | |
| Futures contracts | | $ — | | $ 57,576 |
| Forward foreign currency contracts | | 393,338 | | 832,952 |
| Options | | — | | 29,906 |
| Centrally cleared swaps | | — | | 9,332 |
| Swap agreements | | 3,039 | | — |
| Total derivative assets and liabilities in the Statements of Assets and Liabilities | | 396,377 | | 929,766 |
| Derivatives not subject to an ISDA MA or similar agreement | | — | | 204,585 |
| Total assets and liabilities subject to an ISDA MA | | $ 396,377 | | $ 725,181 |
| Medium-Duration Bond | | | | |
| Derivative Financial Instruments: | | | | |
| Futures contracts | | $ 311,199 | | $ — |
| Forward foreign currency contracts | | 580,030 | | 2,376,296 |
| Options | | 254,079 | | 928,304 |
| Centrally cleared swaps | | — | | 333,855 |
| Swap agreements | | 4,754 | | 263,626 |
| Total derivative assets and liabilities in the Statements of Assets and Liabilities | | 1,150,062 | | 3,902,081 |
| Derivatives not subject to an ISDA MA or similar agreement | | 565,278 | | 539,174 |
| Total assets and liabilities subject to an ISDA MA | | $ 584,784 | | $ 3,362,907 |
| Fund | | Assets | | Liabilities |
| Global Bond | | | | |
| Derivative Financial Instruments: | | | | |
| Futures contracts | | $ — | | $ 175,882 |
| Forward foreign currency contracts | | 7,434,119 | | 8,153,342 |
| Options | | 5,397 | | — |
| Centrally cleared swaps | | 5,331 | | — |
| Total derivative assets and liabilities in the Statements of Assets and Liabilities | | 7,444,847 | | 8,329,224 |
| Derivatives not subject to an ISDA MA or similar agreement | | 10,728 | | 175,882 |
| Total assets and liabilities subject to an ISDA MA | | $ 7,434,119 | | $ 8,153,342 |
| Defensive Market Strategies® | | | | |
| Derivative Financial Instruments: | | | | |
| Futures contracts | | $ — | | $ 18,055 |
| Forward foreign currency contracts | | 30,499 | | 331,065 |
| Options | | 91,619,810 | | 2,628,590 |
| Total derivative assets and liabilities in the Statements of Assets and Liabilities | | 91,650,309 | | 2,977,710 |
| Derivatives not subject to an ISDA MA or similar agreement | | 91,650,309 | | 2,977,710 |
| Total assets and liabilities subject to an ISDA MA | | $ — | | $ — |
| Global Impact Fund | | | | |
| Derivative Financial Instruments: | | | | |
| Futures contracts | | $ 31,834 | | $ — |
| Total derivative assets and liabilities in the Statements of Assets and Liabilities | | 31,834 | | — |
| Derivatives not subject to an ISDA MA or similar agreement | | 31,834 | | — |
| Total assets and liabilities subject to an ISDA MA | | $ — | | $ — |
| Equity Index | | | | |
| Derivative Financial Instruments: | | | | |
| Futures contracts | | $ — | | $ 181,500 |
| Total derivative assets and liabilities in the Statements of Assets and Liabilities | | — | | 181,500 |
| Derivatives not subject to an ISDA MA or similar agreement | | — | | 181,500 |
| Total assets and liabilities subject to an ISDA MA | | $ — | | $ — |
| Value Equity | | | | |
| Derivative Financial Instruments: | | | | |
| Futures contracts | | $ — | | $ 132,000 |
| Forward foreign currency contracts | | — | | 811,555 |
| Total derivative assets and liabilities in the Statements of Assets and Liabilities | | — | | 943,555 |
| Derivatives not subject to an ISDA MA or similar agreement | | — | | 943,555 |
| Total assets and liabilities subject to an ISDA MA | | $ — | | $ — |
| Fund | | Assets | | Liabilities |
| Growth Equity | | | | |
| Derivative Financial Instruments: | | | | |
| Futures contracts | | $ — | | $ 224,125 |
| Total derivative assets and liabilities in the Statements of Assets and Liabilities | | — | | 224,125 |
| Derivatives not subject to an ISDA MA or similar agreement | | — | | 224,125 |
| Total assets and liabilities subject to an ISDA MA | | $ — | | $ — |
| Small Cap Equity | | | | |
| Derivative Financial Instruments: | | | | |
| Futures contracts | | $ — | | $ 57,605 |
| Forward foreign currency contracts | | — | | 9,816 |
| Total derivative assets and liabilities in the Statements of Assets and Liabilities | | — | | 67,421 |
| Derivatives not subject to an ISDA MA or similar agreement | | — | | 67,421 |
| Total assets and liabilities subject to an ISDA MA | | $ — | | $ — |
| International Equity Index | | | | |
| Derivative Financial Instruments: | | | | |
| Futures contracts | | $ — | | $ 29,705 |
| Total derivative assets and liabilities in the Statements of Assets and Liabilities | | — | | 29,705 |
| Derivatives not subject to an ISDA MA or similar agreement | | — | | 29,705 |
| Total assets and liabilities subject to an ISDA MA | | $ — | | $ — |
| International Equity | | | | |
| Derivative Financial Instruments: | | | | |
| Futures contracts | | $ 124,255 | | $ — |
| Forward foreign currency contracts | | 1,895,935 | | 2,836,693 |
| Swap agreements | | 1,958,434 | | 687,194 |
| Total derivative assets and liabilities in the Statements of Assets and Liabilities | | 3,978,624 | | 3,523,887 |
| Derivatives not subject to an ISDA MA or similar agreement | | 124,255 | | — |
| Total assets and liabilities subject to an ISDA MA | | $ 3,854,369 | | $ 3,523,887 |
| Emerging Markets Equity | | | | |
| Derivative Financial Instruments: | | | | |
| Futures contracts | | $ — | | $ 471,375 |
| Forward foreign currency contracts | | 3,452,039 | | 3,918,044 |
| Swap agreements | | 306,291 | | 434,322 |
| Total derivative assets and liabilities in the Statements of Assets and Liabilities | | 3,758,330 | | 4,823,741 |
| Derivatives not subject to an ISDA MA or similar agreement | | — | | 471,375 |
| Total assets and liabilities subject to an ISDA MA | | $ 3,758,330 | | $ 4,352,366 |
| Fund | | Assets | | Liabilities |
| Strategic Alternatives | | | | |
| Derivative Financial Instruments: | | | | |
| Futures contracts | | $ — | | $ 303,840 |
| Forward foreign currency contracts | | 1,108,177 | | 865,136 |
| Options | | 31,877 | | 1,050,366 |
| Centrally cleared swaps | | 144,067 | | — |
| Swap agreements | | 1,326,194 | | — |
| Total derivative assets and liabilities in the Statements of Assets and Liabilities | | 2,610,315 | | 2,219,342 |
| Derivatives not subject to an ISDA MA or similar agreement | | 144,067 | | 372,919 |
| Total assets and liabilities subject to an ISDA MA | | $ 2,466,248 | | $ 1,846,423 |
The futures contracts and centrally cleared swap agreements shown above represent the variation margin shown on the Statements of Assets and Liabilities, which is the daily change in the unrealized appreciation (depreciation) for open futures and centrally cleared swap agreements.
At December 31, 2021, derivative assets and liabilities by counterparty net of amounts available for offset under an ISDA MA and net of the related collateral (received)/pledged by the Trust are as follows:
| Fund/Sub-adviser/Counterparty | | Derivative Assets
Subject to
an ISDA MA | | Derivative Liabilities
Subject to
an ISDA MA | | Value of
Derivatives Subject to
an ISDA MA | | Collateral
(Received)/
Pledged | | Net Exposure |
| Low-Duration Bond | | | | | | | | | | |
| Sub-adviser A | | | | | | | | | | |
| Other Counterparties* | | $ 3,039 | | $ — | | $ 3,039 | | $ (3,039) | | $ — |
| Sub-adviser B | | | | | | | | | | |
| Other Counterparties* | | 191,126 | | (718,599) | | (527,473) | | 109,518 | | (417,955) |
| Sub-adviser C | | | | | | | | | | |
| Other Counterparties* | | 202,212 | | (6,582) | | 195,630 | | — | | 195,630 |
| Total Derivatives | | $ 396,377 | | $ (725,181) | | $ (328,804) | | $ 106,479 | | $ (222,325) |
| Medium-Duration Bond | | | | | | | | | | |
| Sub-adviser A | | | | | | | | | | |
| Other Counterparties* | | $ 149,455 | | $ (494,294) | | $ (344,839) | | $ 426,289 | | $ 81,450 |
| Sub-adviser B | | | | | | | | | | |
| Other Counterparties* | | 327,968 | | (2,340,516) | | (2,012,548) | | 1,570,273 | | (442,275) |
| Sub-adviser C | | | | | | | | | | |
| Other Counterparties* | | 107,361 | | (528,097) | | (420,736) | | 387,941 | | (32,795) |
| Total Derivatives | | $ 584,784 | | $(3,362,907) | | $(2,778,123) | | $2,384,503 | | $ (393,620) |
| Global Bond | | | | | | | | | | |
| Sub-adviser A | | | | | | | | | | |
| CITI | | $ 330,765 | | $(1,417,237) | | $(1,086,472) | | $ 80,000 | | $(1,006,472) |
| Other Counterparties* | | 64,923 | | (65,163) | | (240) | | — | | (240) |
| | | 395,688 | | (1,482,400) | | (1,086,712) | | 80,000 | | (1,006,712) |
| Sub-adviser B | | | | | | | | | | |
| Other Counterparties* | | 7,038,431 | | (6,670,942) | | 367,489 | | (283,237) | | 84,252 |
| Total Derivatives | | $7,434,119 | | $(8,153,342) | | $ (719,223) | | $ (203,237) | | $ (922,460) |
| Fund/Sub-adviser/Counterparty | | Derivative Assets
Subject to
an ISDA MA | | Derivative Liabilities
Subject to
an ISDA MA | | Value of
Derivatives Subject to
an ISDA MA | | Collateral
(Received)/
Pledged | | Net Exposure |
| International Equity | | | | | | | | | | |
| Sub-adviser A | | | | | | | | | | |
| Other Counterparties* | | $3,854,369 | | $(3,486,882) | | $ 367,487 | | $ (366,863) | | $ 624 |
| Sub-adviser B | | | | | | | | | | |
| Other Counterparties* | | — | | (37,005) | | (37,005) | | — | | (37,005) |
| Total Derivatives | | $3,854,369 | | $(3,523,887) | | $ 330,482 | | $ (366,863) | | $ (36,381) |
| Emerging Markets Equity | | | | | | | | | | |
| Sub-adviser A | | | | | | | | | | |
| Other Counterparties* | | $3,758,330 | | $(3,788,863) | | $ (30,533) | | $ 30,533 | | $ — |
| Sub-adviser B | | | | | | | | | | |
| MSCS | | — | | (446,677) | | (446,677) | | — | | (446,677) |
| Other Counterparties* | | — | | (116,826) | | (116,826) | | — | | (116,826) |
| | | — | | (563,503) | | (563,503) | | — | | (563,503) |
| Total Derivatives | | $3,758,330 | | $(4,352,366) | | $ (594,036) | | $ 30,533 | | $(563,503) |
| Strategic Alternatives | | | | | | | | | | |
| Sub-adviser B | | | | | | | | | | |
| Other Counterparties* | | $1,140,054 | | $(1,846,423) | | $ (706,369) | | $ 653,547 | | $ (52,822) |
| Sub-adviser E | | | | | | | | | | |
| Other Counterparties* | | 1,326,194 | | — | | 1,326,194 | | (1,326,194) | | — |
| Total Derivatives | | $2,466,248 | | $(1,846,423) | | $ 619,825 | | $ (672,647) | | $ (52,822) |
*Other Counterparties represent amounts that are held with counterparties where the absolute value of the total net exposure is less than 0.05% of the net assets of the respective Fund. Those holdings are deemed individually immaterial to the respective Fund and are listed collectively.
Additional information about netting arrangements under the Master Agreements can be found in the Derivative Financial Instruments and Securities Lending sections of the Notes to Financial Statements.
Derivative Holdings Categorized by Risk Exposure
FASB “Derivatives and Hedging” also requires all companies to disclose information intended to enable financial statement users to understand how and why the entity uses derivative instruments, how derivatives are accounted for, and how derivative instruments affect the entity’s financial position, results of operations, and cash flows.
| | | Location on the Statements of Assets and Liabilities |
| Derivative Type | | Asset Derivatives | | Liability Derivatives |
| Interest rate contracts | | Investments in securities of unaffiliated issuers, at value | | Options written, at value |
| | | Receivables: Variation margin* | | Payables: Variation margin* |
| | | Unrealized appreciation on swap agreements | | Unrealized depreciation on swap agreements |
| | | Unrealized gain on non-deliverable bond forward contracts | | Unrealized loss on non-deliverable bond forwards contracts |
| Foreign exchange contracts | | Investments in securities of unaffiliated issuers, at value | | Options written, at value |
| | | Unrealized appreciation on foreign currency exchange contracts | | Unrealized depreciation on foreign currency exchange contracts |
| Credit contracts | | Unrealized appreciation on swap agreements | | Unrealized depreciation on swap agreements |
| Equity contracts | | Investments in securities of unaffiliated issuers, at value | | Options written, at value |
| | | Receivables: Variation margin* | | Payables: Variation margin* |
*The variation margin shown on the Statements of Assets and Liabilities is the daily change in the unrealized appreciation (depreciation) for open futures and centrally cleared swap agreements. The variation margin presented below is the cumulative change in unrealized appreciation (depreciation) from the date the contract was opened until December 31, 2021.
| | | Asset Derivative Value |
| Fund | | Total Value
at
12/31/21 | | Interest Rate
Contracts | | Foreign
Exchange
Contracts | | Credit
Contracts | | Equity
Contracts |
| MyDestination 2015 | | | | | | | | | | |
| Futures | | $ 75,976 | | $ 29,748 | | $ — | | $ — | | $ 46,228 |
| MyDestination 2025 | | | | | | | | | | |
| Futures | | $ 270,099 | | $ 95,746 | | $ — | | $ — | | $ 174,353 |
| MyDestination 2035 | | | | | | | | | | |
| Futures | | $ 462,969 | | $ 83,295 | | $ — | | $ — | | $ 379,674 |
| MyDestination 2045 | | | | | | | | | | |
| Futures | | $ 405,558 | | $ 37,243 | | $ — | | $ — | | $ 368,315 |
| MyDestination 2055 | | | | | | | | | | |
| Futures | | $ 137,549 | | $ 5,208 | | $ — | | $ — | | $ 132,341 |
| Conservative Allocation | | | | | | | | | | |
| Futures | | $ 29,542 | | $ — | | $ — | | $ — | | $ 29,542 |
| Balanced Allocation | | | | | | | | | | |
| Futures | | $ 358,706 | | $ 72,044 | | $ — | | $ — | | $ 286,662 |
| Growth Allocation | | | | | | | | | | |
| Futures | | $ 491,512 | | $ 43,275 | | $ — | | $ — | | $ 448,237 |
| Aggressive Allocation | | | | | | | | | | |
| Futures | | $ 459,500 | | $ — | | $ — | | $ — | | $ 459,500 |
| | | Asset Derivative Value |
| Fund | | Total Value
at
12/31/21 | | Interest Rate
Contracts | | Foreign
Exchange
Contracts | | Credit
Contracts | | Equity
Contracts |
| Low-Duration Bond | | | | | | | | | | |
| Forwards | | $ 393,338 | | $ — | | $ 393,338 | | $ — | | $ — |
| Futures | | 54,567 | | 54,567 | | — | | — | | — |
| Swaps | | 3,039 | | — | | — | | 3,039 | | — |
| Totals | | $ 450,944 | | $ 54,567 | | $ 393,338 | | $ 3,039 | | $ — |
| Medium-Duration Bond | | | | | | | | | | |
| Forwards | | $ 580,030 | | $ — | | $ 580,030 | | $ — | | $ — |
| Futures | | 2,238,727 | | 2,238,727 | | — | | — | | — |
| Purchased Options | | 254,079 | | 254,079 | | — | | — | | — |
| Swaps | | 5,514,477 | | 4,793,602 | | — | | 720,875 | | — |
| Totals | | $ 8,587,313 | | $ 7,286,408 | | $ 580,030 | | $ 720,875 | | $ — |
| Global Bond | | | | | | | | | | |
| Forwards | | $ 7,434,119 | | $ — | | $ 7,434,119 | | $ — | | $ — |
| Futures | | 346,212 | | 346,212 | | — | | — | | — |
| Purchased Options | | 5,397 | | 5,397 | | — | | — | | — |
| Swaps | | 38,108 | | 38,108 | | — | | — | | — |
| Totals | | $ 7,823,836 | | $ 389,717 | | $ 7,434,119 | | $ — | | $ — |
| Defensive Market Strategies® | | | | | | | | | | |
| Forwards | | $ 30,499 | | $ — | | $ 30,499 | | $ — | | $ — |
| Futures | | 628,226 | | — | | — | | — | | 628,226 |
| Purchased Options | | 91,619,810 | | — | | — | | — | | 91,619,810 |
| Totals | | $ 92,278,535 | | $ — | | $ 30,499 | | $ — | | $ 92,248,036 |
| Global Impact Fund | | | | | | | | | | |
| Futures | | $ 134,179 | | $ 90,094 | | $ 113 | | $ — | | $ 43,972 |
| Equity Index | | | | | | | | | | |
| Futures | | $ 1,295,866 | | $ — | | $ — | | $ — | | $ 1,295,866 |
| Value Equity | | | | | | | | | | |
| Futures | | $ 947,811 | | $ — | | $ — | | $ — | | $ 947,811 |
| Growth Equity | | | | | | | | | | |
| Futures | | $ 1,659,661 | | $ — | | $ — | | $ — | | $ 1,659,661 |
| Small Cap Equity | | | | | | | | | | |
| Futures | | $ 476,169 | | $ — | | $ — | | $ — | | $ 476,169 |
| International Equity Index | | | | | | | | | | |
| Futures | | $ 867,855 | | $ — | | $ — | | $ — | | $ 867,855 |
| International Equity | | | | | | | | | | |
| Forwards | | $ 1,895,935 | | $ — | | $ 1,895,935 | | $ — | | $ — |
| Futures | | 2,069,079 | | — | | — | | — | | 2,069,079 |
| Swaps | | 1,958,434 | | — | | — | | — | | 1,958,434 |
| Totals | | $ 5,923,448 | | $ — | | $ 1,895,935 | | $ — | | $ 4,027,513 |
| | | Asset Derivative Value |
| Fund | | Total Value
at
12/31/21 | | Interest Rate
Contracts | | Foreign
Exchange
Contracts | | Credit
Contracts | | Equity
Contracts |
| Emerging Markets Equity | | | | | | | | | | |
| Forwards | | $ 3,452,039 | | $ — | | $ 3,452,039 | | $ — | | $ — |
| Futures | | 270,468 | | — | | — | | — | | 270,468 |
| Swaps | | 306,291 | | — | | — | | — | | 306,291 |
| Totals | | $ 4,028,798 | | $ — | | $ 3,452,039 | | $ — | | $ 576,759 |
| Global Real Estate Securities | | | | | | | | | | |
| Futures | | $ 229,185 | | $ — | | $ — | | $ — | | $ 229,185 |
| Strategic Alternatives | | | | | | | | | | |
| Forwards | | $ 1,108,177 | | $ — | | $ 1,108,177 | | $ — | | $ — |
| Futures | | 826,168 | | 477,295 | | 16,873 | | — | | 332,000 |
| Purchased Options | | 31,877 | | 31,877 | | — | | — | | — |
| Swaps | | 3,765,014 | | 2,438,820 | | — | | — | | 1,326,194 |
| Totals | | $ 5,731,236 | | $ 2,947,992 | | $ 1,125,050 | | $ — | | $ 1,658,194 |
| | | Liabilities Derivative Value |
| Fund | | Total Value
at
12/31/21 | | Interest Rate
Contracts | | Foreign
Exchange
Contracts | | Credit
Contracts | | Equity
Contracts |
| MyDestination 2015 | | | | | | | | | | |
| Futures | | $ 942 | | $ — | | $ — | | $ — | | $ 942 |
| MyDestination 2025 | | | | | | | | | | |
| Futures | | $ 2,615 | | $ — | | $ — | | $ — | | $ 2,615 |
| MyDestination 2035 | | | | | | | | | | |
| Futures | | $ 10,065 | | $ — | | $ — | | $ — | | $ 10,065 |
| MyDestination 2045 | | | | | | | | | | |
| Futures | | $ 10,196 | | $ — | | $ — | | $ — | | $ 10,196 |
| Conservative Allocation | | | | | | | | | | |
| Futures | | $ 6,674 | | $ 5,731 | | $ — | | $ — | | $ 943 |
| Balanced Allocation | | | | | | | | | | |
| Futures | | $ 14,470 | | $ 4,902 | | $ — | | $ — | | $ 9,568 |
| Growth Allocation | | | | | | | | | | |
| Futures | | $ 21,724 | | $ 3,470 | | $ — | | $ — | | $ 18,254 |
| Aggressive Allocation | | | | | | | | | | |
| Futures | | $ 20,597 | | $ — | | $ — | | $ — | | $ 20,597 |
| Low-Duration Bond | | | | | | | | | | |
| Forwards | | $ 832,952 | | $ — | | $ 832,952 | | $ — | | $ — |
| Futures | | 2,060,166 | | 2,060,166 | | — | | — | | — |
| Written Options | | 29,906 | | 11,084 | | — | | 18,822 | | — |
| Swaps | | 15,628 | | 9,877 | | — | | 5,751 | | — |
| Totals | | $ 2,938,652 | | $ 2,081,127 | | $ 832,952 | | $ 24,573 | | $ — |
| | | Liabilities Derivative Value |
| Fund | | Total Value
at
12/31/21 | | Interest Rate
Contracts | | Foreign
Exchange
Contracts | | Credit
Contracts | | Equity
Contracts |
| Medium-Duration Bond | | | | | | | | | | |
| Forwards | | $ 2,376,296 | | $ — | | $ 2,376,296 | | $ — | | $ — |
| Futures | | 2,723,413 | | 2,723,413 | | — | | — | | — |
| Written Options | | 928,304 | | 928,304 | | — | | — | | — |
| Swaps | | 3,665,097 | | 3,460,055 | | — | | 205,042 | | — |
| Totals | | $ 9,693,110 | | $ 7,111,772 | | $ 2,376,296 | | $ 205,042 | | $ — |
| Global Bond | | | | | | | | | | |
| Forwards | | $ 8,153,342 | | $ — | | $ 8,153,342 | | $ — | | $ — |
| Futures | | 1,110,731 | | 1,110,731 | | — | | — | | — |
| Swaps | | 17,247 | | — | | — | | 17,247 | | — |
| Totals | | $ 9,281,320 | | $ 1,110,731 | | $ 8,153,342 | | $ 17,247 | | $ — |
| Defensive Market Strategies® | | | | | | | | | | |
| Forwards | | $ 331,065 | | $ — | | $ 331,065 | | $ — | | $ — |
| Futures | | 288,921 | | 288,921 | | — | | — | | — |
| Written Options | | 2,628,590 | | — | | — | | — | | 2,628,590 |
| Totals | | $ 3,248,576 | | $ 288,921 | | $ 331,065 | | $ — | | $ 2,628,590 |
| Global Impact Fund | | | | | | | | | | |
| Futures | | $ 78,949 | | $ 72,719 | | $ — | | $ — | | $ 6,230 |
| Value Equity | | | | | | | | | | |
| Forwards | | $ 811,555 | | $ — | | $ 811,555 | | $ — | | $ — |
| Small Cap Equity | | | | | | | | | | |
| Forwards | | $ 9,816 | | $ — | | $ 9,816 | | $ — | | $ — |
| International Equity | | | | | | | | | | |
| Forwards | | $ 2,836,693 | | $ — | | $ 2,836,693 | | $ — | | $ — |
| Futures | | 1,022,716 | | — | | — | | — | | 1,022,716 |
| Swaps | | 687,194 | | — | | — | | — | | 687,194 |
| Totals | | 4,546,603 | | $ — | | $ 2,836,693 | | $ — | | $ 1,709,910 |
| Emerging Markets Equity | | | | | | | | | | |
| Forwards | | $ 3,918,044 | | $ — | | $ 3,918,044 | | $ — | | $ — |
| Futures | | 248,491 | | — | | — | | — | | 248,491 |
| Swaps | | 434,322 | | — | | — | | — | | 434,322 |
| Totals | | $ 4,600,857 | | $ — | | $ 3,918,044 | | $ — | | $ 682,813 |
| Strategic Alternatives | | | | | | | | | | |
| Forwards | | $ 865,136 | | $ — | | $ 865,136 | | $ — | | $ — |
| Futures | | 1,060,746 | | 447,674 | | 613,072 | | — | | — |
| Written Options | | 1,050,366 | | 981,286 | | — | | — | | 69,080 |
| Swaps | | 1,377,455 | | 1,377,455 | | — | | — | | — |
| Totals | | $ 4,353,703 | | $ 2,806,415 | | $ 1,478,208 | | $ — | | $ 69,080 |
| Derivative Type | | Location on the Statements of Operations |
| Interest rate contracts | | Net realized gain (loss) from: Futures transactions |
| | | Net realized gain (loss) from: Swap agreements |
| | | Net realized gain (loss) from: Option contracts written |
| | | Net realized gain (loss) from: Option contracts purchased |
| | | Net change in unrealized appreciation (depreciation) on: Futures |
| | | Net change in unrealized appreciation (depreciation) on: Swap agreements |
| | | Net change in unrealized appreciation (depreciation) on: Option contracts written |
| | | Net change in unrealized appreciation (depreciation) on: Option contracts purchased |
| | | Net change in unrealized appreciation (depreciation) on: Non-deliverable bond forward contracts |
| Foreign exchange contracts | | Net realized gain (loss) from: Foreign currency |
| | | Net realized gain (loss) from: Option contracts written |
| | | Net realized gain (loss) from: Option contracts purchased |
| | | Net change in unrealized appreciation (depreciation) on: Foreign currency |
| | | Net change in unrealized appreciation (depreciation) on: Option contracts written |
| | | Net change in unrealized appreciation (depreciation) on: Option contracts purchased |
| Credit contracts | | Net realized gain (loss) from: Swap agreements |
| | | Net change in unrealized appreciation (depreciation) on: Swap agreements |
| Equity contracts | | Net realized gain (loss) from: Futures transactions |
| | | Net realized gain (loss) from: Option contracts written |
| | | Net realized gain (loss) from: Option contracts purchased |
| | | Net unrealized appreciation (depreciation) on: Futures |
| | | Net unrealized appreciation (depreciation) on: Option contracts written |
| | | Net unrealized appreciation (depreciation) on: Option contracts purchased |
| | | Realized Gain (Loss) on Derivatives Recognized in Income |
| Fund | | Total Value
at
12/31/21 | | Interest Rate
Contracts | | Foreign
Exchange
Contracts | | Credit
Contracts | | Equity
Contracts |
| MyDestination 2015 | | | | | | | | | | |
| Futures | | $ 418,829 | | $ (144,722) | | $ — | | $ — | | $ 563,551 |
| MyDestination 2025 | | | | | | | | | | |
| Futures | | $ 1,895,997 | | $ (374,461) | | $ — | | $ — | | $ 2,270,458 |
| MyDestination 2035 | | | | | | | | | | |
| Futures | | $ 3,247,579 | | $ (303,841) | | $ — | | $ — | | $ 3,551,420 |
| MyDestination 2045 | | | | | | | | | | |
| Futures | | $ 3,029,003 | | $ (120,939) | | $ — | | $ — | | $ 3,149,942 |
| MyDestination 2055 | | | | | | | | | | |
| Futures | | $ 1,262,293 | | $ (26,919) | | $ — | | $ — | | $ 1,289,212 |
| Conservative Allocation | | | | | | | | | | |
| Futures | | $ 383,973 | | $ (52,481) | | $ — | | $ — | | $ 436,454 |
| Balanced Allocation | | | | | | | | | | |
| Futures | | $ 2,160,363 | | $ (461,245) | | $ — | | $ — | | $ 2,621,608 |
| Growth Allocation | | | | | | | | | | |
| Futures | | $ 3,396,829 | | $ (183,844) | | $ — | | $ — | | $ 3,580,673 |
| Aggressive Allocation | | | | | | | | | | |
| Futures | | $ 4,523,657 | | $ — | | $ — | | $ — | | $ 4,523,657 |
| | | Realized Gain (Loss) on Derivatives Recognized in Income |
| Fund | | Total Value
at
12/31/21 | | Interest Rate
Contracts | | Foreign
Exchange
Contracts | | Credit
Contracts | | Equity
Contracts |
| Low-Duration Bond | | | | | | | | | | |
| Forwards | | $ 1,588,941 | | $ — | | $ 1,588,941 | | $ — | | $ — |
| Futures | | 1,507,865 | | 1,507,865 | | — | | — | | — |
| Purchased Options | | (8,539) | | (8,539) | | — | | — | | — |
| Swaps | | (1,327,157) | | (1,045,783) | | — | | (281,374) | | — |
| Written Options | | 214,115 | | 170,875 | | — | | 43,240 | | — |
| Totals | | $ 1,975,225 | | $ 624,418 | | $ 1,588,941 | | $ (238,134) | | $ — |
| Medium-Duration Bond | | | | | | | | | | |
| Forwards | | $ 2,472,569 | | $ — | | $ 2,472,569 | | $ — | | $ — |
| Futures | | (9,902,557) | | (9,902,557) | | — | | — | | — |
| Purchased Options | | (3,848,072) | | (3,521,411) | | (326,661) | | — | | — |
| Swaps | | 320,479 | | (2,114,121) | | — | | 2,434,600 | | — |
| Written Options | | 3,852,411 | | 3,823,565 | | 28,846 | | — | | — |
| Totals | | $ (7,105,170) | | $ (11,714,524) | | $ 2,174,754 | | $ 2,434,600 | | $ — |
| Global Bond | | | | | | | | | | |
| Forwards | | $ (5,852,985) | | $ — | | $ (5,852,985) | | $ — | | $ — |
| Futures | | 3,997,426 | | 3,997,426 | | — | | — | | — |
| Purchased Options | | (209,494) | | (2,489) | | (207,005) | | — | | — |
| Swaps | | (817,277) | | 1,005 | | — | | (818,282) | | — |
| Totals | | $ (2,882,330) | | $ 3,995,942 | | $ (6,059,990) | | $ (818,282) | | $ — |
| Defensive Market Strategies® | | | | | | | | | | |
| Forwards | | $ 2,343,713 | | $ — | | $ 2,343,713 | | $ — | | $ — |
| Futures | | (286,846) | | (12,621) | | — | | — | | (274,225) |
| Written Options | | 26,986,233 | | — | | — | | — | | 26,986,233 |
| Totals | | $ 29,043,100 | | $ (12,621) | | $ 2,343,713 | | $ — | | $ 26,712,008 |
| Global Impact Fund | | | | | | | | | | |
| Futures | | $ 774,734 | | $ 350,400 | | $ 6,662 | | $ — | | $ 417,672 |
| Equity Index | | | | | | | | | | |
| Futures | | $ 16,050,263 | | $ — | | $ — | | $ — | | $ 16,050,263 |
| Value Equity | | | | | | | | | | |
| Forwards | | $ 2,757,551 | | $ — | | $ 2,757,551 | | $ — | | $ — |
| Futures | | 10,091,869 | | — | | — | | — | | 10,091,869 |
| Totals | | $ 12,849,420 | | $ — | | $ 2,757,551 | | $ — | | $ 10,091,869 |
| Growth Equity | | | | | | | | | | |
| Futures | | $ 14,525,795 | | $ — | | $ — | | $ — | | $ 14,525,795 |
| Small Cap Equity | | | | | | | | | | |
| Forwards | | $ 103,558 | | $ — | | $ 103,558 | | $ — | | $ — |
| Futures | | 3,063,481 | | — | | — | | — | | 3,063,481 |
| Totals | | $ 3,167,039 | | $ — | | $ 103,558 | | $ — | | $ 3,063,481 |
| International Equity Index | | | | | | | | | | |
| Futures | | $ 5,507,743 | | $ — | | $ — | | $ — | | $ 5,507,743 |
| | | Realized Gain (Loss) on Derivatives Recognized in Income |
| Fund | | Total Value
at
12/31/21 | | Interest Rate
Contracts | | Foreign
Exchange
Contracts | | Credit
Contracts | | Equity
Contracts |
| International Equity | | | | | | | | | | |
| Forwards | | $ (7,855,214) | | $ — | | $ (7,855,214) | | $ — | | $ — |
| Futures | | 11,422,115 | | — | | — | | — | | 11,422,115 |
| Swaps | | 6,801,048 | | — | | — | | — | | 6,801,048 |
| Totals | | $ 10,367,949 | | $ — | | $ (7,855,214) | | $ — | | $ 18,223,163 |
| Emerging Markets Equity | | | | | | | | | | |
| Forwards | | $ (1,104,514) | | $ — | | $ (1,104,514) | | $ — | | $ — |
| Futures | | 1,842,239 | | — | | — | | — | | 1,842,239 |
| Swaps | | 4,186,171 | | — | | — | | — | | 4,186,171 |
| Totals | | $ 4,923,896 | | $ — | | $ (1,104,514) | | $ — | | $ 6,028,410 |
| Global Real Estate Securities | | | | | | | | | | |
| Futures | | $ 1,823,778 | | $ — | | $ — | | $ — | | $ 1,823,778 |
| Totals | | $ 1,823,778 | | $ — | | $ — | | $ — | | $ 1,823,778 |
| Strategic Alternatives | | | | | | | | | | |
| Forwards | | $ 109,941 | | $ — | | $ 109,941 | | $ — | | $ — |
| Futures | | 6,536,350 | | 442,316 | | 3,958,523 | | — | | 2,135,511 |
| Non-Deliverable Bond Forwards | | (133,950) | | — | | (133,950) | | — | | — |
| Purchased Options | | (114,642) | | (114,642) | | — | | — | | — |
| Swaps | | 4,676,945 | | (527,413) | | — | | 25,235 | | 5,179,123 |
| Written Options | | 2,262,224 | | 481,327 | | — | | — | | 1,780,897 |
| Totals | | $ 13,336,868 | | $ 281,588 | | $ 3,934,514 | | $ 25,235 | | $ 9,095,531 |
| | | Change in Unrealized Appreciation (Depreciation) on Derivatives Recognized in Income |
| Fund | | Total Value
at
12/31/21 | | Interest Rate
Contracts | | Foreign
Exchange
Contracts | | Credit
Contracts | | Equity
Contracts |
| MyDestination 2015 | | | | | | | | | | |
| Futures | | $ 23,379 | | $ 23,390 | | $ — | | $ — | | $ (11) |
| MyDestination 2025 | | | | | | | | | | |
| Futures | | $ 44,841 | | $ 78,591 | | $ — | | $ — | | $ (33,750) |
| MyDestination 2035 | | | | | | | | | | |
| Futures | | $ 134,771 | | $ 77,447 | | $ — | | $ — | | $ 57,324 |
| MyDestination 2045 | | | | | | | | | | |
| Futures | | $ 117,207 | | $ 34,989 | | $ — | | $ — | | $ 82,218 |
| MyDestination 2055 | | | | | | | | | | |
| Futures | | $ 23,329 | | $ 4,376 | | $ — | | $ — | | $ 18,953 |
| Conservative Allocation | | | | | | | | | | |
| Futures | | $ (17,601) | | $ (7,009) | | $ — | | $ — | | $ (10,592) |
| Balanced Allocation | | | | | | | | | | |
| Futures | | $ (11,600) | | $ 79,104 | | $ — | | $ — | | $ (90,704) |
| Growth Allocation | | | | | | | | | | |
| Futures | | $ 94,018 | | $ 40,418 | | $ — | | $ — | | $ 53,600 |
| | | Change in Unrealized Appreciation (Depreciation) on Derivatives Recognized in Income |
| Fund | | Total Value
at
12/31/21 | | Interest Rate
Contracts | | Foreign
Exchange
Contracts | | Credit
Contracts | | Equity
Contracts |
| Aggressive Allocation | | | | | | | | | | |
| Futures | | $ 106,659 | | $ — | | $ — | | $ — | | $ 106,659 |
| Low-Duration Bond | | | | | | | | | | |
| Forwards | | $ 1,618,670 | | $ — | | $ 1,618,670 | | $ — | | $ — |
| Futures | | (2,231,095) | | (2,231,095) | | — | | — | | — |
| Purchased Options | | 1,458 | | 1,458 | | — | | — | | — |
| Swaps | | 1,033,875 | | 1,283,828 | | — | | (249,953) | | — |
| Written Options | | 57,046 | | 57,046 | | — | | — | | — |
| Totals | | $ 479,954 | | $ (888,763) | | $ 1,618,670 | | $ (249,953) | | $ — |
| Medium-Duration Bond | | | | | | | | | | |
| Forwards | | $ (387,054) | | $ — | | $ (387,054) | | $ — | | $ — |
| Futures | | 343,810 | | — | | — | | — | | 343,810 |
| Purchased Options | | (21,609) | | (21,609) | | — | | — | | — |
| Swaps | | (1,961,832) | | 854,129 | | — | | (2,815,961) | | — |
| Written Options | | (33,984) | | (33,984) | | — | | — | | — |
| Totals | | $ (2,060,669) | | $ 798,536 | | $ (387,054) | | $ (2,815,961) | | $ 343,810 |
| Global Bond | | | | | | | | | | |
| Forwards | | $ 1,725,567 | | $ — | | $ 1,725,567 | | $ — | | $ — |
| Futures | | (968,762) | | (968,762) | | — | | — | | — |
| Purchased Options | | 3,134 | | 3,134 | | — | | — | | — |
| Swaps | | 20,861 | | 38,108 | | — | | (17,247) | | — |
| Totals | | $ 780,800 | | $ (927,520) | | $ 1,725,567 | | $ (17,247) | | $ — |
| Defensive Market Strategies® | | | | | | | | | | |
| Forwards | | $ (326,563) | | $ — | | $ (326,563) | | $ — | | $ — |
| Futures | | 339,305 | | (288,921) | | — | | — | | 628,226 |
| Purchased Options | | 11,776,696 | | — | | — | | — | | 11,776,696 |
| Written Options | | 1,631,848 | | — | | — | | — | | 1,631,848 |
| Totals | | $ 13,421,286 | | $ (288,921) | | $ (326,563) | | $ — | | $ 14,036,770 |
| Global Impact Fund | | | | | | | | | | |
| Futures | | $ 55,230 | | $ 17,375 | | $ 113 | | $ — | | $ 37,742 |
| Equity Index | | | | | | | | | | |
| Futures | | $ 316,156 | | $ — | | $ — | | $ — | | $ 316,156 |
| Value Equity | | | | | | | | | | |
| Forwards | | $ (575,964) | | $ — | | $ (575,964) | | $ — | | $ — |
| Futures | | 514,976 | | — | | — | | — | | 514,976 |
| Totals | | $ (60,988) | | $ — | | $ (575,964) | | $ — | | $ 514,976 |
| Growth Equity | | | | | | | | | | |
| Futures | | $ 284,589 | | $ — | | $ — | | $ — | | $ 284,589 |
| | | Change in Unrealized Appreciation (Depreciation) on Derivatives Recognized in Income |
| Fund | | Total Value
at
12/31/21 | | Interest Rate
Contracts | | Foreign
Exchange
Contracts | | Credit
Contracts | | Equity
Contracts |
| Small Cap Equity | | | | | | | | | | |
| Forwards | | $ (9,816) | | $ — | | $ (9,816) | | $ — | | $ — |
| Futures | | (118,290) | | — | | — | | — | | (118,290) |
| Totals | | $ (128,106) | | $ — | | $ (9,816) | | $ — | | $ (118,290) |
| International Equity Index | | | | | | | | | | |
| Futures | | $ 404,213 | | $ — | | $ — | | $ — | | $ 404,213 |
| International Equity | | | | | | | | | | |
| Forwards | | $ (2,597,095) | | $ — | | $ (2,597,095) | | $ — | | $ — |
| Futures | | (1,392,531) | | — | | — | | — | | (1,392,531) |
| Swaps | | 3,650,429 | | — | | — | | — | | 3,650,429 |
| Totals | | $ (339,197) | | $ — | | $ (2,597,095) | | $ — | | $ 2,257,898 |
| Emerging Markets Equity | | | | | | | | | | |
| Forwards | | $ (478,289) | | $ — | | $ (478,289) | | $ — | | $ — |
| Futures | | (2,380,566) | | — | | — | | — | | (2,380,566) |
| Swaps | | (1,537,325) | | — | | — | | — | | (1,537,325) |
| Totals | | $ (4,396,180) | | $ — | | $ (478,289) | | $ — | | $ (3,917,891) |
| Global Real Estate Securities | | | | | | | | | | |
| Futures | | $ 128,267 | | $ — | | $ — | | $ — | | $ 128,267 |
| Strategic Alternatives | | | | | | | | | | |
| Forwards | | $ 185,699 | | $ — | | $ 185,699 | | $ — | | $ — |
| Futures | | 114,093 | | 114,093 | | — | | — | | — |
| Purchased Options | | (83,431) | | (83,431) | | — | | — | | — |
| Swaps | | 2,127,582 | | 804,075 | | — | | (2,686) | | 1,326,193 |
| Written Options | | (42,942) | | 31,945 | | — | | — | | (74,887) |
| Non-deliverable Bond Forwards | | (29,258) | | — | | (29,258) | | — | | — |
| Totals | | $ 2,271,743 | | $ 866,682 | | $ 156,441 | | $ (2,686) | | $ 1,251,306 |
Volume of Derivative Transactions
The tables below summarize the average daily notional derivative transactions by Fund during the year ended December 31, 2021.
Activity for the period is measured by the number of transactions during the fiscal year and the average daily notional amount for open forward foreign currency contract transactions was as follows:
| Fund | Number of
transactions | | Average
notional
market value
of contracts |
| Low-Duration Bond | 253 | | $3,936,596 |
| Medium-Duration Bond | 542 | | 2,801,409 |
| Global Bond | 1,603 | | 3,172,887 |
| Defensive Market Strategies® | 156 | | 2,059,996 |
| Value Equity | 177 | | 2,859,231 |
| Small Cap Equity | 46 | | 184,665 |
| International Equity | 2,649 | | 1,529,468 |
| Emerging Markets Equity | 4,100 | | 879,675 |
| Strategic Alternatives | 3,497 | | 1,113,113 |
Activity for the period is measured by the average daily notional amount for long and short open future contracts was as follows:
| Fund | Long average
notional
market value
of contracts | | Short average
notional
market value
of contracts |
| MyDestination 2015 | $ 706,507 | | $ — |
| MyDestination 2025 | 1,360,715 | | — |
| MyDestination 2035 | 1,295,533 | | — |
| MyDestination 2045 | 982,704 | | 534,680 |
| MyDestination 2055 | 362,504 | | — |
| Conservative Allocation | 990,968 | | — |
| Balanced Allocation | 1,899,196 | | 312,125 |
| Growth Allocation | 1,429,616 | | — |
| Aggressive Allocation | 1,736,704 | | — |
| Low-Duration Bond | 18,016,025 | | 2,980,427 |
| Medium-Duration Bond | 5,546,097 | | 3,617,095 |
| Global Bond | 5,900,110 | | 5,334,339 |
| Defensive Market Strategies® | 34,190,223 | | — |
| Global Impact Fund | 929,015 | | 2,578,765 |
| Equity Index | 10,861,540 | | — |
| Value Equity | 11,536,163 | | — |
| Growth Equity | 24,787,010 | | — |
| Small Cap Equity | 5,675,002 | | — |
| International Equity Index | 2,567,745 | | — |
| International Equity | 2,456,006 | | 2,266,731 |
| Emerging Markets Equity | 1,669,093 | | 1,027,362 |
| Global Real Estate Securities | 1,947,933 | | — |
| Strategic Alternatives | 1,789,232 | | 1,936,775 |
Activity for the period is measured by the number of transactions during the fiscal year and the average daily premiums paid and received on open options transactions was as follows:
| Fund | Number of
transactions | | Average
premiums
paid and
received |
| Low-Duration Bond | 60 | | $ 5,188 |
| Medium-Duration Bond | 776 | | 13,563 |
| Global Bond | 48 | | 5,154 |
| Defensive Market Strategies® | 707 | | 167,341 |
| Strategic Alternatives | 225 | | 20,258 |
Activity for the period is measured by the average daily notional amount for buy and sell protection on credit default swap transactions was as follows:
| Fund | Buy protection
average
notional
market value | | Sell protection
average
notional
market value |
| Low-Duration Bond | $6,022,222 | | $16,800,000 |
| Medium-Duration Bond | 176,429 | | 2,597,903 |
| Global Bond | 4,609,220 | | — |
Activity for the period is measured by the average daily notional amount for interest rate swaps based on the payment or receipt of the fixed rate was as follows:
| Fund | Paid fixed rate
average
notional
market value | | Received
fixed rate
average
notional
market value |
| Low-Duration Bond | $2,455,812 | | $3,396,619 |
| Medium-Duration Bond | 2,141,393 | | 3,440,669 |
| Global Bond | — | | 2,042,960 |
| Strategic Alternatives | 2,108,183 | | 2,334,337 |
Activity for the period is measured by the average daily notional amount for total return swaps was as follows:
| Fund | Average
notional
market value
of
transactions |
| International Equity | $ 440,312 |
| Emerging Markets Equity | 1,125,391 |
| Strategic Alternatives | 95,904 |
Activity for the period is measured by the number of contracts during the fiscal year and the average daily notional amount for open non-deliverable bond forward contracts was as follows:
| Fund | Average
notional
market value
of contracts |
| Strategic Alternatives | $930,617 |
j. Dividends and Distributions to Shareholders
The Fixed Income Funds declare and pay dividends from net investment income monthly. The Money Market Fund declares income dividends daily and pays them monthly. The Defensive Market Strategies® Fund, Equity Index Fund, Global Real Estate Securities Fund, Value Equity Fund and Growth Equity Fund declare and pay dividends from net investment income semi-annually. Each of the other Funds (including all the Target Date Funds and Target Risk Funds) declares and pays dividends from net investment income annually. Each Fund also distributes to its shareholders at least annually any realized net capital gains and net gains, if any, from certain foreign currency transactions. Dividends and distributions to shareholders are recorded on the ex-dividend date.
k. Expenses
Expenses arising in connection with a Fund are charged directly to that Fund. Expenses common to all Funds are generally allocated to each Fund in proportion to their relative net assets. Each Class of shares bears its pro-rata portion of expenses attributable to its Class, except that each Class separately bears expenses related specifically to that Class, such as shareholder reporting, registration, transfer agent and shareholder servicing fees.
l. Security Transactions, Income and Realized Gains and Losses
Security transactions are accounted for on the date securities are purchased or sold (the trade date). Dividend income is recognized on the ex-dividend date, except certain dividends from foreign securities where the ex-date may have passed, which are recorded as soon as the Fund is informed of the ex-dividend date. Interest income is accrued daily, including the amortization of market premium and the accretion of market discount using the effective interest method. Realized gains and losses from security transactions are on an identified cost basis.
3. FEES AND OTHER TRANSACTIONS
a. Investment Advisory Fees (Affiliate)
Pursuant to a separate investment advisory agreement, GuideStone Capital Management, LLC ("GSCM") acts as the Adviser to the Funds. As the Adviser, it provides an investment program for the Funds and for such services is paid a fee. GSCM and the Trust have entered into sub-advisory agreements with various sub-advisers to manage each Select Fund’s investments. Under the asset allocation and general supervision of GSCM, the sub-advisers make the day-to-day investment decisions for the Select Funds, and for such services, each sub-adviser receives a fee from the Funds. GSCM and the Trust have entered into sub-advisory agreements with Parametric Portfolio Associates LLC ("Parametric") with respect to the overlay program of each Fund (except the Money Market Fund) and the completion portfolio program of each Fund (except the Money Market Fund, Global Real Estate Securities Fund, Equity Index Fund and International Equity Index Fund). When such services are utilized, Parametric receives a fee from the respective Funds. The aggregate advisory fees and sub-adviser fees are included in the Statements of Assets and Liabilities and Statements of Operations under “Investment advisory fees”.
The advisory fees paid to GSCM and aggregate sub-advisory fees paid to the sub-advisers are computed daily based upon the net assets of each Fund. The actual advisory fees accrued and the sub-advisory fees accrued during the year ended December 31, 2021, based upon average daily net assets, were as follows:
| Fund | | Advisory Fees | | Sub-Adviser Fees |
| MyDestination 2015 | | 0.10% | | 0.01% |
| MyDestination 2025 | | 0.10% | | 0.00% |
| MyDestination 2035 | | 0.10% | | 0.00% |
| MyDestination 2045 | | 0.10% | | 0.00% |
| MyDestination 2055 | | 0.10% | | 0.00% |
| Conservative Allocation | | 0.10% | | 0.00% |
| Balanced Allocation | | 0.10% | | 0.00% |
| Growth Allocation | | 0.10% | | 0.00% |
| Aggressive Allocation | | 0.10% | | 0.00% |
| Money Market | | 0.07% | | 0.04% |
| Low-Duration Bond | | 0.11% | | 0.18% |
| Medium-Duration Bond | | 0.13% | | 0.18% |
| Global Bond | | 0.25% | | 0.22% |
| Defensive Market Strategies® | | 0.33% | | 0.29% |
| Global Impact Fund | | 0.36% | | 0.27% |
| Equity Index | | 0.08% | | 0.01% |
| Value Equity | | 0.33% | | 0.27% |
| Growth Equity | | 0.33% | | 0.32% |
| Small Cap Equity | | 0.33% | | 0.52% |
| International Equity Index | | 0.10% | | 0.01% |
| International Equity | | 0.33% | | 0.44% |
| Emerging Markets Equity | | 0.33% | | 0.52% |
| Global Real Estate Securities | | 0.30% | | 0.38% |
| Strategic Alternatives | | 0.40% | | 0.51% |
b. Shareholder Servicing Fees (Affiliate)
The Board of Trustees has adopted a Shareholder Service Plan for each Fund with an Investor Class. Under this Plan, the Investor Class is authorized to pay fees of 0.25% of average daily net assets to parties that provide services for and maintain shareholder accounts.
c. Expense Limitation (Affiliate)
The Strategic Alternatives Fund, International Equity Index Fund, and the Emerging Markets Equity Fund entered into expense cap agreements with GSCM, pursuant to which GSCM has agreed to pay, waive or assume expenses of the Class(es) of the Fund without regard to any expense reductions realized through use of directed brokerage, (and excluding interest, taxes, brokerage commissions, acquired fund fees and expenses, expenses on securities sold short, and extraordinary expenses) which exceed, in the aggregate, the annual percentage rate of that Class’ average daily net assets as indicated below through April 30, 2021, for the Investor Class of Emerging Markets Equity Fund and April 30, 2022, for the Institutional Class and Investor Class of Strategic Alternatives Fund and Institutional Class of International Equity Index Fund.
The Target Date Funds have entered into an expense cap agreement with GSCM, pursuant to which GSCM has agreed to pay, waive, or assume expenses of the Class(es) of the Fund (excluding extraordinary expenses) which exceed, in the aggregate, the annual percentage rate of that Class’ average daily net assets as indicated below through April 30, 2022.
The Expense Caps were as follows:
| | | For the Period
January 1, 2021
to
April 30, 2021 | | For the Period
May 1, 2021
to
December 31, 2021 |
| Fund | | Institutional
Class | | Investor
Class | | Institutional
Class | | Investor
Class |
| MyDestination 2015 | | 0.50% | | 0.75% | | 0.50% | | 0.75% |
| MyDestination 2025 | | 0.50% | | 0.75% | | 0.50% | | 0.75% |
| MyDestination 2035 | | 0.50% | | 0.75% | | 0.50% | | 0.75% |
| MyDestination 2045 | | 0.50% | | 0.75% | | 0.50% | | 0.75% |
| MyDestination 2055 | | 0.50% | | 0.75% | | 0.50% | | 0.75% |
| International Equity Index | | 0.22% | | N/A | | 0.22% | | N/A |
| Emerging Markets Equity | | N/A | | 1.57% | | N/A | | N/A |
| Strategic Alternatives | | N/A | | N/A | | 1.08% | | 1.40% |
Each Fund in turn agreed to reimburse GSCM for any operating expenses in excess of the expense limitation paid, waived or assumed by GSCM for that Fund during the limitation period, provided GSCM would not be entitled to reimbursement for any amount that would cause operating expenses to exceed the expense limitation in place during the year in which (1) GSCM incurred or waived the operating expenses, or (2) during the year in which the reimbursement would be made, whichever is lower, and provided further that no amount will be reimbursed by the respective class of that Fund more than three years after the year in which it was incurred or waived.
For those Funds that had operating expenses in excess of the expense limitation paid, waived or assumed by GSCM during the limitation period, the amounts subject to possible future reimbursement under the expense limitation agreement and the expiration schedule at December 31, 2021, are as follows:
| | | Institutional Class | | Investor Class |
| Fund | | 2022 | | 2023 | | 2024 | | 2022 | | 2023 | | 2024 |
| MyDestination 2015 | | $ 85,750 | | $114,196 | | $ 44,635 | | $356,438 | | $368,132 | | $110,648 |
| MyDestination 2025 | | 107,568 | | 153,908 | | 44,948 | | 352,125 | | 415,281 | | 119,203 |
| MyDestination 2035 | | — | | — | | — | | — | | — | | — |
| MyDestination 2045 | | — | | — | | — | | — | | — | | — |
| MyDestination 2055 | | 22,333 | | 19,316 | | 8,367 | | 40,211 | | 29,868 | | 4,715 |
| International Equity Index | | — | | — | | — | | N/A | | N/A | | N/A |
| Emerging Markets Equity | | N/A | | N/A | | N/A | | — | | — | | — |
| Strategic Alternatives | | — | | — | | 246,313 | | — | | — | | 42,950 |
The shareholder servicing agent, the Adviser, and/or the sub-adviser may voluntarily waive fees and/or reimburse expenses to the extent necessary to assist the Money Market Fund in attempting to maintain a yield of at least 0.00%. Such yield waivers and reimbursements are voluntary and could change or be terminated at any time at the discretion of the Adviser. There is no guarantee that the Money Market Fund will maintain a positive yield. These previously waived fees are not subject to recoupment.
d. Brokerage Service Arrangements
Subject to best execution, the Adviser directs the sub-advisers to place a certain percentage of security trades with designated brokers who have agreed to pay certain custody, transfer agency or other operating expenses through the use of Brokerage Service Arrangements on behalf of the Funds. These payments can be found on the Statements of Operation under the heading “Fees Paid Indirectly.”
| Fund | | Expenses Paid
Through Brokerage
Service Agreements |
| Value Equity | | $20,498 |
| Growth Equity | | 43,997 |
| Small Cap Equity | | 57,447 |
| Emerging Markets Equity | | 1,963 |
| Global Real Estate Securities | | 14,188 |
e. Administrator, Transfer Agent and Distributor
The Northern Trust Company (“Northern Trust”) provides administrative and accounting services to the Funds. For its services as Administrator, Northern Trust is entitled to receive fees, computed daily and paid monthly, based upon the average daily net assets of each Fund. The fees, excluding out of pocket expenses, range between 0.0028% and 0.0225% of average daily net assets. For its services as Transfer Agent, BNY Mellon Investment Servicing (US) Inc. (“BNY Mellon”) receives a fee based mainly upon the number of accounts serviced. Certain minimum fees and transaction charges may apply.
Foreside Funds Distributors LLC serves as the Underwriter and does not receive any fees in its capacity as Underwriter from GuideStone Funds. The fees are paid by GSCM.
f. Investments in Affiliates
The Target Date and Target Risk Funds do not invest in the underlying Select Funds for the purpose of exercising management or control; however, investments made by each Target Date and Target Risk Fund within each of its principal investment strategies may represent a significant portion of an underlying Select Fund’s net assets. At December 31, 2021, the Target Date and Target Risk Funds were the owners of record of the following approximate percentages of the total outstanding shares of the underlying Select Funds as detailed below:
| Fund | | | | MyDestination
2015 Fund | | MyDestination
2025 Fund | | MyDestination
2035 Fund | | MyDestination
2045 Fund | | MyDestination
2055 Fund |
| Money Market | | | | 0.59% | | 1.57% | | 1.96% | | 1.63% | | 0.57% |
| Low-Duration Bond | | | | 10.69 | | 13.90 | | — | | — | | — |
| Medium-Duration Bond | | | | 7.47 | | 17.67 | | 10.88 | | 3.65 | | 0.77 |
| Global Bond | | | | 6.14 | | 15.42 | | 10.63 | | 3.49 | | 0.74 |
| Defensive Market Strategies® | | | | 5.63 | | 14.46 | | 7.40 | | 3.72 | | 1.46 |
| Equity Index | | | | 4.15 | | 13.24 | | 16.22 | | 15.71 | | 6.56 |
| Small Cap Equity | | | | 2.00 | | 6.21 | | 7.39 | | 7.37 | | 3.09 |
| International Equity Index | | | | 7.13 | | 22.61 | | 27.42 | | 26.48 | | 11.11 |
| Emerging Markets Equity | | | | 2.94 | | 9.58 | | 11.64 | | 11.21 | | 4.82 |
| Global Real Estate Securities | | | | 2.02 | | 6.17 | | 6.49 | | 5.96 | | 2.48 |
| Strategic Alternatives | | | | 6.28 | | 9.85 | | 1.47 | | — | | — |
| Fund | | | | Conservative
Allocation Fund | | Balanced
Allocation Fund | | Growth
Allocation Fund | | Aggressive
Allocation Fund |
| Money Market | | | | 0.39% | | 2.12% | | 2.06% | | 1.73% |
| Low-Duration Bond | | | | 25.03 | | 6.51 | | 2.30 | | — |
| Medium-Duration Bond | | | | 2.98 | | 20.08 | | 6.99 | | — |
| Global Bond | | | | 2.83 | | 22.41 | | 7.81 | | — |
| Defensive Market Strategies® | | | | 2.86 | | 11.87 | | 4.36 | | — |
| Value Equity | | | | 2.18 | | 12.61 | | 18.57 | | 23.91 |
| Growth Equity | | | | 1.43 | | 8.00 | | 11.92 | | 15.31 |
| Small Cap Equity | | | | 0.66 | | 3.92 | | 5.78 | | 7.41 |
| International Equity | | | | 2.27 | | 13.15 | | 19.37 | | 25.52 |
| Fund | | | | Conservative
Allocation Fund | | Balanced
Allocation Fund | | Growth
Allocation Fund | | Aggressive
Allocation Fund |
| Emerging Markets Equity | | | | 1.54% | | 8.82% | | 13.00% | | 16.96% |
| Global Real Estate Securities | | | | 2.12 | | 10.65 | | 13.45 | | — |
| Strategic Alternatives | | | | 8.04 | | 19.57 | | 10.08 | | — |
| Global Impact | | | | 10.04 | | 40.24 | | 31.88 | | — |
A summary of the Funds' total long-term and short-term purchases and sales of the shares of the underlying Select Funds during the year ended December 31, 2021, is as follows (amounts in thousands):
| | Total Value
at
12/31/20 | | Purchases | | Sales Proceeds | | Net Realized
Gains/(Losses) | | Change in
Unrealized
Appreciation/
(Depreciation) | | Total Value
at
12/31/21 | | Dividend
Income | | Distributions
of Realized
Gains |
| MyDestination 2015 | | | | | | | | | | | | | | | |
| Money Market | $ 9,284 | | $ 145,292 | | $ 145,166 | | $ — | | $ — | | $ 9,410 | | $ — | | $ — |
| Low-Duration Bond | 112,047 | | 14,038 | | 9,720 | | 111 | | (1,833) | | 114,643 | | 1,161 | | 95 |
| Medium-Duration Bond | 188,415 | | 36,672 | | 37,540 | | 347 | | (8,003) | | 179,891 | | 3,350 | | 322 |
| Global Bond | 37,775 | | 5,091 | | 2,200 | | 84 | | (2,429) | | 38,321 | | 826 | | 609 |
| Defensive Market Strategies® | 72,416 | | 14,039 | | 2,591 | | 566 | | 209 | | 84,639 | | 590 | | 7,699 |
| Equity Index | 113,332 | | 29,166 | | 30,944 | | 9,598 | | 17,409 | | 138,561 | | 1,484 | | 3,053 |
| Small Cap Equity | 13,824 | | 4,691 | | 1,590 | | 297 | | 288 | | 17,510 | | 21 | | 2,428 |
| International Equity Index | 60,312 | | 14,104 | | 18,266 | | 3,209 | | 85 | | 59,444 | | 1,676 | | 1,427 |
| Emerging Markets Equity | 26,523 | | 7,019 | | 6,060 | | 1,909 | | (5,043) | | 24,348 | | 184 | | 2,714 |
| Global Real Estate Securities | 5,509 | | 1,016 | | 1,020 | | 74 | | 1,215 | | 6,794 | | 242 | | 196 |
| Strategic Alternatives | 20,611 | | 2,154 | | 1,380 | | 31 | | 698 | | 22,114 | | 45 | | 313 |
| | $ 660,048 | | $ 273,282 | | $ 256,477 | | $16,226 | | $ 2,596 | | $ 695,675 | | $ 9,579 | | $ 18,856 |
| MyDestination 2025 | | | | | | | | | | | | | | | |
| Money Market | $ 26,446 | | $ 155,921 | | $ 157,203 | | $ — | | $ — | | $ 25,164 | | $ — | | $ — |
| Low-Duration Bond | 110,274 | | 46,116 | | 5,100 | | 85 | | (2,328) | | 149,047 | | 1,470 | | 122 |
| Medium-Duration Bond | 400,140 | | 61,884 | | 19,970 | | 158 | | (16,774) | | 425,438 | | 7,700 | | 684 |
| Global Bond | 89,006 | | 16,036 | | 3,200 | | 179 | | (5,844) | | 96,177 | | 2,009 | | 1,508 |
| Defensive Market Strategies® | 179,947 | | 36,010 | | 94 | | 21 | | 1,634 | | 217,518 | | 1,484 | | 19,625 |
| Equity Index | 356,143 | | 46,337 | | 44,662 | | 13,646 | | 70,350 | | 441,814 | | 4,632 | | 9,505 |
| Small Cap Equity | 44,282 | | 15,123 | | 7,000 | | 808 | | 1,068 | | 54,281 | | 65 | | 7,528 |
| International Equity Index | 191,791 | | 29,343 | | 42,870 | | 7,624 | | 2,632 | | 188,520 | | 5,317 | | 4,526 |
| Emerging Markets Equity | 82,255 | | 25,371 | | 18,130 | | 4,876 | | (15,195) | | 79,177 | | 597 | | 8,824 |
| Global Real Estate Securities | 17,708 | | 1,728 | | 2,500 | | 178 | | 3,676 | | 20,790 | | 694 | | 581 |
| Strategic Alternatives | 28,222 | | 5,398 | | — | | — | | 1,043 | | 34,663 | | 68 | | 474 |
| | $1,526,214 | | $ 439,267 | | $ 300,729 | | $27,575 | | $ 40,262 | | $1,732,589 | | $24,036 | | $ 53,377 |
| | Total Value
at
12/31/20 | | Purchases | | Sales Proceeds | | Net Realized
Gains/(Losses) | | Change in
Unrealized
Appreciation/
(Depreciation) | | Total Value
at
12/31/21 | | Dividend
Income | | Distributions
of Realized
Gains |
| MyDestination 2035 | | | | | | | | | | | | | | | |
| Money Market | $ 26,107 | | $ 147,809 | | $ 142,433 | | $ — | | $ — | | $ 31,483 | | $ — | | $ — |
| Medium-Duration Bond | 214,587 | | 77,602 | | 20,763 | | 208 | | (9,593) | | 262,041 | | 4,631 | | 386 |
| Global Bond | 50,996 | | 22,034 | | 3,000 | | (16) | | (3,707) | | 66,307 | | 1,336 | | 1,046 |
| Defensive Market Strategies® | 74,913 | | 36,387 | | — | | — | | 67 | | 111,367 | | 741 | | 9,946 |
| Equity Index | 400,025 | | 69,408 | | 26,784 | | 12,767 | | 85,833 | | 541,249 | | 5,555 | | 11,406 |
| Small Cap Equity | 49,849 | | 20,266 | | 7,500 | | 1,277 | | 686 | | 64,578 | | 77 | | 8,956 |
| International Equity Index | 216,992 | | 37,791 | | 37,442 | | 7,607 | | 3,640 | | 228,588 | | 6,447 | | 5,488 |
| Emerging Markets Equity | 91,962 | | 42,155 | | 25,308 | | 7,135 | | (19,674) | | 96,270 | | 726 | | 10,729 |
| Global Real Estate Securities | 16,768 | | 2,250 | | 1,000 | | 73 | | 3,771 | | 21,862 | | 734 | | 610 |
| Strategic Alternatives | 2,548 | | 2,700 | | 204 | | — | | 115 | | 5,159 | | 10 | | 71 |
| | $1,144,747 | | $ 458,402 | | $ 264,434 | | $29,051 | | $ 61,138 | | $1,428,904 | | $20,257 | | $ 48,638 |
| MyDestination 2045 | | | | | | | | | | | | | | | |
| Money Market | $ 19,105 | | $ 110,615 | | $ 103,588 | | $ — | | $ — | | $ 26,132 | | $ — | | $ — |
| Medium-Duration Bond | 76,230 | | 28,895 | | 13,940 | | 392 | | (3,684) | | 87,893 | | 1,608 | | 137 |
| Global Bond | 18,246 | | 8,052 | | 3,266 | | 153 | | (1,414) | | 21,771 | | 461 | | 334 |
| Defensive Market Strategies® | 41,072 | | 14,583 | | — | | — | | 252 | | 55,907 | | 375 | | 4,981 |
| Equity Index | 371,295 | | 76,897 | | 18,000 | | 8,855 | | 85,044 | | 524,091 | | 5,327 | | 10,948 |
| Small Cap Equity | 46,852 | | 21,873 | | 5,977 | | 1,057 | | 576 | | 64,381 | | 76 | | 8,788 |
| International Equity Index | 202,512 | | 43,121 | | 35,300 | | 6,544 | | 3,838 | | 220,715 | | 6,224 | | 5,299 |
| Emerging Markets Equity | 85,829 | | 40,332 | | 21,122 | | 6,566 | | (18,887) | | 92,718 | | 699 | | 10,333 |
| Global Real Estate Securities | 14,680 | | 2,492 | | 527 | | (21) | | 3,438 | | 20,062 | | 655 | | 560 |
| | $ 875,821 | | $ 346,860 | | $ 201,720 | | $23,546 | | $ 69,163 | | $1,113,670 | | $15,425 | | $ 41,380 |
| MyDestination 2055 | | | | | | | | | | | | | | | |
| Money Market | $ 7,667 | | $ 63,762 | | $ 62,313 | | $ — | | $ — | | $ 9,116 | | $ — | | $ — |
| Medium-Duration Bond | 17,627 | | 8,215 | | 6,615 | | 222 | | (985) | | 18,464 | | 361 | | 32 |
| Global Bond | 4,404 | | 2,108 | | 1,604 | | 41 | | (329) | | 4,620 | | 105 | | 72 |
| Defensive Market Strategies® | 15,424 | | 6,777 | | 235 | | 28 | | 4 | | 21,998 | | 146 | | 1,949 |
| Equity Index | 142,573 | | 47,082 | | 8,053 | | 3,181 | | 34,097 | | 218,880 | | 2,193 | | 4,512 |
| Small Cap Equity | 17,459 | | 13,007 | | 3,845 | | 781 | | (403) | | 26,999 | | 32 | | 3,700 |
| International Equity Index | 75,238 | | 26,522 | | 12,899 | | 2,457 | | 1,283 | | 92,601 | | 2,606 | | 2,219 |
| Emerging Markets Equity | 32,382 | | 19,535 | | 6,591 | | 1,435 | | (6,892) | | 39,869 | | 295 | | 4,355 |
| Global Real Estate Securities | 5,846 | | 1,776 | | 613 | | 47 | | 1,291 | | 8,347 | | 262 | | 230 |
| | $ 318,620 | | $ 188,784 | | $ 102,768 | | $ 8,192 | | $ 28,066 | | $ 440,894 | | $ 6,000 | | $ 17,069 |
| | Total Value
at
12/31/20 | | Purchases | | Sales Proceeds | | Net Realized
Gains/(Losses) | | Change in
Unrealized
Appreciation/
(Depreciation) | | Total Value
at
12/31/21 | | Dividend
Income | | Distributions
of Realized
Gains |
| Conservative Allocation | | | | | | | | | | | | | | | |
| Money Market | $ 8,807 | | $ 62,580 | | $ 65,139 | | $ — | | $ — | | $ 6,248 | | $ — | | $ — |
| Low-Duration Bond | 262,080 | | 12,200 | | 1,900 | | 25 | | (4,004) | | 268,401 | | 2,678 | | 223 |
| Medium-Duration Bond | 68,319 | | 7,499 | | 1,400 | | 15 | | (2,769) | | 71,664 | | 1,284 | | 115 |
| Global Bond | 17,340 | | 1,656 | | 280 | | 2 | | (1,044) | | 17,674 | | 375 | | 281 |
| Defensive Market Strategies® | 40,752 | | 4,249 | | 2,600 | | 573 | | 48 | | 43,022 | | 305 | | 3,943 |
| Global Impact | — | | 16,129 | | — | | — | | 1,521 | | 17,650 | | 42 | | 88 |
| Value Equity | 32,737 | | 3,472 | | 8,800 | | 324 | | 3,017 | | 30,750 | | 539 | | 2,933 |
| Growth Equity | 31,877 | | 6,139 | | 7,900 | | 1,838 | | (1,896) | | 30,058 | | 7 | | 5,239 |
| Small Cap Equity | 6,421 | | 803 | | 2,000 | | 692 | | (173) | | 5,743 | | — | | 797 |
| International Equity | 34,598 | | 2,384 | | 7,000 | | 1,087 | | (491) | | 30,578 | | 96 | | 2,017 |
| Emerging Markets Equity | 14,137 | | 2,214 | | 2,000 | | 774 | | (2,398) | | 12,727 | | 366 | | 1,418 |
| Global Real Estate Securities | 6,684 | | 442 | | 1,450 | | 123 | | 1,341 | | 7,140 | | 243 | | 199 |
| Strategic Alternatives | 26,728 | | 1,455 | | 800 | | 19 | | 894 | | 28,296 | | 57 | | 398 |
| | $ 550,480 | | $ 121,222 | | $ 101,269 | | $ 5,472 | | $ (5,954) | | $ 569,951 | | $ 5,992 | | $ 17,651 |
| Balanced Allocation | | | | | | | | | | | | | | | |
| Money Market | $ 35,198 | | $ 175,568 | | $ 176,807 | | $ — | | $ — | | $ 33,959 | | $ — | | $ — |
| Low-Duration Bond | 103,592 | | 4,750 | | 37,600 | | 538 | | (1,485) | | 69,795 | | 692 | | 58 |
| Medium-Duration Bond | 385,477 | | 134,949 | | 18,700 | | 151 | | (18,198) | | 483,679 | | 8,671 | | 777 |
| Global Bond | 137,177 | | 15,935 | | 5,000 | | 92 | | (8,412) | | 139,792 | | 2,921 | | 2,213 |
| Defensive Market Strategies® | 171,724 | | 17,753 | | 13,600 | | 2,876 | | (258) | | 178,495 | | 1,287 | | 16,467 |
| Global Impact | — | | 66,519 | | 2,000 | | 148 | | 6,098 | | 70,765 | | 165 | | 353 |
| Extended-Duration Bond Fund | 69,462 | | — | | 68,234 | | 1,045 | | (2,273) | | — | | — | | — |
| Value Equity | 181,702 | | 25,072 | | 47,428 | | (1,665) | | 20,041 | | 177,722 | | 3,119 | | 16,954 |
| Growth Equity | 177,367 | | 40,023 | | 48,598 | | 15,393 | | (15,849) | | 168,336 | | — | | 29,423 |
| Small Cap Equity | 35,903 | | 4,787 | | 8,700 | | 2,443 | | (211) | | 34,222 | | 41 | | 4,746 |
| International Equity | 193,375 | | 19,909 | | 39,500 | | (308) | | 3,496 | | 176,972 | | 2,120 | | 11,675 |
| Emerging Markets Equity | 79,096 | | 16,875 | | 14,000 | | 3,802 | | (12,866) | | 72,907 | | 550 | | 8,125 |
| Global Real Estate Securities | 33,524 | | 2,341 | | 7,150 | | 434 | | 6,727 | | 35,876 | | 1,297 | | 1,044 |
| Strategic Alternatives | 64,381 | | 3,179 | | 800 | | 18 | | 2,120 | | 68,898 | | 136 | | 943 |
| | $1,667,978 | | $ 527,660 | | $ 488,117 | | $24,967 | | $(21,070) | | $1,711,418 | | $20,999 | | $ 92,778 |
| | Total Value
at
12/31/20 | | Purchases | | Sales Proceeds | | Net Realized
Gains/(Losses) | | Change in
Unrealized
Appreciation/
(Depreciation) | | Total Value
at
12/31/21 | | Dividend
Income | | Distributions
of Realized
Gains |
| Growth Allocation | | | | | | | | | | | | | | | |
| Money Market | $ 26,309 | | $ 132,102 | | $ 125,429 | | $ — | | $ — | | $ 32,982 | | $ — | | $ — |
| Low-Duration Bond | 35,515 | | 3,515 | | 14,000 | | 251 | | (598) | | 24,683 | | 245 | | 20 |
| Medium-Duration Bond | 136,994 | | 44,087 | | 6,600 | | 30 | | (6,266) | | 168,245 | | 3,020 | | 268 |
| Global Bond | 46,960 | | 7,487 | | 2,900 | | 56 | | (2,915) | | 48,688 | | 1,017 | | 771 |
| Defensive Market Strategies® | 59,721 | | 7,371 | | 2,350 | | 295 | | 501 | | 65,538 | | 465 | | 6,006 |
| Global Impact | — | | 53,111 | | 1,944 | | 144 | | 4,747 | | 56,058 | | 131 | | 279 |
| Extended-Duration Bond Fund | 24,154 | | 2,000 | | 25,729 | | 1,001 | | (1,426) | | — | | — | | — |
| Value Equity | 252,615 | | 34,574 | | 51,753 | | (6,351) | | 32,577 | | 261,662 | | 4,604 | | 24,970 |
| Growth Equity | 246,973 | | 59,607 | | 54,741 | | 14,840 | | (16,047) | | 250,632 | | — | | 43,758 |
| Small Cap Equity | 48,319 | | 7,068 | | 7,800 | | 1,707 | | 1,237 | | 50,531 | | 60 | | 7,008 |
| International Equity | 265,837 | | 26,326 | | 34,994 | | (376) | | 3,966 | | 260,759 | | 3,123 | | 17,202 |
| Emerging Markets Equity | 108,579 | | 28,792 | | 15,550 | | 4,098 | | (18,417) | | 107,502 | | 811 | | 11,981 |
| Global Real Estate Securities | 39,588 | | 4,771 | | 7,800 | | 252 | | 8,479 | | 45,290 | | 1,506 | | 1,265 |
| Strategic Alternatives | 31,518 | | 3,456 | | 560 | | 4 | | 1,077 | | 35,495 | | 70 | | 486 |
| | $1,323,082 | | $ 414,267 | | $ 352,150 | | $15,951 | | $ 6,915 | | $1,408,065 | | $15,052 | | $114,014 |
| Aggressive Allocation | | | | | | | | | | | | | | | |
| Money Market | $ 19,020 | | $ 87,384 | | $ 78,682 | | $ — | | $ — | | $ 27,722 | | $ — | | $ — |
| Value Equity | 303,980 | | 46,472 | | 46,120 | | (4,660) | | 37,168 | | 336,840 | | 5,968 | | 32,505 |
| Growth Equity | 304,001 | | 74,951 | | 55,495 | | 13,522 | | (14,956) | | 322,023 | | — | | 55,951 |
| Small Cap Equity | 61,249 | | 10,558 | | 10,673 | | 1,224 | | 2,395 | | 64,753 | | 77 | | 8,980 |
| International Equity | 320,381 | | 35,772 | | 16,128 | | (253) | | 3,690 | | 343,462 | | 4,114 | | 22,658 |
| Emerging Markets Equity | 131,199 | | 36,685 | | 8,083 | | 2,166 | | (21,744) | | 140,223 | | 1,058 | | 15,627 |
| | $1,139,830 | | $ 291,822 | | $ 215,181 | | $11,999 | | $ 6,553 | | $1,235,023 | | $11,217 | | $135,721 |
| Low-Duration Bond | | | | | | | | | | | | | | | |
| Money Market | $ 34,879 | | $ 620,699 | | $ 627,070 | | $ — | | $ — | | $ 28,508 | | $ — | | $ — |
| Medium-Duration Bond | | | | | | | | | | | | | | | |
| Money Market | $ 118,803 | | $1,603,023 | | $1,588,162 | | $ — | | $ — | | $ 133,664 | | $ — | | $ — |
| Global Bond | | | | | | | | | | | | | | | |
| Money Market | $ 46,167 | | $ 297,604 | | $ 310,762 | | $ — | | $ — | | $ 33,009 | | $ — | | $ — |
| Defensive Market Strategies® | | | | | | | | | | | | | | | |
| Money Market | $ 85,866 | | $1,009,149 | | $1,055,795 | | $ — | | $ — | | $ 39,220 | | $ — | | $ — |
| Global Impact Fund | | | | | | | | | | | | | | | |
| Money Market | $ — | | $ 75,050 | | $ 69,758 | | $ — | | $ — | | $ 5,292 | | $ — | | $ — |
| Equity Index | | | | | | | | | | | | | | | |
| Money Market | $ 40,898 | | $ 622,205 | | $ 600,968 | | $ — | | $ — | | $ 62,135 | | $ — | | $ — |
| Value Equity | | | | | | | | | | | | | | | |
| Money Market | $ 36,795 | | $ 413,558 | | $ 406,023 | | $ — | | $ — | | $ 44,330 | | $ — | | $ — |
| | Total Value
at
12/31/20 | | Purchases | | Sales Proceeds | | Net Realized
Gains/(Losses) | | Change in
Unrealized
Appreciation/
(Depreciation) | | Total Value
at
12/31/21 | | Dividend
Income | | Distributions
of Realized
Gains |
| Growth Equity | | | | | | | | | | | | | | | |
| Money Market | $ 62,159 | | $ 698,283 | | $ 684,378 | | $ — | | $ — | | $ 76,064 | | $ — | | $ — |
| Small Cap Equity | | | | | | | | | | | | | | | |
| Money Market | $ 25,631 | | $ 267,453 | | $ 262,185 | | $ — | | $ — | | $ 30,899 | | $ — | | $ — |
| International Equity Index | | | | | | | | | | | | | | | |
| Money Market | $ 21,415 | | $ 344,069 | | $ 319,397 | | $ — | | $ — | | $ 46,087 | | $ — | | $ — |
| International Equity | | | | | | | | | | | | | | | |
| Money Market | $ 86,428 | | $ 466,425 | | $ 467,032 | | $ — | | $ — | | $ 85,821 | | $ — | | $ — |
| Emerging Markets Equity | | | | | | | | | | | | | | | |
| Money Market | $ 21,824 | | $ 470,218 | | $ 443,175 | | $ — | | $ — | | $ 48,867 | | $ — | | $ — |
| Global Real Estate Securities | | | | | | | | | | | | | | | |
| Money Market | $ 7,709 | | $ 74,133 | | $ 72,010 | | $ — | | $ — | | $ 9,832 | | $ — | | $ — |
| Strategic Alternatives | | | | | | | | | | | | | | | |
| Money Market | $ 67,070 | | $ 358,826 | | $ 412,707 | | $ — | | $ — | | $ 13,189 | | $ — | | $ — |
4. SECURITIES LENDING
Pursuant to a Securities Lending Authorization Agreement with Northern Trust, the Select Funds may lend portfolio securities to certain brokers, dealers and other financial institutions that pay the Select Funds a negotiated fee. When loaning securities, the Select Funds retain the benefits of owning the securities, including the economic equivalent of dividends or interest generated by the security. The Select Funds also have the ability to terminate the loans at any time and can do so in order to vote proxies or sell the securities. The Select Funds receive cash or U.S. government securities, such as U.S. Treasury Bills and U.S. Treasury Notes, as collateral against the loaned securities in an amount at least equal to the market value of the loaned securities. The adequacy of the collateral is monitored on a daily basis and the market value of the securities loaned is determined at the close of each business day. It is the policy of these Funds to obtain additional collateral from or return excess collateral to the borrower by the end of the next business day, following the valuation date of the securities loaned. Therefore, the value of the collateral held may be temporarily less than the value of the securities on loan. However, in the event of default or bankruptcy by the other party to the agreement, realization and/or retention of the collateral may be subject to legal proceedings. Cash collateral has been invested in a short-term government money market fund managed by an affiliate of Northern Trust, which invests 99.5% or more of its total assets in U.S. government securities. This investment is presented on the Funds’ Schedules of Investments. The Funds do not have control of non-cash securities lending collateral, and as such, this amount is not presented on the Funds’ Schedules of Investments.
The securities lending agreements with borrowers permit the Funds, under certain circumstances including an event of default (such as bankruptcy or insolvency), to offset amounts payable by the Fund to the same counterparty against amounts to be received and create one single net payment due to or from the Fund. Securities lending transactions pose certain risks to the Funds. There is a risk that a borrower may default on its obligations to return loaned securities. A Fund will be responsible for the risks associated with the investment of cash collateral, including any collateral invested in an unaffiliated or affiliated money market fund. A Fund may lose money on its investment of cash collateral or may fail to earn sufficient income on its investment to
meet obligations to the borrower. In addition, delays may occur in the recovery of securities from borrowers, which could interfere with a Fund’s ability to vote proxies or to settle transactions.
At December 31, 2021, the market values of loaned securities and collateral received were as follows:
| Fund | | Value of
Securities Loaned | | Value of
Non-cash
Collateral | | Value of
Cash
Collateral | | Total
Value of
Collateral * |
| Low-Duration Bond | | $ 10,974,907 | | $ 3,227,489 | | $ 8,092,328 | | $ 11,319,817 |
| Medium-Duration Bond | | 56,108,216 | | 29,881,594 | | 27,825,685 | | 57,707,279 |
| Global Bond | | 20,294,920 | | 8,299,506 | | 12,778,817 | | 21,078,323 |
| Defensive Market Strategies® | | 50,672,747 | | 17,784,948 | | 34,282,159 | | 52,067,107 |
| Global Impact Fund | | 1,702,427 | | 1,796,990 | | — | | 1,796,990 |
| Equity Index | | 93,675,896 | | 94,779,298 | | 1,227,216 | | 96,006,514 |
| Value Equity | | 29,420,706 | | 28,774,647 | | 1,685,880 | | 30,460,527 |
| Growth Equity | | 167,628,183 | | 162,461,518 | | 10,176,712 | | 172,638,230 |
| Small Cap Equity | | 93,396,584 | | 78,396,213 | | 17,934,148 | | 96,330,361 |
| International Equity Index | | 23,787,825 | | 16,357,055 | | 8,717,861 | | 25,074,916 |
| International Equity | | 21,147,390 | | 24,465,650 | | 40,586 | | 24,506,236 |
| Emerging Markets Equity | | 11,370,117 | | 7,850,723 | | 4,026,413 | | 11,877,136 |
| Global Real Estate Securities | | 24,651,876 | | 25,346,246 | | 67,622 | | 25,413,868 |
*As of the end of the reporting period, the value of the collateral pledged from the counterparty exceeded the value of the securities out on loan in certain Funds resulting in a net amount of $0. Refer to the Fund's Schedule of Investments for details on the securities out on loan. Additional information about master netting arrangements can be found in the Repurchase Agreements and Derivative Financial Instruments sections of the Notes to Financial Statements.
The Funds’ securities lending transactions are accounted for as secured borrowings and have an overnight and continuous contractual maturity. The gross amounts of recognized liabilities for securities lending transactions outstanding as of December 31, 2021, are disclosed as “Collateral held for securities on loan, at value” on the Statements of Assets and Liabilities, where applicable.
5. INVESTMENT TRANSACTIONS
For the year ended December 31, 2021, the cost of purchases and proceeds from sales and maturities for each Fund were as follows:
| | | Cost of Purchases and
Proceeds from Sales and Maturities
of Long-Term Securities
(other than U.S. Government Obligations) | | Cost of Purchases and
Proceeds from Sales and Maturities
of Long-Term U.S Government Obligations |
| Fund | | Purchases | | Sale and Maturity
Proceeds | | Purchases | | Sale and Maturity
Proceeds |
| MyDestination 2015 | | $127,987,801 | | $111,310,133 | | $ 23,603,966 | | $ 12,746,802 |
| MyDestination 2025 | | 283,344,994 | | 143,526,019 | | 20,541,706 | | 10,342,875 |
| MyDestination 2035 | | 310,593,461 | | 122,001,128 | | — | | — |
| MyDestination 2045 | | 236,245,025 | | 98,132,417 | | — | | — |
| MyDestination 2055 | | 125,020,281 | | 40,454,471 | | — | | — |
| Conservative Allocation | | 58,642,588 | | 36,130,000 | | — | | — |
| | | Cost of Purchases and
Proceeds from Sales and Maturities
of Long-Term Securities
(other than U.S. Government Obligations) | | Cost of Purchases and
Proceeds from Sales and Maturities
of Long-Term U.S Government Obligations |
| Fund | | Purchases | | Sale and Maturity
Proceeds | | Purchases | | Sale and Maturity
Proceeds |
| Balanced Allocation | | $352,092,142 | | $311,309,300 | | $ — | | $ — |
| Growth Allocation | | 282,165,268 | | 226,720,778 | | — | | — |
| Aggressive Allocation | | 204,438,174 | | 136,500,000 | | — | | — |
| Low-Duration Bond | | 408,236,528 | | 362,889,095 | | 2,741,656,856 | | 2,680,339,893 |
| Medium-Duration Bond | | 525,333,414 | | 313,227,009 | | 7,541,910,478 | | 7,547,686,359 |
| Global Bond | | 200,059,713 | | 142,361,535 | | 200,640,693 | | 180,536,809 |
| Defensive Market Strategies® | | 491,492,447 | | 915,097,141 | | 339,562,477 | | — |
| Global Impact Fund | | 154,478,609 | | 20,708,628 | | 90,146,421 | | 69,607,762 |
| Equity Index | | 287,153,498 | | 124,473,778 | | — | | — |
| Value Equity | | 486,978,735 | | 581,504,587 | | — | | — |
| Growth Equity | | 498,346,863 | | 772,330,813 | | — | | — |
| Small Cap Equity | | 439,646,649 | | 419,555,516 | | — | | — |
| International Equity Index | | 139,115,459 | | 170,010,191 | | — | | — |
| International Equity | | 445,837,165 | | 519,670,364 | | — | | — |
| Emerging Markets Equity | | 497,871,314 | | 460,464,916 | | — | | — |
| Global Real Estate Securities | | 308,763,735 | | 302,199,768 | | — | | — |
| Strategic Alternatives | | 143,699,037 | | 198,901,758 | | 330,705,150 | | 352,912,945 |
6. CAPITAL SHARE TRANSACTIONS
Transactions in shares of capital stock were as follows:
| | Year Ended 12/31/21 | | Year Ended 12/31/20 |
| Fund | | Institutional
Class | | Investor
Class | | Institutional
Class | | Investor
Class |
| MyDestination 2015 | | | | | | | | |
| Shares sold | | 4,844,150 | | 5,226,545 | | 3,954,586 | | 5,841,286 |
| Shares reinvested | | 1,001,867 | | 2,486,585 | | 584,325 | | 1,712,284 |
| Shares redeemed | | (2,642,499) | | (7,315,739) | | (2,774,775) | | (9,781,383) |
| Net increase (decrease) | | 3,203,518 | | 397,391 | | 1,764,136 | | (2,227,813) |
| MyDestination 2025 | | | | | | | | |
| Shares sold | | 7,699,621 | | 11,913,369 | | 9,502,995 | | 10,223,052 |
| Shares reinvested | | 2,219,905 | | 5,057,284 | | 1,613,446 | | 3,787,610 |
| Shares redeemed | | (4,967,608) | | (8,259,662) | | (5,285,427) | | (13,900,994) |
| Net increase (decrease) | | 4,951,918 | | 8,710,991 | | 5,831,014 | | 109,668 |
| MyDestination 2035 | | | | | | | | |
| Shares sold | | 7,371,277 | | 9,546,137 | | 9,316,171 | | 7,801,251 |
| Shares reinvested | | 2,187,422 | | 4,015,920 | | 1,092,132 | | 2,060,346 |
| Shares redeemed | | (2,781,760) | | (3,609,896) | | (2,464,219) | | (6,219,666) |
| Net increase (decrease) | | 6,776,939 | | 9,952,161 | | 7,944,084 | | 3,641,931 |
| | Year Ended 12/31/21 | | Year Ended 12/31/20 |
| Fund | | Institutional
Class | | Investor
Class | | Institutional
Class | | Investor
Class |
| MyDestination 2045 | | | | | | | | |
| Shares sold | | 5,208,028 | | 6,187,399 | | 7,274,383 | | 5,459,257 |
| Shares reinvested | | 1,887,851 | | 2,968,234 | | 752,810 | | 1,174,641 |
| Shares redeemed | | (1,694,482) | | (2,320,015) | | (1,856,485) | | (3,891,331) |
| Net increase (decrease) | | 5,401,397 | | 6,835,618 | | 6,170,708 | | 2,742,567 |
| MyDestination 2055 | | | | | | | | |
| Shares sold | | 2,243,114 | | 2,971,428 | | 3,221,084 | | 2,974,790 |
| Shares reinvested | | 546,705 | | 768,682 | | 192,281 | | 255,699 |
| Shares redeemed | | (799,085) | | (701,731) | | (544,192) | | (1,329,427) |
| Net increase (decrease) | | 1,990,734 | | 3,038,379 | | 2,869,173 | | 1,901,062 |
| Conservative Allocation | | | | | | | | |
| Shares sold | | 1,789,607 | | 4,484,988 | | 3,115,181 | | 6,025,256 |
| Shares reinvested | | 456,714 | | 1,239,603 | | 345,262 | | 972,786 |
| Shares redeemed | | (1,368,515) | | (5,081,411) | | (1,814,211) | | (8,399,243) |
| Net increase (decrease) | | 877,806 | | 643,180 | | 1,646,232 | | (1,401,201) |
| Balanced Allocation | | | | | | | | |
| Shares sold | | 3,094,219 | | 3,693,466 | | 6,048,706 | | 3,807,383 |
| Shares reinvested | | 2,070,923 | | 5,088,637 | | 1,679,755 | | 4,353,835 |
| Shares redeemed | | (3,187,287) | | (9,005,150) | | (3,762,664) | | (14,949,314) |
| Net increase (decrease) | | 1,977,855 | | (223,047) | | 3,965,797 | | (6,788,096) |
| Growth Allocation | | | | | | | | |
| Shares sold | | 1,687,894 | | 2,458,447 | | 6,985,174 | | 2,555,985 |
| Shares reinvested | | 2,118,339 | | 4,513,988 | | 1,523,051 | | 3,326,240 |
| Shares redeemed | | (2,493,913) | | (6,321,515) | | (3,351,456) | | (12,391,878) |
| Net increase (decrease) | | 1,312,320 | | 650,920 | | 5,156,769 | | (6,509,653) |
| Aggressive Allocation | | | | | | | | |
| Shares sold | | 1,550,024 | | 1,747,896 | | 3,705,297 | | 2,019,950 |
| Shares reinvested | | 1,764,819 | | 4,706,171 | | 1,334,823 | | 3,803,971 |
| Shares redeemed | | (1,782,441) | | (6,557,198) | | (2,725,590) | | (10,759,488) |
| Net increase (decrease) | | 1,532,402 | | (103,131) | | 2,314,530 | | (4,935,567) |
| Money Market | | | | | | | | |
| Shares sold | | 6,595,566,663 | | 478,461,978 | | 6,163,830,443 | | 592,641,014 |
| Shares reinvested | | — | | — | | 956,522 | | 1,146,593 |
| Shares redeemed | | (6,609,506,460) | | (503,905,897) | | (5,900,852,960) | | (510,679,540) |
| Net increase (decrease) | | (13,939,797) | | (25,443,919) | | 263,934,005 | | 83,108,067 |
| Low-Duration Bond | | | | | | | | |
| Shares sold | | 12,297,352 | | 4,121,869 | | 13,014,811 | | 6,641,741 |
| Shares reinvested | | 660,541 | | 133,558 | | 977,656 | | 259,595 |
| Shares redeemed | | (11,092,405) | | (4,237,065) | | (10,491,843) | | (6,615,258) |
| Net increase (decrease) | | 1,865,488 | | 18,362 | | 3,500,624 | | 286,078 |
| | Year Ended 12/31/21 | | Year Ended 12/31/20 |
| Fund | | Institutional
Class | | Investor
Class | | Institutional
Class | | Investor
Class |
| Medium-Duration Bond | | | | | | | | |
| Shares sold | | 30,002,575 | | 8,924,700 | | 23,174,330 | | 11,372,906 |
| Shares reinvested | | 2,496,653 | | 492,007 | | 4,833,083 | | 1,102,570 |
| Shares redeemed | | (11,091,537) | | (5,852,084) | | (17,808,905) | | (6,032,291) |
| Net increase (decrease) | | 21,407,691 | | 3,564,623 | | 10,198,508 | | 6,443,185 |
| Global Bond | | | | | | | | |
| Shares sold | | 8,076,227 | | 3,182,942 | | 4,679,608 | | 3,717,306 |
| Shares reinvested | | 1,844,923 | | 416,321 | | 748,219 | | 167,753 |
| Shares redeemed | | (2,909,811) | | (2,594,597) | | (9,666,069) | | (4,803,998) |
| Net increase (decrease) | | 7,011,339 | | 1,004,666 | | (4,238,242) | | (918,939) |
| Defensive Market Strategies® | | | | | | | | |
| Shares sold | | 6,902,932 | | 5,231,876 | | 8,837,431 | | 8,553,413 |
| Shares reinvested | | 7,183,992 | | 3,045,077 | | 2,102,310 | | 863,559 |
| Shares redeemed | | (6,285,174) | | (5,409,566) | | (5,938,430) | | (15,047,761) |
| Net increase (decrease) | | 7,801,750 | | 2,867,387 | | 5,001,311 | | (5,630,789) |
| Global Impact Fund(1) | | | | | | | | |
| Shares sold | | 13,898,564 | | 2,857,207 | | | | |
| Shares reinvested | | 98,040 | | 13,964 | | | | |
| Shares redeemed | | (715,315) | | (92,096) | | | | |
| Net increase (decrease) | | 13,281,289 | | 2,779,075 | | | | |
| Equity Index | | | | | | | | |
| Shares sold | | 6,459,229 | | 2,714,850 | | 7,172,193 | | 4,028,675 |
| Shares reinvested | | 1,550,151 | | 580,780 | | 1,094,506 | | 407,965 |
| Shares redeemed | | (3,920,446) | | (2,392,583) | | (7,203,880) | | (4,783,978) |
| Net increase (decrease) | | 4,088,934 | | 903,047 | | 1,062,819 | | (347,338) |
| Value Equity | | | | | | | | |
| Shares sold | | 2,429,719 | | 3,353,149 | | 7,795,853 | | 1,777,945 |
| Shares reinvested | | 5,205,254 | | 2,284,610 | | 1,118,804 | | 427,101 |
| Shares redeemed | | (8,502,943) | | (2,853,079) | | (6,309,723) | | (4,638,934) |
| Net increase (decrease) | | (867,970) | | 2,784,680 | | 2,604,934 | | (2,433,888) |
| Growth Equity | | | | | | | | |
| Shares sold | | 2,838,191 | | 2,248,238 | | 4,120,060 | | 5,586,233 |
| Shares reinvested | | 6,350,653 | | 5,774,226 | | 4,898,291 | | 4,462,768 |
| Shares redeemed | | (6,916,409) | | (6,366,272) | | (9,884,270) | | (7,786,124) |
| Net increase (decrease) | | 2,272,435 | | 1,656,192 | | (865,919) | | 2,262,877 |
| Small Cap Equity | | | | | | | | |
| Shares sold | | 3,728,451 | | 3,807,008 | | 5,631,789 | | 1,898,770 |
| Shares reinvested | | 3,780,241 | | 2,611,136 | | 253,228 | | 161,944 |
| Shares redeemed | | (3,876,671) | | (2,771,764) | | (4,462,268) | | (4,061,625) |
| Net increase (decrease) | | 3,632,021 | | 3,646,380 | | 1,422,749 | | (2,000,911) |
| | Year Ended 12/31/21 | | Year Ended 12/31/20 |
| Fund | | Institutional
Class | | Investor
Class | | Institutional
Class | | Investor
Class |
| International Equity Index | | | | | | | | |
| Shares sold | | 10,004,669 | | | | 12,672,824 | | |
| Shares reinvested | | 3,598,778 | | | | 1,293,518 | | |
| Shares redeemed | | (12,093,750) | | | | (12,004,967) | | |
| Net increase (decrease) | | 1,509,697 | | | | 1,961,375 | | |
| International Equity | | | | | | | | |
| Shares sold | | 3,523,313 | | 2,489,465 | | 7,361,947 | | 4,542,828 |
| Shares reinvested | | 5,146,144 | | 1,834,359 | | 698,441 | | 248,191 |
| Shares redeemed | | (8,391,353) | | (3,674,758) | | (11,713,326) | | (6,717,160) |
| Net increase (decrease) | | 278,104 | | 649,066 | | (3,652,938) | | (1,926,141) |
| Emerging Markets Equity | | | | | | | | |
| Shares sold | | 13,190,047 | | 3,838,437 | | 15,079,591 | | 3,378,715 |
| Shares reinvested | | 7,911,253 | | 1,221,571 | | 524,454 | | 69,903 |
| Shares redeemed | | (9,678,323) | | (2,416,761) | | (4,887,986) | | (3,050,235) |
| Net increase (decrease) | | 11,422,977 | | 2,643,247 | | 10,716,059 | | 398,383 |
| Global Real Estate Securities | | | | | | | | |
| Shares sold | | 2,223,392 | | 2,568,833 | | 3,516,750 | | 1,923,142 |
| Shares reinvested | | 1,199,318 | | 600,819 | | 485,813 | | 244,982 |
| Shares redeemed | | (2,981,327) | | (1,458,760) | | (1,093,397) | | (3,814,177) |
| Net increase (decrease) | | 441,383 | | 1,710,892 | | 2,909,166 | | (1,646,053) |
| Strategic Alternatives | | | | | | | | |
| Shares sold | | 4,924,640 | | 709,263 | | 3,501,927 | | 1,381,827 |
| Shares reinvested | | 458,724 | | 52,746 | | 437,942 | | 71,618 |
| Shares redeemed | | (3,836,192) | | (1,535,551) | | (7,675,637) | | (2,384,115) |
| Net increase (decrease) | | 1,547,172 | | (773,542) | | (3,735,768) | | (930,670) |
| (1) | For the period January 29, 2021 (commencement of operations) through December 31, 2021. |
7. BANK BORROWINGS
Pursuant to a Line of Credit Agreement, the Funds are permitted to borrow cash from Northern Trust up to a limit of $50 million, collectively. Each Fund is individually, and not jointly, liable for its particular advances, if any, under the line of credit. If the line of credit was utilized, interest would be charged to each Fund based on its borrowings at a rate equal to the greater of the Federal Funds Rate plus 1.00% or 1.50%. Each Fund also paid a facility fee equal to its pro rata share of the amount of the credit facility, based on average net assets, at a rate of 0.20% per annum. The agreement will expire on November 16, 2022.
There were no draws on the line of credit for the year ended December 31, 2021, and there were no outstanding loans at December 31, 2021.
8. FEDERAL INCOME TAXES
Each Fund has elected to be treated as and intends to qualify as a regulated investment company each year by complying with all sections of the Internal Revenue Code of 1986, as amended, that apply to regulated investment companies and to distribute substantially all of its taxable income and capital gains to shareholders. No provision for income or excise taxes is thus required. Each Fund is treated as a separate entity for federal income tax purposes.
The Funds may be subject to taxes imposed by countries in which they invest in issuers existing or operating in such countries. Such taxes are generally based on income earned. The Funds accrue such taxes when the related income is earned. Gains realized by the Funds on the sale of securities in certain countries are subject to non-U.S. taxes. The Funds record a liability based on unrealized gains to provide for potential non-U.S. taxes payable upon the sale of these securities.
Management has analyzed the Funds’ tax positions and has concluded that no material provision for income tax is required in the Funds’ financial statements except as noted above. The Funds are not aware of any tax positions for which it is reasonably possible that the total amounts of unrecognized tax benefits will significantly change in the next twelve months. However, management’s conclusions may be subject to review and adjustment at a later date based on factors including, but not limited to new tax laws, regulations and administrative interpretations (including court decisions). Each of the Funds’ federal tax returns for the prior three fiscal years and the current year (year ended December 31, 2018, through year ended December 31, 2021), remains subject to examination by the Internal Revenue Service. In regard to foreign taxes only, certain Funds have open tax years in certain foreign countries they invest in that may date back to the inception of the Funds.
Distributions during the years ended December 31, 2021, and December 31, 2020, were characterized as follows for tax purposes:
| Fund | | Year | | Ordinary
Income | | Long-Term
Capital Gain | | Return
of Capital | | Total
Distribution |
| MyDestination 2015 | | 2021 | | $16,366,140 | | $ 22,651,767 | | $— | | $ 39,017,907 |
| 2020 | | 12,565,070 | | 12,607,570 | | — | | 25,172,640 |
| MyDestination 2025 | | 2021 | | 40,508,972 | | 44,139,652 | | — | | 84,648,624 |
| 2020 | | 27,713,188 | | 32,209,350 | | — | | 59,922,538 |
| MyDestination 2035 | | 2021 | | 33,393,700 | | 41,638,226 | | — | | 75,031,926 |
| 2020 | | 17,996,374 | | 17,071,606 | | — | | 35,067,980 |
| MyDestination 2045 | | 2021 | | 26,310,514 | | 32,873,431 | | — | | 59,183,945 |
| 2020 | | 12,069,806 | | 8,891,954 | | — | | 20,961,760 |
| MyDestination 2055 | | 2021 | | 10,461,781 | | 12,177,927 | | — | | 22,639,708 |
| 2020 | | 4,190,065 | | 2,627,172 | | — | | 6,817,237 |
| Conservative Allocation | | 2021 | | 9,264,362 | | 11,278,760 | | — | | 20,543,122 |
| 2020 | | 8,066,854 | | 7,767,774 | | — | | 15,834,628 |
| Balanced Allocation | | 2021 | | 41,868,787 | | 52,429,849 | | — | | 94,298,636 |
| 2020 | | 28,506,102 | | 49,210,305 | | — | | 77,716,407 |
| Growth Allocation | | 2021 | | 38,017,659 | | 54,761,306 | | — | | 92,778,965 |
| 2020 | | 17,369,914 | | 46,300,306 | | — | | 63,670,220 |
| Aggressive Allocation | | 2021 | | 38,902,102 | | 52,142,935 | | — | | 91,045,037 |
| 2020 | | 8,916,496 | | 56,673,604 | | — | | 65,590,100 |
| Money Market | | 2021 | | — | | — | | — | | — |
| 2020 | | 5,470,866 | | — | | — | | 5,470,866 |
| Low-Duration Bond | | 2021 | | 10,274,701 | | 481,506 | | — | | 10,756,207 |
| 2020 | | 16,775,256 | | — | | — | | 16,775,256 |
| Medium-Duration Bond | | 2021 | | 43,133,548 | | 2,553,507 | | — | | 45,687,055 |
| 2020 | | 75,884,836 | | 17,168,953 | | — | | 93,053,789 |
| Global Bond | | 2021 | | 18,993,319 | | 3,532,184 | | — | | 22,525,503 |
| 2020 | | 5,241,240 | | 3,452,155 | | — | | 8,693,395 |
| Defensive Market Strategies® | | 2021 | | 61,857,721 | | 84,527,216 | | — | | 146,384,937 |
| 2020 | | 23,036,188 | | 17,204,915 | | — | | 40,241,103 |
| Global Impact Fund | | 2021 | | 736,151 | | 481,606 | | — | | 1,217,757 |
| Fund | | Year | | Ordinary
Income | | Long-Term
Capital Gain | | Return
of Capital | | Total
Distribution |
| Equity Index | | 2021 | | $40,916,918 | | $ 62,439,120 | | $— | | $103,356,038 |
| 2020 | | 35,622,071 | | 21,573,380 | | — | | 57,195,451 |
| Value Equity | | 2021 | | 53,580,516 | | 104,857,148 | | — | | 158,437,664 |
| 2020 | | 19,235,843 | | 5,328,149 | | — | | 24,563,992 |
| Growth Equity | | 2021 | | 13,290,950 | | 351,980,455 | | — | | 365,271,405 |
| 2020 | | 7,209,774 | | 268,265,100 | | — | | 275,474,874 |
| Small Cap Equity | | 2021 | | 63,621,325 | | 58,500,598 | | — | | 122,121,923 |
| 2020 | | 141,264 | | 7,359,533 | | — | | 7,500,797 |
| International Equity Index | | 2021 | | 24,814,894 | | 18,694,988 | | — | | 43,509,882 |
| 2020 | | 14,997,073 | | — | | — | | 14,997,073 |
| International Equity | | 2021 | | 49,827,532 | | 54,284,848 | | — | | 104,112,380 |
| 2020 | | 12,000,055 | | 1,905,316 | | — | | 13,905,371 |
| Emerging Markets Equity | | 2021 | | 44,331,334 | | 53,668,789 | | — | | 98,000,123 |
| 2020 | | 7,195,743 | | — | | — | | 7,195,743 |
| Global Real Estate Securities | | 2021 | | 16,177,915 | | 4,012,374 | | — | | 20,190,289 |
| 2020 | | 6,343,774 | | — | | — | | 6,343,774 |
| Strategic Alternatives | | 2021 | | 4,747,893 | | 493,166 | | — | | 5,241,059 |
| 2020 | | 5,034,145 | | 39,191 | | — | | 5,073,336 |
At December 31, 2021, the components of distributable earnings on a tax basis were as follows:
| Fund | | Undistributed
Ordinary
Income | | Undistributed
Long-Term
Capital Gain | | Qualified
Late Year
Losses | | Net Unrealized
Appreciation
Depreciation |
| MyDestination 2015 | | $ 257,111 | | $ 13,245,720 | | $ — | | $ 62,994,835 |
| MyDestination 2025 | | 612,220 | | 34,356,542 | | — | | 205,393,659 |
| MyDestination 2035 | | 672,419 | | 32,587,635 | | — | | 218,443,599 |
| MyDestination 2045 | | 743,999 | | 28,337,200 | | — | | 211,021,785 |
| MyDestination 2055 | | 257,479 | | 11,505,126 | | — | | 75,598,682 |
| Conservative Allocation | | 146,141 | | 11,999,506 | | — | | 18,164,135 |
| Balanced Allocation | | 634,889 | | 63,533,258 | | — | | 72,619,171 |
| Growth Allocation | | 772,142 | | 81,735,315 | | — | | 77,441,041 |
| Aggressive Allocation | | 1,074,804 | | 102,159,450 | | — | | 68,614,401 |
| Money Market | | 6,949 | | — | | — | | — |
| Low-Duration Bond | | 535,388 | | — | | (1,493,460) | | (4,745,940) |
| Medium-Duration Bond | | — | | — | | (2,510,520) | | 19,583,781 |
| Global Bond | | 69,075 | | 323,287 | | (1,356,507) | | (9,836,522) |
| Defensive Market Strategies® | | 16,581,189 | | 186,894,401 | | — | | 62,313,792 |
| Global Impact Fund | | 370,218 | | — | | (57,274) | | 14,971,035 |
| Equity Index | | 1,964,677 | | 21,048,481 | | — | | 1,567,609,576 |
| Value Equity | | 2,194,089 | | 19,805,269 | | — | | 293,671,126 |
| Growth Equity | | 1,197,031 | | 63,602,721 | | — | | 757,223,458 |
| Small Cap Equity | | 1,233,863 | | 13,631,809 | | — | | 162,536,687 |
| International Equity Index | | 1,756,139 | | 2,765,624 | | — | | 122,494,868 |
| International Equity | | 2,739,083 | | 1,252,957 | | — | | 179,734,590 |
| Emerging Markets Equity | | — | | — | | (8,169,353) | | 65,377,056 |
| Global Real Estate Securities | | 979,972 | | 3,604,566 | | — | | 46,739,444 |
| Fund | | Undistributed
Ordinary
Income | | Undistributed
Long-Term
Capital Gain | | Qualified
Late Year
Losses | | Net Unrealized
Appreciation
Depreciation |
| Strategic Alternatives | | $ 5,492,945 | | $ 644,482 | | $ — | | $ 1,228,944 |
For Federal income tax purposes, realized capital losses may be carried forward and applied against future realized capital gains. Capital loss carryovers were as follows as of December 31, 2021:
| Fund | | Unlimited |
| Medium-Duration Bond | | $6,312,090 |
During the year ended December 31, 2021, the following Funds utilized capital loss carryforwards to offset capital gains:
| Fund | | Carryforward
Utilized |
| International Equity Index | | $ 6,911,397 |
| International Equity | | 9,212,708 |
| Global Real Estate Securities | | 18,847,410 |
| Strategic Alternatives | | 7,356,834 |
| | | |
The Funds have elected to defer qualified late-year losses in accordance with the federal income tax rules. These losses are treated as having arisen on the first day of the following year. Capital losses were incurred from November 1, 2021, through December 31, 2021. The deferral amounts impacting ordinary income were from specified losses incurred from November 1, 2021, through December 31, 2021.
| Fund | | Capital | | Ordinary
Income | | Total |
| Low-Duration Bond | | $1,493,460 | | $ — | | $1,493,460 |
| Medium-Duration Bond | | — | | 2,510,549 | | 2,510,549 |
| Global Bond | | — | | 1,356,507 | | 1,356,507 |
| Global Impact Fund | | 57,274 | | — | | 57,274 |
| Emerging Markets Equity | | 5,155,498 | | 3,013,855 | | 8,169,353 |
At December 31, 2021, the aggregate cost of investments for federal income tax purposes (including securities sold short and derivative related items) and the net unrealized appreciation from investments having an excess of value over cost and net unrealized depreciation from investments having an excess of cost over value were as follows:
| Fund | | Federal Tax
Cost | | Net Unrealized
Appreciation
(Depreciation) | | Appreciated
Investments | | Depreciated
Investments |
| MyDestination 2015 | | $ 683,588,032 | | $ 62,994,835 | | $ 63,938,742 | | $ (943,907) |
| MyDestination 2025 | | 1,580,941,635 | | 205,393,659 | | 207,656,363 | | (2,262,704) |
| MyDestination 2035 | | 1,210,460,650 | | 218,443,599 | | 221,026,528 | | (2,582,929) |
| MyDestination 2045 | | 902,648,098 | | 211,021,785 | | 212,352,799 | | (1,331,014) |
| MyDestination 2055 | | 365,294,879 | | 75,598,682 | | 76,675,382 | | (1,076,700) |
| Conservative Allocation | | 551,786,606 | | 18,164,135 | | 18,856,463 | | (692,328) |
| Balanced Allocation | | 1,638,799,197 | | 72,619,171 | | 77,833,388 | | (5,214,217) |
| Growth Allocation | | 1,330,623,760 | | 77,441,042 | | 79,554,139 | | (2,113,097) |
| Fund | | Federal Tax
Cost | | Net Unrealized
Appreciation
(Depreciation) | | Appreciated
Investments | | Depreciated
Investments |
| Aggressive Allocation | | $1,166,408,705 | | $ 68,614,401 | | $ 68,614,401 | | $ — |
| Money Market | | 1,642,985,821 | | (2) | | (2) | | — |
| Low-Duration Bond | | 1,103,775,804 | | (4,915,163) | | 6,928,085 | | (11,843,248) |
| Medium-Duration Bond | | 2,545,878,898 | | 19,378,111 | | 58,560,247 | | (39,182,136) |
| Global Bond | | 642,431,405 | | (9,658,298) | | 19,522,344 | | (29,180,642) |
| Defensive Market Strategies® | | 1,460,095,480 | | 62,307,588 | | 77,233,316 | | (14,925,728) |
| Global Impact Fund | | 159,673,554 | | 14,971,020 | | 21,669,323 | | (6,698,303) |
| Equity Index | | 1,765,858,347 | | 1,567,609,576 | | 1,613,128,149 | | (45,518,573) |
| Value Equity | | 1,115,089,090 | | 293,671,126 | | 315,468,246 | | (21,797,120) |
| Growth Equity | | 1,338,246,631 | | 757,223,458 | | 785,498,457 | | (28,274,999) |
| Small Cap Equity | | 726,105,597 | | 162,536,687 | | 206,307,149 | | (43,770,462) |
| International Equity Index | | 711,789,980 | | 122,421,717 | | 164,730,127 | | (42,308,410) |
| International Equity | | 1,132,291,663 | | 179,767,613 | | 224,114,991 | | (44,347,378) |
| Emerging Markets Equity | | 751,588,904 | | 66,391,493 | | 124,060,979 | | (57,669,486) |
| Global Real Estate Securities | | 288,980,959 | | 46,738,260 | | 51,257,729 | | (4,519,469) |
| Strategic Alternatives | | 303,024,746 | | 1,230,777 | | 7,807,124 | | (6,576,347) |
The differences between book basis and tax-basis unrealized appreciation (depreciation) are attributable primarily to the tax deferral of losses on wash sales, the deferral of losses on straddles, gains on constructive sales, premium amortization on convertible bonds and investments in passive foreign investment companies ("PFIC"), partnerships, swaps and other securities with book and tax cost differences.
The timing and character of income and capital gain distributions are determined in accordance with income tax regulations, which may differ from U.S. GAAP. Reclassifications are made for permanent tax differences to reflect income and gains available for distribution under income tax regulations. For the period ended December 31, 2021, the capital accounts have been adjusted for current period permanent book/tax differences which arose principally from differing book/tax treatments of PFICs, paydown losses, net operating losses, swaps, foreign currency transactions, distributions received from regulated investment companies, reclassifications of dividends paid, equalization and non-deductible expenses. Net assets were not affected by these reclassifications.
9. RISKS
In the normal course of business, the Funds trade financial instruments and enter into financial transactions where the risk of potential loss exists due to changes in the market (market risk) or due to the failure of the other party to a transaction to perform (credit and counterparty risks).
Market Risks — A Fund’s investments in derivatives and other financial instruments expose the Fund to various risks such as, but not limited to, interest rate, foreign currency, equity and commodity risks.
Interest rate risk is the risk that fixed income securities will decline in value because of changes in interest rates. As nominal interest rates rise, the value of certain fixed income securities held by a Fund is likely to decrease. A nominal interest rate can be described as the sum of a real interest rate and an expected inflation rate. Fixed income securities with longer durations tend to be more sensitive to changes in interest rates, usually making them more volatile than securities with shorter durations. Duration is useful primarily as a measure of the sensitivity of a fixed income’s market price to interest rate (e.g. yield) movements.
If a Fund invests directly in foreign currencies or in securities that trade in, and receive revenues in, foreign currencies, or in derivatives that provide exposure to foreign currencies, it will be subject to the risk that those currencies will decline in value relative to the base currency of the Fund, or, in the case of hedging positions, that the Fund’s base currency will decline in value relative to the currency being hedged. Currency rates in foreign countries may fluctuate significantly over short periods of time for a number of reasons, including changes in interest rates, intervention (or the failure to intervene) by U.S. or foreign governments, central banks or supranational entities such as the International Monetary Fund, or by the imposition of currency controls or other political developments in the United States or abroad. As a result, a Fund’s investments in foreign currency denominated securities may reduce the returns of the Fund.
The market values of equities, such as common stocks and preferred stocks, or equity related investments such as futures and options, may decline due to general market conditions which are not specifically related to a particular company, such as real or perceived adverse economic conditions, changes in the general outlook for corporate earnings, changes in interest or currency rates or adverse investor sentiment. Market values may also decline due to factors which affect a particular industry or industries, such as labor shortages or increased production costs and competitive conditions within an industry. Equity securities and equity related investments generally have greater market price volatility than fixed income securities.
A Fund’s investments in commodity-linked derivative instruments may subject the Fund to greater market price volatility than investments in traditional securities. The value of commodity-linked derivative instruments may be affected by changes in overall market movements, commodity index volatility, changes in interest rates, or factors affecting a particular industry or commodity, such as drought, floods, weather, livestock disease, embargoes, tariffs and international economic, political and regulatory developments.
In countries with limited or developing markets, investments may present greater risks than in more developed markets and the prices of such investments may be volatile. The consequences of political, social or economic changes in these markets may have disruptive effects on the market prices of these investments and the income they generate, as well as the Fund’s ability to repatriate such amounts.
Local, regional or global events such as the spread of infectious illnesses or other public health issues, recessions, natural disasters or other events could have a significant impact on the Funds and their investments. For example, the outbreak of COVID-19, a novel coronavirus disease, has negatively affected economies, markets and individual companies throughout the world, including those in which the Funds invest. The effects of this pandemic to public health and business and market conditions, including exchange trading suspensions and closures may continue to have a significant negative impact on the performance of a Fund’s investments, increase a Fund’s volatility, exacerbate pre-existing political, social and economic risks to the Funds, and negatively impact broad segments of businesses and populations. The Funds' operations may be interrupted as a result, which may contribute to the negative impact on investment performance. In addition, governments, their regulatory agencies, or self-regulatory organizations may take actions in response to the pandemic that affect the instruments in which a Fund invests, or the issuers of such instruments, in ways that could have a significant negative impact on a Fund’s investment performance. The full impact of the COVID-19 pandemic, or other future epidemics or pandemics, is currently unknown.
Credit and Counterparty Risks — A Fund will be exposed to credit risk on parties with whom it trades and will also bear the risk of settlement default. A Fund minimizes concentrations of credit risk by undertaking transactions with a large number of customers and counterparties on recognized and reputable exchanges. A Fund could lose money if the issuer or guarantor of a fixed income security, or the counterparty to a derivatives contract, repurchase agreement or a loan of portfolio securities, is unable or unwilling to make timely principal and/or interest payments, or to otherwise honor its obligations. Securities are subject to varying degrees of credit risk, which are often reflected in credit ratings.
Similar to credit risk, a Fund may be exposed to counterparty risk, or the risk that an institution or other entity with which the Fund has unsettled or open transactions will default. Financial assets, which potentially expose a Fund to counterparty risk, consist principally of cash due from counterparties and investments. The investment advisers minimize counterparty risks to the Funds by performing extensive reviews of each counterparty and obtaining approval from the Counterparty Risk Committee prior to entering into transactions with a third party. All transactions in listed securities are settled/paid for upon delivery using approved counterparties. The risk of default is considered minimal, as delivery of securities sold is only made once a Fund has received payment. Payment is made on a purchase once the securities have been delivered by the counterparty. The trade will fail if either party fails to meet its obligation.
Brexit Risks — In June 2016, the United Kingdom (the “UK”) approved a referendum to leave the European Union ("EU"), commonly referred to as “Brexit,” which sparked depreciation in the value of the British pound, short-term declines in global stock markets, and heightened risk of continued worldwide economic volatility. The UK officially left the EU on January 31, 2020, with a transitional period which ended on December 31, 2020. Brexit created and may continue to create an uncertain political and economic environment in the UK and other EU countries. This long-term uncertainty may affect other countries in the EU and elsewhere. Further, the UK’s departure from the EU may cause volatility within the EU, triggering prolonged economic downturns in certain European countries or sparking additional member states to contemplate departing the EU. In addition, the UK’s departure from the EU may create actual or perceived additional economic stresses for the UK, including potential for decreased trade, capital outflows, devaluation of the British pound, wider corporate bond spreads due to uncertainty, and possible declines in business and consumer spending, as well as foreign direct investment.
LIBOR Risks — The United Kingdom’s Financial Conduct Authority, which regulates LIBOR, announced a phase out of LIBOR such that after June 30, 2023, the overnight, 1-month, 3-month, 6-month and 12-month U.S. dollar LIBOR settings will cease to be published or will no longer be representative. All other LIBOR settings and certain other interbank offered rates, such as the Euro Overnight Index Average (“EONIA”), ceased to be published or representative after December 31, 2021. A Fund may have investments linked to other interbank offered rates that may also cease to be published in the future. Various financial industry groups have been planning for the transition away from LIBOR, but there remain challenges to converting certain securities and transactions to a new reference rate (e.g., the Secured Overnight Financing Rate (“SOFR”), which is intended to replace the U.S. dollar LIBOR). The transition process away from LIBOR may involve, among other things, increased volatility or illiquidity in markets for instruments that currently rely on LIBOR. The transition process may also result in a reduction in the value of certain instruments held by a Fund or reduce the effectiveness of related Fund transactions such as hedges. Volatility, the potential reduction in value, and/or the hedge effectiveness of financial instruments may be heightened for financial instruments that do not include fallback provisions that address the cessation of LIBOR. Global regulators have advised market participants to cease entering into new contracts using LIBOR as a reference rate, and it is possible that investments in LIBOR-based instruments could invite regulatory scrutiny. In addition, a liquid market for newly-issued instruments that use a reference rate other than LIBOR still may be developing. There may also be challenges for the Fund to enter into hedging transactions against such newly issued instruments until a market for such hedging transactions develops. Any potential effects of the transition away from LIBOR on any of the Funds or on financial instruments in which a Fund invests, as well as other unforeseen effects, could result in losses to a Fund.
10. RECENT PRONOUNCEMENTS
In March 2020, the FASB issued ASU 2020-04, Reference Rate Reform Topic 848 ("ASU 2020-04"), "Facilitation of the Effects of Reference Rate Reform on Financial Reporting," which provides optional temporary financial reporting relief from the effect of certain types of contract modifications due to the planned discontinuation of the London Interbank Offered Rate ("LIBOR") and other interbank-offered based reference rates as of the end of 2021. The new guidance is effective for certain reference rate-related
contract modifications that occur during the period March 12, 2020 through December 31, 2022, and the adoption of ASU 2020-04 is elective. Management is currently evaluating the impact, if any, of applying ASU 2020-04.
In October 2020, the SEC adopted new regulations governing the use of derivatives by registered investment companies. Rule 18f-4 (the “Derivatives Rule”) imposes limits on the amount of derivatives contracts the Funds could enter, eliminates the asset segregation framework currently used by the Funds to comply with Section 18 of the 1940 Act, and require funds whose use of derivatives is more than a limited specified exposure to establish and maintain a derivatives risk management program and appoint a derivatives risk manager. The Derivatives Rule became effective February 19, 2021, and has a compliance date of August 19, 2022. Management is currently evaluating the effect, if any, the Derivatives Rule will have on the Funds.
On December 3, 2020, the SEC announced that it voted to adopt a new rule that establishes an updated regulatory framework for fund valuation practices. Investment Company Act Rule 2a-5 (the “Rule”), in part, provides (i) a framework for determining fair value in good faith and (ii) provides for a fund Board’s assignment of its responsibility for the execution of valuation-related activities to a fund’s investment adviser. Further, the SEC is rescinding previously issued guidance on related issues. The rule became effective on March 8, 2021 and has a compliance date effective September 8, 2022. Management is currently evaluating the Rule and its impact to the Funds.
11. REGULATORY EXAMINATIONS
Federal and state regulatory authorities from time to time make inquiries and conduct examinations regarding compliance by the Trust and its affiliates with securities and other laws and regulations affecting the Funds. There are currently no such matters which the Trust and its affiliates believe will be material to these financial statements.
REPORT OF INDEPENDENT REGISTERED PUBLIC ACCOUNTING FIRM
To the Board of Trustees of GuideStone Funds and Shareholders of MyDestination 2015 Fund, MyDestination 2025 Fund, MyDestination 2035 Fund, MyDestination 2045 Fund, MyDestination 2055 Fund, Conservative Allocation Fund, Balanced Allocation Fund, Growth Allocation Fund, Aggressive Allocation Fund, Money Market Fund, Low-Duration Bond Fund, Medium-Duration Bond Fund, Global Bond Fund, Defensive Market Strategies® Fund, Global Impact Fund, Equity Index Fund, Value Equity Fund, Growth Equity Fund, Small Cap Equity Fund, International Equity Index Fund, International Equity Fund, Emerging Markets Equity Fund, Global Real Estate Securities Fund and Strategic Alternatives Fund
Opinions on the Financial Statements
We have audited the accompanying statements of assets and liabilities, including the schedules of investments, of MyDestination 2015 Fund, MyDestination 2025 Fund, MyDestination 2035 Fund, MyDestination 2045 Fund, MyDestination 2055 Fund, Conservative Allocation Fund, Balanced Allocation Fund, Growth Allocation Fund, Aggressive Allocation Fund, Money Market Fund, Low-Duration Bond Fund, Medium-Duration Bond Fund, Global Bond Fund, Defensive Market Strategies® Fund, Global Impact Fund, Equity Index Fund, Value Equity Fund, Growth Equity Fund, Small Cap Equity Fund, International Equity Index Fund, International Equity Fund, Emerging Markets Equity Fund, Global Real Estate Securities Fund and Strategic Alternatives Fund (constituting GuideStone Funds, hereafter collectively referred to as the "Funds") as of December 31, 2021, the related statements of operations for the year ended December 31, 2021 (or for Global Impact Fund, for the period January 29, 2021 (commencement of operations) through December 31, 2021), the statements of changes in net assets for each of the two years in the period ended December 31, 2021 (or for Global Impact Fund, for the period January 29, 2021 (commencement of operations) through December 31, 2021), including the related notes, and the financial highlights for each of the periods indicated therein (collectively referred to as the “financial statements”). In our opinion, the financial statements present fairly, in all material respects, the financial position of each of the Funds as of December 31, 2021, the results of each of their operations for the year then ended (or for Global Impact Fund, for the period January 29, 2021 (commencement of operations) through December 31, 2021), the changes in each of their net assets for each of the two years in the period ended December 31, 2021 (or for Global Impact Fund, for the period January 29, 2021 (commencement of operations) through December 31, 2021) and each of the financial highlights for each of the periods indicated therein in conformity with accounting principles generally accepted in the United States of America.
Basis for Opinions
These financial statements are the responsibility of the Funds’ management. Our responsibility is to express an opinion on the Funds’ financial statements based on our audits. We are a public accounting firm registered with the Public Company Accounting Oversight Board (United States) (PCAOB) and are required to be independent with respect to the Funds in accordance with the U.S. federal securities laws and the applicable rules and regulations of the Securities and Exchange Commission and the PCAOB.
We conducted our audits of these financial statements in accordance with the standards of the PCAOB. Those standards require that we plan and perform the audit to obtain reasonable assurance about whether the financial statements are free of material misstatement, whether due to error or fraud.
Our audits included performing procedures to assess the risks of material misstatement of the financial statements, whether due to error or fraud, and performing procedures that respond to those risks. Such procedures included examining, on a test basis, evidence regarding the amounts and disclosures in the financial statements. Our audits also included evaluating the accounting principles used and significant estimates made by management, as well as evaluating the overall presentation of the financial statements. Our procedures included confirmation of securities owned as of December 31, 2021 by correspondence with the custodian, transfer agent, brokers and agent banks; when replies were not received from brokers and agent banks, we performed other auditing procedures. We believe that our audits provide a reasonable basis for our opinions.
/s/ PricewaterhouseCoopers LLP
Chicago, Illinois
February 25, 2022
We have served as the auditor of one or more investment companies in GuideStone Funds since 2001.
NOTICE TO SHAREHOLDERS (Unaudited)
Each Fund is required by Subchapter M of the Internal Revenue Code of 1986, as amended, to advise its shareholders of the federal tax status of distributions received by each Fund’s shareholders. During the year ended December 31, 2021, the Funds hereby designate the following dividends and distributions paid by each of the Funds:
| Fund | | Ordinary
Income | | Long-Term
Capital Gain
(20% rate) | | Return
of Capital |
| MyDestination 2015 | | $ 16,366,140 | | $ 22,651,767 | | $ — |
| MyDestination 2025 | | 40,508,972 | | 44,139,652 | | — |
| MyDestination 2035 | | 33,393,700 | | 41,638,226 | | — |
| MyDestination 2045 | | 26,310,514 | | 32,873,431 | | — |
| MyDestination 2055 | | 10,461,781 | | 12,177,927 | | — |
| Conservative Allocation | | 9,264,362 | | 11,278,760 | | — |
| Balanced Allocation | | 41,868,787 | | 52,429,849 | | — |
| Growth Allocation | | 38,017,659 | | 54,761,306 | | — |
| Aggressive Allocation | | 38,902,102 | | 52,142,935 | | — |
| Money Market | | — | | — | | — |
| Low-Duration Bond | | 10,274,701 | | 481,506 | | — |
| Medium-Duration Bond | | 43,133,548 | | 2,553,507 | | — |
| Global Bond | | 18,993,319 | | 3,532,184 | | — |
| Defensive Market Strategies® | | 61,857,721 | | 84,527,216 | | — |
| Global Impact Fund | | 736,151 | | 481,606 | | — |
| Equity Index | | 40,916,918 | | 62,439,120 | | — |
| Value Equity | | 53,580,516 | | 104,857,148 | | — |
| Growth Equity | | 13,290,950 | | 351,980,455 | | — |
| Small Cap Equity | | 63,621,325 | | 58,500,598 | | — |
| International Equity Index | | 24,814,894 | | 18,694,988 | | — |
| International Equity | | 49,827,532 | | 54,284,848 | | — |
| Emerging Markets Equity | | 44,331,334 | | 53,668,789 | | — |
| Global Real Estate Securities | | 16,177,915 | | 4,012,374 | | — |
| Strategic Alternatives | | 4,747,893 | | 493,166 | | — |
| | | | | | | |
| | | | | | | |
Dividends from net investment income and short-term capital gains are treated as ordinary income dividends for federal income tax purposes. Long-term capital gain distributions are taxable as capital gain dividends.
NOTICE TO SHAREHOLDERS (Continued)
The following percentages of ordinary income dividends paid for the year ended December 31, 2021, have been designated as qualified for the reduced tax rate under The Job and Growth Tax Relief Reconciliation Act of 2003.
| Fund | | Qualified
Dividend
Income | | Qualified
Short Term |
| MyDestination 2015 | | 26.03 % | | — % |
| MyDestination 2025 | | 31.69 % | | — % |
| MyDestination 2035 | | 42.73 % | | — % |
| MyDestination 2045 | | 50.74 % | | — % |
| MyDestination 2055 | | 52.99 % | | — % |
| Conservative Allocation | | 21.53 % | | — % |
| Balanced Allocation | | 25.48 % | | — % |
| Growth Allocation | | 35.13 % | | — % |
| Aggressive Allocation | | 41.78 % | | — % |
| Global Bond | | 0.70 % | | — % |
| Defensive Market Strategies® | | 100.00 % | | 5.72 % |
| Global Impact Fund | | 100.00 % | | 100.00 % |
| Equity Index | | 100.00 % | | 35.72 % |
| Value Equity | | 100.00 % | | 6.64 % |
| Growth Equity | | — % | | 70.42 % |
| Small Cap Equity | | 100.00 % | | 8.38 % |
| International Equity Index | | 75.52 % | | — % |
| International Equity | | 100.00 % | | 14.75 % |
| Emerging Markets Equity | | 100.00 % | | 12.73 % |
| Global Real Estate Securities | | 16.65 % | | — % |
| Strategic Alternatives | | 50.05 % | | — % |
| | | | | |
| | | | | |
All above designations are based on financial information available as of the date of this annual report, and accordingly, are subject to change. It is the intention of the Funds to designate the maximum amount permitted under the Internal Revenue Code and the regulations thereunder. Shareholders are advised to consult their own tax advisers with respect to the tax consequences of their investment in the Funds.
NOTICE TO SHAREHOLDERS (Continued)
The following Funds made capital gain distributions in the year ended December 31, 2021, and hereby designated these long-term capital gain distributions as follows:
| Fund | Long Term
Capital
Gain Rate |
| MyDestination 2015 | $0.3528 |
| MyDestination 2025 | 0.2983 |
| MyDestination 2035 | 0.3680 |
| MyDestination 2045 | 0.3776 |
| MyDestination 2055 | 0.5001 |
| Conservative Allocation | 0.2453 |
| Balanced Allocation | 0.4201 |
| Growth Allocation | 0.5738 |
| Aggressive Allocation | 0.6293 |
| Low-Duration Bond | 0.0061 |
| Global Bond | 0.0566 |
| Defensive Market Strategies® | 0.7299 |
| Global Impact Fund | 0.3020 |
| Equity Index | 0.5663 |
| Value Equity | 1.5788 |
| Growth Equity | 5.2420 |
| Small Cap Equity | 1.5220 |
| International Equity Index | 0.2856 |
| International Equity | 0.6490 |
| Global Real Estate Securities | 0.1439 |
| Strategic Alternatives | 0.0152 |
| | |
GuideStone Financial Resources of the Southern Baptist Convention (“GuideStone Financial Resources”) at all times during the fiscal year ended December 31, 2021, directly or indirectly controlled the vote of at least 60% of the outstanding shares of GuideStone Funds (the “Trust”). This means that GuideStone Financial Resources, which is an affiliate of the Trust’s investment adviser, GuideStone Capital Management, LLC, controls the vote on any matter that requires shareholder approval.
FUND MANAGEMENT (Unaudited)
Information pertaining to the Trustees and officers of the Trust is set forth below. This information is current as of July 1, 2021. The statement of additional information (SAI) includes additional information about the Trustees and is available without charge, upon request, by calling 1-888-GS-FUNDS(1-888-473-8637).
Name, (Year of Birth), Address
and Position(s) with Trust | Term of Office
and Length of
Time Served1 | Principal Occupation(s)
During Past 5 Years | Number of
Portfolios
in Fund
Complex
Overseen
by Trustee | Other Trusteeships/
Directorships
Held by Trustee2 |
| INDEPENDENT TRUSTEES |
Thomas G. Evans (1961)
5005 Lyndon B. Johnson
Freeway Suite 2200
Dallas, TX 75244-6152
Trustee | Since 2020 | President and Owner, Encompass Financial Services, Inc., 1985 – present; Trustee, GuideStone Financial Resources, 2010 – 2018. | 24 | None |
William Craig George (1958)
5005 Lyndon B. Johnson
Freeway Suite 2200
Dallas, TX 75244-6152
Trustee | Since 2004 | Senior Vice President and Regional Credit Officer, First National Bank, 2017 – present. | 24 | None |
Barry D. Hartis (1945)
5005 Lyndon B. Johnson
Freeway Suite 2200
Dallas, TX 75244-6152
Trustee | Since 2014 | Retired – Certified Public Accountant, 1975 – 2021. | 24 | None |
Grady R. Hazel (1947)
5005 Lyndon B. Johnson
Freeway Suite 2200
Dallas, TX 75244-6152
Trustee | Since 2011 | Chief Financial Officer, The Dunham School,
2015 – present; Certified Public Accountant,
1978 – present. | 24 | None |
David B. McMillan (1957)
5005 Lyndon B. Johnson
Freeway Suite 2200
Dallas, TX 75244-6152
Trustee | Since 2019 | Chief Executive Officer and Founder, Peridot
Energy LLC, 2008 – present; Trustee, GuideStone Financial Resources, 2010 – 2018;
Trustee, GuideStone Investment Services and GuideStone Resource Management, Inc., 2014 – 2018. | 24 | None |
Franklin R. Morgan (1943)
5005 Lyndon B. Johnson
Freeway Suite 2200
Dallas, TX 75244-6152
Trustee | Since 2005 | Retired – Senior Vice President, Director of
International Administration, Prudential
Securities, Inc., 1962 – 2003. | 24 | None |
Ronald D. Murff (1953)
5005 Lyndon B. Johnson
Freeway Suite 2200
Dallas, TX 75244-6152
Trustee | Since 2019 | President, JKL Group, LLC, 2010 – present;
Principal, Dalcor Companies, 2012 –
present. | 24 | None |
| INTERESTED TRUSTEES3 |
David Cox, Sr. (1972)
5005 Lyndon B. Johnson
Freeway Suite 2200
Dallas, TX 75244-6152
Trustee | Since 2020 | Supply Chain Manager, Penske
Logistics, Inc., 2004 – present. | 24 | None |
Randall T. Hahn, D.Min. (1965)
5005 Lyndon B. Johnson
Freeway Suite 2200
Dallas, TX 75244-6152
Trustee | Since 2018 | Senior Pastor, The Heights Baptist
Church, 2002 – present. | 24 | None |
FUND MANAGEMENT (Continued)
Name, (Year of Birth), Address
and Position(s) with Trust | Term of Office
and Length of
Time Served1 | Principal Occupation(s)
During Past 5 Years | Number of
Portfolios
in Fund
Complex
Overseen
by Trustee | Other Trusteeships/
Directorships
Held by Trustee2 |
| OFFICERS WHO ARE NOT TRUSTEES4 |
Melanie Childers (1971)
5005 Lyndon B. Johnson
Freeway Suite 2200
Dallas, TX 75244-6152
Vice President – Fund
Operations and Secretary | Since 20145 | Managing Director, Fund Operations,
GuideStone Financial Resources, 2014 –
present. | N/A | N/A |
John R. Jones (1953)
5005 Lyndon B. Johnson
Freeway Suite 2200
Dallas, TX 75244-6152
President | Since 2000 | Executive Vice President and Chief Operating
Officer, GuideStone Financial Resources, 1997
– present. | N/A | N/A |
Patrick Pattison (1974)
5005 Lyndon B. Johnson
Freeway Suite 2200
Dallas, TX 75244-6152
Vice President and Treasurer | Since 2008 | Chief Accounting Officer, GuideStone
Financial Resources, 2015 – present. | N/A | N/A |
Brandon Pizzurro (1981)
5005 Lyndon B. Johnson
Freeway Suite 2200
Dallas, TX 75244-6152
Vice President and Investment
Officer | Since 2021 | Director of Public Investments, GuideStone
Financial Resources, 2021 – present; Portfolio
Manager, GuideStone Financial Resources,
2019 - 2021; Senior Investment Analyst,
GuideStone Financial Resources, 2017 – 2019. | N/A | N/A |
David S. Spika (1964)
5005 Lyndon B. Johnson
Freeway Suite 2200
Dallas, TX 75244-6152
Executive Vice President | Since 2019 | Vice President and Chief Investment Officer
GuideStone Financial Resources, 2021 – present;
Vice President and Chief Strategic Investment Officer, GuideStone
Financial Resources, 2016 – 2021. | N/A | N/A |
Brandon Waldeck (1977)
5005 Lyndon B. Johnson
Freeway Suite 2200
Dallas, TX 75244-6152
AML Compliance Officer | Since 2020 | Senior Manager – Fraud
Risk, GuideStone Financial Resources,
2019 – present; Director
of Ethics Office Trade Monitoring,
Fidelity Investments, 2001 – 2019. | N/A | N/A |
Matthew A. Wolfe (1982)
5005 Lyndon B. Johnson
Freeway Suite 2200
Dallas, TX 75244-6152
Chief Compliance Officer and
Chief Legal Officer | Since 20176 | Managing Director, Compliance and Legal,
GuideStone Financial Resources, 2020 – present;
Associate Counsel – Investment and
Corporate Services, GuideStone Financial
Resources, 2015 – 2020. | N/A | N/A |
Erin Wynne (1981)
5005 Lyndon B. Johnson
Freeway Suite 2200
Dallas, TX 75244-6152
Assistant Treasurer | Since 2016 | Director, Financial Reporting & Analysis,
GuideStone Financial Resources, 2015 –
present. | N/A | N/A |
1 Each Independent Trustee serves until his or her resignation, removal or mandatory retirement. Each Interested Trustee serves until his or her resignation, removal or mandatory retirement or until he or she ceases to be a member of the Board of Trustees of GuideStone Financial Resources. All Trustees must retire at the end of the calendar year in which they attain the age of 80 or after achieving 10 years of service, whichever occurs last. Officers serve at the pleasure of the Board.
2 Directorships not included in the Trust complex that are held by a director in any company with a class of securities registered pursuant to section 12 of the Securities Exchange Act of 1934 or any company registered as an investment company under the 1940 Act.
3 Mr. Cox and Dr. Hahn are “interested persons” of the Trust as the term is defined in the 1940 Act due to their positions on the Board of Trustees of
GuideStone Financial Resources.
4 The officers of the Trust are affiliates of the Adviser due to their positions with the Adviser, GuideStone Financial Resources, GuideStone Investment Services and/or GuideStone Resource Management, Inc.
5 Ms. Childers has served as Vice President – Fund Operations since 2014. She has served as Vice President – Fund Operations and Secretary since 2021.
6 Mr. Wolfe has served as Chief Legal Officer since 2017. He has served as CCO and Chief Legal Officer since 2020.
PROXY VOTING
A description of the policies and procedures that GuideStone Funds uses to determine how to vote proxies relating to their portfolio securities as well as information regarding how GuideStone Funds voted proxies during the most recent 12-month period ended June 30 is available without charge by calling 1-888-GS-FUNDS (1-888-473-8637), by visiting our website at GuideStoneFunds.com or by visiting the SEC’s website at http://www.sec.gov.
FORM N-MFP
Beginning December 2009, the GuideStone Money Market Fund began filing Form N-MFP with the SEC. Form N-MFP is filed on a monthly basis by money market mutual funds and includes detailed information about a money market fund’s investments and the market-based price of its portfolio known as its "shadow NAV" or mark-to-market valuation. The portfolio holdings information is posted on our website, GuideStoneFunds.com within five business days after the end of the month. Form N-MFP is made available online with a 60-day delay at http://www.sec.gov.
QUARTERLY SCHEDULES OF INVESTMENTS
In addition to the semi-annual and annual reports that GuideStone Funds delivers to shareholders and makes available through its website, GuideStone Funds files a complete schedule of portfolio holdings with the SEC for each Fund’s first and third fiscal quarters on Form N-PORT. GuideStone Funds does not deliver the schedule for the first and third fiscal quarters to shareholders; however, the schedule is posted to our website, GuideStoneFunds.com. You may also obtain Form N-PORT filings by accessing the SEC’s website at http://www.sec.gov.
BOARD REVIEW OF EXISTING ADVISORY AGREEMENT AND SUB-ADVISORY AGREEMENTS (Unaudited)
As required by the Investment Company Act of 1940, as amended (the “1940 Act”), the Board of Trustees (the “Board”) of GuideStone Funds (the “Trust”), including the Trustees who are not “interested persons” of the Trust (the “Independent Trustees”), as the term “interested persons” is defined in Section 2(a)(19) of the 1940 Act, recently considered the renewal of (i) the investment advisory agreement between GuideStone Capital Management, LLC (the “Adviser” or “GSCM”) and the Trust on behalf of each series of the Trust (except as noted below) (each, a “Fund,” and collectively, the “Funds”) (the “Advisory Agreement”); and (ii) the existing sub-advisory agreements among the Adviser, each sub-adviser and the Trust on behalf of each Select Fund (except as noted below) (referred to collectively as the “Sub-Advisory Agreements”). The Advisory Agreement and the Sub-Advisory Agreements (each, an “Agreement,” and collectively, the “Agreements”) were approved for an additional one-year term, at a meeting of the Board held on September 16-17, 2021 (the “September Meeting”). The Board’s decision to approve the Agreements reflects the exercise of its reasonable business judgment to continue each Agreement. In approving the continuation of the Agreements, the Board considered, with the assistance and advice of counsel to the Independent Trustees (“Independent Counsel”) and counsel to the Trust, information provided by the Adviser, each applicable sub-adviser and an independent provider of investment company data engaged by the Trust. Because the Board had approved them for an initial two-year term within the last year, the following Agreements were not subject to annual renewal at the September Meeting: (i) the Advisory Agreement with respect to the Global Impact Fund (“GIF”); (ii) the sub-advisory agreement with Barrow, Hanley, Mewhinney & Strauss, LLC on behalf of the Value Equity Fund (“VEF”); (iii) the sub-advisory agreement with American Century Investment Management, Inc. on behalf of the Small Cap Equity Fund (“SCEF”); (iv) the sub-advisory agreement with Altrinsic Global Advisors, LLC on behalf of the International Equity Fund (“IEF”); (v) the sub-advisory agreement with Janus Capital Management LLC on behalf of the GIF; (vi) the sub-advisory agreement with RBC Global Asset Management (U.S.) Inc. on behalf of the GIF; (vii) the sub-advisory agreement with AQR Capital Management, LLC (“AQR”) on behalf of the Strategic Alternatives Fund (“SAF”); (viii) the sub-advisory agreement with Forward Management, LLC (d/b/a Salient) (“Salient”) on behalf of the SAF, and Salient’s sub-subadvisory agreement with Broadmark Asset Management LLC; (ix) the sub-advisory agreement with P/E Global LLC on behalf of the SAF; (x) the sub-advisory agreement with SSI Investment Management LLC on behalf of the SAF; (xi) the sub-advisory agreement with Parametric Portfolio Associates LLC (“Parametric”) on behalf of the Defensive Market Strategies Fund (“DMSF”) and for the completion portfolio and cash overlay programs of certain Funds; and (xii) BlackRock Financial Management Inc.’s sub-sub-investment advisory agreements with BlackRock International Limited and BlackRock (Singapore) Limited with respect to the Low-Duration Bond Fund.
The Board’s consideration of various factors and its conclusions with respect to such factors formed the basis for the Board’s determination to continue the Agreements. The factors considered by the Board included, but were not limited to: (i) the personnel resources of the Adviser and sub-advisers; (ii) the experience and expertise of the Adviser and sub-advisers; (iii) the financial capabilities and resources of the Adviser and sub-advisers; (iv) the compliance procedures and histories of the Adviser and sub-advisers; (v) the performance of the Funds or portfolio accounts in comparison to relevant benchmarks, peer universes of similarly managed funds and/or the sub-advisers’ other clients; (vi) the amount of the contractual advisory fees in comparison to similarly managed funds and/or the sub-advisers’ other clients and the effect of any fee waiver and expense reimbursement arrangements; (vii) the total expenses of the Funds in comparison to similarly managed funds and the use of past and anticipated expense caps; (viii) the profitability of the Adviser and, to the extent available, of the sub-advisers with respect to the Funds or portfolio accounts and their overall businesses, as well as the effect of fee waivers and expense caps on profitability levels; (ix) the extent of any economies of scale and whether the fee structures reflect such economies of scale through breakpoints or effectively do so as a result of recent reductions in fee levels; (x) the existence of any collateral benefits realized by the Adviser or sub-advisers, such the use of soft dollars; and (xi) the existence of any collateral benefits realized by the Funds resulting from relationships with the Adviser or sub-advisers. In addition, with respect to the Funds that utilize a multi-manager approach (i.e., the Fund is advised by multiple sub-advisers), the Board considered the ongoing role each sub-adviser plays in the overall
structure of the Fund’s portfolio, including how each sub-adviser’s strategy complements the strategies of the other sub-advisers. In addition, in light of the on-going coronavirus pandemic (“COVID-19”), the Board considered whether and to what extent COVID-19 had affected the Adviser’s and each sub-adviser’s operations, human resources and financial condition.
In its decision to renew the Agreements, the Board was also mindful of the potential disruptions of the Trust’s operations and various risks, uncertainties and other effects that could occur as a result of a decision to terminate or not renew an Agreement. The Board also evaluated whether the approval of each Agreement was in the best interests of the applicable Fund and its shareholders. No one factor was determinative in the Board’s consideration of the Agreements.
The Board undertook a review of the terms of the Agreements and the nature, extent and quality of the services provided by the Adviser and each applicable sub-adviser. The Board conducted its analysis on a Fund-by-Fund basis with respect to the Adviser and then each applicable sub-adviser. The Adviser provided the Board with substantial detailed information in the form of reports about itself and each Fund and applicable sub-advisory firm prior to and during the September Meeting, which addressed the factors listed previously. The Adviser also provided additional information about the Adviser and each sub-adviser in presentations made during the September Meeting and responded to questions from the Trustees. In addition, the Independent Trustees met separately in executive session with Independent Counsel, as did the Investment Management Committee of the Board (“IMC”), to discuss and consider information presented in connection with the continuation of the Agreements as well as the Trustees’ responsibilities and duties in approving the Agreements.
BOARD APPROVAL OF CONTINUATION OF THE ADVISORY AGREEMENT WITH GSCM
In considering the renewal of the existing Advisory Agreement with GSCM, the Board took into account all the materials provided prior to and during the September Meeting, the presentations made during the September Meeting and the comprehensive discussions during the September Meeting, including the discussions between the Independent Trustees and Independent Counsel during executive sessions. The Board also considered the IMC’s review of information related to the Advisory Agreement, questions submitted by the IMC to the Adviser and Trust management regarding GSCM, GSCM’s and/or Trust management’s responses to those questions and recommendations made by the IMC.
The Board examined the nature, extent and quality of the services to be provided by GSCM to each of the Funds. The Board evaluated GSCM’s experience serving as the investment adviser to the Trust and each of its Funds, including GSCM’s experience overseeing and managing the allocation of each Fund’s assets among the Trust’s sub-advisers, continually reviewing the investment performance of each Fund, continually reviewing the nature and quality of the services provided by the Trust’s sub-advisers and recommending changes to the Trust’s sub-advisers and the allocation of each Select Fund’s assets among their applicable sub-advisers, as and when appropriate, and potentially directly managing Fund investments. With respect to the Target Date Funds and the Target Risk Funds, the Board evaluated the nature, extent and quality of the services that GSCM provides that are in addition to, rather than duplicative of, services provided to any underlying Select Fund. Specifically, the Board evaluated GSCM’s services in determining the glide path or the asset mix for each Fund and selecting the specific underlying Select Funds in which to invest, as well as rebalancing services. The Board considered the experience of key personnel at GSCM providing investment management services to the Trust and to each Fund as well as the administrative services provided to the Trust, the systems used by such persons and the ability of GSCM to attract and retain capable personnel. The Board considered the reputation, compliance history, compliance program and financial condition of GSCM. The Board also considered the terms of the Advisory Agreement and the responsibilities that GSCM has as investment adviser to each of the Funds, including oversight of sub-adviser compliance with each Fund’s policies and objectives and oversight of general Fund compliance, including compliance with the faith-based investing (“FBI”) policies and restrictions and Board directives. In light of COVID-19, the Board considered whether and the extent to which COVID-19 had affected GSCM’s operations, human resources or financial condition. The Board concluded that each Fund is likely to benefit from the nature, extent and quality of GSCM’s services based on its experience,
personnel, operations and resources. During their deliberations, the Trustees did not identify any particular information that was all-important or controlling, and each Trustee may have attributed different weights to the various factors deliberated upon, among others.
The Board considered the advisory fees for each of the Funds under the Advisory Agreement, as well as each Fund’s total management fees. The Board examined fee information for each Select Fund, as compared to other funds in each Select Fund’s designated peer group (“Expense Group”) for the Institutional and Investor Classes, based on information provided by an independent provider of investment company data as of June 30, 2021. The Board took into account that this comparison of each of the Select Funds Institutional Class contractual management fees, not inclusive of any fee waivers or expense reimbursements, ranked the SAF, Low-Duration Bond Fund (“LDBF”), Medium-Duration Bond Fund (“MDBF”), Global Bond Fund (“GBF”), Equity Index Fund (“EIF”) and VEF in the first quintile; the Money Market Fund (“MMF”), Global Real Estate Securities Fund (“GRESF”), International Equity Index Fund (“IEIF”) and Emerging Markets Equity Fund (“EMEF”) in the second quintile; the Growth Equity Fund (“GEF”) in the third quintile; the DMSF, SCEF and IEF in the fourth quintile; and no Fund in the fifth quintile. With respect to the comparison of each of the Select Funds Investor Class contractual management fees, not inclusive of any fee waivers or expense reimbursements, the Board noted that the MMF, LDBF, MDBF, GBF and EMEF ranked in the first quintile; the EIF, VEF and GRESF ranked in the second quintile; the DMSF, GEF, SCEF and IEF ranked in the third quintile; and no Fund ranked in the fourth or fifth quintile. It was further noted that the Investor Class of the SAF was not assigned a quintile due to its small peer group.
The Board evaluated the total expense ratios for other funds in each Select Fund’s Expense Group for the Institutional and Investor Classes based on information provided by an independent provider of investment company data as of June 30, 2021, and reflected upon the results of each of the Select Funds Institutional Class total expense ratios, net of any fee waivers or expense reimbursements, noting that the LDBF, SAF, DMSF, VEF and IEIF ranked in the first quintile; the MMF, MDBF, GBF, EIF, GRESF and GEF ranked in the second quintile; the SCEF and EMEF ranked in the third quintile; the IEF ranked in the fourth quintile; and no Fund ranked in the fifth quintile. For the comparison of each of the Select Funds Investor Class total expense ratios, net of any fee waivers or expense reimbursements, the Board considered that no Fund ranked in the first or second quintile; the MMF, LDBF, DMSF and VEF ranked in the third quintile; the MDBF, GBF, EIF, GEF and EMEF ranked in the fourth quintile; and the GRESF, SCEF and IEF ranked in the fifth quintile. It was further noted that the Investor Class of the SAF was not assigned a quintile due to its small peer group.
The Board also examined fee and expense information for the Target Date Funds and the Target Risk Funds (collectively, the “Funds-of-Funds”), as compared to other funds in these Funds’ Expense Groups for both the Institutional and Investor Classes, based on information provided by an independent provider of investment company data as of June 30, 2021, noting the relatively small size of the Expense Groups. The Board reviewed each Fund’s contractual management fees, not inclusive of any fee waivers or expense reimbursements, noting that most of the Institutional Class Funds-of-Funds resided in the second quintile, with the exception of the Conservative Allocation Fund (“CAF”), which ranked in the first quintile, and the Aggressive Allocation Fund (“AAF”) and MyDestination Fund 2015 (“MDF 2015”), which were not assigned a quintile ranking due to the size of their respective peer groups. Regarding the Investor Class of the Funds-of-Funds’ rankings of contractual management fees, not inclusive of any fee waivers or expense reimbursements, the Board observed that most of these Funds-of-Funds were in the first quintile, except for the second quintile ranked Balanced Allocation Fund (“BAF”) and the MDF 2015, CAF and AAF, which were not assigned quintile rankings due to the size of their respective peer groups.
Also, with respect to the Funds-of-Funds, the Board assessed the total expense ratios, not inclusive of any fee waivers or expense reimbursements, in these Funds’ Expense Groups for both the Institutional and Investor Classes, based on information from an independent provider of investment company data as of June 30, 2021, continuing to note the relatively small size of the Expense Groups. For the Institutional Class, the Board observed that the Funds-of-Funds were ranked in either the second or third quintile, except for the MDF 2015, Growth Allocation Fund (“GAF”) and BAF, which were in the fourth quintile, and the CAF and AAF,
which were in the fifth quintile. For the Investor Class, the Board observed that the Funds-of-Funds were ranked in either the second or third quintile, except for the BAF, which was in the fourth quintile, the MDF 2015, CAF and GAF, which were in the fifth quintile, and the AAF, which was not assigned quintile rankings due to the size of its respective peer group.
The Board examined the performance information for both the Institutional and Investor Classes of the Funds compared to each Fund’s designated peer group (“Performance Universe”) based on information provided by an independent provider of investment company data, specifically the average annual total returns for the one-, three-, five- and 10-year periods ended June 30, 2021, as applicable.
For the three-year average annual total returns for the period ended June 30, 2021, the Board noted that for the Institutional Class, the MMF, MDBF and SCEF ranked in the first quintile; the BAF, GBF, EIF, GRESF and GEF ranked in the second quintile; the GAF, AAF, DMSF, VEF and EMEF ranked in the third quintile; the MDF 2015, MyDestination Fund 2025 (“MDF 2025”), MyDestination Fund 2035 (“MDF 2035”), MyDestination Fund 2045 (“MDF 2045”), MyDestination Fund 2055 (“MDF 2055”), CAF, LDBF, SAF, IEIF and IEF ranked in the fourth quintile; and no Fund ranked in the fifth quintile. As for the three-year average annual total returns for the Investor Class of the Funds, the Board noted that the report results had the SCEF ranked in the first quintile; the BAF, MDBF, EIF and GRESF ranked in the second quintile; the GAF, AAF, MMF, GBF, VEF, GEF and EMEF ranked in the third quintile; the MDF 2025, MDF 2035, MDF 2045, MDF 2055, CAF, SAF, DMSF and IEF in the fourth quintile; and the MDF 2015 and LDBF in the fifth quintile.
For the five-year average annual total returns for the period ended June 30, 2021, the Board noted that for the Institutional Class of the Funds, the BAF, MMF, MDBF, GBF and EIF ranked in the first quintile; the AAF, GRESF, GEF, SCEF and IEF ranked in the second quintile; the CAF, GAF, LDBF, DMSF, VEF, IEIF and EMEF ranked in the third quintile; and no Fund ranked in the fourth or fifth quintile. Regarding the five-year average annual total returns for the Investor Class of the Funds, the GBF ranked in the first quintile; the BAF, MDBF, EIF, GEF, SCEF and IEF in the second quintile; the MDF 2045, MDF 2055, GAF, AAF, MMF, GRESF, VEF and EMEF in the third quintile; the MDF 2025, MDF 2035, CAF, LDBF and DMSF in the fourth quintile; and the MDF 2015 in the fifth quintile.
For the 10-year average annual total returns for the period ended June 30, 2021, the Board noted that for the Institutional Class of the Funds, the MMF, MDBF and EIF ranked in the first quintile; the VEF and GEF ranked in the second quintile; the LDBF, SCEF and IEF ranked in the third quintile; and no Fund ranked in the fourth or fifth quintile. With respect to the 10-year average annual total returns for the Investor Class of the Funds, the GBF and EIF ranked in the first quintile; the MDBF and GRESF ranked in the second quintile; the BAF, AAF, GEF, MMF, VEF and SCEF ranked in the third quintile; the MDF 2025, MDF 2035, GAF, LDBF and IEF ranked in the fourth quintile; and the MDF 2015, MDF 2045 and CAF ranked in the fifth quintile.
The Board considered the costs to GSCM of serving as the investment adviser to the Funds, including the costs associated with the personnel, systems and equipment necessary to manage the Funds in accordance with the existing Advisory Agreement. The Board considered the revenues that GSCM received for serving as the investment adviser to the Funds and that any profit realized by GSCM is forwarded to GuideStone Financial Resources of the Southern Baptist Convention, an affiliate of GSCM, which for many years had operated at a deficit with respect to the Trust. The Board also considered the profitability information for GSCM, first, without taking into account sub-advisory fees, and second, taking into account sub-advisory fees. The Board considered whether any direct or indirect collateral benefits inured to either GSCM or the Trust as a result of their affiliation with one another. In light of these considerations, the Board concluded that any profits realized in connection with GSCM’s services appeared reasonable.
The Board also considered the extent to which the advisory fees to be paid to the Adviser for each Fund reflected economies of scale, taking into account the nature and extent of the services provided by the Adviser, including the multi-manager structure of the Funds. The Board noted that only certain Funds are subject to an expense cap. The Board considered the amount of any fees waived by GSCM for each applicable Fund and the total amount of fees waived for the Trust as a whole during the past year. The
Board also considered the practices identified by GSCM that have resulted in shareholder savings, how those practices reflect economies of scale and how savings are shared between GSCM and the Trust.
Based on all of the information presented to the Board and its consideration of relevant factors, the Board concluded that the fee paid to GSCM by each Fund was fair and reasonable in light of the services to be performed, and in the exercise of its business judgment, determined to approve the continuation of the Advisory Agreement for each Fund. The Board also determined that approval of the continuation of the Advisory Agreement for each Fund is in the best interests of each Fund and its shareholders.
BOARD APPROVAL OF CONTINUATION OF SUB-ADVISORY AGREEMENTS FOR THE SELECT FUNDS
In considering the Sub-Advisory Agreements being presented for renewal, the Board took into account the materials provided prior to and during the meeting, the presentations made during the meeting and the extensive discussions during the meeting, including the discussions the Independent Trustees had during their executive sessions with Independent Counsel. The Board also took into account the IMC’s review of information related to the Trust’s sub-advisers, questions submitted by the IMC to GSCM regarding various sub-advisers, GSCM’s responses to those questions and recommendations made by the IMC.
The Board examined the nature, extent and quality of the services to be provided by each sub-adviser. The Board evaluated each sub-adviser’s experience serving as a sub-adviser to the applicable Fund. The Board noted that each sub-adviser currently provides investment advice to various clients, including, in some cases, other pooled investment vehicles. The Board noted the experience of key personnel at each sub-adviser providing investment management services, the systems used by such persons and the ability of each sub-adviser to attract and retain capable personnel. The Board noted the reputation, compliance history, compliance program and financial condition of each sub-adviser. The Board also noted the terms of the existing Sub-Advisory Agreements and the responsibilities that each sub-adviser has with respect to the applicable Fund, including the responsibility of the day-to-day management of the investment portfolio of such Fund, compliance with such Fund’s policies and objectives and the implementation of FBI restrictions and Board directives as they relate to such Fund. The Board also took into account the overall structure of each Fund and the particular role each sub-adviser plays in that structure and in achieving each Fund’s overall investment objective. In light of COVID-19, the Board considered whether and the extent to which COVID-19 had affected each sub-adviser’s operations, human resources or financial condition. The Board concluded that each Fund is likely to benefit from the nature, extent and quality of these services as a result of each sub-adviser’s experience, personnel, operations and resources. During their deliberations, the Trustees did not identify any particular information that was all-important or controlling, and each Trustee may have attributed different weights to the various factors deliberated upon, among others.
The Board examined performance information for each segment of a Fund managed by a sub-adviser. The Board noted that, for many of the sub-advisers, the performance record of the segment of the Fund managed by the sub-adviser compared favorably to the relevant benchmark, the composite performance for the sub-adviser’s clients (on a gross fee basis) and/or the peer universe of similarly managed funds. In cases where the sub-adviser’s performance lagged, the Board also considered historical and recent investment performance, whether and how the sub-adviser’s strategy deviated from the composition of the benchmark, the sub-adviser’s role within a Fund and the outlook for future performance. The Board also noted that, in certain cases, market trends and the current situation caused by COVID-19 may have contributed to the underperformance of some sub-advisers. The Board also considered whether a sub-adviser’s underperformance was within the expected tracking error for the sub-adviser’s investment strategy. The Board concluded that, although past performance is no guarantee of future performance, the performance of each sub-adviser’s segment was satisfactory in light of all relevant considerations and the applicable Funds were likely to benefit from each sub-adviser continuing to serve as sub-adviser to the Trust.
The Board examined the fee schedule for each sub-adviser, noting how the fee levels charged to each applicable Fund compared with available information about fees charged by the sub-advisers to their other similarly situated clients, which in many cases include separately managed accounts, as well as how sub-adviser fee levels for each Select Fund compared to the median sub-advisory fee for the peer universe of similarly managed funds. The Board determined that the fees to be charged by each sub-adviser were reasonable in relation to the nature, extent and quality of the services to be provided.
The Board also took into account the profitability and the financial capability of each sub-adviser in light of the information presented at the meeting. In light of these considerations, the Board concluded that the profits realized by each sub-adviser who completed a profitability questionnaire appeared reasonable. For the limited number of sub-advisers that did not provide profitability information, the Board relied upon other relevant information, particularly the independent negotiation of the fee schedules, the level of the fees, each sub-adviser’s performance history and feedback received from the sub-advisers regarding the inability of their firm to estimate profitability. The Board noted that based on the Adviser’s representations, the financial statements of the sub-advisers did not appear to raise any significant concerns regarding the financial capability of those sub-advisers. The Board also considered the Adviser’s representations in the materials prepared for the meeting, and the discussions earlier in the meeting, that no sub-adviser experienced any material adverse change in its financial condition since the date of its most recent audited financial statements and took into account the Adviser’s representation that it would continue to monitor the financial condition of each sub-adviser.
The Board considered the extent to which sub-adviser fees to be paid to each sub-adviser reflected economies of scale. The Board noted that each sub-adviser’s fee schedule either reflected economies of scale by reducing the fee on assets in excess of certain stated breakpoints or the fee level negotiated was below or on par with the standard fee level for the sub-adviser.
In evaluating the benefits that are expected to accrue to each sub-adviser through its relationship as sub-adviser to a Select Fund, the Board noted that certain sub-advisers allocate portfolio brokerage to affiliated broker-dealers that receive commissions from the execution of Fund trades. The Board also noted that certain sub-advisers expect to benefit from “soft dollar” arrangements by which brokers will provide research and other services to the sub-adviser in exchange for commissions on trades of the portfolio securities of a Select Fund. The Board considered whether any direct or indirect collateral benefits were inured to the Trust because of its affiliation with each sub-adviser.
Based on all of the information presented to the Board and its consideration of relevant factors, the Board, in the exercise of its reasonable business judgment, determined to approve the continuation of each Sub-Advisory Agreement that was presented for renewal. The Board also determined that approval of the continuation of each Sub-Advisory Agreement presented for renewal is in the best interests of each Select Fund and their respective shareholders.
BOARD REVIEW OF NEW SUB-ADVISORY AGREEMENTS FOR THE DEFENSIVE MARKET STRATEGIES® FUND
As required by the 1940 Act, the Board, including a majority of the Independent Trustees, advised by Independent Counsel, considered the approval of two new sub-advisory agreements (the “New Sub-Advisory Agreements”) among the Adviser, the Trust and the following entities (each, a “New Sub-Adviser” and together, the “New Sub-Advisers”), respectively: (i) Neuberger Berman Investment Advisers LLC (“Neuberger”) on behalf of the DMSF (the “Neuberger Agreement”); and (ii) PGIM Quantitative Solutions LLC (“PGIM QS”) on behalf of the DMSF (the “PGIM QS Agreement”). The Board approved the New Sub-Advisory Agreements at the September Meeting.
The Board’s decision to approve the New Sub-Advisory Agreements reflects the exercise of the Board’s business judgment and the Board’s consideration of its fiduciary duties to the Funds and their shareholders. Prior to approving the New Sub-Advisory Agreements, the Board requested and received information from the Adviser and the Sub-Advisers, and considered such information with the assistance and advice of Independent Counsel and counsel to the Trust.
The Board’s consideration of various factors, and its conclusions with respect to such factors, formed the basis for the Board’s determination to approve the New Sub-Advisory Agreements. The factors considered by the Board included, but were not limited to: (i) the nature, extent and quality of the services to be provided by each New Sub-Adviser; (ii) the personnel resources of the New Sub-Advisers; (iii) the experience and expertise of each New Sub-Adviser; (iv) the financial capabilities and financial resources of each New Sub-Adviser; (v) the compliance program and compliance history of each New Sub-Adviser; (vi) the composite performance history of each New Sub-Adviser’s proposed investment strategy, as applicable, in comparison to relevant benchmarks, if available; (vii) the amount of the contractual sub-advisory fees proposed to be paid to each New Sub-Adviser in comparison to available fee information for the New Sub-Advisers’ other clients and similar funds; (viii) the expected profitability
of each New Sub-Adviser with respect to the Funds and their overall business; (ix) the extent of any economies of scale and whether the fee structures for each New Sub-Adviser reflect such economies of scale; (x) the existence of any collateral benefits that may be realized by each New Sub-Adviser, such as affiliate brokerage arrangements or the use of soft dollars; and (xi) any collateral benefits that may be realized by the Funds. With respect to each New Sub-Advisory Agreement, the Board also evaluated whether the approval of the New Sub-Advisory Agreements was in the best interests of the Funds and their respective shareholders. In light of COVID-19, the Board considered whether and the extent to which COVID-19 had affected each New Sub-Adviser’s operations, human resources and financial condition. No one factor was determinative in the Board’s consideration of each New Sub-Advisory Agreement, and each Trustee may have attributed different weights to the factors considered.
The Board undertook a review of the terms of the New Sub-Advisory Agreements, as well as the nature, extent and quality of the services to be provided by the New Sub-Advisers under the New Sub-Advisory Agreements and the proposed fees in exchange for such services. The Adviser provided the Board with information in the form of reports about the New Sub-Advisers prior to and during the September Meeting, which addressed the factors listed previously. During the September Meeting, the Adviser also gave presentations to the Board during which the Adviser provided additional information about the New Sub-Advisers, discussed the comprehensive review process used by the Adviser to recommend the New Sub-Advisers and responded to questions from the Board.
In addition, the Independent Trustees met separately in executive session with Independent Counsel, to discuss and consider the information presented in connection with the approval of the New Sub-Advisory Agreements, as well as the Trustees’ responsibilities and duties in approving the agreements.
BOARD APPROVAL OF NEW SUB-ADVISORY AGREEMENTS FOR THE DEFENSIVE MARKET STRATEGIES® FUND
In considering the approval of the New Sub-Advisory Agreements, the Board took into account the materials provided prior to and during the September Meeting, the presentations made and the extensive discussions held during the September Meeting, including the discussions the Independent Trustees had during their executive session with Independent Counsel. The Board also took into account the IMC’s review of information related to the New Sub-Advisory Agreements and recommendations made by the IMC. The Board considered its responsibilities with respect to reviewing and approving the terms of the New Sub-Advisory Agreements, the investment management team at the New Sub-Advisers, the reasonableness of the New Sub-Advisers’ sub-advisory fees and whether the appointment of the New Sub-Advisers and would be in the best interests of the DMSF and its shareholders. The Board reviewed the factors that it should consider in evaluating whether to approve the New Sub-Advisory Agreements and the materials provided to support each factor.
In making its determination to approve the selection of the New Sub-Advisers, the Board, including the Independent Trustees advised by Independent Counsel, considered a number of factors. Such factors included the nature, extent and quality of the services to be provided by the New Sub-Advisers; the composite performance history of each New Sub-Adviser’s respective strategy; the fees charged by each New Sub-Adviser for its services; and information regarding the ownership structure, investment management experience, personnel, clients, assets under management (“AUM”), legal and regulatory history, compliance policies and procedures, brokerage and soft dollar practices and investment philosophies and processes of each New Sub-Adviser. In light of COVID-19, the Board considered whether and the extent to which COVID-19 had affected the New Sub-Advisers’ operations, human resources and financial condition. The Board also reviewed presentations by the Adviser regarding the comprehensive review process it used to recommend the New Sub-Advisers. The Board received and considered information about the potential of the New Sub-Advisers to contribute economies of scale as the DMSF grows in size. The Board considered that the Adviser had been able to negotiate fees that were favorable compared to Neuberger’s and PGIM QS’s stated fee schedules, respectively.
Because the engagements with the New Sub-Advisers would be new, there was no relevant historical profitability information for the Board to assess. The Board noted, however, that each New Sub-Adviser did provide an estimate of profitability for providing its services to the DMSF – Neuberger’s was based on available information and derived using consistent methodologies used to report profitability elsewhere across the firm; and PGIM QS’s was based on a full cost approach. The Trustees considered the Adviser’s assessment of each New Sub-Adviser’s financial condition. The Trustees noted that the Adviser, after reviewing certain financial information provided by the New Sub-Advisers, believed that each New Sub-Adviser was financially sound.
The Board considered the fees to be paid to the New Sub-Advisers under the New Sub-Advisory Agreements, as well as the overall fee structure under the New Sub-Advisory Agreements, in light of the nature, extent and quality of the services to be provided. The Board also considered information about the fees charged by other investment advisers that offer similar services. The Board noted that the DMSF’s overall management and advisory fees at current asset levels would not be impacted as a result of the addition of the New Sub-Advisers and the terminations of AQR and Parametric. The Board also noted that the DMSF, and not the Adviser, would pay fees to Neuberger and PGIM QS directly. In addition, the Board noted that GSCM’s profitability would not be impacted by the addition of the New Sub-Advisers.
The Board considered potential “fall-out” or ancillary benefits anticipated to be received by each New Sub-Adviser, and its respective affiliates as a result of its arrangements with the DMSF. The Board concluded that any potential benefits to be derived by the New Sub-Advisers included potential access to additional research resources, increased AUM and reputational benefits, which were consistent with those generally derived by sub-advisers offering similar services to mutual funds.
The Adviser informed the Board that it has a positive working relationship with Neuberger, noting that Neuberger currently serves as a sub-adviser to the GBF.
While acknowledging that past performance does not indicate future results, the Board considered the historical performance of the Neuberger S&P 500 PutWrite (ATM) Strategy (the “Neuberger Strategy”). The Board noted the Neuberger Strategy’s performance history versus the benchmark, the CBOE S&P 500® PutWrite Index, had been favorable over historic time periods, with the Neuberger Strategy outperforming its benchmark for the three-, five- and seven-year and analysis periods ended June 30, 2021, performing in line with the benchmark for the year-to-date period and underperforming the benchmark for the one-year period.
While acknowledging that past performance does not indicate future results, the Board considered the historical performance of the PGIM QS’s Market Participation Strategy (the “PGIM QS Strategy”). The Board noted the PGM QS Strategy’s performance history versus the blended benchmark, 55% S&P 500® Index and 45% Bloomberg 1-3 Month US Treasury Bill Index, had been favorable over historic time periods, with the PGIM QS Strategy outperforming its benchmark for all periods ended June 30, 2021.
The Board considered the Adviser’s representation that each New Sub-Adviser would be comfortable managing its respective strategy in accordance with the DMSF’s FBI policy.
The Board noted that the Adviser had not planned to use a transition manager to re-allocate assets among the DMSF’s sub-advisers. The Board noted that the estimated transaction costs were expected to be modest to the DMSF.
Based on all of the information provided to the Board and its consideration of relevant factors, the Board determined that the New Sub-Advisers would provide investment management services that are appropriate in scope and that the fees to be paid to Neuberger and PGIM QS by the DMSF under the New Sub-Advisory Agreements would be fair and reasonable in light of the nature, extent and quality of services to be provided. In their deliberations, the Trustees did not identify any particular information that was all-important or controlling, and each Trustee may have attributed different weights to the various factors deliberated upon, among others.
INVESTMENT SUB-ADVISERS (Assets under management as of December 31, 2021) (Unaudited)
GuideStone Funds employs a broad array of proven investment managers for the benefit of their investors. Each manager is distinctive in its investment management process and business approach.
| Fund | | Sub-Adviser | | Firm
Established | | Total Assets
Managed |
| Money Market | | BlackRock Advisors, LLC | | 1994 | | $10.0Tr |
| Low-Duration Bond | | BlackRock Financial Management, Inc.(1) | | 1994 | | $10.0Tr |
| | | Pacific Investment Management Company LLC | | 1971 | | $2.2Tr |
| | | Parametric Portfolio Associates LLC | | 1987 | | $428.9B |
| | | Payden & Rygel | | 1983 | | $151.6B |
| Medium-Duration Bond | | Goldman Sachs Asset Management, L.P. | | 1984 | | $2.2Tr |
| | | Pacific Investment Management Company LLC | | 1971 | | $2.2Tr |
| | | Parametric Portfolio Associates LLC | | 1987 | | $428.9B |
| | | Western Asset Management Company, LLC | | 1971 | | $492.4B |
| Global Bond | | Loomis, Sayles & Company, L.P. | | 1926 | | $363.1B |
| | | Neuberger Berman Investment Advisers LLC | | 2002 | | $460.0B |
| | | Parametric Portfolio Associates LLC | | 1987 | | $428.9B |
| | | Western Asset Management Company, LLC | | 1971 | | $492.4B |
| Defensive Market Strategies® | | American Century Investment Management, Inc. | | 1958 | | $246.9B |
| | | Neuberger Berman Investment Advisers LLC | | 2002 | | $460.0B |
| | | Parametric Portfolio Associates LLC | | 1987 | | $428.9B |
| | | PGIM Quantitative Solutions LLC | | 1975 | | $116.4B |
| | | Shenkman Capital Management, Inc. | | 1985 | | $30.9B |
| Global Impact | | Janus Capital Management LLC | | 1969 | | $432.0B |
| | | Parametric Portfolio Associates LLC | | 1987 | | $428.9B |
| | | RBC Global Asset Management (U.S.) Inc. | | 1983 | | $63.2B |
| Equity Index | | Legal & General Investment Management America, Inc. | | 2006 | | $275.0B |
| Value Equity | | American Century Investment Management, Inc. | | 1958 | | $246.9B |
| | | Barrow, Hanley, Mewhinney & Strauss, LLC | | 1979 | | $50.6B |
| | | The London Company of Virginia, LLC | | 1994 | | $17.1B |
| | | Parametric Portfolio Associates LLC | | 1987 | | $428.9B |
| | | TCW Investment Management Company LLC | | 1971 | | $264.5B |
| Growth Equity | | Brown Advisory, LLC | | 1993 | | $79.7B |
| | | ClearBridge Investments, LLC | | 2005 | | $208.3B |
| | | Loomis, Sayles & Company, L.P. | | 1926 | | $363.1B |
| | | Parametric Portfolio Associates LLC | | 1987 | | $428.9B |
| | | Sands Capital Management, LLC | | 1992 | | $73.1B |
| Small Cap Equity | | American Century Investment Management, Inc. | | 1958 | | $246.9B |
| | | Delaware Investments Fund Advisers | | 1929 | | $545.7B |
| | | Jacobs Levy Equity Management, Inc. | | 1986 | | $14.7B |
| | | Parametric Portfolio Associates LLC | | 1987 | | $428.9B |
| | | TimesSquare Capital Management, LLC | | 2000 | | $15.1B |
| International Equity Index | | Legal & General Investment Management America, Inc. | | 2006 | | $275.0B |
| International Equity | | Altrinsic Global Advisors, LLC | | 2000 | | $10.5B |
| | | AQR Capital Management, LLC | | 1998 | | $123.5B |
| | | Harris Associates L.P. | | 1976 | | $123.8B |
| | | MFS Institutional Advisors, Inc. | | 1924 | | $692.6B |
| | | Parametric Portfolio Associates LLC | | 1987 | | $428.9B |
| | | WCM Investment Management, LLC | | 1976 | | $107.5B |
| Emerging Markets Equity | | AQR Capital Management, LLC | | 1998 | | $123.5B |
| | | Goldman Sachs Asset Management, L.P. | | 1984 | | $2.2Tr |
| | | Parametric Portfolio Associates LLC | | 1987 | | $428.9B |
| | | RBC Global Asset Management (UK) Limited | | 2013 | | $71.7B |
| | | Wellington Management Company LLP | | 1928 | | $1.4B |
| Global Real Estate Securities | | Heitman Real Estate Securities, LLC | | 1989 | | $51.0B |
| | | RREEF America L.L.C. | | 1975 | | $86.5B |
| Strategic Alternatives Fund | | AQR Capital Management, LLC | | 1998 | | $123.5B |
| | | Forward Management, LLC (d/b/a Salient) | | 1998 | | $1.7B |
| Fund | | Sub-Adviser | | Firm
Established | | Total Assets
Managed |
| | | Broadmark Asset Management LLC | | 1999 | | $1.4B |
| | | Goldman Sachs Asset Management, L.P. | | 1984 | | $2.2Tr |
| | | Parametric Portfolio Associates LLC | | 1987 | | $428.9B |
| | | P/E Global LLC | | 2000 | | $14.9B |
| | | SSI Investment Management LLC | | 1973 | | $2.6B |
| Custodian for GuideStone Funds Assets | | The Northern Trust Company | | 1889 | | $12.6Tr |
| Cash Overlay for All Funds, except the Money Market Fund | | Parametric Portfolio Associates LLC | | 1987 | | $428.9B |
(1) Includes BlackRock International Limited and BlackRock (Singapore) Limited, which serve as sub-subadvisers.
Item 1. Reports to Stockholders (cont.).
Item 2. Code of Ethics.
| | (a) | The registrant, as of the end of the period covered by this report, has adopted a code of ethics that applies to the registrant’s principal executive officer, principal financial officer, principal accounting officer or controller, or persons performing similar functions, regardless of whether these individuals are employed by the registrant or a third party. |
| | (c) | There have been no amendments, during the period covered by this report, to a provision of the code of ethics that applies to the registrant’s principal executive officer, principal financial officer, principal accounting officer or controller, or persons performing similar functions, regardless of whether these individuals are employed by the registrant or a third party, and that relates to any element of the code of ethics description. |
| | (d) | The registrant has not granted any waivers, including an implicit waiver, from a provision of the code of ethics that applies to the registrant’s principal executive officer, principal financial officer, principal accounting officer or controller, or persons performing similar functions, regardless of whether these individuals are employed by the registrant or a third party, that relates to one or more of the items set forth in paragraph (b) of this item’s instructions. |
Item 3. Audit Committee Financial Expert.
As of the end of the period covered by the report, the registrant’s board of directors has determined that Grady R. Hazel is qualified to serve as an audit committee financial expert serving on its audit committee and that he is “independent,” as defined by Item 3 of Form N-CSR.
Item 4. Principal Accountant Fees and Services.
Audit Fees
| | (a) | The aggregate fees billed for each of the last two fiscal years for professional services rendered by the principal accountant for the audit of the registrant’s annual financial statements or services that are normally provided by the accountant in connection with statutory and regulatory filings or engagements for those fiscal years are $791,260 and $815,000 for 2020 and 2021, respectively. |
Audit-Related Fees
| | (b) | The aggregate fees billed in each of the last two fiscal years for assurance and related services by the principal accountant that are reasonably related to the performance of the audit of the registrant’s financial statements and are not reported under paragraph (a) of this Item are $0 and $0 for 2020 and 2021, respectively. |
Tax Fees
| | (c) | The aggregate fees billed in each of the last two fiscal years for professional services rendered by the principal accountant for tax compliance, tax advice, and tax planning are $123,260 and $139,000 for 2020 and 2021, respectively. Tax fees are related to tax services in connection with Funds’ excise tax calculations and review of the Funds’ applicable tax returns. |
All Other Fees
| | (d) | The aggregate fees billed in each of the last two fiscal years for products and services provided by the principal accountant, other than the services reported in paragraphs (a) through (c) of this Item are $19,975 and $0 for 2020 and 2021, respectively. $19,975 of fees were for tax and accounting services rendered to implement a change in accounting method for the Defensive Market Strategies Fund. |
| | (e)(1) | The policy of the registrant’s Audit Committee is to pre-approve all permissible non-audit services (e.g., tax services) to be provided to the registrant by the Auditors, including the fees therefor; provided, that if the Committee chooses to delegate the authority to grant pre-approvals to one or more Committee members, each acting on behalf of the Committee, then the Committee shall adopt policies and procedures detailed as to the particular service and designed to safeguard the continued independence of the auditors, consistent with the requirements of the Sarbanes-Oxley Act of 2002 (the “S-O Act”) and related SEC regulations, which shall then be used in making such pre-approvals; and, further provided, that each delegated pre-approval shall be reported to the Committee during its next regularly scheduled meeting. |
The pre-approval requirement for a permitted non-audit service may be waived if:
| | (1) | the aggregate amount of all such non-audit services provided constitutes not more than 5% of the total revenues paid by the registrant to the Auditors in the fiscal year in which the non-audit services are provided; |
| | (2) | such services were not recognized by the registrant at the time of the engagement to be non-audit services; and |
| | (3) | such services are promptly brought to the attention of, and approved by, the Audit Committee or by a member of the Audit Committee to whom the Committee has delegated the authority to grant such approvals, if any, prior to the Auditors’ completion of the registrant’s audit. |
Additionally, if the Auditors’ engagement relates directly to the operations and financial reporting of the registrant, to the extent required by Rule 2-01 of Regulation S-X, the Audit Committee shall pre-approve their engagements for non-audit services with:
| | (1) | the registrant’s investment adviser (the “Adviser”) (excluding any subadviser whose role is primarily portfolio management and is sub-contracted or overseen by the Adviser), and |
| | (2) | any entity controlling, controlled by, or under common control with such Adviser that provides ongoing services to the registrant (each, a “Control Entity”), |
in accordance with the foregoing paragraph, unless the aggregate amount of all services provided constitutes no more than 5% of the total amount of revenues paid to the Auditors by the registrant, the Adviser and any such Control Entity during the fiscal year in which the services are provided that would have to be pre-approved by the Audit Committee pursuant to this paragraph (in the absence of this exception). The Auditors may not perform contemporaneously any prohibited non-audit services for the registrant, which currently include the following:
1. bookkeeping or other services related to the accounting records or financial statements of the registrant;
2. financial information systems design and implementation;
3. appraisal or valuation services, fairness opinions, or contribution-in-kind reports;
4. actuarial services;
5. internal audit outsourcing services;
6. management functions or human resources;
7. broker or dealer, investment adviser, or investment banking services;
8. legal services and expert services unrelated to the audit; and
9. any other service that the Public Company Accounting Oversight Board determines, by regulation, is impermissible.
| (e)(2) | The percentage of services described in each of paragraphs (b) through (d) of this Item that were approved by the audit committee pursuant to paragraph (c)(7)(i)(C) of Rule 2-01 of Regulation S-X are as follows: |
| | (f) | The percentage of hours expended on the principal accountant’s engagement to audit the registrant’s financial statements for the most recent fiscal year that were attributed to work performed by persons other than the principal accountant’s full-time, permanent employees was less than fifty percent. |
| | (g) | The aggregate non-audit fees billed by the registrant’s accountant for services rendered to the registrant was $166,760 and $139,000 for 2020 and 2021, respectively; for services rendered to the registrant’s investment adviser (not including any sub-adviser whose role is primarily portfolio management and is subcontracted with or overseen by another investment adviser) was $0 and $0 for 2020 and 2021, respectively, and for services rendered to GuideStone Financial Resources was $75,000 and $130,000 for 2020 and 2021, respectively. |
| | (h) | The registrant’s audit committee of the board of directors has not considered whether the provision of non-audit services that were rendered to any entity controlling, controlled by, or under common control with the investment adviser that provides ongoing services to the registrant that were not pre-approved pursuant to paragraph (c)(7)(ii) of Rule 2-01 of Regulation S-X is compatible with maintaining the principal accountant’s independence. |
Item 5. Audit Committee of Listed Registrants.
Not applicable.
Item 6. Investments.
| | (a) | Schedule of Investments in securities of unaffiliated issuers as of the close of the reporting period is included as part of the report to shareholders filed under Item 1(a) of this form. |
Item 7. Disclosure of Proxy Voting Policies and Procedures for Closed-End Management Investment Companies.
Not applicable.
Item 8. Portfolio Managers of Closed-End Management Investment Companies.
Not applicable.
Item 9. Purchases of Equity Securities by Closed-End Management Investment Company and Affiliated Purchasers.
Not applicable.
Item 10. Submission of Matters to a Vote of Security Holders.
There have been no material changes to the procedures by which the shareholders may recommend nominees to the registrant’s board of directors, where those changes were implemented after the registrant last provided disclosure in response to the requirements of Item 407(c)(2)(iv) of Regulation S-K (17 CFR 229.407) (as required by Item 22(b)(15) of Schedule 14A (17 CFR 240.14a-101)), or this Item.
Item 11. Controls and Procedures.
| | (a) | The registrant’s principal executive and principal financial officers, or persons performing similar functions, have concluded that the registrant’s disclosure controls and procedures (as defined in Rule 30a-3(c) under the Investment Company Act of 1940, as amended (the “1940 Act”) (17 CFR 270.30a-3(c))) are effective, as of a date within 90 days of the filing date of the report that includes the disclosure required by this paragraph, based on their evaluation of these controls and procedures required by Rule 30a-3(b) under the 1940 Act (17 CFR 270.30a-3(b)) and Rules 13a-15(b) or 15d-15(b) under the Securities Exchange Act of 1934, as amended (17 CFR 240.13a-15(b) or 240.15d-15(b)). |
| | (b) | There were no changes in the registrant’s internal control over financial reporting (as defined in Rule 30a-3(d) under the 1940 Act) that occurred during the period covered by this report that has materially affected, or is reasonably likely to materially affect, the registrant’s internal control over financial reporting. |
Item 12. Disclosure of Securities Lending Activities for Closed-End Management Investment Companies.
Item 13. Exhibits.
SIGNATURES
Pursuant to the requirements of the Securities Exchange Act of 1934 and the Investment Company Act of 1940, the registrant has duly caused this report to be signed on its behalf by the undersigned, thereunto duly authorized.
| | |
| (Registrant) | | GuideStone Funds |
| | |
| |
| By (Signature and Title)* | | /s/ John R. Jones |
| | John R. Jones, President |
| | (Principal Executive Officer) |
Pursuant to the requirements of the Securities Exchange Act of 1934 and the Investment Company Act of 1940, this report has been signed below by the following persons on behalf of the registrant and in the capacities and on the dates indicated.
| | |
| By (Signature and Title)* | | /s/ John R. Jones |
| | John R. Jones, President |
| | (Principal Executive Officer) |
| | |
| |
| By (Signature and Title)* | | /s/ Patrick Pattison |
| | Patrick Pattison, Vice President and Treasurer |
| | (Principal Financial Officer) |
| * | Print the name and title of each signing officer under his or her signature. |