UNITED STATES
SECURITIES AND EXCHANGE COMMISSION
Washington, D.C. 20549
FORM N-CSR
CERTIFIED SHAREHOLDER REPORT OF REGISTERED
MANAGEMENT INVESTMENT COMPANIES
Investment Company Act file number 811-10263
GuideStone Funds
(Exact name of registrant as specified in charter)
5005 Lyndon B. Johnson Freeway, Suite 2200
Dallas, TX 75244-6152
(Address of principal executive offices) (Zip code)
Matthew A. Wolfe, Esq.
GuideStone Financial Resources of the Southern Baptist Convention
5005 Lyndon B. Johnson Freeway, Suite 2200
Dallas, TX 75244-6152
(Name and address of agent for service)
Registrant’s telephone number, including area code: 214-720-4640
Date of fiscal year end: December 31
Date of reporting period: December 31, 2023
Item 1. Reports to Stockholders.
| | (a) | The following is a copy of the report transmitted to shareholders pursuant to Rule 30e-1 under the Investment Company Act of 1940 (17 CFR 270.30e-1) |
GuideStone Funds
Privacy Notice
NOTICE CONCERNING OUR PRIVACY PRACTICES
This notice provides you with information concerning our policies with respect to non-public personal information that we collect about you in connection with the following financial products and services provided and/or serviced by the entities listed below: Individual Retirement Accounts (“IRAs”), personal mutual fund accounts and/or GuideStone Personal Advisory Services.
The confidentiality of your information is important to us, as we recognize that you depend on us to keep your information confidential, as described in this notice.
We collect non-public personal information about you with regard to the products and services listed above from the following sources:
| • | Information we receive from you on applications or other forms |
| • | Information about your transactions with us, our affiliates or others (including our third-party service providers) |
| • | Information we receive from others, such as service providers, broker-dealers and your personal agents or representatives |
| • | Information you and others provide to us in correspondence sent to us, whether written, electronic or by telephone |
We may disclose such non-public personal financial information about you to one or more of our affiliates as permitted by law. An affiliate of an organization means any entity that controls, is controlled by or is under common control with that organization. GuideStone Funds, GuideStone Financial Resources of the Southern Baptist Convention, GuideStone Capital Management, LLC, GuideStone Resource Management, Inc., GuideStone Investment Services, GuideStone Trust Services, GuideStone Financial Services, GuideStone Advisors and GuideStone Advisors, LLC (collectively “GuideStone”) are affiliates of one another. GuideStone does not sell your personal information to non-affiliated third parties.
We may also disclose any of the personal information that we collect about you to non-affiliated third parties as permitted by law. For example, we may provide your information to non-affiliated companies that provide account services or that perform marketing services on our behalf. We restrict access to non-public personal information about you to those of our employees who need to know that information in order for us to provide products and services to you. We also maintain physical, electronic and procedural safeguards to guard your personal information.
We may continue to maintain and disclose non-public personal information about you after you cease to receive financial products and services from us.
If you have any questions concerning our customer information policy, please contact a customer solutions specialist at 1-888-GS-FUNDS (1-888-473-8637).
This report has been prepared for shareholders of GuideStone Funds. It is not authorized for distribution to prospective investors unless accompanied or preceded by a current prospectus, which contains more complete information about the Funds. Investors are reminded to read the prospectus carefully before investing. The performance data quoted represents past performance and does not guarantee future results. Current performance may be lower or higher than the performance quoted. Performance data current to the most recent month-end may be obtained at www.GuideStoneFunds.com. The investment return and principal value of an investment will fluctuate so that shares, when redeemed, may be worth more or less than their original cost. Fund shares are distributed by Foreside Funds Distributors LLC.
LETTER FROM THE PRESIDENT AND CHIEF INVESTMENT OFFICER
Dear Shareholder:
Allow me the privilege of introducing myself to you: effective January 1, 2024, I became the President of GuideStone Funds, as well as President and Chief Investment Officer of its investment adviser, GuideStone Capital Management, LLC. I joined GuideStone in 2017 and most recently served as Director of Public Investments, where I led the Public Markets complex in overseeing all aspects of the management of the GuideStone Funds lineup.
This 2024 GuideStone Funds Annual Report marks the first time I am writing you in this capacity. It continues our commitment to financial reporting integrity so that you can stay fully informed of your investments. We trust you will find this information helpful.
I invite you to learn more about GuideStone Funds by visiting our website, GuideStoneFunds.com or by contacting us at 1-888-GS-FUNDS (1-888-473-8637).
The following is our recap of the markets over the last half of 2023, a look ahead to 2024 and some of the key risks and challenges we’re closely watching.
Market Recap
A year ago, most analysts were broadly forecasting a recession, but the Federal Reserve (“Fed”) has, thus far, generally navigated the highwire act of maintaining economic growth while lowering inflation. Not only did the U.S. economy skirt a recession and see prices fall, but financial markets posted a solid 12 months of returns.
| Index | 1 st Quarter
2023 Return | 2 nd Quarter
2023 Return | 3 rd Quarter
2023 Return | 4 th Quarter
2023 Return | YTD Return as of December 31, 2023 |
| U.S. Equities |
| S&P 500® | 7.50% | 8.74% | -3.27% | 11.69% | 26.29% |
| Russell 2000® | 2.74% | 5.21% | -5.13% | 14.03% | 16.93% |
| International Equities |
| MSCI EAFE | 8.47% | 2.95% | -4.11% | 10.42% | 18.24% |
| MSCI Emerging Markets | 3.96% | 0.90% | -2.93% | 7.86% | 9.83% |
| U.S. Fixed Income |
| Bloomberg US Aggregate | 2.96% | -0.84% | -3.23% | 6.82% | 5.53% |
| Bloomberg US High Yield Corporate | 3.57% | 1.75% | 0.46% | 7.15% | 13.44% |
| Global Fixed Income |
| Bloomberg Global Aggregate Bond | 3.01% | -1.53% | -3.59% | 8.10% | 5.72% |
Headline inflation has peaked across developed economies and is progressing toward lower levels. Nevertheless, prices remain higher than the Fed’s target, and the economy is starting to feel the effects of the drastic monetary policy tightening that began almost two years ago. Global central bank rate reductions are expected in 2024, with cuts already being priced into most markets worldwide. In the United States, monetary policy has yet to achieve its goal of reducing inflation to 2%, but rates are probably more restrictive than they need to be. Rather than “overengineer” interest rates and risk crushing the economy, the Fed will likely be satisfied with targeting a threshold for lowering rates at a core Personal Consumption Expenditures Index1 (PCE, excluding
food and energy) reading of around 2.5% (as of December 31, 2023, this rate was 2.9%). However, officials have communicated that cuts are not imminent as they evaluate if enough has been done to tame inflation. Reductions to interest rates will likely come later in 2024.
That said, the question remains: are these lower inflation levels sustainable? Historically, inflation comes in waves, with subsequent bouts of inflation tending to be more persistent. In the United States, the M2 money supply (comprised of cash, checking and savings accounts, money market accounts and certificates of deposit) is above its pre-COVID trend, so too much money may still be chasing too few goods and services. The three primary factors that could contribute to a second wave of inflation are energy price volatility, sticky wages and rents and long-term structural dynamics (e.g., changing demographics, geopolitical risk, energy source transitions, etc.).
The U.S. labor market was surprisingly resilient throughout 2023. Despite the rapid rise in interest rates, labor demand remained unprecedented and continued to outstrip labor supply and prop up inflation. This imbalance is expected to persist into 2024 and will likely keep the labor market relatively tight for the near-to-medium term. Nevertheless, labor growth is slowing, putting downward pressure on wage growth (and thus, prices). As tighter financial conditions catch up to consumers and businesses, we expect to see employment drop but labor hoarding by employers to continue to act as a powerful counterbalance.
The U.S. consumer was the mainstay of the global economy last year. Consumers continued to ride a wave of excess savings created by government stimulus and loan repayment moratoriums, which resulted in widespread credit availability and inflated credit performance. Going into 2024, consumer balance sheets remain strong, and wage growth will likely outstrip inflation. However, consumers are now facing some notable headwinds as savings rates have declined well below pre-COVID levels, and access to credit is becoming increasingly constrained due to the higher cost of funding.
The big technology stock rally led to top-heavy U.S. equity performance in 2023, with the “Magnificent Seven” (Alphabet, Amazon, Apple, Meta, Microsoft, Nvidia and Tesla) representing 30% of the S&P 500®2 Index market value and accounting for roughly 60% of the Index’s total return. Since narrow markets are challenging to maintain for long periods, we could experience a reversal of market leadership and greater breadth. In fact, the equal-weighted S&P 500®2 Index handily outperformed the Magnificent Seven group of stocks over the last two months of last year.
Corporate earnings will likely remain resilient in the near term. Still, companies with high interest expense will feel the pressure of the higher rates, particularly as the need to tap the debt markets to sustain business operations occurs into the future, and the lagged effects of the tighter monetary policy add uncertainty to global growth.
The economy endured 2023 despite heavily restrictive monetary policy, but we expect a continued softening of growth this year. Barring a wave of layoffs, the economy should hold up reasonably well. Recession remains the critical question. Many financial markets have already priced in a Goldilocks scenario (i.e., steady economic growth, preventing a recession, but not so much growth that inflation rises too much). Should the economy hiccup, asset prices could fall disproportionately.
Fed policy error is still a possibility. Loosening policy too quickly or too much could unleash a second wave of inflation as growth flourishes. Loosening too slowly or not enough could spark a recession as companies and consumers struggle with debt financing.
Government debt in many countries (including the United States) is a problem. While this will unlikely impact 2024 in a significant manner, it looms over long-term economic prospects as well as the U.S. Presidential election. In fact, elections loom large globally as half the world’s population will be voting in 2024.
Geopolitical risks (e.g., wars in Ukraine and Israel and tensions between the United States and China) remain higher than usual and add additional economic and financial market uncertainty for the coming months.
In conclusion, we look for financial markets to enjoy a continued run of robust returns for at least much of this year, with dollars flowing from money market funds into risk assets supporting valuations. However, we do see higher downside risks to financial assets as markets are essentially “priced to perfection.”
Thank you for your continued confidence in GuideStone Funds and for allowing us the privilege of managing your assets. Please feel free to reach out to us if you have any comments, questions or concerns. For additional information on GuideStone Funds, we invite you to visit our website at GuideStoneFunds.com.
Sincerely,
Brandon Pizzurro
President
GuideStone Funds
Past performance does not guarantee future results and the Funds may experience negative performance. There can be no guarantee that any strategy (risk management or otherwise) will be successful. All investing involves risk, including the potential loss of principal. You cannot invest directly in an index.
1The Personal Consumption Expenditures Index (“PCE”) includes a measure of consumer spending on goods and services among households in the U.S. The PCE is used as a mechanism to gauge how much earned income of households is being spent on current consumption for various goods and services.
2The S&P 500® Index is a market capitalization-weighted equity index composed of approximately 500 U.S. companies representing all major industries. The Index is designed to measure performance of the broad domestic economy through changes in the aggregate market value of its constituents. "Standard & Poor's®", "S&P 500®", "Standard & Poor's 500" and "500" are trademarks of The McGraw-Hill Companies, Inc. and have been licensed for use by GuideStone.
Asset Class Performance Comparison
The following graph illustrates the performance of the major asset classes during 2023.
1The Bloomberg US Aggregate Bond Index is a broad-based flagship benchmark that measures the investment grade, U.S. dollar-denominated, fixed-rate taxable bond market. The index includes Treasuries, government-related and corporate securities, fixed-rate MBS, ABS and commercial mortgage-backed securities (agency and non-agency).
2The MSCI EAFE Index is an equity index which captures large- and mid-cap representation across 21 developed market countries around the world, excluding the United States and Canada. With 783 constituents, the index covers approximately 85% of the free float-adjusted market capitalization in each country. Developed market countries included in the index are: Australia, Austria, Belgium, Denmark, Finland, France, Germany, Hong Kong, Ireland, Israel, Italy, Japan, the Netherlands, New Zealand, Norway, Portugal, Singapore, Spain, Sweden, Switzerland and the United Kingdom.
3The MSCI Emerging Markets Index captures large- and mid-cap representation across 24 emerging markets countries. With 1,441 constituents, the index covers approximately 85% of the free float-adjusted market capitalization in each country. Emerging markets countries included in the index are: Brazil, Chile, China, Colombia, Czech Republic, Egypt, Greece, Hungary, India, Indonesia, Korea, Kuwait, Malaysia, Mexico, Peru, Philippines, Poland, Qatar, Saudi Arabia, South Africa, Taiwan, Thailand, Turkey and United Arab Emirates.
4The Russell 2000® Index measures the performance of the small-cap segment of the U.S. equity universe. The Russell 2000® Index is a subset of the Russell 3000® Index representing approximately 7% of the total market capitalization of that index. It includes approximately 2,000 of the smallest securities based on a combination of their market capitalization and current index membership. The Russell 2000® Index is constructed to provide a comprehensive and unbiased small-cap barometer and is completely reconstituted annually to ensure that larger stocks do not distort the performance and characteristics of the actual small-cap opportunity set.
5The S&P 500® Index is widely regarded as the best single gauge of large-cap U.S. equities. The index includes 500 leading companies and covers approximately 80% of available market capitalization.
S&P 500® Index Returns
2023 ended with a strong rally generated by an easing of financial conditions and the Fed’s indication of a policy pivot. The U.S. large-cap equity market, as measured by the S&P 500® Index, posted a strong double-digit fourth quarter return and finished the year up +26.3%. There was a notable broadening of market strength in the fourth quarter, but the S&P 500® Index remained historically concentrated as the Magnificent Seven stocks (Alphabet, Amazon, Apple, Meta, Microsoft, NVIDIA, and Tesla) drove the majority of Index returns for calendar year 2023. All sectors were positive with the exception of utilities (-7.1%) and energy (-1.3%) for the year. The information technology (+61.3%), communication services (+56.4%) and consumer discretionary (+43.2%) sectors were by far the strongest performers and significantly outperformed the overall Index for the year.
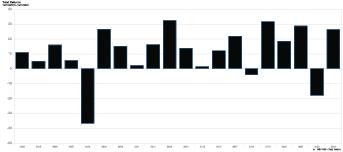
The S&P 500® Index is widely regarded as the best single gauge of large-cap U.S. equities. The index includes 500 leading companies and covers approximately 80% of available market capitalization.
Data Source: Dow Jones Indices LLC
Russell 2000® Index Returns
The U.S. small cap equity market, as measured by the Russell 2000® Index, advanced by +16.9% in 2023. The index generated positive returns during three of the four quarters of the year and posted a strong double-digit return during the fourth quarter. Despite the strong performance for the year, smaller capitalization stocks still lagged their larger capitalization brethren as the Russell 2000® Index finished roughly -9.4% below the S&P 500® Index for the year. Both posted double-digit gains during a period where the market rewarded stocks with higher quality, higher market capitalizations and higher growth characteristics within the Index. All sectors were positive, with the exception of utilities which was down -7.8% for the year. The industrials (+28.4%), consumer discretionary (+26.2%) and information technology (+24.3%) sectors posted the strongest performance returns within the Index during calendar year 2023.
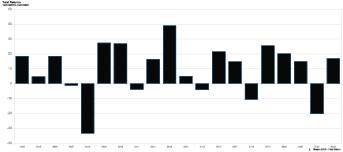
The Russell 2000® Index measures the performance of the small-cap segment of the U.S. equity universe. The Russell 2000® Index is a subset of the Russell 3000® Index representing approximately 7% of the total market capitalization of that index. It includes approximately 2,000 of the smallest securities based on a combination of their market capitalization and current index membership. The Russell 2000® Index is constructed to provide a comprehensive and unbiased small-cap barometer and is completely reconstituted annually to ensure that larger stocks do not distort the performance and characteristics of the actual small-cap opportunity set.
Data Source: Russell Investments, Bloomberg
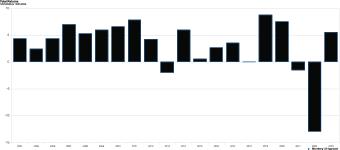
MSCI EAFE Index Returns
In 2023, developed-country international stocks posted strong returns, reversing 2022’s weak showing. The MSCI EAFE Index was up 18.24% for the year after a -14.45% return in 2022. Equity markets experienced a robust recovery this year despite macro and geopolitical developments, including aggressive monetary policy, the collapse of Credit Suisse, weakness in Chinese consumer demand, instability in the Middle East and the continuing Russia-Ukraine war. International markets were led by technology stocks, although markets broaden out in the fourth quarter with cyclical stocks rallying on the prospect of lower rates, as inflation and economic activity surprised positively.
Every country in the MSCI EAFE Index, generated a positive return for the year except for Hong Kong and Finland. Hong Kong’s sensitivity to the Chinese economy was a significant headwind. Returns in southern European countries were strong with Italy and Spain outperforming all other geographies for the year.
Sector performance was positive across all sectors, with information technology, industrials and consumer discretionary leading the way. Consumer staples, real estate and healthcare were the relative laggards.
The MSCI EAFE Index is an equity index which captures large- and mid-cap representation across 21 developed market countries around the world, excluding the United States and Canada. With 783 constituents, the index covers approximately 85% of the free float-adjusted market capitalization in each country. Developed market countries included in the index are: Australia, Austria, Belgium, Denmark, Finland, France, Germany, Hong Kong, Ireland, Israel, Italy, Japan, the Netherlands, New Zealand, Norway, Portugal, Singapore, Spain, Sweden, Switzerland and the United Kingdom.
Data Source: FactSet
MSCI Emerging Markets Index Returns
The broad Emerging Market Equity, as measured by the MSCI Emerging Market Index, was up 9.83% for 2023 following a weak 2022. Emerging Market Equity had several tailwinds in 2023. The first tailwind was from the cooling inflation. For most emerging market nations, inflation has significantly cooled down from the peak in the second half of 2023. This makes rate cuts possible and benefit the equity market. In addition, many emerging market countries have avoided recessions. This is another strong tailwind. However, not every emerging market nation performed the same. China was an exception and pulled back by more than 12%. On the other hand, countries like India, Brazil and Mexico have done well and outperformed the MSCI Emerging Market Index.

The MSCI Emerging Markets Index captures large- and mid-cap representation across 24 emerging markets countries. With 1,441 constituents, the index covers approximately 85% of the free float-adjusted market capitalization in each country. Emerging markets countries included in the index are: Brazil, Chile, China, Colombia, Czech Republic, Egypt, Greece, Hungary, India, Indonesia, Korea, Kuwait, Malaysia, Mexico, Peru, Philippines, Poland, Qatar, Saudi Arabia, South Africa, Taiwan, Thailand, Turkey and United Arab Emirates.
Data Source: FactSet
Bloomberg US Aggregate Bond Index Returns
The broad U.S. bond market, as measured by the Bloomberg US Aggregate Bond Index, was up 5.53% for 2023 after consecutive years of negative performance in 2021 and 2022. Although the Federal Reserve ("Fed") raised its benchmark rate multiple times throughout the year, economic data showed signs of cooling inflation in the second half of 2023. This caused the 10Y Treasury to decrease by over 100 basis points during the fourth quarter, in anticipation of Fed rate cuts in 2024. All major sectors of the index were up as rates ended up close to where they started the year and spreads tightened on a year over year basis. Investment grade and high yield corporates were the best performing sectors, as corporate fundamentals strengthened throughout the year.
The Bloomberg US Aggregate Bond Index is a broad-based flagship benchmark that measures the investment grade, U.S. dollar-denominated, fixed-rate taxable bond market. The index includes Treasuries, government-related and corporate securities, fixed-rate MBS, ABS and commercial mortgage-backed securities (agency and non-agency).
Data Source: FactSet
Federal Reserve
The Federal Reserve ("Fed") once again increased its target rate in 2023, demonstrating its commitment to bringing inflation back to its targeted levels. The Fed increased the targeted Fed funds rate from 4.25% – 4.50% at the end of last year to 5.25% – 5.50% at the end of 2023. This included four incremental hikes of 0.25%. After its last rate hike in July of 2023, the Fed has kept its benchmark rate steady, even as inflation has started to show signs of cooling. The Fed also continued with its balance sheet runoff plan in 2023. Despite turmoil in the banking system at the beginning of 2023, in which the Fed temporarily added assets to its balance sheet, the Fed’s assets ended the year lower. The Fed offloaded around $900B (net) during the year, ending with under $7.7T in assets.
In its December meeting, members of the Fed provided forward guidance in the form of a new dot plot. The consensus view for the committee was for inflation to continue cooling towards its long-term target of 2%. Fed Chair Jerome Powell further indicated that there would be three 0.25% rate cuts in 2024, followed by an additional four 0.25% rate cuts in 2025. Fed Chair Powell reiterated that the committee would continue to make its projections based on the most readily available economic data.

The Federal Reserve (“Fed”) is the central bank of the United States. It was created by Congress to provide the nation with a safer, more flexible, and more stable monetary and financial system. The Federal Funds Rate is the interest rate at which depository institutions lend balances at the Fed to other depository institutions overnight. The rate is one tool the Fed can use in their efforts of controlling the supply of money. Changes in the Federal Funds Rate trigger a chain of events that affect other short-term interest rates, foreign exchange rates, long-term interest rates, the amount of money and credit, and, ultimately, a range of economic variables, including employment, output and prices of goods and services.
Data Source: Bloomberg, Federal Reserve
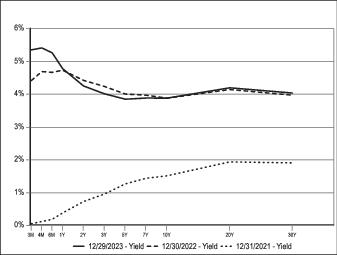
U.S. Treasury Yield Curve
The Federal Reserve ("Fed") increased its target for the Fed Funds rate by 100 basis points in 2023 in response to persistent inflation. Balance sheet normalization also continued and ultimately ended the year with a 14% reduction from its peak, although still large by historical standards. Although rates spiked during the year to 15-year highs, rates ended the year mostly unchanged. The 10-year U.S. Treasury began the year at 3.75% and ended the year at 3.87% but peaked at 5.02% in the fourth quarter, before rallying over 100 basis points in the final two months of the year. Front end rates (2-year U.S. Treasury) closed the year lower, starting at 4.33% and ending at 4.25%, after peaking around 5.20%. The 2Y/10Y spread curve remained inverted throughout the year and ended at -0.38% after starting the year -0.58%. Peak inversion of the curve occurred during the third quarter of 2023, in which the 2Y/10Y spread was -1.06%.
Inflation concerns continued through the first half of 2023, although these concerns somewhat eased as more economic data was released towards the back half of the year. With the Fed pausing its rate hikes due to cooling inflation and signaling potential rate cuts in both 2024 and 2025, rates across all time periods rallied in some form to close the year.
The Treasury yield curve illustrates the relationship between yields on short-term, intermediate-term and long-term Treasury securities. Normally, the shape of the yield curve is upward sloping with rates increasing from the short end of the curve moving higher to the long end. The short end of the curve is impacted more by monetary policy (demand for money) while inflationary expectations and market forces impact the long end of the curve.
Data Source: Bloomberg
About Your Expenses (Unaudited)
As a shareholder of the Funds, you incur ongoing costs, including advisory fees and to the extent applicable, shareholder services fees, as well as other Fund expenses. This example is intended to help you to understand your ongoing costs (in dollars) of investing in the Funds and to compare these costs with the ongoing costs of investing in other mutual funds. It is based on an investment of $1,000 invested at the beginning of the period and held for the entire period from July 1, 2023 to December 31, 2023. The Annualized Expense Ratio may be different from the expense ratio in the Financial Highlights which is for the fiscal year ended December 31, 2023.
Actual Expenses
The first section of the table below provides information about actual account values and actual expenses. You may use the information in this section, together with the amount you invested, to estimate the expenses that you incurred over the period. Simply divide your account value by $1,000 (for example, an $8,600 account value divided by $1,000 = 8.6), then multiply the result by the number in the first section under the heading entitled “Expenses Paid During Period” to estimate the expenses attributable to your investment during this period.
Hypothetical Example for Comparison Purposes
The second section of the table below provides information about hypothetical account values and hypothetical expenses based on the Fund’s actual expense ratio and an assumed rate of return of 5% per year before expenses, which is not the Fund’s actual return. Thus, you should not use the hypothetical account values and expenses to estimate the actual ending account balance or your expenses for the period. Rather, these figures are provided to enable you to compare the ongoing costs of investing in the Fund and other funds. To do so, compare this 5% hypothetical example with the 5% hypothetical examples that appear in the shareholder reports of the other funds. Please note that the expenses shown in the table are meant to highlight your ongoing costs only. Therefore, the second section of the table is useful in comparing ongoing costs only and will not help you determine the relative total costs of owning different funds.
| Actual |
| Fund | | Class | | Beginning Account Value
07/01/23 | | Ending Account Value
12/31/23 | | Annualized Expense Ratio(1) | | Expenses Paid During Period(2) |
MyDestination 2015 Fund
| | Institutional | | $1,000.00 | | $1,047.60 | | 0.08% | | $0.41 |
| Investor | | 1,000.00 | | 1,046.90 | | 0.38 | | 1.96 |
MyDestination 2025 Fund
| | Institutional | | 1,000.00 | | 1,050.70 | | 0.07 | | 0.36 |
| Investor | | 1,000.00 | | 1,050.00 | | 0.37 | | 1.91 |
MyDestination 2035 Fund
| | Institutional | | 1,000.00 | | 1,058.20 | | 0.07 | | 0.36 |
| Investor | | 1,000.00 | | 1,056.60 | | 0.38 | | 1.97 |
MyDestination 2045 Fund
| | Institutional | | 1,000.00 | | 1,063.40 | | 0.11 | | 0.57 |
| Investor | | 1,000.00 | | 1,063.10 | | 0.38 | | 1.98 |
MyDestination 2055 Fund
| | Institutional | | 1,000.00 | | 1,065.90 | | 0.12 | | 0.62 |
| Investor | | 1,000.00 | | 1,064.30 | | 0.42 | | 2.19 |
Conservative Allocation Fund
| | Institutional | | 1,000.00 | | 1,044.20 | | 0.17 | | 0.88 |
| Investor | | 1,000.00 | | 1,042.40 | | 0.42 | | 2.16 |
Balanced Allocation Fund
| | Institutional | | 1,000.00 | | 1,050.40 | | 0.13 | | 0.67 |
| Investor | | 1,000.00 | | 1,049.70 | | 0.39 | | 2.01 |
Growth Allocation Fund
| | Institutional | | 1,000.00 | | 1,059.00 | | 0.14 | | 0.73 |
| Investor | | 1,000.00 | | 1,057.50 | | 0.39 | | 2.02 |
About Your Expenses (Unaudited) (Continued)
| Actual |
| Fund | | Class | | Beginning Account Value
07/01/23 | | Ending Account Value
12/31/23 | | Annualized Expense Ratio(1) | | Expenses Paid During Period(2) |
Aggressive Allocation Fund
| | Institutional | | $1,000.00 | | $1,065.40 | | 0.14% | | $0.73 |
| Investor | | 1,000.00 | | 1,064.30 | | 0.39 | | 2.03 |
Money Market Fund
| | Institutional | | 1,000.00 | | 1,026.60 | | 0.14 | | 0.72 |
| Investor | | 1,000.00 | | 1,025.10 | | 0.42 | | 2.14 |
Low-Duration Bond Fund(3)
| | Institutional | | 1,000.00 | | 1,037.30 | | 0.34 | | 1.75 |
| Investor | | 1,000.00 | | 1,035.90 | | 0.61 | | 3.13 |
Medium-Duration Bond Fund
| | Institutional | | 1,000.00 | | 1,037.40 | | 0.38 | | 1.95 |
| Investor | | 1,000.00 | | 1,036.00 | | 0.66 | | 3.39 |
Global Bond Fund
| | Institutional | | 1,000.00 | | 1,044.40 | | 0.58 | | 2.99 |
| Investor | | 1,000.00 | | 1,041.90 | | 0.90 | | 4.63 |
Impact Bond Fund
| | Institutional | | 1,000.00 | | 1,032.00 | | 0.50 | | 2.56 |
| Investor | | 1,000.00 | | 1,030.50 | | 0.79 | | 4.04 |
Defensive Market Strategies® Fund
| | Institutional | | 1,000.00 | | 1,042.20 | | 0.64 | | 3.29 |
| Investor | | 1,000.00 | | 1,040.60 | | 0.91 | | 4.68 |
Impact Equity Fund
| | Institutional | | 1,000.00 | | 1,047.80 | | 1.03 | | 5.32 |
| Investor | | 1,000.00 | | 1,047.80 | | 1.21 | | 6.25 |
Equity Index Fund
| | Institutional | | 1,000.00 | | 1,082.80 | | 0.12 | | 0.63 |
| Investor | | 1,000.00 | | 1,081.30 | | 0.39 | | 2.05 |
Value Equity Index Fund
| | Institutional | | 1,000.00 | | 1,062.90 | | 0.20 | | 1.04 |
| Investor | | 1,000.00 | | 1,061.00 | | 0.47 | | 2.44 |
Value Equity Fund
| | Institutional | | 1,000.00 | | 1,059.80 | | 0.66 | | 3.43 |
| Investor | | 1,000.00 | | 1,058.40 | | 0.93 | | 4.83 |
Growth Equity Index Fund
| | Institutional | | 1,000.00 | | 1,104.50 | | 0.20 | | 1.06 |
| Investor | | 1,000.00 | | 1,103.50 | | 0.47 | | 2.49 |
Growth Equity Fund
| | Institutional | | 1,000.00 | | 1,102.00 | | 0.66 | | 3.50 |
| Investor | | 1,000.00 | | 1,100.20 | | 0.92 | | 4.87 |
Small Cap Equity Fund
| | Institutional | | 1,000.00 | | 1,076.50 | | 0.93 | | 4.87 |
| Investor | | 1,000.00 | | 1,074.60 | | 1.21 | | 6.33 |
International Equity Index Fund
| | Institutional | | 1,000.00 | | 1,053.80 | | 0.21 | | 1.09 |
| Investor | | 1,000.00 | | 1,053.00 | | 0.50 | | 2.59 |
International Equity Fund(3)
| | Institutional | | 1,000.00 | | 1,053.10 | | 0.83 | | 4.30 |
| Investor | | 1,000.00 | | 1,051.20 | | 1.11 | | 5.74 |
Emerging Markets Equity Fund
| | Institutional | | 1,000.00 | | 1,035.00 | | 1.08 | | 5.54 |
| Investor | | 1,000.00 | | 1,032.20 | | 1.39 | | 7.12 |
Global Real Estate Securities Fund
| | Institutional | | 1,000.00 | | 1,082.90 | | 0.89 | | 4.67 |
| Investor | | 1,000.00 | | 1,082.00 | | 1.20 | | 6.30 |
Strategic Alternatives Fund(3)
| | Institutional | | 1,000.00 | | 1,042.70 | | 1.15 | | 5.92 |
| Investor | | 1,000.00 | | 1,041.00 | | 1.47 | | 7.56 |
| | | | | | | | | | | |
| Hypothetical (assuming a 5% return before expenses) |
| Fund | | Class | | Beginning Account Value
07/01/23 | | Ending Account Value
12/31/23 | | Annualized Expense Ratio(1) | | Expenses Paid During Period(2) |
MyDestination 2015 Fund
| | Institutional | | $1,000.00 | | $1,024.80 | | 0.08% | | $0.41 |
| Investor | | 1,000.00 | | 1,023.29 | | 0.38 | | 1.94 |
MyDestination 2025 Fund
| | Institutional | | 1,000.00 | | 1,024.85 | | 0.07 | | 0.36 |
| Investor | | 1,000.00 | | 1,023.34 | | 0.37 | | 1.89 |
MyDestination 2035 Fund
| | Institutional | | 1,000.00 | | 1,024.85 | | 0.07 | | 0.36 |
| Investor | | 1,000.00 | | 1,023.29 | | 0.38 | | 1.94 |
MyDestination 2045 Fund
| | Institutional | | 1,000.00 | | 1,024.65 | | 0.11 | | 0.56 |
| Investor | | 1,000.00 | | 1,023.29 | | 0.38 | | 1.94 |
MyDestination 2055 Fund
| | Institutional | | 1,000.00 | | 1,024.60 | | 0.12 | | 0.61 |
| Investor | | 1,000.00 | | 1,023.09 | | 0.42 | | 2.14 |
Conservative Allocation Fund
| | Institutional | | 1,000.00 | | 1,024.35 | | 0.17 | | 0.87 |
| Investor | | 1,000.00 | | 1,023.09 | | 0.42 | | 2.14 |
Balanced Allocation Fund
| | Institutional | | 1,000.00 | | 1,024.55 | | 0.13 | | 0.66 |
| Investor | | 1,000.00 | | 1,023.24 | | 0.39 | | 1.99 |
Growth Allocation Fund
| | Institutional | | 1,000.00 | | 1,024.50 | | 0.14 | | 0.71 |
| Investor | | 1,000.00 | | 1,023.24 | | 0.39 | | 1.99 |
Aggressive Allocation Fund
| | Institutional | | 1,000.00 | | 1,024.50 | | 0.14 | | 0.71 |
| Investor | | 1,000.00 | | 1,023.24 | | 0.39 | | 1.99 |
Money Market Fund
| | Institutional | | 1,000.00 | | 1,024.50 | | 0.14 | | 0.71 |
| Investor | | 1,000.00 | | 1,023.09 | | 0.42 | | 2.14 |
Low-Duration Bond Fund(3)
| | Institutional | | 1,000.00 | | 1,023.49 | | 0.34 | | 1.73 |
| Investor | | 1,000.00 | | 1,022.13 | | 0.61 | | 3.11 |
Medium-Duration Bond Fund
| | Institutional | | 1,000.00 | | 1,023.29 | | 0.38 | | 1.94 |
| Investor | | 1,000.00 | | 1,021.88 | | 0.66 | | 3.36 |
Global Bond Fund
| | Institutional | | 1,000.00 | | 1,022.28 | | 0.58 | | 2.96 |
| Investor | | 1,000.00 | | 1,020.67 | | 0.90 | | 4.58 |
Impact Bond Fund
| | Institutional | | 1,000.00 | | 1,022.68 | | 0.50 | | 2.55 |
| Investor | | 1,000.00 | | 1,021.22 | | 0.79 | | 4.02 |
Defensive Market Strategies® Fund
| | Institutional | | 1,000.00 | | 1,021.98 | | 0.64 | | 3.26 |
| Investor | | 1,000.00 | | 1,020.62 | | 0.91 | | 4.63 |
Impact Equity Fund
| | Institutional | | 1,000.00 | | 1,020.01 | | 1.03 | | 5.24 |
| Investor | | 1,000.00 | | 1,019.11 | | 1.21 | | 6.16 |
Equity Index Fund
| | Institutional | | 1,000.00 | | 1,024.60 | | 0.12 | | 0.61 |
| Investor | | 1,000.00 | | 1,023.24 | | 0.39 | | 1.99 |
Value Equity Index Fund
| | Institutional | | 1,000.00 | | 1,024.20 | | 0.20 | | 1.02 |
| Investor | | 1,000.00 | | 1,022.84 | | 0.47 | | 2.40 |
Value Equity Fund
| | Institutional | | 1,000.00 | | 1,021.88 | | 0.66 | | 3.36 |
| Investor | | 1,000.00 | | 1,020.52 | | 0.93 | | 4.74 |
Growth Equity Index Fund
| | Institutional | | 1,000.00 | | 1,024.20 | | 0.20 | | 1.02 |
| Investor | | 1,000.00 | | 1,022.84 | | 0.47 | | 2.40 |
Growth Equity Fund
| | Institutional | | 1,000.00 | | 1,021.88 | | 0.66 | | 3.36 |
| Investor | | 1,000.00 | | 1,020.57 | | 0.92 | | 4.69 |
Small Cap Equity Fund
| | Institutional | | 1,000.00 | | 1,020.52 | | 0.93 | | 4.74 |
| Investor | | 1,000.00 | | 1,019.11 | | 1.21 | | 6.16 |
About Your Expenses (Unaudited) (Continued)
| Hypothetical (assuming a 5% return before expenses) |
| Fund | | Class | | Beginning Account Value
07/01/23 | | Ending Account Value
12/31/23 | | Annualized Expense Ratio(1) | | Expenses Paid During Period(2) |
International Equity Index Fund
| | Institutional | | $1,000.00 | | $1,024.15 | | 0.21% | | $1.07 |
| Investor | | 1,000.00 | | 1,022.68 | | 0.50 | | 2.55 |
International Equity Fund(3)
| | Institutional | | 1,000.00 | | 1,021.02 | | 0.83 | | 4.23 |
| Investor | | 1,000.00 | | 1,019.61 | | 1.11 | | 5.65 |
Emerging Markets Equity Fund
| | Institutional | | 1,000.00 | | 1,019.76 | | 1.08 | | 5.50 |
| Investor | | 1,000.00 | | 1,018.20 | | 1.39 | | 7.07 |
Global Real Estate Securities Fund
| | Institutional | | 1,000.00 | | 1,020.72 | | 0.89 | | 4.53 |
| Investor | | 1,000.00 | | 1,019.16 | | 1.20 | | 6.11 |
Strategic Alternatives Fund(3)
| | Institutional | | 1,000.00 | | 1,019.41 | | 1.15 | | 5.85 |
| Investor | | 1,000.00 | | 1,017.80 | | 1.47 | | 7.48 |
| | | | | | | | | | | |
| (1) Expenses include the effect of expense reimbursements by GuideStone Capital Management, LLC. The Target Date Funds’ and the Target Risk Funds’ proportionate share of the operating expenses of the Select Funds is not reflected in the tables above. | |
| (2) Expenses are equal to the Fund’s annualized expense ratios for the period July 1, 2023 through December 31, 2023, multiplied by the average account value over the period, multiplied by 184/365 (to reflect the one-half year period). | |
| (3) The expense ratios for International Equity Fund, Low-Duration Bond Fund and Strategic Alternatives Fund include the impact of dividend or interest expense on securities sold short. | |
ABBREVIATIONS, FOOTNOTES AND INDEX DEFINITIONS
| INVESTMENT ABBREVIATIONS: |
| 10Y | — | 10 Year |
| 12M | — | 12 Month |
| 12Y | — | 12 Year |
| 13Y | — | 13 Year |
| 1M | — | 1 Month |
| 1Y | — | 1 Year |
| 25M | — | 25 Month |
| 2M | — | 2 Month |
| 2Y | — | 2 Year |
| 36M | — | 36 Month |
| 3M | — | 3 Month |
| 5Y | — | 5 Year |
| 6M | — | 6 Month |
| 7Y | — | 7 Year |
| 8Y | — | 8 Year |
| 9Y | — | 9 Year |
| AB | — | Aktiebolag |
| ABS | — | Asset-Backed Security |
| ACES | — | Alternative Credit Enhancement Securities |
| ADR | — | American Depositary Receipt |
| AEX | — | Amsterdam Exchange |
| AG | — | Aktiengesellschaft |
| AGM | — | Assured Guarantee Municipal Corporation |
| ARM | — | Adjustable Rate Mortgage |
| ASA | — | Allmennaksjeselskap |
| ASX | — | Australian Securities Exchange |
| BAM | — | Build America Mutual |
| BBR | — | Bank Bill Rate |
| BBSW | — | Bank Bill Swap Rate |
| BDC | — | Business Development Company |
| Bhd | — | Berhad |
| Bobl | — | Bundesobligation ("federal government bond") |
| Bovespa Index | — | Bolsa de Valores de São Paulo Index |
| BTPN | — | Bank Tabungan Pensiunan Nasional |
| Bund | — | Bundesanleihe ("federal bond") |
| Buxl | — | German Long-term Bonds |
| BV | — | Besloten Vennootschap |
| CAC | — | Cotation Assistée en Continu |
| CDI | — | Crest Depository Interest |
| CDO | — | Collateralized Debt Obligation |
| CDX | — | A series of indexes that track North American and emerging market credit derivative indexes. |
| Cetip | — | Central of Custody and Financial Settlement of Securities |
| CFETS | — | China Foreign Exchange Trade System |
| CLO | — | Collateralized Loan Obligation |
| CLP-TNA | — | Chilean Pesos Floating Rate Index |
| CME | — | Chicago Mercantile Exchange |
| CMT | — | Constant Maturity |
| COFI | — | Federal Cost of Funds Index |
| CONV | — | Convertible |
| COPS | — | Certificates of Participation |
| CVA | — | Dutch Certificate |
| DAC | — | Designated Activity Company |
| DAX | — | Deutscher Aktien Index |
| DETNT/N | — | Danish Kroner Tomorrow/Next Interest Rate |
| EAFE | — | Europe, Australasia, Far East |
| EONIA | — | Euro Overnight Index Average |
| ESTR | — | Euro Short-Term Rate |
| ETF | — | Exchange Traded Fund |
| EURIBOR | — | Euro Interbank Offered Rate |
| Fannie Mae | — | Federal National Mortgage Association |
| FHA | — | Federal Housing Administration |
| FHLMC | — | Federal Home Loan Mortgage Corporation |
| FRA | — | Forward Rate Agreements |
| FTSE | — | Financial Times Stock Exchange |
| GDR | — | Global Depositary Receipt |
| GmbH | — | Gesellschaft mit beschrankter Haftung |
| Gtd. | — | Guaranteed |
| HIBOR | — | Hong Kong Interbank Offered Rate |
| HSCEI | — | Hang Seng China Enterprises Index |
| HTS | — | Harmonized Tariff Schedule |
| HY | — | High Yield |
| IBEX | — | Iberia Index |
| ICE | — | Intercontinental Exchange |
| IG | — | Investment Grade |
| IO | — | Interest Only (Principal amount shown is notional) |
| iTraxx | — | A group of international credit derivative indexes that are monitored by the International Index Company (IIC). iTraxx indexes cover credit derivatives markets in Europe, Asia and Australia |
| JIBAR | — | Johannesburg Interbank Average Rate |
| JSC | — | Joint Stock Company |
| JSE | — | Johannesburg Stock Exchange |
| KLCI | — | Kuala Lumpur Composite Index |
| KOSPI | — | Korea Composite Stock Price Index |
| KSCP | — | Kuwaiti Shareholding Company Public |
| KWCDC | — | Korean Won Certificate of Deposit |
| LIBOR | — | London Interbank Offered Rate |
| LLC | — | Limited Liability Company |
| LP | — | Limited Partnership |
| MIB Index | — | Milano Indice di Borsa Index |
| MIBOR | — | Mumbai Inter-Bank Overnight Rate |
| MMY | — | Money Market Yield |
| MSCI | — | Morgan Stanley Capital International |
| MUTSCALM | — | Bank of Japan Estimate Unsecured Overnight Call Rate |
| NA | — | North American |
| NIBOR | — | Norwegian Interbank Offered Rate |
| NOK | — | Norwegian Krone |
| NOWA | — | Norwegian Overnight Weighted Average |
| NV | — | Naamloze Vennootschap |
| NVDR | — | Non-Voting Depository Receipt |
| OAT | — | Obligations Assimilables du Trésor |
| OYJ | — | Julkinen Osakeyhtio |
| PCL | — | Public Company Limited |
| PIK | — | Payment-in-Kind Bonds |
| PJSC | — | Public Joint Stock Company |
| PLC | — | Public Limited Company |
| PLN | — | Polish Zloty |
| PRIBOR | — | Prague Inter-bank Offered Rate |
| PSF | — | Permanent School Fund |
| PT | — | Perseroan Terbatas |
| QPSC | — | Qatari Public Shareholding Company |
| RBA | — | Reserve Bank of Australia |
| REIT | — | Real Estate Investment Trust |
| REMIC | — | Real Estate Mortgage Investment Conduit |
| SA | — | Societe Anonyme |
| SA de CV | — | Sociedad Anonima de Capital Variable |
| SAB de CV | — | Sociedad Anonima Bursatil de Capital Variable |
| SAKP | — | Societe Anonyme Kuwaitienne pour le Partage dans les Investissements |
| SAQ | — | Societe Anonyme Qatar |
| S.a.r.l. | — | Societa a responsabilita limitata |
| SAS | — | Societe par Actions Simplifiee |
| SASU | — | Societe par Actions Simplifiee Unipersonnelle |
| SBA | — | Small Business Administration |
| SCA | — | Societe en Commandite par Actions |
| Schatz | — | Short Bond Future |
ABBREVIATIONS, FOOTNOTES AND INDEX DEFINITIONS
| SDR | — | Special Drawing Rights |
| SE | — | Societas Europea |
| SEK | — | Swedish Krona |
| SGD | — | Singapore Dollar |
| SGPS | — | Sociedade Gestora de Participacoes Sociais |
| SOFR | — | Secured Overnight Financing Rate |
| SONIA | — | Sterling Overnight Index Average Rate |
| SORA | — | Singapore Overnight Rate Average |
| SSARON | — | Swiss Average Rate Overnight |
| STACR | — | Structured Agency Credit Risk |
| STEP | — | Stepped Coupon Bonds: Interest rates shown reflect the rates currently in effect. |
| STIBOR | — | Stockholm Interbank Offered Rate |
| STRIP | — | Stripped Security |
| TAIEX | — | Taiwan Stock Exchange Capitalization Weighted Stock Index |
| TBA | — | To be announced |
| Tbk | — | Terbuka |
| TELBOR | — | Tel Aviv Inter-Bank Offered Rate |
| TIIE | — | The Equilibrium Interbank Interest Rate |
| TSX | — | Toronto Stock Exchange |
| WIBOR | — | Warsaw Interbank Offered Rates |
| WIG20 | — | Warsaw Stock Exchange Index |
| 144A | — | Security was purchased pursuant to Rule 144A under the Securities Act of 1933 and may not be resold subject to that rule except to qualified institutional buyers. As of December 31, 2023, the total market values and percentages of net assets for 144A securities by fund were as follows: |
| Fund | | Value of
144A Securities | | Percentage of
Net Assets |
| Low-Duration Bond | | $294,402,138 | | 33.92% |
| Medium-Duration Bond | | 516,432,847 | | 20.98 |
| Global Bond | | 92,960,651 | | 16.11 |
| Impact Bond | | 14,067,202 | | 17.17 |
| Defensive Market Strategies® | | 66,227,613 | | 4.79 |
| Impact Equity | | 38,451 | | 0.04 |
| International Equity Index | | 10,715,432 | | 1.16 |
| International Equity | | 14,842,190 | | 1.32 |
| Emerging Markets Equity | | 19,222,812 | | 2.42 |
| Global Real Estate Securities | | 1,401,291 | | 0.59 |
| Strategic Alternatives | | 14,285,461 | | 5.78 |
| INVESTMENT FOOTNOTES: |
| « | — | Century bond maturing in 2110. |
| π | — | Century bond maturing in 2115. |
| ‡‡ | — | All or a portion of the security was held as collateral for open futures, options, securities sold short and/or swap agreements. |
| * | — | Non-income producing security. |
| # | — | Security in default. |
| § | — | Security purchased with the cash proceeds from securities loaned. |
| ^ | — | Variable rate security. Security issued at a fixed coupon rate, which converts to a variable rate at a specified date. Rate shown is the rate in effect as of year end. |
| † | — | Variable rate security. Rate shown reflects the rate in effect as of December 31, 2023. |
| γ | — | Variable or floating rate security, the interest rate of which adjusts periodically based on changes in current interest rates and prepayments on the underlying pool of assets. |
| Ξ | — | Variable or floating rate security, the interest rate of which adjusts periodically and is linked to changes in current local market conditions. |
| Ω | — | Rate shown reflects the effective yield as of December 31, 2023. |
| ∞ | — | Affiliated fund. |
| INVESTMENT FOOTNOTES: |
| Δ | — | Security either partially or fully on loan. |
| ††† | — | Security is a Level 3 investment (see Note 2 in Notes to Financial Statements). |
| Ø | — | 7-day current yield as of December 31, 2023 is disclosed. |
| ρ | — | Perpetual bond. Maturity date represents the next call date. |
| ~ | — | Century bond maturing in 2121. |
| ◊ | — | Current yield is disclosed. Dividends are calculated based on a percentage of the issuer’s net income. |
| » | — | Zero coupon bond. |
| ++ | — | Loan Commitment. The closing of the commitment was held on May 31, 2023. The uncalled capital commitment at December 31, 2023 was $1,200,000. |
| Σ | — | All or a portion of this position has not settled. Full contract rates do not take effect until settlement date. |
| FOREIGN BOND FOOTNOTES: |
| (A) | — | Par is denominated in Australian Dollars (AUD). |
| (B) | — | Par is denominated in Brazilian Reals (BRL). |
| (C) | — | Par is denominated in Canadian Dollars (CAD). |
| (E) | — | Par is denominated in Euro (EUR). |
| (I) | — | Par is denominated in Indonesian Rupiahs (IDR). |
| (J) | — | Par is denominated in Japanese Yen (JPY). |
| (KW) | — | Par is denominated in South Korean Won (KRW). |
| (M) | — | Par is denominated in Mexican Pesos (MXN). |
| (P) | — | Par is denominated in Polish Zloty (PLN). |
| (S) | — | Par is denominated in South African Rand (ZAR). |
| (U) | — | Par is denominated in British Pounds (GBP). |
| (Y) | — | Par is denominated in Chinese Yuan (CNY). |
| (Z) | — | Par is denominated in New Zealand Dollars (NZD). |
| (ZE) | — | Par is denominated in Czech Koruna (CZK). |
| (ZF) | — | Par is denominated in Thai Baht (THB). |
| (ZG) | — | Par is denominated in Hungarian Forint (HUF). |
| (ZH) | — | Par is denominated in Indian Rupees (INR). |
| COUNTERPARTY ABBREVIATIONS: |
| BAR | — | Counterparty to contract is Barclays Capital. |
| BNP | — | Counterparty to contract is BNP Paribas. |
| BOA | — | Counterparty to contract is Bank of America. |
| CITI | — | Counterparty to contract is Citibank NA London. |
| DEUT | — | Counterparty to contract is Deutsche Bank AG. |
| GSC | — | Counterparty to contract is Goldman Sachs Capital Markets, LP. |
| HSBC | — | Counterparty to contract is HSBC Securities. |
| JPM | — | Counterparty to contract is JPMorgan Chase Bank. |
| MLIB | — | Counterparty to contract is Merrill Lynch International Bank |
| MSCS | — | Counterparty to contract is Morgan Stanley Capital Services. |
| RBC | — | Counterparty to contract is Royal Bank of Canada. |
| SC | — | Counterparty to contract is Standard Chartered PLC. |
| SS | — | Counterparty to contract is State Street Global Markets. |
| UBS | — | Counterparty to contract is UBS AG. |
| WB | — | Counterparty to contract is Westpac Bank. |
ABBREVIATIONS, FOOTNOTES AND INDEX DEFINITIONS
INDEX DEFINITIONS:
The Bloomberg Global Aggregate Bond Index is a flagship measure of global investment grade debt from 28 local currency markets. This multi-currency benchmark includes treasury, government-related, corporate and securitized fixed-rate bonds from both developed and emerging markets issuers.
The Bloomberg US Aggregate Bond Index is a broad-based flagship benchmark that measures the investment grade, U.S. dollar-denominated, fixed-rate taxable bond market. The index includes treasuries, government-related and corporate securities, fixed-rate MBS. ABS and commercial mortage-backed securities (agency and non-agency).
The Bloomberg US Corporate High Yield 2% Issuer Capped Bond Index is an issuer-constrained version of the flagship US Corporate High Yield Index, which measures the U.S. dollar-denominated, high yield, fixed-rate corporate bond market. The index follows the same rules as the uncapped version but limits the exposure of each issuer to 2% of the total market value and redistributes any excess market value index-wide on a pro rata basis.
The FTSE EPRA Nareit Developed Index is designed to track the performance of listed real estate companies and REITS worldwide. By making the index constituents free-float adjusted and liquidity, size and revenue screened, the series is suitable for use as the basis for investment products, such as derivatives and ETFs.
The Bloomberg US Treasury 1-3 Year Index measures U.S. dollar-denominated, fixed-rate, nominal debt issued by the U.S. Treasury with one to 2.999 years to maturity. Treasury bills are excluded by the maturity constraint but are part of a separate Short Treasury Index. Separate Trading of Registered Interest and Principal Securities (STRIPS) are excluded from the index because their inclusion would result in double-counting.
The Bloomberg 1-3 Month US Treasury Bill Index tracks the market for Treasury bills with one to 2.9999 months to maturity issued by the U.S. government. U.S. Treasury bills are issued in fixed maturity terms of four, eight, 13, 17, 26 and 52 weeks.
The J.P. Morgan Emerging Markets Bond Index (EMBI) Plus tracks liquid, U.S. dollar emerging market fixed and floating-rate debt instruments issued by sovereign entities only. The index is based on the established flagship J.P. Morgan EMBI Global and applies a rules-based filtering to capture liquid investments.
The MSCI ACWI (All Country World Index) ex USA Index captures large- and mid-cap representation across 22 of 23 developed countries (excluding the United States) and 24 emerging markets countries. The index targets coverage of approximately 85% of the global equity opportunity set outside the United States. The developed markets countries included in the index are: Australia, Austria, Belgium, Canada, Denmark, Finland, France, Germany, Hong Kong, Ireland, Israel, Italy, Japan, Netherlands, New Zealand, Norway, Portugal, Singapore, Spain, Sweden and the United Kingdom. The emerging markets countries included in the index are: Brazil, Chile, China, Colombia, Czech Republic, Egypt, Greece, Hungary, India, Indonesia, Korea, Kuwait, Malaysia, Mexico, Peru, Philippines, Poland, Qatar, Saudi Arabia, South Africa, Taiwan, Thailand, Turkey and the United Arab Emirates.
The MSCI EAFE Index is an equity index which captures large- and mid-cap representation across 21 developed market countries around the world, excluding the United States and Canada. With 783 constituents, the index covers approximately 85% of the free float-adjusted market capitalization in each country. Developed market countries included in the index are: Australia, Austria, Belgium, Denmark, Finland, France, Germany, Hong Kong, Ireland, Israel, Italy, Japan, the Netherlands, New Zealand, Norway, Portugal, Singapore, Spain, Sweden, Switzerland and the United Kingdom.
The MSCI Emerging Markets Index captures large- and mid-cap representation across 24 emerging markets countries. With 1,441 constituents, the index covers approximately 85% of the free float-adjusted market capitalization in each country. Emerging markets countries included in the index are: Brazil, Chile, China, Colombia, Czech Republic, Egypt, Greece, Hungary, India, Indonesia, Korea, Kuwait, Malaysia, Mexico, Peru, Philippines, Poland, Qatar, Saudi Arabia, South Africa, Taiwan, Thailand, Turkey and United Arab Emirates.
The MSCI ACWI Growth Index captures large- and mid-cap securities exhibiting overall growth style characteristics across 23 developed markets countries. The growth investment style characteristics for index construction are defined using five variables: long-term forward earnings per share growth rate, short-term forward earnings per share growth rate, current internal growth rate and long-term historical earnings per share growth trend and long-term historical sales per share growth trend. Developed market countries included in the index
ABBREVIATIONS, FOOTNOTES AND INDEX DEFINITIONS
are: Australia, Austria, Belgium, Canada, Denmark, Finland, France, Germany, Hong Kong, Ireland, Israel, Italy, Japan, the Netherlands, New Zealand, Norway, Portugal, Singapore, Spain, Sweden, Switzerland, the United Kingdom and the United States.
The Russell 1000® Growth Index measures the performance of the large-cap growth segment of the U.S. equity universe. It includes those Russell 1000 companies with relatively higher price-to-book ratios, higher Institutional Brokers’ Estimate System (I/B/E/S) forecast medium term (two year) growth and higher sales per share historical growth (five years). The Russell 1000® Growth Index is constructed to provide a comprehensive and unbiased barometer for the large-cap growth segment. The index is completely reconstituted annually to ensure new and growing equities are included and that the represented companies continue to reflect growth characteristics.
The Russell 1000® Value Index measures the performance of the large-cap value segment of the U.S. equity universe. It includes those Russell 1000 companies with relatively lower price-to-book ratios, lower Institutional Brokers’ Estimate System (I/B/E/S) forecast medium term (two year) growth and lower sales per share historical growth (five years). The Russell 1000® Value Index is constructed to provide a comprehensive and unbiased barometer for the large-cap value segment. The index is completely reconstituted annually to ensure new and growing equities are included and that the represented companies continue to reflect value characteristics.
The Russell 2000® Index measures the performance of the small-cap segment of the U.S. equity universe. The Russell 2000® Index is a subset of the Russell 3000® Index representing approximately 7% of the total market capitalization of that index. It includes approximately 2,000 of the smallest securities based on a combination of their market capitalization and current index membership. The Russell 2000® Index is constructed to provide a comprehensive and unbiased small-cap barometer and is completely reconstituted annually to ensure that larger stocks do not distort the performance and characteristics of the actual small-cap opportunity set.
The Russell 3000® Index measures the performance of the largest 3,000 U.S. companies representing approximately 96% of the investable U.S. equity market, as of the most recent reconstitution. The Russell 3000® Index is constructed to provide a comprehensive, unbiased and stable barometer of the broad market and is completely reconstituted annually to ensure new and growing equities are included.
The S&P 500® Index is widely regarded as the best single gauge of large-cap U.S. equities. The index includes 500 leading companies and covers approximately 80% of available market capitalization.
“Bloomberg®” and the Bloomberg Global Aggregate Bond Index, Bloomberg US Aggregate Bond Index, Bloomberg US Corporate High Yield 2% Issuer Capped Bond Index, Bloomberg Global Aggregate Bond Index (USD-Hedged), Bloomberg US Treasury 1-3 Year Index and Bloomberg 1-3 Month US Treasury Bill Index (collectively, the “Bloomberg Indexes”) are service marks of Bloomberg Finance L.P. and its affiliates, including Bloomberg Index Services Limited (“BISL”), the administrator of the index (collectively, “Bloomberg”) and have been licensed for use for certain purposes by GuideStone Funds.
The Target Date Funds, Target Risk Funds (except the Aggressive Allocation Fund), Money Market Fund, Low-Duration Bond Fund, Medium-Duration Bond Fund, Global Bond Fund, Strategic Alternatives Fund and Defensive Market Strategies Fund (collectively, “Certain Funds”) are not sponsored, endorsed, sold or promoted by Bloomberg. Bloomberg does not make any representation or warranty, express or implied, to the owners of or counterparties to the Certain Funds or any member of the public regarding the advisability of investing in securities generally or in the Certain Funds particularly. The only relationship of Bloomberg to GuideStone Financial Resources and its affiliates is the licensing of certain trademarks, trade names and service marks and of the Bloomberg Index/Indexes, which is determined, composed and calculated by BISL without regard to GuideStone Financial Resources and its affiliates or the Certain Funds. Bloomberg has no obligation to take the needs of GuideStone Financial Resources or its affiliates or the owners of the Certain Funds into consideration in determining, composing or calculating the Bloomberg Indexes. Bloomberg is not responsible for and has not participated in the determination of the timing of, prices at, or quantities of the Certain Funds to be issued. Bloomberg shall not have any obligation or liability, including, without limitation, to Certain Funds customers, in connection with the administration, marketing or trading of the Certain Funds.
BLOOMBERG DOES NOT GUARANTEE THE ACCURACY AND/OR THE COMPLETENESS OF THE BLOOMBERG
INDEXES OR ANY DATA RELATED THERETO AND SHALL HAVE NO LIABILITY FOR ANY ERRORS, OMISSIONS OR INTERRUPTIONS THEREIN. BLOOMBERG DOES NOT MAKE ANY WARRANTY, EXPRESS OR IMPLIED, AS TO RESULTS TO BE OBTAINED BY GUIDESTONE FINANCIAL RESOURCES AND ITS AFFILIATES, OWNERS OF THE CERTAIN FUNDS OR ANY OTHER PERSON OR ENTITY FROM THE USE OF THE BLOOMBERG INDEXES OR ANY DATA RELATED THERETO. BLOOMBERG DOES NOT MAKE ANY EXPRESS OR IMPLIED WARRANTIES AND EXPRESSLY DISCLAIMS ALL WARRANTIES OF MERCHANTABILITY OR FITNESS FOR A PARTICULAR PURPOSE OR USE WITH RESPECT TO THE BLOOMBERG INDEXES OR ANY DATA RELATED THERETO. WITHOUT LIMITING ANY OF THE FOREGOING, TO THE MAXIMUM EXTENT ALLOWED BY LAW, BLOOMBERG, ITS LICENSORS, AND ITS AND THEIR RESPECTIVE EMPLOYEES, CONTRACTORS, AGENTS, SUPPLIERS, AND VENDORS SHALL HAVE NO LIABILITY OR RESPONSIBILITY WHATSOEVER FOR ANY INJURY OR DAMAGE—WHETHER DIRECT, INDIRECT, CONSEQUENTIAL, INCIDENTAL, PUNITIVE OR OTHERWISE—ARISING IN CONNECTION WITH THE CERTAIN FUNDS OR BLOOMBERG INDEXES OR ANY DATA OR VALUES RELATING THERETO—WHETHER ARISING FROM THEIR NEGLIGENCE OR OTHERWISE, EVEN IF NOTIFIED OF THE POSSIBILITY THEREOF.
The Russell Indexes (the “Indexes”) are a trademark of Frank Russell Company (“Russell”) and have been licensed for use by GuideStone Capital Management, LLC. The Funds are not in any way sponsored, endorsed, sold or promoted by Russell or the London Stock Exchange Group plc (together, the “Licensor Parties”), and none of the Licensor Parties make any claim, promotion, warranty or representation whatsoever, expressly or impliedly, either as to (i) the results to be obtained from the use of the Indexes (upon which certain Funds are based); (ii) the figure at which the Indexes are said to stand at any particular time on any particular day or otherwise; or (iii) the suitability of the Index for the purpose to which it is being put in connection with the Funds. None of the Licensor Parties shall be (a) liable (whether in negligence or otherwise) to any person for any error in the Indexes; or (b) under any obligation to advise any person of any error therein.
The GuideStone Funds Global Real Estate Securities Fund has been developed solely by the Adviser. The Fund is not in any way sponsored, endorsed, sold or promoted by the London Stock Exchange Group plc and its group undertakings, including FTSE International Limited (collectively, the “LSE Group”), European Public Real Estate Association (“EPRA”) or the National Association of Real Estate Investments Trusts (“Nareit”) (and together, the "Licensor Parties”). FTSE Russell is a trading name of certain of the LSE Group companies.
All rights in the FTSE EPRA/Nareit Developed Index (the “Index”) vest in the Licensor Parties. “FTSE®” and “FTSE Russell®” are trade mark(s) of the relevant LSE Group company under license. “Nareit®” is a trademark of Nareit, “EPRA®” is a trademark of EPRA and all are used by the LSE Group under license.
The Index is calculated by or on behalf of FTSE International Limited or its affiliate, agent or partner. The Licensor Parties doe not accept any liability whatsoever to any person arising out of (a) the use of, reliance on or any error in the Index or (b) investment in or operations of the Fund. The Licensor Parties makes no claim, prediction, warranty or representation either as to the results to be obtained from the Fund or the suitability of the Index for the purpose to which it is being put by the Adviser.
Information has been obtained from sources believed to be reliable, but J.P. Morgan does not warrant its completeness or accuracy. The Index is used with permission. The Index may not be copied, used or distributed without J.P. Morgan’s prior written approval. Copyright 2024, JPMorgan Chase & Co. All rights reserved.
THE INTERNATIONAL EQUITY INDEX FUND IS NOT SPONSORED, ENDORSED, SOLD OR PROMOTED BY MSCI INC. (“MSCI”), ANY OF ITS AFFILIATES, ANY OF ITS INFORMATION PROVIDERS OR ANY OTHER THIRD PARTY INVOLVED IN, OR RELATED TO, COMPILING, COMPUTING OR CREATING ANY MSCI INDEX (COLLECTIVELY, THE “MSCI PARTIES”). THE MSCI INDEXES ARE THE EXCLUSIVE PROPERTY OF MSCI. MSCI AND THE MSCI INDEX NAMES ARE SERVICE MARK(S) OF MSCI OR ITS AFFILIATES AND HAVE BEEN LICENSED FOR USE FOR CERTAIN PURPOSES BY LICENSEE. NONE OF THE MSCI PARTIES MAKES ANY REPRESENTATION OR WARRANTY, EXPRESS OR IMPLIED, TO THE ISSUER OR OWNERS OF THESE FUNDS OR ANY OTHER PERSON OR ENTITY REGARDING THE ADVISABILITY OF INVESTING IN FUNDS GENERALLY OR IN THE FUND PARTICULARLY OR THE ABILITY OF ANY MSCI INDEX TO TRACK CORRESPONDING STOCK MARKET PERFORMANCE. MSCI OR ITS AFFILIATES ARE THE LICENSORS OF CERTAIN TRADEMARKS, SERVICE MARKS AND TRADE NAMES AND OF THE MSCI INDEXES WHICH ARE DETERMINED, COMPOSED AND CALCULATED BY MSCI WITHOUT REGARD TO THE FUND OR THE ISSUER OR OWNERS OF THESE FUNDS OR ANY OTHER PERSON OR ENTITY. NONE OF THE MSCI PARTIES HAS ANY OBLIGATION TO TAKE THE NEEDS OF THE ISSUER OR OWNERS OF THE FUND OR ANY OTHER PERSON OR ENTITY INTO CONSIDERATION IN DETERMINING, COMPOSING OR CALCULATING THE MSCI INDEXES. NONE OF THE MSCI PARTIES IS RESPONSIBLE FOR OR HAS PARTICIPATED IN THE DETERMINATION OF THE TIMING OF, PRICES AT, OR QUANTITIES OF THESE FUNDS TO BE ISSUED OR IN THE DETERMINATION OR CALCULATION OF THE EQUATION BY OR THE CONSIDERATION INTO WHICH THESE FUNDS ARE REDEEMABLE. FURTHER, NONE OF THE MSCI PARTIES HAS ANY OBLIGATION OR LIABILITY TO THE ISSUER OR OWNERS OF THE FUND OR ANY OTHER PERSON OR ENTITY IN CONNECTION WITH THE ADMINISTRATION, MARKETING OR OFFERING OF THE FUND.
ALTHOUGH MSCI SHALL OBTAIN INFORMATION FOR INCLUSION IN OR FOR USE IN THE CALCULATION OF THE MSCI INDEXES FROM SOURCES THAT MSCI CONSIDERS RELIABLE, NONE OF THE MSCI PARTIES WARRANTS OR GUARANTEES THE ORIGINALITY, ACCURACY AND/OR THE COMPLETENESS OF ANY MSCI INDEX OR ANY DATA INCLUDED THEREIN. NONE OF THE MSCI PARTIES MAKES ANY WARRANTY, EXPRESS OR IMPLIED, AS TO RESULTS TO BE OBTAINED BY THE ISSUER OF THE FUND, OWNERS OF THE FUND, OR ANY OTHER PERSON OR
ENTITY, FROM THE USE OF ANY MSCI INDEX OR ANY DATA INCLUDED THEREIN. NONE OF THE MSCI PARTIES SHALL HAVE ANY LIABILITY FOR ANY ERRORS, OMISSIONS OR INTERRUPTIONS OF OR IN CONNECTION WITH ANY MSCI INDEX OR ANY DATA INCLUDED THEREIN. FURTHER, NONE OF THE MSCI PARTIES MAKES ANY EXPRESS OR IMPLIED WARRANTIES OF ANY KIND, AND THE MSCI PARTIES HEREBY EXPRESSLY DISCLAIM ALL WARRANTIES OF MERCHANTABILITY AND FITNESS FOR A PARTICULAR PURPOSE, WITH RESPECT TO EACH MSCI INDEX AND ANY DATA INCLUDED THEREIN. WITHOUT LIMITING ANY OF THE FOREGOING, IN NO EVENT SHALL ANY OF THE MSCI PARTIES HAVE ANY LIABILITY FOR ANY DIRECT, INDIRECT, SPECIAL, PUNITIVE, CONSEQUENTIAL OR ANY OTHER DAMAGES (INCLUDING LOST PROFITS) EVEN IF NOTIFIED OF THE POSSIBILITY OF SUCH DAMAGES.
No purchaser, seller, or holder of this security, product or fund, or any other person or entity, should use or refer to any MSCI trade name, trademark, or service mark to sponsor, endorse, market or promote this security without first contacting MSCI to determine whether MSCI’s permission is required. Under no circumstances may any person or entity claim any affiliation with MSCI without the prior written permission of MSCI.
The GuideStone Funds Equity Index Fund is not sponsored, endorsed, sold or promoted by Standard & Poor’s®, a division of The McGraw-Hill Companies, Inc. (“S&P®”). S&P® makes no representation or warranty, express or implied, to the owners of the Fund or any member of the public regarding the advisability of investing in securities generally, or in the Fund particularly, or the ability of the S&P 500® Index to track general stock market performance. S&P®’s only relationship to the Trust is the licensing of certain trademarks and trade names of S&P® and of the S&P 500® Index which is determined, composed and calculated by S&P® without regard to the Trust or the Fund. S&P® has no obligation to take the needs of the Trust or the owners of the Fund into consideration in determining, composing or calculating the S& P 500® Index. S&P® is not responsible for and has not participated in the determination of the prices and amount of the Fund or the timing of the issuance or sale of the Fund or in the determination or calculation of the equation by which the Fund is to be converted into cash. S&P® has no obligation or liability in connection with the administration, marketing or trading of the Fund.
S&P® DOES NOT GUARANTEE THE ACCURACY AND/OR THE COMPLETENESS OF THE S&P 500® INDEX OR ANY DATA INCLUDED THEREIN, AND S&P® SHALL HAVE NO LIABILITY FOR ANY ERRORS, OMISSIONS OR INTERRUPTIONS THEREIN. S&P® MAKES NO WARRANTY, EXPRESS OR IMPLIED, AS TO RESULTS TO BE OBTAINED BY THE TRUST, OWNERS OF THE FUND OR ANY OTHER PERSON OR ENTITY FROM THE USE OF THE S&P 500® INDEX OR ANY DATA INCLUDED THEREIN. S&P® MAKES NO EXPRESS OR IMPLIED
WARRANTIES AND EXPRESSLY DISCLAIMS ALL WARRANTIES OF MERCHANTABILITY OR FITNESS FOR A PARTICULAR PURPOSE OR USE WITH RESPECT TO THE S&P 500® INDEX OR ANY DATA INCLUDED THEREIN. WITHOUT LIMITING ANY OF THE FOREGOING, IN NO EVENT SHALL S&P® HAVE ANY LIABILITY FOR ANY SPECIAL, PUNITIVE, INDIRECT OR CONSEQUENTIAL DAMAGES (INCLUDING LOST PROFITS), EVEN IF NOTIFIED OF THE POSSIBILITY OF SUCH DAMAGES.
MyDestination 2015 Fund (Unaudited)
The Fund, through investments primarily in the Select Funds, combined a greater percentage of exposure to fixed income securities with smaller percentages allocated to equity securities, real assets and alternative investments. The Fund followed an allocation glide path designed to become more conservative over time, and the targeted allocations were approximately 57% fixed income securities, 41% equity securities, 1% real assets and 1% alternative investments as of December 31, 2023.
As a fund of funds, the Fund’s performance was based on the performance of its underlying investments. The Investor Class of the Fund generated a return of 10.86%, net of fees, for the one-year period ended December 31, 2023. Contribution to absolute performance from each major asset class was additive in a strong year for almost all financial assets. Exposure to U.S. equities was a significant driver of relatively stronger performance with U.S. financial assets generally outpacing those in other markets. U.S. equities, led by the Magnificent Seven stocks (Apple, Alphabet, Microsoft, Amazon, Meta, Tesla and Nvidia), outperformed fixed income. The U.S. regional banking crisis in March became a distant memory by the second half of the year as the economy demonstrated resilience despite aggressive monetary policy. The persistently solid labor market and consumer debt service-to-income near historic lows helped fuel consumption. Fixed income markets delivered a strong rally into year-end as the market started to price in rate cuts for early 2024. Despite the euro area and U.K. economies muddling through the inflation battle in a weakening economy, international developed equity market performance broadly was strong in absolute terms. China’s economic recovery following its post-COVID reopening was anemic, and the subsequent policy measures to stimulate the economy did not keep pace with expectations. The Equity Index Fund was the largest contributor to Fund performance due to its broad exposure to the strength of the S&P 500® Index. Intermediate duration bonds rallied into the end of the year as markets raced to price in rate cuts, and exposure to the Medium-Duration Bond Fund was the strongest performer within the fixed income allocation. The contribution to absolute performance by the Fund’s exposure to real assets, via its investment in the Global Real Estate Securities Fund as well as Treasury Inflation Protected Securities (TIPS), was also positive. Exposures to the Strategic Alternatives Fund and Defensive Market Strategies® Fund were positive contributors to the Fund’s performance. For more information on a Select Fund’s performance, please refer to that Select Fund’s section in this Annual Report.
Certain derivatives were utilized to provide market exposure for the cash positions held in the Fund. These derivative positions primarily included stock index futures and fixed income futures. Overall, derivative exposure had a negative impact on Fund performance for the year.
The Fund attempted to achieve its objective by investing in a diversified portfolio of primarily the Select Funds that represent various asset classes. The Fund is managed to the specific retirement year included in its name (“Target Date”) and assumes a retirement age of 65. The Target Date refers to the approximate year an investor in the Fund would plan to retire and likely stop making any new investments in the Fund. The Fund is designed for an investor who anticipates retiring at or near the Target Date and who plans to withdraw the value of the account in the Fund gradually after retirement. Over time, the allocation to asset classes will change according to a predetermined “glide path,” which adjusts the percentage of fixed income securities and equity securities to become more conservative each year until 15 years after Target Date. The Fund’s value will fluctuate due to changes in interest rates. There is a risk that the issuer of a fixed income investment may fail to pay interest or even principal due in a timely manner or at all. The Fund’s value will fluctuate due to business developments concerning a particular issuer, industry or country, as well as general market, economic and geopolitical conditions and other factors. Securities of foreign issuers may be negatively impacted by political events, economic conditions or inefficient, illiquid or unregulated markets in foreign countries, and they also may be subject to inadequate regulatory or accounting standards, which may increase investment risk. By investing in this Fund, you will incur the expenses of the Fund in addition to those of the underlying Select Funds. You may directly invest in the Select Funds. The Fund’s value will go up and down in response to changes in the share prices of the investments that it owns. The amount invested in the Fund is not guaranteed to increase, is not guaranteed against loss nor is the amount of the original investment guaranteed at the Target Date. It is possible to lose money by investing in the Fund.
See Notes to Financial Statements.
MyDestination 2015 Fund (Unaudited)
At December 31, 2023, the portfolio holdings of the Fund, as a percentage of net assets, is shown in the following table. Portfolio holdings are subject to risk and may change at any time.
| | % |
| Fixed Income Select Funds | 47.8 |
| U.S. Equity Select Funds | 31.5 |
| Non-U.S. Equity Select Funds | 10.4 |
| U.S. Treasury Obligations | 7.3 |
| Money Market Funds | 2.1 |
| Alternative Select Fund | 1.0 |
| Real Assets Select Fund | 0.5 |
| | 100.6 |
| Average Annual Total Returns as of 12/31/23 | |
| | | Institutional Class* | | Investor Class* | |
| One Year | | 11.17% | | 10.86%** | |
| Five Year | | 5.51% | | 5.25% | |
| Ten Year | | N/A | | 4.23% | |
| Since Inception | | 4.62% | | 4.28% | |
| Inception Date | | 05/01/17 | | 12/29/06 | |
| Total Fund Operating Expenses (May 1, 2023 Prospectus)(1)# | | 0.45% | | 0.75% | |
(1)The Fund’s shareholders indirectly bear the expenses of the Institutional Class shares of the Select Funds in which the Fund invests. Current information regarding the Fund’s Operating Expenses can be found in the Financial Highlights.
#Net expense ratio
The performance data quoted represents past performance and does not guarantee future results. The performance data in the table and graph does not reflect the deduction of taxes that a shareholder would pay on Fund distributions or the redemption of Fund shares. Current performance may be lower or higher. Performance data current to the most recent month-end may be obtained at GuideStoneFunds.com. The investment return and principal value of an investment will fluctuate so that shares, when redeemed, may be worth more or less than their original cost.
The Adviser has agreed to waive fees and/or reimburse expenses to the extent needed to limit total annual operating expenses to 0.45% for the Institutional Class and 0.75% for the Investor Class. This contractual waiver and reimbursement applies to Fund operating expenses only and will remain in place until April 30, 2024.
See Notes to Financial Statements.
MyDestination 2015 Fund (Unaudited)
The graph illustrates the results of a hypothetical $10,000 investment in the Investor Class of the Fund for the 10-year period from December 31, 2013 to December 31, 2023, with all dividends and capital gains reinvested.
*These returns reflect investment advisory and shareholder servicing fee waivers, if applicable, during the reported time periods.
**Total returns may differ from the financial highlights due to adjustments required by U.S. GAAP.
Unlike a mutual fund, an index is not available for direct investment and the performance of an index assumes no taxes, transaction costs, management fees or other expenses.
See Notes to Financial Statements.
| | | Shares | | Value |
| MUTUAL FUNDS — 91.2% |
GuideStone Low-Duration Bond Fund
(Institutional Class)∞ | 5,562,386 | | $ 71,254,162 |
GuideStone Medium-Duration Bond Fund
(Institutional Class)∞ | 16,393,117 | | 210,979,421 |
GuideStone Global Bond Fund
(Institutional Class)∞ | 4,203,138 | | 36,693,395 |
GuideStone Defensive Market Strategies® Fund
(Institutional Class)∞ | 6,303,150 | | 72,738,355 |
GuideStone Equity Index Fund
(Institutional Class)∞ | 2,593,318 | | 126,113,056 |
GuideStone International Equity Index Fund
(Institutional Class)∞ | 4,302,438 | | 48,617,544 |
GuideStone Small Cap Equity Fund
(Institutional Class)∞ | 676,531 | | 11,561,919 |
GuideStone Emerging Markets Equity Fund
(Institutional Class)∞ | 2,342,708 | | 20,896,952 |
GuideStone Global Real Estate Securities Fund
(Institutional Class)∞ | 388,705 | | 3,475,020 |
GuideStone Strategic Alternatives Fund
(Institutional Class)∞ | 715,343 | | 6,588,307 |
Total Mutual Funds
(Cost $617,441,731) | | 608,918,131 |
| MONEY MARKET FUNDS — 2.1% |
GuideStone Money Market Fund, 5.28%
(Institutional Class)Ø∞ | 9,212,694 | | 9,212,694 |
| Northern Institutional U.S. Treasury Portfolio (Premier), 5.22%Ø | 4,922,819 | | 4,922,819 |
Total Money Market Funds
(Cost $14,135,513) | | 14,135,513 |
| | | Par | | Value |
| U.S. TREASURY OBLIGATIONS — 7.3% |
| U.S. Treasury Bill | | | | |
| 4.98%, 03/28/24Ω | $ 830,000 | | $ 819,706 |
| U.S. Treasury Inflationary Index Bonds | | | | |
| 3.88%, 04/15/29 | 10,546,184 | | 11,646,653 |
| 3.38%, 04/15/32 | 5,763,422 | | 6,468,518 |
| 0.63%, 02/15/43 | 3,432,535 | | 2,702,795 |
| 1.00%, 02/15/48 | 2,089,847 | | 1,702,044 |
| 0.13%, 02/15/51 | 1,961,705 | | 1,228,568 |
| 1.50%, 02/15/53 | 652,075 | | 597,138 |
| | | | | 24,345,716 |
| U.S. Treasury Inflationary Index Notes | | | | |
| 0.13%, 07/15/24 | 1,882,725 | | 1,850,422 |
| 0.13%, 07/15/26 | 12,399,190 | | 11,822,505 |
| 0.38%, 07/15/27 | 4,339,272 | | 4,127,891 |
| 0.63%, 07/15/32 | 5,453,489 | | 5,000,339 |
| 1.38%, 07/15/33 | 577,438 | | 562,125 |
| | | | | 23,363,282 |
Total U.S. Treasury Obligations
(Cost $52,933,962) | | 48,528,704 |
TOTAL INVESTMENTS — 100.6%
(Cost $684,511,206) | | | 671,582,348 |
Liabilities in Excess of Other
Assets — (0.6)% | | | (3,901,530) |
| NET ASSETS — 100.0% | | | $667,680,818 |
VALUATION HIERARCHY
The following is a summary of the inputs used, as of December 31, 2023, in valuing the Fund’s investments carried at fair value:
| | Total
Value | | Level 1
Quoted Prices | | Level 2
Other Significant
Observable Inputs | | Level 3
Significant
Unobservable Inputs |
| Assets: | | | | | | | |
| Investments in Securities: | | | | | | | |
| Money Market Funds | $ 14,135,513 | | $ 14,135,513 | | $ — | | $ — |
| Mutual Funds | 608,918,131 | | 608,918,131 | | — | | — |
| U.S. Treasury Obligations | 48,528,704 | | — | | 48,528,704 | | — |
| Total Assets - Investments in Securities | $671,582,348 | | $623,053,644 | | $48,528,704 | | $ — |
See Notes to Financial Statements.
MyDestination 2025 Fund (Unaudited)
The Fund, through investments primarily in the Select Funds, combined a greater percentage of exposure to equity securities with smaller percentages allocated to fixed income securities, real assets and alternative investments. The Fund followed an allocation glide path designed to become more conservative over time, and the targeted allocations were approximately 47% fixed income securities, 51% equity securities, 1% real assets and 1% alternative investments as of December 31, 2023.
As a fund of funds, the Fund’s performance was based on the performance of its underlying investments. The Investor Class of the Fund generated a return of 12.64%, net of fees, for the one-year period ended December 31, 2023. Contribution to absolute performance from each major asset class was additive in a strong year for almost all financial assets. Exposure to U.S. equities was a significant driver of relatively stronger performance with U.S. financial assets generally outpacing those in other markets. U.S. equities, led by the Magnificent Seven stocks (Apple, Alphabet, Microsoft, Amazon, Meta, Tesla and Nvidia), outperformed fixed income. The U.S. regional banking crisis in March became a distant memory by the second half of the year as the economy demonstrated resilience despite aggressive monetary policy. The persistently solid labor market and consumer debt service-to-income near historic lows helped fuel consumption. Fixed income markets delivered a strong rally into year-end as the market started to price in rate cuts for early 2024. Despite the euro area and U.K. economies muddling through the inflation battle in a weakening economy, international developed equity market performance broadly was strong in absolute terms. China’s economic recovery following its post-COVID reopening was anemic, and the subsequent policy measures to stimulate the economy did not keep pace with expectations. The Equity Index Fund was the largest contributor to Fund performance due to its broad exposure to the strength of the S&P 500® Index. Intermediate duration bonds rallied into the end of the year as markets raced to price in rate cuts, and exposure to the Medium-Duration Bond Fund was the strongest performer within the fixed income allocation. The contribution to absolute performance by the Fund’s exposure to real assets, via its investment in the Global Real Estate Securities Fund as well as Treasury Inflation Protected Securities (TIPS), was also positive. Exposures to the Strategic Alternatives Fund and Defensive Market Strategies® Fund was positive contributors to the Fund’s performance. For more information on a Select Fund’s performance, please refer to that Select Fund’s section in this Annual Report.
Certain derivatives were utilized to provide market exposure for the cash positions held in the Fund. These derivative positions primarily included stock index futures and fixed income futures. Overall, derivative exposure had a negative impact on Fund performance for the year.
The Fund attempted to achieve its objective by investing in a diversified portfolio of primarily the Select Funds that represent various asset classes. The Fund is managed to the specific retirement year included in its name (“Target Date”) and assumes a retirement age of 65. The Target Date refers to the approximate year an investor in the Fund would plan to retire and likely stop making any new investments in the Fund. The Fund is designed for an investor who anticipates retiring at or near the Target Date and who plans to withdraw the value of the account in the Fund gradually after retirement. Over time, the allocation to asset classes will change according to a predetermined “glide path,” which adjusts the percentage of fixed income securities and equity securities to become more conservative each year until 15 years after Target Date. The Fund’s value will fluctuate due to changes in interest rates. There is a risk that the issuer of a fixed income investment may fail to pay interest or even principal due in a timely manner or at all. The Fund’s value will fluctuate due to business developments concerning a particular issuer, industry or country, as well as general market, economic and political conditions and other factors. Securities of foreign issuers may be negatively impacted by political events, economic conditions or inefficient, illiquid or unregulated markets in foreign countries, and they also may be subject to inadequate regulatory or accounting standards, which may increase investment risk. By investing in this Fund, you will incur the expenses of the Fund in addition to those of the underlying Select Funds. You may directly invest in the Select Funds. The Fund’s value will go up and down in response to changes in the share prices of the investments that it owns. The amount invested in the Fund is not guaranteed to increase, is not guaranteed against loss nor is the amount of the original investment guaranteed at the Target Date. It is possible to lose money by investing in the Fund.
See Notes to Financial Statements.
MyDestination 2025 Fund (Unaudited)
At December 31, 2023, the portfolio holdings of the Fund, as a percentage of net assets, is shown in the following table. Portfolio holdings are subject to risk and may change at any time.
| | % |
| Fixed Income Select Funds | 39.9 |
| U.S. Equity Select Funds | 39.3 |
| Non-U.S. Equity Select Funds | 13.4 |
| U.S. Treasury Obligations | 4.0 |
| Money Market Funds | 2.3 |
| Alternative Select Fund | 1.0 |
| Real Assets Select Fund | 0.7 |
| | 100.6 |
| Average Annual Total Returns as of 12/31/23 | |
| | | Institutional Class* | | Investor Class* | |
| One Year | | 12.83% | | 12.64% | |
| Five Year | | 6.82% | | 6.56% | |
| Ten Year | | N/A | | 5.05% | |
| Since Inception | | 5.68% | | 4.76% | |
| Inception Date | | 05/01/17 | | 12/29/06 | |
| Total Fund Operating Expenses (May 1, 2023 Prospectus)(1)# | | 0.45% | | 0.75% | |
(1)The Fund’s shareholders indirectly bear the expenses of the Institutional Class shares of the Select Funds in which the Fund invests. Current information regarding the Fund’s Operating Expenses can be found in the Financial Highlights.
#Net expense ratio
The performance data quoted represents past performance and does not guarantee future results. The performance data in the table and graph does not reflect the deduction of taxes that a shareholder would pay on Fund distributions or the redemption of Fund shares. Current performance may be lower or higher. Performance data current to the most recent month-end may be obtained at GuideStoneFunds.com. The investment return and principal value of an investment will fluctuate so that shares, when redeemed, may be worth more or less than their original cost.
The Adviser has agreed to waive fees and/or reimburse expenses to the extent needed to limit total annual operating expenses to 0.45% for the Institutional Class and 0.75% for the Investor Class. This contractual waiver and reimbursement applies to Fund operating expenses only and will remain in place until April 30, 2024.
See Notes to Financial Statements.
MyDestination 2025 Fund (Unaudited)
The graph illustrates the results of a hypothetical $10,000 investment in the Investor Class of the Fund for the 10-year period from December 31, 2013 to December 31, 2023, with all dividends and capital gains reinvested.
*These returns reflect investment advisory and shareholder servicing fee waivers, if applicable, during the reported time periods.
Unlike a mutual fund, an index is not available for direct investment and the performance of an index assumes no taxes, transaction costs, management fees or other expenses.
See Notes to Financial Statements.
| | | Shares | | Value |
| MUTUAL FUNDS — 94.3% |
GuideStone Low-Duration Bond Fund
(Institutional Class)∞ | 6,308,346 | | $ 80,809,915 |
GuideStone Medium-Duration Bond Fund
(Institutional Class)∞ | 41,091,462 | | 528,847,113 |
GuideStone Global Bond Fund
(Institutional Class)∞ | 11,087,568 | | 96,794,468 |
GuideStone Defensive Market Strategies® Fund
(Institutional Class)∞ | 19,999,359 | | 230,792,608 |
GuideStone Equity Index Fund
(Institutional Class)∞ | 8,694,540 | | 422,815,500 |
GuideStone International Equity Index Fund
(Institutional Class)∞ | 14,749,854 | | 166,673,345 |
GuideStone Small Cap Equity Fund
(Institutional Class)∞ | 2,452,393 | | 41,911,399 |
GuideStone Emerging Markets Equity Fund
(Institutional Class)∞ | 8,019,068 | | 71,530,087 |
GuideStone Global Real Estate Securities Fund
(Institutional Class)∞ | 1,473,700 | | 13,174,877 |
GuideStone Strategic Alternatives Fund
(Institutional Class)∞ | 1,903,086 | | 17,527,420 |
Total Mutual Funds
(Cost $1,638,589,903) | | 1,670,876,732 |
| MONEY MARKET FUNDS — 2.3% |
GuideStone Money Market Fund, 5.28%
(Institutional Class)Ø∞ | 29,378,615 | | 29,378,615 |
| Northern Institutional U.S. Treasury Portfolio (Premier), 5.22%Ø | 11,590,510 | | 11,590,510 |
Total Money Market Funds
(Cost $40,969,125) | | 40,969,125 |
| | | Par | | Value |
| U.S. TREASURY OBLIGATIONS — 4.0% |
| U.S. Treasury Bill | | | | |
| 4.98%, 03/28/24Ω | $ 1,200,000 | | $ 1,185,117 |
| U.S. Treasury Inflationary Index Bonds | | | | |
| 3.88%, 04/15/29 | 15,608,727 | | 17,237,459 |
| 3.38%, 04/15/32 | 8,580,132 | | 9,629,824 |
| 0.63%, 02/15/43 | 5,265,896 | | 4,146,394 |
| 1.00%, 02/15/48 | 3,106,698 | | 2,530,203 |
| 0.13%, 02/15/51 | 3,302,991 | | 2,068,583 |
| 1.50%, 02/15/53 | 734,879 | | 672,966 |
| | | | | 36,285,429 |
| U.S. Treasury Inflationary Index Notes | | | | |
| 0.13%, 07/15/24 | 2,811,778 | | 2,763,534 |
| 0.13%, 07/15/26 | 18,040,436 | | 17,201,378 |
| 0.38%, 07/15/27 | 6,376,843 | | 6,066,205 |
| 0.63%, 07/15/32 | 8,074,341 | | 7,403,414 |
| 1.38%, 07/15/33 | 891,484 | | 867,842 |
| | | | | 34,302,373 |
Total U.S. Treasury Obligations
(Cost $77,278,748) | | 71,772,919 |
TOTAL INVESTMENTS — 100.6%
(Cost $1,756,837,776) | | | 1,783,618,776 |
Liabilities in Excess of Other
Assets — (0.6)% | | | (11,278,410) |
| NET ASSETS — 100.0% | | | $1,772,340,366 |
VALUATION HIERARCHY
The following is a summary of the inputs used, as of December 31, 2023, in valuing the Fund’s investments carried at fair value:
| | Total
Value | | Level 1
Quoted Prices | | Level 2
Other Significant
Observable Inputs | | Level 3
Significant
Unobservable Inputs |
| Assets: | | | | | | | |
| Investments in Securities: | | | | | | | |
| Money Market Funds | $ 40,969,125 | | $ 40,969,125 | | $ — | | $ — |
| Mutual Funds | 1,670,876,732 | | 1,670,876,732 | | — | | — |
| U.S. Treasury Obligations | 71,772,919 | | — | | 71,772,919 | | — |
| Total Assets - Investments in Securities | $1,783,618,776 | | $1,711,845,857 | | $71,772,919 | | $ — |
See Notes to Financial Statements.
MyDestination 2035 Fund (Unaudited)
The Fund, through investments primarily in the Select Funds, combined a greater percentage of exposure to equity securities with smaller percentages allocated to fixed income securities, real assets and alternative investments. The Fund followed an allocation glide path designed to become more conservative over time, and the targeted allocations were approximately 27% fixed income securities, 71% equity securities, 1% real assets and 1% alternative investments as of December 31, 2023.
As a fund of funds, the Fund’s performance was based on the performance of its underlying investments. The Investor Class of the Fund generated a return of 15.82%, net of fees, for the one-year period ended December 31, 2023. Contribution to absolute performance from each major asset class was additive in a strong year for almost all financial assets. Exposure to U.S. equities was a significant driver of relatively stronger performance with U.S. financial assets generally outpacing those in other markets. U.S. equities, led by the Magnificent Seven stocks (Apple, Alphabet, Microsoft, Amazon, Meta, Tesla and Nvidia), outperformed fixed income. The U.S. regional banking crisis in March became a distant memory by the second half of the year as the economy demonstrated resilience despite aggressive monetary policy. The persistently solid labor market and consumer debt service-to-income near historic lows helped fuel consumption. Fixed income markets delivered a strong rally into year-end as the market started to price in rate cuts for early 2024. Despite the euro area and U.K. economies muddling through the inflation battle in a weakening economy, international developed equity market performance broadly was strong in absolute terms. China’s economic recovery following its post-COVID reopening was anemic, and the subsequent policy measures to stimulate the economy did not keep pace with expectations. The Equity Index Fund was the largest contributor to Fund performance due to its broad exposure to the strength of the S&P 500® Index. Broadly, fixed income markets delivered positive returns alongside equity markets, albeit to a lesser extent. As such, the contribution to performance emanating from the fixed income Funds was additive. The contribution to absolute performance by the Fund’s exposure to real assets, via its investment in the Global Real Estate Securities Fund, was also positive. Exposures to the Strategic Alternatives Fund and Defensive Market Strategies® Fund were positive contributors to Fund performance on a relative basis. For more information on a Select Fund’s performance, please refer to that Select Fund’s section in this Annual Report.
Certain derivatives were utilized to provide market exposure for the cash positions held in the Fund. These derivative positions primarily included stock index futures and fixed income futures. Overall, derivative exposure had a negative impact on Fund performance for the year.
The Fund attempted to achieve its objective by investing in a diversified portfolio of primarily the Select Funds that represent various asset classes. The Fund is managed to the specific retirement year included in its name (“Target Date”) and assumes a retirement age of 65. The Target Date refers to the approximate year an investor in the Fund would plan to retire and likely stop making any new investments in the Fund. The Fund is designed for an investor who anticipates retiring at or near the Target Date and who plans to withdraw the value of the account in the Fund gradually after retirement. Over time, the allocation to asset classes will change according to a predetermined “glide path,” which adjusts the percentage of fixed income securities and equity securities to become more conservative each year until 15 years after Target Date. The Fund’s value will fluctuate due to changes in interest rates. There is a risk that the issuer of a fixed income investment may fail to pay interest or even principal due in a timely manner or at all. The Fund’s value will fluctuate due to business developments concerning a particular issuer, industry or country, as well as general market, economic and political conditions and other factors. Securities of foreign issuers may be negatively impacted by political events, economic conditions or inefficient, illiquid or unregulated markets in foreign countries, and they also may be subject to inadequate regulatory or accounting standards, which may increase investment risk. By investing in this Fund, you will incur the expenses of the Fund in addition to those of the underlying Select Funds. You may directly invest in the Select Funds. The Fund’s value will go up and down in response to changes in the share prices of the investments that it owns. The amount invested in the Fund is not guaranteed to increase, is not guaranteed against loss nor is the amount of the original investment guaranteed at the Target Date. It is possible to lose money by investing in the Fund.
See Notes to Financial Statements.
MyDestination 2035 Fund (Unaudited)
At December 31, 2023, the portfolio holdings of the Fund, as a percentage of net assets, is shown in the following table. Portfolio holdings are subject to risk and may change at any time.
| | % |
| U.S. Equity Select Funds | 49.5 |
| Fixed Income Select Funds | 25.9 |
| Non-U.S. Equity Select Funds | 20.7 |
| Money Market Funds | 2.3 |
| Real Assets Select Fund | 1.1 |
| Alternative Select Fund | 0.8 |
| | 100.3 |
| Average Annual Total Returns as of 12/31/23 | |
| | | Institutional Class* | | Investor Class* | |
| One Year | | 16.23% | | 15.82% | |
| Five Year | | 8.85% | | 8.57% | |
| Ten Year | | N/A | | 5.91% | |
| Since Inception | | 7.21% | | 5.22% | |
| Inception Date | | 05/01/17 | | 12/29/06 | |
| Total Fund Operating Expenses (May 1, 2023 Prospectus)(1)# | | 0.45% | | 0.75% | |
(1)The Fund’s shareholders indirectly bear the expenses of the Institutional Class shares of the Select Funds in which the Fund invests. Current information regarding the Fund’s Operating Expenses can be found in the Financial Highlights.
#Net expense ratio
The performance data quoted represents past performance and does not guarantee future results. The performance data in the table and graph does not reflect the deduction of taxes that a shareholder would pay on Fund distributions or the redemption of Fund shares. Current performance may be lower or higher. Performance data current to the most recent month-end may be obtained at GuideStoneFunds.com. The investment return and principal value of an investment will fluctuate so that shares, when redeemed, may be worth more or less than their original cost.
The Adviser has agreed to waive fees and/or reimburse expenses to the extent needed to limit total annual operating expenses to 0.45% for the Institutional Class and 0.75% for the Investor Class. This contractual waiver and reimbursement applies to Fund operating expenses only and will remain in place until April 30, 2024.
See Notes to Financial Statements.
MyDestination 2035 Fund (Unaudited)
The graph illustrates the results of a hypothetical $10,000 investment in the Investor Class of the Fund for the 10-year period from December 31, 2013 to December 31, 2023, with all dividends and capital gains reinvested.
*These returns reflect investment advisory and shareholder servicing fee waivers, if applicable, during the reported time periods.
Unlike a mutual fund, an index is not available for direct investment and the performance of an index assumes no taxes, transaction costs, management fees or other expenses.
See Notes to Financial Statements.
| | | Shares | | Value |
| MUTUAL FUNDS — 98.0% |
GuideStone Medium-Duration Bond Fund
(Institutional Class)∞ | 26,463,788 | | $340,588,951 |
GuideStone Global Bond Fund
(Institutional Class)∞ | 9,795,487 | | 85,514,600 |
GuideStone Defensive Market Strategies® Fund
(Institutional Class)∞ | 14,085,285 | | 162,544,188 |
GuideStone Equity Index Fund
(Institutional Class)∞ | 12,118,957 | | 589,344,915 |
GuideStone International Equity Index Fund
(Institutional Class)∞ | 21,062,260 | | 238,003,544 |
GuideStone Small Cap Equity Fund
(Institutional Class)∞ | 3,677,196 | | 62,843,276 |
GuideStone Emerging Markets Equity Fund
(Institutional Class)∞ | 11,551,852 | | 103,042,518 |
GuideStone Global Real Estate Securities Fund
(Institutional Class)∞ | 2,028,278 | | 18,132,803 |
| | | Shares | | Value |
GuideStone Strategic Alternatives Fund
(Institutional Class)∞ | 1,378,248 | | $ 12,693,664 |
Total Mutual Funds
(Cost $1,530,772,924) | | 1,612,708,459 |
| MONEY MARKET FUNDS — 2.3% |
GuideStone Money Market Fund, 5.28%
(Institutional Class)Ø∞ | 33,385,321 | | 33,385,321 |
| Northern Institutional U.S. Treasury Portfolio (Premier), 5.22%Ø | 5,042,416 | | 5,042,416 |
Total Money Market Funds
(Cost $38,427,737) | | 38,427,737 |
TOTAL INVESTMENTS — 100.3%
(Cost $1,569,200,661) | | | 1,651,136,196 |
Liabilities in Excess of Other
Assets — (0.3)% | | | (5,346,301) |
| NET ASSETS — 100.0% | | | $1,645,789,895 |
VALUATION HIERARCHY
The following is a summary of the inputs used, as of December 31, 2023, in valuing the Fund’s investments carried at fair value:
| | Total
Value | | Level 1
Quoted Prices | | Level 2
Other Significant
Observable Inputs | | Level 3
Significant
Unobservable Inputs |
| Assets: | | | | | | | |
| Investments in Securities: | | | | | | | |
| Money Market Funds | $ 38,427,737 | | $ 38,427,737 | | $ — | | $ — |
| Mutual Funds | 1,612,708,459 | | 1,612,708,459 | | — | | — |
| Total Assets - Investments in Securities | $1,651,136,196 | | $1,651,136,196 | | $ — | | $ — |
See Notes to Financial Statements.
MyDestination 2045 Fund (Unaudited)
The Fund, through investments primarily in the Select Funds, combined a high percentage of exposure to equity securities with only modest percentages allocated to fixed income securities and real assets. The Fund followed an allocation glide path designed to become more conservative over time, and the targeted allocations were approximately 12% fixed income securities, 86% equity securities and 2% real assets as of December 31, 2023.
As a fund of funds, the Fund’s performance was based on the performance of its underlying investments. The Investor Class of the Fund generated a return of 18.69%, net of fees, for the one-year period ended December 31, 2023. Contribution to absolute performance from each major asset class was additive in a strong year for almost all financial assets. Exposure to U.S. equities was a significant driver of relatively stronger performance with U.S. financial assets generally outpacing those in other markets. U.S. equities, led by the Magnificent Seven stocks (Apple, Alphabet, Microsoft, Amazon, Meta, Tesla and Nvidia), outperformed fixed income. The U.S. regional banking crisis in March became a distant memory by the second half of the year as the economy demonstrated resilience despite aggressive monetary policy. The persistently solid labor market and consumer debt service-to-income near historic lows helped fuel consumption. Fixed income markets delivered a strong rally into year-end as the market started to price in rate cuts for early 2024. Despite the euro area and U.K. economies muddling through the inflation battle in a weakening economy, international developed equity market performance broadly was strong in absolute terms. China’s economic recovery following its post-COVID reopening was anemic, and the subsequent policy measures to stimulate the economy did not keep pace with expectations. The Equity Index Fund was the largest contributor to Fund performance due to its broad exposure to the strength of the S&P 500® Index. Broadly, fixed income markets delivered positive returns alongside equity markets, albeit to a lesser extent. As such, the contribution to performance emanating from the fixed income Funds was additive. The contribution to absolute performance by the Fund’s exposure to real assets, via its investment in the Global Real Estate Securities Fund, was also positive. Exposure to the Defensive Market Strategies® Fund was a positive contributor to Fund performance. For more information on a Select Fund’s performance, please refer to that Select Fund’s section in this Annual Report.
Certain derivatives were utilized to provide market exposure for the cash positions held in the Fund. These derivative positions primarily included stock index futures and fixed income futures. Overall, derivative exposure had a negative impact on Fund performance for the year.
The Fund attempted to achieve its objective by investing in a diversified portfolio of primarily the Select Funds that represent various asset classes. The Fund is managed to the specific retirement year included in its name (“Target Date”) and assumes a retirement age of 65. The Target Date refers to the approximate year an investor in the Fund would plan to retire and likely stop making any new investments in the Fund. The Fund is designed for an investor who anticipates retiring at or near the Target Date and who plans to withdraw the value of the account in the Fund gradually after retirement. Over time, the allocation to asset classes will change according to a predetermined “glide path,” which adjusts the percentage of fixed income securities and equity securities to become more conservative each year until 15 years after Target Date. The Fund’s value will fluctuate due to changes in interest rates. There is a risk that the issuer of a fixed income investment may fail to pay interest or even principal due in a timely manner or at all. The Fund’s value will fluctuate due to business developments concerning a particular issuer, industry or country, as well as general market, economic and political conditions and other factors. Securities of foreign issuers may be negatively impacted by political events, economic conditions or inefficient, illiquid or unregulated markets in foreign countries, and they also may be subject to inadequate regulatory or accounting standards, which may increase investment risk. By investing in this Fund, you will incur the expenses of the Fund in addition to those of the underlying Select Funds. You may directly invest in the Select Funds. The Fund’s value will go up and down in response to changes in the share prices of the investments that it owns. The amount invested in the Fund is not guaranteed to increase, is not guaranteed against loss nor is the amount of the original investment guaranteed at the Target Date. It is possible to lose money by investing in the Fund.
See Notes to Financial Statements.
MyDestination 2045 Fund (Unaudited)
At December 31, 2023, the portfolio holdings of the Fund, as a percentage of net assets, is shown in the following table. Portfolio holdings are subject to risk and may change at any time.
| | % |
| U.S. Equity Select Funds | 57.9 |
| Non-U.S. Equity Select Funds | 27.8 |
| Fixed Income Select Funds | 11.0 |
| Money Market Funds | 2.0 |
| Real Assets Select Fund | 1.4 |
| | 100.1 |
| Average Annual Total Returns as of 12/31/23 | |
| | | Institutional Class* | | Investor Class* | |
| One Year | | 18.81%** | | 18.69% | |
| Five Year | | 10.29% | | 10.02% | |
| Ten Year | | N/A | | 6.66% | |
| Since Inception | | 8.31% | | 5.58% | |
| Inception Date | | 05/01/17 | | 12/29/06 | |
| Total Fund Operating Expenses (May 1, 2023 Prospectus)(1)# | | 0.45% | | 0.72% | |
(1)The Fund’s shareholders indirectly bear the expenses of the Institutional Class shares of the Select Funds in which the Fund invests. Current information regarding the Fund’s Operating Expenses can be found in the Financial Highlights.
#Net expense ratio
The performance data quoted represents past performance and does not guarantee future results. The performance data in the table and graph does not reflect the deduction of taxes that a shareholder would pay on Fund distributions or the redemption of Fund shares. Current performance may be lower or higher. Performance data current to the most recent month-end may be obtained at GuideStoneFunds.com. The investment return and principal value of an investment will fluctuate so that shares, when redeemed, may be worth more or less than their original cost.
The Adviser has agreed to waive fees and/or reimburse expenses to the extent needed to limit total annual operating expenses to 0.45% for the Institutional Class and 0.75% for the Investor Class. This contractual waiver and reimbursement applies to Fund operating expenses only and will remain in place until April 30, 2024.
See Notes to Financial Statements.
MyDestination 2045 Fund (Unaudited)
The graph illustrates the results of a hypothetical $10,000 investment in the Investor Class of the Fund for the 10-year period from December 31, 2013 to December 31, 2023, with all dividends and capital gains reinvested.
*These returns reflect investment advisory and shareholder servicing fee waivers, if applicable, during the reported time periods.
**Total returns may differ from the financial highlights due to adjustments required by U.S. GAAP.
Unlike a mutual fund, an index is not available for direct investment and the performance of an index assumes no taxes, transaction costs, management fees or other expenses.
See Notes to Financial Statements.
| | | Shares | | Value |
| MUTUAL FUNDS — 98.1% |
GuideStone Medium-Duration Bond Fund
(Institutional Class)∞ | 8,973,293 | | $ 115,486,277 |
GuideStone Global Bond Fund
(Institutional Class)∞ | 3,322,281 | | 29,003,514 |
GuideStone Defensive Market Strategies® Fund
(Institutional Class)∞ | 5,984,394 | | 69,059,910 |
GuideStone Equity Index Fund
(Institutional Class)∞ | 12,800,147 | | 622,471,159 |
GuideStone International Equity Index Fund
(Institutional Class)∞ | 22,534,777 | | 254,642,977 |
GuideStone Small Cap Equity Fund
(Institutional Class)∞ | 4,066,452 | | 69,495,663 |
GuideStone Emerging Markets Equity Fund
(Institutional Class)∞ | 12,347,806 | | 110,142,433 |
GuideStone Global Real Estate Securities Fund
(Institutional Class)∞ | 2,085,236 | | 18,642,008 |
Total Mutual Funds
(Cost $1,160,628,639) | | 1,288,943,941 |
| | | Shares | | Value |
| MONEY MARKET FUNDS — 2.0% |
GuideStone Money Market Fund, 5.28%
(Institutional Class)Ø∞ | 24,946,451 | | $ 24,946,451 |
| Northern Institutional U.S. Treasury Portfolio (Premier), 5.22%Ø | 1,244,194 | | 1,244,194 |
Total Money Market Funds
(Cost $26,190,645) | | 26,190,645 |
TOTAL INVESTMENTS — 100.1%
(Cost $1,186,819,284) | | | 1,315,134,586 |
Liabilities in Excess of Other
Assets — (0.1)% | | | (1,059,015) |
| NET ASSETS — 100.0% | | | $1,314,075,571 |
VALUATION HIERARCHY
The following is a summary of the inputs used, as of December 31, 2023, in valuing the Fund’s investments carried at fair value:
| | Total
Value | | Level 1
Quoted Prices | | Level 2
Other Significant
Observable Inputs | | Level 3
Significant
Unobservable Inputs |
| Assets: | | | | | | | |
| Investments in Securities: | | | | | | | |
| Money Market Funds | $ 26,190,645 | | $ 26,190,645 | | $ — | | $ — |
| Mutual Funds | 1,288,943,941 | | 1,288,943,941 | | — | | — |
| Total Assets - Investments in Securities | $1,315,134,586 | | $1,315,134,586 | | $ — | | $ — |
See Notes to Financial Statements.
MyDestination 2055 Fund (Unaudited)
The Fund, through investments primarily in the Select Funds, combined a high percentage of exposure to equity securities with only modest percentages allocated to fixed income securities and real assets. The Fund followed an allocation glide path designed to become more conservative over time, and the targeted allocations were approximately 6% fixed income securities, 92% equity securities and 2% real assets as of December 31, 2023.
As a fund of funds, the Fund’s performance was based on the performance of its underlying investments. The Investor Class of the Fund generated a return of 19.49%, net of fees, for the one-year period ended December 31, 2023. Contribution to absolute performance from each major asset class was additive in a strong year for almost all financial assets. Exposure to U.S. equities was a significant driver of relatively stronger performance with U.S. financial assets generally outpacing those in other markets. U.S. equities, led by the Magnificent Seven stocks (Apple, Alphabet, Microsoft, Amazon, Meta, Tesla and Nvidia), outperformed fixed income. The U.S. regional banking crisis in March became a distant memory by the second half of the year as the economy demonstrated resilience despite aggressive monetary policy. The persistently solid labor market and consumer debt service-to-income near historic lows helped fuel consumption. Fixed income markets delivered a strong rally into year-end as the market started to price in rate cuts for early 2024. Despite the euro area and U.K. economies muddling through the inflation battle in a weakening economy, international developed equity market performance broadly was strong in absolute terms. China’s economic recovery following its post-COVID reopening was anemic, and the subsequent policy measures to stimulate the economy did not keep pace with expectations. The Equity Index Fund was the largest contributor to Fund performance due to its broad exposure to the strength of the S&P 500® Index. Broadly, fixed income markets delivered positive returns alongside equity markets, albeit to a lesser extent. As such, the contribution to performance emanating from the fixed income Funds was additive. The contribution to absolute performance by the Fund’s exposure to real assets, via its investment in the Global Real Estate Securities Fund, was also positive. Exposure to the Defensive Market Strategies® Fund was a positive contributor to Fund performance. For more information on a Select Fund’s performance, please refer to that Select Fund’s section in this Annual Report.
Certain derivatives were utilized to provide market exposure for the cash positions held in the Fund. These derivative positions primarily included stock index futures and fixed income futures. Overall, derivative exposure had a negative impact on Fund performance for the year.
The Fund attempted to achieve its objective by investing in a diversified portfolio of primarily the Select Funds that represent various asset classes. The Fund is managed to the specific retirement year included in its name (“Target Date”) and assumes a retirement age of 65. The Target Date refers to the approximate year an investor in the Fund would plan to retire and likely stop making any new investments in the Fund. The Fund is designed for an investor who anticipates retiring at or near the Target Date and who plans to withdraw the value of the account in the Fund gradually after retirement. Over time, the allocation to asset classes will change according to a predetermined “glide path,” which adjusts the percentage of fixed income securities and equity securities to become more conservative each year until 15 years after Target Date. The Fund’s value will fluctuate due to changes in interest rates. There is a risk that the issuer of a fixed income investment may fail to pay interest or even principal due in a timely manner or at all. The Fund’s value will fluctuate due to business developments concerning a particular issuer, industry or country, as well as general market, economic and political conditions and other factors. Securities of foreign issuers may be negatively impacted by political events, economic conditions or inefficient, illiquid or unregulated markets in foreign countries, and they also may be subject to inadequate regulatory or accounting standards, which may increase investment risk. By investing in this Fund, you will incur the expenses of the Fund in addition to those of the underlying Select Funds. You may directly invest in the Select Funds. The Fund’s value will go up and down in response to changes in the share prices of the investments that it owns. The amount invested in the Fund is not guaranteed to increase, is not guaranteed against loss nor is the amount of the original investment guaranteed at the Target Date. It is possible to lose money by investing in the Fund.
See Notes to Financial Statements.
MyDestination 2055 Fund (Unaudited)
At December 31, 2023, the portfolio holdings of the Fund, as a percentage of net assets, is shown in the following table. Portfolio holdings are subject to risk and may change at any time.
| | % |
| U.S. Equity Select Funds | 61.7 |
| Non-U.S. Equity Select Funds | 29.9 |
| Fixed Income Select Funds | 4.9 |
| Money Market Funds | 2.3 |
| Real Assets Select Fund | 1.5 |
| | 100.3 |
| Average Annual Total Returns as of 12/31/23 | |
| | | Institutional Class* | | Investor Class* | |
| One Year | | 19.88% | | 19.49% | |
| Five Year | | 10.70% | | 10.41% | |
| Ten Year | | N/A | | 6.92% | |
| Since Inception | | 8.63% | | 8.80% | |
| Inception Date | | 05/01/17 | | 01/01/12 | |
| Total Fund Operating Expenses (May 1, 2023 Prospectus)(1)# | | 0.45% | | 0.75% | |
(1)The Fund’s shareholders indirectly bear the expenses of the Institutional Class shares of the Select Funds in which the Fund invests. Current information regarding the Fund’s Operating Expenses can be found in the Financial Highlights.
#Net expense ratio
The performance data quoted represents past performance and does not guarantee future results. The performance data in the table and graph does not reflect the deduction of taxes that a shareholder would pay on Fund distributions or the redemption of Fund shares. Current performance may be lower or higher. Performance data current to the most recent month-end may be obtained at GuideStoneFunds.com. The investment return and principal value of an investment will fluctuate so that shares, when redeemed, may be worth more or less than their original cost.
The Adviser has agreed to waive fees and/or reimburse expenses to the extent needed to limit total annual operating expenses to 0.45% for the Institutional Class and 0.75% for the Investor Class. This contractual waiver and reimbursement applies to Fund operating expenses only and will remain in place until April 30, 2024.
See Notes to Financial Statements.
MyDestination 2055 Fund (Unaudited)
The graph illustrates the results of a hypothetical $10,000 investment in the Investor Class of the Fund for the 10-year period from December 31, 2013 to December 31, 2023, with all dividends and capital gains reinvested.
*These returns reflect investment advisory and shareholder servicing fee waivers, if applicable, during the reported time periods.
Unlike a mutual fund, an index is not available for direct investment and the performance of an index assumes no taxes, transaction costs, management fees or other expenses.
See Notes to Financial Statements.
| | | Shares | | Value |
| MUTUAL FUNDS — 98.0% |
GuideStone Medium-Duration Bond Fund
(Institutional Class)∞ | 1,844,870 | | $ 23,743,471 |
GuideStone Global Bond Fund
(Institutional Class)∞ | 663,849 | | 5,795,404 |
GuideStone Defensive Market Strategies® Fund
(Institutional Class)∞ | 2,715,406 | | 31,335,783 |
GuideStone Equity Index Fund
(Institutional Class)∞ | 6,375,350 | | 310,033,266 |
GuideStone International Equity Index Fund
(Institutional Class)∞ | 11,195,223 | | 126,506,017 |
GuideStone Small Cap Equity Fund
(Institutional Class)∞ | 2,023,036 | | 34,573,687 |
GuideStone Emerging Markets Equity Fund
(Institutional Class)∞ | 6,205,776 | | 55,355,527 |
GuideStone Global Real Estate Securities Fund
(Institutional Class)∞ | 1,050,059 | | 9,387,527 |
Total Mutual Funds
(Cost $540,887,218) | | 596,730,682 |
| | | Shares | | Value |
| MONEY MARKET FUNDS — 2.3% |
GuideStone Money Market Fund, 5.28%
(Institutional Class)Ø∞ | 12,205,770 | | $ 12,205,770 |
| Northern Institutional U.S. Treasury Portfolio (Premier), 5.22%Ø | 1,506,408 | | 1,506,408 |
Total Money Market Funds
(Cost $13,712,178) | | 13,712,178 |
TOTAL INVESTMENTS — 100.3%
(Cost $554,599,396) | | | 610,442,860 |
Liabilities in Excess of Other
Assets — (0.3)% | | | (1,577,277) |
| NET ASSETS — 100.0% | | | $608,865,583 |
VALUATION HIERARCHY
The following is a summary of the inputs used, as of December 31, 2023, in valuing the Fund’s investments carried at fair value:
| | Total
Value | | Level 1
Quoted Prices | | Level 2
Other Significant
Observable Inputs | | Level 3
Significant
Unobservable Inputs |
| Assets: | | | | | | | |
| Investments in Securities: | | | | | | | |
| Money Market Funds | $ 13,712,178 | | $ 13,712,178 | | $ — | | $ — |
| Mutual Funds | 596,730,682 | | 596,730,682 | | — | | — |
| Total Assets - Investments in Securities | $610,442,860 | | $610,442,860 | | $ — | | $ — |
See Notes to Financial Statements.
(This page intentionally left blank)
| STATEMENTS OF ASSETS AND LIABILITIES | December 31, 2023 |
| | MyDestination
2015 Fund | | MyDestination
2025 Fund |
| Assets | | | |
| Investments in securities of unaffiliated issuers, at value | $ 53,451,523 | | $ 83,363,429 |
| Investments in securities of affiliated issuers, at value | 618,130,825 | | 1,700,255,347 |
| Total investments, at value(1) | 671,582,348 | | 1,783,618,776 |
| Receivables: | | | |
| Dividends | 38,829 | | 104,062 |
| Interest | 184,386 | | 272,631 |
| Investment securities sold | 1,894,246 | | 2,336,388 |
| Fund shares sold | 32,503 | | 283,124 |
| Prepaid expenses and other assets | 24,615 | | 30,843 |
| Total Assets | 673,756,927 | | 1,786,645,824 |
| Liabilities | | | |
| Cash Overdraft | 2,900,022 | | 9,949,917 |
| Payables: | | | |
| Investment securities purchased | 2,951,459 | | 3,882,050 |
| Fund shares redeemed | 55,255 | | 87,477 |
| Accrued expenses: | | | |
| Investment advisory fees | 33,504 | | 101,928 |
| Shareholder servicing fees | 88,922 | | 227,137 |
| Director fees | 1,253 | | 2,338 |
| Other expenses | 45,694 | | 54,611 |
| Total Liabilities | 6,076,109 | | 14,305,458 |
| Commitments and contingencies | — (2) | | — (2) |
| Net Assets | $667,680,818 | | $1,772,340,366 |
| Net Assets Consist of: | | | |
| Paid-in-capital | $687,782,204 | | $1,752,067,913 |
| Distributable earnings (loss) | (20,101,386) | | 20,272,453 |
| Net Assets | $667,680,818 | | $1,772,340,366 |
| Net Asset Value: | | | |
| $0.001 par value, unlimited shares authorized | | | |
| Net assets applicable to the Institutional Class | $242,557,698 | | $ 680,628,003 |
| Institutional shares outstanding | 25,273,519 | | 67,758,688 |
| Net asset value, offering and redemption price per Institutional share | $ 9.60 | | $ 10.04 |
| Net assets applicable to the Investor Class | $425,123,120 | | $1,091,712,363 |
| Investor shares outstanding | 44,304,488 | | 108,631,818 |
| Net asset value, offering and redemption price per Investor share | $ 9.60 | | $ 10.05 |
| | | |
| | | | |
| (1)Investments in securities of unaffiliated issuers, at cost | $ 57,856,781 | | $ 88,869,258 |
| Investments in securities of affiliated issuers, at cost | 626,654,425 | | 1,667,968,518 |
| Total investments, at cost | $684,511,206 | | $1,756,837,776 |
| (2)See Note 3c in Notes to Financial Statements. | | | |
| | | | |
See Notes to Financial Statements.
MyDestination
2035 Fund | | MyDestination
2045 Fund | | MyDestination
2055 Fund |
| | | | | |
| $ 5,042,416 | | $ 1,244,194 | | $ 1,506,408 |
| 1,646,093,780 | | 1,313,890,392 | | 608,936,452 |
| 1,651,136,196 | | 1,315,134,586 | | 610,442,860 |
| | | | | |
| 128,873 | | 101,306 | | 48,471 |
| — | | — | | — |
| 300,000 | | — | | — |
| 915,680 | | 162,472 | | 423,469 |
| 28,821 | | 27,274 | | 26,756 |
| 1,652,509,570 | | 1,315,425,638 | | 610,941,556 |
| | | | | |
| 4,950,000 | | 19 | | 699,948 |
| | | | | |
| 1,000,000 | | 600,000 | | 1,200,000 |
| 423,519 | | 439,996 | | 10,827 |
| | | | | |
| 89,039 | | 96,018 | | 41,689 |
| 195,411 | | 155,409 | | 70,370 |
| 2,074 | | 1,742 | | 1,579 |
| 59,632 | | 56,883 | | 51,560 |
| 6,719,675 | | 1,350,067 | | 2,075,973 |
| — (2) | | — (2) | | — (2) |
| $1,645,789,895 | | $1,314,075,571 | | $608,865,583 |
| | | | | |
| $1,558,738,877 | | $1,175,606,493 | | $549,081,772 |
| 87,051,018 | | 138,469,078 | | 59,783,811 |
| $1,645,789,895 | | $1,314,075,571 | | $608,865,583 |
| | | | | |
| | | | | |
| $ 699,632,386 | | $ 561,262,424 | | $266,001,955 |
| 66,910,968 | | 52,137,836 | | 17,198,098 |
| $ 10.46 | | $ 10.76 | | $ 15.47 |
| $ 946,157,509 | | $ 752,813,147 | | $342,863,628 |
| 90,553,180 | | 70,041,818 | | 22,232,966 |
| $ 10.45 | | $ 10.75 | | $ 15.42 |
| | | | | |
| | | | | |
| $ 5,042,416 | | $ 1,244,194 | | $ 1,506,408 |
| 1,564,158,245 | | 1,185,575,090 | | 553,092,988 |
| $1,569,200,661 | | $1,186,819,284 | | $554,599,396 |
| | | | | |
| | | | | |
See Notes to Financial Statements.
| STATEMENTS OF OPERATIONS | For the Year Ended December 31, 2023 |
| | MyDestination
2015 Fund |
| Investment Income | |
| Dividends | $ 17,550 |
| Income distributions received from affiliated funds | 16,622,387 |
| Interest | 1,403,123 |
| Total Investment Income | 18,043,060 |
| Expenses | |
| Investment advisory fees | 696,872 |
| Transfer agent fees: | |
| Institutional shares | 3,717 |
| Investor shares | 19,681 |
| Custodian fees | 16,663 |
| Shareholder servicing fees: | |
| Investor shares | 1,045,422 |
| Accounting and administration fees | 24,674 |
| Professional fees | 91,337 |
| Blue sky fees: | |
| Institutional shares | 14,246 |
| Investor shares | 16,036 |
| Shareholder reporting fees: | |
| Institutional shares | 18 |
| Investor shares | 14,435 |
| Directors expenses | 7,475 |
| Line of credit facility fees | 2,572 |
| Other expenses | 45,925 |
| Recoupment of prior expenses reduced by the Advisor | 11,741 |
| Total Expenses | 2,010,814 |
| Expenses waived/reimbursed(1) | (187,561) |
| Net Expenses | 1,823,253 |
| Net Investment Income | 16,219,807 |
| Realized and Unrealized Gain (Loss) | |
| Capital gain distributions received from affiliated funds | 3,907,710 |
| Net realized gain on investment securities of affiliated issuers | 3,367,416 |
| Net realized loss on investment securities of unaffiliated issuers | (1,797,976) |
| Net realized loss on futures transactions | (24,952) |
| Net realized gain | 5,452,198 |
| Change in unrealized appreciation (depreciation) on investment securities of affiliated issuers | 44,531,868 |
| Change in unrealized appreciation (depreciation) on investment securities of unaffiliated issuers | 2,280,433 |
| Net change in unrealized appreciation (depreciation) | 46,812,301 |
| Net Realized and Unrealized Gain | 52,264,499 |
| Net Increase in Net Assets Resulting from Operations | $68,484,306 |
| |
| (1) | See Note 3c in Notes to Financial Statements. |
See Notes to Financial Statements.
MyDestination
2025 Fund | | MyDestination
2035 Fund | | MyDestination
2045 Fund | | MyDestination
2055 Fund |
| | | | | | | |
| $ 16,286 | | $ 4,467 | | $ 44,751 | | $ 771 |
| 42,598,965 | | 36,230,787 | | 26,132,129 | | 11,588,548 |
| 2,117,843 | | 1,706 | | 1,400 | | — |
| 44,733,094 | | 36,236,960 | | 26,178,280 | | 11,589,319 |
| | | | | | | |
| 1,750,602 | | 1,499,970 | | 1,172,302 | | 520,312 |
| | | | | | | |
| 3,792 | | 3,835 | | 3,763 | | 3,732 |
| 30,922 | | 26,259 | | 21,764 | | 20,156 |
| 26,002 | | 26,628 | | 24,015 | | 19,606 |
| | | | | | | |
| 2,605,126 | | 2,147,943 | | 1,667,909 | | 722,763 |
| 54,092 | | 48,317 | | 38,454 | | 18,849 |
| 92,103 | | 91,927 | | 91,674 | | 91,199 |
| | | | | | | |
| 15,246 | | 15,246 | | 15,246 | | 10,748 |
| 16,969 | | 17,253 | | 16,460 | | 5,498 |
| | | | | | | |
| 23 | | 139 | | 319 | | 9 |
| 26,850 | | 24,637 | | 21,247 | | 19,651 |
| 13,210 | | 11,514 | | 9,724 | | 8,585 |
| 6,697 | | 5,976 | | 4,685 | | 2,098 |
| 71,898 | | 80,963 | | 70,820 | | 55,377 |
| 60,564 | | 61,236 | | 20,334 | | 78,412 |
| 4,774,096 | | 4,061,843 | | 3,178,716 | | 1,576,995 |
| (380,655) | | (274,075) | | (69,672) | | (63,127) |
| 4,393,441 | | 3,787,768 | | 3,109,044 | | 1,513,868 |
| 40,339,653 | | 32,449,192 | | 23,069,236 | | 10,075,451 |
| | | | | | | |
| 12,742,690 | | 16,831,368 | | 16,826,438 | | 8,289,386 |
| 3,285,051 | | 15,547,522 | | 9,843,800 | | 3,394,908 |
| (1,848,982) | | — | | — | | — |
| (102,055) | | (58,988) | | (40,261) | | (28,846) |
| 14,076,704 | | 32,319,902 | | 26,629,977 | | 11,655,448 |
| 147,576,241 | | 160,240,807 | | 154,645,302 | | 73,577,972 |
| 2,222,179 | | — | | — | | — |
| 149,798,420 | | 160,240,807 | | 154,645,302 | | 73,577,972 |
| 163,875,124 | | 192,560,709 | | 181,275,279 | | 85,233,420 |
| $204,214,777 | | $225,009,901 | | $204,344,515 | | $95,308,871 |
See Notes to Financial Statements.
| STATEMENTS OF CHANGES IN NET ASSETS |
| | MyDestination 2015 Fund | | MyDestination 2025 Fund |
| | For the Year Ended | | For the Year Ended |
| | 12/31/23 | | 12/31/22 | | 12/31/23 | | 12/31/22 |
| | | | | | | | |
| Operations: | | | | | | | |
| Net investment income | $ 16,219,807 | | $ 10,845,126 | | $ 40,339,653 | | $ 24,257,121 |
| Net realized gain on investment securities and futures transactions | 5,452,198 | | 19,688,884 | | 14,076,704 | | 55,603,730 |
| Net change in unrealized appreciation (depreciation) on investment securities and futures | 46,812,301 | | (125,494,870) | | 149,798,420 | | (333,050,758) |
| Net increase (decrease) in net assets resulting from operations | 68,484,306 | | (94,960,860) | | 204,214,777 | | (253,189,907) |
| Distributions to Shareholders: | | | | | | | |
| Distributions paid | | | | | | | |
| Institutional shares | (9,568,347) | | (16,080,809) | | (22,966,277) | | (43,588,582) |
| Investor shares | (15,625,221) | | (28,848,121) | | (33,935,727) | | (70,624,252) |
| Return of capital | | | | | | | |
| Institutional shares | — | | — | | — | | — |
| Investor shares | — | | — | | — | | — |
| Total distributions | (25,193,568) | | (44,928,930) | | (56,902,004) | | (114,212,834) |
| Capital Share Transactions: | | | | | | | |
| Proceeds from shares sold | | | | | | | |
| Institutional shares | 31,700,254 | | 82,394,063 | | 89,822,575 | | 207,115,538 |
| Investor shares | 25,521,838 | | 31,683,118 | | 61,844,521 | | 63,627,566 |
| Reinvestment of dividends and distributions | | | | | | | |
| Institutional shares | 9,568,347 | | 16,080,809 | | 22,966,277 | | 43,588,581 |
| Investor shares | 15,621,888 | | 28,844,637 | | 33,931,781 | | 70,616,203 |
| Total proceeds from shares sold and reinvested | 82,412,327 | | 159,002,627 | | 208,565,154 | | 384,947,888 |
| Value of shares redeemed | | | | | | | |
| Institutional shares | (38,638,110) | | (39,514,382) | | (96,194,287) | | (49,720,875) |
| Investor shares | (61,223,079) | | (84,460,063) | | (112,662,031) | | (129,197,425) |
| Total value of shares redeemed | (99,861,189) | | (123,974,445) | | (208,856,318) | | (178,918,300) |
| Net increase (decrease) from capital share transactions(1) | (17,448,862) | | 35,028,182 | | (291,164) | | 206,029,588 |
| Total increase (decrease) in net assets | 25,841,876 | | (104,861,608) | | 147,021,609 | | (161,373,153) |
| Net Assets: | | | | | | | |
| Beginning of Year | 641,838,942 | | 746,700,550 | | 1,625,318,757 | | 1,786,691,910 |
| End of Year | $667,680,818 | | $ 641,838,942 | | $1,772,340,366 | | $1,625,318,757 |
| |
| (1) | See Note 6 in Notes to Financial Statements. |
See Notes to Financial Statements.
| MyDestination 2035 Fund | | MyDestination 2045 Fund | | MyDestination 2055 Fund |
| For the Year Ended | | For the Year Ended | | For the Year Ended |
| 12/31/23 | | 12/31/22 | | 12/31/23 | | 12/31/22 | | 12/31/23 | | 12/31/22 |
| | | | | | | | | | | |
| | | | | | | | | | | |
| $ 32,449,192 | | $ 18,683,072 | | $ 23,069,236 | | $ 14,305,140 | | $ 10,075,451 | | $ 5,780,213 |
| 32,319,902 | | 45,442,728 | | 26,629,977 | | 29,778,397 | | 11,655,448 | | 9,297,519 |
| 160,240,807 | | (299,032,541) | | 154,645,302 | | (239,035,644) | | 73,577,972 | | (95,245,484) |
| 225,009,901 | | (234,906,741) | | 204,344,515 | | (194,952,107) | | 95,308,871 | | (80,167,752) |
| | | | | | | | | | | |
| | | | | | | | | | | |
| (26,696,097) | | (40,255,248) | | (19,093,738) | | (29,062,734) | | (7,976,461) | | (10,818,466) |
| (33,637,518) | | (54,166,932) | | (23,965,038) | | (38,904,804) | | (9,488,697) | | (14,434,971) |
| | | | | | | | | | | |
| — | | — | | — | | — | | — | | — |
| — | | — | | — | | — | | — | | — |
| (60,333,615) | | (94,422,180) | | (43,058,776) | | (67,967,538) | | (17,465,158) | | (25,253,437) |
| | | | | | | | | | | |
| | | | | | | | | | | |
| 99,415,522 | | 190,049,365 | | 90,858,503 | | 106,471,021 | | 72,672,127 | | 46,662,378 |
| 89,244,637 | | 72,523,171 | | 79,506,880 | | 63,610,295 | | 62,758,953 | | 53,121,148 |
| | | | | | | | | | | |
| 26,696,097 | | 40,255,248 | | 19,093,738 | | 29,062,734 | | 7,976,461 | | 10,818,466 |
| 33,636,181 | | 54,164,673 | | 23,962,746 | | 38,904,777 | | 9,488,721 | | 14,434,761 |
| 248,992,437 | | 356,992,457 | | 213,421,867 | | 238,048,827 | | 152,896,262 | | 125,036,753 |
| | | | | | | | | | | |
| (69,681,806) | | (26,310,624) | | (55,851,204) | | (17,866,622) | | (33,456,606) | | (9,223,921) |
| (72,102,897) | | (57,055,100) | | (47,831,944) | | (28,923,819) | | (27,766,436) | | (12,355,242) |
| (141,784,703) | | (83,365,724) | | (103,683,148) | | (46,790,441) | | (61,223,042) | | (21,579,163) |
| 107,207,734 | | 273,626,733 | | 109,738,719 | | 191,258,386 | | 91,673,220 | | 103,457,590 |
| 271,884,020 | | (55,702,188) | | 271,024,458 | | (71,661,259) | | 169,516,933 | | (1,963,599) |
| | | | | | | | | | | |
| 1,373,905,875 | | 1,429,608,063 | | 1,043,051,113 | | 1,114,712,372 | | 439,348,650 | | 441,312,249 |
| $1,645,789,895 | | $1,373,905,875 | | $1,314,075,571 | | $1,043,051,113 | | $608,865,583 | | $439,348,650 |
See Notes to Financial Statements.
| For a Share Outstanding For the Years Ending December 31, unless otherwise indicated | | | | | | | | | | Ratios to Average Net Assets | |
| | | Net Asset
Value,
Beginning
of Year | Net Investment
Income#(1) | Realized
and
Unrealized
Gain
(Loss) on
Investments | | Total Income
From Investment
Operations | Dividends
from Net
Investment
Income | Distributions
from Net
Realized
Capital
Gains | Total
Distributions
Paid | Net Asset
Value,
End of
Year | | Total
Return | | Net Assets,
End of Year
(000) | | Expenses,
Net(2) | | Expenses,
Gross(2) | | Investment
Income,
Net(1) | Portfolio
Turnover
Rate |
| MyDestination 2015 Fund | |
| Institutional Class | |
| 2023 | | $ 8.99 | $0.25 | $ 0.75 | | $ 1.00 | $(0.27) | $(0.12) | $(0.39) | $ 9.60 | | 11.17% | | $ 242,558 | | 0.10% | | 0.15% | | 2.69% | 27% |
| 2022 | | 11.09 | 0.19 | (1.61) | | (1.42) | (0.19) | (0.49) | (0.68) | 8.99 | | (12.87) | | 224,236 | | 0.11 | | 0.15 | | 1.91 | 21 |
| 2021 | | 10.95 | 0.17 | 0.59 | | 0.76 | (0.26) | (0.36) | (0.62) | 11.09 | | 6.98 | | 207,506 | | 0.12 | | 0.14 | | 1.46 | 17 |
| 2020 | | 10.40 | 0.16 | 0.82 | | 0.98 | (0.22) | (0.21) | (0.43) | 10.95 | | 9.41 | | 169,812 | | 0.06 | | 0.14 | | 1.58 | 23 |
| 2019 | | 9.40 | 0.25 | 1.19 | | 1.44 | (0.28) | (0.16) | (0.44) | 10.40 | | 15.32 | | 142,900 | | 0.06 | | 0.13 | | 2.48 | 7 |
| Investor Class | |
| 2023 | | $ 8.98 | $0.22 | $ 0.76 | | $ 0.98 | $(0.24) | $(0.12) | $(0.36) | $ 9.60 | | 10.99% | | $ 425,123 | | 0.38% | | 0.40% | | 2.38% | 27% |
| 2022 | | 11.09 | 0.15 | (1.60) | | (1.45) | (0.17) | (0.49) | (0.66) | 8.98 | | (13.10) | | 417,603 | | 0.36 | | 0.40 | | 1.50 | 21 |
| 2021 | | 10.95 | 0.13 | 0.60 | | 0.73 | (0.23) | (0.36) | (0.59) | 11.09 | | 6.72 | | 539,194 | | 0.37 | | 0.39 | | 1.15 | 17 |
| 2020 | | 10.40 | 0.13 | 0.82 | | 0.95 | (0.19) | (0.21) | (0.40) | 10.95 | | 9.16 | | 528,088 | | 0.31 | | 0.39 | | 1.29 | 23 |
| 2019 | | 9.40 | 0.21 | 1.21 | | 1.42 | (0.26) | (0.16) | (0.42) | 10.40 | | 15.09 | | 524,696 | | 0.31 | | 0.38 | | 2.09 | 7 |
| | |
| MyDestination 2025 Fund | |
| Institutional Class | |
| 2023 | | $ 9.21 | $0.25 | $ 0.93 | | $ 1.18 | $(0.26) | $(0.09) | $(0.35) | $10.04 | | 12.83% | | $ 680,628 | | 0.09% | | 0.13% | | 2.58% | 31% |
| 2022 | | 11.53 | 0.18 | (1.80) | | (1.62) | (0.17) | (0.53) | (0.70) | 9.21 | | (14.11) | | 606,791 | | 0.11 | | 0.13 | | 1.76 | 14 |
| 2021 | | 11.10 | 0.16 | 0.85 | | 1.01 | (0.28) | (0.30) | (0.58) | 11.53 | | 9.17 | | 524,604 | | 0.12 | | 0.13 | | 1.41 | 9 |
| 2020 | | 10.42 | 0.17 | 0.97 | | 1.14 | (0.22) | (0.24) | (0.46) | 11.10 | | 10.95 | | 449,798 | | 0.08 | | 0.12 | | 1.60 | 19 |
| 2019 | | 9.15 | 0.25 | 1.44 | | 1.69 | (0.27) | (0.15) | (0.42) | 10.42 | | 18.45 | | 361,408 | | 0.09 | | 0.12 | | 2.43 | 5 |
| Investor Class | |
| 2023 | | $ 9.21 | $0.22 | $ 0.94 | | $ 1.16 | $(0.23) | $(0.09) | $(0.32) | $10.05 | | 12.64% | | $1,091,712 | | 0.37% | | 0.38% | | 2.27% | 31% |
| 2022 | | 11.54 | 0.14 | (1.79) | | (1.65) | (0.15) | (0.53) | (0.68) | 9.21 | | (14.40) | | 1,018,527 | | 0.36 | | 0.38 | | 1.34 | 14 |
| 2021 | | 11.11 | 0.13 | 0.85 | | 0.98 | (0.25) | (0.30) | (0.55) | 11.54 | | 8.91 | | 1,262,088 | | 0.37 | | 0.38 | | 1.15 | 9 |
| 2020 | | 10.43 | 0.14 | 0.97 | | 1.11 | (0.19) | (0.24) | (0.43) | 11.11 | | 10.69 | | 1,118,397 | | 0.34 | | 0.38 | | 1.31 | 19 |
| 2019 | | 9.16 | 0.21 | 1.45 | | 1.66 | (0.24) | (0.15) | (0.39) | 10.43 | | 18.18 | | 1,048,140 | | 0.34 | | 0.37 | | 2.06 | 5 |
| | |
| MyDestination 2035 Fund | |
| Institutional Class | |
| 2023 | | $ 9.36 | $0.23 | $ 1.28 | | $ 1.51 | $(0.23) | $(0.18) | $(0.41) | $10.46 | | 16.23% | | $ 699,632 | | 0.09% | | 0.12% | | 2.33% | 11% |
| 2022 | | 12.00 | 0.17 | (2.11) | | (1.94) | (0.16) | (0.54) | (0.70) | 9.36 | | (16.26) | | 572,407 | | 0.13 | | 0.13 | | 1.67 | 11 |
| 2021 | | 11.19 | 0.17 | 1.32 | | 1.49 | (0.30) | (0.38) | (0.68) | 12.00 | | 13.29 | | 488,921 | | 0.12 | | 0.12 | | 1.43 | 10 |
| 2020 | | 10.22 | 0.16 | 1.18 | | 1.34 | (0.19) | (0.18) | (0.37) | 11.19 | | 13.15 | | 379,986 | | 0.14 | | 0.14 | | 1.61 | 11 |
| 2019 | | 8.65 | 0.24 | 1.70 | | 1.94 | (0.24) | (0.13) | (0.37) | 10.22 | | 22.47 | | 266,012 | | 0.13 | | 0.13 | | 2.41 | 4 |
| Investor Class | |
| 2023 | | $ 9.36 | $0.20 | $ 1.27 | | $ 1.47 | $(0.20) | $(0.18) | $(0.38) | $10.45 | | 15.82% | | $ 946,158 | | 0.37% | | 0.38% | | 2.04% | 11% |
| 2022 | | 12.00 | 0.13 | (2.10) | | (1.97) | (0.13) | (0.54) | (0.67) | 9.36 | | (16.46) | | 801,499 | | 0.38 | | 0.38 | | 1.22 | 11 |
| 2021 | | 11.19 | 0.14 | 1.32 | | 1.46 | (0.27) | (0.38) | (0.65) | 12.00 | | 13.04 | | 940,687 | | 0.38 | | 0.38 | | 1.16 | 10 |
| 2020 | | 10.22 | 0.13 | 1.19 | | 1.32 | (0.17) | (0.18) | (0.35) | 11.19 | | 12.90 | | 765,874 | | 0.39 | | 0.39 | | 1.29 | 11 |
| 2019 | | 8.65 | 0.20 | 1.72 | | 1.92 | (0.22) | (0.13) | (0.35) | 10.22 | | 22.16 | | 662,810 | | 0.39 | | 0.39 | | 2.01 | 4 |
| | | | | | | | | | | | | | | | | | | | | | |
| # | Calculated using the average shares outstanding method. |
| (1) | Recognition of net investment income by the Fund is affected by the timing of the declaration of dividends by the underlying investment companies in which the Fund invests. |
| (2) | Does not include expenses of the investment companies in which the Fund invests. Estimated acquired fund fees and expenses (i.e., the fees and expenses incurred by the underlying funds) for the MyDestination 2015 Fund, MyDestination 2025 Fund, MyDestination 2035 Fund, MyDestination 2045 Fund and MyDestination 2055 Fund were 0.37%, 0.38%, 0.38%, 0.34% and 0.33%, respectively, for 2023. These acquired fund fees and expenses impact the net asset value of the underlying funds in which each Fund invests, and therefore the effect of the acquired fund fees and expenses is reflected in each Fund's total return. |
See Notes to Financial Statements.
| For a Share Outstanding For the Years Ending December 31, unless otherwise indicated | | | | | | | | | | Ratios to Average Net Assets | |
| | | Net Asset
Value,
Beginning
of Year | Net Investment
Income#(1) | Realized
and
Unrealized
Gain
(Loss) on
Investments | | Total Income
From Investment
Operations | Dividends
from Net
Investment
Income | Distributions
from Net
Realized
Capital
Gains | Total
Distributions
Paid | Net Asset
Value,
End of
Year | | Total
Return | | Net Assets,
End of Year
(000) | | Expenses,
Net(2) | | Expenses,
Gross(2) | | Investment
Income,
Net(1) | Portfolio
Turnover
Rate |
| MyDestination 2045 Fund | |
| Institutional Class | |
| 2023 | | $ 9.37 | $0.22 | $ 1.55 | | $ 1.77 | $(0.21) | $(0.17) | $(0.38) | $10.76 | | 18.94% | | $561,262 | | 0.11% | | 0.12% | | 2.12% | 10% |
| 2022 | | 12.10 | 0.17 | (2.24) | | (2.07) | (0.15) | (0.51) | (0.66) | 9.37 | | (17.08) | | 437,044 | | 0.13 | | 0.13 | | 1.61 | 7 |
| 2021 | | 10.97 | 0.17 | 1.65 | | 1.82 | (0.30) | (0.39) | (0.69) | 12.10 | | 16.61 | | 422,303 | | 0.13 | | 0.13 | | 1.41 | 10 |
| 2020 | | 9.87 | 0.15 | 1.24 | | 1.39 | (0.17) | (0.12) | (0.29) | 10.97 | | 14.06 | | 323,697 | | 0.14 | | 0.14 | | 1.58 | 7 |
| 2019 | | 8.21 | 0.22 | 1.79 | | 2.01 | (0.22) | (0.13) | (0.35) | 9.87 | | 24.56 | | 230,295 | | 0.13 | | 0.13 | | 2.31 | 4 |
| Investor Class | |
| 2023 | | $ 9.36 | $0.19 | $ 1.55 | | $ 1.74 | $(0.18) | $(0.17) | $(0.35) | $10.75 | | 18.69% | | $752,813 | | 0.38% | | 0.38% | | 1.85% | 10% |
| 2022 | | 12.09 | 0.13 | (2.22) | | (2.09) | (0.13) | (0.51) | (0.64) | 9.36 | | (17.38) | | 606,007 | | 0.38 | | 0.38 | | 1.25 | 7 |
| 2021 | | 10.97 | 0.14 | 1.64 | | 1.78 | (0.27) | (0.39) | (0.66) | 12.09 | | 16.26 | | 692,409 | | 0.38 | | 0.38 | | 1.15 | 10 |
| 2020 | | 9.87 | 0.12 | 1.24 | | 1.36 | (0.14) | (0.12) | (0.26) | 10.97 | | 13.80 | | 553,181 | | 0.41 | | 0.41 | | 1.26 | 7 |
| 2019 | | 8.21 | 0.18 | 1.80 | | 1.98 | (0.19) | (0.13) | (0.32) | 9.87 | | 24.24 | | 470,796 | | 0.41 | | 0.41 | | 1.94 | 4 |
| | |
| MyDestination 2055 Fund | |
| Institutional Class | |
| 2023 | | $13.31 | $0.30 | $ 2.34 | | $ 2.64 | $(0.29) | $(0.19) | $(0.48) | $15.47 | | 19.88% | | $266,002 | | 0.14% | | 0.16% | | 2.08% | 9% |
| 2022 | | 17.11 | 0.23 | (3.20) | | (2.97) | (0.21) | (0.62) | (0.83) | 13.31 | | (17.43) | | 184,087 | | 0.17 | | 0.17 | | 1.56 | 7 |
| 2021 | | 15.37 | 0.24 | 2.44 | | 2.68 | (0.42) | (0.52) | (0.94) | 17.11 | | 17.46 | | 178,971 | | 0.17 | | 0.17 | | 1.39 | 11 |
| 2020 | | 13.77 | 0.21 | 1.74 | | 1.95 | (0.22) | (0.13) | (0.35) | 15.37 | | 14.23 | | 130,214 | | 0.16 | | 0.18 | | 1.58 | 12 |
| 2019 | | 11.48 | 0.30 | 2.58 | | 2.88 | (0.30) | (0.29) | (0.59) | 13.77 | | 25.15 | | 77,156 | | 0.16 | | 0.20 | | 2.26 | 10 |
| Investor Class | |
| 2023 | | $13.28 | $0.26 | $ 2.32 | | $ 2.58 | $(0.25) | $(0.19) | $(0.44) | $15.42 | | 19.49% | | $342,864 | | 0.42% | | 0.43% | | 1.82% | 9% |
| 2022 | | 17.07 | 0.19 | (3.18) | | (2.99) | (0.18) | (0.62) | (0.80) | 13.28 | | (17.61) | | 255,261 | | 0.42 | | 0.42 | | 1.27 | 7 |
| 2021 | | 15.34 | 0.19 | 2.44 | | 2.63 | (0.38) | (0.52) | (0.90) | 17.07 | | 17.18 | | 262,341 | | 0.42 | | 0.42 | | 1.15 | 11 |
| 2020 | | 13.76 | 0.17 | 1.73 | | 1.90 | (0.19) | (0.13) | (0.32) | 15.34 | | 13.85 | | 189,213 | | 0.42 | | 0.44 | | 1.27 | 12 |
| 2019 | | 11.47 | 0.27 | 2.58 | | 2.85 | (0.27) | (0.29) | (0.56) | 13.76 | | 24.92 | | 143,473 | | 0.41 | | 0.44 | | 2.03 | 10 |
| | | | | | | | | | | | | | | | | | | | | | |
| # | Calculated using the average shares outstanding method. |
| (1) | Recognition of net investment income by the Fund is affected by the timing of the declaration of dividends by the underlying investment companies in which the Fund invests. |
| (2) | Does not include expenses of the investment companies in which the Fund invests. Estimated acquired fund fees and expenses (i.e., the fees and expenses incurred by the underlying funds) for the MyDestination 2015 Fund, MyDestination 2025 Fund, MyDestination 2035 Fund, MyDestination 2045 Fund and MyDestination 2055 Fund were 0.37%, 0.38%, 0.38%, 0.34% and 0.33%, respectively, for 2023. These acquired fund fees and expenses impact the net asset value of the underlying funds in which each Fund invests, and therefore the effect of the acquired fund fees and expenses is reflected in each Fund's total return. |
See Notes to Financial Statements.
Conservative Allocation Fund (Unaudited)
The Fund, through investments primarily in the Select Funds, combined a greater percentage of exposure to fixed income securities with a smaller percentage to equity securities, real assets and alternative investments. The Fund had an approximate target asset allocation of 65% fixed income securities, 29% equity securities, 1% real assets and 5% alternative investments as of December 31, 2023.
As a fund of funds, the Fund’s performance was based on the performance of its underlying investments. The Investor Class of the Fund generated a return of 8.80%, net of fees, for the one-year period ended December 31, 2023. All major asset class groupings experienced positive performance contribution, as the year was one of solid returns for both equity and fixed income. In general, equity outperformed fixed income and U.S. equity outperformed non-U.S. equity for the year. Notable contributors to performance within the Fund include exposures to emerging markets and U.S. equities. The Fund’s largest fixed income exposure, the Low-Duration Bond Fund, had a strong year in absolute terms and was additive to Fund performance. The two passive U.S. equity Funds, the Growth Equity Index Fund, which broadly tracks the U.S. large cap growth segment of the market, and the Value Equity Index Fund, which broadly tracks the U.S. large cap value segment of the market, were both positive contributors to performance. While both active U.S. equity Funds were additive to performance during the year, the Growth Equity Fund contributed more to the Fund’s overall performance than the Value Equity Fund. The contribution to absolute performance by the Fund’s exposure to real assets, via its investment in the Global Real Estate Securities Fund, was additive. Exposures to the Strategic Alternatives Fund and Defensive Market Strategies® Fund were positive contributors to Fund performance. In 2023, the Investor Class of the Fund underperformed its composite benchmark of 49.00% Bloomberg US Treasury 1-3 Year Index, 16.00% Bloomberg US Aggregate Bond Index, 5.00% Bloomberg 1-3 Month US Treasury Bill Index, 21.00% Russell 3000® Index, 1.00% FTSE EPRA Nareit Developed Index and 8.00% MSCI ACSI (All Country World Index) ex USA Index (8.80% versus 9.97%). The performance difference between the Fund and the composite benchmark was due to the performance differences of the underlying Select Funds versus their respective benchmarks in addition to exposure differences between the Select Funds’ benchmarks and the Fund’s composite benchmark. For more information on a Select Fund’s performance, please refer to that Select Fund’s section in this Annual Report.
Certain derivatives were utilized to provide market exposure for the cash positions held in the Fund. These derivative positions primarily included stock index futures and fixed income futures. Overall, derivative exposure had a negative impact on Fund performance for the year.
The Fund attempted to achieve its objective, through investments primarily in the Select Funds, by combining a greater percentage of fixed income securities with a smaller percentage of equity securities. The Fund may be suitable for investors who have a short- to medium-term investment horizon, possess a relatively low tolerance for risk and want some exposure to the growth potential of the equity market tempered by a larger allocation to short-term, fixed income securities. This Fund is subject to interest rate risk. Meaning, when interest rates rise, the value of the existing bonds decrease and vice versa. Changes in interest rates have a bigger impact on long duration holdings than on short duration holdings. By investing in the Fund, you will also incur the expenses and risks of the underlying Select Funds. You may directly invest in the Select Funds. The Fund’s value will go up and down in response to changes in the share prices of the investments that it owns. It is possible to lose money by investing in the Fund.
At December 31, 2023, the portfolio holdings of the Fund, as a percentage of net assets, is shown in the following table. Portfolio holdings are subject to risk and may change at any time.
| | % |
| Fixed Income Select Funds | 63.3 |
| U.S. Equity Select Funds | 21.8 |
| Non-U.S. Equity Select Funds | 7.6 |
| Alternative Select Fund | 4.9 |
| Money Market Funds | 2.0 |
| Real Assets Select Fund | 0.9 |
| | 100.5 |
See Notes to Financial Statements.
Conservative Allocation Fund (Unaudited)
| Average Annual Total Returns as of 12/31/23 | |
| | | Institutional Class* | | Investor Class* | | Benchmark** | |
| One Year | | 9.08% | | 8.80% | | 9.97% | |
| Five Year | | 4.00% | | 3.74% | | 4.91% | |
| Ten Year | | N/A | | 2.78% | | 3.66% | |
| Since Inception(1) | | 3.61% | | 3.48% | | 4.01% | |
| Inception Date | | 11/23/15 | | 08/27/01 | | | |
| Total Fund Operating Expenses (May 1, 2023 Prospectus)(2)# | | 0.66% | | 0.91% | | | |
| (1) | The Since Inception benchmark performance is based on the start date of August 27, 2001, which corresponds with the inception date of the Investor Class, the longest operating class of the Fund. |
| (2) | The Fund’s shareholders indirectly bear the expenses of the Institutional Class shares of the Select Funds in which the Fund invests. Current information regarding the Fund’s Operating Expenses can be found in the Financial Highlights. |
#Net expense ratio
The performance data quoted represents past performance and does not guarantee future results. The performance data in the table and graph does not reflect the deduction of taxes that a shareholder would pay on Fund distributions or the redemption of Fund shares. Current performance may be lower or higher. Performance data current to the most recent month-end may be obtained at GuideStoneFunds.com. The investment return and principal value of an investment will fluctuate so that shares, when redeemed, may be worth more or less than their original cost.
See Notes to Financial Statements.
Conservative Allocation Fund (Unaudited)
The graph illustrates the results of a hypothetical $10,000 investment in the Investor Class of the Fund for the 10-year period from December 31, 2013 to December 31, 2023, with all dividends and capital gains reinvested, with the Fund's composite benchmark index.
*These returns reflect investment advisory and shareholder servicing fee waivers, if applicable, during the reported time periods.
**The Benchmark Index shows how the Fund’s performance compares with the returns of an index constructed by the Adviser as a composite of various broad-based market indexes to reflect the market sectors in which the Fund invests. The percentage allocations to the broad-based market indexes comprising the Benchmark Index are intended to correspond to the Fund’s investment allocation, as represented by the Fund’s investment in the Select Funds. The Benchmark Index is 49.00% Bloomberg US Treasury 1-3 Year Index, 5.00% Bloomberg 1-3 Month US Treasury Bill Index, 16.00% Bloomberg US Aggregate Bond Index, 21.00% Russell 3000® Index, 1.00% FTSE EPRA Nareit Developed Index and 8.00% MSCI ACWI (All Country World Index) ex USA Index. The weightings of the Benchmark Index were modified effective November 30, 2020, and therefore, the weightings of the underlying indexes were different than the current benchmark weightings prior to that date. Benchmark Index performance represents the Fund’s current benchmark linked with its previous benchmark.
Unlike a mutual fund, an index is not available for direct investment and the performance of an index assumes no taxes, transaction costs, management fees or other expenses.
The blended returns are calculated by the Adviser (an affiliate of GuideStone Financial Resources) using end of day index level values licensed from MSCI (“MSCI Data”). For the avoidance of doubt, MSCI is not the benchmark “administrator” for, or a “contributor”, “submitter” or “supervised contributor” to, the blended returns, and the MSCI Data is not considered a “contribution” or “submission” in relation to the blended returns, as those terms may be defined in any rules, laws, regulations, legislation or international standards. MSCI Data is provided “AS IS” without warranty or liability and no copying or distribution is permitted. MSCI does not make any representation regarding the advisability of any investment or strategy and does not sponsor, promote, issue, sell or otherwise recommend or endorse any investment or strategy, including any financial products or strategies based on, tracking or otherwise utilizing any MSCI Data, models, analytics or other materials or information.
See Notes to Financial Statements.
CONSERVATIVE ALLOCATION FUND
| | | Shares | | Value |
| MUTUAL FUNDS — 98.5% |
GuideStone Low-Duration Bond Fund
(Institutional Class)∞ | 14,485,734 | | $185,562,248 |
GuideStone Medium-Duration Bond Fund
(Institutional Class)∞ | 4,096,945 | | 52,727,687 |
GuideStone Global Bond Fund
(Institutional Class)∞ | 1,433,878 | | 12,517,753 |
GuideStone Defensive Market Strategies® Fund
(Institutional Class)∞ | 2,739,309 | | 31,611,626 |
GuideStone Impact Bond Fund
(Institutional Class)∞ | 1,685,543 | | 16,619,458 |
GuideStone Impact Equity Fund
(Institutional Class)∞ | 675,622 | | 7,519,675 |
GuideStone Value Equity Index Fund
(Institutional Class)∞ | 587,298 | | 6,378,055 |
GuideStone Value Equity Fund
(Institutional Class)∞ | 1,048,694 | | 18,845,021 |
GuideStone Growth Equity Index Fund
(Institutional Class)∞ | 491,053 | | 6,324,762 |
GuideStone Growth Equity Fund
(Institutional Class)∞ | 786,212 | | 18,680,386 |
GuideStone Small Cap Equity Fund
(Institutional Class)∞ | 139,661 | | 2,386,802 |
GuideStone International Equity Fund
(Institutional Class)∞ | 1,622,254 | | 22,565,555 |
| | | Shares | | Value |
GuideStone Emerging Markets Equity Fund
(Institutional Class)∞ | 1,108,601 | | $ 9,888,724 |
GuideStone Global Real Estate Securities Fund
(Institutional Class)∞ | 416,663 | | 3,724,969 |
GuideStone Strategic Alternatives Fund
(Institutional Class)∞ | 2,266,863 | | 20,877,808 |
Total Mutual Funds
(Cost $418,999,111) | | 416,230,529 |
| MONEY MARKET FUNDS — 2.0% |
GuideStone Money Market Fund, 5.28%
(Institutional Class)Ø∞ | 6,716,388 | | 6,716,388 |
| Northern Institutional U.S. Treasury Portfolio (Premier), 5.22%Ø | 1,925,000 | | 1,925,000 |
Total Money Market Funds
(Cost $8,641,388) | | 8,641,388 |
TOTAL INVESTMENTS — 100.5%
(Cost $427,640,499) | | | 424,871,917 |
Liabilities in Excess of Other
Assets — (0.5)% | | | (2,068,559) |
| NET ASSETS — 100.0% | | | $422,803,358 |
VALUATION HIERARCHY
The following is a summary of the inputs used, as of December 31, 2023, in valuing the Fund’s investments carried at fair value:
| | Total
Value | | Level 1
Quoted Prices | | Level 2
Other Significant
Observable Inputs | | Level 3
Significant
Unobservable Inputs |
| Assets: | | | | | | | |
| Investments in Securities: | | | | | | | |
| Money Market Funds | $ 8,641,388 | | $ 8,641,388 | | $ — | | $ — |
| Mutual Funds | 416,230,529 | | 416,230,529 | | — | | — |
| Total Assets - Investments in Securities | $424,871,917 | | $424,871,917 | | $ — | | $ — |
See Notes to Financial Statements.
Balanced Allocation Fund (Unaudited)
The Fund, through investments primarily in the Select Funds, combined approximately equal percentages of exposure to equity securities and fixed income securities in addition to smaller allocations to real assets and alternative investments. The Fund had an approximate target asset allocation of 44% fixed income securities, 50% equity securities, 2% real assets and 4% alternative investments as of December 31, 2023.
As a fund of funds, the Fund’s performance was based on the performance of its underlying investments. The Investor Class of the Fund generated a return of 12.32%, net of fees, for the one-year period ended December 31, 2023. All major asset class groupings experienced positive performance contribution, as the year was one of solid returns for both equity and fixed income. In general, equity outperformed fixed income and U.S. equity outperformed non-U.S. equity for the year. Notable contributors to performance within the Fund include exposures to emerging markets and U.S. equities. The Medium-Duration Bond Fund held up the best, on a relative basis, within the fixed income allocation, which was additive to Fund performance. The two passive U.S. equity Funds, the Growth Equity Index Fund, which broadly tracks the U.S. large cap growth segment of the market, and the Value Equity Index Fund, which broadly tracks the U.S. large cap value segment of the market, were both positive contributors to the Fund’s performance. While both active U.S. equity Funds were additive to performance for the year, the Growth Equity Fund contributed more to the Fund’s overall performance than the Value Equity Fund. The contribution to absolute performance by the Fund’s exposure to real assets, via its investment in the Global Real Estate Securities Fund, was additive. Exposures to the Strategic Alternatives Fund and Defensive Market Strategies® Fund were additive to performance. In 2023, the Investor Class of the Fund underperformed its composite benchmark of 43.50% Bloomberg US Aggregate Bond Index, 4.00% Bloomberg 1-3 Month US Treasury Bill Index, 34.50% Russell 3000® Index, 2.00% FTSE EPRA Nareit Developed Index and 16.00% MSCI ACWI (All Country World Index) ex USA Index (12.32% versus 14.09%). The performance difference between the Fund and the composite benchmark was due to the performance differences of the underlying Select Funds versus their respective benchmarks in addition to exposure differences between the Select Funds’ benchmarks and the Fund’s composite benchmark. For more information on a Select Fund’s performance, please refer to that Select Fund’s section in this Annual Report.
Certain derivatives were utilized to provide market exposure for the cash positions held in the Fund. These derivative positions primarily included stock index futures and fixed income futures. Overall, derivative exposure had a negative impact on Fund performance for the year.
The Fund attempted to achieve its objective, through investments primarily in the Select Funds, by combining approximately equal percentages of fixed income securities and equity securities. This Fund may be suitable for investors who have a medium- to long-term investment horizon, possess a moderate tolerance for risk and seek to participate in the return potential of equities but want to achieve this result more slowly and with less volatility through a balanced allocation of fixed income and equity investments. This Fund is subject to interest rate risk. Meaning, when interest rates rise, the value of the existing bonds decrease and vice versa. Changes in interest rates have a bigger impact on long duration holdings than on short duration holdings. By investing in the Fund, you will also incur the expenses and risks of the underlying Select Funds. You may directly invest in the Select Funds. The Fund’s value will go up and down in response to changes in the share prices of the investments that it owns. It is possible to lose money by investing in the Fund.
At December 31, 2023, the portfolio holdings of the Fund, as a percentage of net assets, is shown in the following table. Portfolio holdings are subject to risk and may change at any time.
| | % |
| Fixed Income Select Funds | 41.9 |
| U.S. Equity Select Funds | 35.4 |
| Non-U.S. Equity Select Funds | 14.8 |
| Alternative Select Fund | 3.8 |
| Money Market Funds | 2.5 |
| Real Assets Select Fund | 1.8 |
| | 100.2 |
See Notes to Financial Statements.
Balanced Allocation Fund (Unaudited)
| Average Annual Total Returns as of 12/31/23 | |
| | | Institutional Class* | | Investor Class* | | Benchmark** | |
| One Year | | 12.49%*** | | 12.32% | | 14.09% | |
| Five Year | | 5.91% | | 5.65% | | 7.21% | |
| Ten Year | | N/A | | 4.17% | | 5.41% | |
| Since Inception(1) | | 5.20% | | 5.02% | | 5.79% | |
| Inception Date | | 11/23/15 | | 08/27/01 | | | |
| Total Fund Operating Expenses (May 1, 2023 Prospectus)(2)# | | 0.72% | | 0.97% | | | |
| (1) | The Since Inception benchmark performance is based on the start date of August 27, 2001, which corresponds with the inception date of the Investor Class, the longest operating class of the Fund. |
| (2) | The Fund’s shareholders indirectly bear the expenses of the Institutional Class shares of the Select Funds in which the Fund invests. Current information regarding the Fund’s Operating Expenses can be found in the Financial Highlights. |
#Net expense ratio
The performance data quoted represents past performance and does not guarantee future results. The performance data in the table and graph does not reflect the deduction of taxes that a shareholder would pay on Fund distributions or the redemption of Fund shares. Current performance may be lower or higher. Performance data current to the most recent month-end may be obtained at GuideStoneFunds.com. The investment return and principal value of an investment will fluctuate so that shares, when redeemed, may be worth more or less than their original cost.
See Notes to Financial Statements.
Balanced Allocation Fund (Unaudited)
The graph illustrates the results of a hypothetical $10,000 investment in the Investor Class of the Fund for the 10-year period from December 31, 2013 to December 31, 2023, with all dividends and capital gains reinvested, with the Fund's composite benchmark index.
*These returns reflect investment advisory and shareholder servicing fee waivers, if applicable, during the reported time periods.
**The Benchmark Index shows how the Fund’s performance compares with the returns of an index constructed by the Adviser as a composite of various broad-based market indexes to reflect the market sectors in which the Fund invests. The percentage allocations to the broad-based market indexes comprising the Benchmark Index are intended to correspond to the Fund’s investment allocation, as represented by the Fund’s investment in the Select Funds. The Benchmark Index is 4.00% Bloomberg 1-3 Month US Treasury Bill Index, 43.50% Bloomberg US Aggregate Bond Index, 34.50% Russell 3000® Index, 2.00% FTSE EPRA Nareit Developed Index and 16.00% MSCI ACWI (All Country World Index) ex USA Index. The weightings of the Benchmark Index were modified effective November 30, 2020, and therefore, the weightings of the underlying indexes were different than the current benchmark weightings prior to that date. Benchmark Index performance represents the Fund’s current benchmark linked with its previous benchmark.
***Total returns may differ from the financial highlights due to adjustments required by U.S. GAAP.
Unlike a mutual fund, an index is not available for direct investment and the performance of an index assumes no taxes, transaction costs, management fees or other expenses.
The blended returns are calculated by the Adviser (an affiliate of GuideStone Financial Resources) using end of day index level values licensed from MSCI (“MSCI Data”). For the avoidance of doubt, MSCI is not the benchmark “administrator” for, or a “contributor”, “submitter” or “supervised contributor” to, the blended returns, and the MSCI Data is not considered a “contribution” or “submission” in relation to the blended returns, as those terms may be defined in any rules, laws, regulations, legislation or international standards. MSCI Data is provided “AS IS” without warranty or liability and no copying or distribution is permitted. MSCI does not make any representation regarding the advisability of any investment or strategy and does not sponsor, promote, issue, sell or otherwise recommend or endorse any investment or strategy, including any financial products or strategies based on, tracking or otherwise utilizing any MSCI Data, models, analytics or other materials or information.
See Notes to Financial Statements.
| | | Shares | | Value |
| MUTUAL FUNDS — 97.7% |
GuideStone Low-Duration Bond Fund
(Institutional Class)∞ | 3,367,652 | | $ 43,139,628 |
GuideStone Medium-Duration Bond Fund
(Institutional Class)∞ | 27,828,347 | | 358,150,833 |
GuideStone Global Bond Fund
(Institutional Class)∞ | 11,388,844 | | 99,424,609 |
GuideStone Defensive Market Strategies® Fund
(Institutional Class)∞ | 11,125,374 | | 128,386,817 |
GuideStone Impact Bond Fund
(Institutional Class)∞ | 1,972,021 | | 19,444,122 |
GuideStone Impact Equity Fund
(Institutional Class)∞ | 2,624,553 | | 29,211,271 |
GuideStone Value Equity Index Fund
(Institutional Class)∞ | 3,127,720 | | 33,967,036 |
GuideStone Value Equity Fund
(Institutional Class)∞ | 5,488,931 | | 98,636,097 |
GuideStone Growth Equity Index Fund
(Institutional Class)∞ | 2,617,624 | | 33,714,992 |
GuideStone Growth Equity Fund
(Institutional Class)∞ | 4,137,153 | | 98,298,755 |
GuideStone Small Cap Equity Fund
(Institutional Class)∞ | 1,121,392 | | 19,164,590 |
GuideStone International Equity Fund
(Institutional Class)∞ | 9,157,834 | | 127,385,467 |
| | | Shares | | Value |
GuideStone Emerging Markets Equity Fund
(Institutional Class)∞ | 6,375,651 | | $ 56,870,808 |
GuideStone Global Real Estate Securities Fund
(Institutional Class)∞ | 2,438,972 | | 21,804,409 |
GuideStone Strategic Alternatives Fund
(Institutional Class)∞ | 5,140,027 | | 47,339,649 |
Total Mutual Funds
(Cost $1,273,499,028) | | 1,214,939,083 |
| MONEY MARKET FUNDS — 2.5% |
GuideStone Money Market Fund, 5.28%
(Institutional Class)Ø∞ | 29,252,723 | | 29,252,723 |
| Northern Institutional U.S. Treasury Portfolio (Premier), 5.22%Ø | 1,600,000 | | 1,600,000 |
Total Money Market Funds
(Cost $30,852,723) | | 30,852,723 |
TOTAL INVESTMENTS — 100.2%
(Cost $1,304,351,751) | | | 1,245,791,806 |
Liabilities in Excess of Other
Assets — (0.2)% | | | (1,935,248) |
| NET ASSETS — 100.0% | | | $1,243,856,558 |
Futures Contracts outstanding at December 31, 2023:
| Future Type | | Expiration Date | | Open Long
(Short) Contracts | | Notional
Market Value
of Contracts | | Value and
Unrealized
Appreciation
(Depreciation) |
| MSCI EAFE Index | | 03/2024 | | 2 | | $ 225,240 | | $1,480 |
| MSCI Emerging Markets | | 03/2024 | | 2 | | 103,370 | | 2,197 |
| S&P 500® E-Mini | | 03/2024 | | 3 | | 723,000 | | 2,203 |
| 10-Year U.S. Treasury Note | | 03/2024 | | 1 | | 112,890 | | 234 |
| U.S. Treasury Long Bond | | 03/2024 | | 2 | | 249,875 | | 2,063 |
| Ultra 10-Year U.S. Treasury Note | | 03/2024 | | 1 | | 118,016 | | 344 |
| 2-Year U.S. Treasury Note | | 03/2024 | | 2 | | 411,828 | | 125 |
| 5-Year U.S. Treasury Note | | 03/2024 | | 2 | | 217,547 | | 328 |
| Total Futures Contracts outstanding at December 31, 2023 | | | | | | $2,161,766 | | $8,974 |
See Notes to Financial Statements.
SCHEDULE OF INVESTMENTS (Continued)
VALUATION HIERARCHY
The following is a summary of the inputs used, as of December 31, 2023, in valuing the Fund’s investments carried at fair value:
| | Total
Value | | Level 1
Quoted Prices | | Level 2
Other Significant
Observable Inputs | | Level 3
Significant
Unobservable Inputs |
| Assets: | | | | | | | |
| Investments in Securities: | | | | | | | |
| Money Market Funds | $ 30,852,723 | | $ 30,852,723 | | $ — | | $ — |
| Mutual Funds | 1,214,939,083 | | 1,214,939,083 | | — | | — |
| Total Assets - Investments in Securities | $1,245,791,806 | | $1,245,791,806 | | $ — | | $ — |
| Other Financial Instruments*** | | | | | | | |
| Futures Contracts | $ 8,974 | | $ 8,974 | | $ — | | $ — |
| Total Assets - Other Financial Instruments | $ 8,974 | | $ 8,974 | | $ — | | $ — |
| *** | Other financial instruments are derivative instruments, such as futures contracts, which are valued at the unrealized appreciation (depreciation) on the investment. Further details regarding the value of these investments can be found in the preceding "Futures Contracts outstanding" disclosure. |
See Notes to Financial Statements.
Growth Allocation Fund (Unaudited)
The Fund, through investments primarily in the Select Funds, combined a greater percentage of exposure to equity securities with a smaller percentage to fixed income securities, real assets and alternatives investments. The Fund had an approximate target asset allocation of 20% fixed income securities, 78% equity securities and 2% alternative investments as of December 31, 2023.
As a fund of funds, the Fund’s performance was based on the performance of its underlying investments. The Investor Class of the Fund generated a return of 16.57%, net of fees, for the one-year period ended December 31, 2023. All major asset class groupings experienced positive performance contribution. In general, equity outperformed fixed income and U.S. equity outperformed non-U.S. equity for the year. Notable contributors to performance within the Fund include exposures to emerging markets and U.S. equities. The Fund’s Medium-Duration Bond Fund held up the best, on a relative basis, within the fixed income allocation, which was additive to Fund performance. The two passive U.S. equity Funds, the Growth Equity Index Fund, which broadly tracks the U.S. large cap growth segment of the market, and the Value Equity Index Fund, which broadly tracks the U.S. large cap value segment of the market, were both positive contributors to performance. While both active U.S. equity Funds were additive to performance for the year, the Growth Equity Fund contributed more to the Fund’s overall performance than the Value Equity Fund. The contribution to absolute performance by the Fund’s exposure to real assets, via its investment in the Global Real Estate Securities Fund, was additive. Exposure to the Strategic Alternatives Fund was a positive contributor to Fund performance. In 2023, the Investor Class of the Fund underperformed its composite benchmark of 19.50% Bloomberg US Aggregate Bond Index, 2.50% Bloomberg 1-3 Month US Treasury Bill Index, 47.00% Russell 3000® Index, 3.00% FTSE EPRA Nareit Developed Index and 28.00% MSCI ACWI (All Country World Index) ex USA Index (16.57% versus 17.95%). The performance difference between the Fund and the composite benchmark was due to the performance differences of the underlying Select Funds versus their respective benchmarks in addition to exposure differences between the Select Funds’ benchmarks and the Fund’s composite benchmark. For more information on a Select Fund’s performance, please refer to the section of that Select Fund in this Annual Report.
Certain derivatives were utilized to provide market exposure for the cash positions held in the Fund. These derivative positions primarily included stock index futures and fixed income futures. Overall, derivative exposure had a negative impact on Fund performance for the year.
The Fund attempted to achieve its objective, through investments primarily in the Select Funds, by combining a greater percentage of equity securities with a small percentage of fixed income securities. This Fund may be suitable for investors who have a long-term investment horizon, possess a relatively high tolerance for risk and seek to participate in the return potential of stocks at a slightly lower risk level than an all-stock portfolio. Securities of foreign issuers may be negatively impacted by political events, economic conditions or inefficient, illiquid or unregulated markets in foreign countries, and they also may be subject to inadequate regulatory or accounting standards, which may increase investment risk. Small company stocks are subject to greater risk than large company stocks due to more volatility and less liquidity. This Fund is subject to interest rate risk. Meaning, when interest rates rise, the value of the existing bonds decrease and vice versa. Changes in interest rates have a bigger impact on long duration holdings than on short duration holdings. By investing in the Fund, you will also incur the expenses and risks of the underlying Select Funds. The Fund’s value will go up and down in response to changes in the share prices of the investments that it owns. It is possible to lose money by investing in the Fund.
At December 31, 2023, the portfolio holdings of the Fund, as a percentage of net assets, is shown in the following table. Portfolio holdings are subject to risk and may change at any time.
| | % |
| U.S. Equity Select Funds | 47.5 |
| Non-U.S. Equity Select Funds | 26.8 |
| Fixed Income Select Funds | 18.3 |
| Real Assets Select Fund | 2.7 |
| Alternative Select Fund | 2.4 |
| Money Market Funds | 2.3 |
| | 100.0 |
See Notes to Financial Statements.
Growth Allocation Fund (Unaudited)
| Average Annual Total Returns as of 12/31/23 | |
| | | Institutional Class* | | Investor Class* | | Benchmark** | |
| One Year | | 16.82% | | 16.57% | | 17.95% | |
| Five Year | | 8.35% | | 8.06% | | 9.63% | |
| Ten Year | | N/A | | 5.53% | | 6.81% | |
| Since Inception(1) | | 6.95% | | 5.68% | | 6.50% | |
| Inception Date | | 11/23/15 | | 08/27/01 | | | |
| Total Fund Operating Expenses (May 1, 2023 Prospectus)(2)# | | 0.79% | | 1.05% | | | |
| (1) | The Since Inception benchmark performance is based on the start date of August 27, 2001, which corresponds with the inception date of the Investor Class, the longest operating class of the Fund. |
| (2) | The Fund’s shareholders indirectly bear the expenses of the Institutional Class shares of the Select Funds in which the Fund invests. Current information regarding the Fund’s Operating Expenses can be found in the Financial Highlights. |
#Net expense ratio
The performance data quoted represents past performance and does not guarantee future results. The performance data in the table and graph does not reflect the deduction of taxes that a shareholder would pay on Fund distributions or the redemption of Fund shares. Current performance may be lower or higher. Performance data current to the most recent month-end may be obtained at GuideStoneFunds.com. The investment return and principal value of an investment will fluctuate so that shares, when redeemed, may be worth more or less than their original cost.
See Notes to Financial Statements.
Growth Allocation Fund (Unaudited)
The graph illustrates the results of a hypothetical $10,000 investment in the Investor Class of the Fund for the 10-year period from December 31, 2013 to December 31, 2023, with all dividends and capital gains reinvested, with the Fund’s composite benchmark index.
*These returns reflect investment advisory and shareholder servicing fee waivers, if applicable, during the reported time periods.
**The Benchmark Index shows how the Fund’s performance compares with the returns of an index constructed by the Adviser as a composite of various broad-based market indexes to reflect the market sectors in which the Fund invests. The percentage allocations to the broad-based market indexes comprising the Benchmark Index are intended to correspond to the Fund’s investment allocation, as represented by the Fund’s investment in the Select Funds. The Benchmark Index is 2.50% Bloomberg 1-3 Month US Treasury Bill Index, 19.50% Bloomberg US Aggregate Bond Index, 47.00% Russell 3000® Index, 3.00% FTSE EPRA Nareit Developed Index and 28.00% MSCI ACWI (All Country World Index) ex USA Index. The weightings of the Benchmark Index were modified effective November 30, 2020, and therefore, the weightings of the underlying indexes were different than the current benchmark weightings prior to that date. Benchmark Index performance represents the Fund’s current benchmark linked with its previous benchmark.
Unlike a mutual fund, an index is not available for direct investment and the performance of an index assumes no taxes, transaction costs, management fees or other expenses.
The blended returns are calculated by the Adviser (an affiliate of GuideStone Financial Resources) using end of day index level values licensed from MSCI (“MSCI Data”). For the avoidance of doubt, MSCI is not the benchmark “administrator” for, or a “contributor”, “submitter” or “supervised contributor” to, the blended returns, and the MSCI Data is not considered a “contribution” or “submission” in relation to the blended returns, as those terms may be defined in any rules, laws, regulations, legislation or international standards. MSCI Data is provided “AS IS” without warranty or liability and no copying or distribution is permitted. MSCI does not make any representation regarding the advisability of any investment or strategy and does not sponsor, promote, issue, sell or otherwise recommend or endorse any investment or strategy, including any financial products or strategies based on, tracking or otherwise utilizing any MSCI Data, models, analytics or other materials or information.
See Notes to Financial Statements.
| | | Shares | | Value |
| MUTUAL FUNDS — 97.7% |
GuideStone Low-Duration Bond Fund
(Institutional Class)∞ | 917,648 | | $ 11,755,071 |
GuideStone Medium-Duration Bond Fund
(Institutional Class)∞ | 9,652,590 | | 124,228,832 |
GuideStone Global Bond Fund
(Institutional Class)∞ | 4,037,798 | | 35,249,978 |
GuideStone Defensive Market Strategies® Fund
(Institutional Class)∞ | 4,041,250 | | 46,636,027 |
GuideStone Impact Bond Fund
(Institutional Class)∞ | 1,619,447 | | 15,967,746 |
GuideStone Impact Equity Fund
(Institutional Class)∞ | 2,157,011 | | 24,007,536 |
GuideStone Value Equity Index Fund
(Institutional Class)∞ | 4,479,301 | | 48,645,206 |
GuideStone Value Equity Fund
(Institutional Class)∞ | 7,943,041 | | 142,736,441 |
GuideStone Growth Equity Index Fund
(Institutional Class)∞ | 3,761,778 | | 48,451,702 |
GuideStone Growth Equity Fund
(Institutional Class)∞ | 5,992,928 | | 142,391,963 |
GuideStone Small Cap Equity Fund
(Institutional Class)∞ | 1,989,103 | | 33,993,771 |
GuideStone International Equity Fund
(Institutional Class)∞ | 13,667,072 | | 190,108,967 |
| | | Shares | | Value |
GuideStone Emerging Markets Equity Fund
(Institutional Class)∞ | 9,366,852 | | $ 83,552,322 |
GuideStone Global Real Estate Securities Fund
(Institutional Class)∞ | 3,122,799 | | 27,917,820 |
GuideStone Strategic Alternatives Fund
(Institutional Class)∞ | 2,679,264 | | 24,676,025 |
Total Mutual Funds
(Cost $1,018,864,922) | | 1,000,319,407 |
| MONEY MARKET FUNDS — 2.3% |
GuideStone Money Market Fund, 5.28%
(Institutional Class)Ø∞ | 22,026,820 | | 22,026,820 |
| Northern Institutional U.S. Treasury Portfolio (Premier), 5.22%Ø | 1,029,125 | | 1,029,125 |
Total Money Market Funds
(Cost $23,055,945) | | 23,055,945 |
TOTAL INVESTMENTS — 100.0%
(Cost $1,041,920,867) | | | 1,023,375,352 |
Other Assets in Excess of
Liabilities — 0.0% | | | 164,847 |
| NET ASSETS — 100.0% | | | $1,023,540,199 |
Futures Contracts outstanding at December 31, 2023:
| Future Type | | Expiration Date | | Open Long
(Short) Contracts | | Notional
Market Value
of Contracts | | Value and
Unrealized
Appreciation
(Depreciation) |
| MSCI EAFE Index | | 03/2024 | | 2 | | $225,240 | | $ 8,442 |
| MSCI Emerging Markets | | 03/2024 | | 2 | | 103,370 | | 4,518 |
| S&P 500® E-Mini | | 03/2024 | | 2 | | 482,000 | | 17,841 |
| Ultra Long U.S. Treasury Bond | | 03/2024 | | 1 | | 133,594 | | 12,916 |
| Total Futures Contracts outstanding at December 31, 2023 | | | | | | $944,204 | | $43,717 |
See Notes to Financial Statements.
VALUATION HIERARCHY
The following is a summary of the inputs used, as of December 31, 2023, in valuing the Fund’s investments carried at fair value:
| | Total
Value | | Level 1
Quoted Prices | | Level 2
Other Significant
Observable Inputs | | Level 3
Significant
Unobservable Inputs |
| Assets: | | | | | | | |
| Investments in Securities: | | | | | | | |
| Money Market Funds | $ 23,055,945 | | $ 23,055,945 | | $ — | | $ — |
| Mutual Funds | 1,000,319,407 | | 1,000,319,407 | | — | | — |
| Total Assets - Investments in Securities | $1,023,375,352 | | $1,023,375,352 | | $ — | | $ — |
| Other Financial Instruments*** | | | | | | | |
| Futures Contracts | $ 43,717 | | $ 43,717 | | $ — | | $ — |
| Total Assets - Other Financial Instruments | $ 43,717 | | $ 43,717 | | $ — | | $ — |
| *** | Other financial instruments are derivative instruments, such as futures contracts, which are valued at the unrealized appreciation (depreciation) on the investment. Further details regarding the value of these investments can be found in the preceding "Futures Contracts outstanding" disclosure. |
See Notes to Financial Statements.
Aggressive Allocation Fund (Unaudited)
The Fund, through investments primarily in the Select Funds, combined a greater percentage of exposure to U.S. equity securities with a smaller percentage to non-U.S. equity securities. The Fund had a target asset allocation of 100% equity securities as of December 31, 2023.
As a fund of funds, the Fund’s performance was based on the performance of its underlying investments. The Investor Class of the Fund generated a return of 20.66%, net of fees, for the one-year period ended December 31, 2023. The two passive U.S. equity Funds, the Growth Equity Index Fund, which broadly tracks the U.S. large cap growth segment of the market, and the Value Equity Index Fund, which broadly tracks the U.S. large cap value segment of the market, were both positive contributors to performance. While both active U.S. equity Funds were additive to performance for the year, the Growth Equity Fund contributed more to the Fund’s overall performance than the Value Equity Fund. In 2023, the Investor Class of the Fund underperformed its composite benchmark of 60.00% Russell 3000® Index and 40% MSCI ACWI (All World Country Index) ex USA Index (20.66% versus 21.77%). The performance difference between the Fund and the composite benchmark was due to the performance differences of the underlying Select Funds versus their respective benchmarks in addition to exposure differences between the Select Funds’ benchmarks and the Fund’s composite benchmark. For more information on a Select Fund’s performance, please refer to that Select Fund’s section in this Annual Report.
Certain derivatives were utilized to provide market exposure for the cash positions held in the Fund. These derivative positions primarily included stock index futures. Overall, derivative exposure had a negative impact on Fund performance for the year.
The Fund attempted to achieve its objective, through investments primarily in the Select Funds, by combining a greater percentage of U.S. equity securities with a smaller percentage of non-U.S. equity securities. This Fund may be suitable for investors who have a long-term investment horizon, possess a relatively high tolerance for risk and want to diversify by adding an aggressive investment option that combines U.S. and non-U.S. equity securities. Securities of foreign issuers may be negatively impacted by political events, economic conditions or inefficient, illiquid or unregulated markets in foreign countries, and they also may be subject to inadequate regulatory or accounting standards, which may increase investment risk. Small company stocks are subject to greater risk than large company stocks due to more volatility and less liquidity. By investing in the Fund, you will also incur the expenses and risks of the underlying Select Funds. You may directly invest in the Select Funds. The Fund’s value will go up and down in response to changes in the share prices of the investments that it owns. It is possible to lose money by investing in the Fund.
At December 31, 2023, the portfolio holdings of the Fund, as a percentage of net assets, is shown in the following table. Portfolio holdings are subject to risk and may change at any time.
| | % |
| U.S. Equity Select Funds | 60.5 |
| Non-U.S. Equity Select Funds | 37.1 |
| Money Market Funds | 2.3 |
| | 99.9 |
| Average Annual Total Returns as of 12/31/23 | |
| | | Institutional Class* | | Investor Class* | | Benchmark** | |
| One Year | | 20.92% | | 20.66% | | 21.77% | |
| Five Year | | 10.59% | | 10.31% | | 11.94% | |
| Ten Year | | N/A | | 7.05% | | 8.43% | |
| Since Inception(1) | | 8.53% | | 6.30% | | 7.26% | |
| Inception Date | | 11/23/15 | | 08/27/01 | | | |
| Total Fund Operating Expenses (May 1, 2023 Prospectus)(2)# | | 0.84% | | 1.10% | | | |
| (1) | The Since Inception benchmark performance is based on the start date of August 27, 2001, which corresponds with the inception date of the Investor Class, the longest operating class of the Fund. |
| (2) | The Fund’s shareholders indirectly bear the expenses of the Institutional Class shares of the Select Funds in which the Fund invests. Current information regarding the Fund’s Operating Expenses can be found in the Financial Highlights. |
See Notes to Financial Statements.
Aggressive Allocation Fund (Unaudited)
#Net expense ratio
The performance data quoted represents past performance and does not guarantee future results. The performance data in the table and graph does not reflect the deduction of taxes that a shareholder would pay on Fund distributions or the redemption of Fund shares. Current performance may be lower or higher. Performance data current to the most recent month-end may be obtained at GuideStoneFunds.com. The investment return and principal value of an investment will fluctuate so that shares, when redeemed, may be worth more or less than their original cost.
The graph illustrates the results of a hypothetical $10,000 investment in the Investor Class of the Fund for the 10-year period from December 31, 2013 to December 31, 2023, with all dividends and capital gains reinvested, with the Fund’s composite benchmark index.
*These returns reflect investment advisory and shareholder servicing fee waivers, if applicable, during the reported time periods.
**The Benchmark Index shows how the Fund’s performance compares with the returns of an index constructed by the Adviser as a composite of various broad-based market indexes to reflect the market sectors in which the Fund invests. The percentage allocations to the broad-based market indexes comprising the Benchmark Index are intended to correspond to the Fund’s investment allocation, as represented by the Fund’s investment in the Select Funds. The Benchmark Index is 60% Russell 3000® Index and 40% MSCI ACWI (All Country World Index) ex USA Index. The weightings of the Benchmark Index were modified effective December 1, 2012, and therefore, the weightings of the underlying indexes were different than the current benchmark weightings prior to that date. Benchmark Index performance represents the Fund’s current benchmark linked with its previous benchmark.
Unlike a mutual fund, an index is not available for direct investment and the performance of an index assumes no taxes, transaction costs, management fees or other expenses.
See Notes to Financial Statements.
Aggressive Allocation Fund (Unaudited)
The blended returns are calculated by the Adviser (an affiliate of GuideStone Financial Resources) using end of day index level values licensed from MSCI (“MSCI Data”). For the avoidance of doubt, MSCI is not the benchmark “administrator” for, or a “contributor”, “submitter” or “supervised contributor” to, the blended returns, and the MSCI Data is not considered a “contribution” or “submission” in relation to the blended returns, as those terms may be defined in any rules, laws, regulations, legislation or international standards. MSCI Data is provided “AS IS” without warranty or liability and no copying or distribution is permitted. MSCI does not make any representation regarding the advisability of any investment or strategy and does not sponsor, promote, issue, sell or otherwise recommend or endorse any investment or strategy, including any financial products or strategies based on, tracking or otherwise utilizing any MSCI Data, models, analytics or other materials or information.
See Notes to Financial Statements.
AGGRESSIVE ALLOCATION FUND
| | | Shares | | Value |
| MUTUAL FUNDS — 97.6% |
GuideStone Impact Equity Fund
(Institutional Class)∞ | 3,446,512 | | $ 38,359,684 |
GuideStone Value Equity Index Fund
(Institutional Class)∞ | 5,937,685 | | 64,483,254 |
GuideStone Value Equity Fund
(Institutional Class)∞ | 10,595,588 | | 190,402,717 |
GuideStone Growth Equity Index Fund
(Institutional Class)∞ | 4,987,605 | | 64,240,351 |
GuideStone Growth Equity Fund
(Institutional Class)∞ | 7,990,600 | | 189,856,646 |
GuideStone Small Cap Equity Fund
(Institutional Class)∞ | 2,771,411 | | 47,363,417 |
GuideStone International Equity Fund
(Institutional Class)∞ | 18,249,366 | | 253,848,687 |
GuideStone Emerging Markets Equity Fund
(Institutional Class)∞ | 12,421,632 | | 110,800,957 |
Total Mutual Funds
(Cost $953,867,679) | | 959,355,713 |
| | | Shares | | Value |
| MONEY MARKET FUNDS — 2.3% |
GuideStone Money Market Fund, 5.28%
(Institutional Class)Ø∞ | 21,348,806 | | $ 21,348,806 |
| Northern Institutional U.S. Treasury Portfolio (Premier), 5.22%Ø | 895,285 | | 895,285 |
Total Money Market Funds
(Cost $22,244,091) | | 22,244,091 |
TOTAL INVESTMENTS — 99.9%
(Cost $976,111,770) | | | 981,599,804 |
Other Assets in Excess of
Liabilities — 0.1% | | | 1,104,033 |
| NET ASSETS — 100.0% | | | $982,703,837 |
Futures Contracts outstanding at December 31, 2023:
| Future Type | | Expiration Date | | Open Long
(Short) Contracts | | Notional
Market Value
of Contracts | | Value and
Unrealized
Appreciation
(Depreciation) |
| MSCI EAFE Index | | 03/2024 | | 6 | | $ 675,720 | | $15,585 |
| MSCI Emerging Markets | | 03/2024 | | 6 | | 310,110 | | 10,685 |
| S&P 500® E-Mini | | 03/2024 | | 6 | | 1,446,000 | | 21,025 |
| Total Futures Contracts outstanding at December 31, 2023 | | | | | | $2,431,830 | | $47,295 |
VALUATION HIERARCHY
The following is a summary of the inputs used, as of December 31, 2023, in valuing the Fund’s investments carried at fair value:
| | Total
Value | | Level 1
Quoted Prices | | Level 2
Other Significant
Observable Inputs | | Level 3
Significant
Unobservable Inputs |
| Assets: | | | | | | | |
| Investments in Securities: | | | | | | | |
| Money Market Funds | $ 22,244,091 | | $ 22,244,091 | | $ — | | $ — |
| Mutual Funds | 959,355,713 | | 959,355,713 | | — | | — |
| Total Assets - Investments in Securities | $981,599,804 | | $981,599,804 | | $ — | | $ — |
| Other Financial Instruments*** | | | | | | | |
| Futures Contracts | $ 47,295 | | $ 47,295 | | $ — | | $ — |
| Total Assets - Other Financial Instruments | $ 47,295 | | $ 47,295 | | $ — | | $ — |
| *** | Other financial instruments are derivative instruments, such as futures contracts, which are valued at the unrealized appreciation (depreciation) on the investment. Further details regarding the value of these investments can be found in the preceding "Futures Contracts outstanding" disclosure. |
See Notes to Financial Statements.
| STATEMENTS OF ASSETS AND LIABILITIES | December 31, 2023 |
| | Conservative
Allocation Fund | | Balanced
Allocation Fund | | Growth
Allocation Fund | | Aggressive
Allocation Fund |
| Assets | | | | | | | |
| Investments in securities of unaffiliated issuers, at value | $ 1,925,000 | | $ 1,600,000 | | $ 1,029,125 | | $ 895,285 |
| Investments in securities of affiliated issuers, at value | 422,946,917 | | 1,244,191,806 | | 1,022,346,227 | | 980,704,519 |
| Total investments, at value(1) | 424,871,917 | | 1,245,791,806 | | 1,023,375,352 | | 981,599,804 |
| Deposits with broker for futures contracts | — | | — | | 30,655 | | 83,799 |
| Receivables: | | | | | | | |
| Dividends from affiliated funds | 26,655 | | 125,543 | | 101,760 | | 97,303 |
| Investment securities sold | — | | — | | 1,300,000 | | 800,000 |
| Fund shares sold | 486,938 | | 124,152 | | 144,179 | | 420,819 |
| Prepaid expenses and other assets | 16,174 | | 24,277 | | 20,180 | | 18,548 |
| Total Assets | 425,401,684 | | 1,246,065,778 | | 1,024,972,126 | | 983,020,273 |
| Liabilities | | | | | | | |
| Cash Overdraft | 1,925,000 | | 1,491,000 | | — | | — |
| Payables: | | | | | | | |
| Investment securities purchased | — | | — | | 1,100,000 | | — |
| Fund shares redeemed | 522,731 | | 353,728 | | 29,753 | | 22,350 |
| Variation margin on futures contracts | — | | 1,664 | | 1,536 | | 3,015 |
| Accrued expenses: | | | | | | | |
| Investment advisory fees | 35,555 | | 103,810 | | 85,065 | | 81,477 |
| Shareholder servicing fees | 65,727 | | 196,931 | | 157,616 | | 153,928 |
| Director fees | 1,911 | | 3,278 | | 2,683 | | 2,448 |
| Other expenses | 47,402 | | 58,809 | | 55,274 | | 53,218 |
| Total Liabilities | 2,598,326 | | 2,209,220 | | 1,431,927 | | 316,436 |
| Net Assets | $422,803,358 | | $1,243,856,558 | | $1,023,540,199 | | $ 982,703,837 |
| Net Assets Consist of: | | | | | | | |
| Paid-in-capital | $449,244,621 | | $1,357,146,590 | | $1,078,569,264 | | $1,010,726,210 |
| Distributable earnings (loss) | (26,441,263) | | (113,290,032) | | (55,029,065) | | (28,022,373) |
| Net Assets | $422,803,358 | | $1,243,856,558 | | $1,023,540,199 | | $ 982,703,837 |
| Net Asset Value: | | | | | | | |
| $0.001 par value, unlimited shares authorized | | | | | | | |
| Net assets applicable to the Institutional Class | $110,242,968 | | $ 300,114,287 | | $ 264,645,287 | | $ 240,030,624 |
| Institutional shares outstanding | 10,217,865 | | 27,059,414 | | 22,627,482 | | 20,747,625 |
| Net asset value, offering and redemption price per Institutional share | $ 10.79 | | $ 11.09 | | $ 11.70 | | $ 11.57 |
| Net assets applicable to the Investor Class | $312,560,390 | | $ 943,742,271 | | $ 758,894,912 | | $ 742,673,213 |
| Investor shares outstanding | 28,975,405 | | 85,135,395 | | 64,965,567 | | 64,587,745 |
| Net asset value, offering and redemption price per Investor share | $ 10.79 | | $ 11.09 | | $ 11.68 | | $ 11.50 |
| | | | | | | |
| | | | | | | | |
| (1)Investments in securities of unaffiliated issuers, at cost | $ 1,925,000 | | $ 1,600,000 | | $ 1,029,125 | | $ 895,285 |
| Investments in securities of affiliated issuers, at cost | 425,715,499 | | 1,302,751,751 | | 1,040,891,742 | | 975,216,485 |
| Total investments, at cost | $427,640,499 | | $1,304,351,751 | | $1,041,920,867 | | $ 976,111,770 |
| | | | | | | | |
See Notes to Financial Statements.
| STATEMENTS OF OPERATIONS | For the Year Ended December 31, 2023 |
| | Conservative
Allocation Fund | | Balanced
Allocation Fund | | Growth
Allocation Fund | | Aggressive
Allocation Fund |
| Investment Income | | | | | | | |
| Dividends | $ 3,843 | | $ 11,176 | | $ 20,413 | | $ 6,703 |
| Income distributions received from affiliated funds | 12,437,539 | | 30,731,521 | | 20,221,329 | | 14,475,987 |
| Interest | — | | 15,147 | | 21,989 | | 30,066 |
| Total Investment Income | 12,441,382 | | 30,757,844 | | 20,263,731 | | 14,512,756 |
| Expenses | | | | | | | |
| Investment advisory fees | 424,621 | | 1,227,365 | | 982,430 | | 930,477 |
| Transfer agent fees: | | | | | | | |
| Institutional shares | 3,916 | | 4,072 | | 3,862 | | 3,770 |
| Investor shares | 27,526 | | 45,880 | | 36,718 | | 33,246 |
| Custodian fees | 14,039 | | 37,292 | | 33,753 | | 25,734 |
| Shareholder servicing fees: | | | | | | | |
| Investor shares | 805,862 | | 2,329,757 | | 1,826,345 | | 1,753,095 |
| Accounting and administration fees | 19,336 | | 46,364 | | 36,668 | | 34,356 |
| Professional fees | 97,409 | | 98,012 | | 97,810 | | 98,512 |
| Blue sky fees: | | | | | | | |
| Institutional shares | 13,834 | | 14,834 | | 14,833 | | 14,834 |
| Investor shares | 14,834 | | 16,017 | | 16,394 | | 14,894 |
| Shareholder reporting fees: | | | | | | | |
| Institutional shares | 801 | | 1,743 | | 738 | | 654 |
| Investor shares | 20,253 | | 34,364 | | 28,640 | | 27,837 |
| Directors expenses | 10,907 | | 18,392 | | 14,969 | | 13,540 |
| Line of credit facility fees | 1,678 | | 4,844 | | 3,901 | | 3,687 |
| Other expenses | 51,178 | | 85,093 | | 72,673 | | 68,057 |
| Total Expenses | 1,506,194 | | 3,964,029 | | 3,169,734 | | 3,022,693 |
| Net Investment Income | 10,935,188 | | 26,793,815 | | 17,093,997 | | 11,490,063 |
| Realized and Unrealized Gain (Loss) | | | | | | | |
| Capital gain distributions received from affiliated funds | 3,647,465 | | 14,837,615 | | 18,279,446 | | 21,859,814 |
| Net realized loss on investment securities of affiliated issuers | (19,316,780) | | (33,308,229) | | (27,042,873) | | (25,293,949) |
| Net realized loss on futures transactions | (448) | | (134,930) | | (208,420) | | (176,002) |
| Net realized loss | (15,669,763) | | (18,605,544) | | (8,971,847) | | (3,610,137) |
| Change in unrealized appreciation (depreciation) on investment securities of affiliated issuers | 40,741,274 | | 134,561,686 | | 143,620,878 | | 167,490,333 |
| Change in unrealized appreciation (depreciation) on futures | — | | 8,974 | | 43,717 | | 47,295 |
| Net change in unrealized appreciation (depreciation) | 40,741,274 | | 134,570,660 | | 143,664,595 | | 167,537,628 |
| Net Realized and Unrealized Gain | 25,071,511 | | 115,965,116 | | 134,692,748 | | 163,927,491 |
| Net Increase in Net Assets Resulting from Operations | $ 36,006,699 | | $142,758,931 | | $151,786,745 | | $175,417,554 |
See Notes to Financial Statements.
| STATEMENTS OF CHANGES IN NET ASSETS |
| | Conservative Allocation Fund | | Balanced Allocation Fund |
| | For the Year Ended | | For the Year Ended |
| | 12/31/23 | | 12/31/22 | | 12/31/23 | | 12/31/22 |
| | | | | | | | |
| Operations: | | | | | | | |
| Net investment income | $ 10,935,188 | | $ 5,725,695 | | $ 26,793,815 | | $ 14,261,131 |
| Net realized gain (loss) on investment securities and futures transactions | (15,669,763) | | 3,287,510 | | (18,605,544) | | 17,536,938 |
| Net change in unrealized appreciation (depreciation) on investment securities and futures | 40,741,274 | | (66,147,252) | | 134,570,660 | | (293,192,262) |
| Net increase (decrease) in net assets resulting from operations | 36,006,699 | | (57,134,047) | | 142,758,931 | | (261,394,193) |
| Distributions to Shareholders: | | | | | | | |
| Distributions paid | | | | | | | |
| Institutional shares | (4,277,511) | | (4,771,114) | | (12,541,679) | | (19,961,623) |
| Investor shares | (11,351,263) | | (15,223,809) | | (37,220,208) | | (61,718,578) |
| Return of capital | | | | | | | |
| Institutional shares | — | | — | | — | | — |
| Investor shares | — | | — | | — | | — |
| Total distributions | (15,628,774) | | (19,994,923) | | (49,761,887) | | (81,680,201) |
| Capital Share Transactions: | | | | | | | |
| Proceeds from shares sold | | | | | | | |
| Institutional shares | 21,908,281 | | 31,328,624 | | 42,078,111 | | 53,552,809 |
| Investor shares | 13,505,177 | | 30,943,787 | | 26,054,756 | | 27,574,647 |
| Reinvestment of dividends and distributions | | | | | | | |
| Institutional shares | 4,256,561 | | 4,744,242 | | 12,494,732 | | 19,589,091 |
| Investor shares | 11,309,241 | | 15,183,685 | | 37,181,925 | | 61,672,995 |
| Total proceeds from shares sold and reinvested | 50,979,260 | | 82,200,338 | | 117,809,524 | | 162,389,542 |
| Value of shares redeemed | | | | | | | |
| Institutional shares | (19,322,444) | | (64,218,095) | | (67,330,991) | | (167,853,847) |
| Investor shares | (62,216,772) | | (77,874,555) | | (118,414,377) | | (144,538,785) |
| Total value of shares redeemed | (81,539,216) | | (142,092,650) | | (185,745,368) | | (312,392,632) |
| Net decrease from capital share transactions(1) | (30,559,956) | | (59,892,312) | | (67,935,844) | | (150,003,090) |
| Total increase (decrease) in net assets | (10,182,031) | | (137,021,282) | | 25,061,200 | | (493,077,484) |
| Net Assets: | | | | | | | |
| Beginning of Year | 432,985,389 | | 570,006,671 | | 1,218,795,358 | | 1,711,872,842 |
| End of Year | $422,803,358 | | $ 432,985,389 | | $1,243,856,558 | | $1,218,795,358 |
| |
| (1) | See Note 6 in Notes to Financial Statements. |
See Notes to Financial Statements.
| Growth Allocation Fund | | Aggressive Allocation Fund |
| For the Year Ended | | For the Year Ended |
| 12/31/23 | | 12/31/22 | | 12/31/23 | | 12/31/22 |
| | | | | | | |
| | | | | | | |
| $ 17,093,997 | | $ 10,206,764 | | $ 11,490,063 | | $ 9,148,197 |
| (8,971,847) | | (3,306,480) | | (3,610,137) | | 3,431,441 |
| 143,664,595 | | (256,698,812) | | 167,537,628 | | (250,613,254) |
| 151,786,745 | | (249,798,528) | | 175,417,554 | | (238,033,616) |
| | | | | | | |
| | | | | | | |
| (9,249,048) | | (21,105,665) | | (8,689,299) | | (25,308,110) |
| (24,756,120) | | (61,854,947) | | (25,331,224) | | (77,924,492) |
| | | | | | | |
| — | | — | | — | | — |
| — | | — | | — | | — |
| (34,005,168) | | (82,960,612) | | (34,020,523) | | (103,232,602) |
| | | | | | | |
| | | | | | | |
| 42,852,587 | | 42,584,905 | | 30,251,056 | | 25,773,583 |
| 21,259,902 | | 21,081,035 | | 18,768,298 | | 15,322,598 |
| | | | | | | |
| 9,240,768 | | 20,833,242 | | 8,687,669 | | 25,292,613 |
| 24,737,886 | | 61,789,216 | | 25,328,267 | | 77,918,252 |
| 98,091,143 | | 146,288,398 | | 83,035,290 | | 144,307,046 |
| | | | | | | |
| (54,622,641) | | (163,968,569) | | (47,252,267) | | (77,809,334) |
| (84,350,186) | | (112,149,457) | | (73,223,867) | | (82,646,759) |
| (138,972,827) | | (276,118,026) | | (120,476,134) | | (160,456,093) |
| (40,881,684) | | (129,829,628) | | (37,440,844) | | (16,149,047) |
| 76,899,893 | | (462,588,768) | | 103,956,187 | | (357,415,265) |
| | | | | | | |
| 946,640,306 | | 1,409,229,074 | | 878,747,650 | | 1,236,162,915 |
| $1,023,540,199 | | $ 946,640,306 | | $ 982,703,837 | | $ 878,747,650 |
See Notes to Financial Statements.
| For a Share Outstanding For the Years Ending December 31, unless otherwise indicated | | | | | | | | | | Ratios to Average Net Assets | |
| | | Net Asset
Value,
Beginning
of Year | Net Investment
Income#(1) | Realized
and
Unrealized
Gain
(Loss) on
Investments | | Total Income
From Investment
Operations | Dividends
from Net
Investment
Income | Distributions
from Net
Realized
Capital
Gains | Total
Distributions
Paid | Net Asset
Value,
End of
Year | | Total
Return | | Net Assets,
End of Year
(000) | | Expenses,
Net(2) | | Expenses,
Gross(2) | | Investment
Income,
Net(1) | Portfolio
Turnover
Rate |
| Conservative Allocation Fund | |
| Institutional Class | |
| 2023 | | $10.29 | $0.30 | $ 0.63 | | $ 0.93 | $(0.36) | $(0.07) | $(0.43) | $10.79 | | 9.08% | | $ 110,243 | | 0.16% | | 0.16% | | 2.85% | 43% |
| 2022 | | 11.99 | 0.14 | (1.33) | | (1.19) | (0.19) | (0.32) | (0.51) | 10.29 | | (9.93) | | 98,566 | | 0.16 | | 0.16 | | 1.28 | 15 |
| 2021 | | 11.97 | 0.11 | 0.38 | | 0.49 | (0.22) | (0.25) | (0.47) | 11.99 | | 4.07 | | 146,436 | | 0.15 | | 0.15 | | 0.92 | 6 |
| 2020 | | 11.52 | 0.16 | 0.67 | | 0.83 | (0.20) | (0.18) | (0.38) | 11.97 | | 7.17 | | 135,681 | | 0.15 | | 0.15 | | 1.35 | 15 |
| 2019 | | 10.87 | 0.25 | 0.95 | | 1.20 | (0.27) | (0.28) | (0.55) | 11.52 | | 11.01 | | 111,611 | | 0.13 | | 0.13 | | 2.19 | 7 |
| Investor Class | |
| 2023 | | $10.29 | $0.27 | $ 0.63 | | $ 0.90 | $(0.33) | $(0.07) | $(0.40) | $10.79 | | 8.80% | | $ 312,560 | | 0.41% | | 0.41% | | 2.49% | 43% |
| 2022 | | 11.99 | 0.13 | (1.35) | | (1.22) | (0.16) | (0.32) | (0.48) | 10.29 | | (10.17) | | 334,419 | | 0.41 | | 0.41 | | 1.14 | 15 |
| 2021 | | 11.97 | 0.08 | 0.38 | | 0.46 | (0.19) | (0.25) | (0.44) | 11.99 | | 3.81 | | 423,571 | | 0.40 | | 0.40 | | 0.65 | 6 |
| 2020 | | 11.52 | 0.13 | 0.67 | | 0.80 | (0.17) | (0.18) | (0.35) | 11.97 | | 6.92 | | 415,174 | | 0.40 | | 0.40 | | 1.09 | 15 |
| 2019 | | 10.87 | 0.21 | 0.96 | | 1.17 | (0.24) | (0.28) | (0.52) | 11.52 | | 10.73 | | 415,743 | | 0.39 | | 0.39 | | 1.86 | 7 |
| | |
| Balanced Allocation Fund | |
| Institutional Class | |
| 2023 | | $10.28 | $0.26 | $ 1.02 | | $ 1.28 | $(0.32) | $(0.15) | $(0.47) | $11.09 | | 12.60% | | $ 300,115 | | 0.13% | | 0.13% | | 2.38% | 14% |
| 2022 | | 13.03 | 0.13 | (2.14) | | (2.01) | (0.17) | (0.57) | (0.74) | 10.28 | | (15.34) | | 290,280 | | 0.13 | | 0.13 | | 1.11 | 18 |
| 2021 | | 12.88 | 0.15 | 0.77 | | 0.92 | (0.34) | (0.43) | (0.77) | 13.03 | | 7.17 | | 481,118 | | 0.12 | | 0.12 | | 1.12 | 19 |
| 2020 | | 12.19 | 0.15 | 1.18 | | 1.33 | (0.23) | (0.41) | (0.64) | 12.88 | | 11.00 | | 450,122 | | 0.12 | | 0.12 | | 1.21 | 15 |
| 2019 | | 11.07 | 0.26 | 1.69 | | 1.95 | (0.29) | (0.54) | (0.83) | 12.19 | | 17.62 | | 377,832 | | 0.12 | | 0.12 | | 2.12 | 9 |
| Investor Class | |
| 2023 | | $10.28 | $0.23 | $ 1.03 | | $ 1.26 | $(0.30) | $(0.15) | $(0.45) | $11.09 | | 12.32% | | $ 943,742 | | 0.38% | | 0.38% | | 2.12% | 14% |
| 2022 | | 13.02 | 0.11 | (2.14) | | (2.03) | (0.14) | (0.57) | (0.71) | 10.28 | | (15.58) | | 928,515 | | 0.38 | | 0.38 | | 1.01 | 18 |
| 2021 | | 12.87 | 0.11 | 0.78 | | 0.89 | (0.31) | (0.43) | (0.74) | 13.02 | | 6.92 | | 1,230,755 | | 0.37 | | 0.37 | | 0.85 | 19 |
| 2020 | | 12.19 | 0.11 | 1.18 | | 1.29 | (0.20) | (0.41) | (0.61) | 12.87 | | 10.66 | | 1,219,621 | | 0.37 | | 0.37 | | 0.93 | 15 |
| 2019 | | 11.07 | 0.22 | 1.70 | | 1.92 | (0.26) | (0.54) | (0.80) | 12.19 | | 17.33 | | 1,237,755 | | 0.38 | | 0.38 | | 1.79 | 9 |
| | | | | | | | | | | | | | | | | | | | | | |
| # | Calculated using the average shares outstanding method. |
| (1) | Recognition of net investment income by the Fund is affected by the timing of the declaration of dividends by the underlying investment companies in which the Fund invests. |
| (2) | Does not include expenses of the investment companies in which the Fund invests. Estimated acquired fund fees and expenses (i.e., the fees and expenses incurred by the underlying funds) for the Conservative Allocation Fund, Balanced Allocation Fund, Growth Allocation Fund and Aggressive Allocation Fund were 0.50%, 0.59%, 0.66% and 0.71%, respectively for 2023. These acquired fund fees and expenses impact the net asset value of the underlying funds in which each Fund invests, and therefore the effect of the acquired fund fees and expenses is reflected in each Fund's total return. |
See Notes to Financial Statements.
| For a Share Outstanding For the Years Ending December 31, unless otherwise indicated | | | | | | | | | | Ratios to Average Net Assets | |
| | | Net Asset
Value,
Beginning
of Year | Net Investment
Income#(1) | Realized
and
Unrealized
Gain
(Loss) on
Investments | | Total Income
From Investment
Operations | Dividends
from Net
Investment
Income | Distributions
from Net
Realized
Capital
Gains | Total
Distributions
Paid | Net Asset
Value,
End of
Year | | Total
Return | | Net Assets,
End of Year
(000) | | Expenses,
Net(2) | | Expenses,
Gross(2) | | Investment
Income,
Net(1) | Portfolio
Turnover
Rate |
| Growth Allocation Fund | |
| Institutional Class | |
| 2023 | | $10.38 | $0.22 | $ 1.52 | | $ 1.74 | $(0.42) | $ — | $(0.42) | $11.70 | | 16.82% | | $264,645 | | 0.13% | | 0.13% | | 1.94% | 15% |
| 2022 | | 13.83 | 0.11 | (2.55) | | (2.44) | (0.03) | (0.98) | (1.01) | 10.38 | | (17.73) | | 236,709 | | 0.13 | | 0.13 | | 0.96 | 22 |
| 2021 | | 13.25 | 0.14 | 1.42 | | 1.56 | (0.40) | (0.58) | (0.98) | 13.83 | | 11.82 | | 440,338 | | 0.12 | | 0.12 | | 0.96 | 17 |
| 2020 | | 12.31 | 0.11 | 1.51 | | 1.62 | (0.18) | (0.50) | (0.68) | 13.25 | | 13.30 | | 404,479 | | 0.13 | | 0.13 | | 0.90 | 15 |
| 2019 | | 11.02 | 0.23 | 2.25 | | 2.48 | (0.22) | (0.97) | (1.19) | 12.31 | | 22.62 | | 312,347 | | 0.12 | | 0.12 | | 1.86 | 10 |
| Investor Class | |
| 2023 | | $10.36 | $0.19 | $ 1.52 | | $ 1.71 | $(0.39) | $ — | $(0.39) | $11.68 | | 16.57% | | $758,895 | | 0.39% | | 0.39% | | 1.67% | 15% |
| 2022 | | 13.82 | 0.11 | (2.59) | | (2.48) | (—)† | (0.98) | (0.98) | 10.36 | | (18.03) | | 709,931 | | 0.39 | | 0.39 | | 0.93 | 22 |
| 2021 | | 13.24 | 0.10 | 1.43 | | 1.53 | (0.37) | (0.58) | (0.95) | 13.82 | | 11.56 | | 968,891 | | 0.38 | | 0.38 | | 0.71 | 17 |
| 2020 | | 12.31 | 0.07 | 1.51 | | 1.58 | (0.15) | (0.50) | (0.65) | 13.24 | | 12.96 | | 919,826 | | 0.38 | | 0.38 | | 0.61 | 15 |
| 2019 | | 11.02 | 0.19 | 2.26 | | 2.45 | (0.19) | (0.97) | (1.16) | 12.31 | | 22.33 | | 935,085 | | 0.38 | | 0.38 | | 1.51 | 10 |
| | |
| Aggressive Allocation Fund | |
| Institutional Class | |
| 2023 | | $ 9.93 | $0.15 | $ 1.92 | | $ 2.07 | $(0.34) | $(0.09) | $(0.43) | $11.57 | | 20.92% | | $240,031 | | 0.13% | | 0.13% | | 1.42% | 15% |
| 2022 | | 13.92 | 0.12 | (2.78) | | (2.66) | (0.03) | (1.30) | (1.33) | 9.93 | | (19.29) | | 213,158 | | 0.13 | | 0.13 | | 1.04 | 30 |
| 2021 | | 13.06 | 0.12 | 1.85 | | 1.97 | (0.46) | (0.65) | (1.11) | 13.92 | | 15.09 | | 331,642 | | 0.13 | | 0.13 | | 0.81 | 12 |
| 2020 | | 12.00 | 0.07 | 1.80 | | 1.87 | (0.11) | (0.70) | (0.81) | 13.06 | | 15.75 | | 290,969 | | 0.13 | | 0.13 | | 0.59 | 13 |
| 2019 | | 10.61 | 0.18 | 2.69 | | 2.87 | (0.15) | (1.33) | (1.48) | 12.00 | | 27.25 | | 239,577 | | 0.12 | | 0.12 | | 1.48 | 9 |
| Investor Class | |
| 2023 | | $ 9.87 | $0.13 | $ 1.90 | | $ 2.03 | $(0.31) | $(0.09) | $(0.40) | $11.50 | | 20.66% | | $742,673 | | 0.39% | | 0.39% | | 1.18% | 15% |
| 2022 | | 13.86 | 0.10 | (2.78) | | (2.68) | (—)† | (1.31) | (1.31) | 9.87 | | (19.57) | | 665,590 | | 0.39 | | 0.39 | | 0.90 | 30 |
| 2021 | | 13.00 | 0.08 | 1.85 | | 1.93 | (0.42) | (0.65) | (1.07) | 13.86 | | 14.89 | | 904,521 | | 0.38 | | 0.38 | | 0.54 | 12 |
| 2020 | | 11.95 | 0.03 | 1.80 | | 1.83 | (0.08) | (0.70) | (0.78) | 13.00 | | 15.49 | | 849,922 | | 0.38 | | 0.38 | | 0.30 | 13 |
| 2019 | | 10.58 | 0.14 | 2.68 | | 2.82 | (0.12) | (1.33) | (1.45) | 11.95 | | 26.86 | | 840,397 | | 0.38 | | 0.38 | | 1.12 | 9 |
| | | | | | | | | | | | | | | | | | | | | | |
| # | Calculated using the average shares outstanding method. |
| † | Amount represents less than $0.005 per share. |
| (1) | Recognition of net investment income by the Fund is affected by the timing of the declaration of dividends by the underlying investment companies in which the Fund invests. |
| (2) | Does not include expenses of the investment companies in which the Fund invests. Estimated acquired fund fees and expenses (i.e., the fees and expenses incurred by the underlying funds) for the Conservative Allocation Fund, Balanced Allocation Fund, Growth Allocation Fund and Aggressive Allocation Fund were 0.50%, 0.59%, 0.66% and 0.71%, respectively for 2023. These acquired fund fees and expenses impact the net asset value of the underlying funds in which each Fund invests, and therefore the effect of the acquired fund fees and expenses is reflected in each Fund's total return. |
See Notes to Financial Statements.
Money Market Fund (Unaudited)
The Federal Reserve (“Fed”) increased the target range of the federal funds rate to 5.25% – 5.50% in 2023. Money market fund investors were generally able to preserve capital for the year and generate a positive return net of fees and expenses.
The Fed’s monetary policy in response to persistent inflation moved rates higher and provided the opportunity for positive returns for the year. At the end of 2023, the three-month U.S. Treasury Bill was yielding 5.35%.
The Fund is a government money market fund and invested no less than 99.5% of its total assets in eligible government money market fund securities. Throughout 2023, the Fund maintained a stable per share price of $1.00, while declaring dividends daily and paying them monthly based on its daily value. The Investor Class of the Fund returned 4.73%, net of fees, for the one-year period ended December 31, 2023, as compared to a 5.14% return for its benchmark, the Bloomberg 1-3 Month US Treasury Bill Index. The Fed increased the federal funds rate again in 2023, and the opportunity to find income generating assets in the cash markets continued. At year end, the Fund’s weighted average maturity was 37 days, compared to 14 days at the end of 2022. In a rising rate environment, the management of the Fund remained true and steadfast to its investment objective to maximize current income to the extent consistent with the preservation of capital and liquidity and the maintenance of a stable per share price of $1.00.
This Fund may be suitable for investors who have a short-term investment horizon, seek to maintain a stable dollar value for their investment and can accept a long-term rate of return that may be lower than other fixed income and equity investments.
At December 31, 2023, the portfolio holdings of the Fund, as a percentage of net assets, is shown in the following table. Portfolio holdings are subject to risk and may change at any time.
| | % |
| Repurchase Agreements | 46.1 |
| U.S. Treasury Obligations | 30.1 |
| Agency Obligations | 25.3 |
| | 101.5 |
| Average Annual Total Returns as of 12/31/23 | |
| | | Institutional Class* | | Investor Class* | | Benchmark** | |
| One Year | | 5.01% | | 4.73% | | 5.14% | |
| Five Year | | 1.80% | | 1.62% | | 1.87% | |
| Ten Year | | 1.18% | | 1.01% | | 1.23% | |
| Since Inception | | 1.49% | | 1.35% | | 1.43% | |
| Inception Date | | 08/27/01 | | 08/27/01 | | | |
| Total Fund Operating Expenses (May 1, 2023 Prospectus)(1)# | | 0.14% | | 0.41% | | | |
| Yield as of 12/31/23(2) | |
| | | Institutional Class* | | Investor Class* | |
| 7-Day Annualized Yield (Net) | | 5.28% | | 5.04% | |
| 7-Day Annualized Yield (Gross) | | 5.44% | | 5.44% | |
| (1) | Current information regarding the Fund’s Operating Expenses can be found in the Financial Highlights. |
| (2) | Yield for the Money Market Fund represents the annualization of the Fund’s declared dividends over the period indicated, excluding capital gains distributions. The yield more closely reflects the current earnings of the Fund than the total return. Gross Yield reflects the yield without expenses. |
#Net expense ratio
See Notes to Financial Statements.
Money Market Fund (Unaudited)
The performance data quoted represents past performance and does not guarantee future results. The performance data in the table and graph does not reflect the deduction of taxes that a shareholder would pay on Fund distributions or the redemption of Fund shares. Current performance may be lower or higher. Performance data current to the most recent month-end may be obtained at GuideStoneFunds.com. The investment return and principal value of an investment will fluctuate so that shares, when redeemed, may be worth more or less than their original cost. The yield for the Money Market Fund represents annualization of the Fund’s declared dividends over the period indicated, excluding capital gains distributions. The 7-day annualized yield more closely reflects the current earnings of the Fund than the total return.
The graph illustrates the results of a hypothetical $10,000 investment in the Investor Class of the Fund for the 10-year period from December 31, 2013 to December 31, 2023, with all dividends and capital gains reinvested, with the Bloomberg 1-3 Month US Treasury Bill Index.
*These returns reflect investment advisory and shareholder servicing fee waivers, if applicable, during the reported time periods.
Unlike a mutual fund, an index is not available for direct investment and the performance of an index assumes no taxes, transaction costs, management fees or other expenses.
See Notes to Financial Statements.
| | | Par | | Value |
| AGENCY OBLIGATIONS — 25.3% |
| Federal Farm Credit Bank Discount Notes | | | | |
| 5.18%, 09/19/24 | $ 3,905,000 | | $ 3,757,786 |
| Federal Farm Credit Banks Funding Corporation | | | | |
| (Floating, U.S. SOFR + 0.06%), 5.45%, 01/10/24† | 1,660,000 | | 1,660,000 |
| (Floating, U.S. SOFR + 0.05%), 5.44%, 02/20/24† | 13,140,000 | | 13,140,000 |
| (Floating, U.S. SOFR + 0.05%), 5.44%, 05/09/24† | 7,680,000 | | 7,680,000 |
| (Floating, U.S. SOFR + 0.10%), 5.49%, 08/01/24† | 3,425,000 | | 3,425,000 |
| (Floating, U.S. SOFR + 0.09%), 5.48%, 08/26/24† | 16,270,000 | | 16,270,000 |
| (Floating, U.S. SOFR + 0.09%), 5.48%, 09/23/24† | 5,070,000 | | 5,070,000 |
| (Floating, U.S. SOFR + 0.14%), 5.53%, 11/07/24† | 8,840,000 | | 8,840,000 |
| 5.13%, 12/04/24 | 2,294,000 | | 2,293,144 |
| (Floating, U.S. SOFR + 0.14%), 5.53%, 05/27/25† | 10,095,000 | | 10,095,000 |
| Federal Home Loan Bank | | | | |
| (Floating, U.S. SOFR + 0.03%), 5.43%, 01/03/24† | 16,800,000 | | 16,800,000 |
| (Floating, U.S. SOFR + 0.03%), 5.41%, 01/04/24† | 8,100,000 | | 8,100,000 |
| (Floating, U.S. SOFR + 0.04%), 5.43%, 01/19/24† | 25,305,000 | | 25,305,000 |
| (Floating, U.S. SOFR + 0.04%), 5.43%, 01/23/24† | 9,675,000 | | 9,675,000 |
| (Floating, U.S. SOFR + 0.08%), 5.47%, 01/24/24† | 23,000,000 | | 23,000,000 |
| (Floating, U.S. SOFR + 0.04%), 5.43%, 01/26/24† | 21,395,000 | | 21,395,000 |
| (Floating, U.S. SOFR + 0.04%), 5.43%, 01/29/24† | 6,900,000 | | 6,900,000 |
| (Floating, U.S. SOFR + 0.04%), 5.43%, 02/05/24† | 5,900,000 | | 5,900,055 |
| (Floating, U.S. SOFR + 0.04%), 5.43%, 02/20/24† | 43,090,000 | | 43,090,000 |
| 5.45%, 03/08/24 | 5,070,000 | | 5,069,414 |
| (Floating, U.S. SOFR + 0.05%), 5.44%, 03/25/24† | 12,900,000 | | 12,900,000 |
| (Floating, U.S. SOFR + 0.07%), 5.46%, 07/12/24† | 2,310,000 | | 2,310,000 |
| (Floating, U.S. SOFR + 0.11%), 5.50%, 10/28/24† | 6,600,000 | | 6,600,088 |
| 5.53%, 01/08/25 | 6,205,000 | | 6,205,000 |
| (Floating, U.S. SOFR + 0.16%), 5.55%, 07/21/25† | 12,830,000 | | 12,830,000 |
| (Floating, U.S. SOFR + 0.20%), 5.59%, 11/13/25† | 9,690,000 | | 9,690,000 |
| Federal Home Loan Bank Discount Notes | | | | |
| 5.26%, 01/04/24 | 9,045,000 | | 9,041,035 |
| | | Par | | Value |
| 4.64%, 02/02/24 | $ 5,265,000 | | $ 5,243,098 |
| 5.24%, 02/05/24 | 837,000 | | 832,732 |
| 4.94%, 02/09/24 | 22,035,000 | | 21,916,687 |
| 5.29%, 02/15/24 | 4,740,000 | | 4,708,479 |
| 5.28%, 03/01/24 | 2,845,000 | | 2,819,798 |
| 5.30%, 04/15/24 | 5,210,000 | | 5,129,462 |
| 5.25%, 06/10/24 | 27,705,000 | | 27,054,510 |
| 5.24%, 06/17/24 | 1,400,000 | | 1,365,733 |
| 5.06%, 08/02/24 | 4,100,000 | | 3,976,676 |
| 4.85%, 09/03/24 | 1,737,000 | | 1,679,492 |
| 5.02%, 11/01/24 | 15,428,000 | | 14,771,839 |
| 4.91%, 11/04/24 | 1,746,000 | | 1,672,654 |
| Federal National Mortgage Association | | | | |
| 2.63%, 09/06/24 | 5,935,000 | | 5,822,512 |
Total Agency Obligations
(Cost $394,035,194) | | | 394,035,194 |
| U.S. TREASURY OBLIGATIONS — 30.1% |
| U.S. Treasury Bills | | | | |
| 5.17%, 01/04/24Ω | 11,155,000 | | 11,150,110 |
| 5.21%, 01/11/24Ω | 14,985,000 | | 14,963,045 |
| 5.09%, 01/18/24Ω | 71,512,000 | | 71,332,896 |
| 5.04%, 01/25/24Ω | 2,458,000 | | 2,449,340 |
| 4.80%, 01/30/24Ω | 23,395,000 | | 23,295,918 |
| 5.09%, 02/06/24Ω | 9,090,000 | | 9,041,369 |
| 5.22%, 02/08/24Ω | 1,914,000 | | 1,903,333 |
| 5.10%, 02/13/24Ω | 18,335,000 | | 18,217,572 |
| 5.20%, 02/22/24Ω | 2,843,000 | | 2,821,287 |
| 5.26%, 02/29/24Ω | 6,089,400 | | 6,036,008 |
| 5.08%, 03/05/24Ω | 3,125,000 | | 3,095,333 |
| 5.00%, 03/19/24Ω | 37,815,000 | | 37,384,445 |
| 5.25%, 04/04/24Ω | 16,860,000 | | 16,624,915 |
| 5.05%, 04/16/24Ω | 4,315,000 | | 4,248,704 |
| 5.25%, 04/18/24Ω | 21,850,000 | | 21,500,291 |
| 5.17%, 05/09/24Ω | 28,977,000 | | 28,430,832 |
| 5.18%, 05/16/24Ω | 35,270,000 | | 34,567,813 |
| 5.12%, 05/23/24Ω | 43,335,000 | | 42,434,727 |
| 4.96%, 06/13/24Ω | 7,764,000 | | 7,587,773 |
| 5.05%, 06/20/24Ω | 23,995,700 | | 23,411,140 |
| 5.14%, 09/05/24Ω | 5,265,000 | | 5,078,209 |
| 5.08%, 10/31/24Ω | 2,699,000 | | 2,582,934 |
| | | | | 388,157,994 |
| U.S. Treasury Floating Rate Notes | | | | |
| (Floating, U.S. Treasury 3M Bill MMY - 0.08%), 5.24%, 04/30/24† | 15,920,000 | | 15,917,162 |
| (Floating, U.S. Treasury 3M Bill MMY + 0.14%), 5.46%, 10/31/24† | 11,970,000 | | 11,977,484 |
| (Floating, U.S. Treasury 3M Bill MMY + 0.13%), 5.44%, 07/31/25† | 32,140,000 | | 32,135,267 |
See Notes to Financial Statements.
| | | Par | | Value |
| (Floating, U.S. Treasury 3M Bill MMY + 0.17%), 5.49%, 10/31/25† | $ 21,865,000 | | $ 21,860,735 |
| | | | | 81,890,648 |
Total U.S. Treasury Obligations
(Cost $470,048,642) | | | 470,048,642 |
| REPURCHASE AGREEMENTS — 46.1% |
| Bank of Nova Scotia | | | |
| 5.33% (dated 12/29/23, due 01/02/24, repurchase price $80,047,378, collateralized by U.S. Treasury Bills, U.S. Treasury Bonds and U.S. Treasury Notes, 0.000% to 4.625%, due 02/06/24 to 02/15/53, total market value $81,648,380) | 80,000,000 | | 80,000,000 |
| BNP Paribas | | | |
| 5.34% (dated 12/29/23, due 01/02/24, repurchase price $51,030,260, collateralized by U.S. Treasury Bills, U.S. Treasury Bonds and U.S. Treasury Notes, 0.000% to 5.256%, due 04/30/24 to 08/15/47, total market value $52,020,000) | 51,000,000 | | 51,000,000 |
| | | | |
| 5.35% (dated 12/29/23, due 01/02/24, repurchase price $15,008,917, collateralized by Federal National Mortgage Association, Government National Mortgage Association and U.S. Treasury Bills, 0.000% to 7.000%, due 02/22/24 to 11/20/53, total market value $15,300,038) | 15,000,000 | | 15,000,000 |
| Citigroup Global Markets, Inc. | | | |
| 5.35% (dated 12/29/23, due 01/02/24, repurchase price $70,041,611, collateralized by U.S. Treasury Notes, 0.250%, due 05/31/25, total market value $71,400,049) | 70,000,000 | | 70,000,000 |
| Goldman Sachs & Co. | | | |
| 5.35% (dated 12/29/23, due 01/02/24, repurchase price $105,062,417, collateralized by U.S. Treasury Notes, 3.875%, due 09/30/29, total market value $107,100,054) | 105,000,000 | | 105,000,000 |
| | | Par | | Value |
| Mitsubishi UFJ Securities USA, Inc. | | | |
| 5.35% (dated 12/29/23, due 01/02/24, repurchase price $80,047,556, collateralized by Federal Home Loan Mortgage Corporation, 2.000% to 5.000%, due 05/01/25 to 02/01/53, total market value $82,400,000) | $80,000,000 | | $ 80,000,000 |
| Mizuho Securities USA, Inc. | | | |
| 5.35% (dated 12/29/23, due 01/02/24, repurchase price $85,050,528, collateralized by U.S. Treasury Bonds, 2.250% to 3.625%, due 02/15/52 to 02/15/53, total market value $86,700,086) | 85,000,000 | | 85,000,000 |
| Morgan Stanley | | | |
| 5.33% (dated 12/29/23, due 01/02/24, repurchase price $80,047,378, collateralized by U.S. Treasury Bonds, 0.000% to 4.375%, due 02/15/38 to 08/15/53, total market value $81,600,017) | 80,000,000 | | 80,000,000 |
| Natixis SA | | | |
| 5.33% (dated 12/29/23, due 01/02/24, repurchase price $73,043,232, collateralized by U.S. Treasury Bonds and U.S. Treasury Notes, 0.125% to 4.875%, due 11/30/25 to 11/15/53, total market value $74,460,018) | 73,000,000 | | 73,000,000 |
| TD Securities USA LLC | | | |
| 5.35% (dated 12/29/23, due 01/02/24, repurchase price $80,047,556, collateralized by Federal Home Loan Mortgage Corporation, 2.000% to 5.000%, due 12/01/51 to 07/01/52, total market value $82,400,000) | 80,000,000 | | 80,000,000 |
Total Repurchase Agreements
(Cost $719,000,000) | | | 719,000,000 |
TOTAL INVESTMENTS —101.5%
(Cost $1,583,083,836) | | | 1,583,083,836 |
Liabilities in Excess of Other
Assets — (1.5)% | | | (23,804,722) |
| NET ASSETS — 100.0% | | | $1,559,279,114 |
See Notes to Financial Statements.
SCHEDULE OF INVESTMENTS (Continued)
VALUATION HIERARCHY
The following is a summary of the inputs used, as of December 31, 2023, in valuing the Fund’s investments carried at fair value:
| | Total
Value | | Level 1
Quoted Prices | | Level 2
Other Significant
Observable Inputs | | Level 3
Significant
Unobservable Inputs |
| Assets: | | | | | | | |
| Investments in Securities: | | | | | | | |
| Agency Obligations | $ 394,035,194 | | $ — | | $ 394,035,194 | | $ — |
| Repurchase Agreements | 719,000,000 | | — | | 719,000,000 | | — |
| U.S. Treasury Obligations | 470,048,642 | | — | | 470,048,642 | | — |
| Total Assets - Investments in Securities | $1,583,083,836 | | $ — | | $1,583,083,836 | | $ — |
See Notes to Financial Statements.
Low-Duration Bond Fund (Unaudited)
The Fund invested in a diversified portfolio composed primarily of investment grade fixed income securities with a dollar-weighted effective duration normally between one to three years. Duration measures the sensitivity of a fixed income security’s price to changes in interest rates. The average dollar-weighted effective duration at the end of 2023 was 1.74 years. The Investor Class of the Fund outpaced its all U.S. Treasury benchmark, the Bloomberg US Treasury 1-3 Year Index, for the one-year period ended December 31, 2023 (4.82% (net of fees) versus 4.29%). In an effort to outpace its benchmark, the Fund tactically utilized spread sectors (such as high yield and investment grade corporates, mortgage-backed securities, U.S. dollar denominated emerging markets securities and asset-backed securities) that traded at a yield premium relative to U.S. Treasuries. The strategy of overweighting non-U.S. Treasury sectors added value for the year.
Other strategies involving derivatives were utilized during the year. U.S. Treasury futures were used for both duration management and yield curve positioning strategies. Over the course of 2023, these positions were neutral to relative performance. Credit default swaps were used to manage credit risk and detracted from relative performance during the year. In an effort to gain exposure to U.S. and non-U.S. interest rates and duration, interest rate swaps were utilized and detracted from performance. Currency forward contracts were used to hedge certain non-U.S. dollar positions and to express views on the relative value of differing currencies. In aggregate, this exposure detracted from relative performance.
During the year, the Fund remained true to its overall objective of seeking current income consistent with preservation of capital.
This Fund may be suitable for investors who have a short-term investment horizon, seek an investment return that is relatively stable and want to diversify their portfolio with a fixed income investment option. This Fund is subject to interest rate risk, meaning, when interest rates rise, the value of the existing fixed income securities decrease and vice versa. Changes in interest rates have a bigger impact on long duration holdings than on short duration holdings. To the extent that the investment adviser or sub-advisers misjudge current market conditions, the Fund’s volatility may be amplified by its use of derivatives and by its ability to select sub-advisers to allocate assets. Derivatives involve different risks from, and in some respects greater risks than, those associated with investing directly in securities, currencies or other instruments. Derivatives may be illiquid or less liquid, volatile, difficult to price and leveraged, so small changes in the value of the underlying instruments may produce disproportionate losses to the Fund. It is possible to lose money by investing in the Fund.
At December 31, 2023, the portfolio holdings of the Fund, as a percentage of net assets, is shown in the following table. Portfolio holdings are subject to risk and may change at any time.
| | % |
| U.S. Treasury Obligations | 29.5 |
| Asset-Backed Securities | 23.9 |
| Corporate Bonds | 19.5 |
| Mortgage-Backed Securities | 15.8 |
| Foreign Bonds | 9.3 |
| Money Market Funds | 5.4 |
| Agency Obligations | 2.9 |
| Municipal Bonds | 0.5 |
| Commercial Paper | 0.2 |
| | 107.0 |
See Notes to Financial Statements.
Low-Duration Bond Fund (Unaudited)
| Average Annual Total Returns as of 12/31/23 | |
| | | Institutional Class* | | Investor Class* | | Benchmark** | |
| One Year | | 5.09% | | 4.82% | | 4.29% | |
| Five Year | | 1.54% | | 1.27% | | 1.28% | |
| Ten Year | | 1.44% | | 1.18% | | 1.04% | |
| Since Inception | | 2.55% | | 2.35% | | 2.08% | |
| Inception Date | | 08/27/01 | | 08/27/01 | | | |
| Total Fund Operating Expenses (May 1, 2023 Prospectus)(1)# | | 0.34% | | 0.61% | | | |
| (1) | Current information regarding the Fund’s Operating Expenses can be found in the Financial Highlights. |
#Net expense ratio
The performance data quoted represents past performance and does not guarantee future results. The performance data in the table and graph does not reflect the deduction of taxes that a shareholder would pay on Fund distributions or the redemption of Fund shares. Current performance may be lower or higher. Performance data current to the most recent month-end may be obtained at GuideStoneFunds.com. The investment return and principal value of an investment will fluctuate so that shares, when redeemed, may be worth more or less than their original cost.
The graph illustrates the results of a hypothetical $10,000 investment in the Investor Class of the Fund for the 10-year period from December 31, 2013 to December 31, 2023, with all dividends and capital gains reinvested, with the Bloomberg US Treasury 1-3 Year Index.
*These returns reflect investment advisory and shareholder servicing fee waivers, if applicable, during the reported time periods.
Unlike a mutual fund, an index is not available for direct investment and the performance of an index assumes no taxes, transaction costs, management fees or other expenses.
See Notes to Financial Statements.
| | | Par | | Value |
| AGENCY OBLIGATIONS — 2.9% |
| Federal Farm Credit Banks Funding Corporation | | | | |
| 0.70%, 01/27/27 | $2,000,000 | | $ 1,799,926 |
| 2.25%, 08/15/29 | 1,000,000 | | 901,582 |
| 2.17%, 10/29/29 | 750,000 | | 670,526 |
| 1.30%, 02/03/31 | 870,000 | | 709,688 |
| 1.68%, 09/17/35 | 2,300,000 | | 1,696,373 |
| Federal Home Loan Bank | | | | |
| 1.04%, 06/14/24 | 1,000,000 | | 980,935 |
| 5.00%, 02/28/25 | 3,400,000 | | 3,413,329 |
| 5.50%, 05/08/25 | 3,000,000 | | 2,982,226 |
| 2.06%, 09/27/29 | 1,000,000 | | 889,919 |
| 2.18%, 11/06/29 | 750,000 | | 670,323 |
| 1.61%, 01/27/33 | 600,000 | | 478,558 |
| Federal Home Loan Mortgage Corporation | | | | |
| 5.36%, 11/22/24 | 2,300,000 | | 2,297,819 |
| 5.55%, 05/09/25 | 3,500,000 | | 3,479,844 |
| 4.20%, 08/28/25 | 1,300,000 | | 1,286,809 |
| Federal National Mortgage Association | | | | |
| 0.74%, 08/25/27 | 2,000,000 | | 1,771,762 |
| 0.81%, 09/25/28 | 1,000,000 | | 859,933 |
Total Agency Obligations
(Cost $24,748,568) | | | 24,889,552 |
| ASSET-BACKED SECURITIES — 23.9% |
| ACAS CLO, Ltd., Series 2015-1A, Class AR3 | | | |
| (Floating, CME Term SOFR 3M + 1.15%, 0.89% Floor), 6.55%, 10/18/28 144A † | 162,489 | | 162,317 |
| AGL CLO 20, Ltd., Series 2022-20A, Class B | | | |
| (Floating, CME Term SOFR 3M + 2.95%, 2.95% Floor), 8.37%, 07/20/35 144A † | 250,000 | | 250,877 |
| Allegro CLO VII, Ltd., Series 2018-1A, Class A | | | |
| (Floating, CME Term SOFR 3M + 1.36%, 1.10% Floor), 6.76%, 06/13/31 144A † | 475,663 | | 475,709 |
| American Express Credit Account Master Trust, Series 2022-3, Class A | | | |
| 3.75%, 08/15/27 | 372,000 | | 365,894 |
| AMMC CLO XIII, Ltd., Series 2013-13A, Class A1R2 | | | |
| (Floating, CME Term SOFR 3M + 1.31%), 6.71%, 07/24/29 144A † | 309,431 | | 309,660 |
| Anchorage Capital CLO 7, Ltd., Series 2015-7A, Class CR2 | | | |
| (Floating, CME Term SOFR 3M + 2.46%, 2.20% Floor), 7.85%, 01/28/31 144A † | 450,000 | | 449,546 |
| | | Par | | Value |
| Apidos CLO XII, Series 2013-12A, Class AR | | | |
| (Floating, CME Term SOFR 3M + 1.34%), 6.74%, 04/15/31 144A † | $2,534,947 | | $2,540,473 |
| Apidos CLO XXII, Series 2015-22A, Class A2R | | | |
| (Floating, CME Term SOFR 3M + 1.76%), 7.18%, 04/20/31 144A † | 250,000 | | 250,105 |
| Apidos CLO XXVI, Series 2017-26A, Class A1AR | | | |
| (Floating, CME Term SOFR 3M + 1.16%, 0.90% Floor), 6.56%, 07/18/29 144A † | 201,942 | | 201,819 |
| Arbor Realty Commercial Real Estate Notes, Ltd., Series 2021-FL4, Class A | | | |
| (Floating, CME Term SOFR 1M + 1.46%, 1.46% Floor), 6.83%, 11/15/36 144A † | 360,000 | | 357,114 |
| Ares LVI CLO, Ltd., Series 2020-56A, Class AR | | | |
| (Floating, CME Term SOFR 3M + 1.42%, 1.42% Floor), 6.80%, 10/25/34 144A † | 250,000 | | 250,135 |
| BA Credit Card Trust, Series 2023-A1, Class A1 | | | |
| 4.79%, 05/15/28 | 2,313,000 | | 2,323,584 |
| BA Credit Card Trust, Series 2023-A2, Class A2 | | | |
| 4.98%, 11/15/28 | 2,044,000 | | 2,070,628 |
| Bain Capital Credit CLO, Series 2018-1A, Class A1 | | | |
| (Floating, CME Term SOFR 3M + 1.22%, 0.26% Floor), 6.63%, 04/23/31 144A † | 313,534 | | 313,509 |
| Bank of America Auto Trust, Series 2023-1A, Class A3 | | | |
| 5.53%, 02/15/28 144A | 1,400,000 | | 1,417,445 |
| Bank of America Auto Trust, Series 2023-2A, Class A3 | | | |
| 5.74%, 06/15/28 144A | 800,000 | | 816,106 |
| Barings CLO, Ltd., Series 2020-4A, Class B | | | |
| (Floating, CME Term SOFR 3M + 1.81%, 1.55% Floor), 7.23%, 01/20/32 144A † | 350,000 | | 348,786 |
| BDS, Ltd., Series 2020-FL5, Class A | | | |
| (Floating, CME Term SOFR 1M + 1.26%, 1.15% Floor), 6.62%, 02/16/37 144A † | 103,473 | | 102,471 |
| BDS, Ltd., Series 2021-FL7, Class A | | | |
| (Floating, CME Term SOFR 1M + 1.18%, 1.07% Floor), 6.54%, 06/16/36 144A † | 850,600 | | 838,778 |
| Benefit Street Partners CLO II, Ltd., Series 2013-IIA, Class A2R2 | | | |
| (Floating, CME Term SOFR 3M + 1.71%, 1.71% Floor), 7.11%, 07/15/29 144A † | 300,000 | | 300,868 |
See Notes to Financial Statements.
SCHEDULE OF INVESTMENTS (Continued)
| | | Par | | Value |
| BHG Securitization Trust, Series 2022-B, Class A | | | |
| 3.75%, 06/18/35 144A | $ 20,927 | | $ 20,824 |
| BlueMountain CLO XXII, Ltd., Series 2018-22A, Class A1 | | | |
| (Floating, CME Term SOFR 3M + 1.34%, 1.08% Floor), 6.74%, 07/15/31 144A † | 297,135 | | 297,024 |
| BlueMountain Fuji U.S. CLO III, Ltd., Series 2017-3A, Class A2 | | | |
| (Floating, CME Term SOFR 3M + 1.41%, 1.15% Floor), 6.81%, 01/15/30 144A † | 250,000 | | 246,172 |
| BMW Vehicle Lease Trust, Series 2023-2, Class A3 | | | |
| 5.99%, 09/25/26 | 2,000,000 | | 2,029,957 |
| BMW Vehicle Owner Trust, Series 2023-A, Class A3 | | | |
| 5.47%, 02/25/28 | 373,000 | | 377,166 |
| BRSP, Ltd., Series 2021-FL1, Class A | | | |
| (Floating, CME Term SOFR 1M + 1.26%, 1.15% Floor), 6.62%, 08/19/38 144A † | 2,184,425 | | 2,127,711 |
| BSPRT Issuer, Ltd., Series 2023-FL10, Class A | | | |
| (Floating, CME Term SOFR 1M + 2.26%, 2.26% Floor), 7.62%, 09/15/35 144A † | 1,300,000 | | 1,298,506 |
| Capital One Multi-Asset Execution Trust, Series 2022-A1, Class A1 | | | |
| 2.80%, 03/15/27 | 2,700,000 | | 2,632,618 |
| Capital One Multi-Asset Execution Trust, Series 2022-A3, Class A | | | |
| 4.95%, 10/15/27 | 2,528,000 | | 2,536,754 |
| Capital One Multi-Asset Execution Trust, Series 2023-A1, Class A | | | |
| 4.42%, 05/15/28 | 1,157,000 | | 1,153,574 |
| Carmax Auto Owner Trust, Series 2022-4, Class A2A | | | |
| 5.34%, 12/15/25 | 660,467 | | 659,944 |
| Carmax Auto Owner Trust, Series 2023-2, Class A2B | | | |
| (Floating, U.S. 30-Day Average SOFR + 0.85%), 6.19%, 06/15/26† | 890,700 | | 892,213 |
| Carmax Auto Owner Trust, Series 2023-2, Class A3 | | | |
| 5.05%, 01/18/28 | 2,200,000 | | 2,204,709 |
| Carmax Auto Owner Trust, Series 2023-3, Class A3 | | | |
| 5.28%, 05/15/28 | 464,000 | | 469,399 |
| CarMax Auto Owner Trust, Series 2023-4, Class A2A | | | |
| 6.08%, 12/15/26 | 1,500,000 | | 1,512,212 |
| CARS-DB4 LP, Series 2020-1A, Class A1 | | | |
| 2.69%, 02/15/50 144A | 310,940 | | 298,775 |
| CARS-DB5 LP, Series 2021-1A, Class A1 | | | |
| 1.44%, 08/15/51 144A | 1,909,884 | | 1,703,366 |
| | | Par | | Value |
| Carvana Auto Receivables Trust, Series 2022-P2, Class A3 | | | |
| 4.13%, 04/12/27 | $2,349,377 | | $2,313,353 |
| Carvana Auto Receivables Trust, Series 2023-P2, Class A3 | | | |
| 5.42%, 04/10/28 144A | 1,700,000 | | 1,705,086 |
| Carvana Auto Receivables Trust, Series 2023-P5, Class A3 | | | |
| 5.62%, 01/10/29 144A | 1,000,000 | | 1,012,269 |
| CCG Receivables Trust, Series 2022-1, Class A2 | | | |
| 3.91%, 07/16/29 144A | 1,944,248 | | 1,920,538 |
| Cedar Funding X CLO, Ltd., Series 2019-10A, Class BR | | | |
| (Floating, CME Term SOFR 3M + 1.86%, 1.60% Floor), 7.28%, 10/20/32 144A † | 250,000 | | 248,534 |
| Chesapeake Funding II LLC, Series 2020-1A, Class B | | | |
| 1.24%, 08/15/32 144A | 100,000 | | 98,578 |
| Chesapeake Funding II LLC, Series 2023-1A, Class A1 | | | |
| 5.65%, 05/15/35 144A | 833,819 | | 836,428 |
| Chesapeake Funding II LLC, Series 2023-2A, Class A1 | | | |
| 6.16%, 10/15/35 144A | 438,603 | | 443,395 |
| CIFC Funding, Ltd., Series 2017-5A, Class A1 | | | |
| (Floating, CME Term SOFR 3M + 1.44%), 6.84%, 11/16/30 144A † | 1,111,379 | | 1,113,139 |
| CIFC Funding, Ltd., Series 2021-5A, Class A | | | |
| (Floating, CME Term SOFR 3M + 1.40%, 1.40% Floor), 6.80%, 07/15/34 144A † | 250,000 | | 250,413 |
| Citibank Credit Card Issuance Trust, Series 2023-A1, Class A1 | | | |
| 5.23%, 12/08/27 | 377,000 | | 380,136 |
| CLNC, Ltd., Series 2019-FL1, Class A | | | |
| (Floating, CME Term SOFR 1M + 1.36%, 1.25% Floor), 6.72%, 08/20/35 144A † | 789 | | 789 |
| College Ave Student Loans LLC, Series 2021-B, Class A1 | | | |
| (Floating, CME Term SOFR 1M + 0.91%, 0.80% Floor), 6.27%, 06/25/52 144A † | 168,376 | | 162,580 |
| College Ave Student Loans LLC, Series 2021-C, Class B | | | |
| 2.72%, 07/26/55 144A | 100,000 | | 87,822 |
| College Ave Student Loans LLC, Series 2023-A, Class A1 | | | |
| (Floating, CME Term SOFR 1M + 1.90%, 1.90% Floor), 7.26%, 05/25/55 144A † | 521,024 | | 524,776 |
| Credit Acceptance Auto Loan Trust, Series 2021-2A, Class A | | | |
| 0.96%, 02/15/30 144A | 96,978 | | 96,534 |
See Notes to Financial Statements.
| | | Par | | Value |
| Credit Acceptance Auto Loan Trust, Series 2022-1A, Class A | | | |
| 4.60%, 06/15/32 144A | $ 620,000 | | $ 614,017 |
| CSAB Mortgage-Backed Trust, Series 2006-2, Class A6A | | | |
| (Step to 6.10% on 07/25/36), 6.22%, 09/25/36 STEP | 231,179 | | 69,675 |
| CWABS, Inc. Asset-Backed Certificates Trust, Series 2004-6, Class 1A1 | | | |
| (Floating, CME Term SOFR 1M + 0.65%, 0.54% Floor), 6.01%, 12/25/34† | 548,802 | | 533,039 |
| Daimler Trucks Retail Trust, Series 2022-1, Class A2 | | | |
| 5.07%, 09/16/24 | 255,109 | | 254,803 |
| Dell Equipment Finance Trust, Series 2023-1, Class A3 | | | |
| 5.65%, 09/22/28 144A | 1,600,000 | | 1,613,670 |
| Dell Equipment Finance Trust, Series 2023-2, Class A3 | | | |
| 5.65%, 01/22/29 144A | 1,600,000 | | 1,620,614 |
| Dewolf Park CLO, Ltd., Series 2017-1A, Class AR | | | |
| (Floating, CME Term SOFR 3M + 1.18%, 0.90% Floor), 6.58%, 10/15/30 144A † | 2,807,872 | | 2,811,169 |
| Diamond Infrastructure Funding LLC, Series 2021-1A, Class A | | | |
| 1.76%, 04/15/49 144A | 1,650,000 | | 1,467,282 |
| Diamond Issuer, Series 2021-1A, Class A | | | |
| 2.31%, 11/20/51 144A | 1,750,000 | | 1,545,323 |
| Discover Card Execution Note Trust, Series 2023-A1, Class A | | | |
| 4.31%, 03/15/28 | 852,000 | | 846,888 |
| Discover Card Execution Note Trust, Series 2023-A2, Class A | | | |
| 4.93%, 06/15/28 | 943,000 | | 951,272 |
| Drive Auto Receivables Trust, Series 2021-3, Class B | | | |
| 1.11%, 05/15/26 | 67,635 | | 67,495 |
| Dryden 36 Senior Loan Fund, Series 2014-36A, Class AR3 | | | |
| (Floating, CME Term SOFR 3M + 1.28%, 1.02% Floor), 6.68%, 04/15/29 144A † | 167,764 | | 167,619 |
| EDvestinU Private Education Loan Issue No. 1 LLC, Series 2019-A, Class A | | | |
| 3.58%, 11/25/38 144A | 136,681 | | 130,619 |
| EDvestinU Private Education Loan Issue No. 3 LLC, Series 2021-A, Class A | | | |
| 1.80%, 11/25/45 144A | 59,034 | | 52,255 |
| ELFI Graduate Loan Program LLC, Series 2021-A, Class A | | | |
| 1.53%, 12/26/46 144A | 3,054,721 | | 2,658,950 |
| | | Par | | Value |
| ELFI Graduate Loan Program LLC, Series 2022-A, Class A | | | |
| 4.51%, 08/26/47 144A | $ 378,510 | | $ 364,529 |
| ELFI Graduate Loan Program LLC, Series 2023-A, Class A | | | |
| 6.37%, 02/04/48 144A | 528,507 | | 542,105 |
| Enterprise Fleet Financing LLC, Series 2023-3, Class A2 | | | |
| 6.40%, 03/20/30 144A | 727,000 | | 743,685 |
| Enterprise Fleet Financing LLC, Series 2023-1, Class A2 | | | |
| 5.51%, 01/22/29 144A | 2,576,873 | | 2,585,360 |
| Enterprise Fleet Financing LLC, Series 2023-2, Class A2 | | | |
| 5.56%, 04/22/30 144A | 1,083,000 | | 1,086,542 |
| Enterprise Fleet Financing LLC, Series 2023-2, Class A3 | | | |
| 5.50%, 04/22/30 144A | 219,000 | | 221,802 |
| Fairstone Financial Issuance Trust I, Series 2020-1A, Class A | | | |
| 2.51%, 10/20/39(C) 144A | 401,509 | | 284,543 |
| Flagship Credit Auto Trust, Series 2023-3, Class A3 | | | |
| 5.44%, 04/17/28 144A | 600,000 | | 601,923 |
| Flexential Issuer, Series 2021-1A, Class A2 | | | |
| 3.25%, 11/27/51 144A | 1,550,000 | | 1,394,550 |
| Ford Auto Securitization Trust II, Series 2023-AA, Class A1 | | | |
| 5.21%, 06/15/25(C) 144A | 1,060,084 | | 799,473 |
| Ford Credit Auto Lease Trust, Series 2023-B, Class A2A | | | |
| 5.90%, 02/15/26 | 2,000,000 | | 2,008,620 |
| Ford Credit Auto Owner Trust, Series 2022-D, Class A2A | | | |
| 5.37%, 08/15/25 | 617,608 | | 617,211 |
| Ford Credit Auto Owner Trust, Series 2023-1, Class A | | | |
| 4.85%, 08/15/35 144A | 1,453,000 | | 1,460,283 |
| Ford Credit Auto Owner Trust, Series 2023-2, Class A | | | |
| 5.28%, 02/15/36 144A | 1,269,000 | | 1,299,140 |
| Ford Credit Auto Owner Trust, Series 2023-B, Class A3 | | | |
| 5.23%, 05/15/28 | 289,000 | | 291,759 |
| Ford Credit Floorplan Master Owner Trust, Series 2018-4, Class A | | | |
| 4.06%, 11/15/30 | 440,000 | | 428,862 |
| Ford Credit Floorplan Master Owner Trust, Series 2023-1, Class A1 | | | |
| 4.92%, 05/15/28 144A | 3,498,000 | | 3,510,277 |
| Ford Credit Floorplan Master Owner Trust, Series 2023-1, Class A2 | | | |
| (Floating, U.S. 30-Day Average SOFR + 1.25%), 6.59%, 05/15/28 144A † | 290,000 | | 292,293 |
See Notes to Financial Statements.
SCHEDULE OF INVESTMENTS (Continued)
| | | Par | | Value |
| Ford Credit Floorplan Master Owner Trust, Series 2023-1, Class B | | | |
| 5.31%, 05/15/28 144A | $ 310,000 | | $ 310,027 |
| FS Rialto Issuer LLC, Series 2022-FL6, Class A | | | |
| (Floating, CME Term SOFR 1M + 2.58%, 2.58% Floor), 7.94%, 08/17/37 144A † | 265,000 | | 265,588 |
| FS RIALTO, Series 2021-FL2, Class A | | | |
| (Floating, CME Term SOFR 1M + 1.33%, 1.33% Floor), 6.69%, 05/16/38 144A † | 260,947 | | 254,399 |
| GM Financial Consumer Automobile Receivables Trust, Series 2022-4, Class A4 | | | |
| 4.88%, 08/16/28 | 3,900,000 | | 3,905,760 |
| GM Financial Consumer Automobile Receivables Trust, Series 2023-4, Class A2A | | | |
| 5.89%, 11/16/26 | 1,200,000 | | 1,206,747 |
| GM Financial Consumer Automobile Receivables Trust, Series 2023-4, Class A3 | | | |
| 5.78%, 08/16/28 | 866,000 | | 888,812 |
| GM Financial Revolving Receivables Trust, Series 2023-2, Class A | | | |
| 5.77%, 08/11/36 144A | 1,132,000 | | 1,182,542 |
| GMF Floorplan Owner Revolving Trust, Series 2019-2, Class A | | | |
| 2.90%, 04/15/26 144A | 2,000,000 | | 1,983,583 |
| GMF Floorplan Owner Revolving Trust, Series 2023-1, Class A1 | | | |
| 5.34%, 06/15/28 144A | 1,244,000 | | 1,260,988 |
| Golden Credit Card Trust, Series 2022-4A, Class A | | | |
| 4.31%, 09/15/27 144A | 3,000,000 | | 2,966,425 |
| Goldentree Loan Management U.S. CLO 1, Ltd., Series 2017-1A, Class A1R2 | | | |
| (Floating, CME Term SOFR 3M + 1.28%, 1.02% Floor), 6.70%, 04/20/34 144A † | 348,000 | | 347,333 |
| GoodLeap Sustainable Home Solutions Trust, Series 2021-4GS, Class A | | | |
| 1.93%, 07/20/48 144A | 120,868 | | 90,425 |
| GoodLeap Sustainable Home Solutions Trust, Series 2022-1GS, Class A | | | |
| 2.70%, 01/20/49 144A | 102,246 | | 81,214 |
| GoodLeap Sustainable Home Solutions Trust, Series 2022-2CS, Class A | | | |
| 4.00%, 04/20/49 144A | 61,065 | | 53,810 |
| GoodLeap Sustainable Home Solutions Trust, Series 2022-3CS, Class A | | | |
| 4.95%, 07/20/49 144A | 255,801 | | 235,736 |
| | | Par | | Value |
| Goodleap Sustainable Home Solutions Trust, Series 2023-3C, Class A | | | |
| 6.50%, 07/20/55 144A | $ 357,928 | | $ 369,353 |
| Greystone CRE Notes, Ltd., Series 2019-FL2, Class A | | | |
| (Floating, CME Term SOFR 1M + 1.29%, 1.18% Floor), 6.66%, 09/15/37 144A † | 300,319 | | 300,086 |
| Hertz Vehicle Financing LLC, Series 2021-1A, Class A | | | |
| 1.21%, 12/26/25 144A | 1,700,000 | | 1,641,684 |
| Honda Auto Receivables Owner Trust, Series 2023-2, Class A3 | | | |
| 4.93%, 11/15/27 | 288,000 | | 289,581 |
| Honda Auto Receivables Owner Trust, Series 2023-4, Class A2 | | | |
| 5.87%, 06/22/26 | 2,000,000 | | 2,013,215 |
| HPS Loan Management, Ltd., Series 2017-11A, Class AR | | | |
| (Floating, CME Term SOFR 3M + 1.28%, 1.02% Floor), 6.67%, 05/06/30 144A † | 271,662 | | 272,125 |
| Hyundai Auto Lease Securitization Trust, Series 2023-B, Class A2A | | | |
| 5.47%, 09/15/25 144A | 2,444,614 | | 2,443,406 |
| Hyundai Auto Receivables Trust, Series 2022-B, Class A3 | | | |
| 3.72%, 11/16/26 | 409,000 | | 403,304 |
| Hyundai Auto Receivables Trust, Series 2023-C, Class A3 | | | |
| 5.54%, 10/16/28 | 636,000 | | 649,896 |
| Kubota Credit Owner Trust, Series 2023-2A, Class A3 | | | |
| 5.28%, 01/18/28 144A | 1,750,000 | | 1,772,277 |
| LCCM Trust, Series 2021-FL2, Class A | | | |
| (Floating, CME Term SOFR 1M + 1.31%, 1.31% Floor), 6.68%, 12/13/38 144A † | 1,592,032 | | 1,572,637 |
| LoanCore Issuer, Ltd., Series 2021-CRE5, Class A | | | |
| (Floating, CME Term SOFR 1M + 1.41%, 1.41% Floor), 6.78%, 07/15/36 144A † | 1,831,774 | | 1,808,432 |
| Madison Park Funding XIII, Ltd., Series 2014-13A, Class CR2 | | | |
| (Floating, CME Term SOFR 3M + 2.16%), 7.56%, 04/19/30 144A † | 400,000 | | 401,006 |
| Madison Park Funding XIX, Ltd., Series 2015-19A, Class A2R2 | | | |
| (Floating, CME Term SOFR 3M + 1.76%, 1.50% Floor), 7.17%, 01/22/28 144A † | 600,000 | | 600,030 |
| Madison Park Funding XIX, Ltd., Series 2015-19A, Class BR3 | | | |
| (Floating, 2.25% - CME Term SOFR 3M), 0.00%, 01/22/37 144A † | 350,000 | | 350,000 |
See Notes to Financial Statements.
| | | Par | | Value |
| Madison Park Funding XVII, Ltd., Series 2015-17A, Class AR2 | | | |
| (Floating, CME Term SOFR 3M + 1.26%), 6.67%, 07/21/30 144A † | $4,116,700 | | $4,118,978 |
| Madison Park Funding XXIII, Ltd., Series 2017-23A, Class AR | | | |
| (Floating, CME Term SOFR 3M + 1.23%, 0.97% Floor), 6.62%, 07/27/31 144A † | 955,807 | | 956,046 |
| Madison Park Funding XXX, Ltd., Series 2018-30A, Class A | | | |
| (Floating, CME Term SOFR 3M + 1.01%, 1.01% Floor), 6.41%, 04/15/29 144A † | 1,116,383 | | 1,116,185 |
| Madison Park Funding XXXIV, Ltd., Series 2019-34A, Class BR | | | |
| (Floating, CME Term SOFR 3M + 1.91%, 1.65% Floor), 7.29%, 04/25/32 144A † | 250,000 | | 250,627 |
| Madison Park Funding XXXVII, Ltd., Series 2019-37A, Class BR | | | |
| (Floating, CME Term SOFR 3M + 1.91%, 1.65% Floor), 7.31%, 07/15/33 144A † | 250,000 | | 250,578 |
| Magnetite VII, Ltd., Series 2012-7A, Class A1R2 | | | |
| (Floating, CME Term SOFR 3M + 1.06%), 6.46%, 01/15/28 144A † | 1,559,576 | | 1,559,339 |
| Magnetite VIII, Ltd., Series 2014-8A, Class AR2 | | | |
| (Floating, CME Term SOFR 3M + 1.24%, 0.98% Floor), 6.64%, 04/15/31 144A † | 492,553 | | 492,903 |
| Mariner Finance Issuance Trust, Series 2020-AA, Class A | | | |
| 2.19%, 08/21/34 144A | 182,587 | | 178,485 |
| Mariner Finance Issuance Trust, Series 2021-AA, Class A | | | |
| 1.86%, 03/20/36 144A | 110,000 | | 100,245 |
| Master Credit Card Trust II, Series 2023-2A, Class A | | | |
| (Floating, U.S. 30-Day Average SOFR + 0.85%), 6.19%, 01/21/27 144A † | 2,100,000 | | 2,108,777 |
| Mercedes-Benz Auto Receivables Trust, Series 2023-2, Class A2 | | | |
| 5.92%, 11/16/26 | 2,200,000 | | 2,217,340 |
| MMAF Equipment Finance LLC, Series 2022-B, Class A2 | | | |
| 5.57%, 09/09/25 144A | 1,516,876 | | 1,515,250 |
| Morgan Stanley Eaton Vance CLO, Ltd., Series 2021-1A, Class B | | | |
| (Floating, CME Term SOFR 3M + 1.91%, 1.65% Floor), 7.32%, 10/20/34 144A † | 255,000 | | 254,218 |
| Mosaic Solar Loan Trust, Series 2022-3A, Class A | | | |
| 6.10%, 06/20/53 144A | 130,291 | | 132,855 |
| | | Par | | Value |
| Navient Private Education Loan Trust, Series 2020-A, Class A2A | | | |
| 2.46%, 11/15/68 144A | $ 351,966 | | $ 329,706 |
| Navient Private Education Loan Trust, Series 2020-A, Class A2B | | | |
| (Floating, CME Term SOFR 1M + 1.01%), 6.38%, 11/15/68 144A † | 58,661 | | 57,853 |
| Navient Private Education Refinancing Loan Trust, Series 2018-DA, Class A2A | | | |
| 4.00%, 12/15/59 144A | 265,101 | | 256,070 |
| Navient Private Education Refinancing Loan Trust, Series 2019-CA, Class A2 | | | |
| 3.13%, 02/15/68 144A | 115,937 | | 111,377 |
| Navient Private Education Refinancing Loan Trust, Series 2019-EA, Class A2B | | | |
| (Floating, CME Term SOFR 1M + 1.03%), 6.40%, 05/15/68 144A † | 224,509 | | 222,877 |
| Navient Private Education Refinancing Loan Trust, Series 2019-GA, Class A | | | |
| 2.40%, 10/15/68 144A | 153,976 | | 144,248 |
| Navient Private Education Refinancing Loan Trust, Series 2020-DA, Class A | | | |
| 1.69%, 05/15/69 144A | 514,264 | | 468,541 |
| Navient Private Education Refinancing Loan Trust, Series 2020-FA, Class A | | | |
| 1.22%, 07/15/69 144A | 234,134 | | 212,628 |
| Navient Private Education Refinancing Loan Trust, Series 2020-HA, Class A | | | |
| 1.31%, 01/15/69 144A | 704,730 | | 645,598 |
| Navient Private Education Refinancing Loan Trust, Series 2020-IA, Class A1B | | | |
| (Floating, CME Term SOFR 1M + 1.11%, 1.00% Floor), 6.48%, 04/15/69 144A † | 1,181,768 | | 1,171,426 |
| Navient Private Education Refinancing Loan Trust, Series 2021-A, Class A | | | |
| 0.84%, 05/15/69 144A | 341,821 | | 301,558 |
| Navient Private Education Refinancing Loan Trust, Series 2021-CA, Class A | | | |
| 1.06%, 10/15/69 144A | 1,312,737 | | 1,139,668 |
| Navient Private Education Refinancing Loan Trust, Series 2021-EA, Class A | | | |
| 0.97%, 12/16/69 144A | 859,561 | | 741,948 |
| Navient Private Education Refinancing Loan Trust, Series 2021-FA, Class A | | | |
| 1.11%, 02/18/70 144A | 1,153,477 | | 984,222 |
See Notes to Financial Statements.
SCHEDULE OF INVESTMENTS (Continued)
| | | Par | | Value |
| Navient Private Education Refinancing Loan Trust, Series 2022-A, Class A | | | |
| 2.23%, 07/15/70 144A | $1,357,476 | | $1,199,065 |
| Navient Student Loan Trust, Series 2017-2A, Class A | | | |
| (Floating, U.S. 30-Day Average SOFR + 1.16%), 6.50%, 12/27/66 144A † | 673,214 | | 671,014 |
| Navient Student Loan Trust, Series 2017-5A, Class A | | | |
| (Floating, U.S. 30-Day Average SOFR + 0.91%), 6.25%, 07/26/66 144A † | 626,306 | | 625,068 |
| Navient Student Loan Trust, Series 2018-EA, Class A2 | | | |
| 4.00%, 12/15/59 144A | 26,458 | | 25,896 |
| Navient Student Loan Trust, Series 2019-BA, Class A2A | | | |
| 3.39%, 12/15/59 144A | 178,455 | | 170,683 |
| Navient Student Loan Trust, Series 2019-BA, Class A2B | | | |
| (Floating, CME Term SOFR 1M + 1.09%), 6.46%, 12/15/59 144A † | 155,576 | | 154,302 |
| Navistar Financial Dealer Note Master Owner Trust II, Series 2023-1, Class A | | | |
| 6.18%, 08/25/28 144A | 1,184,000 | | 1,196,635 |
| Nelnet Student Loan Trust, Series 2016-1A, Class A | | | |
| (Floating, U.S. 30-Day Average SOFR + 0.91%), 6.25%, 09/25/65 144A † | 471,806 | | 469,322 |
| Nelnet Student Loan Trust, Series 2021-A, Class APT2 | | | |
| 1.36%, 04/20/62 144A | 482,005 | | 436,855 |
| Nelnet Student Loan Trust, Series 2021-BA, Class AFX | | | |
| 1.42%, 04/20/62 144A | 452,087 | | 411,014 |
| Neuberger Berman CLO XVII, Ltd., Series 2014-17A, Class BR2 | | | |
| (Floating, CME Term SOFR 3M + 1.76%, 1.50% Floor), 7.17%, 04/22/29 144A † | 500,000 | | 500,457 |
| Neuberger Berman CLO XVI-S, Ltd., Series 2017-16SA, Class AR | | | |
| (Floating, CME Term SOFR 3M + 1.30%, 1.04% Floor), 6.70%, 04/15/34 144A † | 620,000 | | 620,400 |
| Neuberger Berman Loan Advisers CLO, Ltd., Series 2017-26A, Class AR | | | |
| (Floating, CME Term SOFR 3M + 1.18%, 0.92% Floor), 6.58%, 10/18/30 144A † | 654,069 | | 653,371 |
| Nissan Auto Receivables Owner Trust, Series 2023-A, Class A3 | | | |
| 4.91%, 11/15/27 | 2,600,000 | | 2,602,541 |
| Nissan Auto Receivables Owner Trust, Series 2023-B, Class A3 | | | |
| 5.93%, 03/15/28 | 700,000 | | 717,569 |
| | | Par | | Value |
| OCP CLO, Ltd., Series 2020-19A, Class BR | | | |
| (Floating, CME Term SOFR 3M + 1.96%, 1.70% Floor), 7.38%, 10/20/34 144A † | $ 250,000 | | $ 249,829 |
| Octagon Investment Partners 31, Ltd., Series 2017-1A, Class AR | | | |
| (Floating, CME Term SOFR 3M + 1.31%, 1.05% Floor), 6.73%, 07/20/30 144A † | 806,650 | | 806,273 |
| OHA Credit Funding 2, Ltd., Series 2019-2A , Class AR | | | |
| (Floating, CME Term SOFR 3M + 1.41%, 1.15% Floor), 6.82%, 04/21/34 144A † | 750,000 | | 751,127 |
| OneMain Direct Auto Receivables Trust, Series 2022-1A, Class A1 | | | |
| 4.65%, 03/14/29 144A | 2,450,000 | | 2,424,148 |
| OneMain Direct Auto Receivables Trust, Series 2023-1A, Class A | | | |
| 5.41%, 11/14/29 144A | 3,080,000 | | 3,093,320 |
| OneMain Financial Issuance Trust, Series 2019-2A, Class A | | | |
| 3.14%, 10/14/36 144A | 641,000 | | 601,014 |
| OneMain Financial Issuance Trust, Series 2022-2A, Class A | | | |
| 4.89%, 10/14/34 144A | 1,700,000 | | 1,679,614 |
| OneMain Financial Issuance Trust, Series 2022-3A, Class A | | | |
| 5.94%, 05/15/34 144A | 1,800,000 | | 1,805,789 |
| OneMain Financial Issuance Trust, Series 2022-S1, Class A | | | |
| 4.13%, 05/14/35 144A | 566,000 | | 551,874 |
| OneMain Financial Issuance Trust, Series 2023-1A, Class A | | | |
| 5.50%, 06/14/38 144A | 980,000 | | 994,968 |
| OneMain Financial Issuance Trust, Series 2023-2A, Class A2 | | | |
| (Floating, U.S. 30-Day Average SOFR + 1.50%), 6.84%, 09/14/36 144A † | 436,000 | | 438,763 |
| OZLM Funding IV, Ltd., Series 2013-4A, Class A1R | | | |
| (Floating, CME Term SOFR 3M + 1.51%), 6.92%, 10/22/30 144A † | 578,641 | | 579,225 |
| Pagaya AI Technology in Housing Trust, Series 2023-1, Class A | | | |
| 3.60%, 10/25/40 144A | 444,000 | | 407,301 |
| Palmer Square CLO, Ltd., Series 2013-2A, Class A1A3 | | | |
| (Floating, CME Term SOFR 3M + 1.26%, 1.26% Floor), 6.66%, 10/17/31 144A † | 250,000 | | 250,026 |
| PFP, Ltd., Series 2021-8, Class A | | | |
| (Floating, CME Term SOFR 1M + 1.11%, 1.00% Floor), 6.48%, 08/09/37 144A † | 476,519 | | 470,134 |
| PFS Financing Corporation, Series 2020-G, Class A | | | |
| 0.97%, 02/15/26 144A | 330,000 | | 328,069 |
See Notes to Financial Statements.
| | | Par | | Value |
| PFS Financing Corporation, Series 2021-A, Class A | | | |
| 0.71%, 04/15/26 144A | $ 230,000 | | $ 226,493 |
| PFS Financing Corporation, Series 2022-D, Class A | | | |
| 4.27%, 08/15/27 144A | 167,000 | | 164,173 |
| PFS Financing Corporation, Series 2023-A, Class A | | | |
| 5.80%, 03/15/28 144A | 1,097,000 | | 1,114,119 |
| PFS Financing Corporation, Series 2023-C, Class A | | | �� |
| 5.52%, 10/15/28 144A | 1,482,000 | | 1,501,041 |
| Porsche Financial Auto Securitization Trust, Series 2023-1A, Class A3 | | | |
| 4.81%, 09/22/28 144A | 1,262,000 | | 1,261,038 |
| Porsche Financial Auto Securitization Trust, Series 2023-2A, Class A3 | | | |
| 5.79%, 01/22/29 144A | 468,000 | | 478,523 |
| Pretium Mortgage Credit Partners LLC, Series 2021-RN1, Class A1 | | | |
| (Step to 4.99% on 07/25/24), 1.99%, 02/25/61 144A STEP | 406,871 | | 398,210 |
| Prodigy Finance CM DAC, Series 2021-1A, Class A | | | |
| (Floating, CME Term SOFR 1M + 1.36%), 6.72%, 07/25/51 144A † | 63,219 | | 62,731 |
| Progress Residential Trust, Series 2021-SFR10, Class A | | | |
| 2.39%, 12/17/40 144A | 150,084 | | 130,477 |
| Ready Capital Mortgage Financing LLC, Series 2021-FL6, Class A | | | |
| (Floating, CME Term SOFR 1M + 1.06%, 0.95% Floor), 6.42%, 07/25/36 144A † | 1,002,826 | | 986,172 |
| Regional Management Issuance Trust, Series 2020-1, Class A | | | |
| 2.34%, 10/15/30 144A | 81,372 | | 79,496 |
| Regional Management Issuance Trust, Series 2021-1, Class A | | | |
| 1.68%, 03/17/31 144A | 129,000 | | 123,598 |
| Regional Management Issuance Trust, Series 2021-2, Class A | | | |
| 1.90%, 08/15/33 144A | 221,000 | | 195,832 |
| Regional Management Issuance Trust, Series 2022-2B, Class A | | | |
| 7.10%, 11/17/32 144A | 140,000 | | 141,360 |
| RRX 4, Ltd., Series 2021-4A, Class A1 | | | |
| (Floating, CME Term SOFR 3M + 1.46%, 1.20% Floor), 6.86%, 07/15/34 144A † | 900,000 | | 902,267 |
| Santander Bank Auto Credit-Linked Notes Series, Series 2022-B, Class C | | | |
| 5.92%, 08/16/32 144A | 362,735 | | 361,580 |
| | | Par | | Value |
| Santander Bank Auto Credit-Linked Notes, Series 2022-C, Class C | | | |
| 6.99%, 12/15/32 144A | $ 591,025 | | $ 593,134 |
| Santander Bank Auto Credit-Linked Notes, Series 2022-C, Class D | | | |
| 8.20%, 12/15/32 144A | 268,648 | | 270,998 |
| Santander Bank NA, Series 2021-1A, Class B | | | |
| 1.83%, 12/15/31 144A | 129,278 | | 125,970 |
| Santander Drive Auto Receivables Trust, Series 2022-2, Class A3 | | | |
| 2.98%, 10/15/26 | 426,638 | | 424,322 |
| Santander Drive Auto Receivables Trust, Series 2022-3, Class A3 | | | |
| 3.40%, 12/15/26 | 631,324 | | 626,628 |
| Santander Drive Auto Receivables Trust, Series 2023-5, Class A3 | | | |
| 6.02%, 09/15/28 | 1,002,000 | | 1,017,408 |
| Santander Drive Auto Receivables Trust, Series 2023-6, Class A3 | | | |
| 5.93%, 07/17/28 | 1,400,000 | | 1,426,759 |
| SBNA Auto Lease Trust, Series 2023-A, Class A2 | | | |
| 6.27%, 04/20/26 144A | 2,500,000 | | 2,518,082 |
| SCCU Auto Receivables Trust, Series 2023-1A, Class A2 | | | |
| 5.85%, 05/17/27 144A | 500,000 | | 501,352 |
| Shelter Growth CRE Issuer, Ltd., Series 2023-FL5, Class A | | | |
| (Floating, CME Term SOFR 1M + 2.75%, 2.75% Floor), 8.11%, 05/19/38 144A † | 1,100,000 | | 1,096,565 |
| Signal Peak CLO 12, Ltd., Series 2022-12A, Class A1 | | | |
| (Floating, CME Term SOFR 3M + 1.54%, 1.54% Floor), 6.94%, 07/18/34 144A † | 350,000 | | 348,244 |
| Signal Peak CLO 5, Ltd., Series 2018-5A, Class A | | | |
| (Floating, CME Term SOFR 3M + 1.37%, 1.11% Floor), 6.75%, 04/25/31 144A † | 340,390 | | 340,682 |
| SLM Private Credit Student Loan Trust, Series 2004-A, Class A3 | | | |
| (Floating, CME Term SOFR 3M + 0.66%), 6.05%, 06/15/33† | 131,633 | | 129,864 |
| SLM Private Credit Student Loan Trust, Series 2007-A, Class A4A | | | |
| (Floating, CME Term SOFR 3M + 0.50%), 5.89%, 12/16/41† | 123,795 | | 120,327 |
| SLM Private Education Loan Trust, Series 2010-C, Class A5 | | | |
| (Floating, CME Term SOFR 1M + 4.86%), 10.23%, 10/15/41 144A † | 70,933 | | 74,681 |
See Notes to Financial Statements.
SCHEDULE OF INVESTMENTS (Continued)
| | | Par | | Value |
| SMB Private Education Loan Trust, Series 2016-A, Class A2B | | | |
| (Floating, CME Term SOFR 1M + 1.61%), 6.98%, 05/15/31 144A † | $ 93,895 | | $ 94,055 |
| SMB Private Education Loan Trust, Series 2018-B, Class A2B | | | |
| (Floating, CME Term SOFR 1M + 0.83%), 6.20%, 01/15/37 144A † | 202,934 | | 200,973 |
| SMB Private Education Loan Trust, Series 2020-A, Class A2A | | | |
| 2.23%, 09/15/37 144A | 535,962 | | 498,047 |
| SMB Private Education Loan Trust, Series 2020-A, Class A2B | | | |
| (Floating, CME Term SOFR 1M + 0.94%), 6.31%, 09/15/37 144A † | 53,596 | | 52,983 |
| SMB Private Education Loan Trust, Series 2020-PTA, Class A2B | | | |
| (Floating, CME Term SOFR 1M + 0.96%), 6.32%, 09/15/54 144A † | 1,504,573 | | 1,485,378 |
| SMB Private Education Loan Trust, Series 2021-A, Class APL | | | |
| (Floating, CME Term SOFR 1M + 0.84%), 6.21%, 01/15/53 144A † | 489,527 | | 480,851 |
| SMB Private Education Loan Trust, Series 2021-A, Class B | | | |
| 2.31%, 01/15/53 144A | 158,240 | | 146,572 |
| SMB Private Education Loan Trust, Series 2021-B, Class A | | | |
| 1.31%, 07/17/51 144A | 771,040 | | 697,064 |
| SMB Private Education Loan Trust, Series 2022-A, Class APT | | | |
| 2.85%, 11/16/54 144A | 1,252,730 | | 1,159,229 |
| SMB Private Education Loan Trust, Series 2022-D, Class A1B | | | |
| (Floating, U.S. 30-Day Average SOFR + 1.80%, 1.80% Floor), 7.14%, 10/15/58 144A † | 740,466 | | 746,964 |
| SMB Private Education Loan Trust, Series 2023-A, Class A1B | | | |
| (Floating, U.S. 30-Day Average SOFR + 1.50%, 1.50% Floor), 6.84%, 01/15/53 144A † | 337,090 | | 337,529 |
| SMB Private Education Loan Trust, Series 2023-C, Class A1A | | | |
| 5.67%, 11/15/52 144A | 185,480 | | 186,762 |
| SoFi Professional Loan Program LLC, Series 2016-F, Class A2 | | | |
| 3.02%, 02/25/40 144A | 206,944 | | 197,523 |
| SoFi Professional Loan Program LLC, Series 2019-B, Class A2FX | | | |
| 3.09%, 08/17/48 144A | 61,273 | | 58,426 |
| SoFi Professional Loan Program Trust, Series 2018-C, Class A2FX | | | |
| 3.59%, 01/25/48 144A | 56,128 | | 54,512 |
| | | Par | | Value |
| SoFi Professional Loan Program Trust, Series 2020-A, Class A2FX | | | |
| 2.54%, 05/15/46 144A | $ 256,160 | | $ 239,411 |
| SoFi Professional Loan Program Trust, Series 2021-A, Class AFX | | | |
| 1.03%, 08/17/43 144A | 153,328 | | 130,413 |
| SoFi Professional Loan Program Trust, Series 2021-B, Class AFX | | | |
| 1.14%, 02/15/47 144A | 1,331,698 | | 1,122,470 |
| SoFi Professional Loan Program, Series 2018-B, Class A2FX | | | |
| 3.34%, 08/25/47 144A | 123,043 | | 120,099 |
| Stack Infrastructure Issuer LLC, Series 2021-1A, Class A2 | | | |
| 1.88%, 03/26/46 144A | 1,600,000 | | 1,460,133 |
| Structured Asset Securities Corporation Mortgage Loan Trust, Series 2005-7XS, Class 2A1A | | | |
| (Floating, CME Term SOFR 1M + 1.61%, 1.50% Floor), 6.96%, 04/25/35† | 56,142 | | 55,324 |
| STWD, Ltd., Series 2019-FL1, Class A | | | |
| (Floating, CME Term SOFR 1M + 1.19%, 1.19% Floor), 6.56%, 07/15/38 144A † | 487,485 | | 484,624 |
| Synchrony Card Funding LLC, Series 2023-A1, Class A | | | |
| 5.54%, 07/15/29 | 1,200,000 | | 1,223,628 |
| TCI-Symphony CLO, Ltd., Series 2017-1A, Class AR | | | |
| (Floating, CME Term SOFR 3M + 1.19%, 0.93% Floor), 6.59%, 07/15/30 144A † | 1,588,120 | | 1,588,439 |
| Tesla Auto Lease Trust, Series 2023-B, Class A3 | | | |
| 6.13%, 09/21/26 144A | 1,100,000 | | 1,111,683 |
| TICP CLO XIV, Ltd., Series 2019-14A, Class A2R | | | |
| (Floating, CME Term SOFR 3M + 1.91%, 1.65% Floor), 7.33%, 10/20/32 144A † | 250,000 | | 249,381 |
| TierPoint Issuer LLC, Series 2023-1A, Class A2 | | | |
| 6.00%, 06/25/53 144A | 1,600,000 | | 1,565,624 |
| Towd Point Mortgage Trust, Series 2019-MH1, Class A1 | | | |
| 3.00%, 11/25/58 144A | 22,958 | | 22,855 |
| Toyota Auto Loan Extended Note Trust, Series 2023-1A, Class A | | | |
| 4.93%, 06/25/36 144A | 775,000 | | 783,709 |
| Toyota Auto Receivables Owner Trust, Series 2023-B, Class A2A | | | |
| 5.28%, 05/15/26 | 2,833,968 | | 2,830,181 |
| Toyota Auto Receivables Owner Trust, Series 2023-C, Class A3 | | | |
| 5.16%, 04/17/28 | 372,000 | | 374,954 |
See Notes to Financial Statements.
| | | Par | | Value |
| Toyota Auto Receivables Owner Trust, Series 2023-D, Class A3 | | | |
| 5.54%, 08/15/28 | $1,090,000 | | $ 1,112,488 |
| TRESTLES CLO III, Ltd., Series 2020-3A, Class A1 | | | |
| (Floating, CME Term SOFR 3M + 1.59%, 1.33% Floor), 7.01%, 01/20/33 144A † | 1,050,000 | | 1,049,010 |
| TRESTLES CLO, Ltd., Series 2017-1A, Class A1R | | | |
| (Floating, CME Term SOFR 3M + 1.25%, 0.99% Floor), 6.63%, 04/25/32 144A † | 550,000 | | 548,761 |
| Trillium Credit Card Trust II, Series 2023-3A, Class A | | | |
| (Floating, U.S. SOFR + 0.85%), 6.23%, 08/26/28 144A † | 1,500,000 | | 1,505,852 |
| Trinitas CLO XVIII, Ltd., Series 2021-18A, Class A1 | | | |
| (Floating, CME Term SOFR 3M + 1.43%, 1.17% Floor), 6.85%, 01/20/35 144A † | 250,000 | | 248,815 |
| United Airlines Pass-Through Trust, Series 2020-1, Class A | | | |
| 5.88%, 10/15/27 | 113,222 | | 114,777 |
| United Airlines Pass-Through Trust, Series 2020-1, Class B | | | |
| 4.88%, 01/15/26 | 27,360 | | 26,524 |
| Vantage Data Centers Issuer LLC, Series 2019-1A, Class A2 | | | |
| 3.19%, 07/15/44 144A | 621,833 | | 610,453 |
| Venture XVII CLO, Ltd., Series 2014-17A, Class ARR | | | |
| (Floating, CME Term SOFR 3M + 1.14%), 6.54%, 04/15/27 144A † | 100,443 | | 100,413 |
| Volkswagen Auto Loan Enhanced Trust, Series 2023-1, Class A3 | | | |
| 5.02%, 06/20/28 | 500,000 | | 503,140 |
| Volkswagen Auto Loan Enhanced Trust, Series 2023-2, Class A2A | | | |
| 5.72%, 03/22/27 | 2,500,000 | | 2,516,079 |
| Wingstop Funding LLC, Series 2020-1A, Class A2 | | | |
| 2.84%, 12/05/50 144A | 1,034,250 | | 934,068 |
| World Omni Auto Receivables Trust, Series 2022-D, Class A2A | | | |
| 5.51%, 03/16/26 | 689,243 | | 688,953 |
| World Omni Automobile Lease Securitization Trust, Series 2023-A, Class A2A | | | |
| 5.47%, 11/17/25 | 2,526,783 | | 2,526,102 |
Total Asset-Backed Securities
(Cost $209,784,403) | | | 207,571,755 |
| COMMERCIAL PAPER — 0.2% |
| Societe Generale SA | | | |
5.35%, 03/06/24Ω
(Cost $1,287,349) | 1,300,000 | | 1,296,776 |
| CORPORATE BONDS — 19.5% |
| AES Corporation (The) | | | |
| 1.38%, 01/15/26 | 1,700,000 | | 1,574,233 |
| | | Par | | Value |
| Air Lease Corporation | | | |
| 0.80%, 08/18/24 | $ 490,000 | | $ 475,116 |
| 1.88%, 08/15/26 | 225,000 | | 207,166 |
| Albertsons Cos., Inc. | | | |
| 3.25%, 03/15/26 144A | 590,000 | | 556,893 |
| Allison Transmission, Inc. | | | |
| 4.75%, 10/01/27 144A Δ | 590,000 | | 570,388 |
| Ally Financial, Inc. | | | |
| 3.88%, 05/21/24Δ | 400,000 | | 396,638 |
| 5.75%, 11/20/25 | 200,000 | | 199,599 |
| American Electric Power Co., Inc. | | | |
| 5.70%, 08/15/25 | 960,000 | | 967,019 |
| American Express Co. | | | |
| 2.55%, 03/04/27Δ | 755,000 | | 708,013 |
| (Variable, U.S. SOFR + 0.97%), 5.39%, 07/28/27^ | 2,015,000 | | 2,039,793 |
| American Tower Corporation REIT | | | |
| 0.45%, 01/15/27(E) Δ | 205,000 | | 207,195 |
| 0.40%, 02/15/27(E) | 300,000 | | 302,073 |
| 3.55%, 07/15/27Δ | 455,000 | | 437,046 |
| 5.50%, 03/15/28 | 150,000 | | 153,561 |
| Amgen, Inc. | | | |
| 5.15%, 03/02/28 | 511,000 | | 522,996 |
| Aon Corporation | | | |
| 2.85%, 05/28/27Δ | 79,000 | | 74,767 |
| Ardagh Metal Packaging Finance U.S.A. LLC | | | |
| 3.25%, 09/01/28 144A | 290,000 | | 254,055 |
| AT&T, Inc. | | | |
| 3.55%, 11/18/25(E) | 490,000 | | 544,178 |
| Athene Global Funding | | | |
| 1.00%, 04/16/24 144A | 1,800,000 | | 1,772,033 |
| (Floating, U.S. SOFR Index + 0.70%), 6.10%, 05/24/24 144A † | 1,000,000 | | 999,436 |
| AutoZone, Inc. | | | |
| 5.05%, 07/15/26 | 1,230,000 | | 1,238,766 |
| Aviation Capital Group LLC | | | |
| 4.38%, 01/30/24 144A | 1,000,000 | | 998,443 |
| Bank of America Corporation | | | |
| (Variable, U.S. SOFR + 0.69%), 0.98%, 04/22/25^ | 1,555,000 | | 1,530,459 |
| (Variable, CME Term SOFR 3M + 1.35%), 3.09%, 10/01/25^ | 1,500,000 | | 1,471,256 |
| (Variable, U.S. SOFR + 0.65%), 1.53%, 12/06/25Δ ^ | 1,860,000 | | 1,788,558 |
| (Variable, U.S. SOFR + 1.33%), 3.38%, 04/02/26^ | 480,000 | | 467,190 |
| (Variable, U.S. SOFR + 1.15%), 1.32%, 06/19/26^ | 439,000 | | 413,526 |
| (Variable, U.S. SOFR + 1.29%), 5.08%, 01/20/27^ | 1,205,000 | | 1,203,262 |
| (Variable, U.S. SOFR + 1.57%), 5.82%, 09/15/29^ | 440,000 | | 454,762 |
| Berry Global, Inc. | | | |
| 1.57%, 01/15/26 | 1,600,000 | | 1,487,581 |
| Blue Owl Capital Corporation | | | |
| 3.75%, 07/22/25 | 510,000 | | 488,824 |
See Notes to Financial Statements.
SCHEDULE OF INVESTMENTS (Continued)
| | | Par | | Value |
| Blue Owl Technology Finance Corporation | | | |
| 3.75%, 06/17/26 144A | $ 345,000 | | $ 315,761 |
| Boeing Co. (The) | | | |
| 1.43%, 02/04/24 | 1,200,000 | | 1,194,968 |
| 2.20%, 02/04/26 | 699,000 | | 660,820 |
| Booking Holdings, Inc. | | | |
| 0.10%, 03/08/25(E) | 160,000 | | 169,836 |
| Brighthouse Financial Global Funding | | | |
| 1.75%, 01/13/25 144A | 1,330,000 | | 1,278,276 |
| Broadcom Corporation | | | |
| 3.88%, 01/15/27 | 552,000 | | 538,971 |
| Brunswick Corporation | | | |
| 0.85%, 08/18/24Δ | 1,045,000 | | 1,011,532 |
| Cantor Fitzgerald LP | | | |
| 4.88%, 05/01/24 144A | 1,800,000 | | 1,786,549 |
| Capital One Financial Corporation | | | |
| (Variable, U.S. SOFR + 2.44%), 7.15%, 10/29/27^ | 930,000 | | 966,428 |
| (Variable, U.S. SOFR + 2.64%), 6.31%, 06/08/29Δ ^ | 440,000 | | 452,205 |
| Carnival Corporation | | | |
| 4.00%, 08/01/28 144A | 375,000 | | 348,806 |
| Carrier Global Corporation | | | |
| 4.38%, 05/29/25(E) Δ | 560,000 | | 623,785 |
| CCO Holdings LLC | | | |
| 5.13%, 05/01/27 144A | 1,330,000 | | 1,284,307 |
| CenterPoint Energy Resources Corporation | | | |
| 5.25%, 03/01/28 | 27,000 | | 27,731 |
| Charles Schwab Corporation (The) | | | |
| 5.88%, 08/24/26 | 243,000 | | 249,369 |
| Citigroup, Inc. | | | |
| (Variable, U.S. SOFR + 1.53%), 3.29%, 03/17/26^ | 1,000,000 | | 974,162 |
| (Variable, U.S. SOFR + 1.55%), 5.61%, 09/29/26^ | 1,425,000 | | 1,436,779 |
| (Variable, U.S. SOFR + 0.77%), 1.46%, 06/09/27^ | 759,000 | | 695,159 |
| Citizens Bank NA | | | |
| (Variable, U.S. SOFR + 1.45%), 6.06%, 10/24/25^ | 1,000,000 | | 975,942 |
| Civitas Resources, Inc. | | | |
| 8.38%, 07/01/28 144A | 710,000 | | 742,138 |
| Columbia Pipelines Holding Co. LLC | | | |
| 6.06%, 08/15/26 144A | 755,000 | | 773,542 |
| CommonSpirit Health | | | |
| 1.55%, 10/01/25 | 800,000 | | 749,773 |
| Conagra Brands, Inc. | | | |
| 5.30%, 10/01/26 | 975,000 | | 987,853 |
| Concentrix Corporation | | | |
| 6.65%, 08/02/26 | 1,320,000 | | 1,354,247 |
| Corebridge Financial, Inc. | | | |
| 3.50%, 04/04/25 | 2,000,000 | | 1,951,608 |
| 3.65%, 04/05/27 | 600,000 | | 577,877 |
| Crown Castle, Inc. REIT | | | |
| 1.05%, 07/15/26Δ | 320,000 | | 289,002 |
| CrownRock LP | | | |
| 5.63%, 10/15/25 144A | 215,000 | | 214,848 |
| | | Par | | Value |
| CVS Health Corporation | | | |
| 4.30%, 03/25/28 | $ 23,000 | | $ 22,651 |
| Daimler Truck Finance North America LLC | | | |
| 5.60%, 08/08/25 144A | 700,000 | | 705,098 |
| 5.15%, 01/16/26 144A Δ | 900,000 | | 903,200 |
| 2.00%, 12/14/26 144A | 150,000 | | 138,016 |
| Diamondback Energy, Inc. | | | |
| 3.25%, 12/01/26 | 352,000 | | 341,515 |
| 3.50%, 12/01/29 | 290,000 | | 269,840 |
| DPL, Inc. | | | |
| 4.13%, 07/01/25Δ | 200,000 | | 195,157 |
| Edison International | | | |
| 4.70%, 08/15/25 | 690,000 | | 682,018 |
| Elevance Health, Inc. | | | |
| 5.35%, 10/15/25 | 145,000 | | 145,976 |
| 3.65%, 12/01/27 | 20,000 | | 19,385 |
| Enact Holdings, Inc. | | | |
| 6.50%, 08/15/25 144A | 580,000 | | 578,686 |
| Enbridge Energy Partners LP | | | |
| 5.88%, 10/15/25 | 85,000 | | 85,957 |
| Energy Transfer LP | | | |
| 4.05%, 03/15/25 | 652,000 | | 642,031 |
| 2.90%, 05/15/25 | 270,000 | | 261,874 |
| 6.05%, 12/01/26 | 1,330,000 | | 1,367,717 |
| 5.63%, 05/01/27 144A | 417,000 | | 415,853 |
| 6.10%, 12/01/28 | 574,000 | | 603,475 |
| 6.00%, 02/01/29 144A | 100,000 | | 100,964 |
| EnLink Midstream Partners LP | | | |
| 4.15%, 06/01/25 | 110,000 | | 107,620 |
| Enterprise Products Operating LLC | | | |
| 4.15%, 10/16/28 | 455,000 | | 450,200 |
| EQM Midstream Partners LP | | | |
| 6.50%, 07/01/27 144A | 80,000 | | 81,497 |
| 5.50%, 07/15/28 | 220,000 | | 218,081 |
| EQT Corporation | | | |
| 5.00%, 01/15/29 | 57,000 | | 56,508 |
| Equinix, Inc. REIT | | | |
| 2.63%, 11/18/24 | 985,000 | | 959,791 |
| Equitable Financial Life Global Funding | | | |
| 1.00%, 01/09/26 144A | 1,600,000 | | 1,465,630 |
| Eversource Energy | | | |
| 4.75%, 05/15/26Δ | 250,000 | | 248,993 |
| 2.90%, 03/01/27 | 415,000 | | 393,321 |
| 5.45%, 03/01/28Δ | 250,000 | | 257,295 |
| Exelon Corporation | | | |
| 2.75%, 03/15/27 | 150,000 | | 141,456 |
| 5.15%, 03/15/28 | 300,000 | | 304,627 |
| F&G Global Funding | | | |
| 0.90%, 09/20/24 144A | 1,860,000 | | 1,791,197 |
| Fidelity National Information Services, Inc. | | | |
| 1.15%, 03/01/26Δ | 1,017,000 | | 940,427 |
| 4.70%, 07/15/27 | 184,000 | | 184,212 |
| Fifth Third Bank NA | | | |
| (Variable, U.S. SOFR Index + 1.23%), 5.85%, 10/27/25^ | 630,000 | | 628,622 |
See Notes to Financial Statements.
| | | Par | | Value |
| First-Citizens Bank & Trust Co. | | | |
| (Variable, CME Term SOFR 3M + 1.72%), 2.97%, 09/27/25^ | $ 440,000 | | $ 429,657 |
| Fiserv, Inc. | | | |
| 3.20%, 07/01/26Δ | 410,000 | | 394,995 |
| Ford Motor Credit Co. LLC | | | |
| 5.58%, 03/18/24 | 300,000 | | 299,631 |
| 2.30%, 02/10/25Δ | 1,300,000 | | 1,251,215 |
| 5.13%, 06/16/25 | 640,000 | | 632,343 |
| 4.13%, 08/04/25 | 700,000 | | 680,962 |
| 6.95%, 06/10/26 | 407,000 | | 417,911 |
| 7.35%, 11/04/27 | 540,000 | | 570,106 |
| FS KKR Capital Corporation | | | |
| 4.25%, 02/14/25 144A | 880,000 | | 857,337 |
| GA Global Funding Trust | | | |
| 1.63%, 01/15/26 144A | 400,000 | | 368,570 |
| Gartner, Inc. | | | |
| 4.50%, 07/01/28 144A | 130,000 | | 123,325 |
| General Mills, Inc. | | | |
| 5.24%, 11/18/25 | 155,000 | | 154,814 |
| General Motors Financial Co., Inc. | | | |
| 1.20%, 10/15/24Δ | 900,000 | | 868,915 |
| 3.50%, 11/07/24 | 2,000,000 | | 1,964,059 |
| 6.05%, 10/10/25 | 179,000 | | 181,138 |
| 5.40%, 04/06/26 | 1,310,000 | | 1,319,408 |
| 2.35%, 02/26/27 | 145,000 | | 133,640 |
| Glencore Funding LLC | | | |
| 6.13%, 10/06/28 144A | 529,000 | | 555,141 |
| Global Payments, Inc. | | | |
| 1.20%, 03/01/26 | 2,008,000 | | 1,846,272 |
| Goldman Sachs Group, Inc. (The) | | | |
| (Variable, U.S. SOFR + 0.61%), 0.86%, 02/12/26Δ ^ | 810,000 | | 768,339 |
| (Variable, U.S. SOFR + 1.08%), 5.80%, 08/10/26^ | 1,856,000 | | 1,875,159 |
| (Variable, U.S. SOFR + 1.11%), 2.64%, 02/24/28^ | 758,000 | | 703,197 |
| (Variable, U.S. SOFR + 1.77%), 6.48%, 10/24/29^ | 356,000 | | 378,389 |
| Golub Capital BDC, Inc. | | | |
| 3.38%, 04/15/24 | 575,000 | | 570,600 |
| Graham Holdings Co. | | | |
| 5.75%, 06/01/26 144A | 200,000 | | 198,663 |
| HCA, Inc. | | | |
| 5.38%, 02/01/25 | 395,000 | | 394,669 |
| 5.25%, 04/15/25 | 773,000 | | 772,725 |
| 5.88%, 02/15/26 | 225,000 | | 227,059 |
| 5.25%, 06/15/26Δ | 331,000 | | 332,419 |
| Healthpeak OP LLC REIT | | | |
| 1.35%, 02/01/27 | 145,000 | | 130,331 |
| Honeywell International, Inc. | | | |
| 3.50%, 05/17/27(E) | 220,000 | | 246,915 |
| Howmet Aerospace, Inc. | | | |
| 5.90%, 02/01/27Δ | 580,000 | | 595,569 |
| Huntington National Bank (The) | | | |
| (Variable, U.S. SOFR + 1.22%), 5.70%, 11/18/25^ | 825,000 | | 816,156 |
| Hyundai Capital America | | | |
| 1.00%, 09/17/24 144A | 485,000 | | 469,636 |
| | | Par | | Value |
| 6.25%, 11/03/25 144A | $ 370,000 | | $ 375,764 |
| 5.50%, 03/30/26 144A | 1,300,000 | | 1,307,849 |
| 5.65%, 06/26/26 144A | 2,200,000 | | 2,216,259 |
| 1.65%, 09/17/26 144A | 385,000 | | 350,225 |
| Illumina, Inc. | | | |
| 5.80%, 12/12/25 | 300,000 | | 301,291 |
| International Flavors & Fragrances, Inc. | | | |
| 1.23%, 10/01/25 144A | 1,000,000 | | 926,468 |
| IQVIA, Inc. | | | |
| 5.00%, 05/15/27 144A | 200,000 | | 196,420 |
| JPMorgan Chase & Co. | | | |
| (Variable, U.S. SOFR + 0.98%), 3.85%, 06/14/25^ | 1,770,000 | | 1,756,468 |
| (Variable, CME Term SOFR 3M + 0.58%), 0.97%, 06/23/25^ | 1,000,000 | | 976,858 |
| (Variable, U.S. SOFR + 1.07%), 5.55%, 12/15/25^ | 1,610,000 | | 1,611,390 |
| (Variable, U.S. SOFR + 1.32%), 4.08%, 04/26/26Δ ^ | 940,000 | | 925,353 |
| (Variable, U.S. SOFR + 1.02%), 2.07%, 06/01/29^ | 225,000 | | 199,799 |
| (Variable, U.S. SOFR + 1.45%), 5.30%, 07/24/29^ | 634,000 | | 644,291 |
| (Variable, U.S. SOFR + 1.57%), 6.09%, 10/23/29Δ ^ | 605,000 | | 636,922 |
| KeyBank NA | | | |
| 4.70%, 01/26/26 | 340,000 | | 332,300 |
| L3Harris Technologies, Inc. | | | |
| 5.40%, 01/15/27 | 546,000 | | 557,889 |
| 4.40%, 06/15/28 | 181,000 | | 179,179 |
| Ladder Capital Finance Holdings LLLP | | | |
| 4.25%, 02/01/27 144A | 200,000 | | 188,625 |
| Lennar Corporation | | | |
| 4.50%, 04/30/24Δ | 1,000,000 | | 995,008 |
| Manufacturers & Traders Trust Co. | | | |
| 4.65%, 01/27/26 | 1,720,000 | | 1,685,070 |
| Marathon Petroleum Corporation | | | |
| 4.70%, 05/01/25 | 100,000 | | 99,421 |
| Matador Resources Co. | | | |
| 5.88%, 09/15/26 | 305,000 | | 302,981 |
| McDonald’s Corporation | | | |
| (Floating, Australian BBSW 3M + 1.13%), 5.47%, 03/08/24(A) † | 2,000,000 | | 1,363,364 |
| 3.63%, 11/28/27(E) | 300,000 | | 338,465 |
| Meritage Homes Corporation | | | |
| 5.13%, 06/06/27 | 580,000 | | 571,930 |
| Microchip Technology, Inc. | | | |
| 4.25%, 09/01/25Δ | 103,000 | | 101,514 |
| MMS U.S.A. Holdings, Inc. | | | |
| 0.63%, 06/13/25(E) | 100,000 | | 105,862 |
| Morgan Stanley | | | |
| 1.75%, 03/11/24(E) | 205,000 | | 225,344 |
| (Variable, U.S. SOFR + 1.15%), 2.72%, 07/22/25^ | 790,000 | | 777,114 |
| (Variable, U.S. SOFR + 0.75%), 0.86%, 10/21/25Δ ^ | 525,000 | | 504,451 |
| (Variable, U.S. SOFR + 0.56%), 1.16%, 10/21/25Δ ^ | 3,060,000 | | 2,945,934 |
See Notes to Financial Statements.
SCHEDULE OF INVESTMENTS (Continued)
| | | Par | | Value |
| (Variable, U.S. SOFR + 1.77%), 6.14%, 10/16/26Δ ^ | $ 980,000 | | $ 998,599 |
| (Variable, U.S. SOFR + 1.59%), 5.16%, 04/20/29^ | 615,000 | | 619,395 |
| (Variable, U.S. SOFR + 1.63%), 5.45%, 07/20/29Δ ^ | 424,000 | | 432,663 |
| (Variable, U.S. SOFR + 1.83%), 6.41%, 11/01/29^ | 105,000 | | 111,494 |
| MPLX LP | | | |
| 4.25%, 12/01/27 | 300,000 | | 293,783 |
| MPT Operating Partnership LP REIT | | | |
| 5.00%, 10/15/27Δ | 350,000 | | 286,203 |
| Nasdaq, Inc. | | | |
| 5.35%, 06/28/28Δ | 680,000 | | 700,486 |
| National Grid North America, Inc. | | | |
| 0.41%, 01/20/26(E) | 100,000 | | 104,197 |
| 4.15%, 09/12/27(E) | 351,000 | | 398,462 |
| National Rural Utilities Cooperative Finance Corporation | | | |
| 1.88%, 02/07/25 | 539,000 | | 520,712 |
| Navient Corporation | | | |
| 5.00%, 03/15/27Δ | 580,000 | | 560,448 |
| New Fortress Energy, Inc. | | | |
| 6.50%, 09/30/26 144A | 185,000 | | 177,807 |
| NextEra Energy Capital Holdings, Inc. | | | |
| 2.94%, 03/21/24Δ | 540,000 | | 536,557 |
| 5.75%, 09/01/25 | 331,000 | | 334,383 |
| NextEra Energy Operating Partners LP | | | |
| 4.25%, 07/15/24 144A | 405,000 | | 400,566 |
| NiSource, Inc. | | | |
| 5.25%, 03/30/28 | 432,000 | | 440,995 |
| Nissan Motor Acceptance Co. LLC | | | |
| 1.13%, 09/16/24 144A Δ | 690,000 | | 665,824 |
| Nordstrom, Inc. | | | |
| 2.30%, 04/08/24 | 250,000 | | 247,458 |
| Occidental Petroleum Corporation | | | |
| 8.50%, 07/15/27Δ | 455,000 | | 496,725 |
| Oncor Electric Delivery Co. LLC | | | |
| 4.30%, 05/15/28 144A | 220,000 | | 217,699 |
| OneMain Finance Corporation | | | |
| 7.13%, 03/15/26 | 580,000 | | 591,360 |
| ONEOK, Inc. | | | |
| 5.55%, 11/01/26 | 1,260,000 | | 1,282,750 |
| 5.65%, 11/01/28Δ | 144,000 | | 148,990 |
| Oracle Corporation | | | |
| 1.65%, 03/25/26Δ | 1,464,000 | | 1,366,649 |
| 2.65%, 07/15/26 | 286,000 | | 271,431 |
| 4.50%, 05/06/28Δ | 75,000 | | 75,113 |
| Otis Worldwide Corporation | | | |
| 5.25%, 08/16/28Δ | 22,000 | | 22,597 |
| Ovintiv, Inc. | | | |
| 5.65%, 05/15/25 | 960,000 | | 965,161 |
| Pacific Gas and Electric Co. | | | |
| 3.75%, 02/15/24 | 200,000 | | 199,397 |
| 4.95%, 06/08/25 | 1,000,000 | | 994,301 |
| 3.45%, 07/01/25 | 111,000 | | 107,495 |
| | | Par | | Value |
| 2.10%, 08/01/27 | $ 600,000 | | $ 541,612 |
| Pacific Life Global Funding II | | | |
| (Floating, U.S. SOFR + 0.62%), 6.02%, 06/04/26 144A † | 500,000 | | 495,853 |
| PeaceHealth Obligated Group | | | |
| 1.38%, 11/15/25 | 104,000 | | 96,685 |
| Pennsylvania Electric Co. | | | |
| 5.15%, 03/30/26 144A | 480,000 | | 479,833 |
| Penske Truck Leasing Co. LP | | | |
| 3.45%, 07/01/24 144A | 1,500,000 | | 1,482,233 |
| 2.70%, 11/01/24 144A | 1,105,000 | | 1,075,345 |
| 1.20%, 11/15/25 144A | 300,000 | | 278,349 |
| Piedmont Natural Gas Co., Inc. | | | |
| 3.50%, 06/01/29 | 24,000 | | 22,426 |
| Pioneer Natural Resources Co. | | | |
| 1.13%, 01/15/26 | 285,000 | | 264,793 |
| 5.10%, 03/29/26 | 175,000 | | 176,387 |
| Plains All American Pipeline LP | | | |
| 4.50%, 12/15/26 | 1,900,000 | | 1,876,172 |
| PNC Financial Services Group, Inc. (The) | | | |
| (Variable, U.S. SOFR Index + 1.09%), 4.76%, 01/26/27^ | 945,000 | | 938,315 |
| PRA Group, Inc. | | | |
| 7.38%, 09/01/25 144A | 200,000 | | 198,557 |
| Prime Security Services Borrower LLC | | | |
| 5.25%, 04/15/24 144A | 200,000 | | 198,886 |
| PTC, Inc. | | | |
| 3.63%, 02/15/25 144A Δ | 580,000 | | 567,816 |
| Qorvo, Inc. | | | |
| 1.75%, 12/15/24 | 620,000 | | 594,667 |
| Quanta Services, Inc. | | | |
| 0.95%, 10/01/24Δ | 385,000 | | 371,170 |
| Regal Rexnord Corporation | | | |
| 6.05%, 02/15/26 144A | 825,000 | | 834,653 |
| RTX Corporation | | | |
| 3.95%, 08/16/25Δ | 544,000 | | 536,394 |
| 5.75%, 01/15/29Δ | 215,000 | | 225,063 |
| Ryder System, Inc. | | | |
| 3.65%, 03/18/24 | 680,000 | | 676,780 |
| 2.85%, 03/01/27 | 360,000 | | 338,924 |
| Sabine Pass Liquefaction LLC | | | |
| 5.63%, 03/01/25 | 1,051,000 | | 1,053,823 |
| 5.00%, 03/15/27 | 134,000 | | 134,690 |
| San Diego Gas & Electric Co. | | | |
| 4.95%, 08/15/28Δ | 630,000 | | 643,692 |
| SBA Tower Trust REIT | | | |
| 2.84%, 01/15/25 144A | 3,225,000 | | 3,115,530 |
| 1.88%, 01/15/26 144A | 680,000 | | 631,479 |
| 1.63%, 11/15/26 144A | 800,000 | | 715,432 |
| Sempra | | | |
| 3.30%, 04/01/25 | 295,000 | | 288,088 |
| Sirius XM Radio, Inc. | | | |
| 3.13%, 09/01/26 144A Δ | 600,000 | | 564,487 |
| Sonoco Products Co. | | | |
| 2.25%, 02/01/27 | 355,000 | | 327,467 |
See Notes to Financial Statements.
| | | Par | | Value |
| Southern California Edison Co. | | | |
| 5.65%, 10/01/28 | $ 45,000 | | $ 46,983 |
| Southern Co. (The) | | | |
| 4.48%, 08/01/24Δ STEP | 532,000 | | 527,785 |
| Sprint LLC | | | |
| 7.13%, 06/15/24 | 657,000 | | 660,284 |
| 7.63%, 03/01/26 | 173,000 | | 180,759 |
| Sprint Spectrum Co. LLC | | | |
| 4.74%, 03/20/25 144A | 139,063 | | 137,941 |
| Standard Industries, Inc. | | | |
| 5.00%, 02/15/27 144A | 580,000 | | 565,846 |
| Starwood Property Trust, Inc. | | | |
| 4.75%, 03/15/25 | 585,000 | | 577,737 |
| Steel Dynamics, Inc. | | | |
| 2.40%, 06/15/25Δ | 35,000 | | 33,561 |
| Synchrony Bank | | | |
| 5.40%, 08/22/25 | 1,600,000 | | 1,577,078 |
| Targa Resources Corporation | | | |
| 5.20%, 07/01/27 | 442,000 | | 444,489 |
| 6.15%, 03/01/29 | 220,000 | | 230,456 |
| TerraForm Power Operating LLC | | | |
| 5.00%, 01/31/28 144A | 595,000 | | 577,763 |
| Texas Electric Market Stabilization Funding N LLC | | | |
| 4.27%, 08/01/34 144A | 260,596 | | 252,275 |
| T-Mobile U.S.A., Inc. | | | |
| 2.25%, 02/15/26 | 486,000 | | 460,833 |
| 2.63%, 04/15/26 | 252,000 | | 239,835 |
| 3.75%, 04/15/27 | 381,000 | | 370,057 |
| 3.38%, 04/15/29 | 375,000 | | 348,829 |
| Travel + Leisure Co. | | | |
| 6.63%, 07/31/26 144A | 580,000 | | 586,345 |
| United Airlines, Inc. | | | |
| 4.38%, 04/15/26 144A | 540,000 | | 526,889 |
| UnitedHealth Group, Inc. | | | |
| 4.25%, 01/15/29Δ | 143,000 | | 142,974 |
| Verizon Communications, Inc. | | | |
| 4.33%, 09/21/28 | 267,000 | | 264,579 |
| Viasat, Inc. | | | |
| 5.63%, 04/15/27 144A | 270,000 | | 261,510 |
| Viper Energy, Inc. | | | |
| 7.38%, 11/01/31 144A Δ | 1,465,000 | | 1,517,930 |
| Virginia Electric and Power Co. | | | |
| 3.80%, 04/01/28 | 83,000 | | 80,618 |
| Vistra Operations Co. LLC | | | |
| 4.88%, 05/13/24 144A | 365,000 | | 363,394 |
| 3.55%, 07/15/24 144A | 900,000 | | 887,525 |
| 5.63%, 02/15/27 144A Δ | 250,000 | | 246,748 |
| 5.00%, 07/31/27 144A | 200,000 | | 194,873 |
| VMware LLC | | | |
| 3.90%, 08/21/27 | 635,000 | | 615,415 |
| Volkswagen Group of America Finance LLC | | | |
| 3.95%, 06/06/25 144A | 2,410,000 | | 2,362,940 |
| 5.70%, 09/12/26 144A | 1,710,000 | | 1,736,032 |
| Warnermedia Holdings, Inc. | | | |
| 3.64%, 03/15/25 | 300,000 | | 293,709 |
| | | Par | | Value |
| 3.79%, 03/15/25Δ | $ 600,000 | | $ 588,382 |
| WEC Energy Group, Inc. | | | |
| 4.75%, 01/09/26Δ | 575,000 | | 573,175 |
| Wells Fargo & Co. | | | |
| (Variable, U.S. SOFR + 1.32%), 3.91%, 04/25/26^ | 1,420,000 | | 1,392,857 |
| (Variable, U.S. SOFR + 1.56%), 4.54%, 08/15/26Δ ^ | 505,000 | | 500,034 |
| (Variable, U.S. SOFR + 1.74%), 5.57%, 07/25/29^ | 1,059,000 | | 1,083,029 |
| (Variable, U.S. SOFR + 1.79%), 6.30%, 10/23/29^ | 315,000 | | 332,483 |
| WESCO Distribution, Inc. | | | |
| 7.13%, 06/15/25 144A | 210,000 | | 211,715 |
| Western Midstream Operating LP | | | |
| 4.65%, 07/01/26 | 63,000 | | 61,966 |
| 6.35%, 01/15/29 | 145,000 | | 151,436 |
| Westinghouse Air Brake Technologies Corporation | | | |
| 4.15%, 03/15/24 | 1,600,000 | | 1,593,467 |
| 3.20%, 06/15/25 | 325,000 | | 314,558 |
| Williams Cos., Inc. (The) | | | |
| 5.40%, 03/02/26 | 1,694,000 | | 1,712,261 |
| 5.30%, 08/15/28 | 398,000 | | 407,959 |
| Workday, Inc. | | | |
| 3.50%, 04/01/27 | 163,000 | | 157,908 |
Total Corporate Bonds
(Cost $169,970,870) | | | 168,785,585 |
| FOREIGN BONDS — 9.3% |
| Australia — 0.6% | | |
| Macquarie Group, Ltd. | | | |
| (Variable, U.S. SOFR + 0.69%), 1.20%, 10/14/25 144A ^ | 800,000 | | 772,097 |
| National Australia Bank, Ltd. | | | |
| 4.94%, 01/12/28Δ | 250,000 | | 253,088 |
| NBN Co., Ltd. | | | |
| 0.88%, 10/08/24 144A | 880,000 | | 850,723 |
| Sydney Airport Finance Co. Pty, Ltd. | | | |
| 3.38%, 04/30/25 | 1,000,000 | | 975,878 |
| Transurban Queensland Finance Pty., Ltd. | | | |
| (Floating, Australian BBSW 3M + 2.05%), 6.41%, 12/16/24(A) † | 720,000 | | 494,447 |
| Woodside Finance, Ltd. | | | |
| 3.65%, 03/05/25 144A | 1,900,000 | | 1,859,721 |
| 3.70%, 09/15/26 144A | 400,000 | | 384,730 |
| | | | | 5,590,684 |
| Belgium — 0.0% | | |
| KBC Group NV | | | |
| (Variable, 1.10% - EUR Swap Rate 5Y), 0.50%, 12/03/29(E) ^ | 200,000 | | 211,695 |
| Canada — 1.3% | | |
| Canadian Pacific Railway Co. | | | |
| 1.35%, 12/02/24 | 1,101,000 | | 1,060,986 |
| CDP Financial, Inc. | | | |
| 1.00%, 05/26/26 144A | 520,000 | | 479,907 |
See Notes to Financial Statements.
SCHEDULE OF INVESTMENTS (Continued)
| | | Par | | Value |
| CPPIB Capital, Inc. | | | |
| 0.50%, 09/16/24 144A | $1,265,000 | | $ 1,224,367 |
| 4.13%, 10/21/24 144A | 2,200,000 | | 2,183,229 |
| Element Fleet Management Corporation | | | |
| 1.60%, 04/06/24 144A Δ | 315,000 | | 311,042 |
| Enbridge, Inc. | | | |
| 2.50%, 02/14/25 | 640,000 | | 621,056 |
| 6.00%, 11/15/28 | 265,000 | | 278,674 |
| GFL Environmental, Inc. | | | |
| 3.75%, 08/01/25 144A | 175,000 | | 170,993 |
| 5.13%, 12/15/26 144A Δ | 175,000 | | 173,263 |
| OMERS Finance Trust | | | |
| 1.10%, 03/26/26 144A | 675,000 | | 625,386 |
| 4.00%, 04/20/28 144A | 555,000 | | 545,411 |
| Ontario Teachers' Finance Trust | | | |
| 4.25%, 04/25/28 144A | 1,065,000 | | 1,062,308 |
| Rogers Communications, Inc. | | | |
| 3.20%, 03/15/27Δ | 597,000 | | 570,399 |
| Royal Bank of Canada | | | |
| 6.00%, 11/01/27 | 256,000 | | 268,573 |
| Toronto-Dominion Bank (The) | | | |
| 0.38%, 04/25/24(E) | 305,000 | | 332,959 |
| TransCanada PipeLines, Ltd. | | | |
| 1.00%, 10/12/24 | 1,000,000 | | 964,740 |
| | | | | 10,873,293 |
| France — 1.0% | | |
| Banque Federative du Credit Mutuel SA | | | |
| 5.90%, 07/13/26 144A | 1,785,000 | | 1,824,205 |
| Banque Stellantis France SACA | | | |
| 0.00%, 01/22/25(E) | 100,000 | | 106,202 |
| BNP Paribas SA | | | |
| 3.38%, 01/09/25 144A | 700,000 | | 685,860 |
| BPCE SA | | | |
| 0.63%, 04/28/25(E) | 100,000 | | 106,339 |
| (Variable, U.S. SOFR + 2.10%), 5.98%, 01/18/27 144A ^ | 1,815,000 | | 1,830,866 |
| Credit Agricole SA | | | |
| (Variable, U.S. SOFR + 0.89%), 1.25%, 01/26/27 144A ^ | 250,000 | | 230,406 |
| Electricite de France SA | | | |
| 3.75%, 06/05/27(E) | 200,000 | | 225,264 |
| Engie SA | | | |
| 3.63%, 12/06/26(E) | 300,000 | | 336,046 |
| Societe Generale SA | | | |
| 2.63%, 01/22/25 144A | 2,800,000 | | 2,715,249 |
| (Variable, U.S. Treasury Yield Curve Rate CMT 1Y + 1.10%), 1.49%, 12/14/26 144A ^ | 200,000 | | 184,301 |
| Teleperformance SE | | | |
| 5.25%, 11/22/28(E) | 200,000 | | 231,182 |
| | | | | 8,475,920 |
| Germany — 0.5% | | |
| Commerzbank AG | | | |
| (Variable, 1.30% - Euribor 3M), 0.75%, 03/24/26(E) ^ | 100,000 | | 106,044 |
| | | Par | | Value |
| Deutsche Bank AG | | | |
| (Variable, U.S. SOFR + 2.58%), 3.96%, 11/26/25^ | $2,800,000 | | $2,755,027 |
| (Variable, U.S. SOFR + 2.51%), 6.82%, 11/20/29^ | 170,000 | | 179,264 |
| E.ON SE | | | |
| 0.88%, 01/08/25(E) | 50,000 | | 53,835 |
| Traton Finance Luxembourg SA | | | |
| 0.00%, 06/14/24(E) | 100,000 | | 108,416 |
| 0.13%, 11/10/24(E) | 100,000 | | 106,767 |
| Volkswagen Bank GmbH | | | |
| 1.88%, 01/31/24(E) | 300,000 | | 330,531 |
| 4.25%, 01/07/26(E) | 200,000 | | 223,523 |
| 2.50%, 07/31/26(E) | 100,000 | | 107,655 |
| Volkswagen Financial Services AG | | | |
| 0.88%, 01/31/28(E) | 120,000 | | 120,029 |
| Volkswagen Leasing GmbH | | | |
| 0.38%, 07/20/26(E) | 60,000 | | 61,481 |
| | | | | 4,152,572 |
| Ireland — 0.5% | | |
| AerCap Ireland Capital DAC | | | |
| 2.88%, 08/14/24 | 150,000 | | 147,185 |
| 1.65%, 10/29/24 | 2,585,000 | | 2,495,975 |
| 3.50%, 01/15/25 | 350,000 | | 342,365 |
| 2.45%, 10/29/26 | 150,000 | | 138,969 |
| CA Auto Bank SpA | | | |
| 0.00%, 04/16/24(E) | 100,000 | | 109,213 |
| CRH SMW Finance DAC | | | |
| 4.00%, 07/11/27(E) | 170,000 | | 192,936 |
| ESB Finance DAC | | | |
| 3.49%, 01/12/24(E) | 100,000 | | 110,379 |
| Fresenius Finance Ireland PLC | | | |
| 0.00%, 10/01/25(E) | 100,000 | | 104,133 |
| Linde PLC | | | |
| 3.63%, 06/12/25(E) | 200,000 | | 222,343 |
| SMBC Aviation Capital Finance DAC | | | |
| 3.55%, 04/15/24 144A Δ | 800,000 | | 794,672 |
| | | | | 4,658,170 |
| Italy — 0.1% | | |
| ACEA SpA | | | |
| 0.00%, 09/28/25(E) | 100,000 | | 104,143 |
| ASTM SpA | | | |
| 1.00%, 11/25/26(E) | 170,000 | | 175,158 |
| Eni SpA | | | |
| 3.63%, 05/19/27(E) | 240,000 | | 269,250 |
| Snam SpA | | | |
| 0.00%, 08/15/25(E) | 100,000 | | 104,779 |
| Telecom Italia SpA | | | |
| 5.30%, 05/30/24 144A | 200,000 | | 199,218 |
| | | | | 852,548 |
| Japan — 1.3% | | |
| Mitsubishi UFJ Financial Group, Inc. | | | |
| (Variable, U.S. Treasury Yield Curve Rate CMT 1Y + 1.08%), 5.72%, 02/20/26^ | 990,000 | | 994,607 |
See Notes to Financial Statements.
| | | Par | | Value |
| Mizuho Financial Group, Inc. | | | |
| 0.52%, 06/10/24(E) | $ 100,000 | | $ 108,744 |
| Nomura Holdings, Inc. | | | |
| 1.85%, 07/16/25 | 2,700,000 | | 2,558,237 |
| 2.33%, 01/22/27 | 600,000 | | 550,808 |
| NTT Finance Corporation | | | |
| 4.37%, 07/27/27 144A | 200,000 | | 198,397 |
| Renesas Electronics Corporation | | | |
| 1.54%, 11/26/24 144A | 1,245,000 | | 1,198,419 |
| Sumitomo Mitsui Financial Group, Inc. | | | |
| (Floating, Australian BBSW 3M + 1.25%), 5.40%, 10/16/24(A) † | 1,000,000 | | 682,892 |
| 1.47%, 07/08/25 | 1,100,000 | | 1,041,462 |
| 5.46%, 01/13/26 | 1,700,000 | | 1,717,692 |
| Sumitomo Mitsui Trust Bank, Ltd. | | | |
| 5.65%, 09/14/26 144A | 2,500,000 | | 2,542,770 |
| | | | | 11,594,028 |
| Jersey — 0.1% | | |
| Aptiv PLC | | | |
| 2.40%, 02/18/25 | 355,000 | | 343,556 |
| Heathrow Funding, Ltd. | | | |
| 1.50%, 10/12/25(E) | 185,000 | | 197,869 |
| | | | | 541,425 |
| Netherlands — 0.8% | | |
| ABN AMRO Bank NV | | | |
| (Variable, U.S. Treasury Yield Curve Rate CMT 1Y + 1.55%), 6.58%, 10/13/26 144A ^ | 600,000 | | 609,692 |
| (Variable, U.S. Treasury Yield Curve Rate CMT 1Y + 1.65%), 6.34%, 09/18/27 144A ^ | 900,000 | | 921,033 |
| Conti-Gummi Finance BV | | | |
| 1.13%, 09/25/24(E) | 110,000 | | 119,001 |
| Cooperatieve Rabobank UA | | | |
| (Variable, U.S. Treasury Yield Curve Rate CMT 1Y + 0.73%), 1.98%, 12/15/27 144A ^ | 1,000,000 | | 911,203 |
| Enel Finance International NV | | | |
| 2.65%, 09/10/24 | 500,000 | | 488,433 |
| 6.80%, 10/14/25 144A | 500,000 | | 512,937 |
| ING Groep NV | | | |
| (Variable, U.S. SOFR + 1.64%), 3.87%, 03/28/26^ | 800,000 | | 784,668 |
| JDE Peet's NV | | | |
| 0.80%, 09/24/24 144A | 430,000 | | 413,695 |
| LeasePlan Corporation NV | | | |
| 2.88%, 10/24/24 144A | 1,900,000 | | 1,857,589 |
| NXP BV | | | |
| 2.70%, 05/01/25 | 50,000 | | 48,261 |
| 4.30%, 06/18/29 | 140,000 | | 136,260 |
| Redexis Gas Finance BV | | | |
| 1.88%, 05/28/25(E) | 100,000 | | 107,650 |
| | | Par | | Value |
| Sartorius Finance BV | | | |
| 4.25%, 09/14/26(E) | $ 300,000 | | $ 338,910 |
| Toyota Motor Finance Netherlands BV | | | |
| 0.00%, 10/27/25(E) | 100,000 | | 104,289 |
| | | | | 7,353,621 |
| Norway — 0.3% | | |
| Aker BP ASA | | | |
| 2.88%, 01/15/26 144A | 895,000 | | 852,049 |
| DNB Bank ASA | | | |
| (Variable, U.S. Treasury Yield Curve Rate CMT 1Y + 0.85%), 1.13%, 09/16/26 144A ^ | 1,000,000 | | 928,411 |
| Var Energi ASA | | | |
| 7.50%, 01/15/28 144A | 410,000 | | 435,174 |
| | | | | 2,215,634 |
| Spain — 0.1% | | |
| Banco Santander SA | | | |
| (Variable, U.S. Treasury Yield Curve Rate CMT 1Y + 0.45%), 5.74%, 06/30/24^ | 800,000 | | 799,939 |
| Sweden — 0.3% | | |
| Skandinaviska Enskilda Banken AB | | | |
| 1.40%, 11/19/25 144A Δ | 2,000,000 | | 1,871,373 |
| Svensk Exportkredit AB | | | |
| 4.00%, 07/15/25 | 780,000 | | 772,439 |
| Volvo Treasury AB | | | |
| 0.00%, 05/09/24(E) | 210,000 | | 228,611 |
| | | | | 2,872,423 |
| Switzerland — 0.8% | | |
| Credit Suisse AG | | | |
| 3.70%, 02/21/25 | 250,000 | | 245,092 |
| 7.50%, 02/15/28 | 350,000 | | 383,875 |
| SIG Combibloc PurchaseCo S.a.r.l. | | | |
| 2.13%, 06/18/25(E) | 100,000 | | 108,405 |
| UBS Group AG | | | |
| (Variable, 0.55% - EURIBOR ICE SWAP RATE), 0.25%, 01/29/26(E) ^ | 200,000 | | 211,690 |
| (Variable, U.S. Treasury Yield Curve Rate CMT 1Y + 1.55%), 5.71%, 01/12/27 144A ^ | 3,000,000 | | 3,019,067 |
| (Variable, U.S. Treasury Yield Curve Rate CMT 1Y + 2.05%), 4.70%, 08/05/27 144A ^ | 680,000 | | 670,899 |
| (Variable, U.S. Treasury Yield Curve Rate CMT 1Y + 0.85%), 1.49%, 08/10/27 144A ^ | 350,000 | | 316,547 |
See Notes to Financial Statements.
SCHEDULE OF INVESTMENTS (Continued)
| | | Par | | Value |
| (Variable, U.S. Treasury Yield Curve Rate CMT 1Y + 1.60%), 6.33%, 12/22/27 144A ^ | $1,675,000 | | $ 1,728,119 |
| | | | | 6,683,694 |
| United Kingdom — 1.6% | | |
| Barclays PLC | | | |
| 4.38%, 01/12/26 | 700,000 | | 691,143 |
| (Variable, U.S. SOFR + 2.71%), 2.85%, 05/07/26^ | 1,000,000 | | 964,985 |
| (Variable, U.S. Treasury Yield Curve Rate CMT 1Y + 2.30%), 5.30%, 08/09/26Δ ^ | 900,000 | | 897,036 |
| (Variable, U.S. SOFR + 2.21%), 5.83%, 05/09/27Δ ^ | 304,000 | | 306,914 |
| British Telecommunications PLC | | | |
| 4.25%, 01/06/33(E) | 190,000 | | 221,363 |
| HSBC Holdings PLC | | | |
| (Floating, CME Term SOFR 3M + 1.49%), 6.86%, 03/11/25† Δ | 3,000,000 | | 3,005,179 |
| (Variable, U.S. SOFR + 3.35%), 7.39%, 11/03/28^ | 200,000 | | 214,600 |
| (Variable, CME Term SOFR 3M + 1.80%), 4.58%, 06/19/29Δ ^ | 200,000 | | 194,284 |
| INEOS Quattro Finance 2 PLC | | | |
| 9.63%, 03/15/29 144A | 525,000 | | 561,094 |
| Informa PLC | | | |
| 2.13%, 10/06/25(E) | 485,000 | | 520,869 |
| Lloyds Banking Group PLC | | | |
| 4.45%, 05/08/25 | 300,000 | | 296,692 |
| (Variable, U.S. Treasury Yield Curve Rate CMT 1Y + 1.60%), 3.51%, 03/18/26^ | 1,500,000 | | 1,466,037 |
| (Variable, U.S. Treasury Yield Curve Rate CMT 1Y + 1.75%), 4.72%, 08/11/26^ | 1,000,000 | | 987,755 |
| National Grid Electricity Transmission PLC | | | |
| 0.19%, 01/20/25(E) | 100,000 | | 106,546 |
| NatWest Group PLC | | | |
| (Variable, U.S. Treasury Yield Curve Rate CMT 1Y + 1.35%), 5.85%, 03/02/27^ | 900,000 | | 908,570 |
| NatWest Markets PLC | | | |
| (Floating, U.S. SOFR + 1.45%), 6.86%, 03/22/25† | 1,500,000 | | 1,510,092 |
| Reckitt Benckiser Treasury Services PLC | | | |
| 3.63%, 09/14/28(E) | 310,000 | | 354,259 |
| Rolls-Royce PLC | | | |
| 5.75%, 10/15/27 144A | 350,000 | | 350,834 |
| Santander UK Group Holdings PLC | | | |
| (Variable, U.S. SOFR + 2.75%), 6.83%, 11/21/26^ | 500,000 | | 509,678 |
| | | | | 14,067,930 |
Total Foreign Bonds
(Cost $82,000,796) | | 80,943,576 |
| | | Par | | Value |
| MORTGAGE-BACKED SECURITIES — 15.8% |
| Alen Mortgage Trust, Series 2021-ACEN, Class A | | | |
| (Floating, CME Term SOFR 1M + 1.26%, 1.15% Floor), 6.63%, 04/15/34 144A † | $ 350,000 | | $315,376 |
| American Home Mortgage Assets Trust, Series 2006-5, Class A1 | | | |
| (Floating, Federal Reserve U.S. 12 1Y CMT + 0.92%, 0.92% Floor), 5.93%, 11/25/46† | 532,405 | | 150,007 |
| Angel Oak Mortgage Trust, Series 2022-2, Class A1 | | | |
| 3.35%, 01/25/67 144A † γ | 288,154 | | 264,067 |
| Angel Oak Mortgage Trust, Series 2023-6, Class A1 | | | |
| (Step to 6.56% on 09/25/27), 6.50%, 12/25/67 144A STEP | 206,468 | | 208,057 |
| Arroyo Mortgage Trust, Series 2022-2, Class A1 | | | |
| (Step to 5.95% on 07/25/26), 4.95%, 07/25/57 144A STEP | 212,315 | | 210,469 |
| Banc of America Mortgage Trust, Series 2003-L, Class 3A1 | | | |
| 4.37%, 01/25/34† γ | 19,760 | | 18,364 |
| BANK, Series 2019-BNK18, Class A2 | | | |
| 3.47%, 05/15/62 | 610,000 | | 597,495 |
| BBCMS Mortgage Trust, Series 2023-C19, Class A2B | | | |
| 5.75%, 04/15/56 | 460,000 | | 470,491 |
| Bear Stearns ARM Trust, Series 2003-8, Class 4A1 | | | |
| 5.58%, 01/25/34† γ | 44,579 | | 43,786 |
| Bear Stearns ARM Trust, Series 2004-5, Class 2A | | | |
| 3.67%, 07/25/34† γ | 43,611 | | 39,237 |
| Bellemeade Re, Ltd., Series 2021-3A, Class M1A | | | |
| (Floating, U.S. 30-Day Average SOFR + 1.00%, 1.00% Floor), 6.34%, 09/25/31 144A † | 262,175 | | 261,646 |
| Benchmark Mortgage Trust, Series 2019-B12, Class AAB | | | |
| 3.04%, 08/15/52 | 1,000,000 | | 946,807 |
| Benchmark Mortgage Trust, Series 2022-B34, Class AM | | | |
| 3.83%, 04/15/55† γ | 225,000 | | 188,172 |
| Benchmark Mortgage Trust, Series 2023-V3, Class A3 | | | |
| 6.36%, 07/15/56 | 545,000 | | 572,117 |
| BRAVO Residential Funding Trust, Series 2023-NQM6, Class A1 | | | |
| (Step to 7.60% on 09/25/27), 6.60%, 09/25/63 144A STEP | 466,737 | | 473,122 |
See Notes to Financial Statements.
| | | Par | | Value |
| BX Commercial Mortgage Trust, Series 2019-XL, Class A | | | |
| (Floating, CME Term SOFR 1M + 1.03%, 0.92% Floor), 6.40%, 10/15/36 144A † | $379,668 | | $378,801 |
| BX Commercial Mortgage Trust, Series 2019-XL, Class B | | | |
| (Floating, CME Term SOFR 1M + 1.19%, 1.08% Floor), 6.56%, 10/15/36 144A † | 569,500 | | 566,804 |
| BX Commercial Mortgage Trust, Series 2019-XL, Class D | | | |
| (Floating, CME Term SOFR 1M + 1.56%, 1.45% Floor), 6.93%, 10/15/36 144A † | 352,750 | | 350,665 |
| BX Commercial Mortgage Trust, Series 2020-VKNG, Class B | | | |
| (Floating, CME Term SOFR 1M + 1.24%, 1.13% Floor), 6.61%, 10/15/37 144A † | 994,000 | | 981,818 |
| BX Commercial Mortgage Trust, Series 2023-XL3, Class A | | | |
| (Floating, CME Term SOFR 1M + 1.76%, 1.76% Floor), 7.12%, 12/09/40 144A † | 545,000 | | 546,362 |
| BX Trust, Series 2018-BILT, Class D | | | |
| (Floating, CME Term SOFR 1M + 2.07%, 1.77% Floor), 7.43%, 05/15/30 144A † | 235,000 | | 231,966 |
| BX Trust, Series 2021-VIEW, Class A | | | |
| (Floating, CME Term SOFR 1M + 1.39%, 1.28% Floor), 6.76%, 06/15/36 144A † | 150,000 | | 143,789 |
| BX Trust, Series 2023-DELC, Class A | | | |
| (Floating, CME Term SOFR 1M + 2.69%, 2.69% Floor), 8.05%, 05/15/38 144A † | 510,000 | | 512,227 |
| CENT Trust, Series 2023-CITY, Class A | | | |
| (Floating, CME Term SOFR 1M + 2.62%, 2.62% Floor), 7.98%, 09/15/28 144A † | 490,000 | | 493,623 |
| CFCRE Commercial Mortgage Trust, Series 2017-C8, Class ASB | | | |
| 3.37%, 06/15/50 | 977,580 | | 946,791 |
| Chase Home Lending Mortgage Trust, Series 2019-ATR2, Class A11 | | | |
| (Floating, CME Term SOFR 1M + 1.01%, 6.50% Cap), 6.37%, 07/25/49 144A † | 34,557 | | 33,200 |
| Chase Home Lending Mortgage Trust, Series 2019-ATR2, Class A3 | | | |
| 3.50%, 07/25/49 144A † γ | 70,596 | | 62,693 |
| Citigroup Commercial Mortgage Trust, Series 2016-P4, Class AAB | | | |
| 2.78%, 07/10/49 | 305,780 | | 297,018 |
| COAST Commercial Mortgage Trust, Series 2023-2HTL, Class A | | | |
| (Floating, CME Term SOFR 1M + 2.59%, 2.59% Floor), 7.95%, 08/15/36 144A † | 335,000 | | 333,206 |
| | | Par | | Value |
| COLT Mortgage Loan Trust, Series 2022-3, Class A1 | | | |
| 3.90%, 02/25/67 144A † γ | $ 207,197 | | $ 196,201 |
| COMM Mortgage Trust, Series 2013-CR8, Class B | | | |
| 3.60%, 06/10/46 144A † γ | 158,484 | | 147,177 |
| COMM Mortgage Trust, Series 2014-LC15, Class A4 | | | |
| 4.01%, 04/10/47 | 89,091 | | 88,913 |
| COMM Mortgage Trust, Series 2014-UBS5, Class ASB | | | |
| 3.55%, 09/10/47 | 44,658 | | 44,365 |
| COMM Mortgage Trust, Series 2015-CR24, Class ASB | | | |
| 3.45%, 08/10/48 | 45,942 | | 45,361 |
| COMM Mortgage Trust, Series 2015-PC1, Class A4 | | | |
| 3.62%, 07/10/50 | 150,581 | | 148,232 |
| Connecticut Avenue Securities Trust, Series 2019-HRP1, Class M2 | | | |
| (Floating, U.S. 30-Day Average SOFR + 2.26%), 7.60%, 11/25/39 144A † | 915,297 | | 923,507 |
| Connecticut Avenue Securities Trust, Series 2021-R01, Class 1M2 | | | |
| (Floating, U.S. 30-Day Average SOFR + 1.55%), 6.89%, 10/25/41 144A † | 1,050,000 | | 1,049,962 |
| CSAIL Commercial Mortgage Trust, Series 2016-C6, Class XA | | | |
| 1.86%, 01/15/49† IO γ | 596,919 | | 18,523 |
| CSMC, Series 2020-NET, Class A | | | |
| 2.26%, 08/15/37 144A | 301,818 | | 279,509 |
| CSMC, Series 2021-980M, Class C | | | |
| 3.20%, 07/15/31 144A | 150,000 | | 132,135 |
| CSMC, Series 2022-ATH1, Class A1A | | | |
| 2.87%, 01/25/67 144A † γ | 270,380 | | 253,396 |
| Deutsche Alt-B Securities Mortgage Loan Trust, Series 2006-AB4, Class A6A1 | | | |
| (Step to 5.16% on 02/25/24), 6.37%, 10/25/36 STEP | 85,066 | | 71,509 |
| Deutsche Alt-B Securities Mortgage Loan Trust, Series 2006-AB4, Class A6A2 | | | |
| (Step to 5.16% on 02/25/24), 6.39%, 10/25/36 STEP | 85,066 | | 71,508 |
| Extended Stay America Trust, Series 2021-ESH, Class A | | | |
| (Floating, CME Term SOFR 1M + 1.19%, 1.08% Floor), 6.56%, 07/15/38 144A † | 1,586,848 | | 1,573,385 |
| Fannie Mae Connecticut Avenue Securities, Series 2021-R02, Class 2M2 | | | |
| (Floating, U.S. 30-Day Average SOFR + 2.00%), 7.34%, 11/25/41 144A † | 3,000,000 | | 2,979,029 |
See Notes to Financial Statements.
SCHEDULE OF INVESTMENTS (Continued)
| | | Par | | Value |
| Federal Home Loan Mortgage Corporation | | | |
| 3.00%, 10/01/26 | $ 583,058 | | $ 569,527 |
| 3.00%, 01/01/27 | 1,740,857 | | 1,698,742 |
| (Floating, U.S. Treasury Yield Curve Rate CMT 1Y + 2.36%, 2.36% Floor, 13.19% Cap), 5.94%, 07/01/27† | 824 | | 818 |
| (Floating, U.S. Treasury Yield Curve Rate CMT 1Y + 2.25%, 2.25% Floor, 11.23% Cap), 6.34%, 11/01/31† | 6,882 | | 6,815 |
| 3.00%, 12/01/31 | 166,359 | | 159,386 |
| 3.50%, 04/01/32 | 94,087 | | 90,824 |
| (Floating, U.S. Treasury Yield Curve Rate CMT 1Y + 2.25%, 2.25% Floor, 10.91% Cap), 5.25%, 04/01/32† | 1,554 | | 1,555 |
| 3.00%, 09/01/32 | 138,246 | | 132,586 |
| 3.50%, 09/01/32 | 330,790 | | 324,548 |
| (Floating, U.S. Treasury Yield Curve Rate CMT 1Y + 2.04%, 2.04% Floor, 9.71% Cap), 4.95%, 06/01/33† | 132,161 | | 133,952 |
| (Floating, Refinitiv USD IBOR Consumer Cash Fallbacks 1Y Index + 1.75%, 1.75% Floor, 10.85% Cap), 5.50%, 08/01/35† | 20,809 | | 20,761 |
| (Floating, Refinitiv USD IBOR Consumer Cash Fallbacks 1Y Index + 1.35%, 1.35% Floor, 10.44% Cap), 5.59%, 09/01/35† | 44,030 | | 44,556 |
| (Floating, Refinitiv USD IBOR Consumer Cash Fallbacks 1Y Index + 1.63%, 1.63% Floor, 10.77% Cap), 5.88%, 10/01/35† | 40,352 | | 41,151 |
| 3.00%, 02/01/36 | 36,942 | | 34,622 |
| 4.00%, 11/01/36 | 4,312 | | 4,229 |
| 2.50%, 03/01/37 | 152,041 | | 140,353 |
| 4.00%, 06/01/37 | 57,593 | | 56,386 |
| 4.50%, 10/01/37 | 74,201 | | 74,079 |
| 3.50%, 11/01/38 | 54,918 | | 52,426 |
| 4.50%, 07/01/47 | 31,146 | | 30,934 |
| 4.50%, 03/01/49 | 1,488,580 | | 1,476,530 |
| 4.50%, 01/01/50 | 138,326 | | 138,357 |
| 4.00%, 10/01/52 | 483,629 | | 458,192 |
| 4.00%, 12/01/52 | 515,822 | | 488,736 |
| 4.00%, 04/01/53 | 296,433 | | 280,734 |
| Federal Home Loan Mortgage Corporation REMIC, Series 3228 | | | |
| (Floating, U.S. 30-Day Average SOFR + 0.61%, 0.50% Floor, 6.50% Cap), 5.95%, 10/15/36† | 549,264 | | 542,000 |
| Federal Home Loan Mortgage Corporation REMIC, Series 3710 | | | |
| 4.00%, 08/15/25 STEP | 9,751 | | 9,627 |
| | | Par | | Value |
| Federal Home Loan Mortgage Corporation REMIC, Series 3959 | | | |
| 4.50%, 11/15/41 | $ 81,833 | | $ 80,698 |
| Federal Home Loan Mortgage Corporation REMIC, Series 3986 | | | |
| 4.50%, 09/15/41 | 15,276 | | 15,141 |
| Federal Home Loan Mortgage Corporation REMIC, Series 4459 | | | |
| 3.00%, 08/15/43 | 217,537 | | 199,417 |
| Federal Home Loan Mortgage Corporation REMIC, Series 4494 | | | |
| 3.75%, 10/15/42 | 61,719 | | 60,471 |
| Federal Home Loan Mortgage Corporation REMIC, Series 4752 | | | |
| 3.00%, 09/15/46 | 186,606 | | 175,794 |
| Federal Home Loan Mortgage Corporation REMIC, Series 4777 | | | |
| 3.50%, 10/15/45 | 296,730 | | 286,185 |
| Federal Home Loan Mortgage Corporation REMIC, Series 4904 | | | |
| (Floating, U.S. 30-Day Average SOFR + 0.56%, 0.45% Floor, 6.50% Cap), 5.90%, 06/15/49† | 336,379 | | 327,559 |
| Federal Home Loan Mortgage Corporation REMIC, Series 4941 | | | |
| 3.00%, 07/25/49 | 164,961 | | 146,883 |
| Federal Home Loan Mortgage Corporation REMIC, Series 4948 | | | |
| 2.50%, 10/25/48 | 103,402 | | 92,002 |
| Federal Home Loan Mortgage Corporation REMIC, Series 5000 | | | |
| 2.00%, 06/25/44 | 127,485 | | 115,362 |
| Federal Home Loan Mortgage Corporation REMIC, Series 5006 | | | |
| 2.00%, 06/25/45 | 363,459 | | 325,021 |
| Federal Home Loan Mortgage Corporation REMIC, Series 5047 | | | |
| 0.75%, 10/15/28 | 2,182,370 | | 2,031,765 |
| Federal Home Loan Mortgage Corporation REMIC, Series 5057 | | | |
| 1.00%, 04/15/54 | 1,574,018 | | 1,421,774 |
| Federal Home Loan Mortgage Corporation REMIC, Series 5105 | | | |
| 1.50%, 04/15/44 | 603,551 | | 570,421 |
| Federal Home Loan Mortgage Corporation REMIC, Series 5115 | | | |
| 1.00%, 02/25/42 | 1,827,302 | | 1,569,730 |
| Federal Home Loan Mortgage Corporation STACR REMIC Trust, Series 2021-DNA5, Class M2 | | | |
| (Floating, U.S. 30-Day Average SOFR + 1.65%), 6.99%, 01/25/34 144A † | 686,424 | | 689,550 |
See Notes to Financial Statements.
| | | Par | | Value |
| Federal Home Loan Mortgage Corporation STACR REMIC Trust, Series 2021-DNA6, Class M2 | | | |
| (Floating, U.S. 30-Day Average SOFR + 1.50%), 6.84%, 10/25/41 144A † | $1,850,000 | | $1,836,020 |
| Federal Home Loan Mortgage Corporation STACR REMIC Trust, Series 2022-HQA1, Class M1A | | | |
| (Floating, U.S. 30-Day Average SOFR + 2.10%), 7.44%, 03/25/42 144A † | 412,986 | | 416,290 |
| Federal Home Loan Mortgage Corporation STACR Trust, Series 2019-DNA4, Class M2 | | | |
| (Floating, U.S. 30-Day Average SOFR + 2.06%), 7.40%, 10/25/49 144A † | 4,570 | | 4,573 |
| Federal National Mortgage Association | | | |
| 2.50%, 12/01/27 | 174,954 | | 168,398 |
| 3.00%, 09/01/30 | 98,514 | | 94,771 |
| 3.00%, 02/01/31 | 628,605 | | 603,279 |
| 3.00%, 04/01/31 | 10,287 | | 9,865 |
| 1.50%, 06/01/31 | 1,789,550 | | 1,646,304 |
| (Floating, U.S. Treasury Yield Curve Rate CMT 1Y + 2.22%, 2.22% Floor, 11.65% Cap), 6.11%, 09/01/31† | 15,035 | | 14,931 |
| 2.50%, 10/01/31 | 233,648 | | 221,024 |
| 2.50%, 11/01/31 | 544,915 | | 514,656 |
| 2.50%, 01/01/32 | 3,807 | | 3,605 |
| 3.00%, 03/01/32 | 362,344 | | 346,458 |
| 3.00%, 07/01/32 | 369,379 | | 353,410 |
| (Floating, Refinitiv USD IBOR Consumer Cash Fallbacks 1M Index + 1.31%, 1.31% Floor, 11.27% Cap), 6.68%, 08/01/32† | 75,288 | | 75,022 |
| 3.00%, 11/01/32 | 36,592 | | 34,950 |
| 3.00%, 12/01/32 | 383,095 | | 366,365 |
| (Floating, U.S. Treasury Yield Curve Rate CMT 1Y + 2.25%, 2.25% Floor, 9.73% Cap), 4.57%, 12/01/32† | 189,051 | | 187,218 |
| (Floating, U.S. Treasury Yield Curve Rate CMT 1Y + 2.41%, 2.41% Floor, 9.66% Cap), 6.15%, 06/01/33† | 3,456 | | 3,455 |
| 4.00%, 09/01/33 | 702,152 | | 693,178 |
| 3.00%, 02/01/34 | 721,679 | | 689,886 |
| 4.00%, 05/01/34 | 347,082 | | 345,408 |
| 3.00%, 02/01/35 | 89,492 | | 85,527 |
| (Floating, Refinitiv USD IBOR Consumer Cash Fallbacks 1Y Index + 1.66%, 1.66% Floor, 10.15% Cap), 4.56%, 02/01/35† | 18,443 | | 18,456 |
| 3.00%, 09/01/35 | 66,264 | | 62,190 |
| 2.50%, 02/01/36 | 116,707 | | 108,246 |
| | | Par | | Value |
| 2.50%, 12/01/36 | $ 87,874 | | $ 81,499 |
| 3.50%, 05/01/37 | 379,254 | | 371,849 |
| 4.00%, 07/01/37 | 20,700 | | 20,234 |
| 4.50%, 08/01/37 | 511,948 | | 512,397 |
| 4.00%, 09/01/37 | 25,535 | | 24,953 |
| 4.50%, 10/01/37 | 852,704 | | 850,387 |
| 5.00%, 10/01/37 | 41,535 | | 42,062 |
| 4.50%, 11/01/37 | 54,320 | | 54,432 |
| 5.00%, 02/01/38 | 1,807,876 | | 1,834,851 |
| 4.00%, 03/01/38 | 17,595 | | 17,145 |
| 4.50%, 05/01/38 | 64,180 | | 64,095 |
| (Floating, Refinitiv USD IBOR Consumer Cash Fallbacks 1Y Index + 1.73%, 1.73% Floor, 9.49% Cap), 5.46%, 05/01/38† | 382,971 | | 393,992 |
| 5.50%, 05/01/38 | 119,867 | | 123,013 |
| 6.13%, 08/01/42† | 115,009 | | 111,340 |
| (Floating, Refinitiv USD IBOR Consumer Cash Fallbacks 1Y Index + 1.74%, 1.74% Floor, 8.77% Cap), 4.98%, 09/01/42† | 86,260 | | 88,765 |
| (Floating, Refinitiv USD IBOR Consumer Cash Fallbacks 1Y Index + 1.70%, 1.70% Floor, 7.76% Cap), 5.55%, 07/01/43† | 136,276 | | 140,220 |
| (Floating, Federal Reserve U.S. 12 1Y CMT + 1.20%, 1.20% Floor, 8.52% Cap), 6.13%, 07/01/44† | 34,395 | | 33,293 |
| (Floating, Federal Reserve U.S. 12 1Y CMT + 1.20%, 1.20% Floor, 9.25% Cap), 6.13%, 10/01/44† | 28,839 | | 27,497 |
| (Floating, Refinitiv USD IBOR Consumer Cash Fallbacks 1Y Index + 1.59%, 1.59% Floor, 7.86% Cap), 5.84%, 06/01/45† | 172,191 | | 173,721 |
| 4.50%, 03/01/47 | 91,566 | | 90,870 |
| 4.50%, 05/01/47 | 281,461 | | 279,003 |
| 4.50%, 07/01/47 | 37,649 | | 37,347 |
| 4.50%, 11/01/47 | 310,220 | | 308,596 |
| 4.50%, 06/01/48 | 50,603 | | 50,168 |
| 4.50%, 11/01/48 | 153,623 | | 152,303 |
| 4.50%, 02/01/49 | 476,459 | | 473,726 |
| 4.50%, 04/01/49 | 136,732 | | 135,948 |
| 4.00%, 09/01/52 | 1,180,802 | | 1,118,916 |
| 4.00%, 11/01/52 | 593,905 | | 562,628 |
| 4.00%, 12/01/52 | 388,802 | | 368,336 |
| 4.00%, 01/01/53 | 724,429 | | 686,257 |
| 4.00%, 02/01/53 | 718,729 | | 680,914 |
| Federal National Mortgage Association REMIC, Series 2006-98 | | | |
| (Floating, U.S. 30-Day Average SOFR + 0.54%, 0.43% Floor, 7.00% Cap), 5.88%, 10/25/36† | 90,536 | | 89,635 |
See Notes to Financial Statements.
SCHEDULE OF INVESTMENTS (Continued)
| | | Par | | Value |
| Federal National Mortgage Association REMIC, Series 2007-100 | | | |
| (Floating, U.S. 30-Day Average SOFR + 0.66%, 0.55% Floor, 7.00% Cap), 6.00%, 10/25/37† | $301,280 | | $299,255 |
| Federal National Mortgage Association REMIC, Series 2011-48 | | | |
| 4.00%, 06/25/26 STEP | 27,892 | | 27,435 |
| Federal National Mortgage Association REMIC, Series 2012-79 | | | |
| (Floating, U.S. 30-Day Average SOFR + 0.56%, 0.45% Floor, 6.50% Cap), 5.90%, 07/25/42† | 97,242 | | 95,254 |
| Federal National Mortgage Association REMIC, Series 2015-38 | | | |
| (Floating, U.S. 30-Day Average SOFR + 0.42%, 0.31% Floor), 5.64%, 06/25/55† | 103,897 | | 102,709 |
| Federal National Mortgage Association REMIC, Series 2016-11 | | | |
| (Floating, U.S. 30-Day Average SOFR + 0.61%, 0.50% Floor), 5.40%, 03/25/46† | 476,307 | | 473,015 |
| Federal National Mortgage Association REMIC, Series 2016-40 | | | |
| (Floating, U.S. 30-Day Average SOFR + 0.56%, 0.45% Floor), 5.37%, 07/25/46† | 595,514 | | 592,080 |
| Federal National Mortgage Association REMIC, Series 2018-21 | | | |
| 3.50%, 04/25/45 | 84,999 | | 82,878 |
| Federal National Mortgage Association REMIC, Series 2019-30 | | | |
| (Floating, U.S. 30-Day Average SOFR + 0.61%, 0.50% Floor, 6.50% Cap), 5.95%, 07/25/49† | 448,871 | | 437,633 |
| Federal National Mortgage Association REMIC, Series 2019-53 | | | |
| (Floating, U.S. 30-Day Average SOFR + 0.51%, 0.40% Floor), 5.32%, 09/25/49† | 726,851 | | 707,724 |
| Federal National Mortgage Association REMIC, Series 2019-60 | | | |
| (Floating, U.S. 30-Day Average SOFR + 0.51%, 0.40% Floor), 5.37%, 10/25/59† | 729,331 | | 722,762 |
| Federal National Mortgage Association REMIC, Series 2019-9 | | | |
| 3.50%, 06/25/48 | 632,930 | | 599,188 |
| Federal National Mortgage Association REMIC, Series 2020-79 | | | |
| 1.50%, 11/25/50 | 515,921 | | 450,165 |
| | | Par | | Value |
| Federal National Mortgage Association REMIC, Series 2022-65 | | | |
| (Floating, U.S. 30-Day Average SOFR + 0.80%, 0.80% Floor, 6.00% Cap), 6.00%, 09/25/52† | $1,840,703 | | $1,788,457 |
| FHLMC Multifamily Structured Pass-Through Certificates, Series K121 | | | |
| 1.12%, 10/25/30† IO γ | 591,164 | | 31,587 |
| FHLMC Multifamily Structured Pass-Through Certificates, Series K727 | | | |
| 2.95%, 07/25/24 | 2,654,693 | | 2,618,445 |
| FHLMC Multifamily Structured Pass-Through Certificates, Series KIR2 | | | |
| 2.75%, 03/25/27 | 191,146 | | 184,959 |
| FHLMC Structured Pass-Through Certificates, Series T-32, Class A1 | | | |
| (Floating, CME Term SOFR 1M + 0.37%, 0.26% Floor), 5.73%, 08/25/31† | 117,546 | | 118,612 |
| FHLMC Structured Pass-Through Certificates, Series T-56, Class 3AF | | | |
| (Floating, U.S. 30-Day Average SOFR + 1.11%, 1.00% Floor, 8.50% Cap), 6.45%, 05/25/43† | 296,535 | | 303,450 |
| FHLMC Structured Pass-Through Certificates, Series T-61, Class 1A1 | | | |
| (Floating, Federal Reserve U.S. 12 1Y CMT + 1.40%, 1.40% Floor), 6.41%, 07/25/44† | 218,069 | | 202,993 |
| First Horizon Alternative Mortgage Securities Trust, Series 2004-AA1, Class A1 | | | |
| 6.84%, 06/25/34† γ | 64,514 | | 60,376 |
| FIVE Mortgage Trust, Series 2023-V1, Class A3 | | | |
| 5.67%, 02/10/56 | 490,000 | | 498,788 |
| Flagstar Mortgage Trust, Series 2021-12, Class A19 | | | |
| 5.00%, 11/25/51 144A † γ | 1,119,631 | | 1,092,903 |
| FREMF Mortgage Trust, Series 2015-K45, Class B | | | |
| 3.73%, 04/25/48 144A † γ | 250,000 | | 243,974 |
| GCAT Trust, Series 2021-NQM7, Class A1 | | | |
| 1.92%, 08/25/66 144A | 197,716 | | 173,141 |
| Gemgarto PLC, Series 2021-1A, Class A | | | |
| (Floating, SONIA Interest Rate + 0.59%), 5.81%, 12/16/67(U) 144A † | 715,586 | | 911,816 |
| Government National Mortgage Association | | | |
| (Floating, U.S. Treasury Yield Curve Rate CMT 1Y + 1.50%, 1.50% Floor, 10.00% Cap), 3.88%, 05/20/24† | 433 | | 432 |
See Notes to Financial Statements.
| | | Par | | Value |
| (Floating, U.S. Treasury Yield Curve Rate CMT 1Y + 1.50%, 1.50% Floor, 11.50% Cap), 3.63%, 07/20/25† | $ 3,671 | | $ 3,644 |
| (Floating, U.S. Treasury Yield Curve Rate CMT 1Y + 1.50%, 1.50% Floor, 11.00% Cap), 3.63%, 08/20/25† | 1,150 | | 1,142 |
| (Floating, U.S. Treasury Yield Curve Rate CMT 1Y + 1.50%, 1.50% Floor, 11.00% Cap), 2.75%, 11/20/25† | 4,091 | | 4,041 |
| (Floating, U.S. Treasury Yield Curve Rate CMT 1Y + 1.50%, 1.50% Floor, 11.50% Cap), 2.75%, 12/20/26† | 9,256 | | 9,198 |
| (Floating, U.S. Treasury Yield Curve Rate CMT 1Y + 1.50%, 1.50% Floor, 11.00% Cap), 3.63%, 07/20/27† | 232 | | 228 |
| (Floating, U.S. Treasury Yield Curve Rate CMT 1Y + 1.50%, 1.50% Floor, 10.00% Cap), 2.75%, 10/20/27† | 3,571 | | 3,539 |
| 8.50%, 10/15/29 | 13,082 | | 13,068 |
| 8.50%, 04/15/30 | 892 | | 891 |
| 8.50%, 05/15/30 | 37,542 | | 37,786 |
| (Floating, U.S. Treasury Yield Curve Rate CMT 1Y + 1.50%, 1.50% Floor, 11.50% Cap), 3.88%, 05/20/30† | 7,826 | | 7,761 |
| 8.50%, 07/15/30 | 13,921 | | 13,988 |
| 8.50%, 08/15/30 | 2,326 | | 2,323 |
| 8.50%, 11/15/30 | 2,438 | | 2,435 |
| 8.50%, 12/15/30 | 2,046 | | 2,044 |
| Government National Mortgage Association, Series 2007-30 | | | |
| (Floating, CME Term SOFR 1M + 0.41%, 0.30% Floor, 6.50% Cap), 5.77%, 05/20/37† | 42,957 | | 42,768 |
| Government National Mortgage Association, Series 2011-H08 | | | |
| (Floating, CME Term SOFR 1M + 0.71%, 0.60% Floor, 10.50% Cap), 6.04%, 02/20/61† | 169,530 | | 169,125 |
| Government National Mortgage Association, Series 2013-H13 | | | |
| (Floating, U.S. Treasury Yield Curve Rate CMT 1Y + 0.45%, 0.45% Floor, 15.00% Cap), 5.86%, 05/20/63† | 335,967 | | 334,960 |
| Government National Mortgage Association, Series 2016-H07 | | | |
| (Floating, CME Term SOFR 1M + 0.88%, 0.77% Floor), 6.21%, 02/20/66† | 3,995 | | 3,970 |
| Government National Mortgage Association, Series 2016-H22 | | | |
| (Floating, CME Term SOFR 1M + 0.88%, 0.77% Floor, 7.50% Cap), 6.21%, 10/20/66† | 1,056,056 | | 1,055,566 |
| | | Par | | Value |
| Government National Mortgage Association, Series 2017-136 | | | |
| 3.00%, 03/20/47 | $ 81,244 | | $ 74,754 |
| Government National Mortgage Association, Series 2017-H09 | | | |
| (Floating, CME Term SOFR 12M + 1.47%, 0.75% Floor, 7.50% Cap), 4.96%, 04/20/67† | 1,318,244 | | 1,322,082 |
| Government National Mortgage Association, Series 2017-H10 | | | |
| (Floating, CME Term SOFR 12M + 1.47%, 0.75% Floor, 7.50% Cap), 6.46%, 04/20/67† | 1,616,654 | | 1,620,447 |
| Government National Mortgage Association, Series 2020-127 | | | |
| 1.50%, 06/20/50 | 461,274 | | 367,071 |
| Government National Mortgage Association, Series 2020-17 | | | |
| 2.50%, 10/20/49 | 75,033 | | 66,615 |
| Government National Mortgage Association, Series 2022-H22 | | | |
| (Floating, U.S. 30-Day Average SOFR + 0.75%, 0.75% Floor, 11.00% Cap), 6.09%, 10/20/72† | 817,900 | | 810,843 |
| Government National Mortgage Association, Series 2023-H23 | | | |
| (Floating, U.S. 30-Day Average SOFR + 0.98%, 0.98% Floor, 10.00% Cap), 6.32%, 09/20/73† | 2,497,419 | | 2,498,003 |
| GreenPoint Mortgage Funding Trust, Series 2005-AR5, Class 1A1 | | | |
| (Floating, CME Term SOFR 1M + 0.65%, 0.54% Floor, 10.50% Cap), 6.01%, 11/25/45† | 46,603 | | 40,994 |
| GreenPoint Mortgage Funding Trust, Series 2006-OH1, Class A1 | | | |
| (Floating, CME Term SOFR 1M + 0.47%, 0.36% Floor), 5.83%, 01/25/37† | 208,020 | | 182,860 |
| GS Mortgage Securities Corporation II, Series 2023-SHIP, Class B | | | |
| 4.94%, 09/06/26 144A † γ | 1,200,000 | | 1,169,186 |
| GS Mortgage Securities Corporation Trust, Series 2022-GTWY, Class A | | | |
| (Floating, CME Term SOFR 1M + 3.40%, 3.19% Floor), 8.76%, 09/15/27 144A † | 1,600,000 | | 1,613,232 |
| GS Mortgage Securities Corporation Trust, Series 2023-FUN, Class A | | | |
| (Floating, CME Term SOFR 1M + 2.09%, 2.09% Floor), 7.45%, 03/15/28 144A † | 440,000 | | 439,224 |
| GS Mortgage Securities Corporation Trust, Series 2023-FUN, Class B | | | |
| (Floating, CME Term SOFR 1M + 2.79%, 2.79% Floor), 8.15%, 03/15/28 144A † | 375,000 | | 374,087 |
See Notes to Financial Statements.
SCHEDULE OF INVESTMENTS (Continued)
| | | Par | | Value |
| GS Mortgage Securities Trust, Series 2011-GC5, Class AS | | | |
| 5.15%, 08/10/44 144A † γ | $ 198,686 | | $191,943 |
| GS Mortgage-Backed Securities Corporation Trust, Series 2020-PJ4, Class A2 | | | |
| 3.00%, 01/25/51 144A † γ | 158,545 | | 136,055 |
| GS Mortgage-Backed Securities Corporation Trust, Series 2022-PJ2, Class A4 | | | |
| 2.50%, 06/25/52 144A † γ | 509,323 | | 419,477 |
| GSR Mortgage Loan Trust, Series 2004-11, Class 5A1 | | | |
| 6.10%, 09/25/34† γ | 51,384 | | 50,161 |
| GSR Mortgage Loan Trust, Series 2005-AR6, Class 2A1 | | | |
| 4.66%, 09/25/35† γ | 27,715 | | 26,047 |
| Homeward Opportunities Fund Trust, Series 2022-1, Class A1 | | | |
| (Step to 5.05% on 02/25/24), 5.08%, 07/25/67 144A STEP | 142,049 | | 139,947 |
| IndyMac INDX Mortgage Loan Trust, Series 2006-AR12, Class A1 | | | |
| (Floating, CME Term SOFR 1M + 0.49%, 0.38% Floor), 5.85%, 09/25/46† | 262,837 | | 223,942 |
| IndyMac INDX Mortgage Loan Trust, Series 2007-FLX3, Class A2 | | | |
| (Floating, CME Term SOFR 1M + 0.65%, 0.54% Floor), 6.01%, 06/25/37† | 92,746 | | 109,464 |
| J.P. Morgan Mortgage Trust, Series 2023-DSC1, Class A1 | | | |
| 4.63%, 07/25/63 144A † γ | 439,050 | | 415,265 |
| JP Morgan Chase Commercial Mortgage Securities Trust, Series 2018-WPT, Class AFX | | | |
| 4.25%, 07/05/33 144A | 190,000 | | 167,308 |
| JP Morgan Mortgage Trust, Series 2005-A1, Class 6T1 | | | |
| 4.27%, 02/25/35† γ | 7,061 | | 6,516 |
| JP Morgan Mortgage Trust, Series 2016-2, Class A1 | | | |
| 7.07%, 06/25/46 144A † γ | 79,357 | | 75,735 |
| JP Morgan Mortgage Trust, Series 2020-7, Class A3 | | | |
| 3.00%, 01/25/51 144A † γ | 122,182 | | 105,410 |
| JP Morgan Mortgage Trust, Series 2020-LTV1, Class A11 | | | |
| (Floating, CME Term SOFR 1M + 1.11%, 6.00% Cap), 6.00%, 06/25/50 144A † | 12,223 | | 12,096 |
| JP Morgan Mortgage Trust, Series 2021-12, Class A11 | | | |
| (Floating, U.S. 30-Day Average SOFR + 0.85%, 5.00% Cap), 5.00%, 02/25/52 144A † | 158,010 | | 146,335 |
| JP Morgan Mortgage Trust, Series 2021-14, Class A12 | | | |
| 5.00%, 05/25/52 144A † γ | 260,258 | | 254,045 |
| JP Morgan Mortgage Trust, Series 2021-7, Class A3 | | | |
| 2.50%, 11/25/51 144A † γ | 1,019,372 | | 839,544 |
| | | Par | | Value |
| JP Morgan Mortgage Trust, Series 2022-INV3, Class A3B | | | |
| 3.00%, 09/25/52 144A † γ | $ 345,349 | | $ 295,794 |
| JPMBB Commercial Mortgage Securities Trust, Series 2014-C23, Class ASB | | | |
| 3.66%, 09/15/47 | 49,744 | | 49,267 |
| JPMBB Commercial Mortgage Securities Trust, Series 2015-C33, Class A3 | | | |
| 3.50%, 12/15/48 | 188,967 | | 182,146 |
| JPMCC Commercial Mortgage Securities Trust, Series 2017-JP7, Class A3 | | | |
| 3.38%, 09/15/50 | 1,442,504 | | 1,402,605 |
| KNDL Mortgage Trust, Series 2019-KNSQ, Class D | | | |
| (Floating, CME Term SOFR 1M + 1.55%, 1.35% Floor), 6.91%, 05/15/36 144A † | 136,000 | | 134,382 |
| KSL Commercial Mortgage Trust, Series 2023-HT, Class A | | | |
| (Floating, CME Term SOFR 1M + 2.29%, 2.29% Floor), 7.64%, 12/15/36 144A † | 230,000 | | 230,411 |
| Life Mortgage Trust, Series 2021-BMR, Class A | | | |
| (Floating, CME Term SOFR 1M + 0.81%, 0.70% Floor), 6.18%, 03/15/38 144A † | 982,970 | | 962,271 |
| Luminent Mortgage Trust, Series 2006-7, Class 2A1 | | | |
| (Floating, CME Term SOFR 1M + 0.45%, 0.34% Floor, 10.50% Cap), 5.81%, 12/25/36† | 223,837 | | 192,842 |
| LUX, Series 2023-LION, Class A | | | |
| (Floating, CME Term SOFR 1M + 2.69%, 2.69% Floor), 8.05%, 08/15/28 144A † | 206,513 | | 207,753 |
| MASTR Adjustable Rate Mortgages Trust, Series 2003-6, Class 3A1 | | | |
| 3.56%, 12/25/33† γ | 18,033 | | 17,699 |
| Mello Mortgage Capital Acceptance, Series 2022-INV2, Class A3 | | | |
| 3.00%, 04/25/52 144A † γ | 423,654 | | 363,917 |
| MF1, Series 2021-W10, Class A | | | |
| (Floating, CME Term SOFR 1M + 1.07%, 1.07% Floor), 6.43%, 12/15/34 144A † | 110,000 | | 107,423 |
| MFA Trust, Series 2021-INV2, Class A1 | | | |
| 1.91%, 11/25/56 144A | 247,706 | | 210,393 |
| MFA Trust, Series 2021-RPL1, Class A1 | | | |
| 1.13%, 07/25/60 144A | 704,228 | | 625,521 |
| MFA Trust, Series 2023-INV2, Class A1 | | | |
| (Step to 7.78% on 10/25/27), 6.78%, 10/25/58 144A STEP | 177,926 | | 180,144 |
| MFA Trust, Series 2023-NQM3, Class A1 | | | |
| (Step to 7.62% on 09/25/27), 6.62%, 07/25/68 144A STEP | 506,839 | | 511,310 |
See Notes to Financial Statements.
| | | Par | | Value |
| MFA Trust, Series 2023-NQM4, Class A1 | | | |
| (Step to 7.11% on 01/25/28), 6.11%, 12/25/68 144A STEP | $ 300,000 | | $ 301,815 |
| Mill City Mortgage Loan Trust, Series 2017-3, Class A1 | | | |
| 2.75%, 01/25/61 144A | 183,116 | | 179,517 |
| Morgan Stanley Bank of America Merrill Lynch Trust, Series 2014-C18, Class ASB | | | |
| 3.62%, 10/15/47 | 18,949 | | 18,875 |
| Morgan Stanley Bank of America Merrill Lynch Trust, Series 2015-C22, Class ASB | | | |
| 3.04%, 04/15/48 | 396,507 | | 391,039 |
| Morgan Stanley Bank of America Merrill Lynch Trust, Series 2015-C24, Class A4 | | | |
| 3.73%, 05/15/48 | 955,000 | | 924,569 |
| Morgan Stanley Bank of America Merrill Lynch Trust, Series 2015-C25, Class A5 | | | |
| 3.64%, 10/15/48 | 535,000 | | 516,795 |
| Morgan Stanley Bank of America Merrill Lynch Trust, Series 2016-C32, Class XA | | | |
| 0.65%, 12/15/49† IO γ | 1,762,882 | | 28,574 |
| Morgan Stanley Capital I Trust, Series 2021-230P, Class A | | | |
| (Floating, CME Term SOFR 1M + 1.28%, 1.17% Floor), 6.65%, 12/15/38 144A † | 1,000,000 | | 929,667 |
| Natixis Commercial Mortgage Securities Trust, Series 2022-RRI, Class A | | | |
| (Floating, CME Term SOFR 1M + 1.82%, 1.82% Floor), 7.19%, 03/15/35 144A † | 1,357,333 | | 1,346,698 |
| New Residential Mortgage Loan Trust, Series 2017-3A, Class A1 | | | |
| 4.00%, 04/25/57 144A † γ | 1,637,764 | | 1,557,136 |
| New Residential Mortgage Loan Trust, Series 2017-4A, Class A1 | | | |
| 4.00%, 05/25/57 144A † γ | 485,649 | | 460,830 |
| New Residential Mortgage Loan Trust, Series 2018-1A, Class A1A | | | |
| 4.00%, 12/25/57 144A † γ | 728,635 | | 695,892 |
| New Residential Mortgage Loan Trust, Series 2019-RPL3, Class A1 | | | |
| 2.75%, 07/25/59 144A | 798,423 | | 755,047 |
| New Residential Mortgage Loan Trust, Series 2020-1A, Class A1B | | | |
| 3.50%, 10/25/59 144A † γ | 363,745 | | 341,480 |
| New Residential Mortgage Loan Trust, Series 2020-RPL1, Class A1 | | | |
| 2.75%, 11/25/59 144A | 1,019,431 | | 958,961 |
| Oaktown Re VII, Ltd., Series 2021-2, Class M1A | | | |
| (Floating, U.S. 30-Day Average SOFR + 1.60%, 1.60% Floor), 6.94%, 04/25/34 144A † | 436,749 | | 437,073 |
| | | Par | | Value |
| OBX Trust, Series 2020-EXP3, Class 2A1B | | | |
| (Floating, CME Term SOFR 1M + 1.01%), 6.37%, 01/25/60 144A † | $ 422,828 | | $ 415,617 |
| OBX Trust, Series 2022-INV3, Class A1 | | | |
| 3.00%, 02/25/52 144A † γ | 190,214 | | 164,104 |
| OBX Trust, Series 2023-NQM6, Class A1 | | | |
| (Step to 7.52% on 08/25/27), 6.52%, 07/25/63 144A STEP | 1,284,774 | | 1,298,033 |
| ONE Mortgage Trust, Series 2021-PARK, Class A | | | |
| (Floating, CME Term SOFR 1M + 0.81%, 0.70% Floor), 6.18%, 03/15/36 144A † | 1,900,000 | | 1,811,119 |
| One New York Plaza Trust, Series 2020-1NYP, Class A | | | |
| (Floating, CME Term SOFR 1M + 1.06%, 0.95% Floor), 6.43%, 01/15/36 144A † | 240,000 | | 228,824 |
| OPEN Trust, Series 2023-AIR, Class A | | | |
| (Floating, CME Term SOFR 1M + 3.09%, 3.09% Floor), 8.45%, 10/15/28 144A † | 118,503 | | 118,502 |
| PRKCM Trust, Series 2021-AFC2, Class A1 | | | |
| 2.07%, 11/25/56 144A | 290,715 | | 243,972 |
| PRKCM Trust, Series 2023-AFC3, Class A1 | | | |
| (Step to 7.58% on 09/25/27), 6.58%, 09/25/58 144A STEP | 553,222 | | 562,539 |
| Radnor RE, Ltd., Series 2021-2, Class M1A | | | |
| (Floating, U.S. 30-Day Average SOFR + 1.85%, 1.85% Floor), 7.19%, 11/25/31 144A † | 114,717 | | 114,791 |
| Residential Mortgage Securities 32 PLC, Class A | | | |
| (Floating, SONIA Interest Rate + 1.25%), 6.47%, 06/20/70(U) 144A † | 535,161 | | 684,085 |
| Resimac Bastille Trust, Series 2021-2NCA, Class A1A | | | |
| (Floating, CME Term SOFR 1M + 0.76%), 6.12%, 02/03/53 144A † | 417,328 | | 417,207 |
| RFMSI Trust, Series 2003-S9, Class A1 | | | |
| 6.50%, 03/25/32 | 3,772 | | 3,694 |
| Seasoned Credit Risk Transfer Trust Series, Series 2019-4, Class MA | | | |
| 3.00%, 02/25/59 | 527,319 | | 483,040 |
| Seasoned Credit Risk Transfer Trust, Series 2018-2, Class MA | | | |
| 3.50%, 11/25/57 | 187,809 | | 178,495 |
| Seasoned Credit Risk Transfer Trust, Series 2018-3, Class MA | | | |
| 3.50%, 08/25/57 | 229,641 | | 217,072 |
See Notes to Financial Statements.
SCHEDULE OF INVESTMENTS (Continued)
| | | Par | | Value |
| Sequoia Mortgage Trust, Series 2017-CH1, Class A2 | | | |
| 3.50%, 08/25/47 144A | $ 18,847 | | $ 17,349 |
| SG Residential Mortgage Trust, Series 2022-2, Class A1 | | | |
| (Step to 5.31% on 02/25/24), 5.35%, 08/25/62 144A STEP | 115,911 | | 116,099 |
| Starwood Mortgage Residential Trust, Series 2020-3, Class A1 | | | |
| 1.49%, 04/25/65 144A | 142,982 | | 133,484 |
| Starwood Mortgage Residential Trust, Series 2020-INV1, Class A1 | | | |
| 1.03%, 11/25/55 144A | 96,515 | | 86,929 |
| Stratton Mortgage Funding, Series 2021-2A, Class A | | | |
| (Floating, SONIA Interest Rate + 0.90%), 6.12%, 07/20/60(U) 144A † | 174,374 | | 222,415 |
| Structured Adjustable Rate Mortgage Loan Trust, Series 2004-13, Class A2 | | | |
| (Floating, CME Term SOFR 1M + 0.41%, 0.30% Floor), 5.77%, 09/25/34† | 36,464 | | 31,756 |
| Structured Asset Mortgage Investments II Trust, Series 2005-AR5, Class A1 | | | |
| (Floating, CME Term SOFR 1M + 0.61%, 0.50% Floor, 11.00% Cap), 5.97%, 07/19/35† | 18,988 | | 17,056 |
| Structured Asset Mortgage Investments II Trust, Series 2005-AR8, Class A1A | | | |
| (Floating, CME Term SOFR 1M + 0.67%, 0.56% Floor, 10.50% Cap), 6.03%, 02/25/36† | 127,664 | | 104,875 |
| STWD Mortgage Trust, Series 2021-HTS, Class A | | | |
| (Floating, CME Term SOFR 1M + 1.16%, 1.05% Floor), 6.53%, 04/15/34 144A † | 1,528,720 | | 1,505,703 |
| Taubman Centers Commercial Mortgage Trust, Series 2022-DPM, Class A | | | |
| (Floating, CME Term SOFR 1M + 2.19%, 2.19% Floor), 7.55%, 05/15/37 144A † | 210,000 | | 209,117 |
| TBW Mortgage-Backed Trust, Series 2007-2, Class A6A | | | |
| (Step to 4.27% on 02/25/24), 6.51%, 07/25/37 STEP | 162,005 | | 62,636 |
| Towd Point Mortgage Funding PLC, Series 2019-GR4A, Class A1 | | | |
| (Floating, SONIA Interest Rate + 1.14%), 6.37%, 10/20/51(U) 144A † | 570,198 | | 727,933 |
| Towd Point Mortgage Funding, Series 2019-A13A, Class A1 | | | |
| (Floating, SONIA Interest Rate + 1.35%), 6.57%, 07/20/45(U) 144A † | 1,352,728 | | 1,727,091 |
| | | Par | | Value |
| Towd Point Mortgage Trust, Series 2015-1, Class A5 | | | |
| 4.41%, 10/25/53 144A † γ | $ 753,000 | | $ 748,266 |
| Towd Point Mortgage Trust, Series 2018-1, Class A1 | | | |
| 3.00%, 01/25/58 144A | 482,933 | | 470,206 |
| Towd Point Mortgage Trust, Series 2018-2, Class A1 | | | |
| 3.25%, 03/25/58 144A | 530,412 | | 515,177 |
| Towd Point Mortgage Trust, Series 2018-6, Class A1A | | | |
| 3.75%, 03/25/58 144A | 801,652 | | 785,189 |
| Towd Point Mortgage Trust, Series 2020-1, Class A1 | | | |
| 2.71%, 01/25/60 144A † γ | 451,146 | | 424,559 |
| Towd Point Mortgage Trust, Series 2020-2, Class A1A | | | |
| 1.64%, 04/25/60 144A | 1,481,207 | | 1,317,695 |
| Towd Point Mortgage Trust, Series 2021-SJ2, Class A1A | | | |
| 2.25%, 12/25/61 144A | 613,530 | | 579,703 |
| Trinity Square PLC, Series 2021-1A, Class A | | | |
| (Floating, SONIA Interest Rate + 0.85%), 6.07%, 07/15/59(U) 144A † | 791,792 | | 1,010,177 |
| UBS Commercial Mortgage Trust, Series 2019-C16, Class ASB | | | |
| 3.46%, 04/15/52 | 540,000 | | 518,142 |
| Uniform Mortgage Backed Securities | | | |
| 5.00%, 01/01/53 TBA | 12,900,000 | | 12,778,055 |
| 5.00%, 02/01/53 TBA | 5,000,000 | | 4,954,688 |
| Verus Securitization Trust, Series 2021-6, Class A1 | | | |
| 1.63%, 10/25/66 144A | 849,115 | | 708,719 |
| Verus Securitization Trust, Series 2022-1, Class A1 | | | |
| (Step to 3.72% on 02/25/26), 2.72%, 01/25/67 144A STEP | 146,074 | | 131,581 |
| Verus Securitization Trust, Series 2022-2, Class A1 | | | |
| 4.26%, 02/25/67 144A STEP | 273,193 | | 254,098 |
| Verus Securitization Trust, Series 2022-3, Class A1 | | | |
| (Step to 4.09% on 02/25/24), 4.13%, 02/25/67 144A STEP | 360,663 | | 337,566 |
| Washington Mutual Mortgage Pass-Through Certificates Trust, Series 2002-AR6, Class A | | | |
| (Floating, Federal Reserve U.S. 12 1Y CMT + 1.40%, 1.40% Floor), 6.41%, 06/25/42† | 2,242 | | 2,054 |
| Washington Mutual Mortgage Pass-Through Certificates Trust, Series 2003-AR8, Class A | | | |
| 5.60%, 08/25/33† γ | 54,743 | | 52,181 |
See Notes to Financial Statements.
| | | Par | | Value |
| Washington Mutual Mortgage Pass-Through Certificates Trust, Series 2005-AR2, Class 2A1A | | | |
| (Floating, CME Term SOFR 1M + 0.73%, 0.62% Floor, 10.50% Cap), 6.09%, 01/25/45† | $ 89,589 | | $ 86,749 |
| Washington Mutual Mortgage Pass-Through Certificates Trust, Series 2006-AR19, Class 1A | | | |
| (Floating, Federal Reserve U.S. 12 1Y CMT + 0.74%, 0.74% Floor), 5.75%, 01/25/47† | 134,007 | | 118,400 |
| Washington Mutual Mortgage Pass-Through Certificates Trust, Series 2006-AR5, Class A12A | | | |
| (Floating, Federal Reserve U.S. 12 1Y CMT + 0.98%, 0.98% Floor), 5.99%, 06/25/46† | 270,572 | | 242,077 |
| Washington Mutual Mortgage Pass-Through Certificates Trust, Series 2007-HY1, Class 1A1 | | | |
| 3.65%, 02/25/37† γ | 104,965 | | 90,596 |
| Washington Mutual Mortgage Pass-Through Certificates Trust, Series 2007-HY5, Class 2A1 | | | |
| 3.31%, 05/25/37† γ | 132,088 | | 102,647 |
| Washington Mutual Mortgage Pass-Through Certificates Trust, Series 2007-OA5, Class A1B | | | |
| (Floating, Federal Reserve U.S. 12 1Y CMT + 0.84%, 0.84% Floor), 5.85%, 05/25/47† | 36,529 | | 4,891 |
| Wells Fargo Commercial Mortgage Trust, Series 2015-C27, Class A5 | | | |
| 3.45%, 02/15/48 | 435,000 | | 420,719 |
| Wells Fargo Commercial Mortgage Trust, Series 2016-NXS5, Class A6FL | | | |
| (Floating, CME Term SOFR 1M + 1.66%, 1.55% Floor), 7.03%, 01/15/59 144A † | 2,000,000 | | 1,981,365 |
| Wells Fargo Mortgage Backed Securities Trust, Series 2020-RR1, Class A1 | | | |
| 3.00%, 05/25/50 144A † γ | 64,105 | | 55,145 |
| WFRBS Commercial Mortgage Trust, Series 2014-C21, Class ASB | | | |
| 3.39%, 08/15/47 | 2 | | 2 |
Total Mortgage-Backed Securities
(Cost $141,033,556) | | | 137,224,190 |
| MUNICIPAL BONDS — 0.5% |
| Hawaii State, General Obligation, Series GB | | | |
| 0.80%, 10/01/24 | 1,000,000 | | 969,682 |
| Texas Natural Gas Securitization Finance Corporation, Revenue Bond | | | |
| 5.10%, 04/01/35 | 3,210,000 | | 3,274,393 |
Total Municipal Bonds
(Cost $4,210,000) | | | 4,244,075 |
| | | Par | | Value |
| U.S. TREASURY OBLIGATIONS — 29.5% |
| U.S. Treasury Bills | | | | |
| 5.27%, 01/04/24Ω | $10,500,000 | | $ 10,496,952 |
| 4.94%, 03/21/24Ω | 3,500,000 | | 3,460,163 |
| 5.04%, 08/08/24Ω | 6,000,000 | | 5,827,533 |
| | | | | 19,784,648 |
| U.S. Treasury Bonds | | | | |
| 7.50%, 11/15/24 | 2,000,000 | | 2,049,695 |
| U.S. Treasury Inflationary Indexed Bonds | | | | |
| 0.25%, 01/15/25 | 21,173,537 | | 20,555,287 |
| U.S. Treasury Notes | | | | |
| 2.25%, 03/31/24 | 1,255,000 | | 1,245,652 |
| 3.25%, 08/31/24 | 3,800,000 | | 3,755,144 |
| 4.25%, 09/30/24 | 8,600,000 | | 8,556,301 |
| 0.63%, 10/15/24 | 4,000,000 | | 3,868,898 |
| 0.75%, 11/15/24 | 19,100,000 | | 18,433,026 |
| 1.00%, 12/15/24 | 900,000 | | 867,943 |
| 2.63%, 04/15/25 | 6,245,000 | | 6,093,632 |
| 2.75%, 05/15/25 | 10,310,000 | | 10,068,158 |
| 3.00%, 07/15/25 | 20,045,000 | | 19,613,171 |
| 4.63%, 03/15/26 | 12,115,000 | | 12,225,265 |
| 3.75%, 04/15/26 | 13,584,000 | | 13,464,079 |
| 3.63%, 05/15/26 | 10,435,000 | | 10,318,422 |
| 4.13%, 06/15/26 | 12,090,000 | | 12,093,306 |
| 4.50%, 07/15/26 | 12,060,000 | | 12,177,773 |
| 4.38%, 08/15/26 | 33,163,000 | | 33,403,302 |
| 4.63%, 09/15/26 | 9,970,000 | | 10,113,708 |
| 4.63%, 10/15/26 | 10,200,000 | | 10,357,383 |
| 4.63%, 11/15/26Δ | 16,890,000 | | 17,166,442 |
| 4.38%, 12/15/26 | 9,300,000 | | 9,395,906 |
| 4.88%, 10/31/28 | 400,000 | | 417,984 |
| | | | | 213,635,495 |
Total U.S. Treasury Obligations
(Cost $255,835,510) | | | 256,025,125 |
| | | Shares | |
| MONEY MARKET FUNDS — 5.4% |
| Northern Institutional Liquid Assets Portfolio (Shares), 5.40%Ø § | 12,188,915 | 12,188,915 |
GuideStone Money Market Fund, 5.28%
(Institutional Class)Ø ∞ | 34,160,936 | 34,160,936 |
| Northern Institutional U.S. Treasury Portfolio (Premier), 5.22%Ø | 900,610 | 900,610 |
Total Money Market Funds
(Cost $47,250,461) | | 47,250,461 |
TOTAL INVESTMENTS —107.0%
(Cost $936,121,513) | | 928,231,095 |
Liabilities in Excess of Other
Assets — (7.0)% | | (60,359,607) |
| NET ASSETS — 100.0% | | $867,871,488 |
See Notes to Financial Statements.
SCHEDULE OF INVESTMENTS (Continued)
Futures Contracts outstanding at December 31, 2023:
| Future Type | | Expiration Date | | Open Long
(Short) Contracts | | Notional
Market Value
of Contracts | | Value and
Unrealized
Appreciation
(Depreciation) |
| Euro-Bund | | 03/2024 | | (2) | | $ (302,968) | | $ (7,841) |
| Euro-Bobl | | 03/2024 | | (27) | | (3,555,337) | | (46,040) |
| Euro-Schatz | | 03/2024 | | (22) | | (2,587,648) | | (17,973) |
| 10-Year Commonwealth Treasury Bond | | 03/2024 | | 44 | | 3,498,082 | | 69,132 |
| 10-Year U.S. Treasury Note | | 03/2024 | | (85) | | (9,595,703) | | (194,204) |
| U.S. Treasury Long Bond | | 03/2024 | | (20) | | (2,498,750) | | (181,401) |
| Ultra 10-Year U.S. Treasury Note | | 03/2024 | | (191) | | (22,540,985) | | (951,464) |
| Ultra Long U.S. Treasury Bond | | 03/2024 | | (34) | | (4,542,188) | | (215,039) |
| 2-Year U.S. Treasury Note | | 03/2024 | | 1,270 | | 261,510,860 | | 2,374,211 |
| 5-Year U.S. Treasury Note | | 03/2024 | | (514) | | (55,909,547) | | (1,184,173) |
| Total Futures Contracts outstanding at December 31, 2023 | | | | | | $163,475,816 | | $ (354,792) |
Forward Foreign Currency Contracts outstanding at December 31, 2023:
| Expiration Date | | Currency
Purchased | | Amount
of Currency
Purchased | | Currency
Sold | | Amount
of Currency
Sold | | Counter-
party | | Net Unrealized
Appreciation
(Depreciation) |
| 01/09/24 | | Japanese Yen | | 177,671,240 | | U.S. Dollars | | 1,211,787 | | BNP | | $ 50,136 |
| 01/09/24 | | Japanese Yen | | 115,987,623 | | U.S. Dollars | | 786,736 | | MSCS | | 37,075 |
| Subtotal Appreciation | | | | | | | | | | $ 87,211 |
| 01/09/24 | | U.S. Dollars | | 94,331 | | Australian Dollars | | 140,000 | | MSCS | | $ (1,102) |
| 03/20/24 | | U.S. Dollars | | 317,161 | | Canadian Dollars | | 424,000 | | MSCS | | (3,179) |
| 01/09/24 | | U.S. Dollars | | 813,868 | | British Pounds | | 641,634 | | BNP | | (4,035) |
| 01/09/24 | | U.S. Dollars | | 202,110 | | Australian Dollars | | 305,000 | | BNP | | (5,798) |
| 01/09/24 | | U.S. Dollars | | 611,373 | | Japanese Yen | | 87,900,000 | | BAR | | (12,944) |
| 01/09/24 | | U.S. Dollars | | 546,193 | | Australian Dollars | | 823,740 | | HSBC | | (15,323) |
| 01/09/24 | | U.S. Dollars | | 875,655 | | Canadian Dollars | | 1,185,000 | | GSC | | (18,768) |
| 01/09/24 | | U.S. Dollars | | 4,624,722 | | British Pounds | | 3,654,366 | | UBS | | (33,566) |
| 01/09/24 | | U.S. Dollars | | 1,044,313 | | Australian Dollars | | 1,582,952 | | BAR | | (34,733) |
| 03/20/24 | | U.S. Dollars | | 9,698,070 | | Euro | | 8,838,000 | | UBS | | (90,272) |
| Subtotal Depreciation | | | | | | | | | | $(219,720) |
| Total Forward Foreign Currency Contracts outstanding at December 31, 2023 | | | | $(132,509) |
Swap Agreements outstanding at December 31, 2023:
| Reference Obligation | | Fixed
Deal
(Pay) Rate | | Maturity
Date | | Currency | | Notional
Amount | | Market Value | | Upfront
Premiums
Paid/
(Received) | | Unrealized
Appreciation
(Depreciation) |
| Centrally Cleared Credit Default Swaps on Credit Indexes—Buy Protection | | | | | | | | | | | | | | |
| Markit CDX.NA.IG.41 Index (Pay Quarterly) | | (1.00)% | | 12/20/2028 | | USD | | 17,380,000 | | $(342,915) | | $(290,220) | | $(52,695) |
| | | $(342,915) | | $(290,220) | | $(52,695) |
See Notes to Financial Statements.
| Pay Rate Index/Pay Rate | | Receive
Rate Index/Receive
Rate | | Maturity
Date | | Currency | | Notional
Amount | | Market Value | | Upfront
Premiums
Paid/
(Received) | | Unrealized
Appreciation
(Depreciation) |
| Centrally Cleared Interest Rate Swaps | | | | | | | | | | | | | | |
| 6-Month ASX BBSW (Semiannually) | | 4.50% (Semiannually) | | 9/20/2033 | | AUD | | 5,300,000 | | $ 98,282 | | $ — | | $ 98,282 |
| Subtotal Appreciation | | | | | | | | | | $ 98,282 | | $ — | | $ 98,282 |
| Centrally Cleared Interest Rate Swaps | | | | | | | | | | | | |
| 0.23% (Annually) | | Bank of Japan Unsecured Overnight Call Rate (Annually) | | 11/24/2025 | | JPY | | 1,218,021,220 | | $(10,261) | | $ — | | $(10,261) |
| Subtotal Depreciation | | | | | | | | | | $(10,261) | | $ — | | $(10,261) |
| Net Centrally Cleared Interest Rate Swaps outstanding at December 31, 2023 | | $ 88,021 | | $ — | | $ 88,021 |
VALUATION HIERARCHY
The following is a summary of the inputs used, as of December 31, 2023, in valuing the Fund’s investments carried at fair value:
| | Total
Value | | Level 1
Quoted Prices | | Level 2
Other Significant
Observable Inputs | | Level 3
Significant
Unobservable Inputs |
| Assets: | | | | | | | |
| Investments in Securities: | | | | | | | |
| Agency Obligations | $ 24,889,552 | | $ — | | $ 24,889,552 | | $ — |
| Asset-Backed Securities | 207,571,755 | | — | | 207,571,755 | | — |
| Commercial Paper | 1,296,776 | | — | | 1,296,776 | | — |
| Corporate Bonds | 168,785,585 | | — | | 168,785,585 | | — |
| Foreign Bonds | 80,943,576 | | — | | 80,943,576 | | — |
| Money Market Funds | 47,250,461 | | 47,250,461 | | — | | — |
| Mortgage-Backed Securities | 137,224,190 | | — | | 137,224,190 | | — |
| Municipal Bonds | 4,244,075 | | — | | 4,244,075 | | — |
| U.S. Treasury Obligations | 256,025,125 | | — | | 256,025,125 | | — |
| Total Assets - Investments in Securities | $928,231,095 | | $47,250,461 | | $880,980,634 | | $ — |
| Other Financial Instruments*** | | | | | | | |
| Forward Foreign Currency Contracts | $ 87,211 | | $ — | | $ 87,211 | | $ — |
| Futures Contracts | 2,443,343 | | 2,443,343 | | — | | — |
| Swap Agreements | 98,282 | | — | | 98,282 | | — |
| Total Assets - Other Financial Instruments | $ 2,628,836 | | $ 2,443,343 | | $ 185,493 | | $ — |
| Liabilities: | | | | | | | |
| Other Financial Instruments*** | | | | | | | |
| Forward Foreign Currency Contracts | $ (219,720) | | $ — | | $ (219,720) | | $ — |
| Futures Contracts | (2,798,135) | | (2,798,135) | | — | | — |
| Swap Agreements | (62,956) | | — | | (62,956) | | — |
| Total Liabilities - Other Financial Instruments | $ (3,080,811) | | $ (2,798,135) | | $ (282,676) | | $ — |
| *** | Other financial instruments are derivative instruments, such as futures contracts, forward foreign currency contracts and swap agreements, which are valued at the unrealized appreciation (depreciation) on the investment. Further details regarding the value of these investments can be found in the preceding "Futures Contracts outstanding", "Forward Foreign Currency Contracts outstanding" and "Swap Agreements outstanding" disclosures. |
See Notes to Financial Statements.
Medium-Duration Bond Fund (Unaudited)
The Fund invested in a diversified portfolio composed primarily of investment grade fixed income securities with a dollar-weighted effective duration that normally varies, in years, between +/- 30% of the duration of the Fund’s benchmark index, the Bloomberg US Aggregate Bond Index. Duration measures the sensitivity of a fixed income security’s price to changes in interest rates. The average dollar-weighted effective duration at the end of 2023 was 6.05 years. The Investor Class of the Fund outperformed its benchmark for the one-year period ended December 31, 2023 (6.01% (net of fees) versus 5.53%).
The Fund maintained an overweight to credit throughout the year, which was additive as credit spreads generally tightened. Investment grade and high yield corporate bonds were the two best performing sectors in the U.S. fixed income market in 2023, and the Fund was overweight in both of these investments versus the benchmark. Additionally, the Fund’s allocation to non-benchmark investments like asset-backed securities and emerging markets debt added value. The Fund’s duration positioning throughout the year was also a positive to Fund performance. The Fund added duration versus the benchmark as federal funds rates rose throughout the year, and this added value, as rates rallied over 100 basis points off their highs in the fourth quarter of 2023.
Other strategies involving derivatives were utilized during 2023. U.S. Treasury futures contracts, options on U.S. Treasuries, interest rate futures, interest rate swaps and basis swaps were used for the common purposes of managing both U.S. and non-U.S. duration, implementing yield curve positioning strategies and expressing cross-sector views. Overall, on a net basis, these positions were additive to performance. In an effort to better manage credit risks, credit default swaps were utilized on a limited basis and were a detractor from performance. Currency forwards and futures contracts were included in the Fund to hedge foreign currency risk and to express active currency views and, in aggregate, added to performance. Swaptions were also used to manage portfolio duration along with credit risk and contributed to relative performance.
During the year, the Fund remained focused on its objective of seeking maximum total return consistent with preservation of capital.
This Fund may be suitable for investors who have a short- to medium-term investment horizon, seek higher returns than those offered by a shorter maturity bond fund, can accept some short-term fluctuations in account value and want to diversify their portfolio with a fixed income investment option. This Fund is subject to interest rate risk, meaning, when interest rates rise, the value of the existing fixed income securities decrease and vice versa. Changes in interest rates have a bigger impact on long duration holdings than on short duration holdings. To the extent that the investment adviser or sub-advisers misjudge current market conditions, the Fund’s volatility may be amplified by its use of derivatives and by its ability to select sub-advisers to allocate assets. Derivatives involve different risks from, and in some respects greater risks than, those associated with investing directly in securities, currencies or other instruments. Derivatives may be illiquid or less liquid, volatile, difficult to price and leveraged, so small changes in value of the underlying instruments may produce disproportionate losses to the Fund. It is possible to lose money by investing in the Fund.
See Notes to Financial Statements.
Medium-Duration Bond Fund (Unaudited)
At December 31, 2023, the portfolio holdings of the Fund, as a percentage of net assets, is shown in the following table. Portfolio holdings are subject to risk and may change at any time.
| | % |
| Mortgage-Backed Securities | 44.4 |
| Corporate Bonds | 22.0 |
| U.S. Treasury Obligations | 16.1 |
| Repurchase Agreements | 13.9 |
| Asset-Backed Securities | 10.3 |
| Foreign Bonds | 9.2 |
| Money Market Funds | 6.5 |
| Agency Obligations | 1.4 |
| Loan Agreements | 0.9 |
| Municipal Bonds | 0.4 |
| Purchased Options | 0.1 |
| Financials | —** |
| Written Options | (—) ** |
| TBA Sale Commitments | (2.6) |
| | 122.6 |
| **Rounds to less than 0.05% | |
| Average Annual Total Returns as of 12/31/23 | |
| | | Institutional Class* | | Investor Class* | | Benchmark** | |
| One Year | | 6.28%*** | | 6.01% | | 5.53% | |
| Five Year | | 1.28% | | 1.01% | | 1.10% | |
| Ten Year | | 1.93% | | 1.66% | | 1.81% | |
| Since Inception | | 3.94% | | 3.78% | | 3.55% | |
| Inception Date | | 08/27/01 | | 08/27/01 | | | |
| Total Fund Operating Expenses (May 1, 2023 Prospectus)(1)# | | 0.40% | | 0.67% | | | |
| (1) | Current information regarding the Fund’s Operating Expenses can be found in the Financial Highlights. |
#Net expense ratio
The performance data quoted represents past performance and does not guarantee future results. The performance data in the table and graph does not reflect the deduction of taxes that a shareholder would pay on Fund distributions or the redemption of Fund shares. Current performance may be lower or higher. Performance data current to the most recent month-end may be obtained at GuideStoneFunds.com. The investment return and principal value of an investment will fluctuate so that shares, when redeemed, may be worth more or less than their original cost.
See Notes to Financial Statements.
Medium-Duration Bond Fund (Unaudited)
The graph illustrates the results of a hypothetical $10,000 investment in the Investor Class of the Fund for the 10-year period from December 31, 2013 to December 31, 2023, with all dividends and capital gains reinvested, with the Bloomberg US Aggregate Bond Index.
*These returns reflect investment advisory and shareholder servicing fee waivers, if applicable, during the reported time periods.
***Total returns may differ from the financial highlights due to adjustments required by U.S. GAAP.
Unlike a mutual fund, an index is not available for direct investment and the performance of an index assumes no taxes, transaction costs, management fees or other expenses.
See Notes to Financial Statements.
MEDIUM-DURATION BOND FUND
| | | Par | | Value |
| AGENCY OBLIGATIONS — 1.4% |
| Federal Farm Credit Banks Funding Corporation | | | | |
| 2.90%, 04/12/32 | $2,640,000 | | $ 2,390,753 |
| 3.30%, 05/19/32 | 1,310,000 | | 1,220,605 |
| 2.85%, 03/28/34 | 2,880,000 | | 2,527,269 |
| 1.70%, 04/23/35 | 3,800,000 | | 2,856,314 |
| 3.08%, 03/30/37 | 1,770,000 | | 1,533,398 |
| Federal Home Loan Bank Discount Notes | | | | |
| 5.20%, 01/02/24Ω | 2,025,000 | | 2,023,830 |
| Federal Home Loan Mortgage Corporation | | | | |
| 0.65%, 10/22/25 | 7,100,000 | | 6,627,795 |
| 0.65%, 10/27/25 | 7,200,000 | | 6,717,588 |
| 0.80%, 10/28/26‡‡ | 7,200,000 | | 6,531,867 |
| Federal National Mortgage Association | | | | |
| 6.63%, 11/15/30 | 670,000 | | 772,727 |
| Tennessee Valley Authority | | | | |
| 3.50%, 12/15/42 | 500,000 | | 422,754 |
| Tennessee Valley Authority Principal Strip | | | | |
| 2.25%, 04/01/56Ω | 1,000,000 | | 202,617 |
Total Agency Obligations
(Cost $37,239,976) | | | 33,827,517 |
| ASSET-BACKED SECURITIES — 10.3% |
| 37 Capital CLO 1, Ltd., Series 2021-1A, Class A | | | |
| (Floating, CME Term SOFR 3M + 1.46%, 1.20% Floor), 6.86%, 10/15/34 144A † | 1,300,000 | | 1,294,641 |
| 522 Funding CLO, Ltd., Series 2020-6A, Class A1R | | | |
| (Floating, CME Term SOFR 3M + 1.41%, 1.15% Floor), 6.82%, 10/23/34 144A † | 610,000 | | 604,841 |
| Aaset Trust, Series 2021-1A, Class A | | | |
| 2.95%, 11/16/41 144A | 744,816 | | 668,558 |
| Aaset Trust, Series 2021-2A, Class A | | | |
| 2.80%, 01/15/47 144A | 811,046 | | 699,876 |
| AB BSL CLO 4, Ltd., Series 2023-4A, Class A | | | |
| (Floating, CME Term SOFR 3M + 2.00%, 2.00% Floor), 7.42%, 04/20/36 144A † | 320,000 | | 321,754 |
| ACE Securities Corporation Home Equity Loan Trust, Series 2007-ASP1, Class A2B | | | |
| (Floating, CME Term SOFR 1M + 0.51%, 0.40% Floor), 5.87%, 03/25/37† | 2,262,503 | | 925,815 |
| | | Par | | Value |
| AGL CLO 13, Ltd., Series 2021-13A, Class A1 | | | |
| (Floating, CME Term SOFR 3M + 1.42%, 1.16% Floor), 6.84%, 10/20/34 144A † | $ 950,000 | | $ 947,873 |
| AIMCO CLO, Series 2017-AA, Class AR | | | |
| (Floating, CME Term SOFR 3M + 1.31%, 1.05% Floor), 6.73%, 04/20/34 144A † | 500,000 | | 498,402 |
| Alaska Airlines Pass-Through Trust, Series 2020-1, Class A | | | |
| 4.80%, 08/15/27 144A | 1,300,220 | | 1,265,888 |
| Aligned Data Centers Issuer LLC, Series 2021-1A, Class A2 | | | |
| 1.94%, 08/15/46 144A | 3,400,000 | | 3,052,478 |
| American Airlines Pass-Through Trust, Series 2013-1, Class A | | | |
| 4.00%, 07/15/25 | 585,779 | | 561,666 |
| American Airlines Pass-Through Trust, Series 2017-2, Class AA | | | |
| 3.35%, 10/15/29 | 1,474,888 | | 1,334,811 |
| American Airlines Pass-Through Trust, Series 2021-1, Class A | | | |
| 2.88%, 07/11/34Δ | 2,176,667 | | 1,854,307 |
| Ameriquest Mortgage Securities, Inc. Asset-Backed Pass-Through Certificates, Series 2005-R10, Class M3 | | | |
| (Floating, CME Term SOFR 1M + 0.79%, 0.68% Floor), 6.15%, 01/25/36† | 1,690,990 | | 1,653,719 |
| AMMC CLO XI, Ltd., Series 2012-11A, Class A1R2 | | | |
| (Floating, CME Term SOFR 3M + 1.27%), 6.66%, 04/30/31 144A † | 1,043,348 | | 1,042,730 |
| Apidos CLO XXIII, Series 2015-23A, Class AR | | | |
| (Floating, CME Term SOFR 3M + 1.48%, 1.22% Floor), 6.88%, 04/15/33 144A † | 1,500,000 | | 1,501,286 |
| Apidos CLO XXXV, Series 2021-35A, Class A | | | |
| (Floating, CME Term SOFR 3M + 1.31%, 1.05% Floor), 6.73%, 04/20/34 144A † | 540,000 | | 539,090 |
| Applebee's Funding LLC, Series 2019-1A, Class A2II | | | |
| 4.72%, 06/05/49 144A | 643,500 | | 618,917 |
| Arbor Realty Commercial Real Estate Notes, Ltd., Series 2022-FL1, Class A | | | |
| (Floating, U.S. 30-Day Average SOFR + 1.45%, 1.45% Floor), 6.79%, 01/15/37 144A † | 1,500,000 | | 1,483,461 |
| Arbys Funding LLC, Series 2020-1A, Class A2 | | | |
| 3.24%, 07/30/50 144A | 1,354,500 | | 1,241,473 |
See Notes to Financial Statements.
MEDIUM-DURATION BOND FUND
SCHEDULE OF INVESTMENTS (Continued)
| | | Par | | Value |
| AREIT Trust, Series 2021-CRE5, Class A | | | |
| (Floating, CME Term SOFR 1M + 1.19%, 1.08% Floor), 6.55%, 11/17/38 144A † | $1,860,340 | | $1,831,845 |
| Ares Loan Funding IV, Ltd., Series 2023-ALF4A, Class A1 | | | |
| (Floating, CME Term SOFR 3M + 1.75%, 1.75% Floor), 7.10%, 10/15/36 144A † | 730,000 | | 733,689 |
| Avis Budget Rental Car Funding AESOP LLC, Series 2023-8A, Class A | | | |
| 6.02%, 02/20/30 144A | 560,000 | | 578,502 |
| Balboa Bay Loan Funding, Ltd., Series 2023-1A, Class A | | | |
| (Floating, CME Term SOFR 3M + 1.90%, 1.90% Floor), 7.32%, 04/20/35 144A † | 4,400,000 | | 4,409,120 |
| Ballyrock CLO, Ltd., Series 2018-1A, Class C | | | |
| (Floating, CME Term SOFR 3M + 3.41%), 8.83%, 04/20/31 144A † | 750,000 | | 738,486 |
| Ballyrock CLO, Ltd., Series 2019-2A, Class A1BR | | | |
| (Floating, CME Term SOFR 3M + 1.46%, 1.20% Floor), 6.83%, 11/20/30 144A † | 490,000 | | 488,420 |
| Bank of America Auto Trust, Series 2023-2A, Class A2 | | | |
| 5.85%, 08/17/26 144A | 1,075,000 | | 1,081,539 |
| Barclays Dryrock Issuance Trust, Series 2023-1, Class A | | | |
| 4.72%, 02/15/29 | 2,400,000 | | 2,401,454 |
| Barclays Dryrock Issuance Trust, Series 2023-2, Class A | | | |
| (Floating, U.S. 30-Day Average SOFR + 0.90%), 6.23%, 08/15/28† | 1,600,000 | | 1,603,640 |
| Barings Loan Partners CLO, Ltd., Series LP-3A, Class B | | | |
| (Floating, CME Term SOFR 3M + 3.05%, 3.05% Floor), 8.46%, 07/20/33 144A † | 1,000,000 | | 1,000,000 |
| Basswood Park CLO, Ltd., Series 2021-1A, Class A | | | |
| (Floating, CME Term SOFR 3M + 1.26%, 1.26% Floor), 6.68%, 04/20/34 144A † | 1,500,000 | | 1,498,109 |
| BCRED MML CLO LLC, Series 2022-1A, Class A1 | | | |
| (Floating, CME Term SOFR 3M + 1.65%, 1.65% Floor), 7.07%, 04/20/35 144A † | 820,000 | | 811,759 |
| Bear Stearns Asset Backed Securities Trust, Series 2007-SD1, Class 1A2A | | | |
| 6.00%, 10/25/36 | 693,198 | | 300,280 |
| Bear Stearns Asset Backed Securities Trust, Series 2007-SD1, Class 1A3A | | | |
| 6.50%, 10/25/36 | 2,085,261 | | 890,438 |
| | | Par | | Value |
| Birch Grove CLO 7, Ltd., Series 2023-7A, Class A1 | | | |
| (Floating, CME Term SOFR 3M + 1.80%, 1.80% Floor), 7.18%, 10/20/36 144A † | $ 570,000 | | $ 572,009 |
| Blue Stream Issuer LLC, Series 2023-1A, Class A2 | | | |
| 5.40%, 05/20/53 144A | 1,000,000 | | 971,443 |
| BlueMountain CLO XXVIII, Ltd., Series 2021-28A, Class A | | | |
| (Floating, CME Term SOFR 3M + 1.52%, 1.26% Floor), 6.92%, 04/15/34 144A † | 400,000 | | 398,571 |
| BSPRT Issuer, Ltd., Series 2022-FL9, Class B | | | |
| (Floating, CME Term SOFR 1M + 3.37%, 3.37% Floor), 8.73%, 07/15/39 144A † | 2,000,000 | | 1,959,144 |
| Capital One Multi-Asset Execution Trust, Series 2022-A3, Class A | | | |
| 4.95%, 10/15/27 | 1,200,000 | | 1,204,156 |
| Carrington Mortgage Loan Trust, Series 2006-NC5, Class A3 | | | |
| (Floating, CME Term SOFR 1M + 0.26%, 0.15% Floor, 14.50% Cap), 5.62%, 01/25/37† | 1,071,690 | | 922,494 |
| CARS-DB7 LP, Series 2023-1A, Class A1 | | | |
| 5.75%, 09/15/53 144A | 544,500 | | 547,841 |
| Cayuga Park CLO, Ltd., Series 2020-1A, Class AR | | | |
| (Floating, CME Term SOFR 3M + 1.38%, 1.38% Floor), 6.78%, 07/17/34 144A † | 790,000 | | 789,036 |
| Cedar Funding IX CLO, Ltd., Series 2018-9A, Class A1 | | | |
| (Floating, CME Term SOFR 3M + 1.24%, 0.98% Floor), 6.66%, 04/20/31 144A † | 983,629 | | 983,529 |
| Cedar Funding V CLO, Ltd., Series 2016-5A, Class AFRR | | | |
| 1.94%, 07/17/31 144A | 560,000 | | 531,798 |
| Cerberus Loan Funding XL LLC, Series 2023-1A, Class A | | | |
| (Floating, CME Term SOFR 3M + 2.40%, 2.40% Floor), 7.79%, 03/22/35 144A † | 1,250,000 | | 1,252,048 |
| Cerberus Loan Funding XLII LLC, Series 2023-3A, Class B | | | |
| (Floating, CME Term SOFR 3M + 3.35%, 3.35% Floor), 8.78%, 09/13/35 144A † | 750,000 | | 752,120 |
| Cerberus Loan Funding XLIV LLC, Series 2023-5A, Class A | | | |
| (Floating, 2.35% - CME Term SOFR 3M), 0.00%, 01/15/36 144A † | 1,750,000 | | 1,750,000 |
| Cerberus Loan Funding XLIV LLC, Series 2023-5A, Class B | | | |
| (Floating, 3.20% - CME Term SOFR 3M), 0.00%, 01/15/36 144A † | 1,000,000 | | 1,000,000 |
See Notes to Financial Statements.
| | | Par | | Value |
| Cerberus Loan Funding XXXII LP, Series 2021-2A, Class A | | | |
| (Floating, CME Term SOFR 3M + 1.88%, 1.88% Floor), 7.28%, 04/22/33 144A † | $1,000,000 | | $ 991,332 |
| Cerberus Loan Funding XXXIII LP, Series 2021-3A, Class A | | | |
| (Floating, CME Term SOFR 3M + 1.82%, 1.56% Floor), 7.22%, 07/23/33 144A † | 1,250,000 | | 1,238,753 |
| Cerberus Loan Funding XXXV LP, Series 2021-5A, Class A | | | |
| (Floating, CME Term SOFR 3M + 1.76%, 1.50% Floor), 7.16%, 09/22/33 144A † | 1,250,000 | | 1,246,902 |
| Cerberus Loan Funding XXXVIII LP, Series 2022-2A, Class A1 | | | |
| (Floating, CME Term SOFR 3M + 2.75%, 2.75% Floor), 8.14%, 10/15/34 144A † | 1,250,000 | | 1,242,829 |
| CF Hippolyta Issuer LLC, Series 2022-1A, Class A2 | | | |
| 6.11%, 08/15/62 144A | 1,709,978 | | 1,675,976 |
| CFMT LLC Series 2022-HB9, Class A | | | |
| 3.25%, 09/25/37 144A | 1,131,008 | | 1,047,052 |
| CIFC Funding, Ltd., Series 2017-2A, Class CR | | | |
| (Floating, CME Term SOFR 3M + 2.11%, 1.85% Floor), 7.53%, 04/20/30 144A † | 1,000,000 | | 994,871 |
| CIFC Funding, Ltd., Series 2018-2A, Class A1 | | | |
| (Floating, CME Term SOFR 3M + 1.30%), 6.72%, 04/20/31 144A † | 986,010 | | 988,147 |
| Cifc Funding, Ltd., Series 2023-3A, Class B | | | |
| (Floating, 2.30% - CME Term SOFR 3M, 2.30% Floor), 0.00%, 01/20/37 144A † | 1,200,000 | | 1,200,000 |
| Citibank Credit Card Issuance Trust, Series 2023-A1, Class A1 | | | |
| 5.23%, 12/08/27 | 1,250,000 | | 1,260,398 |
| Citigroup Mortgage Loan Trust, Series 2006-WF1, Class A1 | | | |
| (Step to 4.95% on 02/25/24), 4.96%, 03/25/36 STEP | 1,970,857 | | 994,839 |
| CLI Funding VI LLC, Series 2020-3A, Class A | | | |
| 2.07%, 10/18/45 144A | 64,000 | | 57,528 |
| CLI Funding VIII LLC, Series 2021-1A, Class A | | | |
| 1.64%, 02/18/46 144A | 1,080,216 | | 954,832 |
| CLI Funding VIII LLC, Series 2022-1A, Class A1 | | | |
| 2.72%, 01/18/47 144A | 209,533 | | 185,556 |
| | | Par | | Value |
| CMFT Net Lease Master Issuer LLC, Series 2021-1, Class A4 | | | |
| 3.04%, 07/20/51 144A | $ 800,000 | | $ 590,913 |
| Credit Suisse European Mortgage Capital, Ltd., Series 2019-1OTF, Class A | | | |
| (Floating, ICE LIBOR USD 3M + 2.90%), 8.55%, 08/09/24 144A † | 920,000 | | 902,433 |
| CVS Pass-Through Trust | | | |
| 6.94%, 01/10/30 | 390,877 | | 399,644 |
| CWABS, Inc. Asset-Backed Certificates, Series 2004-1, Class M1 | | | |
| (Floating, CME Term SOFR 1M + 0.86%, 0.75% Floor), 6.22%, 03/25/34† | 63,986 | | 63,548 |
| CWHEQ Revolving Home Equity Loan Trust, Series 2005-F, Class 2A | | | |
| (Floating, CME Term SOFR 1M + 0.35%, 0.24% Floor, 16.00% Cap), 5.72%, 12/15/35† | 15,762 | | 15,345 |
| Discover Card Execution Note Trust, Series 2023-A1, Class A | | | |
| 4.31%, 03/15/28 | 1,200,000 | | 1,192,800 |
| Domino's Pizza Master Issuer LLC, Series 2019-1A, Class A2 | | | |
| 3.67%, 10/25/49 144A | 1,300,337 | | 1,190,217 |
| Dryden 75 CLO, Ltd., Series 2019-75A, Class AR2 | | | |
| (Floating, CME Term SOFR 3M + 1.30%, 1.04% Floor), 6.70%, 04/15/34 144A † | 250,000 | | 248,705 |
| Dryden 77 CLO, Ltd., Series 2020-77A, Class AR | | | |
| (Floating, CME Term SOFR 3M + 1.38%, 1.38% Floor), 6.75%, 05/20/34 144A † | 6,500,000 | | 6,501,175 |
| Dryden 87 CLO, Ltd., Series 2021-87A, Class A1 | | | |
| (Floating, CME Term SOFR 3M + 1.36%, 1.10% Floor), 6.73%, 05/20/34 144A † | 480,000 | | 479,656 |
| Dryden XXVI Senior Loan Fund, Series 2013-26A, Class CR | | | |
| (Floating, CME Term SOFR 3M + 2.11%), 7.51%, 04/15/29 144A † | 1,500,000 | | 1,496,114 |
| ECMC Group Student Loan Trust, Series 2017-1A, Class A | | | |
| (Floating, U.S. 30-Day Average SOFR + 1.31%), 6.65%, 12/27/66 144A † | 665,333 | | 666,741 |
See Notes to Financial Statements.
MEDIUM-DURATION BOND FUND
SCHEDULE OF INVESTMENTS (Continued)
| | | Par | | Value |
| Elmwood CLO IV, Ltd., Series 2020-1A, Class A | | | |
| (Floating, CME Term SOFR 3M + 1.50%, 1.24% Floor), 6.90%, 04/15/33 144A † | $2,550,000 | | $2,553,858 |
| Empower CLO, Ltd., Series 2023-2A, Class A1 | | | |
| (Floating, CME Term SOFR 3M + 2.20%, 2.20% Floor), 7.54%, 07/15/36 144A † | 760,000 | | 764,196 |
| Finance of America HECM Buyout, Series 2022-HB2, Class M2 | | | |
| 6.00%, 04/25/26 144A | 600,000 | | 578,945 |
| Financial Asset Securities Corporation AAA Trust, Series 2005-1A, Class 1A3B | | | |
| (Floating, CME Term SOFR 1M + 0.52%, 0.41% Floor), 5.88%, 02/27/35 144A † | 309,019 | | 289,088 |
| FirstKey Homes Trust, Series 2020-SFR2, Class F3 | | | |
| 3.37%, 10/19/37 144A | 150,000 | | 139,258 |
| FirstKey Homes Trust, Series 2020-SFR2, Class G1 | | | |
| 4.00%, 10/19/37 144A | 250,000 | | 233,803 |
| FirstKey Homes Trust, Series 2020-SFR2, Class G2 | | | |
| 4.50%, 10/19/37 144A | 250,000 | | 234,534 |
| FirstKey Homes Trust, Series 2022-SFR3, Class B | | | |
| 4.50%, 07/17/26 144A | 1,500,000 | | 1,448,304 |
| Ford Credit Auto Owner Trust, Series 2022-B, Class A3 | | | |
| 3.74%, 09/15/26 | 1,200,000 | | 1,185,184 |
| Ford Credit Auto Owner Trust, Series 2023-C, Class A2A | | | |
| 5.68%, 09/15/26 | 1,275,000 | | 1,280,808 |
| FORT CRE Issuer LLC, Series 2022-FL3, Class A | | | |
| (Floating, U.S. 30-Day Average SOFR + 1.85%, 1.85% Floor), 7.19%, 02/23/39 144A † | 1,250,000 | | 1,221,863 |
| Fortress Credit BSL XV, Ltd., Series 2022-2A, Class B | | | |
| (Floating, CME Term SOFR 3M + 3.00%, 3.00% Floor), 8.40%, 10/18/33 144A † | 1,250,000 | | 1,253,626 |
| FS Rialto Issuer LLC, Series 2022-FL5, Class AS | | | |
| (Floating, CME Term SOFR 1M + 2.87%, 2.87% Floor), 8.23%, 06/19/37 144A † | 1,800,000 | | 1,792,090 |
| FS Rialto Issuer LLC, Series 2022-FL5, Class B | | | |
| (Floating, CME Term SOFR 1M + 3.37%, 3.37% Floor), 8.73%, 06/19/27 144A † | 550,000 | | 545,070 |
| FS Rialto Issuer LLC, Series 2022-FL6, Class AS | | | |
| (Floating, CME Term SOFR 1M + 3.13%, 3.13% Floor), 8.49%, 08/17/37 144A † | 1,000,000 | | 1,001,267 |
| | | Par | | Value |
| FS Rialto Issuer LLC, Series 2022-FL6, Class B | | | |
| (Floating, CME Term SOFR 1M + 3.63%, 3.63% Floor), 8.99%, 08/17/37 144A † | $1,000,000 | | $ 999,430 |
| FS Rialto Issuer LLC, Series 2022-FL7, Class B | | | |
| (Floating, CME Term SOFR 1M + 3.91%, 3.91% Floor), 9.27%, 10/19/39 144A † | 650,000 | | 651,008 |
| GM Financial Consumer Automobile Receivables Trust, Series 2022-2, Class A2 | | | |
| 2.52%, 05/16/25 | 140,299 | | 140,025 |
| GM Financial Consumer Automobile Receivables Trust, Series 2023-4, Class A2A | | | |
| 5.89%, 11/16/26 | 1,450,000 | | 1,458,153 |
| GMF Floorplan Owner Revolving Trust, Series 2023-1, Class A1 | | | |
| 5.34%, 06/15/28 144A | 1,200,000 | | 1,216,387 |
| Goldentree Loan Management U.S. CLO 7, Ltd., Series 2020-7A, Class AR | | | |
| (Floating, CME Term SOFR 3M + 1.33%, 1.07% Floor), 6.75%, 04/20/34 144A † | 470,000 | | 469,197 |
| GoldenTree Loan Opportunities IX, Ltd., Series 2014-9A, Class AR2 | | | |
| (Floating, CME Term SOFR 3M + 1.37%, 1.11% Floor), 6.76%, 10/29/29 144A † | 1,130,843 | | 1,131,573 |
| GoldentTree Loan Management U.S. CLO 1, Ltd., Series 2021-9A, Class C | | | |
| (Floating, CME Term SOFR 3M + 2.06%, 1.80% Floor), 7.48%, 01/20/33 144A † | 1,000,000 | | 985,185 |
| GoldentTree Loan Management US CLO 1, Ltd., Series 2021-11A, Class A | | | |
| (Floating, CME Term SOFR 3M + 1.39%, 1.13% Floor), 6.81%, 10/20/34 144A † | 1,100,000 | | 1,100,751 |
| Golub Capital Partners CLO 16, Ltd., Series 2013-16A, Class A1R2 | | | |
| (Floating, CME Term SOFR 3M + 1.87%, 1.61% Floor), 7.25%, 07/25/33 144A † | 2,450,000 | | 2,442,661 |
| Golub Capital Partners CLO 25M, Ltd., Series 2015-25A, Class AR | | | |
| (Floating, CME Term SOFR 3M + 1.64%, 1.38% Floor), 7.03%, 05/05/30 144A † | 288,192 | | 287,729 |
| Golub Capital Partners CLO 36M, Ltd., Series 2018-36A, Class A | | | |
| (Floating, CME Term SOFR 3M + 1.56%), 6.95%, 02/05/31 144A † | 2,104,109 | | 2,095,417 |
See Notes to Financial Statements.
| | | Par | | Value |
| Golub Capital Partners CLO 66B, Ltd., Series 2023-66A, Class A | | | |
| (Floating, CME Term SOFR 3M + 1.95%, 1.95% Floor), 7.33%, 04/25/36 144A † | $ 320,000 | | $ 320,879 |
| GoodLeap Sustainable Home Solutions Trust, Series 2021-3CS, Class A | | | |
| 2.10%, 05/20/48 144A | 1,794,139 | | 1,388,909 |
| GoodLeap Sustainable Home Solutions Trust, Series 2022-2CS, Class A | | | |
| 4.00%, 04/20/49 144A | 1,762,229 | | 1,552,873 |
| GPMT, Ltd., Series 2021-FL3, Class A | | | |
| (Floating, CME Term SOFR 1M + 1.36%, 1.36% Floor), 6.72%, 07/16/35 144A † | 1,146,593 | | 1,101,039 |
| Greywolf CLO V, Ltd., Series 2015-1A, Class A1R | | | |
| (Floating, CME Term SOFR 3M + 1.42%, 1.16% Floor), 6.80%, 01/27/31 144A † | 464,177 | | 464,402 |
| Halseypoint CLO 7, Ltd., Series 2023-7A, Class A | | | |
| (Floating, CME Term SOFR 3M + 2.25%, 2.25% Floor), 7.51%, 07/20/36 144A † | 1,900,000 | | 1,914,317 |
| Hardee's Funding LLC, Series 2018-1A, Class A2II | | | |
| 4.96%, 06/20/48 144A | 1,421,250 | | 1,365,693 |
| Hayfin U.S. XII, Ltd. | | | |
| (Floating, CME Term SOFR 3M + 1.38%, 1.12% Floor), 6.80%, 04/20/31 144A † | 950,760 | | 950,853 |
| Helios Issuer LLC, Series 2023-GRID1, Class 1A | | | |
| 5.75%, 12/20/50 144A | 172,172 | | 178,959 |
| Hildene Community Funding CDO, Ltd., Series 2015-1A, Class ARR | | | |
| 2.60%, 11/01/35 144A | 699,036 | | 563,834 |
| Honda Auto Receivables Owner Trust, Series 2023-4, Class A3 | | | |
| 5.67%, 06/21/28 | 2,450,000 | | 2,503,795 |
| Hotwire Funding LLC, Series 2021-1, Class A2 | | | |
| 2.31%, 11/20/51 144A | 1,350,000 | | 1,220,157 |
| Hotwire Funding LLC, Series 2023-1A, Class C | | | |
| 8.84%, 05/20/53 144A | 750,000 | | 706,105 |
| HPS Loan Management, Ltd., Series 2021-16A, Class A1 | | | |
| (Floating, CME Term SOFR 3M + 1.40%, 1.14% Floor), 6.81%, 01/23/35 144A † | 640,000 | | 639,719 |
| Hyundai Auto Lease Securitization Trust, Series 2022-A, Class A4 | | | |
| 1.32%, 12/15/25 144A | 3,050,000 | | 3,005,296 |
| | | Par | | Value |
| Hyundai Auto Receivables Trust, Series 2023-A, Class A2A | | | |
| 5.19%, 12/15/25 | $ 969,876 | | $ 968,623 |
| Hyundai Auto Receivables Trust, Series 2023-C, Class A2A | | | |
| 5.80%, 01/15/27 | 2,050,000 | | 2,062,498 |
| ICG U.S. CLO, Ltd., Series 2017-1A, Class ARR | | | |
| (Floating, CME Term SOFR 3M + 1.43%, 1.17% Floor), 6.82%, 07/28/34 144A † | 1,500,000 | | 1,481,530 |
| InStar Leasing III LLC, Series 2021-1A, Class A | | | |
| 2.30%, 02/15/54 144A | 876,347 | | 767,389 |
| Invesco CLO, Ltd., Series 2021-2A, Class A | | | |
| (Floating, CME Term SOFR 3M + 1.38%, 1.12% Floor), 6.78%, 07/15/34 144A † | 2,500,000 | | 2,486,405 |
| J.G. Wentworth XXXVIII LLC, Series 2017-1A, Class A | | | |
| 3.99%, 08/16/60 144A | 175,560 | | 154,570 |
| Jersey Mike's Funding, Series 2019-1A, Class A2 | | | |
| 4.43%, 02/15/50 144A | 49,625 | | 47,162 |
| Jersey Mike's Funding, Series 2021-1A, Class A2I | | | |
| 2.89%, 02/15/52 144A | 348,250 | | 315,743 |
| JetBlue Pass-Through Trust, Series 2019-1, Class AA | | | |
| 2.75%, 05/15/32 | 1,715,925 | | 1,453,903 |
| JG Wentworth XXXV LLC, Series 2015-2A, Class A | | | |
| 3.87%, 03/15/58 144A | 61,558 | | 54,348 |
| JP Morgan Mortgage Trust, Series 2023-HE3, Class A1 | | | |
| (Floating, U.S. 30-Day Average SOFR + 1.60%), 6.94%, 05/20/54 144A † | 630,000 | | 634,725 |
| Kings Park CLO, Ltd., Series 2021-1A, Class A | | | |
| (Floating, CME Term SOFR 3M + 1.39%, 1.39% Floor), 6.80%, 01/21/35 144A † | 280,000 | | 280,361 |
| KKR CLO, Ltd., Series 16, Class A2R2 | | | |
| (Floating, CME Term SOFR 3M + 2.01%, 1.75% Floor), 7.43%, 10/20/34 144A † | 2,500,000 | | 2,485,022 |
| KKR CLO, Ltd., Series 32A, Class A1 | | | |
| (Floating, CME Term SOFR 3M + 1.58%, 1.32% Floor), 6.98%, 01/15/32 144A † | 340,000 | | 340,543 |
| KREF, Ltd., Series 2021-FL2, Class AS | | | |
| (Floating, CME Term SOFR 1M + 1.41%, 1.30% Floor), 6.78%, 02/15/39 144A † | 300,000 | | 278,336 |
See Notes to Financial Statements.
MEDIUM-DURATION BOND FUND
SCHEDULE OF INVESTMENTS (Continued)
| | | Par | | Value |
| LCCM Trust, Series 2021-FL2, Class A | | | |
| (Floating, CME Term SOFR 1M + 1.31%, 1.31% Floor), 6.68%, 12/13/38 144A † | $ 746,265 | | $ 737,174 |
| Lendmark Funding Trust, Series 2021-1A, Class A | | | |
| 1.90%, 11/20/31 144A | 2,200,000 | | 1,982,304 |
| LL ABS Trust, Series 2022-1A, Class A | | | |
| 3.76%, 11/15/29 144A | 284,040 | | 282,467 |
| LoanCore Issuer, Ltd., Series 2019-CRE2, Class C | | | |
| (Floating, CME Term SOFR 1M + 2.11%, 2.00% Floor), 7.48%, 05/15/36 144A † | 250,000 | | 239,793 |
| LoanCore Issuer, Ltd., Series 2021-CRE5, Class AS | | | |
| (Floating, CME Term SOFR 1M + 1.86%, 1.86% Floor), 7.23%, 07/15/36 144A † | 1,100,000 | | 1,068,526 |
| LoanCore Issuer, Ltd., Series 2021-CRE6, Class AS | | | |
| (Floating, CME Term SOFR 1M + 1.76%, 1.65% Floor), 7.13%, 11/15/38 144A † | 940,000 | | 898,562 |
| Lunar Structured Aircraft Portfolio Notes, Series 2021-1, Class A | | | |
| 2.64%, 10/15/46 144A | 729,230 | | 630,251 |
| Madison Avenue Secured Funding Trust, Series 2023-1, Class A1 | | | |
| (Floating, CME Term SOFR 1M + 2.00%, 2.00% Floor), 7.36%, 03/04/24 144A † | 1,250,000 | | 1,250,000 |
| Madison Avenue Secured Funding Trust, Series 2023-2, Class A | | | |
| (Floating, CME Term SOFR 1M + 1.85%, 1.85% Floor), 7.20%, 10/15/24 144A † | 1,025,000 | | 1,025,000 |
| Magnetite VIII, Ltd., Series 2014-8A, Class CR2 | | | |
| (Floating, CME Term SOFR 3M + 2.11%, 1.85% Floor), 7.51%, 04/15/31 144A † | 500,000 | | 498,755 |
| MAPS Trust, Series 2021-1A, Class A | | | |
| 2.52%, 06/15/46 144A | 227,212 | | 201,347 |
| Mariner Finance Issuance Trust, Series 2021-AA, Class A | | | |
| 1.86%, 03/20/36 144A | 2,200,000 | | 2,004,892 |
| MC Ltd., Series 2021-1, Class A | | | |
| 2.63%, 11/05/35 144A | 940,000 | | 846,029 |
| Mercedes-Benz Auto Receivables Trust, Series 2023-2, Class A2 | | | |
| 5.92%, 11/16/26 | 650,000 | | 655,123 |
| MF1 Multifamily Housing Mortgage Loan Trust, Series 2021-FL5, Class A | | | |
| (Floating, CME Term SOFR 1M + 0.96%, 0.96% Floor), 6.33%, 07/15/36 144A † | 430,730 | | 425,833 |
| | | Par | | Value |
| MF1, Ltd., Series 2021-FL6, Class A | | | |
| (Floating, CME Term SOFR 1M + 1.21%, 1.10% Floor), 6.57%, 07/16/36 144A † | $1,939,506 | | $1,909,144 |
| Mississippi Higher Education Assistance Corporation, Series 2014-1, Class A1 | | | |
| (Floating, U.S. 30-Day Average SOFR + 0.79%, 0.68% Floor), 6.13%, 10/25/35† | 214,705 | | 211,144 |
| Morgan Stanley ABS Capital I, Inc. Trust, Series 2007-NC3, Class A2C | | | |
| (Floating, CME Term SOFR 1M + 0.30%, 0.19% Floor), 5.66%, 05/25/37† | 1,318,872 | | 965,407 |
| Morgan Stanley IXIS Real Estate Capital Trust, Series 2006-2, Class A3 | | | |
| (Floating, CME Term SOFR 1M + 0.26%, 0.15% Floor), 5.62%, 11/25/36† | 4,829,206 | | 1,621,016 |
| Mosaic Solar Loan Trust, Series 2021-1A, Class D | | | |
| 3.71%, 12/20/46 144A | 267,674 | | 228,715 |
| Mosaic Solar Loan Trust, Series 2022-1A, Class A | | | |
| 2.64%, 01/20/53 144A | 1,676,138 | | 1,438,296 |
| Nationstar Home Equity Loan Trust, Series 2007-C, Class 1AV1 | | | |
| (Floating, CME Term SOFR 1M + 0.29%, 0.18% Floor), 5.65%, 06/25/37† | 1,774,561 | | 1,710,875 |
| Navient Private Education Loan Trust, Series 2015-BA, Class A3 | | | |
| (Floating, CME Term SOFR 1M + 1.56%), 6.93%, 07/16/40 144A † | 1,300,981 | | 1,306,223 |
| Navient Student Loan Trust, Series 2020-1A, Class A1B | | | |
| (Floating, U.S. 30-Day Average SOFR + 1.16%, 1.05% Floor), 6.50%, 06/25/69 144A † | 1,452,023 | | 1,449,026 |
| Navigator Aircraft ABS, Ltd., Series 2021-1, Class A | | | |
| 2.77%, 11/15/46 144A STEP | 854,167 | | 747,114 |
| Nelnet Student Loan Trust, Series 2021-A, Class A2 | | | |
| (Floating, CME Term SOFR 1M + 1.14%), 6.50%, 04/20/62 144A † | 111,000 | | 109,189 |
| Neuberger Berman Loan Advisers CLO, Ltd., Series 2018-29A, Class A1 | | | |
| (Floating, CME Term SOFR 3M + 1.39%, 1.13% Floor), 6.79%, 10/19/31 144A † | 1,040,000 | | 1,040,334 |
See Notes to Financial Statements.
| | | Par | | Value |
| New Mountain CLO 1, Ltd., Series CLO-1A, Class AR | | | |
| (Floating, CME Term SOFR 3M + 1.46%, 1.20% Floor), 6.86%, 10/15/34 144A † | $1,050,000 | | $1,048,170 |
| Nissan Auto Receivables Owner Trust, Series 2023-A, Class A2A | | | |
| 5.34%, 02/17/26 | 1,162,734 | | 1,160,680 |
| Nissan Auto Receivables Owner Trust, Series 2023-B, Class A3 | | | |
| 5.93%, 03/15/28 | 425,000 | | 435,667 |
| Oak Street Investment Grade Net Lease Fund, Series 2020-1A, Class A1 | | | |
| 1.85%, 11/20/50 144A | 644,141 | | 585,357 |
| Oaktree CLO, Ltd., Series 2022-2A, Class A1R | | | |
| (Floating, 1.55% - CME Term SOFR 3M, 1.55% Floor), 0.00%, 07/15/33 144A † | 330,000 | | 330,000 |
| Oaktree CLO, Ltd., Series 2022-3A, Class A2 | | | |
| (Floating, CME Term SOFR 3M + 2.30%, 2.30% Floor), 7.69%, 07/15/35 144A † | 250,000 | | 250,998 |
| Octagon Investment Partners 36, Ltd., Series 2018-1A, Class A1 | | | |
| (Floating, CME Term SOFR 3M + 1.23%), 6.63%, 04/15/31 144A † | 663,799 | | 663,656 |
| Octagon Investment Partners XXI, Ltd., Series 2014-1A, Class AAR3 | | | |
| (Floating, CME Term SOFR 3M + 1.26%, 1.00% Floor), 6.64%, 02/14/31 144A † | 530,000 | | 529,531 |
| Option One Mortgage Loan Trust, Series 2007-5, Class 2A4 | | | |
| (Floating, CME Term SOFR 1M + 0.41%, 0.30% Floor), 5.77%, 05/25/37† | 1,631,808 | | 873,823 |
| Owl Rock CLO I LLC, Series 2019-1A, Class ANR | | | |
| (Floating, CME Term SOFR 3M + 2.40%, 2.40% Floor), 7.84%, 02/20/36 144A † | 1,000,000 | | 1,000,000 |
| Owl Rock CLO III, Ltd., Series 2020-3A, Class A1L | | | |
| (Floating, CME Term SOFR 3M + 2.06%), 7.48%, 04/20/32 144A † | 600,000 | | 597,055 |
| Owl Rock CLO X LLC, Series 2023-10A, Class A | | | |
| (Floating, CME Term SOFR 3M + 2.45%, 2.45% Floor), 7.87%, 04/20/35 144A † | 500,000 | | 499,786 |
| Palmer Square CLO, Ltd., Series 2021-2A, Class A | | | |
| (Floating, CME Term SOFR 3M + 1.41%, 1.41% Floor), 6.81%, 07/15/34 144A † | 2,000,000 | | 1,998,349 |
| | | Par | | Value |
| Palmer Square Loan Funding, Ltd., Series 2022-2A, Class A2 | | | |
| (Floating, CME Term SOFR 3M + 1.90%, 1.90% Floor), 7.29%, 10/15/30 144A † | $1,000,000 | | $ 999,325 |
| Palmer Square Loan Funding, Ltd., Series 2022-4A, Class B | | | |
| (Floating, CME Term SOFR 3M + 2.75%, 2.75% Floor), 8.15%, 07/24/31 144A † | 1,700,000 | | 1,703,031 |
| Palmer Square Loan Funding, Ltd., Series 2023-2A, Class B | | | |
| (Floating, CME Term SOFR 3M + 2.70%, 2.70% Floor), 8.05%, 01/25/32 144A † | 1,000,000 | | 1,002,473 |
| PFP, Ltd., Series 2021-8, Class A | | | |
| (Floating, CME Term SOFR 1M + 1.11%, 1.00% Floor), 6.48%, 08/09/37 144A † | 644,702 | | 636,064 |
| PHEAA Student Loan Trust, Series 2012-1A, Class A1 | | | |
| (Floating, U.S. 30-Day Average SOFR + 0.66%), 6.00%, 05/25/57 144A † | 246,789 | | 242,616 |
| PHEAA Student Loan Trust, Series 2016-1A, Class A | | | |
| (Floating, U.S. 30-Day Average SOFR + 1.26%, 1.15% Floor), 6.60%, 09/25/65 144A † | 230,425 | | 230,963 |
| PHEAA Student Loan Trust, Series 2016-2A, Class A | | | |
| (Floating, U.S. 30-Day Average SOFR + 1.06%), 6.40%, 11/25/65 144A † | 215,941 | | 214,155 |
| Progress Residential Trust, Series 2022-SFR5, Class C | | | |
| 5.19%, 06/17/39 144A | 1,000,000 | | 977,365 |
| PRPM LLC, Series 2022-1, Class A1 | | | |
| (Step to 6.72% on 03/25/25), 3.72%, 02/25/27 144A STEP | 1,140,083 | | 1,103,052 |
| PRPM LLC, Series 2023-1, Class A1 | | | |
| 6.88%, 02/25/28 144A † γ | 231,694 | | 234,237 |
| Rad CLO 22, Ltd., Series 2023-22A, Class A1 | | | |
| (Floating, CME Term SOFR 3M + 1.83%, 1.83% Floor), 7.20%, 01/20/37 144A † | 1,230,000 | | 1,232,326 |
| Ready Capital Mortgage Financing LLC, Series 2021-FL6, Class A | | | |
| (Floating, CME Term SOFR 1M + 1.06%, 0.95% Floor), 6.42%, 07/25/36 144A † | 1,537,667 | | 1,512,130 |
| Ready Capital Mortgage Financing LLC, Series 2021-FL7, Class A | | | |
| (Floating, CME Term SOFR 1M + 1.31%, 1.20% Floor), 6.67%, 11/25/36 144A † | 1,590,904 | | 1,568,012 |
See Notes to Financial Statements.
MEDIUM-DURATION BOND FUND
SCHEDULE OF INVESTMENTS (Continued)
| | | Par | | Value |
| Recette CLO, Ltd., Series 2015-1A, Class ARR | | | |
| (Floating, CME Term SOFR 3M + 1.34%), 6.76%, 04/20/34 144A † | $ 340,000 | | $ 338,728 |
| REESE PARK CLO, Ltd., Series 2020-1A, Class AR | | | |
| (Floating, CME Term SOFR 3M + 1.39%, 1.39% Floor), 6.79%, 10/15/34 144A † | 1,350,000 | | 1,350,170 |
| Sabey Data Center Issuer LLC, Series 2021-1, Class A2 | | | |
| 1.88%, 06/20/46 144A | 815,000 | | 731,976 |
| Saluda Grade Alternative Mortgage Trust, Series 2023-FIG4, Class A | | | |
| 6.72%, 11/25/53 144A | 350,000 | | 353,416 |
| Santander Drive Auto Receivables Trust, Series 2023-6, Class A2 | | | |
| 6.08%, 05/17/27 | 1,775,000 | | 1,781,465 |
| Saxon Asset Securities Trust, Series 2004-1, Class M1 | | | |
| (Floating, CME Term SOFR 1M + 0.91%, 0.80% Floor, 10.28% Cap), 2.16%, 03/25/35† | 56,976 | | 54,405 |
| Securitized Asset Backed Receivables LLC Trust, Series 2006-WM4, Class A2C | | | |
| (Floating, CME Term SOFR 1M + 0.43%, 0.32% Floor), 5.79%, 11/25/36† | 1,785,393 | | 510,804 |
| Securitized Asset Backed Receivables LLC Trust, Series 2007-BR2, Class A1 | | | |
| (Floating, CME Term SOFR 1M + 0.47%, 0.36% Floor), 5.83%, 02/25/37 144A † | 1,940,933 | | 1,618,722 |
| SERVPRO Master Issuer LLC, Series 2019-1A, Class A2 | | | |
| 3.88%, 10/25/49 144A | 1,296,000 | | 1,222,873 |
| Shackleton CLO, Ltd., Series 2019-14A, Class A1R | | | |
| (Floating, CME Term SOFR 3M + 1.46%, 1.20% Floor), 6.88%, 07/20/34 144A † | 4,200,000 | | 4,173,327 |
| Sierra Timeshare Receivables Funding LLC, Series 2021-2A, Class A | | | |
| 1.35%, 09/20/38 144A | 163,573 | | 153,552 |
| Slam, Ltd., Series 2021-1A, Class A | | | |
| 2.43%, 06/15/46 144A | 1,265,550 | | 1,096,219 |
| SMB Private Education Loan Trust, Series 2020-BA, Class A1A | | | |
| 1.29%, 07/15/53 144A | 247,358 | | 223,363 |
| SMB Private Education Loan Trust, Series 2021-A, Class A2B | | | |
| 1.59%, 01/15/53 144A | 1,045,460 | | 928,274 |
| SMB Private Education Loan Trust, Series 2021-A, Class B | | | |
| 2.31%, 01/15/53 144A | 652,739 | | 604,609 |
| SMB Private Education Loan Trust, Series 2021-C, Class B | | | |
| 2.30%, 01/15/53 144A | 580,000 | | 533,662 |
| | | Par | | Value |
| Sonic Capital LLC, Series 2020-1A, Class A2I | | | |
| 3.85%, 01/20/50 144A | $1,276,000 | | $1,207,808 |
| Sonic Capital LLC, Series 2020-1A, Class A2II | | | |
| 4.34%, 01/20/50 144A | 483,333 | | 446,850 |
| Sonic Capital LLC, Series 2021-1A, Class A2II | | | |
| 2.64%, 08/20/51 144A | 782,000 | | 625,938 |
| Sound Point CLO XX, Ltd., Series 2018-2A, Class A | | | |
| (Floating, CME Term SOFR 3M + 1.36%), 6.74%, 07/26/31 144A † | 496,336 | | 495,482 |
| Soundview Home Loan Trust, Series 2007-OPT1, Class 2A4 | | | |
| (Floating, CME Term SOFR 1M + 0.39%, 0.28% Floor), 5.75%, 06/25/37† | 1,554,345 | | 1,026,390 |
| Southwick Park CLO LLC, Series 2019-4A, Class A1R | | | |
| (Floating, CME Term SOFR 3M + 1.32%, 1.32% Floor), 6.74%, 07/20/32 144A † | 1,000,000 | | 998,326 |
| Spirit Airlines Pass-Through Trust, Series 2015-1, Class A | | | |
| 4.10%, 04/01/28 | 844,851 | | 777,348 |
| Stack Infrastructure Issuer LLC, Series 2023-1A, Class A2 | | | |
| 5.90%, 03/25/48 144A | 1,000,000 | | 986,924 |
| Station Place Securitization Trust, Series 2023-SP1, Class A | | | |
| (Floating, CME Term SOFR 1M + 1.85%, 1.85% Floor), 7.20%, 10/15/24 144A † | 525,000 | | 525,000 |
| Stonepeak, Series 2021-1A, Class AA | | | |
| 2.30%, 02/28/33 144A | 1,279,972 | | 1,177,397 |
| Storm King Park CLO, Ltd., Series 2022-1A, Class A1 | | | |
| (Floating, CME Term SOFR 3M + 2.05%, 2.05% Floor), 7.44%, 10/15/35 144A † | 250,000 | | 251,521 |
| Structured Asset Investment Loan Trust, Series 2005-1, Class M3 | | | |
| (Floating, CME Term SOFR 1M + 0.89%, 0.78% Floor), 6.25%, 02/25/35 144A † | 1,553,460 | | 1,519,206 |
| Structured Asset Securities Corporation Mortgage Loan Trust, Series 2007-BC4, Class A1 | | | |
| (Floating, CME Term SOFR 1M + 0.74%, 0.63% Floor), 6.10%, 11/25/37† | 2,048,694 | | 1,957,412 |
| STWD, Ltd., Series 2022-FL3, Class E | | | |
| (Floating, U.S. 30-Day Average SOFR + 3.25%, 3.25% Floor), 8.59%, 11/15/38 144A † | 1,210,000 | | 1,058,815 |
| Sunrun Demeter Issuer LLC, Series 2021-2A, Class A | | | |
| 2.27%, 01/30/57 144A | 2,061,885 | | 1,749,222 |
See Notes to Financial Statements.
| | | Par | | Value |
| SVC ABS LLC, Series 2023-1A, Class A | | | |
| 5.15%, 02/20/53 144A | $ 647,292 | | $ 624,597 |
| Symphony CLO 40, Ltd., Series 2023-40A, Class A1 | | | |
| (Floating, CME Term SOFR 3M + 1.64%, 1.64% Floor), 6.98%, 01/14/34 144A † | 1,100,000 | | 1,102,801 |
| Taco Bell Funding LLC, Series 2016-1A, Class A23 | | | |
| 4.97%, 05/25/46 144A | 609,375 | | 602,074 |
| Textainer Marine Containers VII, Ltd., Series 2021-2A, Class A | | | |
| 2.23%, 04/20/46 144A | 786,667 | | 703,738 |
| TIF Funding II LLC, Series 2021-1A, Class A | | | |
| 1.65%, 02/20/46 144A | 1,154,062 | | 993,583 |
| Tikehau US CLO III, Ltd., Series 2022-2A, Class C1R | | | |
| (Floating, 3.20% - CME Term SOFR 3M, 3.20% Floor), 0.00%, 01/20/36 144A † | 900,000 | | 900,000 |
| Towd Point Mortgage Trust, Series 2023-CES2, Class A1A | | | |
| 7.29%, 10/25/63 144A | 981,480 | | 1,006,391 |
| Tricon Residential Trust, Series 2023-SFR1, Class C | | | |
| 5.10%, 07/17/40 144A | 1,000,000 | | 969,913 |
| Tricon Residential Trust, Series 2023-SFR2, Class C | | | |
| 5.00%, 12/17/28 144A | 500,000 | | 478,456 |
| Triton Container Finance VIII LLC, Series 2021-1A, Class A | | | |
| 1.86%, 03/20/46 144A | 1,103,400 | | 963,697 |
| Trysail CLO, Ltd., Series 2021-1A, Class A1 | | | |
| (Floating, CME Term SOFR 3M + 1.58%, 1.32% Floor), 7.00%, 07/20/32 144A † | 2,900,000 | | 2,888,304 |
| Turkish Airlines Pass-Through Trust, Series 2015-1, Class A | | | |
| 4.20%, 03/15/27 144A | 711,074 | | 673,647 |
| U.S. Bank NA, Series 2023-1, Class B | | | |
| 6.79%, 08/25/32 144A | 330,000 | | 331,353 |
| United Airlines Pass-Through Trust, Series 2016-2, Class A | | | |
| 3.10%, 10/07/28 | 550,280 | | 481,388 |
| United Airlines Pass-Through Trust, Series 2016-2, Class AA | | | |
| 2.88%, 10/07/28 | 550,280 | | 493,070 |
| United Airlines Pass-Through Trust, Series 2020-1, Class A | | | |
| 5.88%, 10/15/27Δ | 1,423,363 | | 1,442,916 |
| United Airlines Pass-Through Trust, Series 2023-1, Class A | | | |
| 5.80%, 01/15/36 | 600,000 | | 610,805 |
| | | Par | | Value |
| United States Small Business Administration, Series 2019-20D, Class 1 | | | |
| 2.98%, 04/01/39 | $ 83,317 | | $ 76,636 |
| United States Small Business Administration, Series 2019-25G, Class 1 | | | |
| 2.69%, 07/01/44 | 151,970 | | 134,460 |
| Vantage Data Centers Issuer LLC, Series 2020-1A, Class A2 | | | |
| 1.65%, 09/15/45 144A | 500,000 | | 462,743 |
| Venture 39 CLO, Ltd., Series 2020-39A, Class A1 | | | |
| (Floating, CME Term SOFR 3M + 1.54%, 1.54% Floor), 6.94%, 04/15/33 144A † | 2,525,000 | | 2,518,590 |
| Voya CLO, Ltd., Series 2016-3A, Class A1R | | | |
| (Floating, CME Term SOFR 3M + 1.45%), 6.85%, 10/18/31 144A † | 500,000 | | 500,543 |
| Voya CLO, Ltd., Series 2017-3A, Class A1R | | | |
| (Floating, CME Term SOFR 3M + 1.30%), 6.72%, 04/20/34 144A † | 490,000 | | 489,249 |
| Voya CLO, Ltd., Series 2018-3A, Class A1A | | | |
| (Floating, CME Term SOFR 3M + 1.41%, 1.15% Floor), 6.81%, 10/15/31 144A † | 1,250,000 | | 1,250,425 |
| Voya CLO, Ltd., Series 2019-1A, Class AR | | | |
| (Floating, CME Term SOFR 3M + 1.32%, 1.06% Floor), 6.72%, 04/15/31 144A † | 1,460,266 | | 1,463,103 |
| Voya CLO, Series 2017-2A, Class A2AR | | | |
| (Floating, CME Term SOFR 3M + 1.91%, 1.65% Floor), 7.31%, 06/07/30 144A † | 500,000 | | 500,957 |
| WAVE LLC, Series 2019-1, Class A | | | |
| 3.60%, 09/15/44 144A | 177,157 | | 148,815 |
| Wellfleet CLO X, Ltd., Series 2019-XA, Class A1R | | | |
| (Floating, CME Term SOFR 3M + 1.43%), 6.85%, 07/20/32 144A † | 6,891,190 | | 6,872,546 |
| Wellfleet CLO, Ltd., Series 2022-2A, Class B | | | |
| (Floating, CME Term SOFR 3M + 3.15%, 3.15% Floor), 8.55%, 10/18/35 144A † | 1,250,000 | | 1,254,767 |
| Wendy's Funding LLC, Series 2019-1A, Class A2II | | | |
| 4.08%, 06/15/49 144A | 644,824 | | 600,523 |
See Notes to Financial Statements.
MEDIUM-DURATION BOND FUND
SCHEDULE OF INVESTMENTS (Continued)
| | | Par | | Value |
| Whitebox CLO II, Ltd., Series 2020-2A, Class A1R | | | |
| (Floating, CME Term SOFR 3M + 1.48%, 1.22% Floor), 6.88%, 10/24/34 144A † | $ 650,000 | | $ 647,427 |
| Whitebox CLO III, Ltd., Series 2021-3A, Class A1 | | | |
| (Floating, CME Term SOFR 3M + 1.48%, 1.22% Floor), 6.88%, 10/15/34 144A † | 780,000 | | 779,044 |
| Wingstop Funding LLC, Series 2020-1A, Class A2 | | | |
| 2.84%, 12/05/50 144A | 1,244,892 | | 1,124,306 |
| WISE CLO, Ltd., Series 2023-2A, Class A | | | |
| (Floating, 1.80% - CME Term SOFR 3M, 1.80% Floor), 0.00%, 01/15/37 144A † | 500,000 | | 500,212 |
| World Omni Auto Receivables Trust, Series 2023-B, Class A2A | | | |
| 5.25%, 11/16/26 | 1,029,773 | | 1,027,879 |
Total Asset-Backed Securities
(Cost $259,728,206) | | | 254,336,282 |
| CORPORATE BONDS — 22.0% |
| 3M Co. | | | |
| 2.38%, 08/26/29 | 40,000 | | 35,457 |
| 3.05%, 04/15/30 | 50,000 | | 45,158 |
| 3.70%, 04/15/50 | 380,000 | | 302,150 |
| 7-Eleven, Inc. | | | |
| 1.30%, 02/10/28 144A | 725,000 | | 635,354 |
| Abbott Laboratories | | | |
| 4.75%, 11/30/36 | 170,000 | | 174,656 |
| 4.90%, 11/30/46 | 390,000 | | 400,679 |
| Accident Fund Insurance Co. of America | | | |
| 8.50%, 08/01/32 144A Δ | 100,000 | | 101,904 |
| Acushnet Co. | | | |
| 7.38%, 10/15/28 144A | 750,000 | | 782,936 |
| Adobe, Inc. | | | |
| 2.30%, 02/01/30 | 650,000 | | 583,401 |
| Advance Auto Parts, Inc. | | | |
| 3.90%, 04/15/30Δ | 1,000,000 | | 898,874 |
| Adventist Health System | | | |
| 2.95%, 03/01/29 | 160,000 | | 144,881 |
| AEP Texas, Inc. | | | |
| 3.95%, 06/01/28 | 30,000 | | 28,941 |
| Air Lease Corporation | | | |
| 3.38%, 07/01/25 | 1,020,000 | | 987,968 |
| 2.88%, 01/15/26 | 950,000 | | 905,760 |
| 3.75%, 06/01/26 | 875,000 | | 844,993 |
| (Variable, U.S. Treasury Yield Curve Rate CMT 5Y + 3.15%), 4.13%, 12/15/26ρ ^ | 600,000 | | 466,923 |
| 5.30%, 02/01/28Δ | 300,000 | | 303,876 |
| Albemarle Corporation | | | |
| 5.65%, 06/01/52 | 10,000 | | 9,340 |
| Alexander Funding Trust II | | | |
| 7.47%, 07/31/28 144A Δ | 350,000 | | 368,246 |
| | | Par | | Value |
| Alexandria Real Estate Equities, Inc. REIT | | | |
| 2.75%, 12/15/29 | $1,400,000 | | $1,234,125 |
| 3.38%, 08/15/31 | 325,000 | | 293,593 |
| 5.15%, 04/15/53 | 600,000 | | 582,182 |
| Allegion U.S. Holding Co., Inc. | | | |
| 3.20%, 10/01/24 | 400,000 | | 392,112 |
| Alliant Energy Finance LLC | | | |
| 4.25%, 06/15/28 144A | 75,000 | | 73,292 |
| Allied Universal Holdco LLC | | | |
| 6.63%, 07/15/26 144A Δ | 10,000 | | 9,957 |
| Allstate Corporation (The) | | | |
| 0.75%, 12/15/25 | 35,000 | | 32,298 |
| Alphabet, Inc. | | | |
| 1.90%, 08/15/40 | 140,000 | | 97,527 |
| 2.05%, 08/15/50 | 90,000 | | 56,763 |
| Amazon.com, Inc. | | | |
| 3.30%, 04/13/27 | 100,000 | | 97,248 |
| 1.20%, 06/03/27 | 60,000 | | 54,190 |
| 3.45%, 04/13/29Δ | 220,000 | | 213,434 |
| 1.50%, 06/03/30 | 190,000 | | 161,218 |
| 3.60%, 04/13/32Δ | 850,000 | | 811,439 |
| 4.80%, 12/05/34 | 75,000 | | 77,626 |
| 3.88%, 08/22/37 | 1,945,000 | | 1,810,926 |
| 4.95%, 12/05/44 | 10,000 | | 10,329 |
| 4.05%, 08/22/47 | 290,000 | | 262,909 |
| 2.50%, 06/03/50 | 20,000 | | 13,366 |
| 4.25%, 08/22/57 | 130,000 | | 120,365 |
| Amdocs, Ltd. | | | |
| 2.54%, 06/15/30 | 1,600,000 | | 1,385,658 |
| American Airlines, Inc. | | | |
| 8.50%, 05/15/29 144A | 200,000 | | 211,299 |
| American Equity Investment Life Holding Co. | | | |
| 5.00%, 06/15/27 | 1,250,000 | | 1,203,247 |
| American Express Co. | | | |
| 3.38%, 05/03/24 | 20,000 | | 19,851 |
| 1.65%, 11/04/26 | 5,000 | | 4,599 |
| 4.05%, 05/03/29 | 370,000 | | 366,907 |
| (Variable, U.S. SOFR + 1.28%), 5.28%, 07/27/29^ | 30,000 | | 30,667 |
| (Variable, U.S. SOFR + 1.76%), 4.42%, 08/03/33^ | 35,000 | | 33,773 |
| American Homes 4 Rent LP REIT | | | |
| 4.90%, 02/15/29 | 309,000 | | 306,240 |
| 2.38%, 07/15/31 | 205,000 | | 169,479 |
| American International Group, Inc. | | | |
| 3.40%, 06/30/30 | 250,000 | | 230,775 |
| 4.75%, 04/01/48 | 20,000 | | 18,966 |
| American National Group LLC | | | |
| 6.14%, 06/13/32 144A | 600,000 | | 578,030 |
| American Tower Corporation REIT | | | |
| 3.38%, 10/15/26 | 1,200,000 | | 1,151,019 |
| 2.75%, 01/15/27 | 5,000 | | 4,694 |
| 3.13%, 01/15/27 | 5,000 | | 4,733 |
| 3.65%, 03/15/27 | 5,000 | | 4,815 |
See Notes to Financial Statements.
| | | Par | | Value |
| 3.95%, 03/15/29 | $ 300,000 | | $ 286,940 |
| American Transmission Systems, Inc. | | | |
| 2.65%, 01/15/32 144A | 390,000 | | 330,790 |
| Americo Life, Inc. | | | |
| 3.45%, 04/15/31 144A | 1,450,000 | | 1,139,321 |
| AmFam Holdings, Inc. | | | |
| 3.83%, 03/11/51 144A Δ | 600,000 | | 367,197 |
| Amgen, Inc. | | | |
| 3.63%, 05/22/24 | 50,000 | | 49,610 |
| 5.25%, 03/02/30 | 1,873,000 | | 1,928,877 |
| 4.20%, 03/01/33 | 2,775,000 | | 2,646,343 |
| 5.25%, 03/02/33 | 995,000 | | 1,021,918 |
| 4.66%, 06/15/51 | 254,000 | | 232,148 |
| Amsted Industries, Inc. | | | |
| 4.63%, 05/15/30 144A | 200,000 | | 183,309 |
| Apache Corporation | | | |
| 4.25%, 01/15/30 | 650,000 | | 612,563 |
| 6.00%, 01/15/37 | 5,000 | | 4,926 |
| Appalachian Power Co. | | | |
| 2.70%, 04/01/31 | 2,200,000 | | 1,883,885 |
| 5.80%, 10/01/35 | 50,000 | | 50,991 |
| Apple, Inc. | | | |
| 2.40%, 08/20/50Δ | 55,000 | | 36,267 |
| Arch Capital Finance LLC | | | |
| 4.01%, 12/15/26 | 600,000 | | 582,603 |
| Arch Capital Group, Ltd. | | | |
| 7.35%, 05/01/34 | 175,000 | | 201,230 |
| Archer-Daniels-Midland Co. | | | |
| 3.25%, 03/27/30 | 150,000 | | 140,388 |
| Ares Finance Co. II LLC | | | |
| 3.25%, 06/15/30 144A | 1,800,000 | | 1,594,852 |
| Arko Corporation | | | |
| 5.13%, 11/15/29 144A Δ | 675,000 | | 582,997 |
| Arsenal AIC Parent LLC | | | |
| 8.00%, 10/01/30 144A | 100,000 | | 104,461 |
| Ashtead Capital, Inc. | | | |
| 1.50%, 08/12/26 144A | 350,000 | | 317,653 |
| Assurant, Inc. | | | |
| 6.10%, 02/27/26 | 800,000 | | 813,647 |
| AT&T, Inc. | | | |
| 2.30%, 06/01/27 | 430,000 | | 399,667 |
| 2.75%, 06/01/31 | 175,000 | | 153,747 |
| 2.25%, 02/01/32 | 1,185,000 | | 980,789 |
| 2.55%, 12/01/33 | 3,779,000 | | 3,084,975 |
| 4.90%, 08/15/37 | 200,000 | | 193,883 |
| 4.85%, 03/01/39 | 10,000 | | 9,610 |
| 5.35%, 09/01/40 | 80,000 | | 79,272 |
| 3.50%, 06/01/41 | 400,000 | | 318,974 |
| 5.55%, 08/15/41 | 40,000 | | 40,659 |
| 4.35%, 06/15/45Δ | 94,000 | | 81,540 |
| 4.75%, 05/15/46Δ | 65,000 | | 59,022 |
| 5.15%, 11/15/46Δ | 125,000 | | 120,191 |
| 4.50%, 03/09/48 | 207,000 | | 181,516 |
| 3.65%, 06/01/51 | 500,000 | | 378,677 |
| 3.50%, 09/15/53 | 1,888,000 | | 1,377,904 |
| 3.55%, 09/15/55 | 21,000 | | 15,197 |
| 3.80%, 12/01/57 | 90,000 | | 67,280 |
| | | Par | | Value |
| 3.65%, 09/15/59 | $ 127,000 | | $ 91,525 |
| AutoNation, Inc. | | | |
| 1.95%, 08/01/28Δ | 150,000 | | 129,281 |
| 4.75%, 06/01/30Δ | 225,000 | | 217,534 |
| AutoZone, Inc. | | | |
| 3.75%, 04/18/29 | 5,000 | | 4,781 |
| Avangrid, Inc. | | | |
| 3.20%, 04/15/25 | 275,000 | | 267,387 |
| Aviation Capital Group LLC | | | |
| 5.50%, 12/15/24 144A | 2,000,000 | | 1,990,119 |
| 1.95%, 01/30/26 144A | 400,000 | | 371,104 |
| Axalta Coating Systems LLC | | | |
| 3.38%, 02/15/29 144A | 665,000 | | 597,970 |
| Ball Corporation | | | |
| 3.13%, 09/15/31Δ | 280,000 | | 241,938 |
| Bank of America Corporation | | | |
| 4.00%, 04/01/24 | 30,000 | | 29,889 |
| (Variable, CME Term SOFR 3M + 3.97%), 6.25%, 09/05/24ρ ^ | 300,000 | | 298,304 |
| (Variable, CME Term SOFR 3M + 4.44%), 6.50%, 10/23/24ρ Δ ^ | 150,000 | | 149,674 |
| 4.00%, 01/22/25 | 30,000 | | 29,621 |
| (Variable, CME Term SOFR 3M + 1.35%), 3.09%, 10/01/25^ | 2,200,000 | | 2,157,842 |
| 4.45%, 03/03/26 | 420,000 | | 415,744 |
| 3.50%, 04/19/26 | 600,000 | | 584,317 |
| (Variable, U.S. SOFR + 1.15%), 1.32%, 06/19/26^ | 60,000 | | 56,518 |
| 4.25%, 10/22/26 | 480,000 | | 471,776 |
| (Variable, U.S. SOFR + 1.29%), 5.08%, 01/20/27^ | 1,000,000 | | 998,558 |
| (Variable, U.S. Treasury Yield Curve Rate CMT 5Y + 2.76%), 4.38%, 01/27/27ρ ^ | 700,000 | | 625,471 |
| (Variable, U.S. SOFR + 0.91%), 1.66%, 03/11/27^ | 70,000 | | 64,802 |
| (Variable, CME Term SOFR 3M + 1.32%), 3.56%, 04/23/27^ | 65,000 | | 62,612 |
| (Variable, U.S. SOFR + 0.96%), 1.73%, 07/22/27^ | 55,000 | | 50,430 |
| 3.25%, 10/21/27 | 875,000 | | 833,894 |
| 4.18%, 11/25/27 | 950,000 | | 924,711 |
| (Variable, CME Term SOFR 3M + 1.84%), 3.82%, 01/20/28^ | 5,000 | | 4,810 |
| (Variable, U.S. SOFR + 1.05%), 2.55%, 02/04/28^ | 50,000 | | 46,373 |
| (Variable, CME Term SOFR 3M + 1.77%), 3.71%, 04/24/28^ | 2,000,000 | | 1,912,725 |
| (Variable, CME Term SOFR 3M + 1.63%), 3.59%, 07/21/28^ | 860,000 | | 816,818 |
| (Variable, CME Term SOFR 3M + 1.30%), 3.42%, 12/20/28^ | 378,000 | | 356,172 |
| (Variable, CME Term SOFR 3M + 1.33%), 3.97%, 03/05/29^ | 1,190,000 | | 1,138,023 |
| (Variable, U.S. SOFR + 1.63%), 5.20%, 04/25/29^ | 4,385,000 | | 4,418,523 |
| (Variable, CME Term SOFR 3M + 1.57%), 4.27%, 07/23/29^ | 525,000 | | 507,898 |
| (Variable, CME Term SOFR 3M + 1.25%), 2.50%, 02/13/31^ | 75,000 | | 64,533 |
See Notes to Financial Statements.
MEDIUM-DURATION BOND FUND
SCHEDULE OF INVESTMENTS (Continued)
| | | Par | | Value |
| (Variable, U.S. SOFR + 2.15%), 2.59%, 04/29/31^ | $1,010,000 | | $ 872,272 |
| (Variable, U.S. SOFR + 1.53%), 1.90%, 07/23/31^ | 1,150,000 | | 942,964 |
| (Variable, U.S. SOFR + 1.22%), 2.65%, 03/11/32^ | 525,000 | | 444,244 |
| (Variable, U.S. SOFR + 1.22%), 2.30%, 07/21/32^ | 755,000 | | 617,571 |
| (Variable, U.S. SOFR + 1.21%), 2.57%, 10/20/32^ | 2,010,000 | | 1,670,512 |
| (Variable, U.S. SOFR + 1.33%), 2.97%, 02/04/33^ | 2,125,000 | | 1,808,765 |
| (Variable, U.S. SOFR + 1.83%), 4.57%, 04/27/33^ | 1,065,000 | | 1,018,248 |
| (Variable, U.S. SOFR + 2.16%), 5.02%, 07/22/33Δ ^ | 600,000 | | 594,611 |
| (Variable, U.S. Treasury Yield Curve Rate CMT 5Y + 1.20%), 2.48%, 09/21/36^ | 1,712,000 | | 1,359,263 |
| 5.00%, 01/21/44 | 490,000 | | 482,829 |
| (Variable, CME Term SOFR 3M + 1.45%), 3.95%, 01/23/49^ | 120,000 | | 101,451 |
| (Variable, CME Term SOFR 3M + 1.78%), 4.33%, 03/15/50^ | 10,000 | | 8,849 |
| (Variable, CME Term SOFR 3M + 3.41%), 4.08%, 03/20/51^ | 60,000 | | 50,759 |
| (Variable, U.S. SOFR + 1.88%), 2.83%, 10/24/51^ | 10,000 | | 6,797 |
| Bank of New York Mellon Corporation (The) | | | |
| (Variable, U.S. Treasury Yield Curve Rate CMT 5Y + 2.63%), 3.75%, 12/20/26ρ Δ ^ | 700,000 | | 606,882 |
| (Variable, CME Term SOFR 3M + 1.33%), 3.44%, 02/07/28^ | 25,000 | | 24,085 |
| (Variable, U.S. SOFR + 1.17%), 4.54%, 02/01/29Δ ^ | 65,000 | | 64,631 |
| Banner Health | | | |
| 2.34%, 01/01/30 | 865,000 | | 749,156 |
| Barrick North America Finance LLC | | | |
| 5.70%, 05/30/41 | 150,000 | | 158,989 |
| 5.75%, 05/01/43 | 80,000 | | 86,112 |
| Baxter International, Inc. | | | |
| 1.92%, 02/01/27 | 367,000 | | 336,484 |
| 3.13%, 12/01/51Δ | 25,000 | | 17,295 |
| Baylor Scott & White Holdings | | | |
| 1.78%, 11/15/30 | 305,000 | | 254,331 |
| Beacon Roofing Supply, Inc. | | | |
| 6.50%, 08/01/30 144A | 650,000 | | 665,232 |
| Becton, Dickinson and Co. | | | |
| 3.36%, 06/06/24 | 81,000 | | 80,240 |
| 3.73%, 12/15/24 | 47,000 | | 46,277 |
| 2.82%, 05/20/30 | 650,000 | | 581,854 |
| 4.69%, 12/15/44 | 83,000 | | 77,962 |
| Belvoir Land LLC | | | |
| 5.60%, 12/15/35 144A | 1,000,000 | | 957,411 |
| Berkshire Hathaway Energy Co. | | | |
| 3.70%, 07/15/30 | 400,000 | | 379,015 |
| Berkshire Hathaway Finance Corporation | | | |
| 1.85%, 03/12/30Δ | 725,000 | | 632,106 |
| | | Par | | Value |
| 4.25%, 01/15/49 | $ 490,000 | | $ 459,319 |
| Berry Global, Inc. | | | |
| 1.57%, 01/15/26 | 2,100,000 | | 1,952,450 |
| Biogen, Inc. | | | |
| 3.15%, 05/01/50Δ | 25,000 | | 17,647 |
| Black Hills Corporation | | | |
| 2.50%, 06/15/30 | 490,000 | | 412,235 |
| Black Knight InfoServ LLC | | | |
| 3.63%, 09/01/28 144A | 345,000 | | 328,645 |
| BlackRock, Inc. | | | |
| 2.40%, 04/30/30 | 70,000 | | 62,657 |
| Block Financial LLC | | | |
| 3.88%, 08/15/30 | 1,600,000 | | 1,465,957 |
| Blue Owl Capital Corporation | | | |
| 2.88%, 06/11/28Δ | 2,200,000 | | 1,938,423 |
| Boardwalk Pipelines LP | | | |
| 3.60%, 09/01/32 | 700,000 | | 622,950 |
| Boeing Co. (The) | | | |
| 1.43%, 02/04/24 | 470,000 | | 468,029 |
| 4.88%, 05/01/25 | 450,000 | | 448,164 |
| 2.20%, 02/04/26 | 110,000 | | 103,992 |
| 2.70%, 02/01/27 | 70,000 | | 66,089 |
| 5.15%, 05/01/30 | 3,290,000 | | 3,355,481 |
| 3.25%, 02/01/35 | 1,610,000 | | 1,361,887 |
| 6.63%, 02/15/38 | 210,000 | | 234,623 |
| 3.55%, 03/01/38 | 70,000 | | 57,291 |
| 5.71%, 05/01/40 | 1,145,000 | | 1,189,437 |
| 3.85%, 11/01/48 | 25,000 | | 19,553 |
| 5.81%, 05/01/50 | 190,000 | | 197,679 |
| 5.93%, 05/01/60 | 100,000 | | 104,174 |
| Boston Properties LP REIT | | | |
| 2.75%, 10/01/26 | 25,000 | | 23,222 |
| 4.50%, 12/01/28 | 900,000 | | 857,758 |
| 3.40%, 06/21/29 | 25,000 | | 22,459 |
| 2.90%, 03/15/30 | 10,000 | | 8,581 |
| 2.55%, 04/01/32Δ | 1,100,000 | | 876,729 |
| BP Capital Markets America, Inc. | | | |
| 4.23%, 11/06/28 | 150,000 | | 149,312 |
| 3.63%, 04/06/30 | 270,000 | | 258,982 |
| 3.00%, 02/24/50 | 350,000 | | 249,122 |
| Brighthouse Financial, Inc. | | | |
| 4.70%, 06/22/47 | 15,000 | | 12,006 |
| Bristol-Myers Squibb Co. | | | |
| 3.20%, 06/15/26 | 65,000 | | 63,106 |
| 6.25%, 11/15/53 | 465,000 | | 534,760 |
| Brixmor Operating Partnership LP REIT | | | |
| 3.90%, 03/15/27 | 5,000 | | 4,775 |
| Broadcom Corporation | | | |
| 3.88%, 01/15/27 | 40,000 | | 39,056 |
| Broadcom, Inc. | | | |
| 2.45%, 02/15/31 144A | 2,000,000 | | 1,712,991 |
| 4.15%, 04/15/32 144A | 2,420,000 | | 2,288,375 |
| 3.42%, 04/15/33 144A | 900,000 | | 792,557 |
| 3.47%, 04/15/34 144A | 2,475,000 | | 2,158,152 |
| 3.14%, 11/15/35 144A | 3,788,000 | | 3,119,350 |
| 3.19%, 11/15/36 144A | 28,000 | | 22,737 |
See Notes to Financial Statements.
| | | Par | | Value |
| 3.50%, 02/15/41 144A | $ 325,000 | | $ 258,785 |
| Brookfield Capital Finance LLC | | | |
| 6.09%, 06/14/33 | 100,000 | | 104,635 |
| Brooklyn Union Gas Co. (The) | | | |
| 6.39%, 09/15/33 144A | 1,250,000 | | 1,309,011 |
| Brown & Brown, Inc. | | | |
| 2.38%, 03/15/31 | 10,000 | | 8,219 |
| 4.95%, 03/17/52 | 5,000 | | 4,463 |
| Brunswick Corporation | | | |
| 2.40%, 08/18/31Δ | 5,000 | | 4,055 |
| 4.40%, 09/15/32 | 20,000 | | 18,277 |
| Builders FirstSource, Inc. | | | |
| 4.25%, 02/01/32 144A | 20,000 | | 18,069 |
| Burlington Northern Santa Fe LLC | | | |
| 2.88%, 06/15/52 | 70,000 | | 49,238 |
| Cameron LNG LLC | | | |
| 2.90%, 07/15/31 144A | 70,000 | | 61,567 |
| 3.30%, 01/15/35 144A | 460,000 | | 392,630 |
| Capital One Financial Corporation | | | |
| 3.30%, 10/30/24 | 345,000 | | 339,440 |
| (Variable, U.S. SOFR + 0.86%), 1.88%, 11/02/27^ | 35,000 | | 31,516 |
| (Variable, U.S. SOFR + 1.79%), 3.27%, 03/01/30^ | 50,000 | | 44,743 |
| (Variable, U.S. SOFR + 2.60%), 5.25%, 07/26/30^ | 1,200,000 | | 1,182,471 |
| Cardinal Health, Inc. | | | |
| 4.37%, 06/15/47 | 20,000 | | 17,221 |
| Carrier Global Corporation | | | |
| 2.72%, 02/15/30 | 650,000 | | 582,688 |
| 5.90%, 03/15/34 144A | 1,600,000 | | 1,735,315 |
| 3.58%, 04/05/50 | 20,000 | | 15,678 |
| Catalent Pharma Solutions, Inc. | | | |
| 3.13%, 02/15/29 144A Δ | 100,000 | | 87,625 |
| CBRE Services, Inc. | | | |
| 5.95%, 08/15/34 | 100,000 | | 104,985 |
| CCO Holdings LLC | | | |
| 4.50%, 05/01/32 | 10,000 | | 8,574 |
| 4.50%, 06/01/33 144A | 980,000 | | 830,871 |
| CDW LLC | | | |
| 3.25%, 02/15/29 | 5,000 | | 4,577 |
| 3.57%, 12/01/31 | 395,000 | | 350,515 |
| Celanese U.S. Holdings LLC | | | |
| 6.17%, 07/15/27 | 5,000 | | 5,129 |
| 6.33%, 07/15/29 | 30,000 | | 31,499 |
| Centene Corporation | | | |
| 4.63%, 12/15/29 | 70,000 | | 67,203 |
| CenterPoint Energy, Inc. | | | |
| 4.25%, 11/01/28 | 206,000 | | 198,791 |
| Central Parent, Inc. | | | |
| 7.25%, 06/15/29 144A | 600,000 | | 613,609 |
| CH Robinson Worldwide, Inc. | | | |
| 4.20%, 04/15/28Δ | 1,500,000 | | 1,452,683 |
| Charles Schwab Corporation (The) | | | |
| (Variable, U.S. Treasury Yield Curve Rate CMT 5Y + 4.97%), 5.38%, 06/01/25ρ ^ | 578,000 | | 571,675 |
| | | Par | | Value |
| 3.25%, 05/22/29 | $ 10,000 | | $ 9,396 |
| (Variable, U.S. SOFR + 1.88%), 6.20%, 11/17/29^ | 65,000 | | 68,265 |
| (Variable, U.S. Treasury Yield Curve Rate CMT 10Y + 3.08%), 4.00%, 12/01/30ρ ^ | 1,000,000 | | 790,964 |
| (Variable, U.S. SOFR + 2.50%), 5.85%, 05/19/34^ | 1,420,000 | | 1,468,576 |
| Charter Communications Operating LLC | | | |
| 4.91%, 07/23/25 | 1,790,000 | | 1,774,312 |
| 4.20%, 03/15/28Δ | 310,000 | | 298,163 |
| 2.25%, 01/15/29 | 2,300,000 | | 1,998,970 |
| 5.05%, 03/30/29 | 460,000 | | 456,119 |
| 4.40%, 04/01/33Δ | 350,000 | | 323,736 |
| 6.38%, 10/23/35 | 505,000 | | 514,215 |
| 5.38%, 04/01/38 | 350,000 | | 317,594 |
| 3.50%, 03/01/42 | 130,000 | | 90,840 |
| 6.48%, 10/23/45 | 90,000 | | 88,822 |
| 5.38%, 05/01/47 | 30,000 | | 25,622 |
| 5.75%, 04/01/48 | 20,000 | | 17,838 |
| 5.13%, 07/01/49 | 140,000 | | 114,191 |
| 4.80%, 03/01/50 | 140,000 | | 108,688 |
| Cheniere Energy Partners LP | | | |
| 4.00%, 03/01/31 | 170,000 | | 154,525 |
| 3.25%, 01/31/32 | 80,000 | | 68,263 |
| 5.95%, 06/30/33 144A | 330,000 | | 338,963 |
| Choice Hotels International, Inc. | | | |
| 3.70%, 12/01/29 | 1,500,000 | | 1,330,279 |
| Ciena Corporation | | | |
| 4.00%, 01/31/30 144A Δ | 400,000 | | 364,742 |
| Cigna Group (The) | | | |
| 4.13%, 11/15/25 | 60,000 | | 59,258 |
| 4.38%, 10/15/28 | 510,000 | | 505,829 |
| 2.40%, 03/15/30 | 550,000 | | 482,514 |
| 2.38%, 03/15/31 | 1,100,000 | | 942,040 |
| 4.80%, 08/15/38 | 1,265,000 | | 1,227,375 |
| 3.20%, 03/15/40 | 675,000 | | 529,879 |
| 3.88%, 10/15/47 | 35,000 | | 28,635 |
| 4.90%, 12/15/48Δ | 830,000 | | 790,768 |
| Cintas Corporation No. 2 | | | |
| 3.70%, 04/01/27 | 10,000 | | 9,786 |
| 4.00%, 05/01/32 | 140,000 | | 135,623 |
| Cisco Systems, Inc. | | | |
| 5.50%, 01/15/40 | 75,000 | | 80,154 |
| Citigroup, Inc. | | | |
| (Variable, CME Term SOFR 3M + 4.17%), 5.95%, 05/15/25ρ ^ | 350,000 | | 342,923 |
| 4.40%, 06/10/25 | 100,000 | | 98,815 |
| 5.50%, 09/13/25 | 220,000 | | 221,169 |
| (Variable, U.S. SOFR + 2.84%), 3.11%, 04/08/26^ | 10,000 | | 9,725 |
| 3.40%, 05/01/26 | 1,250,000 | | 1,207,212 |
| (Variable, CME Term SOFR 3M + 4.78%), 6.25%, 08/15/26ρ ^ | 150,000 | | 148,426 |
| 4.30%, 11/20/26 | 575,000 | | 564,229 |
See Notes to Financial Statements.
MEDIUM-DURATION BOND FUND
SCHEDULE OF INVESTMENTS (Continued)
| | | Par | | Value |
| (Variable, U.S. SOFR + 0.77%), 1.12%, 01/28/27^ | $ 55,000 | | $ 50,570 |
| (Variable, U.S. SOFR + 0.77%), 1.46%, 06/09/27^ | 65,000 | | 59,533 |
| 4.45%, 09/29/27 | 990,000 | | 967,488 |
| (Variable, U.S. SOFR + 1.28%), 3.07%, 02/24/28^ | 10,000 | | 9,433 |
| (Variable, U.S. Treasury Yield Curve Rate CMT 5Y + 3.21%), 7.38%, 05/15/28ρ Δ ^ | 1,200,000 | | 1,217,557 |
| (Variable, U.S. SOFR + 1.89%), 4.66%, 05/24/28Δ ^ | 230,000 | | 228,669 |
| (Variable, CME Term SOFR 3M + 1.65%), 3.67%, 07/24/28^ | 150,000 | | 143,156 |
| (Variable, CME Term SOFR 3M + 1.41%), 3.52%, 10/27/28^ | 35,000 | | 33,150 |
| (Variable, U.S. SOFR + 1.15%), 2.67%, 01/29/31^ | 25,000 | | 21,730 |
| (Variable, U.S. SOFR + 3.91%), 4.41%, 03/31/31^ | 710,000 | | 680,589 |
| (Variable, U.S. SOFR + 2.11%), 2.57%, 06/03/31^ | 510,000 | | 436,534 |
| 6.63%, 06/15/32 | 50,000 | | 54,532 |
| (Variable, U.S. SOFR + 1.18%), 2.52%, 11/03/32^ | 860,000 | | 710,633 |
| (Variable, U.S. SOFR + 1.94%), 3.79%, 03/17/33^ | 540,000 | | 486,724 |
| (Variable, U.S. SOFR + 2.09%), 4.91%, 05/24/33^ | 1,140,000 | | 1,118,719 |
| 8.13%, 07/15/39 | 20,000 | | 25,855 |
| 4.65%, 07/30/45 | 124,000 | | 113,295 |
| 4.65%, 07/23/48 | 10,000 | | 9,260 |
| Citizens Bank NA | | | |
| (Variable, U.S. SOFR + 2.00%), 4.58%, 08/09/28^ | 1,250,000 | | 1,188,328 |
| Clorox Co. (The) | | | |
| 1.80%, 05/15/30 | 15,000 | | 12,539 |
| CoBank ACB | | | |
| (Variable, U.S. Treasury Yield Curve Rate CMT 5Y + 3.49%), 6.45%, 10/01/27ρ Δ ^ | 600,000 | | 583,500 |
| Coca-Cola Co. (The) | | | |
| 2.50%, 06/01/40 | 20,000 | | 15,184 |
| 2.60%, 06/01/50 | 130,000 | | 90,316 |
| Cogent Communications Group, Inc. | | | |
| 7.00%, 06/15/27 144A | 600,000 | | 603,561 |
| Columbia Pipelines Operating Co. LLC | | | |
| 6.04%, 11/15/33 144A | 1,630,000 | | 1,710,616 |
| 6.54%, 11/15/53 144A | 80,000 | | 88,585 |
| Comcast Corporation | | | |
| 3.95%, 10/15/25 | 425,000 | | 419,497 |
| 4.15%, 10/15/28 | 990,000 | | 977,914 |
| 3.40%, 04/01/30 | 700,000 | | 656,380 |
| 4.25%, 10/15/30 | 520,000 | | 513,510 |
| 7.05%, 03/15/33 | 50,000 | | 58,458 |
| 5.65%, 06/15/35 | 420,000 | | 451,565 |
| 6.50%, 11/15/35 | 7,000 | | 7,993 |
| 3.90%, 03/01/38 | 30,000 | | 26,917 |
| 3.25%, 11/01/39 | 400,000 | | 325,541 |
| | | Par | | Value |
| 3.75%, 04/01/40 | $ 265,000 | | $ 228,710 |
| 3.40%, 07/15/46 | 50,000 | | 38,942 |
| 4.00%, 08/15/47 | 60,000 | | 50,837 |
| 3.97%, 11/01/47 | 60,000 | | 50,635 |
| 4.00%, 03/01/48 | 40,000 | | 33,771 |
| 4.70%, 10/15/48Δ | 100,000 | | 96,005 |
| 4.00%, 11/01/49 | 40,000 | | 33,559 |
| 3.45%, 02/01/50 | 100,000 | | 77,163 |
| 2.80%, 01/15/51 | 160,000 | | 107,259 |
| 2.89%, 11/01/51 | 40,000 | | 27,217 |
| 2.94%, 11/01/56 | 135,000 | | 89,335 |
| 4.95%, 10/15/58 | 40,000 | | 39,419 |
| CommonSpirit Health | | | |
| 4.35%, 11/01/42 | 40,000 | | 34,750 |
| 6.46%, 11/01/52 | 1,005,000 | | 1,182,828 |
| Commonwealth Edison Co. | | | |
| 3.80%, 10/01/42 | 300,000 | | 249,890 |
| 3.13%, 03/15/51 | 50,000 | | 35,617 |
| CommScope, Inc. | | | |
| 6.00%, 03/01/26 144A | 130,000 | | 115,986 |
| 4.75%, 09/01/29 144A Δ | 10,000 | | 6,723 |
| Conagra Brands, Inc. | | | |
| 5.40%, 11/01/48 | 5,000 | | 4,863 |
| ConocoPhillips Co. | | | |
| 6.95%, 04/15/29 | 220,000 | | 245,600 |
| Consolidated Edison Co. of New York, Inc. | | | |
| 3.35%, 04/01/30 | 130,000 | | 121,415 |
| Constellation Energy Generation LLC | | | |
| 3.25%, 06/01/25 | 1,600,000 | | 1,555,887 |
| 5.60%, 06/15/42 | 20,000 | | 20,076 |
| Continental Resources, Inc. | | | |
| 2.27%, 11/15/26 144A | 180,000 | | 165,763 |
| 4.38%, 01/15/28Δ | 580,000 | | 562,538 |
| 5.75%, 01/15/31 144A | 210,000 | | 208,923 |
| 4.90%, 06/01/44 | 170,000 | | 138,146 |
| Corebridge Financial, Inc. | | | |
| (Variable, U.S. Treasury Yield Curve Rate CMT 5Y + 3.85%), 6.88%, 12/15/52Δ ^ | 200,000 | | 199,746 |
| CoStar Group, Inc. | | | |
| 2.80%, 07/15/30 144A | 625,000 | | 532,703 |
| Costco Wholesale Corporation | | | |
| 1.38%, 06/20/27 | 530,000 | | 481,612 |
| 1.60%, 04/20/30 | 550,000 | | 472,162 |
| Coterra Energy, Inc. | | | |
| 3.90%, 05/15/27 | 660,000 | | 639,381 |
| 4.38%, 03/15/29 | 650,000 | | 631,675 |
| CRH America Finance, Inc. | | | |
| 3.40%, 05/09/27 144A Δ | 2,100,000 | | 2,012,113 |
| 3.95%, 04/04/28 144A | 500,000 | | 484,148 |
| Crown Castle, Inc. REIT | | | |
| 1.05%, 07/15/26Δ | 45,000 | | 40,641 |
| 4.00%, 03/01/27 | 30,000 | | 29,046 |
| 2.90%, 04/01/41 | 20,000 | | 14,351 |
| CSC Holdings LLC | | | |
| 3.38%, 02/15/31 144A | 200,000 | | 146,195 |
See Notes to Financial Statements.
| | | Par | | Value |
| 4.50%, 11/15/31 144A Δ | $1,120,000 | | $ 848,170 |
| CSX Corporation | | | |
| 4.10%, 11/15/32Δ | 500,000 | | 487,318 |
| 3.80%, 04/15/50 | 300,000 | | 246,427 |
| CubeSmart LP REIT | | | |
| 2.25%, 12/15/28 | 75,000 | | 66,232 |
| 2.50%, 02/15/32Δ | 305,000 | | 254,036 |
| Cummins, Inc. | | | |
| 2.60%, 09/01/50Δ | 30,000 | | 20,018 |
| CVS Health Corporation | | | |
| 3.88%, 07/20/25 | 113,000 | | 111,103 |
| 3.63%, 04/01/27 | 80,000 | | 77,607 |
| 4.30%, 03/25/28 | 334,000 | | 328,931 |
| 3.75%, 04/01/30 | 1,090,000 | | 1,026,256 |
| 1.88%, 02/28/31 | 70,000 | | 57,736 |
| 2.13%, 09/15/31Δ | 4,265,000 | | 3,540,498 |
| 4.78%, 03/25/38 | 830,000 | | 788,918 |
| 4.13%, 04/01/40 | 470,000 | | 405,332 |
| 2.70%, 08/21/40 | 700,000 | | 501,207 |
| 5.13%, 07/20/45 | 250,000 | | 237,581 |
| 5.05%, 03/25/48 | 1,140,000 | | 1,072,170 |
| 4.25%, 04/01/50 | 80,000 | | 67,180 |
| Darling Ingredients, Inc. | | | |
| 6.00%, 06/15/30 144A Δ | 325,000 | | 325,431 |
| Deere & Co. | | | |
| 3.10%, 04/15/30 | 50,000 | | 46,469 |
| 3.75%, 04/15/50Δ | 480,000 | | 421,951 |
| Dell International LLC | | | |
| 5.85%, 07/15/25 | 18,000 | | 18,177 |
| 5.30%, 10/01/29 | 125,000 | | 128,931 |
| 8.10%, 07/15/36Δ | 10,000 | | 12,340 |
| 8.35%, 07/15/46 | 34,000 | | 44,894 |
| Delta Air Lines, Inc. | | | |
| 4.50%, 10/20/25 144A | 386,918 | | 381,272 |
| 4.75%, 10/20/28 144A | 860,000 | | 846,538 |
| Devon Energy Corporation | | | |
| 5.85%, 12/15/25 | 210,000 | | 212,473 |
| 5.25%, 10/15/27 | 38,000 | | 38,246 |
| 4.50%, 01/15/30Δ | 32,000 | | 30,791 |
| 5.60%, 07/15/41Δ | 487,000 | | 472,107 |
| 4.75%, 05/15/42Δ | 710,000 | | 623,577 |
| 5.00%, 06/15/45Δ | 750,000 | | 665,866 |
| DH Europe Finance II S.a.r.l. | | | |
| 2.60%, 11/15/29 | 225,000 | | 204,031 |
| Diamondback Energy, Inc. | | | |
| 3.50%, 12/01/29 | 310,000 | | 288,449 |
| 6.25%, 03/15/33 | 15,000 | | 16,054 |
| 4.40%, 03/24/51 | 280,000 | | 233,091 |
| 4.25%, 03/15/52 | 10,000 | | 8,121 |
| Discover Financial Services | | | |
| 3.75%, 03/04/25 | 450,000 | | 440,067 |
| 6.70%, 11/29/32Δ | 25,000 | | 26,246 |
| Discovery Communications LLC | | | |
| 3.63%, 05/15/30Δ | 1,800,000 | | 1,634,725 |
| 5.20%, 09/20/47 | 46,000 | | 39,823 |
| DISH DBS Corporation | | | |
| 5.88%, 11/15/24Δ | 170,000 | | 159,553 |
| 7.75%, 07/01/26 | 150,000 | | 104,631 |
| | | Par | | Value |
| 5.25%, 12/01/26 144A | $ 120,000 | | $ 103,035 |
| 5.75%, 12/01/28 144A | 20,000 | | 15,990 |
| 5.13%, 06/01/29 | 140,000 | | 72,299 |
| Dollar Tree, Inc. | | | |
| 4.00%, 05/15/25Δ | 325,000 | | 319,379 |
| Dominion Energy, Inc. | | | |
| 3.07%, 08/15/24 STEP | 675,000 | | 664,082 |
| 3.38%, 04/01/30 | 225,000 | | 207,578 |
| 2.25%, 08/15/31 | 2,300,000 | | 1,909,103 |
| Dow Chemical Co. (The) | | | |
| 6.30%, 03/15/33 | 30,000 | | 33,135 |
| 6.90%, 05/15/53 | 5,000 | | 6,044 |
| Duke Energy Corporation | | | |
| 3.75%, 04/15/24 | 10,000 | | 9,947 |
| 2.45%, 06/01/30Δ | 1,800,000 | | 1,572,770 |
| Duke Energy Florida LLC | | | |
| 2.50%, 12/01/29 | 1,600,000 | | 1,429,786 |
| 5.88%, 11/15/33 | 2,000,000 | | 2,161,747 |
| Duke Energy Ohio, Inc. | | | |
| 3.65%, 02/01/29 | 380,000 | | 366,608 |
| Duke Energy Progress LLC | | | |
| 3.40%, 04/01/32 | 2,300,000 | | 2,084,966 |
| DuPont de Nemours, Inc. | | | |
| 4.49%, 11/15/25 | 350,000 | | 347,709 |
| 4.73%, 11/15/28Δ | 350,000 | | 355,813 |
| East Ohio Gas Co. (The) | | | |
| 2.00%, 06/15/30 144A | 125,000 | | 104,131 |
| Eaton Corporation | | | |
| 4.15%, 11/02/42 | 200,000 | | 184,296 |
| eBay, Inc. | | | |
| 2.70%, 03/11/30Δ | 10,000 | | 8,912 |
| Ecolab, Inc. | | | |
| 2.75%, 08/18/55 | 68,000 | | 46,074 |
| Elevance Health, Inc. | | | |
| 3.35%, 12/01/24 | 10,000 | | 9,815 |
| 3.65%, 12/01/27 | 190,000 | | 184,161 |
| 4.10%, 05/15/32 | 640,000 | | 612,644 |
| 4.55%, 05/15/52 | 30,000 | | 27,524 |
| 6.10%, 10/15/52 | 25,000 | | 28,383 |
| Emera U.S. Finance LP | | | |
| 4.75%, 06/15/46 | 20,000 | | 16,567 |
| Enbridge Energy Partners LP | | | |
| 7.50%, 04/15/38 | 15,000 | | 17,534 |
| Enel Finance America LLC | | | |
| 2.88%, 07/12/41 144A | 2,300,000 | | 1,572,811 |
| Energy Transfer LP | | | |
| (Variable, ICE LIBOR USD 3M + 4.03%), 9.67%, 01/18/24† ρ Δ | 60,000 | | 57,694 |
| 4.25%, 04/01/24 | 100,000 | | 99,635 |
| 4.50%, 04/15/24 | 230,000 | | 229,182 |
| 5.95%, 12/01/25 | 300,000 | | 303,395 |
| (Variable, U.S. Treasury Yield Curve Rate CMT 5Y + 5.69%), 6.50%, 11/15/26ρ ^ | 60,000 | | 57,167 |
| 4.40%, 03/15/27 | 20,000 | | 19,580 |
| 5.63%, 05/01/27 144A Δ | 200,000 | | 199,450 |
| 5.50%, 06/01/27 | 675,000 | | 684,202 |
| 4.95%, 05/15/28 | 900,000 | | 897,266 |
See Notes to Financial Statements.
MEDIUM-DURATION BOND FUND
SCHEDULE OF INVESTMENTS (Continued)
| | | Par | | Value |
| 4.95%, 06/15/28 | $ 110,000 | | $ 109,785 |
| 5.25%, 04/15/29 | 1,830,000 | | 1,847,157 |
| 3.75%, 05/15/30 | 1,290,000 | | 1,200,588 |
| 5.75%, 02/15/33 | 1,300,000 | | 1,342,897 |
| 6.50%, 02/01/42 | 10,000 | | 10,612 |
| 5.30%, 04/01/44 | 20,000 | | 18,503 |
| 6.13%, 12/15/45 | 5,000 | | 5,061 |
| 5.30%, 04/15/47 | 125,000 | | 115,266 |
| 5.40%, 10/01/47 | 50,000 | | 46,878 |
| 6.00%, 06/15/48 | 70,000 | | 70,916 |
| 6.25%, 04/15/49 | 80,000 | | 83,110 |
| 5.00%, 05/15/50 | 120,000 | | 107,704 |
| EnLink Midstream LLC | | | |
| 5.38%, 06/01/29 | 100,000 | | 97,976 |
| Entegris Escrow Corporation | | | |
| 5.95%, 06/15/30 144A Δ | 650,000 | | 646,210 |
| Entergy Louisiana LLC | | | |
| 5.40%, 11/01/24Δ | 1,200,000 | | 1,199,871 |
| 4.75%, 09/15/52 | 25,000 | | 23,111 |
| Enterprise Products Operating LLC | | | |
| 4.15%, 10/16/28 | 480,000 | | 474,937 |
| 3.13%, 07/31/29 | 100,000 | | 93,687 |
| 2.80%, 01/31/30 | 420,000 | | 380,533 |
| 6.65%, 10/15/34 | 160,000 | | 183,739 |
| 7.55%, 04/15/38 | 50,000 | | 61,446 |
| 5.70%, 02/15/42 | 60,000 | | 63,526 |
| 4.85%, 03/15/44 | 780,000 | | 753,409 |
| 4.80%, 02/01/49Δ | 30,000 | | 28,501 |
| 4.20%, 01/31/50 | 680,000 | | 592,901 |
| 3.70%, 01/31/51 | 80,000 | | 63,983 |
| 3.95%, 01/31/60Δ | 20,000 | | 16,313 |
| (Variable, CME Term SOFR 3M + 2.83%), 5.38%, 02/15/78Δ ^ | 330,000 | | 296,584 |
| EOG Resources, Inc. | | | |
| 4.38%, 04/15/30Δ | 90,000 | | 89,826 |
| 3.90%, 04/01/35 | 260,000 | | 240,142 |
| 4.95%, 04/15/50Δ | 370,000 | | 365,472 |
| EPR Properties REIT | | | |
| 4.75%, 12/15/26 | 1,245,000 | | 1,192,505 |
| 3.60%, 11/15/31 | 2,300,000 | | 1,913,020 |
| EQM Midstream Partners LP | | | |
| 4.13%, 12/01/26Δ | 1,800,000 | | 1,740,529 |
| 5.50%, 07/15/28 | 20,000 | | 19,826 |
| EQT Corporation | | | |
| 6.13%, 02/01/25 | 12,000 | | 12,061 |
| 3.13%, 05/15/26 144A | 10,000 | | 9,496 |
| 3.90%, 10/01/27 | 1,550,000 | | 1,485,295 |
| 5.00%, 01/15/29 | 100,000 | | 99,137 |
| 7.00%, 02/01/30 | 45,000 | | 48,349 |
| 3.63%, 05/15/31 144A Δ | 70,000 | | 62,603 |
| Equifax, Inc. | | | |
| 5.10%, 12/15/27Δ | 1,800,000 | | 1,819,333 |
| Equinix, Inc. REIT | | | |
| 2.63%, 11/18/24 | 1,700,000 | | 1,656,492 |
| 1.45%, 05/15/26 | 70,000 | | 64,728 |
| 2.90%, 11/18/26Δ | 5,000 | | 4,757 |
| 1.55%, 03/15/28 | 2,200,000 | | 1,934,087 |
| | | Par | | Value |
| Equitable Holdings, Inc. | | | |
| 4.35%, 04/20/28 | $2,600,000 | | $2,516,650 |
| Exelon Corporation | | | |
| 4.05%, 04/15/30 | 325,000 | | 311,061 |
| 5.63%, 06/15/35 | 285,000 | | 294,528 |
| 4.70%, 04/15/50 | 25,000 | | 22,610 |
| Expedia Group, Inc. | | | |
| 6.25%, 05/01/25 144A | 2,054,000 | | 2,075,252 |
| 4.63%, 08/01/27 | 303,000 | | 301,902 |
| 3.80%, 02/15/28 | 300,000 | | 289,740 |
| 3.25%, 02/15/30Δ | 225,000 | | 206,697 |
| 2.95%, 03/15/31 | 635,000 | | 560,103 |
| Extra Space Storage LP REIT | | | |
| 3.88%, 12/15/27Δ | 900,000 | | 860,691 |
| Exxon Mobil Corporation | | | |
| 3.04%, 03/01/26 | 15,000 | | 14,584 |
| 3.48%, 03/19/30 | 540,000 | | 513,768 |
| 4.11%, 03/01/46 | 230,000 | | 206,118 |
| 4.33%, 03/19/50Δ | 190,000 | | 173,790 |
| 3.45%, 04/15/51 | 20,000 | | 15,784 |
| F&G Global Funding | | | |
| 5.15%, 07/07/25 144A | 1,200,000 | | 1,183,389 |
| Federal Realty OP LP REIT | | | |
| 3.50%, 06/01/30 | 1,900,000 | | 1,732,130 |
| FedEx Corporation | | | |
| 4.55%, 04/01/46 | 5,000 | | 4,502 |
| 4.05%, 02/15/48Δ | 380,000 | | 318,375 |
| Fidelity National Information Services, Inc. | | | |
| 1.15%, 03/01/26 | 2,200,000 | | 2,034,354 |
| Fifth Third Bancorp | | | |
| 2.38%, 01/28/25 | 375,000 | | 362,900 |
| (Variable, U.S. SOFR Index + 2.19%), 6.36%, 10/27/28^ | 20,000 | | 20,774 |
| (Variable, U.S. SOFR Index + 2.13%), 4.77%, 07/28/30Δ ^ | 1,200,000 | | 1,174,496 |
| First American Financial Corporation | | | |
| 4.00%, 05/15/30 | 450,000 | | 405,896 |
| First-Citizens Bank & Trust Co. | | | |
| (Variable, CME Term SOFR 3M + 1.72%), 2.97%, 09/27/25^ | 550,000 | | 537,072 |
| Fiserv, Inc. | | | |
| 3.20%, 07/01/26 | 70,000 | | 67,438 |
| 4.20%, 10/01/28Δ | 375,000 | | 367,175 |
| 2.65%, 06/01/30Δ | 120,000 | | 105,739 |
| 5.60%, 03/02/33 | 52,000 | | 54,331 |
| Florida Power & Light Co. | | | |
| 3.80%, 12/15/42 | 425,000 | | 368,017 |
| Ford Motor Co. | | | |
| 3.25%, 02/12/32Δ | 780,000 | | 649,773 |
| 6.10%, 08/19/32Δ | 380,000 | | 383,957 |
| Ford Motor Credit Co. LLC | | | |
| 6.95%, 03/06/26 | 2,500,000 | | 2,563,234 |
| 4.95%, 05/28/27 | 580,000 | | 566,694 |
| 2.90%, 02/16/28 | 380,000 | | 341,772 |
| 2.90%, 02/10/29 | 200,000 | | 175,489 |
| 5.11%, 05/03/29Δ | 220,000 | | 214,363 |
See Notes to Financial Statements.
| | | Par | | Value |
| 7.35%, 03/06/30 | $ 300,000 | | $ 323,041 |
| 4.00%, 11/13/30 | 1,220,000 | | 1,097,662 |
| Fort Moore Family Communities LLC | | | |
| 6.09%, 01/15/51 144A | 1,150,842 | | 1,097,284 |
| Fortune Brands Innovations, Inc. | | | |
| 4.00%, 03/25/32Δ | 1,250,000 | | 1,168,994 |
| Foundry JV Holdco LLC | | | |
| 5.88%, 01/25/34 144A | 200,000 | | 206,055 |
| Fox Corporation | | | |
| 4.03%, 01/25/24 | 300,000 | | 299,645 |
| 4.71%, 01/25/29 | 250,000 | | 248,894 |
| 3.50%, 04/08/30 | 125,000 | | 115,538 |
| 6.50%, 10/13/33 | 970,000 | | 1,052,356 |
| 5.48%, 01/25/39 | 145,000 | | 141,512 |
| Freeport-McMoRan, Inc. | | | |
| 4.55%, 11/14/24Δ | 10,000 | | 9,900 |
| 5.45%, 03/15/43 | 582,000 | | 567,061 |
| GA Global Funding Trust | | | |
| 2.90%, 01/06/32 144A | 1,450,000 | | 1,189,881 |
| Garden Spinco Corporation | | | |
| 8.63%, 07/20/30 144A | 600,000 | | 642,798 |
| GATX Corporation | | | |
| 6.90%, 05/01/34Δ | 1,550,000 | | 1,710,998 |
| GE HealthCare Technologies, Inc. | | | |
| 6.38%, 11/22/52Δ | 320,000 | | 373,675 |
| General Dynamics Corporation | | | |
| 4.25%, 04/01/40 | 30,000 | | 28,090 |
| 4.25%, 04/01/50Δ | 160,000 | | 149,144 |
| General Electric Co. | | | |
| 4.35%, 05/01/50 | 20,000 | | 18,124 |
| General Motors Co. | | | |
| 4.00%, 04/01/25 | 200,000 | | 196,666 |
| 6.13%, 10/01/25 | 190,000 | | 192,649 |
| 5.60%, 10/15/32Δ | 100,000 | | 102,507 |
| 6.60%, 04/01/36 | 20,000 | | 21,483 |
| 5.15%, 04/01/38 | 170,000 | | 161,528 |
| 5.95%, 04/01/49Δ | 214,000 | | 210,718 |
| General Motors Financial Co., Inc. | | | |
| 4.30%, 07/13/25 | 300,000 | | 295,022 |
| 4.35%, 01/17/27Δ | 380,000 | | 372,881 |
| 4.30%, 04/06/29 | 400,000 | | 385,975 |
| 2.70%, 06/10/31 | 1,511,000 | | 1,269,994 |
| Gilead Sciences, Inc. | | | |
| 3.70%, 04/01/24 | 60,000 | | 59,722 |
| 3.65%, 03/01/26 | 40,000 | | 39,161 |
| 4.00%, 09/01/36 | 45,000 | | 41,538 |
| 4.50%, 02/01/45 | 275,000 | | 255,466 |
| 4.75%, 03/01/46 | 20,000 | | 19,144 |
| Glencore Funding LLC | | | |
| 4.13%, 03/12/24 144A | 925,000 | | 921,739 |
| 4.63%, 04/29/24 144A | 658,000 | | 655,311 |
| 4.00%, 03/27/27 144A Δ | 480,000 | | 466,774 |
| 3.88%, 10/27/27 144A | 210,000 | | 203,113 |
| 2.63%, 09/23/31 144A | 575,000 | | 489,095 |
| Global Payments, Inc. | | | |
| 2.65%, 02/15/25 | 400,000 | | 387,858 |
| 1.20%, 03/01/26 | 55,000 | | 50,570 |
| | | Par | | Value |
| 5.30%, 08/15/29 | $ 550,000 | | $ 554,577 |
| 2.90%, 05/15/30 | 1,600,000 | | 1,410,307 |
| 5.95%, 08/15/52 | 15,000 | | 15,367 |
| Goldman Sachs Capital II | | | |
| (Variable, CME Term SOFR 3M + 1.03%), 6.41%, 02/02/24† ρ | 3,000 | | 2,512 |
| Goldman Sachs Group, Inc. (The) | | | |
| 3.85%, 07/08/24 | 10,000 | | 9,912 |
| 3.50%, 04/01/25 | 20,000 | | 19,565 |
| 4.25%, 10/21/25 | 400,000 | | 392,909 |
| 3.50%, 11/16/26 | 700,000 | | 674,614 |
| (Floating, CME Term SOFR 3M + 2.01%), 7.40%, 10/28/27† | 1,800,000 | | 1,833,865 |
| (Variable, U.S. SOFR + 1.85%), 3.62%, 03/15/28^ | 120,000 | | 115,204 |
| (Variable, CME Term SOFR 3M + 1.42%), 3.81%, 04/23/29^ | 390,000 | | 370,742 |
| (Variable, CME Term SOFR 3M + 1.56%), 4.22%, 05/01/29^ | 1,350,000 | | 1,308,184 |
| (Variable, U.S. SOFR + 1.26%), 2.65%, 10/21/32^ | 2,070,000 | | 1,728,500 |
| 6.25%, 02/01/41 | 410,000 | | 458,396 |
| (Variable, U.S. SOFR + 1.51%), 3.21%, 04/22/42^ | 60,000 | | 46,135 |
| (Variable, U.S. SOFR + 1.47%), 2.91%, 07/21/42^ | 150,000 | | 109,907 |
| 5.15%, 05/22/45 | 20,000 | | 19,421 |
| 4.75%, 10/21/45Δ | 90,000 | | 85,680 |
| Goodman U.S. Finance Five LLC REIT | | | |
| 4.63%, 05/04/32 144A | 2,000,000 | | 1,867,141 |
| Goodman U.S. Finance Three LLC REIT | | | |
| 3.70%, 03/15/28 144A | 1,000,000 | | 932,447 |
| Great-West Lifeco Finance 2018 LP | | | |
| 4.05%, 05/17/28 144A | 89,000 | | 86,734 |
| GTCR W-2 Merger Sub LLC | | | |
| 7.50%, 01/15/31 144A | 500,000 | | 528,686 |
| Guardian Life Global Funding | | | |
| 1.10%, 06/23/25 144A | 100,000 | | 94,439 |
| H&E Equipment Services, Inc. | | | |
| 3.88%, 12/15/28 144A | 375,000 | | 341,070 |
| Halliburton Co. | | | |
| 6.70%, 09/15/38 | 10,000 | | 11,745 |
| 5.00%, 11/15/45Δ | 60,000 | | 58,485 |
| Hasbro, Inc. | | | |
| 3.55%, 11/19/26 | 10,000 | | 9,496 |
| 3.90%, 11/19/29Δ | 10,000 | | 9,322 |
| HCA, Inc. | | | |
| 5.25%, 04/15/25 | 120,000 | | 119,957 |
| 5.25%, 06/15/26 | 10,000 | | 10,043 |
| 5.38%, 09/01/26 | 1,600,000 | | 1,608,929 |
| 3.13%, 03/15/27Δ | 2,100,000 | | 1,992,646 |
| 5.88%, 02/01/29 | 5,000 | | 5,169 |
| 3.50%, 09/01/30 | 400,000 | | 363,044 |
| 3.63%, 03/15/32 | 700,000 | | 627,017 |
| 5.50%, 06/15/47 | 75,000 | | 72,471 |
| 5.25%, 06/15/49 | 10,000 | | 9,343 |
See Notes to Financial Statements.
MEDIUM-DURATION BOND FUND
SCHEDULE OF INVESTMENTS (Continued)
| | | Par | | Value |
| Healthcare Realty Holdings LP REIT | | | |
| 3.10%, 02/15/30 | $1,500,000 | | $1,315,255 |
| 2.05%, 03/15/31 | 175,000 | | 136,009 |
| Hess Corporation | | | |
| 5.80%, 04/01/47Δ | 15,000 | | 16,252 |
| Hewlett Packard Enterprise Co. | | | |
| 6.35%, 10/15/45 | 45,000 | | 48,777 |
| Hillenbrand, Inc. | | | |
| 3.75%, 03/01/31Δ | 350,000 | | 302,540 |
| Home Depot, Inc. (The) | | | |
| 2.50%, 04/15/27 | 90,000 | | 84,886 |
| 3.90%, 12/06/28 | 270,000 | | 266,123 |
| 2.70%, 04/15/30 | 170,000 | | 154,979 |
| 3.25%, 04/15/32Δ | 625,000 | | 578,518 |
| 3.30%, 04/15/40 | 450,000 | | 373,217 |
| 5.95%, 04/01/41 | 10,000 | | 11,227 |
| 4.50%, 12/06/48 | 35,000 | | 33,198 |
| 3.35%, 04/15/50 | 250,000 | | 195,338 |
| Hormel Foods Corporation | | | |
| 1.80%, 06/11/30 | 55,000 | | 46,879 |
| Host Hotels & Resorts LP REIT | | | |
| 3.38%, 12/15/29 | 25,000 | | 22,519 |
| 2.90%, 12/15/31 | 267,000 | | 224,789 |
| HP, Inc. | | | |
| 4.00%, 04/15/29 | 105,000 | | 102,054 |
| Humana, Inc. | | | |
| 4.50%, 04/01/25 | 40,000 | | 39,696 |
| 3.95%, 03/15/27 | 150,000 | | 146,802 |
| 3.70%, 03/23/29 | 35,000 | | 33,678 |
| 2.15%, 02/03/32 | 90,000 | | 74,219 |
| 4.63%, 12/01/42 | 60,000 | | 55,093 |
| 4.95%, 10/01/44 | 70,000 | | 66,596 |
| 4.80%, 03/15/47 | 10,000 | | 9,372 |
| 5.50%, 03/15/53Δ | 191,000 | | 198,719 |
| Huntington Bancshares, Inc. | | | |
| 4.00%, 05/15/25Δ | 550,000 | | 539,972 |
| Huntsman International LLC | | | |
| 4.50%, 05/01/29 | 325,000 | | 313,556 |
| 2.95%, 06/15/31 | 250,000 | | 211,869 |
| Hyatt Hotels Corporation | | | |
| 1.80%, 10/01/24 | 2,875,000 | | 2,790,597 |
| 5.38%, 04/23/25 | 1,250,000 | | 1,252,615 |
| Hyundai Capital America | | | |
| 1.00%, 09/17/24 144A | 1,150,000 | | 1,113,570 |
| 1.65%, 09/17/26 144A | 2,300,000 | | 2,092,253 |
| 5.70%, 06/26/30 144A Δ | 525,000 | | 538,641 |
| Intel Corporation | | | |
| 1.60%, 08/12/28 | 460,000 | | 407,628 |
| 5.13%, 02/10/30Δ | 220,000 | | 228,585 |
| 5.20%, 02/10/33Δ | 825,000 | | 863,161 |
| 4.60%, 03/25/40 | 10,000 | | 9,768 |
| 3.73%, 12/08/47 | 76,000 | | 62,020 |
| 3.25%, 11/15/49 | 5,000 | | 3,737 |
| 4.75%, 03/25/50Δ | 10,000 | | 9,493 |
| 3.05%, 08/12/51Δ | 120,000 | | 85,023 |
| Intercontinental Exchange, Inc. | | | |
| 4.60%, 03/15/33Δ | 20,000 | | 19,951 |
| | | Par | | Value |
| 3.00%, 06/15/50 | $1,500,000 | | $1,080,824 |
| International Flavors & Fragrances, Inc. | | | |
| 1.23%, 10/01/25 144A | 280,000 | | 259,411 |
| 1.83%, 10/15/27 144A | 650,000 | | 570,685 |
| 4.38%, 06/01/47 | 1,000,000 | | 773,038 |
| Invitation Homes Operating Partnership LP REIT | | | |
| 2.30%, 11/15/28 | 375,000 | | 333,094 |
| IPALCO Enterprises, Inc. | | | |
| 4.25%, 05/01/30 | 2,450,000 | | 2,270,526 |
| ITC Holdings Corporation | | | |
| 2.95%, 05/14/30 144A | 1,900,000 | | 1,674,436 |
| J M Smucker Co. (The) | | | |
| 6.20%, 11/15/33 | 2,135,000 | | 2,334,651 |
| 4.25%, 03/15/35 | 5,000 | | 4,661 |
| Jackson Financial, Inc. | | | |
| 3.13%, 11/23/31 | 599,800 | | 505,336 |
| JBS U.S.A. LUX SA | | | |
| 5.13%, 02/01/28 | 1,200,000 | | 1,193,988 |
| Jefferies Finance LLC | | | |
| 5.00%, 08/15/28 144A | 650,000 | | 583,142 |
| Jefferies Financial Group, Inc. | | | |
| 2.63%, 10/15/31 | 35,000 | | 29,066 |
| JPMorgan Chase & Co. | | | |
| (Variable, U.S. SOFR + 1.16%), 2.30%, 10/15/25^ | 650,000 | | 633,563 |
| (Variable, U.S. SOFR + 1.85%), 2.08%, 04/22/26^ | 210,000 | | 201,251 |
| 2.95%, 10/01/26 | 700,000 | | 667,381 |
| (Variable, CME Term SOFR 3M + 1.51%), 3.96%, 01/29/27^ | 875,000 | | 855,424 |
| 4.25%, 10/01/27 | 320,000 | | 316,970 |
| 3.63%, 12/01/27 | 900,000 | | 865,329 |
| (Variable, CME Term SOFR 3M + 1.60%), 3.78%, 02/01/28^ | 1,134,000 | | 1,096,815 |
| (Variable, U.S. SOFR + 1.17%), 2.95%, 02/24/28^ | 65,000 | | 61,221 |
| (Variable, U.S. SOFR + 1.89%), 2.18%, 06/01/28^ | 70,000 | | 64,097 |
| (Variable, CME Term SOFR 3M + 1.21%), 3.51%, 01/23/29^ | 1,720,000 | | 1,632,648 |
| (Variable, CME Term SOFR 3M + 1.52%), 4.20%, 07/23/29^ | 380,000 | | 369,868 |
| (Variable, U.S. SOFR + 1.45%), 5.30%, 07/24/29Δ ^ | 2,000,000 | | 2,032,463 |
| (Variable, U.S. SOFR + 1.75%), 4.57%, 06/14/30^ | 1,200,000 | | 1,176,369 |
| (Variable, CME Term SOFR 3M + 3.79%), 4.49%, 03/24/31^ | 75,000 | | 73,294 |
| (Variable, U.S. SOFR + 2.04%), 2.52%, 04/22/31^ | 550,000 | | 476,556 |
| (Variable, CME Term SOFR 3M + 2.52%), 2.96%, 05/13/31^ | 200,000 | | 176,123 |
| (Variable, CME Term SOFR 3M + 1.25%), 2.58%, 04/22/32^ | 750,000 | | 635,932 |
| (Variable, U.S. SOFR + 1.18%), 2.55%, 11/08/32^ | 590,000 | | 493,619 |
| (Variable, U.S. SOFR + 2.58%), 5.72%, 09/14/33Δ ^ | 600,000 | | 621,673 |
See Notes to Financial Statements.
| | | Par | | Value |
| 4.95%, 06/01/45 | $ 140,000 | | $ 134,379 |
| (Variable, U.S. SOFR + 1.58%), 3.33%, 04/22/52^ | 45,000 | | 33,826 |
| Kennedy-Wilson, Inc. | | | |
| 4.75%, 03/01/29 | 100,000 | | 83,600 |
| Kilroy Realty LP REIT | | | |
| 4.75%, 12/15/28Δ | 1,678,000 | | 1,596,364 |
| Kimberly-Clark Corporation | | | |
| 3.20%, 04/25/29 | 10,000 | | 9,484 |
| 2.88%, 02/07/50Δ | 5,000 | | 3,621 |
| Kinder Morgan Energy Partners LP | | | |
| 4.25%, 09/01/24 | 100,000 | | 99,110 |
| 5.80%, 03/15/35 | 150,000 | | 153,556 |
| Kinder Morgan, Inc. | | | |
| 4.30%, 03/01/28 | 50,000 | | 49,396 |
| 5.20%, 06/01/33Δ | 250,000 | | 249,097 |
| 5.45%, 08/01/52 | 28,000 | | 26,938 |
| Kinetik Holdings LP | | | |
| 6.63%, 12/15/28 144A | 1,650,000 | | 1,682,295 |
| KKR Group Finance Co. II LLC | | | |
| 5.50%, 02/01/43 144A | 30,000 | | 28,881 |
| Kraft Heinz Foods Co. | | | |
| 6.88%, 01/26/39 | 30,000 | | 34,718 |
| Kroger Co. (The) | | | |
| 3.50%, 02/01/26Δ | 10,000 | | 9,749 |
| Kyndryl Holdings, Inc. | | | |
| 4.10%, 10/15/41 | 10,000 | | 7,550 |
| L3Harris Technologies, Inc. | | | |
| 5.05%, 04/27/45 | 160,000 | | 158,614 |
| Laboratory Corporation of America Holdings | | | |
| 1.55%, 06/01/26Δ | 20,000 | | 18,493 |
| LBJ Infrastructure Group LLC | | | |
| 3.80%, 12/31/57 144A | 1,000,000 | | 689,979 |
| Leidos, Inc. | | | |
| 5.75%, 03/15/33 | 400,000 | | 418,280 |
| Lincoln National Corporation | | | |
| (Variable, U.S. Treasury Yield Curve Rate CMT 5Y + 5.32%), 9.25%, 12/01/27ρ ^ | 11,000 | | 12,040 |
| LKQ Corporation | | | |
| 6.25%, 06/15/33 | 250,000 | | 261,133 |
| Lockheed Martin Corporation | | | |
| 3.90%, 06/15/32Δ | 160,000 | | 154,609 |
| 5.25%, 01/15/33Δ | 675,000 | | 717,633 |
| 4.50%, 05/15/36 | 50,000 | | 49,646 |
| 4.15%, 06/15/53 | 510,000 | | 458,697 |
| Louisville Gas and Electric Co. | | | |
| 4.25%, 04/01/49 | 25,000 | | 21,360 |
| Lowe's Cos., Inc. | | | |
| 1.70%, 09/15/28 | 900,000 | | 796,212 |
| 4.50%, 04/15/30 | 110,000 | | 109,604 |
| 1.70%, 10/15/30Δ | 675,000 | | 561,927 |
| 3.00%, 10/15/50 | 150,000 | | 102,560 |
| 4.25%, 04/01/52 | 475,000 | | 404,134 |
| M&T Bank Corporation | | | |
| (Variable, U.S. SOFR + 1.85%), 5.05%, 01/27/34^ | 710,000 | | 674,269 |
| | | Par | | Value |
| Maple Grove Funding Trust I | | | |
| 4.16%, 08/15/51 144A | $ 495,000 | | $ 350,155 |
| Marathon Petroleum Corporation | | | |
| 3.80%, 04/01/28 | 125,000 | | 119,625 |
| 6.50%, 03/01/41 | 5,000 | | 5,394 |
| Markel Group, Inc. | | | |
| (Variable, U.S. Treasury Yield Curve Rate CMT 5Y + 5.66%), 6.00%, 06/01/25ρ ^ | 500,000 | | 495,224 |
| Marriott International, Inc. | | | |
| 4.00%, 04/15/28 | 40,000 | | 38,788 |
| 4.90%, 04/15/29 | 325,000 | | 327,639 |
| 4.63%, 06/15/30Δ | 600,000 | | 589,979 |
| Mars, Inc. | | | |
| 2.70%, 04/01/25 144A | 200,000 | | 194,802 |
| 3.20%, 04/01/30 144A | 475,000 | | 439,561 |
| 2.38%, 07/16/40 144A | 150,000 | | 108,062 |
| Marsh & McLennan Cos., Inc. | | | |
| 3.75%, 03/14/26 | 350,000 | | 343,828 |
| 4.38%, 03/15/29 | 500,000 | | 498,691 |
| Martin Marietta Materials, Inc. | | | |
| 3.20%, 07/15/51 | 325,000 | | 243,420 |
| Masco Corporation | | | |
| 1.50%, 02/15/28 | 2,200,000 | | 1,928,414 |
| Mastercard, Inc. | | | |
| 3.30%, 03/26/27 | 40,000 | | 38,844 |
| 3.85%, 03/26/50 | 310,000 | | 272,032 |
| McDonald’s Corporation | | | |
| 1.45%, 09/01/25Δ | 40,000 | | 37,882 |
| 3.70%, 01/30/26 | 130,000 | | 127,862 |
| 3.50%, 03/01/27Δ | 600,000 | | 584,774 |
| 3.50%, 07/01/27Δ | 330,000 | | 320,979 |
| 3.80%, 04/01/28 | 90,000 | | 87,914 |
| 3.60%, 07/01/30Δ | 160,000 | | 152,078 |
| 6.30%, 03/01/38 | 35,000 | | 39,987 |
| 3.63%, 09/01/49 | 130,000 | | 104,770 |
| 4.20%, 04/01/50 | 480,000 | | 425,367 |
| Medtronic, Inc. | | | |
| 4.63%, 03/15/45 | 36,000 | | 35,148 |
| Meta Platforms, Inc. | | | |
| 3.85%, 08/15/32 | 3,000 | | 2,859 |
| 5.75%, 05/15/63 | 790,000 | | 869,344 |
| MetLife Capital Trust IV | | | |
| 7.88%, 12/15/37 144A Δ | 300,000 | | 322,973 |
| MetLife, Inc. | | | |
| (Variable, U.S. Treasury Yield Curve Rate CMT 5Y + 3.58%), 3.85%, 09/15/25ρ ^ | 1,000,000 | | 949,120 |
| 6.40%, 12/15/36 | 50,000 | | 51,707 |
| 4.60%, 05/13/46 | 5,000 | | 4,767 |
| 5.00%, 07/15/52Δ | 15,000 | | 14,973 |
| Metropolitan Life Global Funding I | | | |
| 3.45%, 12/18/26 144A Δ | 2,000,000 | | 1,928,509 |
| Micron Technology, Inc. | | | |
| 4.19%, 02/15/27 | 5,000 | | 4,910 |
| 6.75%, 11/01/29 | 35,000 | | 37,891 |
| 5.88%, 02/09/33 | 130,000 | | 135,448 |
See Notes to Financial Statements.
MEDIUM-DURATION BOND FUND
SCHEDULE OF INVESTMENTS (Continued)
| | | Par | | Value |
| Microsoft Corporation | | | |
| 2.88%, 02/06/24 | $ 80,000 | | $ 79,807 |
| 3.45%, 08/08/36 | 515,000 | | 475,451 |
| 2.53%, 06/01/50 | 18,000 | | 12,367 |
| 3.04%, 03/17/62 | 108,000 | | 78,456 |
| MidAmerican Energy Co. | | | |
| 3.65%, 04/15/29 | 350,000 | | 335,115 |
| Mileage Plus Holdings LLC | | | |
| 6.50%, 06/20/27 144A | 21,000 | | 21,076 |
| Mondelez International, Inc. | | | |
| 1.50%, 05/04/25 | 370,000 | | 353,100 |
| Morgan Stanley | | | |
| (Variable, U.S. SOFR + 1.15%), 2.72%, 07/22/25^ | 725,000 | | 713,174 |
| (Variable, U.S. SOFR + 1.99%), 2.19%, 04/28/26^ | 560,000 | | 538,285 |
| (Variable, U.S. SOFR + 0.72%), 0.99%, 12/10/26^ | 40,000 | | 36,835 |
| 3.63%, 01/20/27 | 800,000 | | 776,539 |
| (Variable, U.S. SOFR + 1.30%), 5.05%, 01/28/27Δ ^ | 826,000 | | 827,317 |
| 3.95%, 04/23/27 | 398,000 | | 386,799 |
| (Variable, U.S. SOFR + 0.88%), 1.59%, 05/04/27^ | 65,000 | | 59,941 |
| (Variable, U.S. SOFR + 0.86%), 1.51%, 07/20/27^ | 70,000 | | 63,995 |
| (Variable, U.S. SOFR + 1.00%), 2.48%, 01/21/28^ | 30,000 | | 27,884 |
| (Variable, CME Term SOFR 3M + 1.40%), 3.77%, 01/24/29^ | 220,000 | | 210,096 |
| (Variable, U.S. SOFR + 1.59%), 5.16%, 04/20/29^ | 2,130,000 | | 2,145,222 |
| (Variable, CME Term SOFR 3M + 1.89%), 4.43%, 01/23/30^ | 385,000 | | 375,664 |
| (Variable, U.S. SOFR + 1.14%), 2.70%, 01/22/31^ | 1,795,000 | | 1,571,676 |
| (Variable, U.S. SOFR + 3.12%), 3.62%, 04/01/31^ | 1,000,000 | | 922,288 |
| (Variable, U.S. SOFR + 1.03%), 1.79%, 02/13/32^ | 725,000 | | 580,192 |
| (Variable, U.S. SOFR + 1.20%), 2.51%, 10/20/32^ | 340,000 | | 282,316 |
| (Variable, U.S. SOFR + 2.08%), 4.89%, 07/20/33^ | 1,200,000 | | 1,172,838 |
| (Variable, U.S. SOFR + 1.36%), 2.48%, 09/16/36^ | 1,120,000 | | 890,400 |
| Mosaic Co. (The) | | | |
| 5.45%, 11/15/33Δ | 30,000 | | 30,717 |
| Motorola Solutions, Inc. | | | |
| 2.30%, 11/15/30 | 20,000 | | 16,925 |
| 2.75%, 05/24/31 | 10,000 | | 8,567 |
| MPLX LP | | | |
| 4.88%, 12/01/24 | 10,000 | | 9,948 |
| 4.88%, 06/01/25 | 100,000 | | 99,466 |
| 4.00%, 03/15/28 | 50,000 | | 48,297 |
| 4.80%, 02/15/29 | 745,000 | | 741,077 |
| 4.50%, 04/15/38 | 570,000 | | 509,616 |
| 4.70%, 04/15/48 | 40,000 | | 34,651 |
| 5.50%, 02/15/49 | 400,000 | | 389,030 |
| MPT Operating Partnership LP REIT | | | |
| 4.63%, 08/01/29Δ | 435,000 | | 313,188 |
| | | Par | | Value |
| MSCI, Inc. | | | |
| 3.88%, 02/15/31 144A | $1,380,000 | | $1,262,348 |
| 3.63%, 11/01/31 144A | 250,000 | | 220,323 |
| Nature Conservancy (The) | | | |
| 0.94%, 07/01/26 | 25,000 | | 22,586 |
| 1.30%, 07/01/28 | 25,000 | | 21,328 |
| Netflix, Inc. | | | |
| 6.38%, 05/15/29 | 895,000 | | 973,956 |
| New York Life Global Funding | | | |
| 0.95%, 06/24/25 144A | 20,000 | | 18,897 |
| NextEra Energy Capital Holdings, Inc. | | | |
| 1.90%, 06/15/28 | 965,000 | | 857,493 |
| 2.25%, 06/01/30 | 1,900,000 | | 1,627,310 |
| NFP Corporation | | | |
| 7.50%, 10/01/30 144A | 600,000 | | 638,600 |
| Niagara Mohawk Power Corporation | | | |
| 4.28%, 12/15/28 144A | 2,000,000 | | 1,921,910 |
| NIKE, Inc. | | | |
| 2.75%, 03/27/27 | 20,000 | | 19,069 |
| 3.25%, 03/27/40 | 110,000 | | 92,744 |
| 3.38%, 03/27/50 | 270,000 | | 221,826 |
| NiSource, Inc. | | | |
| 3.60%, 05/01/30 | 100,000 | | 93,221 |
| 3.95%, 03/30/48 | 450,000 | | 366,320 |
| Nissan Motor Acceptance Co. LLC | | | |
| 2.75%, 03/09/28 144A | 2,200,000 | | 1,944,558 |
| NNN REIT, Inc. REIT | | | |
| 3.90%, 06/15/24 | 255,000 | | 252,459 |
| 3.60%, 12/15/26 | 250,000 | | 239,531 |
| Northern Trust Corporation | | | |
| 1.95%, 05/01/30Δ | 60,000 | | 51,655 |
| Northrop Grumman Corporation | | | |
| 3.25%, 01/15/28 | 840,000 | | 803,573 |
| 5.25%, 05/01/50 | 340,000 | | 351,899 |
| Northwestern Mutual Life Insurance Co. (The) | | | |
| 6.06%, 03/30/40 144A | 300,000 | | 321,116 |
| 3.85%, 09/30/47 144A | 250,000 | | 201,521 |
| NOV, Inc. | | | |
| 3.95%, 12/01/42 | 15,000 | | 11,639 |
| NRG Energy, Inc. | | | |
| 3.75%, 06/15/24 144A | 625,000 | | 617,946 |
| 3.63%, 02/15/31 144A | 850,000 | | 731,377 |
| NuStar Logistics LP | | | |
| 5.75%, 10/01/25 | 235,000 | | 233,449 |
| 6.38%, 10/01/30Δ | 700,000 | | 702,233 |
| NVIDIA Corporation | | | |
| 3.70%, 04/01/60 | 20,000 | | 16,842 |
| Occidental Petroleum Corporation | | | |
| 6.95%, 07/01/24 | 136,000 | | 136,655 |
| 5.55%, 03/15/26Δ | 360,000 | | 362,828 |
| 3.20%, 08/15/26 | 260,000 | | 245,940 |
| 6.63%, 09/01/30 | 190,000 | | 202,299 |
| 7.88%, 09/15/31 | 675,000 | | 768,727 |
| 6.45%, 09/15/36 | 205,000 | | 217,730 |
| 4.63%, 06/15/45 | 270,000 | | 213,847 |
| 6.60%, 03/15/46 | 220,000 | | 238,499 |
See Notes to Financial Statements.
| | | Par | | Value |
| 4.40%, 04/15/46Δ | $ 650,000 | | $ 529,987 |
| 4.20%, 03/15/48Δ | 80,000 | | 63,035 |
| Omega Healthcare Investors, Inc. REIT | | | |
| 3.63%, 10/01/29 | 1,630,000 | | 1,440,445 |
| ONEOK, Inc. | | | |
| 5.55%, 11/01/26 | 130,000 | | 132,347 |
| 5.80%, 11/01/30 | 210,000 | | 218,768 |
| 6.35%, 01/15/31 | 1,600,000 | | 1,711,254 |
| 6.05%, 09/01/33 | 320,000 | | 339,284 |
| 5.20%, 07/15/48 | 20,000 | | 18,875 |
| 6.63%, 09/01/53 | 530,000 | | 596,039 |
| Oracle Corporation | | | |
| 1.65%, 03/25/26Δ | 65,000 | | 60,678 |
| 2.95%, 04/01/30 | 121,000 | | 109,348 |
| 4.65%, 05/06/30 | 805,000 | | 803,485 |
| 2.88%, 03/25/31 | 1,595,000 | | 1,415,604 |
| 6.25%, 11/09/32Δ | 1,125,000 | | 1,226,172 |
| 4.90%, 02/06/33Δ | 946,000 | | 943,761 |
| 6.13%, 07/08/39 | 15,000 | | 16,018 |
| 3.60%, 04/01/40 | 405,000 | | 324,538 |
| 4.00%, 07/15/46 | 290,000 | | 233,814 |
| 6.90%, 11/09/52 | 780,000 | | 916,741 |
| Otis Worldwide Corporation | | | |
| 2.06%, 04/05/25 | 130,000 | | 125,085 |
| 2.57%, 02/15/30 | 25,000 | | 22,309 |
| Outfront Media Capital LLC | | | |
| 7.38%, 02/15/31 144A | 800,000 | | 841,741 |
| Pacific Gas and Electric Co. | | | |
| 3.40%, 08/15/24 | 600,000 | | 590,197 |
| 3.15%, 01/01/26 | 1,300,000 | | 1,247,590 |
| 2.95%, 03/01/26 | 800,000 | | 758,543 |
| 2.10%, 08/01/27 | 370,000 | | 333,994 |
| 4.55%, 07/01/30 | 1,800,000 | | 1,715,766 |
| 2.50%, 02/01/31 | 470,000 | | 388,943 |
| 6.40%, 06/15/33 | 2,000,000 | | 2,110,315 |
| 3.30%, 08/01/40 | 165,000 | | 121,443 |
| 4.95%, 07/01/50 | 35,000 | | 30,075 |
| 3.50%, 08/01/50 | 80,000 | | 55,597 |
| PacifiCorp | | | |
| 4.15%, 02/15/50 | 45,000 | | 36,627 |
| Paramount Global | | | |
| 5.90%, 10/15/40 | 187,000 | | 170,060 |
| 4.85%, 07/01/42 | 79,000 | | 63,626 |
| 5.25%, 04/01/44 | 101,000 | | 81,327 |
| 4.90%, 08/15/44 | 291,000 | | 230,137 |
| 4.60%, 01/15/45 | 43,000 | | 32,860 |
| Parsley Energy LLC | | | |
| 4.13%, 02/15/28 144A | 30,000 | | 28,975 |
| PayPal Holdings, Inc. | | | |
| 2.65%, 10/01/26 | 50,000 | | 47,540 |
| 2.85%, 10/01/29 | 50,000 | | 45,825 |
| 2.30%, 06/01/30Δ | 300,000 | | 262,799 |
| PepsiCo, Inc. | | | |
| 2.63%, 03/19/27 | 30,000 | | 28,476 |
| 2.88%, 10/15/49 | 100,000 | | 73,789 |
| Permian Resources Operating LLC | | | |
| 7.00%, 01/15/32 144A | 830,000 | | 856,115 |
| | | Par | | Value |
| Phillips 66 | | | |
| 3.85%, 04/09/25 | $ 100,000 | | $ 98,480 |
| Physicians Realty LP REIT | | | |
| 3.95%, 01/15/28 | 2,400,000 | | 2,290,657 |
| Pioneer Natural Resources Co. | | | |
| 1.13%, 01/15/26 | 70,000 | | 65,037 |
| 2.15%, 01/15/31Δ | 290,000 | | 246,918 |
| PNC Financial Services Group, Inc. (The) | | | |
| (Variable, U.S. SOFR + 1.32%), 5.81%, 06/12/26^ | 20,000 | | 20,136 |
| (Variable, U.S. Treasury Yield Curve Rate CMT 5Y + 2.60%), 3.40%, 09/15/26ρ ^ | 1,000,000 | | 803,281 |
| (Variable, U.S. SOFR + 1.84%), 5.58%, 06/12/29^ | 490,000 | | 500,601 |
| (Variable, U.S. SOFR + 2.28%), 6.88%, 10/20/34^ | 800,000 | | 890,117 |
| Post Holdings, Inc. | | | |
| 5.50%, 12/15/29 144A | 960,000 | | 926,149 |
| Principal Life Global Funding II | | | |
| 1.25%, 06/23/25 144A | 90,000 | | 85,234 |
| Procter & Gamble Co. (The) | | | |
| 2.80%, 03/25/27 | 65,000 | | 62,319 |
| Progress Energy, Inc. | | | |
| 7.75%, 03/01/31 | 350,000 | | 404,760 |
| Progressive Corporation (The) | | | |
| 3.20%, 03/26/30 | 5,000 | | 4,638 |
| Prologis LP REIT | | | |
| 4.63%, 01/15/33 | 650,000 | | 654,611 |
| Prudential Financial, Inc. | | | |
| (Variable, U.S. Treasury Yield Curve Rate CMT 5Y + 3.23%), 6.00%, 09/01/52Δ ^ | 600,000 | | 598,611 |
| (Variable, U.S. Treasury Yield Curve Rate CMT 5Y + 2.85%), 6.75%, 03/01/53Δ ^ | 400,000 | | 417,764 |
| Public Service Co. of Colorado | | | |
| 4.50%, 06/01/52 | 35,000 | | 30,840 |
| Public Service Enterprise Group, Inc. | | | |
| 6.13%, 10/15/33 | 950,000 | | 1,024,009 |
| Public Storage Operating Co. REIT | | | |
| 0.88%, 02/15/26 | 65,000 | | 60,184 |
| 1.85%, 05/01/28 | 10,000 | | 8,999 |
| 0.50%, 09/09/30(E) | 2,000,000 | | 1,831,625 |
| PulteGroup, Inc. | | | |
| 5.50%, 03/01/26 | 60,000 | | 60,615 |
| Qorvo, Inc. | | | |
| 4.38%, 10/15/29 | 45,000 | | 42,744 |
| QUALCOMM, Inc. | | | |
| 4.65%, 05/20/35Δ | 55,000 | | 56,455 |
| Quest Diagnostics, Inc. | | | |
| 2.95%, 06/30/30 | 10,000 | | 8,969 |
| Range Resources Corporation | | | |
| 4.88%, 05/15/25 | 10,000 | | 9,883 |
| Realty Income Corporation REIT | | | |
| 4.13%, 10/15/26 | 65,000 | | 63,848 |
| 3.95%, 08/15/27 | 150,000 | | 146,060 |
| 3.25%, 01/15/31Δ | 1,800,000 | | 1,638,702 |
See Notes to Financial Statements.
MEDIUM-DURATION BOND FUND
SCHEDULE OF INVESTMENTS (Continued)
| | | Par | | Value |
| Regency Centers LP REIT | | | |
| 2.95%, 09/15/29 | $ 775,000 | | $ 696,496 |
| Regeneron Pharmaceuticals, Inc. | | | |
| 1.75%, 09/15/30 | 1,500,000 | | 1,235,971 |
| Reinsurance Group of America, Inc. | | | |
| 3.90%, 05/15/29 | 25,000 | | 23,832 |
| Republic Services, Inc. | | | |
| 4.88%, 04/01/29 | 350,000 | | 357,091 |
| Retail Opportunity Investments Partnership LP REIT | | | |
| 6.75%, 10/15/28Δ | 875,000 | | 921,004 |
| Revvity, Inc. | | | |
| 3.30%, 09/15/29 | 15,000 | | 13,635 |
| Roche Holdings, Inc. | | | |
| 2.61%, 12/13/51 144A | 550,000 | | 372,769 |
| Rocket Mortgage LLC | | | |
| 4.00%, 10/15/33 144A | 850,000 | | 723,646 |
| Roper Technologies, Inc. | | | |
| 4.20%, 09/15/28 | 500,000 | | 492,235 |
| RTX Corporation | | | |
| 3.15%, 12/15/24 | 120,000 | | 117,629 |
| 3.95%, 08/16/25 | 380,000 | | 374,687 |
| 3.50%, 03/15/27Δ | 585,000 | | 564,339 |
| 4.13%, 11/16/28 | 795,000 | | 777,748 |
| 2.25%, 07/01/30 | 270,000 | | 233,651 |
| 6.00%, 03/15/31 | 230,000 | | 245,428 |
| 6.10%, 03/15/34 | 1,700,000 | | 1,849,411 |
| 4.50%, 06/01/42 | 510,000 | | 465,255 |
| 3.03%, 03/15/52 | 90,000 | | 62,438 |
| Rush Obligated Group | | | |
| 3.92%, 11/15/29 | 400,000 | | 380,729 |
| Sabine Pass Liquefaction LLC | | | |
| 5.63%, 03/01/25 | 450,000 | | 451,208 |
| 5.00%, 03/15/27 | 425,000 | | 427,190 |
| 4.20%, 03/15/28Δ | 300,000 | | 294,196 |
| Sabra Health Care LP REIT | | | |
| 3.90%, 10/15/29 | 1,500,000 | | 1,352,789 |
| Safehold GL Holdings LLC REIT | | | |
| 2.85%, 01/15/32 | 750,000 | | 610,907 |
| Santander Holdings U.S.A., Inc. | | | |
| 4.50%, 07/17/25 | 60,000 | | 59,389 |
| 3.24%, 10/05/26 | 1,100,000 | | 1,037,031 |
| (Variable, U.S. SOFR + 1.25%), 2.49%, 01/06/28^ | 45,000 | | 41,289 |
| SBA Tower Trust REIT | | | |
| 2.84%, 01/15/25 144A | 2,200,000 | | 2,125,323 |
| 2.33%, 01/15/28 144A | 2,300,000 | | 2,035,273 |
| Schlumberger Holdings Corporation | | | |
| 3.90%, 05/17/28 144A | 252,000 | | 245,117 |
| Sempra | | | |
| 3.40%, 02/01/28 | 275,000 | | 262,576 |
| ServiceNow, Inc. | | | |
| 1.40%, 09/01/30Δ | 675,000 | | 556,359 |
| Sherwin-Williams Co. (The) | | | |
| 3.13%, 06/01/24 | 700,000 | | 692,730 |
| 2.95%, 08/15/29Δ | 475,000 | | 437,944 |
| Skyworks Solutions, Inc. | | | |
| 1.80%, 06/01/26 | 2,200,000 | | 2,042,358 |
| | | Par | | Value |
| Smithfield Foods, Inc. | | | |
| 5.20%, 04/01/29 144A | $ 650,000 | | $ 623,681 |
| Sodexo, Inc. | | | |
| 2.72%, 04/16/31 144A | 2,000,000 | | 1,703,398 |
| Sotheby's | | | |
| 5.88%, 06/01/29 144A | 325,000 | | 284,193 |
| Southern California Edison Co. | | | |
| 3.70%, 08/01/25Δ | 2,800,000 | | 2,744,393 |
| 4.20%, 03/01/29 | 400,000 | | 393,023 |
| 4.88%, 03/01/49 | 30,000 | | 27,758 |
| Southern California Gas Co. | | | |
| 2.95%, 04/15/27 | 2,100,000 | | 1,993,872 |
| Southern Co. (The) | | | |
| 4.40%, 07/01/46 | 10,000 | | 8,857 |
| Southern Co. Gas Capital Corporation | | | |
| 3.25%, 06/15/26 | 300,000 | | 288,941 |
| Southern Copper Corporation | | | |
| 5.25%, 11/08/42 | 2,110,000 | | 2,046,764 |
| Southern Natural Gas Co. LLC | | | |
| 8.00%, 03/01/32 | 400,000 | | 469,498 |
| Southern Power Co. | | | |
| 0.90%, 01/15/26 | 2,200,000 | | 2,028,539 |
| 4.95%, 12/15/46 | 30,000 | | 27,132 |
| Southwestern Electric Power Co. | | | |
| 2.75%, 10/01/26 | 65,000 | | 61,200 |
| Southwestern Energy Co. | | | |
| 5.38%, 02/01/29 | 10,000 | | 9,769 |
| 5.38%, 03/15/30 | 70,000 | | 68,493 |
| 4.75%, 02/01/32 | 120,000 | | 111,186 |
| Spirit Realty LP REIT | | | |
| 4.45%, 09/15/26 | 1,200,000 | | 1,177,997 |
| 4.00%, 07/15/29 | 750,000 | | 713,199 |
| Sprint Capital Corporation | | | |
| 6.88%, 11/15/28 | 1,500,000 | | 1,625,313 |
| 8.75%, 03/15/32 | 60,000 | | 74,143 |
| Standard Industries, Inc. | | | |
| 5.00%, 02/15/27 144A | 200,000 | | 195,119 |
| Stanley Black & Decker, Inc. | | | |
| 2.30%, 03/15/30 | 30,000 | | 25,573 |
| Starbucks Corporation | | | |
| 4.00%, 11/15/28Δ | 475,000 | | 468,719 |
| 2.55%, 11/15/30 | 1,900,000 | | 1,684,129 |
| State Street Corporation | | | |
| (Variable, U.S. SOFR + 0.73%), 2.20%, 02/07/28^ | 15,000 | | 13,947 |
| (Variable, U.S. SOFR + 1.72%), 5.82%, 11/04/28Δ ^ | 60,000 | | 62,315 |
| (Variable, U.S. SOFR + 1.48%), 5.68%, 11/21/29^ | 5,000 | | 5,176 |
| (Variable, U.S. SOFR + 2.65%), 3.15%, 03/30/31^ | 240,000 | | 216,036 |
| Steel Dynamics, Inc. | | | |
| 2.40%, 06/15/25Δ | 140,000 | | 134,242 |
| 1.65%, 10/15/27 | 275,000 | | 245,148 |
| Stifel Financial Corporation | | | |
| 4.00%, 05/15/30Δ | 1,900,000 | | 1,728,817 |
| Sunoco LP | | | |
| 7.00%, 09/15/28 144A | 810,000 | | 836,016 |
See Notes to Financial Statements.
| | | Par | | Value |
| Sutter Health | | | |
| 2.29%, 08/15/30 | $ 215,000 | | $ 184,652 |
| Synchrony Financial | | | |
| 2.88%, 10/28/31 | 25,000 | | 20,089 |
| Sysco Corporation | | | |
| 6.60%, 04/01/40 | 645,000 | | 725,924 |
| Tallgrass Energy Partners LP | | | |
| 6.00%, 12/31/30 144A | 10,000 | | 9,312 |
| Tapestry, Inc. | | | |
| 3.05%, 03/15/32 | 10,000 | | 8,146 |
| Targa Resources Corporation | | | |
| 4.20%, 02/01/33 | 790,000 | | 728,770 |
| Targa Resources Partners LP | | | |
| 6.50%, 07/15/27 | 355,000 | | 359,908 |
| 5.00%, 01/15/28 | 70,000 | | 69,258 |
| 6.88%, 01/15/29 | 1,180,000 | | 1,219,719 |
| 5.50%, 03/01/30 | 320,000 | | 320,326 |
| 4.88%, 02/01/31 | 295,000 | | 286,612 |
| 4.00%, 01/15/32 | 30,000 | | 27,480 |
| Teachers Insurance & Annuity Association of America | | | |
| 6.85%, 12/16/39 144A | 46,000 | | 53,322 |
| 4.90%, 09/15/44 144A | 150,000 | | 142,350 |
| Tennessee Gas Pipeline Co. LLC | | | |
| 2.90%, 03/01/30 144A | 1,440,000 | | 1,270,167 |
| Texas Instruments, Inc. | | | |
| 1.75%, 05/04/30 | 120,000 | | 103,743 |
| Textron, Inc. | | | |
| 2.45%, 03/15/31Δ | 1,700,000 | | 1,452,339 |
| Time Warner Cable Enterprises LLC | | | |
| 8.38%, 07/15/33 | 390,000 | | 452,353 |
| Time Warner Cable LLC | | | |
| 6.55%, 05/01/37 | 105,000 | | 103,802 |
| 7.30%, 07/01/38 | 780,000 | | 807,210 |
| 6.75%, 06/15/39 | 5,000 | | 4,981 |
| 5.88%, 11/15/40 | 430,000 | | 391,031 |
| T-Mobile U.S.A., Inc. | | | |
| 3.50%, 04/15/25 | 748,000 | | 732,749 |
| 2.25%, 02/15/26 | 10,000 | | 9,482 |
| 3.75%, 04/15/27 | 50,000 | | 48,564 |
| 3.38%, 04/15/29 | 1,370,000 | | 1,274,388 |
| 3.88%, 04/15/30 | 2,176,000 | | 2,065,812 |
| 2.55%, 02/15/31Δ | 1,570,000 | | 1,354,610 |
| 3.50%, 04/15/31 | 450,000 | | 411,629 |
| 2.70%, 03/15/32 | 610,000 | | 520,970 |
| 5.20%, 01/15/33 | 4,475,000 | | 4,595,486 |
| 3.00%, 02/15/41 | 380,000 | | 285,673 |
| 3.40%, 10/15/52 | 30,000 | | 21,972 |
| Transcontinental Gas Pipe Line Co. LLC | | | |
| 7.85%, 02/01/26 | 910,000 | | 953,835 |
| 3.25%, 05/15/30 | 870,000 | | 790,132 |
| TransDigm, Inc. | | | |
| 7.50%, 03/15/27 | 300,000 | | 301,460 |
| 4.63%, 01/15/29 | 130,000 | | 122,135 |
| 6.88%, 12/15/30 144A | 1,010,000 | | 1,040,962 |
| Trimble, Inc. | | | |
| 6.10%, 03/15/33 | 650,000 | | 695,577 |
| | | Par | | Value |
| TriNet Group, Inc. | | | |
| 7.13%, 08/15/31 144A | $ 725,000 | | $ 747,433 |
| Trinity Industries, Inc. | | | |
| 7.75%, 07/15/28 144A | 750,000 | | 775,280 |
| Tronox, Inc. | | | |
| 4.63%, 03/15/29 144A Δ | 1,225,000 | | 1,085,485 |
| Truist Bank | | | |
| 4.05%, 11/03/25 | 600,000 | | 590,354 |
| Truist Financial Corporation | | | |
| (Variable, U.S. SOFR + 0.61%), 1.27%, 03/02/27^ | 15,000 | | 13,744 |
| (Variable, U.S. SOFR + 2.05%), 6.05%, 06/08/27^ | 535,000 | | 544,856 |
| (Variable, U.S. SOFR + 0.86%), 1.89%, 06/07/29^ | 75,000 | | 64,923 |
| (Variable, U.S. SOFR + 2.36%), 5.87%, 06/08/34^ | 1,120,000 | | 1,145,601 |
| Trustage Financial Group, Inc. | | | |
| 4.63%, 04/15/32 144A | 1,300,000 | | 1,136,581 |
| Tyson Foods, Inc. | | | |
| 4.35%, 03/01/29 | 15,000 | | 14,599 |
| 5.10%, 09/28/48 | 15,000 | | 13,683 |
| U.S. Bancorp | | | |
| 1.45%, 05/12/25Δ | 200,000 | | 190,562 |
| (Variable, U.S. Treasury Yield Curve Rate CMT 5Y + 2.54%), 3.70%, 01/15/27ρ ^ | 775,000 | | 610,348 |
| (Variable, U.S. SOFR + 0.73%), 2.22%, 01/27/28Δ ^ | 60,000 | | 55,205 |
| (Variable, U.S. SOFR + 1.23%), 4.65%, 02/01/29Δ ^ | 30,000 | | 29,570 |
| (Variable, U.S. SOFR + 2.02%), 5.78%, 06/12/29^ | 985,000 | | 1,013,416 |
| (Variable, U.S. SOFR + 2.09%), 5.85%, 10/21/33^ | 2,075,000 | | 2,143,607 |
| (Variable, U.S. SOFR + 2.26%), 5.84%, 06/12/34^ | 590,000 | | 610,038 |
| UDR, Inc. REIT | | | |
| 3.20%, 01/15/30 | 1,200,000 | | 1,092,648 |
| 2.10%, 08/01/32 | 150,000 | | 117,965 |
| Union Pacific Corporation | | | |
| 2.89%, 04/06/36Δ | 600,000 | | 508,246 |
| 3.84%, 03/20/60 | 250,000 | | 205,244 |
| 3.75%, 02/05/70 | 80,000 | | 62,209 |
| United Parcel Service, Inc. | | | |
| 6.20%, 01/15/38 | 35,000 | | 40,201 |
| United Rentals North America, Inc. | | | |
| 3.88%, 02/15/31Δ | 60,000 | | 54,588 |
| 3.75%, 01/15/32 | 190,000 | | 168,943 |
| UnitedHealth Group, Inc. | | | |
| 4.00%, 05/15/29Δ | 290,000 | | 286,231 |
| 5.30%, 02/15/30 | 1,600,000 | | 1,677,217 |
| 2.00%, 05/15/30 | 150,000 | | 129,902 |
| 2.30%, 05/15/31 | 50,000 | | 43,424 |
| 4.20%, 05/15/32 | 330,000 | | 323,685 |
| 5.35%, 02/15/33 | 3,050,000 | | 3,231,915 |
| 6.88%, 02/15/38 | 40,000 | | 48,437 |
| 2.75%, 05/15/40 | 700,000 | | 530,295 |
| 4.25%, 06/15/48 | 175,000 | | 157,241 |
See Notes to Financial Statements.
MEDIUM-DURATION BOND FUND
SCHEDULE OF INVESTMENTS (Continued)
| | | Par | | Value |
| 4.45%, 12/15/48 | $ 50,000 | | $ 46,006 |
| 3.70%, 08/15/49 | 170,000 | | 138,599 |
| 2.90%, 05/15/50 | 290,000 | | 204,044 |
| 5.05%, 04/15/53 | 560,000 | | 568,632 |
| 3.88%, 08/15/59 | 10,000 | | 8,195 |
| 3.13%, 05/15/60 | 30,000 | | 21,327 |
| Universal Health Services, Inc. | | | |
| 2.65%, 10/15/30 | 700,000 | | 594,753 |
| University of Chicago (The) | | | |
| 5.42%, 10/01/30 | 100,000 | | 104,067 |
| Vanguard Group, Inc. (The) | | | |
| 3.05%, 08/22/50††† | 390,000 | | 255,360 |
| Ventas Realty LP REIT | | | |
| 3.00%, 01/15/30 | 1,700,000 | | 1,504,098 |
| Venture Global Calcasieu Pass LLC | | | |
| 6.25%, 01/15/30 144A | 125,000 | | 124,480 |
| 3.88%, 11/01/33 144A | 200,000 | | 169,909 |
| Venture Global LNG, Inc. | | | |
| 9.50%, 02/01/29 144A | 400,000 | | 423,415 |
| 9.88%, 02/01/32 144A | 150,000 | | 156,358 |
| Veralto Corporation | | | |
| 5.45%, 09/18/33 144A | 2,115,000 | | 2,194,665 |
| Verizon Communications, Inc. | | | |
| 3.00%, 03/22/27 | 70,000 | | 66,624 |
| 2.10%, 03/22/28 | 470,000 | | 425,750 |
| 4.33%, 09/21/28 | 202,000 | | 200,168 |
| 3.15%, 03/22/30 | 490,000 | | 448,671 |
| 1.75%, 01/20/31 | 900,000 | | 739,647 |
| 2.55%, 03/21/31 | 1,578,000 | | 1,363,038 |
| 4.50%, 08/10/33 | 530,000 | | 518,211 |
| 5.25%, 03/16/37 | 270,000 | | 281,068 |
| 2.65%, 11/20/40 | 380,000 | | 274,990 |
| 3.40%, 03/22/41 | 80,000 | | 63,958 |
| 3.85%, 11/01/42 | 40,000 | | 33,632 |
| 4.13%, 08/15/46 | 100,000 | | 86,055 |
| 4.86%, 08/21/46 | 30,000 | | 28,765 |
| 5.50%, 03/16/47 | 40,000 | | 41,877 |
| 4.00%, 03/22/50 | 40,000 | | 33,410 |
| 2.88%, 11/20/50 | 115,000 | | 78,472 |
| Viatris, Inc. | | | |
| 4.00%, 06/22/50 | 20,000 | | 14,147 |
| Viper Energy, Inc. | | | |
| 7.38%, 11/01/31 144A | 750,000 | | 777,097 |
| Visa, Inc. | | | |
| 3.15%, 12/14/25 | 65,000 | | 63,470 |
| 2.05%, 04/15/30Δ | 270,000 | | 237,771 |
| 4.30%, 12/14/45 | 460,000 | | 431,107 |
| VMware LLC | | | |
| 4.65%, 05/15/27Δ | 700,000 | | 694,918 |
| 3.90%, 08/21/27 | 500,000 | | 484,578 |
| 1.80%, 08/15/28 | 225,000 | | 197,624 |
| 2.20%, 08/15/31 | 600,000 | | 498,211 |
| Vontier Corporation | | | |
| 2.40%, 04/01/28 | 700,000 | | 615,755 |
| Voya Financial, Inc. | | | |
| 5.70%, 07/15/43 | 170,000 | | 167,682 |
| Walmart, Inc. | | | |
| 1.05%, 09/17/26 | 75,000 | | 68,979 |
| | | Par | | Value |
| 1.50%, 09/22/28 | $ 20,000 | | $ 17,896 |
| 1.80%, 09/22/31Δ | 80,000 | | 67,930 |
| 5.25%, 09/01/35 | 25,000 | | 27,381 |
| Walt Disney Co. (The) | | | |
| 6.65%, 11/15/37 | 150,000 | | 176,754 |
| Warnermedia Holdings, Inc. | | | |
| 6.41%, 03/15/26 | 30,000 | | 30,015 |
| 3.76%, 03/15/27 | 140,000 | | 134,303 |
| 4.05%, 03/15/29 | 180,000 | | 170,946 |
| 4.28%, 03/15/32 | 2,600,000 | | 2,383,522 |
| 5.05%, 03/15/42 | 370,000 | | 327,579 |
| 5.14%, 03/15/52 | 303,000 | | 261,626 |
| Waste Management, Inc. | | | |
| 1.15%, 03/15/28Δ | 250,000 | | 220,158 |
| WEA Finance LLC REIT | | | |
| 3.75%, 09/17/24 144A | 770,000 | | 756,356 |
| Wells Fargo & Co. | | | |
| 4.48%, 01/16/24Δ | 6,000 | | 5,997 |
| 3.75%, 01/24/24Δ | 365,000 | | 364,522 |
| (Variable, U.S. Treasury Yield Curve Rate CMT 5Y + 3.45%), 3.90%, 03/15/26ρ Δ ^ | 1,050,000 | | 970,730 |
| (Variable, U.S. SOFR + 2.00%), 2.19%, 04/30/26^ | 40,000 | | 38,361 |
| 4.10%, 06/03/26 | 440,000 | | 430,676 |
| (Variable, U.S. SOFR + 1.56%), 4.54%, 08/15/26Δ ^ | 1,700,000 | | 1,683,281 |
| 3.00%, 10/23/26 | 1,660,000 | | 1,577,395 |
| (Variable, CME Term SOFR 3M + 1.43%), 3.20%, 06/17/27^ | 30,000 | | 28,690 |
| 4.30%, 07/22/27 | 1,255,000 | | 1,229,977 |
| (Variable, CME Term SOFR 3M + 1.57%), 3.58%, 05/22/28^ | 20,000 | | 19,084 |
| (Variable, U.S. SOFR + 2.10%), 2.39%, 06/02/28^ | 70,000 | | 64,188 |
| (Variable, U.S. SOFR + 1.98%), 4.81%, 07/25/28^ | 1,800,000 | | 1,788,403 |
| 4.15%, 01/24/29 | 655,000 | | 637,866 |
| (Variable, U.S. SOFR + 1.74%), 5.57%, 07/25/29^ | 420,000 | | 429,530 |
| (Variable, CME Term SOFR 3M + 1.43%), 2.88%, 10/30/30^ | 465,000 | | 414,256 |
| (Variable, CME Term SOFR 3M + 1.26%), 2.57%, 02/11/31^ | 20,000 | | 17,318 |
| (Variable, CME Term SOFR 3M + 4.03%), 4.48%, 04/04/31^ | 420,000 | | 406,665 |
| (Variable, U.S. SOFR + 1.50%), 3.35%, 03/02/33^ | 500,000 | | 438,138 |
| (Variable, U.S. SOFR + 2.10%), 4.90%, 07/25/33^ | 1,953,000 | | 1,906,358 |
| (Variable, U.S. SOFR + 2.02%), 5.39%, 04/24/34^ | 2,000,000 | | 2,013,390 |
| (Variable, U.S. SOFR + 1.99%), 5.56%, 07/25/34^ | 540,000 | | 551,221 |
| 5.38%, 11/02/43 | 190,000 | | 185,466 |
| 4.65%, 11/04/44 | 200,000 | | 176,469 |
| 4.90%, 11/17/45 | 30,000 | | 27,416 |
| 4.75%, 12/07/46 | 20,000 | | 17,770 |
| (Variable, CME Term SOFR 3M + 4.50%), 5.01%, 04/04/51^ | 3,485,000 | | 3,319,875 |
See Notes to Financial Statements.
| | | Par | | Value |
| Welltower OP LLC REIT | | | |
| 4.25%, 04/01/26 | $ 898,000 | | $ 885,197 |
| 4.13%, 03/15/29 | 10,000 | | 9,675 |
| 3.10%, 01/15/30 | 45,000 | | 40,710 |
| Western Digital Corporation | | | |
| 2.85%, 02/01/29 | 35,000 | | 30,168 |
| Western Midstream Operating LP | | | |
| 4.50%, 03/01/28 | 60,000 | | 58,117 |
| 4.05%, 02/01/30Δ | 980,000 | | 920,063 |
| 5.45%, 04/01/44 | 75,000 | | 68,430 |
| 5.30%, 03/01/48 | 195,000 | | 170,165 |
| 5.50%, 08/15/48 | 130,000 | | 116,025 |
| 5.25%, 02/01/50 | 20,000 | | 17,964 |
| Westinghouse Air Brake Technologies Corporation | | | |
| 4.70%, 09/15/28 | 55,000 | | 54,476 |
| Weyerhaeuser Co. REIT | | | |
| 4.00%, 04/15/30 | 45,000 | | 42,952 |
| Williams Cos., Inc. (The) | | | |
| 3.90%, 01/15/25 | 300,000 | | 295,439 |
| 7.50%, 01/15/31 | 100,000 | | 113,524 |
| 7.75%, 06/15/31 | 1,005,000 | | 1,128,853 |
| 8.75%, 03/15/32 | 181,000 | | 220,100 |
| 5.65%, 03/15/33Δ | 525,000 | | 549,846 |
| 5.75%, 06/24/44 | 210,000 | | 212,764 |
| Willis North America, Inc. | | | |
| 2.95%, 09/15/29 | 40,000 | | 35,859 |
| 3.88%, 09/15/49 | 10,000 | | 7,782 |
| Workday, Inc. | | | |
| 3.70%, 04/01/29 | 325,000 | | 312,518 |
| 3.80%, 04/01/32Δ | 225,000 | | 209,871 |
| WP Carey, Inc. REIT | | | |
| 4.00%, 02/01/25 | 105,000 | | 103,488 |
| 3.85%, 07/15/29 | 900,000 | | 846,368 |
| WR Grace Holdings LLC | | | |
| 4.88%, 06/15/27 144A | 730,000 | | 703,299 |
| WRKCo, Inc. | | | |
| 3.75%, 03/15/25 | 500,000 | | 490,495 |
| 4.00%, 03/15/28Δ | 1,100,000 | | 1,062,742 |
| Xerox Holdings Corporation | | | |
| 5.00%, 08/15/25 144A | 1,240,000 | | 1,215,897 |
Total Corporate Bonds
(Cost $570,541,432) | | | 540,625,366 |
| FOREIGN BONDS — 9.2% |
| Argentina — 0.1% | | |
| Argentine Republic Government International Bond | | | |
| (Step to 1.75% on 07/09/27), 0.75%, 07/09/30 STEP | 254,303 | | 102,613 |
| (Step to 4.88% on 07/09/29), 3.50%, 07/09/41 STEP | 810,000 | | 278,364 |
| Provincia de Buenos Aires | | | |
| (Step to 6.63% on 09/01/24), 6.38%, 09/01/37 144A STEP | 666,200 | | 256,797 |
| (Step to 6.63% on 09/01/24), 6.38%, 09/01/37 STEP | 1,125,000 | | 433,649 |
| | | | | 1,071,423 |
| | | Par | | Value |
| Australia — 0.1% | | |
| BHP Billiton Finance U.S.A., Ltd. | | | |
| 5.00%, 09/30/43 | $ 50,000 | | $ 50,672 |
| Commonwealth Bank of Australia | | | |
| 3.90%, 07/12/47 144A | 110,000 | | 95,828 |
| Macquarie Bank, Ltd. | | | |
| (Variable, U.S. Treasury Yield Curve Rate CMT 5Y + 1.70%), 3.05%, 03/03/36 144A ^ | 225,000 | | 181,558 |
| Macquarie Group, Ltd. | | | |
| (Variable, U.S. SOFR + 1.07%), 1.34%, 01/12/27 144A ^ | 250,000 | | 229,869 |
| (Variable, U.S. SOFR + 1.53%), 2.87%, 01/14/33 144A ^ | 600,000 | | 494,754 |
| (Variable, U.S. SOFR + 2.41%), 4.44%, 06/21/33 144A Δ ^ | 650,000 | | 595,221 |
| Newcrest Finance Pty, Ltd. | | | |
| 3.25%, 05/13/30 144A | 175,000 | | 158,519 |
| Westpac Banking Corporation | | | |
| (Variable, USD SOFR ICE Swap Rate 5Y + 2.24%), 4.32%, 11/23/31^ | 175,000 | | 168,476 |
| (Variable, U.S. Treasury Yield Curve Rate CMT 5Y + 2.00%), 4.11%, 07/24/34^ | 275,000 | | 252,047 |
| | | | | 2,226,944 |
| Austria — 0.0% | | |
| Suzano Austria GmbH | | | |
| 3.75%, 01/15/31 | 230,000 | | 201,924 |
| 3.13%, 01/15/32 | 820,000 | | 680,847 |
| | | | | 882,771 |
| Brazil — 0.7% | | |
| Brazil Letras do Tesouro Nacional | | | |
| 0.00%, 01/01/24(B) » | 14,700,000 | | 3,026,186 |
| 0.00%, 07/01/24(B) » | 62,400,000 | | 12,225,754 |
| Vale Overseas, Ltd. | | | |
| 6.88%, 11/21/36 | 444,000 | | 484,914 |
| | | | | 15,736,854 |
| Canada — 0.3% | | |
| Alimentation Couche-Tard, Inc. | | | |
| 3.55%, 07/26/27 144A | 75,000 | | 72,257 |
| Bank of Montreal | | | |
| 1.85%, 05/01/25 | 420,000 | | 403,027 |
| (Variable, U.S. SOFR + 0.60%), 0.95%, 01/22/27^ | 70,000 | | 64,585 |
| (Variable, USD Swap 5Y + 1.43%), 3.80%, 12/15/32^ | 100,000 | | 92,158 |
| Bank of Nova Scotia (The) | | | |
| 1.30%, 06/11/25Δ | 90,000 | | 85,373 |
| (Variable, U.S. Treasury Yield Curve Rate CMT 5Y + 2.05%), 4.59%, 05/04/37^ | 260,000 | | 233,373 |
| Brookfield Finance, Inc. | | | |
| 3.50%, 03/30/51 | 820,000 | | 603,338 |
| Canadian National Railway Co. | | | |
| 2.45%, 05/01/50 | 35,000 | | 23,122 |
See Notes to Financial Statements.
MEDIUM-DURATION BOND FUND
SCHEDULE OF INVESTMENTS (Continued)
| | | Par | | Value |
| Canadian Pacific Railway Co. | | | |
| 3.10%, 12/02/51 | $ 370,000 | | $ 268,936 |
| CGI, Inc. | | | |
| 1.45%, 09/14/26 | 2,300,000 | | 2,084,398 |
| Element Fleet Management Corporation | | | |
| 6.32%, 12/04/28 144A | 250,000 | | 258,739 |
| Enbridge, Inc. | | | |
| 2.50%, 08/01/33 | 850,000 | | 697,311 |
| Fairfax Financial Holdings, Ltd. | | | |
| 4.85%, 04/17/28Δ | 400,000 | | 394,690 |
| 5.63%, 08/16/32 | 800,000 | | 800,817 |
| First Quantum Minerals, Ltd. | | | |
| 6.88%, 10/15/27 144A | 200,000 | | 170,250 |
| Intact Financial Corporation | | | |
| 5.46%, 09/22/32 144A | 600,000 | | 602,909 |
| Rogers Communications, Inc. | | | |
| 4.35%, 05/01/49 | 15,000 | | 12,779 |
| Royal Bank of Canada | | | |
| 1.15%, 06/10/25Δ | 30,000 | | 28,461 |
| Teck Resources, Ltd. | | | |
| 6.00%, 08/15/40 | 10,000 | | 10,200 |
| Toronto-Dominion Bank (The) | | | |
| 1.15%, 06/12/25 | 40,000 | | 37,902 |
| 4.46%, 06/08/32 | 775,000 | | 754,664 |
| | | | | 7,699,289 |
| Chile — 0.1% | | |
| Chile Government International Bond | | | |
| 4.95%, 01/05/36 | 1,611,005 | | 1,595,982 |
| China — 0.1% | | |
| Avolon Holdings Funding, Ltd. | | | |
| 2.88%, 02/15/25 144A | 800,000 | | 772,343 |
| 2.13%, 02/21/26 144A | 2,500,000 | | 2,318,990 |
| 4.25%, 04/15/26 144A | 125,000 | | 120,871 |
| Park Aerospace Holdings, Ltd. | | | |
| 5.50%, 02/15/24 144A | 60,000 | | 59,894 |
| | | | | 3,272,098 |
| Colombia — 0.1% | | |
| Colombia Government International Bond | | | |
| 4.13%, 02/22/42 | 850,000 | | 610,253 |
| 5.63%, 02/26/44 | 750,000 | | 632,917 |
| Ecopetrol SA | | | |
| 8.63%, 01/19/29 | 90,000 | | 96,015 |
| 6.88%, 04/29/30 | 40,000 | | 39,680 |
| 8.88%, 01/13/33 | 220,000 | | 239,323 |
| 5.88%, 05/28/45 | 1,240,000 | | 980,749 |
| | | | | 2,598,937 |
| Denmark — 0.1% | | |
| Danske Bank A/S | | | |
| 5.38%, 01/12/24 144A | 540,000 | | 539,887 |
| (Variable, ICE LIBOR USD 3M + 1.59%), 3.24%, 12/20/25 144A ^ | 220,000 | | 214,442 |
| | | Par | | Value |
| (Variable, U.S. Treasury Yield Curve Rate CMT 1Y + 1.35%), 1.62%, 09/11/26 144A Δ ^ | $1,800,000 | | $1,681,115 |
| (Variable, U.S. Treasury Yield Curve Rate CMT 1Y + 1.18%), 6.26%, 09/22/26 144A ^ | 200,000 | | 203,619 |
| | | | | 2,639,063 |
| Finland — 0.0% | | |
| Nokia OYJ | | | |
| 4.38%, 06/12/27 | 9,000 | | 8,722 |
| France — 0.7% | | |
| BNP Paribas SA | | | |
| (Variable, USD SOFR ICE Swap Rate 5Y + 4.15%), 6.63%, 03/25/24 144A ρ ^ | 200,000 | | 199,253 |
| 3.38%, 01/09/25 144A | 450,000 | | 440,910 |
| (Variable, U.S. SOFR + 2.07%), 2.22%, 06/09/26 144A ^ | 1,790,000 | | 1,709,959 |
| (Variable, U.S. SOFR + 1.00%), 1.32%, 01/13/27 144A ^ | 775,000 | | 715,404 |
| 4.40%, 08/14/28 144A | 780,000 | | 761,303 |
| (Variable, U.S. Treasury Yield Curve Rate CMT 5Y + 4.35%), 8.50%, 08/14/28 144A ρ Δ ^ | 490,000 | | 514,393 |
| (Variable, U.S. SOFR + 1.61%), 1.90%, 09/30/28 144A ^ | 1,800,000 | | 1,601,511 |
| (Variable, U.S. Treasury Yield Curve Rate CMT 1Y + 1.45%), 5.13%, 01/13/29 144A ^ | 910,000 | | 918,121 |
| (Variable, USD Swap 5Y + 1.48%), 4.38%, 03/01/33 144A ^ | 880,000 | | 825,517 |
| (Variable, U.S. SOFR + 1.87%), 5.89%, 12/05/34 144A ^ | 820,000 | | 858,936 |
| BPCE SA | | | |
| 4.63%, 09/12/28 144A | 375,000 | | 367,647 |
| (Variable, U.S. SOFR + 1.31%), 2.28%, 01/20/32 144A ^ | 375,000 | | 301,160 |
| (Variable, U.S. SOFR + 1.73%), 3.12%, 10/19/32 144A ^ | 875,000 | | 715,522 |
| (Variable, U.S. SOFR + 2.87%), 5.75%, 07/19/33 144A ^ | 600,000 | | 604,037 |
| (Variable, U.S. SOFR + 2.59%), 7.00%, 10/19/34 144A ^ | 1,000,000 | | 1,088,327 |
| Credit Agricole SA | | | |
| (Variable, USD Swap 5Y + 4.32%), 6.88%, 09/23/24 144A ρ ^ | 300,000 | | 298,759 |
| 4.38%, 03/17/25Δ | 275,000 | | 270,695 |
| (Variable, U.S. SOFR + 1.68%), 1.91%, 06/16/26 144A ^ | 2,025,000 | | 1,922,526 |
| 4.13%, 01/10/27 144A Δ | 450,000 | | 437,160 |
| (Variable, USD Swap 5Y + 1.64%), 4.00%, 01/10/33 144A ^ | 250,000 | | 232,027 |
See Notes to Financial Statements.
| | | Par | | Value |
| Danone SA | | | |
| 2.95%, 11/02/26 144A | $ 310,000 | | $ 296,487 |
| SNF Group SACA | | | |
| 3.38%, 03/15/30 144A | 680,000 | | 584,512 |
| Societe Generale SA | | | |
| (Variable, U.S. Treasury Yield Curve Rate CMT 1Y + 1.10%), 1.49%, 12/14/26 144A ^ | 1,700,000 | | 1,566,558 |
| TotalEnergies Capital International SA | | | |
| 2.83%, 01/10/30 | 35,000 | | 32,221 |
| 3.13%, 05/29/50Δ | 25,000 | | 18,436 |
| TotalEnergies Capital SA | | | |
| 3.88%, 10/11/28 | 5,000 | | 4,915 |
| | | | | 17,286,296 |
| Germany — 0.3% | | |
| Deutsche Bank AG | | | |
| (Variable, U.S. SOFR + 3.19%), 6.12%, 07/14/26^ | 1,800,000 | | 1,818,537 |
| (Variable, 1.85% - Euribor 3M), 1.38%, 09/03/26(E) ^ | 1,500,000 | | 1,587,085 |
| (Variable, U.S. SOFR + 1.87%), 2.13%, 11/24/26^ | 450,000 | | 422,170 |
| (Variable, 2.05% - Euribor 3M), 1.75%, 11/19/30(E) ^ | 900,000 | | 865,014 |
| (Variable, 2.05% - Euribor 3M), 1.75%, 11/19/30(E) ^ | 800,000 | | 768,901 |
| Muenchener Rueckversicherungs-Gesellschaft A.G. in Muenchen | | | |
| (Variable, U.S. Treasury Yield Curve Rate CMT 5Y + 3.98%), 5.88%, 05/23/42 144A ^ | 1,200,000 | | 1,206,000 |
| | | | | 6,667,707 |
| Hong Kong — 0.0% | | |
| AIA Group, Ltd. | | | |
| 3.90%, 04/06/28 144A | 200,000 | | 193,708 |
| Hungary — 0.1% | | |
| Hungary Government International Bond | | | |
| 6.13%, 05/22/28 | 500,000 | | 520,654 |
| 3.13%, 09/21/51 | 1,290,000 | | 878,531 |
| | | | | 1,399,185 |
| Indonesia — 0.0% | | |
| Indonesia Government International Bond | | | |
| 3.05%, 03/12/51 | 290,000 | | 222,321 |
| Ireland — 0.2% | | |
| AerCap Ireland Capital DAC | | | |
| 4.88%, 01/16/24 | 350,000 | | 349,786 |
| 6.50%, 07/15/25Δ | 290,000 | | 293,866 |
| 2.45%, 10/29/26 | 1,160,000 | | 1,074,693 |
| 3.00%, 10/29/28 | 1,480,000 | | 1,353,445 |
| | | Par | | Value |
| 3.30%, 01/30/32 | $ 1,075,000 | | $ 937,053 |
| STERIS Irish FinCo Unlimited Co. | | | |
| 2.70%, 03/15/31 | 843,000 | | 726,820 |
| | | | | 4,735,663 |
| Israel — 0.0% | | |
| Israel Government International Bond | | | |
| 2.75%, 07/03/30 | 260,000 | | 230,263 |
| 3.38%, 01/15/50 | 430,000 | | 306,496 |
| | | | | 536,759 |
| Italy — 0.1% | | |
| Intesa Sanpaolo SpA | | | |
| 5.02%, 06/26/24 144A | 1,310,000 | | 1,296,833 |
| 3.25%, 09/23/24 144A | 1,400,000 | | 1,374,845 |
| 5.71%, 01/15/26 144A | 200,000 | | 199,188 |
| | | | | 2,870,866 |
| Japan — 2.1% | | |
| Japan Treasury Discount Bill | | | |
| 0.00%, 02/05/24(J) » | 4,510,000,000 | | 31,991,180 |
| 0.00%, 03/11/24(J) » | 850,000,000 | | 6,030,421 |
| Mitsubishi UFJ Financial Group, Inc. | | | |
| (Variable, U.S. Treasury Yield Curve Rate CMT 1Y + 1.30%), 4.08%, 04/19/28Δ ^ | 270,000 | | 262,841 |
| (Variable, U.S. Treasury Yield Curve Rate CMT 1Y + 2.13%), 5.13%, 07/20/33^ | 1,250,000 | | 1,272,248 |
| 4.29%, 07/26/38 | 30,000 | | 28,313 |
| Mizuho Financial Group, Inc. | | | |
| (Variable, CME Term SOFR 3M + 1.09%), 2.23%, 05/25/26^ | 1,600,000 | | 1,530,063 |
| (Variable, U.S. Treasury Yield Curve Rate CMT 1Y + 2.05%), 5.41%, 09/13/28Δ ^ | 1,700,000 | | 1,724,912 |
| (Variable, U.S. Treasury Yield Curve Rate CMT 1Y + 1.25%), 3.26%, 05/22/30^ | 2,100,000 | | 1,918,546 |
| Nissan Motor Co., Ltd. | | | |
| 3.52%, 09/17/25 144A | 2,850,000 | | 2,745,723 |
| 4.35%, 09/17/27 144A Δ | 770,000 | | 737,760 |
| Nomura Holdings, Inc. | | | |
| 2.61%, 07/14/31 | 270,000 | | 224,880 |
| Sumitomo Mitsui Financial Group, Inc. | | | |
| 1.90%, 09/17/28 | 2,300,000 | | 2,016,528 |
| 5.77%, 01/13/33Δ | 1,740,000 | | 1,841,198 |
| | | | | 52,324,613 |
| Jersey — 0.0% | | |
| Aptiv PLC | | | |
| 3.10%, 12/01/51Δ | 20,000 | | 13,114 |
| Galaxy Pipeline Assets Bidco, Ltd. | | | |
| 2.94%, 09/30/40 | 877,133 | | 724,363 |
| | | | | 737,477 |
See Notes to Financial Statements.
MEDIUM-DURATION BOND FUND
SCHEDULE OF INVESTMENTS (Continued)
| | | Par | | Value |
| Kazakhstan — 0.0% | | |
| KazMunayGas National Co. JSC | | | |
| 5.38%, 04/24/30 144A | $ 200,000 | | $ 198,825 |
| Luxembourg — 0.0% | | |
| Altice Financing SA | | | |
| 5.75%, 08/15/29 144A | 250,000 | | 222,404 |
| ArcelorMittal SA | | | |
| 7.00%, 10/15/39 | 85,000 | | 92,468 |
| | | | | 314,872 |
| Mexico — 0.9% | | |
| Mexican Bonos | | | |
| 7.75%, 11/23/34(M) | 15,250,000 | | 821,000 |
| 7.75%, 11/13/42(M) | 214,985,200 | | 11,146,162 |
| 8.00%, 11/07/47(M) | 33,320,000 | | 1,755,240 |
| Mexico City Airport Trust | | | |
| 3.88%, 04/30/28 144A | 360,000 | | 338,282 |
| Mexico Government International Bond | | | |
| 4.75%, 04/27/32 | 2,300,000 | | 2,219,141 |
| 3.50%, 02/12/34 | 1,620,000 | | 1,374,606 |
| 6.35%, 02/09/35 | 430,000 | | 451,538 |
| 3.77%, 05/24/61 | 2,232,000 | | 1,520,205 |
| Orbia Advance Corporation SAB de CV | | | |
| 1.88%, 05/11/26 144A | 350,000 | | 321,554 |
| 2.88%, 05/11/31 144A Δ | 320,000 | | 265,075 |
| Petroleos Mexicanos | | | |
| 6.88%, 08/04/26 | 200,000 | | 194,244 |
| 6.38%, 01/23/45 | 370,000 | | 241,550 |
| 6.75%, 09/21/47 | 19,000 | | 12,474 |
| | | | | 20,661,071 |
| Netherlands — 0.6% | | |
| ABN AMRO Bank NV | | | |
| 4.75%, 07/28/25 144A | 200,000 | | 196,192 |
| Cooperatieve Rabobank UA | | | |
| 4.38%, 08/04/25 | 420,000 | | 412,784 |
| (Variable, U.S. Treasury Yield Curve Rate CMT 1Y + 1.00%), 1.34%, 06/24/26 144A ^ | 810,000 | | 764,181 |
| (Variable, U.S. Treasury Yield Curve Rate CMT 1Y + 1.22%), 3.65%, 04/06/28 144A ^ | 280,000 | | 267,249 |
| (Variable, U.S. Treasury Yield Curve Rate CMT 1Y + 1.75%), 4.66%, 08/22/28 144A Δ ^ | 2,300,000 | | 2,268,433 |
| (Variable, U.S. Treasury Yield Curve Rate CMT 1Y + 1.42%), 3.76%, 04/06/33 144A ^ | 270,000 | | 243,012 |
| Deutsche Telekom International Finance BV | | | |
| 8.75%, 06/15/30 | 40,000 | | 48,314 |
| Enel Finance International NV | | | |
| 5.00%, 06/15/32 144A | 1,200,000 | | 1,173,497 |
| ING Groep NV | | | |
| 4.63%, 01/06/26 144A | 1,600,000 | | 1,590,502 |
| | | Par | | Value |
| (Variable, U.S. Treasury Yield Curve Rate CMT 1Y + 1.10%), 1.40%, 07/01/26 144A ^ | $1,000,000 | | $ 941,546 |
| JDE Peet's NV | | | |
| 1.38%, 01/15/27 144A | 475,000 | | 427,374 |
| MEGlobal BV | | | |
| 4.25%, 11/03/26 144A | 320,000 | | 309,899 |
| NXP BV | | | |
| 2.70%, 05/01/25 | 1,720,000 | | 1,660,189 |
| 3.88%, 06/18/26 | 1,500,000 | | 1,462,540 |
| 3.40%, 05/01/30 | 250,000 | | 230,208 |
| 2.50%, 05/11/31 | 200,000 | | 170,181 |
| Petrobras Global Finance BV | | | |
| 6.00%, 01/27/28 | 500,000 | | 508,827 |
| 6.85%, 06/05/15π | 550,000 | | 518,799 |
| Prosus NV | | | |
| 3.68%, 01/21/30 144A | 200,000 | | 175,498 |
| 3.06%, 07/13/31 144A Δ | 920,000 | | 744,925 |
| 4.03%, 08/03/50 144A | 220,000 | | 144,448 |
| 3.83%, 02/08/51 144A | 420,000 | | 265,373 |
| Shell International Finance BV | | | |
| 4.13%, 05/11/35 | 20,000 | | 19,091 |
| 6.38%, 12/15/38 | 5,000 | | 5,778 |
| 4.55%, 08/12/43 | 120,000 | | 113,958 |
| 4.38%, 05/11/45 | 660,000 | | 607,890 |
| 4.00%, 05/10/46 | 330,000 | | 287,887 |
| 3.25%, 04/06/50Δ | 150,000 | | 113,331 |
| | | | | 15,671,906 |
| New Zealand — 0.0% | | |
| ASB Bank, Ltd. | | | |
| (Variable, U.S. Treasury Yield Curve Rate CMT 5Y + 2.25%), 5.28%, 06/17/32 144A ^ | 600,000 | | 590,106 |
| Norway — 0.0% | | |
| Aker BP ASA | | | |
| 2.00%, 07/15/26 144A | 438,000 | | 404,029 |
| Panama — 0.1% | | |
| Panama Government International Bond | | | |
| 6.40%, 02/14/35 | 600,000 | | 587,141 |
| 4.50%, 04/16/50 | 250,000 | | 174,102 |
| 6.85%, 03/28/54 | 240,000 | | 225,159 |
| | | | | 986,402 |
| Paraguay — 0.0% | | |
| Paraguay Government International Bond | | | |
| 3.85%, 06/28/33 144A | 240,000 | | 213,420 |
| Peru — 0.0% | | |
| Peruvian Government International Bond | | | |
| 2.78%, 01/23/31 | 320,000 | | 279,427 |
| 5.63%, 11/18/50Δ | 70,000 | | 73,217 |
| 2.78%, 12/01/60 | 270,000 | | 169,222 |
See Notes to Financial Statements.
| | | Par | | Value |
| 3.23%, 07/28/21~ Δ | $ 50,000 | | $ 31,191 |
| | | | | 553,057 |
| Qatar — 0.1% | | |
| Qatar Government International Bond | | | |
| 5.10%, 04/23/48 | 1,000,000 | | 1,014,628 |
| Romania — 0.2% | | |
| Romanian Government International Bond | | | |
| 3.00%, 02/27/27 144A | 2,200,000 | | 2,053,249 |
| 3.62%, 05/26/30(E) 144A | 250,000 | | 254,445 |
| 2.00%, 01/28/32(E) 144A | 70,000 | | 60,029 |
| 2.00%, 04/14/33(E) | 2,400,000 | | 1,990,462 |
| 3.38%, 01/28/50(E) 144A | 60,000 | | 45,372 |
| 3.38%, 01/28/50(E) | 70,000 | | 52,934 |
| | | | | 4,456,491 |
| Saudi Arabia — 0.0% | | |
| Greensaif Pipelines Bidco S.a.r.l. | | | |
| 6.13%, 02/23/38 144A | 200,000 | | 209,302 |
| Singapore — 0.0% | | |
| Flex, Ltd. | | | |
| 4.88%, 06/15/29 | 5,000 | | 4,916 |
| Greenko Power II, Ltd. | | | |
| 4.30%, 12/13/28 144A | 180,000 | | 162,720 |
| | | | | 167,636 |
| South Africa — 0.0% | | |
| Republic of South Africa Government International Bond | | | |
| 4.30%, 10/12/28 | 280,000 | | 262,517 |
| 5.88%, 04/20/32 | 360,000 | | 341,916 |
| 7.30%, 04/20/52 | 370,000 | | 351,465 |
| | | | | 955,898 |
| South Korea — 0.0% | | |
| Export-Import Bank of Korea | | | |
| 5.00%, 01/11/28Δ | 240,000 | | 244,609 |
| 5.13%, 01/11/33 | 200,000 | | 208,033 |
| Korea Hydro & Nuclear Power Co., Ltd. | | | |
| 4.25%, 07/27/27 144A | 250,000 | | 246,265 |
| | | | | 698,907 |
| Spain — 0.1% | | |
| Banco Santander SA | | | |
| 2.75%, 05/28/25 | 1,000,000 | | 965,850 |
| 3.31%, 06/27/29Δ | 400,000 | | 369,403 |
| 2.75%, 12/03/30 | 200,000 | | 166,610 |
| 6.92%, 08/08/33Δ | 1,200,000 | | 1,283,282 |
| Telefonica Emisiones SA | | | |
| 7.05%, 06/20/36 | 30,000 | | 34,042 |
| | | | | 2,819,187 |
| Supranational — 0.2% | | |
| African Export-Import Bank (The) | | | |
| 3.80%, 05/17/31 144A | 250,000 | | 212,617 |
| | | Par | | Value |
| Asian Development Bank | | | |
| 6.55%, 01/26/25(S) | $ 34,000,000 | | $ 1,814,834 |
| Inter-American Development Bank | | | |
| 7.35%, 10/06/30(ZH) | 300,000,000 | | 3,683,560 |
| | | | | 5,711,011 |
| Switzerland — 0.7% | | |
| Credit Suisse AG | | | |
| 7.95%, 01/09/25 | 740,000 | | 756,930 |
| 2.95%, 04/09/25 | 665,000 | | 645,023 |
| 7.50%, 02/15/28 | 430,000 | | 471,618 |
| Credit Suisse Group AG | | | |
| (Variable, U.S. SOFR + 1.56%), 2.59%, 09/11/25 144A ^ | 427,000 | | 417,877 |
| (Variable, U.S. SOFR + 2.04%), 2.19%, 06/05/26 144A ^ | 610,000 | | 580,563 |
| (Variable, U.S. SOFR Index + 0.98%), 1.31%, 02/02/27 144A ^ | 400,000 | | 367,091 |
| 4.28%, 01/09/28 144A | 1,800,000 | | 1,744,879 |
| (Variable, ICE LIBOR USD 3M + 1.41%), 3.87%, 01/12/29 144A ^ | 425,000 | | 401,344 |
| (Variable, U.S. SOFR + 3.73%), 4.19%, 04/01/31 144A ^ | 630,000 | | 587,968 |
| (Variable, U.S. SOFR + 1.73%), 3.09%, 05/14/32 144A ^ | 395,000 | | 337,294 |
| (Variable, U.S. SOFR + 3.92%), 6.54%, 08/12/33 144A ^ | 3,900,000 | | 4,164,166 |
| (Variable, U.S. SOFR + 5.02%), 9.02%, 11/15/33 144A ^ | 700,000 | | 862,492 |
| UBS AG | | | |
| 4.50%, 06/26/48Δ | 280,000 | | 276,971 |
| UBS Group AG | | | |
| (Variable, USD Swap 5Y + 4.34%), 7.00%, 01/31/24 144A ρ Δ ^ | 840,000 | | 840,266 |
| 4.55%, 04/17/26Δ | 1,390,000 | | 1,372,749 |
| 4.25%, 03/23/28 144A | 760,000 | | 734,516 |
| (Variable, U.S. Treasury Yield Curve Rate CMT 5Y + 4.75%), 9.25%, 11/13/28 144A ρ ^ | 900,000 | | 973,149 |
| (Variable, U.S. Treasury Yield Curve Rate CMT 1Y + 2.40%), 4.99%, 08/05/33 144A ^ | 600,000 | | 581,369 |
| (Variable, U.S. Treasury Yield Curve Rate CMT 5Y + 4.76%), 9.25%, 11/13/33 144A ρ ^ | 220,000 | | 244,368 |
| | | | | 16,360,633 |
| United Arab Emirates — 0.0% | | |
| DP World, Ltd. | | | |
| 5.63%, 09/25/48 144A | 420,000 | | 403,549 |
| United Kingdom — 1.2% | | |
| Anglo American Capital PLC | | | |
| 4.00%, 09/11/27 144A | 220,000 | | 211,701 |
See Notes to Financial Statements.
MEDIUM-DURATION BOND FUND
SCHEDULE OF INVESTMENTS (Continued)
| | | Par | | Value |
| Barclays PLC | | | |
| (Variable, U.S. SOFR + 2.71%), 2.85%, 05/07/26^ | $ 800,000 | | $ 771,988 |
| (Variable, U.S. Treasury Yield Curve Rate CMT 1Y + 3.05%), 7.33%, 11/02/26^ | 525,000 | | 542,788 |
| (Variable, U.S. SOFR + 1.88%), 6.50%, 09/13/27Δ ^ | 1,900,000 | | 1,956,804 |
| (Variable, U.S. Treasury Yield Curve Rate CMT 1Y + 3.30%), 7.39%, 11/02/28Δ ^ | 1,000,000 | | 1,070,202 |
| (Variable, ICE LIBOR USD 3M + 1.90%), 4.97%, 05/16/29^ | 1,760,000 | | 1,730,885 |
| (Variable, ICE LIBOR USD 3M + 3.05%), 5.09%, 06/20/30^ | 1,220,000 | | 1,184,626 |
| BP Capital Markets PLC | | | |
| (Variable, U.S. Treasury Yield Curve Rate CMT 5Y + 4.40%), 4.88%, 03/22/30ρ Δ ^ | 650,000 | | 619,857 |
| British Telecommunications PLC | | | |
| 9.63%, 12/15/30 | 35,000 | | 43,394 |
| CK Hutchison International 23, Ltd. | | | |
| 4.75%, 04/21/28 144A | 200,000 | | 200,566 |
| Hammerson PLC REIT | | | |
| 3.50%, 10/27/25(U) | 100,000 | | 123,038 |
| HSBC Holdings PLC | | | |
| (Variable, CME Term SOFR 3M + 1.47%), 3.80%, 03/11/25^ | 625,000 | | 622,545 |
| (Variable, U.S. SOFR + 1.54%), 1.65%, 04/18/26^ | 225,000 | | 214,017 |
| (Variable, U.S. SOFR + 1.93%), 2.10%, 06/04/26^ | 370,000 | | 352,431 |
| (Variable, U.S. SOFR + 1.97%), 6.16%, 03/09/29^ | 2,650,000 | | 2,739,441 |
| (Variable, CME Term SOFR 3M + 1.80%), 4.58%, 06/19/29^ | 310,000 | | 301,140 |
| 4.95%, 03/31/30 | 200,000 | | 198,732 |
| (Variable, U.S. SOFR + 1.19%), 2.80%, 05/24/32^ | 2,190,000 | | 1,832,257 |
| (Variable, U.S. SOFR + 1.41%), 2.87%, 11/22/32^ | 440,000 | | 366,493 |
| (Variable, U.S. SOFR + 2.53%), 4.76%, 03/29/33Δ ^ | 360,000 | | 336,178 |
| (Variable, U.S. SOFR + 2.39%), 6.25%, 03/09/34Δ ^ | 800,000 | | 852,389 |
| (Variable, U.S. SOFR + 3.02%), 7.40%, 11/13/34^ | 1,980,000 | | 2,175,896 |
| 6.10%, 01/14/42 | 35,000 | | 39,617 |
| Lloyds Bank PLC | | | |
| 0.00%, 04/02/32 STEP | 2,000,000 | | 1,293,123 |
| Lloyds Banking Group PLC | | | |
| 4.38%, 03/22/28Δ | 2,400,000 | | 2,350,340 |
| 4.55%, 08/16/28 | 230,000 | | 226,693 |
| (Variable, U.S. Treasury Yield Curve Rate CMT 1Y + 1.70%), 5.87%, 03/06/29^ | 600,000 | | 615,730 |
| Nationwide Building Society | | | |
| 4.85%, 07/27/27 144A Δ | 650,000 | | 648,867 |
| NatWest Group PLC | | | |
| (Variable, ICE LIBOR USD 3M + 1.76%), 4.27%, 03/22/25^ | 875,000 | | 872,078 |
| | | Par | | Value |
| (Variable, U.S. Treasury Yield Curve Rate CMT 1Y + 2.85%), 7.47%, 11/10/26^ | $ 600,000 | | $ 621,551 |
| (Variable, U.S. Treasury Yield Curve Rate CMT 5Y + 2.10%), 3.75%, 11/01/29^ | 200,000 | | 195,144 |
| (Variable, ICE LIBOR USD 3M + 1.91%), 5.08%, 01/27/30^ | 2,000,000 | | 1,973,113 |
| Royalty Pharma PLC | | | |
| 3.30%, 09/02/40 | 5,000 | | 3,776 |
| 3.55%, 09/02/50Δ | 10,000 | | 7,123 |
| 3.35%, 09/02/51 | 10,000 | | 6,798 |
| Santander UK Group Holdings PLC | | | |
| (Variable, U.S. SOFR + 2.75%), 6.83%, 11/21/26^ | 300,000 | | 305,807 |
| (Variable, U.S. SOFR + 1.48%), 2.90%, 03/15/32^ | 1,200,000 | | 1,027,327 |
| Society of Lloyd's | | | |
| 4.75%, 10/30/24(U) | 100,000 | | 126,275 |
| Virgin Media Secured Finance PLC | | | |
| 5.50%, 05/15/29 144A | 210,000 | | 203,106 |
| Vmed O2 UK Financing I PLC | | | |
| 4.75%, 07/15/31 144A | 220,000 | | 196,785 |
| | | | | 29,160,621 |
Total Foreign Bonds
(Cost $231,539,084) | | 226,258,229 |
| LOAN AGREEMENTS — 0.9% |
| Acrisure LLC 2021-2 Additional Term Loan | | | |
| (Floating, ICE Syn LIBOR USD 3M + 4.25%, 0.50% Floor), 9.90%, 02/15/27† | 197,980 | | 198,846 |
| Ali Group North America Corporation Initial Tranche B Term Loan | | | |
| (Floating, ICE CME Term SOFR USD 1M + 2.00%), 7.47%, 07/30/29† | 119,667 | | 120,011 |
| AmWINS Group, Inc. February 2023 Incremental Term Loan | | | |
| (Floating, ICE CME Term SOFR USD 1M + 2.75%, 0.75% Floor), 8.22%, 02/19/28† | 128,700 | | 129,223 |
| APi Group DE, Inc. Repriced Initial Term Loan | | | |
| (Floating, ICE CME Term SOFR USD 1M + 2.25%), 7.72%, 10/01/26† | 128,645 | | 129,013 |
| Apple Bidco LLC Initial Term Loan | | | |
| (Floating, ICE CME Term SOFR USD 1M + 2.75%, 0.50% Floor), 8.22%, 09/22/28† | 227,677 | | 227,748 |
| Asurion LLC New B-11 Term Loan | | | |
| (Floating, ICE CME Term SOFR USD 1M + 4.25%), 9.71%, 08/19/28† | 257,804 | | 257,253 |
| Asurion LLC New B-9 Term Loan | | | |
| (Floating, ICE CME Term SOFR USD 1M + 3.25%), 8.72%, 07/31/27† | 233,400 | | 232,032 |
See Notes to Financial Statements.
| | | Par | | Value |
| athenahealth Group, Inc. Initial Term Loan | | | |
| (Floating, ICE CME Term SOFR USD 1M + 3.25%, 0.50% Floor), 8.61%, 02/15/29† | $ 922,020 | | $ 919,254 |
| Avolon TLB Borrower 1 LLC Term B-5 Loan | | | |
| (Floating, ICE CME Term SOFR USD 1M + 2.50%, 0.50% Floor), 7.36%, 06/22/28† | 175,050 | | 175,648 |
| Bombardier Recreational Products, Inc. 2023 Replacement Term Loan | | | |
| (Floating, ICE CME Term SOFR USD 1M + 2.75%, 0.50% Floor), 8.11%, 12/13/29† | 247,505 | | 247,762 |
| Brown Group Holding LLC Initial Term Loan | | | |
| (Floating, ICE CME Term SOFR USD 1M + 2.75%, 0.50% Floor), 8.21%, 06/07/28† | 312,294 | | 313,006 |
| Brown Group Holding, LLC Incremental Term B-2 Facility | | | |
| (Floating, ICE CME Term SOFR USD 3M + 3.75%, 0.50% Floor), 9.11%, 07/02/29† | 127,174 | | 127,686 |
| (Floating, ICE CME Term SOFR USD 3M + 3.75%, 0.50% Floor), 9.13%, 07/02/29† | 315,577 | | 316,849 |
| (Floating, ICE CME Term SOFR USD 3M + 3.75%, 0.50% Floor), 9.14%, 07/02/29† | 149,749 | | 150,353 |
| Castlelake Aviation One Designated Activity Co. Initial Term Loan | | | |
| (Floating, ICE CME Term SOFR USD 3M + 2.75%), 8.15%, 10/22/26† | 136,015 | | 136,450 |
| Century De Buyer LLC Initial Term Loan | | | |
| (Floating, ICE CME Term SOFR USD 3M + 4.00%), 9.39%, 10/30/30† | 550,000 | | 552,406 |
| Charter Communications Operating LLC Term B-2 Loan | | | |
| (Floating, ICE CME Term SOFR USD 3M + 1.75%), 7.13%, 02/01/27† | 125,732 | | 125,890 |
| Citadel Securities LP 2023 Term Loan | | | |
| 0.00%, 07/29/30† Σ | 698,289 | | 700,761 |
| (Floating, ICE CME Term SOFR USD 1M + 2.50%), 7.97%, 07/29/30† | 1,017,717 | | 1,021,320 |
| Citco Funding LLC Additional 2023 Term B Loan | | | |
| (Floating, ICE CME Term SOFR USD 3M + 3.25%, 0.50% Floor), 8.64%, 04/27/28† | 798,000 | | 801,866 |
| Clarios Global LP 2023 Term Loan | | | |
| (Floating, ICE CME Term SOFR USD 1M + 3.75%), 9.11%, 05/06/30† | 169,575 | | 170,169 |
| Cloudera, Inc. Initial Term Loan | | | |
| (Floating, ICE CME Term SOFR USD 1M + 3.75%, 0.50% Floor), 9.21%, 10/08/28† | 216,150 | | 214,664 |
| | | Par | | Value |
| Coherent Corporation Initial Term B Loan | | | |
| (Floating, ICE CME Term SOFR USD 1M + 2.75%, 0.50% Floor), 8.22%, 07/02/29† | $ 461,059 | | $ 463,652 |
| CP Atlas Buyer, Inc. Term B Loan | | | |
| (Floating, ICE CME Term SOFR USD 1M + 3.75%, 0.50% Floor), 9.21%, 11/23/27† | 148,514 | | 146,487 |
| DCert Buyer, Inc. Initial Term Loan | | | |
| (Floating, ICE CME Term SOFR USD 1M + 4.00%), 9.36%, 10/16/26† | 721,180 | | 716,305 |
| Emrld Borrower LP Initial Term B Loan | | | |
| (Floating, ICE CME Term SOFR USD 1M + 3.00%), 8.36%, 05/31/30† | 369,075 | | 370,806 |
| EyeCare Partners LLC Amendment No. 1 Term Loan | | | |
| (Floating, ICE CME Term SOFR USD 3M + 3.75%, 0.50% Floor), 9.39%, 11/15/28† | 589,500 | | 292,645 |
| First Brands Group LLC 2021 Term Loan | | | |
| (Floating, ICE CME Term SOFR USD 6M + 5.00%, 1.00% Floor), 10.88%, 03/30/27† | 589,394 | | 585,710 |
| Focus Financial Partners LLC Tranche B-5 Term Loan | | | |
| (Floating, ICE CME Term SOFR USD 1M + 3.25%, 0.50% Floor), 8.61%, 06/30/28† | 83,896 | | 84,184 |
| Gen Digital, Inc. Initial Tranche B Term Loan | | | |
| (Floating, ICE CME Term SOFR USD 1M + 2.00%, 0.50% Floor), 7.46%, 09/12/29† | 631,840 | | 633,518 |
| Genesee & Wyoming, Inc. Initial Term Loan | | | |
| (Floating, ICE CME Term SOFR USD 3M + 2.00%), 7.45%, 12/30/26† | 702,724 | | 705,191 |
| GTCR W Merger Sub LLC (USD) Term Loan B | | | |
| 0.00%, 09/20/30† Σ | 1,000,000 | | 1,005,625 |
| Harbor Freight Tools U.S.A., Inc. Initial Loan | | | |
| (Floating, ICE CME Term SOFR USD 1M + 2.75%, 0.50% Floor), 8.22%, 10/19/27† | 730,692 | | 730,824 |
| HighTower Holding LLC Initial Term Loan | | | |
| (Floating, ICE CME Term SOFR USD 1M + 4.00%, 0.75% Floor), 9.64%, 04/21/28† | 150,000 | | 149,688 |
| HV Eight LLC Loan | | | |
| (Floating, ICE USD CHECK + 3.50%, 1.00% Floor), 7.43%, 11/22/27† | 918,418 | | 1,013,888 |
See Notes to Financial Statements.
MEDIUM-DURATION BOND FUND
SCHEDULE OF INVESTMENTS (Continued)
| | | Par | | Value |
| Iron Mountain Information Management LLC Amendment No.1 Incremental Term B Loan | | | |
| 0.00%, 01/31/31† Σ | $ 850,000 | | $ 851,330 |
| ISolved, Inc. Closing Date Term Loan | | | |
| (Floating, ICE CME Term SOFR USD 6M + 4.00%, 0.50% Floor), 9.48%, 10/14/30† | 500,000 | | 501,562 |
| Medline Borrower LP Initial Dollar Term Loan | | | |
| (Floating, ICE CME Term SOFR USD 1M + 3.00%, 0.50% Floor), 8.47%, 10/23/28† | 625,227 | | 629,085 |
| Mileage Plus Holdings LLC Initial Term Loan | | | |
| (Floating, ICE CME Term SOFR USD 3M + 5.25%, 1.00% Floor), 10.77%, 06/21/27† | 1,055,600 | | 1,093,301 |
| NA Rail Hold Co. LLC Tranche B-2 Term Loan | | | |
| (Floating, ICE CME Term SOFR USD 3M + 4.00%), 9.61%, 10/19/26† | 797,927 | | 799,423 |
| New Trojan Parent, Inc. Initial Term Loan | | | |
| (Floating, ICE CME Term SOFR USD 1M + 3.25%), 8.72%, 01/06/28† | 491,184 | | 135,427 |
| Nexstar Media, Inc. Term B-4 Loan | | | |
| (Floating, ICE CME Term SOFR USD 1M + 2.50%), 7.97%, 09/18/26† | 252,471 | | 252,905 |
| Peraton Corporation Term B Loan | | | |
| (Floating, ICE CME Term SOFR USD 1M + 3.75%, 0.75% Floor), 9.21%, 02/01/28† | 702,423 | | 705,057 |
| PMH Newco LP Term Loan | | | |
| (Floating, ICE CME Term SOFR USD 3M + 3.15%), 8.50%, 01/26/27† | 1,165,119 | | 1,165,119 |
| PMH SPV - C LLC Term Loan | | | |
| (Floating, ICE CME Term SOFR USD 3M + 3.15%), 8.50%, 01/26/27† | 376,829 | | 376,829 |
| QUIKRETE Holdings, Inc. Fourth Amendment Loan | | | |
| (Floating, ICE CME Term SOFR USD 1M + 2.75%), 8.22%, 03/19/29† | 356,373 | | 357,857 |
| Summit Materials LLC Incremental Term Loan B | | | |
| 0.00%, 11/30/28† Σ | 400,000 | | 401,752 |
| UFC Holdings LLC Term B-3 Loan | | | |
| (Floating, ICE CME Term SOFR USD 3M + 2.75%, 0.75% Floor), 8.40%, 04/29/26† | 334,489 | | 336,138 |
| USIC Holdings, Inc. Initial Term Loan | | | |
| (Floating, ICE CME Term SOFR USD 3M + 3.50%, 0.75% Floor), 8.85%, 05/12/28† | 294,718 | | 292,950 |
| | | Par | | Value |
| Verscend Holding Corporation Term B-1 Loan | | | |
| (Floating, ICE CME Term SOFR USD 1M + 4.00%), 9.47%, 08/27/25† | $ 203,688 | | $ 204,621 |
| VFH Parent LLC Initial Term Loan | | | |
| (Floating, ICE CME Term SOFR USD 1M + 3.00%, 0.50% Floor), 8.46%, 01/13/29† | 268,645 | | 269,551 |
Total Loan Agreements
(Cost $22,901,154) | | | 22,539,640 |
| MORTGAGE-BACKED SECURITIES — 44.4% |
| 280 Park Avenue Mortgage Trust, Series 2017-280P, Class A | | | |
| (Floating, CME Term SOFR 1M + 1.18%, 1.13% Floor), 6.54%, 09/15/34 144A † | 1,510,000 | | 1,452,014 |
| 3650R Commercial Mortgage Trust, Series 2021-PF1, Class AS | | | |
| 2.78%, 11/15/54 | 750,000 | | 587,065 |
| Alba PLC, Series 2007-1, Class A3 | | | |
| (Floating, SONIA Interest Rate + 0.29%), 5.51%, 03/17/39(U) † | 391,358 | | 484,872 |
| Alternative Loan Trust, Series 2006-OA11, Class A1B | | | |
| (Floating, CME Term SOFR 1M + 0.49%, 0.38% Floor), 5.85%, 09/25/46† | 147,654 | | 137,002 |
| Angel Oak Mortgage Trust, Series 2021-6, Class A1 | | | |
| 1.46%, 09/25/66 144A | 450,948 | | 365,253 |
| Angel Oak Mortgage Trust, Series 2023-1, Class A1 | | | |
| (Step to 4.81% on 02/25/27), 4.75%, 09/26/67 144A STEP | 1,100,857 | | 1,081,671 |
| Arbor Multifamily Mortgage Securities Trust, Series 2020-MF1, Class A5 | | | |
| 2.75%, 05/15/53 144A | 1,300,000 | | 1,151,370 |
| Atlas Funding PLC, Series 2021-1, Class A | | | |
| (Floating, SONIA Interest Rate + 0.90%), 6.12%, 07/25/58(U) † | 1,271,946 | | 1,622,411 |
| BAMLL Commercial Mortgage Securities Trust, Series 2020-BOC, Class A | | | |
| 2.63%, 01/15/32 144A | 1,750,000 | | 1,363,617 |
| BAMLL Commercial Mortgage Securities Trust, Series 2021-JACX, Class A | | | |
| (Floating, CME Term SOFR 1M + 1.16%, 1.05% Floor), 6.53%, 09/15/38 144A † | 2,300,000 | | 2,177,380 |
| Banc of America Funding Trust, Series 2005-D, Class A1 | | | |
| 4.67%, 05/25/35† γ | 168,202 | | 155,802 |
See Notes to Financial Statements.
| | | Par | | Value |
| Banc of America Mortgage Trust, Series 2004-F, Class 1A1 | | | |
| 5.27%, 07/25/34† γ | $ 17,408 | | $ 15,960 |
| BANK, Series 2017-BNK9, Class XA | | | |
| 0.76%, 11/15/54† IO γ | 7,802,362 | | 173,300 |
| BANK, Series 2022-BNK40, Class A4 | | | |
| 3.39%, 03/15/64† γ | 2,100,000 | | 1,879,670 |
| BANK, Series 2022-BNK43, Class A5 | | | |
| 4.40%, 08/15/55 | 1,000,000 | | 958,043 |
| BANK, Series 2022-BNK44, Class A5 | | | |
| 5.75%, 11/15/55† γ | 290,000 | | 307,070 |
| BANK, Series 2023-BNK46, Class A4 | | | |
| 5.75%, 08/15/56 | 1,760,000 | | 1,857,896 |
| BANK5, Series 2023-5YR2, Class A3 | | | |
| 6.66%, 07/15/56 | 1,400,000 | | 1,484,789 |
| BANK5, Series 2023-5YR3, Class A3 | | | |
| 6.72%, 09/15/56 | 850,000 | | 907,645 |
| BANK5, Series 2023-5YR4, Class A3 | | | |
| 6.50%, 12/15/56 | 300,000 | | 317,932 |
| BANK5, Series 2023-5YR4, Class AS | | | |
| 7.27%, 12/15/56 | 400,000 | | 426,321 |
| BBCCRE Trust, Series 2015-GTP, Class A | | | |
| 3.97%, 08/10/33 144A | 1,600,000 | | 1,490,463 |
| BBCCRE Trust, Series 2015-GTP, Class D | | | |
| 4.56%, 08/10/33 144A † γ | 390,000 | | 313,860 |
| BBCMS Mortgage Trust, Series 2018-C2, Class A5 | | | |
| 4.31%, 12/15/51 | 1,700,000 | | 1,646,430 |
| BBCMS Mortgage Trust, Series 2020-C6, Class ASB | | | |
| 2.60%, 02/15/53 | 1,800,000 | | 1,666,911 |
| BBCMS Mortgage Trust, Series 2023-5C23, Class A3 | | | |
| 6.68%, 12/15/56 | 1,850,000 | | 1,977,264 |
| BBCMS Mortgage Trust, Series 2023-5C23, Class AS | | | |
| 7.70%, 12/15/56† γ | 650,000 | | 690,383 |
| BBCMS Mortgage Trust, Series 2023-C21, Class AS | | | |
| 6.30%, 09/15/56† γ | 675,000 | | 703,523 |
| Bear Stearns ALT-A Trust, Series 2005-4, Class 23A2 | | | |
| 4.48%, 05/25/35† γ | 64,464 | | 60,469 |
| Bear Stearns ARM Trust, Series 2002-11, Class 1A1 | | | |
| 6.34%, 02/25/33† γ | 1,930 | | 1,907 |
| Bear Stearns Structured Products, Inc. Trust, Series 2007-R6, Class 1A1 | | | |
| 4.77%, 01/26/36† γ | 170,708 | | 136,596 |
| Benchmark Mortgage Trust, Series 2018-B3, Class A5 | | | |
| 4.03%, 04/10/51 | 420,000 | | 398,663 |
| | | Par | | Value |
| Benchmark Mortgage Trust, Series 2019-B9, Class A5 | | | |
| 4.02%, 03/15/52 | $1,800,000 | | $1,685,166 |
| Benchmark Mortgage Trust, Series 2020-B20, Class XA | | | |
| 1.61%, 10/15/53† IO γ | 3,465,481 | | 230,946 |
| Benchmark Mortgage Trust, Series 2021-B28, Class XA | | | |
| 1.27%, 08/15/54† IO γ | 3,829,640 | | 252,643 |
| Benchmark Mortgage Trust, Series 2023-B38, Class A4 | | | |
| 5.52%, 04/15/56 | 300,000 | | 310,099 |
| Benchmark Mortgage Trust, Series 2023-B39, Class A5 | | | |
| 5.75%, 07/15/56 | 950,000 | | 1,003,741 |
| Benchmark Mortgage Trust, Series 2023-V3, Class A3 | | | |
| 6.36%, 07/15/56 | 320,000 | | 335,922 |
| Blue Owl GP Stakes V Issuer A | | | |
| 7.21%, 08/22/43 | 374,250 | | 373,644 |
| Blue Owl GP Stakes V Issuer B, Class A2 | | | |
| 7.21%, 08/22/43 | 375,750 | | 375,141 |
| BMO Mortgage Trust, Series 2022-C3, Class A5 | | | |
| 5.31%, 09/15/54 | 275,000 | | 280,532 |
| BMO Mortgage Trust, Series 2023-C5, Class A5 | | | |
| 5.77%, 06/15/56 | 1,200,000 | | 1,269,139 |
| BMO Mortgage Trust, Series 2023-C7, Class A5 | | | |
| 6.16%, 12/15/56 | 2,100,000 | | 2,287,900 |
| BRAVO Residential Funding Trust, Series 2022-NQM3, Class A1 | | | |
| 5.11%, 07/25/62 144A † γ | 262,327 | | 263,516 |
| BWAY Mortgage Trust, Series 2021-1450, Class A | | | |
| (Floating, CME Term SOFR 1M + 1.36%, 1.25% Floor), 6.73%, 09/15/36 144A † | 2,300,000 | | 2,106,544 |
| BX Commercial Mortgage Trust, Series 2019-XL, Class F | | | |
| (Floating, CME Term SOFR 1M + 2.11%, 2.00% Floor), 7.48%, 10/15/36 144A † | 1,249,500 | | 1,240,680 |
| BX Commercial Mortgage Trust, Series 2021-21M, Class A | | | |
| (Floating, CME Term SOFR 1M + 0.84%, 0.73% Floor), 6.21%, 10/15/36 144A † | 1,552,304 | | 1,523,688 |
| BX Commercial Mortgage Trust, Series 2021-VOLT, Class D | | | |
| (Floating, CME Term SOFR 1M + 1.76%, 1.65% Floor), 7.13%, 09/15/36 144A † | 1,350,000 | | 1,300,043 |
| BX Trust, Series 2023-DELC, Class B | | | |
| (Floating, CME Term SOFR 1M + 3.34%, 3.34% Floor), 8.70%, 05/15/38 144A † | 500,000 | | 502,142 |
See Notes to Financial Statements.
MEDIUM-DURATION BOND FUND
SCHEDULE OF INVESTMENTS (Continued)
| | | Par | | Value |
| Cantor Commercial Real Estate Lending, Series 2019-CF1, Class A2 | | | |
| 3.62%, 05/15/52 | $ 630,000 | | $ 597,623 |
| CD Mortgage Trust, Series 2017-CD3, Class A4 | | | |
| 3.63%, 02/10/50 | 250,000 | | 232,476 |
| CFMT LLC, Series 2022-HB8, Class M2 | | | |
| 3.75%, 04/25/25 144A | 2,500,000 | | 2,358,036 |
| CHL Mortgage Pass-Through Trust, Series 2003-58, Class 2A2 | | | |
| 6.03%, 02/19/34† γ | 109,278 | | 105,572 |
| CIM Trust, Series 2023-R4, Class A1 | | | |
| 5.00%, 05/25/62 144A † γ | 618,474 | | 608,671 |
| Citigroup Commercial Mortgage Trust, Series 2014-GC23, Class B | | | |
| 4.18%, 07/10/47 | 370,000 | | 352,909 |
| Citigroup Commercial Mortgage Trust, Series 2016-C1, Class A4 | | | |
| 3.21%, 05/10/49 | 330,000 | | 312,440 |
| Citigroup Commercial Mortgage Trust, Series 2019-C7, Class A4 | | | |
| 3.10%, 12/15/72 | 360,000 | | 323,300 |
| Citigroup Commercial Mortgage Trust, Series 2019-GC41, Class A5 | | | |
| 2.87%, 08/10/56 | 1,450,000 | | 1,289,287 |
| Citigroup Commercial Mortgage Trust, Series 2021-KEYS, Class A | | | |
| (Floating, CME Term SOFR 1M + 1.29%, 1.18% Floor), 6.66%, 10/15/36 144A † | 2,300,000 | | 2,267,396 |
| Citigroup Commercial Mortgage Trust, Series 2023-PRM3, Class A | | | |
| 6.36%, 07/10/28 144A † γ | 900,000 | | 927,054 |
| Citigroup Mortgage Loan Trust, Series 2022-A, Class A1 | | | |
| (Step to 9.17% on 09/25/25), 6.17%, 09/25/62 144A STEP | 1,085,337 | | 1,090,505 |
| COLT Mortgage Loan Trust, Series 2023-3, Class A1 | | | |
| (Step to 7.58% on 10/25/27), 7.18%, 09/25/68 144A STEP | 1,575,088 | | 1,616,422 |
| COLT Mortgage Loan Trust, Series 2023-3, Class A3 | | | |
| (Step to 7.58% on 02/25/25), 7.58%, 09/25/68 144A STEP | 787,544 | | 798,456 |
| COMM Mortgage Trust, Series 2013-CR6, Class B | | | |
| 3.40%, 03/10/46 144A | 181,281 | | 158,654 |
| COMM Mortgage Trust, Series 2014-277P, Class A | | | |
| 3.61%, 08/10/49 144A † γ | 160,000 | | 148,638 |
| COMM Mortgage Trust, Series 2014-UBS6, Class A5 | | | |
| 3.64%, 12/10/47 | 2,400,000 | | 2,339,790 |
| | | Par | | Value |
| COMM Mortgage Trust, Series 2020-CX, Class B | | | |
| 2.45%, 11/10/46 144A | $1,060,000 | | $859,013 |
| Connecticut Avenue Securities Trust, Series 2018-R07, Class 1M2 | | | |
| (Floating, U.S. 30-Day Average SOFR + 2.51%), 7.85%, 04/25/31 144A † | 5,939 | | 5,950 |
| Connecticut Avenue Securities Trust, Series 2019-R03, Class 1B1 | | | |
| (Floating, U.S. 30-Day Average SOFR + 4.21%), 9.55%, 09/25/31 144A † | 896,928 | | 944,468 |
| Connecticut Avenue Securities Trust, Series 2019-R05, Class 1B1 | | | |
| (Floating, U.S. 30-Day Average SOFR + 4.21%), 9.55%, 07/25/39 144A † | 841,020 | | 873,568 |
| Connecticut Avenue Securities Trust, Series 2021-R01, Class 1B1 | | | |
| (Floating, U.S. 30-Day Average SOFR + 3.10%), 8.44%, 10/25/41 144A † | 310,000 | | 313,061 |
| Connecticut Avenue Securities Trust, Series 2021-R01, Class 1M2 | | | |
| (Floating, U.S. 30-Day Average SOFR + 1.55%), 6.89%, 10/25/41 144A † | 589,000 | | 588,979 |
| Connecticut Avenue Securities Trust, Series 2021-R03, Class 1M2 | | | |
| (Floating, U.S. 30-Day Average SOFR + 1.65%, 1.65% Floor), 6.99%, 12/25/41 144A † | 245,000 | | 241,962 |
| Connecticut Avenue Securities Trust, Series 2023-R03, Class 2M2 | | | |
| (Floating, U.S. 30-Day Average SOFR + 3.90%), 9.24%, 04/25/43 144A † | 229,179 | | 245,776 |
| Connecticut Avenue Securities Trust, Series 2023-R05, Class 1M2 | | | |
| (Floating, U.S. 30-Day Average SOFR + 3.10%, 3.10% Floor), 8.44%, 06/25/43 144A † | 510,000 | | 533,740 |
| Connecticut Avenue Securities Trust, Series 2023-R06, Class 1M2 | | | |
| (Floating, U.S. 30-Day Average SOFR + 2.70%), 8.04%, 07/25/43 144A † | 190,000 | | 194,075 |
| Connecticut Avenue Securities Trust, Series 2023-R08, Class 1B1 | | | |
| (Floating, U.S. 30-Day Average SOFR + 3.55%), 8.89%, 10/25/43 144A † | 610,000 | | 619,905 |
| Connecticut Avenue Securities Trust, Series 2023-R08, Class 1M2 | | | |
| (Floating, U.S. 30-Day Average SOFR + 2.50%), 7.84%, 10/25/43 144A † | 545,000 | | 558,886 |
See Notes to Financial Statements.
| | | Par | | Value |
| CRSNT Trust, Series 2021-MOON, Class A | | | |
| (Floating, CME Term SOFR 1M + 0.93%, 0.82% Floor), 6.30%, 04/15/36 144A † | $2,500,000 | | $2,396,826 |
| CSAIL Commercial Mortgage Trust, Series 2021-C20, Class A3 | | | |
| 2.80%, 03/15/54 | 800,000 | | 673,558 |
| CSMC Trust, Series 2010-16, Class B9 | | | |
| 4.35%, 06/25/50 144A † γ | 1,862,033 | | 1,572,120 |
| CSMC Trust, Series 2018-J1, Class A2 | | | |
| 3.50%, 02/25/48 144A † γ | 855,222 | | 760,911 |
| CSMC Trust, Series 2020-RPL5, Class A1 | | | |
| 4.66%, 08/25/60 144A † γ | 559,045 | | 566,782 |
| CSMC Trust, Series 2021-JR2, Class A1 | | | |
| 2.22%, 11/25/61 144A † γ | 755,534 | | 731,137 |
| CSMC, Series 2017-TIME, Class A | | | |
| 3.65%, 11/13/39 144A | 530,000 | | 459,846 |
| CSMC, Series 2020-FACT, Class D | | | |
| (Floating, CME Term SOFR 1M + 4.07%, 3.71% Floor), 9.44%, 10/15/37 144A † | 670,000 | | 619,311 |
| CSMC, Series 2020-NET, Class A | | | |
| 2.26%, 08/15/37 144A | 1,916,302 | | 1,774,658 |
| CSMC, Series 2020-NET, Class B | | | |
| 2.82%, 08/15/37 144A | 650,000 | | 600,144 |
| CSMC, Series 2021-ADV, Class A | | | |
| (Floating, CME Term SOFR 1M + 1.51%, 1.40% Floor), 6.88%, 07/15/38 144A † | 2,600,000 | | 2,301,251 |
| CSMC, Series 2021-NQM4, Class A1 | | | |
| 1.10%, 05/25/66 144A | 1,296,600 | | 1,078,746 |
| CSMC, Series 2021-NQM8, Class A1 | | | |
| 1.84%, 10/25/66 144A † γ | 270,402 | | 228,936 |
| CSWF, Series 2021-SOP2, Class A | | | |
| (Floating, CME Term SOFR 1M + 1.08%, 0.97% Floor), 6.44%, 06/15/34 144A † | 1,021,149 | | 945,178 |
| DBJPM Mortgage Trust, Series 2016-C3, Class A4 | | | |
| 2.63%, 08/10/49 | 219,907 | | 204,696 |
| Deutsche Alt-A Securities, Inc. Mortgage Loan Trust, Series 2006-AR1, Class 3A1 | | | |
| 4.36%, 02/25/36† γ | 483,976 | | 317,416 |
| DOLP Trust, Series 2021-NYC, Class A | | | |
| 2.96%, 05/10/41 144A | 3,400,000 | | 2,813,061 |
| DTP Commercial Mortgage Trust, Series 2023-STE2, Class A | | | |
| 6.04%, 01/15/41 144A † γ | 500,000 | | 494,294 |
| EFMT, Series 2023-1, Class A2 | | | |
| (Step to 6.88% on 02/25/27), 6.24%, 02/25/68 144A STEP | 1,156,696 | | 1,148,524 |
| Ellington Financial Mortgage Trust, Series 2021-2, Class A3 | | | |
| 1.29%, 06/25/66 144A | 953,447 | | 761,842 |
| | | Par | | Value |
| ELP Commercial Mortgage Trust, Series 2021-ELP, Class A | | | |
| (Floating, CME Term SOFR 1M + 0.82%, 0.70% Floor), 6.18%, 11/15/38 144A † | $ 839,023 | | $ 824,054 |
| EQUS Mortgage Trust, Series 2021-EQAZ, Class A | | | |
| (Floating, CME Term SOFR 1M + 0.87%, 0.76% Floor), 6.23%, 10/15/38 144A † | 1,099,978 | | 1,079,077 |
| Eurohome UK Mortgages PLC, Series 2007-1, Class A | | | |
| (Floating, ICE LIBOR GBP 3M + 0.15%), 5.49%, 06/15/44(U) † | 606,936 | | 759,491 |
| Extended Stay America Trust, Series 2021-ESH, Class A | | | |
| (Floating, CME Term SOFR 1M + 1.19%, 1.08% Floor), 6.56%, 07/15/38 144A † | 6,254,048 | | 6,200,989 |
| Federal Home Loan Mortgage Corporation | | | |
| 8.00%, 08/01/24 | 45 | | 45 |
| 5.50%, 02/01/27 | 4,201 | | 4,226 |
| 4.50%, 10/01/29 | 517 | | 513 |
| 7.50%, 11/01/29 | 1,155 | | 1,193 |
| 7.50%, 12/01/29 | 1,278 | | 1,323 |
| (Floating, U.S. Treasury Yield Curve Rate CMT 1Y + 2.23%, 2.23% Floor, 11.36% Cap), 6.23%, 07/01/31† | 1,838 | | 1,831 |
| 7.50%, 11/01/31 | 5,701 | | 5,716 |
| (Floating, Refinitiv USD IBOR Consumer Cash Fallbacks 1Y Index + 1.98%, 1.98% Floor, 10.60% Cap), 5.35%, 04/01/32† | 176 | | 174 |
| 4.00%, 09/01/32 | 100,000 | | 96,512 |
| 3.50%, 08/01/33 | 262,819 | | 252,671 |
| 4.22%, 08/01/33 | 100,000 | | 97,837 |
| 5.00%, 08/01/33 | 1,635 | | 1,666 |
| 5.00%, 09/01/33 | 271 | | 276 |
| 5.00%, 10/01/33 | 907 | | 924 |
| (Floating, U.S. Treasury Yield Curve Rate CMT 1Y + 2.37%, 2.37% Floor, 9.23% Cap), 4.68%, 03/01/34† | 515 | | 510 |
| 5.00%, 12/01/34 | 18,442 | | 18,795 |
| 5.00%, 07/01/35 | 1,271 | | 1,295 |
| 5.00%, 11/01/35 | 38,630 | | 39,368 |
| 5.50%, 11/01/35 | 7,426 | | 7,667 |
| 5.00%, 12/01/35 | 3,688 | | 3,758 |
| 5.00%, 02/01/37 | 4,401 | | 4,486 |
| 5.50%, 07/01/37 | 9,136 | | 9,433 |
| 3.00%, 04/01/38 | 37,700 | | 35,010 |
| 5.50%, 04/01/38 | 2,336 | | 2,412 |
| 7.00%, 03/01/39 | 5,124 | | 5,469 |
| 6.50%, 09/01/39 | 11,317 | | 11,887 |
| 2.00%, 10/01/40 | 633,422 | | 545,736 |
| 1.50%, 11/01/40 | 950,433 | | 794,859 |
| 4.00%, 02/01/41 | 13,947 | | 13,624 |
| 2.50%, 04/01/41 | 73,889 | | 65,877 |
See Notes to Financial Statements.
MEDIUM-DURATION BOND FUND
SCHEDULE OF INVESTMENTS (Continued)
| | | Par | | Value |
| 1.50%, 05/01/41 | $1,377,585 | | $1,144,971 |
| 5.00%, 06/01/41 | 872 | | 888 |
| 1.50%, 07/01/41 | 1,074,297 | | 891,224 |
| 2.00%, 07/01/41 | 625,514 | | 537,165 |
| 2.00%, 09/01/41 | 1,147,005 | | 982,603 |
| 1.50%, 10/01/41 | 67,948 | | 56,368 |
| 2.00%, 10/01/41 | 333,716 | | 285,750 |
| 1.50%, 11/01/41 | 17,146 | | 14,224 |
| 2.00%, 11/01/41 | 332,674 | | 286,504 |
| 2.00%, 12/01/41 | 425,157 | | 363,654 |
| 2.00%, 01/01/42 | 86,564 | | 73,960 |
| 2.50%, 03/01/42 | 174,543 | | 155,414 |
| 2.00%, 04/01/42 | 853,626 | | 732,117 |
| 2.00%, 08/01/42 | 493,889 | | 422,128 |
| 3.50%, 10/01/42 | 44,369 | | 41,850 |
| 4.00%, 10/01/42 | 14,617 | | 14,244 |
| 3.50%, 11/01/42 | 94,494 | | 89,000 |
| 3.50%, 12/01/42 | 6,380 | | 6,018 |
| 3.50%, 01/01/43 | 13,355 | | 12,413 |
| 3.50%, 02/01/43 | 67,036 | | 63,116 |
| 4.00%, 04/01/43 | 42,905 | | 41,820 |
| 3.50%, 05/01/43 | 154,872 | | 146,384 |
| 4.00%, 05/01/43 | 21,981 | | 21,387 |
| 4.00%, 06/01/43 | 21,897 | | 21,365 |
| 4.00%, 07/01/43 | 88,532 | | 86,381 |
| 4.00%, 08/01/43 | 34,443 | | 33,572 |
| 4.50%, 12/01/43 | 286,953 | | 287,011 |
| 3.50%, 02/01/44 | 21,149 | | 19,896 |
| 4.50%, 02/01/44 | 210,455 | | 210,645 |
| 4.50%, 03/01/44 | 61,441 | | 60,960 |
| 3.50%, 03/01/45 | 204,899 | | 193,263 |
| 4.00%, 12/01/45 | 111,481 | | 107,806 |
| 3.50%, 06/01/46 | 22,579 | | 21,234 |
| 4.00%, 09/01/46 | 124,097 | | 120,007 |
| (Floating, U.S. Treasury Yield Curve Rate CMT 5Y + 1.29%, 1.29% Floor, 7.20% Cap), 2.11%, 03/01/47† | 298,268 | | 279,022 |
| 4.50%, 03/01/47 | 91,840 | | 91,587 |
| 3.50%, 04/01/47 | 3,856,299 | | 3,626,818 |
| 4.00%, 07/01/47 | 116,677 | | 112,830 |
| 4.00%, 08/01/47 | 43,825 | | 42,367 |
| (Floating, Refinitiv USD IBOR Consumer Cash Fallbacks 1Y Index + 1.62%, 1.62% Floor, 7.87% Cap), 2.87%, 11/01/47† | 219,842 | | 211,079 |
| 3.50%, 03/01/48 | 44,591 | | 41,766 |
| 4.00%, 03/01/48 | 26,285 | | 25,355 |
| 4.00%, 06/01/48 | 1,021,716 | | 987,500 |
| 4.50%, 08/01/48 | 499,731 | | 494,324 |
| 5.00%, 08/01/48 | 5,478 | | 5,524 |
| (Floating, Refinitiv USD IBOR Consumer Cash Fallbacks 1Y Index + 1.63%, 1.63% Floor, 8.01% Cap), 3.01%, 11/01/48† | 799,117 | | 758,972 |
| 3.00%, 02/01/49 | 848,079 | | 776,841 |
| 3.50%, 07/01/49 | 94,786 | | 88,670 |
| 4.00%, 07/01/49 | 313,455 | | 302,345 |
| 3.00%, 09/01/49 | 1,690,507 | | 1,523,766 |
| | | Par | | Value |
| 4.50%, 09/01/49 | $ 243,977 | | $ 240,113 |
| 3.00%, 11/01/49 | 225,738 | | 203,667 |
| 4.50%, 12/01/49 | 328,378 | | 322,711 |
| (Floating, Refinitiv USD IBOR Consumer Cash Fallbacks 1Y Index + 1.62%, 1.62% Floor, 8.10% Cap), 3.10%, 02/01/50† | 109,270 | | 103,695 |
| 4.00%, 03/01/50 | 3,269,924 | | 3,136,109 |
| 4.50%, 03/01/50 | 7,601,428 | | 7,502,227 |
| 4.50%, 05/01/50 | 172,679 | | 169,306 |
| 2.50%, 07/01/50 | 617,102 | | 534,867 |
| 4.00%, 07/01/50 | 93,564 | | 90,352 |
| 3.00%, 08/01/50 | 1,822,840 | | 1,635,223 |
| 2.00%, 09/01/50 | 1,378,155 | | 1,134,544 |
| 4.50%, 09/01/50 | 485,097 | | 477,266 |
| 2.00%, 11/01/50 | 530,417 | | 440,320 |
| 2.50%, 11/01/50 | 466,139 | | 404,082 |
| 2.50%, 12/01/50 | 1,507,545 | | 1,300,633 |
| 3.00%, 12/01/50 | 2,453,272 | | 2,211,897 |
| 3.50%, 12/01/50 | 665,953 | | 618,639 |
| 2.00%, 01/01/51 | 2,350,199 | | 1,934,512 |
| 4.50%, 01/01/51 | 208,591 | | 205,824 |
| 1.50%, 02/01/51 | 247,902 | | 194,074 |
| 2.00%, 02/01/51 | 1,039,686 | | 863,215 |
| 2.50%, 02/01/51 | 933,392 | | 800,241 |
| 2.00%, 03/01/51 | 936,953 | | 780,477 |
| 2.00%, 04/01/51 | 286,261 | | 240,371 |
| 2.00%, 05/01/51 | 4,437,561 | | 3,651,155 |
| 2.50%, 05/01/51 | 8,041,631 | | 6,923,036 |
| 2.50%, 07/01/51 | 261,132 | | 221,890 |
| 2.50%, 08/01/51 | 834,571 | | 720,353 |
| 2.00%, 09/01/51 | 171,610 | | 142,430 |
| 2.50%, 09/01/51 | 1,830,829 | | 1,570,462 |
| 2.50%, 10/01/51 | 529,851 | | 455,081 |
| 2.00%, 11/01/51 | 699,074 | | 575,616 |
| 2.50%, 11/01/51 | 3,752,863 | | 3,223,091 |
| 2.50%, 12/01/51 | 81,494 | | 69,897 |
| 3.00%, 12/01/51 | 91,856 | | 82,115 |
| 2.00%, 01/01/52 | 5,327,915 | | 4,358,031 |
| 2.50%, 01/01/52 | 2,236,151 | | 1,929,113 |
| 3.50%, 01/01/52 | 21,163 | | 19,521 |
| 2.00%, 02/01/52 | 1,005,201 | | 822,250 |
| 2.50%, 02/01/52 | 263,630 | | 227,546 |
| 1.50%, 03/01/52 | 129,320 | | 100,837 |
| 2.00%, 03/01/52 | 16,200,682 | | 13,251,540 |
| 3.00%, 03/01/52 | 177,779 | | 157,640 |
| 4.50%, 03/01/52 | 202,581 | | 196,727 |
| 2.50%, 04/01/52 | 2,738,570 | | 2,363,738 |
| 3.00%, 04/01/52 | 1,155,798 | | 1,024,936 |
| 4.00%, 04/01/52 | 1,589,788 | | 1,516,078 |
| 5.00%, 05/01/52 | 41,372 | | 41,479 |
| 3.00%, 06/01/52 | 935,116 | | 829,112 |
| 3.50%, 06/01/52 | 185,337 | | 170,324 |
| 4.00%, 06/01/52 | 1,097,789 | | 1,049,367 |
| 4.50%, 06/01/52 | 270,191 | | 263,579 |
| 5.00%, 06/01/52 | 900,358 | | 904,722 |
| 3.00%, 07/01/52 | 1,750,617 | | 1,552,224 |
See Notes to Financial Statements.
| | | Par | | Value |
| 3.50%, 07/01/52 | $ 960,253 | | $ 882,526 |
| 5.00%, 07/01/52 | 2,163,411 | | 2,166,887 |
| 5.00%, 08/01/52 | 27,431 | | 27,450 |
| 5.00%, 09/01/52 | 924,313 | | 916,986 |
| 4.50%, 11/01/52 | 746,034 | | 726,242 |
| 5.00%, 11/01/52 | 187,578 | | 186,761 |
| 6.00%, 11/01/52 | 1,059,225 | | 1,093,812 |
| 5.00%, 12/01/52 | 187,159 | | 185,588 |
| 5.50%, 12/01/52 | 95,664 | | 96,350 |
| 6.00%, 12/01/52 | 449,079 | | 458,244 |
| 5.00%, 01/01/53 | 276,980 | | 274,784 |
| 5.50%, 01/01/53 | 285,561 | | 288,831 |
| 6.00%, 01/01/53 | 1,855,668 | | 1,910,329 |
| 6.50%, 01/01/53 | 249,665 | | 256,273 |
| 4.00%, 02/01/53 | 657,689 | | 631,083 |
| 6.50%, 02/01/53 | 278,025 | | 285,434 |
| 5.00%, 03/01/53 | 1,184,033 | | 1,175,589 |
| 5.50%, 03/01/53 | 283,874 | | 286,513 |
| 5.00%, 04/01/53 | 4,584,535 | | 4,550,134 |
| 5.50%, 04/01/53 | 1,160,836 | | 1,167,715 |
| 6.50%, 04/01/53 | 369,777 | | 379,974 |
| 4.50%, 05/01/53 | 5,871,094 | | 5,761,812 |
| 5.50%, 05/01/53 | 662,128 | | 668,609 |
| 6.50%, 05/01/53 | 561,835 | | 581,206 |
| 5.00%, 06/01/53 | 3,558,784 | | 3,525,178 |
| 5.50%, 06/01/53 | 1,829,112 | | 1,840,797 |
| 5.00%, 07/01/53 | 699,930 | | 693,321 |
| 5.50%, 07/01/53 | 196,341 | | 198,667 |
| 5.00%, 08/01/53 | 1,845,593 | | 1,865,964 |
| 5.50%, 08/01/53 | 383,803 | | 386,097 |
| 5.50%, 09/01/53 | 14,580,385 | | 14,655,552 |
| 6.00%, 09/01/53 | 5,864,218 | | 5,997,305 |
| Federal Home Loan Mortgage Corporation Reference REMIC, Series R007 | | | |
| 6.00%, 05/15/36 | 58,193 | | 61,119 |
| Federal Home Loan Mortgage Corporation REMIC, Series 3325 | | | |
| (Floating, U.S. 30-Day Average SOFR + 0.61%, 0.50% Floor, 6.75% Cap), 5.95%, 06/15/37† | 36,669 | | 36,106 |
| Federal Home Loan Mortgage Corporation REMIC, Series 3621 | | | |
| (Floating, 6.12% - U.S. 30-Day Average SOFR, 6.23% Cap), 0.78%, 01/15/40† IO | 83,958 | | 8,839 |
| Federal Home Loan Mortgage Corporation REMIC, Series 3947 | | | |
| (Floating, 5.84% - U.S. 30-Day Average SOFR, 5.95% Cap), 0.50%, 10/15/41† IO | 33,291 | | 3,387 |
| Federal Home Loan Mortgage Corporation REMIC, Series 3973 | | | |
| (Floating, 6.38% - U.S. 30-Day Average SOFR, 6.49% Cap), 1.04%, 12/15/41† IO | 100,582 | | 12,505 |
| Federal Home Loan Mortgage Corporation REMIC, Series 4099 | | | |
| (Floating, 5.89% - U.S. 30-Day Average SOFR, 6.00% Cap), 0.55%, 08/15/42† IO | 69,742 | | 8,451 |
| | | Par | | Value |
| Federal Home Loan Mortgage Corporation REMIC, Series 4194 | | | |
| 3.50%, 04/15/43 IO | $102,010 | | $ 16,231 |
| Federal Home Loan Mortgage Corporation REMIC, Series 4210 | | | |
| 3.00%, 05/15/43 | 109,437 | | 89,959 |
| Federal Home Loan Mortgage Corporation REMIC, Series 4239 | | | |
| 3.50%, 06/15/27 IO | 37,604 | | 1,117 |
| Federal Home Loan Mortgage Corporation REMIC, Series 4298 | | | |
| 4.00%, 04/15/43 IO | 14,679 | | 349 |
| Federal Home Loan Mortgage Corporation REMIC, Series 4310 | | | |
| (Floating, 5.84% - U.S. 30-Day Average SOFR, 5.95% Cap), 0.50%, 02/15/44† IO | 34,162 | | 3,480 |
| Federal Home Loan Mortgage Corporation REMIC, Series 4335 | | | |
| (Floating, 5.89% - U.S. 30-Day Average SOFR, 6.00% Cap), 0.55%, 05/15/44† IO | 35,025 | | 3,325 |
| Federal Home Loan Mortgage Corporation REMIC, Series 4391 | | | |
| 3.00%, 09/15/44 | 395,811 | | 351,692 |
| Federal Home Loan Mortgage Corporation REMIC, Series 4415 | | | |
| 0.00%, 04/15/41† IO γ | 41,084 | | 2,180 |
| Federal Home Loan Mortgage Corporation REMIC, Series 4638 | | | |
| (Floating, U.S. 30-Day Average SOFR + 0.55%), 5.26%, 07/15/40† | 113,704 | | 114,366 |
| Federal Home Loan Mortgage Corporation REMIC, Series 4793 | | | |
| 3.00%, 05/15/48 | 201,399 | | 179,681 |
| 3.00%, 06/15/48 | 137,440 | | 122,527 |
| Federal Home Loan Mortgage Corporation REMIC, Series 4813 | | | |
| 3.00%, 08/15/48 | 103,527 | | 92,033 |
| Federal Home Loan Mortgage Corporation REMIC, Series 4989 | | | |
| (Floating, U.S. 30-Day Average SOFR + 0.46%), 5.10%, 08/15/40† | 471,821 | | 465,533 |
| (Floating, U.S. 30-Day Average SOFR + 0.46%), 5.24%, 10/15/40† | 408,916 | | 403,517 |
| Federal Home Loan Mortgage Corporation REMIC, Series 5010 | | | |
| 2.50%, 09/25/50 IO | 520,661 | | 81,564 |
| Federal Home Loan Mortgage Corporation REMIC, Series 5013 | | | |
| 2.50%, 09/25/50 IO | 159,215 | | 25,371 |
| Federal Home Loan Mortgage Corporation REMIC, Series 5018 | | | |
| 2.00%, 10/25/50 IO | 326,305 | | 43,110 |
| Federal Home Loan Mortgage Corporation REMIC, Series 5040 | | | |
| 2.50%, 11/25/50 IO | 69,282 | | 10,050 |
See Notes to Financial Statements.
MEDIUM-DURATION BOND FUND
SCHEDULE OF INVESTMENTS (Continued)
| | | Par | | Value |
| Federal Home Loan Mortgage Corporation REMIC, Series 5059 | | | |
| 2.50%, 01/25/51 IO | $411,157 | | $ 64,737 |
| Federal Home Loan Mortgage Corporation REMIC, Series 5140 | | | |
| 2.50%, 05/25/49 IO | 608,676 | | 83,597 |
| Federal Home Loan Mortgage Corporation REMIC, Series 5161 | | | |
| 2.00%, 03/25/51 IO | 797,992 | | 108,084 |
| Federal Home Loan Mortgage Corporation REMIC, Series 5202 | | | |
| 3.00%, 01/25/47 IO | 734,382 | | 95,244 |
| Federal Home Loan Mortgage Corporation REMIC, Series 5224 | | | |
| 4.00%, 04/25/52 | 900,000 | | 827,007 |
| Federal Home Loan Mortgage Corporation REMIC, Series 5274 | | | |
| 2.50%, 01/25/51 IO | 652,444 | | 104,074 |
| Federal Home Loan Mortgage Corporation STACR REMIC Trust, Series 2020-DNA3, Class B1 | | | |
| (Floating, U.S. 30-Day Average SOFR + 5.21%), 10.55%, 06/25/50 144A † | 864,875 | | 948,565 |
| Federal Home Loan Mortgage Corporation STACR REMIC Trust, Series 2020-DNA4, Class B1 | | | |
| (Floating, U.S. 30-Day Average SOFR + 6.11%), 11.45%, 08/25/50 144A † | 146,891 | | 165,346 |
| Federal Home Loan Mortgage Corporation STACR REMIC Trust, Series 2020-DNA5, Class B1 | | | |
| (Floating, U.S. 30-Day Average SOFR + 4.80%), 10.14%, 10/25/50 144A † | 540,000 | | 605,499 |
| Federal Home Loan Mortgage Corporation STACR REMIC Trust, Series 2020-DNA5, Class M2 | | | |
| (Floating, U.S. 30-Day Average SOFR + 2.80%), 8.14%, 10/25/50 144A † | 281,848 | | 285,876 |
| Federal Home Loan Mortgage Corporation STACR REMIC Trust, Series 2021-DNA5, Class M2 | | | |
| (Floating, U.S. 30-Day Average SOFR + 1.65%), 6.99%, 01/25/34 144A † | 124,804 | | 125,373 |
| Federal Home Loan Mortgage Corporation STACR REMIC Trust, Series 2022-DNA1, Class M1B | | | |
| (Floating, U.S. 30-Day Average SOFR + 1.85%), 7.19%, 01/25/42 144A † | 310,000 | | 310,451 |
| | | Par | | Value |
| Federal Home Loan Mortgage Corporation STACR REMIC Trust, Series 2022-DNA2, Class M2 | | | |
| (Floating, U.S. 30-Day Average SOFR + 3.75%), 9.09%, 02/25/42 144A † | $ 310,000 | | $ 320,687 |
| Federal Home Loan Mortgage Corporation STACR REMIC Trust, Series 2022-DNA4, Class M1B | | | |
| (Floating, U.S. 30-Day Average SOFR + 3.35%), 8.69%, 05/25/42 144A † | 330,000 | | 343,833 |
| Federal Home Loan Mortgage Corporation STACR REMIC Trust, Series 2022-HQA1, Class M1B | | | |
| (Floating, U.S. 30-Day Average SOFR + 3.50%), 8.84%, 03/25/42 144A † | 357,000 | | 370,272 |
| Federal Home Loan Mortgage Corporation STACR REMIC Trust, Series 2023-DNA1 Class M1A | | | |
| (Floating, U.S. 30-Day Average SOFR + 2.10%), 7.44%, 03/25/43 144A † | 1,029,929 | | 1,046,930 |
| Federal Home Loan Mortgage Corporation STRIP, Series 353 | | | |
| (Floating, 5.89% - U.S. 30-Day Average SOFR, 6.00% Cap), 0.55%, 12/15/46Ω † IO | 155,684 | | 17,425 |
| Federal National Mortgage Association | | | |
| 2.81%, 04/01/25 | 50,000 | | 48,603 |
| (Floating, Enterprise 11th District COFI Index + 1.35%, 1.35% Floor, 12.05% Cap), 4.36%, 07/01/27† | 2,005 | | 1,969 |
| (Floating, U.S. Treasury Yield Curve Rate CMT 1Y + 2.13%, 2.13% Floor, 11.81% Cap), 5.78%, 08/01/27† | 1,370 | | 1,364 |
| (Floating, Enterprise 11th District COFI Index + 1.22%, 1.22% Floor, 10.42% Cap), 5.46%, 11/01/27 CONV † | 2,036 | | 1,994 |
| 4.49%, 06/01/28 | 100,000 | | 100,746 |
| 5.34%, 09/01/28 | 100,000 | | 104,231 |
| 5.45%, 10/01/28 | 99,839 | | 104,150 |
| 5.43%, 11/01/28 | 100,000 | | 105,064 |
| 4.31%, 02/01/30 | 200,000 | | 199,024 |
| 2.93%, 06/01/30 | 18,639 | | 17,179 |
| 8.00%, 10/01/30 | 3,748 | | 3,916 |
| (Floating, U.S. Treasury Yield Curve Rate CMT 1Y + 2.51%, 2.51% Floor, 12.62% Cap), 6.63%, 12/01/30 CONV † | 1,042 | | 1,033 |
| 4.50%, 04/01/31 | 12,379 | | 12,324 |
See Notes to Financial Statements.
| | | Par | | Value |
| 4.50%, 05/01/31 | $ 48,474 | | $ 48,219 |
| 4.50%, 06/01/31 | 14,668 | | 14,595 |
| 2.85%, 09/01/31 | 977,496 | | 884,508 |
| 4.50%, 11/01/31 | 22,277 | | 22,199 |
| 4.50%, 12/01/31 | 31,670 | | 31,519 |
| 6.00%, 01/01/32 | 20,355 | | 20,968 |
| 2.15%, 02/01/32† γ | 39,765 | | 33,553 |
| 6.00%, 03/01/32 | 1,286 | | 1,327 |
| 6.00%, 04/01/32 | 63,350 | | 65,814 |
| 3.35%, 06/01/32 | 100,000 | | 92,386 |
| (Floating, Federal Reserve U.S. 12 1Y CMT + 1.13%, 1.13% Floor, 10.95% Cap), 6.05%, 06/01/32† | 4,652 | | 4,499 |
| 3.84%, 07/01/32 | 100,000 | | 95,787 |
| 3.89%, 07/01/32 | 300,000 | | 284,407 |
| 4.06%, 07/01/32 | 198,069 | | 191,536 |
| 3.85%, 08/01/32 | 100,000 | | 94,448 |
| (Floating, Enterprise 11th District COFI Index + 1.25%, 1.25% Floor, 12.21% Cap), 4.14%, 08/01/32† | 4,634 | | 4,469 |
| 3.98%, 10/01/32 | 400,000 | | 381,245 |
| 4.84%, 10/01/32 | 98,705 | | 101,396 |
| 5.18%, 11/01/32 | 200,000 | | 210,320 |
| 4.94%, 12/01/32 | 98,731 | | 101,113 |
| 4.58%, 01/01/33 | 100,000 | | 101,041 |
| 4.69%, 01/01/33 | 100,000 | | 101,851 |
| (Floating, Enterprise 11th District COFI Index + 1.32%, 1.32% Floor, 11.97% Cap), 4.21%, 05/01/33† | 3,676 | | 3,543 |
| 4.72%, 05/01/33 | 100,000 | | 102,144 |
| 5.35%, 07/01/33 | 100,000 | | 106,802 |
| 5.10%, 12/01/33 | 100,000 | | 105,126 |
| 3.50%, 05/01/34 | 57,263 | | 54,890 |
| 6.00%, 10/01/34 | 19,842 | | 20,539 |
| 3.50%, 12/01/34 | 12,791 | | 12,278 |
| (Floating, Refinitiv USD IBOR Consumer Cash Fallbacks 1Y Index + 1.55%, 1.55% Floor, 9.67% Cap), 3.80%, 12/01/34† | 9,889 | | 9,832 |
| 3.50%, 01/01/35 | 13,165 | | 12,636 |
| 6.00%, 05/01/35 | 103,084 | | 106,944 |
| 3.00%, 07/01/35 | 17,229 | | 16,179 |
| 6.00%, 07/01/35 | 21,950 | | 22,825 |
| 5.50%, 09/01/35 | 16,954 | | 17,206 |
| 6.00%, 10/01/35 | 10,116 | | 10,563 |
| (Floating, Enterprise 11th District COFI Index + 1.30%, 1.30% Floor, 10.55% Cap), 4.31%, 11/01/35† | 1,744 | | 1,733 |
| 6.00%, 11/01/35 | 65,320 | | 67,557 |
| (Floating, Federal Reserve U.S. 12 1Y CMT + 1.82%, 1.82% Floor, 8.96% Cap), 6.75%, 11/01/35† | 7,149 | | 6,943 |
| 3.00%, 02/01/36 | 250,313 | | 234,391 |
| 3.00%, 04/01/36 | 199,460 | | 186,858 |
| 5.50%, 04/01/36 | 1,212 | | 1,216 |
| | | Par | | Value |
| (Floating, Enterprise 11th District COFI Index + 1.26%, 3.95% Floor, 12.83% Cap), 4.59%, 05/01/36† | $ 8,755 | | $ 8,647 |
| 3.00%, 07/01/36 | 392,386 | | 366,676 |
| 3.00%, 08/01/36 | 154,273 | | 144,097 |
| 2.50%, 09/01/36 | 94,576 | | 86,123 |
| 3.00%, 10/01/36 | 786,851 | | 733,969 |
| 5.50%, 11/01/36 | 22,562 | | 23,263 |
| 3.00%, 12/01/36 | 334,602 | | 312,111 |
| 3.50%, 02/01/37 | 60,880 | | 58,235 |
| 3.50%, 03/01/37 | 45,042 | | 43,342 |
| 5.50%, 03/01/37 | 1,245 | | 1,275 |
| 6.00%, 07/01/37 | 255,000 | | 266,575 |
| 6.50%, 10/01/37 | 21,547 | | 22,532 |
| 7.00%, 11/01/37 | 3,012 | | 3,109 |
| 3.00%, 12/01/37 | 47,047 | | 43,522 |
| 3.50%, 12/01/37 | 74,295 | | 70,828 |
| (Floating, Enterprise 11th District COFI Index + 1.26%, 1.26% Floor, 10.71% Cap), 4.79%, 12/01/37† | 5,577 | | 5,472 |
| 7.00%, 12/01/37 | 1,093 | | 1,128 |
| (Floating, Federal Reserve U.S. 12 1Y CMT + 1.15%, 1.15% Floor, 10.60% Cap), 6.08%, 01/01/38† | 1,348 | | 1,326 |
| 2.50%, 03/01/38 | 335,311 | | 305,227 |
| 3.00%, 06/01/38 | 189,601 | | 177,339 |
| 5.00%, 06/01/38 | 25,624 | | 26,076 |
| 5.50%, 08/01/38 | 16,160 | | 16,662 |
| 7.00%, 11/01/38 | 4,263 | | 4,446 |
| 7.00%, 02/01/39 | 2,447 | | 2,580 |
| 3.50%, 08/01/39 | 48,279 | | 46,228 |
| 3.50%, 02/01/40 | 131,057 | | 125,754 |
| 3.00%, 03/01/40 | 188,835 | | 176,020 |
| (Floating, Federal Reserve U.S. 12 1Y CMT + 1.40%, 1.40% Floor, 9.64% Cap), 6.33%, 06/01/40† | 8,427 | | 8,468 |
| 6.33%, 10/01/40† | 20,635 | | 20,115 |
| 2.50%, 11/01/40 | 232,185 | | 207,028 |
| (Floating, Federal Reserve U.S. 12 1Y CMT + 1.18%, 1.18% Floor, 10.25% Cap), 6.10%, 11/01/40† | 2,913 | | 2,833 |
| 2.50%, 03/01/41 | 75,491 | | 67,306 |
| 2.50%, 04/01/41 | 234,351 | | 208,942 |
| 4.50%, 04/01/41 | 47,786 | | 47,796 |
| 2.50%, 05/01/41 | 559,499 | | 499,883 |
| 2.00%, 06/01/41 | 160,090 | | 137,356 |
| 6.00%, 07/01/41 | 176,763 | | 184,854 |
| 4.50%, 08/01/41 | 19,825 | | 19,829 |
| 2.00%, 09/01/41 | 250,078 | | 214,551 |
| 2.00%, 10/01/41 | 920,465 | | 788,413 |
| 2.00%, 11/01/41 | 167,728 | | 144,366 |
| 2.50%, 11/01/41 | 82,488 | | 73,492 |
| 4.50%, 11/01/41 | 65,968 | | 65,942 |
| 2.00%, 12/01/41 | 85,350 | | 73,016 |
See Notes to Financial Statements.
MEDIUM-DURATION BOND FUND
SCHEDULE OF INVESTMENTS (Continued)
| | | Par | | Value |
| 2.00%, 01/01/42 | $1,138,185 | | $ 973,559 |
| 2.00%, 02/01/42 | 519,370 | | 443,996 |
| 2.50%, 02/01/42 | 336,264 | | 299,516 |
| 2.50%, 03/01/42 | 172,846 | | 153,903 |
| 2.50%, 04/01/42 | 443,181 | | 391,587 |
| 2.00%, 05/01/42 | 91,271 | | 78,167 |
| 2.50%, 05/01/42 | 88,673 | | 78,953 |
| 2.00%, 06/01/42 | 791,979 | | 677,042 |
| 3.00%, 06/01/42 | 90,078 | | 82,386 |
| 4.00%, 06/01/42 | 18,478 | | 17,985 |
| 2.50%, 09/01/42 | 94,689 | | 84,368 |
| 3.50%, 09/01/42 | 15,485 | | 14,584 |
| 4.00%, 10/01/42 | 53,809 | | 52,376 |
| 2.50%, 11/01/42 | 9,372 | | 8,251 |
| 4.00%, 11/01/42 | 606,951 | | 588,509 |
| 2.50%, 12/01/42 | 4,806 | | 4,238 |
| 3.00%, 12/01/42 | 6,938 | | 6,433 |
| 3.50%, 12/01/42 | 30,080 | | 28,430 |
| 4.00%, 12/01/42 | 40,510 | | 39,471 |
| 2.50%, 01/01/43 | 6,759 | | 5,958 |
| 3.00%, 01/01/43 | 134,108 | | 123,059 |
| 3.50%, 01/01/43 | 499,007 | | 469,990 |
| 2.50%, 02/01/43 | 7,076 | | 6,227 |
| 2.50%, 03/01/43 | 604,605 | | 533,090 |
| 3.00%, 03/01/43 | 94,880 | | 87,514 |
| 3.50%, 03/01/43 | 236,526 | | 224,350 |
| 2.50%, 04/01/43 | 762,629 | | 669,200 |
| 3.00%, 04/01/43 | 143,654 | | 132,350 |
| 4.00%, 04/01/43 | 22,092 | | 21,525 |
| 2.50%, 05/01/43 | 11,074 | | 9,675 |
| 3.00%, 05/01/43 | 86,828 | | 79,969 |
| 2.50%, 06/01/43 | 12,761 | | 11,235 |
| 3.00%, 06/01/43 | 81,259 | | 74,839 |
| 4.00%, 06/01/43 | 189,397 | | 184,682 |
| 3.00%, 07/01/43 | 370,510 | | 341,239 |
| 4.00%, 07/01/43 | 208,616 | | 203,266 |
| 2.50%, 08/01/43 | 118,841 | | 104,188 |
| 4.00%, 08/01/43 | 65,834 | | 64,080 |
| 4.50%, 09/01/43 | 131,719 | | 130,310 |
| 2.50%, 10/01/43 | 20,822 | | 18,331 |
| 3.00%, 10/01/43 | 121,514 | | 111,924 |
| 4.50%, 10/01/43 | 54,471 | | 54,029 |
| 4.50%, 11/01/43 | 34,494 | | 34,212 |
| 4.50%, 12/01/43 | 57,892 | | 57,419 |
| 4.50%, 01/01/44 | 30,763 | | 30,512 |
| 4.00%, 04/01/44 | 481,104 | | 467,957 |
| 4.50%, 10/01/44 | 141,776 | | 140,932 |
| 4.00%, 12/01/44 | 891,162 | | 868,197 |
| 3.00%, 01/01/45 | 163,026 | | 150,162 |
| 4.00%, 01/01/45 | 54,696 | | 52,832 |
| 4.50%, 02/01/45 | 456,878 | | 454,259 |
| 4.50%, 04/01/45 | 224,641 | | 223,304 |
| 4.50%, 05/01/45 | 27,955 | | 27,789 |
| 4.50%, 06/01/45 | 203,757 | | 202,544 |
| 4.00%, 08/01/45 | 2,330,477 | | 2,254,258 |
| 3.00%, 11/01/45 | 462,776 | | 423,516 |
| 3.50%, 01/01/46 | 142,472 | | 133,553 |
| 3.00%, 07/01/46 | 239,168 | | 218,569 |
| | | Par | | Value |
| 3.00%, 08/01/46 | $ 31,207 | | $ 28,482 |
| 3.00%, 09/01/46 | 57,280 | | 52,287 |
| 3.00%, 10/01/46 | 31,610 | | 28,752 |
| 3.00%, 11/01/46 | 742,098 | | 674,361 |
| 3.50%, 11/01/46 | 18,855 | | 17,855 |
| 4.50%, 11/01/46 | 172,767 | | 171,419 |
| 5.00%, 11/01/46 | 323,086 | | 325,086 |
| 3.50%, 12/01/46 | 120,892 | | 113,012 |
| 4.00%, 01/01/47 | 501,421 | | 485,344 |
| 4.50%, 01/01/47 | 18,912 | | 18,784 |
| 4.00%, 02/01/47 | 45,998 | | 44,422 |
| 4.50%, 03/01/47 | 263,829 | | 261,605 |
| 4.00%, 05/01/47 | 41,967 | | 40,467 |
| 4.50%, 06/01/47 | 234,770 | | 231,476 |
| 4.50%, 07/01/47 | 380,446 | | 376,771 |
| 4.00%, 08/01/47 | 324,831 | | 314,087 |
| 3.00%, 09/01/47 | 566,875 | | 517,206 |
| 3.50%, 09/01/47 | 7,591,607 | | 7,027,860 |
| 3.50%, 10/01/47 | 8,916,385 | | 8,261,587 |
| 3.50%, 11/01/47 | 11,594,106 | | 10,740,290 |
| 4.50%, 11/01/47 | 97,167 | | 96,368 |
| 3.50%, 12/01/47 | 12,038,919 | | 11,164,953 |
| 4.00%, 12/01/47 | 190,297 | | 183,870 |
| 5.00%, 12/01/47 | 90,379 | | 91,972 |
| 4.00%, 01/01/48 | 178,120 | | 172,140 |
| 4.00%, 02/01/48 | 666,212 | | 643,637 |
| 4.00%, 03/01/48 | 461,602 | | 445,334 |
| 4.00%, 06/01/48 | 282,514 | | 272,915 |
| 4.00%, 07/01/48 | 552,636 | | 533,289 |
| 4.50%, 07/01/48 | 132,874 | | 131,248 |
| 3.50%, 08/01/48 | 2,360,868 | | 2,189,897 |
| 4.00%, 08/01/48 | 1,378,112 | | 1,332,219 |
| 4.50%, 09/01/48 | 258,440 | | 255,225 |
| 5.00%, 09/01/48 | 510,967 | | 520,466 |
| 3.00%, 11/01/48 | 167,680 | | 154,448 |
| 3.50%, 11/01/48 | 2,068,376 | | 1,934,719 |
| 5.00%, 11/01/48 | 1,189,271 | | 1,202,978 |
| 4.00%, 01/01/49 | 20,380 | | 19,645 |
| 4.50%, 01/01/49 | 214,291 | | 211,450 |
| 4.50%, 02/01/49 | 47,393 | | 46,741 |
| 4.50%, 05/01/49 | 719,989 | | 710,088 |
| 4.50%, 06/01/49 | 471,718 | | 465,508 |
| 3.50%, 07/01/49 | 919,541 | | 860,239 |
| 4.50%, 07/01/49 | 404,891 | | 399,062 |
| 3.50%, 08/01/49 | 651,414 | | 608,023 |
| 4.50%, 09/01/49 | 59,422 | | 58,331 |
| 3.00%, 12/01/49 | 575,402 | | 519,213 |
| 4.00%, 12/01/49 | 109,727 | | 105,408 |
| 4.50%, 01/01/50 | 196,250 | | 196,031 |
| 3.00%, 02/01/50 | 1,755,604 | | 1,596,706 |
| 4.50%, 03/01/50 | 187,119 | | 185,861 |
| 4.50%, 05/01/50 | 755,075 | | 743,106 |
| 2.50%, 06/01/50 | 871,862 | | 754,795 |
| 3.50%, 06/01/50 | 220,576 | | 206,238 |
| 4.50%, 06/01/50 | 60,535 | | 59,659 |
| 4.50%, 07/01/50 | 28,507 | | 27,847 |
| 2.00%, 08/01/50 | 291,372 | | 241,148 |
| 3.00%, 08/01/50 | 135,592 | | 121,528 |
See Notes to Financial Statements.
| | | Par | | Value |
| 2.00%, 09/01/50 | $ 280,327 | | $ 231,614 |
| 2.50%, 09/01/50 | 2,649,200 | | 2,298,781 |
| 2.00%, 10/01/50 | 6,294,273 | | 5,183,372 |
| 2.50%, 10/01/50 | 545,619 | | 468,634 |
| 3.00%, 10/01/50 | 216,001 | | 194,857 |
| 2.00%, 11/01/50 | 6,669,980 | | 5,492,268 |
| 2.50%, 11/01/50 | 1,467,539 | | 1,266,006 |
| 3.00%, 11/01/50 | 492,042 | | 439,594 |
| 2.00%, 12/01/50 | 444,599 | | 366,218 |
| 2.50%, 12/01/50 | 174,742 | | 150,882 |
| 4.50%, 12/01/50 | 435,052 | | 427,680 |
| 1.50%, 01/01/51 | 81,737 | | 63,998 |
| 2.00%, 01/01/51 | 80,456 | | 66,307 |
| 2.50%, 01/01/51 | 2,078,031 | | 1,776,761 |
| 2.00%, 02/01/51 | 1,381,507 | | 1,138,473 |
| 2.50%, 02/01/51 | 48,321 | | 41,859 |
| 4.50%, 02/01/51 | 1,380,333 | | 1,342,858 |
| 1.50%, 03/01/51 | 665,821 | | 520,049 |
| 2.00%, 03/01/51 | 2,749,654 | | 2,284,763 |
| 2.50%, 03/01/51 | 296,980 | | 257,015 |
| 2.00%, 04/01/51 | 1,020,089 | | 843,447 |
| 2.50%, 04/01/51 | 82,617 | | 71,521 |
| 2.50%, 05/01/51 | 950,592 | | 813,536 |
| 2.50%, 06/01/51 | 1,541,238 | | 1,326,016 |
| 3.00%, 06/01/51 | 143,481 | | 130,021 |
| 2.50%, 07/01/51 | 568,929 | | 491,648 |
| 2.00%, 08/01/51 | 257,073 | | 212,098 |
| 2.50%, 08/01/51 | 2,032,282 | | 1,744,547 |
| 3.00%, 08/01/51 | 599,348 | | 542,601 |
| 2.50%, 09/01/51 | 489,910 | | 424,763 |
| 3.00%, 09/01/51 | 385,858 | | 344,528 |
| 4.50%, 09/01/51 | 69,687 | | 68,160 |
| 2.00%, 10/01/51 | 761,271 | | 633,764 |
| 2.50%, 10/01/51 | 2,371,337 | | 2,039,400 |
| 2.00%, 11/01/51 | 171,785 | | 140,770 |
| 2.50%, 11/01/51 | 1,110,224 | | 959,211 |
| 3.00%, 11/01/51 | 568,194 | | 511,773 |
| 2.00%, 12/01/51 | 5,200,020 | | 4,253,535 |
| 3.00%, 12/01/51 | 167,571 | | 151,448 |
| 3.50%, 12/01/51 | 493,612 | | 457,440 |
| 2.00%, 01/01/52 | 528,535 | | 436,539 |
| 2.50%, 01/01/52 | 862,174 | | 742,129 |
| 3.00%, 01/01/52 | 929,874 | | 837,652 |
| 3.50%, 01/01/52 | 342,064 | | 317,959 |
| 2.00%, 02/01/52 | 847,156 | | 701,210 |
| 2.50%, 02/01/52 | 1,197,509 | | 1,023,849 |
| 2.00%, 03/01/52 | 1,691,135 | | 1,398,682 |
| 2.50%, 03/01/52 | 641,244 | | 550,921 |
| 3.00%, 03/01/52 | 3,004,059 | | 2,694,152 |
| 2.00%, 04/01/52 | 9,516,562 | | 7,788,500 |
| 2.50%, 04/01/52 | 3,066,130 | | 2,611,592 |
| 3.00%, 04/01/52 | 1,071,217 | | 951,190 |
| 3.50%, 04/01/52 | 717,248 | | 659,257 |
| 4.00%, 04/01/52 | 8,972 | | 8,536 |
| 2.00%, 05/01/52 | 913,425 | | 748,156 |
| 2.50%, 05/01/52 | 532,823 | | 454,138 |
| 3.50%, 05/01/52 | 1,412,909 | | 1,310,142 |
| 4.00%, 05/01/52 | 1,542,783 | | 1,470,844 |
| | | Par | | Value |
| 2.00%, 06/01/52 | $ 648,327 | | $ 530,873 |
| 3.00%, 06/01/52 | 1,890,275 | | 1,676,165 |
| 3.50%, 06/01/52 | 645,976 | | 593,731 |
| 4.00%, 06/01/52 | 1,172,213 | | 1,122,545 |
| 5.00%, 06/01/52 | 174,772 | | 174,841 |
| 3.00%, 07/01/52 | 1,703,309 | | 1,510,005 |
| 3.50%, 07/01/52 | 200,000 | | 183,824 |
| 4.00%, 07/01/52 | 2,682,334 | | 2,569,157 |
| 4.50%, 07/01/52 | 95,663 | | 93,462 |
| 5.00%, 07/01/52 | 1,081,899 | | 1,080,492 |
| 3.00%, 08/01/52 | 939,747 | | 832,926 |
| 5.00%, 08/01/52 | 884,345 | | 886,219 |
| 5.50%, 08/01/52 | 82,863 | | 83,330 |
| 4.00%, 09/01/52 | 938,583 | | 889,205 |
| 4.50%, 09/01/52 | 276,372 | | 269,627 |
| 5.00%, 09/01/52 | 352,311 | | 349,519 |
| 5.50%, 09/01/52 | 1,852,461 | | 1,887,398 |
| 5.00%, 10/01/52 | 187,291 | | 185,927 |
| 4.50%, 11/01/52 | 359,322 | | 348,940 |
| 5.00%, 11/01/52 | 274,600 | | 272,261 |
| 6.00%, 11/01/52 | 200,000 | | 203,330 |
| 2.50%, 12/01/52 | 67,177 | | 57,219 |
| 3.00%, 12/01/52 | 49,567 | | 43,944 |
| 4.00%, 12/01/52 | 390,039 | | 369,507 |
| 6.00%, 12/01/52 | 902,951 | | 932,437 |
| 4.50%, 01/01/53 | 279,472 | | 271,396 |
| 5.00%, 01/01/53 | 190,463 | | 188,953 |
| 6.00%, 01/01/53 | 88,929 | | 90,795 |
| 6.50%, 01/01/53 | 722,316 | | 748,693 |
| 5.00%, 02/01/53 | 191,482 | | 189,963 |
| 5.50%, 02/01/53 | 581,108 | | 589,045 |
| 6.50%, 02/01/53 | 174,822 | | 179,514 |
| 4.50%, 03/01/53 | 286,763 | | 278,493 |
| 5.00%, 04/01/53 | 2,319,073 | | 2,298,861 |
| 5.50%, 04/01/53 | 3,173,236 | | 3,205,043 |
| 4.00%, 05/01/53 | 969,568 | | 918,278 |
| 5.00%, 05/01/53 | 12,899,880 | | 12,797,836 |
| 5.50%, 05/01/53 | 484,641 | | 490,693 |
| 6.00%, 05/01/53 | 379,336 | | 387,640 |
| 5.00%, 06/01/53 | 5,501,302 | | 5,457,413 |
| 6.00%, 06/01/53 | 1,155,921 | | 1,186,826 |
| 4.50%, 07/01/53 | 399,999 | | 388,440 |
| 5.00%, 07/01/53 | 240,639 | | 238,507 |
| 6.00%, 07/01/53 | 672,882 | | 687,555 |
| 5.00%, 08/01/53 | 959,800 | | 951,047 |
| 5.50%, 08/01/53 | 599,156 | | 604,378 |
| 5.50%, 09/01/53 | 1,759,854 | | 1,769,984 |
| 6.50%, 09/01/53 | 14,366,801 | | 14,728,694 |
| 5.00%, 10/01/53 | 899,999 | | 891,500 |
| 5.50%, 11/01/53 | 218,403 | | 219,522 |
| 6.50%, 11/01/53 | 808,200 | | 828,558 |
| 6.50%, 12/01/53 | 25,003 | | 25,633 |
| 4.00%, 02/01/56 | 253,732 | | 247,589 |
| 5.50%, 09/01/56 | 359,842 | | 374,422 |
| 4.00%, 01/01/57 | 163,204 | | 155,211 |
| 4.00%, 06/01/57 | 247,668 | | 237,230 |
| 4.50%, 09/01/57 | 382,469 | | 373,421 |
| 4.50%, 08/01/58 | 105,204 | | 102,716 |
See Notes to Financial Statements.
MEDIUM-DURATION BOND FUND
SCHEDULE OF INVESTMENTS (Continued)
| | | Par | | Value |
| 2.50%, 07/01/61 | $3,144,485 | | $2,610,322 |
| 2.50%, 09/01/61 | 87,958 | | 73,016 |
| 3.50%, 09/01/62 | 3,855,911 | | 3,507,021 |
| Federal National Mortgage Association ACES, Series 2015-M1 | | | |
| 0.50%, 09/25/24† IO γ | 2,017,984 | | 3,425 |
| Federal National Mortgage Association ACES, Series 2016-M11 | | | |
| 2.94%, 07/25/39 | 31,496 | | 28,709 |
| Federal National Mortgage Association ACES, Series 2017-M8 | | | |
| 3.06%, 05/25/27 | 79,073 | | 75,911 |
| Federal National Mortgage Association ACES, Series 2019-M23 | | | |
| 2.72%, 10/25/31† γ | 274,955 | | 244,870 |
| Federal National Mortgage Association ACES, Series 2020-M33 | | | |
| 2.24%, 01/25/31† IO γ | 6,948,575 | | 553,129 |
| Federal National Mortgage Association ACES, Series 2020-M6 | | | |
| 2.50%, 10/25/37 | 83,423 | | 73,333 |
| Federal National Mortgage Association ACES, Series 2023-M4 | | | |
| 3.77%, 08/25/32† γ | 200,000 | | 190,910 |
| Federal National Mortgage Association Grantor Trust, Series 2017-T1 | | | |
| 2.90%, 06/25/27 | 99,130 | | 93,906 |
| Federal National Mortgage Association Interest STRIP, Series 409 | | | |
| 3.00%, 04/25/27Ω IO | 41,079 | | 1,343 |
| 4.50%, 11/25/39Ω IO | 12,804 | | 2,369 |
| 3.50%, 11/25/41Ω IO | 45,579 | | 6,923 |
| 4.00%, 11/25/41Ω IO | 61,563 | | 11,120 |
| 4.00%, 04/25/42Ω IO | 112,613 | | 20,733 |
| Federal National Mortgage Association Interest STRIP, Series 427 | | | |
| 2.00%, 03/25/50Ω IO | 830,321 | | 99,660 |
| Federal National Mortgage Association REMIC, Series 2000-32 | | | |
| (Floating, U.S. 30-Day Average SOFR + 0.56%, 0.45% Floor, 9.00% Cap), 5.90%, 10/18/30† | 2,944 | | 2,944 |
| Federal National Mortgage Association REMIC, Series 2005-29 | | | |
| 5.50%, 04/25/35 | 182,825 | | 189,722 |
| Federal National Mortgage Association REMIC, Series 2007-24 | | | |
| (Floating, 6.64% - U.S. 30-Day Average SOFR, 6.75% Cap), 1.30%, 03/25/37† IO | 183,355 | | 21,491 |
| | | Par | | Value |
| Federal National Mortgage Association REMIC, Series 2011-52 | | | |
| 5.00%, 06/25/41 | $104,973 | | $106,139 |
| Federal National Mortgage Association REMIC, Series 2011-59 | | | |
| 5.50%, 07/25/41 | 358,036 | | 370,066 |
| Federal National Mortgage Association REMIC, Series 2011-96 | | | |
| (Floating, 6.44% - U.S. 30-Day Average SOFR, 6.55% Cap), 1.10%, 10/25/41† IO | 133,692 | | 11,320 |
| Federal National Mortgage Association REMIC, Series 2012-101 | | | |
| 4.00%, 09/25/27 IO | 7,610 | | 128 |
| Federal National Mortgage Association REMIC, Series 2012-111 | | | |
| 7.00%, 10/25/42 | 9,478 | | 10,276 |
| Federal National Mortgage Association REMIC, Series 2012-118 | | | |
| 3.00%, 11/25/42 | 129,045 | | 117,408 |
| Federal National Mortgage Association REMIC, Series 2012-133 | | | |
| (Floating, 6.04% - U.S. 30-Day Average SOFR, 6.15% Cap), 0.70%, 12/25/42† IO | 42,465 | | 5,028 |
| Federal National Mortgage Association REMIC, Series 2012-153 | | | |
| 7.00%, 07/25/42 | 31,805 | | 34,036 |
| Federal National Mortgage Association REMIC, Series 2012-28 | | | |
| 6.50%, 06/25/39 | 723 | | 736 |
| Federal National Mortgage Association REMIC, Series 2012-35 | | | |
| (Floating, 6.39% - U.S. 30-Day Average SOFR, 6.50% Cap), 1.05%, 04/25/42† IO | 50,459 | | 6,481 |
| Federal National Mortgage Association REMIC, Series 2012-46 | | | |
| 6.00%, 05/25/42 | 46,018 | | 48,322 |
| Federal National Mortgage Association REMIC, Series 2012-74 | | | |
| (Floating, 6.54% - U.S. 30-Day Average SOFR, 6.65% Cap), 1.20%, 03/25/42† IO | 50,487 | | 3,429 |
| Federal National Mortgage Association REMIC, Series 2012-75 | | | |
| (Floating, 6.49% - U.S. 30-Day Average SOFR, 6.60% Cap), 1.15%, 07/25/42† IO | 11,985 | | 1,492 |
See Notes to Financial Statements.
| | | Par | | Value |
| Federal National Mortgage Association REMIC, Series 2013-124 | | | |
| (Floating, 5.84% - U.S. 30-Day Average SOFR, 5.95% Cap), 0.50%, 12/25/43† IO | $161,435 | | $ 15,651 |
| Federal National Mortgage Association REMIC, Series 2013-14 | | | |
| 4.00%, 03/25/43 IO | 47,007 | | 7,925 |
| Federal National Mortgage Association REMIC, Series 2013-17 | | | |
| 3.00%, 03/25/28 IO | 198,592 | | 8,277 |
| Federal National Mortgage Association REMIC, Series 2013-29 | | | |
| 4.00%, 04/25/43 IO | 134,046 | | 22,683 |
| Federal National Mortgage Association REMIC, Series 2013-54 | | | |
| (Floating, 6.04% - U.S. 30-Day Average SOFR, 6.15% Cap), 0.70%, 06/25/43† IO | 67,509 | | 8,787 |
| Federal National Mortgage Association REMIC, Series 2013-9 | | | |
| 5.50%, 04/25/42 | 200,438 | | 205,886 |
| 6.50%, 07/25/42 | 84,163 | | 90,273 |
| Federal National Mortgage Association REMIC, Series 2014-47 | | | |
| 0.00%, 08/25/44† IO γ | 128,630 | | 5,499 |
| Federal National Mortgage Association REMIC, Series 2014-6 | | | |
| 2.50%, 02/25/44 | 512,409 | | 443,518 |
| Federal National Mortgage Association REMIC, Series 2015-55 | | | |
| 0.00%, 08/25/55† IO γ | 44,966 | | 2,173 |
| Federal National Mortgage Association REMIC, Series 2015-56 | | | |
| (Floating, 6.04% - U.S. 30-Day Average SOFR, 6.15% Cap), 0.70%, 08/25/45† IO | 27,266 | | 3,698 |
| Federal National Mortgage Association REMIC, Series 2017-76 | | | |
| (Floating, 5.99% - U.S. 30-Day Average SOFR, 6.10% Cap), 0.65%, 10/25/57† IO | 343,415 | | 44,224 |
| Federal National Mortgage Association REMIC, Series 2017-85 | | | |
| (Floating, 6.09% - U.S. 30-Day Average SOFR, 6.20% Cap), 0.75%, 11/25/47† IO | 110,248 | | 11,257 |
| Federal National Mortgage Association REMIC, Series 2020-47 | | | |
| 2.00%, 07/25/50 | 321,734 | | 197,948 |
| | | Par | | Value |
| Federal National Mortgage Association REMIC, Series 2020-56 | | | |
| 2.50%, 08/25/50 IO | $ 151,719 | | $ 23,782 |
| Federal National Mortgage Association REMIC, Series 2020-57 | | | |
| 2.00%, 04/25/50 | 49,169 | | 42,888 |
| Federal National Mortgage Association REMIC, Series 2020-73 | | | |
| 3.00%, 10/25/50 IO | 609,540 | | 99,827 |
| Federal National Mortgage Association REMIC, Series 2020-74 | | | |
| 2.50%, 10/25/50 IO | 147,533 | | 23,683 |
| Federal National Mortgage Association REMIC, Series 2020-89 | | | |
| 2.50%, 12/25/50 IO | 734,805 | | 113,296 |
| Federal National Mortgage Association REMIC, Series 2021-1 | | | |
| 2.50%, 02/25/51 IO | 583,953 | | 95,328 |
| Federal National Mortgage Association REMIC, Series 2021-28 | | | |
| 2.00%, 04/25/51 | 375,571 | | 312,273 |
| Federal National Mortgage Association REMIC, Series 2021-3 | | | |
| 2.50%, 02/25/51 IO | 768,024 | | 117,516 |
| Federal National Mortgage Association REMIC, Series 2021-43 | | | |
| 2.50%, 06/25/51 IO | 1,469,228 | | 216,305 |
| Federal National Mortgage Association REMIC, Series 2022-86 | | | |
| 2.50%, 05/25/50 IO | 753,214 | | 104,198 |
| Federal National Mortgage Association REMIC, Series 2023-2 | | | |
| 2.00%, 10/25/50 IO | 1,885,708 | | 231,203 |
| Federal National Mortgage Association REMIC, Series 2023-54 | | | |
| 6.50%, 04/25/49 | 969,640 | | 1,005,262 |
| FHLMC Multifamily Structured Pass-Through Certificates, Series K068 | | | |
| 0.55%, 08/25/27† IO γ | 2,297,474 | | 30,468 |
| FHLMC Multifamily Structured Pass-Through Certificates, Series K091 | | | |
| 0.71%, 03/25/29† IO γ | 1,388,476 | | 35,019 |
| FHLMC Multifamily Structured Pass-Through Certificates, Series K093 | | | |
| 1.08%, 05/25/29† IO γ | 1,921,433 | | 78,662 |
See Notes to Financial Statements.
MEDIUM-DURATION BOND FUND
SCHEDULE OF INVESTMENTS (Continued)
| | | Par | | Value |
| FHLMC Multifamily Structured Pass-Through Certificates, Series K094 | | | |
| 1.01%, 06/25/29† IO γ | $ 989,974 | | $ 38,931 |
| FHLMC Multifamily Structured Pass-Through Certificates, Series K104 | | | |
| 1.25%, 01/25/30† IO γ | 3,426,787 | | 183,001 |
| FHLMC Multifamily Structured Pass-Through Certificates, Series K128 | | | |
| 0.61%, 03/25/31† IO γ | 8,822,262 | | 257,241 |
| FHLMC Multifamily Structured Pass-Through Certificates, Series K130 | | | |
| 1.14%, 06/25/31† IO γ | 8,084,020 | | 489,696 |
| FHLMC Multifamily Structured Pass-Through Certificates, Series K131 | | | |
| 0.83%, 07/25/31† IO γ | 4,489,684 | | 197,950 |
| FHLMC Multifamily Structured Pass-Through Certificates, Series K148 | | | |
| 0.39%, 07/25/32† IO γ | 19,183,974 | | 392,578 |
| FHLMC Multifamily Structured Pass-Through Certificates, Series K-1519 | | | |
| 0.69%, 12/25/35† IO γ | 6,097,312 | | 284,132 |
| FHLMC Multifamily Structured Pass-Through Certificates, Series K-152 | | | |
| 3.78%, 11/25/32 | 1,000,000 | | 954,713 |
| FHLMC Multifamily Structured Pass-Through Certificates, Series K-157 | | | |
| 0.42%, 05/25/33† IO γ | 8,999,727 | | 207,621 |
| FHLMC Multifamily Structured Pass-Through Certificates, Series K-161 | | | |
| 4.90%, 10/25/33 | 1,550,000 | | 1,608,057 |
| FHLMC Multifamily Structured Pass-Through Certificates, Series K510 | | | |
| 5.07%, 10/25/28 | 600,000 | | 618,834 |
| FHLMC Multifamily Structured Pass-Through Certificates, Series K736 | | | |
| 1.41%, 07/25/26† IO γ | 956,161 | | 24,162 |
| FHLMC Multifamily Structured Pass-Through Certificates, Series K741 | | | |
| 0.65%, 12/25/27† IO γ | 2,982,444 | | 54,734 |
| FHLMC Multifamily Structured Pass-Through Certificates, Series KF153 | | | |
| (Floating, U.S. 30-Day Average SOFR + 0.68%, 0.68% Floor), 6.01%, 02/25/33† | 700,000 | | 700,204 |
| FHLMC Structured Agency Credit Risk Debt Notes, Series 2016-DNA4, Class M3 | | | |
| (Floating, U.S. 30-Day Average SOFR + 3.91%), 9.25%, 03/25/29† | 106,911 | | 111,560 |
| | | Par | | Value |
| FHLMC Structured Agency Credit Risk Debt Notes, Series 2023-DNA2, Class M1A | | | |
| (Floating, U.S. 30-Day Average SOFR + 2.10%), 7.44%, 04/25/43 144A † | $1,064,099 | | $1,081,531 |
| FHLMC Structured Agency Credit Risk Debt Notes, Series 2023-HQA2, Class M1B | | | |
| (Floating, U.S. 30-Day Average SOFR + 3.35%), 8.69%, 06/25/43 144A † | 374,000 | | 395,410 |
| FHLMC Structured Pass-Through Certificates, Series T-61, Class 1A1 | | | |
| (Floating, Federal Reserve U.S. 12 1Y CMT + 1.40%, 1.40% Floor), 6.41%, 07/25/44† | 220,016 | | 204,805 |
| First Horizon Alternative Mortgage Securities Trust, Series 2004-AA1, Class A1 | | | |
| 6.84%, 06/25/34† γ | 86,019 | | 80,501 |
| GCAT Trust, Series 2022-NQM3, Class A3 | | | |
| 4.35%, 04/25/67 144A † γ | 2,244,986 | | 2,091,615 |
| GCAT Trust, Series 2022-NQM4, Class A1 | | | |
| (Step to 5.77% on 09/25/26), 5.27%, 08/25/67 144A STEP | 118,750 | | 117,091 |
| GCAT Trust, Series 2022-NQM4, Class A2 | | | |
| (Step to 5.77% on 09/25/26), 5.73%, 08/25/67 144A STEP | 527,778 | | 521,992 |
| GCAT Trust, Series 2022-NQM4, Class A3 | | | |
| (Step to 5.77% on 09/25/26), 5.73%, 08/25/67 144A STEP | 1,583,333 | | 1,562,206 |
| Government National Mortgage Association | | | |
| 7.00%, 01/15/26 | 758 | | 759 |
| 7.00%, 07/15/27 | 4,197 | | 4,209 |
| 7.00%, 01/15/28 | 6,179 | | 6,208 |
| 7.00%, 03/15/28 | 8,645 | | 8,750 |
| 7.00%, 07/15/28 | 772 | | 774 |
| 6.50%, 08/15/28 | 752 | | 775 |
| 7.00%, 08/15/28 | 1,068 | | 1,076 |
| 7.50%, 08/15/28 | 3,702 | | 3,765 |
| 6.50%, 09/15/28 | 1,231 | | 1,259 |
| 7.00%, 10/15/28 | 6,814 | | 6,855 |
| 7.50%, 03/15/29 | 3,510 | | 3,543 |
| (Floating, U.S. Treasury Yield Curve Rate CMT 1Y + 1.50%, 1.50% Floor, 11.00% Cap), 2.75%, 11/20/29† | 7,096 | | 6,912 |
| 8.50%, 11/20/30 | 3,080 | | 3,235 |
| 6.50%, 08/15/31 | 7,893 | | 8,138 |
| 7.50%, 08/15/31 | 3,726 | | 3,765 |
| 6.50%, 10/15/31 | 14,835 | | 15,373 |
| 6.00%, 11/15/31 | 43,574 | | 44,431 |
| 6.00%, 12/15/31 | 4,827 | | 4,977 |
| 6.00%, 01/15/32 | 37,029 | | 38,051 |
| 6.00%, 02/15/32 | 26,326 | | 26,789 |
See Notes to Financial Statements.
| | | Par | | Value |
| 6.50%, 02/15/32 | $ 4,791 | | $ 4,951 |
| 6.00%, 04/15/32 | 23,641 | | 24,317 |
| 6.50%, 06/15/32 | 21,400 | | 22,080 |
| 6.50%, 08/15/32 | 19,338 | | 19,884 |
| 6.50%, 09/15/32 | 24,464 | | 25,356 |
| 6.00%, 10/15/32 | 37,229 | | 38,628 |
| 5.50%, 11/15/32 | 4,156 | | 4,185 |
| 6.00%, 11/15/32 | 21,786 | | 22,469 |
| 6.00%, 12/15/32 | 11,232 | | 11,581 |
| 5.50%, 01/15/33 | 1,525 | | 1,532 |
| 6.00%, 01/15/33 | 9,575 | | 9,874 |
| 5.50%, 02/15/33 | 4,821 | | 4,879 |
| 6.00%, 02/15/33 | 9,985 | | 10,357 |
| 5.50%, 03/15/33 | 5,336 | | 5,401 |
| 6.50%, 04/15/33 | 54,287 | | 55,734 |
| 6.00%, 06/15/33 | 13,885 | | 14,258 |
| 5.50%, 07/15/33 | 7,171 | | 7,232 |
| 5.50%, 08/15/33 | 2,346 | | 2,374 |
| 5.50%, 09/15/33 | 998 | | 1,004 |
| 6.00%, 10/15/33 | 13,017 | | 13,214 |
| 6.50%, 10/15/33 | 37,919 | | 38,853 |
| 5.50%, 04/15/34 | 2,412 | | 2,421 |
| 5.50%, 05/15/34 | 2,028 | | 2,053 |
| 6.50%, 08/15/34 | 25,663 | | 26,509 |
| 5.50%, 09/15/34 | 24,904 | | 25,179 |
| 5.50%, 12/15/34 | 24,792 | | 25,091 |
| 5.50%, 01/15/35 | 18,834 | | 19,058 |
| 6.00%, 09/20/38 | 53,669 | | 55,714 |
| 5.00%, 07/20/40 | 4,009 | | 4,087 |
| 5.00%, 09/20/40 | 19,299 | | 19,685 |
| 4.00%, 10/20/40 | 2,192 | | 2,151 |
| 6.00%, 10/20/40 | 6,496 | | 6,863 |
| 6.00%, 01/20/41 | 5,737 | | 6,038 |
| 4.50%, 04/20/41 | 75,093 | | 75,176 |
| 3.00%, 09/15/42 | 182,413 | | 166,855 |
| 3.00%, 10/15/42 | 84,056 | | 76,366 |
| 3.00%, 11/15/42 | 36,241 | | 32,713 |
| 4.00%, 08/20/43 | 127,995 | | 125,583 |
| 3.50%, 06/20/44 | 44,456 | | 42,238 |
| 3.00%, 01/15/45 | 601,994 | | 541,643 |
| 3.50%, 03/20/45 | 19,126 | | 18,073 |
| 3.50%, 04/15/45 | 185,707 | | 175,682 |
| 3.50%, 04/20/45 | 113,257 | | 107,192 |
| 4.00%, 05/20/45 | 10,812 | | 10,565 |
| 4.00%, 10/20/45 | 78,358 | | 76,252 |
| 3.50%, 11/20/45 | 126,379 | | 119,307 |
| 3.50%, 01/20/46 | 50,322 | | 47,617 |
| 3.50%, 04/20/46 | 107,400 | | 101,379 |
| 3.50%, 05/20/46 | 54,338 | | 51,291 |
| 3.50%, 06/20/46 | 111,128 | | 104,880 |
| 3.50%, 07/20/46 | 56,114 | | 52,956 |
| 3.00%, 08/20/46 | 144,844 | | 133,292 |
| 3.50%, 09/20/46 | 463,414 | | 431,950 |
| 3.00%, 11/20/46 | 35,073 | | 32,241 |
| 3.50%, 04/20/47 | 1,181,442 | | 1,114,468 |
| 3.50%, 05/20/47 | 65,642 | | 61,938 |
| 4.00%, 06/20/47 | 463,666 | | 447,440 |
| 4.50%, 08/20/47 | 21,566 | | 21,391 |
| | | Par | | Value |
| 3.00%, 09/20/47 | $ 9,660 | | $ 8,866 |
| 4.00%, 09/20/47 | 291,843 | | 282,046 |
| 3.50%, 10/20/47 | 302,005 | | 283,369 |
| 4.00%, 11/20/47 | 178,512 | | 172,503 |
| 3.50%, 12/20/47 | 1,098,598 | | 1,037,283 |
| 4.00%, 12/20/47 | 81,909 | | 79,015 |
| 3.00%, 02/20/48 | 45,561 | | 41,770 |
| 4.00%, 02/20/48 | 50,474 | | 48,814 |
| 4.00%, 03/20/48 | 593,217 | | 573,676 |
| 4.00%, 04/20/48 | 50,645 | | 48,972 |
| 4.50%, 04/20/48 | 133,173 | | 131,825 |
| 4.00%, 05/20/48 | 108,629 | | 105,006 |
| 4.50%, 05/20/48 | 519,880 | | 514,377 |
| 5.00%, 05/20/48 | 46,191 | | 46,603 |
| 3.50%, 06/15/48 | 90,003 | | 85,244 |
| 4.50%, 06/20/48 | 398,011 | | 393,737 |
| 4.50%, 07/20/48 | 8,942 | | 8,846 |
| 5.00%, 07/20/48 | 103,461 | | 104,414 |
| 4.50%, 08/20/48 | 1,300,696 | | 1,286,525 |
| 5.00%, 08/20/48 | 119,550 | | 120,396 |
| 3.50%, 09/20/48 | 126,180 | | 118,922 |
| 4.50%, 09/20/48 | 782,010 | | 773,452 |
| 4.50%, 10/20/48 | 123,636 | | 122,277 |
| 5.00%, 10/20/48 | 696,716 | | 702,392 |
| 3.50%, 11/20/48 | 459,296 | | 432,674 |
| 5.00%, 11/20/48 | 994,048 | | 1,003,395 |
| 4.50%, 12/20/48 | 573,406 | | 567,044 |
| 5.00%, 12/20/48 | 653,545 | | 658,165 |
| 4.50%, 01/20/49 | 2,071,627 | | 2,048,524 |
| 5.00%, 01/20/49 | 1,678,133 | | 1,687,927 |
| 4.00%, 02/20/49 | 1,222,335 | | 1,183,454 |
| 4.50%, 02/20/49 | 361,504 | | 357,456 |
| 5.00%, 02/20/49 | 36,480 | | 36,659 |
| 4.00%, 03/20/49 | 873,914 | | 843,424 |
| 4.50%, 03/20/49 | 573,428 | | 567,042 |
| 5.00%, 03/20/49 | 164,321 | | 165,229 |
| 4.00%, 04/20/49 | 99,115 | | 95,656 |
| 5.00%, 04/20/49 | 63,965 | | 64,336 |
| 3.50%, 07/20/49 | 167,582 | | 157,815 |
| 3.00%, 08/20/49 | 1,265,117 | | 1,156,674 |
| 5.00%, 08/20/49 | 2,564,997 | | 2,583,124 |
| 5.00%, 09/20/49 | 107,852 | | 108,781 |
| 3.50%, 10/20/49 | 33,154 | | 31,090 |
| 4.00%, 10/20/49 | 29,060 | | 28,170 |
| 4.50%, 10/20/49 | 159,027 | | 157,280 |
| 4.00%, 11/20/49 | 34,327 | | 32,880 |
| 5.00%, 11/20/49 | 275,761 | | 278,177 |
| 3.00%, 01/20/50 | 178,748 | | 162,307 |
| 4.00%, 01/20/50 | 35,894 | | 35,150 |
| 5.00%, 01/20/50 | 90,005 | | 90,721 |
| 3.50%, 02/20/50 | 626,023 | | 588,981 |
| 4.00%, 02/20/50 | 31,130 | | 30,413 |
| 3.00%, 03/20/50 | 7,264,951 | | 6,627,801 |
| 4.00%, 03/20/50 | 29,520 | | 28,909 |
| 4.00%, 04/20/50 | 120,830 | | 116,196 |
| 3.50%, 05/15/50 | 80,001 | | 75,087 |
| 4.50%, 05/20/50 | 366,803 | | 361,933 |
| 3.50%, 06/20/50 | 731,084 | | 687,879 |
See Notes to Financial Statements.
MEDIUM-DURATION BOND FUND
SCHEDULE OF INVESTMENTS (Continued)
| | | Par | | Value |
| 2.00%, 08/20/50 | $ 61,125 | | $ 51,845 |
| 3.50%, 11/20/50 | 831,087 | | 782,664 |
| 2.50%, 12/20/50 | 140,434 | | 120,486 |
| 4.50%, 12/20/50 | 234,181 | | 231,582 |
| 2.00%, 01/20/51 | 699,648 | | 593,685 |
| 2.00%, 02/20/51 | 291,565 | | 247,364 |
| 3.00%, 02/20/51 | 100,322 | | 91,682 |
| 2.00%, 03/20/51 | 764,876 | | 633,121 |
| 2.50%, 06/20/51 | 409,638 | | 354,913 |
| 3.00%, 07/20/51 | 128,688 | | 116,822 |
| 2.50%, 08/20/51 | 644,555 | | 558,421 |
| 2.50%, 09/20/51 | 378,841 | | 326,109 |
| 3.00%, 09/20/51 | 1,520,915 | | 1,379,670 |
| 2.50%, 10/20/51 | 3,489,019 | | 3,022,754 |
| 2.50%, 11/20/51 | 822,504 | | 712,572 |
| 3.00%, 11/20/51 | 1,174,489 | | 1,065,961 |
| 2.50%, 12/20/51 | 4,265,676 | | 3,686,341 |
| 3.00%, 12/20/51 | 836,141 | | 758,022 |
| 2.50%, 01/20/52 | 984,868 | | 848,806 |
| 3.00%, 02/20/52 | 607,531 | | 552,395 |
| 3.00%, 03/20/52 | 1,621,017 | | 1,458,727 |
| 3.50%, 03/20/52 | 184,704 | | 170,284 |
| 3.00%, 04/20/52 | 935,330 | | 828,363 |
| 3.50%, 06/20/52 | 182,609 | | 167,890 |
| 4.00%, 06/20/52 | 368,242 | | 353,145 |
| 4.50%, 08/20/52 | 466,868 | | 456,153 |
| 4.50%, 09/20/52 | 10,830,395 | | 10,583,842 |
| 5.00%, 09/20/52 | 188,402 | | 189,686 |
| 5.00%, 10/20/52 | 467,548 | | 465,460 |
| 5.00%, 11/20/52 | 1,039,893 | | 1,034,088 |
| 5.00%, 12/20/52 | 1,423,643 | | 1,416,681 |
| 5.00%, 01/20/53 | 568,927 | | 568,535 |
| 3.50%, 02/20/53 | 1,875,030 | | 1,755,412 |
| 5.50%, 02/20/53 | 288,784 | | 292,012 |
| 3.00%, 04/20/53 | 93,197 | | 84,981 |
| 5.50%, 05/20/53 | 1,079,012 | | 1,086,619 |
| 5.50%, 07/20/53 | 197,734 | | 200,343 |
| 5.00%, 08/20/53 | 788,354 | | 787,169 |
| 5.50%, 08/20/53 | 896,846 | | 906,188 |
| 6.50%, 09/20/53 | 197,971 | | 204,562 |
| 6.50%, 11/20/53 | 99,896 | | 103,723 |
| 2.00%, 01/01/54 TBA | 4,900,000 | | 4,154,281 |
| 2.50%, 01/01/54 TBA | 5,600,000 | | 4,904,813 |
| 3.00%, 01/01/54 TBA | 1,300,000 | | 1,178,469 |
| 3.50%, 01/01/54 TBA | 1,200,000 | | 1,118,531 |
| 4.00%, 01/01/54 TBA | 600,000 | | 573,281 |
| 5.00%, 01/01/54 TBA | 6,400,000 | | 6,363,000 |
| 5.50%, 01/01/54 TBA | 9,600,000 | | 9,665,250 |
| 6.00%, 01/01/54 TBA | 11,400,000 | | 11,593,266 |
| 6.50%, 01/01/54 TBA | 14,000,000 | | 14,333,703 |
| 6.50%, 03/01/54 TBA | 200,000 | | 204,298 |
| Government National Mortgage Association, Series 2007-30 | | | |
| (Floating, CME Term SOFR 1M + 0.41%, 0.30% Floor, 6.50% Cap), 5.77%, 05/20/37† | 44,342 | | 44,148 |
| | | Par | | Value |
| Government National Mortgage Association, Series 2007-51 | | | |
| (Floating, 6.47% - CME Term SOFR 1M, 6.58% Cap), 1.11%, 08/20/37† IO | $ 417,380 | | $ 14,081 |
| Government National Mortgage Association, Series 2010-85 | | | |
| (Floating, 6.54% - CME Term SOFR 1M, 6.65% Cap), 1.18%, 01/20/40† IO | 1,312 | | 7 |
| Government National Mortgage Association, Series 2010-H28 | | | |
| (Floating, CME Term SOFR 1M + 0.51%, 0.40% Floor, 10.50% Cap), 5.84%, 12/20/60† | 67,071 | | 66,723 |
| Government National Mortgage Association, Series 2011-H08 | | | |
| (Floating, CME Term SOFR 1M + 0.59%, 0.48% Floor, 10.50% Cap), 5.92%, 03/20/61† | 92,479 | | 92,152 |
| Government National Mortgage Association, Series 2011-H09 | | | |
| (Floating, CME Term SOFR 1M + 0.61%, 0.50% Floor, 10.50% Cap), 5.94%, 03/20/61† | 43,480 | | 43,316 |
| Government National Mortgage Association, Series 2012-144 | | | |
| 0.32%, 01/16/53† IO γ | 2,492,081 | | 16,932 |
| Government National Mortgage Association, Series 2012-34 | | | |
| (Floating, 5.94% - CME Term SOFR 1M, 6.05% Cap), 0.58%, 03/20/42† IO | 15,948 | | 1,933 |
| Government National Mortgage Association, Series 2012-H27 | | | |
| 1.72%, 10/20/62† IO γ | 167,358 | | 4,332 |
| Government National Mortgage Association, Series 2012-H30 | | | |
| (Floating, CME Term SOFR 1M + 0.46%, 0.35% Floor, 10.50% Cap), 5.79%, 12/20/62† | 158,764 | | 157,642 |
| Government National Mortgage Association, Series 2013-107 | | | |
| 2.84%, 11/16/47† γ | 110,185 | | 98,398 |
| Government National Mortgage Association, Series 2013-53 | | | |
| 3.50%, 04/20/43 IO | 28,946 | | 3,010 |
| Government National Mortgage Association, Series 2014-118 | | | |
| (Floating, 6.09% - CME Term SOFR 1M, 6.20% Cap), 0.73%, 08/20/44† IO | 85,629 | | 10,882 |
| Government National Mortgage Association, Series 2014-17 | | | |
| 3.54%, 06/16/48† γ | 3,819 | | 3,605 |
| Government National Mortgage Association, Series 2014-93 | | | |
| 0.66%, 11/16/55† IO γ | 627,526 | | 16,062 |
| Government National Mortgage Association, Series 2015-167 | | | |
| 4.00%, 04/16/45 IO | 42,158 | | 7,779 |
See Notes to Financial Statements.
| | | Par | | Value |
| Government National Mortgage Association, Series 2015-H11 | | | |
| (Floating, CME Term SOFR 1M + 0.66%, 0.55% Floor, 7.50% Cap), 5.99%, 05/20/65† | $1,155,288 | | $1,145,425 |
| Government National Mortgage Association, Series 2015-H14 | | | |
| (Floating, CME Term SOFR 1M + 0.54%, 0.43% Floor, 11.00% Cap), 5.87%, 05/20/65† | 470,234 | | 468,271 |
| (Floating, CME Term SOFR 1M + 0.68%, 0.57% Floor, 7.50% Cap), 6.01%, 06/20/65† | 2,043,696 | | 2,029,472 |
| Government National Mortgage Association, Series 2015-H15 | | | |
| (Floating, CME Term SOFR 1M + 0.69%, 0.58% Floor, 7.50% Cap), 6.02%, 06/20/65† | 836,234 | | 828,912 |
| (Floating, CME Term SOFR 1M + 0.71%, 0.60% Floor, 7.50% Cap), 6.04%, 06/20/65† | 1,890,225 | | 1,876,749 |
| Government National Mortgage Association, Series 2015-H16 | | | |
| (Floating, CME Term SOFR 1M + 0.71%, 0.60% Floor), 6.04%, 07/20/65† | 1,978,802 | | 1,963,213 |
| Government National Mortgage Association, Series 2015-H17 | | | |
| (Floating, CME Term SOFR 1M + 0.57%, 0.46% Floor), 5.90%, 06/20/65† | 127,807 | | 127,245 |
| Government National Mortgage Association, Series 2015-H18 | | | |
| (Floating, CME Term SOFR 1M + 0.71%, 0.60% Floor, 7.50% Cap), 6.04%, 07/20/65† | 273,560 | | 271,612 |
| Government National Mortgage Association, Series 2015-H19 | | | |
| (Floating, CME Term SOFR 1M + 0.71%, 0.60% Floor), 6.04%, 08/20/65† | 286,583 | | 284,202 |
| Government National Mortgage Association, Series 2015-H22 | | | |
| (Floating, CME Term SOFR 1M + 0.71%, 0.60% Floor, 7.50% Cap), 6.04%, 09/20/65† | 320,306 | | 317,643 |
| Government National Mortgage Association, Series 2015-H23 | | | |
| (Floating, CME Term SOFR 1M + 0.73%, 0.62% Floor, 7.50% Cap), 6.06%, 09/20/65† | 341,332 | | 338,411 |
| Government National Mortgage Association, Series 2015-H26 | | | |
| (Floating, CME Term SOFR 1M + 0.63%, 0.52% Floor, 11.00% Cap), 5.96%, 10/20/65† | 795,335 | | 791,816 |
| Government National Mortgage Association, Series 2015-H30 | | | |
| (Floating, CME Term SOFR 1M + 0.79%, 0.68% Floor), 6.12%, 08/20/61† | 1,474 | | 1,459 |
| | | Par | | Value |
| Government National Mortgage Association, Series 2016-152 | | | |
| 0.74%, 08/15/58† IO γ | $2,254,873 | | $ 79,582 |
| Government National Mortgage Association, Series 2017-190 | | | |
| 0.62%, 03/16/60† IO γ | 1,422,517 | | 49,660 |
| Government National Mortgage Association, Series 2017-H15 | | | |
| 0.84%, 07/20/67† IO γ | 307,458 | | 14,762 |
| (Floating, CME Term SOFR 12M + 1.52%, 0.80% Floor, 7.50% Cap), 6.53%, 07/20/67† | 1,000,276 | | 1,005,862 |
| Government National Mortgage Association, Series 2017-H18 | | | |
| 0.05%, 09/20/67† IO γ | 2,327,644 | | 71,406 |
| Government National Mortgage Association, Series 2017-H20 | | | |
| 0.25%, 10/20/67† IO γ | 102,740 | | 3,526 |
| Government National Mortgage Association, Series 2017-H22 | | | |
| 0.00%, 11/20/67† IO γ | 791,999 | | 22,585 |
| Government National Mortgage Association, Series 2018-H07 | | | |
| (Floating, CME Term SOFR 1M + 0.41%, 0.30% Floor, 11.00% Cap), 5.74%, 05/20/68† | 285,305 | | 284,707 |
| Government National Mortgage Association, Series 2020-123 | | | |
| 2.50%, 08/20/50 IO | 509,447 | | 67,853 |
| Government National Mortgage Association, Series 2020-127 | | | |
| 2.50%, 08/20/50 IO | 144,557 | | 19,681 |
| Government National Mortgage Association, Series 2020-129 | | | |
| 2.50%, 09/20/50 IO | 150,667 | | 20,495 |
| Government National Mortgage Association, Series 2020-160 | | | |
| 2.50%, 10/20/50 IO | 688,456 | | 93,484 |
| Government National Mortgage Association, Series 2020-173 | | | |
| 2.50%, 11/20/50 IO | 2,106,811 | | 285,949 |
| Government National Mortgage Association, Series 2020-179 | | | |
| 1.01%, 09/16/62† IO γ | 6,758,690 | | 430,222 |
| Government National Mortgage Association, Series 2020-181 | | | |
| 2.00%, 12/20/50 IO | 1,154,883 | | 125,723 |
| Government National Mortgage Association, Series 2020-47 | | | |
| 3.50%, 04/20/50 IO | 311,396 | | 52,394 |
| Government National Mortgage Association, Series 2020-H09 | | | |
| (Floating, CME Term SOFR 1M + 1.36%, 1.25% Floor, 11.00% Cap), 6.69%, 04/20/70† | 102,389 | | 103,354 |
| (Floating, CME Term SOFR 1M + 1.26%, 1.15% Floor), 6.59%, 05/20/70† | 308,072 | | 307,187 |
See Notes to Financial Statements.
MEDIUM-DURATION BOND FUND
SCHEDULE OF INVESTMENTS (Continued)
| | | Par | | Value |
| Government National Mortgage Association, Series 2020-H13 | | | |
| (Floating, CME Term SOFR 1M + 0.56%, 0.45% Floor, 7.50% Cap), 5.89%, 07/20/70† | $ 124,846 | | $ 120,995 |
| Government National Mortgage Association, Series 2021-135 | | | |
| 2.00%, 08/20/51 | 3,876,276 | | 3,210,777 |
| Government National Mortgage Association, Series 2021-14 | | | |
| 1.34%, 06/16/63 | 360,258 | | 272,582 |
| Government National Mortgage Association, Series 2021-188 | | | |
| 2.00%, 10/20/51 | 1,052,736 | | 858,556 |
| Government National Mortgage Association, Series 2021-191 | | | |
| 3.00%, 10/20/51 IO | 634,286 | | 111,836 |
| Government National Mortgage Association, Series 2021-21 | | | |
| 1.40%, 06/16/63 | 693,709 | | 526,435 |
| Government National Mortgage Association, Series 2021-223 | | | |
| 2.00%, 06/20/51 | 843,098 | | 736,982 |
| Government National Mortgage Association, Series 2021-29 | | | |
| 2.50%, 02/20/51 IO | 451,988 | | 81,518 |
| Government National Mortgage Association, Series 2021-77 | | | |
| 1.25%, 07/20/50 | 356,815 | | 283,399 |
| Government National Mortgage Association, Series 2022-102 | | | |
| 2.25%, 06/16/64 | 1,500,000 | | 882,751 |
| Government National Mortgage Association, Series 2022-139 | | | |
| 4.00%, 07/20/51 | 300,000 | | 273,653 |
| Government National Mortgage Association, Series 2022-189 | | | |
| 2.50%, 10/20/51 | 560,056 | | 472,256 |
| Government National Mortgage Association, Series 2022-196 | | | |
| 3.00%, 10/16/64† γ | 300,000 | | 226,981 |
| Government National Mortgage Association, Series 2022-210 | | | |
| 0.70%, 07/16/64† IO γ | 1,483,117 | | 94,557 |
| Government National Mortgage Association, Series 2022-216 | | | |
| 0.75%, 07/16/65† IO γ | 1,488,896 | | 95,607 |
| Government National Mortgage Association, Series 2022-220 | | | |
| 3.00%, 10/16/64 | 300,000 | | 229,115 |
| Government National Mortgage Association, Series 2022-3 | | | |
| 0.64%, 02/16/61† IO γ | 96,458 | | 4,853 |
| Government National Mortgage Association, Series 2023-92 | | | |
| 0.61%, 06/16/64† IO γ | 1,999,794 | | 124,941 |
| 2.00%, 06/16/64 | 1,699,825 | | 1,317,488 |
| GreenPoint Mortgage Funding Trust, Series 2006-OH1, Class A1 | | | |
| (Floating, CME Term SOFR 1M + 0.47%, 0.36% Floor), 5.83%, 01/25/37† | 263,492 | | 231,623 |
| | | Par | | Value |
| GS Mortgage Securities Corporation Trust, Series 2018-SRP5, Class A | | | |
| (Floating, CME Term SOFR 1M + 1.91%, 1.30% Floor), 7.28%, 09/15/31 144A † | $1,361,908 | | $ 939,712 |
| GS Mortgage Securities Corporation Trust, Series 2021-DM, Class AS | | | |
| (Floating, CME Term SOFR 1M + 1.50%, 1.39% Floor), 6.86%, 11/15/36 144A † | 1,370,000 | | 1,354,865 |
| GS Mortgage Securities Corporation Trust, Series 2021-RENT, Class B | | | |
| (Floating, CME Term SOFR 1M + 1.21%, 1.10% Floor), 6.58%, 11/21/35 144A † | 663,129 | | 641,466 |
| GS Mortgage Securities Trust, Series 2015-GC30, Class AS | | | |
| 3.78%, 05/10/50 | 370,000 | | 350,977 |
| GS Mortgage Securities Trust, Series 2017-GS6, Class A2 | | | |
| 3.16%, 05/10/50 | 295,302 | | 276,857 |
| GS Mortgage Securities Trust, Series 2017-GS7, Class A4 | | | |
| 3.43%, 08/10/50 | 850,000 | | 785,033 |
| GS Mortgage-Backed Securities Trust, Series 2022-GR2, Class A2 | | | |
| 3.00%, 08/26/52 144A † γ | 2,329,012 | | 1,997,714 |
| GS Mortgage-Backed Securities Trust, Series 2022-PJ3, Class A4 | | | |
| 2.50%, 08/25/52 144A † γ | 1,968,392 | | 1,621,596 |
| GSR Mortgage Loan Trust, Series 2005-AR6, Class 2A1 | | | |
| 4.66%, 09/25/35† γ | 133,682 | | 125,640 |
| HIT Trust, Series 2022-HI32, Class C | | | |
| (Floating, CME Term SOFR 1M + 3.74%, 3.74% Floor), 9.10%, 07/15/24 144A † | 1,211,424 | | 1,208,148 |
| Impac CMB Trust, Series 2004-8, Class 1A | | | |
| (Floating, CME Term SOFR 1M + 0.83%, 0.72% Floor, 11.00% Cap), 6.19%, 10/25/34† | 7,488 | | 7,034 |
| IndyMac ARM Trust, Series 2001-H2, Class A1 | | | |
| 5.69%, 01/25/32† γ | 2,676 | | 2,561 |
| JP Morgan Chase Commercial Mortgage Securities Trust, Series 2012-C6, Class D | | | |
| 4.96%, 05/15/45† γ | 197,480 | | 179,050 |
| JP Morgan Chase Commercial Mortgage Securities Trust, Series 2021-410T, Class A | | | |
| 2.29%, 03/05/42 144A | 1,900,000 | | 1,532,314 |
| JP Morgan Mortgage Trust, Series 2005-A1, Class 6T1 | | | |
| 4.27%, 02/25/35† γ | 9,268 | | 8,552 |
| JP Morgan Mortgage Trust, Series 2018-4, Class A1 | | | |
| 3.50%, 10/25/48 144A † γ | 109,621 | | 96,815 |
See Notes to Financial Statements.
| | | Par | | Value |
| JP Morgan Mortgage Trust, Series 2021-14, Class A11 | | | |
| (Floating, U.S. 30-Day Average SOFR + 0.95%, 5.00% Cap), 5.00%, 05/25/52 144A † | $1,930,948 | | $1,792,541 |
| JP Morgan Mortgage Trust, Series 2021-6, Class A3 | | | |
| 2.50%, 10/25/51 144A † γ | 1,817,111 | | 1,498,108 |
| JP Morgan Mortgage Trust, Series 2021-LTV2, Class A1 | | | |
| 2.52%, 05/25/52 144A | 913,215 | | 755,490 |
| JP Morgan Mortgage Trust, Series 2022-INV1, Class A3 | | | |
| 3.00%, 03/25/52 144A † γ | 1,924,720 | | 1,653,329 |
| JP Morgan Mortgage Trust, Series 2022-LTV2, Class A3 | | | |
| 3.50%, 09/25/52 144A † γ | 1,924,991 | | 1,715,281 |
| JPMBB Commercial Mortgage Securities Trust, Series 2014-C25, Class ASB | | | |
| 3.41%, 11/15/47 | 133,943 | | 132,401 |
| JPMBB Commercial Mortgage Securities Trust, Series 2015-C32, Class ASB | | | |
| 3.36%, 11/15/48 | 248,041 | | 242,572 |
| JPMDB Commercial Mortgage Securities Trust, Series 2017-C5, Class B | | | |
| 4.01%, 03/15/50 | 630,000 | | 484,151 |
| KREST Commercial Mortgage Securities Trust, Series 2021-CHIP, Class A | | | |
| 2.56%, 11/05/44 144A | 2,300,000 | | 1,722,784 |
| LSTAR Securities Investment, Ltd., Series 2023-1, Class A1 | | | |
| (Floating, U.S. SOFR + 3.50%), 8.89%, 01/01/28 144A † | 527,903 | | 527,628 |
| Ludgate Funding PLC, Series 2007-1, Class A2A | | | |
| (Floating, ICE LIBOR GBP 3M + 0.16%), 5.48%, 01/01/61(U) † | 415,551 | | 508,479 |
| Ludgate Funding PLC, Series 2008-W1X, Class A1 | | | |
| (Floating, ICE LIBOR GBP 3M + 0.60%), 5.92%, 01/01/61(U) † | 336,226 | | 411,969 |
| Manhattan West Mortgage Trust, Series 2020-OMW, Class A | | | |
| 2.13%, 09/10/39 144A | 1,700,000 | | 1,504,951 |
| Mansard Mortgages PLC, Series 2007-1X, Class A2 | | | |
| (Floating, SONIA Interest Rate + 0.30%), 5.52%, 04/15/47(U) † | 411,452 | | 515,304 |
| MASTR Adjustable Rate Mortgages Trust, Series 2004-13, Class 3A7 | | | |
| 5.40%, 11/21/34† γ | 69,748 | | 65,591 |
| MASTR Adjustable Rate Mortgages Trust, Series 2004-4, Class 4A1 | | | |
| 4.60%, 05/25/34† γ | 36,343 | | 33,068 |
| | | Par | | Value |
| Mill City Mortgage Loan Trust, Series 2017-2, Class A3 | | | |
| 3.22%, 07/25/59 144A † γ | $ 105,945 | | $ 101,541 |
| Mill City Mortgage Loan Trust, Series 2019-GS2, Class M1 | | | |
| 3.00%, 08/25/59 144A | 870,000 | | 776,028 |
| Morgan Stanley Bank of America Merrill Lynch Trust, Series 2014-C19, Class B | | | |
| 4.00%, 12/15/47 | 370,000 | | 352,450 |
| Morgan Stanley Bank of America Merrill Lynch Trust, Series 2015-C22, Class AS | | | |
| 3.56%, 05/15/46 | 480,000 | | 457,051 |
| Morgan Stanley Bank of America Merrill Lynch Trust, Series 2015-C25, Class A4 | | | |
| 3.37%, 10/15/48 | 1,400,000 | | 1,355,083 |
| Morgan Stanley Bank of America Merrill Lynch Trust, Series 2015-C27, Class ASB | | | |
| 3.56%, 12/15/47 | 246,027 | | 241,582 |
| Morgan Stanley Capital I Trust, Series 2019-BPR, Class A | | | |
| (Floating, CME Term SOFR 1M + 1.99%, 1.40% Floor), 7.34%, 05/15/36 144A † | 795,790 | | 779,446 |
| Morgan Stanley Capital I Trust, Series 2020-CNP, Class A | | | |
| 2.43%, 04/05/42 144A † γ | 1,600,000 | | 1,237,658 |
| MortgageIT Trust, Series 2005-4, Class A1 | | �� | |
| (Floating, CME Term SOFR 1M + 0.67%, 0.56% Floor, 11.50% Cap), 6.03%, 10/25/35† | 58,526 | | 56,933 |
| NADG NNN Operating LP, Series 2019-1, Class A | | | |
| 3.37%, 12/28/49 144A | 857,936 | | 821,899 |
| New Residential Mortgage Loan Trust, Series 2022-NQM4, Class A1 | | | |
| (Step to 4.98% on 02/25/24), 5.00%, 06/25/62 144A STEP | 253,781 | | 252,438 |
| New Residential Mortgage Loan Trust, Series 2022-NQM5, Class A2 | | | |
| (Step to 6.47% on 02/25/26), 6.50%, 11/25/52 144A STEP | 409,168 | | 409,910 |
| NYMT Loan Trust, Series 2022-SP1, Class A1 | | | |
| (Step to 8.25% on 08/25/25), 5.25%, 07/25/62 144A STEP | 3,180,372 | | 3,113,603 |
| NYO Commercial Mortgage Trust, Series 2021-1290, Class A | | | |
| (Floating, CME Term SOFR 1M + 1.21%, 1.10% Floor), 6.57%, 11/15/38 144A † | 2,300,000 | | 2,128,346 |
See Notes to Financial Statements.
MEDIUM-DURATION BOND FUND
SCHEDULE OF INVESTMENTS (Continued)
| | | Par | | Value |
| OBX Trust, Series 2018-1, Class A2 | | | |
| (Floating, CME Term SOFR 1M + 0.76%), 6.12%, 06/25/57 144A † | $ 720,833 | | $ 689,225 |
| OBX Trust, Series 2022-NQM6, Class A1 | | | |
| (Step to 4.72% on 07/25/26), 4.70%, 07/25/62 144A STEP | 1,234,896 | | 1,217,130 |
| OBX Trust, Series 2022-NQM7, Class A1 | | | |
| (Step to 5.77% on 09/25/26), 5.11%, 08/25/62 144A STEP | 1,247,563 | | 1,228,663 |
| OBX Trust, Series 2022-NQM7, Class A3 | | | |
| (Step to 5.77% on 09/25/26), 5.70%, 08/25/62 144A STEP | 1,720,777 | | 1,698,795 |
| OBX Trust, Series 2022-NQM8, Class A2 | | | |
| (Step to 5.96% on 02/25/24), 6.10%, 09/25/62 144A STEP | 433,374 | | 429,841 |
| OBX Trust, Series 2022-NQM9, Class A1A | | | |
| (Step to 6.48% on 12/25/26), 6.45%, 09/25/62 144A STEP | 132,495 | | 134,038 |
| OBX Trust, Series 2022-NQM9, Class A2 | | | |
| (Step to 6.48% on 12/25/26), 6.45%, 09/25/62 144A STEP | 1,192,459 | | 1,195,195 |
| OBX Trust, Series 2023-NQM1, Class A3 | | | |
| 6.50%, 11/25/62 144A † γ | 397,354 | | 396,066 |
| OBX Trust, Series 2023-NQM3, Class A1 | | | |
| (Step to 6.86% on 05/25/27), 5.95%, 02/25/63 144A STEP | 1,083,452 | | 1,084,901 |
| OBX Trust, Series 2023-NQM6, Class A3 | | | |
| (Step to 7.85% on 08/25/27), 6.98%, 07/25/63 144A STEP | 1,469,593 | | 1,480,762 |
| One Bryant Park Trust, Series 2019-OBP, Class A | | | |
| 2.52%, 09/15/54 144A | 1,070,000 | | 909,162 |
| OSAT Trust, Series 2021-RPL1, Class A1 | | | |
| (Step to 3.69% on 07/25/24), 2.12%, 05/25/65 144A STEP | 1,064,161 | | 1,038,853 |
| PRKCM Trust, Series 2022-AFC1, Class A1A | | | |
| 4.10%, 04/25/57 144A † γ | 1,022,094 | | 980,711 |
| PRKCM Trust, Series 2023-AFC3, Class A3 | | | |
| (Step to 7.81% on 09/25/27), 7.09%, 09/25/58 144A STEP | 1,087,034 | | 1,105,176 |
| Resloc UK PLC, Series 2007-1X, Class A3A | | | |
| (Floating, Euribor 3M + 0.16%), 4.09%, 12/15/43(E) † | 593,579 | | 631,594 |
| Resloc UK PLC, Series 2007-1X, Class A3B | | | |
| (Floating, SONIA Interest Rate + 0.28%), 5.50%, 12/15/43(U) † | 148,395 | | 182,787 |
| | | Par | | Value |
| Ripon Mortgages PLC, Series 1RA, Class A | | | |
| (Floating, SONIA Interest Rate + 0.70%), 5.92%, 08/28/56(U) 144A † | $3,077,382 | | $3,922,570 |
| Ripon Mortgages PLC, Series 1RA, Class C | | | |
| (Floating, SONIA Interest Rate + 1.15%), 6.37%, 08/28/56(U) 144A † | 3,100,000 | | 3,896,404 |
| Sequoia Mortgage Trust, Series 6, Class A | | | |
| (Floating, CME Term SOFR 1M + 0.43%, 0.64% Floor, 11.00% Cap), 6.11%, 04/19/27† | 50,167 | | 48,427 |
| SFO Commercial Mortgage Trust, Series 2021-555, Class D | | | |
| (Floating, CME Term SOFR 1M + 2.51%, 2.40% Floor), 7.88%, 05/15/38 144A † | 970,000 | | 801,816 |
| SG Commercial Mortgage Securities Trust, Series 2016-C5, Class A3 | | | |
| 2.78%, 10/10/48 | 330,000 | | 313,639 |
| Shops at Crystals Trust, Series 2016-CSTL, Class A | | | |
| 3.13%, 07/05/36 144A | 340,000 | | 317,499 |
| SLG Office Trust, Series 2021-OVA, Class A | | | |
| 2.59%, 07/15/41 144A | 430,000 | | 356,758 |
| SMRT, Series 2022-MINI, Class D | | | |
| (Floating, CME Term SOFR 1M + 1.95%, 1.95% Floor), 7.31%, 01/15/39 144A † | 1,290,000 | | 1,229,897 |
| SREIT Trust, Series 2021-IND, Class A | | | |
| (Floating, CME Term SOFR 1M + 0.81%, 0.70% Floor), 6.18%, 10/15/38 144A † | 2,300,000 | | 2,256,151 |
| SREIT Trust, Series 2021-MFP2, Class A | | | |
| (Floating, CME Term SOFR 1M + 0.94%, 0.82% Floor), 6.30%, 11/15/36 144A † | 450,000 | | 444,081 |
| Structured Asset Mortgage Investments II Trust, Series 2005-AR5, Class A1 | | | |
| (Floating, CME Term SOFR 1M + 0.61%, 0.50% Floor, 11.00% Cap), 5.97%, 07/19/35† | 24,922 | | 22,386 |
| STWD Mortgage Trust, Series 2021-HTS, Class A | | | |
| (Floating, CME Term SOFR 1M + 1.16%, 1.05% Floor), 6.53%, 04/15/34 144A † | 1,761,625 | | 1,735,102 |
| Taubman Centers Commercial Mortgage Trust, Series 2022-DPM, Class A | | | |
| (Floating, CME Term SOFR 1M + 2.19%, 2.19% Floor), 7.55%, 05/15/37 144A † | 850,000 | | 846,425 |
See Notes to Financial Statements.
| | | Par | | Value |
| Thornburg Mortgage Securities Trust, Series 2003-4, Class A1 | | | |
| (Floating, CME Term SOFR 1M + 0.75%, 0.64% Floor, 11.50% Cap), 6.11%, 09/25/43† | $ 2,462 | | $ 2,318 |
| Thornburg Mortgage Securities Trust, Series 2005-1, Class A3 | | | |
| 3.95%, 04/25/45† γ | 14,724 | | 14,078 |
| Towd Point Mortgage Funding PLC, Series 2019-A13X, Class A1 | | | |
| (Floating, SONIA Interest Rate + 1.35%), 6.57%, 07/20/45(U) † | 1,040,560 | | 1,328,532 |
| Towd Point Mortgage Funding PLC, Series 2019-GR4A, Class A1 | | | |
| (Floating, SONIA Interest Rate + 1.14%), 6.37%, 10/20/51(U) 144A † | 570,198 | | 727,933 |
| Towd Point Mortgage Funding PLC, Series 2020-A14X, Class A | | | |
| (Floating, SONIA Interest Rate + 1.35%), 6.57%, 05/20/45(U) † | 2,467,302 | | 3,150,098 |
| Towd Point Mortgage Funding, Series 2019-A13A, Class A1 | | | |
| (Floating, SONIA Interest Rate + 1.35%), 6.57%, 07/20/45(U) 144A † | 1,040,560 | | 1,328,532 |
| Towd Point Mortgage Trust, Series 2020-2, Class A1A | | | |
| 1.64%, 04/25/60 144A | 314,195 | | 279,511 |
| Uniform Mortgage Backed Securities | | | |
| 2.50%, 01/01/52 TBA | 2,000,000 | | 1,703,281 |
| 3.00%, 01/01/52 TBA | 11,700,000 | | 10,368,564 |
| 3.50%, 01/01/52 TBA | 17,000,000 | | 15,617,422 |
| 3.00%, 03/01/52 TBA | 16,000,000 | | 14,211,733 |
| 5.00%, 01/01/53 TBA | 110,900,000 | | 109,851,649 |
| 6.00%, 01/01/53 TBA | 1,000,000 | | 1,016,250 |
| 3.00%, 02/01/53 TBA | 54,308,964 | | 48,179,631 |
| 4.00%, 02/01/53 TBA | 62,500,000 | | 59,250,489 |
| 5.50%, 02/01/53 TBA | 40,300,000 | | 40,517,243 |
| 4.00%, 01/01/54 TBA | 500,000 | | 473,574 |
| 4.50%, 01/01/54 TBA | 100,000 | | 97,059 |
| 7.00%, 01/01/54 TBA | 1,000,000 | | 1,031,641 |
| 4.50%, 02/01/54 TBA | 21,900,000 | | 21,268,664 |
| 6.00%, 02/01/54 TBA | 30,300,000 | | 30,791,191 |
| 7.00%, 02/01/54 TBA | 3,000,000 | | 3,091,875 |
| UWM Mortgage Trust, Series 2021-INV2, Class A9 | | | |
| (Floating, U.S. 30-Day Average SOFR + 1.00%, 5.00% Cap), 5.00%, 09/25/51 144A † | 1,946,372 | | 1,808,305 |
| UWM Mortgage Trust, Series 2021-INV3, Class A3 | | | |
| 2.50%, 11/25/51 144A † γ | 2,758,694 | | 2,270,956 |
| UWM Mortgage Trust, Series 2021-INV3, Class A9 | | | |
| (Floating, U.S. 30-Day Average SOFR + 0.95%, 5.00% Cap), 5.00%, 11/25/51 144A † | 1,982,811 | | 1,840,457 |
| | | Par | | Value |
| UWM Mortgage Trust, Series 2021-INV4, Class A3 | | | |
| 2.50%, 12/25/51 144A † γ | $1,916,850 | | $1,580,337 |
| VASA Trust, Series 2021-VASA, Class A | | | |
| (Floating, CME Term SOFR 1M + 1.01%, 0.90% Floor), 6.38%, 07/15/39 144A † | 390,000 | | 353,151 |
| Verus Securitization Trust, Series 2022-6, Class A3 | | | |
| (Step to 4.93% on 07/25/26), 4.91%, 06/25/67 144A STEP | 2,121,682 | | 2,068,269 |
| Verus Securitization Trust, Series 2022-8, Class A2 | | | |
| (Step to 6.15% on 11/25/26), 6.13%, 09/25/67 144A STEP | 895,504 | | 893,973 |
| Verus Securitization Trust, Series 2022-INV1, Class A1 | | | |
| (Step to 5.87% on 09/25/26), 5.04%, 08/25/67 144A STEP | 87,719 | | 86,631 |
| Verus Securitization Trust, Series 2023-3, Class A3 | | | |
| (Step to 7.74% on 05/25/27), 6.74%, 03/25/68 144A STEP | 1,061,888 | | 1,062,417 |
| Verus Securitization Trust, Series 2023-4, Class A1 | | | |
| (Step to 6.81% on 06/25/27), 5.81%, 05/25/68 144A STEP | 876,537 | | 876,304 |
| Verus Securitization Trust, Series 2023-7, Class A3 | | | |
| (Step to 7.96% on 11/25/27), 7.42%, 10/25/68 144A STEP | 982,336 | | 998,130 |
| Washington Mutual Mortgage Pass-Through Certificates Trust, Series 2002-AR19, Class A7 | | | |
| 4.24%, 02/25/33† γ | 1,329 | | 1,260 |
| Washington Mutual Mortgage Pass-Through Certificates Trust, Series 2002-AR6, Class A | | | |
| (Floating, Federal Reserve U.S. 12 1Y CMT + 1.40%, 1.40% Floor), 6.41%, 06/25/42† | 2,663 | | 2,439 |
| Washington Mutual Mortgage Pass-Through Certificates Trust, Series 2005-AR1, Class A1B | | | |
| (Floating, CME Term SOFR 1M + 0.89%, 0.78% Floor, 10.50% Cap), 6.25%, 01/25/45† | 449,471 | | 415,413 |
| Washington Mutual Mortgage Pass-Through Certificates Trust, Series 2005-AR13, Class A1A1 | | | |
| (Floating, CME Term SOFR 1M + 0.69%, 0.58% Floor, 10.50% Cap), 6.05%, 10/25/45† | 273,787 | | 260,518 |
| Washington Mutual Mortgage Pass-Through Certificates Trust, Series 2007-HY1, Class 1A1 | | | |
| 3.65%, 02/25/37† γ | 105,087 | | 90,702 |
See Notes to Financial Statements.
MEDIUM-DURATION BOND FUND
SCHEDULE OF INVESTMENTS (Continued)
| | | Par | | Value |
| Washington Mutual Mortgage Pass-Through Certificates Trust, Series 2007-HY1, Class 2A3 | | | |
| 3.69%, 02/25/37† γ | $ 64,472 | | $ 57,804 |
| Washington Mutual Mortgage Pass-Through Certificates Trust, Series 2007-OA3, Class 2A1A | | | |
| (Floating, Federal Reserve U.S. 12 1Y CMT + 0.76%, 0.76% Floor), 5.77%, 04/25/47† | 222,956 | | 191,211 |
| Washington Mutual Mortgage Pass-Through Certificates, Series 2005-AR8, Class 1A1A | | | |
| (Floating, CME Term SOFR 1M + 0.65%, 0.54% Floor, 10.50% Cap), 6.01%, 07/25/45† | 211,301 | | 198,101 |
| Washington Mutual Mortgage Pass-Through Certificates, Series 2005-AR8, Class 2A1A | | | |
| (Floating, CME Term SOFR 1M + 0.69%, 0.58% Floor, 10.50% Cap), 6.05%, 07/25/45† | 58,542 | | 54,948 |
| Wells Fargo Alternative Loan Trust, Series 2007-PA6, Class A1 | | | |
| 5.69%, 12/28/37† γ | 120,602 | | 108,080 |
| Wells Fargo Commercial Mortgage Trust, Series 2017-RC1, Class D | | | |
| 3.25%, 01/15/60 144A | 150,000 | | 109,340 |
| Wells Fargo Commercial Mortgage Trust, Series 2019-C51, Class ASB | | | |
| 3.16%, 06/15/52 | 300,000 | | 283,985 |
| Wells Fargo Mortgage Backed Securities Trust, Series 2019-3, Class A1 | | | |
| 3.50%, 07/25/49 144A † γ | 26,910 | | 24,119 |
| WFRBS Commercial Mortgage Trust, Series 2014-C19, Class XA | | | |
| 0.89%, 03/15/47 IO | 343,688 | | 111 |
| WFRBS Commercial Mortgage Trust, Series 2014-C21, Class XA | | | |
| 0.98%, 08/15/47† IO γ | 2,173,379 | | 10,457 |
| WFRBS Commercial Mortgage Trust, Series 2014-C24, Class AS | | | |
| 3.93%, 11/15/47 | 290,000 | | 271,993 |
| WFRBS Commercial Mortgage Trust, Series 2014-C24, Class C | | | |
| 4.29%, 11/15/47 | 300,000 | | 243,637 |
| Worldwide Plaza Trust, Series 2017-WWP, Class A | | | |
| 3.53%, 11/10/36 144A | 1,900,000 | | 1,449,684 |
Total Mortgage-Backed Securities
(Cost $1,114,206,001) | | | 1,092,582,228 |
| MUNICIPAL BONDS — 0.4% |
| American Municipal Power, Inc., Hydroelectric Projects, Revenue Bond, Series B | | | |
| 8.08%, 02/15/50 | 600,000 | | 812,887 |
| American Municipal Power, Inc., Revenue Bond, Series E | | | |
| 6.27%, 02/15/50 | 225,000 | | 245,783 |
| | | Par | | Value |
| California Statewide Communities Development Authority, Revenue Bond | | | |
| 1.81%, 02/01/30 | $ 25,000 | | $ 21,470 |
| 1.88%, 02/01/31 | 150,000 | | 125,886 |
| California Statewide Communities Development Authority, Revenue Bond (AGM Insured) | | | |
| 7.14%, 08/15/47 | 1,200,000 | | 1,309,418 |
| Central Texas Regional Mobility Authority, Revenue Bond, Series E | | | |
| 3.17%, 01/01/41 | 1,000,000 | | 770,025 |
| Chicago Transit Authority Sales & Transfer Tax Receipts Revenue, Revenue Bond, Series A | | | |
| 6.90%, 12/01/40 | 659,803 | | 754,888 |
| Chicago Transit Authority Sales & Transfer Tax Receipts Revenue, Revenue Bond, Series B | | | |
| 6.90%, 12/01/40 | 281,388 | | 320,712 |
| City of New Orleans Louisiana Sewerage Service Revenue, Revenue Bond (AGM Insured) | | | |
| 0.96%, 06/01/26 | 25,000 | | 22,890 |
| 1.41%, 06/01/28 | 65,000 | | 57,004 |
| City of New Orleans Louisiana Water System Revenue, Revenue Bond (AGM Insured) | | | |
| 1.01%, 12/01/26 | 30,000 | | 26,990 |
| 1.46%, 12/01/28 | 65,000 | | 55,995 |
| Commonwealth Financing Authority, Revenue Bond, Series C | | | |
| 2.76%, 06/01/30 | 50,000 | | 44,598 |
| Louisiana Local Government Environmental Facilities & Community Development Authority, Revenue Bond | | | |
| 4.28%, 02/01/36 | 1,300,000 | | 1,264,376 |
| Louisiana State Transportation Authority, Revenue Bond, Series A | | | |
| 2.00%, 02/15/30 | 50,000 | | 43,104 |
| Metropolitan Transportation Authority, Revenue Bond, Series A-2 | | | |
| 5.99%, 11/15/30 | 115,000 | | 122,494 |
| Metropolitan Transportation Authority, Revenue Bond, Series C-2 | | | |
| 5.18%, 11/15/49 | 825,000 | | 807,683 |
| Municipal Improvement Corporation of Los Angeles, Revenue Bond, Series A | | | |
| 2.07%, 11/01/30 | 670,000 | | 573,877 |
| Municipal Improvement Corporation of Los Angeles, Revenue Bond, Series C | | | |
| 1.83%, 11/01/29 | 70,000 | | 60,616 |
| Port Authority of New York & New Jersey, Revenue Bond, Series 192 | | | |
| 4.81%, 10/15/65 | 300,000 | | 292,294 |
See Notes to Financial Statements.
| | | Par | | Value |
| Port of Oakland, Senior Lien Revenue Bond, Series R | | | |
| 1.95%, 05/01/28 | $ 90,000 | | $ 81,199 |
| 2.10%, 05/01/30 | 25,000 | | 21,632 |
| 2.20%, 05/01/31 | 135,000 | | 114,642 |
| San Francisco Municipal Transportation Agency, Revenue Bond, Series A | | | |
| 1.30%, 03/01/28 | 155,000 | | 136,200 |
| San Jose Financing Authority, Revenue Bond | | | |
| 1.81%, 06/01/29 | 100,000 | | 87,046 |
| 1.86%, 06/01/30 | 55,000 | | 46,690 |
| State Board of Administration Finance Corporation, Revenue Bond, Series A | | | |
| 2.15%, 07/01/30 | 235,000 | | 200,692 |
| State of California, General Obligation | | | |
| 7.55%, 04/01/39 | 410,000 | | 518,682 |
| State of Illinois, General Obligation | | | |
| 5.10%, 06/01/33 | 405,000 | | 401,116 |
| 6.63%, 02/01/35 | 456,923 | | 479,018 |
| 7.35%, 07/01/35 | 398,571 | | 433,337 |
| State of Louisiana, Revenue Bond, I-49 North Project | | | |
| 1.06%, 09/01/26 | 15,000 | | 13,680 |
| State of Louisiana, Revenue Bond, I-49 South Project | | | |
| 1.54%, 09/01/28 | 70,000 | | 61,469 |
| Tarrant County Cultural Education Facilities Finance Corporation, Revenue Bond (AGM Insured) | | | |
| 2.78%, 09/01/34 | 1,000,000 | | 811,853 |
| University of North Carolina at Charlotte (The), Revenue Bond | | | |
| 1.71%, 04/01/28 | 5,000 | | 4,505 |
Total Municipal Bonds
(Cost $11,596,700) | | | 11,144,751 |
| | Number of
Contracts | | Notional
Amount | |
| PURCHASED OPTIONS — 0.1% |
| Call Options — 0.1% |
10-Year U.S. Treasury Note Future expiration date 02/2024, Strike Price
$110.00, Expires
01/26/24 (GSC) | 45 | | $5,080,078 | 134,297 |
10-Year U.S. Treasury Note Future expiration date 02/2024, Strike Price
$110.50, Expires
01/26/24 (GSC) | 60 | | 6,773,437 | 153,750 |
| | Number of
Contracts | | Notional
Amount | | Value |
10-Year U.S. Treasury Note Future expiration date 02/2024, Strike Price
$111.00, Expires
01/26/24 (GSC) | 64 | | $ 7,225,000 | | $137,000 |
10-Year U.S. Treasury Note Future expiration date 02/2024, Strike Price
$111.50, Expires
01/26/24 (GSC) | 30 | | 3,386,719 | | 52,969 |
10-Year U.S. Treasury Note Future expiration date 02/2024, Strike Price
$112.00, Expires
01/26/24 (GSC) | 35 | | 3,951,172 | | 49,766 |
10-Year U.S. Treasury Note Future expiration date 02/2024, Strike Price
$113.00, Expires
01/26/24 (GSC) | 134 | | 15,127,344 | | 115,157 |
10-Year U.S. Treasury Note Future expiration date 02/2024, Strike Price
$113.50, Expires
01/26/24 (GSC) | 64 | | 7,225,000 | | 42,000 |
3-Month SOFR Interest Rate Swap expiration 03/2024, Strike Price
$94.62, Expires
03/15/24 (GSC) | 57 | | 13,539,637 | | 56,288 |
5-Year U.S. Treasury Note Future expiration date 02/2024, Strike Price
$106.75, Expires
01/26/24 (GSC) | 90 | | 9,789,606 | | 187,734 |
5-Year U.S. Treasury Note Future expiration date 02/2024, Strike Price
$107.50, Expires
01/26/24 (GSC) | 48 | | 5,221,123 | | 69,750 |
5-Year U.S. Treasury Note Future expiration date 02/2024, Strike Price
$108.50, Expires
01/26/24 (GSC) | 139 | | 15,119,503 | | 108,594 |
See Notes to Financial Statements.
MEDIUM-DURATION BOND FUND
SCHEDULE OF INVESTMENTS (Continued)
| | Number of
Contracts | | Notional
Amount | | Value |
Bank of America, N.A. 2Y-10 SOFR CAP Expiring on June 2024, Strike Price
$0.47, Expires
06/20/24 (BOA) | 1 | | $ 3,400,000 | | $ 4,981 |
Barclays, N.A. 2Y-10 SOFR CAP Expiring on June 2024, Strike Price
$0.44, Expires
06/20/24 (BAR) | 1 | | 3,400,000 | | 4,984 |
Barclays, N.A. 2Y-10 SOFR CAP Expiring on June 2024, Strike Price
$0.46, Expires
06/20/24 (BAR) | 1 | | 3,350,000 | | 4,908 |
Long U.S. Treasury Bond Future expiration date 02/2024, Strike Price
$120.00, Expires
01/26/24 (GSC) | 15 | | 1,874,062 | | 78,750 |
Long U.S. Treasury Bond Future expiration date 02/2024, Strike Price
$121.00, Expires
01/26/24 (GSC) | 15 | | 1,874,063 | | 66,094 |
Morgan Stanley, N.A. 2Y-10 SOFR CAP Expiring on June, Strike Price
$0.45, Expires
06/20/24 (MSCS) | 1 | | 3,400,000 | | 4,984 |
Morgan Stanley, N.A. 2Y-10 SOFR CAP Expiring on June 2024, Strike Price
$0.44, Expires
06/20/24 (MSCS) | 1 | | 3,400,000 | | 4,984 |
U.S. Dollar vs. Swiss Franc, Strike Price
$0.85, Expires
03/16/24 (GSC) | 1 | | 2,934,982 | | 18,634 |
| | | | | | 1,295,624 |
| Put Options — 0.0% |
10-Year U.S. Treasury Note Future expiration date 02/2024, Strike Price
$112.50, Expires
01/26/24 (GSC) | 47 | | 5,305,859 | | 34,516 |
3-Month SOFR Interest Rate Swap expiration 03/2024, Strike Price
$94.50, Expires
03/15/24 (GSC) | 199 | | 47,269,963 | | 2,487 |
| | Number of
Contracts | | Notional
Amount | | Value |
3-Month SOFR Interest Rate Swap expiration 04/2024, Strike Price
$94.75, Expires
04/12/24 (GSC) | 98 | | $23,393,825 | | $ 4,900 |
3-Month SOFR Interest Rate Swap expiration 12/2024, Strike Price
$96.00, Expires
12/13/24 (GSC) | 118 | | 28,399,650 | | 115,050 |
Euro vs. U.S. Dollar, Strike Price
$1.06, Expires
02/05/24 (CITI) | 1 | | 2,930,592 | | 781 |
Euro vs. U.S. Dollar, Strike Price
$1.06, Expires
02/07/24 (CITI) | 1 | | 1,797,317 | | 714 |
| | | | | | 158,448 |
Total Purchased Options
(Premiums paid $1,030,425) | | | | 1,454,072 |
| | | Par | |
| U.S. TREASURY OBLIGATIONS — 16.1% |
| U.S. Treasury Bills | | | |
| 5.25%, 01/25/24Ω ‡‡ | $ 5,500,000 | 5,481,490 |
| 5.24%, 02/15/24Ω ‡‡ | 314,000 | 311,990 |
| 5.25%, 02/22/24Ω | 9,000,000 | 8,933,160 |
| 5.20%, 02/29/24Ω ‡‡ | 927,000 | 919,145 |
| 5.22%, 03/28/24Ω ‡‡ | 648,000 | 639,963 |
| 5.29%, 04/25/24Ω ‡‡ | 10,000,000 | 9,836,331 |
| | | | 26,122,079 |
| U.S. Treasury Bonds | | | |
| 4.38%, 02/15/38 | 10,000 | 10,547 |
| 4.25%, 05/15/39 | 4,300,000 | 4,445,293 |
| 4.38%, 11/15/39 | 200,000 | 209,098 |
| 1.38%, 11/15/40‡‡ | 35,860,000 | 23,901,531 |
| 1.88%, 02/15/41 | 7,850,000 | 5,668,712 |
| 4.75%, 02/15/41‡‡ | 1,900,000 | 2,061,871 |
| 2.25%, 05/15/41‡‡ | 4,080,100 | 3,121,197 |
| 3.13%, 11/15/41 | 3,580,000 | 3,125,578 |
| 2.38%, 02/15/42 | 2,800,000 | 2,157,805 |
| 3.25%, 05/15/42 | 7,050,000 | 6,210,747 |
| 2.75%, 08/15/42 | 10,430,000 | 8,495,561 |
| 2.75%, 11/15/42 | 7,050,000 | 5,725,096 |
| 3.88%, 02/15/43‡‡ | 1,450,000 | 1,388,007 |
| 2.88%, 05/15/43 | 3,200,000 | 2,638,000 |
| 3.88%, 05/15/43 | 1,160,000 | 1,110,337 |
| 3.63%, 08/15/43‡‡ | 280,000 | 258,453 |
| 4.38%, 08/15/43 | 490,000 | 502,135 |
| 4.75%, 11/15/43Δ | 4,090,000 | 4,403,780 |
| 3.63%, 02/15/44‡‡ | 6,490,000 | 5,970,800 |
| 3.38%, 05/15/44‡‡ | 3,200,000 | 2,833,000 |
| 3.13%, 08/15/44 | 5,260,000 | 4,472,746 |
See Notes to Financial Statements.
| | | Par | | Value |
| 3.00%, 11/15/44 | $ 3,100,000 | | $ 2,576,693 |
| 2.50%, 02/15/45 | 950,000 | | 722,631 |
| 2.88%, 08/15/45 | 4,550,000 | | 3,685,056 |
| 3.00%, 02/15/48 | 6,170,000 | | 5,052,169 |
| 3.38%, 11/15/48 | 1,370,000 | | 1,199,472 |
| 3.00%, 02/15/49 | 3,730,000 | | 3,050,295 |
| 2.88%, 05/15/49 | 6,720,000 | | 5,367,075 |
| 2.25%, 08/15/49 | 400,000 | | 280,789 |
| 1.38%, 08/15/50 | 4,900,000 | | 2,746,775 |
| 1.63%, 11/15/50 | 15,020,000 | | 9,001,146 |
| 1.88%, 02/15/51 | 1,630,000 | | 1,039,571 |
| 2.38%, 05/15/51 | 5,720,000 | | 4,103,765 |
| 2.00%, 08/15/51 | 3,830,000 | | 2,515,158 |
| 1.88%, 11/15/51 | 651,000 | | 413,944 |
| 4.00%, 11/15/52 | 750,000 | | 743,584 |
| 3.63%, 02/15/53 | 280,000 | | 259,859 |
| 3.63%, 05/15/53 | 1,360,000 | | 1,263,737 |
| 4.13%, 08/15/53 | 1,680,000 | | 1,706,644 |
| 4.75%, 11/15/53 | 8,180,000 | | 9,217,837 |
| | | | | 143,656,494 |
| U.S. Treasury Inflationary Index Notes | | | | |
| 0.13%, 04/15/25 | 3,108,849 | | 2,998,542 |
| 0.13%, 10/15/25 | 3,201,579 | | 3,079,729 |
| 1.25%, 04/15/28 | 666,731 | | 650,327 |
| 0.63%, 07/15/32 | 19,378,419 | | 17,768,194 |
| 1.13%, 01/15/33 | 17,910,139 | | 17,008,912 |
| 1.38%, 07/15/33 | 334,307 | | 325,441 |
| | | | | 41,831,145 |
| U.S. Treasury Inflationary Indexed Bonds | | | | |
| 1.50%, 02/15/53 | 4,316,117 | | 3,952,491 |
| U.S. Treasury Notes | | | | |
| 3.00%, 06/30/24‡‡ | 650,000 | | 643,211 |
| 5.00%, 08/31/25 | 80,000 | | 80,758 |
| 0.75%, 05/31/26 | 2,720,000 | | 2,512,228 |
| 4.38%, 08/15/26 | 6,550,000 | | 6,597,462 |
| 0.75%, 08/31/26 | 25,990,000 | | 23,841,764 |
| 1.38%, 08/31/26 | 2,680,000 | | 2,499,833 |
| 4.63%, 09/15/26 | 19,860,000 | | 20,146,263 |
| 2.63%, 05/31/27 | 4,310,000 | | 4,128,509 |
| 0.50%, 06/30/27 | 26,870,000 | | 23,887,010 |
| 2.75%, 02/15/28‡‡ | 1,400,000 | | 1,339,652 |
| 1.25%, 03/31/28‡‡ | 510,000 | | 457,825 |
| 4.38%, 08/31/28 | 20,000 | | 20,449 |
| 4.63%, 09/30/28‡‡ | 7,000,000 | | 7,232,832 |
| 4.38%, 11/30/28 | 27,500,000 | | 28,171,387 |
| 3.75%, 12/31/28 | 13,890,000 | | 13,841,168 |
| 2.63%, 02/15/29 | 5,260,000 | | 4,958,372 |
| 4.63%, 09/30/30 | 7,200,000 | | 7,517,109 |
| 3.38%, 05/15/33 | 2,005,000 | | 1,928,559 |
| | | Par | | Value |
| 4.50%, 11/15/33 | $ 4,800,000 | | $ 5,050,125 |
| | | | | 154,854,516 |
| U.S. Treasury Strips | | | | |
| 2.22%, 02/15/40Ω ‡‡ | 2,790,000 | | 1,410,765 |
| 2.18%, 08/15/41Ω | 1,080,000 | | 503,415 |
| 2.42%, 05/15/44Ω ‡‡ | 3,405,000 | | 1,447,620 |
| 2.48%, 11/15/44Ω | 820,000 | | 341,262 |
| 2.33%, 02/15/46Ω | 4,115,000 | | 1,629,002 |
| 1.97%, 05/15/52Ω ‡‡ | 42,750,000 | | 13,994,074 |
| 2.42%, 08/15/53Ω | 19,000,000 | | 6,079,831 |
| | | | | 25,405,969 |
Total U.S. Treasury Obligations
(Cost $425,620,277) | | | 395,822,694 |
| | | Shares | |
| PREFERRED STOCK — 0.0% |
| Jackson Financial, Inc. | | |
(Variable, U.S. Treasury Yield Curve Rate CMT 5Y + 3.73%), 8.00% †
(Cost $150,000) | 6,000 | 151,440 |
| MONEY MARKET FUNDS — 6.5% |
| Northern Institutional Liquid Assets Portfolio (Shares), 5.40%Ø § | 37,680,005 | 37,680,005 |
GuideStone Money Market Fund, 5.28%
(Institutional Class)Ø ∞ | 34,318,962 | 34,318,962 |
| Northern Institutional U.S. Treasury Portfolio (Premier), 5.22%Ø | 89,234,862 | 89,234,862 |
Total Money Market Funds
(Cost $161,233,829) | | 161,233,829 |
| | | Par | |
| REPURCHASE AGREEMENTS — 13.9% |
| Citigroup Global Markets, Inc. | | |
| 5.51% (dated 12/29/23, due 01/03/24, repurchase price $170,530,403, collateralized by U.S. Treasury Notes, 0.375%, due 01/31/26, total market value $173,963,228) | $170,400,000 | 170,400,000 |
| Deutsche Bank Securities, Inc. | | |
| 5.60% (dated 12/29/23, due 01/02/24, repurchase price $96,074,667, collateralized by U.S. Treasury Bonds, 3.875%, due 02/15/43, total market value $96,579,537) | 96,000,000 | 96,000,000 |
See Notes to Financial Statements.
MEDIUM-DURATION BOND FUND
SCHEDULE OF INVESTMENTS (Continued)
| | | Par | | Value |
| JPMorgan Securities LLC | | | |
| 5.64% (dated 12/29/23, due 01/02/24, repurchase price $77,160,395, collateralized by U.S. Treasury Notes, 0.125%, due 07/15/26, total market value $78,588,939) | $77,100,000 | | $ 77,100,000 |
Total Repurchase Agreements
(Cost $343,500,000) | | | 343,500,000 |
TOTAL INVESTMENTS —125.2%
(Cost $3,179,287,084) | | | 3,083,476,048 |
| | Number of
Contracts | | Notional
Amount | |
| WRITTEN OPTIONS — (0.0)% |
| Call Options — (0.0)% |
10-Year U.S. Treasury Note Future expiration date 02/2024, Strike Price
$112.50, Expires
01/26/24 (GSC) | (64) | | $ (7,225,000) | (72,000) |
10-Year U.S. Treasury Note Future expiration date 02/2024, Strike Price
$114.50, Expires
01/26/24 (GSC) | (106) | | (11,966,406) | (38,094) |
10-Year U.S. Treasury Note Future expiration date 02/2024, Strike Price
$114.75, Expires
01/26/24 (GSC) | (66) | | (7,450,781) | (20,625) |
10-Year U.S. Treasury Note Future expiration date 02/2024, Strike Price
$115.00, Expires
01/26/24 (GSC) | (94) | | (10,611,719) | (24,969) |
10-Year U.S. Treasury Note Future expiration date 03/2024, Strike Price
$116.00, Expires
02/23/24 (GSC) | (96) | | (10,837,500) | (37,500) |
3-Month SOFR Interest Rate Swap expiration 03/2024, Strike Price
$95.25, Expires
03/15/24 (GSC) | (57) | | (13,539,638) | (10,331) |
3-Month SOFR Interest Rate Swap expiration 03/2024, Strike Price
$96.12, Expires
03/15/24 (GSC) | (114) | | (27,079,275) | (7,125) |
| | Number of
Contracts | | Notional
Amount | | Value |
3-Month SOFR Interest Rate Swap expiration 12/2024, Strike Price
$97.12, Expires
12/13/24 (GSC) | (118) | | $(28,399,650) | | $ (73,013) |
5-Year U.S. Treasury Note Future expiration date 02/2024, Strike Price
$108.20, Expires
01/26/24 (GSC) | (46) | | (5,003,576) | | (42,766) |
5-Year U.S. Treasury Note Future expiration date 02/2024, Strike Price
$110.00, Expires
01/26/24 (GSC) | (84) | | (9,136,966) | | (20,344) |
| | | | | | (346,767) |
| Call Swaptions — (0.0)% |
Pay 2.697% (Annually); Receive 1-Day SOFR (Annually); Interest Rate Swap Maturing 04/04/2025 USD, Strike Price
$2.70, Expires
04/02/24 (GSC) | (1) | | (5,800,000) | | (837) |
Pay 3.72% (Annually); Receive 3-Month EURIBOR (Quarterly); Interest Rate Swap Maturing 03/18/2025 EUR, Strike Price
$3.72, Expires
03/14/24 (CITI) | (1) | | (31,080,000) | | (277,519) |
Pay 3.744% (Annually); Receive 3-Month EURIBOR (Quarterly); Interest Rate Swap Maturing 03/18/2025 EUR, Strike Price
$3.74, Expires
03/14/24 (CITI) | (1) | | (31,080,000) | | (285,246) |
| | | | | | (563,602) |
| Put Option — (0.0)% |
| 3-Month SOFR Interest Rate Swap expiration 12/2024, Strike Price $95.50, Expires 12/13/24 (GSC) | (118) | | (28,399,650) | | (59,000) |
See Notes to Financial Statements.
| | Number of
Contracts | | Notional
Amount | | Value |
| Put Swaptions — (0.0)% |
Pay 1-Day SOFR (Annually); Receive 2.697% (Annually); Interest Rate Swap Maturing 04/04/2025 USD, Strike Price
$2.70, Expires
04/02/24 (GSC) | (1) | | $ (5,800,000) | | $ (91,320) |
Pay 3-Month EURIBOR (Quarterly); Receive 3.72% (Annually); Interest Rate Swap Maturing 03/18/2025 EUR, Strike Price
$3.72, Expires
03/14/24 (CITI) | (1) | | (31,080,000) | | (2,306) |
Pay 3-Month EURIBOR (Quarterly); Receive 3.744% (Annually); Interest Rate Swap Maturing 03/18/2025 EUR, Strike Price
$3.74, Expires
03/14/24 (CITI) | (1) | | (31,080,000) | | (2,100) |
| | | | | | (95,726) |
Total Written Options
(Premiums received $ (680,596)) | | | | (1,065,095) |
| | | Par | | Value |
| TBA SALE COMMITMENTS — (2.6)% |
Uniform Mortgage Backed Securities
3.50%, 02/01/53 TBA | $ (100,000) | | $ (91,961) |
Uniform Mortgage Backed Securities
2.00%, 01/01/53 TBA | (16,000,000) | | (13,085,000) |
Uniform Mortgage Backed Securities
4.50%, 01/01/54 TBA | (20,000,000) | | (19,411,719) |
Government National Mortgage Association
4.50%, 01/01/54 TBA | (12,000,000) | | (11,719,688) |
Uniform Mortgage Backed Securities
5.00%, 01/01/53 TBA | (13,000,000) | | (12,877,109) |
Uniform Mortgage Backed Securities
5.50%, 01/01/53 TBA | (4,000,000) | | (4,020,937) |
Government National Mortgage Association
3.00%, 01/01/54 TBA | (3,000,000) | | (2,719,544) |
Government National Mortgage Association
3.50%, 01/01/54 TBA | (1,000,000) | | (932,109) |
Total TBA Sale Commitments
(Proceeds $(63,721,207)) | | | (64,858,067) |
Liabilities in Excess of Other
Assets — (22.6)% | | | (556,267,778) |
| NET ASSETS — 100.0% | | | $2,461,285,108 |
Futures Contracts outstanding at December 31, 2023:
| Future Type | | Expiration Date | | Open Long
(Short) Contracts | | Notional
Market Value
of Contracts | | Value and
Unrealized
Appreciation
(Depreciation) |
| 30-Year Euro Buxl | | 03/2024 | | (10) | | $ (1,564,518) | | $ (120,558) |
| Euro-Bund | | 03/2024 | | (237) | | (35,901,713) | | (1,047,930) |
| Euro-OAT | | 03/2024 | | 19 | | 2,758,429 | | 109,293 |
| Euro-Bobl | | 03/2024 | | (129) | | (16,986,611) | | (231,664) |
| 10-Year Japanese Treasury Bond | | 03/2024 | | (23) | | (23,931,419) | | (202,444) |
| 10-Year Bond | | 03/2024 | | 115 | | 10,777,480 | | 428,222 |
| 10-Year U.S. Treasury Note | | 03/2024 | | (505) | | (57,009,765) | | (2,435,634) |
| 3-Month CME SOFR | | 03/2024 | | 16 | | 3,785,700 | | 384 |
| U.S. Treasury Long Bond | | 03/2024 | | (286) | | (35,732,125) | | (2,927,632) |
| Ultra 10-Year U.S. Treasury Note | | 03/2024 | | 550 | | 64,908,594 | | 2,733,417 |
| Ultra Long U.S. Treasury Bond | | 03/2024 | | 816 | | 109,012,500 | | 7,255,935 |
| Long GILT | | 03/2024 | | 27 | | 3,532,756 | | 195,576 |
| 2-Year U.S. Treasury Note | | 03/2024 | | 266 | | 54,773,141 | | 364,468 |
| 5-Year U.S. Treasury Note | | 03/2024 | | 383 | | 41,660,226 | | 822,556 |
| 3-Month CME SOFR | | 06/2024 | | (38) | | (9,026,425) | | (41,867) |
| 3-Month CME SOFR | | 03/2025 | | 160 | | 38,508,000 | | 233,000 |
| 3-Month CME SOFR | | 06/2025 | | 132 | | 31,871,400 | | 244,694 |
See Notes to Financial Statements.
MEDIUM-DURATION BOND FUND
SCHEDULE OF INVESTMENTS (Continued)
| Future Type | | Expiration Date | | Open Long
(Short) Contracts | | Notional
Market Value
of Contracts | | Value and
Unrealized
Appreciation
(Depreciation) |
| 3-Month CME SOFR | | 03/2026 | | 397 | | $ 96,207,987 | | $ 837,207 |
| Total Futures Contracts outstanding at December 31, 2023 | | | | | | $277,643,637 | | $6,217,023 |
Forward Foreign Currency Contracts outstanding at December 31, 2023:
| Expiration Date | | Currency
Purchased | | Amount
of Currency
Purchased | | Currency
Sold | | Amount
of Currency
Sold | | Counter-
party | | Net Unrealized
Appreciation
(Depreciation) |
| 01/19/24 | | Japanese Yen | | 1,259,084,551 | | U.S. Dollars | | 8,543,899 | | CITI | | $413,355 |
| 02/02/24 | | Brazilian Reals | | 25,474,609 | | U.S. Dollars | | 4,990,729 | | GSC | | 242,193 |
| 01/09/24 | | Japanese Yen | | 692,411,371 | | U.S. Dollars | | 4,722,515 | | BNP | | 195,388 |
| 01/09/24 | | Japanese Yen | | 452,021,135 | | U.S. Dollars | | 3,066,028 | | MSCS | | 144,486 |
| 03/20/24 | | Swiss Francs | | 2,158,205 | | U.S. Dollars | | 2,476,426 | | MSCS | | 111,084 |
| 03/21/24 | | Japanese Yen | | 450,804,734 | | U.S. Dollars | | 3,132,237 | | UBS | | 106,075 |
| 01/19/24 | | Euro | | 2,326,395 | | U.S. Dollars | | 2,465,511 | | CITI | | 104,815 |
| 03/20/24 | | Norwegian Kroner | | 14,425,645 | | U.S. Dollars | | 1,317,714 | | CITI | | 104,677 |
| 03/20/24 | | Canadian Dollars | | 5,406,893 | | U.S. Dollars | | 3,987,866 | | CITI | | 97,137 |
| 01/31/24 | | Mexican Pesos | | 60,570,075 | | U.S. Dollars | | 3,452,990 | | GSC | | 94,137 |
| 03/20/24 | | Swiss Francs | | 1,482,171 | | U.S. Dollars | | 1,700,660 | | DEUT | | 76,341 |
| 03/20/24 | | Australian Dollars | | 3,294,871 | | U.S. Dollars | | 2,180,159 | | BNP | | 70,567 |
| 01/19/24 | | Norwegian Kroner | | 21,451,091 | | Euro | | 1,851,514 | | GSC | | 66,778 |
| 03/20/24 | | Swedish Kronor | | 16,636,675 | | U.S. Dollars | | 1,589,724 | | MSCS | | 64,990 |
| 03/20/24 | | Euro | | 2,746,225 | | U.S. Dollars | | 2,995,312 | | SS | | 46,211 |
| 01/19/24 | | Canadian Dollars | | 1,943,077 | | U.S. Dollars | | 1,426,646 | | GSC | | 40,179 |
| 03/21/24 | | Japanese Yen | | 165,388,397 | | U.S. Dollars | | 1,150,380 | | MSCS | | 37,672 |
| 01/16/24 | | Mexican Pesos | | 14,277,469 | | U.S. Dollars | | 806,319 | | MSCS | | 32,048 |
| 03/20/24 | | Norwegian Kroner | | 8,178,545 | | U.S. Dollars | | 776,062 | | JPM | | 30,355 |
| 01/19/24 | | Mexican Pesos | | 16,000,000 | | U.S. Dollars | | 912,289 | | GSC | | 26,714 |
| 01/19/24 | | South African Rand | | 8,641,283 | | U.S. Dollars | | 452,686 | | UBS | | 18,885 |
| 03/20/24 | | Euro | | 1,453,000 | | U.S. Dollars | | 1,591,243 | | UBS | | 17,997 |
| 03/20/24 | | Canadian Dollars | | 1,491,918 | | U.S. Dollars | | 1,110,200 | | MLIB | | 16,970 |
| 01/09/24 | | Australian Dollars | | 748,592 | | U.S. Dollars | | 493,865 | | BAR | | 16,426 |
| 01/09/24 | | Australian Dollars | | 819,949 | | U.S. Dollars | | 543,679 | | HSBC | | 15,253 |
| 01/19/24 | | Japanese Yen | | 35,000,000 | | U.S. Dollars | | 234,673 | | GSC | | 14,320 |
| 03/20/24 | | New Zealand Dollars | | 1,283,417 | | U.S. Dollars | | 797,619 | | JPM | | 13,854 |
| 03/20/24 | | Swedish Kronor | | 8,700,388 | | U.S. Dollars | | 851,513 | | BNP | | 13,843 |
| 01/09/24 | | Australian Dollars | | 1,447,000 | | U.S. Dollars | | 973,066 | | GSC | | 13,306 |
| 03/20/24 | | British Pounds | | 1,731,042 | | U.S. Dollars | | 2,197,720 | | BNP | | 9,621 |
| 03/20/24 | | Australian Dollars | | 988,000 | | U.S. Dollars | | 665,569 | | SS | | 9,334 |
| 01/19/24 | | South African Rand | | 14,769,782 | | U.S. Dollars | | 796,714 | | BNP | | 9,300 |
| 01/19/24 | | Australian Dollars | | 150,776 | | U.S. Dollars | | 95,868 | | CITI | | 6,947 |
| 01/03/24 | | Brazilian Reals | | 19,600,000 | | U.S. Dollars | | 4,028,777 | | JPM | | 5,437 |
| 03/20/24 | | Euro | | 607,000 | | U.S. Dollars | | 667,007 | | CITI | | 5,263 |
| 02/29/24 | | Indian Rupees | | 236,587,945 | | U.S. Dollars | | 2,831,998 | | JPM | | 4,108 |
| 03/20/24 | | Indonesian Rupiahs | | 1,553,646,996 | | U.S. Dollars | | 97,548 | | JPM | | 3,349 |
| 03/20/24 | | Australian Dollars | | 2,311,000 | | Canadian Dollars | | 2,085,324 | | UBS | | 3,145 |
| 01/22/24 | | South African Rand | | 5,630,000 | | U.S. Dollars | | 304,010 | | BNP | | 3,144 |
| 02/02/24 | | Brazilian Reals | | 1,782,113 | | U.S. Dollars | | 363,363 | | JPM | | 2,714 |
| 01/09/24 | | U.S. Dollars | | 558,448 | | Canadian Dollars | | 737,000 | | BAR | | 2,170 |
| 01/19/24 | | South African Rand | | 1,848,605 | | U.S. Dollars | | 99,261 | | BAR | | 1,621 |
| 03/20/24 | | Indonesian Rupiahs | | 2,495,580,500 | | U.S. Dollars | | 161,000 | | BNP | | 1,068 |
| 03/20/24 | | Indonesian Rupiahs | | 3,812,267,119 | | U.S. Dollars | | 246,633 | | BAR | | 943 |
See Notes to Financial Statements.
| Expiration Date | | Currency
Purchased | | Amount
of Currency
Purchased | | Currency
Sold | | Amount
of Currency
Sold | | Counter-
party | | Net Unrealized
Appreciation
(Depreciation) |
| 03/20/24 | | Indonesian Rupiahs | | 1,549,650,117 | | U.S. Dollars | | 99,802 | | MSCS | | $ 835 |
| 01/08/24 | | Indonesian Rupiahs | | 1,546,617,570 | | U.S. Dollars | | 100,000 | | BNP | | 454 |
| 01/09/24 | | U.S. Dollars | | 201,249 | | Euro | | 182,000 | | BNP | | 253 |
| 01/19/24 | | U.S. Dollars | | 66,492 | | Euro | | 60,000 | | CITI | | 201 |
| 01/08/24 | | South Korean Won | | 64,807,438 | | U.S. Dollars | | 50,102 | | JPM | | 170 |
| 03/20/24 | | Indonesian Rupiahs | | 1,458,066,897 | | U.S. Dollars | | 94,563 | | GSC | | 127 |
| 01/09/24 | | U.S. Dollars | | 40,093 | | Canadian Dollars | | 53,000 | | HSBC | | 90 |
| 01/19/24 | | Indonesian Rupiahs | | 459,002,853 | | U.S. Dollars | | 29,761 | | GSC | | 54 |
| 01/31/24 | | U.S. Dollars | | 100,000 | | South Korean Won | | 129,230,000 | | BAR | | 14 |
| Subtotal Appreciation | | | | | | | | | | $2,316,418 |
| 01/31/24 | | Indonesian Rupiahs | | 1,538,700,000 | | U.S. Dollars | | 100,000 | | JPM | | $ (46) |
| 03/20/24 | | Indonesian Rupiahs | | 3,078,058,794 | | U.S. Dollars | | 199,982 | | DEUT | | (86) |
| 01/31/24 | | Mexican Pesos | | 3,789,000 | | U.S. Dollars | | 221,985 | | BAR | | (92) |
| 01/08/24 | | U.S. Dollars | | 96,858 | | Indonesian Rupiahs | | 1,493,259,786 | | BAR | | (131) |
| 01/03/24 | | Brazilian Reals | | 2,700,025 | | U.S. Dollars | | 556,000 | | JPM | | (261) |
| 01/22/24 | | U.S. Dollars | | 50,000 | | South Korean Won | | 64,985,000 | | DEUT | | (325) |
| 03/20/24 | | Indian Rupees | | 21,187,664 | | U.S. Dollars | | 254,000 | | MSCS | | (346) |
| 01/19/24 | | U.S. Dollars | | 143,189 | | Euro | | 130,000 | | GSC | | (442) |
| 01/19/24 | | U.S. Dollars | | 29,180 | | Indonesian Rupiahs | | 459,002,853 | | CITI | | (635) |
| 03/20/24 | | Indonesian Rupiahs | | 25,129,912,037 | | U.S. Dollars | | 1,632,682 | | MSCS | | (695) |
| 01/19/24 | | U.S. Dollars | | 105,893 | | Japanese Yen | | 15,000,000 | | CITI | | (819) |
| 01/09/24 | | U.S. Dollars | | 200,726 | | Danish Kroner | | 1,360,811 | | BNP | | (895) |
| 01/08/24 | | U.S. Dollars | | 50,000 | | South Korean Won | | 65,689,013 | | BNP | | (956) |
| 03/26/24 | | U.S. Dollars | | 513,326 | | Chinese Offshore Yuan | | 3,645,000 | | BAR | | (1,304) |
| 01/31/24 | | U.S. Dollars | | 20,186 | | Mexican Pesos | | 370,000 | | GSC | | (1,482) |
| 03/20/24 | | Turkish Lira | | 4,015,616 | | U.S. Dollars | | 128,000 | | GSC | | (1,603) |
| 04/15/24 | | Turkish Lira | | 4,786,106 | | U.S. Dollars | | 148,683 | | BAR | | (1,661) |
| 01/19/24 | | U.S. Dollars | | 86,548 | | Euro | | 80,000 | | CITI | | (1,841) |
| 03/20/24 | | Indonesian Rupiahs | | 6,126,385,905 | | U.S. Dollars | | 399,764 | | BNP | | (1,904) |
| 01/09/24 | | U.S. Dollars | | 72,778 | | Canadian Dollars | | 99,000 | | RBS | | (1,946) |
| 06/20/24 | | U.S. Dollars | | 149,917 | | South Korean Won | | 194,779,473 | | GSC | | (1,967) |
| 03/25/24 | | Turkish Lira | | 10,252,275 | | U.S. Dollars | | 323,323 | | BAR | | (2,117) |
| 02/14/24 | | Turkish Lira | | 9,072,606 | | U.S. Dollars | | 297,365 | | BAR | | (2,277) |
| 03/21/24 | | Turkish Lira | | 6,394,308 | | U.S. Dollars | | 203,446 | | GSC | | (2,363) |
| 01/09/24 | | U.S. Dollars | | 264,939 | | Danish Kroner | | 1,804,687 | | UBS | | (2,448) |
| 03/29/24 | | Turkish Lira | | 6,907,066 | | U.S. Dollars | | 218,281 | | BAR | | (2,689) |
| 04/24/24 | | Turkish Lira | | 5,946,420 | | U.S. Dollars | | 184,151 | | BAR | | (3,043) |
| 03/22/24 | | Turkish Lira | | 8,025,535 | | U.S. Dollars | | 255,574 | | BAR | | (3,428) |
| 04/22/24 | | Turkish Lira | | 9,619,662 | | U.S. Dollars | | 297,408 | | BAR | | (3,865) |
| 06/20/24 | | U.S. Dollars | | 333,720 | | South Korean Won | | 434,052,918 | | MSCS | | (4,742) |
| 03/20/24 | | British Pounds | | 1,356,656 | | U.S. Dollars | | 1,734,974 | | CITI | | (5,031) |
| 03/27/24 | | Turkish Lira | | 12,908,721 | | U.S. Dollars | | 409,172 | | BAR | | (5,494) |
| 01/31/24 | | U.S. Dollars | | 150,178 | | Mexican Pesos | | 2,658,580 | | UBS | | (5,515) |
| 03/21/24 | | U.S. Dollars | | 2,015,606 | | Japanese Yen | | 281,423,344 | | MSCS | | (5,972) |
| 04/09/24 | | Turkish Lira | | 13,979,844 | | U.S. Dollars | | 438,188 | | BAR | | (6,307) |
| 03/20/24 | | U.S. Dollars | | 974,127 | | British Pounds | | 769,000 | | CITI | | (6,465) |
| 01/03/24 | | Brazilian Reals | | 74,762,921 | | U.S. Dollars | | 15,394,721 | | BNP | | (6,476) |
| 03/15/24 | | Turkish Lira | | 16,414,066 | | U.S. Dollars | | 525,738 | | BAR | | (6,682) |
| 03/20/24 | | U.S. Dollars | | 389,000 | | Taiwan Dollars | | 11,946,968 | | DEUT | | (6,926) |
| 03/20/24 | | U.S. Dollars | | 969,808 | | Indonesian Rupiahs | | 15,059,218,094 | | JPM | | (8,168) |
| 06/20/24 | | U.S. Dollars | | 568,430 | | South Korean Won | | 739,885,541 | | DEUT | | (8,512) |
| 03/20/24 | | U.S. Dollars | | 899,000 | | Canadian Dollars | | 1,201,229 | | BNP | | (8,549) |
| 04/26/24 | | Turkish Lira | | 18,637,907 | | U.S. Dollars | | 575,382 | | BAR | | (8,817) |
| 03/20/24 | | British Pounds | | 609,000 | | Canadian Dollars | | 1,039,637 | | CITI | | (8,897) |
| 06/20/24 | | U.S. Dollars | | 524,357 | | South Korean Won | | 684,390,756 | | BAR | | (9,312) |
See Notes to Financial Statements.
MEDIUM-DURATION BOND FUND
SCHEDULE OF INVESTMENTS (Continued)
| Expiration Date | | Currency
Purchased | | Amount
of Currency
Purchased | | Currency
Sold | | Amount
of Currency
Sold | | Counter-
party | | Net Unrealized
Appreciation
(Depreciation) |
| 03/21/24 | | U.S. Dollars | | 463,408 | | Japanese Yen | | 65,876,088 | | DEUT | | $ (9,807) |
| 02/14/24 | | U.S. Dollars | | 520,286 | | Euro | | 479,363 | | SS | | (9,885) |
| 07/02/24 | | U.S. Dollars | | 8,641,053 | | Brazilian Reals | | 42,800,000 | | GSC | | (9,927) |
| 06/20/24 | | U.S. Dollars | | 773,232 | | South Korean Won | | 1,004,941,946 | | BNP | | (10,394) |
| 06/20/24 | | U.S. Dollars | | 830,319 | | South Korean Won | | 1,078,962,285 | | JPM | | (11,026) |
| 03/20/24 | | U.S. Dollars | | 489,997 | | Peruvian Nuevo Soles | | 1,860,813 | | BNP | | (11,752) |
| 01/03/24 | | Brazilian Reals | | 40,700,000 | | U.S. Dollars | | 8,389,504 | | GSC | | (12,336) |
| 03/26/24 | | U.S. Dollars | | 804,536 | | Chinese Offshore Yuan | | 5,790,254 | | BNP | | (12,979) |
| 01/09/24 | | U.S. Dollars | | 2,730,703 | | British Pounds | | 2,152,820 | | BNP | | (13,537) |
| 03/26/24 | | U.S. Dollars | | 820,714 | | Chinese Offshore Yuan | | 5,921,616 | | GSC | | (15,348) |
| 07/02/24 | | U.S. Dollars | | 3,945,408 | | Brazilian Reals | | 19,600,000 | | JPM | | (16,255) |
| 01/17/24 | | U.S. Dollars | | 386,606 | | South African Rand | | 7,388,615 | | HSBC | | (16,679) |
| 03/20/24 | | U.S. Dollars | | 711,804 | | Canadian Dollars | | 964,477 | | MSCS | | (16,875) |
| 03/26/24 | | U.S. Dollars | | 948,756 | | Chinese Offshore Yuan | | 6,842,062 | | MSCS | | (17,262) |
| 03/20/24 | | U.S. Dollars | | 490,684 | | Australian Dollars | | 745,220 | | SS | | (18,376) |
| 04/02/24 | | U.S. Dollars | | 15,394,721 | | Brazilian Reals | | 75,526,499 | | BNP | | (19,509) |
| 02/29/24 | | U.S. Dollars | | 332,599 | | Taiwan Dollars | | 10,653,479 | | JPM | | (19,576) |
| 03/20/24 | | Euro | | 1,440,000 | | Swedish Kronor | | 16,240,514 | | UBS | | (20,469) |
| 01/31/24 | | U.S. Dollars | | 935,248 | | Mexican Pesos | | 16,326,000 | | BAR | | (20,841) |
| 01/17/24 | | U.S. Dollars | | 954,573 | | Euro | | 883,000 | | BAR | | (20,929) |
| 03/20/24 | | U.S. Dollars | | 557,824 | | Swedish Kronor | | 5,833,352 | | WB | | (22,372) |
| 03/20/24 | | U.S. Dollars | | 1,617,870 | | Euro | | 1,486,171 | | DEUT | | (28,107) |
| 03/21/24 | | U.S. Dollars | | 2,757,512 | | Japanese Yen | | 388,997,252 | | BNP | | (36,812) |
| 03/26/24 | | U.S. Dollars | | 3,065,826 | | Chinese Offshore Yuan | | 22,091,732 | | DEUT | | (53,263) |
| 03/20/24 | | U.S. Dollars | | 4,355,240 | | British Pounds | | 3,461,927 | | BNP | | (59,241) |
| 01/09/24 | | U.S. Dollars | | 13,841,368 | | Euro | | 12,589,000 | | HSBC | | (61,649) |
| 04/02/24 | | Brazilian Reals | | 63,182,774 | | U.S. Dollars | | 12,958,708 | | JPM | | (63,714) |
| 03/20/24 | | U.S. Dollars | | 2,310,649 | | Taiwan Dollars | | 71,840,388 | | JPM | | (70,163) |
| 01/19/24 | | U.S. Dollars | | 3,810,753 | | Chinese Offshore Yuan | | 27,671,022 | | CITI | | (77,844) |
| 01/19/24 | | U.S. Dollars | | 1,080,898 | | Mexican Pesos | | 19,776,652 | | GSC | | (79,748) |
| 03/20/24 | | U.S. Dollars | | 2,371,426 | | Swiss Francs | | 2,045,644 | | CITI | | (81,133) |
| 02/29/24 | | U.S. Dollars | | 1,606,065 | | Taiwan Dollars | | 51,205,050 | | BNP | | (86,636) |
| 03/20/24 | | U.S. Dollars | | 2,434,000 | | Swiss Francs | | 2,108,143 | | SS | | (93,490) |
| 03/20/24 | | U.S. Dollars | | 2,966,525 | | New Zealand Dollars | | 4,846,035 | | BNP | | (97,503) |
| 03/20/24 | | U.S. Dollars | | 4,739,368 | | Euro | | 4,372,711 | | BNP | | (103,537) |
| 01/09/24 | | U.S. Dollars | | 15,516,932 | | British Pounds | | 12,261,180 | | UBS | | (112,621) |
| 01/19/24 | | U.S. Dollars | | 3,371,003 | | British Pounds | | 2,757,868 | | CITI | | (144,712) |
| 03/20/24 | | U.S. Dollars | | 1,870,619 | | Norwegian Kroner | | 20,513,754 | | BNP | | (152,069) |
| 01/09/24 | | U.S. Dollars | | 6,629,317 | | Canadian Dollars | | 9,008,943 | | GSC | | (170,522) |
| 03/11/24 | | U.S. Dollars | | 5,842,464 | | Japanese Yen | | 850,000,000 | | MSCS | | (253,547) |
| 01/03/24 | | U.S. Dollars | | 14,803,498 | | Brazilian Reals | | 75,000,000 | | GSC | | (633,544) |
| 02/05/24 | | U.S. Dollars | | 30,493,478 | | Japanese Yen | | 4,510,000,000 | | HSBC | | (1,677,358) |
| Subtotal Depreciation | | | | | | | | | | $(4,616,879) |
| Total Forward Foreign Currency Contracts outstanding at December 31, 2023 | | | | $(2,300,461) |
See Notes to Financial Statements.
Swap Agreements outstanding at December 31, 2023:
| Reference Obligation | | Implied
Credit
Spread | | Fixed
Deal
Receive Rate | | Maturity
Date | | Currency | | Notional
Amount | | Market Value | | Upfront
Premiums
Paid/
(Received) | | Unrealized
Appreciation
(Depreciation) |
| Centrally Cleared Credit Default Swaps on Corporate Issuers—Sell Protection | | | | | | | | | | | | | | | | |
| Devon Energy Corporation 7.95% due 4/15/32 (Receive Quarterly) | | 0.58% | | 1.00% | | 6/20/2026 | | USD | | 2,800,000 | | $ 28,407 | | $ (26,054) | | $ 54,461 |
| General Electric Co, 2.7% due 10/9/22 (Receive Quarterly) | | 0.29% | | 1.00% | | 6/20/2026 | | USD | | 1,100,000 | | 18,902 | | 17,601 | | 1,301 |
| General Electric Co., 2.70% due 10/9/22 (Receive Quarterly) | | 0.29% | | 1.00% | | 6/20/2026 | | USD | | 2,100,000 | | 36,087 | | 11,126 | | 24,961 |
| The Boeing Company, 2.6% due 10/30/25 (Receive Quarterly) | | 0.41% | | 1.00% | | 6/20/2026 | | USD | | 2,400,000 | | 34,102 | | (17,161) | | 51,263 |
| General Electric Co, 2.7% due 10/9/22 (Receive Quarterly) | | 0.31% | | 1.00% | | 12/20/2026 | | USD | | 2,600,000 | | 51,055 | | 29,130 | | 21,925 |
| British Telecommunications 5.75% due 12/7/28 (Receive Quarterly) | | 0.68% | | 1.00% | | 6/20/2028 | | EUR | | 2,000,000 | | 30,080 | | (11,393) | | 41,473 |
| General Motors Co., 4.2% due 10/1/27 (Receive Quarterly) | | 1.34% | | 5.00% | | 6/20/2028 | | USD | | 995,000 | | 147,402 | | 119,736 | | 27,666 |
| Verizon Communications, 4.125% due 3/16/27 (Receive Quarterly) | | 0.70% | | 1.00% | | 6/20/2028 | | USD | | 1,400,000 | | 17,541 | | (4,067) | | 21,608 |
| British Telecommunications 5.75% due 12/7/28 (Receive Quarterly) | | 0.76% | | 1.00% | | 12/20/2028 | | EUR | | 2,000,000 | | 25,746 | | (23,988) | | 49,734 |
| Verizon Communications, 4.125% due 3/16/27 (Receive Quarterly) | | 0.74% | | 1.00% | | 12/20/2028 | | USD | | 300,000 | | 3,596 | | (746) | | 4,342 |
| Subtotal Appreciation | | | | | | | | | | | | $392,918 | | $ 94,184 | | $298,734 |
| The Boeing Company, 8.75% due 8/15/21 (Receive Quarterly) | | 0.23% | | 1.00% | | 6/20/2024 | | USD | | 475,000 | | $ 1,886 | | $ 11,965 | | $ (10,079) |
| General Motors Co., 4.88% due 10/2/23 (Receive Quarterly) | | 0.92% | | 5.00% | | 12/20/2026 | | USD | | 870,000 | | 100,031 | | 175,392 | | (75,361) |
| Subtotal Depreciation | | | | | | | | | | | | $101,917 | | $187,357 | | $ (85,440) |
Net Centrally Cleared Credit Default Swaps on Corporate Issuers—Sell Protection outstanding at
December 31, 2023 | | $494,835 | | $281,541 | | $213,294 |
| Reference Obligation | | Fixed
Deal
(Pay) Rate | | Maturity
Date | | Currency | | Notional
Amount | | Market Value | | Upfront
Premiums
Paid/
(Received) | | Unrealized
Appreciation
(Depreciation) |
| Centrally Cleared Credit Default Swaps on Credit Indexes—Buy Protection | | | | | | | | | | | | | | |
| iTraxx Europe & Crossover Series 38 (Pay Quarterly) | | (1.00)% | | 12/20/2027 | | EUR | | 2,900,000 | | $ (66,855) | | $(26,751) | | $ (40,104) |
| CDS_IX_CCP CDX.NA.HY.41 5% 20281220 (Pay Quarterly) | | (5.00)% | | 12/20/2028 | | USD | | 1,683,000 | | (100,979) | | 6,395 | | (107,374) |
| Markit CDX.NA.HY.41 Index (Pay Quarterly) | | (5.00)% | | 12/20/2028 | | USD | | 821,700 | | (49,302) | | (6,034) | | (43,268) |
| | | $(217,136) | | $(26,390) | | $(190,746) |
See Notes to Financial Statements.
MEDIUM-DURATION BOND FUND
SCHEDULE OF INVESTMENTS (Continued)
| Reference Obligation | | Implied
Credit
Spread | | Fixed
Deal
Receive Rate | | Maturity
Date | | Currency | | Notional
Amount | | Market Value | | Upfront
Premiums
Paid/
(Received) | | Unrealized
Appreciation
(Depreciation) |
| Centrally Cleared Credit Default Swaps on Credit Indexes—Sell Protection | | | | | | | | | | | | | | | | |
| Markit CDX.NA.IG.34 Index (Receive Quarterly) | | 0.22% | | 1.00% | | 6/20/2025 | | USD | | 22,475,000 | | $258,783 | | $232,086 | | $ 26,697 |
| Markit CDX.NA.IG.41 Index (Receive Quarterly) | | 0.57% | | 1.00% | | 12/20/2028 | | USD | | 17,046,700 | | 336,338 | | 220,496 | | 115,842 |
| Subtotal Appreciation | | | | | | | | | | | | $595,121 | | $452,582 | | $142,539 |
| Markit CDX.NA.IG.36 Index (Receive Quarterly) | | 0.30% | | 1.00% | | 6/20/2026 | | USD | | 1,800,000 | | $ 30,069 | | $ 41,673 | | $ (11,604) |
| Subtotal Depreciation | | | | | | | | | | | | $ 30,069 | | $ 41,673 | | $ (11,604) |
Net Centrally Cleared Credit Default Swaps on Credit Indexes—Sell Protection outstanding at
December 31, 2023 | | $625,190 | | $494,255 | | $130,935 |
| Pay Rate Index/Pay Rate | | Receive
Rate/Receive
Rate Index | | Maturity
Date | | Counterparty | | Currency | | Notional
Amount | | Market Value | | Upfront
Premiums
Paid/
(Received) | | Unrealized
Appreciation
(Depreciation) |
| Interest Rate Swaps | | | | | | | | | | | | | | | | |
| 1-Day Brazil Cetip DI Interbank Deposit Rate (Upon termination) | | 10.24% (Upon termination) | | 1/2/2029 | | CITI | | BRL | | 29,522,574 | | $41,856 | | $ — | | $41,856 |
| | | | | | | | | | | $41,856 | | $ — | | $41,856 |
| Pay Rate Index/Pay Rate | | Receive
Rate Index/Receive
Rate | | Maturity
Date | | Currency | | Notional Amount | | Market Value | | Upfront
Premiums
Paid/
(Received) | | Unrealized
Appreciation
(Depreciation) |
| Centrally Cleared Interest Rate Swaps | | | | | | | | | | | | |
| 12.80% (Upon termination) | | 1-Day Brazil Cetip DI Interbank Deposit Rate (Upon termination) | | 1/2/2024 | | BRL | | 6,874,848 | | $ 9,030 | | $ — | | $ 9,030 |
| 1-Day Brazil Cetip DI Interbank Deposit Rate (Upon termination) | | 13.95% (Upon termination) | | 1/2/2024 | | BRL | | 2,795,216 | | 4,435 | | (457) | | 4,892 |
| 4.27% (Annually) | | 1-Day SOFR (Annually) | | 9/13/2024 | | USD | | 1,500,000 | | 13,194 | | — | | 13,194 |
| 13.30% (Upon termination) | | 1-Day Brazil Cetip DI Interbank Deposit Rate (Upon termination) | | 1/2/2025 | | BRL | | 3,355,039 | | (24,400) | | (157,192) | | 132,792 |
| 1-Day Brazil Cetip DI Interbank Deposit Rate (Upon termination) | | 12.23% (Upon termination) | | 1/2/2025 | | BRL | | 72,980,941 | | 93,649 | | — | | 93,649 |
| 3-Month EURIBOR (Quarterly) | | 3.72% (Annually) | | 3/18/2025 | | EUR | | 55,000,000 | | 426,805 | | 203,702 | | 223,103 |
| 1-Day SOFR (Annually) | | 4.99% (Annually) | | 10/11/2025 | | USD | | 19,749,000 | | 246,941 | | — | | 246,941 |
| 1-Day Brazil Cetip DI Interbank Deposit Rate (Upon termination) | | 10.85% (Upon termination) | | 1/2/2026 | | BRL | | 23,567,011 | | 65,550 | | 5,665 | | 59,885 |
| 1.25% (Annually) | | Swiss Average Overnight Rate (Annually) | | 3/20/2026 | | CHF | | 19,830,000 | | (89,317) | | (98,649) | | 9,332 |
| 1-Day SOFR (Annually) | | 4.00% (Annually) | | 3/20/2026 | | USD | | 24,320,000 | | 83,950 | | (57,259) | | 141,209 |
| 1-Day SONIA (Annually) | | 5.25% (Annually) | | 3/20/2026 | | GBP | | 24,990,000 | | 877,580 | | 682,462 | | 195,118 |
| 3-Month KWCDC (Quarterly) | | 3.75% (Quarterly) | | 3/20/2026 | | KRW | | 2,953,860,000 | | 27,333 | | 19,766 | | 7,567 |
| 3-Month STIBOR (Quarterly) | | 3.50% (Annually) | | 3/20/2026 | | SEK | | 340,950,000 | | 533,017 | | 355,434 | | 177,583 |
| 6-Month NIBOR (Semiannually) | | 4.25% (Annually) | | 3/20/2026 | | NOK | | 332,190,000 | | 292,222 | | 248,798 | | 43,424 |
| 7-Day CFETS Repo Rate (Quarterly) | | 2.00% (Quarterly) | | 3/20/2026 | | CNY | | 25,210,000 | | (907) | | (10,853) | | 9,946 |
| Bank Of Canada Overnight Repo Rate (Semiannually) | | 3.75% (Semiannually) | | 3/20/2026 | | CAD | | 28,230,000 | | 61,667 | | (29,061) | | 90,728 |
| 1-Day Brazil Cetip DI Interbank Deposit Rate (Upon termination) | | 11.98% (Upon termination) | | 1/4/2027 | | BRL | | 25,571,178 | | 300,203 | | — | | 300,203 |
See Notes to Financial Statements.
| Pay Rate Index/Pay Rate | | Receive
Rate Index/Receive
Rate | | Maturity
Date | | Currency | | Notional Amount | | Market Value | | Upfront
Premiums
Paid/
(Received) | | Unrealized
Appreciation
(Depreciation) |
| 1-Day Brazil Cetip DI Interbank Deposit Rate (Upon termination) | | 13.03% (Upon termination) | | 1/4/2027 | | BRL | | 1,495,928 | | $ 33,142 | | $ 2,345 | | $ 30,797 |
| 8.50% (Upon termination) | | 1-Day Brazil Cetip DI Interbank Deposit Rate (Upon termination) | | 1/4/2027 | | BRL | | 773,155 | | (18,317) | | (28,983) | | 10,666 |
| 1-Day SOFR (Annually) | | 3.35% (Annually) | | 10/6/2027 | | USD | | 69,720,000 | | 317,114 | | 227,172 | | 89,942 |
| 6-Month EURIBOR (Semiannually) | | 3.00% (Annually) | | 10/20/2027 | | EUR | | 31,330,000 | | 589,994 | | 24,278 | | 565,716 |
| 1-Day SOFR (Annually) | | 3.73% (Annually) | | 11/28/2027 | | USD | | 13,860,000 | | 156,281 | | 67,224 | | 89,057 |
| 1-Day ESTR (Annually) | | 2.67% (Annually) | | 4/22/2028 | | EUR | | 24,510,000 | | 626,876 | | 77,923 | | 548,953 |
| 1-Day SOFR (Annually) | | 3.95% (Annually) | | 5/31/2028 | | USD | | 4,020,000 | | 72,329 | | 11,230 | | 61,099 |
| 0.50% (Annually) | | Bank of Japan Unsecured Overnight Call Rate (Annually) | | 8/3/2028 | | JPY | | 4,512,080,000 | | 89,349 | | 76,444 | | 12,905 |
| 1-Day SOFR (Annually) | | 3.70% (Annually) | | 9/22/2028 | | USD | | 58,610,000 | | 554,743 | | (130,179) | | 684,922 |
| 1-Day SOFR (Annually) | | 4.38% (Annually) | | 10/3/2028 | | USD | | 16,000,000 | | 535,280 | | — | | 535,280 |
| 1-Day SOFR (Annually) | | 4.51% (Annually) | | 10/11/2028 | | USD | | 8,370,000 | | 334,506 | | — | | 334,506 |
| 1-Day ESTR (Annually) | | 2.50% (Annually) | | 10/19/2028 | | EUR | | 17,350,000 | | 328,905 | | 121,296 | | 207,609 |
| 1-Day SOFR (Annually) | | 3.60% (Annually) | | 12/18/2028 | | USD | | 13,000,000 | | 29,785 | | — | | 29,785 |
| 1-Day SOFR (Annually) | | 4.25% (Annually) | | 3/20/2029 | | USD | | 16,140,000 | | 593,358 | | 512,144 | | 81,214 |
| 1-Day SONIA (Annually) | | 4.75% (Annually) | | 3/20/2029 | | GBP | | 6,440,000 | | 544,926 | | 315,148 | | 229,778 |
| 3-Month KWCDC (Quarterly) | | 3.75% (Quarterly) | | 3/20/2029 | | KRW | | 2,619,370,000 | | 75,913 | | 16,942 | | 58,971 |
| 7-Day CFETS Repo Rate (Quarterly) | | 2.50% (Quarterly) | | 3/20/2029 | | CNY | | 8,780,000 | | 12,450 | | 4,182 | | 8,268 |
| 8.50% (Quarterly) | | 3-Month JIBAR (Quarterly) | | 3/20/2029 | | ZAR | | 26,640,000 | | (24,045) | | (26,255) | | 2,210 |
| 1-Day SOFR (Annually) | | 4.33% (Annually) | | 10/13/2029 | | USD | | 1,700,000 | | 68,757 | | — | | 68,757 |
| 1-Day SOFR (Annually) | | 4.55% (Annually) | | 10/19/2030 | | USD | | 9,600,000 | | 597,720 | | — | | 597,720 |
| 1-Day SOFR (Annually) | | 4.18% (Annually) | | 11/7/2030 | | USD | | 1,950,000 | | 78,626 | | — | | 78,626 |
| 2.68% (Annually) | | 1-Day SOFR (Annually) | | 7/28/2032 | | USD | | 15,530,000 | | 407,600 | | 301,562 | | 106,038 |
| 2.00% (Annually) | | 1-Day SOFR (Annually) | | 12/21/2032 | | USD | | 10,100,000 | | 1,149,448 | | 1,040,439 | | 109,009 |
| 3.00% (Annually) | | 1-Day SOFR (Annually) | | 6/21/2033 | | USD | | 8,300,000 | | 424,793 | | 367,635 | | 57,158 |
| 1-Day SOFR (Annually) | | 4.31% (Annually) | | 10/5/2033 | | USD | | 24,550,000 | | 860,271 | | 1,347 | | 858,924 |
| 6-Month EURIBOR (Semiannually) | | 3.00% (Annually) | | 11/10/2033 | | EUR | | 23,560,000 | | 489,566 | | 302,541 | | 187,025 |
| 6-Month ASX BBSW (Semiannually) | | 4.75% (Semiannually) | | 12/20/2033 | | AUD | | 64,500,000 | | 443,596 | | (510,060) | | 953,656 |
| 1-Day SOFR (Annually) | | 4.25% (Annually) | | 3/20/2034 | | USD | | 1,940,000 | | 132,329 | | 123,490 | | 8,839 |
| 1-Day SONIA (Annually) | | 4.25% (Annually) | | 3/20/2034 | | GBP | | 230,000 | | 24,561 | | 12,425 | | 12,136 |
| 3-Month JIBAR (Quarterly) | | 9.50% (Quarterly) | | 3/20/2034 | | ZAR | | 4,630,000 | | 5,196 | | 2,984 | | 2,212 |
| 3-Month KWCDC (Quarterly) | | 3.75% (Quarterly) | | 3/20/2034 | | KRW | | 856,910,000 | | 45,807 | | 32,979 | | 12,828 |
| 3-Month New Zealand BBR FRA (Quarterly) | | 4.75% (Semiannually) | | 3/20/2034 | | NZD | | 4,440,000 | | 146,046 | | 5,134 | | 140,912 |
| 6-Month ASX BBSW (Semiannually) | | 4.25% (Semiannually) | | 3/20/2034 | | AUD | | 3,940,000 | | 14,842 | | (91,618) | | 106,460 |
| 6-Month EURIBOR (Semiannually) | | 3.00% (Annually) | | 3/20/2034 | | EUR | | 25,280,000 | | 1,330,931 | | (74,491) | | 1,405,422 |
| 6-Month WIBOR (Semiannually) | | 5.00% (Annually) | | 3/20/2034 | | PLN | | 3,240,000 | | 35,219 | | 35,115 | | 104 |
| Swiss Average Overnight Rate (Annually) | | 1.50% (Annually) | | 3/20/2034 | | CHF | | 2,880,000 | | 113,420 | | 105,957 | | 7,463 |
| 3.24% (Annually) | | 1-Day SOFR (Annually) | | 10/6/2035 | | USD | | 16,010,000 | | 125,835 | | 71,994 | | 53,841 |
| 6-Month EURIBOR (Semiannually) | | 2.15% (Annually) | | 8/9/2037 | | EUR | | 18,290,000 | | (445,602) | | (604,387) | | 158,785 |
| 0.75% (Semiannually) | | Bank of Japan Unsecured Overnight Call Rate (Semiannually) | | 3/20/2038 | | JPY | | 489,200,000 | | 185,880 | | 39,965 | | 145,915 |
| 1-Day SOFR (Annually) | | 3.39% (Annually) | | 5/10/2038 | | USD | | 45,970,000 | | (286,880) | | (504,694) | | 217,814 |
| 0.50% (Annually) | | Bank of Japan Unsecured Overnight Call Rate (Annually) | | 3/15/2042 | | JPY | | 1,080,000,000 | | 991,682 | | 300,339 | | 691,343 |
| 1.45% (Annually) | | 6-Month EURIBOR (Semiannually) | | 8/10/2042 | | EUR | | 46,790,000 | | 1,744,184 | | 1,439,137 | | 305,047 |
| 1.52% (Annually) | | 1-Day SOFR (Annually) | | 2/15/2047 | | USD | | 2,594,000 | | 868,900 | | (23,965) | | 892,865 |
| 2.08% (Annually) | | 1-Day SOFR (Annually) | | 7/28/2047 | | USD | | 40,780,000 | | 933,784 | | 716,551 | | 217,233 |
| 2.60% (Annually) | | 1-Day SOFR (Annually) | | 2/15/2048 | | USD | | 4,813,000 | | 747,471 | | 330,836 | | 416,635 |
| 3.05% (Annually) | | 1-Day SOFR (Annually) | | 2/15/2048 | | USD | | 6,287,000 | | 490,985 | | 307,047 | | 183,938 |
See Notes to Financial Statements.
MEDIUM-DURATION BOND FUND
SCHEDULE OF INVESTMENTS (Continued)
| Pay Rate Index/Pay Rate | | Receive
Rate Index/Receive
Rate | | Maturity
Date | | Currency | | Notional Amount | | Market Value | | Upfront
Premiums
Paid/
(Received) | | Unrealized
Appreciation
(Depreciation) |
| 3.15% (Annually) | | 1-Day SOFR (Annually) | | 5/15/2048 | | USD | | 7,725,000 | | $ 434,370 | | $ (399,069) | | $ 833,439 |
| 0.80% (Annually) | | Bank of Japan Unsecured Overnight Call Rate (Annually) | | 6/15/2052 | | JPY | | 250,000,000 | | 280,928 | | 11,645 | | 269,283 |
| Subtotal Appreciation | | | | | | | | | | $20,213,806 | | $5,774,105 | | $14,439,701 |
| 1-Day Brazil Cetip DI Interbank Deposit Rate (Upon termination) | | 9.20% (Upon termination) | | 1/2/2024 | | BRL | | 6,468,748 | | $ (95,958) | | $ (28,018) | | $ (67,940) |
| 1-Day Brazil Cetip DI Interbank Deposit Rate (Upon termination) | | 12.30% (Upon termination) | | 1/2/2024 | | BRL | | 1,293,456 | | (1,060) | | 1,647 | | (2,707) |
| 5.41% (Upon termination) | | 1-Day US Federal Fund Effective Rate (Upon termination) | | 1/31/2024 | | USD | | 118,167,000 | | (10,338) | | — | | (10,338) |
| Bank of Japan Unsecured Overnight Call Rate (Annually) | | 0.00% (Annually) | | 3/17/2024 | | JPY | | 750,000,000 | | 1,720 | | 11,605 | | (9,885) |
| 1-Day SOFR (Annually) | | 2.20% (Annually) | | 6/15/2024 | | USD | | 14,700,000 | | (460,535) | | — | | (460,535) |
| 1-Day SOFR (Annually) | | 4.72% (Annually) | | 9/13/2024 | | USD | | 6,900,000 | | (30,559) | | — | | (30,559) |
| 1-Day SOFR (Annually) | | 3.50% (Annually) | | 9/30/2024 | | USD | | 5,189,000 | | (82,323) | | (36,591) | | (45,732) |
| 1-Day SOFR (Annually) | | 3.65% (Annually) | | 11/22/2024 | | USD | | 7,900,000 | | (98,400) | | — | | (98,400) |
| 1-Day Brazil Cetip DI Interbank Deposit Rate (Upon termination) | | 12.06% (Upon termination) | | 1/2/2025 | | BRL | | 10,122,091 | | 16,078 | | 357,647 | | (341,569) |
| 1-Day SOFR (Annually) | | 3.50% (Annually) | | 4/19/2025 | | USD | | 230,000 | | (1,660) | | 723 | | (2,383) |
| 9.50% (Lunar) | | 28-Day Mexico Interbank TIIE (Lunar) | | 3/18/2026 | | MXN | | 52,480,000 | | (10,443) | | (1,377) | | (9,066) |
| 3.00% (Annually) | | 1-Day ESTR (Annually) | | 3/20/2026 | | EUR | | 81,850,000 | | (1,188,608) | | (832,806) | | (355,802) |
| 3-Month ASX BBSW (Quarterly) | | 3.75% (Quarterly) | | 3/20/2026 | | AUD | | 47,330,000 | | 23,429 | | 192,786 | | (169,357) |
| 3-Month JIBAR (Quarterly) | | 8.00% (Quarterly) | | 3/20/2026 | | ZAR | | 43,310,000 | | 13,477 | | 14,800 | | (1,323) |
| Bank of Japan Unsecured Overnight Call Rate (Annually) | | 0.50% (Annually) | | 8/2/2026 | | JPY | | 2,166,040,000 | | 56,283 | | 60,526 | | (4,243) |
| 10.29% (Upon termination) | | 1-Day Brazil Cetip DI Interbank Deposit Rate (Upon termination) | | 1/4/2027 | | BRL | | 3,926,736 | | (9,744) | | — | | (9,744) |
| 11.23% (Upon termination) | | 1-Day Brazil Cetip DI Interbank Deposit Rate (Upon termination) | | 1/4/2027 | | BRL | | 4,115,212 | | (23,616) | | 13,071 | | (36,687) |
| 6-Month EURIBOR (Semiannually) | | 1.00% (Annually) | | 5/18/2027 | | EUR | | 3,600,000 | | (188,223) | | (163,593) | | (24,630) |
| 1-Day SOFR (Annually) | | 2.15% (Annually) | | 6/15/2027 | | USD | | 14,700,000 | | (981,766) | | — | | (981,766) |
| 1-Day SOFR (Annually) | | 2.87% (Annually) | | 7/22/2027 | | USD | | 1,700,000 | | (63,226) | | — | | (63,226) |
| 1-Day SOFR (Annually) | | 2.85% (Annually) | | 8/29/2027 | | USD | | 3,200,000 | | (114,812) | | — | | (114,812) |
| 2.85% (Annually) | | 3-Month EURIBOR (Quarterly) | | 4/22/2028 | | EUR | | 24,510,000 | | (614,740) | | (66,238) | | (548,502) |
| 1-Day SOFR (Annually) | | 3.70% (Annually) | | 6/9/2028 | | USD | | 5,700,000 | | (24,288) | | — | | (24,288) |
| 11.50% (Upon termination) | | 1-Day Brazil Cetip DI Interbank Deposit Rate (Upon termination) | | 1/2/2029 | | BRL | | 3,713,698 | | (59,467) | | (8,999) | | (50,468) |
| 0.50% (Annually) | | Bank of Japan Unsecured Overnight Call Rate (Annually) | | 3/21/2029 | | JPY | | 13,094,000,000 | | (26,391) | | 898,968 | | (925,359) |
| 28-Day Mexico Interbank TIIE (Lunar) | | 7.45% (Lunar) | | 7/18/2029 | | MXN | | 165,770,000 | | (475,111) | | 68,836 | | (543,947) |
| 1-Day SOFR (Annually) | | 3.08% (Annually) | | 3/28/2030 | | USD | | 4,500,000 | | (181,363) | | — | | (181,363) |
| 3.50% (Semiannually) | | Bank Of Canada Overnight Repo Rate (Semiannually) | | 6/1/2032 | | CAD | | 11,000,000 | | (303,539) | | 45,028 | | (348,567) |
| 1-Day SOFR (Annually) | | 3.52% (Annually) | | 6/9/2033 | | USD | | 10,000,000 | | (68,900) | | — | | (68,900) |
| Bank of Japan Unsecured Overnight Call Rate (Annually) | | 1.25% (Annually) | | 8/2/2033 | | JPY | | 929,300,000 | | 12,602 | | 19,592 | | (6,990) |
| 1.25% (Annually) | | Bank of Japan Unsecured Overnight Call Rate (Annually) | | 8/3/2033 | | JPY | | 1,014,000,000 | | (13,616) | | (8,212) | | (5,404) |
| 1-Day SOFR (Annually) | | 3.50% (Annually) | | 12/20/2033 | | USD | | 280,000 | | 283 | | 1,311 | | (1,028) |
| 3.75% (Semiannually) | | Bank Of Canada Overnight Repo Rate (Semiannually) | | 12/20/2033 | | CAD | | 3,200,000 | | (139,030) | | (11,985) | | (127,045) |
| 9.00% (Lunar) | | 28-Day Mexico Interbank TIIE (Lunar) | | 3/8/2034 | | MXN | | 10,490,000 | | (26,584) | | (20,629) | | (5,955) |
See Notes to Financial Statements.
| Pay Rate Index/Pay Rate | | Receive
Rate Index/Receive
Rate | | Maturity
Date | | Currency | | Notional Amount | | Market Value | | Upfront
Premiums
Paid/
(Received) | | Unrealized
Appreciation
(Depreciation) |
| 3.00% (Annually) | | 3-Month STIBOR (Quarterly) | | 3/20/2034 | | SEK | | 78,720,000 | | $ (467,406) | | $ (288,468) | | $ (178,938) |
| 3.25% (Semiannually) | | Bank Of Canada Overnight Repo Rate (Semiannually) | | 3/20/2034 | | CAD | | 190,000 | | (2,780) | | 562 | | (3,342) |
| 3.75% (Annually) | | 6-Month NIBOR (Semiannually) | | 3/20/2034 | | NOK | | 11,030,000 | | (41,855) | | (29,167) | | (12,688) |
| 3.78% (Annually) | | 1-Day SOFR (Annually) | | 9/22/2036 | | USD | | 13,220,000 | | (397,637) | | 221,622 | | (619,259) |
| 1-Day SOFR (Annually) | | 2.91% (Annually) | | 7/28/2037 | | USD | | 41,480,000 | | (915,659) | | (684,966) | | (230,693) |
| Bank of Japan Unsecured Overnight Call Rate (Annually) | | 1.50% (Annually) | | 8/3/2038 | | JPY | | 1,099,000,000 | | (75,753) | | (51,233) | | (24,520) |
| 6-Month EURIBOR (Semiannually) | | 1.05% (Annually) | | 8/11/2047 | | EUR | | 27,390,000 | | (842,834) | | (641,932) | | (200,902) |
| 2.56% (Annually) | | 1-Day SOFR (Annually) | | 5/11/2053 | | USD | | 39,120,000 | | 423,920 | | 455,730 | | (31,810) |
| 2.00% (Semiannually) | | 6-Month EURIBOR (Annually) | | 5/17/2053 | | EUR | | 8,730,000 | | 38,573 | | 303,968 | | (265,395) |
| 2.50% (Annually) | | 6-Month EURIBOR (Semiannually) | | 11/10/2053 | | EUR | | 10,510,000 | | (496,824) | | (355,195) | | (141,629) |
| 3.61% (Annually) | | 1-Day SOFR (Annually) | | 11/15/2053 | | USD | | 13,100,000 | | (556,084) | | (86,950) | | (469,134) |
| 3.51% (Annually) | | 1-Day SOFR (Annually) | | 11/29/2053 | | USD | | 4,370,000 | | (154,746) | | (78,652) | | (76,094) |
| 2.50% (Annually) | | 6-Month EURIBOR (Semiannually) | | 3/20/2054 | | EUR | | 2,400,000 | | (107,236) | | (70,658) | | (36,578) |
| Subtotal Depreciation | | | | | | | | | | $ (8,766,749) | | $ (797,247) | | $ (7,969,502) |
| Net Centrally Cleared Interest Rate Swaps outstanding at December 31, 2023 | | $11,447,057 | | $4,976,858 | | $ 6,470,199 |
| Pay Rate Index/Pay Rate | | Receive
Rate Index/Receive
Rate | | Maturity
Date | | Counterparty | | Currency | | Notional
Amount | | Market Value | | Upfront
Premiums
Paid/
(Received) | | Unrealized
Appreciation
(Depreciation) |
| Total Return Swaps | | | | | | | | | | | | | | | | |
| Financing Index: 1-Day US Federal Fund Effective Rate - 0.15% | | Vanguard Intermediate-Term Corporate Bond Index Fund (Monthly) | | 1/4/2024 | | JPM | | USD | | 425,931 | | $ 13,465 | | $ — | | $ 13,465 |
| Financing Index: 1-Day US Federal Fund Effective Rate + 0.45% | | Vanguard Short-Term Corporate Bond Index Fund (Monthly) | | 1/6/2025 | | BOA | | USD | | 404,488 | | 4,988 | | — | | 4,988 |
| Subtotal Appreciation | | | | | | | | | | | | $ 18,453 | | $ — | | $ 18,453 |
| Markit iBoxx USD Liquid Investment Grade Index (Monthly) | | Financing Index: 1-Day US Federal Fund Effective Rate - 0.8% | | 1/6/2025 | | JPM | | USD | | 470,381 | | $(17,209) | | $ — | | $(17,209) |
| Subtotal Depreciation | | | | | | | | | | | | $(17,209) | | $ — | | $(17,209) |
| Net Total Return Swaps outstanding at December 31, 2023 | | $ 1,244 | | $ — | | $ 1,244 |
See Notes to Financial Statements.
MEDIUM-DURATION BOND FUND
SCHEDULE OF INVESTMENTS (Continued)
VALUATION HIERARCHY
The following is a summary of the inputs used, as of December 31, 2023, in valuing the Fund’s investments carried at fair value:
| | Total
Value | | Level 1
Quoted Prices | | Level 2
Other Significant
Observable Inputs | | Level 3
Significant
Unobservable Inputs |
| Assets: | | | | | | | |
| Investments in Securities: | | | | | | | |
| Agency Obligations | $ 33,827,517 | | $ — | | $ 33,827,517 | | $ — |
| Asset-Backed Securities | 254,336,282 | | — | | 254,336,282 | | — |
| Corporate Bonds | 540,625,366 | | — | | 540,370,006 | | 255,360 |
| Foreign Bonds | 226,258,229 | | — | | 226,258,229 | | — |
| Loan Agreements | 22,539,640 | | — | | 22,539,640 | | — |
| Money Market Funds | 161,233,829 | | 161,233,829 | | — | | — |
| Mortgage-Backed Securities | 1,092,582,228 | | — | | 1,092,582,228 | | — |
| Municipal Bonds | 11,144,751 | | — | | 11,144,751 | | — |
| Preferred Stock | 151,440 | | 151,440 | | — | | — |
| Purchased Options: | | | | | | | |
| Call Options | 1,295,624 | | 1,295,624 | | — | | — |
| Put Options | 158,448 | | 158,448 | | — | | — |
| Total Purchased Options | 1,454,072 | | 1,454,072 | | — | | — |
| Repurchase Agreements | 343,500,000 | | — | | 343,500,000 | | — |
| U.S. Treasury Obligations | 395,822,694 | | — | | 395,822,694 | | — |
| Total Assets - Investments in Securities | $3,083,476,048 | | $162,839,341 | | $2,920,381,347 | | $255,360 |
| Other Financial Instruments*** | | | | | | | |
| Forward Foreign Currency Contracts | $ 2,316,418 | | $ — | | $ 2,316,418 | | $ — |
| Futures Contracts | 13,224,752 | | 13,224,752 | | — | | — |
| Swap Agreements | 14,941,283 | | — | | 14,941,283 | | — |
| Total Assets - Other Financial Instruments | $ 30,482,453 | | $ 13,224,752 | | $ 17,257,701 | | $ — |
See Notes to Financial Statements.
| | Total
Value | | Level 1
Quoted Prices | | Level 2
Other Significant
Observable Inputs | | Level 3
Significant
Unobservable Inputs |
| Liabilities: | | | | | | | |
| Investments in Securities: | | | | | | | |
| TBA Sale Commitments | $(64,858,067) | | $ — | | $(64,858,067) | | $ — |
| Written Options: | | | | | | | |
| Call Options | (346,767) | | (346,767) | | — | | — |
| Call Swaptions | (563,602) | | (563,602) | | — | | — |
| Put Option | (59,000) | | (59,000) | | — | | — |
| Put Swaptions | (95,726) | | (95,726) | | — | | — |
| Total Written Options | (1,065,095) | | (1,065,095) | | — | | — |
| Total Liabilities - Investments in Securities | $(65,923,162) | | $(1,065,095) | | $(64,858,067) | | $ — |
| Other Financial Instruments*** | | | | | | | |
| Forward Foreign Currency Contracts | $ (4,616,879) | | $ — | | $ (4,616,879) | | $ — |
| Futures Contracts | (7,007,729) | | (7,007,729) | | — | | — |
| Swap Agreements | (8,274,501) | | — | | (8,274,501) | | — |
| Total Liabilities - Other Financial Instruments | $(19,899,109) | | $(7,007,729) | | $(12,891,380) | | $ — |
| *** | Other financial instruments are derivative instruments, such as futures contracts, forward foreign currency contracts and swap agreements, which are valued at the unrealized appreciation (depreciation) on the investment. Further details regarding the value of these investments can be found in the preceding "Futures Contracts outstanding", "Forward Foreign Currency Contracts outstanding" and "Swap Agreements outstanding" disclosures. |
There were no transfers to or from Level 3 during the year ended December 31, 2023.
Management has determined that the amount of Level 3 securities compared to total net assets is not material; therefore, the reconciliation of Level 3 securities and assumptions is not shown for the year ended December 31, 2023.
See Notes to Financial Statements.
Global Bond Fund (Unaudited)
The Fund invested in a diversified portfolio composed of global fixed income securities with a dollar-weighted effective duration normally between three to 10 years. Duration measures the sensitivity of a fixed income security's price to changes in interest rates. The Fund maintained its global focus, seeking investment opportunities across a wide array of economies, credits, yield curves and currencies. For the one-year period ended December 31, 2023, the Investor Class of the Fund underperformed its composite benchmark of 70% Bloomberg Global Aggeregate Bond Index, 15% J.P. Morgan Emerging Markets Bond Index (EMBI) Plus and 15% Bloomberg US Corporate High Yield 2% Issuer Capped Bond Index (5.77% (net of fees) versus 7.54%).
Underperformance within the Fund relative to the composite benchmark was driven primarily by an underweight to emerging markets debt. An underweight to broad duration relative to the composite benchmark was additive as well with rates rising across the globe in response to inflation.
Government bond futures, interest rate futures, options and swaps were used for the common purpose of implementing yield curve positioning strategies, managing duration and taking a directional position on the path of inflation. In aggregate, these added to relative performance. Currency options and forward contracts were used to adjust exposure to various currency markets and/or to hedge against foreign currency fluctuations. In aggregate, currency derivatives were detractors from performance. Credit default swaps, purchased to tactically adjust credit exposure, were neutral to the Fund’s relative performance during the year.
During the year, the Fund remained focused on its objective of seeking to maximize total return through capital gains and current income while preserving principal value.
This Fund may be suitable for investors who have a medium- to long-term investment horizon, seek higher returns than those offered by a shorter maturity fixed income fund, can accept short-term fluctuations in account value and want to diversify their portfolio with a globally diversified fixed income investment option. This Fund may invest, to a large extent, in below-investment grade securities (i.e., high yield securities or junk bonds). These securities involve greater risks of default, are more volatile than fixed income securities rated investment grade and are inherently speculative. Obligations of foreign issuers may be negatively impacted by political events, economic conditions or inefficient, illiquid or unregulated markets in foreign countries, and they also may be subject to inadequate regulatory or accounting standards, which may increase investment risk. Investing in emerging markets may involve greater risks than investing in more developed foreign markets because, among other things, emerging markets often have more political and economic instability. This Fund is subject to interest rate risk, meaning, when interest rates rise, the value of the existing fixed income securities decrease and vice versa. Changes in interest rates have a bigger impact on long duration holdings than on short duration holdings. To the extent that the investment adviser or sub-advisers misjudge current market conditions, the Fund’s volatility may be amplified by its use of derivatives and by its ability to select sub-advisers to allocate assets. Derivatives involve different risks from, and in some respects greater risks than, those associated with investing directly in securities, currencies or other instruments. Derivatives may be illiquid or less liquid, volatile, difficult to price and leveraged, so small changes in value of the underlying instruments may produce disproportionate losses to the Fund. It is possible to lose money by investing in the Fund.
See Notes to Financial Statements.
Global Bond Fund (Unaudited)
At December 31, 2023, the portfolio holdings of the Fund, as a percentage of net assets, is shown in the following table. Portfolio holdings are subject to risk and may change at any time.
| | % |
| Foreign Bonds | 44.7 |
| U.S. Treasury Obligations | 18.5 |
| Corporate Bonds | 16.2 |
| Money Market Funds | 10.3 |
| Mortgage-Backed Securities | 9.0 |
| Asset-Backed Securities | 2.2 |
| Loan Agreements | 1.4 |
| Mutual Funds | 0.2 |
| Energy | 0.1 |
| Financials | —** |
| Communication Services | —** |
| Industrials | —** |
| Purchased Options | —** |
| | 102.6 |
| **Rounds to less than 0.05% | |
| Average Annual Total Returns as of 12/31/23 | |
| | | Institutional Class* | | Investor Class* | | Benchmark** | |
| One Year | | 6.02% | | 5.77%*** | | 7.54% | |
| Five Year | | 1.01% | | 0.71% | | 0.34% | |
| Ten Year | | N/A | | 1.33% | | 1.42% | |
| Since Inception(1) | | 1.27% | | 3.35% | | 3.48% | |
| Inception Date | | 05/01/15 | | 12/29/06 | | | |
| Total Fund Operating Expenses (May 1, 2023 Prospectus)(2)# | | 0.58% | | 0.87% | | | |
| (1) | The Since Inception benchmark performance is based on the start date of December 29, 2006, which corresponds with the inception date of the Investor Class, the longest operating class of the Fund. |
| (2) | Current information regarding the Fund’s Operating Expenses can be found in the Financial Highlights. |
#Net expense ratio
The performance data quoted represents past performance and does not guarantee future results. The performance data in the table and graph does not reflect the deduction of taxes that a shareholder would pay on Fund distributions or the redemption of Fund shares. Current performance may be lower or higher. Performance data current to the most recent month-end may be obtained at GuideStoneFunds.com. The investment return and principal value of an investment will fluctuate so that shares, when redeemed, may be worth more or less than their original cost.
See Notes to Financial Statements.
Global Bond Fund (Unaudited)
The graph illustrates the results of a hypothetical $10,000 investment in the Investor Class of the Fund for the 10-year period from December 31, 2013 to December 31, 2023, with all dividends and capital gains reinvested, with the Fund’s composite benchmark index.
*These returns reflect investment advisory and shareholder servicing fee waivers, if applicable, during the reported time periods.
**The Benchmark Index shows how the Fund’s performance compares with the returns of an index constructed by the Adviser as a composite of various broad-based market indexes to reflect the market sectors in which the Fund invests. The Benchmark Index is 15% J.P. Morgan Emerging Markets Bond Index (EMBI) Plus, 70% Bloomberg Global Aggregate Bond Index and 15% Bloomberg US Corporate High Yield 2% Issuer Capped Bond Index. The weightings of the Benchmark Index were modified effective May 1, 2020, and therefore, the weightings of the underlying indexes were different than the current benchmark weightings prior to that date. Benchmark Index performance represents the Fund’s current benchmark linked with its previous benchmark.
***Total returns may differ from the financial highlights due to adjustments required by U.S. GAAP.
Unlike a mutual fund, an index is not available for direct investment and the performance of an index assumes no taxes, transaction costs, management fees or other expenses.
See Notes to Financial Statements.
| | | Par | | Value |
| ASSET-BACKED SECURITIES — 2.2% |
| 510 Asset Backed Trust, Series 2021-NPL1, Class A1 | | | |
| (Step to 5.24% on 07/25/24), 2.24%, 06/25/61 144A STEP | $ 57,103 | | $ 54,457 |
| Aaset Trust, Series 2021-2A, Class A | | | |
| 2.80%, 01/15/47 144A | 202,762 | | 174,969 |
| Air Canada Pass-Through Trust, Series 2020-2, Class A | | | |
| 5.25%, 04/01/29 144A | 327,017 | | 321,163 |
| American Airlines Pass-Through Trust, Series 2016-3, Class B | | | |
| 3.75%, 10/15/25 | 140,910 | | 132,990 |
| American Airlines Pass-Through Trust, Series 2017-2, Class B | | | |
| 3.70%, 10/15/25 | 53,270 | | 50,164 |
| American Credit Acceptance Receivables Trust, Series 2021-3, Class D | | | |
| 1.34%, 11/15/27 144A | 80,000 | | 77,386 |
| American Credit Acceptance Receivables Trust, Series 2021-4, Class D | | | |
| 1.82%, 02/14/28 144A | 105,000 | | 101,370 |
| Applebee's Funding LLC, Series 2023-1A, Class A2 | | | |
| 7.82%, 03/05/53 144A | 100,000 | | 102,307 |
| Arbys Funding LLC, Series 2020-1A, Class A2 | | | |
| 3.24%, 07/30/50 144A | 1,199,700 | | 1,099,591 |
| Ares XXXIR CLO, Ltd., Series 2014-31RA, Class B | | | |
| (Floating, CME Term SOFR 3M + 1.86%, 1.60% Floor), 7.24%, 05/24/30 144A † | 250,000 | | 248,456 |
| Avis Budget Rental Car Funding AESOP LLC, Series 2023-3A, Class C | | | |
| 7.05%, 02/22/28 144A | 400,000 | | 405,251 |
| BHG Securitization Trust, Series 2022-A, Class B | | | |
| 2.70%, 02/20/35 144A | 110,000 | | 101,853 |
| Bravo Mortgage Asset Trust, Series 2006-1A, Class M1 | | | |
| (Floating, CME Term SOFR 1M + 0.71%, 0.60% Floor), 6.07%, 07/25/36 144A † | 555,032 | | 487,924 |
| Bridgecrest Lending Auto Securitization Trust, Series 2023-1, Class D | | | |
| 7.84%, 08/15/29 | 125,000 | | 130,015 |
| Carvana Auto Receivables Trust, Series 2021-N3, Class C | | | |
| 1.02%, 06/12/28 | 12,329 | | 11,496 |
| Carvana Auto Receivables Trust, Series 2021-N4, Class C | | | |
| 1.72%, 09/11/28 | 4,819 | | 4,545 |
| Carvana Auto Receivables Trust, Series 2021-N4, Class D | | | |
| 2.30%, 09/11/28 | 45,496 | | 43,662 |
| | | Par | | Value |
| Carvana Auto Receivables Trust, Series 2021-P3, Class C | | | |
| 1.93%, 10/12/27 | $ 60,000 | | $ 52,809 |
| Carvana Auto Receivables Trust, Series 2021-P4, Class C | | | |
| 2.33%, 02/10/28 | 25,000 | | 22,206 |
| CLI Funding VI LLC, Series 2020-1A, Class B | | | |
| 3.62%, 09/18/45 144A | 900,787 | | 821,030 |
| CLI Funding VIII LLC, Series 2021-1A, Class A | | | |
| 1.64%, 02/18/46 144A | 88,253 | | 78,009 |
| DT Auto Owner Trust, Series 2021-3A, Class D | | | |
| 1.31%, 05/17/27 144A | 165,000 | | 153,511 |
| DT Auto Owner Trust, Series 2021-4A, Class D | | | |
| 1.99%, 09/15/27 144A | 65,000 | | 60,318 |
| DT Auto Owner Trust, Series 2022-1A, Class D | | | |
| 3.40%, 12/15/27 144A | 95,000 | | 90,777 |
| DT Auto Owner Trust, Series 2023-3A, Class D | | | |
| 7.12%, 05/15/29 144A | 50,000 | | 50,891 |
| Exeter Automobile Receivables Trust, Series 2021-3A, Class D | | | |
| 1.55%, 06/15/27 | 120,000 | | 111,958 |
| Exeter Automobile Receivables Trust, Series 2022-6A, Class C | | | |
| 6.32%, 05/15/28 | 20,000 | | 20,110 |
| Exeter Automobile Receivables Trust, Series 2023-2A, Class D | | | |
| 6.32%, 08/15/29 | 40,000 | | 40,128 |
| Exeter Automobile Receivables Trust, Series 2023-3A, Class D | | | |
| 6.68%, 04/16/29 | 20,000 | | 20,217 |
| Exeter Automobile Receivables Trust, Series 2023-5A, Class D | | | |
| 7.13%, 02/15/30 | 100,000 | | 102,846 |
| Flagship Credit Auto Trust, Series 2021-2, Class D | | | |
| 1.59%, 06/15/27 144A | 40,000 | | 36,438 |
| Flagship Credit Auto Trust, Series 2021-3, Class D | | | |
| 1.65%, 09/15/27 144A | 50,000 | | 44,820 |
| Ford Credit Auto Lease Trust, Series 2023-B, Class D | | | |
| 6.97%, 06/15/28 | 25,000 | | 25,391 |
| Ford Credit Auto Owner Trust, Series 2021-A, Class A3 | | | |
| 0.30%, 08/15/25 | 60,235 | | 59,389 |
| Frontier Issuer LLC, Series 2023-1, Class A2 | | | |
| 6.60%, 08/20/53 144A | 190,000 | | 189,647 |
| GITSIT Mortgage Loan Trust, Series 2023-NPL1, Class A1 | | | |
| 8.35%, 05/25/53 144A STEP | 47,741 | | 47,994 |
See Notes to Financial Statements.
SCHEDULE OF INVESTMENTS (Continued)
| | | Par | | Value |
| GLS Auto Receivables Issuer Trust, Series 2021-1A, Class D | | | |
| 1.68%, 01/15/27 144A | $ 175,000 | | $ 170,041 |
| GLS Auto Receivables Issuer Trust, Series 2021-2A, Class D | | | |
| 1.42%, 04/15/27 144A | 65,000 | | 61,511 |
| GLS Auto Receivables Issuer Trust, Series 2021-3A, Class D | | | |
| 1.48%, 07/15/27 144A | 80,000 | | 74,673 |
| GLS Auto Receivables Issuer Trust, Series 2021-4A, Class D | | | |
| 2.48%, 10/15/27 144A | 135,000 | | 126,372 |
| GLS Auto Receivables Issuer Trust, Series 2023-2A, Class D | | | |
| 6.31%, 03/15/29 144A | 30,000 | | 30,210 |
| Honda Auto Receivables Owner Trust, Series 2021-1, Class A3 | | | |
| 0.27%, 04/21/25 | 25,778 | | 25,467 |
| JP Morgan Mortgage Trust, Series 2023-HE3, Class A1 | | | |
| (Floating, U.S. 30-Day Average SOFR + 1.60%), 6.94%, 05/20/54 144A † | 143,000 | | 144,072 |
| Merchants Fleet Funding LLC, Series 2023-1A, Class A | | | |
| 7.21%, 05/20/36 144A | 120,000 | | 121,317 |
| MVW LLC, Series 2021-2A, Class C | | | |
| 2.23%, 05/20/39 144A | 64,611 | | 58,856 |
| Navient Private Education Refinancing Loan Trust, Series 2021-FA, Class B | | | |
| 2.12%, 02/18/70 144A | 100,000 | | 65,715 |
| Navient Student Loan Trust, Series 2018-EA, Class B | | | |
| 4.44%, 12/15/59 144A | 560,000 | | 525,769 |
| Neighborly Issuer, Series 2023-1A, Class A2 | | | |
| 7.31%, 01/30/53 144A | 1,230,700 | | 1,234,713 |
| Nelnet Student Loan Trust, Series 2021-CA, Class D | | | |
| 4.44%, 04/20/62 144A | 1,040,000 | | 860,277 |
| New Century Home Equity Loan Trust, Series 2003-6, Class M1 | | | |
| (Floating, CME Term SOFR 1M + 1.19%, 1.08% Floor, 12.50% Cap), 6.55%, 01/25/34† | 148,248 | | 148,079 |
| Prestige Auto Receivables Trust, Series 2022-1A, Class D | | | |
| 8.08%, 08/15/28 144A | 80,000 | | 81,966 |
| Progress Residential, Series 2021-SFR3, Class E1 | | | |
| 2.54%, 05/17/26 144A | 20,000 | | 18,037 |
| PRPM LLC, Series 2021-1, Class A1 | | | |
| 2.12%, 01/25/26 144A † γ | 66,328 | | 66,198 |
| PRPM LLC, Series 2021-5, Class A1 | | | |
| (Step to 4.79% on 07/25/24), 1.79%, 06/25/26 144A STEP | 71,730 | | 70,089 |
| | | Par | | Value |
| PRPM LLC, Series 2022-5, Class A1 | | | |
| (Step to 0.36% on 01/25/24), 6.90%, 09/27/27 144A STEP | $ 113,431 | | $113,700 |
| ServiceMaster Funding LLC, Series 2021-1, Class A2II | | | |
| 3.11%, 07/30/51 144A | 908,666 | | 733,023 |
| Sierra Timeshare Receivables Funding LLC, Series 2019-2A, Class C | | | |
| 3.12%, 05/20/36 144A | 11,960 | | 11,715 |
| SLM Student Loan Trust, Series 2003-4, Class A5E | | | |
| (Floating, U.S. 90-Day Average SOFR + 1.01%), 6.36%, 03/15/33 144A † | 86,761 | | 84,110 |
| SLM Student Loan Trust, Series 2006-10, Class A6 | | | |
| (Floating, U.S. 90-Day Average SOFR + 0.41%), 5.75%, 03/25/44† | 84,592 | | 81,428 |
| SMB Private Education Loan Trust, Seres 2021-A, Class A2A2 | | | |
| (Floating, CME Term SOFR 1M + 0.84%), 6.21%, 01/15/53 144A † | 68,331 | | 67,120 |
| SMB Private Education Loan Trust, Series 2021-A, Class A2B | | | |
| 1.59%, 01/15/53 144A | 163,994 | | 145,612 |
| SMB Private Education Loan Trust, Series 2021-B, Class A | | | |
| 1.31%, 07/17/51 144A | 1,102,170 | | 996,425 |
| SMB Private Education Loan Trust, Series 2021-E, Class B | | | |
| 2.49%, 02/15/51 144A | 100,000 | | 81,038 |
| Sunnova Helios X Issuer LLC, Series 2022-C, Class C | | | |
| 6.00%, 11/22/49 144A | 93,694 | | 81,401 |
| Textainer Marine Containers VII, Ltd., Series 2021-1A, Class A | | | |
| 1.68%, 02/20/46 144A | 77,333 | | 67,948 |
| U.S. Airways Pass-Through Trust, Series 2012-2, Class A | | | |
| 4.63%, 06/03/25 | 52,153 | | 50,742 |
| United Airlines Pass-Through Trust, Series 2016-2, Class B | | | |
| 3.65%, 04/07/27 | 48,611 | | 45,720 |
| United Airlines Pass-Through Trust, Series 2023-1, Class A | | | |
| 5.80%, 01/15/36 | 140,000 | | 142,521 |
| VCAT LLC, Series 2021-NPL5, Class A1 | | | |
| (Step to 4.87% on 09/25/24), 1.87%, 08/25/51 144A STEP | 60,821 | | 59,835 |
| VCAT LLC, Series 2021-NPL6, Class A1 | | | |
| (Step to 4.92% on 10/25/24), 1.92%, 09/25/51 144A STEP | 100,956 | | 98,984 |
See Notes to Financial Statements.
| | | Par | | Value |
| VOLT XCVII LLC, Series 2021-NPL6, Class A1 | | | |
| (Step to 5.24% on 04/25/24), 2.24%, 04/25/51 144A STEP | $ 58,603 | | $ 56,724 |
| Westlake Automobile Receivables Trust, Series 2023-4A, Class D | | | |
| 7.19%, 07/16/29 144A | 100,000 | | 102,092 |
Total Asset-Backed Securities
(Cost $12,745,139) | | | 12,479,588 |
| CORPORATE BONDS — 16.2% |
| Air Lease Corporation | | | |
| 2.30%, 02/01/25 | 280,000 | | 270,358 |
| (Variable, U.S. Treasury Yield Curve Rate CMT 5Y + 4.08%), 4.65%, 06/15/26ρ ^ | 120,000 | | 108,014 |
| 4.63%, 10/01/28 | 50,000 | | 48,960 |
| 3.00%, 02/01/30 | 30,000 | | 26,680 |
| 3.13%, 12/01/30 | 25,000 | | 21,921 |
| Allied Universal Holdco LLC | | | |
| 6.00%, 06/01/29 144A | 270,000 | | 220,346 |
| Ally Financial, Inc. | | | |
| (Variable, U.S. Treasury Yield Curve Rate CMT 5Y + 3.87%), 4.70%, 05/15/26ρ ^ | 140,000 | | 105,359 |
| (Variable, U.S. Treasury Yield Curve Rate CMT 7Y + 3.48%), 4.70%, 05/15/28ρ ^ | 125,000 | | 85,141 |
| 2.20%, 11/02/28 | 50,000 | | 42,587 |
| 8.00%, 11/01/31 | 175,000 | | 192,101 |
| Amazon.com, Inc. | | | |
| 0.45%, 05/12/24 | 595,000 | | 584,645 |
| American Airlines, Inc. | | | |
| 5.50%, 04/20/26 144A | 650,000 | | 645,801 |
| 5.75%, 04/20/29 144A Δ | 750,000 | | 731,705 |
| American Express Co. | | | |
| (Variable, U.S. Treasury Yield Curve Rate CMT 5Y + 2.85%), 3.55%, 09/15/26ρ ^ | 1,000,000 | | 859,800 |
| (Variable, U.S. SOFR + 1.76%), 4.42%, 08/03/33^ | 25,000 | | 24,123 |
| American Homes 4 Rent LP REIT | | | |
| 2.38%, 07/15/31 | 20,000 | | 16,535 |
| American Tower Corporation REIT | | | |
| 0.50%, 01/15/28(E) Δ | 400,000 | | 394,309 |
| 5.50%, 03/15/28 | 85,000 | | 87,018 |
| 5.90%, 11/15/33 | 165,000 | | 175,172 |
| Amgen, Inc. | | | |
| 5.25%, 03/02/33 | 25,000 | | 25,676 |
| 5.75%, 03/02/63 | 55,000 | | 58,051 |
| Antares Holdings LP | | | |
| 3.75%, 07/15/27 144A | 250,000 | | 225,602 |
| Apple, Inc. | | | |
| 0.50%, 11/15/31(E) | 180,000 | | 169,905 |
| 4.65%, 02/23/46 | 120,000 | | 118,891 |
| Aramark International Finance S.a.r.l. | | | |
| 3.13%, 04/01/25(E) | 184,000 | | 202,676 |
| Ardagh Metal Packaging Finance U.S.A. LLC | | | |
| 3.00%, 09/01/29(E) | 100,000 | | 89,338 |
| | | Par | | Value |
| Ares Capital Corporation | | | |
| 2.88%, 06/15/28Δ | $ 105,000 | | $ 93,219 |
| 3.20%, 11/15/31 | 135,000 | | 113,241 |
| Arrow Electronics, Inc. | | | |
| 2.95%, 02/15/32Δ | 30,000 | | 25,413 |
| Asbury Automotive Group, Inc. | | | |
| 4.63%, 11/15/29 144A Δ | 40,000 | | 37,081 |
| Ashtead Capital, Inc. | | | |
| 5.95%, 10/15/33 144A | 200,000 | | 204,312 |
| AT&T, Inc. | | | |
| 0.25%, 03/04/26(E) | 650,000 | | 674,127 |
| 2.90%, 12/04/26(U) | 1,650,000 | | 2,006,311 |
| 3.65%, 06/01/51 | 155,000 | | 117,390 |
| Athene Global Funding | | | |
| 1.61%, 06/29/26 144A | 110,000 | | 99,669 |
| AutoNation, Inc. | | | |
| 3.85%, 03/01/32 | 25,000 | | 22,267 |
| Avantor Funding, Inc. | | | |
| 3.88%, 07/15/28(E) Δ | 137,000 | | 148,486 |
| Aviation Capital Group LLC | | | |
| 1.95%, 01/30/26 144A | 80,000 | | 74,221 |
| 6.25%, 04/15/28 144A | 55,000 | | 56,192 |
| 6.75%, 10/25/28 144A | 100,000 | | 104,544 |
| 6.38%, 07/15/30 144A | 105,000 | | 108,451 |
| Avnet, Inc. | | | |
| 5.50%, 06/01/32 | 130,000 | | 129,005 |
| Bank of America Corporation | | | |
| 1.38%, 03/26/25(E) | 595,000 | | 640,807 |
| (Variable, CME Term SOFR 3M + 3.19%), 5.88%, 03/15/28ρ ^ | 900,000 | | 862,622 |
| (Variable, CME Term SOFR 3M + 1.77%), 3.71%, 04/24/28^ | 215,000 | | 205,618 |
| (Variable, CME Term SOFR 3M + 1.30%), 3.42%, 12/20/28^ | 435,000 | | 409,880 |
| (Variable, CME Term SOFR 3M + 1.25%), 2.50%, 02/13/31^ | 120,000 | | 103,253 |
| (Variable, U.S. SOFR + 1.37%), 1.92%, 10/24/31^ | 360,000 | | 292,916 |
| (Variable, U.S. SOFR + 1.33%), 2.97%, 02/04/33^ | 115,000 | | 97,886 |
| (Variable, U.S. SOFR + 2.16%), 5.02%, 07/22/33Δ ^ | 25,000 | | 24,775 |
| (Variable, U.S. SOFR + 1.91%), 5.29%, 04/25/34^ | 290,000 | | 291,688 |
| (Variable, U.S. SOFR + 1.84%), 5.87%, 09/15/34Δ ^ | 90,000 | | 94,503 |
| (Variable, U.S. Treasury Yield Curve Rate CMT 5Y + 1.20%), 2.48%, 09/21/36^ | 60,000 | | 47,638 |
| (Variable, U.S. Treasury Yield Curve Rate CMT 5Y + 2.00%), 3.85%, 03/08/37^ | 105,000 | | 92,421 |
| (Variable, U.S. SOFR + 1.58%), 3.31%, 04/22/42^ | 1,860,000 | | 1,463,634 |
| (Variable, CME Term SOFR 3M + 3.41%), 4.08%, 03/20/51^ | 170,000 | | 143,819 |
| Barings BDC, Inc. | | | |
| 3.30%, 11/23/26 | 70,000 | | 63,912 |
See Notes to Financial Statements.
SCHEDULE OF INVESTMENTS (Continued)
| | | Par | | Value |
| Belden, Inc. | | | |
| 3.38%, 07/15/27(E) | $100,000 | | $107,119 |
| BioMarin Pharmaceutical, Inc. | | | |
| 0.60%, 08/01/24 CONV | 80,000 | | 79,048 |
| 1.25%, 05/15/27 CONV Δ | 235,000 | | 242,496 |
| Blackstone Secured Lending Fund | | | |
| 2.13%, 02/15/27 | 190,000 | | 169,072 |
| Block, Inc. | | | |
| 3.50%, 06/01/31Δ | 65,000 | | 57,840 |
| Blue Owl Capital Corporation | | | |
| 2.88%, 06/11/28Δ | 105,000 | | 92,516 |
| Blue Owl Technology Finance Corporation | | | |
| 4.75%, 12/15/25 144A | 265,000 | | 250,846 |
| Boeing Co. (The) | | | |
| 4.88%, 05/01/25 | 690,000 | | 687,185 |
| 3.75%, 02/01/50 | 350,000 | | 273,158 |
| 5.81%, 05/01/50 | 245,000 | | 254,902 |
| Booking Holdings, Inc. | | | |
| 0.50%, 03/08/28(E) | 275,000 | | 275,697 |
| Brighthouse Financial, Inc. | | | |
| 5.63%, 05/15/30Δ | 375,000 | | 380,726 |
| Brixmor Operating Partnership LP REIT | | | |
| 2.25%, 04/01/28 | 15,000 | | 13,349 |
| Broadcom, Inc. | | | |
| 4.15%, 11/15/30 | 60,000 | | 57,426 |
| 2.45%, 02/15/31 144A | 45,000 | | 38,542 |
| 4.15%, 04/15/32 144A | 35,000 | | 33,096 |
| 2.60%, 02/15/33 144A Δ | 185,000 | | 152,784 |
| 3.42%, 04/15/33 144A | 75,000 | | 66,046 |
| 3.47%, 04/15/34 144A | 110,000 | | 95,918 |
| 3.14%, 11/15/35 144A | 140,000 | | 115,287 |
| Carnival Corporation | | | |
| 5.75%, 03/01/27 144A | 80,000 | | 78,180 |
| 9.88%, 08/01/27 144A Δ | 50,000 | | 52,535 |
| 4.00%, 08/01/28 144A | 95,000 | | 88,364 |
| 6.00%, 05/01/29 144A | 45,000 | | 43,320 |
| 7.00%, 08/15/29 144A | 20,000 | | 20,905 |
| Caterpillar Financial Services Corporation | | | |
| 0.95%, 01/10/24 | 225,000 | | 224,781 |
| 0.45%, 05/17/24 | 595,000 | | 584,222 |
| CCO Holdings LLC | | | |
| 4.25%, 01/15/34 144A | 295,000 | | 240,209 |
| CDW LLC | | | |
| 4.25%, 04/01/28 | 40,000 | | 38,342 |
| 3.28%, 12/01/28 | 30,000 | | 27,472 |
| 3.25%, 02/15/29 | 55,000 | | 50,352 |
| 3.57%, 12/01/31 | 280,000 | | 248,466 |
| Celanese U.S. Holdings LLC | | | |
| 6.33%, 07/15/29 | 40,000 | | 41,999 |
| 6.55%, 11/15/30 | 40,000 | | 42,392 |
| 6.38%, 07/15/32 | 25,000 | | 26,458 |
| 6.70%, 11/15/33Δ | 170,000 | | 185,185 |
| Centene Corporation | | | |
| 2.45%, 07/15/28 | 5,000 | | 4,466 |
| | | Par | | Value |
| 4.63%, 12/15/29 | $1,445,000 | | $1,387,263 |
| 3.38%, 02/15/30 | 30,000 | | 26,942 |
| 3.00%, 10/15/30 | 30,000 | | 26,034 |
| 2.50%, 03/01/31 | 255,000 | | 212,739 |
| 2.63%, 08/01/31 | 100,000 | | 83,364 |
| Charles Schwab Corporation (The) | | | |
| (Variable, U.S. Treasury Yield Curve Rate CMT 10Y + 3.08%), 4.00%, 12/01/30ρ ^ | 490,000 | | 387,572 |
| Charter Communications Operating LLC | | | |
| 2.80%, 04/01/31 | 255,000 | | 215,629 |
| 2.30%, 02/01/32 | 235,000 | | 187,492 |
| 4.40%, 04/01/33 | 55,000 | | 50,873 |
| 3.50%, 06/01/41 | 370,000 | | 262,630 |
| 5.75%, 04/01/48 | 890,000 | | 793,807 |
| 4.80%, 03/01/50 | 285,000 | | 221,258 |
| 3.70%, 04/01/51 | 65,000 | | 42,507 |
| 3.85%, 04/01/61 | 30,000 | | 18,819 |
| 4.40%, 12/01/61 | 245,000 | | 170,293 |
| 3.95%, 06/30/62 | 245,000 | | 155,052 |
| Cheniere Energy Partners LP | | | |
| 4.50%, 10/01/29 | 20,000 | | 19,115 |
| 4.00%, 03/01/31 | 235,000 | | 213,608 |
| 3.25%, 01/31/32 | 55,000 | | 46,931 |
| 5.95%, 06/30/33 144A | 70,000 | | 71,901 |
| Cigna Group (The) | | | |
| 4.80%, 08/15/38 | 280,000 | | 271,672 |
| 3.20%, 03/15/40 | 125,000 | | 98,126 |
| 3.40%, 03/15/50 | 260,000 | | 193,561 |
| Citigroup, Inc. | | | |
| (Variable, CME Term SOFR 3M + 3.68%), 6.30%, 05/15/24ρ Δ ^ | 690,000 | | 682,630 |
| (Variable, CME Term SOFR 3M + 1.16%), 3.35%, 04/24/25^ | 275,000 | | 272,971 |
| (Variable, CME Term SOFR 3M + 4.17%), 5.95%, 05/15/25ρ ^ | 100,000 | | 97,978 |
| (Variable, CME Term SOFR 3M + 1.82%), 3.89%, 01/10/28^ | 150,000 | | 145,266 |
| (Variable, CME Term SOFR 3M + 1.41%), 3.52%, 10/27/28^ | 155,000 | | 146,807 |
| (Variable, U.S. SOFR + 1.42%), 2.98%, 11/05/30^ | 165,000 | | 147,218 |
| (Variable, U.S. SOFR + 1.94%), 3.79%, 03/17/33^ | 155,000 | | 139,708 |
| Civitas Resources, Inc. | | | |
| 8.63%, 11/01/30 144A | 25,000 | | 26,533 |
| Comcast Corporation | | | |
| 2.94%, 11/01/56 | 225,000 | | 148,892 |
| CommScope, Inc. | | | |
| 4.75%, 09/01/29 144A Δ | 245,000 | | 164,725 |
| ConocoPhillips | | | |
| 6.50%, 02/01/39 | 10,000 | | 11,608 |
| Continental Resources, Inc. | | | |
| 4.38%, 01/15/28 | 15,000 | | 14,548 |
| 5.75%, 01/15/31 144A | 475,000 | | 472,564 |
| 2.88%, 04/01/32 144A | 160,000 | | 130,137 |
| 4.90%, 06/01/44 | 270,000 | | 219,408 |
See Notes to Financial Statements.
| | | Par | | Value |
| Corebridge Financial, Inc. | | | |
| 4.35%, 04/05/42 | $ 45,000 | | $ 38,351 |
| Corporate Office Properties LP REIT | | | |
| 2.75%, 04/15/31 | 20,000 | | 16,183 |
| Coty, Inc. | | | |
| 3.88%, 04/15/26(E) | 100,000 | | 110,456 |
| CSC Holdings LLC | | | |
| 4.13%, 12/01/30 144A Δ | 200,000 | | 152,384 |
| 4.63%, 12/01/30 144A | 400,000 | | 241,479 |
| 3.38%, 02/15/31 144A | 200,000 | | 146,195 |
| CVS Health Corporation | | | |
| 1.75%, 08/21/30 | 30,000 | | 24,834 |
| 4.13%, 04/01/40 | 80,000 | | 68,993 |
| 5.05%, 03/25/48 | 255,000 | | 239,828 |
| DCP Midstream Operating LP | | | |
| 5.13%, 05/15/29 | 20,000 | | 20,001 |
| 3.25%, 02/15/32 | 135,000 | | 116,893 |
| 6.75%, 09/15/37 144A | 500,000 | | 551,644 |
| Dell International LLC | | | |
| 5.75%, 02/01/33Δ | 25,000 | | 26,377 |
| 8.10%, 07/15/36Δ | 122,000 | | 150,542 |
| 8.35%, 07/15/46 | 14,000 | | 18,486 |
| Devon Energy Corporation | | | |
| 5.88%, 06/15/28 | 384,000 | | 388,312 |
| DH Europe Finance II S.a.r.l. | | | |
| 0.45%, 03/18/28(E) | 275,000 | | 274,663 |
| Digital Euro Finco LLC REIT | | | |
| 1.13%, 04/09/28(E) | 305,000 | | 304,822 |
| Dillard's, Inc. | | | |
| 7.75%, 07/15/26 | 450,000 | | 468,378 |
| Directv Financing LLC | | | |
| 5.88%, 08/15/27 144A | 1,370,000 | | 1,289,224 |
| Discovery Communications LLC | | | |
| 3.63%, 05/15/30Δ | 100,000 | | 90,818 |
| DISH DBS Corporation | | | |
| 7.75%, 07/01/26 | 1,545,000 | | 1,077,699 |
| 5.75%, 12/01/28 144A | 885,000 | | 707,535 |
| 5.13%, 06/01/29 | 90,000 | | 46,478 |
| DISH Network Corporation | | | |
| 2.38%, 03/15/24 CONV Δ | 275,000 | | 273,281 |
| 3.38%, 08/15/26 CONV | 565,000 | | 302,275 |
| Dollar Tree, Inc. | | | |
| 2.65%, 12/01/31Δ | 30,000 | | 25,526 |
| DTE Energy Co. | | | |
| 3.40%, 06/15/29Δ | 117,000 | | 109,564 |
| Duke Energy Corporation | | | |
| 2.55%, 06/15/31 | 250,000 | | 213,855 |
| El Paso Natural Gas Co. LLC | | | |
| 8.38%, 06/15/32 | 50,000 | | 58,496 |
| Electronic Arts, Inc. | | | |
| 1.85%, 02/15/31 | 30,000 | | 25,094 |
| Elevance Health, Inc. | | | |
| 4.10%, 05/15/32 | 25,000 | | 23,931 |
| Endeavor Energy Resources LP | | | |
| 5.75%, 01/30/28 144A | 230,000 | | 230,361 |
| Energy Transfer LP | | | |
| 5.75%, 02/15/33 | 155,000 | | 160,115 |
| | | Par | | Value |
| 6.55%, 12/01/33 | $ 125,000 | | $ 135,841 |
| EnLink Midstream LLC | | | |
| 6.50%, 09/01/30 144A | 10,000 | | 10,218 |
| Entegris Escrow Corporation | | | |
| 4.75%, 04/15/29 144A | 185,000 | | 178,379 |
| Enterprise Products Operating LLC | | | |
| 5.35%, 01/31/33 | 20,000 | | 20,982 |
| 4.80%, 02/01/49Δ | 290,000 | | 275,510 |
| EPR Properties REIT | | | |
| 3.60%, 11/15/31 | 295,000 | | 245,366 |
| EQT Corporation | | | |
| 5.70%, 04/01/28 | 20,000 | | 20,315 |
| 5.00%, 01/15/29 | 900,000 | | 892,230 |
| 7.00%, 02/01/30 | 105,000 | | 112,814 |
| 3.63%, 05/15/31 144A Δ | 105,000 | | 93,904 |
| ERAC U.S.A. Finance LLC | | | |
| 7.00%, 10/15/37 144A | 535,000 | | 627,351 |
| Etsy, Inc. | | | |
| 0.13%, 09/01/27 CONV | 35,000 | | 29,946 |
| 0.25%, 06/15/28 CONV | 85,000 | | 68,263 |
| Expedia Group, Inc. | | | |
| 3.25%, 02/15/30Δ | 15,000 | | 13,780 |
| 2.95%, 03/15/31 | 490,000 | | 432,205 |
| Exxon Mobil Corporation | | | |
| 3.45%, 04/15/51 | 170,000 | | 134,161 |
| Fidelity & Guaranty Life Holdings, Inc. | | | |
| 5.50%, 05/01/25 144A | 430,000 | | 425,097 |
| Fidelity National Information Services, Inc. | | | |
| 1.00%, 12/03/28(E) | 300,000 | | 299,281 |
| Fiserv, Inc. | | | |
| 1.63%, 07/01/30(E) | 290,000 | | 290,136 |
| 5.63%, 08/21/33 | 215,000 | | 225,762 |
| Ford Motor Credit Co. LLC | | | |
| 3.02%, 03/06/24(E) | 100,000 | | 110,081 |
| 2.75%, 06/14/24(U) | 1,360,000 | | 1,710,442 |
| 3.82%, 11/02/27 | 400,000 | | 374,054 |
| 2.90%, 02/10/29 | 875,000 | | 767,765 |
| 4.00%, 11/13/30 | 850,000 | | 764,765 |
| Freeport-McMoRan, Inc. | | | |
| 4.25%, 03/01/30 | 10,000 | | 9,401 |
| 4.63%, 08/01/30 | 5,000 | | 4,888 |
| Gartner, Inc. | | | |
| 3.63%, 06/15/29 144A | 65,000 | | 58,686 |
| 3.75%, 10/01/30 144A | 10,000 | | 8,851 |
| GATX Corporation | | | |
| 5.45%, 09/15/33 | 140,000 | | 141,216 |
| 6.05%, 03/15/34 | 10,000 | | 10,405 |
| 6.90%, 05/01/34Δ | 60,000 | | 66,232 |
| General Motors Co. | | | |
| 5.60%, 10/15/32Δ | 25,000 | | 25,627 |
| General Motors Financial Co., Inc. | | | |
| (Variable, ICE LIBOR USD 3M + 3.60%), 5.75%, 09/30/27ρ ^ | 5,000 | | 4,448 |
| 5.85%, 04/06/30 | 5,000 | | 5,168 |
See Notes to Financial Statements.
SCHEDULE OF INVESTMENTS (Continued)
| | | Par | | Value |
| (Variable, U.S. Treasury Yield Curve Rate CMT 5Y + 5.00%), 5.70%, 09/30/30ρ Δ ^ | $ 10,000 | | $ 9,275 |
| 3.10%, 01/12/32 | 50,000 | | 42,668 |
| 6.40%, 01/09/33Δ | 110,000 | | 117,377 |
| GEO Group, Inc. (The) | | | |
| 10.50%, 06/30/28 | 217,000 | | 220,447 |
| Georgia-Pacific LLC | | | |
| 8.88%, 05/15/31 | 305,000 | | 380,872 |
| Glencore Funding LLC | | | |
| 6.13%, 10/06/28 144A | 190,000 | | 199,389 |
| 2.50%, 09/01/30 144A Δ | 55,000 | | 47,348 |
| 6.38%, 10/06/30 144A Δ | 180,000 | | 193,688 |
| 2.85%, 04/27/31 144A | 420,000 | | 363,504 |
| 5.70%, 05/08/33 144A Δ | 105,000 | | 109,230 |
| 6.50%, 10/06/33 144A | 370,000 | | 404,495 |
| Global Payments, Inc. | | | |
| 5.30%, 08/15/29 | 30,000 | | 30,250 |
| 2.90%, 05/15/30 | 65,000 | | 57,294 |
| 2.90%, 11/15/31 | 65,000 | | 55,729 |
| 5.40%, 08/15/32 | 65,000 | | 65,808 |
| Go Daddy Operating Co. LLC | | | |
| 3.50%, 03/01/29 144A | 105,000 | | 95,595 |
| Goldman Sachs Capital II | | | |
| (Variable, CME Term SOFR 3M + 1.03%), 6.41%, 02/02/24† ρ | 40,000 | | 33,489 |
| Goldman Sachs Group, Inc. (The) | | | |
| (Variable, CME Term SOFR 3M + 1.46%), 3.27%, 09/29/25^ | 150,000 | | 147,496 |
| (Variable, U.S. SOFR + 0.79%), 1.09%, 12/09/26Δ ^ | 360,000 | | 331,791 |
| (Variable, U.S. SOFR + 0.82%), 1.54%, 09/10/27^ | 65,000 | | 58,979 |
| 0.25%, 01/26/28(E) | 428,000 | | 418,947 |
| (Variable, CME Term SOFR 3M + 1.77%), 3.69%, 06/05/28^ | 175,000 | | 167,404 |
| (Variable, U.S. SOFR + 1.73%), 4.48%, 08/23/28^ | 275,000 | | 270,529 |
| (Variable, CME Term SOFR 3M + 1.42%), 3.81%, 04/23/29^ | 240,000 | | 228,149 |
| (Variable, U.S. SOFR + 1.28%), 2.62%, 04/22/32^ | 190,000 | | 159,829 |
| (Variable, U.S. SOFR + 1.41%), 3.10%, 02/24/33^ | 25,000 | | 21,499 |
| 6.75%, 10/01/37 | 180,000 | | 198,793 |
| (Variable, CME Term SOFR 3M + 1.63%), 4.02%, 10/31/38^ | 135,000 | | 118,233 |
| GTCR W-2 Merger Sub LLC | | | |
| 7.50%, 01/15/31 144A | 680,000 | | 719,013 |
| HCA, Inc. | | | |
| 5.38%, 09/01/26 | 18,000 | | 18,100 |
| 4.13%, 06/15/29 | 70,000 | | 66,971 |
| 3.50%, 09/01/30 | 50,000 | | 45,381 |
| 2.38%, 07/15/31 | 30,000 | | 24,779 |
| 3.63%, 03/15/32 | 170,000 | | 152,276 |
| 5.50%, 06/01/33Δ | 290,000 | | 295,152 |
| 5.25%, 06/15/49 | 140,000 | | 130,802 |
| Hercules LLC | | | |
| 6.50%, 06/30/29 | 130,000 | | 122,400 |
| | | Par | | Value |
| Hess Midstream Operations LP | | | |
| 4.25%, 02/15/30 144A | $ 30,000 | | $ 27,635 |
| Hilton Domestic Operating Co., Inc. | | | |
| 3.63%, 02/15/32 144A | 75,000 | | 65,568 |
| Hilton Grand Vacations Borrower Escrow LLC | | | |
| 5.00%, 06/01/29 144A | 60,000 | | 55,425 |
| 4.88%, 07/01/31 144A | 20,000 | | 17,723 |
| Hologic, Inc. | | | |
| 3.25%, 02/15/29 144A | 50,000 | | 45,379 |
| HUB International, Ltd. | | | |
| 7.25%, 06/15/30 144A | 95,000 | | 100,406 |
| Icahn Enterprises LP | | | |
| 4.75%, 09/15/24 | 5,000 | | 4,973 |
| 5.25%, 05/15/27 | 15,000 | | 13,513 |
| 4.38%, 02/01/29 | 280,000 | | 234,150 |
| iHeartCommunications, Inc. | | | |
| 5.25%, 08/15/27 144A Δ | 35,000 | | 27,844 |
| Ingersoll Rand, Inc. | | | |
| 5.70%, 08/14/33Δ | 155,000 | | 164,164 |
| Jacobs Engineering Group, Inc. | | | |
| 6.35%, 08/18/28 | 140,000 | | 146,345 |
| JBS U.S.A. LUX SA | | | |
| 3.00%, 02/02/29 | 45,000 | | 39,609 |
| 3.75%, 12/01/31 | 50,000 | | 43,178 |
| Jefferies Financial Group, Inc. | | | |
| 6.25%, 01/15/36 | 350,000 | | 369,127 |
| 6.50%, 01/20/43 | 260,000 | | 272,590 |
| JELD-WEN, Inc. | | | |
| 4.88%, 12/15/27 144A | 150,000 | | 141,907 |
| John Deere Capital Corporation | | | |
| 0.90%, 01/10/24 | 55,000 | | 54,953 |
| 1.25%, 01/10/25 | 85,000 | | 82,048 |
| JPMorgan Chase & Co. | | | |
| (Variable, U.S. SOFR + 1.56%), 4.32%, 04/26/28^ | 135,000 | | 133,141 |
| (Variable, Euribor 3M + 0.84%), 1.64%, 05/18/28(E) ^ | 250,000 | | 260,958 |
| (Variable, CME Term SOFR 3M + 2.52%), 2.96%, 05/13/31^ | 445,000 | | 391,873 |
| (Variable, U.S. SOFR + 2.08%), 4.91%, 07/25/33^ | 25,000 | | 24,767 |
| (Variable, CME Term SOFR 3M + 2.46%), 3.11%, 04/22/41^ | 115,000 | | 88,905 |
| (Variable, U.S. SOFR + 2.44%), 3.11%, 04/22/51^ | 460,000 | | 332,330 |
| (Variable, U.S. SOFR + 1.58%), 3.33%, 04/22/52^ | 1,880,000 | | 1,413,163 |
| Kinder Morgan Energy Partners LP | | | |
| 6.50%, 02/01/37 | 40,000 | | 42,260 |
| 6.95%, 01/15/38 | 50,000 | | 55,098 |
| Kinder Morgan, Inc. | | | |
| 7.75%, 01/15/32 | 560,000 | | 638,797 |
| L3Harris Technologies, Inc. | | | |
| 5.40%, 01/15/27 | 35,000 | | 35,762 |
| 5.40%, 07/31/33 | 55,000 | | 57,323 |
| 5.60%, 07/31/53Δ | 50,000 | | 53,513 |
See Notes to Financial Statements.
| | | Par | | Value |
| Legacy LifePoint Health LLC | | | |
| 4.38%, 02/15/27 144A Δ | $230,000 | | $ 212,856 |
| Leidos, Inc. | | | |
| 4.38%, 05/15/30 | 15,000 | | 14,391 |
| 2.30%, 02/15/31 | 35,000 | | 29,348 |
| 5.75%, 03/15/33 | 140,000 | | 146,398 |
| Lennar Corporation | | | |
| 4.75%, 11/29/27 | 720,000 | | 720,013 |
| Lithia Motors, Inc. | | | |
| 3.88%, 06/01/29 144A Δ | 185,000 | | 167,275 |
| 4.38%, 01/15/31 144A | 15,000 | | 13,648 |
| Livongo Health, Inc. | | | |
| 0.88%, 06/01/25 CONV | 35,000 | | 32,879 |
| Marathon Oil Corporation | | | |
| 6.80%, 03/15/32Δ | 20,000 | | 21,701 |
| Marathon Petroleum Corporation | | | |
| 4.70%, 05/01/25 | 80,000 | | 79,537 |
| Marriott International, Inc. | | | |
| 2.85%, 04/15/31 | 75,000 | | 65,045 |
| Marriott Ownership Resorts, Inc. | | | |
| 4.50%, 06/15/29 144A Δ | 45,000 | | 39,706 |
| Marvell Technology, Inc. | | | |
| 2.45%, 04/15/28 | 70,000 | | 63,284 |
| 2.95%, 04/15/31 | 60,000 | | 52,546 |
| 5.95%, 09/15/33 | 5,000 | | 5,319 |
| Masco Corporation | | | |
| 7.75%, 08/01/29 | 62,000 | | 69,093 |
| 6.50%, 08/15/32 | 27,000 | | 29,562 |
| Matador Resources Co. | | | |
| 6.88%, 04/15/28 144A Δ | 20,000 | | 20,319 |
| MBIA Insurance Corporation | | | |
| 16.92%, 01/15/33 144A # | 215,000 | | 7,794 |
| McDonald’s Corporation | | | |
| 1.60%, 03/15/31(E) | 400,000 | | 398,123 |
| Meta Platforms, Inc. | | | |
| 4.95%, 05/15/33 | 175,000 | | 181,094 |
| Micron Technology, Inc. | | | |
| 6.75%, 11/01/29 | 185,000 | | 200,279 |
| 2.70%, 04/15/32 | 30,000 | | 25,253 |
| 5.88%, 02/09/33 | 165,000 | | 171,914 |
| 5.88%, 09/15/33Δ | 440,000 | | 458,497 |
| Mileage Plus Holdings LLC | | | |
| 6.50%, 06/20/27 144A | 262,500 | | 263,449 |
| Molina Healthcare, Inc. | | | |
| 4.38%, 06/15/28 144A | 55,000 | | 52,093 |
| 3.88%, 05/15/32 144A | 90,000 | | 78,774 |
| Morgan Stanley | | | |
| (Variable, U.S. SOFR + 0.51%), 0.79%, 01/22/25^ | 430,000 | | 428,752 |
| 4.35%, 09/08/26 | 120,000 | | 117,897 |
| 3.63%, 01/20/27 | 215,000 | | 208,695 |
| 3.95%, 04/23/27 | 27,000 | | 26,240 |
| (Variable, U.S. SOFR + 1.14%), 2.70%, 01/22/31^ | 245,000 | | 214,518 |
| (Variable, U.S. SOFR + 2.56%), 6.34%, 10/18/33^ | 20,000 | | 21,614 |
| (Variable, SONIA Interest Rate + 2.25%), 5.79%, 11/18/33(U) ^ | 820,000 | | 1,114,678 |
| | | Par | | Value |
| (Variable, U.S. SOFR + 1.87%), 5.25%, 04/21/34^ | $105,000 | | $105,294 |
| (Variable, U.S. SOFR + 1.88%), 5.42%, 07/21/34^ | 100,000 | | 101,739 |
| (Variable, U.S. SOFR + 1.36%), 2.48%, 09/16/36^ | 190,000 | | 151,050 |
| (Variable, U.S. Treasury Yield Curve Rate CMT 5Y + 2.43%), 5.95%, 01/19/38^ | 175,000 | | 177,389 |
| Motorola Solutions, Inc. | | | |
| 5.60%, 06/01/32 | 25,000 | | 25,816 |
| MPLX LP | | | |
| 5.00%, 03/01/33 | 25,000 | | 24,537 |
| 4.70%, 04/15/48 | 85,000 | | 73,633 |
| Mutual of Omaha Insurance Co. | | | |
| 6.80%, 06/15/36 144A | 605,000 | | 644,723 |
| Nationstar Mortgage Holdings, Inc. | | | |
| 5.00%, 02/01/26 144A Δ | 60,000 | | 58,709 |
| Navient Corporation | | | |
| 6.75%, 06/15/26Δ | 125,000 | | 126,973 |
| NCL Corporation, Ltd. | | | |
| 5.88%, 03/15/26 144A | 65,000 | | 63,503 |
| 1.13%, 02/15/27 CONV | 95,000 | | 87,219 |
| 5.88%, 02/15/27 144A | 65,000 | | 64,487 |
| 8.13%, 01/15/29 144A | 95,000 | | 99,263 |
| NCL Finance, Ltd. | | | |
| 6.13%, 03/15/28 144A | 25,000 | | 23,901 |
| Netflix, Inc. | | | |
| 3.63%, 05/15/27(E) | 100,000 | | 111,887 |
| 5.88%, 11/15/28Δ | 90,000 | | 94,980 |
| 6.38%, 05/15/29 | 135,000 | | 146,910 |
| 5.38%, 11/15/29 144A | 10,000 | | 10,342 |
| 4.88%, 06/15/30 144A Δ | 145,000 | | 146,968 |
| NGPL PipeCo LLC | | | |
| 7.77%, 12/15/37 144A | 200,000 | | 223,045 |
| Nordson Corporation | | | |
| 5.80%, 09/15/33 | 25,000 | | 26,648 |
| Occidental Petroleum Corporation | | | |
| 3.50%, 08/15/29 | 280,000 | | 248,569 |
| 8.88%, 07/15/30 | 10,000 | | 11,714 |
| 6.63%, 09/01/30 | 35,000 | | 37,266 |
| 6.13%, 01/01/31 | 75,000 | | 77,956 |
| 7.50%, 05/01/31 | 30,000 | | 33,679 |
| 7.88%, 09/15/31 | 10,000 | | 11,389 |
| Olympus Water U.S. Holding Corporation | | | |
| 9.63%, 11/15/28(E) | 100,000 | | 118,668 |
| OneMain Finance Corporation | | | |
| 6.88%, 03/15/25 | 125,000 | | 126,636 |
| 3.50%, 01/15/27 | 10,000 | | 9,262 |
| 3.88%, 09/15/28 | 15,000 | | 13,285 |
| 5.38%, 11/15/29 | 40,000 | | 37,556 |
| 4.00%, 09/15/30 | 25,000 | | 21,425 |
| Open Text Holdings, Inc. | | | |
| 4.13%, 02/15/30 144A Δ | 300,000 | | 271,829 |
| Oracle Corporation | | | |
| 6.15%, 11/09/29 | 65,000 | | 70,066 |
| 2.95%, 04/01/30 | 25,000 | | 22,593 |
See Notes to Financial Statements.
SCHEDULE OF INVESTMENTS (Continued)
| | | Par | | Value |
| 4.00%, 07/15/46 | $ 175,000 | | $ 141,095 |
| 3.95%, 03/25/51 | 150,000 | | 118,188 |
| 5.55%, 02/06/53Δ | 80,000 | | 80,440 |
| Organon & Co. | | | |
| 2.88%, 04/30/28(E) Δ | 150,000 | | 152,526 |
| Outfront Media Capital LLC | | | |
| 7.38%, 02/15/31 144A | 15,000 | | 15,783 |
| Ovintiv, Inc. | | | |
| 8.13%, 09/15/30 | 15,000 | | 16,970 |
| 7.20%, 11/01/31 | 5,000 | | 5,445 |
| 7.38%, 11/01/31 | 10,000 | | 11,046 |
| 6.50%, 08/15/34Δ | 120,000 | | 127,348 |
| 6.63%, 08/15/37 | 30,000 | | 31,228 |
| 6.50%, 02/01/38 | 5,000 | | 5,180 |
| Owens Corning | | | |
| 7.00%, 12/01/36 | 523,000 | | 603,274 |
| Pacific Gas and Electric Co. | | | |
| 4.55%, 07/01/30 | 25,000 | | 23,830 |
| 3.25%, 06/01/31 | 160,000 | | 138,944 |
| 3.30%, 08/01/40 | 95,000 | | 69,922 |
| Penn Mutual Life Insurance Co. (The) | | | |
| 7.63%, 06/15/40 144A | 345,000 | | 393,682 |
| Pilgrim's Pride Corporation | | | |
| 4.25%, 04/15/31 | 35,000 | | 31,656 |
| 3.50%, 03/01/32 | 145,000 | | 122,774 |
| Plains All American Pipeline LP | | | |
| 3.55%, 12/15/29 | 70,000 | | 64,575 |
| 3.80%, 09/15/30 | 85,000 | | 78,377 |
| PLT VII Finance S.a.r.l. | | | |
| 4.63%, 01/05/26(E) | 100,000 | | 110,052 |
| PPL Capital Funding, Inc. | | | |
| 2.88%, 03/15/28 144A CONV | 140,000 | | 136,290 |
| Primo Water Holdings, Inc. | | | |
| 3.88%, 10/31/28(E) | 100,000 | | 106,819 |
| Rand Parent LLC | | | |
| 8.50%, 02/15/30 144A Δ | 50,000 | | 47,933 |
| Range Resources Corporation | | | |
| 4.75%, 02/15/30 144A | 840,000 | | 777,416 |
| Rocket Mortgage LLC | | | |
| 2.88%, 10/15/26 144A | 370,000 | | 341,638 |
| 3.63%, 03/01/29 144A | 15,000 | | 13,593 |
| 3.63%, 03/01/29 | 130,000 | | 117,809 |
| 3.88%, 03/01/31 144A | 325,000 | | 286,065 |
| 4.00%, 10/15/33 144A | 165,000 | | 140,473 |
| Rockies Express Pipeline LLC | | | |
| 6.88%, 04/15/40 144A | 1,340,000 | | 1,317,737 |
| Royal Caribbean Cruises, Ltd. | | | |
| 4.25%, 07/01/26 144A | 10,000 | | 9,662 |
| 5.50%, 04/01/28 144A | 215,000 | | 212,443 |
| RTX Corporation | | | |
| 2.38%, 03/15/32 | 15,000 | | 12,521 |
| 5.15%, 02/27/33 | 165,000 | | 168,480 |
| 6.10%, 03/15/34 | 115,000 | | 125,107 |
| S&P Global, Inc. | | | |
| 5.25%, 09/15/33 144A Δ | 50,000 | | 52,455 |
| Sasol Financing U.S.A. LLC | | | |
| 5.50%, 03/18/31 | 1,470,000 | | 1,239,671 |
| | | Par | | Value |
| SBA Communications Corporation REIT | | | |
| 3.13%, 02/01/29 | $155,000 | | $139,459 |
| Seagate HDD Cayman | | | |
| 4.09%, 06/01/29 | 5,000 | | 4,631 |
| 9.63%, 12/01/32 | 7,650 | | 8,754 |
| Sensata Technologies, Inc. | | | |
| 4.38%, 02/15/30 144A Δ | 720,000 | | 669,632 |
| 3.75%, 02/15/31 144A Δ | 15,000 | | 13,243 |
| Southern Co. (The) | | | |
| 5.70%, 03/15/34 | 65,000 | | 68,503 |
| (Variable, U.S. Treasury Yield Curve Rate CMT 5Y + 3.73%), 4.00%, 01/15/51^ | 120,000 | | 114,325 |
| (Variable, 2.11% - EUR Swap Rate 5Y), 1.88%, 09/15/81(E) ^ | 250,000 | | 237,386 |
| Southern Co. Gas Capital Corporation | | | |
| 5.75%, 09/15/33 | 30,000 | | 31,595 |
| Southwest Airlines Co. | | | |
| 1.25%, 05/01/25 CONV | 175,000 | | 177,494 |
| Southwestern Energy Co. | | | |
| 4.75%, 02/01/32 | 765,000 | | 708,814 |
| Spectrum Brands, Inc. | | | |
| 5.00%, 10/01/29 144A | 90,000 | | 86,139 |
| Splunk, Inc. | | | |
| 1.13%, 06/15/27 CONV | 60,000 | | 58,410 |
| Spotify U.S.A., Inc. | | | |
| 0.00%, 03/15/26 CONV » | 65,000 | | 57,362 |
| Sprint Capital Corporation | | | |
| 8.75%, 03/15/32 | 715,000 | | 883,534 |
| Starbucks Corporation | | | |
| 3.00%, 02/14/32 | 25,000 | | 22,482 |
| Steel Dynamics, Inc. | | | |
| 3.25%, 01/15/31 | 25,000 | | 22,570 |
| Stewart Information Services Corporation | | | |
| 3.60%, 11/15/31Δ | 135,000 | | 105,583 |
| Synchrony Financial | | | |
| 2.88%, 10/28/31 | 185,000 | | 148,658 |
| Sysco Corporation | | | |
| 6.60%, 04/01/50 | 117,000 | | 138,033 |
| Tapestry, Inc. | | | |
| 3.05%, 03/15/32 | 30,000 | | 24,437 |
| Targa Resources Corporation | | | |
| 5.20%, 07/01/27 | 5,000 | | 5,028 |
| 6.13%, 03/15/33 | 115,000 | | 121,412 |
| 6.50%, 03/30/34 | 160,000 | | 173,288 |
| Targa Resources Partners LP | | | |
| 5.50%, 03/01/30 | 285,000 | | 285,291 |
| 4.88%, 02/01/31 | 10,000 | | 9,716 |
| 4.00%, 01/15/32 | 95,000 | | 87,019 |
| Teladoc Health, Inc. | | | |
| 1.25%, 06/01/27 CONV | 275,000 | | 227,397 |
| Teva Pharmaceutical Finance Co. LLC | | | |
| 6.15%, 02/01/36Δ | 75,000 | | 71,872 |
| Textron, Inc. | | | |
| 2.45%, 03/15/31 | 25,000 | | 21,358 |
See Notes to Financial Statements.
| | | Par | | Value |
| Time Warner Cable LLC | | | |
| 5.50%, 09/01/41 | $ 35,000 | | $ 30,409 |
| 4.50%, 09/15/42 | 55,000 | | 43,379 |
| T-Mobile U.S.A., Inc. | | | |
| 2.40%, 03/15/29 | 25,000 | | 22,472 |
| 3.88%, 04/15/30 | 675,000 | | 640,820 |
| 2.70%, 03/15/32 | 515,000 | | 439,835 |
| 5.75%, 01/15/34 | 25,000 | | 26,589 |
| 4.50%, 04/15/50 | 235,000 | | 208,706 |
| Toyota Motor Credit Corporation | | | |
| 0.50%, 06/18/24 | 595,000 | | 581,397 |
| Transcontinental Gas Pipe Line Co. LLC | | | |
| 3.25%, 05/15/30 | 320,000 | | 290,623 |
| 4.45%, 08/01/42 | 750,000 | | 665,690 |
| TransDigm, Inc. | | | |
| 6.25%, 03/15/26 144A | 50,000 | | 49,961 |
| 6.75%, 08/15/28 144A | 35,000 | | 35,849 |
| Travel + Leisure Co. | | | |
| 6.63%, 07/31/26 144A | 10,000 | | 10,109 |
| 6.00%, 04/01/27 | 10,000 | | 9,976 |
| 4.50%, 12/01/29 144A | 110,000 | | 98,645 |
| 4.63%, 03/01/30 144A | 70,000 | | 62,688 |
| Travelers Cos., Inc. (The) | | | |
| 5.45%, 05/25/53 | 35,000 | | 37,959 |
| Trimble, Inc. | | | |
| 6.10%, 03/15/33 | 130,000 | | 139,115 |
| TriNet Group, Inc. | | | |
| 3.50%, 03/01/29 144A | 35,000 | | 31,475 |
| Truist Financial Corporation | | | |
| (Variable, U.S. SOFR + 2.36%), 5.87%, 06/08/34^ | 245,000 | | 250,600 |
| Uber Technologies, Inc. | | | |
| 0.00%, 12/15/25 CONV » | 155,000 | | 158,388 |
| 8.00%, 11/01/26 144A | 15,000 | | 15,289 |
| 7.50%, 09/15/27 144A | 305,000 | | 316,058 |
| 6.25%, 01/15/28 144A | 120,000 | | 120,407 |
| 4.50%, 08/15/29 144A | 345,000 | | 329,709 |
| UGI International LLC | | | |
| 2.50%, 12/01/29(E) | 100,000 | | 94,284 |
| United Rentals North America, Inc. | | | |
| 5.25%, 01/15/30Δ | 410,000 | | 404,916 |
| 3.88%, 02/15/31Δ | 1,290,000 | | 1,173,642 |
| Unity Software, Inc. | | | |
| 0.00%, 11/15/26 CONV » | 105,000 | | 87,780 |
| Utah Acquisition Sub, Inc. | | | |
| 3.13%, 11/22/28(E) | 410,000 | | 441,679 |
| Venture Global Calcasieu Pass LLC | | | |
| 6.25%, 01/15/30 144A | 45,000 | | 44,813 |
| 4.13%, 08/15/31 144A | 205,000 | | 180,848 |
| Veralto Corporation | | | |
| 5.45%, 09/18/33 144A | 145,000 | | 150,462 |
| Verisk Analytics, Inc. | | | |
| 5.75%, 04/01/33 | 90,000 | | 96,768 |
| Verizon Communications, Inc. | | | |
| 1.13%, 11/03/28(U) | 290,000 | | 320,140 |
| | | Par | | Value |
| 1.88%, 10/26/29(E) | $ 410,000 | | $ 423,132 |
| 2.36%, 03/15/32 | 485,000 | | 404,210 |
| 0.75%, 03/22/32(E) Δ | 185,000 | | 167,999 |
| Viking Cruises, Ltd. | | | |
| 5.88%, 09/15/27 144A | 90,000 | | 86,929 |
| Viking Ocean Cruises Ship VII, Ltd. | | | |
| 5.63%, 02/15/29 144A | 900,000 | | 878,274 |
| Viper Energy, Inc. | | | |
| 7.38%, 11/01/31 144A | 40,000 | | 41,445 |
| VMware LLC | | | |
| 2.20%, 08/15/31 | 140,000 | | 116,249 |
| VOC Escrow, Ltd. | | | |
| 5.00%, 02/15/28 144A Δ | 280,000 | | 268,753 |
| Warnermedia Holdings, Inc. | | | |
| 4.05%, 03/15/29 | 40,000 | | 37,988 |
| 4.28%, 03/15/32 | 230,000 | | 210,850 |
| 5.14%, 03/15/52 | 190,000 | | 164,056 |
| Wells Fargo & Co. | | | |
| 5.88%, 06/15/25ρ Δ ^ | 170,000 | | 168,817 |
| (Variable, CME Term SOFR 3M + 1.26%), 2.57%, 02/11/31^ | 190,000 | | 164,517 |
| (Variable, U.S. SOFR + 2.02%), 5.39%, 04/24/34^ | 1,380,000 | | 1,389,239 |
| (Variable, CME Term SOFR 3M + 4.50%), 5.01%, 04/04/51Δ ^ | 840,000 | | 800,199 |
| Western Digital Corporation | | | |
| 2.85%, 02/01/29 | 65,000 | | 56,026 |
| Western Midstream Operating LP | | | |
| 3.10%, 02/01/25 | 850,000 | | 827,681 |
| 6.35%, 01/15/29 | 65,000 | | 67,885 |
| 4.05%, 02/01/30Δ | 20,000 | | 18,777 |
| 6.15%, 04/01/33 | 100,000 | | 104,084 |
| 5.45%, 04/01/44 | 10,000 | | 9,124 |
| 5.30%, 03/01/48 | 50,000 | | 43,632 |
| 5.50%, 08/15/48 | 835,000 | | 745,236 |
| 5.25%, 02/01/50 | 25,000 | | 22,456 |
| WestRock MWV LLC | | | |
| 8.20%, 01/15/30 | 75,000 | | 86,594 |
| 7.95%, 02/15/31 | 25,000 | | 29,198 |
| Weyerhaeuser Co. REIT | | | |
| 6.88%, 12/15/33 | 250,000 | | 276,070 |
| Williams Cos., Inc. (The) | | | |
| 7.50%, 01/15/31 | 40,000 | | 45,410 |
| 4.65%, 08/15/32 | 25,000 | | 24,401 |
| 5.75%, 06/24/44 | 320,000 | | 324,212 |
| WMG Acquisition Corporation | | | |
| 2.25%, 08/15/31(E) | 100,000 | | 97,169 |
| Yum! Brands, Inc. | | | |
| 4.63%, 01/31/32 | 195,000 | | 182,626 |
| ZF North America Capital, Inc. | | | |
| 6.88%, 04/14/28 144A | 150,000 | | 155,847 |
Total Corporate Bonds
(Cost $98,752,128) | | | 93,618,878 |
See Notes to Financial Statements.
SCHEDULE OF INVESTMENTS (Continued)
| | | Par | | Value |
| FOREIGN BONDS — 44.7% |
| Andorra — 0.0% | | |
| Andorra International Bond | | | |
| 1.25%, 02/23/27(E) | $ 100,000 | | $ 103,306 |
| Angola — 0.0% | | |
| Angolan Government International Bond | | | |
| 9.38%, 05/08/48 | 200,000 | | 166,956 |
| Argentina — 0.3% | | |
| Argentine Republic Government International Bond | | | |
| 1.00%, 07/09/29 | 136,957 | | 55,057 |
| (Step to 1.75% on 07/09/27), 0.75%, 07/09/30 STEP | 828,157 | | 334,167 |
| (Step to 4.13% on 07/09/24), 3.63%, 07/09/35 STEP | 1,625,941 | | 561,868 |
| Provincia de Buenos Aires | | | |
| (Step to 6.63% on 09/01/24), 6.38%, 09/01/37 144A STEP | 623,391 | | 240,296 |
| YPF SA | | | |
| 8.50%, 07/28/25 144A | 780,000 | | 753,943 |
| | | | | 1,945,331 |
| Australia — 0.5% | | |
| Australia Government Bond | | | |
| 3.00%, 11/21/33(A) | 518,000 | | 325,586 |
| 1.75%, 06/21/51(A) | 2,000,000 | | 805,617 |
| FMG Resources August 2006 Pty, Ltd. | | | |
| 4.38%, 04/01/31 144A | 100,000 | | 91,708 |
| Queensland Treasury Corporation | | | |
| 4.50%, 03/09/33(A) 144A | 1,842,000 | | 1,267,294 |
| 5.25%, 07/21/36(A) 144A | 677,000 | | 485,975 |
| | | | | 2,976,180 |
| Austria — 0.4% | | |
| Benteler International AG | | | |
| 9.38%, 05/15/28(E) Δ | 100,000 | | 118,208 |
| Republic of Austria Government Bond | | | |
| 0.90%, 02/20/32(E) 144A | 50,000 | | 48,650 |
| Suzano Austria GmbH | | | |
| 5.00%, 01/15/30 | 730,000 | | 706,495 |
| 3.75%, 01/15/31Δ | 1,450,000 | | 1,272,999 |
| | | | | 2,146,352 |
| Azerbaijan — 0.0% | | |
| State Oil Co. of the Azerbaijan Republic | | | |
| 6.95%, 03/18/30 | 200,000 | | 210,875 |
| Belgium — 0.1% | | |
| Elia Transmission Belgium SA | | | |
| 0.88%, 04/28/30(E) | 500,000 | | 482,255 |
| Kingdom of Belgium Government Bond | | | |
| 3.00%, 06/22/33(E) 144A | 27,000 | | 30,800 |
| 1.45%, 06/22/37(E) 144A | 33,774 | | 31,507 |
| 0.40%, 06/22/40(E) 144A | 40,594 | | 29,904 |
| 3.75%, 06/22/45(E) | 18,000 | | 21,996 |
| 3.30%, 06/22/54(E) 144A | 36,000 | | 40,571 |
| | | | | 637,033 |
| | | Par | | Value |
| Brazil — 1.0% | | |
| Brazil Minas SPE via State of Minas Gerais | | | |
| 5.33%, 02/15/28 | $ 100,000 | | $ 98,533 |
| Brazil Notas do Tesouro Nacional Serie F | | | |
| 10.00%, 01/01/25(B) ††† | 17,030,000 | | 3,501,355 |
| 10.00%, 01/01/27(B) ††† | 9,227,000 | | 1,905,392 |
| 10.00%, 01/01/29(B) ††† | 1,944,000 | | 398,458 |
| Brazilian Government International Bond | | | |
| 5.63%, 01/07/41 | 100,000 | | 92,686 |
| | | | | 5,996,424 |
| Canada — 1.5% | | |
| Bausch Health Cos., Inc. | | | |
| 4.88%, 06/01/28 144A | 170,000 | | 102,656 |
| Canadian Government Bond | | | |
| 3.50%, 03/01/28(C) | 3,071,000 | | 2,342,018 |
| 2.75%, 06/01/33(C) | 3,403,000 | | 2,496,141 |
| 3.25%, 12/01/33(C) | 460,000 | | 351,682 |
| Clarios Global LP | | | |
| 4.38%, 05/15/26(E) | 151,000 | | 165,857 |
| Enbridge, Inc. | | | |
| 5.70%, 03/08/33 | 170,000 | | 177,129 |
| First Quantum Minerals, Ltd. | | | |
| 7.50%, 04/01/25 144A Δ | 550,000 | | 525,980 |
| 6.88%, 10/15/27 144A | 200,000 | | 170,250 |
| Glencore Finance Canada, Ltd. | | | |
| 6.00%, 11/15/41 | 340,000 | | 348,065 |
| MEG Energy Corporation | | | |
| 7.13%, 02/01/27 144A | 1,310,000 | | 1,331,754 |
| Open Text Corporation | | | |
| 6.90%, 12/01/27 144A | 40,000 | | 41,615 |
| 3.88%, 02/15/28 144A | 190,000 | | 176,768 |
| Rogers Communications, Inc. | | | |
| 3.80%, 03/15/32Δ | 136,000 | | 125,337 |
| | | | | 8,355,252 |
| Chile — 0.0% | | |
| Empresa de los Ferrocarriles del Estado | | | |
| 3.83%, 09/14/61 | 200,000 | | 137,585 |
| China — 4.1% | | |
| Avolon Holdings Funding, Ltd. | | | |
| 4.25%, 04/15/26 144A | 680,000 | | 657,540 |
| China Government Bond | | | |
| 2.20%, 07/27/25(Y) | 29,500,000 | | 4,119,687 |
| 3.85%, 12/12/26(Y) | 18,000,000 | | 2,612,452 |
| 3.48%, 06/29/27(Y) | 33,000,000 | | 4,778,025 |
| 4.15%, 12/04/27(Y) | 13,000,000 | | 1,921,763 |
| 4.29%, 05/22/29(Y) | 16,500,000 | | 2,489,108 |
| 3.60%, 05/21/30(Y) | 7,000,000 | | 1,027,732 |
| 2.62%, 06/25/30(Y) | 15,640,000 | | 2,206,645 |
| 2.88%, 02/25/33(Y) | 13,620,000 | | 1,958,210 |
| 3.95%, 06/29/43(Y) | 4,000,000 | | 604,228 |
| 4.10%, 05/21/45(Y) | 1,000,000 | | 153,478 |
| Park Aerospace Holdings, Ltd. | | | |
| 5.50%, 02/15/24 144A | 830,000 | | 828,526 |
See Notes to Financial Statements.
| | | Par | | Value |
| Times China Holdings, Ltd. | | | |
| 6.75%, 07/08/25# | $ 200,000 | | $ 4,800 |
| Yuzhou Group Holdings Co., Ltd. | | | |
| 7.70%, 02/20/25# | 495,000 | | 32,675 |
| | | | | 23,394,869 |
| Colombia — 0.7% | | |
| Colombia Government International Bond | | | |
| 3.88%, 04/25/27 | 200,000 | | 191,233 |
| 3.00%, 01/30/30 | 315,000 | | 266,594 |
| 6.13%, 01/18/41 | 100,000 | | 91,224 |
| 5.63%, 02/26/44 | 3,170,000 | | 2,675,128 |
| Ecopetrol SA | | | |
| 8.88%, 01/13/33 | 690,000 | | 750,605 |
| | | | | 3,974,784 |
| Czech Republic — 0.2% | | |
| Czech Republic Government Bond | | | |
| 4.90%, 04/14/34(ZE) | 23,150,000 | | 1,136,913 |
| Dominican Republic — 0.2% | | |
| Dominican Republic International Bond | | | |
| 5.95%, 01/25/27 | 100,000 | | 100,590 |
| 4.88%, 09/23/32 144A | 990,000 | | 903,969 |
| 6.00%, 02/22/33 | 150,000 | | 148,050 |
| 6.85%, 01/27/45 | 100,000 | | 99,875 |
| | | | | 1,252,484 |
| Ecuador — 0.0% | | |
| Ecuador Government International Bond | | | |
| 0.00%, 07/31/30» | 19,073 | | 5,488 |
| (Step to 6.90% on 07/31/24), 6.00%, 07/31/30 STEP | 45,243 | | 21,142 |
| (Step to 5.50% on 07/31/24), 3.50%, 07/31/35 STEP | 248,031 | | 89,375 |
| (Step to 5.00% on 07/31/24), 2.50%, 07/31/40 STEP | 64,317 | | 20,581 |
| | | | | 136,586 |
| Egypt — 0.2% | | |
| Egypt Government International Bond | | | |
| 6.38%, 04/11/31(E) | 1,200,000 | | 853,933 |
| 7.90%, 02/21/48 | 200,000 | | 121,166 |
| | | | | 975,099 |
| El Salvador — 0.0% | | |
| El Salvador Government International Bond | | | |
| 7.65%, 06/15/35 | 130,000 | | 101,888 |
| France — 2.1% | | |
| Accor SA | | | |
| (Variable, 3.25% - EUR Swap Rate 5Y), 2.63%, 01/30/25(E) ρ ^ | 100,000 | | 107,885 |
| Altice France SA | | | |
| 2.13%, 02/15/25(E) | 1,220,000 | | 1,302,400 |
| 3.38%, 01/15/28(E) | 100,000 | | 87,916 |
| | | Par | | Value |
| 4.13%, 01/15/29(E) | $ 100,000 | | $ 88,561 |
| Banijay Group SAS | | | |
| 6.50%, 03/01/26(E) | 100,000 | | 110,566 |
| Banque Federative du Credit Mutuel SA | | | |
| 1.25%, 06/03/30(E) | 400,000 | | 382,736 |
| BNP Paribas SA | | | |
| (Variable, USD Swap 5Y + 5.15%), 7.38%, 08/19/25 144A ρ ^ | 740,000 | | 742,878 |
| (Variable, Euribor 3M + 1.80%), 2.13%, 01/23/27(E) ^ | 300,000 | | 321,946 |
| (Variable, USD SOFR ICE Swap Rate 5Y + 3.98%), 7.00%, 08/16/28 144A ρ ^ | 300,000 | | 295,253 |
| (Variable, U.S. Treasury Yield Curve Rate CMT 5Y + 4.90%), 7.75%, 08/16/29 144A ρ ^ | 860,000 | | 880,012 |
| (Variable, 0.83% - Euribor 3M), 0.50%, 01/19/30(E) ^ | 300,000 | | 284,426 |
| BPCE SA | | | |
| 0.25%, 01/14/31(E) | 500,000 | | 445,231 |
| CAB SELAS | | | |
| 3.38%, 02/01/28(E) 144A | 600,000 | | 592,059 |
| Constellium SE | | | |
| 4.25%, 02/15/26(E) | 185,000 | | 203,798 |
| Credit Agricole SA | | | |
| (Variable, ICE SWAP Rate GBP SONIA 5Y + 4.81%), 7.50%, 06/23/26(U) ρ ^ | 1,590,000 | | 2,017,543 |
| Electricite de France SA | | | |
| (Variable, GBP Swap Rate 13Y + 4.23%), 6.00%, 01/29/26(U) ρ Δ ^ | 600,000 | | 746,609 |
| Forvia SE | | | |
| 2.38%, 06/15/27(E) | 165,000 | | 172,711 |
| French Republic Government Bond OAT | | | |
| 1.50%, 05/25/31(E) | 22,499 | | 23,467 |
| 0.75%, 05/25/52(E) | 9,396 | | 5,958 |
| 1.75%, 05/25/66(E) 144A | 12,350 | | 9,771 |
| Goldstory SAS | | | |
| 5.38%, 03/01/26(E) | 820,000 | | 905,592 |
| Iliad Holding SASU | | | |
| 5.63%, 10/15/28(E) Δ | 200,000 | | 222,267 |
| Kapla Holding SAS | | | |
| 3.38%, 12/15/26(E) | 100,000 | | 107,193 |
| (Floating, Euribor 3M + 5.50%), 9.47%, 07/15/27(E) 144A † | 330,000 | | 372,090 |
| Loxam SAS | | | |
| 5.75%, 07/15/27(E) | 200,000 | | 218,152 |
| Matterhorn Telecom SA | | | |
| 4.00%, 11/15/27(E) | 140,000 | | 152,624 |
| Orange SA | | | |
| 0.50%, 09/04/32(E) | 400,000 | | 361,489 |
| Picard Groupe SAS | | | |
| 3.88%, 07/01/26(E) Δ | 100,000 | | 107,849 |
See Notes to Financial Statements.
SCHEDULE OF INVESTMENTS (Continued)
| | | Par | | Value |
| SNF Group SACA | | | |
| 2.63%, 02/01/29(E) | $ 100,000 | | $ 101,748 |
| Suez SACA | | | |
| 2.88%, 05/24/34(E) | 200,000 | | 206,416 |
| Valeo SE | | | |
| 5.38%, 05/28/27(E) | 100,000 | | 114,853 |
| Veolia Environnement SA | | | |
| (Variable, 2.71% - EUR Swap Rate 5Y), 2.25%, 01/20/26(E) ρ ^ | 200,000 | | 209,057 |
| | | | | 11,901,056 |
| Germany — 8.4% | | |
| Allianz SE | | | |
| (Variable, U.S. Treasury Yield Curve Rate CMT 5Y + 2.17%), 3.20%, 10/30/27 144A ρ ^ | 3,200,000 | | 2,533,753 |
| APCOA Parking Holdings GmbH | | | |
| 4.63%, 01/15/27(E) 144A | 100,000 | | 104,170 |
| 4.63%, 01/15/27(E) | 710,000 | | 739,603 |
| Aroundtown SA | | | |
| 0.38%, 04/15/27(E) | 200,000 | | 178,167 |
| Bundesobligation | | | |
| 1.30%, 10/15/27(E) | 368,000 | | 396,617 |
| 2.40%, 10/19/28(E) | 478,000 | | 538,614 |
| Bundesrepublik Deutschland Bundesanleihe | | | |
| 1.00%, 08/15/24(E) | 3,140,000 | | 3,416,564 |
| 0.50%, 02/15/26(E) | 76,324 | | 81,182 |
| 0.00%, 02/15/31(E) Δ | 18,440,000 | | 17,812,010 |
| 1.70%, 08/15/32(E) | 13,363,706 | | 14,450,365 |
| 1.00%, 05/15/38(E) | 661,000 | | 620,972 |
| 3.25%, 07/04/42(E) | 162,000 | | 204,464 |
| 0.00%, 08/15/52(E) | 31,700 | | 18,677 |
| Bundesschatzanweisungen | | | |
| 2.50%, 03/13/25(E) | 1,070,000 | | 1,176,815 |
| 3.10%, 09/18/25(E) | 2,720,000 | | 3,031,517 |
| CECONOMY AG | | | |
| 1.75%, 06/24/26(E) | 100,000 | | 96,238 |
| Cheplapharm Arzneimittel GmbH | | | |
| 4.38%, 01/15/28(E) | 100,000 | | 107,922 |
| Deutsche Bank AG | | | |
| (Variable, U.S. SOFR + 2.76%), 3.73%, 01/14/32^ | 201,000 | | 169,174 |
| Deutsche Lufthansa AG | | | |
| 3.00%, 05/29/26(E) | 100,000 | | 107,718 |
| Douglas GmbH | | | |
| 6.00%, 04/08/26(E) | 100,000 | | 109,422 |
| Gruenenthal GmbH | | | |
| 4.13%, 05/15/28(E) Δ | 160,000 | | 175,221 |
| IHO Verwaltungs GmbH | | | |
| 3.88%, 05/15/27(E) 1 | 215,000 | | 233,103 |
| Infineon Technologies AG | | | |
| (Variable, 4.00% - EUR Swap Rate 5Y), 3.63%, 01/01/28(E) ρ ^ | 100,000 | | 106,278 |
| Kreditanstalt fuer Wiederaufbau | | | |
| 0.38%, 03/09/26(E) | 21,000 | | 22,159 |
| | | Par | | Value |
| 0.00%, 06/15/26(E) Δ | $ 77,000 | | $ 80,055 |
| 0.01%, 05/05/27(E) | 22,000 | | 22,449 |
| 1.25%, 06/30/27(E) | 29,000 | | 30,784 |
| 0.75%, 06/28/28(E) | 61,000 | | 62,667 |
| 0.75%, 01/15/29(E) | 43,000 | | 43,748 |
| 0.00%, 09/15/31(E) | 33,000 | | 30,187 |
| Schaeffler AG | | | |
| 3.38%, 10/12/28(E) Δ | 100,000 | | 107,218 |
| State of North Rhine-Westphalia Germany | | | |
| 1.65%, 02/22/38(E) | 11,000 | | 10,460 |
| Techem Verwaltungsgesellschaft 675 mbH | | | |
| 2.00%, 07/15/25(E) Δ | 300,000 | | 324,791 |
| TK Elevator Midco GmbH | | | |
| 4.38%, 07/15/27(E) 144A | 350,000 | | 374,868 |
| (Floating, Euribor 3M + 4.75%), 8.72%, 07/15/27(E) † | 165,000 | | 185,248 |
| TUI Cruises GmbH | | | |
| 6.50%, 05/15/26(E) 144A | 120,000 | | 131,151 |
| Vonovia SE | | | |
| 0.25%, 09/01/28(E) | 400,000 | | 375,970 |
| WEPA Hygieneprodukte GmbH | | | |
| 2.88%, 12/15/27(E) | 108,000 | | 111,948 |
| | | | | 48,322,269 |
| Ghana — 0.0% | | |
| Ghana Government International Bond | | | |
| 7.63%, 05/16/29 | 200,000 | | 87,710 |
| 7.88%, 02/11/35 | 200,000 | | 88,073 |
| | | | | 175,783 |
| Guatemala — 0.1% | | |
| Guatemala Government Bond | | | |
| 6.60%, 06/13/36 | 200,000 | | 206,500 |
| Millicom International Cellular SA | | | |
| 5.13%, 01/15/28 144A | 540,000 | | 501,581 |
| | | | | 708,081 |
| Hong Kong — 0.0% | | |
| Shimao Group Holdings, Ltd. | | | |
| 6.13%, 02/21/24# | 200,000 | | 8,000 |
| Hungary — 0.1% | | |
| Hungary Government Bond | | | |
| 4.75%, 11/24/32(ZG) | 242,600,000 | | 646,441 |
| Hungary Government International Bond | | | |
| 1.75%, 06/05/35(E) | 19,000 | | 16,154 |
| Magyar Export-Import Bank Zrt | | | |
| 6.00%, 05/16/29(E) | 100,000 | | 117,437 |
| | | | | 780,032 |
| Indonesia — 2.0% | | |
| Indonesia Government International Bond | | | |
| 1.40%, 10/30/31(E) | 220,000 | | 206,493 |
| 8.50%, 10/12/35 | 100,000 | | 133,250 |
| 5.25%, 01/17/42 144A | 1,940,000 | | 2,025,959 |
See Notes to Financial Statements.
| | | Par | | Value |
| 5.25%, 01/17/42 | $ 370,000 | | $ 386,394 |
| Indonesia Treasury Bond | | | |
| 7.00%, 05/15/27(I) | 51,272,000,000 | | 3,387,009 |
| 6.38%, 08/15/28(I) | 2,062,000,000 | | 133,687 |
| 6.88%, 04/15/29(I) | 2,056,000,000 | | 135,686 |
| 8.25%, 05/15/29(I) | 25,029,000,000 | | 1,753,054 |
| 6.38%, 04/15/32(I) | 8,635,000,000 | | 555,165 |
| 7.00%, 02/15/33(I) | 40,094,000,000 | | 2,700,232 |
| Perusahaan Perseroan Persero PT Perusahaan Listrik Negara | | | |
| 5.45%, 05/21/28Δ | 200,000 | | 203,375 |
| | | | | 11,620,304 |
| Ireland — 0.3% | | |
| AerCap Ireland Capital DAC | | | |
| 1.75%, 01/30/26 | 240,000 | | 223,085 |
| 5.75%, 06/06/28Δ | 150,000 | | 153,769 |
| 3.30%, 01/30/32 | 660,000 | | 575,307 |
| Ardagh Packaging Finance PLC | | | |
| 5.25%, 08/15/27 144A Δ | 300,000 | | 233,173 |
| eircom Finance DAC | | | |
| 2.63%, 02/15/27(E) | 100,000 | | 104,142 |
| Ireland Government Bond | | | |
| 0.20%, 10/18/30(E) | 20,000 | | 19,252 |
| 0.55%, 04/22/41(E) | 36,000 | | 27,927 |
| 3.00%, 10/18/43(E) | 12,000 | | 13,790 |
| Motion Bondco DAC | | | |
| 4.50%, 11/15/27(E) | 100,000 | | 100,740 |
| | | | | 1,451,185 |
| Israel — 0.0% | | |
| Energean Israel Finance, Ltd. | | | |
| 5.38%, 03/30/28 144A | 65,000 | | 57,284 |
| 5.88%, 03/30/31 144A | 90,000 | | 76,205 |
| Leviathan Bond, Ltd. | | | |
| 6.50%, 06/30/27 144A | 40,000 | | 37,728 |
| 6.75%, 06/30/30 144A | 45,000 | | 41,200 |
| | | | | 212,417 |
| Italy — 1.8% | | |
| Cromwell Ereit Lux Finco S.a.r.l. REIT | | | |
| 2.13%, 11/19/25(E) | 347,000 | | 361,663 |
| Fiber Bidco SpA | | | |
| (Floating, Euribor 3M + 6.00%), 9.89%, 10/25/27(E) † | 100,000 | | 112,491 |
| International Design Group SpA | | | |
| (Floating, Euribor 3M + 4.25%), 8.25%, 05/15/26(E) 144A † | 250,000 | | 273,323 |
| Italy Buoni Poliennali Del Tesoro | | | |
| 1.75%, 05/30/24(E) | 80,000 | | 87,589 |
| 3.40%, 03/28/25(E) | 137,000 | | 151,659 |
| 1.40%, 05/26/25(E) 144A | 32,536 | | 30,397 |
| 1.20%, 08/15/25(E) | 142,000 | | 152,442 |
| 0.00%, 04/01/26(E) | 163,000 | | 169,004 |
| 1.60%, 06/01/26(E) | 86,000 | | 92,356 |
| 0.00%, 08/01/26(E) | 26,000 | | 26,742 |
| | | Par | | Value |
| 2.05%, 08/01/27(E) | $ 4,240,000 | | $ 4,560,219 |
| 1.35%, 04/01/30(E) | 290,000 | | 287,138 |
| 0.90%, 04/01/31(E) | 14,000 | | 13,074 |
| 0.60%, 08/01/31(E) 144A | 1,301,000 | | 1,173,967 |
| 2.50%, 12/01/32(E) Δ | 399,000 | | 406,914 |
| 4.35%, 11/01/33(E) | 57,000 | | 66,651 |
| Mooney Group SpA | | | |
| (Floating, Euribor 3M + 3.88%), 7.81%, 12/17/26(E) † | 100,000 | | 108,811 |
| Multiversity S.r.l. | | | |
| (Floating, Euribor 3M + 4.25%), 8.20%, 10/30/28(E) † | 100,000 | | 111,027 |
| Telecom Italia Capital SA | | | |
| 6.38%, 11/15/33 | 105,000 | | 102,800 |
| Telecom Italia SpA | | | |
| 3.63%, 05/25/26(E) | 155,000 | | 168,732 |
| 2.38%, 10/12/27(E) | 1,400,000 | | 1,448,621 |
| 7.88%, 07/31/28(E) | 100,000 | | 122,947 |
| UniCredit SpA | | | |
| (Variable, 2.55% - Euribor 3M), 2.20%, 07/22/27(E) ^ | 300,000 | | 320,135 |
| | | | | 10,348,702 |
| Ivory Coast — 0.2% | | |
| Ivory Coast Government International Bond | | | |
| 5.25%, 03/22/30(E) | 510,000 | | 506,776 |
| 5.88%, 10/17/31(E) | 200,000 | | 198,496 |
| 4.88%, 01/30/32(E) 144A | 340,000 | | 317,302 |
| 5.75%, 12/31/32 144A STEP | 277,803 | | 263,204 |
| | | | | 1,285,778 |
| Japan — 0.4% | | |
| Aircastle, Ltd. | | | |
| 6.50%, 07/18/28 144A | 120,000 | | 122,612 |
| Japan Government Ten Year Bond | | | |
| 0.10%, 12/20/28(J) | 140,000,000 | | 987,026 |
| 0.50%, 03/20/33(J) | 83,400,000 | | 587,364 |
| Japan Government Thirty Year Bond | | | |
| 0.70%, 12/20/48(J) | 30,000,000 | | 174,728 |
| 1.80%, 09/20/53(J) | 13,150,000 | | 96,433 |
| SoftBank Group Corporation | | | |
| 4.63%, 07/06/28 | 200,000 | | 183,913 |
| | | | | 2,152,076 |
| Jersey — 0.1% | | |
| AA Bond Co., Ltd. | | | |
| 6.50%, 01/31/26(U) | 100,000 | | 121,729 |
| Aptiv PLC | | | |
| 3.25%, 03/01/32Δ | 25,000 | | 22,143 |
| CPUK Finance, Ltd. | | | |
| 6.50%, 08/28/26(U) | 100,000 | | 123,542 |
| Rossini S.a.r.l. | | | |
| (Floating, Euribor 3M + 3.88%), 7.83%, 10/30/25(E) † | 100,000 | | 110,947 |
See Notes to Financial Statements.
SCHEDULE OF INVESTMENTS (Continued)
| | | Par | | Value |
| TVL Finance PLC | | | |
| 10.25%, 04/28/28(U) | $ 100,000 | | $ 132,808 |
| | | | | 511,169 |
| Kazakhstan — 0.2% | | |
| KazMunayGas National Co. JSC | | | |
| 5.38%, 04/24/30 144A | 500,000 | | 497,062 |
| 5.38%, 04/24/30Δ | 300,000 | | 298,237 |
| QazaqGaz NC JSC | | | |
| 4.38%, 09/26/27 144A Δ | 630,000 | | 605,686 |
| | | | | 1,400,985 |
| Luxembourg — 0.4% | | |
| Altice Financing SA | | | |
| 2.25%, 01/15/25(E) Δ | 1,180,000 | | 1,268,544 |
| 4.25%, 08/15/29(E) | 145,000 | | 142,505 |
| ArcelorMittal SA | | | |
| 6.80%, 11/29/32Δ | 180,000 | | 195,124 |
| Cidron Aida Finco S.a.r.l. | | | |
| 6.25%, 04/01/28(U) 144A | 580,000 | | 699,723 |
| Dana Financing Luxembourg S.a.r.l. | | | |
| 8.50%, 07/15/31(E) | 100,000 | | 121,131 |
| SES SA | | | |
| (Variable, 3.19% - EUR Swap Rate 5Y), 2.88%, 05/27/26(E) ρ ^ | 150,000 | | 151,042 |
| | | | | 2,578,069 |
| Mexico — 3.9% | | |
| Banco Mercantil del Norte SA | | | |
| (Variable, U.S. Treasury Yield Curve Rate CMT 10Y + 5.47%), 7.50%, 06/27/29 144A ρ ^ | 1,125,000 | | 1,062,799 |
| Banco Santander Mexico SA Institucion de Banca Multiple Grupo Financiero Santand | | | |
| 5.38%, 04/17/25 144A | 580,000 | | 579,618 |
| BBVA Bancomer SA | | | |
| (Variable, U.S. Treasury Yield Curve Rate CMT 5Y + 2.65%), 5.13%, 01/18/33 144A ^ | 630,000 | | 571,278 |
| Cemex SAB de CV | | | |
| 5.20%, 09/17/30 144A | 200,000 | | 192,851 |
| 3.88%, 07/11/31 144A | 400,000 | | 358,130 |
| Mexican Bonos | | | |
| 7.50%, 06/03/27(M) | 151,900,000 | | 8,477,811 |
| 7.75%, 05/29/31(M) | 46,100,000 | | 2,533,776 |
| 7.50%, 05/26/33(M) | 51,300,300 | | 2,738,393 |
| 7.75%, 11/13/42(M) | 76,750,000 | | 3,979,194 |
| Mexico Government International Bond | | | |
| 3.63%, 04/09/29(E) | 100,000 | | 110,947 |
| 2.88%, 04/08/39(E) | 700,000 | | 623,614 |
| 5.75%, 10/12/10« | 130,000 | | 116,828 |
| Orbia Advance Corporation SAB de CV | | | |
| 5.88%, 09/17/44 144A | 1,100,000 | | 999,248 |
| Petroleos Mexicanos | | | |
| 4.75%, 02/26/29(E) | 100,000 | | 91,204 |
| | | Par | | Value |
| 7.69%, 01/23/50 | $ 210,000 | | $ 149,589 |
| | | | | 22,585,280 |
| Morocco & Antilles — 0.1% | | |
| OCP SA | | | |
| 5.63%, 04/25/24 144A | 350,000 | | 349,723 |
| 4.50%, 10/22/25 144A | 320,000 | | 312,551 |
| | | | | 662,274 |
| Netherlands — 2.5% | | |
| Abertis Infraestructuras Finance BV | | | |
| (Variable, 3.69% - EUR Swap Rate 5Y), 3.25%, 11/24/25(E) ρ ^ | 200,000 | | 212,490 |
| Ashland Services BV | | | |
| 2.00%, 01/30/28(E) | 100,000 | | 102,873 |
| Braskem Netherlands Finance BV | | | |
| 8.50%, 01/12/31 144A Δ | 200,000 | | 186,250 |
| Cooperatieve Rabobank UA | | | |
| (Variable, 3.70% - EUR Swap Rate 5Y), 3.25%, 12/29/26(E) ρ Δ ^ | 1,000,000 | | 985,679 |
| (Variable, U.S. Treasury Yield Curve Rate CMT 1Y + 1.22%), 3.65%, 04/06/28 144A ^ | 250,000 | | 238,615 |
| Dufry One BV | | | |
| 2.00%, 02/15/27(E) | 200,000 | | 207,101 |
| E.ON International Finance BV | | | |
| 6.38%, 06/07/32(U) | 155,000 | | 218,607 |
| EnBW International Finance BV | | | |
| 0.13%, 03/01/28(E) | 410,000 | | 408,613 |
| Enel Finance International NV | | | |
| 6.80%, 10/14/25 144A | 1,630,000 | | 1,672,174 |
| Energizer Gamma Acquisition BV | | | |
| 3.50%, 06/30/29(E) | 100,000 | | 95,527 |
| GTCR W-2 Merger Sub LLC | | | |
| 8.50%, 01/15/31(U) 144A | 140,000 | | 193,486 |
| Heimstaden Bostad Treasury BV | | | |
| 1.38%, 07/24/28(E) | 250,000 | | 198,909 |
| 1.63%, 10/13/31(E) | 100,000 | | 70,050 |
| ING Groep NV | | | |
| (Variable, Euribor 3M + 1.15%), 1.75%, 02/16/31(E) ^ | 300,000 | | 296,839 |
| IPD 3 BV | | | |
| 8.00%, 06/15/28(E) 144A | 500,000 | | 590,870 |
| Koninklijke KPN NV | | | |
| (Variable, EUR Swap Rate 5Y + 3.77%), 6.00%, 09/21/27(E) ρ ^ | 131,000 | | 150,164 |
| Netherlands Government Bond | | | |
| 0.25%, 07/15/25(E) 144A | 1,167,000 | | 1,244,187 |
| Petrobras Global Finance BV | | | |
| 6.25%, 03/17/24 | 780,000 | | 780,117 |
| 6.88%, 01/20/40 | 80,000 | | 82,065 |
| 6.90%, 03/19/49Δ | 880,000 | | 874,502 |
| Prosus NV | | | |
| 3.83%, 02/08/51 | 1,020,000 | | 644,476 |
| Q-Park Holding I BV | | | |
| 1.50%, 03/01/25(E) | 100,000 | | 108,431 |
See Notes to Financial Statements.
| | | Par | | Value |
| Telefonica Europe BV | | | |
| (Variable, EUR Swap Rate 8Y + 2.97%), 3.88%, 06/22/26(E) ρ ^ | $ 400,000 | | $ 428,430 |
| Teva Pharmaceutical Finance Netherlands II BV | | | |
| 1.88%, 03/31/27(E) | 100,000 | | 100,741 |
| 4.38%, 05/09/30(E) | 100,000 | | 103,939 |
| Teva Pharmaceutical Finance Netherlands III BV | | | |
| 3.15%, 10/01/26 | 45,000 | | 41,701 |
| 4.75%, 05/09/27 | 200,000 | | 191,749 |
| 4.10%, 10/01/46 | 390,000 | | 264,544 |
| TMNL Holding BV | | | |
| 3.75%, 01/15/29(E) 144A | 480,000 | | 504,448 |
| 3.75%, 01/15/29(E) | 100,000 | | 105,093 |
| Trivium Packaging Finance BV | | | |
| 3.75%, 08/15/26(E) Δ | 100,000 | | 107,254 |
| United Group BV | | | |
| 3.13%, 02/15/26(E) | 100,000 | | 106,113 |
| 5.25%, 02/01/30(E) 144A | 500,000 | | 524,669 |
| UPC Holding BV | | | |
| 5.50%, 01/15/28 144A | 310,000 | | 292,549 |
| UPCB Finance VII, Ltd. | | | |
| 3.63%, 06/15/29(E) | 100,000 | | 105,818 |
| Volkswagen International Finance NV | | | |
| (Variable, 3.96% - EUR Swap Rate 9Y), 3.88%, 06/17/29(E) ρ ^ | 200,000 | | 202,978 |
| VZ Secured Financing BV | | | |
| 5.00%, 01/15/32 144A | 1,370,000 | | 1,167,533 |
| ZF Europe Finance BV | | | |
| 3.00%, 10/23/29(E) | 300,000 | | 305,725 |
| Ziggo Bond Co. BV | | | |
| 3.38%, 02/28/30(E) | 150,000 | | 140,365 |
| | | | | 14,255,674 |
| New Zealand — 1.2% | | |
| New Zealand Government Bond | | | |
| 3.50%, 04/14/33(Z) | 11,217,000 | | 6,649,253 |
| Nigeria — 0.2% | | |
| Nigeria Government International Bond | | | |
| 8.38%, 03/24/29 | 220,000 | | 211,760 |
| 7.14%, 02/23/30 144A | 440,000 | | 397,566 |
| 7.63%, 11/28/47 144A | 940,000 | | 748,226 |
| | | | | 1,357,552 |
| Norway — 0.2% | | |
| Adevinta ASA | | | |
| 3.00%, 11/15/27(E) 144A | 540,000 | | 594,583 |
| Aker BP ASA | | | |
| 3.75%, 01/15/30 144A | 150,000 | | 138,054 |
| 4.00%, 01/15/31 144A | 150,000 | | 138,018 |
| | | | | 870,655 |
| Oman — 0.0% | | |
| Oman Government International Bond | | | |
| 6.75%, 01/17/48 | 200,000 | | 209,770 |
| | | Par | | Value |
| Panama — 0.1% | | |
| Panama Government International Bond | | | |
| 6.40%, 02/14/35 | $ 200,000 | | $ 195,714 |
| 6.70%, 01/26/36 | 100,000 | | 99,349 |
| | | | | 295,063 |
| Paraguay — 0.0% | | |
| Paraguay Government International Bond | | | |
| 6.10%, 08/11/44 | 200,000 | | 197,075 |
| Peru — 0.1% | | |
| Peruvian Government International Bond | | | |
| 1.95%, 11/17/36(E) | 100,000 | | 83,486 |
| Petroleos del Peru SA | | | |
| 5.63%, 06/19/47 144A | 750,000 | | 462,731 |
| Volcan Cia Minera SAA, Class B | | | |
| 4.38%, 02/11/26 144A | 20,000 | | 12,459 |
| | | | | 558,676 |
| Philippines — 0.0% | | |
| Philippine Government International Bond | | | |
| 1.75%, 04/28/41(E) | 100,000 | | 77,439 |
| Poland — 1.6% | | |
| Canpack SA | | | |
| 2.38%, 11/01/27(E) Δ | 100,000 | | 101,476 |
| Republic of Poland Government Bond | | | |
| 2.75%, 04/25/28(P) | 5,370,000 | | 1,252,170 |
| 7.50%, 07/25/28(P) | 2,394,000 | | 669,999 |
| 1.75%, 04/25/32(P) | 27,420,000 | | 5,423,359 |
| 6.00%, 10/25/33(P) | 5,671,000 | | 1,529,554 |
| | | | | 8,976,558 |
| Portugal — 0.3% | | |
| EDP - Energias de Portugal SA | | | |
| (Variable, EUR Swap Rate 5Y + 3.18%), 5.94%, 04/23/83(E) ^ | 100,000 | | 114,814 |
| Portugal Obrigacoes do Tesouro OT | | | |
| 1.65%, 07/16/32(E) 144A | 1,308,500 | | 1,339,239 |
| | | | | 1,454,053 |
| Qatar — 0.0% | | |
| Qatar Government International Bond | | | |
| 4.82%, 03/14/49 | 200,000 | | 195,139 |
| Romania — 0.1% | | |
| RCS & RDS SA | | | |
| 3.25%, 02/05/28(E) | 100,000 | | 98,943 |
| Romanian Government International Bond | | | |
| 6.63%, 09/27/29(E) | 70,000 | | 82,797 |
| 3.62%, 05/26/30(E) | 84,000 | | 85,493 |
| 1.75%, 07/13/30(E) | 41,000 | | 36,685 |
| 6.38%, 09/18/33(E) | 148,000 | | 173,109 |
| 3.75%, 02/07/34(E) | 100,000 | | 95,462 |
| 3.88%, 10/29/35(E) Δ | 200,000 | | 188,857 |
| | | | | 761,346 |
See Notes to Financial Statements.
SCHEDULE OF INVESTMENTS (Continued)
| | | Par | | Value |
| Serbia — 0.1% | | |
| Serbia International Bond | | | |
| 1.50%, 06/26/29(E) | $ 290,000 | | $ 271,107 |
| Slovakia — 0.0% | | |
| Slovakia Government Bond | | | |
| 0.38%, 04/21/36(E) | 18,400 | | 14,082 |
| Slovenia — 0.0% | | |
| Slovenia Government Bond | | | |
| 3.63%, 03/11/33(E) | 30,000 | | 35,072 |
| 1.50%, 03/25/35(E) | 23,000 | | 21,490 |
| | | | | 56,562 |
| South Africa — 1.2% | | |
| Republic of South Africa Government Bond | | | |
| 8.88%, 02/28/35(S) Δ | 5,920,000 | | 273,629 |
| 6.25%, 03/31/36(S) | 2,140,000 | | 76,902 |
| 6.50%, 02/28/41(S) | 75,016,000 | | 2,482,284 |
| Republic of South Africa Government International Bond | | | |
| 4.85%, 09/30/29 | 2,190,000 | | 2,059,126 |
| 5.75%, 09/30/49 | 2,420,000 | | 1,939,872 |
| 7.30%, 04/20/52 | 330,000 | | 313,469 |
| | | | | 7,145,282 |
| South Korea — 0.1% | | |
| Korea Treasury Bond | | | |
| 4.25%, 12/10/32(KW) | 830,110,000 | | 696,692 |
| Spain — 0.9% | | |
| Cellnex Finance Co. SA | | | |
| 1.50%, 06/08/28(E) Δ | 100,000 | | 101,356 |
| 2.00%, 02/15/33(E) | 2,000,000 | | 1,888,852 |
| Cellnex Telecom SA | | | |
| 1.75%, 10/23/30(E) Δ | 100,000 | | 96,996 |
| Iberdrola Finanzas SA | | | |
| 7.38%, 01/29/24(U) | 100,000 | | 127,598 |
| Lorca Telecom Bondco SA | | | |
| 4.00%, 09/18/27(E) | 780,000 | | 842,779 |
| 4.00%, 09/18/27(E) 144A | 300,000 | | 324,146 |
| Spain Government Bond | | | |
| 0.80%, 07/30/27(E) 144A | 26,000 | | 27,035 |
| 1.40%, 07/30/28(E) 144A | 73,000 | | 76,737 |
| 3.55%, 10/31/33(E) 144A | 155,000 | | 179,418 |
| 1.85%, 07/30/35(E) 144A | 40,000 | | 38,879 |
| Via Celere Desarrollos Inmobiliarios SA | | | |
| 5.25%, 04/01/26(E) | 1,170,000 | | 1,242,138 |
| | | | | 4,945,934 |
| Sri Lanka — 0.1% | | |
| Sri Lanka Government International Bond | | | |
| 6.85%, 11/03/25 | 200,000 | | 103,500 |
| | | Par | | Value |
| 6.75%, 04/18/28 | $ 500,000 | | $ 252,779 |
| | | | | 356,279 |
| Supranational — 1.9% | | |
| European Bank for Reconstruction & Development | | | |
| 6.30%, 10/26/27(ZH) | 351,800,000 | | 4,175,477 |
| European Union | | | |
| 0.00%, 07/06/26(E) | 118,000 | | 122,505 |
| 2.00%, 10/04/27(E) | 91,000 | | 98,988 |
| 1.63%, 12/04/29(E) | 129,825 | | 136,820 |
| 3.25%, 07/04/34(E) Δ | 1,522,000 | | 1,762,342 |
| 2.75%, 12/04/37(E) | 41,000 | | 44,458 |
| 3.38%, 10/04/38(E) | 64,350 | | 74,677 |
| 0.70%, 07/06/51(E) | 12,000 | | 7,557 |
| International Bank for Reconstruction & Development | | | |
| 6.75%, 07/13/29(ZH) | 366,100,000 | | 4,361,113 |
| | | | | 10,783,937 |
| Sweden — 0.4% | | |
| Apollo Swedish Bidco AB | | | |
| (Floating, Euribor 3M + 5.00%), 8.91%, 07/05/29(E) 144A † | 460,000 | | 516,643 |
| Intrum AB | | | |
| 3.50%, 07/15/26(E) | 100,000 | | 94,010 |
| Verisure Holding AB | | | |
| 3.25%, 02/15/27(E) Δ | 200,000 | | 212,569 |
| 7.13%, 02/01/28(E) 144A | 970,000 | | 1,129,695 |
| Verisure Midholding AB | | | |
| 5.25%, 02/15/29(E) 144A | 240,000 | | 253,690 |
| | | | | 2,206,607 |
| Switzerland — 0.4% | | |
| UBS Group AG | | | |
| (Variable, USD Swap 5Y + 4.34%), 7.00%, 01/31/24 144A ρ Δ ^ | 1,420,000 | | 1,420,449 |
| (Variable, EUR Swap Rate 1Y + 0.75%), 1.25%, 04/17/25(E) ^ | 400,000 | | 437,698 |
| (Variable, 1.05% - EURIBOR ICE SWAP RATE), 1.00%, 06/24/27(E) ^ | 400,000 | | 414,775 |
| | | | | 2,272,922 |
| Thailand — 0.1% | | |
| Thailand Government Bond | | | |
| 2.00%, 12/17/31(ZF) | 14,795,000 | | 414,267 |
| Turkey — 0.3% | | |
| Turkiye Government International Bond | | | |
| 6.00%, 03/25/27 | 1,570,000 | | 1,554,614 |
| 4.88%, 04/16/43 | 500,000 | | 366,410 |
| | | | | 1,921,024 |
See Notes to Financial Statements.
| | | Par | | Value |
| Ukraine — 0.0% | | |
| Ukraine Government International Bond | | | |
| 7.75%, 09/01/25 | $ 100,000 | | $ 27,662 |
| 9.75%, 11/01/30 | 250,000 | | 72,500 |
| 7.75%, 05/31/40Ξ | 100,000 | | 45,111 |
| | | | | 145,273 |
| United Arab Emirates — 0.1% | | |
| Abu Dhabi Crude Oil Pipeline LLC | | | |
| 4.60%, 11/02/47Δ | 200,000 | | 184,155 |
| DP World Crescent, Ltd. | | | |
| 3.88%, 07/18/29 | 200,000 | | 189,875 |
| | | | | 374,030 |
| United Kingdom — 3.5% | | |
| Anglo American Capital PLC | | | |
| 4.75%, 04/10/27 144A Δ | 200,000 | | 197,677 |
| 3.38%, 03/11/29(U) | 250,000 | | 294,333 |
| 2.88%, 03/17/31 144A | 200,000 | | 170,526 |
| 5.50%, 05/02/33 144A Δ | 200,000 | | 202,662 |
| B&M European Value Retail SA | | | |
| 4.00%, 11/15/28(U) | 100,000 | | 119,089 |
| Barclays PLC | | | |
| (Variable, EUR Swap Rate 1Y + 0.78%), 1.38%, 01/24/26(E) ^ | 300,000 | | 321,694 |
| (Variable, U.S. SOFR + 2.71%), 2.85%, 05/07/26^ | 380,000 | | 366,694 |
| (Variable, U.S. Treasury Yield Curve Rate CMT 1Y + 1.05%), 2.28%, 11/24/27Δ ^ | 235,000 | | 216,113 |
| (Variable, U.S. Treasury Yield Curve Rate CMT 5Y + 3.41%), 4.38%, 03/15/28ρ ^ | 200,000 | | 155,981 |
| (Variable, 1.26% - EUR Swap Rate 1Y), 0.58%, 08/09/29(E) ^ | 410,000 | | 390,071 |
| BCP V Modular Services Finance II PLC | | | |
| 4.75%, 11/30/28(E) | 100,000 | | 102,846 |
| Bellis Acquisition Co. PLC | | | |
| 4.50%, 02/16/26(U) 144A | 840,000 | | 1,016,255 |
| Bellis Finco PLC | | | |
| 4.00%, 02/16/27(U) | 103,000 | | 114,623 |
| British Telecommunications PLC | | | |
| (Variable, UK Gilts 5Y + 3.82%), 8.38%, 12/20/83(U) ^ | 100,000 | | 134,911 |
| Castle UK Finco PLC | | | |
| (Floating, Euribor 3M + 5.25%), 9.25%, 05/15/28(E) † | 100,000 | | 102,527 |
| Centrica PLC | | | |
| (Variable, GBP Swap Rate 5Y + 3.86%), 5.25%, 04/10/75(U) Δ ^ | 100,000 | | 126,195 |
| Co-operative Group Holdings 2011, Ltd. | | | |
| 7.50%, 07/08/26(U) STEP | 100,000 | | 126,062 |
| Gatwick Airport Finance PLC | | | |
| 4.38%, 04/07/26(U) | 1,480,000 | | 1,813,381 |
| | | Par | | Value |
| HSBC Holdings PLC | | | |
| (Variable, USD ICE Swap Rate 5Y + 4.37%), 6.38%, 03/30/25ρ ^ | $ 400,000 | | $ 395,447 |
| (Variable, U.S. SOFR + 2.61%), 5.21%, 08/11/28^ | 680,000 | | 680,297 |
| (Variable, U.S. SOFR + 1.97%), 6.16%, 03/09/29^ | 200,000 | | 206,750 |
| (Variable, U.S. SOFR + 2.53%), 4.76%, 03/29/33Δ ^ | 200,000 | | 186,766 |
| INEOS Finance PLC | | | |
| 2.88%, 05/01/26(E) | 250,000 | | 268,109 |
| INEOS Quattro Finance 1 PLC | | | |
| 3.75%, 07/15/26(E) 144A | 110,000 | | 117,571 |
| 3.75%, 07/15/26(E) | 100,000 | | 106,882 |
| Jaguar Land Rover Automotive PLC | | | |
| 4.50%, 07/15/28(E) | 100,000 | | 108,140 |
| Lloyds Banking Group PLC | | | |
| (Variable, U.S. Treasury Yield Curve Rate CMT 1Y + 1.60%), 3.51%, 03/18/26^ | 390,000 | | 381,170 |
| (Variable, U.S. Treasury Yield Curve Rate CMT 1Y + 1.75%), 4.72%, 08/11/26^ | 2,070,000 | | 2,044,653 |
| (Variable, EUR Swap Rate 1Y + 1.50%), 3.13%, 08/24/30(E) ^ | 425,000 | | 457,742 |
| Mobico Group PLC | | | |
| (Variable, UK Gilts 5Y + 4.14%), 4.25%, 11/26/25(U) ρ ^ | 200,000 | | 225,717 |
| National Grid Electricity Transmission PLC | | | |
| 0.19%, 01/20/25(E) | 154,000 | | 164,082 |
| NatWest Group PLC | | | |
| (Variable, U.S. Treasury Yield Curve Rate CMT 1Y + 2.55%), 3.07%, 05/22/28^ | 120,000 | | 111,591 |
| (Variable, U.S. Treasury Yield Curve Rate CMT 5Y + 2.35%), 3.03%, 11/28/35^ | 200,000 | | 166,217 |
| NGG Finance PLC | | | |
| (Variable, GBP Swap Rate 12Y + 3.48%), 5.63%, 06/18/73(U) ^ | 296,000 | | 372,965 |
| PEU Fin PLC | | | |
| 7.25%, 07/01/28(E) 144A | 390,000 | | 444,253 |
| 7.25%, 07/01/28(E) Δ | 420,000 | | 478,426 |
| Pinewood Finance Co., Ltd. | | | |
| 3.25%, 09/30/25(U) | 940,000 | | 1,167,884 |
| Pinnacle Bidco PLC | | | |
| 10.00%, 10/11/28(U) 144A | 600,000 | | 797,049 |
| 10.00%, 10/11/28(U) | 100,000 | | 132,841 |
| Premier Foods Finance PLC | | | |
| 3.50%, 10/15/26(U) | 920,000 | | 1,096,599 |
| RAC Bond Co. PLC | | | |
| 5.25%, 11/04/27(U) | 100,000 | | 111,823 |
| SSE PLC | | | |
| 1.75%, 04/16/30(E) | 350,000 | | 355,235 |
| Synthomer PLC | | | |
| 3.88%, 07/01/25(E) | 100,000 | | 109,469 |
See Notes to Financial Statements.
SCHEDULE OF INVESTMENTS (Continued)
| | | Par | | Value |
| Tesco Property Finance 6 PLC | | | |
| 5.41%, 07/13/44(U) | $ 367,064 | | $ 455,096 |
| United Kingdom Gilt | | | |
| 4.50%, 09/07/34(U) | 644,000 | | 882,358 |
| 4.50%, 12/07/42(U) | 444,000 | | 596,958 |
| 1.25%, 07/31/51(U) | 1,226,000 | | 832,305 |
| Vedanta Resources Finance II PLC | | | |
| 8.95%, 03/11/25 | 200,000 | | 148,908 |
| Victoria PLC | | | |
| 3.63%, 08/24/26(E) | 130,000 | | 115,576 |
| Virgin Media Secured Finance PLC | | | |
| 4.25%, 01/15/30(U) | 300,000 | | 335,358 |
| Vodafone Group PLC | | | |
| 4.88%, 06/19/49 | 160,000 | | 145,608 |
| | | | | 20,171,485 |
Total Foreign Bonds
(Cost $271,877,446) | | 257,985,113 |
| LOAN AGREEMENTS — 1.4% |
| 1011778 B.C. Unlimited Liability Company Term B-5 Loan | | | |
| (Floating, ICE CME Term SOFR USD 1M + 2.25%), 7.61%, 09/20/30† | 75,000 | | 75,120 |
| Allied Universal Holdco LLC Initial U.S. Dollar Term Loan | | | |
| (Floating, ICE CME Term SOFR USD 1M + 3.75%, 0.50% Floor), 9.21%, 05/12/28† | 482,641 | | 481,390 |
| Apollo Commercial Real Estate Finance, Inc. Initial Term Loan | | | |
| (Floating, ICE CME Term SOFR USD 1M + 2.75%), 8.22%, 05/15/26† | 484,771 | | 479,923 |
| Asurion LLC New B-11 Term Loan | | | |
| (Floating, ICE CME Term SOFR USD 1M + 4.25%), 9.71%, 08/19/28† | 508,713 | | 507,624 |
| Asurion LLC New B-9 Term Loan | | | |
| (Floating, ICE CME Term SOFR USD 1M + 3.25%), 8.72%, 07/31/27† | 781,909 | | 777,328 |
| Charter Communications Operating LLC Term B-2 Loan | | | |
| (Floating, ICE CME Term SOFR USD 3M + 1.75%), 7.13%, 02/01/27† | 484,810 | | 485,419 |
| Focus Financial Partners LLC Tranche B-5 Term Loan | | | |
| (Floating, ICE CME Term SOFR USD 1M + 3.25%, 0.50% Floor), 8.61%, 06/30/28† | 268,100 | | 269,021 |
| Froneri International Limited Facility B1 | | | |
| (Floating, ICE EURIBOR USD 6M + 2.13%), 6.10%, 01/29/27† | 380,000 | | 416,250 |
| Fugue Finance LLC Existing Term Loan | | | |
| (Floating, ICE CME Term SOFR USD 3M + 4.00%, 0.50% Floor), 9.39%, 01/31/28† | 605,425 | | 608,973 |
| | | Par | | Value |
| Garda World Security Corporation Term B-2 Loan | | | |
| (Floating, ICE CME Term SOFR USD 3M + 4.25%), 9.72%, 10/30/26† | $405,368 | | $ 406,605 |
| Genesee & Wyoming, Inc. Initial Term Loan | | | |
| (Floating, ICE CME Term SOFR USD 3M + 2.00%), 7.45%, 12/30/26† | 173,250 | | 173,858 |
| GTCR W Merger Sub LLC Term Loan B | | | |
| 0.00%, 09/20/30† Σ | 45,000 | | 45,253 |
| Ineos Quattro Holdings UK Limited 2029 Tranche B Euro Term Loan | | | |
| (Floating, ICE Euribor USD 1M + 4.50%), 8.34%, 04/02/29† | 450,000 | | 489,326 |
| IU Finance Management GmbH Facility B | | | |
| (Floating, ICE EURIBOR USD 3M + 4.98%), 8.93%, 12/08/28† | 690,000 | | 761,154 |
| Lakeshore Learning Materials LLC Initial Term Loan | | | |
| (Floating, ICE CME Term SOFR USD 1M + 3.50%, 0.50% Floor), 8.97%, 09/29/28† | 784,000 | | 784,247 |
| Nexstar Media, Inc. Term B-4 Loan | | | |
| (Floating, ICE CME Term SOFR USD 1M + 2.50%), 7.97%, 09/18/26† | 61,128 | | 61,233 |
| Sedgwick Claims Management Services, Inc. 2023 Term Loan | | | |
| (Floating, ICE CME Term SOFR USD 1M + 3.75%), 9.11%, 02/24/28† | 249,600 | | 250,674 |
| Star Parent, Inc. Term Loan | | | |
| (Floating, ICE CME Term SOFR USD 3M + 4.00%), 9.35%, 09/27/30† | 85,012 | | 84,221 |
| Summit Materials LLC Incremental Term Loan B | | | |
| 0.00%, 11/30/28† Σ | 55,000 | | 55,241 |
| TransDigm, Inc. Tranche I Term Loan | | | |
| (Floating, ICE CME Term SOFR USD 3M + 3.25%), 8.60%, 08/24/28† | 663,632 | | 667,484 |
| TransDigm, Inc. Tranche J Term Loan | | | |
| 0.00%, 02/28/31† Σ | 10,000 | | 10,057 |
| UFC Holdings LLC Term B-3 Loan | | | |
| (Floating, ICE CME Term SOFR USD 3M + 2.75%, 0.75% Floor), 8.40%, 04/29/26† | 104,267 | | 104,781 |
Total Loan Agreements
(Cost $8,042,212) | | | 7,995,182 |
| MORTGAGE-BACKED SECURITIES — 9.0% |
| BANK, Series 2018-BNK15, Class B | | | |
| 4.66%, 11/15/61† γ | 260,000 | | 232,777 |
| BANK, Series 2021-BN35, Class AS | | | |
| 2.46%, 06/15/64 | 85,000 | | 68,155 |
See Notes to Financial Statements.
| | | Par | | Value |
| BINOM Securitization Trust, Series 2022-RPL1, Class M1 | | | |
| 3.00%, 02/25/61 144A † γ | $100,000 | | $ 76,409 |
| BPR Trust, Series 2021-NRD, Class B | | | |
| (Floating, CME Term SOFR 1M + 2.12%, 2.12% Floor), 7.49%, 12/15/38 144A † | 25,000 | | 23,694 |
| BPR Trust, Series 2021-NRD, Class C | | | |
| (Floating, CME Term SOFR 1M + 2.42%, 2.42% Floor), 7.79%, 12/15/38 144A † | 25,000 | | 23,608 |
| BPR Trust, Series 2021-NRD, Class D | | | |
| (Floating, CME Term SOFR 1M + 3.72%, 3.72% Floor), 9.09%, 12/15/38 144A † | 20,000 | | 18,801 |
| BPR Trust, Series 2022-STAR, Class A | | | |
| (Floating, CME Term SOFR 1M + 3.23%, 3.23% Floor), 8.59%, 08/15/24 144A † | 65,000 | | 64,751 |
| CAFL Issuer LLC, Series 2021-RTL1, Class A1 | | | |
| (Step to 4.24% on 04/28/25), 2.24%, 03/28/29 144A STEP | 105,000 | | 99,255 |
| COMM Mortgage Trust, Series 2012-CR3, Class AM | | | |
| 3.42%, 10/15/45 144A | 638 | | 582 |
| COMM Mortgage Trust, Series 2012-LC4, Class B | | | |
| 4.93%, 12/10/44 | 13,540 | | 12,202 |
| COMM Mortgage Trust, Series 2018-COR3, Class B | | | |
| 4.51%, 05/10/51† γ | 440,000 | | 364,878 |
| Connecticut Avenue Securities Trust, Series 2019-R03, Class 1B1 | | | |
| (Floating, U.S. 30-Day Average SOFR + 4.21%), 9.55%, 09/25/31 144A † | 511,153 | | 538,245 |
| Connecticut Avenue Securities Trust, Series 2019-R05, Class 1B1 | | | |
| (Floating, U.S. 30-Day Average SOFR + 4.21%), 9.55%, 07/25/39 144A † | 520,986 | | 541,148 |
| Connecticut Avenue Securities Trust, Series 2019-R07, Class 1M2 | | | |
| (Floating, U.S. 30-Day Average SOFR + 2.21%), 7.55%, 10/25/39 144A † | 2,192 | | 2,192 |
| Connecticut Avenue Securities Trust, Series 2020-R01, Class 1M2 | | | |
| (Floating, U.S. 30-Day Average SOFR + 2.16%), 7.50%, 01/25/40 144A † | 126,456 | | 128,189 |
| Connecticut Avenue Securities Trust, Series 2021-R01, Class 1B1 | | | |
| (Floating, U.S. 30-Day Average SOFR + 3.10%), 8.44%, 10/25/41 144A † | 900,000 | | 908,886 |
| Connecticut Avenue Securities Trust, Series 2021-R03, Class 1B1 | | | |
| (Floating, U.S. 30-Day Average SOFR + 2.75%, 2.75% Floor), 8.09%, 12/25/41 144A † | 420,000 | | 421,854 |
| | | Par | | Value |
| Connecticut Avenue Securities Trust, Series 2021-R03, Class 1M2 | | | |
| (Floating, U.S. 30-Day Average SOFR + 1.65%, 1.65% Floor), 6.99%, 12/25/41 144A † | $1,333,000 | | $1,316,471 |
| Connecticut Avenue Securities Trust, Series 2022-R01, Class 1M2 | | | |
| (Floating, U.S. 30-Day Average SOFR + 1.90%), 7.24%, 12/25/41 144A † | 706,000 | | 708,206 |
| Connecticut Avenue Securities Trust, Series 2022-R03, Class 1M2 | | | |
| (Floating, U.S. 30-Day Average SOFR + 3.50%), 8.84%, 03/25/42 144A † | 365,000 | | 382,065 |
| Connecticut Avenue Securities Trust, Series 2022-R04, Class 1M2 | | | |
| (Floating, U.S. 30-Day Average SOFR + 3.10%), 8.44%, 03/25/42 144A † | 406,000 | | 419,699 |
| Connecticut Avenue Securities Trust, Series 2022-R08, Class 1M1 | | | |
| (Floating, U.S. 30-Day Average SOFR + 2.55%, 2.55% Floor), 7.89%, 07/25/42 144A † | 417,337 | | 428,283 |
| Connecticut Avenue Securities Trust, Series 2022-R08, Class 1M2 | | | |
| (Floating, U.S. 30-Day Average SOFR + 3.60%, 3.60% Floor), 8.94%, 07/25/42 144A † | 329,000 | | 345,485 |
| CSMC OA LLC, Series 2014-USA, Class F | | | |
| 4.37%, 09/15/37 144A | 1,610,000 | | 628,123 |
| CSMC Trust, Series 2021-RPL1, Class A1 | | | |
| 1.67%, 09/27/60 144A † γ | 59,664 | | 58,119 |
| CSMC Trust, Series 2021-RPL3, Class M2 | | | |
| 3.75%, 01/25/60 144A | 100,000 | | 77,669 |
| DC Commercial Mortgage Trust, Series 2023-DC, Class C | | | |
| 7.14%, 09/10/28 144A † γ | 100,000 | | 102,837 |
| Fannie Mae Connecticut Avenue Securities, Series 2018-C04, Class 2M2 | | | |
| (Floating, U.S. 30-Day Average SOFR + 2.66%, 2.55% Floor), 8.00%, 12/25/30† | 817,480 | | 840,464 |
| Federal Home Loan Mortgage Corporation | | | |
| 3.00%, 03/01/50 | 67,899 | | 61,304 |
| 3.50%, 04/01/50 | 40,962 | | 38,214 |
| 3.00%, 07/01/50 | 74,334 | | 66,681 |
| 2.50%, 12/01/50 | 408,690 | | 348,469 |
| 2.50%, 08/01/51 | 133,730 | | 114,125 |
| 2.50%, 09/01/51 | 571,746 | | 487,327 |
| 2.50%, 01/01/52 | 291,097 | | 248,096 |
| 2.50%, 02/01/52 | 916,446 | | 781,068 |
| 2.50%, 03/01/52 | 719,159 | | 613,168 |
| 2.50%, 04/01/52 | 618,875 | | 527,419 |
| 3.50%, 05/01/52 | 1,210,967 | | 1,112,333 |
See Notes to Financial Statements.
SCHEDULE OF INVESTMENTS (Continued)
| | | Par | | Value |
| 3.50%, 06/01/52 | $ 321,415 | | $ 295,302 |
| 4.50%, 07/01/52 | 41,110 | | 39,922 |
| 4.50%, 08/01/52 | 1,388,824 | | 1,348,691 |
| 4.00%, 09/01/52 | 679,689 | | 643,976 |
| 5.50%, 09/01/52 | 411,353 | | 414,746 |
| 5.00%, 10/01/52 | 368,180 | | 365,209 |
| 5.50%, 10/01/52 | 363,359 | | 366,015 |
| 5.00%, 11/01/52 | 301,236 | | 298,848 |
| 4.50%, 01/01/53 | 486,760 | | 472,694 |
| 5.00%, 01/01/53 | 377,741 | | 374,398 |
| 5.00%, 02/01/53 | 710,435 | | 703,838 |
| 5.50%, 02/01/53 | 279,190 | | 280,953 |
| 5.00%, 03/01/53 | 145,100 | | 143,759 |
| 6.00%, 03/01/53 | 237,381 | | 241,354 |
| 5.00%, 04/01/53 | 411,293 | | 407,473 |
| 6.00%, 04/01/53 | 600,438 | | 610,362 |
| 5.50%, 05/01/53 | 344,881 | | 346,703 |
| 6.00%, 05/01/53 | 1,018,866 | | 1,036,010 |
| 6.00%, 06/01/53 | 863,737 | | 878,014 |
| 6.00%, 09/01/53 | 209,561 | | 213,606 |
| 6.00%, 10/01/53 | 48,821 | | 49,620 |
| Federal Home Loan Mortgage Corporation STACR REMIC Trust, Series 2020-DNA6, Class M2 | | | |
| (Floating, U.S. 30-Day Average SOFR + 2.00%), 7.34%, 12/25/50 144A † | 215,494 | | 217,299 |
| Federal Home Loan Mortgage Corporation STACR REMIC Trust, Series 2021-DNA3, Class B1 | | | |
| (Floating, U.S. 30-Day Average SOFR + 3.50%), 8.84%, 10/25/33 144A † | 610,000 | | 637,042 |
| Federal Home Loan Mortgage Corporation STACR REMIC Trust, Series 2021-DNA6, Class B1 | | | |
| (Floating, U.S. 30-Day Average SOFR + 3.40%), 8.74%, 10/25/41 144A † | 470,000 | | 478,456 |
| Federal Home Loan Mortgage Corporation STACR REMIC Trust, Series 2021-HQA2, Class M2 | | | |
| (Floating, U.S. 30-Day Average SOFR + 2.05%), 7.39%, 12/25/33 144A † | 193,000 | | 190,385 |
| Federal Home Loan Mortgage Corporation STACR REMIC Trust, Series 2022-DNA2, Class M1B | | | |
| (Floating, U.S. 30-Day Average SOFR + 2.40%), 7.74%, 02/25/42 144A † | 1,169,000 | | 1,184,951 |
| Federal Home Loan Mortgage Corporation STACR REMIC Trust, Series 2022-DNA3, Class M1A | | | |
| (Floating, U.S. 30-Day Average SOFR + 2.00%), 7.34%, 04/25/42 144A † | 29,342 | | 29,620 |
| | | Par | | Value |
| Federal Home Loan Mortgage Corporation STACR REMIC Trust, Series 2022-DNA3, Class M1B | | | |
| (Floating, U.S. 30-Day Average SOFR + 2.90%), 8.24%, 04/25/42 144A † | $ 179,000 | | $ 184,153 |
| Federal Home Loan Mortgage Corporation STACR REMIC Trust, Series 2022-DNA6, Class M2 | | | |
| (Floating, U.S. 30-Day Average SOFR + 5.75%), 11.09%, 09/25/42 144A † | 380,000 | | 423,426 |
| Federal Home Loan Mortgage Corporation STACR REMIC Trust, Series 2022-HQA1, Class M1B | | | |
| (Floating, U.S. 30-Day Average SOFR + 3.50%), 8.84%, 03/25/42 144A † | 106,000 | | 109,941 |
| Federal National Mortgage Association | | | |
| 3.00%, 08/01/46 | 75,455 | | 68,680 |
| 3.00%, 12/01/47 | 227,395 | | 207,433 |
| 3.50%, 08/01/49 | 100,414 | | 93,618 |
| 4.00%, 08/01/49 | 89,217 | | 85,654 |
| 3.50%, 09/01/49 | 173,496 | | 161,753 |
| 4.00%, 10/01/49 | 130,957 | | 125,787 |
| 3.00%, 03/01/50 | 103,041 | | 92,292 |
| 3.00%, 05/01/50 | 123,639 | | 110,530 |
| 3.50%, 06/01/50 | 32,731 | | 30,502 |
| 3.00%, 07/01/50 | 34,584 | | 30,838 |
| 3.00%, 07/01/51 | 186,388 | | 165,296 |
| 2.50%, 09/01/51 | 417,490 | | 355,677 |
| 2.50%, 10/01/51 | 273,087 | | 233,098 |
| 2.50%, 01/01/52 | 321,337 | | 273,728 |
| 3.00%, 02/01/52 | 514,466 | | 456,269 |
| 2.50%, 03/01/52 | 979,413 | | 834,983 |
| 2.50%, 04/01/52 | 355,893 | | 303,325 |
| 4.00%, 04/01/52 | 299,708 | | 284,134 |
| 3.50%, 05/01/52 | 602,898 | | 556,115 |
| 4.00%, 05/01/52 | 366,314 | | 347,278 |
| 3.00%, 06/01/52 | 208,852 | | 185,203 |
| 4.00%, 06/01/52 | 463,782 | | 439,453 |
| 4.00%, 07/01/52 | 571,046 | | 542,399 |
| 3.50%, 08/01/52 | 174,312 | | 160,210 |
| 4.00%, 08/01/52 | 1,105,716 | | 1,047,678 |
| 5.00%, 08/01/52 | 222,301 | | 220,539 |
| 4.50%, 09/01/52 | 835,016 | | 810,886 |
| 4.00%, 10/01/52 | 136,376 | | 129,211 |
| 4.50%, 10/01/52 | 927,853 | | 901,040 |
| 5.00%, 11/01/52 | 186,278 | | 184,745 |
| 4.50%, 01/01/53 | 658,403 | | 639,377 |
| 5.00%, 01/01/53 | 543,913 | | 539,534 |
| 5.50%, 01/01/53 | 1,048,519 | | 1,054,376 |
| 5.50%, 02/01/53 | 509,441 | | 512,305 |
| 5.00%, 04/01/53 | 432,958 | | 428,948 |
| 5.50%, 05/01/53 | 177,780 | | 178,814 |
| 5.50%, 07/01/53 | 625,129 | | 629,061 |
See Notes to Financial Statements.
| | | Par | | Value |
| 6.00%, 07/01/53 | $ 665,161 | | $ 676,052 |
| 6.00%, 08/01/53 | 105,706 | | 107,436 |
| 6.00%, 10/01/53 | 209,436 | | 213,204 |
| GCAT Trust, Series 2019-RPL1, Class A1 | | | |
| 2.65%, 10/25/68 144A | 34,015 | | 32,428 |
| Government National Mortgage Association | | | |
| 4.50%, 08/20/48 | 59,290 | | 58,644 |
| 2.50%, 05/20/52 | 379,412 | | 332,200 |
| 4.50%, 09/20/52 | 248,846 | | 243,135 |
| 5.00%, 11/20/52 | 118,170 | | 117,510 |
| 5.00%, 03/20/53 | 193,842 | | 192,852 |
| 5.50%, 03/20/53 | 313,080 | | 315,336 |
| 5.00%, 07/20/53 | 153,349 | | 152,423 |
| 6.00%, 08/20/53 | 346,709 | | 352,710 |
| 5.00%, 01/01/54 TBA | 735,000 | | 730,751 |
| 5.50%, 01/01/54 TBA | 1,105,000 | | 1,112,511 |
| GS Mortgage Securities Corporation Trust, Series 2018-SRP5, Class C | | | |
| (Floating, CME Term SOFR 1M + 4.36%, 3.75% Floor), 9.73%, 09/15/31 144A † | 1,415,317 | | 303,021 |
| GS Mortgage Securities Trust, Series 2014-GC18, Class AS | | | |
| 4.38%, 01/10/47 | 33,294 | | 32,633 |
| GS Mortgage Securities Trust, Series 2014-GC18, Class B | | | |
| 4.89%, 01/10/47 | 25,000 | | 23,398 |
| Hawaii Hotel Trust, Series 2019-MAUI, Class F | | | |
| (Floating, CME Term SOFR 1M + 2.80%, 2.75% Floor), 8.16%, 05/15/38 144A † | 780,000 | | 752,403 |
| Hilton U.S.A. Trust, Series 2016-HHV, Class D | | | |
| 4.19%, 11/05/38 144A † γ | 540,000 | | 506,521 |
| Impac Secured Assets Trust, Series 2006-2, Class 2M3 | | | |
| (Floating, CME Term SOFR 1M + 1.76%, 1.65% Floor, 11.50% Cap), 7.12%, 08/25/36† | 5,077 | | 5,082 |
| JP Morgan Chase Commercial Mortgage Securities Trust, Series 2007-LD12, Class AJ | | | |
| 6.35%, 02/15/51† γ | 712 | | 660 |
| JP Morgan Chase Commercial Mortgage Securities Trust, Series 2018-PHMZ, Class M | | | |
| (Floating, CME Term SOFR 1M + 8.62%, 8.21% Floor), 13.98%, 06/15/35 144A † | 1,500,000 | | 17,219 |
| Legacy Mortgage Asset Trust, Series 2020-RPL1, Class A2 | | | |
| 3.25%, 09/25/59 144A | 120,000 | | 107,701 |
| | | Par | | Value |
| PMT Credit Risk Transfer Trust, Series 2021-1R, Class A | | | |
| (Floating, CME Term SOFR 1M + 3.01%, 2.90% Floor), 8.37%, 02/27/24 144A † | $ 90,232 | | $ 89,867 |
| Radnor RE, Ltd., Series 2021-1, Class M1C | | | |
| (Floating, U.S. 30-Day Average SOFR + 2.70%, 2.70% Floor), 8.04%, 12/27/33 144A † | 790,000 | | 801,499 |
| Seasoned Credit Risk Transfer Trust, Series 2017-2, Class M1 | | | |
| 4.00%, 08/25/56 144A | 262,220 | | 256,141 |
| Seasoned Credit Risk Transfer Trust, Series 2017-2, Class M2 | | | |
| 4.00%, 08/25/56 144A | 570,000 | | 519,515 |
| Seasoned Credit Risk Transfer Trust, Series 2019-1, Class M | | | |
| 4.75%, 07/25/58 144A | 750,000 | | 687,903 |
| Seasoned Credit Risk Transfer Trust, Series 2020-2, Class M | | | |
| 4.25%, 11/25/59 144A | 1,170,000 | | 1,046,785 |
| SFO Commercial Mortgage Trust, Series 2021-555, Class D | | | |
| (Floating, CME Term SOFR 1M + 2.51%, 2.40% Floor), 7.88%, 05/15/38 144A † | 760,000 | | 628,227 |
| Toorak Mortgage Corporation, Ltd., Series 2021-1, Class A1 | | | |
| (Step to 3.24% on 01/25/24), 2.24%, 06/25/24 144A STEP | 55,204 | | 54,173 |
| Towd Point Mortgage Trust, Series 2019-4, Class A1 | | | |
| 2.90%, 10/25/59 144A | 52,778 | | 49,652 |
| UBS Commercial Mortgage Trust, Series 2017-C3, Class C | | | |
| 4.39%, 08/15/50† γ | 410,000 | | 327,783 |
| UBS Commercial Mortgage Trust, Series 2018-C13, Class B | | | |
| 4.79%, 10/15/51 | 270,000 | | 237,447 |
| Verus Securitization Trust, Series 2022-4, Class A1 | | | |
| (Step to 5.08% on 05/25/26), 4.47%, 04/25/67 144A STEP | 821,147 | | 803,688 |
| Wells Fargo Commercial Mortgage Trust, Series 2013-LC12, Class B | | | |
| 3.95%, 07/15/46† γ | 18,129 | | 15,880 |
| Wells Fargo Commercial Mortgage Trust, Series 2016-C36, Class B | | | |
| 3.67%, 11/15/59 | 25,000 | | 21,257 |
| WFRBS Commercial Mortgage Trust, Series 2013-C15, Class B | | | |
| 4.20%, 08/15/46† γ | 35,000 | | 28,826 |
See Notes to Financial Statements.
SCHEDULE OF INVESTMENTS (Continued)
| | | Par | | Value |
| WFRBS Commercial Mortgage Trust, Series 2014-C20, Class B | | | |
| 4.38%, 05/15/47 | $35,000 | | $ 27,512 |
Total Mortgage-Backed Securities
(Cost $55,381,013) | | | 51,620,771 |
| | Number of
Contracts | | Notional
Amount | |
| PURCHASED OPTIONS — 0.0% |
| Put Options — 0.0% |
Euro vs. U.S. Dollar, Strike Price
$1.06, Expires
01/25/24 (GSC) | 1 | | $12,687,204 | 1,199 |
Euro-Bobl expiration date 01/2024, Strike Price
$118.00, Expires
01/26/24 (CITI) | 3 | | 357,840 | 629 |
Total Purchased Options
(Premiums paid $140,256) | | | 1,828 |
| | | Par | |
| U.S. TREASURY OBLIGATIONS — 18.5% |
| U.S. Treasury Bills | | | |
| 5.23%, 01/04/24Ω | $2,670,000 | 2,669,225 |
| 5.21%, 05/02/24Ω | 1,080,000 | 1,061,297 |
| 5.17%, 05/23/24Ω | 1,130,000 | 1,107,291 |
| 5.15%, 05/30/24Ω | 570,000 | 558,102 |
| 5.12%, 06/06/24Ω | 575,000 | 562,430 |
| 5.10%, 06/13/24Ω | 585,000 | 571,634 |
| 5.02%, 06/27/24Ω | 590,000 | 575,385 |
| | | | 7,105,364 |
| U.S. Treasury Bonds | | | |
| 3.50%, 02/15/39 | 3,300,000 | 3,136,934 |
| 4.25%, 05/15/39 | 30,000 | 31,014 |
| 3.88%, 08/15/40 | 20,000 | 19,571 |
| 1.75%, 08/15/41 | 650,000 | 454,073 |
| 2.00%, 11/15/41 | 40,000 | 29,065 |
| 2.75%, 08/15/42 | 90,000 | 73,308 |
| 3.38%, 08/15/42‡‡ | 660,000 | 590,919 |
| 4.00%, 11/15/42 | 6,480,000 | 6,321,923 |
| 3.88%, 02/15/43 | 96,000 | 91,896 |
| 2.88%, 05/15/43 | 2,045,000 | 1,685,847 |
| 4.38%, 08/15/43 | 2,229,000 | 2,284,203 |
| 3.00%, 05/15/45 | 30,000 | 24,859 |
| 3.00%, 11/15/45 | 660,000 | 545,415 |
| 2.50%, 05/15/46 | 590,000 | 443,848 |
| 2.25%, 08/15/46 | 690,000 | 492,973 |
| 2.88%, 11/15/46 | 1,520,000 | 1,222,828 |
| 3.00%, 05/15/47 | 60,000 | 49,236 |
| 2.75%, 08/15/47 | 90,000 | 70,420 |
| 3.13%, 05/15/48 | 40,000 | 33,486 |
| 3.38%, 11/15/48 | 770,000 | 674,156 |
| 1.25%, 05/15/50 | 50,000 | 27,111 |
| 1.38%, 08/15/50 | 3,730,000 | 2,090,913 |
| | | Par | | Value |
| 2.38%, 05/15/51 | $ 870,000 | | $ 624,174 |
| 3.00%, 08/15/52 | 960,000 | | 789,150 |
| 3.63%, 05/15/53 | 930,000 | | 864,173 |
| 4.13%, 08/15/53 | 889,000 | | 903,099 |
| 4.75%, 11/15/53 | 250,000 | | 281,719 |
| | | | | 23,856,313 |
| U.S. Treasury Notes | | | | |
| 2.75%, 02/15/24 | 4,760,000 | | 4,745,021 |
| 1.50%, 02/29/24 | 555,000 | | 551,637 |
| 2.38%, 02/29/24 | 10,000 | | 9,953 |
| 0.25%, 06/15/24‡‡ | 1,050,000 | | 1,027,095 |
| 1.50%, 10/31/24 | 410,000 | | 398,901 |
| 2.25%, 11/15/24 | 20,520,000 | | 20,061,552 |
| 2.00%, 02/15/25 | 70,000 | | 67,957 |
| 0.38%, 11/30/25 | 21,280,000 | | 19,770,034 |
| 1.63%, 02/15/26 | 6,110,000 | | 5,792,566 |
| 1.63%, 05/15/26 | 340,000 | | 320,968 |
| 2.00%, 11/15/26 | 4,680,000 | | 4,427,170 |
| 1.25%, 11/30/26 | 200,000 | | 185,023 |
| 0.63%, 03/31/27 | 4,600,000 | | 4,137,574 |
| 4.38%, 08/31/28‡‡ | 1,387,000 | | 1,418,099 |
| 0.88%, 11/15/30 | 8,550,000 | | 7,037,051 |
| 1.25%, 08/15/31 | 730,000 | | 605,287 |
| 1.38%, 11/15/31 | 550,000 | | 457,585 |
| 2.88%, 05/15/32 | 2,850,000 | | 2,646,270 |
| 2.75%, 08/15/32 | 1,090,000 | | 1,000,288 |
| 3.38%, 05/15/33 | 1,100,000 | | 1,058,063 |
| | | | | 75,718,094 |
Total U.S. Treasury Obligations
(Cost $114,309,874) | | | 106,679,771 |
| | | Shares | |
| COMMON STOCKS — 0.0% |
| Communication Services — 0.0% | |
| Altice U.S.A., Inc. Class A* | 16,976 | 55,172 |
| Energy — 0.0% | |
| Berry Corporation | 2,492 | 17,519 |
| Diamondback Energy, Inc. | 516 | 80,021 |
| | | | 97,540 |
Total Common Stocks
(Cost $345,375) | | 152,712 |
| FOREIGN COMMON STOCKS — 0.0% |
| Canada — 0.0% | |
| Canadian Natural Resources, Ltd. | 1,332 | 87,273 |
| Jersey — 0.0% | |
| Clarivate PLC* | 59 | 546 |
Total Foreign Common Stocks
(Cost $80,703) | | 87,819 |
| PREFERRED STOCKS — 0.1% |
| Bank of America Corporation | | |
| 7.25% CONV | 207 | 249,493 |
See Notes to Financial Statements.
| | | Shares | | Value |
| El Paso Energy Capital Trust I | | | |
| 4.50% CONV | 2,799 | | $ 131,833 |
| Wells Fargo & Co. | | | |
| 7.50% CONV | 36 | | 43,042 |
Total Preferred Stocks
(Cost $374,373) | | | 424,368 |
| FOREIGN PREFERRED STOCK — 0.0% |
| Jersey — 0.0% | | |
| Clarivate PLC | | | |
5.25%, CONV
(Cost $128,000) | 1,280 | | 49,024 |
| MUTUAL FUNDS — 0.2% |
VanEck JP Morgan EM Local Currency Bond ETFΔ
(Cost $1,328,443) | 54,000 | | 1,368,900 |
| MONEY MARKET FUNDS — 10.3% |
| Northern Institutional Liquid Assets Portfolio (Shares), 5.40%Ø § | 28,080,100 | | 28,080,100 |
| | | Shares | | Value |
GuideStone Money Market Fund, 5.28%
(Institutional Class)Ø ∞ | 25,785,040 | | $ 25,785,040 |
| Northern Institutional U.S. Treasury Portfolio (Premier), 5.22%Ø | 5,787,703 | | 5,787,703 |
Total Money Market Funds
(Cost $59,652,843) | | | 59,652,843 |
TOTAL INVESTMENTS —102.6%
(Cost $623,157,805) | | | 592,116,797 |
Liabilities in Excess of Other
Assets — (2.6)% | | | (15,071,016) |
| NET ASSETS — 100.0% | | | $577,045,781 |
Futures Contracts outstanding at December 31, 2023:
| Future Type | | Expiration Date | | Open Long
(Short) Contracts | | Notional
Market Value
of Contracts | | Value and
Unrealized
Appreciation
(Depreciation) |
| 30-Year Euro Buxl | | 03/2024 | | 9 | | $ 1,408,066 | | $ 105,694 |
| Euro-Bund | | 03/2024 | | 77 | | 11,664,270 | | 304,733 |
| FTSE Bursa Malaysia KLCI | | 03/2024 | | (19) | | (2,499,177) | | (84,424) |
| Euro-Bobl | | 03/2024 | | 28 | | 3,687,017 | | 62,310 |
| Euro-Schatz | | 03/2024 | | 63 | | 7,410,082 | | 44,308 |
| 10 -Year Mini JGB | | 03/2024 | | 81 | | 8,417,681 | | 70,566 |
| 10-Year Commonwealth Treasury Bond | | 03/2024 | | 5 | | 397,509 | | 4,060 |
| 10-Year Bond | | 03/2024 | | 4 | | 374,869 | | 17,781 |
| 10-Year U.S. Treasury Note | | 03/2024 | | 95 | | 10,724,609 | | 305,928 |
| U.S. Treasury Long Bond | | 03/2024 | | 88 | | 10,994,501 | | 691,744 |
| Ultra 10-Year U.S. Treasury Note | | 03/2024 | | (219) | | (25,845,422) | | (845,177) |
| Ultra Long U.S. Treasury Bond | | 03/2024 | | 25 | | 3,339,844 | | 346,104 |
| Long GILT | | 03/2024 | | 88 | | 11,514,169 | | 661,186 |
| 2-Year U.S. Treasury Note | | 03/2024 | | 186 | | 38,300,015 | | 343,992 |
| 5-Year U.S. Treasury Note | | 03/2024 | | 701 | | 76,250,180 | | 1,619,423 |
| Total Futures Contracts outstanding at December 31, 2023 | | | | | | $156,138,213 | | $3,648,228 |
Forward Foreign Currency Contracts outstanding at December 31, 2023:
| Expiration Date | | Currency
Purchased | | Amount
of Currency
Purchased | | Currency
Sold | | Amount
of Currency
Sold | | Counter-
party | | Net Unrealized
Appreciation
(Depreciation) |
| 01/18/24 | | Euro | | 142,554,309 | | U.S. Dollars | | 152,128,443 | | SC | | $5,366,447 |
| 01/18/24 | | Euro | | 52,265,225 | | U.S. Dollars | | 55,855,679 | | UBS | | 1,887,268 |
| 01/19/24 | | Japanese Yen | | 5,717,458,465 | | U.S. Dollars | | 38,797,545 | | CITI | | 1,877,032 |
| 01/18/24 | | Australian Dollars | | 32,084,161 | | U.S. Dollars | | 20,490,484 | | GSC | | 1,387,185 |
| 01/18/24 | | Euro | | 27,360,352 | | U.S. Dollars | | 29,202,866 | | SS | | 1,025,022 |
| 01/18/24 | | New Zealand Dollars | | 20,440,959 | | U.S. Dollars | | 12,030,831 | | GSC | | 891,939 |
| 01/18/24 | | Swiss Francs | | 10,692,500 | | U.S. Dollars | | 11,984,682 | | BNP | | 754,009 |
| 01/18/24 | | Australian Dollars | | 17,948,867 | | U.S. Dollars | | 11,514,909 | | BNP | | 724,133 |
See Notes to Financial Statements.
SCHEDULE OF INVESTMENTS (Continued)
| Expiration Date | | Currency
Purchased | | Amount
of Currency
Purchased | | Currency
Sold | | Amount
of Currency
Sold | | Counter-
party | | Net Unrealized
Appreciation
(Depreciation) |
| 01/18/24 | | Swiss Francs | | 9,791,458 | | U.S. Dollars | | 10,993,092 | | GSC | | $672,128 |
| 01/18/24 | | Australian Dollars | | 16,946,192 | | U.S. Dollars | | 10,903,797 | | SS | | 651,538 |
| 01/18/24 | | Euro | | 15,640,686 | | U.S. Dollars | | 16,688,798 | | BNP | | 591,129 |
| 01/18/24 | | Norwegian Kroner | | 84,791,513 | | U.S. Dollars | | 7,761,967 | | UBS | | 587,791 |
| 01/18/24 | | Japanese Yen | | 1,569,725,454 | | U.S. Dollars | | 10,584,086 | | GSC | | 581,290 |
| 01/18/24 | | Swedish Kronor | | 57,877,786 | | U.S. Dollars | | 5,263,499 | | GSC | | 479,412 |
| 01/18/24 | | British Pounds | | 10,965,199 | | U.S. Dollars | | 13,500,172 | | SC | | 478,121 |
| 01/19/24 | | Australian Dollars | | 10,188,572 | | U.S. Dollars | | 6,478,200 | | CITI | | 469,468 |
| 01/18/24 | | Canadian Dollars | | 18,659,862 | | U.S. Dollars | | 13,656,355 | | GSC | | 429,728 |
| 01/18/24 | | Euro | | 11,520,267 | | U.S. Dollars | | 12,364,839 | | GSC | | 362,823 |
| 01/18/24 | | Mexican Pesos | | 83,717,660 | | U.S. Dollars | | 4,553,602 | | GSC | | 360,486 |
| 01/18/24 | | Australian Dollars | | 8,980,463 | | U.S. Dollars | | 5,776,907 | | CITI | | 346,725 |
| 01/18/24 | | Swedish Kronor | | 50,016,453 | | U.S. Dollars | | 4,620,671 | | CITI | | 342,200 |
| 01/18/24 | | Swedish Kronor | | 48,594,367 | | U.S. Dollars | | 4,481,465 | | BNP | | 340,299 |
| 01/18/24 | | New Zealand Dollars | | 9,533,125 | | U.S. Dollars | | 5,711,108 | | SS | | 315,731 |
| 01/18/24 | | Norwegian Kroner | | 41,365,292 | | U.S. Dollars | | 3,766,876 | | GSC | | 306,528 |
| 01/18/24 | | Japanese Yen | | 1,010,443,245 | | U.S. Dollars | | 6,883,583 | | SC | | 303,647 |
| 01/18/24 | | British Pounds | | 5,792,212 | | U.S. Dollars | | 7,117,892 | | GSC | | 265,946 |
| 01/18/24 | | Japanese Yen | | 883,337,827 | | U.S. Dollars | | 6,018,584 | | UBS | | 264,553 |
| 01/18/24 | | Swiss Francs | | 4,900,697 | | U.S. Dollars | | 5,588,895 | | UBS | | 249,634 |
| 01/18/24 | | Norwegian Kroner | | 35,734,063 | | U.S. Dollars | | 3,302,279 | | RBC | | 216,596 |
| 01/18/24 | | Canadian Dollars | | 11,357,965 | | U.S. Dollars | | 8,370,124 | | SC | | 203,854 |
| 01/19/24 | | Canadian Dollars | | 9,608,964 | | U.S. Dollars | | 7,055,092 | | GSC | | 198,694 |
| 01/18/24 | | Japanese Yen | | 624,748,242 | | U.S. Dollars | | 4,255,814 | | RBC | | 187,988 |
| 01/18/24 | | New Zealand Dollars | | 5,012,336 | | U.S. Dollars | | 3,006,790 | | UBS | | 162,008 |
| 01/18/24 | | British Pounds | | 3,036,681 | | U.S. Dollars | | 3,715,860 | | BNP | | 155,262 |
| 01/18/24 | | Mexican Pesos | | 52,701,327 | | U.S. Dollars | | 2,945,290 | | SC | | 148,190 |
| 01/18/24 | | Brazilian Reals | | 13,003,815 | | U.S. Dollars | | 2,546,313 | | GSC | | 127,901 |
| 01/18/24 | | Polish Zloty | | 12,420,989 | | U.S. Dollars | | 3,031,971 | | GSC | | 123,984 |
| 01/18/24 | | Polish Zloty | | 6,076,046 | | U.S. Dollars | | 1,420,830 | | BNP | | 122,987 |
| 01/19/24 | | Polish Zloty | | 14,530,000 | | Euro | | 3,231,410 | | GSC | | 121,531 |
| 01/18/24 | | British Pounds | | 3,670,409 | | U.S. Dollars | | 4,557,757 | | UBS | | 121,232 |
| 01/18/24 | | Hungarian Forint | | 1,099,847,698 | | U.S. Dollars | | 3,040,954 | | GSC | | 120,734 |
| 01/18/24 | | Polish Zloty | | 6,229,003 | | U.S. Dollars | | 1,464,080 | | UBS | | 118,600 |
| 01/19/24 | | South Korean Won | | 3,422,044,000 | | U.S. Dollars | | 2,540,927 | | CITI | | 110,079 |
| 01/18/24 | | Swiss Francs | | 1,530,059 | | U.S. Dollars | | 1,717,843 | | SS | | 105,018 |
| 01/18/24 | | Canadian Dollars | | 5,015,331 | | U.S. Dollars | | 3,681,607 | | BNP | | 104,400 |
| 01/18/24 | | Polish Zloty | | 5,125,623 | | U.S. Dollars | | 1,198,839 | | SC | | 103,492 |
| 01/18/24 | | Japanese Yen | | 340,835,297 | | U.S. Dollars | | 2,325,169 | | BNP | | 99,175 |
| 01/18/24 | | Canadian Dollars | | 3,214,475 | | U.S. Dollars | | 2,331,503 | | UBS | | 95,061 |
| 01/18/24 | | Mexican Pesos | | 26,804,053 | | U.S. Dollars | | 1,480,863 | | BNP | | 92,490 |
| 01/18/24 | | Swiss Francs | | 1,354,559 | | U.S. Dollars | | 1,524,374 | | SC | | 89,403 |
| 01/18/24 | | New Zealand Dollars | | 2,751,312 | | U.S. Dollars | | 1,650,341 | | RBC | | 89,037 |
| 01/18/24 | | Norwegian Kroner | | 14,349,173 | | U.S. Dollars | | 1,326,073 | | CITI | | 86,947 |
| 01/18/24 | | Mexican Pesos | | 25,002,643 | | U.S. Dollars | | 1,381,401 | | RBC | | 86,212 |
| 01/18/24 | | Chilean Pesos | | 1,324,822,660 | | U.S. Dollars | | 1,418,440 | | SC | | 83,373 |
| 01/18/24 | | Australian Dollars | | 2,237,179 | | U.S. Dollars | | 1,446,355 | | UBS | | 79,142 |
| 01/18/24 | | Polish Zloty | | 3,706,086 | | U.S. Dollars | | 866,704 | | RBC | | 74,947 |
| 01/18/24 | | Swedish Kronor | | 9,778,323 | | U.S. Dollars | | 902,588 | | RBC | | 67,663 |
| 01/18/24 | | British Pounds | | 1,325,358 | | U.S. Dollars | | 1,623,817 | | SS | | 65,731 |
| 01/18/24 | | New Zealand Dollars | | 1,269,169 | | U.S. Dollars | | 739,151 | | BNP | | 63,217 |
| 01/18/24 | | Czech Republic Koruna | | 51,256,003 | | U.S. Dollars | | 2,227,510 | | GSC | | 62,952 |
| 01/18/24 | | Hungarian Forint | | 373,386,382 | | U.S. Dollars | | 1,014,402 | | SS | | 58,957 |
| 01/18/24 | | Czech Republic Koruna | | 37,556,090 | | U.S. Dollars | | 1,623,241 | | SC | | 55,017 |
| 01/18/24 | | Chilean Pesos | | 683,014,643 | | U.S. Dollars | | 735,888 | | GSC | | 38,374 |
| 01/18/24 | | Czech Republic Koruna | | 25,099,939 | | U.S. Dollars | | 1,083,716 | | CITI | | 37,918 |
See Notes to Financial Statements.
| Expiration Date | | Currency
Purchased | | Amount
of Currency
Purchased | | Currency
Sold | | Amount
of Currency
Sold | | Counter-
party | | Net Unrealized
Appreciation
(Depreciation) |
| 01/18/24 | | Norwegian Kroner | | 5,510,754 | | U.S. Dollars | | 508,786 | | SC | | $ 33,880 |
| 01/18/24 | | British Pounds | | 696,217 | | U.S. Dollars | | 857,065 | | RBC | | 30,464 |
| 01/18/24 | | Czech Republic Koruna | | 18,171,017 | | U.S. Dollars | | 784,879 | | RBC | | 27,124 |
| 01/18/24 | | Norwegian Kroner | | 9,732,482 | | U.S. Dollars | | 936,219 | | BNP | | 22,177 |
| 01/18/24 | | South African Rand | | 11,560,940 | | U.S. Dollars | | 609,257 | | SC | | 21,703 |
| 01/19/24 | | Mexican Pesos | | 17,533,310 | | U.S. Dollars | | 1,008,056 | | GSC | | 20,934 |
| 01/18/24 | | Polish Zloty | | 1,006,189 | | U.S. Dollars | | 235,066 | | SS | | 20,589 |
| 01/18/24 | | Swedish Kronor | | 12,937,713 | | U.S. Dollars | | 1,264,867 | | SS | | 18,875 |
| 01/18/24 | | Canadian Dollars | | 1,021,754 | | U.S. Dollars | | 760,737 | | SS | | 10,572 |
| 01/18/24 | | Euro | | 306,125 | | U.S. Dollars | | 327,733 | | RBC | | 10,476 |
| 01/18/24 | | Mexican Pesos | | 2,140,706 | | U.S. Dollars | | 118,219 | | CITI | | 7,436 |
| 01/18/24 | | Japanese Yen | | 226,783,463 | | U.S. Dollars | | 1,606,142 | | SS | | 6,957 |
| 01/18/24 | | Czech Republic Koruna | | 4,872,994 | | U.S. Dollars | | 211,215 | | UBS | | 6,543 |
| 01/18/24 | | Hungarian Forint | | 36,669,187 | | U.S. Dollars | | 99,671 | | RBC | | 5,740 |
| 01/18/24 | | Czech Republic Koruna | | 2,861,488 | | U.S. Dollars | | 123,522 | | SS | | 4,349 |
| 01/18/24 | | Hungarian Forint | | 15,128,338 | | U.S. Dollars | | 41,017 | | SC | | 2,472 |
| 01/19/24 | | Indian Rupees | | 41,071,535 | | U.S. Dollars | | 491,316 | | CITI | | 1,796 |
| 01/18/24 | | U.S. Dollars | | 135,776 | | British Pounds | | 106,152 | | GSC | | 455 |
| 01/18/24 | | U.S. Dollars | | 132,013 | | New Zealand Dollars | | 208,171 | | GSC | | 407 |
| 01/18/24 | | U.S. Dollars | | 83,465 | | South Korean Won | | 107,265,645 | | RBC | | 358 |
| 01/18/24 | | U.S. Dollars | | 99,803 | | Euro | | 90,096 | | GSC | | 264 |
| 01/18/24 | | Canadian Dollars | | 14,676 | | U.S. Dollars | | 10,816 | | RBC | | 262 |
| 01/18/24 | | U.S. Dollars | | 89,543 | | Australian Dollars | | 130,990 | | GSC | | 223 |
| 01/18/24 | | Indonesian Rupiahs | | 11,428,019 | | U.S. Dollars | | 725 | | UBS | | 17 |
| 01/18/24 | | South Korean Won | | 276,936 | | U.S. Dollars | | 208 | | SC | | 7 |
| 01/18/24 | | South African Rand | | 1,403 | | U.S. Dollars | | 74 | | RBC | | 3 |
| Subtotal Appreciation | | | | | | | | | | $26,444,461 |
| 01/18/24 | | U.S. Dollars | | 7,256 | | South African Rand | | 137,759 | | BNP | | $ (263) |
| 01/18/24 | | Euro | | 94,012 | | British Pounds | | 81,755 | | SC | | (356) |
| 01/18/24 | | U.S. Dollars | | 116,585 | | South Korean Won | | 151,175,429 | | RBC | | (543) |
| 01/18/24 | | Euro | | 85,903 | | U.S. Dollars | | 95,468 | | GSC | | (562) |
| 03/20/24 | | U.S. Dollars | | 92,086 | | Euro | | 84,000 | | MLIB | | (947) |
| 01/18/24 | | U.S. Dollars | | 1,048,429 | | Indonesian Rupiahs | | 16,157,338,447 | | GSC | | (1,071) |
| 01/18/24 | | U.S. Dollars | | 48,619 | | Czech Republic Koruna | | 1,126,300 | | SS | | (1,712) |
| 01/18/24 | | U.S. Dollars | | 70,019 | | Czech Republic Koruna | | 1,620,000 | | SC | | (2,373) |
| 01/18/24 | | U.S. Dollars | | 46,410 | | Mexican Pesos | | 840,000 | | RBC | | (2,896) |
| 01/18/24 | | U.S. Dollars | | 82,348 | | South Korean Won | | 110,784,948 | | GSC | | (3,485) |
| 01/18/24 | | U.S. Dollars | | 78,096 | | Australian Dollars | | 121,403 | | CITI | | (4,687) |
| 01/18/24 | | U.S. Dollars | | 86,528 | | Polish Zloty | | 370,000 | | RBC | | (7,482) |
| 01/18/24 | | U.S. Dollars | | 226,769 | | Czech Republic Koruna | | 5,250,000 | | RBC | | (7,837) |
| 01/18/24 | | U.S. Dollars | | 226,913 | | South African Rand | | 4,308,235 | | SS | | (8,217) |
| 01/18/24 | | U.S. Dollars | | 1,141,582 | | Indonesian Rupiahs | | 17,706,466,205 | | SS | | (8,542) |
| 01/18/24 | | U.S. Dollars | | 299,194 | | South Korean Won | | 398,556,551 | | SC | | (9,599) |
| 01/18/24 | | U.S. Dollars | | 240,265 | | Japanese Yen | | 35,200,000 | | SC | | (10,111) |
| 01/18/24 | | U.S. Dollars | | 369,187 | | South African Rand | | 7,011,349 | | GSC | | (13,471) |
| 01/18/24 | | U.S. Dollars | | 807,609 | | New Zealand Dollars | | 1,302,536 | | SS | | (15,854) |
| 01/18/24 | | U.S. Dollars | | 477,084 | | British Pounds | | 387,548 | | RBC | | (16,958) |
| 01/18/24 | | U.S. Dollars | | 336,434 | | New Zealand Dollars | | 560,875 | | RBC | | (18,151) |
| 01/18/24 | | U.S. Dollars | | 385,152 | | Thai Baht | | 13,800,000 | | GSC | | (19,859) |
| 01/18/24 | | U.S. Dollars | | 618,534 | | British Pounds | | 502,476 | | UBS | | (22,016) |
| 01/18/24 | | U.S. Dollars | | 1,159,605 | | Mexican Pesos | | 20,200,007 | | SS | | (26,102) |
| 01/18/24 | | U.S. Dollars | | 1,098,117 | | Indonesian Rupiahs | | 17,313,489,139 | | UBS | | (26,480) |
| 01/19/24 | | U.S. Dollars | | 862,365 | | British Pounds | | 700,000 | | GSC | | (29,991) |
| 01/18/24 | | U.S. Dollars | | 838,396 | | Hungarian Forint | | 302,205,818 | | GSC | | (30,343) |
| 01/18/24 | | U.S. Dollars | | 1,298,018 | | Canadian Dollars | | 1,760,804 | | CITI | | (31,190) |
See Notes to Financial Statements.
SCHEDULE OF INVESTMENTS (Continued)
| Expiration Date | | Currency
Purchased | | Amount
of Currency
Purchased | | Currency
Sold | | Amount
of Currency
Sold | | Counter-
party | | Net Unrealized
Appreciation
(Depreciation) |
| 01/18/24 | | U.S. Dollars | | 544,099 | | Hungarian Forint | | 200,275,000 | | SS | | $ (31,623) |
| 01/18/24 | | U.S. Dollars | | 1,422,146 | | Mexican Pesos | | 24,775,527 | | SC | | (32,136) |
| 01/18/24 | | U.S. Dollars | | 616,092 | | Chilean Pesos | | 575,035,385 | | BNP | | (35,766) |
| 01/18/24 | | U.S. Dollars | | 1,028,156 | | Czech Republic Koruna | | 23,821,681 | | GSC | | (36,357) |
| 01/18/24 | | U.S. Dollars | | 1,664,304 | | Canadian Dollars | | 2,258,199 | | RBC | | (40,381) |
| 01/18/24 | | U.S. Dollars | | 781,308 | | Hungarian Forint | | 287,570,038 | | BNP | | (45,358) |
| 01/18/24 | | U.S. Dollars | | 1,814,157 | | Brazilian Reals | | 9,055,177 | | GSC | | (48,026) |
| 01/18/24 | | U.S. Dollars | | 1,450,983 | | Czech Republic Koruna | | 33,560,433 | | UBS | | (48,723) |
| 01/18/24 | | U.S. Dollars | | 1,488,201 | | Canadian Dollars | | 2,036,038 | | BNP | | (48,777) |
| 01/18/24 | | U.S. Dollars | | 2,638,046 | | Canadian Dollars | | 3,579,230 | | UBS | | (63,867) |
| 01/18/24 | | U.S. Dollars | | 797,722 | | Polish Zloty | | 3,401,650 | | SC | | (66,578) |
| 01/18/24 | | U.S. Dollars | | 4,138,121 | | Chinese Yuan Renminbi | | 29,873,095 | | SC | | (77,446) |
| 01/18/24 | | U.S. Dollars | | 1,478,319 | | Chilean Pesos | | 1,374,836,552 | | SC | | (80,189) |
| 01/18/24 | | U.S. Dollars | | 982,467 | | Polish Zloty | | 4,205,397 | | SS | | (86,051) |
| 01/18/24 | | U.S. Dollars | | 1,033,082 | | Polish Zloty | | 4,419,526 | | CITI | | (89,841) |
| 01/19/24 | | U.S. Dollars | | 2,029,219 | | Euro | | 1,920,000 | | GSC | | (92,100) |
| 01/18/24 | | U.S. Dollars | | 2,012,331 | | Japanese Yen | | 297,164,112 | | GSC | | (101,382) |
| 01/18/24 | | U.S. Dollars | | 1,894,218 | | Hungarian Forint | | 695,263,156 | | UBS | | (104,427) |
| 01/18/24 | | U.S. Dollars | | 3,453,426 | | Czech Republic Koruna | | 79,959,523 | | BNP | | (119,702) |
| 01/18/24 | | U.S. Dollars | | 2,760,733 | | Australian Dollars | | 4,225,594 | | SS | | (120,631) |
| 01/18/24 | | U.S. Dollars | | 1,465,212 | | Mexican Pesos | | 27,044,938 | | BNP | | (122,281) |
| 01/18/24 | | U.S. Dollars | | 2,795,708 | | Japanese Yen | | 410,531,341 | | CITI | | (124,379) |
| 01/18/24 | | U.S. Dollars | | 2,941,154 | | Japanese Yen | | 432,803,975 | | UBS | | (137,359) |
| 01/19/24 | | Euro | | 3,937,868 | | Polish Zloty | | 17,670,000 | | GSC | | (138,806) |
| 01/18/24 | | U.S. Dollars | | 2,759,769 | | New Zealand Dollars | | 4,590,524 | | BNP | | (142,359) |
| 01/18/24 | | U.S. Dollars | | 2,286,886 | | Norwegian Kroner | | 24,705,688 | | UBS | | (145,981) |
| 01/19/24 | | U.S. Dollars | | 3,482,729 | | British Pounds | | 2,849,273 | | CITI | | (149,509) |
| 01/18/24 | | U.S. Dollars | | 2,506,478 | | Swiss Francs | | 2,231,016 | | CITI | | (151,481) |
| 01/18/24 | | U.S. Dollars | | 2,227,388 | | Polish Zloty | | 9,383,789 | | BNP | | (156,867) |
| 01/18/24 | | U.S. Dollars | | 2,636,086 | | Australian Dollars | | 4,100,113 | | RBC | | (159,715) |
| 01/18/24 | | U.S. Dollars | | 3,164,371 | | New Zealand Dollars | | 5,271,316 | | CITI | | (168,154) |
| 01/18/24 | | U.S. Dollars | | 2,653,648 | | Swiss Francs | | 2,369,523 | | GSC | | (169,324) |
| 01/18/24 | | U.S. Dollars | | 2,576,557 | | Polish Zloty | | 10,847,055 | | GSC | | (179,489) |
| 01/19/24 | | U.S. Dollars | | 3,434,825 | | Taiwan Dollars | | 110,204,629 | | CITI | | (179,825) |
| 01/18/24 | | U.S. Dollars | | 5,940,790 | | British Pounds | | 4,803,322 | | GSC | | (182,422) |
| 01/18/24 | | U.S. Dollars | | 4,347,061 | | British Pounds | | 3,554,561 | | SC | | (184,247) |
| 01/19/24 | | U.S. Dollars | | 2,113,018 | | Polish Zloty | | 9,049,000 | | GSC | | (186,142) |
| 01/18/24 | | U.S. Dollars | | 2,406,840 | | Swedish Kronor | | 26,159,515 | | BNP | | (188,831) |
| 01/18/24 | | U.S. Dollars | | 6,137,071 | | Canadian Dollars | | 8,389,000 | | SC | | (195,674) |
| 01/18/24 | | U.S. Dollars | | 3,890,753 | | Swedish Kronor | | 41,198,774 | | SC | | (197,185) |
| 01/18/24 | | U.S. Dollars | | 3,359,854 | | Mexican Pesos | | 60,900,243 | | UBS | | (214,888) |
| 01/18/24 | | U.S. Dollars | | 6,886,892 | | British Pounds | | 5,575,131 | | CITI | | (220,212) |
| 01/18/24 | | U.S. Dollars | | 2,584,216 | | Polish Zloty | | 11,053,417 | | UBS | | (224,263) |
| 01/18/24 | | U.S. Dollars | | 6,648,003 | | Euro | | 6,229,892 | | RBC | | (234,821) |
| 01/18/24 | | U.S. Dollars | | 2,552,097 | | Swedish Kronor | | 28,106,740 | | SS | | (236,787) |
| 01/18/24 | | U.S. Dollars | | 7,326,435 | | Euro | | 6,846,055 | | BNP | | (237,129) |
| 01/18/24 | | U.S. Dollars | | 4,828,101 | | New Zealand Dollars | | 8,030,970 | | UBS | | (249,077) |
| 01/18/24 | | U.S. Dollars | | 7,185,747 | | British Pounds | | 5,848,536 | | BNP | | (269,890) |
| 01/18/24 | | U.S. Dollars | | 4,292,230 | | Norwegian Kroner | | 46,379,369 | | GSC | | (274,931) |
| 01/18/24 | | U.S. Dollars | | 11,568,398 | | Canadian Dollars | | 15,695,221 | | SS | | (279,717) |
| 01/18/24 | | U.S. Dollars | | 5,225,324 | | Australian Dollars | | 8,089,713 | | BNP | | (290,920) |
| 01/18/24 | | U.S. Dollars | | 4,812,068 | | Swiss Francs | | 4,287,938 | | RBC | | (296,439) |
| 01/18/24 | | U.S. Dollars | | 3,764,631 | | Norwegian Kroner | | 41,524,706 | | BNP | | (324,472) |
| 01/18/24 | | U.S. Dollars | | 5,867,855 | | Mexican Pesos | | 105,582,788 | | GSC | | (329,678) |
| 01/18/24 | | U.S. Dollars | | 8,856,140 | | Euro | | 8,321,905 | | SC | | (337,952) |
| 01/18/24 | | U.S. Dollars | | 5,888,746 | | Swiss Francs | | 5,244,722 | | BNP | | (359,642) |
See Notes to Financial Statements.
| Expiration Date | | Currency
Purchased | | Amount
of Currency
Purchased | | Currency
Sold | | Amount
of Currency
Sold | | Counter-
party | | Net Unrealized
Appreciation
(Depreciation) |
| 01/18/24 | | U.S. Dollars | | 10,655,725 | | Canadian Dollars | | 14,637,060 | | GSC | | $ (393,598) |
| 01/18/24 | | U.S. Dollars | | 11,915,275 | | Euro | | 11,168,651 | | CITI | | (423,920) |
| 01/18/24 | | U.S. Dollars | | 10,314,823 | | Japanese Yen | | 1,511,697,864 | | BNP | | (437,805) |
| 01/18/24 | | U.S. Dollars | | 5,920,123 | | Norwegian Kroner | | 64,816,760 | | SS | | (462,641) |
| 01/18/24 | | U.S. Dollars | | 12,057,444 | | Japanese Yen | | 1,761,359,914 | | SS | | (471,017) |
| 01/18/24 | | U.S. Dollars | | 8,889,503 | | New Zealand Dollars | | 14,860,914 | | GSC | | (505,565) |
| 01/18/24 | | U.S. Dollars | | 7,209,412 | | Swedish Kronor | | 77,791,432 | | UBS | | (509,424) |
| 01/18/24 | | U.S. Dollars | | 16,168,280 | | Euro | | 15,110,357 | | GSC | | (525,736) |
| 01/18/24 | | U.S. Dollars | | 10,751,180 | | New Zealand Dollars | | 17,899,690 | | SC | | (565,000) |
| 01/18/24 | | U.S. Dollars | | 16,263,725 | | British Pounds | | 13,212,046 | | SS | | (578,819) |
| 01/18/24 | | U.S. Dollars | | 19,611,615 | | Euro | | 18,355,125 | | UBS | | (667,241) |
| 01/19/24 | | U.S. Dollars | | 15,940,884 | | Euro | | 15,041,422 | | CITI | | (677,688) |
| 01/18/24 | | U.S. Dollars | | 11,104,047 | | Swiss Francs | | 9,891,041 | | SC | | (679,812) |
| 01/18/24 | | U.S. Dollars | | 11,770,184 | | Australian Dollars | | 18,277,391 | | SC | | (692,873) |
| 01/18/24 | | U.S. Dollars | | 14,441,074 | | Swiss Francs | | 12,741,983 | | UBS | | (739,303) |
| 01/18/24 | | U.S. Dollars | | 12,205,063 | | Swedish Kronor | | 132,825,949 | | GSC | | (974,560) |
| 01/18/24 | | U.S. Dollars | | 21,433,321 | | Australian Dollars | | 33,423,910 | | GSC | | (1,357,903) |
| 01/18/24 | | U.S. Dollars | | 229,930,187 | | Euro | | 215,514,836 | | SS | | (8,171,947) |
| Subtotal Depreciation | | | | | | | | | | $(28,166,159) |
| Total Forward Foreign Currency Contracts outstanding at December 31, 2023 | | | | $ (1,721,698) |
Swap Agreements outstanding at December 31, 2023:
| Reference Obligation | | Fixed
Deal
(Pay) Rate | | Maturity
Date | | Currency | | Notional
Amount | | Market Value | | Upfront
Premiums
Paid/
(Received) | | Unrealized
Appreciation
(Depreciation) |
| Centrally Cleared Credit Default Swaps on Credit Indexes—Buy Protection | | | | | | | | | | | | | | |
| iTraxx Europe & Crossover Series 40 (Pay Quarterly) | | (5.00)% | | 12/20/2028 | | EUR | | 12,172,000 | | $(1,092,808) | | $(405,499) | | $ (687,309) |
| Markit CDX.EM.IG.40 Index (Pay Quarterly) | | (1.00)% | | 12/20/2028 | | USD | | 14,024,000 | | 401,122 | | 719,431 | | (318,309) |
| | | $ (691,686) | | $ 313,932 | | $(1,005,618) |
| Pay Rate Index/Pay Rate | | Receive
Rate Index/Receive
Rate | | Maturity
Date | | Currency | | Notional
Amount | | Market Value | | Upfront
Premiums
Paid/
(Received) | | Unrealized
Appreciation
(Depreciation) |
| Centrally Cleared Interest Rate Swaps | | | | | | | | | | | | |
| 7-Day CFETS Repo Rate (Quarterly) | | 2.05% (Quarterly) | | 8/17/2026 | | CNY | | 33,632,000 | | $ (1,165) | | $ — | | $ (1,165) |
| 3-Month KWCDC (Quarterly) | | 2.36% (Quarterly) | | 2/11/2032 | | KRW | | 604,702,000 | | (22,324) | | — | | (22,324) |
| 3-Month KWCDC (Quarterly) | | 2.37% (Quarterly) | | 2/18/2032 | | KRW | | 1,195,630,000 | | (43,546) | | — | | (43,546) |
| 3-Month KWCDC (Quarterly) | | 2.88% (Quarterly) | | 8/11/2032 | | KRW | | 2,048,372,000 | | (14,514) | | — | | (14,514) |
| | | $(81,549) | | $ — | | $(81,549) |
See Notes to Financial Statements.
SCHEDULE OF INVESTMENTS (Continued)
VALUATION HIERARCHY
The following is a summary of the inputs used, as of December 31, 2023, in valuing the Fund’s investments carried at fair value:
| | Total
Value | | Level 1
Quoted Prices | | Level 2
Other Significant
Observable Inputs | | Level 3
Significant
Unobservable Inputs |
| Assets: | | | | | | | |
| Investments in Securities: | | | | | | | |
| Asset-Backed Securities | $ 12,479,588 | | $ — | | $ 12,479,588 | | $ — |
| Common Stocks | 152,712 | | 152,712 | | — | | — |
| Corporate Bonds | 93,618,878 | | — | | 93,618,878 | | — |
| Foreign Bonds: | | | | | | | |
| Brazil | 5,996,424 | | — | | 191,219 | | 5,805,205 |
| Other ^^ | 251,988,689 | | — | | 251,988,689 | | — |
| Total Foreign Bonds | 257,985,113 | | — | | 252,179,908 | | 5,805,205 |
| Foreign Common Stocks | 87,819 | | 87,819 | | — | | — |
| Foreign Preferred Stock | 49,024 | | 49,024 | | — | | — |
| Loan Agreements | 7,995,182 | | — | | 7,995,182 | | — |
| Money Market Funds | 59,652,843 | | 59,652,843 | | — | | — |
| Mortgage-Backed Securities | 51,620,771 | | — | | 51,620,771 | | — |
| Mutual Funds | 1,368,900 | | 1,368,900 | | — | | — |
| Preferred Stocks | 424,368 | | 424,368 | | — | | — |
| Purchased Options: | | | | | | | |
| Put Options | 1,828 | | 1,828 | | — | | — |
| U.S. Treasury Obligations | 106,679,771 | | — | | 106,679,771 | | — |
| Total Assets - Investments in Securities | $592,116,797 | | $61,737,494 | | $524,574,098 | | $5,805,205 |
| Other Financial Instruments*** | | | | | | | |
| Forward Foreign Currency Contracts | $ 26,444,461 | | $ — | | $ 26,444,461 | | $ — |
| Futures Contracts | 4,577,829 | | 4,577,829 | | — | | — |
| Total Assets - Other Financial Instruments | $ 31,022,290 | | $ 4,577,829 | | $ 26,444,461 | | $ — |
See Notes to Financial Statements.
| | Total
Value | | Level 1
Quoted Prices | | Level 2
Other Significant
Observable Inputs | | Level 3
Significant
Unobservable Inputs |
| Liabilities: | | | | | | | |
| Other Financial Instruments*** | | | | | | | |
| Forward Foreign Currency Contracts | $(28,166,159) | | $ — | | $(28,166,159) | | $ — |
| Futures Contracts | (929,601) | | (929,601) | | — | | — |
| Swap Agreements | (1,087,167) | | — | | (1,087,167) | | — |
| Total Liabilities - Other Financial Instruments | $(30,182,927) | | $(929,601) | | $(29,253,326) | | $ — |
| ^^ | Classifications as defined in the Schedule of Investments. |
| *** | Other financial instruments are derivative instruments, such as futures contracts, forward foreign currency contracts and swap agreements, which are valued at the unrealized appreciation (depreciation) on the investment. Further details regarding the value of these investments can be found in the preceding "Futures Contracts outstanding", "Forward Foreign Currency Contracts outstanding" and "Swap Agreements outstanding" disclosures. |
The unobservable inputs used in the fair value measurement of the reporting entity’s foreign bonds are values based on evaluated quotations received from dealers who make markets in such securities. Significant increases (decreases) in those evaluated quotations would result in a significantly higher (lower) fair value measurement.
The following is a reconciliation of assets in which significant unobservable inputs (Level 3) were used in determining fair value:
| | Total
Value | | Foreign
Bonds | | | | | |
| Balance, 12/31/22 | $ — | | $ — | | | | | |
| Accrued discounts/premiums | — | | — | | | | | |
| Realized gain (loss) | — | | — | | | | | |
Change in unrealized
appreciation (depreciation) | — | | — | | | | | |
| Purchases | 398,458 | | 398,458 | | | | | |
| Sales | — | | — | | | | | |
| Transfers in to Level 3(1) | 5,406,747 | | 5,406,747 | | | | | |
| Transfers out of Level 3 | — | | — | | | | | |
| Maturities | — | | — | | | | | |
| Paydowns | — | | — | | | | | |
| Balance, 12/31/23 | $ 5,805,205 | | $ 5,805,205 | | | | | |
(1)Transfers in to Level 3 represent the value of securities at December 31, 2023 that were transferred from Level 2 to Level 3 of the fair value hierarchy as a result of the inability of the Fund to obtain a price using an objective method such as a pricing vendor.
See Notes to Financial Statements.
Impact Bond Fund (Unaudited)
The Fund invested in a diversified portfolio composed primarily of investment grade fixed income securities with a dollar-weighted effective duration that normally varies, in years, between +/- 20% of the duration of the Fund’s benchmark index, the Bloomberg US Aggregate Bond Index. Duration measures the sensitivity of a fixed income security’s price to changes in interest rates. The average dollar-weighted effective duration at the end of the reporting period was 5.96 years. The Investor Class of the Fund underperformed its benchmark since its inception on January 27, 2023 (2.28% (net of fees) versus 2.47%).
The Fund maintained an overweight to mortgages, asset-backed securities and taxable municipal debt throughout the time period along with an underweight to treasuries and corporates. The underweight positions to credit and treasuries were a drag with rates significantly lower on the year and spreads tighter. An underweight to duration was additive over the full time period, and the exposure to out of benchmark taxable municipal bonds offset underperformance from the underweight to treasuries.
Derivatives were not utilized in the Fund over the time period.
During the year, the Fund remained focused on its objective of maximizing total return while preserving capital and its strategy of seeking to make investments that provide current income with the intent of generating positive impact in line with the Adviser’s Christian values.
This Fund may be suitable for investors who have a short- to medium-term investment horizon, seek higher returns than those offered by a shorter maturity bond fund, can accept some short-term fluctuations in account value and want to diversify their portfolio with a fixed income investment option. This Fund is subject to interest rate risk, meaning, when interest rates rise, the value of the existing fixed income securities decrease and vice versa. Changes in interest rates have a bigger impact on long duration holdings than on short duration holdings. To the extent that the investment adviser or sub-advisers misjudge current market conditions, the Fund’s volatility may be amplified by its use of derivatives and by its ability to select sub-advisers to allocate assets.
At December 31, 2023, the portfolio holdings of the Fund, as a percentage of net assets, is shown in the following table. Portfolio holdings are subject to risk and may change at any time.
| | % |
| Mortgage-Backed Securities | 38.7 |
| Corporate Bonds | 20.9 |
| Asset-Backed Securities | 14.7 |
| U.S. Treasury Obligations | 11.5 |
| Municipal Bonds | 11.2 |
| Money Market Funds | 7.4 |
| Private Investment | 1.1 |
| Agency Obligations | 1.1 |
| Foreign Bond | 0.7 |
| Loan Agreements | 0.1 |
| | 107.4 |
See Notes to Financial Statements.
| | | Par | | Value |
| AGENCY OBLIGATIONS — 1.1% |
| United States International Development Finance Corporation | | | | |
| 1.44%, 04/15/28 | $ 500,000 | | $ 450,432 |
| 1.65%, 04/15/28 | 500,000 | | 453,818 |
Total Agency Obligations
(Cost $906,177) | | | 904,250 |
| ASSET-BACKED SECURITIES — 14.7% |
| Dext ABS LLC, Series 2020-1, Class B | | | |
| 1.92%, 11/15/27 144A | 92,556 | | 92,237 |
| Dext ABS LLC, Series 2021-1, Class D | | | |
| 2.81%, 03/15/29 144A | 450,000 | | 400,314 |
| Dext ABS LLC, Series 2023-1, Class C | | | |
| 7.13%, 09/15/32 144A | 535,000 | | 532,040 |
| Dext ABS LLC, Series 2023-1, Class D | | | |
| 8.82%, 03/15/33 144A | 370,000 | | 368,157 |
| Dext ABS LLC, Series 2023-2, Class D | | | |
| 8.30%, 05/15/34 144A | 560,000 | | 545,346 |
| GoodLeap Sustainable Home Solutions Trust, Series 2022-1GS, Class B | | | |
| 2.94%, 01/20/49 144A | 450,550 | | 338,832 |
| Helios Issuer LLC, Series 2023-GRID1, Class 1A | | | |
| 5.75%, 12/20/50 144A | 314,828 | | 327,239 |
| Hertz Vehicle Financing III LLC, Series 2023-1A, Class A | | | |
| 5.49%, 06/25/27 144A | 1,000,000 | | 1,004,916 |
| Lendbuzz Securitization Trust, Series 2023-3A, Class A2 | | | |
| 7.50%, 12/15/28 144A | 1,200,000 | | 1,217,128 |
| Loanpal Solar Loan, Ltd., Series 2021-2GS, Class A | | | |
| 2.22%, 03/20/48 144A | 403,018 | | 301,513 |
| Luminace ABS-2022 Issuer LLC, Series 2022-1, Class B | | | |
| 5.91%, 07/30/62 144A | 759,412 | | 714,655 |
| SUNNOVA HELIOS II ISSUER LLC, Series 2019-AA, Class A | | | |
| 3.75%, 06/20/46 144A | 459,176 | | 419,878 |
| Sunnova Helios II Issuer LLC, Series 2021-B, Class A | | | |
| 1.62%, 07/20/48 144A | 285,770 | | 244,475 |
| Sunnova Helios V Issuer LLC, Series 2021-A, Class A | | | |
| 1.80%, 02/20/48 144A | 318,736 | | 277,273 |
| Sunnova Helios VII Issuer LLC, Series 2021-C, Class A | | | |
| 2.03%, 10/20/48 144A | 429,125 | | 368,393 |
| Sunnova Helios XI Issuer LLC, Series 2023-A, Class B | | | |
| 5.60%, 05/20/50 144A | 607,104 | | 586,364 |
| | | Par | | Value |
| Sunnova Helios XII Issuer LLC, Series 2023-B, Class C | | | |
| 6.00%, 08/22/50 144A | $ 488,101 | | $ 451,942 |
| Sunnova Sol IV Issuer LLC, Series 2022-A, Class C | | | |
| 3.53%, 02/22/49 144A | 1,809,932 | | 1,470,886 |
| Sunrun Iris Issuer LLC, Series 2023-1A, Class A | | | |
| 5.75%, 01/30/59 144A | 198,430 | | 192,012 |
| Tesla Auto Lease Trust, Series 2021-A, Class D | | | |
| 1.34%, 03/20/25 144A | 890,000 | | 886,981 |
| Tesla Auto Lease Trust, Series 2021-B, Class C | | | |
| 1.12%, 09/22/25 144A | 800,000 | | 778,691 |
| Tesla Auto Lease Trust, Series 2021-B, Class D | | | |
| 1.32%, 09/22/25 144A | 500,000 | | 484,606 |
Total Asset-Backed Securities
(Cost $11,904,543) | | | 12,003,878 |
| CORPORATE BONDS — 20.9% |
| Agilent Technologies, Inc. | | | |
| 2.30%, 03/12/31 | 1,550,000 | | 1,346,387 |
| American Water Capital Corporation | | | |
| 4.45%, 06/01/32Δ | 1,300,000 | | 1,290,418 |
| Amgen, Inc. | | | |
| 5.25%, 03/02/33 | 1,285,000 | | 1,319,763 |
| 4.20%, 02/22/52 | 750,000 | | 638,246 |
| Avangrid, Inc. | | | |
| 3.15%, 12/01/24 | 850,000 | | 830,698 |
| 3.80%, 06/01/29 | 450,000 | | 424,672 |
| Baxalta, Inc. | | | |
| 4.00%, 06/23/25 | 500,000 | | 491,662 |
| Becton, Dickinson and Co. | | | |
| 4.69%, 02/13/28 | 1,600,000 | | 1,609,148 |
| 4.67%, 06/06/47 | 800,000 | | 751,132 |
| BlueHub Loan Fund, Inc. | | | |
| 3.10%, 01/01/30 | 625,000 | | 540,445 |
| Bridge Housing Corporation | | | |
| 3.25%, 07/15/30 | 300,000 | | 256,152 |
| DH Europe Finance II S.a.r.l. | | | |
| 2.60%, 11/15/29 | 300,000 | | 272,041 |
| Essential Utilities, Inc. | | | |
| 5.30%, 05/01/52 | 750,000 | | 720,504 |
| Gilead Sciences, Inc. | | | |
| 3.65%, 03/01/26 | 392,000 | | 383,775 |
| 5.65%, 12/01/41 | 438,000 | | 470,314 |
| Haleon U.S. Capital LLC | | | |
| 3.63%, 03/24/32 | 838,000 | | 774,711 |
| IQVIA, Inc. | | | |
| 6.25%, 02/01/29 144A | 750,000 | | 784,574 |
| Low Income Investment Fund | | | |
| 3.39%, 07/01/26 | 600,000 | | 566,297 |
| Mary Free Bed Rehabilitation Hospital | | | |
| 3.79%, 04/01/51 | 300,000 | | 223,055 |
See Notes to Financial Statements.
SCHEDULE OF INVESTMENTS (Continued)
| | | Par | | Value |
| National Community Renaissance of California | | | |
| 3.27%, 12/01/32 | $ 600,000 | | $ 495,516 |
| NextEra Energy Capital Holdings, Inc. | | | |
| 3.55%, 05/01/27 | 500,000 | | 482,139 |
| 2.44%, 01/15/32 | 980,000 | | 823,381 |
| Preservation Of Affordable Housing, Inc. | | | |
| 4.48%, 12/01/32 | 470,000 | | 453,726 |
| Providence College | | | |
| 3.19%, 11/01/50 | 600,000 | | 421,002 |
| Reinvestment Fund, Inc. (The) | | | |
| 3.93%, 02/15/28 | 500,000 | | 464,919 |
| Verizon Communications, Inc. | | | |
| 3.88%, 02/08/29 | 300,000 | | 291,359 |
Total Corporate Bonds
(Cost $17,001,081) | | | 17,126,036 |
| FOREIGN BOND — 0.7% |
| United Kingdom — 0.7% | | |
| Reckitt Benckiser Treasury Services PLC | | | |
3.00%, 06/26/27 144A
(Cost $620,039) | 650,000 | | 618,028 |
| LOAN AGREEMENTS — 0.1% |
| Ciello Supermarket, Inc. STRIP, SBA Loan | | | |
| 0.23%, 09/15/31 IO ††† | 1,596,735 | | 6,305 |
| Georgia Act and Healthcare Services, Inc. STRIP, SBA Loan | | | |
| 1.28%, 03/15/46 IO ††† | 276,210 | | 9,206 |
| Ideal Therapy Rehabilitative Services II LLC STRIP, SBA Loan | | | |
| 0.48%, 01/15/46 IO ††† | 474,334 | | 5,929 |
| MBT Industries LLC STRIP, SBA Loan | | | |
| 0.53%, 08/15/31 IO ††† | 438,876 | | 3,993 |
| MCJT Phamaceutical Care, Inc. STRIP, SBA Loan | | | |
| 1.28%, 08/15/46 IO ††† | 352,425 | | 11,747 |
| N&K Market, Inc. STRIP, SBA Loan | | | |
| 0.73%, 02/15/31 IO ††† | 249,123 | | 3,861 |
| Southwest Technologies, Inc. STRIP, SBA Loan | | | |
| 1.23%, 06/15/31 IO ††† | 371,262 | | 9,427 |
Total Loan Agreements
(Cost $55,970) | | | 50,468 |
| MORTGAGE-BACKED SECURITIES — 38.7% |
| BX Commercial Mortgage Trust, Series 2022-AHP, Class C | | | |
| (Floating, CME Term SOFR 1M + 2.09%, 2.09% Floor), 7.45%, 01/17/39 144A † | 685,000 | | 660,722 |
| Federal Home Loan Mortgage Corporation | | | |
| 2.00%, 02/01/51 | 296,063 | | 243,143 |
| 2.00%, 03/01/51 | 727,819 | | 597,424 |
| 3.00%, 02/01/52 | 629,481 | | 558,503 |
| | | Par | | Value |
| 3.50%, 03/01/52 | $1,435,764 | | $1,319,549 |
| 4.00%, 06/01/52 | 495,414 | | 469,397 |
| 4.50%, 07/01/52 | 288,233 | | 279,904 |
| 5.50%, 08/01/53 | 2,791,911 | | 2,806,225 |
| 6.00%, 08/01/53 | 1,240,054 | | 1,263,989 |
| 6.00%, 09/01/53 | 566,777 | | 576,056 |
| Federal National Mortgage Association | | | |
| 3.15%, 11/01/27 | 245,641 | | 234,813 |
| 5.16%, 10/01/28 | 500,000 | | 517,972 |
| 4.97%, 11/01/28 | 750,000 | | 769,593 |
| 1.59%, 03/01/31 | 500,000 | | 412,186 |
| 1.61%, 03/01/31 | 471,109 | | 397,382 |
| 1.62%, 03/01/31 | 500,000 | | 407,674 |
| 2.03%, 04/01/31 | 250,000 | | 211,922 |
| 2.59%, 03/01/32 | 533,386 | | 467,750 |
| 1.65%, 03/01/33 | 500,000 | | 403,172 |
| 2.01%, 03/01/33 | 100,000 | | 82,688 |
| 2.00%, 03/01/51 | 1,894,726 | | 1,555,199 |
| 3.00%, 02/01/52 | 1,991,269 | | 1,766,065 |
| 3.50%, 03/01/52 | 1,437,395 | | 1,321,185 |
| 3.50%, 04/01/52 | 721,288 | | 662,929 |
| 4.00%, 06/01/52 | 1,371,933 | | 1,299,919 |
| 4.50%, 07/01/52 | 349,125 | | 339,036 |
| 5.00%, 09/01/52 | 482,872 | | 479,045 |
| 5.50%, 10/01/52 | 536,231 | | 540,605 |
| 6.00%, 11/01/52 | 241,694 | | 246,094 |
| 6.50%, 11/01/52 | 197,554 | | 202,571 |
| 6.50%, 12/01/52 | 242,339 | | 248,494 |
| 6.00%, 08/01/53 | 1,500,666 | | 1,525,312 |
| 6.50%, 09/01/53 | 671,237 | | 688,179 |
| FRESB Mortgage Trust, Series 2021-SB87, Class A5H | | | |
| 0.78%, 04/25/41 | 441,223 | | 406,545 |
| Small Business Administration | | | |
| (Floating, Prime Rate U.S. + 1.07%), 9.57%, 06/25/30† | 44,331 | | 47,361 |
| (Floating, Prime Rate U.S. + 0.90%), 9.40%, 12/25/30† | 105,342 | | 114,399 |
| (Floating, Prime Rate U.S. + 2.33%), 10.83%, 01/25/31† | 89,601 | | 96,874 |
| (Floating, Prime Rate U.S. + 1.03%), 9.53%, 02/25/31† | 136,459 | | 148,404 |
| (Floating, Prime Rate U.S. + 0.33%), 8.83%, 07/25/31† | 233,222 | | 248,305 |
| (Floating, Prime Rate U.S. + 0.79%), 9.29%, 08/25/31† | 173,075 | | 189,638 |
| (Floating, Prime Rate U.S. + 0.64%), 9.14%, 07/25/32† | 78,895 | | 84,347 |
| (Floating, Prime Rate U.S. + 0.58%), 9.08%, 05/25/34† | 148,189 | | 164,780 |
| (Floating, Prime Rate U.S. - 0.34%), 8.16%, 12/25/45† | 162,348 | | 177,249 |
| (Floating, Prime Rate U.S. + 0.59%), 9.09%, 12/25/45† | 148,646 | | 161,918 |
| (Floating, Prime Rate U.S. + 0.12%), 8.62%, 01/25/46† | 140,326 | | 151,470 |
| (Floating, Prime Rate U.S. + 0.33%), 8.83%, 04/25/46† | 187,562 | | 200,777 |
See Notes to Financial Statements.
| | | Par | | Value |
| (Floating, Prime Rate U.S. + 0.38%), 8.88%, 08/25/46† | $ 462,820 | | $ 508,097 |
| Uniform Mortgage Backed Securities | | | |
| 2.50%, 01/01/52 TBA | 4,000,000 | | 3,406,562 |
| 2.00%, 01/01/53 TBA | 2,500,000 | | 2,044,531 |
Total Mortgage-Backed Securities
(Cost $31,823,562) | | | 31,705,954 |
| MUNICIPAL BONDS — 11.2% |
| California Municipal Finance Authority, Revenue Bond | | | |
| 4.57%, 10/01/52 | 500,000 | | 453,281 |
| California State Health Facilities Financing Authority, Revenue Bond | | | |
| 1.98%, 06/01/30 | 600,000 | | 514,711 |
| Carroll County Water Authority, Revenue Bond, Series B | | | |
| 1.96%, 07/01/29 | 150,000 | | 132,007 |
| City & County of San Francisco, General Obligation, Series A | | | |
| 1.78%, 06/15/29 | 600,000 | | 515,640 |
| City of Deltona Utility System, Revenue Bond (BAM Insured) | | | |
| 1.54%, 10/01/29 | 250,000 | | 213,365 |
| City of Phoenix Civic Improvement Corporation, Junior Lien Revenue Bond, Series C | | | |
| 1.84%, 07/01/29 | 640,000 | | 562,650 |
| Connecticut Green Bank, Revenue Bond | | | |
| 2.15%, 11/15/29 | 207,000 | | 180,089 |
| Connecticut Housing Finance Authority, Revenue Bond, Series 29 | | | |
| 1.20%, 06/15/25 | 400,000 | | 379,565 |
| District of Columbia Housing Finance Agency, Revenue Bond, Series A-2 (FHA Insured) | | | |
| 1.90%, 03/01/29 | 140,000 | | 120,243 |
| 2.05%, 03/01/30 | 420,000 | | 352,998 |
| Lancaster Power Authority, Revenue Bond (AGM Insured) | | | |
| 2.56%, 11/01/33 | 275,000 | | 225,705 |
| 2.68%, 11/01/34 | 275,000 | | 223,211 |
| Metropolitan Water District of Salt Lake & Sandy, Revenue Bond, Series B | | | |
| 1.52%, 07/01/28 | 200,000 | | 177,776 |
| Monterey Regional Waste Management Authority, Revenue Bond | | | |
| 2.31%, 04/01/32 | 700,000 | | 592,839 |
| Narragansett Bay Commission, Revenue Bond | | | |
| 2.09%, 09/01/30 | 500,000 | | 431,700 |
| New York City Housing Development Corporation, Revenue Bond, Series B | | | |
| 0.82%, 05/01/25 | 150,000 | | 142,008 |
| | | Par | | Value |
| 0.92%, 11/01/25 | $ 200,000 | | $ 186,225 |
| 1.02%, 05/01/26 | 250,000 | | 229,179 |
| Newark Higher Education Finance Corporation, Revenue Bond, Series A | | | |
| 4.62%, 04/01/50 | 600,000 | | 503,491 |
| North Carolina Capital Facilities Finance Agency, Revenue Bond, Series B | | | |
| 1.43%, 10/01/24 | 100,000 | | 97,034 |
| Philadelphia Authority for Industrial Development, Revenue Bond, Holy Family University Project | | | |
| 4.30%, 09/01/24 | 200,000 | | 198,361 |
| Redevelopment Authority of the City of Philadelphia, Revenue Bond, Series A | | | |
| 1.93%, 09/01/27 | 500,000 | | 456,550 |
| Rowland Water District, Revenue Bond, Series A | | | |
| 2.56%, 12/01/36 | 590,000 | | 458,828 |
| San Antonio Education Facilities Corporation, Revenue Bond | | | |
| 1.74%, 04/01/25 | 250,000 | | 237,542 |
| San Diego Public Facilities Financing Authority, Revenue Bond, Series B | | | |
| 2.13%, 08/01/29 | 290,000 | | 256,457 |
| Santa Clara Valley Water District COPS | | | |
| 1.78%, 06/01/31 | 440,000 | | 363,229 |
| Somerset County Improvement Authority, Revenue Bond (County Gtd.) | | | |
| 0.97%, 04/15/25 | 530,000 | | 503,954 |
| Tift County Hospital Authority, Revenue Bond (County Gtd.) | | | |
| 1.05%, 12/01/25 | 325,000 | | 302,318 |
| United Independent School District, General Obligation (PSF-Gtd.) | | | |
| 5.00%, 08/15/25 | 160,000 | | 160,773 |
Total Municipal Bonds
(Cost $9,249,892) | | | 9,171,729 |
| PRIVATE INVESTMENT — 1.1% |
Calvert Impact Capital, Inc.
2.50%, 01/30/26 | 1,000,000 | | 938,067 |
FBC ROGERS 6.00% 5/15/50
0.00%, 05/16/50++ ††† | — | | — |
Total Private Investment
(Cost $1,000,000) | | | 938,067 |
| U.S. TREASURY OBLIGATIONS — 11.5% |
| U.S. Treasury Bonds | | | | |
| 3.63%, 08/15/43 | 1,600,000 | | 1,476,875 |
| 4.00%, 11/15/52 | 1,350,000 | | 1,338,451 |
| 3.63%, 02/15/53 | 2,750,000 | | 2,552,183 |
| | | | | 5,367,509 |
| U.S. Treasury Notes | | | | |
| 3.88%, 12/31/27 | 2,000,000 | | 1,998,594 |
See Notes to Financial Statements.
SCHEDULE OF INVESTMENTS (Continued)
| | | Par | | Value |
| 1.13%, 08/31/28 | $2,300,000 | | $2,033,119 |
| | | | | 4,031,713 |
Total U.S. Treasury Obligations
(Cost $9,266,937) | | | 9,399,222 |
| | | Shares | |
| MONEY MARKET FUNDS — 7.4% |
| Northern Institutional Liquid Assets Portfolio (Shares), 5.40%Ø § | 1,319,500 | 1,319,500 |
GuideStone Money Market Fund, 5.28%
(Institutional Class)Ø ∞ | 4,580,181 | 4,580,181 |
| | | Shares | | Value |
| Northern Institutional U.S. Treasury Portfolio (Premier), 5.22%Ø | 183,314 | | $ 183,314 |
Total Money Market Funds
(Cost $6,082,995) | | | 6,082,995 |
TOTAL INVESTMENTS —107.4%
(Cost $87,911,196) | | | 88,000,627 |
Liabilities in Excess of Other
Assets — (7.4)% | | | (6,093,897) |
| NET ASSETS — 100.0% | | | $81,906,730 |
VALUATION HIERARCHY
The following is a summary of the inputs used, as of December 31, 2023, in valuing the Fund’s investments carried at fair value:
| | Total
Value | | Level 1
Quoted Prices | | Level 2
Other Significant
Observable Inputs | | Level 3
Significant
Unobservable Inputs |
| Assets: | | | | | | | |
| Investments in Securities: | | | | | | | |
| Agency Obligations | $ 904,250 | | $ — | | $ 904,250 | | $ — |
| Asset-Backed Securities | 12,003,878 | | — | | 12,003,878 | | — |
| Corporate Bonds | 17,126,036 | | — | | 17,126,036 | | — |
| Foreign Bond | 618,028 | | — | | 618,028 | | — |
| Loan Agreements | 50,468 | | — | | — | | 50,468 |
| Money Market Funds | 6,082,995 | | 6,082,995 | | — | | — |
| Mortgage-Backed Securities | 31,705,954 | | — | | 31,705,954 | | — |
| Municipal Bonds | 9,171,729 | | — | | 9,171,729 | | — |
| Private Investment | 938,067 | | — | | 938,067 | | —** |
| U.S. Treasury Obligations | 9,399,222 | | — | | 9,399,222 | | — |
| Total Assets - Investments in Securities | $88,000,627 | | $6,082,995 | | $81,867,164 | | $50,468 |
| ** | Level 3 security has zero value. |
Management has determined that the amount of Level 3 securities compared to total net assets is not material; therefore, the reconciliation of Level 3 securities and assumptions is not shown for the year ended December 31, 2023.
See Notes to Financial Statements.
(This page intentionally left blank)
| STATEMENTS OF ASSETS AND LIABILITIES | December 31, 2023 |
| | Money
Market Fund | | Low-Duration
Bond Fund |
| Assets | | | |
| Investments in securities of unaffiliated issuers, at value* | $ 864,083,836 | | $894,070,159 |
| Investments in repurchase agreements, at value | 719,000,000 | | — |
| Investments in securities of affiliated issuers, at value | — | | 34,160,936 |
| Total investments, at value(1), (2) | 1,583,083,836 | | 928,231,095 |
| Cash | 1,823,930 | | 88,396 |
| Cash collateral for derivatives | — | | 962,949 |
| Deposits with broker for futures contracts | — | | 2,522,896 |
| Foreign currency(3) | — | | 419,543 |
| Upfront premiums paid from swap agreements | — | | — |
| Receivables: | | | |
| Dividends | — | | 178,745 |
| Reclaims | — | | — |
| Interest | 3,517,164 | | 6,120,594 |
| Securities lending | — | | 9,075 |
| From advisor | — | | — |
| Investment securities sold | — | | 13,386,097 |
| Fund shares sold | 9,993,965 | | 867,674 |
| Variation margin on centrally cleared swaps | — | | 1,284 |
| Variation margin on futures contracts | — | | 152,026 |
| Unrealized appreciation on foreign currency exchange contracts | — | | 87,211 |
| Unrealized appreciation on swap agreements | — | | — |
| Prepaid expenses and other assets | 34,769 | | 20,642 |
| Total Assets | 1,598,453,664 | | 953,048,227 |
| Liabilities | | | |
| Cash Overdraft | — | | — |
| TBA sale commitments, at value(4) | — | | — |
| Options written, at value(5) | — | | — |
| Upfront premiums received from swap agreements | — | | 290,220 |
| Unrealized depreciation on foreign currency exchange contracts | — | | 219,720 |
| Unrealized depreciation on swap agreements | — | | — |
| Collateral held for securities on loan, at value | — | | 12,188,915 |
| Collateral from counterparty | — | | 125,956 |
| Payables: | | | |
| Investment securities purchased | 3,380,984 | | 70,521,907 |
| Fund shares redeemed | 32,722,436 | | 1,417,636 |
| Variation margin on centrally cleared swaps | — | | — |
| Distributions | 2,710,347 | | — |
| Accrued expenses: | | | |
| Investment advisory fees | 146,016 | | 249,972 |
| Shareholder servicing fees | 122,931 | | 41,311 |
| Director fees | 4,657 | | 1,517 |
| Other expenses | 87,179 | | 119,585 |
| Total Liabilities | 39,174,550 | | 85,176,739 |
| Commitments and contingencies | — | | — |
| Net Assets | $1,559,279,114 | | $867,871,488 |
| Net Assets Consist of: | | | |
| Paid-in-capital | $1,559,276,118 | | $923,278,642 |
| Distributable earnings (loss) | 2,996 | | (55,407,154) |
| Net Assets | $1,559,279,114 | | $867,871,488 |
| Net Asset Value: | | | |
| $0.001 par value, unlimited shares authorized | | | |
| Net assets applicable to the Institutional Class | $ 977,070,754 | | $670,255,391 |
| Institutional shares outstanding | 977,033,901 | | 52,321,733 |
| Net asset value, offering and redemption price per Institutional share | $ 1.00 | | $ 12.81 |
| Net assets applicable to the Investor Class | $ 582,208,360 | | $197,616,097 |
| Investor shares outstanding | 582,152,293 | | 15,421,775 |
| Net asset value, offering and redemption price per Investor share | $ 1.00 | | $ 12.81 |
| | | |
| | | | |
| (1)Investments in securities of unaffiliated issuers, at cost* | $ 864,083,836 | | $901,960,577 |
| Investments in repurchase agreements, at cost | 719,000,000 | | — |
| Investments in securities of affiliated issuers, at cost | — | | 34,160,936 |
| Total investments, at cost | $1,583,083,836 | | $936,121,513 |
| (2)Includes securities loaned of: | $ — | | $ 18,091,929 |
| (3)Foreign currency, at cost | $ — | | $ 414,805 |
| (4)TBA sale commitments, at cost | $ — | | $ — |
| (5)Premiums received on options written | $ — | | $ — |
| (6)The closing of the commitment was held on May 31, 2023. The uncalled capital commitment at December 31, 2023 was $1,200,000. | | | |
| (7)See Note 3c in Notes to Financial Statements. | | | |
| * Includes Purchased Options |
See Notes to Financial Statements.
Medium-Duration
Bond Fund | | Global
Bond Fund | | Impact Bond Fund |
| | | | | |
| $2,705,657,086 | | $566,331,757 | | $83,420,446 |
| 343,500,000 | | — | | — |
| 34,318,962 | | 25,785,040 | | 4,580,181 |
| 3,083,476,048 | | 592,116,797 | | 88,000,627 |
| — | | 1,245,033 | | — |
| 22,525,924 | | 9,262,740 | | — |
| 2,507,733 | | 1,917,405 | | — |
| 4,326,746 | | 6,460,385 | | — |
| 12,234,471 | | 719,431 | | — |
| | | | | |
| 424,482 | | 143,871 | | 21,494 |
| 91,350 | | 81,552 | | — |
| 14,893,156 | | 5,249,461 | | 521,622 |
| 13,639 | | 7,232 | | 254 |
| — | | — | | 22,246 |
| 449,874,537 | | 12,490 | | 3,299,075 |
| 2,749,284 | | 132,798 | | 2,518 |
| 198,045 | | — | | — |
| 56,222 | | 1,897,049 | | — |
| 2,316,418 | | 26,444,461 | | — |
| 60,308 | | — | | — |
| 31,747 | | 21,070 | | 22,698 |
| 3,595,780,110 | | 645,711,775 | | 91,890,534 |
| | | | | |
| 1,424,343 | | — | | 144,958 |
| 64,858,067 | | — | | — |
| 1,065,095 | | — | | — |
| 6,508,206 | | 405,499 | | — |
| 4,616,879 | | 28,166,159 | | — |
| 17,209 | | — | | — |
| 37,680,005 | | 28,080,100 | | 1,319,500 |
| 26,049,316 | | 7,416,670 | | — |
| | | | | |
| 991,198,629 | | 1,942,993 | | 8,417,005 |
| 152,592 | | 2,289,049 | | 57 |
| — | | 497 | | — |
| — | | — | | — |
| | | | | |
| 636,098 | | 229,399 | | 25,894 |
| 80,904 | | 23,153 | | 3,590 |
| 1,954 | | 936 | | 72 |
| 205,705 | | 111,539 | | 72,728 |
| 1,134,495,002 | | 68,665,994 | | 9,983,804 |
| — | | — | | — (6), (7) |
| $2,461,285,108 | | $577,045,781 | | $81,906,730 |
| | | | | |
| $2,786,716,065 | | $652,825,910 | | $82,488,875 |
| (325,430,957) | | (75,780,129) | | (582,145) |
| $2,461,285,108 | | $577,045,781 | | $81,906,730 |
| | | | | |
| | | | | |
| $2,071,217,476 | | $466,381,312 | | $64,778,228 |
| 160,901,756 | | 53,428,622 | | 6,567,719 |
| $ 12.87 | | $ 8.73 | | $ 9.86 |
| $ 390,067,632 | | $110,664,469 | | $17,128,502 |
| 30,298,727 | | 12,747,359 | | 1,737,121 |
| $ 12.87 | | $ 8.68 | | $ 9.86 |
| | | | | |
| | | | | |
| $2,801,468,122 | | $597,372,765 | | $83,331,015 |
| 343,500,000 | | — | | — |
| 34,318,962 | | 25,785,040 | | 4,580,181 |
| $3,179,287,084 | | $623,157,805 | | $87,911,196 |
| $ 58,163,504 | | $ 30,430,142 | | $ 1,290,418 |
| $ 4,342,154 | | $ 6,420,720 | | $ — |
| $ 63,721,207 | | $ — | | $ — |
| $ 680,596 | | $ — | | $ — |
| | | | | |
| | | | | |
| | | | | |
See Notes to Financial Statements.
| STATEMENTS OF OPERATIONS | For the Year Ended December 31, 2023 |
| | Money
Market Fund | | Low-Duration
Bond Fund |
| Investment Income | | | |
| Dividends | $ — | | $ 176,030 |
| Income distributions received from affiliated funds | — | | 1,366,725 |
| Interest | 78,955,182 | | 44,968,628 |
| Securities lending, net | — | | 170,260 |
| Less foreign taxes withheld | — | | (5,094) |
| Total Investment Income | 78,955,182 | | 46,676,549 |
| Expenses | | | |
| Investment advisory fees | 1,722,286 | | 3,115,755 |
| Transfer agent fees: | | | |
| Institutional shares | 4,917 | | 5,546 |
| Investor shares | 53,169 | | 20,475 |
| Custodian fees | 16,250 | | 133,521 |
| Shareholder servicing fees: | | | |
| Investor shares | 1,349,962 | | 517,536 |
| Accounting and administration fees | 212,059 | | 152,443 |
| Professional fees | 122,992 | | 184,981 |
| Blue sky fees: | | | |
| Institutional shares | 34,247 | | 18,755 |
| Investor shares | 32,620 | | 20,123 |
| Shareholder reporting fees: | | | |
| Institutional shares | 3,474 | | 5,254 |
| Investor shares | 48,700 | | 10,119 |
| Directors expenses | 24,594 | | 8,960 |
| Line of credit facility fees | 6,008 | | 4,451 |
| Dividends on securities sold short | — | | 28,763 |
| Other expenses | 81,231 | | 44,973 |
| Total Expenses | 3,712,509 | | 4,271,655 |
| Expenses waived/reimbursed(2) | — | | — |
| Net Expenses | 3,712,509 | | 4,271,655 |
| Net Investment Income | 75,242,673 | | 42,404,894 |
| Realized and Unrealized Gain (Loss) | | | |
| Net realized gain (loss) from: | | | |
| Capital gain distributions received from affiliated funds | — | | 110 |
| Investment securities | 13,646 | | (15,578,242) |
| Investment securities sold short | — | | (8,398) |
| TBA sale commitments | — | | 14,997 |
| Futures transactions | — | | (2,186,525) |
| Swap agreements | — | | (2,846,762) |
| Option contracts written | — | | — |
| Option contracts purchased | — | | (2) |
| Forward foreign currency contracts | — | | (1,491,381) |
| Foreign currency | — | | 17,567 |
| Net realized gain (loss) | 13,646 | | (22,078,636) |
| Net change in unrealized appreciation (depreciation) on: | | | |
| Investment securities | — | | 30,831,742 |
| TBA sale commitments | — | | (7,930) |
| Futures | — | | (966,062) |
| Swap agreements | — | | 2,324,079 |
| Option contracts written | — | | — |
| Option contracts purchased | — | | — |
| Forward foreign currency contracts | — | | 1,075,313 |
| Foreign currency | — | | 17 |
| Net change in unrealized appreciation (depreciation) | — | | 33,257,159 |
| Net Realized and Unrealized Gain (Loss) | 13,646 | | 11,178,523 |
| Net Increase in Net Assets Resulting from Operations | $75,256,319 | | $ 53,583,417 |
| |
| (2) | See Note 3c in Notes to Financial Statements. |
See Notes to Financial Statements.
Medium-Duration
Bond Fund | | Global
Bond Fund | | Impact Bond Fund(1) |
| | | | | |
| $ 684,278 | | $ 226,892 | | $ 25,046 |
| 2,868,821 | | 1,523,521 | | 197,491 |
| 89,160,362 | | 22,922,372 | | 2,967,289 |
| 298,429 | | 137,684 | | 1,910 |
| (742) | | (69,939) | | — |
| 93,011,148 | | 24,740,530 | | 3,191,736 |
| | | | | |
| 6,904,366 | | 2,601,027 | | 241,729 |
| | | | | |
| 5,639 | | 5,133 | | 3,681 |
| 48,419 | | 30,531 | | 12,327 |
| 438,167 | | 200,880 | | 15,271 |
| | | | | |
| 912,811 | | 258,136 | | 29,237 |
| 279,101 | | 80,133 | | 24,244 |
| 194,532 | | 186,857 | | 206,488 |
| | | | | |
| 17,612 | | 19,695 | | 22,225 |
| 26,337 | | 17,629 | | 22,275 |
| | | | | |
| 9,458 | | 5,603 | | 130 |
| 30,700 | | 15,827 | | 5,877 |
| 11,070 | | 5,555 | | 948 |
| 8,333 | | 2,199 | | 279 |
| — | | — | | — |
| 114,250 | | 49,337 | | 27,696 |
| 9,000,795 | | 3,478,542 | | 612,407 |
| — | | — | | (258,036) |
| 9,000,795 | | 3,478,542 | | 354,371 |
| 84,010,353 | | 21,261,988 | | 2,837,365 |
| | | | | |
| | | | | |
| 48 | | 210 | | 39 |
| (89,535,725) | | (29,668,913) | | (692,294) |
| 256,205 | | — | | — |
| — | | — | | — |
| (1,667,363) | | (5,334,478) | | — |
| 1,261,824 | | (2,154,943) | | — |
| 2,316,721 | | — | | — |
| (6,098,772) | | (142,085) | | — |
| 2,988,851 | | (8,972,678) | | — |
| 195,879 | | 247,244 | | — |
| (90,282,332) | | (46,025,643) | | (692,255) |
| | | | | |
| 132,064,014 | | 52,442,025 | | 89,431 |
| (1,852,095) | | — | | — |
| 4,489,772 | | 4,886,491 | | — |
| 4,708,911 | | (368,632) | | — |
| (269,603) | | — | | — |
| 616,358 | | (106,103) | | — |
| (1,685,137) | | 569,000 | | — |
| 104,646 | | (18,883) | | — |
| 138,176,866 | | 57,403,898 | | 89,431 |
| 47,894,534 | | 11,378,255 | | (602,824) |
| $131,904,887 | | $ 32,640,243 | | $2,234,541 |
| |
| (1) | For the period January 27, 2023 (commencement of operations) through December 31, 2023. |
See Notes to Financial Statements.
| STATEMENTS OF CHANGES IN NET ASSETS |
| | Money Market Fund |
| | For the Year Ended |
| | 12/31/23 | | 12/31/22 |
| | | | |
| Operations: | | | |
| Net investment income | $ 75,242,673 | | $ 23,559,141 |
| Net realized gain (loss) on investment securities, foreign currency and derivatives | 13,646 | | 29,636 |
| Net change in unrealized appreciation (depreciation) on investment securities, foreign currency and derivatives | — | | — |
| Net increase (decrease) in net assets resulting from operations | 75,256,319 | | 23,588,777 |
| Distributions to Shareholders: | | | |
| Distributions paid | | | |
| Institutional shares | (50,192,980) | | (17,026,225) |
| Investor shares | (25,064,833) | | (6,565,132) |
| Return of capital | | | |
| Institutional shares | — | | — |
| Investor shares | — | | — |
| Total distributions | (75,257,813) | | (23,591,357) |
| Capital Share Transactions: | | | |
| Proceeds from shares sold | | | |
| Institutional shares | 6,084,020,619 | | 6,874,995,603 |
| Investor shares | 211,736,909 | | 464,431,470 |
| Reinvestment of dividends and distributions | | | |
| Institutional shares | 18,382,350 | | 4,659,638 |
| Investor shares | 24,945,983 | | 6,450,251 |
| Total proceeds from shares sold and reinvested | 6,339,085,861 | | 7,350,536,962 |
| Value of shares redeemed | | | |
| Institutional shares | (6,174,935,623) | | (6,984,269,683) |
| Investor shares | (172,212,164) | | (402,783,948) |
| Total value of shares redeemed | (6,347,147,787) | | (7,387,053,631) |
| Net increase (decrease) from capital share transactions(1) | (8,061,926) | | (36,516,669) |
| Total increase (decrease) in net assets | (8,063,420) | | (36,519,249) |
| Net Assets: | | | |
| Beginning of Year | 1,567,342,534 | | 1,603,861,783 |
| End of Year | $ 1,559,279,114 | | $ 1,567,342,534 |
| |
| (1) | See Note 6 in Notes to Financial Statements. |
See Notes to Financial Statements.
| Low-Duration Bond Fund | | Medium-Duration Bond Fund |
| For the Year Ended | | For the Year Ended |
| 12/31/23 | | 12/31/22 | | 12/31/23 | | 12/31/22 |
| | | | | | | |
| | | | | | | |
| $ 42,404,894 | | $ 17,715,749 | | $ 84,010,353 | | $ 53,833,894 |
| (22,078,636) | | (25,896,741) | | (90,282,332) | | (151,055,541) |
| 33,257,159 | | (37,690,801) | | 138,176,866 | | (249,811,226) |
| 53,583,417 | | (45,871,793) | | 131,904,887 | | (347,032,873) |
| | | | | | | |
| | | | | | | |
| (31,023,568) | | (15,626,094) | | (62,975,505) | | (37,521,331) |
| (6,384,985) | | (3,878,106) | | (12,405,888) | | (6,572,146) |
| | | | | | | |
| — | | — | | — | | — |
| — | | — | | — | | — |
| (37,408,553) | | (19,504,200) | | (75,381,393) | | (44,093,477) |
| | | | | | | |
| | | | | | | |
| 350,032,622 | | 231,724,581 | | 644,728,519 | | 360,156,796 |
| 59,521,542 | | 98,385,818 | | 121,158,549 | | 104,393,941 |
| | | | | | | |
| 31,008,986 | | 15,177,576 | | 62,337,084 | | 37,198,933 |
| 6,365,388 | | 3,842,898 | | 12,004,132 | | 6,308,115 |
| 446,928,538 | | 349,130,873 | | 840,228,284 | | 508,057,785 |
| | | | | | | |
| (502,571,156) | | (252,952,555) | | (355,499,857) | | (351,920,454) |
| (78,117,202) | | (118,245,155) | | (90,230,580) | | (163,714,524) |
| (580,688,358) | | (371,197,710) | | (445,730,437) | | (515,634,978) |
| (133,759,820) | | (22,066,837) | | 394,497,847 | | (7,577,193) |
| (117,584,956) | | (87,442,830) | | 451,021,341 | | (398,703,543) |
| | | | | | | |
| 985,456,444 | | 1,072,899,274 | | 2,010,263,767 | | 2,408,967,310 |
| $ 867,871,488 | | $ 985,456,444 | | $2,461,285,108 | | $2,010,263,767 |
See Notes to Financial Statements.
| STATEMENTS OF CHANGES IN NET ASSETS |
| | Global Bond Fund | | Impact Bond Fund |
| | For the Year Ended | | For the Period Ended |
| | 12/31/23 | | 12/31/22 | | 12/31/23 (1) |
| | | | | | |
| Operations: | | | | | |
| Net investment income | $ 21,261,988 | | $ 16,403,985 | | $ 2,837,365 |
| Net realized loss on investment securities, foreign currency and derivatives | (46,025,643) | | (16,576,368) | | (692,255) |
| Net change in unrealized appreciation (depreciation) on investment securities, foreign currency and derivatives | 57,403,898 | | (83,356,007) | | 89,431 |
| Net increase (decrease) in net assets resulting from operations | 32,640,243 | | (83,528,390) | | 2,234,541 |
| Distributions to Shareholders: | | | | | |
| Distributions paid | | | | | |
| Institutional shares | (6,322,187) | | (5,395,149) | | (2,246,032) |
| Investor shares | (1,185,622) | | (1,012,319) | | (487,981) |
| Return of capital | | | | | |
| Institutional shares | — | | (525,427) | | — |
| Investor shares | — | | (119,981) | | — |
| Total distributions | (7,507,809) | | (7,052,876) | | (2,734,013) |
| Capital Share Transactions: | | | | | |
| Proceeds from shares sold | | | | | |
| Institutional shares | 74,323,483 | | 67,742,082 | | 77,889,598 |
| Investor shares | 29,897,055 | | 20,775,064 | | 18,038,597 |
| Reinvestment of dividends and distributions | | | | | |
| Institutional shares | 6,315,505 | | 5,915,236 | | 2,245,920 |
| Investor shares | 1,163,996 | | 1,116,198 | | 487,981 |
| Total proceeds from shares sold and reinvested | 111,700,039 | | 95,548,580 | | 98,662,096 |
| Value of shares redeemed | | | | | |
| Institutional shares | (68,631,892) | | (68,473,196) | | (14,842,562) |
| Investor shares | (23,182,164) | | (27,460,526) | | (1,413,332) |
| Total value of shares redeemed | (91,814,056) | | (95,933,722) | | (16,255,894) |
| Net increase (decrease) from capital share transactions(2) | 19,885,983 | | (385,142) | | 82,406,202 |
| Total increase (decrease) in net assets | 45,018,417 | | (90,966,408) | | 81,906,730 |
| Net Assets: | | | | | |
| Beginning of Year | 532,027,364 | | 622,993,772 | | — |
| End of Year | $577,045,781 | | $532,027,364 | | $ 81,906,730 |
| |
| (1) | For the period January 27, 2023 (commencement of operations) through December 31, 2023. |
| (2) | See Note 6 in Notes to Financial Statements. |
See Notes to Financial Statements.
| For a Share Outstanding For the Years Ending December 31, unless otherwise indicated | | | | | | | | | | Ratios to Average Net Assets | |
| | | Net Asset
Value,
Beginning
of Year | Net Investment
Income# | Realized
and
Unrealized
Gain
(Loss) on
Investments | | Total Income
From Investment
Operations | Dividends
from Net
Investment
Income | Distributions
from Net
Realized
Capital
Gains | Total
Distributions
Paid | Net Asset
Value,
End of
Year | | Total
Return | | Net Assets,
End of Year
(000) | | Expenses,
Net | | Expenses,
Gross | | Investment
Income,
Net | Portfolio
Turnover
Rate |
| Money Market Fund | |
| Institutional Class | |
| 2023 | | $ 1.00 | $0.05 | $ —† | | $ 0.05 | $(0.05) | $ —† | $(0.05) | $ 1.00 | | 5.01% | | $ 977,071 | | 0.14% | | 0.14% | | 4.89% | N/A |
| 2022 | | 1.00 | 0.01 | —† | | 0.01 | (0.01) | —† | (0.01) | 1.00 | | 1.50 | | 1,049,604 | | 0.13 | | 0.14 | | 1.49 | N/A |
| 2021 | | 1.00 | — | —† | | —† | — | — | — | 1.00 | | — | | 1,154,219 | | 0.07 | | 0.14 | | — | N/A |
| 2020 | | 1.00 | —† | —† | | —† | —† | — | —† | 1.00 | | 0.43 | | 1,168,144 | | 0.14 | | 0.15 | | 0.39 | N/A |
| 2019 | | 1.00 | 0.02 | —† | | 0.02 | (0.02) | — | (0.02) | 1.00 | | 2.13 | | 904,202 | | 0.14 | | 0.14 | | 2.10 | N/A |
| Investor Class | |
| 2023 | | $ 1.00 | $0.05 | $ —† | | $ 0.05 | $(0.05) | $ —† | $(0.05) | $ 1.00 | | 4.73% | | $ 582,208 | | 0.41% | | 0.41% | | 4.64% | N/A |
| 2022 | | 1.00 | 0.01 | —† | | 0.01 | (0.01) | —† | (0.01) | 1.00 | | 1.29 | | 517,739 | | 0.34 | | 0.41 | | 1.31 | N/A |
| 2021 | | 1.00 | — | —† | | —† | — | — | — | 1.00 | | — | | 449,643 | | 0.08 | | 0.41 | | — | N/A |
| 2020 | | 1.00 | —† | —† | | —† | —† | — | —† | 1.00 | | 0.28 | | 475,081 | | 0.29 | | 0.42 | | 0.25 | N/A |
| 2019 | | 1.00 | 0.02 | —† | | 0.02 | (0.02) | — | (0.02) | 1.00 | | 1.85 | | 391,966 | | 0.42 | | 0.42 | | 1.83 | N/A |
| | |
| Low-Duration Bond Fund | |
| Institutional Class | |
| 2023 | | $12.61 | $0.49 | $ 0.14 | | $ 0.63 | $(0.43) | $ — | $(0.43) | $12.81 | | 5.09% | | $ 670,255 | | 0.34%(1) | | 0.34%(1) | | 3.89% | 209% |
| 2022 | | 13.42 | 0.23 | (0.78) | | (0.55) | (0.26) | — | (0.26) | 12.61 | | (4.13) | | 778,792 | | 0.34 | | 0.34 | | 1.79 | 233 |
| 2021 | | 13.62 | 0.12 | (0.17) | | (0.05) | (0.14) | (0.01) | (0.15) | 13.42 | | (0.40) | | 835,297 | | 0.34 | | 0.34 | | 0.85 | 304 |
| 2020 | | 13.40 | 0.19 | 0.26 | | 0.45 | (0.23) | — | (0.23) | 13.62 | | 3.42 | | 822,079 | | 0.35 | | 0.35 | | 1.44 | 220 |
| 2019 | | 13.21 | 0.32 | 0.20 | | 0.52 | (0.33) | — | (0.33) | 13.40 | | 3.99 | | 761,737 | | 0.35 | | 0.35 | | 2.39 | 525 |
| Investor Class | |
| 2023 | | $12.61 | $0.46 | $ 0.14 | | $ 0.60 | $(0.40) | $ — | $(0.40) | $12.81 | | 4.82% | | $ 197,616 | | 0.61%(1) | | 0.61%(1) | | 3.60% | 209% |
| 2022 | | 13.43 | 0.19 | (0.78) | | (0.59) | (0.23) | — | (0.23) | 12.61 | | (4.43) | | 206,664 | | 0.61 | | 0.61 | | 1.48 | 233 |
| 2021 | | 13.62 | 0.08 | (0.17) | | (0.09) | (0.09) | (0.01) | (0.10) | 13.43 | | (0.65) | | 237,602 | | 0.61 | | 0.61 | | 0.58 | 304 |
| 2020 | | 13.40 | 0.16 | 0.26 | | 0.42 | (0.20) | — | (0.20) | 13.62 | | 3.16 | | 240,682 | | 0.62 | | 0.62 | | 1.17 | 220 |
| 2019 | | 13.21 | 0.29 | 0.20 | | 0.49 | (0.30) | — | (0.30) | 13.40 | | 3.71 | | 232,967 | | 0.62 | | 0.62 | | 2.16 | 525 |
| | |
| Medium-Duration Bond Fund | |
| Institutional Class | |
| 2023 | | $12.55 | $0.51 | $ 0.27 | | $ 0.78 | $(0.46) | $ — | $(0.46) | $12.87 | | 6.37% | | $2,071,217 | | 0.38% | | 0.38% | | 4.03% | 414% |
| 2022 | | 15.04 | 0.35 | (2.55) | | (2.20) | (0.29) | — | (0.29) | 12.55 | | (14.68) | | 1,672,089 | | 0.38 | | 0.38 | | 2.63 | 366 |
| 2021 | | 15.65 | 0.24 | (0.56) | | (0.32) | (0.27) | (0.02) | (0.29) | 15.04 | | (2.01) | | 1,950,666 | | 0.36 | | 0.36 | | 1.60 | 347 |
| 2020 | | 15.05 | 0.33 | 1.03 | | 1.36 | (0.37) | (0.39) | (0.76) | 15.65 | | 9.13 | | 1,694,858 | | 0.38 | | 0.38 | | 2.12 | 444 |
| 2019 | | 14.28 | 0.43 | 0.96 | | 1.39 | (0.42) | (0.20) | (0.62) | 15.05 | | 9.81 | | 1,476,286 | | 0.39 | | 0.39 | | 2.90 | 433 |
| Investor Class | |
| 2023 | | $12.56 | $0.47 | $ 0.27 | | $ 0.74 | $(0.43) | $ — | $(0.43) | $12.87 | | 6.01% | | $ 390,068 | | 0.66% | | 0.66% | | 3.75% | 414% |
| 2022 | | 15.05 | 0.31 | (2.55) | | (2.24) | (0.25) | — | (0.25) | 12.56 | | (14.89) | | 338,175 | | 0.65 | | 0.65 | | 2.35 | 366 |
| 2021 | | 15.66 | 0.20 | (0.56) | | (0.36) | (0.23) | (0.02) | (0.25) | 15.05 | | (2.27) | | 458,302 | | 0.62 | | 0.62 | | 1.33 | 347 |
| 2020 | | 15.06 | 0.29 | 1.02 | | 1.31 | (0.32) | (0.39) | (0.71) | 15.66 | | 8.84 | | 421,106 | | 0.65 | | 0.65 | | 1.84 | 444 |
| 2019 | | 14.28 | 0.39 | 0.97 | | 1.36 | (0.38) | (0.20) | (0.58) | 15.06 | | 9.58 | | 307,912 | | 0.65 | | 0.65 | | 2.63 | 433 |
| | | | | | | | | | | | | | | | | | | | | | |
| # | Calculated using the average shares outstanding method. |
| † | Amount represents less than $0.005 per share. |
| (1) | The ratio for the Low-Duration Bond Fund includes the effect of dividend expense on securities sold short which increased the ratio by 0.00% for 2023. |
See Notes to Financial Statements.
FINANCIAL HIGHLIGHTS (Continued)
| For a Share Outstanding For the Years Ending December 31, unless otherwise indicated | | | | | | | | | | | | Ratios to Average Net Assets |
| | | Net Asset
Value,
Beginning
of Year | Net Investment
Income# | Realized
and
Unrealized
Gain
(Loss) on
Investments | | Total Income
From Investment
Operations | | Dividends
from Net
Investment
Income | Distributions
from Net
Realized
Capital
Gains | Return
of
capital | Total
Distributions
Paid | Net Asset
Value,
End of
Year | | Total
Return | | Net Assets,
End of Year
(000) | | Expenses,
Net | | Expenses,
Gross | Investment
Income,
Net | Portfolio
Turnover
Rate |
| Global Bond Fund | |
| Institutional Class | |
| 2023 | | $ 8.35 | $0.33 | $ 0.17 | | $ 0.50 | | $(0.12) | $ — | $ — | $(0.12) | $ 8.73 | | 6.02% | | $466,381 | | 0.57% | | 0.57% | 3.92% | 48% |
| 2022 | | 9.77 | 0.26 | (1.56) | | (1.30) | | (0.10) | (0.01) | (0.01) | (0.12) | 8.35 | | (13.37) | | 433,956 | | 0.57 | | 0.57 | 3.04 | 59 |
| 2021 | | 10.38 | 0.27 | (0.51) | | (0.24) | | (0.21) | (0.16) | — | (0.37) | 9.77 | | (2.31) | | 502,292 | | 0.56 | | 0.56 | 2.69 | 57 |
| 2020 | | 10.01 | 0.29 | 0.23 | | 0.52 | | (0.07) | (0.08) | — | (0.15) | 10.38 | | 5.28 | | 460,852 | | 0.56 | | 0.56 | 2.91 | 95 |
| 2019 | | 9.32 | 0.42 | 0.62 | | 1.04 | | (0.35) | — | — | (0.35) | 10.01 | | 11.31 | | 486,865 | | 0.54 | | 0.54 | 4.30 | 59 |
| Investor Class | |
| 2023 | | $ 8.31 | $0.30 | $ 0.17 | | $ 0.47 | | $(0.10) | $ — | $ — | $(0.10) | $ 8.68 | | 5.64% | | $110,665 | | 0.88% | | 0.88% | 3.61% | 48% |
| 2022 | | 9.73 | 0.24 | (1.56) | | (1.32) | | (0.08) | (0.01) | (0.01) | (0.10) | 8.31 | | (13.62) | | 98,071 | | 0.86 | | 0.86 | 2.74 | 59 |
| 2021 | | 10.34 | 0.24 | (0.50) | | (0.26) | | (0.19) | (0.16) | — | (0.35) | 9.73 | | (2.53) | | 120,702 | | 0.85 | | 0.85 | 2.40 | 57 |
| 2020 | | 10.00 | 0.26 | 0.22 | | 0.48 | | (0.06) | (0.08) | — | (0.14) | 10.34 | | 4.93 | | 117,947 | | 0.85 | | 0.85 | 2.64 | 95 |
| 2019 | | 9.31 | 0.40 | 0.62 | | 1.02 | | (0.33) | — | — | (0.33) | 10.00 | | 11.03 | | 123,225 | | 0.82 | | 0.82 | 4.02 | 59 |
| | |
| Impact Bond Fund | |
| Institutional Class | |
| 2023(1) | | $10.00 | $0.40 | $(0.16) | | $ 0.24 | | $(0.38) | $ — | $ — | $(0.38) | $ 9.86 | | 2.53% | | $ 64,778 | | 0.50% | | 0.85% | 4.46% | 122% |
| Investor Class | |
| 2023(1) | | $10.00 | $0.38 | $(0.17) | | $ 0.21 | | $(0.35) | $ — | $ — | $(0.35) | $ 9.86 | | 2.28% | | $ 17,129 | | 0.79% | | 1.41% | 4.20% | 122% |
| | | | | | | | | | | | | | | | | | | | | | | |
| # | Calculated using the average shares outstanding method. |
| (1) | For the period January 27, 2023 (commencement of operations) through December 31, 2023. All ratios for the period have been annualized with the exception of total return and portfolio turnover which have not been annualized. |
See Notes to Financial Statements.
Defensive Market Strategies® Fund (Unaudited)
The Fund combines multiple investment strategies that in aggregate seek to provide long-term capital appreciation with reduced volatility compared to the U.S. equity markets. For 2023, the Investor Class of the Fund underperformed its composite benchmark of 50% S&P 500® Index and 50% Bloomberg 1-3 Month US Treasury Bill Index (11.15% (net of fees) versus 15.55%).
In a strong year for U.S. equities, the Fund lagged the S&P 500® Index by 4.40%, net of fees. The Fund’s relative underperformance to the S&P 500® Index was due to the Fund’s intentional and materially lower market sensitivity and volatility. The Fund allocated its assets among three principal investment strategies – long-only equity, options equity and convertible bond. For the calendar year of 2023, these investment strategies contributed negatively to Fund returns. The short portion of the option strategy did post positive relative performance at the Fund level, with its performance emanating from strong equity premium.
The derivative exposures overall contributed 9.85% to Fund performance for the year. The main source of the contribution was from the put option premiums collected.
This Fund may be suitable for investors who have a medium- to long-term investment horizon, possess a moderate tolerance for risk and seek to participate in the return potential of equities at a slightly lower risk level than an all-equity portfolio. In addition to the interest and credit rate risks associated with fixed income securities, a convertible security’s market value also tends to reflect the market price of the common stock of the issuing company when that stock price approaches or is greater than the convertible security’s “conversion price.” This Fund is subject to interest rate risk, meaning, when interest rates rise, the value of the existing fixed income securities decrease and vice versa. Securities of foreign issuers may be negatively impacted by political events, economic conditions or inefficient, illiquid or unregulated markets in foreign countries, and they also may be subject to inadequate regulatory or accounting standards, which may increase investment risk. To the extent that the investment adviser or sub-adviser misjudge current market conditions, the Fund’s volatility may be amplified by its use of short sales and derivatives and by its ability to select sub-advisers to allocate assets. Derivatives involve different risks from, and in some respects greater risks than, those associated with investing directly in securities, currencies or other instruments. Derivatives may be illiquid or less liquid, volatile, difficult to price and leveraged, so small changes in the value of the underlying instruments may produce disproportionate losses to the Fund. Short sales involve selling a security the Fund does not own in anticipation that the security will decline in price. Short sales expose the Fund to the risk that it will be required to buy the security sold short (also known as “covering” the short position) at a time when the security has appreciated in value, thus resulting in a loss to the Fund. The Fund’s potential loss on a short position is limited only by the maximum attainable price of the security, less the price at which the security was sold by the Fund. Therefore, in theory, stocks sold short have unlimited risk. The Fund’s use of short sales in effect leverages the Fund. The use of leverage may magnify the Fund’s gains or losses, and leverage also creates interest expense that may lower the Fund’s overall returns. It is possible to lose money by investing in the Fund.
See Notes to Financial Statements.
Defensive Market Strategies® Fund (Unaudited)
At December 31, 2023, the portfolio holdings of the Fund, as a percentage of net assets, is shown in the following table. Portfolio holdings are subject to risk and may change at any time.
| | % |
| U.S. Treasury Obligations | 48.0 |
| Corporate Bonds | 19.9 |
| Money Market Funds | 8.7 |
| Purchased Options | 5.0 |
| Health Care | 3.2 |
| Information Technology | 3.0 |
| Financials | 2.8 |
| Consumer Staples | 2.5 |
| Industrials | 1.7 |
| Foreign Bonds | 1.4 |
| Utilities | 1.0 |
| Communication Services | 0.9 |
| Energy | 0.8 |
| Consumer Discretionary | 0.7 |
| Materials | 0.6 |
| Equity-Linked Securities | 0.4 |
| Real Estate | 0.3 |
| Master Limited Partnership | 0.1 |
| Written Options | (0.2) |
| | 100.8 |
| Average Annual Total Returns as of 12/31/23 | |
| | | Institutional Class* | | Investor Class* | | Benchmark** | |
| One Year | | 11.43% | | 11.15% | | 15.55% | |
| Five Year | | 7.91% | | 7.62% | | 9.04% | |
| Ten Year | | 7.48% | | 7.20% | | 6.82% | |
| Since Inception | | 8.45% | | 8.17% | | 7.56% | |
| Inception Date | | 09/01/11 | | 09/01/11 | | | |
| Total Fund Operating Expenses (May 1, 2023 Prospectus)(1)# | | 0.69% | | 0.96% | | | |
| (1) | Current information regarding the Fund’s Operating Expenses can be found in the Financial Highlights. |
#Net expense ratio
The performance data quoted represents past performance and does not guarantee future results. The performance data in the table and graph does not reflect the deduction of taxes that a shareholder would pay on Fund distributions or the redemption of Fund shares. Current performance may be lower or higher. Performance data current to the most recent month-end may be obtained at GuideStoneFunds.com. The investment return and principal value of an investment will fluctuate so that shares, when redeemed, may be worth more or less than their original cost.
See Notes to Financial Statements.
Defensive Market Strategies® Fund (Unaudited)
The graph illustrates the results of a hypothetical $10,000 investment in the Investor Class of the Fund from December 31, 2013 to December 31, 2023, with all dividends and capital gains reinvested, with the Fund's composite benchmark index.
*These returns reflect investment advisory and shareholder servicing fee waivers, if applicable, during the reported time periods.
**The Benchmark Index shows how the Fund’s performance compares with the returns of an index constructed by the Adviser as a composite of various broad-based market indexes to reflect the market sectors in which the Fund invests. The Benchmark Index is 50% S&P 500® Index and 50% Bloomberg 1-3 Month US Treasury Bill Index. The weightings of the Benchmark Index were modified effective November 30, 2020, and therefore, the weightings of the underlying indexes were different than the current benchmark weightings prior to that date. Benchmark Index performance represents the Fund’s current benchmark linked with its previous benchmark.
Unlike a mutual fund, an index is not available for direct investment and the performance of an index assumes no taxes, transaction costs, management fees or other expenses.
See Notes to Financial Statements.
DEFENSIVE MARKET STRATEGIES® FUND
| | | Shares | | Value |
| COMMON STOCKS — 15.0% |
| Communication Services — 0.9% | | |
| Alphabet, Inc. Class A* | 6,931 | | $ 968,191 |
| Alphabet, Inc. Class C* | 5,798 | | 817,112 |
| AT&T, Inc. | 15,512 | | 260,291 |
| Charter Communications, Inc. Class AΔ* | 870 | | 338,152 |
| Comcast Corporation Class A | 16,183 | | 709,625 |
| Electronic Arts, Inc. | 2,875 | | 393,329 |
| Fox Corporation Class A | 923 | | 27,385 |
| Fox Corporation Class B | 2,914 | | 80,572 |
| Liberty Broadband Corporation* | 1,812 | | 146,029 |
| Meta Platforms, Inc. Class A* | 3,228 | | 1,142,583 |
| Netflix, Inc.* | 504 | | 245,388 |
| Omnicom Group, Inc. | 8,928 | | 772,361 |
| Roku, Inc.* | 1,020 | | 93,493 |
| Sirius XM Holdings, Inc.Δ | 22,135 | | 121,078 |
| Snap, Inc. Class A* | 8,207 | | 138,945 |
| Take-Two Interactive Software, Inc.* | 1,093 | | 175,918 |
| T-Mobile US, Inc. | 6,008 | | 963,263 |
| Verizon Communications, Inc. | 109,296 | | 4,120,459 |
| Walt Disney Co. (The) | 10,099 | | 911,839 |
| ZoomInfo Technologies, Inc.* | 2,492 | | 46,077 |
| | | | | 12,472,090 |
| Consumer Discretionary — 0.7% | | |
| Amazon.com, Inc.* | 14,285 | | 2,170,463 |
| Booking Holdings, Inc.* | 35 | | 124,153 |
| Domino’s Pizza, Inc. | 236 | | 97,286 |
| Ford Motor Co. | 8,917 | | 108,698 |
| Genuine Parts Co. | 2,075 | | 287,387 |
| Home Depot, Inc. (The) | 3,198 | | 1,108,267 |
| Lear Corporation | 613 | | 86,562 |
| Lowe’s Cos., Inc. | 807 | | 179,598 |
| McDonald’s Corporation | 8,625 | | 2,557,399 |
| NIKE, Inc. Class B | 1,650 | | 179,141 |
| O’Reilly Automotive, Inc.* | 478 | | 454,138 |
| Pool Corporation | 306 | | 122,005 |
| Rivian Automotive, Inc. Class A* | 3,329 | | 78,098 |
| Service Corporation International | 844 | | 57,772 |
| Starbucks Corporation | 1,362 | | 130,766 |
| Tesla, Inc.* | 4,871 | | 1,210,346 |
| TJX Cos., Inc. (The) | 1,799 | | 168,764 |
| Tractor Supply Co. | 593 | | 127,513 |
| Yum! Brands, Inc. | 2,109 | | 275,562 |
| | | | | 9,523,918 |
| Consumer Staples — 2.2% | | |
| Church & Dwight Co., Inc. | 1,296 | | 122,550 |
| Clorox Co. (The) | 800 | | 114,072 |
| Coca-Cola Co. (The) | 9,068 | | 534,377 |
| Colgate-Palmolive Co. | 49,427 | | 3,939,826 |
| Costco Wholesale Corporation | 636 | | 419,811 |
| Dollar General Corporation | 2,829 | | 384,602 |
| Dollar Tree, Inc.* | 882 | | 125,288 |
| General Mills, Inc. | 9,092 | | 592,253 |
| Hershey Co. (The) | 8,717 | | 1,625,197 |
| Hormel Foods Corporation | 1,816 | | 58,312 |
| J.M. Smucker Co. (The) | 523 | | 66,097 |
| | | Shares | | Value |
| Kellanova | 4,024 | | $ 224,982 |
| Kenvue, Inc. | 77,036 | | 1,658,585 |
| Kimberly-Clark Corporation | 25,167 | | 3,058,042 |
| Kroger Co. (The) | 1,546 | | 70,668 |
| McCormick & Co., Inc. (Non-Voting Shares) | 1,680 | | 114,946 |
| Mondelez International, Inc. Class A | 53,853 | | 3,900,573 |
| PepsiCo, Inc. | 22,358 | | 3,797,283 |
| Procter & Gamble Co. (The) | 33,793 | | 4,952,026 |
| Target Corporation | 1,296 | | 184,576 |
| Tyson Foods, Inc. Class A | 2,036 | | 109,435 |
| Walmart, Inc. | 27,755 | | 4,375,576 |
| WK Kellogg Co. | 473 | | 6,215 |
| | | | | 30,435,292 |
| Energy — 0.7% | | |
| Baker Hughes Co. | 35,314 | | 1,207,033 |
| Chevron Corporation | 21,029 | | 3,136,686 |
| ConocoPhillips | 2,061 | | 239,220 |
| Coterra Energy, Inc. | 9,999 | | 255,174 |
| EOG Resources, Inc. | 3,650 | | 441,467 |
| EQT Corporation | 2,139 | | 82,694 |
| Exxon Mobil Corporation | 37,981 | | 3,797,340 |
| Pioneer Natural Resources Co. | 1,643 | | 369,478 |
| | | | | 9,529,092 |
| Financials — 2.6% | | |
| Aflac, Inc. | 10,214 | | 842,655 |
| Allstate Corporation (The) | 14,228 | | 1,991,635 |
| American Express Co. | 716 | | 134,135 |
| Arch Capital Group, Ltd.* | 1,656 | | 122,991 |
| Arthur J. Gallagher & Co. | 3,010 | | 676,889 |
| Bank of America Corporation | 8,271 | | 278,484 |
| Bank of New York Mellon Corporation (The) | 14,917 | | 776,430 |
| Berkshire Hathaway, Inc. Class B* | 18,257 | | 6,511,542 |
| BlackRock, Inc. | 1,673 | | 1,358,141 |
| Capitol Federal Financial, Inc.Δ | 99,113 | | 639,279 |
| Cboe Global Markets, Inc. | 1,124 | | 200,701 |
| Charles Schwab Corporation (The) | 19,139 | | 1,316,763 |
| Cincinnati Financial Corporation | 1,282 | | 132,636 |
| Citigroup, Inc. | 2,684 | | 138,065 |
| CME Group, Inc. | 4,606 | | 970,023 |
| Commerce Bancshares, Inc. | 9,930 | | 530,343 |
| Cullen/Frost Bankers, Inc. | 843 | | 91,457 |
| Everest Group, Ltd. | 334 | | 118,096 |
| First Citizens BancShares, Inc. Class A | 115 | | 163,181 |
| First Horizon Corporation | 9,110 | | 128,997 |
| Fiserv, Inc.* | 5,266 | | 699,535 |
| Intercontinental Exchange, Inc. | 5,727 | | 735,519 |
| Jack Henry & Associates, Inc. | 605 | | 98,863 |
| JPMorgan Chase & Co. | 16,688 | | 2,838,629 |
| M&T Bank Corporation | 1,866 | | 255,791 |
| Markel Corporation* | 119 | | 168,968 |
| MarketAxess Holdings, Inc. | 301 | | 88,148 |
| Marsh & McLennan Cos., Inc. | 15,295 | | 2,897,944 |
| Mastercard, Inc. Class A | 1,470 | | 626,970 |
| Morgan Stanley | 1,573 | | 146,682 |
See Notes to Financial Statements.
| | | Shares | | Value |
| Nasdaq, Inc. | 2,512 | | $ 146,048 |
| Northern Trust Corporation | 8,365 | | 705,839 |
| PayPal Holdings, Inc.* | 604 | | 37,092 |
| PNC Financial Services Group, Inc. (The) | 5,147 | | 797,013 |
| Progressive Corporation (The) | 6,890 | | 1,097,439 |
| Regions Financial Corporation | 3,781 | | 73,276 |
| Reinsurance Group of America, Inc. | 5,472 | | 885,260 |
| S&P Global, Inc. | 365 | | 160,790 |
| T. Rowe Price Group, Inc. | 13,891 | | 1,495,922 |
| Travelers Cos., Inc. (The) | 3,886 | | 740,244 |
| Truist Financial Corporation | 10,902 | | 402,502 |
| U.S. Bancorp | 14,049 | | 608,041 |
| Visa, Inc. Class AΔ | 9,443 | | 2,458,485 |
| W.R. Berkley Corporation | 1,276 | | 90,239 |
| Wells Fargo & Co. | 4,791 | | 235,813 |
| | | | | 35,613,495 |
| Health Care — 2.2% | | |
| Abbott Laboratories | 7,086 | | 779,956 |
| Amgen, Inc. | 3,076 | | 885,950 |
| Becton, Dickinson and Co. | 21,127 | | 5,151,396 |
| Bio-Rad Laboratories, Inc. Class A* | 272 | | 87,826 |
| Bristol-Myers Squibb Co. | 51,439 | | 2,639,335 |
| CVS Health Corporation | 8,651 | | 683,083 |
| Danaher Corporation | 5,510 | | 1,274,683 |
| Eli Lilly and Co. | 7,267 | | 4,236,080 |
| Fortrea Holdings, Inc.* | 4,199 | | 146,545 |
| Gilead Sciences, Inc. | 4,661 | | 377,588 |
| Henry Schein, Inc.* | 5,600 | | 423,976 |
| Hologic, Inc.* | 9,830 | | 702,353 |
| Incyte Corporation* | 11,173 | | 701,553 |
| Laboratory Corporation of America Holdings | 3,093 | | 703,008 |
| Neurocrine Biosciences, Inc.* | 3,578 | | 471,437 |
| Quest Diagnostics, Inc. | 11,235 | | 1,549,082 |
| Regeneron Pharmaceuticals, Inc.* | 1,318 | | 1,157,586 |
| Revvity, Inc. | 2,270 | | 248,134 |
| Thermo Fisher Scientific, Inc. | 3,719 | | 1,974,008 |
| UnitedHealth Group, Inc. | 6,755 | | 3,556,305 |
| Vertex Pharmaceuticals, Inc.* | 2,835 | | 1,153,533 |
| Zimmer Biomet Holdings, Inc. | 13,895 | | 1,691,021 |
| | | | | 30,594,438 |
| Industrials — 1.6% | | |
| 3M Co. | 11,179 | | 1,222,088 |
| AGCO Corporation | 905 | | 109,876 |
| Automatic Data Processing, Inc. | 15,083 | | 3,513,886 |
| Boeing Co. (The)* | 415 | | 108,174 |
| Booz Allen Hamilton Holding Corporation | 881 | | 112,689 |
| Caterpillar, Inc. | 530 | | 156,705 |
| Cummins, Inc. | 1,440 | | 344,981 |
| Deere & Co. | 353 | | 141,154 |
| Emerson Electric Co. | 846 | | 82,341 |
| Expeditors International of Washington, Inc. | 781 | | 99,343 |
| | | Shares | | Value |
| Fastenal Co. | 5,191 | | $ 336,221 |
| General Dynamics Corporation | 2,515 | | 653,070 |
| General Electric Co. | 4,647 | | 593,097 |
| J.B. Hunt Transport Services, Inc. | 713 | | 142,415 |
| L3Harris Technologies, Inc. | 1,631 | | 343,521 |
| Leidos Holdings, Inc. | 365 | | 39,508 |
| Lockheed Martin Corporation | 2,822 | | 1,279,043 |
| Norfolk Southern Corporation | 13,881 | | 3,281,191 |
| Northrop Grumman Corporation | 1,313 | | 614,668 |
| Old Dominion Freight Line, Inc. | 667 | | 270,355 |
| Paychex, Inc. | 3,127 | | 372,457 |
| Republic Services, Inc. | 9,045 | | 1,491,611 |
| Rollins, Inc. | 2,452 | | 107,079 |
| RTX Corporation | 37,873 | | 3,186,634 |
| Southwest Airlines Co. | 7,555 | | 218,188 |
| Union Pacific Corporation | 1,487 | | 365,237 |
| United Parcel Service, Inc. Class B | 13,632 | | 2,143,359 |
| Veralto Corporation | 1,226 | | 100,851 |
| W.W. Grainger, Inc. | 175 | | 145,021 |
| Waste Management, Inc. | 3,795 | | 679,684 |
| Watsco, Inc. | 248 | | 106,261 |
| | | | | 22,360,708 |
| Information Technology — 2.7% | | |
| Adobe, Inc.* | 550 | | 328,130 |
| Advanced Micro Devices, Inc.* | 1,588 | | 234,087 |
| Akamai Technologies, Inc.* | 565 | | 66,868 |
| Amdocs, Ltd. | 1,390 | | 122,167 |
| Amphenol Corporation Class A | 3,980 | | 394,537 |
| ANSYS, Inc.* | 445 | | 161,482 |
| Apple, Inc. | 29,732 | | 5,724,302 |
| Broadcom, Inc. | 605 | | 675,331 |
| CDW Corporation | 746 | | 169,581 |
| Cisco Systems, Inc. | 82,713 | | 4,178,661 |
| Cognizant Technology Solutions Corporation Class A | 1,842 | | 139,126 |
| Corning, Inc. | 82,662 | | 2,517,058 |
| Fair Isaac Corporation* | 177 | | 206,030 |
| First Solar, Inc.* | 424 | | 73,047 |
| Intel Corporation | 38,158 | | 1,917,439 |
| International Business Machines Corporation | 2,593 | | 424,085 |
| Keysight Technologies, Inc.* | 1,984 | | 315,635 |
| Micron Technology, Inc. | 8,031 | | 685,365 |
| Microsoft Corporation | 30,405 | | 11,433,496 |
| Motorola Solutions, Inc. | 1,458 | | 456,485 |
| NVIDIA Corporation | 2,948 | | 1,459,909 |
| Oracle Corporation | 17,402 | | 1,834,693 |
| QUALCOMM, Inc. | 1,790 | | 258,888 |
| Roper Technologies, Inc. | 1,017 | | 554,438 |
| Salesforce, Inc.* | 1,222 | | 321,557 |
| Texas Instruments, Inc. | 14,546 | | 2,479,511 |
| Twilio, Inc. Class A* | 928 | | 70,407 |
| VeriSign, Inc.* | 657 | | 135,316 |
| Workday, Inc. Class A* | 1,619 | | 446,941 |
See Notes to Financial Statements.
DEFENSIVE MARKET STRATEGIES® FUND
SCHEDULE OF INVESTMENTS (Continued)
| | | Shares | | Value |
| Zoom Video Communications, Inc. Class A* | 1,360 | | $ 97,798 |
| | | | | 37,882,370 |
| Materials — 0.2% | | |
| Ball Corporation | 2,078 | | 119,527 |
| Corteva, Inc. | 4,525 | | 216,838 |
| Dow, Inc. | 3,650 | | 200,166 |
| Newmont Corporation | 7,568 | | 313,239 |
| Packaging Corporation of America | 10,405 | | 1,695,079 |
| | | | | 2,544,849 |
| Real Estate — 0.3% | | |
| American Tower Corporation REIT | 6,261 | | 1,351,625 |
| Equinix, Inc. REIT | 703 | | 566,189 |
| Prologis, Inc. REIT | 1,365 | | 181,955 |
| Public Storage REIT | 5,501 | | 1,677,805 |
| SBA Communications Corporation REIT | 593 | | 150,438 |
| | | | | 3,928,012 |
| Utilities — 0.9% | | |
| American Water Works Co., Inc. | 1,057 | | 139,514 |
| Atmos Energy Corporation | 30,888 | | 3,579,919 |
| Consolidated Edison, Inc. | 4,492 | | 408,637 |
| Dominion Energy, Inc. | 9,713 | | 456,511 |
| Duke Energy Corporation | 20,368 | | 1,976,511 |
| Essential Utilities, Inc. | 1,601 | | 59,797 |
| Eversource Energy | 18,104 | | 1,117,379 |
| NextEra Energy, Inc. | 3,785 | | 229,901 |
| ONE Gas, Inc.Δ | 32,119 | | 2,046,623 |
| Southern Co. (The) | 3,294 | | 230,975 |
| Spire, Inc. | 34,565 | | 2,154,782 |
| WEC Energy Group, Inc. | 4,564 | | 384,152 |
| | | | | 12,784,701 |
Total Common Stocks
(Cost $199,533,455) | | 207,668,965 |
| FOREIGN COMMON STOCKS — 2.4% |
| Canada — 0.0% | | |
| BCE, Inc.Δ | 14,345 | | 564,793 |
| France — 0.3% | | |
| Legrand SA | 6,181 | | 643,667 |
| Sanofi SA | 22,596 | | 2,245,427 |
| TotalEnergies SE | 16,011 | | 1,088,732 |
| | | | | 3,977,826 |
| Ireland — 1.1% | | |
| Accenture PLC Class A | 7,127 | | 2,500,936 |
| Aon PLC Class A | 2,096 | | 609,978 |
| CRH PLC | 5,114 | | 353,684 |
| Linde PLC | 10,645 | | 4,372,008 |
| Medtronic PLC | 81,183 | | 6,687,855 |
| Willis Towers Watson PLC | 1,063 | | 256,396 |
| | | | | 14,780,857 |
| Jersey — 0.1% | | |
| Amcor PLC | 75,880 | | 731,483 |
| | | Shares | | Value |
| Netherlands — 0.1% | | |
| Akzo Nobel NV | 11,023 | | $ 912,779 |
| Koninklijke Ahold Delhaize NV | 33,806 | | 972,648 |
| | | | | 1,885,427 |
| Sweden — 0.0% | | |
| Assa Abloy AB, B Shares | 16,399 | | 472,606 |
| Switzerland — 0.6% | | |
| Chubb, Ltd. | 8,639 | | 1,952,414 |
| Nestle SA | 8,691 | | 1,007,460 |
| Novartis AG | 14,336 | | 1,448,086 |
| Roche Holding AG | 9,094 | | 2,643,567 |
| TE Connectivity, Ltd. | 8,710 | | 1,223,755 |
| | | | | 8,275,282 |
| United Kingdom — 0.2% | | |
| Bunzl PLC | 14,817 | | 602,097 |
| Unilever PLC | 49,392 | | 2,393,905 |
| | | | | 2,996,002 |
Total Foreign Common Stocks
(Cost $33,135,198) | | 33,684,276 |
| PREFERRED STOCKS — 0.1% |
| Bank of America Corporation | | | | |
| 7.25% CONV | 360 | | 433,901 |
| NextEra Energy, Inc. | | | | |
| 6.93% CONV | 20,505 | | 781,650 |
Total Preferred Stocks
(Cost $1,396,451) | | 1,215,551 |
| MASTER LIMITED PARTNERSHIP — 0.1% |
AllianceBernstein Holding LP
(Cost $1,146,195) | 32,348 | | 1,003,758 |
| | | Par | |
| CORPORATE BONDS — 19.9% |
| Advanced Energy Industries, Inc. | | | |
| 2.50%, 09/15/28 144A CONVΔ | $1,301,000 | 1,375,808 |
| Akamai Technologies, Inc. | | | |
| 0.13%, 05/01/25 CONV | 634,000 | 808,350 |
| 0.38%, 09/01/27 CONVΔ | 5,419,000 | 6,061,151 |
| 1.13%, 02/15/29 144A CONV | 1,254,000 | 1,362,471 |
| Alnylam Pharmaceuticals, Inc. | | | |
| 1.00%, 09/15/27 CONVΔ | 3,409,000 | 3,366,387 |
| Altair Engineering, Inc. | | | |
| 1.75%, 06/15/27 CONV | 1,148,000 | 1,489,530 |
| Amphastar Pharmaceuticals, Inc. | | | |
| 2.00%, 03/15/29 144A CONVΔ | 1,404,000 | 1,709,370 |
| Array Technologies, Inc. | | | |
| 1.00%, 12/01/28 CONV | 583,000 | 575,567 |
See Notes to Financial Statements.
| | | Par | | Value |
| Axon Enterprise, Inc. | | | | |
| 0.50%, 12/15/27 CONV | $2,271,000 | | $2,873,950 |
| Bank of America Corporation | | | | |
| (Variable, CME Term SOFR 3M + 4.81%), 6.30%, 03/10/26ρΔ^ | 1,278,000 | | 1,288,177 |
| Bank of New York Mellon Corporation (The) | | | | |
| (Variable, U.S. Treasury Yield Curve Rate CMT 5Y + 4.36%), 4.70%, 09/20/25ρ^ | 1,660,000 | | 1,622,237 |
| Bentley Systems, Inc. | | | | |
| 0.13%, 01/15/26 CONV | 1,349,000 | | 1,339,692 |
| 0.38%, 07/01/27 CONV | 2,305,000 | | 2,073,348 |
| BioMarin Pharmaceutical, Inc. | | | | |
| 1.25%, 05/15/27 CONVΔ | 2,016,000 | | 2,080,310 |
| Blackline, Inc. | | | | |
| 0.13%, 08/01/24 CONV | 2,718,000 | | 2,787,581 |
| 0.00%, 03/15/26 CONV» | 2,079,000 | | 1,855,508 |
| Bloom Energy Corporation | | | | |
| 3.00%, 06/01/28 144A CONV | 927,000 | | 991,890 |
| Booking Holdings, Inc. | | | | |
| 0.75%, 05/01/25 CONV | 219,000 | | 413,647 |
| Box, Inc. | | | | |
| 0.00%, 01/15/26 CONV» | 1,997,000 | | 2,238,637 |
| Bridgebio Pharma, Inc. | | | | |
| 2.50%, 03/15/27 CONV | 750,000 | | 907,875 |
| Burlington Stores, Inc. | | | | |
| 2.25%, 04/15/25 CONV | 1,947,000 | | 2,112,495 |
| Ceridian HCM Holding, Inc. | | | | |
| 0.25%, 03/15/26 CONV | 1,933,000 | | 1,744,533 |
| Charles Schwab Corporation (The) | | | | |
| (Variable, U.S. Treasury Yield Curve Rate CMT 5Y + 4.97%), 5.38%, 06/01/25ρ^ | 2,260,000 | | 2,235,271 |
| Chefs' Warehouse, Inc. (The) | | | | |
| 2.38%, 12/15/28 CONV | 2,179,000 | | 2,079,239 |
| CMS Energy Corporation | | | | |
| 3.38%, 05/01/28 144A CONV | 1,281,000 | | 1,273,314 |
| CONMED Corporation | | | | |
| 2.25%, 06/15/27 CONV | 3,649,000 | | 3,665,056 |
| Cracker Barrel Old Country Store, Inc. | | | | |
| 0.63%, 06/15/26 CONV | 1,549,000 | | 1,341,899 |
| CSG Systems International, Inc. | | | | |
| 3.88%, 09/15/28 144A CONV | 1,379,000 | | 1,391,963 |
| Cytokinetics, Inc. | | | | |
| 3.50%, 07/01/27 CONV | 1,274,000 | | 2,242,240 |
| Datadog, Inc. | | | | |
| 0.13%, 06/15/25 CONV | 2,657,000 | | 3,722,457 |
| | | Par | | Value |
| Dexcom, Inc. | | | | |
| 0.25%, 11/15/25 CONV | $2,718,000 | | $2,851,182 |
| 0.38%, 05/15/28 144A CONV | 3,334,000 | | 3,430,686 |
| DigitalOcean Holdings, Inc. | | | | |
| 0.00%, 12/01/26 CONV» | 6,913,000 | | 5,733,642 |
| Dropbox, Inc. | | | | |
| 0.00%, 03/01/26 CONV» | 2,186,000 | | 2,155,396 |
| 0.00%, 03/01/28 CONVΔ» | 2,740,000 | | 2,770,825 |
| Enphase Energy, Inc. | | | | |
| 0.00%, 03/01/26 CONV» | 738,000 | | 676,008 |
| 0.00%, 03/01/28 CONV» | 1,128,000 | | 1,008,883 |
| Envestnet, Inc. | | | | |
| 2.63%, 12/01/27 CONVΔ | 3,928,000 | | 3,893,630 |
| Envista Holdings Corporation | | | | |
| 1.75%, 08/15/28 144A CONV | 1,089,000 | | 996,435 |
| Etsy, Inc. | | | | |
| 0.13%, 10/01/26 CONV | 3,173,000 | | 3,663,228 |
| Exact Sciences Corporation | | | | |
| 0.38%, 03/15/27 CONV | 5,296,000 | | 5,150,360 |
| 2.00%, 03/01/30 144A CONV | 1,221,000 | | 1,470,695 |
| FirstEnergy Corporation | | | | |
| 4.00%, 05/01/26 144A CONV | 4,619,000 | | 4,598,214 |
| Five9, Inc. | | | | |
| 0.50%, 06/01/25 CONV | 2,391,000 | | 2,290,578 |
| Ford Motor Co. | | | | |
| 0.00%, 03/15/26 CONV» | 7,119,000 | | 7,119,000 |
| Goldman Sachs Group, Inc. (The) | | | | |
| (Variable, U.S. Treasury Yield Curve Rate CMT 5Y + 3.62%), 5.50%, 08/10/24ρ^ | 194,000 | | 191,943 |
| Greenbrier Cos., Inc. (The) | | | | |
| 2.88%, 04/15/28 CONV | 2,440,000 | | 2,405,840 |
| Halozyme Therapeutics, Inc. | | | | |
| 0.25%, 03/01/27 CONV | 1,778,000 | | 1,545,793 |
| 1.00%, 08/15/28 CONV | 1,709,000 | | 1,591,934 |
| Insmed, Inc. | | | | |
| 0.75%, 06/01/28 CONV | 1,332,000 | | 1,527,804 |
| Insulet Corporation | | | | |
| 0.38%, 09/01/26 CONV | 2,290,000 | | 2,642,660 |
| Integer Holdings Corporation | | | | |
| 2.13%, 02/15/28 144A CONV | 1,276,000 | | 1,634,556 |
| Integra LifeSciences Holdings Corporation | | | | |
| 0.50%, 08/15/25 CONVΔ | 798,000 | | 753,312 |
| InterDigital, Inc. | | | | |
| 3.50%, 06/01/27 CONV | 1,219,000 | | 1,791,199 |
| Ionis Pharmaceuticals, Inc. | | | | |
| 0.00%, 04/01/26 CONV» | 2,881,000 | | 3,045,217 |
See Notes to Financial Statements.
DEFENSIVE MARKET STRATEGIES® FUND
SCHEDULE OF INVESTMENTS (Continued)
| | | Par | | Value |
| Ironwood Pharmaceuticals, Inc. | | | | |
| 0.75%, 06/15/24 CONV | $4,246,000 | | $4,468,915 |
| Itron, Inc. | | | | |
| 0.00%, 03/15/26 CONV» | 1,609,000 | | 1,489,290 |
| Jamf Holding Corporation | | | | |
| 0.13%, 09/01/26 CONV | 1,286,000 | | 1,102,745 |
| Jazz Investments I, Ltd. | | | | |
| 2.00%, 06/15/26 CONV | 2,850,000 | | 2,888,475 |
| JetBlue Airways Corporation | | | | |
| 0.50%, 04/01/26 CONV | 1,454,000 | | 1,054,139 |
| John Bean Technologies Corporation | | | | |
| 0.25%, 05/15/26 CONV | 3,139,000 | | 2,848,329 |
| JPMorgan Chase & Co. | | | | |
| (Variable, CME Term SOFR 3M + 3.38%), 5.00%, 08/01/24ρ^ | 1,303,000 | | 1,279,908 |
| Lantheus Holdings, Inc. | | | | |
| 2.63%, 12/15/27 CONV | 1,435,000 | | 1,615,236 |
| LCI Industries | | | | |
| 1.13%, 05/15/26 CONV | 2,742,000 | | 2,694,015 |
| Liberty Media Corporation | | | | |
| 3.75%, 03/15/28 144A CONV | 2,189,000 | | 2,623,517 |
| Liberty Media Corporation-Liberty Formula One | | | | |
| 2.25%, 08/15/27 CONV | 2,283,000 | | 2,327,351 |
| Live Nation Entertainment, Inc. | | | | |
| 2.00%, 02/15/25 CONV | 2,510,000 | | 2,652,819 |
| 3.13%, 01/15/29 144A CONVΔ | 3,599,000 | | 4,096,022 |
| Lumentum Holdings, Inc. | | | | |
| 0.25%, 03/15/24 CONV | 1,160,000 | | 1,167,308 |
| 0.50%, 12/15/26 CONVΔ | 2,361,000 | | 2,115,456 |
| M&T Bank Corporation | | | | |
| (Variable, CME Term SOFR 3M + 3.87%), 6.45%, 02/15/24ρ^ | 270,000 | | 268,271 |
| MACOM Technology Solutions Holdings, Inc. | | | | |
| 0.25%, 03/15/26 CONV | 1,987,000 | | 2,453,945 |
| Marriott Vacations Worldwide Corporation | | | | |
| 0.00%, 01/15/26 CONV» | 2,871,000 | | 2,535,093 |
| 3.25%, 12/15/27 CONVΔ | 740,000 | | 658,230 |
| Merit Medical Systems, Inc. | | | | |
| 3.00%, 02/01/29 144A CONV | 1,714,000 | | 1,905,111 |
| Microchip Technology, Inc. | | | | |
| 0.13%, 11/15/24 CONVΔ | 4,391,000 | | 4,819,122 |
| | | Par | | Value |
| MicroStrategy, Inc. | | | | |
| 0.75%, 12/15/25 CONV | $1,665,000 | | $2,757,739 |
| NCL Corporation, Ltd. | | | | |
| 1.13%, 02/15/27 CONV | 4,808,000 | | 4,414,225 |
| NRG Energy, Inc. | | | | |
| 2.75%, 06/01/48 CONV | 1,885,000 | | 2,431,650 |
| NuVasive, Inc. | | | | |
| 0.38%, 03/15/25 CONV | 1,502,000 | | 1,385,595 |
| Okta, Inc. | | | | |
| 0.38%, 06/15/26 CONV | 2,137,000 | | 1,899,793 |
| ON Semiconductor Corporation | | | | |
| 0.50%, 03/01/29 144A CONV | 3,567,000 | | 3,807,772 |
| Patrick Industries, Inc. | | | | |
| 1.75%, 12/01/28 CONV | 1,382,000 | | 1,575,480 |
| Peloton Interactive, Inc. | | | | |
| 0.00%, 02/15/26 CONV» | 1,677,000 | | 1,306,185 |
| Perficient, Inc. | | | | |
| 0.13%, 11/15/26 CONV | 1,473,000 | | 1,227,156 |
| Post Holdings, Inc. | | | | |
| 2.50%, 08/15/27 CONV | 2,796,000 | | 2,839,338 |
| Rapid7, Inc. | | | | |
| 0.25%, 03/15/27 CONV | 3,841,000 | | 3,468,903 |
| 1.25%, 03/15/29 144A CONV | 1,138,000 | | 1,270,349 |
| Rivian Automotive, Inc. | | | | |
| 4.63%, 03/15/29 144A CONV | 3,067,000 | | 4,321,403 |
| 3.63%, 10/15/30 144A CONV | 2,617,000 | | 3,227,023 |
| Sabre GLBL, Inc. | | | | |
| 4.00%, 04/15/25 CONV | 1,406,000 | | 1,386,738 |
| Sarepta Therapeutics, Inc. | | | | |
| 1.25%, 09/15/27 CONV | 2,693,000 | | 2,738,512 |
| Seagate HDD Cayman | | | | |
| 3.50%, 06/01/28 144A CONVΔ | 3,985,000 | | 4,827,827 |
| Shift4 Payments, Inc. | | | | |
| 0.00%, 12/15/25 CONVΔ» | 1,681,000 | | 1,873,306 |
| 0.50%, 08/01/27 CONV | 1,129,000 | | 1,057,760 |
| Shockwave Medical, Inc. | | | | |
| 1.00%, 08/15/28 144A CONV | 1,128,000 | | 1,103,748 |
| Snap, Inc. | | | | |
| 0.75%, 08/01/26 CONV | 2,671,000 | | 2,849,289 |
| Southwest Airlines Co. | | | | |
| 1.25%, 05/01/25 CONVΔ | 6,385,000 | | 6,475,986 |
| Spirit Airlines, Inc. | | | | |
| 1.00%, 05/15/26 CONV | 2,888,000 | | 2,015,824 |
| Stride, Inc. | | | | |
| 1.13%, 09/01/27 CONV | 1,084,000 | | 1,377,764 |
| Tetra Tech, Inc. | | | | |
| 2.25%, 08/15/28 144A CONV | 2,143,000 | | 2,256,793 |
| TransMedics Group, Inc. | | | | |
| 1.50%, 06/01/28 144A CONV | 621,000 | | 704,090 |
See Notes to Financial Statements.
| | | Par | | Value |
| Truist Financial Corporation | | | | |
| (Variable, U.S. Treasury Yield Curve Rate CMT 5Y + 4.61%), 4.95%, 09/01/25ρΔ^ | $2,303,000 | | $ 2,210,720 |
| Uber Technologies, Inc. | | | | |
| 0.00%, 12/15/25 CONV» | 683,000 | | 697,930 |
| 0.88%, 12/01/28 144A CONV | 1,775,000 | | 1,939,188 |
| Varonis Systems, Inc. | | | | |
| 1.25%, 08/15/25 CONV | 370,000 | | 566,840 |
| Ventas Realty LP REIT | | | | |
| 3.75%, 06/01/26 144A CONV | 2,287,000 | | 2,424,220 |
| Verint Systems, Inc. | | | | |
| 0.25%, 04/15/26 CONV | 3,087,000 | | 2,726,207 |
| Wayfair, Inc. | | | | |
| 1.00%, 08/15/26 CONV | 1,725,000 | | 1,514,550 |
| 3.25%, 09/15/27 CONVΔ | 1,851,000 | | 2,288,391 |
| Western Digital Corporation | | | | |
| 3.00%, 11/15/28 144A CONV | 3,537,000 | | 4,334,593 |
| Winnebago Industries, Inc. | | | | |
| 1.50%, 04/01/25 CONV | 1,564,000 | | 1,965,166 |
| Wolfspeed, Inc. | | | | |
| 1.88%, 12/01/29 CONV | 2,658,000 | | 1,821,395 |
| Workiva, Inc. | | | | |
| 1.25%, 08/15/28 144A CONVΔ | 1,833,000 | | 1,857,746 |
| Ziff Davis, Inc. | | | | |
| 1.75%, 11/01/26 CONV | 3,836,000 | | 3,644,200 |
| Zillow Group, Inc. | | | | |
| 0.75%, 09/01/24 CONV | 2,012,000 | | 2,723,242 |
| 2.75%, 05/15/25 CONVΔ | 2,466,000 | | 2,721,971 |
| 1.38%, 09/01/26 CONV | 843,000 | | 1,157,439 |
| Zscaler, Inc. | | | | |
| 0.13%, 07/01/25 CONV | 2,816,000 | | 4,281,728 |
Total Corporate Bonds
(Cost $262,406,718) | | 274,508,044 |
| FOREIGN BONDS — 1.4% |
| Canada — 0.2% | | |
| IMAX Corporation | | | | |
| 0.50%, 04/01/26 CONV | 3,492,000 | | 3,116,610 |
| China — 0.2% | | |
| NIO, Inc. | | | | |
| 3.88%, 10/15/29 144A CONV | 2,700,000 | | 2,878,200 |
| Israel — 0.4% | | |
| CyberArk Software, Ltd. | | | | |
| 0.00%, 11/15/24 CONV» | 1,636,000 | | 2,324,756 |
| Nice, Ltd. | | | | |
| 0.00%, 09/15/25 CONV» | 2,828,000 | | 2,689,428 |
| | | | | 5,014,184 |
| Jersey — 0.1% | | |
| Novocure, Ltd. | | | | |
| 0.00%, 11/01/25 CONV» | 1,596,000 | | 1,385,488 |
| Netherlands — 0.5% | | |
| QIAGEN NV | | | | |
| 0.00%, 12/17/27 CONV» | 2,600,000 | | 2,355,136 |
| | | Par | | Value |
| STMicroelectronics NV | | | | |
| 0.00%, 08/04/25 CONV» | $3,200,000 | | $ 3,878,538 |
| | | | | 6,233,674 |
| United Kingdom — 0.0% | | |
| Barclays Bank PLC | | | | |
| 0.00%, 02/04/25 CONV†††» | 359,000 | | 682,157 |
Total Foreign Bonds
(Cost $18,508,897) | | 19,310,313 |
| | | Shares | |
| EQUITY-LINKED SECURITIES — 0.4% |
| Analog Devices, Inc., Issued by JPMorgan Chase Bank National Association, Maturity Date 02/20/2024††† | 1,895 | 347,827 |
| Applied Materials, Inc., Issued by Merrill Lynch International & Co. CV, Maturity Date 03/20/2024††† | 2,398 | 337,902 |
| Aptiv PLC, Issued by JPMorgan Chase Bank National Association, Maturity Date 05/21/2024††† | 3,620 | 292,677 |
| Automatic Data Processing, Inc., Issued by Citigroup Global Markets Holdings, Inc., Maturity 01/24/2024 144A††† | 1,681 | 401,137 |
| Berkshire Hathaway, Inc. Class B, Issued by UBS AG, Maturity Date 03/20/2024 144A††† | 1,148 | 420,363 |
| Berkshire Hathaway, Inc., Issued by Citigroup Global Markets Holdings, Inc., Maturity Date 01/24/2024 144A††† | 1,148 | 398,574 |
| Berkshire Hathaway, Inc., Issued by Citigroup Global Markets Holdings, Inc., Maturity Date 02/07/2024 144A††† | 1,372 | 485,016 |
| Deere & Co., Issued by JPMorgan Chase Bank National Association, Maturity Date 05/03/2024††† | 1,062 | 406,284 |
| Johnson Controls International PLC, Issued by JPMorgan Chase Bank National Association, Maturity Date 05/03/2024††† | 7,918 | 412,369 |
| Linde PLC, Issued by Merrill Lynch International & Co. CV, Maturity Date 01/03/2024††† | 1,045 | 402,889 |
| Masco Corporation, Issued by Royal Bank of Canada, Maturity Date 04/24/2024 144A††† | 6,853 | 361,085 |
| Target Corporation, Issued by Merrill Lynch International & Co. CV, Maturity Date 01/03/2024††† | 2,816 | 389,650 |
| Teradyne, Inc., Issued by UBS AG, Maturity Date 04/24/2024 144A††† | 3,884 | 348,434 |
Total Equity-Linked Securities
(Cost $4,872,026) | 5,004,207 |
| MONEY MARKET FUNDS — 8.7% |
| Northern Institutional Liquid Assets Portfolio (Shares), 5.40%ا | 15,441,996 | 15,441,996 |
See Notes to Financial Statements.
DEFENSIVE MARKET STRATEGIES® FUND
SCHEDULE OF INVESTMENTS (Continued)
| | | Shares | | Value |
GuideStone Money Market Fund, 5.28%
(Institutional Class)Ø∞ | 44,820,578 | | $ 44,820,578 |
| Northern Institutional U.S. Treasury Portfolio (Premier), 5.22%Ø | 59,833,927 | | 59,833,927 |
Total Money Market Funds
(Cost $120,096,501) | | 120,096,501 |
| | | Par | |
| U.S. TREASURY OBLIGATIONS — 48.0% |
| U.S. Treasury Bill | | | |
| 5.24%, 02/08/24Ω‡‡ | $141,400,000 | 140,634,940 |
| U.S. Treasury Notes | | | |
| 0.25%, 03/15/24 | 95,300,000 | 94,351,660 |
| 0.25%, 06/15/24‡‡ | 97,900,000 | 95,764,371 |
| 0.38%, 09/15/24‡‡ | 96,800,000 | 93,747,952 |
| 1.00%, 12/15/24‡‡ | 94,700,000 | 91,326,843 |
| 1.13%, 02/28/27 | 81,000,000 | 74,249,473 |
| 0.75%, 01/31/28 | 84,000,000 | 74,130,000 |
| | | | 523,570,299 |
Total U.S. Treasury Obligations
(Cost $678,910,570) | 664,205,239 |
| | Number of
Contracts | | Notional
Amount | |
| PURCHASED OPTIONS — 5.0% |
| Call Options — 5.0% | |
| S&P 500®, Strike Price $4,510.00, Expires 02/28/29 (MSCS) | 240 | | $114,475,920 | 30,460,117 |
| S&P 500®, Strike Price $4,650.00, Expires 11/30/27 (MSCS) | 390 | | 186,023,370 | 39,186,227 |
Total Purchased Options
(Premiums paid $64,369,404) | 69,646,344 |
TOTAL INVESTMENTS — 101.0%
(Cost $1,384,375,415) | | | 1,396,343,198 |
| | | | |
| WRITTEN OPTIONS — (0.2)% |
| Put Options — (0.2)% | |
| S&P 500®, Strike Price $4,595.00, Expires 01/05/24 (MSCS) | (1) | (476,983) | (60) |
| S&P 500®, Strike Price $4,630.00, Expires 01/12/24 (MSCS) | (19) | (9,062,677) | (10,032) |
| S&P 500®, Strike Price $4,695.00, Expires 01/12/24 (MSCS) | (32) | (15,263,456) | (39,040) |
| S&P 500®, Strike Price $4,715.00, Expires 01/12/24 (MSCS) | (17) | (8,108,711) | (27,455) |
| | Number of Contracts | | Notional Amount | | Value |
| S&P 500®, Strike Price $4,720.00, Expires 01/19/24 (MSCS) | (2) | | $ (953,966) | | $ (4,650) |
| S&P 500®, Strike Price $4,725.00, Expires 01/05/24 (MSCS) | (27) | | (12,878,541) | | (21,735) |
| S&P 500®, Strike Price $4,725.00, Expires 01/12/24 (MSCS) | (9) | | (4,292,847) | | (16,605) |
| S&P 500®, Strike Price $4,725.00, Expires 01/19/24 (MSCS) | (8) | | (3,815,864) | | (19,200) |
| S&P 500®, Strike Price $4,730.00, Expires 01/05/24 (MSCS) | (95) | | (45,313,385) | | (87,875) |
| S&P 500®, Strike Price $4,740.00, Expires 01/05/24 (MSCS) | (23) | | (10,970,609) | | (26,749) |
| S&P 500®, Strike Price $4,745.00, Expires 01/19/24 (MSCS) | (13) | | (6,200,779) | | (39,390) |
| S&P 500®, Strike Price $4,750.00, Expires 01/05/24 (MSCS) | (61) | | (29,095,963) | | (88,450) |
| S&P 500®, Strike Price $4,750.00, Expires 01/12/24 (MSCS) | (23) | | (10,970,609) | | (58,880) |
| S&P 500®, Strike Price $4,755.00, Expires 01/19/24 (MSCS) | (87) | | (41,497,521) | | (293,190) |
| S&P 500®, Strike Price $4,760.00, Expires 01/05/24 (MSCS) | (6) | | (2,861,898) | | (11,070) |
| S&P 500®, Strike Price $4,760.00, Expires 01/12/24 (MSCS) | (78) | | (37,204,674) | | (230,100) |
| S&P 500®, Strike Price $4,765.00, Expires 01/05/24 (MSCS) | (3) | | (1,430,949) | | (6,150) |
| S&P 500®, Strike Price $4,765.00, Expires 01/12/24 (MSCS) | (39) | | (18,602,337) | | (122,421) |
| S&P 500®, Strike Price $4,765.00, Expires 01/19/24 (MSCS) | (50) | | (23,849,150) | | (185,500) |
| S&P 500®, Strike Price $4,765.00, Expires 01/26/24 (MSCS) | (6) | | (2,861,898) | | (27,120) |
| S&P 500®, Strike Price $4,770.00, Expires 01/26/24 (MSCS) | (92) | | (43,882,436) | | (433,320) |
| S&P 500®, Strike Price $4,770.00, Expires 02/02/24 (MSCS) | (6) | | (2,861,898) | | (33,390) |
| S&P 500®, Strike Price $4,775.00, Expires 01/19/24 (MSCS) | (57) | | (27,188,031) | | (236,835) |
See Notes to Financial Statements.
| | Number ofContracts | | NotionalAmount | | Value |
| S&P 500®, Strike Price $4,780.00, Expires 01/26/24 (MSCS) | (73) | | $(34,819,759) | | $ (373,760) |
| S&P 500®, Strike Price $4,785.00, Expires 01/26/24 (MSCS) | (46) | | (21,941,218) | | (245,640) |
Total Written Options
(Premiums received $(3,413,348)) | | | | (2,638,617) |
Liabilities in Excess of Other
Assets — (0.8)% | | | | (11,314,925) |
| NET ASSETS — 100.0% | | | | $1,382,389,656 |
Futures Contracts outstanding at December 31, 2023:
| Future Type | | Expiration Date | | Open Long
(Short) Contracts | | Notional
Market Value
of Contracts | | Value and
Unrealized
Appreciation
(Depreciation) |
| S&P 500® E-Mini | | 03/2024 | | 133 | | $ 32,053,000 | | $ 336,811 |
| 10-Year U.S. Treasury Note | | 03/2024 | | 110 | | 12,417,969 | | 391,875 |
| U.S. Treasury Long Bond | | 03/2024 | | 51 | | 6,371,813 | | 471,352 |
| 2-Year U.S. Treasury Note | | 03/2024 | | 212 | | 43,653,781 | | 262,588 |
| 5-Year U.S. Treasury Note | | 03/2024 | | 449 | | 48,839,273 | | 929,948 |
| Total Futures Contracts outstanding at December 31, 2023 | | | | | | $143,335,836 | | $2,392,574 |
Forward Foreign Currency Contracts outstanding at December 31, 2023:
| Expiration Date | | Currency
Purchased | | Amount
of Currency
Purchased | | Currency
Sold | | Amount
of Currency
Sold | | Counter-
party | | Net Unrealized
Appreciation
(Depreciation) |
| 03/28/24 | | Swiss Francs | | 114,171 | | U.S. Dollars | | 134,243 | | MSCS | | $ 2,755 |
| 03/28/24 | | Swedish Kronor | | 265,879 | | U.S. Dollars | | 26,308 | | UBS | | 144 |
| 03/28/24 | | U.S. Dollars | | 10,230 | | Swedish Kronor | | 101,756 | | UBS | | 106 |
| Subtotal Appreciation | | | | | | | | | | $ 3,005 |
| 03/28/24 | | U.S. Dollars | | 514,538 | | British Pounds | | 405,919 | | GSC | | $ (3,086) |
| 03/28/24 | | U.S. Dollars | | 414,811 | | Swedish Kronor | | 4,213,447 | | UBS | | (4,395) |
| 03/28/24 | | U.S. Dollars | | 472,092 | | Canadian Dollars | | 631,366 | | GSC | | (4,965) |
| 03/28/24 | | U.S. Dollars | | 2,353,025 | | Euro | | 2,144,045 | | JPM | | (22,358) |
| 03/28/24 | | U.S. Dollars | | 2,353,025 | | Euro | | 2,144,045 | | MSCS | | (22,358) |
| 03/28/24 | | U.S. Dollars | | 2,352,607 | | Euro | | 2,144,045 | | MLIB | | (22,776) |
| 03/28/24 | | U.S. Dollars | | 4,396,253 | | Swiss Francs | | 3,776,073 | | MSCS | | (134,802) |
| Subtotal Depreciation | | | | | | | | | | $(214,740) |
| Total Forward Foreign Currency Contracts outstanding at December 31, 2023 | | | | $(211,735) |
See Notes to Financial Statements.
DEFENSIVE MARKET STRATEGIES® FUND
SCHEDULE OF INVESTMENTS (Continued)
VALUATION HIERARCHY
The following is a summary of the inputs used, as of December 31, 2023, in valuing the Fund’s investments carried at fair value:
| | Total
Value | | Level 1
Quoted Prices | | Level 2
Other Significant
Observable Inputs | | Level 3
Significant
Unobservable Inputs |
| Assets: | | | | | | | |
| Investments in Securities: | | | | | | | |
| Common Stocks | $ 207,668,965 | | $207,668,965 | | $ — | | $ — |
| Corporate Bonds | 274,508,044 | | — | | 274,508,044 | | — |
| Equity-Linked Securities | 5,004,207 | | — | | — | | 5,004,207 |
| Foreign Bonds: | | | | | | | |
| United Kingdom | 682,157 | | — | | — | | 682,157 |
| Other ^^ | 18,628,156 | | — | | 18,628,156 | | — |
| Total Foreign Bonds | 19,310,313 | | — | | 18,628,156 | | 682,157 |
| Foreign Common Stocks: | | | | | | | |
| Canada | 564,793 | | 564,793 | | — | | — |
| Ireland | 14,780,857 | | 14,780,857 | | — | | — |
| Jersey | 731,483 | | 731,483 | | — | | — |
| Switzerland | 8,275,282 | | 3,176,169 | | 5,099,113 | | — |
| Other ^^ | 9,331,861 | | — | | 9,331,861 | | — |
| Total Foreign Common Stocks | 33,684,276 | | 19,253,302 | | 14,430,974 | | — |
| Master Limited Partnership | 1,003,758 | | 1,003,758 | | — | | — |
| Money Market Funds | 120,096,501 | | 120,096,501 | | — | | — |
| Preferred Stocks | 1,215,551 | | 1,215,551 | | — | | — |
| Purchased Options: | | | | | | | |
| Call Options | 69,646,344 | | — | | 69,646,344 | | — |
| U.S. Treasury Obligations | 664,205,239 | | — | | 664,205,239 | | — |
| Total Assets - Investments in Securities | $1,396,343,198 | | $349,238,077 | | $1,041,418,757 | | $5,686,364 |
| Other Financial Instruments*** | | | | | | | |
| Forward Foreign Currency Contracts | $ 3,005 | | $ — | | $ 3,005 | | $ — |
| Futures Contracts | 2,392,574 | | 2,392,574 | | — | | — |
| Total Assets - Other Financial Instruments | $ 2,395,579 | | $ 2,392,574 | | $ 3,005 | | $ — |
See Notes to Financial Statements.
| | Total
Value | | Level 1
Quoted Prices | | Level 2
Other Significant
Observable Inputs | | Level 3
Significant
Unobservable Inputs |
| Liabilities: | | | | | | | |
| Investments in Securities: | | | | | | | |
| Written Options: | | | | | | | |
| Put Options | $(2,638,617) | | $(2,638,617) | | $ — | | $ — |
| Total Liabilities - Investments in Securities | $(2,638,617) | | $(2,638,617) | | $ — | | $ — |
| Other Financial Instruments*** | | | | | | | |
| Forward Foreign Currency Contracts | $ (214,740) | | $ — | | $(214,740) | | $ — |
| Total Liabilities - Other Financial Instruments | $ (214,740) | | $ — | | $(214,740) | | $ — |
| ^^ | Classifications as defined in the Schedule of Investments. |
| *** | Other financial instruments are derivative instruments, such as futures contracts and forward foreign currency contracts, which are valued at the unrealized appreciation (depreciation) on the investment. Further details regarding the value of these investments can be found in the preceding "Futures Contracts outstanding" and "Forward Foreign Currency Contracts outstanding" disclosures. |
There were no transfers to or from Level 3 during the period ended December 31, 2023.
Management has determined that the amount of Level 3 securities compared to total net assets is not material; therefore, the reconciliation of Level 3 securities and assumptions is not shown for the year ended December 31, 2023.
See Notes to Financial Statements.
Impact Equity Fund (Unaudited)
The Fund is actively managed and invests in a diversified portfolio of global equity securities, including companies in countries having economies and markets generally considered to be developed and equity securities of foreign companies located in emerging markets. The Fund is benchmarked to the MSCI ACWI (All Country World Index) Growth Index. Since its inception on January 27, 2023, the Investor Class of the Fund underperformed its benchmark (12.11% (net of fees) versus 21.05%).
On a sector basis, stock selection within the information technology and financials sectors was a drag. An underweight to the magnificent seven stocks (Apple, Alphabet, Microsoft, Amazon, Meta, Tesla and Nvidia) was a headwind and market returns were highly concentrated into this small subset of companies. An overweight to the insurance industry, which lagged, also detracted from performance. Selection within consumer staples and industrials was additive. On a country basis, stock selection within the United States, Japan and Canada detracted from the Fund’s relative performance while an underweight to China was additive.
Derivatives were utilized in the Fund to provide market exposure for the cash positions. These derivative positions primarily included stock index futures. In aggregate, these positions detracted from performance.
During the year, the Fund remained focused on its objective of providing long-term capital appreciation by investing in a diversified mix of global equities with the intent of generating positive impact in line with the Adviser’s Christian values.
This Fund may be suitable to investors who seek higher, long-term rates of return, can accept significant short-term fluctuations in account value and want to diversify their portfolio with global equity securities. Securities of foreign issuers may be negatively impacted by political events, economic conditions or inefficient, illiquid or unregulated markets in foreign countries, and they also may be subject to inadequate regulatory or accounting standards, which may increase investment risk. Small company stocks are subject to greater risk than large company stocks due to more volatility and less liquidity. Derivatives involve different risks from, and in some respects greater than, those risks associated with investing directly in securities, currencies or other instruments. The derivatives may be illiquid or less liquid, volatile, difficult to price and leveraged, so that small changes in the value of the underlying instruments may produce disproportionate losses to the Fund. It is possible to lose money by investing in the Fund.
At December 31, 2023, the portfolio holdings of the Fund, as a percentage of net assets, is shown in the following table. Portfolio holdings are subject to risk and may change at any time.
| | % |
| Information Technology | 31.0 |
| Industrials | 20.5 |
| Financials | 17.6 |
| Health Care | 8.0 |
| Consumer Discretionary | 5.3 |
| Utilities | 4.2 |
| Communication Services | 4.1 |
| Money Market Funds | 3.5 |
| Real Estate | 2.9 |
| Materials | 1.9 |
| Consumer Staples | 0.8 |
| Energy | —** |
| | 99.8 |
| **Rounds to less than 0.05% | |
See Notes to Financial Statements.
| | | Shares | | Value |
| COMMON STOCKS — 52.2% |
| Communication Services — 2.3% | | |
| Alphabet, Inc. Class A* | 989 | | $ 138,153 |
| Alphabet, Inc. Class C* | 588 | | 82,867 |
| Electronic Arts, Inc. | 75 | | 10,261 |
| Netflix, Inc.* | 177 | | 86,178 |
| T-Mobile US, Inc. | 13,760 | | 2,206,141 |
| | | | | 2,523,600 |
| Consumer Discretionary — 2.2% | | |
| Best Buy Co., Inc. | 111 | | 8,689 |
| Chipotle Mexican Grill, Inc.* | 6 | | 13,722 |
| Domino’s Pizza, Inc. | 41 | | 16,901 |
| Genuine Parts Co. | 132 | | 18,282 |
| Home Depot, Inc. (The) | 3,561 | | 1,234,065 |
| LKQ Corporation | 171 | | 8,172 |
| Lowe’s Cos., Inc. | 319 | | 70,993 |
| NIKE, Inc. Class B | 8,300 | | 901,131 |
| O’Reilly Automotive, Inc.* | 36 | | 34,203 |
| Tractor Supply Co. | 71 | | 15,267 |
| Ulta Beauty, Inc.* | 52 | | 25,480 |
| | | | | 2,346,905 |
| Consumer Staples — 0.6% | | |
| Clorox Co. (The) | 32 | | 4,563 |
| Colgate-Palmolive Co. | 305 | | 24,312 |
| Costco Wholesale Corporation | 182 | | 120,135 |
| Estee Lauder Cos., Inc. (The) Class A | 140 | | 20,475 |
| General Mills, Inc. | 381 | | 24,818 |
| Kimberly-Clark Corporation | 38 | | 4,617 |
| Kroger Co. (The) | 249 | | 11,382 |
| McCormick & Co., Inc. (Non-Voting Shares) | 5,219 | | 357,084 |
| Sysco Corporation | 67 | | 4,900 |
| Target Corporation | 174 | | 24,781 |
| Walmart, Inc. | 602 | | 94,905 |
| | | | | 691,972 |
| Financials — 10.1% | | |
| American Express Co. | 119 | | 22,293 |
| Arthur J. Gallagher & Co. | 27 | | 6,072 |
| BlackRock, Inc. | 14 | | 11,365 |
| Brown & Brown, Inc. | 90 | | 6,400 |
| CME Group, Inc. | 145 | | 30,537 |
| LPL Financial Holdings, Inc. | 67 | | 15,251 |
| MarketAxess Holdings, Inc. | 31 | | 9,078 |
| Marsh & McLennan Cos., Inc. | 12,273 | | 2,325,365 |
| Mastercard, Inc. Class A | 6,042 | | 2,576,973 |
| Moody’s Corporation | 76 | | 29,683 |
| Progressive Corporation (The) | 17,794 | | 2,834,228 |
| S&P Global, Inc. | 2,380 | | 1,048,438 |
| T. Rowe Price Group, Inc. | 24 | | 2,585 |
| Travelers Cos., Inc. (The) | 151 | | 28,764 |
| Walker & Dunlop, Inc. | 18,398 | | 2,042,362 |
| | | | | 10,989,394 |
| Health Care — 4.7% | | |
| Abbott Laboratories | 449 | | 49,421 |
| Align Technology, Inc.* | 35 | | 9,590 |
| | | Shares | | Value |
| Bristol-Myers Squibb Co. | 475 | | $ 24,372 |
| Cardinal Health, Inc. | 199 | | 20,059 |
| Cigna Group (The) | 120 | | 35,934 |
| CVS Health Corporation | 332 | | 26,215 |
| Edwards Lifesciences Corporation* | 257 | | 19,596 |
| Elevance Health, Inc. | 99 | | 46,684 |
| Encompass Health Corporation | 30,376 | | 2,026,687 |
| HCA Healthcare, Inc. | 76 | | 20,572 |
| Humana, Inc. | 5,712 | | 2,615,011 |
| Mettler-Toledo International, Inc.* | 21 | | 25,472 |
| UnitedHealth Group, Inc. | 352 | | 185,318 |
| | | | | 5,104,931 |
| Industrials — 9.0% | | |
| 3M Co. | 218 | | 23,832 |
| Advanced Drainage Systems, Inc. | 10,235 | | 1,439,450 |
| Booz Allen Hamilton Holding Corporation | 156 | | 19,954 |
| Cintas Corporation | 59 | | 35,557 |
| Core & Main, Inc. Class A* | 23,799 | | 961,718 |
| Expeditors International of Washington, Inc. | 46 | | 5,851 |
| Fastenal Co. | 266 | | 17,229 |
| FedEx Corporation | 79 | | 19,985 |
| Honeywell International, Inc. | 106 | | 22,229 |
| Hubbell, Inc. | 40 | | 13,157 |
| J.B. Hunt Transport Services, Inc. | 27 | | 5,393 |
| Old Dominion Freight Line, Inc. | 42 | | 17,024 |
| Parker-Hannifin Corporation | 51 | | 23,496 |
| Paychex, Inc. | 46 | | 5,479 |
| Rollins, Inc. | 144 | | 6,288 |
| RTX Corporation | 582 | | 48,969 |
| United Parcel Service, Inc. Class B | 298 | | 46,855 |
| Waste Management, Inc. | 82 | | 14,686 |
| Westinghouse Air Brake Technologies Corporation | 29,971 | | 3,803,320 |
| Xylem, Inc. | 27,715 | | 3,169,487 |
| | | | | 9,699,959 |
| Information Technology — 20.4% | | |
| Adobe, Inc.* | 185 | | 110,371 |
| Advanced Micro Devices, Inc.* | 674 | | 99,354 |
| ANSYS, Inc.* | 20 | | 7,258 |
| Apple, Inc. | 325 | | 62,572 |
| Autodesk, Inc.* | 8,039 | | 1,957,336 |
| Cadence Design Systems, Inc.* | 6,876 | | 1,872,816 |
| Cisco Systems, Inc. | 1,686 | | 85,177 |
| Fortinet, Inc.* | 199 | | 11,647 |
| Intel Corporation | 1,396 | | 70,149 |
| Intuit, Inc. | 66 | | 41,252 |
| IPG Photonics Corporation* | 10,321 | | 1,120,241 |
| Keysight Technologies, Inc.* | 10,827 | | 1,722,467 |
| Lam Research Corporation | 2,623 | | 2,054,491 |
| Microsoft Corporation | 16,897 | | 6,353,948 |
| Motorola Solutions, Inc. | 9 | | 2,818 |
| NVIDIA Corporation | 8,391 | | 4,155,391 |
| Oracle Corporation | 55 | | 5,799 |
| Palo Alto Networks, Inc.* | 34 | | 10,026 |
See Notes to Financial Statements.
SCHEDULE OF INVESTMENTS (Continued)
| | | Shares | | Value |
| Roper Technologies, Inc. | 12 | | $ 6,542 |
| ServiceNow, Inc.* | 82 | | 57,932 |
| Synopsys, Inc.* | 52 | | 26,775 |
| Texas Instruments, Inc. | 12,858 | | 2,191,775 |
| Trimble, Inc.* | 51 | | 2,713 |
| VeriSign, Inc.* | 103 | | 21,214 |
| Zebra Technologies Corporation Class A* | 57 | | 15,580 |
| | | | | 22,065,644 |
| Materials — 0.0% | | |
| Air Products and Chemicals, Inc. | 90 | | 24,642 |
| Ecolab, Inc. | 31 | | 6,149 |
| | | | | 30,791 |
| Real Estate — 2.9% | | |
| Crown Castle, Inc. REIT | 4,344 | | 500,385 |
| Equinix, Inc. REIT | 1,683 | | 1,355,472 |
| Prologis, Inc. REIT | 9,164 | | 1,221,561 |
| Public Storage REIT | 77 | | 23,485 |
| Welltower, Inc. REIT | 218 | | 19,657 |
| | | | | 3,120,560 |
| Utilities — 0.0% | | |
| Xcel Energy, Inc. | 228 | | 14,115 |
Total Common Stocks
(Cost $47,263,748) | | | 56,587,871 |
| FOREIGN COMMON STOCKS — 44.1% |
| Australia — 0.5% | | |
| BHP Group, Ltd. | 1,663 | | 56,816 |
| CAR Group, Ltd. | 887 | | 18,797 |
| CSL, Ltd. | 209 | | 40,744 |
| Fortescue, Ltd. | 1,291 | | 25,455 |
| Nanosonics, Ltd.* | 93,383 | | 279,778 |
| QBE Insurance Group, Ltd. | 515 | | 5,218 |
| REA Group, Ltd. | 243 | | 29,964 |
| Rio Tinto, Ltd. | 197 | | 18,242 |
| Wesfarmers, Ltd. | 889 | | 34,572 |
| WiseTech Global, Ltd. | 112 | | 5,741 |
| Woolworths Group, Ltd. | 204 | | 5,175 |
| | | | | 520,502 |
| Austria — 0.0% | | |
| ANDRITZ AG | 129 | | 8,026 |
| EVN AG | 168 | | 5,271 |
| | | | | 13,297 |
| Belgium — 0.0% | | |
| UCB SA | 194 | | 16,911 |
| Canada — 4.9% | | |
| Alimentation Couche-Tard, Inc. | 203 | | 11,954 |
| Bank of Nova Scotia (The) | 516 | | 25,117 |
| BCE, Inc. | 107 | | 4,213 |
| Boralex, Inc. Class A | 67,488 | | 1,715,404 |
| Brookfield Corporation | 256 | | 10,269 |
| BRP, Inc. | 136 | | 9,732 |
| Canadian Imperial Bank of Commerce | 277 | | 13,337 |
| Canadian National Railway Co. | 221 | | 27,778 |
| | | Shares | | Value |
| CGI, Inc.* | 145 | | $ 15,534 |
| Element Fleet Management Corporation | 384 | | 6,248 |
| Franco-Nevada Corporation | 120 | | 13,292 |
| Gildan Activewear, Inc. | 257 | | 8,499 |
| Innergex Renewable Energy, Inc.Δ | 108,459 | | 752,227 |
| Intact Financial Corporation | 16,497 | | 2,538,077 |
| Loblaw Cos., Ltd. | 255 | | 24,687 |
| Magna International, Inc. | 543 | | 32,083 |
| Manulife Financial Corporation | 1,854 | | 40,968 |
| Metro, Inc. | 132 | | 6,833 |
| Suncor Energy, Inc. | 528 | | 16,915 |
| Tourmaline Oil Corporation | 339 | | 15,245 |
| West Fraser Timber Co., Ltd. | 101 | | 8,641 |
| WSP Global, Inc. | 129 | | 18,083 |
| | | | | 5,315,136 |
| Denmark — 0.0% | | |
| Coloplast A/S Class B | 285 | | 32,566 |
| Finland — 0.0% | | |
| Neste OYJ | 166 | | 5,901 |
| Orion OYJ Class B | 274 | | 11,873 |
| | | | | 17,774 |
| France — 5.3% | | |
| Cie Generale des Etablissements Michelin SCA | 811 | | 29,137 |
| Hermes International SCA | 26 | | 55,264 |
| L’Oreal SA | 156 | | 77,766 |
| Legrand SA | 22,415 | | 2,334,215 |
| Orange SA | 441 | | 5,026 |
| Schneider Electric SE | 16,339 | | 3,289,141 |
| | | | | 5,790,549 |
| Germany — 3.2% | | |
| adidas AG | 144 | | 29,262 |
| Deutsche Post AG | 381 | | 18,858 |
| Deutsche Telekom AG | 1,419 | | 34,117 |
| Hannover Rueck SE | 25 | | 5,978 |
| HeidelbergCement AG | 140 | | 12,514 |
| Infineon Technologies AG | 36,660 | | 1,531,018 |
| Knorr-Bremse AG | 27,268 | | 1,761,115 |
| Muenchener Rueckversicherungs-Gesellschaft AG | 52 | | 21,570 |
| SAP SE | 432 | | 66,494 |
| Zalando SE 144A * | 415 | | 9,825 |
| | | | | 3,490,751 |
| Hong Kong — 1.7% | | |
| AIA Group, Ltd. | 205,000 | | 1,784,091 |
| Chow Tai Fook Jewellery Group, Ltd. | 3,400 | | 5,065 |
| CK Asset Holdings, Ltd. | 1,500 | | 7,529 |
| Henderson Land Development Co., Ltd. | 1,000 | | 3,079 |
| Sun Hung Kai Properties, Ltd. | 2,000 | | 21,643 |
| Techtronic Industries Co., Ltd. | 1,000 | | 11,915 |
See Notes to Financial Statements.
| | | Shares | | Value |
| Wharf Real Estate Investment Co., Ltd. | 1,000 | | $ 3,381 |
| | | | | 1,836,703 |
| India — 1.3% | | |
| HDFC Bank, Ltd. ADR | 20,377 | | 1,367,500 |
| Ireland — 6.3% | | |
| Accenture PLC Class A | 276 | | 96,851 |
| Aon PLC Class A | 7,333 | | 2,134,050 |
| ICON PLC* | 10,113 | | 2,862,687 |
| James Hardie Industries PLC CDI* | 225 | | 8,675 |
| Linde PLC | 185 | | 75,981 |
| nVent Electric PLC | 27,440 | | 1,621,430 |
| Willis Towers Watson PLC | 24 | | 5,789 |
| | | | | 6,805,463 |
| Israel — 0.0% | | |
| Bank Leumi Le-Israel BM | 2,139 | | 17,214 |
| Check Point Software Technologies, Ltd.* | 41 | | 6,265 |
| Strauss Group, Ltd.* | 242 | | 4,552 |
| | | | | 28,031 |
| Italy — 1.0% | | |
| Assicurazioni Generali SpA | 764 | | 16,141 |
| Prysmian SpA | 23,537 | | 1,072,936 |
| Recordati Industria Chimica e Farmaceutica SpA | 409 | | 22,054 |
| | | | | 1,111,131 |
| Japan — 7.8% | | |
| Advantest Corporation | 400 | | 13,478 |
| Asahi Kasei Corporation | 600 | | 4,428 |
| Bandai Namco Holdings, Inc. | 300 | | 6,000 |
| Bridgestone Corporation | 500 | | 20,651 |
| Canon, Inc. | 900 | | 23,088 |
| Chugai Pharmaceutical Co., Ltd. | 1,100 | | 41,556 |
| Eisai Co., Ltd. | 400 | | 19,917 |
| Fujitsu, Ltd. | 100 | | 15,049 |
| Goldwin, Inc. | 100 | | 7,170 |
| Hoya Corporation | 100 | | 12,454 |
| Kakaku.com, Inc. | 200 | | 2,471 |
| Keyence Corporation | 3,700 | | 1,625,619 |
| Kyowa Kirin Co., Ltd. | 1,000 | | 16,779 |
| Mitsubishi Electric Corporation | 2,100 | | 29,703 |
| Murata Manufacturing Co., Ltd. | 82,700 | | 1,747,615 |
| Nintendo Co., Ltd. | 33,100 | | 1,722,322 |
| Nippon Shinyaku Co., Ltd. | 100 | | 3,537 |
| Nippon Telegraph & Telephone Corporation | 25,000 | | 30,527 |
| Nitori Holdings Co., Ltd. | 200 | | 26,855 |
| Ono Pharmaceutical Co., Ltd. | 1,100 | | 19,569 |
| Otsuka Holdings Co., Ltd. | 900 | | 33,657 |
| Panasonic Holdings Corporation | 1,000 | | 9,848 |
| Recruit Holdings Co., Ltd. | 1,000 | | 41,811 |
| Rohto Pharmaceutical Co., Ltd. | 200 | | 4,022 |
| Santen Pharmaceutical Co., Ltd. | 1,100 | | 10,944 |
| Shimadzu Corporation | 49,000 | | 1,366,269 |
| Shimano, Inc. | 9,300 | | 1,432,611 |
| Shionogi & Co., Ltd. | 500 | | 24,064 |
| | | Shares | | Value |
| Shiseido Co., Ltd. | 100 | | $ 3,014 |
| Sumitomo Dainippon Pharma Co., Ltd.* | 1,200 | | 3,962 |
| Taisho Pharmaceutical Holdings Co., Ltd. | 300 | | 18,333 |
| Tokyo Electron, Ltd. | 300 | | 53,322 |
| | | | | 8,390,645 |
| Jersey — 1.5% | | |
| Aptiv PLC* | 17,309 | | 1,552,963 |
| Experian PLC | 416 | | 16,971 |
| | | | | 1,569,934 |
| Netherlands — 4.2% | | |
| AerCap Holdings NV* | 275 | | 20,438 |
| ASML Holding NV | 3,160 | | 2,385,444 |
| Ferrari NV | 47 | | 15,868 |
| Koninklijke Ahold Delhaize NV | 274 | | 7,883 |
| Koninklijke Philips NV* | 195 | | 4,564 |
| STMicroelectronics NV | 231 | | 11,574 |
| Wolters Kluwer NV | 14,605 | | 2,077,846 |
| | | | | 4,523,617 |
| New Zealand — 0.0% | | |
| Fisher & Paykel Healthcare Corporation, Ltd. | 483 | | 7,203 |
| Norway — 0.0% | | |
| Orkla ASA | 1,197 | | 9,296 |
| Salmar ASA | 116 | | 6,497 |
| Telenor ASA | 429 | | 4,923 |
| | | | | 20,716 |
| Singapore — 0.1% | | |
| Jardine Cycle & Carriage, Ltd. | 300 | | 6,761 |
| Oversea-Chinese Banking Corporation, Ltd. | 1,500 | | 14,759 |
| United Overseas Bank, Ltd. | 500 | | 10,792 |
| Wilmar International, Ltd. | 6,900 | | 18,639 |
| | | | | 50,951 |
| Spain — 0.0% | | |
| Banco Santander SA | 1,470 | | 6,149 |
| Industria de Diseno Textil SA | 704 | | 30,718 |
| | | | | 36,867 |
| Sweden — 0.1% | | |
| Atlas Copco AB, A Shares | 1,468 | | 25,295 |
| Atlas Copco AB, B Shares | 1,106 | | 16,409 |
| H & M Hennes & Mauritz AB, B Shares | 641 | | 11,243 |
| Investor AB, A Shares | 538 | | 12,368 |
| Investor AB, B Shares | 1,267 | | 29,381 |
| Sandvik AB | 249 | | 5,410 |
| | | | | 100,106 |
| Switzerland — 2.5% | | |
| EMS-Chemie Holding AG | 7 | | 5,676 |
| Geberit AG | 12 | | 7,703 |
| Roche Holding AG | 156 | | 45,348 |
| Roche Holding AG (Swiss Exchange) | 63 | | 19,576 |
| SGS SA | 125 | | 10,791 |
See Notes to Financial Statements.
SCHEDULE OF INVESTMENTS (Continued)
| | | Shares | | Value |
| Swisscom AG | 14 | | $ 8,426 |
| TE Connectivity, Ltd. | 18,180 | | 2,554,290 |
| | | | | 2,651,810 |
| United Kingdom — 3.7% | | |
| 3i Group PLC | 562 | | 17,298 |
| Associated British Foods PLC | 388 | | 11,694 |
| Auto Trader Group PLC 144A | 3,116 | | 28,626 |
| BT Group PLC | 6,123 | | 9,647 |
| Burberry Group PLC | 1,005 | | 18,127 |
| CK Hutchison Holdings, Ltd. | 1,000 | | 5,373 |
| DS Smith PLC | 436,275 | | 1,707,177 |
| JD Sports Fashion PLC | 11,701 | | 24,693 |
| Kingfisher PLC | 2,966 | | 9,190 |
| London Stock Exchange Group PLC | 90 | | 10,639 |
| Pearson PLC | 751 | | 9,224 |
| RELX PLC | 708 | | 28,089 |
| Rightmove PLC | 1,395 | | 10,255 |
| Rio Tinto PLC | 551 | | 40,984 |
| SSE PLC | 87,662 | | 2,069,349 |
| | | Shares | | Value |
| Vodafone Group PLC | 14,905 | | $ 13,017 |
| | | | | 4,013,382 |
Total Foreign Common Stocks
(Cost $46,255,488) | | | 47,711,545 |
| MONEY MARKET FUNDS — 3.5% |
GuideStone Money Market Fund, 5.28%
(Institutional Class)Ø ∞ | 3,620,894 | | 3,620,894 |
| Northern Institutional U.S. Treasury Portfolio (Premier), 5.22%Ø | 198,797 | | 198,797 |
Total Money Market Funds
(Cost $3,819,691) | | | 3,819,691 |
TOTAL INVESTMENTS —99.8%
(Cost $97,338,927) | | | 108,119,107 |
Other Assets in Excess of
Liabilities — 0.2% | | | 176,557 |
| NET ASSETS — 100.0% | | | $108,295,664 |
Futures Contracts outstanding at December 31, 2023:
| Future Type | | Expiration Date | | Open Long
(Short) Contracts | | Notional
Market Value
of Contracts | | Value and
Unrealized
Appreciation
(Depreciation) |
| MSCI EAFE Index | | 03/2024 | | 5 | | $ 563,100 | | $10,187 |
| MSCI Emerging Markets | | 03/2024 | | 5 | | 258,425 | | 5,729 |
| S&P 500® E-Mini | | 03/2024 | | 4 | | 964,000 | | 8,696 |
| Total Futures Contracts outstanding at December 31, 2023 | | | | | | $1,785,525 | | $24,612 |
See Notes to Financial Statements.
VALUATION HIERARCHY
The following is a summary of the inputs used, as of December 31, 2023, in valuing the Fund’s investments carried at fair value:
| | Total
Value | | Level 1
Quoted Prices | | Level 2
Other Significant
Observable Inputs | | Level 3
Significant
Unobservable Inputs |
| Assets: | | | | | | | |
| Investments in Securities: | | | | | | | |
| Common Stocks | $ 56,587,871 | | $56,587,871 | | $ — | | $ — |
| Foreign Common Stocks: | | | | | | | |
| Canada | 5,315,136 | | 5,315,136 | | — | | — |
| India | 1,367,500 | | 1,367,500 | | — | | — |
| Ireland | 6,805,463 | | 6,796,788 | | 8,675 | | — |
| Israel | 28,031 | | 6,265 | | 21,766 | | — |
| Jersey | 1,569,934 | | 1,552,963 | | 16,971 | | — |
| Netherlands | 4,523,617 | | 20,438 | | 4,503,179 | | — |
| Norway | 20,716 | | 4,923 | | 15,793 | | — |
| Switzerland | 2,651,810 | | 2,554,290 | | 97,520 | | — |
| Other ^^ | 25,429,338 | | — | | 25,429,338 | | — |
| Total Foreign Common Stocks | 47,711,545 | | 17,618,303 | | 30,093,242 | | — |
| Money Market Funds | 3,819,691 | | 3,819,691 | | — | | — |
| Total Assets - Investments in Securities | $108,119,107 | | $78,025,865 | | $30,093,242 | | $ — |
| Other Financial Instruments*** | | | | | | | |
| Futures Contracts | $ 24,612 | | $ 24,612 | | $ — | | $ — |
| Total Assets - Other Financial Instruments | $ 24,612 | | $ 24,612 | | $ — | | $ — |
| ^^ | Classifications as defined in the Schedule of Investments. |
| *** | Other financial instruments are derivative instruments, such as futures contracts, which are valued at the unrealized appreciation (depreciation) on the investment. Further details regarding the value of these investments can be found in the preceding "Futures Contracts outstanding" disclosures. |
See Notes to Financial Statements.
Equity Index Fund (Unaudited)
The Fund was passively managed and attempted to replicate the performance of its benchmark, the S&P 500® Index. The Fund was comprised of domestic, large-cap equity stocks with both value- and growth-style orientations. The objective of the Fund is to provide investment results approximating the aggregate price and dividend performance of the securities included in the S&P 500® Index. However, the Fund’s returns relative to its benchmark could be lower in certain market environments and also due to the exclusion of certain securities from the Fund’s portfolio because of the Fund’s faith-based investment policies and restrictions.
The Investor Class of the Fund returned 26.16%, net of fees, for the one-year period ended December 31, 2023, as compared to a return of 26.29% for the S&P 500® Index. The return differential was primarily a result of the faith-based investment restrictions and expenses of the Fund.
In 2023, exchange-listed equity index futures contracts were utilized to provide market exposure to the cash positions held in the Fund. Overall, derivative exposure had a positive impact on Fund performance for the year.
This Fund may be suitable for investors who seek higher, long-term rates of return, can accept significant short-term fluctuations in account value and want to diversify their portfolio by adding a potentially higher return, higher risk option of equity securities. It is possible to lose money by investing in the Fund.
At December 31, 2023, the portfolio holdings of the Fund, as a percentage of net assets, is shown in the following table. Portfolio holdings are subject to risk and may change at any time.
| | % |
| Information Technology | 27.8 |
| Financials | 12.7 |
| Health Care | 11.9 |
| Consumer Discretionary | 10.4 |
| Industrials | 8.5 |
| Communication Services | 8.4 |
| Consumer Staples | 6.0 |
| Energy | 3.8 |
| Money Market Funds | 3.1 |
| Real Estate | 2.4 |
| Materials | 2.4 |
| Utilities | 2.4 |
| | 99.8 |
| Average Annual Total Returns as of 12/31/23 | |
| | | Institutional Class* | | Investor Class* | | Benchmark** | |
| One Year | | 26.51% | | 26.16% | | 26.29% | |
| Five Year | | 15.47% | | 15.17% | | 15.68% | |
| Ten Year | | 11.91% | | 11.62% | | 12.03% | |
| Since Inception | | 8.32% | | 8.15% | | 8.51% | |
| Inception Date | | 08/27/01 | | 08/27/01 | | | |
| Total Fund Operating Expenses (May 1, 2023 Prospectus)(1)# | | 0.12% | | 0.39% | | | |
| (1) | Current information regarding the Fund’s Operating Expenses can be found in the Financial Highlights. |
#Net expense ratio
The performance data quoted represents past performance and does not guarantee future results. The performance data in the table and graph does not reflect the deduction of taxes that a shareholder would pay on Fund distributions or the redemption of Fund shares. Current performance may be lower or higher. Performance data current to the most recent month-end may be obtained at GuideStoneFunds.com. The investment return and principal value of an investment will fluctuate so that shares, when redeemed, may be worth more or less than their original cost.
See Notes to Financial Statements.
Equity Index Fund (Unaudited)
The graph illustrates the results of a hypothetical $10,000 investment in the Investor Class of the Fund for the 10-year period from December 31, 2013 to December 31, 2023, with all dividends and capital gains reinvested, with the S&P 500® Index.
*These returns reflect investment advisory and shareholder servicing fee waivers, if applicable, during the reported time periods.
Unlike a mutual fund, an index is not available for direct investment and the performance of an index assumes no taxes, transaction costs, management fees or other expenses.
See Notes to Financial Statements.
| | | Shares | | Value |
| COMMON STOCKS — 93.6% |
| Communication Services — 8.4% | | |
| Alphabet, Inc. Class A* | 532,520 | | $ 74,387,719 |
| Alphabet, Inc. Class C* | 463,815 | | 65,365,448 |
| AT&T, Inc. | 695,409 | | 11,668,963 |
| Charter Communications, Inc. Class A* | 8,432 | | 3,277,350 |
| Comcast Corporation Class A | 372,191 | | 16,320,575 |
| Electronic Arts, Inc. | 29,821 | | 4,079,811 |
| Fox Corporation Class A | 31,129 | | 923,597 |
| Fox Corporation Class B | 9,099 | | 251,587 |
| Interpublic Group of Cos., Inc. (The) | 47,139 | | 1,538,617 |
| Live Nation Entertainment, Inc.* | 10,940 | | 1,023,984 |
| Meta Platforms, Inc. Class A* | 201,950 | | 71,482,222 |
| Netflix, Inc.* | 39,413 | | 19,189,401 |
| News Corporation Class A | 13,865 | | 340,386 |
| News Corporation Class B | 13,984 | | 359,669 |
| Omnicom Group, Inc. | 24,095 | | 2,084,459 |
| Paramount Global Class B | 52,671 | | 779,004 |
| Take-Two Interactive Software, Inc.* | 14,065 | | 2,263,762 |
| T-Mobile US, Inc. | 58,192 | | 9,329,923 |
| Verizon Communications, Inc. | 402,790 | | 15,185,183 |
| Walt Disney Co. (The) | 167,923 | | 15,161,768 |
| Warner Bros Discovery, Inc.* | 173,969 | | 1,979,767 |
| | | | | 316,993,195 |
| Consumer Discretionary — 10.3% | | |
| Airbnb, Inc. Class A* | 42,314 | | 5,760,628 |
| Amazon.com, Inc.* | 824,929 | | 125,339,712 |
| AutoZone, Inc.* | 1,895 | | 4,899,731 |
| Bath & Body Works, Inc. | 13,836 | | 597,162 |
| Best Buy Co., Inc. | 15,833 | | 1,239,407 |
| Booking Holdings, Inc.* | 3,123 | | 11,077,968 |
| BorgWarner, Inc. | 15,500 | | 555,675 |
| CarMax, Inc.Δ* | 12,596 | | 966,617 |
| Carnival Corporation* | 59,898 | | 1,110,509 |
| Chipotle Mexican Grill, Inc.* | 2,537 | | 5,802,018 |
| D.R. Horton, Inc. | 21,727 | | 3,302,069 |
| Darden Restaurants, Inc. | 14,447 | | 2,373,642 |
| Domino’s Pizza, Inc. | 3,030 | | 1,249,057 |
| eBay, Inc. | 40,981 | | 1,787,591 |
| Etsy, Inc. | 6,963 | | 564,351 |
| Expedia Group, Inc.* | 10,462 | | 1,588,027 |
| Ford Motor Co. | 360,267 | | 4,391,655 |
| General Motors Co. | 115,117 | | 4,135,003 |
| Genuine Parts Co. | 16,089 | | 2,228,327 |
| Hasbro, Inc. | 12,552 | | 640,905 |
| Hilton Worldwide Holdings, Inc. | 27,117 | | 4,937,735 |
| Home Depot, Inc. (The) | 89,463 | | 31,003,403 |
| Lennar Corporation Class A | 16,158 | | 2,408,188 |
| | | Shares | | Value |
| LKQ Corporation | 21,437 | | $ 1,024,474 |
| Lowe’s Cos., Inc. | 50,808 | | 11,307,320 |
| Lululemon Athletica, Inc.* | 10,232 | | 5,231,519 |
| Marriott International, Inc. Class A | 25,094 | | 5,658,948 |
| McDonald’s Corporation | 75,356 | | 22,343,808 |
| Mohawk Industries, Inc.* | 2,387 | | 247,055 |
| NIKE, Inc. Class B | 119,062 | | 12,926,561 |
| Norwegian Cruise Line Holdings, Ltd.Δ* | 18,047 | | 361,662 |
| NVR, Inc.* | 171 | | 1,197,077 |
| O’Reilly Automotive, Inc.* | 5,505 | | 5,230,190 |
| Pool Corporation | 3,147 | | 1,254,740 |
| PulteGroup, Inc. | 12,455 | | 1,285,605 |
| Ralph Lauren Corporation | 2,058 | | 296,764 |
| Ross Stores, Inc. | 29,803 | | 4,124,437 |
| Royal Caribbean Cruises, Ltd.* | 22,682 | | 2,937,092 |
| Starbucks Corporation | 108,959 | | 10,461,154 |
| Tapestry, Inc. | 11,906 | | 438,260 |
| Tesla, Inc.* | 250,550 | | 62,256,664 |
| TJX Cos., Inc. (The) | 112,934 | | 10,594,339 |
| Tractor Supply Co. | 10,039 | | 2,158,686 |
| Ulta Beauty, Inc.* | 3,993 | | 1,956,530 |
| VF Corporation | 27,573 | | 518,372 |
| Whirlpool Corporation | 5,122 | | 623,706 |
| Yum! Brands, Inc. | 32,785 | | 4,283,688 |
| | | | | 386,678,031 |
| Consumer Staples — 6.0% | | |
| Archer-Daniels-Midland Co. | 53,884 | | 3,891,502 |
| Campbell Soup Co. | 28,952 | | 1,251,595 |
| Church & Dwight Co., Inc. | 27,416 | | 2,592,457 |
| Clorox Co. (The) | 12,213 | | 1,741,452 |
| Coca-Cola Co. (The) | 419,531 | | 24,722,962 |
| Colgate-Palmolive Co. | 86,323 | | 6,880,806 |
| Conagra Brands, Inc. | 80,687 | | 2,312,489 |
| Costco Wholesale Corporation | 40,012 | | 26,411,121 |
| Dollar General Corporation | 21,189 | | 2,880,645 |
| Dollar Tree, Inc.* | 18,243 | | 2,591,418 |
| Estee Lauder Cos., Inc. (The) Class A | 24,032 | | 3,514,680 |
| General Mills, Inc. | 74,513 | | 4,853,777 |
| Hershey Co. (The) | 17,543 | | 3,270,717 |
| Hormel Foods Corporation | 54,805 | | 1,759,789 |
| J.M. Smucker Co. (The) | 15,075 | | 1,905,178 |
| Kellanova | 47,724 | | 2,668,249 |
| Kenvue, Inc. | 192,282 | | 4,139,831 |
| Keurig Dr. Pepper, Inc. | 116,575 | | 3,884,279 |
| Kimberly-Clark Corporation | 30,596 | | 3,717,720 |
| Kraft Heinz Co. (The) | 103,030 | | 3,810,049 |
| Kroger Co. (The) | 65,482 | | 2,993,182 |
| Lamb Weston Holdings, Inc. | 10,228 | | 1,105,545 |
See Notes to Financial Statements.
| | | Shares | | Value |
| McCormick & Co., Inc. (Non-Voting Shares) | 25,400 | | $ 1,737,868 |
| Mondelez International, Inc. Class A | 137,331 | | 9,946,884 |
| Monster Beverage Corporation* | 86,214 | | 4,966,789 |
| PepsiCo, Inc. | 149,304 | | 25,357,791 |
| Procter & Gamble Co. (The) | 241,747 | | 35,425,605 |
| Sysco Corporation | 42,504 | | 3,108,318 |
| Target Corporation | 40,435 | | 5,758,753 |
| Tyson Foods, Inc. Class A | 27,409 | | 1,473,234 |
| Walgreens Boots Alliance, Inc. | 68,939 | | 1,799,997 |
| Walmart, Inc. | 135,600 | | 21,377,340 |
| | | | | 223,852,022 |
| Energy — 3.6% | | |
| APA Corporation | 16,020 | | 574,798 |
| Archrock, Inc. | 13 | | 200 |
| Baker Hughes Co. | 101,928 | | 3,483,899 |
| Chevron Corporation | 164,328 | | 24,511,164 |
| ConocoPhillips | 110,526 | | 12,828,753 |
| Coterra Energy, Inc. | 73,032 | | 1,863,777 |
| Devon Energy Corporation | 56,709 | | 2,568,918 |
| Diamondback Energy, Inc. | 14,141 | | 2,192,986 |
| EOG Resources, Inc. | 52,844 | | 6,391,482 |
| EQT Corporation | 31,097 | | 1,202,210 |
| Exxon Mobil Corporation | 369,105 | | 36,903,118 |
| Halliburton Co. | 68,091 | | 2,461,490 |
| Hess Corporation | 22,208 | | 3,201,505 |
| Kinder Morgan, Inc. | 206,299 | | 3,639,114 |
| Marathon Oil Corporation | 36,685 | | 886,310 |
| Marathon Petroleum Corporation | 33,656 | | 4,993,204 |
| Occidental Petroleum Corporation | 64,318 | | 3,840,428 |
| ONEOK, Inc. | 46,483 | | 3,264,036 |
| Phillips 66 | 41,166 | | 5,480,841 |
| Pioneer Natural Resources Co. | 21,443 | | 4,822,102 |
| Targa Resources Corporation | 19,483 | | 1,692,488 |
| Valero Energy Corporation | 31,345 | | 4,074,850 |
| Williams Cos., Inc. (The) | 127,227 | | 4,431,316 |
| | | | | 135,308,989 |
| Financials — 12.2% | | |
| Aflac, Inc. | 55,516 | | 4,580,070 |
| Allstate Corporation (The) | 28,840 | | 4,037,023 |
| American Express Co. | 56,945 | | 10,668,076 |
| American International Group, Inc. | 65,815 | | 4,458,966 |
| Ameriprise Financial, Inc. | 10,345 | | 3,929,341 |
| Arch Capital Group, Ltd.* | 33,000 | | 2,450,910 |
| Arthur J. Gallagher & Co. | 18,366 | | 4,130,146 |
| Assurant, Inc. | 6,335 | | 1,067,384 |
| Bank of America Corporation | 619,659 | | 20,863,919 |
| Bank of New York Mellon Corporation (The) | 72,967 | | 3,797,932 |
| Berkshire Hathaway, Inc. Class B* | 166,497 | | 59,382,820 |
| BlackRock, Inc. | 13,016 | | 10,566,389 |
| Blackstone, Inc. | 70,980 | | 9,292,702 |
| Brown & Brown, Inc. | 18,702 | | 1,329,899 |
| Capital One Financial Corporation | 34,907 | | 4,577,006 |
| Cboe Global Markets, Inc. | 13,221 | | 2,360,742 |
| Charles Schwab Corporation (The) | 139,112 | | 9,570,906 |
| | | Shares | | Value |
| Cincinnati Financial Corporation | 10,988 | | $ 1,136,818 |
| Citigroup, Inc. | 159,253 | | 8,191,974 |
| Citizens Financial Group, Inc. | 34,788 | | 1,152,874 |
| CME Group, Inc. | 34,101 | | 7,181,671 |
| Comerica, Inc. | 10,547 | | 588,628 |
| Discover Financial Services | 22,685 | | 2,549,794 |
| Everest Group, Ltd. | 3,173 | | 1,121,909 |
| FactSet Research Systems, Inc. | 4,700 | | 2,242,135 |
| Fidelity National Information Services, Inc. | 56,930 | | 3,419,785 |
| Fifth Third Bancorp | 52,084 | | 1,796,377 |
| Fiserv, Inc.* | 57,099 | | 7,585,031 |
| FleetCor Technologies, Inc.* | 6,254 | | 1,767,443 |
| Franklin Resources, Inc. | 23,495 | | 699,916 |
| Global Payments, Inc. | 22,769 | | 2,891,663 |
| Globe Life, Inc. | 4,186 | | 509,520 |
| Goldman Sachs Group, Inc. (The) | 28,733 | | 11,084,329 |
| Hartford Financial Services Group, Inc. (The) | 28,747 | | 2,310,684 |
| Huntington Bancshares, Inc. | 118,830 | | 1,511,518 |
| Intercontinental Exchange, Inc. | 50,280 | | 6,457,460 |
| Invesco, Ltd. | 17,740 | | 316,482 |
| Jack Henry & Associates, Inc. | 7,793 | | 1,273,454 |
| JPMorgan Chase & Co. | 262,643 | | 44,675,574 |
| KeyCorp | 64,549 | | 929,506 |
| Loews Corporation | 28,928 | | 2,013,100 |
| M&T Bank Corporation | 18,081 | | 2,478,544 |
| MarketAxess Holdings, Inc. | 2,840 | | 831,694 |
| Marsh & McLennan Cos., Inc. | 46,486 | | 8,807,702 |
| Mastercard, Inc. Class A | 72,970 | | 31,122,435 |
| MetLife, Inc. | 64,005 | | 4,232,651 |
| Moody’s Corporation | 11,483 | | 4,484,801 |
| Morgan Stanley | 122,245 | | 11,399,346 |
| MSCI, Inc. | 5,628 | | 3,183,478 |
| Nasdaq, Inc. | 27,420 | | 1,594,199 |
| Northern Trust Corporation | 16,617 | | 1,402,142 |
| PayPal Holdings, Inc.* | 97,844 | | 6,008,600 |
| PNC Financial Services Group, Inc. (The)Δ | 32,804 | | 5,079,699 |
| Principal Financial Group, Inc. | 19,881 | | 1,564,038 |
| Progressive Corporation (The) | 51,756 | | 8,243,696 |
| Prudential Financial, Inc. | 36,128 | | 3,746,835 |
| Raymond James Financial, Inc. | 13,842 | | 1,543,383 |
| Regions Financial Corporation | 64,510 | | 1,250,204 |
| S&P Global, Inc. | 31,215 | | 13,750,832 |
| State Street Corporation | 30,870 | | 2,391,190 |
| Synchrony Financial | 32,331 | | 1,234,721 |
| T. Rowe Price Group, Inc. | 22,044 | | 2,373,918 |
| Travelers Cos., Inc. (The) | 30,201 | | 5,752,989 |
| Truist Financial Corporation | 110,967 | | 4,096,902 |
| U.S. Bancorp | 125,414 | | 5,427,918 |
| Visa, Inc. Class AΔ | 145,418 | | 37,859,576 |
| W.R. Berkley Corporation | 31,137 | | 2,202,009 |
| Wells Fargo & Co. | 346,762 | | 17,067,626 |
| Zions Bancorp NA | 4,475 | | 196,318 |
| | | | | 459,799,322 |
See Notes to Financial Statements.
SCHEDULE OF INVESTMENTS (Continued)
| | | Shares | | Value |
| Health Care — 11.6% | | |
| Abbott Laboratories | 165,788 | | $18,248,285 |
| Agilent Technologies, Inc. | 34,112 | | 4,742,591 |
| Align Technology, Inc.* | 5,801 | | 1,589,474 |
| Amgen, Inc. | 65,402 | | 18,837,084 |
| Baxter International, Inc. | 49,046 | | 1,896,118 |
| Becton, Dickinson and Co. | 32,351 | | 7,888,144 |
| Biogen, Inc.Δ* | 33,934 | | 8,781,101 |
| Bio-Rad Laboratories, Inc. Class A* | 3,770 | | 1,217,295 |
| Boston Scientific Corporation* | 137,673 | | 7,958,876 |
| Bristol-Myers Squibb Co. | 367,919 | | 18,877,924 |
| Cardinal Health, Inc. | 27,527 | | 2,774,722 |
| Catalent, Inc.* | 44,854 | | 2,015,290 |
| Cencora, Inc.Δ | 17,971 | | 3,690,884 |
| Centene Corporation* | 55,255 | | 4,100,474 |
| Charles River Laboratories International, Inc.Δ* | 8,090 | | 1,912,476 |
| Cigna Group (The) | 31,811 | | 9,525,804 |
| CVS Health Corporation | 128,942 | | 10,181,260 |
| Danaher Corporation | 66,412 | | 15,363,752 |
| DaVita, Inc.* | 9,259 | | 969,973 |
| DENTSPLY SIRONA, Inc. | 16,089 | | 572,608 |
| Dexcom, Inc.Δ* | 34,256 | | 4,250,827 |
| Edwards Lifesciences Corporation* | 57,327 | | 4,371,184 |
| Elevance Health, Inc. | 24,139 | | 11,382,987 |
| Eli Lilly and Co. | 82,837 | | 48,287,344 |
| GE HealthCare Technologies, Inc. | 36,757 | | 2,842,051 |
| Gilead Sciences, Inc. | 188,887 | | 15,301,736 |
| HCA Healthcare, Inc. | 21,308 | | 5,767,649 |
| Henry Schein, Inc.* | 19,612 | | 1,484,825 |
| Hologic, Inc.* | 29,305 | | 2,093,842 |
| Humana, Inc. | 13,229 | | 6,056,369 |
| IDEXX Laboratories, Inc.* | 6,761 | | 3,752,693 |
| Illumina, Inc.* | 14,975 | | 2,085,119 |
| Incyte Corporation* | 87,699 | | 5,506,620 |
| Insulet Corporation* | 4,630 | | 1,004,617 |
| Intuitive Surgical, Inc.* | 32,557 | | 10,983,430 |
| IQVIA Holdings, Inc.* | 19,293 | | 4,464,014 |
| Laboratory Corporation of America HoldingsΔ | 9,830 | | 2,234,261 |
| McKesson Corporation | 15,139 | | 7,009,054 |
| Mettler-Toledo International, Inc.* | 3,103 | | 3,763,815 |
| Moderna, Inc.* | 44,540 | | 4,429,503 |
| Molina Healthcare, Inc.* | 6,429 | | 2,322,862 |
| Quest Diagnostics, Inc. | 16,017 | | 2,208,424 |
| Regeneron Pharmaceuticals, Inc.* | 15,385 | | 13,512,492 |
| ResMed, Inc. | 11,820 | | 2,033,276 |
| Revvity, Inc. | 21,618 | | 2,363,064 |
| Stryker Corporation | 31,480 | | 9,427,001 |
| Teleflex, Inc. | 4,060 | | 1,012,320 |
| Thermo Fisher Scientific, Inc. | 36,607 | | 19,430,630 |
| UnitedHealth Group, Inc. | 86,181 | | 45,371,711 |
| Universal Health Services, Inc. Class B | 6,340 | | 966,470 |
| Vertex Pharmaceuticals, Inc.* | 38,659 | | 15,729,961 |
| Viatris, Inc.Δ | 696,689 | | 7,545,142 |
| Waters Corporation* | 8,473 | | 2,789,566 |
| West Pharmaceutical Services, Inc. | 9,420 | | 3,316,970 |
| | | Shares | | Value |
| Zimmer Biomet Holdings, Inc. | 18,826 | | $ 2,291,124 |
| Zoetis, Inc. | 80,250 | | 15,838,942 |
| | | | | 434,376,030 |
| Industrials — 8.0% | | |
| 3M Co. | 48,179 | | 5,266,928 |
| A.O. Smith Corporation | 16,217 | | 1,336,929 |
| American Airlines Group, Inc.Δ* | 39,524 | | 543,060 |
| AMETEK, Inc. | 20,180 | | 3,327,480 |
| Automatic Data Processing, Inc. | 42,820 | | 9,975,775 |
| Axon Enterprise, Inc.* | 6,195 | | 1,600,354 |
| Boeing Co. (The)* | 51,055 | | 13,307,996 |
| Broadridge Financial Solutions, Inc. | 10,733 | | 2,208,315 |
| Builders FirstSource, Inc.* | 6,452 | | 1,077,097 |
| C.H. Robinson Worldwide, Inc. | 12,459 | | 1,076,333 |
| Carrier Global Corporation | 73,991 | | 4,250,783 |
| Caterpillar, Inc. | 46,694 | | 13,806,015 |
| Ceridian HCM Holding, Inc.* | 10,792 | | 724,359 |
| Cintas Corporation | 7,570 | | 4,562,136 |
| Copart, Inc.* | 60,148 | | 2,947,252 |
| CSX Corporation | 215,904 | | 7,485,392 |
| Cummins, Inc. | 12,679 | | 3,037,508 |
| Deere & Co. | 25,133 | | 10,049,933 |
| Delta Air Lines, Inc. | 58,547 | | 2,355,346 |
| Dover Corporation | 11,833 | | 1,820,034 |
| Emerson Electric Co. | 51,542 | | 5,016,583 |
| Equifax, Inc. | 9,414 | | 2,327,988 |
| Expeditors International of Washington, Inc. | 6,818 | | 867,250 |
| Fastenal Co. | 46,855 | | 3,034,798 |
| FedEx Corporation | 18,166 | | 4,595,453 |
| Fortive Corporation | 28,087 | | 2,068,046 |
| Generac Holdings, Inc.* | 4,876 | | 630,174 |
| General Dynamics Corporation | 23,726 | | 6,160,930 |
| General Electric Co. | 92,027 | | 11,745,406 |
| Honeywell International, Inc. | 58,926 | | 12,357,371 |
| Howmet Aerospace, Inc. | 32,372 | | 1,751,973 |
| Hubbell, Inc. | 4,746 | | 1,561,102 |
| Huntington Ingalls Industries, Inc. | 2,805 | | 728,290 |
| IDEX Corporation | 6,919 | | 1,502,184 |
| Illinois ToolWorks, Inc. | 24,645 | | 6,455,511 |
| Ingersoll-Rand, Inc. | 25,879 | | 2,001,482 |
| J.B. Hunt Transport Services, Inc. | 9,677 | | 1,932,884 |
| Jacobs Solutions, Inc. | 12,155 | | 1,577,719 |
| L3Harris Technologies, Inc. | 20,606 | | 4,340,036 |
| Leidos Holdings, Inc. | 16,258 | | 1,759,766 |
| Lockheed Martin Corporation | 21,861 | | 9,908,280 |
| Masco Corporation | 23,878 | | 1,599,348 |
| Nordson Corporation | 5,292 | | 1,397,935 |
| Norfolk Southern Corporation | 24,732 | | 5,846,150 |
| Northrop Grumman Corporation | 14,300 | | 6,694,402 |
| Old Dominion Freight Line, Inc. | 7,428 | | 3,010,791 |
| Otis Worldwide Corporation | 33,919 | | 3,034,733 |
| PACCAR, Inc. | 45,897 | | 4,481,842 |
| Parker-Hannifin Corporation | 10,021 | | 4,616,675 |
| Paychex, Inc. | 36,801 | | 4,383,367 |
| Paycom Software, Inc. | 3,850 | | 795,872 |
| Quanta Services, Inc. | 8,814 | | 1,902,061 |
See Notes to Financial Statements.
| | | Shares | | Value |
| Republic Services, Inc. | 27,745 | | $ 4,575,428 |
| Robert Half, Inc. | 4,920 | | 432,566 |
| Rockwell Automation, Inc. | 10,107 | | 3,138,021 |
| Rollins, Inc. | 21,375 | | 933,446 |
| RTX Corporation | 143,659 | | 12,087,468 |
| Snap-on, Inc. | 5,899 | | 1,703,867 |
| Southwest Airlines Co. | 82,468 | | 2,381,676 |
| Stanley Black & Decker, Inc. | 10,352 | | 1,015,531 |
| Textron, Inc. | 15,886 | | 1,277,552 |
| TransDigm Group, Inc. | 3,578 | | 3,619,505 |
| Uber Technologies, Inc.* | 180,424 | | 11,108,706 |
| Union Pacific Corporation | 57,242 | | 14,059,780 |
| United Airlines Holdings, Inc.* | 20,930 | | 863,572 |
| United Parcel Service, Inc. Class B | 68,802 | | 10,817,738 |
| United Rentals, Inc. | 4,416 | | 2,532,223 |
| Veralto Corporation | 22,137 | | 1,820,990 |
| Verisk Analytics, Inc. | 12,938 | | 3,090,371 |
| W.W. Grainger, Inc. | 2,817 | | 2,334,420 |
| Waste Management, Inc. | 42,596 | | 7,628,944 |
| Westinghouse Air Brake Technologies Corporation | 11,295 | | 1,433,336 |
| Xylem, Inc. | 21,548 | | 2,464,229 |
| | | | | 300,164,796 |
| Information Technology — 26.9% | | |
| Adobe, Inc.* | 41,557 | | 24,792,906 |
| Advanced Micro Devices, Inc.* | 143,215 | | 21,111,323 |
| Akamai Technologies, Inc.* | 12,022 | | 1,422,804 |
| Amphenol Corporation Class A | 53,541 | | 5,307,519 |
| Analog Devices, Inc. | 46,113 | | 9,156,197 |
| ANSYS, Inc.* | 6,671 | | 2,420,773 |
| Apple, Inc. | 1,329,173 | | 255,905,678 |
| Applied Materials, Inc. | 73,851 | | 11,969,032 |
| Arista Networks, Inc.* | 21,619 | | 5,091,491 |
| Autodesk, Inc.* | 18,555 | | 4,517,771 |
| Broadcom, Inc. | 39,737 | | 44,356,426 |
| Cadence Design Systems, Inc.* | 23,784 | | 6,478,048 |
| CDW Corporation | 11,000 | | 2,500,520 |
| Cisco Systems, Inc. | 379,514 | | 19,173,047 |
| Cognizant Technology Solutions Corporation Class A | 43,107 | | 3,255,872 |
| Corning, Inc. | 81,585 | | 2,484,263 |
| Enphase Energy, Inc.* | 12,624 | | 1,668,135 |
| EPAM Systems, Inc.* | 4,578 | | 1,361,223 |
| F5, Inc.* | 3,179 | | 568,977 |
| Fair Isaac Corporation* | 1,636 | | 1,904,320 |
| First Solar, Inc.* | 9,794 | | 1,687,310 |
| Fortinet, Inc.* | 57,750 | | 3,380,108 |
| Gartner, Inc.* | 5,374 | | 2,424,265 |
| Gen Digital, Inc. | 62,969 | | 1,436,953 |
| Hewlett Packard Enterprise Co. | 153,179 | | 2,600,979 |
| HP, Inc. | 87,406 | | 2,630,047 |
| Intel Corporation | 388,769 | | 19,535,642 |
| International Business Machines Corporation | 86,753 | | 14,188,453 |
| Intuit, Inc. | 25,035 | | 15,647,626 |
| Jabil, Inc. | 5,560 | | 708,344 |
| Juniper Networks, Inc. | 33,556 | | 989,231 |
| | | Shares | | Value |
| Keysight Technologies, Inc.* | 13,420 | | $ 2,134,988 |
| KLA Corporation | 11,211 | | 6,516,954 |
| Lam Research Corporation | 11,555 | | 9,050,569 |
| Microchip Technology, Inc. | 43,842 | | 3,953,672 |
| Micron Technology, Inc. | 101,205 | | 8,636,835 |
| Microsoft Corporation | 675,761 | | 254,113,167 |
| Monolithic Power Systems, Inc. | 3,722 | | 2,347,763 |
| Motorola Solutions, Inc. | 13,943 | | 4,365,414 |
| NetApp, Inc. | 19,952 | | 1,758,968 |
| NVIDIA Corporation | 223,296 | | 110,580,645 |
| ON Semiconductor Corporation* | 33,696 | | 2,814,627 |
| Oracle Corporation | 145,192 | | 15,307,593 |
| Palo Alto Networks, Inc.* | 27,463 | | 8,098,290 |
| PTC, Inc.* | 10,548 | | 1,845,478 |
| Qorvo, Inc.* | 3,926 | | 442,107 |
| QUALCOMM, Inc. | 101,161 | | 14,630,915 |
| Roper Technologies, Inc. | 12,111 | | 6,602,554 |
| Salesforce, Inc.* | 90,121 | | 23,714,440 |
| ServiceNow, Inc.* | 17,894 | | 12,641,932 |
| Skyworks Solutions, Inc. | 15,419 | | 1,733,404 |
| Synopsys, Inc.* | 14,009 | | 7,213,374 |
| Teledyne Technologies, Inc.* | 4,739 | | 2,114,968 |
| Teradyne, Inc.Δ | 9,806 | | 1,064,147 |
| Texas Instruments, Inc. | 85,276 | | 14,536,147 |
| Trimble, Inc.* | 19,275 | | 1,025,430 |
| Tyler Technologies, Inc.* | 3,141 | | 1,313,315 |
| VeriSign, Inc.* | 4,350 | | 895,926 |
| Western Digital Corporation* | 33,866 | | 1,773,562 |
| Zebra Technologies Corporation Class A* | 4,187 | | 1,144,433 |
| | | | | 1,013,046,900 |
| Materials — 1.8% | | |
| Air Products and Chemicals, Inc. | 20,651 | | 5,654,244 |
| Albemarle CorporationΔ | 8,321 | | 1,202,218 |
| Avery Dennison Corporation | 5,863 | | 1,185,264 |
| Ball CorporationΔ | 26,240 | | 1,509,325 |
| Celanese CorporationΔ | 7,902 | | 1,227,734 |
| CF Industries Holdings, Inc. | 17,573 | | 1,397,053 |
| Corteva, Inc. | 61,678 | | 2,955,610 |
| Dow, Inc. | 79,059 | | 4,335,595 |
| DuPont de Nemours, Inc. | 47,302 | | 3,638,943 |
| Eastman Chemical Co. | 14,389 | | 1,292,420 |
| Ecolab, Inc. | 20,111 | | 3,989,017 |
| FMC Corporation | 14,783 | | 932,068 |
| Freeport-McMoRan, Inc. | 123,949 | | 5,276,509 |
| International Flavors & Fragrances, Inc. | 23,797 | | 1,926,843 |
| International Paper Co. | 43,581 | | 1,575,453 |
| Martin Marietta Materials, Inc. | 5,969 | | 2,977,994 |
| Mosaic Co. (The) | 35,598 | | 1,271,916 |
| Newmont Corporation | 96,320 | | 3,986,685 |
| Nucor Corporation | 23,742 | | 4,132,058 |
| Packaging Corporation of America | 13,571 | | 2,210,852 |
| PPG Industries, Inc. | 18,443 | | 2,758,151 |
| Sherwin-Williams Co. (The) | 21,527 | | 6,714,271 |
| Steel Dynamics, Inc. | 14,925 | | 1,762,642 |
See Notes to Financial Statements.
SCHEDULE OF INVESTMENTS (Continued)
| | | Shares | | Value |
| Vulcan Materials Co. | 17,870 | | $ 4,056,669 |
| Westrock Co. | 21,818 | | 905,883 |
| | | | | 68,875,417 |
| Real Estate — 2.4% | | |
| Alexandria Real Estate Equities, Inc. REIT | 13,587 | | 1,722,424 |
| American Tower Corporation REIT | 41,821 | | 9,028,318 |
| AvalonBay Communities, Inc. REIT | 14,896 | | 2,788,829 |
| Boston Properties, Inc. REIT | 11,272 | | 790,956 |
| Camden Property Trust REIT | 8,401 | | 834,135 |
| CBRE Group, Inc. Class A* | 35,708 | | 3,324,058 |
| CoStar Group, Inc.* | 41,877 | | 3,659,631 |
| Crown Castle, Inc. REIT | 38,898 | | 4,480,661 |
| Digital Realty Trust, Inc. REITΔ | 27,415 | | 3,689,511 |
| Equinix, Inc. REIT | 8,316 | | 6,697,623 |
| Equity Residential REIT | 40,640 | | 2,485,542 |
| Essex Property Trust, Inc. REIT | 8,395 | | 2,081,456 |
| Extra Space Storage, Inc. REITΔ | 18,174 | | 2,913,837 |
| Federal Realty Investment Trust REIT | 2,600 | | 267,930 |
| Healthpeak Properties, Inc. REIT | 68,876 | | 1,363,745 |
| Host Hotels & Resorts, Inc. REIT | 47,716 | | 929,031 |
| Invitation Homes, Inc. REIT | 51,636 | | 1,761,304 |
| Iron Mountain, Inc. REIT | 32,755 | | 2,292,195 |
| Kimco Realty Corporation REIT | 56,971 | | 1,214,052 |
| Mid-America Apartment Communities, Inc. REIT | 12,145 | | 1,633,017 |
| Prologis, Inc. REIT | 86,686 | | 11,555,244 |
| Public Storage REIT | 14,785 | | 4,509,425 |
| Realty Income Corporation REITΔ | 88,739 | | 5,095,393 |
| Regency Centers Corporation REIT | 15,104 | | 1,011,968 |
| SBA Communications Corporation REIT | 9,082 | | 2,304,013 |
| Simon Property Group, Inc. REIT | 26,802 | | 3,823,037 |
| UDR, Inc. REIT | 34,368 | | 1,315,951 |
| Ventas, Inc. REIT | 35,191 | | 1,753,919 |
| Welltower, Inc. REIT | 51,201 | | 4,616,794 |
| Weyerhaeuser Co. REIT | 61,400 | | 2,134,878 |
| | | | | 92,078,877 |
| Utilities — 2.4% | | |
| AES Corporation (The) | 56,201 | | 1,081,869 |
| Alliant Energy Corporation | 22,632 | | 1,161,022 |
| Ameren Corporation | 19,884 | | 1,438,409 |
| American Electric Power Co., Inc. | 45,717 | | 3,713,135 |
| American Water Works Co., Inc. | 28,898 | | 3,814,247 |
| Atmos Energy Corporation | 15,856 | | 1,837,710 |
| CenterPoint Energy, Inc. | 50,231 | | 1,435,100 |
| CMS Energy Corporation | 24,417 | | 1,417,895 |
| Consolidated Edison, Inc. | 54,284 | | 4,938,215 |
| Constellation Energy Corporation | 27,905 | | 3,261,815 |
| Dominion Energy, Inc. | 84,336 | | 3,963,792 |
| DTE Energy Co. | 18,119 | | 1,997,801 |
| Duke Energy Corporation | 84,950 | | 8,243,548 |
| Edison International | 35,412 | | 2,531,604 |
| Entergy Corporation | 16,902 | | 1,710,313 |
| Evergy, Inc. | 17,247 | | 900,293 |
| Eversource Energy | 27,044 | | 1,669,156 |
| Exelon Corporation | 97,262 | | 3,491,706 |
| | | Shares | | Value |
| FirstEnergy Corporation | 45,258 | | $ 1,659,158 |
| NextEra Energy, Inc. | 183,172 | | 11,125,867 |
| NiSource, Inc. | 23,079 | | 612,747 |
| NRG Energy, Inc. | 19,377 | | 1,001,791 |
| PG&E Corporation | 133,703 | | 2,410,665 |
| Pinnacle West Capital Corporation | 4,108 | | 295,119 |
| PPL Corporation | 38,698 | | 1,048,716 |
| Public Service Enterprise Group, Inc. | 46,751 | | 2,858,824 |
| Sempra | 64,983 | | 4,856,180 |
| Southern Co. (The) | 114,911 | | 8,057,559 |
| WEC Energy Group, Inc. | 35,929 | | 3,024,144 |
| Xcel Energy, Inc. | 45,771 | | 2,833,683 |
| | | | | 88,392,083 |
Total Common Stocks
(Cost $2,030,819,933) | | 3,519,565,662 |
| FOREIGN COMMON STOCKS — 3.1% |
| Canada — 0.0% | | |
| Enerflex, Ltd. | 6 | | 28 |
| Curacao — 0.2% | | |
| Schlumberger NV | 127,652 | | 6,643,010 |
| Ireland — 2.1% | | |
| Accenture PLC Class AΔ | 57,709 | | 20,250,665 |
| Allegion PLC | 8,862 | | 1,122,727 |
| Aon PLC Class A | 19,060 | | 5,546,841 |
| Eaton Corporation PLCΔ | 35,677 | | 8,591,735 |
| Johnson Controls International PLC | 65,453 | | 3,772,711 |
| Linde PLC | 44,316 | | 18,201,024 |
| Medtronic PLCΔ | 130,312 | | 10,735,103 |
| Pentair PLC | 6,692 | | 486,575 |
| Seagate Technology Holdings PLCΔ | 20,280 | | 1,731,304 |
| STERIS PLC | 7,784 | | 1,711,313 |
| Trane Technologies PLC | 20,780 | | 5,068,242 |
| Willis Towers Watson PLC | 12,561 | | 3,029,713 |
| | | | | 80,247,953 |
| Jersey — 0.1% | | |
| Amcor PLC | 174,148 | | 1,678,787 |
| Aptiv PLC* | 24,127 | | 2,164,674 |
| | | | | 3,843,461 |
| Netherlands — 0.2% | | |
| LyondellBasell Industries NV Class A | 27,312 | | 2,596,825 |
| NXP Semiconductor NV | 22,877 | | 5,254,390 |
| | | | | 7,851,215 |
| Switzerland — 0.5% | | |
| Bunge Global SA | 7,541 | | 761,264 |
| Chubb, Ltd. | 46,095 | | 10,417,470 |
| Garmin, Ltd. | 16,408 | | 2,109,084 |
| TE Connectivity, Ltd. | 28,610 | | 4,019,705 |
| | | | | 17,307,523 |
Total Foreign Common Stocks
(Cost $73,665,579) | | 115,893,190 |
| MONEY MARKET FUNDS — 3.1% |
GuideStone Money Market Fund, 5.28%
(Institutional Class)Ø∞ | 87,683,933 | | 87,683,933 |
See Notes to Financial Statements.
| | | Shares | | Value |
| Northern Institutional U.S. Treasury Portfolio (Premier), 5.22%Ø | 28,378,012 | | $ 28,378,012 |
Total Money Market Funds
(Cost $116,061,945) | | 116,061,945 |
TOTAL INVESTMENTS — 99.8%
(Cost $2,220,547,457) | | | 3,751,520,797 |
Other Assets in Excess of
Liabilities — 0.2% | | | 7,882,964 |
| NET ASSETS — 100.0% | | | $3,759,403,761 |
Futures Contracts outstanding at December 31, 2023:
| Future Type | | Expiration Date | | Open Long
(Short) Contracts | | Notional
Market Value
of Contracts | | Value and
Unrealized
Appreciation
(Depreciation) |
| S&P 500® E-Mini | | 03/2024 | | 499 | | $120,259,000 | | $2,540,106 |
VALUATION HIERARCHY
The following is a summary of the inputs used, as of December 31, 2023, in valuing the Fund’s investments carried at fair value:
| | Total
Value | | Level 1
Quoted Prices | | Level 2
Other Significant
Observable Inputs | | Level 3
Significant
Unobservable Inputs |
| Assets: | | | | | | | |
| Investments in Securities: | | | | | | | |
| Common Stocks | $3,519,565,662 | | $3,519,565,662 | | $ — | | $ — |
| Foreign Common Stocks | 115,893,190 | | 115,893,190 | | — | | — |
| Money Market Funds | 116,061,945 | | 116,061,945 | | — | | — |
| Total Assets - Investments in Securities | $3,751,520,797 | | $3,751,520,797 | | $ — | | $ — |
| Other Financial Instruments*** | | | | | | | |
| Futures Contracts | $ 2,540,106 | | $ 2,540,106 | | $ — | | $ — |
| Total Assets - Other Financial Instruments | $ 2,540,106 | | $ 2,540,106 | | $ — | | $ — |
| *** | Other financial instruments are derivative instruments, such as futures contracts, which are valued at the unrealized appreciation (depreciation) on the investment. Further details regarding the value of these investments can be found in the preceding "Futures Contracts outstanding" disclosure. |
See Notes to Financial Statements.
Value Equity Index Fund (Unaudited)
The Fund was passively managed and attempted to replicate the performance of its benchmark, the Russell 1000® Value Index. The Fund was comprised of domestic, large-cap equity stocks with value-style orientations. The objective of the Fund is to provide investment results approximating the aggregate price and dividend performance of the securities included in the Russell 1000® Value Index. However, the Fund’s returns relative to its benchmark could be lower in certain market environments and also due to the exclusion of certain securities from the Fund’s portfolio because of the Fund’s faith-based investment policies and restrictions.
The Investor Class of the Fund returned 11.68%, net of fees, for the one-year period ended December 31, 2023, as compared to the return of 11.46% for the Russell 1000® Value Index. The return differential was primarily a result of the faith-based investment restrictions and expenses of the Fund.
In 2023, exchange-listed equity index futures contracts were utilized to provide market exposure to the cash positions held in the Fund. Overall, derivative exposure had a positive impact on Fund performance for the year.
This Fund may be suitable for investors who seek higher, long-term rates of return, can accept significant short-term fluctuations in account value and want to diversify their portfolio by adding a potentially higher return, higher risk option of equity securities. This Fund is subject to value investing risk. This involves the risk that an investment in companies whose securities are believed to be undervalued, relative to their underlying profitability, will not appreciate in value as anticipated. It is possible to lose money by investing in the Fund.
At December 31, 2023, the portfolio holdings of the Fund, as a percentage of net assets, is shown in the following table. Portfolio holdings are subject to risk and may change at any time.
| | % |
| Financials | 20.6 |
| Industrials | 13.3 |
| Health Care | 13.3 |
| Information Technology | 8.9 |
| Energy | 7.4 |
| Consumer Staples | 7.1 |
| Consumer Discretionary | 4.9 |
| Real Estate | 4.9 |
| Utilities | 4.7 |
| Materials | 4.6 |
| Communication Services | 4.5 |
| Money Market Funds | 3.6 |
| Mutual Funds | 2.1 |
| | 99.9 |
| Average Annual Total Returns as of 12/31/23 | |
| | | Institutional Class* | | Investor Class* | | Benchmark** | |
| One Year | | 12.04% | | 11.68% | | 11.46% | |
| Five Year | | N/A | | N/A | | N/A | |
| Ten Year | | N/A | | N/A | | N/A | |
| Since Inception | | 10.40% | | 10.07% | | 10.55% | |
| Inception Date | | 08/31/22 | | 08/31/22 | | | |
| Total Fund Operating Expenses (May 1, 2023 Prospectus)(1)# | | 0.21% | | 0.48% | | | |
| (1) | Current information regarding the Fund’s Operating Expenses can be found in the Financial Highlights. |
#Net expense ratio
See Notes to Financial Statements.
Value Equity Index Fund (Unaudited)
The performance data quoted represents past performance and does not guarantee future results. The performance data in the table and graph does not reflect the deduction of taxes that a shareholder would pay on Fund distributions or the redemption of Fund shares. Current performance may be lower or higher. Performance data current to the most recent month-end may be obtained at GuideStoneFunds.com. The investment return and principal value of an investment will fluctuate so that shares, when redeemed, may be worth more or less than their original cost.
The Adviser has agreed to waive fees and/or reimburse expenses to the extent needed to limit total annual operating expenses (before expense payments by broker-dealers and excluding interest, taxes, brokerage commissions, extraordinary expenses,acquired fund fees and expenses and expenses incurred in connection with the short sales of securities) to 0.20% for the Institutional Class and 0.47% for the Investor Class. This contractual waiver and reimbursement applies to Fund operating expenses only and will remain in place until April 30, 2024.
The graph illustrates the results of a hypothetical $10,000 investment in the Investor Class of the Fund since August 31, 2022 with all dividends and capital gains reinvested, with the Russell 1000® Value Index.
*These returns reflect investment advisory and shareholder servicing fee waivers, if applicable, during the reported time periods.
Unlike a mutual fund, an index is not available for direct investment and the performance of an index assumes no taxes, transaction costs, management fees or other expenses.
See Notes to Financial Statements.
| | | Shares | | Value |
| COMMON STOCKS — 88.9% |
| Communication Services — 4.5% | | |
| AMC Entertainment Holdings, Inc. Class AΔ* | 343 | | $ 2,099 |
| AT&T, Inc. | 60,847 | | 1,021,013 |
| Cable One, Inc. | 15 | | 8,349 |
| Comcast Corporation Class A | 33,902 | | 1,486,603 |
| Electronic Arts, Inc. | 2,288 | | 313,021 |
| Fox Corporation Class A | 2,285 | | 67,796 |
| Fox Corporation Class B | 1,520 | | 42,028 |
| Frontier Communications Parent, Inc.* | 840 | | 21,286 |
| IAC, Inc.* | 624 | | 32,685 |
| Interpublic Group of Cos., Inc. (The) | 2,902 | | 94,721 |
| Liberty Broadband Corporation* | 529 | | 42,632 |
| Liberty Broadband Corporation Class A* | 105 | | 8,467 |
| Liberty Media Corporation-Liberty Formula One Class A* | 112 | | 6,494 |
| Liberty Media Corporation-Liberty Formula One Class C* | 1,591 | | 100,440 |
| Liberty Media Corporation-Liberty Live Class A* | 448 | | 16,374 |
| Liberty Media Corporation-Liberty Live Class C* | 173 | | 6,468 |
| Liberty Media Corporation-Liberty SiriusXM* | 423 | | 12,174 |
| Liberty Media Corporation-Liberty SiriusXM Class A* | 1,775 | | 51,013 |
| Live Nation Entertainment, Inc.* | 1,059 | | 99,122 |
| New York Times Co. (The) Class A | 1,000 | | 48,990 |
| News Corporation Class A | 2,285 | | 56,097 |
| News Corporation Class B | 1,802 | | 46,347 |
| Nexstar Media Group, Inc. Class A | 191 | | 29,939 |
| Omnicom Group, Inc. | 1,654 | | 143,088 |
| Paramount Global Class B | 5,200 | | 76,908 |
| Roku, Inc.* | 807 | | 73,970 |
| Sirius XM Holdings, Inc.Δ | 7,642 | | 41,802 |
| Take-Two Interactive Software, Inc.* | 1,336 | | 215,029 |
| T-Mobile US, Inc. | 4,796 | | 768,943 |
| TripAdvisor, Inc.* | 1,766 | | 38,022 |
| Verizon Communications, Inc. | 35,412 | | 1,335,032 |
| Walt Disney Co. (The) | 15,631 | | 1,411,323 |
| Warner Bros Discovery, Inc.* | 17,507 | | 199,230 |
| ZoomInfo Technologies, Inc.* | 1,250 | | 23,113 |
| | | | | 7,940,618 |
| Consumer Discretionary — 4.7% | | |
| ADT, Inc. | 2,684 | | 18,305 |
| Advance Auto Parts, Inc. | 456 | | 27,830 |
| Aramark | 2,497 | | 70,166 |
| AutoNation, Inc.* | 330 | | 49,559 |
| AutoZone, Inc.* | 26 | | 67,226 |
| Bath & Body Works, Inc. | 1,381 | | 59,604 |
| Best Buy Co., Inc. | 1,245 | | 97,459 |
| BorgWarner, Inc. | 2,686 | | 96,293 |
| Bright Horizons Family Solutions, Inc.* | 438 | | 41,277 |
| Brunswick Corporation | 461 | | 44,602 |
| Capri Holdings, Ltd.* | 604 | | 30,345 |
| | | Shares | | Value |
| CarMax, Inc.Δ* | 852 | | $ 65,382 |
| Carnival Corporation* | 8,217 | | 152,343 |
| Carter's, Inc. | 444 | | 33,251 |
| Columbia Sportswear Co. | 538 | | 42,793 |
| D.R. Horton, Inc. | 2,394 | | 363,840 |
| Darden Restaurants, Inc. | 843 | | 138,505 |
| Dick's Sporting Goods, Inc. | 459 | | 67,450 |
| DoorDash, Inc. Class A* | 525 | | 51,917 |
| eBay, Inc. | 3,941 | | 171,906 |
| Etsy, Inc. | 247 | | 20,019 |
| Expedia Group, Inc.* | 205 | | 31,117 |
| Ford Motor Co. | 35,278 | | 430,039 |
| GameStop Corporation Class AΔ* | 1,865 | | 32,693 |
| Gap, Inc. (The) | 1,948 | | 40,733 |
| General Motors Co. | 12,088 | | 434,201 |
| Gentex Corporation | 2,642 | | 86,288 |
| Genuine Parts Co. | 1,658 | | 229,633 |
| Grand Canyon Education, Inc.* | 469 | | 61,927 |
| H&R Block, Inc. | 786 | | 38,019 |
| Harley-Davidson, Inc. | 462 | | 17,020 |
| Hasbro, Inc. | 1,505 | | 76,845 |
| Hilton Worldwide Holdings, Inc. | 1,314 | | 239,266 |
| Hyatt Hotels Corporation Class A | 418 | | 54,511 |
| Kohl’s CorporationΔ | 720 | | 20,650 |
| Lear Corporation | 656 | | 92,634 |
| Leggett & Platt, Inc. | 530 | | 13,870 |
| Lennar Corporation Class A | 2,183 | | 325,354 |
| Lithia Motors, Inc. | 189 | | 62,234 |
| LKQ Corporation | 4,469 | | 213,573 |
| Lowe’s Cos., Inc. | 1,223 | | 272,179 |
| Lucid Group, Inc.Δ* | 5,070 | | 21,345 |
| Macy’s, Inc. | 782 | | 15,734 |
| Marriott Vacations Worldwide Corporation | 292 | | 24,788 |
| Mattel, Inc.* | 3,422 | | 64,607 |
| McDonald’s Corporation | 3,764 | | 1,116,064 |
| Mister Car Wash, Inc.* | 754 | | 6,515 |
| Mohawk Industries, Inc.* | 337 | | 34,879 |
| Newell Brands, Inc. | 2,906 | | 25,224 |
| NIKE, Inc. Class B | 4,497 | | 488,239 |
| Norwegian Cruise Line Holdings, Ltd.* | 3,153 | | 63,186 |
| NVR, Inc.* | 18 | | 126,008 |
| O’Reilly Automotive, Inc.* | 95 | | 90,258 |
| Ollie's Bargain Outlet Holdings, Inc.* | 324 | | 24,588 |
| Penske Automotive Group, Inc. | 192 | | 30,818 |
| Phinia, Inc. | 349 | | 10,571 |
| Planet Fitness, Inc. Class A* | 477 | | 34,821 |
| Polaris, Inc. | 403 | | 38,192 |
| PulteGroup, Inc. | 1,309 | | 135,115 |
| PVH Corporation | 162 | | 19,783 |
| Ralph Lauren Corporation | 379 | | 54,652 |
| RH* | 18 | | 5,247 |
| Rivian Automotive, Inc. Class AΔ* | 6,171 | | 144,772 |
| Ross Stores, Inc. | 556 | | 76,945 |
| Royal Caribbean Cruises, Ltd.* | 1,398 | | 181,027 |
| Service Corporation International | 1,858 | | 127,180 |
| Skechers U.S.A., Inc. Class A* | 658 | | 41,020 |
See Notes to Financial Statements.
| | | Shares | | Value |
| Tapestry, Inc. | 1,755 | | $ 64,602 |
| Tempur Sealy International, Inc. | 1,204 | | 61,368 |
| Thor Industries, Inc. | 326 | | 38,549 |
| Toll Brothers, Inc. | 336 | | 34,537 |
| TopBuild Corporation* | 119 | | 44,537 |
| Under Armour, Inc. Class C* | 968 | | 8,083 |
| Vail Resorts, Inc. | 282 | | 60,199 |
| Valvoline, Inc.* | 606 | | 22,773 |
| VF Corporation | 3,534 | | 66,439 |
| Wayfair, Inc. Class A* | 385 | | 23,754 |
| Whirlpool Corporation | 379 | | 46,151 |
| Williams-Sonoma, Inc.Δ | 497 | | 100,285 |
| Wyndham Hotels & Resorts, Inc. | 505 | | 40,607 |
| Yum! Brands, Inc. | 833 | | 108,840 |
| | | | | 8,205,160 |
| Consumer Staples — 7.1% | | |
| Albertsons Cos., Inc. Class A | 1,406 | | 32,338 |
| Archer-Daniels-Midland Co. | 4,615 | | 333,295 |
| BJ's Wholesale Club Holdings, Inc.* | 631 | | 42,063 |
| Campbell Soup Co. | 2,083 | | 90,048 |
| Casey’s General Stores, Inc. | 223 | | 61,267 |
| Church & Dwight Co., Inc. | 593 | | 56,074 |
| Coca-Cola Co. (The) | 21,153 | | 1,246,546 |
| Colgate-Palmolive Co. | 6,797 | | 541,789 |
| Conagra Brands, Inc. | 5,282 | | 151,382 |
| Coty, Inc. Class A* | 5,539 | | 68,794 |
| Darling Ingredients, Inc.* | 1,055 | | 52,581 |
| Dollar Tree, Inc.* | 1,636 | | 232,394 |
| Estee Lauder Cos., Inc. (The) Class A | 1,547 | | 226,249 |
| Flowers Foods, Inc. | 2,526 | | 56,860 |
| General Mills, Inc. | 5,796 | | 377,551 |
| Grocery Outlet Holding Corporation* | 444 | | 11,970 |
| Hershey Co. (The) | 526 | | 98,067 |
| Hormel Foods Corporation | 3,563 | | 114,408 |
| Ingredion, Inc. | 566 | | 61,428 |
| J.M. Smucker Co. (The) | 1,236 | | 156,206 |
| Kellanova | 2,653 | | 148,329 |
| Kenvue, Inc. | 13,949 | | 300,322 |
| Keurig Dr. Pepper, Inc. | 11,696 | | 389,711 |
| Kimberly-Clark Corporation | 696 | | 84,571 |
| Kraft Heinz Co. (The) | 7,887 | | 291,661 |
| Kroger Co. (The) | 5,693 | | 260,227 |
| McCormick & Co., Inc. (Non-Voting Shares) | 2,235 | | 152,919 |
| Mondelez International, Inc. Class A | 12,418 | | 899,436 |
| PepsiCo, Inc. | 5,694 | | 967,069 |
| Performance Food Group Co.* | 469 | | 32,431 |
| Pilgrim’s Pride Corporation* | 209 | | 5,781 |
| Post Holdings, Inc.Δ* | 304 | | 26,770 |
| Procter & Gamble Co. (The) | 16,905 | | 2,477,259 |
| Reynolds Consumer Products, Inc. | 1,447 | | 38,838 |
| Seaboard Corporation | 3 | | 10,710 |
| Tyson Foods, Inc. Class A | 2,592 | | 139,320 |
| U.S. Foods Holding Corporation* | 1,212 | | 55,037 |
| Walgreens Boots Alliance, Inc. | 5,752 | | 150,185 |
| Walmart, Inc. | 12,290 | | 1,937,519 |
| | | Shares | | Value |
| WK Kellogg Co. | 663 | | $ 8,712 |
| | | | | 12,388,117 |
| Energy — 7.0% | | |
| Antero Midstream Corporation | 2,130 | | 26,689 |
| Antero Resources Corporation* | 1,429 | | 32,410 |
| Baker Hughes Co. | 8,018 | | 274,055 |
| Chesapeake Energy CorporationΔ | 923 | | 71,016 |
| Chevron Corporation | 14,802 | | 2,207,866 |
| ConocoPhillips | 10,386 | | 1,205,503 |
| Coterra Energy, Inc. | 6,273 | | 160,087 |
| Devon Energy Corporation | 5,467 | | 247,655 |
| Diamondback Energy, Inc. | 1,509 | | 234,016 |
| DT Midstream, Inc. | 459 | | 25,153 |
| EOG Resources, Inc. | 5,199 | | 628,819 |
| EQT Corporation | 2,588 | | 100,052 |
| Exxon Mobil Corporation | 33,575 | | 3,356,829 |
| Halliburton Co. | 5,587 | | 201,970 |
| Hess Corporation | 989 | | 142,574 |
| HF Sinclair Corporation | 1,101 | | 61,183 |
| Kinder Morgan, Inc. | 16,831 | | 296,899 |
| Marathon Oil Corporation | 4,540 | | 109,687 |
| Marathon Petroleum Corporation | 2,936 | | 435,585 |
| NOV, Inc. | 2,112 | | 42,831 |
| Occidental Petroleum Corporation | 5,830 | | 348,109 |
| ONEOK, Inc. | 3,727 | | 261,710 |
| Ovintiv, Inc. | 255 | | 11,200 |
| Phillips 66 | 3,831 | | 510,059 |
| Pioneer Natural Resources Co. | 2,048 | | 460,554 |
| Range Resources Corporation | 2,037 | | 62,006 |
| Southwestern Energy Co.* | 2,354 | | 15,419 |
| Valero Energy Corporation | 2,877 | | 374,010 |
| Williams Cos., Inc. (The) | 10,769 | | 375,084 |
| | | | | 12,279,030 |
| Financials — 19.6% | | |
| Affirm Holdings, Inc.Δ* | 2,058 | | 101,130 |
| Aflac, Inc. | 5,153 | | 425,123 |
| AGNC Investment Corporation REITΔ | 1,368 | | 13,420 |
| Allstate Corporation (The) | 2,412 | | 337,632 |
| Ally Financial, Inc. | 1,544 | | 53,916 |
| American Express Co. | 3,535 | | 662,247 |
| American Financial Group, Inc. | 583 | | 69,313 |
| American International Group, Inc. | 5,459 | | 369,847 |
| Annaly Capital Management, Inc. REIT | 3,135 | | 60,725 |
| Arch Capital Group, Ltd.* | 2,291 | | 170,153 |
| Arthur J. Gallagher & Co. | 1,830 | | 411,530 |
| Assurant, Inc. | 456 | | 76,831 |
| Assured Guaranty, Ltd. | 287 | | 21,476 |
| Axis Capital Holdings, Ltd. | 655 | | 36,267 |
| Bank of America Corporation | 57,457 | | 1,934,577 |
| Bank of New York Mellon Corporation (The) | 6,536 | | 340,199 |
| Bank OZK | 159 | | 7,923 |
| Berkshire Hathaway, Inc. Class B* | 15,293 | | 5,454,401 |
See Notes to Financial Statements.
SCHEDULE OF INVESTMENTS (Continued)
| | | Shares | | Value |
| BlackRock, Inc. | 1,237 | | $1,004,197 |
| Block, Inc.* | 2,493 | | 192,834 |
| Blue Owl Capital, Inc. | 2,268 | | 33,793 |
| Brown & Brown, Inc. | 1,623 | | 115,412 |
| Capital One Financial Corporation | 3,152 | | 413,290 |
| Carlyle Group, Inc. (The) | 1,085 | | 44,149 |
| Cboe Global Markets, Inc. | 1,007 | | 179,810 |
| Charles Schwab Corporation (The) | 11,988 | | 824,774 |
| Cincinnati Financial Corporation | 1,398 | | 144,637 |
| Citigroup, Inc. | 16,061 | | 826,178 |
| Citizens Financial Group, Inc. | 3,357 | | 111,251 |
| CME Group, Inc. | 3,124 | | 657,914 |
| CNA Financial Corporation | 1,208 | | 51,110 |
| Coinbase Global, Inc. Class A* | 1,364 | | 237,227 |
| Columbia Banking System, Inc. | 1,700 | | 45,356 |
| Comerica, Inc. | 982 | | 54,805 |
| Commerce Bancshares, Inc. | 1,310 | | 69,988 |
| Corebridge Financial, Inc. | 1,595 | | 34,548 |
| Credit Acceptance CorporationΔ* | 27 | | 14,384 |
| Cullen/Frost Bankers, Inc. | 436 | | 47,302 |
| Discover Financial Services | 2,174 | | 244,358 |
| East West Bancorp, Inc. | 887 | | 63,820 |
| Evercore, Inc. Class A | 54 | | 9,237 |
| Everest Group, Ltd. | 276 | | 97,588 |
| Fidelity National Financial, Inc. | 2,377 | | 121,275 |
| Fidelity National Information Services, Inc. | 5,126 | | 307,919 |
| Fifth Third Bancorp | 5,109 | | 176,209 |
| First American Financial Corporation | 743 | | 47,879 |
| First Citizens BancShares, Inc. Class A | 66 | | 93,652 |
| First Hawaiian, Inc. | 562 | | 12,847 |
| First Horizon Corporation | 4,487 | | 63,536 |
| Fiserv, Inc.* | 3,871 | | 514,224 |
| FNB Corporation | 3,594 | | 49,489 |
| Franklin Resources, Inc. | 2,081 | | 61,993 |
| Global Payments, Inc. | 2,019 | | 256,413 |
| Globe Life, Inc. | 503 | | 61,225 |
| Goldman Sachs Group, Inc. (The) | 2,617 | | 1,009,560 |
| Hanover Insurance Group, Inc. (The) | 343 | | 41,647 |
| Hartford Financial Services Group, Inc. (The) | 2,999 | | 241,060 |
| Houlihan Lokey, Inc. | 294 | | 35,254 |
| Huntington Bancshares, Inc. | 13,265 | | 168,731 |
| Interactive Brokers Group, Inc. Class A | 742 | | 61,512 |
| Intercontinental Exchange, Inc. | 5,236 | | 672,459 |
| Invesco, Ltd. | 1,036 | | 18,482 |
| Jack Henry & Associates, Inc. | 274 | | 44,774 |
| Jefferies Financial Group, Inc. | 847 | | 34,227 |
| JPMorgan Chase & Co. | 23,733 | | 4,036,983 |
| Kemper Corporation | 372 | | 18,105 |
| KeyCorp | 7,730 | | 111,312 |
| KKR & Co., Inc. | 4,369 | | 361,972 |
| Lazard, Ltd. Class A | 471 | | 16,391 |
| Lincoln National Corporation | 535 | | 14,429 |
| Loews Corporation | 1,752 | | 121,922 |
| | | Shares | | Value |
| M&T Bank Corporation | 1,439 | | $ 197,258 |
| Markel Corporation* | 73 | | 103,653 |
| Marsh & McLennan Cos., Inc. | 855 | | 161,997 |
| MetLife, Inc. | 5,568 | | 368,212 |
| MGIC Investment Corporation | 1,510 | | 29,128 |
| Moody’s Corporation | 99 | | 38,665 |
| Morgan Stanley | 10,110 | | 942,758 |
| MSCI, Inc. | 223 | | 126,140 |
| Nasdaq, Inc. | 2,708 | | 157,443 |
| NCR Atleos Corporation* | 386 | | 9,376 |
| New York Community Bancorp, Inc. | 3,240 | | 33,145 |
| Northern Trust Corporation | 1,693 | | 142,855 |
| Old Republic International Corporation | 2,745 | | 80,703 |
| OneMain Holdings, Inc. | 688 | | 33,850 |
| PayPal Holdings, Inc.* | 832 | | 51,093 |
| Pinnacle Financial Partners, Inc. | 110 | | 9,594 |
| PNC Financial Services Group, Inc. (The) | 3,315 | | 513,328 |
| Popular, Inc. | 352 | | 28,889 |
| Primerica, Inc. | 63 | | 12,963 |
| Principal Financial Group, Inc. | 1,733 | | 136,335 |
| Progressive Corporation (The) | 1,392 | | 221,718 |
| Prosperity Bancshares, Inc. | 992 | | 67,188 |
| Prudential Financial, Inc. | 3,074 | | 318,805 |
| Raymond James Financial, Inc. | 1,518 | | 169,257 |
| Regions Financial Corporation | 7,234 | | 140,195 |
| Reinsurance Group of America, Inc. | 566 | | 91,567 |
| RLI Corporation | 187 | | 24,893 |
| Robinhood Markets, Inc. Class A* | 2,796 | | 35,621 |
| S&P Global, Inc. | 2,472 | | 1,088,965 |
| SEI Investments Co. | 617 | | 39,210 |
| SLM Corporation | 959 | | 18,336 |
| SoFi Technologies, Inc.* | 6,461 | | 64,287 |
| State Street Corporation | 2,876 | | 222,775 |
| Stifel Financial Corporation | 466 | | 32,224 |
| Synchrony Financial | 3,426 | | 130,839 |
| T. Rowe Price Group, Inc. | 1,891 | | 203,642 |
| TFS Financial Corporation | 2,703 | | 39,707 |
| Tradeweb Markets, Inc. Class A | 580 | | 52,710 |
| Travelers Cos., Inc. (The) | 1,966 | | 374,503 |
| Truist Financial Corporation | 10,926 | | 403,388 |
| U.S. Bancorp | 12,539 | | 542,688 |
| Unum Group | 1,632 | | 73,799 |
| Virtu Financial, Inc. Class A | 751 | | 15,215 |
| Voya Financial, Inc. | 610 | | 44,506 |
| W.R. Berkley Corporation | 1,763 | | 124,679 |
| Webster Financial Corporation | 1,035 | | 52,537 |
| Wells Fargo & Co. | 31,144 | | 1,532,908 |
| Western Alliance Bancorp | 621 | | 40,856 |
| Western Union Co. (The) | 2,540 | | 30,277 |
| WEX, Inc.* | 99 | | 19,260 |
| White Mountains Insurance Group, Ltd. | 8 | | 12,040 |
| Wintrust Financial Corporation | 428 | | 39,697 |
See Notes to Financial Statements.
| | | Shares | | Value |
| Zions Bancorp NA | 877 | | $ 38,474 |
| | | | | 34,324,304 |
| Health Care — 11.9% | | |
| Abbott Laboratories | 13,785 | | 1,517,315 |
| Acadia Healthcare Co., Inc.* | 774 | | 60,186 |
| Agilent Technologies, Inc. | 982 | | 136,528 |
| agilon health, Inc.* | 238 | | 2,987 |
| Alnylam Pharmaceuticals, Inc.* | 485 | | 92,834 |
| Amedisys, Inc.* | 220 | | 20,913 |
| Amgen, Inc. | 1,870 | | 538,597 |
| Avantor, Inc.* | 6,026 | | 137,574 |
| Azenta, Inc.Δ* | 710 | | 46,249 |
| Baxter International, Inc. | 4,662 | | 180,233 |
| Becton, Dickinson and Co. | 2,509 | | 611,770 |
| Biogen, Inc.* | 1,747 | | 452,071 |
| BioMarin Pharmaceutical, Inc.* | 2,584 | | 249,149 |
| Bio-Rad Laboratories, Inc. Class A* | 239 | | 77,171 |
| Boston Scientific Corporation* | 12,881 | | 744,651 |
| Bristol-Myers Squibb Co. | 29,185 | | 1,497,482 |
| Cardinal Health, Inc. | 1,777 | | 179,122 |
| Catalent, Inc.* | 3,269 | | 146,876 |
| Centene Corporation* | 4,897 | | 363,406 |
| Certara, Inc.* | 1,253 | | 22,040 |
| Charles River Laboratories International, Inc.* | 424 | | 100,234 |
| Chemed Corporation | 73 | | 42,687 |
| Cigna Group (The) | 2,452 | | 734,251 |
| CVS Health Corporation | 11,158 | | 881,036 |
| Danaher Corporation | 5,753 | | 1,330,899 |
| DENTSPLY SIRONA, Inc. | 1,831 | | 65,165 |
| Doximity, Inc. Class A* | 382 | | 10,711 |
| Elanco Animal Health, Inc.* | 17,175 | | 255,908 |
| Elevance Health, Inc. | 1,820 | | 858,239 |
| Encompass Health Corporation | 918 | | 61,249 |
| Enovis Corporation* | 373 | | 20,895 |
| Envista Holdings Corporation* | 1,454 | | 34,983 |
| Exact Sciences Corporation* | 1,307 | | 96,692 |
| Exelixis, Inc.* | 5,348 | | 128,299 |
| Fortrea Holdings, Inc.* | 797 | | 27,815 |
| GE HealthCare Technologies, Inc. | 3,198 | | 247,269 |
| Gilead Sciences, Inc. | 13,127 | | 1,063,418 |
| Globus Medical, Inc. Class A* | 372 | | 19,824 |
| HCA Healthcare, Inc. | 1,456 | | 394,110 |
| Henry Schein, Inc.* | 1,447 | | 109,552 |
| Hologic, Inc.* | 2,335 | | 166,836 |
| Humana, Inc. | 684 | | 313,142 |
| ICU Medical, Inc.* | 185 | | 18,452 |
| Illumina, Inc.* | 1,033 | | 143,835 |
| Incyte Corporation* | 2,118 | | 132,989 |
| Integra LifeSciences Holdings Corporation* | 399 | | 17,376 |
| Ionis Pharmaceuticals, Inc.* | 1,914 | | 96,829 |
| IQVIA Holdings, Inc.* | 284 | | 65,712 |
| Karuna Therapeutics, Inc.* | 422 | | 133,567 |
| Laboratory Corporation of America Holdings | 797 | | 181,150 |
| McKesson Corporation | 843 | | 390,292 |
| Mirati Therapeutics, Inc.* | 540 | | 31,725 |
| | | Shares | | Value |
| Moderna, Inc.* | 2,953 | | $ 293,676 |
| Molina Healthcare, Inc.* | 304 | | 109,838 |
| Organon & Co. | 15,930 | | 229,711 |
| Premier, Inc. Class A | 1,336 | | 29,873 |
| Quest Diagnostics, Inc. | 1,217 | | 167,800 |
| QuidelOrtho Corporation* | 438 | | 32,281 |
| R1 RCM, Inc.* | 1,265 | | 13,371 |
| Regeneron Pharmaceuticals, Inc.* | 974 | | 855,455 |
| Repligen Corporation* | 365 | | 65,627 |
| Revvity, Inc. | 1,317 | | 143,961 |
| Roivant Sciences, Ltd.* | 2,207 | | 24,785 |
| Stryker Corporation | 2,313 | | 692,651 |
| Teladoc Health, Inc.* | 1,591 | | 34,286 |
| Teleflex, Inc. | 413 | | 102,977 |
| Tenet Healthcare Corporation* | 811 | | 61,287 |
| Thermo Fisher Scientific, Inc. | 1,383 | | 734,083 |
| United Therapeutics Corporation* | 758 | | 166,677 |
| UnitedHealth Group, Inc. | 1,398 | | 736,005 |
| Universal Health Services, Inc. Class B | 520 | | 79,269 |
| Vertex Pharmaceuticals, Inc.* | 592 | | 240,879 |
| Viatris, Inc. | 57,585 | | 623,646 |
| Zimmer Biomet Holdings, Inc. | 1,812 | | 220,520 |
| | | | | 20,910,953 |
| Industrials — 12.1% | | |
| 3M Co. | 4,933 | | 539,276 |
| A.O. Smith Corporation | 1,076 | | 88,705 |
| Acuity Brands, Inc. | 224 | | 45,882 |
| AECOM | 1,080 | | 99,824 |
| AGCO Corporation | 472 | | 57,306 |
| Alaska Air Group, Inc.* | 1,150 | | 44,930 |
| Allison Transmission Holdings, Inc. | 407 | | 23,667 |
| American Airlines Group, Inc.* | 3,333 | | 45,795 |
| AMETEK, Inc. | 1,907 | | 314,445 |
| Automatic Data Processing, Inc. | 1,085 | | 252,772 |
| Avis Budget Group, Inc. | 89 | | 15,776 |
| Boeing Co. (The)* | 3,886 | | 1,012,925 |
| Broadridge Financial Solutions, Inc. | 207 | | 42,590 |
| Builders FirstSource, Inc.* | 1,126 | | 187,974 |
| BWX Technologies, Inc. | 488 | | 37,444 |
| C.H. Robinson Worldwide, Inc. | 126 | | 10,885 |
| CACI International, Inc. Class A* | 218 | | 70,601 |
| Carlisle Cos., Inc. | 468 | | 146,217 |
| Carrier Global Corporation | 6,892 | | 395,945 |
| Caterpillar, Inc. | 1,169 | | 345,638 |
| Ceridian HCM Holding, Inc.* | 758 | | 50,877 |
| Cintas Corporation | 143 | | 86,180 |
| Clean Harbors, Inc.* | 363 | | 63,347 |
| Concentrix Corporation | 396 | | 38,891 |
| Crane Co. | 265 | | 31,307 |
| CSX Corporation | 16,453 | | 570,426 |
| Cummins, Inc. | 1,199 | | 287,244 |
| Curtiss-Wright Corporation | 244 | | 54,361 |
| Deere & Co. | 231 | | 92,370 |
| Delta Air Lines, Inc. | 5,289 | | 212,776 |
| Donaldson Co., Inc. | 810 | | 52,933 |
| Dover Corporation | 958 | | 147,350 |
See Notes to Financial Statements.
SCHEDULE OF INVESTMENTS (Continued)
| | | Shares | | Value |
| Dun & Bradstreet Holdings, Inc. | 719 | | $ 8,412 |
| EMCOR Group, Inc. | 124 | | 26,713 |
| Emerson Electric Co. | 4,873 | | 474,289 |
| Equifax, Inc. | 374 | | 92,486 |
| Esab Corporation | 116 | | 10,048 |
| Expeditors International of Washington, Inc. | 838 | | 106,594 |
| Fastenal Co. | 1,715 | | 111,081 |
| FedEx Corporation | 1,908 | | 482,667 |
| Flowserve Corporation | 500 | | 20,610 |
| Fortive Corporation | 3,112 | | 229,137 |
| Fortune Brands Innovations, Inc. | 689 | | 52,460 |
| FTI Consulting, Inc.* | 316 | | 62,931 |
| Generac Holdings, Inc.* | 289 | | 37,350 |
| General Dynamics Corporation | 2,327 | | 604,252 |
| General Electric Co. | 8,649 | | 1,103,872 |
| Genpact, Ltd. | 1,201 | | 41,687 |
| Graco, Inc. | 941 | | 81,641 |
| HEICO Corporation | 37 | | 6,618 |
| HEICO Corporation Class A | 81 | | 11,538 |
| Hertz Global Holdings, Inc.* | 1,399 | | 14,536 |
| Hexcel Corporation | 328 | | 24,190 |
| Honeywell International, Inc. | 4,819 | | 1,010,592 |
| Howmet Aerospace, Inc. | 2,483 | | 134,380 |
| Hubbell, Inc. | 319 | | 104,929 |
| Huntington Ingalls Industries, Inc. | 331 | | 85,941 |
| IDEX Corporation | 634 | | 137,648 |
| Illinois ToolWorks, Inc. | 606 | | 158,736 |
| Ingersoll-Rand, Inc. | 3,593 | | 277,883 |
| ITT, Inc. | 963 | | 114,905 |
| J.B. Hunt Transport Services, Inc. | 721 | | 144,013 |
| Jacobs Solutions, Inc. | 1,171 | | 151,996 |
| KBR, Inc. | 1,130 | | 62,613 |
| Kirby Corporation* | 1,335 | | 104,771 |
| Knight-Swift Transportation Holdings, Inc. | 1,485 | | 85,610 |
| L3Harris Technologies, Inc. | 1,828 | | 385,013 |
| Landstar System, Inc. | 266 | | 51,511 |
| Leidos Holdings, Inc. | 1,208 | | 130,754 |
| Lennox International, Inc. | 275 | | 123,068 |
| Lincoln Electric Holdings, Inc. | 114 | | 24,790 |
| ManpowerGroup, Inc. | 282 | | 22,411 |
| Masco Corporation | 1,466 | | 98,193 |
| MasTec, Inc.* | 176 | | 13,327 |
| MDU Resources Group, Inc. | 1,489 | | 29,482 |
| Mercury Systems, Inc.* | 340 | | 12,434 |
| Middleby Corporation (The)* | 190 | | 27,962 |
| MSA Safety, Inc. | 222 | | 37,480 |
| MSC Industrial Direct Co., Inc. Class A | 225 | | 22,784 |
| Nordson Corporation | 498 | | 131,552 |
| Norfolk Southern Corporation | 2,019 | | 477,251 |
| Northrop Grumman Corporation | 1,189 | | 556,618 |
| Old Dominion Freight Line, Inc. | 98 | | 39,722 |
| Oshkosh Corporation | 349 | | 37,835 |
| Otis Worldwide Corporation | 3,040 | | 271,989 |
| Owens Corning | 521 | | 77,228 |
| PACCAR, Inc. | 4,751 | | 463,935 |
| | | Shares | | Value |
| Parker-Hannifin Corporation | 1,057 | | $ 486,960 |
| Paycor HCM, Inc.* | 463 | | 9,996 |
| Plug Power, Inc.Δ* | 1,317 | | 5,927 |
| Quanta Services, Inc. | 657 | | 141,781 |
| RBC Bearings, Inc.Δ* | 184 | | 52,420 |
| Regal Beloit Corporation | 394 | | 58,320 |
| Republic Services, Inc. | 1,989 | | 328,006 |
| Robert Half, Inc. | 712 | | 62,599 |
| RTX Corporation | 12,815 | | 1,078,254 |
| Ryder System, Inc. | 362 | | 41,652 |
| Saia, Inc.* | 186 | | 81,509 |
| Schneider National, Inc. Class B | 610 | | 15,525 |
| Science Applications International Corporation | 391 | | 48,609 |
| Snap-on, Inc. | 480 | | 138,643 |
| Southwest Airlines Co. | 5,604 | | 161,844 |
| Spirit AeroSystems Holdings, Inc. Class A* | 1,253 | | 39,820 |
| SS&C Technologies Holdings, Inc. | 1,442 | | 88,121 |
| Stanley Black & Decker, Inc. | 1,152 | | 113,011 |
| Stericycle, Inc.* | 330 | | 16,355 |
| Sunrun, Inc.Δ* | 1,174 | | 23,046 |
| Tetra Tech, Inc. | 243 | | 40,564 |
| Textron, Inc. | 1,849 | | 148,697 |
| Timken Co. (The) | 350 | | 28,052 |
| TransDigm Group, Inc. | 345 | | 349,002 |
| TransUnion | 1,081 | | 74,276 |
| U-Haul Holding Co. | 729 | | 51,351 |
| U-Haul Holding Co. (New York Exchange)Δ* | 81 | | 5,816 |
| Union Pacific Corporation | 3,235 | | 794,581 |
| United Airlines Holdings, Inc.* | 2,706 | | 111,650 |
| United Parcel Service, Inc. Class B | 4,719 | | 741,968 |
| United Rentals, Inc. | 404 | | 231,662 |
| Valmont Industries, Inc. | 46 | | 10,741 |
| Veralto Corporation | 1,864 | | 153,333 |
| Vertiv Holdings Co. Class A | 2,551 | | 122,525 |
| Vestis Corporation | 1,248 | | 26,383 |
| Waste Management, Inc. | 435 | | 77,908 |
| Watsco, Inc. | 153 | | 65,556 |
| WESCO International, Inc. | 137 | | 23,822 |
| Westinghouse Air Brake Technologies Corporation | 1,403 | | 178,041 |
| WillScot Mobile Mini Holdings Corporation* | 592 | | 26,344 |
| Woodward, Inc. | 253 | | 34,441 |
| XPO Logistics, Inc.* | 972 | | 85,137 |
| Xylem, Inc. | 1,684 | | 192,582 |
| | | | | 21,245,957 |
| Information Technology — 8.9% | | |
| Advanced Micro Devices, Inc.* | 5,694 | | 839,353 |
| Akamai Technologies, Inc.* | 1,184 | | 140,126 |
| Amdocs, Ltd. | 1,243 | | 109,247 |
| Amphenol Corporation Class A | 2,988 | | 296,200 |
| Analog Devices, Inc. | 4,026 | | 799,403 |
| ANSYS, Inc.* | 249 | | 90,357 |
| Applied Materials, Inc. | 1,091 | | 176,818 |
See Notes to Financial Statements.
| | | Shares | | Value |
| AppLovin Corporation Class A* | 1,020 | | $ 40,647 |
| Arrow Electronics, Inc.* | 438 | | 53,546 |
| Aspen Technology, Inc.* | 276 | | 60,761 |
| Avnet, Inc. | 501 | | 25,250 |
| BILL Holdings, Inc.* | 694 | | 56,623 |
| CCC Intelligent Solutions Holdings, Inc.* | 1,695 | | 19,306 |
| Ciena Corporation* | 691 | | 31,102 |
| Cirrus Logic, Inc.* | 450 | | 37,436 |
| Cisco Systems, Inc. | 34,472 | | 1,741,525 |
| Cognex Corporation | 1,100 | | 45,914 |
| Cognizant Technology Solutions Corporation Class A | 4,269 | | 322,438 |
| Coherent Corporation* | 596 | | 25,944 |
| Corning, Inc. | 6,687 | | 203,619 |
| Crane Holdings Co. | 265 | | 15,071 |
| Dolby Laboratories, Inc. Class A | 889 | | 76,614 |
| Dropbox, Inc. Class A* | 159 | | 4,687 |
| DXC Technology Co.* | 1,336 | | 30,554 |
| Entegris, Inc. | 857 | | 102,686 |
| F5, Inc.* | 240 | | 42,955 |
| First Solar, Inc.* | 891 | | 153,502 |
| Gen Digital, Inc. | 3,806 | | 86,853 |
| GoDaddy, Inc. Class A* | 98 | | 10,404 |
| Guidewire Software, Inc.* | 719 | | 78,400 |
| Hewlett Packard Enterprise Co. | 13,200 | | 224,136 |
| HP, Inc. | 6,109 | | 183,820 |
| Informatica, Inc. Class A* | 265 | | 7,523 |
| Intel Corporation | 34,859 | | 1,751,665 |
| International Business Machines Corporation | 7,987 | | 1,306,274 |
| IPG Photonics Corporation* | 106 | | 11,505 |
| Jabil, Inc. | 378 | | 48,157 |
| Juniper Networks, Inc. | 2,633 | | 77,621 |
| Keysight Technologies, Inc.* | 903 | | 143,658 |
| Kyndryl Holdings, Inc.* | 643 | | 13,362 |
| Lam Research Corporation | 35 | | 27,414 |
| Littelfuse, Inc. | 202 | | 54,047 |
| Lumentum Holdings, Inc.* | 375 | | 19,658 |
| Marvell Technology, Inc. | 7,185 | | 433,327 |
| Microchip Technology, Inc. | 857 | | 77,284 |
| Micron Technology, Inc. | 8,884 | | 758,161 |
| MKS Instruments, Inc. | 178 | | 18,311 |
| nCino, Inc.* | 211 | | 7,096 |
| NCR Voyix Corporation* | 772 | | 13,055 |
| NetApp, Inc. | 1,484 | | 130,829 |
| Nutanix, Inc. Class A* | 1,776 | | 84,697 |
| Okta, Inc.* | 1,012 | | 91,616 |
| ON Semiconductor Corporation* | 3,223 | | 269,217 |
| Oracle Corporation | 7,481 | | 788,722 |
| PTC, Inc.* | 346 | | 60,536 |
| Pure Storage, Inc. Class A* | 615 | | 21,931 |
| Qorvo, Inc.* | 625 | | 70,381 |
| QUALCOMM, Inc. | 1,106 | | 159,961 |
| Roper Technologies, Inc. | 967 | | 527,179 |
| Salesforce, Inc.* | 2,108 | | 554,699 |
| SentinelOne, Inc. Class A* | 1,444 | | 39,623 |
| Skyworks Solutions, Inc. | 1,231 | | 138,389 |
| | | Shares | | Value |
| TD SYNNEX Corporation | 222 | | $ 23,889 |
| Teledyne Technologies, Inc.* | 395 | | 176,285 |
| Texas Instruments, Inc. | 4,448 | | 758,206 |
| Trimble, Inc.* | 1,900 | | 101,080 |
| Twilio, Inc. Class A* | 964 | | 73,139 |
| Tyler Technologies, Inc.* | 82 | | 34,286 |
| Ubiquiti, Inc. | 15 | | 2,093 |
| UiPath, Inc. Class A* | 819 | | 20,344 |
| Unity Software, Inc.* | 1,102 | | 45,061 |
| VeriSign, Inc.* | 499 | | 102,774 |
| Viasat, Inc.* | 326 | | 9,112 |
| Western Digital Corporation* | 3,054 | | 159,938 |
| Wolfspeed, Inc.Δ* | 737 | | 32,067 |
| Zebra Technologies Corporation Class A* | 206 | | 56,306 |
| Zoom Video Communications, Inc. Class A* | 1,817 | | 130,661 |
| | | | | 15,556,436 |
| Materials — 3.5% | | |
| Air Products and Chemicals, Inc. | 1,858 | | 508,720 |
| Albemarle Corporation | 891 | | 128,732 |
| Alcoa Corporation | 1,294 | | 43,996 |
| AptarGroup, Inc. | 791 | | 97,783 |
| Ashland, Inc. | 357 | | 30,099 |
| Avery Dennison Corporation | 331 | | 66,915 |
| Axalta Coating Systems, Ltd.* | 370 | | 12,569 |
| Ball Corporation | 2,218 | | 127,579 |
| Berry Global Group, Inc. | 252 | | 16,982 |
| Celanese CorporationΔ | 700 | | 108,759 |
| CF Industries Holdings, Inc. | 1,686 | | 134,037 |
| Chemours Co. (The) | 827 | | 26,084 |
| Cleveland-Cliffs, Inc.* | 3,198 | | 65,303 |
| Corteva, Inc. | 6,123 | | 293,414 |
| Crown Holdings, Inc. | 583 | | 53,688 |
| Dow, Inc. | 6,414 | | 351,744 |
| DuPont de Nemours, Inc. | 3,816 | | 293,565 |
| Eagle Materials, Inc. | 91 | | 18,458 |
| Eastman Chemical Co. | 839 | | 75,359 |
| Ecolab, Inc. | 314 | | 62,282 |
| Element Solutions, Inc. | 899 | | 20,803 |
| FMC Corporation | 830 | | 52,332 |
| Freeport-McMoRan, Inc. | 11,301 | | 481,084 |
| Ginkgo Bioworks Holdings, Inc.Δ* | 14,819 | | 25,044 |
| Graphic Packaging Holding Co. | 445 | | 10,969 |
| Huntsman Corporation | 1,831 | | 46,013 |
| International Flavors & Fragrances, Inc. | 2,205 | | 178,539 |
| International Paper Co. | 2,923 | | 105,666 |
| Louisiana-Pacific Corporation | 566 | | 40,090 |
| Martin Marietta Materials, Inc. | 575 | | 286,873 |
| Mosaic Co. (The) | 2,576 | | 92,040 |
| NewMarket Corporation | 72 | | 39,300 |
| Newmont Corporation | 9,137 | | 378,180 |
| Nucor Corporation | 2,085 | | 362,873 |
| Olin Corporation | 1,045 | | 56,378 |
| Packaging Corporation of America | 943 | | 153,624 |
| PPG Industries, Inc. | 1,210 | | 180,956 |
See Notes to Financial Statements.
SCHEDULE OF INVESTMENTS (Continued)
| | | Shares | | Value |
| Reliance Steel & Aluminum Co. | 540 | | $ 151,027 |
| Royal Gold, Inc. | 623 | | 75,358 |
| RPM International, Inc. | 912 | | 101,807 |
| Sherwin-Williams Co. (The) | 302 | | 94,194 |
| Silgan Holdings, Inc. | 886 | | 40,092 |
| Sonoco Products Co. | 1,092 | | 61,010 |
| Steel Dynamics, Inc. | 1,434 | | 169,355 |
| United States Steel Corporation | 1,233 | | 59,985 |
| Vulcan Materials Co. | 1,157 | | 262,651 |
| Westlake Corporation | 385 | | 53,885 |
| Westrock Co. | 2,759 | | 114,554 |
| | | | | 6,210,750 |
| Real Estate — 4.9% | | |
| Agree Realty Corporation REITΔ | 1,057 | | 66,538 |
| Alexandria Real Estate Equities, Inc. REIT | 1,625 | | 206,001 |
| American Homes 4 Rent Class A REIT | 3,171 | | 114,029 |
| Americold Realty Trust REIT | 2,045 | | 61,902 |
| Apartment Income REIT Corporation | 1,306 | | 45,357 |
| AvalonBay Communities, Inc. REIT | 1,865 | | 349,165 |
| Boston Properties, Inc. REIT | 1,492 | | 104,694 |
| Brixmor Property Group, Inc. REIT | 1,476 | | 34,347 |
| Camden Property Trust REIT | 916 | | 90,950 |
| CBRE Group, Inc. Class A* | 3,076 | | 286,345 |
| CoStar Group, Inc.* | 2,342 | | 204,667 |
| Cousins Properties, Inc. REIT | 1,298 | | 31,606 |
| Crown Castle, Inc. REIT | 3,444 | | 396,714 |
| CubeSmart REIT | 1,816 | | 84,172 |
| Digital Realty Trust, Inc. REIT | 2,593 | | 348,966 |
| EastGroup Properties, Inc. REIT | 275 | | 50,474 |
| EPR Properties REIT | 259 | | 12,549 |
| Equinix, Inc. REIT | 405 | | 326,183 |
| Equity LifeStyle Properties, Inc. REIT | 843 | | 59,465 |
| Equity Residential REIT | 3,615 | | 221,093 |
| Essex Property Trust, Inc. REIT | 650 | | 161,161 |
| Extra Space Storage, Inc. REIT | 1,762 | | 282,501 |
| Federal Realty Investment Trust REIT | 852 | | 87,799 |
| First Industrial Realty Trust, Inc. REIT | 658 | | 34,657 |
| Healthcare Realty Trust, Inc. REIT | 3,831 | | 66,008 |
| Healthpeak Properties, Inc. REIT | 5,431 | | 107,534 |
| Highwoods Properties, Inc. REIT | 625 | | 14,350 |
| Host Hotels & Resorts, Inc. REIT | 5,729 | | 111,544 |
| Howard Hughes Holdings, Inc.* | 597 | | 51,073 |
| Invitation Homes, Inc. REIT | 4,692 | | 160,044 |
| Iron Mountain, Inc. REIT | 713 | | 49,896 |
| Jones Lang LaSalle, Inc.* | 491 | | 92,735 |
| Kilroy Realty Corporation REIT | 743 | | 29,601 |
| Kimco Realty Corporation REIT | 4,882 | | 104,035 |
| Medical Properties Trust, Inc. REITΔ | 6,269 | | 30,781 |
| Mid-America Apartment Communities, Inc. REIT | 955 | | 128,409 |
| National Storage Affiliates Trust REIT | 423 | | 17,542 |
| NET Lease Office Properties REIT | 147 | | 2,717 |
| NNN REIT, Inc. | 1,716 | | 73,960 |
| | | Shares | | Value |
| Omega Healthcare Investors, Inc. REIT | 2,753 | | $ 84,407 |
| Prologis, Inc. REIT | 7,865 | | 1,048,404 |
| Public Storage REIT | 671 | | 204,655 |
| Rayonier, Inc. REIT | 888 | | 29,668 |
| Realty Income Corporation REITΔ | 7,054 | | 405,041 |
| Regency Centers Corporation REIT | 1,495 | | 100,165 |
| Rexford Industrial Realty, Inc. REIT | 1,998 | | 112,088 |
| SBA Communications Corporation REIT | 743 | | 188,492 |
| Simon Property Group, Inc. REIT | 1,853 | | 264,312 |
| Spirit Realty Capital, Inc. REIT | 1,499 | | 65,491 |
| STAG Industrial, Inc. REIT | 874 | | 34,313 |
| Sun Communities, Inc. REIT | 891 | | 119,082 |
| UDR, Inc. REIT | 3,059 | | 117,129 |
| Ventas, Inc. REIT | 3,176 | | 158,292 |
| Vornado Realty Trust REITΔ | 2,039 | | 57,602 |
| Welltower, Inc. REIT | 4,478 | | 403,781 |
| Weyerhaeuser Co. REIT | 6,055 | | 210,532 |
| WP Carey, Inc. REIT | 2,217 | | 143,684 |
| Zillow Group, Inc. Class A* | 576 | | 32,671 |
| Zillow Group, Inc. Class C* | 1,218 | | 70,473 |
| | | | | 8,551,846 |
| Utilities — 4.7% | | |
| AES Corporation (The) | 2,762 | | 53,169 |
| Alliant Energy Corporation | 1,125 | | 57,713 |
| Ameren Corporation | 2,073 | | 149,961 |
| American Electric Power Co., Inc. | 4,147 | | 336,819 |
| American Water Works Co., Inc. | 2,115 | | 279,159 |
| Atmos Energy Corporation | 1,538 | | 178,254 |
| Avangrid, Inc. | 595 | | 19,284 |
| CenterPoint Energy, Inc. | 4,585 | | 130,993 |
| CMS Energy Corporation | 2,613 | | 151,737 |
| Consolidated Edison, Inc. | 4,048 | | 368,247 |
| Constellation Energy Corporation | 2,652 | | 309,992 |
| Dominion Energy, Inc. | 7,552 | | 354,944 |
| DTE Energy Co. | 1,700 | | 187,442 |
| Duke Energy Corporation | 7,092 | | 688,208 |
| Edison International | 2,536 | | 181,299 |
| Entergy Corporation | 1,262 | | 127,702 |
| Essential Utilities, Inc. | 4,351 | | 162,510 |
| Evergy, Inc. | 1,627 | | 84,929 |
| Eversource Energy | 2,957 | | 182,506 |
| Exelon Corporation | 8,246 | | 296,031 |
| FirstEnergy Corporation | 3,450 | | 126,477 |
| National Fuel Gas Co. | 62 | | 3,111 |
| NextEra Energy, Inc. | 16,879 | | 1,025,230 |
| NiSource, Inc. | 4,690 | | 124,519 |
| NRG Energy, Inc. | 1,827 | | 94,456 |
| OGE Energy Corporation | 248 | | 8,663 |
| PG&E Corporation | 12,987 | | 234,156 |
| Pinnacle West Capital Corporation | 616 | | 44,253 |
| PPL Corporation | 4,429 | | 120,026 |
| Public Service Enterprise Group, Inc. | 5,346 | | 326,908 |
| Sempra | 6,534 | | 488,286 |
| Southern Co. (The) | 9,661 | | 677,429 |
See Notes to Financial Statements.
| | | Shares | | Value |
| UGI Corporation | 1,214 | | $ 29,864 |
| Vistra Corporation | 2,406 | | 92,679 |
| WEC Energy Group, Inc. | 3,437 | | 289,292 |
| Xcel Energy, Inc. | 3,973 | | 245,968 |
| | | | | 8,232,216 |
Total Common Stocks
(Cost $144,402,236) | | 155,845,387 |
| FOREIGN COMMON STOCKS — 5.3% |
| Bermuda — 0.0% | | |
| RenaissanceRe Holdings, Ltd. | 298 | | 58,408 |
| Brazil — 0.1% | | |
| NU Holdings, Ltd. Class A* | 5,100 | | 42,483 |
| XP, Inc. Class A | 2,335 | | 60,873 |
| | | | | 103,356 |
| Canada — 0.0% | | |
| Brookfield Renewable Corporation Class A | 748 | | 21,535 |
| RB Global, Inc. | 387 | | 25,887 |
| SSR Mining, Inc. | 1,640 | | 17,646 |
| | | | | 65,068 |
| Curacao — 0.4% | | |
| Schlumberger NV | 11,657 | | 606,630 |
| Ireland — 3.2% | | |
| Aon PLC Class A | 1,564 | | 455,155 |
| Eaton Corporation PLC | 3,280 | | 789,890 |
| ICON PLC* | 673 | | 190,506 |
| Jazz Pharmaceuticals PLC* | 3,082 | | 379,086 |
| Johnson Controls International PLC | 6,140 | | 353,910 |
| Linde PLC | 3,804 | | 1,562,341 |
| Medtronic PLC | 11,789 | | 971,178 |
| nVent Electric PLC | 1,046 | | 61,808 |
| Pentair PLC | 1,088 | | 79,109 |
| STERIS PLC | 964 | | 211,935 |
| Trane Technologies PLC | 1,501 | | 366,094 |
| Willis Towers Watson PLC | 897 | | 216,356 |
| | | | | 5,637,368 |
| Jersey — 0.4% | | |
| Amcor PLC | 13,514 | | 130,275 |
| Aptiv PLC* | 2,434 | | 218,378 |
| Clarivate PLC* | 2,929 | | 27,123 |
| Ferguson PLC | 1,391 | | 268,560 |
| Janus Henderson Group PLC | 927 | | 27,949 |
| | | | | 672,285 |
| Netherlands — 0.2% | | |
| CNH Industrial NV | 6,828 | | 83,165 |
| LyondellBasell Industries NV Class A | 2,370 | | 225,340 |
| QIAGEN NV* | 2,450 | | 106,403 |
| | | | | 414,908 |
| Switzerland — 0.6% | | |
| Bunge Global SA | 1,227 | | 123,866 |
| Chubb, Ltd. | 3,811 | | 861,286 |
| Garmin, Ltd.Δ | 1,119 | | 143,836 |
| | | | | 1,128,988 |
| | | Shares | | Value |
| United Arab Emirates — 0.0% | | |
| GLOBALFOUNDRIES, Inc.Δ* | 321 | | $ 19,453 |
| United Kingdom — 0.4% | | |
| Royalty Pharma PLC Class A | 18,653 | | 523,963 |
| Sensata Technologies Holding PLC | 466 | | 17,508 |
| TechnipFMC PLC | 3,609 | | 72,685 |
| | | | | 614,156 |
Total Foreign Common Stocks
(Cost $8,278,774) | | 9,320,620 |
| MUTUAL FUNDS — 2.1% |
iShares Russell 1000 Value ETFΔ
(Cost $3,571,018) | 22,218 | | 3,671,525 |
| MONEY MARKET FUNDS — 3.6% |
| Northern Institutional Liquid Assets Portfolio (Shares), 5.40%ا | 276,063 | | 276,063 |
GuideStone Money Market Fund, 5.28%
(Institutional Class)Ø∞ | 5,631,478 | | 5,631,478 |
| Northern Institutional U.S. Treasury Portfolio (Premier), 5.22%Ø | 333,161 | | 333,161 |
Total Money Market Funds
(Cost $6,240,702) | | 6,240,702 |
TOTAL INVESTMENTS — 99.9%
(Cost $162,492,730) | | | 175,078,234 |
Other Assets in Excess of
Liabilities — 0.1% | | | 183,401 |
| NET ASSETS — 100.0% | | | $175,261,635 |
See Notes to Financial Statements.
SCHEDULE OF INVESTMENTS (Continued)
Futures Contracts outstanding at December 31, 2023:
| Future Type | | Expiration Date | | Open Long
(Short) Contracts | | Notional
Market Value
of Contracts | | Value and
Unrealized
Appreciation
(Depreciation) |
| S&P 500® E-Mini | | 03/2024 | | 23 | | $5,543,000 | | $138,724 |
| S&P 500® Micro E-Mini | | 03/2024 | | 14 | | 337,400 | | 11,193 |
| Total Futures Contracts outstanding at December 31, 2023 | | | | | | $5,880,400 | | $149,917 |
VALUATION HIERARCHY
The following is a summary of the inputs used, as of December 31, 2023, in valuing the Fund’s investments carried at fair value:
| | Total
Value | | Level 1
Quoted Prices | | Level 2
Other Significant
Observable Inputs | | Level 3
Significant
Unobservable Inputs |
| Assets: | | | | | | | |
| Investments in Securities: | | | | | | | |
| Common Stocks | $155,845,387 | | $155,845,387 | | $ — | | $ — |
| Foreign Common Stocks | 9,320,620 | | 9,320,620 | | — | | — |
| Money Market Funds | 6,240,702 | | 6,240,702 | | — | | — |
| Mutual Funds | 3,671,525 | | 3,671,525 | | — | | — |
| Total Assets - Investments in Securities | $175,078,234 | | $175,078,234 | | $ — | | $ — |
| Other Financial Instruments*** | | | | | | | |
| Futures Contracts | $ 149,917 | | $ 149,917 | | $ — | | $ — |
| Total Assets - Other Financial Instruments | $ 149,917 | | $ 149,917 | | $ — | | $ — |
| *** | Other financial instruments are derivative instruments, such as futures contracts, which are valued at the unrealized appreciation (depreciation) on the investment. Further details regarding the value of these investments can be found in the preceding "Futures Contracts outstanding" disclosure. |
See Notes to Financial Statements.
Value Equity Fund (Unaudited)
The Fund invested in a diversified portfolio of large- and medium-sized U.S. companies whose stocks were considered to be attractive from a valuation perspective. The Investor Class of the Fund underperformed its benchmark, the Russell 1000® Value Index, for the one-year period ended December 31, 2023 (10.55% (net of fees) versus 11.46%). While the Fund underperformed its benchmark, it still managed to post a double-digit positive return for the year. Large capitalization value stocks significantly underperformed large capitalization growth stocks but still posted strong positive returns across many sectors in 2023, particularly communication services and technology. The Fund remained diversified, with a modest underweight to the real estate and health care sectors and a modest overweight to the technology sector. The underweight exposure and security selection within the communication services sector were the primary detractors from benchmark-relative returns, while the underweight exposure and security selection within the health care sector contributed to benchmark-relative returns during the year.
In 2023, exchange-listed equity index futures contracts were utilized to provide market exposure to the cash positions held in the Fund. In addition, currency forwards were used to hedge modest foreign currency exposure back to the U.S. dollar. Overall, derivative exposure had a positive impact on Fund performance for the year.
This Fund may be suitable for investors who seek higher, long-term rates of return, can accept significant short-term fluctuations in account value and want to diversify their portfolio by adding a potentially higher return, higher risk option of value equity securities. This Fund is subject to value investing risk. This involves the risk that an investment in companies whose securities are believed to be undervalued, relative to their underlying profitability, will not appreciate in value as anticipated. It is possible to lose money by investing in the Fund.
At December 31, 2023, the portfolio holdings of the Fund, as a percentage of net assets, is shown in the following table. Portfolio holdings are subject to risk and may change at any time.
| | % |
| Financials | 19.9 |
| Health Care | 15.1 |
| Information Technology | 11.5 |
| Industrials | 10.2 |
| Consumer Staples | 7.9 |
| Energy | 7.6 |
| Communication Services | 5.6 |
| Consumer Discretionary | 5.1 |
| Materials | 5.1 |
| Utilities | 4.7 |
| Money Market Funds | 4.5 |
| Real Estate | 2.7 |
| Mutual Funds | 0.8 |
| | 100.7 |
| Average Annual Total Returns as of 12/31/23 | |
| | | Institutional Class* | | Investor Class* | | Benchmark** | |
| One Year | | 10.83%*** | | 10.55% | | 11.46% | |
| Five Year | | 11.47% | | 11.18% | | 10.90% | |
| Ten Year | | 8.02% | | 7.74% | | 8.39% | |
| Since Inception | | 7.21% | | 6.93% | | 7.41% | |
| Inception Date | | 08/27/01 | | 08/27/01 | | | |
| Total Fund Operating Expenses (May 1, 2023 Prospectus)(1)# | | 0.65% | | 0.92% | | | |
| (1) | Current information regarding the Fund’s Operating Expenses can be found in the Financial Highlights. |
#Net expense ratio
See Notes to Financial Statements.
Value Equity Fund (Unaudited)
The performance data quoted represents past performance and does not guarantee future results. The performance data in the table and graph does not reflect the deduction of taxes that a shareholder would pay on Fund distributions or the redemption of Fund shares. Current performance may be lower or higher. Performance data current to the most recent month-end may be obtained at GuideStoneFunds.com. The investment return and principal value of an investment will fluctuate so that shares, when redeemed, may be worth more or less than their original cost.
The graph illustrates the results of a hypothetical $10,000 investment in the Investor Class of the Fund for the 10-year period from December 31, 2013 to December 31, 2023, with all dividends and capital gains reinvested, with the Russell 1000® Value Index.
*These returns reflect investment advisory and shareholder servicing fee waivers, if applicable, during the reported time periods.
***Total returns may differ from the financial highlights due to adjustments required by U.S. GAAP.
Unlike a mutual fund, an index is not available for direct investment and the performance of an index assumes no taxes, transaction costs, management fees or other expenses.
See Notes to Financial Statements.
| | | Shares | | Value |
| COMMON STOCKS — 82.2% |
| Communication Services — 5.3% | | |
| Alphabet, Inc. Class C* | 48,497 | | $ 6,834,682 |
| Comcast Corporation Class A | 522,378 | | 22,906,275 |
| Electronic Arts, Inc. | 58,020 | | 7,937,716 |
| Verizon Communications, Inc. | 230,086 | | 8,674,242 |
| Walt Disney Co. (The) | 37,491 | | 3,385,063 |
| Warner Bros Discovery, Inc.* | 187,570 | | 2,134,547 |
| | | | | 51,872,525 |
| Consumer Discretionary — 4.1% | | |
| Aramark | 191,185 | | 5,372,299 |
| Darden Restaurants, Inc. | 30,655 | | 5,036,617 |
| Dick's Sporting Goods, Inc. | 22,231 | | 3,266,845 |
| General Motors Co. | 50,437 | | 1,811,697 |
| Lennar Corporation Class A | 50,834 | | 7,576,299 |
| Lithia Motors, Inc. | 21,381 | | 7,040,336 |
| Lowe’s Cos., Inc. | 24,728 | | 5,503,216 |
| Starbucks Corporation | 48,476 | | 4,654,181 |
| | | | | 40,261,490 |
| Consumer Staples — 6.0% | | |
| Church & Dwight Co., Inc. | 20,867 | | 1,973,184 |
| Colgate-Palmolive Co. | 140,870 | | 11,228,748 |
| Conagra Brands, Inc. | 220,187 | | 6,310,559 |
| Kenvue, Inc. | 235,296 | | 5,065,923 |
| Keurig Dr. Pepper, Inc. | 181,426 | | 6,045,114 |
| Kimberly-Clark Corporation | 65,691 | | 7,982,113 |
| Lamb Weston Holdings, Inc. | 41,550 | | 4,491,140 |
| Mondelez International, Inc. Class A | 102,965 | | 7,457,755 |
| PepsiCo, Inc. | 23,097 | | 3,922,794 |
| Walmart, Inc. | 26,506 | | 4,178,671 |
| | | | | 58,656,001 |
| Energy — 5.6% | | |
| Baker Hughes Co. | 123,250 | | 4,212,685 |
| Chevron Corporation | 29,937 | | 4,465,403 |
| Exxon Mobil Corporation | 155,367 | | 15,533,593 |
| Halliburton Co. | 228,316 | | 8,253,623 |
| Hess Corporation | 43,930 | | 6,332,949 |
| Phillips 66 | 70,147 | | 9,339,372 |
| Pioneer Natural Resources Co. | 31,890 | | 7,171,423 |
| | | | | 55,309,048 |
| Financials — 19.1% | | |
| Allstate Corporation (The) | 120,859 | | 16,917,843 |
| American Express Co. | 19,109 | | 3,579,880 |
| American International Group, Inc. | 141,671 | | 9,598,210 |
| Ameriprise Financial, Inc. | 12,485 | | 4,742,177 |
| Apollo Global Management, Inc. | 54,179 | | 5,048,941 |
| Bank of New York Mellon Corporation (The) | 174,753 | | 9,095,894 |
| Berkshire Hathaway, Inc. Class B* | 47,154 | | 16,817,946 |
| BlackRock, Inc. | 14,182 | | 11,512,948 |
| Charles Schwab Corporation (The) | 137,538 | | 9,462,614 |
| Cincinnati Financial Corporation | 26,887 | | 2,781,729 |
| Fidelity National Information Services, Inc. | 242,000 | | 14,536,940 |
| Fiserv, Inc.* | 46,915 | | 6,232,189 |
| | | Shares | | Value |
| Intercontinental Exchange, Inc. | 41,163 | | $ 5,286,564 |
| JPMorgan Chase & Co. | 91,206 | | 15,514,141 |
| M&T Bank Corporation | 62,881 | | 8,619,727 |
| Marsh & McLennan Cos., Inc. | 23,374 | | 4,428,672 |
| MetLife, Inc. | 62,682 | | 4,145,161 |
| Morgan Stanley | 36,262 | | 3,381,431 |
| Progressive Corporation (The) | 32,670 | | 5,203,678 |
| Reinsurance Group of America, Inc. | 54,697 | | 8,848,881 |
| Truist Financial Corporation | 205,915 | | 7,602,382 |
| U.S. Bancorp | 92,077 | | 3,985,092 |
| Wells Fargo & Co. | 213,734 | | 10,519,987 |
| | | | | 187,863,027 |
| Health Care — 10.3% | | |
| Amgen, Inc. | 12,621 | | 3,635,100 |
| Avantor, Inc.* | 371,337 | | 8,477,624 |
| Becton, Dickinson and Co. | 19,501 | | 4,754,929 |
| Centene Corporation* | 70,977 | | 5,267,203 |
| CVS Health Corporation | 129,311 | | 10,210,396 |
| Elevance Health, Inc. | 22,421 | | 10,572,847 |
| GE HealthCare Technologies, Inc.Δ | 33,162 | | 2,564,086 |
| Gilead Sciences, Inc. | 46,954 | | 3,803,743 |
| Henry Schein, Inc.* | 101,697 | | 7,699,480 |
| McKesson Corporation | 14,600 | | 6,759,508 |
| Molina Healthcare, Inc.* | 9,260 | | 3,345,731 |
| Quest Diagnostics, Inc. | 62,042 | | 8,554,351 |
| UnitedHealth Group, Inc. | 14,978 | | 7,885,468 |
| Zimmer Biomet Holdings, Inc. | 139,653 | | 16,995,770 |
| | | | | 100,526,236 |
| Industrials — 9.6% | | |
| AECOM | 24,635 | | 2,277,013 |
| Fastenal Co. | 67,812 | | 4,392,183 |
| General Electric Co. | 43,483 | | 5,549,735 |
| J.B. Hunt Transport Services, Inc.Δ | 46,161 | | 9,220,198 |
| Norfolk Southern Corporation | 64,908 | | 15,342,953 |
| Northrop Grumman Corporation | 7,958 | | 3,725,458 |
| Paychex, Inc. | 34,344 | | 4,090,714 |
| RTX Corporation | 99,736 | | 8,391,787 |
| Stanley Black & Decker, Inc. | 39,273 | | 3,852,682 |
| Textron, Inc. | 56,060 | | 4,508,345 |
| United Parcel Service, Inc. Class B | 116,660 | | 18,342,452 |
| Vertiv Holdings Co. Class A | 305,600 | | 14,677,968 |
| | | | | 94,371,488 |
| Information Technology — 10.4% | | |
| Akamai Technologies, Inc.* | 15,491 | | 1,833,360 |
| Apple, Inc. | 36,501 | | 7,027,537 |
| Broadcom, Inc. | 18,042 | | 20,139,382 |
| Cisco Systems, Inc. | 159,581 | | 8,062,032 |
| Cognizant Technology Solutions Corporation Class A | 81,292 | | 6,139,985 |
| F5, Inc.* | 42,061 | | 7,528,078 |
| International Business Machines Corporation | 28,841 | | 4,716,946 |
| Juniper Networks, Inc. | 56,164 | | 1,655,715 |
| Microsoft Corporation | 16,052 | | 6,036,194 |
| ON Semiconductor Corporation* | 34,995 | | 2,923,132 |
See Notes to Financial Statements.
SCHEDULE OF INVESTMENTS (Continued)
| | | Shares | | Value |
| Oracle Corporation | 60,419 | | $ 6,369,975 |
| QUALCOMM, Inc. | 60,053 | | 8,685,465 |
| Salesforce, Inc.* | 10,419 | | 2,741,656 |
| Skyworks Solutions, Inc. | 69,686 | | 7,834,100 |
| Texas Instruments, Inc. | 61,567 | | 10,494,711 |
| | | | | 102,188,268 |
| Materials — 4.4% | | |
| Air Products and Chemicals, Inc. | 55,811 | | 15,281,052 |
| Axalta Coating Systems, Ltd.* | 204,754 | | 6,955,493 |
| DuPont de Nemours, Inc. | 87,852 | | 6,758,454 |
| Freeport-McMoRan, Inc. | 74,988 | | 3,192,239 |
| Packaging Corporation of America | 25,503 | | 4,154,694 |
| Sonoco Products Co. | 120,662 | | 6,741,386 |
| | | | | 43,083,318 |
| Real Estate — 2.7% | | |
| Crown Castle, Inc. REIT | 30,101 | | 3,467,334 |
| Jones Lang LaSalle, Inc.* | 14,412 | | 2,721,994 |
| Public Storage REIT | 49,698 | | 15,157,890 |
| Simon Property Group, Inc. REIT | 21,196 | | 3,023,398 |
| Weyerhaeuser Co. REIT | 63,212 | | 2,197,881 |
| | | | | 26,568,497 |
| Utilities — 4.7% | | |
| AES Corporation (The) | 93,756 | | 1,804,803 |
| Atmos Energy Corporation | 102,330 | | 11,860,047 |
| Dominion Energy, Inc. | 60,489 | | 2,842,983 |
| Duke Energy Corporation | 121,900 | | 11,829,176 |
| Entergy Corporation | 92,054 | | 9,314,944 |
| NiSource, Inc. | 92,085 | | 2,444,857 |
| Pinnacle West Capital Corporation | 84,345 | | 6,059,345 |
| | | | | 46,156,155 |
Total Common Stocks
(Cost $678,367,763) | | 806,856,053 |
| FOREIGN COMMON STOCKS — 13.2% |
| Canada — 1.0% | | |
| Enbridge, Inc. | 261,856 | | 9,432,053 |
| France — 1.0% | | |
| TotalEnergies SE ADRΔ | 141,060 | | 9,504,623 |
| Ireland — 5.4% | | |
| CRH PLC | 103,115 | | 7,131,433 |
| Johnson Controls International PLC | 69,774 | | 4,021,773 |
| Medtronic PLC | 375,294 | | 30,916,720 |
| nVent Electric PLC | 22,727 | | 1,342,939 |
| STERIS PLC | 10,588 | | 2,327,772 |
| | | Shares | | Value |
| Willis Towers Watson PLC | 30,342 | | $ 7,318,490 |
| | | | | 53,059,127 |
| Japan — 0.3% | | |
| Nintendo Co., Ltd. ADR | 243,671 | | 3,165,286 |
| Jersey — 1.0% | | |
| Aptiv PLC* | 114,870 | | 10,306,136 |
| Netherlands — 0.3% | | |
| Koninklijke Ahold Delhaize NV | 115,234 | | 3,315,450 |
| Singapore — 0.5% | | |
| Flex, Ltd.* | 171,047 | | 5,210,092 |
| Switzerland — 2.4% | | |
| Nestle SA ADR | 31,804 | | 3,677,497 |
| Novartis AG | 45,149 | | 4,560,522 |
| Roche Holding AG | 34,562 | | 10,046,951 |
| TE Connectivity, Ltd. | 36,672 | | 5,152,416 |
| | | | | 23,437,386 |
| United Kingdom — 1.3% | | |
| Unilever PLC ADR | 255,118 | | 12,368,121 |
Total Foreign Common Stocks
(Cost $127,017,658) | | 129,798,274 |
| MUTUAL FUNDS — 0.8% |
iShares Russell 1000 Value ETFΔ
(Cost $7,567,421) | 47,600 | | 7,865,900 |
| MONEY MARKET FUNDS — 4.5% |
| Northern Institutional Liquid Assets Portfolio (Shares), 5.40%ا | 7,874,690 | | 7,874,690 |
| Northern Institutional U.S. Government Portfolio (Shares), 5.17%Ø | 94,556 | | 94,556 |
GuideStone Money Market Fund, 5.28%
(Institutional Class)Ø∞ | 33,435,633 | | 33,435,633 |
| Northern Institutional U.S. Treasury Portfolio (Premier), 5.22%Ø | 2,478,034 | | 2,478,034 |
Total Money Market Funds
(Cost $43,882,913) | | 43,882,913 |
TOTAL INVESTMENTS — 100.7%
(Cost $856,835,755) | | | 988,403,140 |
Liabilities in Excess of Other
Assets — (0.7)% | | | (6,512,620) |
| NET ASSETS — 100.0% | | | $981,890,520 |
Futures Contracts outstanding at December 31, 2023:
| Future Type | | Expiration Date | | Open Long
(Short) Contracts | | Notional
Market Value
of Contracts | | Value and
Unrealized
Appreciation
(Depreciation) |
| S&P 500® E-Mini | | 03/2024 | | 67 | | $16,147,000 | | $411,104 |
See Notes to Financial Statements.
Forward Foreign Currency Contracts outstanding at December 31, 2023:
| Expiration Date | | Currency
Purchased | | Amount
of Currency
Purchased | | Currency
Sold | | Amount
of Currency
Sold | | Counter-
party | | Net Unrealized
Appreciation
(Depreciation) |
| 03/28/24 | | U.S. Dollars | | 4,169,201 | | Euro | | 3,798,920 | | JPM | | $ (39,614) |
| 03/28/24 | | U.S. Dollars | | 4,169,200 | | Euro | | 3,798,920 | | MSCS | | (39,615) |
| 03/28/24 | | U.S. Dollars | | 4,168,460 | | Euro | | 3,798,920 | | MLIB | | (40,355) |
| 03/28/24 | | U.S. Dollars | | 11,827,365 | | British Pounds | | 9,327,981 | | GSC | | (67,578) |
| 03/28/24 | | U.S. Dollars | | 13,884,884 | | Swiss Francs | | 11,926,144 | | MSCS | | (425,752) |
| Total Forward Foreign Currency Contracts outstanding at December 31, 2023 | | | | $(612,914) |
VALUATION HIERARCHY
The following is a summary of the inputs used, as of December 31, 2023, in valuing the Fund’s investments carried at fair value:
| | Total
Value | | Level 1
Quoted Prices | | Level 2
Other Significant
Observable Inputs | | Level 3
Significant
Unobservable Inputs |
| Assets: | | | | | | | |
| Investments in Securities: | | | | | | | |
| Common Stocks | $806,856,053 | | $806,856,053 | | $ — | | $ — |
| Foreign Common Stocks: | | | | | | | |
| Netherlands | 3,315,450 | | — | | 3,315,450 | | — |
| Switzerland | 23,437,386 | | 8,829,913 | | 14,607,473 | | — |
| Other ^^ | 103,045,438 | | 103,045,438 | | — | | — |
| Total Foreign Common Stocks | 129,798,274 | | 111,875,351 | | 17,922,923 | | — |
| Money Market Funds | 43,882,913 | | 43,882,913 | | — | | — |
| Mutual Funds | 7,865,900 | | 7,865,900 | | — | | — |
| Total Assets - Investments in Securities | $988,403,140 | | $970,480,217 | | $17,922,923 | | $ — |
| Other Financial Instruments*** | | | | | | | |
| Futures Contracts | $ 411,104 | | $ 411,104 | | $ — | | $ — |
| Total Assets - Other Financial Instruments | $ 411,104 | | $ 411,104 | | $ — | | $ — |
| Liabilities: | | | | | | | |
| Other Financial Instruments*** | | | | | | | |
| Forward Foreign Currency Contracts | $ (612,914) | | $ — | | $ (612,914) | | $ — |
| Total Liabilities - Other Financial Instruments | $ (612,914) | | $ — | | $ (612,914) | | $ — |
| ^^ | Classifications as defined in the Schedule of Investments. |
| *** | Other financial instruments are derivative instruments, such as futures contracts and forward foreign currency contracts, which are valued at the unrealized appreciation (depreciation) on the investment. Further details regarding the value of these investments can be found in the preceding "Futures Contracts outstanding" and "Forward Foreign Currency Contracts outstanding" disclosures. |
See Notes to Financial Statements.
Growth Equity Index Fund (Unaudited)
The Fund was passively managed and attempted to replicate the performance of its benchmark, the Russell 1000® Growth Index. The Fund was comprised of domestic, large-cap equity stocks with growth-style orientations. The objective of the Fund is to provide investment results approximating the aggregate price and dividend performance of the securities included in the Russell 1000® Growth Index. However, the Fund’s returns relative to its benchmark could be lower in certain market environments and also due to the exclusion of certain securities from the Fund’s portfolio because of the Fund’s faith-based investment policies and restrictions.
The Investor Class of the Fund returned 41.60%, net of fees, for the one-year period ended December 31, 2023, as compared to a return of 42.68% for the Russell 1000® Growth Index. The return differential was primarily a result of the faith-based investment restrictions and expenses of the Fund.
In 2023, exchange-listed equity index futures contracts were utilized to provide market exposure to the cash positions held in the Fund. Overall, derivative exposure had a positive impact on Fund performance for the year.
This Fund may be suitable for investors who seek higher, long-term rates of return, can accept significant short-term fluctuations in account value and want to diversify their portfolio by adding a potentially higher return, higher risk option of equity securities. This Fund is subject to growth investing risk. This involves the risk that the stock price of one or more companies will fall or will fail to appreciate as anticipated, regardless of movements in the securities market. It is possible to lose money by investing in the Fund.
At December 31, 2023, the portfolio holdings of the Fund, as a percentage of net assets, is shown in the following table. Portfolio holdings are subject to risk and may change at any time.
| | % |
| Information Technology | 41.3 |
| Consumer Discretionary | 14.9 |
| Communication Services | 10.8 |
| Health Care | 9.8 |
| Financials | 6.2 |
| Industrials | 5.6 |
| Consumer Staples | 4.2 |
| Money Market Funds | 3.1 |
| Mutual Funds | 2.0 |
| Real Estate | 0.9 |
| Materials | 0.6 |
| Energy | 0.4 |
| Utilities | 0.1 |
| | 99.9 |
| Average Annual Total Returns as of 12/31/23 | |
| | | Institutional Class* | | Investor Class* | | Benchmark** | |
| One Year | | 42.00% | | 41.60% | | 42.68% | |
| Five Year | | N/A | | N/A | | N/A | |
| Ten Year | | N/A | | N/A | | N/A | |
| Since Inception | | 22.49% | | 22.15% | | 22.88% | |
| Inception Date | | 08/31/22 | | 08/31/22 | | | |
| Total Fund Operating Expenses (May 1, 2023 Prospectus)(1)# | | 0.21% | | 0.48% | | | |
| (1) | Current information regarding the Fund’s Operating Expenses can be found in the Financial Highlights. |
#Net expense ratio
See Notes to Financial Statements.
Growth Equity Index Fund (Unaudited)
The performance data quoted represents past performance and does not guarantee future results. The performance data in the table and graph does not reflect the deduction of taxes that a shareholder would pay on Fund distributions or the redemption of Fund shares. Current performance may be lower or higher. Performance data current to the most recent month-end may be obtained at GuideStoneFunds.com. The investment return and principal value of an investment will fluctuate so that shares, when redeemed, may be worth more or less than their original cost.
The Adviser has agreed to waive fees and/or reimburse expenses to the extent needed to limit total annual operating expenses (before expense payments by broker-dealers and excluding interest, taxes, brokerage commissions, extraordinary expenses,acquired fund fees and expenses and expenses incurred in connection with the short sales of securities) to 0.20% for the Institutional Class and 0.47% for the Investor Class. This contractual waiver and reimbursement applies to Fund operating expenses only and will remain in place until April 30, 2024.
The graph illustrates the results of a hypothetical $10,000 investment in the Investor Class of the Fund since August 31, 2022 with all dividends and capital gains reinvested, with the Russell® 1000 Growth Index.
*These returns reflect investment advisory and shareholder servicing fee waivers, if applicable, during the reported time periods.
Unlike a mutual fund, an index is not available for direct investment and the performance of an index assumes no taxes, transaction costs, management fees or other expenses.
See Notes to Financial Statements.
| | | Shares | | Value |
| COMMON STOCKS — 93.5% |
| Communication Services — 10.8% | | |
| Alphabet, Inc. Class A* | 50,243 | | $ 7,018,445 |
| Alphabet, Inc. Class C* | 41,875 | | 5,901,444 |
| Charter Communications, Inc. Class A* | 861 | | 334,653 |
| Iridium Communications, Inc. | 1,490 | | 61,328 |
| Liberty Broadband Corporation* | 137 | | 11,041 |
| Live Nation Entertainment, Inc.* | 287 | | 26,863 |
| Meta Platforms, Inc. Class A* | 18,561 | | 6,569,852 |
| Netflix, Inc.* | 3,616 | | 1,760,558 |
| Nexstar Media Group, Inc. Class A | 97 | | 15,205 |
| Pinterest, Inc. Class A* | 4,699 | | 174,051 |
| Playtika Holding Corporation* | 453 | | 3,950 |
| ROBLOX Corporation Class A* | 3,775 | | 172,593 |
| Roku, Inc.* | 157 | | 14,391 |
| Spotify Technology SA* | 1,103 | | 207,265 |
| TKO Group Holdings, Inc. | 371 | | 30,266 |
| Trade Desk, Inc. (The) Class A* | 3,749 | | 269,778 |
| ZoomInfo Technologies, Inc.* | 1,046 | | 19,340 |
| | | | | 22,591,023 |
| Consumer Discretionary — 14.9% | | |
| Airbnb, Inc. Class A* | 3,400 | | 462,876 |
| Amazon.com, Inc.* | 75,614 | | 11,488,791 |
| AutoZone, Inc.* | 126 | | 325,787 |
| Best Buy Co., Inc. | 248 | | 19,413 |
| Booking Holdings, Inc.* | 301 | | 1,067,713 |
| Bright Horizons Family Solutions, Inc.* | 70 | | 6,597 |
| Burlington Stores, Inc.* | 482 | | 93,739 |
| CarMax, Inc.Δ* | 86 | | 6,600 |
| Chipotle Mexican Grill, Inc.* | 232 | | 530,575 |
| Choice Hotels International, Inc.Δ | 278 | | 31,497 |
| Coupang, Inc.* | 10,023 | | 162,272 |
| Crocs, Inc.* | 433 | | 40,447 |
| Darden Restaurants, Inc. | 585 | | 96,116 |
| Deckers Outdoor Corporation* | 198 | | 132,349 |
| Domino’s Pizza, Inc. | 270 | | 111,302 |
| DoorDash, Inc. Class A* | 2,032 | | 200,944 |
| eBay, Inc. | 359 | | 15,660 |
| Etsy, Inc. | 556 | | 45,064 |
| Expedia Group, Inc.* | 871 | | 132,209 |
| Five Below, Inc.* | 413 | | 88,035 |
| Floor & Decor Holdings, Inc. Class A* | 853 | | 95,161 |
| H&R Block, Inc. | 1,223 | | 59,157 |
| Hilton Worldwide Holdings, Inc. | 1,148 | | 209,039 |
| Home Depot, Inc. (The) | 8,481 | | 2,939,091 |
| Lowe’s Cos., Inc. | 3,635 | | 808,969 |
| Lululemon Athletica, Inc.* | 912 | | 466,296 |
| Marriott International, Inc. Class A | 2,080 | | 469,061 |
| McDonald’s Corporation | 2,789 | | 826,966 |
| Murphy U.S.A., Inc. | 118 | | 42,074 |
| NIKE, Inc. Class B | 5,233 | | 568,147 |
| Norwegian Cruise Line Holdings, Ltd.* | 1,153 | | 23,106 |
| NVR, Inc.* | 2 | | 14,001 |
| O’Reilly Automotive, Inc.* | 427 | | 405,684 |
| | | Shares | | Value |
| Peloton Interactive, Inc. Class A* | 2,924 | | $ 17,807 |
| Planet Fitness, Inc. Class A* | 450 | | 32,850 |
| Pool Corporation | 333 | | 132,770 |
| RH* | 18 | | 5,247 |
| Ross Stores, Inc. | 2,591 | | 358,568 |
| Royal Caribbean Cruises, Ltd.* | 555 | | 71,867 |
| Service Corporation International | 800 | | 54,760 |
| Starbucks Corporation | 9,604 | | 922,080 |
| Tesla, Inc.* | 23,132 | | 5,747,839 |
| Texas Roadhouse, Inc. | 486 | | 59,404 |
| TJX Cos., Inc. (The) | 9,661 | | 906,298 |
| TopBuild Corporation* | 33 | | 12,351 |
| Tractor Supply Co. | 951 | | 204,494 |
| Travel + Leisure Co. | 386 | | 15,089 |
| Ulta Beauty, Inc.* | 399 | | 195,506 |
| Vail Resorts, Inc. | 104 | | 22,201 |
| Valvoline, Inc.* | 360 | | 13,529 |
| Victoria's Secret & Co. | 263 | | 6,980 |
| Wayfair, Inc. Class A* | 267 | | 16,474 |
| Wendy's Co. (The) | 1,644 | | 32,025 |
| Williams-Sonoma, Inc. | 96 | | 19,371 |
| Wingstop, Inc. | 228 | | 58,500 |
| Wyndham Hotels & Resorts, Inc. | 239 | | 19,218 |
| YETI Holdings, Inc.* | 280 | | 14,498 |
| Yum! Brands, Inc. | 2,357 | | 307,966 |
| | | | | 31,232,430 |
| Consumer Staples — 4.1% | | |
| Albertsons Cos., Inc. Class A | 1,025 | | 23,575 |
| BJ's Wholesale Club Holdings, Inc.* | 617 | | 41,129 |
| Casey’s General Stores, Inc. | 66 | | 18,133 |
| Celsius Holdings, Inc.* | 1,272 | | 69,349 |
| Church & Dwight Co., Inc. | 2,019 | | 190,917 |
| Clorox Co. (The) | 1,161 | | 165,547 |
| Coca-Cola Co. (The) | 18,242 | | 1,075,001 |
| Costco Wholesale Corporation | 3,755 | | 2,478,600 |
| Dollar General Corporation | 1,894 | | 257,489 |
| Estee Lauder Cos., Inc. (The) Class A | 669 | | 97,841 |
| Hershey Co. (The) | 1,149 | | 214,220 |
| Kenvue, Inc. | 5,491 | | 118,221 |
| Kimberly-Clark Corporation | 3,250 | | 394,908 |
| Lamb Weston Holdings, Inc. | 1,280 | | 138,355 |
| Monster Beverage Corporation* | 6,589 | | 379,592 |
| PepsiCo, Inc. | 8,678 | | 1,473,872 |
| Performance Food Group Co.* | 624 | | 43,150 |
| Procter & Gamble Co. (The) | 4,325 | | 633,786 |
| Sysco Corporation | 4,828 | | 353,072 |
| Target Corporation | 3,939 | | 560,992 |
| | | | | 8,727,749 |
| Energy — 0.4% | | |
| APA Corporation | 1,788 | | 64,153 |
| Cheniere Energy, Inc. | 2,005 | | 342,274 |
| Halliburton Co. | 1,716 | | 62,033 |
| Hess Corporation | 1,266 | | 182,507 |
| New Fortress Energy, Inc.Δ | 351 | | 13,243 |
| ONEOK, Inc. | 280 | | 19,662 |
| Ovintiv, Inc. | 653 | | 28,680 |
See Notes to Financial Statements.
| | | Shares | | Value |
| Targa Resources Corporation | 1,566 | | $ 136,038 |
| Texas Pacific Land Corporation | 58 | | 91,202 |
| | | | | 939,792 |
| Financials — 6.1% | | |
| American Express Co. | 1,643 | | 307,800 |
| Ameriprise Financial, Inc. | 895 | | 339,948 |
| Apollo Global Management, Inc. | 4,427 | | 412,552 |
| Arch Capital Group, Ltd.* | 583 | | 43,299 |
| Ares Management Corporation Class A | 1,427 | | 169,699 |
| Arthur J. Gallagher & Co. | 277 | | 62,292 |
| Blackstone, Inc. | 6,071 | | 794,815 |
| Block, Inc.* | 1,555 | | 120,279 |
| Blue Owl Capital, Inc. | 717 | | 10,683 |
| Brown & Brown, Inc. | 886 | | 63,004 |
| Equitable Holdings, Inc. | 2,559 | | 85,215 |
| Euronet Worldwide, Inc.* | 182 | | 18,471 |
| Everest Group, Ltd. | 79 | | 27,933 |
| FactSet Research Systems, Inc. | 348 | | 166,013 |
| First Citizens BancShares, Inc. Class A | 6 | | 8,514 |
| Fiserv, Inc.* | 1,437 | | 190,891 |
| FleetCor Technologies, Inc.* | 536 | | 151,479 |
| Jack Henry & Associates, Inc. | 233 | | 38,075 |
| Kinsale Capital Group, Inc. | 173 | | 57,939 |
| KKR & Co., Inc. | 1,272 | | 105,385 |
| Lincoln National Corporation | 267 | | 7,201 |
| LPL Financial Holdings, Inc. | 610 | | 138,848 |
| MarketAxess Holdings, Inc. | 299 | | 87,562 |
| Marsh & McLennan Cos., Inc. | 3,520 | | 666,934 |
| Mastercard, Inc. Class A | 7,002 | | 2,986,423 |
| Moody’s Corporation | 1,241 | | 484,685 |
| Morningstar, Inc. | 227 | | 64,977 |
| MSCI, Inc. | 323 | | 182,705 |
| PayPal Holdings, Inc.* | 8,097 | | 497,237 |
| Primerica, Inc. | 153 | | 31,481 |
| Progressive Corporation (The) | 3,690 | | 587,743 |
| RLI Corporation | 159 | | 21,166 |
| Ryan Specialty Holdings, Inc.* | 1,138 | | 48,957 |
| S&P Global, Inc. | 264 | | 116,297 |
| Shift4 Payments, Inc. Class AΔ* | 282 | | 20,964 |
| Toast, Inc. Class A* | 2,731 | | 49,868 |
| Tradeweb Markets, Inc. Class A | 511 | | 46,440 |
| Visa, Inc. Class AΔ | 13,489 | | 3,511,861 |
| Western Union Co. (The) | 22 | | 262 |
| WEX, Inc.* | 223 | | 43,385 |
| | | | | 12,769,282 |
| Health Care — 9.8% | | |
| 10X Genomics, Inc. Class A* | 604 | | 33,800 |
| Abbott Laboratories | 1,392 | | 153,217 |
| Agilent Technologies, Inc. | 2,403 | | 334,089 |
| agilon health, Inc.Δ* | 2,522 | | 31,651 |
| Align Technology, Inc.* | 608 | | 166,592 |
| Alnylam Pharmaceuticals, Inc.* | 1,258 | | 240,794 |
| Amgen, Inc. | 3,703 | | 1,066,538 |
| Apellis Pharmaceuticals, Inc.* | 1,057 | | 63,272 |
| | | Shares | | Value |
| BioMarin Pharmaceutical, Inc.* | 1,317 | | $ 126,985 |
| Bruker Corporation | 1,212 | | 89,058 |
| Cardinal Health, Inc. | 1,048 | | 105,638 |
| Cencora, Inc. | 1,470 | | 301,909 |
| Certara, Inc.* | 504 | | 8,865 |
| Chemed Corporation | 120 | | 70,170 |
| Cigna Group (The) | 299 | | 89,536 |
| DaVita, Inc.* | 415 | | 43,475 |
| Dexcom, Inc.* | 3,302 | | 409,745 |
| Doximity, Inc. Class A* | 274 | | 7,683 |
| Edwards Lifesciences Corporation* | 5,339 | | 407,099 |
| Elevance Health, Inc. | 324 | | 152,785 |
| Eli Lilly and Co. | 7,206 | | 4,200,521 |
| Exact Sciences Corporation* | 1,059 | | 78,345 |
| Exelixis, Inc.* | 7,287 | | 174,815 |
| GE HealthCare Technologies, Inc. | 294 | | 22,732 |
| Globus Medical, Inc. Class A* | 460 | | 24,513 |
| HCA Healthcare, Inc. | 414 | | 112,061 |
| Humana, Inc. | 476 | | 217,918 |
| IDEXX Laboratories, Inc.* | 685 | | 380,209 |
| Illumina, Inc.* | 411 | | 57,228 |
| Incyte Corporation* | 3,534 | | 221,900 |
| Inspire Medical Systems, Inc.* | 227 | | 46,179 |
| Insulet Corporation* | 553 | | 119,990 |
| Intuitive Surgical, Inc.* | 2,985 | | 1,007,020 |
| Ionis Pharmaceuticals, Inc.* | 2,667 | | 134,924 |
| IQVIA Holdings, Inc.* | 1,544 | | 357,251 |
| Karuna Therapeutics, Inc.* | 648 | | 205,099 |
| Maravai LifeSciences Holdings, Inc. Class A* | 994 | | 6,511 |
| Masimo Corporation* | 378 | | 44,305 |
| McKesson Corporation | 469 | | 217,138 |
| Medpace Holdings, Inc.* | 181 | | 55,482 |
| Mettler-Toledo International, Inc.* | 201 | | 243,805 |
| Molina Healthcare, Inc.* | 304 | | 109,838 |
| Natera, Inc.* | 1,411 | | 88,385 |
| Neurocrine Biosciences, Inc.* | 1,866 | | 245,864 |
| Penumbra, Inc.* | 275 | | 69,173 |
| Regeneron Pharmaceuticals, Inc.* | 232 | | 203,763 |
| Repligen Corporation* | 187 | | 33,623 |
| ResMed, Inc. | 1,236 | | 212,617 |
| Roivant Sciences, Ltd.* | 5,324 | | 59,788 |
| Sarepta Therapeutics, Inc.* | 1,268 | | 122,273 |
| Shockwave Medical, Inc.* | 291 | | 55,453 |
| Sotera Health Co.* | 125 | | 2,106 |
| Stryker Corporation | 839 | | 251,247 |
| Tandem Diabetes Care, Inc.* | 305 | | 9,022 |
| Thermo Fisher Scientific, Inc. | 2,158 | | 1,145,445 |
| Ultragenyx Pharmaceutical, Inc.* | 1,534 | | 73,356 |
| UnitedHealth Group, Inc. | 6,645 | | 3,498,393 |
| Veeva Systems, Inc. Class A* | 1,215 | | 233,912 |
| Vertex Pharmaceuticals, Inc.* | 2,382 | | 969,212 |
| Waters Corporation* | 604 | | 198,855 |
| West Pharmaceutical Services, Inc. | 691 | | 243,315 |
| Zoetis, Inc. | 4,211 | | 831,125 |
| | | | | 20,487,612 |
See Notes to Financial Statements.
SCHEDULE OF INVESTMENTS (Continued)
| | | Shares | | Value |
| Industrials — 5.5% | | |
| Advanced Drainage Systems, Inc. | 436 | | $ 61,319 |
| Allison Transmission Holdings, Inc. | 19 | | 1,105 |
| American Airlines Group, Inc.* | 1,345 | | 18,480 |
| Armstrong World Industries, Inc. | 72 | | 7,079 |
| Automatic Data Processing, Inc. | 3,062 | | 713,354 |
| Axon Enterprise, Inc.* | 499 | | 128,907 |
| Boeing Co. (The)* | 592 | | 154,311 |
| Booz Allen Hamilton Holding Corporation | 1,241 | | 158,736 |
| Broadridge Financial Solutions, Inc. | 834 | | 171,596 |
| C.H. Robinson Worldwide, Inc. | 854 | | 73,777 |
| Caterpillar, Inc. | 3,231 | | 955,310 |
| Ceridian HCM Holding, Inc.* | 103 | | 6,913 |
| ChargePoint Holdings, Inc.Δ* | 917 | | 2,146 |
| Cintas Corporation | 679 | | 409,206 |
| Copart, Inc.* | 7,044 | | 345,156 |
| CSX Corporation | 2,523 | | 87,472 |
| Deere & Co. | 2,077 | | 830,530 |
| Delta Air Lines, Inc. | 491 | | 19,753 |
| Donaldson Co., Inc. | 105 | | 6,862 |
| EMCOR Group, Inc. | 124 | | 26,713 |
| Equifax, Inc. | 704 | | 174,092 |
| Fastenal Co. | 3,895 | | 252,279 |
| FTI Consulting, Inc.* | 121 | | 24,097 |
| Genpact, Ltd. | 801 | | 27,803 |
| Graco, Inc. | 502 | | 43,554 |
| HEICO Corporation | 359 | | 64,214 |
| HEICO Corporation Class A | 496 | | 70,650 |
| Honeywell International, Inc. | 1,006 | | 210,968 |
| Hubbell, Inc. | 221 | | 72,694 |
| IDEX Corporation | 18 | | 3,908 |
| Illinois ToolWorks, Inc. | 2,058 | | 539,073 |
| J.B. Hunt Transport Services, Inc. | 180 | | 35,953 |
| KBR, Inc. | 382 | | 21,167 |
| Landstar System, Inc. | 234 | | 45,314 |
| Lincoln Electric Holdings, Inc. | 469 | | 101,989 |
| Lockheed Martin Corporation | 1,888 | | 855,717 |
| Lyft, Inc. Class A* | 3,446 | | 51,656 |
| Northrop Grumman Corporation | 87 | | 40,728 |
| Old Dominion Freight Line, Inc. | 756 | | 306,429 |
| Otis Worldwide Corporation | 154 | | 13,778 |
| Paychex, Inc. | 2,832 | | 337,320 |
| Paycom Software, Inc. | 371 | | 76,693 |
| Paylocity Holding Corporation* | 293 | | 48,301 |
| Quanta Services, Inc. | 371 | | 80,062 |
| Rockwell Automation, Inc. | 931 | | 289,057 |
| Rollins, Inc. | 2,329 | | 101,707 |
| SiteOne Landscape Supply, Inc.* | 59 | | 9,588 |
| Tetra Tech, Inc. | 83 | | 13,855 |
| Toro Co. (The) | 733 | | 70,361 |
| TransDigm Group, Inc. | 61 | | 61,708 |
| Trex Co., Inc.* | 643 | | 53,234 |
| Uber Technologies, Inc.* | 16,474 | | 1,014,304 |
| U-Haul Holding Co. | 627 | | 44,166 |
| Union Pacific Corporation | 2,346 | | 576,225 |
| United Parcel Service, Inc. Class B | 1,761 | | 276,882 |
| United Rentals, Inc. | 112 | | 64,223 |
| | | Shares | | Value |
| Valmont Industries, Inc. | 28 | | $ 6,538 |
| Verisk Analytics, Inc. | 1,169 | | 279,227 |
| W.W. Grainger, Inc. | 373 | | 309,101 |
| Waste Management, Inc. | 3,364 | | 602,492 |
| Watsco, Inc. | 68 | | 29,136 |
| WillScot Mobile Mini Holdings Corporation* | 504 | | 22,428 |
| Xylem, Inc. | 111 | | 12,694 |
| | | | | 11,514,090 |
| Information Technology — 40.3% | | |
| Adobe, Inc.* | 3,851 | | 2,297,507 |
| Advanced Micro Devices, Inc.* | 7,653 | | 1,128,128 |
| Allegro MicroSystems, Inc.* | 447 | | 13,531 |
| Alteryx, Inc. Class A* | 387 | | 18,251 |
| Amphenol Corporation Class A | 2,470 | | 244,851 |
| ANSYS, Inc.* | 633 | | 229,703 |
| Apple, Inc. | 123,805 | | 23,836,177 |
| Applied Materials, Inc. | 5,889 | | 954,430 |
| AppLovin Corporation Class A* | 544 | | 21,678 |
| Arista Networks, Inc.* | 2,075 | | 488,683 |
| Atlassian Corporation Class A* | 1,322 | | 314,451 |
| Autodesk, Inc.* | 1,824 | | 444,108 |
| Bentley Systems, Inc. Class B | 1,697 | | 88,549 |
| Broadcom, Inc. | 3,623 | | 4,044,174 |
| Cadence Design Systems, Inc.* | 2,264 | | 616,646 |
| CDW Corporation | 1,072 | | 243,687 |
| Cloudflare, Inc. Class A* | 2,339 | | 194,745 |
| Confluent, Inc. Class A* | 1,501 | | 35,123 |
| Crowdstrike Holdings, Inc. Class A* | 1,791 | | 457,278 |
| Datadog, Inc. Class A* | 2,321 | | 281,723 |
| DocuSign, Inc.* | 1,770 | | 105,227 |
| DoubleVerify Holdings, Inc.* | 867 | | 31,888 |
| Dropbox, Inc. Class A* | 1,845 | | 54,391 |
| Dynatrace, Inc.* | 1,850 | | 101,177 |
| Enphase Energy, Inc.* | 1,031 | | 136,236 |
| Entegris, Inc. | 79 | | 9,466 |
| EPAM Systems, Inc.* | 472 | | 140,344 |
| Fair Isaac Corporation* | 195 | | 226,982 |
| Five9, Inc.* | 486 | | 38,243 |
| Fortinet, Inc.* | 5,569 | | 325,954 |
| Gartner, Inc.* | 654 | | 295,026 |
| Gen Digital, Inc. | 1,826 | | 41,669 |
| Gitlab, Inc. Class A* | 896 | | 56,412 |
| Globant SA* | 384 | | 91,384 |
| GoDaddy, Inc. Class A* | 806 | | 85,565 |
| HashiCorp, Inc. Class A* | 817 | | 19,314 |
| HP, Inc. | 1,973 | | 59,368 |
| HubSpot, Inc.* | 382 | | 221,766 |
| Intuit, Inc. | 2,310 | | 1,443,819 |
| Jabil, Inc. | 521 | | 66,375 |
| Keysight Technologies, Inc.* | 338 | | 53,772 |
| KLA Corporation | 1,141 | | 663,263 |
| Lam Research Corporation | 1,018 | | 797,359 |
| Lattice Semiconductor Corporation* | 936 | | 64,575 |
| Manhattan Associates, Inc.* | 442 | | 95,171 |
| Microchip Technology, Inc. | 3,086 | | 278,295 |
| Microsoft Corporation | 62,550 | | 23,521,302 |
See Notes to Financial Statements.
| | | Shares | | Value |
| MongoDB, Inc.* | 573 | | $ 234,271 |
| Monolithic Power Systems, Inc. | 362 | | 228,342 |
| Motorola Solutions, Inc. | 1,293 | | 404,825 |
| NetApp, Inc. | 830 | | 73,173 |
| Nutanix, Inc. Class A* | 917 | | 43,732 |
| NVIDIA Corporation | 19,919 | | 9,864,287 |
| Okta, Inc.* | 52 | | 4,708 |
| Oracle Corporation | 5,440 | | 573,539 |
| Palantir Technologies, Inc. Class A* | 15,650 | | 268,711 |
| Palo Alto Networks, Inc.* | 2,533 | | 746,931 |
| Pegasystems, Inc. | 132 | | 6,450 |
| Procore Technologies, Inc.* | 635 | | 43,955 |
| PTC, Inc.* | 543 | | 95,003 |
| Pure Storage, Inc. Class A* | 2,110 | | 75,243 |
| QUALCOMM, Inc. | 8,206 | | 1,186,834 |
| RingCentral, Inc. Class A* | 475 | | 16,126 |
| Salesforce, Inc.* | 6,019 | | 1,583,840 |
| ServiceNow, Inc.* | 1,710 | | 1,208,098 |
| Smartsheet, Inc. Class A* | 1,211 | | 57,910 |
| Snowflake, Inc. Class A* | 2,604 | | 518,196 |
| Splunk, Inc.* | 1,322 | | 201,407 |
| Synopsys, Inc.* | 1,269 | | 653,421 |
| Teradata Corporation* | 688 | | 29,935 |
| Teradyne, Inc.Δ | 942 | | 102,226 |
| Texas Instruments, Inc. | 3,248 | | 553,654 |
| Twilio, Inc. Class A* | 353 | | 26,782 |
| Tyler Technologies, Inc.* | 269 | | 112,474 |
| Ubiquiti, Inc. | 16 | | 2,233 |
| UiPath, Inc. Class A* | 2,306 | | 57,281 |
| Unity Software, Inc.* | 906 | | 37,046 |
| Universal Display Corporation | 150 | | 28,689 |
| VeriSign, Inc.* | 31 | | 6,385 |
| Workday, Inc. Class A* | 1,661 | | 458,536 |
| Zebra Technologies Corporation Class A* | 28 | | 7,653 |
| Zscaler, Inc.* | 735 | | 162,847 |
| | | | | 84,652,509 |
| Materials — 0.6% | | |
| Avery Dennison Corporation | 199 | | 40,230 |
| Eagle Materials, Inc. | 53 | | 10,750 |
| Ecolab, Inc. | 1,543 | | 306,054 |
| FMC Corporation | 132 | | 8,322 |
| Graphic Packaging Holding Co. | 1,018 | | 25,094 |
| PPG Industries, Inc. | 460 | | 68,793 |
| RPM International, Inc. | 160 | | 17,861 |
| Scotts Miracle-Gro Co. (The) | 461 | | 29,389 |
| Sealed Air Corporation | 435 | | 15,886 |
| Sherwin-Williams Co. (The) | 1,680 | | 523,992 |
| Southern Copper CorporationΔ | 942 | | 81,078 |
| Vulcan Materials Co. | 294 | | 66,741 |
| | | | | 1,194,190 |
| | | Shares | | Value |
| Real Estate — 0.9% | | |
| American Tower Corporation REIT | 3,960 | | $ 854,885 |
| CoStar Group, Inc.* | 1,582 | | 138,251 |
| Crown Castle, Inc. REIT | 539 | | 62,087 |
| Equinix, Inc. REIT | 385 | | 310,075 |
| Equity LifeStyle Properties, Inc. REIT | 686 | | 48,390 |
| Iron Mountain, Inc. REIT | 1,257 | | 87,965 |
| Lamar Advertising Co. Class A REIT | 504 | | 53,565 |
| Public Storage REIT | 835 | | 254,675 |
| SBA Communications Corporation REIT | 61 | | 15,475 |
| Simon Property Group, Inc. REIT | 718 | | 102,416 |
| Sun Communities, Inc. REIT | 275 | | 36,754 |
| | | | | 1,964,538 |
| Utilities — 0.1% | | |
| AES Corporation (The) | 4,723 | | 90,917 |
| Vistra Corporation | 1,415 | | 54,506 |
| | | | | 145,423 |
Total Common Stocks
(Cost $153,255,872) | | 196,218,638 |
| FOREIGN COMMON STOCKS — 1.3% |
| Bermuda — 0.0% | | |
| RenaissanceRe Holdings, Ltd. | 163 | | 31,948 |
| Brazil — 0.1% | | |
| NU Holdings, Ltd. Class A* | 12,726 | | 106,008 |
| Canada — 0.0% | | |
| RB Global, Inc. | 1,387 | | 92,776 |
| Ireland — 1.2% | | |
| Accenture PLC Class A | 5,384 | | 1,889,299 |
| Allegion PLC | 734 | | 92,991 |
| ICON PLC* | 110 | | 31,138 |
| Jazz Pharmaceuticals PLC* | 694 | | 85,362 |
| Linde PLC | 405 | | 166,338 |
| Trane Technologies PLC | 587 | | 143,169 |
| Willis Towers Watson PLC | 121 | | 29,185 |
| | | | | 2,437,482 |
| Jersey — 0.0% | | |
| Novocure, Ltd.* | 838 | | 12,511 |
| Netherlands — 0.0% | | |
| Elastic NV* | 701 | | 79,003 |
Total Foreign Common Stocks
(Cost $2,337,240) | | 2,759,728 |
| MUTUAL FUNDS — 2.0% |
iShares Russell 1000 Growth ETFΔ
(Cost $3,849,959) | 13,725 | | 4,161,008 |
| MONEY MARKET FUNDS — 3.1% |
| Northern Institutional Liquid Assets Portfolio (Shares), 5.40%ا | 65,893 | | 65,893 |
See Notes to Financial Statements.
SCHEDULE OF INVESTMENTS (Continued)
| | | Shares | | Value |
GuideStone Money Market Fund, 5.28%
(Institutional Class)Ø∞ | 5,758,790 | | $ 5,758,790 |
| Northern Institutional U.S. Treasury Portfolio (Premier), 5.22%Ø | 625,990 | | 625,990 |
Total Money Market Funds
(Cost $6,450,673) | | 6,450,673 |
TOTAL INVESTMENTS — 99.9%
(Cost $165,893,744) | | | 209,590,047 |
Other Assets in Excess of
Liabilities — 0.1% | | | 226,986 |
| NET ASSETS — 100.0% | | | $209,817,033 |
Futures Contracts outstanding at December 31, 2023:
| Future Type | | Expiration Date | | Open Long
(Short) Contracts | | Notional
Market Value
of Contracts | | Value and
Unrealized
Appreciation
(Depreciation) |
| S&P 500® E-Mini | | 03/2024 | | 26 | | $6,266,000 | | $ 86,370 |
| S&P 500® Micro E-Mini | | 03/2024 | | 20 | | 482,000 | | 15,990 |
| Total Futures Contracts outstanding at December 31, 2023 | | | | | | $6,748,000 | | $102,360 |
VALUATION HIERARCHY
The following is a summary of the inputs used, as of December 31, 2023, in valuing the Fund’s investments carried at fair value:
| | Total
Value | | Level 1
Quoted Prices | | Level 2
Other Significant
Observable Inputs | | Level 3
Significant
Unobservable Inputs |
| Assets: | | | | | | | |
| Investments in Securities: | | | | | | | |
| Common Stocks | $196,218,638 | | $196,218,638 | | $ — | | $ — |
| Foreign Common Stocks | 2,759,728 | | 2,759,728 | | — | | — |
| Money Market Funds | 6,450,673 | | 6,450,673 | | — | | — |
| Mutual Funds | 4,161,008 | | 4,161,008 | | — | | — |
| Total Assets - Investments in Securities | $209,590,047 | | $209,590,047 | | $ — | | $ — |
| Other Financial Instruments*** | | | | | | | |
| Futures Contracts | $ 102,360 | | $ 102,360 | | $ — | | $ — |
| Total Assets - Other Financial Instruments | $ 102,360 | | $ 102,360 | | $ — | | $ — |
| *** | Other financial instruments are derivative instruments, such as futures contracts, which are valued at the unrealized appreciation (depreciation) on the investment. Further details regarding the value of these investments can be found in the preceding "Futures Contracts outstanding" disclosure. |
See Notes to Financial Statements.
Growth Equity Fund (Unaudited)
The Fund invested in a diversified portfolio of large- and medium-sized U.S. companies whose stocks were considered to have above average potential for growth in revenue and earnings. The Investor Class of the Fund underperformed its benchmark, the Russell 1000® Growth Index, for the one-year period ended December 31, 2023 (41.81% (net of fees) versus 42.68%). While the Fund experienced slight underperformance relative to the benchmark, it placed in the second quartile from a peer-relative perspective for the same period. Large capitalization growth stocks significantly outperformed large capitalization value stocks during 2023, as the market rewarded a handful of mega capitalization stocks, which accounted for a large portion of the performance of the benchmark index. This created a significant hurdle for active management as growth managers that were underweight in these particular stocks most likely experienced underperformance for the year. The Fund had a modest underweight to the technology sector and a modest overweight to the communication services sector. The allocation to cash and underweight exposure to technology detracted from benchmark-relative performance, while the underweight exposure and security selection within the industrials sector benefited benchmark-relative returns during the year.
In 2023, exchange-listed equity index futures contracts were utilized to provide market exposure to the cash positions held in the Fund. Overall, derivative exposure had a positive impact on Fund performance for the year.
This Fund may be suitable for investors who seek high, long-term rates of return, can accept significant short-term fluctuations in account value, want to invest in growth-oriented equities and would like to diversify their portfolio by adding a potentially higher return, higher risk option of equity securities. The Fund will not concentrate in any particular industry, but at times, it may be heavily invested in a particular economic sector. This may result in greater short-term price volatility. It is possible to lose money by investing in the Fund.
At December 31, 2023, the portfolio holdings of the Fund, as a percentage of net assets, is shown in the following table. Portfolio holdings are subject to risk and may change at any time.
| | % |
| Information Technology | 40.5 |
| Consumer Discretionary | 14.9 |
| Communication Services | 13.4 |
| Health Care | 10.2 |
| Financials | 7.6 |
| Industrials | 5.5 |
| Consumer Staples | 2.8 |
| Money Market Funds | 2.7 |
| Materials | 1.6 |
| Real Estate | 0.7 |
| Energy | 0.3 |
| | 100.2 |
| Average Annual Total Returns as of 12/31/23 | |
| | | Institutional Class* | | Investor Class* | | Benchmark** | |
| One Year | | 42.22% | | 41.81% | | 42.68% | |
| Five Year | | 14.94% | | 14.64% | | 19.49% | |
| Ten Year | | 11.97% | | 11.70% | | 14.85% | |
| Since Inception | | 8.21% | | 8.02% | | 9.63% | |
| Inception Date | | 08/27/01 | | 08/27/01 | | | |
| Total Fund Operating Expenses (May 1, 2023 Prospectus)(1)# | | 0.67% | | 0.93% | | | |
| (1) | Current information regarding the Fund’s Operating Expenses can be found in the Financial Highlights. |
#Net expense ratio
See Notes to Financial Statements.
Growth Equity Fund (Unaudited)
The performance data quoted represents past performance and does not guarantee future results. The performance data in the table and graph does not reflect the deduction of taxes that a shareholder would pay on Fund distributions or the redemption of Fund shares. Current performance may be lower or higher. Performance data current to the most recent month-end may be obtained at GuideStoneFunds.com. The investment return and principal value of an investment will fluctuate so that shares, when redeemed, may be worth more or less than their original cost.
The graph illustrates the results of a hypothetical $10,000 investment in the Investor Class of the Fund for the 10-year period from December 31, 2013 to December 31, 2023, with all dividends and capital gains reinvested, with the Russell 1000® Growth Index.
*These returns reflect investment advisory and shareholder servicing fee waivers, if applicable, during the reported time periods.
Unlike a mutual fund, an index is not available for direct investment and the performance of an index assumes no taxes, transaction costs, management fees or other expenses.
See Notes to Financial Statements.
| | | Shares | | Value |
| COMMON STOCKS — 92.4% |
| Communication Services — 13.4% | | |
| Alphabet, Inc. Class A* | 488,014 | | $ 68,170,676 |
| Alphabet, Inc. Class C* | 165,629 | | 23,342,095 |
| Live Nation Entertainment, Inc.Δ* | 106,655 | | 9,982,908 |
| Meta Platforms, Inc. Class A* | 156,378 | | 55,351,557 |
| Netflix, Inc.* | 62,001 | | 30,187,047 |
| Spotify Technology SA* | 7,386 | | 1,387,903 |
| Trade Desk, Inc. (The) Class A* | 38,901 | | 2,799,316 |
| Walt Disney Co. (The) | 119,374 | | 10,778,278 |
| | | | | 201,999,780 |
| Consumer Discretionary — 14.7% | | |
| Airbnb, Inc. Class A* | 19,021 | | 2,589,519 |
| Amazon.com, Inc.* | 679,283 | | 103,210,259 |
| AutoZone, Inc.* | 1,279 | | 3,306,995 |
| Chipotle Mexican Grill, Inc.* | 8,122 | | 18,574,689 |
| D.R. Horton, Inc. | 17,133 | | 2,603,873 |
| DoorDash, Inc. Class A* | 41,851 | | 4,138,645 |
| Floor & Decor Holdings, Inc. Class AΔ* | 13,838 | | 1,543,767 |
| Lowe’s Cos., Inc. | 18,012 | | 4,008,571 |
| Marriott International, Inc. Class A | 24,269 | | 5,472,902 |
| MercadoLibre, Inc.* | 4,145 | | 6,514,033 |
| NIKE, Inc. Class B | 76,265 | | 8,280,091 |
| O’Reilly Automotive, Inc.* | 9,847 | | 9,355,438 |
| Starbucks Corporation | 169,165 | | 16,241,532 |
| Tesla, Inc.* | 122,770 | | 30,505,890 |
| Yum China Holdings, Inc. | 39,829 | | 1,689,945 |
| Yum! Brands, Inc. | 34,039 | | 4,447,536 |
| | | | | 222,483,685 |
| Consumer Staples — 2.9% | | |
| Celsius Holdings, Inc.Δ* | 50,872 | | 2,773,541 |
| Costco Wholesale Corporation | 24,048 | | 15,873,604 |
| Estee Lauder Cos., Inc. (The) Class A | 1,522 | | 222,592 |
| Monster Beverage Corporation* | 422,301 | | 24,328,761 |
| | | | | 43,198,498 |
| Energy — 0.3% | | |
| Cheniere Energy, Inc. | 11,014 | | 1,880,200 |
| ConocoPhillips | 20,168 | | 2,340,900 |
| | | | | 4,221,100 |
| Financials — 7.5% | | |
| Apollo Global Management, Inc. | 103,201 | | 9,617,301 |
| Blackstone, Inc. | 24,827 | | 3,250,351 |
| Block, Inc.* | 114,180 | | 8,831,823 |
| Carlyle Group, Inc. (The)Δ | 232,221 | | 9,449,072 |
| Charles Schwab Corporation (The) | 8,854 | | 609,155 |
| FactSet Research Systems, Inc. | 12,960 | | 6,182,568 |
| Mastercard, Inc. Class A | 91,351 | | 38,962,115 |
| Morgan Stanley | 19,511 | | 1,819,401 |
| MSCI, Inc. | 1,221 | | 690,659 |
| PayPal Holdings, Inc.* | 56,702 | | 3,482,070 |
| SEI Investments Co. | 73,824 | | 4,691,515 |
| Visa, Inc. Class AΔ | 96,332 | | 25,080,036 |
| | | | | 112,666,066 |
| | | Shares | | Value |
| Health Care — 9.5% | | |
| 10X Genomics, Inc. Class A* | 21,602 | | $ 1,208,848 |
| Agilent Technologies, Inc. | 40,134 | | 5,579,830 |
| Align Technology, Inc.* | 7,432 | | 2,036,368 |
| Alnylam Pharmaceuticals, Inc.* | 4,102 | | 785,164 |
| Dexcom, Inc.* | 42,999 | | 5,335,746 |
| Edwards Lifesciences Corporation* | 37,360 | | 2,848,700 |
| Eli Lilly and Co. | 33,092 | | 19,289,989 |
| Exact Sciences Corporation* | 41,342 | | 3,058,481 |
| HCA Healthcare, Inc. | 3,421 | | 925,996 |
| Illumina, Inc.* | 36,548 | | 5,088,943 |
| Intuitive Surgical, Inc.* | 62,775 | | 21,177,774 |
| McKesson Corporation | 10,815 | | 5,007,129 |
| Moderna, Inc.* | 5,063 | | 503,515 |
| Regeneron Pharmaceuticals, Inc.* | 18,992 | | 16,680,484 |
| Thermo Fisher Scientific, Inc. | 10,561 | | 5,605,673 |
| Ultragenyx Pharmaceutical, Inc.* | 24,812 | | 1,186,510 |
| UnitedHealth Group, Inc. | 39,758 | | 20,931,394 |
| Veeva Systems, Inc. Class A* | 26,590 | | 5,119,107 |
| Vertex Pharmaceuticals, Inc.* | 26,093 | | 10,616,981 |
| Zoetis, Inc. | 56,204 | | 11,092,983 |
| | | | | 144,079,615 |
| Industrials — 4.7% | | |
| Boeing Co. (The)* | 85,224 | | 22,214,488 |
| Copart, Inc.* | 242,552 | | 11,885,048 |
| Deere & Co. | 12,930 | | 5,170,319 |
| Expeditors International of Washington, Inc. | 49,186 | | 6,256,459 |
| Quanta Services, Inc. | 11,008 | | 2,375,526 |
| TransDigm Group, Inc. | 5,581 | | 5,645,740 |
| Uber Technologies, Inc.* | 253,310 | | 15,596,297 |
| W.W. Grainger, Inc. | 2,920 | | 2,419,775 |
| | | | | 71,563,652 |
| Information Technology — 37.9% | | |
| Adobe, Inc.* | 12,221 | | 7,291,049 |
| Advanced Micro Devices, Inc.* | 114,387 | | 16,861,788 |
| Amphenol Corporation Class A | 40,719 | | 4,036,474 |
| Apple, Inc. | 407,422 | | 78,440,958 |
| Arista Networks, Inc.* | 13,792 | | 3,248,154 |
| Atlassian Corporation Class A* | 12,178 | | 2,896,659 |
| Autodesk, Inc.* | 49,604 | | 12,077,582 |
| Broadcom, Inc. | 9,750 | | 10,883,437 |
| Cloudflare, Inc. Class A* | 18,956 | | 1,578,277 |
| Cognizant Technology Solutions Corporation Class A | 25,853 | | 1,952,677 |
| Datadog, Inc. Class A* | 24,866 | | 3,018,235 |
| Entegris, Inc. | 18,598 | | 2,228,412 |
| First Solar, Inc.* | 4,949 | | 852,614 |
| HubSpot, Inc.* | 4,524 | | 2,626,363 |
| Intuit, Inc. | 38,004 | | 23,753,640 |
| Jabil, Inc. | 16,895 | | 2,152,423 |
| Lam Research Corporation | 22,936 | | 17,964,851 |
| Microsoft Corporation | 410,051 | | 154,195,578 |
| MongoDB, Inc.* | 3,986 | | 1,629,676 |
| NVIDIA Corporation | 172,968 | | 85,657,213 |
See Notes to Financial Statements.
SCHEDULE OF INVESTMENTS (Continued)
| | | Shares | | Value |
| Okta, Inc.* | 19,301 | | $ 1,747,319 |
| ON Semiconductor Corporation* | 18,052 | | 1,507,884 |
| Oracle Corporation | 214,235 | | 22,586,796 |
| Palo Alto Networks, Inc.* | 59,965 | | 17,682,479 |
| QUALCOMM, Inc. | 47,609 | | 6,885,690 |
| Salesforce, Inc.* | 143,761 | | 37,829,270 |
| ServiceNow, Inc.* | 34,899 | | 24,655,794 |
| Snowflake, Inc. Class A* | 18,565 | | 3,694,435 |
| Synopsys, Inc.* | 10,758 | | 5,539,402 |
| Texas Instruments, Inc. | 55,059 | | 9,385,357 |
| Workday, Inc. Class A* | 27,915 | | 7,706,215 |
| | | | | 572,566,701 |
| Materials — 0.8% | | |
| Freeport-McMoRan, Inc. | 35,878 | | 1,527,326 |
| Martin Marietta Materials, Inc. | 20,646 | | 10,300,496 |
| | | | | 11,827,822 |
| Real Estate — 0.7% | | |
| CoStar Group, Inc.Δ* | 118,525 | | 10,357,900 |
Total Common Stocks
(Cost $994,614,515) | | 1,394,964,819 |
| FOREIGN COMMON STOCKS — 5.1% |
| Brazil — 0.1% | | |
| NU Holdings, Ltd. Class A* | 230,826 | | 1,922,781 |
| Canada — 1.1% | | |
| Shopify, Inc. Class A* | 217,553 | | 16,947,379 |
| China — 0.2% | | |
| Alibaba Group Holding, Ltd. ADR | 40,739 | | 3,157,680 |
| Ireland — 2.9% | | |
| Accenture PLC Class A | 56,952 | | 19,985,026 |
| Eaton Corporation PLC | 28,409 | | 6,841,455 |
| Linde PLC | 29,486 | | 12,110,195 |
| Trane Technologies PLC | 17,776 | | 4,335,567 |
| | | | | 43,272,243 |
| | | Shares | | Value |
| Netherlands — 0.1% | | |
| ASML Holding NV (NASDAQ Exchange) | 1,879 | | $ 1,422,253 |
| Singapore — 0.1% | | |
| Sea, Ltd. ADR* | 21,662 | | 877,311 |
| Switzerland — 0.6% | | |
| Novartis AG ADR | 49,189 | | 4,966,613 |
| Roche Holding AG ADRΔ | 111,895 | | 4,053,956 |
| Sandoz Group AG ADRΔ* | 9,838 | | 314,914 |
| | | | | 9,335,483 |
Total Foreign Common Stocks
(Cost $68,365,972) | | 76,935,130 |
| MONEY MARKET FUNDS — 2.7% |
| Northern Institutional Liquid Assets Portfolio (Shares), 5.40%ا | 2,609,718 | | 2,609,718 |
| Northern Institutional U.S. Government Portfolio (Shares), 5.17%Ø | 235,298 | | 235,298 |
GuideStone Money Market Fund, 5.28%
(Institutional Class)Ø∞ | 35,191,794 | | 35,191,794 |
| Northern Institutional U.S. Treasury Portfolio (Premier), 5.22%Ø∞ | 1,756,327 | | 1,756,327 |
Total Money Market Funds
(Cost $39,793,137) | | 39,793,137 |
TOTAL INVESTMENTS — 100.2%
(Cost $1,102,773,624) | | | 1,511,693,086 |
Liabilities in Excess of Other
Assets — (0.2)% | | | (2,402,730) |
| NET ASSETS — 100.0% | | | $1,509,290,356 |
Futures Contracts outstanding at December 31, 2023:
| Future Type | | Expiration Date | | Open Long
(Short) Contracts | | Notional
Market Value
of Contracts | | Value and
Unrealized
Appreciation
(Depreciation) |
| S&P 500® E-Mini | | 03/2024 | | 25 | | $6,025,000 | | $31,563 |
See Notes to Financial Statements.
VALUATION HIERARCHY
The following is a summary of the inputs used, as of December 31, 2023, in valuing the Fund’s investments carried at fair value:
| | Total
Value | | Level 1
Quoted Prices | | Level 2
Other Significant
Observable Inputs | | Level 3
Significant
Unobservable Inputs |
| Assets: | | | | | | | |
| Investments in Securities: | | | | | | | |
| Common Stocks | $1,394,964,819 | | $1,394,964,819 | | $ — | | $ — |
| Foreign Common Stocks | 76,935,130 | | 76,935,130 | | — | | — |
| Money Market Funds | 39,793,137 | | 39,793,137 | | — | | — |
| Total Assets - Investments in Securities | $1,511,693,086 | | $1,511,693,086 | | $ — | | $ — |
| Other Financial Instruments*** | | | | | | | |
| Futures Contracts | $ 31,563 | | $ 31,563 | | $ — | | $ — |
| Total Assets - Other Financial Instruments | $ 31,563 | | $ 31,563 | | $ — | | $ — |
| *** | Other financial instruments are derivative instruments, such as futures contracts, which are valued at the unrealized appreciation (depreciation) on the investment. Further details regarding the value of these investments can be found in the preceding "Futures Contracts outstanding" disclosure. |
See Notes to Financial Statements.
Small Cap Equity Fund (Unaudited)
The Fund invested in a diversified portfolio of domestic, small capitalization stocks with both value- and growth-style orientations. The Investor Class of the Fund outperformed its benchmark, the Russell 2000® Index, for the one-year period ended December 31, 2023 (14.57% (net of fees) versus 16.93%). Small capitalization stocks underperformed large capitalization stocks but still generated strong double-digit returns during a period where all sectors posted positive returns, with the exception of the utilities sector. The Fund maintained an allocation across all sectors, with a modest overweight to the industrials and financials sectors and modest underweights to the health care and energy sectors. Security selection across most sectors was detractive during the year. Security selection within the health care, energy and consumer discretionary sectors were the primary detractors from benchmark-relative returns, while the overweight exposure and security selection within the utilities sector contributed to benchmark-relative returns for the one-year period.
In 2023, exchange-listed equity index futures contracts were utilized to provide market exposure to the cash positions held in the Fund. In addition, currency forwards were used to hedge modest foreign currency exposure back to the U.S. dollar. Overall, derivative exposure had a positive impact on Fund performance for the year.
This Fund may be suitable for investors who seek higher, long-term rates of return, can accept significant short-term fluctuations in account value, want to invest in stocks of small- to medium-sized U.S. companies and would like to diversify their portfolio by adding a potentially higher return, higher risk option of equity securities. Small capitalization stocks are subject to greater risk than large capitalization stocks due to more volatility and less liquidity. It is possible to lose money by investing in the Fund.
At December 31, 2023, the portfolio holdings of the Fund, as a percentage of net assets, is shown in the following table. Portfolio holdings are subject to risk and may change at any time.
| | % |
| Industrials | 19.9 |
| Financials | 18.9 |
| Information Technology | 13.9 |
| Health Care | 12.5 |
| Consumer Discretionary | 10.6 |
| Energy | 6.2 |
| Real Estate | 4.7 |
| Materials | 4.0 |
| Money Market Funds | 4.0 |
| Communication Services | 2.2 |
| Consumer Staples | 2.1 |
| Utilities | 1.4 |
| Master Limited Partnership | 0.1 |
| Rights | —** |
| | 100.5 |
| **Rounds to less than 0.05% | |
| Average Annual Total Returns as of 12/31/23 | |
| | | Institutional Class* | | Investor Class* | | Benchmark** | |
| One Year | | 14.90% | | 14.57% | | 16.93% | |
| Five Year | | 11.65% | | 11.34% | | 9.97% | |
| Ten Year | | 7.12% | | 6.84% | | 7.15% | |
| Since Inception | | 7.71% | | 7.49% | | 8.08% | |
| Inception Date | | 08/27/01 | | 08/27/01 | | | |
| Total Fund Operating Expenses (May 1, 2023 Prospectus)(1)# | | 0.94% | | 1.21% | | | |
| (1) | Current information regarding the Fund’s Operating Expenses can be found in the Financial Highlights. |
#Net expense ratio
See Notes to Financial Statements.
Small Cap Equity Fund (Unaudited)
The performance data quoted represents past performance and does not guarantee future results. The performance data in the table and graph does not reflect the deduction of taxes that a shareholder would pay on Fund distributions or the redemption of Fund shares. Current performance may be lower or higher. Performance data current to the most recent month-end may be obtained at GuideStoneFunds.com. The investment return and principal value of an investment will fluctuate so that shares, when redeemed, may be worth more or less than their original cost.
The graph illustrates the results of a hypothetical $10,000 investment in the Investor Class of the Fund for the 10-year period from December 31, 2013 to December 31, 2023, with all dividends and capital gains reinvested, with the Russell 2000® Index.
*These returns reflect investment advisory and shareholder servicing fee waivers, if applicable, during the reported time periods.
Unlike a mutual fund, an index is not available for direct investment and the performance of an index assumes no taxes, transaction costs, management fees or other expenses.
See Notes to Financial Statements.
| | | Shares | | Value |
| COMMON STOCKS — 91.1% |
| Communication Services — 2.0% | | |
| ATN International, Inc. | 19,179 | | $ 747,406 |
| Bandwidth, Inc. Class A* | 21,574 | | 312,176 |
| Cable One, Inc. | 4,216 | | 2,346,583 |
| Cardlytics, Inc.* | 3,500 | | 32,235 |
| Clear Channel Outdoor Holdings, Inc.* | 81,900 | | 149,058 |
| Entravision Communications Corporation Class A | 240,839 | | 1,004,299 |
| IAC, Inc.Δ* | 36,100 | | 1,890,918 |
| Integral Ad Science Holding Corporation* | 232,800 | | 3,349,992 |
| Outbrain, Inc.* | 3,625 | | 15,877 |
| Playstudios, Inc.Δ* | 10,069 | | 27,287 |
| Playtika Holding CorporationΔ* | 32,969 | | 287,490 |
| PubMatic, Inc. Class AΔ* | 6,000 | | 97,860 |
| Scholastic Corporation | 995 | | 37,511 |
| Stagwell, Inc.* | 62,512 | | 414,455 |
| Townsquare Media, Inc. Class A | 20,547 | | 216,976 |
| TrueCar, Inc.* | 13,502 | | 46,717 |
| Vimeo, Inc.* | 51,287 | | 201,045 |
| WideOpenWest, Inc.* | 24,300 | | 98,415 |
| Yelp, Inc.* | 49,539 | | 2,345,176 |
| Ziff Davis, Inc.Δ* | 17,951 | | 1,206,128 |
| | | | | 14,827,604 |
| Consumer Discretionary — 10.0% | | |
| 1-800-Flowers.com, Inc. Class A* | 22,015 | | 237,322 |
| 1stdibs.com, Inc.* | 2,758 | | 12,907 |
| 2U, Inc.Δ* | 54,073 | | 66,510 |
| Aaron's Co., Inc. (The) | 32,865 | | 357,571 |
| Adtalem Global Education, Inc.* | 30,800 | | 1,815,660 |
| American Axle & Manufacturing Holdings, Inc.Δ* | 19,276 | | 169,822 |
| American Outdoor Brands, Inc.* | 1,431 | | 12,020 |
| American Public Education, Inc.* | 1,507 | | 14,543 |
| Atmus Filtration Technologies, Inc.Δ* | 27,268 | | 640,525 |
| Bloomin' Brands, Inc. | 63,674 | | 1,792,423 |
| Boot Barn Holdings, Inc.Δ* | 26,700 | | 2,049,492 |
| Brinker International, Inc.* | 41,124 | | 1,775,734 |
| Brunswick Corporation | 36,567 | | 3,537,857 |
| Cavco Industries, Inc.* | 2,516 | | 872,096 |
| Chegg, Inc.* | 42,013 | | 477,268 |
| Chuy's Holdings, Inc.* | 28,825 | | 1,101,980 |
| Cooper-Standard Holdings, Inc.* | 4,802 | | 93,831 |
| Dana, Inc. | 140,375 | | 2,050,879 |
| Dave & Buster's Entertainment, Inc.Δ* | 69,295 | | 3,731,536 |
| European Wax Center, Inc. Class AΔ* | 103,500 | | 1,406,565 |
| Figs, Inc. Class AΔ* | 15,400 | | 107,030 |
| Funko, Inc. Class A* | 46,028 | | 355,796 |
| Genesco, Inc.* | 14,860 | | 523,221 |
| G-III Apparel Group, Ltd.* | 27,437 | | 932,309 |
| Goodyear Tire & Rubber Co. (The)* | 57,082 | | 817,414 |
| GoPro, Inc. Class A* | 123,566 | | 428,774 |
| Helen of Troy, Ltd.* | 11,359 | | 1,372,281 |
| | | Shares | | Value |
| Hibbett, Inc. | 16,783 | | $ 1,208,712 |
| Hooker Furnishings CorporationΔ | 2,651 | | 69,138 |
| Jack in the Box, Inc. | 14,744 | | 1,203,553 |
| KB HomeΔ | 54,287 | | 3,390,766 |
| Kontoor Brands, Inc.Δ | 18,817 | | 1,174,557 |
| Lands' End, Inc.Δ* | 15,785 | | 150,905 |
| Landsea Homes Corporation* | 20,550 | | 270,027 |
| Latham Group, Inc.* | 16,985 | | 44,671 |
| La-Z-Boy, Inc. | 28,687 | | 1,059,124 |
| Malibu Boats, Inc. Class A* | 62,625 | | 3,433,102 |
| MarineMax, Inc.* | 46,878 | | 1,823,554 |
| Meritage Homes Corporation | 656 | | 114,275 |
| Movado Group, Inc. | 900 | | 27,135 |
| OneWater Marine, Inc. Class AΔ* | 39,538 | | 1,335,989 |
| Penske Automotive Group, Inc. | 7,138 | | 1,145,720 |
| PetMed Express, Inc.Δ | 21,100 | | 159,516 |
| Planet Fitness, Inc. Class AΔ* | 2,519 | | 183,887 |
| Red Robin Gourmet Burgers, Inc.Δ* | 21,136 | | 263,566 |
| Savers Value Village, Inc.Δ* | 85,400 | | 1,484,252 |
| Skyline Champion Corporation* | 45,462 | | 3,376,008 |
| Sleep Number Corporation* | 19,600 | | 290,668 |
| Solo Brands, Inc. Class AΔ* | 111,255 | | 685,331 |
| Sonic Automotive, Inc. Class A | 34,000 | | 1,911,140 |
| Steven Madden, Ltd.Δ | 86,148 | | 3,618,216 |
| Stoneridge, Inc.* | 8,225 | | 160,963 |
| Tapestry, Inc. | 97,222 | | 3,578,742 |
| Taylor Morrison Home Corporation Class A* | 72,084 | | 3,845,681 |
| Texas Roadhouse, Inc. | 2,051 | | 250,694 |
| ThredUp, Inc. Class AΔ* | 7,100 | | 15,975 |
| Tilly's, Inc. Class A* | 11,461 | | 86,416 |
| Topgolf Callaway Brands CorporationΔ* | 114,100 | | 1,636,194 |
| Unifi, Inc.* | 6,881 | | 45,827 |
| Universal Electronics, Inc.* | 6,078 | | 57,072 |
| Universal Technical Institute, Inc.* | 9,500 | | 118,940 |
| Vera Bradley, Inc.Δ* | 21,857 | | 168,299 |
| Visteon Corporation* | 16,000 | | 1,998,400 |
| Vizio Holding Corporation Class A* | 84,459 | | 650,334 |
| VOXX International CorporationΔ* | 2,698 | | 28,815 |
| Warby Parker, Inc. Class A* | 59,635 | | 840,853 |
| Wingstop, Inc. | 9,600 | | 2,463,168 |
| Worthington Enterprises, Inc.Δ | 25,332 | | 1,457,857 |
| YETI Holdings, Inc.* | 22,122 | | 1,145,477 |
| Zumiez, Inc.* | 17,302 | | 351,923 |
| | | | | 74,078,808 |
| Consumer Staples — 2.1% | | |
| Andersons, Inc. (The)Δ | 16,515 | | 950,273 |
| BJ's Wholesale Club Holdings, Inc.* | 55,500 | | 3,699,630 |
| Edgewell Personal Care Co. | 71,334 | | 2,612,964 |
| Hain Celestial Group, Inc. (The)* | 3,295 | | 36,080 |
| J&J Snack Foods Corporation | 17,739 | | 2,964,897 |
| Nature's Sunshine Products, Inc.* | 5,942 | | 102,737 |
| Simply Good Foods Co. (The)* | 48,600 | | 1,924,560 |
| SpartanNash Co. | 19,211 | | 440,893 |
See Notes to Financial Statements.
| | | Shares | | Value |
| Spectrum Brands Holdings, Inc. | 33,531 | | $ 2,674,768 |
| | | | | 15,406,802 |
| Energy — 6.0% | | |
| Atlas Energy Solutions, Inc.Δ | 33,774 | | 581,588 |
| Berry Corporation | 58,488 | | 411,171 |
| Cactus, Inc. Class A | 119,569 | | 5,428,433 |
| California Resources CorporationΔ | 27,420 | | 1,499,326 |
| Centrus Energy Corporation Class A* | 3,788 | | 206,105 |
| ChampionX Corporation | 92,491 | | 2,701,662 |
| Chord Energy Corporation | 13,142 | | 2,184,595 |
| CNX Resources CorporationΔ* | 42,220 | | 844,400 |
| CONSOL Energy, Inc.Δ | 3,721 | | 374,072 |
| CVR Energy, Inc. | 19,899 | | 602,940 |
| Delek US Holdings, Inc. | 25,180 | | 649,644 |
| DHT Holdings, Inc. | 31,424 | | 308,269 |
| Gulfport Energy Corporation* | 9,502 | | 1,265,666 |
| Helix Energy Solutions Group, Inc.* | 9,926 | | 102,039 |
| Magnolia Oil & Gas Corporation Class AΔ | 306,258 | | 6,520,233 |
| Matador Resources Co.Δ | 56,700 | | 3,223,962 |
| Newpark Resources, Inc.* | 14,041 | | 93,232 |
| Northern Oil and Gas, Inc.Δ | 58,775 | | 2,178,789 |
| Oil States International, Inc.* | 47,098 | | 319,795 |
| Par Pacific Holdings, Inc.* | 24,911 | | 906,013 |
| Patterson-UTI Energy, Inc. | 346,164 | | 3,738,571 |
| Permian Resources Corporation | 387,107 | | 5,264,655 |
| REX American Resources Corporation* | 3,367 | | 159,259 |
| SM Energy Co.Δ | 67,512 | | 2,614,065 |
| Southwestern Energy Co.* | 242,527 | | 1,588,552 |
| World Fuel Services Corporation | 42,007 | | 956,920 |
| | | | | 44,723,956 |
| Financials — 18.6% | | |
| Amalgamated Financial Corporation | 6,528 | | 175,864 |
| A-Mark Precious Metals, Inc.Δ | 40,931 | | 1,238,163 |
| Amerant Bancorp, Inc. | 2,789 | | 68,526 |
| Ameris Bancorp | 42,927 | | 2,277,277 |
| Atlantic Union Bankshares CorporationΔ | 966 | | 35,298 |
| AvidXchange Holdings, Inc.* | 188,800 | | 2,339,232 |
| Axis Capital Holdings, Ltd. | 56,137 | | 3,108,306 |
| Axos Financial, Inc.* | 6,306 | | 344,308 |
| BankUnited, Inc. | 77,838 | | 2,524,286 |
| BCB Bancorp, Inc.Δ | 2,368 | | 30,429 |
| Berkshire Hills Bancorp, Inc. | 19,037 | | 472,689 |
| Brighthouse Financial, Inc.* | 5,754 | | 304,502 |
| BRP Group, Inc. Class AΔ* | 91,701 | | 2,202,658 |
| Byline Bancorp, Inc. | 5,492 | | 129,392 |
| Capital Bancorp, Inc. | 546 | | 13,213 |
| Capital City Bank Group, Inc. | 2,633 | | 77,489 |
| Carter Bankshares, Inc.* | 972 | | 14,551 |
| Central Pacific Financial Corporation | 10,516 | | 206,955 |
| City Holding Co. | 14,653 | | 1,615,640 |
| CNO Financial Group, Inc. | 109,366 | | 3,051,311 |
| Columbia Banking System, Inc.Δ | 92,384 | | 2,464,805 |
| Community Trust Bancorp, Inc. | 4,027 | | 176,624 |
| Compass Diversified Holdings | 128,323 | | 2,880,851 |
| | | Shares | | Value |
| ConnectOne Bancorp, Inc. | 8,603 | | $ 197,095 |
| Corebridge Financial, Inc. | 9,276 | | 200,918 |
| Cullen/Frost Bankers, Inc. | 2,499 | | 271,117 |
| Customers Bancorp, Inc.* | 18,164 | | 1,046,610 |
| CVB Financial Corporation | 100,602 | | 2,031,154 |
| Donegal Group, Inc. Class A | 3,593 | | 50,266 |
| Donnelley Financial Solutions, Inc.* | 11,770 | | 734,095 |
| East West Bancorp, Inc. | 1,524 | | 109,652 |
| Eastern Bankshares, Inc.Δ | 35,235 | | 500,337 |
| eHealth, Inc.* | 3,233 | | 28,192 |
| Employers Holdings, Inc. | 14,096 | | 555,382 |
| Enact Holdings, Inc. | 8,180 | | 236,320 |
| Enterprise Financial Services Corporation | 22,583 | | 1,008,331 |
| Essent Group, Ltd. | 46,955 | | 2,476,407 |
| Euronet Worldwide, Inc.* | 25,102 | | 2,547,602 |
| EVERTEC, Inc. | 94,063 | | 3,850,939 |
| EZCORP, Inc. Class A* | 38,747 | | 338,649 |
| FB Financial Corporation | 13,347 | | 531,878 |
| Financial Institutions, Inc. | 5,744 | | 122,347 |
| First BanCorpΔ | 33,008 | | 1,221,626 |
| First BanCorp (New York Exchange) | 220,801 | | 3,632,176 |
| First Financial Bancorp | 60,542 | | 1,437,873 |
| First Financial CorporationΔ | 6,075 | | 261,407 |
| First Foundation, Inc. | 38,296 | | 370,705 |
| First Internet BancorpΔ | 5,447 | | 131,763 |
| First Interstate BancSystem, Inc. Class AΔ | 105,653 | | 3,248,830 |
| First Merchants Corporation | 21,647 | | 802,671 |
| First Savings Financial Group, Inc.Δ | 999 | | 16,783 |
| Five Star Bancorp | 1,141 | | 29,871 |
| Flywire Corporation* | 37,200 | | 861,180 |
| FNB CorporationΔ | 264,142 | | 3,637,235 |
| FS Bancorp, Inc. | 1,863 | | 68,857 |
| Granite Point Mortgage Trust, Inc. REIT | 11,500 | | 68,310 |
| Great Ajax Corporation REIT | 3,400 | | 18,020 |
| Great Southern Bancorp, Inc.Δ | 2,345 | | 139,176 |
| Green Dot Corporation Class A* | 40,172 | | 397,703 |
| Guaranty Bancshares, Inc.Δ | 800 | | 26,896 |
| Hamilton Lane, Inc. Class A | 60,821 | | 6,899,534 |
| Hanmi Financial Corporation | 18,753 | | 363,808 |
| Hanover Insurance Group, Inc. (The)Δ | 3,101 | | 376,523 |
| HarborOne Bancorp, Inc. | 20,356 | | 243,865 |
| HBT Financial, Inc. | 4,604 | | 97,190 |
| Hilltop Holdings, Inc. | 27,820 | | 979,542 |
| Home BancShares, Inc. | 118,824 | | 3,009,812 |
| HomeStreet, Inc.Δ | 21,198 | | 218,339 |
| HomeTrust Bancshares, Inc. | 4,818 | | 129,701 |
| Horace Mann Educators Corporation | 15,633 | | 511,199 |
| Horizon Bancorp, Inc. | 1,382 | | 19,776 |
| Independent Bank Corporation | 23,072 | | 1,518,368 |
| Independent Bank Corporation (NASDAQ Exchange) | 6,368 | | 165,695 |
| Independent Bank Group, Inc. | 20,239 | | 1,029,760 |
| Investar Holding Corporation | 1,661 | | 24,766 |
| Jackson Financial, Inc. Class A | 28,997 | | 1,484,646 |
| James River Group Holdings, Ltd. | 15,152 | | 140,005 |
See Notes to Financial Statements.
SCHEDULE OF INVESTMENTS (Continued)
| | | Shares | | Value |
| Kearny Financial Corporation | 13,760 | | $ 123,427 |
| LendingClub Corporation* | 86,313 | | 754,376 |
| LendingTree, Inc.* | 810 | | 24,559 |
| Macatawa Bank Corporation | 1,714 | | 19,334 |
| Mercantile Bank Corporation | 2,654 | | 107,169 |
| Mercury General Corporation | 10,968 | | 409,216 |
| Metropolitan Bank Holding CorporationΔ* | 8,361 | | 463,032 |
| Midland States Bancorp, Inc. | 7,569 | | 208,602 |
| MVB Financial Corporation | 65,300 | | 1,473,168 |
| Navient CorporationΔ | 50,549 | | 941,222 |
| NMI Holdings, Inc. Class A* | 58,622 | | 1,739,901 |
| Northfield Bancorp, Inc. | 1,000 | | 12,580 |
| Northrim BanCorp, Inc. | 2,154 | | 123,230 |
| OceanFirst Financial Corporation | 4,282 | | 74,336 |
| Ocwen Financial Corporation* | 2,128 | | 65,457 |
| OFG Bancorp | 24,381 | | 913,800 |
| Old National BancorpΔ | 380,251 | | 6,422,439 |
| Old Second Bancorp, Inc. | 1,933 | | 29,846 |
| Oportun Financial CorporationΔ* | 10,550 | | 41,251 |
| Origin Bancorp, Inc. | 10,402 | | 369,999 |
| Pacific Premier Bancorp, Inc. | 123,611 | | 3,598,316 |
| Pathward Financial, Inc. | 6,148 | | 325,414 |
| Peapack-Gladstone Financial Corporation | 7,231 | | 215,628 |
| PJT Partners, Inc. Class A | 40,012 | | 4,076,022 |
| Popular, Inc.Δ | 10,631 | | 872,486 |
| PRA Group, Inc.Δ* | 12,016 | | 314,819 |
| Preferred Bank | 3,570 | | 260,789 |
| Primis Financial Corporation | 6,684 | | 84,619 |
| Priority Technology Holdings, Inc.Δ* | 105,290 | | 374,832 |
| ProAssurance Corporation | 157,949 | | 2,178,117 |
| PROG Holdings, Inc.* | 33,794 | | 1,044,573 |
| Provident Bancorp, Inc.Δ* | 98 | | 987 |
| Provident Financial Services, Inc.Δ | 38,204 | | 688,818 |
| QCR Holdings, Inc. | 5,873 | | 342,925 |
| RBB Bancorp | 4,966 | | 94,553 |
| Regional Management Corporation | 3,540 | | 88,783 |
| Reinsurance Group of America, Inc. | 4,901 | | 792,884 |
| Repay Holdings CorporationΔ* | 43,548 | | 371,900 |
| Robinhood Markets, Inc. Class A* | 6,683 | | 85,141 |
| Safety Insurance Group, Inc. | 20,580 | | 1,563,874 |
| Selective Insurance Group, Inc. | 26,192 | | 2,605,580 |
| Sierra Bancorp | 3,644 | | 82,172 |
| Skyward Specialty Insurance Group, Inc.Δ* | 17,813 | | 603,504 |
| SLM Corporation | 20,946 | | 400,488 |
| SmartFinancial, Inc. | 31 | | 759 |
| South Plains Financial, Inc. | 2,500 | | 72,400 |
| Southern First Bancshares, Inc.* | 2,442 | | 90,598 |
| SouthState Corporation | 61,439 | | 5,188,524 |
| StoneX Group, Inc.* | 8,175 | | 603,560 |
| Texas Capital Bancshares, Inc.Δ* | 25,533 | | 1,650,198 |
| Third Coast Bancshares, Inc.* | 1,848 | | 36,720 |
| TPG, Inc. | 4,409 | | 190,337 |
| Trustmark Corporation | 1,248 | | 34,794 |
| UMB Financial Corporation | 37,110 | | 3,100,541 |
| United Community Banks, Inc. | 55,403 | | 1,621,092 |
| | | Shares | | Value |
| United Fire Group, Inc. | 6,607 | | $ 132,933 |
| Universal Insurance Holdings, Inc. | 20,082 | | 320,910 |
| Valley National BancorpΔ | 408,785 | | 4,439,405 |
| Veritex Holdings, Inc. | 8,743 | | 203,450 |
| Victory Capital Holdings, Inc. Class A | 73,347 | | 2,526,071 |
| Webster Financial Corporation | 46,719 | | 2,371,456 |
| WesBanco, Inc. | 48,046 | | 1,507,203 |
| WSFS Financial Corporation | 43,837 | | 2,013,433 |
| | | | | 137,661,823 |
| Health Care — 11.5% | | |
| Aadi Bioscience, Inc.* | 3,200 | | 6,464 |
| Addus HomeCare Corporation* | 33,694 | | 3,128,488 |
| Agios Pharmaceuticals, Inc.* | 59,388 | | 1,322,571 |
| American Well Corporation Class A* | 142,586 | | 212,453 |
| Amicus Therapeutics, Inc.* | 174,834 | | 2,480,894 |
| AMN Healthcare Services, Inc.Δ* | 6,972 | | 522,063 |
| AngioDynamics, Inc.* | 41,906 | | 328,543 |
| Apellis Pharmaceuticals, Inc.Δ* | 10,160 | | 608,178 |
| Arcturus Therapeutics Holdings, Inc.* | 1,950 | | 61,484 |
| Arcus Biosciences, Inc.Δ* | 7,016 | | 134,006 |
| Artivion, Inc.* | 82,730 | | 1,479,212 |
| Atea Pharmaceuticals, Inc.* | 12,163 | | 37,097 |
| AtriCure, Inc.* | 126,997 | | 4,532,523 |
| Azenta, Inc.Δ* | 25,339 | | 1,650,582 |
| Blueprint Medicines Corporation* | 38,216 | | 3,525,044 |
| Butterfly Network, Inc.Δ* | 17,300 | | 18,684 |
| Cara Therapeutics, Inc.* | 35,277 | | 26,211 |
| CareDx, Inc.Δ* | 42,459 | | 509,508 |
| Castle Biosciences, Inc.* | 19,971 | | 430,974 |
| Certara, Inc.Δ* | 53,700 | | 944,583 |
| Codexis, Inc.* | 33,902 | | 103,401 |
| Coherus Biosciences, Inc.Δ* | 2,900 | | 9,657 |
| Computer Programs and Systems, Inc.* | 15,347 | | 171,886 |
| CONMED CorporationΔ | 19,393 | | 2,123,727 |
| Cue Health, Inc.* | 4,531 | | 736 |
| Day One Biopharmaceuticals, Inc.Δ* | 162,500 | | 2,372,500 |
| Design Therapeutics, Inc.* | 13,300 | | 35,245 |
| Editas Medicine, Inc.* | 15,058 | | 152,538 |
| Embecta Corporation | 61,061 | | 1,155,885 |
| Emergent BioSolutions, Inc.Δ* | 56,671 | | 136,010 |
| Enanta Pharmaceuticals, Inc.* | 22,417 | | 210,944 |
| Enovis Corporation* | 25,864 | | 1,448,901 |
| Envista Holdings Corporation* | 38,682 | | 930,689 |
| Exelixis, Inc.* | 12,040 | | 288,840 |
| Fate Therapeutics, Inc.* | 93,205 | | 348,587 |
| FibroGen, Inc.Δ* | 112,336 | | 99,563 |
| Gossamer Bio, Inc.Δ* | 11,700 | | 10,676 |
| Halozyme Therapeutics, Inc.Δ* | 59,603 | | 2,202,927 |
| Health Catalyst, Inc.* | 51,178 | | 473,908 |
| HealthEquity, Inc.* | 26,800 | | 1,776,840 |
| HealthStream, Inc. | 3,767 | | 101,822 |
| Inogen, Inc.* | 23,212 | | 127,434 |
| Insmed, Inc.* | 86,763 | | 2,688,785 |
| Intra-Cellular Therapies, Inc.* | 74,414 | | 5,329,531 |
| Ironwood Pharmaceuticals, Inc.* | 92,742 | | 1,060,969 |
| iTeos Therapeutics, Inc.* | 19,599 | | 214,609 |
See Notes to Financial Statements.
| | | Shares | | Value |
| Kodiak Sciences, Inc.Δ* | 4,211 | | $ 12,801 |
| Krystal Biotech, Inc.* | 21,700 | | 2,692,102 |
| Lantheus Holdings, Inc.* | 33,378 | | 2,069,436 |
| Ligand Pharmaceuticals, Inc.Δ* | 24,425 | | 1,744,434 |
| MaxCyte, Inc.Δ* | 35,249 | | 165,670 |
| Merit Medical Systems, Inc.* | 34,726 | | 2,637,787 |
| Mersana Therapeutics, Inc.* | 8,300 | | 19,256 |
| MoonLake ImmunotherapeuticsΔ* | 42,200 | | 2,548,458 |
| Nektar TherapeuticsΔ* | 161,219 | | 91,089 |
| NeoGenomics, Inc.Δ* | 81,362 | | 1,316,437 |
| NGM Biopharmaceuticals, Inc.* | 27,381 | | 23,520 |
| Nurix Therapeutics, Inc.Δ* | 21,677 | | 223,707 |
| Omnicell, Inc.* | 23,208 | | 873,317 |
| OraSure Technologies, Inc.* | 16,693 | | 136,883 |
| Organogenesis Holdings, Inc.* | 4,100 | | 16,769 |
| Orthofix Medical, Inc.* | 31,953 | | 430,726 |
| Pacific Biosciences of California, Inc.Δ* | 135,230 | | 1,326,606 |
| Pacira BioSciences, Inc.* | 41,738 | | 1,408,240 |
| Phathom Pharmaceuticals, Inc.* | 23,661 | | 216,025 |
| Phreesia, Inc.Δ* | 78,490 | | 1,817,044 |
| PMV Pharmaceuticals, Inc.* | 17,857 | | 55,357 |
| Poseida Therapeutics, Inc.* | 10,700 | | 35,952 |
| Prestige Consumer Healthcare, Inc.* | 57,265 | | 3,505,763 |
| PTC Therapeutics, Inc.* | 17,627 | | 485,800 |
| Quanterix Corporation* | 19,078 | | 521,593 |
| RAPT Therapeutics, Inc.Δ* | 44,915 | | 1,116,138 |
| REGENXBIO, Inc.* | 33,208 | | 596,084 |
| Relay Therapeutics, Inc.* | 80,748 | | 889,036 |
| Sangamo Therapeutics, Inc.Δ* | 37,816 | | 20,545 |
| Seer, Inc.Δ* | 20,585 | | 39,935 |
| Sharecare, Inc.* | 34,694 | | 37,470 |
| Shockwave Medical, Inc.* | 15,190 | | 2,894,606 |
| Stoke Therapeutics, Inc.Δ* | 4,505 | | 23,696 |
| Supernus Pharmaceuticals, Inc.* | 68,760 | | 1,989,914 |
| Sutro Biopharma, Inc.Δ* | 48,751 | | 209,142 |
| Tandem Diabetes Care, Inc.Δ* | 7,377 | | 218,212 |
| Theravance Biopharma, Inc.Δ* | 7,550 | | 84,862 |
| TransMedics Group, Inc.* | 27,338 | | 2,157,788 |
| Travere Therapeutics, Inc.Δ* | 159,856 | | 1,437,105 |
| Treace Medical Concepts, Inc.* | 160,500 | | 2,046,375 |
| Vanda Pharmaceuticals, Inc.Δ* | 72,061 | | 304,097 |
| Veradigm, Inc.* | 69,502 | | 729,076 |
| Vir Biotechnology, Inc.* | 11,198 | | 112,652 |
| Y-mAbs Therapeutics, Inc.* | 394 | | 2,687 |
| Zimvie, Inc.* | 21,046 | | 373,567 |
| Zymeworks, Inc.Δ* | 33,269 | | 345,665 |
| | | | | 85,539,596 |
| Industrials — 18.3% | | |
| ABM Industries, Inc. | 47,115 | | 2,112,165 |
| ACV Auctions, Inc. Class AΔ* | 132,100 | | 2,001,315 |
| AGCO Corporation | 5,027 | | 610,328 |
| Allegiant Travel Co.Δ | 13,794 | | 1,139,522 |
| Ameresco, Inc. Class A* | 43,441 | | 1,375,776 |
| Applied Industrial Technologies, Inc. | 29,943 | | 5,170,857 |
| ArcBest Corporation | 15,481 | | 1,860,971 |
| Argan, Inc. | 7,808 | | 365,336 |
| | | Shares | | Value |
| ASGN, Inc.* | 32,302 | | $3,106,483 |
| Astec Industries, Inc. | 9,331 | | 347,113 |
| Atkore, Inc.* | 8,315 | | 1,330,400 |
| AZEK Co., Inc. (The)* | 61,900 | | 2,367,675 |
| Barrett Business Services, Inc. | 4,228 | | 489,602 |
| Beacon Roofing Supply, Inc.* | 28,093 | | 2,444,653 |
| Boise Cascade Co. | 43,528 | | 5,630,782 |
| BrightView Holdings, Inc.* | 100,151 | | 843,271 |
| Brink's Co. (The) | 34,792 | | 3,059,956 |
| Casella Waste Systems, Inc. Class A* | 98,296 | | 8,400,376 |
| Chart Industries, Inc.Δ* | 13,857 | | 1,889,125 |
| Columbus McKinnon Corporation | 45,322 | | 1,768,464 |
| Comfort Systems U.S.A., Inc. | 6,900 | | 1,419,123 |
| Conduent, Inc.* | 25,210 | | 92,017 |
| Construction Partners, Inc. Class AΔ* | 27,182 | | 1,182,961 |
| Covenant Logistics Group, Inc. | 6,917 | | 318,459 |
| Deluxe Corporation | 67,537 | | 1,448,669 |
| Driven Brands Holdings, Inc.* | 125,100 | | 1,783,926 |
| DXP Enterprises, Inc.* | 16,518 | | 556,657 |
| Dycom Industries, Inc.* | 2,596 | | 298,774 |
| EMCOR Group, Inc. | 16,200 | | 3,489,966 |
| Enviri Corporation* | 42,648 | | 383,832 |
| Esab Corporation | 44,300 | | 3,837,266 |
| ESCO Technologies, Inc.Δ | 14,032 | | 1,642,165 |
| ExlService Holdings, Inc.* | 81,522 | | 2,514,954 |
| Exponent, Inc. | 41,400 | | 3,644,856 |
| Federal Signal Corporation | 58,158 | | 4,463,045 |
| Fluor Corporation* | 14,397 | | 563,931 |
| Global Industrial Co. | 5,718 | | 222,087 |
| GMS, Inc.* | 34,658 | | 2,856,859 |
| Great Lakes Dredge & Dock Corporation* | 4,270 | | 32,794 |
| Greenbrier Cos., Inc. (The) | 4,202 | | 185,644 |
| H&E Equipment Services, Inc. | 25,058 | | 1,311,035 |
| Heidrick & Struggles International, Inc. | 6,211 | | 183,411 |
| Hexcel Corporation | 55,400 | | 4,085,750 |
| Hillman Solutions Corporation* | 169,457 | | 1,560,699 |
| HireRight Holdings Corporation* | 13,418 | | 180,472 |
| Hub Group, Inc. Class A* | 23,045 | | 2,118,757 |
| IBEX Holdings, Ltd.* | 29,172 | | 554,560 |
| ICF International, Inc. | 12,100 | | 1,622,489 |
| Insteel Industries, Inc. | 6,243 | | 239,044 |
| Interface, Inc. | 6,900 | | 87,078 |
| ITT, Inc. | 16,500 | | 1,968,780 |
| JELD-WEN Holding, Inc.* | 26,709 | | 504,266 |
| Kadant, Inc.Δ | 10,117 | | 2,835,896 |
| Kaman Corporation | 7,559 | | 181,038 |
| Karat Packaging, Inc. | 7,120 | | 176,932 |
| Kelly Services, Inc. Class A | 6,595 | | 142,584 |
| Korn Ferry | 42,449 | | 2,519,348 |
| Limbach Holdings, Inc.* | 1,458 | | 66,295 |
| Manitowoc Co., Inc. (The)* | 33,237 | | 554,726 |
| Marten Transport, Ltd. | 112,500 | | 2,360,250 |
| Matrix Service Co.* | 8,100 | | 79,218 |
| Mistras Group, Inc.Δ* | 4,709 | | 34,470 |
| MYR Group, Inc.* | 18,507 | | 2,676,667 |
See Notes to Financial Statements.
SCHEDULE OF INVESTMENTS (Continued)
| | | Shares | | Value |
| NOW, Inc.* | 47,765 | | $ 540,700 |
| NV5 Global, Inc.* | 8,125 | | 902,850 |
| OPENLANE, Inc.* | 19,995 | | 296,126 |
| Paycor HCM, Inc.Δ* | 73,100 | | 1,578,229 |
| Powell Industries, Inc. | 7,426 | | 656,458 |
| Primoris Services Corporation | 288 | | 9,564 |
| Proto Labs, Inc.* | 13,740 | | 535,310 |
| Radiant Logistics, Inc.* | 3,215 | | 21,348 |
| RBC Bearings, Inc.Δ* | 7,100 | | 2,022,719 |
| Regal Beloit Corporation | 23,321 | | 3,451,974 |
| Resideo Technologies, Inc.* | 38,441 | | 723,460 |
| Resources Connection, Inc. | 15,639 | | 221,605 |
| REV Group, Inc. | 8,922 | | 162,113 |
| Saia, Inc.Δ* | 1,750 | | 766,885 |
| Science Applications International Corporation | 6,939 | | 862,657 |
| Steelcase, Inc. Class A | 59,517 | | 804,670 |
| Sun Country Airlines Holdings, Inc.* | 102,519 | | 1,612,624 |
| Tetra Tech, Inc. | 19,500 | | 3,255,135 |
| Timken Co. (The) | 43,803 | | 3,510,810 |
| Titan International, Inc.* | 34,000 | | 505,920 |
| Titan Machinery, Inc.* | 21,578 | | 623,173 |
| Trinity Industries, Inc. | 21,307 | | 566,553 |
| TrueBlue, Inc.* | 32,482 | | 498,274 |
| TuSimple Holdings, Inc. Class A* | 17,124 | | 15,031 |
| Tutor Perini Corporation* | 33,103 | | 301,237 |
| Verra Mobility Corporation* | 36,981 | | 851,672 |
| Werner Enterprises, Inc.Δ | 57,834 | | 2,450,427 |
| WillScot Mobile Mini Holdings Corporation* | 57,204 | | 2,545,578 |
| Zurn Water Solutions CorporationΔ | 63,521 | | 1,868,153 |
| | | | | 135,457,175 |
| Information Technology — 12.8% | | |
| Adeia, Inc.Δ | 49,358 | | 611,546 |
| ADTRAN Holdings, Inc. | 47,575 | | 349,200 |
| Allegro MicroSystems, Inc.* | 32,800 | | 992,856 |
| Alpha & Omega Semiconductor, Ltd.* | 4,280 | | 111,537 |
| American Software, Inc. Class A | 9,150 | | 103,396 |
| Avnet, Inc. | 58,864 | | 2,966,746 |
| Belden, Inc. | 11,197 | | 864,968 |
| Benchmark Electronics, Inc. | 3,834 | | 105,972 |
| Box, Inc. Class AΔ* | 65,305 | | 1,672,461 |
| Brightcove, Inc.* | 3,770 | | 9,764 |
| Clearwater Analytics Holdings, Inc. Class A* | 182,108 | | 3,647,623 |
| Coherent Corporation* | 87,755 | | 3,819,975 |
| Cohu, Inc.* | 96,633 | | 3,419,842 |
| Comtech Telecommunications Corporation | 15,366 | | 129,535 |
| CS Disco, Inc.* | 12,053 | | 91,482 |
| Daktronics, Inc.* | 32,805 | | 278,186 |
| Dropbox, Inc. Class A* | 35,270 | | 1,039,760 |
| DXC Technology Co.Δ* | 11,729 | | 268,242 |
| DZS, Inc.Δ* | 5,534 | | 10,902 |
| E2open Parent Holdings, Inc.* | 28,400 | | 124,676 |
| Edgio, Inc.Δ* | 9,158 | | 3,137 |
| FARO Technologies, Inc.* | 18,552 | | 417,977 |
| FormFactor, Inc.Δ* | 37,300 | | 1,555,783 |
| | | Shares | | Value |
| Guidewire Software, Inc.Δ* | 3,060 | | $ 333,662 |
| HashiCorp, Inc. Class A* | 69,300 | | 1,638,252 |
| Ichor Holdings, Ltd.* | 35,179 | | 1,183,070 |
| Instructure Holdings, Inc.Δ* | 49,462 | | 1,335,969 |
| Kulicke & Soffa Industries, Inc. | 108,119 | | 5,916,272 |
| KVH Industries, Inc.* | 3,807 | | 20,025 |
| Kyndryl Holdings, Inc.* | 13,728 | | 285,268 |
| LiveRamp Holdings, Inc.* | 39 | | 1,477 |
| MACOM Technology Solutions Holdings, Inc.* | 50,174 | | 4,663,673 |
| MaxLinear, Inc.* | 60,967 | | 1,449,186 |
| MeridianLink, Inc.* | 14,560 | | 360,651 |
| MKS Instruments, Inc. | 4,892 | | 503,240 |
| NETGEAR, Inc.* | 26,470 | | 385,933 |
| Nutanix, Inc. Class A* | 25,183 | | 1,200,977 |
| ON24, Inc.Δ | 7,148 | | 56,326 |
| Onto Innovation, Inc.* | 16,600 | | 2,538,140 |
| PowerSchool Holdings, Inc. Class AΔ* | 174,900 | | 4,120,644 |
| Progress Software Corporation | 21,813 | | 1,184,446 |
| Q2 Holdings, Inc.* | 111,245 | | 4,829,145 |
| Quantum Corporation* | 13,340 | | 4,656 |
| Rackspace Technology, Inc.Δ* | 52,935 | | 105,870 |
| Rapid7, Inc.* | 37,088 | | 2,117,725 |
| Ribbon Communications, Inc.Δ* | 53,233 | | 154,376 |
| ScanSource, Inc.Δ* | 4,729 | | 187,316 |
| SecureWorks Corporation Class A* | 2,403 | | 17,734 |
| Semtech CorporationΔ* | 57,774 | | 1,265,828 |
| SentinelOne, Inc. Class A* | 4,422 | | 121,340 |
| Silicon Laboratories, Inc.* | 19,959 | | 2,639,977 |
| SMART Global Holdings, Inc.Δ* | 23,132 | | 437,889 |
| Smartsheet, Inc. Class A* | 77,600 | | 3,710,832 |
| SolarWinds Corporation* | 30,139 | | 376,436 |
| Sprout Social, Inc. Class AΔ* | 59,451 | | 3,652,669 |
| SPS Commerce, Inc.Δ* | 13,052 | | 2,530,000 |
| Squarespace, Inc. Class A* | 31,453 | | 1,038,263 |
| Synaptics, Inc.Δ* | 34,000 | | 3,878,720 |
| Teradata Corporation* | 68,173 | | 2,966,207 |
| Turtle Beach Corporation* | 12,425 | | 136,054 |
| Unisys Corporation* | 34,796 | | 195,553 |
| Upland Software, Inc.Δ* | 26,660 | | 112,772 |
| Varonis Systems, Inc.* | 66,440 | | 3,008,403 |
| Verint Systems, Inc.* | 49,357 | | 1,334,120 |
| Vertex, Inc. Class A* | 145,000 | | 3,906,300 |
| Vontier Corporation | 17,488 | | 604,210 |
| Workiva, Inc.* | 52,673 | | 5,347,890 |
| Xerox Holdings CorporationΔ | 10,825 | | 198,422 |
| Xperi, Inc.* | 28,379 | | 312,737 |
| | | | | 94,964,221 |
| Materials — 3.9% | | |
| Alpha Metallurgical Resources, Inc. | 500 | | 169,460 |
| American Vanguard Corporation | 12,800 | | 140,416 |
| Avient Corporation | 48,700 | | 2,024,459 |
| Balchem Corporation | 1,699 | | 252,726 |
| Clearwater Paper Corporation* | 12,048 | | 435,174 |
| Ecovyst, Inc.* | 47,740 | | 466,420 |
| Graphic Packaging Holding Co.Δ | 162,717 | | 4,010,974 |
See Notes to Financial Statements.
| | | Shares | | Value |
| Huntsman Corporation | 51,752 | | $ 1,300,528 |
| Ingevity Corporation* | 16,090 | | 759,770 |
| Kaiser Aluminum Corporation | 20,976 | | 1,493,281 |
| Knife River CorporationΔ* | 2,870 | | 189,937 |
| Louisiana-Pacific Corporation | 4,013 | | 284,241 |
| Minerals Technologies, Inc. | 74,118 | | 5,285,355 |
| Olympic Steel, Inc. | 9,948 | | 663,532 |
| Origin Materials, Inc.Δ* | 78,975 | | 66,039 |
| Pactiv Evergreen, Inc. | 110,964 | | 1,521,316 |
| Quaker Chemical CorporationΔ | 8,975 | | 1,915,444 |
| Ramaco Resources, Inc. Class AΔ | 8,050 | | 138,299 |
| Ranpak Holdings Corporation* | 28,100 | | 163,542 |
| Rayonier Advanced Materials, Inc.Δ* | 35,463 | | 143,625 |
| Ryerson Holding Corporation | 24,966 | | 865,821 |
| Schnitzer Steel Industries, Inc. Class A | 17,305 | | 521,919 |
| Summit Materials, Inc. Class A* | 90,049 | | 3,463,284 |
| SunCoke Energy, Inc. | 65,270 | | 701,000 |
| Warrior Met Coal, Inc. | 18,522 | | 1,129,286 |
| Worthington Steel, Inc.* | 36,681 | | 1,030,736 |
| | | | | 29,136,584 |
| Real Estate — 4.5% | | |
| Armada Hoffler Properties, Inc. REITΔ | 103,151 | | 1,275,978 |
| CareTrust REIT, Inc. | 77,192 | | 1,727,557 |
| Chatham Lodging Trust REIT | 13,243 | | 141,965 |
| Compass, Inc. Class AΔ* | 92,761 | | 348,781 |
| DiamondRock Hospitality Co. REITΔ | 180,753 | | 1,697,271 |
| Douglas Elliman, Inc. | 66,007 | | 194,721 |
| Easterly Government Properties, Inc. REITΔ | 19,178 | | 257,752 |
| Equity Commonwealth REIT | 62,607 | | 1,202,054 |
| Forestar Group, Inc.* | 14,246 | | 471,115 |
| Four Corners Property Trust, Inc. REITΔ | 73,389 | | 1,856,742 |
| Howard Hughes Holdings, Inc.Δ* | 2,196 | | 187,868 |
| Independence Realty Trust, Inc. REIT | 136,396 | | 2,086,859 |
| Kite Realty Group Trust REIT | 130,035 | | 2,972,600 |
| LXP Industrial Trust REIT | 170,353 | | 1,689,902 |
| National Storage Affiliates Trust REITΔ | 77,800 | | 3,226,366 |
| Newmark Group, Inc. Class A | 7,700 | | 84,392 |
| Opendoor Technologies, Inc.* | 58,340 | | 261,363 |
| Orion Office REIT, Inc.Δ | 39,800 | | 227,656 |
| Park Hotels & Resorts, Inc. REITΔ | 4,895 | | 74,893 |
| Pebblebrook Hotel Trust REITΔ | 9,479 | | 151,474 |
| Phillips Edison & Co., Inc. REITΔ | 41,997 | | 1,532,051 |
| Physicians Realty Trust REIT | 137,937 | | 1,835,941 |
| Plymouth Industrial REIT, Inc. | 1,140 | | 27,440 |
| RE/MAX Holdings, Inc. Class AΔ | 16,769 | | 223,531 |
| RLJ Lodging Trust REIT | 115,496 | | 1,353,613 |
| RMR Group, Inc. (The) Class A | 1,100 | | 31,053 |
| RPT Realty REIT | 60,084 | | 770,878 |
| Ryman Hospitality Properties, Inc. REIT | 18,761 | | 2,064,836 |
| Sunstone Hotel Investors, Inc. REITΔ | 102,450 | | 1,099,288 |
| Terreno Realty Corporation REIT | 33,585 | | 2,104,772 |
| | | Shares | | Value |
| UMH Properties, Inc. REIT | 66,808 | | $ 1,023,499 |
| Xenia Hotels & Resorts, Inc. REITΔ | 79,363 | | 1,080,924 |
| | | | | 33,285,135 |
| Utilities — 1.4% | | |
| ALLETE, Inc. | 13,493 | | 825,232 |
| Black Hills Corporation | 37,632 | | 2,030,246 |
| Northwest Natural Holding Co. | 17,703 | | 689,355 |
| Northwestern Energy Group, Inc. | 40,631 | | 2,067,711 |
| NRG Energy, Inc.Δ | 16,757 | | 866,337 |
| ONE Gas, Inc.Δ | 1,901 | | 121,132 |
| Southwest Gas Holdings, Inc. | 21,564 | | 1,366,079 |
| Spire, Inc. | 26,915 | | 1,677,881 |
| Vistra Corporation | 18,905 | | 728,221 |
| | | | | 10,372,194 |
Total Common Stocks
(Cost $608,952,270) | | 675,453,898 |
| FOREIGN COMMON STOCKS — 5.3% |
| Bahamas — 0.1% | | |
| OneSpaWorld Holdings, Ltd.* | 50,008 | | 705,113 |
| Bermuda — 0.2% | | |
| Fidelis Insurance Holdings, Ltd.Δ* | 79,163 | | 1,002,995 |
| Hamilton Insurance Group, Ltd.* | 35,463 | | 530,172 |
| | | | | 1,533,167 |
| Canada — 0.7% | | |
| DIRTT Environmental SolutionsΔ* | 96,127 | | 33,356 |
| IMAX Corporation* | 85,285 | | 1,280,981 |
| Teekay Tankers, Ltd. Class A | 11,783 | | 588,796 |
| Xenon Pharmaceuticals, Inc.Δ* | 70,400 | | 3,242,624 |
| | | | | 5,145,757 |
| Cayman Islands — 0.1% | | |
| Patria Investments, Ltd. Class A | 41,625 | | 645,604 |
| Colombia — 0.5% | | |
| Tecnoglass, Inc.Δ | 78,645 | | 3,594,863 |
| Denmark — 0.5% | | |
| Ascendis Pharma A/S ADR* | 30,700 | | 3,866,665 |
| Ireland — 0.2% | | |
| Adient PLC* | 24,917 | | 905,982 |
| Trinseo PLC | 40,352 | | 337,746 |
| | | | | 1,243,728 |
| Israel — 1.5% | | |
| CyberArk Software, Ltd.* | 16,850 | | 3,690,993 |
| Global-e Online, Ltd.Δ* | 67,800 | | 2,686,914 |
| JFrog, Ltd.* | 137,400 | | 4,755,414 |
| | | | | 11,133,321 |
| Jersey — 0.7% | | |
| WNS Holdings, Ltd. ADR* | 82,490 | | 5,213,368 |
| Monaco — 0.2% | | |
| Scorpio Tankers, Inc. | 18,309 | | 1,113,187 |
See Notes to Financial Statements.
SCHEDULE OF INVESTMENTS (Continued)
| | | Shares | | Value |
| Panama — 0.0% | | |
| Banco Latinoamericano de Comercio Exterior SA | 2,200 | | $ 54,428 |
| Singapore — 0.0% | | |
| WaVe Life Sciences, Ltd.* | 7,400 | | 37,370 |
| Sweden — 0.1% | | |
| Loomis ABΔ | 33,869 | | 901,614 |
| United Kingdom — 0.5% | | |
| Cushman & Wakefield PLC* | 126,523 | | 1,366,448 |
| Gates Industrial Corporation PLCΔ* | 187,298 | | 2,513,539 |
| Luxfer Holdings PLC | 16,223 | | 145,034 |
| | | | | 4,025,021 |
Total Foreign Common Stocks
(Cost $34,833,728) | | 39,213,206 |
| MASTER LIMITED PARTNERSHIP — 0.1% |
Mach Natural Resources LP*
(Cost $657,039) | 35,351 | | 582,938 |
| RIGHTS — 0.0% |
| Aduro Biotech, Inc.†††* | 2,713 | | — |
| DIRTT Environmental SolutionsΔ* | 96,127 | | 1,922 |
| Omniab, Inc.†††* | 7,376 | | 1 |
| Omniab, Inc. (NASDAQ Exchange)†††* | 7,376 | | 1 |
Total Rights
(Cost $—) | | 1,924 |
| MONEY MARKET FUNDS — 4.0% |
| Northern Institutional Liquid Assets Portfolio (Shares), 5.40%ا | 12,218,785 | | 12,218,785 |
| Northern Institutional U.S. Government Portfolio (Shares), 5.17%Ø | 68,269 | | 68,269 |
GuideStone Money Market Fund, 5.28%
(Institutional Class)Ø∞ | 16,612,080 | | 16,612,080 |
| Northern Institutional U.S. Treasury Portfolio (Premier), 5.22%Ø | 1,038,750 | | 1,038,750 |
Total Money Market Funds
(Cost $29,937,884) | | 29,937,884 |
TOTAL INVESTMENTS — 100.5%
(Cost $674,380,921) | | | 745,189,850 |
Liabilities in Excess of Other
Assets — (0.5)% | | | (3,630,732) |
| NET ASSETS — 100.0% | | | $741,559,118 |
See Notes to Financial Statements.
Futures Contracts outstanding at December 31, 2023:
| Future Type | | Expiration Date | | Open Long
(Short) Contracts | | Notional
Market Value
of Contracts | | Value and
Unrealized
Appreciation
(Depreciation) |
| E-Mini Russell 2000 Index | | 03/2024 | | 24 | | $2,457,240 | | $(57,008) |
Forward Foreign Currency Contracts outstanding at December 31, 2023:
| Expiration Date | | Currency
Purchased | | Amount
of Currency
Purchased | | Currency
Sold | | Amount
of Currency
Sold | | Counter-
party | | Net Unrealized
Appreciation
(Depreciation) |
| 03/28/24 | | Swedish Kronor | | 927,583 | | U.S. Dollars | | 92,781 | | UBS | | $ (493) |
| 03/28/24 | | U.S. Dollars | | 978,675 | | Swedish Kronor | | 9,940,888 | | UBS | | (10,370) |
| Total Forward Foreign Currency Contracts outstanding at December 31, 2023 | | | | $(10,863) |
VALUATION HIERARCHY
The following is a summary of the inputs used, as of December 31, 2023, in valuing the Fund’s investments carried at fair value:
| | Total
Value | | Level 1
Quoted Prices | | Level 2
Other Significant
Observable Inputs | | Level 3
Significant
Unobservable Inputs |
| Assets: | | | | | | | |
| Investments in Securities: | | | | | | | |
| Common Stocks | $675,453,898 | | $675,453,898 | | $ — | | $ — |
| Foreign Common Stocks: | | | | | | | |
| Sweden | 901,614 | | — | | 901,614 | | — |
| Other ^^ | 38,311,592 | | 38,311,592 | | — | | — |
| Total Foreign Common Stocks | 39,213,206 | | 38,311,592 | | 901,614 | | — |
| Master Limited Partnership | 582,938 | | 582,938 | | — | | — |
| Money Market Funds | 29,937,884 | | 29,937,884 | | — | | — |
| Rights | 1,924 | | 1,922 | | — | | 2 |
| Total Assets - Investments in Securities | $745,189,850 | | $744,288,234 | | $901,614 | | $ 2 |
| Liabilities: | | | | | | | |
| Other Financial Instruments*** | | | | | | | |
| Forward Foreign Currency Contracts | $ (10,863) | | $ — | | $ (10,863) | | $ — |
| Futures Contracts | (57,008) | | (57,008) | | — | | — |
| Total Liabilities - Other Financial Instruments | $ (67,871) | | $ (57,008) | | $ (10,863) | | $ — |
| ^^ | Classifications as defined in the Schedule of Investments. |
| *** | Other financial instruments are derivative instruments, such as futures contracts and forward foreign currency contracts, which are valued at the unrealized appreciation (depreciation) on the investment. Further details regarding the value of these investments can be found in the preceding "Futures Contracts outstanding" and "Forward Foreign Currency Contracts outstanding" disclosures. |
There were no transfers to or from Level 3 during the period ended December 31, 2023.
Management has determined that the amount of Level 3 securities compared to total net assets is not material; therefore, the reconciliation of Level 3 securities and assumptions is not shown for the year ended December 31, 2023.
See Notes to Financial Statements.
International Equity Index Fund (Unaudited)
With an annual return of 18.24%, developed non-U.S. markets (represented by the MSCI EAFE Index) saw strong positive performance in 2023, rebounding from a challenging 2022, but lagging their U.S. counterparts. Style had less of an impact on returns this year than in 2022 with the MSCI EAFE Value Index up 19.79% and MSCI EAFE Growth Index up 17.97%. Among major foreign developed markets, Japan, France and Germany were the largest contributors to index return, while Finland, New Zealand and Portugal were the relative laggards. Sector performance was positive across all sectors in a strong year for international markets, with information technology posting the highest returns and consumer staples and real estate up the least.
The Fund was passively managed and attempted to replicate the performance of its benchmark, the MSCI EAFE Index. The objective of the Fund is to provide investment results approximating the aggregate price and dividend performance of the securities included in the MSCI EAFE Index. (The MSCI EAFE Index is a free-float-adjusted market capitalization index that is designed to measure the equity market performance of developed markets, excluding the United States and Canada.) The correlation between the Fund’s performance and its benchmark is expected to be greater than 98%. However, it could be lower in certain market environments and as a result of the exclusion of certain securities from the Fund’s portfolio due to the Fund’s faith-based investment policies and restrictions (100% would indicate a perfect correlation). For the one-year period ended December 31, 2023, the Investor Class of the Fund returned 17.87%, net of fees, while the target index returned 18.24%. The return differential was primarily a result of the faith-based restrictions of the Fund but also as a result of Fund expenses.
In 2023, exchange-listed equity index futures contracts were utilized to provide market exposure to the cash positions held in the Fund. Overall, derivative exposure had a positive impact on Fund performance for the year.
This Fund may be suitable to investors who seek higher, long-term rates of return, can accept significant short-term fluctuations in account value and want to diversify their portfolio with international equity securities. Securities of foreign issuers may be negatively impacted by political events, economic conditions or inefficient, illiquid or unregulated markets in foreign countries, and they also may be subject to inadequate regulatory or accounting standards, which may increase investment risk. Derivatives involve different risks from, and in some respects greater than, those risks associated with investing directly in securities, currencies or other instruments. The derivatives may be illiquid or less liquid, volatile, difficult to price and leveraged, so that small changes in the value of the underlying instruments may produce disproportionate losses to the Fund. It is possible to lose money by investing in the Fund.
At December 31, 2023, the portfolio holdings of the Fund, as a percentage of net assets, is shown in the following table. Portfolio holdings are subject to risk and may change at any time.
| | % |
| Financials | 18.5 |
| Industrials | 16.1 |
| Health Care | 12.5 |
| Consumer Discretionary | 11.5 |
| Consumer Staples | 9.1 |
| Information Technology | 8.4 |
| Materials | 7.7 |
| Energy | 4.3 |
| Communication Services | 4.0 |
| Utilities | 3.4 |
| Money Market Funds | 3.1 |
| Real Estate | 2.2 |
| | 100.8 |
See Notes to Financial Statements.
International Equity Index Fund (Unaudited)
| Average Annual Total Returns as of 12/31/23 | |
| | | Institutional Class* | | Investor Class* | | Benchmark** | |
| One Year | | 18.08% | | 17.87% | | 18.24% | |
| Five Year | | 7.59% | | N/A | | 8.16% | |
| Ten Year | | N/A | | N/A | | N/A | |
| Since Inception(1) | | 4.29% | | 8.51% | | 4.60% | |
| Inception Date | | 06/01/15 | | 04/29/22 | | | |
| Total Fund Operating Expenses (May 1, 2023 Prospectus)(2)# | | 0.22% | | 0.51% | | | |
| (1) | The Since Inception benchmark performance is based on the start date of June 1, 2015, which corresponds with the inception date of the Institutional Class, the longest operating class of the Fund. |
| (2) | Current information regarding the Fund’s Operating Expenses can be found in the Financial Highlights. |
#Net expense ratio
The performance data quoted represents past performance and does not guarantee future results. The performance data in the table and graph does not reflect the deduction of taxes that a shareholder would pay on Fund distributions or the redemption of Fund shares. Current performance may be lower or higher. Performance data current to the most recent month-end may be obtained at GuideStoneFunds.com. The investment return and principal value of an investment will fluctuate so that shares, when redeemed, may be worth more or less than their original cost.
The Adviser has agreed to waive fees and/or reimburse expenses to the extent needed to limit total annual operating expenses (before expense payments by broker-dealers and excluding interest, taxes, brokerage commissions, extraordinary expenses, acquired fund fees and expenses and expenses incurred in connection with the short sales of securities) to 0.22% for the Institutional Class and 0.50% for the Investor Class. This contractual waiver and reimbursement applies to Fund operating expenses only and will remain in place until April 30, 2024.
See Notes to Financial Statements.
International Equity Index Fund (Unaudited)
The graph illustrates the results of a hypothetical $10,000 investment in the Institutional Class of the Fund since June 1, 2015 (commencement of operations), with all dividends and capital gains reinvested, with the MSCI EAFE Index.
*These returns reflect investment advisory and shareholder servicing fee waivers, if applicable, during the reported time periods.
Unlike a mutual fund, an index is not available for direct investment and the performance of an index assumes no taxes, transaction costs, management fees or other expenses.
See Notes to Financial Statements.
INTERNATIONAL EQUITY INDEX FUND
| | | Shares | | Value |
| FOREIGN COMMON STOCKS — 97.2% |
| Australia — 7.2% | | |
| Ampol, Ltd. | 9,256 | | $ 228,116 |
| ANZ Group Holdings, Ltd. | 155,132 | | 2,740,877 |
| APA Group | 56,822 | | 330,678 |
| ASX, Ltd. | 9,397 | | 403,723 |
| Aurizon Holdings, Ltd. | 144,275 | | 373,519 |
| BHP Group, Ltd. | 275,010 | | 9,395,611 |
| BlueScope Steel, Ltd. | 21,263 | | 338,985 |
| Brambles, Ltd. | 107,348 | | 994,997 |
| Cochlear, Ltd. | 7,986 | | 1,624,719 |
| Coles Group, Ltd. | 137,380 | | 1,509,128 |
| Commonwealth Bank of Australia | 93,381 | | 7,117,223 |
| Computershare, Ltd. | 31,223 | | 520,031 |
| CSL, Ltd. | 32,664 | | 6,367,818 |
| Dexus REIT | 65,896 | | 344,382 |
| Fortescue, Ltd. | 86,232 | | 1,700,266 |
| Goodman Group REIT | 96,925 | | 1,668,744 |
| GPT Group (The) REIT | 15,364 | | 48,488 |
| IDP Education, Ltd.Δ | 17,951 | | 244,872 |
| Insurance Australia Group, Ltd. | 115,449 | | 446,253 |
| Macquarie Group, Ltd. | 19,625 | | 2,456,693 |
| Medibank Pvt., Ltd. | 179,765 | | 436,428 |
| Mineral Resources, Ltd. | 7,000 | | 333,435 |
| Mirvac Group REIT | 260,355 | | 370,388 |
| National Australia Bank, Ltd. | 204,242 | | 4,268,840 |
| Northern Star Resources, Ltd. | 45,766 | | 424,622 |
| Orica, Ltd. | 17,805 | | 193,545 |
| Origin Energy, Ltd. | 81,077 | | 467,871 |
| Pilbara Minerals, Ltd.Δ | 120,000 | | 322,095 |
| Qantas Airways, Ltd.* | 66,392 | | 243,195 |
| QBE Insurance Group, Ltd. | 75,406 | | 764,058 |
| REA Group, Ltd.Δ | 4,130 | | 509,268 |
| Rio Tinto, Ltd. | 16,350 | | 1,513,974 |
| Santos, Ltd. | 155,840 | | 810,291 |
| Scentre Group REIT | 265,947 | | 541,577 |
| SEEK, Ltd. | 16,462 | | 299,494 |
| Sonic Healthcare, Ltd. | 65,006 | | 1,420,429 |
| South32, Ltd. | 212,814 | | 481,309 |
| Stockland REIT | 133,688 | | 405,427 |
| Suncorp Group, Ltd. | 68,156 | | 645,394 |
| Telstra Corporation, Ltd. | 341,734 | | 923,461 |
| Transurban Group | 182,153 | | 1,702,107 |
| Vicinity Centres REIT | 216,299 | | 300,464 |
| Wesfarmers, Ltd. | 62,996 | | 2,449,847 |
| Westpac Banking Corporation | 173,355 | | 2,704,769 |
| WiseTech Global, Ltd. | 6,300 | | 322,904 |
| Woodside Energy Group, Ltd. | 102,306 | | 2,160,357 |
| Woolworths Group, Ltd. | 99,504 | | 2,524,412 |
| | | | | 66,395,084 |
| Austria — 0.2% | | |
| Erste Group Bank AG | 21,419 | | 867,575 |
| OMV AG | 10,806 | | 474,089 |
| Verbund AG | 5,255 | | 486,989 |
| voestalpine AG | 4,506 | | 141,875 |
| | | | | 1,970,528 |
| | | Shares | | Value |
| Belgium — 0.7% | | |
| Ageas SA/NV | 10,480 | | $ 455,571 |
| D'ieteren Group | 2,641 | | 516,612 |
| Elia Group SA/NVΔ | 2,782 | | 348,237 |
| Groupe Bruxelles Lambert NV | 5,725 | | 450,860 |
| KBC Group NV | 21,628 | | 1,403,643 |
| Sofina SAΔ | 865 | | 215,667 |
| Syensqo SA* | 9,910 | | 1,031,218 |
| UCB SA | 19,739 | | 1,720,681 |
| Umicore SAΔ | 9,507 | | 261,509 |
| Warehouses De Pauw CVA REIT | 12,473 | | 392,627 |
| | | | | 6,796,625 |
| Denmark — 3.1% | | |
| AP Moeller - Maersk A/S Class A | 649 | | 1,152,813 |
| AP Moeller - Maersk A/S Class B | 610 | | 1,098,015 |
| Chr. Hansen Holding A/S | 13,414 | | 1,124,995 |
| Coloplast A/S Class BΔ | 25,701 | | 2,936,754 |
| Danske Bank A/S | 112,273 | | 3,001,203 |
| Demant A/S* | 18,113 | | 794,439 |
| DSV A/S | 24,494 | | 4,303,762 |
| Genmab A/S* | 10,830 | | 3,453,178 |
| Novozymes A/S Class BΔ | 27,803 | | 1,528,425 |
| Orsted A/S 144AΔ | 25,730 | | 1,426,383 |
| Pandora A/S | 15,325 | | 2,118,760 |
| ROCKWOOL International A/S Class B | 2,073 | | 606,503 |
| Tryg A/S | 43,880 | | 954,926 |
| Vestas Wind Systems A/S* | 132,117 | | 4,180,410 |
| | | | | 28,680,566 |
| Finland — 1.0% | | |
| Elisa OYJ | 7,229 | | 334,142 |
| Fortum OYJΔ | 22,487 | | 324,806 |
| Kesko OYJ Class B | 12,949 | | 256,697 |
| Kone OYJ Class B | 19,989 | | 999,872 |
| Neste OYJ | 21,037 | | 747,862 |
| Nokia OYJ | 358,262 | | 1,220,216 |
| Nordea Bank Abp | 184,779 | | 2,294,004 |
| Orion OYJ Class B | 17,254 | | 747,639 |
| Sampo OYJ Class A | 35,114 | | 1,538,426 |
| Stora Enso OYJ, R Shares | 34,560 | | 478,848 |
| UPM-Kymmene OYJΔ | 11,906 | | 449,103 |
| | | | | 9,391,615 |
| France — 10.9% | | |
| Accor SA | 16,778 | | 642,196 |
| Aeroports de Paris SA | 2,268 | | 294,285 |
| Air Liquide SA | 35,542 | | 6,919,865 |
| Alstom SAΔ | 13,681 | | 184,492 |
| Arkema SA | 2,715 | | 309,287 |
| AXA SA | 97,306 | | 3,177,669 |
| BioMerieux | 6,876 | | 765,020 |
| BNP Paribas SA | 59,911 | | 4,160,562 |
| Bollore SE | 40,000 | | 250,313 |
| Bouygues SA | 11,283 | | 425,699 |
| Bureau Veritas SA | 15,449 | | 390,856 |
| Capgemini SE | 9,756 | | 2,038,922 |
See Notes to Financial Statements.
INTERNATIONAL EQUITY INDEX FUND
SCHEDULE OF INVESTMENTS (Continued)
| | | Shares | | Value |
| Carrefour SA | 98,085 | | $ 1,796,392 |
| Cie de Saint-Gobain SA | 26,241 | | 1,935,203 |
| Cie Generale des Etablissements Michelin SCA | 56,663 | | 2,035,706 |
| Credit Agricole SA | 30,092 | | 427,808 |
| Danone SA | 50,297 | | 3,263,197 |
| Dassault Aviation SA | 2,825 | | 559,718 |
| Dassault Systemes SE | 37,571 | | 1,839,000 |
| Edenred SE | 19,978 | | 1,195,578 |
| Eiffage SA | 6,925 | | 743,403 |
| Engie SA | 92,715 | | 1,633,295 |
| EssilorLuxottica SA | 22,374 | | 4,492,672 |
| Eurazeo SE | 3,083 | | 245,142 |
| Gecina SA REIT | 2,894 | | 352,313 |
| Getlink SE | 29,669 | | 543,384 |
| Hermes International SCA | 2,518 | | 5,352,048 |
| Ipsen SA | 7,320 | | 873,198 |
| Kering SA | 5,668 | | 2,510,349 |
| Klepierre REITΔ | 14,221 | | 388,243 |
| L’Oreal SA | 17,503 | | 8,725,259 |
| Legrand SA | 16,102 | | 1,676,803 |
| Orange SA | 132,848 | | 1,514,155 |
| Publicis Groupe SA | 12,484 | | 1,159,912 |
| Renault SA | 16,883 | | 690,513 |
| Safran SA | 18,996 | | 3,349,193 |
| Sanofi SA | 74,351 | | 7,388,464 |
| Sartorius Stedim Biotech | 3,225 | | 855,214 |
| Schneider Electric SE | 26,838 | | 5,402,655 |
| Societe Generale SA | 58,734 | | 1,562,637 |
| Sodexo SAΔ | 8,568 | | 943,238 |
| Teleperformance SE | 3,388 | | 496,028 |
| Thales SA | 6,325 | | 936,560 |
| TotalEnergies SE | 153,051 | | 10,407,319 |
| Unibail-Rodamco-Westfield CDI* | 10,140 | | 37,343 |
| Unibail-Rodamco-Westfield REIT* | 6,095 | | 450,807 |
| Veolia Environnement SA | 31,981 | | 1,010,813 |
| Vinci SA | 27,022 | | 3,400,591 |
| Vivendi SE | 35,000 | | 374,674 |
| Worldline SA 144A* | 13,200 | | 229,548 |
| | | | | 100,357,541 |
| Germany — 7.8% | | |
| adidas AG | 11,209 | | 2,277,745 |
| Allianz SE | 19,078 | | 5,098,430 |
| BASF SE | 49,106 | | 2,644,215 |
| Bayerische Motoren Werke AG | 18,094 | | 2,013,349 |
| Bechtle AG | 3,882 | | 194,440 |
| Beiersdorf AG | 11,389 | | 1,705,557 |
| Brenntag SE | 7,869 | | 723,220 |
| Carl Zeiss Meditec AG | 4,095 | | 445,759 |
| Commerzbank AG | 49,702 | | 590,748 |
| Continental AG | 4,960 | | 421,260 |
| Covestro AG 144A* | 8,920 | | 519,785 |
| Daimler Truck Holding AG | 22,258 | | 836,101 |
| Delivery Hero SE 144A* | 7,927 | | 218,175 |
| Deutsche Bank AG | 104,927 | | 1,432,368 |
| Deutsche Boerse AG | 11,154 | | 2,296,997 |
| Deutsche Lufthansa AG* | 49,931 | | 443,899 |
| | | Shares | | Value |
| Deutsche Post AG | 54,831 | | $ 2,713,919 |
| Deutsche Telekom AG | 209,528 | | 5,037,745 |
| E.ON SE | 94,768 | | 1,273,214 |
| Evonik Industries AG | 13,302 | | 271,746 |
| Fresenius Medical Care AG | 15,717 | | 657,101 |
| Fresenius SE & Co. KGaA | 57,197 | | 1,772,852 |
| GEA Group AG | 7,555 | | 314,093 |
| Hannover Rueck SE | 3,483 | | 832,799 |
| HeidelbergCement AG | 9,249 | | 826,751 |
| HelloFresh SE* | 7,006 | | 110,460 |
| Henkel AG & Co. KGaA | 12,105 | | 868,517 |
| Infineon Technologies AG | 67,044 | | 2,799,933 |
| LEG Immobilien SE* | 1,506 | | 131,789 |
| Mercedes-Benz Group AG | 52,967 | | 3,654,609 |
| MTU Aero Engines AG | 2,932 | | 631,687 |
| Muenchener Rueckversicherungs-Gesellschaft AG | 8,326 | | 3,453,740 |
| Nemetschek SE | 785 | | 67,773 |
| Puma SE | 13,626 | | 758,008 |
| Rheinmetall AG | 2,384 | | 756,053 |
| RWE AG | 27,660 | | 1,258,887 |
| SAP SE | 61,183 | | 9,417,386 |
| Siemens AG | 44,317 | | 8,314,282 |
| Siemens Energy AG* | 18,963 | | 250,620 |
| Siemens Healthineers AG 144A | 25,788 | | 1,497,216 |
| Symrise AG | 6,729 | | 739,488 |
| Volkswagen AG | 1,304 | | 170,635 |
| Vonovia SE | 23,337 | | 733,288 |
| Zalando SE 144A* | 10,454 | | 247,493 |
| | | | | 71,424,132 |
| Hong Kong — 2.1% | | |
| AIA Group, Ltd. | 652,000 | | 5,674,280 |
| BOC Hong Kong Holdings, Ltd. | 214,500 | | 582,695 |
| CK Asset Holdings, Ltd. | 161,057 | | 808,360 |
| CLP Holdings, Ltd. | 156,000 | | 1,288,890 |
| ESR Cayman, Ltd. 144AΔ | 132,400 | | 183,103 |
| Futu Holdings, Ltd. ADRΔ* | 2,522 | | 137,777 |
| Hang Lung Properties, Ltd. | 117,000 | | 162,666 |
| Hang Seng Bank, Ltd. | 34,300 | | 400,468 |
| Henderson Land Development Co., Ltd. | 71,275 | | 219,487 |
| HKT Trust & HKT, Ltd. | 289,000 | | 345,045 |
| Hong Kong & China Gas Co., Ltd. | 562,138 | | 431,038 |
| Hong Kong Exchanges and Clearing, Ltd. | 64,997 | | 2,229,414 |
| Hongkong Land Holdings, Ltd. | 52,200 | | 181,555 |
| Jardine Matheson Holdings, Ltd. | 13,200 | | 543,349 |
| Link REIT | 154,304 | | 866,426 |
| MTR Corporation, Ltd. | 183,463 | | 712,083 |
| Power Assets Holdings, Ltd. | 86,500 | | 501,501 |
| Sino Land Co., Ltd. | 356,447 | | 387,630 |
| SITC International Holdings Co., Ltd. | 59,000 | | 101,836 |
| Sun Hung Kai Properties, Ltd. | 109,500 | | 1,184,940 |
| Swire Pacific, Ltd. Class A | 22,500 | | 190,567 |
| Swire Properties, Ltd. | 63,800 | | 129,148 |
| Techtronic Industries Co., Ltd. | 71,500 | | 851,929 |
See Notes to Financial Statements.
| | | Shares | | Value |
| WH Group, Ltd. 144A | 585,591 | | $ 378,174 |
| Wharf Real Estate Investment Co., Ltd. | 115,000 | | 388,755 |
| Xinyi Glass Holdings, Ltd.Δ | 95,866 | | 107,675 |
| | | | | 18,988,791 |
| Ireland — 0.9% | | |
| Bank of Ireland Group PLC | 80,800 | | 733,539 |
| CRH PLC | 42,988 | | 2,958,403 |
| DCC PLC | 5,616 | | 413,231 |
| James Hardie Industries PLC CDI* | 25,315 | | 976,043 |
| Kerry Group PLC Class A | 15,874 | | 1,377,853 |
| Kingspan Group PLC | 13,457 | | 1,163,026 |
| Smurfit Kappa Group PLC | 23,856 | | 945,664 |
| | | | | 8,567,759 |
| Israel — 0.6% | | |
| Azrieli Group, Ltd. | 1,239 | | 80,140 |
| Bank Hapoalim BM | 76,213 | | 684,665 |
| Bank Leumi Le-Israel BM | 72,431 | | 582,912 |
| Check Point Software Technologies, Ltd.* | 6,172 | | 943,020 |
| CyberArk Software, Ltd.* | 2,381 | | 521,558 |
| Elbit Systems, Ltd. | 1,618 | | 343,163 |
| ICL Group, Ltd. | 5,905 | | 29,688 |
| Israel Discount Bank, Ltd. Class A | 52,953 | | 265,132 |
| Mizrahi Tefahot Bank, Ltd. | 11,154 | | 431,793 |
| Nice, Ltd.* | 3,728 | | 741,420 |
| Teva Pharmaceutical Industries, Ltd. ADR* | 91,181 | | 951,930 |
| Wix.com, Ltd.* | 2,346 | | 288,605 |
| | | | | 5,864,026 |
| Italy — 1.9% | | |
| Amplifon SpA | 15,067 | | 522,081 |
| Assicurazioni Generali SpA | 54,358 | | 1,148,450 |
| DiaSorin SpA | 692 | | 71,320 |
| Enel SpA | 530,480 | | 3,946,672 |
| Eni SpA | 160,136 | | 2,716,130 |
| FinecoBank Banca Fineco SpA | 27,715 | | 416,949 |
| Infrastrutture Wireless Italiane SpA 144AΔ | 26,318 | | 333,210 |
| Intesa Sanpaolo SpA | 830,817 | | 2,431,299 |
| Mediobanca Banca di Credito Finanziario SpA | 21,353 | | 264,602 |
| Moncler SpA | 13,822 | | 851,011 |
| Nexi SpA 144A* | 24,702 | | 202,384 |
| Poste Italiane SpA 144AΔ | 25,999 | | 295,524 |
| Prysmian SpA | 6,256 | | 285,180 |
| Recordati Industria Chimica e Farmaceutica SpA | 16,364 | | 882,393 |
| Snam SpA | 116,668 | | 600,248 |
| Terna - Rete Elettrica NazionaleΔ | 90,920 | | 758,514 |
| UniCredit SpA | 76,639 | | 2,086,856 |
| | | | | 17,812,823 |
| Japan — 22.0% | | |
| Advantest CorporationΔ | 35,600 | | 1,199,562 |
| Aeon Co., Ltd. | 52,800 | | 1,178,205 |
| AGC, Inc.Δ | 9,300 | | 344,699 |
| | | Shares | | Value |
| Aisin Corporation | 3,600 | | $ 125,501 |
| Ajinomoto Co., Inc. | 33,800 | | 1,301,091 |
| Asahi Intecc Co., Ltd. | 7,400 | | 150,064 |
| Asahi Kasei Corporation | 28,600 | | 211,078 |
| Bandai Namco Holdings, Inc. | 35,400 | | 707,938 |
| Bridgestone Corporation | 41,300 | | 1,705,747 |
| Brother Industries, Ltd. | 21,000 | | 334,425 |
| Canon, Inc. | 66,900 | | 1,716,234 |
| Capcom Co., Ltd. | 17,600 | | 567,965 |
| Central Japan Railway Co. | 36,500 | | 926,380 |
| Chugai Pharmaceutical Co., Ltd. | 68,800 | | 2,599,151 |
| Dai Nippon Printing Co., Ltd. | 11,500 | | 339,607 |
| Daifuku Co., Ltd. | 14,100 | | 284,312 |
| Dai-ichi Life Holdings, Inc. | 49,600 | | 1,052,161 |
| Daiichi Sankyo Co., Ltd. | 137,500 | | 3,764,300 |
| Daikin Industries, Ltd. | 15,200 | | 2,465,744 |
| Daito Trust Construction Co., Ltd. | 3,500 | | 405,113 |
| Daiwa House Industry Co., Ltd. | 21,900 | | 662,046 |
| Daiwa House REIT Investment Corporation | 101 | | 180,103 |
| Denso Corporation | 118,000 | | 1,771,457 |
| Dentsu Group, Inc.Δ | 11,700 | | 299,560 |
| Disco Corporation | 5,700 | | 1,407,711 |
| East Japan Railway Co. | 17,300 | | 995,835 |
| Eisai Co., Ltd. | 27,700 | | 1,379,216 |
| ENEOS Holdings, Inc. | 55,150 | | 218,738 |
| FANUC Corporation | 49,000 | | 1,438,107 |
| Fast Retailing Co., Ltd. | 11,000 | | 2,720,068 |
| Fuji Electric Co., Ltd. | 5,000 | | 214,310 |
| FUJIFILM Holdings Corporation | 21,500 | | 1,288,490 |
| Fujitsu, Ltd. | 9,900 | | 1,489,888 |
| GLP J-REIT | 17 | | 16,922 |
| Hamamatsu Photonics KK | 6,400 | | 262,578 |
| Hankyu Hanshin Holdings, Inc. | 14,100 | | 448,096 |
| Hikari Tsushin, Inc. | 1,200 | | 198,323 |
| Hirose Electric Co., Ltd.Δ | 1,805 | | 203,854 |
| Hitachi, Ltd. | 50,200 | | 3,610,873 |
| Honda Motor Co., Ltd. | 301,800 | | 3,113,133 |
| Hoya Corporation | 30,600 | | 3,810,901 |
| Ibiden Co., Ltd. | 4,100 | | 226,180 |
| Inpex Corporation | 52,800 | | 706,556 |
| Isuzu Motors, Ltd. | 25,100 | | 321,774 |
| ITOCHU Corporation | 61,300 | | 2,497,353 |
| Japan Exchange Group, Inc. | 25,800 | | 544,522 |
| Japan Metropolitan Fund Invest REIT | 469 | | 338,525 |
| Japan Post Bank Co., Ltd.Δ | 120,000 | | 1,221,232 |
| Japan Post Holdings Co., Ltd. | 105,100 | | 938,277 |
| Japan Real Estate Investment Corporation REIT | 83 | | 343,368 |
| JFE Holdings, Inc. | 24,900 | | 385,233 |
| JSR CorporationΔ | 6,200 | | 176,417 |
| Kansai Electric Power Co., Inc. (The)Δ | 4,800 | | 63,706 |
| Kao Corporation | 34,100 | | 1,401,702 |
| KDDI Corporation | 95,000 | | 3,013,258 |
| KDX Realty Investment Corporation REIT | 230 | | 261,978 |
| Keisei Electric Railway Co., Ltd. | 5,400 | | 254,830 |
See Notes to Financial Statements.
INTERNATIONAL EQUITY INDEX FUND
SCHEDULE OF INVESTMENTS (Continued)
| | | Shares | | Value |
| Keyence Corporation | 10,900 | | $4,788,986 |
| Kintetsu Group Holdings Co., Ltd.Δ | 18,100 | | 573,481 |
| Kobe Bussan Co., Ltd.Δ | 8,600 | | 254,050 |
| Koito Manufacturing Co., Ltd. | 8,600 | | 133,633 |
| Komatsu, Ltd. | 54,200 | | 1,410,465 |
| Konami Holdings Corporation | 5,500 | | 287,310 |
| Kose CorporationΔ | 1,400 | | 104,643 |
| Kubota Corporation | 52,500 | | 787,920 |
| Kyocera Corporation | 75,600 | | 1,100,741 |
| Kyowa Kirin Co., Ltd. | 53,600 | | 899,351 |
| Lasertec Corporation | 4,200 | | 1,102,612 |
| LY Corporation | 129,000 | | 456,181 |
| M3, Inc. | 36,000 | | 594,083 |
| Marubeni Corporation | 83,500 | | 1,314,669 |
| MatsukiyoCocokara & Co.Δ | 27,000 | | 477,196 |
| Mazda Motor Corporation | 20,700 | | 221,264 |
| McDonald’s Holdings Co. Japan, Ltd.Δ | 18,000 | | 779,708 |
| MEIJI Holdings Co., Ltd. | 16,000 | | 380,058 |
| MINEBEA MITSUMI, Inc. | 14,700 | | 300,880 |
| MISUMI Group, Inc. | 13,600 | | 229,619 |
| Mitsubishi Chemical Group Corporation | 63,200 | | 386,349 |
| Mitsubishi Corporation | 201,900 | | 3,216,119 |
| Mitsubishi Electric Corporation | 95,700 | | 1,353,589 |
| Mitsubishi Estate Co., Ltd. | 66,800 | | 915,699 |
| Mitsubishi Heavy Industries, Ltd. | 14,700 | | 855,895 |
| Mitsubishi UFJ Financial Group, Inc. | 740,700 | | 6,356,788 |
| Mitsui & Co., Ltd. | 81,600 | | 3,057,059 |
| Mitsui Chemicals, Inc. | 9,400 | | 277,977 |
| Mitsui Fudosan Co., Ltd. | 52,400 | | 1,281,164 |
| Mitsui OSK Lines, Ltd. | 4,400 | | 140,669 |
| Mizuho Financial Group, Inc. | 122,590 | | 2,091,118 |
| MonotaRO Co., Ltd.Δ | 11,900 | | 129,487 |
| MS&AD Insurance Group Holdings, Inc. | 24,200 | | 951,516 |
| Murata Manufacturing Co., Ltd. | 90,900 | | 1,920,897 |
| NEC Corporation | 11,400 | | 673,582 |
| Nexon Co., Ltd. | 24,400 | | 443,814 |
| Nidec Corporation | 22,800 | | 919,003 |
| Nintendo Co., Ltd. | 61,000 | | 3,174,067 |
| Nippon Building Fund, Inc. REIT | 69 | | 298,693 |
| NIPPON EXPRESS HOLDINGS, INC. | 4,000 | | 226,960 |
| Nippon Paint Holdings Co., Ltd. | 41,100 | | 331,526 |
| Nippon Prologis REIT, Inc. | 121 | | 232,657 |
| Nippon Sanso Holdings Corporation | 8,800 | | 234,983 |
| Nippon Steel Corporation | 37,900 | | 865,779 |
| Nippon Telegraph & Telephone Corporation | 1,725,000 | | 2,106,370 |
| Nippon Yusen KK | 25,500 | | 787,530 |
| Nissan Chemical Corporation | 5,900 | | 229,738 |
| Nissan Motor Co., Ltd. | 112,800 | | 441,040 |
| Nissin Foods Holdings Co., Ltd. | 23,100 | | 806,648 |
| Nitori Holdings Co., Ltd. | 4,000 | | 537,106 |
| Nitto Denko Corporation | 7,100 | | 529,839 |
| Nomura Holdings, Inc. | 229,400 | | 1,033,119 |
| Nomura Real Estate Master Fund, Inc. REIT | 184 | | 215,195 |
| | | Shares | | Value |
| Nomura Research Institute, Ltd.Δ | 18,157 | | $ 527,329 |
| NTT Data Corporation | 31,300 | | 442,446 |
| Obic Co., Ltd. | 3,600 | | 619,398 |
| Oji Holdings Corporation | 23,900 | | 91,869 |
| Olympus Corporation | 139,900 | | 2,019,356 |
| Omron Corporation | 8,300 | | 386,223 |
| Ono Pharmaceutical Co., Ltd. | 52,300 | | 930,392 |
| Oracle Corporation | 700 | | 53,885 |
| Oriental Land Co., Ltd.Δ | 60,500 | | 2,248,682 |
| ORIX Corporation | 63,200 | | 1,186,971 |
| Osaka Gas Co., Ltd. | 15,000 | | 313,117 |
| Otsuka Corporation | 6,900 | | 283,969 |
| Otsuka Holdings Co., Ltd. | 66,000 | | 2,468,202 |
| Pan Pacific International Holdings Corporation | 18,800 | | 447,524 |
| Panasonic Holdings Corporation | 118,600 | | 1,167,923 |
| Recruit Holdings Co., Ltd. | 75,000 | | 3,135,835 |
| Renesas Electronics CorporationΔ* | 63,600 | | 1,137,229 |
| Resona Holdings, Inc. | 94,500 | | 479,052 |
| Ricoh Co., Ltd. | 26,200 | | 200,653 |
| Rohm Co., Ltd. | 16,400 | | 313,088 |
| SBI Holdings, Inc. | 9,400 | | 210,967 |
| Secom Co., Ltd. | 12,500 | | 899,253 |
| Seiko Epson Corporation | 18,200 | | 271,743 |
| Sekisui House, Ltd.Δ | 33,600 | | 744,785 |
| Seven & i Holdings Co., Ltd. | 56,700 | | 2,242,460 |
| SG Holdings Co., Ltd. | 13,100 | | 187,800 |
| Shimadzu Corporation | 12,300 | | 342,961 |
| Shimano, Inc. | 3,600 | | 554,559 |
| Shin-Etsu Chemical Co., Ltd. | 100,500 | | 4,203,228 |
| Shionogi & Co., Ltd. | 27,200 | | 1,309,081 |
| Shiseido Co., Ltd. | 35,800 | | 1,079,097 |
| SMC Corporation | 2,900 | | 1,551,314 |
| SoftBank Corporation | 155,200 | | 1,934,061 |
| SoftBank Group Corporation | 62,600 | | 2,763,068 |
| Sompo Holdings, Inc. | 14,400 | | 704,569 |
| Sony Group CorporationΔ | 70,400 | | 6,662,157 |
| Square Enix Holdings Co., Ltd. | 1,300 | | 46,605 |
| Subaru Corporation | 32,200 | | 587,309 |
| SUMCO CorporationΔ | 15,200 | | 227,379 |
| Sumitomo Corporation | 54,900 | | 1,194,715 |
| Sumitomo Electric Industries, Ltd. | 65,100 | | 826,027 |
| Sumitomo Metal Mining Co., Ltd. | 10,900 | | 323,707 |
| Sumitomo Mitsui Financial Group, Inc. | 64,500 | | 3,138,560 |
| Sumitomo Mitsui Trust Holdings, Inc. | 14,000 | | 268,126 |
| Sumitomo Realty & Development Co., Ltd. | 9,600 | | 284,487 |
| Suntory Beverage & Food, Ltd. | 38,700 | | 1,272,452 |
| Suzuki Motor Corporation | 17,300 | | 737,266 |
| Sysmex Corporation | 14,500 | | 806,063 |
| T&D Holdings, Inc. | 22,500 | | 357,198 |
| Taisei Corporation | 13,300 | | 454,167 |
| Takeda Pharmaceutical Co., Ltd.Δ | 128,236 | | 3,677,558 |
| TDK Corporation | 19,900 | | 943,745 |
| Terumo Corporation | 55,100 | | 1,801,826 |
| TIS, Inc. | 14,800 | | 325,294 |
| Tobu Railway Co., Ltd. | 11,900 | | 319,269 |
See Notes to Financial Statements.
| | | Shares | | Value |
| Tokio Marine Holdings, Inc. | 104,700 | | $ 2,607,134 |
| Tokyo Electric Power Co. Holdings, Inc.* | 56,100 | | 293,578 |
| Tokyo Electron, Ltd. | 27,500 | | 4,887,846 |
| Tokyo Gas Co., Ltd. | 23,400 | | 536,765 |
| Tokyu Corporation | 27,000 | | 329,213 |
| TOPPAN Holdings, Inc. | 15,000 | | 417,744 |
| Toray Industries, Inc. | 89,700 | | 464,648 |
| Toyota Industries Corporation | 6,500 | | 528,387 |
| Toyota Motor Corporation | 678,480 | | 12,432,277 |
| Toyota Tsusho Corporation | 10,000 | | 586,822 |
| Trend Micro, Inc. | 8,500 | | 453,645 |
| Unicharm Corporation | 26,300 | | 951,201 |
| USS Co., Ltd. | 22,100 | | 443,684 |
| West Japan Railway Co.Δ | 9,300 | | 387,516 |
| Yakult Honsha Co., Ltd. | 23,000 | | 516,295 |
| Yamaha CorporationΔ | 5,400 | | 124,387 |
| Yamaha Motor Co., Ltd. | 42,900 | | 381,740 |
| Yamato Holdings Co., Ltd. | 11,600 | | 214,060 |
| Yaskawa Electric CorporationΔ | 11,200 | | 466,165 |
| Yokogawa Electric Corporation | 22,800 | | 433,382 |
| ZOZO, Inc. | 5,700 | | 128,644 |
| | | | | 202,314,354 |
| Jersey — 0.8% | | |
| Experian PLC | 66,013 | | 2,693,023 |
| Glencore PLC | 768,456 | | 4,619,225 |
| WPP PLC | 45,700 | | 436,521 |
| | | | | 7,748,769 |
| Luxembourg — 0.2% | | |
| ArcelorMittal SA | 34,529 | | 979,934 |
| Eurofins Scientific SE | 12,824 | | 836,540 |
| | | | | 1,816,474 |
| Netherlands — 6.2% | | |
| Adyen NV 144A* | 1,167 | | 1,506,528 |
| Aegon, Ltd. | 115,549 | | 671,808 |
| AerCap Holdings NV* | 7,600 | | 564,832 |
| Airbus SE | 26,375 | | 4,074,631 |
| Akzo Nobel NV | 10,566 | | 874,937 |
| Argenx SE* | 6,029 | | 2,293,243 |
| ASM International NV | 2,234 | | 1,162,740 |
| ASML Holding NV | 22,877 | | 17,269,559 |
| Euronext NV 144A | 4,841 | | 420,715 |
| EXOR NV | 6,961 | | 696,780 |
| Ferrari NV | 7,866 | | 2,655,615 |
| Ferrovial SE | 20,185 | | 736,770 |
| IMCD NV | 2,480 | | 431,926 |
| ING Groep NV | 200,643 | | 3,008,551 |
| JDE Peet's NVΔ | 20,956 | | 563,553 |
| Koninklijke Ahold Delhaize NV | 89,313 | | 2,569,665 |
| Koninklijke KPN NV | 184,467 | | 635,513 |
| Koninklijke Philips NV* | 68,389 | | 1,600,455 |
| NN Group NV | 15,629 | | 617,672 |
| OCI NV | 10,264 | | 297,465 |
| Prosus NV* | 109,409 | | 3,259,304 |
| QIAGEN NV* | 25,509 | | 1,109,037 |
| Stellantis NV | 155,970 | | 3,654,479 |
| | | Shares | | Value |
| STMicroelectronics NV | 37,246 | | $ 1,868,222 |
| Tenaris SA | 20,000 | | 347,863 |
| Universal Music Group NV | 64,973 | | 1,854,793 |
| Wolters Kluwer NV | 17,451 | | 2,482,745 |
| | | | | 57,229,401 |
| New Zealand — 0.3% | | |
| Auckland International Airport, Ltd. | 81,803 | | 455,063 |
| EBOS Group, Ltd. | 10,882 | | 244,053 |
| Fisher & Paykel Healthcare Corporation, Ltd. | 49,666 | | 740,691 |
| Spark New Zealand, Ltd. | 145,344 | | 475,934 |
| Xero, Ltd.Δ* | 5,756 | | 439,117 |
| | | | | 2,354,858 |
| Norway — 0.7% | | |
| Aker BP ASA | 14,477 | | 420,522 |
| DNB Bank ASA | 74,294 | | 1,579,583 |
| Equinor ASAΔ | 59,657 | | 1,890,648 |
| Gjensidige Forsikring ASA | 8,027 | | 148,129 |
| Kongsberg Gruppen ASA | 2,955 | | 135,283 |
| Mowi ASA | 26,051 | | 466,515 |
| Norsk Hydro ASA | 67,659 | | 454,777 |
| Orkla ASA | 106,700 | | 828,605 |
| Salmar ASAΔ | 6,863 | | 384,361 |
| Telenor ASA | 8,257 | | 94,761 |
| Yara International ASA | 10,434 | | 370,685 |
| | | | | 6,773,869 |
| Portugal — 0.2% | | |
| EDP - Energias de Portugal SA | 154,225 | | 776,215 |
| Galp Energia SGPS SA | 27,004 | | 397,328 |
| Jeronimo Martins SGPS SA | 19,382 | | 493,282 |
| | | | | 1,666,825 |
| Singapore — 1.3% | | |
| CapitaLand Ascendas REIT | 157,957 | | 362,128 |
| CapitaLand Integrated Commercial Trust REIT | 425,903 | | 663,895 |
| Capitaland Investment, Ltd. | 174,460 | | 417,112 |
| DBS Group Holdings, Ltd. | 130,460 | | 3,299,181 |
| Grab Holdings, Ltd. Class A* | 55,000 | | 185,350 |
| Keppel Corporation, Ltd. | 84,500 | | 452,143 |
| Mapletree Logistics Trust REIT | 8,066 | | 10,620 |
| Oversea-Chinese Banking Corporation, Ltd. | 165,140 | | 1,624,880 |
| Sea, Ltd. ADR* | 18,281 | | 740,380 |
| Seatrium, Ltd.Δ* | 1,612,685 | | 144,000 |
| Singapore Airlines, Ltd.Δ | 190,850 | | 947,634 |
| Singapore Telecommunications, Ltd. | 454,500 | | 850,827 |
| United Overseas Bank, Ltd. | 56,959 | | 1,229,358 |
| UOL Group, Ltd. | 7,561 | | 35,919 |
| Wilmar International, Ltd. | 258,000 | | 696,955 |
| | | | | 11,660,382 |
| Spain — 2.6% | | |
| Acciona SA | 827 | | 121,771 |
| ACS Actividades de Construccion y Servicios SAΔ | 9,963 | | 442,505 |
| Aena SME SA 144A | 3,930 | | 713,339 |
See Notes to Financial Statements.
INTERNATIONAL EQUITY INDEX FUND
SCHEDULE OF INVESTMENTS (Continued)
| | | Shares | | Value |
| Amadeus IT Group SA | 28,463 | | $ 2,044,257 |
| Banco Bilbao Vizcaya Argentaria SA | 326,478 | | 2,975,606 |
| Banco Santander SA | 896,523 | | 3,749,873 |
| CaixaBank SA | 262,455 | | 1,080,879 |
| Cellnex Telecom SA 144A* | 23,895 | | 940,818 |
| EDP Renovaveis SAΔ | 18,830 | | 385,475 |
| Enagas SAΔ | 227 | | 3,829 |
| Endesa SAΔ | 13,556 | | 276,557 |
| Grifols SA* | 31,106 | | 532,142 |
| Iberdrola SA | 349,226 | | 4,580,721 |
| Industria de Diseno Textil SA | 83,714 | | 3,652,781 |
| Naturgy Energy Group SA | 15,059 | | 449,168 |
| Redeia Corporation SA | 23,715 | | 390,791 |
| Repsol SAΔ | 75,615 | | 1,121,668 |
| Telefonica SAΔ | 185,885 | | 726,787 |
| | | | | 24,188,967 |
| Sweden — 3.2% | | |
| Alfa Laval AB | 14,717 | | 589,181 |
| Assa Abloy AB, B Shares | 75,283 | | 2,169,595 |
| Atlas Copco AB, A Shares | 196,397 | | 3,384,139 |
| Atlas Copco AB, B Shares | 116,912 | | 1,734,522 |
| Boliden AB | 12,271 | | 384,076 |
| Epiroc AB, A Shares | 31,158 | | 627,176 |
| Epiroc AB, B Shares | 20,075 | | 352,071 |
| EQT ABΔ | 12,795 | | 362,273 |
| Essity AB, B Shares | 59,852 | | 1,483,263 |
| Fastighets AB Balder, B SharesΔ* | 28,806 | | 204,289 |
| Getinge AB, B Shares | 12,152 | | 270,594 |
| H & M Hennes & Mauritz AB, B Shares | 42,435 | | 744,312 |
| Hexagon AB, B Shares | 134,111 | | 1,610,848 |
| Industrivarden AB, A Shares | 1,009 | | 32,988 |
| Industrivarden AB, C SharesΔ | 18,571 | | 605,970 |
| Investment AB Latour, B SharesΔ | 9,171 | | 239,237 |
| Investor AB, B Shares | 76,085 | | 1,764,390 |
| L E Lundbergforetagen AB, B Shares | 5,888 | | 320,642 |
| Nibe Industrier AB, B SharesΔ | 74,413 | | 522,559 |
| Sagax AB, B Shares | 11,741 | | 323,166 |
| Sandvik AB | 81,379 | | 1,767,988 |
| Securitas AB, B SharesΔ | 23,710 | | 232,453 |
| Skandinaviska Enskilda Banken AB, A Shares | 79,780 | | 1,101,020 |
| Skanska AB, B Shares | 13,311 | | 241,163 |
| SKF AB, B Shares | 17,959 | | 359,908 |
| Svenska Cellulosa AB SCA, B SharesΔ | 49,432 | | 742,591 |
| Svenska Handelsbanken AB, A Shares | 80,926 | | 879,459 |
| Swedbank AB, A Shares | 41,659 | | 842,248 |
| Swedish Orphan Biovitrum AB* | 26,881 | | 711,599 |
| Tele2 AB, B Shares | 37,286 | | 320,499 |
| Telefonaktiebolaget LM Ericsson, B Shares | 166,228 | | 1,046,103 |
| Telia Co. AB | 126,527 | | 322,825 |
| Volvo AB, B Shares | 120,875 | | 3,145,168 |
| | | | | 29,438,315 |
| Switzerland — 10.0% | | |
| ABB, Ltd. | 67,933 | | 3,016,100 |
| | | Shares | | Value |
| Alcon, Inc. | 39,578 | | $ 3,096,425 |
| Bachem Holding AG Class BΔ | 3,310 | | 256,331 |
| Baloise Holding AG | 2,546 | | 399,183 |
| Barry Callebaut AGΔ | 404 | | 682,024 |
| Chocoladefabriken Lindt & Spruengli AG | 65 | | 780,236 |
| Chocoladefabriken Lindt & Spruengli AG (Swiss Exchange) | 8 | | 970,549 |
| Cie Financiere Richemont SA | 30,877 | | 4,264,858 |
| Clariant AG* | 4,630 | | 68,407 |
| Coca-Cola HBC AG CDI* | 53,299 | | 1,565,016 |
| DSM-Firmenich AG | 9,526 | | 968,732 |
| EMS-Chemie Holding AG | 227 | | 184,058 |
| Geberit AG | 1,229 | | 788,918 |
| Givaudan SA | 396 | | 1,642,098 |
| Holcim, Ltd.* | 30,626 | | 2,405,410 |
| Julius Baer Group, Ltd. | 11,052 | | 619,996 |
| Kuehne + Nagel International AG | 1,928 | | 665,347 |
| Logitech International SA | 9,124 | | 867,586 |
| Lonza Group AG | 5,846 | | 2,464,594 |
| Nestle SA | 149,472 | | 17,326,777 |
| Novartis AG | 131,422 | | 13,275,000 |
| Partners Group Holding AG | 837 | | 1,210,261 |
| Roche Holding AG | 43,856 | | 12,748,657 |
| Roche Holding AG (Swiss Exchange)Δ | 2,216 | | 688,568 |
| Sandoz Group AG* | 39,284 | | 1,263,926 |
| SGS SA | 4,725 | | 407,913 |
| SIG Group AG* | 6,984 | | 160,849 |
| Sika AG | 5,090 | | 1,659,728 |
| Sonova Holding AG | 4,089 | | 1,337,299 |
| Straumann Holding AG | 13,370 | | 2,160,631 |
| Swatch Group AG (The) | 13,947 | | 731,230 |
| Swiss Life Holding AG | 1,832 | | 1,273,155 |
| Swiss Prime Site AG | 4,457 | | 476,201 |
| Swiss Re AG | 16,099 | | 1,811,629 |
| Swisscom AG | 891 | | 536,266 |
| Temenos AG | 3,832 | | 357,097 |
| UBS Group AG | 142,874 | | 4,437,893 |
| VAT Group AG 144A | 1,112 | | 558,511 |
| Zurich Insurance Group AG | 8,111 | | 4,240,651 |
| | | | | 92,368,110 |
| United Kingdom — 13.3% | | |
| 3i Group PLC | 66,813 | | 2,056,472 |
| abrdn PLCΔ | 114,480 | | 260,278 |
| Admiral Group PLC | 8,048 | | 275,149 |
| Anglo American PLC | 72,180 | | 1,806,428 |
| Antofagasta PLC | 23,560 | | 503,759 |
| Ashtead Group PLC | 24,479 | | 1,701,466 |
| Associated British Foods PLC | 48,376 | | 1,458,005 |
| Auto Trader Group PLC 144AΔ | 54,162 | | 497,567 |
| Aviva PLC | 188,579 | | 1,043,490 |
| BAE Systems PLC | 197,243 | | 2,791,973 |
| Barclays PLC | 1,098,843 | | 2,151,609 |
| Barratt Developments PLC | 90,118 | | 645,561 |
| Berkeley Group Holdings PLC | 15,143 | | 904,054 |
| BP PLC | 887,542 | | 5,261,414 |
See Notes to Financial Statements.
| | | Shares | | Value |
| BT Group PLCΔ | 453,308 | | $ 714,226 |
| Bunzl PLC | 26,142 | | 1,062,294 |
| Burberry Group PLC | 55,860 | | 1,007,544 |
| Centrica PLC | 350,000 | | 627,446 |
| CK Hutchison Holdings, Ltd. | 212,500 | | 1,141,678 |
| CK Infrastructure Holdings, Ltd. | 35,000 | | 193,697 |
| Coca-Cola Europacific Partners PLC | 18,569 | | 1,239,295 |
| Compass Group PLC | 143,434 | | 3,924,833 |
| Croda International PLC | 8,431 | | 542,315 |
| Haleon PLC | 481,639 | | 1,971,962 |
| Halma PLC | 38,546 | | 1,120,760 |
| Hargreaves Lansdown PLCΔ | 23,678 | | 221,294 |
| Hikma Pharmaceuticals PLC | 41,006 | | 934,408 |
| HSBC Holdings PLC | 1,241,177 | | 10,041,081 |
| Informa PLC | 87,112 | | 866,451 |
| InterContinental Hotels Group PLCΔ | 22,571 | | 2,035,361 |
| Intertek Group PLC | 16,272 | | 880,911 |
| J Sainsbury PLCΔ | 118,172 | | 455,603 |
| JD Sports Fashion PLC | 259,615 | | 547,875 |
| Kingfisher PLC | 252,818 | | 783,328 |
| Land Securities Group PLC REIT | 93,472 | | 838,857 |
| Legal & General Group PLC | 335,080 | | 1,070,812 |
| Lloyds Banking Group PLC | 4,085,048 | | 2,477,733 |
| London Stock Exchange Group PLC | 27,951 | | 3,304,131 |
| M&G PLCΔ | 174,268 | | 493,198 |
| Mondi PLC | 49,454 | | 967,553 |
| National Grid PLC | 232,414 | | 3,130,925 |
| NatWest Group PLC | 356,433 | | 992,810 |
| Next PLC | 11,694 | | 1,208,866 |
| Ocado Group PLCΔ* | 59,115 | | 571,047 |
| Pearson PLC | 41,042 | | 504,116 |
| Persimmon PLC | 15,563 | | 275,094 |
| Phoenix Group Holdings PLCΔ | 52,209 | | 355,498 |
| Prudential PLC | 159,227 | | 1,796,510 |
| Reckitt Benckiser Group PLC | 51,635 | | 3,562,992 |
| RELX PLC | 123,017 | | 4,880,555 |
| Rentokil Initial PLC | 164,319 | | 926,146 |
| Rio Tinto PLC | 76,199 | | 5,667,767 |
| Rolls-Royce Holdings PLC* | 602,696 | | 2,298,906 |
| Sage Group PLC (The) | 115,730 | | 1,727,712 |
| Schroders PLC | 111,805 | | 611,323 |
| Segro PLC REIT | 80,953 | | 912,928 |
| Severn Trent PLC | 25,238 | | 829,940 |
| Shell PLC | 353,541 | | 11,572,844 |
| Smith & Nephew PLC | 86,838 | | 1,192,900 |
| Smiths Group PLC | 48,466 | | 1,087,840 |
| Spirax-Sarco Engineering PLC | 6,430 | | 860,306 |
| | | Shares | | Value |
| SSE PLC | 62,340 | | $ 1,471,598 |
| St. James’s Place PLC | 37,454 | | 325,861 |
| Standard Chartered PLC | 147,424 | | 1,251,061 |
| Taylor Wimpey PLC | 203,676 | | 381,265 |
| Tesco PLC | 610,319 | | 2,261,065 |
| Unilever PLC | 159,554 | | 7,724,173 |
| United Utilities Group PLC | 72,451 | | 978,688 |
| Vodafone Group PLC | 711,364 | | 621,263 |
| Whitbread PLC | 28,617 | | 1,332,331 |
| | | | | 122,136,201 |
Total Foreign Common Stocks
(Cost $782,263,964) | | 895,946,015 |
| FOREIGN PREFERRED STOCKS — 0.5% |
| Germany — 0.5% | | |
| Bayerische MotorenWerke AG 9.80%◊ | | 7,785 | | 774,630 |
| Dr. Ing hc F Porsche AG 1.20% 144A◊ | | 6,210 | | 546,959 |
| Henkel AG & Co. KGaA 2.57%◊ | | 13,912 | | 1,119,110 |
| Porsche Automobil Holding SE 5.70%◊ | | 6,933 | | 354,289 |
| Sartorius AG 0.49%◊ | | 2,399 | | 880,962 |
| Volkswagen AG 8.25%◊ | | 11,005 | | 1,356,436 |
Total Foreign Preferred Stocks
(Cost $5,328,663) | | 5,032,386 |
| MONEY MARKET FUNDS — 3.1% |
| Northern Institutional Liquid Assets Portfolio (Shares), 5.40%ا | 13,524,095 | | 13,524,095 |
GuideStone Money Market Fund, 5.28%
(Institutional Class)Ø∞ | 11,554,017 | | 11,554,017 |
| Northern Institutional U.S. Treasury Portfolio (Premier), 5.22%Ø | 3,045,555 | | 3,045,555 |
Total Money Market Funds
(Cost $28,123,667) | | 28,123,667 |
TOTAL INVESTMENTS — 100.8%
(Cost $815,716,294) | | | 929,102,068 |
Liabilities in Excess of Other
Assets — (0.8)% | | | (7,083,932) |
| NET ASSETS — 100.0% | | | $922,018,136 |
Futures Contracts outstanding at December 31, 2023:
| Future Type | | Expiration Date | | Open Long
(Short) Contracts | | Notional
Market Value
of Contracts | | Value and
Unrealized
Appreciation
(Depreciation) |
| MSCI EAFE Index | | 03/2024 | | 169 | | $19,032,780 | | $207,082 |
See Notes to Financial Statements.
INTERNATIONAL EQUITY INDEX FUND
SCHEDULE OF INVESTMENTS (Continued)
VALUATION HIERARCHY
The following is a summary of the inputs used, as of December 31, 2023, in valuing the Fund’s investments carried at fair value:
| | Total
Value | | Level 1
Quoted Prices | | Level 2
Other Significant
Observable Inputs | | Level 3
Significant
Unobservable Inputs |
| Assets: | | | | | | | |
| Investments in Securities: | | | | | | | |
| Foreign Common Stocks: | | | | | | | |
| Belgium | $ 6,796,625 | | $ 1,031,218 | | $ 5,765,407 | | $ — |
| Finland | 9,391,615 | | 334,142 | | 9,057,473 | | — |
| Hong Kong | 18,988,791 | | 137,777 | | 18,851,014 | | — |
| Israel | 5,864,026 | | 2,705,113 | | 3,158,913 | | — |
| Netherlands | 57,229,401 | | 4,387,689 | | 52,841,712 | | — |
| New Zealand | 2,354,858 | | 930,997 | | 1,423,861 | | — |
| Norway | 6,773,869 | | 94,761 | | 6,679,108 | | — |
| Singapore | 11,660,382 | | 925,730 | | 10,734,652 | | — |
| Sweden | 29,438,315 | | 711,599 | | 28,726,716 | | — |
| Switzerland | 92,368,110 | | 1,263,926 | | 91,104,184 | | — |
| United Kingdom | 122,136,201 | | 4,031,268 | | 118,104,933 | | — |
| Other ^^ | 532,943,822 | | — | | 532,943,822 | | — |
| Total Foreign Common Stocks | 895,946,015 | | 16,554,220 | | 879,391,795 | | — |
| Foreign Preferred Stocks | 5,032,386 | | — | | 5,032,386 | | — |
| Money Market Funds | 28,123,667 | | 28,123,667 | | — | | — |
| Total Assets - Investments in Securities | $929,102,068 | | $44,677,887 | | $884,424,181 | | $ — |
| Other Financial Instruments*** | | | | | | | |
| Futures Contracts | $ 207,082 | | $ 207,082 | | $ — | | $ — |
| Total Assets - Other Financial Instruments | $ 207,082 | | $ 207,082 | | $ — | | $ — |
| ^^ | Classifications as defined in the Schedule of Investments. |
| *** | Other financial instruments are derivative instruments, such as futures contracts, which are valued at the unrealized appreciation (depreciation) on the investment. Further details regarding the value of these investments can be found in the preceding "Futures Contracts outstanding" disclosure. |
See Notes to Financial Statements.
International Equity Fund (Unaudited)
With an annual return of 18.24%, developed non-U.S. markets (represented by the MSCI EAFE Index) saw strong positive performance in 2023, rebounding from a challenging 2022, but lagging their U.S. counterparts. Style had less of an impact on returns this year than in 2022 with MSCI EAFE Value Index up 19.79% and MSCI EAFE Growth Index up 17.97%. Among major foreign developed markets, Japan, France and Germany were the largest contributors to index return, while Finland, New Zealand and Portugal were the relative laggards. Sector performance was positive across all sectors in a strong year for international markets, with information technology posting the highest returns and consumer staples and real estate up the least.
The Fund primarily invests in equity securities of foreign companies in countries having economies and markets generally considered to be developed but may also invest in equity securities of foreign companies located in emerging markets. The Fund’s portfolio is diversified among a large number of companies across different industries, economic sectors and countries. The Investor Class of the Fund underperformed its benchmark, the MSCI EAFE Index, for the one-year period ended December 31, 2023 (18.03% (net of fees) versus 18.24%). On a country basis, stock selection within the United Kingdom, Italy and France benefited the Fund’s relative performance while exposure to U.S. listed stocks detracted. On a sector basis, stock selection within consumer staples and materials was additive, but stock selection within financials weighed on relative returns with exposure to the insurance industry being a relative laggard.
Within the Fund, certain derivatives were utilized to express active views in currency and country selection. These derivative positions primarily included currency forward contracts, stock index futures and total return swaps. Overall, derivative exposure had a slight positive impact on Fund performance over the course of the year.
This Fund may be suitable to investors who seek higher, long-term rates of return, can accept significant short-term fluctuations in account value and want to diversify their portfolio with international equity securities. Securities of foreign issuers may be negatively impacted by political events, economic conditions or inefficient, illiquid or unregulated markets in foreign countries, and they also may be subject to inadequate regulatory or accounting standards, which may increase investment risk. Investing in emerging markets may involve greater risks than investing in more developed foreign markets because, among other things, emerging markets often have more political and economic instability. To the extent that the investment adviser misjudges current market conditions, the Fund’s volatility may be amplified by its use of short sales and derivatives and by its ability to select sub-advisers to allocate assets. Derivatives involve different risks from, and in some respects greater than, those risks associated with investing directly in securities, currencies or other instruments. Derivatives may be illiquid or less liquid, volatile, difficult to price and leveraged, so that small changes in the value of the underlying instruments may produce disproportionate losses to the Fund. Short sales involve selling a security the Fund does not own in anticipation that the security will decline in price. Short sales expose the Fund to the risk that it will be required to buy the security sold short (also known as “covering” the short position) at a time when the security has appreciated in value, thus resulting in a loss to the Fund. The Fund’s potential loss on a short position is limited only by the maximum attainable price of the security, less the price at which the security was sold by the Fund. Therefore, in theory, stocks sold short have unlimited risk. The Fund’s use of short sales in effect “leverages” the Fund. The use of leverage may magnify the Fund’s gains or losses, and leverage also creates interest expense that may lower the Fund’s overall returns. It is possible to lose money by investing in the Fund.
See Notes to Financial Statements.
International Equity Fund (Unaudited)
At December 31, 2023, the portfolio holdings of the Fund, as a percentage of net assets, is shown in the following table. Portfolio holdings are subject to risk and may change at any time.
| | % |
| Financials | 21.3 |
| Industrials | 17.1 |
| Consumer Discretionary | 10.9 |
| Information Technology | 10.5 |
| Health Care | 10.2 |
| Consumer Staples | 7.9 |
| Materials | 5.7 |
| Money Market Funds | 5.7 |
| Energy | 3.0 |
| Communication Services | 2.5 |
| Real Estate | 1.4 |
| Utilities | 0.8 |
| | 97.0 |
| Average Annual Total Returns as of 12/31/23 | |
| | | Institutional Class* | | Investor Class* | | Benchmark** | |
| One Year | | 18.39% | | 18.03% | | 18.24% | |
| Five Year | | 7.73% | | 7.42% | | 8.16% | |
| Ten Year | | 4.31% | | 4.03% | | 4.28% | |
| Since Inception | | 5.62% | | 5.39% | | 5.36% | |
| Inception Date | | 08/27/01 | | 08/27/01 | | | |
| Total Fund Operating Expenses (May 1, 2023 Prospectus)(1)# | | 0.86% | | 1.14% | | | |
| (1) | Current information regarding the Fund’s Operating Expenses can be found in the Financial Highlights. |
#Net expense ratio
The performance data quoted represents past performance and does not guarantee future results. The performance data in the table and graph does not reflect the deduction of taxes that a shareholder would pay on Fund distributions or the redemption of Fund shares. Current performance may be lower or higher. Performance data current to the most recent month-end may be obtained at GuideStoneFunds.com. The investment return and principal value of an investment will fluctuate so that shares, when redeemed, may be worth more or less than their original cost.
See Notes to Financial Statements.
International Equity Fund (Unaudited)
The graph illustrates the results of a hypothetical $10,000 investment in the Investor Class of the Fund for the 10-year period from December 31, 2013 to December 31, 2023, with all dividends and capital gains reinvested, with the MSCI EAFE Index.
*These returns reflect investment advisory and shareholder servicing fee waivers, if applicable, during the reported time periods.
Unlike a mutual fund, an index is not available for direct investment and the performance of an index assumes no taxes, transaction costs, management fees or other expenses.
See Notes to Financial Statements.
INTERNATIONAL EQUITY FUND
| | | Shares | | Value |
| COMMON STOCKS — 3.6% |
| Consumer Discretionary — 0.7% | | |
| MercadoLibre, Inc.* | 5,160 | | $ 8,109,147 |
| Financials — 1.9% | | |
| Arch Capital Group, Ltd.* | 63,139 | | 4,689,333 |
| Axis Capital Holdings, Ltd. | 86,948 | | 4,814,311 |
| Everest Group, Ltd. | 32,019 | | 11,321,278 |
| | | | | 20,824,922 |
| Information Technology — 1.0% | | |
| Atlassian Corporation Class A* | 34,230 | | 8,141,947 |
| EPAM Systems, Inc.* | 10,370 | | 3,083,416 |
| | | | | 11,225,363 |
Total Common Stocks
(Cost $36,946,479) | | 40,159,432 |
| FOREIGN COMMON STOCKS — 86.7% |
| Australia — 1.9% | | |
| ASX, Ltd.‡‡ | 2,477 | | 106,419 |
| BHP Group, Ltd.‡‡ | 104,203 | | 3,560,056 |
| BlueScope Steel, Ltd.‡‡ | 173,572 | | 2,767,167 |
| Cochlear, Ltd. | 303 | | 61,644 |
| Coles Group, Ltd. | 13,939 | | 153,121 |
| Dexus REIT‡‡ | 60,007 | | 313,605 |
| Fortescue, Ltd. | 8,689 | | 171,324 |
| Goodman Group REIT‡‡ | 53,845 | | 927,042 |
| GPT Group (The) REIT | 112,950 | | 356,466 |
| IDP Education, Ltd. | 15,441 | | 210,633 |
| Incitec Pivot, Ltd. | 376,755 | | 729,721 |
| JB Hi-Fi, Ltd. | 45,436 | | 1,642,010 |
| Macquarie Group, Ltd. | 494 | | 61,840 |
| Mirvac Group REIT‡‡ | 382,582 | | 544,272 |
| Northern Star Resources, Ltd. | 199,789 | | 1,853,664 |
| Qantas Airways, Ltd.* | 386,810 | | 1,416,891 |
| QBE Insurance Group, Ltd. | 7,862 | | 79,662 |
| Rio Tinto, Ltd.‡‡ | 5,159 | | 477,712 |
| Scentre Group REIT‡‡ | 200,985 | | 409,288 |
| Sonic Healthcare, Ltd. | 47,177 | | 1,030,852 |
| South32, Ltd. | 358,707 | | 811,267 |
| Stockland REIT‡‡ | 222,407 | | 674,479 |
| Vicinity Centres REIT‡‡ | 362,344 | | 503,337 |
| Westpac Banking Corporation | 36,136 | | 563,811 |
| Whitehaven Coal, Ltd. | 302,430 | | 1,534,754 |
| Woolworths Group, Ltd. | 13,754 | | 348,938 |
| | | | | 21,309,975 |
| Belgium — 0.6% | | |
| Ageas SA/NV | 3,171 | | 137,845 |
| Groupe Bruxelles Lambert NV‡‡ | 446 | | 35,124 |
| Liberty Global, Ltd. Class A* | 288,865 | | 5,133,131 |
| Proximus SADP | 127,405 | | 1,197,776 |
| | | | | 6,503,876 |
| Brazil — 0.4% | | |
| Lojas Renner SA* | 1,182,881 | | 4,244,454 |
| Canada — 3.8% | | |
| Agnico Eagle Mines, Ltd. | 51,386 | | 2,818,522 |
| Canadian National Railway Co.Δ | 60,151 | | 7,556,770 |
| | | Shares | | Value |
| Canadian Natural Resources, Ltd. | 55,620 | | $ 3,643,917 |
| Canadian Pacific Kansas City, Ltd. | 122,998 | | 9,724,222 |
| Kinross Gold Corporation | 408,838 | | 2,474,534 |
| Thomson Reuters CorporationΔ | 28,150 | | 4,115,693 |
| Toronto-Dominion Bank (The) | 125,237 | | 8,092,368 |
| Waste Connections, Inc. | 28,480 | | 4,251,209 |
| | | | | 42,677,235 |
| China — 0.5% | | |
| Baidu, Inc. Class A* | 378,052 | | 5,627,651 |
| Denmark — 0.4% | | |
| AP Moeller - Maersk A/S Class B | 522 | | 939,613 |
| Coloplast A/S Class B | 1,003 | | 114,609 |
| Danske Bank A/S | 24,743 | | 661,413 |
| Demant A/S* | 1,259 | | 55,220 |
| Genmab A/S* | 1,936 | | 617,299 |
| ISS A/S | 69,246 | | 1,322,572 |
| Novozymes A/S Class B | 1,383 | | 76,028 |
| Pandora A/S | 5,870 | | 811,558 |
| | | | | 4,598,312 |
| Finland — 0.0% | | |
| Fortum OYJ | 11,009 | | 159,015 |
| UPM-Kymmene OYJ | 3,000 | | 113,162 |
| Wartsila OYJ Abp | 12,894 | | 187,394 |
| | | | | 459,571 |
| France — 11.1% | | |
| Air Liquide SA | 49,677 | | 9,671,885 |
| AXA SA | 132,432 | | 4,324,760 |
| Bureau Veritas SA | 241,407 | | 6,107,536 |
| Capgemini SE | 57,432 | | 12,002,807 |
| Cie Generale des Etablissements Michelin SCA | 170,884 | | 6,139,273 |
| Danone SA | 137,488 | | 8,920,024 |
| Engie SA | 495,697 | | 6,584,480 |
| L’Oreal SA | 35,347 | | 17,620,507 |
| Safran SA | 30,700 | | 5,412,730 |
| Sanofi SA | 128,439 | | 12,763,338 |
| Schneider Electric SE | 92,966 | | 18,714,628 |
| SCOR SE | 119,751 | | 3,508,829 |
| TotalEnergies SE | 191,900 | | 13,049,013 |
| | | | | 124,819,810 |
| Germany — 7.9% | | |
| adidas AG | 21,820 | | 4,433,973 |
| Allianz SE | 1,114 | | 297,707 |
| Bayerische Motoren Werke AG | 30,232 | | 3,363,965 |
| Beiersdorf AG | 67,518 | | 10,111,145 |
| BioNTech SE ADR* | 57,653 | | 6,084,698 |
| Carl Zeiss Meditec AG | 2,128 | | 231,642 |
| Daimler Truck Holding AG | 146,759 | | 5,512,864 |
| Deutsche Bank AG | 128,874 | | 1,759,271 |
| Deutsche Boerse AG | 81,065 | | 16,694,106 |
| Deutsche Lufthansa AG* | 7,211 | | 64,108 |
| Deutsche Post AG | 121,045 | | 5,991,252 |
| E.ON SE‡‡ | 96,288 | | 1,293,635 |
| Fresenius SE & Co. KGaA‡‡ | 5,845 | | 181,169 |
See Notes to Financial Statements.
| | | Shares | | Value |
| HOCHTIEF AG | 4,532 | | $ 501,900 |
| KION Group AG | 12,726 | | 543,138 |
| Mercedes-Benz Group AG | 51,621 | | 3,561,738 |
| Muenchener Rueckversicherungs-Gesellschaft AG | 953 | | 395,318 |
| Nemetschek SE | 2,547 | | 219,894 |
| SAP SE | 109,795 | | 16,899,823 |
| Siemens AG | 39,834 | | 7,473,230 |
| Siemens Energy AG* | 3,521 | | 46,534 |
| TeamViewer AG 144A* | 70,366 | | 1,092,962 |
| Telefonica Deutschland Holding AG | 359,419 | | 933,735 |
| thyssenkrupp AG | 213,032 | | 1,481,946 |
| Vonovia SE | 8,772 | | 275,631 |
| | | | | 89,445,384 |
| Guatemala — 0.0% | | |
| Millicom International Cellular SA SDR* | 30,643 | | 549,043 |
| Hong Kong — 1.8% | | |
| AIA Group, Ltd. | 1,036,800 | | 8,930,898 |
| Alibaba Group Holding, Ltd. | 512,272 | | 4,934,482 |
| Tencent Holdings, Ltd. | 183,600 | | 6,931,795 |
| | | | | 20,797,175 |
| India — 1.9% | | |
| HDFC Bank, Ltd. | 354,890 | | 7,266,735 |
| HDFC Bank, Ltd. ADR | 138,912 | | 9,322,384 |
| ICICI Bank, Ltd. ADR | 201,340 | | 4,799,946 |
| | | | | 21,389,065 |
| Ireland — 5.9% | | |
| Accenture PLC Class A | 12,850 | | 4,509,194 |
| Aon PLC Class A | 19,700 | | 5,733,094 |
| CRH PLC | 58,715 | | 4,060,729 |
| ICON PLC* | 29,830 | | 8,443,978 |
| James Hardie Industries PLC CDI* | 19,201 | | 740,312 |
| Kerry Group PLC Class A | 28,843 | | 2,503,554 |
| Linde PLC | 9,660 | | 3,967,459 |
| Medtronic PLC | 125,072 | | 10,303,431 |
| Ryanair Holdings PLC ADR* | 79,679 | | 10,625,991 |
| STERIS PLC | 21,120 | | 4,643,232 |
| Willis Towers Watson PLC | 46,142 | | 11,129,450 |
| | | | | 66,660,424 |
| Israel — 0.9% | | |
| Check Point Software Technologies, Ltd.* | 63,248 | | 9,663,662 |
| Italy — 0.4% | | |
| Banco BPM SpA | 92,917 | | 492,362 |
| Brunello Cucinelli SpA | 813 | | 79,570 |
| Buzzi SpA | 7,468 | | 227,136 |
| Leonardo SpA | 80,709 | | 1,333,564 |
| UniCredit SpA | 41,782 | | 1,137,711 |
| Unipol Gruppo SpA | 276,644 | | 1,578,814 |
| | | | | 4,849,157 |
| Japan — 19.0% | | |
| Advantest CorporationΔ | 133,200 | | 4,488,248 |
| Aeon Co., Ltd. | 11,500 | | 256,617 |
| | | Shares | | Value |
| Aisin Corporation | 3,800 | | $ 132,473 |
| Ajinomoto Co., Inc. | 17,200 | | 662,094 |
| ANA Holdings, Inc.* | 14,100 | | 305,484 |
| Bandai Namco Holdings, Inc. | 19,600 | | 391,966 |
| BayCurrent Consulting, Inc. | 6,200 | | 217,037 |
| Bridgestone Corporation | 17,000 | | 702,124 |
| Brother Industries, Ltd. | 25,000 | | 398,125 |
| Canon, Inc. | 21,700 | | 556,686 |
| Central Japan Railway Co. | 18,000 | | 456,845 |
| Chugai Pharmaceutical Co., Ltd. | 17,100 | | 646,010 |
| Concordia Financial Group, Ltd. | 96,400 | | 439,408 |
| Dai-ichi Life Holdings, Inc. | 81,800 | | 1,735,217 |
| Daiichi Sankyo Co., Ltd. | 80,900 | | 2,214,777 |
| Daikin Industries, Ltd. | 44,200 | | 7,170,123 |
| Daito Trust Construction Co., Ltd.‡‡ | 69,011 | | 7,987,779 |
| Daiwa House Industry Co., Ltd.‡‡ | 33,290 | | 1,006,370 |
| Denso Corporation | 40,000 | | 600,494 |
| Dentsu Group, Inc.Δ | 8,000 | | 204,827 |
| Disco Corporation | 3,300 | | 814,990 |
| East Japan Railway Co. | 9,000 | | 518,065 |
| Eisai Co., Ltd. | 116,510 | | 5,801,170 |
| ENEOS Holdings, Inc. | 96,100 | | 381,155 |
| FANUC Corporation | 18,600 | | 545,894 |
| Fast Retailing Co., Ltd. | 5,800 | | 1,434,218 |
| Fuji Electric Co., Ltd. | 10,100 | | 432,906 |
| FUJIFILM Holdings Corporation | 7,700 | | 461,459 |
| Fujitsu, Ltd. | 6,400 | | 963,160 |
| Hankyu Hanshin Holdings, Inc. | 14,000 | | 444,918 |
| Hitachi Construction Machinery Co., Ltd. | 52,901 | | 1,392,556 |
| Hitachi, Ltd.‡‡ | 15,800 | | 1,136,490 |
| Honda Motor Co., Ltd. | 231,400 | | 2,386,941 |
| Hoya Corporation | 66,400 | | 8,269,405 |
| Ibiden Co., Ltd. | 5,100 | | 281,345 |
| Iida Group Holdings Co., Ltd. | 91,482 | | 1,366,412 |
| Inpex CorporationΔ | 54,100 | | 723,953 |
| ITOCHU Corporation | 26,100 | | 1,063,310 |
| Japan Airlines Co., Ltd. | 16,200 | | 318,250 |
| Japan Metropolitan Fund Invest REIT | 178 | | 128,481 |
| Japan Post Bank Co., Ltd. | 13,400 | | 136,371 |
| Japan Post Holdings Co., Ltd. | 66,600 | | 594,569 |
| Japan Post Insurance Co., Ltd. | 94,492 | | 1,677,293 |
| Japan Real Estate Investment Corporation REITΔ | 127 | | 525,394 |
| JFE Holdings, Inc. | 115,362 | | 1,784,790 |
| JSR CorporationΔ | 12,905 | | 367,203 |
| Kansai Paint Co., Ltd. | 20,100 | | 342,734 |
| Kao Corporation | 10,600 | | 435,720 |
| Kawasaki Kisen Kaisha, Ltd. | 18,335 | | 784,673 |
| KDDI Corporation | 29,700 | | 942,040 |
| Keyence Corporation | 13,900 | | 6,107,055 |
| Kintetsu Group Holdings Co., Ltd.Δ | 13,000 | | 411,892 |
| Komatsu, Ltd. | 42,200 | | 1,098,185 |
| Kubota CorporationΔ | 578,499 | | 8,682,111 |
| Kuraray Co., Ltd. | 32,419 | | 327,232 |
| Kyocera Corporation | 32,800 | | 477,570 |
| Lasertec Corporation | 2,700 | | 708,822 |
| Lawson, Inc. | 5,400 | | 278,923 |
See Notes to Financial Statements.
INTERNATIONAL EQUITY FUND
SCHEDULE OF INVESTMENTS (Continued)
| | | Shares | | Value |
| Lion Corporation | 40,400 | | $ 374,666 |
| LY Corporation | 45,000 | | 159,133 |
| M3, Inc. | 55,400 | | 914,227 |
| Makita Corporation | 137,591 | | 3,784,492 |
| Marubeni Corporation | 14,500 | | 228,296 |
| MatsukiyoCocokara & Co. | 20,400 | | 360,548 |
| Mazda Motor Corporation | 121,135 | | 1,294,823 |
| McDonald’s Holdings Co. Japan, Ltd. | 6,100 | | 264,235 |
| MEIJI Holdings Co., Ltd. | 18,200 | | 432,316 |
| MINEBEA MITSUMI, Inc. | 225,771 | | 4,621,088 |
| MISUMI Group, Inc. | 23,400 | | 395,080 |
| Mitsubishi Chemical Group Corporation | 69,700 | | 426,084 |
| Mitsubishi Corporation | 168,702 | | 2,687,299 |
| Mitsubishi Electric Corporation | 47,400 | | 670,430 |
| Mitsubishi Estate Co., Ltd.‡‡ | 60,369 | | 827,543 |
| Mitsubishi Gas Chemical Co., Inc. | 5,939 | | 94,818 |
| Mitsubishi Heavy Industries, Ltd. | 9,200 | | 535,662 |
| Mitsubishi Motors Corporation | 397,648 | | 1,258,577 |
| Mitsubishi UFJ Financial Group, Inc. | 277,400 | | 2,380,685 |
| Mitsui & Co., Ltd. | 43,427 | | 1,626,947 |
| Mitsui Chemicals, Inc. | 14,100 | | 416,965 |
| Mitsui Fudosan Co., Ltd.‡‡ | 35,314 | | 863,417 |
| Mizuho Financial Group, Inc. | 221,100 | | 3,771,483 |
| Murata Manufacturing Co., Ltd. | 24,900 | | 526,186 |
| NEC Corporation | 9,500 | | 561,319 |
| Nexon Co., Ltd.Δ | 11,900 | | 216,450 |
| NGK Insulators, Ltd. | 27,009 | | 322,106 |
| Nidec Corporation | 9,000 | | 362,764 |
| Nintendo Co., Ltd. | 20,600 | | 1,071,898 |
| Nippon Building Fund, Inc. REIT | 20 | | 86,578 |
| NIPPON EXPRESS HOLDINGS, INC. | 10,294 | | 584,081 |
| Nippon Shinyaku Co., Ltd. | 1,700 | | 60,136 |
| Nippon Steel Corporation | 89,446 | | 2,043,285 |
| Nippon Telegraph & Telephone Corporation | 560,000 | | 683,807 |
| Nippon Yusen KK | 42,400 | | 1,309,461 |
| Nissan Motor Co., Ltd. | 15,600 | | 60,995 |
| Nitori Holdings Co., Ltd. | 2,500 | | 335,691 |
| Nomura Holdings, Inc. | 136,100 | | 612,936 |
| NSK, Ltd. | 111,000 | | 599,827 |
| Obayashi Corporation | 50,764 | | 438,521 |
| Obic Co., Ltd. | 2,600 | | 447,343 |
| Olympus Corporation | 26,200 | | 378,178 |
| Omron Corporation | 7,200 | | 335,037 |
| Ono Pharmaceutical Co., Ltd. | 10,600 | | 188,569 |
| Oracle Corporation | 800 | | 61,583 |
| Oriental Land Co., Ltd.Δ | 24,800 | | 921,774 |
| ORIX Corporation | 34,900 | | 655,463 |
| Osaka Gas Co., Ltd. | 21,900 | | 457,151 |
| Otsuka Holdings Co., Ltd. | 16,000 | | 598,352 |
| Pan Pacific International Holdings Corporation | 15,100 | | 359,447 |
| Panasonic Holdings Corporation | 164,600 | | 1,620,912 |
| Recruit Holdings Co., Ltd. | 25,400 | | 1,062,003 |
| Renesas Electronics Corporation* | 99,000 | | 1,770,216 |
| | | Shares | | Value |
| Ricoh Co., Ltd. | 48,003 | | $ 367,632 |
| Ryohin Keikaku Co., Ltd. | 13,900 | | 232,166 |
| SCREEN Holdings Co., Ltd. | 5,500 | | 463,599 |
| Secom Co., Ltd. | 6,700 | | 482,000 |
| Sekisui Chemical Co., Ltd. | 38,500 | | 553,744 |
| Seven & i Holdings Co., Ltd. | 13,300 | | 526,009 |
| Shimamura Co., Ltd. | 17,636 | | 1,969,305 |
| Shimano, Inc. | 2,000 | | 308,088 |
| Shin-Etsu Chemical Co., Ltd. | 32,500 | | 1,359,253 |
| Shionogi & Co., Ltd. | 32,800 | | 1,578,598 |
| Shiseido Co., Ltd. | 10,900 | | 328,552 |
| SMC Corporation | 16,600 | | 8,879,938 |
| SoftBank Corporation | 68,800 | | 857,367 |
| SoftBank Group Corporation | 16,500 | | 728,285 |
| Sohgo Security Services Co., Ltd. | 35,345 | | 203,088 |
| Sojitz Corporation‡‡ | 55,160 | | 1,242,694 |
| Sompo Holdings, Inc. | 102,302 | | 5,005,470 |
| Sony Group Corporation | 75,776 | | 7,170,904 |
| Stanley Electric Co., Ltd. | 19,800 | | 371,463 |
| Subaru Corporation | 101,144 | | 1,844,807 |
| Sumitomo Corporation | 94,479 | | 2,056,019 |
| Sumitomo Electric Industries, Ltd. | 39,500 | | 501,199 |
| Sumitomo Forestry Co., Ltd. | 26,636 | | 791,384 |
| Sumitomo Heavy Industries, Ltd. | 19,701 | | 495,187 |
| Sumitomo Metal Mining Co., Ltd. | 7,300 | | 216,794 |
| Sumitomo Mitsui Financial Group, Inc. | 28,600 | | 1,391,672 |
| Sumitomo Mitsui Trust Holdings, Inc. | 385,222 | | 7,377,726 |
| Sumitomo Realty & Development Co., Ltd.‡‡ | 6,455 | | 191,288 |
| Suntory Beverage & Food, Ltd. | 12,800 | | 420,863 |
| Suzuki Motor Corporation | 181,692 | | 7,743,087 |
| Sysmex Corporation | 5,000 | | 277,953 |
| T&D Holdings, Inc. | 23,900 | | 379,423 |
| Takeda Pharmaceutical Co., Ltd. | 33,000 | | 946,376 |
| TDK Corporation | 13,700 | | 649,714 |
| Terumo Corporation | 197,200 | | 6,448,639 |
| THK Co., Ltd. | 16,423 | | 320,922 |
| Tokio Marine Holdings, Inc. | 201,884 | | 5,027,112 |
| Tokyo Electron, Ltd.‡‡ | 17,100 | | 3,039,352 |
| Tokyo Gas Co., Ltd. | 19,100 | | 438,129 |
| Tokyu Corporation | 35,900 | | 437,732 |
| Tosoh Corporation | 29,600 | | 377,342 |
| Toyo Suisan Kaisha, Ltd. | 4,300 | | 221,864 |
| Toyota Motor Corporation | 212,700 | | 3,897,455 |
| Toyota Tsusho Corporation | 14,177 | | 831,937 |
| Trend Micro, Inc. | 9,100 | | 485,667 |
| Unicharm Corporation | 7,400 | | 267,638 |
| USS Co., Ltd. | 21,800 | | 437,661 |
| Welcia Holdings Co., Ltd. | 3,300 | | 57,659 |
| Yakult Honsha Co., Ltd. | 33,700 | | 756,485 |
| Yamada Holdings Co., Ltd. | 440,188 | | 1,367,869 |
| | | | | 214,566,352 |
| Jersey — 1.9% | | |
| Arcadium Lithium PLC CDI* | 68,035 | | 519,723 |
| Experian PLC | 383,285 | | 15,636,243 |
See Notes to Financial Statements.
| | | Shares | | Value |
| Ferguson PLC | 30,150 | | $ 5,774,561 |
| | | | | 21,930,527 |
| Luxembourg — 0.1% | | |
| ArcelorMittal SA | 22,996 | | 652,627 |
| Mexico — 0.8% | | |
| Fomento Economico Mexicano SAB de CV ADR | 27,796 | | 3,623,209 |
| Wal-Mart de Mexico SAB de CV | 1,187,105 | | 4,990,720 |
| | | | | 8,613,929 |
| Netherlands — 4.9% | | |
| Adyen NV 144A* | 5,620 | | 7,255,089 |
| Akzo Nobel NV | 116,648 | | 9,659,249 |
| Argenx SE* | 1,148 | | 436,663 |
| ASM International NV | 11,260 | | 5,860,545 |
| ASML Holding NV | 5,497 | | 4,149,616 |
| ASML Holding NV (NASDAQ Exchange) | 7,230 | | 5,472,532 |
| BE Semiconductor Industries NV | 11,435 | | 1,726,410 |
| Euronext NV 144A | 60,448 | | 5,253,332 |
| Ferrari NV | 24,110 | | 8,139,699 |
| ING Groep NV‡‡ | 38,871 | | 582,853 |
| Koninklijke Ahold Delhaize NV | 9,885 | | 284,406 |
| Koninklijke Philips NV* | 68,568 | | 1,604,644 |
| Koninklijke Vopak NV | 20,333 | | 684,277 |
| NN Group NV | 28,184 | | 1,113,856 |
| Prosus NV* | 32,091 | | 955,994 |
| Signify NV 144A | 36,999 | | 1,240,807 |
| Stellantis NV | 54,076 | | 1,267,036 |
| | | | | 55,687,008 |
| New Zealand — 0.1% | | |
| Xero, Ltd.* | 14,252 | | 1,087,264 |
| Norway — 0.1% | | |
| DNB Bank ASA | 3,561 | | 75,711 |
| Equinor ASA | 23,503 | | 744,857 |
| | | | | 820,568 |
| Peru — 0.4% | | |
| Credicorp, Ltd. | 31,221 | | 4,680,965 |
| Portugal — 0.5% | | |
| Galp Energia SGPS SA | 394,363 | | 5,802,531 |
| Singapore — 0.9% | | |
| CapitaLand Integrated Commercial Trust REIT‡‡ | 204,670 | | 319,038 |
| Singapore Airlines, Ltd. | 382,200 | | 1,897,750 |
| Singapore Exchange, Ltd.‡‡ | 785,976 | | 5,847,182 |
| United Overseas Bank, Ltd. | 35,400 | | 764,046 |
| Wilmar International, Ltd. | 364,644 | | 985,041 |
| | | | | 9,813,057 |
| South Korea — 2.0% | | |
| Hana Financial Group, Inc. | 138,077 | | 4,631,736 |
| KB Financial Group, Inc. | 208,604 | | 8,703,334 |
| Samsung Electronics Co., Ltd. GDR | 6,349 | | 9,488,018 |
| | | | | 22,823,088 |
| | | Shares | | Value |
| Spain — 0.9% | | |
| Amadeus IT Group SA | 97,285 | | $ 6,987,160 |
| Banco Bilbao Vizcaya Argentaria SA | 395,252 | | 3,602,430 |
| | | | | 10,589,590 |
| Sweden — 1.0% | | |
| Atlas Copco AB, A Shares | 205,750 | | 3,545,302 |
| Atlas Copco AB, B Shares | 16,984 | | 251,977 |
| Billerud Aktiebolag | 15,711 | | 160,117 |
| Electrolux AB, B Shares* | 22,484 | | 241,532 |
| Elekta AB, B Shares | 31,188 | | 255,429 |
| Getinge AB, B Shares | 5,459 | | 121,558 |
| H & M Hennes & Mauritz AB, B Shares | 40,635 | | 712,740 |
| Investor AB, B Shares‡‡ | 24,240 | | 562,119 |
| Skanska AB, B Shares | 3,767 | | 68,249 |
| SKF AB, B Shares | 32,699 | | 655,306 |
| SSAB AB, B Shares | 104,902 | | 803,185 |
| Swedbank AB, A Shares | 56,342 | | 1,139,103 |
| Trelleborg AB, B Shares | 47,898 | | 1,607,652 |
| Volvo AB, B Shares | 12,355 | | 321,477 |
| Volvo Car AB, B Shares* | 86,303 | | 279,897 |
| | | | | 10,725,643 |
| Switzerland — 12.0% | | |
| ABB, Ltd. | 86,377 | | 3,834,980 |
| Chubb, Ltd. | 68,269 | | 15,428,794 |
| Cie Financiere Richemont SA | 80,117 | | 11,066,090 |
| Georg Fischer AG | 4,855 | | 353,319 |
| Holcim, Ltd.* | 30,420 | | 2,389,230 |
| Lonza Group AG | 1,295 | | 545,954 |
| Nestle SA‡‡ | 213,567 | | 24,756,662 |
| Novartis AG‡‡ | 138,073 | | 13,946,821 |
| Roche Holding AG‡‡ | 71,914 | | 20,904,937 |
| Sandoz Group AG* | 135,065 | | 4,345,591 |
| Sika AG | 21,272 | | 6,936,293 |
| Swatch Group AG (The) | 2,367 | | 644,037 |
| Swiss Re AG | 27,746 | | 3,122,271 |
| Temenos AG | 573 | | 53,397 |
| UBS Group AG | 516,169 | | 16,033,027 |
| Zurich Insurance Group AG | 19,992 | | 10,452,361 |
| | | | | 134,813,764 |
| Taiwan — 1.0% | | |
| Taiwan Semiconductor Manufacturing Co., Ltd. ADR | 103,518 | | 10,765,872 |
| Turkey — 0.0% | | |
| Yapi ve Kredi Bankasi AS | 1 | | 1 |
| United Kingdom — 3.6% | | |
| BAE Systems PLC | 433,810 | | 6,140,576 |
| BP PLC ADR | 208,301 | | 7,373,855 |
| Compass Group PLC | 509,415 | | 13,939,294 |
| Haleon PLC | 1,213,826 | | 4,969,735 |
| Lloyds Banking Group PLC‡‡ | 8,214,147 | | 4,982,185 |
| Schroders PLC | 1 | | 5 |
See Notes to Financial Statements.
INTERNATIONAL EQUITY FUND
SCHEDULE OF INVESTMENTS (Continued)
| | | Shares | | Value |
| Vodafone Group PLC ADR | 353,227 | | $ 3,073,075 |
| | | | | 40,478,725 |
Total Foreign Common Stocks
(Cost $869,513,526) | | 977,446,305 |
| FOREIGN PREFERRED STOCKS — 1.0% |
| Brazil — 0.6% | | |
| Itau Unibanco Holding SA 0.97%* | | 978,338 | | 6,806,785 |
| Germany — 0.4% | | |
| Henkel AG & Co. KGaA 2.57%◊ | | 52,796 | | 4,247,019 |
| Porsche Automobil Holding SE 5.70%‡‡◊ | | 2,838 | | 145,027 |
| Volkswagen AG 8.25%◊ | | 2,174 | | 267,959 |
| | | | | 4,660,005 |
Total Foreign Preferred Stocks
(Cost $10,072,947) | | 11,466,790 |
| | | Shares | | Value |
| MONEY MARKET FUNDS — 5.7% |
| Northern Institutional Liquid Assets Portfolio (Shares), 5.40%ا | 306,900 | | $ 306,900 |
| Northern Institutional U.S. Government Portfolio (Shares), 5.17%Ø | 53 | | 53 |
GuideStone Money Market Fund, 5.28%
(Institutional Class)Ø∞ | 44,496,887 | | 44,496,887 |
| Northern Institutional U.S. Treasury Portfolio (Premier), 5.22%Ø | 19,759,349 | | 19,759,349 |
Total Money Market Funds
(Cost $64,563,189) | | 64,563,189 |
TOTAL INVESTMENTS — 97.0%
(Cost $981,096,141) | | | 1,093,635,716 |
Other Assets in Excess of
Liabilities — 3.0% | | | 34,070,381 |
| NET ASSETS — 100.0% | | | $1,127,706,097 |
Futures Contracts outstanding at December 31, 2023:
| Future Type | | Expiration Date | | Open Long
(Short) Contracts | | Notional
Market Value
of Contracts | | Value and
Unrealized
Appreciation
(Depreciation) |
| CAC40 10 Euro | | 01/2024 | | (116) | | $ (9,674,797) | | $ 46,692 |
| IBEX 35 Index | | 01/2024 | | (9) | | (1,002,118) | | 4,601 |
| OMXS30 Index | | 01/2024 | | (604) | | (14,379,812) | | (210,219) |
| Hang Seng Index | | 01/2024 | | (15) | | (1,645,515) | | (44,937) |
| MSCI Singapore Index | | 01/2024 | | (3) | | (65,399) | | (2,177) |
| Topix Index® | | 03/2024 | | 246 | | 41,279,149 | | 209,717 |
| S&P/TSX 60 Index | | 03/2024 | | (15) | | (2,876,269) | | (75,513) |
| DAX Index | | 03/2024 | | (37) | | (17,270,774) | | 76,753 |
| FTSE 100 Index | | 03/2024 | | 332 | | 32,824,255 | | 469,027 |
| FTSE/MIB Index | | 03/2024 | | 178 | | 29,987,356 | | (130,963) |
| MSCI EAFE Index | | 03/2024 | | 321 | | 36,151,020 | | 868,177 |
| ASX SPI 200 Index | | 03/2024 | | (172) | | (22,225,834) | | (411,796) |
| Total Futures Contracts outstanding at December 31, 2023 | | | | | | $ 71,101,262 | | $ 799,362 |
Forward Foreign Currency Contracts outstanding at December 31, 2023:
| Expiration Date | | Currency
Purchased | | Amount
of Currency
Purchased | | Currency
Sold | | Amount
of Currency
Sold | | Counter-
party | | Net Unrealized
Appreciation
(Depreciation) |
| 03/20/24 | | Norwegian Kroner | | 353,621,000 | | U.S. Dollars | | 32,892,683 | | CITI | | $1,974,899 |
| 03/20/24 | | Canadian Dollars | | 63,278,000 | | U.S. Dollars | | 46,770,529 | | CITI | | 1,037,113 |
| 03/20/24 | | Euro | | 56,448,739 | | U.S. Dollars | | 61,535,276 | | CITI | | 983,342 |
| 03/21/24 | | Japanese Yen | | 4,640,000,000 | | U.S. Dollars | | 32,502,662 | | CITI | | 828,334 |
| 03/20/24 | | British Pounds | | 41,892,000 | | U.S. Dollars | | 52,982,981 | | CITI | | 435,663 |
| 03/20/24 | | Australian Dollars | | 14,798,000 | | U.S. Dollars | | 9,874,449 | | CITI | | 234,065 |
| 03/20/24 | | Swiss Francs | | 2,880,000 | | U.S. Dollars | | 3,311,497 | | CITI | | 141,385 |
| 03/20/24 | | New Zealand Dollars | | 5,352,000 | | U.S. Dollars | | 3,297,297 | | CITI | | 86,641 |
| 03/20/24 | | Israeli Shekels | | 5,160,000 | | U.S. Dollars | | 1,396,125 | | CITI | | 32,586 |
See Notes to Financial Statements.
| Expiration Date | | Currency
Purchased | | Amount
of Currency
Purchased | | Currency
Sold | | Amount
of Currency
Sold | | Counter-
party | | Net Unrealized
Appreciation
(Depreciation) |
| 03/20/24 | | U.S. Dollars | | 10,799,267 | | British Pounds | | 8,444,000 | | CITI | | $ 31,889 |
| 03/20/24 | | U.S. Dollars | | 10,799,053 | | Euro | | 9,723,000 | | CITI | | 30,548 |
| 03/20/24 | | U.S. Dollars | | 3,357,161 | | Swiss Francs | | 2,787,000 | | CITI | | 15,778 |
| 03/20/24 | | Danish Kroner | | 19,743,000 | | U.S. Dollars | | 2,924,296 | | CITI | | 11,544 |
| 03/20/24 | | U.S. Dollars | | 2,434,787 | | Canadian Dollars | | 3,211,000 | | CITI | | 8,820 |
| 03/20/24 | | Singapore Dollars | | 60,000 | | U.S. Dollars | | 45,286 | | CITI | | 347 |
| 03/20/24 | | U.S. Dollars | | 223,681 | | Danish Kroner | | 1,502,000 | | CITI | | 329 |
| 03/20/24 | | Hong Kong Dollars | | 2,213,000 | | U.S. Dollars | | 283,828 | | CITI | | 102 |
| 03/20/24 | | U.S. Dollars | | 104,739 | | Hong Kong Dollars | | 816,000 | | CITI | | 46 |
| 03/20/24 | | U.S. Dollars | | 10,529 | | Israeli Shekels | | 38,000 | | CITI | | 7 |
| 03/20/24 | | U.S. Dollars | | 11,415 | | Singapore Dollars | | 15,000 | | CITI | | 7 |
| Subtotal Appreciation | | | | | | | | | | $ 5,853,445 |
| 03/20/24 | | Danish Kroner | | 360,000 | | U.S. Dollars | | 53,573 | | CITI | | $ (40) |
| 03/20/24 | | Israeli Shekels | | 64,000 | | U.S. Dollars | | 17,785 | | CITI | | (65) |
| 03/20/24 | | U.S. Dollars | | 509,802 | | Hong Kong Dollars | | 3,976,000 | | CITI | | (322) |
| 03/20/24 | | U.S. Dollars | | 85,022 | | Israeli Shekels | | 311,000 | | CITI | | (1,089) |
| 03/20/24 | | Hong Kong Dollars | | 35,719,987 | | U.S. Dollars | | 4,585,635 | | CITI | | (2,733) |
| 03/20/24 | | Australian Dollars | | 5,009,000 | | U.S. Dollars | | 3,429,917 | | CITI | | (8,269) |
| 03/20/24 | | U.S. Dollars | | 790,127 | | Danish Kroner | | 5,380,000 | | CITI | | (9,894) |
| 03/20/24 | | U.S. Dollars | | 1,387,557 | | Singapore Dollars | | 1,842,000 | | CITI | | (13,356) |
| 03/20/24 | | U.S. Dollars | | 2,539,319 | | Canadian Dollars | | 3,380,000 | | CITI | | (14,330) |
| 03/21/24 | | U.S. Dollars | | 5,637,796 | | Japanese Yen | | 790,000,000 | | CITI | | (37,093) |
| 03/20/24 | | Swedish Kronor | | 61,000,000 | | U.S. Dollars | | 6,132,287 | | CITI | | (65,116) |
| 03/20/24 | | U.S. Dollars | | 2,589,084 | | Norwegian Kroner | | 27,000,000 | | CITI | | (73,158) |
| 03/20/24 | | U.S. Dollars | | 17,998,615 | | British Pounds | | 14,263,000 | | CITI | | (188,870) |
| 03/20/24 | | U.S. Dollars | | 17,969,101 | | Australian Dollars | | 26,932,000 | | CITI | | (428,148) |
| 03/20/24 | | U.S. Dollars | | 21,301,087 | | Swedish Kronor | | 220,000,000 | | CITI | | (580,514) |
| 03/20/24 | | U.S. Dollars | | 34,319,736 | | Euro | | 31,617,000 | | CITI | | (697,010) |
| 03/20/24 | | U.S. Dollars | | 37,440,318 | | New Zealand Dollars | | 60,893,000 | | CITI | | (1,060,826) |
| 03/20/24 | | U.S. Dollars | | 44,937,508 | | Swiss Francs | | 38,680,000 | | CITI | | (1,436,619) |
| Subtotal Depreciation | | | | | | | | | | $(4,617,452) |
| Total Forward Foreign Currency Contracts outstanding at December 31, 2023 | | | | $ 1,235,993 |
Swap Agreements outstanding at December 31, 2023:
| Pay Rate Index/Pay Rate | | Receive
Rate Index/Receive
Rate | | Maturity
Date | | Counterparty | | Currency | | Notional
Amount | | Market Value | | Upfront
Premiums
Paid/
(Received) | | Unrealized
Appreciation
(Depreciation) |
| Total Return Swaps | | | | | | | | | | | | | | | | |
| Increase in total return of AEX Index (At Termination) | | Decrease in total return of AEX Index (At Termination) | | 1/19/2024 | | GSC | | EUR | | 5,537,350 | | $ 12,988 | | $ — | | $ 12,988 |
| Financing Index: 1-Day SONIA + 0.49% | | MSCI United Kingdom Net Return GBP Index (Monthly) | | 3/20/2024 | | GSC | | GBP | | 3,166,607 | | 91,677 | | — | | 91,677 |
| Financing Index: 1-Month TELBOR - 0.15% | | Tel Aviv Interbank Offered Rate (Monthly) | | 3/20/2024 | | GSC | | ILS | | 4,823,405 | | 47,974 | | — | | 47,974 |
| MSCI Spain Net Return EUR Index (Monthly) | | Financing Index: Euro Short Term Rate - 0.19% | | 3/20/2024 | | GSC | | EUR | | 1,743,482 | | 4,618 | | — | | 4,618 |
| MSCI Switzerland Net Return CHF Index (Monthly) | | Financing Index: Swiss Average Rate Overnight - 0.15% | | 3/20/2024 | | GSC | | CHF | | 301,110 | | 342 | | — | | 342 |
| Financing Index: Bank of Japan Unsecured Overnight Call Rate + 0% | | MSCI Japan Net Return JPY Index (Monthly) | | 3/21/2024 | | GSC | | JPY | | 112,915,038 | | 3,884 | | — | | 3,884 |
| Subtotal Appreciation | | | | | | | | | | | | $ 161,483 | | $ — | | $ 161,483 |
See Notes to Financial Statements.
INTERNATIONAL EQUITY FUND
SCHEDULE OF INVESTMENTS (Continued)
| Pay Rate Index/Pay Rate | | Receive
Rate Index/Receive
Rate | | Maturity
Date | | Counterparty | | Currency | | Notional
Amount | | Market Value | | Upfront
Premiums
Paid/
(Received) | | Unrealized
Appreciation
(Depreciation) |
| Increase in total return of Swiss Market Index (At Termination) | | Decrease in total return of Swiss Market Index (At Termination) | | 3/15/2024 | | GSC | | CHF | | 6,981,030 | | $ (3,377) | | $ — | | $ (3,377) |
| Financing Index: Euro Short Term Rate + 0.41% | | MSCI Italy Net Return EUR Index (Monthly) | | 3/20/2024 | | GSC | | EUR | | 3,792,813 | | (7,680) | | — | | (7,680) |
| MSCI Australia Net Return AUD Index (Monthly) | | Financing Index: 1-Month ASX BBSW + 0.1% | | 3/20/2024 | | GSC | | AUD | | 592,117 | | (17,245) | | — | | (17,245) |
| MSCI Canada Net Return CAD Index (Monthly) | | Financing Index: Canadian Overnight Repo Rate Average - 0.95% | | 3/20/2024 | | GSC | | CAD | | 6,334,866 | | (86,649) | | — | | (86,649) |
| MSCI Netherlands Net Return EUR Index (Monthly) | | Financing Index: Euro Short Term Rate + 0.05% | | 3/20/2024 | | GSC | | EUR | | 49,844 | | (211) | | — | | (211) |
| MSCI Sweden Net Return SEK Index (Monthly) | | Financing Index: 1-Month STIBOR - 0.19% | | 3/20/2024 | | GSC | | SEK | | 34,156,758 | | (121,537) | | — | | (121,537) |
| MSCI Switzerland Net Return CHF Index (Monthly) | | Financing Index: Swiss Average Rate Overnight - 0.15% | | 3/20/2024 | | GSC | | CHF | | 1,102,903 | | (9,185) | | — | | (9,185) |
| Subtotal Depreciation | | | | | | | | | | | | $(245,884) | | $ — | | $(245,884) |
| Net Total Return Swaps outstanding at December 31, 2023 | | $ (84,401) | | $ — | | $ (84,401) |
Total Return Basket Swap Agreements outstanding at December 31, 2023:
| Description | | Maturity
Date | | Counterparty | | Notional
Amount | | Market Value | | Upfront
Premiums
Paid/
(Received) | | Unrealized
Appreciation
(Depreciation) |
| The Fund receives the total return on a portfolio of long and short equity positions and pays or receives the SONIA plus or minus a specified spread (-0.25% to 0.25%), which is denominated in GBP based on the local currencies of the positions within the swap (Monthly).* | | 20-60 months maturity ranging from 08/08/2025- 12/21/2028 | | GSC | | $26,377,398 | | $395,776 | | $ — | | $395,776 |
| The Fund receives the total return on a portfolio of short equity positions and receives the SSARON minus a specified spread (-0.35%), which is denominated in CHF based on the local currencies of the positions within the swap (Monthly). | | 37-53 months maturity ranging from 01/06/2027- 05/26/2028 | | GSC | | 2,720,900 | | 1,885 | | — | | 1,885 |
| The Fund receives the total return on a portfolio of long equity positions and pays HIBOR plus a specified spread (0.33%), which is denominated in HKD based on the local currencies of the positions within the swap (Monthly). | | 20-56 months maturity ranging from 08/08/2025- 08/31/2028 | | GSC | | 43,352,953 | | 381,676 | | — | | 381,676 |
| The Fund receives the total return on a portfolio of short equity positions and receives the NOWA minus a specified spread (-0.35%), which is denominated in NOK based on the local currencies of the positions within the swap (Monthly). | | 47 months maturity 11/03/2027 | | GSC | | 14,396,927 | | 39,480 | | — | | 39,480 |
| Subtotal Appreciation | | | | | | | | $818,817 | | $ — | | $818,817 |
| * The following table represents disclosures associated with the underlying components of the total return basket swap as of year end. |
See Notes to Financial Statements.
| Common Stocks | | Shares | | Notional | | Unrealized
Appreciation
(Depreciation) | | Percentage of
Swap Value |
| Shell PLC | | 151,096 | | $ 3,880,273 | | $ 138,471 | | 34.99% |
| HSBC Holdings PLC | | 585,262 | | 3,714,549 | | 182,423 | | 46.09 |
| Centrica PLC | | 1,424,591 | | 2,003,585 | | (62,643) | | (15.83) |
| Rolls-Royce Holdings PLC | | 616,918 | | 1,846,117 | | 12,903 | | 3.26 |
| BP PLC | | 362,157 | | 1,684,300 | | 20,783 | | 5.25 |
| Antofagasta PLC | | (92,362) | | 1,549,352 | | (162,648) | | (41.10) |
| InterContinental Hotels Group PLC | | 20,586 | | 1,456,369 | | 38,334 | | 9.69 |
| Marks & Spencer Group PLC | | 487,182 | | 1,324,585 | | 45,056 | | 11.38 |
| Man Group PLC | | 392,368 | | 912,648 | | 60,896 | | 15.39 |
| Vodafone Group PLC | | 1,295,553 | | 887,662 | | 85,672 | | 21.65 |
| Barratt Developments PLC | | 149,149 | | 838,215 | | 35,945 | | 9.08 |
| Hiscox, Ltd. | | 51,076 | | 538,341 | | 6,196 | | 1.57 |
| Associated British Foods PLC | | 22,113 | | 522,861 | | (14,250) | | (3.60) |
| Burberry Group PLC | | 33,533 | | 474,509 | | (28,945) | | (7.31) |
| Whitbread PLC | | 12,433 | | 454,122 | | 46,048 | | 11.63 |
| NatWest Group PLC | | (191,146) | | 417,698 | | 1,910 | | 0.48 |
| Melrose Industries PLC | | 68,585 | | 388,937 | | (2,331) | | (0.59) |
| London Stock Exchange Group PLC | | 3,917 | | 363,264 | | 5,104 | | 1.29 |
| Carnival PLC | | 23,425 | | 304,947 | | 814 | | 0.21 |
| Endeavor Mining PLC | | (17,259) | | 302,978 | | (11,395) | | (2.88) |
| Ashtead Group PLC | | (4,936) | | 269,162 | | (22,022) | | (5.56) |
| CRH PLC | | 4,849 | | 261,801 | | 16,703 | | 4.22 |
| 3i Group PLC | | 10,296 | | 248,622 | | 12,373 | | 3.13 |
| EasyJet PLC | | 45,092 | | 229,493 | | 17,592 | | 4.44 |
| Direct Line Insurance Group | | 100,936 | | 183,381 | | (11,737) | | (2.97) |
| RS Group PLC | | (22,343) | | 182,969 | | (2,438) | | (0.62) |
| TUI AG | | 29,383 | | 179,608 | | 1,431 | | 0.36 |
| GBP Spectris PLC | | 4,401 | | 166,078 | | 1,139 | | 0.29 |
| Rentokil Initial PLC | | (36,222) | | 160,167 | | (10,747) | | (2.72) |
| Barclays PLC | | 90,974 | | 139,751 | | 12,496 | | 3.16 |
| Anglo American PLC | | (6,397) | | 125,600 | | (13,906) | | (3.51) |
| Croda International PLC | | (2,218) | | 111,929 | | (7,721) | | (1.95) |
| BAE Systems PLC | | 9,645 | | 107,108 | | 8,055 | | 2.03 |
| International Distributions | | 35,425 | | 96,391 | | (3,692) | | (0.93) |
| Ocado Group PLC | | 6,601 | | 50,026 | | (93) | | (0.02) |
| | | | | $26,377,398 | | $ 395,776 | | 100.00% |
| Description | | Maturity
Date | | Counterparty | | Notional
Amount | | Market Value | | Upfront
Premiums
Paid/
(Received) | | Unrealized
Appreciation
(Depreciation) |
| The Fund receives the total return on a portfolio of short equity positions and receives the DETNT/N minus a specified spread (-0.35%), which is denominated in DKK based on the local currencies of the positions within the swap (Monthly). | | 20 months maturity 08/08/2025 | | GSC | | $ 820,974 | | $(12,540) | | $— | | $(12,540) |
| The Fund receives the total return on a portfolio of short equity positions and pays 1-Month SORA minus a specified spread (0.40%), which is denominated in SGD based on the local currencies of the positions within the swap (Monthly). | | 51-57 months maturity ranging from 03/23/2028- 09/15/2028 | | GSC | | 1,656,251 | | (73,450) | | — | | (73,450) |
See Notes to Financial Statements.
INTERNATIONAL EQUITY FUND
SCHEDULE OF INVESTMENTS (Continued)
| Description | | Maturity
Date | | Counterparty | | Notional
Amount | | Market Value | | Upfront
Premiums
Paid/
(Received) | | Unrealized
Appreciation
(Depreciation) |
| The Fund receives the total return on a portfolio of short equity positions and receives the STIBOR minus a specified spread (-0.90 to -0.35%), which is denominated in SEK based on the local currencies of the positions within the swap (Monthly). | | 51-60 months maturity ranging from 03/03/2028- 12/21/2028 | | GSC | | $ 25,197,544 | | $ (213,975) | | $ — | | $ (213,975) |
| The Fund receives the total return on a portfolio of short equity positions and receives the MUTSCALM minus a specified spread (-0.30%), which is denominated in JPY based on the local currencies of the positions within the swap (Monthly). | | 20-60 months maturity ranging from 08/08/2025- 12/21/2028 | | GSC | | 1,501,620,218 | | (428,697) | | — | | (428,697) |
| The Fund receives the total return on a portfolio of long and short equity positions and pays or receives the EONIA or EURIBOR plus or minus a specified spread (-0.35% to 0.25%), which is denominated in EUR based on the local currencies of the positions within the swap (Monthly).** | | 20-60 months maturity ranging from 08/08/2025- 12/21/2028 | | GSC | | 47,247,558 | | (749,296) | | — | | (749,296) |
| The Fund receives the total return on a portfolio of short equity positions and receives the RBA minus a specified spread (-2.00 to -0.40%), which is denominated in AUD based on the local currencies of the positions within the swap (Monthly). | | 37-59 months maturity ranging from 01/06/2027- 11/06/2028 | | GSC | | 13,097,543 | | (975,828) | | — | | (975,828) |
| Subtotal Depreciation | | | | | | | | $(2,453,786) | | $ — | | $(2,453,786) |
| Net Total Return Basket Swaps | | | | | | | | $(1,634,969) | | $ — | | $(1,634,969) |
| ** The following table represents disclosures associated with the underlying components of the total return basket swap as of year end. |
| Common Stocks | | Shares | | Notional | | Unrealized
Appreciation
(Depreciation) | | Percentage of
Swap Value |
| Sanofi | | 24,314 | | $ 2,188,640 | | $ 55,122 | | (7.36)% |
| Engie SA | | 121,925 | | 1,945,620 | | (26,953) | | 3.60 |
| TotalEnergies SE | | 31,468 | | 1,938,306 | | (16,961) | | 2.26 |
| Unibail-Rodamco-Westfield REIT | | (28,391) | | 1,902,167 | | (97,726) | | 13.04 |
| Orange SA | | 177,149 | | 1,828,962 | | (156,464) | | 20.88 |
| DSM-Firmenich AG | | (18,560) | | 1,709,706 | | (78,241) | | 10.44 |
| Repsol SA | | 119,002 | | 1,599,046 | | (52,989) | | 7.07 |
| Banco de Sabadell SA | | 1,414,914 | | 1,577,697 | | (158,763) | | 21.19 |
| Cellnex Telecom SA | | (43,383) | | 1,547,279 | | (5,207) | | 0.70 |
| Eiffage SA | | 14,493 | | 1,409,333 | | 8,066 | | (1.08) |
| Compagnie De Saint Gobain | | 20,481 | | 1,368,195 | | 95,366 | | (12.73) |
| Banco Santander SA | | 359,322 | | 1,361,412 | | (63,245) | | 8.44 |
| Rexel SA | | 54,538 | | 1,355,915 | | 26,905 | | (3.59) |
| Sodexo SA | | 13,116 | | 1,307,958 | | 28,731 | | (3.83) |
| L’Oreal SA | | 2,710 | | 1,223,730 | | 20,619 | | (2.75) |
| Societe Generale SA | | 44,418 | | 1,070,479 | | 11,581 | | (1.55) |
| Dassault Aviation SA | | 5,963 | | 1,070,203 | | (10,266) | | 1.37 |
| Worldline SA | | 63,362 | | 998,111 | | (4,660) | | 0.62 |
| STMicroelectronics NV | | 21,797 | | 990,367 | | 20,545 | | (2.74) |
| Corp ACCIONA Energias Renovables | | (32,913) | | 925,305 | | (43,260) | | 5.77 |
| Telefonica | | 252,790 | | 895,310 | | (98,288) | | 13.12 |
See Notes to Financial Statements.
| Common Stocks | | Shares | | Notional | | Unrealized
Appreciation
(Depreciation) | | Percentage of
Swap Value |
| Wacker Chemie AG | | (7,689) | | $ 878,143 | | $ (11,692) | | 1.56% |
| Safran SA | | 5,432 | | 867,538 | | (36,440) | | 4.86 |
| Mapfre SA | | 443,259 | | 862,878 | | (31,825) | | 4.25 |
| Dr. Ing hc F Porsche AG | | (10,365) | | 826,957 | | 28,467 | | (3.80) |
| CTS Eventim AG & Co. KGaA | | (12,722) | | 797,066 | | 21,770 | | (2.91) |
| BNP Paribas SA | | 12,414 | | 780,922 | | 22,114 | | (2.95) |
| Hermes International SCA | | 378 | | 727,791 | | (26,908) | | 3.59 |
| Sartorius Stedim Biotech | | (2,549) | | 612,302 | | (87,453) | | 11.67 |
| Ferrari NV | | (1,960) | | 599,402 | | 83,360 | | (11.12) |
| Axa SA | | 19,718 | | 583,287 | | (11,624) | | 1.55 |
| Ipsen SA | | 5,289 | | 571,512 | | 31,341 | | (4.18) |
| Bouygues SA | | 16,408 | | 560,769 | | (37,680) | | 5.03 |
| Adyen NV | | (436) | | 509,851 | | 24,133 | | (3.22) |
| Acerinox SA | | 46,203 | | 493,231 | | 23,283 | | (3.11) |
| Eurofins Scientific | | (7,494) | | 442,820 | | (35,428) | | 4.73 |
| S.o.i.t.e.c. | | (2,673) | | 433,279 | | 1,224 | | (0.16) |
| D'ieteren Group | | (2,416) | | 428,099 | | (36,100) | | 4.82 |
| Faurecia SE (Euronext Paris Exchange) | | (20,131) | | 413,083 | | (29,982) | | 4.00 |
| Siemens Healthineers AG | | (7,682) | | 404,010 | | (1,934) | | 0.26 |
| Rubis | | 17,899 | | 403,352 | | 7,391 | | (0.99) |
| OCI NV | | (14,484) | | 380,240 | | (112,682) | | 15.04 |
| Air France-KLM | | 26,883 | | 366,446 | | 41,269 | | (5.51) |
| Reply SPA | | (2,899) | | 347,079 | | (29,922) | | 3.99 |
| Orion OYJ Class B | | (8,031) | | 315,226 | | (15,001) | | 2.00 |
| SCOR SE | | 10,201 | | 270,755 | | (10,006) | | 1.34 |
| Rheinmetall AG | | (918) | | 263,718 | | (2,959) | | 0.40 |
| Aurubis AG | | (3,386) | | 250,979 | | 7,473 | | (1.00) |
| DiaSorin SpA | | (2,537) | | 236,852 | | (9,739) | | 1.30 |
| Vivendi SE | | 23,741 | | 230,216 | | 17,149 | | (2.29) |
| Other | | (62,049) | | 2,176,015 | | 15,193 | | (2.02) |
| | | | | $47,247,559 | | $(749,296) | | 100.00% |
See Notes to Financial Statements.
INTERNATIONAL EQUITY FUND
SCHEDULE OF INVESTMENTS (Continued)
VALUATION HIERARCHY
The following is a summary of the inputs used, as of December 31, 2023, in valuing the Fund’s investments carried at fair value:
| | Total
Value | | Level 1
Quoted Prices | | Level 2
Other Significant
Observable Inputs | | Level 3
Significant
Unobservable Inputs |
| Assets: | | | | | | | |
| Investments in Securities: | | | | | | | |
| Common Stocks | $ 40,159,432 | | $ 40,159,432 | | $ — | | $ — |
| Foreign Common Stocks: | | | | | | | |
| Belgium | 6,503,876 | | 5,133,131 | | 1,370,745 | | — |
| Canada | 42,677,235 | | 42,677,235 | | — | | — |
| Germany | 89,445,384 | | 6,084,698 | | 83,360,686 | | — |
| India | 21,389,065 | | 14,122,330 | | 7,266,735 | | — |
| Ireland | 66,660,424 | | 63,416,558 | | 3,243,866 | | — |
| Israel | 9,663,662 | | 9,663,662 | | — | | — |
| Japan | 214,566,352 | | 278,923 | | 214,287,429 | | — |
| Jersey | 21,930,527 | | 519,723 | | 21,410,804 | | — |
| Mexico | 8,613,929 | | 8,613,929 | | — | | — |
| Netherlands | 55,687,008 | | 6,428,526 | | 49,258,482 | | — |
| Peru | 4,680,965 | | 4,680,965 | | — | | — |
| Switzerland | 134,813,764 | | 19,774,385 | | 115,039,379 | | — |
| Taiwan | 10,765,872 | | 10,765,872 | | — | | — |
| United Kingdom | 40,478,725 | | 16,587,506 | | 23,891,219 | | — |
| Other ^^ | 249,569,517 | | — | | 249,569,517 | | — |
| Total Foreign Common Stocks | 977,446,305 | | 208,747,443 | | 768,698,862 | | — |
| Foreign Preferred Stocks | 11,466,790 | | — | | 11,466,790 | | — |
| Money Market Funds | 64,563,189 | | 64,563,189 | | — | | — |
| Total Assets - Investments in Securities | $1,093,635,716 | | $313,470,064 | | $780,165,652 | | $ — |
| Other Financial Instruments*** | | | | | | | |
| Forward Foreign Currency Contracts | $ 5,853,445 | | $ — | | $ 5,853,445 | | $ — |
| Futures Contracts | 1,674,967 | | 1,674,967 | | — | | — |
| Swap Agreements | 980,300 | | — | | 980,300 | | — |
| Total Assets - Other Financial Instruments | $ 8,508,712 | | $ 1,674,967 | | $ 6,833,745 | | $ — |
See Notes to Financial Statements.
| | Total
Value | | Level 1
Quoted Prices | | Level 2
Other Significant
Observable Inputs | | Level 3
Significant
Unobservable Inputs |
| Liabilities: | | | | | | | |
| Other Financial Instruments*** | | | | | | | |
| Forward Foreign Currency Contracts | $(4,617,452) | | $ — | | $(4,617,452) | | $ — |
| Futures Contracts | (875,605) | | (875,605) | | — | | — |
| Swap Agreements | (2,699,670) | | — | | (2,699,670) | | — |
| Total Liabilities - Other Financial Instruments | $(8,192,727) | | $(875,605) | | $(7,317,122) | | $ — |
| ^^ | Classifications as defined in the Schedule of Investments. |
| *** | Other financial instruments are derivative instruments, such as futures contracts, forward foreign currency contracts and swap agreements, which are valued at the unrealized appreciation (depreciation) on the investment. Further details regarding the value of these investments can be found in the preceding "Futures Contracts outstanding", "Forward Foreign Currency Contracts outstanding" and "Swap Agreements outstanding" disclosures. |
See Notes to Financial Statements.
Emerging Markets Equity Fund (Unaudited)
Emerging markets equity performed decently in 2023, up 9.83% as measured by the MSCI Emerging Markets Index. China, the largest regional component of the index, was the primary drag on index returns for the year, as the economic recovery lagged most other countries.
The Fund is actively managed and invests mainly in equity securities that are economically tied to emerging markets. In addition, the Fund’s portfolio is diversified among a large number of companies across different industries and economic sectors. The Investor Class of the Fund outperformed its benchmark, the MSCI Emerging Markets Index, for the one-year period ended December 31, 2023 (10.67% (net of fees) versus 9.83%). The outperformance was mainly driven by the underweight to Chinese equities and an overweight to some of the more value sensitive sectors.
Within the Fund, certain derivatives were utilized to express active views in currency and country selection. These derivative positions primarily included currency forward contracts, stock index futures and total return swaps. Overall, derivative exposure outperformed the benchmark index.
This Fund may be suitable to investors who seek higher, long-term rates of return, can accept significant short-term fluctuations in account value and want to diversify their portfolio with emerging markets equity securities. Securities of foreign issuers may be negatively impacted by political events, economic conditions or inefficient, illiquid or unregulated markets in foreign countries, and they also may be subject to inadequate regulatory or accounting standards, which may increase investment risk. Investing in emerging markets may involve greater risks than investing in more developed foreign markets because, among other things, emerging markets often have more political and economic instability. Medium- and small-sized companies’ stocks have historically been subject to more investment risk and more volatile and less liquid than large company stocks, respectively. To the extent that the investment adviser misjudges current market conditions, the Fund’s volatility may be amplified by its use of derivatives and by its ability to select sub-advisers to allocate assets. Derivatives involve different risks from, and in some respects greater risks than, those associated with investing directly in securities, currencies or other instruments. Derivatives may be illiquid or less liquid, volatile, difficult to price and leveraged, so that small changes in the value of the underlying instruments may produce disproportionate losses to the Fund. It is possible to lose money by investing in the Fund.
At December 31, 2023, the portfolio holdings of the Fund, as a percentage of net assets, is shown in the following table. Portfolio holdings are subject to risk and may change at any time.
| | % |
| Financials | 24.0 |
| Information Technology | 21.2 |
| Consumer Discretionary | 12.1 |
| Consumer Staples | 7.0 |
| Industrials | 7.0 |
| Communication Services | 6.2 |
| Money Market Funds | 6.0 |
| Materials | 4.8 |
| Energy | 4.7 |
| Real Estate | 2.2 |
| Health Care | 2.1 |
| Utilities | 1.2 |
| Rights | —** |
| | 98.5 |
| **Rounds to less than 0.05% | |
See Notes to Financial Statements.
Emerging Markets Equity Fund (Unaudited)
| Average Annual Total Returns as of 12/31/23 | |
| | | Institutional Class* | | Investor Class* | | Benchmark** | |
| One Year | | 11.07% | | 10.67% | | 9.83% | |
| Five Year | | 4.68% | | 4.32% | | 3.68% | |
| Ten Year | | 1.84% | | 1.53% | | 2.66% | |
| Since Inception | | 1.56% | | 1.25% | | 2.32% | |
| Inception Date | | 10/31/13 | | 10/31/13 | | | |
| Total Fund Operating Expenses (May 1, 2023 Prospectus)(1)# | | 1.11% | | 1.41% | | | |
| (1) | Current information regarding the Fund’s Operating Expenses can be found in the Financial Highlights. |
#Net expense ratio
The performance data quoted represents past performance and does not guarantee future results. The performance data in the table and graph does not reflect the deduction of taxes that a shareholder would pay on Fund distributions or the redemption of Fund shares. Current performance may be lower or higher. Performance data current to the most recent month-end may be obtained at GuideStoneFunds.com. The investment return and principal value of an investment will fluctuate so that shares, when redeemed, may be worth more or less than their original cost.
The graph illustrates the results of a hypothetical $10,000 investment in the Investor Class of the Fund for the 10-year period from December 31, 2013 to December 31, 2023, with all dividends and capital gains reinvested, with the MSCI Emerging Markets Index.
*These returns reflect investment advisory and shareholder servicing fee waivers, if applicable, during the reported time periods.
Unlike a mutual fund, an index is not available for direct investment and the performance of an index assumes no taxes, transaction costs, management fees or other expenses.
See Notes to Financial Statements.
EMERGING MARKETS EQUITY FUND
| | | Shares | | Value |
| COMMON STOCKS — 2.0% |
| Consumer Discretionary — 2.0% | | |
| Coupang, Inc.* | 180,352 | | $ 2,919,899 |
| MercadoLibre, Inc.* | 3,730 | | 5,861,844 |
| Samsonite International SA 144A* | 216,300 | | 713,622 |
| Yum China Holdings, Inc. | 144,920 | | 6,148,955 |
| | | | | 15,644,320 |
| Materials — 0.0% | | |
| Southern Copper Corporation | 2,441 | | 210,097 |
Total Common Stocks
(Cost $15,930,836) | | 15,854,417 |
| FOREIGN COMMON STOCKS — 88.8% |
| Brazil — 5.3% | | |
| Atacadao SA | 848,800 | | 2,175,119 |
| B3 SA - Brasil Bolsa Balcao | 2,096,600 | | 6,272,965 |
| Banco Bradesco SA* | 887,600 | | 2,794,459 |
| Banco BTG Pactual SA* | 331,732 | | 2,565,790 |
| Banco do Brasil SA | 264,000 | | 3,009,451 |
| BB Seguridade Participacoes SA | 134,200 | | 932,050 |
| Caixa Seguridade Participacoes S/A | 181,024 | | 481,066 |
| Cyrela Brazil Realty SA Empreendimentos e Participacoes | 400,900 | | 1,977,148 |
| Fleury SA* | 94,400 | | 350,521 |
| Klabin SA | 209,600 | | 958,773 |
| Localiza Rent a Car SA* | 187,516 | | 2,455,110 |
| Magazine Luiza SA* | 3,110,518 | | 1,382,936 |
| NU Holdings, Ltd. Class A* | 52,003 | | 433,185 |
| Odontoprev SA | 109,400 | | 261,720 |
| PRIO SA | 29,600 | | 280,006 |
| Raia Drogasil SA | 1,263,320 | | 7,647,640 |
| Rede D'Or Sao Luiz SA 144A* | 328,389 | | 1,945,583 |
| Rumo SA | 77,700 | | 367,313 |
| Sendas Distribuidora SA | 178,000 | | 493,145 |
| Suzano SA* | 80,600 | | 917,860 |
| TIM SA | 123,200 | | 453,703 |
| TOTVS SA* | 70,300 | | 487,555 |
| Ultrapar Participacoes SA | 62,600 | | 339,590 |
| Vale SA | 199,400 | | 3,158,233 |
| Vale SA ADR | 9,830 | | 155,904 |
| | | | | 42,296,825 |
| Canada — 0.2% | | |
| Parex Resources, Inc.Δ | 105,881 | | 1,993,684 |
| Cayman Islands — 0.3% | | |
| Patria Investments, Ltd. Class A | 146,934 | | 2,278,946 |
| Chile — 0.3% | | |
| Banco de Chile ADR | 8,371 | | 193,203 |
| Banco Santander Chile ADRΔ | 3,609 | | 70,339 |
| Cencosud SA | 578,080 | | 1,085,938 |
| Empresas CMPC SA | 350,803 | | 676,911 |
| Enel Chile SA | 7,657,877 | | 496,020 |
| | | | | 2,522,411 |
| China — 15.0% | | |
| 360 Security Technology, Inc. Class A* | 46,300 | | 58,500 |
| | | Shares | | Value |
| 37 Interactive Entertainment Network Technology Group Co., Ltd. Class A | 24,700 | | $ 65,228 |
| Agricultural Bank of China, Ltd. Class A | 92,500 | | 47,251 |
| AIMA Technology Group Co., Ltd. Class A | 11,700 | | 41,106 |
| Alibaba Group Holding, Ltd. ADR | 154,963 | | 12,011,182 |
| Aluminum Corporation of China, Ltd. Class H | 1,664,000 | | 831,894 |
| Amlogic Shanghai Co., Ltd. Class A | 806 | | 7,083 |
| Angel Yeast Co., Ltd. Class A | 1,700 | | 8,396 |
| Anhui Jianghuai Automobile Group Corporation, Ltd. Class A* | 26,000 | | 58,923 |
| Anjoy Foods Group Co., Ltd. Class A | 6,800 | | 99,812 |
| ANTA Sports Products, Ltd. | 67,000 | | 651,194 |
| Apeloa Pharmaceutical Co., Ltd. Class A | 8,200 | | 17,696 |
| Avary Holding Shenzhen Co., Ltd. Class A | 30,800 | | 96,441 |
| AVIC Airborne Systems Co., Ltd. | 4,453 | | — |
| Baidu, Inc. Class A* | 168,950 | | 2,514,976 |
| Bank of Beijing Co., Ltd. Class A | 220,100 | | 139,905 |
| Bank of China, Ltd. Class A | 41,100 | | 23,014 |
| Bank of China, Ltd. Class H | 2,323,000 | | 882,698 |
| Bank of Communications Co., Ltd. Class A | 139,400 | | 112,320 |
| Bank of Shanghai Co., Ltd. Class A | 156,800 | | 131,362 |
| Baoshan Iron & Steel Co., Ltd. Class A | 95,500 | | 79,498 |
| Beijing E-Hualu Information Technology Co., Ltd. Class A* | 13,300 | | 58,675 |
| Beijing Kingsoft Office Software, Inc. Class A | 835 | | 37,022 |
| Beijing Roborock Technology Co., Ltd. Class A | 251 | | 9,962 |
| Beijing Shiji Information Technology Co., Ltd. Class A* | 7,100 | | 9,690 |
| Bloomage Biotechnology Corporation, Ltd. Class A | 560 | | 5,260 |
| BYD Co., Ltd. Class A | 4,200 | | 116,717 |
| BYD Co., Ltd. Class H | 32,500 | | 896,501 |
| China Cinda Asset Management Co., Ltd. Class H | 3,793,000 | | 378,944 |
| China CITIC Bank Corporation, Ltd. Class H | 4,522,000 | | 2,132,698 |
| China Communications Services Corporation, Ltd. Class H | 2,934,000 | | 1,216,678 |
| China Construction Bank Corporation Class A | 38,500 | | 35,185 |
| China Construction Bank Corporation Class H | 7,328,000 | | 4,359,065 |
| China Everbright Bank Co., Ltd. Class A | 346,500 | | 141,035 |
| China Mengniu Dairy Co., Ltd.* | 132,000 | | 355,596 |
| China Merchants Bank Co., Ltd. Class A | 14,756 | | 57,629 |
| China Merchants Bank Co., Ltd. Class H | 322,000 | | 1,120,086 |
| China Merchants Securities Co., Ltd. Class A | 27,700 | | 53,039 |
See Notes to Financial Statements.
| | | Shares | | Value |
| China National Building Material Co., Ltd. Class H | 2,196,000 | | $ 940,400 |
| China National Nuclear Power Co., Ltd. Class A | 64,100 | | 67,467 |
| China Pacific Insurance Group Co., Ltd. Class A | 34,500 | | 115,298 |
| China Pacific Insurance Group Co., Ltd. Class H | 1,036,067 | | 2,095,865 |
| China Petroleum & Chemical Corporation Class A | 327,000 | | 256,047 |
| China Railway Group, Ltd. Class A | 181,400 | | 144,659 |
| China Railway Group, Ltd. Class H | 1,035,000 | | 461,497 |
| China Railway Signal & Communication Corporation, Ltd. Class A | 13,568 | | 8,341 |
| China Resources Land, Ltd.Δ | 1,625,987 | | 5,834,078 |
| China Resources Microelectronics, Ltd. Class A | 1,964 | | 12,314 |
| China Shenhua Energy Co., Ltd. Class A | 19,100 | | 84,087 |
| China State Construction Engineering Corporation, Ltd. Class A | 329,700 | | 222,636 |
| China State Construction International Holdings, Ltd. | 452,000 | | 523,057 |
| China Yangtze Power Co., Ltd. Class A | 114,199 | | 374,092 |
| Chongqing Changan Automobile Co., Ltd. Class A | 84,600 | | 199,845 |
| CNPC Capital Co., Ltd. Class A | 11,900 | | 9,013 |
| Contemporary Amperex Technology Co., Ltd. Class A | 28,918 | | 662,588 |
| COSCO SHIPPING Holdings Co., Ltd. Class A | 111,700 | | 150,174 |
| CSC Financial Co., Ltd. Class A | 190,100 | | 631,228 |
| CSC Financial Co., Ltd. Class H 144A | 233,500 | | 206,387 |
| Daqin Railway Co., Ltd. Class A | 73,300 | | 74,168 |
| DHC Software Co., Ltd. Class A | 19,700 | | 17,051 |
| Dong-E-E-Jiao Co., Ltd. Class A | 2,800 | | 19,371 |
| Dongfeng Motor Group Co., Ltd. Class H | 2,038,000 | | 1,015,574 |
| East Money Information Co., Ltd. Class A | 30,960 | | 61,056 |
| Eastroc Beverage Group Co., Ltd. Class A | 500 | | 12,805 |
| ENN Energy Holdings, Ltd. | 47,700 | | 352,238 |
| Focus Media Information Technology Co., Ltd. Class A | 54,300 | | 48,200 |
| Foshan Haitian Flavouring & Food Co., Ltd. Class A | 39,677 | | 211,384 |
| Foxconn Industrial Internet Co., Ltd. Class A | 102,500 | | 217,331 |
| Fuyao Glass Industry Group Co., Ltd. Class A | 361,300 | | 1,895,387 |
| Fuyao Glass Industry Group Co., Ltd. Class H 144A | 91,200 | | 444,095 |
| G-bits Network Technology Xiamen Co., Ltd. Class A | 1,000 | | 34,365 |
| GCL Technology Holdings, Ltd. | 2,487,000 | | 394,933 |
| Geely Automobile Holdings, Ltd. | 309,000 | | 340,398 |
| Giant Network Group Co., Ltd. Class A | 19,400 | | 30,320 |
| | | Shares | | Value |
| Gree Electric Appliances, Inc. of Zhuhai Class A | 17,800 | | $ 80,423 |
| Guangdong Haid Group Co., Ltd. Class A | 16,400 | | 103,362 |
| Guangzhou Baiyunshan Pharmaceutical Holdings Co., Ltd. Class A | 7,600 | | 30,499 |
| Guosen Securities Co., Ltd. Class A | 17,100 | | 20,499 |
| Guotai Junan Securities Co., Ltd. Class A | 69,200 | | 144,527 |
| Guoyuan Securities Co., Ltd. Class A | 3,200 | | 3,067 |
| H World Group, Ltd. ADR | 3,029 | | 101,290 |
| Hainan Airport Infrastructure Co., Ltd. Class A* | 22,000 | | 11,424 |
| Henan Shenhuo Coal & Power Co., Ltd. Class A | 23,900 | | 56,388 |
| Henan Shuanghui Investment & Development Co., Ltd. Class A | 67,300 | | 252,420 |
| Hengdian Group DMEGC Magnetics Co., Ltd. Class A | 33,300 | | 63,260 |
| Hithink RoyalFlush Information Network Co., Ltd. Class A | 900 | | 19,829 |
| Huaibei Mining Holdings Co., Ltd. Class A | 102,400 | | 239,081 |
| Hualan Biological Engineering, Inc. Class A | 110,700 | | 343,735 |
| Huatai Securities Co., Ltd. Class A | 66,900 | | 131,032 |
| Huaxia Bank Co., Ltd. Class A | 213,907 | | 168,696 |
| Huayu Automotive Systems Co., Ltd. Class A | 77,000 | | 175,888 |
| Hubei Jumpcan Pharmaceutical Co., Ltd. Class A | 17,800 | | 78,482 |
| Hunan Valin Steel Co., Ltd. Class A | 149,400 | | 107,991 |
| Hundsun Technologies, Inc. Class A | 25,000 | | 100,851 |
| Industrial & Commercial Bank of China, Ltd. Class A | 105,400 | | 70,701 |
| Industrial & Commercial Bank of China, Ltd. Class H | 2,910,000 | | 1,418,169 |
| Industrial Bank Co., Ltd. Class A | 58,400 | | 132,866 |
| Inner Mongolia Yili Industrial Group Co., Ltd. Class A | 346,861 | | 1,302,655 |
| Isoftstone Information Technology Group Co., Ltd. Class A* | 1,900 | | 12,307 |
| JA Solar Technology Co., Ltd. Class A | 7,400 | | 21,528 |
| JCET Group Co., Ltd. Class A | 16,800 | | 70,349 |
| Jiangsu Pacific Quartz Co., Ltd. Class A | 500 | | 6,098 |
| Jiangsu Phoenix Publishing & Media Corporation, Ltd. Class A | 24,000 | | 29,665 |
| Jizhong Energy Resources Co., Ltd. Class A | 13,700 | | 13,725 |
| Jointown Pharmaceutical Group Co., Ltd. Class A | 118,517 | | 116,593 |
| Juewei Food Co., Ltd. Class A | 1,300 | | 4,900 |
| Kanzhun, Ltd. ADR | 117,383 | | 1,949,732 |
| KE Holdings, Inc. ADR | 111,924 | | 1,814,288 |
| Kingnet Network Co., Ltd. Class A | 14,400 | | 22,573 |
| Kingsoft Corporation, Ltd. | 42,200 | | 130,458 |
| Kunlun Energy Co., Ltd. | 1,006,000 | | 907,881 |
| Kunlun Tech Co., Ltd. Class A* | 6,000 | | 31,485 |
| Lens Technology Co., Ltd. Class A | 25,800 | | 47,762 |
See Notes to Financial Statements.
EMERGING MARKETS EQUITY FUND
SCHEDULE OF INVESTMENTS (Continued)
| | | Shares | | Value |
| Li Auto, Inc. Class A* | 119,800 | | $2,244,587 |
| Lingyi iTech Guangdong Co. Class A | 156,600 | | 148,362 |
| LONGi Green Energy Technology Co., Ltd. Class A | 11,800 | | 37,917 |
| Luxshare Precision Industry Co., Ltd. Class A | 11,400 | | 55,098 |
| Mango Excellent Media Co., Ltd. Class A | 9,800 | | 34,667 |
| Meihua Holdings Group Co., Ltd. Class A | 126,300 | | 169,272 |
| Meituan Class B 144A* | 435,350 | | 4,570,643 |
| Metallurgical Corporation of China, Ltd. Class A | 448,900 | | 192,732 |
| Midea Group Co., Ltd. Class A | 783,992 | | 6,012,419 |
| Montage Technology Co., Ltd. Class A | 1,970 | | 16,219 |
| Muyuan Foods Co., Ltd. Class A | 1,600 | | 9,252 |
| NARI Technology Co., Ltd. Class A | 1,506,426 | | 4,717,333 |
| National Silicon Industry Group Co., Ltd. Class A* | 5,208 | | 12,657 |
| NetEase, Inc. | 61,100 | | 1,102,341 |
| NetEase, Inc. ADR | 20,039 | | 1,866,833 |
| New China Life Insurance Co., Ltd. Class A | 17,800 | | 77,825 |
| New China Life Insurance Co., Ltd. Class H | 170,000 | | 331,680 |
| New Oriental Education & Technology Group, Inc.* | 120,600 | | 879,131 |
| Ningbo Ronbay New Energy Technology Co., Ltd. Class A | 800 | | 4,466 |
| NIO, Inc. ADRΔ* | 36,022 | | 326,720 |
| Offshore Oil Engineering Co., Ltd. Class A | 251,300 | | 209,442 |
| Orient Overseas International, Ltd.Δ | 100,000 | | 1,396,600 |
| PDD Holdings, Inc. ADR* | 18,687 | | 2,734,095 |
| People.cn Co., Ltd. Class A | 3,600 | | 14,116 |
| People's Insurance Co. Group of China, Ltd. (The) Class A | 64,500 | | 43,851 |
| People's Insurance Co. Group of China, Ltd. (The) Class H | 420,000 | | 129,186 |
| PetroChina Co., Ltd. Class A | 267,500 | | 264,956 |
| PetroChina Co., Ltd. Class H | 514,000 | | 339,646 |
| PICC Property & Casualty Co., Ltd. Class H | 2,522,000 | | 3,001,224 |
| Ping An Bank Co., Ltd. Class A | 63,600 | | 83,820 |
| Ping An Insurance Group Co. of China, Ltd. Class A | 35,200 | | 199,314 |
| Ping An Insurance Group Co. of China, Ltd. Class H | 1,567,996 | | 7,098,787 |
| Power Construction Corporation of China, Ltd. Class A | 25,500 | | 17,497 |
| SDIC Power Holdings Co., Ltd. Class A | 22,300 | | 41,247 |
| Seres Group Co., Ltd. Class A* | 3,000 | | 32,072 |
| Shandong Nanshan Aluminum Co., Ltd. Class A | 81,000 | | 33,407 |
| Shandong Weigao Group Medical Polymer Co., Ltd. Class H | 1,790,400 | | 1,744,886 |
| Shanghai Baosight Software Co., Ltd. Class A | 24,720 | | 169,262 |
| | | Shares | | Value |
| Shanghai BOCHU Electronic Technology Corporation, Ltd. Class A | 278 | | $ 9,875 |
| Shanghai Junshi Biosciences Co., Ltd. Class A* | 1,216 | | 7,136 |
| Shanxi Coal International Energy Group Co., Ltd. Class A | 53,900 | | 132,450 |
| Shanxi Coking Coal Energy Group Co., Ltd. Class A | 10,800 | | 14,973 |
| Shanxi Lu'an Environmental Energy Development Co., Ltd. Class A | 5,200 | | 15,989 |
| Shenzhen Inovance Technology Co., Ltd. Class A | 363,326 | | 3,221,052 |
| Shenzhen Mindray Bio-Medical Electronics Co., Ltd. Class A | 130,090 | | 5,309,278 |
| Shenzhen SC New Energy Technology Corporation Class A | 1,000 | | 10,385 |
| Shenzhen Transsion Holdings Co., Ltd. Class A | 1,226 | | 23,803 |
| Shenzhou International Group Holdings, Ltd. | 65,300 | | 669,904 |
| Sichuan Kelun Pharmaceutical Co., Ltd. Class A | 4,500 | | 18,347 |
| Sichuan Kelun-Biotech Biopharmaceutical Co., Ltd.* | 51,200 | | 673,817 |
| Silergy Corporation | 41,000 | | 665,467 |
| Sinopharm Group Co., Ltd. Class H | 734,000 | | 1,923,665 |
| SooChow Securities Co., Ltd. Class A | 12,800 | | 13,133 |
| Sungrow Power Supply Co., Ltd. Class A | 25,899 | | 318,268 |
| Sunny Optical Technology Group Co., Ltd. | 6,700 | | 60,909 |
| Sunresin New Materials Co., Ltd. Class A | 47,850 | | 356,259 |
| Suzhou Dongshan Precision Manufacturing Co., Ltd. Class A | 3,800 | | 9,686 |
| Tencent Music Entertainment Group ADR* | 22,026 | | 198,454 |
| Thunder Software Technology Co., Ltd. Class A | 7,200 | | 80,810 |
| Tongling Nonferrous Metals Group Co., Ltd. Class A | 7,700 | | 3,544 |
| Tongwei Co., Ltd. Class A | 14,500 | | 50,913 |
| Trina Solar Co., Ltd. Class A | 3,900 | | 15,620 |
| Unisplendour Corporation, Ltd. Class A* | 5,200 | | 14,112 |
| Universal Scientific Industrial Shanghai Co., Ltd. Class A | 53,400 | | 113,209 |
| Vipshop Holdings, Ltd. ADR* | 13,960 | | 247,930 |
| Weichai Power Co., Ltd. Class A | 53,400 | | 102,219 |
| Weichai Power Co., Ltd. Class H | 266,000 | | 444,392 |
| Western Mining Co., Ltd. Class A | 6,200 | | 12,406 |
| Western Superconducting Technologies Co., Ltd. Class A | 1,152 | | 8,607 |
| Will Semiconductor Co., Ltd. Class A | 119,503 | | 1,789,501 |
| WUS Printed Circuit Kunshan Co., Ltd. Class A | 4,000 | | 12,405 |
| WuXi AppTec Co., Ltd. Class A | 400 | | 4,086 |
| WuXi AppTec Co., Ltd. Class H 144A | 51,600 | | 525,705 |
| Xiamen C&D, Inc. Class A | 51,600 | | 69,807 |
See Notes to Financial Statements.
| | | Shares | | Value |
| Xiaomi Corporation Class B 144A* | 30,200 | | $ 60,474 |
| Yadea Group Holdings, Ltd. 144A | 36,000 | | 63,409 |
| Yealink Network Technology Corporation, Ltd. Class A | 8,780 | | 36,400 |
| Yihai Kerry Arawana Holdings Co., Ltd. Class A | 1,900 | | 8,905 |
| Yunnan Aluminium Co., Ltd. Class A | 373,748 | | 641,001 |
| Yutong Bus Co., Ltd. Class A | 130,100 | | 242,001 |
| Zhejiang Century Huatong Group Co., Ltd. Class A* | 21,800 | | 15,786 |
| Zhejiang Dahua Technology Co., Ltd. Class A | 6,300 | | 16,311 |
| Zhejiang Dingli Machinery Co., Ltd. Class A | 3,000 | | 21,545 |
| Zhejiang Sanhua Intelligent Controls Co., Ltd. Class A | 132,030 | | 544,677 |
| Zhejiang Zheneng Electric Power Co., Ltd. Class A* | 16,800 | | 10,869 |
| Zhongji Innolight Co., Ltd. Class A | 22,000 | | 347,609 |
| Zhongjin Gold Corporation, Ltd. Class A | 38,700 | | 54,037 |
| Zhongsheng Group Holdings, Ltd. | 131,000 | | 313,775 |
| Zhuzhou CRRC Times Electric Co., Ltd. Class A | 1,033 | | 5,267 |
| ZTE Corporation Class A | 38,200 | | 141,903 |
| ZTO Express Cayman, Inc. | 40,824 | | 858,055 |
| ZTO Express Cayman, Inc. ADR | 36,693 | | 780,827 |
| | | | | 119,041,018 |
| Egypt — 0.0% | | |
| Commercial International Bank - Egypt (CIB) GDR | 211,021 | | 270,107 |
| Greece — 0.4% | | |
| JUMBO SA | 22,453 | | 622,649 |
| National Bank of Greece SA* | 131,468 | | 913,406 |
| Piraeus Financial Holdings SA* | 434,511 | | 1,535,449 |
| Sarantis SA | 3,461 | | 32,018 |
| | | | | 3,103,522 |
| Hong Kong — 6.9% | | |
| AIA Group, Ltd. | 749,800 | | 6,525,421 |
| Alibaba Group Holding, Ltd. | 713,296 | | 6,870,854 |
| China Merchants Port Holdings Co., Ltd. | 506,000 | | 689,553 |
| China Overseas Land & Investment, Ltd. | 180,000 | | 317,571 |
| China Taiping Insurance Holdings Co., Ltd. | 1,293,600 | | 1,115,539 |
| CITIC, Ltd. | 2,794,000 | | 2,793,591 |
| Hong Kong Exchanges and Clearing, Ltd. | 168,200 | | 5,769,304 |
| Lenovo Group, Ltd. | 296,000 | | 414,234 |
| Sinotruk Hong Kong, Ltd. | 298,500 | | 585,963 |
| Tencent Holdings, Ltd. | 795,967 | | 30,051,633 |
| | | | | 55,133,663 |
| Hungary — 0.5% | | |
| MOL Hungarian Oil & Gas PLC | 177,008 | | 1,441,929 |
| OTP Bank Nyrt PLC | 60,852 | | 2,771,952 |
| | | | | 4,213,881 |
| | | Shares | | Value |
| India — 16.3% | | |
| Amber Enterprises India, Ltd.* | 6,037 | | $ 227,267 |
| Apollo Hospitals Enterprise, Ltd. | 8,699 | | 595,919 |
| Axis Bank, Ltd. | 275,707 | | 3,648,810 |
| Bajaj Auto, Ltd. | 7,392 | | 603,628 |
| Bajaj Finance, Ltd. | 18,323 | | 1,612,265 |
| Bank of Baroda | 599,030 | | 1,662,080 |
| Bharat Petroleum Corporation, Ltd. | 219,530 | | 1,188,889 |
| Bharti Airtel, Ltd. | 291,589 | | 3,614,849 |
| Cartrade Tech, Ltd.* | 16,164 | | 138,549 |
| CG Power & Industrial Solutions, Ltd. | 82,946 | | 452,770 |
| Coal India, Ltd. | 649,506 | | 2,932,909 |
| Coforge, Ltd. | 8,539 | | 643,156 |
| Computer Age Management Services, Ltd. | 20,806 | | 662,405 |
| Craftsman Automation, Ltd. | 3,394 | | 220,509 |
| Crompton Greaves Consumer Electricals, Ltd. | 97,752 | | 365,036 |
| DLF, Ltd. | 33,609 | | 293,098 |
| Embassy Office Parks REIT | 374,223 | | 1,459,993 |
| Five-Star Business Finance, Ltd.* | 28,737 | | 253,696 |
| Godrej Properties, Ltd.* | 29,317 | | 708,652 |
| HDFC Bank, Ltd. | 1,018,521 | | 20,855,258 |
| HDFC Life Insurance Co., Ltd. 144A | 103,836 | | 806,821 |
| Hindustan Aeronautics, Ltd. | 41,573 | | 1,400,381 |
| Hindustan Petroleum Corporation, Ltd.* | 133,259 | | 638,811 |
| ICICI Bank, Ltd. | 406,684 | | 4,859,792 |
| ICICI Lombard General Insurance Co., Ltd. 144A | 37,421 | | 638,264 |
| Indian Oil Corporation, Ltd. | 1,442,933 | | 2,250,465 |
| Info Edge India, Ltd. | 6,804 | | 419,957 |
| Infosys, Ltd. | 50,236 | | 929,893 |
| InterGlobe Aviation, Ltd. 144A* | 3,533 | | 125,867 |
| Jio Financial Services, Ltd.* | 233,143 | | 651,814 |
| Kotak Mahindra Bank, Ltd. | 86,904 | | 1,991,193 |
| Larsen & Toubro, Ltd. | 185,848 | | 7,870,268 |
| Macrotech Developers, Ltd. 144A | 106,757 | | 1,311,510 |
| Mahindra & Mahindra, Ltd. | 605,739 | | 12,580,344 |
| Marico, Ltd. | 1,236,510 | | 8,147,656 |
| Max Healthcare Institute, Ltd. | 63,108 | | 520,441 |
| Navin Fluorine International, Ltd. | 9,316 | | 431,134 |
| Netweb Technologies India, Ltd.* | 16,918 | | 241,090 |
| NTPC, Ltd. | 836,327 | | 3,124,552 |
| Oil & Natural Gas Corporation, Ltd. | 1,173,495 | | 2,889,166 |
| PB Fintech, Ltd.* | 100,916 | | 962,757 |
| Petronet LNG, Ltd. | 629,119 | | 1,682,259 |
| Power Finance Corporation, Ltd. | 199,663 | | 917,396 |
| Power Grid Corporation of India, Ltd. | 1,016,856 | | 2,896,358 |
| REC, Ltd. | 185,843 | | 921,317 |
| Reliance Industries, Ltd. | 137,324 | | 4,262,256 |
| Route Mobile, Ltd. | 19,390 | | 372,262 |
| SBI Life Insurance Co., Ltd. 144A | 214,306 | | 3,688,157 |
| Sona Blw Precision Forgings, Ltd. 144A | 66,522 | | 514,843 |
| State Bank of India | 136,914 | | 1,055,424 |
| Tata Consultancy Services, Ltd. | 246,036 | | 11,205,439 |
See Notes to Financial Statements.
EMERGING MARKETS EQUITY FUND
SCHEDULE OF INVESTMENTS (Continued)
| | | Shares | | Value |
| Tata Consumer Products, Ltd. | 89,607 | | $ 1,169,704 |
| Tata Motors, Ltd. | 90,879 | | 851,410 |
| TeamLease Services, Ltd.* | 10,222 | | 392,517 |
| UltraTech Cement, Ltd. | 7,294 | | 920,147 |
| Vedanta, Ltd. | 847,559 | | 2,631,376 |
| Zomato, Ltd.* | 884,351 | | 1,312,623 |
| | | | | 129,725,402 |
| Indonesia — 2.8% | | |
| Aneka Tambang Tbk | 1,999,900 | | 221,468 |
| PT Adaro Energy Indonesia Tbk | 13,313,900 | | 2,056,314 |
| PT Astra International Tbk | 432,100 | | 158,460 |
| PT Bank BTPN Syariah Tbk | 1,116,500 | | 122,542 |
| PT Bank Central Asia Tbk | 18,766,502 | | 11,460,696 |
| PT Bank Mandiri Persero Tbk | 4,948,128 | | 1,943,811 |
| PT Bank Negara Indonesia Persero Tbk | 894,100 | | 311,987 |
| PT BFI Finance Indonesia Tbk | 4,306,700 | | 337,051 |
| PT Indah Kiat Pulp & Paper Tbk | 662,100 | | 357,859 |
| PT Map Aktif Adiperkasa | 8,633,100 | | 459,774 |
| PT Nusantara Sejahtera Raya Tbk 144A* | 10,412,800 | | 185,303 |
| PT Nusantara Sejahtera Raya Tbk (Indonesia Stock Exchange) 144A* | 1,770,500 | | 31,048 |
| PT Pakuwon Jati Tbk | 8,260,800 | | 243,499 |
| PT Semen Indonesia Persero Tbk | 665,725 | | 276,678 |
| PT Telkom Indonesia Persero Tbk | 5,292,100 | | 1,357,668 |
| PT United Tractors Tbk | 1,621,660 | | 2,382,815 |
| | | | | 21,906,973 |
| Kazakhstan — 0.1% | | |
| Kaspi.KZ JSC GDR 144A | 3,113 | | 286,396 |
| Kaspi.KZ JSC GDR (London Exchange) | 6,571 | | 604,532 |
| | | | | 890,928 |
| Kuwait — 0.1% | | |
| Kuwait Finance House KSCP | 1 | | 2 |
| National Bank of Kuwait SAKP | 214,155 | | 623,025 |
| | | | | 623,027 |
| Malaysia — 0.4% | | |
| AMMB Holdings Bhd | 163,000 | | 142,173 |
| Malayan Banking Bhd | 1,106,133 | | 2,139,542 |
| RHB Bank Bhd | 571,800 | | 678,058 |
| Sime Darby Plantation Bhd | 111,600 | | 108,188 |
| | | | | 3,067,961 |
| Mexico — 3.2% | | |
| Alfa SAB de CV Series A | 1,294,900 | | 1,036,315 |
| Alpek SAB de CVΔ | 80,518 | | 60,124 |
| Alsea SAB de CV* | 127,900 | | 484,304 |
| Arca Continental SAB de CV | 59,921 | | 655,211 |
| Banco del Bajio SA 144A | 173,600 | | 581,291 |
| Cemex SAB de CV ADR* | 296,195 | | 2,295,511 |
| Corporation Inmobiliaria Vesta SAB de CV ADR | 50,370 | | 1,995,659 |
| | | Shares | | Value |
| Fibra Uno Administracion SA de CV REIT | 223,800 | | $ 401,973 |
| Fomento Economico Mexicano SAB de CV ADR | 86,400 | | 11,262,240 |
| GCC SAB de CV | 35,200 | | 416,509 |
| Gentera SAB de CV | 266,050 | | 369,910 |
| Grupo Aeroportuario del Sureste SAB de CV ADR | 3,892 | | 1,145,299 |
| Grupo Financiero Banorte SAB de CV Series O | 249,749 | | 2,516,463 |
| Orbia Advance Corporation SAB de CV | 332,300 | | 735,596 |
| Prologis Property Mexico SA de CV REIT | 120,459 | | 571,047 |
| Promotora y Operadora de Infraestructura SAB de CV | 17,525 | | 189,131 |
| Wal-Mart de Mexico SAB de CV | 106,300 | | 446,897 |
| | | | | 25,163,480 |
| Peru — 0.7% | | |
| Credicorp, Ltd. | 39,223 | | 5,880,704 |
| Philippines — 0.3% | | |
| Ayala Land, Inc. | 1,157,500 | | 719,512 |
| BDO Unibank, Inc. | 288,764 | | 680,304 |
| Jollibee Foods Corporation | 88,760 | | 402,812 |
| Monde Nissin Corporation 144A | 3,502,500 | | 530,040 |
| SM Prime Holdings, Inc. | 473,200 | | 281,143 |
| | | | | 2,613,811 |
| Poland — 0.6% | | |
| Bank Polska Kasa Opieki SA | 73,324 | | 2,834,944 |
| Budimex SA | 890 | | 141,614 |
| Dino Polska SA 144A* | 5,403 | | 632,612 |
| Powszechny Zaklad Ubezpieczen SA | 86,536 | | 1,039,447 |
| | | | | 4,648,617 |
| Qatar — 0.1% | | |
| Commercial Bank PSQC (The) | 60,247 | | 98,454 |
| Qatar Islamic Bank SAQ | 46,149 | | 264,904 |
| Qatar National Bank QPSC | 174,224 | | 767,650 |
| | | | | 1,131,008 |
| Romania — 0.1% | | |
| Societatea De Producere A Energiei Electrice in Hidrocentrale Hidroelectrica SA* | 22,661 | | 643,036 |
| Russia — 0.0% | | |
| Gazprom PJSC ADR†††* | 170,565 | | — |
| LUKOIL PJSC ADR†††* | 11,047 | | — |
| MMC Norilsk Nickel PJSC ADR†††* | 19,198 | | — |
| Mobile TeleSystems PJSC ADR†††* | 34,508 | | — |
| Novatek PJSC GDR†††* | 1,991 | | — |
| Novolipetsk Steel PJSC GDR†††* | 13,631 | | — |
| Rosneft Oil Co. PJSC GDR†††* | 16,843 | | — |
| Sberbank of Russia PJSC ADR†††* | 75,573 | | — |
| Severstal PAO GDR†††* | 18,988 | | — |
| Surgutneftegas PJSC ADR†††* | 17,904 | | — |
See Notes to Financial Statements.
| | | Shares | | Value |
| Tatneft PJSC ADR†††* | 15,224 | | $ — |
| | | | | — |
| Saudi Arabia — 2.8% | | |
| Alinma Bank | 36,816 | | 380,171 |
| Arab National Bank | 145,191 | | 981,491 |
| Arabian Drilling Co. | 22,736 | | 1,147,107 |
| Banque Saudi Fransi | 112,137 | | 1,195,628 |
| Catrion Catering Holding Co. | 29,353 | | 989,392 |
| Co for Cooperative Insurance (The) | 13,950 | | 485,088 |
| Elm Co. | 2,099 | | 455,976 |
| Etihad Etisalat Co. | 33,424 | | 440,305 |
| Middle East Healthcare Co.* | 41,927 | | 989,956 |
| National Industrialization Co.* | 33,757 | | 110,683 |
| Riyad Bank | 192,956 | | 1,468,116 |
| Sahara International Petrochemical Co. | 11,194 | | 101,533 |
| Saudi Arabian Oil Co. 144A | 100,033 | | 880,706 |
| Saudi Basic Industries Corporation | 93,621 | | 2,078,239 |
| Saudi British Bank (The) | 279,098 | | 2,796,683 |
| Saudi Electricity Co. | 58,960 | | 298,032 |
| Saudi Ground Services Co.* | 217,536 | | 2,086,533 |
| Saudi National Bank (The) | 380,361 | | 3,922,741 |
| Saudi Telecom Co. | 104,359 | | 1,126,471 |
| Savola Group (The) | 6,083 | | 60,587 |
| | | | | 21,995,438 |
| Singapore — 0.0% | | |
| Nanofilm Technologies International, Ltd. | 202,706 | | 140,216 |
| TDCX, Inc. ADR* | 18,358 | | 89,036 |
| | | | | 229,252 |
| Slovenia — 0.1% | | |
| Nova Ljubljanska Banka dd GDR | 34,167 | | 639,331 |
| South Africa — 2.6% | | |
| Absa Group, Ltd. | 67,751 | | 604,655 |
| African Rainbow Minerals, Ltd. | 106,298 | | 1,162,203 |
| Anglo American Platinum, Ltd.Δ | 10,990 | | 576,835 |
| Clicks Group, Ltd. | 38,480 | | 685,162 |
| Discovery, Ltd. | 460,208 | | 3,614,743 |
| Exxaro Resources, Ltd. | 166,526 | | 1,869,580 |
| JSE, Ltd. | 44,616 | | 225,464 |
| Naspers, Ltd. Class N | 36,476 | | 6,243,598 |
| Nedbank Group, Ltd. | 98,893 | | 1,167,391 |
| Old Mutual, Ltd. | 4,039,784 | | 2,884,219 |
| Sanlam, Ltd. | 54,266 | | 215,966 |
| Sasol, Ltd. | 76,891 | | 774,884 |
| Standard Bank Group, Ltd. | 24,035 | | 273,428 |
| | | | | 20,298,128 |
| South Korea — 10.7% | | |
| BGF retail Co., Ltd. | 7,797 | | 791,884 |
| Celltrion, Inc. | 1,512 | | 236,074 |
| DB Insurance Co., Ltd. | 22,147 | | 1,434,310 |
| Doosan Bobcat, Inc. | 56,628 | | 2,205,848 |
| GS Holdings Corporation | 42,371 | | 1,341,448 |
| Hana Financial Group, Inc. | 86,719 | | 2,908,953 |
| | | Shares | | Value |
| Hanmi Semiconductor Co., Ltd. | 25,383 | | $ 1,206,074 |
| Hanon Systems | 230,341 | | 1,297,504 |
| HMM Co., Ltd. | 53,960 | | 818,641 |
| Hyundai Glovis Co., Ltd. | 783 | | 116,020 |
| Hyundai Steel Co. | 81,649 | | 2,301,027 |
| Industrial Bank of Korea | 175,756 | | 1,615,462 |
| JYP Entertainment Corporation | 5,484 | | 429,480 |
| KB Financial Group, Inc. | 26,871 | | 1,121,106 |
| Kia Corporation | 57,339 | | 4,434,215 |
| Korea Investment Holdings Co., Ltd. | 21,563 | | 1,021,300 |
| Korean Air Lines Co., Ltd. | 3,404 | | 62,889 |
| LG Corporation | 18,043 | | 1,199,033 |
| LG Electronic, Inc. | 11,426 | | 898,517 |
| LG Uplus Corporation | 13,101 | | 103,901 |
| NAVER Corporation | 3,756 | | 649,865 |
| NCSoft Corporation | 1,030 | | 191,571 |
| Orion Corporation | 5,132 | | 460,546 |
| Posco International Corporation | 1,422 | | 68,359 |
| Samsung Biologics Co., Ltd. 144A* | 816 | | 480,036 |
| Samsung Electronics Co., Ltd. | 428,385 | | 26,001,616 |
| Samsung Engineering Co., Ltd.* | 56,757 | | 1,271,429 |
| Samsung Fire & Marine Insurance Co., Ltd. | 41,250 | | 8,404,125 |
| Samsung SDI Co., Ltd. | 1,184 | | 431,084 |
| Shinhan Financial Group Co., Ltd. | 12,298 | | 381,282 |
| SK Hynix, Inc. | 151,181 | | 16,499,587 |
| SK Telecom Co., Ltd. | 45,023 | | 1,749,138 |
| Woori Financial Group, Inc. | 271,398 | | 2,731,627 |
| | | | | 84,863,951 |
| Taiwan — 14.9% | | |
| Advantech Co., Ltd. | 198,073 | | 2,396,961 |
| ASE Technology Holding Co., Ltd. | 698,000 | | 3,058,803 |
| ASPEED Technology, Inc. | 24,720 | | 2,504,160 |
| Catcher Technology Co., Ltd. | 311,000 | | 1,963,803 |
| Chailease Holding Co., Ltd. | 104,595 | | 657,248 |
| Chang Hwa Commercial Bank, Ltd. | 230,925 | | 134,611 |
| China Development Financial Holding Corporation* | 3,089,000 | | 1,262,389 |
| Chroma ATE, Inc. | 29,000 | | 200,782 |
| Compal Electronics, Inc. | 301,000 | | 389,888 |
| CTBC Financial Holding Co., Ltd. | 1,871,000 | | 1,726,567 |
| Delta Electronics, Inc. | 679,982 | | 6,934,750 |
| Eva Airways Corporation | 1,610,000 | | 1,647,601 |
| Evergreen Marine Corporation Taiwan, Ltd. | 104,000 | | 485,507 |
| Gigabyte Technology Co., Ltd. | 53,000 | | 457,211 |
| Hon Hai Precision Industry Co., Ltd. | 498,000 | | 1,694,314 |
| Jentech Precision Industrial Co., Ltd. | 14,000 | | 350,331 |
| Lite-On Technology Corporation | 58,000 | | 220,237 |
| MediaTek, Inc. | 302,396 | | 9,985,086 |
| Nien Made Enterprise Co., Ltd. | 39,000 | | 448,132 |
| Novatek Microelectronics Corporation | 99,000 | | 1,665,107 |
| Pegatron Corporation | 206,000 | | 585,338 |
| Pou Chen Corporation | 1,430,000 | | 1,438,973 |
| President Chain Store Corporation | 742,000 | | 6,513,417 |
| Realtek Semiconductor Corporation | 89,000 | | 1,364,809 |
See Notes to Financial Statements.
EMERGING MARKETS EQUITY FUND
SCHEDULE OF INVESTMENTS (Continued)
| | | Shares | | Value |
| Shanghai Commercial & Savings Bank, Ltd. (The) | 109,000 | | $ 166,109 |
| Taiwan Semiconductor Manufacturing Co., Ltd. | 2,156,986 | | 41,352,768 |
| Taiwan Semiconductor Manufacturing Co., Ltd. ADR | 188,546 | | 19,608,784 |
| Unimicron Technology Corporation | 526,734 | | 3,009,493 |
| United Microelectronics Corporation | 584,000 | | 995,035 |
| Voltronic Power Technology Corporation | 79,817 | | 4,438,849 |
| Wistron Corporation | 203,000 | | 649,417 |
| WPG Holdings, Ltd. | 50,000 | | 132,836 |
| | | | | 118,439,316 |
| Thailand — 0.8% | | |
| Central Pattana PCL | 734,600 | | 1,506,541 |
| Central Pattana PCL NVDR | 92,600 | | 189,587 |
| Electricity Generating PCL NVDR | 7,600 | | 28,469 |
| Krung Thai Bank PCL NVDR | 402,000 | | 216,463 |
| PTT Exploration & Production PCL | 687,200 | | 2,996,040 |
| PTT Exploration & Production PCL NVDR | 106,800 | | 465,220 |
| SCB X PCL NVDR | 265,900 | | 824,934 |
| | | | | 6,227,254 |
| Turkey — 0.3% | | |
| Akbank TAS | 739,273 | | 914,302 |
| KOC Holding AS | 258,058 | | 1,239,078 |
| Yapi ve Kredi Bankasi AS | 531,849 | | 351,539 |
| | | | | 2,504,919 |
| United Arab Emirates — 0.4% | | |
| Abu Dhabi Commercial Bank PJSC | 285,551 | | 713,731 |
| Americana Restaurants International PLC | 1,332,333 | | 1,135,444 |
| Burjeel Holdings PLC | 717,847 | | 607,856 |
| Emaar Properties PJSC | 30,020 | | 64,739 |
| Emirates NBD Bank PJSC | 45,844 | | 215,942 |
| First Abu Dhabi Bank PJSC | 126,635 | | 481,336 |
| | | | | 3,219,048 |
| United Kingdom — 2.6% | | |
| Anglo American PLC | 82,257 | | 2,058,622 |
| Antofagasta PLC | 491,487 | | 10,508,963 |
| Standard Chartered PLC | 48,617 | | 412,571 |
| Unilever PLC | 161,893 | | 7,837,407 |
| | | | | 20,817,563 |
Total Foreign Common Stocks
(Cost $678,855,113) | | 706,383,204 |
| | | Shares | | Value |
| FOREIGN PREFERRED STOCKS — 1.6% |
| Brazil — 0.7% | | |
| Itau Unibanco Holding SA 0.97%* | | 95,600 | | $ 665,137 |
| Gerdau SA 8.60%◊ | | 79,600 | | 385,184 |
| Petroleo Brasileiro SA 2.71%◊ | | 628,300 | | 4,793,810 |
| | | | | 5,844,131 |
| Chile — 0.3% | | |
| Embotelladora Andina SA Class B 5.66%◊ | | 851,078 | | 2,115,596 |
| South Korea — 0.6% | | |
| Samsung Electronics Co., Ltd. 2.50%◊ | | 103,219 | | 4,973,763 |
Total Foreign Preferred Stocks
(Cost $11,844,503) | | 12,933,490 |
| RIGHTS — 0.0% |
Localiza Rent a Car SA*
(Cost $—) | 672 | | 2,767 |
| MONEY MARKET FUNDS — 6.1% |
| Northern Institutional Liquid Assets Portfolio (Shares), 5.40%ا | 185,548 | | 185,548 |
GuideStone Money Market Fund, 5.28%
(Institutional Class)Ø∞ | 20,485,019 | | 20,485,019 |
| Northern Institutional U.S. Treasury Portfolio (Premier), 5.22%Ø | 27,477,322 | | 27,477,322 |
Total Money Market Funds
(Cost $48,147,889) | | 48,147,889 |
TOTAL INVESTMENTS — 98.5%
(Cost $754,778,341) | | | 783,321,767 |
Other Assets in Excess of
Liabilities — 1.5% | | | 11,658,738 |
| NET ASSETS — 100.0% | | | $794,980,505 |
Futures Contracts outstanding at December 31, 2023:
| Future Type | | Expiration Date | | Open Long
(Short) Contracts | | Notional
Market Value
of Contracts | | Value and
Unrealized
Appreciation
(Depreciation) |
| IFSC NIFTY 50 Index | | 01/2024 | | 1 | | $ 43,697 | | $ (192) |
| FTSE Taiwan Index | | 01/2024 | | 13 | | 806,260 | | 4,281 |
| Hang Seng China Enterprises Index | | 01/2024 | | 109 | | 4,045,361 | | 108,491 |
| MSCI Singapore Index | | 01/2024 | | (290) | | (6,321,879) | | (219,937) |
See Notes to Financial Statements.
| Future Type | | Expiration Date | | Open Long
(Short) Contracts | | Notional
Market Value
of Contracts | | Value and
Unrealized
Appreciation
(Depreciation) |
| FTSE Bursa Malaysia KLCI | | 01/2024 | | 201 | | $ 3,175,756 | | $ (16,140) |
| KOSPI2 Index | | 03/2024 | | 140 | | 9,856,743 | | 590,743 |
| Mexican Bolsa Index | | 03/2024 | | 6 | | 206,800 | | 6,554 |
| MSCI Emerging Markets | | 03/2024 | | 721 | | 37,264,885 | | 1,294,571 |
| FTSE/JSE Top 40 Index | | 03/2024 | | (101) | | (3,941,719) | | (106,945) |
| Thai SET50 Index | | 03/2024 | | (1,437) | | (7,352,455) | | (70,526) |
| Total Futures Contracts outstanding at December 31, 2023 | | | | | | $37,783,449 | | $1,590,900 |
Forward Foreign Currency Contracts outstanding at December 31, 2023:
| Expiration Date | | Currency
Purchased | | Amount
of Currency
Purchased | | Currency
Sold | | Amount
of Currency
Sold | | Counter-
party | | Net Unrealized
Appreciation
(Depreciation) |
| 03/20/24 | | Mexican Pesos | | 348,653,479 | | U.S. Dollars | | 19,844,771 | | CITI | | $ 419,469 |
| 03/20/24 | | Taiwan Dollars | | 471,477,890 | | U.S. Dollars | | 15,271,916 | | CITI | | 353,003 |
| 03/20/24 | | Colombian Pesos | | 38,100,000,000 | | U.S. Dollars | | 9,359,715 | | CITI | | 314,066 |
| 03/20/24 | | South African Rand | | 170,462,000 | | U.S. Dollars | | 9,046,577 | | CITI | | 206,683 |
| 03/20/24 | | Thai Baht | | 333,269,624 | | U.S. Dollars | | 9,644,260 | | CITI | | 187,926 |
| 03/20/24 | | Polish Zloty | | 38,123,000 | | U.S. Dollars | | 9,514,328 | | CITI | | 163,801 |
| 03/20/24 | | Hungarian Forint | | 2,859,770,667 | | U.S. Dollars | | 8,057,567 | | CITI | | 112,946 |
| 03/20/24 | | U.S. Dollars | | 7,728,956 | | Chilean Pesos | | 6,744,307,277 | | CITI | | 108,355 |
| 07/16/25 | | Chinese Offshore Yuan | | 24,819,000 | | U.S. Dollars | | 3,538,494 | | CITI | | 43,499 |
| 03/20/24 | | Singapore Dollars | | 5,175,000 | | U.S. Dollars | | 3,898,867 | | CITI | | 36,924 |
| 03/20/24 | | Chinese Offshore Yuan | | 71,209,343 | | U.S. Dollars | | 10,019,364 | | CITI | | 30,182 |
| 03/20/24 | | Indian Rupees | | 1,792,532,000 | | U.S. Dollars | | 21,435,943 | | CITI | | 23,814 |
| 03/20/24 | | Euro | | 1,129,000 | | U.S. Dollars | | 1,231,572 | | CITI | | 18,833 |
| 03/20/24 | | Indonesian Rupiahs | | 44,000,000,000 | | U.S. Dollars | | 2,838,812 | | CITI | | 18,636 |
| 03/20/24 | | U.S. Dollars | | 4,133,243 | | South Korean Won | | 5,310,027,000 | | CITI | | 13,617 |
| 03/20/24 | | Czech Republic Koruna | | 48,100,000 | | U.S. Dollars | | 2,132,715 | | CITI | | 13,576 |
| 03/20/24 | | Brazilian Reals | | 2,636,000 | | U.S. Dollars | | 525,786 | | CITI | | 12,777 |
| 03/20/24 | | U.S. Dollars | | 3,731,315 | | Polish Zloty | | 14,665,538 | | CITI | | 8,235 |
| 03/20/24 | | U.S. Dollars | | 1,748,294 | | Czech Republic Koruna | | 39,000,000 | | CITI | | 8,058 |
| 03/20/24 | | Israeli Shekels | | 1,887,000 | | U.S. Dollars | | 514,683 | | CITI | | 7,794 |
| 03/20/24 | | U.S. Dollars | | 5,367,386 | | Philippine Pesos | | 296,804,375 | | CITI | | 6,504 |
| 03/20/24 | | U.S. Dollars | | 4,921,970 | | Chinese Offshore Yuan | | 34,830,919 | | CITI | | 6,394 |
| 03/20/24 | | Peruvian Nuevo Soles | | 1,247,874 | | U.S. Dollars | | 333,302 | | CITI | | 3,174 |
| 03/20/24 | | South Korean Won | | 800,000,000 | | U.S. Dollars | | 617,617 | | CITI | | 3,039 |
| 03/20/24 | | Hong Kong Dollars | | 48,328,898 | | U.S. Dollars | | 6,198,458 | | CITI | | 2,176 |
| 03/20/24 | | Chilean Pesos | | 600,000,000 | | U.S. Dollars | | 675,857 | | CITI | | 2,101 |
| 03/20/24 | | Saudi Riyals | | 14,551,550 | | U.S. Dollars | | 3,877,407 | | CITI | | 1,007 |
| 03/20/24 | | U.S. Dollars | | 343,407 | | Hungarian Forint | | 120,000,000 | | CITI | | 560 |
| 03/20/24 | | U.S. Dollars | | 5,139 | | Peruvian Nuevo Soles | | 19,000 | | CITI | | 16 |
| 03/20/24 | | U.S. Dollars | | 14,410 | | Euro | | 13,000 | | CITI | | 13 |
| 03/20/24 | | U.S. Dollars | | 63,076 | | Hong Kong Dollars | | 491,529 | | CITI | | 12 |
| Subtotal Appreciation | | | | | | | | | | $2,127,190 |
| 03/20/24 | | Euro | | 3,000 | | U.S. Dollars | | 3,349 | | CITI | | $ (26) |
| 03/20/24 | | Peruvian Nuevo Soles | | 44,000 | | U.S. Dollars | | 11,895 | | CITI | | (30) |
| 03/20/24 | | Saudi Riyals | | 5,505,237 | | U.S. Dollars | | 1,467,367 | | CITI | | (60) |
| 03/20/24 | | U.S. Dollars | | 628,335 | | Hungarian Forint | | 220,000,000 | | CITI | | (216) |
| 03/20/24 | | U.S. Dollars | | 22,920 | | Euro | | 21,000 | | CITI | | (338) |
| 03/20/24 | | U.S. Dollars | | 29,966 | | Peruvian Nuevo Soles | | 113,000 | | CITI | | (503) |
| 03/20/24 | | U.S. Dollars | | 1,025,711 | | Czech Republic Koruna | | 23,000,000 | | CITI | | (582) |
See Notes to Financial Statements.
EMERGING MARKETS EQUITY FUND
SCHEDULE OF INVESTMENTS (Continued)
| Expiration Date | | Currency
Purchased | | Amount
of Currency
Purchased | | Currency
Sold | | Amount
of Currency
Sold | | Counter-
party | | Net Unrealized
Appreciation
(Depreciation) |
| 03/20/24 | | U.S. Dollars | | 5,321,006 | | Saudi Riyals | | 19,968,958 | | CITI | | $ (1,307) |
| 03/20/24 | | Colombian Pesos | | 1,500,000,000 | | U.S. Dollars | | 382,563 | | CITI | | (1,706) |
| 03/20/24 | | Czech Republic Koruna | | 10,000,000 | | U.S. Dollars | | 448,373 | | CITI | | (2,159) |
| 03/20/24 | | U.S. Dollars | | 2,697,052 | | Polish Zloty | | 10,632,462 | | CITI | | (2,167) |
| 03/20/24 | | U.S. Dollars | | 659,818 | | Taiwan Dollars | | 20,000,000 | | CITI | | (2,988) |
| 03/20/24 | | Hong Kong Dollars | | 43,168,401 | | U.S. Dollars | | 5,541,712 | | CITI | | (3,173) |
| 03/20/24 | | U.S. Dollars | | 4,123,749 | | Hong Kong Dollars | | 32,166,920 | | CITI | | (3,292) |
| 03/20/24 | | Chinese Offshore Yuan | | 22,951,686 | | U.S. Dollars | | 3,242,669 | | CITI | | (3,571) |
| 03/20/24 | | U.S. Dollars | | 1,733,007 | | Indonesian Rupiahs | | 26,741,417,908 | | CITI | | (3,634) |
| 03/20/24 | | Brazilian Reals | | 8,698,000 | | U.S. Dollars | | 1,782,490 | | CITI | | (5,397) |
| 03/20/24 | | Indian Rupees | | 560,000,000 | | U.S. Dollars | | 6,711,911 | | CITI | | (7,728) |
| 03/20/24 | | U.S. Dollars | | 1,457,047 | | Chilean Pesos | | 1,300,000,000 | | CITI | | (11,864) |
| 03/20/24 | | Hungarian Forint | | 959,885,333 | | U.S. Dollars | | 2,755,774 | | CITI | | (13,332) |
| 03/20/24 | | Chilean Pesos | | 2,700,000,000 | | U.S. Dollars | | 3,069,488 | | CITI | | (18,675) |
| 03/20/24 | | U.S. Dollars | | 689,061 | | Thai Baht | | 24,000,000 | | CITI | | (18,992) |
| 03/20/24 | | U.S. Dollars | | 8,417,000 | | Chinese Offshore Yuan | | 59,796,632 | | CITI | | (21,907) |
| 03/20/24 | | Mexican Pesos | | 78,000,000 | | U.S. Dollars | | 4,556,055 | | CITI | | (22,583) |
| 03/20/24 | | U.S. Dollars | | 6,307,564 | | Philippine Pesos | | 350,482,625 | | CITI | | (22,856) |
| 03/20/24 | | U.S. Dollars | | 2,403,579 | | Mexican Pesos | | 42,000,000 | | CITI | | (37,521) |
| 03/20/24 | | U.S. Dollars | | 3,471,267 | | South African Rand | | 65,000,000 | | CITI | | (57,156) |
| 03/20/24 | | U.S. Dollars | | 6,087,992 | | Brazilian Reals | | 30,111,000 | | CITI | | (64,001) |
| 03/20/24 | | U.S. Dollars | | 5,148,932 | | South Korean Won | | 6,755,013,500 | | CITI | | (91,743) |
| 03/20/24 | | U.S. Dollars | | 8,233,828 | | Israeli Shekels | | 30,443,000 | | CITI | | (195,286) |
| 07/16/25 | | U.S. Dollars | | 3,253,457 | | Chinese Offshore Yuan | | 24,819,000 | | MSCS | | (328,536) |
| 03/20/24 | | U.S. Dollars | | 41,870,237 | | Singapore Dollars | | 55,644,000 | | CITI | | (449,213) |
| Subtotal Depreciation | | | | | | | | | | $(1,392,542) |
| Total Forward Foreign Currency Contracts outstanding at December 31, 2023 | | | | $ 734,648 |
Swap Agreements outstanding at December 31, 2023:
| Pay Rate Index/Pay Rate | | Receive
Rate Index/Receive
Rate | | Maturity
Date | | Counterparty | | Currency | | Notional
Amount | | Market Value | | Upfront
Premiums
Paid/
(Received) | | Unrealized
Appreciation
(Depreciation) |
| Total Return Swaps | | | | | | | | | | | | | | | | |
| Decrease in total return of TAIEX (At Termination) | | Increase in total return of TAIEX (At Termination) | | 1/17/2024 | | CITI | | TWD | | 260,902,000 | | $ 66,748 | | $ — | | $ 66,748 |
| Decrease in total return of HSCEI Index (At Termination) | | Increase in total return of HSCEI Index (At Termination) | | 1/30/2024 | | CITI | | HKD | | 28,509,020 | | 5,108 | | — | | 5,108 |
| Decrease in total return of Bovespa Index (At Termination) | | Increase in total return of Bovespa Index (At Termination) | | 2/14/2024 | | CITI | | BRL | | 80,387,680 | | 703,316 | | — | | 703,316 |
| Decrease in total return of KOSPI 200 Index (At Termination) | | Increase in total return of KOSPI 200 Index (At Termination) | | 3/14/2024 | | CITI | | KRW | | 18,860,400,000 | | 975,457 | | — | | 975,457 |
| Increase in total return of WIG20 Index (At Termination) | | Decrease in total return of WIG20 Index (At Termination) | | 3/15/2024 | | CITI | | PLN | | 3,079,700 | | 3,130 | | — | | 3,130 |
| Financing Index: 28-Day Mexico Interbank TIIE + 0.3% | | MSCI Mexico Net MXN Index (Monthly) | | 3/20/2024 | | CITI | | MXN | | 1,885,537 | | 4,017 | | — | | 4,017 |
| Financing Index: Overnight Bank Funding Rate + 0.3% | | MSCI Saudi Arabia Index Futures (Monthly) | | 3/20/2024 | | GSC | | USD | | 1,865,243 | | 83,919 | | — | | 83,919 |
See Notes to Financial Statements.
| Pay Rate Index/Pay Rate | | Receive
Rate Index/Receive
Rate | | Maturity
Date | | Counterparty | | Currency | | Notional
Amount | | Market Value | | Upfront
Premiums
Paid/
(Received) | | Unrealized
Appreciation
(Depreciation) |
| Financing Index: Overnight Brazil CETIP - 0.65% | | MSCI Brazil Net Return BRL Index (Monthly) | | 3/20/2024 | | CITI | | BRL | | 14,773,117 | | $ 61,952 | | $ — | | $ 61,952 |
| Subtotal Appreciation | | | | | | | | | | | | $1,903,647 | | $ — | | $1,903,647 |
| Financing Index: 28-Day Mexico Interbank TIIE + 0.3% | | MSCI Mexico Net MXN Index (Monthly) | | 3/20/2024 | | CITI | | MXN | | 3,263,053 | | $ (1,085) | | $ — | | $ (1,085) |
| Increase in total return of FTSE/JSE Shareholder Weighted Top 40 Index (At Termination) | | Decrease in total return of FTSE/JSE Shareholder Weighted Top 40 Index (At Termination) | | 3/20/2024 | | CITI | | ZAR | | 7,963,200 | | (8,626) | | — | | (8,626) |
| MSCI Emerging Markets Thailand Net Total Return USD Index (Monthly) | | Financing Index: Overnight Bank Funding Rate - 0.05% | | 3/20/2024 | | CITI | | USD | | 6,305,632 | | (536,277) | | — | | (536,277) |
| MSCI Poland Net Return PLN Index (Monthly) | | Financing Index: 1-Month WIBOR - 0.25% | | 3/20/2024 | | CITI | | PLN | | 2,585,258 | | (15,018) | | — | | (15,018) |
| MSCI Singapore Net Return SGD Index (Monthly) | | Financing Index: Singapore Overnight Rate - 0.05% | | 3/20/2024 | | CITI | | SGD | | 10,666,569 | | (342,572) | | — | | (342,572) |
| MSCI South Africa Net Return ZAR Index (Monthly) | | Financing Index: 1-Month SAFE South Africa JIBAR - 0.5% | | 3/20/2024 | | CITI | | ZAR | | 10,503,832 | | (14,333) | | — | | (14,333) |
| Tel Aviv Interbank Offered Rate (Monthly) | | Financing Index: 1-Month TELBOR - 0.55% | | 3/20/2024 | | GSC | | ILS | | 3,716,729 | | (37,088) | | — | | (37,088) |
| Subtotal Depreciation | | | | | | | | | | | | $ (954,999) | | $ — | | $ (954,999) |
| Net Total Return Swaps outstanding at December 31, 2023 | | $ 948,648 | | $ — | | $ 948,648 |
See Notes to Financial Statements.
EMERGING MARKETS EQUITY FUND
SCHEDULE OF INVESTMENTS (Continued)
VALUATION HIERARCHY
The following is a summary of the inputs used, as of December 31, 2023, in valuing the Fund’s investments carried at fair value:
| | Total
Value | | Level 1
Quoted Prices | | Level 2
Other Significant
Observable Inputs | | Level 3
Significant
Unobservable Inputs |
| Assets: | | | | | | | |
| Investments in Securities: | | | | | | | |
| Common Stocks: | | | | | | | |
| Consumer Discretionary | $ 15,644,320 | | $ 14,930,698 | | $ 713,622 | | $ — |
| Materials | 210,097 | | 210,097 | | — | | — |
| Total Common Stocks | 15,854,417 | | 15,140,795 | | 713,622 | | — |
| Foreign Common Stocks: | | | | | | | |
| Brazil | 42,296,825 | | 589,089 | | 41,707,736 | | — |
| Canada | 1,993,684 | | 1,993,684 | | — | | — |
| Cayman Islands | 2,278,946 | | 2,278,946 | | — | | — |
| Chile | 2,522,411 | | 2,026,391 | | 496,020 | | — |
| China | 119,041,018 | | 24,461,941 | | 94,579,077 | | — |
| Egypt | 270,107 | | 270,107 | | — | | — |
| Greece | 3,103,522 | | 654,667 | | 2,448,855 | | — |
| Hungary | 4,213,881 | | 1,441,929 | | 2,771,952 | | — |
| India | 129,725,402 | | 1,980,434 | | 127,744,968 | | — |
| Indonesia | 21,906,973 | | 1,013,176 | | 20,893,797 | | — |
| Kazakhstan | 890,928 | | 604,532 | | 286,396 | | — |
| Mexico | 25,163,480 | | 25,163,480 | | — | | — |
| Peru | 5,880,704 | | 5,880,704 | | — | | — |
| Philippines | 2,613,811 | | 811,183 | | 1,802,628 | | — |
| Qatar | 1,131,008 | | 363,358 | | 767,650 | | — |
| Saudi Arabia | 21,995,438 | | 4,103,970 | | 17,891,468 | | — |
| Singapore | 229,252 | | 89,036 | | 140,216 | | — |
| Slovenia | 639,331 | | 639,331 | | — | | — |
| South Africa | 20,298,128 | | 9,061,185 | | 11,236,943 | | — |
| Taiwan | 118,439,316 | | 19,608,784 | | 98,830,532 | | — |
| United Arab Emirates | 3,219,048 | | 3,154,309 | | 64,739 | | — |
| Other ^^ | 178,529,991 | | — | | 178,529,991 | | —** |
| Total Foreign Common Stocks | 706,383,204 | | 106,190,236 | | 600,192,968 | | — |
| Foreign Preferred Stocks: | | | | | | | |
| Chile | 2,115,596 | | 2,115,596 | | — | | — |
| Other ^^ | 10,817,894 | | — | | 10,817,894 | | — |
| Total Foreign Preferred Stocks | 12,933,490 | | 2,115,596 | | 10,817,894 | | — |
| Money Market Funds | 48,147,889 | | 48,147,889 | | — | | — |
| Rights | 2,767 | | 2,767 | | — | | — |
| Total Assets - Investments in Securities | $783,321,767 | | $171,597,283 | | $611,724,484 | | $ — |
| Other Financial Instruments*** | | | | | | | |
| Forward Foreign Currency Contracts | $ 2,127,190 | | $ — | | $ 2,127,190 | | $ — |
| Futures Contracts | 2,004,640 | | 2,004,640 | | — | | — |
| Swap Agreements | 1,903,647 | | — | | 1,903,647 | | — |
| Total Assets - Other Financial Instruments | $ 6,035,477 | | $ 2,004,640 | | $ 4,030,837 | | $ — |
See Notes to Financial Statements.
| | Total
Value | | Level 1
Quoted Prices | | Level 2
Other Significant
Observable Inputs | | Level 3
Significant
Unobservable Inputs |
| Liabilities: | | | | | | | |
| Other Financial Instruments*** | | | | | | | |
| Forward Foreign Currency Contracts | $(1,392,542) | | $ — | | $(1,392,542) | | $ — |
| Futures Contracts | (413,740) | | (413,740) | | — | | — |
| Swap Agreements | (954,999) | | — | | (954,999) | | — |
| Total Liabilities - Other Financial Instruments | $(2,761,281) | | $(413,740) | | $(2,347,541) | | $ — |
| ^^ | Classifications as defined in the Schedule of Investments. |
| ** | Level 3 security has zero value. |
| *** | Other financial instruments are derivative instruments, such as futures contracts, forward foreign currency contracts and swap agreements, which are valued at the unrealized appreciation (depreciation) on the investment. Further details regarding the value of these investments can be found in the preceding "Futures Contracts outstanding", "Forward Foreign Currency Contracts outstanding" and "Swap Agreements outstanding" disclosures. |
Management has determined that the amount of transfers between Level 3 and Level 2 compared to total net assets is not
material; therefore, the amount of transfers between Level 3 and Level 2 is not shown for the year ended December 31, 2023.
Management has determined that the amount of Level 3 securities compared to total net assets is not material; therefore, the reconciliation of Level 3 securities and assumptions is not shown for the year ended December 31, 2023.
See Notes to Financial Statements.
| STATEMENTS OF ASSETS AND LIABILITIES | December 31, 2023 |
| | Defensive Market
Strategies® Fund | | Impact Equity Fund | | Equity Index
Fund | | Value Equity
Index Fund |
| Assets | | | | | | | |
| Investments in securities of unaffiliated issuers, at value* | $1,351,522,620 | | $104,498,213 | | $3,663,836,864 | | $169,446,756 |
| Investments in securities of affiliated issuers, at value | 44,820,578 | | 3,620,894 | | 87,683,933 | | 5,631,478 |
| Total investments, at value(1), (2) | 1,396,343,198 | | 108,119,107 | | 3,751,520,797 | | 175,078,234 |
| Cash | — | | — | | — | | — |
| Cash collateral for derivatives | — | | — | | — | | — |
| Deposits with broker for futures contracts | 1,145,001 | | 114,993 | | 2,655,000 | | 327,523 |
| Foreign currency(3) | 341 | | 21,189 | | — | | — |
| Receivables: | | | | | | | |
| Dividends | 742,172 | | 100,326 | | 3,348,028 | | 211,841 |
| Reclaims | 333,920 | | 41,879 | | — | | 656 |
| Interest | 1,665,626 | | — | | — | | — |
| Securities lending | 54,192 | | 162 | | 33,624 | | 1,550 |
| From advisor | — | | 5,065 | | — | | 15,895 |
| Investment securities sold | 398,286 | | 215,386 | | — | | — |
| Fund shares sold | 1,591,544 | | 1,024 | | 4,566,333 | | 164,262 |
| Variation margin on futures contracts | — | | — | | — | | — |
| Unrealized appreciation on foreign currency exchange contracts | 3,005 | | — | | — | | — |
| Unrealized appreciation on swap agreements | — | | — | | — | | — |
| Prepaid expenses and other assets | 19,128 | | 22,969 | | 31,476 | | 3,366 |
| Total Assets | 1,402,296,413 | | 108,642,100 | | 3,762,155,258 | | 175,803,327 |
| Liabilities | | | | | | | |
| Cash Overdraft | 220,332 | | — | | 500,987 | | 75,237 |
| Options written, at value(4) | 2,638,617 | | — | | — | | — |
| Unrealized depreciation on foreign currency exchange contracts | 214,740 | | — | | — | | — |
| Unrealized depreciation on swap agreements | — | | — | | — | | — |
| Collateral held for securities on loan, at value | 15,441,996 | | — | | — | | 276,063 |
| Collateral from counterparty | — | | — | | — | | — |
| Payables: | | | | | | | |
| Investment securities purchased | 12,194 | | 218,269 | | — | | 90,866 |
| Fund shares redeemed | 480,635 | | 32 | | 1,172,975 | | 2 |
| Variation margin on futures contracts | 25,939 | | 1,900 | | 282,075 | | 14,945 |
| Foreign capital gains taxes | — | | — | | — | | — |
| Accrued expenses: | | | | | | | |
| Investment advisory fees | 675,555 | | 57,268 | | 268,508 | | 13,881 |
| Shareholder servicing fees | 78,440 | | 1,867 | | 195,398 | | 2,500 |
| Director fees | 1,905 | | 52 | | 4,272 | | 96 |
| Other expenses | 116,404 | | 67,048 | | 327,282 | | 68,102 |
| Total Liabilities | 19,906,757 | | 346,436 | | 2,751,497 | | 541,692 |
| Commitments and contingencies | — | | — (5) | | — | | — (5) |
| Net Assets | $1,382,389,656 | | $108,295,664 | | $3,759,403,761 | | $175,261,635 |
| Net Assets Consist of: | | | | | | | |
| Paid-in-capital | $1,377,161,941 | | $ 96,791,983 | | $2,220,190,807 | | $161,985,791 |
| Distributable earnings (loss) | 5,227,715 | | 11,503,681 | | 1,539,212,954 | | 13,275,844 |
| Net Assets | $1,382,389,656 | | $108,295,664 | | $3,759,403,761 | | $175,261,635 |
| Net Asset Value: | | | | | | | |
| $0.001 par value, unlimited shares authorized | | | | | | | |
| Net assets applicable to the Institutional Class | $1,010,265,403 | | $ 99,362,567 | | $2,820,627,382 | | $162,254,255 |
| Institutional shares outstanding | 87,544,752 | | 8,924,238 | | 58,002,843 | | 14,942,092 |
| Net asset value, offering and redemption price per Institutional share | $ 11.54 | | $ 11.13 | | $ 48.63 | | $ 10.86 |
| Net assets applicable to the Investor Class | $ 372,124,253 | | $ 8,933,097 | | $ 938,776,379 | | $ 13,007,380 |
| Investor shares outstanding | 32,283,818 | | 801,346 | | 19,297,068 | | 1,196,204 |
| Net asset value, offering and redemption price per Investor share | $ 11.53 | | $ 11.15 | | $ 48.65 | | $ 10.87 |
| | | | | | | |
| | | | | | | | |
| (1)Investments in securities of unaffiliated issuers, at cost* | $1,339,554,837 | | $ 93,718,033 | | $2,132,863,524 | | $156,861,252 |
| Investments in securities of affiliated issuers, at cost | 44,820,578 | | 3,620,894 | | 87,683,933 | | 5,631,478 |
| Total investments, at cost | $1,384,375,415 | | $ 97,338,927 | | $2,220,547,457 | | $162,492,730 |
| (2)Includes securities loaned of: | $ 26,010,084 | | $ 384,280 | | $ 98,036,156 | | $ 1,797,104 |
| (3)Foreign currency, at cost | $ 341 | | $ 20,862 | | $ — | | $ — |
| (4)Premiums received on options written | $ 3,413,348 | | $ — | | $ — | | $ — |
| (5)See Note 3c in Notes to Financial Statements. | | | | | | | |
| (6)Net of $(123,632) and $(1,116,862) accrued foreign capital gains taxed on appreciated securities for International Equity Fund and Emerging Markets Equity Fund, respectively. |
| * Includes Purchased Options |
See Notes to Financial Statements.
Value Equity
Fund | | Growth Equity
Index Fund | | Growth Equity
Fund | | Small Cap
Equity Fund | | International Equity
Index Fund | | International
Equity Fund | | Emerging Markets
Equity Fund |
| | | | | | | | | | | | | |
| $954,967,507 | | $203,831,257 | | $1,476,501,292 | | $728,577,770 | | $917,548,051 | | $1,049,138,829 | | $762,836,748 |
| 33,435,633 | | 5,758,790 | | 35,191,794 | | 16,612,080 | | 11,554,017 | | 44,496,887 | | 20,485,019 |
| 988,403,140 | | 209,590,047 | | 1,511,693,086 | | 745,189,850 | | 929,102,068 | | 1,093,635,716 | | 783,321,767 |
| — | | — | | — | | 249,731 | | 63,227 | | — | | 222,450 |
| — | | — | | — | | — | | — | | 16,241,121 | | 8,749,073 |
| 955,008 | | 378,596 | | 355,000 | | — | | 679,667 | | 13,093,967 | | 4,090,991 |
| — | | — | | — | | — | | 1,990,232 | | 6,783,204 | | 1,574,691 |
| | | | | | | | | | | | | |
| 1,194,153 | | 134,048 | | 759,836 | | 713,192 | | 724,778 | | 1,295,675 | | 1,832,866 |
| 90,806 | | — | | 165,387 | | — | | 3,119,395 | | 5,313,234 | | 20,696 |
| — | | — | | — | | — | | — | | — | | — |
| 3,818 | | 489 | | 3,944 | | 10,147 | | 7,031 | | 1,726 | | 543 |
| — | | 15,660 | | — | | — | | 3,341 | | — | | — |
| 577,763 | | — | | — | | 8,550,667 | | — | | 835,372 | | 45,748 |
| 429,989 | | 728 | | 335,338 | | 475,893 | | 235,182 | | 480,746 | | 1,511,630 |
| — | | — | | — | | — | | 9,403 | | 95,694 | | 60,323 |
| — | | — | | — | | — | | — | | 5,853,445 | | 2,127,190 |
| — | | — | | — | | — | | — | | 980,300 | | 1,903,647 |
| 21,359 | | 3,367 | | 26,880 | | 22,018 | | 5,024 | | 18,200 | | 23,968 |
| 991,676,036 | | 210,122,935 | | 1,513,339,471 | | 755,211,498 | | 935,939,348 | | 1,144,628,400 | | 805,485,583 |
| | | | | | | | | | | | | |
| 286,575 | | — | | 120,673 | | — | | — | | 5,188,679 | | — |
| — | | — | | — | | — | | — | | — | | — |
| 612,914 | | — | | — | | 10,863 | | — | | 4,617,452 | | 1,392,542 |
| — | | — | | — | | — | | — | | 2,699,670 | | 954,999 |
| 7,874,690 | | 65,893 | | 2,609,718 | | 12,218,785 | | 13,524,095 | | 306,900 | | 185,548 |
| — | | — | | — | | — | | — | | — | | 2,429,882 |
| | | | | | | | | | | | | |
| — | | — | | — | | 568,293 | | — | | 2,677,311 | | 91,997 |
| 305,568 | | 126,639 | | 264,393 | | 126,206 | | 154,454 | | 118,080 | | 866,815 |
| 41,038 | | 17,150 | | 15,312 | | 37,920 | | — | | — | | — |
| — | | — | | — | | — | | — | | 123,632 | | 3,730,336 |
| | | | | | | | | | | | | |
| 500,422 | | 16,628 | | 773,230 | | 536,944 | | 85,889 | | 701,331 | | 550,989 |
| 75,980 | | 9,588 | | 156,201 | | 57,098 | | 3,228 | | 69,974 | | 21,979 |
| 1,910 | | 283 | | 3,163 | | 2,165 | | 293 | | 2,002 | | 1,382 |
| 86,419 | | 69,721 | | 106,425 | | 94,106 | | 153,253 | | 417,272 | | 278,609 |
| 9,785,516 | | 305,902 | | 4,049,115 | | 13,652,380 | | 13,921,212 | | 16,922,303 | | 10,505,078 |
| — | | — (5) | | — | | — | | — (5) | | — | | — |
| $981,890,520 | | $209,817,033 | | $1,509,290,356 | | $741,559,118 | | $922,018,136 | | $1,127,706,097 | | $794,980,505 |
| | | | | | | | | | | | | |
| $859,611,681 | | $165,003,508 | | $1,133,529,740 | | $668,091,350 | | $822,111,955 | | $1,037,176,347 | | $865,956,120 |
| 122,278,839 | | 44,813,525 | | 375,760,616 | | 73,467,768 | | 99,906,181 | | 90,529,750 (6) | | (70,975,615) (6) |
| $981,890,520 | | $209,817,033 | | $1,509,290,356 | | $741,559,118 | | $922,018,136 | | $1,127,706,097 | | $794,980,505 |
| | | | | | | | | | | | | |
| | | | | | | | | | | | | |
| $616,544,171 | | $162,617,806 | | $ 759,562,815 | | $461,183,840 | | $906,219,360 | | $ 788,300,072 | | $687,674,915 |
| 34,309,658 | | 12,627,377 | | 31,969,467 | | 26,987,686 | | 80,173,071 | | 56,690,491 | | 77,125,513 |
| $ 17.97 | | $ 12.88 | | $ 23.76 | | $ 17.09 | | $ 11.30 | | $ 13.91 | | $ 8.92 |
| $365,346,349 | | $ 47,199,227 | | $ 749,727,541 | | $280,375,278 | | $ 15,798,776 | | $ 339,406,025 | | $107,305,590 |
| 20,352,161 | | 3,661,968 | | 32,332,341 | | 16,587,811 | | 1,394,919 | | 24,434,967 | | 12,081,998 |
| $ 17.95 | | $ 12.89 | | $ 23.19 | | $ 16.90 | | $ 11.33 | | $ 13.89 | | $ 8.88 |
| | | | | | | | | | | | | |
| | | | | | | | | | | | | |
| $823,400,122 | | $160,134,954 | | $1,067,581,830 | | $657,768,841 | | $804,162,277 | | $ 936,599,254 | | $734,293,322 |
| 33,435,633 | | 5,758,790 | | 35,191,794 | | 16,612,080 | | 11,554,017 | | 44,496,887 | | 20,485,019 |
| $856,835,755 | | $165,893,744 | | $1,102,773,624 | | $674,380,921 | | $815,716,294 | | $ 981,096,141 | | $754,778,341 |
| $ 16,398,890 | | $ 3,758,922 | | $ 35,522,814 | | $ 74,595,048 | | $ 22,857,706 | | $ 8,775,219 | | $ 3,630,437 |
| $ — | | $ 1 | | $ — | | $ — | | $ 1,956,301 | | $ 6,505,079 | | $ 1,620,731 |
| $ — | | $ — | | $ — | | $ — | | $ — | | $ — | | $ — |
| | | | | | | | | | | | | |
| | | | | | | | | | | | | |
| | | | | | | | | | | | | |
See Notes to Financial Statements.
| STATEMENTS OF OPERATIONS | For the Year Ended December 31, 2023 |
| | Defensive Market
Strategies® Fund | | Impact Equity Fund(1) | | Equity Index
Fund | | Value Equity
Index Fund |
| Investment Income | | | | | | | |
| Dividends | $ 9,434,549 | | $ 1,452,112 | | $ 51,845,718 | | $ 3,483,945 |
| Non Cash Dividends | — | | — | | — | | — |
| Income distributions received from affiliated funds | 1,780,902 | | 225,500 | | 3,150,805 | | 224,811 |
| Interest | 25,241,779 | | 8,377 | | 178,183 | | 13,405 |
| Securities lending, net | 796,639 | | 1,702 | | 224,271 | | 22,549 |
| Less foreign taxes withheld | (95,856) | | (79,761) | | (266,508) | | — |
| Total Investment Income | 37,158,013 | | 1,607,930 | | 55,132,469 | | 3,744,710 |
| Expenses | | | | | | | |
| Investment advisory fees | 7,966,727 | | 625,828 | | 2,869,260 | | 152,612 |
| Transfer agent fees: | | | | | | | |
| Institutional shares | 5,454 | | 3,645 | | 5,890 | | 3,736 |
| Investor shares | 35,957 | | 12,362 | | 74,673 | | 12,600 |
| Custodian fees | 87,239 | | 46,381 | | 58,694 | | 22,808 |
| Shareholder servicing fees: | | | | | | | |
| Investor shares | 913,882 | | 28,524 | | 2,108,977 | | 26,409 |
| Accounting and administration fees | 175,775 | | 24,091 | | 436,778 | | 28,478 |
| Professional fees | 152,797 | | 170,264 | | 111,984 | | 113,336 |
| Blue sky fees: | | | | | | | |
| Institutional shares | 16,554 | | 22,226 | | 21,710 | | 15,339 |
| Investor shares | 22,704 | | 22,325 | | 29,162 | | 16,018 |
| Shareholder reporting fees: | | | | | | | |
| Institutional shares | 3,255 | | 81 | | 12,177 | | 11 |
| Investor shares | 22,211 | | 5,921 | | 53,357 | | 3,616 |
| Directors expenses | 10,690 | | 965 | | 22,610 | | 1,170 |
| Line of credit facility fees | 5,244 | | 424 | | 13,191 | | 628 |
| S&P license fees | — | | — | | 337,546 | | — |
| MSCI license fees | — | | — | | — | | — |
| Russell license fees | — | | — | | — | | 25,758 |
| Dividends on securities sold short | — | | — | | — | | — |
| Other expenses | 196,078 | | 50,883 | | 161,331 | | 37,104 |
| Total Expenses | 9,614,567 | | 1,013,920 | | 6,317,340 | | 459,623 |
| Expenses waived/reimbursed(2) | — | | (35,007) | | — | | (114,915) |
| Fees paid indirectly | — | | — | | — | | — |
| Net Expenses | 9,614,567 | | 978,913 | | 6,317,340 | | 344,708 |
| Net Investment Income | 27,543,446 | | 629,017 | | 48,815,129 | | 3,400,002 |
| Realized and Unrealized Gain (Loss) | | | | | | | |
| Net realized gain (loss) from: | | | | | | | |
| Capital gain distributions received from affiliated funds | 562 | | 36 | | 708 | | 32 |
Investment securities
(net of capital gains taxes of $(6,231) and $(219,361) for International Equity Fund and Emerging Markets Equity Fund, respectively) | 8,945,647 | | 978,611 | | 88,720,925 | | 3,337,018 |
| Investment securities sold short | — | | — | | — | | — |
| Futures transactions | (3,220,926) | | (102,434) | | 11,529,172 | | 789,002 |
| Swap agreements | — | | — | | — | | — |
| Option contracts written | 39,301,345 | | — | | — | | — |
| Option contracts purchased | (1,817,024) | | — | | — | | — |
| Forward foreign currency contracts | (417,727) | | (228) | | — | | — |
| Foreign currency | 53,938 | | 183,927 | | 93 | | — |
| Net realized gain | 42,845,815 | | 1,059,912 | | 100,250,898 | | 4,126,052 |
| Net change in unrealized appreciation (depreciation) on: | | | | | | | |
Investment securities
(net of estimated capital gains taxes of $(123,632) and $(3,730,336) for International Equity Fund and Emerging Markets Equity Fund, respectively) | 36,396,304 | | 10,780,180 | | 633,572,184 | | 10,748,668 |
| Investment securities sold short | — | | — | | — | | — |
| Futures | 4,738,008 | | 24,612 | | 4,902,222 | | 369,223 |
| Swap agreements | — | | — | | — | | — |
| Option contracts written | (201,327) | | — | | — | | — |
| Option contracts purchased | 30,865,216 | | — | | — | | — |
| Forward foreign currency contracts | (46,554) | | — | | — | | — |
| Foreign currency | 27,982 | | 928 | | — | | — |
| Net change in unrealized appreciation (depreciation) | 71,779,629 | | 10,805,720 | | 638,474,406 | | 11,117,891 |
| Net Realized and Unrealized Gain | 114,625,444 | | 11,865,632 | | 738,725,304 | | 15,243,943 |
| Net Increase in Net Assets Resulting from Operations | $142,168,890 | | $12,494,649 | | $787,540,433 | | $18,643,945 |
| |
| (1) | For the period January 27, 2023 (commencement of operations) through December 31, 2023. |
| (2) | See Note 3c in Notes to Financial Statements. |
See Notes to Financial Statements.
Value Equity
Fund | | Growth Equity
Index Fund | | Growth Equity
Fund | | Small Cap
Equity Fund | | International Equity
Index Fund | | International
Equity Fund | | Emerging Markets
Equity Fund |
| | | | | | | | | | | | | |
| $21,829,632 | | $ 1,464,760 | | $ 8,429,400 | | $ 9,692,881 | | $ 27,226,256 | | $ 26,843,396 | | $ 22,285,142 |
| — | | — | | — | | — | | — | | — | | 1,617,316 |
| 1,508,716 | | 267,980 | | 1,872,060 | | 1,430,817 | | 1,144,634 | | 2,390,674 | | 1,168,716 |
| 30,775 | | 15,471 | | 23,919 | | 53,229 | | 73,258 | | 538,172 | | 96,558 |
| 163,095 | | 9,281 | | 85,156 | | 235,999 | | 175,490 | | 93,913 | | 64,221 |
| (259,550) | | (159) | | (53,388) | | (1,793) | | (1,826,218) | | (2,417,210) | | (2,668,347) |
| 23,272,668 | | 1,757,333 | | 10,357,147 | | 11,411,133 | | 26,793,420 | | 27,448,945 | | 22,563,606 |
| | | | | | | | | | | | | |
| 5,793,457 | | 165,362 | | 8,350,619 | | 6,226,804 | | 954,312 | | 8,038,670 | | 6,236,716 |
| | | | | | | | | | | | | |
| 4,898 | | 3,720 | | 5,114 | | 5,466 | | 4,416 | | 5,560 | | 5,394 |
| 23,835 | | 13,087 | | 49,700 | | 35,260 | | 12,890 | | 38,657 | | 19,133 |
| 51,251 | | 28,147 | | 64,486 | | 103,111 | | 189,601 | | 475,461 | | 1,295,433 |
| | | | | | | | | | | | | |
| 928,084 | | 64,486 | | 1,670,930 | | 659,668 | | 31,225 | | 788,444 | | 253,506 |
| 120,300 | | 30,200 | | 166,919 | | 100,187 | | 114,705 | | 139,128 | | 105,767 |
| 109,810 | | 112,793 | | 138,878 | | 132,280 | | 134,368 | | 154,320 | | 157,893 |
| | | | | | | | | | | | | |
| 16,601 | | 15,439 | | 16,162 | | 16,027 | | 18,158 | | 15,401 | | 15,501 |
| 18,606 | | 17,133 | | 22,072 | | 18,010 | | 16,682 | | 17,583 | | 15,085 |
| | | | | | | | | | | | | |
| 5,902 | | 2 | | 7,053 | | 9,093 | | 4,881 | | 5,593 | | 6,694 |
| 23,392 | | 4,445 | | 36,676 | | 24,735 | | 288 | | 24,901 | | 18,647 |
| 10,832 | | 1,607 | | 16,822 | | 12,189 | | 2,078 | | 11,194 | | 7,773 |
| 3,680 | | 697 | | 5,355 | | 2,830 | | 3,415 | | 4,209 | | 2,955 |
| — | | — | | — | | — | | — | | — | | — |
| — | | — | | — | | — | | 285,506 | | — | | — |
| — | | 25,758 | | — | | — | | — | | — | | — |
| — | | — | | — | | — | | — | | 1,075 | | — |
| 93,786 | | 38,218 | | 127,829 | | 100,115 | | 41,007 | | 129,671 | | 172,528 |
| 7,204,434 | | 521,094 | | 10,678,615 | | 7,445,775 | | 1,813,532 | | 9,849,867 | | 8,313,025 |
| — | | (108,679) | | — | | — | | (23,846) | | — | | — |
| (2,857) | | — | | (8,213) | | (43,188) | | — | | — | | (2,580) |
| 7,201,577 | | 412,415 | | 10,670,402 | | 7,402,587 | | 1,789,686 | | 9,849,867 | | 8,310,445 |
| 16,071,091 | | 1,344,918 | | (313,255) | | 4,008,546 | | 25,003,734 | | 17,599,078 | | 14,253,161 |
| | | | | | | | | | | | | |
| | | | | | | | | | | | | |
| 277 | | 55 | | 312 | | 200 | | 130 | | 404 | | 353 |
| 39,758,388 | | 1,517,697 | | 93,136,640 | | 27,636,457 | | (316,017) | | 36,956,685 | | (28,138,493) |
| — | | — | | — | | — | | — | | 323,914 | | — |
| 1,550,803 | | 749,725 | | 1,083,094 | | 92,822 | | 2,397,287 | | 12,244,119 | | (71,097) |
| — | | — | | — | | — | | — | | 7,421,980 | | 36,084 |
| — | | — | | — | | — | | — | | — | | — |
| — | | — | | — | | — | | — | | — | | — |
| (1,199,545) | | — | | — | | (24,666) | | — | | (3,140,638) | | 3,874,064 |
| 279,048 | | — | | (187) | | 21,129 | | (28,408) | | (665,685) | | (510,439) |
| 40,388,971 | | 2,267,477 | | 94,219,859 | | 27,725,942 | | 2,052,992 | | 53,140,779 | | (24,809,528) |
| | | | | | | | | | | | | |
| 41,391,550 | | 55,330,338 | | 375,087,793 | | 69,553,802 | | 117,748,428 | | 113,361,746 | | 86,187,258 |
| — | | — | | — | | — | | — | | (448,177) | | — |
| 411,104 | | 425,157 | | 31,563 | | (57,008) | | 814,529 | | 2,013,410 | | 1,848,269 |
| — | | — | | — | | — | | — | | (5,603,761) | | 1,226,746 |
| — | | — | | — | | — | | — | | — | | — |
| — | | — | | — | | — | | — | | — | | — |
| (506,065) | | — | | — | | (15,539) | | — | | 338,776 | | 1,654,023 |
| — | | — | | — | | 54 | | 138,279 | | 436,136 | | 26,546 |
| 41,296,589 | | 55,755,495 | | 375,119,356 | | 69,481,309 | | 118,701,236 | | 110,098,130 | | 90,942,842 |
| 81,685,560 | | 58,022,972 | | 469,339,215 | | 97,207,251 | | 120,754,228 | | 163,238,909 | | 66,133,314 |
| $97,756,651 | | $59,367,890 | | $469,025,960 | | $101,215,797 | | $145,757,962 | | $180,837,987 | | $ 80,386,475 |
See Notes to Financial Statements.
| STATEMENTS OF CHANGES IN NET ASSETS |
| | Defensive Market Strategies® Fund | | Impact Equity Fund |
| | For the Year Ended | | For the Period Ended |
| | 12/31/23 | | 12/31/22 | | 12/31/23 (1) |
| | | | | | |
| Operations: | | | | | |
| Net investment income | $ 27,543,446 | | $ 8,012,102 | | $ 629,017 |
| Net realized gain (loss) on investment securities, foreign currency and derivatives | 42,845,815 | | (36,627,183) | | 1,059,912 |
| Net change in unrealized appreciation (depreciation) on investment securities, foreign currency and derivatives | 71,779,629 | | (138,150,724) | | 10,805,720 |
| Net increase (decrease) in net assets resulting from operations | 142,168,890 | | (166,765,805) | | 12,494,649 |
| Distributions to Shareholders: | | | | | |
| Distributions paid | | | | | |
| Institutional shares | (22,634,901) | | (147,211,492) | | (897,953) |
| Investor shares | (7,692,093) | | (58,420,824) | | (48,081) |
| Return of capital | | | | | |
| Institutional shares | — | | — | | — |
| Investor shares | — | | — | | — |
| Total distributions | (30,326,994) | | (205,632,316) | | (946,034) |
| Capital Share Transactions: | | | | | |
| Proceeds from shares sold | | | | | |
| Institutional shares | 117,965,711 | | 99,084,688 | | 100,456,468 |
| Investor shares | 48,571,183 | | 56,413,322 | | 15,211,525 |
| Reinvestment of dividends and distributions | | | | | |
| Institutional shares | 22,573,458 | | 147,097,825 | | 897,813 |
| Investor shares | 7,447,790 | | 57,884,320 | | 48,081 |
| Total proceeds from shares sold and reinvested | 196,558,142 | | 360,480,155 | | 116,613,887 |
| Value of shares redeemed | | | | | |
| Institutional shares | (119,131,767) | | (123,704,784) | | (12,438,603) |
| Investor shares | (71,000,165) | | (104,112,137) | | (7,428,235) |
| Total value of shares redeemed | (190,131,932) | | (227,816,921) | | (19,866,838) |
| Net increase (decrease) from capital share transactions(3) | 6,426,210 | | 132,663,234 | | 96,747,049 |
| Total increase (decrease) in net assets | 118,268,106 | | (239,734,887) | | 108,295,664 |
| Net Assets: | | | | | |
| Beginning of Year | 1,264,121,550 | | 1,503,856,437 | | — |
| End of Year | $1,382,389,656 | | $1,264,121,550 | | $108,295,664 |
| |
| (1) | For the period January 27, 2023 (commencement of operations) through December 31, 2023. |
| (3) | See Note 6 in Notes to Financial Statements. |
See Notes to Financial Statements.
| Equity Index Fund | | Value Equity Index Fund | | Value Equity Fund |
| For the Year Ended | | For the Year Ended | | For the Period Ended | | For the Year Ended |
| 12/31/23 | | 12/31/22 | | 12/31/23 | | 12/31/22 (2) | | 12/31/23 | | 12/31/22 |
| | | | | | | | | | | |
| | | | | | | | | | | |
| $ 48,815,129 | | $ 41,247,579 | | $ 3,400,002 | | $ 1,053,732 | | $ 16,071,091 | | $ 17,374,682 |
| 100,250,898 | | 15,018,959 | | 4,126,052 | | (59,477) | | 40,388,971 | | 118,345,855 |
| 638,474,406 | | (678,761,142) | | 11,117,891 | | 1,617,530 | | 41,296,589 | | (227,196,774) |
| 787,540,433 | | (622,494,604) | | 18,643,945 | | 2,611,785 | | 97,756,651 | | (91,476,237) |
| | | | | | | | | | | |
| | | | | | | | | | | |
| (106,992,810) | | (57,947,628) | | (6,490,689) | | (1,015,078) | | (28,723,533) | | (92,445,869) |
| (33,880,572) | | (17,631,530) | | (436,191) | | (45,412) | | (16,377,600) | | (62,130,910) |
| | | | | | | | | | | |
| — | | — | | — | | — | | — | | — |
| — | | — | | — | | — | | — | | — |
| (140,873,382) | | (75,579,158) | | (6,926,880) | | (1,060,490) | | (45,101,133) | | (154,576,779) |
| | | | | | | | | | | |
| | | | | | | | | | | |
| 360,164,851 | | 540,825,846 | | 24,259,593 | | 142,365,294 | | 80,662,662 | | 58,096,137 |
| 132,984,611 | | 156,353,113 | | 10,289,180 | | 10,642,022 | | 36,958,588 | | 78,848,890 |
| | | | | | | | | | | |
| 105,533,826 | | 56,905,289 | | 6,489,943 | | 1,015,078 | | 28,702,530 | | 92,392,428 |
| 33,711,229 | | 17,474,895 | | 436,190 | | 45,395 | | 16,349,430 | | 62,061,046 |
| 632,394,517 | | 771,559,143 | | 41,474,906 | | 154,067,789 | | 162,673,210 | | 291,398,501 |
| | | | | | | | | | | |
| (355,142,947) | | (269,956,517) | | (20,438,785) | | (4,022,161) | | (83,661,548) | | (407,906,024) |
| (152,325,130) | | (152,270,340) | | (7,444,127) | | (1,644,347) | | (106,830,754) | | (89,038,002) |
| (507,468,077) | | (422,226,857) | | (27,882,912) | | (5,666,508) | | (190,492,302) | | (496,944,026) |
| 124,926,440 | | 349,332,286 | | 13,591,994 | | 148,401,281 | | (27,819,092) | | (205,545,525) |
| 771,593,491 | | (348,741,476) | | 25,309,059 | | 149,952,576 | | 24,836,426 | | (451,598,541) |
| | | | | | | | | | | |
| 2,987,810,270 | | 3,336,551,746 | | 149,952,576 | | — | | 957,054,094 | | 1,408,652,635 |
| $3,759,403,761 | | $2,987,810,270 | | $175,261,635 | | $149,952,576 | | $ 981,890,520 | | $ 957,054,094 |
| |
| (2) | For the period August 31, 2022 (commencement of operations) through December 31, 2022. |
See Notes to Financial Statements.
| STATEMENTS OF CHANGES IN NET ASSETS |
| | Growth Equity Index Fund | | Growth Equity Fund |
| | For the Year Ended | | For the Period Ended | | For the Year Ended |
| | 12/31/23 | | 12/31/22 (1) | | 12/31/23 | | 12/31/22 |
| | | | | | | | |
| Operations: | | | | | | | |
| Net investment income (loss) | $ 1,344,918 | | $ 449,776 | | $ (313,255) | | $ (1,087,693) |
| Net realized gain (loss) on investment securities, foreign currency and derivatives | 2,267,477 | | 114,825 | | 94,219,859 | | 22,155,646 |
| Net change in unrealized appreciation (depreciation) on investment securities, foreign currency and derivatives | 55,755,495 | | (11,956,832) | | 375,119,356 | | (729,818,975) |
| Net increase (decrease) in net assets resulting from operations | 59,367,890 | | (11,392,231) | | 469,025,960 | | (708,751,022) |
| Distributions to Shareholders: | | | | | | | |
| Distributions paid | | | | | | | |
| Institutional shares | (2,192,473) | | (460,655) | | (35,711,600) | | (73,820,250) |
| Investor shares | (501,469) | | (3,483) | | (35,852,758) | | (62,355,365) |
| Return of capital | | | | | | | |
| Institutional shares | — | | — | | — | | — |
| Investor shares | — | | — | | — | | — |
| Total distributions | (2,693,942) | | (464,138) | | (71,564,358) | | (136,175,615) |
| Capital Share Transactions: | | | | | | | |
| Proceeds from shares sold | | | | | | | |
| Institutional shares | 24,223,199 | | 143,186,598 | | 97,893,962 | | 245,567,662 |
| Investor shares | 40,698,618 | | 9,394,844 | | 87,151,590 | | 65,401,542 |
| Reinvestment of dividends and distributions | | | | | | | |
| Institutional shares | 2,192,214 | | 460,656 | | 35,696,458 | | 73,788,671 |
| Investor shares | 501,342 | | 3,213 | | 35,797,957 | | 62,246,525 |
| Total proceeds from shares sold and reinvested | 67,615,373 | | 153,045,311 | | 256,539,967 | | 447,004,400 |
| Value of shares redeemed | | | | | | | |
| Institutional shares | (45,087,823) | | (198,613) | | (190,268,031) | | (355,477,062) |
| Investor shares | (8,635,743) | | (1,739,051) | | (129,565,733) | | (159,109,366) |
| Total value of shares redeemed | (53,723,566) | | (1,937,664) | | (319,833,764) | | (514,586,428) |
| Net increase (decrease) from capital share transactions(2) | 13,891,807 | | 151,107,647 | | (63,293,797) | | (67,582,028) |
| Total increase (decrease) in net assets | 70,565,755 | | 139,251,278 | | 334,167,805 | | (912,508,665) |
| Net Assets: | | | | | | | |
| Beginning of Year | 139,251,278 | | — | | 1,175,122,551 | | 2,087,631,216 |
| End of Year | $209,817,033 | | $139,251,278 | | $1,509,290,356 | | $1,175,122,551 |
| |
| (1) | For the period August 31, 2022 (commencement of operations) through December 31, 2022. |
| (2) | See Note 6 in Notes to Financial Statements. |
See Notes to Financial Statements.
| Small Cap Equity Fund | | International Equity Index Fund | | International Equity Fund |
| For the Year Ended | | For the Year Ended | | For the Year Ended |
| 12/31/23 | | 12/31/22 | | 12/31/23 | | 12/31/22 | | 12/31/23 | | 12/31/22 |
| | | | �� | | | | | | | |
| | | | | | | | | | | |
| $ 4,008,546 | | $ 2,085,413 | | $ 25,003,734 | | $ 23,381,739 | | $ 17,599,078 | | $ 15,784,424 |
| 27,725,942 | | 14,726,983 | | 2,052,992 | | (12,173,169) | | 53,140,779 | | (23,714,915) |
| 69,481,309 | | (169,703,864) | | 118,701,236 | | (132,675,908) | | 110,098,130 | | (203,916,050) |
| 101,215,797 | | (152,891,468) | | 145,757,962 | | (121,467,338) | | 180,837,987 | | (211,846,541) |
| | | | | | | | | | | |
| | | | | | | | | | | |
| (12,551,318) | | (20,795,442) | | (27,378,053) | | (23,117,160) | | (30,696,873) | | (14,335,043) |
| (6,582,014) | | (12,291,323) | | (427,871) | | (206,368) (1) | | (12,237,315) | | (4,919,095) |
| | | | | | | | | | | |
| — | | — | | — | | — | | — | | — |
| — | | — | | — | | — | | — | | — |
| (19,133,332) | | (33,086,765) | | (27,805,924) | | (23,323,528) | | (42,934,188) | | (19,254,138) |
| | | | | | | | | | | |
| | | | | | | | | | | |
| 91,600,028 | | 61,742,485 | | 113,054,777 | | 188,800,230 | | 72,580,222 | | 75,793,784 |
| 39,992,636 | | 28,792,945 | | 11,972,521 | | 9,092,425 (1) | | 45,871,626 | | 40,647,704 |
| | | | | | | | | | | |
| 12,523,929 | | 20,730,693 | | 27,231,011 | | 22,987,331 | | 30,349,576 | | 14,062,820 |
| 6,552,410 | | 12,169,460 | | 427,748 | | 195,254 (1) | | 12,195,250 | | 4,861,099 |
| 150,669,003 | | 123,435,583 | | 152,686,057 | | 221,075,240 | | 160,996,674 | | 135,365,407 |
| | | | | | | | | | | |
| (121,187,686) | | (64,770,146) | | (137,677,727) | | (114,075,522) | | (145,068,271) | | (175,336,358) |
| (55,958,472) | | (56,973,765) | | (6,062,281) | | (982,850) (1) | | (50,669,374) | | (50,039,936) |
| (177,146,158) | | (121,743,911) | | (143,740,008) | | (115,058,372) | | (195,737,645) | | (225,376,294) |
| (26,477,155) | | 1,691,672 | | 8,946,049 | | 106,016,868 | | (34,740,971) | | (90,010,887) |
| 55,605,310 | | (184,286,561) | | 126,898,087 | | (38,773,998) | | 103,162,828 | | (321,111,566) |
| | | | | | | | | | | |
| 685,953,808 | | 870,240,369 | | 795,120,049 | | 833,894,047 | | 1,024,543,269 | | 1,345,654,835 |
| $ 741,559,118 | | $ 685,953,808 | | $ 922,018,136 | | $ 795,120,049 | | $1,127,706,097 | | $1,024,543,269 |
| |
| (1) | Investor Class was launched on April 29, 2022. |
See Notes to Financial Statements.
| STATEMENTS OF CHANGES IN NET ASSETS |
| | Emerging Markets Equity Fund |
| | For the Year Ended |
| | 12/31/23 | | 12/31/22 |
| | | | |
| Operations: | | | |
| Net investment income | $ 14,253,161 | | $ 16,349,972 |
| Net realized loss on investment securities, foreign currency and derivatives | (24,809,528) | | (61,282,119) |
| Net change in unrealized appreciation (depreciation) on investment securities, foreign currency and derivatives | 90,942,842 | | (132,982,997) |
| Net increase (decrease) in net assets resulting from operations | 80,386,475 | | (177,915,144) |
| Distributions to Shareholders: | | | |
| Distributions paid | | | |
| Institutional shares | (14,700,861) | | (11,508,709) |
| Investor shares | (1,985,371) | | (1,505,227) |
| Return of capital | | | |
| Institutional shares | — | | (1,481,061) |
| Investor shares | — | | (226,017) |
| Total distributions | (16,686,232) | | (14,721,014) |
| Capital Share Transactions: | | | |
| Proceeds from shares sold | | | |
| Institutional shares | 98,047,879 | | 108,993,697 |
| Investor shares | 25,727,035 | | 29,141,905 |
| Reinvestment of dividends and distributions | | | |
| Institutional shares | 14,696,203 | | 12,985,293 |
| Investor shares | 1,978,706 | | 1,727,625 |
| Total proceeds from shares sold and reinvested | 140,449,823 | | 152,848,520 |
| Value of shares redeemed | | | |
| Institutional shares | (94,317,130) | | (55,883,329) |
| Investor shares | (22,828,989) | | (22,595,589) |
| Total value of shares redeemed | (117,146,119) | | (78,478,918) |
| Net increase from capital share transactions(1) | 23,303,704 | | 74,369,602 |
| Total increase (decrease) in net assets | 87,003,947 | | (118,266,556) |
| Net Assets: | | | |
| Beginning of Year | 707,976,558 | | 826,243,114 |
| End of Year | $ 794,980,505 | | $ 707,976,558 |
| |
| (1) | See Note 6 in Notes to Financial Statements. |
See Notes to Financial Statements.
| For a Share Outstanding For the Years Ending December 31, unless otherwise indicated | | | | | | | | | | Ratios to Average Net Assets | |
| | | Net Asset
Value,
Beginning
of Year | Net Investment
Income# | Realized
and
Unrealized
Gain
(Loss) on
Investments | | Total Income
From Investment
Operations | Dividends
from Net
Investment
Income | Distributions
from Net
Realized
Capital
Gains | Total
Distributions
Paid | Net Asset
Value,
End of
Year | | Total
Return | | Net Assets,
End of Year
(000) | | Expenses,
Net | | Expenses,
Gross | | Investment
Income,
Net | Portfolio
Turnover
Rate |
| Defensive Market Strategies® Fund | |
| Institutional Class | |
| 2023 | | $10.60 | $0.24 | $ 0.96 | | $ 1.20 | $(0.26) | $ — | $(0.26) | $11.54 | | 11.43% | | $1,010,266 | | 0.65% | | 0.65% | | 2.17% | 68% |
| 2022 | | 14.30 | 0.08 | (1.75) | | (1.67) | (0.05) | (1.98) | (2.03) | 10.60 | | (11.19) | | 907,990 | | 0.66 | | 0.66 | | 0.69 | 36 |
| 2021 | | 14.14 | 0.07 | 1.62 | | 1.69 | (0.11) | (1.42) | (1.53) | 14.30 | | 12.15 | | 1,049,002 | | 0.65 | | 0.65 | | 0.48 | 79 |
| 2020 | | 13.27 | 0.12 | 1.19 | | 1.31 | (0.16) | (0.28) | (0.44) | 14.14 | | 10.08 | | 927,539 | | 0.67 | | 0.67 | | 0.90 | 67 |
| 2019 | | 11.73 | 0.17 | 2.13 | | 2.30 | (0.17) | (0.59) | (0.76) | 13.27 | | 19.78 | | 803,696 | | 0.67 | | 0.67 | | 1.29 | 55 |
| Investor Class | |
| 2023 | | $10.59 | $0.21 | $ 0.96 | | $ 1.17 | $(0.23) | $ — | $(0.23) | $11.53 | | 11.15% | | $ 372,124 | | 0.92% | | 0.92% | | 1.89% | 68% |
| 2022 | | 14.30 | 0.05 | (1.75) | | (1.70) | (0.03) | (1.98) | (2.01) | 10.59 | | (11.40) | | 356,132 | | 0.93 | | 0.93 | | 0.40 | 36 |
| 2021 | | 14.15 | 0.03 | 1.61 | | 1.64 | (0.07) | (1.42) | (1.49) | 14.30 | | 11.79 | | 454,854 | | 0.92 | | 0.92 | | 0.21 | 79 |
| 2020 | | 13.27 | 0.08 | 1.20 | | 1.28 | (0.12) | (0.28) | (0.40) | 14.15 | | 9.86 | | 409,500 | | 0.94 | | 0.94 | | 0.64 | 67 |
| 2019 | | 11.74 | 0.13 | 2.13 | | 2.26 | (0.14) | (0.59) | (0.73) | 13.27 | | 19.38 | | 458,825 | | 0.93 | | 0.93 | | 1.02 | 55 |
| | |
| Impact Equity Fund | |
| Institutional Class | |
| 2023(1) | | $10.00 | $0.06 | $ 1.17 | | $ 1.23 | $(0.08) | $(0.02) | $(0.10) | $11.13 | | 12.33% | | $ 99,363 | | 0.97% | | 0.97% | | 0.67% | 44% |
| Investor Class | |
| 2023(1) | | $10.00 | $0.04 | $ 1.17 | | $ 1.21 | $(0.04) | $(0.02) | $(0.06) | $11.15 | | 12.11% | | $ 8,933 | | 1.21% | | 1.52% | | 0.42% | 44% |
| | |
| Equity Index Fund | |
| Institutional Class | |
| 2023 | | $40.02 | $0.69 | $ 9.84 | | $10.53 | $(0.66) | $(1.26) | $(1.92) | $48.63 | | 26.51% | | $2,820,628 | | 0.12% | | 0.12% | | 1.54% | 5% |
| 2022 | | 50.59 | 0.62 | (10.10) | | (9.48) | (0.61) | (0.48) | (1.09) | 40.02 | | (18.70) | | 2,226,390 | | 0.12 | | 0.12 | | 1.45 | 4 |
| 2021 | | 40.83 | 0.56 | 10.86 | | 11.42 | (0.54) | (1.12) | (1.66) | 50.59 | | 28.28 | | 2,403,001 | | 0.12 | | 0.12 | | 1.21 | 4 |
| 2020 | | 35.45 | 0.57 | 5.78 | | 6.35 | (0.57) | (0.40) | (0.97) | 40.83 | | 18.19 | | 1,772,397 | | 0.13 | | 0.13 | | 1.60 | 3 |
| 2019 | | 27.56 | 0.59 | 8.11 | | 8.70 | (0.58) | (0.23) | (0.81) | 35.45 | | 31.68 | | 1,501,076 | | 0.13 | | 0.13 | | 1.82 | 2 |
| Investor Class | |
| 2023 | | $40.05 | $0.57 | $ 9.83 | | $10.40 | $(0.54) | $(1.26) | $(1.80) | $48.65 | | 26.16% | | $ 938,776 | | 0.39% | | 0.39% | | 1.28% | 5% |
| 2022 | | 50.61 | 0.51 | (10.10) | | (9.59) | (0.49) | (0.48) | (0.97) | 40.05 | | (18.91) | | 761,420 | | 0.39 | | 0.39 | | 1.17 | 4 |
| 2021 | | 40.85 | 0.44 | 10.86 | | 11.30 | (0.42) | (1.12) | (1.54) | 50.61 | | 27.95 | | 933,551 | | 0.39 | | 0.39 | | 0.95 | 4 |
| 2020 | | 35.47 | 0.47 | 5.79 | | 6.26 | (0.48) | (0.40) | (0.88) | 40.85 | | 17.89 | | 716,627 | | 0.40 | | 0.40 | | 1.34 | 3 |
| 2019 | | 27.58 | 0.50 | 8.11 | | 8.61 | (0.49) | (0.23) | (0.72) | 35.47 | | 31.33 | | 634,578 | | 0.39 | | 0.39 | | 1.56 | 2 |
| | | | | | | | | | | | | | | | | | | | | | |
| # | Calculated using the average shares outstanding method. |
| (1) | For the period January 27, 2023 (commencement of operations) through December 31, 2023. All ratios for the period have been annualized with the exception of total return and portfolio turnover which have not been annualized. |
See Notes to Financial Statements.
FINANCIAL HIGHLIGHTS (Continued)
| For a Share Outstanding For the Years Ending December 31, unless otherwise indicated | | | | | | | | | | Ratios to Average Net Assets | |
| | | Net Asset
Value,
Beginning
of Year | Net Investment
Income/ (Loss)# | Realized
and
Unrealized
Gain
(Loss) on
Investments | | Total Income
From Investment
Operations | Dividends
from Net
Investment
Income | Distributions
from Net
Realized
Capital
Gains | Total
Distributions
Paid | Net Asset
Value,
End of
Year | | Total
Return | | Net Assets,
End of Year
(000) | | Expenses,
Net | | Expenses,
Gross | | Investment
Income/
(Loss),
Net | Portfolio
Turnover
Rate |
| Value Equity Index Fund | |
| Institutional Class | |
| 2023 | | $10.11 | $ 0.23 | $ 0.97 | | $ 1.20 | $(0.22) | $(0.23) | $(0.45) | $10.86 | | 12.04% | | $ 162,254 | | 0.20% | | 0.25% | | 2.17% | 21% |
| 2022(1) | | 10.00 | 0.07 | 0.11 | | 0.18 | (0.07) | — | (0.07) | 10.11 | | 1.84 | | 140,881 | | 0.20 | | 0.44 | | 2.18 | 3 |
| Investor Class | |
| 2023 | | $10.13 | $ 0.20 | $ 0.96 | | $ 1.16 | $(0.19) | $(0.23) | $(0.42) | $10.87 | | 11.68% | | $ 13,008 | | 0.47% | | 0.80% | | 1.91% | 21% |
| 2022(1) | | 10.00 | 0.07 | 0.11 | | 0.18 | (0.05) | — | (0.05) | 10.13 | | 1.77 | | 9,072 | | 0.47 | | 2.00 | | 1.95 | 3 |
| | |
| Value Equity Fund | |
| Institutional Class | |
| 2023 | | $17.02 | $ 0.32 | $ 1.50 | | $ 1.82 | $(0.27) | $(0.60) | $(0.87) | $17.97 | | 10.89% | | $ 616,544 | | 0.66%(2) | | 0.66% | | 1.81% | 38% |
| 2022 | | 21.37 | 0.32 | (1.64) | | (1.32) | (0.48) | (2.55) | (3.03) | 17.02 | | (5.96) | | 558,078 | | 0.64(2) | | 0.64 | | 1.60 | 34 |
| 2021 | | 19.35 | 0.30 | 4.38 | | 4.68 | (0.40) | (2.26) | (2.66) | 21.37 | | 24.61 | | 971,586 | | 0.64(2) | | 0.64 | | 1.35 | 38 |
| 2020 | | 19.02 | 0.30 | 0.42 | | 0.72 | (0.15) | (0.24) | (0.39) | 19.35 | | 4.19 | | 896,523 | | 0.64(2) | | 0.64 | | 1.80 | 97 |
| 2019 | | 16.79 | 0.35 | 4.16 | | 4.51 | (0.34) | (1.94) | (2.28) | 19.02 | | 27.14 | | 831,854 | | 0.62(2) | | 0.62 | | 1.81 | 92 |
| Investor Class | |
| 2023 | | $17.01 | $ 0.27 | $ 1.50 | | $ 1.77 | $(0.23) | $(0.60) | $(0.83) | $17.95 | | 10.55% | | $ 365,347 | | 0.92%(2) | | 0.92% | | 1.54% | 38% |
| 2022 | | 21.35 | 0.27 | (1.63) | | (1.36) | (0.43) | (2.55) | (2.98) | 17.01 | | (6.16) | | 398,976 | | 0.91(2) | | 0.91 | | 1.36 | 34 |
| 2021 | | 19.34 | 0.24 | 4.37 | | 4.61 | (0.34) | (2.26) | (2.60) | 21.35 | | 24.27 | | 437,067 | | 0.90(2) | | 0.90 | | 1.09 | 38 |
| 2020 | | 19.04 | 0.26 | 0.40 | | 0.66 | (0.12) | (0.24) | (0.36) | 19.34 | | 3.89 | | 342,014 | | 0.90(2) | | 0.90 | | 1.54 | 97 |
| 2019 | | 16.81 | 0.30 | 4.16 | | 4.46 | (0.29) | (1.94) | (2.23) | 19.04 | | 26.80 | | 383,041 | | 0.89(2) | | 0.89 | | 1.55 | 92 |
| | |
| Growth Equity Index Fund | |
| Institutional Class | |
| 2023 | | $ 9.20 | $ 0.09 | $ 3.77 | | $ 3.86 | $(0.09) | $(0.09) | $(0.18) | $12.88 | | 42.00% | | $ 162,618 | | 0.20% | | 0.25% | | 0.83% | 21% |
| 2022(1) | | 10.00 | 0.03 | (0.80) | | (0.77) | (0.03) | (—)† | (0.03) | 9.20 | | (7.68) | | 132,092 | | 0.20 | | 0.45 | | 0.97 | 2 |
| Investor Class | |
| 2023 | | $ 9.22 | $ 0.06 | $ 3.77 | | $ 3.83 | $(0.07) | $(0.09) | $(0.16) | $12.89 | | 41.60% | | $ 47,199 | | 0.47% | | 0.61% | | 0.54% | 21% |
| 2022(1) | | 10.00 | 0.02 | (0.80) | | (0.78) | (—)† | (—)† | — | 9.22 | | (7.76) | | 7,159 | | 0.47 | | 2.23 | | 0.74 | 2 |
| | |
| Growth Equity Fund | |
| Institutional Class | |
| 2023 | | $17.56 | $ 0.02 | $ 7.35 | | $ 7.37 | $(0.01) | $(1.16) | $(1.17) | $23.76 | | 42.22% | | $ 759,563 | | 0.66%(3) | | 0.66% | | 0.11% | 41% |
| 2022 | | 29.92 | 0.01 | (10.32) | | (10.31) | — | (2.05) | (2.05) | 17.56 | | (34.50) | | 611,961 | | 0.66(3) | | 0.66 | | 0.05 | 66 |
| 2021 | | 30.63 | (0.06) | 5.44 | | 5.38 | — | (6.09) | (6.09) | 29.92 | | 17.68 | | 1,108,031 | | 0.68(3) | | 0.68 | | (0.17) | 25 |
| 2020 | | 26.23 | 0.02 | 9.11 | | 9.13 | (0.05) | (4.68) | (4.73) | 30.63 | | 35.75 | | 1,064,559 | | 0.69(3) | | 0.69 | | 0.08 | 40 |
| 2019 | | 21.47 | 0.03 | 7.36 | | 7.39 | (0.03) | (2.60) | (2.63) | 26.23 | | 34.79 | | 934,297 | | 0.71(3) | | 0.71 | | 0.13 | 21 |
| Investor Class | |
| 2023 | | $17.20 | $(0.03) | $ 7.18 | | $ 7.15 | $ — | $(1.16) | $(1.16) | $23.19 | | 41.81% | | $ 749,727 | | 0.92%(3) | | 0.92% | | (0.16)% | 41% |
| 2022 | | 29.44 | (0.04) | (10.15) | | (10.19) | — | (2.05) | (2.05) | 17.20 | | (34.66) | | 563,162 | | 0.92(3) | | 0.92 | | (0.21) | 66 |
| 2021 | | 30.29 | (0.14) | 5.38 | | 5.24 | — | (6.09) | (6.09) | 29.44 | | 17.41 | | 979,600 | | 0.94(3) | | 0.94 | | (0.43) | 25 |
| 2020 | | 26.02 | (0.05) | 9.02 | | 8.97 | (0.02) | (4.68) | (4.70) | 30.29 | | 35.39 | | 957,853 | | 0.95(3) | | 0.95 | | (0.19) | 40 |
| 2019 | | 21.35 | (0.03) | 7.30 | | 7.27 | — | (2.60) | (2.60) | 26.02 | | 34.42 | | 763,853 | | 0.96(3) | | 0.96 | | (0.13) | 21 |
| | | | | | | | | | | | | | | | | | | | | | |
| # | Calculated using the average shares outstanding method. |
| † | Amount represents less than $0.005 per share. |
| (1) | For the period August 31, 2022 (commencement of operations) through December 31, 2022. All ratios for the period have been annualized with the exception of total return and portfolio turnover which have not been annualized. |
| (2) | The ratio for the Value Equity Fund includes the effect of fees paid indirectly which decreased the ratio by 0.00% for the years 2019, 2020, 2021, 2022 and 2023. |
| (3) | The ratio for the Growth Equity Fund includes the effect of fees paid indirectly which decreased the ratio by 0.00% for the years 2019, 2020, 2021, 2022 and 2023. |
See Notes to Financial Statements.
| For a Share Outstanding For the Years Ending December 31, unless otherwise indicated | | | | | | | | | | Ratios to Average Net Assets | |
| | | Net Asset
Value,
Beginning
of Year | Net Investment
Income/ (Loss)# | Realized
and
Unrealized
Gain
(Loss) on
Investments | | Total Income
From Investment
Operations | Dividends
from Net
Investment
Income | Distributions
from Net
Realized
Capital
Gains | Total
Distributions
Paid | Net Asset
Value,
End of
Year | | Total
Return | | Net Assets,
End of Year
(000) | | Expenses,
Net | | Expenses,
Gross | | Investment
Income/
(Loss),
Net | Portfolio
Turnover
Rate |
| Small Cap Equity Fund | |
| Institutional Class | |
| 2023 | | $15.29 | $ 0.11 | $ 2.14 | | $ 2.25 | $(0.12) | $(0.33) | $(0.45) | $17.09 | | 14.90% | | $461,184 | | 0.92%(1) | | 0.93% | | 0.66% | 54% |
| 2022 | | 19.54 | 0.07 | (3.54) | | (3.47) | (0.06) | (0.72) | (0.78) | 15.29 | | (17.80) | | 424,994 | | 0.92(1) | | 0.93 | | 0.39 | 54 |
| 2021 | | 18.67 | 0.02 | 4.03 | | 4.05 | (0.02) | (3.16) | (3.18) | 19.54 | | 22.09 | | 519,549 | | 0.90(1) | | 0.91 | | 0.08 | 54 |
| 2020 | | 15.72 | 0.02 | 3.13 | | 3.15 | (—)† | (0.20) | (0.20) | 18.67 | | 20.07 | | 428,451 | | 0.98(1) | | 0.99 | | 0.12 | 90 |
| 2019 | | 13.04 | 0.03 | 3.26 | | 3.29 | (0.02) | (0.59) | (0.61) | 15.72 | | 25.29 | | 338,440 | | 1.00(1) | | 1.01 | | 0.20 | 84 |
| Investor Class | |
| 2023 | | $15.13 | $ 0.06 | $ 2.12 | | $ 2.18 | $(0.08) | $(0.33) | $(0.41) | $16.90 | | 14.57% | | $280,375 | | 1.20%(1) | | 1.21% | | 0.38% | 54% |
| 2022 | | 19.35 | 0.03 | (3.51) | | (3.48) | (0.02) | (0.72) | (0.74) | 15.13 | | (18.05) | | 260,960 | | 1.19(1) | | 1.20 | | 0.12 | 54 |
| 2021 | | 18.54 | (0.04) | 4.01 | | 3.97 | — | (3.16) | (3.16) | 19.35 | | 21.79 | | 350,691 | | 1.16(1) | | 1.17 | | (0.18) | 54 |
| 2020 | | 15.66 | (0.02) | 3.11 | | 3.09 | (0.01) | (0.20) | (0.21) | 18.54 | | 19.75 | | 268,364 | | 1.24(1) | | 1.25 | | (0.15) | 90 |
| 2019 | | 13.01 | (0.01) | 3.25 | | 3.24 | — | (0.59) | (0.59) | 15.66 | | 24.97 | | 258,018 | | 1.26(1) | | 1.27 | | (0.06) | 84 |
| | |
| International Equity Index Fund | |
| Institutional Class | |
| 2023 | | $ 9.87 | $ 0.32 | $ 1.46 | | $ 1.78 | $(0.35) | $ — | $(0.35) | $11.30 | | 18.08% | | $906,219 | | 0.20% | | 0.20% | | 2.92% | 9% |
| 2022 | | 12.06 | 0.32 | (2.21) | | (1.89) | (0.26) | (0.04) | (0.30) | 9.87 | | (15.69) | | 787,046 | | 0.21 | | 0.21 | | 3.05 | 14 |
| 2021 | | 11.53 | 0.31 | 0.88 | | 1.19 | (0.35) | (0.31) | (0.66) | 12.06 | | 10.43 | | 833,894 | | 0.22 | | 0.22 | | 2.52 | 18 |
| 2020 | | 10.87 | 0.22 | 0.67 | | 0.89 | (0.23) | — | (0.23) | 11.53 | | 8.17 | | 779,329 | | 0.22 | | 0.22 | | 2.16 | 12 |
| 2019 | | 9.24 | 0.31 | 1.65 | | 1.96 | (0.33) | — | (0.33) | 10.87 | | 21.21 | | 713,864 | | 0.22 | | 0.23 | | 3.05 | 5 |
| Investor Class | |
| 2023 | | $ 9.89 | $ 0.28 | $ 1.48 | | $ 1.76 | $(0.32) | $ — | $(0.32) | $11.33 | | 17.87% | | $ 15,799 | | 0.50% | | 0.69% | | 2.60% | 9% |
| 2022(2) | | 10.43 | 0.15 | (0.43) | | (0.28) | (0.22) | (0.04) | (0.26) | 9.89 | | (2.73) | | 8,074 | | 0.50 | | 1.45 | | 2.36 | 14 |
| | | | | | | | | | | | | | | | | | | | | | |
| # | Calculated using the average shares outstanding method. |
| † | Amount represents less than $0.005 per share. |
| (1) | The ratio for the Small Cap Equity Fund includes the effect of fees paid indirectly which decreased the ratio by 0.01% for the years 2019, 2020, 2021, 2022 and 2023. |
| (2) | For the period April 29, 2022 (commencement of operations) through December 31, 2022. All ratios for the period have been annualized with the exception of total return and portfolio turnover which have not been annualized. |
See Notes to Financial Statements.
FINANCIAL HIGHLIGHTS (Continued)
| For a Share Outstanding For the Years Ending December 31, unless otherwise indicated | | | | | | | | | | | Ratios to Average Net Assets |
| | | Net Asset
Value,
Beginning
of Year | Net Investment
Income# | Realized
and
Unrealized
Gain
(Loss) on
Investments | | Total Income
From Investment
Operations | | Dividends
from Net
Investment
Income | Distributions
from Net
Realized
Capital
Gains | Return
of
capital | Total
Distributions
Paid | Net Asset
Value,
End of
Year | | Total
Return | | Net Assets,
End of Year
(000) | | Expenses,
Net | | Expenses,
Gross | Investment
Income,
Net | Portfolio
Turnover
Rate |
| International Equity Fund | |
| Institutional Class | |
| 2023 | | $12.23 | $0.23 | $ 2.00 | | $ 2.23 | | $(0.32) | $(0.23) | $ — | $(0.55) | $13.91 | | 18.39% | | $788,300 | | 0.84%(1) | | 0.84%(1) | 1.73% | 57% |
| 2022 | | 14.85 | 0.19 | (2.57) | | (2.38) | | (0.19) | (0.05) | — | (0.24) | 12.23 | | (16.01) | | 732,342 | | 0.85(1) | | 0.85(1) | 1.52 | 58 |
| 2021 | | 14.70 | 0.14 | 1.25 | | 1.39 | | (0.18) | (1.06) | — | (1.24) | 14.85 | | 9.61 | | 987,439 | | 0.87(1) | | 0.87(1) | 0.90 | 37 |
| 2020 | | 13.78 | 0.14 | 0.93 | | 1.07 | | (0.13) | (0.02) | — | (0.15) | 14.70 | | 7.81(2) | | 973,352 | | 0.93(1) | | 0.93(1) | 1.10 | 90 |
| 2019 | | 11.74 | 0.31(3) | 2.44 | | 2.75 | | (0.31) | (0.40) | — | (0.71) | 13.78 | | 23.45 | | 963,046 | | 1.07(1) | | 1.07(1) | 2.31(3) | 54 |
| Investor Class | |
| 2023 | | $12.22 | $0.20 | $ 1.99 | | $ 2.19 | | $(0.29) | $(0.23) | $ — | $(0.52) | $13.89 | | 18.03% | | $339,406 | | 1.12%(1) | | 1.12%(1) | 1.47% | 57% |
| 2022 | | 14.84 | 0.15 | (2.56) | | (2.41) | | (0.16) | (0.05) | — | (0.21) | 12.22 | | (16.25) | | 292,201 | | 1.13(1) | | 1.13(1) | 1.22 | 58 |
| 2021 | | 14.69 | 0.10 | 1.25 | | 1.35 | | (0.14) | (1.06) | — | (1.20) | 14.84 | | 9.35 | | 358,216 | | 1.14(1) | | 1.14(1) | 0.64 | 37 |
| 2020 | | 13.81 | 0.11 | 0.93 | | 1.04 | | (0.14) | (0.02) | — | (0.16) | 14.69 | | 7.52(2) | | 345,120 | | 1.20(1) | | 1.20(1) | 0.84 | 90 |
| 2019 | | 11.77 | 0.27(3) | 2.45 | | 2.72 | | (0.28) | (0.40) | — | (0.68) | 13.81 | | 23.10 | | 351,124 | | 1.35(1) | | 1.34(1) | 2.05(3) | 54 |
| | |
| Emerging Markets Equity Fund | |
| Institutional Class | |
| 2023 | | $ 8.21 | $0.17 | $ 0.73 | | $ 0.90 | | $(0.19) | $ — | $ — | $(0.19) | $ 8.92 | | 11.07% | | $687,675 | | 1.08%(4) | | 1.08% | 1.97% | 63% |
| 2022 | | 10.67 | 0.21 | (2.49) | | (2.28) | | (0.16) | — | (0.02) | (0.18) | 8.21 | | (21.38) | | 613,701 | | 1.10(4) | | 1.10 | 2.31 | 62 |
| 2021 | | 12.33 | 0.11 | (0.34) | | (0.23) | | (0.08) | (1.35) | — | (1.43) | 10.67 | | (1.85) | | 714,818 | | 1.04(4) | | 1.04 | 0.86 | 62 |
| 2020 | | 10.19 | 0.07 | 2.19 | | 2.26 | | (0.12) | — | — | (0.12) | 12.33 | | 22.15 | | 685,246 | | 1.11(4) | | 1.11 | 0.70 | 67 |
| 2019 | | 8.71 | 0.18(5) | 1.57 | | 1.75 | | (0.27) | — | — | (0.27) | 10.19 | | 20.06 | | 457,074 | | 1.19(4) | | 1.19 | 1.92(5) | 92 |
| Investor Class | |
| 2023 | | $ 8.18 | $0.14 | $ 0.73 | | $ 0.87 | | $(0.17) | $ — | $ — | $(0.17) | $ 8.88 | | 10.67% | | $107,306 | | 1.38%(4) | | 1.38% | 1.67% | 63% |
| 2022 | | 10.63 | 0.18 | (2.48) | | (2.30) | | (0.13) | — | (0.02) | (0.15) | 8.18 | | (21.61) | | 94,276 | | 1.40(4) | | 1.40 | 2.00 | 62 |
| 2021 | | 12.29 | 0.08 | (0.34) | | (0.26) | | (0.05) | (1.35) | — | (1.40) | 10.63 | | (2.12) | | 111,425 | | 1.33(4) | | 1.33 | 0.60 | 62 |
| 2020 | | 10.20 | 0.03 | 2.17 | | 2.20 | | (0.11) | — | — | (0.11) | 12.29 | | 21.60 | | 96,362 | | 1.51(4) | | 1.51 | 0.30 | 67 |
| 2019 | | 8.72 | 0.14(5) | 1.57 | | 1.71 | | (0.23) | — | — | (0.23) | 10.20 | | 19.64 | | 75,866 | | 1.57(4) | | 1.57 | 1.48(5) | 92 |
| | | | | | | | | | | | | | | | | | | | | | | |
| # | Calculated using the average shares outstanding method. |
| (1) | For the years ended December 31, 2019, 2020, 2021, 2022 and 2023, the effect of dividend expense on securities sold short increased the ratio by 0.19%, 0.06%, 0.00%, 0.00% and 0.00%. |
| (2) | Amount includes the effect of the Adviser pay-in for an economic loss. Had the pay-in not been made, the net asset value total return would have been 7.77% and 7.46% for the Institutional Class and Investor Class, respectively. In addition, the portfolio turnover calculation includes the value of securities purchased and sold related to this transaction. |
| (3) | Net investment income per share and the ratio of net investment income to average net assets include $0.01 and 0.09% for the Institutional Class and $0.01 and 0.09% for the Investor Class, respectively, resulting from a special dividend from Naspers Ltd. in September 2019. |
| (4) | The ratio for the Emerging Markets Equity Fund includes the effect of fees paid indirectly which decreased the ratio by 0.00% for the years 2018, 2019, 2020, 2021, 2022 and 2023. |
| (5) | Net investment income per share and the ratio of net investment income to average net assets include $0.06 and 0.68% for the Institutional Class and $0.06 and 0.62% for the Investor Class, respectively, resulting from a special dividend from Naspers Ltd. in September 2019. |
See Notes to Financial Statements.
Global Real Estate Securities Fund (Unaudited)
The Fund provides exposure to real estate by investing in equity securities of real estate investment trusts (“REITs”) and other real estate related companies. The Fund was diversified among property sectors and geographical locations. Global real estate securities underperformed their global equity counterparts during the year. The Investor Class of the Fund outperformed its benchmark, the FTSE EPRA Nareit Developed Index, for the one-year period ended December 31, 2023 (11.06% (net of fees) versus 9.67%). Stock selection within Canada and the United States were the primary contributors to benchmark relative returns in 2023. Stock selection within the healthcare and residential property sectors was also particularly strong.
In 2023, exchange-listed equity index futures contracts were utilized to provide market exposure to the cash positions held in the Fund. Overall, derivative exposure had a positive impact on Fund performance for the year.
This Fund may be suitable for investors who seek the potential for current income and long-term capital appreciation. Investors should be willing to accept significant short-term fluctuations in account value and want to diversify their portfolio through exposure to publicly traded global real estate securities. This Fund invests substantial assets in REITs that involve equity market risks as well as risks linked directly to the real estate market. Risks include declines in the value of real estate, general and economic conditions, changes in the value of the underlying property and defaults by borrowers. The value of assets in the real estate industry may go through cycles of relative underperformance and outperformance in comparison to equity securities markets in general. Securities of foreign issuers may be negatively impacted by political events, economic conditions or inefficient, illiquid or unregulated markets in foreign countries, and they also may be subject to inadequate regulatory or accounting standards, which may increase investment risk. Investing in emerging markets may involve greater risks than investing in more developed foreign markets because, among other things, emerging markets often have more political and economic instability. It is possible to lose money by investing in the Fund.
At December 31, 2023, the portfolio holdings of the Fund, as a percentage of net assets, is shown in the following table. Portfolio holdings are subject to risk and may change at any time.
| | % |
| Real Estate | 95.1 |
| Money Market Funds | 4.5 |
| Health Care | 1.2 |
| Information Technology | 0.1 |
| | 100.9 |
| Average Annual Total Returns as of 12/31/23 | |
| | | Institutional Class* | | Investor Class* | | Benchmark** | |
| One Year | | 11.45% | | 11.06% | | 9.67% | |
| Five Year | | 5.12% | | 4.80% | | 2.81% | |
| Ten Year | | N/A | | 4.88% | | 3.57% | |
| Since Inception(1) | | 3.84% | | 3.38% | | 1.94% | |
| Inception Date | | 05/01/15 | | 12/29/06 | | | |
| Total Fund Operating Expenses (May 1, 2023 Prospectus)(2)# | | 0.84% | | 1.13% | | | |
| (1) | The Since Inception benchmark performance is based on the start date of December 29, 2006, which corresponds with the inception date of the Investor Class, the longest operating class of the Fund. |
| (2) | Current information regarding the Fund’s Operating Expenses can be found in the Financial Highlights. |
#Net expense ratio
The performance data quoted represents past performance and does not guarantee future results. The performance data in the table and graph does not reflect the deduction of taxes that a shareholder would pay on Fund distributions or the redemption of Fund shares. Current performance may be lower or higher. Performance data current to the most recent month-end may be obtained at GuideStoneFunds.com. The investment return and principal value of an investment will fluctuate so that shares, when redeemed, may be worth more or less than their original cost.
See Notes to Financial Statements.
Global Real Estate Securities Fund (Unaudited)
The graph illustrates the results of a hypothetical $10,000 investment in the Investor Class of the Fund for the 10-year period from December 31, 2013 to December 31, 2023, with all dividends and capital gains reinvested, with the FTSE EPRA Nareit Developed Index.
*These returns reflect investment advisory and shareholder servicing fee waivers, if applicable, during the reported time periods.
Unlike a mutual fund, an index is not available for direct investment and the performance of an index assumes no taxes, transaction costs, management fees or other expenses.
See Notes to Financial Statements.
GLOBAL REAL ESTATE SECURITIES FUND
| | | Shares | | Value |
| COMMON STOCKS — 60.1% |
| Real Estate — 60.1% | | |
| Agree Realty Corporation REITΔ | 65,622 | | $ 4,130,905 |
| Alexandria Real Estate Equities, Inc. REIT | 4,600 | | 583,142 |
| American Homes 4 Rent Class A REIT | 70,090 | | 2,520,436 |
| American Tower Corporation REIT | 6,041 | | 1,304,131 |
| Americold Realty Trust REIT | 17,803 | | 538,897 |
| AvalonBay Communities, Inc. REIT | 38,462 | | 7,200,856 |
| Boston Properties, Inc. REIT | 26,809 | | 1,881,187 |
| Brixmor Property Group, Inc. REIT | 87,576 | | 2,037,893 |
| Camden Property Trust REIT | 9,723 | | 965,397 |
| CareTrust REIT, Inc. | 54,329 | | 1,215,883 |
| Cousins Properties, Inc. REIT | 48,540 | | 1,181,949 |
| CTO Realty Growth, Inc. REITΔ | 45,429 | | 787,285 |
| CubeSmart REIT | 41,536 | | 1,925,194 |
| Digital Realty Trust, Inc. REIT | 41,273 | | 5,554,520 |
| EastGroup Properties, Inc. REIT | 15,005 | | 2,754,018 |
| EPR Properties REIT | 26,402 | | 1,279,177 |
| Equinix, Inc. REIT | 15,026 | | 12,101,790 |
| Equity LifeStyle Properties, Inc. REIT | 6,208 | | 437,912 |
| Essential Properties Realty Trust, Inc. REIT | 145,723 | | 3,724,680 |
| Essex Property Trust, Inc. REIT | 9,337 | | 2,315,016 |
| Extra Space Storage, Inc. REIT | 20,260 | | 3,248,286 |
| Federal Realty Investment Trust REIT | 5,972 | | 615,415 |
| Four Corners Property Trust, Inc. REIT | 50,251 | | 1,271,350 |
| Healthpeak Properties, Inc. REIT | 86,032 | | 1,703,434 |
| Invitation Homes, Inc. REIT | 74,764 | | 2,550,200 |
| Iron Mountain, Inc. REIT | 47,387 | | 3,316,142 |
| Kimco Realty Corporation REIT | 160,177 | | 3,413,372 |
| Kite Realty Group Trust REIT | 135,819 | | 3,104,822 |
| Medical Properties Trust, Inc. REITΔ | 62,912 | | 308,898 |
| NETSTREIT Corporation | 100,327 | | 1,790,837 |
| Omega Healthcare Investors, Inc. REIT | 18,896 | | 579,351 |
| Prologis, Inc. REIT | 117,742 | | 15,695,009 |
| Public Storage REIT | 19,689 | | 6,005,145 |
| Realty Income Corporation REITΔ | 67,974 | | 3,903,067 |
| Regency Centers Corporation REIT | 10,448 | | 700,016 |
| Rexford Industrial Realty, Inc. REITΔ | 41,925 | | 2,351,992 |
| Ryman Hospitality Properties, Inc. REIT | 37,306 | | 4,105,898 |
| SBA Communications Corporation REIT | 2,550 | | 646,909 |
| Simon Property Group, Inc. REIT | 36,557 | | 5,214,490 |
| SL Green Realty Corporation REITΔ | 28,609 | | 1,292,269 |
| Spirit Realty Capital, Inc. REIT | 42,142 | | 1,841,184 |
| STAG Industrial, Inc. REITΔ | 71,370 | | 2,801,986 |
| Sun Communities, Inc. REIT | 27,615 | | 3,690,745 |
| UDR, Inc. REIT | 113,395 | | 4,341,895 |
| Ventas, Inc. REIT | 78,788 | | 3,926,794 |
| | | Shares | | Value |
| Vornado Realty Trust REITΔ | 63,929 | | $ 1,805,994 |
| Welltower, Inc. REIT | 91,624 | | 8,261,736 |
| | | | | 142,927,504 |
Total Common Stocks
(Cost $130,607,957) | | 142,927,504 |
| FOREIGN COMMON STOCKS — 36.3% |
| Australia — 3.8% | | |
| Centuria Industrial REITΔ | 142,373 | | 315,280 |
| Charter Hall Retail REIT | 133,843 | | 329,073 |
| Dexus REIT | 121,795 | | 636,519 |
| Goodman Group REIT | 29,333 | | 505,022 |
| GPT Group (The) REIT | 366,229 | | 1,155,806 |
| Ingenia Communities Group REIT | 240,436 | | 728,303 |
| Mirvac Group REIT | 759,119 | | 1,079,943 |
| Region RE, Ltd. REIT | 862,436 | | 1,326,881 |
| Scentre Group REIT | 928,479 | | 1,890,764 |
| Stockland REIT | 346,241 | | 1,050,023 |
| | | | | 9,017,614 |
| Belgium — 0.7% | | |
| Aedifica SA REIT | 5,320 | | 373,907 |
| VGP NVΔ | 4,383 | | 507,867 |
| Warehouses De Pauw CVA REIT | 11,289 | | 355,357 |
| Xior Student Housing NV REIT | 8,465 | | 278,192 |
| | | | | 1,515,323 |
| Canada — 3.1% | | |
| Boardwalk REIT | 18,446 | | 993,123 |
| Chartwell Retirement Residences | 315,970 | | 2,794,739 |
| InterRent Real Estate Investment Trust REIT | 116,175 | | 1,159,953 |
| Minto Apartment Real Estate Investment Trust REIT 144A | 40,370 | | 492,952 |
| RioCan REIT | 32,491 | | 456,573 |
| Tricon Residential, Inc. | 150,090 | | 1,365,819 |
| | | | | 7,263,159 |
| Finland — 0.2% | | |
| Kojamo OYJ | 31,499 | | 413,488 |
| France — 1.4% | | |
| Gecina SA REIT | 5,152 | | 627,200 |
| ICADE REIT | 13,823 | | 542,530 |
| Klepierre REIT | 57,594 | | 1,572,354 |
| Unibail-Rodamco-Westfield REITΔ* | 8,108 | | 599,696 |
| | | | | 3,341,780 |
| Germany — 2.3% | | |
| Aroundtown SAΔ* | 122,887 | | 334,911 |
| LEG Immobilien SE* | 3,218 | | 281,606 |
| Sirius Real Estate, Ltd. REIT | 457,579 | | 550,008 |
| Vonovia SE | 139,035 | | 4,368,717 |
| | | | | 5,535,242 |
See Notes to Financial Statements.
GLOBAL REAL ESTATE SECURITIES FUND
SCHEDULE OF INVESTMENTS (Continued)
| | | Shares | | Value |
| Hong Kong — 3.8% | | |
| CK Asset Holdings, Ltd. | 542,544 | | $ 2,723,080 |
| Hongkong Land Holdings, Ltd. | 58,268 | | 202,660 |
| Link REIT | 623,592 | | 3,501,503 |
| Sun Hung Kai Properties, Ltd. | 165,090 | | 1,786,500 |
| Sun Hung Kai Properties, Ltd. (Hong Kong Exchange) | 8,500 | | 91,982 |
| SUNeVision Holdings, Ltd. | 624,794 | | 247,400 |
| Swire Properties, Ltd. | 49,176 | | 99,545 |
| Wharf Real Estate Investment Co., Ltd. | 121,153 | | 409,555 |
| | | | | 9,062,225 |
| Japan — 9.5% | | |
| Activia Properties, Inc. REITΔ | 301 | | 828,671 |
| Advance Logistics Investment Corporation REIT | 357 | | 320,759 |
| Advance Residence Investment Corporation REIT | 164 | | 367,245 |
| CRE Logistics REIT, Inc.Δ | 341 | | 375,311 |
| Daiwa House REIT Investment Corporation | 820 | | 1,462,222 |
| GLP J-REIT | 373 | | 371,299 |
| Industrial & Infrastructure Fund Investment Corporation REIT | 908 | | 897,852 |
| Invincible Investment Corporation REIT | 81 | | 35,010 |
| Japan Hotel REIT Investment Corporation | 2,558 | | 1,254,041 |
| Japan Metropolitan Fund Invest REIT | 174 | | 125,594 |
| KDX Realty Investment Corporation REIT | 1,583 | | 1,802,270 |
| Keihanshin Building Co., Ltd. | 76,600 | | 770,702 |
| LaSalle Logiport REIT | 237 | | 255,186 |
| Mitsubishi Estate Co., Ltd. | 289,031 | | 3,962,058 |
| Mitsui Fudosan Co., Ltd. | 128,268 | | 3,136,115 |
| Mori Trust REIT, Inc. | 2,579 | | 1,325,038 |
| Nippon Building Fund, Inc. REITΔ | 130 | | 562,755 |
| Nippon Prologis REIT, Inc. | 922 | | 1,772,806 |
| NIPPON REIT Investment Corporation | 344 | | 819,161 |
| One REIT, Inc. | 145 | | 272,531 |
| Orix JREIT, Inc. | 817 | | 964,064 |
| Sekisui House REIT, Inc. | 295 | | 161,142 |
| Sumitomo Realty & Development Co., Ltd. | 28,349 | | 840,095 |
| | | | | 22,681,927 |
| Netherlands — 0.4% | | |
| CTP NV 144A | 29,975 | | 506,400 |
| Eurocommercial Properties NV REIT | 10,973 | | 269,084 |
| NSI NV REITΔ | 10,369 | | 214,743 |
| | | | | 990,227 |
| Norway — 0.1% | | |
| Entra ASA 144A | 18,008 | | 204,542 |
| Singapore — 3.4% | | |
| CapitaLand Ascendas REIT | 557,700 | | 1,278,568 |
| Capitaland India Trust | 327,019 | | 282,479 |
| | | Shares | | Value |
| CapitaLand Integrated Commercial Trust REIT | 193,756 | | $ 302,026 |
| Capitaland Investment, Ltd. | 872,148 | | 2,085,199 |
| Digital Core REIT Management Pte, Ltd. | 951,433 | | 613,322 |
| Frasers Logistics & Commercial Trust REIT | 1,598,285 | | 1,391,419 |
| Keppel DC REIT | 472,200 | | 697,117 |
| Mapletree Industrial Trust REIT | 314,700 | | 597,894 |
| Mapletree Pan Asia Commercial Trust REIT | 749,563 | | 890,515 |
| | | | | 8,138,539 |
| Spain — 0.7% | | |
| Arima Real Estate SOCIMI SA REIT* | 17,802 | | 124,794 |
| Inmobiliaria Colonial Socimi SA REIT | 21,353 | | 154,520 |
| Merlin Properties Socimi SA REIT | 121,887 | | 1,353,321 |
| | | | | 1,632,635 |
| Sweden — 1.8% | | |
| Castellum AB | 110,880 | | 1,574,357 |
| Catena ABΔ | 10,698 | | 500,911 |
| Fabege ABΔ | 91,627 | | 984,272 |
| Fastighets AB Balder, B SharesΔ* | 153,459 | | 1,088,311 |
| Samhallsbyggnadsbolaget i Norden AB | 127,417 | | 63,950 |
| | | | | 4,211,801 |
| Switzerland — 0.7% | | |
| Mobimo Holding AG | 433 | | 134,275 |
| PSP Swiss Property AG | 11,379 | | 1,590,885 |
| | | | | 1,725,160 |
| United Kingdom — 4.4% | | |
| Big Yellow Group PLC REIT | 36,643 | | 570,440 |
| British Land Co. PLC (The) REIT | 363,482 | | 1,847,861 |
| Derwent London PLC REIT | 15,105 | | 454,297 |
| Grainger PLC | 317,402 | | 1,069,700 |
| Great Portland Estates PLC REIT | 41,637 | | 222,905 |
| Hammerson PLC REIT | 1,275,794 | | 461,117 |
| Land Securities Group PLC REIT | 41,708 | | 374,305 |
| Life Science Reit PLC REIT | 305,316 | | 245,956 |
| PRS REIT PLC (The) | 208,070 | | 228,617 |
| Safestore Holdings PLC REIT | 22,886 | | 257,742 |
| Segro PLC REIT | 178,377 | | 2,011,604 |
| Shaftesbury Capital PLC REIT | 389,919 | | 686,315 |
| Tritax Big Box REIT PLC | 295,928 | | 635,028 |
| Tritax EuroBox PLC 144A | 257,482 | | 197,397 |
| UNITE Group PLC (The) REIT | 93,025 | | 1,235,697 |
| | | | | 10,498,981 |
Total Foreign Common Stocks
(Cost $86,707,164) | | 86,232,643 |
| MONEY MARKET FUNDS — 4.5% |
| Northern Institutional Liquid Assets Portfolio (Shares), 5.40%ا | 4,199,404 | | 4,199,404 |
See Notes to Financial Statements.
| | | Shares | | Value |
GuideStone Money Market Fund, 5.28%
(Institutional Class)Ø∞ | 3,217,381 | | $ 3,217,381 |
| Northern Institutional U.S. Treasury Portfolio (Premier), 5.22%Ø | 3,339,571 | | 3,339,571 |
Total Money Market Funds
(Cost $10,756,356) | | 10,756,356 |
TOTAL INVESTMENTS — 100.9%
(Cost $228,071,477) | | | 239,916,503 |
Liabilities in Excess of Other
Assets — (0.9)% | | | (2,026,242) |
| NET ASSETS — 100.0% | | | $237,890,261 |
Futures Contracts outstanding at December 31, 2023:
| Future Type | | Expiration Date | | Open Long
(Short) Contracts | | Notional
Market Value
of Contracts | | Value and
Unrealized
Appreciation
(Depreciation) |
| E-Mini S&P MidCap 400 | | 03/2024 | | 7 | | $1,966,650 | | $7,990 |
See Notes to Financial Statements.
GLOBAL REAL ESTATE SECURITIES FUND
SCHEDULE OF INVESTMENTS (Continued)
VALUATION HIERARCHY
The following is a summary of the inputs used, as of December 31, 2023, in valuing the Fund’s investments carried at fair value:
| | Total
Value | | Level 1
Quoted Prices | | Level 2
Other Significant
Observable Inputs | | Level 3
Significant
Unobservable Inputs |
| Assets: | | | | | | | |
| Investments in Securities: | | | | | | | |
| Common Stocks | $142,927,504 | | $142,927,504 | | $ — | | $ — |
| Foreign Common Stocks: | | | | | | | |
| Canada | 7,263,159 | | 7,263,159 | | — | | — |
| Germany | 5,535,242 | | 550,008 | | 4,985,234 | | — |
| Netherlands | 990,227 | | 214,743 | | 775,484 | | — |
| Norway | 204,542 | | 204,542 | | — | | — |
| Singapore | 8,138,539 | | 282,479 | | 7,856,060 | | — |
| Spain | 1,632,635 | | 124,794 | | 1,507,841 | | — |
| United Kingdom | 10,498,981 | | 1,767,178 | | 8,731,803 | | — |
| Other ^^ | 51,969,318 | | — | | 51,969,318 | | — |
| Total Foreign Common Stocks | 86,232,643 | | 10,406,903 | | 75,825,740 | | — |
| Money Market Funds | 10,756,356 | | 10,756,356 | | — | | — |
| Total Assets - Investments in Securities | $239,916,503 | | $164,090,763 | | $75,825,740 | | $ — |
| Other Financial Instruments*** | | | | | | | |
| Futures Contracts | $ 7,990 | | $ 7,990 | | $ — | | $ — |
| Total Assets - Other Financial Instruments | $ 7,990 | | $ 7,990 | | $ — | | $ — |
| ^^ | Classifications as defined in the Schedule of Investments. |
| *** | Other financial instruments are derivative instruments, such as futures contracts, which are valued at the unrealized appreciation (depreciation) on the investment. Further details regarding the value of these investments can be found in the preceding "Futures Contracts outstanding" disclosure. |
See Notes to Financial Statements.
| STATEMENTS OF ASSETS AND LIABILITIES | December 31, 2023 |
| | Global
Real Estate
Securities Fund |
| Assets | |
| Investments in securities of unaffiliated issuers, at value | $236,699,122 |
| Investments in securities of affiliated issuers, at value | 3,217,381 |
| Total investments, at value(1), (2) | 239,916,503 |
| Deposits with broker for futures contracts | 140,000 |
| Foreign currency(3) | 641,501 |
| Receivables: | |
| Dividends | 1,038,149 |
| Reclaims | 104,453 |
| Securities lending | 2,475 |
| Investment securities sold | 2,374,410 |
| Fund shares sold | 61,422 |
| Prepaid expenses and other assets | 21,842 |
| Total Assets | 244,300,755 |
| Liabilities | |
| Cash Overdraft | 884,898 |
| Collateral held for securities on loan, at value | 4,199,404 |
| Payables: | |
| Investment securities purchased | 705,165 |
| Fund shares redeemed | 364,233 |
| Variation margin on futures contracts | 18,340 |
| Accrued expenses: | |
| Investment advisory fees | 136,988 |
| Shareholder servicing fees | 16,702 |
| Director fees | 1,310 |
| Other expenses | 83,454 |
| Total Liabilities | 6,410,494 |
| Net Assets | $237,890,261 |
| Net Assets Consist of: | |
| Paid-in-capital | $261,572,368 |
| Distributable earnings (loss) | (23,682,107) |
| Net Assets | $237,890,261 |
| Net Asset Value: | |
| $0.001 par value, unlimited shares authorized | |
| Net assets applicable to the Institutional Class | $157,441,541 |
| Institutional shares outstanding | 17,620,632 |
| Net asset value, offering and redemption price per Institutional share | $ 8.94 |
| Net assets applicable to the Investor Class | $ 80,448,720 |
| Investor shares outstanding | 8,961,505 |
| Net asset value, offering and redemption price per Investor share | $ 8.98 |
| |
| | |
| (1)Investments in securities of unaffiliated issuers, at cost | $224,854,096 |
| Investments in securities of affiliated issuers, at cost | 3,217,381 |
| Total investments, at cost | $228,071,477 |
| (2)Includes securities loaned of: | $ 19,530,607 |
| (3)Foreign currency, at cost | $ 636,086 |
| | |
See Notes to Financial Statements.
| STATEMENTS OF OPERATIONS | For the Year Ended December 31, 2023 |
| | Global
Real Estate
Securities Fund |
| Investment Income | |
| Dividends | $ 9,497,939 |
| Income distributions received from affiliated funds | 351,937 |
| Interest | 10,715 |
| Securities lending, net | 44,835 |
| Less foreign taxes withheld | (300,931) |
| Total Investment Income | 9,604,495 |
| Expenses | |
| Investment advisory fees | 1,720,764 |
| Transfer agent fees: | |
| Institutional shares | 5,159 |
| Investor shares | 20,036 |
| Custodian fees | 180,794 |
| Shareholder servicing fees: | |
| Investor shares | 197,949 |
| Accounting and administration fees | 40,832 |
| Professional fees | 132,118 |
| Blue sky fees: | |
| Institutional shares | 14,693 |
| Investor shares | 14,914 |
| Shareholder reporting fees: | |
| Institutional shares | 4,447 |
| Investor shares | 16,678 |
| Directors expenses | 7,508 |
| Line of credit facility fees | 980 |
| Other expenses | 70,396 |
| Total Expenses | 2,427,268 |
| Fees paid indirectly | (27,877) |
| Net Expenses | 2,399,391 |
| Net Investment Income | 7,205,104 |
| Realized and Unrealized Gain (Loss) | |
| Net realized gain (loss) from: | |
| Capital gain distributions received from affiliated funds | 50 |
| Investment securities | (22,103,189) |
| Futures transactions | 907,964 |
| Forward foreign currency contracts | 4,782 |
| Foreign currency | (111,857) |
| Net realized loss | (21,302,250) |
| Net change in unrealized appreciation (depreciation) on: | |
| Investment securities | 38,951,899 |
| Futures | 7,990 |
| Foreign currency | 13,180 |
| Net change in unrealized appreciation (depreciation) | 38,973,069 |
| Net Realized and Unrealized Gain | 17,670,819 |
| Net Increase in Net Assets Resulting from Operations | $ 24,875,923 |
See Notes to Financial Statements.
| STATEMENTS OF CHANGES IN NET ASSETS |
| | Global Real Estate Securities Fund |
| | For the Year Ended |
| | 12/31/23 | | 12/31/22 |
| | | | |
| Operations: | | | |
| Net investment income | $ 7,205,104 | | $ 5,969,647 |
| Net realized loss on investment securities, foreign currency and derivatives | (21,302,250) | | (6,293,730) |
| Net change in unrealized appreciation (depreciation) on investment securities, foreign currency and derivatives | 38,973,069 | | (83,362,596) |
| Net increase (decrease) in net assets resulting from operations | 24,875,923 | | (83,686,679) |
| Distributions to Shareholders: | | | |
| Distributions paid | | | |
| Institutional shares | (5,971,693) | | (5,350,565) |
| Investor shares | (2,455,889) | | (2,439,747) |
| Return of capital | | | |
| Institutional shares | — | | — |
| Investor shares | — | | — |
| Total distributions | (8,427,582) | | (7,790,312) |
| Capital Share Transactions: | | | |
| Proceeds from shares sold | | | |
| Institutional shares | 27,225,776 | | 28,461,267 |
| Investor shares | 10,954,287 | | 17,225,372 |
| Reinvestment of dividends and distributions | | | |
| Institutional shares | 5,881,667 | | 5,280,916 |
| Investor shares | 2,431,739 | | 2,426,742 |
| Total proceeds from shares sold and reinvested | 46,493,469 | | 53,394,297 |
| Value of shares redeemed | | | |
| Institutional shares | (50,842,326) | | (28,603,573) |
| Investor shares | (19,121,567) | | (25,635,960) |
| Total value of shares redeemed | (69,963,893) | | (54,239,533) |
| Net decrease from capital share transactions(1) | (23,470,424) | | (845,236) |
| Total decrease in net assets | (7,022,083) | | (92,322,227) |
| Net Assets: | | | |
| Beginning of Year | 244,912,344 | | 337,234,571 |
| End of Year | $237,890,261 | | $244,912,344 |
| |
| (1) | See Note 6 in Notes to Financial Statements. |
See Notes to Financial Statements.
| For a Share Outstanding For the Years Ending December 31, unless otherwise indicated | | | | | | | | | | Ratios to Average Net Assets | |
| | | Net Asset
Value,
Beginning
of Year | Net Investment
Income# | Realized
and
Unrealized
Gain
(Loss) on
Investments | | Total Income
From Investment
Operations | Dividends
from Net
Investment
Income | Distributions
from Net
Realized
Capital
Gains | Total
Distributions
Paid | Net Asset
Value,
End of
Year | | Total
Return | | Net Assets,
End of Year
(000) | | Expenses,
Net | | Expenses,
Gross | | Investment
Income,
Net | Portfolio
Turnover
Rate |
| Global Real Estate Securities Fund | |
| Institutional Class | |
| 2023 | | $ 8.30 | $0.25 | $ 0.68 | | $ 0.93 | $(0.26) | $(0.03) | $(0.29) | $ 8.94 | | 11.45% | | $157,441 | | 0.86%(1) | | 0.87% | | 2.95% | 139% |
| 2022 | | 11.53 | 0.22 | (3.17) | | (2.95) | (0.14) | (0.14) | (0.28) | 8.30 | | (25.66) | | 164,351 | | 0.83(1) | | 0.84 | | 2.30 | 102 |
| 2021 | | 9.47 | 0.17 | 2.63 | | 2.80 | (0.40) | (0.34) | (0.74) | 11.53 | | 29.97 | | 218,705 | | 0.79(1) | | 0.80 | | 1.59 | 105 |
| 2020 | | 10.21 | 0.18 | (0.67) | | (0.49) | (0.18) | (0.07) | (0.25) | 9.47 | | (4.54) | | 175,384 | | 0.86(1) | | 0.87 | | 1.98 | 141 |
| 2019 | | 8.83 | 0.22 | 1.95 | | 2.17 | (0.61) | (0.18) | (0.79) | 10.21 | | 24.87 | | 159,523 | | 0.82(1) | | 0.83 | | 2.13 | 118 |
| Investor Class | |
| 2023 | | $ 8.34 | $0.22 | $ 0.69 | | $ 0.91 | $(0.24) | $(0.03) | $(0.27) | $ 8.98 | | 11.06% | | $ 80,449 | | 1.16%(1) | | 1.17% | | 2.65% | 139% |
| 2022 | | 11.58 | 0.19 | (3.18) | | (2.99) | (0.11) | (0.14) | (0.25) | 8.34 | | (25.88) | | 80,561 | | 1.12(1) | | 1.13 | | 1.97 | 102 |
| 2021 | | 9.51 | 0.14 | 2.64 | | 2.78 | (0.37) | (0.34) | (0.71) | 11.58 | | 29.61 | | 118,530 | | 1.07(1) | | 1.08 | | 1.31 | 105 |
| 2020 | | 10.25 | 0.15 | (0.67) | | (0.52) | (0.15) | (0.07) | (0.22) | 9.51 | | (4.79) | | 81,053 | | 1.13(1) | | 1.14 | | 1.68 | 141 |
| 2019 | | 8.87 | 0.19 | 1.95 | | 2.14 | (0.58) | (0.18) | (0.76) | 10.25 | | 24.42 | | 104,312 | | 1.09(1) | | 1.10 | | 1.87 | 118 |
| | | | | | | | | | | | | | | | | | | | | | |
| # | Calculated using the average shares outstanding method. |
| (1) | The ratio for the Global Real Estate Securities Fund includes the effect of fees paid indirectly which decreased the ratio by 0.01% for the years 2019, 2020, 2021, 2022 and 2023. |
See Notes to Financial Statements.
Strategic Alternatives Fund (Unaudited)
The Fund combines multiple strategies that, in aggregate, seek to provide absolute returns with both lower volatility than and low correlation to traditional equity and fixed income markets. The Investor Class of the Fund outperformed its benchmark, the Bloomberg 1-3 Month US Treasury Bill Index, for the one-year period ended December 31, 2023 (5.59% (net of fees) versus 5.14%).
During the year, the Fund allocated its assets among four principal investment strategies – long-short equity, currency trading, relative value and global macro. For 2023, all strategies outperformed the Fund’s benchmark index. Long-short equity and currency trading contributed positively to the performance of the Fund when almost all asset classes, including short-term bonds, posted negative returns. The most additive investment strategy to the Fund’s performance during the year was the global macro strategy. The strategy was very bullish on emerging markets debt, which outperformed in 2023, when many emerging markets economies entered rate cutting cycles.
The derivative exposure contributed 4.37% to Fund performance for the year. The main contributors were single name equity swaps and interest rate futures.
This Fund may be suitable for investors who have a short- to medium-term investment horizon, can accept short-term fluctuations in account value and would like to diversify their portfolio with an alternatives investment option. The alternative investment strategies that the Fund pursues are complex and may involve greater risk than traditional investments (stocks, bonds and cash). The performance of alternative investments is not expected to correlate closely with more traditional investments; however, it is possible that alternative investments will decline in value along with equity or fixed income markets, or both, or that they may not otherwise perform in accordance with expectations. Alternative investments can be highly volatile, are often less liquid, particularly in periods of stress, are generally more complex and less transparent and may have more complicated tax profiles than traditional investments. In addition, the performance of alternative investments may be more dependent on a sub-adviser’s experience and skill than traditional investments. The use of alternative investments may not achieve the desired effect. Securities of foreign issuers may be negatively impacted by political events, economic conditions or inefficient, illiquid or unregulated markets in foreign countries, and they also may be subject to inadequate regulatory or accounting standards, which may increase investment risk. Derivatives involve different risks from, and in some respects greater risks than, those associated with investing directly in securities, currencies or other instruments. Derivatives may be illiquid or less liquid, volatile, difficult to price and leveraged, so that small changes in the value of the underlying instruments may produce disproportionate losses to the Fund. Short sales involve selling a security the Fund does not own in anticipation that the security will decline in price. Short sales expose the Fund to the risk that it will be required to buy the security sold short (also known as “covering” the short position) at a time when the security has appreciated in value, thus resulting in a loss to the Fund. The Fund’s potential loss on a short position is limited only by the maximum attainable price of the security less the price at which the security was sold by the Fund. Therefore, in theory, stocks sold short have unlimited risk. The Fund’s use of short sales in effect “leverages” the Fund. The use of leverage may magnify the Fund’s gains or losses, and leverage also creates interest expense that may lower the Fund’s overall returns. The Fund’s currency investment strategy may be impacted by currency exchange rates, which can fluctuate significantly over short or extended periods of time. These changes may be caused by governmental or political factors that affect the value of what the Fund owns and its share price. It is possible to lose money by investing in the Fund.
See Notes to Financial Statements.
Strategic Alternatives Fund (Unaudited)
At December 31, 2023, the portfolio holdings of the Fund, as a percentage of net assets, is shown in the following table. Portfolio holdings are subject to risk and may change at any time.
| | % |
| U.S. Treasury Obligations | 40.7 |
| Money Market Funds | 33.8 |
| Corporate Bonds | 18.6 |
| Mortgage-Backed Securities | 3.2 |
| Financials | 1.6 |
| Information Technology | 1.5 |
| Materials | 1.5 |
| Consumer Discretionary | 1.3 |
| Consumer Staples | 0.9 |
| Industrials | 0.3 |
| Purchased Options | 0.3 |
| Real Estate | 0.1 |
| Foreign Bond | 0.1 |
| Mutual Funds | 0.1 |
| Communication Services | —** |
| Rights Sold Short | — |
| Foreign Common Stocks Sold Short | (0.1) |
| Written Options | (0.4) |
| TBA Sale Commitments | (0.8) |
| Common Stocks Sold Short | (4.5) |
| | 98.2 |
| **Rounds to less than 0.05% | |
| Average Annual Total Returns as of 12/31/23 | |
| | | Institutional Class* | | Investor Class* | | Benchmark** | |
| One Year | | 5.97% | | 5.59%*** | | 5.14% | |
| Five Year | | 2.98% | | 2.66% | | 1.87% | |
| Ten Year | | N/A | | N/A | | N/A | |
| Since Inception | | 2.53% | | 2.21% | | 1.80% | |
| Inception Date | | 06/30/17 | | 06/30/17 | | | |
| Total Fund Operating Expenses (May 1, 2023 Prospectus)(1)# | | 1.27% | | 1.59% | | | |
| (1) | Current information regarding the Fund’s Operating Expenses can be found in the Financial Highlights. |
#Net expense ratio
The performance data quoted represents past performance and does not guarantee future results. The performance data in the table and graph does not reflect the deduction of taxes that a shareholder would pay on Fund distributions or the redemption of Fund shares. Current performance may be lower or higher. Performance data current to the most recent month-end may be obtained at GuideStoneFunds.com. The investment return and principal value of an investment will fluctuate so that shares, when redeemed, may be worth more or less than their original cost.
The Adviser has agreed to waive fees and/or reimburse expenses to the extent needed to limit total annual operating expenses (before expense payments by broker-dealers and excluding interest, taxes, brokerage commissions, extraordinary expenses, acquired fund fees and expenses and expenses incurred in connection with the short sales of securities) to 1.12% for the Institutional Class and 1.44% for the Investor Class. This contractual waiver and reimbursement applies to Fund operating expenses only and will remain in place until April 30, 2024.
See Notes to Financial Statements.
Strategic Alternatives Fund (Unaudited)
The graph illustrates the results of a hypothetical $10,000 investment in the Investor Class of the Fund since June 30, 2017 (commencement of operations), with all dividends and capital gains reinvested, with the Bloomberg 1-3 Month US Treasury Bill Index.
*These returns reflect investment advisory and shareholder servicing fee waivers, if applicable, during the reported time periods.
***Total returns may differ from the financial highlights due to adjustments required by U.S. GAAP.
Unlike a mutual fund, an index is not available for direct investment and the performance of an index assumes no taxes, transaction costs, management fees or other expenses.
See Notes to Financial Statements.
STRATEGIC ALTERNATIVES FUND
| | | Par | | Value |
| CORPORATE BONDS — 18.6% |
| 8x8, Inc. | | | |
| 0.50%, 02/01/24‡‡ CONV | $563,000 | | $557,327 |
| Affirm Holdings, Inc. | | | |
| 0.00%, 11/15/26 CONV » | 659,000 | | 542,028 |
| Air Transport Services Group, Inc. | | | |
| 3.88%, 08/15/29 144A ‡‡ CONV | 833,000 | | 743,452 |
| Airbnb, Inc. | | | |
| 0.00%, 03/15/26‡‡ CONV » | 303,000 | | 272,882 |
| Alteryx, Inc. | | | |
| 0.50%, 08/01/24 CONV | 266,000 | | 259,516 |
| American Airlines Group, Inc. | | | |
| 6.50%, 07/01/25‡‡ CONV | 670,000 | | 745,375 |
| Beauty Health Co. (The) | | | |
| 1.25%, 10/01/26 144A ‡‡ CONV | 786,000 | | 589,028 |
| Bentley Systems, Inc. | | | |
| 0.38%, 07/01/27‡‡ CONV | 611,000 | | 549,595 |
| BILL Holdings, Inc. | | | |
| 0.00%, 12/01/25‡‡ CONV » | 243,000 | | 229,149 |
| Block, Inc. | | | |
| 0.25%, 11/01/27‡‡ CONV | 449,000 | | 370,986 |
| Bridgebio Pharma, Inc. | | | |
| 2.25%, 02/01/29‡‡ CONV | 459,000 | | 391,022 |
| Cable One, Inc. | | | |
| 1.13%, 03/15/28‡‡ CONV | 761,000 | | 580,262 |
| CenterPoint Energy, Inc. | | | |
| 4.25%, 08/15/26 144A ‡‡ CONV | 176,000 | | 177,672 |
| Ceridian HCM Holding, Inc. | | | |
| 0.25%, 03/15/26 CONV | 767,000 | | 692,217 |
| Cheesecake Factory, Inc. (The) | | | |
| 0.38%, 06/15/26‡‡ CONV | 735,000 | | 637,612 |
| Chegg, Inc. | | | |
| 0.13%, 03/15/25 CONV | 599,000 | | 554,375 |
| Coherus Biosciences, Inc. | | | |
| 1.50%, 04/15/26‡‡ CONV | 280,000 | | 158,814 |
| Collegium Pharmaceutical, Inc. | | | |
| 2.88%, 02/15/29 144A ‡‡ CONV | 677,000 | | 714,235 |
| CONMED Corporation | | | |
| 2.25%, 06/15/27‡‡ CONV | 646,000 | | 648,842 |
| CryoPort, Inc. | | | |
| 0.75%, 12/01/26 144A ‡‡ CONV | 611,000 | | 487,273 |
| CSG Systems International, Inc. | | | |
| 3.88%, 09/15/28 144A ‡‡ CONV | 198,000 | | 199,861 |
| Duke Energy Corporation | | | |
| 4.13%, 04/15/26 144A ‡‡ CONV | 530,000 | | 532,650 |
| Enovis Corporation | | | |
| 3.88%, 10/15/28 144A ‡‡ CONV | 362,000 | | 435,305 |
| Envestnet, Inc. | | | |
| 2.63%, 12/01/27 CONV | 722,000 | | 715,682 |
| Evolent Health, Inc. | | | |
| 3.50%, 12/01/29 144A ‡‡ CONV | 411,000 | | 481,281 |
| EZCORP, Inc. | | | |
| 2.38%, 05/01/25 CONV | 362,000 | | 339,592 |
| 3.75%, 12/15/29 144A ‡‡ CONV | 229,000 | | 232,321 |
| Greenbrier Cos., Inc. (The) | | | |
| 2.88%, 02/01/24 CONV | 238,000 | | 236,810 |
| 2.88%, 04/15/28‡‡ CONV | 482,000 | | 475,252 |
| | | Par | | Value |
| Haemonetics Corporation | | | |
| 0.00%, 03/01/26‡‡ CONV » | $ 755,000 | | $ 675,725 |
| Halozyme Therapeutics, Inc. | | | |
| 0.25%, 03/01/27‡‡ CONV | 582,000 | | 505,991 |
| HAT Holdings I LLC REIT | | | |
| 0.00%, 05/01/25 144A ‡‡ CONV » | 591,000 | | 597,678 |
| Helix Energy Solutions Group, Inc. | | | |
| 6.75%, 02/15/26‡‡ CONV | 250,000 | | 403,125 |
| Herbalife, Ltd. | | | |
| 2.63%, 03/15/24 CONV | 644,000 | | 636,916 |
| i3 Verticals LLC | | | |
| 1.00%, 02/15/25‡‡ CONV | 433,000 | | 406,208 |
| Insmed, Inc. | | | |
| 0.75%, 06/01/28‡‡ CONV | 358,000 | | 410,626 |
| Integer Holdings Corporation | | | |
| 2.13%, 02/15/28 144A ‡‡ CONV | 474,000 | | 607,194 |
| Itron, Inc. | | | |
| 0.00%, 03/15/26‡‡ CONV » | 577,000 | | 534,071 |
| Jamf Holding Corporation | | | |
| 0.13%, 09/01/26‡‡ CONV | 690,000 | | 591,675 |
| Jazz Investments I, Ltd. | | | |
| 1.50%, 08/15/24‡‡ CONV | 545,000 | | 531,239 |
| Kaman Corporation | | | |
| 3.25%, 05/01/24‡‡ CONV | 490,000 | | 477,750 |
| LendingTree, Inc. | | | |
| 0.50%, 07/15/25‡‡ CONV | 918,000 | | 766,530 |
| Liberty Latin America, Ltd. | | | |
| 2.00%, 07/15/24 CONV | 208,000 | | 200,720 |
| Liberty Media Corporation | | | |
| 3.75%, 03/15/28 144A ‡‡ CONV | 902,000 | | 1,081,047 |
| Liberty TripAdvisor Holdings, Inc. | | | |
| 0.50%, 06/30/51 144A ‡‡ CONV | 1,143,000 | | 1,004,468 |
| Live Nation Entertainment, Inc. | | | |
| 3.13%, 01/15/29 144A ‡‡ CONV | 600,000 | | 682,860 |
| Lumentum Holdings, Inc. | | | |
| 0.50%, 12/15/26‡‡ CONV | 657,000 | | 588,672 |
| Marcus Corporation (The) | | | |
| 5.00%, 09/15/25 CONV | 125,000 | | 184,625 |
| Marriott Vacations Worldwide Corporation | | | |
| 3.25%, 12/15/27 CONV | 613,000 | | 545,264 |
| Mesa Laboratories, Inc. | | | |
| 1.38%, 08/15/25‡‡ CONV | 234,000 | | 216,005 |
| MFA Financial, Inc. | | | |
| 6.25%, 06/15/24‡‡ CONV | 1,690,000 | | 1,698,447 |
| MicroStrategy, Inc. | | | |
| 0.00%, 02/15/27‡‡ CONV » | 459,000 | | 401,350 |
| Mirum Pharmaceuticals, Inc. | | | |
| 4.00%, 05/01/29 144A ‡‡ CONV | 405,000 | | 494,100 |
| Mitek Systems, Inc. | | | |
| 0.75%, 02/01/26 CONV | 563,000 | | 527,813 |
| NextEra Energy Partners LP | | | |
| 0.00%, 06/15/24 144A CONV » | 583,000 | | 565,218 |
| NRG Energy, Inc. | | | |
| 2.75%, 06/01/48‡‡ CONV | 583,000 | | 752,070 |
See Notes to Financial Statements.
| | | Par | | Value |
| Pebblebrook Hotel Trust REIT | | | |
| 1.75%, 12/15/26‡‡ CONV | $ 941,000 | | $ 842,760 |
| PennyMac Corporation | | | |
| 5.50%, 11/01/24‡‡ CONV | 1,042,000 | | 1,017,252 |
| 5.50%, 03/15/26 CONV | 548,000 | | 507,612 |
| Perficient, Inc. | | | |
| 0.13%, 11/15/26‡‡ CONV | 749,000 | | 623,992 |
| PG&E Corporation | | | |
| 4.25%, 12/01/27 144A ‡‡ CONV | 592,000 | | 623,376 |
| Q2 Holdings, Inc. | | | |
| 0.75%, 06/01/26‡‡ CONV | 203,000 | | 185,501 |
| Realogy Group LLC | | | |
| 0.25%, 06/15/26‡‡ CONV | 362,000 | | 285,546 |
| Redwood Trust, Inc. | | | |
| 5.63%, 07/15/24‡‡ CONV | 573,000 | | 567,269 |
| Repay Holdings Corporation | | | |
| 0.00%, 02/01/26 144A CONV » | 240,000 | | 205,200 |
| Revance Therapeutics, Inc. | | | |
| 1.75%, 02/15/27‡‡ CONV | 562,000 | | 429,579 |
| Rivian Automotive, Inc. | | | |
| 4.63%, 03/15/29 144A ‡‡ CONV | 261,000 | | 367,749 |
| RWT Holdings, Inc. | | | |
| 5.75%, 10/01/25‡‡ CONV | 815,000 | | 765,591 |
| Snap, Inc. | | | |
| 0.00%, 05/01/27 CONV » | 716,000 | | 575,521 |
| SoFi Technologies, Inc. | | | |
| 0.00%, 10/15/26 144A ‡‡ CONV » | 972,000 | | 822,798 |
| Sphere Entertainment Co. | | | |
| 3.50%, 12/01/28 144A CONV | 333,000 | | 385,248 |
| Spirit Airlines, Inc. | | | |
| 1.00%, 05/15/26‡‡ CONV | 387,000 | | 270,126 |
| Splunk, Inc. | | | |
| 1.13%, 06/15/27‡‡ CONV | 486,000 | | 473,121 |
| Summit Hotel Properties, Inc. REIT | | | |
| 1.50%, 02/15/26‡‡ CONV | 794,000 | | 707,851 |
| Sunnova Energy International, Inc. | | | |
| 0.25%, 12/01/26 CONV | 685,000 | | 467,513 |
| 2.63%, 02/15/28 CONV | 321,000 | | 214,107 |
| Two Harbors Investment Corporation | | | |
| 6.25%, 01/15/26‡‡ CONV | 927,000 | | 857,475 |
| Uniti Fiber Holdings, Inc. REIT | | | |
| 4.00%, 06/15/24 144A CONV | 637,000 | | 635,533 |
| Upstart Holdings, Inc. | | | |
| 0.25%, 08/15/26 CONV | 906,000 | | 667,088 |
| Upwork, Inc. | | | |
| 0.25%, 08/15/26‡‡ CONV | 525,000 | | 447,878 |
| Verint Systems, Inc. | | | |
| 0.25%, 04/15/26 CONV | 678,000 | | 598,759 |
| Viavi Solutions, Inc. | | | |
| 1.00%, 03/01/24 CONV | 371,000 | | 364,044 |
| Wayfair, Inc. | | | |
| 1.00%, 08/15/26‡‡ CONV | 571,000 | | 501,338 |
| Western Digital Corporation | | | |
| 3.00%, 11/15/28 144A ‡‡ CONV | 559,000 | | 685,054 |
| WisdomTree, Inc. | | | |
| 5.75%, 08/15/28 144A ‡‡ CONV | 580,000 | | 600,880 |
| | | Par | | Value |
| Xometry, Inc. | | | |
| 1.00%, 02/01/27 CONV | $ 229,000 | | $ 216,290 |
| Ziff Davis, Inc. | | | |
| 1.75%, 11/01/26 CONV | 474,000 | | 450,300 |
Total Corporate Bonds
(Cost $45,700,426) | | | 46,000,154 |
| FOREIGN BOND — 0.1% |
| Canada — 0.1% | | |
| Equinox Gold Corporation | | | |
4.75%, 10/15/28(C) 144A ‡‡ CONV
(Cost $315,089) | 316,000 | | 333,980 |
| MORTGAGE-BACKED SECURITIES — 3.2% |
| Federal Home Loan Mortgage Corporation | | | |
| 6.00%, 01/01/53 | 918,285 | | 935,409 |
| Federal Home Loan Mortgage Corporation REMIC, Series 4248 | | | |
| (Floating, 5.89% - U.S. 30-Day Average SOFR, 6.00% Cap), 0.55%, 09/15/43† IO | 202,428 | | 20,427 |
| Federal Home Loan Mortgage Corporation REMIC, Series 4468 | | | |
| (Floating, 5.99% - U.S. 30-Day Average SOFR, 6.10% Cap), 0.65%, 05/15/45† IO | 202,701 | | 19,219 |
| Federal National Mortgage Association | | | |
| 6.50%, 09/01/53 | 1,970,053 | | 2,028,959 |
| Federal National Mortgage Association REMIC, Series 2017-31 | | | |
| (Floating, 5.99% - U.S. 30-Day Average SOFR, 6.10% Cap), 0.65%, 05/25/47† IO | 287,959 | | 37,262 |
| Federal National Mortgage Association REMIC, Series 2018-17 | | | |
| (Floating, 3.34% - U.S. 30-Day Average SOFR, 2.50% Cap), 0.00%, 03/25/48† IO | 1,540,228 | | 30,250 |
| Federal National Mortgage Association REMIC, Series 2018-8 | | | |
| (Floating, 6.04% - U.S. 30-Day Average SOFR, 6.15% Cap), 0.70%, 02/25/48† IO | 164,601 | | 20,427 |
| Federal National Mortgage Association STRIP, Series 405 | | | |
| (Floating, 4.94% - U.S. 30-Day Average SOFR, 5.05% Cap), 0.00%, 10/25/40† IO | 503,233 | | 39,336 |
| Government National Mortgage Association | | | |
| 4.00%, 05/20/48 | 936,834 | | 905,586 |
| 2.50%, 09/20/51 | 151,849 | | 130,713 |
| 2.50%, 11/20/51 | 564,341 | | 488,921 |
| 2.50%, 12/20/51 | 322,008 | | 278,982 |
See Notes to Financial Statements.
STRATEGIC ALTERNATIVES FUND
SCHEDULE OF INVESTMENTS (Continued)
| | | Par | | Value |
| Government National Mortgage Association, Series 2015-110 | | | |
| (Floating, 5.59% - CME Term SOFR 1M, 5.70% Cap), 0.23%, 08/20/45† IO | $113,930 | | $13,140 |
| Government National Mortgage Association, Series 2018-124 | | | |
| (Floating, 6.09% - CME Term SOFR 1M, 6.20% Cap), 0.73%, 09/20/48† IO | 336,669 | | 40,619 |
| Government National Mortgage Association, Series 2018-139 | | | |
| (Floating, 6.04% - CME Term SOFR 1M, 6.15% Cap), 0.68%, 10/20/48† IO | 129,870 | | 14,573 |
| Government National Mortgage Association, Series 2018-7 | | | |
| (Floating, 5.59% - CME Term SOFR 1M, 5.70% Cap), 0.23%, 01/20/48† IO | 817,192 | | 77,163 |
| Government National Mortgage Association, Series 2019-1 | | | |
| (Floating, 5.94% - CME Term SOFR 1M, 6.05% Cap), 0.58%, 01/20/49† IO | 148,188 | | 15,208 |
| Government National Mortgage Association, Series 2019-110 | | | |
| 0.63%, 09/20/49† IO | 562,324 | | 56,527 |
| Government National Mortgage Association, Series 2019-111 | | | |
| (Floating, 6.04% - CME Term SOFR 1M, 6.15% Cap), 0.68%, 01/20/49† IO | 430,510 | | 48,025 |
| Government National Mortgage Association, Series 2019-151 | | | |
| 3.50%, 10/20/49 IO | 631,093 | | 97,886 |
| 3.50%, 12/20/49 IO | 367,543 | | 58,581 |
| Government National Mortgage Association, Series 2019-20 | | | |
| (Floating, 3.68% - CME Term SOFR 1M, 3.79% Cap), 0.00%, 02/20/49† IO | 333,647 | | 9,732 |
| Government National Mortgage Association, Series 2019-6 | | | |
| (Floating, 5.94% - CME Term SOFR 1M, 6.05% Cap), 0.58%, 01/20/49† IO | 125,275 | | 12,861 |
| Government National Mortgage Association, Series 2020-146 | | | |
| 2.50%, 10/20/50 IO | 295,998 | | 39,069 |
| Government National Mortgage Association, Series 2020-21 | | | |
| (Floating, 5.94% - CME Term SOFR 1M, 6.05% Cap), 0.58%, 02/20/50† IO | 292,926 | | 35,181 |
| | | Par | | Value |
| Government National Mortgage Association, Series 2020-55 | | | |
| (Floating, 5.94% - CME Term SOFR 1M, 6.05% Cap), 0.58%, 04/20/50† IO | $ 478,957 | | $ 58,723 |
| 3.50%, 04/20/50 IO | 270,115 | | 46,734 |
| Government National Mortgage Association, Series 2020-61 | | | |
| (Floating, 6.33% - CME Term SOFR 1M, 6.44% Cap), 0.97%, 07/20/43† IO | 449,329 | | 48,299 |
| (Floating, 5.94% - CME Term SOFR 1M, 6.05% Cap), 0.58%, 08/20/49† IO | 631,158 | | 67,862 |
| Government National Mortgage Association, Series 2020-78 | | | |
| 4.00%, 06/20/50 IO | 502,493 | | 96,789 |
| Government National Mortgage Association, Series 2020-79 | | | |
| 4.00%, 06/20/50 IO | 133,146 | | 24,087 |
| Uniform Mortgage Backed Securities | | | |
| 7.00%, 02/01/54 TBA | 2,000,000 | | 2,061,250 |
Total Mortgage-Backed Securities
(Cost $8,303,380) | | | 7,857,800 |
| | Number of
Contracts | | Notional
Amount | |
| PURCHASED OPTIONS — 0.3% |
| Call Swaptions — 0.3% |
Pay 3-Month EURIBOR (Quarterly); Receive 3.425% (Annually); Interest Rate Swap Maturing 03/15/2025 EUR, Strike Price
$3.43, Expires
03/13/24 (MSCS) | 1 | | $31,120,000 | 153,137 |
Pay 3-Month EURIBOR (Quarterly); Receive 3.8% (Annually); Interest Rate Swap Maturing 03/15/2025 EUR, Strike Price
$3.80, Expires
03/13/24 (MSCS) | 1 | | 62,240,000 | 537,291 |
| | | | | 690,428 |
See Notes to Financial Statements.
| | Number of
Contracts | | Notional
Amount | | Value |
| Put Swaptions — 0.0% |
Pay 3.7% (Annually); Receive 3-Month EURIBOR (Quarterly); Interest Rate Swap Maturing 02/07/2025 EUR, Strike Price
$3.70, Expires
02/05/24 (CITI) | 1 | | $15,120,000 | | $ 681 |
Pay 3.75% (Annually); Receive 3-Month EURIBOR (Quarterly); Interest Rate Swap Maturing 02/07/2025 EUR, Strike Price
$3.75, Expires
02/05/24 (CITI) | 1 | | 15,120,000 | | 476 |
Pay 4% (Annually); Receive 3-Month EURIBOR (Quarterly); Interest Rate Swap Maturing 02/07/2025 EUR, Strike Price
$4.00, Expires
02/05/24 (CITI) | 1 | | 15,120,000 | | 83 |
Pay 4.05% (Annually); Receive 3-Month EURIBOR (Quarterly); Interest Rate Swap Maturing 02/07/2025 EUR, Strike Price
$4.05, Expires
02/05/24 (CITI) | 1 | | 15,120,000 | | 60 |
| | | | | | 1,300 |
Total Purchased Options
(Premiums paid $89,429) | | | | 691,728 |
| | | Par | |
| U.S. TREASURY OBLIGATIONS — 40.7% |
| U.S. Treasury Bills | | | |
| 5.27%, 01/04/24Ω | $ 750,000 | 749,782 |
| 5.21%, 01/11/24Ω | 17,525,000 | 17,502,122 |
| 5.25%, 01/25/24Ω | 8,650,000 | 8,620,888 |
| 5.12%, 02/01/24Ω | 4,900,000 | 4,878,488 |
| 5.22%, 02/08/24Ω | 5,625,000 | 5,594,565 |
| 5.18%, 02/15/24Ω | 4,300,000 | 4,272,482 |
| 5.25%, 02/22/24Ω | 5,350,000 | 5,310,267 |
| 5.14%, 02/27/24Ω | 4,900,000 | 4,859,775 |
| 5.11%, 02/29/24Ω | 5,640,000 | 5,592,211 |
| 5.18%, 03/07/24Ω | 6,500,000 | 6,438,958 |
| 5.15%, 03/14/24Ω | 2,300,000 | 2,276,156 |
| 5.16%, 03/21/24Ω | 4,300,000 | 4,251,057 |
| 5.29%, 04/25/24Ω | 5,350,000 | 5,262,437 |
| | | | 75,609,188 |
| | | Par | | Value |
| U.S. Treasury Bonds | | | | |
| 4.75%, 11/15/43 | $1,860,000 | | $ 2,002,697 |
| U.S. Treasury Inflationary Indexed Bonds | | | | |
| 1.50%, 02/15/53 | 3,467,384 | | 3,175,262 |
| U.S. Treasury Notes | | | | |
| 3.75%, 12/31/28 | 9,880,000 | | 9,845,266 |
| 3.75%, 12/31/30 | 9,910,000 | | 9,842,643 |
| | | | | 19,687,909 |
Total U.S. Treasury Obligations
(Cost $100,053,101) | | | 100,475,056 |
| | | Shares | |
| COMMON STOCKS — 6.3% |
| Communication Services — 0.0% | |
| Escrow NII Holdings, Inc.††† * | 76,167 | 19,804 |
| Consumer Discretionary — 1.3% | |
| AutoZone, Inc.* | 80 | 206,849 |
| Best Buy Co., Inc. | 3,241 | 253,705 |
| Chewy, Inc. Class A* | 6,641 | 156,927 |
| Dick's Sporting Goods, Inc. | 3,015 | 443,054 |
| eBay, Inc. | 6,519 | 284,359 |
| Etsy, Inc. | 1,301 | 105,446 |
| Genuine Parts Co. | 1,358 | 188,083 |
| Lowe’s Cos., Inc. | 1,202 | 267,505 |
| Macy’s, Inc. | 2,534 | 50,984 |
| MercadoLibre, Inc.* | 10 | 15,715 |
| Murphy U.S.A., Inc. | 485 | 172,932 |
| O’Reilly Automotive, Inc.* | 295 | 280,274 |
| Penske Automotive Group, Inc. | 748 | 120,061 |
| Ross Stores, Inc. | 113 | 15,638 |
| TJX Cos., Inc. (The) | 991 | 92,966 |
| Tractor Supply Co. | 618 | 132,888 |
| Ulta Beauty, Inc.* | 302 | 147,977 |
| Victoria's Secret & Co. | 457 | 12,129 |
| Williams-Sonoma, Inc. | 1,196 | 241,329 |
| Worthington Enterprises, Inc. | 1,323 | 76,139 |
| | | | 3,264,960 |
| Consumer Staples — 0.9% | |
| Casey’s General Stores, Inc. | 654 | 179,680 |
| Church & Dwight Co., Inc. | 1,011 | 95,600 |
| Clorox Co. (The) | 496 | 70,725 |
| Colgate-Palmolive Co. | 5,010 | 399,347 |
| Costco Wholesale Corporation | 123 | 81,190 |
| Kimberly-Clark Corporation | 1,460 | 177,405 |
| Kroger Co. (The) | 5,958 | 272,340 |
| Sysco Corporation | 3,388 | 247,764 |
| Target Corporation | 221 | 31,475 |
| U.S. Foods Holding Corporation* | 2,808 | 127,511 |
| Walmart, Inc. | 3,820 | 602,223 |
| | | | 2,285,260 |
| Financials — 1.3% | |
| Aflac, Inc. | 1,332 | 109,890 |
See Notes to Financial Statements.
STRATEGIC ALTERNATIVES FUND
SCHEDULE OF INVESTMENTS (Continued)
| | | Shares | | Value |
| American Financial Group, Inc. | 1,262 | | $ 150,039 |
| American International Group, Inc. | 452 | | 30,623 |
| Arch Capital Group, Ltd.* | 1,552 | | 115,267 |
| Axis Capital Holdings, Ltd. | 669 | | 37,043 |
| Cincinnati Financial Corporation | 1,879 | | 194,401 |
| CNO Financial Group, Inc. | 3,299 | | 92,042 |
| Erie Indemnity Co. Class A | 465 | | 155,738 |
| Fidelity National Financial, Inc. | 1,388 | | 70,816 |
| Hartford Financial Services Group, Inc. (The) | 2,129 | | 171,129 |
| Loews Corporation | 2,038 | | 141,824 |
| Markel Corporation* | 13 | | 18,459 |
| Marsh & McLennan Cos., Inc. | 2,082 | | 394,477 |
| Old Republic International Corporation | 6,091 | | 179,075 |
| Primerica, Inc. | 1,202 | | 247,323 |
| Reinsurance Group of America, Inc. | 679 | | 109,849 |
| RLI Corporation | 1,799 | | 239,483 |
| Selective Insurance Group, Inc. | 231 | | 22,980 |
| Travelers Cos., Inc. (The) | 655 | | 124,771 |
| Unum Group | 3,875 | | 175,227 |
| W.R. Berkley Corporation | 4,478 | | 316,684 |
| | | | | 3,097,140 |
| Information Technology — 1.3% | | |
| Amphenol Corporation Class A | 1,020 | | 101,113 |
| Apple, Inc. | 4,303 | | 828,457 |
| Arista Networks, Inc.* | 444 | | 104,566 |
| Arrow Electronics, Inc.* | 619 | | 75,673 |
| Avnet, Inc. | 2,257 | | 113,753 |
| Belden, Inc. | 2,123 | | 164,002 |
| Calix, Inc. | 1,502 | | 65,622 |
| Cisco Systems, Inc. | 11,350 | | 573,402 |
| Cognex Corporation | 745 | | 31,096 |
| Dell Technologies, Inc. Class C | 840 | | 64,260 |
| F5, Inc.* | 1,090 | | 195,088 |
| Juniper Networks, Inc. | 2,045 | | 60,287 |
| Keysight Technologies, Inc.* | 2,515 | | 400,111 |
| NetApp, Inc. | 2,352 | | 207,352 |
| Pure Storage, Inc. Class A* | 4,429 | | 157,938 |
| TD SYNNEX Corporation | 664 | | 71,453 |
| Vishay Intertechnology, Inc. | 1,349 | | 32,336 |
| | | | | 3,246,509 |
| Materials — 1.4% | | |
| Albemarle Corporation | 261 | | 37,710 |
| AptarGroup, Inc. | 876 | | 108,291 |
| Berry Global Group, Inc. | 2,260 | | 152,302 |
| Cabot Corporation | 2,284 | | 190,714 |
| Commercial Metals Co. | 1,574 | | 78,763 |
| DuPont de Nemours, Inc. | 243 | | 18,694 |
| Eastman Chemical Co. | 962 | | 86,407 |
| Element Solutions, Inc. | 7,581 | | 175,424 |
| FMC Corporation‡‡ | 527 | | 33,227 |
| Graphic Packaging Holding Co. | 3,392 | | 83,613 |
| Greif, Inc. Class A | 363 | | 23,809 |
| Martin Marietta Materials, Inc. | 109 | | 54,381 |
| Mosaic Co. (The) | 14,223 | | 508,188 |
| | | Shares | | Value |
| NewMarket Corporation | 411 | | $ 224,336 |
| Reliance Steel & Aluminum Co. | 712 | | 199,132 |
| Royal Gold, Inc. | 2,118 | | 256,193 |
| RPM International, Inc. | 1,210 | | 135,072 |
| Sherwin-Williams Co. (The) | 797 | | 248,584 |
| Steel Dynamics, Inc. | 3,405 | | 402,131 |
| Westlake Corporation | 2,982 | | 417,361 |
| | | | | 3,434,332 |
| Real Estate — 0.1% | | |
| Howard Hughes Holdings, Inc.* | 826 | | 70,664 |
| Jones Lang LaSalle, Inc.* | 302 | | 57,039 |
| | | | | 127,703 |
Total Common Stocks
(Cost $13,326,915) | | | 15,475,708 |
| FOREIGN COMMON STOCKS — 0.3% |
| Bermuda — 0.0% | | |
| RenaissanceRe Holdings, Ltd. | 58 | | 11,368 |
| Ireland — 0.1% | | |
| Aon PLC Class A | 264 | | 76,830 |
| Willis Towers Watson PLC | 121 | | 29,185 |
| | | | | 106,015 |
| Jersey — 0.0% | | |
| Amcor PLC | 3,205 | | 30,896 |
| Netherlands — 0.1% | | |
| LyondellBasell Industries NV Class A | 2,062 | | 196,055 |
| Switzerland — 0.1% | | |
| Chubb, Ltd. | 489 | | 110,514 |
| TE Connectivity, Ltd. | 1,566 | | 220,023 |
| | | | | 330,537 |
Total Foreign Common Stocks
(Cost $614,635) | | | 674,871 |
| PREFERRED STOCKS — 0.7% |
| Apollo Global Management, Inc. | | | |
| 6.75%, 10/15/23 CONV | 4,976 | | 280,597 |
| Chart Industries, Inc. | | | |
| 6.75%, 12/15/25 CONV | 12,583 | | 699,363 |
| Lyondellbasell Advanced Polymers, Inc. | | | |
| 6.00% CONV | 12 | | 10,140 |
| NCR Voyix Corporation | | | |
| PIK, 5.50% CONV 1 | 250 | | 304,415 |
| New York Community Capital Trust V | | | |
| 6.00% CONV | 10,163 | | 421,866 |
Total Preferred Stocks
(Cost $1,788,080) | | | 1,716,381 |
| MUTUAL FUNDS — 0.1% |
ProShares Short 20+ Year Treasury
(Cost $191,704) | 9,591 | | 212,057 |
| MONEY MARKET FUNDS — 33.8% |
| Northern Institutional U.S. Government Portfolio (Shares), 5.17%Ø | 376 | | 376 |
See Notes to Financial Statements.
| | | Shares | | Value |
GuideStone Money Market Fund, 5.28%
(Institutional Class)Ø ∞ | 8,338,250 | | $ 8,338,250 |
| Northern Institutional U.S. Treasury Portfolio (Premier), 5.22%Ø | 75,232,554 | | 75,232,554 |
Total Money Market Funds
(Cost $83,571,180) | | | 83,571,180 |
TOTAL INVESTMENTS —104.1%
(Cost $253,953,939) | | | 257,008,915 |
| COMMON STOCKS SOLD SHORT — (4.5)% |
| Communication Services — (0.6)% | | |
| Cable One, Inc. | (36) | | (20,037) |
| Liberty Media Corporation-Liberty SiriusXM Class A * | (22,897) | | (658,060) |
| Live Nation Entertainment, Inc. * | (3,959) | | (370,563) |
| Marcus Corporation (The) | (10,300) | | (150,174) |
| Snap, Inc. Class A * | (842) | | (14,255) |
| Sphere Entertainment Co. * | (7,615) | | (258,605) |
| TripAdvisor, Inc. * | (821) | | (17,676) |
| Ziff Davis, Inc. * | (1,927) | | (129,475) |
| | | | | (1,618,845) |
| Consumer Discretionary — (0.2)% | | |
| Airbnb, Inc. Class A * | (215) | | (29,270) |
| Cheesecake Factory, Inc. (The) | (1,901) | | (66,554) |
| Marriott Vacations Worldwide Corporation | (909) | | (77,165) |
| Rivian Automotive, Inc. Class A * | (11,014) | | (258,388) |
| Wayfair, Inc. Class A * | (1,455) | | (89,774) |
| | | | | (521,151) |
| Consumer Staples — (0.0)% | | |
| Beauty Health Co. (The) * | (2,396) | | (7,451) |
| Energy — (0.1)% | | |
| Helix Energy Solutions Group, Inc. * | (31,495) | | (323,769) |
| Financials — (0.4)% | | |
| Apollo Global Management, Inc. | (2,177) | | (202,875) |
| Block, Inc. * | (277) | | (21,426) |
| EZCORP, Inc. Class A * | (15,374) | | (134,369) |
| I3 Verticals, Inc. Class A * | (1,509) | | (31,945) |
| New York Community Bancorp, Inc. | (8,865) | | (90,689) |
| SoFi Technologies, Inc. * | (17,132) | | (170,463) |
| WisdomTree, Inc. | (36,443) | | (252,550) |
| | | | | (904,317) |
| Health Care — (1.1)% | | |
| Bridgebio Pharma, Inc. * | (2,481) | | (100,158) |
| Coherus Biosciences, Inc. * | (4,140) | | (13,786) |
| Collegium Pharmaceutical, Inc. * | (13,879) | | (427,196) |
| CONMED Corporation | (2,584) | | (282,974) |
| CryoPort, Inc. * | (461) | | (7,141) |
| Enovis Corporation * | (4,725) | | (264,694) |
| Evolent Health, Inc. Class A * | (8,217) | | (271,408) |
| Haemonetics Corporation * | (854) | | (73,026) |
| Halozyme Therapeutics, Inc. * | (3,026) | | (111,841) |
| Insmed, Inc. * | (8,582) | | (265,956) |
| | | Shares | | Value |
| Integer Holdings Corporation * | (4,334) | | $ (429,413) |
| Mesa Laboratories, Inc. | (59) | | (6,181) |
| Mirum Pharmaceuticals, Inc. * | (10,198) | | (301,045) |
| Revance Therapeutics, Inc. * | (6,070) | | (53,355) |
| | | | | (2,608,174) |
| Industrials — (0.7)% | | |
| Air Transport Services Group, Inc. * | (15,256) | | (268,658) |
| American Airlines Group, Inc. * | (19,832) | | (272,492) |
| Ceridian HCM Holding, Inc. * | (1,350) | | (90,612) |
| Chart Industries, Inc. * | (4,001) | | (545,456) |
| CSG Systems International, Inc. | (1,672) | | (88,967) |
| Greenbrier Cos., Inc. (The) | (5,206) | | (230,001) |
| Spirit Airlines, Inc. | (4,190) | | (68,674) |
| Upwork, Inc. * | (788) | | (11,718) |
| Xometry, Inc. Class A * | (1,832) | | (65,787) |
| | | | | (1,642,365) |
| Information Technology — (0.7)% | | |
| Bentley Systems, Inc. Class B | (2,922) | | (152,470) |
| BILL Holdings, Inc. * | (365) | | (29,780) |
| Envestnet, Inc. * | (5,034) | | (249,284) |
| Itron, Inc. * | (1,698) | | (128,216) |
| Jamf Holding Corporation * | (2,856) | | (51,579) |
| Lumentum Holdings, Inc. * | (2,312) | | (121,195) |
| MicroStrategy, Inc. * | (166) | | (104,849) |
| Mitek Systems, Inc. * | (10,269) | | (133,908) |
| NCR Voyix Corporation * | (8,225) | | (139,085) |
| Perficient, Inc. * | (839) | | (55,223) |
| Q2 Holdings, Inc. * | (650) | | (28,216) |
| Verint Systems, Inc. * | (2,001) | | (54,087) |
| Western Digital Corporation * | (7,826) | | (409,848) |
| | | | | (1,657,740) |
| Real Estate — (0.2)% | | |
| Anywhere Real Estate, Inc. * | (2,218) | | (17,988) |
| Pebblebrook Hotel Trust REIT | (17,536) | | (280,225) |
| Summit Hotel Properties, Inc. REIT | (23,188) | | (155,824) |
| | | | | (454,037) |
| Utilities — (0.5)% | | |
| CenterPoint Energy, Inc. | (1,426) | | (40,741) |
| Duke Energy Corporation | (1,341) | | (130,130) |
| NRG Energy, Inc. | (11,483) | | (593,671) |
| PG&E Corporation | (13,708) | | (247,155) |
| Sunnova Energy International, Inc. * | (18,255) | | (278,389) |
| | | | | (1,290,086) |
Total Common Stocks Sold Short
(Proceeds $(10,123,400)) | | | (11,027,935) |
| FOREIGN COMMON STOCKS SOLD SHORT — (0.1)% |
| Canada — (0.1)% | | |
| Equinox Gold Corporation * | (35,118) | | (171,727) |
See Notes to Financial Statements.
STRATEGIC ALTERNATIVES FUND
SCHEDULE OF INVESTMENTS (Continued)
| | | Shares | | Value |
| Ireland — (0.0)% | | |
| Jazz Pharmaceuticals PLC * | (46) | | $ (5,658) |
Total Foreign Common Stocks Sold Short
(Proceeds $(160,343)) | | | (177,385) |
| RIGHTS SOLD SHORT — 0.0% |
Ligand Pharmaceuticals, Inc. *
(Proceeds $—) | (58) | | — |
TOTAL SECURITIES SOLD SHORT —(4.6)%
(Proceeds $(10,283,743)) | | | (11,205,320) |
| | Number of
Contracts | | Notional
Amount | |
| WRITTEN OPTIONS — (0.5)% |
| Call Swaptions — (0.5)% |
Pay 3.65% (Annually); Receive 3-Month EURIBOR (Quarterly); Interest Rate Swap Maturing 03/15/2025 EUR, Strike Price
$3.65, Expires
03/13/24 (MSCS) | (1) | | $(93,360,000) | (662,418) |
Pay 3.72% (Annually); Receive 3-Month EURIBOR (Quarterly); Interest Rate Swap Maturing 03/18/2025 EUR, Strike Price
$3.72, Expires
03/14/24 (CITI) | (1) | | (26,300,000) | (234,838) |
Pay 3.744% (Annually); Receive 3-Month EURIBOR (Quarterly); Interest Rate Swap Maturing 03/18/2025 EUR, Strike Price
$3.74, Expires
03/14/24 (CITI) | (1) | | (26,300,000) | (241,376) |
| | | | | (1,138,632) |
| Put Swaptions — (0.0)% |
Pay 3-Month EURIBOR (Quarterly); Receive 3.72% (Annually); Interest Rate Swap Maturing 03/18/2025 EUR, Strike Price
$3.72, Expires
03/14/24 (CITI) | (1) | | (26,300,000) | (1,951) |
| | Number of
Contracts | | Notional
Amount | | Value |
Pay 3-Month EURIBOR (Quarterly); Receive 3.744% (Annually); Interest Rate Swap Maturing 03/18/2025 EUR, Strike Price
$3.74, Expires
03/14/24 (CITI) | (1) | | $(26,300,000) | | $ (1,777) |
Pay 3-Month EURIBOR (Quarterly); Receive 3.85% (Annually); Interest Rate Swap Maturing 02/07/2025 EUR, Strike Price
$3.85, Expires
02/05/24 (CITI) | (1) | | (30,240,000) | | (467) |
Pay 3-Month EURIBOR (Quarterly); Receive 3.9% (Annually); Interest Rate Swap Maturing 02/07/2025 EUR, Strike Price
$3.90, Expires
02/05/24 (CITI) | (1) | | (30,240,000) | | (331) |
| | | | | | (4,526) |
Total Written Options
(Premiums received $ (308,637)) | | | | (1,143,158) |
| | | Par | |
| TBA SALE COMMITMENTS — (0.8)% |
Uniform Mortgage Backed Securities
6.50%, 01/01/54 TBA | $(1,000,000) | (1,024,961) |
Uniform Mortgage Backed Securities
7.00%, 01/01/54 TBA | (1,000,000) | (1,031,641) |
Total TBA Sale Commitments
(Proceeds $(2,049,102)) | | (2,056,602) |
Other Assets in Excess of
Liabilities — 1.8% | | 4,392,938 |
| NET ASSETS — 100.0% | | $246,996,773 |
See Notes to Financial Statements.
Futures Contracts outstanding at December 31, 2023:
| Future Type | | Expiration Date | | Open Long
(Short) Contracts | | Notional
Market Value
of Contracts | | Value and
Unrealized
Appreciation
(Depreciation) |
| Brazilian Reals/U.S. Dollars | | 02/2024 | | 1 | | $ 20,595 | | $ 115 |
| 30-Year Euro Buxl | | 03/2024 | | (1) | | (156,452) | | (9,815) |
| Euro-Bund | | 03/2024 | | 2 | | 302,968 | | 6,108 |
| Euro-Bund | | 03/2024 | | (2) | | (302,968) | | (3,104) |
| Euro-OAT | | 03/2024 | | (4) | | (580,722) | | 2,715 |
| Euro-Bobl | | 03/2024 | | (116) | | (15,274,783) | | (206,657) |
| Australian Dollars/U.S. Dollars | | 03/2024 | | (129) | | (8,811,345) | | (285,735) |
| British Pounds/U.S. Dollars | | 03/2024 | | (33) | | (2,629,894) | | (37,125) |
| Mexican Pesos/U.S. Dollars | | 03/2024 | | 2 | | 58,240 | | 1,540 |
| New Zealand Dollars/U.S. Dollars | | 03/2024 | | (3) | | (189,675) | | (5,235) |
| South African Rand/U.S. Dollars | | 03/2024 | | 2 | | 54,275 | | 2,075 |
| Swiss Francs/U.S. Dollars | | 03/2024 | | (7) | | (1,048,250) | | (39,462) |
| U.S. Dollars/Norwegian Kroner | | 03/2024 | | 1 | | 99,753 | | (7,051) |
| U.S. Dollars/Swedish Kronor | | 03/2024 | | 1 | | 99,695 | | (3,576) |
| 10-Year Bond | | 03/2024 | | (4) | | (374,869) | | (17,275) |
| 10-Year U.S. Treasury Note | | 03/2024 | | 206 | | 23,255,470 | | 313,938 |
| U.S. Treasury Long Bond | | 03/2024 | | (26) | | (3,248,375) | | (61,507) |
| Ultra 10-Year U.S. Treasury Note | | 03/2024 | | (19) | | (2,242,297) | | (100,665) |
| Ultra Long U.S. Treasury Bond | | 03/2024 | | (119) | | (15,897,656) | | (1,045,410) |
| Canadian Dollars/U.S. Dollars | | 03/2024 | | (4) | | (302,500) | | (7,140) |
| Euro/U.S. Dollars | | 03/2024 | | (81) | | (11,213,438) | | (249,075) |
| Japanese Yen/U.S. Dollars | | 03/2024 | | (9) | | (807,300) | | (22,162) |
| Long GILT | | 03/2024 | | 2 | | 261,686 | | 18,191 |
| Long GILT | | 03/2024 | | (2) | | (261,686) | | (17,661) |
| 2-Year U.S. Treasury Note | | 03/2024 | | (12) | | (2,470,969) | | (9,393) |
| 5-Year U.S. Treasury Note | | 03/2024 | | (129) | | (14,031,773) | | (52,736) |
| Total Futures Contracts outstanding at December 31, 2023 | | | | | | $(55,692,270) | | $(1,836,102) |
Forward Foreign Currency Contracts outstanding at December 31, 2023:
| Expiration Date | | Currency
Purchased | | Amount
of Currency
Purchased | | Currency
Sold | | Amount
of Currency
Sold | | Counter-
party | | Net Unrealized
Appreciation
(Depreciation) |
| 02/14/24 | | Euro | | 2,335,923 | | U.S. Dollars | | 2,537,472 | | MSCS | | $46,041 |
| 03/20/24 | | Norwegian Kroner | | 2,998,400 | | U.S. Dollars | | 273,890 | | MSCS | | 21,757 |
| 03/20/24 | | Polish Zloty | | 3,443,830 | | U.S. Dollars | | 852,618 | | MSCS | | 21,653 |
| 03/20/24 | | Australian Dollars | | 826,087 | | U.S. Dollars | | 543,896 | | MSCS | | 20,404 |
| 03/21/24 | | Japanese Yen | | 84,597,872 | | U.S. Dollars | | 587,834 | | MSCS | | 19,867 |
| 01/10/24 | | British Pounds | | 301,307 | | U.S. Dollars | | 366,372 | | MSCS | | 17,711 |
| 03/13/24 | | Taiwan Dollars | | 17,458,653 | | U.S. Dollars | | 560,373 | | MSCS | | 17,705 |
| 03/20/24 | | Swedish Kronor | | 5,389,421 | | U.S. Dollars | | 519,431 | | MSCS | | 16,610 |
| 03/20/24 | | Canadian Dollars | | 1,105,382 | | U.S. Dollars | | 820,249 | | MSCS | | 14,887 |
| 03/20/24 | | Singapore Dollars | | 981,375 | | U.S. Dollars | | 733,067 | | MSCS | | 13,307 |
| 03/20/24 | | Swiss Francs | | 211,771 | | U.S. Dollars | | 242,997 | | MSCS | | 10,900 |
| 02/09/24 | | Canadian Dollars | | 301,459 | | U.S. Dollars | | 220,344 | | MSCS | | 7,293 |
| 02/12/24 | | Australian Dollars | | 216,636 | | U.S. Dollars | | 141,072 | | MSCS | | 6,764 |
| 03/20/24 | | South Korean Won | | 382,237,230 | | U.S. Dollars | | 291,000 | | MSCS | | 5,547 |
| 01/16/24 | | Mexican Pesos | | 1,510,668 | | U.S. Dollars | | 85,173 | | MSCS | | 3,532 |
| 03/20/24 | | Euro | | 208,000 | | U.S. Dollars | | 227,698 | | MSCS | | 2,668 |
| 03/21/24 | | Australian Dollars | | 222,000 | | Japanese Yen | | 20,825,398 | | MSCS | | 2,055 |
| 03/20/24 | | South African Rand | | 2,684,306 | | U.S. Dollars | | 143,892 | | MSCS | | 1,822 |
See Notes to Financial Statements.
STRATEGIC ALTERNATIVES FUND
SCHEDULE OF INVESTMENTS (Continued)
| Expiration Date | | Currency
Purchased | | Amount
of Currency
Purchased | | Currency
Sold | | Amount
of Currency
Sold | | Counter-
party | | Net Unrealized
Appreciation
(Depreciation) |
| 03/20/24 | | British Pounds | | 381,611 | | U.S. Dollars | | 484,822 | | MSCS | | $ 1,790 |
| 03/20/24 | | Israeli Shekels | | 303,329 | | U.S. Dollars | | 82,521 | | MSCS | | 1,466 |
| 03/20/24 | | Mexican Pesos | | 913,000 | | U.S. Dollars | | 51,618 | | MSCS | | 1,447 |
| 03/20/24 | | Euro | | 135,000 | | Polish Zloty | | 584,685 | | MSCS | | 1,085 |
| 03/20/24 | | New Zealand Dollars | | 232,130 | | U.S. Dollars | | 146,000 | | MSCS | | 770 |
| 03/20/24 | | Chinese Offshore Yuan | | 4,142,525 | | U.S. Dollars | | 584,000 | | MSCS | | 621 |
| 03/20/24 | | Hungarian Forint | | 10,047,222 | | U.S. Dollars | | 28,116 | | MSCS | | 590 |
| Subtotal Appreciation | | | | | | | | | | $ 258,292 |
| 03/20/24 | | U.S. Dollars | | 292,000 | | Polish Zloty | | 1,150,932 | | MSCS | | $ (182) |
| 03/20/24 | | Turkish Lira | | 4,217,760 | | U.S. Dollars | | 133,094 | | MSCS | | (334) |
| 03/20/24 | | New Zealand Dollars | | 221,762 | | Australian Dollars | | 205,845 | | MSCS | | (398) |
| 03/20/24 | | Chinese Offshore Yuan | | 2,148,429 | | U.S. Dollars | | 303,828 | | MSCS | | (627) |
| 03/13/24 | | U.S. Dollars | | 277,542 | | South Korean Won | | 359,200,657 | | MSCS | | (1,027) |
| 03/20/24 | | U.S. Dollars | | 35,606 | | Mexican Pesos | | 630,812 | | MSCS | | (1,058) |
| 03/20/24 | | British Pounds | | 350,090 | | U.S. Dollars | | 447,754 | | MSCS | | (1,337) |
| 03/20/24 | | U.S. Dollars | | 44,953 | | Swedish Kronor | | 470,042 | | MSCS | | (1,799) |
| 03/20/24 | | U.S. Dollars | | 166,141 | | South Korean Won | | 216,751,444 | | MSCS | | (2,019) |
| 03/20/24 | | U.S. Dollars | | 215,584 | | Czech Republic Koruna | | 4,882,122 | | MSCS | | (2,263) |
| 02/09/24 | | U.S. Dollars | | 70,988 | | Canadian Dollars | | 97,120 | | MSCS | | (2,350) |
| 03/20/24 | | U.S. Dollars | | 284,088 | | Canadian Dollars | | 379,568 | | MSCS | | (2,683) |
| 03/20/24 | | U.S. Dollars | | 293,000 | | Singapore Dollars | | 388,792 | | MSCS | | (2,691) |
| 03/20/24 | | Euro | | 233,000 | | Swedish Kronor | | 2,627,734 | | MSCS | | (3,305) |
| 02/23/24 | | U.S. Dollars | | 88,983 | | Swiss Francs | | 77,211 | | MSCS | | (3,337) |
| 01/16/24 | | U.S. Dollars | | 83,530 | | Mexican Pesos | | 1,481,520 | | MSCS | | (3,464) |
| 03/20/24 | | Euro | | 266,000 | | Swiss Francs | | 249,809 | | MSCS | | (4,897) |
| 03/20/24 | | U.S. Dollars | | 226,353 | | Israeli Shekels | | 837,154 | | MSCS | | (5,439) |
| 03/21/24 | | U.S. Dollars | | 433,366 | | Japanese Yen | | 61,309,840 | | MSCS | | (7,047) |
| 01/30/24 | | U.S. Dollars | | 159,002 | | Swedish Kronor | | 1,718,972 | | MSCS | | (11,652) |
| 03/20/24 | | U.S. Dollars | | 1,238,840 | | British Pounds | | 982,649 | | MSCS | | (14,186) |
| 03/20/24 | | U.S. Dollars | | 1,688,541 | | Chinese Offshore Yuan | | 12,068,835 | | MSCS | | (14,695) |
| 03/20/24 | | Euro | | 270,000 | | Norwegian Kroner | | 3,206,412 | | MSCS | | (17,124) |
| 03/20/24 | | U.S. Dollars | | 434,931 | | South African Rand | | 8,370,851 | | MSCS | | (19,467) |
| 03/20/24 | | U.S. Dollars | | 899,691 | | New Zealand Dollars | | 1,462,269 | | MSCS | | (24,866) |
| 02/14/24 | | U.S. Dollars | | 1,632,926 | | Euro | | 1,508,667 | | MSCS | | (35,648) |
| 02/13/24 | | U.S. Dollars | | 830,763 | | Japanese Yen | | 121,789,010 | | MSCS | | (39,031) |
| 01/10/24 | | U.S. Dollars | | 1,338,394 | | British Pounds | | 1,088,084 | | MSCS | | (48,616) |
| 03/20/24 | | U.S. Dollars | | 2,403,925 | | Euro | | 2,219,027 | | MSCS | | (53,711) |
| Subtotal Depreciation | | | | | | | | | | $(325,253) |
| Total Forward Foreign Currency Contracts outstanding at December 31, 2023 | | | | $ (66,961) |
Swap Agreements outstanding at December 31, 2023:
| Pay Rate Index/Pay Rate | | Receive
Rate Index/Receive
Rate | | Maturity
Date | | Currency | | Notional Amount | | Market Value | | Upfront
Premiums
Paid/
(Received) | | Unrealized
Appreciation
(Depreciation) |
| Centrally Cleared Interest Rate Swaps | | | | | | | | | | | | |
| 12.80% (Upon termination) | | 1-Day Brazil Cetip DI Interbank Deposit Rate (Upon termination) | | 1/2/2024 | | BRL | | 60,306 | | $ 79 | | $ — | | $ 79 |
| 1-Day Brazil Cetip DI Interbank Deposit Rate (Upon termination) | | 13.95% (Upon termination) | | 1/2/2024 | | BRL | | 12,231,240 | | 19,409 | | (1,613) | | 21,022 |
| 12.71% (Upon termination) | | 1-Day Brazil Cetip DI Interbank Deposit Rate (Upon termination) | | 1/2/2025 | | BRL | | 1,437,365 | | (6,881) | | (59,806) | | 52,925 |
| 13.30% (Upon termination) | | 1-Day Brazil Cetip DI Interbank Deposit Rate (Upon termination) | | 1/2/2025 | | BRL | | 8,356,958 | | (60,779) | | (391,546) | | 330,767 |
| 3-Month EURIBOR (Quarterly) | | 3.72% (Annually) | | 3/18/2025 | | EUR | | 46,570,000 | | 361,388 | | 172,454 | | 188,934 |
See Notes to Financial Statements.
| Pay Rate Index/Pay Rate | | Receive
Rate Index/Receive
Rate | | Maturity
Date | | Currency | | Notional Amount | | Market Value | | Upfront
Premiums
Paid/
(Received) | | Unrealized
Appreciation
(Depreciation) |
| 3.50% (Annually) | | 3-Month TELBOR (Quarterly) | | 3/20/2025 | | ILS | | 43,540,000 | | $ 20,405 | | $ 10,439 | | $ 9,966 |
| 0.27% (Annually) | | 1-Day SONIA (Annually) | | 6/17/2025 | | GBP | | 10,000 | | 1,060 | | (174) | | 1,234 |
| 6-Month BUBOR (Semiannually) | | 8.50% (Annually) | | 12/20/2025 | | HUF | | 506,760,000 | | 48,586 | | 25,849 | | 22,737 |
| 10.85% (Upon termination) | | 1-Day Brazil Cetip DI Interbank Deposit Rate (Upon termination) | | 1/2/2026 | | BRL | | 55,748,958 | | 155,062 | | 5,468 | | 149,594 |
| 1-Day Brazil Cetip DI Interbank Deposit Rate (Upon termination) | | 12.92% (Upon termination) | | 1/2/2026 | | BRL | | 5,983,532 | | 84,452 | | 51,575 | | 32,877 |
| 1.25% (Annually) | | Swiss Average Overnight Rate (Annually) | | 3/20/2026 | | CHF | | 15,630,000 | | (70,399) | | (77,755) | | 7,356 |
| 1-Day MIBOR (Semiannually) | | 6.50% (Semiannually) | | 3/20/2026 | | INR | | 2,942,360,000 | | 201,482 | | (5,305) | | 206,787 |
| 1-Day SOFR (Annually) | | 4.00% (Annually) | | 3/20/2026 | | USD | | 19,040,000 | | 65,724 | | (44,924) | | 110,648 |
| 1-Day SONIA (Annually) | | 5.25% (Annually) | | 3/20/2026 | | GBP | | 20,050,000 | | 704,101 | | 542,559 | | 161,542 |
| 3-Month KWCDC (Quarterly) | | 3.75% (Quarterly) | | 3/20/2026 | | KRW | | 7,929,550,000 | | 73,375 | | 45,879 | | 27,496 |
| 3-Month STIBOR (Quarterly) | | 3.50% (Annually) | | 3/20/2026 | | SEK | | 258,230,000 | | 403,698 | | 266,311 | | 137,387 |
| 6-Month BUBOR (Semiannually) | | 7.50% (Annually) | | 3/20/2026 | | HUF | | 146,900,000 | | 11,711 | | 9,072 | | 2,639 |
| 6-Month NIBOR (Semiannually) | | 4.25% (Annually) | | 3/20/2026 | | NOK | | 262,640,000 | | 231,040 | | 196,983 | | 34,057 |
| 6-Month PRIBOR (Semiannually) | | 4.50% (Annually) | | 3/20/2026 | | CZK | | 183,470,000 | | 95,753 | | 51,986 | | 43,767 |
| 7-Day CFETS Repo Rate (Quarterly) | | 2.00% (Quarterly) | | 3/20/2026 | | CNY | | 41,490,000 | | (1,493) | | (14,709) | | 13,216 |
| Bank Of Canada Overnight Repo Rate (Semiannually) | | 3.75% (Semiannually) | | 3/20/2026 | | CAD | | 23,730,000 | | 51,837 | | (11,138) | | 62,975 |
| Thai Overnight Repurchase Rate (Quarterly) | | 2.50% (Quarterly) | | 3/20/2026 | | THB | | 43,690,000 | | 8,859 | | 6,567 | | 2,292 |
| 1-Day Brazil Cetip DI Interbank Deposit Rate (Upon termination) | | 13.03% (Upon termination) | | 1/4/2027 | | BRL | | 1,502,187 | | 33,280 | | — | | 33,280 |
| 1-Day Brazil Cetip DI Interbank Deposit Rate (Upon termination) | | 12.53% (Upon termination) | | 1/4/2027 | | BRL | | 1,483,606 | | 26,499 | | — | | 26,499 |
| 8.50% (Upon termination) | | 1-Day Brazil Cetip DI Interbank Deposit Rate (Upon termination) | | 1/4/2027 | | BRL | | 1,954,887 | | 46,315 | | (6,797) | | 53,112 |
| 6-Month EURIBOR (Semiannually) | | 3.00% (Annually) | | 10/20/2027 | | EUR | | 24,280,000 | | 457,232 | | 19,211 | | 438,021 |
| 1-Day SOFR (Annually) | | 3.73% (Annually) | | 11/28/2027 | | USD | | 10,940,000 | | 123,356 | | 53,033 | | 70,323 |
| 1-Day ESTR (Annually) | | 2.67% (Annually) | | 4/22/2028 | | EUR | | 23,400,000 | | 598,486 | | 115,926 | | 482,560 |
| 0.50% (Annually) | | Bank of Japan Unsecured Overnight Call Rate (Annually) | | 8/3/2028 | | JPY | | 3,595,650,000 | | 71,201 | | 59,707 | | 11,494 |
| 1-Day ESTR (Annually) | | 2.50% (Annually) | | 10/19/2028 | | EUR | | 13,750,000 | | 260,659 | | 96,128 | | 164,531 |
| 1-Day CLP-TNA (Semiannually) | | 5.25% (Semiannually) | | 3/20/2029 | | CLP | | 4,225,720,000 | | 153,884 | | 100,762 | | 53,122 |
| 1-Day SOFR (Annually) | | 4.25% (Annually) | | 3/20/2029 | | USD | | 13,860,000 | | 509,538 | | 444,618 | | 64,920 |
| 1-Day SONIA (Annually) | | 4.75% (Annually) | | 3/20/2029 | | GBP | | 5,320,000 | | 450,155 | | 274,739 | | 175,416 |
| 3-Month KWCDC (Quarterly) | | 3.75% (Quarterly) | | 3/20/2029 | | KRW | | 9,702,840,000 | | 281,202 | | 67,222 | | 213,980 |
| 6-Month PRIBOR (Semiannually) | | 4.25% (Annually) | | 3/20/2029 | | CZK | | 73,490,000 | | 129,250 | | 88,085 | | 41,165 |
| 7-Day CFETS Repo Rate (Quarterly) | | 2.50% (Quarterly) | | 3/20/2029 | | CNY | | 38,220,000 | | 54,194 | | 13,126 | | 41,068 |
| 8.50% (Quarterly) | | 3-Month JIBAR (Quarterly) | | 3/20/2029 | | ZAR | | 67,040,000 | | (60,508) | | (66,067) | | 5,559 |
| Thai Overnight Repurchase Rate (Quarterly) | | 2.75% (Quarterly) | | 3/20/2029 | | THB | | 3,580,000 | | 2,272 | | 738 | | 1,534 |
| 2.68% (Annually) | | 1-Day SOFR (Annually) | | 7/28/2032 | | USD | | 12,240,000 | | 321,251 | | 218,826 | | 102,425 |
| 1-Day SOFR (Annually) | | 4.31% (Annually) | | 10/5/2033 | | USD | | 19,690,000 | | 689,969 | | 2,027 | | 687,942 |
| 6-Month EURIBOR (Semiannually) | | 3.00% (Annually) | | 11/10/2033 | | EUR | | 18,340,000 | | 381,097 | | 232,219 | | 148,878 |
| 1-Day SOFR (Annually) | | 4.25% (Annually) | | 3/20/2034 | | USD | | 2,830,000 | | 193,037 | | 180,136 | | 12,901 |
| 1-Day SONIA (Annually) | | 4.25% (Annually) | | 3/20/2034 | | GBP | | 250,000 | | 26,697 | | 13,506 | | 13,191 |
| 3.00% (Annually) | | 6-Month EURIBOR (Semiannually) | | 3/20/2034 | | EUR | | 3,170,000 | | 166,893 | | 158,419 | | 8,474 |
| 3-Month JIBAR (Quarterly) | | 9.50% (Quarterly) | | 3/20/2034 | | ZAR | | 22,930,000 | | 25,735 | | 14,779 | | 10,956 |
| 3-Month KWCDC (Quarterly) | | 3.75% (Quarterly) | | 3/20/2034 | | KRW | | 1,960,450,000 | | 104,796 | | 75,613 | | 29,183 |
| 3-Month New Zealand BBR FRA (Quarterly) | | 4.75% (Semiannually) | | 3/20/2034 | | NZD | | 4,120,000 | | 135,520 | | 4,764 | | 130,756 |
| 3-Month TELBOR (Quarterly) | | 4.00% (Annually) | | 3/20/2034 | | ILS | | 6,580,000 | | 47,226 | | 20,319 | | 26,907 |
| 6-Month ASX BBSW (Semiannually) | | 4.25% (Semiannually) | | 3/20/2034 | | AUD | | 3,980,000 | | 14,993 | | (92,548) | | 107,541 |
| 6-Month BUBOR (Semiannually) | | 7.00% (Annually) | | 3/20/2034 | | HUF | | 305,090,000 | | 89,789 | | 50,865 | | 38,924 |
| 6-Month PRIBOR (Semiannually) | | 4.25% (Annually) | | 3/20/2034 | | CZK | | 29,670,000 | | 94,695 | | 51,504 | | 43,191 |
| Swiss Average Overnight Rate (Annually) | | 1.50% (Annually) | | 3/20/2034 | | CHF | | 2,830,000 | | 111,452 | | 101,453 | | 9,999 |
| 6-Month EURIBOR (Semiannually) | | 2.15% (Annually) | | 8/9/2037 | | EUR | | 14,120,000 | | (344,008) | | (389,172) | | 45,164 |
| 1-Day SOFR (Annually) | | 3.39% (Annually) | | 5/10/2038 | | USD | | 36,300,000 | | (226,534) | | (381,443) | | 154,909 |
| 1.45% (Annually) | | 6-Month EURIBOR (Semiannually) | | 8/10/2042 | | EUR | | 36,110,000 | | 1,346,067 | | 841,662 | | 504,405 |
| 2.08% (Annually) | | 1-Day SOFR (Annually) | | 7/28/2047 | | USD | | 32,130,000 | | 735,716 | | 613,204 | | 122,512 |
| Subtotal Appreciation | | | | | | | | | | $ 9,449,875 | | $3,754,736 | | $ 5,695,139 |
See Notes to Financial Statements.
STRATEGIC ALTERNATIVES FUND
SCHEDULE OF INVESTMENTS (Continued)
| Pay Rate Index/Pay Rate | | Receive
Rate Index/Receive
Rate | | Maturity
Date | | Currency | | Notional Amount | | Market Value | | Upfront
Premiums
Paid/
(Received) | | Unrealized
Appreciation
(Depreciation) |
| 1-Day Brazil Cetip DI Interbank Deposit Rate (Upon termination) | | 12.30% (Upon termination) | | 1/2/2024 | | BRL | | 1,496,045 | | $ (1,226) | | $ 1,905 | | $ (3,131) |
| 1-Day Brazil Cetip DI Interbank Deposit Rate (Upon termination) | | 12.06% (Upon termination) | | 1/2/2025 | | BRL | | 22,114,689 | | 39,637 | | 773,298 | | (733,661) |
| 9.50% (Lunar) | | 28-Day Mexico Interbank TIIE (Lunar) | | 3/18/2026 | | MXN | | 61,790,000 | | (12,296) | | (1,622) | | (10,674) |
| 3.00% (Annually) | | 1-Day ESTR (Annually) | | 3/20/2026 | | EUR | | 66,850,000 | | (970,781) | | (684,729) | | (286,052) |
| 3.75% (Quarterly) | | 3-Month ASX BBSW (Quarterly) | | 3/20/2026 | | AUD | | 39,120,000 | | 19,365 | | 153,084 | | (133,719) |
| 3-Month JIBAR (Quarterly) | | 8.00% (Quarterly) | | 3/20/2026 | | ZAR | | 76,000,000 | | 23,647 | | 25,970 | | (2,323) |
| 5.75% (Semiannually) | | 1-Day CLP-TNA (Semiannually) | | 3/20/2026 | | CLP | | 2,669,255,000 | | (58,281) | | (36,511) | | (21,770) |
| 8.50% (Quarterly) | | 1-Day COP-IBR-OIS (Quarterly) | | 3/20/2026 | | COP | | 6,306,160,000 | | (14,725) | | (6,669) | | (8,056) |
| 0.50% (Annually) | | Bank of Japan Unsecured Overnight Call Rate (Annually) | | 8/2/2026 | | JPY | | 1,726,440,000 | | 44,860 | | 48,073 | | (3,213) |
| 10.29% (Upon termination) | | 1-Day Brazil Cetip DI Interbank Deposit Rate (Upon termination) | | 1/4/2027 | | BRL | | 6,662,458 | | (16,533) | | — | | (16,533) |
| 11.23% (Upon termination) | | 1-Day Brazil Cetip DI Interbank Deposit Rate (Upon termination) | | 1/4/2027 | | BRL | | 6,127,316 | | (35,164) | | 17,190 | | (52,354) |
| 2.85% (Annually) | | 3-Month EURIBOR (Quarterly) | | 4/22/2028 | | EUR | | 23,400,000 | | (586,899) | | (100,699) | | (486,200) |
| 11.50% (Upon termination) | | 1-Day Brazil Cetip DI Interbank Deposit Rate (Upon termination) | | 1/2/2029 | | BRL | | 9,990,531 | | (159,975) | | (24,697) | | (135,278) |
| 3.50% (Annually) | | 3-Month TELBOR (Quarterly) | | 3/20/2029 | | ILS | | 11,300,000 | | (26,701) | | (9,154) | | (17,547) |
| 6.50% (Semiannually) | | 1-Day MIBOR (Semiannually) | | 3/20/2029 | | INR | | 1,712,540,000 | | (314,985) | | 29,809 | | (344,794) |
| 0.50% (Annually) | | Bank of Japan Unsecured Overnight Call Rate (Annually) | | 3/21/2029 | | JPY | | 10,189,000,000 | | (20,536) | | 739,674 | | (760,210) |
| 1-Day SONIA (Annually) | | 0.31% (Annually) | | 6/17/2030 | | GBP | | 10,000 | | (2,502) | | 307 | | (2,809) |
| Bank of Japan Unsecured Overnight Call Rate (Annually) | | 1.25% (Annually) | | 8/2/2033 | | JPY | | 741,090,000 | | 10,050 | | 13,525 | | (3,475) |
| 1.25% (Annually) | | Bank of Japan Unsecured Overnight Call Rate (Annually) | | 8/3/2033 | | JPY | | 838,000,000 | | (11,253) | | (7,077) | | (4,176) |
| 9.00% (Lunar) | | 28-Day Mexico Interbank TIIE (Lunar) | | 3/8/2034 | | MXN | | 29,380,000 | | (74,454) | | (59,631) | | (14,823) |
| 3.25% (Semiannually) | | Bank Of Canada Overnight Repo Rate (Semiannually) | | 3/20/2034 | | CAD | | 750,000 | | (10,973) | | (1,600) | | (9,373) |
| 3.75% (Semiannually) | | 6-Month NIBOR (Annually) | | 3/20/2034 | | NOK | | 16,780,000 | | (63,675) | | (44,373) | | (19,302) |
| 3-Month STIBOR (Quarterly) | | 3.00% (Annually) | | 3/20/2034 | | SEK | | 63,570,000 | | (377,451) | | (232,496) | | (144,955) |
| 5.50% (Semiannually) | | 1-Day CLP-TNA (Semiannually) | | 3/20/2034 | | CLP | | 2,190,510,000 | | (129,072) | | (98,049) | | (31,023) |
| 6-Month WIBOR (Semiannually) | | 5.00% (Annually) | | 3/20/2034 | | PLN | | 5,550,000 | | 60,330 | | 64,508 | | (4,178) |
| 8.25% (Quarterly) | | 1-Day COP-IBR-OIS (Quarterly) | | 3/20/2034 | | COP | | 2,028,330,000 | | (24,195) | | (18,852) | | (5,343) |
| 1-Day SOFR (Annually) | | 2.91% (Annually) | | 7/28/2037 | | USD | | 32,700,000 | | (721,842) | | (563,114) | | (158,728) |
| Bank of Japan Unsecured Overnight Call Rate (Annually) | | 1.50% (Annually) | | 8/3/2038 | | JPY | | 906,000,000 | | (62,450) | | (41,799) | | (20,651) |
| 1-Day SONIA (Annually) | | 0.40% (Annually) | | 6/17/2040 | | GBP | | 10,000 | | (5,093) | | 512 | | (5,605) |
| 6-Month EURIBOR (Semiannually) | | 1.05% (Annually) | | 8/11/2047 | | EUR | | 21,130,000 | | (650,204) | | (365,523) | | (284,681) |
| 2.56% (Annually) | | 1-Day SOFR (Annually) | | 5/11/2053 | | USD | | 30,890,000 | | 334,736 | | 340,280 | | (5,544) |
| 2.00% (Annually) | | 6-Month EURIBOR (Semiannually) | | 5/17/2053 | | EUR | | 6,760,000 | | 29,869 | | 244,407 | | (214,538) |
| 2.50% (Annually) | | 6-Month EURIBOR (Semiannually) | | 11/10/2053 | | EUR | | 8,180,000 | | (386,682) | | (273,941) | | (112,741) |
| 3.61% (Annually) | | 1-Day SOFR (Annually) | | 11/15/2053 | | USD | | 10,510,000 | | (446,141) | | (69,771) | | (376,370) |
| 3.51% (Annually) | | 1-Day SOFR (Annually) | | 11/29/2053 | | USD | | 3,450,000 | | (122,168) | | (62,059) | | (60,109) |
| 6-Month EURIBOR (Semiannually) | | 2.50% (Annually) | | 3/20/2054 | | EUR | | 2,000,000 | | (89,363) | | (58,882) | | (30,481) |
| Subtotal Depreciation | | | | | | | | | | $(4,833,126) | | $ (308,706) | | $(4,524,420) |
| Net Centrally Cleared Interest Rate Swaps outstanding at December 31, 2023 | | $ 4,616,749 | | $3,446,030 | | $ 1,170,719 |
See Notes to Financial Statements.
Total Return Basket Swap Agreements outstanding at December 31, 2023:
| Description | | Maturity
Date | | Counterparty | | Notional
Amount | | Market Value | | Upfront
Premiums
Paid/
(Received) | | Unrealized
Appreciation
(Depreciation) |
| The Fund receives the total return on a portfolio of long and short equity positions and pays or receives the USFFE or 1-Month LIBOR plus or minus a specified spread(-3.42% to 0.15%), which is denominated in USD based on the local currencies of the positions within the swap (Monthly).* | | 29-60 months maturity ranging from 05/26/2026 - 12/22/2028 | | GSC | | $130,962,364 | | $(1,759,422) | | $— | | $(1,759,422) |
| * The following table represents disclosures associated with the underlying components of the total return basket swap as of period end. |
| Common Stocks | | Shares | | Notional | | Unrealized
Appreciation
(Depreciation) | | Percentage of
Swap Value |
| Marriott International, Inc. Class A | | 3,669 | | $ 827,396 | | $ 33,104 | | (1.88)% |
| First Citizens BancShares, Inc. Class A | | 502 | | 712,323 | | (3,314) | | 0.19 |
| Applied Materials, Inc. | | 4,186 | | 678,425 | | 28,841 | | (1.64) |
| Crane Holdings Co. | | (5,295) | | 625,551 | | (56,537) | | 3.21 |
| Intel Corporation | | (11,567) | | 581,242 | | (64,884) | | 3.69 |
| Vornado Realty Trust REIT | | (19,300) | | 545,225 | | (25,190) | | 1.43 |
| Micron Technology, Inc. | | (6,235) | | 532,095 | | (46,696) | | 2.65 |
| Booking Holdings, Inc. | | 149 | | 528,536 | | 28,661 | | (1.63) |
| Veeva Systems, Inc. Class A | | 2,743 | | 528,082 | | 48,318 | | (2.75) |
| Hyatt Hotels Corporation Class A | | (4,004) | | 522,162 | | (9,536) | | 0.54 |
| Welltower, Inc. REIT | | (5,753) | | 518,748 | | (10,937) | | 0.62 |
| NNN REIT, Inc. | | 11,913 | | 513,450 | | 29,321 | | (1.67) |
| PulteGroup, Inc. | | 4,944 | | 510,320 | | 35,281 | | (2.01) |
| Ingersoll-Rand, Inc. | | (6,548) | | 506,422 | | (21,046) | | 1.20 |
| New York Times Co. (The) Class A | | 10,073 | | 493,476 | | 23,739 | | (1.35) |
| Wendy's Co. (The) | | 25,005 | | 487,097 | | 5,316 | | (0.30) |
| Landstar System, Inc. | | 2,485 | | 481,220 | | 29,343 | | (1.67) |
| Cardinal Health, Inc. | | 4,757 | | 479,506 | | (28,209) | | 1.60 |
| Union Pacific Corporation | | (1,943) | | 477,240 | | (27,913) | | 1.59 |
| KB Home | | 7,609 | | 475,258 | | 47,506 | | (2.70) |
| Celanese Corporation | | (3,014) | | 468,285 | | (38,183) | | 2.17 |
| American Tower Corporation REIT | | (2,147) | | 463,494 | | (24,911) | | 1.42 |
| Monolithic Power Systems, Inc. | | 712 | | 449,115 | | 27,011 | | (1.54) |
| General Dynamics Corporation | | 1,715 | | 445,334 | | 11,379 | | (0.65) |
| Old Dominion Freight Line, Inc. | | 1,087 | | 440,594 | | 22,497 | | (1.28) |
| Entegris, Inc. | | (3,677) | | 440,578 | | (34,974) | | 1.99 |
| AGCO Corporation | | 3,435 | | 417,043 | | 22,225 | | (1.26) |
| Paramount Global Class B | | (28,073) | | 415,200 | | 40,195 | | (2.28) |
| Hilton Worldwide Holdings, Inc. | | (2,271) | | 413,526 | | (11,120) | | 0.63 |
| Waste Management, Inc. | | (2,277) | | 407,811 | | (13,727) | | 0.78 |
| Dropbox, Inc. Class A | | 13,795 | | 406,677 | | 20,306 | | (1.15) |
| Vertex Pharmaceuticals, Inc. | | 994 | | 404,449 | | 49,434 | | (2.81) |
| Nexstar Media Group, Inc. Class A | | 2,575 | | 403,631 | | 25,759 | | (1.46) |
| Hexcel Corporation | | 5,378 | | 396,627 | | 12,296 | | (0.70) |
| EnerSys, Inc. | | 3,889 | | 392,633 | | 32,036 | | (1.82) |
| Xcel Energy, Inc. | | 6,278 | | 388,671 | | 4,584 | | (0.26) |
| News Corporation Class A | | (15,670) | | 384,699 | | (38,081) | | 2.16 |
| New Fortress Energy, Inc. | | (10,177) | | 383,978 | | (4,119) | | 0.23 |
| Mercury Systems, Inc. | | (10,403) | | 380,438 | | 5,342 | | (0.30) |
| Dominion Energy, Inc. | | (8,062) | | 378,914 | | 726 | | (0.04) |
| Insperity, Inc. | | 3,223 | | 377,800 | | 2,532 | | (0.14) |
See Notes to Financial Statements.
STRATEGIC ALTERNATIVES FUND
SCHEDULE OF INVESTMENTS (Continued)
| Common Stocks | | Shares | | Notional | | Unrealized
Appreciation
(Depreciation) | | Percentage of
Swap Value |
| Choice Hotels International, Inc. | | 3,274 | | $ 370,944 | | $ (1,636) | | 0.09% |
| Catalent, Inc. | | (8,193) | | 368,111 | | (56,649) | | 3.22 |
| Cintas Corporation | | 603 | | 363,404 | | 26,195 | | (1.49) |
| NRG Energy, Inc. | | (7,006) | | 362,210 | | (26,006) | | 1.48 |
| Keurig Dr. Pepper, Inc. | | (10,785) | | 359,356 | | (5,242) | | 0.30 |
| Owens Corning | | 2,411 | | 357,383 | | 9,836 | | (0.56) |
| Emerson Electric Co. | | (3,622) | | 352,529 | | (26,830) | | 1.52 |
| NXP Semiconductor NV | | 1,521 | | 349,343 | | 14,778 | | (0.84) |
| General Motors Co. | | 9,716 | | 348,999 | | 22,815 | | (1.30) |
| Other | | (640,621) | | 108,046,814 | | (1,843,058) | | 104.77 |
| | | | | $130,962,364 | | $(1,759,422) | | 100.00% |
See Notes to Financial Statements.
VALUATION HIERARCHY
The following is a summary of the inputs used, as of December 31, 2023, in valuing the Fund’s investments carried at fair value:
| | Total
Value | | Level 1
Quoted Prices | | Level 2
Other Significant
Observable Inputs | | Level 3
Significant
Unobservable Inputs |
| Assets: | | | | | | | |
| Investments in Securities: | | | | | | | |
| Common Stocks: | | | | | | | |
| Communication Services | $ 19,804 | | $ — | | $ — | | $ 19,804 |
| Other ^^ | 15,455,904 | | 15,455,904 | | — | | — |
| Total Common Stocks | 15,475,708 | | 15,455,904 | | — | | 19,804 |
| Corporate Bonds | 46,000,154 | | — | | 46,000,154 | | — |
| Foreign Bond | 333,980 | | — | | 333,980 | | — |
| Foreign Common Stocks | 674,871 | | 674,871 | | — | | — |
| Money Market Funds | 83,571,180 | | 83,571,180 | | — | | — |
| Mortgage-Backed Securities | 7,857,800 | | — | | 7,857,800 | | — |
| Mutual Funds | 212,057 | | 212,057 | | — | | — |
| Preferred Stocks: | | | | | | | |
| Information Technology | 304,415 | | — | | 304,415 | | — |
| Materials | 10,140 | | — | | 10,140 | | — |
| Other ^^ | 1,401,826 | | 1,401,826 | | — | | — |
| Total Preferred Stocks | 1,716,381 | | 1,401,826 | | 314,555 | | — |
| Purchased Options: | | | | | | | |
| Call Swaptions | 690,428 | | 690,428 | | — | | — |
| Put Swaptions | 1,300 | | 1,300 | | — | | — |
| Total Purchased Options | 691,728 | | 691,728 | | — | | — |
| U.S. Treasury Obligations | 100,475,056 | | — | | 100,475,056 | | — |
| Total Assets - Investments in Securities | $257,008,915 | | $102,007,566 | | $154,981,545 | | $ 19,804 |
| Other Financial Instruments*** | | | | | | | |
| Forward Foreign Currency Contracts | $ 258,292 | | $ — | | $ 258,292 | | $ — |
| Futures Contracts | 344,682 | | 344,682 | | — | | — |
| Swap Agreements | 5,695,139 | | — | | 5,695,139 | | — |
| Total Assets - Other Financial Instruments | $ 6,298,113 | | $ 344,682 | | $ 5,953,431 | | $ — |
See Notes to Financial Statements.
STRATEGIC ALTERNATIVES FUND
SCHEDULE OF INVESTMENTS (Continued)
| | Total
Value | | Level 1
Quoted Prices | | Level 2
Other Significant
Observable Inputs | | Level 3
Significant
Unobservable Inputs |
| Liabilities: | | | | | | | |
| Investments in Securities: | | | | | | | |
| Common Stocks Sold Short | $(11,027,935) | | $(11,027,935) | | $ — | | $ — |
| Foreign Common Stocks Sold Short | (177,385) | | (177,385) | | — | | — |
| Rights Sold Short | — | | — | | — | | — |
| TBA Sale Commitments | (2,056,602) | | — | | (2,056,602) | | — |
| Written Options: | | | | | | | |
| Call Swaptions | (1,138,632) | | (1,138,632) | | — | | — |
| Put Swaptions | (4,526) | | (4,526) | | — | | — |
| Total Written Options | (1,143,158) | | (1,143,158) | | — | | — |
| Total Liabilities - Investments in Securities | $(14,405,080) | | $(12,348,478) | | $(2,056,602) | | $ — |
| Other Financial Instruments*** | | | | | | | |
| Forward Foreign Currency Contracts | $ (325,253) | | $ — | | $ (325,253) | | $ — |
| Futures Contracts | (2,180,784) | | (2,180,784) | | — | | — |
| Swap Agreements | (6,283,842) | | — | | (6,283,842) | | — |
| Total Liabilities - Other Financial Instruments | $ (8,789,879) | | $ (2,180,784) | | $(6,609,095) | | $ — |
| ^^ | Classifications as defined in the Schedule of Investments. |
| *** | Other financial instruments are derivative instruments, such as futures contracts, forward foreign currency contracts and swap agreements, which are valued at the unrealized appreciation (depreciation) on the investment. Further details regarding the value of these investments can be found in the preceding "Futures Contracts outstanding", "Forward Foreign Currency Contracts outstanding" and "Swap Agreements outstanding" disclosures. |
There were no transfers to or from Level 3 during the period ended December 31, 2023.
Management has determined that the amount of Level 3 securities compared to total net assets is not material; therefore, the reconciliation of Level 3 securities and assumptions is not shown for the year ended December 31, 2023.
See Notes to Financial Statements.
| STATEMENTS OF ASSETS AND LIABILITIES | December 31, 2023 |
| | Strategic Alternatives Fund |
| Assets | |
| Investments in securities of unaffiliated issuers, at value* | $248,670,665 |
| Investments in securities of affiliated issuers, at value | 8,338,250 |
| Total investments, at value(1) | 257,008,915 |
| Cash | 11,567,307 |
| Cash collateral for derivatives | 15,406,775 |
| Deposits with broker for futures contracts | 1,662,611 |
| Foreign currency(2) | 58,190 |
| Upfront premiums paid from swap agreements | 7,750,275 |
| Receivables: | |
| Dividends | 364,390 |
| Reclaims | 84 |
| Interest | 328,185 |
| From advisor | 48,227 |
| Investment securities sold | 15,005,654 |
| Fund shares sold | 441,208 |
| Variation margin on centrally cleared swaps | 101,602 |
| Variation margin on futures contracts | 10,534 |
| Unrealized appreciation on foreign currency exchange contracts | 258,292 |
| Prepaid expenses and other assets | 6,441 |
| Total Assets | 310,018,690 |
| Liabilities | |
| Securities sold short, at value(3) | 11,205,320 |
| TBA sale commitments, at value(4) | 2,056,602 |
| Options written, at value(5) | 1,143,158 |
| Upfront premiums received from swap agreements | 4,304,245 |
| Unrealized depreciation on foreign currency exchange contracts | 325,253 |
| Unrealized depreciation on swap agreements | 1,759,422 |
| Collateral from counterparty | 4,810,993 |
| Due to broker | 433,306 |
| Payables: | |
| Investment securities purchased | 36,590,650 |
| Dividends on short sales | 1,520 |
| Fund shares redeemed | 40,743 |
| Variation margin on centrally cleared swaps | 2,527 |
| Accrued expenses: | |
| Investment advisory fees | 185,746 |
| Shareholder servicing fees | 8,657 |
| Director fees | 725 |
| Other expenses | 153,050 |
| Total Liabilities | 63,021,917 |
| Commitments and contingencies | — (6) |
| Net Assets | $246,996,773 |
| Net Assets Consist of: | |
| Paid-in-capital | $269,024,569 |
| Distributable earnings (loss) | (22,027,796) |
| Net Assets | $246,996,773 |
| Net Asset Value: | |
| $0.001 par value, unlimited shares authorized | |
| Net assets applicable to the Institutional Class | $205,864,932 |
| Institutional shares outstanding | 22,346,275 |
| Net asset value, offering and redemption price per Institutional share | $ 9.21 |
| Net assets applicable to the Investor Class | $ 41,131,841 |
| Investor shares outstanding | 4,494,042 |
| Net asset value, offering and redemption price per Investor share | $ 9.15 |
| |
| | |
| (1)Investments in securities of unaffiliated issuers, at cost* | $245,615,689 |
| Investments in securities of affiliated issuers, at cost | 8,338,250 |
| Total investments, at cost | $253,953,939 |
| (2)Foreign currency, at cost | $ 58,134 |
| (3)Proceeds from securities sold short | $ 10,283,743 |
| (4)TBA sale commitments, at cost | $ 2,049,102 |
| (5)Premiums received on options written | $ 308,637 |
| (6)See Note 3c in Notes to Financial Statements. | |
| * Includes Purchased Options |
See Notes to Financial Statements.
| STATEMENTS OF OPERATIONS | For the Year Ended December 31, 2023 |
| | Strategic Alternatives Fund |
| Investment Income | |
| Dividends | $ 4,979,648 |
| Income distributions received from affiliated funds | 495,282 |
| Interest | 5,089,020 |
| Less foreign taxes withheld | (1,652) |
| Total Investment Income | 10,562,298 |
| Expenses | |
| Investment advisory fees | 2,225,796 |
| Transfer agent fees: | |
| Institutional shares | 4,786 |
| Investor shares | 14,615 |
| Custodian fees | 719,571 |
| Shareholder servicing fees: | |
| Investor shares | 101,367 |
| Accounting and administration fees | 43,964 |
| Professional fees | 198,689 |
| Blue sky fees: | |
| Institutional shares | 13,910 |
| Investor shares | 14,960 |
| Shareholder reporting fees: | |
| Institutional shares | 2,435 |
| Investor shares | 8,927 |
| Directors expenses | 4,355 |
| Line of credit facility fees | 919 |
| Dividends on securities sold short | 118,968 |
| Other expenses | 35,687 |
| Total Expenses | 3,508,949 |
| Expenses waived/reimbursed | (600,144) |
| Net Expenses | 2,908,805 |
| Net Investment Income | 7,653,493 |
| Realized and Unrealized Gain (Loss) | |
| Net realized gain (loss) from: | |
| Capital gain distributions received from affiliated funds | 148 |
| Investment securities | 89,557 |
| Investment securities sold short | 1,197,152 |
| TBA sale commitments | (7,305) |
| Futures transactions | 1,962,481 |
| Swap agreements | 1,617,693 |
| Option contracts written | 129,085 |
| Option contracts purchased | (48,870) |
| Forward foreign currency contracts | (51,360) |
| Foreign currency | (90,830) |
| Net realized gain | 4,797,751 |
| Net change in unrealized appreciation (depreciation) on: | |
| Investment securities | 6,122,111 |
| Investment securities sold short | (2,352,909) |
| TBA sale commitments | (7,500) |
| Futures | (1,483,968) |
| Swap agreements | (933,426) |
| Option contracts written | (735,971) |
| Option contracts purchased | 662,354 |
| Forward foreign currency contracts | (45,446) |
| Foreign currency | 549 |
| Net change in unrealized appreciation (depreciation) | 1,225,794 |
| Net Realized and Unrealized Gain | 6,023,545 |
| Net Increase in Net Assets Resulting from Operations | $13,677,038 |
See Notes to Financial Statements.
| STATEMENTS OF CHANGES IN NET ASSETS |
| | Strategic Alternatives Fund |
| | For the Year Ended |
| | 12/31/23 | | 12/31/22 |
| | | | |
| Operations: | | | |
| Net investment income | $ 7,653,493 | | $ 898,907 |
| Net realized gain on investment securities, foreign currency and derivatives | 4,797,751 | | 3,178,134 |
| Net change in unrealized appreciation (depreciation) on investment securities, foreign currency and derivatives | 1,225,794 | | (6,567,047) |
| Net increase (decrease) in net assets resulting from operations | 13,677,038 | | (2,490,006) |
| Distributions to Shareholders: | | | |
| Distributions paid | | | |
| Institutional shares | (23,865,915) | | (9,783,955) |
| Investor shares | (4,781,625) | | (1,902,911) |
| Return of capital | | | |
| Institutional shares | — | | — |
| Investor shares | — | | — |
| Total distributions | (28,647,540) | | (11,686,866) |
| Capital Share Transactions: | | | |
| Proceeds from shares sold | | | |
| Institutional shares | 39,282,481 | | 68,880,884 |
| Investor shares | 13,191,796 | | 42,431,998 |
| Reinvestment of dividends and distributions | | | |
| Institutional shares | 23,857,725 | | 8,379,830 |
| Investor shares | 4,779,350 | | 1,902,455 |
| Total proceeds from shares sold and reinvested | 81,111,352 | | 121,595,167 |
| Value of shares redeemed | | | |
| Institutional shares | (81,433,890) | | (141,393,501) |
| Investor shares | (25,055,071) | | (30,360,422) |
| Total value of shares redeemed | (106,488,961) | | (171,753,923) |
| Net decrease from capital share transactions(1) | (25,377,609) | | (50,158,756) |
| Total decrease in net assets | (40,348,111) | | (64,335,628) |
| Net Assets: | | | |
| Beginning of Year | 287,344,884 | | 351,680,512 |
| End of Year | $ 246,996,773 | | $ 287,344,884 |
| |
| (1) | See Note 6 in Notes to Financial Statements. |
See Notes to Financial Statements.
| For a Share Outstanding For the Years Ending December 31, unless otherwise indicated | | | | | | | | | | Ratios to Average Net Assets | |
| | | Net Asset
Value,
Beginning
of Year | Net Investment
Income/ (Loss)# | Realized
and
Unrealized
Gain
(Loss) on
Investments | | Total Income
From Investment
Operations | Dividends
from Net
Investment
Income | Distributions
from Net
Realized
Capital
Gains | Total
Distributions
Paid | Net Asset
Value,
End of
Year | | Total
Return | | Net Assets,
End of Year
(000) | | Expenses,
Net | | Expenses,
Gross | | Investment
Income/
(Loss),
Net | Portfolio
Turnover
Rate |
| Strategic Alternatives Fund | |
| Institutional Class | |
| 2023 | | $ 9.82 | $ 0.33 | $ 0.26 | | $ 0.59 | $(0.38) | $(0.82) | $(1.20) | $ 9.21 | | 5.97% | | $205,865 | | 1.16%(1) | | 1.41%(1) | | 3.25% | 718% |
| 2022 | | 10.29 | 0.03 | (0.09) | | (0.06) | (0.04) | (0.37) | (0.41) | 9.82 | | (0.56) | | 236,559 | | 1.15(1) | | 1.36(1) | | 0.31 | 327 |
| 2021 | | 9.96 | (0.05) | 0.54 | | 0.49 | (0.02) | (0.14) | (0.16) | 10.29 | | 4.96 | | 312,466 | | 1.09(1) | | 1.17(1) | | (0.46) | 377 |
| 2020 | | 10.13 | 0.08 | (0.10) | | (0.02) | (0.14) | (0.01) | (0.15) | 9.96 | | (0.20) | | 287,088 | | 1.10(1) | | 1.10(1) | | 0.82 | 483 |
| 2019 | | 9.87 | 0.13 | 0.36 | | 0.49 | (0.19) | (0.04) | (0.23) | 10.13 | | 4.93 | | 330,017 | | 1.12(1) | | 1.12(1) | | 1.32 | 364 |
| Investor Class | |
| 2023 | | $ 9.76 | $ 0.29 | $ 0.27 | | $ 0.56 | $(0.35) | $(0.82) | $(1.17) | $ 9.15 | | 5.70% | | $ 41,132 | | 1.48%(1) | | 1.74%(1) | | 2.93% | 718% |
| 2022 | | 10.23 | 0.01 | (0.10) | | (0.09) | (0.01) | (0.37) | (0.38) | 9.76 | | (0.91) | | 50,786 | | 1.46(1) | | 1.67(1) | | 0.06 | 327 |
| 2021 | | 9.92 | (0.08) | 0.53 | | 0.45 | — | (0.14) | (0.14) | 10.23 | | 4.57 | | 39,214 | | 1.41(1) | | 1.52(1) | | (0.76) | 377 |
| 2020 | | 10.13 | 0.06 | (0.11) | | (0.05) | (0.15) | (0.01) | (0.16) | 9.92 | | (0.51) | | 45,689 | | 1.36(1) | | 1.36(1) | | 0.59 | 483 |
| 2019 | | 9.87 | 0.10 | 0.36 | | 0.46 | (0.16) | (0.04) | (0.20) | 10.13 | | 4.62 | | 56,076 | | 1.46(1) | | 1.46(1) | | 0.99 | 364 |
| | | | | | | | | | | | | | | | | | | | | | |
| # | Calculated using the average shares outstanding method. |
| (1) | The ratio for the Strategic Alternatives Fund includes the effect of dividend expense on securities sold short which increased the ratio by 0.10%, 0.11%, 0.04%, 0.07%, and 0.05% for the years 2019, 2020, 2021, 2022 and 2023. |
See Notes to Financial Statements.
NOTES TO FINANCIAL STATEMENTS
1. DESCRIPTION OF THE FUNDS
GuideStone Funds (the “Trust”) was organized as a Delaware statutory trust on March 2, 2000. The Trust has established 27 series (each, a “Fund” and together, the “Funds”). Each Fund, except the Growth Equity Fund, is a diversified, open-end management investment company, registered under the Investment Company Act of 1940, as amended (the “1940 Act”). The Equity Index Fund, Value Equity Index Fund, Growth Equity Index Fund and International Equity Index Fund may each become non-diversified solely as a result of a change in relative market capitalization or index weightings of one or more constituents of their respective target indexes.
The MyDestination 2015 Fund, MyDestination 2025 Fund, MyDestination 2035 Fund, MyDestination 2045 Fund and MyDestination 2055 Fund are each referred to as a “Target Date Fund” and together as the “Target Date Funds.”
The Conservative Allocation Fund, Balanced Allocation Fund, Growth Allocation Fund and Aggressive Allocation Fund are each referred to as a “Target Risk Fund” and together as the “Target Risk Funds.”
The remaining Funds are each referred to as a “Select Fund” and are together referred to as the “Select Funds.” The Money Market Fund is referred to as the “Money Market Fund.” The Low-Duration Bond Fund, Medium-Duration Bond Fund, Global Bond Fund and Impact Bond Fund are together referred to as the “Fixed Income Funds.”
The Defensive Market Strategies® Fund, Impact Equity Fund, Equity Index Fund, Value Equity Index Fund, Value Equity Fund, Growth Equity Index Fund, Growth Equity Fund, Small Cap Equity Fund, International Equity Index Fund, International Equity Fund and Emerging Markets Equity Fund are together referred to as the “Equity Funds.”
The Global Real Estate Securities Fund is referred to as the “Real Assets Fund.”
The Strategic Alternatives Fund is referred to as the “Alternatives Fund.”
The Global Impact Fund was liquidated and terminated on January 27, 2023. In connection with the liquidation, the Fund made cash pro-rata distributions to all remaining shareholders who had not previously exchanged or redeemed all of their shares on or about the liquidation date.
There are two classes of shares issued by the Funds — the Institutional Class and the Investor Class (each, a “Class” and together the “Classes”). All Classes of shares have identical voting, dividend and liquidation rights. Income, expenses (other than class specific expenses) and realized and unrealized gains or losses on investments are allocated to each Class of shares based upon its relative net assets.
Each Fund is a separate mutual fund with its own investment objective, strategies and risks. The Select Funds invest directly in particular types of fixed-income obligations, stocks and other investments. The Target Date and Target Risk Funds primarily invest in a different mix of the Select Funds to meet a specified investment strategy. The Target Date and Target Risk Funds are commonly referred to as “Fund of Funds.”
2. SUMMARY OF SIGNIFICANT ACCOUNTING POLICIES
The following is a summary of significant accounting policies followed by the Funds in the accounting and the preparation of their financial statements. The Funds are investment companies and follow accounting and reporting guidance in the Financial Accounting Standards Board ("FASB") Accounting Standards Codification Topic 946 (“ASC 946”). The policies are in conformity with accounting principles generally accepted in the United States of America (“U.S. GAAP”), including but not limited to ASC 946. The preparation of financial statements requires the Funds’ management to make estimates and assumptions that affect the reported amounts of assets and liabilities, the disclosure of contingent assets and liabilities at the date of the financial statements, and the reported amounts of income and expenses for the period. The Funds utilize various methods to measure the value of their
investments on a recurring basis. Amounts received upon the sale of such investments could differ from estimated values and those differences could be significant.
a. Valuation of Securities
Each Fund, except the Money Market Fund, values securities traded on national securities exchanges or included in national market systems at the last quoted sale price, or official close price, on the principal exchange on which they were traded, or, in the absence of any sale or official close price, at the closing bid price. Non-exchange traded securities for which an over-the-counter quotation is readily available are valued at the last quoted bid price.
Debt securities, excluding asset-backed and mortgage-backed securities, are valued at the mean of the last bid and ask prices available, which approximates fair value. Asset-backed and mortgage-backed securities are generally valued at the last bid price, if available.
Short-term securities maturing in more than 60 days from the valuation date are valued at the mean of the last bid and ask prices; those maturing in 60 days or less are generally valued at amortized cost which approximates current market value.
Forward foreign currency contracts are valued based upon closing exchange rates from each respective foreign market.
Futures contracts are valued at the closing settlement price on the exchange on which they are primarily traded.
Options, rights and warrants for which the primary market is a national securities exchange are valued at the last sale price on the exchange on which they are traded, or, in the absence of any sale, at the closing bid price. Options, rights and warrants not traded on a national securities exchange are valued at the last quoted bid price.
Swap agreements are valued daily based upon the terms specific to each agreement with its counterparty. (Please see Note 2.i., “Derivative Financial Instruments” for additional information regarding the valuation of swap agreements).
Non-deliverable bond forward contracts are valued daily based upon the terms specific to each agreement with its counterparty. (Please see Note 2.i., “Derivative Financial Instruments” for additional information regarding the valuation of non-deliverable bond forward contracts).
To the extent available, valuations of portfolio securities are provided by independent pricing services approved by the Valuation Designee, which consists of the voting member of the Adviser's Valuation Committee. Securities for which market quotations are not readily available are valued at fair value according to methods established by the Valuation Designee. Due to the potential excessive volatility at the time valuations are developed, pricing may materially vary from the actual amounts realized upon sale of the securities.
For securities that principally trade on a foreign market or exchange, a significant gap in time can exist between the time of a particular security’s last trade and the time at which a Fund calculates its Net Asset Value (“NAV”). The closing prices of such securities may no longer reflect their market value at the time the Fund calculates its NAV if an event that could materially affect the value of those securities (a “Significant Event”) has occurred between the time of the security’s last close and the time that the Fund calculates its NAV. A Significant Event may relate to a single issuer or to an entire market sector. If management becomes aware of a Significant Event that has occurred with respect to a security or group of securities after the closing of the exchange or market on which the security or securities principally trade, but before the time at which the Fund calculates its NAV, a Valuation Committee meeting may be called. The Funds use Intercontinental Exchange (“ICE”) as a third party fair valuation vendor. ICE provides a fair value for foreign equity securities held by the Funds based on certain factors and methodologies applied by ICE in the event that there is movement in the U.S. market that exceeds a specific threshold established by the Valuation Committee in consultation with the Board of Directors. The specific threshold may be set to 0.00% such that the adjustments to fair value for market movements occur daily to strike a more accurate NAV according to the most recently available information. Such methodologies generally involve tracking valuation correlations between the U.S. market and each non-U.S. security. This value is
called the fair value trigger. The methodologies will only apply to those securities for which a "confidence interval" has been exceeded. ICE has established confidence intervals for each foreign security that determines the level of correlation between the fair value of the foreign equity security and movements in the U.S. market before a particular security will be fair valued. In the event that the threshold established by the valuation procedures is exceeded on a specific day, the Funds will typically value non-U.S. equity securities in its portfolio that exceed the applicable confidence interval based upon the fair values provided by ICE.
Each Fund values their investments in underlying Funds daily at the closing NAV of each respective Fund.
The Financial Accounting Standards Board’s “Fair Value Measurements and Disclosures” defines fair value as the price that a fund would receive to sell an asset or pay to transfer a liability in an orderly transaction between market participants at the measurement date. It establishes and requires disclosure of a fair value hierarchy, separately for each major category of assets and liabilities, that segregates fair value measurements into levels (Levels 1, 2, and 3). Categorizations of fair value measurements, and the criteria used to determine each categorization, are as follows:
Level 1 – quoted prices in active markets for identical securities
Level 2 – prices determined using other significant observable inputs (including quoted prices for similar securities, interest rates, prepayment speeds, credit risk, etc.)
Level 3 – prices determined using significant unobservable inputs (including the valuation committee’s own assumptions in determining the fair value of investments)
Valuation levels are not necessarily an indication of the risk associated with investing in those securities. Changes in valuation techniques may result in transfers into or out of an assigned level within the disclosure hierarchy. In accordance with the requirements of U.S. GAAP, the amounts of transfers in and out of level 3, if material, are disclosed in the Note to Schedule of Investments for each respective fund.
b. Fixed Income Securities
The Fixed Income Funds, the Money Market Fund, and the Strategic Alternatives Fund may invest in mortgage-related and other asset-backed securities. These securities include mortgage pass-through securities, collateralized mortgage obligations, commercial mortgage-backed securities, stripped mortgage-backed securities, asset-backed securities, collateralized debt obligations and/or other securities that directly or indirectly represent a participation in, or are secured by and payable from, mortgage loans on real property. Mortgage-related and other asset-backed securities are interests in pools of loans or other receivables. Mortgage-related securities are created from pools of residential or commercial mortgage loans, including mortgage loans made by savings and loan institutions, mortgage bankers, commercial banks and others. Asset-backed securities are created from many types of assets, including auto loans, credit card receivables, home equity loans and student loans. These securities provide a monthly payment which consists of both interest and principal payments. Interest payments may be determined by fixed or adjustable rates. The rate of pre-payments on underlying mortgages will affect the price and volatility of a mortgage-related security and may have the effect of shortening or extending the effective duration of the security relative to what was anticipated at the time of purchase. The timely payment of principal and interest of certain mortgage-related securities is guaranteed with the full faith and credit of the U.S. government. Pools created and guaranteed by non-governmental issuers, including government-sponsored corporations, may be supported by various forms of insurance or guarantees, but there can be no assurance that the private insurers or guarantors can meet their obligations under the insurance policies or guarantee arrangements.
Collateralized Mortgage Obligations (“CMOs”) are debt obligations of a legal entity that are collateralized by mortgages and divided into classes. CMOs are structured into multiple classes, often referred to as “tranches,” with each class bearing a different stated maturity and entitled to a different schedule for payments of principal and interest, including pre-payments. Commercial
Mortgage-Backed Securities (“CMBS”) include securities that reflect an interest in, and are secured by, mortgage loans on commercial real property. Many of the risks of investing in CMBS reflect the risks of investing in the real estate securing the underlying mortgage loans. These risks reflect the effects of local and other economic conditions on real estate markets, the ability of tenants to make loan payments and the ability of a property to attract and retain tenants. CMOs and CMBS may be less liquid and may exhibit greater price volatility than other types of mortgage- or asset-backed securities.
Stripped Mortgage-Backed Securities (“SMBS”) are derivative multi-class mortgage securities. SMBS are usually structured with two classes that receive different proportions of the interest and principal distributions on a pool of mortgage assets. A common type of SMBS will have one class receiving some of the interest and most of the principal from the mortgage assets, while the other class will receive most of the interest and the remainder of the principal. In the most extreme case, one class will receive all of the interest (the interest-only or “IO” class), while the other class will receive the entire principal (the principal-only or “PO” class). Payments received for IOs are included in interest income on the Statements of Operations. Because little to no principal will be received at the maturity of an IO, adjustments are made to the book value of the security on a monthly basis until maturity. These adjustments are included in interest income on the Statements of Operations. Payments received for POs are treated as reductions to the cost and par value of the securities.
Inflation-indexed bonds are fixed-income securities whose principal value is periodically adjusted to the rate of inflation. The interest rate on these bonds is generally fixed at issuance at a rate lower than typical bonds. Over the life of an inflation-indexed bond, however, interest will be paid based on a principal value, which is adjusted for inflation. Any increase or decrease in the principal amount of an inflation-indexed bond will be included as interest income on the Statements of Operations, even though investors do not receive their principal until maturity.
“TBA” (to be announced) commitments are commitments to purchase or sell mortgage-backed securities for a fixed price at a future date, typically not exceeding 45 days. TBAs may be considered securities in themselves and involve a risk of loss if the value of the security to be purchased declines prior to settlement date. This risk is in addition to the risk of decline in each Fund’s other assets. Unsettled TBAs are valued at the current market value of the underlying securities, according to the procedures described in the section entitled “Valuation of Securities.”
The Fixed Income Funds may enter into dollar roll transactions, pursuant to which they sell a mortgage-backed TBA or security and simultaneously purchase a similar, but not identical, TBA with the same issuer, rate and terms. The Funds may execute a “roll” to obtain better underlying mortgage securities or to increase yield. The Funds account for dollar roll transactions as purchases and sales, which has the effect of increasing their portfolio turnover rates. Risks associated with dollar rolls are that actual mortgages received by the Funds may be less favorable than those anticipated or that counterparties may fail to perform under the terms of the contracts.
U.S. government securities are obligations of and, in certain cases, guaranteed by, the U.S. government, its agencies or instrumentalities. The U.S. government does not guarantee the NAV of the Funds’ shares. Some U.S. government securities, such as Treasury bills, notes and bonds and securities guaranteed by the Government National Mortgage Association (“GNMA” or “Ginnie Mae”), are supported by the full faith and credit of the U.S. government; others, such as those of the Federal Home Loan Bank, are supported by the right of the issuer to borrow from the U.S. Department of the Treasury (the “U.S. Treasury”); others, such as those of the Federal National Mortgage Association (“FNMA” or “Fannie Mae”), are supported by the discretionary authority of the U.S. government to purchase the agency’s obligations; and still others, such as those of the Student Loan Marketing Association, are supported only by the credit of the instrumentality. U.S. government securities may include zero
coupon securities, which do not distribute interest on a current basis and tend to be subject to greater risk than interest-paying securities of similar maturities.
Government-related guarantors (i.e., not backed by the full faith and credit of the U.S. government) include FNMA and the Federal Home Loan Mortgage Corporation (“FHLMC” or “Freddie Mac”). FNMA is a government-sponsored corporation, the common stock of which is owned entirely by private stockholders. FNMA purchases conventional (i.e., not insured or guaranteed by any government agency) residential mortgages from a list of approved seller/servicers which include state and federally chartered savings and loan associations, mutual savings banks, commercial banks and credit unions and mortgage bankers. Pass-through securities issued by FNMA are guaranteed as to timely payment of principal and interest by FNMA, but are not backed by the full faith and credit of the U.S. government. FHLMC issues Participation Certificates (“PCs”), which are pass-through securities, each representing an undivided interest in a pool of residential mortgages. FHLMC guarantees the timely payment of interest and ultimate collection of principal, but PCs are not backed by the full faith and credit of the U.S. government.
c. Foreign Currency Translations
Investment securities and other assets and liabilities denominated in foreign currencies are translated into U.S. dollar amounts at the date of valuation. Purchases and sales of investment securities and income and expense items denominated in foreign currencies are translated into U.S. dollar amounts on the respective dates of such transactions.
The Funds isolate that portion of the results of operations resulting from changes in foreign exchange rates on investments from the fluctuations arising from changes in market prices of securities held.
Reported net realized foreign exchange gains or losses arise from sales of portfolio securities, sales and maturities of short-term securities, sales of foreign currencies, currency gains or losses realized between the trade and settlement dates on securities transactions and the difference between the amounts of dividends, interest, and foreign withholding taxes recorded on the Fund’s books and the U.S. dollar equivalent of the amounts actually received or paid. Net unrealized foreign exchange gains and losses arise from changes in the values of assets and liabilities, including investments in securities at fiscal year-end, resulting from changes in the exchange rate.
d. Loan Participations
The Fixed Income Funds, Defensive Market Strategies® Fund and Strategic Alternatives Fund may invest in direct debt instruments which are interests in amounts owed to lenders or lending syndicates by corporate borrowers. Investments in loans may be in the form of participations in loans. A loan is often administered by a bank or other financial institution (the “lender”) that acts as agent for all holders. The agent administers the terms of the loan, as specified in the loan agreement. The holder may invest in multiple series of a loan, which may have varying terms and carry different associated risks. The holder generally has no right to enforce compliance with the terms of the loan agreement with the borrower. As a result, these instruments may be subject to the credit risk of both the borrower and the lender that is selling the loan agreement. When investing in a loan participation, the holder has the right to receive payments of principal, interest and any fees to which it is entitled only from the lender selling the loan agreement and only upon receipt of payments by the lender from the borrower.
The Fixed Income Funds, Defensive Market Strategies® Fund and Strategic Alternatives Fund may invest in floating rate loans, some of which may be unfunded corporate loan commitments (“commitments”). Commitments may obligate the holder to furnish temporary financing to a borrower until permanent financing can be arranged. The holder may receive a commitment fee based on the undrawn portion of the underlying line of credit portion of a floating rate loan. In certain circumstances, the holder may receive a prepayment penalty fee upon the prepayment of a floating rate loan by a borrower. Fees earned or paid are recorded as a component of interest income or interest expense on the Statements of Operations.
e. Real Estate Investment Securities
Each Select Fund may invest in real estate investment trusts (“REITs”) and other real-estate related securities. A REIT is a company dedicated to owning, and usually operating, income-producing real estate or to financing real estate and can generally be classified as an equity REIT, mortgage REIT or hybrid REIT. Equity REITs invest directly in real property, while mortgage REITs invest in mortgages on real property. Hybrid REITs combine characteristics of both equity REITs and mortgage REITs. REITs may be subject to certain risks associated with the direct ownership of real estate, including declines in the value of real estate, risks related to general and local economic conditions, overbuilding and increased competition, increases in property taxes and operating expenses and variations in rental income. Equity REITs may be affected by changes in the value of the underlying property owned by the REITs, while mortgage REITs may be affected by the quality of credit extended. Equity and mortgage REITs are dependent upon management skill and are subject to the risks of financing projects. REITs are also subject to heavy cash flow dependency, defaults by borrowers and self-liquidation. In addition, adverse economic, business or political developments affecting the real estate sector could have a major effect on the value of a REIT and other real-estate related securities.
Dividend income from REITs is recorded using management’s estimate of the income included in distributions received from REIT investments. The actual amounts of income, return of capital and capital gains are only determined by each REIT after its fiscal year-end and may differ from the estimated amount. Estimates of income are adjusted in the Funds to the actual amounts when the amounts are determined.
f. Repurchase Agreements
Each Fund may agree to purchase securities from financial institutions subject to the seller’s agreement to repurchase them at a mutually agreed upon date and price. It is the Trust's policy that repurchase agreements are fully collateralized by U.S. Treasury and Government Agency securities, or by other securities sufficiently guaranteed and liquid in accordance with Rule 5b-3 under the 1940 Act. Any repurchase agreement entered into by a Fund will be collateralized by at least 100% of the repurchase price (including accrued interest) for repurchase agreements collateralized by U.S. Government securities or cash, and at least 102% of the repurchase price (including accrued interest) for other types of collateral. All collateral is held by the Fund’s custodian bank or a bank with which the custodian bank has entered into a subcustodian agreement, or is segregated in the Federal Reserve Book Entry System. In connection with transactions in repurchase agreements, if the seller defaults and the value of the collateral declines, or if the seller enters an insolvency proceeding, realization of the collateral by the Fund may be delayed or limited.
Repurchase transactions are entered into by the Funds under Master Repurchase Agreements (“MRA”) which permit the Funds, under certain circumstances including an event of default (such as bankruptcy or insolvency), to offset payables and/or receivables under the MRA with collateral held and/or posted to the counterparty and create one single net payment due to or from the Fund.
At December 31, 2023, the open repurchase agreements by counterparty which are subject to an MRA on a net payment basis are as follows:
| Fund/Counterparty | | Repurchase
Agreements | | Fair Value of
Non-cash
Collateral
Received(1) | | Cash
Collateral
Received | | Net Amount(2) |
| Money Market | | | | | | | | |
| Bank of Nova Scotia | | $ 80,000,000 | | $ (80,000,000) | | $ — | | $ — |
| BNP Paribas | | 66,000,000 | | (66,000,000) | | — | | — |
| Citigroup Global Markets, Inc. | | 70,000,000 | | (70,000,000) | | — | | — |
| Goldman Sachs & Co. | | 105,000,000 | | (105,000,000) | | — | | — |
| Mitsubishi UFJ Securities USA, Inc. | | 80,000,000 | | (80,000,000) | | — | | — |
| Mizuho Securities USA, Inc. | | 85,000,000 | | (85,000,000) | | — | | — |
| Fund/Counterparty | | Repurchase
Agreements | | Fair Value of
Non-cash
Collateral
Received(1) | | Cash
Collateral
Received | | Net Amount(2) |
| Morgan Stanley | | $ 80,000,000 | | $ (80,000,000) | | $ — | | $ — |
| Natixis SA | | 73,000,000 | | (73,000,000) | | — | | — |
| TD Securities USA LLC | | 80,000,000 | | (80,000,000) | | — | | — |
| Total Repurchase Agreements | | $ 719,000,000 | | $ (719,000,000) | | $ — | | $ — |
| Medium-Duration Bond | | | | | | | | |
| Citigroup Global Markets, Inc. | | $ 170,400,000 | | $ (170,400,000) | | $ — | | $ — |
| Deutsche Bank Securities, Inc. | | 96,000,000 | | (96,000,000) | | — | | — |
| JPMorgan Securities LLC | | 77,100,000 | | (77,100,000) | | — | | — |
| Total Repurchase Agreements | | $ 343,500,000 | | $ (343,500,000) | | $ — | | $ — |
(1) The value of the related collateral received exceeded the value of the repurchase agreement as of December 31, 2023.
(2) Net amount represents the net amount of receivable due from (payable to) the counterparty in the event of a default.
Additional information about netting arrangements under the Master Agreements can be found in the Derivative Financial Instruments and Securities Lending sections of the Notes to Financial Statements.
g. Short Sales
A short sale is a transaction in which a Fund sells a security it does not own. The Fund’s obligation to replace the security borrowed and sold short will be collateralized by cash equivalents maintained in a segregated account with the broker. Cash deposited with the broker is recorded as an asset on the Statements of Assets and Liabilities. If the price of the security sold short increases between the time of the short sale and the time the Fund replaces the borrowed security, the Fund will realize a loss; and if the price declines during the period, the Fund will realize a gain. Any realized gain will be decreased, and any realized loss increased, by the amount of transaction costs.
The Fixed Income Funds and Strategic Alternatives Fund may sell short U.S. Treasury securities and derivatives such as, but not limited to, swaps, futures contracts and currency forwards to manage risk (e.g., duration, currency, credit, etc.). The Fixed Income Funds may occasionally enter into a short sale to initiate a dollar roll transaction. The Low-Duration Bond Fund may be involved in dollar roll transactions with U.S. Treasury securities throughout the year. The Strategic Alternatives Fund may establish short positions in stocks of companies with a market value of up to 40% of the Fund's assets. The Defensive Market Strategies® Fund may establish short positions in stocks of companies with a market value of up to 30% of the Fund’s assets. The International Equity Fund may establish short positions in stocks of foreign companies with a market value of up to 10% of the Fund’s assets.
At December 31, 2023, the value of securities sold short was $11,205,320 in the Strategic Alternatives Fund.
h. Synthetic Convertible Instruments
The Defensive Market Strategies® Fund establishes synthetic convertible instruments. Synthetic convertible instruments combine fixed-income securities (which may be convertible or non-convertible) with the right to acquire equity securities. In establishing a synthetic instrument, a basket of fixed-income securities are pooled with a basket of options or warrants that produce the characteristics similar to a convertible security. The risks of investing in synthetic convertible instruments include unfavorable price movements in the underlying security and the credit risk of the issuing financial institution. There may be no guarantee of a
return of principal with synthetic convertible instruments and the appreciation potential may be limited. Synthetic convertible instruments may be more volatile and less liquid than other investments held by the Fund.
i. Derivative Financial Instruments
The Funds may engage in various portfolio strategies to seek to increase their return by hedging their portfolios against adverse movements in the equity, debt and currency markets. Losses may arise due to changes in the value of the contract if the counterparty does not perform under the contract. The Funds, in their normal course of business, may enter into contracts that contain a variety of representations and warranties and which provide general indemnifications. The Funds’ exposure may include future claims that may be made against the Funds that have not yet occurred.
FASB “Derivatives and Hedging” includes required disclosure for (i) the nature and terms of the derivative, reasons for entering into the derivative, the events or circumstances that would require the seller to perform under the derivative, and the current status of the payment/performance risk of the derivative, (ii) the maximum potential amount of future payments (undiscounted) the seller could be required to make under the derivative, (iii) the fair value of the derivative and (iv) the nature of any recourse provisions and assets held either as collateral or by third parties. FASB “Guarantees” requires additional disclosures about the current status of the payment/performance risk of a guarantee. All of this information has been incorporated for the current period as part of the Schedules of Investments within the Swap agreements outstanding disclosure and in the Notes to Financial Statements.
Financial Futures Contracts — The Funds (except the Money Market Fund) may purchase or sell financial futures contracts and the options on such futures contracts for the purpose of hedging risk on existing securities, demonstrating purchase of securities or gaining market exposure on cash balances. Financial futures contracts are contracts for the delivery of securities at a specified future date at an agreed upon price or yield. Upon entering into a contract, the Funds deposit and maintain as collateral such initial margin as required by the exchange on which the transaction is effected.
Pursuant to the contract, the Funds agree to pay to or receive from the broker an amount of cash equal to the daily fluctuation in the value of the contract. Such payments or receipts are known as variation margin and are recorded by the Funds as unrealized gains or losses until the contract is closed or settled.
Risks of entering into futures contracts include the possibility that there will be an imperfect price correlation between the futures and the underlying securities. Second, it is possible that a lack of liquidity for futures contracts could exist in the secondary market, resulting in an inability to close a futures position prior to its maturity date. Third, the purchase of a futures contract involves the risk that a Fund could lose more than the original margin deposit required to initiate a futures transaction. Futures contracts involve, to varying degrees, risk of loss in excess of the variation margin disclosed on the Statements of Assets and Liabilities.
Foreign Currency Options and Futures — The Fixed Income Funds, Impact Equity Fund, Real Assets Fund, International Equity Index Fund, International Equity Fund, Emerging Markets Equity Fund, Strategic Alternatives Fund and the Defensive Market Strategies® Fund may also enter into futures contracts on foreign currencies and related options on transactions as a short or long hedge against possible variations in foreign exchange rates.
Forward Foreign Currency Contracts — Certain Funds may enter into forward foreign currency contracts to hedge against adverse exchange rate fluctuation to the U.S. dollar or between different foreign currencies in connection with either specific security transactions or portfolio positions. Each contract is valued daily and the change in value is recorded as an unrealized gain or loss. When the contract is closed, a realized gain or loss is recorded equal to the difference between the opening value and the closing value of the contract. These contracts may involve market risk in excess of the unrealized gain or loss reflected on the Statements of Assets and Liabilities. The Funds could be exposed to risk if the counterparties to the
contracts are unable to meet the terms of the contract and from unanticipated movements in the value of a foreign currency relative to the U.S. dollar.
Non-Deliverable Bond Forward Contracts — A non-deliverable bond forward is a short-term forward contract between two parties to buy or sell a bond denominated in a non-deliverable foreign currency at a specified future time and price. Non-deliverable bond forwards are marked-to-market daily using market quotations. Unrealized gains or losses on non-deliverable bond forwards are recorded by the Fund on a daily basis, and realized gains or losses are recorded on the termination date or sale of a contract.
Options — Certain Funds are authorized to write and purchase put and call options. The risk in writing a call option is that the Funds give up the opportunity for profit if the market price of the security increases. The risk in writing a put option is that the Funds may incur a loss if the market price of the security decreases and the option is exercised. The risk in purchasing an option is that the Funds pay a premium whether or not the option is exercised. The Funds also have the additional risk of being unable to enter into a closing transaction at an acceptable price if a liquid secondary market does not exist. The Funds also may write over-the-counter options where completing the obligation depends upon the credit standing of the other party and that party’s ability to perform. Option contracts also involve the risk that they may not work as intended due to unanticipated developments in market conditions or other causes.
Options purchased are recorded as an asset and written options are recorded as liabilities to the extent of premiums paid or received. Each Fund will realize a gain or loss when the option transaction expires or closes. When an option is exercised, the proceeds on sales for a written call option, the purchase cost for a written put option or the cost of a security for a purchased put or call option is adjusted by the amount of the premium received or paid.
When a Fund writes a call or put option, an amount equal to the premium received is recorded as a liability and subsequently marked to market to reflect the current value of the option written. These liabilities are reflected as written options on the Statements of Assets and Liabilities.
Certain Funds may write swaption contracts to manage exposure to fluctuations in interest rates and to enhance portfolio yield. Swaption contracts written by the Funds represent an option that gives the purchaser the right, but not the obligation, to enter into a previously agreed upon swap agreement on a future date. If a written call swaption is exercised, the writer will enter a swap and is obligated to pay the fixed-rate and receive a floating rate in exchange. If a written put swaption is exercised, the writer will enter a swap and is obligated to pay the floating rate and receive a fixed rate in exchange. Swaptions are marked-to-market daily based upon quotations from market makers. When a Fund writes a swaption, the premium received is recorded as a liability and is subsequently adjusted to the current market value of the swaption.
Entering into a swaption contract involves, to varying degrees, the elements of credit, market and interest rate risk in excess of the associated option and swap agreement amounts reported in the Statements of Assets and Liabilities. The Funds bear the market risk arising from any change in index values or interest rates.
Swap Agreements — Certain Funds may enter into swap agreements, such as total return swaps. The Equity Funds may enter into equity swap agreements, and the International Equity Fund and Emerging Markets Equity Fund may also enter into cross-currency swap agreements. The Fixed Income Funds may enter into interest rate, credit default, and cross-currency swap agreements. The Strategic Alternatives Fund may enter into equity and interest rate swap agreements.
Swap agreements are privately negotiated agreements between a Fund and a counterparty to exchange or swap investment cash flows, assets, foreign currencies or market-linked returns at specified, future intervals. A swap may be entered into in order to, among other things, change the maturity of a Fund’s portfolio, to protect a Fund’s value from changes in interest
rates, to expose a Fund to a different security or market or to help a Fund achieve a strategy relative to an index or other benchmark. By entering into a swap agreement, a Fund is exposed to the risk of unanticipated movements in interest rates or in the value of an underlying security or index (or the risk that the counterparty will not fulfill its obligation under the agreement).
Swaps are marked-to-market daily based upon values from third party vendors or quotations from market makers to the extent available; and the change in value, if any, is recorded as an unrealized gain or loss on the Statements of Assets and Liabilities. In the event that market quotations are not readily available or deemed reliable, certain swap agreements may be valued pursuant to guidelines established by the Board of Directors. In the event that market quotes are not readily available and the swap cannot be valued pursuant to one of the valuation methods, the value of the swap will be determined in good faith by the Valuation Committee, generally based upon recommendations provided by the Fund’s sub-adviser.
Payments received or made at the beginning of the measurement period are reflected as such on the Statements of Assets and Liabilities and represent payments made or received upon entering into the swap agreement to compensate for differences between the stated terms of the swap agreement and prevailing market conditions (credit spreads, currency exchange rates, interest rates, and other relevant factors). These upfront payments are recorded as realized gains or losses on the Statements of Operations upon termination or maturity of the swap. A liquidation payment received or made at the termination of the swap is recorded as realized gain or loss on the Statements of Operations. Net periodic payments received or paid by a Fund are included as part of realized gains or losses on the Statements of Operations.
Certain Funds’ derivative agreements contain provisions that require a Fund to maintain a predetermined level of net assets, and/or provide limits regarding the decline of the Fund’s NAV over one-month, three-month and 12-month periods. If a Fund were to violate such provisions, the counterparties to the derivative instruments could request immediate payment or demand immediate collateralization on derivative instruments in net liability positions. For the year ended December 31, 2023, all of the Funds maintained the required level of net assets and/or the NAVs of the Funds did not decline below the limits set forth in the derivative agreements.
Entering into these agreements involves, to varying degrees, elements of credit, market and documentation risk in excess of the amounts recognized on the Statements of Assets and Liabilities. Such risks involve the possibility that there will be no liquid market for these agreements, that the counterparty to the agreements may default on its obligation to perform or disagree as to the meaning of contractual terms in the agreements and that there may be unfavorable changes in interest rates.
Credit Default Swaps — Credit default swap (“CDS”) agreements involve one party making a stream of payments (referred to as the buyer of protection) to another party (the seller of protection) in exchange for the right to receive a specified return in the event of a default or other credit event for the referenced entity, obligation or index. As a seller of protection on CDS agreements, a Fund will generally receive from the buyer of protection a fixed rate of income throughout the term of the swap provided that there is no credit event. As the seller, a Fund would effectively add leverage to its portfolio because, in addition to its total net assets, a Fund would be subject to investment exposure on the notional amount of the swap. In connection with these agreements, securities are set aside as collateral by the Fund’s custodian.
Upfront payments made or received in connection with CDS agreements are amortized over the expected life of the CDS agreements as unrealized gains or losses on swap agreements. The change in value of the CDS agreements is recorded daily as unrealized appreciation or depreciation. A realized gain or loss is recorded upon a credit event (as defined in the CDS agreement) or the maturity or termination of the agreement.
The sub-advisers monitor a variety of factors including cash flow assumptions, market activity, market sentiment and valuation as part of their ongoing process of assessing payment and performance risk. As payment and performance risk increases, the value of a CDS increases, resulting in recognition of unrealized gains for long positions and unrealized losses for short positions. Conversely, as payment and performance risk decreases, unrealized gains are recognized for short positions and unrealized losses are recognized for long positions. Any current or future declines in the fair value of the swap may be partially offset by upfront payments received by the Fund as a seller of protection if applicable. The change in value is recorded within unrealized appreciation (depreciation) until the occurrence of a credit event or the termination of the swap, at which time a realized gain (loss) is recorded.
If a Fund is a seller of protection and a credit event occurs, as defined under the terms of that particular swap agreement, a Fund will either (i) pay to the buyer of protection an amount equal to the notional amount of the swap and take delivery of the referenced obligation, other deliverable obligations or underlying securities comprising the referenced index or (ii) pay a net settlement amount in the form of cash or securities equal to the notional amount of the swap less the recovery value of the referenced obligation or underlying securities comprising the referenced index. If a Fund is a buyer of protection and a credit event occurs, as defined under the terms of that particular swap agreement, a Fund will either (i) receive from the seller of protection an amount equal to the notional amount of the swap and deliver the referenced obligation, other deliverable obligations or underlying securities comprising the referenced index or (ii) receive a net settlement amount in the form of cash or securities equal to the notional amount of the swap less the recovery value of the referenced obligation or underlying securities comprising the referenced index. Recovery values are assumed by market makers considering either industry standard recovery rates or entity specific factors and considerations until a credit event occurs. If a credit event has occurred, the recovery value is determined by a facilitated auction whereby a minimum number of allowable broker bids, together with a specified valuation method, are used to calculate the settlement value.
CDS agreements on corporate issues or sovereign issues of an emerging country involve one party making a stream of payments to another party in exchange for the right to receive a specified return in the event of a default or other credit event. If a credit event occurs and cash settlement is not elected, a variety of other deliverable obligations may be delivered in lieu of the specific referenced obligation. The ability to deliver other obligations may result in a cheapest-to-deliver option (the buyer of protection’s right to choose the deliverable obligation with the lowest value following a credit event). A Fund may use CDS on corporate issues or sovereign issues of an emerging country to provide a measure of protection against defaults of the issuers (i.e., to reduce risk where a Fund owns or has exposure to the referenced obligation) or to take an active long or short position with respect to the likelihood of a particular issuer’s default.
CDS agreements on asset-backed securities involve one party making a stream of payments to another party in exchange for the right to receive a specified return in the event of a default or other credit event. Unlike CDS on corporate issues or sovereign issues of an emerging country, deliverable obligations in most instances would be limited to the specific referenced obligation as performance for asset-backed securities can vary across deals. Prepayments, principal paydowns, and other write down or loss events on the underlying loans will reduce the outstanding principal balance of the referenced obligation. These reductions may be temporary or permanent as defined under the terms of the swap agreement, and the notional amount for the swap agreement will be adjusted by corresponding amounts. A Fund may use CDS on asset-backed securities to provide a measure of protection against defaults of the referenced obligation or to take an active long or short position with respect to the likelihood of a particular referenced obligation's default.
CDS agreements on credit indexes involve one party making a stream of payments to another party in exchange for the right to receive a specified return in the event of a write-down, principal shortfall, interest shortfall or default of all or part of the referenced entities comprising the credit index. A credit index is a list of a basket of credit instruments or exposures designed to be representative of some part of the credit market as a whole. These indexes are made up of reference credits
that are judged by a poll of dealers to be the most liquid entities in the CDS market based on the sector of the index. Components of the indexes may include, but are not limited to, investment grade securities, high yield securities, asset-backed securities, emerging markets, and/or various credit ratings within each sector. Credit indexes are traded using CDS with standardized terms including a fixed spread and standard maturity dates. An index CDS references all the names in the index, and if there is a default, the credit event is settled based on that name’s weight in the index. The composition of the indexes changes periodically, usually every six months, and for most indexes, each name has an equal weight in the index. A Fund may use CDS on credit indexes to hedge a portfolio of CDS or bonds with a CDS on indexes which is less expensive than it would be to buy many CDS to achieve a similar effect. CDS on indexes are benchmarks for protecting investors owning bonds against default, and traders use them to speculate on changes in credit quality.
Implied credit spreads, represented in absolute terms, utilized in determining the market value of CDS agreements on corporate issues or sovereign issues of an emerging country as of year-end are disclosed in the Schedules of Investments and serve as an indicator of the current status of the payment/performance risk and represent the likelihood or risk of default for the credit derivative. The implied credit spread of a particular referenced entity reflects the cost of buying/selling protection and may include upfront payments required to be made to enter into the agreement. For CDS agreements on asset-backed securities and credit indexes, the quoted market prices and resulting values serve as the indicator of the current status of the payment/performance risk. Wider credit spreads and increasing market values, in absolute terms when compared to the notional amount of the swap, represent a deterioration of the referenced entity’s credit soundness and a greater likelihood or risk of default or other credit event occurring as defined under the terms of the agreement.
The maximum potential amount of future payments (undiscounted) that a Fund as a seller of protection could be required to make under a CDS agreement would be an amount equal to the notional amount of the agreement. These potential amounts would be partially offset by any recovery values of the respective referenced obligations, upfront payments received upon entering into the agreement, or net amounts received from the settlement of buy protection CDS agreements entered into by a Fund for the same referenced entity or entities.
CDS involve greater risks than if the Funds had invested in the referenced obligation directly. In addition to general market risks, CDS are subject to liquidity risk and counterparty credit risk. The Funds enter into CDS with counterparties meeting defined criteria for financial strength. A buyer also may lose its investment and recover nothing should a credit event not occur. If a credit event did occur, the value of the referenced obligation received by the seller, coupled with the periodic payments previously received, may be less than the full notional value it pays to the buyer, resulting in a loss of value.
The maximum potential amount of future payments (undiscounted) that a Fund as a seller of protection could be required to make under a CDS agreement equals the notional amount of the agreement. Notional amounts of each individual CDS agreement outstanding as of year-end for which a Fund is the seller of protection are disclosed in the Schedules of Investments. These potential amounts would be partially offset by any recovery values of the respective referenced obligations, upfront payments received upon entering into the agreement or net amounts received from the settlement of buy protection CDS agreements entered into by a Fund for the same referenced entity or entities.
Centrally Cleared Swap Agreements — Centrally cleared swaps are either interest rate or CDS agreements brokered by the Chicago Mercantile Exchange, London Clearing House or the Intercontinental Exchange (the “Exchanges”) where the Exchanges are the counterparty to both the buyer and seller of protection. Centrally cleared swaps involve a lesser degree of risk because the Exchanges, as counterparties, monitor risk factors for the involved parties. Centrally cleared swaps are subject to general market risks and to liquidity risk. Pursuant to the agreement, the Funds agree to pay to or receive from the broker an amount of cash equal to the daily fluctuation in the value of the contract (the “margin”) and daily interest on the
margin. In the case of centrally cleared interest rate swaps, the daily settlement also includes the daily portion of interest. Such payments are recorded by the Funds as unrealized gains or losses until the contract is closed or settled.
Centrally cleared swaps require no payments at the beginning of the measurement period, nor are there liquidation payments at the termination of the swap.
Cross-Currency Swap Agreements — Cross-currency swap agreements involve two parties exchanging two different currencies with an agreement to reverse the exchange at a later date at specified exchange rates. The exchange of currencies at the inception date of the contract takes place at the current spot rate. The re-exchange at maturity may take place at the same exchange rate, a specified rate, or the then current spot rate. Interest payments, if applicable, are made between the parties based on interest rates available in the two currencies at the inception of the contract. The terms of cross-currency swap agreements may extend for many years. Cross-currency swaps are usually negotiated with commercial and investment banks. Some cross-currency swaps may not provide for exchanging principal cash flows but only for exchanging interest cash flows.
Interest Rate Swap Agreements — Interest rate swap agreements involve the exchange by a Fund with another party of their respective commitments to pay or receive interest with respect to the notional amount of principal. Certain forms of interest rate swap agreements may include: (i) interest rate caps, under which, in return for a premium, one party agrees to make payments to the other to the extent that interest rates exceed a specified rate, or “cap”, (ii) interest rate floors, under which, in return for a premium, one party agrees to make payments to the other to the extent that interest rates fall below a specified rate, or “floor”, (iii) interest rate collars, under which a party sells a cap and purchases a floor or vice versa in an attempt to protect itself against interest rate movements exceeding given minimum or maximum levels, (iv) callable interest rate swaps, under which the counterparty may terminate the swap transaction in whole at zero cost by a predetermined date and time prior to the maturity date, (v) spread locks, which allow the interest rate swap users to lock in the forward differential (or spread) between the interest rate swap rate and a specified benchmark or (vi) basis swaps, under which two parties can exchange variable interest rates based on different money markets.
Total Return Swap Agreements — Total return swap agreements on commodities involve commitments where exchanged cash flows are based on the price of an underlying commodity. In return, a Fund receives either a fixed rate of interest or a rate determined by a floating rate index. One party would receive payments based on the market value of the commodity involved and pay a fixed amount. Total return swap agreements on indexes involve commitments to pay interest in exchange for a market-linked return. One counterparty pays out the total return of a specific reference asset, which may be an equity, index or bond, and in return receives a regular stream of payments. To the extent the total return of the security or index underlying the transaction exceeds or falls short of the offsetting interest rate obligation, a Fund will receive a payment from or make a payment to the counterparty.
Forward Rate Agreements — Forward rate agreements represent an agreement between counterparties to exchange cash flows based on the difference between two interest rates, applied to a notional principal amount on a fixed future date. The Funds enter into forward rate agreements to gain yield exposure based on anticipated market conditions at the specified termination date of the agreement.
Variance Swap Agreements — Variance swap agreements involve two parties exchanging cash payments based on the difference between the stated level of variance (“Variance Strike Price”) and the actual variance realized on an underlying asset or index. As a receiver of the realized price variance, a Fund would receive the payoff amount when the realized price variance of the underlying asset is greater than the strike price and would owe the payoff amount when the variance is less than the strike price. As a payer of the realized price variance, a Fund would owe the payoff amount when the realized price
variance of the underlying asset is greater than the strike price and would receive the payoff amount when the variance is less than the strike. A Fund may enter into variance swaps in an attempt to hedge market risk or adjust exposure to the markets.
Offsetting of Financial and Derivative Assets and Liabilities
Certain Funds are parties to International Swap and Derivatives Association, Inc. (“ISDA”) Master Agreements (“MA”) with various counterparties that govern over-the-counter derivative and foreign exchange contracts entered into from time to time. The ISDA MA may contain provisions regarding, among other things, the parties’ general obligations, representations, agreements, collateral requirements, events of default and early termination. With respect to certain counterparties, in accordance with the terms of the ISDA MA, collateral posted to the Fund is held in a segregated account by the Fund’s custodian and with respect to those amounts which can be sold or repledged, is presented in the Fund’s portfolio or Statements of Assets and Liabilities. For financial reporting purposes, the Funds do not offset derivative assets and derivative liabilities that are subject to an ISDA MA in the Statements of Assets and Liabilities.
At December 31, 2023, derivative assets and liabilities (by type) held by the Funds are as follows:
| Fund | | Assets | | Liabilities |
| Balanced Allocation | | | | |
| Derivative Financial Instruments: | | | | |
| Futures contracts | | $ — | | $ 1,664 |
| Total derivative assets and liabilities in the Statements of Assets and Liabilities | | — | | 1,664 |
| Derivatives not subject to an ISDA MA or similar agreement | | — | | 1,664 |
| Total assets and liabilities subject to an ISDA MA | | $ — | | $ — |
| Growth Allocation | | | | |
| Derivative Financial Instruments: | | | | |
| Futures contracts | | $ — | | $ 1,536 |
| Total derivative assets and liabilities in the Statements of Assets and Liabilities | | — | | 1,536 |
| Derivatives not subject to an ISDA MA or similar agreement | | — | | 1,536 |
| Total assets and liabilities subject to an ISDA MA | | $ — | | $ — |
| Aggressive Allocation | | | | |
| Derivative Financial Instruments: | | | | |
| Futures contracts | | $ — | | $ 3,015 |
| Total derivative assets and liabilities in the Statements of Assets and Liabilities | | — | | 3,015 |
| Derivatives not subject to an ISDA MA or similar agreement | | — | | 3,015 |
| Total assets and liabilities subject to an ISDA MA | | $ — | | $ — |
| Low-Duration Bond | | | | |
| Derivative Financial Instruments: | | | | |
| Futures contracts | | $ 152,026 | | $ — |
| Forward foreign currency contracts | | 87,211 | | 219,720 |
| Centrally cleared swaps | | 1,284 | | — |
| Total derivative assets and liabilities in the Statements of Assets and Liabilities | | 240,521 | | 219,720 |
| Derivatives not subject to an ISDA MA or similar agreement | | 153,310 | | 93,451 |
| Total assets and liabilities subject to an ISDA MA | | $ 87,211 | | $ 126,269 |
| Fund | | Assets | | Liabilities |
| Medium-Duration Bond | | | | |
| Derivative Financial Instruments: | | | | |
| Futures contracts | | $ 56,222 | | $ — |
| Forward foreign currency contracts | | 2,316,418 | | 4,616,879 |
| Options | | 1,454,072 | | 1,065,095 |
| Centrally cleared swaps | | 198,045 | | — |
| Swap agreements | | 60,308 | | 17,209 |
| Total derivative assets and liabilities in the Statements of Assets and Liabilities | | 4,085,065 | | 5,699,183 |
| Derivatives not subject to an ISDA MA or similar agreement | | 1,654,098 | | 443,903 |
| Total assets and liabilities subject to an ISDA MA | | $ 2,430,967 | | $ 5,255,280 |
| Global Bond | | | | |
| Derivative Financial Instruments: | | | | |
| Futures contracts | | $ 1,897,049 | | $ — |
| Forward foreign currency contracts | | 26,444,461 | | 28,166,159 |
| Options | | 1,828 | | — |
| Centrally cleared swaps | | — | | 497 |
| Total derivative assets and liabilities in the Statements of Assets and Liabilities | | 28,343,338 | | 28,166,656 |
| Derivatives not subject to an ISDA MA or similar agreement | | 1,898,877 | | 1,439 |
| Total assets and liabilities subject to an ISDA MA | | $26,444,461 | | $28,165,217 |
| Defensive Market Strategies® | | | | |
| Derivative Financial Instruments: | | | | |
| Futures contracts | | $ — | | $ 25,939 |
| Forward foreign currency contracts | | 3,005 | | 214,740 |
| Options | | 69,646,344 | | 2,638,617 |
| Total derivative assets and liabilities in the Statements of Assets and Liabilities | | 69,649,349 | | 2,879,296 |
| Derivatives not subject to an ISDA MA or similar agreement | | 69,649,349 | | 2,879,296 |
| Total assets and liabilities subject to an ISDA MA | | $ — | | $ — |
| Impact Equity | | | | |
| Derivative Financial Instruments: | | | | |
| Futures contracts | | $ — | | $ 1,900 |
| Total derivative assets and liabilities in the Statements of Assets and Liabilities | | — | | 1,900 |
| Derivatives not subject to an ISDA MA or similar agreement | | — | | 1,900 |
| Total assets and liabilities subject to an ISDA MA | | $ — | | $ — |
| Equity Index | | | | |
| Derivative Financial Instruments: | | | | |
| Futures contracts | | $ — | | $ 282,075 |
| Total derivative assets and liabilities in the Statements of Assets and Liabilities | | — | | 282,075 |
| Derivatives not subject to an ISDA MA or similar agreement | | — | | 282,075 |
| Total assets and liabilities subject to an ISDA MA | | $ — | | $ — |
| Fund | | Assets | | Liabilities |
| Value Equity Index | | | | |
| Derivative Financial Instruments: | | | | |
| Futures contracts | | $ — | | $ 14,945 |
| Total derivative assets and liabilities in the Statements of Assets and Liabilities | | — | | 14,945 |
| Derivatives not subject to an ISDA MA or similar agreement | | — | | 14,945 |
| Total assets and liabilities subject to an ISDA MA | | $ — | | $ — |
| Value Equity | | | | |
| Derivative Financial Instruments: | | | | |
| Futures contracts | | $ — | | $ 41,038 |
| Forward foreign currency contracts | | — | | 612,914 |
| Total derivative assets and liabilities in the Statements of Assets and Liabilities | | — | | 653,952 |
| Derivatives not subject to an ISDA MA or similar agreement | | — | | 653,952 |
| Total assets and liabilities subject to an ISDA MA | | $ — | | $ — |
| Growth Equity Index | | | | |
| Derivative Financial Instruments: | | | | |
| Futures contracts | | $ — | | $ 17,150 |
| Total derivative assets and liabilities in the Statements of Assets and Liabilities | | — | | 17,150 |
| Derivatives not subject to an ISDA MA or similar agreement | | — | | 17,150 |
| Total assets and liabilities subject to an ISDA MA | | $ — | | $ — |
| Growth Equity | | | | |
| Derivative Financial Instruments: | | | | |
| Futures contracts | | $ — | | $ 15,312 |
| Total derivative assets and liabilities in the Statements of Assets and Liabilities | | — | | 15,312 |
| Derivatives not subject to an ISDA MA or similar agreement | | — | | 15,312 |
| Total assets and liabilities subject to an ISDA MA | | $ — | | $ — |
| Small Cap Equity | | | | |
| Derivative Financial Instruments: | | | | |
| Futures contracts | | $ — | | $ 37,920 |
| Forward foreign currency contracts | | — | | 10,863 |
| Total derivative assets and liabilities in the Statements of Assets and Liabilities | | — | | 48,783 |
| Derivatives not subject to an ISDA MA or similar agreement | | — | | 48,783 |
| Total assets and liabilities subject to an ISDA MA | | $ — | | $ — |
| International Equity Index | | | | |
| Derivative Financial Instruments: | | | | |
| Futures contracts | | $ 9,403 | | $ — |
| Total derivative assets and liabilities in the Statements of Assets and Liabilities | | 9,403 | | — |
| Derivatives not subject to an ISDA MA or similar agreement | | 9,403 | | — |
| Total assets and liabilities subject to an ISDA MA | | $ — | | $ — |
| Fund | | Assets | | Liabilities |
| International Equity | | | | |
| Derivative Financial Instruments: | | | | |
| Futures contracts | | $ 95,694 | | $ — |
| Forward foreign currency contracts | | 5,853,445 | | 4,617,452 |
| Swap agreements | | 980,300 | | 2,699,670 |
| Total derivative assets and liabilities in the Statements of Assets and Liabilities | | 6,929,439 | | 7,317,122 |
| Derivatives not subject to an ISDA MA or similar agreement | | 95,694 | | — |
| Total assets and liabilities subject to an ISDA MA | | $ 6,833,745 | | $ 7,317,122 |
| Emerging Markets Equity | | | | |
| Derivative Financial Instruments: | | | | |
| Futures contracts | | $ 60,323 | | $ — |
| Forward foreign currency contracts | | 2,127,190 | | 1,392,542 |
| Swap agreements | | 1,903,647 | | 954,999 |
| Total derivative assets and liabilities in the Statements of Assets and Liabilities | | 4,091,160 | | 2,347,541 |
| Derivatives not subject to an ISDA MA or similar agreement | | 60,323 | | — |
| Total assets and liabilities subject to an ISDA MA | | $ 4,030,837 | | $ 2,347,541 |
| Global Real Estate Securities | | | | |
| Derivative Financial Instruments: | | | | |
| Futures contracts | | $ — | | $ 18,340 |
| Total derivative assets and liabilities in the Statements of Assets and Liabilities | | — | | 18,340 |
| Derivatives not subject to an ISDA MA or similar agreement | | — | | 18,340 |
| Total assets and liabilities subject to an ISDA MA | | $ — | | $ — |
| Strategic Alternatives | | | | |
| Derivative Financial Instruments: | | | | |
| Futures contracts | | $ 10,534 | | $ — |
| Forward foreign currency contracts | | 258,292 | | 325,253 |
| Options | | 691,728 | | 1,143,158 |
| Centrally cleared swaps | | 101,602 | | 2,527 |
| Swap agreements | | — | | 1,759,422 |
| Total derivative assets and liabilities in the Statements of Assets and Liabilities | | 1,062,156 | | 3,230,360 |
| Derivatives not subject to an ISDA MA or similar agreement | | 112,136 | | 2,527 |
| Total assets and liabilities subject to an ISDA MA | | $ 950,020 | | $ 3,227,833 |
The futures contracts and centrally cleared swap agreements shown above represent the variation margin shown on the Statements of Assets and Liabilities, which is the daily change in the unrealized appreciation (depreciation) for open futures and centrally cleared swap agreements.
At December 31, 2023, derivative assets and liabilities by counterparty net of amounts available for offset under an ISDA MA and net of the related collateral (received)/pledged by the Trust are as follows:
| Fund/Sub-adviser/Counterparty | | Derivative Assets
Subject to
an ISDA MA | | Derivative Liabilities
Subject to
an ISDA MA | | Value of
Derivatives Subject to
an ISDA MA | | Collateral
(Received)/
Pledged | | Net Exposure |
| Low-Duration Bond | | | | | | | | | | |
| Sub-adviser B | | | | | | | | | | |
| Other Counterparties* | | $ 87,211 | | $ (126,269) | | $ (39,058) | | $ — | | $ (39,058) |
| Total Derivatives | | $ 87,211 | | $ (126,269) | | $ (39,058) | | $ — | | $ (39,058) |
| Medium-Duration Bond | | | | | | | | | | |
| Sub-adviser A | | | | | | | | | | |
| Other Counterparties* | | $ 867,185 | | $ (1,351,763) | | $ (484,578) | | $ 461,620 | | $ (22,958) |
| Sub-adviser B | | | | | | | | | | |
| Other Counterparties* | | 865,577 | | (3,597,476) | | (2,731,899) | | 2,241,318 | | (490,581) |
| Sub-adviser C | | | | | | | | | | |
| Other Counterparties* | | 673,363 | | (306,041) | | 367,322 | | (367,322) | | — |
| Sub-adviser D | | | | | | | | | | |
| Other Counterparties* | | 24,842 | | — | | 24,842 | | (4,981) | | 19,861 |
| Total Derivatives | | $ 2,430,967 | | $ (5,255,280) | | $(2,824,313) | | $ 2,330,635 | | $ (493,678) |
| Global Bond | | | | | | | | | | |
| Sub-adviser A | | | | | | | | | | |
| CITI | | $ 2,458,375 | | $ (1,007,022) | | $ 1,451,353 | | $ (40,000) | | $ 1,411,353 |
| Other Counterparties* | | 341,158 | | (447,039) | | (105,881) | | 46,000 | | (59,881) |
| | | 2,799,533 | | (1,454,061) | | 1,345,472 | | 6,000 | | 1,351,472 |
| Sub-adviser B | | | | | | | | | | |
| BNP | | 3,069,277 | | (2,780,063) | | 289,214 | | — | | 289,214 |
| SS | | 2,283,339 | | (10,499,658) | | (8,216,319) | | 7,035,000 | | (1,181,319) |
| Other Counterparties* | | 18,292,312 | | (13,431,435) | | 4,860,877 | | (4,783,873) | | 77,004 |
| | | 23,644,928 | | (26,711,156) | | (3,066,228) | | 2,251,127 | | (815,101) |
| Total Derivatives | | $26,444,461 | | $(28,165,217) | | $(1,720,756) | | $ 2,257,127 | | $ 536,371 |
| International Equity | | | | | | | | | | |
| Sub-adviser A | | | | | | | | | | |
| Other Counterparties* | | $ 6,833,745 | | $ (7,317,122) | | $ (483,377) | | $ 483,377 | | $ — |
| Total Derivatives | | $ 6,833,745 | | $ (7,317,122) | | $ (483,377) | | $ 483,377 | | $ — |
| Emerging Markets Equity | | | | | | | | | | |
| Sub-adviser A | | | | | | | | | | |
| Other Counterparties* | | $ 3,987,336 | | $ (2,019,003) | | $ 1,968,333 | | $(1,968,333) | | $ — |
| Sub-adviser B | | | | | | | | | | |
| Other Counterparties* | | 43,501 | | (328,538) | | (285,037) | | — | | (285,037) |
| Total Derivatives | | $ 4,030,837 | | $ (2,347,541) | | $ 1,683,296 | | $(1,968,333) | | $ (285,037) |
| Strategic Alternatives | | | | | | | | | | |
| Sub-adviser B | | | | | | | | | | |
| Other Counterparties* | | $ 950,020 | | $ (1,468,411) | | $ (518,391) | | $ 488,952 | | $ (29,439) |
| Sub-adviser E | | | | | | | | | | |
| Other Counterparties* | | — | | (1,759,422) | | (1,759,422) | | 1,759,422 | | — |
| Total Derivatives | | $ 950,020 | | $ (3,227,833) | | $(2,277,813) | | $ 2,248,374 | | $ (29,439) |
*Other Counterparties represent amounts that are held with counterparties where the absolute value of the total net exposure is less than 0.05% of the net assets of the respective Fund. Those holdings are deemed individually immaterial to the respective Fund and are listed collectively.
Additional information about netting arrangements under the Master Agreements can be found in the Derivative Financial Instruments and Securities Lending sections of the Notes to Financial Statements.
Derivative Holdings Categorized by Risk Exposure
FASB “Derivatives and Hedging” also requires all companies to disclose information intended to enable financial statement users to understand how and why the entity uses derivative instruments, how derivatives are accounted for, and how derivative instruments affect the entity’s financial position, results of operations, and cash flows.
| | | Location on the Statements of Assets and Liabilities |
| Derivative Type | | Asset Derivatives | | Liability Derivatives |
| Interest rate contracts | | Investments in securities of unaffiliated issuers, at value | | Options written, at value |
| | | Receivables: Variation margin* | | Payables: Variation margin* |
| | | Unrealized appreciation on swap agreements | | Unrealized depreciation on swap agreements |
| Foreign exchange contracts | | Investments in securities of unaffiliated issuers, at value | | Options written, at value |
| | | Unrealized appreciation on foreign currency exchange contracts | | Unrealized depreciation on foreign currency exchange contracts |
| Credit contracts | | Unrealized appreciation on swap agreements | | Unrealized depreciation on swap agreements |
| Equity contracts | | Investments in securities of unaffiliated issuers, at value | | Options written, at value |
| | | Receivables: Variation margin* | | Payables: Variation margin* |
*The variation margin shown on the Statements of Assets and Liabilities is the daily change in the unrealized appreciation (depreciation) for open futures and centrally cleared swap agreements. The variation margin presented below is the cumulative change in unrealized appreciation (depreciation) from the date the contract was opened until December 31, 2023.
| | | Asset Derivative Value |
| Fund | | Total Value
at
12/31/23 | | Interest Rate
Contracts | | Foreign
Exchange
Contracts | | Credit
Contracts | | Equity
Contracts |
| Balanced Allocation | | | | | | | | | | |
| Futures | | $ 8,974 | | $ 3,094 | | $ — | | $ — | | $ 5,880 |
| Growth Allocation | | | | | | | | | | |
| Futures | | $ 43,717 | | $ 12,916 | | $ — | | $ — | | $ 30,801 |
| Aggressive Allocation | | | | | | | | | | |
| Futures | | $ 47,295 | | $ — | | $ — | | $ — | | $ 47,295 |
| Low-Duration Bond | | | | | | | | | | |
| Forwards | | $ 87,211 | | $ — | | $ 87,211 | | $ — | | $ — |
| Futures | | 2,443,343 | | 2,443,343 | | — | | — | | — |
| Swaps | | 98,282 | | 98,282 | | — | | — | | — |
| Totals | | $ 2,628,836 | | $ 2,541,625 | | $ 87,211 | | $ — | | $ — |
| Medium-Duration Bond | | | | | | | | | | |
| Forwards | | $ 2,316,418 | | $ — | | $ 2,316,418 | | $ — | | $ — |
| Futures | | 13,224,752 | | 13,224,752 | | — | | — | | — |
| Purchased Options | | 1,454,072 | | 1,433,943 | | 20,129 | | — | | — |
| Swaps | | 14,941,283 | | 14,481,557 | | — | | 441,273 | | 18,453 |
| Totals | | $ 31,936,525 | | $ 29,140,252 | | $ 2,336,547 | | $ 441,273 | | $ 18,453 |
| | | Asset Derivative Value |
| Fund | | Total Value
at
12/31/23 | | Interest Rate
Contracts | | Foreign
Exchange
Contracts | | Credit
Contracts | | Equity
Contracts |
| Global Bond | | | | | | | | | | |
| Forwards | | $ 26,444,461 | | $ — | | $ 26,444,461 | | $ — | | $ — |
| Futures | | 4,577,829 | | 4,577,829 | | — | | — | | — |
| Purchased Options | | 1,828 | | 629 | | 1,199 | | — | | — |
| Totals | | $ 31,024,118 | | $ 4,578,458 | | $ 26,445,660 | | $ — | | $ — |
| Defensive Market Strategies® | | | | | | | | | | |
| Forwards | | $ 3,005 | | $ — | | $ 3,005 | | $ — | | $ — |
| Futures | | 2,392,574 | | 2,055,763 | | — | | — | | 336,811 |
| Purchased Options | | 69,646,344 | | — | | — | | — | | 69,646,344 |
| Totals | | $ 72,041,923 | | $ 2,055,763 | | $ 3,005 | | $ — | | $ 69,983,155 |
| Impact Equity | | | | | | | | | | |
| Futures | | $ 24,612 | | $ — | | $ — | | $ — | | $ 24,612 |
| Equity Index | | | | | | | | | | |
| Futures | | $ 2,540,106 | | $ — | | $ — | | $ — | | $ 2,540,106 |
| Value Equity Index | | | | | | | | | | |
| Futures | | $ 149,917 | | $ — | | $ — | | $ — | | $ 149,917 |
| Value Equity | | | | | | | | | | |
| Futures | | $ 411,104 | | $ — | | $ — | | $ — | | $ 411,104 |
| Growth Equity Index | | | | | | | | | | |
| Futures | | $ 102,360 | | $ — | | $ — | | $ — | | $ 102,360 |
| Growth Equity | | | | | | | | | | |
| Futures | | $ 31,563 | | $ — | | $ — | | $ — | | $ 31,563 |
| International Equity Index | | | | | | | | | | |
| Futures | | $ 207,082 | | $ — | | $ — | | $ — | | $ 207,082 |
| International Equity | | | | | | | | | | |
| Forwards | | $ 5,853,445 | | $ — | | $ 5,853,445 | | $ — | | $ — |
| Futures | | 1,674,967 | | 46,692 | | — | | — | | 1,628,275 |
| Swaps | | 980,300 | | — | | — | | — | | 980,300 |
| Totals | | $ 8,508,712 | | $ 46,692 | | $ 5,853,445 | | $ — | | $ 2,608,575 |
| Emerging Markets Equity | | | | | | | | | | |
| Forwards | | $ 2,127,190 | | $ — | | $ 2,127,190 | | $ — | | $ — |
| Futures | | 2,004,640 | | — | | — | | — | | 2,004,640 |
| Swaps | | 1,903,647 | | — | | — | | — | | 1,903,647 |
| Totals | | $ 6,035,477 | | $ — | | $ 2,127,190 | | $ — | | $ 3,908,287 |
| Global Real Estate Securities | | | | | | | | | | |
| Futures | | $ 7,990 | | $ — | | $ — | | $ — | | $ 7,990 |
| | | Asset Derivative Value |
| Fund | | Total Value
at
12/31/23 | | Interest Rate
Contracts | | Foreign
Exchange
Contracts | | Credit
Contracts | | Equity
Contracts |
| Strategic Alternatives | | | | | | | | | | |
| Forwards | | $ 258,292 | | $ — | | $ 258,292 | | $ — | | $ — |
| Futures | | 344,682 | | 344,682 | | — | | — | | — |
| Purchased Options | | 691,728 | | 691,728 | | — | | — | | — |
| Swaps | | 5,695,139 | | 5,695,139 | | — | | — | | — |
| Totals | | $ 6,989,841 | | $ 6,731,549 | | $ 258,292 | | $ — | | $ — |
| | | Liabilities Derivative Value |
| Fund | | Total Value
at
12/31/23 | | Interest Rate
Contracts | | Foreign
Exchange
Contracts | | Credit
Contracts | | Equity
Contracts |
| Low-Duration Bond | | | | | | | | | | |
| Forwards | | $ 219,720 | | $ — | | $ 219,720 | | $ — | | $ — |
| Futures | | 2,798,135 | | 2,798,135 | | — | | — | | — |
| Swaps | | 62,956 | | 10,261 | | — | | 52,695 | | — |
| Totals | | $ 3,080,811 | | $ 2,808,396 | | $ 219,720 | | $ 52,695 | | $ — |
| Medium-Duration Bond | | | | | | | | | | |
| Forwards | | $ 4,616,879 | | $ — | | $ 4,616,879 | | $ — | | $ — |
| Futures | | 7,007,729 | | 7,007,729 | | — | | — | | — |
| Written Options | | 1,065,095 | | 1,065,095 | | — | | — | | — |
| Swaps | | 8,274,501 | | 7,969,502 | | — | | 287,790 | | 17,209 |
| Totals | | $ 20,964,204 | | $ 16,042,326 | | $ 4,616,879 | | $ 287,790 | | $ 17,209 |
| Global Bond | | | | | | | | | | |
| Forwards | | $ 28,166,159 | | $ — | | $ 28,166,159 | | $ — | | $ — |
| Futures | | 929,601 | | 929,601 | | — | | — | | — |
| Swaps | | 1,087,167 | | 81,549 | | — | | 1,005,618 | | — |
| Totals | | $ 30,182,927 | | $ 1,011,150 | | $ 28,166,159 | | $ 1,005,618 | | $ — |
| Defensive Market Strategies® | | | | | | | | | | |
| Forwards | | $ 214,740 | | $ — | | $ 214,740 | | $ — | | $ — |
| Written Options | | 2,638,617 | | — | | — | | — | | 2,638,617 |
| Totals | | $ 2,853,357 | | $ — | | $ 214,740 | | $ — | | $ 2,638,617 |
| Value Equity | | | | | | | | | | |
| Forwards | | $ 612,914 | | $ — | | $ 612,914 | | $ — | | $ — |
| Small Cap Equity | | | | | | | | | | |
| Forwards | | $ 10,863 | | $ — | | $ 10,863 | | $ — | | $ — |
| Futures | | 57,008 | | — | | — | | — | | 57,008 |
| Totals | | $ 67,871 | | $ — | | $ 10,863 | | $ — | | $ 57,008 |
| International Equity | | | | | | | | | | |
| Forwards | | $ 4,617,452 | | $ — | | $ 4,617,452 | | $ — | | $ — |
| Futures | | 875,605 | | — | | — | | — | | 875,605 |
| Swaps | | 2,699,670 | | — | | — | | — | | 2,699,670 |
| Totals | | $ 8,192,727 | | $ — | | $ 4,617,452 | | $ — | | $ 3,575,275 |
| | | Liabilities Derivative Value |
| Fund | | Total Value
at
12/31/23 | | Interest Rate
Contracts | | Foreign
Exchange
Contracts | | Credit
Contracts | | Equity
Contracts |
| Emerging Markets Equity | | | | | | | | | | |
| Forwards | | $ 1,392,542 | | $ — | | $ 1,392,542 | | $ — | | $ — |
| Futures | | 413,740 | | — | | — | | — | | 413,740 |
| Swaps | | 954,999 | | — | | — | | — | | 954,999 |
| Totals | | $ 2,761,281 | | $ — | | $ 1,392,542 | | $ — | | $ 1,368,739 |
| Strategic Alternatives | | | | | | | | | | |
| Forwards | | $ 325,253 | | $ — | | $ 325,253 | | $ — | | $ — |
| Futures | | 2,180,784 | | 2,180,784 | | — | | — | | — |
| Written Options | | 1,143,158 | | 1,143,158 | | — | | — | | — |
| Swaps | | 6,283,842 | | 4,524,420 | | — | | — | | 1,759,422 |
| Totals | | $ 9,933,037 | | $ 7,848,362 | | $ 325,253 | | $ — | | $ 1,759,422 |
| Derivative Type | | Location on the Statements of Operations |
| Interest rate contracts | | Net realized gain (loss) from: Futures transactions |
| | | Net realized gain (loss) from: Swap agreements |
| | | Net realized gain (loss) from: Option contracts written |
| | | Net realized gain (loss) from: Option contracts purchased |
| | | Net change in unrealized appreciation (depreciation) on: Futures |
| | | Net change in unrealized appreciation (depreciation) on: Swap agreements |
| | | Net change in unrealized appreciation (depreciation) on: Option contracts written |
| | | Net change in unrealized appreciation (depreciation) on: Option contracts purchased |
| Foreign exchange contracts | | Net realized gain (loss) from: Foreign currency |
| | | Net realized gain (loss) from: Option contracts written |
| | | Net realized gain (loss) from: Option contracts purchased |
| | | Net change in unrealized appreciation (depreciation) on: Foreign currency |
| | | Net change in unrealized appreciation (depreciation) on: Option contracts written |
| | | Net change in unrealized appreciation (depreciation) on: Option contracts purchased |
| Credit contracts | | Net realized gain (loss) from: Swap agreements |
| | | Net change in unrealized appreciation (depreciation) on: Swap agreements |
| Equity contracts | | Net realized gain (loss) from: Futures transactions |
| | | Net realized gain (loss) from: Option contracts written |
| | | Net realized gain (loss) from: Option contracts purchased |
| | | Net unrealized appreciation (depreciation) on: Futures |
| | | Net unrealized appreciation (depreciation) on: Option contracts written |
| | | Net unrealized appreciation (depreciation) on: Option contracts purchased |
| | | Realized Gain (Loss) on Derivatives Recognized in Income |
| Fund | | Total Value
at
12/31/23 | | Interest Rate
Contracts | | Foreign
Exchange
Contracts | | Credit
Contracts | | Equity
Contracts |
| MyDestination 2015 | | | | | | | | | | |
| Futures | | $ (24,952) | | $ (4,813) | | $ — | | $ — | | $ (20,139) |
| MyDestination 2025 | | | | | | | | | | |
| Futures | | $ (102,055) | | $ (19,859) | | $ — | | $ — | | $ (82,196) |
| | | Realized Gain (Loss) on Derivatives Recognized in Income |
| Fund | | Total Value
at
12/31/23 | | Interest Rate
Contracts | | Foreign
Exchange
Contracts | | Credit
Contracts | | Equity
Contracts |
| MyDestination 2035 | | | | | | | | | | |
| Futures | | $ (58,988) | | $ 4,387 | | $ — | | $ — | | $ (63,375) |
| MyDestination 2045 | | | | | | | | | | |
| Futures | | $ (40,261) | | $ (38,318) | | $ — | | $ — | | $ (1,943) |
| MyDestination 2055 | | | | | | | | | | |
| Futures | | $ (28,846) | | $ (11,825) | | $ — | | $ — | | $ (17,021) |
| Conservative Allocation | | | | | | | | | | |
| Futures | | $ (448) | | $ (352) | | $ — | | $ — | | $ (96) |
| Balanced Allocation | | | | | | | | | | |
| Futures | | $ (134,930) | | $ (140,199) | | $ — | | $ — | | $ 5,269 |
| Growth Allocation | | | | | | | | | | |
| Futures | | $ (208,420) | | $ (92,804) | | $ — | | $ — | | $ (115,616) |
| Aggressive Allocation | | | | | | | | | | |
| Futures | | $ (176,002) | | $ — | | $ — | | $ — | | $ (176,002) |
| Low-Duration Bond | | | | | | | | | | |
| Forwards | | $ (1,491,381) | | $ — | | $ (1,491,381) | | $ — | | $ — |
| Futures | | (2,186,525) | | (2,186,525) | | — | | — | | — |
| Purchased Options | | (2) | | — | | — | | — | | (2) |
| Swaps | | (2,846,762) | | (2,593,519) | | — | | (253,243) | | — |
| Totals | | $ (6,524,670) | | $ (4,780,044) | | $ (1,491,381) | | $ (253,243) | | $ (2) |
| Medium-Duration Bond | | | | | | | | | | |
| Forwards | | $ 2,988,851 | | $ — | | $ 2,988,851 | | $ — | | $ — |
| Futures | | (1,667,363) | | (1,667,363) | | — | | — | | — |
| Purchased Options | | (6,098,772) | | (6,098,772) | | — | | — | | — |
| Swaps | | 1,261,824 | | 891,935 | | — | | 387,400 | | (17,511) |
| Written Options | | 2,316,721 | | 2,297,146 | | 19,575 | | — | | — |
| Totals | | $ (1,198,739) | | $ (4,577,054) | | $ 3,008,426 | | $ 387,400 | | $ (17,511) |
| Global Bond | | | | | | | | | | |
| Forwards | | $ (8,972,678) | | $ — | | $ (8,972,678) | | $ — | | $ — |
| Futures | | (5,334,478) | | (5,334,478) | | — | | — | | — |
| Purchased Options | | (142,085) | | (90,904) | | (51,181) | | — | | — |
| Swaps | | (2,154,943) | | (32,162) | | — | | (2,122,781) | | — |
| Totals | | $ (16,604,184) | | $ (5,457,544) | | $ (9,023,859) | | $ (2,122,781) | | $ — |
| Defensive Market Strategies® | | | | | | | | | | |
| Forwards | | $ (417,727) | | $ — | | $ (417,727) | | $ — | | $ — |
| Futures | | (3,220,926) | | (4,013,071) | | — | | — | | 792,145 |
| Purchased Options | | (1,817,024) | | — | | — | | — | | (1,817,024) |
| Written Options | | 39,301,345 | | — | | — | | — | | 39,301,345 |
| Totals | | $ 33,845,668 | | $ (4,013,071) | | $ (417,727) | | $ — | | $ 38,276,466 |
| | | Realized Gain (Loss) on Derivatives Recognized in Income |
| Fund | | Total Value
at
12/31/23 | | Interest Rate
Contracts | | Foreign
Exchange
Contracts | | Credit
Contracts | | Equity
Contracts |
| Impact Equity | | | | | | | | | | |
| Forwards | | $ (228) | | $ — | | $ (228) | | $ — | | $ — |
| Futures | | (102,434) | | — | | — | | — | | (102,434) |
| Totals | | $ (102,662) | | $ — | | $ (228) | | $ — | | $ (102,434) |
| Equity Index | | | | | | | | | | |
| Futures | | $ 11,529,172 | | $ — | | $ — | | $ — | | $ 11,529,172 |
| Value Equity Index | | | | | | | | | | |
| Futures | | $ 789,002 | | $ — | | $ — | | $ — | | $ 789,002 |
| Value Equity | | | | | | | | | | |
| Forwards | | $ (1,199,545) | | $ — | | $ (1,199,545) | | $ — | | $ — |
| Futures | | 1,550,803 | | — | | — | | — | | 1,550,803 |
| Totals | | $ 351,258 | | $ — | | $ (1,199,545) | | $ — | | $ 1,550,803 |
| Growth Equity Index | | | | | | | | | | |
| Futures | | $ 749,725 | | $ — | | $ — | | $ — | | $ 749,725 |
| Growth Equity | | | | | | | | | | |
| Futures | | $ 1,083,094 | | $ — | | $ — | | $ — | | $ 1,083,094 |
| Small Cap Equity | | | | | | | | | | |
| Forwards | | $ (24,666) | | $ — | | $ (24,666) | | $ — | | $ — |
| Futures | | 92,822 | | — | | — | | — | | 92,822 |
| Totals | | $ 68,156 | | $ — | | $ (24,666) | | $ — | | $ 92,822 |
| International Equity Index | | | | | | | | | | |
| Futures | | $ 2,397,287 | | $ — | | $ — | | $ — | | $ 2,397,287 |
| International Equity | | | | | | | | | | |
| Forwards | | $ (3,140,638) | | $ — | | $ (3,140,638) | | $ — | | $ — |
| Futures | | 12,244,119 | | — | | — | | — | | 12,244,119 |
| Swaps | | 7,421,980 | | — | | — | | — | | 7,421,980 |
| Totals | | $ 16,525,461 | | $ — | | $ (3,140,638) | | $ — | | $ 19,666,099 |
| Emerging Markets Equity | | | | | | | | | | |
| Forwards | | $ 3,874,064 | | $ — | | $ 3,874,064 | | $ — | | $ — |
| Futures | | (71,097) | | — | | — | | — | | (71,097) |
| Swaps | | 36,084 | | — | | — | | — | | 36,084 |
| Totals | | $ 3,839,051 | | $ — | | $ 3,874,064 | | $ — | | $ (35,013) |
| Global Real Estate Securities | | | | | | | | | | |
| Forwards | | $ 4,782 | | $ — | | $ 4,782 | | $ — | | $ — |
| Futures | | 907,964 | | — | | — | | — | | 907,964 |
| Totals | | $ 912,746 | | $ — | | $ 4,782 | | $ — | | $ 907,964 |
| | | Realized Gain (Loss) on Derivatives Recognized in Income |
| Fund | | Total Value
at
12/31/23 | | Interest Rate
Contracts | | Foreign
Exchange
Contracts | | Credit
Contracts | | Equity
Contracts |
| Strategic Alternatives | | | | | | | | | | |
| Forwards | | $ (51,360) | | $ — | | $ (51,360) | | $ — | | $ — |
| Futures | | 1,962,481 | | 2,408,545 | | 443,803 | | — | | (889,867) |
| Purchased Options | | (48,870) | | (48,870) | | — | | — | | — |
| Swaps | | 1,617,693 | | 1,039,059 | | — | | 71,381 | | 507,253 |
| Written Options | | 129,085 | | 129,085 | | — | | — | | — |
| Totals | | $ 3,609,029 | | $ 3,527,819 | | $ 392,443 | | $ 71,381 | | $ (382,614) |
| | | Change in Unrealized Appreciation (Depreciation) on Derivatives Recognized in Income |
| Fund | | Total Value
at
12/31/23 | | Interest Rate
Contracts | | Foreign
Exchange
Contracts | | Credit
Contracts | | Equity
Contracts |
| Balanced Allocation | | | | | | | | | | |
| Futures | | $ 8,974 | | $ 3,094 | | $ — | | $ — | | $ 5,880 |
| Growth Allocation | | | | | | | | | | |
| Futures | | $ 43,717 | | $ 12,916 | | $ — | | $ — | | $ 30,801 |
| Aggressive Allocation | | | | | | | | | | |
| Futures | | $ 47,295 | | $ — | | $ — | | $ — | | $ 47,295 |
| Low-Duration Bond | | | | | | | | | | |
| Forwards | | $ 1,075,313 | | $ — | | $ 1,075,313 | | $ — | | $ — |
| Futures | | (966,062) | | (966,062) | | — | | — | | — |
| Swaps | | 2,324,079 | | 2,679,857 | | — | | (355,778) | | — |
| Totals | | $ 2,433,330 | | $ 1,713,795 | | $ 1,075,313 | | $ (355,778) | | $ — |
| Medium-Duration Bond | | | | | | | | | | |
| Forwards | | $ (1,685,137) | | $ — | | $ (1,685,137) | | $ — | | $ — |
| Futures | | 4,489,772 | | 4,489,772 | | — | | — | | — |
| Purchased Options | | 616,358 | | 616,358 | | — | | — | | — |
| Swaps | | 4,708,911 | | 3,777,137 | | — | | 930,531 | | 1,243 |
| Written Options | | (269,603) | | (269,603) | | — | | — | | — |
| Totals | | $ 7,860,301 | | $ 8,613,664 | | $ (1,685,137) | | $ 930,531 | | $ 1,243 |
| Global Bond | | | | | | | | | | |
| Forwards | | $ 569,000 | | $ — | | $ 569,000 | | $ — | | $ — |
| Futures | | 4,886,491 | | 4,886,491 | | — | | — | | — |
| Purchased Options | | (106,103) | | (9,397) | | (96,706) | | — | | — |
| Swaps | | (368,632) | | 135,088 | | — | | (503,720) | | — |
| Totals | | $ 4,980,756 | | $ 5,012,182 | | $ 472,294 | | $ (503,720) | | $ — |
| Defensive Market Strategies® | | | | | | | | | | |
| Forwards | | $ (46,554) | | $ — | | $ (46,554) | | $ — | | $ — |
| Futures | | 4,738,008 | | 2,245,513 | | — | | — | | 2,492,495 |
| Purchased Options | | 30,865,216 | | — | | — | | — | | 30,865,216 |
| Written Options | | (201,327) | | — | | — | | — | | (201,327) |
| Totals | | $ 35,355,343 | | $ 2,245,513 | | $ (46,554) | | $ — | | $ 33,156,384 |
| | | Change in Unrealized Appreciation (Depreciation) on Derivatives Recognized in Income |
| Fund | | Total Value
at
12/31/23 | | Interest Rate
Contracts | | Foreign
Exchange
Contracts | | Credit
Contracts | | Equity
Contracts |
| Impact Equity | | | | | | | | | | |
| Futures | | $ 24,612 | | $ — | | $ — | | $ — | | $ 24,612 |
| Equity Index | | | | | | | | | | |
| Futures | | $ 4,902,222 | | $ — | | $ — | | $ — | | $ 4,902,222 |
| Value Equity Index | | | | | | | | | | |
| Futures | | $ 369,223 | | $ — | | $ — | | $ — | | $ 369,223 |
| Value Equity | | | | | | | | | | |
| Forwards | | $ (506,065) | | $ — | | $ (506,065) | | $ — | | $ — |
| Futures | | 411,104 | | — | | — | | — | | 411,104 |
| Totals | | $ (94,961) | | $ — | | $ (506,065) | | $ — | | $ 411,104 |
| Growth Equity Index | | | | | | | | | | |
| Futures | | $ 425,157 | | $ — | | $ — | | $ — | | $ 425,157 |
| Growth Equity | | | | | | | | | | |
| Futures | | $ 31,563 | | $ — | | $ — | | $ — | | $ 31,563 |
| Small Cap Equity | | | | | | | | | | |
| Forwards | | $ (15,539) | | $ — | | $ (15,539) | | $ — | | $ — |
| Futures | | (57,008) | | — | | — | | — | | (57,008) |
| Totals | | $ (72,547) | | $ — | | $ (15,539) | | $ — | | $ (57,008) |
| International Equity Index | | | | | | | | | | |
| Futures | | $ 814,529 | | $ — | | $ — | | $ — | | $ 814,529 |
| International Equity | | | | | | | | | | |
| Forwards | | $ 338,776 | | $ — | | $ 338,776 | | $ — | | $ — |
| Futures | | 2,013,410 | | — | | — | | — | | 2,013,410 |
| Swaps | | (5,603,761) | | — | | — | | — | | (5,603,761) |
| Totals | | $ (3,251,575) | | $ — | | $ 338,776 | | $ — | | $ (3,590,351) |
| Emerging Markets Equity | | | | | | | | | | |
| Forwards | | $ 1,654,023 | | $ — | | $ 1,654,023 | | $ — | | $ — |
| Futures | | 1,848,269 | | — | | — | | — | | 1,848,269 |
| Swaps | | 1,226,746 | | — | | — | | — | | 1,226,746 |
| Totals | | $ 4,729,038 | | $ — | | $ 1,654,023 | | $ — | | $ 3,075,015 |
| Global Real Estate Securities | | | | | | | | | | |
| Futures | | $ 7,990 | | $ — | | $ — | | $ — | | $ 7,990 |
| Strategic Alternatives | | | | | | | | | | |
| Forwards | | $ (45,446) | | $ — | | $ (45,446) | | $ — | | $ — |
| Futures | | (1,483,968) | | (1,591,500) | | 15,530 | | — | | 92,002 |
| Purchased Options | | 662,354 | | 662,354 | | — | | — | | — |
| Swaps | | (933,426) | | 792,714 | | — | | (1,726,140) | | — |
| Written Options | | (735,971) | | (735,971) | | — | | — | | — |
| Totals | | $ (2,536,457) | | $ (872,403) | | $ (29,916) | | $ (1,726,140) | | $ 92,002 |
Volume of Derivative Transactions
The tables below summarize the average daily notional derivative transactions by Fund during the year ended December 31, 2023.
Activity for the period is measured by the number of transactions during the fiscal year and the average daily notional amount for open forward foreign currency contract transactions were as follows:
| Fund | | Number of
transactions | | Average
notional
market value
of contracts |
| Low-Duration Bond | | 166 | | $1,893,339 |
| Medium-Duration Bond | | 1,069 | | 1,766,367 |
| Global Bond | | 2,578 | | 3,096,992 |
| Defensive Market Strategies® | | 180 | | 693,147 |
| Impact Equity | | 3 | | 11,529 |
| Value Equity | | 139 | | 1,486,249 |
| Small Cap Equity | | 60 | | 94,622 |
| International Equity | | 2,503 | | 1,766,504 |
| Emerging Markets Equity | | 4,035 | | 778,302 |
| Global Real Estate Securities | | 5 | | 181,034 |
| Strategic Alternatives | | 2,000 | | 312,029 |
Activity for the period is measured by the average daily notional amount for long and short open future contracts. The amounts were as follows:
| Fund | | Long average
notional
market value
of contracts | | Short average
notional
market value
of contracts |
| MyDestination 2015 | | $ 749,098 | | $ — |
| MyDestination 2025 | | 2,937,963 | | — |
| MyDestination 2035 | | 1,499,382 | | — |
| MyDestination 2045 | | 1,522,918 | | — |
| MyDestination 2055 | | 683,478 | | — |
| Conservative Allocation | | 1,059,650 | | — |
| Balanced Allocation | | 501,184 | | — |
| Growth Allocation | | 528,788 | | — |
| Aggressive Allocation | | 1,090,791 | | 466,513 |
| Low-Duration Bond | | 12,663,757 | | 3,097,498 |
| Medium-Duration Bond | | 3,160,534 | | 2,400,343 |
| Global Bond | | 2,049,083 | | 1,154,524 |
| Defensive Market Strategies® | | 12,179,652 | | 1,838,200 |
| Impact Equity | | 779,877 | | — |
| Equity Index | | 8,235,967 | | — |
| Value Equity Index | | 1,051,287 | | — |
| Value Equity | | 6,190,771 | | — |
| Growth Equity Index | | 861,169 | | — |
| Growth Equity | | 6,958,304 | | 698,950 |
| Small Cap Equity | | 3,948,911 | | — |
| International Equity Index | | 1,977,614 | | — |
| International Equity | | 3,381,522 | | 2,599,022 |
| Emerging Markets Equity | | 1,583,579 | | 1,070,131 |
| Global Real Estate Securities | | 1,848,148 | | — |
| Fund | | Long average
notional
market value
of contracts | | Short average
notional
market value
of contracts |
| Strategic Alternatives | | $1,258,054 | | $1,357,165 |
Activity for the period is measured by the number of transactions during the fiscal year and the average daily premiums paid and received on open options transactions. The amounts were as follows:
| Fund | | Number of
transactions | | Average
premiums
paid and
received |
| Low-Duration Bond | | 1 | | $138,716 |
| Medium-Duration Bond | | 771 | | 75,400 |
| Global Bond | | 25 | | 588,506 |
| Defensive Market Strategies® | | 529 | | 229,884 |
| Strategic Alternatives | | 54 | | 130,301 |
Activity for the period is measured by the average daily notional amount for buy and sell protection on credit default swap transactions. The amounts were as follows:
| Fund | | Buy protection
average
notional
market value | | Sell protection
average
notional
market value |
| Low-Duration Bond | | $5,056,522 | | $ — |
| Medium-Duration Bond | | 2,740,590 | | 3,107,256 |
| Global Bond | | 5,098,415 | | — |
Activity for the period is measured by the average daily notional amount for interest rate swaps based on the payment or receipt of the fixed rate. The amounts were as follows:
| Fund | | Paid fixed rate
average
notional
market value | | Received
fixed rate
average
notional
market value |
| Low-Duration Bond | | $7,504,003 | | $1,197,435 |
| Medium-Duration Bond | | 4,401,632 | | 3,879,928 |
| Global Bond | | — | | 4,613,443 |
| Strategic Alternatives | | 3,131,667 | | 3,027,963 |
Activity for the period is measured by the average daily notional amount for total return swaps. The amounts were as follows:
| Fund | | Average
notional
market value
of
transactions |
| Medium-Duration Bond | | $ 409,852 |
| International Equity | | 604,251 |
| Emerging Markets Equity | | 1,181,726 |
| Strategic Alternatives | | 33,301 |
j. Dividends and Distributions to Shareholders
The Fixed Income Funds declare and pay dividends from net investment income monthly. The Money Market Fund declares income dividends daily and pays them monthly. The Defensive Market Strategies® Fund, Equity Index Fund, Global Real Estate Securities Fund, Value Equity Fund, Growth Equity Fund, Value Equity Index Fund and Growth Equity Index Fund declare and pay dividends from net investment income semi-annually. Each of the other Funds (including all the Target Date Funds and Target Risk Funds) declares and pays dividends from net investment income annually. Each Fund also distributes to its shareholders at least annually any realized net capital gains and net gains, if any, from certain foreign currency transactions. Dividends and distributions to shareholders are recorded on the ex-dividend date.
k. Expenses
Expenses arising in connection with a Fund are charged directly to that Fund. Expenses common to all Funds are generally allocated to each Fund in proportion to their relative net assets. Each Class of shares bears its pro-rata portion of expenses attributable to its Class, except that each Class separately bears expenses related specifically to that Class, such as shareholder reporting, registration, transfer agent and shareholder servicing fees.
l. Security Transactions, Income and Realized Gains and Losses
Security transactions are accounted for on the date securities are purchased or sold (the trade date). Dividend income is recognized on the ex-dividend date, except certain dividends from foreign securities where the ex-date may have passed, which are recorded as soon as the Fund is informed of the ex-dividend date. Interest income is accrued daily, including the amortization of market premium and the accretion of market discount using the effective interest method. Realized gains and losses from security transactions are on an identified cost basis.
3. FEES AND OTHER TRANSACTIONS
a. Investment Advisory Fees (Affiliate)
Pursuant to a separate investment advisory agreement, GuideStone Capital Management, LLC ("GSCM") acts as the Adviser to the Funds. As the Adviser, it provides an investment program for the Funds and for such services is paid a fee. GSCM and the Trust have entered into sub-advisory agreements with various sub-advisers to manage each Select Fund’s investments. Under the asset allocation and general supervision of GSCM, the sub-advisers make the day-to-day investment decisions for the Select Funds, and for such services, each sub-adviser receives a fee from the Funds. GSCM and the Trust have entered into sub-advisory agreements with Parametric Portfolio Associates LLC ("Parametric") with respect to the overlay program of each Fund (except the Money Market Fund) and the completion portfolio program of each Fund (except the Money Market Fund, Global Real Estate Securities Fund, Equity Index Fund, International Equity Index Fund, Value Equity Index Fund and Growth Equity Index Fund). When such services are utilized, Parametric receives a fee from the respective Funds. The aggregate advisory fees and sub-adviser fees are included in the Statements of Assets and Liabilities and Statements of Operations under “Investment advisory fees”.
The advisory fees paid to GSCM and aggregate sub-advisory fees paid to the sub-advisers are computed daily based upon the net assets of each Fund. The actual advisory fees accrued and the sub-advisory fees accrued during the year ended December 31, 2023, based upon average daily net assets, were as follows:
| Fund | | Advisory Fees | | Sub-Adviser Fees |
| MyDestination 2015 | | 0.10% | | 0.01% |
| MyDestination 2025 | | 0.10% | | 0.00% |
| MyDestination 2035 | | 0.10% | | 0.00% |
| MyDestination 2045 | | 0.10% | | 0.00% |
| MyDestination 2055 | | 0.10% | | 0.00% |
| Conservative Allocation | | 0.10% | | 0.00% |
| Balanced Allocation | | 0.10% | | 0.00% |
| Growth Allocation | | 0.10% | | 0.00% |
| Aggressive Allocation | | 0.10% | | 0.00% |
| Money Market | | 0.07% | | 0.04% |
| Low-Duration Bond | | 0.11% | | 0.17% |
| Medium-Duration Bond | | 0.13% | | 0.20% |
| Global Bond | | 0.25% | | 0.22% |
| Impact Bond | | 0.15% | | 0.23% |
| Defensive Market Strategies® | | 0.33% | | 0.27% |
| Impact Equity | | 0.33% | | 0.30% |
| Equity Index | | 0.08% | | 0.01% |
| Value Equity Index | | 0.08% | | 0.02% |
| Value Equity | | 0.33% | | 0.28% |
| Growth Equity Index | | 0.08% | | 0.02% |
| Growth Equity | | 0.33% | | 0.29% |
| Small Cap Equity | | 0.33% | | 0.53% |
| International Equity Index | | 0.10% | | 0.01% |
| International Equity | | 0.33% | | 0.42% |
| Emerging Markets Equity | | 0.33% | | 0.51% |
| Global Real Estate Securities | | 0.30% | | 0.38% |
| Strategic Alternatives | | 0.40% | | 0.53% |
b. Shareholder Servicing Fees (Affiliate)
The Board of Directors has adopted a Shareholder Service Plan for each Fund with an Investor Class. Under this Plan, the Investor Class is authorized to pay fees of 0.25% of average daily net assets to parties that provide services for and maintain shareholder accounts.
c. Expense Limitation (Affiliate)
The Impact Bond Fund, Strategic Alternatives Fund, Impact Equity Fund, Value Equity Index Fund, Growth Equity Index Fund and International Equity Index Fund entered into expense cap agreements with GSCM, pursuant to which GSCM has agreed to pay, waive or assume expenses of the Class(es) of the Fund without regard to any expense reductions realized through use of directed brokerage, (and excluding interest, taxes, brokerage commissions, acquired fund fees and expenses, expenses on securities sold short, and extraordinary expenses) which exceed, in the aggregate, the annual percentage rate of that Class’ average daily net assets as indicated below through April 30, 2024.
The Target Date Funds have entered into an expense cap agreement with GSCM, pursuant to which GSCM has agreed to pay, waive, or assume expenses of the Class(es) of the Fund (excluding extraordinary expenses) which exceed, in the aggregate, the annual percentage rate of that Class’ average daily net assets as indicated below through April 30, 2024.
The Expense Caps were as follows:
| | | For the Period
January 1, 2023
to
January 26, 2023 | | For the Period
January 27, 2023
to
April 30, 2023 | | For the Period
May 1, 2023
to
December 31, 2023 |
| Fund | | Institutional
Class | | Investor
Class | | Institutional
Class | | Investor
Class | | Institutional
Class | | Investor
Class |
| MyDestination 2015 | | 0.50% | | 0.75% | | 0.50% | | 0.75% | | 0.45% | | 0.75% |
| MyDestination 2025 | | 0.50% | | 0.75% | | 0.50% | | 0.75% | | 0.45% | | 0.75% |
| MyDestination 2035 | | 0.50% | | 0.75% | | 0.50% | | 0.75% | | 0.45% | | 0.75% |
| MyDestination 2045 | | 0.50% | | 0.75% | | 0.50% | | 0.75% | | 0.45% | | 0.75% |
| MyDestination 2055 | | 0.50% | | 0.75% | | 0.50% | | 0.75% | | 0.45% | | 0.75% |
| Impact Bond | | N/A | | N/A | | 0.50% | | 0.79% | | 0.50% | | 0.79% |
| Impact Equity | | N/A | | N/A | | N/A | | 1.21% | | N/A | | 1.21% |
| Value Equity Index | | 0.20% | | 0.47% | | 0.20% | | 0.47% | | 0.20% | | 0.47% |
| Growth Equity Index | | 0.20% | | 0.47% | | 0.20% | | 0.47% | | 0.20% | | 0.47% |
| International Equity Index | | 0.22% | | 0.50% | | 0.22% | | 0.50% | | 0.22% | | 0.50% |
| Strategic Alternatives | | 1.08% | | 1.40% | | 1.08% | | 1.40% | | 1.12% | | 1.44% |
| | | | | | | | | | | | | |
Each Fund in turn agreed to reimburse GSCM for any operating expenses in excess of the expense limitation paid, waived or assumed by GSCM for that Fund during the limitation period, provided GSCM would not be entitled to reimbursement for any amount that would cause operating expenses to exceed the expense limitation in place during the year in which (1) GSCM incurred or waived the operating expenses, or (2) during the year in which the reimbursement would be made, whichever is lower, and provided further that no amount will be reimbursed by the respective class of that Fund more than three years after the year in which it was incurred or waived.
For those Funds that had operating expenses in excess of the expense limitation paid, waived or assumed by GSCM during the limitation period, the amounts subject to possible future reimbursement under the expense limitation agreement and the expiration schedule at December 31, 2023, are as follows:
| | | Institutional Class | | Investor Class |
| Fund | | 2024 | | 2025 | | 2026 | | 2024 | | 2025 | | 2026 |
| MyDestination 2015 | | $ 44,635 | | $ 70,345 | | $111,279 | | $110,648 | | $161,238 | | $ 76,282 |
| MyDestination 2025 | | 44,948 | | 103,517 | | 263,265 | | 119,203 | | 228,539 | | 117,390 |
| MyDestination 2035 | | — | | — | | 202,386 | | — | | — | | 10,453 |
| MyDestination 2045 | | — | | — | | 49,338 | | — | | — | | — |
| MyDestination 2055 | | 3,246 | | 8,332 | | 50,202 | | — | | 5,433 | | 12,925 |
| Impact Bond | | N/A | | N/A | | 185,566 | | N/A | | N/A | | 72,470 |
| Impact Equity | | N/A | | N/A | | N/A | | N/A | | N/A | | 35,007 |
| Value Equity Index | | N/A | | 109,631 | | 80,475 | | N/A | | 30,924 | | 34,440 |
| Growth Equity Index | | N/A | | 111,101 | | 70,819 | | N/A | | 30,987 | | 37,860 |
| International Equity Index | | — | | — | | — | | N/A | | 28,216 | | 23,846 |
| Strategic Alternatives | | 246,313 | | 589,090 | | 493,819 | | 42,950 | | 121,475 | | 106,325 |
The shareholder servicing agent, the Adviser, and/or the sub-adviser may voluntarily waive fees and/or reimburse expenses to the extent necessary to assist the Money Market Fund in attempting to maintain a yield of at least 0.00%. Such yield waivers and reimbursements are voluntary and could change or be terminated at any time at the discretion of the Adviser. There is no guarantee that the Money Market Fund will maintain a positive yield. These previously waived fees are not subject to recoupment.
d. Brokerage Service Arrangements
Subject to best execution, the Adviser directs the sub-advisers to place a certain percentage of security trades with designated brokers who have agreed to pay certain custody, transfer agency or other operating expenses through the use of Brokerage Service Arrangements on behalf of the Funds. These payments can be found on the Statements of Operations under the heading “Fees Paid Indirectly.”
| Fund | | Expenses Paid
Through Brokerage
Service Agreements |
| Value Equity | | $ 2,857 |
| Growth Equity | | 8,213 |
| Small Cap Equity | | 43,188 |
| Emerging Markets Equity | | 2,580 |
| Global Real Estate Securities | | 27,877 |
e. Administrator, Transfer Agent and Distributor
The Northern Trust Company (“Northern Trust”) provides administrative and accounting services to the Funds. For its services as Administrator, Northern Trust is entitled to receive fees, computed daily and paid monthly, based upon the average daily net assets of each Fund. The fees, excluding out of pocket expenses, range between 0.0028% and 0.0174% of average daily net assets. For its services as Transfer Agent, BNY Mellon Investment Servicing (US) Inc. (“BNY Mellon”) receives a fee based mainly upon the number of accounts serviced. Certain minimum fees and transaction charges may apply.
Foreside Funds Distributors LLC serves as the Underwriter and does not receive any fees in its capacity as Underwriter from GuideStone Funds. The fees are paid by GSCM.
f. Investments in Affiliates
The Target Date and Target Risk Funds do not invest in the underlying Select Funds for the purpose of exercising management or control; however, investments made by each Target Date and Target Risk Fund within each of its principal investment strategies may represent a significant portion of an underlying Select Fund’s net assets. At December 31, 2023, the Target Date and Target Risk Funds were the owners of record of the following approximate percentages of the total outstanding shares of the underlying Select Funds as detailed below:
| Fund | | | | MyDestination
2015 Fund | | MyDestination
2025 Fund | | MyDestination
2035 Fund | | MyDestination
2045 Fund | | MyDestination
2055 Fund |
| Money Market | | | | 0.59% | | 1.88% | | 2.14% | | 1.60% | | 0.78% |
| Low-Duration Bond | | | | 8.21 | | 9.31 | | — | | — | | — |
| Medium-Duration Bond | | | | 8.57 | | 21.49 | | 13.84 | | 4.69 | | 0.96 |
| Global Bond | | | | 6.35 | | 16.75 | | 14.80 | | 5.02 | | 1.00 |
| Defensive Market Strategies® | | | | 5.26 | | 16.69 | | 11.75 | | 4.99 | | 2.27 |
| Equity Index | | | | 3.35 | | 11.25 | | 15.68 | | 16.56 | | 8.25 |
| Small Cap Equity | | | | 1.55 | | 5.63 | | 8.44 | | 9.33 | | 4.64 |
| International Equity Index | | | | 5.27 | | 18.08 | | 25.82 | | 27.63 | | 13.73 |
| Emerging Markets Equity | | | | 2.63 | | 8.99 | | 12.95 | | 13.84 | | 6.96 |
| Global Real Estate Securities | | | | 1.46 | | 5.54 | | 7.63 | | 7.84 | | 3.95 |
| Strategic Alternatives | | | | 2.67 | | 7.09 | | 5.13 | | — | | — |
| Fund | | | | Conservative
Allocation Fund | | Balanced
Allocation Fund | | Growth
Allocation Fund | | Aggressive
Allocation Fund |
| Money Market | | | | 0.43% | | 1.88% | | 1.41% | | 1.37% |
| Low-Duration Bond | | | | 21.38 | | 4.97 | | 1.35 | | — |
| Medium-Duration Bond | | | | 2.14 | | 14.55 | | 5.05 | | — |
| Fund | | | | Conservative
Allocation Fund | | Balanced
Allocation Fund | | Growth
Allocation Fund | | Aggressive
Allocation Fund |
| Global Bond | | | | 2.17% | | 17.21% | | 6.10% | | —% |
| Impact Bond | | | | 20.30 | | 23.75 | | 19.50 | | — |
| Defensive Market Strategies® | | | | 2.29 | | 9.28 | | 3.37 | | — |
| Impact Equity | | | | 6.95 | | 26.99 | | 22.18 | | 35.44 |
| Value Equity Index | | | | 3.64 | | 19.38 | | 27.76 | | 36.79 |
| Value Equity | | | | 1.92 | | 10.04 | | 14.53 | | 19.38 |
| Growth Equity Index | | | | 3.01 | | 16.07 | | 23.09 | | 30.62 |
| Growth Equity | | | | 1.22 | | 6.43 | | 9.32 | | 12.43 |
| Small Cap Equity | | | | 0.32 | | 2.57 | | 4.56 | | 6.36 |
| International Equity | | | | 2.00 | | 11.29 | | 16.85 | | 22.50 |
| Emerging Markets Equity | | | | 1.24 | | 7.15 | | 10.50 | | 13.92 |
| Global Real Estate Securities | | | | 1.57 | | 9.18 | | 11.75 | | — |
| Strategic Alternatives | | | | 8.45 | | 19.15 | | 9.98 | | — |
A summary of the Funds' total long-term and short-term purchases and sales of the shares of the underlying Select Funds during the year ended December 31, 2023, is as follows (amounts in thousands):
| | Total Value
at
12/31/22 | | Purchases | | Sales Proceeds | | Net Realized
Gains/(Losses) | | Change in
Unrealized
Appreciation/
(Depreciation) | | Total Value
at
12/31/23 | | Dividend
Income | | Distributions
of Realized
Gains |
| MyDestination 2015 | | | | | | | | | | | | | | | |
| Money Market | $ 7,072 | | $ 86,419 | | $ 84,278 | | $ — | | $ — | | $ 9,213 | | $ 434 | | $ — |
| Low-Duration Bond | 102,608 | | 39,292 | | 72,296 | | (3,779) | | 5,429 | | 71,254 | | 4,278 | | — |
| Medium-Duration Bond | 158,609 | | 72,041 | | 24,183 | | (3,840) | | 8,353 | | 210,980 | | 5,547 | | — |
| Global Bond | 34,697 | | 4,521 | | 4,160 | | (792) | | 2,427 | | 36,693 | | 502 | | — |
| Defensive Market Strategies® | 70,293 | | 5,572 | | 9,073 | | (600) | | 6,546 | | 72,738 | | 1,621 | | — |
| Equity Index | 114,186 | | 21,474 | | 33,198 | | 11,493 | | 12,158 | | 126,113 | | 1,713 | | 3,131 |
| International Equity Index | 49,747 | | 8,332 | | 16,549 | | 729 | | 6,359 | | 48,618 | | 1,557 | | — |
| Small Cap Equity | 14,231 | | 3,325 | | 7,643 | | 403 | | 1,246 | | 11,562 | | 94 | | 250 |
| Emerging Markets Equity | 22,064 | | 3,033 | | 6,139 | | 558 | | 1,381 | | 20,897 | | 472 | | — |
| Global Real Estate Securities | 5,195 | | 572 | | 2,510 | | (420) | | 638 | | 3,475 | | 153 | | 23 |
| Strategic Alternatives | 19,464 | | 1,339 | | 13,825 | | (385) | | (5) | | 6,588 | | 251 | | 504 |
| | $ 598,166 | | $ 245,920 | | $ 273,854 | | $ 3,367 | | $ 44,532 | | $ 618,131 | | $16,622 | | $ 3,908 |
| | Total Value
at
12/31/22 | | Purchases | | Sales Proceeds | | Net Realized
Gains/(Losses) | | Change in
Unrealized
Appreciation/
(Depreciation) | | Total Value
at
12/31/23 | | Dividend
Income | | Distributions
of Realized
Gains |
| MyDestination 2025 | | | | | | | | | | | | | | | |
| Money Market | $ 22,258 | | $ 174,226 | | $ 167,105 | | $ — | | $ — | | $ 29,379 | | $ 1,182 | | $ — |
| Low-Duration Bond | 164,871 | | 129,008 | | 216,090 | | (7,063) | | 10,084 | | 80,810 | | 8,902 | | — |
| Medium-Duration Bond | 380,718 | | 225,860 | | 89,346 | | (13,346) | | 24,961 | | 528,847 | | 12,212 | | — |
| Global Bond | 89,998 | | 10,279 | | 7,750 | | (1,426) | | 5,693 | | 96,794 | | 1,257 | | — |
| Defensive Market Strategies® | 201,112 | | 23,445 | | 11,925 | | (644) | | 18,805 | | 230,793 | | 5,054 | | — |
| Equity Index | 377,965 | | 55,206 | | 88,970 | | 25,795 | | 52,820 | | 422,816 | | 5,730 | | 10,475 |
| International Equity Index | 165,677 | | 19,582 | | 42,185 | | 476 | | 23,123 | | 166,673 | | 5,183 | | — |
| Small Cap Equity | 46,218 | | 6,329 | | 16,010 | | 159 | | 5,215 | | 41,911 | | 325 | | 863 |
| Emerging Markets Equity | 71,728 | | 8,788 | | 15,331 | | 926 | | 5,419 | | 71,530 | | 1,573 | | — |
| Global Real Estate Securities | 17,454 | | 1,398 | | 6,575 | | (1,056) | | 1,954 | | 13,175 | | 512 | | 75 |
| Strategic Alternatives | 33,758 | | 3,809 | | 19,006 | | (536) | | (498) | | 17,527 | | 669 | | 1,330 |
| | $1,571,757 | | $ 657,930 | | $ 680,293 | | $ 3,285 | | $147,576 | | $1,700,255 | | $42,599 | | $12,743 |
| MyDestination 2035 | | | | | | | | | | | | | | | |
| Money Market | $ 27,339 | | $ 159,962 | | $ 153,916 | | $ — | | $ — | | $ 33,385 | | $ 1,532 | | $ — |
| Medium-Duration Bond | 276,623 | | 76,163 | | 20,320 | | (3,120) | | 11,243 | | 340,589 | | 11,409 | | — |
| Global Bond | 69,066 | | 16,047 | | 3,260 | | (476) | | 4,138 | | 85,515 | | 1,104 | | — |
| Defensive Market Strategies® | 119,677 | | 31,807 | | 790 | | (28) | | 11,878 | | 162,544 | | 3,318 | | — |
| Equity Index | 491,626 | | 57,303 | | 64,405 | | 19,467 | | 85,354 | | 589,345 | | 7,884 | | 14,519 |
| International Equity Index | 213,526 | | 29,709 | | 36,140 | | 919 | | 29,990 | | 238,004 | | 7,158 | | — |
| Small Cap Equity | 58,664 | | 12,914 | | 16,405 | | 601 | | 7,069 | | 62,843 | | 479 | | 1,270 |
| Emerging Markets Equity | 90,960 | | 15,738 | | 11,953 | | (849) | | 9,146 | | 103,042 | | 2,239 | | — |
| Global Real Estate Securities | 18,353 | | 4,217 | | 5,730 | | (975) | | 2,268 | | 18,133 | | 627 | | 89 |
| Strategic Alternatives | 8,051 | | 5,839 | | 360 | | 9 | | (845) | | 12,694 | | 481 | | 953 |
| | $1,373,885 | | $ 409,699 | | $ 313,279 | | $ 15,548 | | $160,241 | | $1,646,094 | | $36,231 | | $16,831 |
| MyDestination 2045 | | | | | | | | | | | | | | | |
| Money Market | $ 20,898 | | $ 133,873 | | $ 129,825 | | $ — | | $ — | | $ 24,946 | | $ 1,145 | | $ — |
| Medium-Duration Bond | 91,289 | | 37,010 | | 15,655 | | (2,677) | | 5,519 | | 115,486 | | 3,905 | | — |
| Global Bond | 22,863 | | 9,079 | | 4,189 | | (749) | | 2,000 | | 29,004 | | 379 | | — |
| Defensive Market Strategies® | 52,967 | | 14,585 | | 3,605 | | (575) | | 5,688 | | 69,060 | | 1,450 | | — |
| Equity Index | 481,615 | | 72,431 | | 37,808 | | 13,881 | | 92,352 | | 622,471 | | 8,183 | | 15,369 |
| International Equity Index | 207,242 | | 37,625 | | 21,399 | | 1,094 | | 30,081 | | 254,643 | | 7,600 | | — |
| Small Cap Equity | 58,172 | | 17,239 | | 13,986 | | (261) | | 8,332 | | 69,496 | | 518 | | 1,373 |
| Emerging Markets Equity | 90,197 | | 19,459 | | 7,989 | | (108) | | 8,583 | | 110,142 | | 2,347 | | — |
| Global Real Estate Securities | 17,716 | | 4,517 | | 4,920 | | (761) | | 2,090 | | 18,642 | | 605 | | 84 |
| | $1,042,959 | | $ 345,818 | | $ 239,376 | | $ 9,844 | | $154,645 | | $1,313,890 | | $26,132 | | $16,826 |
| | Total Value
at
12/31/22 | | Purchases | | Sales Proceeds | | Net Realized
Gains/(Losses) | | Change in
Unrealized
Appreciation/
(Depreciation) | | Total Value
at
12/31/23 | | Dividend
Income | | Distributions
of Realized
Gains |
| MyDestination 2055 | | | | | | | | | | | | | | | |
| Money Market | $ 10,867 | | $ 104,390 | | $ 103,051 | | $ — | | $ — | | $ 12,206 | | $ 545 | | $ — |
| Medium-Duration Bond | 19,148 | | 10,596 | | 6,628 | | (1,607) | | 2,234 | | 23,743 | | 854 | | — |
| Global Bond | 4,800 | | 2,683 | | 1,970 | | (294) | | 576 | | 5,795 | | 84 | | — |
| Defensive Market Strategies® | 21,593 | | 8,787 | | 1,253 | | (185) | | 2,394 | | 31,336 | | 640 | | — |
| Equity Index | 215,446 | | 58,622 | | 14,501 | | 4,718 | | 45,748 | | 310,033 | | 3,993 | | 7,567 |
| International Equity Index | 92,876 | | 27,006 | | 8,101 | | 494 | | 14,231 | | 126,506 | | 3,756 | | — |
| Small Cap Equity | 25,994 | | 11,235 | | 6,614 | | 972 | | 2,987 | | 34,574 | | 258 | | 682 |
| Emerging Markets Equity | 40,400 | | 15,095 | | 4,203 | | (304) | | 4,367 | | 55,355 | | 1,168 | | — |
| Global Real Estate Securities | 7,914 | | 2,692 | | 1,860 | | (399) | | 1,041 | | 9,388 | | 291 | | 40 |
| | $ 439,038 | | $ 241,106 | | $ 148,181 | | $ 3,395 | | $ 73,578 | | $ 608,936 | | $11,589 | | $ 8,289 |
| Conservative Allocation | | | | | | | | | | | | | | | |
| Money Market | $ 5,318 | | $ 60,907 | | $ 59,509 | | $ — | | $ — | | $ 6,716 | | $ 300 | | $ — |
| Low-Duration Bond | 205,332 | | 71,760 | | 94,568 | | (5,087) | | 8,125 | | 185,562 | | 6,427 | | — |
| Medium-Duration Bond | 53,889 | | 62,673 | | 65,202 | | (8,910) | | 10,278 | | 52,728 | | 1,869 | | — |
| Global Bond | 13,906 | | 277 | | 2,262 | | (403) | | 1,000 | | 12,518 | | 177 | | — |
| Defensive Market Strategies® | 32,225 | | 2,286 | | 5,622 | | (346) | | 3,069 | | 31,612 | | 736 | | — |
| Global Impact | 12,892 | | 54 | | 13,713 | | (1,290) | | 2,057 | | — | | 54 | | — |
| Impact Bond | — | | 18,453 | | 1,656 | | (56) | | (122) | | 16,619 | | 647 | | — |
| Impact Equity | — | | 8,579 | | 1,893 | | 76 | | 758 | | 7,520 | | 55 | | 14 |
| Value Equity Index | 5,703 | | 2,500 | | 2,289 | | 122 | | 342 | | 6,378 | | 122 | | 125 |
| Value Equity | 16,984 | | 5,784 | | 4,973 | | (151) | | 1,201 | | 18,845 | | 273 | | 561 |
| Growth Equity Index | 5,283 | | 1,830 | | 2,724 | | 357 | | 1,579 | | 6,325 | | 42 | | 41 |
| Growth Equity | 16,352 | | 5,884 | | 8,869 | | (3,388) | | 8,701 | | 18,680 | | 9 | | 826 |
| Small Cap Equity | 4,412 | | 1,510 | | 3,948 | | — | | 413 | | 2,387 | | 22 | | 60 |
| International Equity | 23,754 | | 4,359 | | 8,668 | | 434 | | 2,686 | | 22,565 | | 528 | | 381 |
| Emerging Markets Equity | 10,210 | | 2,245 | | 3,472 | | (412) | | 1,318 | | 9,889 | | 225 | | — |
| Global Real Estate Securities | 4,883 | | 810 | | 2,246 | | (298) | | 576 | | 3,725 | | 143 | | 21 |
| Strategic Alternatives | 21,911 | | 3,388 | | 3,216 | | 35 | | (1,240) | | 20,878 | | 809 | | 1,618 |
| | $ 433,054 | | $ 253,299 | | $ 284,830 | | $(19,317) | | $ 40,741 | | $ 422,947 | | $12,438 | | $ 3,647 |
| | Total Value
at
12/31/22 | | Purchases | | Sales Proceeds | | Net Realized
Gains/(Losses) | | Change in
Unrealized
Appreciation/
(Depreciation) | | Total Value
at
12/31/23 | | Dividend
Income | | Distributions
of Realized
Gains |
| Balanced Allocation | | | | | | | | | | | | | | | |
| Money Market | $ 22,773 | | $ 130,541 | | $ 124,061 | | $ — | | $ — | | $ 29,253 | | $ 1,407 | | $ — |
| Low-Duration Bond | 50,157 | | 20,412 | | 28,180 | | (1,388) | | 2,139 | | 43,140 | | 1,691 | | — |
| Medium-Duration Bond | 349,728 | | 55,442 | | 55,650 | | (9,934) | | 18,565 | | 358,151 | | 12,761 | | — |
| Global Bond | 101,534 | | 5,270 | | 11,705 | | (2,374) | | 6,700 | | 99,425 | | 1,392 | | — |
| Defensive Market Strategies® | 126,481 | | 5,776 | | 14,631 | | (976) | | 11,737 | | 128,387 | | 2,976 | | — |
| Global Impact | 47,748 | | 201 | | 50,791 | | (5,154) | | 7,996 | | — | | 201 | | — |
| Impact Bond | — | | 22,165 | | 2,420 | | (75) | | (226) | | 19,444 | | 743 | | — |
| Impact Equity | — | | 30,857 | | 4,761 | | 177 | | 2,938 | | 29,211 | | 213 | | 51 |
| Value Equity Index | 30,678 | | 5,892 | | 5,002 | | 255 | | 2,144 | | 33,967 | | 659 | | 683 |
| Value Equity | 92,409 | | 16,710 | | 16,062 | | (1,195) | | 6,774 | | 98,636 | | 1,475 | | 3,069 |
| Growth Equity Index | 29,080 | | 4,206 | | 10,166 | | 1,264 | | 9,331 | | 33,715 | | 231 | | 226 |
| Growth Equity | 89,386 | | 13,906 | | 33,970 | | (13,270) | | 42,247 | | 98,299 | | 50 | | 4,506 |
| Small Cap Equity | 24,078 | | 3,256 | | 10,793 | | 714 | | 1,909 | | 19,164 | | 152 | | 404 |
| International Equity | 127,384 | | 13,042 | | 30,134 | | (2,030) | | 19,123 | | 127,385 | | 2,954 | | 2,088 |
| Emerging Markets Equity | 54,779 | | 7,176 | | 10,100 | | 1,690 | | 3,326 | | 56,871 | | 1,221 | | — |
| Global Real Estate Securities | 24,330 | | 3,266 | | 7,421 | | (1,117) | | 2,746 | | 21,804 | | 743 | | 104 |
| Strategic Alternatives | 48,412 | | 8,818 | | 7,108 | | 105 | | (2,887) | | 47,340 | | 1,863 | | 3,707 |
| | $1,218,957 | | $ 346,936 | | $ 422,955 | | $(33,308) | | $134,562 | | $1,244,192 | | $30,732 | | $14,838 |
| Growth Allocation | | | | | | | | | | | | | | | |
| Money Market | $ 17,726 | | $ 101,808 | | $ 97,507 | | $ — | | $ — | | $ 22,027 | | $ 1,133 | | $ — |
| Low-Duration Bond | 16,766 | | 10,085 | | 15,350 | | (884) | | 1,138 | | 11,755 | | 576 | | — |
| Medium-Duration Bond | 114,420 | | 28,882 | | 22,050 | | (3,683) | | 6,660 | | 124,229 | | 4,340 | | — |
| Global Bond | 33,505 | | 3,225 | | 2,989 | | (624) | | 2,133 | | 35,250 | | 474 | | — |
| Defensive Market Strategies® | 44,404 | | 2,565 | | 4,165 | | (752) | | 4,584 | | 46,636 | | 1,066 | | — |
| Global Impact | 36,852 | | 155 | | 39,200 | | (4,062) | | 6,255 | | — | | 155 | | — |
| Impact Bond | — | | 18,078 | | 1,882 | | (65) | | (163) | | 15,968 | | 597 | | — |
| Impact Equity | — | | 23,880 | | 2,389 | | 115 | | 2,401 | | 24,007 | | 175 | | 42 |
| Value Equity Index | 43,743 | | 6,686 | | 5,166 | | 218 | | 3,164 | | 48,645 | | 945 | | 1,007 |
| Value Equity | 130,850 | | 19,631 | | 15,577 | | 75 | | 7,757 | | 142,736 | | 2,142 | | 4,516 |
| Growth Equity Index | 40,343 | | 5,960 | | 12,998 | | 1,606 | | 13,541 | | 48,452 | | 331 | | 329 |
| Growth Equity | 124,614 | | 18,092 | | 41,623 | | (13,600) | | 54,909 | | 142,392 | | 72 | | 6,620 |
| Small Cap Equity | 33,591 | | 6,488 | | 10,148 | | (187) | | 4,250 | | 33,994 | | 248 | | 674 |
| International Equity | 181,603 | | 16,947 | | 32,712 | | (4,902) | | 29,173 | | 190,109 | | 4,328 | | 3,069 |
| Emerging Markets Equity | 77,365 | | 9,100 | | 9,848 | | 865 | | 6,070 | | 83,552 | | 1,784 | | 1 |
| Global Real Estate Securities | 27,213 | | 4,846 | | 6,185 | | (1,179) | | 3,223 | | 27,918 | | 900 | | 124 |
| Strategic Alternatives | 23,977 | | 5,608 | | 3,451 | | 16 | | (1,474) | | 24,676 | | 955 | | 1,897 |
| | $ 946,972 | | $ 282,036 | | $ 323,240 | | $(27,043) | | $143,621 | | $1,022,346 | | $20,221 | | $18,279 |
| | Total Value
at
12/31/22 | | Purchases | | Sales Proceeds | | Net Realized
Gains/(Losses) | | Change in
Unrealized
Appreciation/
(Depreciation) | | Total Value
at
12/31/23 | | Dividend
Income | | Distributions
of Realized
Gains |
| Aggressive Allocation | | | | | | | | | | | | | | | |
| Money Market | $ 14,586 | | $ 90,605 | | $ 83,842 | | $ — | | $ — | | $ 21,349 | | $ 1,044 | | $ — |
| Impact Equity | — | | 37,631 | | 3,194 | | 107 | | 3,816 | | 38,360 | | 279 | | 67 |
| Value Equity Index | 59,073 | | 6,707 | | 5,872 | | 316 | | 4,259 | | 64,483 | | 1,259 | | 1,347 |
| Value Equity | 177,598 | | 24,026 | | 21,673 | | 98 | | 10,354 | | 190,403 | | 2,873 | | 6,097 |
| Growth Equity Index | 55,660 | | 5,630 | | 17,264 | | 1,611 | | 18,603 | | 64,240 | | 443 | | 437 |
| Growth Equity | 175,316 | | 16,007 | | 56,855 | | (18,406) | | 73,795 | | 189,857 | | 98 | | 8,858 |
| Small Cap Equity | 45,126 | | 7,871 | | 11,290 | | (1,078) | | 6,734 | | 47,363 | | 344 | | 934 |
| International Equity | 245,838 | | 23,988 | | 48,460 | | (8,112) | | 40,595 | | 253,849 | | 5,818 | | 4,120 |
| Emerging Markets Equity | 105,618 | | 11,389 | | 15,710 | | 170 | | 9,334 | | 110,801 | | 2,318 | | — |
| | $ 878,815 | | $ 223,854 | | $ 264,160 | | $(25,294) | | $167,490 | | $ 980,705 | | $14,476 | | $21,860 |
| Low-Duration Bond | | | | | | | | | | | | | | | |
| Money Market | $ 21,270 | | $1,044,479 | | $1,031,588 | | $ — | | $ — | | $ 34,161 | | $ 1,367 | | $ —* |
| Medium-Duration Bond | | | | | | | | | | | | | | | |
| Money Market | $ 71,772 | | $1,088,201 | | $1,125,654 | | $ — | | $ — | | $ 34,319 | | $ 2,869 | | $ —* |
| Global Bond | | | | | | | | | | | | | | | |
| Money Market | $ 33,998 | | $ 317,250 | | $ 325,463 | | $ — | | $ — | | $ 25,785 | | $ 1,524 | | $ —* |
| Impact Bond | | | | | | | | | | | | | | | |
| Money Market | $ — | | $ 68,937 | | $ 64,357 | | $ — | | $ — | | $ 4,580 | | $ 197 | | $ —* |
| Defensive Market Strategies® | | | | | | | | | | | | | | | |
| Money Market | $ 28,530 | | $ 434,902 | | $ 418,611 | | $ — | | $ — | | $ 44,821 | | $ 1,781 | | $ 1 |
| Impact Equity | | | | | | | | | | | | | | | |
| Money Market | $ — | | $ 89,675 | | $ 86,054 | | $ — | | $ — | | $ 3,621 | | $ 226 | | $ —* |
| Equity Index | | | | | | | | | | | | | | | |
| Money Market | $ 102,717 | | $ 635,363 | | $ 650,396 | | $ — | | $ — | | $ 87,684 | | $ 3,151 | | $ 1 |
| Value Equity Index | | | | | | | | | | | | | | | |
| Money Market | $ 6,950 | | $ 60,083 | | $ 61,402 | | $ — | | $ — | | $ 5,631 | | $ 225 | | $ —* |
| Value Equity | | | | | | | | | | | | | | | |
| Money Market | $ 37,901 | | $ 334,251 | | $ 338,716 | | $ — | | $ — | | $ 33,436 | | $ 1,509 | | $ —* |
| Growth Equity Index | | | | | | | | | | | | | | | |
| Money Market | $ 10,051 | | $ 88,849 | | $ 93,141 | | $ — | | $ — | | $ 5,759 | | $ 268 | | $ —* |
| Growth Equity | | | | | | | | | | | | | | | |
| Money Market | $ 53,072 | | $ 481,592 | | $ 499,472 | | $ — | | $ — | | $ 35,192 | | $ 1,872 | | $ —* |
| Small Cap Equity | | | | | | | | | | | | | | | |
| Money Market | $ 27,482 | | $ 309,336 | | $ 320,206 | | $ — | | $ — | | $ 16,612 | | $ 1,431 | | $ —* |
| International Equity Index | | | | | | | | | | | | | | | |
| Money Market | $ 25,347 | | $ 295,764 | | $ 309,557 | | $ — | | $ — | | $ 11,554 | | $ 1,145 | | $ —* |
| | Total Value
at
12/31/22 | | Purchases | | Sales Proceeds | | Net Realized
Gains/(Losses) | | Change in
Unrealized
Appreciation/
(Depreciation) | | Total Value
at
12/31/23 | | Dividend
Income | | Distributions
of Realized
Gains |
| International Equity | | | | | | | | | | | | | | | |
| Money Market | $ 55,955 | | $ 655,729 | | $ 667,187 | | $ — | | $ — | | $ 44,497 | | $ 2,391 | | $ —* |
| Emerging Markets Equity | | | | | | | | | | | | | | | |
| Money Market | $ 21,531 | | $ 252,853 | | $ 253,899 | | $ — | | $ — | | $ 20,485 | | $ 1,169 | | $ —* |
| Global Real Estate Securities | | | | | | | | | | | | | | | |
| Money Market | $ 9,921 | | $ 161,026 | | $ 167,730 | | $ — | | $ — | | $ 3,217 | | $ 352 | | $ —* |
| Strategic Alternatives | | | | | | | | | | | | | | | |
| Money Market | $ 8,616 | | $ 201,274 | | $ 201,552 | | $ — | | $ — | | $ 8,338 | | $ 495 | | $ —* |
*Amount rounds to less than $1,000.
4. SECURITIES LENDING
Pursuant to a Securities Lending Authorization Agreement with Northern Trust, the Select Funds may lend portfolio securities to certain brokers, dealers and other financial institutions that pay the Select Funds a negotiated fee. When loaning securities, the Select Funds retain the benefits of owning the securities, including the economic equivalent of dividends or interest generated by the security. The Select Funds also have the ability to terminate the loans at any time and can do so in order to vote proxies or sell the securities. The Select Funds receive cash or U.S. government securities, such as U.S. Treasury Bills and U.S. Treasury Notes, as collateral against the loaned securities in an amount at least equal to the market value of the loaned securities. The adequacy of the collateral is monitored on a daily basis, and the market value of the securities loaned is determined at the close of each business day. It is the policy of these Funds to obtain additional collateral from or return excess collateral to the borrower by the end of the next business day, following the valuation date of the securities loaned. Therefore, the value of the collateral held may be temporarily less than the value of the securities on loan. However, in the event of default or bankruptcy by the other party to the agreement, realization and/or retention of the collateral may be subject to legal proceedings. Cash collateral has been invested in a short-term government money market fund managed by an affiliate of Northern Trust, which invests 99.5% or more of its total assets in U.S. government securities. This investment is presented on the Funds’ Schedules of Investments. The Funds do not have control of non-cash securities lending collateral, and as such, this amount is not presented on the Funds’ Schedules of Investments.
The securities lending agreements with borrowers permit the Funds, under certain circumstances including an event of default (such as bankruptcy or insolvency), to offset amounts payable by the Fund to the same counterparty against amounts to be received and create one single net payment due to or from the Fund. Securities lending transactions pose certain risks to the Funds. There is a risk that a borrower may default on its obligations to return loaned securities. A Fund will be responsible for the risks associated with the investment of cash collateral, including any collateral invested in an unaffiliated or affiliated money market fund. A Fund may lose money on its investment of cash collateral or may fail to earn sufficient income on its investment to meet obligations to the borrower. In addition, delays may occur in the recovery of securities from borrowers, which could interfere with a Fund’s ability to vote proxies or to settle transactions.
At December 31, 2023, the market values of loaned securities and collateral received were as follows:
| Fund | | Value of
Securities Loaned | | Value of
Non-cash
Collateral | | Value of
Cash
Collateral | | Total
Value of
Collateral * |
| Low-Duration Bond | | $18,091,929 | | $ 6,452,080 | | $12,188,915 | | $ 18,640,995 |
| Medium-Duration Bond | | 58,163,504 | | 22,046,088 | | 37,680,005 | | 59,726,093 |
| Global Bond | | 30,430,142 | | 3,945,406 | | 28,080,100 | | 32,025,506 |
| Impact Bond | | 1,290,418 | | — | | 1,319,500 | | 1,319,500 |
| Defensive Market Strategies® | | 26,010,084 | | 11,280,847 | | 15,441,996 | | 26,722,843 |
| Impact Equity | | 384,280 | | 407,250 | | — | | 407,250 |
| Equity Index | | 98,036,156 | | 100,466,758 | | — | | 100,466,758 |
| Value Equity Index | | 1,797,104 | | 1,588,795 | | 276,063 | | 1,864,858 |
| Value Equity | | 16,398,890 | | 8,841,998 | | 7,874,690 | | 16,716,688 |
| Growth Equity Index | | 3,758,922 | | 3,773,596 | | 65,893 | | 3,839,489 |
| Growth Equity | | 35,522,814 | | 33,730,498 | | 2,609,718 | | 36,340,216 |
| Small Cap Equity | | 74,595,048 | | 66,017,956 | | 12,218,785 | | 78,236,741 |
| International Equity Index | | 22,857,706 | | 10,707,936 | | 13,524,095 | | 24,232,031 |
| International Equity | | 8,775,219 | | 9,082,292 | | 306,900 | | 9,389,192 |
| Emerging Markets Equity | | 3,630,437 | | 3,656,726 | | 185,548 | | 3,842,274 |
| Global Real Estate Securities | | 19,530,607 | | 16,178,747 | | 4,199,404 | | 20,378,151 |
*As of the end of the reporting period, the value of the collateral pledged from the counterparty exceeded the value of the securities out on loan in certain Funds. Refer to the Fund's Schedule of Investments for details on the securities out on loan. Additional information about master netting arrangements can be found in the Repurchase Agreements and Derivative Financial Instruments sections of the Notes to Financial Statements.
The Funds’ securities lending transactions are accounted for as secured borrowings and have an overnight and continuous contractual maturity. The gross amounts of recognized liabilities for securities lending transactions outstanding as of December 31, 2023, are disclosed as “Collateral held for securities on loan, at value” on the Statements of Assets and Liabilities, where applicable.
5. INVESTMENT TRANSACTIONS
For the year ended December 31, 2023, the cost of purchases and proceeds from sales and maturities for each Fund were as follows:
| | | Cost of Purchases and
Proceeds from Sales and Maturities
of Long-Term Securities
(other than U.S. Government Obligations) | | Cost of Purchases and
Proceeds from Sales and Maturities
of Long-Term U.S Government Obligations |
| Fund | | Purchases | | Sale and Maturity
Proceeds | | Purchases | | Sale and Maturity
Proceeds |
| MyDestination 2015 | | $ 159,501,613 | | $ 189,576,656 | | $ 16,219,036 | | $ 12,066,140 |
| MyDestination 2025 | | 483,704,240 | | 513,187,267 | | 30,636,776 | | 14,316,082 |
| MyDestination 2035 | | 249,737,439 | | 159,362,503 | | — | | — |
| MyDestination 2045 | | 211,946,162 | | 109,552,390 | | — | | — |
| MyDestination 2055 | | 136,715,348 | | 45,128,879 | | — | | — |
| Conservative Allocation | | 178,676,442 | | 211,606,535 | | — | | — |
| | | Cost of Purchases and
Proceeds from Sales and Maturities
of Long-Term Securities
(other than U.S. Government Obligations) | | Cost of Purchases and
Proceeds from Sales and Maturities
of Long-Term U.S Government Obligations |
| Fund | | Purchases | | Sale and Maturity
Proceeds | | Purchases | | Sale and Maturity
Proceeds |
| Balanced Allocation | | $ 165,602,347 | | $ 248,100,887 | | $ — | | $ — |
| Growth Allocation | | 141,027,837 | | 186,532,356 | | — | | — |
| Aggressive Allocation | | 133,249,119 | | 180,318,632 | | — | | — |
| Low-Duration Bond | | 416,967,685 | | 439,384,567 | | 1,770,088,567 | | 1,852,951,435 |
| Medium-Duration Bond | | 1,063,335,160 | | 1,020,300,432 | | 8,407,412,083 | | 8,102,955,907 |
| Global Bond | | 136,388,133 | | 132,006,809 | | 120,438,800 | | 111,845,301 |
| Impact Bond | | 22,975,474 | | 8,386,636 | | 94,454,902 | | 74,331,679 |
| Defensive Market Strategies® | | 458,623,970 | | 482,188,819 | | 197,778,617 | | 177,800,000 |
| Impact Equity | | 66,767,248 | | 44,137,457 | | — | | — |
| Equity Index | | 193,983,512 | | 157,211,189 | | — | | — |
| Value Equity Index | | 44,515,163 | | 32,156,674 | | — | | — |
| Value Equity | | 344,715,885 | | 397,503,419 | | — | | — |
| Growth Equity Index | | 53,179,701 | | 35,454,639 | | — | | — |
| Growth Equity | | 532,579,703 | | 649,637,923 | | — | | — |
| Small Cap Equity | | 370,116,334 | | 409,477,608 | | — | | — |
| International Equity Index | | 92,374,154 | | 71,895,866 | | — | | — |
| International Equity | | 545,018,186 | | 587,977,091 | | — | | — |
| Emerging Markets Equity | | 449,387,388 | | 429,212,120 | | — | | — |
| Global Real Estate Securities | | 337,973,330 | | 359,395,798 | | — | | — |
| Strategic Alternatives | | 59,173,607 | | 67,156,685 | | 575,166,908 | | 587,647,199 |
6. CAPITAL SHARE TRANSACTIONS
Transactions in shares of capital stock were as follows:
| | | Year Ended 12/31/23 | | Year Ended 12/31/22 |
| Fund | | Institutional
Class | | Investor
Class | | Institutional
Class | | Investor
Class |
| MyDestination 2015 | | | | | | | | |
| Shares sold | | 3,389,923 | | 2,717,622 | | 8,506,602 | | 3,171,752 |
| Shares reinvested | | 1,000,603 | | 1,635,222 | | 1,747,936 | | 3,137,619 |
| Shares redeemed | | (4,073,551) | | (6,530,924) | | (4,010,625) | | (8,468,329) |
| Net increase (decrease) | | 316,975 | | (2,178,080) | | 6,243,913 | | (2,158,958) |
| MyDestination 2025 | | | | | | | | |
| Shares sold | | 9,306,610 | | 6,345,956 | | 20,703,809 | | 6,169,619 |
| Shares reinvested | | 2,298,357 | | 3,395,002 | | 4,619,412 | | 7,487,388 |
| Shares redeemed | | (9,745,415) | | (11,657,261) | | (4,903,977) | | (12,467,074) |
| Net increase (decrease) | | 1,859,552 | | (1,916,303) | | 20,419,244 | | 1,189,933 |
| | | Year Ended 12/31/23 | | Year Ended 12/31/22 |
| Fund | | Institutional
Class | | Investor
Class | | Institutional
Class | | Investor
Class |
| MyDestination 2035 | | | | | | | | |
| Shares sold | | 9,942,740 | | 8,888,153 | | 18,708,159 | | 6,971,108 |
| Shares reinvested | | 2,577,916 | | 3,253,158 | | 4,189,601 | | 5,645,932 |
| Shares redeemed | | (6,743,730) | | (7,223,990) | | (2,509,370) | | (5,399,724) |
| Net increase (decrease) | | 5,776,926 | | 4,917,321 | | 20,388,390 | | 7,217,316 |
| MyDestination 2045 | | | | | | | | |
| Shares sold | | 8,975,002 | | 7,810,903 | | 10,394,985 | | 6,088,518 |
| Shares reinvested | | 1,794,897 | | 2,259,847 | | 3,020,304 | | 4,054,049 |
| Shares redeemed | | (5,253,067) | | (4,750,061) | | (1,693,624) | | (2,699,101) |
| Net increase (decrease) | | 5,516,832 | | 5,320,689 | | 11,721,665 | | 7,443,466 |
| MyDestination 2055 | | | | | | | | |
| Shares sold | | 5,036,438 | | 4,333,172 | | 3,191,968 | | 3,617,776 |
| Shares reinvested | | 522,144 | | 624,039 | | 792,656 | | 1,060,564 |
| Shares redeemed | | (2,188,644) | | (1,944,689) | | (618,920) | | (826,922) |
| Net increase (decrease) | | 3,369,938 | | 3,012,522 | | 3,365,704 | | 3,851,418 |
| Conservative Allocation | | | | | | | | |
| Shares sold | | 2,053,812 | | 1,268,739 | | 2,819,742 | | 2,778,612 |
| Shares reinvested | | 394,942 | | 1,049,660 | | 453,854 | | 1,454,123 |
| Shares redeemed | | (1,807,738) | | (5,845,696) | | (5,909,164) | | (7,065,981) |
| Net increase (decrease) | | 641,016 | | (3,527,297) | | (2,635,568) | | (2,833,246) |
| Balanced Allocation | | | | | | | | |
| Shares sold | | 3,887,087 | | 2,400,329 | | 4,559,693 | | 2,383,404 |
| Shares reinvested | | 1,131,806 | | 3,372,994 | | 1,862,057 | | 5,869,878 |
| Shares redeemed | | (6,183,376) | | (10,953,614) | | (15,132,731) | | (12,472,479) |
| Net increase (decrease) | | (1,164,483) | | (5,180,291) | | (8,710,981) | | (4,219,197) |
| Growth Allocation | | | | | | | | |
| Shares sold | | 3,825,967 | | 1,906,544 | | 3,443,739 | | 1,767,261 |
| Shares reinvested | | 795,247 | | 2,130,739 | | 1,973,986 | | 5,873,834 |
| Shares redeemed | | (4,808,899) | | (7,579,273) | | (14,439,226) | | (9,264,432) |
| Net increase (decrease) | | (187,685) | | (3,541,990) | | (9,021,501) | | (1,623,337) |
| Aggressive Allocation | | | | | | | | |
| Shares sold | | 2,767,422 | | 1,720,306 | | 2,111,487 | | 1,315,352 |
| Shares reinvested | | 756,663 | | 2,220,518 | | 2,500,380 | | 7,760,851 |
| Shares redeemed | | (4,244,561) | | (6,774,780) | | (6,960,583) | | (6,938,216) |
| Net increase (decrease) | | (720,476) | | (2,833,956) | | (2,348,716) | | 2,137,987 |
| Money Market | | | | | | | | |
| Shares sold | | 6,084,020,618 | | 211,736,909 | | 6,874,995,603 | | 464,431,471 |
| Shares reinvested | | 18,382,350 | | 24,945,983 | | 4,659,638 | | 6,450,251 |
| Shares redeemed | | (6,174,935,622) | | (172,212,164) | | (6,984,269,683) | | (402,783,948) |
| Net increase (decrease) | | (72,532,654) | | 64,470,728 | | (104,614,442) | | 68,097,774 |
| | | Year Ended 12/31/23 | | Year Ended 12/31/22 |
| Fund | | Institutional
Class | | Investor
Class | | Institutional
Class | | Investor
Class |
| Low-Duration Bond | | | | | | | | |
| Shares sold | | 27,539,206 | | 4,690,694 | | 17,910,281 | | 7,563,125 |
| Shares reinvested | | 2,448,259 | | 502,360 | | 1,193,162 | | 302,208 |
| Shares redeemed | | (39,430,479) | | (6,153,764) | | (19,561,367) | | (9,168,175) |
| Net increase (decrease) | | (9,443,014) | | (960,710) | | (457,924) | | (1,302,842) |
| Medium-Duration Bond | | | | | | | | |
| Shares sold | | 50,783,206 | | 9,598,326 | | 26,885,387 | | 7,858,108 |
| Shares reinvested | | 4,974,556 | | 957,473 | | 2,878,012 | | 489,779 |
| Shares redeemed | | (28,046,946) | | (7,186,292) | | (26,243,291) | | (11,874,551) |
| Net increase (decrease) | | 27,710,816 | | 3,369,507 | | 3,520,108 | | (3,526,664) |
| Global Bond | | | | | | | | |
| Shares sold | | 8,826,703 | | 3,580,271 | | 7,715,614 | | 2,396,264 |
| Shares reinvested | | 748,846 | | 138,729 | | 697,759 | | 131,981 |
| Shares redeemed | | (8,131,410) | | (2,779,417) | | (7,853,978) | | (3,131,026) |
| Net increase (decrease) | | 1,444,139 | | 939,583 | | 559,395 | | (602,781) |
| Impact Bond1 | | | | | | | | |
| Shares sold | | 7,877,393 | | 1,834,127 | | | | |
| Shares reinvested | | 233,283 | | 50,835 | | | | |
| Shares redeemed | | (1,542,957) | | (147,841) | | | | |
| Net increase (decrease) | | 6,567,719 | | 1,737,121 | | | | |
| Defensive Market Strategies® | | | | | | | | |
| Shares sold | | 10,610,907 | | 4,425,416 | | 7,990,961 | | 4,756,059 |
| Shares reinvested | | 2,012,636 | | 665,238 | | 14,407,231 | | 5,669,375 |
| Shares redeemed | | (10,730,606) | | (6,436,954) | | (10,128,292) | | (8,607,452) |
| Net increase (decrease) | | 1,892,937 | | (1,346,300) | | 12,269,900 | | 1,817,982 |
| Impact Equity1 | | | | | | | | |
| Shares sold | | 10,037,257 | | 1,520,359 | | | | |
| Shares reinvested | | 82,019 | | 4,403 | | | | |
| Shares redeemed | | (1,195,038) | | (723,416) | | | | |
| Net increase (decrease) | | 8,924,238 | | 801,346 | | | | |
| Equity Index | | | | | | | | |
| Shares sold | | 7,932,287 | | 2,957,549 | | 12,752,274 | | 3,590,940 |
| Shares reinvested | | 2,233,519 | | 713,756 | | 1,443,049 | | 442,762 |
| Shares redeemed | | (7,790,100) | | (3,386,917) | | (6,066,700) | | (3,466,858) |
| Net increase (decrease) | | 2,375,706 | | 284,388 | | 8,128,623 | | 566,844 |
| Value Equity Index2 | | | | | | | | |
| Shares sold | | 2,340,356 | | 982,538 | | 14,231,133 | | 1,054,807 |
| Shares reinvested | | 614,511 | | 41,392 | | 101,406 | | 4,526 |
| Shares redeemed | | (1,947,318) | | (723,430) | | (397,996) | | (163,629) |
| Net increase (decrease) | | 1,007,549 | | 300,500 | | 13,934,543 | | 895,704 |
| | | Year Ended 12/31/23 | | Year Ended 12/31/22 |
| Fund | | Institutional
Class | | Investor
Class | | Institutional
Class | | Investor
Class |
| Value Equity | | | | | | | | |
| Shares sold | | 4,657,452 | | 2,116,571 | | 2,882,096 | | 3,949,332 |
| Shares reinvested | | 1,635,269 | | 933,762 | | 5,310,194 | | 3,575,910 |
| Shares redeemed | | (4,768,842) | | (6,159,433) | | (20,871,820) | | (4,533,432) |
| Net increase (decrease) | | 1,523,879 | | (3,109,100) | | (12,679,530) | | 2,991,810 |
| Growth Equity Index2 | | | | | | | | |
| Shares sold | | 2,113,555 | | 3,614,020 | | 14,325,442 | | 963,241 |
| Shares reinvested | | 177,057 | | 40,473 | | 49,232 | | 341 |
| Shares redeemed | | (4,017,751) | | (768,903) | | (20,158) | | (187,204) |
| Net increase (decrease) | | (1,727,139) | | 2,885,590 | | 14,354,516 | | 776,378 |
| Growth Equity | | | | | | | | |
| Shares sold | | 4,574,112 | | 4,135,483 | | 10,657,475 | | 3,111,055 |
| Shares reinvested | | 1,555,696 | | 1,598,123 | | 4,062,386 | | 3,495,032 |
| Shares redeemed | | (9,004,338) | | (6,148,763) | | (16,903,460) | | (7,133,911) |
| Net increase (decrease) | | (2,874,530) | | (415,157) | | (2,183,599) | | (527,824) |
| Small Cap Equity | | | | | | | | |
| Shares sold | | 5,889,445 | | 2,505,729 | | 3,714,047 | | 1,725,397 |
| Shares reinvested | | 770,923 | | 409,974 | | 1,328,169 | | 789,102 |
| Shares redeemed | | (7,469,008) | | (3,575,314) | | (3,830,548) | | (3,392,048) |
| Net increase (decrease) | | (808,640) | | (659,611) | | 1,211,668 | | (877,549) |
| International Equity Index3 | | | | | | | | |
| Shares sold | | 10,580,424 | | 1,112,565 | | 19,059,814 | | 897,958 |
| Shares reinvested | | 2,471,054 | | 38,710 | | 2,330,387 | | 19,789 |
| Shares redeemed | | (12,645,127) | | (572,707) | | (10,745,667) | | (101,396) |
| Net increase (decrease) | | 406,351 | | 578,568 | | 10,644,534 | | 816,351 |
| International Equity | | | | | | | | |
| Shares sold | | 5,486,691 | | 3,437,492 | | 5,998,120 | | 3,253,789 |
| Shares reinvested | | 2,222,136 | | 894,464 | | 1,148,221 | | 397,094 |
| Shares redeemed | | (10,898,864) | | (3,810,328) | | (13,766,544) | | (3,883,732) |
| Net increase (decrease) | | (3,190,037) | | 521,628 | | (6,620,203) | | (232,849) |
| Emerging Markets Equity | | | | | | | | |
| Shares sold | | 11,383,885 | | 2,983,801 | | 12,331,251 | | 3,290,389 |
| Shares reinvested | | 1,689,219 | | 228,488 | | 1,595,286 | | 213,024 |
| Shares redeemed | | (10,681,454) | | (2,653,308) | | (6,197,919) | | (2,462,757) |
| Net increase (decrease) | | 2,391,650 | | 558,981 | | 7,728,618 | | 1,040,656 |
| Global Real Estate Securities | | | | | | | | |
| Shares sold | | 3,254,877 | | 1,300,312 | | 3,057,694 | | 1,762,139 |
| Shares reinvested | | 693,357 | | 285,332 | | 612,383 | | 279,563 |
| Shares redeemed | | (6,117,472) | | (2,279,935) | | (2,848,041) | | (2,623,179) |
| Net increase (decrease) | | (2,169,238) | | (694,291) | | 822,036 | | (581,477) |
| | | Year Ended 12/31/23 | | Year Ended 12/31/22 |
| Fund | | Institutional
Class | | Investor
Class | | Institutional
Class | | Investor
Class |
| Strategic Alternatives | | | | | | | | |
| Shares sold | | 3,929,499 | | 1,322,629 | | 6,779,653 | | 4,180,255 |
| Shares reinvested | | 2,520,257 | | 508,745 | | 848,697 | | 194,330 |
| Shares redeemed | | (8,198,107) | | (2,538,352) | | (13,912,587) | | (3,006,927) |
| Net increase (decrease) | | (1,748,351) | | (706,978) | | (6,284,237) | | 1,367,658 |
| 1 | For the period January 27, 2023 (commencement of operations) through December 31, 2023. |
| 2 | For the period August 31, 2022 (commencement of operations) through December 31, 2022. |
| 3 | For the Investor Class only, the period of April 29, 2022 through December 31, 2022. |
7. BANK BORROWINGS
Pursuant to a Line of Credit Agreement, the Funds are permitted to borrow cash from Northern Trust up to a limit of $50 million, collectively. Each Fund is individually, and not jointly, liable for its particular advances, if any, under the line of credit. If the line of credit was utilized, interest would be charged to each Fund based on its borrowings at a rate equal to the greater of the Federal Funds Rate plus 1.00% or 1.50%. Each Fund also paid a facility fee equal to its pro rata share of the amount of the credit facility, based on average net assets, at a rate of 0.20% per annum. The agreement will expire on November 13, 2024.
There were no draws on the line of credit for the year ended December 31, 2023, and there were no outstanding loans at December 31, 2023.
8. FEDERAL INCOME TAXES
Each Fund has elected to be treated as and intends to qualify as a regulated investment company each year by complying with all sections of the Internal Revenue Code of 1986, as amended, that apply to regulated investment companies and to distribute substantially all of its taxable income and capital gains to shareholders. No provision for income or excise taxes is thus required. Each Fund is treated as a separate entity for federal income tax purposes.
The Funds may be subject to taxes imposed by countries in which they invest in issuers existing or operating in such countries. Such taxes are generally based on income earned. The Funds accrue such taxes when the related income is earned. Gains realized by the Funds on the sale of securities in certain countries are subject to non-U.S. taxes. The Funds record a liability based on unrealized gains to provide for potential non-U.S. taxes payable upon the sale of these securities.
Management has analyzed the Funds’ tax positions and has concluded that no material provision for income tax is required in the Funds’ financial statements except as noted above. The Funds are not aware of any tax positions for which it is reasonably possible that the total amounts of unrecognized tax benefits will significantly change in the next twelve months. However, management’s conclusions may be subject to review and adjustment at a later date based on factors including, but not limited to new tax laws, regulations and administrative interpretations (including court decisions). Each of the Funds’ federal tax returns for the prior three fiscal years and the current year (year ended December 31, 2020, through year ended December 31, 2023), remains subject to examination by the Internal Revenue Service. In regard to foreign taxes only, certain Funds have open tax years in certain foreign countries they invest in that may date back to the inception of the Funds.
Distributions during the years ended December 31, 2023, and December 31, 2022, were characterized as follows for tax purposes:
| Fund | | Year | | Ordinary
Income | | Long-Term
Capital Gain | | Return
of Capital | | Total
Distribution |
| MyDestination 2015 | | 2023 | | $16,899,568 | | $ 8,294,000 | | $ — | | $ 25,193,568 |
| 2022 | | 12,278,432 | | 32,650,498 | | — | | 44,928,930 |
| MyDestination 2025 | | 2023 | | 42,103,861 | | 14,798,143 | | — | | 56,902,004 |
| 2022 | | 27,613,983 | | 86,598,851 | | — | | 114,212,834 |
| MyDestination 2035 | | 2023 | | 33,595,360 | | 26,738,255 | | — | | 60,333,615 |
| 2022 | | 20,619,529 | | 73,802,651 | | — | | 94,422,180 |
| MyDestination 2045 | | 2023 | | 23,298,048 | | 19,760,728 | | — | | 43,058,776 |
| 2022 | | 15,565,154 | | 52,402,384 | | — | | 67,967,538 |
| MyDestination 2055 | | 2023 | | 10,101,388 | | 7,363,770 | | — | | 17,465,158 |
| 2022 | | 6,265,546 | | 18,987,891 | | — | | 25,253,437 |
| Conservative Allocation | | 2023 | | 12,755,277 | | 2,873,497 | | — | | 15,628,774 |
| 2022 | | 6,900,535 | | 13,094,388 | | — | | 19,994,923 |
| Balanced Allocation | | 2023 | | 33,012,652 | | 16,749,235 | | — | | 49,761,887 |
| 2022 | | 17,907,368 | | 63,772,833 | | — | | 81,680,201 |
| Growth Allocation | | 2023 | | 34,005,168 | | — | | — | | 34,005,168 |
| 2022 | | 1,225,298 | | 81,735,314 | | — | | 82,960,612 |
| Aggressive Allocation | | 2023 | | 26,502,803 | | 7,517,720 | | — | | 34,020,523 |
| 2022 | | 1,072,963 | | 102,159,639 | | — | | 103,232,602 |
| Money Market | | 2023 | | 75,256,603 | | 1,210 | | — | | 75,257,813 |
| 2022 | | 23,591,357 | | — | | — | | 23,591,357 |
| Low-Duration Bond | | 2023 | | 37,408,553 | | — | | — | | 37,408,553 |
| 2022 | | 19,504,200 | | — | | — | | 19,504,200 |
| Medium-Duration Bond | | 2023 | | 75,381,393 | | — | | — | | 75,381,393 |
| 2022 | | 44,093,477 | | — | | — | | 44,093,477 |
| Global Bond | | 2023 | | 7,507,809 | | — | | — | | 7,507,809 |
| 2022 | | 6,084,043 | | 323,287 | | 645,546 | | 7,052,876 |
| Impact Bond | | 2023 | | 2,734,013 | | — | | — | | 2,734,013 |
| Defensive Market Strategies® | | 2023 | | 30,326,994 | | — | | — | | 30,326,994 |
| 2022 | | 18,737,915 | | 186,894,401 | | — | | 205,632,316 |
| Impact Equity | | 2023 | | 946,034 | | — | | — | | 946,034 |
| Equity Index | | 2023 | | 48,926,026 | | 91,947,356 | | — | | 140,873,382 |
| 2022 | | 42,981,741 | | 32,597,417 | | — | | 75,579,158 |
| Value Equity Index | | 2023 | | 6,503,854 | | 423,026 | | — | | 6,926,880 |
| 2022 | | 1,060,490 | | — | | — | | 1,060,490 |
| Value Equity | | 2023 | | 15,507,753 | | 29,593,380 | | — | | 45,101,133 |
| 2022 | | 26,459,616 | | 128,117,163 | | — | | 154,576,779 |
| Growth Equity Index | | 2023 | | 1,982,547 | | 711,395 | | — | | 2,693,942 |
| 2022 | | 464,138 | | — | | — | | 464,138 |
| Growth Equity | | 2023 | | 364,137 | | 71,200,221 | | — | | 71,564,358 |
| 2022 | | 1,198,853 | | 134,976,762 | | — | | 136,175,615 |
| Small Cap Equity | | 2023 | | 4,752,645 | | 14,380,687 | | — | | 19,133,332 |
| 2022 | | 2,824,239 | | 30,262,526 | | — | | 33,086,765 |
| International Equity Index | | 2023 | | 27,805,924 | | — | | — | | 27,805,924 |
| 2022 | | 20,557,904 | | 2,765,624 | | — | | 23,323,528 |
| Fund | | Year | | Ordinary
Income | | Long-Term
Capital Gain | | Return
of Capital | | Total
Distribution |
| International Equity | | 2023 | | $42,934,188 | | $ — | | $ — | | $ 42,934,188 |
| 2022 | | 18,001,181 | | 1,252,957 | | — | | 19,254,138 |
| Emerging Markets Equity | | 2023 | | 16,686,232 | | — | | — | | 16,686,232 |
| 2022 | | 13,013,936 | | — | | 1,707,078 | | 14,721,014 |
| Global Real Estate Securities | | 2023 | | 7,439,277 | | 988,305 | | — | | 8,427,582 |
| 2022 | | 4,183,549 | | 3,606,763 | | — | | 7,790,312 |
| Strategic Alternatives | | 2023 | | 28,647,540 | | — | | — | | 28,647,540 |
| 2022 | | 10,078,085 | | 1,608,781 | | — | | 11,686,866 |
At December 31, 2023, the components of distributable earnings on a tax basis were as follows:
| Fund | | Undistributed
Ordinary
Income | | Undistributed
Long-Term
Capital Gain | | Qualified
Late Year
Losses | | Net Unrealized
Appreciation
(Depreciation) |
| MyDestination 2015 | | $ 244,899 | | $ 3,022,170 | | $ — | | $ (23,368,455) |
| MyDestination 2025 | | 944,951 | | 10,747,804 | | — | | 8,579,698 |
| MyDestination 2035 | | 701,746 | | 17,912,890 | | — | | 68,436,382 |
| MyDestination 2045 | | 464,292 | | 17,041,231 | | — | | 120,963,555 |
| MyDestination 2055 | | 260,951 | | 7,682,889 | | — | | 51,839,971 |
| Conservative Allocation | | 532,419 | | — | | — | | (22,740,137) |
| Balanced Allocation | | 1,148,958 | | — | | — | | (105,115,650) |
| Growth Allocation | | 1,249,833 | | — | | — | | (47,961,243) |
| Aggressive Allocation | | 999,582 | | — | | — | | (25,166,559) |
| Money Market | | — | | 4,281 | | — | | (1,285) |
| Low-Duration Bond | | 458,484 | | — | | — | | (10,851,705) |
| Medium-Duration Bond | | 7,029,945 | | — | | — | | (111,730,507) |
| Global Bond | | 872,095 | | — | | — | | (36,416,252) |
| Impact Bond | | 73,242 | | — | | — | | 89,431 |
| Defensive Market Strategies® | | 11,836,646 | | — | | — | | (2,036,720) |
| Impact Equity | | 879,839 | | — | | — | | 10,623,842 |
| Equity Index | | 6,067,852 | | 6,004,419 | | — | | 1,527,140,683 |
| Value Equity Index | | 335,933 | | 440,499 | | — | | 12,499,412 |
| Value Equity | | — | | 4,262,303 | | (197,597) | | 118,214,133 |
| Growth Equity Index | | 655,170 | | 579,438 | | — | | 43,596,917 |
| Growth Equity | | 1,392,479 | | 14,033,464 | | — | | 360,334,673 |
| Small Cap Equity | | 2,767,287 | | 12,702,986 | | — | | 57,997,495 |
| International Equity Index | | 4,465,217 | | — | | — | | 104,884,934 |
| International Equity | | 4,378,741 | | 3,239,331 | | — | | 82,911,678 |
| Emerging Markets Equity | | 5,389,443 | | — | | — | | (1,056,073) |
| Global Real Estate Securities | | 4,217,449 | | — | | — | | (6,658,827) |
| Strategic Alternatives | | — | | — | | (1,341,610) | | (20,686,186) |
For Federal income tax purposes, realized capital losses may be carried forward and applied against future realized capital gains. Capital loss carryovers were as follows as of December 31, 2023:
| Fund | | Unlimited |
| Conservative Allocation | | $ 4,233,545 |
| Balanced Allocation | | 9,323,340 |
| Growth Allocation | | 8,317,655 |
| Aggressive Allocation | | 3,855,396 |
| Low-Duration Bond | | 45,013,933 |
| Medium-Duration Bond | | 220,730,395 |
| Global Bond | | 40,235,972 |
| Impact Bond | | 744,818 |
| Defensive Market Strategies® | | 4,572,211 |
| International Equity Index | | 9,443,970 |
| Emerging Markets Equity | | 75,308,985 |
| Global Real Estate Securities | | 21,240,729 |
During the year ended December 31, 2023, the following Funds utilized capital loss carryforwards to offset capital gains:
| Fund | | Carryforward
Utilized |
| Defensive Market Strategies® | | $76,707,792 |
| Value Equity Index | | 277,225 |
| International Equity Index | | 2,303,486 |
| International Equity | | 15,212,103 |
| | | |
The Funds have elected to defer qualified late-year losses in accordance with the federal income tax rules. These losses are treated as having arisen on the first day of the following year. Capital losses were incurred from November 1, 2023, through December 31, 2023. The deferral amounts impacting ordinary income were from specified losses incurred from November 1, 2023, through December 31, 2023.
| Fund | | Capital | | Ordinary
Income | | Total |
| Value Equity | | $ — | | $ 197,597 | | $ 197,597 |
| Strategic Alternatives | | 320,502 | | 1,021,108 | | 1,341,610 |
At December 31, 2023, the aggregate cost of investments for federal income tax purposes (including securities sold short and derivative related items) and the net unrealized appreciation from investments having an excess of value over cost and net unrealized depreciation from investments having an excess of cost over value were as follows:
| Fund | | Federal Tax
Cost | | Net Unrealized
Appreciation
(Depreciation) | | Appreciated
Investments | | Depreciated
Investments |
| MyDestination 2015 | | $ 694,950,803 | | $ (23,368,455) | | $ 10,841,048 | | $ (34,209,503) |
| MyDestination 2025 | | 1,775,039,078 | | 8,579,698 | | 86,060,084 | | (77,480,386) |
| MyDestination 2035 | | 1,582,699,813 | | 68,436,383 | | 135,704,453 | | (67,268,070) |
| MyDestination 2045 | | 1,194,171,030 | | 120,963,556 | | 151,984,215 | | (31,020,659) |
| MyDestination 2055 | | 558,602,889 | | 51,839,971 | | 61,319,822 | | (9,479,851) |
| Conservative Allocation | | 447,612,056 | | (22,740,139) | | 7,302,956 | | (30,043,095) |
| Fund | | Federal Tax
Cost | | Net Unrealized
Appreciation
(Depreciation) | | Appreciated
Investments | | Depreciated
Investments |
| Balanced Allocation | | $1,350,907,453 | | $ (105,115,647) | | $ 23,948,873 | | $(129,064,520) |
| Growth Allocation | | 1,071,336,595 | | (47,961,243) | | 24,762,459 | | (72,723,702) |
| Aggressive Allocation | | 1,006,766,363 | | (25,166,559) | | 29,659,913 | | (54,826,472) |
| Money Market | | 1,583,085,121 | | (1,285) | | — | | (1,285) |
| Low-Duration Bond | | 939,410,531 | | (11,023,608) | | 5,085,020 | | (16,108,628) |
| Medium-Duration Bond | | 3,136,262,580 | | (112,171,887) | | 38,452,256 | | (150,624,143) |
| Global Bond | | 628,389,003 | | (36,509,089) | | 37,468,493 | | (73,977,582) |
| Impact Bond | | 87,911,196 | | 89,431 | | 905,497 | | (816,066) |
| Defensive Market Strategies® | | 1,389,713,841 | | (2,060,931) | | 34,746,842 | | (36,807,773) |
| Impact Equity | | 97,496,193 | | 10,622,914 | | 13,986,644 | | (3,363,730) |
| Equity Index | | 2,224,380,115 | | 1,527,140,682 | | 1,610,368,630 | | (83,227,948) |
| Value Equity Index | | 162,578,823 | | 12,499,411 | | 20,443,676 | | (7,944,265) |
| Value Equity | | 870,189,005 | | 118,214,134 | | 143,441,223 | | (25,227,089) |
| Growth Equity Index | | 166,011,131 | | 43,578,916 | | 45,778,664 | | (2,199,748) |
| Growth Equity | | 1,151,358,409 | | 360,334,677 | | 383,670,392 | | (23,335,715) |
| Small Cap Equity | | 687,192,355 | | 57,997,441 | | 101,584,383 | | (43,586,942) |
| International Equity Index | | 824,350,270 | | 104,751,798 | | 154,363,295 | | (49,611,497) |
| International Equity | | 1,010,627,399 | | 82,590,714 | | 123,556,601 | | (40,965,887) |
| Emerging Markets Equity | | 783,286,030 | | 746,010 | | 69,300,063 | | (68,554,053) |
| Global Real Estate Securities | | 246,752,943 | | (6,671,141) | | 590,061 | | (7,261,202) |
| Strategic Alternatives | | 264,555,631 | | (20,638,327) | | 11,646,679 | | (32,285,006) |
The differences between book basis and tax-basis unrealized appreciation (depreciation) are attributable primarily to the tax deferral of losses on wash sales, the deferral of losses on straddles, premium amortization on convertible bonds, Ukrainian debt restructuring, convertible securities, investments in passive foreign investment companies ("PFIC"), outstanding litigations basis adjustments, swaps and other securities with book and tax cost differences.
The timing and character of income and capital gain distributions are determined in accordance with income tax regulations, which may differ from U.S. GAAP. Reclassifications are made for permanent tax differences to reflect income and gains available for distribution under income tax regulations. For the period ended December 31, 2023, the capital accounts have been adjusted for current period permanent book/tax differences which arose principally from differing book/tax treatments of PFICs, paydown losses, foreign currency transactions, foreign capital gains taxes, convertible securities, distributions received from regulated investment companies, reclassifications of dividends paid, equalization and convertible bonds. Net assets were not affected by these reclassifications.
9. RISKS
In the normal course of business, the Funds trade financial instruments and enter into financial transactions where the risk of potential loss exists due to changes in the market (market risk) or due to the failure of the other party to a transaction to perform (credit and counterparty risks).
Market Risks — A Fund’s investments in derivatives and other financial instruments expose the Fund to various risks such as, but not limited to, interest rate, foreign currency, equity and commodity risks.
Interest rate risk is the risk that fixed income securities will decline in value because of changes in interest rates. As nominal interest rates rise, the value of certain fixed income securities held by a Fund is likely to decrease. A nominal interest rate can be described as the sum of a real interest rate and an expected inflation rate. Fixed income securities with longer durations tend to be
more sensitive to changes in interest rates, usually making them more volatile than securities with shorter durations. Duration is useful primarily as a measure of the sensitivity of a fixed income’s market price to interest rate (e.g., yield) movements. The Federal Reserve Board's decision to increase interest rates from historic lows has increased market volatility and heightened risks associated with rising interest rates.
If a Fund invests directly in foreign currencies or in securities that trade in, and receive revenues in, foreign currencies, or in derivatives that provide exposure to foreign currencies, it will be subject to the risk that those currencies will decline in value relative to the base currency of the Fund, or, in the case of hedging positions, that the Fund’s base currency will decline in value relative to the currency being hedged. Currency rates in foreign countries may fluctuate significantly over short periods of time for a number of reasons, including changes in interest rates, intervention (or the failure to intervene) by U.S. or foreign governments, central banks or supranational entities such as the International Monetary Fund, or by the imposition of currency controls or other political developments in the United States or abroad. As a result, a Fund’s investments in foreign currency denominated securities may reduce the returns of the Fund.
The market values of equities, such as common stocks and preferred stocks, or equity related investments such as futures and options, may decline due to general market conditions which are not specifically related to a particular company, such as real or perceived adverse economic conditions, changes in the general outlook for corporate earnings, changes in interest or currency rates or adverse investor sentiment. Market values may also decline due to factors which affect a particular industry or industries, such as labor shortages or increased production costs and competitive conditions within an industry. Equity securities and equity related investments generally have greater market price volatility than fixed income securities.
A Fund’s investments in commodity-linked derivative instruments may subject the Fund to greater market price volatility than investments in traditional securities. The value of commodity-linked derivative instruments may be affected by changes in overall market movements, commodity index volatility, changes in interest rates, or factors affecting a particular industry or commodity, such as drought, floods, weather, livestock disease, embargoes, tariffs and international economic, political and regulatory developments.
In countries with limited or developing markets, investments may present greater risks than in more developed markets and the prices of such investments may be volatile. The consequences of political, social or economic changes in these markets may have disruptive effects on the market prices of these investments and the income they generate, as well as the Fund’s ability to repatriate such amounts.
Local, regional or global events such as the spread of infectious illnesses or other public health issues, recessions, natural disasters or other events could have a significant impact on the Funds and their investments. For example, the outbreak of COVID-19, a novel coronavirus disease, has negatively affected economies, markets and individual companies throughout the world, including those in which the Funds invest. The effects of this pandemic to public health and business and market conditions, including exchange trading suspensions and closures may continue to have a significant negative impact on the performance of a Fund’s investments, increase a Fund’s volatility, exacerbate pre-existing political, social and economic risks to the Funds, and negatively impact broad segments of businesses and populations. The Funds' operations may be interrupted as a result, which may contribute to the negative impact on investment performance. In addition, governments, their regulatory agencies, or self-regulatory organizations may take actions in response to the pandemic that affect the instruments in which a Fund invests, or the issuers of such instruments, in ways that could have a significant negative impact on a Fund’s investment performance. The full impact of the COVID-19 pandemic, or other future epidemics or pandemics, remains unknown.
As a result of increasingly interconnected global economies and financial markets, armed conflict between countries or in a geographic region, for example the current conflicts between Russia and Ukraine in Europe and Hamas and Israel in the Middle East, has the potential to adversely impact the Funds' investments. Such conflicts, and other corresponding events, have had, and could continue to have, severe negative effects on regional and global economic and financial markets, including increased
volatility, reduced liquidity, and overall uncertainty. The negative impacts may be particularly acute in certain sectors. The timing and duration of such conflicts, resulting sanctions, related events and other implications cannot be predicted. The foregoing may result in a negative impact on Fund performance and the value of an investment in a Fund, even beyond any direct investment exposure the Fund may have to issuers located in or with significant exposure to an impacted country or geographic region.
Credit and Counterparty Risks — A Fund will be exposed to credit risk on parties with whom it trades and will also bear the risk of settlement default. A Fund minimizes concentrations of credit risk by undertaking transactions with a large number of customers and counterparties on recognized and reputable exchanges. A Fund could lose money if the issuer or guarantor of a fixed income security, or the counterparty to a derivatives contract, repurchase agreement or a loan of portfolio securities, is unable or unwilling to make timely principal and/or interest payments, or to otherwise honor its obligations. Securities are subject to varying degrees of credit risk, which are often reflected in credit ratings.
Similar to credit risk, a Fund may be exposed to counterparty risk, or the risk that an institution or other entity with which the Fund has unsettled or open transactions will default. Financial assets, which potentially expose a Fund to counterparty risk, consist principally of cash due from counterparties and investments. The investment advisers minimize counterparty risks to the Funds by performing extensive reviews of each counterparty and obtaining approval from the Counterparty Risk Committee prior to entering into transactions with a third party. All transactions in listed securities are settled/paid for upon delivery using approved counterparties. The risk of default is considered minimal, as delivery of securities sold is only made once a Fund has received payment. Payment is made on a purchase once the securities have been delivered by the counterparty. The trade will fail if either party fails to meet its obligation.
10. PRIVATE INVESTMENT
The Impact Bond Fund entered into participation in a loan made by WatersEdge for First Baptist Church – Rogers, Arkansas, on May 31, 2023, with a total uncalled capital commitment of $1,200,000 and a maturity date of May 15, 2050. The note proceeds will be utilized by First Baptist Church – Rogers, Arkansas, to construct a new worship center adjacent to the church’s existing location.
11. RECENT PRONOUNCEMENTS
In March 2020, the FASB issued ASU 2020-04 to provide temporary, optional expedients related to the accounting for contract modifications and hedging transactions as a result of the global markets’ anticipated transition away from the use of LIBOR and other interbank offered rates to alternative reference rates. Preceding the issuance of ASU 2020-04, which established ASC 848, the United Kingdom’s Financial Conduct Authority (FCA) announced that it would no longer need to persuade or compel banks to submit to LIBOR after December 31, 2021. In response, the FASB established a December 31, 2022, expiration date for ASC 848. In March 2021, the FCA announced that the intended cessation date of LIBOR in the United States would be June 30, 2023. In December 2022, the FASB issued ASU 2022-06 which includes amendments to defer the application of the amendments through December 31, 2024. Management notes that there are uncertainties regarding the use of replacement rates and the transition away from LIBOR, but does not anticipate a material impact on the Funds' financial statements.
In June 2022, the FASB issued ASU 2022-03 to clarify the guidance in Topic 820, Fair Value Measurement (Topic 820). The amendments in ASU 2022-03 affect all entities that have investments in equity securities measured at fair value that are subject to a contractual sale restriction. ASU 2022-03 (1) clarifies the guidance in Topic 820, when measuring the fair value of an equity security subject to contractual restrictions that prohibit the sale of equity security, (2) amends a related illustrative example, and (3) introduces new disclosure requirements for equity securities subject to contractual sale restrictions that are measured at fair value in accordance with Topic 820. For public business entities, the amendments in ASU 2022-03 are effective for fiscal years beginning after December 15, 2023, and interim periods within those fiscal years. For all other entities, the amendments are effective for fiscal years beginning after December 15, 2024, and interim periods within those fiscal years. Early adoption is
permitted for both interim and annual financial statements that have not yet been issued or made available for issuance. Management believes that there will be no material impact on the Funds’ financial statements.
The SEC has adopted new regulations that will result in changes to the design and delivery of annual and semiannual shareholder reports. Beginning in July 2024, Funds will be required to send shareholders a paper copy of a new tailored shareholder report for each class of a Fund in place of the full shareholder report that is currently being provided. The tailored shareholder reports will highlight key information such as a Fund's expenses, performance and portfolio holdings. Other, more detailed information that currently appears in a Fund's shareholder report, such as the financial statements, will instead be made available on the Fund's website and filed with the SEC on a semi-annual and annual basis on Form N-CSR. The regulations require mandatory mailing of the reports, unless a shareholder specifically opts out and chooses electronic delivery. The first tailored shareholder reports to be prepared for the Funds will be for the reporting period ended June 30, 2024. Management is evaluating the impact of these regulations on the content of the current shareholder reports and newly created tailored shareholder reports.
12. REGULATORY EXAMINATIONS
Federal and state regulatory authorities from time to time make inquiries and conduct examinations regarding compliance by the Trust and its affiliates with securities and other laws and regulations affecting the Funds. There are currently no such matters which the Trust and its affiliates believe will be material to these financial statements.
REPORT OF INDEPENDENT REGISTERED PUBLIC ACCOUNTING FIRM
To the Board of Directors of GuideStone Funds and Shareholders of MyDestination 2015 Fund, MyDestination 2025 Fund, MyDestination 2035 Fund, MyDestination 2045 Fund, MyDestination 2055 Fund, Conservative Allocation Fund, Balanced Allocation Fund, Growth Allocation Fund, Aggressive Allocation Fund, Money Market Fund, Low-Duration Bond Fund, Medium-Duration Bond Fund, Global Bond Fund, Impact Bond Fund, Defensive Market Strategies® Fund, Impact Equity Fund, Equity Index Fund, Value Equity Index Fund, Value Equity Fund, Growth Equity Index Fund, Growth Equity Fund, Small Cap Equity Fund, International Equity Index Fund, International Equity Fund, Emerging Markets Equity Fund, Global Real Estate Securities Fund and Strategic Alternatives Fund
Opinions on the Financial Statements
We have audited the accompanying statements of assets and liabilities, including the schedules of investments, of each of the funds indicated in the table below (constituting GuideStone Funds, hereafter collectively referred to as the "Funds") as of December 31, 2023, the related statements of operations and of changes in net assets for each of the periods indicated in the table below, including the related notes, and the financial highlights for each of the periods indicated in the table below (collectively referred to as the “financial statements”). In our opinion, the financial statements present fairly, in all material respects, the financial position of each of the Funds as of December 31, 2023, the results of each of their operations, the changes in each of their net assets, and each of the financial highlights for each of the periods indicated in the table below, in conformity with accounting principles generally accepted in the United States of America.
| MyDestination 2015 Fund, MyDestination 2025 Fund, MyDestination 2035 Fund, MyDestination 2045 Fund, MyDestination 2055 Fund, Conservative Allocation Fund, Balanced Allocation Fund, Growth Allocation Fund, Aggressive Allocation Fund, Money Market Fund, Low-Duration Bond Fund, Medium-Duration Bond Fund, Global Bond Fund, Defensive Market Strategies® Fund, Equity Index Fund, Value Equity Fund, Growth Equity Fund, Small Cap Equity Fund, International Equity Index Fund, International Equity Fund, Emerging Markets Equity Fund, Global Real Estate Securities Fund and Strategic Alternatives Fund | Statement of operations for the year ended December 31, 2023, the statements of changes in net assets for each of the two years in the period ended December 31, 2023, and the financial highlights for each of periods presented |
| Value Equity Index Fund and Growth Equity Index Fund | Statement of operations for the year ended December 31, 2023 and the statements of changes in net assets and financial highlights for the year ended December 31, 2023 and for the period August 31, 2022 (commencement of operations) through December 31, 2022 |
| Impact Bond Fund and Impact Equity Fund | Statement of operations, changes in net assets and financial highlights for the period January 27, 2023 (commencement of operations) through December 31, 2023 |
Basis for Opinions
These financial statements are the responsibility of the Funds’ management. Our responsibility is to express an opinion on the Funds’ financial statements based on our audits. We are a public accounting firm registered with the Public Company Accounting Oversight Board (United States) (PCAOB) and are required to be independent with respect to the Funds in accordance with the U.S. federal securities laws and the applicable rules and regulations of the Securities and Exchange Commission and the PCAOB.
We conducted our audits of these financial statements in accordance with the standards of the PCAOB. Those standards require that we plan and perform the audit to obtain reasonable assurance about whether the financial statements are free of material misstatement, whether due to error or fraud.
Our audits included performing procedures to assess the risks of material misstatement of the financial statements, whether due to error or fraud, and performing procedures that respond to those risks. Such procedures included examining, on a test basis, evidence regarding the amounts and disclosures in the financial statements. Our audits also included evaluating the accounting principles used and significant estimates made by management, as well as evaluating the overall presentation of the financial statements. Our procedures included confirmation of securities owned as of December 31, 2023 by correspondence with the
REPORT OF INDEPENDENT REGISTERED PUBLIC ACCOUNTING FIRM
custodian, transfer agent, agent banks and brokers; when replies were not received from brokers and agent banks, we performed other auditing procedures. We believe that our audits provide a reasonable basis for our opinions.
/s/ PricewaterhouseCoopers LLP
Chicago, Illinois
February 26, 2024
We have served as the auditor of one or more investment companies in GuideStone Funds since 2001.
NOTICE TO SHAREHOLDERS (Unaudited)
Each Fund is required by Subchapter M of the Internal Revenue Code of 1986, as amended, to advise its shareholders of the federal tax status of distributions received by each Fund’s shareholders. During the year ended December 31, 2023, the Funds hereby designate the following dividends and distributions paid by each of the Funds:
| Fund | | Ordinary
Income | | Long-Term
Capital Gain
(20% rate) | | Return
of Capital |
| MyDestination 2015 | | $ 16,899,568 | | $ 8,294,000 | | $ — |
| MyDestination 2025 | | 42,103,861 | | 14,798,143 | | — |
| MyDestination 2035 | | 33,595,360 | | 26,738,255 | | — |
| MyDestination 2045 | | 23,298,048 | | 19,760,728 | | — |
| MyDestination 2055 | | 10,101,388 | | 7,363,770 | | — |
| Conservative Allocation | | 12,755,277 | | 2,873,497 | | — |
| Balanced Allocation | | 33,012,652 | | 16,749,235 | | — |
| Growth Allocation | | 34,005,168 | | — | | — |
| Aggressive Allocation | | 26,502,803 | | 7,517,720 | | — |
| Money Market | | 75,256,603 | | 1,210 | | — |
| Low-Duration Bond | | 37,408,553 | | — | | — |
| Medium-Duration Bond | | 75,381,393 | | — | | — |
| Global Bond | | 7,507,809 | | — | | — |
| Impact Bond | | 2,734,013 | | — | | — |
| Defensive Market Strategies® | | 30,326,994 | | — | | — |
| Impact Equity | | 946,034 | | — | | — |
| Equity Index | | 48,926,026 | | 91,947,356 | | — |
| Value Equity Index | | 6,503,854 | | 423,026 | | — |
| Value Equity | | 15,507,753 | | 29,593,380 | | — |
| Growth Equity Index | | 1,982,547 | | 711,395 | | — |
| Growth Equity | | 364,137 | | 71,200,221 | | — |
| Small Cap Equity | | 4,752,645 | | 14,380,687 | | — |
| International Equity Index | | 27,805,924 | | — | | — |
| International Equity | | 42,934,188 | | — | | — |
| Emerging Markets Equity | | 16,686,232 | | — | | — |
| Global Real Estate Securities | | 7,439,277 | | 988,305 | | — |
| Strategic Alternatives | | 28,647,540 | | — | | — |
| | | | | | | |
| | | | | | | |
Dividends from net investment income and short-term capital gains are treated as ordinary income dividends for federal income tax purposes. Long-term capital gain distributions are taxable as capital gain dividends.
NOTICE TO SHAREHOLDERS (Continued)
The following percentages of ordinary income dividends paid for the year ended December 31, 2023, have been designated as qualified for the reduced tax rate under The Job and Growth Tax Relief Reconciliation Act of 2003.
| Fund | | Qualified
Dividend
Income |
| MyDestination 2015 | | 20.46 % |
| MyDestination 2025 | | 27.28 % |
| MyDestination 2035 | | 43.75 % |
| MyDestination 2045 | | 63.69 % |
| MyDestination 2055 | | 71.04 % |
| Conservative Allocation | | 11.37 % |
| Balanced Allocation | | 23.30 % |
| Growth Allocation | | 54.03 % |
| Aggressive Allocation | | 82.95 % |
| Medium-Duration Bond | | 0.02 % |
| Global Bond | | 0.54 % |
| Defensive Market Strategies® | | 27.68 % |
| Impact Equity | | 68.21 % |
| Equity Index | | 85.56 % |
| Value Equity Index | | 46.18 % |
| Value Equity | | 100.00 % |
| Growth Equity Index | | 52.76 % |
| Growth Equity | | 100.00 % |
| Small Cap Equity | | 94.57 % |
| International Equity Index | | 70.13 % |
| International Equity | | 61.35 % |
| Emerging Markets Equity | | 61.98 % |
| Global Real Estate Securities | | 15.29 % |
| Strategic Alternatives | | 2.44 % |
| | | |
| | | |
All above designations are based on financial information available as of the date of this annual report, and accordingly, are subject to change. It is the intention of the Funds to designate the maximum amount permitted under the Internal Revenue Code and the regulations thereunder. Shareholders are advised to consult their own tax advisers with respect to the tax consequences of their investment in the Funds.
NOTICE TO SHAREHOLDERS (Continued)
The following Funds made capital gain distributions in the year ended December 31, 2023, and hereby designated these long-term capital gain distributions as follows:
| Fund | Long Term
Capital
Gain Rate |
| MyDestination 2015 | $0.1227 |
| MyDestination 2025 | 0.0865 |
| MyDestination 2035 | 0.1766 |
| MyDestination 2045 | 0.1679 |
| MyDestination 2055 | 0.1940 |
| Conservative Allocation | 0.0754 |
| Balanced Allocation | 0.1547 |
| Aggressive Allocation | 0.0909 |
| Equity Index | 1.2420 |
| Value Equity Index | 0.0276 |
| Value Equity | 0.5676 |
| Growth Equity Index | 0.0454 |
| Growth Equity | 1.1603 |
| Small Cap Equity | 0.3285 |
| Global Real Estate Securities | 0.0323 |
| | |
SHAREHOLDER ACTIONS (Unaudited)
GuideStone Financial Resources of the Southern Baptist Convention (“GuideStone Financial Resources”) at all times during the fiscal year ended December 31, 2023, directly or indirectly controlled the vote of at least 60% of the outstanding shares of GuideStone Funds (the “Trust”). This means that GuideStone Financial Resources, which is an affiliate of the Trust’s investment adviser, GuideStone Capital Management, LLC, controls the vote on any matter that requires shareholder approval.
During the fiscal year ended December 31, 2023, GuideStone Financial Resources approved by written consent in lieu of a shareholder meeting, dated October 3, 2023, the election of Jill R. Rayburn and Brandon Pizzurro to the Board of Directors of the Trust, as an Independent Director and Interested Director, respectively, effective January 1, 2024.
Additionally, GuideStone Financial Resources approved by written consent in lieu of a shareholder meeting, dated August 1, 2023, amendments to the Trust's Amended and Restated Trust Instrument (the “Trust Instrument”) to change the references to the Trustees to the nomenclature of “Directors”, to permit Independent Directors to be reasonably compensated by the Trust, and to revise and move to the Trust's By-Laws the provision related to the mandatory retirement age for the Directors, effective August 31, 2023.
Additionally, GuideStone Financial Resources approved by written consent in lieu of a shareholder meeting, dated March 1, 2023, the election of Deanna A. Mankins and James D. Caldwell to the Board of Trustees of the Trust, both as Independent Trustees, effective March 21, 2023.
FUND MANAGEMENT (Unaudited)
Information pertaining to the Directors and officers of the Trust is set forth below. This information is current as of January 1, 2024. The statement of additional information (SAI) includes additional information about the Directors and is available without charge, upon request, by calling 1-888-GS-FUNDS (1-888-473-8637).
Name, (Year of Birth), Address
and Position(s) with Trust | Term of Office
and Length of
Time Served1 | Principal Occupation(s)
During Past 5 Years | Number of
Portfolios
in Fund
Complex
Overseen
by Director | Other Trusteeships/
Directorships
Held by Director2 |
| INDEPENDENT DIRECTORS* |
James D. Caldwell (1955)
5005 Lyndon B. Johnson
Freeway Suite 2200
Dallas, TX 75244-6152
Director | Since 2023 | President, Rowling Foundation, 2024 – present; Executive Vice President, TRT Holdings, Inc. (holding company of Omni Hotels), 2018 – present; Chief Executive Officer, Origins Behavioral HealthCare, LLC, 2018 – present. | 27 | None |
Thomas G. Evans (1961)
5005 Lyndon B. Johnson
Freeway Suite 2200
Dallas, TX 75244-6152
Director | Since 2020 | President and Owner, Encompass Financial Services, Inc., 1985 – present. | 27 | None |
William Craig George (1958)
5005 Lyndon B. Johnson
Freeway Suite 2200
Dallas, TX 75244-6152
Director | Since 2004 | Senior Vice President and Regional Credit Officer, First National Bank, 2017 – present. | 27 | None |
Grady R. Hazel (1947)
5005 Lyndon B. Johnson
Freeway Suite 2200
Dallas, TX 75244-6152
Director | Since 2011 | Chief Financial Officer, The Dunham School,
2015 – present; Certified Public Accountant,
1978 – present. | 27 | None |
Deanna A. Mankins (1971)
5005 Lyndon B. Johnson
Freeway Suite 2200
Dallas, TX 75244-6152
Director | Since 2023 | Chief Financial Officer, City of Zachary, 2019 – present; Tax Manager, Postlethwaite & Netterville, APAC, 2001 – 2019. | 27 | None |
David B. McMillan (1957)
5005 Lyndon B. Johnson
Freeway Suite 2200
Dallas, TX 75244-6152
Director | Since 2019 | Chief Executive Officer and Founder, Peridot
Energy LLC, 2008 – present. | 27 | None |
Ronald D. Murff (1953)
5005 Lyndon B. Johnson
Freeway Suite 2200
Dallas, TX 75244-6152
Director | Since 2019 | President, JKL Group, LLC, 2010 – present;
Principal, Dalcor Companies, 2012 –
present. | 27 | None |
Jill R. Rayburn (1969)
5005 Lyndon B. Johnson
Freeway Suite 2200
Dallas, TX 75244-6152
Director | Since 2024 | University General Counsel, North Greenville University, 2021 – present; Adjunct Professor, North Greenville University, 2009 – present; Managing Partner, Richey Family, GP; Richey Girls, GP, and Richey Development, GP, 2004 – present; Assistant Provost for Academic Outreach and Director of Professional Programs/Title IX Coordinator, North Greenville University, 2019 – 2020. | 27 | None |
| INTERESTED DIRECTOR AND OFFICER* |
Brandon Pizzurro (1981)
5005 Lyndon B. Johnson
Freeway Suite 2200
Dallas, TX 75244-6152
President | Since 20233 | Chief Investment Officer, GuideStone Financial Resources, 2024 – present; Director of Public Investments, GuideStone Financial Resources, 2021 – present; Portfolio Manager, GuideStone Financial Resources, 2019 – 2021; Senior Investment Analyst, GuideStone Financial Resources, 2017 – 2019. | 27 | None |
FUND MANAGEMENT (Continued)
Name, (Year of Birth), Address
and Position(s) with Trust | Term of Office
and Length of
Time Served1 | Principal Occupation(s)
During Past 5 Years | Number of
Portfolios
in Fund
Complex
Overseen
by Director | Other Trusteeships/
Directorships
Held by Director2 |
| OFFICERS WHO ARE NOT DIRECTORS4 |
Melanie Childers (1971)
5005 Lyndon B. Johnson
Freeway Suite 2200
Dallas, TX 75244-6152
Vice President – Fund
Operations and Secretary | Since 20145 | Managing Director, Fund Operations,
GuideStone Financial Resources, 2014 –
present. | N/A | N/A |
Patrick Pattison (1974)
5005 Lyndon B. Johnson
Freeway Suite 2200
Dallas, TX 75244-6152
Vice President and Treasurer | Since 2008 | Chief Accounting Officer, GuideStone
Financial Resources, 2015 – present. | N/A | N/A |
Brandon Waldeck (1977)
5005 Lyndon B. Johnson
Freeway Suite 2200
Dallas, TX 75244-6152
AML Compliance Officer | Since 2020 | Senior Manager – Fraud Risk,
Risk, GuideStone Financial Resources,
2019 – present; Director
of Ethics Office Trade Monitoring,
Fidelity Investments, 2001 – 2019. | N/A | N/A |
Matthew A. Wolfe (1982)
5005 Lyndon B. Johnson
Freeway Suite 2200
Dallas, TX 75244-6152
Chief Compliance Officer and
Chief Legal Officer | Since 20176 | Managing Director, Compliance and Legal,
GuideStone Financial Resources, 2020 – present;
Associate Counsel – Investment and
Corporate Services, GuideStone Financial
Resources, 2015 – 2020. | N/A | N/A |
Erin Wynne (1981)
5005 Lyndon B. Johnson
Freeway Suite 2200
Dallas, TX 75244-6152
Assistant Treasurer | Since 2016 | Director, Financial Reporting & Analysis,
GuideStone Financial Resources, 2015 –
present. | N/A | N/A |
1Each Independent Director serves until his or her resignation, removal or mandatory retirement. Each Interested Director serves until his or her resignation, removal or mandatory retirement or until he or she ceases to be a member of the Board of Directors of GuideStone Financial Resources, if applicable. All Directors must retire at the end of the calendar year in which they attain the age of 80. Officers serve at the pleasure of the Board of Directors.
2Trusteeships or Directorships not included in the Trust complex that are held by a Director in any company with a class of securities registered pursuant to section 12 of the Securities Exchange Act of 1934 or any company registered as an investment company under the 1940 Act.
3Effective January 1, 2024, Mr. Pizzurro joined the Trust's Board of Directors as an Interested Director. Mr. Pizzurro is considered an Interested Director due to his positions with the Trust, GuideStone Financial Resources, the Adviser and GuideStone Investment Services. Mr. Pizzurro has served as an officer of the Trust since 2021.
4The officers of the Trust are affiliates of the Adviser due to their positions with the Adviser, GuideStone Financial Resources, GuideStone Investment Services and/or GuideStone Resource Management, Inc.
5Ms. Childers has served as Vice President – Fund Operations since 2014. She has served as Vice President – Fund Operations and Secretary since 2021.
6Mr. Wolfe has served as Chief Legal Officer since 2017. He has served as CCO and Chief Legal Officer since 2020.
*“Independent Directors” are Directors who are not “interested persons” of the Trust, as the term “interested person” is defined in Section 2(a)(19) of the 1940 Act. “Interested Directors” are Directors who are “interested persons” of the Trust, as the term “interested person” is defined in Section 2(a)(19) of the 1940 Act.
PROXY VOTING
A description of the policies and procedures that GuideStone Funds uses to determine how to vote proxies relating to their portfolio securities as well as information regarding how GuideStone Funds voted proxies during the most recent 12-month period ended June 30 is available without charge by calling 1-888-GS-FUNDS (1-888-473-8637), by visiting our website at GuideStoneFunds.com or by visiting the SEC’s website at http://www.sec.gov.
FORM N-MFP
GuideStone Money Market Fund files detailed month-end portfolio holdings information on Form N-MFP with the SEC each month. The portfolio holdings information is posted on our website, GuideStoneFunds.com within five business days after the end of the month. Form N-MFP is made available online with a 60-day delay at http://www.sec.gov.
QUARTERLY SCHEDULES OF INVESTMENTS
In addition to the semi-annual and annual reports that GuideStone Funds delivers to shareholders and makes available through its website, GuideStone Funds files a complete schedule of portfolio holdings with the SEC for each Fund’s first and third fiscal quarters on Form N-PORT. GuideStone Funds does not deliver the schedule for the first and third fiscal quarters to shareholders; however, the schedule is posted to our website, GuideStoneFunds.com. You may also obtain Form N-PORT filings by accessing the SEC’s website at http://www.sec.gov.
BOARD REVIEW OF EXISTING ADVISORY AGREEMENT AND SUB-ADVISORY AGREEMENTS
As required by the Investment Company Act of 1940, as amended (the “1940 Act”), the Board of Directors (the “Board” or the “Directors”) of GuideStone Funds (the “Trust”), including a majority of the Directors who are not “interested persons” of the Trust (the “Independent Directors”), as the term “interested person” is defined in Section 2(a)(19) of the 1940 Act, recently considered the renewal of (i) the investment advisory agreement between GuideStone Capital Management, LLC (“GSCM” or the “Adviser”) and the Trust on behalf of each series of the Trust (each, a “Fund” and collectively, the “Funds”), except as noted below (the “Advisory Agreement”); and (ii) the existing sub-advisory agreements among the Adviser, each sub-adviser and the Trust on behalf of each Select Fund(1) (except as noted below) (referred to collectively as the “Sub-Advisory Agreements”). The Advisory Agreement and the Sub-Advisory Agreements (each, an “Agreement,” and collectively, the “Agreements”) were approved for an additional one-year term, at a meeting of the Board held on September 14-15, 2023 (the “September Meeting”). The Board’s decision to approve the Agreements reflects the exercise of its reasonable business judgment to continue each Agreement. In approving the continuation of the Agreements, the Board considered, with the assistance and advice of counsel to Independent Directors (“Independent Counsel”) and counsel to the Trust, information provided by the Adviser, each applicable sub-adviser and Broadridge, an independent provider of investment company data engaged by the Trust. Because the Board had approved them for an initial two-year term within the last year, the following Agreements were not subject to annual renewal at the September Meeting: (i) the investment advisory agreements between the Adviser and the Trust on behalf of the Impact Bond Fund (the “MBF”) and Impact Equity Fund (the “MEF”); (ii) the sub-advisory agreement with RBC Global Asset Management (U.S.) Inc. on behalf of the MBF; (iii) the sub-advisory agreement with Janus Henderson Investors US LLC on behalf of the MEF; and (iv) the sub-advisory agreements with Parametric Portfolio Associates LLC on behalf of MBF and MEF.
The Board’s consideration of various factors and its conclusions with respect to such factors formed the basis for the Board’s determination to continue the Agreements. The factors considered by the Board included, but were not limited to: (i) the personnel resources of the Adviser and sub-advisers; (ii) the experience and expertise of the Adviser and sub-advisers; (iii) the financial capabilities and resources of the Adviser and sub-advisers; (iv) the compliance procedures and histories of the Adviser and sub-advisers; (v) the performance of the Funds or portfolio accounts in comparison to relevant benchmarks, peer universes of similarly managed funds and/or the sub-advisers’ other clients; (vi) the amount of the contractual advisory fees in comparison to similarly managed funds and/or the sub-advisers’ other clients and the effect of any fee waiver and expense reimbursement arrangements; (vii) the total expenses of the Funds in comparison to similarly managed funds and the use of past and anticipated expense caps; (viii) the profitability of the Adviser and, to the extent available, of the sub-advisers with respect to the Funds or portfolio accounts and their overall businesses, as well as the effect of fee waivers and expense caps on profitability levels; (ix) the extent of any economies of scale and whether the advisory fees reflect such economies of scale through breakpoints or otherwise, or effectively do so as a result of recent reductions in fee levels; (x) the existence of any collateral benefits realized by the Adviser or sub-advisers, such as the use of soft dollars; and (xi) the existence of any collateral benefits realized by the Funds resulting from relationships with the Adviser or sub-advisers. In addition, the Board considered each sub-adviser’s human resources, business continuity and cybersecurity practices and policies and financial condition. With respect to the Funds that utilize a multi-manager approach (i.e., the Fund is advised by multiple sub-advisers), the Board considered the ongoing role each sub-adviser plays in the overall structure of the Fund’s portfolio, including how each sub-adviser’s strategy complements the strategies of the other sub-advisers.
(1)“Select Funds” refers collectively to the Money Market Fund, Low-Duration Bond Fund, Medium-Duration Bond Fund, Global Bond Fund, Strategic Alternatives Fund, Defensive Market Strategies® Fund, Impact Bond Fund, Impact Equity Fund, Equity Index Fund, Global Real Estate Securities Fund, Value Equity Index Fund, Value Equity Fund, Growth Equity Index Fund, Growth Equity Fund, Small Cap Equity Fund, International Equity Index Fund, International Equity Fund and Emerging Markets Equity Fund.
In its decision to renew the Agreements, the Board evaluated whether the approval of each Agreement was in the best interests of the applicable Fund and its shareholders. No one factor was determinative in the Board’s consideration of the Agreements. The Board was also mindful of the potential disruptions of the Trust’s operations and various risks, uncertainties and other effects that could occur as a result of a decision to terminate or not renew an Agreement.
The Board undertook a review of the terms of the Agreements and the nature, extent and quality of the services provided by the Adviser and each applicable sub-adviser. The Board conducted its analysis on a Fund-by-Fund basis with respect to the Adviser and then each applicable sub-adviser. The Adviser provided the Board with substantial detailed information in the form of reports about itself and each Fund and the applicable sub-advisory firms prior to and during the September Meeting, which addressed the factors listed previously. The Adviser also provided additional information about the Adviser and each sub-adviser in presentations made during the September Meeting and responded to questions from the Directors. In addition, the Independent Directors met separately in executive session with Independent Counsel, as did the Investment Management Committee of the Board (the “IMC”), to discuss and consider information presented in connection with the continuation of the Agreements as well as the Directors’ responsibilities and duties in approving the Agreements.
BOARD APPROVAL OF CONTINUATION OF THE ADVISORY AGREEMENT WITH GSCM
In considering the renewal of the Advisory Agreement, the Board took into account all the materials provided prior to and during the meeting, the presentations made during the meeting and the comprehensive discussions during the meeting, including the discussions between the Independent Directors and Independent Counsel during executive sessions. The Board also considered the IMC’s review of information related to the renewal of the Advisory Agreement, questions submitted by the IMC to the Adviser and Trust management regarding GSCM and the responses to those questions that were discussed with the Board.
The Board examined the nature, extent and quality of the services to be provided by GSCM to each of the Funds. The Board evaluated GSCM’s experience serving as the investment adviser to the Trust and each of the Funds, including GSCM’s experience overseeing and managing the allocation of each Fund’s assets among the Trust’s sub-advisers, continually reviewing the investment performance of each Fund, continually reviewing the nature and quality of the services provided by the Trust’s sub-advisers and recommending changes to the Trust’s sub-advisers and the allocation of each Select Fund’s assets among the applicable sub-advisers, as and when appropriate, and potentially directly managing Fund investments. With respect to the Target Date Funds(2) and the Target Risk Funds(3) (each, a “Fund-of-Fund”, and collectively, the “Funds-of-Funds”), the Board evaluated the nature, extent and quality of the services that GSCM provides that are in addition to, rather than duplicative of, services provided to any underlying Select Fund. Specifically, the Board evaluated GSCM’s services in determining the glide path or the asset mix for each Fund and selecting the specific underlying Select Funds in which to invest, as well as rebalancing services. The Board considered the experience of key personnel at GSCM providing investment management services to the Trust and to each Fund as well as the administrative services provided to the Trust, the systems used by such persons and the ability of GSCM to attract and retain capable personnel. The Board considered the reputation, operations, business continuity and cybersecurity policies and practices, compliance history, compliance program and financial condition of GSCM. The Board also considered the terms of the Advisory Agreement and the responsibilities that GSCM has as investment adviser to each of the Funds, including oversight of sub-adviser compliance with each Fund’s policies and objectives and oversight of general Fund compliance, including compliance with faith-based investing (“FBI”) restrictions and Board directives.
(2)“Target Date Funds” refers collectively to the MyDestination 2015 Fund, MyDestination 2025 Fund, MyDestination 2035 Fund, MyDestination 2045 Fund and MyDestination 2055 Fund.
(3)“Target Risk Funds” refers collectively to the Conservative Allocation Fund, Balanced Allocation Fund, Growth Allocation Fund and Aggressive Allocation Fund.
The Board concluded that each Fund is likely to benefit from the nature, extent and quality of GSCM’s services based on its experience, personnel, operations and resources. During their deliberations, the Directors did not identify any particular information that was all-important or controlling, and each Director may have attributed different weights to the various factors deliberated upon, among others.
The Board considered the advisory fees for each of the applicable Funds under the Advisory Agreement, as well as each applicable Fund’s contractual management (combined Adviser and sub-adviser) fees. The Board examined the fee information for each Select Fund, as compared to other funds in each Select Fund’s designated peer group (“Expense Group”) for the Institutional and Investor Classes, based on information provided by Broadridge as of June 30, 2023. The Board took into account that this comparison of each of the Select Funds Institutional Class contractual management fees, not inclusive of any fee waivers or expense reimbursements, if applicable, ranked the Low-Duration Bond Fund (“LDBF”), Medium-Duration Bond Fund (“MDBF”), Global Bond Fund (“GBF”), Equity Index Fund (“EIF”), Global Real Estate Securities Fund (“GRESF”), Value Equity Fund (“VEF”), Growth Equity Index Fund (the “GEIF”) and International Equity Index Fund (the “IEIF”) in the first quintile; the Money Market Fund (“MMF”), Strategic Alternatives Fund (“SAF”), Growth Equity Fund (“GEF”) and Emerging Markets Equity Fund (“EMEF”) in the second quintile; the Defensive Market Strategies® Fund (“DMSF”), Small Cap Equity Fund (“SCEF”) and International Equity Fund (“IEF”) in the third quintile; and no Fund in the fourth or fifth quintile. The Board noted that the Value Equity Index Fund (“VEIF”) did not receive a quintile ranking for contractual management fees but ranked second out of five relevant peers in its Expense Group for contractual management fees. With respect to the comparison of each of the Select Funds Investor Class contractual management fees, not inclusive of any fee waivers or expense reimbursements, if applicable, the Board noted that the MMF, LDBF, MDBF, GBF, GRESF, GEIF and EMEF ranked in the first quintile; the DMSF, EIF, VEF, GEF and IEIF ranked in the second quintile; the SAF ranked in the third quintile; the SCEF and IEF ranked in the fourth quintile; and no Fund ranked in the fifth quintile. The Board noted that the VEIF did not receive a quintile ranking for contractual management fees but ranked first out of five relevant peers in its Expense Group for contractual management fees.
The Board evaluated the total expense ratios for other funds in each Select Fund’s Expense Group for the Institutional and Investor Classes based on information provided by Broadridge as of June 30, 2023 It reflected upon the results of each of the Select Funds Institutional Class total expense ratios, net of any fee waivers or expense reimbursements, if applicable, noting that the LDBF, MDBF, GBF, GEIF, GEF and IEIF ranked in the first quintile; the DMSF, EIF, GRESF, VEF and IEF ranked in the second quintile; the SAF and SCEF ranked in the third quintile; the MMF and EMEF ranked in the fourth quintile; and no Fund ranked in the fifth quintile. The Board noted that the VEIF did not receive a quintile ranking for total expense ratio but ranked second out of five relevant peers in its Expense Group for total expense ratio. For the comparison of each of the Select Funds Investor Class total expense ratios, net of any fee waivers or expense reimbursements, if applicable, the Board noted that the GEIF ranked in the first quintile; no Funds ranked in the second quintile; the MDBF and IEIF ranked in the third quintile; the MMF, LDBF, GBF, SAF, DMSF, EIF, VEF, GEF, IEF and EMEF ranked in the fourth quintile; and the GRESF and SCEF ranked in the fifth quintile. The Board noted that the VEIF did not receive a quintile ranking for total expense ratio but ranked first out of five relevant peers in its Expense Group for total expense ratio.
The Board also examined fee information for the Funds-of-Funds, as compared to other funds in these Funds’ Expense Groups for both the Institutional and Investor Classes, based on information provided by Broadridge as of June 30, 2023, noting the relatively small size of the Expense Groups. The Board reviewed each Fund-of-Fund’s contractual management fees, not inclusive of any fee waivers or expense reimbursements, if applicable, noting that most of the Institutional Class Funds-of-Funds resided in the second quintile, with the exception of the Conservative Allocation Fund (“CAF”) and Growth Allocation Fund (“GAF”), which ranked in the first quintile, and the MyDestination 2015 Fund (“MDF 2015”), Balanced Allocation Fund (“BAF”) and Aggressive
Allocation Fund (“AAF”), which were not assigned a quintile ranking due to the number of relevant peers in their respective Expense Groups. The Board took note, however, that for contractual management fee rankings compared with relevant peers in each Fund’s respective Expense Group, the MDF 2015 ranked third of three peers, BAF ranked third of five peers, and AAF ranked first of five peers. Regarding the Investor Class of the Funds-of-Funds’ rankings of contractual management fees, not inclusive of any fee waivers or expense reimbursements, if applicable, the Board observed that most of the Funds-of-Funds were in the first quintile, except for the MDF 2015, BAF and AAF, which were not assigned quintile rankings due to the number of relevant peers in their respective Expense Groups. The Board took note, however, that for contractual management fee rankings compared with relevant peers in each Fund’s respective Expense Group, the MDF 2015 ranked second of three peers, BAF ranked third of five peers and AAF ranked first of four peers.
Also, with respect to the Funds-of-Funds, the Board assessed the total expense ratios, net of any fee waivers or expense reimbursements, if applicable, in these Funds’ Expense Groups for both the Institutional and Investor Classes, based on information from Broadridge as of June 30, 2023, continuing to note the relatively small size of the Expense Groups. For the Institutional Class, the Board observed that the MyDestination 2055 Fund (“MDF 2055”) was in the first quintile; the MyDestination 2025 Fund (“MDF 2025”), MyDestination Fund 2035 (“MDF 2035”) and MyDestination 2045 Fund (“MDF 2045”) were in the second quintile; no Funds were in the third quintile; the CAF and BAF were in fourth quintile; and the GAF was in the fifth quintile. The MDF 2015 and AAF were not assigned quintiles with respect to their total expense ratios due to the number of relevant peers in their respective Expense Groups. The Board took note, however, that for total expense ratio rankings compared with relevant peers in each Fund’s respective Expense Group, the MDF 2015 ranked third of five peers and the AAF ranked fourth of five peers. Regarding the Investor Class, the Board observed that no Fund ranked in the first quintile; the MDF 2025, MDF 2035, MDF 2045 and MDF 2055 ranked in the second quintile; the CAF ranked in the third quintile; the BAF and GAF ranked in the fourth quintile; and no Funds were in the fifth quintile. The MDF 2015 and AAF were not assigned quintiles with respect to their total expense ratios due to the number of relevant peers in their respective Expense Groups. The Board took note, however, that for total expense ratio rankings compared with relevant peers in each Fund’s respective Expense Group, the MDF 2015 ranked second of four peers and the AAF ranked third of four peers.
The Board examined the performance information for both the Institutional and Investor Classes of the Funds compared to each Fund’s designated broad peer group (“Performance Universe”) based on information provided by Broadridge, specifically the average annual total returns for the three-, five- and 10-year periods ended June 30, 2023, as applicable.
For the three-year average annual total returns for the period ended June 30, 2023, the Board noted that for the Institutional Class, the CAF, MMF and GRESF ranked in the first quintile; the GBF, DMSF and EIF ranked in the second quintile; the MDF 2025, MDF 2055, BAF, LDBF, SAF, VEF, IEIF, IEF and EMEF ranked in the third quintile; the MDF 2015, MDF 2035, MDF 2045, AAF, GEF and SCEF ranked in the fourth quintile; and the GAF and MDBF ranked in the fifth quintile. As for the three-year average annual total returns for the Investor Class of the Funds, the Board noted that the report results had no Fund ranked in the first quintile; the CAF, GBF, DMSF and GRESF ranked in the second quintile; the BAF, EIF, VEF, IEF and EMEF ranked in the third quintile; the MDF 2015, MDF 2025, MDF 2045, MDF 2055, AAF, MMF, LDBF, SAF, GEF and SCEF in the fourth quintile; and the MDF 2035, GAF and MDBF in the fifth quintile.
For the five-year average annual total returns for the period ended June 30, 2023, the Board noted that for the Institutional Class of the Funds, the MMF and GBF ranked in the first quintile; the MDF 2055, CAF, BAF, DMSF, EIF, GRESF and SCEF ranked in the second quintile; the MDF 2025, MDF 2035, MDF 2045, MDBF, VEF, IEIF, IEF and EMEF ranked in the third quintile; the MDF 2015, GAF, AAF, LDBF, SAF and GEF ranked in the fourth quintile; and no Fund ranked in the fifth quintile. Regarding the five-year average annual total returns for the Investor Class of the Funds, no Fund ranked in the first quintile; the GBF, DMSF, EIF and GRESF ranked in the second quintile; the MDF 2025, CAF, BAF, MMF, SCEF and EMEF ranked in the third quintile;
the MDF 2035, MDF 2045, MDF 2055, AAF, LDBF, MDBF, SAF, VEF, GEF and IEF ranked in the fourth quintile; and the MDF 2015 and GAF ranked in the fifth quintile.
For the 10-year average annual total returns for the period ended June 30, 2023, the Board noted that for the Institutional Class of the Funds, the MMF, DMSF and EIF ranked in the first quintile; the IEF ranked in the second quintile; the LDBF, MDBF, VEF, GEF and SCEF ranked in the third quintile; and no Fund ranked in the fourth or fifth quintiles. With respect to the 10-year average annual total returns for the Investor Class of the Funds, the GBF and DMSF ranked in the first quintile; the EIF, GRESF and IEF ranked in the second quintile; the BAF, AAF, MMF and VEF ranked in the third quintile; the MDF 2025, MDF 2035, MDF 2055, CAF, LDBF, MDBF, GEF and SCEF ranked in the fourth quintile; and the MDF 2015, MDF 2045 and GAF ranked in the fifth quintile.
The Board considered the costs to GSCM of serving as the investment adviser to the Funds, including the costs associated with the personnel, systems and equipment necessary to manage the Funds in accordance with the existing Advisory Agreement. The Board considered the revenues that GSCM received for serving as the investment adviser to the Funds and the fact that any profits realized by GSCM are forwarded to GuideStone Financial Resources of the Southern Baptist Convention, an affiliate of GSCM, which for many years had operated at a deficit with respect to the Trust. The Board also considered the profitability information for GSCM; first, without taking into account sub-advisory fees, and second, taking into account sub-advisory fees. The Board considered whether any direct or indirect collateral benefits inured to either GSCM or the Trust as a result of their affiliation with one another. In light of these considerations, the Board concluded that any profits realized in connection with GSCM’s services appeared reasonable.
The Board also considered the extent to which the advisory fees to be paid to the Adviser for each Fund reflected economies of scale, taking into account the nature and extent of the services provided by the Adviser, including the multi-manager structure of the Funds. The Board noted that only certain Funds are subject to an expense cap. The Board considered the amount of any fees waived by GSCM for each applicable Fund and the total amount of fees waived for the Trust as a whole during the past year. The Board also considered the practices identified by GSCM that have resulted in shareholder savings, how those practices reflect economies of scale and how savings are shared between GSCM and the Trust.
Based on all of the information presented to the Board and its consideration of relevant factors, the Board concluded that the fees paid to GSCM by each Fund were fair and reasonable in light of the services to be performed, and in the exercise of its business judgment, determined to approve the continuation of the Advisory Agreement for each Fund. The Board also determined that approval of the continuation of the Advisory Agreement for each Fund is in the best interests of each Fund and its shareholders.
BOARD APPROVAL OF CONTINUATION OF SUB-ADVISORY AGREEMENTS FOR THE SELECT FUNDS
In considering the Sub-Advisory Agreements being presented for renewal, the Board took into account the materials provided prior to and during the meeting, the presentations made during the meeting and the extensive discussions during the meeting, including the discussions the Independent Directors had during their executive sessions with Independent Counsel. The Board also took into account the IMC’s review of information related to the Trust’s sub-advisers, questions submitted by the IMC to GSCM regarding various sub-advisers, GSCM’s responses to those questions and recommendations made by the IMC.
The Board examined the nature, extent and quality of the services to be provided by each sub-adviser. The Board evaluated each sub-adviser’s experience serving as a sub-adviser to the applicable Fund. The Board noted that each sub-adviser currently provides investment advice to various clients, including, in some cases, other pooled investment vehicles. The Board noted the experience of key personnel at each sub-adviser providing investment management services, the systems used by such persons and the ability of each sub-adviser to attract and retain capable personnel. The Board noted the reputation, compliance history,
compliance program and financial condition of each sub-adviser. The Board also noted the terms of the existing Sub-Advisory Agreements and the responsibilities that each sub-adviser has with respect to the applicable Fund, including the responsibility of the day-to-day management of the investment portfolio of such Fund, compliance with such Fund’s policies and objectives and the implementation of FBI restrictions and Board directives as they relate to such Fund. The Board also took into account the overall structure of each Fund and the particular role each sub-adviser plays in that structure and in achieving each Fund’s overall investment objective. The Board considered each sub-adviser’s human resources, business continuity and cybersecurity practices and policies and financial condition. The Board concluded that each Fund is likely to benefit from the nature, extent and quality of these services as a result of each sub-adviser’s experience, personnel, operations and resources. During their deliberations, the Directors did not identify any particular information that was all-important or controlling, and each Director may have attributed different weights to the various factors deliberated upon, among others.
The Board examined performance information for each segment of a Fund managed by a sub-adviser. The Board noted that, for many of the sub-advisers, the performance record over relevant periods of the segment of the Fund managed by the sub-adviser compared favorably to the relevant benchmark, the composite performance for the sub-adviser’s clients (on a gross fee basis) and/or the peer universe of similarly managed funds. In cases where the sub-adviser’s performance lagged, the Board also considered historical and recent investment performance, whether and how the sub-adviser’s strategy deviated from the composition of the benchmark, the sub-adviser’s role within a Fund and the outlook for future performance. The Board also noted that, in certain cases, market trends and the market environment caused by COVID-19 may have contributed to the underperformance of some sub-advisers during some periods. The Board also considered whether a sub-adviser’s underperformance was within the expected tracking error for the sub-adviser’s investment strategy. The Board concluded that, although past performance is no guarantee of future performance, the performance of each sub-adviser’s segment was satisfactory in light of all relevant considerations and the applicable Funds were likely to benefit from each sub-adviser continuing to serve as a sub-adviser to the Trust.
The Board examined the fee schedule for each sub-adviser, noting how the fee levels charged to each applicable Fund compared with available information about fees charged by the sub-advisers to their other similarly situated clients, which in many cases include separately managed accounts, as well as how sub-adviser fee levels for each Select Fund compared to the median sub-advisory fee for the peer universe of similarly managed funds. The Board determined that the fees to be charged by each sub-adviser were reasonable in relation to the nature, extent and quality of the services to be provided.
The Board also took into account the profitability and the financial capability of each sub-adviser in light of the information presented at the meeting and provided to the Adviser. In light of these considerations, the Board concluded that the profits realized by each sub-adviser who completed a profitability questionnaire appeared reasonable. For the limited number of sub-advisers that did not provide profitability information, the Board relied upon other relevant information, particularly the independent negotiation of the fee schedules, the level of the fees, each sub-adviser’s performance history and feedback received from the sub-advisers regarding the inability of their firm to estimate profitability. The Board noted that based on the Adviser’s representations, the financial statements of the sub-advisers did not appear to raise any significant concerns regarding the financial capability of those sub-advisers. The Board also considered the Adviser’s representations in the materials prepared for the meeting, and the discussions earlier in the meeting, that no sub-adviser experienced any material adverse change in its financial condition since the date of its most recent audited financial statements. The Board took into account the Adviser’s representation that it would continue to monitor the financial condition of each sub-adviser.
The Board considered the extent to which sub-adviser fees to be paid to each sub-adviser reflected economies of scale. The Board noted that each sub-adviser’s fee schedule either reflected economies of scale by reducing the fee on assets in excess of certain stated breakpoints or the fee level negotiated was below or on par with the standard fee schedule of each sub-adviser.
In evaluating the benefits that are expected to accrue to each sub-adviser through its relationship as sub-adviser to a Select Fund, the Board noted that certain sub-advisers allocate portfolio brokerage to affiliated broker-dealers that receive commissions from the execution of Fund trades. The Board also noted that certain sub-advisers expect to benefit from “soft dollar” arrangements by which brokers will provide research and other services to the sub-adviser in exchange for commissions on trades of the portfolio securities of a Select Fund. The Board considered whether any direct or indirect collateral benefits were inured to the Trust because of its affiliation with each sub-adviser.
Based on all of the information presented to the Board and its consideration of relevant factors, the Board, in the exercise of its reasonable business judgment, determined to approve the continuation of each Sub-Advisory Agreement that was presented for renewal. The Board also determined that approval of the continuation of each Sub-Advisory Agreement presented for renewal is in the best interests of each Select Fund and their respective shareholders.
BOARD REVIEW OF NEW SUB-ADVISORY AGREEMENT FOR THE STRATEGIC ALTERNATIVES FUND
As required by the 1940 Act, the Board, including a majority of the Independent Directors, advised by Independent Counsel, considered the approval of a new sub-advisory agreement (the “New SSI Agreement”) among the Trust on behalf of the SAF, GSCM and SSI Investment Management LLC (“SSI”), due to a change in control of SSI. The Board approved the New SSI Agreement at the September Meeting.
The Board’s decision to approve the New SSI Agreements reflects the exercise of the Board’s business judgment and the Board’s consideration of its fiduciary duties to the SAF and its shareholders. Prior to approving the New SSI Agreement, the Board received information from the Adviser and SSI and considered such information with the assistance and advice of Independent Counsel and counsel to the Trust.
The Board considered that SSI was currently a sub-adviser to the SAF and that approval of the New SSI Agreement was being sought as a result of an anticipated change in control of SSI and an assignment of the existing investment sub-advisory agreement among the Trust, the Adviser and SSI. The Board noted that the change in control of SSI was a result of Resolute Investment Holdings, LLC (“RIH”), Resolute Investment Managers, Inc., (“Resolute”), an indirect wholly owned subsidiary of RIH and the majority owner of SSI, and certain of their affiliates entering into a transaction agreement (the “Transaction”) with certain creditors of Resolute (“New Ownership Group”). Upon close of the Transaction, which was anticipated to occur during the fourth quarter of 2023, SSI would become indirectly majority-owned by the New Ownership Group. The Board noted that SSI confirmed that it would continue to operate independently and there would not be any change to the nature, extent or quality of the sub-advisory services that SSI provides to the SAF.
The Board undertook a review of the terms of the New SSI Agreement, as well as the nature, extent and quality of the services to be provided by SSI under the New SSI Agreement and the proposed fees in exchange for such services. The Adviser provided the Board with information about SSI prior to and during the September Meeting. During the September Meeting, the Adviser also gave a presentation to the Board during which the Adviser provided additional information about the Transaction and responded to questions from the Board.
In addition, the Independent Directors met separately in executive session with Independent Counsel, to discuss and consider the information presented in connection with the approval of the New SSI Agreement, as well as the Directors’ responsibilities and duties in approving the agreement.
BOARD APPROVAL OF NEW SUB-ADVISORY AGREEMENT FOR THE STRATEGIC ALTERNATIVES FUND
In considering the approval of the New SSI Agreement, the Board took into account the materials provided prior to and during the September Meeting, the presentations made and the extensive discussions held during the meeting, including the discussions the Independent Directors had during their executive session with Independent Counsel.
In making its determination to approve the New SSI Agreement, the Board, including the Independent Directors advised by Independent Counsel, took into account a number of considerations. The Board noted that the Transaction was anticipated to close in the fourth quarter of 2023, and that upon closing, the SSI Agreement would be terminated as the Transaction would be considered an “assignment” (as defined under the 1940 Act and the rules thereunder).
The Board considered that the New SSI Agreement was substantially similar to the current agreement. The Board noted that SSI confirmed it would retain its autonomy in its relationship with Resolute, ensuring that the firm’s investment philosophies, processes and brands would remain unchanged. The Board took into account that SSI stated there would not be any change to the nature, extent or quality of the investment sub-advisory services that it provides to the SAF. Further, the Board took note of the Adviser’s representation that the portfolio management team and the investment processes for the SAF would remain the same after the Transaction.
The Board considered the profitability information provided by SSI for the services provided to the SAF. The Directors also considered the Adviser’s assessment of SSI’s financial condition. The Directors noted that the Adviser, after reviewing certain financial information provided by SSI, believed that SSI should be financially sound.
The Board considered the fees to be paid to SSI under the New SSI Agreement, as well as the overall fee structure, in light of the nature, extent and quality of the services to be provided and noted that there would not be any change to the current fee schedule with SSI. The Board also considered the fees charged by other investment advisers that offer similar services. The Board additionally noted that there would be no impact to the Adviser’s profitability as a result of the New SSI Agreement.
The Board considered potential “fall-out” or ancillary benefits anticipated to be received by SSI and its affiliates as a result of the New SSI Agreement. The Board concluded that any potential benefits to be derived by SSI included potential access to additional research resources, increased assets under management and reputational benefits, which were consistent with those generally derived by sub-advisers offering similar services to mutual funds. The Board considered the representations made that SSI would be comfortable continuing to manage its strategy in accordance with the SAF’s FBI policy.
Based on all of the information provided to the Board and its consideration of relevant factors, the Board determined that SSI would continue to provide investment management services that are appropriate in scope and that the fees to be paid to SSI under the New SSI Agreement would be fair and reasonable in light of the nature, extent and quality of services to be provided. In their deliberations, the Directors did not identify any particular information that was all-important or controlling, and each Director may have attributed different weights to the various factors deliberated upon, among others.
INVESTMENT SUB-ADVISERS (Assets under management as of December 31, 2023) (Unaudited)
GuideStone Funds employs a broad array of proven investment managers for the benefit of their investors. Each manager is distinctive in its investment management process and business approach.
| Fund | | Sub-Adviser | | Firm
Established | | Total Assets
Managed |
| Money Market | | BlackRock Advisors, LLC | | 1994 | | $ 10.0Tr |
| Low-Duration Bond | | BlackRock Financial Management, Inc.1 | | 1994 | | $ 10.0Tr |
| | | Pacific Investment Management Company LLC | | 1971 | | $ 1.9Tr |
| | | Parametric Portfolio Associates LLC | | 1987 | | $475.1B |
| | | Payden & Rygel | | 1983 | | $151.0B |
| Medium-Duration Bond | | Goldman Sachs Asset Management, L.P. | | 1984 | | $ 2.5Tr |
| | | Guggenheim Partners Investment Management, LLC | | 2005 | | $206.0B |
| | | Pacific Investment Management Company LLC | | 1971 | | $ 1.9Tr |
| | | Parametric Portfolio Associates LLC | | 1987 | | $475.1B |
| | | Western Asset Management Company, LLC | | 1971 | | $388.9B |
| Global Bond | | Loomis, Sayles & Company, L.P. | | 1926 | | $335.2B |
| | | Neuberger Berman Investment Advisers LLC | | 2002 | | $463.0B |
| | | Parametric Portfolio Associates LLC | | 1987 | | $475.1B |
| | | Western Asset Management Company, LLC | | 1971 | | $388.9B |
| Defensive Market Strategies ® | | American Century Investment Management, Inc. | | 1958 | | $229.8B |
| | | Neuberger Berman Investment Advisers LLC | | 2002 | | $463.0B |
| | | Parametric Portfolio Associates LLC | | 1987 | | $475.1B |
| | | PGIM Quantitative Solutions LLC | | 1975 | | $ 95.8B |
| | | Shenkman Capital Management, Inc. | | 1985 | | $ 30.5B |
| Impact Bond | | RBC Global Asset Management (U.S.) Inc. | | 1983 | | $ 50.2B |
| | | Parametric Portfolio Associates LLC | | 1987 | | $475.1B |
| Impact Equity | | Janus Henderson Investors US LLC | | 1969 | | $334.9B |
| | | Parametric Portfolio Associates LLC | | 1987 | | $475.1B |
| Equity Index | | Legal & General Investment Management America, Inc. | | 2006 | | $214.8B |
| Value Equity Index | | Legal & General Investment Management America, Inc. | | 2006 | | $214.8B |
| Value Equity | | American Century Investment Management, Inc. | | 1958 | | $229.8B |
| | | Barrow, Hanley, Mewhinney & Strauss, LLC | | 1979 | | $ 49.9B |
| | | The London Company of Virginia, LLC | | 1994 | | $ 15.6B |
| | | Parametric Portfolio Associates LLC | | 1987 | | $475.1B |
| | | TCW Investment Management Company LLC | | 1971 | | $209.6B |
| Growth Equity Index | | Legal & General Investment Management America, Inc. | | 2006 | | $214.8B |
| Growth Equity | | J.P. Morgan Investment Mangement Inc. | | 1984 | | $ 2.9Tr |
| | | Loomis, Sayles & Company, L.P. | | 1926 | | $335.2B |
| | | Parametric Portfolio Associates LLC | | 1987 | | $475.1B |
| | | Sands Capital Management, LLC | | 1992 | | $ 45.0B |
| | | William Blair Investment Management, LLC | | 2014 | | $ 67.1B |
| Small Cap Equity | | American Century Investment Management, Inc. | | 1958 | | $229.8B |
| | | Delaware Investments Fund Advisers | | 1929 | | $601.9B |
| | | Jacobs Levy Equity Management, Inc. | | 1986 | | $ 20.1B |
| | | Parametric Portfolio Associates LLC | | 1987 | | $475.1B |
| | | TimesSquare Capital Management, LLC | | 2000 | | $ 8.3B |
| International Equity Index | | Legal & General Investment Management America, Inc. | | 2006 | | $214.8B |
| International Equity | | Altrinsic Global Advisors, LLC | | 2000 | | $ 8.5B |
| | | AQR Capital Management, LLC | | 1998 | | $ 98.9B |
| | | MFS Institutional Advisors, Inc. | | 1924 | | $597.6B |
| | | Parametric Portfolio Associates LLC | | 1987 | | $475.1B |
| | | WCM Investment Management, LLC | | 1976 | | $ 82.0B |
| Emerging Markets Equity | | AQR Capital Management, LLC | | 1998 | | $ 98.9B |
| | | Goldman Sachs Asset Management, L.P. | | 1984 | | $ 2.5Tr |
| | | Parametric Portfolio Associates LLC | | 1987 | | $475.1B |
| | | RBC Global Asset Management (U.K.) Limited | | 2013 | | $121.9B |
| | | Wellington Management Company LLP | | 1928 | | $ 1.2Tr |
| Global Real Estate Securities | | Heitman Real Estate Securities LLC | | 1989 | | $ 50.5B |
| Fund | | Sub-Adviser | | Firm
Established | | Total Assets
Managed |
| | | RREEF America L.L.C. | | 1975 | | $ 81.1B |
| Strategic Alternatives Fund | | AQR Capital Management, LLC | | 1998 | | $ 98.9B |
| | | Goldman Sachs Asset Management, L.P. | | 1984 | | $ 2.5Tr |
| | | Parametric Portfolio Associates LLC | | 1987 | | $475.1B |
| | | P/E Global LLC | | 2000 | | $ 16.8B |
| | | SSI Investment Management LLC | | 1973 | | $ 2.0B |
| Custodian for GuideStone Funds Assets | | The Northern Trust Company | | 1889 | | $ 11.9Tr |
| All Funds, except the Money Market Fund | | Parametric Portfolio Associates LLC | | 1987 | | $475.1B |
(1) Includes BlackRock International Limited and BlackRock (Singapore) Limited, which serve as sub-subadvisers.
Item 1. Reports to Stockholders (cont.).
Item 2. Code of Ethics.
| | (a) | The registrant, as of the end of the period covered by this report, has adopted a code of ethics that applies to the registrant’s principal executive officer, principal financial officer, principal accounting officer or controller, or persons performing similar functions, regardless of whether these individuals are employed by the registrant or a third party. |
| | (c) | There have been no amendments, during the period covered by this report, to a provision of the code of ethics that applies to the registrant’s principal executive officer, principal financial officer, principal accounting officer or controller, or persons performing similar functions, regardless of whether these individuals are employed by the registrant or a third party, and that relates to any element of the code of ethics description. |
| | (d) | The registrant has not granted any waivers, including an implicit waiver, from a provision of the code of ethics that applies to the registrant’s principal executive officer, principal financial officer, principal accounting officer or controller, or persons performing similar functions, regardless of whether these individuals are employed by the registrant or a third party, that relates to one or more of the items set forth in paragraph (b) of this item’s instructions. |
Item 3. Audit Committee Financial Expert.
As of the end of the period covered by the report, the registrant’s board of directors has determined that Grady R. Hazel and Deanna A. Mankins are each qualified to serve as audit committee financial experts serving on its audit committee and that each of them is “independent,” as defined by Item 3 of Form N-CSR.
Item 4. Principal Accountant Fees and Services.
Audit Fees
| | (a) | The aggregate fees billed for each of the last two fiscal years for professional services rendered by the principal accountant for the audit of the registrant’s annual financial statements or services that are normally provided by the accountant in connection with statutory and regulatory filings or engagements for those fiscal years are $961,000 and $1,081,440 for 2022 and 2023, respectively. |
Audit-Related Fees
| | (b) | The aggregate fees billed in each of the last two fiscal years for assurance and related services by the principal accountant that are reasonably related to the performance of the audit of the registrant’s financial statements and are not reported under paragraph (a) of this Item are $0 and $0 for 2022 and 2023, respectively. |
Tax Fees
| | (c) | The aggregate fees billed in each of the last two fiscal years for professional services rendered by the principal accountant for tax compliance, tax advice, and tax planning are $313,000 and $425,160 for 2022 and 2023, respectively. Tax fees are related to tax services in connection with Funds’ excise tax calculations, shareholder reporting preparation, PFIC identification services, and preparation of the Funds’ applicable tax returns in 2022 and 2023. |
All Other Fees
| | (d) | The aggregate fees billed in each of the last two fiscal years for products and services provided by the principal accountant, other than the services reported in paragraphs (a) through (c) of this Item are $14,200 and $56,700 for 2022 and 2023, respectively. The fees in 2022 and 2023 were for analysis services related to Internal Revenue Code Registered Investment Company qualification testing. |
| | (e)(1) | The policy of the registrant’s Audit Committee (the “Committee”) is to pre-approve all permissible non-audit services (e.g., tax services) to be provided to the registrant by the independent registered public accounting firm (the “Auditor”), including the fees therefor; provided, that if the Committee chooses to delegate the authority to grant pre-approvals to one or more Committee members, each acting on behalf of the Committee, then each delegated pre-approval shall be reported to the full Committee during its next regularly scheduled meeting. In addition, the engagement to render the non-audit service must be entered into pursuant to the pre-approval policies and procedures that have been established by the Committee, and that are detailed as to the particular service(s). The Committee shall be informed of each service, and the pre-approval policies and procedures shall not include delegation of the Committee’s responsibilities under the Securities Exchange Act of 1934, as amended to management. The preapproval policies and procedures are attached as an Appendix to the Committee’s Charter. |
The pre-approval requirement for a permitted non-audit service may be waived if:
| | (1) | the aggregate amount of all such non-audit services provided constitutes not more than 5% of the total revenues paid by the registrant to the Auditor in the fiscal year in which the non-audit services are provided; |
| | (2) | such services were not recognized by the registrant at the time of the engagement to be non-audit services; and |
| | (3) | such services are promptly brought to the attention of, and approved by, the Committee or by a member of the Committee to whom the Committee has delegated the authority to grant such approvals, if any, prior to the Auditor’s completion of the registrant’s audit. |
Additionally, if the Auditor’s engagement by the registrant’s investment adviser (the “Adviser”) or an entity controlling, controlled by, or under common control with the Adviser that provides ongoing services to the registrant (each, a “Control Entity”) relates directly to the operations and financial reporting of the registrant, to the extent required by Rule 2-01 of Regulation S-X, the Committee shall pre-approve the Auditor’s engagements for non-audit services with the Adviser or Control Entity. The pre-approval requirement for non-audit services provided by the Auditor to the Adviser or a Control Entity shall not be waived pursuant to the foregoing paragraph unless the aggregate amount of all services provided constitutes no more than 5% of the total amount of revenues paid to the Auditor by the registrant, the Adviser, and any such Control Entity during the fiscal year in which the services are provided that would have to be pre-approved by the Committee pursuant to this paragraph (in the absence of this waiver provision).
The Auditor may not perform contemporaneously any prohibited non-audit services for the registrant, which currently include the following:
1. bookkeeping or other services related to the accounting records or financial statements of the registrant;
2. financial information systems design and implementation;
3. appraisal or valuation services, fairness opinions, or contribution-in-kind reports;
4. actuarial services;
5. internal audit outsourcing services;
6. management functions or human resources;
7. broker or dealer, investment adviser, or investment banking services;
8. legal services and expert services unrelated to the audit; and
9. any other service that the Securities and Exchange Commission or the Public Company Accounting Oversight Board determines, by regulation, is impermissible;
except that the Auditor may perform services 1 through 5 above if it is reasonable to conclude that the results of such services will not be subject to audit procedures during an audit of the registrant’s financial statements.
The Committee shall consider whether the non-audit services provided by the Auditor to the Adviser and any Control Entity that were not pre-approved by the Committee in accordance with Rule 2-01 of Regulation S-X are compatible with maintaining the Auditor’s independence.
| (e)(2) | The percentage of services described in each of paragraphs (b) through (d) of this Item that were approved by the audit committee pursuant to paragraph (c)(7)(i)(C) of Rule 2-01 of Regulation S-X are as follows: |
| | (f) | The percentage of hours expended on the principal accountant’s engagement to audit the registrant’s financial statements for the most recent fiscal year that were attributed to work performed by persons other than the principal accountant’s full-time, permanent employees was less than fifty percent. |
| | (g) | The aggregate non-audit fees billed by the registrant’s accountant for services rendered: to the registrant was $327,200 and $481,860 for 2022 and 2023, respectively; to the registrant’s investment adviser (not including any sub-adviser whose role is primarily portfolio management and is subcontracted with or overseen by another investment adviser) was $0 and $0 for 2022 and 2023, respectively; and to GuideStone Financial Resources was $0 and $0 for 2022 and 2023, respectively. |
| | (h) | The registrant’s audit committee of the board of directors has not considered whether the provision of non-audit services that were rendered to the registrant’s investment adviser (not including any sub-adviser whose role is primarily portfolio management and is subcontracted with or overseen by another investment adviser), and any entity controlling, controlled by, or under common control with the investment adviser that provides ongoing services to the registrant that were not pre-approved pursuant to paragraph (c)(7)(ii) of Rule 2-01 of Regulation S-X is compatible with maintaining the principal accountant’s independence. |
Item 5. Audit Committee of Listed Registrants.
Not applicable.
Item 6. Investments.
| | (a) | Schedule of Investments in securities of unaffiliated issuers as of the close of the reporting period is included as part of the report to shareholders filed under Item 1(a) of this Form. |
Item 7. Disclosure of Proxy Voting Policies and Procedures for Closed-End Management Investment Companies.
Not applicable.
Item 8. Portfolio Managers of Closed-End Management Investment Companies.
Not applicable.
Item 9. Purchases of Equity Securities by Closed-End Management Investment Company and Affiliated Purchasers.
Not applicable.
Item 10. Submission of Matters to a Vote of Security Holders.
There have been no material changes to the procedures by which the shareholders may recommend nominees to the registrant’s board of directors, where those changes were implemented after the registrant last provided disclosure in response to the requirements of Item 407(c)(2)(iv) of Regulation S-K (17 CFR 229.407) (as required by Item 22(b)(15) of Schedule 14A (17 CFR 240.14a-101)), or this Item.
Item 11. Controls and Procedures.
| | (a) | The registrant’s principal executive and principal financial officers, or persons performing similar functions, have concluded that the registrant’s disclosure controls and procedures (as defined in Rule 30a-3(c) under the Investment Company Act of 1940, as amended (the “1940 Act”) (17 CFR 270.30a-3(c))) are effective, as of a date within 90 days of the filing date of the report that includes the disclosure required by this paragraph, based on their evaluation of these controls and procedures required by Rule 30a-3(b) under the 1940 Act (17 CFR 270.30a-3(b)) and Rules 13a-15(b) or 15d-15(b) under the Securities Exchange Act of 1934, as amended (17 CFR 240.13a-15(b) or 240.15d-15(b)). |
| | (b) | There were no changes in the registrant’s internal control over financial reporting (as defined in Rule 30a-3(d) under the 1940 Act) that occurred during the period covered by this report that has materially affected, or is reasonably likely to materially affect, the registrant’s internal control over financial reporting. |
Item 12. Disclosure of Securities Lending Activities for Closed-End Management Investment Companies.
Item 13. Exhibits.
SIGNATURES
Pursuant to the requirements of the Securities Exchange Act of 1934 and the Investment Company Act of 1940, the registrant has duly caused this report to be signed on its behalf by the undersigned, thereunto duly authorized.
| | |
| (Registrant) | | GuideStone Funds |
| | |
| |
| By (Signature and Title)* | | /s/ Brandon Pizzurro |
| | Brandon Pizzurro, President |
| | (Principal Executive Officer) |
Pursuant to the requirements of the Securities Exchange Act of 1934 and the Investment Company Act of 1940, this report has been signed below by the following persons on behalf of the registrant and in the capacities and on the dates indicated.
| | |
| By (Signature and Title)* | | /s/ Brandon Pizzurro |
| | Brandon Pizzurro, President |
| | (Principal Executive Officer) |
| | |
| |
| By (Signature and Title)* | | /s/ Patrick Pattison |
| | Patrick Pattison, Vice President and Treasurer |
| | (Principal Financial Officer) |
| * | Print the name and title of each signing officer under his or her signature. |