UNITED STATES
SECURITIES AND EXCHANGE COMMISSION
Washington, D.C. 20549
FORMN-CSR
CERTIFIED SHAREHOLDER REPORT OF REGISTERED
MANAGEMENT INVESTMENT COMPANIES
Investment Company Act file number811-10267
GPS Funds I
(Exact name of registrant as specified in charter)
1655 Grant Street, 10th Floor
Concord, CA 94520
(Address of principal executive offices) (Zip code)
Patrick R Young
AssetMark, Inc.
1655 Grant Street, 10th Floor
Concord, CA 94520
(Name and address of agent for service)
800-664-5345
Registrant’s telephone number, including area code
Date of fiscal year end: March 31, 2020
Date of reporting period: April 1, 2019 through March 31, 2020
Item 1. Reports to Stockholders.
GuideMark® Funds
GuidePath® Funds
Investment Advisor
AssetMark, Inc.
March 31, 2020
GUIDEMARK® LARGE CAP CORE FUND
GUIDEMARK® EMERGING MARKETS FUND
GUIDEMARK® SMALL/MID CAP CORE FUND
GUIDEMARK® WORLD EX-US FUND
GUIDEMARK® CORE FIXED INCOME FUND
GUIDEMARK® TAX-EXEMPT FIXED INCOME FUND
GUIDEMARK® OPPORTUNISTIC FIXED INCOME FUND
GUIDEPATH® GROWTH ALLOCATION FUND
GUIDEPATH® CONSERVATIVE ALLOCATION FUND
GUIDEPATH® TACTICAL ALLOCATION FUND
GUIDEPATH® ABSOLUTE RETURN ALLOCATION FUND
GUIDEPATH® MULTI-ASSET INCOME ALLOCATION FUND
GUIDEPATH® FLEXIBLE INCOME ALLOCATION FUND
GUIDEPATH® MANAGED FUTURES STRATEGY FUND
GUIDEPATH® CONSERVATIVE INCOME FUND
GUIDEPATH® INCOME FUND
GUIDEPATH® GROWTH AND INCOME FUND
Notice to Shareholders
Beginning January 1, 2021, as permitted by regulations adopted by the Securities and Exchange Commission, the Funds’ shareholder reports will no longer be sent by mail unless you specifically request paper copies of the reports. Instead, these reports will be made available online.
If you already elected to receive shareholder reports electronically, you will not be affected by this change and you do not need to take any action. If you receive shareholder reports by mail, you will be sent a single-page document that includes the web address to access the full report with instructions to request a printed copy at no charge. You may elect to receive shareholder reports and other communications electronically from the Fund anytime by contacting your financial advisor or institution.
You may elect to receive all future shareholder reports in paper free of charge. If you’d like to continue to receive a paper copy of the full report, visit www.fundreports.com any time prior to January 1, 2021. Your election will apply to all funds held in your account.
5/29/2020
Dear Shareholder:
Enclosed is the Annual Report for the GuideMark® and GuidePath®Funds covering the period from April 1, 2019 to March 31, 2020.
Market Review
During the twelve months ended March 31, 2020, the equity markets generally rallied, with the S&P 500® Index rising to anall-time high on February 16, 2020. But conditions dramatically turned and global equity markets tumbled into bear market territory by the end of the first quarter of 2020. For the twelve month period, the US equity market returned-7.0%1, the international developed equity market returned-13.9%2 and emerging market equities returned-17.4%3. As the spread ofCOVID-19 accelerated in the first quarter of 2020, parts of the global economy started to shut down as the world began sheltering in place. This caused the equity markets to fall precipitously.
Surprisingly, it wasn’t a defensive equity sector that held up best in the downturn. Technology was the best performing sector during the first quarter of 2020, returning-11.9%4 and was the only sector that had a positive return for the twelve month period ending March 31, 2020.Mega-cap, cash-rich technology companies benefitted from the new environment of working from home, home schooling and online-shopping. At the opposite end of the scale was the energy sector, which was adversely impacted by not only the Saudi/Russia oil price conflict, but also lower demand for gasoline as people stayed home. Oil prices dropped over 50%5 during the first quarter of 2020, causing much of the-52.4%6 return seen by the energy sector for the twelve month period.
The divergent performance of specific equity sectors also led to the spread seen between growth and value across the globe. For the12-month period, the spread between growth and value was 17.4 percentage points7 – one of the widest spreads recorded. Smaller capitalization equities experienced relatively weak returns during the market fall in the first quarter of 2020 due to their lower levels of profitability and higher leverage. This weighed on their12-month returns, with small cap index returns trailing the broader market by almost 12 percentage points8 as of the end of the reporting period.
Real Estate Investment Trusts (“REITs”) and equities with high dividend yields trailed the broad markets during the market decline in the first quarter of 2020, negatively impacting12-month performance returns. REITs fell 23.4% in the first quarter, seeing the weakest returns from malls, hotels, and retail industries, all of which were impacted by shelter in place orders. This led to a return of-15.9%9 for REITs for the reporting period. Dividend-yielding equities fell almost 30% in the first quarter of 2020, leading to a return of-21.7%10 for the12-month period. Companies within the high dividend equity universe in sectors such as energy were at high risk of dividend cuts and had low interest coverage ratios, resulting in weaker relative returns.
The US bond market returned 8.9% for the12-months ended March 31, 2020, including a 3.2%11 return in the first quarter of 2020. Treasuries rallied in the investor flight to safety during the market downturn, with longer duration Treasuries returning 20.9% for the quarter. However, these gains masked significant deterioration in certain segments of the bond market in the first quarter of 2020. Due to the sensitivity of high-yield bonds to the equity markets, the high yield sector registered double-digit losses of-12.7% for the first quarter of 2020, leading to a 12-month return of-6.9%12. Other credit sectors that underperformed in the first quarter of 2020 include bank loans, which also saw double-digit losses, returning-12.0%13 for the quarter as the U.S. Federal Reserve (the “Federal Reserve”) lowered interest rates to zero, and thenon-agency mortgage backed security (“MBS”) market, which returned-13.4%14 for the quarter.
As liquidity dried up in US bond markets with investors selling anything they could, the Federal Reserve stepped in to help limit any further carnage in the bond market. As the Federal Reserve lowered rates and initiated substantial quantitative easing programs, bond sectors supported by expansive Federal Reserve monetary policy started to recover and regain ground at the end of the first quarter of 2020. This effect was particularly pronounced in the agency MBS market, with returns of 2.8% for the quarter and 7.01%15 for the12-month period.
International bond markets also saw weakness in the first quarter, partially attributable to the strength of the U.S. dollar, but returned 2.0%16 for the12-month period. Emerging markets bonds returned-2.9% for the12-month period, having been impacted more significantly in the first quarter with a return of-9.5%17 due to the higher risk associated with emerging markets.
| 1 | | US equities represented by the S&P 500® Index |
| 2 | | International developed market equities represented by the MSCI EAFE Index |
| 3 | | Emerging market equities represented by the MSCI Emerging Markets Index |
| 4 | | Technology sector represented by the S&P 500®Information Technology (Sector) Index |
| 5 | | Represented by WTI Crude Oil prices |
| 6 | | Energy sector represented by S&P 500® Energy (Sector) Index |
| 7 | | Spread represented as difference between MSCI ACWI Growth and MSCI ACWI Value indices |
| 8 | | Spread represented as difference between MSCI ACWI and MSCI ACWI Small Cap indices |
| 9 | | REITs represented by FTSE Nareit All Equity REITs Index |
| 10 | | Dividend equities represented by Dow Jones US Select Dividend Index |
| 11 | | US bonds represented by Bloomberg Barclays US Aggregate Bond Index |
| 12 | | High yield bonds represented by Bloomberg Barclays US Corporate High Yield Index |
| 13 | | Bank loans represented by S&P/LSTA US Leveraged Loan 100 Index |
| 14 | | Non-agency MBS represented by Markit iBoxx Non-Agency RMBS Index |
| 15 | | Agency MBS represented by Bloomberg Barclays US MBS Index |
| 16 | | International bonds represented by Bloomberg Barclays Global Treasury ex US Index |
| 17 | | Emerging market bonds represented by Blomberg Barclays EM USD Aggregate Index |
1
Fund Review
Looking across the fund family it was a very difficult period, resulting in most of the funds trailing their benchmarks for the12-month period.
All of the GuideMark® funds trailed their respective benchmarks during the reporting period. Biases toward value and smaller capitalization issuers, which are intended to offer value over the long term, were the primary detractors for each of the GuideMark® Large Cap Core Fund, GuideMark® Emerging Markets Fund, GuideMark® Small/Mid Cap Core Fund and GuideMark® World ex-US Fund during the12-month period. The GuideMark®CoreFixed Income Fund trailed its benchmark for the reporting period due to shorter relative duration positioning during a time when long-term Treasuries rallied over 30%. Exposure to lower-quality credit sectors in the first quarter of 2020 hurt the GuideMark®Tax Exempt Fixed Income Fund’s performance for the quarter and significantly detracted from the full period results. The GuideMark®Opportunistic Fixed Income Fund’s significant underweight exposure to Treasuries and shorter duration as well as the Fund’s overweight exposure to foreign bonds relative to its benchmark detracted from the Fund’s returns for the period, given the flight to quality and strengthening of the US dollar over the reporting period.
Across the GuidePath® allocation funds, two funds outperformed and the remaining funds trailed their benchmarks for the period. The GuidePath® Multi-Asset Income Allocation Fund’s exposure to intermediate- and longer-term Treasuries contributed positively to the Fund’s returns, and helped the Fund outperform the benchmark for the reporting period. The GuidePath®Managed Futures Strategy Fund uses derivatives to implement its investment strategy, specifically index futures contracts. Futures positioning within bonds benefitted the GuidePath®Managed Futures Strategy Fund’s returns during the period. Specifically, long positions in longer maturity bonds contributed to the Fund’s outperformance relative to the benchmark for the period.
The GuidePath®Growth Allocation Fund, GuidePath®Conservative Allocation Fund, and GuidePath®Flexible Income Fundunderperformed their respective benchmarks for the reporting period. Broader diversification, including exposure to US small capitalization stocks, and an emphasis on high yield credit exposure within fixed income positioning relative to benchmark weightings detracted from the Funds’ returns. The GuidePath®Tactical Allocation Fund trailed its benchmark due to underperformance in the first quarter of 2020, as the Fund had higher exposure to equities relative to its benchmark. The GuidePath®Absolute Return Fund also trailed its benchmark for the period as a result of the Fund’s relative underperformance in the first quarter of 2020 due to the Fund’s exposure to credit, specifically, high yield, emerging markets,non-agency mortgages and loans.
The GuidePath® Growth and Income Fund outperformed its benchmark for the twelve months ending March 31, 2020. The Fund’s volatility targeting component enabled the Fund to navigate both the strong up market of the fourth quarter of 2019 and steep down market of the first quarter of 2020 and maintain healthy relative returns during the market volatility. In addition to purchasing and selling futures contracts, the Fund engaged in a strategy of selling (writing) put options on indexes and ETFs in pursuing its investment objective. The Fund’s investments in futures and options contracts contributed positively to the Fund’s performance for the reporting period. The GuidePath® Conservative Income Fund trailed the benchmark as of the period end due to its lower duration positioning during a time when longer duration Treasuries rallied. Exposure to credit markets hurt the GuidePath® Income Fund’s returns relative to its benchmark in the market downturn during the first quarter of 2020 as the full effects of the coronavirus global pandemic led to panic selling and significant widening of spreads on corporate credits.
Looking Ahead
Given the current economic and market environment uncertainties, AssetMark does not believe that investors should try to make market-timing calls. Rebounds from market bottoms have often been quick and sharp, and we believe removing equity exposure from portfolios has a high opportunity cost under current market conditions. We believe investors should emphasize capital protection and prepare for sudden market trend reversals by broadly diversifying across risk assets and strategies. Positioning for an uncertain environment is different from de-risking—it entails broad diversification that seeks to spread portfolio risk across a variety of markets and risk factors.
Please contact your financial advisor to discuss any questions about your investment strategy or changes in your financial goals. We thank you for including the funds in your portfolio and appreciate the trust you have placed in us.
Sincerely,
Carrie E. Hansen
Trustee, Chairperson and President of the Funds
Important Information
All index returns are sourced from Morningstar and Bloomberg. It is not possible to invest directly in any index.
Past performance is no guarantee of future results.
The AssetMark platform providesfee-based investment advisory programs. Investors are advised to refer to the appropriate Disclosure Brochure, which can be obtained from your financial advisor, for a full description of services provided, including all applicable fees.
The prospectus includes additional information about the GuideMark® and GuidePath® Funds including investment objectives, risk factors, fees and charges as well as other important information that should be carefully read and considered before investing. You may obtain a prospectus by contacting your registered representative.
AssetMark, Inc. is an investment advisor registered with the Securities and Exchange Commission. The Principal Underwriter for the GuideMark® and GuidePath® Funds is AssetMark Brokerage™, LLC, a member of the Financial Industry Regulatory Authority, Inc. AssetMark Brokerage™, LLC is an affiliate of AssetMark, Inc. and shares its address.©2020 AssetMark, Inc. All rights reserved.
2
Investment Terms
Currency Hedged Indicesseek to mitigate the currency exposures in an index compared to a ‘home’ currency (e.g., the US dollar). A currency hedged index may experience higher or lower returns than an unhedged index, depending on relative currency fluctuations. Currency hedges employed by hedged indices may be imperfect.
Market Capitalizationrefers to the total value of an issuer’s shares of stock. It is calculated by multiplying the price of a stock by its total number of outstanding shares.
Volatilityis a statistical measure of the dispersion of returns for a given security or market index.
Index Definitions
Bloomberg Barclays U.S. Aggregate Bond Index is a broad-based index that measures the investment-grade, U.S. dollar-denominated, fixed rate taxable bond market, including Treasuries, government-related and corporate securities, mortgage- and asset-backed securities. All securities contained in the Bloomberg Barclays U.S. Aggregate Bond Index have a minimum term to maturity of one year.
Bloomberg Barclays U.S. Corporate High Yield Index measures the U.S. dollar denominated, high yield, fixed-rate corporate bond market. Securities are classified as high yield if the middle rating of Moody’s, Fitch and S&P is Ba1/BB+/BB+ or below.
Bloomberg Barclays US MBS Index measures fixed-rate agency mortgage backed pass-through securities guaranteed by Ginnie Mae (GNMA), Fannie Mae (FNMA), and Freddie Mac (FHLMC).
Bloomberg Barclays Global Treasury ex US Indexmeasures returns of investment grade, fixed-rate bonds issued by governments in their local currencies, excluding US debt.
Blomberg Barclays EM USD Aggregate Indexmeasures hard currency emerging markets debt that includesUSD-denominated debt from sovereign, quasi-sovereign, and corporate emerging markets issuers.
FTSE Nareit All Equity REITs Indexis a free-float adjusted, market capitalization-weighted index of U.S. equity REITs. Constituents of the index include alltax-qualified REITs with more than 50 percent of total assets in qualifying real estate assets other than mortgages secured by real property.
Markit iBoxxNon-Agency RMBS Indicesmeasures the U.S.non-agency residential MBS market.
MSCI EAFE (Europe, Australasia, Far East) Index measures the equity market performance of countries considered to represent developed markets, excluding the U.S. and Canada.
MSCI Emerging MarketsIndex measures the equity market performance of countries considered to represent emerging markets.
S&P 500®Index focuses on thelarge-cap segment of the US equity market. It includes 500 leading companies in leading industries of the U.S. economy, capturing approximately 75% coverage of US equities.
S&P 500® Energy (Sector)Index comprises those companies included in the S&P 500® Index that are classified as members of the GICS® energy sector.
S&P 500® Information Technology (Sector) Index comprises those companies included in the S&P 500® Index that are classified as members of the GICS® information technology sector.
S&P/LSTA US Leveraged Loan 100 Index measures the performance of the largest facilities in the leveraged loan market.
3
GuideMark® Large Cap Core Fund
MANAGER’S DISCUSSION OF FUND PERFORMANCE (Unaudited)
TOTAL RETURN BASED ON A $10,000 INVESTMENT
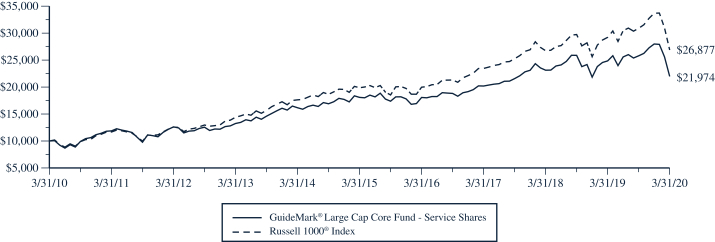
This chart assumes an initial gross investment of $10,000 made on March 31, 2010. Returns shown include the reinvestment of all dividends. Returns shown do not reflect the deduction of taxes that a shareholder would pay on Fund distributions or the redemption of Fund shares. In the absence of fee waivers and reimbursements, when they are necessary to keep expenses at the expense cap, total return would be reduced. Past performance is not predictive of future performance. Investment return and principal value will fluctuate so that your shares, when redeemed, may be worth more or less than the original cost. Index returns do not reflect the effects of fees or expenses. It is not possible to invest directly in an index.
RUSSELL 1000® INDEX – The Russell 1000® Index measures the performance of thelarge-cap segment of the U.S. equity universe. As of May 10, 2019, the market capitalization of the companies in the Russell 1000® Index ranged from $2.4 billion to $974.2 billion.
| | | | | | | | | | | | | | | | |
| AVERAGE ANNUAL TOTAL RETURN (for periods ended March 31) | | | | | | | |
| | | One Year
| | | Five Year
| | | Ten Year
| | | Since Inception(1)
| |
GuideMark® Large Cap Core Fund | | | | | | | | | | | | | | | | |
Service Shares | | | -11.59 | % | | | 3.97 | % | | | 8.19 | % | | | 3.75 | % |
Institutional Shares | | | -11.07 | % | | | 4.57 | % | | | N/A | | | | 7.37 | % |
Russell 1000® Index | | | -8.03 | % | | | 6.22 | % | | | 10.39 | % | | | 6.32 | %(2) |
| (1) | Inception date is 6/29/01 for Service Shares and 4/29/11 for Institutional Shares. |
| (2) | The return shown for the Russell 1000® Index is from the inception date of the Service Shares. The Russell 1000® Index return from the inception date of the Institutional Shares is 9.44%. |
4
GuideMark® Large Cap Core Fund
MANAGER’S DISCUSSION OF FUND PERFORMANCE (Continued) (Unaudited)
| • | | For the 12 months ended March 31, 2020, the Fund’s Service Shares returned -11.6%, underperforming the Russell 1000® Index at -8.0%. |
| • | | As part of the Fund’s three-factor investment approach, the Fund’s dedicated allocation to the value factor was a detractor as cheaper stocks significantly underperformed during the 12-month period. |
| • | | The Fund saw positive contributions from the quality and momentum factors, as well as favorable sector weightings including an overweight allocation to technology and underweight exposure to energy and financials relative to the benchmark. |
| • | | Fund results were also hurt by a tilt toward stocks with smaller market capitalizations and higher volatility relative to the benchmark. |
Components of Portfolio Holdings*
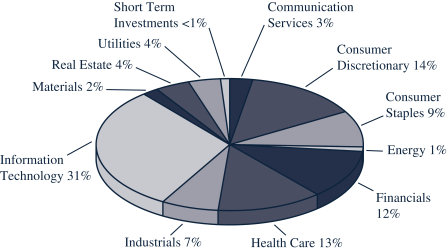
* Pie chart represents percentages of total portfolio, less securities lending collateral.
Top Ten Holdings
| | | | | | | | |
| Rank | | | Security/Holding | | % of Net
Assets | |
| | 1 | | | Microsoft Corp. | | | 4.70 | % |
| | 2 | | | Apple, Inc. | | | 4.35 | % |
| | 3 | | | Vanguard S&P 500 ETF | | | 3.73 | % |
| | 4 | | | Amazon.com, Inc. | | | 2.97 | % |
| | 5 | | | Facebook, Inc. – Class A | | | 1.53 | % |
| | 6 | | | Johnson & Johnson | | | 1.40 | % |
| | 7 | | | Alphabet, Inc. – Class A | | | 1.19 | % |
| | 8 | | | Alphabet, Inc. – Class C | | | 1.19 | % |
| | 9 | | | Berkshire Hathaway, Inc. – Class B | | | 1.15 | % |
| | 10 | | | JPMorgan Chase & Co. | | | 0.98 | % |
The Global Industry Classification Standard (“GICS®”) was developed by and/or is the exclusive property of MSCI, Inc. (“MSCI”) and Standard & Poor’s Financial Services LLC (“S&P”). GICS is a service mark of MSCI and S&P, and has been licensed for use by U.S. Bancorp Fund Services, LLC.
5
GuideMark® Emerging Markets Fund
MANAGER’S DISCUSSION OF FUND PERFORMANCE (Unaudited)
TOTAL RETURN BASED ON A $10,000 INVESTMENT
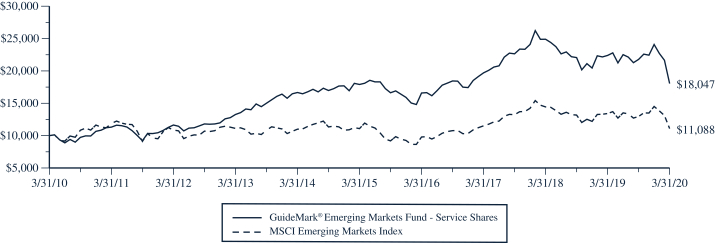
This chart assumes an initial gross investment of $10,000 made on March 31, 2010. Returns shown include the reinvestment of all dividends. Returns shown do not reflect the deduction of taxes that a shareholder would pay on Fund distributions or the redemption of Fund shares. In the absence of fee waivers and reimbursements, when they are necessary to keep expenses at the expense cap, total return would be reduced. Past performance is not predictive of future performance. Investment return and principal value will fluctuate so that your shares, when redeemed, may be worth more or less than the original cost. Index returns do not reflect the effects of fees or expenses. It is not possible to invest directly in an index.
MSCI EMERGING MARKETS INDEX – The MSCI Emerging Markets Index measures the equity market performance of countries considered to represent emerging markets. The emerging market country indices included are: Argentina, Brazil, Chile, China, Colombia, Czech Republic, Egypt, Greece, Hungary, India, Indonesia, Korea, Malaysia, Mexico, Pakistan, Peru, Philippines, Poland, Russia, Qatar, Saudi Arabia, South Africa, Taiwan, Thailand, Turkey and the United Arab Emirates.
| | | | | | | | | | | | | | | | |
| AVERAGE ANNUAL TOTAL RETURN (for periods ended March 31) | |
| | | One Year
| | | Five Year
| | | Ten Year
| | | Since Inception(1)
| |
GuideMark®Emerging Markets Fund | | | | | | | | | | | | | | | | |
Service Shares | | | -19.40 | % | | | 0.16 | % | | | 6.08 | % | | | 3.29 | % |
Institutional Shares(2) | | | -18.91 | % | | | 0.33 | % | | | N/A | | | | 5.44 | % |
MSCI Emerging Markets Index | | | -17.36 | % | | | 0.01 | % | | | 1.04 | % | | | 8.17 | %(3) |
| (1) | Inception date is 6/29/01 for Service Shares and 4/29/11 for Institutional Shares. |
| (2) | During the period August 3, 2017 through September 25, 2017, there were no Institutional Shares of the Fund outstanding. Performance information provided for the Institutional Shares during that period reflects the last calculated net asset value of the Institutional Shares on August 2, 2017, without any adjustments. Had there been Institutional Shares outstanding during the period August 3, 2017 through September 25, 2017, their annual returns would have been substantially similar to those of the Service Shares of the Fund because they would have been invested in the same portfolio securities, but would have differed to the extent that the classes have different expenses. Because the Service Shares have higher expenses than the Institutional Shares, the returns of the Service Shares would have been lower than the returns of the Institutional Shares during the same period. |
| (3) | The return shown for the MSCI Emerging Markets Index is from the inception date of the Service Shares. The MSCI Emerging Markets Index return from the inception date of the Institutional Shares is-1.11%. |
6
GuideMark® Emerging Markets Fund
MANAGER’S DISCUSSION OF FUND PERFORMANCE (Continued) (Unaudited)
| • | | For the 12 months ended March 31, 2020, the Fund’s Service Shares returned -19.4%, underperforming the MSCI Emerging Markets Index at-17.4%. |
| • | | As part of the Fund’s equal weighted three-factor investment approach, the Fund’s dedicated allocation to the value factor was a detractor, as cheaper stocks significantly underperformed during the 12-month period. |
| • | | The Fund saw positive contributions from the quality and momentum factors, as well as favorable sector weightings including an underweight allocation to financials relative to the benchmark. |
| • | | Fund results were also hurt by a tilt toward stocks with smaller market capitalizations and higher volatility relative to the benchmark. |
Components of Portfolio Holdings*
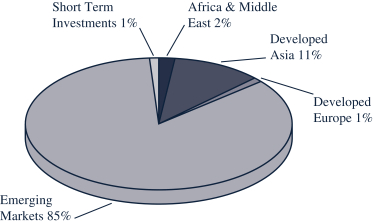
* Pie chart represents percentages of total portfolio, less securities lending collateral.
Top Ten Holdings
| | | | | | | | |
| Rank | | | Security/Holding | | % of Net
Assets | |
| | 1 | | | Alibaba Group Holding, Ltd. – ADR | | | 5.50 | % |
| | 2 | | | Tencent Holdings Ltd. | | | 5.08 | % |
| | 3 | | | KraneShares Bosera MSCI China ETF – Class A | | | 4.58 | % |
| | 4 | | | Taiwan Semiconductor Manufaccturing Co., Ltd. | | | 4.34 | % |
| | 5 | | | Samsung Electronics Co., Ltd. | | | 3.72 | % |
| | 6 | | | iShares Core MSCI Emerging Markets ETF | | | 3.10 | % |
| | 7 | | | iShares MSCI Saudi Arabia ETF | | | 2.15 | % |
| | 8 | | | China Construction Bank Corp. – Series H | | | 1.20 | % |
| | 9 | | | Ping An Insurance Group Co. of China, Ltd. – Series H | | | 1.16 | % |
| | 10 | | | LUKOIL PJSC – ADR | | | 0.78 | % |
7
GuideMark®Small/Mid Cap Core Fund
MANAGER’S DISCUSSION OF FUND PERFORMANCE (Unaudited)
TOTAL RETURN BASED ON A $10,000 INVESTMENT
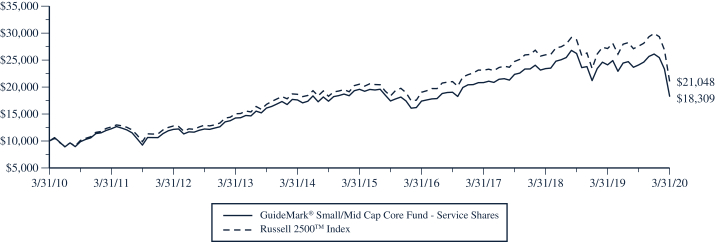
This chart assumes an initial gross investment of $10,000 made on March 31, 2010. Returns shown include the reinvestment of all dividends. Returns shown do not reflect the deduction of taxes that a shareholder would pay on Fund distributions or the redemption of Fund shares. In the absence of fee waivers and reimbursements, when they are necessary to keep expenses at the expense cap, total return would be reduced. Past performance is not predictive of future performance. Investment return and principal value will fluctuate so that your shares, when redeemed, may be worth more or less than the original cost. Index returns do not reflect the effects of fees or expenses. It is not possible to invest directly in an index.
RUSSELL 2500TM INDEX – The Russell 2500TM Index measures the performance of the small- tomid-cap segment of the U.S. equity universe, commonly referred to as “smid” cap. It includes approximately 2,500 of the smallest securities based on a combination of their market cap and current index membership. As of May 10, 2019, the market capitalization of the companies in the Russell 2500TM Index ranged from $152.3 million to $12.2 billion.
| | | | | | | | | | | | | | | | |
| AVERAGE ANNUAL TOTAL RETURN (for periods ended March 31) | |
| | | One Year
| | | Five Year
| | | Ten Year
| | | Since Inception(1)
| |
GuideMark®Small/Mid Cap Core Fund | | | | | | | | | | | | | | | | |
Service Shares | | | -24.10 | % | | | -1.34 | % | | | 6.23 | % | | | 5.27 | % |
Russell 2500TM Index | | | -22.47 | % | | | 0.49 | % | | | 7.73 | % | | | 6.79 | % |
| (1) | Inception date is 6/29/01. |
8
GuideMark®Small/Mid Cap Core Fund
MANAGER’S DISCUSSION OF FUND PERFORMANCE (Continued) (Unaudited)
| • | | For the 12 months ended March 31, 2020, the Fund’s Service Shares returned -24.1%, underperforming the Russell 2500TM Index at -22.5%. |
| • | | As part of the Fund’s equal weighted three-factor investment approach, the Fund’s dedicated allocation to the value factor was a detractor as cheaper stocks significantly underperformed during the 12-month period. |
| • | | The Fund saw positive contributions from the quality and momentum factors, as well as favorable sector weightings including an overweight allocation to technology and underweight exposure to energy and financials relative to the benchmark. |
| • | | Fund results were also hurt by a tilt toward stocks with smaller market capitalizations and higher volatility relative to the benchmark. |
Components of Portfolio Holdings*
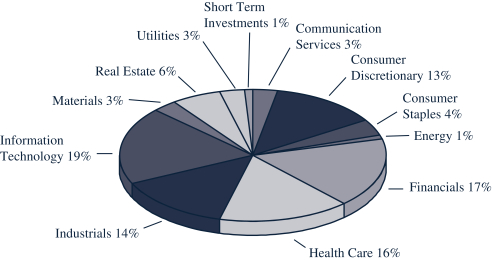
* Pie chart represents percentages of total portfolio, less securities lending collateral.
Top Ten Holdings
| | | | | | | | |
| Rank | | | Security/Holding | | % of Net
Assets | |
| | 1 | | | Vanguard Extended Market ETF | | | 4.03 | % |
| | 2 | | | DexCom, Inc. | | | 0.57 | % |
| | 3 | | | RingCentral, Inc. – Class A | | | 0.51 | % |
| | 4 | | | Domino’s Pizza, Inc. | | | 0.34 | % |
| | 5 | | | Amedisys, Inc. | | | 0.32 | % |
| | 6 | | | Leidos Holdings, Inc. | | | 0.31 | % |
| | 7 | | | DocuSign, Inc. | | | 0.30 | % |
| | 8 | | | Booz Allen Hamilton Holding Corp. | | | 0.29 | % |
| | 9 | | | Seattle Genetics, Inc. | | | 0.29 | % |
| | 10 | | | Pool Corp. | | | 0.28 | % |
9
GuideMark®Worldex-US Fund
MANAGER’S DISCUSSION OF FUND PERFORMANCE (Unaudited)
TOTAL RETURN BASED ON A $10,000 INVESTMENT
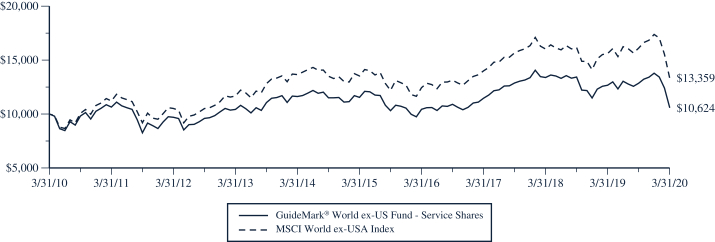
This chart assumes an initial gross investment of $10,000 made on March 31, 2010. Returns shown include the reinvestment of all dividends. Returns shown do not reflect the deduction of taxes that a shareholder would pay on Fund distributions or the redemption of Fund shares. In the absence of fee waivers and reimbursements, when they are necessary to keep expenses at the expense cap, total return would be reduced. Past performance is not predictive of future performance. Investment return and principal value will fluctuate so that your shares, when redeemed, may be worth more or less than the original cost. Index returns do not reflect the effects of fees or expenses. It is not possible to invest directly in an index.
MSCI WORLDEX-USA INDEX – The MSCI Worldex-USA Index captures large andmid-cap representation across 22 of 23 developed markets countries excluding the U.S. The developed market country indices included are: Australia, Austria, Belgium, Canada, Denmark, Finland, France, Germany, Hong Kong, Ireland, Israel, Italy, Japan, Netherlands, New Zealand, Norway, Portugal, Singapore, Spain, Sweden, Switzerland and the United Kingdom.
| | | | | | | | | | | | | | | | |
| AVERAGE ANNUAL TOTAL RETURN (for periods ended March 31) | |
| | | One Year
| | | Five Year
| | | Ten Year
| | | Since Inception(1)
| |
GuideMark®Worldex-US Fund | | | | | | | | | | | | | | | | |
Service Shares | | | -16.16 | % | | | -1.65 | % | | | 0.61 | % | | | 1.48 | % |
Institutional Shares(2) | | | -15.69 | % | | | -0.89 | % | | | N/A | | | | 0.16 | % |
MSCI Worldex-USA Index | | | -14.42 | % | | | -0.25 | % | | | 2.94 | % | | | 4.37 | %(3) |
| (1) | Inception date is 6/29/01 for Service Shares and 4/29/11 for Institutional Shares. |
| (2) | During the period August 3, 2017 through September 5, 2017, there were no Institutional Shares of the Fund outstanding. Performance information provided for the Institutional Shares during that period reflects the last calculated net asset value of the Institutional Shares on August 2, 2017, without any adjustments. Had there been Institutional Shares outstanding during the period August 3, 2017 through September 5, 2017, their annual returns would have been substantially similar to those of the Service Shares of the Fund because they would have been invested in the same portfolio securities, but would have differed to the extent that the classes have different expenses. Because the Service Shares have higher expenses than the Institutional Shares, the returns of the Service Shares would have been lower than the returns of the Institutional Shares during the same period. |
| (3) | The return shown for the MSCI Worldex-USA Index is from the inception date of the Service Shares. The MSCI Worldex-USA Index return from the inception date of the Institutional Shares is 1.37%. |
10
GuideMark®Worldex-US Fund
MANAGER’S DISCUSSION OF FUND PERFORMANCE (Continued) (Unaudited)
| • | | For the 12 months ended March 31, 2020, the Fund’s Service Shares returned -16.2%, underperforming the MSCI World ex-USA Index at -14.4%. |
| • | | As part of the Fund’s equal weighted three-factor investment approach, the Fund’s dedicated allocation to the value factor was a detractor as cheaper stocks significantly underperformed during the 12-month period. |
| • | | The Fund saw positive contributions from the quality and momentum factors, as well as favorable sector weightings including underweight allocations to energy and financials relative to the benchmark. |
| • | | Fund results were also hurt by a tilt toward stocks with smaller market capitalizations and higher volatility relative to the benchmark. |
Components of Portfolio Holdings*
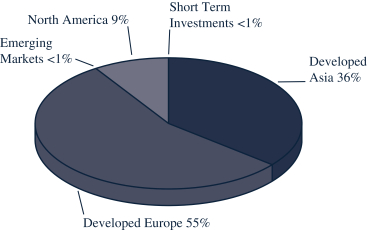
* Pie chart represents percentages of total portfolio, less securities lending collateral.
Top Ten Holdings
| | | | | | | | |
| Rank | | | Security/Holding | | % of Net
Assets | |
| | 1 | | | iShares MSCI EAFE ETF | | | 2.99 | % |
| | 2 | | | Nestle SA | | | 2.35 | % |
| | 3 | | | Roche Holdings AG | | | 2.15 | % |
| | 4 | | | Novartis AG | | | 1.40 | % |
| | 5 | | | LVMH Moet Hennessy Louis Vuitton SE | | | 0.86 | % |
| | 6 | | | GlaxoSmithKline PLC | | | 0.82 | % |
| | 7 | | | Novo Nordisk AS – Series B | | | 0.77 | % |
| | 8 | | | AstraZeneca PLC | | | 0.73 | % |
| | 9 | | | Nippon Telegraph & Telephone Corp. | | | 0.71 | % |
| | 10 | | | AIA Group, Ltd. | | | 0.65 | % |
11
GuideMark®Core Fixed Income Fund
MANAGER’S DISCUSSION OF FUND PERFORMANCE (Unaudited)
TOTAL RETURN BASED ON A $10,000 INVESTMENT
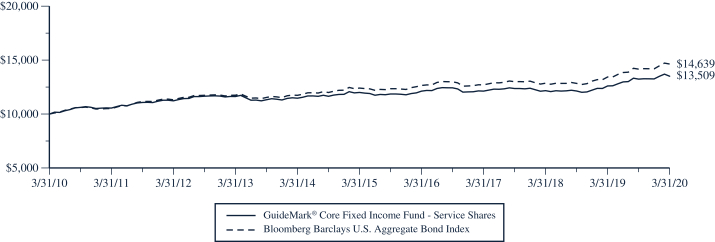
This chart assumes an initial gross investment of $10,000 made on March 31, 2010. Returns shown include the reinvestment of all dividends. Returns shown do not reflect the deduction of taxes that a shareholder would pay on Fund distributions or the redemption of Fund shares. In the absence of fee waivers and reimbursements, when they are necessary to keep expenses at the expense cap, total return would be reduced. Past performance is not predictive of future performance. Investment return and principal value will fluctuate so that your shares, when redeemed, may be worth more or less than the original cost. Index returns do not reflect the effects of fees or expenses. It is not possible to invest directly in an index.
BLOOMBERG BARCLAYS U.S. AGGREGATE BOND INDEX – The Bloomberg Barclays U.S. Aggregate Bond Index is a broad-based benchmark that measures the investment-grade, U.S. dollar-denominated, fixed-rate taxable bond market, including Treasuries, government-related and corporate debt securities, mortgage- and asset-backed securities. All securities contained in the Bloomberg Barclays U.S. Aggregate Bond Index have a minimum term to maturity of one year.
| | | | | | | | | | | | | | | | |
| AVERAGE ANNUAL TOTAL RETURN (for periods ended March 31) | | | | |
| | | One Year
| | | Five Year
| | | Ten Year
| | | Since Inception(1)
| |
GuideMark®Core Fixed Income Fund | | | | | | | | | | | | | | | | |
Service Shares | | | 7.16 | % | | | 2.39 | % | | | 3.05 | % | | | 3.86 | % |
Bloomberg Barclays U.S. Aggregate Bond Index | | | 8.93 | % | | | 3.36 | % | | | 3.88 | % | | | 4.73 | % |
| (1) | Inception date is 6/29/01. |
12
GuideMark®Core Fixed Income Fund
MANAGER’S DISCUSSION OF FUND PERFORMANCE (Continued) (Unaudited)
| • | | For the 12 months ended March 31, 2020, the Fund’s Service Shares returned 7.2%, underperforming the Bloomberg Barclays U.S. Aggregate Bond Index at 8.9%. |
| • | | Exposure to securitized credit sectors including non-agency residential mortgage-backed securities, consumer asset-backed securities, and commercial mortgage-backed securities was a headwind to Fund returns for the 12-month period. |
| • | | Favorable positioning within corporate credit, including an overweight allocation to financials relative to the benchmark and security selection within the industrials sector proved beneficial to Fund returns for the 12-month period. |
| • | | Positioning within U.S. Treasuries, including exposure to Treasury Inflation Protected Securities (“TIPS”) and a tactical underweight to duration in the second quarter of 2019, also weighed on the Fund’s returns for the 12-month period. |
Components of Portfolio Holdings*
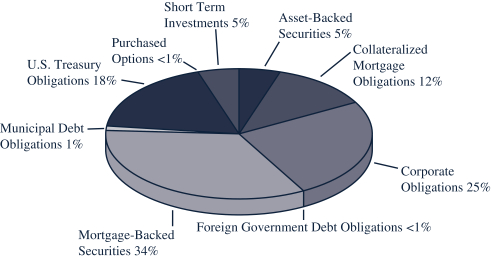
* Pie chart represents percentages of total portfolio, less securities lending collateral.
Percentages expressed exclude derivative instruments, such as futures, options written and swap contracts.
Top Ten Holdings
| | | | | | | | |
| Rank | | | Security/Holding | | % of Net
Assets | |
| | 1 | | | Government National Mortgage Association, Pool #TBA, 2.500%, 4/15/2050 | | | 4.71 | % |
| | 2 | | | Federal National Mortgage Association, Pool #TBA, 2.500%, 5/15/2050 | | | 3.36 | % |
| | 3 | | | U.S. Treasury Note, 2.375%, 8/15/2024 | | | 2.71 | % |
| | 4 | | | Federal National Mortgage Association, Pool #TBA, 3.000%, 4/15/2027 | | | 2.47 | % |
| | 5 | | | Federal National Mortgage Association, Pool #TBA, 3.500%, 4/15/2041 | | | 2.34 | % |
| | 6 | | | U.S. Treasury Bond, 2.500%, 5/15/2046 | | | 2.20 | % |
| | 7 | | | U.S. Treasury Bond, 3.750%, 11/15/2043 | | | 2.04 | % |
| | 8 | | | U.S. Treasury Note, 2.625%, 2/15/2029 | | | 2.01 | % |
| | 9 | | | U.S. Treasury Note, 2.875%, 5/31/2025 | | | 1.82 | % |
| | 10 | | | Federal National Mortgage Association, Pool #BN5279, 4.000%, 2/1/2049 | | | 1.81 | % |
13
GuideMark®Tax-Exempt Fixed Income Fund
MANAGER’S DISCUSSION OF FUND PERFORMANCE (Unaudited)
TOTAL RETURN BASED ON A $10,000 INVESTMENT
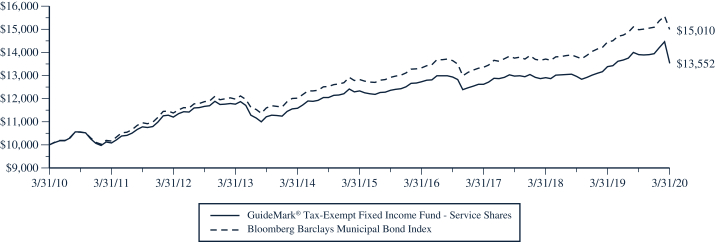
This chart assumes an initial gross investment of $10,000 made on March 31, 2010. Returns shown include the reinvestment of all dividends. Returns shown do not reflect the deduction of taxes that a shareholder would pay on Fund distributions or the redemption of Fund shares. In the absence of fee waivers and reimbursements, when they are necessary to keep expenses at the expense cap, total return would be reduced. Past performance is not predictive of future performance. Investment return and principal value will fluctuate so that your shares, when redeemed, may be worth more or less than the original cost. Index returns do not reflect the effects of fees or expenses. It is not possible to invest directly in an index.
BLOOMBERG BARCLAYS MUNICIPAL BOND INDEX – The Bloomberg Barclays Municipal Bond Index is a market-value-weighted index for the long-termtax-exempt bond market. The index has four main sectors: state and local general obligation bonds, revenue bonds, insured bonds, andpre-refunded bonds.
| | | | | | | | | | | | | | | | |
| AVERAGE ANNUAL TOTAL RETURN (for periods ended March 31) | | | | |
| | | One Year
| | | Five Year
| | | Ten Year
| | | Since Inception(1)
| |
GuideMark®Tax-Exempt Fixed Income Fund | | | | | | | | | | | | | | | | |
Service Shares | | | 1.16 | % | | | 1.90 | % | | | 3.09 | % | | | 3.26 | % |
Bloomberg Barclays Municipal Bond Index | | | 3.85 | % | | | 3.19 | % | | | 4.15 | % | | | 4.57 | % |
| (1) | Inception date is 6/29/01. |
14
GuideMark®Tax-Exempt Fixed Income Fund
MANAGER’S DISCUSSION OF FUND PERFORMANCE (Continued) (Unaudited)
| • | | For the 12 months ended March 31, 2020, the Fund’s Service Shares returned 1.2%, underperforming the Bloomberg Barclays Municipal Bond Index at 3.9%. |
| • | | An overweight position in BBB-rated bonds relative to the benchmark was a detractor from the Fund’s performance, due to weakness seen in the BBB-rated bonds sector and longer duration bonds within the corporate credit segment. |
| • | | The Fund’s out-of-benchmark exposure to below investment grade bonds was also a detractor, as a sell off driven by the coronavirus pandemic and fund outflows led to weakness within municipal credit markets. |
| • | | Security selection within Industry Development Revenue and Pollution Control Revenue bonds positively contributed to Fund returns during the 12-month period, along with an overweight in this sector relative to the benchmark. |
Components of Portfolio Holdings*
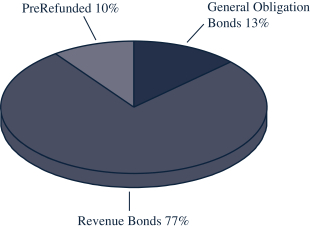
* Pie chart represents percentages of total portfolio.
Top Ten Holdings
| | | | | | | | |
| Rank | | | Security/Holding | | % of Net
Assets | |
| | 1 | | | New York Environmental Facilities Corp., Series B, Prerefunded, Revenue Bond, 5.500%, 10/15/2027 | | | 2.86 | % |
| | 2 | | | Wisconsin, Series 2, Unrefunded, GO, 5.000%, 05/01/2025 | | | 2.36 | % |
| | 3 | | | Utah Associated Municipal Power Systems San Juan Project, Refunding, Revenue Bond, 5.500%, 06/01/2022 | | | 2.33 | % |
| | 4 | | | Charleston Educational Excellence Financing Corp., Refunding, Revenue Bond, 5.000%, 12/01/2025 | | | 2.01 | % |
| | 5 | | | Virginia College Building Educational Facilities Authority, Revenue Bond, 5.750%, 01/01/2034 | | | 1.96 | % |
| | 6 | | | Puerto Rico Sales Tax Financing Corp. Sales Tax Revenue, Series A1, Revenue Bond, 4.750%, 07/01/2053 | | | 1.70 | % |
| | 7 | | | Illinois, GO, 5.000%, 01/01/2029 | | | 1.58 | % |
| | 8 | | | M-S-R Energy Authority, Revenue Bond, 6.500%, 11/01/2039 | | | 1.56 | % |
| | 9 | | | Mississippi Business Finance Corp., Series H, Revenue Bond, 0.650%, 11/01/2035 | | | 1.56 | % |
| | 10 | | | Central Puget Sound Regional Transit Authority, Series P-1, Refunding, Revenue Bond, 5.000%, 02/01/2027 | | | 1.55 | % |
15
GuideMark®Opportunistic Fixed Income Fund
MANAGER’S DISCUSSION OF FUND PERFORMANCE (Unaudited)
TOTAL RETURN BASED ON A $10,000 INVESTMENT
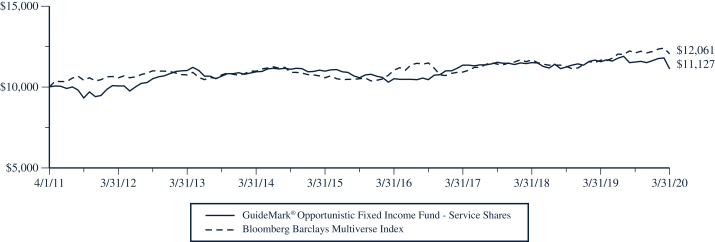
This chart assumes an initial gross investment of $10,000 made on April 1, 2011 (commencement of the Fund’s Service Shares operations). Returns shown include the reinvestment of all dividends. Returns shown do not reflect the deduction of taxes that a shareholder would pay on Fund distributions or the redemption of Fund shares. In the absence of fee waivers and reimbursements, when they are necessary to keep expenses at the expense cap, total return would be reduced. Past performance is not predictive of future performance. Investment return and principal value will fluctuate so that your shares, when redeemed, may be worth more or less than the original cost. Index returns do not reflect the effects of fees or expenses. It is not possible to invest directly in an index.
BLOOMBERG BARCLAYS MULTIVERSE INDEX – The Bloomberg Barclays Multiverse Index provides a broad-based measure of the global fixed-income bond market, and captures investment grade and high yield securities in all eligible currencies.
| | | | | | | | | | | | |
| AVERAGE ANNUAL TOTAL RETURN (for periods ended March 31) | |
| | | One Year
| | | Five Year
| | | Since Inception(1)
| |
GuideMark®Opportunistic Fixed Income Fund | | | | | | | | | | | | |
Service Shares(3) | | | -3.89 | % | | | 0.26 | % | | | 1.19 | % |
Institutional Shares(3) | | | -3.30 | % | | | 1.03 | % | | | 1.80 | % |
Bloomberg Barclays Multiverse Index | | | 3.47 | % | | | 2.67 | % | | | 2.10 | %(2) |
| (1) | Inception date is 4/1/11 for Service Shares and 4/29/11 for Institutional Shares. |
| (2) | The return shown for the Bloomberg Barclays Multiverse Index is from the inception date of the Service Shares. The Bloomberg Barclays Multiverse Index return from the inception date of the Institutional Shares is 1.73%. |
| (3) | The returns reflect the actual performance for each period and do not include the impact of any adjustments made for financial reporting required by Generally Accepted Accounting Principles (GAAP). |
16
GuideMark®Opportunistic Fixed Income Fund
MANAGER’S DISCUSSION OF FUND PERFORMANCE (Continued) (Unaudited)
| • | | For the 12 months ended March 31, 2020, the Fund’s Service Shares returned -3.9%, underperforming the Bloomberg Barclays Multiverse Index at 3.5%. |
| • | | Maintaining an underweight to Treasury duration was a major detractor from the Fund’s returns for the 12-month period, as U.S. Treasury bonds rallied strongly in the first quarter of 2020 with the flight to safety. |
| • | | Narrow spreads throughout most of the period and the backstop of the Federal Reserve expansive monetary policy in March prompting investment grade credit to rally after falling precipitously was a noticeable detractor from the Fund’s returns due to the Fund’s underweight positioning in the sector relative to the benchmark in favor of sovereign and securitized credit. |
| • | | Duration exposure in select emerging market regions contributed to the Fund’s absolute returns. |
Components of Portfolio Holdings*
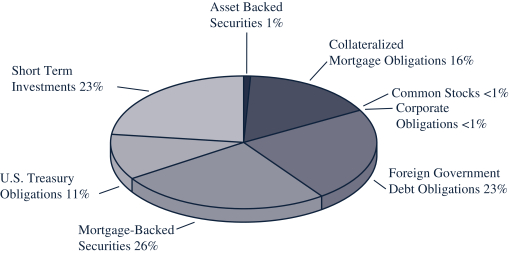
* Pie chart represents percentages of total portfolio.
Percentages expressed exclude derivative instruments, such as forward currency contracts.
Top Ten Holdings
| | | | | | | | |
| Rank | | | Security/Holding | | % of Net
Assets | |
| | 1 | | | U.S. Treasury Note, 1.750%, 12/31/2024 | | | 8.65 | % |
| | 2 | | | Indonesia Treasury Bond, 8.375%, 9/15/2026 | | | 2.98 | % |
| | 3 | | | Mexican Bonos, 7.250%, 12/9/2021 | | | 2.12 | % |
| | 4 | | | Mexican Bonos, 6.500%, 6/9/2022 | | | 1.96 | % |
| | 5 | | | Federal National Mortgage Association, Pool #2014-95, 3.000%, 4/25/2041 | | | 1.92 | % |
| | 6 | | | Mexican Bonos, 8.000%, 12/7/2023 | | | 1.82 | % |
| | 7 | | | Government National Mortgage Association, Pool #2012-40, 4.000%, 1/20/2042 | | | 1.57 | % |
| | 8 | | | Indonesia Treasury Bond, 8.250%, 7/15/2021 | | | 1.46 | % |
| | 9 | | | Federal Home Loan Mortgage Corp., Series 4868, 4.000%, 3/15/2049 | | | 1.42 | % |
| | 10 | | | Columbia TES, 7.750%, 9/18/2030 | | | 1.22 | % |
17
GuidePath®Growth Allocation Fund
MANAGER’S DISCUSSION OF FUND PERFORMANCE (Unaudited)
TOTAL RETURN BASED ON A $10,000 INVESTMENT
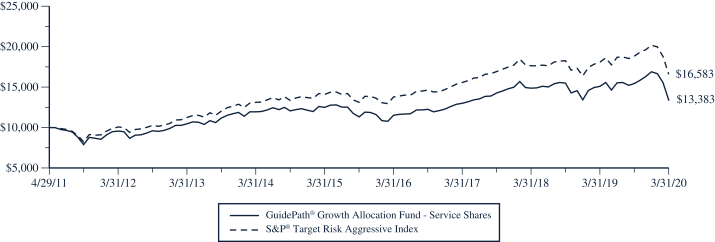
This chart assumes an initial gross investment of $10,000 made on April 29, 2011 (commencement of the Fund’s Service Shares operations). Returns shown include the reinvestment of all dividends. Returns shown do not reflect the deduction of taxes that a shareholder would pay on Fund distributions or the redemption of Fund shares. In the absence of fee waivers and reimbursements, when they are necessary to keep expenses at the expense cap, total return would be reduced. Past performance is not predictive of future performance. Investment return and principal value will fluctuate so that your shares, when redeemed, may be worth more or less than the original cost. Index returns do not reflect the effects of fees or expenses. It is not possible to invest directly in an index.
S&P® TARGET RISK AGGRESSIVE INDEX – The S&P® Target Risk Aggressive Index is designed to measure the performance of an investment benchmark strategy which seeks to emphasize exposure to equity securities, maximizing opportunities for long-term capital accumulation, while also allocating a portion of exposure to fixed income to enhance portfolio efficiency.
| | | | | | | | | | | | |
| AVERAGE ANNUAL TOTAL RETURN (for periods ended March 31) | |
| | | One Year
| | | Five Year
| | | Since Inception(1)
| |
GuidePath®Growth Allocation Fund | | | | | | | | | | | | |
Service Shares | | | -11.35 | % | | | 1.41 | % | | | 3.32 | % |
Institutional Shares | | | -10.82 | % | | | 2.01 | % | | | 4.92 | % |
S&P® Target Risk Aggressive Index | | | -8.31 | % | | | 3.35 | % | | | 5.83 | %(2) |
| (1) | Inception date is 4/29/11 for Service Shares and 9/13/12 for Institutional Shares. |
| (2) | The return shown for the S&P® Target Risk Aggressive Index is annualized from the inception date of the Service Shares. The S&P® Target Risk Aggressive Index average annual return from the inception date of the Institutional Shares is 6.36%. |
18
GuidePath®Growth Allocation Fund
MANAGER’S DISCUSSION OF FUND PERFORMANCE (Continued) (Unaudited)
| • | | For the 12 months ended March 31, 2020, the Fund’s Service Shares returned -11.4% underperforming the S&P® Target Risk Aggressive Index at-8.3%. |
| • | | Exposure to small capitalization equity was the largest detractor from the Fund’s returns, as economic concerns dramatically increased in the first quarter of 2020 and investors moved to asset classes perceived to be safer. |
| • | | Global REITs exposure detracted from the Fund’s returns as forced sales and liquidation in the underlying securities resulted in poor price discovery at the end of the period, particularly in malls, hotels and retail industries. |
| • | | Small, country-specific exposure to Switzerland and China through investment in ETFs benefitted the Fund’s relative returns for the period. |
Components of Portfolio Holdings*
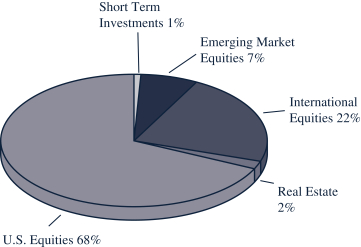
* Pie chart represents percentages of total portfolio, less securities lending collateral.
Top Ten Holdings
| | | | | | | | |
| Rank | | | Security/Holding | | % of Net
Assets | |
| | 1 | | | Vanguard S&P 500 ETF | | | 16.55 | % |
| | 2 | | | Vanguard FTSE Developed Markets ETF | | | 11.20 | % |
| | 3 | | | Schwab U.S.Large-Cap ETF | | | 10.06 | % |
| | 4 | | | American Funds EuroPacific Growth Fund – Class F3 | | | 7.50 | % |
| | 5 | | | iShares Core MSCI Emerging Markets ETF | | | 5.36 | % |
| | 6 | | | American Funds – The Growth Fund of America – Class F3 | | | 5.02 | % |
| | 7 | | | iShares Core S&PSmall-Cap ETF | | | 4.98 | % |
| | 8 | | | American Funds – Fundamental Investors – Class F3 | | | 4.97 | % |
| | 9 | | | AMCAP Fund – Class F3 | | | 4.97 | % |
| | 10 | | | Schwab U.S.Large-Cap Growth ETF | | | 4.96 | % |
19
GuidePath® Conservative Allocation Fund
MANAGER’S DISCUSSION OF FUND PERFORMANCE (Unaudited)
TOTAL RETURN BASED ON A $10,000 INVESTMENT
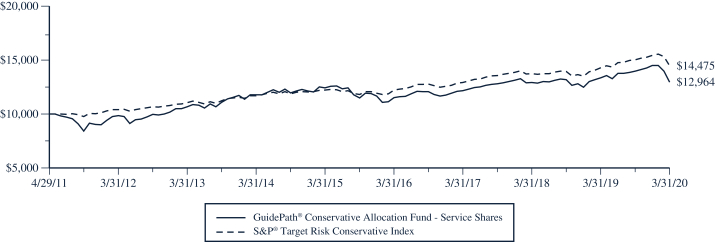
This chart assumes an initial gross investment of $10,000 made on April 29, 2011 (commencement of the Fund’s Service Shares operations). Returns shown include the reinvestment of all dividends. Returns shown do not reflect the deduction of taxes that a shareholder would pay on Fund distributions or the redemption of Fund shares. In the absence of fee waivers and reimbursements, when they are necessary to keep expenses at the expense cap, total return would be reduced. Past performance is not predictive of future performance. Investment return and principal value will fluctuate so that your shares, when redeemed, may be worth more or less than the original cost. Index returns do not reflect the effects of fees or expenses. It is not possible to invest directly in an index.
S&P® TARGET RISK CONSERVATIVE INDEX – The S&P® Target Risk Conservative Index seeks to emphasize exposure to fixed income securities in order to produce a current income stream and avoid excessive volatility of returns. Equity securities are included to protect long-term purchasing power.
| | | | | | | | | | | | |
| AVERAGE ANNUAL TOTAL RETURN (for periods ended March 31) | |
| | | One Year
| | | Five Year
| | | Since Inception(1)
| |
GuidePath® Conservative Allocation Fund | | | | | | | | | | | | |
Service Shares | | | -2.99 | % | | | 0.86 | % | | | 2.95 | % |
Institutional Shares | | | -2.41 | % | | | 1.48 | % | | | 4.03 | % |
S&P® Target Risk Conservative Index | | | 1.24 | % | | | 3.47 | % | | | 4.23 | %(2) |
| (1) | Inception date is 4/29/11 for Service Shares and 9/13/12 for Institutional Shares. |
| (2) | The return shown for the S&P® Target Risk Conservative Index is annualized from the inception date of the Service Shares. The S&P® Target Risk Conservative Index average annual return from the inception date of the Institutional Shares is 4.07%. |
20
GuidePath® Conservative Allocation Fund
MANAGER’S DISCUSSION OF FUND PERFORMANCE (Continued) (Unaudited)
| • | | For the 12 months ended March 31, 2020, the Fund’s Service Shares returned -3.0% underperforming the S&P® Target Risk Conservative Index at 1.2%. |
| • | | Exposure to small capitalization equities detracted from the Fund’s performance, as economic concerns dramatically increased in the first quarter of 2020 and investors moved to asset classes perceived to be safer. Holdings in U.S. REITs also detracted from the Fund’s returns due to forced sales and liquidation in the underlying securities at the end of the period. |
| • | | Exposure to high yield and emerging market bonds detracted from the Fund’s returns as credit spreads widened and investors sought the safety of U.S. Treasuries specifically during the first quarter of 2020. |
| • | | Exposure to long-term bonds, particularly U.S. Treasuries, lifted the Fund’s returns in the flight to safety during the first quarter of 2020. |
Components of Portfolio Holdings*
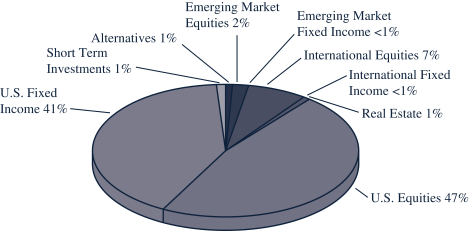
* Pie chart represents percentages of total portfolio, less securities lending collateral.
Top Ten Holdings
| | | | | | | | |
| Rank | | | Security/Holding | | % of Net
Assets | |
| | 1 | | | Vanguard Mortgage-Backed Securities ETF | | | 7.64 | % |
| | 2 | | | iShares Core Growth Allocation ETF | | | 6.49 | % |
| | 3 | | | American Funds – Capital Income Builder – Class F3 | | | 6.23 | % |
| | 4 | | | American Funds – The Income Fund of America – Class F3 | | | 6.17 | % |
| | 5 | | | Vanguard S&P 500 ETF | | | 5.45 | % |
| | 6 | | | iShares Core Aggressive Allocation ETF | | | 5.05 | % |
| | 7 | | | American Funds – Mutual Fund – Class F3 | | | 4.91 | % |
| | 8 | | | Vanguard High Dividend Yield ETF | | | 4.75 | % |
| | 9 | | | Vanguard FTSE Developed Markets ETF | | | 4.16 | % |
| | 10 | | | SPDR Bloomberg Barclays High Yield Bond ETF | | | 4.12 | % |
21
GuidePath® Tactical Allocation Fund
MANAGER’S DISCUSSION OF FUND PERFORMANCE (Unaudited)
TOTAL RETURN BASED ON A $10,000 INVESTMENT
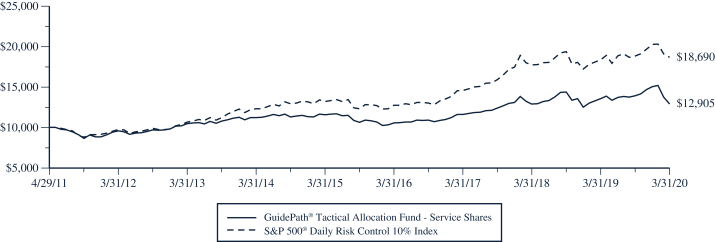
This chart assumes an initial gross investment of $10,000 made on April 29, 2011 (commencement of the Fund’s Service Shares operations). Returns shown include the reinvestment of all dividends. Returns shown do not reflect the deduction of taxes that a shareholder would pay on Fund distributions or the redemption of Fund shares. In the absence of fee waivers and reimbursements, when they are necessary to keep expenses at the expense cap, total return would be reduced. Past performance is not predictive of future performance. Investment return and principal value will fluctuate so that your shares, when redeemed, may be worth more or less than the original cost. Index returns do not reflect the effects of fees or expenses. It is not possible to invest directly in an index.
S&P 500® DAILY RISK CONTROL 10% INDEX – The S&P 500® Daily Risk Control 10% Index represents a portfolio of the S&P 500® Low Volatility Index plus an interest accruing cash component. The index is dynamically rebalanced to target a 10% level of volatility. Volatility is calculated as a function of historical returns.
| | | | | | | | | | | | |
| AVERAGE ANNUAL TOTAL RETURN (for periods ended March 31) | |
| | | One Year
| | | Five Year
| | | Since Inception(1)
| |
GuidePath® Tactical Allocation Fund | | | | | | | | | | | | |
Service Shares | | | -4.83 | % | | | 2.20 | % | | | 2.90 | % |
Institutional Shares | | | -4.27 | % | | | 2.80 | % | | | 4.33 | % |
S&P 500® Daily Risk Control 10% Index | | | 1.85 | % | | | 7.15 | % | | | 7.26 | %(2) |
| (1) | Inception date is 4/29/11 for Service Shares and 9/13/12 for Institutional Shares. |
| (2) | The return shown for the S&P 500® Daily Risk Control 10% Index is annualized from the inception date of the Service Shares. The S&P 500® Daily Risk Control 10% Index average annual return from the inception date of the Institutional Shares is 8.65%. |
22
GuidePath® Tactical Allocation Fund
MANAGER’S DISCUSSION OF FUND PERFORMANCE (Continued) (Unaudited)
| • | | For the 12 months ended March 31, 2020, the Fund’s Service Shares returned -4.8% underperforming the S&P® 500 Daily Risk Control 10% Index at 1.9%. |
| • | | Larger relative equity exposure compared to the Fund’s benchmark during the bear market fall in the first quarter of 2020 was the largest detractor from the Fund’s returns. The reduction in the Fund’s equity exposure lagged the benchmark in response to the sharp and sudden downturn in equity markets, dampening the Fund’s relative returns. |
| • | | Positioning in intermediate and long-term U.S. Treasuries benefited the Fund’s relative returns as the Federal Reserve lowered interest rates and investors sought safety toward the end of the 12-month period. |
| • | | Within equities, exposure to the technology sector benefitted the Fund’s relative returns, as mega-cap, cash rich technology companies were able to weather the market downturn in the first quarter of 2020 while also benefiting from greater use of technology in response to Shelter in Place orders. |
Components of Portfolio Holdings*
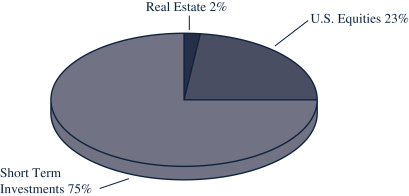
* Pie chart represents percentages of total portfolio, less securities lending collateral.
Top Ten Holdings
| | | | | | | | |
| Rank | | | Security/Holding | | % of Net
Assets | |
| | 1 | | | SPDR Bloomberg Barclays 1-3 Month T-Bill ETF | | | 23.05 | % |
| | 2 | | | Goldman Sachs Access Treasury 0-1 Year ETF | | | 19.94 | % |
| | 3 | | | FactSet Research Systems, Inc. | | | 1.29 | % |
| | 4 | | | Bristol-Myers Squibb Co. | | | 1.28 | % |
| | 5 | | | Clorox Co. | | | 1.11 | % |
| | 6 | | | Zoetis, Inc. | | | 1.07 | % |
| | 7 | | | Scotts Miracle Grow Co. | | | 0.92 | % |
| | 8 | | | MarketAxess Holdings, Inc. | | | 0.83 | % |
| | 9 | | | Hershey Co. | | | 0.81 | % |
| | 10 | | | RenaissanceRe Holdings Ltd. | | | 0.79 | % |
23
GuidePath® Absolute Return Allocation Fund
MANAGER’S DISCUSSION OF FUND PERFORMANCE (Unaudited)
TOTAL RETURN BASED ON A $10,000 INVESTMENT
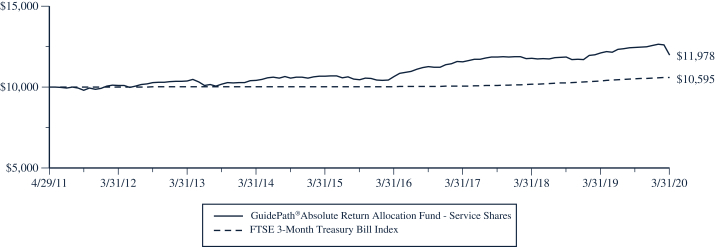
This chart assumes an initial gross investment of $10,000 made on April 29, 2011 (commencement of the Fund’s Service Shares operations). Returns shown include the reinvestment of all dividends. Returns shown do not reflect the deduction of taxes that a shareholder would pay on Fund distributions or the redemption of Fund shares. In the absence of fee waivers and reimbursements, when they are necessary to keep expenses at the expense cap, total return would be reduced. Past performance is not predictive of future performance. Investment return and principal value will fluctuate so that your shares, when redeemed, may be worth more or less than the original cost. Index returns do not reflect the effects of fees or expenses. It is not possible to invest directly in an index.
FTSE 3-MONTH TREASURY BILL INDEX – The FTSE 3-Month Treasury Bill Index tracks the performance of U.S. Treasury Bills with a remaining maturity of three months.
| | | | | | | | | | | | |
| AVERAGE ANNUAL TOTAL RETURN (for periods ended March 31) | |
| | | One Year
| | | Five Year
| | | Since Inception(1)
| |
GuidePath® Absolute Return Allocation Fund | | | | | | | | | | | | |
Service Shares | | | -1.11 | % | | | 2.33 | % | | | 2.05 | % |
Institutional Shares | | | -0.53 | % | | | 2.96 | % | | | 2.71 | % |
FTSE 3-Month Treasury Bill Index | | | 2.04 | % | | | 1.12 | % | | | 0.65 | %(2) |
| (1) | Inception date is 4/29/11 for Service Shares and 9/13/12 for Institutional Shares. |
| (2) | The return shown for the FTSE 3-Month Treasury Bill Index is annualized from the inception date of the Service Shares. The FTSE 3-Month Treasury Bill Index average annual return from the inception date of the Institutional Shares is 0.76%. |
24
GuidePath® Absolute Return Allocation Fund
MANAGER’S DISCUSSION OF FUND PERFORMANCE (Continued) (Unaudited)
| • | | For the 12 months ended March 31, 2020, the Fund’s Service Shares returned -1.1% underperforming the FTSE 3-Month Treasury Bill Index at 2.0%. |
| • | | Exposure to global equities dampened the Fund’s returns as economic concerns dramatically increased in the first quarter of 2020 and equity markets faced a sharp and sudden downturn. |
| • | | Exposure to high yield bonds, floating rate loans and emerging markets bonds detracted from the Fund’s performance specifically during the first quarter or 2020, as credit spreads widened and investors sought the safety of U.S. Treasuries. |
| • | | Positioning in U.S. Treasuries lifted the Fund’s relative returns in light of the investor flight to safety during the first quarter of 2020. |
Components of Portfolio Holdings*
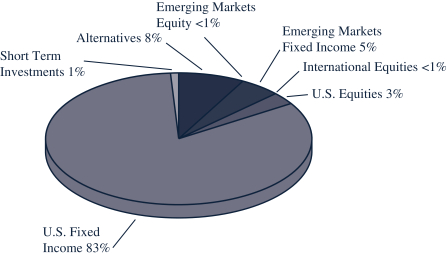
* Pie chart represents percentages of total portfolio, less securities lending collateral.
Top Ten Holdings
| | | | | | | | |
| Rank | | | Security/Holding | | % of Net
Assets | |
| | 1 | | | Vanguard Mortgage-Backed Securities ETF | | | 19.94 | % |
| | 2 | | | DoubleLine Total Return Bond Fund – Institutional Shares | | | 10.08 | % |
| | 3 | | | BlackRock Low Duration Bond Portfolio – Institutional Shares | | | 9.51 | % |
| | 4 | | | DoubleLine Low Duration Bond Fund – Institutional Shares | | | 9.22 | % |
| | 5 | | | ProShares Investment Grade-Interest Rate Hedged ETF | | | 7.61 | % |
| | 6 | | | Schwab Short-Term U.S. Treasury ETF | | | 7.27 | % |
| | 7 | | | iShares iBoxx $ Investment Grade Corporate Bond ETF | | | 7.25 | % |
| | 8 | | | Vanguard Emerging Markets Government Bond ETF | | | 5.42 | % |
| | 9 | | | Vanguard Intermediate-Term Corporate Bond ETF | | | 5.26 | % |
| | 10 | | | DoubleLine Flexible Income Fund – Institutional Shares | | | 4.71 | % |
25
GuidePath® Multi-Asset Income Allocation Fund
MANAGER’S DISCUSSION OF FUND PERFORMANCE (Unaudited)
TOTAL RETURN BASED ON A $10,000 INVESTMENT
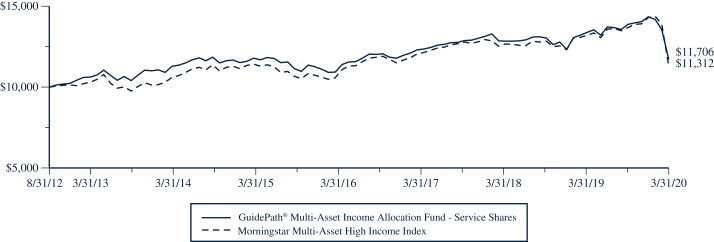
This chart assumes an initial gross investment of $10,000 made on August 31, 2012 (commencement of the Fund’s operations). Returns shown include the reinvestment of all dividends. Returns shown do not reflect the deduction of taxes that a shareholder would pay on Fund distributions or the redemption of Fund shares. In the absence of fee waivers and reimbursements, when they are necessary to keep expenses at the expense cap, total return would be reduced. Past performance is not predictive of future performance. Investment return and principal value will fluctuate so that your shares, when redeemed, may be worth more or less than the original cost. Index returns do not reflect the effects of fees or expenses. It is not possible to invest directly in an index.
MORNINGSTAR MULTI-ASSET HIGH INCOME INDEX – The Morningstar Multi-Asset High Income Index is a broadly diversified index that seeks to deliver high current income while maintaining long-term capital appreciation.
| | | | | | | | | | | | |
| AVERAGE ANNUAL TOTAL RETURN (for periods ended March 31) | |
| | | One Year
| | | Five Years
| | | Since Inception(1)
| |
GuidePath® Multi-Asset Income Allocation Fund | | | | | | | | | | | | |
Service Shares | | | -12.53 | % | | | 0.01 | % | | | 2.10 | % |
Morningstar Multi-Asset High Income Index | | | -14.35 | % | | | 0.03 | % | | | 1.64 | % |
| (1) | Inception date is 8/31/12. |
26
GuidePath® Multi-Asset Income Allocation Fund
MANAGER’S DISCUSSION OF FUND PERFORMANCE (Continued) (Unaudited)
| • | | For the 12 months ended March 31, 2020, the Fund’s Service Shares returned -12.5% outperforming the Morningstar Multi-Asset High Income Index at -14.4%. |
| • | | Positioning in intermediate and long-term U.S. Treasuries benefited the Fund’s relative returns as the Federal Reserve lowered interest rates and investors sought safety toward the end of the 12-month period. |
| • | | Exposure to small capitalization equities detracted from Fund returns, as economic concerns dramatically increased in the first quarter of 2020 and investors moved to asset classes perceived to be safer. |
| • | | Global REITs exposure detracted from the Fund’s returns as forced sales and liquidation in the underlying securities resulted in poor price discovery at the end of the period, particularly in malls, hotels and retail industries. |
Components of Portfolio Holdings*
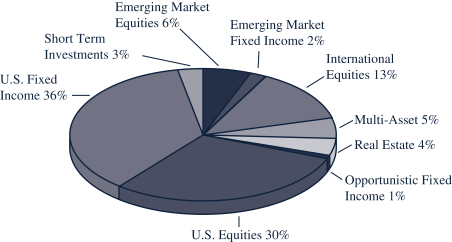
* Pie chart represents percentages of total portfolio, less securities lending collateral.
Top Ten Holdings
| | | | | | | | |
| Rank | | | Security/Holding | | % of Net
Assets | |
| | 1 | | | iShares 0-5 Year High Yield Corporate Bond ETF | | | 6.14 | % |
| | 2 | | | T. Rowe Price Institutional Floating Rate Fund | | | 6.09 | % |
| | 3 | | | iShares Emerging Markets Dividend ETF | | | 5.88 | % |
| | 4 | | | SPDR S&P International Dividend ETF | | | 5.74 | % |
| | 5 | | | Loomis Sayles Global Allocation Fund – Y Shares | | | 4.94 | % |
| | 6 | | | WisdomTree U.S. LargeCap Dividend Fund | | | 4.52 | % |
| | 7 | | | iShares Select Dividend ETF | | | 4.51 | % |
| | 8 | | | iShares International Select Dividend ETF | | | 4.35 | % |
| | 9 | | | Schwab U.S. Dividend Equity ETF | | | 4.18 | % |
| | 10 | | | Vanguard High Dividend Yield ETF | | | 4.18 | % |
27
GuidePath® Flexible Income Allocation Fund
MANAGER’S DISCUSSION OF FUND PERFORMANCE (Unaudited)
TOTAL RETURN BASED ON A $10,000 INVESTMENT
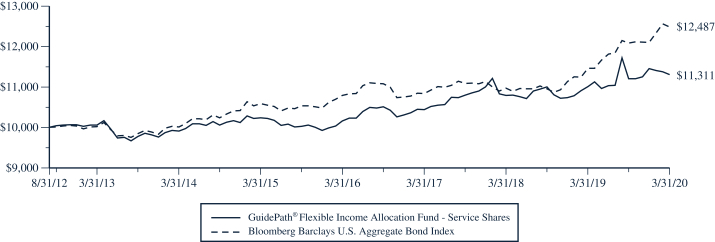
This chart assumes an initial gross investment of $10,000 made on August 31, 2012 (commencement of the Fund’s Service Shares operations). Returns shown include the reinvestment of all dividends. Returns shown do not reflect the deduction of taxes that a shareholder would pay on Fund distributions or the redemption of Fund shares. In the absence of fee waivers and reimbursements, when they are necessary to keep expenses at the expense cap, total return would be reduced. Past performance is not predictive of future performance. Investment return and principal value will fluctuate so that your shares, when redeemed, may be worth more or less than the original cost. Index returns do not reflect the effects of fees or expenses. It is not possible to invest directly in an index.
BLOOMBERG BARCLAYS U.S. AGGREGATE BOND INDEX – The Bloomberg Barclays U.S. Aggregate Bond Index is a broad-based benchmark that measures the investment-grade, U.S. dollar-denominated, fixed-rate taxable bond market, including Treasuries, government-related and corporate debt securities, mortgage- and asset-backed securities. All securities contained in the Bloomberg Barclays U.S. Aggregate Bond Index have a minimum term to maturity of one year.
| | | | | | | | | | | | |
| AVERAGE ANNUAL TOTAL RETURN (for periods ended March 31) | |
| | | One Year
| | | Five Years
| | | Since Inception(1)
| |
GuidePath® Flexible Income Allocation Fund | | | | | | | | | | | | |
Service Shares | | | 2.76 | % | | | 2.01 | % | | | 1.64 | % |
Institutional Shares | | | 3.38 | % | | | 2.77 | % | | | 2.33 | % |
Bloomberg Barclays U.S. Aggregate Bond Index | | | 8.93 | % | | | 3.36 | % | | | 2.97 | %(2) |
| (1) | Inception date is 8/31/12 for Service Shares and 9/13/12 for Institutional Shares. |
| (2) | The return shown for the Bloomberg Barclays U.S. Aggregate Bond Index is from the inception date of the Service Shares. The Bloomberg Barclays U.S. Aggregate Bond Index return from the inception date of the Institutional Shares is 3.04%. |
28
GuidePath® Flexible Income Allocation Fund
MANAGER’S DISCUSSION OF FUND PERFORMANCE (Continued) (Unaudited)
| • | | For the 12 months ended March 31, 2020, the Fund’s Service Shares returned 2.8% underperforming the Bloomberg Barclays U.S. Aggregate Bond Index at 8.9%. |
| • | | Positions in high yield bonds in late February through early March were the main detractors from the Fund’s performance, as credit spreads widened and investors sought out the safety of U.S. Treasuries during the 12-month period. |
| • | | Exposure to long-term and intermediate-term U.S. Treasuries during the third quarter of 2019 was additive to the Fund’s returns as the Federal Reserve lowered interest rates during the 12-month period. |
Components of Portfolio Holdings*
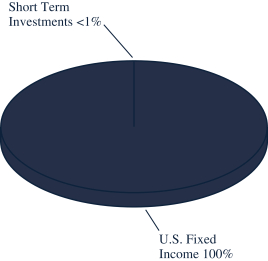
* Pie chart represents percentages of total portfolio.
Top Ten Holdings
| | | | | | | | |
| Rank | | | Security/Holding | | % of Net
Assets | |
| | 1 | | | SPDR Bloomberg Barclays High Yield Bond ETF | | | 24.12 | % |
| | 2 | | | iShares iBoxx high Yield Corporate Bond ETF | | | 23.38 | % |
| | 3 | | | iShares Broad USD High Yield Corporate Bond ETF | | | 14.80 | % |
| | 4 | | | iShares 0-5 Year High Yield Corporate Bond ETF | | | 12.41 | % |
| | 5 | | | X-Trackers USD High Yield Corporate Bond ETF | | | 10.08 | % |
| | 6 | | | BlackRock High Yield Portfolio – Institutional Shares | | | 9.79 | % |
| | 7 | | | Vanguard High-Yield Corporate Fund – Admiral Shares | | | 4.81 | % |
29
GuidePath® Managed Futures Strategy Fund
MANAGER’S DISCUSSION OF FUND PERFORMANCE (Unaudited)
TOTAL RETURN BASED ON A $10,000 INVESTMENT
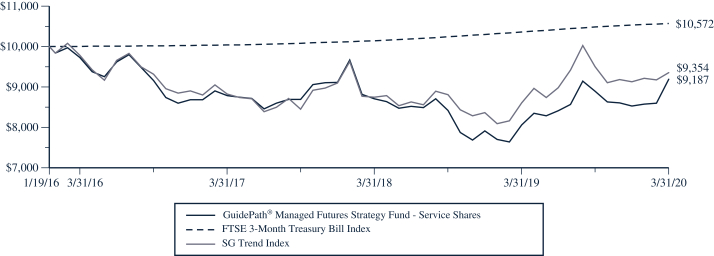
This chart assumes an initial gross investment of $10,000 made on January 19, 2016 (commencement of the Fund’s operations). Returns shown include the reinvestment of all dividends. Returns shown do not reflect the deduction of taxes that a shareholder would pay on Fund distributions or the redemption of Fund shares. In the absence of fee waivers and reimbursements, when they are necessary to keep expenses at the expense cap, total return would be reduced. Past performance is not predictive of future performance. Investment return and principal value will fluctuate so that your shares, when redeemed, may be worth more or less than the original cost. Index returns do not reflect the effects of fees or expenses. It is not possible to invest directly in an index.
FTSE 3-MONTH TREASURY BILL INDEX – The FTSE 3-Month Treasury Bill Index tracks the performance of U.S. Treasury Bills with a remaining maturity of three months.
SG TREND INDEX – The SG Trend Index is designed to track the 10 largest (by AUM) trend following commodity trading advisors and be representative of the trend followers in the managed futures space. Managers must meet the following criteria: must be open to new investment, must report returns on a daily basis, must be an industry recognized trend follower as determined at the discretion of the SG Index Committee, and must exhibit significant correlation to trend following peers and the SG Trend Indicator.
| | | | | | | | |
| AVERAGE ANNUAL TOTAL RETURN (for periods ended March 31) | |
| | | One Year
| | | Since Inception(1)
| |
GuidePath® Managed Futures Strategy Fund | | | | | | | | |
Service Shares | | | 14.03 | % | | | -2.00 | % |
Institutional Shares | | | 14.70 | % | | | -1.41 | % |
FTSE 3-Month Treasury Bill Index | | | 2.04 | % | | | 1.33 | % |
SG Trend Index | | | 8.75 | % | | | -1.58 | % |
| (1) | Inception date is 1/19/16 for Service Shares and Institutional Shares. |
30
GuidePath® Managed Futures Strategy Fund
MANAGER’S DISCUSSION OF FUND PERFORMANCE (Continued) (Unaudited)
| • | | For the 12 months ended March 31, 2020, the Fund’s Service Shares returned 14.0%, outperforming the SG Trend Index at 8.8%. |
| • | | Long positions in bonds, specifically longer-term U.S. Treasuries, were a significant driver of the Fund’s returns as investors fled to the safety of Treasuries causing interest rates to decline to historic lows in light of the uncertainty caused by the coronavirus pandemic. |
| • | | With the turn in equity trends in the first quarter of 2020, equity exposure shifted from long to net short by the end of the first quarter of 2020, which helped to limit the Fund’s losses relative to the benchmark. |
| • | | Positions in grain commodities including corn were a headwind to Fund returns during the period, due to trade tensions causing grain prices to swing up and down significantly. |
Components of Portfolio Holdings*
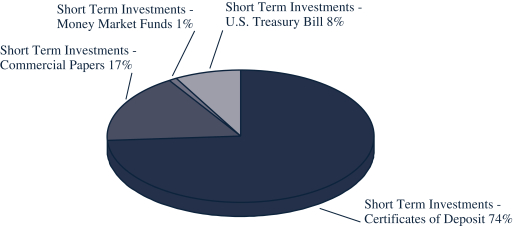
* Pie chart represents percentages of total portfolio.
Percentages expressed exclude derivative instruments, such as forward currency contracts and futures contracts.
Top Ten Holdings
| | | | |
| Rank | | Security/Holding | | % of Net
Assets |
| The GuidePath® Managed Futures Strategy Fund did not hold any long term investments as of March 31, 2020. |
31
GuidePath® Conservative Income Fund
MANAGER’S DISCUSSION OF FUND PERFORMANCE (Unaudited)
TOTAL RETURN BASED ON A $10,000 INVESTMENT
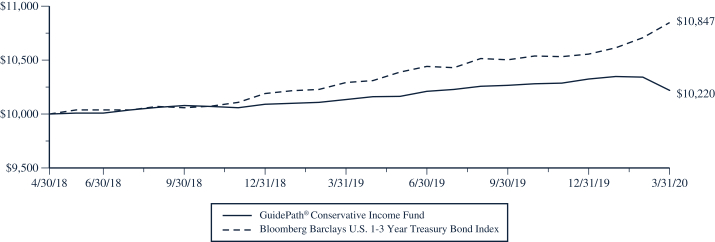
This chart assumes an initial gross investment of $10,000 made on April 30, 2018 (commencement of the Fund’s operations). Returns shown include the reinvestment of all dividends. Returns shown do not reflect the deduction of taxes that a shareholder would pay on Fund distributions or the redemption of Fund shares. In the absence of fee waivers and reimbursements, when they are necessary to keep expenses at the expense cap, total return would be reduced. Past performance is not predictive of future performance. Investment return and principal value will fluctuate so that your shares, when redeemed, may be worth more or less than the original cost. Index returns do not reflect the effects of fees or expenses. It is not possible to invest directly in an index.
BLOOMBERG BARCLAYS U.S. 1-3 YEAR TREASURY BOND INDEX – The Bloomberg Barclays U.S. 1-3 Year Treasury Bond Index measures the performance of the U.S. government bond market and includes public obligations of the U.S. Treasury with a maturity between 1 and up to (but not including) 3 years. Certain special issues, such as state and local government series bonds (SLGs), as well as U.S. Treasury TIPS, are excluded. Separate trading of registered interest and principal securities (STRIPS) are excluded from the Index because their inclusion would result indouble-counting.
| | | | | | | | |
| AVERAGE ANNUAL TOTAL RETURN (for periods ended March 31) | |
| | | One Year
| | | Since Inception(1)
| |
GuidePath® Conservative Income Fund | | | | | | | | |
Shares | | | 0.85 | % | | | 1.14 | % |
Bloomberg Barclays U.S. 1-3 Year Treasury Bond Index | | | 5.41 | % | | | 4.33 | % |
| (1) | Inception date for the Fund is 4/30/18. |
32
GuidePath® Conservative Income Fund
MANAGER’S DISCUSSION OF FUND PERFORMANCE (Continued) (Unaudited)
| • | | For the 12 months ended March 31, 2020, the Fund returned 0.9% trailing the Bloomberg Barclays U.S. 1-3 Year Treasury Bond Index at 5.4%. |
| • | | Exposure to corporate credit in the first quarter of 2020, both investment grade and high yield, detracted from the Fund’s returns for the 12-month period. |
| • | | A target allocation of 50% to cash equivalents dampened the Fund’s returns, as the Federal Reserve reversed course from tightening to easing monetary policy, and bond yields across the curve fell. |
Components of Portfolio Holdings*
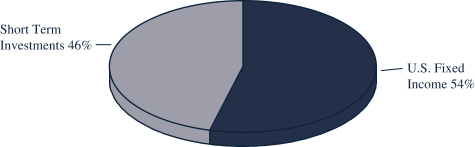
* Pie chart represents percentages of total portfolio.
Top Ten Holdings
| | | | | | | | |
| Rank | | | Security/Holding | | % of Net
Assets | |
| | 1 | | | Schwab Short-Term U.S. Treasury ETF | | | 52.61 | % |
33
GuidePath® Income Fund
MANAGER’S DISCUSSION OF FUND PERFORMANCE (Unaudited)
TOTAL RETURN BASED ON A $10,000 INVESTMENT
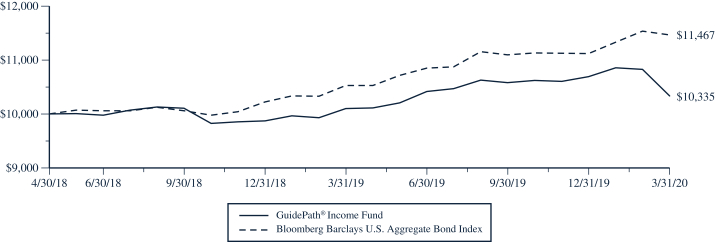
This chart assumes an initial gross investment of $10,000 made on April 30, 2018 (commencement of the Fund’s operations). Returns shown include the reinvestment of all dividends. Returns shown do not reflect the deduction of taxes that a shareholder would pay on Fund distributions or the redemption of Fund shares. In the absence of fee waivers and reimbursements, when they are necessary to keep expenses at the expense cap, total return would be reduced. Past performance is not predictive of future performance. Investment return and principal value will fluctuate so that your shares, when redeemed, may be worth more or less than the original cost. Index returns do not reflect the effects of fees or expenses. It is not possible to invest directly in an index.
BLOOMBERG BARCLAYS U.S. AGGREGATE BOND INDEX – The Bloomberg Barclays U.S. Aggregate Bond Index is a broad-based benchmark that measures the investment-grade, U.S. dollar-denominated, fixed-rate taxable bond market, including Treasuries, government-related and corporate debt securities, mortgage- and asset-backed securities. All securities contained in the Bloomberg Barclays U.S. Aggregate Bond Index have a minimum term to maturity of one year.
| | | | | | | | |
| AVERAGE ANNUAL TOTAL RETURN (for periods ended March 31) | |
| | | One Year
| | | Since Inception(1)
| |
GuidePath® Income Fund | | | | | | | | |
Shares | | | 2.34 | % | | | 1.73 | % |
Bloomberg Barclays U.S. Aggregate Bond Index | | | 8.93 | % | | | 7.40 | % |
| (1) | Inception date for the Fund is 4/30/18. |
34
GuidePath® Income Fund
MANAGER’S DISCUSSION OF FUND PERFORMANCE (Continued) (Unaudited)
| • | | For the 12 months ended March 31, 2020, the Fund returned 2.3% trailing the Bloomberg Barclays U.S. Aggregate Bond Index at 8.9%. |
| • | | Exposure to corporate credit in the first quarter of 2020, both investment grade and high yield, detracted from the Fund’s returns for the 12-month period. |
| • | | While the Fund’s relative returns were impeded by its credit exposure, the Fund still garnered a positive return, benefitting from the tailwind of falling interest rates throughout the period. |
Components of Portfolio Holdings*
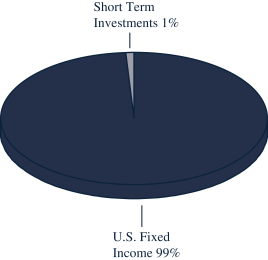
* Pie chart represents percentages of total portfolio.
Top Ten Holdings
| | | | | | | | |
| Rank | | | Security/Holding | | % of Net
Assets | |
| | 1 | | | iShares Core U.S. Aggregate Bond ETF | | | 50.76 | % |
| | 2 | | | Schwab Intermediate-Term U.S. Treasury ETF | | | 46.85 | % |
35
GuidePath® Growth and Income Fund
MANAGER’S DISCUSSION OF FUND PERFORMANCE (Unaudited)
TOTAL RETURN BASED ON A $10,000 INVESTMENT
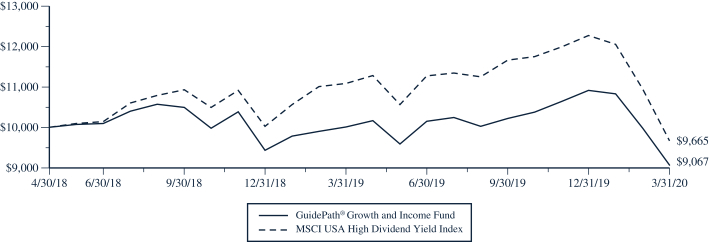
This chart assumes an initial gross investment of $10,000 made on April 30, 2018 (commencement of the Fund’s operations). Returns shown include the reinvestment of all dividends. Returns shown do not reflect the deduction of taxes that a shareholder would pay on Fund distributions or the redemption of Fund shares. In the absence of fee waivers and reimbursements, when they are necessary to keep expenses at the expense cap, total return would be reduced. Past performance is not predictive of future performance. Investment return and principal value will fluctuate so that your shares, when redeemed, may be worth more or less than the original cost. Index returns do not reflect the effects of fees or expenses. It is not possible to invest directly in an index.
MSCI USA HIGH DIVIDEND YIELD INDEX – The MSCI USA High Dividend Yield Index is based on the MSCI USA Index, its parent index, and includes large and mid cap stocks. The index is designed to reflect the performance of equities in the parent index (excluding REITs) with higher dividend income and quality characteristics than average dividend yields that are both sustainable and persistent. The index also applies quality screens and reviews 12-month past performance to omit stocks with potentially deteriorating fundamentals that could force them to cut or reduce dividends.
| | | | | | | | |
| AVERAGE ANNUAL TOTAL RETURN (for periods ended March 31) | |
| | | One Year
| | | Since Inception(1)
| |
GuidePath® Growth and Income Fund | | | | | | | | |
Shares | | | -9.45 | % | | | -4.98 | % |
MSCI USA High Dividend Yield Index | | | -12.86 | % | | | -1.76 | % |
| (1) | Inception date for the Fund is 4/30/18. |
36
GuidePath® Growth and Income Fund
MANAGER’S DISCUSSION OF FUND PERFORMANCE (Continued) (Unaudited)
| • | | For the 12 months ended March 30, 2020, the Fund returned -9.5% outperforming the MSCI USA High Dividend Yield Index at -12.9%. |
| • | | The Fund’s volatility targeting component materially aided the Fund’s relative returns, generating 125% equity exposure in the strong up market in the fourth quarter of 2019 and reducing exposure to 75% in the tumultuous down market of the first quarter of 2020. |
| • | | While the highest dividend paying equities faced significant headwinds in the market downturn of the first quarter of 2020, the slight overweight to larger capitalization issuers relative to the benchmark within the Fund’s stock component was additive to returns. |
Components of Portfolio Holdings*
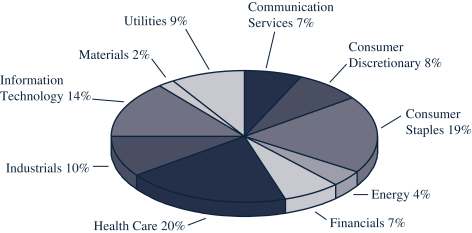
* Pie chart represents percentages of total portfolio, less securities lending collateral.
Percentages expressed exclude derivative instruments, such as futures contracts and options written.
Top Ten Holdings
| | | | | | | | |
| Rank | | | Security/Holding | | % of Net
Assets | |
| | 1 | | | Schwab U.S. Large-Cap ETF | | | 32.28 | % |
| | 2 | | | Verizon Communications, Inc. | | | 1.22 | % |
| | 3 | | | Intel Corp. | | | 1.19 | % |
| | 4 | | | The Procter & Gamble Co. | | | 1.11 | % |
| | 5 | | | Merck & Co., Inc. | | | 1.10 | % |
| | 6 | | | Pfizer, Inc. | | | 1.10 | % |
| | 7 | | | PepsiCo, Inc. | | | 1.10 | % |
| | 8 | | | NextEra Energy, Inc. | | | 1.09 | % |
| | 9 | | | Johnson & Johnson | | | 1.09 | % |
| | 10 | | | Cisco Systems, Inc. | | | 1.01 | % |
37
GuideMark® Funds & GuidePath® Funds
EXPENSE EXAMPLE (Unaudited)
March 31, 2020
As a shareholder of the GuideMark® & GuidePath® Funds (the “Funds”), you incur ongoing costs, including management fees, distribution and/or service fees, and other Fund expenses. The Expense Example shown in this section is intended to help you understand your ongoing costs (in dollars) of investing in the Funds and to compare these costs with the ongoing costs of investing in other mutual funds.
The Expense Examples are based on an investment of $1,000 invested at the beginning of asix-month period and held for the entire period, which for all Funds is from October 1, 2019 to March 31, 2020.
Actual Expenses
The first line of the Expense Example table provides information about actual account values and actual expenses. You may use the information in this line, together with the amount you invested, to estimate the expenses that you paid over the period. Simply divide your account value by $1,000 (for example, an $8,600 account value divided by $1,000 = 8.6), then multiply the result by the number in the first line under the heading entitled “Expenses Paid During Period” to estimate the expenses you paid on your account during this period.
The example includes, but is not limited to, management fees, shareholder servicing fees, distribution fees, fund accounting fees, custody fees and transfer agent fees. However, the example below does not include portfolio trading commissions and related expenses, interest expense or dividends on short positions taken by a Fund and other extraordinary expenses as determined under U.S. generally accepted accounting principles. To the extent that a Fund invests in shares of other investment companies as part of its investment strategy, you will indirectly bear your proportionate share of any fees and expenses charged by the underlying funds in which a Fund invests in addition to the expenses of the Fund. Actual expenses of the underlying funds are expected to vary among the various underlying funds. These expenses are not included in the example below.
Hypothetical Example for Comparison Purposes
The second line of the table below provides information about hypothetical account values and hypothetical expenses based on each Fund’s actual expenses ratios and an assumed rate of return of 5% per year before expenses, which is not the Fund’s actual return. The hypothetical account values and expenses may not be used to estimate the actual ending account balance or expenses you paid for the period. You may use this information to compare the ongoing costs of investing in the Funds and other funds. To do so, compare this 5% hypothetical example with the 5% hypothetical examples that appear in the shareholder reports of the other funds.
| | | | | | | | | | | | | | | | | | |
| Fund | | | | Beginning
Account Value
October 1, 2019 | | | Ending
Account Value
March 31, 2020 | | | Annualized
Expense Ratio1
based on the period
October 1, 2019 –
March 31, 2020 | | | Expenses Paid
During Period2
October 1, 2019 –
March 31, 2020 | |
| INSTITUTIONAL SHARES | | | | | | | | | | | | | | | | | | |
| GuideMark® Large Cap | | Actual | | $ | 1,000.00 | | | $ | 854.40 | | | | 0.58% | | | $ | 2.69 | |
| Core Fund | | Hypothetical3 | | $ | 1,000.00 | | | $ | 1,022.10 | | | | 0.58% | | | $ | 2.93 | |
| GuideMark® Emerging | | Actual | | $ | 1,000.00 | | | $ | 831.00 | | | | 1.07% | | | $ | 4.90 | |
| Markets Fund | | Hypothetical3 | | $ | 1,000.00 | | | $ | 1,019.65 | | | | 1.07% | | | $ | 5.40 | |
| GuideMark® World | | Actual | | $ | 1,000.00 | | | $ | 828.70 | | | | 0.80% | | | $ | 3.66 | |
| ex-US Fund | | Hypothetical3 | | $ | 1,000.00 | | | $ | 1,021.00 | | | | 0.80% | | | $ | 4.04 | |
| GuideMark® Opportunistic | | Actual | | $ | 1,000.00 | | | $ | 965.70 | | | | 0.95% | | | $ | 4.67 | |
| Fixed Income Fund | | Hypothetical3 | | $ | 1,000.00 | | | $ | 1,020.25 | | | | 0.95% | | | $ | 4.80 | |
| GuidePath® Growth | | Actual | | $ | 1,000.00 | | | $ | 869.40 | | | | 0.36% | | | $ | 1.68 | |
| Allocation Fund | | Hypothetical3 | | $ | 1,000.00 | | | $ | 1,023.20 | | | | 0.36% | | | $ | 1.82 | |
| GuidePath® Conservative | | Actual | | $ | 1,000.00 | | | $ | 930.50 | | | | 0.17% | | | $ | 0.82 | |
| Allocation Fund | | Hypothetical3 | | $ | 1,000.00 | | | $ | 1,024.15 | | | | 0.17% | | | $ | 0.86 | |
| GuidePath® Tactical | | Actual | | $ | 1,000.00 | | | $ | 929.10 | | | | 0.51% | | | $ | 2.46 | |
| Allocation Fund | | Hypothetical3 | | $ | 1,000.00 | | | $ | 1,022.45 | | | | 0.51% | | | $ | 2.58 | |
| GuidePath® Absolute Return | | Actual | | $ | 1,000.00 | | | $ | 965.20 | | | | 0.25% | | | $ | 1.23 | |
| Allocation Fund | | Hypothetical3 | | $ | 1,000.00 | | | $ | 1,023.75 | | | | 0.25% | | | $ | 1.26 | |
| GuidePath® Flexible Income | | Actual | | $ | 1,000.00 | | | $ | 1,012.60 | | | | 0.22% | | | $ | 1.11 | |
| Allocation Fund | | Hypothetical3 | | $ | 1,000.00 | | | $ | 1,023.90 | | | | 0.22% | | | $ | 1.11 | |
| GuidePath® Managed Futures | | Actual | | $ | 1,000.00 | | | $ | 1,035.60 | | | | 1.31% | | | $ | 6.67 | |
| Strategy Fund | | Hypothetical3 | | $ | 1,000.00 | | | $ | 1,018.45 | | | | 1.31% | | | $ | 6.61 | |
| 1 | The expense ratio excludes securities lending credits, if applicable. |
| 2 | Expenses (net of waiver, if applicable) are equal to the Fund’s annualized expense ratio, multiplied by the average account value over the period, multiplied by 183/366 to reflect theone-half year period. |
| 3 | 5% annualized return before expenses. |
38
GuideMark® Funds & GuidePath® Funds
EXPENSE EXAMPLE (Continued) (Unaudited)
March 31, 2020
| | | | | | | | | | | | | | | | | | |
| Fund | | | | Beginning
Account Value
October 1, 2019 | | | Ending
Account Value
March 31, 2020 | | | Annualized
Expense Ratio
based on the period
October 1, 2019 –
March 31, 2020 | | | Expenses Paid
During Period1
October 1, 2019 –
March 31, 2020 | |
| SINGLE CLASS SHARES | | | | | | | | | | | | | | | | | | |
| GuidePath® Conservative | | Actual | | $ | 1,000.00 | | | $ | 995.60 | | | | 0.72% | | | $ | 3.59 | |
| Income Fund | | Hypothetical2 | | $ | 1,000.00 | | | $ | 1,021.40 | | | | 0.72% | | | $ | 3.64 | |
| GuidePath® Income | | Actual | | $ | 1,000.00 | | | $ | 976.60 | | | | 0.84% | | | $ | 4.15 | |
| Fund | | Hypothetical2 | | $ | 1,000.00 | | | $ | 1,020.80 | | | | 0.84% | | | $ | 4.24 | |
| GuidePath® Growth and | | Actual | | $ | 1,000.00 | | | $ | 887.00 | | | | 0.84% | 3 | | $ | 3.96 | |
| Income Fund | | Hypothetical2 | | $ | 1,000.00 | | | $ | 1,020.80 | | | | 0.84% | 3 | | $ | 4.24 | |
| 1 | Expenses are (net of waiver, if applicable) equal to the Fund’s annualized expense ratio, multiplied by the average account value over the period, multiplied by 183/366 to reflect theone-half year period. |
| 2 | 5% annualized return before expenses. |
| 3 | The expense ratio excludes securities lending credits, if applicable. |
| | | | | | | | | | | | | | | | | | |
| Fund | | | | Beginning
Account Value
October 1, 2019 | | | Ending
Account Value
March 31, 2020 | | | Annualized
Expense Ratio1
based on the period
October 1, 2019 –
March 31, 2020 | | | Expenses Paid
During Period2
October 1, 2019 –
March 31, 2020 | |
| SERVICE SHARES | | | | | | | | | | | | | | | | | | |
| GuideMark® Large Cap | | Actual | | $ | 1,000.00 | | | $ | 851.90 | | | | 1.17% | | | $ | 5.42 | |
| Core Fund | | Hypothetical3 | | $ | 1,000.00 | | | $ | 1,019.15 | | | | 1.17% | | | $ | 5.91 | |
| GuideMark® Emerging | | Actual | | $ | 1,000.00 | | | $ | 828.50 | | | | 1.67% | | | $ | 7.63 | |
| Markets Fund | | Hypothetical3 | | $ | 1,000.00 | | | $ | 1,016.65 | | | | 1.67% | | | $ | 8.42 | |
| GuideMark® Small/Mid Cap | | Actual | | $ | 1,000.00 | | | $ | 759.70 | | | | 1.51% | | | $ | 6.64 | |
| Core Fund | | Hypothetical3 | | $ | 1,000.00 | | | $ | 1,017.45 | | | | 1.51% | | | $ | 7.62 | |
| GuideMark® World | | Actual | | $ | 1,000.00 | | | $ | 826.40 | | | | 1.35% | | | $ | 6.16 | |
| ex-US Fund | | Hypothetical3 | | $ | 1,000.00 | | | $ | 1,018.25 | | | | 1.35% | | | $ | 6.81 | |
| GuideMark® Core | | Actual | | $ | 1,000.00 | | | $ | 1,020.30 | | | | 1.19% | | | $ | 6.01 | |
| Fixed Income Fund | | Hypothetical3 | | $ | 1,000.00 | | | $ | 1,019.05 | | | | 1.19% | | | $ | 6.01 | |
| GuideMark®Tax-Exempt | | Actual | | $ | 1,000.00 | | | $ | 974.40 | | | | 1.29% | | | $ | 6.37 | |
| Fixed Income Fund | | Hypothetical3 | | $ | 1,000.00 | | | $ | 1,018.55 | | | | 1.29% | | | $ | 6.51 | |
| GuideMark® Opportunistic | | Actual | | $ | 1,000.00 | | | $ | 962.70 | | | | 1.55% | | | $ | 7.61 | |
| Fixed Income Fund | | Hypothetical3 | | $ | 1,000.00 | | | $ | 1,017.25 | | | | 1.55% | | | $ | 7.82 | |
| GuidePath® Growth | | Actual | | $ | 1,000.00 | | | $ | 866.90 | | | | 0.96% | | | $ | 4.48 | |
| Allocation Fund | | Hypothetical3 | | $ | 1,000.00 | | | $ | 1,020.20 | | | | 0.96% | | | $ | 4.85 | |
| GuidePath® Conservative | | Actual | | $ | 1,000.00 | | | $ | 927.80 | | | | 0.77% | | | $ | 3.71 | |
| Allocation Fund | | Hypothetical3 | | $ | 1,000.00 | | | $ | 1,021.15 | | | | 0.77% | | | $ | 3.89 | |
| GuidePath® Tactical | | Actual | | $ | 1,000.00 | | | $ | 926.40 | | | | 1.10% | | | $ | 5.30 | |
| Allocation Fund | | Hypothetical3 | | $ | 1,000.00 | | | $ | 1,019.50 | | | | 1.10% | | | $ | 5.55 | |
| GuidePath® Absolute Return | | Actual | | $ | 1,000.00 | | | $ | 962.30 | | | | 0.85% | | | $ | 4.17 | |
| Allocation Fund | | Hypothetical3 | | $ | 1,000.00 | | | $ | 1,020.75 | | | | 0.85% | | | $ | 4.29 | |
| GuidePath® Multi-Asset Income | | Actual | | $ | 1,000.00 | | | $ | 843.80 | | | | 1.09% | | | $ | 5.02 | |
| Allocation Fund | | Hypothetical3 | | $ | 1,000.00 | | | $ | 1,019.55 | | | | 1.09% | | | $ | 5.50 | |
| GuidePath® Flexible Income | | Actual | | $ | 1,000.00 | | | $ | 1,009.70 | | | | 0.82% | | | $ | 4.12 | |
| Allocation Fund | | Hypothetical3 | | $ | 1,000.00 | | | $ | 1,020.90 | | | | 0.82% | | | $ | 4.14 | |
| GuidePath® Managed Futures | | Actual | | $ | 1,000.00 | | | $ | 1,032.60 | | | | 1.91% | | | $ | 9.71 | |
| Strategy Fund | | Hypothetical3 | | $ | 1,000.00 | | | $ | 1,015.45 | | | | 1.91% | | | $ | 9.62 | |
| 1 | The expense ratio excludes securities lending credits, if applicable. |
| 2 | Expenses are (net of waiver, if applicable) equal to the Fund’s annualized expense ratio, multiplied by the average account value over the period, multiplied by 183/366 to reflect theone-half year period. |
| 3 | 5% annualized return before expenses. |
39
GuideMark® Large Cap Core Fund
SCHEDULE OF INVESTMENTS
March 31, 2020
| | | | | | | | |
Number of
Shares
| | | | | Value
| |
| | | | | COMMON STOCKS - 90.63% | | | | |
| | | | | Aerospace & Defense - 1.20% | | | | |
| | 12,372 | | | Arconic, Inc. (d) | | $ | 198,694 | |
| | 824 | | | Curtiss-Wright Corp. | | | 76,146 | |
| | 2,081 | | | HEICO Corp. | | | 155,263 | |
| | 5,590 | | | HEICO Corp. - Class A | | | 357,201 | |
| | 1,904 | | | L3Harris Technologies, Inc. | | | 342,948 | |
| | 1,765 | | | Lockheed Martin Corp. | | | 598,247 | |
| | 1,111 | | | Northrop Grumman Corp. | | | 336,133 | |
| | 2,000 | | | Raytheon Co. | | | 262,300 | |
| | 22,443 | | | Spirit AeroSystems Holdings, Inc. - Class A | | | 537,061 | |
| | 655 | | | Teledyne Technologies, Inc. (a) | | | 194,712 | |
| | 12,562 | | | Textron, Inc. | | | 335,029 | |
| | 799 | | | TransDigm Group, Inc. (b) | | | 255,832 | |
| | 2,958 | | | United Technologies Corp. | | | 279,028 | |
| | | | | | |
|
|
|
| | | | | | | | 3,928,594 | |
| | | | | | |
|
|
|
| | | | | Air Freight & Logistics - 0.14% | |
| | 5,047 | | | C.H. Robinson Worldwide, Inc. | | | 334,111 | |
| | 2,572 | | | XPO Logistics, Inc. (a) | | | 125,385 | |
| | | | | | |
|
|
|
| | | | | | | | 459,496 | |
| | | | | | |
|
|
|
| | | | | Airlines - 0.40% | |
| | 11,642 | | | Alaska Air Group, Inc. | | | 331,448 | |
| | 3,659 | | | Delta Air Lines, Inc. | | | 104,391 | |
| | 34,497 | | | JetBlue Airways Corp. (a) | | | 308,748 | |
| | 1,663 | | | Southwest Airlines Co. | | | 59,219 | |
| | 15,623 | | | United Airlines Holdings, Inc. (a)(b) | | | 492,906 | |
| | | | | | |
|
|
|
| | | | | | | | 1,296,712 | |
| | | | | | |
|
|
|
| | | | | Auto Components - 0.13% | |
| | 4,092 | | | Gentex Corp. | | | 90,679 | |
| | 41,625 | | | Goodyear Tire & Rubber Co. | | | 242,257 | |
| | 711 | | | WABCO Holdings, Inc. (a) | | | 96,021 | |
| | | | | | |
|
|
|
| | | | | | | | 428,957 | |
| | | | | | |
|
|
|
| | | | | Automobiles - 0.21% | |
| | 62,037 | | | Ford Motor Co. (b) | | | 299,639 | |
| | 736 | | | Tesla, Inc. (a)(b) | | | 385,664 | |
| | | | | | |
|
|
|
| | | | | | | | 685,303 | |
| | | | | | |
|
|
|
| | | | | Banks - 2.13% | |
| | 53,991 | | | Bank of America Corp. | | | 1,146,229 | |
| | 17,001 | | | CIT Group, Inc. | | | 293,437 | |
| | 19,759 | | | Citigroup, Inc. | | | 832,249 | |
| | 9,249 | | | Citizens Financial Group, Inc. | | | 173,974 | |
| | 2,378 | | | Comerica, Inc. | | | 69,771 | |
| | 11,772 | | | Fifth Third Bancorp | | | 174,814 | |
| | 35,796 | | | JPMorgan Chase & Co. | | | 3,222,714 | |
| | 7,361 | | | Popular, Inc. | | | 257,635 | |
| | 12,499 | | | Regions Financial Corp. (b) | | | 112,116 | |
| | 6,775 | | | Texas Capital Bancshares, Inc. (a) | | | 150,202 | |
| | 668 | | | The PNC Financial Services Group, Inc. | | | 63,941 | |
| | 1,771 | | | U.S. Bancorp | | | 61,011 | |
| | 14,082 | | | Wells Fargo & Co. | | | 404,153 | |
| | | | | | |
|
|
|
| | | | | | | | 6,962,246 | |
| | | | | | |
|
|
|
| | | | | Beverages - 1.60% | |
| | 2,857 | | | Brown-Forman Corp. - Class A | | | 146,793 | |
| | 6,762 | | | Brown-Forman Corp. - Class B | | | 375,358 | |
| | 9,203 | | | Keurig Dr. Pepper, Inc. (b) | | | 223,357 | |
| | 15,904 | | | Molson Coors Brewing Co. - Class B (b) | | | 620,415 | |
| | 5,936 | | | Monster Beverage Corp. (a) | | | 333,959 | |
| | | | | | | | |
Number of
Shares
| | | | | Value
| |
| | | | | Beverages (Continued) | |
| | 17,609 | | | PepsiCo, Inc. | | $ | 2,114,841 | |
| | 32,303 | | | The Coca-Cola Co. | | | 1,429,408 | |
| | | | | | |
|
|
|
| | | | | | | | 5,244,131 | |
| | | | | | |
|
|
|
| | | | | Biotechnology - 1.67% | |
| | 3,926 | | | Alexion Pharmaceuticals, Inc. (a) | | | 352,516 | |
| | 6,758 | | | Alkermes PLC (a) | | | 97,450 | |
| | 5,505 | | | Amgen, Inc. | | | 1,116,029 | |
| | 3,438 | | | Biogen, Inc. (a) | | | 1,087,714 | |
| | 23,154 | | | Exelixis, Inc. (a) | | | 398,712 | |
| | 11,201 | | | Gilead Sciences, Inc. | | | 837,387 | |
| | 5,825 | | | Incyte Corp. (a) | | | 426,565 | |
| | 442 | | | Regeneron Pharmaceuticals, Inc. (a) | | | 215,824 | |
| | 2,122 | | | Seattle Genetics, Inc. (a) | | | 244,836 | |
| | 736 | | | United Therapeutics Corp. (a) | | | 69,791 | |
| | 2,603 | | | Vertex Pharmaceuticals, Inc. (a) | | | 619,384 | |
| | | | | | |
|
|
|
| | | | | | | | 5,466,208 | |
| | | | | | |
|
|
|
| | | | | Building Products - 0.60% | |
| | 2,381 | | | A. O. Smith Corp. | | | 90,026 | |
| | 3,942 | | | Allegion PLC (b) | | | 362,743 | |
| | 2,312 | | | Armstrong World Industries, Inc. | | | 183,619 | |
| | 2,102 | | | Fortune Brands Home & Security, Inc. | | | 90,911 | |
| | 2,985 | | | Johnson Controls International PLC | | | 80,476 | |
| | 1,668 | | | Lennox International, Inc. (b) | | | 303,226 | |
| | 7,582 | | | Masco Corp. | | | 262,110 | |
| | 10,776 | | | Owens Corning, Inc. | | | 418,216 | |
| | 2,092 | | | Trane Technologies PLC | | | 172,778 | |
| | | | | | |
|
|
|
| | | | | | | | 1,964,105 | |
| | | | | | |
|
|
|
| | | | | Capital Markets - 2.10% | |
| | 2,359 | | | Ameriprise Financial, Inc. | | | 241,750 | |
| | 1,922 | | | Cboe Global Markets, Inc. | | | 171,538 | |
| | 2,066 | | | CME Group, Inc. | | | 357,232 | |
| | 6,614 | | | Eaton Vance Corp. | | | 213,301 | |
| | 4,359 | | | Evercore, Inc. - Class A | | | 200,776 | |
| | 2,192 | | | FactSet Research Systems, Inc. | | | 571,411 | |
| | 3,013 | | | Intercontinental Exchange, Inc. | | | 243,300 | |
| | 9,904 | | | Invesco Ltd. | | | 89,928 | |
| | 11,714 | | | Lazard, Ltd. - Class A | | | 275,982 | |
| | 3,252 | | | Legg Mason, Inc. | | | 158,860 | |
| | 5,784 | | | LPL Financial Holdings, Inc. | | | 314,823 | |
| | 1,373 | | | MarketAxess Holdings, Inc. | | | 456,619 | |
| | 4,217 | | | Moody’s Corp. | | | 891,896 | |
| | 8,753 | | | Morgan Stanley | | | 297,602 | |
| | 1,419 | | | Morningstar, Inc. | | | 164,959 | |
| | 1,200 | | | MSCI, Inc. | | | 346,752 | |
| | 4,783 | | | S&P Global, Inc. | | | 1,172,074 | |
| | 4,106 | | | SEI Investments Co. | | | 190,272 | |
| | 2,656 | | | T. Rowe Price Group, Inc. | | | 259,358 | |
| | 2,823 | | | TD Ameritrade Holding Corp. | | | 97,845 | |
| | 4,367 | | | The Charles Schwab Corp. (b) | | | 146,819 | |
| | | | | | |
|
|
|
| | | | | | | | 6,863,097 | |
| | | | | | |
|
|
|
| | | | | Chemicals - 0.68% | |
| | 1,632 | | | Air Products & Chemicals, Inc. | | | 325,764 | |
| | 2,074 | | | Eastman Chemical Co. | | | 96,607 | |
| | 1,932 | | | Ecolab, Inc. | | | 301,064 | |
| | 15,922 | | | Huntsman Corp. | | | 229,754 | |
| | 3,321 | | | Linde PLC (b) | | | 574,533 | |
| | 7,422 | | | Olin Corp. (b) | | | 86,615 | |
See notes to financial statements.
40
GuideMark® Large Cap Core Fund
SCHEDULE OF INVESTMENTS (Continued)
March 31, 2020
| | | | | | | | |
Number of
Shares
| | | | | Value
| |
| | | | | COMMON STOCKS (Continued) | | | | |
| | | | | Chemicals (Continued) | | | | |
| | 1,175 | | | PPG Industries, Inc. | | $ | 98,230 | |
| | 3,409 | | | RPM International, Inc. | | | 202,835 | |
| | 2,010 | | | The Scotts Miracle-Gro Co. - Class A | | | 205,824 | |
| | 9,304 | | | Valvoline, Inc. | | | 121,789 | |
| | | | | | |
|
|
|
| | | | | | | | 2,243,015 | |
| | | | | | |
|
|
|
| | | | | Commercial Services & Supplies - 0.71% | |
| | 95,892 | | | ADT, Inc. (b) | | | 414,253 | |
| | 735 | | | Avery Dennison Corp. (b) | | | 74,874 | |
| | 2,336 | | | Cintas Corp. | | | 404,642 | |
| | 4,760 | | | Copart, Inc. (a) | | | 326,155 | |
| | 2,661 | | | IAA, Inc. (a) | | | 79,724 | |
| | 4,719 | | | KAR Auction Services, Inc. | | | 56,628 | |
| | 3,112 | | | Republic Services, Inc. | | | 233,587 | |
| | 7,979 | | | Rollins, Inc. | | | 288,361 | |
| | 1,567 | | | Stericycle, Inc. (a)(b) | | | 76,125 | |
| | 4,060 | | | Waste Management, Inc. | | | 375,794 | |
| | | | | | |
|
|
|
| | | | | | | | 2,330,143 | |
| | | | | | |
|
|
|
| | | | | Communications Equipment - 1.30% | |
| | 1,159 | | | Arista Networks, Inc. (a)(b) | | | 234,756 | |
| | 3,063 | | | Ciena Corp. (a) | | | 121,938 | |
| | 29,904 | | | Cisco Systems, Inc. | | | 1,175,526 | |
| | 66,493 | | | CommScope Holding Co., Inc. (a) | | | 605,751 | |
| | 2,423 | | | EchoStar Corp. - Class A (a) | | | 77,463 | |
| | 2,681 | | | F5 Networks, Inc. (a) | | | 285,875 | |
| | 3,184 | | | Juniper Networks, Inc. | | | 60,942 | |
| | 2,542 | | | Motorola Solutions, Inc. | | | 337,883 | |
| | 944 | | | Palo Alto Networks, Inc. (a) | | | 154,778 | |
| | 9,819 | | | Qualcomm, Inc. (a)(b) | | | 664,256 | |
| | 3,785 | | | Ubiquiti, Inc. (b) | | | 535,880 | |
| | | | | | |
|
|
|
| | | | | | | | 4,255,048 | |
| | | | | | |
|
|
|
| | | | | Construction & Engineering - 0.38% | |
| | 30,544 | | | AECOM (a) | | | 911,738 | |
| | 1,810 | | | Jacobs Engineering Group, Inc. | | | 143,479 | |
| | 990 | | | Martin Marietta Materials, Inc. | | | 187,338 | |
| | | | | | |
|
|
|
| | | | | | | | 1,242,555 | |
| | | | | | |
|
|
|
| | | | | Construction Materials - 0.03% | |
| | 910 | | | Vulcan Materials Co. | | | 98,344 | |
| | | | | | |
|
|
|
| | | | | Consumer Finance - 0.84% | |
| | 21,372 | | | Ally Financial, Inc. | | | 308,398 | |
| | 4,986 | | | American Express Co. (b) | | | 426,851 | |
| | 7,769 | | | Capital One Financial Corp. | | | 391,713 | |
| | 524 | | | Credit Acceptance Corp. (a)(b) | | | 133,982 | |
| | 2,265 | | | Discover Financial Services | | | 80,793 | |
| | 74,259 | | | Navient Corp. | | | 562,883 | |
| | 16,484 | | | OneMain Holdings, Inc. | | | 315,174 | |
| | 20,067 | | | Santander Consumer USA Holdings, Inc. | | | 279,132 | |
| | 15,575 | | | Synchrony Financial | | | 250,602 | |
| | | | | | |
|
|
|
| | | | | | | | 2,749,528 | |
| | | | | | |
|
|
|
| | | | | Containers & Packaging - 0.33% | |
| | 604 | | | AptarGroup, Inc. | | | 60,122 | |
| | 9,264 | | | Ardagh Group SA | | | 109,871 | |
| | 3,382 | | | Ball Corp. | | | 218,680 | |
| | 4,339 | | | Crown Holdings, Inc. (a) | | | 251,835 | |
| | 3,206 | | | International Paper Co. | | | 99,803 | |
| | 12,407 | | | WestRock Co. | | | 350,622 | |
| | | | | | |
|
|
|
| | | | | | | | 1,090,933 | |
| | | | | | |
|
|
|
| | | | | | | | |
Number of
Shares
| | | | | Value
| |
| | | | | Distributors - 0.20% | |
| | 2,757 | | | Genuine Parts Co. | | $ | 185,629 | |
| | 23,538 | | | LKQ Corp. (a) | | | 482,764 | |
| | | | | | |
|
|
|
| | | | | | | | 668,393 | |
| | | | | | |
|
|
|
| | | | | Diversified Consumer Services - 0.23% | |
| | 2,591 | | | Bright Horizons Family Solutions, Inc. (a) | | | 264,282 | |
| | 6,511 | | | frontdoor, Inc. (a) | | | 226,453 | |
| | 11,030 | | | H&R Block, Inc. (b) | | | 155,302 | |
| | 2,770 | | | Service Corp. International | | | 108,335 | |
| | | | | | |
|
|
|
| | | | | | | | 754,372 | |
| | | | | | |
|
|
|
| | | | | Diversified Financial Services - 0.14% | |
| | 20,407 | | | Jefferies Financial Group, Inc. (b) | | | 278,964 | |
| | 4,213 | | | Voya Financial, Inc. | | | 170,837 | |
| | | | | | |
|
|
|
| | | | | | | | 449,801 | |
| | | | | | |
|
|
|
| | | | | Diversified Telecommunication Services - 1.39% | |
| | 65,655 | | | AT&T, Inc. | | | 1,913,843 | |
| | 71,403 | | | CenturyLink, Inc. | | | 675,472 | |
| | 36,401 | | | Verizon Communications, Inc. | | | 1,955,826 | |
| | | | | | |
|
|
|
| | | | | | | | 4,545,141 | |
| | | | | | |
|
|
|
| | | | | Electric Utilities - 1.61% | |
| | 5,116 | | | American Electric Power Co., Inc. | | | 409,178 | |
| | 4,834 | | | Duke Energy Corp. (b) | | | 390,974 | |
| | 2,500 | | | Edison International | | | 136,975 | |
| | 3,225 | | | Entergy Corp. | | | 303,053 | |
| | 4,459 | | | Evergy, Inc. | | | 245,468 | |
| | 4,704 | | | Eversource Energy (b) | | | 367,900 | |
| | 8,917 | | | Exelon Corp. (b) | | | 328,235 | |
| | 8,672 | | | FirstEnergy Corp. | | | 347,487 | |
| | 5,118 | | | Hawaiian Electric Industries, Inc. | | | 220,330 | |
| | 4,196 | | | NextEra Energy, Inc. | | | 1,009,642 | |
| | 3,086 | | | OGE Energy Corp. | | | 94,833 | |
| | 25,639 | | | PG&E Corp. (a) | | | 230,495 | |
| | 1,712 | | | Pinnacle West Capital Corp. | | | 129,752 | |
| | 4,855 | | | PPL Corp. | | | 119,821 | |
| | 10,936 | | | The Southern Co. (b) | | | 592,075 | |
| | 5,908 | | | Xcel Energy, Inc. | | | 356,252 | |
| | | | | | |
|
|
|
| | | | | | | | 5,282,470 | |
| | | | | | |
|
|
|
| | | | | Electrical Equipment - 0.53% | |
| | 2,944 | | | Acuity Brands, Inc. | | | 252,183 | |
| | 849 | | | Agilent Technologies, Inc. | | | 60,805 | |
| | 1,760 | | | Eaton Corp. PLC | | | 136,734 | |
| | 3,422 | | | Emerson Electric Co. | | | 163,058 | |
| | 34,604 | | | GrafTech International, Ltd. (b) | | | 280,985 | |
| | 9,165 | | | nVent Electric PLC | | | 154,614 | |
| | 4,694 | | | Regal Beloit Corp. | | | 295,487 | |
| | 2,152 | | | Rockwell Automation, Inc. (b) | | | 324,758 | |
| | 203 | | | Roper Industries, Inc. | | | 63,298 | |
| | | | | | |
|
|
|
| | | | | | | | 1,731,922 | |
| | | | | | |
|
|
|
| | | | | Electronic Equipment, Instruments & Components - 0.79% | |
| | 14,716 | | | Arrow Electronics, Inc. (a) | | | 763,319 | |
| | 23,941 | | | Avnet, Inc. | | | 600,919 | |
| | 2,970 | | | CDW Corp. | | | 277,012 | |
| | 1,271 | | | Cognex Corp. | | | 53,662 | |
| | 2,181 | | | Dolby Laboratories, Inc. - Class A | | | 118,232 | |
| | 2,627 | | | Keysight Technologies, Inc. (a) | | | 219,827 | |
| | 10,520 | | | National Instruments Corp. | | | 348,002 | |
| | 1,179 | | | Zebra Technologies Corp. - Class A (a) | | | 216,464 | |
| | | | | | |
|
|
|
| | | | | | | | 2,597,437 | |
| | | | | | |
|
|
|
See notes to financial statements.
41
GuideMark® Large Cap Core Fund
SCHEDULE OF INVESTMENTS (Continued)
March 31, 2020
| | | | | | | | |
Number of
Shares
| | | | | Value
| |
| | | | | COMMON STOCKS (Continued) | | | | |
| | | | | Energy Equipment & Services - 0.17% | |
| | 25,411 | | | Apergy Corp. (a)(b) | | $ | 146,113 | |
| | 182,238 | | | Patterson-UTI Energy, Inc. | | | 428,260 | |
| | | | | | |
|
|
|
| | | | | | | | 574,373 | |
| | | | | | |
|
|
|
| | | | | Entertainment - 1.17% | |
| | 2,443 | | | Activision Blizzard, Inc. | | | 145,310 | |
| | 1,746 | | | Electronic Arts, Inc. (a) | | | 174,897 | |
| | 173,933 | | | Lions Gate Entertainment Corp. - Class A (a)(b) | | | 1,057,513 | |
| | 187,887 | | | Lions Gate Entertainment Corp. - Class B (a) | | | 1,048,409 | |
| | 2,409 | | | Live Nation Entertainment, Inc. (a)(b) | | | 109,513 | |
| | 1,097 | | | Netflix, Inc. (a) | | | 411,923 | |
| | 9,063 | | | The Walt Disney Co. | | | 875,486 | |
| | | | | | |
|
|
|
| | | | | | | | 3,823,051 | |
| | | | | | |
|
|
|
| | | | | Food & Staples Retailing - 2.92% | |
| | 3,519 | | | Casey’s General Stores, Inc. | | | 466,232 | |
| | 6,136 | | | Costco Wholesale Corp. | | | 1,749,558 | |
| | 19,918 | | | CVS Health Corp. | | | 1,181,735 | |
| | 19,293 | | | Kroger Co. | | | 581,105 | |
| | 36,959 | | | Sprouts Farmers Market, Inc. (a)(b) | | | 687,068 | |
| | 11,517 | | | SYSCO Corp. | | | 525,521 | |
| | 81,791 | | | US Foods Holding Corp. (a) | | | 1,448,518 | |
| | 12,621 | | | Walgreens Boots Alliance, Inc. (b) | | | 577,411 | |
| | 20,597 | | | Walmart, Inc. | | | 2,340,231 | |
| | | | | | |
|
|
|
| | | | | | | | 9,557,379 | |
| | | | | | |
|
|
|
| | | | | Food Products - 1.71% | |
| | 3,485 | | | Campbell Soup Co. | | | 160,868 | |
| | 7,024 | | | ConAgra Brands, Inc. | | | 206,084 | |
| | 17,075 | | | Flowers Foods, Inc. | | | 350,379 | |
| | 9,147 | | | General Mills, Inc. | | | 482,687 | |
| | 4,833 | | | Ingredion, Inc. | | | 364,891 | |
| | 4,456 | | | Lamb Weston Holdings, Inc. (b) | | | 254,438 | |
| | 1,183 | | | McCormick & Co, Inc. - Non Voting | | | 167,051 | |
| | 10,022 | | | Mondelez International, Inc. - Class A | | | 501,902 | |
| | 29,232 | | | Pilgrim’s Pride Corp. (a) | | | 529,684 | |
| | 5,265 | | | Post Holdings, Inc. (a) | | | 436,837 | |
| | 2,388 | | | The Hain Celestial Group, Inc. (a) | | | 62,016 | |
| | 4,524 | | | The Hershey Co. | | | 599,430 | |
| | 2,495 | | | The J.M. Smucker Co. | | | 276,945 | |
| | 4,955 | | | The Kraft Heinz Co. (b) | | | 122,587 | |
| | 14,388 | | | TreeHouse Foods, Inc. (a) | | | 635,230 | |
| | 7,739 | | | Tyson Foods, Inc. - Class A | | | 447,856 | |
| | | | | | |
|
|
|
| | | | | | | | 5,598,885 | |
| | | | | | |
|
|
|
| | | | | Gas Utilities - 0.25% | |
| | 2,160 | | | Atmos Energy Corp. | | | 214,337 | |
| | 12,769 | | | EQT Corp. | | | 90,277 | |
| | 3,262 | | | National Fuel Gas Co. | | | 121,640 | |
| | 14,726 | | | UGI Corp. | | | 392,742 | |
| | | | | | |
|
|
|
| | | | | | | | 818,996 | |
| | | | | | |
|
|
|
| | | | | Health Care Equipment & Supplies - 2.15% | |
| | 2,253 | | | ABIOMED, Inc. (a) | | | 327,045 | |
| | 2,505 | | | Align Technology, Inc. (a) | | | 435,745 | |
| | 2,719 | | | Baxter International, Inc. | | | 220,756 | |
| | 3,401 | | | Boston Scientific Corp. (a) | | | 110,975 | |
| | 3,603 | | | Danaher Corp. | | | 498,691 | |
| | 2,197 | | | DexCom, Inc. (a) | | | 591,586 | |
| | 2,475 | | | Edwards Lifesciences Corp. (a) | | | 466,834 | |
| | 623 | | | Hill-Rom Holdings, Inc. | | | 62,674 | |
| | | | | | | | |
Number of
Shares
| | | | | Value
| |
| | | | | Health Care Equipment & Supplies (Continued) | |
| | 4,492 | | | Hologic, Inc. (a) | | $ | 157,669 | |
| | 318 | | | ICU Medical, Inc. (a) | | | 64,163 | |
| | 3,271 | | | IDEXX Laboratories, Inc. (a) | | | 792,367 | |
| | 1,647 | | | Insulet Corp. (a) | | | 272,875 | |
| | 320 | | | Intuitive Surgical, Inc. (a) | | | 158,467 | |
| | 1,776 | | | Masimo Corp. (a) | | | 314,565 | |
| | 8,366 | | | Medtronic PLC | | | 754,446 | |
| | 2,016 | | | Penumbra, Inc. (a)(b) | | | 325,241 | |
| | 2,537 | | | ResMed, Inc. | | | 373,675 | |
| | 1,338 | | | STERIS PLC | | | 187,280 | |
| | 3,419 | | | Stryker Corp. | | | 569,229 | |
| | 239 | | | Teleflex, Inc. (b) | | | 69,994 | |
| | 313 | | | The Cooper Cos., Inc. | | | 86,285 | |
| | 1,009 | | | Varian Medical Systems, Inc. (a) | | | 103,584 | |
| | 631 | | | West Pharmaceutical Services, Inc. | | | 96,070 | |
| | | | | | |
|
|
|
| | | | | | | | 7,040,216 | |
| | | | | | |
|
|
|
| | | | | Health Care Providers & Services - 3.21% | |
| | 1,953 | | | AmerisourceBergen Corp. | | | 172,841 | |
| | 3,168 | | | Anthem, Inc. | | | 719,263 | |
| | 6,915 | | | Cardinal Health, Inc. | | | 331,505 | |
| | 4,224 | | | Centene Corp. (a) | | | 250,948 | |
| | 7,473 | | | Cerner Corp. (b) | | | 470,724 | |
| | 1,337 | | | Chemed Corp. | | | 579,188 | |
| | 5,917 | | | Cigna Corp. | | | 1,048,374 | |
| | 7,045 | | | DaVita, Inc. (a) | | | 535,843 | |
| | 1,808 | | | HCA Healthcare, Inc. | | | 162,449 | |
| | 3,156 | | | Henry Schein, Inc. (a) | | | 159,441 | |
| | 2,316 | | | Humana, Inc. | | | 727,270 | |
| | 2,052 | | | Laboratory Corp. of America Holdings (a) | | | 259,352 | |
| | 4,568 | | | McKesson Corp. | | | 617,868 | |
| | 102,110 | | | MEDNAX, Inc. (a) | | | 1,188,560 | |
| | 1,670 | | | Molina Healthcare, Inc. (a) | | | 233,316 | |
| | 11,230 | | | UnitedHealth Group, Inc. | | | 2,800,537 | |
| | 2,633 | | | Universal Health Services, Inc. - Class B | | | 260,878 | |
| | | | | | |
|
|
|
| | | | | | | | 10,518,357 | |
| | | | | | |
|
|
|
| | | | | Health Care Technology - 0.05% | |
| | 972 | | | Veeva Systems, Inc. - Class A (a) | | | 151,992 | |
| | | | | | |
|
|
|
| | | | | Hotels, Restaurants & Leisure - 1.73% | | | | |
| | 11,299 | | | Aramark | | | 225,641 | |
| | 445 | | | Chipotle Mexican Grill, Inc. (a) | | | 291,208 | |
| | 2,240 | | | Choice Hotels International, Inc. (b) | | | 137,200 | |
| | 2,413 | | | Darden Restaurants, Inc. | | | 131,412 | |
| | 1,726 | | | Domino’s Pizza, Inc. | | | 559,345 | |
| | 1,870 | | | Dunkin’ Brands Group, Inc. | | | 99,297 | |
| | 1,031 | | | Hilton Worldwide Holdings, Inc. | | | 70,355 | |
| | 166,619 | | | International Game Technology Plc (b) | | | 991,383 | |
| | 5,633 | | | McDonald’s Corp. | | | 931,416 | |
| | 41,115 | | | MGM Resorts International | | | 485,157 | |
| | 24,660 | | | Norwegian Cruise Line Holdings, Ltd. (a) | | | 270,274 | |
| | 2,791 | | | Planet Fitness, Inc. - Class A (a) | | | 135,922 | |
| | 8,181 | | | Starbucks Corp. (b) | | | 537,819 | |
| | 8,220 | | | The Wendy’s Co. | | | 122,314 | |
| | 3,297 | | | Wyndham Destinations, Inc. | | | 71,545 | |
| | 9,072 | | | Yum! Brands, Inc. | | | 621,704 | |
| | | | | | |
|
|
|
| | | | | | | | 5,681,992 | |
| | | | | | |
|
|
|
| | | | | Household Durables - 0.68% | |
| | 5,112 | | | DR Horton, Inc. | | | 173,808 | |
| | 1,261 | | | Garmin Ltd. | | | 94,525 | |
See notes to financial statements.
42
GuideMark® Large Cap Core Fund
SCHEDULE OF INVESTMENTS (Continued)
March 31, 2020
| | | | | | | | |
Number of
Shares
| | | | | Value
| |
| | | | | COMMON STOCKS (Continued) | | | | |
| | | | | Household Durables (Continued) | |
| | 7,612 | | | Lennar Corp. - Class A | | $ | 290,778 | |
| | 7,934 | | | Lennar Corp. - Class B | | | 229,451 | |
| | 1,405 | | | Mohawk Industries, Inc. (a) | | | 107,117 | |
| | 105 | | | NVR, Inc. (a) | | | 269,757 | |
| | 14,170 | | | PulteGroup, Inc. | | | 316,274 | |
| | 3,701 | | | Roku, Inc. (a)(b) | | | 323,764 | |
| | 3,589 | | | Tempur Sealy International, Inc. (a) | | | 156,875 | |
| | 13,540 | | | Toll Brothers, Inc. | | | 260,645 | |
| | | | | | |
|
|
|
| | | | | | | | 2,222,994 | |
| | | | | | |
|
|
|
| | | | | Household Products - 1.65% | |
| | 4,244 | | | Church & Dwight, Inc. (b) | | | 272,380 | |
| | 2,363 | | | Clorox Co. | | | 409,390 | |
| | 12,247 | | | Colgate-Palmolive Co. | | | 812,711 | |
| | 5,589 | | | Kimberly-Clark Corp. | | | 714,665 | |
| | 29,082 | | | The Procter & Gamble Co. | | | 3,199,020 | |
| | | | | | |
|
|
|
| | | | | | | | 5,408,166 | |
| | | | | | |
|
|
|
| | | | | Independent Power and Renewable Electricity Producers - 0.62% | |
| | 15,849 | | | AES Corp. | | | 215,547 | |
| | 20,236 | | | NRG Energy, Inc. | | | 551,633 | |
| | 78,296 | | | Vistra Energy Corp. | | | 1,249,604 | |
| | | | | | |
|
|
|
| | | | | | | | 2,016,784 | |
| | | | | | |
|
|
|
| | | | | Industrial Conglomerates - 0.25% | |
| | 2,787 | | | 3M Co. | | | 380,453 | |
| | 473 | | | Carlisle Companies, Inc. | | | 59,257 | |
| | 16,589 | | | General Electric Co. | | | 131,717 | |
| | 1,825 | | | Honeywell International, Inc. | | | 244,167 | |
| | | | | | |
|
|
|
| | | | | | | | 815,594 | |
| | | | | | |
|
|
|
| | | | | Insurance - 3.24% | |
| | 3,090 | | | American National Insurance Co. | | | 254,554 | |
| | 5,074 | | | Aon PLC | | | 837,413 | |
| | 8,502 | | | Arch Capital Group, Ltd. (a) | | | 241,967 | |
| | 2,582 | | | Arthur J. Gallagher & Co. | | | 210,459 | |
| | 2,092 | | | Assurant, Inc. | | | 217,756 | |
| | 12,886 | | | Athene Holding, Ltd. - Class A (a) | | | 319,831 | |
| | 20,574 | | | Berkshire Hathaway, Inc. - Class B (a) | | | 3,761,544 | |
| | 7,024 | | | Brown & Brown, Inc. | | | 254,409 | |
| | 2,055 | | | Chubb, Ltd. | | | 229,523 | |
| | 2,805 | | | Cincinnati Financial Corp. | | | 211,637 | |
| | 918 | | | Erie Indemnity Co. - Class A | | | 136,084 | |
| | 8,557 | | | Fidelity National Financial, Inc. | | | 212,898 | |
| | 5,187 | | | First American Financial Corp. | | | 219,981 | |
| | 3,585 | | | Hartford Financial Services Group, Inc. | | | 126,335 | |
| | 7,335 | | | Lincoln National Corp. | | | 193,057 | |
| | 3,475 | | | Marsh & McLennan Cos., Inc. | | | 300,449 | |
| | 13,584 | | | MetLife, Inc. | | | 415,263 | |
| | 6,235 | | | Old Republic International Corp. | | | 95,084 | |
| | 3,650 | | | Principal Financial Group, Inc. | | | 114,391 | |
| | 5,611 | | | Prudential Financial, Inc. | | | 292,558 | |
| | 2,267 | | | Reinsurance Group of America, Inc. | | | 190,745 | |
| | 1,549 | | | RenaissanceRe Holdings, Ltd. | | | 231,297 | |
| | 2,061 | | | The Allstate Corp. | | | 189,056 | |
| | 905 | | | The Hanover Insurance Group, Inc. | | | 81,975 | |
| | 4,986 | | | The Progressive Corp. (b) | | | 368,166 | |
| | 18,211 | | | Unum Group | | | 273,347 | |
| | 4,716 | | | W.R. Berkley Corp. | | | 246,034 | |
| | 205 | | | White Mountains Insurance Group, Ltd. - ADR | | | 186,550 | |
| | | | | | | | |
Number of
Shares
| | | | | Value
| |
| | | | | Insurance (Continued) | |
| | 1,086 | | | Willis Towers Watson PLC (d) | | $ | 184,457 | |
| | | | | | |
|
|
|
| | | | | | | | 10,596,820 | |
| | | | | | |
|
|
|
| | | | | Interactive Media & Services - 4.24% | |
| | 3,359 | | | Alphabet, Inc. - Class A (a) | | | 3,902,990 | |
| | 3,339 | | | Alphabet, Inc. - Class C (a) | | | 3,882,623 | |
| | 30,051 | | | Facebook, Inc. - Class A (a) | | | 5,012,507 | |
| | 2,984 | | | IAC InterActive Corp. (a) | | | 534,822 | |
| | 5,804 | | | Match Group, Inc. (a)(b) | | | 383,296 | |
| | 10,285 | | | TripAdvisor, Inc. | | | 178,856 | |
| | | | | | |
|
|
|
| | | | | | | | 13,895,094 | |
| | | | | | |
|
|
|
| | | | | Internet & Direct Marketing Retail - 3.76% | |
| | 4,986 | | | Amazon.com, Inc. (a) | | | 9,721,304 | |
| | 419 | | | Booking Holdings, Inc. (a) | | | 563,689 | |
| | 10,036 | | | eBay, Inc. (b) | | | 301,682 | |
| | 4,795 | | | Etsy, Inc. (a) | | | 184,320 | |
| | 2,144 | | | Expedia Group, Inc. | | | 120,643 | |
| | 178,286 | | | Qurate Retail, Inc. - Series A (a) | | | 1,088,436 | |
| | 6,165 | | | Wayfair, Inc. - Class A (a)(b) | | | 329,457 | |
| | | | | | |
|
|
|
| | | | | | | | 12,309,531 | |
| | | | | | |
|
|
|
| | | | | IT Services - 5.55% | |
| | 9,809 | | | Accenture PLC - Class A | | | 1,601,417 | |
| | 2,291 | | | Akamai Technologies, Inc. (a) | | | 209,604 | |
| | 39,007 | | | Alliance Data Systems Corp. | | | 1,312,586 | |
| | 2,867 | | | Amdocs Ltd. | | | 157,599 | |
| | 649 | | | Automatic Data Processing, Inc. | | | 88,705 | |
| | 4,085 | | | Black Knight, Inc. (a) | | | 237,175 | |
| | 4,386 | | | Booz Allen Hamilton Holding Corp. | | | 301,055 | |
| | 1,036 | | | Broadridge Financial Solutions, Inc. | | | 98,244 | |
| | 3,214 | | | CACI International, Inc. - Class A (a) | | | 678,636 | |
| | 9,910 | | | Cognizant Technology Solutions Corp. - Class A | | | 460,518 | |
| | 6,780 | | | CoreLogic, Inc. | | | 207,061 | |
| | 110,512 | | | DXC Technology Co. | | | 1,442,182 | |
| | 823 | | | EPAM Systems, Inc. (a) | | | 152,798 | |
| | 1,846 | | | Euronet Worldwide, Inc. (a) | | | 158,239 | |
| | 5,441 | | | Fidelity National Information Services, Inc. | | | 661,843 | |
| | 6,357 | | | Fiserv, Inc. (a) | | | 603,851 | |
| | 556 | | | FleetCor Technologies, Inc. (a) | | | 103,716 | |
| | 1,040 | | | Gartner, Inc. (a) | | | 103,553 | |
| | 8,668 | | | Genpact, Ltd. | | | 253,106 | |
| | 3,708 | | | Global Payments, Inc. | | | 534,805 | |
| | 3,004 | | | GoDaddy, Inc. - Class A (a) | | | 171,558 | |
| | 5,916 | | | Leidos Holdings, Inc. | | | 542,201 | |
| | 9,749 | | | MasterCard, Inc. - Class A | | | 2,354,968 | |
| | 1,614 | | | Okta, Inc. (a)(b) | | | 197,328 | |
| | 1,096 | | | Paychex, Inc. | | | 68,960 | |
| | 4,870 | | | PayPal Holdings, Inc. (a) | | | 466,254 | |
| | 94,905 | | | Sabre Corp. | | | 562,787 | |
| | 5,041 | | | Square, Inc. - Class A (a)(b) | | | 264,048 | |
| | 17,520 | | | Switch, Inc. - Class A | | | 252,814 | |
| | 12,400 | | | The Western Union Co. (b) | | | 224,812 | |
| | 4,684 | | | T-Mobile USA, Inc. (a) | | | 392,988 | |
| | 2,160 | | | VeriSign, Inc. (a) | | | 388,994 | |
| | 17,699 | | | Visa, Inc. - Class A (b) | | | 2,851,663 | |
| | 644 | | | WEX, Inc. (a) | | | 67,330 | |
| | | | | | |
|
|
|
| | | | | | | | 18,173,398 | |
| | | | | | |
|
|
|
| | | | | Leisure Products - 0.27% | |
| | 2,137 | | | Hasbro, Inc. | | | 152,902 | |
| | 12,791 | | | Mattel, Inc. (a)(b) | | | 112,689 | |
See notes to financial statements.
43
GuideMark® Large Cap Core Fund
SCHEDULE OF INVESTMENTS (Continued)
March 31, 2020
| | | | | | | | |
Number of
Shares
| | | | | Value
| |
| | | | | COMMON STOCKS (Continued) | | | | |
| | | | | Leisure Products (Continued) | |
| | 1,279 | | | Polaris Industries, Inc. | | $ | 61,584 | |
| | 2,900 | | | Pool Corp. | | | 570,633 | |
| | | | | | |
|
|
|
| | | | | | | | 897,808 | |
| | | | | | |
|
|
|
| | | | | Life Sciences Tools & Services - 0.77% | |
| | 355 | | | Bio-Techne Corp. | | | 67,315 | |
| | 4,895 | | | Bruker Corp. | | | 175,535 | |
| | 1,691 | | | Charles River Laboratories International, Inc. (a) | | | 213,421 | |
| | 751 | | | Illumina, Inc. (a) | | | 205,113 | |
| | 1,686 | | | IQVIA Holdings, Inc. (a) | | | 181,852 | |
| | 528 | | | Mettler-Toledo International, Inc. (a) | | | 364,589 | |
| | 3,500 | | | Thermo Fisher Scientific, Inc. | | | 992,600 | |
| | 1,753 | | | Waters Corp. (a) | | | 319,134 | |
| | | | | | |
|
|
|
| | | | | | | | 2,519,559 | |
| | | | | | |
|
|
|
| | | | | Machinery - 1.10% | |
| | 9,463 | | | AGCO Corp. | | | 447,127 | |
| | 1,112 | | | Caterpillar, Inc. | | | 129,036 | |
| | 1,374 | | | Cummins, Inc. | | | 185,930 | |
| | 4,671 | | | Donaldson Co., Inc. | | | 180,441 | |
| | 837 | | | Dover Corp. | | | 70,258 | |
| | 55,852 | | | Gates Industrial Corp PLC (a)(b) | | | 412,188 | |
| | 6,628 | | | Graco, Inc. | | | 322,982 | |
| | 2,347 | | | Illinois Tool Works, Inc. (b) | | | 333,556 | |
| | 3,041 | | | Ingersoll Rand, Inc. (a) | | | 75,417 | |
| | 2,798 | | | Lincoln Electric Holdings, Inc. | | | 193,062 | |
| | 4,015 | | | Oshkosh Corp. | | | 258,285 | |
| | 671 | | | Parker-Hannifin Corp. | | | 87,049 | |
| | 920 | | | Snap-on, Inc. | | | 100,114 | |
| | 14,690 | | | The Timken Co. | | | 475,074 | |
| | 4,915 | | | The Toro Co. | | | 319,917 | |
| | | | | | |
|
|
|
| | | | | | | | 3,590,436 | |
| | | | | | |
|
|
|
| | | | | Media - 1.72% | |
| | 13,500 | | | AMC Networks, Inc. - Class A (a)(b) | | | 328,185 | |
| | 232 | | | Cable One, Inc. (b) | | | 381,410 | |
| | 1,229 | | | Charter Communications, Inc. - Class A (a)(b) | | | 536,225 | |
| | 62,803 | | | Cinemark Holdings, Inc. | | | 639,963 | |
| | 33,638 | | | Comcast Corp. - Class A | | | 1,156,474 | |
| | 4,179 | | | Discovery Communications, Inc. - Series A (a)(b) | | | 81,240 | |
| | 4,310 | | | Discovery Communications, Inc. - Series C (a) | | | 75,597 | |
| | 3,912 | | | GCI Liberty, Inc. - Class A (a) | | | 222,867 | |
| | 3,144 | | | John Wiley & Sons, Inc. - Class A | | | 117,869 | |
| | 1,828 | | | Liberty Broadband Corp. - Class A (a) | | | 195,596 | |
| | 2,554 | | | Liberty Broadband Corp. - Class C (a) | | | 282,779 | |
| | 8,139 | | | Liberty Media Corp.-Liberty SiriusXM - Class A (a) | | | 257,925 | |
| | 11,158 | | | Liberty Media Corp.-Liberty SiriusXM - Class C (a) | | | 352,816 | |
| | 1,343 | | | Nexstar Media Group, Inc. - Class A | | | 77,531 | |
| | 17,204 | | | Sinclair Broadcast Group, Inc. - Class A (b) | | | 276,640 | |
| | 31,816 | | | Sirius XM Holdings, Inc. (b) | | | 157,171 | |
| | 8,407 | | | The Interpublic Group of Companies, Inc. | | | 136,109 | |
| | 9,360 | | | The New York Times Co. - Class A | | | 287,446 | |
| | 4,057 | | | ViacomCBS, Inc. - Class A | | | 72,336 | |
| | | | | | |
|
|
|
| | | | | | | | 5,636,179 | |
| | | | | | |
|
|
|
| | | | | Metals & Mining - 0.67% | |
| | 96,480 | | | Alcoa Corp. (a) | | | 594,317 | |
| | 7,332 | | | Newmont Goldcorp Corp. | | | 331,993 | |
| | | | | | | | |
Number of
Shares
| | | | | Value
| |
| | | | | Metals & Mining (Continued) | |
| | 3,705 | | | Nucor Corp. | | $ | 133,454 | |
| | 5,285 | | | Reliance Steel & Aluminum Co. (b) | | | 462,913 | |
| | 2,970 | | | Royal Gold, Inc. | | | 260,499 | |
| | 18,217 | | | Steel Dynamics, Inc. | | | 410,611 | |
| | | | | | |
|
|
|
| | | | | | | | 2,193,787 | |
| | | | | | |
|
|
|
| | | | | Multiline Retail - 0.97% | |
| | 3,311 | | | Burlington Stores, Inc. (a)(b) | | | 524,661 | |
| | 3,508 | | | Dollar General Corp. | | | 529,743 | |
| | 2,542 | | | Dollar Tree, Inc. (a) | | | 186,761 | |
| | 22,047 | | | Kohl’s Corp. (b) | | | 321,665 | |
| | 85,135 | | | Macy’s, Inc. (b) | | | 418,013 | |
| | 14,436 | | | Nordstrom, Inc. (b) | | | 221,448 | |
| | 2,444 | | | Ollie’s Bargain Outlet Holdings, Inc. (a)(b) | | | 113,255 | |
| | 9,438 | | | Target Corp. | | | 877,451 | |
| | | | | | |
|
|
|
| | | | | | | | 3,192,997 | |
| | | | | | |
|
|
|
| | | | | Multi-Utilities - 0.84% | |
| | 6,099 | | | Alliant Energy Corp. | | | 294,521 | |
| | 3,350 | | | Ameren Corp. | | | 243,980 | |
| | 5,853 | | | CenterPoint Energy, Inc. | | | 90,429 | |
| | 5,052 | | | CMS Energy Corp. | | | 296,805 | |
| | 2,724 | | | Consolidated Edison, Inc. | | | 212,472 | |
| | 3,740 | | | Dominion Energy, Inc. (b) | | | 269,991 | |
| | 1,880 | | | DTE Energy Co. | | | 178,543 | |
| | 5,018 | | | MDU Resources Group, Inc. | | | 107,887 | |
| | 3,427 | | | NiSource, Inc. | | | 85,572 | |
| | 4,107 | | | Public Service Enterprise Group, Inc. (b) | | | 184,445 | |
| | 3,421 | | | Sempra Energy (b) | | | 386,539 | |
| | 4,428 | | | WEC Energy Group, Inc. (b) | | | 390,240 | |
| | | | | | |
|
|
|
| | | | | | | | 2,741,424 | |
| | | | | | |
|
|
|
| | | | | Oil, Gas & Consumable Fuels - 0.37% | |
| | 3,515 | | | EOG Resources, Inc. | | | 126,259 | |
| | 15,341 | | | HollyFrontier Corp. | | | 376,008 | |
| | 252,553 | | | Kosmos Energy Ltd. | | | 226,186 | |
| | 14,777 | | | Marathon Petroleum Corp. | | | 349,033 | |
| | 19,223 | | | PBF Energy, Inc. - Class A | | | 136,099 | |
| | | | | | |
|
|
|
| | | | | | | | 1,213,585 | |
| | | | | | |
|
|
|
| | | | | Paper & Forest Products - 0.02% | |
| | 3,497 | | | Domtar Corp. (b) | | | 75,675 | |
| | | | | | |
|
|
|
| | | | | Personal Products - 0.51% | |
| | 79,786 | | | Coty, Inc. - Class A | | | 411,696 | |
| | 15,613 | | | Herbalife Nutrition, Ltd. (a)(b) | | | 455,275 | |
| | 14,992 | | | Nu Skin Enterprises, Inc. - Class A | | | 327,575 | |
| | 2,962 | | | The Estee Lauder Cos., Inc. - Class A | | | 471,965 | |
| | | | | | |
|
|
|
| | | | | | | | 1,666,511 | |
| | | | | | |
|
|
|
| | | | | Pharmaceuticals - 5.20% | |
| | 11,275 | | | Abbott Laboratories | | | 889,710 | |
| | 17,799 | | | AbbVie, Inc. (b) | | | 1,356,106 | |
| | 4,931 | | | Allergan PLC | | | 873,280 | |
| | 20,619 | | | Bristol-Myers Squibb Co. | | | 1,149,303 | |
| | 1,582 | | | Catalent, Inc. (a) | | | 82,185 | |
| | 9,521 | | | Eli Lilly & Co. (b) | | | 1,320,753 | |
| | 4,319 | | | Horizon Therapeutics Plc (a) | | | 127,929 | |
| | 2,746 | | | Jazz Pharmaceuticals PLC (a) | | | 273,886 | |
| | 34,982 | | | Johnson & Johnson | | | 4,587,190 | |
| | 29,231 | | | Merck & Co., Inc. | | | 2,249,033 | |
| | 81,137 | | | Mylan NV (a) | | | 1,209,753 | |
| | 7,220 | | | Perrigo Co. PLC | | | 347,210 | |
See notes to financial statements.
44
GuideMark® Large Cap Core Fund
SCHEDULE OF INVESTMENTS (Continued)
March 31, 2020
| | | | | | | | |
Number of
Shares
| | | | | Value
| |
| | | | | COMMON STOCKS (Continued) | | | | |
| | | | | Pharmaceuticals (Continued) | |
| | 54,943 | | | Pfizer, Inc. | | $ | 1,793,339 | |
| | 6,397 | | | Zoetis, Inc. | | | 752,863 | |
| | | | | | |
|
|
|
| | | | | | | | 17,012,540 | |
| | | | | | |
|
|
|
| | | | | Professional Services - 0.55% | |
| | 796 | | | CoStar Group, Inc. (a) | | | 467,419 | |
| | 1,461 | | | Equifax, Inc. | | | 174,516 | |
| | 4,565 | | | IHS Markit, Ltd. | | | 273,900 | |
| | 5,604 | | | ManpowerGroup, Inc. | | | 296,956 | |
| | 8,892 | | | Robert Half International, Inc. | | | 335,673 | |
| | 1,894 | | | Verisk Analytics, Inc. | | | 263,986 | |
| | | | | | |
|
|
|
| | | | | | | | 1,812,450 | |
| | | | | | |
|
|
|
| | | | | Real Estate Management & Development - 0.18% | |
| | 7,391 | | | CBRE Group, Inc. - Class A (a) | | | 278,714 | |
| | 2,955 | | | Jones Lang LaSalle, Inc. | | | 298,396 | |
| | | | | | |
|
|
|
| | | | | | | | 577,110 | |
| | | | | | |
|
|
|
| | | | | Road & Rail - 0.17% | |
| | 885 | | | Kansas City Southern | | | 112,554 | |
| | 3,027 | | | Landstar System, Inc. | | | 290,168 | |
| | 447 | | | Norfolk Southern Corp. | | | 65,262 | |
| | 729 | | | Old Dominion Freight Line, Inc. (b) | | | 95,689 | |
| | | | | | |
|
|
|
| | | | | | | | 563,673 | |
| | | | | | |
|
|
|
| | | | | Semiconductors & Semiconductor Equipment - 3.91% | |
| | 28,440 | | | Advanced Micro Devices, Inc. (a) | | | 1,293,451 | |
| | 1,150 | | | Analog Devices, Inc. | | | 103,098 | |
| | 16,140 | | | Applied Materials, Inc. | | | 739,535 | |
| | 3,954 | | | Broadcom, Inc. | | | 937,493 | |
| | 4,293 | | | Cypress Semiconductor Corp. | | | 100,113 | |
| | 2,846 | | | Entegris, Inc. | | | 127,415 | |
| | 51,392 | | | Intel Corp. | | | 2,781,335 | |
| | 2,862 | | | KLA-Tencor Corp. | | | 411,384 | |
| | 3,314 | | | Lam Research Corp. | | | 795,360 | |
| | 3,281 | | | Maxim Integrated Products, Inc. | | | 159,489 | |
| | 2,946 | | | Microchip Technology, Inc. (b) | | | 199,739 | |
| | 15,144 | | | Micron Technology, Inc. (a) | | | 636,957 | |
| | 3,304 | | | MKS Instruments, Inc. | | | 269,111 | |
| | 488 | | | Monolithic Power Systems, Inc. | | | 81,720 | |
| | 5,878 | | | NVIDIA Corp. | | | 1,549,441 | |
| | 28,065 | | | ON Semiconductor Corp. (a)(b) | | | 349,129 | |
| | 2,941 | | | Qorvo, Inc. (a) | | | 237,133 | |
| | 3,522 | | | Skyworks Solutions, Inc. (b) | | | 314,796 | |
| | 5,964 | | | Teradyne, Inc. | | | 323,070 | |
| | 11,352 | | | Texas Instruments, Inc. | | | 1,134,405 | |
| | 3,362 | | | Xilinx, Inc. | | | 262,034 | |
| | | | | | |
|
|
|
| | | | | | | | 12,806,208 | |
| | | | | | |
|
|
|
| | | | | Software - 9.55% | |
| | 5,386 | | | Adobe Systems, Inc. (a) | | | 1,714,041 | |
| | 2,056 | | | Alteryx, Inc. - Class A (a)(b) | | | 195,670 | |
| | 1,320 | | | ANSYS, Inc. (a)(b) | | | 306,860 | |
| | 3,032 | | | Aspen Technology, Inc. (a) | | | 288,252 | |
| | 764 | | | Atlassian Corp. PLC - Class A (a) | | | 104,867 | |
| | 2,893 | | | Autodesk, Inc. (a) | | | 451,597 | |
| | 1,004 | | | Avalara, Inc. (a) | | | 74,898 | |
| | 7,209 | | | Cadence Design System, Inc. (a) | | | 476,082 | |
| | 2,770 | | | CDK Global, Inc. | | | 90,995 | |
| | 37,988 | | | Cerence, Inc. (a)(b) | | | 585,015 | |
| | 1,792 | | | Ceridian HCM Holding, Inc. (a) | | | 89,725 | |
| | | | | | | | |
Number of
Shares
| | | | | Value
| |
| | | | | Software (Continued) | |
| | 3,688 | | | Citrix Systems, Inc. | | $ | 522,036 | |
| | 861 | | | Coupa Software, Inc. (a) | | | 120,308 | |
| | 3,384 | | | DocuSign, Inc. (a) | | | 312,682 | |
| | 15,701 | | | Dropbox, Inc. - Class A (a) | | | 284,188 | |
| | 1,902 | | | Elastic NV (a) | | | 106,151 | |
| | 2,198 | | | Fair Isaac Corp. (a) | | | 676,303 | |
| | 3,377 | | | Fortinet, Inc. (a) | | | 341,651 | |
| | 597 | | | HubSpot, Inc. (a)(b) | | | 79,514 | |
| | 2,597 | | | Intuit, Inc. | | | 597,310 | |
| | 2,523 | | | Jack Henry & Associates, Inc. | | | 391,671 | |
| | 4,583 | | | LogMeIn, Inc. | | | 381,672 | |
| | 9,498 | | | Manhattan Associates, Inc. (a)(b) | | | 473,190 | |
| | 97,524 | | | Microsoft Corp. | | | 15,380,510 | |
| | 17,155 | | | NortonLifeLock, Inc. | | | 320,970 | |
| | 21,303 | | | Nuance Communications, Inc. (a) | | | 357,464 | |
| | 14,379 | | | Nutanix, Inc. - Class A (a) | | | 227,188 | |
| | 19,020 | | | Oracle Corp. | | | 919,237 | |
| | 990 | | | Paycom Software, Inc. (a)(b) | | | 199,990 | |
| | 1,444 | | | Paylocity Holding Corp. (a) | | | 127,534 | |
| | 6,247 | | | Pegasystems, Inc. (b) | | | 444,974 | |
| | 585 | | | Proofpoint, Inc. (a) | | | 60,015 | |
| | 1,191 | | | PTC, Inc. (a) | | | 72,901 | |
| | 5,343 | | | RingCentral, Inc. - Class A (a) | | | 1,132,235 | |
| | 5,409 | | | salesforce.com, Inc. (a) | | | 778,788 | |
| | 2,233 | | | ServiceNow, Inc. (a)(b) | | | 639,933 | |
| | 970 | | | Splunk, Inc. (a) | | | 122,443 | |
| | 8,722 | | | SS&C Technologies Holdings, Inc. | | | 382,198 | |
| | 2,773 | | | Synopsys, Inc. (a) | | | 357,135 | |
| | 405 | | | The Trade Desk, Inc. - Class A (a) | | | 78,165 | |
| | 763 | | | Tyler Technologies, Inc. (a) | | | 226,275 | |
| | 1,673 | | | VMware, Inc. - Class A (a)(b) | | | 202,600 | |
| | 1,681 | | | Workday, Inc. - Class A (a) | | | 218,900 | |
| | 2,586 | | | Zendesk, Inc. (a)(b) | | | 165,530 | |
| | 3,396 | | | Zscaler, Inc. (a)(b) | | | 206,681 | |
| | | | | | |
|
|
|
| | | | | | | | 31,286,344 | |
| | | | | | |
|
|
|
| | | | | Specialty Retail - 3.11% | |
| | 1,551 | | | Advance Auto Parts, Inc. | | | 144,739 | |
| | 18,294 | | | AutoNation, Inc. (a)(b) | | | 513,330 | |
| | 788 | | | AutoZone, Inc. (a) | | | 666,648 | |
| | 7,146 | | | Best Buy Co., Inc. | | | 407,322 | |
| | 4,736 | | | Dick’s Sporting Goods, Inc. | | | 100,687 | |
| | 3,902 | | | Floor & Decor Holdings, Inc. - Class A (a) | | | 125,215 | |
| | 22,772 | | | Foot Locker, Inc. | | | 502,123 | |
| | 16,432 | | | L Brands, Inc. | | | 189,954 | |
| | 8,044 | | | Lowe’s Cos., Inc. | | | 692,186 | |
| | 1,882 | | | O’Reilly Automotive, Inc. (a) | | | 566,576 | |
| | 14,086 | | | Penske Automotive Group, Inc. (b) | | | 394,408 | |
| | 8,084 | | | Ross Stores, Inc. | | | 703,065 | |
| | 689 | | | Sherwin-Williams Co. | | | 316,609 | |
| | 13,889 | | | The Gap, Inc. (b) | | | 97,779 | |
| | 12,696 | | | The Home Depot, Inc. | | | 2,370,470 | |
| | 18,428 | | | The TJX Cos., Inc. | | | 881,043 | |
| | 2,231 | | | Tiffany & Co. | | | 288,915 | |
| | 3,910 | | | Tractor Supply Co. | | | 330,591 | |
| | 2,472 | | | Ulta Beauty, Inc. (a) | | | 434,330 | |
| | 10,013 | | | Urban Outfitters, Inc. (a) | | | 142,585 | |
| | 7,145 | | | Williams Sonoma, Inc. (b) | | | 303,805 | |
| | | | | | |
|
|
|
| | | | | | | | 10,172,380 | |
| | | | | | |
|
|
|
See notes to financial statements.
45
GuideMark® Large Cap Core Fund
SCHEDULE OF INVESTMENTS (Continued)
March 31, 2020
| | | | | | | | |
Number of
Shares
| | | | | Value
| |
| | | | | COMMON STOCKS (Continued) | | | | |
| | | | | Technology Hardware, Storage & Peripherals - 5.01% | |
| | 56,019 | | | Apple, Inc. (b) | | $ | 14,245,071 | |
| | 2,185 | | | Dell Technologies, Inc. - Class C (a) | | | 86,417 | |
| | 12,136 | | | HP, Inc. | | | 210,681 | |
| | 7,548 | | | International Business Machines Corp. | | | 837,300 | |
| | 14,207 | | | NCR Corp. (a) | | | 251,464 | |
| | 6,464 | | | NetApp, Inc. | | | 269,484 | |
| | 18,687 | | | Pure Storage, Inc. - Class A (a) | | | 229,850 | |
| | 9,829 | | | Teradata Corp. (a) | | | 201,396 | |
| | 3,658 | | | Xerox Holdings Corp. | �� | | 69,283 | |
| | | | | | |
|
|
|
| | | | | | | | 16,400,946 | |
| | | | | | |
|
|
|
| | | | | Textiles, Apparel & Luxury Goods - 1.37% | | | | |
| | 18,116 | | | Capri Holdings, Ltd. (a) | | | 195,472 | |
| | 3,858 | | | Carter’s, Inc. | | | 253,586 | |
| | 4,067 | | | Columbia Sportswear Co. | | | 283,755 | |
| | 5,967 | | | lululemon athletica, Inc. (a) | | | 1,131,045 | |
| | 11,078 | | | NIKE, Inc. - Class B | | | 916,594 | |
| | 8,126 | | | PVH Corp. (b) | | | 305,863 | |
| | 3,485 | | | Ralph Lauren Corp. | | | 232,902 | |
| | 11,450 | | | Skechers U.S.A., Inc. - Class A (a) | | | 271,823 | |
| | 16,579 | | | Tapestry, Inc. | | | 214,698 | |
| | 16,512 | | | Under Armour, Inc. - Class A (a)(b) | | | 152,075 | |
| | 20,916 | | | Under Armour, Inc. - Class C (a) | | | 168,583 | |
| | 6,607 | | | VF Corp. | | | 357,306 | |
| | | | | | |
|
|
|
| | | | | | | | 4,483,702 | |
| | | | | | |
|
|
|
| | | | | Thrifts & Mortgage Finance - 0.07% | |
| | 5,556 | | | New York Community Bancorp, Inc. | | | 52,171 | |
| | 10,606 | | | TFS Financial Corp. (b) | | | 161,954 | |
| | | | | | |
|
|
|
| | | | | | | | 214,125 | |
| | | | | | |
|
|
|
| | | | | Tobacco - 0.31% | |
| | 13,769 | | | Philip Morris International, Inc. | | | 1,004,586 | |
| | | | | | |
|
|
|
| | | | | Trading Companies & Distributors - 1.07% | |
| | 12,320 | | | Fastenal Co. | | | 385,000 | |
| | 10,012 | | | HD Supply Holdings, Inc. (a) | | | 284,641 | |
| | 5,815 | | | MSC Industrial Direct Co., Inc. - Class A | | | 319,651 | |
| | 1,121 | | | United Rentals, Inc. (a)(b) | | | 115,351 | |
| | 74,168 | | | Univar, Inc. (a)(b) | | | 795,081 | |
| | 1,565 | | | W.W. Grainger, Inc. | | | 388,902 | |
| | 1,505 | | | Watsco, Inc. - Class A | | | 237,835 | |
| | 42,810 | | | WESCO International, Inc. (a) | | | 978,209 | |
| | | | | | |
|
|
|
| | | | | | | | 3,504,670 | |
| | | | | | |
|
|
|
| | | | | Water Utilities - 0.17% | |
| | 2,656 | | | American Water Works Co., Inc. (b) | | | 317,551 | |
| | 5,851 | | | Essential Utilities, Inc. (b) | | | 238,136 | |
| | | | | | |
|
|
|
| | | | | | | | 555,687 | |
| | | | | | |
|
|
|
| | | | | Wireless Telecommunication Services - 0.03% | |
| | 3,028 | | | United States Cellular Corp. (a) | | | 88,690 | |
| | | | | | |
|
|
|
| | | | | Total Common Stocks
(Cost $258,243,186) | | | 296,752,645 | |
| | | | | | |
|
|
|
| | | | | INVESTMENT COMPANIES - 3.73% | |
| | | | | Exchange Traded Funds - 3.73% | |
| | 51,531 | | | Vanguard S&P 500 ETF | | | 12,203,571 | |
| | | | | | |
|
|
|
| | | | | Total Investment Companies
(Cost $11,370,470) | | | 12,203,571 | |
| | | | | | |
|
|
|
| | | | | | | | |
Number of
Shares
| | | | | Value
| |
| | | | | REAL ESTATE INVESTMENT TRUSTS - 3.95% | |
| | | | | Real Estate Investment Trusts - 3.95% | |
| | 1,205 | | | Alexandria Real Estate Equities, Inc. (b) | | $ | 165,157 | |
| | 3,115 | | | American Campus Communities, Inc. | | | 86,441 | |
| | 16,885 | | | American Homes 4 Rent - Class A | | | 391,732 | |
| | 3,441 | | | American Tower Corp. | | | 749,278 | |
| | 9,143 | | | Americold Realty Trust | | | 311,228 | |
| | 1,873 | | | Apartment Investment & Management Co. - Class A | | | 65,836 | |
| | 44,567 | | | Apple Hospitality REIT, Inc. | | | 408,679 | |
| | 1,267 | | | AvalonBay Communities, Inc. | | | 186,464 | |
| | 11,647 | | | Brandywine Realty Trust | | | 122,526 | |
| | 13,667 | | | Brixmor Property Group, Inc. | | | 129,836 | |
| | 2,446 | | | Camden Property Trust | | | 193,821 | |
| | 10,502 | | | Chimera Investment Corp. | | | 95,568 | |
| | 111,427 | | | Colony Capital, Inc. | | | 194,997 | |
| | 808 | | | CoreSite Realty Corp. | | | 93,647 | |
| | 6,200 | | | Corporate Office Properties Trust | | | 137,206 | |
| | 2,491 | | | Crown Castle International Corp. | | | 359,700 | |
| | 3,323 | | | CubeSmart | | | 89,023 | |
| | 1,448 | | | Digital Realty Trust, Inc. | | | 201,142 | |
| | 3,072 | | | Douglas Emmett, Inc. | | | 93,727 | |
| | 7,499 | | | Duke Realty Corp. | | | 242,818 | |
| | 29,156 | | | Empire State Realty Trust, Inc. - Class A (b) | | | 261,238 | |
| | 744 | | | Equinix, Inc. | | | 464,680 | |
| | 3,610 | | | Equity Commonwealth | | | 114,473 | |
| | 6,122 | | | Equity LifeStyle Properties, Inc. | | | 351,893 | |
| | 3,296 | | | Equity Residential | | | 203,396 | |
| | 1,176 | | | Essex Property Trust, Inc. | | | 259,002 | |
| | 1,979 | | | Extra Space Storage, Inc. | | | 189,509 | |
| | 7,340 | | | Gaming and Leisure Properties, Inc. | | | 203,391 | |
| | 3,035 | | | Healthcare Trust of America, Inc. - Class A (b) | | | 73,690 | |
| | 7,852 | | | Healthpeak Properties, Inc. | | | 187,270 | |
| | 28,653 | | | Host Hotels & Resorts, Inc. | | | 316,329 | |
| | 14,192 | | | Invitation Homes, Inc. | | | 303,283 | |
| | 1,066 | | | Kilroy Realty Corp. (b) | | | 67,904 | |
| | 852 | | | Life Storage, Inc. | | | 80,557 | |
| | 15,016 | | | Medical Properties Trust, Inc. | | | 259,627 | |
| | 22,438 | | | MFA Financial, Inc. | | | 34,779 | |
| | 2,870 | | | Mid-America Apartment Communities, Inc. | | | 295,696 | |
| | 3,483 | | | National Retail Properties, Inc. | | | 112,118 | |
| | 9,036 | | | Omega Healthcare Investors, Inc. | | | 239,815 | |
| | 7,288 | | | Outfront Media, Inc. | | | 98,242 | |
| | 24,646 | | | Paramount Group, Inc. | | | 216,885 | |
| | 6,071 | | | Prologis, Inc. | | | 487,926 | |
| | 924 | | | Public Storage | | | 183,516 | |
| | 5,364 | | | Realty Income Corp. | | | 267,449 | |
| | 61,396 | | | Retail Properties of America, Inc. - Class A | | | 317,417 | |
| | 1,247 | | | SBA Communications Corp. | | | 336,653 | |
| | 194,689 | | | Service Properties Trust | | | 1,051,321 | |
| | 7,021 | | | Spirit Realty Capital, Inc. | | | 183,599 | |
| | 14,458 | | | Starwood Property Trust, Inc. | | | 148,195 | |
| | 9,609 | | | STORE Capital Corp. | | | 174,115 | |
| | 2,677 | | | Sun Communities, Inc. | | | 334,223 | |
| | 2,955 | | | UDR, Inc. | | | 107,976 | |
| | 4,658 | | | Ventas, Inc. | | | 124,834 | |
| | 28,685 | | | VEREIT, Inc. (b) | | | 140,270 | |
| | 4,843 | | | Welltower, Inc. | | | 221,713 | |
| | 3,408 | | | WP Carey, Inc. | | | 197,937 | |
| | | | | | |
|
|
|
| | | | | Total Real Estate Investment Trusts
(Cost $16,262,993) | | | 12,929,747 | |
| | | | | | |
|
|
|
See notes to financial statements.
46
GuideMark® Large Cap Core Fund
SCHEDULE OF INVESTMENTS (Continued)
March 31, 2020
| | | | | | | | |
Number of
Shares
| | | | | Value
| |
| | | | | SHORT TERM INVESTMENTS - 0.50% | |
| | | | | Money Market Funds - 0.50% | |
| | 1,648,225 | | | DWS Government Money Market Series -Institutional Shares
Effective Yield, 0.41% (c) | | $ | 1,648,225 | |
| | | | | | |
|
|
|
| | | | | Total Short Term Investments
(Cost $1,648,225) | | | 1,648,225 | |
| | | | | | |
|
|
|
| | | | | INVESTMENTS PURCHASED WITH PROCEEDS FROM SECURITIES LENDING COLLATERAL - 13.74% | |
| | 44,978,979 | | | Mount Vernon Liquid Assets Portfolio, LLC Effective Yield, 0.91% (c) | | | 44,978,979 | |
| | | | | | |
|
|
|
| | | | | Total Investments Purchased with Proceeds from Securities Lending Collateral
(Cost $44,978,979) | | | 44,978,979 | |
| | | | | | |
|
|
|
| | | | | Total Investments
(Cost $332,503,853) - 112.55% | | | 368,513,167 | |
| | | | | Liabilities in Excess of
Other Assets - (12.55)% | | | (41,080,399 | ) |
| | | | | | |
|
|
|
| | | | | TOTAL NET ASSETS - 100.00% | | $ | 327,432,768 | |
| | | | | | |
|
|
|
Percentages are stated as a percent of net assets.
| (a) | | Non-income producing security. |
| (b) | | All or portion of this security is on loan. |
| (c) | | Seven-day yield as of March 31, 2020. |
| (d) | | These securities have been deemed illiquid according to the Fund’s liquidity guidelines. The value of these securities total $383,151, which represents 0.12% of total net assets. |
See notes to financial statements.
47
GuideMark® Emerging Markets Fund
SCHEDULE OF INVESTMENTS
March 31, 2020
| | | | | | | | |
Number of
Shares
| | | | | Value
| |
| | | | | COMMON STOCKS - 83.20% | |
| | | | | Argentina - 0.13% | |
| | 932 | | | Globant SA (a)(b) | | $ | 81,904 | |
| | | | | | |
|
|
|
| | | | | Brazil - 4.81% | |
| | 43,485 | | | Ambev SA | | | 99,421 | |
| | 13,415 | | | B3 SA - Brasil Bolsa Balcao | | | 91,987 | |
| | 9,872 | | | Banco BTG Pactual SA | | | 63,912 | |
| | 18,352 | | | Banco do Brasil SA | | | 98,010 | |
| | 31,060 | | | BB Seguridade Participacoes SA | | | 150,037 | |
| | 19,235 | | | BR Malls Participacoes SA | | | 36,574 | |
| | 14,351 | | | Centrais Eletricas Brasileiras SA | | | 65,898 | |
| | 15,268 | | | Cia de Saneamento Basico do Estado de Sao Paulo | | | 114,273 | |
| | 5,539 | | | Cosan SA | | | 57,308 | |
| | 7,494 | | | Energisa SA | | | 55,108 | |
| | 19,680 | | | Equatorial Energia SA - Ordinary Shares | | | 66,091 | |
| | 8,985 | | | Hapvida Participacoes e Investimentos SA | | | 73,438 | |
| | 38,898 | | | IRB Brasil Resseguros SA | | | 72,614 | |
| | 63,724 | | | JBS SA | | | 249,446 | |
| | 11,744 | | | Localiza Rent a Car SA | | | 59,374 | |
| | 30,084 | | | Lojas Renner SA | | | 194,593 | |
| | 26,843 | | | Magazine Luiza SA | | | 203,437 | |
| | 29,122 | | | Natura & Co Holding SA | | | 145,663 | |
| | 11,648 | | | Notre Dame Intermedica Participacoes SA | | | 100,113 | |
| | 54,732 | | | Petroleo Brasileiro SA | | | 149,467 | |
| | 6,542 | | | Porto Seguro SA | | | 55,775 | |
| | 10,454 | | | Raia Drogasil SA | | | 203,805 | |
| | 20,882 | | | Sul America SA | | | 136,759 | |
| | 20,287 | | | Ultrapar Participacoes SA | | | 49,233 | |
| | 49,899 | | | Vale SA | | | 414,857 | |
| | 11,896 | | | WEG SA | | | 76,604 | |
| | | | | | |
|
|
|
| | | | | | | | 3,083,797 | |
| | | | | | |
|
|
|
| | | | | Chile - 0.26% | |
| | 12,234 | | | Cia Cervecerias Unidas SA | | | 83,725 | |
| | 484,102 | | | Enel Americas SA | | | 58,990 | |
| | 10,237 | | | Latam Airlines Group SA | | | 26,118 | |
| | | | | | |
|
|
|
| | | | | | | | 168,833 | |
| | | | | | |
|
|
|
| | | | | China - 26.86% | |
| | 1,824 | | | 58.com, Inc. - ADR (a)(b) | | | 88,865 | |
| | 23,434 | | | A-Living Services Co., Ltd. - Series H | | | 112,385 | |
| | 373,865 | | | Agricultural Bank of China Ltd. - Series H | | | 149,271 | |
| | 18,159 | | | Alibaba Group Holding, Ltd. - ADR (a) | | | 3,531,562 | |
| | 25,182 | | | Anhui Conch Cement Co., Ltd. - Series H | | | 172,991 | |
| | 38,191 | | | ANTA Sports Products Ltd. | | | 277,141 | |
| | 1,525 | | | Autohome, Inc. - ADR (a)(b) | | | 108,305 | |
| | 262,339 | | | BAIC Motor Corp., Ltd. - Series H | | | 103,193 | |
| | 2,593 | | | Baidu, Inc. - ADR (a) | | | 261,348 | |
| | 877,670 | | | Bank of China Ltd. - Series H | | | 334,097 | |
| | 246,960 | | | Bank of Communications Co., Ltd. - Series H | | | 150,414 | |
| | 4,540 | | | Baozun, Inc. - ADR (a)(b) | | | 126,848 | |
| | 101,879 | | | China Aoyuan Group Ltd. | | | 117,386 | |
| | 569,672 | | | China Cinda Asset Management Co., Ltd. - Series H | | | 107,145 | |
| | 268,528 | | | China CITIC Bank Corp., Ltd. - Series H | | | 132,052 | |
| | 239,358 | | | China Coal Energy Co., Ltd. - Series H | | | 65,836 | |
| | 16,383 | | | China Conch Venture Holdings Ltd. | | | 72,659 | |
| | 950,534 | | | China Construction Bank Corp. - Series H | | | 772,639 | |
| | 347,000 | | | China Everbright Bank Co., Ltd. - Series H | | | 131,997 | |
| | 76,414 | | | China Lesso Group Holdings Ltd. | | | 98,925 | |
| | 41,264 | | | China Merchants Bank Co., Ltd. - Series H | | | 184,606 | |
| | | | | | | | |
Number of
Shares
| | | | | Value
| |
| | | | | China (Continued) | |
| | 230,247 | | | China Minsheng Banking Corp., Ltd. - Series H | | $ | 170,301 | |
| | 170,617 | | | China National Building Material Co., Ltd. - Series H | | | 183,295 | |
| | 54,879 | | | China Oilfield Services, Ltd. - Series H | | | 41,896 | |
| | 174,343 | | | China Petroleum & Chemical Corp. - Series H | | | 85,185 | |
| | 107,055 | | | China Resources Pharmaceutical Group, Ltd. | | | 63,920 | |
| | 346,338 | | | China Telecom Corp., Ltd. - Series H | | | 104,935 | |
| | 182,941 | | | CNOOC, Ltd. | | | 190,108 | |
| | 63,696 | | | Country Garden Holdings Co., Ltd. | | | 76,150 | |
| | 28,276 | | | Country Garden Services Holdings Co., Ltd. | | | 113,777 | |
| | 92,512 | | | CSPC Pharmaceutical Group Ltd. | | | 181,979 | |
| | 607,819 | | | Industrial & Commercial Bank of China Ltd. - Series H | | | 414,641 | |
| | 7,417 | | | JD.com, Inc. - ADR (a)(b) | | | 300,389 | |
| | 100,483 | | | Jiangxi Copper Co., Ltd. Series H | | | 92,205 | |
| | 1,555 | | | JOYY, Inc. - ADR (a)(b) | | | 82,819 | |
| | 158,377 | | | Lenovo Group Ltd. | | | 83,899 | |
| | 104,214 | | | Li Ning Co., Ltd. | | | 299,812 | |
| | 37,647 | | | Longfor Group Holdings Ltd. | | | 181,191 | |
| | 223,067 | | | Maanshan Iron & Steel Co Ltd. - Series H | | | 69,417 | |
| | 6,544 | | | Meituan Dianping (a) | | | 78,013 | |
| | 4,705 | | | Momo, Inc. - ADR (b) | | | 102,051 | |
| | 918 | | | NetEase, Inc. - ADR (b) | | | 294,641 | |
| | 2,090 | | | New Oriental Education & Technology Group, Inc. - ADR (a) | | | 226,222 | |
| | 306,000 | | | PetroChina Co. - Series H | | | 110,907 | |
| | 99,746 | | | PICC Property & Casualty Co., Ltd. - Series H | | | 95,515 | |
| | 76,065 | | | Ping An Insurance Group Co. of China, Ltd. - Series H | | | 742,871 | |
| | 157,293 | | | Postal Savings Bank of China Co., Ltd. - Series H | | | 95,766 | |
| | 38,821 | | | Semiconductor Manufacturing International Corp. (a) | | | 60,974 | |
| | 500,362 | | | Shui On Land Ltd. | | | 83,380 | |
| | 24,597 | | | Sunac China Holdings Ltd. | | | 112,181 | |
| | 2,880 | | | TAL Education Group - ADR (a)(b) | | | 153,389 | |
| | 65,897 | | | Tencent Holdings Ltd. | | | 3,257,131 | |
| | 136,824 | | | Tingyi Cayman Islands Holding Corp. | | | 222,453 | |
| | 100,731 | | | Uni-President China Holdings Ltd. | | | 97,356 | |
| | 24,103 | | | Vipshop Holdings Ltd. - ADR (a) | | | 375,525 | |
| | 108,591 | | | Want Want China Holdings, Ltd. | | | 78,307 | |
| | 2,046 | | | Weibo Corp. - ADR (a) | | | 67,743 | |
| | 55,626 | | | Weichai Power Co., Ltd. - Series H | | | 88,606 | |
| | 157,446 | | | Xinyi Solar Holdings Ltd. | | | 87,351 | |
| | 120,761 | | | Yanzhou Coal Mining Co Ltd. Series H | | | 93,549 | |
| | 52,168 | | | Yihai International Holding Ltd. | | | 392,955 | |
| | 6,045 | | | Yum China Holdings, Inc. | | | 257,698 | |
| | 1,416 | | | Zai Lab Ltd. - ADR (a)(b) | | | 72,896 | |
| | 108,295 | | | Zoomlion Heavy Industry Science and Technology Co., Ltd. - Series H | | | 77,901 | |
| | 20,376 | | | Zhongsheng Group Holdings, Ltd. | | | 70,709 | |
| | | | | | |
|
|
|
| | | | | | | | 17,231,674 | |
| | | | | | |
|
|
|
| | | | | Colombia - 0.07% | |
| | 7,332 | | | Bancolombia SA | | | 45,270 | |
| | | | | | |
|
|
|
| | | | | Egypt - 0.47% | |
| | 54,211 | | | Commercial International Bank Egypt SAE | | | 201,047 | |
| | 129,005 | | | Eastern Co. SAE | | | 100,766 | |
| | | | | | |
|
|
|
| | | | | | | | 301,813 | |
| | | | | | |
|
|
|
See notes to financial statements.
48
GuideMark® Emerging Markets Fund
SCHEDULE OF INVESTMENTS (Continued)
March 31, 2020
| | | | | | | | |
Number of
Shares
| | | | | Value
| |
| | | | | COMMON STOCKS (Continued) | | | | |
| | | | | Hong Kong - 2.59% | |
| | 431,103 | | | Bosideng International Holdings Ltd. | | $ | 100,133 | |
| | 127,912 | | | China Jinmao Holdings Group Ltd. | | | 81,544 | |
| | 49,767 | | | China Mengniu Dairy Co., Ltd. | | | 171,632 | |
| | 51,816 | | | China Mobile Ltd. | | | 388,324 | |
| | 25,942 | | | China Resources Land Ltd. | | | 105,882 | |
| | 117,065 | | | China Unicom Hong Kong Ltd. | | | 68,278 | |
| | 143,338 | | | CITIC Ltd. | | | 148,554 | |
| | 129,910 | | | Kunlun Energy Co., Ltd. | | | 75,076 | |
| | 121,788 | | | Sino Biopharmaceutical Ltd. | | | 158,943 | |
| | 133,292 | | | SSY Group, Ltd. | | | 103,278 | |
| | 100,529 | | | Sun Art Retail Group Ltd. | | | 147,892 | |
| | 612,961 | | | Yuexiu Property Co., Ltd. | | | 109,523 | |
| | | | | | |
|
|
|
| | | | | | | | 1,659,059 | |
| | | | | | |
|
|
|
| | | | | Hungary - 0.10% | |
| | 2,138 | | | OTP Bank Plc | | | 61,327 | |
| | | | | | |
|
|
|
| | | | | India - 8.01% | |
| | 6,122 | | | Asian Paints Ltd. | | | 134,853 | |
| | 7,134 | | | Avenue Supermarts Ltd. (a) | | | 206,319 | |
| | 591 | | | Bajaj Finserv Ltd. | | | 35,738 | |
| | 12,033 | | | Berger Paints India Ltd. | | | 78,933 | |
| | 16,708 | | | Bharat Petroleum Corp., Ltd. | | | 69,924 | |
| | 15,777 | | | Bharti Airtel Ltd. (a) | | | 91,950 | |
| | 2,057 | | | Britannia Industries Ltd. | | | 72,751 | |
| | 5,602 | | | Divi’s Laboratories Ltd. | | | 146,153 | |
| | 25,973 | | | DLF Ltd. | | | 47,011 | |
| | 4,115 | | | Dr. Reddy’s Laboratories Ltd. | | | 167,532 | |
| | 36,488 | | | HCL Technologies Ltd. | | | 210,476 | |
| | 4,734 | | | HDFC Asset Management Co., Ltd. (a) | | | 131,755 | |
| | 11,862 | | | HDFC Life Insurance Co., Ltd. | | | 68,788 | |
| | 3,002 | | | Hero MotoCorp Ltd. | | | 63,303 | |
| | 74,700 | | | Hindalco Industries Ltd. | | | 94,107 | |
| | 12,801 | | | Hindustan Unilever Ltd. | | | 388,216 | |
| | 15,350 | | | Housing Development Finance Corp. Ltd. | | | 331,320 | |
| | 25,648 | | | ICICI Bank Ltd. | | | 111,607 | |
| | 7,321 | | | ICICI Lombard General Insurance Co., Ltd. | | | 104,588 | |
| | 11,703 | | | ICICI Prudential Life Insurance Co., Ltd. | | | 54,699 | |
| | 57,688 | | | Infosys Ltd. | | | 477,944 | |
| | 7,952 | | | InterGlobe Aviation Ltd. | | | 112,568 | |
| | 30,369 | | | ITC Ltd. | | | 68,481 | |
| | 960 | | | Nestle India Ltd. | | | 207,566 | |
| | 102,927 | | | Oil & Natural Gas Corp. Ltd. | | | 92,155 | |
| | 370 | | | Page Industries Ltd. | | | 82,760 | |
| | 125,009 | | | REC Ltd. | | | 146,335 | |
| | 21,930 | | | Reliance Industries Ltd. | | | 319,788 | |
| | 8,054 | | | SBI Life Insurance Co., Ltd. | | | 68,257 | |
| | 239 | | | Shree Cement Ltd. | | | 55,045 | |
| | 4,649 | | | Siemens Ltd. | | | 68,430 | |
| | 12,556 | | | Tata Consultancy Services Ltd. | | | 302,060 | |
| | 78,067 | | | Tata Motors Ltd. (a) | | | 72,483 | |
| | 18,498 | | | Tata Steel Ltd. | | | 65,551 | |
| | 9,876 | | | Tech Mahindra Ltd. | | | 73,566 | |
| | 5,844 | | | Titan Co., Ltd. | | | 71,979 | |
| | 11,088 | | | UPL Ltd. | | | 47,746 | |
| | 63,000 | | | Vedanta Ltd. | | | 53,417 | |
| | 55,331 | | | Wipro Ltd. | | | 143,940 | |
| | | | | | |
|
|
|
| | | | | | | | 5,140,094 | |
| | | | | | |
|
|
|
| | | | | | | | |
Number of
Shares
| | | | | Value
| |
| | | | | Indonesia - 1.34% | |
| | 1,331,115 | | | Adaro Energy Tbk PT | | $ | 79,537 | |
| | 114,026 | | | Bank Central Asia Tbk PT | | | 192,125 | |
| | 650,761 | | | Bank Rakyat Indonesia Persero Tbk PT | | | 119,353 | |
| | 2,332,960 | | | Barito Pacific Tbk PT (a) | | | 102,237 | |
| | 285,257 | | | Indah Kiat Pulp & Paper Corp. Tbk PT | | | 69,654 | |
| | 1,215,482 | | | Kalbe Farma Tbk PT | | | 89,123 | |
| | 463,270 | | | Telekomunikasi Indonesia Persero Tbk PT | | | 89,975 | |
| | 260,065 | | | Unilever Indonesia Tbk PT | | | 115,003 | |
| | | | | | |
|
|
|
| | | | | | | | 857,007 | |
| | | | | | |
|
|
|
| | | | | Luxembourg - 0.09% | |
| | 3,610 | | | Reinet Investments SCA | | | 57,479 | |
| | | | | | |
|
|
|
| | | | | Mexico - 1.48% | |
| | 175,537 | | | Alfa SAB de CV - Series A | | | 46,913 | |
| | 44,536 | | | Alsea SAB de CV (a) | | | 28,255 | |
| | 400,485 | | | America Movil SAB de CV - Series L | | | 238,037 | |
| | 484,811 | | | Cemex SAB de CV | | | 101,571 | |
| | 13,335 | | | Fomento Economico Mexicano SAB de CV | | | 81,075 | |
| | 12,221 | | | Grupo Aeroportuario del Pacifico SAB de CV - Series B | | | 66,075 | |
| | 70,159 | | | Grupo Bimbo SAB de CV - Series A | | | 102,891 | |
| | 24,765 | | | Grupo Financiero Banorte SAB de CV - Series O | | | 67,857 | |
| | 93,130 | | | Wal-Mart de Mexico SAB de CV | | | 219,413 | |
| | | | | | |
|
|
|
| | | | | | | | 952,087 | |
| | | | | | |
|
|
|
| | | | | Philippines - 0.42% | |
| | 5,802 | | | Globe Telecom, Inc. | | | 219,883 | |
| | 35,686 | | | International Container Terminal Services, Inc. | | | 52,184 | |
| | | | | | |
|
|
|
| | | | | | | | 272,067 | |
| | | | | | |
|
|
|
| | | | | Poland - 0.94% | |
| | 1,206 | | | CD Projekt SA | | | 83,059 | |
| | 5,674 | | | Dino Polska SA (a) | | | 220,714 | |
| | 4,937 | | | Grupa Lotos SA | | | 61,616 | |
| | 4,074 | | | KGHM Polska Miedz SA (a) | | | 58,228 | |
| | 89 | | | LPP SA | | | 111,939 | |
| | 5,142 | | | Polski Koncern Naftowy ORLEN SA | | | 68,809 | |
| | | | | | |
|
|
|
| | | | | | | | 604,365 | |
| | | | | | |
|
|
|
| | | | | Qatar - 1.27% | |
| | 137,960 | | | Ooredoo QPSC | | | 220,745 | |
| | 23,122 | | | Qatar Fuel QSC (a) | | | 103,189 | |
| | 37,061 | | | Qatar International Islamic Bank QSC | | | 73,723 | |
| | 27,710 | | | Qatar Islamic Bank SAQ | | | 108,557 | |
| | 50,280 | | | Qatar National Bank QPSC | | | 229,767 | |
| | 72,650 | | | The Commercial Bank PQSC | | | 77,287 | |
| | | | | | |
|
|
|
| | | | | | | | 813,268 | |
| | | | | | |
|
|
|
| | | | | Republic of Korea - 11.57% | |
| | 925 | | | Amorepacific Corp. | | | 126,852 | |
| | 718 | | | BGF retail Co., Ltd. | | | 77,772 | |
| | 19,836 | | | BNK Financial Group, Inc. | | | 71,985 | |
| | 8,743 | | | Cheil Worldwide, Inc. | | | 113,298 | |
| | 2,258 | | | Daelim Industrial Co Ltd. | | | 135,392 | |
| | 5,104 | | | Daewoo Shipbuilding & Marine Engineering Co., Ltd. (a) | | | 55,857 | |
| | 2,578 | | | DB Insurance Co., Ltd. | | | 73,049 | |
| | 5,495 | | | Fila Korea Ltd. | | | 129,880 | |
| | 6,073 | | | GS Engineering & Construction Corp. | | | 100,903 | |
| | 2,793 | | | GS Holdings Corp. | | | 84,200 | |
| | 5,533 | | | Hana Financial Group, Inc. | | | 104,096 | |
| | 4,323 | | | Hankook Tire Co., Ltd. | | | 68,267 | |
See notes to financial statements.
49
GuideMark® Emerging Markets Fund
SCHEDULE OF INVESTMENTS (Continued)
March 31, 2020
| | | | | | | | |
Number of
Shares
| | | | | Value
| |
| | | | | COMMON STOCKS (Continued) | | | | |
| | | | | Republic of Korea (Continued) | |
| | 5,513 | | | Hanwha Corp. | | $ | 68,340 | |
| | 2,557 | | | Hotel Shilla Co., Ltd. | | | 146,328 | |
| | 1,825 | | | Hyundai Department Store Co. Ltd. | | | 87,757 | |
| | 933 | | | Hyundai Glovis Co., Ltd. | | | 69,044 | |
| | 5,096 | | | Hyundai Marine & Fire Insurance Co., Ltd. | | | 94,228 | |
| | 720 | | | Hyundai Mobis Co., Ltd. | | | 99,596 | |
| | 10,541 | | | Industrial Bank of Korea | | | 64,407 | |
| | 925 | | | Kakao Corp. | | | 116,997 | |
| | 4,354 | | | KB Financial Group, Inc. | | | 122,452 | |
| | 5,113 | | | Kia Motors Corp. | | | 107,623 | |
| | 5,861 | | | KMW Co Ltd. (a) | | | 237,614 | |
| | 10,058 | | | Korean Air Lines Co., Ltd. (a) | | | 152,215 | |
| | 1,945 | | | Kumho Petrochemical Co., Ltd. | | | 102,679 | |
| | 2,269 | | | LG Electronics, Inc. | | | 89,212 | |
| | 279 | | | LG Household & Health Care Ltd. | | | 255,561 | |
| | 15,796 | | | LG Uplus Corp. | | | 138,773 | |
| | 46,426 | | | Meritz Securities Co., Ltd. | | | 107,140 | |
| | 611 | | | Naver Corp. | | | 84,950 | |
| | 449 | | | NCSoft Corp. | | | 239,633 | |
| | 681 | | | Pearl Abyss Corp. (a) | | | 99,344 | |
| | 1,183 | | | POSCO | | | 155,668 | |
| | 8,295 | | | Posco International Corp. | | | 76,816 | |
| | 1,070 | | | Samsung Electro-Mechanics Co., Ltd. | | | 84,785 | |
| | 61,339 | | | Samsung Electronics Co., Ltd. | | | 2,384,953 | |
| | 295 | | | Samsung SDI Co., Ltd. | | | 57,434 | |
| | 538 | | | Samsung SDS Co., Ltd. | | | 65,762 | |
| | 7,430 | | | Shinhan Financial Group Co., Ltd. | | | 173,819 | |
| | 430 | | | Shinsegae, Inc. | | | 76,250 | |
| | 7,080 | | | SK Hynix, Inc. | | | 478,637 | |
| | 3,601 | | | Woongjin Coway Co., Ltd. | | | 170,341 | |
| | 11,904 | | | Woori Financial Group Inc. | | | 74,061 | |
| | | | | | |
|
|
|
| | | | | | | | 7,423,970 | |
| | | | | | |
|
|
|
| | | | | Russian Federation - 3.47% | |
| | 46,472 | | | Gazprom PJSC - ADR (b) | | | 211,912 | |
| | 8,407 | | | LUKOIL PJSC - ADR | | | 497,358 | |
| | 9,927 | | | MMC Norilsk Nickel PJSC - ADR | | | 240,829 | |
| | 7,701 | | | Mobile TeleSystems PJSC - ADR | | | 58,528 | |
| | 2,122 | | | Polyus PJSC - GDR (d) | | | 144,005 | |
| | 20,711 | | | Rosneft Oil Co PJSC - ADR (d) | | | 83,325 | |
| | 37,721 | | | Sberbank of Russia PJSC - ADR | | | 354,577 | |
| | 9,904 | | | Severstal PJSC - GDR (d) | | | 108,510 | |
| | 36,200 | | | Surgutneftegas OJSC - ADR | | | 150,592 | |
| | 4,243 | | | Tatneft PJSC - ADR (b) | | | 160,810 | |
| | 140,137 | | | VTB Bank PJSC - GDR (d) | | | 112,713 | |
| | 3,865 | | | X5 Retail Group NV - GDR | | | 103,273 | |
| | | | | | |
|
|
|
| | | | | | | | 2,226,432 | |
| | | | | | |
|
|
|
| | | | | South Africa - 3.08% | |
| | 13,226 | | | Absa Group Ltd. | | | 55,024 | |
| | 2,203 | | | Anglo American Platinum, Ltd. | | | 92,025 | |
| | 7,441 | | | AngloGold Ashanti Ltd. | | | 126,065 | |
| | 20,362 | | | Aspen Pharmacare Holdings Ltd. (a) | | | 106,505 | |
| | 4,290 | | | Bid Corp. Ltd. | | | 50,566 | |
| | 1,711 | | | Capitec Bank Holdings Ltd. | | | 84,164 | |
| | 7,902 | | | Clicks Group, Ltd. | | | 113,896 | |
| | 32,408 | | | FirstRand Ltd. | | | 72,728 | |
| | 24,328 | | | Gold Fields Ltd. | | | 118,732 | |
| | 19,194 | | | Impala Platinum Holdings Ltd. | | | 79,974 | |
| | 4,843 | | | Kumba Iron Ore, Ltd. | | | 75,516 | |
| | | | | | | | |
Number of
Shares
| | | | | Value
| |
| | | | | South Africa (Continued) | |
| | 13,842 | | | Mr. Price Group Ltd. | | $ | 87,839 | |
| | 19,305 | | | MultiChoice Group Ltd. (a) | | | 91,741 | |
| | 2,010 | | | Naspers Ltd. - N Shares | | | 285,650 | |
| | 7,114 | | | Nedbank Group Ltd. | | | 33,058 | |
| | 17,408 | | | Northam Platinum Ltd. (a) | | | 66,418 | |
| | 125,275 | | | Old Mutual Ltd. | | | 83,109 | |
| | 36,910 | | | Pick n Pay Stores Ltd. | | | 125,059 | |
| | 17,604 | | | Standard Bank Group Ltd. | | | 100,750 | |
| | 9,714 | | | The Bidvest Group Ltd. | | | 79,195 | |
| | 32,969 | | | Woolworths Holdings Ltd. | | | 50,815 | |
| | | | | | |
|
|
|
| | | | | | | | 1,978,829 | |
| | | | | | |
|
|
|
| | | | | Taiwan, Province of China - 13.08% | |
| | 29,739 | | | Advantech Co., Ltd. | | | 245,040 | |
| | 36,138 | | | ASE Technology Holding Co., Ltd. | | | 70,000 | |
| | 54,319 | | | Asia Cement Corp. | | | 70,525 | |
| | 69,121 | | | Cathay Financial Holding Co., Ltd. | | | 80,446 | |
| | 31,707 | | | Chailease Holding Co., Ltd. | | | 95,499 | |
| | 152,062 | | | Chang Hwa Commercial Bank Ltd. | | | 96,000 | |
| | 43,026 | | | Chicony Electronics Co., Ltd. | | | 107,425 | |
| | 652,496 | | | China Airlines Ltd. | | | 142,134 | |
| | 121,901 | | | CTBC Financial Holding Co., Ltd. | | | 71,780 | |
| | 215,098 | | | E.Sun Financial Holdings Co., Ltd. | | | 171,703 | |
| | 11,065 | | | Eclat Textile Co., Ltd. | | | 87,595 | |
| | 323,198 | | | Eva Airways Corp. | | | 94,308 | |
| | 39,619 | | | Feng TAY Enterprise Co., Ltd. | | | 169,688 | |
| | 131,750 | | | First Financial Holding Co., Ltd. | | | 85,137 | |
| | 42,739 | | | Foxconn Technology Co., Ltd. | | | 69,602 | |
| | 103,394 | | | Fubon Financial Holding Co., Ltd. | | | 127,798 | |
| | 96,714 | | | Hon Hai Precision Industry Co., Ltd. | | | 222,661 | |
| | 8,851 | | | Hotai Motor Co., Ltd. | | | 142,922 | |
| | 231,298 | | | Hua Nan Financial Holdings Co., Ltd. | | | 137,600 | |
| | 1,054 | | | Largan Precision Co., Ltd. | | | 133,088 | |
| | 56,679 | | | Lite-On Technology Corp. | | | 77,106 | |
| | 12,584 | | | MediaTek, Inc. | | | 135,067 | |
| | 155,054 | | | Mega Financial Holding Co., Ltd. | | | 145,596 | |
| | 34,179 | | | Micro-Star International Co., Ltd. | | | 99,898 | |
| | 28,533 | | | Nanya Technology Corp. | | | 50,218 | |
| | 22,253 | | | Nien Made Enterprise Co., Ltd. | | | 132,205 | |
| | 107,426 | | | Pou Chen Corp. | | | 90,799 | |
| | 33,661 | | | Powertech Technology, Inc. | | | 95,328 | |
| | 26,608 | | | President Chain Store Corp. | | | 248,752 | |
| | 23,737 | | | Realtek Semiconductor Corp. | | | 170,405 | |
| | 289,842 | | | SinoPac Financial Holdings Co., Ltd. | | | 105,620 | |
| | 51,000 | | | Standard Foods Corp. | | | 102,901 | |
| | 284,596 | | | Taiwan Business Bank | | | 90,575 | |
| | 71,709 | | | Taiwan Cement Corp. | | | 93,129 | |
| | 310,941 | | | Taiwan Cooperative Financial Holding Co., Ltd. | | | 187,776 | |
| | 33,743 | | | Taiwan Mobile Co., Ltd. | | | 111,413 | |
| | 309,488 | | | Taiwan Semiconductor Manufacturing Co., Ltd. | | | 2,786,109 | |
| | 138,249 | | | Uni-President Enterprises Corp. | | | 299,229 | |
| | 337,279 | | | United Microelectronics Corp. | | | 151,223 | |
| | 20,967 | | | Walsin Technology Corp. | | | 110,772 | |
| | 9,815 | | | Win Semiconductors Corp. | | | 84,235 | |
| | 204,162 | | | Wistron Corp. | | | 165,051 | |
| | 3,140 | | | Wiwynn Corp. | | | 72,199 | |
| | 10,373 | | | Yageo Corp. | | | 93,153 | |
| | 243,896 | | | Yuanta Financial Holding Co Ltd. | | | 124,522 | |
| | 48,592 | | | Zhen Ding Technology Holding Ltd. | | | 148,501 | |
| | | | | | |
|
|
|
| | | | | | | | 8,392,733 | |
| | | | | | |
|
|
|
See notes to financial statements.
50
GuideMark® Emerging Markets Fund
SCHEDULE OF INVESTMENTS (Continued)
March 31, 2020
| | | | | | | | |
Number of
Shares
| | | | | Value
| |
| | | | | COMMON STOCKS (Continued) | | | | |
| | | | | Thailand - 1.89% | |
| | 20,684 | | | Advanced Info Service PCL - NVDR | | $ | 125,410 | |
| | 77,961 | | | B Grimm Power PCL - NVDR | | | 93,969 | |
| | 316,187 | | | BTS Group Holdings PCL - NVDR | | | 87,220 | |
| | 61,152 | | | CP ALL PCL - NVDR | | | 113,045 | |
| | 13,648 | | | Electricity Generating PCL - NVDR | | | 95,613 | |
| | 35,564 | | | Gulf Energy Development PCL - NVDR | | | 161,979 | |
| | 345,796 | | | Home Product Center PCL - NVDR | | | 115,768 | |
| | 79,676 | | | Muangthai Capital PCL - NVDR | | | 84,441 | |
| | 94,420 | | | Osotspa PCL - NVDR | | | 102,522 | |
| | 25,039 | | | PTT Exploration & Production PCL - NVDR | | | 50,961 | |
| | 73,424 | | | PTT PCL - NVDR | | | 67,881 | |
| | 40,541 | | | Ratch Group PCL - NVDR | | | 70,221 | |
| | 33,688 | | | Srisawad Corp PCL - NVDR | | | 43,341 | |
| | | | | | |
|
|
|
| | | | | | | | 1,212,371 | |
| | | | | | |
|
|
|
| | | | | Turkey - 1.13% | |
| | 110,695 | | | Akbank Turk AS (a) | | | 92,949 | |
| | 26,000 | | | Arcelik AS (a) | | | 52,962 | |
| | 25,776 | | | BIM Birlesik Magazalar AS | | | 195,466 | |
| | 115,676 | | | Haci Omer Sabanci Holding AS | | | 130,417 | |
| | 70,698 | | | Turkiye Garanti Bankasi AS (a) | | | 86,707 | |
| | 235,956 | | | Turkiye Is Bankasi AS - Series C (a) | | | 168,374 | |
| | | | | | |
|
|
|
| | | | | | | | 726,875 | |
| | | | | | |
|
|
|
| | | | | United Arab Emirates - 0.14% | |
| | 34,962 | | | First Abu Dhabi Bank PJSC | | | 90,145 | |
| | | | | | |
|
|
|
| | | | | Total Common Stocks
(Cost $52,651,424) | | | 53,381,399 | |
| | | | | | |
|
|
|
| | | | | INVESTMENT COMPANIES - 9.83% | |
| | | | | China - 7.68% | |
| | 49,071 | | | iShares Core MSCI Emerging Markets ETF | | | 1,985,903 | |
| | 99,660 | | | KraneShares Bosera MSCI China ETF - Class A (b) | | | 2,938,974 | |
| | | | | | |
|
|
|
| | | | | | | | 4,924,877 | |
| | | | | | |
|
|
|
| | | | | Saudi Arabia - 2.15% | |
| | 57,763 | | | iShares MSCI Saudi Arabia ETF | | | 1,382,268 | |
| | | | | | |
|
|
|
| | | | | Total Investment Companies
(Cost $6,770,681) | | | 6,307,145 | |
| | | | | | |
|
|
|
| | | | | PREFERRED STOCKS - 2.73% | |
| | | | | Brazil - 1.43% | |
| | 53,258 | | | Banco Bradesco SA - Preference Shares | | | 214,012 | |
| | 12,086 | | | Centrais Eletricas Brasileiras SA -
Preference Shares | | | 61,406 | |
| | 28,567 | | | Cia Energetica de Minas Gerais - Preference Shares | | | 48,875 | |
| | 65,761 | | | Itau Unibanco Holding SA - Preference Shares | | | 293,868 | |
| | 38,402 | | | Itausa - Investimentos Itau SA - Preference Shares | | | 64,298 | |
| | 66,546 | | | Petroleo Brasileiro SA - Preference Shares | | | 178,656 | |
| | 6,046 | | | Telefonica Brasil SA - Preference Shares | | | 57,550 | |
| | | | | | |
|
|
|
| | | | | | | | 918,665 | |
| | | | | | |
|
|
|
| | | | | Colombia - 0.07% | |
| | 6,924 | | | Bancolombia SA - Preference Shares | | | 43,467 | |
| | | | | | |
|
|
|
| | | | | Republic of Korea - 1.23% | |
| | 2,259 | | | Amorepacific Corp. - Preference Shares | | | 109,091 | |
| | 393 | | | LG Household & Health Care Ltd. -
Preference Shares | | | 204,887 | |
| | 14,623 | | | Samsung Electronics Co., Ltd. - Preference Shares | | | 476,529 | |
| | | | | | |
|
|
|
| | | | | | | | 790,507 | |
| | | | | | |
|
|
|
| | | | | Total Preferred Stocks
(Cost $1,840,106) | | | 1,752,639 | |
| | | | | | |
|
|
|
| | | | | | | | |
Number of
Shares
| | | | | Value
| |
| | | | | REAL ESTATE INVESTMENT TRUSTS - 0.06% | |
| | | | | Mexico - 0.06% | |
| | 53,067 | | | Fibra Uno Administracion SA de CV | | $ | 41,653 | |
| | | | | | |
|
|
|
| | | | | Total Real Estate Investment Trusts
(Cost $79,927) | | | 41,653 | |
| | | | | | |
|
|
|
| | | | | SHORT TERM INVESTMENTS - 0.88% | |
| | | | | Money Market Funds - 0.88% | |
| | 563,124 | | | DWS Government Money Market Series - Institutional Shares
Effective Yield, 0.41% (c) | | | 563,124 | |
| | | | | | |
|
|
|
| | | | | Total Short Term Investments
(Cost $563,124) | | | 563,124 | |
| | | | | | |
|
|
|
| | | | | INVESTMENTS PURCHASED WITH PROCEEDS FROM SECURITIES LENDING COLLATERAL - 5.45% | |
| | 3,496,618 | | | Mount Vernon Liquid Assets Portfolio, LLC
Effective Yield, 0.91% (c) | | | 3,496,618 | |
| | | | | | |
|
|
|
| | | | | Total Investments Purchased with Proceeds from Securities Lending Collateral
(Cost $3,496,618) | | | 3,496,618 | |
| | | | | | |
|
|
|
| | | | | Total Investments
(Cost $65,401,880) - 102.15% | | | 65,542,578 | |
| | | | | Liabilities in Excess of
Other Assets - (2.15)% | | | (1,380,630 | ) |
| | | | | | |
|
|
|
| | | | | TOTAL NET ASSETS - 100.00% | | $ | 64,161,948 | |
| | | | | | |
|
|
|
Percentages are stated as a percent of net assets.
| (a) | | Non-income producing security. |
| (b) | | All or portion of this security is on loan. |
| (c) | | Seven-day yield as of March 31, 2020. |
| (d) | | Regulation S securities, as defined under the Securities Act of 1933. Such securities are treated as liquid according to the Fund’s liquidity guidelines. The value of these securities total $448,553, which represents 0.70% of total net assets. |
Glossary of Terms
| | | | |
| ADR | | - | | American Depositary Receipt |
| GDR | | - | | Global Depositary Receipt |
| NVDR | | - | | Non-Voting Depositary Receipt |
See notes to financial statements.
51
GuideMark® Emerging Markets Fund
SCHEDULE OF INVESTMENTS BY INDUSTRY
March 31, 2020
| | | | |
COMMON STOCKS | | | | |
Air Freight & Logistics | | | 0.11% | |
Airlines | | | 0.82% | |
Auto Components | | | 0.26% | |
Automobiles | | | 0.54% | |
Banks | | | 10.60% | |
Beverages | | | 0.57% | |
Biotechnology | | | 0.11% | |
Building Products | | | 0.15% | |
Capital Markets | | | 1.07% | |
Chemicals | | | 0.73% | |
Commercial Services & Supplies | | | 0.35% | |
Communications Equipment | | | 0.37% | |
Construction & Engineering | | | 0.37% | |
Construction Materials | | | 1.05% | |
Consumer Finance | | | 0.20% | |
Diversified Consumer Services | | | 0.59% | |
Diversified Financial Services | | | 0.69% | |
Diversified Telecommunication Services | | | 0.86% | |
Electric Utilities | | | 0.38% | |
Electrical Equipment | | | 0.12% | |
Electronic Equipment, Instruments & Components | | | 1.43% | |
Energy Equipment & Services | | | 0.07% | |
Entertainment | | | 0.74% | |
Food & Staples Retailing | | | 3.04% | |
Food Products | | | 3.11% | |
Health Care Providers & Services | | | 0.27% | |
Hotels, Restaurants & Leisure | | | 0.45% | |
Household Durables | | | 0.87% | |
Household Products | | | 1.00% | |
Independent Power and Renewable Electricity Producers | | | 0.66% | |
Industrial Conglomerates | | | 0.76% | |
Insurance | | | 3.19% | |
Interactive Media & Services | | | 1.29% | |
Internet & Direct Marketing Retail | | | 6.88% | |
IT Services | | | 7.20% | |
Life Sciences Tools & Services | | | 0.23% | |
Machinery | | | 0.46% | |
Media | | | 0.77% | |
Metals & Mining | | | 3.20% | |
Multiline Retail | | | 0.96% | |
Oil, Gas & Consumable Fuels | | | 4.64% | |
Paper & Forest Products | | | 0.11% | |
Personal Products | | | 0.42% | |
Pharmaceuticals | | | 1.36% | |
Real Estate Management & Development | | | 1.48% | |
| | | | |
| | | | | |
Road & Rail | | | 0.23% | |
Semiconductors & Semiconductor Equipment | | | 10.22% | |
Software | | | 0.50% | |
Specialty Retail | | | 0.88% | |
Technology Hardware, Storage & Peripherals | | | 1.33% | |
Textiles, Apparel & Luxury Goods | | | 2.22% | |
Thrifts & Mortgage Finance | | | 0.52% | |
Tobacco | | | 0.26% | |
Trading Companies & Distributors | | | 0.12% | |
Transportation Infrastructure | | | 0.18% | |
Water Utilities | | | 0.18% | |
Wireless Telecommunication Services | | | 2.03% | |
| | |
|
|
|
TOTAL COMMON STOCKS | | | 83.20% | |
| | |
|
|
|
INVESTMENT COMPANIES | | | | |
Exchange Traded Funds | | | 9.83% | |
| | |
|
|
|
TOTAL INVESTMENT COMPANIES | | | 9.83% | |
| | |
|
|
|
PREFERRED STOCKS | | | | |
Banks | | | 0.96% | |
Diversified Telecommunication Services | | | 0.09% | |
Electric Utilities | | | 0.17% | |
Oil, Gas & Consumable Fuels | | | 0.28% | |
Personal Products | | | 0.49% | |
Semiconductors & Semiconductor Equipment | | | 0.74% | |
| | |
|
|
|
TOTAL PREFERRED STOCKS | | | 2.73% | |
| | |
|
|
|
REAL ESTATE INVESTMENT TRUSTS | | | | |
Real Estate Investment Trusts | | | 0.06% | |
| | |
|
|
|
TOTAL REAL ESTATE INVESTMENT TRUSTS | | | 0.06% | |
| | |
|
|
|
SHORT TERM INVESTMENTS | | | | |
Money Market Funds | | | 0.88% | |
| | |
|
|
|
TOTAL SHORT TERM INVESTMENTS | | | 0.88% | |
| | |
|
|
|
INVESTMENTS PURCHASED WITH PROCEEDS FROM SECURITIES LENDING COLLATERAL | | | | |
Investments Purchased with Proceeds from Securities Lending Collateral | | | 5.45% | |
| | |
|
|
|
TOTAL INVESTMENTS PURCHASED WITH PROCEEDS FROM SECURITIES LENDING COLLATERAL | | | 5.45% | |
| | |
|
|
|
TOTAL INVESTMENTS | | | 102.15% | |
Liabilities in Excess of Other Assets | | | (2.15)% | |
| | |
|
|
|
TOTAL NET ASSETS | | | 100.00% | |
| | |
|
|
|
Percentages are stated as a percent of net assets.
See notes to financial statements.
52
GuideMark® Small/Mid Cap Core Fund
SCHEDULE OF INVESTMENTS
March 31, 2020
| | | | | | | | |
Number of
Shares
| | | | | Value
| |
| | | | | COMMON STOCKS - 87.60% | |
| | | | | Aerospace & Defense - 1.04% | |
| | 1,059 | | | AAR Corp. | | $ | 18,808 | |
| | 509 | | | Aerojet Rocketdyne Holdings, Inc. (a) | | | 21,291 | |
| | 695 | | | Astronics Corp. (a) | | | 6,380 | |
| | 938 | | | Axon Enterprise, Inc. (a)(b) | | | 66,382 | |
| | 992 | | | BWX Technologies, Inc. | | | 48,320 | |
| | 289 | | | Cubic Corp. | | | 11,939 | |
| | 358 | | | Curtiss-Wright Corp. | | | 33,083 | |
| | 555 | | | Ducommun, Inc. (a) | | | 13,792 | |
| | 525 | | | Hexcel Corp. (b) | | | 19,525 | |
| | 324 | | | Huntington Ingalls Industries, Inc. | | | 59,036 | |
| | 1,178 | | | Kratos Defense & Security Solutions, Inc. (a)(b) | | | 16,304 | |
| | 865 | | | Maxar Technologies, Inc. (b) | | | 9,238 | |
| | 411 | | | Moog, Inc. - Class A | | | 20,768 | |
| | 908 | | | Parsons Corp. (a) | | | 29,020 | |
| | 1,072 | | | Spirit AeroSystems Holdings, Inc. - Class A | | | 25,653 | |
| | 331 | | | Teledyne Technologies, Inc. (a) | | | 98,396 | |
| | 1,203 | | | Vectrus, Inc. (a) | | | 49,816 | |
| | | | | | |
|
|
|
| | | | | | | | 547,751 | |
| | | | | | |
|
|
|
| | | | | Air Freight & Logistics - 0.27% | |
| | 2,482 | | | Echo Global Logistics, Inc. (a) | | | 42,393 | |
| | 226 | | | Forward Air Corp. | | | 11,447 | |
| | 466 | | | Hub Group, Inc. - Class A (a) | | | 21,189 | |
| | 8,035 | | | Radiant Logistics, Inc. (a) | | | 31,095 | |
| | 713 | | | XPO Logistics, Inc. (a)(b) | | | 34,759 | |
| | | | | | |
|
|
|
| | | | | | | | 140,883 | |
| | | | | | |
|
|
|
| | | | | Airlines - 0.24% | |
| | 1,282 | | | Alaska Air Group, Inc. | | | 36,499 | |
| | 93 | | | Allegiant Travel Co. | | | 7,607 | |
| | 308 | | | Copa Holdings SA - Class A | | | 13,949 | |
| | 817 | | | Hawaiian Holdings, Inc. | | | 8,530 | |
| | 3,415 | | | JetBlue Airways Corp. (a) | | | 30,564 | |
| | 2,821 | | | Mesa Air Group, Inc. (a) | | | 9,281 | |
| | 329 | | | SkyWest, Inc. (b) | | | 8,617 | |
| | 872 | | | Spirit Airlines, Inc. (a)(b) | | | 11,240 | |
| | | | | | |
|
|
|
| | | | | | | | 126,287 | |
| | | | | | |
|
|
|
| | | | | Auto Components - 0.70% | |
| | 1,651 | | | Adient PLC - ADR (a) | | | 14,975 | |
| | 2,352 | | | American Axle & Manufacturing Holdings, Inc. (a) | | | 8,491 | |
| | 1,576 | | | BorgWarner, Inc. | | | 38,407 | |
| | 494 | | | Cooper Tire & Rubber Co. | | | 8,052 | |
| | 1,536 | | | Dana, Inc. | | | 11,996 | |
| | 404 | | | Dorman Products, Inc. (a) | | | 22,329 | |
| | 632 | | | Fox Factory Holding Corp. (a) | | | 26,544 | |
| | 2,772 | | | Gentex Corp. | | | 61,428 | |
| | 464 | | | Gentherm, Inc. (a) | | | 14,570 | |
| | 2,143 | | | Goodyear Tire & Rubber Co. | | | 12,472 | |
| | 258 | | | LCI Industries | | | 17,242 | |
| | 2,834 | | | Modine Manufacturing Co. (a) | | | 9,210 | |
| | 340 | | | Standard Motor Products, Inc. | | | 14,134 | |
| | 1,594 | | | Stoneridge, Inc. (a) | | | 26,699 | |
| | 216 | | | Visteon Corp. (a) | | | 10,364 | |
| | 534 | | | WABCO Holdings, Inc. (a) | | | 72,117 | |
| | | | | | |
|
|
|
| | | | | | | | 369,030 | |
| | | | | | |
|
|
|
| | | | | Automobiles - 0.13% | |
| | 757 | | | Harley-Davidson, Inc. (b) | | | 14,330 | |
| | 791 | | | Thor Industries, Inc. (b) | | | 33,364 | |
| | 674 | | | Winnebago Industries, Inc. | | | 18,744 | |
| | | | | | |
|
|
|
| | | | | | | | 66,438 | |
| | | | | | |
|
|
|
| | | | | | | | |
Number of
Shares
| | | | | Value
| |
| | | | | Banks - 4.05% | |
| | 831 | | | 1st Constitution Bancorp. | | $ | 11,011 | |
| | 920 | | | Ameris Bancorp | | | 21,859 | |
| | 1,911 | | | Associated Banc-Corp. | | | 24,442 | |
| | 693 | | | Atlantic Union Bankshares Corp. (b) | | | 15,177 | |
| | 562 | | | BancFirst Corp. | | | 18,754 | |
| | 3,049 | | | Bancorp, Inc. (a) | | | 18,507 | |
| | 758 | | | BancorpSouth, Inc. | | | 14,341 | |
| | 1,501 | | | Bank of Commerce Holdings | | | 11,813 | |
| | 455 | | | Bank of Hawaii Corp. | | | 25,134 | |
| | 426 | | | Bank of Marin Bancorp | | | 12,780 | |
| | 1,046 | | | Bank OZK | | | 17,468 | |
| | 1,592 | | | BankUnited, Inc. | | | 29,770 | |
| | 1,121 | | | BCB Bancorp, Inc. | | | 11,939 | |
| | 306 | | | BOK Financial Corp. | | | 13,023 | |
| | 700 | | | Business First Bancshares, Inc. | | | 9,450 | |
| | 441 | | | C&F Financial Corp. | | | 17,596 | |
| | 1,547 | | | Cadence BanCorp | | | 10,133 | |
| | 374 | | | Camden National Corp. | | | 11,762 | |
| | 568 | | | Cathay General Bancorp (b) | | | 13,036 | |
| | 889 | | | CenterState Bank Corp. | | | 15,318 | |
| | 205 | | | Century Bancorp, Inc. - Class A | | | 12,759 | |
| | 852 | | | CIT Group, Inc. | | | 14,706 | |
| | 221 | | | City Holding Co. | | | 14,703 | |
| | 344 | | | Columbia Banking System, Inc. | | | 9,219 | |
| | 1,127 | | | Commerce Bancshares, Inc. | | | 56,745 | |
| | 435 | | | Community Bank Systems, Inc. | | | 25,578 | |
| | 356 | | | Community Trust Bancorp, Inc. | | | 11,317 | |
| | 991 | | | Cullen Frost Bankers, Inc. | | | 55,288 | |
| | 971 | | | Customers Bancorp, Inc. (a) | | | 10,613 | |
| | 360 | | | Eagle Bancorp, Inc. | | | 10,876 | |
| | 1,796 | | | East West Bancorp, Inc. | | | 46,229 | |
| | 953 | | | Enterprise Financial Services Corp. | | | 26,598 | |
| | 2,369 | | | F.N.B. Corp. | | | 17,460 | |
| | 1,281 | | | Farmers National Banc Corp. | | | 14,898 | |
| | 545 | | | Financial Institutions, Inc. | | | 9,886 | |
| | 437 | | | First Bancorp (North Carolina) | | | 10,086 | |
| | 2,432 | | | First BanCorp (Puerto Rico) | | | 12,938 | |
| | 1,304 | | | First Bank | | | 9,050 | |
| | 890 | | | First Business Financial Services, Inc. | | | 13,795 | |
| | 206 | | | First Capital, Inc. | | | 12,339 | |
| | 105 | | | First Citizens BancShares, Inc. - Class A | | | 34,951 | |
| | 545 | | | First Community Bancshares, Inc. | | | 12,699 | |
| | 1,398 | | | First Financial Bancorp. | | | 20,844 | |
| | 1,556 | | | First Financial Bankshares, Inc. | | | 41,763 | |
| | 795 | | | First Guaranty Bancshares, Inc. | | | 11,472 | |
| | 728 | | | First Hawaiian, Inc. | | | 12,034 | |
| | 3,054 | | | First Horizon National Corp. | | | 24,615 | |
| | 936 | | | First Internet Bancorp | | | 15,369 | |
| | 500 | | | First Merchants Corp. | | | 13,245 | |
| | 970 | | | First Midwest Bancorp, Inc. | | | 12,838 | |
| | 1,790 | | | Fulton Financial Corp. (b) | | | 20,567 | |
| | 667 | | | Glacier Bancorp, Inc. | | | 22,681 | |
| | 343 | | | Great Southern Bancorp, Inc. | | | 13,857 | |
| | 814 | | | Hancock Whitney Corp. | | | 15,889 | |
| | 200 | | | Hawthorn Bancshares, Inc. | | | 3,670 | |
| | 402 | | | Heartland Financial U.S.A., Inc. | | | 12,140 | |
| | 755 | | | Hilltop Holdings, Inc. | | | 11,416 | |
| | 985 | | | Home BancShares, Inc. | | | 11,810 | |
| | 1,405 | | | Hope Bancorp, Inc. | | | 11,549 | |
| | 481 | | | IBERIABANK Corp. | | | 17,393 | |
See notes to financial statements.
53
GuideMark® Small/Mid Cap Core Fund
SCHEDULE OF INVESTMENTS (Continued)
March 31, 2020
| | | | | | | | |
Number of
Shares
| | | | | Value
| |
| | | | | COMMON STOCKS (Continued) | |
| | | | | Banks (Continued) | | | | |
| | 861 | | | Independent Bank Corp. | | $ | 11,081 | |
| | 412 | | | Independent Bank Group, Inc. | | | 9,756 | |
| | 879 | | | International Bancshares Corp. | | | 23,628 | |
| | 1,515 | | | Investors Bancorp, Inc. | | | 12,105 | |
| | 981 | | | Lakeland Bancorp, Inc. | | | 10,605 | |
| | 400 | | | Lakeland Financial Corp. | | | 14,700 | |
| | 1,339 | | | Macatawa Bank Corp. | | | 9,534 | |
| | 573 | | | Midland States Bancorp, Inc. | | | 10,022 | |
| | 462 | | | National Bank Holdings Corp. - Class A | | | 11,042 | |
| | 486 | | | NBT Bancorp, Inc. | | | 15,742 | |
| | 328 | | | Nicolet Bankshares, Inc. (a) | | | 17,902 | |
| | 885 | | | Northeast Bank | | | 10,319 | |
| | 937 | | | OFG Bancorp | | | 10,476 | |
| | 1,437 | | | Old National Bancorp | | | 18,954 | |
| | 1,571 | | | Old Second Bancorp, Inc. | | | 10,856 | |
| | 549 | | | Pacific Premier Bancorp, Inc. | | | 10,343 | |
| | 822 | | | PacWest Bancorp | | | 14,730 | |
| | 183 | | | Park National Corp. | | | 14,208 | |
| | 1,432 | | | Parke Bancorp, Inc. | | | 19,318 | |
| | 624 | | | Peapack Gladstone Financial Corp. | | | 11,201 | |
| | 577 | | | Peoples Bancorp, Inc. | | | 12,781 | |
| | 503 | | | Pinnacle Financial Partners, Inc. | | | 18,883 | |
| | 1,431 | | | Popular, Inc. | | | 50,085 | |
| | 336 | | | Preferred Bank | | | 11,364 | |
| | 1,066 | | | Premier Financial Bancorp, Inc. | | | 13,218 | |
| | 700 | | | Prosperity Bancshares, Inc. (b) | | | 33,775 | |
| | 1,040 | | | RBB Bancorp | | | 14,269 | |
| | 578 | | | S&T Bancorp, Inc. | | | 15,791 | |
| | 658 | | | Sandy Spring Bancorp, Inc. | | | 14,897 | |
| | 838 | | | ServisFirst Bancshares, Inc. | | | 24,570 | |
| | 1,465 | | | Shore Bancshares, Inc. | | | 15,895 | |
| | 634 | | | Signature Bank (b) | | | 50,967 | |
| | 919 | | | Simmons First National Corp. - Class A | | | 16,910 | |
| | 266 | | | South State Corp. | | | 15,622 | |
| | 413 | | | Southside Bancshares, Inc. | | | 12,551 | |
| | 1,205 | | | Sterling Bancorp | | | 12,592 | |
| | 558 | | | Stock Yards Bancorp, Inc. | | | 16,143 | |
| | 582 | | | Summit Financial Group, Inc. | | | 12,344 | |
| | 2,278 | | | Synovus Financial Corp. | | | 40,002 | |
| | 840 | | | TCF Financial Corp. (b) | | | 19,034 | |
| | 496 | | | Texas Capital Bancshares, Inc. (a) | | | 10,996 | |
| | 1,000 | | | The Bank of N.T. Butterfield & Son, Ltd. | | | 17,030 | |
| | 132 | | | Tompkins Financial Corp. | | | 9,478 | |
| | 593 | | | TowneBank | | | 10,727 | |
| | 827 | | | TriState Capital Holdings, Inc. (a) | | | 7,997 | |
| | 493 | | | Triumph Bancorp, Inc. (a) | | | 12,818 | |
| | 586 | | | Trustmark Corp. | | | 13,654 | |
| | 342 | | | UMB Financial Corp. | | | 15,862 | |
| | 1,727 | | | Umpqua Holdings Corp. | | | 18,824 | |
| | 509 | | | Union Bankshares, Inc. | | | 11,453 | |
| | 477 | | | United Bankshares, Inc. (b) | | | 11,009 | |
| | 776 | | | Unity Bancorp, Inc. | | | 9,079 | |
| | 3,562 | | | Valley National Bancorp | | | 26,038 | |
| | 704 | | | Veritex Holdings, Inc. | | | 9,835 | |
| | 323 | | | Washington Trust Bancorp, Inc. | | | 11,809 | |
| | 976 | | | Webster Financial Corp. | | | 22,350 | |
| | 799 | | | WesBanco, Inc. | | | 18,936 | |
| | 901 | | | West Bancorporation, Inc. | | | 14,731 | |
| | 295 | | | WestAmerica Bancorporation | | | 17,340 | |
| | | | | | | | |
Number of
Shares
| | | | | Value
| |
| | | | | Banks (Continued) | | | | |
| | 1,599 | | | Western Alliance Bancorp | | $ | 48,945 | |
| | 852 | | | Wintrust Financial Corp. | | | 27,997 | |
| | 1,851 | | | Zions Bancorporation | | | 49,533 | |
| | | | | | |
|
|
|
| | | | | | | | 2,143,854 | |
| | | | | | |
|
|
|
| | | | | Beverages - 0.32% | |
| | 220 | | | Boston Beer Co., Inc. - Class A (a) | | | 80,863 | |
| | 6,862 | | | Celsius Holdings, Inc. (a) | | | 28,889 | |
| | 167 | | | Coca-Cola Consolidated, Inc. | | | 34,824 | |
| | 552 | | | National Beverage Corp. (a)(b) | | | 23,543 | |
| | | | | | |
|
|
|
| | | | | | | | 168,119 | |
| | | | | | |
|
|
|
| | | | | Biotechnology - 3.84% | |
| | 613 | | | ACADIA Pharmaceuticals, Inc. (a) | | | 25,899 | |
| | 191 | | | Acceleron Pharma, Inc. (a) | | | 17,165 | |
| | 4,854 | | | Achillion Pharmaceuticals, Inc. (a)(c)(d)(e)(f) | | | 9,708 | |
| | 10,880 | | | Acorda Therapeutics, Inc. (a) | | | 10,147 | |
| | 1,316 | | | Adverum Biotechnologies, Inc. (a) | | | 12,857 | |
| | 20,514 | | | Affimed NV (a) | | | 32,412 | |
| | 1,817 | | | Akebia Therapeutics, Inc. (a) | | | 13,773 | |
| | 355 | | | Alector, Inc. (a) | | | 8,566 | |
| | 1,894 | | | Alkermes PLC (a) | | | 27,312 | |
| | 642 | | | Alnylam Pharmaceuticals, Inc. (a) | | | 69,882 | |
| | 3,772 | | | AMAG Pharmaceuticals, Inc. (a) | | | 23,311 | |
| | 511 | | | Apellis Pharmaceuticals, Inc. (a) | | | 13,690 | |
| | 1,717 | | | Arena Pharmaceuticals, Inc. (a)(b) | | | 72,114 | |
| | 1,321 | | | Arrowhead Pharmaceuticals, Inc. (a) | | | 38,005 | |
| | 311 | | | Biohaven Pharmaceutical Holding Co., Ltd. (a) | | | 10,583 | |
| | 281 | | | BioSpecifics Technologies Corp. (a) | | | 15,896 | |
| | 10,732 | | | Catalyst Pharmaceuticals, Inc. (a)(b) | | | 41,318 | |
| | 932 | | | CEL-SCI Corp. (a)(b) | | | 10,755 | |
| | 254 | | | ChemoCentryx, Inc. (a) | | | 10,206 | |
| | 891 | | | Coherus Biosciences, Inc. (a) | | | 14,452 | |
| | 874 | | | Cytokinetics, Inc. (a) | | | 10,304 | |
| | 233 | | | Deciphera Pharmaceuticals, Inc. (a) | | | 9,593 | |
| | 1,302 | | | Dicerna Pharmaceuticals, Inc. (a) | | | 23,918 | |
| | 1,129 | | | Eagle Pharmaceuticals, Inc. (a) | | | 51,934 | |
| | 410 | | | Eidos Therapeutics, Inc. (a) | | | 20,086 | |
| | 505 | | | Emergent BioSolutions, Inc. (a) | | | 29,219 | |
| | 397 | | | Enanta Pharmaceuticals, Inc. (a) | | | 20,418 | |
| | 677 | | | Epizyme, Inc. (a) | | | 10,500 | |
| | 323 | | | Esperion Therapeutics, Inc. (a) | | | 10,184 | |
| | 1,184 | | | Exact Sciences Corp. (a)(b) | | | 68,672 | |
| | 5,691 | | | Exelixis, Inc. (a) | | | 97,999 | |
| | 451 | | | Fate Therapeutics, Inc. (a) | | | 10,017 | |
| | 123 | | | Forty Seven, Inc. (a) | | | 11,737 | |
| | 247 | | | Global Blood Therapeutics, Inc. (a)(b) | | | 12,619 | |
| | 1,156 | | | Halozyme Therapeutics, Inc. (a) | | | 20,796 | |
| | 4,239 | | | ImmunoGen, Inc. (a) | | | 14,455 | |
| | 1,221 | | | Invitae Corp. (a) | | | 16,691 | |
| | 959 | | | Ionis Pharmaceuticals, Inc. (a)(b) | | | 45,342 | |
| | 852 | | | Iovance Biotherapeutics, Inc. (a) | | | 25,505 | |
| | 1,017 | | | Ironwood Pharmaceuticals, Inc. (a) | | | 10,262 | |
| | 764 | | | Karyopharm Therapeutics, Inc. (a) | | | 14,676 | |
| | 209 | | | Kodiak Sciences, Inc. (a) | | | 9,969 | |
| | 299 | | | Krystal Biotech, Inc. (a) | | | 12,929 | |
| | 27,156 | | | Lexicon Pharmaceuticals, Inc. (a)(b) | | | 52,954 | |
| | 382 | | | Mirati Therapeutics, Inc. (a) | | | 29,364 | |
| | 707 | | | Moderna, Inc. (a)(b) | | | 21,175 | |
| | 840 | | | Molecular Templates, Inc. (a) | | | 11,164 | |
| | 604 | | | Momenta Pharmaceuticals, Inc. (a) | | | 16,429 | |
See notes to financial statements.
54
GuideMark® Small/Mid Cap Core Fund
SCHEDULE OF INVESTMENTS (Continued)
March 31, 2020
| | | | | | | | |
Number of
Shares
| | | | | Value
| |
| | | | | COMMON STOCKS (Continued) | |
| | | | | Biotechnology (Continued) | | | | |
| | 4,878 | | | Myriad Genetics, Inc. (a) | | $ | 69,804 | |
| | 1,000 | | | Natera, Inc. (a) | | | 29,860 | |
| | 488 | | | Neurocrine Biosciences, Inc. (a) | | | 42,236 | |
| | 113,129 | | | Palatin Technologies, Inc. (a) | | | 47,921 | |
| | 6,347 | | | PDL BioPharma, Inc. (a) | | | 17,899 | |
| | 1,370 | | | Pfenex, Inc. (a) | | | 12,083 | |
| | 200 | | | Principia Biopharma, Inc. (a) | | | 11,876 | |
| | 369 | | | PTC Therapeutics, Inc. (a) | | | 16,461 | |
| | 8,126 | | | Puma Biotechnology, Inc. (a)(b) | | | 68,583 | |
| | 273 | | | Ra Pharmaceuticals, Inc. (a) | | | 13,107 | |
| | 1,619 | | | Radius Health, Inc. (a) | | | 21,047 | |
| | 1,887 | | | Recro Pharma, Inc. (a)(b) | | | 15,417 | |
| | 324 | | | Repligen Corp. (a) | | | 31,279 | |
| | 278 | | | Sage Therapeutics, Inc. (a) | | | 7,984 | |
| | 1,307 | | | Seattle Genetics, Inc. (a) | | | 150,802 | |
| | 1,046 | | | TG Therapeutics, Inc. (a) | | | 10,293 | |
| | 833 | | | United Therapeutics Corp. (a) | | | 78,989 | |
| | 5,392 | | | Vanda Pharmaceuticals, Inc. (a) | | | 55,861 | |
| | 2,390 | | | Veracyte, Inc. (a)(b) | | | 58,101 | |
| | 3,438 | | | Vericel Corp. (a) | | | 31,526 | |
| | 4,373 | | | Voyager Therapeutics, Inc. (a)(b) | | | 40,013 | |
| | 1,761 | | | XBiotech, Inc. (a) | | | 18,702 | |
| | 459 | | | Xencor, Inc. (a) | | | 13,715 | |
| | | | | | |
|
|
|
| | | | | | | | 2,030,521 | |
| | | | | | |
|
|
|
| | | | | Building Products - 1.68% | |
| | 1,860 | | | A. O. Smith Corp. | | | 70,327 | |
| | 727 | | | AAON, Inc. | | | 35,129 | |
| | 599 | | | Advanced Drainage Systems, Inc. | | | 17,635 | |
| | 995 | | | Allegion PLC (b) | | | 91,560 | |
| | 363 | | | American Woodmark Corp. (a) | | | 16,542 | |
| | 11,879 | | | Armstrong Flooring, Inc. (a) | | | 16,987 | |
| | 528 | | | Armstrong World Industries, Inc. | | | 41,934 | |
| | 3,845 | | | Builders FirstSource, Inc. (a) | | | 47,024 | |
| | 1,959 | | | Caesarstone, Ltd. | | | 20,707 | |
| | 4,991 | | | Cornerstone Building Brands, Inc. (a) | | | 22,759 | |
| | 450 | | | CSW Industrials, Inc. | | | 29,182 | |
| | 1,905 | | | Fortune Brands Home & Security, Inc. | | | 82,391 | |
| | 1,017 | | | Griffon Corp. | | | 12,865 | |
| | 1,046 | | | Insteel Industries, Inc. | | | 13,859 | |
| | 2,018 | | | JELD-WEN Holding, Inc. (a) | | | 19,635 | |
| | 416 | | | Lennox International, Inc. (b) | | | 75,625 | |
| | 353 | | | Masonite International Corp. (a) | | | 16,750 | |
| | 1,361 | | | Owens Corning, Inc. (b) | | | 52,820 | |
| | 485 | | | Patrick Industries, Inc. | | | 13,658 | |
| | 952 | | | PGT Innovations, Inc. (a) | | | 7,987 | |
| | 1,328 | | | Quanex Building Products Corp. | | | 13,386 | |
| | 1,528 | | | Resideo Technologies, Inc. (a) | | | 7,396 | |
| | 669 | | | Simpson Manufacturing Co., Inc. | | | 41,465 | |
| | 1,024 | | | Trex Co., Inc. (a) | | | 82,063 | |
| | 1,113 | | | Universal Forest Products, Inc. | | | 41,392 | |
| | | | | | |
|
|
|
| | | | | | | | 891,078 | |
| | | | | | |
|
|
|
| | | | | Capital Markets - 2.40% | |
| | 1,462 | | | Ares Management Corp. - Class A | | | 45,220 | |
| | 3,198 | | | Arlington Asset Investment Corp. - Class A | | | 7,004 | |
| | 1,629 | | | Artisan Partners Asset Management, Inc. - Class A | | | 35,007 | |
| | 1,168 | | | B. Riley Financial, Inc. | | | 21,515 | |
| | 4,399 | | | Brightsphere Investment Group, Inc. | | | 28,110 | |
| | 733 | | | Cohen & Steers, Inc. | | | 33,315 | |
| | | | | | | | |
Number of
Shares
| | | | | Value
| |
| | | | | Capital Markets (Continued) | | | | |
| | 1,252 | | | Cowen Group, Inc. - Class A | | $ | 12,094 | |
| | 154 | | | Diamond Hill Investment Group, Inc. | | | 13,897 | |
| | 2,421 | | | Donnelley Financial Solutions, Inc. (a) | | | 12,759 | |
| | 1,675 | | | Eaton Vance Corp. | | | 54,019 | |
| | 762 | | | Evercore, Inc. - Class A | | | 35,098 | |
| | 539 | | | FactSet Research Systems, Inc. (b) | | | 140,506 | |
| | 1,946 | | | Federated Investors, Inc. | | | 37,071 | |
| | 1,237 | | | GAMCO Investors, Inc. - Class A | | | 13,595 | |
| | 1,523 | | | Greenhill & Co., Inc. | | | 14,986 | |
| | 733 | | | Hamilton Lane, Inc. - Class A | | | 40,542 | |
| | 748 | | | Houlihan Lokey, Inc. | | | 38,986 | |
| | 531 | | | INTL. FCStone, Inc. (a) | | | 19,254 | |
| | 1,512 | | | Janus Henderson Group Plc | | | 23,164 | |
| | 1,871 | | | Lazard, Ltd. - Class A | | | 44,081 | |
| | 732 | | | Legg Mason, Inc. | | | 35,758 | |
| | 1,383 | | | LPL Financial Holdings, Inc. | | | 75,277 | |
| | 410 | | | MarketAxess Holdings, Inc. (b) | | | 136,354 | |
| | 936 | | | Moelis & Co. - Class A | | | 26,302 | |
| | 478 | | | Morningstar, Inc. | | | 55,567 | |
| | 705 | | | Oppenheimer Holdings, Inc. - Class A | | | 13,931 | |
| | 206 | | | Piper Jaffray Cos. | | | 10,417 | |
| | 611 | | | PJT Partners, Inc. - Class A | | | 26,511 | |
| | 3,100 | | | Pzena Investment Management, Inc. - Class A | | | 13,826 | |
| | 3,510 | | | Safeguard Scientifics, Inc. | | | 19,480 | |
| | 1,551 | | | SEI Investments Co. | | | 71,873 | |
| | 2,242 | | | Siebert Financial Corp. (a) | | | 16,187 | |
| | 1,132 | | | Silvercrest Asset Management Group, Inc. - Class A | | | 10,709 | |
| | 1,078 | | | Stifel Financial Corp. | | | 44,500 | |
| | 241 | | | Virtus Investment Partners, Inc. | | | 18,342 | |
| | 1,922 | | | Waddell & Reed Financial, Inc. - Class A (b) | | | 21,872 | |
| | | | | | |
|
|
|
| | | | | | | | 1,267,129 | |
| | | | | | |
|
|
|
| | | | | Chemicals - 1.22% | |
| | 1,100 | | | Advanced Emissions Solutions, Inc. | | | 7,227 | |
| | 149 | | | Albemarle Corp. (b) | | | 8,399 | |
| | 358 | | | Ashland Global Holdings, Inc. | | | 17,925 | |
| | 1,344 | | | Axalta Coating Systems, Ltd. (a) | | | 23,211 | |
| | 138 | | | Balchem Corp. | | | 13,623 | |
| | 362 | | | Cabot Corp. | | | 9,455 | |
| | 1,971 | | | CF Industries Holdings, Inc. (b) | | | 53,611 | |
| | 222 | | | Chase Corp. | | | 18,268 | |
| | 1,435 | | | Element Solutions, Inc. (a) | | | 11,997 | |
| | 1,455 | | | FutureFuel Corp. | | | 16,398 | |
| | 431 | | | H.B. Fuller Co. | | | 12,038 | |
| | 474 | | | Hawkins, Inc. | | | 16,874 | |
| | 2,022 | | | Huntsman Corp. (b) | | | 29,178 | |
| | 304 | | | Ingevity Corp. (a) | | | 10,701 | |
| | 223 | | | Innospec, Inc. | | | 15,496 | |
| | 711 | | | Koppers Holdings, Inc. (a) | | | 8,795 | |
| | 1,489 | | | Kraton Corp. (a) | | | 12,061 | |
| | 304 | | | Minerals Technologies, Inc. | | | 11,023 | |
| | 81 | | | NewMarket Corp. | | | 31,013 | |
| | 1,503 | | | Olin Corp. (b) | | | 17,540 | |
| | 2,660 | | | OMNOVA Solutions, Inc. (a) | | | 26,972 | |
| | 1,229 | | | Orion Engineered Carbons SA | | | 9,168 | |
| | 799 | | | PolyOne Corp. | | | 15,157 | |
| | 1,415 | | | PQ Group Holdings, Inc. (a) | | | 15,424 | |
| | 1,284 | | | RPM International, Inc. | | | 76,398 | |
| | 298 | | | Sensient Technologies Corp. | | | 12,966 | |
See notes to financial statements.
55
GuideMark® Small/Mid Cap Core Fund
SCHEDULE OF INVESTMENTS (Continued)
March 31, 2020
| | | | | | | | |
Number of
Shares
| | | | | Value
| |
| | | | | COMMON STOCKS (Continued) | |
| | | | | Chemicals (Continued) | | | | |
| | 279 | | | Stepan Co. | | $ | 24,680 | |
| | 328 | | | The Scotts Miracle-Gro Co. - Class A | | | 33,587 | |
| | 3,209 | | | Trecora Resources (a) | | | 19,094 | |
| | 752 | | | Trinseo SA | | | 13,619 | |
| | 1,890 | | | Tronox Holdings PLC - Class A | | | 9,412 | |
| | 2,407 | | | Valvoline, Inc. | | | 31,508 | |
| | 285 | | | Westlake Chemical Corp. | | | 10,878 | |
| | | | | | |
|
|
|
| | | | | | | | 643,696 | |
| | | | | | |
|
|
|
| | | | | Commercial Services & Supplies - 1.80% | |
| | 595 | | | ABM Industries, Inc. (b) | | | 14,494 | |
| | 2,731 | | | ACCO Brands Corp. | | | 13,792 | |
| | 2,505 | | | ADT, Inc. (b) | | | 10,822 | |
| | 732 | | | Advanced Disposal Services, Inc. (a) | | | 24,010 | |
| | 858 | | | Avery Dennison Corp. | | | 87,404 | |
| | 243 | | | Barrett Business Services, Inc. | | | 9,633 | |
| | 977 | | | BrightView Holdings, Inc. (a) | | | 10,806 | |
| | 1,008 | | | Casella Waste Systems, Inc. - Class A (a) | | | 39,372 | |
| | 2,268 | | | CECO Environmental Corp. (a)(b) | | | 10,592 | |
| | 1,000 | | | Charah Solutions, Inc. (a) | | | 1,710 | |
| | 470 | | | Cimpress Plc (a) | | | 25,004 | |
| | 319 | | | Clean Harbors, Inc. (a) | | | 16,377 | |
| | 759 | | | Comfort Systems USA, Inc. | | | 27,741 | |
| | 1,061 | | | Covanta Holding Corp. | | | 9,072 | |
| | 1,262 | | | Deluxe Corp. | | | 32,724 | |
| | 631 | | | Ennis, Inc. | | | 11,850 | |
| | 681 | | | Healthcare Services Group, Inc. (b) | | | 16,283 | |
| | 868 | | | Heritage-Crystal Clean, Inc. (a) | | | 14,096 | |
| | 1,750 | | | Herman Miller, Inc. | | | 38,850 | |
| | 1,219 | | | HNI Corp. | | | 30,707 | |
| | 1,008 | | | IAA, Inc. (a) | | | 30,200 | |
| | 1,162 | | | Interface, Inc. | | | 8,785 | |
| | 1,536 | | | KAR Auction Services, Inc. | | | 18,432 | |
| | 4,551 | | | Kimball International, Inc. - Class B | | | 54,202 | |
| | 2,167 | | | Knoll, Inc. | | | 22,363 | |
| | 200 | | | McGrath RentCorp | | | 10,476 | |
| | 476 | | | MSA Safety, Inc. | | | 48,171 | |
| | 5,960 | | | Pitney Bowes, Inc. | | | 12,158 | |
| | 4,067 | | | Quad/Graphics, Inc. | | | 10,249 | |
| | 2,280 | | | Rollins, Inc. | | | 82,399 | |
| | 415 | | | SP Plus Corp. (a) | | | 8,611 | |
| | 2,956 | | | Steelcase, Inc. - Class A | | | 29,176 | |
| | 382 | | | Stericycle, Inc. (a)(b) | | | 18,558 | |
| | 2,235 | | | Sykes Enterprises, Inc. (a) | | | 60,613 | |
| | 1,445 | | | Team, Inc. (a) | | | 9,392 | |
| | 568 | | | Tetra Tech, Inc. | | | 40,112 | |
| | 370 | | | The Brinks Co. | | | 19,258 | |
| | 347 | | | US Ecology, Inc. | | | 10,549 | |
| | 499 | | | Viad Corp. | | | 10,594 | |
| | | | | | |
|
|
|
| | | | | | | | 949,637 | |
| | | | | | |
|
|
|
| | | | | Communications Equipment - 1.11% | |
| | 315 | | | Acacia Communications, Inc. (a) | | | 21,162 | |
| | 1,732 | | | ADTRAN, Inc. | | | 13,302 | |
| | 3,543 | | | Calix, Inc. (a) | | | 25,084 | |
| | 4,213 | | | Cambium Networks Corp. (a) | | | 23,593 | |
| | 4,257 | | | Casa Systems, Inc. (a) | | | 14,899 | |
| | 1,950 | | | Ciena Corp. (a) | | | 77,629 | |
| | 1,147 | | | Clearfield, Inc. (a) | | | 13,592 | |
| | 2,581 | | | CommScope Holding Co., Inc. (a) | | | 23,513 | |
| | | | | | | | |
Number of
Shares
| | | | | Value
| |
| | | | | Communications Equipment (Continued) | | | | |
| | 1,071 | | | Comtech Telecommunications Corp. | | $ | 14,234 | |
| | 1,468 | | | Digi International, Inc. (a) | | | 14,005 | |
| | 676 | | | EchoStar Corp. - Class A (a)(b) | | | 21,612 | |
| | 12,420 | | | Extreme Networks, Inc. (a) | | | 38,378 | |
| | 3,420 | | | Harmonic, Inc. (a)(b) | | | 19,699 | |
| | 2,248 | | | Infinera Corp. (a) | | | 11,914 | |
| | 2,709 | | | Inseego Corp. (a) | | | 16,877 | |
| | 1,623 | | | KVH Industries, Inc. (a) | | | 15,305 | |
| | 734 | | | Lumentum Holdings, Inc. (a) | | | 54,096 | |
| | 1,520 | | | NetScout Systems, Inc. (a) | | | 35,978 | |
| | 12,569 | | | Ribbon Communications, Inc. (a) | | | 38,084 | |
| | 2,984 | | | TESSCO Technologies, Inc. | | | 14,592 | |
| | 339 | | | Ubiquiti, Inc. (b) | | | 47,996 | |
| | 2,605 | | | Viavi Solutions, Inc. (a) | | | 29,202 | |
| | | | | | |
|
|
|
| | | | | | | | 584,746 | |
| | | | | | |
|
|
|
| | | | | Construction & Engineering - 1.00% | |
| | 2,045 | | | AECOM (a) | | | 61,043 | |
| | 1,248 | | | Aegion Corp. (a) | | | 22,377 | |
| | 1,005 | | | Ameresco, Inc. - Class A (a) | | | 17,115 | |
| | 660 | | | Arcosa, Inc. | | | 26,228 | |
| | 629 | | | Construction Partners, Inc. - Class A (a) | | | 10,624 | |
| | 681 | | | EMCOR Group, Inc. | | | 41,759 | |
| | 2,947 | | | Great Lakes Dredge & Dock Corp. (a) | | | 24,460 | |
| | 1,189 | | | IES Holdings, Inc. (a) | | | 20,986 | |
| | 1,211 | | | Jacobs Engineering Group, Inc. | | | 95,996 | |
| | 3,313 | | | KBR, Inc. | | | 68,513 | |
| | 789 | | | MasTec, Inc. (a)(b) | | | 25,824 | |
| | 500 | | | NV5 Global, Inc. (a)(b) | | | 20,645 | |
| | 1,106 | | | Quanta Services, Inc. (b) | | | 35,093 | |
| | 1,155 | | | Sterling Construction Co., Inc. (a) | | | 10,973 | |
| | 5,156 | | | Tutor Perini Corp. (a) | | | 34,648 | |
| | 1,215 | | | WillScot Corp. (a) | | | 12,308 | |
| | | | | | |
|
|
|
| | | | | | | | 528,592 | |
| | | | | | |
|
|
|
| | | | | Construction Materials - 0.13% | |
| | 211 | | | Eagle Materials, Inc. | | | 12,327 | |
| | 2,880 | | | Forterra, Inc. (a) | | | 17,222 | |
| | 1,257 | | | Summit Materials, Inc. - Class A (a) | | | 18,855 | |
| | 1,128 | | | US Concrete, Inc. (a) | | | 20,462 | |
| | | | | | |
|
|
|
| | | | | | | | 68,866 | |
| | | | | | |
|
|
|
| | | | | Consumer Finance - 0.77% | |
| | 203 | | | Credit Acceptance Corp. (a)(b) | | | 51,905 | |
| | 4,114 | | | Curo Group Holdings Corp. | | | 21,804 | |
| | 10,448 | | | Elevate Credit, Inc. (a) | | | 10,866 | |
| | 2,599 | | | Enova International, Inc. (a) | | | 37,659 | |
| | 395 | | | FirstCash, Inc. | | | 28,337 | |
| | 661 | | | Green Dot Corp. - Class A (a) | | | 16,783 | |
| | 5,200 | | | Navient Corp. | | | 39,416 | |
| | 510 | | | Nelnet, Inc. - Class A | | | 23,159 | |
| | 1,783 | | | OneMain Holdings, Inc. | | | 34,091 | |
| | 648 | | | PRA Group, Inc. (a) | | | 17,963 | |
| | 2,519 | | | Regional Management Corp. (a) | | | 34,410 | |
| | 3,790 | | | Santander Consumer USA Holdings, Inc. | | | 52,719 | |
| | 5,225 | | | SLM Corp. | | | 37,568 | |
| | | | | | |
|
|
|
| | | | | | | | 406,680 | |
| | | | | | |
|
|
|
| | | | | Containers & Packaging - 0.81% | |
| | 414 | | | AptarGroup, Inc. | | | 41,210 | |
| | 783 | | | Ardagh Group SA | | | 9,286 | |
| | 1,225 | | | Berry Plastics Group, Inc. (a) | | | 41,295 | |
See notes to financial statements.
56
GuideMark® Small/Mid Cap Core Fund
SCHEDULE OF INVESTMENTS (Continued)
March 31, 2020
| | | | | | | | |
Number of
Shares
| | | | | Value
| |
| | | | | COMMON STOCKS (Continued) | |
| | | | | Containers & Packaging (Continued) | | | | |
| | 1,242 | | | Crown Holdings, Inc. (a) | | $ | 72,086 | |
| | 2,192 | | | Graphic Packaging Holding Co. | | | 26,742 | |
| | 518 | | | Greif, Inc. - Class A | | | 16,105 | |
| | 436 | | | Greif, Inc. - Class B | | | 17,466 | |
| | 2,215 | | | Myers Industries, Inc. | | | 23,811 | |
| | 949 | | | Packaging Corp. of America | | | 82,402 | |
| | 1,158 | | | Sealed Air Corp. | | | 28,614 | |
| | 990 | | | Silgan Holdings, Inc. | | | 28,730 | |
| | 538 | | | Sonoco Products Co. | | | 24,936 | |
| | 394 | | | UFP Technologies, Inc. (a) | | | 15,007 | |
| | | | | | |
|
|
|
| | | | | | | | 427,690 | |
| | | | | | |
|
|
|
| | | | | Distributors - 0.11% | |
| | 1,251 | | | Core-Mark Holding Co., Inc. | | | 35,741 | |
| | 2,263 | | | Funko, Inc. - Class A (a)(b) | | | 9,029 | |
| | 8,759 | | | Greenlane Holdings, Inc. - Class A (a) | | | 15,066 | |
| | | | | | |
|
|
|
| | | | | | | | 59,836 | |
| | | | | | |
|
|
|
| | | | | Diversified Consumer Services - 1.17% | |
| | 1,613 | | | Adtalem Global Education, Inc. (a) | | | 43,212 | |
| | 1,527 | | | American Public Education, Inc. (a) | | | 36,541 | |
| | 303 | | | Bright Horizons Family Solutions, Inc. (a) | | | 30,906 | |
| | 1,028 | | | Carriage Services, Inc. | | | 16,602 | |
| | 496 | | | Chegg, Inc. (a)(b) | | | 17,747 | |
| | 1,795 | | | Collectors Universe, Inc. | | | 28,128 | |
| | 1,195 | | | frontdoor, Inc. (a) | | | 41,562 | |
| | 63 | | | Graham Holdings Co. - Class B | | | 21,494 | |
| | 410 | | | Grand Canyon Education, Inc. (a) | | | 31,277 | |
| | 4,372 | | | H&R Block, Inc. | | | 61,558 | |
| | 1,493 | | | Hillenbrand, Inc. | | | 28,531 | |
| | 4,953 | | | Houghton Mifflin Harcourt Co. (a) | | | 9,312 | |
| | 2,317 | | | K12, Inc. (a) | | | 43,699 | |
| | 1,705 | | | Laureate Education, Inc. - Class A (a) | | | 17,919 | |
| | 486 | | | Matthews International Corp. - Class A | | | 11,756 | |
| | 3,491 | | | Perdoceo Education Corp. (a) | | | 37,668 | |
| | 1,182 | | | Service Corp. International | | | 46,228 | |
| | 1,069 | | | ServiceMaster Global Holdings, Inc. (a) | | | 28,863 | |
| | 221 | | | Strategic Education, Inc. | | | 30,887 | |
| | 2,012 | | | WW International, Inc. (a) | | | 34,023 | |
| | | | | | |
|
|
|
| | | | | | | | 617,913 | |
| | | | | | |
|
|
|
| | | | | Diversified Financial Services - 0.43% | |
| | 684 | | | Cannae Holdings, Inc. (a) | | | 22,907 | |
| | 898 | | | Encore Capital Group, Inc. (a)(b) | | | 20,995 | |
| | 3,322 | | | FGL Holdings | | | 32,555 | |
| | 1,479 | | | GWG Holdings, Inc. (a) | | | 15,027 | |
| | 2,954 | | | Jefferies Financial Group, Inc. | | | 40,381 | |
| | 675 | | | Marlin Business Services Corp. | | | 7,540 | |
| | 6,979 | | | On Deck Capital, Inc. (a) | | | 10,748 | |
| | 1,429 | | | Voya Financial, Inc. | | | 57,946 | |
| | 361 | | | World Acceptance Corp. (a) | | | 19,714 | |
| | | | | | |
|
|
|
| | | | | | | | 227,813 | |
| | | | | | |
|
|
|
| | | | | Diversified Telecommunication Services - 0.45% | |
| | 270 | | | Bandwidth, Inc. - Class A (a) | | | 18,168 | |
| | 474 | | | Cogent Communications Holdings, Inc. | | | 38,854 | |
| | 3,839 | | | Consolidated Communications Holdings, Inc. | | | 17,468 | |
| | 43,087 | | | Frontier Communications Corp. (a) | | | 16,373 | |
| | 4,629 | | | IDT Corp. - Class B (a) | | | 25,089 | |
| | 658 | | | Iridium Communications, Inc. (a) | | | 14,693 | |
| | | | | | | | |
Number of
Shares
| | | | | Value
| |
| | | | | Diversified Telecommunication Services (Continued) | |
| | 2,787 | | | Ooma, Inc. (a) | | $ | 33,249 | |
| | 10,916 | | | ORBCOMM, Inc. (a) | | | 26,635 | |
| | 6,705 | | | Vonage Holdings Corp. (a) | | | 48,477 | |
| | | | | | |
|
|
|
| | | | | | | | 239,006 | |
| | | | | | |
|
|
|
| | | | | Electric Utilities - 0.82% | |
| | 446 | | | ALLETE, Inc. | | | 27,063 | |
| | 280 | | | El Paso Electric Co. | | | 19,029 | |
| | 6,794 | | | Genie Energy Ltd. - Class B (b) | | | 48,781 | |
| | 1,019 | | | Hawaiian Electric Industries, Inc. | | | 43,868 | |
| | 497 | | | IDACORP, Inc. | | | 43,632 | |
| | 265 | | | MGE Energy, Inc. | | | 17,350 | |
| | 2,036 | | | OGE Energy Corp. | | | 62,566 | |
| | 881 | | | Pinnacle West Capital Corp. | | | 66,771 | |
| | 415 | | | PNM Resources, Inc. | | | 15,770 | |
| | 648 | | | Portland General Electric Co. | | | 31,065 | |
| | 7,364 | | | Spark Energy, Inc. - Class A | | | 46,172 | |
| | 238 | | | Unitil Corp. | | | 12,452 | |
| | | | | | |
|
|
|
| | | | | | | | 434,519 | |
| | | | | | |
|
|
|
| | | | | Electrical Equipment - 1.25% | |
| | 677 | | | Acuity Brands, Inc. | | | 57,992 | |
| | 510 | | | Allied Motion Technologies, Inc. | | | 12,087 | |
| | 1,079 | | | Atkore International Group, Inc. (a) | | | 22,735 | |
| | 417 | | | AZZ, Inc. | | | 11,726 | |
| | 462 | | | Belden, Inc. | | | 16,669 | |
| | 926 | | | Brady Corp. - Class A | | | 41,790 | |
| | 358 | | | Encore Wire Corp. | | | 15,032 | |
| | 327 | | | EnerSys | | | 16,193 | |
| | 2,308 | | | Enphase Energy, Inc. (a)(b) | | | 74,525 | |
| | 524 | | | Franklin Electric Co., Inc. | | | 24,696 | |
| | 583 | | | Generac Holdings, Inc. (a) | | | 54,318 | |
| | 3,356 | | | GrafTech International, Ltd. (b) | | | 27,251 | |
| | 537 | | | Hubbell, Inc. (b) | | | 61,615 | |
| | 1,048 | | | nVent Electric PLC | | | 17,680 | |
| | 4,766 | | | Plug Power, Inc. (a) | | | 16,872 | |
| | 746 | | | Powell Industries, Inc. | | | 19,150 | |
| | 287 | | | Preformed Line Products Co. | | | 14,301 | |
| | 526 | | | Regal Beloit Corp. | | | 33,112 | |
| | 1,068 | | | Sensata Technologies Holding PLC (a) | | | 30,897 | |
| | 1,342 | | | Sunrun, Inc. (a) | | | 13,554 | |
| | 762 | | | Thermon Group Holdings, Inc. (a) | | | 11,483 | |
| | 849 | | | Vicor Corp. (a) | | | 37,815 | |
| | 2,321 | | | Vivint Solar, Inc. (a) | | | 10,143 | |
| | 362 | | | Woodward Governor Co. | | | 21,517 | |
| | | | | | |
|
|
|
| | | | | | | | 663,153 | |
| | | | | | |
|
|
|
| | | | | Electronic Equipment, Instruments & Components - 2.71% | |
| | 2,033 | | | Airgain, Inc. (a) | | | 15,024 | |
| | 842 | | | Anixter International, Inc. (a) | | | 73,987 | |
| | 863 | | | Arrow Electronics, Inc. (a) | | | 44,764 | |
| | 1,197 | | | Avnet, Inc. | | | 30,045 | |
| | 1,530 | | | Bel Fuse, Inc. - Class B | | | 14,902 | |
| | 1,066 | | | Benchmark Electronics, Inc. | | | 21,309 | |
| | 2,498 | | | Coda Octopus Group, Inc. (a) | | | 14,014 | |
| | 1,665 | | | Cognex Corp. | | | 70,296 | |
| | 275 | | | Coherent, Inc. (a) | | | 29,263 | |
| | 508 | | | CTS Corp. | | | 12,644 | |
| | 2,371 | | | Daktronics, Inc. | | | 11,689 | |
| | 764 | | | Dolby Laboratories, Inc. - Class A | | | 41,416 | |
| | 650 | | | Fabrinet (a) | | | 35,464 | |
See notes to financial statements.
57
GuideMark® Small/Mid Cap Core Fund
SCHEDULE OF INVESTMENTS (Continued)
March 31, 2020
| | | | | | | | |
Number of
Shares
| | | | | Value
| |
| | | | | COMMON STOCKS (Continued) | |
| | | | | Electronic Equipment, Instruments & Components (Continued) | |
| | 394 | | | FARO Technologies, Inc. (a) | | $ | 17,533 | |
| | 4,295 | | | Fitbit, Inc. - Class A (a) | | | 28,605 | |
| | 1,161 | | | FLIR Systems, Inc. | | | 37,024 | |
| | 832 | | | Insight Enterprises, Inc. (a) | | | 35,052 | |
| | 5,229 | | | Iteris, Inc. (a) | | | 16,733 | |
| | 503 | | | Itron, Inc. (a) | | | 28,082 | |
| | 1,611 | | | Jabil, Inc. | | | 39,598 | |
| | 1,312 | | | KEMET Corp. | | | 31,698 | |
| | 1,326 | | | Knowles Corp. (a) | | | 17,742 | |
| | 107 | | | Littelfuse, Inc. | | | 14,276 | |
| | 329 | | | Mercury Systems, Inc. (a) | | | 23,471 | |
| | 95 | | | Mesa Laboratories, Inc. | | | 21,479 | |
| | 519 | | | Methode Electronics, Inc. | | | 13,717 | |
| | 1,714 | | | Napco Security Technologies, Inc. (a) | | | 26,001 | |
| | 1,509 | | | National Instruments Corp. | | | 49,918 | |
| | 501 | | | Novanta, Inc. (a) | | | 40,020 | |
| | 244 | | | OSI Systems, Inc. (a) | | | 16,816 | |
| | 1,123 | | | PAR Technology Corp. (a) | | | 14,442 | |
| | 926 | | | PC Connection, Inc. | | | 38,160 | |
| | 369 | | | Plexus Corp. (a) | | | 20,133 | |
| | 166 | | | Rogers Corp. (a) | | | 15,674 | |
| | 1,129 | | | Sanmina Corp. (a) | | | 30,799 | |
| | 1,282 | | | ScanSource, Inc. (a) | | | 27,422 | |
| | 511 | | | SYNNEX Corp. | | | 37,354 | |
| | 533 | | | Tech Data Corp. (a)(b) | | | 69,743 | |
| | 2,532 | | | Trimble, Inc. (a) | | | 80,594 | |
| | 1,874 | | | TTM Technologies, Inc. (a)(b) | | | 19,377 | |
| | 227 | | | Universal Display Corp. | | | 29,914 | |
| | 1,951 | | | Vishay Intertechnology, Inc. | | | 28,114 | |
| | 496 | | | Vishay Precision Group, Inc. (a) | | | 9,960 | |
| | 765 | | | Zebra Technologies Corp. - Class A (a) | | | 140,454 | |
| | | | | | |
|
|
|
| | | | | | | | 1,434,722 | |
| | | | | | |
|
|
|
| | | | | Energy Equipment & Services - 0.14% | |
| | 1,970 | | | Era Group, Inc. (a) | | | 10,500 | |
| | 610 | | | Helmerich & Payne, Inc. | | | 9,546 | |
| | 1,625 | | | Matrix Service Co. (a) | | | 15,389 | |
| | 11,414 | | | NCS Multistage Holdings, Inc. (a) | | | 7,305 | |
| | 4,342 | | | Patterson-UTI Energy, Inc. | | | 10,204 | |
| | 2,841 | | | ProPetro Holding Corp. (a) | | | 7,103 | |
| | 496 | | | Seacor Holdings, Inc. (a) | | | 13,372 | |
| | | | | | |
|
|
|
| | | | | | | | 73,419 | |
| | | | | | |
|
|
|
| | | | | Entertainment - 0.41% | |
| | 4,431 | | | AMC Entertainment Holdings, Inc. - Class A (b) | | | 14,002 | |
| | 8,866 | | | Eros International PLC (a)(b) | | | 14,629 | |
| | 5,123 | | | Glu Mobile, Inc. (a) | | | 32,224 | |
| | 1,223 | | | Liberty Media Corp. - Liberty Formula One - Class C (a) | | | 33,302 | |
| | 2,092 | | | Lions Gate Entertainment Corp. - Class A (a)(b) | | | 12,719 | |
| | 2,917 | | | Lions Gate Entertainment Corp. - Class B (a) | | | 16,277 | |
| | 2,667 | | | Rosetta Stone, Inc. (a) | | | 37,391 | |
| | 67 | | | The Madison Square Garden Co. - Class A (a) | | | 14,165 | |
| | 815 | | | The Marcus Corp. | | | 10,041 | |
| | 4,747 | | | Zynga, Inc. - Class A (a) | | | 32,517 | |
| | | | | | |
|
|
|
| | | | | | | | 217,267 | |
| | | | | | |
|
|
|
| | | | | Food & Staples Retailing - 1.14% | |
| | 625 | | | Andersons, Inc. | | | 11,719 | |
| | 1,885 | | | BJ’s Wholesale Club Holdings, Inc. (a) | | | 48,011 | |
| | | | | | | | |
Number of
Shares
| | | | | Value
| |
| | | | | Food & Staples Retailing (Continued) | | | | |
| | 532 | | | Casey’s General Stores, Inc. | | $ | 70,485 | |
| | 353 | | | Grocery Outlet Holding Corp. (a) | | | 12,122 | |
| | 1,584 | | | HF Foods Group, Inc. (a) | | | 13,290 | |
| | 1,090 | | | Ingles Markets, Inc. - Class A | | | 39,414 | |
| | 2,198 | | | Natural Grocers by Vitamin Cottage, Inc. | | | 18,705 | |
| | 2,866 | | | Performance Food Group Co. (a) | | | 70,847 | |
| | 396 | | | PriceSmart, Inc. | | | 20,810 | |
| | 2,111 | | | Rite Aid Corp. (a) | | | 31,665 | |
| | 2,533 | | | SpartanNash Co. | | | 36,272 | |
| | 2,203 | | | Sprouts Farmers Market, Inc. (a)(b) | | | 40,954 | |
| | 1,314 | | | The Chefs’ Warehouse, Inc. (a) | | | 13,232 | |
| | 3,654 | | | United Natural Foods, Inc. (a) | | | 33,544 | |
| | 3,862 | | | US Foods Holding Corp. (a) | | | 68,396 | |
| | 1,158 | | | Village Super Market, Inc. - Class A | | | 28,464 | |
| | 1,093 | | | Weis Markets, Inc. | | | 45,534 | |
| | | | | | |
|
|
|
| | | | | | | | 603,464 | |
| | | | | | |
|
|
|
| | | | | Food Products - 1.46% | |
| | 799 | | | Alico, Inc. | | | 24,801 | |
| | 128 | | | Beyond Meat, Inc. (a) | | | 8,525 | |
| | 35 | | | Bridgford Foods Corp. (a) | | | 807 | |
| | 724 | | | Bunge Ltd. | | | 29,706 | |
| | 299 | | | Calavo Growers, Inc. | | | 17,249 | |
| | 1,576 | | | Darling International, Inc. (a) | | | 30,212 | |
| | 4,223 | | | Farmer Brothers Co. (a) | | | 29,392 | |
| | 2,828 | | | Flowers Foods, Inc. | | | 58,031 | |
| | 849 | | | Fresh Del Monte Produce, Inc. | | | 23,441 | |
| | 1,758 | | | Freshpet, Inc. (a) | | | 112,283 | |
| | 2,081 | | | Hostess Brands, Inc. (a) | | | 22,183 | |
| | 647 | | | Ingredion, Inc. | | | 48,849 | |
| | 160 | | | J&J Snack Foods Corp. | | | 19,360 | |
| | 272 | | | John B. Sanfilippo & Son, Inc. | | | 24,317 | |
| | 1,582 | | | Lamb Weston Holdings, Inc. | | | 90,332 | |
| | 242 | | | Lancaster Colony Corp. | | | 35,003 | |
| | 1,107 | | | Pilgrim’s Pride Corp. (a) | | | 20,059 | |
| | 711 | | | Post Holdings, Inc. (a) | | | 58,992 | |
| | 142 | | | Sanderson Farms, Inc. | | | 17,511 | |
| | 912 | | | Seneca Foods Corp. - Class A (a) | | | 36,279 | |
| | 723 | | | Simply Good Foods Co. (a) | | | 13,925 | |
| | 545 | | | The Hain Celestial Group, Inc. (a) | | | 14,154 | |
| | 16 | | | Tootsie Roll Industries, Inc. | | | 567 | |
| | 781 | | | TreeHouse Foods, Inc. (a) | | | 34,481 | |
| | | | | | |
|
|
|
| | | | | | | | 770,459 | |
| | | | | | |
|
|
|
| | | | | Gas Utilities - 0.57% | |
| | 919 | | | Atmos Energy Corp. (b) | | | 91,192 | |
| | 2,083 | | | EQT Corp. | | | 14,727 | |
| | 365 | | | National Fuel Gas Co. | | | 13,611 | |
| | 507 | | | New Jersey Resources Corp. | | | 17,223 | |
| | 267 | | | Northwest Natural Holding Co. | | | 16,487 | |
| | 340 | | | ONE Gas, Inc. | | | 28,431 | |
| | 529 | | | South Jersey Industries, Inc. | | | 13,225 | |
| | 295 | | | Southwest Gas Holdings, Inc. | | | 20,520 | |
| | 289 | | | Spire, Inc. | | | 21,524 | |
| | 2,322 | | | UGI Corp. | | | 61,928 | |
| | | | | | |
|
|
|
| | | | | | | | 298,868 | |
| | | | | | |
|
|
|
| | | | | Health Care Equipment & Supplies - 4.82% | |
| | 6,304 | | | Accuray, Inc. (a) | | | 11,978 | |
| | 5,925 | | | Alphatec Holdings, Inc. (a) | | | 20,441 | |
| | 3,218 | | | AngioDynamics, Inc. (a) | | | 33,564 | |
See notes to financial statements.
58
GuideMark® Small/Mid Cap Core Fund
SCHEDULE OF INVESTMENTS (Continued)
March 31, 2020
| | | | | | | | |
Number of
Shares
| | | | | Value
| |
| | | | | COMMON STOCKS (Continued) | |
| | | | | Health Care Equipment & Supplies (Continued) | | | | |
| | 1,178 | | | Anika Therapeutics, Inc. (a) | | $ | 34,056 | |
| | 7,943 | | | Antares Pharma, Inc. (a) | | | 18,745 | |
| | 1,085 | | | AtriCure, Inc. (a) | | | 36,445 | |
| | 50 | | | Atrion Corp. | | | 32,500 | |
| | 1,754 | | | AxoGen, Inc. (a) | | | 18,242 | |
| | 1,253 | | | Cardiovascular Systems, Inc. (a) | | | 44,118 | |
| | 2,668 | | | Cerus Corp. (a) | | | 12,406 | |
| | 22,436 | | | Conformis, Inc. (a) | | | 14,135 | |
| | 304 | | | CONMED Corp. | | | 17,410 | |
| | 636 | | | CryoLife, Inc. (a)(b) | | | 10,761 | |
| | 1,251 | | | CryoPort, Inc. (a)(b) | | | 21,355 | |
| | 1,762 | | | Cutera, Inc. (a) | | | 23,012 | |
| | 4,203 | | | CytoSorbents Corp. (a) | | | 32,489 | |
| | 1,124 | | | DexCom, Inc. (a)(b) | | | 302,659 | |
| | 552 | | | Envista Holdings Corp. (a) | | | 8,247 | |
| | 2,359 | | | GenMark Diagnostics, Inc. (a) | | | 9,719 | |
| | 283 | | | Glaukos Corp. (a) | | | 8,733 | |
| | 2,053 | | | Globus Medical, Inc. - Class A (a) | | | 87,314 | |
| | 776 | | | Haemonetics Corp. (a) | | | 77,336 | |
| | 974 | | | Hill-Rom Holdings, Inc. | | | 97,984 | |
| | 177 | | | ICU Medical, Inc. (a) | | | 35,713 | |
| | 510 | | | Inogen, Inc. (a) | | | 26,347 | |
| | 691 | | | Insulet Corp. (a) | | | 114,485 | |
| | 489 | | | Integer Holdings Corp. (a) | | | 30,739 | |
| | 593 | | | Integra LifeSciences Holdings Corp. (a) | | | 26,489 | |
| | 2,362 | | | Invacare Corp. | | | 17,550 | |
| | 901 | | | iRadimed Corp. (a) | | | 19,236 | |
| | 580 | | | iRhythm Technologies, Inc. (a) | | | 47,183 | |
| | 2,708 | | | Lantheus Holdings, Inc. (a) | | | 34,554 | |
| | 1,427 | | | LeMaitre Vascular, Inc. | | | 35,561 | |
| | 283 | | | LivaNova PLC (a)(b) | | | 12,806 | |
| | 631 | | | Masimo Corp. (a) | | | 111,763 | |
| | 4,429 | | | Meridian Bioscience, Inc. (a) | | | 37,204 | |
| | 534 | | | Merit Medical Systems, Inc. (a) | | | 16,687 | |
| | 1,613 | | | Natus Medical, Inc. (a) | | | 37,309 | |
| | 382 | | | Neogen Corp. (a)(b) | | | 25,590 | |
| | 5,959 | | | Neuronetics, Inc. (a) | | | 11,263 | |
| | 1,245 | | | Novocure, Ltd. (a)(b) | | | 83,838 | |
| | 1,210 | | | NuVasive, Inc. (a) | | | 61,299 | |
| | 1,275 | | | Orthofix Medical, Inc. (a) | | | 35,713 | |
| | 630 | | | OrthoPediatrics Corp. (a) | | | 24,973 | |
| | 474 | | | Penumbra, Inc. (a)(b) | | | 76,470 | |
| | 564 | | | Quidel Corp. (a) | | | 55,165 | |
| | 2,448 | | | SeaSpine Holdings Corp. (a) | | | 20,000 | |
| | 567 | | | Silk Road Medical, Inc. (a) | | | 17,849 | |
| | 2,315 | | | STAAR Surgical Co. (a) | | | 74,682 | |
| | 821 | | | STERIS PLC | | | 114,915 | |
| | 721 | | | SurModics, Inc. (a) | | | 24,024 | |
| | 1,467 | | | Tactile Systems Technology, Inc. (a) | | | 58,915 | |
| | 1,260 | | | Tandem Diabetes Care, Inc. (a)(b) | | | 81,081 | |
| | 1,094 | | | Varex Imaging Corp. (a) | | | 24,845 | |
| | 737 | | | West Pharmaceutical Services, Inc. | | | 112,208 | |
| | 877 | | | Wright Medical Group NV (a) | | | 25,126 | |
| | 4,160 | | | Zynex, Inc. (a) | | | 46,051 | |
| | | | | | |
|
|
|
| | | | | | | | 2,551,282 | |
| | | | | | |
|
|
|
| | | | | Health Care Providers & Services - 3.21% | |
| | 2,050 | | | Acadia Healthcare Co., Inc. (a)(b) | | | 37,617 | |
| | 435 | | | Addus HomeCare Corp. (a) | | | 29,406 | |
| | | | | | | | |
Number of
Shares
| | | | | Value
| |
| | | | | Health Care Providers & Services (Continued) | | | | |
| | 925 | | | Amedisys, Inc. (a) | | $ | 169,774 | |
| | 4,095 | | | American Renal Associates Holdings, Inc. (a) | | | 27,068 | |
| | 1,206 | | | AMN Healthcare Services, Inc. (a) | | | 69,719 | |
| | 1,015 | | | BioTelemetry, Inc. (a) | | | 39,088 | |
| | 5,027 | | | Brookdale Senior Living, Inc. (a) | | | 15,684 | |
| | 2,078 | | | Catasys, Inc. (a)(b) | | | 31,648 | |
| | 234 | | | Chemed Corp. (b) | | | 101,369 | |
| | 359 | | | CorVel Corp. (a) | | | 19,569 | |
| | 2,025 | | | Covetrus, Inc. (a) | | | 16,484 | |
| | 6,262 | | | Cross Country Healthcare, Inc. (a) | | | 42,206 | |
| | 1,150 | | | Encompass Health Corp. | | | 73,635 | |
| | 200 | | | Guardant Health, Inc. (a) | | | 13,920 | |
| | 699 | | | Hanger Orthopedic Group, Inc. (a) | | | 10,890 | |
| | 534 | | | HMS Holdings Corp. (a) | | | 13,494 | |
| | 2,113 | | | Joint Corp/The (a) | | | 22,926 | |
| | 437 | | | LHC Group, Inc. (a) | | | 61,267 | |
| | 854 | | | Magellan Health Services, Inc. (a) | | | 41,086 | |
| | 3,820 | | | MEDNAX, Inc. (a) | | | 44,465 | |
| | 1,059 | | | Molina Healthcare, Inc. (a) | | | 147,953 | |
| | 414 | | | National HealthCare Corp. | | | 29,696 | |
| | 1,763 | | | National Research Corp. | | | 80,181 | |
| | 2,095 | | | Option Care Health, Inc. (a) | | | 19,840 | |
| | 9,679 | | | Owens & Minor, Inc. | | | 88,563 | |
| | 2,306 | | | Patterson Cos., Inc. | | | 35,259 | |
| | 1,108 | | | PerkinElmer, Inc. (b) | | | 83,410 | |
| | 556 | | | PetIQ, Inc. (a)(b) | | | 12,916 | |
| | 848 | | | Premier, Inc. - Class A (a) | | | 27,747 | |
| | 491 | | | Providence Service Corp. (a) | | | 26,946 | |
| | 2,564 | | | R1 RCM, Inc. (a) | | | 23,307 | |
| | 3,599 | | | RadNet, Inc. (a) | | | 37,825 | |
| | 2,880 | | | Select Medical Holdings Corp. (a) | | | 43,200 | |
| | 5,927 | | | Surgery Partners, Inc. (a) | | | 38,703 | |
| | 2,482 | | | Tenet Healthcare Corp. (a)(b) | | | 35,741 | |
| | 898 | | | The Ensign Group, Inc. | | | 33,774 | |
| | 3,610 | | | Tivity Health, Inc. (a) | | | 22,707 | |
| | 1,494 | | | Triple-S Management Corp. - Class B (a)(b) | | | 21,065 | |
| | 119 | | | US Physical Therapy, Inc. | | | 8,211 | |
| | | | | | |
|
|
|
| | | | | | | | 1,698,359 | |
| | | | | | |
|
|
|
| | | | | Health Care Technology - 0.68% | |
| | 3,871 | | | Allscripts Healthcare Solutions, Inc. (a) | | | 27,252 | |
| | 1,567 | | | Computer Programs & Systems, Inc. | | | 34,866 | |
| | 741 | | | HealthStream, Inc. (a) | | | 17,747 | |
| | 1,016 | | | Inovalon Holdings, Inc. - Class A (a) | | | 16,926 | |
| | 477 | | | Inspire Medical Systems, Inc. (a) | | | 28,753 | |
| | 6,097 | | | NextGen Healthcare, Inc. (a) | | | 63,653 | |
| | 482 | | | Omnicell, Inc. (a) | | | 31,610 | |
| | 1,387 | | | Simulations Plus, Inc. | | | 48,434 | |
| | 453 | | | Teladoc Health, Inc. (a)(b) | | | 70,219 | |
| | 958 | | | Vocera Communications, Inc. (a) | | | 20,348 | |
| | | | | | |
|
|
|
| | | | | | | | 359,808 | |
| | | | | | |
|
|
|
| | | | | Hotels, Restaurants & Leisure - 2.12% | |
| | 2,631 | | | Aramark | | | 52,541 | |
| | 7,193 | | | BBX Capital Corp. | | | 16,616 | |
| | 226 | | | Biglari Holdings, Inc. - Class B (a) | | | 11,616 | |
| | 1,157 | | | BJ’s Restaurants, Inc. | | | 16,071 | |
| | 1,404 | | | Bloomin’ Brands, Inc. | | | 10,025 | |
| | 2,372 | | | Bluegreen Vacations Corp. | | | 13,710 | |
| | 1,048 | | | Boyd Gaming Corp. | | | 15,112 | |
| | 440 | | | Brinker International, Inc. | | | 5,284 | |
See notes to financial statements.
59
GuideMark® Small/Mid Cap Core Fund
SCHEDULE OF INVESTMENTS (Continued)
March 31, 2020
| | | | | | | | |
Number of
Shares
| | | | | Value
| |
| | | | | COMMON STOCKS (Continued) | |
| | | | | Hotels, Restaurants & Leisure (Continued) | | | | |
| | 4,975 | | | Caesars Entertainment Corp. (a)(b) | | $ | 33,631 | |
| | 3,135 | | | Callaway Golf Co. | | | 32,040 | |
| | 504 | | | Cheesecake Factory, Inc. (b) | | | 8,608 | |
| | 990 | | | Choice Hotels International, Inc. (b) | | | 60,637 | |
| | 354 | | | Churchill Downs, Inc. | | | 36,444 | |
| | 94 | | | Cracker Barrel Old Country Store, Inc. (b) | | | 7,823 | |
| | 1,712 | | | Dave & Buster’s Entertainment, Inc. | | | 22,393 | |
| | 5,046 | | | Del Taco Restaurants, Inc. (a) | | | 17,308 | |
| | 1,622 | | | Denny’s Corp. (a) | | | 12,457 | |
| | 268 | | | Dine Brands Global, Inc. | | | 7,686 | |
| | 559 | | | Domino’s Pizza, Inc. | | | 181,155 | |
| | 650 | | | Dunkin’ Brands Group, Inc. | | | 34,515 | |
| | 1,638 | | | El Pollo Loco Holdings, Inc. (a) | | | 13,841 | |
| | 1,606 | | | Eldorado Resorts, Inc. (a) | | | 23,126 | |
| | 2,817 | | | Everi Holdings, Inc. (a) | | | 9,296 | |
| | 2,863 | | | Fiesta Restaurant Group, Inc. (a) | | | 11,538 | |
| | 794 | | | Hilton Grand Vacations, Inc. (a) | | | 12,521 | |
| | 260 | | | Hyatt Hotels Corp. - Class A | | | 12,454 | |
| | 3,100 | | | International Game Technology Plc (b) | | | 18,445 | |
| | 3,608 | | | J Alexander’s Holdings, Inc. (a) | | | 13,819 | |
| | 252 | | | Jack in the Box, Inc. (b) | | | 8,833 | |
| | 413 | | | Marriott Vacations Worldwide Corp. | | | 22,955 | |
| | 405 | | | Monarch Casino & Resort, Inc. (a) | | | 11,368 | |
| | 274 | | | Nathan’s Famous, Inc. | | | 16,714 | |
| | 530 | | | Papa John’s International, Inc. (b) | | | 28,286 | |
| | 2,779 | | | Penn National Gaming, Inc. (a)(b) | | | 35,154 | |
| | 518 | | | Planet Fitness, Inc. - Class A (a) | | | 25,227 | |
| | 6,904 | | | PlayAGS, Inc. (a) | | | 18,296 | |
| | 4,210 | | | Potbelly Corp. (a) | | | 13,009 | |
| | 1,139 | | | RCI Hospitality Holdings, Inc. | | | 11,356 | |
| | 6,720 | | | Red Lion Hotels Corp. (a) | | | 9,811 | |
| | 854 | | | Red Robin Gourmet Burgers, Inc. (a) | | | 7,276 | |
| | 1,273 | | | Ruth’s Hospitality Group, Inc. | | | 8,504 | |
| | 1,433 | | | Scientific Games Corp. - Class A (a) | | | 13,900 | |
| | 760 | | | SeaWorld Entertainment, Inc. (a)(b) | | | 8,375 | |
| | 289 | | | Shake Shack, Inc. - Class A (a) | | | 10,907 | |
| | 578 | | | Texas Roadhouse, Inc. | | | 23,871 | |
| | 1,114 | | | The Wendy’s Co. | | | 16,576 | |
| | 203 | | | Vail Resorts, Inc. (b) | | | 29,985 | |
| | 614 | | | Wingstop, Inc. (b) | | | 48,936 | |
| | 754 | | | Wyndham Destinations, Inc. | | | 16,362 | |
| | 854 | | | Wyndham Hotels & Resorts Inc. | | | 26,910 | |
| | | | | | |
|
|
|
| | | | | | | | 1,123,323 | |
| | | | | | |
|
|
|
| | | | | Household Durables - 1.73% | |
| | 2,661 | | | Bassett Furniture Industries, Inc. | | | 14,502 | |
| | 1,900 | | | Beazer Homes USA, Inc. (a) | | | 12,236 | |
| | 114 | | | Cavco Industries, Inc. (a) | | | 16,523 | |
| | 692 | | | Century Communities, Inc. (a) | | | 10,041 | |
| | 1,908 | | | Ethan Allen Interiors, Inc. | | | 19,500 | |
| | 6,318 | | | GoPro, Inc. - Class A (a)(b) | | | 16,553 | |
| | 2,156 | | | Green Brick Partners, Inc. (a) | | | 17,356 | |
| | 1,050 | | | Hamilton Beach Brands Holding Co. - Class A | | | 9,985 | |
| | 322 | | | Helen of Troy, Ltd. (a) | | | 46,378 | |
| | 549 | | | Installed Building Products, Inc. (a) | | | 21,889 | |
| | 689 | | | iRobot Corp. (a)(b) | | | 28,180 | |
| | 1,716 | | | KB Home | | | 31,060 | |
| | 1,375 | | | La-Z-Boy, Inc. | | | 28,256 | |
| | 1,092 | | | Legacy Housing Corp. (a) | | | 10,101 | |
| | | | | | | | |
Number of
Shares
| | | | | Value
| |
| | | | | Household Durables (Continued) | | | | |
| | 716 | | | Leggett & Platt, Inc. | | $ | 19,103 | |
| | 154 | | | LGI Homes, Inc. (a)(b) | | | 6,953 | |
| | 2,004 | | | Lifetime Brands, Inc. | | | 11,323 | |
| | 1,726 | | | Lovesac Co. (a) | | | 10,063 | |
| | 402 | | | M.D.C Holdings, Inc. | | | 9,326 | |
| | 840 | | | M/I Homes, Inc. (a) | | | 13,885 | |
| | 563 | | | Meritage Homes Corp. (a) | | | 20,555 | |
| | 2,946 | | | Newell Rubbermaid, Inc. | | | 39,123 | |
| | 44 | | | NVR, Inc. (a)(b) | | | 113,041 | |
| | 2,665 | | | PulteGroup, Inc. | | | 59,483 | |
| | 3,334 | | | Purple Innovation, Inc. (a) | | | 18,937 | |
| | 1,018 | | | Roku, Inc. (a) | | | 89,055 | |
| | 1,203 | | | Skyline Champion Corp. (a) | | | 18,863 | |
| | 2,422 | | | Sonos, Inc. (a) | | | 20,538 | |
| | 2,083 | | | Taylor Morrison Home Corp. - Class A (a) | | | 22,913 | |
| | 766 | | | Tempur Sealy International, Inc. (a)(b) | | | 33,482 | |
| | 1,872 | | | Toll Brothers, Inc. (b) | | | 36,036 | |
| | 329 | | | TopBuild Corp. (a) | | | 23,569 | |
| | 2,270 | | | TRI Pointe Group, Inc. (a) | | | 19,908 | |
| | 14,303 | | | Tupperware Brands Corp. (b) | | | 23,171 | |
| | 400 | | | Universal Electronics, Inc. (a) | | | 15,348 | |
| | 2,710 | | | ZAGG, Inc. (a) | | | 8,428 | |
| | | | | | |
|
|
|
| | | | | | | | 915,663 | |
| | | | | | |
|
|
|
| | | | | Household Products - 0.29% | |
| | 537 | | | Central Garden & Pet Co. (a)(b) | | | 14,768 | |
| | 890 | | | Central Garden & Pet Co. - Class A (a) | | | 22,757 | |
| | 257 | | | Energizer Holdings, Inc. (b) | | | 7,774 | |
| | 656 | | | Oil-Dri Corp. of America | | | 21,937 | |
| | 438 | | | WD-40 Co. | | | 87,972 | |
| | | | | | |
|
|
|
| | | | | | | | 155,208 | |
| | | | | | |
|
|
|
| | | | | Independent Power and Renewable Electricity
Producers - 0.84% | |
| | 24,162 | | | Atlantic Power Corp. (a) | | | 51,707 | |
| | 2,691 | | | Clearway Energy, Inc. - Class A | | | 46,204 | |
| | 3,175 | | | Clearway Energy, Inc. - Class C | | | 59,690 | |
| | 3,684 | | | NRG Energy, Inc. | | | 100,426 | |
| | 229 | | | Ormat Technologies, Inc. | | | 15,494 | |
| | 3,863 | | | TerraForm Power, Inc. - Class A | | | 60,919 | |
| | 6,962 | | | Vistra Energy Corp. | | | 111,114 | |
| | | | | | |
|
|
|
| | | | | | | | 445,554 | |
| | | | | | |
|
|
|
| | | | | Industrial Conglomerates - 0.27% | |
| | 590 | | | Carlisle Companies, Inc. | | | 73,915 | |
| | 523 | | | Otter Tail Corp. | | | 23,253 | |
| | 467 | | | Raven Industries, Inc. | | | 9,914 | |
| | 4 | | | Seaboard Corp. | | | 11,251 | |
| | 231 | | | Standex International Corp. | | | 11,324 | |
| | 976 | | | Tredegar Corp. | | | 15,255 | |
| | | | | | |
|
|
|
| | | | | | | | 144,912 | |
| | | | | | |
|
|
|
| | | | | Insurance - 3.89% | |
| | 149 | | | Alleghany Corp. | | | 82,300 | |
| | 1,015 | | | American Equity Investment Life Holding Co. | | | 19,082 | |
| | 1,170 | | | American Financial Group, Inc. | | | 81,994 | |
| | 151 | | | American National Insurance Co. | | | 12,439 | |
| | 619 | | | AMERISAFE, Inc. | | | 39,907 | |
| | 328 | | | Argo Group International Holdings, Ltd. | | | 12,156 | |
| | 731 | | | Assurant, Inc. | | | 76,090 | |
| | 1,651 | | | Assured Guaranty, Ltd. | | | 42,579 | |
See notes to financial statements.
60
GuideMark® Small/Mid Cap Core Fund
SCHEDULE OF INVESTMENTS (Continued)
March 31, 2020
| | | | | | | | |
Number of
Shares
| | | | | Value
| |
| | | | | COMMON STOCKS (Continued) | |
| | | | | Insurance (Continued) | | | | |
| | 762 | | | Axis Capital Holdings, Ltd. (b) | | $ | 29,451 | |
| | 725 | | | Benefytt Technologies, Inc. (a)(b) | | | 16,233 | |
| | 819 | | | Brighthouse Financial, Inc. (a) | | | 19,795 | |
| | 3,370 | | | Brown & Brown, Inc. | | | 122,061 | |
| | 1,532 | | | CNO Financial Group, Inc. | | | 18,981 | |
| | 2,086 | | | Crawford & Co. - Class A | | | 15,019 | |
| | 840 | | | Donegal Group, Inc. - Class A | | | 12,768 | |
| | 306 | | | eHealth, Inc. (a) | | | 43,091 | |
| | 662 | | | Employers Holdings, Inc. | | | 26,818 | |
| | 280 | | | Enstar Group Ltd. (a) | | | 44,534 | |
| | 419 | | | Erie Indemnity Co. - Class A | | | 62,113 | |
| | 537 | | | Everest Re Group, Ltd. | | | 103,330 | |
| | 270 | | | FBL Financial Group, Inc. - Class A | | | 12,601 | |
| | 1,790 | | | First American Financial Corp. | | | 75,914 | |
| | 6,765 | | | Genworth Financial, Inc. - Class A (a) | | | 22,460 | |
| | 358 | | | Global Indemnity Ltd. | | | 9,129 | |
| | 1,415 | | | Globe Life, Inc. (b) | | | 101,838 | |
| | 211 | | | Goosehead Insurance, Inc. - Class A (a)(b) | | | 9,417 | |
| | 3,545 | | | Hallmark Financial Services, Inc. (a) | | | 14,322 | |
| | 279 | | | HCI Group, Inc. | | | 11,230 | |
| | 1,279 | | | Heritage Insurance Holdings, Inc. | | | 13,698 | |
| | 419 | | | Horace Mann Educators Corp. | | | 15,331 | |
| | 510 | | | Independence Holding Co. | | | 13,036 | |
| | 124 | | | Investors Title Co. | | | 15,872 | |
| | 470 | | | James River Group Holdings, Ltd. | | | 17,033 | |
| | 826 | | | Kemper Corp. | | | 61,430 | |
| | 298 | | | Kinsale Capital Group, Inc. | | | 31,150 | |
| | 560 | | | Mercury General Corp. | | | 22,803 | |
| | 1,458 | | | National General Holdings Corp. | | | 24,130 | |
| | 85 | | | National Western Life Group, Inc. - Class A | | | 14,620 | |
| | 4,925 | | | Old Republic International Corp. | | | 75,106 | |
| | 626 | | | Primerica, Inc. | | | 55,388 | |
| | 686 | | | Reinsurance Group of America, Inc. | | | 57,720 | |
| | 623 | | | RenaissanceRe Holdings, Ltd. | | | 93,026 | |
| | 576 | | | RLI Corp. | | | 50,648 | |
| | 217 | | | Safety Insurance Group, Inc. | | | 18,321 | |
| | 612 | | | Selective Insurance Group, Inc. | | | 30,416 | |
| | 507 | | | Stewart Information Services Corp. | | | 13,522 | |
| | 633 | | | The Hanover Insurance Group, Inc. | | | 57,337 | |
| | 2,138 | | | Third Point Reinsurance, Ltd. (a) | | | 15,843 | |
| | 2,196 | | | Tiptree, Inc. - Class A | | | 11,463 | |
| | 340 | | | United Fire Group, Inc. | | | 11,087 | |
| | 1,750 | | | Universal Insurance Holdings, Inc. | | | 31,360 | |
| | 2,048 | | | Unum Group | | | 30,740 | |
| | 1,786 | | | W.R. Berkley Corp. | | | 93,176 | |
| | 519 | | | Watford Holdings Ltd. (a) | | | 7,603 | |
| | 42 | | | White Mountains Insurance Group, Ltd. - ADR | | | 38,220 | |
| | | | | | |
|
|
|
| | | | | | | | 2,057,731 | |
| | | | | | |
|
|
|
| | | | | Interactive Media & Services - 0.55% | |
| | 1,455 | | | Cargurus, Inc. (a) | | | 27,558 | |
| | 2,067 | | | Cars.com, Inc. (a) | | | 8,888 | |
| | 9,148 | | | DHI Group, Inc. (a) | | | 19,760 | |
| | 1,970 | | | EverQuote, Inc. - Class A (a) | | | 51,712 | |
| | 2,860 | | | QuinStreet, Inc. (a) | | | 23,023 | |
| | 4,462 | | | The Meet Group, Inc. (a) | | | 26,192 | |
| | 4,879 | | | Travelzoo (a) | | | 19,174 | |
| | 1,713 | | | TripAdvisor, Inc. - Class A | | | 29,789 | |
| | 6,999 | | | TrueCar, Inc. (a) | | | 16,938 | |
| | | | | | | | |
Number of
Shares
| | | | | Value
| |
| | | | | Interactive Media & Services (Continued) | | | | |
| | 1,671 | | | Yelp, Inc. (a) | | $ | 30,128 | |
| | 442 | | | Zillow Group, Inc. - Class A (a) | | | 15,015 | |
| | 701 | | | Zillow Group, Inc. - Class C (a)(b) | | | 25,250 | |
| | | | | | |
|
|
|
| | | | | | | | 293,427 | |
| | | | | | |
|
|
|
| | | | | Internet & Direct Marketing Retail - 0.83% | |
| | 3,202 | | | 1-800-Flowers.com, Inc. - Class A (a) | | | 42,362 | |
| | 2,992 | | | Duluth Holdings, Inc. - Class B (a) | | | 11,998 | |
| | 1,417 | | | Etsy, Inc. (a) | | | 54,470 | |
| | 32,902 | | | Groupon, Inc. (a) | | | 32,251 | |
| | 322 | | | GrubHub, Inc. (a) | | | 13,115 | |
| | 1,853 | | | Lands’ End, Inc. (a) | | | 9,895 | |
| | 10,456 | | | Leaf Group, Ltd. (a) | | | 14,011 | |
| | 7,794 | | | Liberty TripAdvisor Holdings, Inc. - Class A (a) | | | 14,029 | |
| | 1,348 | | | PetMed Express, Inc. | | | 38,795 | |
| | 3,266 | | | Qurate Retail, Inc. - Series A (a) | | | 19,939 | |
| | 740 | | | Shutterstock, Inc. | | | 23,798 | |
| | 670 | | | Stamps.com, Inc. (a) | | | 87,154 | |
| | 1,489 | | | Stitch Fix, Inc. - Class A (a)(b) | | | 18,910 | |
| | 1,218 | | | The RealReal, Inc. (a) | | | 8,538 | |
| | 40,991 | | | Waitr Holdings, Inc. (a)(b) | | | 50,419 | |
| | | | | | |
|
|
|
| | | | | | | | 439,684 | |
| | | | | | |
|
|
|
| | | | | Internet Software & Services - 0.05% | |
| | 1,843 | | | Benefitfocus, Inc. (a) | | | 16,421 | |
| | 5,517 | | | Marchex, Inc. - Class B (a) | | | 8,000 | |
| | | | | | |
|
|
|
| | | | | | | | 24,421 | |
| | | | | | |
|
|
|
| | | | | IT Services - 3.89% | |
| | 1,391 | | | Alliance Data Systems Corp. | | | 46,807 | |
| | 1,662 | | | Amdocs Ltd. | | | 91,360 | |
| | 1,286 | | | Black Knight, Inc. (a) | | | 74,665 | |
| | 2,269 | | | Booz Allen Hamilton Holding Corp. | | | 155,744 | |
| | 3,529 | | | Brightcove, Inc. (a) | | | 24,597 | |
| | 504 | | | CACI International, Inc. - Class A (a) | | | 106,420 | |
| | 1,526 | | | Cardtronics PLC - Class A (a)(b) | | | 31,924 | |
| | 340 | | | Cass Information Systems, Inc. | | | 11,954 | |
| | 5,437 | | | Conduent, Inc. (a) | | | 13,321 | |
| | 1,424 | | | CoreLogic, Inc. | | | 43,489 | |
| | 1,294 | | | CSG Systems International, Inc. | | | 54,154 | |
| | 590 | | | EPAM Systems, Inc. (a)(b) | | | 109,539 | |
| | 657 | | | Euronet Worldwide, Inc. (a) | | | 56,318 | |
| | 1,520 | | | EVERTEC, Inc. | | | 34,550 | |
| | 538 | | | ExlService Holdings, Inc. (a) | | | 27,992 | |
| | 2,351 | | | Genpact, Ltd. | | | 68,649 | |
| | 1,607 | | | GTT Communications, Inc. (a)(b) | | | 12,776 | |
| | 16,924 | | | Information Services Group, Inc. (a) | | | 43,495 | |
| | 2,412 | | | International Money Express, Inc. (a) | | | 22,022 | |
| | 1,765 | | | Leidos Holdings, Inc. | | | 161,762 | |
| | 6,579 | | | Limelight Networks, Inc. (a) | | | 37,500 | |
| | 770 | | | ManTech International Corp. - Class A | | | 55,956 | |
| | 1,785 | | | Maximus, Inc. | | | 103,887 | |
| | 315 | | | MongoDB, Inc. (a) | | | 43,010 | |
| | 2,526 | | | NIC, Inc. | | | 58,098 | |
| | 913 | | | Okta, Inc. (a)(b) | | | 111,623 | |
| | 1,853 | | | Perficient, Inc. (a) | | | 50,198 | |
| | 3,120 | | | Perspecta, Inc. | | | 56,909 | |
| | 6,015 | | | PRGX Global, Inc. (a) | | | 16,842 | |
| | 5,658 | | | Sabre Corp. | | | 33,552 | |
| | 985 | | | Science Applications International Corp. | | | 73,510 | |
| | 1,010 | | | Switch, Inc. - Class A | | | 14,574 | |
See notes to financial statements.
61
GuideMark® Small/Mid Cap Core Fund
SCHEDULE OF INVESTMENTS (Continued)
March 31, 2020
| | | | | | | | |
Number of
Shares
| | | | | Value
| |
| | | | | COMMON STOCKS (Continued) | |
| | | | | IT Services (Continued) | | | | |
| | 2,629 | | | The Hackett Group, Inc. | | $ | 33,441 | |
| | 840 | | | TTEC HLDGS, Inc. | | | 30,845 | |
| | 4,280 | | | Unisys Corp. (a) | | | 52,858 | |
| | 1,467 | | | Verra Mobility Corp. (a) | | | 10,474 | |
| | 1,094 | | | Virtusa Corp. (a) | | | 31,070 | |
| | 512 | | | WEX, Inc. (a) | | | 53,530 | |
| | | | | | |
|
|
|
| | | | | | | | 2,059,415 | |
| | | | | | |
|
|
|
| | | | | Leisure Products - 0.80% | |
| | 1,131 | | | Acushnet Holdings Corp. | | | 29,089 | |
| | 743 | | | Brunswick Corp. | | | 26,280 | |
| | 1,226 | | | Clarus Corp. | | | 12,015 | |
| | 600 | | | Escalade, Inc. | | | 3,570 | |
| | 509 | | | Johnson Outdoors, Inc. - Class A | | | 31,914 | |
| | 970 | | | Malibu Boats, Inc. - Class A (a) | | | 27,926 | |
| | 1,817 | | | Marine Products Corp. | | | 14,681 | |
| | 2,894 | | | MasterCraft Boat Holdings, Inc. (a) | | | 21,126 | |
| | 2,637 | | | Mattel, Inc. (a)(b) | | | 23,232 | |
| | 556 | | | Polaris Industries, Inc. | | | 26,771 | |
| | 763 | | | Pool Corp. (b) | | | 150,136 | |
| | 504 | | | Sturm, Ruger & Co., Inc. | | | 25,659 | |
| | 2,090 | | | Vista Outdoor, Inc. (a) | | | 18,392 | |
| | 701 | | | YETI Holdings, Inc. (a)(b) | | | 13,684 | |
| | | | | | |
|
|
|
| | | | | | | | 424,475 | |
| | | | | | |
|
|
|
| | | | | Life Sciences Tools & Services - 1.23% | |
| | 196 | | | Bio-Rad Laboratories, Inc. - Class A (a) | | | 68,710 | |
| | 228 | | | Bio-Techne Corp. | | | 43,233 | |
| | 1,583 | | | Bruker Corp. | | | 56,766 | |
| | 645 | | | Charles River Laboratories International, Inc. (a) | | | 81,405 | |
| | 4,630 | | | ChromaDex Corp. (a) | | | 15,094 | |
| | 1,706 | | | Luminex Corp. | | | 46,966 | |
| | 847 | | | Medpace holdings, Inc. (a) | | | 62,153 | |
| | 2,056 | | | NanoString Technologies, Inc. (a) | | | 49,447 | |
| | 1,351 | | | NeoGenomics, Inc. (a) | | | 37,301 | |
| | 654 | | | PRA Health Sciences, Inc. (a) | | | 54,308 | |
| | 1,855 | | | QIAGEN NV (a) | | | 77,168 | |
| | 1,444 | | | Syneos Health, Inc. (a) | | | 56,923 | |
| | | | | | |
|
|
|
| | | | | | | | 649,474 | |
| | | | | | |
|
|
|
| | | | | Machinery - 3.22% | |
| | 696 | | | AGCO Corp. | | | 32,886 | |
| | 225 | | | Alamo Group, Inc. | | | 19,975 | |
| | 270 | | | Albany International Corp. - Class A | | | 12,779 | |
| | 1,410 | | | Allison Transmission Holdings, Inc. | | | 45,980 | |
| | 1,361 | | | Altra Industrial Motion Corp. | | | 23,804 | |
| | 506 | | | Astec Industries, Inc. | | | 17,695 | |
| | 525 | | | Badger Meter, Inc. | | | 28,140 | |
| | 583 | | | Barnes Group, Inc. | | | 24,387 | |
| | 750 | | | Blue Bird Corp. (a) | | | 8,198 | |
| | 620 | | | Chart Industries, Inc. (a) | | | 17,968 | |
| | 957 | | | Colfax Corp. (a) | | | 18,949 | |
| | 1,234 | | | Columbus McKinnon Corp. | | | 30,850 | |
| | 6,893 | | | Commercial Vehicle Group, Inc. (a) | | | 10,408 | |
| | 501 | | | Crane Co. | | | 24,639 | |
| | 803 | | | DMC Global, Inc. (b) | | | 18,477 | |
| | 1,525 | | | Donaldson Co., Inc. | | | 58,911 | |
| | 312 | | | Douglas Dynamics, Inc. | | | 11,079 | |
| | 330 | | | EnPro Industries, Inc. | | | 13,061 | |
| | 347 | | | ESCO Technologies, Inc. | | | 26,341 | |
| | | | | | | | |
Number of
Shares
| | | | | Value
| |
| | | | | Machinery (Continued) | | | | |
| | 705 | | | Evoqua Water Technologies Corp. (a) | | $ | 7,903 | |
| | 753 | | | Federal Signal Corp. | | | 20,542 | |
| | 743 | | | Flowserve Corp. | | | 17,750 | |
| | 1,670 | | | Gates Industrial Corp PLC (a)(b) | | | 12,325 | |
| | 1,158 | | | Gencor Industries, Inc. (a) | | | 12,159 | |
| | 1,917 | | | Graco, Inc. (b) | | | 93,415 | |
| | 788 | | | IDEX Corp. (b) | | | 108,831 | |
| | 1,435 | | | Ingersoll Rand, Inc. (a) | | | 35,588 | |
| | 740 | | | ITT, Inc. | | | 33,566 | |
| | 581 | | | John Bean Technologies Corp. | | | 43,151 | |
| | 241 | | | Kadant, Inc. (b) | | | 17,991 | |
| | 667 | | | Kennametal, Inc. | | | 12,420 | |
| | 1,181 | | | L.B. Foster Co. - Class A (a) | | | 14,597 | |
| | 623 | | | Lincoln Electric Holdings, Inc. | | | 42,987 | |
| | 1,450 | | | Lydall, Inc. (a) | | | 9,367 | |
| | 1,403 | | | Meritor, Inc. (a) | | | 18,590 | |
| | 710 | | | Mueller Industries, Inc. | | | 16,997 | |
| | 1,123 | | | Mueller Water Products, Inc. - Class A | | | 8,995 | |
| | 407 | | | Navistar International Corp. (a) | | | 6,711 | |
| | 3,973 | | | NN, Inc. | | | 6,873 | |
| | 581 | | | Nordson Corp. | | | 78,476 | |
| | 635 | | | Omega Flex, Inc. | | | 53,594 | |
| | 697 | | | Oshkosh Corp. | | | 44,838 | |
| | 968 | | | Park-Ohio Holdings Corp. | | | 18,334 | |
| | 1,549 | | | Pentair PLC | | | 46,098 | |
| | 376 | | | Proto Labs, Inc. (a) | | | 28,625 | |
| | 145 | | | RBC Bearings, Inc. (a) | | | 16,355 | |
| | 1,986 | | | REV Group, Inc. | | | 8,282 | |
| | 1,015 | | | Rexnord Corp. | | | 23,010 | |
| | 748 | | | Snap-on, Inc. | | | 81,397 | |
| | 931 | | | Spartan Motors, Inc. | | | 12,019 | |
| | 902 | | | SPX Corp. (a) | | | 29,441 | |
| | 586 | | | SPX FLOW, Inc. (a) | | | 16,654 | |
| | 351 | | | Tennant Co. | | | 20,340 | |
| | 689 | | | Terex Corp. (b) | | | 9,894 | |
| | 568 | | | The Eastern Co. | | | 11,076 | |
| | 350 | | | The Middleby Corp. (a) | | | 19,908 | |
| | 859 | | | The Timken Co. | | | 27,780 | |
| | 1,221 | | | The Toro Co. | | | 79,475 | |
| | 5,684 | | | Titan International, Inc. | | | 8,810 | |
| | 1,320 | | | TriMas Corp. (a) | | | 30,492 | |
| | 118 | | | Valmont Industries, Inc. | | | 12,506 | |
| | 1,564 | | | Wabash National Corp. (b) | | | 11,292 | |
| | 361 | | | Watts Water Technologies, Inc. - Class A | | | 30,559 | |
| | | | | | |
|
|
|
| | | | | | | | 1,704,540 | |
| | | | | | |
|
|
|
| | | | | Marine - 0.09% | |
| | 2,194 | | | Costamere, Inc. | | | 9,917 | |
| | 274 | | | Kirby Corp. (a) | | | 11,911 | |
| | 13,501 | | | Safe Bulkers, Inc. (a) | | | 16,066 | |
| | 4,624 | | | Scorpio Bulkers, Inc. | | | 11,699 | |
| | | | | | |
|
|
|
| | | | | | | | 49,593 | |
| | | | | | |
|
|
|
| | | | | Media - 1.15% | |
| | 438 | | | AMC Networks, Inc. - Class A (a)(b) | | | 10,648 | |
| | 44 | | | Cable One, Inc. | | | 72,337 | |
| | 466 | | | Cardlytics, Inc. (a) | | | 16,291 | |
| | 4,264 | | | Central European Media Enterprises, Ltd. - Class A (a) | | | 13,346 | |
| | 1,437 | | | Cinemark Holdings, Inc. | | | 14,643 | |
| | 3,078 | | | Emerald Holding, Inc. | | | 7,972 | |
See notes to financial statements.
62
GuideMark® Small/Mid Cap Core Fund
SCHEDULE OF INVESTMENTS (Continued)
March 31, 2020
| | | | | | | | |
Number of
Shares
| | | | | Value
| |
| | | | | COMMON STOCKS (Continued) | |
| | | | | Media (Continued) | | | | |
| | 4,653 | | | Entercom Communications Corp. - Class A | | $ | 7,957 | |
| | 8,066 | | | Fluent, Inc. (a) | | | 9,437 | |
| | 496 | | | GCI Liberty, Inc. - Class A (a) | | | 28,257 | |
| | 1,370 | | | Gray Television, Inc. (a) | | | 14,714 | |
| | 1,397 | | | IMAX Corp. (a) | | | 12,643 | |
| | 651 | | | John Wiley & Sons, Inc. - Class A | | | 24,406 | |
| | 1,108 | | | Liberty Latin America, Ltd. - Class A (a) | | | 11,656 | |
| | 1,329 | | | Liberty Latin America, Ltd. - Class C (a) | | | 13,636 | |
| | 19,666 | | | Lee Enterprises, Inc. (a) | | | 19,332 | |
| | 1,208 | | | MSG Networks, Inc. - Class A (a)(b) | | | 12,322 | |
| | 2,506 | | | News Corp. - Class A | | | 22,491 | |
| | 933 | | | News Corp. - Class B | | | 8,388 | |
| | 529 | | | Nexstar Media Group, Inc. - Class A | | | 30,539 | |
| | 644 | | | Scholastic Corp. | | | 16,416 | |
| | 893 | | | Sinclair Broadcast Group, Inc. - Class A (b) | | | 14,359 | |
| | 2,794 | | | TechTarget, Inc. (a) | | | 57,584 | |
| | 2,414 | | | TEGNA, Inc. | | | 26,216 | |
| | 1,184 | | | The E.W. Scripps Co. - Class A | | | 8,927 | |
| | 3,321 | | | The Interpublic Group of Companies, Inc. | | | 53,767 | |
| | 2,099 | | | The New York Times Co. - Class A (b) | | | 64,460 | |
| | 536 | | | Value Line, Inc. | | | 17,340 | |
| | | | | | |
|
|
|
| | | | | | | | 610,084 | |
| | | | | | |
|
|
|
| | | | | Metals & Mining - 0.87% | |
| | 2,495 | | | Alcoa Corp. (a) | | | 15,369 | |
| | 1,375 | | | Allegheny Technologies, Inc. (a)(b) | | | 11,688 | |
| | 2,576 | | | Cleveland-Cliffs, Inc. (b) | | | 10,175 | |
| | 2,826 | | | Coeur Mining, Inc. (a) | | | 9,071 | |
| | 1,494 | | | Commercial Metals Co. | | | 23,590 | |
| | 213 | | | Compass Minerals International, Inc. | | | 8,194 | |
| | 503 | | | Gibraltar Industries, Inc. (a) | | | 21,589 | |
| | 539 | | | Haynes International, Inc. | | | 11,109 | |
| | 5,106 | | | Hecla Mining Co. | | | 9,293 | |
| | 133 | | | Kaiser Aluminum Corp. (b) | | | 9,214 | |
| | 540 | | | Materion Corp. | | | 18,905 | |
| | 2,048 | | | Novagold Resources, Inc. (a) | | | 15,114 | |
| | 2,390 | | | Olympic Steel, Inc. | | | 24,737 | |
| | 1,068 | | | Reliance Steel & Aluminum Co. (b) | | | 93,546 | |
| | 306 | | | Royal Gold, Inc. | | | 26,839 | |
| | 4,021 | | | Ryerson Holding Corp. (a) | | | 21,392 | |
| | 1,101 | | | Schnitzer Steel Industries, Inc. - Class A | | | 14,357 | |
| | 2,359 | | | Steel Dynamics, Inc. | | | 53,172 | |
| | 4,614 | | | SunCoke Energy, Inc. | | | 17,764 | |
| | 3,366 | | | TimkenSteel Corp. (a) | | | 10,872 | |
| | 1,872 | | | Warrior Met Coal, Inc. | | | 19,881 | |
| | 483 | | | Worthington Industries, Inc. | | | 12,679 | |
| | | | | | |
|
|
|
| | | | | | | | 458,550 | |
| | | | | | |
|
|
|
| | | | | Multiline Retail - 0.60% | |
| | 1,391 | | | Big Lots, Inc. | | | 19,780 | |
| | 836 | | | Burlington Stores, Inc. (a)(b) | | | 132,473 | |
| | 634 | | | Dillard’s, Inc. - Class A (b) | | | 23,426 | |
| | 40,412 | | | J.C. Penney Co., Inc. (a) | | | 14,548 | |
| | 2,778 | | | Kohl’s Corp. | | | 40,531 | |
| | 6,034 | | | Macy’s, Inc. (b) | | | 29,627 | |
| | 1,814 | | | Nordstrom, Inc. (b) | | | 27,827 | |
| | 645 | | | Ollie’s Bargain Outlet Holdings, Inc. (a)(b) | | | 29,889 | |
| | | | | | |
|
|
|
| | | | | | | | 318,101 | |
| | | | | | |
|
|
|
| | | | | | | | |
Number of
Shares
| | | | | Value
| |
| | | | | Multi-Utilities - 0.42% | |
| | 1,849 | | | Alliant Energy Corp. | | $ | 89,288 | |
| | 418 | | | Avista Corp. | | | 17,761 | |
| | 634 | | | Black Hills Corp. | | | 40,595 | |
| | 2,100 | | | MDU Resources Group, Inc. | | | 45,150 | |
| | 520 | | | NorthWestern Corp. | | | 31,112 | |
| | | | | | |
|
|
|
| | | | | | | | 223,906 | |
| | | | | | |
|
|
|
| | | | | Oil, Gas & Consumable Fuels - 0.56% | |
| | 7,098 | | | Amyris, Inc. (a)(b) | | | 18,171 | |
| | 424 | | | Arch Coal, Inc. - Class A | | | 12,253 | |
| | 211 | | | Chesapeake Utilities Corp. | | | 18,085 | |
| | 602 | | | CVR Energy, Inc. | | | 9,951 | |
| | 1,176 | | | Delek US Holdings, Inc | | | 18,534 | |
| | 4,203 | | | DHT Holdings, Inc. | | | 32,237 | |
| | 2,527 | | | Dorian LPG, Ltd. (a) | | | 22,010 | |
| | 1,362 | | | HollyFrontier Corp. | | | 33,383 | |
| | 620 | | | NACCO Industries, Inc. - Class A | | | 17,348 | |
| | 6,499 | | | Nordic American Tankers Ltd. | | | 29,440 | |
| | 1,067 | | | Par Pacific Holdings, Inc. (a) | | | 7,576 | |
| | 844 | | | PBF Energy, Inc. - Class A | | | 5,975 | |
| | 1,905 | | | Teekay Tankers Ltd. - Class A (a) | | | 42,367 | |
| | 1,111 | | | World Fuel Services Corp. | | | 27,975 | |
| | | | | | |
|
|
|
| | | | | | | | 295,305 | |
| | | | | | |
|
|
|
| | | | | Paper & Forest Products - 0.20% | |
| | 1,083 | | | Boise Cascade Co. | | | 25,754 | |
| | 749 | | | Domtar Corp. | | | 16,208 | |
| | 978 | | | Louisiana-Pacific Corp. | | | 16,802 | |
| | 1,385 | | | PH Glatfelter Co. | | | 16,925 | |
| | 530 | | | Schweitzer-Mauduit International, Inc. (b) | | | 14,745 | |
| | 1,129 | | | Verso Corp. - Class A (a) | | | 12,735 | |
| | | | | | |
|
|
|
| | | | | | | | 103,169 | |
| | | | | | |
|
|
|
| | | | | Personal Products - 0.65% | |
| | 974 | | | BellRing Brands, Inc. - Class A (a) | | | 16,607 | |
| | 582 | | | Edgewell Personal Care Co. (a) | | | 14,014 | |
| | 1,430 | | | elf Beauty, Inc. (a) | | | 14,071 | |
| | 2,012 | | | Herbalife Nutrition, Ltd. (a)(b) | | | 58,670 | |
| | 537 | | | Inter Parfums, Inc. | | | 24,890 | |
| | 2,986 | | | Lifevantage Corp. (a) | | | 30,756 | |
| | 585 | | | Medifast, Inc. (b) | | | 36,562 | |
| | 3,561 | | | Nature’s Sunshine Products, Inc. (a) | | | 28,951 | |
| | 1,975 | | | Nu Skin Enterprises, Inc. - Class A | | | 43,154 | |
| | 1,263 | | | Revlon, Inc. - Class A (a)(b) | | | 13,805 | |
| | 929 | | | USANA Health Sciences, Inc. (a) | | | 53,659 | |
| | 13,755 | | | Youngevity International, Inc. (a)(b) | | | 9,628 | |
| | | | | | |
|
|
|
| | | | | | | | 344,767 | |
| | | | | | |
|
|
|
| | | | | Pharmaceuticals - 2.12% | |
| | 15,910 | | | Akorn, Inc. (a) | | | 8,929 | |
| | 4,196 | | | Amneal Pharmaceuticals, Inc. (a) | | | 14,602 | |
| | 1,006 | | | ANI Pharmaceuticals, Inc. (a) | | | 40,984 | |
| | 353 | | | Arvinas, Inc. (a) | | | 14,226 | |
| | 75,427 | | | Assertio Therapeutics, Inc. (a) | | | 49,027 | |
| | 431 | | | Axsome Therapeutics, Inc. (a) | | | 25,356 | |
| | 5,683 | | | BioDelivery Sciences International, Inc. (a) | | | 21,539 | |
| | 1,268 | | | Catalent, Inc. (a) | | | 65,873 | |
| | 5,713 | | | Collegium Pharmaceutical, Inc. (a)(b) | | | 93,293 | |
| | 5,875 | | | Corcept Therapeutics, Inc. (a)(b) | | | 69,854 | |
| | 12,032 | | | Endo International PLC (a) | | | 44,518 | |
| | 3,558 | | | Horizon Therapeutics Plc (a) | | | 105,388 | |
See notes to financial statements.
63
GuideMark® Small/Mid Cap Core Fund
SCHEDULE OF INVESTMENTS (Continued)
March 31, 2020
| | | | | | | | |
Number of
Shares
| | | | | Value
| |
| | | | | COMMON STOCKS (Continued) | |
| | | | | Pharmaceuticals (Continued) | | | | |
| | 3,571 | | | Innoviva, Inc. (a)(b) | | $ | 41,995 | |
| | 1,645 | | | Intersect ENT, Inc. (a) | | | 19,493 | |
| | 935 | | | Jazz Pharmaceuticals PLC (a) | | | 93,257 | |
| | 7,438 | | | Lannett Co., Inc. (a)(b) | | | 51,694 | |
| | 28,990 | | | Mallinckrodt PLC (a)(b) | | | 57,400 | |
| | 287 | | | MyoKardia, Inc. (a) | | | 13,455 | |
| | 466 | | | Odonate Therapeutics, Inc. (a) | | | 12,866 | |
| | 530 | | | Pacira Pharmaceuticals, Inc. (a) | | | 17,771 | |
| | 1,769 | | | Perrigo Co. PLC | | | 85,071 | |
| | 1,033 | | | Phibro Animal Health Corp. - Class A | | | 24,968 | |
| | 1,992 | | | Prestige Consumer Healthcare, Inc. (a) | | | 73,067 | |
| | 99 | | | Reata Pharmaceuticals, Inc. - Class A (a) | | | 14,290 | |
| | 663 | | | Revance Therapeutics, Inc. (a) | | | 9,812 | |
| | 2,950 | | | Supernus Pharmaceuticals, Inc. (a) | | | 53,070 | |
| | | | | | |
|
|
|
| | | | | | | | 1,121,798 | |
| | | | | | |
|
|
|
| | | | | Professional Services - 1.20% | |
| | 965 | | | ASGN, Inc. (a) | | | 34,084 | |
| | 3,417 | | | BG Staffing, Inc. | | | 25,559 | |
| | 1,552 | | | CBIZ, Inc. (a) | | | 32,468 | |
| | 422 | | | CRA International, Inc. | | | 14,099 | |
| | 360 | | | Exponent, Inc. | | | 25,888 | |
| | 540 | | | Forrester Research, Inc. (a) | | | 15,784 | |
| | 1,236 | | | Franklin Covey Co. (a) | | | 19,207 | |
| | 504 | | | FTI Consulting, Inc. (a) | | | 60,364 | |
| | 1,340 | | | GP Strategies Corp. (a) | | | 8,723 | |
| | 556 | | | Heidrick & Struggles International, Inc. | | | 12,510 | |
| | 428 | | | Huron Consulting Group, Inc. (a) | | | 19,414 | |
| | 520 | | | ICF International, Inc. | | | 35,724 | |
| | 6,124 | | | InnerWorkings, Inc. (a) | | | 7,165 | |
| | 705 | | | Insperity, Inc. (b) | | | 26,297 | |
| | 1,389 | | | Kelly Services, Inc. - Class A | | | 17,626 | |
| | 1,318 | | | Kforce, Inc. | | | 33,701 | |
| | 507 | | | Korn Ferry International | | | 12,330 | |
| | 903 | | | ManpowerGroup, Inc. | | | 47,850 | |
| | 3,621 | | | Mistras Group, Inc. (a) | | | 15,425 | |
| | 2,235 | | | Resources Connection, Inc. | | | 24,518 | |
| | 2,013 | | | Robert Half International, Inc. | | | 75,991 | |
| | 349 | | | TriNet Group, Inc. (a) | | | 13,143 | |
| | 2,352 | | | TrueBlue, Inc. (a) | | | 30,012 | |
| | 609 | | | VSE Corp. | | | 9,982 | |
| | 837 | | | WILLDAN GROUP, Inc. (a) | | | 17,887 | |
| | | | | | |
|
|
|
| | | | | | | | 635,751 | |
| | | | | | |
|
|
|
| | | | | Real Estate Management & Development - 0.60% | |
| | 4,149 | | | Altisource Portfolio Solutions SA (a) | | | 31,823 | |
| | 741 | | | Cushman & Wakefield Plc (a) | | | 8,699 | |
| | 4,685 | | | eXp World Holdings, Inc. (a) | | | 39,635 | |
| | 1,382 | | | Forestar Group, Inc. (a) | | | 14,304 | |
| | 619 | | | Jones Lang LaSalle, Inc. (b) | | | 62,507 | |
| | 866 | | | Kennedy-Wilson Holdings, Inc. | | | 11,622 | |
| | 1,593 | | | Marcus & Millichap, Inc. (a) | | | 43,170 | |
| | 6,364 | | | Newmark Group, Inc. - Class A | | | 27,047 | |
| | 580 | | | RE/MAX Holdings, Inc. - Class A | | | 12,713 | |
| | 9,163 | | | Realogy Holdings Corp. | | | 27,581 | |
| | 490 | | | Redfin Corp. (a) | | | 7,556 | |
| | 799 | | | The RMR Group, Inc. - Class A | | | 21,549 | |
| | 585 | | | The St. Joe Co. (a) | | | 9,816 | |
| | | | | | |
|
|
|
| | | | | | | | 318,022 | |
| | | | | | |
|
|
|
| | | | | | | | |
Number of
Shares
| | | | | Value
| |
| | | | | Road & Rail - 0.31% | |
| | 1,081 | | | ArcBest Corp. | | $ | 18,939 | |
| | 5,512 | | | Daseke, Inc. (a) | | | 7,717 | |
| | 449 | | | Knight-Swift Transportation Holdings, Inc. | | | 14,727 | |
| | 643 | | | Landstar System, Inc. (b) | | | 61,638 | |
| | 392 | | | PAM Transportation Services, Inc. (a) | | | 12,054 | |
| | 2,432 | | | Roadrunner Transportation Systems, Inc. (a) | | | 6,201 | |
| | 255 | | | Saia, Inc. (a) | | | 18,753 | |
| | 948 | | | Universal Logistics Holdings, Inc. | | | 12,419 | |
| | 296 | | | Werner Enterprises, Inc. (b) | | | 10,733 | |
| | | | | | |
|
|
|
| | | | | | | | 163,181 | |
| | | | | | |
|
|
|
| | | | | Semiconductors & Semiconductor Equipment - 2.49% | |
| | 514 | | | Advanced Energy Industries, Inc. (a) | | | 24,924 | |
| | 346 | | | Ambarella, Inc. (a) | | | 16,802 | |
| | 3,761 | | | Amkor Technology, Inc. (a) | | | 29,298 | |
| | 879 | | | Axcelis Technologies, Inc. (a) | | | 16,094 | |
| | 856 | | | Brooks Automation, Inc. | | | 26,108 | |
| | 170 | | | Cabot Microelectronics Corp. | | | 19,404 | |
| | 1,476 | | | Cirrus Logic, Inc. (a) | | | 96,870 | |
| | 661 | | | Cohu, Inc. | | | 8,183 | |
| | 432 | | | Cree, Inc. (a) | | | 15,319 | |
| | 3,714 | | | Cypress Semiconductor Corp. | | | 86,610 | |
| | 1,068 | | | Diodes, Inc. (a) | | | 43,398 | |
| | 1,319 | | | Entegris, Inc. | | | 59,052 | |
| | 409 | | | First Solar, Inc. (a) | | | 14,749 | |
| | 1,180 | | | FormFactor, Inc. (a) | | | 23,706 | |
| | 1,041 | | | Ichor Holdings, Ltd. (a) | | | 19,946 | |
| | 728 | | | Impinj, Inc. (a) | | | 12,165 | |
| | 289 | | | Inphi Corp. (a) | | | 22,880 | |
| | 1,656 | | | Lattice Semiconductor Corp. (a)(b) | | | 29,510 | |
| | 1,192 | | | MaxLinear, Inc. (a) | | | 13,911 | |
| | 689 | | | MKS Instruments, Inc. | | | 56,119 | |
| | 785 | | | Monolithic Power Systems, Inc. (b) | | | 131,456 | |
| | 4,610 | | | NeoPhotonics Corp. (a) | | | 33,422 | |
| | 5,271 | | | ON Semiconductor Corp. (a)(b) | | | 65,571 | |
| | 1,115 | | | Onto Innovation, Inc. (a) | | | 33,082 | |
| | 2,398 | | | Photronics, Inc. (a) | | | 24,603 | |
| | 755 | | | Power Integrations, Inc. | | | 66,689 | |
| | 2,869 | | | Rambus, Inc. (a) | | | 31,846 | |
| | 623 | | | Semtech Corp. (a) | | | 23,362 | |
| | 319 | | | Silicon Laboratories, Inc. (a) | | | 27,246 | |
| | 1,665 | | | SMART Global Holdings, Inc. (a) | | | 40,460 | |
| | 2,439 | | | Teradyne, Inc. (b) | | | 132,121 | |
| | 2,362 | | | Ultra Clean Holdings, Inc. (a) | | | 32,596 | |
| | 2,619 | | | Xperi Corp. | | | 36,430 | |
| | | | | | |
|
|
|
| | | | | | | | 1,313,932 | |
| | | | | | |
|
|
|
| | | | | Software - 7.96% | |
| | 1,047 | | | 2U, Inc. (a) | | | 22,217 | |
| | 2,527 | | | 8x8, Inc. (a)(b) | | | 35,024 | |
| | 4,084 | | | A10 Networks, Inc. (a) | | | 25,362 | |
| | 1,447 | | | ACI Worldwide, Inc. (a) | | | 34,945 | |
| | 1,402 | | | Agilysys, Inc. (a) | | | 23,413 | |
| | 825 | | | Alarm.com Holdings, Inc. (a)(b) | | | 32,101 | |
| | 1,157 | | | Altair Engineering, Inc. - Class A (a) | | | 30,660 | |
| | 651 | | | Alteryx, Inc. - Class A (a)(b) | | | 61,956 | |
| | 2,127 | | | American Software, Inc. - Class A | | | 30,225 | |
| | 1,089 | | | Anaplan, Inc. (a) | | | 32,953 | |
| | 985 | | | Appfolio, Inc. - Class A (a) | | | 109,286 | |
| | 749 | | | Appian Corp. (a) | | | 30,132 | |
| | 1,181 | | | Aspen Technology, Inc. (a) | | | 112,278 | |
See notes to financial statements.
64
GuideMark® Small/Mid Cap Core Fund
SCHEDULE OF INVESTMENTS (Continued)
March 31, 2020
| | | | | | | | |
Number of
Shares
| | | | | Value
| |
| | | | | COMMON STOCKS (Continued) | |
| | | | | Software (Continued) | | | | |
| | 411 | | | Avalara, Inc. (a) | | $ | 30,661 | |
| | 4,804 | | | Avaya Holdings Corp. (a)(b) | | | 38,864 | |
| | 425 | | | Blackbaud, Inc. | | | 23,609 | |
| | 189 | | | Blackline, Inc. (a) | | | 9,943 | |
| | 633 | | | Bottomline Technologies, Inc. (a) | | | 23,199 | |
| | 2,345 | | | Box, Inc. - Class A (a) | | | 32,924 | |
| | 1,363 | | | CDK Global, Inc. | | | 44,774 | |
| | 2,308 | | | Cerence, Inc. (a)(b) | | | 35,543 | |
| | 455 | | | Ceridian HCM Holding, Inc. (a) | | | 22,782 | |
| | 6,982 | | | ChannelAdvisor Corp. (a) | | | 50,689 | |
| | 1,562 | | | Cloudera, Inc. (a) | | | 12,293 | |
| | 1,135 | | | CommVault Systems, Inc. (a)(b) | | | 45,945 | |
| | 945 | | | Cornerstone OnDemand, Inc. (a) | | | 30,004 | |
| | 331 | | | Coupa Software, Inc. (a) | | | 46,251 | |
| | 5,165 | | | Digital Turbine, Inc. (a) | | | 22,261 | |
| | 1,721 | | | DocuSign, Inc. (a)(b) | | | 159,020 | |
| | 1,736 | | | Domo, Inc. - Class B (a) | | | 17,256 | |
| | 430 | | | Dynatrace, Inc. (a) | | | 10,251 | |
| | 2,627 | | | Ebix, Inc. | | | 39,878 | |
| | 4,503 | | | eGain Corp. (a) | | | 33,007 | |
| | 333 | | | Elastic NV (a) | | | 18,585 | |
| | 373 | | | Envestnet, Inc. (a) | | | 20,060 | |
| | 325 | | | ePlus, Inc. (a) | | | 20,351 | |
| | 326 | | | Everbridge, Inc. (a)(b) | | | 34,673 | |
| | 381 | | | Fair Isaac Corp. (a)(b) | | | 117,230 | |
| | 1,600 | | | Five9, Inc. (a)(b) | | | 122,336 | |
| | 1,187 | | | ForeScout Technologies, Inc. (a) | | | 37,497 | |
| | 406 | | | Guidewire Software, Inc. (a) | | | 32,200 | |
| | 515 | | | HubSpot, Inc. (a) | | | 68,593 | |
| | 664 | | | Intelligent Systems Corp. (a)(b) | | | 22,569 | |
| | 856 | | | j2 Global, Inc. | | | 64,072 | |
| | 922 | | | Jack Henry & Associates, Inc. | | | 143,131 | |
| | 2,398 | | | LivePerson, Inc. (a)(b) | | | 54,554 | |
| | 743 | | | LogMeIn, Inc. | | | 61,877 | |
| | 2,587 | | | Majesco, Inc. (a) | | | 14,125 | |
| | 1,209 | | | Manhattan Associates, Inc. (a) | | | 60,232 | |
| | 318 | | | MicroStrategy, Inc. - Class A (a) | | | 37,556 | |
| | 4,010 | | | Mitek Systems, Inc. (a) | | | 31,599 | |
| | 8,689 | | | MobileIron, Inc. (a) | | | 33,018 | |
| | 1,181 | | | Model N, Inc. (a) | | | 26,230 | |
| | 672 | | | New Relic, Inc. (a)(b) | | | 31,073 | |
| | 5,084 | | | Nuance Communications, Inc. (a) | | | 85,309 | |
| | 1,903 | | | Nutanix, Inc. - Class A (a) | | | 30,067 | |
| | 2,018 | | | OneSpan, Inc. (a) | | | 36,627 | |
| | 465 | | | Paycom Software, Inc. (a) | | | 93,935 | |
| | 229 | | | Paylocity Holding Corp. (a)(b) | | | 20,225 | |
| | 854 | | | Pegasystems, Inc. (b) | | | 60,830 | |
| | 2,176 | | | Progress Software Corp. (b) | | | 69,632 | |
| | 608 | | | Proofpoint, Inc. (a) | | | 62,375 | |
| | 984 | | | PROS Holdings, Inc. (a) | | | 30,533 | |
| | 1,166 | | | PTC, Inc. (a) | | | 71,371 | |
| | 430 | | | Q2 Holdings, Inc. (a) | | | 25,396 | |
| | 927 | | | QAD, Inc. - Class A | | | 37,015 | |
| | 441 | | | Qualys, Inc. (a)(b) | | | 38,363 | |
| | 1,599 | | | Rapid7, Inc. (a) | | | 69,285 | |
| | 674 | | | RealPage, Inc. (a)(b) | | | 35,675 | |
| | 6,884 | | | Rimini Street Inc. (a) | | | 28,156 | |
| | 1,278 | | | RingCentral, Inc. - Class A (a) | | | 270,821 | |
| | 955 | | | SailPoint Technologies Holding Inc. (a) | | | 14,535 | |
| | | | | | | | |
Number of
Shares
| | | | | Value
| |
| | | | | Software (Continued) | | | | |
| | 2,585 | | | SecureWorks Corp. - Class A (a) | | $ | 29,753 | |
| | 1,229 | | | SharpSpring, Inc. (a) | | | 7,448 | |
| | 615 | | | ShotSpotter, Inc. (a) | | | 16,900 | |
| | 1,209 | | | Smartsheet, Inc. - Class A (a) | | | 50,186 | |
| | 773 | | | SolarWinds Corp. (a)(b) | | | 12,113 | |
| | 762 | | | SPS Commerce, Inc. (a) | | | 35,441 | |
| | 809 | | | SVMK, Inc. (a) | | | 10,930 | |
| | 11,621 | | | Synchronoss Technologies, Inc. (a) | | | 35,444 | |
| | 3,142 | | | Telaria, Inc. (a) | | | 18,852 | |
| | 8,846 | | | Telenav, Inc. (a) | | | 38,215 | |
| | 2,009 | | | The Rubicon Project, Inc. (a) | | | 11,150 | |
| | 355 | | | The Trade Desk, Inc. - Class A (a)(b) | | | 68,515 | |
| | 6,201 | | | TiVo Corp. | | | 43,903 | |
| | 302 | | | Tyler Technologies, Inc. (a) | | | 89,561 | |
| | 578 | | | Upland Software, Inc. (a) | | | 15,502 | |
| | 901 | | | Varonis Systems, Inc. (a)(b) | | | 57,367 | |
| | 1,130 | | | Verint Systems, Inc. (a) | | | 48,590 | |
| | 1,337 | | | Workiva, Inc. (a) | | | 43,225 | |
| | 2,651 | | | Yext, Inc. (a) | | | 27,014 | |
| | 722 | | | Zcaler, Inc. (a)(b) | | | 43,941 | |
| | 1,062 | | | Zendesk, Inc. (a)(b) | | | 67,979 | |
| | | | | | |
|
|
|
| | | | | | | | 4,213,446 | |
| | | | | | |
|
|
|
| | | | | Specialty Retail - 2.73% | |
| | 1,581 | | | Aaron’s, Inc. | | | 36,015 | |
| | 3,108 | | | Abercrombie & Fitch Co. - Class A | | | 28,252 | |
| | 2,873 | | | American Eagle Outfitters, Inc. | | | 22,840 | |
| | 833 | | | America’sCar-Mart, Inc. (a) | | | 46,940 | |
| | 461 | | | Asbury Automotive Group, Inc. (a) | | | 25,461 | |
| | 11,172 | | | Ascena Retail Group, Inc. (a) | | | 15,529 | |
| | 981 | | | AutoNation, Inc. (a)(b) | | | 27,527 | |
| | 6,022 | | | Barnes & Noble Education, Inc. (a) | | | 8,190 | |
| | 4,674 | | | Bed Bath & Beyond, Inc. (b) | | | 19,678 | |
| | 758 | | | Boot Barn Holdings, Inc. (a) | | | 9,801 | |
| | 5,959 | | | Caleres, Inc. | | | 30,987 | |
| | 1,566 | | | Camping World Holdings, Inc. - Class A | | | 8,911 | |
| | 481 | | | Carvana Co. (a)(b) | | | 26,498 | |
| | 8,672 | | | Chico’s FAS, Inc. | | | 11,187 | |
| | 2,191 | | | Citi Trends, Inc. | | | 19,500 | |
| | 2,272 | | | Conn’s, Inc. (a) | | | 9,497 | |
| | 2,710 | | | Designer Brands, Inc. - Class A | | | 13,496 | |
| | 1,401 | | | Dick’s Sporting Goods, Inc. | | | 29,785 | |
| | 7,086 | | | Express, Inc. (a) | | | 10,558 | |
| | 708 | | | Five Below, Inc. (a)(b) | | | 49,829 | |
| | 916 | | | Floor & Decor Holdings, Inc. - Class A (a) | | | 29,394 | |
| | 1,702 | | | Foot Locker, Inc. | | | 37,529 | |
| | 3,961 | | | GameStop Corp. - Class A (a)(b) | | | 13,864 | |
| | 1,574 | | | Genesco, Inc. (a) | | | 20,997 | |
| | 21,082 | | | GNC Holdings, Inc. - Class A (a)(b) | | | 9,869 | |
| | 301 | | | Group 1 Automotive, Inc. | | | 13,322 | |
| | 1,392 | | | Guess?, Inc. | | | 9,424 | |
| | 2,397 | | | Haverty Furniture Cos., Inc. | | | 28,500 | |
| | 1,720 | | | Hibbett Sports, Inc. (a) | | | 18,808 | |
| | 6,582 | | | Hudson, Ltd. - Class A (a) | | | 33,042 | |
| | 34,481 | | | J. JILL, Inc. (a)(b) | | | 19,047 | |
| | 2,718 | | | L Brands, Inc. | | | 31,420 | |
| | 305 | | | Lithia Motors, Inc. - Class A | | | 24,946 | |
| | 4,222 | | | Lumber Liquidators Holdings, Inc. (a) | | | 19,801 | |
| | 1,541 | | | MarineMax, Inc. (a) | | | 16,057 | |
| | 383 | | | Monro, Inc. | | | 16,779 | |
See notes to financial statements.
65
GuideMark® Small/Mid Cap Core Fund
SCHEDULE OF INVESTMENTS (Continued)
March 31, 2020
| | | | | | | | |
Number of
Shares
| | | | | Value
| |
| | | | | COMMON STOCKS (Continued) | |
| | | | | Specialty Retail (Continued) | | | | |
| | 544 | | | Murphy USA, Inc. (a)(b) | | $ | 45,892 | |
| | 793 | | | National Vision Holdings, Inc. (a) | | | 15,400 | |
| | 9,873 | | | Office Depot, Inc. | | | 16,192 | |
| | 406 | | | Penske Automotive Group, Inc. (b) | | | 11,368 | |
| | 5,703 | | | Rent-A-Center, Inc. | | | 80,640 | |
| | 647 | | | RH (a)(b) | | | 65,004 | |
| | 51,254 | | | RTW RetailWinds, Inc. (a) | | | 10,769 | |
| | 3,026 | | | Sally Beauty Holdings, Inc. (a) | | | 24,450 | |
| | 1,211 | | | Shoe Carnival, Inc. | | | 25,152 | |
| | 1,493 | | | Signet Jewelers, Ltd. | | | 9,630 | |
| | 1,009 | | | Sleep Number Corp. (a) | | | 19,332 | |
| | 1,067 | | | Sonic Automotive, Inc. - Class A | | | 14,170 | |
| | 6,041 | | | Sportsman’s Warehouse Holdings, Inc. (a) | | | 37,213 | |
| | 9,912 | | | Tailored Brands, Inc. (b) | | | 17,247 | |
| | 1,628 | | | The Buckle, Inc. (b) | | | 22,320 | |
| | 1,540 | | | The Cato Corp. - Class A | | | 16,432 | |
| | 949 | | | The Children’s Place, Inc. | | | 18,562 | |
| | 9,664 | | | The Container Store Group, Inc. (a) | | | 22,807 | |
| | 6,690 | | | The Michaels Cos., Inc. (a)(b) | | | 10,838 | |
| | 5,143 | | | Tilly’s, Inc. - Class A | | | 21,241 | |
| | 1,930 | | | Urban Outfitters, Inc. (a) | | | 27,483 | |
| | 1,298 | | | Williams Sonoma, Inc. (b) | | | 55,191 | |
| | 232 | | | Winmark Corp. | | | 29,561 | |
| | 2,120 | | | Zumiez, Inc. (a) | | | 36,718 | |
| | | | | | |
|
|
|
| | | | | | | | 1,446,892 | |
| | | | | | |
|
|
|
| | | | | Technology Hardware, Storage & Peripherals - 0.62% | |
| | 2,305 | | | 3D Systems Corp. (a) | | | 17,772 | |
| | 1,183 | | | AstroNova, Inc. | | | 9,180 | |
| | 4,908 | | | Avid Technology, Inc. (a) | | | 33,031 | |
| | 2,670 | | | Diebold Nixdorf, Inc. (a)(b) | | | 9,398 | |
| | 1,752 | | | NCR Corp. (a) | | | 31,010 | |
| | 3,341 | | | Pure Storage, Inc. - Class A (a) | | | 41,094 | |
| | 14,384 | | | Sonim Technologies, Inc. (a) | | | 10,069 | |
| | 825 | | | Stratasys, Ltd. (a)(b) | | | 13,159 | |
| | 1,322 | | | Synaptics, Inc. (a)(b) | | | 76,504 | |
| | 2,047 | | | Teradata Corp. (a) | | | 41,943 | |
| | 2,301 | | | Xerox Holdings Corp. | | | 43,581 | |
| | | | | | |
|
|
|
| | | | | | | | 326,741 | |
| | | | | | |
|
|
|
| | | | | Textiles, Apparel & Luxury Goods - 1.28% | |
| | 3,081 | | | Capri Holdings, Ltd. (a)(b) | | | 33,244 | |
| | 633 | | | Carter’s, Inc. | | | 41,607 | |
| | 846 | | | Columbia Sportswear Co. | | | 59,025 | |
| | 3,157 | | | Crocs, Inc. (a) | | | 53,637 | |
| | 613 | | | Deckers Outdoor Corp. (a) | | | 82,142 | |
| | 6,323 | | | Fossil Group, Inc. (a)(b) | | | 20,803 | |
| | 1,776 | | | G-III Apparel Group, Ltd. (a) | | | 13,675 | |
| | 3,663 | | | Hanesbrands, Inc. (b) | | | 28,828 | |
| | 453 | | | Kontoor Brands, Inc. | | | 8,684 | |
| | 1,019 | | | Movado Group, Inc. | | | 12,045 | |
| | 631 | | | Oxford Industries, Inc. | | | 22,880 | |
| | 832 | | | Ralph Lauren Corp. - Class A | | | 55,603 | |
| | 830 | | | Rocky Brands, Inc. | | | 16,061 | |
| | 2,402 | | | Skechers U.S.A., Inc. - Class A (a) | | | 57,024 | |
| | 2,128 | | | Steven Madden, Ltd. | | | 49,433 | |
| | 890 | | | Superior Uniform Group, Inc. | | | 7,529 | |
| | 687 | | | Unifi, Inc. (a) | | | 7,935 | |
| | 213 | | | UniFirst Corp. | | | 32,182 | |
| | 3,460 | | | Vera Bradley, Inc. (a) | | | 14,255 | |
| | | | | | | | |
Number of
Shares
| | | | | Value
| |
| | | | | Textiles, Apparel & Luxury Goods (Continued) | | | | |
| | 3,288 | | | Vince Holding Corp. (a) | | $ | 12,757 | |
| | 708 | | | Weyco Group, Inc. | | | 14,280 | |
| | 2,333 | | | Wolverine World Wide, Inc. | | | 35,462 | |
| | | | | | |
|
|
|
| | | | | | | | 679,091 | |
| | | | | | |
|
|
|
| | | | | Thrifts & Mortgage Finance - 1.28% | |
| | 1,401 | | | Axos Financial, Inc. (a) | | | 25,400 | |
| | 562 | | | Berkshire Hills Bancorp, Inc. | | | 8,351 | |
| | 910 | | | Brookline Bancorp, Inc. | | | 10,265 | |
| | 1,333 | | | Capitol Federal Financial, Inc. | | | 15,476 | |
| | 932 | | | Dime Community Bancshares | | | 12,778 | |
| | 1,421 | | | Essent Group, Ltd. | | | 37,429 | |
| | 488 | | | Federal Agricultural Mortgage Corp. - Class C | | | 27,147 | |
| | 606 | | | First Defiance Financial Corp. | | | 8,932 | |
| | 843 | | | Flagstar Bancorp, Inc. | | | 16,717 | |
| | 308 | | | FS Bancorp, Inc. | | | 11,088 | |
| | 100 | | | Greene County Bancorp, Inc. | | | 2,336 | |
| | 189 | | | Hingham Institution for Savings | | | 27,403 | |
| | 953 | | | HomeStreet, Inc. | | | 21,185 | |
| | 118 | | | LendingTree, Inc. (a)(b) | | | 21,640 | |
| | 1,070 | | | Merchants Bancorp | | | 16,243 | |
| | 881 | | | Meridian Bancorp, Inc. | | | 9,885 | |
| | 648 | | | Meta Financial Group, Inc. | | | 14,075 | |
| | 4,983 | | | MGIC Investment Corp. | | | 31,642 | |
| | 618 | | | MMA Capital Holdings, Inc. (a) | | | 15,283 | |
| | 1,141 | | | Mr Cooper Group, Inc. (a) | | | 8,364 | |
| | 3,984 | | | New York Community Bancorp, Inc. (b) | | | 37,410 | |
| | 1,752 | | | NMI Holdings, Inc. - Class A (a) | | | 20,341 | |
| | 1,031 | | | Northwest Bancshares, Inc. | | | 11,929 | |
| | 1,028 | | | PennyMac Financial Services, Inc. | | | 22,729 | |
| | 3,279 | | | People’s United Financial, Inc. (b) | | | 36,233 | |
| | 764 | | | Provident Financial Services, Inc. | | | 9,825 | |
| | 3,570 | | | Radian Group, Inc. | | | 46,231 | |
| | 1,975 | | | Riverview Bancorp, Inc. | | | 9,895 | |
| | 4,210 | | | Sterling Bancorp, Inc. | | | 18,103 | |
| | 1,059 | | | TFS Financial Corp. (b) | | | 16,171 | |
| | 546 | | | Timberland Bancorp, Inc. | | | 9,986 | |
| | 875 | | | Walker & Dunlop, Inc. | | | 35,236 | |
| | 1,436 | | | Washington Federal, Inc. | | | 37,279 | |
| | 973 | | | Waterstone Financial, Inc. | | | 14,147 | |
| | 411 | | | WSFS Financial Corp. | | | 10,242 | |
| | | | | | |
|
|
|
| | | | | | | | 677,396 | |
| | | | | | |
|
|
|
| | | | | Tobacco - 0.08% | |
| | 634 | | | Turning Point Brands, Inc. (b) | | | 13,384 | |
| | 389 | | | Universal Corp. | | | 17,198 | |
| | 1,453 | | | Vector Group, Ltd. (b) | | | 13,687 | |
| | | | | | |
|
|
|
| | | | | | | | 44,269 | |
| | | | | | |
|
|
|
| | | | | Trading Companies & Distributors - 1.45% | |
| | 436 | | | Air Lease Corp. (b) | | | 9,653 | |
| | 768 | | | Applied Industrial Technologies, Inc. | | | 35,113 | |
| | 1,558 | | | Beacon Roofing Supply, Inc. (a) | | | 25,769 | |
| | 2,633 | | | BMC Stock Holdings, Inc. (a) | | | 46,683 | |
| | 1,598 | | | DXP Enterprises, Inc. (a) | | | 19,591 | |
| | 563 | | | EVI Industries, Inc. (a) | | | 8,884 | |
| | 2,701 | | | Foundation Building Materials, Inc. (a) | | | 27,793 | |
| | 2,276 | | | GMS, Inc. (a) | | | 35,801 | |
| | 1,102 | | | H&E Equipment Services, Inc. | | | 16,177 | |
| | 2,774 | | | HD Supply Holdings, Inc. (a) | | | 78,865 | |
| | 1,339 | | | Lawson Products, Inc. (a) | | | 35,778 | |
See notes to financial statements.
66
GuideMark® Small/Mid Cap Core Fund
SCHEDULE OF INVESTMENTS (Continued)
March 31, 2020
| | | | | | | | |
Number of
Shares
| | | | | Value
| |
| | | | | COMMON STOCKS (Continued) | |
| | | | | Trading Companies & Distributors (Continued) | | | | |
| | 4,114 | | | MRC Global, Inc. (a) | | $ | 17,526 | |
| | 650 | | | MSC Industrial Direct Co., Inc. - Class A | | | 35,731 | |
| | 4,212 | | | NOW, Inc. (a) | | | 21,734 | |
| | 672 | | | Rush Enterprises, Inc. - Class A | | | 21,450 | |
| | 588 | | | Rush Enterprises, Inc. - Class B | | | 17,940 | |
| | 1,051 | | | SiteOne Landscape Supply, Inc. (a) | | | 77,375 | |
| | 1,325 | | | Systemax, Inc. | | | 23,492 | |
| | 1,940 | | | Titan Machinery, Inc. (a) | | | 16,859 | |
| | 650 | | | Transcat, Inc. (a) | | | 17,225 | |
| | 954 | | | Triton International, Ltd. | | | 24,680 | |
| | 2,437 | | | Univar, Inc. (a)(b) | | | 26,125 | |
| | 5,015 | | | Veritiv Corp. (a) | | | 39,418 | |
| | 364 | | | Watsco, Inc. - Class A | | | 57,523 | |
| | 787 | | | WESCO International, Inc. (a) | | | 17,983 | |
| | 368 | | | Willis Lease Finance Corp. (a) | | | 9,789 | |
| | | | | | |
|
|
|
| | | | | | | | 764,957 | |
| | | | | | |
|
|
|
| | | | | Transportation Infrastructure - 0.02% | |
| | 456 | | | Macquarie Infrastructure Corp. | | | 11,514 | |
| | | | | | |
|
|
|
| | | | | Water Utilities - 0.24% | |
| | 303 | | | American States Water Co. | | | 24,767 | |
| | 374 | | | California Water Service Group | | | 18,820 | |
| | 1,705 | | | Consolidated Water Co., Ltd. - Ordinary Shares | | | 27,962 | |
| | 318 | | | Middlesex Water Co. | | | 19,118 | |
| | 1,072 | | | Pure Cycle Corp. (a) | | | 11,953 | |
| | 290 | | | SJW Group | | | 16,753 | |
| | 227 | | | The York Water Co. | | | 9,866 | |
| | | | | | |
|
|
|
| | | | | | | | 129,239 | |
| | | | | | |
|
|
|
| | | | | Wireless Telecommunication Services - 0.09% | |
| | 1,576 | | | Telephone & Data Systems, Inc. | | | 26,414 | |
| | 716 | | | United States Cellular Corp. (a) | | | 20,971 | |
| | | | | | |
|
|
|
| | | | | | | | 47,385 | |
| | | | | | |
|
|
|
| | | | | Total Common Stocks
(Cost $46,771,208) | | | 46,345,801 | |
| | | | | | |
|
|
|
| | | | | INVESTMENT COMPANIES - 4.03% | |
| | | | | Exchange Traded Funds - 4.03% | |
| | 23,536 | | | Vanguard Extended Market ETF (b) | | | 2,130,949 | |
| | | | | | |
|
|
|
| | | | | Total Investment Companies
(Cost $2,261,241) | | | 2,130,949 | |
| | | | | | |
|
|
|
| | | | | REAL ESTATE INVESTMENT TRUSTS - 6.65% | |
| | | | | Real Estate Investment Trusts - 6.65% | |
| | 638 | | | Acadia Realty Trust | | | 7,905 | |
| | 2,515 | | | AG Mortgage Investment Trust, Inc. | | | 6,891 | |
| | 5,148 | | | AGNC Investment Corp. | | | 54,466 | |
| | 242 | | | Agree Realty Corp. | | | 14,980 | |
| | 2,320 | | | Alexander & Baldwin, Inc. | | | 26,030 | |
| | 446 | | | American Assets Trust, Inc. | | | 11,150 | |
| | 702 | | | American Campus Communities, Inc. | | | 19,480 | |
| | 1,233 | | | American Finance Trust, Inc. | | | 7,706 | |
| | 2,911 | | | American Homes 4 Rent - Class A | | | 67,535 | |
| | 1,052 | | | Americold Realty Trust | | | 35,810 | |
| | 788 | | | Apartment Investment & Management Co. - Class A | | | 27,698 | |
| | 1,662 | | | Apollo Commercial Real Estate Finance, Inc. | | | 12,332 | |
| | 4,468 | | | Apple Hospitality REIT, Inc. | | | 40,972 | |
| | 1,064 | | | Ares Commercial Real Estate Corp. (b) | | | 7,437 | |
| | 1,648 | | | Armada Hoffler Properties, Inc. | | | 17,634 | |
| | 913 | | | ARMOUR Residential REIT, Inc. | | | 8,044 | |
| | | | | | | | |
Number of
Shares
| | | | | Value
| |
| | | | | Real Estate Investment Trusts (Continued) | | | | |
| | 45,628 | | | Ashford Hospitality Trust, Inc. | | $ | 33,728 | |
| | 1,124 | | | Blackstone Mortgage Trust, Inc. - Class A (b) | | | 20,929 | |
| | 3,127 | | | Bluerock Residential Growth REIT, Inc. | | | 17,417 | |
| | 12,862 | | | Braemar Hotels & Resorts, Inc. | | | 21,865 | |
| | 1,670 | | | Brandywine Realty Trust | | | 17,568 | |
| | 3,330 | | | Brixmor Property Group, Inc. | | | 31,635 | |
| | 2,774 | | | BRT Apartments Corp. | | | 28,433 | |
| | 814 | | | Camden Property Trust | | | 64,501 | |
| | 849 | | | CareTrust REIT, Inc. | | | 12,557 | |
| | 71,007 | | | CBL & Associates Properties, Inc. | | | 14,208 | |
| | 14,231 | | | Cedar Shopping Centers, Inc. | | | 13,279 | |
| | 2,632 | | | Chatham Lodging Trust (b) | | | 15,634 | |
| | 4,404 | | | Chimera Investment Corp. | | | 40,076 | |
| | 1,181 | | | City Office REIT, Inc. | | | 8,539 | |
| | 10,324 | | | Colony Capital, Inc. | | | 18,067 | |
| | 840 | | | Columbia Property Trust, Inc. | | | 10,500 | |
| | 378 | | | Community Healthcare Trust, Inc. | | | 14,470 | |
| | 879 | | | CoreCivic, Inc. | | | 9,818 | |
| | 467 | | | CorEnergy Infrastructure Trust, Inc. | | | 8,583 | |
| | 185 | | | CoreSite Realty Corp. | | | 21,441 | |
| | 7,782 | | | CorePoint Lodging, Inc. | | | 30,505 | |
| | 1,170 | | | Corporate Office Properties Trust | | | 25,892 | |
| | 1,543 | | | Cousins Properties, Inc. (b) | | | 45,164 | |
| | 926 | | | CubeSmart | | | 24,808 | |
| | 569 | | | CyrusOne, Inc. (b) | | | 35,136 | |
| | 5,358 | | | DiamondRock Hospitality Co. | | | 27,219 | |
| | 10,800 | | | Diversified Healthcare Trust | | | 39,204 | |
| | 1,010 | | | Douglas Emmett, Inc. (b) | | | 30,815 | |
| | 2,282 | | | Duke Realty Corp. | | | 73,891 | |
| | 1,084 | | | Easterly Government Properties, Inc. | | | 26,710 | |
| | 225 | | | EastGroup Properties, Inc. | | | 23,508 | |
| | 1,116 | | | Ellington Financial, Inc. | | | 6,372 | |
| | 2,584 | | | Empire State Realty Trust, Inc. - Class A (b) | | | 23,153 | |
| | 863 | | | EPR Properties | | | 20,902 | |
| | 920 | | | Equity Commonwealth | | | 29,173 | |
| | 976 | | | Equity LifeStyle Properties, Inc. | | | 56,100 | |
| | 683 | | | Essential Properties Realty Trust, Inc. | | | 8,920 | |
| | 1,534 | | | Essential Utilities, Inc. (b) | | | 62,434 | |
| | 1,749 | | | Exantas Capital Corp. | | | 4,827 | |
| | 660 | | | First Industrial Realty Trust, Inc. | | | 21,932 | |
| | 633 | | | Four Corners Property Trust, Inc. (b) | | | 11,843 | |
| | 3,899 | | | Franklin Street Properties Corp. (b) | | | 22,341 | |
| | 1,617 | | | Gaming and Leisure Properties, Inc. | | | 44,807 | |
| | 1,216 | | | Gladstone Commercial Corp. | | | 17,462 | |
| | 1,296 | | | Global Medical REIT, Inc. (b) | | | 13,116 | |
| | 1,036 | | | Global Net Lease, Inc. | | | 13,851 | |
| | 986 | | | Granite Point Mortgage Trust, Inc. | | | 4,999 | |
| | 1,967 | | | Great Ajax Corp. | | | 12,507 | |
| | 744 | | | Hannon Armstrong Sustainable Infrastructure Capital, Inc. | | | 15,185 | |
| | 596 | | | Healthcare Realty Trust, Inc. | | | 16,646 | |
| | 924 | | | Healthcare Trust of America, Inc. - Class A (b) | | | 22,435 | |
| | 7,788 | | | Hersha Hospitality Trust (b) | | | 27,881 | |
| | 715 | | | Highwoods Properties, Inc. | | | 25,325 | |
| | 853 | | | Hudson Pacific Properties, Inc. | | | 21,632 | |
| | 1,211 | | | Independence Realty Trust, Inc. | | | 10,826 | |
| | 587 | | | Industrial Logistics Properties Trust | | | 10,296 | |
| | 325 | | | Innovative Industrial Properties, Inc. (b) | | | 24,677 | |
| | 3,722 | | | Invesco Mortgage Capital, Inc. | | | 12,692 | |
| | 358 | | | Investors Real Estate Trust | | | 19,690 | |
See notes to financial statements.
67
GuideMark® Small/Mid Cap Core Fund
SCHEDULE OF INVESTMENTS (Continued)
March 31, 2020
| | | | | | | | |
Number of
Shares
| | | | | Value
| |
| | | | | REAL ESTATE INVESTMENT TRUSTS (Continued) | |
| | | | | Real Estate Investment Trusts (Continued) | | | | |
| | 1,349 | | | Iron Mountain, Inc. | | $ | 32,106 | |
| | 1,061 | | | iStar Financial, Inc. | | | 11,257 | |
| | 508 | | | JBG SMITH Properties | | | 16,170 | |
| | 975 | | | KKR Real Estate Finance Trust, Inc. (b) | | | 14,635 | |
| | 675 | | | Kilroy Realty Corp. (b) | | | 42,998 | |
| | 2,823 | | | Kimco Realty Corp. | | | 27,298 | |
| | 2,528 | | | Kite Realty Group Trust | | | 23,940 | |
| | 1,490 | | | Ladder Capital Corp. | | | 7,063 | |
| | 417 | | | Lamar Advertising Co. - Class A | | | 21,384 | |
| | 1,555 | | | Lexington Realty Trust | | | 15,441 | |
| | 292 | | | Life Storage, Inc. | | | 27,609 | |
| | 700 | | | LTC Properties, Inc. | | | 21,630 | |
| | 2,003 | | | Mack-Cali Realty Corp. | | | 30,506 | |
| | 3,099 | | | Medical Properties Trust, Inc. | | | 53,582 | |
| | 4,941 | | | MFA Financial, Inc. | | | 7,659 | |
| | 864 | | | Monmouth Real Estate Investment Corp. | | | 10,411 | |
| | 215 | | | National Health Investors, Inc. | | | 10,647 | |
| | 874 | | | National Retail Properties, Inc. | | | 28,134 | |
| | 1,144 | | | National Storage Affiliates Trust | | | 33,862 | |
| | 3,864 | | | New Residential Investment Corp. | | | 19,359 | |
| | 9,849 | | | New Senior Investment Group, Inc. | | | 25,213 | |
| | 5,432 | | | New York Mortgage Trust, Inc. | | | 8,420 | |
| | 399 | | | NexPoint Residential Trust, Inc. | | | 10,059 | |
| | 1,395 | | | Office Properties Income Trust | | | 38,014 | |
| | 2,358 | | | Omega Healthcare Investors, Inc. | | | 62,581 | |
| | 678 | | | One Liberty Properties, Inc. | | | 9,445 | |
| | 824 | | | Outfront Media, Inc. | | | 11,108 | |
| | 3,424 | | | Paramount Group, Inc. | | | 30,131 | |
| | 4,718 | | | Park Hotels & Resorts, Inc. | | | 37,319 | |
| | 3,617 | | | Pebblebrook Hotel Trust | | | 39,389 | |
| | 24,661 | | | Pennsylvania Real Estate Investment Trust (b) | | | 22,481 | |
| | 1,812 | | | PennyMac Mortgage Investment Trust | | | 19,243 | |
| | 1,062 | | | Physicians Realty Trust | | | 14,804 | |
| | 1,695 | | | Piedmont Office Realty Trust, Inc. - Class A | | | 29,934 | |
| | 318 | | | PotlatchDeltic Corp. (b) | | | 9,982 | |
| | 2,057 | | | Preferred Apartment Communities, Inc. - Class A | | | 14,769 | |
| | 125 | | | PS Business Parks, Inc. | | | 16,940 | |
| | 576 | | | QTS Realty Trust, Inc. - Class A | | | 33,414 | |
| | 477 | | | Rayonier, Inc. | | | 11,233 | |
| | 1,227 | | | Ready Capital Corp. (b) | | | 8,859 | |
| | 1,695 | | | Redwood Trust, Inc. | | | 8,577 | |
| | 1,174 | | | Regency Centers Corp. | | | 45,117 | |
| | 1,383 | | | Retail Opportunity Investments Corp. | | | 11,465 | |
| | 4,388 | | | Retail Properties of America, Inc. - Class A | | | 22,686 | |
| | 1,511 | | | Retail Value, Inc. | | | 18,510 | |
| | 890 | | | Rexford Industrial Realty, Inc. | | | 36,499 | |
| | 5,173 | | | RLJ Lodging Trust | | | 39,936 | |
| | 1,712 | | | RPT Realty | | | 10,323 | |
| | 1,117 | | | Ryman Hospitality Properties, Inc. | | | 40,044 | |
| | 2,541 | | | Sabra Health Care REIT, Inc. | | | 27,748 | |
| | 352 | | | Safehold, Inc. (b) | | | 22,257 | |
| | 5,438 | | | Service Properties Trust | | | 29,365 | |
| | 2,932 | | | SITE Centers Corp. | | | 15,276 | |
| | 241 | | | SL Green Realty Corp. | | | 10,387 | |
| | 872 | | | Spirit Realty Capital, Inc. | | | 22,803 | |
| | 680 | | | STAG Industrial, Inc. | | | 15,314 | |
| | 3,120 | | | Starwood Property Trust, Inc. | | | 31,980 | |
| | 2,532 | | | STORE Capital Corp. | | | 45,880 | |
| | 5,075 | | | Summit Hotel Properties, Inc. | | | 21,417 | |
| | 656 | | | Sun Communities, Inc. | | | 81,902 | |
| | | | | | | | |
Number of
Shares
| | | | | Value
| |
| | | | | Real Estate Investment Trusts (Continued) | | | | |
| | 3,165 | | | Sunstone Hotel Investors, Inc. | | $ | 27,567 | |
| | 2,759 | | | Tanger Factory Outlet Centers, Inc. (b) | | | 13,795 | |
| | 382 | | | Terreno Realty Corp. | | | 19,769 | |
| | 2,305 | | | The Geo Group, Inc. | | | 28,029 | |
| | 940 | | | TPG RE Finance Trust, Inc. | | | 5,161 | |
| | 2,899 | | | Two Harbors Investment Corp. | | | 11,045 | |
| | 2,972 | | | Uniti Group, Inc. (b) | | | 17,921 | |
| | 173 | | | Universal Health Realty Income Trust | | | 17,440 | |
| | 740 | | | Urban Edge Properties | | | 6,519 | |
| | 5,876 | | | VEREIT, Inc. (b) | | | 28,734 | |
| | 2,648 | | | VICI Properties, Inc. | | | 44,063 | |
| | 7,979 | | | Washington Prime Group, Inc. (b) | | | 6,424 | |
| | 480 | | | Washington Real Estate Investment Trust (b) | | | 11,458 | |
| | 705 | | | Weingarten Realty Investors | | | 10,173 | |
| | 1,717 | | | Western Asset Mortgage Capital Corp. | | | 3,932 | |
| | 2,320 | | | Whitestone REIT | | | 14,384 | |
| | 2,883 | | | Xenia Hotels & Resorts, Inc. | | | 29,695 | |
| | | | | | |
|
|
|
| | | | | Total Real Estate Investment Trusts
(Cost $5,002,318) | | | 3,516,818 | |
| | | | | | |
|
|
|
| | | | | RIGHTS - 0% | |
| | 395 | | | Schulman, Inc. Contingent Value Right (a)(d)(e)(f) | | | 0 | |
| | | | | | |
|
|
|
| | | | | Total Rights
(Cost $0) | | | 0 | |
| | | | | | |
|
|
|
| | | | | SHORT TERM INVESTMENTS - 0.78% | |
| | | | | Money Market Funds - 0.78% | |
| | 415,284 | | | DWS Government
Money Market Series - Institutional Shares | | | | |
| | | | | Effective Yield, 0.41% (c) | | | 415,284 | |
| | | | | | |
|
|
|
| | | | | Total Short Term Investments
(Cost $415,284) | | | 415,284 | |
| | | | | | |
|
|
|
| | | | | INVESTMENTS PURCHASED WITH PROCEEDS FROM SECURITIES LENDING COLLATERAL - 18.48% | |
| | 9,775,976 | | | Mount Vernon Liquid Assets Portfolio, LLC Effective Yield, 0.91% (c) | | | 9,775,976 | |
| | | | | | |
|
|
|
| | | | | Total Investments Purchased with Proceeds from Securities Lending Collateral
(Cost $9,775,976) | | | 9,775,976 | |
| | | | | | |
|
|
|
| | | | | Total Investments
(Cost $64,226,027) - 117.54% | | | 62,184,828 | |
| | | | | Liabilities in Excess of
Other Assets - (17.54)% | | | (9,280,217 | ) |
| | | | | | |
|
|
|
| | | | | TOTAL NET ASSETS - 100.00% | | $ | 52,904,611 | |
| | | | | | |
|
|
|
Percentages are stated as a percent of net assets.
| (a) | | Non-income producing security. |
| (b) | | All or portion of this security is on loan. |
| (c) | | Seven-day yield as of March 31, 2020. |
| (d) | | Value determined using significant unobservable inputs. Classifies as Level 3 in the fair value hierarchy. |
| (e) | | As of March 31, 2020, the Valuation Committee has fair valued this security. The value of this security was $9,708, which represents 0.02% of total net assets. |
| (f) | | These securities have been deemed illiquid according to the Fund’s liquidity guidelines. The value of these securities total $9,708, which represents 0.02% of total net assets. |
ADR - American Depositary Receipt
See notes to financial statements.
68
GuideMark® Worldex-US Fund
SCHEDULE OF INVESTMENTS
March 31, 2020
| | | | | | | | |
Number of
Shares
| | | | | Value
| |
| | | | | COMMON STOCKS - 94.73% | |
| | | | | Australia - 4.36% | |
| | 9,672 | | | APA Group - Stapled Security (e) | | $ | 61,376 | |
| | 2,658 | | | ASX, Ltd. | | | 124,769 | |
| | 24,501 | | | Aurizon Holdings Ltd. | | | 63,496 | |
| | 12,006 | | | Australia & New Zealand Banking Group, Ltd. | | | 125,912 | |
| | 3,326 | | | BHP Group, Ltd | | | 60,338 | |
| | 3,359 | | | BHP Group PLC | | | 52,130 | |
| | 50,880 | | | BlueScope Steel, Ltd. | | | 266,384 | |
| | 12,343 | | | Brambles, Ltd. | | | 79,782 | |
| | 12,636 | | | CIMIC Group, Ltd. | | | 178,968 | |
| | 7,100 | | | Coca-Cola Amatil, Ltd. | | | 38,321 | |
| | 2,668 | | | Cochlear, Ltd. | | | 304,076 | |
| | 43,862 | | | Coles Group, Ltd. | | | 408,489 | |
| | 8,606 | | | Commonwealth Bank of Australia | | | 324,705 | |
| | 2,107 | | | CSL, Ltd. | | | 381,940 | |
| | 11,826 | | | Flight Centre Travel Group, Ltd. (f) | | | 74,662 | |
| | 23,131 | | | Fortescue Metals Group, Ltd. | | | 141,752 | |
| | 18,317 | | | Harvey Norman Holdings, Ltd. | | | 33,633 | |
| | 477 | | | Macquarie Group, Ltd. | | | 25,404 | |
| | 9,010 | | | Magellan Financial Group Ltd. | | | 238,961 | |
| | 103,275 | | | Medibank Private, Ltd. | | | 169,837 | |
| | 9,139 | | | National Australia Bank, Ltd. | | | 93,747 | |
| | 3,980 | | | Newcrest Mining, Ltd. | | | 54,656 | |
| | 2,828 | | | Orica Ltd. | | | 26,474 | |
| | 10,078 | | | QBE Insurance Group, Ltd. | | | 52,496 | |
| | 2,762 | | | REA Group, Ltd. | | | 129,383 | |
| | 3,242 | | | Sonic Healthcare, Ltd. | | | 48,727 | |
| | 42,422 | | | South32, Ltd. | | | 46,830 | |
| | 12,878 | | | Telstra Corp., Ltd. | | | 24,174 | |
| | 20,028 | | | Transurban Group - Stapled Security (e) | | | 149,181 | |
| | 15,504 | | | Wesfarmers, Ltd. | | | 328,533 | |
| | 10,895 | | | Westpac Banking Corp. | | | 111,900 | |
| | 27,615 | | | Woolworths, Ltd. | | | 600,527 | |
| | | | | | |
|
|
|
| | | | | | | | 4,821,563 | |
| | | | | | |
|
|
|
| | | | | Austria - 0.32% | |
| | 3,203 | | | ANDRITZ AG | | | 100,349 | |
| | 3,461 | | | OMV AG | | | 94,717 | |
| | 6,286 | | | Raiffeisen Bank International AG | | | 90,420 | |
| | 695 | | | Verbund AG | | | 25,066 | |
| | 1,983 | | | voestalpine AG | | | 40,010 | |
| | | | | | |
|
|
|
| | | | | | | | 350,562 | |
| | | | | | |
|
|
|
| | | | | Belgium - 0.76% | |
| | 4,996 | | | Ageas | | | 208,193 | |
| | 4,100 | | | Anheuser-Busch InBev SA | | | 181,097 | |
| | 474 | | | Galapagos NV (a) | | | 93,083 | |
| | 2,668 | | | Proximus SADP | | | 61,269 | |
| | 689 | | | Solvay SA | | | 49,655 | |
| | 2,859 | | | UCB SA | | | 244,623 | |
| | | | | | |
|
|
|
| | | | | | | | 837,920 | |
| | | | | | |
|
|
|
| | | | | Canada - 8.60% | |
| | 1,624 | | | Agnico Eagle Mines, Ltd. | | | 64,831 | |
| | 2,266 | | | Air Canada (a) | | | 25,360 | |
| | 8,070 | | | Algonquin Power & Utilities Corp. | | | 108,667 | |
| | 7,200 | | | Alimentation Couche-Tard, Inc. - Series B | | | 169,601 | |
| | 1,223 | | | Atco Ltd. - Class I | | | 33,867 | |
| | 4,604 | | | Bank of Montreal | | | 232,474 | |
| | 7,243 | | | Barrick Gold Corp. | | | 133,095 | |
| | 3,947 | | | Bausch Health Cos., Inc. (a) | | | 61,170 | |
| | | | | | | | |
Number of
Shares
| | | | | Value
| |
| | | | | Canada (Continued) | | | | |
| | 1,509 | | | BCE, Inc. | | $ | 61,902 | |
| | 3,716 | | | Brookfield Asset Management, Inc. - Class A | | | 164,715 | |
| | 2,285 | | | Canadian Imperial Bank of Commerce | | | 133,141 | |
| | 442 | | | Canadian National Railway Co. | | | 34,558 | |
| | 7,214 | | | Canadian Natural Resources, Ltd. | | | 98,678 | |
| | 191 | | | Canadian Pacific Railway, Ltd. | | | 42,148 | |
| | 2,838 | | | Canadian Utilities Ltd. - Class A | | | 67,839 | |
| | 47,861 | | | Cenovus Energy, Inc. | | | 96,586 | |
| | 2,075 | | | CGI, Inc. (a) | | | 112,339 | |
| | 30,035 | | | CI Financial Corp. | | | 298,152 | |
| | 704 | | | Constellation Software, Inc. | | | 639,828 | |
| | 4,819 | | | Dollarama, Inc. | | | 133,684 | |
| | 5,200 | | | Emera, Inc. | | | 205,074 | |
| | 22,966 | | | Empire Co., Ltd. - Series A | | | 449,267 | |
| | 5,810 | | | Enbridge, Inc. | | | 169,185 | |
| | 347 | | | Fairfax Financial Holdings, Ltd. | | | 106,378 | |
| | 5,866 | | | Fortis, Inc. | | | 226,212 | |
| | 997 | | | Franco-Nevada Corp. | | | 99,615 | |
| | 2,743 | | | George Weston, Ltd. | | | 196,140 | |
| | 1,376 | | | Great-West Lifeco, Inc. | | | 23,769 | |
| | 4,951 | | | Hydro One Ltd. | | | 89,148 | |
| | 5,011 | | | iA Financial Corp., Inc. | | | 157,526 | |
| | 7,896 | | | Imperial Oil, Ltd. | | | 89,267 | |
| | 1,169 | | | Intact Financial Corp. | | | 101,034 | |
| | 14,269 | | | Kinross Gold Corp. (a) | | | 57,287 | |
| | 8,509 | | | Kirkland Lake Gold Ltd. | | | 250,620 | |
| | 6,921 | | | Loblaw Cos., Ltd. | | | 356,796 | |
| | 8,181 | | | Magna International, Inc. | | | 261,073 | |
| | 8,060 | | | Manulife Financial Corp. | | | 101,201 | |
| | 2,573 | | | Metro, Inc. | | | 104,050 | |
| | 2,357 | | | National Bank of Canada | | | 91,094 | |
| | 10,627 | | | Onex Corp. | | | 388,969 | |
| | 26,627 | | | Ovintiv, Inc. (b) | | | 73,034 | |
| | 3,457 | | | Power Corp. of Canada | | | 55,615 | |
| | 10,640 | | | Royal Bank of Canada | | | 659,056 | |
| | 1,602 | | | Saputo, Inc. | | | 38,522 | |
| | 983 | | | Shopify, Inc. - Class A (a) | | | 411,850 | |
| | 1,171 | | | Stars Group, Inc. (a) | | | 23,948 | |
| | 1,709 | | | Sun Life Financial, Inc. | | | 54,975 | |
| | 5,581 | | | Suncor Energy, Inc. | | | 89,071 | |
| | 4,569 | | | TC Energy Corp. | | | 203,077 | |
| | 14,465 | | | Teck Resources, Ltd. - Class B | | | 109,672 | |
| | 2,044 | | | TELUS Corp. | | | 32,316 | |
| | 4,974 | | | The Bank of Nova Scotia | | | 203,124 | |
| | 10,374 | | | The Toronto-Dominion Bank | | | 441,041 | |
| | 3,514 | | | Thomson Reuters Corp. | | | 239,410 | |
| | 2,418 | | | Wheaton Precious Metals Corp. | | | 66,545 | |
| | 10,248 | | | WSP GLOBAL, Inc. | | | 581,980 | |
| | | | | | |
|
|
|
| | | | | | | | 9,519,576 | |
| | | | | | |
|
|
|
| | | | | Denmark - 2.56% | |
| | 411 | | | A.P. Moeller - Maersk AS - Class A | | | 337,563 | |
| | 395 | | | A.P. Moeller - Maersk AS - Class B | | | 350,114 | |
| | 1,766 | | | Carlsberg AS - Series B | | | 198,816 | |
| | 2,447 | | | Coloplast AS - Series B | | | 354,880 | |
| | 12,145 | | | Danske Bank AS | | | 135,167 | |
| | 296 | | | DSV PANALPINA AS | | | 26,915 | |
| | 486 | | | Genmab AS (a) | | | 97,622 | |
| | 14,194 | | | Novo Nordisk AS - Series B | | | 847,610 | |
| | 2,466 | | | Orsted AS | | | 241,416 | |
See notes to financial statements.
69
GuideMark® World ex-US Fund
SCHEDULE OF INVESTMENTS (Continued)
March 31, 2020
| | | | | | | | |
Number of
Shares
| | | | | Value
| |
| | | | | COMMON STOCKS (Continued) | |
| | | | | Denmark (Continued) | | | | |
| | 3,470 | | | Pandora AS | | $ | 111,495 | |
| | 2,740 | | | Tryg AS | | | 66,691 | |
| | 778 | | | Vestas Wind Systems AS | | | 63,302 | |
| | | | | | |
|
|
|
| | | | | | | | 2,831,591 | |
| | | | | | |
|
|
|
| | | | | Finland - 0.69% | |
| | 2,580 | | | Elisa OYJ | | | 159,246 | |
| | 999 | | | Kone OYJ - Series B | | | 55,945 | |
| | 2,519 | | | Neste OYJ | | | 83,751 | |
| | 10,599 | | | Orion OYJ - Class B | | | 431,340 | |
| | 1,089 | | | UPM-Kymmene OYJ | | | 29,694 | |
| | | | | | |
|
|
|
| | | | | | | | 759,976 | |
| | | | | | |
|
|
|
| | | | | France - 10.01% | |
| | 2,027 | | | Air Liquide SA | | | 258,742 | |
| | 1,643 | | | Alstom SA | | | 67,843 | |
| | 604 | | | Amundi SA | | | 34,947 | |
| | 335 | | | Arkema SA | | | 22,872 | |
| | 7,769 | | | Atos SE | | | 517,612 | |
| | 3,572 | | | AXA SA | | | 60,481 | |
| | 3,844 | | | BioMerieux | | | 435,173 | |
| | 7,222 | | | BNP Paribas SA | | | 210,848 | |
| | 90,143 | | | Bollore SA | | | 244,976 | |
| | 14,006 | | | Carrefour SA | | | 222,055 | |
| | 695 | | | Casino Guichard Perrachon SA | | | 26,598 | |
| | 3,287 | | | Cie de Saint-Gobain | | | 78,873 | |
| | 328 | | | Cie Generale des Etablissements Michelin SCA | | | 28,728 | |
| | 20,289 | | | CNP Assurances | | | 196,450 | |
| | 22,956 | | | Credit Agricole SA | | | 162,434 | |
| | 4,836 | | | Danone SA | | | 309,496 | |
| | 1,123 | | | Dassault Systemes SE | | | 163,948 | |
| | 2,771 | | | Edenred | | | 114,995 | |
| | 2,670 | | | Eiffage SA | | | 189,526 | |
| | 5,417 | | | Engie SA | | | 55,473 | |
| | 874 | | | EssilorLuxottica SA | | | 92,535 | |
| | 7,871 | | | Faurecia SA | | | 230,476 | |
| | 4,410 | | | Getlink SE | | | 53,337 | |
| | 765 | | | Hermes International | | | 520,515 | |
| | 2,035 | | | Ingenico Group SA | | | 212,717 | |
| | 4,701 | | | Ipsen SA | | | 240,973 | |
| | 708 | | | Kering SA | | | 369,161 | |
| | 1,360 | | | Legrand SA | | | 86,744 | |
| | 2,652 | | | L’Oreal SA | | | 686,367 | |
| | 2,607 | | | LVMH Moet Hennessy Louis Vuitton SE | | | 956,122 | |
| | 62,099 | | | Natixis SA | | | 197,738 | |
| | 168 | | | Pernod Ricard SA | | | 23,845 | |
| | 21,944 | | | Peugeot SA | | | 285,695 | |
| | 2,759 | | | Publicis Groupe SA | | | 78,849 | |
| | 1,406 | | | Safran SA | | | 124,568 | |
| | 7,540 | | | Sanofi | | | 652,775 | |
| | 2,691 | | | Sartorius Stedim Biotech | | | 537,001 | |
| | 1,757 | | | Schneider Electric SE | | | 148,507 | |
| | 1,270 | | | SCOR SE | | | 27,942 | |
| | 2,949 | | | SEB SA | | | 365,251 | |
| | 12,904 | | | Societe Generale SA | | | 211,395 | |
| | 8,682 | | | Suez | | | 88,204 | |
| | 185 | | | Teleperformance | | | 38,317 | |
| | 14,585 | | | TOTAL SA | | | 549,546 | |
| | 2,770 | | | Ubisoft Entertainment SA (a) | | | 202,462 | |
| | 11,053 | | | Valeo SA | | | 179,896 | |
| | | | | | | | |
Number of
Shares
| | | | | Value
| |
| | | | | France (Continued) | | | | |
| | 8,317 | | | Veolia Environnement SA | | $ | 175,662 | |
| | 3,508 | | | Vinci SA | | | 286,637 | |
| | 879 | | | Worldline SA (a) | | | 51,880 | |
| | | | | | |
|
|
|
| | | | | | | | 11,077,187 | |
| | | | | | |
|
|
|
| | | | | Germany - 5.71% | |
| | 2,848 | | | adidas AG | | | 632,334 | |
| | 3,673 | | | Allianz SE | | | 625,503 | |
| | 1,151 | | | BASF SE | | | 53,800 | |
| | 5,181 | | | Bayer AG | | | 296,864 | |
| | 2,288 | | | Beiersdorf AG | | | 230,381 | |
| | 2,270 | | | Brenntag AG | | | 82,474 | |
| | 1,040 | | | Carl Zeiss Meditec AG | | | 99,029 | |
| | 20,252 | | | Commerzbank AG | | | 72,094 | |
| | 1,449 | | | Covestro AG | | | 43,975 | |
| | 751 | | | Delivery Hero SE (a) | | | 55,217 | |
| | 2,619 | | | Deutsche Boerse AG | | | 359,809 | |
| | 4,543 | | | Deutsche Lufthansa AG (b) | | | 42,491 | |
| | 13,150 | | | Deutsche Post AG | | | 352,534 | |
| | 25,493 | | | Deutsche Telekom AG | | | 329,253 | |
| | 360 | | | Fresenius Medical Care AG & Co. KGaA | | | 23,499 | |
| | 2,230 | | | Fresenius SE & Co. KGaA | | | 83,029 | |
| | 1,995 | | | Hannover Rueck SE | | | 281,706 | |
| | 3,931 | | | HeidelbergCement AG | | | 167,945 | |
| | 1,149 | | | HOCHTIEF AG | | | 75,443 | |
| | 1,772 | | | KION Group AG | | | 76,263 | |
| | 2,052 | | | Knorr-Bremse AG | | | 180,404 | |
| | 1,714 | | | Merck KGaA | | | 173,049 | |
| | 6,968 | | | METRO AG (b) | | | 59,348 | |
| | 500 | | | MTU Aero Engines AG | | | 72,298 | |
| | 1,334 | | | Muenchener Rueckversicherungs-Gesellschaft AG | | | 268,228 | |
| | 6,180 | | | Puma SE | | | 363,107 | |
| | 8,366 | | | RWE AG | | | 218,784 | |
| | 4,888 | | | SAP SE | | | 545,736 | |
| | 764 | | | Siemens AG | | | 63,974 | |
| | 731 | | | Siemens Healthineers AG | | | 28,258 | |
| | 1,327 | | | Vonovia SE | | | 66,010 | |
| | 7,765 | | | Zalando SE (a) | | | 292,664 | |
| | | | | | |
|
|
|
| | | | | | | | 6,315,503 | |
| | | | | | |
|
|
|
| | | | | Hong Kong - 2.38% | |
| | 80,358 | | | AIA Group, Ltd. | | | 719,577 | |
| | 2,563 | | | ASM Pacific Technology, Ltd. | | | 23,765 | |
| | 19,890 | | | BOC Hong Kong Holdings, Ltd. | | | 54,598 | |
| | 40,709 | | | CK Hutchison Holdings, Ltd. | | | 271,332 | |
| | 34,271 | | | Dairy Farm International Holdings, Ltd. | | | 157,628 | |
| | 6,593 | | | Hang Seng Bank, Ltd. | | | 112,327 | |
| | 23,999 | | | HKT Trust and HKT, Ltd. - Stapled Security (e) | | | 32,640 | |
| | 13,049 | | | Hong Kong Exchange & Clearing, Ltd. | | | 390,939 | |
| | 3,031 | | | Jardine Strategic Holdings, Ltd. | | | 67,739 | |
| | 31,080 | | | SJM Holdings, Ltd. | | | 25,934 | |
| | 10,156 | | | Swire Pacific, Ltd. - Class A | | | 64,650 | |
| | 21,296 | | | Techtronic Industries Co., Ltd. | | | 135,228 | |
| | 10,256 | | | The Bank of East Asia, Ltd. | | | 21,917 | |
| | 120,957 | | | Vitasoy International Holdings Ltd. | | | 364,007 | |
| | 36,498 | | | WH Group, Ltd. | | | 33,688 | |
| | 23,296 | | | Wheelock & Co., Ltd. | | | 157,852 | |
| | | | | | |
|
|
|
| | | | | | | | 2,633,821 | |
| | | | | | |
|
|
|
| | | | | Ireland - 0.56% | |
| | 1,417 | | | CRH PLC | | | 38,320 | |
See notes to financial statements.
70
GuideMark® World ex-US Fund
SCHEDULE OF INVESTMENTS (Continued)
March 31, 2020
| | | | | | | | |
Number of
Shares
| | | | | Value
| |
| | | | | COMMON STOCKS (Continued) | |
| | | | | Ireland (Continued) | | | | |
| | 704 | | | DCC PLC | | $ | 43,965 | |
| | 9,011 | | | Experian PLC | | | 250,427 | |
| | 5,189 | | | James Hardie Industries PLC | | | 60,248 | |
| | 246 | | | Kerry Group PLC - Series A | | | 28,407 | |
| | 643 | | | Kingspan Group PLC | | | 34,316 | |
| | 5,865 | | | Smurfit Kappa Group PLC | | | 166,145 | |
| | | | | | |
|
|
|
| | | | | | | | 621,828 | |
| | | | | | |
|
|
|
| | | | | Isle Of Man - 0.03% | |
| | 4,315 | | | GVC Holdings PLC | | | 29,889 | |
| | | | | | |
|
|
|
| | | | | Israel - 0.54% | |
| | 1,564 | | | Azrieli Group, Ltd. | | | 89,422 | |
| | 1 | | | International Flavors & Fragrances, Inc. | | | 60 | |
| | 14,122 | | | Israel Discount Bank, Ltd. - Series A | | | 41,178 | |
| | 3,755 | | | Mizrahi Tefahot Bank, Ltd. | | | 69,113 | |
| | 713 | | | Nice, Ltd. (a) | | | 103,097 | |
| | 26,574 | | | Teva Pharmaceutical Industries, Ltd. - ADR (a)(b) | | | 238,635 | |
| | 587 | | | Wix.com, Ltd. (a) | | | 59,181 | |
| | | | | | |
|
|
|
| | | | | | | | 600,686 | |
| | | | | | |
|
|
|
| | | | | Italy - 3.27% | |
| | 23,456 | | | Assicurazioni Generali SpA | | | 317,707 | |
| | 2,326 | | | Atlantia SpA | | | 28,895 | |
| | 52,665 | | | Enel SpA | | | 363,275 | |
| | 26,279 | | | Eni SpA | | | 261,147 | |
| | 1,663 | | | Ferrari NV | | | 256,160 | |
| | 14,455 | | | FinecoBank Banca Fineco SpA | | | 130,053 | |
| | 24,327 | | | Intesa Sanpaolo SpA | | | 39,363 | |
| | 9,784 | | | Moncler SpA | | | 355,538 | |
| | 35,543 | | | Poste Italiane SpA | | | 299,160 | |
| | 4,911 | | | Prysmian SpA | | | 77,971 | |
| | 5,776 | | | Recordati SpA | | | 243,358 | |
| | 37,023 | | | Snam SpA | | | 169,206 | |
| | 920,834 | | | Telecom Italia SpA (a) | | | 372,730 | |
| | 950,413 | | | Telecom Italia SpA - Savings Shares | | | 371,328 | |
| | 21,654 | | | Terna Rete Elettrica Nazionale SpA | | | 136,114 | |
| | 25,058 | | | UniCredit SpA | | | 193,864 | |
| | | | | | |
|
|
|
| | | | | | | | 3,615,869 | |
| | | | | | |
|
|
|
| | | | | Japan - 22.02% | |
| | 2,731 | | | ABC-Mart, Inc. | | | 136,682 | |
| | 4,585 | | | Advantest Corp. | | | 182,620 | |
| | 4,688 | | | Aeon Co., Ltd. | | | 103,858 | |
| | 4,091 | | | Alps Electric Co., Ltd. | | | 39,419 | |
| | 11,332 | | | Asahi Intecc Co., Ltd. | | | 280,264 | |
| | 26,074 | | | Astellas Pharma, Inc. | | | 401,731 | |
| | 4,700 | | | Bandai Namco Holdings, Inc. | | | 227,965 | |
| | 1,770 | | | Bridgestone Corp. | | | 54,181 | |
| | 13,851 | | | Brother Industries, Ltd. | | | 209,794 | |
| | 8,166 | | | Calbee, Inc. | | | 220,375 | |
| | 1,130 | | | Canon, Inc. | | | 24,556 | |
| | 2,104 | | | Casio Computer Co., Ltd. | | | 29,438 | |
| | 166 | | | Central Japan Railway Co. | | | 26,605 | |
| | 2,761 | | | Chugai Pharmaceutical Co., Ltd. | | | 319,436 | |
| | 7,429 | | | Coca-Cola Bottlers Japan, Inc. | | | 152,469 | |
| | 12,263 | | | Credit Saison Co., Ltd. | | | 142,272 | |
| | 6,659 | | | CyberAgent, Inc. | | | 258,075 | |
| | 1,357 | | | Dai Nippon Printing Co., Ltd. | | | 28,838 | |
| | 11,919 | | | Dai-ichi Life Holdings, Inc. | | | 141,540 | |
| | 3,825 | | | Daiichi Sankyo Co., Ltd. | | | 262,688 | |
| | | | | | | | |
Number of
Shares
| | | | | Value
| |
| | | | | Japan (Continued) | | | | |
| | 505 | | | Daikin Industries, Ltd. | | $ | 60,961 | |
| | 3,348 | | | Eisai Co., Ltd. | | | 244,898 | |
| | 3,495 | | | Electric Power Development Co., Ltd. | | | 70,046 | |
| | 1,273 | | | FamilyMart UNY Holdings Co., Ltd. | | | 22,858 | |
| | 541 | | | Fast Retailing Co., Ltd. | | | 220,751 | |
| | 2,381 | | | FUJIFILM Holdings Corp. | | | 117,335 | |
| | 1,512 | | | Fujitsu, Ltd. | | | 136,184 | |
| | 5,552 | | | Fukuoka Financial Group, Inc. | | | 73,239 | |
| | 4,154 | | | Hakuhodo DY Holdings, Inc. | | | 41,914 | |
| | 156 | | | Hikari Tsushin, Inc. | | | 26,104 | |
| | 5,401 | | | Hitachi Chemical Co., Ltd. | | | 229,831 | |
| | 1,834 | | | Hitachi High-Technologies Corp. | | | 135,481 | |
| | 4,182 | | | Hitachi Metals Ltd. | | | 43,897 | |
| | 10,543 | | | Hitachi, Ltd. | | | 302,863 | |
| | 18,632 | | | Honda Motor Co., Ltd. | | | 416,918 | |
| | 7,500 | | | Hoya Corp. | | | 637,736 | |
| | 3,520 | | | Hulic Co., Ltd. | | | 35,623 | |
| | 11,286 | | | Idemitsu Kosan Co., Ltd. | | | 257,588 | |
| | 19,772 | | | Inpex Corp. | | | 110,922 | |
| | 6,969 | | | Isuzu Motors, Ltd. | | | 46,120 | |
| | 22,535 | | | ITOCHU Corp. | | | 466,353 | |
| | 3,120 | | | Itochu Techno-Solutions Corp. | | | 88,859 | |
| | 17,851 | | | J Front Retailing Co., Ltd. | | | 147,331 | |
| | 29,115 | | | Japan Post Holdings Co., Ltd. | | | 227,755 | |
| | 10,712 | | | Japan Post Insurance Co Ltd. | | | 132,347 | |
| | 8,377 | | | JGC Holdings Corp. | | | 66,865 | |
| | 85,023 | | | JXTG Holdings, Inc. | | | 289,706 | |
| | 19,719 | | | Kakaku.com, Inc. | | | 360,650 | |
| | 1,931 | | | Kamigumi Co., Ltd. | | | 32,594 | |
| | 2,539 | | | Kao Corp. | | | 206,848 | |
| | 20,039 | | | KDDI Corp. | | | 591,924 | |
| | 262 | | | Keyence Corp. | | | 84,236 | |
| | 3,892 | | | Kikkoman Corp. | | | 165,019 | |
| | 1,328 | | | Kobayashi Pharmaceutical Co., Ltd. | | | 122,868 | |
| | 5,238 | | | Konica Minolta, Inc. | | | 21,103 | |
| | 2,291 | | | Kose Corp. | | | 283,492 | |
| | 1,649 | | | Lawson, Inc. | | | 90,513 | |
| | 1,143 | | | LINE Corp. (a) | | | 55,184 | |
| | 7,425 | | | Lion Corp. | | | 158,348 | |
| | 10,427 | | | LIXIL Group Corp. | | | 128,473 | |
| | 3,128 | | | M3, Inc. | | | 92,267 | |
| | 60,169 | | | Marubeni Corp. | | | 298,623 | |
| | 1,874 | | | Marui Group Co., Ltd. | | | 31,350 | |
| | 60,790 | | | Mebuki Financial Group, Inc. | | | 123,302 | |
| | 3,017 | | | Medipal Holdings Corp. | | | 56,375 | |
| | 2,262 | | | MEIJI Holdings Co., Ltd. | | | 160,299 | |
| | 10,948 | | | MISUMI Group, Inc. | | | 236,816 | |
| | 42,856 | | | Mitsubishi Chemical Holdings Corp. | | | 254,480 | |
| | 14,823 | | | Mitsubishi Corp. | | | 313,540 | |
| | 3,234 | | | Mitsubishi Gas Chemical Co., Inc. | | | 34,898 | |
| | 11,571 | | | Mitsubishi Materials Corp. | | | 236,547 | |
| | 39,085 | | | Mitsubishi UFJ Financial Group, Inc. | | | 146,239 | |
| | 43,200 | | | Mitsubishi UFJ Lease & Finance Co., Ltd. | | | 211,455 | |
| | 5,225 | | | Mitsui & Co., Ltd. | | | 72,542 | |
| | 9,672 | | | Mitsui Chemicals, Inc. | | | 182,048 | |
| | 12,148 | | | MonotaRO Co., Ltd. | | | 320,967 | |
| | 3,269 | | | MS & AD Insurance Group Holdings, Inc. | | | 91,209 | |
| | 700 | | | Murata Manufacturing Co., Ltd. | | | 34,800 | |
| | 118 | | | Nintendo Co., Ltd. | | | 45,861 | |
| | 2,244 | | | Nippon Paint Holdings Co., Ltd. | | | 116,805 | |
See notes to financial statements.
71
GuideMark® World ex-US Fund
SCHEDULE OF INVESTMENTS (Continued)
March 31, 2020
| | | | | | | | |
Number of
Shares
| | | | | Value
| |
| | | | | COMMON STOCKS (Continued) | |
| | | | | Japan (Continued) | | | | |
| | 32,994 | | | Nippon Telegraph & Telephone Corp. | | $ | 789,105 | |
| | 1,636 | | | Nitori Holdings Co., Ltd. | | | 221,090 | |
| | 9,270 | | | Nomura Holdings, Inc. | | | 39,120 | |
| | 4,872 | | | Nomura Real Estate Holdings, Inc. | | | 78,833 | |
| | 5,232 | | | Nomura Research Institute, Ltd. | | | 110,514 | |
| | 3,294 | | | NTT Data Corp. | | | 31,532 | |
| | 21,620 | | | NTT DoCoMo, Inc. | | | 676,125 | |
| | 471 | | | Obic Co., Ltd. | | | 61,366 | |
| | 27,364 | | | Olympus Corp. | | | 394,460 | |
| | 3,479 | | | OMRON Corp. | | | 179,874 | |
| | 360 | | | Oriental Land Co., Ltd. | | | 45,957 | |
| | 16,144 | | | ORIX Corp. | | | 192,609 | |
| | 6,590 | | | Osaka Gas Co., Ltd. | | | 123,745 | |
| | 1,432 | | | Park24 Co., Ltd. | | | 21,110 | |
| | 12,379 | | | Persol Holdings Co., Ltd. | | | 123,866 | |
| | 7,979 | | | Pigeon Corp. | | | 305,478 | |
| | 15,657 | | | Pola Orbis Holdings, Inc. | | | 287,845 | |
| | 14,404 | | | Rakuten, Inc. | | | 108,592 | |
| | 18,376 | | | Recruit Holdings Co., Ltd. | | | 474,676 | |
| | 42,166 | | | Resona Holdings, Inc. | | | 126,427 | |
| | 22,390 | | | Ryohin Keikaku Co., Ltd. | | | 248,990 | |
| | 4,071 | | | Seiko Epson Corp. | | | 43,816 | |
| | 18,764 | | | Sekisui House, Ltd. | | | 309,457 | |
| | 4,018 | | | Seven & I Holdings Co., Ltd. - Series A | | | 132,694 | |
| | 1,181 | | | Shimadzu Corp. | | | 30,822 | |
| | 1,458 | | | Shimamura Co., Ltd. | | | 88,112 | |
| | 681 | | | Shin-Etsu Chemical Co., Ltd. | | | 66,934 | |
| | 13,619 | | | Shinsei Bank, Ltd. (a) | | | 180,381 | |
| | 548 | | | Shionogi & Co., Ltd. | | | 26,994 | |
| | 5,997 | | | Shiseido Co., Ltd. | | | 352,458 | |
| | 4,539 | | | Showa Denko KK | | | 93,123 | |
| | 6,013 | | | Sony Corp. | | | 356,171 | |
| | 981 | | | Square Enix Holdings Co Ltd. | | | 43,827 | |
| | 14,285 | | | Sumitomo Corp. | | | 162,910 | |
| | 10,968 | | | Sumitomo Dainippon Pharma Co., Ltd. | | | 142,380 | |
| | 10,559 | | | Sumitomo Mitsui Financial Group, Inc. | | | 256,514 | |
| | 3,044 | | | Sumitomo Mitsui Trust Holdings, Inc. | | | 87,455 | |
| | 18,691 | | | Sumitomo Rubber Industries, Ltd. | | | 175,561 | |
| | 9,167 | | | Sundrug Co., Ltd. | | | 293,749 | |
| | 2,855 | | | Sysmex Corp. | | | 206,630 | |
| | 5,391 | | | T&D Holdings, Inc. | | | 43,703 | |
| | 5,040 | | | Taiheiyo Cement Corp. | | | 85,848 | |
| | 4,696 | | | Taiyo Nippon Sanso Corp. | | | 69,487 | |
| | 1,776 | | | Terumo Corp. | | | 60,848 | |
| | 12,798 | | | The Yokohama Rubber Co., Ltd. | | | 158,658 | |
| | 1,557 | | | Toho Co., Ltd. | | | 47,608 | |
| | 3,217 | | | Tokio Marine Holdings, Inc. | | | 147,192 | |
| | 997 | | | Tokyo Electron, Ltd. | | | 185,814 | |
| | 6,897 | | | Tokyo Gas Co., Ltd. | | | 162,516 | |
| | 1,779 | | | Toyoda Gosei Co., Ltd. | | | 30,276 | |
| | 9,340 | | | Toyota Motor Corp. | | | 562,874 | |
| | 11,648 | | | Toyota Tsusho Corp. | | | 272,090 | |
| | 2,510 | | | Tsuruha Holdings, Inc. | | | 330,938 | |
| | 6,750 | | | Welcia Holdings Co., Ltd. | | | 472,913 | |
| | 47,376 | | | Yamada Denki Co., Ltd. | | | 188,700 | |
| | 680 | | | Yamaha Corp. | | | 26,354 | |
| | 14,860 | | | Yamazaki Baking Co., Ltd. | | | 309,723 | |
| | 19,228 | | | ZOZO, Inc. | | | 258,066 | |
| | | | | | |
|
|
|
| | | | | | | | 24,359,876 | |
| | | | | | |
|
|
|
| | | | | | | | |
Number of
Shares
| | | | | Value
| |
| | | | | Jersey - 0.60% | |
| | 5,660 | | | Ferguson PLC | | $ | 349,971 | |
| | 206,203 | | | Glencore PLC | | | 312,097 | |
| | | | | | |
|
|
|
| | | | | | | | 662,068 | |
| | | | | | |
|
|
|
| | | | | Macau - 0.11% | |
| | 8,793 | | | Sands China, Ltd. | | | 31,990 | |
| | 60,551 | | | Wynn Macau, Ltd. | | | 90,809 | |
| | | | | | |
|
|
|
| | | | | | | | 122,799 | |
| | | | | | |
|
|
|
| | | | | Netherlands - 4.27% | |
| | 7,600 | | | ABN AMRO Group NV | | | 61,672 | |
| | 79,252 | | | Aegon NV | | | 197,924 | |
| | 785 | | | Airbus SE | | | 50,618 | |
| | 977 | | | Akzo Nobel NV | | | 64,256 | |
| | 15,908 | | | Altice NV - Class A (a) | | | 61,397 | |
| | 36,672 | | | ArcelorMittal | | | 346,201 | |
| | 2,270 | | | ASML Holding NV | | | 598,406 | |
| | 4,256 | | | Exor NV | | | 219,351 | |
| | 2,702 | | | Heineken Holding NV | | | 210,563 | |
| | 582 | | | Heineken NV | | | 49,391 | |
| | 23,240 | | | ING Groep NV | | | 119,084 | |
| | 24,414 | | | Koninklijke Ahold Delhaize NV | | | 568,763 | |
| | 1,334 | | | Koninklijke DSM NV | | | 150,060 | |
| | 9,584 | | | Koninklijke Philips NV | | | 393,494 | |
| | 8,411 | | | NN Group NV | | | 228,576 | |
| | 2,454 | | | NXP Semiconductors NV | | | 203,510 | |
| | 5,342 | | | Randstad Holding NV | | | 188,530 | |
| | 7,717 | | | STMicroelectronics NV | | | 165,889 | |
| | 9,747 | | | Unilever NV | | | 479,078 | |
| | 5,244 | | | Wolters Kluwer NV | | | 371,858 | |
| | | | | | |
|
|
|
| | | | | | | | 4,728,621 | |
| | | | | | |
|
|
|
| | | | | New Zealand - 0.24% | |
| | 6,669 | | | a2 Milk Co., Ltd. (a) | | | 68,128 | |
| | 2,799 | | | Fisher & Paykel Healthcare Corp., Ltd. | | | 50,882 | |
| | 23,248 | | | Mercury NZ Ltd. | | | 58,208 | |
| | 35,288 | | | Meridian Energy, Ltd. | | | 84,219 | |
| | | | | | |
|
|
|
| | | | | | | | 261,437 | |
| | | | | | |
|
|
|
| | | | | Norway - 0.64% | |
| | 18,834 | | | Gjensidige Forsikring ASA | | | 320,728 | |
| | 2,495 | | | Mowi ASA | | | 37,723 | |
| | 8,633 | | | Orkla ASA | | | 73,965 | |
| | 8,709 | | | Schibsted ASA - Class B | | | 157,545 | |
| | 7,760 | | | Telenor ASA | | | 113,418 | |
| | | | | | |
|
|
|
| | | | | | | | 703,379 | |
| | | | | | |
|
|
|
| | | | | Portugal - 0.41% | |
| | 57,588 | | | EDP - Energias de Portugal SA | | | 231,699 | |
| | 12,156 | | | Jeronimo Martins SGPS SA | | | 219,405 | |
| | | | | | |
|
|
|
| | | | | | | | 451,104 | |
| | | | | | |
|
|
|
| | | | | Singapore - 1.68% | |
| | 18,480 | | | DBS Group Holdings, Ltd. | | | 241,130 | |
| | 11,947 | | | Jardine Cycle & Carriage, Ltd. | | | 164,262 | |
| | 28,520 | | | Oversea-Chinese Banking Corp., Ltd. | | | 172,801 | |
| | 96,990 | | | Singapore Exchange, Ltd. | | | 624,659 | |
| | 12,204 | | | Singapore Technologies Engineering Ltd. | | | 26,700 | |
| | 16,222 | | | United Overseas Bank, Ltd. | | | 222,566 | |
| | 84,970 | | | Wilmar International, Ltd. | | | 192,152 | |
| | 379,623 | | | Yangzijiang Shipbuilding Holdings, Ltd. | | | 220,273 | |
| | | | | | |
|
|
|
| | | | | | | | 1,864,543 | |
| | | | | | |
|
|
|
See notes to financial statements.
72
GuideMark® World ex-US Fund
SCHEDULE OF INVESTMENTS (Continued)
March 31, 2020
| | | | | | | | |
Number of
Shares
| | | | | Value
| |
| | | | | COMMON STOCKS (Continued) | |
| | | | | Spain - 2.55% | |
| | 6,068 | | | ACS, Actividades de Construccion y Servicios SA | | $ | 120,507 | |
| | 658 | | | Aena SME SA | | | 71,389 | |
| | 4,377 | | | Amadeus IT Holdings SA - Class A | | | 206,021 | |
| | 76,818 | | | Banco Bilbao Vizcaya Argentaria SA | | | 237,871 | |
| | 119,925 | | | Banco de Sabadell SA | | | 60,648 | |
| | 79,557 | | | Banco Santander SA | | | 189,252 | |
| | 4,315 | | | Cellnex Telecom SA | | | 195,739 | |
| | 5,088 | | | Endesa SA | | | 107,664 | |
| | 6,565 | | | Ferrovial SA | | | 155,832 | |
| | 49,237 | | | Iberdrola SA | | | 481,588 | |
| | 22,650 | | | Industria de Diseno Textil SA | | | 586,944 | |
| | 24,121 | | | Mapfre SA | | | 40,919 | |
| | 33,142 | | | Repsol SA | | | 295,669 | |
| | 15,966 | | | Telefonica SA | | | 72,663 | |
| | | | | | |
|
|
|
| | | | | | | | 2,822,706 | |
| | | | | | |
|
|
|
| | | | | Sweden - 2.02% | |
| | 1,290 | | | Assa Abloy AB - Series B | | | 24,083 | |
| | 8,470 | | | Atlas Copco AB - Class A | | | 281,664 | |
| | 4,153 | | | Atlas Copco AB - Class B | | | 120,808 | |
| | 2,834 | | | Epiroc AB - Class A | | | 28,004 | |
| | 4,137 | | | Epiroc AB - Class B | | | 40,777 | |
| | 3,800 | | | Essity AB - Class B | | | 116,408 | |
| | 28,370 | | | Hennes & Mauritz AB - Series B | | | 363,045 | |
| | 1,010 | | | ICA Gruppen AB | | | 42,183 | |
| | 4,173 | | | Investor AB - B Shares | | | 188,259 | |
| | 2,149 | | | L E Lundbergforetagen AB - Series B | | | 87,115 | |
| | 11,856 | | | Skanska AB - Class B (a) | | | 178,423 | |
| | 4,939 | | | SKF AB - B Shares | | | 67,305 | |
| | 8,421 | | | Swedish Match AB | | | 476,794 | |
| | 6,963 | | | Tele2 AB - B Shares | | | 92,768 | |
| | 16,283 | | | Telefonaktiebolaget LM Ericsson - Series B | | | 131,810 | |
| | | | | | |
|
|
|
| | | | | | | | 2,239,446 | |
| | | | | | |
|
|
|
| | | | | Switzerland - 9.24% | |
| | 5,984 | | | Adecco Group AG | | | 235,809 | |
| | 676 | | | Alcon, Inc. (a) | | | 34,632 | |
| | 167 | | | Baloise Holding AG | | | 21,772 | |
| | 1 | | | Chocoladefabriken Lindt & Spruengli AG | | | 86,794 | |
| | 412 | | | Cie Financiere Richemont SA | | | 22,023 | |
| | 17,310 | | | Credit Suisse Group AG | | | 139,715 | |
| | 2,727 | | | Dufry AG | | | 83,692 | |
| | 158 | | | Geberit AG | | | 69,232 | |
| | 62 | | | Givaudan SA | | | 190,773 | |
| | 2,472 | | | Kuehne & Nagel International AG | | | 336,737 | |
| | 1,323 | | | LafargeHolcim, Ltd. | | | 48,281 | |
| | 205 | | | Lonza Group AG | | | 84,321 | |
| | 25,449 | | | Nestle SA | | | 2,605,158 | |
| | 18,712 | | | Novartis AG | | | 1,543,718 | |
| | 438 | | | Partners Group Holding AG | | | 299,884 | |
| | 7,410 | | | Roche Holdings AG | | | 2,384,108 | |
| | 154 | | | SGS SA | | | 355,197 | |
| | 176 | | | Sika AG | | | 28,902 | |
| | 1,132 | | | Sonova Holding AG | | | 201,852 | |
| | 235 | | | Straumann Holding AG | | | 171,810 | |
| | 352 | | | Swiss Life Holding AG | | | 118,148 | |
| | 1,426 | | | Swiss Prime Site AG | | | 138,793 | |
| | 1,457 | | | Swiss Re AG | | | 112,187 | |
| | 133 | | | Swisscom AG | | | 71,219 | |
| | 814 | | | Temenos AG | | | 106,105 | |
| | | | | | | | |
Number of
Shares
| | | | | Value
| |
| | | | | Switzerland (Continued) | | | | |
| | 559 | | | The Swatch Group AG - Group I | | $ | 109,787 | |
| | 1,879 | | | The Swatch Group AG - Group N | | | 72,745 | |
| | 16,125 | | | UBS Group AG | | | 147,804 | |
| | 1,142 | | | Zurich Insurance Group AG | | | 401,192 | |
| | | | | | |
|
|
|
| | | | | | | | 10,222,390 | |
| | | | | | |
|
|
|
| | | | | United Kingdom - 11.16% | |
| | 16,865 | | | 3i Group PLC | | | 163,415 | |
| | 19,360 | | | Admiral Group PLC | | | 533,176 | |
| | 6,944 | | | Anglo American PLC | | | 121,684 | |
| | 1,478 | | | Associated British Foods PLC | | | 33,107 | |
| | 9,067 | | | AstraZeneca PLC | | | 807,858 | |
| | 88,984 | | | Auto Trader Group PLC | | | 480,850 | |
| | 2,539 | | | AVEVA Group PLC | | | 109,392 | |
| | 76,040 | | | Aviva PLC | | | 250,000 | |
| | 17,212 | | | BAE Systems PLC | | | 110,587 | |
| | 11,321 | | | Barratt Developments PLC | | | 61,193 | |
| | 4,332 | | | Berkeley Group Holdings PLC | | | 193,352 | |
| | 91,686 | | | BP PLC | | | 375,998 | |
| | 14,115 | | | British American Tobacco PLC | | | 480,830 | |
| | 3,603 | | | Bunzl PLC | | | 72,120 | |
| | 19,557 | | | Burberry Group PLC | | | 317,893 | |
| | 5,816 | | | Coca-Cola European Partners PLC | | | 218,274 | |
| | 3,900 | | | Coca-Cola HBC AG | | | 83,640 | |
| | 11,507 | | | Compass Group PLC | | | 179,280 | |
| | 513 | | | Croda International PLC | | | 27,065 | |
| | 11,294 | | | Diageo PLC | | | 358,127 | |
| | 56,712 | | | Evraz PLC | | | 162,260 | |
| | 48,224 | | | GlaxoSmithKline PLC | | | 904,881 | |
| | 5,451 | | | Halma PLC | | | 128,022 | |
| | 20,564 | | | Hargreaves Lansdown PLC | | | 349,400 | |
| | 63,729 | | | HSBC Holdings PLC | | | 357,759 | |
| | 2,773 | | | InterContinental Hotels Group PLC | | | 117,972 | |
| | 12,307 | | | J. Sainsbury PLC | | | 31,843 | |
| | 45,568 | | | JD Sports Fashion PLC | | | 255,214 | |
| | 51,792 | | | Kingfisher PLC | | | 90,973 | |
| | 124,791 | | | Legal & General Group PLC | | | 294,843 | |
| | 62,925 | | | Lloyds Banking Group PLC | | | 24,601 | |
| | 3,106 | | | London Stock Exchange Group PLC | | | 277,849 | |
| | 137,941 | | | M&G PLC (a) | | | 191,877 | |
| | 111,920 | | | Marks & Spencer Group PLC | | | 135,673 | |
| | 1,511 | | | Mondi PLC | | | 25,499 | |
| | 18,335 | | | National Grid PLC | | | 214,231 | |
| | 5,022 | | | Next PLC | | | 251,947 | |
| | 6,512 | | | Ocado Group PLC (a) | | | 97,682 | |
| | 4,871 | | | Prudential PLC | | | 61,033 | |
| | 749 | | | Reckitt Benckiser Group PLC | | | 57,055 | |
| | 17,771 | | | RELX PLC | | | 379,276 | |
| | 12,680 | | | Rentokil Initial Plc | | | 60,559 | |
| | 540 | | | Rio Tinto, Ltd. | | | 27,821 | |
| | 3,901 | | | Rio Tinto PLC | | | 178,830 | |
| | 8,276 | | | Rolls-Royce Holdings PLC | | | 34,978 | |
| | 16,958 | | | Royal Dutch Shell PLC - Class A | | | 294,622 | |
| | 14,203 | | | Royal Dutch Shell PLC - Class B | | | 238,241 | |
| | 884 | | | Schroders PLC | | | 27,026 | |
| | 1,217 | | | Severn Trent PLC | | | 34,449 | |
| | 19,048 | | | Smith & Nephew PLC | | | 335,559 | |
| | 1,117 | | | Spirax-Sarco Engineering PLC | | | 112,139 | |
| | 5,937 | | | SSE Plc | | | 95,402 | |
| | 3,322 | | | St. James’s Place PLC | | | 31,021 | |
See notes to financial statements.
73
GuideMark® World ex-US Fund
SCHEDULE OF INVESTMENTS (Continued)
March 31, 2020
| | | | | | | | |
Number of
Shares
| | | | | Value
| |
| | | | | COMMON STOCKS (Continued) | |
| | | | | United Kingdom (Continued) | | | | |
| | 40,579 | | | Standard Life Aberdeen PLC | | $ | 111,990 | |
| | 51,687 | | | Tesco PLC | | | 145,965 | |
| | 51,636 | | | The Sage Group PLC | | | 375,473 | |
| | 8,347 | | | Unilever PLC | | | 420,940 | |
| | 5,883 | | | United Utilities Group PLC | | | 65,854 | |
| | 201,080 | | | Vodafone Group PLC | | | 278,182 | |
| | 43,691 | | | Wm Morrison Supermarkets PLC | | | 95,449 | |
| | | | | | |
|
|
|
| | | | | | | | 12,352,231 | |
| | | | | | |
|
|
|
| | | | | Total Common Stocks
(Cost $109,358,012) | | | 104,806,571 | |
| | | | | | |
|
|
|
| | | | | INVESTMENT COMPANIES - 3.28% | |
| | | | | Canada - 0.29% | |
| | 14,562 | | | iShares MSCI Canada ETF | | | 318,180 | |
| | | | | | |
|
|
|
| | | | | Japan - 2.99% | |
| | 61,952 | | | iShares MSCI EAFE ETF | | | 3,311,954 | |
| | | | | | |
|
|
|
| | | | | Total Investment Companies
(Cost $3,576,829) | | | 3,630,134 | |
| | | | | | |
|
|
|
| | | | | PARTICIPATORY NOTES - 0.11% | |
| | | | | Switzerland - 0.11% | |
| | 11 | | | Chocoladefabriken Lindt & Spruengli AG (d) | | | 92,328 | |
| | 129 | | | Schindler Holding AG (d) | | | 28,223 | |
| | | | | | |
|
|
|
| | | | | Total Participatory Notes
(Cost $122,893) | | | 120,551 | |
| | | | | | |
|
|
|
| | | | | PREFERRED STOCKS - 0.17% | |
| | | | | Germany - 0.17% | |
| | 5,261 | | | Fuchs Petrolub SE - Preference Shares (b) | | | 187,663 | |
| | | | | | |
|
|
|
| | | | | Total Preferred Stocks
(Cost $242,037) | | | 187,663 | |
| | | | | | |
|
|
|
| | | | | REAL ESTATE INVESTMENT TRUSTS - 1.77% | |
| | | | | Australia - 0.17% | |
| | 12,951 | | | Goodman Group | | | 94,926 | |
| | 42,484 | | | Mirvac Group | | | 53,976 | |
| | 25,906 | | | Stockland | | | 39,836 | |
| | | | | | |
|
|
|
| | | | | | | | 188,738 | |
| | | | | | |
|
|
|
| | | | | Canada - 0.03% | |
| | 1,123 | | | Canadian Apartment Properties | | | 33,986 | |
| | | | | | |
|
|
|
| | | | | France - 0.13% | |
| | 539 | | | Covivio | | | 30,271 | |
| | 399 | | | Gecina SA | | | 52,504 | |
| | 732 | | | ICADE | | | 57,454 | |
| | | | | | |
|
|
|
| | | | | | | | 140,229 | |
| | | | | | |
|
|
|
| | | | | Japan - 1.07% | |
| | 76 | | | Daiwa House REIT Investment Corp. | | | 186,270 | |
| | 17 | | | Japan Prime Realty Investment Corp. | | | 51,362 | |
| | 34 | | | Japan Real Estate Investment Corp. | | | 199,862 | |
| | | | | | | | |
Number of
Shares
| | | | | Value
| |
| | | | | Japan (Continued) | | | | |
| | 28 | | | Nippon Building Fund, Inc. | | $ | 188,355 | |
| | 76 | | | Nippon Prologis REIT, Inc. | | | 191,223 | |
| | 123 | | | Nomura Real Estate Master Fund, Inc. | | | 156,446 | |
| | 98 | | | Orix JREIT, Inc. | | | 128,896 | |
| | 85 | | | United Urban Investment Corp. | | | 85,039 | |
| | | | | | |
|
|
|
| | | | | | | | 1,187,453 | |
| | | | | | |
|
|
|
| | | | | Singapore - 0.22% | |
| | 61,774 | | | Ascendas Real Estate Investment Trust | | | 122,313 | |
| | 91,815 | | | Mapletree Commercial Trust | | | 117,760 | |
| | | | | | |
|
|
|
| | | | | | | | 240,073 | |
| | | | | | |
|
|
|
| | | | | United Kingdom - 0.15% | |
| | 18,142 | | | Segro PLC | | | 171,503 | |
| | | | | | |
|
|
|
| | | | | Total Real Estate Investment Trusts
(Cost $2,335,493) | | | 1,961,982 | |
| | | | | | |
|
|
|
| | | | | SHORT TERM INVESTMENTS - 0.41% | |
| | | | | Money Market Funds - 0.41% | |
| | | | | DWS Government Money Market Series - Institutional Shares | | | | |
| | 450,187 | | | Effective Yield, 0.41% (c) | | | 450,187 | |
| | | | | | |
|
|
|
| | | | | Total Short Term Investments
(Cost $450,187) | | | 450,187 | |
| | | | | | |
|
|
|
| | | | | INVESTMENTS PURCHASED WITH PROCEEDS FROM SECURITIES LENDING COLLATERAL - 0.54% | |
| | 593,326 | | | Mount Vernon Liquid Assets Portfolio, LLC
Effective Yield, 0.91% (c) | | | 593,326 | |
| | | | | | |
|
|
|
| | | | | Total Investments Purchased with Proceeds from Securities Lending Collateral
(Cost $593,326) | | | 593,326 | |
| | | | | | |
|
|
|
| | | | | Total Investments
(Cost $116,678,777) - 101.01% | | | 111,750,414 | |
| | | | | Liabilities in Excess of
Other Assets - (1.01)% | | | (1,111,017 | ) |
| | | | | | |
|
|
|
| | | | | TOTAL NET ASSETS - 100.00% | | $ | 110,639,397 | |
| | | | | | |
|
|
|
Percentages are stated as a percent of net assets.
| (a) | | Non-income producing security. |
| (b) | | All or portion of this security is on loan. |
| (c) | | Seven-day yield as of March 31, 2020. |
| (d) | | Represents the value of the underlying security. See note 3u. of the Notes to Financial Statements. |
| (e) | | A security contractually bound to one or more other securities to form a single saleable unit which cannot be sold separately. |
| (f) | | These securities have been deemed illiquid according to the Fund’s liquidity guidelines. The value of these securities total $74,662, which represents 0.07% of total net assets. |
Glossary of Terms
| | | | |
| ADR | | - | | American Depositary Receipt |
| LN | | - | | London Stock Exchange |
| EB | | - | | Cboe European Equities |
See notes to financial statements.
74
GuideMark® Worldex-US Fund
SCHEDULE OF INVESTMENTS BY INDUSTRY
March 31, 2020
| | | | |
COMMON STOCKS | | | | |
Aerospace & Defense | | | 0.38% | |
Air Freight & Logistics | | | 0.54% | |
Airlines | | | 0.06% | |
Auto Components | | | 1.01% | |
Automobiles | | | 1.42% | |
Banks | | | 6.00% | |
Beverages | | | 1.37% | |
Biotechnology | | | 0.52% | |
Building Products | | | 0.36% | |
Capital Markets | | | 3.56% | |
Chemicals | | | 1.78% | |
Commercial Services & Supplies | | | 0.50% | |
Communications Equipment | | | 0.12% | |
Construction & Engineering | | | 1.66% | |
Construction Materials | | | 0.36% | |
Consumer Finance | | | 0.13% | |
Containers & Packaging | | | 0.15% | |
Distributors | | | 0.15% | |
Diversified Financial Services | | | 1.44% | |
Diversified Telecommunication Services | | | 2.96% | |
Electric Utilities | | | 2.10% | |
Electrical Equipment | | | 0.40% | |
Electronic Equipment, Instruments & Components | | | 1.04% | |
Entertainment | | | 0.08% | |
Food & Staples Retailing | | | 4.79% | |
Food Products | | | 4.59% | |
Gas Utilities | | | 0.31% | |
Health Care Equipment & Supplies | | | 3.61% | |
Health Care Providers & Services | | | 0.19% | |
Health Care Technology | | | 0.08% | |
Hotels, Restaurants & Leisure | | | 0.56% | |
Household Durables | | | 1.31% | |
Household Products | | | 0.76% | |
Independent Power and Renewable Electricity Producers | | | 0.14% | |
Industrial Conglomerates | | | 0.47% | |
Insurance | | | 6.55% | |
Interactive Media & Services | | | 0.93% | |
Internet & Direct Marketing Retail | | | 0.73% | |
IT Services | | | 1.62% | |
Leisure Products | | | 0.23% | |
Life Sciences Tools & Services | | | 0.56% | |
Machinery | | | 1.37% | |
Marine | | | 0.93% | |
Media | | | 0.54% | |
Metals & Mining | | | 2.60% | |
Multiline Retail | | | 1.19% | |
Multi-Utilities | | | 0.81% | |
Oil, Gas & Consumable Fuels | | | 3.47% | |
Paper & Forest Products | | | 0.05% | |
| | | | |
| | | | | |
Personal Products | | | 2.21% | |
Pharmaceuticals | | | 9.45% | |
Professional Services | | | 2.18% | |
Real Estate Management & Development | | | 0.57% | |
Road & Rail | | | 0.18% | |
Semiconductors & Semiconductor Equipment | | | 1.23% | |
Software | | | 2.07% | |
Specialty Retail | | | 2.04% | |
Technology Hardware, Storage & Peripherals | | | 0.38% | |
Textiles, Apparel & Luxury Goods | | | 3.55% | |
Tobacco | | | 0.87% | |
Trading Companies & Distributors | | | 2.18% | |
Transportation Infrastructure | | | 0.30% | |
Water Utilities | | | 0.09% | |
Wireless Telecommunication Services | | | 0.95% | |
| | |
|
|
|
TOTAL COMMON STOCKS | | | 94.73% | |
| | |
|
|
|
INVESTMENT COMPANIES | | | | |
Exchange Traded Funds | | | 3.28% | |
| | |
|
|
|
TOTAL INVESTMENT COMPANIES | | | 3.28% | |
| | |
|
|
|
PARTICIPATORY NOTES | | | | |
Food Products | | | 0.08% | |
Machinery | | | 0.03% | |
| | |
|
|
|
TOTAL PARTICIPATORY NOTES | | | 0.11% | |
| | |
|
|
|
PREFERRED STOCKS | | | | |
Chemicals | | | 0.17% | |
| | |
|
|
|
TOTAL PREFERRED STOCKS | | | 0.17% | |
| | |
|
|
|
REAL ESTATE INVESTMENT TRUSTS | | | | |
Real Estate Investment Trusts | | | 1.77% | |
| | |
|
|
|
TOTAL REAL ESTATE INVESTMENT TRUSTS | | | 1.77% | |
| | |
|
|
|
SHORT TERM INVESTMENTS | | | | |
Money Market Funds | | | 0.41% | |
| | |
|
|
|
TOTAL SHORT TERM INVESTMENTS | | | 0.41% | |
| | |
|
|
|
INVESTMENTS PURCHASED WITH PROCEEDS FROM SECURITIES LENDING COLLATERAL | | | | |
Investments Purchased with Proceeds from Securities Lending Collateral | | | 0.54% | |
| | |
|
|
|
TOTAL INVESTMENTS PURCHASED WITH PROCEEDS FROM SECURITIES LENDING COLLATERAL | | | 0.54% | |
| | |
|
|
|
TOTAL INVESTMENTS | | | 101.01% | |
Liabilities in Excess of Other Assets | | | (1.01)% | |
| | |
|
|
|
TOTAL NET ASSETS | | | 100.00% | |
| | |
|
|
|
Percentages are stated as a percent of net assets.
See notes to financial statements.
75
GuideMark® Core Fixed Income Fund
SCHEDULE OF INVESTMENTS
March 31, 2020
| | | | | | | | |
Principal Amount
| | | | | Value
| |
| | | | | ASSET BACKED SECURITIES - 5.94% | |
| | 395,000 | | | Ally Master Owner Trust
Series2018-1, 2.700%, 01/15/2023 | | $ | 389,166 | |
| | 410,000 | | | ALM XVI, Ltd.
Series 2015-16RR, 2.731% (3 Month LIBOR USD + 0.900%, 0.900% Floor), 04/15/2027 (a)(c) | | | 404,443 | |
| | | | | AmeriCredit Automobile Receivables Trust | | | | |
| | 83,206 | | | Series2017-3-A3, 1.900%, 03/18/2022 | | | 82,920 | |
| | 150,000 | | | Series2019-3D, 2.580%, 09/18/2025 | | | 142,313 | |
| | 400,000 | | | Atrium XII
Series2015-12R, 2.632% (3 Month LIBOR USD + 0.830%, 0.000% Floor), 04/22/2027 (a)(c) | | | 388,692 | |
| | 250,000 | | | Carlyle Global Market Strategies CLO, Ltd.
Series2013-2, 2.709% (3 Month LIBOR USD + 0.890%, 0.000% Floor), 01/18/2029 (a)(c) | | | 240,303 | |
| | 2,135 | | | CIG AUTO RECEIVABLES TRUST
Series2017-1, 2.710%, 05/15/2023 (c) | | | 2,129 | |
| | | | | Domino’s Pizza Master Issuer LLC | | | | |
| | 187,150 | | | Series2018-1, 4.116%, 07/25/2048 (c)(g) | | | 179,843 | |
| | 74,813 | | | Series2019-1, 3.668%, 10/25/2049 (c) | | | 67,019 | |
| | 135,000 | | | Drive Auto Receivables Trust
Series2019-4, 2.700%, 02/16/2027 | | | 126,169 | |
| | | | | Exeter Automobile Receivables Trust | | | | |
| | 300,000 | | | Series2019-4A, 2.580%, 09/15/2025 (c) | | | 272,312 | |
| | 90,000 | | | Series2020-1, 2.730%, 12/15/2025 (c) | | | 73,242 | |
| | 77,913 | | | Flagship Credit Auto Trust
Series2018-2, 2.970%, 10/17/2022 (c) | | | 78,010 | |
| | 100,000 | | | GCO Education Loan Funding Trust
Series2006-1, 1.909% (3 Month LIBOR USD + 0.230%, 0.230% Floor), 05/25/2036 (a) | | | 93,815 | |
| | 188,218 | | | GLS Auto Receivables Issuer Trust
Series2019-4, 2.470%, 11/15/2023 (c) | | | 173,055 | |
| | 300,000 | | | GTP Acquisition Partners I LLC
Series2015-2, 3.482%, 06/15/2050 (c) | | | 306,885 | |
| | 250,000 | | | LCM XX LP
Series2015-20R, 2.859% (3 Month LIBOR USD + 1.040%, 1.040% Floor), 10/20/2027 (a)(c) | | | 245,534 | |
| | 220,037 | | | Marlette Funding Trust
Series2019-4, 2.390%, 12/15/2029 (c)(g) | | | 212,628 | |
| | | | | NRZ Excess Spread-Collateralized Notes Series | | | | |
| | 216,243 | | | Series 2018-PLS1, 3.193%, 01/25/2023 (c) | | | 215,943 | |
| | 81,273 | | | Series 2018-PLS2, 3.265%, 02/25/2023 (c) | | | 79,819 | |
| | | | | OCP CLO, Ltd. | | | | |
| | 152,481 | | | Series2015-8R, 2.686% (3 Month LIBOR USD + 0.850%, 0.000% Floor), 04/17/2027 (a)(c) | | | 149,638 | |
| | 211,058 | | | Series2015-9R, 2.631% (3 Month LIBOR USD + 0.800%, 0.000% Floor), 07/15/2027 (a)(c) | | | 207,715 | |
| | 260,000 | | | OnDeck Asset Securitization Trust II LLC
Series2019-1A, 2.650%, 11/17/2024 (c)(g) | | | 252,610 | |
| | | | | OneMain Financial Issuance Trust | | | | |
| | 331,000 | | | Series2018-1A, 3.300%, 03/14/2029 (c) | | | 329,309 | |
| | 73,456 | | | Series2017-1A, 2.370%, 09/14/2032 (c) | | | 72,267 | |
| | 250,000 | | | OZLM VII, Ltd.
Series2014-7R, 2.846% (3 Month LIBOR USD + 1.010%, 1.010% Floor), 07/17/2029 (a)(c) | | | 239,303 | |
| | 300,000 | | | OZLM XII, Ltd.
Series2015-12R, 2.820% (3 Month LIBOR USD + 1.050%, 0.000% Floor), 04/30/2027 (a)(c) | | | 292,343 | |
| | | | | | | | |
Principal Amount
| | | | | Value
| |
| | | | | ASSET BACKED SECURITIES (Continued) | |
| | 107,673 | | | PRPM Trust
Series2019-GS1, 3.500%, 10/25/2024 (b)(c) | | $ | 104,562 | |
| | 180,000 | | | Regional Management Issuance Trust
Series2018-1, 3.830%, 07/15/2027 (c)(g) | | | 175,232 | |
| | 114,485 | | | RMF Buyout Issuance Trust
Series2019-1, 2.475%, 07/25/2029 (b)(c) | | | 112,842 | |
| | 205,000 | | | Santander Drive Auto Receivables Trust
Series2019-3, 2.680%, 10/15/2025 | | | 205,640 | |
| | 39,429 | | | SoFi Consumer Loan Program Trust
Series2016-2, 3.090%, 10/27/2025 (c)(g) | | | 38,750 | |
| | 335,000 | | | Sound Point CLO, Ltd.
Series2016-2, 2.781% (3 Month LIBOR USD + 0.950%, 0.000% Floor), 04/16/2029 (a)(c) | | | 320,898 | |
| | 125,000 | | | Springleaf Funding Trust
Series2017-A, 2.680%, 07/15/2030 (c) | | | 120,014 | |
| | 395,000 | | | TICP CLO, Ltd.
Series2018-3, 2.659% (3 Month LIBOR USD + 0.840%, 0.084% Floor), 04/20/2028 (a)(c) | | | 384,134 | |
| | | | | Voya CLO, Ltd. | | | | |
| | 165,657 | | | Series2014-3, 2.514% (3 Month LIBOR USD + 0.720%, 0.000% Floor), 07/27/2026 (a)(c) | | | 163,476 | |
| | 480,000 | | | Series2015-1, 2.719% (3 Month LIBOR USD + 0.900%, 0.9000% Floor), 01/18/2029 (a)(c) | | | 466,780 | |
| | 78,200 | | | Wendy’s Funding LLC
Series2018-1, 3.884%, 03/15/2048 (c)(g) | | | 70,890 | |
| | 220,000 | | | Westlake Automobile Receivables Trust
Series2019-3, 2.720%, 11/15/2024 (c) | | | 178,974 | |
| | 400,000 | | | Z Capital Credit Partners CLO, Ltd.
Series2015-1, 2.793% (3 Month LIBOR USD + 0.950%, 0.095% Floor), 07/16/2027 (a)(c) | | | 391,029 | |
| | | | | | |
|
|
|
| | | | | Total Asset Backed Securities
(Cost $8,327,976) | | | 8,050,646 | |
| | | | | | |
|
|
|
| | | | | COLLATERALIZED MORTGAGE OBLIGATIONS - 14.14% | |
| | 159,476 | | | Ajax Mortgage Loan Trust
Series2017-B, 3.163%, 09/25/2056 (b)(c) | | | 162,716 | |
| | | | | Angel Oak Mortgage Trust I LLC | | | | |
| | 117,259 | | | Series2018-3, 3.649%, 09/25/2048 (b)(c) | | | 117,383 | |
| | 132,335 | | | Series2019-2, 3.628%, 03/25/2049 (b)(c) | | | 133,684 | |
| | 339,868 | | | Series2019-4, 2.993%, 07/26/2049 (b)(c) | | | 337,342 | |
| | 240,819 | | | Series2019-3, 2.930%, 05/25/2059 (b)(c) | | | 240,038 | |
| | | | | Arroyo Mortgage Trust | | | | |
| | 170,336 | | | Series2018-1, 3.763%, 04/25/2048 (b)(c) | | | 168,032 | |
| | 247,347 | | | Series2019-3, 2.962%, 10/25/2048 (b)(c) | | | 229,117 | |
| | 270,685 | | | Series2019-2, 3.347%, 04/25/2049 (b)(c) | | | 271,439 | |
| | | | | BANK | | | | |
| | 2,153,545 | | | Series 2019-BNK23, 0.701%, 12/17/2052 (b)(j) | | | 117,359 | |
| | 996,805 | | | Series 2019-BNK18, 0.905%, 05/17/2062 (b)(j) | | | 65,144 | |
| | 1,282,346 | | | Series 2019-BNK20, 0.841%, 09/15/2062 (b)(j) | | | 78,781 | |
| | 1,324,516 | | | Series 2019-BNK22, 0.604%, 11/17/2062 (b)(j) | | | 61,354 | |
| | 999,131 | | | Series 2019-BNK24, 0.768%, 11/17/2062 (b)(j) | | | 51,309 | |
| | 1,000,000 | | | Series 2020-BNK26, 1.357%, 03/16/2063 (j) | | | 91,365 | |
| | | | | Bayview Koitere Fund Trust | | | | |
| | 72,919 | | | Series2017-RT4, 3.500%, 07/28/2057 (b)(c) | | | 73,090 | |
| | 54,191 | | | Series 2017-SPL3, 4.000%, 11/28/2053 (b)(c) | | | 54,433 | |
| | 204,993 | | | Bayview Mortgage Fund IVc Trust
Series 2017-RT3A, 3.500%, 01/28/2058 (b)(c) | | | 202,841 | |
| | | | | Bayview Opportunity Master Fund IVa Trust | | | | |
| | 190,405 | | | Series 2017-SPL5A, 3.500%, 07/28/2057 (b)(c) | | | 187,876 | |
| | 65,872 | | | Series 2017-SPL1A, 4.000%, 10/28/2064 (b)(c) | | | 66,432 | |
See notes to financial statements.
76
GuideMark® Core Fixed Income Fund
SCHEDULE OF INVESTMENTS (Continued)
March 31, 2020
| | | | | | | | |
Principal Amount
| | | | | Value
| |
| | | | | COLLATERALIZED MORTGAGE OBLIGATIONS (Continued) | |
| | 70,789 | | | Bayview Opportunity Master Fund IVb Trust
Series2017-RT6, 3.500%, 10/28/2057 (b)(c) | | $ | 70,685 | |
| | 132,000 | | | BBCMS Mortgage Trust
Series 2017-DELC, 1.555% (1 Month LIBOR USD + 0.850%, 0.850% Floor), 08/15/2036 (a)(c) | | | 111,456 | |
| | | | | Benchmark Mortgage Trust | | | | |
| | 325,000 | | | Series2019-B11, 3.410%, 05/17/2052 | | | 343,146 | |
| | 1,003,373 | | | Series2019-B12, 1.068%, 08/16/2052 (b)(j) | | | 68,778 | |
| | | | | BX Commercial Mortgage Trust | | | | |
| | 183,774 | | | Series2018-IND, 1.455% (1 Month LIBOR USD + 0.750%, 0.075% Floor), 11/15/2035 (a)(c) | | | 176,046 | |
| | 329,613 | | | Series2019-XL, 1.625% (1 Month LIBOR USD + 0.920%, 0.920% Floor), 10/15/2036 (a)(c) | | | 313,936 | |
| | 100,000 | | | CAMB Commercial Mortgage Trust
Series 2019-LIFE, 2.155% (1 Month LIBOR USD + 1.450%, 1.450% Floor), 12/15/2037 (a)(c) | | | 93,119 | |
| | 145,000 | | | Century Plaza Towers
Series2019-CPT, 2.865%, 11/16/2039 (c) | | | 145,714 | |
| | 19,256 | | | Chase Mortgage Finance Trust
Series2007-A1, 4.303%, 02/25/2037 (b) | | | 18,140 | |
| | 66,418 | | | CIM Trust
Series2017-7, 3.000%, 04/25/2057 (b)(c) | | | 66,636 | |
| | | | | Citigroup Commercial Mortgage Trust | | | | |
| | 296,312 | | | Series2016-P3, 3.329%, 04/16/2049 | | | 309,942 | |
| | 505,000 | | | Series2016-P4, 2.902%, 07/12/2049 | | | 517,106 | |
| | | | | Citigroup Mortgage Loan Trust, Inc. | | | | |
| | 103,329 | | | Series 2019-IMC1, 2.720%, 07/25/2049 (b)(c) | | | 102,269 | |
| | 246,585 | | | Series2018-R2, 3.500%, 02/25/2058 (b)(c) | | | 245,046 | |
| | 114,808 | | | Series2018-R, 3.000%, 09/25/2064 (b)(c) | | | 114,987 | |
| | 141,597 | | | Series2019-E, 3.228%, 11/25/2070 (c)(k) | | | 137,968 | |
| | | | | COLT Mortgage Loan Trust | | | | |
| | 54,131 | | | Series2019-1, 3.705%, 03/25/2049 (b)(c) | | | 53,971 | |
| | 102,386 | | | Series2019-2, 3.337%, 05/25/2049 (b)(c) | | | 103,515 | |
| | 130,821 | | | Series2019-3, 2.764%, 08/25/2049 (b)(c) | | | 130,095 | |
| | 227,210 | | | Series2019-4 A1, 2.579%, 11/25/2049 (b)(c) | | | 222,520 | |
| | | | | COMM Mortgage Trust | | | | |
| | 120,000 | | | Series 2013-300P, 4.353%, 08/12/2030 (c) | | | 125,732 | |
| | 290,000 | | | Series2019-WCM, 1.605% (1 Month LIBOR USD + 0.900%, 0.900% Floor), 10/16/2034 (a)(c) | | | 276,113 | |
| | | | | Countrywide Home Loans, Inc. | | | | |
| | 7,687 | | | Series 2004-HYB6, 3.921%, 11/20/2034 (b) | | | 6,698 | |
| | 85,930 | | | Series2005-11, 1.547% (1 Month LIBOR USD + 0.600%, 0.300% Floor, 10.500% Cap), 03/25/2035 (a) | | | 65,852 | |
| | 375,000 | | | CSAIL Commercial Mortgage Trust
Series2016-C6, 2.960%, 01/15/2049 | | | 387,305 | |
| | 37,702 | | | CSMC Trust
Series 2017-FHA1, 3.250%, 04/25/2047 (b)(c) | | | 36,643 | |
| | 11,962,832 | | | DBGS Mortgage Trust
Series 2018-BIOD, 0.208%, 10/17/2051 (b)(j) | | | 177,229 | |
| | 475,000 | | | DBJPM Mortgage Trust
Series2016-C3, 2.890%, 08/12/2049 | | | 500,543 | |
| | | | | Deephaven Residential Mortgage Trust | | | | |
| | 106,772 | | | Series2019-2, 3.558%, 04/25/2059 (b)(c) | | | 104,009 | |
| | 250,741 | | | Series2019-3, 2.964%, 07/25/2059 (b)(c) | | | 239,267 | |
| | | | | | | | |
Principal Amount
| | | | | Value
| |
| | | | | COLLATERALIZED MORTGAGE OBLIGATIONS (Continued) | |
| | 368,448 | | | Four Times Square Trust
Series2006-4TS, 5.401%, 12/13/2028 (c) | | $ | 366,720 | |
| | | | | GS Mortgage Securities Trust | | | | |
| | 145,000 | | | Series 2012-ALOH, 3.551%, 04/12/2034 (c) | | | 145,416 | |
| | 145,000 | | | Series 2012-BWTR, 2.954%, 11/07/2034 (c) | | | 144,219 | |
| | 35,000 | | | Series 2015-GC34, 3.506%, 10/13/2048 | | | 37,563 | |
| | 1,450,709 | | | Series 2020-GC45, 0.675%, 02/14/2053 (b)(j) | | | 71,856 | |
| | 131,985 | | | Homeward Opportunities Fund I Trust
Series2019-2, 2.702%, 08/25/2059 (b)(c) | | | 127,722 | |
| | | | | JPMBB Commercial Mortgage Securities Trust | | | | |
| | 90,000 | | | Series2020-NNN, 2.812%, 01/16/2037 (c) | | | 88,676 | |
| | 399,497 | | | Series2013-C12, 3.157%, 07/17/2045 | | | 403,844 | |
| | | | | Mill City Mortgage Loan Trust | | | | |
| | 222,826 | | | Series2018-2, 3.500%, 05/25/2058 (b)(c) | | | 227,478 | |
| | 452,126 | | | Series2019-GS1, 2.750%, 07/25/2059 (b)(c) | | | 449,002 | |
| | 222,006 | | | Series2017-3, 2.750%, 01/25/2061 (b)(c) | | | 223,061 | |
| | 167,097 | | | Series2018-1, 3.250%, 05/25/2062 (b)(c) | | | 169,011 | |
| | 255,518 | | | Series2019-1, 3.250%, 10/25/2069 (b)(c) | | | 259,380 | |
| | | | | Morgan Stanley ABS Capital I, Inc. Trust | | | | |
| | 185,000 | | | Series2014-MP, 3.469%, 08/11/2033 (c) | | | 186,477 | |
| | 149,965 | | | Series 2003-NC10, 1.967% (1 Month LIBOR USD + 1.020%, 0.680% Floor), 10/25/2033 (a) | | | 143,855 | |
| | 175,000 | | | Morgan Stanley Bank of America Merrill Lynch Trust
Series2016-C29, 3.325%, 05/17/2049 | | | 183,032 | |
| | 222,000 | | | Mortgage Insurance-Linked Notes
Series2019-1, 2.847% (1 Month LIBOR USD + 1.900%, 1.900% Floor), 11/26/2029 (a)(c) | | | 204,460 | |
| | | | | MTRO Commercial Mortgage Trust | | | | |
| | 100,000 | | | Series 2019-TECH B, 1.805% (1 Month LIBOR USD + 1.100%, 1.100% Floor), 12/15/2033 (a)(c) | | | 93,167 | |
| | 100,000 | | | Series 2019-TECH C, 2.005% (1 Month LIBOR USD + 1.300%, 1.300% Floor), 12/15/2033 (a)(c) | | | 92,228 | |
| | 160,000 | | | Natixis Commercial Mortgage Securities Trust
Series 2019-1776, 2.507%, 10/17/2036 (c) | | | 158,455 | |
| | 320,000 | | | New Residential Advance Receivables Trust Advance Receivables Backed
Series2019-T4, 2.329%, 10/15/2051 (c) | | | 319,607 | |
| | | | | New Residential Mortgage LLC | | | | |
| | 190,014 | | | Series 2018-FNT1, 3.610%, 05/25/2023 (c) | | | 184,760 | |
| | 210,737 | | | Series 2018-FNT2, 3.790%, 07/25/2024 (c) | | | 207,954 | |
| | | | | New Residential Mortgage Loan Trust | | | | |
| | 80,777 | | | Series2016-2, 3.750%, 11/25/2035 (b)(c) | | | 83,739 | |
| | 201,687 | | | Series2018-4, 1.697% (1 Month LIBOR USD + 0.750%, 0.750% Floor), 01/27/2048 (a) | | | 193,895 | |
| | 65,266 | | | Series2016-4, 3.750%, 11/25/2056 (b)(c) | | | 67,589 | |
| | 105,123 | | | Series2017-1, 4.000%, 02/25/2057 (b)(c) | | | 109,566 | |
| | 96,559 | | | Series2017-2, 4.000%, 03/25/2057 (b)(c) | | | 100,954 | |
| | 53,607 | | | Series2017-3, 4.000%, 04/25/2057 (b)(c) | | | 55,896 | |
| | 57,821 | | | Series2017-4, 4.000%, 05/25/2057 (b)(c) | | | 60,361 | |
| | 59,513 | | | Series2017-5, 2.447% (1 Month LIBOR USD + 1.500%, 1.500% Floor), 06/25/2057 (a)(c) | | | 57,019 | |
| | 77,876 | | | Series2017-6, 4.000%, 08/25/2057 (b)(c) | | | 81,153 | |
| | 170,649 | | | Series2018-1, 4.000%, 12/25/2057 (b)(c) | | | 173,031 | |
| | 169,310 | | | Series2018-2, 4.500%, 02/25/2058 (b)(c) | | | 177,824 | |
| | 280,793 | | | Series2019-3, 3.750%, 11/25/2058 (b)(c) | | | 283,852 | |
| | 223,398 | | | Series2019-5, 3.500%, 08/25/2059 (b)(c) | | | 227,417 | |
See notes to financial statements.
77
GuideMark® Core Fixed Income Fund
SCHEDULE OF INVESTMENTS (Continued)
March 31, 2020
| | | | | | | | |
Principal Amount
| | | | | Value
| |
| | | | | COLLATERALIZED MORTGAGE OBLIGATIONS (Continued) | |
| | 134,423 | | | Series 2019-NQM4, 2.492%, 09/25/2059 (b)(c) | | $ | 132,930 | |
| | | | | SBA Tower Trust | | | | |
| | 90,000 | | | Series2017-1, 3.168%, 04/15/2047 (c) | | | 89,579 | |
| | 125,000 | | | Series2018-1, 3.448%, 03/15/2048 (c) | | | 127,954 | |
| | 155,000 | | | Series2019-1, 2.836%, 01/15/2050 (c) | | | 153,238 | |
| | 73,232 | | | Seasoned Credit Risk Transfer Trust
Series Series2019-3, 3.500%, 10/25/2058 | | | 77,519 | |
| | | | | SG Commercial Mortgage Securities Trust | | | | |
| | 355,000 | | | Series 2020-COVE, 2.632%, 04/17/2037 (c) | | | 354,066 | |
| | 75,000 | | | Series2016-C5, 3.055%, 10/13/2048 | | | 77,438 | |
| | | | | Towd Point Mortgage Trust | | | | |
| | 116,109 | | | Series2015-6, 2.750%, 04/25/2055 (b)(c) | | | 115,966 | |
| | 48,842 | | | Series2016-2, 2.750%, 08/25/2055 (b)(c) | | | 48,219 | |
| | 49,598 | | | Series2016-3, 2.250%, 08/25/2055 (b)(c) | | | 49,386 | |
| | 116,206 | | | Series2017-1, 2.750%, 10/25/2056 (b)(c) | | | 116,984 | |
| | 253,505 | | | Series2017-5, 1.547% (1 Month LIBOR USD + 0.600%, 0.000% Floor), 02/26/2057 (a)(c) | | | 247,576 | |
| | 228,226 | | | Series2017-2, 2.750%, 04/25/2057 (b)(c) | | | 223,862 | |
| | 54,913 | | | Series2017-3, 2.750%, 06/25/2057 (b)(c) | | | 54,307 | |
| | 287,115 | | | Series2017-4, 2.750%, 06/25/2057 (b)(c) | | | 281,196 | |
| | 276,162 | | | Series2017-6, 2.750%, 10/25/2057 (b)(c) | | | 276,584 | |
| | 87,005 | | | Series2018-1, 3.000%, 01/28/2058 (b)(c) | | | 86,757 | |
| | 242,133 | | | Series2018-2, 3.250%, 03/25/2058 (b)(c) | | | 245,202 | |
| | 177,435 | | | Series2018-3, 3.750%, 05/25/2058 (b)(c) | | | 180,484 | |
| | | | | Verus Securitization Trust | | | | |
| | 120,594 | | | Series2019-2, 3.211%, 05/25/2059 (b)(c) | | | 120,751 | |
| | 273,698 | | | Series2019-3, 2.784%, 07/25/2059 (c)(k) | | | 268,694 | |
| | 374,696 | | | Series2019-4, 3.142%, 10/25/2059 (b)(c) | | | 365,593 | |
| | 119,222 | | | VOLT LXXXIII LLC
Series 2019-NPL9, 3.376%, 11/25/2049 (c)(k) | | | 116,194 | |
| | 411,678 | | | VOLT LXXXIV LLC
Series 2019-NPL10, 3.426%, 12/25/2049 (c)(k) | | | 392,482 | |
| | 94,118 | | | VOLT LXXXV LLC
Series 2020-NPL1, 3.228%, 01/25/2050 (c)(k) | | | 85,268 | |
| | 289,850 | | | VOLT LXXXVIII LLC
Series 2020-NPL4, 2.981%, 03/25/2050 (c)(k) | | | 257,159 | |
| | 459,459 | | | WellsFargo-RBS Commercial Mortgage Trust
Series2014-C19, 3.660%, 03/15/2047 | | | 463,120 | |
| | | | | | |
|
|
|
| | | | | Total Collateralized Mortgage Obligations
(Cost $19,472,277) | | | 19,142,948 | |
| | | | | | |
|
|
|
| | | | | CORPORATE OBLIGATIONS - 30.99% | |
| | | | | Aerospace & Defense - 0.41% | |
| | 150,000 | | | L3Harris Technologies, Inc.
3.850%, 06/15/2023 (c) | | | 156,830 | |
| | 45,000 | | | Lockheed Martin Corp.
4.090%, 09/15/2052 | | | 54,329 | |
| | 50,000 | | | The Boeing Co.
3.250%, 02/01/2035 | | | 43,412 | |
| | | | | United Technologies Corp. | | | | |
| | 100,000 | | | 3.950%, 08/16/2025 | | | 109,366 | |
| | 140,000 | | | 3.125%, 05/04/2027 | | | 142,822 | |
| | 20,000 | | | 4.450%, 11/16/2038 | | | 22,839 | |
| | 25,000 | | | 4.625%, 11/16/2048 | | | 29,668 | |
| | | | | | |
|
|
|
| | | | | | | | 559,266 | |
| | | | | | |
|
|
|
| | | | | Automobiles - 0.20% | |
| | 25,000 | | | Ford Motor Co.
5.291%, 12/08/2046 | | | 15,125 | |
| | | | | | | | |
Principal Amount
| | | | | Value
| |
| | | | | Automobiles (Continued) | |
| | | | | General Motors Co. | | | | |
| | 5,000 | | | 6.250%, 10/02/2043 | | $ | 3,963 | |
| | 55,000 | | | 5.200%, 04/01/2045 | | | 43,740 | |
| | 205,000 | | | Volkswagen Group of America Finance LLC
3.875%, 11/13/2020 (c) | | | 204,361 | |
| | | | | | |
|
|
|
| | | | | | | | 267,189 | |
| | | | | | |
|
|
|
| | | | | Banks - 6.51% | |
| | | | | Bank of America Corp. | | | | |
| | 35,000 | | | 2.503%, 10/21/2022 | | | 35,119 | |
| | 60,000 | | | 3.124% (3 Month LIBOR USD + 1.160%), 01/20/2023 (a) | | | 61,014 | |
| | 190,000 | | | 4.100%, 07/24/2023 | | | 202,801 | |
| | 250,000 | | | 3.864% (3 Month LIBOR USD + 0.940%), 07/23/2024 (a) | | | 261,977 | |
| | 140,000 | | | 2.456% (3 Month LIBOR USD + 0.870%), 10/22/2025 (a) | | | 141,550 | |
| | 330,000 | | | 3.366% (3 Month LIBOR USD + 0.810%), 01/23/2026 (a) | | | 346,388 | |
| | 85,000 | | | 3.559% (3 Month LIBOR USD + 1.060%), 04/23/2027 (a) | | | 89,116 | |
| | 130,000 | | | 3.419% (3 Month LIBOR USD + 1.040%), 12/20/2028 (a) | | | 134,373 | |
| | 165,000 | | | 5.000%, 01/21/2044 | | | 210,429 | |
| | 490,000 | | | 4.083% (3 Month LIBOR USD + 3.150%), 03/20/2051 (a) | | | 562,422 | |
| | | | | Citigroup, Inc. | | | | |
| | 125,000 | | | 3.352% (3 Month LIBOR USD + 0.897%), 04/24/2025 (a) | | | 128,281 | |
| | 280,000 | | | 3.700%, 01/12/2026 | | | 289,804 | |
| | 155,000 | | | 4.300%, 11/20/2026 | | | 162,524 | |
| | 35,000 | | | 3.520% (3 Month LIBOR USD + 1.151%), 10/27/2028 (a) | | | 35,083 | |
| | 330,000 | | | 3.980% (3 Month LIBOR USD + 1.338%), 03/20/2030 (a) | | | 352,345 | |
| | 75,000 | | | 2.976% (SOFR + 1.422%), 11/05/2030 (a) | | | 73,397 | |
| | 155,000 | | | 4.412% (SOFR + 3.914%), 03/31/2031 (a) | | | 170,643 | |
| | 200,000 | | | Danske Bank AS
5.375%, 01/12/2024 (c) | | | 206,596 | |
| | 95,000 | | | Fifth Third Bancorp
2.375%, 01/28/2025 | | | 90,472 | |
| | 370,000 | | | HSBC Holdings PLC
3.262% (3 Month LIBOR USD + 1.055%), 03/13/2023 (a) | | | 370,010 | |
| | | | | JPMorgan Chase & Co. | | | | |
| | 150,000 | | | 3.797% (3 Month LIBOR USD + 0.890%), 07/23/2024 (a) | | | 157,223 | |
| | 155,000 | | | 4.023% (3 Month LIBOR USD + 1.000%), 12/05/2024 (a) | | | 164,487 | |
| | 225,000 | | | 3.220% (3 Month LIBOR USD + 1.155%), 03/01/2025 (a) | | | 233,944 | |
| | 170,000 | | | 3.300%, 04/01/2026 | | | 176,895 | |
| | 90,000 | | | 2.950%, 10/01/2026 | | | 93,059 | |
| | 195,000 | | | 3.960% (3 Month LIBOR USD + 1.245%), 01/29/2027 (a) | | | 210,144 | |
| | 300,000 | | | 3.782% (3 Month LIBOR USD + 1.337%), 02/01/2028 (a) | | | 318,168 | |
| | 80,000 | | | 3.509% (3 Month LIBOR USD + 0.945%), 01/23/2029 (a) | | | 82,530 | |
| | 120,000 | | | 3.702% (3 Month LIBOR USD + 1.160%), 05/06/2030 (a) | | | 128,944 | |
See notes to financial statements.
78
GuideMark® Core Fixed Income Fund
SCHEDULE OF INVESTMENTS (Continued)
March 31, 2020
| | | | | | | | |
Principal Amount
| | | | | Value
| |
| | | | | CORPORATE OBLIGATIONS (Continued) | |
| | | | | Banks (Continued) | |
| | 105,000 | | | KeyCorp
2.550%, 10/01/2029 (e) | | $ | 93,966 | |
| | | | | PNC Financial Services Group, Inc. | | | | |
| | 55,000 | | | 2.200%, 11/01/2024 | | | 56,486 | |
| | 195,000 | | | 3.450%, 04/23/2029 | | | 193,622 | |
| | 240,000 | | | 2.550%, 01/22/2030 (e) | | | 233,021 | |
| | | | | Royal Bank of Canada | | | | |
| | 245,000 | | | 2.800%, 04/29/2022 | | | 248,491 | |
| | 185,000 | | | 2.550%, 07/16/2024 | | | 188,501 | |
| | 235,000 | | | Santander Holdings USA, Inc.
3.700%, 03/28/2022 | | | 232,861 | |
| | 310,000 | | | Toronto-Dominion Bank
2.650%, 06/12/2024 | | | 315,510 | |
| | 370,000 | | | Truist Bank
2.250%, 03/11/2030 | | | 340,608 | |
| | | | | Wells Fargo & Co. | | | | |
| | 150,000 | | | 2.625%, 07/22/2022 | | | 150,688 | |
| | 250,000 | | | 2.600%, 01/15/2021 | | | 251,217 | |
| | 265,000 | | | 3.625%, 10/22/2021 | | | 272,473 | |
| | 85,000 | | | 2.406% (3 Month LIBOR USD + 0.825%), 10/30/2025 (a) | | | 83,887 | |
| | 120,000 | | | 3.000%, 04/22/2026 | | | 122,363 | |
| | 135,000 | | | 3.000%, 10/23/2026 | | | 138,317 | |
| | 285,000 | | | 3.584% (3 Month LIBOR USD + 1.310%), 05/22/2028 (a) | | | 290,372 | |
| | 1,000 | | | 5.606%, 01/15/2044 | | | 1,201 | |
| | 45,000 | | | 4.750%, 12/07/2046 | | | 49,931 | |
| | 45,000 | | | 5.013% (3 Month LIBOR USD + 4.240%), 04/04/2051 (a) | | | 57,952 | |
| | | | | | |
|
|
|
| | | | | | | | 8,811,205 | |
| | | | | | |
|
|
|
| | | | | Beverages - 1.12% | |
| | | | | Anheuser-Busch InBev Worldwide, Inc. | | | | |
| | 175,000 | | | 4.750%, 01/23/2029 | | | 193,585 | |
| | 385,000 | | | 5.450%, 01/23/2039 | | | 444,370 | |
| | 5,000 | | | 3.750%, 07/15/2042 | | | 5,052 | |
| | 20,000 | | | 4.900%, 02/01/2046 | | | 21,881 | |
| | 145,000 | | | 4.600%, 04/15/2048 | | | 154,137 | |
| | 162,000 | | | 4.750%, 04/15/2058 | | | 166,890 | |
| | | | | Constellation Brands, Inc. | | | | |
| | 75,000 | | | 4.400%, 11/15/2025 | | | 75,775 | |
| | 40,000 | | | 3.600%, 02/15/2028 | | | 39,215 | |
| | 145,000 | | | Molson Coors Brewing Co.
3.000%, 07/15/2026 | | | 137,299 | |
| | | | | PepsiCo, Inc. | | | | |
| | 40,000 | | | 2.625%, 03/19/2027 | | | 42,029 | |
| | 195,000 | | | 3.625%, 03/19/2050 | | | 232,176 | |
| | | | | | |
|
|
|
| | | | | | | | 1,512,409 | |
| | | | | | |
|
|
|
| | | | | Biotechnology - 0.88% | |
| | | | | AbbVie, Inc. | | | | |
| | 205,000 | | | 2.950%, 11/21/2026 (c) | | | 206,423 | |
| | 355,000 | | | 3.200%, 11/21/2029 (c) | | | 358,620 | |
| | 205,000 | | | 4.250%, 11/21/2049 (c)(e) | | | 220,585 | |
| | | | | Amgen, Inc. | | | | |
| | 45,000 | | | 2.650%, 05/11/2022 | | | 45,568 | |
| | 55,000 | | | 1.900%, 02/21/2025 | | | 55,563 | |
| | 95,000 | | | 2.200%, 02/21/2027 | | | 94,494 | |
| | 135,000 | | | 2.450%, 02/21/2030 | | | 133,649 | |
| | | | | | | | |
Principal Amount
| | | | | Value
| |
| | | | | Biotechnology (Continued) | |
| | 80,000 | | | Gilead Sciences, Inc.
2.500%, 09/01/2023 | | $ | 80,033 | |
| | | | | | |
|
|
|
| | | | | | | | 1,194,935 | |
| | | | | | |
|
|
|
| | | | | Building Products - 0.16% | |
| | 220,000 | | | Carrier Global Corp.
2.242%, 02/15/2025 (c) | | | 214,450 | |
| | | | | | |
|
|
|
| | | | | Capital Markets - 2.56% | |
| | | | | Morgan Stanley | | | | |
| | 75,000 | | | 2.625%, 11/17/2021 | | | 75,340 | |
| | 195,000 | | | 3.737% (3 Month LIBOR USD + 0.847%), 04/24/2024 (a) | | | 199,993 | |
| | 180,000 | | | 3.700%, 10/23/2024 | | | 189,105 | |
| | 65,000 | | | 3.125%, 07/27/2026 | | | 66,808 | |
| | 495,000 | | | 3.591% (3 Month LIBOR USD + 1.340%), 07/22/2028 (a) | | | 503,575 | |
| | 55,000 | | | 4.431% (3 Month LIBOR USD + 1.628%), 01/23/2030 (a) | | | 61,171 | |
| | 210,000 | | | 2.699% (SOFR + 1.143%), 01/22/2031 (a) | | | 206,112 | |
| | 15,000 | | | 3.971% (3 Month LIBOR USD + 1.455%), 07/22/2038 (a) | | | 16,228 | |
| | | | | State Street Corp. | | | | |
| | 80,000 | | | 3.776% (3 Month LIBOR USD + 0.770%), 12/03/2024 (a) | | | 83,867 | |
| | 90,000 | | | 2.354% (SOFR + 0.940%), 11/01/2025 (a) | | | 88,221 | |
| | 80,000 | | | 2.901% (SOFR + 2.600%), 03/30/2026 (a)(c) | | | 81,947 | |
| | 15,000 | | | 3.152% (SOFR + 2.650%), 03/30/2031 (a)(c) | | | 15,397 | |
| | | | | The Bank of New York Mellon Corp. | | | | |
| | 70,000 | | | 1.950%, 08/23/2022 | | | 70,377 | |
| | 290,000 | | | 2.100%, 10/24/2024 | | | 292,314 | |
| | 125,000 | | | 2.661% (3 Month LIBOR USD + 0.634%), 05/16/2023 (a) | | | 125,612 | |
| | | | | The Goldman Sachs Group, Inc. | | | | |
| | 275,000 | | | 2.876% (3 Month LIBOR USD + 0.821%), 10/31/2022 (a) | | | 276,503 | |
| | 55,000 | | | 2.905% (3 Month LIBOR USD + 0.990%), 07/24/2023 (a) | | | 54,870 | |
| | 140,000 | | | 3.500%, 01/23/2025 | | | 143,398 | |
| | 40,000 | | | 3.272% (3 Month LIBOR USD + 1.201%), 09/29/2025 (a) | | | 40,719 | |
| | 130,000 | | | 3.691% (3 Month LIBOR USD + 1.510%), 06/05/2028 (a) | | | 133,731 | |
| | 265,000 | | | 4.223% (3 Month LIBOR USD + 1.301%), 05/01/2029 (a) | | | 282,605 | |
| | 85,000 | | | 2.600%, 02/07/2030 | | | 80,470 | |
| | 140,000 | | | 6.750%, 10/01/2037 (e) | | | 185,849 | |
| | 20,000 | | | 6.250%, 02/01/2041 | | | 27,024 | |
| | | | | Willis North America, Inc. | | | | |
| | 25,000 | | | 3.600%, 05/15/2024 | | | 25,847 | |
| | 145,000 | | | 2.950%, 09/15/2029 | | | 138,519 | |
| | | | | | |
|
|
|
| | | | | | | | 3,465,602 | |
| | | | | | |
|
|
|
| | | | | Chemicals - 0.48% | |
| | 45,000 | | | Dow Chemical Co.
4.800%, 05/15/2049 | | | 47,008 | |
| | 295,000 | | | DuPont de Nemours, Inc.
4.205%, 11/15/2023 | | | 311,185 | |
| | 15,000 | | | Ecolab, Inc.
4.800%, 03/24/2030 | | | 16,916 | |
| | 20,000 | | | Methanex Corp.
5.650%, 12/01/2044 | | | 12,020 | |
See notes to financial statements.
79
GuideMark® Core Fixed Income Fund
SCHEDULE OF INVESTMENTS (Continued)
March 31, 2020
| | | | | | | | |
Principal Amount
| | | | | Value
| |
| | | | | CORPORATE OBLIGATIONS (Continued) | |
| | | | | Chemicals (Continued) | |
| | | | | The Sherwin-Williams Co. | | | | |
| | 15,000 | | | 3.450%, 06/01/2027 | | $ | 15,406 | |
| | 95,000 | | | 2.950%, 08/15/2029 | | | 93,728 | |
| | 105,000 | | | 2.300%, 05/15/2030 | | | 98,447 | |
| | 15,000 | | | 4.500%, 06/01/2047 | | | 16,127 | |
| | 45,000 | | | 3.300%, 05/15/2050 (e) | | | 42,724 | |
| | | | | | |
|
|
|
| | | | | | | | 653,561 | |
| | | | | | |
|
|
|
| | | | | Commercial Services & Supplies - 0.18% | |
| | 55,000 | | | ERAC USA Finance LLC
7.000%, 10/15/2037 (c) | | | 70,122 | |
| | | | | Waste Management, Inc. | | | | |
| | 105,000 | | | 3.200%, 06/15/2026 | | | 109,494 | |
| | 35,000 | | | 3.450%, 06/15/2029 | | | 35,968 | |
| | 20,000 | | | 4.150%, 07/15/2049 | | | 23,068 | |
| | | | | | |
|
|
|
| | | | | | | | 238,652 | |
| | | | | | |
|
|
|
| | | | | Consumer Finance - 0.39% | |
| | 155,000 | | | American Express Co.
4.200%, 11/06/2025 | | | 169,929 | |
| | | | | John Deere Capital Corp. | | | | |
| | 135,000 | | | 3.200%, 01/10/2022 | | | 138,359 | |
| | 25,000 | | | 1.200%, 04/06/2023 | | | 24,531 | |
| | 25,000 | | | 3.450%, 06/07/2023 | | | 26,198 | |
| | 145,000 | | | 2.600%, 03/07/2024 | | | 146,131 | |
| | 25,000 | | | 1.750%, 03/09/2027 | | | 24,149 | |
| | | | | | |
|
|
|
| | | | | | | | 529,297 | |
| | | | | | |
|
|
|
| | | | | Diversified Financial Services - 0.58% | |
| | | | | BAT Capital Corp. | | | | |
| | 55,000 | | | 3.222%, 08/15/2024 | | | 53,033 | |
| | 275,000 | | | 2.789%, 09/06/2024 | | | 266,408 | |
| | 85,000 | | | 4.906%, 04/02/2030 | | | 87,241 | |
| | | | | GlaxoSmithKline Capital, Inc. | | | | |
| | 160,000 | | | 3.625%, 05/15/2025 | | | 173,743 | |
| | 195,000 | | | 2.875%, 06/01/2022 | | | 199,650 | |
| | | | | | |
|
|
|
| | | | | | | | 780,075 | |
| | | | | | |
|
|
|
| | | | | Diversified Telecommunication Services - 1.25% | |
| | | | | AT&T, Inc. | | | | |
| | 60,000 | | | 2.950%, 07/15/2026 | | | 60,033 | |
| | 80,000 | | | 3.800%, 02/15/2027 | | | 83,676 | |
| | 175,000 | | | 4.500%, 05/15/2035 | | | 187,216 | |
| | 125,000 | | | 6.350%, 03/15/2040 | | | 158,752 | |
| | 110,000 | | | 4.350%, 06/15/2045 | | | 116,701 | |
| | | | | Verizon Communications, Inc. | | | | |
| | 160,000 | | | 4.125%, 03/16/2027 | | | 178,275 | |
| | 250,000 | | | 4.016%, 12/03/2029 | | | 282,453 | |
| | 105,000 | | | 3.150%, 03/22/2030 | | | 113,339 | |
| | 140,000 | | | 4.500%, 08/10/2033 | | | 165,361 | |
| | 60,000 | | | 5.250%, 03/16/2037 | | | 76,435 | |
| | 20,000 | | | 4.812%, 03/15/2039 (e) | | | 24,701 | |
| | 155,000 | | | 4.862%, 08/21/2046 | | | 203,111 | |
| | 30,000 | | | 4.000%, 03/22/2050 | | | 35,642 | |
| | 3,000 | | | 4.672%, 03/15/2055 | | | 3,834 | |
| | | | | | |
|
|
|
| | | | | | | | 1,689,529 | |
| | | | | | |
|
|
|
| | | | | Electric Utilities - 1.82% | |
| | 65,000 | | | Alabama Power Co.
2.450%, 03/30/2022 | | | 65,854 | |
| | | | | | | | |
Principal Amount
| | | | | Value
| |
| | | | | Electric Utilities (Continued) | |
| | | | | Cleco Corporate Holdings LLC | | | | |
| | 46,000 | | | 3.743%, 05/01/2026 | | $ | 45,165 | |
| | 5,000 | | | 4.973%, 05/01/2046 | | | 4,835 | |
| | 90,000 | | | Commonwealth Edison Co.
3.650%, 06/15/2046 | | | 95,663 | |
| | | | | Duke Energy Carolinas LLC | | | | |
| | 45,000 | | | 2.500%, 03/15/2023 | | | 45,571 | |
| | 118,000 | | | 5.300%, 02/15/2040 | | | 149,738 | |
| | 60,000 | | | Duke Energy Indiana, Inc.
4.900%, 07/15/2043 | | | 73,282 | |
| | 100,000 | | | Duke Energy Ohio, Inc.
3.650%, 02/01/2029 | | | 107,426 | |
| | | | | Evergy, Inc. | | | | |
| | 55,000 | | | 2.450%, 09/15/2024 | | | 54,056 | |
| | 140,000 | | | 2.900%, 09/15/2029 | | | 133,287 | |
| | | | | Exelon Corp. | | | | |
| | 185,000 | | | 2.450%, 04/15/2021 | | | 183,438 | |
| | 10,000 | | | 4.700%, 04/15/2050 | | | 10,342 | |
| | | | | Georgia Power Co. | | | | |
| | 85,000 | | | 2.400%, 04/01/2021 | | | 85,308 | |
| | 130,000 | | | 2.100%, 07/30/2023 | | | 127,094 | |
| | 45,000 | | | 4.750%, 09/01/2040 | | | 44,381 | |
| | 210,000 | | | Oglethorpe Power Corp.
5.050%, 10/01/2048 | | | 203,161 | |
| | 20,000 | | | Oncor Electric Delivery Co. LLC
5.750%, 03/15/2029 | | | 24,431 | |
| | 135,000 | | | Puget Energy, Inc.
3.650%, 05/15/2025 | | | 132,239 | |
| | 110,000 | | | Sierra Pacific Power Co.
2.600%, 05/01/2026 | | | 110,204 | |
| | 31,000 | | | South Carolina Electric & Gas Co.
5.100%, 06/01/2065 | | | 38,968 | |
| | | | | Southern California Edison Co. | | | | |
| | 90,000 | | | 2.850%, 08/01/2029 (e) | | | 87,255 | |
| | 125,000 | | | 2.250%, 06/01/2030 | | | 113,616 | |
| | 19,000 | | | 4.000%, 04/01/2047 (e) | | | 19,888 | |
| | 61,000 | | | 4.125%, 03/01/2048 | | | 65,363 | |
| | 80,000 | | | 3.650%, 02/01/2050 | | | 78,676 | |
| | | | | The Southern Co. | | | | |
| | 20,000 | | | 2.950%, 07/01/2023 | | | 20,154 | |
| | 160,000 | | | 3.250%, 07/01/2026 | | | 159,656 | |
| | 25,000 | | | 4.400%, 07/01/2046 | | | 26,120 | |
| | | | | Xcel Energy, Inc. | | | | |
| | 120,000 | | | 2.600%, 12/01/2029 | | | 113,925 | |
| | 55,000 | | | 3.500%, 12/01/2049 | | | 49,038 | |
| | | | | | |
|
|
|
| | | | | | | | 2,468,134 | |
| | | | | | |
|
|
|
| | | | | Entertainment - 0.36% | |
| | | | | Viacom, Inc. | | | | |
| | 125,000 | | | 4.250%, 09/01/2023 (e) | | | 127,678 | |
| | 340,000 | | | 4.950%, 01/15/2031 | | | 335,330 | |
| | 30,000 | | | 4.375%, 03/15/2043 | | | 26,715 | |
| | | | | | |
|
|
|
| | | | | | | | 489,723 | |
| | | | | | |
|
|
|
| | | | | Equity Real Estate Investment Trusts (REITs) - 0.21% | |
| | 110,000 | | | American Tower Corp.
2.400%, 03/15/2025 | | | 108,370 | |
| | 90,000 | | | Crown Castle International Corp.
3.300%, 07/01/2030 | | | 89,261 | |
| | 85,000 | | | Welltower, Inc.
2.700%, 02/15/2027 | | | 80,958 | |
| | | | | | |
|
|
|
| | | | | | | | 278,589 | |
| | | | | | |
|
|
|
See notes to financial statements.
80
GuideMark® Core Fixed Income Fund
SCHEDULE OF INVESTMENTS (Continued)
March 31, 2020
| | | | | | | | |
Principal Amount
| | | | | Value
| |
| | | | | CORPORATE OBLIGATIONS (Continued) | |
| | | | | Financials - 0.01% | |
| | 12,000 | | | Massachusetts Mutual Life Insurance Co.
3.729%, 10/15/2070 (c) | | $ | 11,266 | |
| | | | | | |
|
|
|
| | | | | Food & Staples Retailing - 0.20% | |
| | | | | Alimentation Couche-Tard, Inc. | | | | |
| | 25,000 | | | 2.950%, 01/25/2030 (c) | | | 23,358 | |
| | 55,000 | | | 3.800%, 01/25/2050 (c) | | | 48,844 | |
| | 75,000 | | | SYSCO Corp.
5.950%, 04/01/2030 | | | 78,884 | |
| | 115,000 | | | Walmart, Inc.
3.400%, 06/26/2023 (e) | | | 122,183 | |
| | | | | | |
|
|
|
| | | | | | | | 273,269 | |
| | | | | | |
|
|
|
| | | | | Food Products - 0.38% | |
| | 75,000 | | | Archer-Daniels-Midland Co.
3.250%, 03/27/2030 | | | 79,685 | |
| | 90,000 | | | General Mills, Inc.
2.875%, 04/15/2030 | | | 89,820 | |
| | 325,000 | | | Nestle Holdings, Inc.
3.350%, 09/24/2023 (c)(e) | | | 343,035 | |
| | | | | | |
|
|
|
| | | | | | | | 512,540 | |
| | | | | | |
|
|
|
| | | | | Gas Utilities - 0.01% | |
| | 10,000 | | | Southern Co. Gas Capital Corp.
2.450%, 10/01/2023 | | | 10,135 | |
| | | | | | |
|
|
|
| | | | | Health Care Equipment & Supplies - 0.33% | |
| | 40,000 | | | Baxter International, Inc.
3.950%, 04/01/2030 (c) | | | 42,975 | |
| | 205,000 | | | Becton Dickinson and Co.
3.125%, 11/08/2021 | | | 207,765 | |
| | | | | Shire Acquisitions Investments Ireland Designated Activity Co. | | | | |
| | 70,000 | | | 2.400%, 09/23/2021 | | | 69,468 | |
| | 125,000 | | | 2.875%, 09/23/2023 | | | 126,146 | |
| | | | | | |
|
|
|
| | | | | | | | 446,354 | |
| | | | | | |
|
|
|
| | | | | Health Care Providers & Services - 1.51% | |
| | | | | Anthem, Inc. | | | | |
| | 210,000 | | | 3.650%, 12/01/2027 | | | 217,159 | |
| | 205,000 | | | 2.875%, 09/15/2029 | | | 200,460 | |
| | 40,000 | | | 4.375%, 12/01/2047 | | | 43,211 | |
| | | | | Cigna Corp. | | | | |
| | 115,000 | | | 4.125%, 11/15/2025 | | | 123,223 | |
| | 110,000 | | | 3.050%, 10/15/2027 (c) | | | 109,400 | |
| | 125,000 | | | 4.375%, 10/15/2028 | | | 134,477 | |
| | 55,000 | | | 2.400%, 03/15/2030 | | | 52,436 | |
| | 70,000 | | | CommonSpirit Health
2.760%, 10/01/2024 | | | 70,049 | |
| | | | | CVS Health Corp. | | | | |
| | 160,000 | | | 4.100%, 03/25/2025 | | | 169,549 | |
| | 59,000 | | | 3.875%, 07/20/2025 | | | 62,094 | |
| | 165,000 | | | 2.875%, 06/01/2026 | | | 167,144 | |
| | 35,000 | | | 3.000%, 08/15/2026 | | | 35,494 | |
| | 50,000 | | | 4.125%, 04/01/2040 | | | 50,660 | |
| | 55,000 | | | 5.125%, 07/20/2045 | | | 63,564 | |
| | 125,000 | | | 5.050%, 03/25/2048 | | | 143,376 | |
| | 15,000 | | | 4.250%, 04/01/2050 | | | 15,637 | |
| | 60,000 | | | Humana, Inc.
2.500%, 12/15/2020 | | | 59,760 | |
| | | | | UnitedHealth Group, Inc. | | | | |
| | 70,000 | | | 2.375%, 08/15/2024 | | | 71,740 | |
| | | | | | | | |
Principal Amount
| | | | | Value
| |
| | | | | Health Care Providers & Services (Continued) | |
| | 90,000 | | | 2.875%, 08/15/2029 | | $ | 94,454 | |
| | 10,000 | | | 3.500%, 08/15/2039 | | | 10,837 | |
| | 135,000 | | | 3.950%, 10/15/2042 | | | 154,178 | |
| | | | | | |
|
|
|
| | | | | | | | 2,048,902 | |
| | | | | | |
|
|
|
| | | | | Hotels, Restaurants & Leisure - 0.32% | |
| | 65,000 | | | GLP Capital LP / GLP Financing II, Inc.
5.300%, 01/15/2029 | | | 56,041 | |
| | 80,000 | | | Las Vegas Sands Corp.
3.500%, 08/18/2026 | | | 73,338 | |
| | | | | McDonald’s Corp. | | | | |
| | 80,000 | | | 3.350%, 04/01/2023 | | | 82,751 | |
| | 20,000 | | | 4.600%, 05/26/2045 | | | 22,958 | |
| | 15,000 | | | 4.875%, 12/09/2045 | | | 17,584 | |
| | 90,000 | | | 3.625%, 09/01/2049 | | | 92,034 | |
| | | | | Starbucks Corp. | | | | |
| | 65,000 | | | 3.800%, 08/15/2025 | | | 69,060 | |
| | 20,000 | | | 3.350%, 03/12/2050 | | | 19,202 | |
| | | | | | |
|
|
|
| | | | | | | | 432,968 | |
| | | | | | |
|
|
|
| | | | | Industrial Conglomerates - 0.20% | |
| | 30,000 | | | Ingersoll-Rand Luxembourg Finance SA
4.500%, 03/21/2049 | | | 33,643 | |
| | 220,000 | | | NXP BV / NXP Funding LLC
4.875%, 03/01/2024 (c) | | | 235,269 | |
| | | | | | |
|
|
|
| | | | | | | | 268,912 | |
| | | | | | |
|
|
|
| | | | | Insurance - 0.54% | |
| | 135,000 | | | Berkshire Hathaway Finance Corp.
4.200%, 08/15/2048 | | | 159,206 | |
| | | | | Marsh & McLennan Cos, Inc. | | | | |
| | 30,000 | | | 3.500%, 12/29/2020 | | | 30,238 | |
| | 70,000 | | | 4.050%, 10/15/2023 | | | 72,934 | |
| | 110,000 | | | 3.875%, 03/15/2024 | | | 113,985 | |
| | 65,000 | | | 4.375%, 03/15/2029 | | | 71,728 | |
| | 60,000 | | | 4.750%, 03/15/2039 | | | 67,609 | |
| | 40,000 | | | New York Life Global Funding
2.000%, 04/13/2021 (c) | | | 39,968 | |
| | 105,000 | | | Progressive Corp.
3.200%, 03/26/2030 | | | 113,765 | |
| | 55,000 | | | Trinity Acquisition PLC
4.400%, 03/15/2026 | | | 57,412 | |
| | | | | | |
|
|
|
| | | | | | | | 726,845 | |
| | | | | | |
|
|
|
| | | | | Interactive Media & Services - 0.33% | |
| | 400,000 | | | Tencent Holdings Ltd.
3.975%, 04/11/2029 (c) | | | 448,970 | |
| | | | | | |
|
|
|
| | | | | Internet & Direct Marketing Retail - 0.35% | |
| | 200,000 | | | Alibaba Group Holding, Ltd.
3.400%, 12/06/2027 | | | 210,129 | |
| | | | | Amazon.com, Inc. | | | | |
| | 150,000 | | | 3.875%, 08/22/2037 | | | 179,877 | |
| | 60,000 | | | 4.950%, 12/05/2044 | | | 84,965 | |
| | | | | | |
|
|
|
| | | | | | | | 474,971 | |
| | | | | | |
|
|
|
| | | | | IT Services - 0.98% | |
| | 70,000 | | | Fidelity National Information Services, Inc.
4.250%, 05/15/2028 | | | 77,463 | |
| | 135,000 | | | Fiserv, Inc.
3.200%, 07/01/2026 | | | 139,745 | |
| | 55,000 | | | Global Payments, Inc.
3.200%, 08/15/2029 | | | 52,802 | |
See notes to financial statements.
81
GuideMark® Core Fixed Income Fund
SCHEDULE OF INVESTMENTS (Continued)
March 31, 2020
| | | | | | | | |
Principal Amount
| | | | | Value
| |
| | | | | CORPORATE OBLIGATIONS (Continued) | |
| | | | | IT Services (Continued) | |
| | | | | International Business Machines Corp. | | | | |
| | 100,000 | | | 3.000%, 05/15/2024 | | $ | 105,557 | |
| | 250,000 | | | 3.300%, 05/15/2026 | | | 267,767 | |
| | 250,000 | | | 3.500%, 05/15/2029 | | | 271,852 | |
| | 100,000 | | | 4.700%, 02/19/2046 | | | 114,052 | |
| | 100,000 | | | 4.250%, 05/15/2049 | | | 118,085 | |
| | 160,000 | | | Visa, Inc.
3.150%, 12/14/2025 | | | 174,660 | |
| | | | | | |
|
|
|
| | | | | | | | 1,321,983 | |
| | | | | | |
|
|
|
| | | | | Life Sciences Tools & Services - 0.12% | |
| | 160,000 | | | Thermo Fisher Scientific, Inc.
3.000%, 04/15/2023 | | | 164,330 | |
| | | | | | |
|
|
|
| | | | | Machinery - 0.52% | |
| | 625,000 | | | Otis Worldwide Corp.
2.565%, 02/15/2030 (c) | | | 611,385 | |
| | 90,000 | | | Parker-Hannifin Corp.
2.700%, 06/14/2024 | | | 89,797 | |
| | | | | | |
|
|
|
| | | | | | | | 701,182 | |
| | | | | | |
|
|
|
| | | | | Media - 1.69% | |
| | | | | Charter Communications Operating LLC / Charter Communications Operating Capital | | | | |
| | 40,000 | | | 4.908%, 07/23/2025 | | | 42,540 | |
| | 230,000 | | | 3.750%, 02/15/2028 | | | 231,593 | |
| | 150,000 | | | 5.375%, 05/01/2047 | | | 162,605 | |
| | 55,000 | | | 5.750%, 04/01/2048 | | | 62,637 | |
| | 75,000 | | | 5.125%, 07/01/2049 (e) | | | 78,931 | |
| | 60,000 | | | 4.800%, 03/01/2050 (e) | | | 62,734 | |
| | 20,000 | | | 6.834%, 10/23/2055 | | | 23,691 | |
| | | | | Comcast Corp. | | | | |
| | 240,000 | | | 3.150%, 03/01/2026 | | | 252,030 | |
| | 70,000 | | | 2.650%, 02/01/2030 | | | 72,167 | |
| | 75,000 | | | 3.400%, 04/01/2030 | | | 81,394 | |
| | 55,000 | | | 4.250%, 10/15/2030 | | | 64,150 | |
| | 35,000 | | | 3.200%, 07/15/2036 | | | 36,699 | |
| | 125,000 | | | 4.600%, 10/15/2038 | | | 153,495 | |
| | 90,000 | | | 3.250%, 11/01/2039 | | | 93,370 | |
| | 20,000 | | | 4.750%, 03/01/2044 | | | 25,517 | |
| | 30,000 | | | 3.400%, 07/15/2046 | | | 32,585 | |
| | 65,000 | | | 4.700%, 10/15/2048 | | | 84,569 | |
| | 50,000 | | | 4.950%, 10/15/2058 | | | 67,943 | |
| | 291,000 | | | Cox Communications, Inc.
3.150%, 08/15/2024 (c) | | | 297,609 | |
| | | | | Discovery Communications LLC | | | | |
| | 41,000 | | | 2.800%, 06/15/2020 | | | 40,905 | |
| | 45,000 | | | 3.800%, 03/13/2024 | | | 44,804 | |
| | 28,000 | | | 3.950%, 06/15/2025 | | | 27,414 | |
| | 15,000 | | | 3.950%, 03/20/2028 | | | 14,740 | |
| | 60,000 | | | 5.200%, 09/20/2047 (e) | | | 60,718 | |
| | 97,000 | | | 5.300%, 05/15/2049 (e) | | | 98,500 | |
| | | | | Time Warner Cable, Inc. | | | | |
| | 30,000 | | | 5.500%, 09/01/2041 | | | 31,475 | |
| | 50,000 | | | 4.500%, 09/15/2042 | | | 47,175 | |
| | | | | | |
|
|
|
| | | | | | �� | | 2,291,990 | |
| | | | | | |
|
|
|
| | | | | Multi-Utilities - 0.66% | |
| | | | | Berkshire Hathaway Energy Co. | | | | |
| | 50,000 | | | 3.250%, 04/15/2028 | | | 51,779 | |
| | 65,000 | | | 6.125%, 04/01/2036 | | | 85,890 | |
| | | | | | | | |
Principal Amount
| | | | | Value
| |
| | | | | Multi-Utilities (Continued) | |
| | | | | Dominion Energy, Inc. | | | | |
| | 160,000 | | | 2.579%, 07/01/2020 | | $ | 159,816 | |
| | 140,000 | | | 2.500%, 11/15/2024 | | | 135,639 | |
| | 240,000 | | | 2.850%, 08/15/2026 | | | 230,218 | |
| | 25,000 | | | 4.250%, 06/01/2028 | | | 26,177 | |
| | | | | Sempra Energy | | | | |
| | 150,000 | | | 3.400%, 02/01/2028 | | | 150,653 | |
| | 45,000 | | | 3.800%, 02/01/2038 | | | 42,366 | |
| | 15,000 | | | 4.000%, 02/01/2048 | | | 14,430 | |
| | | | | | |
|
|
|
| | | | | | | | 896,968 | |
| | | | | | |
|
|
|
| | | | | Oil, Gas & Consumable Fuels - 1.11% | |
| | | | | Apache Corp. | | | | |
| | 30,000 | | | 4.750%, 04/15/2043 | | | 13,324 | |
| | 5,000 | | | 5.350%, 07/01/2049 | | | 2,523 | |
| | 15,000 | | | Canadian Natural Resources, Ltd.
6.500%, 02/15/2037 | | | 12,517 | |
| | | | | Energy Transfer Operating LP | | | | |
| | 60,000 | | | 4.200%, 09/15/2023 | | | 52,509 | |
| | 85,000 | | | 4.500%, 04/15/2024 | | | 75,948 | |
| | 90,000 | | | 5.250%, 04/15/2029 | | | 74,787 | |
| | 55,000 | | | 3.750%, 05/15/2030 | | | 42,636 | |
| | 130,000 | | | 6.125%, 12/15/2045 | | | 116,561 | |
| | 45,000 | | | 6.250%, 04/15/2049 | | | 38,705 | |
| | 20,000 | | | 5.000%, 05/15/2050 | | | 15,729 | |
| | 215,000 | | | Enterprise Products Operating LLC
4.800%, 02/01/2049 | | | 215,810 | |
| | | | | Exxon Mobil Corp. | | | | |
| | 160,000 | | | 4.227%, 03/19/2040 (e) | | | 187,855 | |
| | 125,000 | | | 4.327%, 03/19/2050 | | | 153,409 | |
| | 20,000 | | | Hess Corp.
5.800%, 04/01/2047 | | | 13,355 | |
| | | | | MPLX LP | | | | |
| | 65,000 | | | 4.250%, 12/01/2027 (c) | | | 52,618 | |
| | 140,000 | | | 5.200%, 03/01/2047 | | | 116,035 | |
| | 7,000 | | | 4.700%, 04/15/2048 | | | 5,444 | |
| | 122,000 | | | Petroleos Mexicanos
6.750%, 09/21/2047 | | | 80,728 | |
| | | | | Sunoco Logistics Partners Operations LP | | | | |
| | 5,000 | | | 5.300%, 04/01/2044 | | | 3,951 | |
| | 5,000 | | | 5.350%, 05/15/2045 | | | 3,938 | |
| | | | | TransCanada PipeLines, Ltd. | | | | |
| | 5,000 | | | 4.750%, 05/15/2038 | | | 4,981 | |
| | 10,000 | | | 6.100%, 06/01/2040 | | | 10,723 | |
| | 120,000 | | | 5.100%, 03/15/2049 | | | 135,129 | |
| | | | | Western Midstream Operating LP | | | | |
| | 45,000 | | | 4.500%, 03/01/2028 | | | 21,637 | |
| | 100,000 | | | 4.750%, 08/15/2028 | | | 47,033 | |
| | 10,000 | | | 5.500%, 08/15/2048 | | | 3,893 | |
| | | | | | |
|
|
|
| | | | | | | | 1,501,778 | |
| | | | | | |
|
|
|
| | | | | Pharmaceuticals - 1.03% | |
| | 135,000 | | | Allergan Funding SCS
3.450%, 03/15/2022 | | | 140,285 | |
| | 230,000 | | | Bayer US Finance II LLC
4.250%, 12/15/2025 (c) | | | 239,422 | |
| | | | | Bristol-Myers Squibb Co. | | | | |
| | 30,000 | | | 3.200%, 06/15/2026 (c) | | | 31,918 | |
| | 75,000 | | | 3.400%, 07/26/2029 (c) | | | 82,971 | |
| | | | | Johnson & Johnson | | | | |
| | 155,000 | | | 2.625%, 01/15/2025 | | | 165,817 | |
See notes to financial statements.
82
GuideMark® Core Fixed Income Fund
SCHEDULE OF INVESTMENTS (Continued)
March 31, 2020
| | | | | | | | |
Principal Amount
| | | | | Value
| |
| | | | | CORPORATE OBLIGATIONS (Continued) | |
| | | | | Pharmaceuticals (Continued) | |
| | 75,000 | | | 3.550%, 03/01/2036 | | $ | 85,059 | |
| | 55,000 | | | 3.625%, 03/03/2037 | | | 62,136 | |
| | 135,000 | | | Merck & Co, Inc.
3.400%, 03/07/2029 | | | 147,397 | |
| | | | | Novartis Capital Corp. | | | | |
| | 195,000 | | | 2.000%, 02/14/2027 | | | 197,298 | |
| | 145,000 | | | 2.200%, 08/14/2030 | | | 149,028 | |
| | 30,000 | | | 2.750%, 08/14/2050 | | | 31,417 | |
| | 60,000 | | | Pfizer, Inc.
2.625%, 04/01/2030 (e) | | | 63,169 | |
| | | | | | |
|
|
|
| | | | | | | | 1,395,917 | |
| | | | | | |
|
|
|
| | | | | Road & Rail - 0.48% | |
| | | | | CSX Corp. | | | | |
| | 110,000 | | | 3.250%, 06/01/2027 | | | 114,765 | |
| | 140,000 | | | 2.400%, 02/15/2030 | | | 138,651 | |
| | 45,000 | | | 4.500%, 03/15/2049 | | | 51,970 | |
| | 30,000 | | | Norfolk Southern Corp.
3.400%, 11/01/2049 | | | 29,517 | |
| | | | | Union Pacific Corp. | | | | |
| | 50,000 | | | 4.375%, 09/10/2038 | | | 55,620 | |
| | 95,000 | | | 3.250%, 02/05/2050 | | | 95,803 | |
| | 160,000 | | | 4.100%, 09/15/2067 | | | 162,324 | |
| | | | | | |
|
|
|
| | | | | | | | 648,650 | |
| | | | | | |
|
|
|
| | | | | Semiconductors & Semiconductor Equipment - 0.81% | |
| | | | | Broadcom Corp / Broadcom Cayman Finance, Ltd. | | | | |
| | 205,000 | | | 3.625%, 01/15/2024 | | | 201,756 | |
| | 90,000 | | | 3.125%, 01/15/2025 | | | 86,438 | |
| | 200,000 | | | 3.875%, 01/15/2027 | | | 191,523 | |
| | | | | Intel Corp. | | | | |
| | 265,000 | | | 2.450%, 11/15/2029 | | | 272,093 | |
| | 59,000 | | | 3.734%, 12/08/2047 | | | 69,116 | |
| | 135,000 | | | 3.250%, 11/15/2049 | | | 145,960 | |
| | 120,000 | | | NVIDIA Corp.
2.850%, 04/01/2030 | | | 125,394 | |
| | | | | | |
|
|
|
| | | | | | | | 1,092,280 | |
| | | | | | |
|
|
|
| | | | | Software - 0.65% | |
| | 155,000 | | | Microsoft Corp.
4.450%, 11/03/2045 | | | 204,663 | |
| | | | | Oracle Corp. | | | | |
| | 225,000 | | | 2.500%, 04/01/2025 | | | 227,390 | |
| | 115,000 | | | 4.300%, 07/08/2034 | | | 133,138 | |
| | 25,000 | | | 3.900%, 05/15/2035 | | | 27,118 | |
| | 50,000 | | | 3.800%, 11/15/2037 | | | 51,703 | |
| | 165,000 | | | 3.600%, 04/01/2050 | | | 165,752 | |
| | 75,000 | | | salesforce.com, Inc.
3.250%, 04/11/2023 | | | 78,053 | |
| | | | | | |
|
|
|
| | | | | | | | 887,817 | |
| | | | | | |
|
|
|
| | | | | Specialty Retail - 0.47% | |
| | | | | AutoZone, Inc. | | | | |
| | 130,000 | | | 3.625%, 04/15/2025 | | | 131,929 | |
| | 195,000 | | | 4.000%, 04/15/2030 | | | 199,700 | |
| | | | | Home Depot, Inc. | | | | |
| | 140,000 | | | 3.350%, 09/15/2025 | | | 151,200 | |
| | 55,000 | | | 2.500%, 04/15/2027 | | | 55,484 | |
| | 55,000 | | | 5.875%, 12/16/2036 | | | 74,835 | |
| | 5,000 | | | 3.500%, 09/15/2056 | | | 5,085 | |
| | | | | | | | |
Principal Amount
| | | | | Value
| |
| | | | | Specialty Retail (Continued) | |
| | 25,000 | | | Lowe’s Cos., Inc.
3.700%, 04/15/2046 | | $ | 23,247 | |
| | | | | | |
|
|
|
| | | | | | | | 641,480 | |
| | | | | | |
|
|
|
| | | | | Technology Hardware, Storage & Peripherals - 0.34% | |
| | | | | Apple, Inc. | | | | |
| | 20,000 | | | 3.350%, 02/09/2027 | | | 21,851 | |
| | 385,000 | | | 2.200%, 09/11/2029 (e) | | | 395,593 | |
| | 40,000 | | | 3.450%, 02/09/2045 | | | 45,523 | |
| | | | | | |
|
|
|
| | | | | | | | 462,967 | |
| | | | | | |
|
|
|
| | | | | Tobacco - 0.38% | |
| | | | | Altria Group, Inc. | | | | |
| | 75,000 | | | 4.400%, 02/14/2026 | | | 79,084 | |
| | 145,000 | | | 2.625%, 09/16/2026 | | | 138,769 | |
| | 80,000 | | | 4.800%, 02/14/2029 | | | 83,437 | |
| | 40,000 | | | 4.250%, 08/09/2042 | | | 39,961 | |
| | 45,000 | | | 5.375%, 01/31/2044 | | | 50,102 | |
| | 90,000 | | | 3.875%, 09/16/2046 | | | 81,550 | |
| | 40,000 | | | 5.950%, 02/14/2049 | | | 46,458 | |
| | | | | | |
|
|
|
| | | | | | | | 519,361 | |
| | | | | | |
|
|
|
| | | | | Water Utilities - 0.12% | |
| | | | | American Water Capital Corp. | | | | |
| | 140,000 | | | 3.750%, 09/01/2028 | | | 145,882 | |
| | 15,000 | | | 4.150%, 06/01/2049 | | | 16,604 | |
| | | | | | |
|
|
|
| | | | | | | | 162,486 | |
| | | | | | |
|
|
|
| | | | | Wireless Telecommunication Services - 0.34% | |
| | | | | Telefonica Emisiones SA | | | | |
| | 150,000 | | | 5.213%, 03/08/2047 | | | 168,878 | |
| | 205,000 | | | 4.895%, 03/06/2048 | | | 228,179 | |
| | 60,000 | | | Vodafone Group Plc
4.250%, 09/17/2050 | | | 62,473 | |
| | | | | | |
|
|
|
| | | | | | | | 459,530 | |
| | | | | | |
|
|
|
| | | | | Total Corporate Obligations
(Cost $40,630,123) | | | 41,956,467 | |
| | | | | | |
|
|
|
| | | | | FOREIGN GOVERNMENT DEBT OBLIGATIONS - 0.34% | |
| | 200,000 | | | Abu Dhabi Government International Bond
3.125%, 09/30/2049 (c) | | | 187,000 | |
| | 200,000 | | | Chile Government International Bond
2.550%, 01/27/2032 | | | 200,250 | |
| | 66,000 | | | Hungary Government International Bond
6.375%, 03/29/2021 | | | 68,558 | |
| | | | | | |
|
|
|
| | | | | Total Foreign Government Debt Obligations
(Cost $462,582) | | | 455,808 | |
| | | | | | |
|
|
|
| | | | | MORTGAGE BACKED SECURITIES - U.S. GOVERNMENT AGENCY - 40.90% | |
| | | | | Federal Home Loan Mortgage Corp. | | | | |
| | 15,709 | | | Pool#D9-6291 4.500%, 09/01/2023 | | | 16,907 | |
| | 40,451 | | | Pool#G1-3624 5.000%, 08/01/2024 | | | 42,594 | |
| | 82,000 | | | SeriesK-068, 3.244%, 08/25/2027 | | | 92,718 | |
| | 724,908 | | | SeriesK-104, 1.127%, 01/25/2030 (b)(j) | | | 65,146 | |
| | 122,165 | | | Series 2329, 6.500%, 06/15/2031 | | | 137,915 | |
| | 58,252 | | | Series 2338, 6.500%, 07/15/2031 | | | 69,082 | |
| | 80,301 | | | Pool#78-0447 4.442% (1 Year CMT Rate + 2.250%, 2.250% Floor, 9.270% Cap), 04/01/2033 (a) | | | 81,359 | |
| | 97 | | | Pool#A4-3129 5.500%, 02/01/2036 | | | 108 | |
| | 126,262 | | | Series 4216, 1.700%, 10/15/2039 | | | 128,042 | |
See notes to financial statements.
83
GuideMark® Core Fixed Income Fund
SCHEDULE OF INVESTMENTS (Continued)
March 31, 2020
| | | | | | | | |
Principal Amount
| | | | | Value
| |
| | | | | MORTGAGE BACKED SECURITIES - U.S. GOVERNMENT AGENCY (Continued) | |
| | 60,235 | | | Series 3883, 3.000%, 05/15/2041 | | $ | 64,601 | |
| | 222,471 | | | Series 4139, 2.500%, 11/15/2041 | | | 232,186 | |
| | 376,616 | | | Pool#U9-0688 4.000%, 05/01/2042 | | | 413,844 | |
| | 208,954 | | | Series 4961, 2.500%, 12/15/2042 | | | 216,975 | |
| | 596,271 | | | Pool#Q4-9389 3.500%, 07/01/2047 | | | 633,454 | |
| | 562,725 | | | Pool#Q5-2093 3.500%, 11/01/2047 | | | 597,699 | |
| | | | | Federal National Mortgage Association | | | | |
| | 338,148 | | | Pool #AJ8325 3.000%, 12/01/2026 | | | 355,057 | |
| | 3,200,000 | | | Pool #TBA 3.000%, 04/15/2027 (h) | | | 3,348,122 | |
| | 868,714 | | | Pool #AN8322 3.190%, 02/01/2028 | | | 979,386 | |
| | 1,015,769 | | | Pool #AN8695 3.550%, 03/01/2028 | | | 1,167,468 | |
| | 2,300,000 | | | Pool #TBA 2.500%, 04/15/2028 (h) | | | 2,385,486 | |
| | 2,938 | | | Pool #544859 2.788% (11th District Cost of Funds Index + 1.799%, 1.799% Floor, 14.713% Cap), 08/01/2029 (a) | | | 2,934 | |
| | 54,468 | | | Pool #BC4938 2.500%, 04/01/2031 | | | 56,644 | |
| | 90,665 | | | Pool #786848 7.000%, 10/01/2031 | | | 105,969 | |
| | 3,048 | | | Pool #727181 5.000%, 08/01/2033 | | | 3,383 | |
| | 1,386 | | | Pool #730727 5.000%, 08/01/2033 | | | 1,538 | |
| | 409 | | | Pool #741862 5.500%, 09/01/2033 | | | 463 | |
| | 503 | | | Pool #766197 5.500%, 02/01/2034 | | | 569 | |
| | 101 | | | Pool #776974 5.500%, 04/01/2034 | | | 115 | |
| | 65,998 | | | Pool #888504 3.577% (1 Year CMT Rate + 2.071%, 2.071% Floor, 9.260% Cap), 04/01/2034 (a) | | | 66,208 | |
| | 235,509 | | | Pool #MA1870 4.500%, 04/01/2034 | | | 258,996 | |
| | 4,002 | | | Pool #775776 5.500%, 05/01/2034 | | | 4,536 | |
| | 1,562,522 | | | Series2019-M21, 1.332%, 06/25/2034 (b)(j) | | | 208,656 | |
| | 110,163 | | | Pool #802783 3.609% (12 Month LIBOR USD + 1.612%, 1.612% Floor, 10.298% Cap), 10/01/2034 (a) | | | 112,410 | |
| | 3,189 | | | Pool #781629 5.500%, 12/01/2034 | | | 3,610 | |
| | 4,832 | | | Pool #822815 5.500%, 04/01/2035 | | | 5,473 | |
| | 4,298 | | | Pool #357850 5.500%, 07/01/2035 | | | 4,881 | |
| | 2,573 | | | Pool #820242 5.000%, 07/01/2035 | | | 2,865 | |
| | 679 | | | Pool #838452 5.500%, 09/01/2035 | | | 771 | |
| | 3,700 | | | Pool #865854 6.000%, 03/01/2036 | | | 4,267 | |
| | 5,896 | | | Pool #891474 6.000%, 04/01/2036 | | | 6,799 | |
| | 3,148 | | | Pool #906000 6.000%, 01/01/2037 | | | 3,563 | |
| | 47 | | | Pool #928062 5.500%, 02/01/2037 | | | 53 | |
| | 60 | | | Pool #899119 5.500%, 04/01/2037 | | | 65 | |
| | 399,371 | | | Pool #AS9772 3.500%, 06/01/2037 | | | 428,649 | |
| | 116 | | | Pool #970131 5.500%, 03/01/2038 | | | 132 | |
| | 78 | | | Pool #985108 5.500%, 07/01/2038 | | | 89 | |
| | 51 | | | Pool #964930 5.500%, 08/01/2038 | | | 56 | |
| | 47 | | | Pool #987032 5.500%, 08/01/2038 | | | 54 | |
| | 68 | | | Pool #968371 5.500%, 09/01/2038 | | | 75 | |
| | 27 | | | Pool #993050 5.500%, 12/01/2038 | | | 31 | |
| | 15,699 | | | Pool #993579 4.000%, 05/01/2039 | | | 16,976 | |
| | 2,998 | | | Pool #AA5840 4.000%, 06/01/2039 | | | 3,245 | |
| | 44,202 | | | Pool #AA8715 4.000%, 06/01/2039 | | | 48,668 | |
| | 157,819 | | | Pool #AD0586 4.500%, 12/01/2039 | | | 174,033 | |
| | 378,592 | | | Pool #AD4062 5.000%, 05/01/2040 | | | 420,018 | |
| | 359,101 | | | Pool #AD6929 5.000%, 06/01/2040 | | | 398,925 | |
| | 9,367 | | | Pool #AD9896 4.000%, 08/01/2040 | | | 10,136 | |
| | 10,983 | | | Pool #AB1500 4.000%, 09/01/2040 | | | 11,889 | |
| | 11,141 | | | Pool #AD9856 4.000%, 09/01/2040 | | | 12,062 | |
| | 6,515 | | | Pool #AE2559 4.000%, 09/01/2040 | | | 7,055 | |
| | 2,304 | | | Pool #AE2562 4.000%, 09/01/2040 | | | 2,493 | |
| | | | | | | | |
Principal Amount
| | | | | Value
| |
| | | | | MORTGAGE BACKED SECURITIES - U.S. GOVERNMENT AGENCY (Continued) | |
| | 3,101 | | | Pool #AE2566 4.000%, 09/01/2040 | | $ | 3,357 | |
| | 21,267 | | | Pool #AE4124 4.000%, 10/01/2040 | | | 23,035 | |
| | 11,565 | | | Pool #AE4888 4.000%, 10/01/2040 | | | 12,520 | |
| | 17,029 | | | Pool #AE3916 4.000%, 11/01/2040 | | | 18,435 | |
| | 2,564 | | | Pool #AE5147 4.000%, 11/01/2040 | | | 2,777 | |
| | 30,394 | | | Pool #AE8715 4.000%, 11/01/2040 | | | 32,905 | |
| | 3,501 | | | Pool #AH0006 4.000%, 12/01/2040 | | | 3,792 | |
| | 9,698 | | | Pool #AH0020 4.000%, 12/01/2040 | | | 10,503 | |
| | 18,394 | | | Pool #AH0599 4.000%, 12/01/2040 | | | 19,913 | |
| | 5,894 | | | Pool #AH0601 4.000%, 12/01/2040 | | | 6,376 | |
| | 11,532 | | | Pool #AH1263 4.000%, 01/01/2041 | | | 12,477 | |
| | 53,754 | | | Pool #AL5233 4.000%, 01/01/2041 | | | 58,152 | |
| | 4,219 | | | Pool #AH4659 4.000%, 02/01/2041 | | | 4,567 | |
| | 62,655 | | | Pool #AH5653 4.000%, 02/01/2041 | | | 67,826 | |
| | 78,812 | | | Pool #AL0934 5.000%, 02/01/2041 | | | 87,549 | |
| | 120,258 | | | Pool #AD1889 4.500%, 03/01/2041 | | | 131,999 | |
| | 7,788 | | | Pool #AH6150 4.000%, 03/01/2041 | | | 8,432 | |
| | 75,554 | | | Pool #AL0215 4.500%, 04/01/2041 | | | 82,934 | |
| | 3,000,000 | | | Pool #TBA 3.500%, 04/15/2041 (h) | | | 3,170,699 | |
| | 400,000 | | | Pool #TBA 4.000%, 04/15/2041 (h) | | | 426,598 | |
| | 58,967 | | | Pool #AL0187 5.000%, 05/01/2041 | | | 65,501 | |
| | 10,518 | | | Pool #AL0456 5.000%, 06/01/2041 | | | 11,684 | |
| | 46,456 | | | Pool #AI8842 4.500%, 08/01/2041 | | | 50,994 | |
| | 138,724 | | | Series2013-43, 1.500%, 08/25/2041 | | | 139,727 | |
| | 28,259 | | | Pool #AL0815 4.000%, 09/01/2041 | | | 31,131 | |
| | 51,074 | | | Series2012-21, 2.000%, 09/25/2041 | | | 52,204 | |
| | 10,373 | | | Pool #AJ1562 4.000%, 10/01/2041 | | | 11,437 | |
| | 8,304 | | | Pool #AJ1972 4.000%, 10/01/2041 | | | 9,051 | |
| | 456,673 | | | Pool #AJ2212 4.500%, 10/01/2041 | | | 501,288 | |
| | 13,909 | | | Pool #AJ4756 4.000%, 10/01/2041 | | | 15,327 | |
| | 13,051 | | | Pool #AJ3330 4.000%, 11/01/2041 | | | 14,398 | |
| | 12,148 | | | Pool #AJ4549 4.000%, 11/01/2041 | | | 13,394 | |
| | 10,493 | | | Pool #AJ4698 4.000%, 11/01/2041 | | | 11,569 | |
| | 20,963 | | | Pool #AJ5424 4.000%, 11/01/2041 | | | 23,094 | |
| | 7,678 | | | Pool #AJ7840 4.000%, 11/01/2041 | | | 8,480 | |
| | 13,211 | | | Pool #AB3995 4.000%, 12/01/2041 | | | 14,578 | |
| | 12,574 | | | Pool #AI0848 4.000%, 12/01/2041 | | | 13,880 | |
| | 11,487 | | | Pool #AJ4187 4.000%, 12/01/2041 | | | 12,658 | |
| | 12,125 | | | Pool #AJ5736 4.000%, 12/01/2041 | | | 13,358 | |
| | 7,444 | | | Pool #AJ5968 4.000%, 12/01/2041 | | | 8,061 | |
| | 15,111 | | | Pool #AJ6061 4.000%, 12/01/2041 | | | 16,675 | |
| | 10,032 | | | Pool #AJ7868 4.000%, 12/01/2041 | | | 11,083 | |
| | 20,148 | | | Pool #AJ8104 4.000%, 12/01/2041 | | | 22,129 | |
| | 14,484 | | | Pool #AJ8109 4.000%, 12/01/2041 | | | 15,983 | |
| | 7,994 | | | Pool #AJ8171 4.000%, 12/01/2041 | | | 8,821 | |
| | 15,671 | | | Pool #AJ8341 4.000%, 12/01/2041 | | | 17,297 | |
| | 26,187 | | | Pool #AJ8436 4.000%, 12/01/2041 | | | 28,890 | |
| | 9,767 | | | Pool #AJ8912 4.000%, 12/01/2041 | | | 10,793 | |
| | 11,878 | | | Pool #AJ9248 4.000%, 12/01/2041 | | | 13,111 | |
| | 101,171 | | | Series2012-18, 2.000%, 12/25/2041 | | | 103,472 | |
| | 104,356 | | | Series2012-75, 2.500%, 12/25/2041 | | | 108,753 | |
| | 11,588 | | | Pool #AJ2446 4.000%, 01/01/2042 | | | 12,548 | |
| | 16,569 | | | Pool #AJ7538 4.000%, 01/01/2042 | | | 18,304 | |
| | 4,542 | | | Pool #AJ8001 4.000%, 01/01/2042 | | | 4,919 | |
| | 14,182 | | | Pool #AJ8369 4.000%, 01/01/2042 | | | 15,624 | |
| | 13,119 | | | Pool #AJ9162 4.000%, 01/01/2042 | | | 14,452 | |
| | 73,645 | | | Pool #AJ9330 4.000%, 01/01/2042 | | | 81,220 | |
| | 7,631 | | | Pool #AJ9779 4.000%, 01/01/2042 | | | 8,310 | |
| | 12,087 | | | Pool #AK0170 4.000%, 01/01/2042 | | | 13,357 | |
See notes to financial statements.
84
GuideMark® Core Fixed Income Fund
SCHEDULE OF INVESTMENTS (Continued)
March 31, 2020
| | | | | | | | |
Principal Amount
| | | | | Value
| |
| | | | | MORTGAGE BACKED SECURITIES - U.S. GOVERNMENT AGENCY (Continued) | |
| | 28,039 | | | Pool #AK0543 4.000%, 01/01/2042 | | $ | 30,967 | |
| | 11,479 | | | Pool #AK0563 4.000%, 01/01/2042 | | | 12,675 | |
| | 20,669 | | | Pool #AK1827 4.000%, 01/01/2042 | | | 22,801 | |
| | 259,794 | | | Pool #AL2752 5.000%, 03/01/2042 | | | 288,141 | |
| | 59,635 | | | Series2012-52, 3.500%, 05/25/2042 | | | 64,419 | |
| | 229,985 | | | Series2012-128, 1.500%, 06/25/2042 | | | 232,992 | |
| | 60,653 | | | Pool #AB5529 4.000%, 07/01/2042 | | | 66,589 | |
| | 160,480 | | | Pool #AB6228 3.500%, 09/01/2042 | | | 172,494 | |
| | 168,572 | | | Series 415, 3.000%, 11/01/2042 | | | 181,960 | |
| | 322,061 | | | Pool #AQ9316 2.500%, 01/01/2043 | | | 335,858 | |
| | 139,590 | | | Series2015-48, 3.000%, 02/25/2043 | | | 146,193 | |
| | 816,913 | | | Pool #AT2720 3.000%, 05/01/2043 | | | 865,064 | |
| | 644,519 | | | Pool #AT5900 3.000%, 06/01/2043 | | | 682,453 | |
| | 121,438 | | | Series2013-77, 1.700%, 06/25/2043 | | | 123,642 | |
| | 357,796 | | | Pool #AU1625 3.500%, 07/01/2043 | | | 384,576 | |
| | 155,455 | | | Series2017-26, 3.500%, 07/25/2044 | | | 166,026 | |
| | 129,933 | | | Series2018-38, 3.500%, 03/25/2045 | | | 134,552 | |
| | 501,299 | | | Pool #AS5469 4.000%, 07/01/2045 | | | 542,857 | |
| | 572,895 | | | Pool #AZ0832 4.000%, 07/01/2045 | | | 620,429 | |
| | 117,251 | | | Pool #AS5597 3.500%, 08/01/2045 | | | 125,104 | |
| | 41,975 | | | Series2016-38, 3.000%, 01/25/2046 | | | 44,322 | |
| | 92,529 | | | Series2016-11, 2.500%, 03/25/2046 | | | 96,486 | |
| | 680,943 | | | Pool #AS7170 3.500%, 05/01/2046 | | | 725,150 | |
| | 641,961 | | | Pool #AS7242 3.500%, 05/01/2046 | | | 683,118 | |
| | 539,281 | | | Pool #BC9468 3.000%, 06/01/2046 | | | 571,659 | |
| | 556,613 | | | Pool #AS7492 4.000%, 07/01/2046 | | | 600,072 | |
| | 441,647 | | | Pool #AS8947 3.500%, 03/01/2047 | | | 470,658 | |
| | 80,412 | | | Series2017-34, 3.000%, 05/25/2047 | | | 84,842 | |
| | 87,736 | | | Pool #MA3038 4.500%, 06/01/2047 | | | 95,132 | |
| | 126,933 | | | Series2017-72, 3.000%, 09/25/2047 | | | 135,324 | |
| | 132,648 | | | Series2017-72, 3.000%, 09/25/2047 | | | 141,731 | |
| | 158,421 | | | Series2018-80, 3.500%, 12/25/2047 | | | 169,324 | |
| | 77,007 | | | Series2018-77, 3.500%, 02/25/2048 | | | 86,610 | |
| | 124,802 | | | Series2018-23, 3.500%, 04/25/2048 | | | 134,896 | |
| | 2,299,519 | | | Pool #BN5279 4.000%, 02/01/2049 | | | 2,455,712 | |
| | 138,734 | | | Series2019-06, 3.000%, 02/25/2049 | | | 146,835 | |
| | 143,894 | | | Series2019-07, 3.500%, 03/25/2049 | | | 154,213 | |
| | 150,762 | | | Series2019-14, 3.500%, 04/25/2049 | | | 164,558 | |
| | 221,177 | | | Series2019-45, 3.000%, 08/25/2049 | | | 237,139 | |
| | 2,160,000 | | | Pool #TBA 2.500%, 09/25/2049 (h) | | | 2,237,794 | |
| | 4,400,000 | | | Pool #TBA 2.500%, 05/15/2050 (h) | | | 4,550,575 | |
| | 170,812 | | | Series2019-41, 2.500%, 03/25/2053 | | | 175,268 | |
| | 172,115 | | | Series2017-35, 3.500%, 04/25/2053 | | | 182,181 | |
| | 105,481 | | | Series2017-84, 3.500%, 04/25/2053 | | | 111,387 | |
| | 149,413 | | | Series2019-15, 3.500%, 05/25/2053 | | | 160,349 | |
| | 137,464 | | | Series2017-49, 4.000%, 07/25/2053 | | | 149,455 | |
| | 191,874 | | | Series2018-72, 3.500%, 07/25/2054 | | | 203,645 | |
| | 159,687 | | | Series2017-96, 3.000%, 12/25/2054 | | | 167,981 | |
| | 77,803 | | | Series2018-19, 3.500%, 05/25/2056 | | | 83,368 | |
| | 148,606 | | | Series2018-70, 3.500%, 10/25/2056 | | | 159,797 | |
| | 147,454 | | | Series2019-07, 3.500%, 11/25/2057 | | | 160,788 | |
| | 157,652 | | | Series2019-12, 3.500%, 11/25/2057 | | | 174,971 | |
| | 449,824 | | | Series2020-1, 3.500%, 08/25/2058 | | | 487,613 | |
| | 142,557 | | | Series2019-28, 3.500%, 06/25/2059 | | | 157,476 | |
| | | | | Government National Mortgage Association | | | | |
| | 10,240 | | | Pool #614436X 5.000%, 08/15/2033 | | | 11,086 | |
| | 26,045 | | | Pool #736686X 5.000%, 02/15/2039 | | | 29,063 | |
| | 551,008 | | | Pool #723248X 5.000%, 10/15/2039 | | | 625,176 | |
| | 201,404 | | | Series2015-56, 1.500%, 04/16/2040 | | | 204,584 | |
| | | | | | | | |
Principal Amount
| | | | | Value
| |
| | | | | MORTGAGE BACKED SECURITIES - U.S. GOVERNMENT AGENCY (Continued) | |
| | 1,500,000 | | | Pool #TBA 4.500%, 04/15/2041 (h) | | $ | 1,592,109 | |
| | 262,942 | | | Pool #783403X 3.500%, 09/15/2041 | | | 283,934 | |
| | 155,658 | | | Series2013-37, 2.000%, 01/20/2042 | | | 161,321 | |
| | 800,000 | | | Pool #TBA 3.000%, 04/15/2045 (h) | | | 845,719 | |
| | 1,400,000 | | | Pool #TBA 3.500%, 04/15/2045 (h) | | | 1,475,697 | |
| | 127,138 | | | Series2015-151, 1.700%, 10/20/2045 | | | 128,922 | |
| | 94,317 | | | Pool #MA4587M 4.000%, 07/20/2047 | | | 102,250 | |
| | 255,406 | | | Pool #MA4652M 3.500%, 08/20/2047 | | | 271,864 | |
| | 494,693 | | | Pool #MA4778M 3.500%, 10/20/2047 | | | 526,468 | |
| | 341,849 | | | Pool #MA4779M 4.000%, 10/20/2047 | | | 365,817 | |
| | 399,641 | | | Pool #MA4780M 4.500%, 10/20/2047 | | | 429,776 | |
| | 1,168,108 | | | Pool #MA6040M 4.000%, 07/20/2049 | | | 1,241,673 | |
| | 6,100,000 | | | Pool #TBA, 2.500%, 04/15/2050 (h) | | | 6,375,453 | |
| | | | | | |
|
|
|
| | | | | Total Mortgage Backed Securities - U.S. Government Agency
(Cost $53,310,300) | | | 55,381,037 | |
| | | | | | |
|
|
|
| | | | | MUNICIPAL DEBT OBLIGATIONS - 0.69% | |
| | | | | California, GO, | | | | |
| | 70,000 | | | 7.550%, 04/01/2039 | | | 113,863 | |
| | 60,000 | | | 7.300%, 10/01/2039 | | | 92,399 | |
| | 5,000 | | | 7.350%, 11/01/2039 | | | 7,746 | |
| | 5,000 | | | 7.625%, 03/01/2040 | | | 8,085 | |
| | 5,000 | | | 7.600%, 11/01/2040 | | | 8,342 | |
| | 105,000 | | | Chicago Transit Authority Sales & Transfer Tax Receipts, Series B, Revenue Bond,
6.899%, 12/01/2040 | | | 141,187 | |
| | 60,000 | | | New York State Thruway Authority - Class M
2.900%, 01/01/2035 | | | 59,406 | |
| | 355,000 | | | Philadelphia Authority for Industrial Development
6.550%, 10/15/2028 | | | 465,575 | |
| | 25,000 | | | University of California Medical Center, Series H Revenue Bond,
6.548%, 05/15/2048 | | | 33,524 | |
| | | | | | |
|
|
|
| | | | | Total Municipal Debt Obligations
(Cost $878,479) | | | 930,127 | |
| | | | | | |
|
|
|
| | |
Notional Amount
| | | | | | |
| | | | | PURCHASED OPTIONS - 0.00% | |
| | | | | Put Interest Rate Swaption - 0.00% | |
| | 535,000 | | | 10-Year Interest Rate Swap,
Receive Floating Rate
Rate Paid: 1.700%
Frequency: Semi-Annual
Rate Received:3-MO-USD-LIBOR
Frequency: Quarterly
Counterparty: Bank of America
Expiration: November, 2020
Exercise Rate: 1.700% (g) | | | 918 | |
| | | | | | |
|
|
|
| | | | | Total Purchased Options
(Cost $13,402) | | | 918 | |
| | | | | | |
|
|
|
| | |
Principal
Amount
| | | | | | |
| | | | | U.S. TREASURY OBLIGATIONS - 22.55% | |
| | | | | U.S. Treasury Bonds - 13.52% | |
| | 689,407 | | | 0.625%, 01/15/2026 (f) | | | 712,174 | |
| | 496,592 | | | 0.375%, 01/15/2027 (f) | | | 508,241 | |
| | 146,416 | | | 0.500%, 01/15/2028 (f) | | | 152,518 | |
See notes to financial statements.
85
GuideMark® Core Fixed Income Fund
SCHEDULE OF INVESTMENTS (Continued)
March 31, 2020
| | | | | | | | |
Principal
Amount
| | | | | Value
| |
| | | | | U.S. TREASURY OBLIGATIONS (Continued) | |
| | | | | U.S. Treasury Bonds (Continued) | |
| | 475,072 | | | 0.875%, 01/15/2029 (f) | | $ | 516,149 | |
| | 1,690,000 | | | 3.125%, 11/15/2041 | | | 2,309,425 | |
| | 1,075,000 | | | 3.125%, 02/15/2043 | | | 1,472,750 | |
| | 275,000 | | | 3.625%, 08/15/2043 | | | 406,076 | |
| | 1,830,000 | | | 3.750%, 11/15/2043 | | | 2,755,580 | |
| | 1,050,000 | | | 3.625%, 02/15/2044 | | | 1,555,558 | |
| | 735,000 | | | 3.125%, 08/15/2044 | | | 1,014,702 | |
| | 240,000 | | | 3.000%, 11/15/2045 | | | 329,156 | |
| | 2,365,000 | | | 2.500%, 05/15/2046 | | | 2,984,427 | |
| | 255,000 | | | 3.000%, 02/15/2047 | | | 353,374 | |
| | 130,766 | | | 1.000%, 02/15/2048 (f) | | | 161,074 | |
| | 500,000 | | | 3.000%, 02/15/2048 | | | 694,297 | |
| | 650,000 | | | 3.125%, 05/15/2048 | | | 921,096 | |
| | 965,000 | | | 3.000%, 02/15/2049 | | | 1,344,780 | |
| | 92,266 | | | 1.000%, 02/15/2049 (f) | | | 114,704 | |
| | | | | U.S. Treasury Notes - 9.03% | |
| | 3,370,000 | | | 2.375%, 08/15/2024 (i) | | | 3,665,138 | |
| | 1,082,000 | | | 2.000%, 02/15/2025 | | | 1,166,109 | |
| | 2,190,000 | | | 2.875%, 05/31/2025 | | | 2,465,974 | |
| | 858,000 | | | 2.875%, 08/15/2028 | | | 1,014,786 | |
| | 2,330,000 | | | 2.625%, 02/15/2029 | | | 2,723,916 | |
| | 1,090,000 | | | 1.625%, 08/15/2029 | | | 1,183,289 | |
| | | | | | |
|
|
|
| | | | | Total U.S. Treasury Obligations
(Cost $25,607,843) | | | 30,525,293 | |
| | | | | | |
|
|
|
| | |
Number of
Shares
| | | | | | |
| | | | | SHORT TERM INVESTMENTS - 5.94% | |
| | | | | Money Market Funds - 5.94% | |
| | 8,048,140 | | | DWS Government Money Market Series - Institutional Shares
Effective Yield, 0.41% (d) | | | 8,048,140 | |
| | | | | | |
|
|
|
| | | | | Total Short Term Investments
(Cost $8,048,140) | | | 8,048,140 | |
| | | | | | |
|
|
|
| | | | | INVESTMENTS PURCHASED WITH PROCEEDS FROM SECURITIES LENDING COLLATERAL - 1.54% | |
| | | | | Investments Purchased with Proceeds from Securities Lending Collateral - 1.54% | |
| | 2,079,473 | | | Mount Vernon Liquid Assets Portfolio, LLC
Effective Yield, 0.91% (d) | | | 2,079,473 | |
| | | | | | |
|
|
|
| | | | | Total Investments Purchased with Proceeds from Securities Lending Collateral
(Cost $2,079,473) | | | 2,079,473 | |
| | | | | | |
|
|
|
| | | | | Total Investments
(Cost $158,830,595) - 123.03% | | | 166,570,857 | |
| | | | | Liabilities in Excess of
Other Assets - (23.03)% | | | (31,183,896 | ) |
| | | | | | |
|
|
|
| | | | | TOTAL NET ASSETS - 100.00% | | $ | 135,386,961 | |
| | | | | | |
|
|
|
Percentages are stated as a percent of net assets.
Principal amounts are denominated in the currency in which the security was purchased.
| (a) | | Variable rate security based on a reference index and spread. The rate reported is the rate in effect as of March 31, 2020. |
| (b) | | Variable rate security. The coupon is based on an underlying pool of assets. The rate reported is the rate in effect as of March 31, 2020. |
| (c) | | Securities were purchased exempt from registration in the U.S. pursuant to Rule 144A of the Securities Act of 1933 (the “Act”) or were acquired in a private placement, and, unless registered under the Act, may only be sold to “qualified institutional buyers” (as defined in the Act) or pursuant to another expemption from registration. The value of these securities total $26,182,737, which represents 19.34% of total net assets. |
| (d) | | Seven-day yield as of March 31, 2020. |
| (e) | | All or portion of this security is on loan. |
| (f) | | Represents a U.S. Treasury Inflation Protected Security. |
| (g) | | These securities have been deemed illiquid according to the Fund’s liquidity guidelines. The value of these securities total $930,871, which represents 0.69% of total net assets. |
| (h) | | Security purchased on a when-issued basis. On March 31, 2020, the total value of investments purchased on a when-issued basis was $26,408,252 or 19.51% of total net assets. |
| (i) | | All or a portion of this security is held as collateral for certain swap and futures contracts. The approximate value of the portion of this security held as collateral is $1,339,715. |
| (j) | | Represents an interest-only security that entitles holders to receive only interest payments on the underlying mortgages. Theyield-to-maturity of an interest-only security is extremely sensitive to the rate of principal payments on the underlying mortgage assets. A rapid (slow) rate of principal repayments may have an adverse (positive) effect on yield to maturity. The principal amount shown is the underlying mortgages. Interest rate disclosed represents yield upon the estimated timing and amount of future cash flows at March 31, 2020. These securities are liquid according to the Fund’s liquidity guidelines and the value of these securities total $1,056,977, which represents 0.78% of total net assets. |
| (k) | | Step-up bond; the interest rate shown is the rate in effect as of March 31, 2020. |
Glossary of Terms
| | | | |
| LIBOR | | - | | London Interbank Offered Rate |
| CMT | | - | | Constant Maturing Treasury Rate |
| SOFR | | - | | Secured Overnight Financing Rate |
See notes to financial statements.
86
GuideMark® Core Fixed Income Fund
SCHEDULE OF OPEN FUTURES CONTRACTS
March 31, 2020
| | | | | | | | | | | | | | |
Description
| | Number of
Contracts
Purchased/(Sold)
| | | Notional
Value
| | | Settlement
Month
| | Value/Unrealized
Appreciation
(Depreciation)
| |
U.S. Treasury 2 Year Note Futures | | | 72 | | | $ | 15,867,562 | | | Jun-20 | | $ | 172,048 | |
U.S. Treasury 5 Year Note Futures | | | 36 | | | | 4,512,938 | | | Jun-20 | | | 64,722 | |
U.S. Treasury 10 Year Note Futures | | | 11 | | | | 1,525,563 | | | Jun-20 | | | 9,558 | |
U.S. Treasury Long Bond Futures | | | (11 | ) | | | (1,969,688 | ) | | Jun-20 | | | (144,364 | ) |
U.S. Treasury Ultra 10 Year Note Futures | | | (4 | ) | | | (624,125 | ) | | Jun-20 | | | (35,009 | ) |
U.S. Treasury Ultra Bond Futures | | | (7 | ) | | | (1,553,125 | ) | | Jun-20 | | | (110,825 | ) |
| | | | | | | | | | | | |
|
|
|
| | | | | | | | | | | | | $ | (43,870 | ) |
| | | | | | | | | | | | |
|
|
|
GuideMark® Core Fixed Income Fund
SCHEDULE OF OPTIONS WRITTEN
March 31, 2020
| | | | | | | | |
Notional Amount
| | | | | Value
| |
| | | | | OPTIONS ON CREDIT DEFAULT SWAPS | | | | |
| | | | | Call Credit Default Swaptions | | | | |
| $ | 3,615,000 | | | U.S. Dollar - Euro
Buy Protection CDX.NA.IG.33
Reference Rate Paid: 1.000%
Frequency: Quarterly
Reference Rate Received: CDX.NA.IG.33
Frequency: Quarterly
Counterparty: Morgan Stanley
Expiration: April, 2020
Exercise Price: $102.50 | | $ | (17,926 | ) |
| | 3,615,000 | | | U.S. Dollar - Euro
Buy Protection CDX.NA.IG.33
Reference Rate Paid: 1.000%
Frequency: Quarterly
Reference Rate Received: CDX.NA.IG.33
Frequency: Quarterly
Counterparty: Morgan Stanley
Expiration: April, 2020
Exercise Price: $65.00 | | | (494 | ) |
| | | | | Put Credit Default Swaptions | | | | |
| | 3,615,000 | | | U.S. Dollar - Euro
Buy Protection CDX.NA.IG.33
Reference Rate Paid: 1.000%
Frequency: Quarterly
Reference Rate Received: CDX.NA.IG.33
Frequency: Quarterly
Counterparty: Morgan Stanley
Expiration: April, 2020
Exercise Price: $102.50 | | | (28,459 | ) |
| | 3,615,000 | | | U.S. Dollar - Euro
Buy Protection CDX.NA.IG.33
Reference Rate Paid: 1.000%
Frequency: Quarterly
Reference Rate Received: CDX.NA.IG.33
Frequency: Quarterly
Counterparty: Morgan Stanley
Expiration: April, 2020
Exercise Price: $65.00 | | | (73,440 | ) |
| | | | | | |
|
|
|
| | | | | Total Options Written (Premiums Received $72,752) | | $ | (120,319 | ) |
| | | | | | |
|
|
|
See notes to financial statements.
87
GuideMark® Core Fixed Income Fund
SCHEDULE OF OPEN SWAP CONTRACTS
CREDIT DEFAULT SWAPS ON CREDIT INDICES — BUY PROTECTION(1)
March 31, 2020
| | | | | | | | | | | | | | | | | | | | | | | | | | | | | | | | | | | | |
Reference Obligation
| | Implied
Credit
Spread at
03/31/2020(3)
| | | Fixed
Pay
Rate
| | | Maturity
Date
| | Counterparty
| | Payment
Frequency
| | | Notional
Amount(4)
| | | Fair
Value
| | | Upfront
Premiums
Paid
(Received)
| | | Unrealized
Appreciation
(Depreciation)
| | |
| |
CMBX. NA. AAA 12 Index | | | 8.51% | | | | 0.500% | | | 08-17-61 | | Morgan Stanley | | | Quarterly | | | $ | 1,490,000 | | | $ | 41,928 | | | $ | 11,310 | | | $ | 30,618 | | | | | |
GuideMark® Core Fixed Income Fund
CREDIT DEFAULT SWAPS ON CREDIT INDICES - SELL PROTECTION(2)
March 31, 2020
| | | | | | | | | | | | | | | | | | | | | | | | | | | | | | | | | | | | |
Reference Obligation
| | Implied
Credit
Spread at
03/31/2020(3)
| | | Fixed
Pay
Rate
| | | Maturity
Date
| | Counterparty
| | Payment
Frequency
| | | Notional
Amount(4)
| | | Fair
Value
| | | Upfront
Premiums
Paid
(Received)
| | | Unrealized
Appreciation
(Depreciation)
| | |
| |
CDX. NA. IG 33 Index* | | | 10.79% | | | | 1.000% | | | 12-20-24 | | Morgan Stanley | | | Quarterly | | | $ | 2,610,000 | | | $ | (7,685) | | | $ | 123,535 | | | $ | (131,220 | ) | | | | |
GuideMark® Core Fixed Income Fund
INTEREST RATE SWAPS
March 31, 2020
| | | | | | | | | | | | | | | | | | | | | | | | | | | | | | | | | | | | |
Pay/Receive Floating Rate
| | Floating
Rate Index
| | | Floating
Payment
Frequency
| | | Fixed
Pay
Rate
| | Fixed Payment Frequency
| | Maturity
Date
| | | Counterparty
| | | Notional
Amount
| | | Fair
Value
| | | Upfront
Premiums
Paid
(Received)
| | | Unrealized
Appreciation
(Depreciation)
| |
Receive | | | 3-MO-USD-LIBOR | ** | | | Quarterly | | | 2.3590% | | Semi-Annual | | | 04-09-24 | | | | Morgan Stanley | | | $ | 1,220,000 | | | $ | (92,478 | ) | | $ | — | | | $ | (92,478 | ) |
Receive | | | 3-MO-USD-LIBOR | ** | | | Quarterly | | | 2.3630% | | Semi-Annual | | | 04-09-24 | | | | Morgan Stanley | | | | 1,265,000 | | | | (96,066 | ) | | | — | | | | (96,066 | ) |
Receive | | | 3-MO-USD-LIBOR | ** | | | Quarterly | | | 2.3600% | | Semi-Annual | | | 04-09-24 | | | | Morgan Stanley | | | | 1,295,000 | | | | (98,215 | ) | | | — | | | | (98,215 | ) |
Receive | | | 3-MO-USD-LIBOR | ** | | | Quarterly | | | 2.3580% | | Semi-Annual | | | 04-09-24 | | | | Morgan Stanley | | | | 1,732,000 | | | | (131,218 | ) | | | — | | | | (131,218 | ) |
Pay | | | 3-MO-USD-LIBOR | ** | | | Quarterly | | | 0.4815% | | Semi-Annual | | | 04-01-25 | | | | Morgan Stanley | | | | 485,000 | | | | 724 | | | | — | | | | 724 | |
Receive | | | 3-MO-USD-LIBOR | ** | | | Quarterly | | | 2.2500% | | Semi-Annual | | | 09-21-26 | | | | Morgan Stanley | | | | 4,143,000 | | | | (446,340 | ) | | | (112,044 | ) | | | (334,296 | ) |
Receive | | | 3-MO-USD-LIBOR | ** | | | Quarterly | | | 1.7160% | | Semi-Annual | | | 10-29-29 | | | | Morgan Stanley | | | | 190,000 | | | | (18,207 | ) | | | — | | | | (18,207 | ) |
Receive | | | 3-MO-USD-LIBOR | ** | | | Quarterly | | | 1.7210% | | Semi-Annual | | | 10-29-29 | | | | Morgan Stanley | | | | 370,000 | | | | (35,631 | ) | | | — | | | | (35,631 | ) |
Receive | | | 3-MO-USD-LIBOR | ** | | | Quarterly | | | 1.7270% | | Semi-Annual | | | 10-29-29 | | | | Morgan Stanley | | | | 615,000 | | | | (59,573 | ) | | | — | | | | (59,573 | ) |
Receive | | | 3-MO-USD-LIBOR | ** | | | Quarterly | | | 1.7690% | | Semi-Annual | | | 10-30-29 | | | | Morgan Stanley | | | | 310,000 | | | | (31,277 | ) | | | — | | | | (31,277 | ) |
Receive | | | 3-MO-USD-LIBOR | ** | | | Quarterly | | | 1.7655% | | Semi-Annual | | | 10-30-29 | | | | Morgan Stanley | | | | 280,000 | | | | (28,157 | ) | | | — | | | | (28,157 | ) |
Receive | | | 3-MO-USD-LIBOR | ** | | | Quarterly | | | 0.8355% | | Semi-Annual | | | 03-20-30 | | | | Morgan Stanley | | | | 690,000 | | | | (9,229 | ) | | | — | | | | (9,229 | ) |
Receive | | | 3-MO-USD-LIBOR | ** | | | Quarterly | | | 2.7500% | | Semi-Annual | | | 12-20-47 | | | | Morgan Stanley | | | | 775,000 | | | | (377,278 | ) | | | (28,616 | ) | | | (348,662 | ) |
| | | | | | | | | | | | | | | | | | | | | | | | | | |
|
|
| |
|
|
| |
|
|
|
| | | | | | | | | | | | | | | | | | | | | | | | | | | $ | (1,422,945 | ) | | $ | (140,660 | ) | | $ | (1,282,285 | ) |
| | | | | | | | | | | | | | | | | | | | | | | | | | |
|
|
| |
|
|
| |
|
|
|
| 1) | | If the Fund is a buyer of protection and a credit event occurs, as defined under the terms of that particular swap agreement, the Fund will either (i) receive from the seller of protection an amount equal to the notional amount of the swap and take delivery of the referenced obligation or underlying securities comprising the referenced index or (ii) receive a net settlement amount in the form of cash or securities equal to the notional amount of the swap less the recovery value of the referenced obligation or underlying securities comprising the referenced index. |
| 2) | | If the Fund is a seller of protection and a credit event occurs, as defined under the terms of that particular swap agreement, the Fund will either (i) pay to the buyer of protection an amount equal to the notional amount of the swap and take delivery of the referenced obligation or underlying securities comprising the referenced index or (ii) pay a net settlement amount in the form of cash or securities equal to the notional amount of the swap less the recovery value of the referenced obligation or underlying securities comprising the referenced index. |
| 3) | | Implied credit spreads, represented in absolute terms, utilized in determining the fair value of credit default swap agreements on U.S. municipal issues, corporate issues or sovereign issues of an emerging country as of year end serve as an indicator of the current status of the payment/performance risk and represent the likelihood or risk of default for the credit derivative. The implied credit spread of a particular referenced entity reflects the cost of buying/selling protection and may include upfront payments required to be made to enter into the agreement. Wider credit spreads represent a deterioration of the referenced entity’s credit soundness and a greater likelihood or risk of default or other credit event occurring as defined under the terms of the agreement. A credit spread identified as “Defaulted” indicates a credit event has occurred for the referenced entity or obligation. |
| 4) | | The maximum potential amount the Fund could be required to pay as seller of credit protection or receive as a buyer of credit protection if a credit event occurs as defined under the terms of that particular swap agreement. |
| * | | Centrally cleared swap, clearing agent: Intercontinental Exchange |
| ** | | Centrally cleared swap, clearing agent: Clearnet |
See notes to financial statements.
88
GuideMark®Tax-Exempt Fixed Income Fund
SCHEDULE OF INVESTMENTS
March 31, 2020
| | | | | | | | |
Principal
Amount
| | | | | Value
| |
| | | | | MUNICIPAL DEBT OBLIGATIONS - 104.14% | |
| | | | | Alabama - 1.71% | |
| | | | | The Lower Alabama Gas District, Series A, Revenue Bond, | | | | |
| $ | 100,000 | | | 5.000%, 09/01/2034 | | $ | 119,025 | |
| | 225,000 | | | 5.000%, 09/01/2046 | | | 264,618 | |
| | | | | | |
|
|
|
| | | | | | | | 383,643 | |
| | | | | | |
|
|
|
| | | | | Arizona - 4.73% | |
| | 145,000 | | | Arizona Board of Regents, Prerefunded, Revenue Bond,
5.000%, 07/01/2028 | | | 157,245 | |
| | 55,000 | | | Arizona Board of Regents, Unrefunded, Revenue Bond,
5.000%, 07/01/2028 | | | 59,529 | |
| | | | | Arizona Industrial Development Authority, Revenue Bond, | | | | |
| | 150,000 | | | 5.000%, 02/01/2030 | | | 182,318 | |
| | 150,000 | | | 6.000%, 07/01/2047 | | | 154,779 | |
| | 100,000 | | | Phoenix Industrial Development Authority, Series A, Refunding, Revenue Bond,
5.000%, 07/01/2037 | | | 112,238 | |
| | | | | Pima County Industrial Development Authority, Revenue Bond, | | | | |
| | 35,000 | | | 5.000%, 06/15/2047 | | | 30,890 | |
| | 30,000 | | | 5.000%, 06/15/2052 | | | 26,244 | |
| | 100,000 | | | Salt River Project Agricultural Improvement & Power District, Revenue Bond,
5.000%, 01/01/2039 | | | 122,814 | |
| | 150,000 | | | Salt Verde Financial Corp., Revenue Bond,
5.000%, 12/01/2037 | | | 176,898 | |
| | 40,000 | | | Tempe Industrial Development Authority, Series A, Revenue Bond,
6.125%, 10/01/2052 | | | 40,418 | |
| | | | | | |
|
|
|
| | | | | | | | 1,063,373 | |
| | | | | | |
|
|
|
| | | | | Arkansas - 1.17% | |
| | 250,000 | | | University of Arkansas, Series A, Revenue Bond,
4.125%, 11/01/2030 | | | 262,058 | |
| | | | | | |
|
|
|
| | | | | California - 12.51% | |
| | 200,000 | | | California Educational Facilities Authority, Revenue Bond,
5.000%, 05/01/2049 | | | 308,714 | |
| | 100,000 | | | California Health Facilities Financing Authority, Series A, Revenue Bond,
5.000%, 11/15/2031 | | | 120,232 | |
| | 100,000 | | | California Municipal Finance Authority, Community Medical Centers, Series A, Revenue Bond,
5.000%, 02/01/2042 | | | 111,734 | |
| | 190,000 | | | California Municipal Finance Authority, Mobile Home Park, Series A, Prerefunded, Revenue Bond,
6.400%, 08/15/2045 | | | 193,692 | |
| | 100,000 | | | California Municipal Finance Authority, Revenue Bond,
5.000%, 12/31/2047 | | | 106,027 | |
| | 250,000 | | | California Pollution Control Financing Authority, Refunding, Revenue Bond,
5.000%, 07/01/2039 | | | 251,212 | |
| | 200,000 | | | California State University, Series A, Revenue Bond,
5.000%, 11/01/2031 | | | 230,110 | |
| | 160,000 | | | California Statewide Communities Development Authority, Series A, Revenue Bond,
6.125%, 11/01/2033 | | | 173,006 | |
| | | | | | | | |
Principal
Amount
| | | | | Value
| |
| | | | | California (Continued) | | | | |
| $ | 300,000 | | | California Statewide Communities Development Authority, Series A, Revenue Bond, CMI Insured,
5.000%, 08/01/2034 | | $ | 330,084 | |
| | 300,000 | | | California, GO,
5.000%, 11/01/2043 | | | 336,585 | |
| | 50,000 | | | California, Refunding, GO,
5.000%, 04/01/2032 | | | 68,464 | |
| | 100,000 | | | Golden State Tobacco Securitization Corp., Series A, Revenue Bond,
4.000%, 06/01/2031 | | | 108,865 | |
| | 125,000 | | | Golden State Tobacco Securitization Corp.,
SeriesA-1, Revenue Bond,
5.000%, 06/01/2047 | | | 120,288 | |
| | 250,000 | | | M-S-R Energy Authority, Revenue Bond,
6.500%, 11/01/2039 | | | 350,245 | |
| | | | | | |
|
|
|
| | | | | | | | 2,809,258 | |
| | | | | | |
|
|
|
| | | | | Colorado - 4.03% | |
| | 150,000 | | | Castle Pines North Metropolitan District, Refunding, Revenue Bond,
4.000%, 12/01/2044 | | | 154,146 | |
| | | | | Colorado Health Facilities Authority, Revenue Bond, | | | | |
| | 250,000 | | | 5.000%, 08/01/2029 | | | 301,365 | |
| | 130,000 | | | 8.000%, 08/01/2043 | | | 138,035 | |
| | 220,000 | | | Public Authority for Colorado Energy, Revenue Bond,
6.500%, 11/15/2038 | | | 312,220 | |
| | | | | | |
|
|
|
| | | | | | | | 905,766 | |
| | | | | | |
|
|
|
| | | | | Delaware - 1.10% | |
| | 200,000 | | | Delaware, Series A, Refunding, GO,
5.000%, 01/01/2027 | | | 248,362 | |
| | | | | | |
|
|
|
| | | | | District of Columbia - 0.73% | |
| | 125,000 | | | District of Columbia, Revenue Bond,
5.000%, 03/01/2034 | | | 163,104 | |
| | | | | | |
|
|
|
| | | | | Florida - 4.46% | |
| | 100,000 | | | Central Florida Expressway Authority, Revenue Bond,
5.000%, 07/01/2033 | | | 126,499 | |
| | 100,000 | | | County of Broward FL Airport System, Revenue Bond,
5.000%, 10/01/2033 | | | 119,002 | |
| | 100,000 | | | Florida Development Finance Corp., Series A, Transportation District, Revenue Bond,
6.500%, 01/01/2049 (b) | | | 88,433 | |
| | 145,000 | | | Florida, Series A, Refunding, GO,
4.000%, 07/01/2033 | | | 172,199 | |
| | 225,000 | | | Miami-Dade County Educational Facilities, Series A, Refunding, Revenue Bond,
5.000%, 04/01/2040 | | | 250,405 | |
| | 190,000 | | | Miami-Dade County Health Facilities, Series A, Refunding, Revenue Bond,
5.250%, 08/01/2021 | | | 192,552 | |
| | | | | Palm Beach County Florida Health Facilities Authority, Series A, Revenue Bond, | | | | |
| | 10,000 | | | 7.250%, 06/01/2034 | | | 10,523 | |
| | 40,000 | | | 7.500%, 06/01/2049 | | | 41,991 | |
| | | | | | |
|
|
|
| | | | | | | | 1,001,604 | |
| | | | | | |
|
|
|
| | | | | Georgia - 1.55% | |
| | 300,000 | | | Atlanta Water & Wastewater, Refunding, Revenue Bond,
5.000%, 11/01/2040 | | | 347,277 | |
| | | | | | |
|
|
|
See notes to financial statements.
89
GuideMark®Tax-Exempt Fixed Income Fund
SCHEDULE OF INVESTMENTS (Continued)
March 31, 2020
| | | | | | | | |
Principal
Amount
| | | | | Value
| |
| | | | | MUNICIPAL DEBT OBLIGATIONS (Continued) | |
| | | | | Illinois - 9.99% | |
| | | | | Chicago Board of Education, Revenue Bond, | | | | |
| $ | 100,000 | | | 5.000%, 04/01/2042 | | $ | 100,821 | |
| | 100,000 | | | 5.000%, 04/01/2046 | | | 100,195 | |
| | 100,000 | | | Chicago Board of Education, Series G, Refunding, GO,
5.000%, 12/01/2044 | | | 98,929 | |
| | 100,000 | | | Chicago Board of Education, Series H, GO,
5.000%, 12/01/2036 | | | 100,970 | |
| | 100,000 | | | Chicago Midway International Airport, Series A, Refunding, Revenue Bond,
5.000%, 01/01/2028 | | | 109,668 | |
| | 70,000 | | | Chicago Waterworks, Revenue Bond,
5.000%, 11/01/2028 | | | 81,875 | |
| | 65,000 | | | Chicago, Series A, Refunding, GO,
5.250%, 01/01/2029 | | | 66,758 | |
| | 160,000 | | | Illinois Finance Authority, Refunding, Revenue Bond,
5.000%, 12/01/2047 | | | 167,790 | |
| | 140,000 | | | Illinois Finance Authority, Series A, Revenue Bond,
5.000%, 02/15/2047 | | | 150,342 | |
| | | | | Illinois, GO, | | | | |
| | 345,000 | | | 5.000%, 01/01/2029 | | | 355,550 | |
| | 75,000 | | | 5.000%, 11/01/2029 | | | 77,748 | |
| | 100,000 | | | 4.000%, 11/01/2034 | | | 94,431 | |
| | 20,000 | | | 5.000%, 05/01/2036 | | | 20,222 | |
| | 70,000 | | | 5.000%, 11/01/2036 | | | 71,118 | |
| | 30,000 | | | 5.000%, 02/01/2039 | | | 30,195 | |
| | 30,000 | | | Illinois, Series A, GO,
5.000%, 04/01/2038 | | | 30,179 | |
| | 100,000 | | | O’Hare International Airport, Series B, Refunding, Revenue Bond,
5.000%, 01/01/2032 | | | 111,531 | |
| | 150,000 | | | O’Hare International Airport, Series D, Revenue Bond,
5.250%, 01/01/2030 | | | 161,706 | |
| | 150,000 | | | Sales Tax Securitization Corp., Series A, Revenue Bond,
5.000%, 01/01/2040 | | | 168,851 | |
| | 120,000 | | | Southwestern Illinois Development Authority, Prerefunded, Revenue Bond,
7.125%, 11/01/2043 | | | 144,422 | |
| | | | | | |
|
|
|
| | | | | | | | 2,243,301 | |
| | | | | | |
|
|
|
| | | | | Indiana - 2.88% | |
| | 100,000 | | | Indiana Health Facility Financing Authority,Series 2001A-1, Revenue Bond,
5.000%, 11/15/2034 | | | 115,422 | |
| | 250,000 | | | Indiana Municipal Power Agency, Series A, Prerefunded, Revenue Bond,
5.250%, 01/01/2032 | | | 281,805 | |
| | 125,000 | | | Shoals Exempt Facilities, Revenue Bond,
7.250%, 11/01/2043 | | | 130,366 | |
| | 115,000 | | | Valparaiso Exempt Facilities, Revenue Bond,
7.000%, 01/01/2044 | | | 119,575 | |
| | | | | | |
|
|
|
| | | | | | | | 647,168 | |
| | | | | | |
|
|
|
| | | | | Iowa - 0.43% | |
| | 100,000 | | | Iowa Finance Authority, Revenue Bond,
5.125%, 08/01/2048 | | | 97,871 | |
| | | | | | |
|
|
|
| | | | | | | | |
Principal
Amount
| | | | | Value
| |
| | | | | Louisiana - 1.02% | |
| $ | 200,000 | | | Louisiana Highway Improvement, Series A, Revenue Bond,
5.000%, 06/15/2029 | | $ | 229,192 | |
| | | | | | |
|
|
|
| | | | | Maryland - 0.93% | |
| | 200,000 | | | Westminster Project Revenue, Lutheran Village at Miller’s Grant, Series A, Revenue Bond,
6.000%, 07/01/2034 | | | 208,016 | |
| | | | | | |
|
|
|
| | | | | Michigan - 0.50% | |
| | 100,000 | | | Royal Oak Hospital Finance Authority, Series D, Refunding, Revenue Bond,
5.000%, 09/01/2033 | | | 112,511 | |
| | | | | | |
|
|
|
| | | | | Minnesota - 3.22% | |
| | 100,000 | | | Apple Valley Senior Living, Series D, Revenue Bond,
7.250%, 01/01/2052 | | | 78,672 | |
| | 160,000 | | | Minneapolis-St. Paul Metropolitan Airports Commission, Series A, Refunding, Revenue Bond,
5.000%, 01/01/2030 | | | 178,026 | |
| | 150,000 | | | Rochester Health Care & Housing Facility, Series A, Revenue Bond,
6.875%, 12/01/2048 | | | 153,699 | |
| | 300,000 | | | Rochester Health Care Facilities Mayo Clinic,
Series C, Revenue Bond,
4.500%, 11/15/2038 (b) | | | 312,180 | |
| | | | | | |
|
|
|
| | | | | | | | 722,577 | |
| | | | | | |
|
|
|
| | | | | Mississippi - 2.89% | |
| | 200,000 | | | Mississippi Business Finance Corp., Series B, Revenue Bond,
0.650%, 12/01/2030 (b) | | | 200,000 | |
| | 100,000 | | | Mississippi Business Finance Corp., Series C, Revenue Bond,
0.650%, 12/01/2030 (b) | | | 100,000 | |
| | 350,000 | | | Mississippi Business Finance Corp., Series H, Revenue Bond,
0.650%, 11/01/2035 (b) | | | 350,000 | |
| | | | | | |
|
|
|
| | | | | | | | 650,000 | |
| | | | | | |
|
|
|
| | | | | Missouri - 0.86% | |
| | 200,000 | | | Conley Road Transportation Development District, Revenue Bond,
5.375%, 05/01/2047 | | | 192,946 | |
| | | | | | |
|
|
|
| | | | | Montana - 0.42% | |
| | 100,000 | | | City of Kalispell, Series A, Revenue Bond,
5.250%, 05/15/2047 (e) | | | 94,212 | |
| | | | | | |
|
|
|
| | | | | Nebraska - 1.82% | |
| | 130,000 | | | Douglas County Hospital Authority No. 3, Refunding, Revenue Bond,
5.000%, 11/01/2024 | | | 150,069 | |
| | 250,000 | | | Omaha Public Power District, Series B, Prerefunded, Revenue Bond,
5.000%, 02/01/2027 | | | 258,140 | |
| | | | | | |
|
|
|
| | | | | | | | 408,209 | |
| | | | | | |
|
|
|
| | | | | New Hampshire - 0.57% | |
| | 120,000 | | | New Hampshire Health & Educational Facilities Authority, Refunding, Revenue Bond,
5.000%, 07/01/2027 | | | 128,832 | |
| | | | | | |
|
|
|
| | | | | New Jersey - 1.75% | |
| | 150,000 | | | New Jersey Economic Development Authority, Refunding, Revenue Bond,
5.250%, 06/15/2030 | | | 160,891 | |
See notes to financial statements.
90
GuideMark®Tax-Exempt Fixed Income Fund
SCHEDULE OF INVESTMENTS (Continued)
March 31, 2020
| | | | | | | | |
Principal
Amount
| | | | | Value
| |
| | | | | MUNICIPAL DEBT OBLIGATIONS (Continued) | |
| | | | | New Jersey (Continued) | |
| $ | 100,000 | | | New Jersey Transportation Trust Fund Authority, Series A, Refunding, Revenue Bond,
5.000%, 06/15/2031 | | $ | 110,306 | |
| | 25,000 | | | South Jersey Port Corp., Series A, Revenue Bond,
5.000%, 01/01/2049 | | | 25,862 | |
| | 100,000 | | | Tobacco Settlement Financing Corp., Series B, Revenue Bond,
5.000%, 06/01/2046 | | | 96,389 | |
| | | | | | |
|
|
|
| | | | | | | | 393,448 | |
| | | | | | |
|
|
|
| | | | | New York - 10.18% | |
| | 300,000 | | | City of New York, GO,
4.000%, 10/01/2041 | | | 334,026 | |
| | 100,000 | | | City of New York, Series E, GO,
5.000%, 03/01/2041 | | | 120,194 | |
| | 40,000 | | | New York City Industrial Development Agency, Series A, Refunding, Revenue Bond,
5.000%, 07/01/2022 | | | 41,653 | |
| | 100,000 | | | New York City Transitional Finance Authority Building Aid Revenue, Revenue Bond,
5.000%, 07/15/2028 | | | 126,836 | |
| | 100,000 | | | New York Dormitory Authority, Refunding, Revenue Bond,
5.000%, 12/01/2035 | | | 113,648 | |
| | 100,000 | | | New York Dormitory Authority, Series A, Revenue Bond,
5.000%, 02/15/2031 | | | 121,643 | |
| | 250,000 | | | New York Dormitory Authority, Series B, Revenue Bond,
5.000%, 07/01/2038 | | | 270,702 | |
| | 500,000 | | | New York Environmental Facilities Corp., Series B, Prerefunded, Revenue Bond,
5.500%, 10/15/2027 | | | 641,680 | |
| | 175,000 | | | New York Liberty Development Corp., Refunding, Revenue Bond,
5.250%, 10/01/2035 | | | 216,148 | |
| | 70,000 | | | New York State Dormitory Authority, Revenue Bond,
5.000%, 02/15/2032 | | | 90,980 | |
| | 200,000 | | | New York, Series E, GO,
4.000%, 12/15/2027 | | | 209,458 | |
| | | | | | |
|
|
|
| | | | | | | | 2,286,968 | |
| | | | | | |
|
|
|
| | | | | North Carolina - 1.55% | |
| | 320,000 | | | North Carolina Eastern Municipal Power Agency Power Systems, Series A, Prerefunded, Revenue Bond,
5.000%, 01/01/2025 | | | 347,398 | |
| | | | | | |
|
|
|
| | | | | Ohio - 2.20% | |
| | 135,000 | | | County of Cuyahoga, Revenue Bond,
5.250%, 02/15/2047 | | | 143,302 | |
| | 100,000 | | | Ohio Higher Education Facilities Commission, Refunding, Revenue Bond,
5.000%, 01/01/2026 | | | 106,539 | |
| | 200,000 | | | Ohio, Series A, Refunding, Revenue Bond,
5.000%, 01/01/2031 | | | 244,826 | |
| | | | | | |
|
|
|
| | | | | | | | 494,667 | |
| | | | | | |
|
|
|
| | | | | Oregon - 0.57% | |
| | 100,000 | | | Oregon, Series A, GO,
5.000%, 05/01/2028 | | | 127,762 | |
| | | | | | |
|
|
|
| | | | | | | | |
Principal
Amount
| | | | | Value
| |
| | | | | Pennsylvania - 3.36% | |
| | | | | Allegheny County Hospital Development Authority, Series A, Revenue Bond, | | | | |
| $ | 50,000 | | | 4.000%, 04/01/2044 | | $ | 52,265 | |
| | 50,000 | | | 5.000%, 04/01/2047 | | | 59,447 | |
| | | | | Commonwealth Financing Authority, Revenue Bond, | | | | |
| | 100,000 | | | 5.000%, 06/01/2034 | | | 119,536 | |
| | 155,000 | | | 5.000%, 06/01/2035 | | | 184,789 | |
| | 150,000 | | | Pennsylvania Economic Development Financing Authority, Revenue Bond,
6.750%, 12/01/2053 | | | 136,238 | |
| | 200,000 | | | Pennsylvania Higher Educational Facilities Authority, Prerefunded, Revenue Bond,
5.800%, 07/01/2030 | | | 202,330 | |
| | | | | | |
|
|
|
| | | | | | | | 754,605 | |
| | | | | | |
|
|
|
| | | | | Puerto Rico - 3.74% | |
| | 95,000 | | | Puerto Rico Electric Power Authority,Series 2012A-RSA-1, Revenue Bond,
5.000%, 07/01/2042 (c)(e) | | | 67,450 | |
| | 55,000 | | | Puerto Rico Electric Power Authority,Series CCC-RSA-1, Revenue Bond,
5.250%, 07/01/2027 (c)(e) | | | 39,188 | |
| | 80,000 | | | Puerto Rico Electric Power Authority,Series WW-RSA-1, Revenue Bond,
5.000%, 07/01/2028 (c)(e) | | | 56,800 | |
| | 90,000 | | | Puerto Rico Electric Power Authority,Series XX-RSA-1, Revenue Bond,
5.250%, 07/01/2040 (c)(e) | | | 64,125 | |
| | | | | Puerto Rico Sales Tax Financing Corp Sales Tax Revenue, Series A1, Revenue Bond, | | | | |
| | 250,000 | | | 4.329%, 07/01/2040 | | | 230,272 | |
| | 405,000 | | | 4.750%, 07/01/2053 | | | 382,385 | |
| | | | | | |
|
|
|
| | | | | | | | 840,220 | |
| | | | | | |
|
|
|
| | | | | South Carolina - 2.47% | |
| | 400,000 | | | Charleston Educational Excellence Financing Corp., Refunding, Revenue Bond,
5.000%, 12/01/2025 | | | 452,432 | |
| | 100,000 | | | South Carolina Jobs-Economic Development Authority, Revenue Bond,
5.750%, 06/15/2039 | | | 103,528 | |
| | | | | | |
|
|
|
| | | | | | | | 555,960 | |
| | | | | | |
|
|
|
| | | | | South Dakota - 0.49% | |
| | 100,000 | | | South Dakota Educational Enhancement Funding Corp. Tobaccos Settlement, Series B, Revenue Bond,
5.000%, 06/01/2026 | | | 109,732 | |
| | | | | | |
|
|
|
| | | | | Texas - 7.52% | |
| | 200,000 | | | Central Texas Regional Mobility Authority, Series A, Prerefunded, Revenue Bond,
6.000%, 01/01/2041 | | | 207,192 | |
| | 100,000 | | | Central Texas Turnpike System, Series C, Refunding, Revenue Bond,
5.000%, 08/15/2029 | | | 106,251 | |
| | 200,000 | | | Dallas-Fort Worth International Airport, Series B, Revenue Bond,
5.000%, 11/01/2026 | | | 214,574 | |
| | 125,000 | | | New Hope Cultural Education Facilities Corp.,Series A-1, Revenue Bond,
5.000%, 07/01/2046 | | | 120,738 | |
See notes to financial statements.
91
GuideMark®Tax-Exempt Fixed Income Fund
SCHEDULE OF INVESTMENTS (Continued)
March 31, 2020
| | | | | | | | |
Principal
Amount
| | | | | Value
| |
| | | | | MUNICIPAL DEBT OBLIGATIONS (Continued) | |
| | | | | Texas (Continued) | |
| $ | 225,000 | | | North Texas Tollway Authority, Refunding, Revenue Bond,
4.000%, 01/01/2038 | | $ | 238,318 | |
| | 100,000 | | | North Texas Tollway Authority, Series B, Refunding, Revenue Bond,
5.000%, 01/01/2029 | | | 114,526 | |
| | 100,000 | | | Tarrant County Cultural Education Facilities Finance Corp., Revenue Bond,
6.625%, 11/15/2037 | | | 106,546 | |
| | | | | Texas Private Activity Surface Transportation Corp., Revenue Bond, | | | | |
| | 200,000 | | | 7.500%, 06/30/2033 | | | 201,834 | |
| | 85,000 | | | 7.000%, 12/31/2038 | | | 96,040 | |
| | 115,000 | | | 6.750%, 06/30/2043 | | | 128,811 | |
| | 100,000 | | | University of Texas, Revenue Bond,
5.000%, 08/15/2049 | | | 154,570 | |
| | | | | | |
|
|
|
| | | | | | | | 1,689,400 | |
| | | | | | |
|
|
|
| | | | | Utah - 2.84% | |
| | 100,000 | | | Salt Lake City Corp. Airport, Series B, Revenue Bond,
5.000%, 07/01/2042 | | | 114,828 | |
| | 500,000 | | | Utah Associated Municipal Power Systems San Juan Project, Refunding, Revenue Bond,
5.500%, 06/01/2022 | | | 524,440 | |
| | | | | | |
|
|
|
| | | | | | | | 639,268 | |
| | | | | | |
|
|
|
| | | | | Virginia - 2.97% | |
| | 1,475,000 | | | Tobacco Settlement Financing Corp., Series C, Revenue Bond,
8.553%, 06/01/2047 (c)(d) | | | 228,168 | |
| | 300,000 | | | Virginia College Building Educational Facilities Authority, Revenue Bond,
5.750%, 01/01/2034 | | | 439,848 | |
| | | | | | |
|
|
|
| | | | | | | | 668,016 | |
| | | | | | |
|
|
|
| | | | | Washington - 1.55% | |
| | 325,000 | | | Central Puget Sound Regional Transit Authority, SeriesP-1, Refunding, Revenue Bond,
5.000%, 02/01/2027 | | | 347,500 | |
| | | | | | |
|
|
|
| | | | | Wisconsin - 5.43% | |
| | 100,000 | | | Wisconsin Health & Educational Facilities Authority, Revenue Bond,
5.000%, 05/01/2025 | | | 111,687 | |
| | | | | | | | |
Principal
Amount
| | | | | Value
| |
| | | | | Wisconsin (Continued) | |
| $ | 100,000 | | | Wisconsin Health & Educational Facilities Authority, Series C, Revenue Bond,
7.000%, 07/01/2043 | | $ | 87,422 | |
| | | | | Wisconsin Public Finance Authority, Refunding, Revenue Bond, | | | | |
| | 95,000 | | | 5.000%, 07/01/2022 | | | 96,500 | |
| | 150,000 | | | 5.750%, 10/01/2031 | | | 152,552 | |
| | 225,000 | | | 5.250%, 05/15/2047 | | | 230,760 | |
| | 10,000 | | | Wisconsin, Series 2, Prerefunded, GO,
5.000%, 05/01/2025 | | | 10,793 | |
| | 490,000 | | | Wisconsin, Series 2, Unrefunded, GO,
5.000%, 05/01/2025 | | | 529,935 | |
| | | | | | |
|
|
|
| | | | | | | | 1,219,649 | |
| | | | | | |
|
|
|
| | | | | Total Municipal Debt Obligations
(Cost $22,546,227) | | | 23,393,873 | |
| | | | | | |
|
|
|
| | |
Number of
Shares
| | | | | | |
| | | | | SHORT TERM INVESTMENTS - 0.30% | |
| | | | | Money Market Funds - 0.30% | |
| | 66,603 | | | STIT – Invesco Treasury Obligations Portfolio – Institutional
Effective Yield, 0.66% (a) | | | 66,603 | |
| | | | | | |
|
|
|
| | | | | Total Short Term Investments
(Cost $66,603) | | | 66,603 | |
| | | | | | |
|
|
|
| | | | | Total Investments
(Cost $22,612,830) - 104.44% | | | 23,460,476 | |
| | | | | Liabilities in Excess of
Other Assets - (4.44)% | | | (997,871 | ) |
| | | | | | |
|
|
|
| | | | | TOTAL NET ASSETS - 100.00% | | $ | 22,462,605 | |
| | | | | | |
|
|
|
Percentages are stated as a percent of net assets.
| (a) | | Seven-day yield as of March 31, 2020. |
| (b) | | Adjustable rate security - the rate is determined by the Remarking Agent. |
| (c) | | Non-income producing. Item identified as in default as to payment of interest. |
| (d) | | Zero coupon bond. Effective yield is listed. |
| (e) | | These securities have been deemed illiquid according to the Fund’s liquidity guidelines. The value of these securities total $321,775, which represents 1.43% of total net assets. |
Glossary of Terms
| | | | |
| CMI | | - | | California Mortgage Insurance |
| GO | | - | | General Obligation |
See notes to financial statements.
92
GuideMark® Opportunistic Fixed Income Fund
SCHEDULE OF INVESTMENTS
March 31, 2020
| | | | | | | | |
Principal
Amount
| | | | | Value
| |
| | | | | ASSET BACKED SECURITIES - 1.07% | | | | |
| | 463,333 | | | Textainer Marine Containers VII Ltd.
Series2019-1A, 3.960%, 04/20/2044 (d) | | $ | 436,320 | |
| | | | | | |
|
|
|
| | | | | Total Asset Backed Securities
(Cost $463,182) | | | 436,320 | |
| | | | | | |
|
|
|
| | | | | COLLATERALIZED MORTGAGE
OBLIGATIONS - 14.58% | |
| | 556,815 | | | Alternative Loan Trust
Series 2007-15CB, 6.000%, 07/25/2037 | | | 450,169 | |
| | 479,595 | | | Banc of America Funding Corp.
Series2007-3, 5.831%, 04/25/2037 (a) | | | 438,062 | |
| | 592,951 | | | Chase Mortgage Finance Trust
Series2007-S3, 6.000%, 05/25/2037 | | | 404,841 | |
| | 123,201 | | | DeutscheAlt-A Securities, Inc. Mortgage Loan Trust
Series2006-AR1, 3.520%, 02/25/2036 (a) | | | 113,708 | |
| | 282,115 | | | Exantas Capital Corp Ltd.
Series 2019-RSO7, 1.800% (1 Month LIBOR USD + 1.000%, 1.000% Floor), 04/17/2036 (c)(d) | | | 232,796 | |
| | 267,411 | | | First Horizon Alternative Mortgage Securities Trust
Series2007-FA4, 6.250%, 08/25/2037 | | | 178,658 | |
| | | | | GSR Mortgage Loan Trust | | | | |
| | 455,438 | | | Series2006-9F, 6.500%, 10/25/2036 | | | 328,152 | |
| | 173,982 | | | Series2007-4F, 6.000%, 07/25/2037 | | | 141,216 | |
| | 472,347 | | | IndyMac IMJA Mortgage Loan Trust
Series2007-A3, 6.250%, 11/25/2037 | | | 306,562 | |
| | 181,277 | | | IndyMac INDX Mortgage Loan Trust
Series2005-AR1, 3.628%, 03/25/2035 (a) | | | 160,138 | |
| | 4,726,329 | | | JP Morgan Chase Commercial Mortgage Securities Trust
Series2012-C8, 1.775%, 10/17/2045 (a)(m) | | | 168,880 | |
| | 361,135 | | | Lehman Mortgage Trust
Series2006-2, 5.750%, 04/25/2036 | | | 368,997 | |
| | 154,071 | | | MASTR Adjustable Rate Mortgages Trust
Series2006-2, 4.120%, 01/25/2036 (a) | | | 142,653 | |
| | 453,217 | | | Morgan Stanley Mortgage Loan Trust
Series2007-12, 6.250%, 08/25/2037 | | | 297,347 | |
| | | | | Residential Asset Securitization Trust | | | | |
| | 587,758 | | | Series2007-A2, 6.000%, 04/25/2037 | | | 462,140 | |
| | 432,382 | | | Series2007-A6, 6.000%, 06/25/2037 | | | 331,046 | |
| | 776,957 | | | Series2007-A7, 6.000%, 07/25/2037 | | | 411,722 | |
| | 737,221 | | | TBW Mortgage-Backed Trust
Series2006-6, 5.630%, 01/25/2037 (j) | | | 358,833 | |
| | 282,354 | | | VOLT LXXXV LLC 2020-NPL1,
3.228%, 01/25/2050 (d)(j) | | | 255,804 | |
| | 313,295 | | | Washington Mutual Asset-Backed Certificates Trust
Series2006-HE3, 1.102% (1 Month LIBOR USD + 0.155%, 0.155% Floor), 08/25/2036 (c) | | | 269,379 | |
| | 149,862 | | | Washington Mutual Mortgage Pass-Through Certificates Trust
Series2006-5, 6.000%, 07/25/2036 | | | 131,117 | |
| | | | | | |
|
|
|
| | | | | Total Collateralized Mortgage Obligations (Cost $7,668,104) | | | 5,952,220 | |
| | | | | | |
|
|
|
| | | | | | | | |
Number of
Shares
| | | | | Value
| |
| | | | | COMMON STOCKS - 0.00% | | | | |
| | | | | Metals & Mining - 0.00% | | | | |
| | 12,305,675 | | | K2016470219 - Class A (b)(e)(f)(g) | | $ | 0 | |
| | 1,336,186 | | | K2016470219 - Class B (b)(e)(f)(g) | | | 0 | |
| | | | | | |
|
|
|
| | | | | Total Common Stocks
(Cost $0) | | | 0 | |
| | | | | | |
|
|
|
| | |
Principal
Amount
| | | | | | |
| | | | | CORPORATE OBLIGATIONS - 0.06% | | | | |
| | | | | Specialty Retail - 0.06% | | | | |
| | 284,446 | | | K2016470260 South Africa, Ltd.
25.000% Cash or 25.000% PIK, 12/31/2022 (b)(d) | | | 10,667 | |
| | | | | K2016470219 South Africa, Ltd. | | | | |
| | 989,896 | | | 3.000% Cash or 3.000% PIK, 12/31/2022 (b)(d)(n) | | | 9,899 | |
| | 195,875 | | | 8.000% Cash or 8.000% PIK, 12/31/2022 (b)(d)(n) | | | 3,240 | |
| | | | | | |
|
|
|
| | | | | Total Corporate Obligations
(Cost $2,137,426) | | | 23,806 | |
| | | | | | |
|
|
|
| | | | | FOREIGN GOVERNMENT DEBT
OBLIGATIONS - 21.00% | |
| | 19,625,556 | | | Argentina Treasury Bond BONCER
1.200%, 03/18/2022 (b)(l)(n) | | | 159,630 | |
| | | | | Argentine Bonos del Tesoro | | | | |
| | 6,954,000 | | | 18.200%, 10/03/2021 (b) | | | 52,333 | |
| | 14,030,048 | | | 1.400%, 03/25/2023 (b) | | | 103,623 | |
| | 10,209,900 | | | 16.000%, 10/17/2023 (b) | | | 62,084 | |
| | 14,030,053 | | | 1.500%, 03/25/2024 (b) | | | 95,495 | |
| | 22,986,100 | | | 15.500%, 10/17/2026 (b) | | | 121,841 | |
| | 160,000,000 | | | Colombia Government International Bond
7.750%, 04/14/2021 | | | 40,434 | |
| | | | | Colombian TES | | | | |
| | 583,000,000 | | | 10.000%, 07/24/2024 | | | 164,112 | |
| | 296,500,000 | | | 7.500%, 08/26/2026 | | | 74,782 | |
| | 342,500,000 | | | 6.000%, 04/28/2028 | | | 78,751 | |
| | 1,946,000,000 | | | 7.750%, 09/18/2030 | | | 497,671 | |
| | | | | Ghana Government Bond | | | | |
| | 300,000 | | | 18.750%, 01/24/2022 | | | 51,042 | |
| | 200,000 | | | 16.500%, 02/06/2023 | | | 31,126 | |
| | 300,000 | | | 19.750%, 03/25/2024 | | | 49,422 | |
| | 910,000 | | | 19.750%, 03/15/2032 | | | 141,914 | |
| | | | | India Government Bond | | | | |
| | 23,000,000 | | | 8.150%, 06/11/2022 | | | 322,847 | |
| | 7,000,000 | | | 8.080%, 08/02/2022 | | | 98,286 | |
| | 2,000,000 | | | 6.840%, 12/19/2022 | | | 27,549 | |
| | 17,370,000 | | | 8.830%, 11/25/2023 | | | 253,563 | |
| | | | | Indonesia Treasury Bond | | | | |
| | 9,416,000,000 | | | 8.250%, 07/15/2021 | | | 595,965 | |
| | 1,500,000,000 | | | 7.000%, 05/15/2022 | | | 93,688 | |
| | 890,000,000 | | | 5.625%, 05/15/2023 | | | 52,961 | |
| | 19,209,000,000 | | | 8.375%, 09/15/2026 | | | 1,215,804 | |
| | | | | Korea Treasury Bond | | | | |
| | 321,110,000 | | | 3.375%, 09/10/2023 | | | 283,042 | |
| | 459,000,000 | | | 3.500%, 03/10/2024 | | | 409,061 | |
| | 267,000,000 | | | 3.000%, 09/10/2024 | | | 235,444 | |
| | | | | Mexican Bonos | | | | |
| | 11,000 | | | 8.000%, 06/11/2020 | | | 46,500 | |
| | 17,600 | | | 6.500%, 06/10/2021 | | | 74,294 | |
| | 201,700 | | | 7.250%, 12/09/2021 | | | 864,660 | |
| | 189,500 | | | 6.500%, 06/09/2022 | | | 801,168 | |
See notes to financial statements.
93
GuideMark® Opportunistic Fixed Income Fund
SCHEDULE OF INVESTMENTS (Continued)
March 31, 2020
| | | | | | | | |
Principal
Amount
| | | | | Value
| |
| | | | | FOREIGN GOVERNMENT DEBT
OBLIGATIONS (Continued) | |
| | 167,700 | | | 8.000%, 12/07/2023 | | $ | 741,980 | |
| | 14,234 | | | Mexican Udibonos
2.500%, 12/10/2020 (l) | | | 59,178 | |
| | | | | Republic of Ghana Government Bond | | | | |
| | 1,810,000 | | | 16.250%, 05/17/2021 | | | 313,308 | |
| | 200,000 | | | 24.500%, 06/21/2021 | | | 37,411 | |
| | 390,000 | | | 24.750%, 07/19/2021 | | | 72,935 | |
| | 99,000 | | | 19.500%, 10/18/2021 | | | 16,829 | |
| | 150,000 | | | 16.250%, 04/07/2025 | | | 21,755 | |
| | 910,000 | | | 19.000%, 11/02/2026 | | | 141,813 | |
| | | | | | |
|
|
|
| | | | | Total Foreign Government Debt Obligations
(Cost $12,499,781) | | | 8,504,301 | |
| | | | | | |
|
|
|
| | | | | MORTGAGE BACKED SECURITIES - U.S. GOVERNMENT AGENCY - 23.83% | |
| | | | | Federal Home Loan Mortgage Corp. | | | | |
| | 269,700 | | | Pool #0039, 2.500%, 04/01/2033 | | | 280,909 | |
| | 387,929 | | | Series 4116, 1.350%, 08/15/2042 | | | 387,853 | |
| | 354,455 | | | Series 4446, 2.250%, 03/15/2045 | | | 368,208 | |
| | 346,710 | | | Pool #1827, 3.000%, 07/01/2047 | | | 366,272 | |
| | 386,091 | | | Series 4768, 1.005% (1 Month LIBOR USD + 0.300%, 0.300% Floor, 6.500% Cap), 03/15/2048 (c) | | | 379,472 | |
| | 322,787 | | | Series 4800, 4.000%, 06/15/2048 | | | 361,575 | |
| | 522,105 | | | Series 4868, 4.000%, 03/15/2049 | | | 580,853 | |
| | 198,060 | | | Pool #5290, 2.500%, 12/01/2049 | | | 205,573 | |
| | | | | Federal National Mortgage Association | | | | |
| | 283,195 | | | Series 9445, 3.000%, 07/01/2031 | | | 299,970 | |
| | 443,105 | | | Pool #1201, 3.500%, 10/01/2032 | | | 477,188 | |
| | 188,307 | | | Pool#2005-56, 6.000% (1 Month LIBOR USD + 42.300%, 0.000% Floor, 6.000% Cap), 08/25/2033 (c)(i) | | | 200,365 | |
| | 385,777 | | | Pool #CA4507, 2.500%, 11/01/2034 | | | 403,373 | |
| | 311,967 | | | Pool#2012-63, 2.000%, 08/25/2040 | | | 316,137 | |
| | 745,443 | | | Pool#2014-95, 3.000%, 04/25/2041 | | | 781,997 | |
| | 344,440 | | | Pool#2012-150, 1.750%, 01/25/2043 | | | 349,176 | |
| | 397,006 | | | Pool#2018-23, 2.750%, 12/25/2043 | | | 405,661 | |
| | 228,462 | | | Pool#2015-08, 2.000%, 03/25/2045 | | | 233,435 | |
| | 148,419 | | | Series 9003, 3.000%, 11/01/2046 | | | 156,842 | |
| | 433,332 | | | Series 0862, 3.500%, 09/01/2047 | | | 459,902 | |
| | 339,208 | | | Pool#2018-27, 3.000%, 12/25/2047 | | | 359,834 | |
| | 314,231 | | | Pool #3392, 4.000%, 01/01/2048 | | | 337,693 | |
| | 407,481 | | | Pool#2018-31, 1.247% (1 Month LIBOR USD + 0.300%, 0.300% Floor, 6.500% Cap), 05/25/2048 (c) | | | 400,745 | |
| | 339,950 | | | Pool#2018-36, 3.000%, 06/25/2048 | | | 357,609 | |
| | 323,032 | | | Pool#2018-38, 3.000%, 06/25/2048 | | | 337,668 | |
| | | | | Government National Mortgage Association | | | | |
| | 449,389 | | | Pool#2010-62, 4.977% (1 Month LIBOR USD + 5.750%, 0.000% Floor, 5.750% Cap), 05/20/2040 (c)(i)(m) | | | 84,353 | |
| | 460,825 | | | Pool#2011-72, 4.607% (1 Month LIBOR USD + 5.380%, 0.000% Floor, 5.380% Cap), 05/20/2041 (c)(i)(m) | | | 80,007 | |
| | 589,707 | | | Pool#2012-40, 4.000%, 01/20/2042 | | | 640,809 | |
| | 839,862 | | | Pool#2013-113, 5.477% (1 Month LIBOR USD + 6.250%, 0.000% Floor, 6.250% Cap), 03/20/2043 (c)(i)(m) | | | 114,115 | |
| | | | | | |
|
|
|
| | | | | Total Mortgage Backed Securities - U.S. Government Agency
(Cost $9,294,208) | | | 9,727,594 | |
| | | | | | |
|
|
|
| | | | | | | | |
Principal
Amount
| | | | | Value
| |
| | | | | U.S. TREASURY OBLIGATIONS - 10.20% | | | | |
| | | | | U.S. Treasury Notes | | | | |
| | 3,316,000 | | | 1.750%, 12/31/2024 | | $ | 3,531,281 | |
| | 249,000 | | | 2.625%, 12/31/2025 | | | 279,454 | |
| | 130,000 | | | 1.625%, 02/15/2026 | | | 138,470 | |
| | 61,000 | | | 2.125%, 05/31/2026 | | | 66,967 | |
| | 140,000 | | | 1.625%, 10/31/2026 | | | 149,882 | |
| | | | | | |
|
|
|
| | | | | Total U.S. Treasury Obligations
(Cost $3,979,587) | | | 4,166,054 | |
| | | | | | |
|
|
|
| | | | | SHORT TERM INVESTMENTS - 21.62% | | | | |
| | | | | Foreign Government Debt Obligation - 8.54% | | | | |
| | | | | Brazil Letras do Tesouro Nacional | | | | |
| | 170,000 | | | (0.126)%, 04/01/2020 (h) | | | 32,717 | |
| | 1,505,000 | | | (0.216)%, 07/01/2020 (h) | | | 287,299 | |
| | 2,310,000 | | | (0.216)%, 10/01/2020 (h) | | | 437,363 | |
| | 80,000 | | | (0.221)%, 04/01/2021 (h) | | | 14,880 | |
| | | | | Japan Treasury Discount Bills | | | | |
| | 14,950,000 | | | (0.117)%, 04/10/2020 (h) | | | 139,047 | |
| | 13,500,000 | | | (0.217)%, 05/11/2020 (h) | | | 125,587 | |
| | 1,500,000 | | | (0.217)%, 05/20/2020 (h) | | | 13,955 | |
| | 14,000,000 | | | (0.216)%, 09/23/2020 (h) | | | 130,341 | |
| | 63,800,000 | | | (0.218)%, 04/06/2020 (h) | | | 593,362 | |
| | 28,800,000 | | | (0.219)%, 05/07/2020 (h) | | | 267,887 | |
| | 49,800,000 | | | 0.000%, 05/25/2020 (b)(h) | | | 463,261 | |
| | 18,900,000 | | | 3.359%, 07/10/2020 (h) | | | 175,877 | |
| | 71,000,000 | | | 3.234%, 08/11/2020 (h) | | | 660,832 | |
| | 15,600,000 | | | 3.357%, 09/10/2020 (h) | | | 145,224 | |
| | | | | | |
|
|
|
| | | | | | | | 3,487,632 | |
| | | | | | |
|
|
|
| | |
Number of
Shares
| | | | | | |
| | | | | Money Market Funds - 6.72% | | | | |
| | 2,741,169 | | | DWS Government Money Market
Series - Institutional Shares
Effective Yield, 0.41% (k) | | | 2,741,169 | |
| | | | | | |
|
|
|
| | |
Principal
Amount
| | | | | | |
| | | | | U.S. Treasury Obligations - 6.36% | | | | |
| | | | | U.S. Treasury Bills | | | | |
| | 2,599,000 | | | 0.000%, 02/25/2021 (h) | | | 2,596,427 | |
| | | | | | |
|
|
|
| | | | | Total Short Term Investments
(Cost $8,813,959) | | | 8,825,228 | |
| | | | | | |
|
|
|
| | | | | Total Investments
(Cost $44,856,247) - 92.35% | | | 37,635,523 | |
| | | | | Other Assets in Excess of
Liabilities - 7.65% | | | 3,121,178 | |
| | | | | | |
|
|
|
| | | | | TOTAL NET ASSETS - 100.00% | | $ | 40,756,701 | |
| | | | | | |
|
|
|
Percentages are stated as a percent of net assets. Principal amounts are denominated in the currency in which the security was purchased.
| (a) | | Variable rate security. The coupon is based on an underlying pool of assets. The rate reported is the rate in effect as of March 31, 2020. |
| (b) | | These securities have been deemed illiquid according to the Fund’s liquidity guidelines. The value of these securities total $1,151,062, which represents 2.82% of total net assets. |
| (c) | | Variable rate security based on a reference index and spread. The rate reported is the rate in effect as of March 31, 2020. |
| (d) | | Securities were purchased exempt from registration in the U.S. pursuant to Rule 144A of the Securities Act of 1933 (the “Act”) or were acquired in a private placement, and, unless registered under the Act, may only be sold to “qualified institutional buyers” (as defined in the Act) or pursuant to another |
See notes to financial statements.
94
GuideMark® Opportunistic Fixed Income Fund
SCHEDULE OF INVESTMENTS (Continued)
March 31, 2020
| | exemption from registration. The value of these securities total $948,725, which represents 2.32% of total net assets. |
| (e) | | As of March 31, 2020, the Valuation Committee has fair valued these securities. The value of these securities total $0, which represents 0.00% of total net assets. |
| (f) | | Value determined using significant unobservable inputs. Classified as level 3 in the fair value hierarchy. |
| (g) | | Non-income producing. |
| (h) | | Zero coupon bond. The yield to maturity is listed. |
| (i) | | Inverse floating rate security whose interest rate moves in the opposite direction of reference interest rates. Reference interest rates are typically based on a negative multiplier or slope. |
| (j) | | Step-up bond; the interest rate shown is the rate in effect as of March 31, 2020. |
| (k) | | Seven-day yield as of March 31, 2020. |
| (l) | | Represents an inflation protected security. |
| (m) | | Represents an interest-only security that entitles holders to receive only interest payments on the underlying mortgages. Theyield-to-maturity of an interest-only security is extremely sensitive to the rate of principal payments on the underlying mortgage assets. A rapid (slow) rate of principal repayments may have an adverse (positive) effect on yield to maturity. The principal amount shown is the underlying mortgages. Interest rate disclosed represents yield upon the estimated timing and amount of future cash flows at March 31, 2020. These securities are liquid according to the Fund’s liquidity guidelines and the value of these securities total $447,355 which represents 1.10% of total net assets. |
| (n) | | Represents defaulted securities. |
Glossary of Terms
| | | | |
| PIK | | - | | Payment-in-Kind |
| LIBOR | | - | | London Interbank Offered Rate |
See notes to financial statements.
95
GuideMark® Opportunistic Fixed Income Fund
SCHEDULE OF OPEN FORWARD CURRENCY CONTRACTS
March 31, 2020
| | | | | | | | | | | | | | | | | | |
Forward
Expiration Date
| | Counterparty
| | Currency to be received
| | Amount of
Currency to
be received
| | | Currency to be delivered
| | Amount of
Currency to
be delivered
| | | Unrealized
Appreciation
(Depreciation)
| |
| 6/17/2020 | | Citibank | | Brazilian Real | | | 3,300,000 | | | Euro | | | 618,093 | | | $ | (51,796 | ) |
| 4/8/2020 | | Bank of America | | Euro | | | 310,152 | | | U.S. Dollar | | | 346,971 | | | | (4,822 | ) |
| 4/14/2020 | | Barclays | | Euro | | | 189,000 | | | U.S. Dollar | | | 211,400 | | | | (2,845 | ) |
| 4/14/2020 | | Citibank | | Euro | | | 602,674 | | | U.S. Dollar | | | 674,002 | | | | (8,971 | ) |
| 4/23/2020 | | Goldman Sachs | | Euro | | | 113,352 | | | U.S. Dollar | | | 126,904 | | | | (1,774 | ) |
| 4/24/2020 | | UBS | | Euro | | | 203,500 | | | U.S. Dollar | | | 228,138 | | | | (3,482 | ) |
| 4/27/2020 | | Deutsche Bank | | Euro | | | 21,315 | | | U.S. Dollar | | | 23,856 | | | | (322 | ) |
| 4/29/2020 | | Goldman Sachs | | Euro | | | 22,812 | | | U.S. Dollar | | | 25,549 | | | | (360 | ) |
| 4/30/2020 | | HSBC | | Euro | | | 34,118 | | | U.S. Dollar | | | 38,203 | | | | (528 | ) |
| 5/4/2020 | | Citibank | | Euro | | | 66,791 | | | U.S. Dollar | | | 74,789 | | | | (1,024 | ) |
| 5/6/2020 | | BNP Parabis | | Euro | | | 1,845,000 | | | U.S. Dollar | | | 2,092,569 | | | | (54,755 | ) |
| 5/21/2020 | | Citibank | | Euro | | | 1,620,000 | | | U.S. Dollar | | | 1,780,268 | | | | 10,035 | |
| 5/26/2020 | | Deutsche Bank | | Euro | | | 333,864 | | | U.S. Dollar | | | 363,705 | | | | 5,326 | |
| 5/27/2020 | | Morgan Stanley | | Euro | | | 88,500 | | | U.S. Dollar | | | 97,385 | | | | 440 | |
| 5/29/2020 | | Bank of America | | Euro | | | 186,500 | | | U.S. Dollar | | | 203,203 | | | | 2,965 | |
| 7/23/2020 | | Citibank | | Euro | | | 556,823 | | | U.S. Dollar | | | 614,922 | | | | 1,749 | |
| 10/15/2020 | | Citibank | | Euro | | | 63,594 | | | U.S. Dollar | | | 70,407 | | | | 197 | |
| 4/7/2020 | | BNP Parabis | | Indian Rupee | | | 951,400 | | | U.S. Dollar | | | 12,548 | | | | 15 | |
| 4/15/2020 | | JP Morgan Chase | | Indian Rupee | | | 11,220,000 | | | U.S. Dollar | | | 150,659 | | | | (2,636 | ) |
| 4/16/2020 | | Citibank | | Indian Rupee | | | 8,137,300 | | | U.S. Dollar | | | 108,191 | | | | (849 | ) |
| 4/29/2020 | | JP Morgan Chase | | Indian Rupee | | | 9,051,000 | | | U.S. Dollar | | | 121,176 | | | | (1,955 | ) |
| 4/30/2020 | | HSBC | | Indian Rupee | | | 12,161,294 | | | U.S. Dollar | | | 157,918 | | | | 2,254 | |
| 5/4/2020 | | HSBC | | Indian Rupee | | | 10,165,299 | | | U.S. Dollar | | | 131,880 | | | | 1,944 | |
| 5/5/2020 | | HSBC | | Indian Rupee | | | 14,268,000 | | | U.S. Dollar | | | 185,058 | | | | 2,756 | |
| 5/15/2020 | | Citibank | | Indian Rupee | | | 6,805,700 | | | U.S. Dollar | | | 88,134 | | | | 1,352 | |
| 5/21/2020 | | JP Morgan Chase | | Japanese Yen | | | 95,856,707 | | | Australian Dollar | | | 1,321,750 | | | | 80,412 | |
| 5/26/2020 | | Citibank | | Japanese Yen | | | 37,915,951 | | | Australian Dollar | | | 512,683 | | | | 38,101 | |
| 6/9/2020 | | Citibank | | Japanese Yen | | | 35,899,093 | | | Australian Dollar | | | 505,500 | | | | 23,890 | |
| 6/12/2020 | | HSBC | | Japanese Yen | | | 12,604,395 | | | Australian Dollar | | | 170,000 | | | | 13,006 | |
| 6/12/2020 | | JP Morgan Chase | | Japanese Yen | | | 34,861,063 | | | Australian Dollar | | | 470,000 | | | | 36,085 | |
| 6/12/2020 | | HSBC | | Japanese Yen | | | 24,599,050 | | | Australian Dollar | | | 335,000 | | | | 23,400 | |
| 6/12/2020 | | JP Morgan Chase | | Japanese Yen | | | 22,034,850 | | | Australian Dollar | | | 300,000 | | | | 21,009 | |
| 6/15/2020 | | Deutsche Bank | | Japanese Yen | | | 169,525,857 | | | Australian Dollar | | | 2,487,000 | | | | 51,732 | |
| 6/16/2020 | | HSBC | | Japanese Yen | | | 11,156,080 | | | Australian Dollar | | | 170,000 | | | | (490 | ) |
| 7/14/2020 | | JP Morgan Chase | | Japanese Yen | | | 32,856,340 | | | Australian Dollar | | | 440,000 | | | | 36,190 | |
| 8/21/2020 | | JP Morgan Chase | | Japanese Yen | | | 71,262,020 | | | Australian Dollar | | | 991,313 | | | | 56,556 | |
| 8/24/2020 | | Citibank | | Japanese Yen | | | 36,292,621 | | | Australian Dollar | | | 511,317 | | | | 24,863 | |
| 9/14/2020 | | HSBC | | Japanese Yen | | | 22,697,255 | | | Australian Dollar | | | 335,000 | | | | 6,329 | |
| 9/14/2020 | | JP Morgan Chase | | Japanese Yen | | | 26,477,899 | | | Australian Dollar | | | 390,000 | | | | 7,876 | |
| 11/24/2020 | | JP Morgan Chase | | Japanese Yen | | | 24,215,250 | | | Australian Dollar | | | 330,437 | | | | 23,851 | |
| 4/30/2020 | | Citibank | | Japanese Yen | | | 37,341,019 | | | Euro | | | 308,680 | | | | 6,980 | |
| 5/22/2020 | | HSBC | | Japanese Yen | | | 25,343,314 | | | Euro | | | 212,798 | | | | 1,080 | |
| 6/15/2020 | | Deutsche Bank | | Japanese Yen | | | 248,376,056 | | | Euro | | | 2,095,000 | | | | 155 | |
| 6/30/2020 | | Citibank | | Japanese Yen | | | 54,740,530 | | | Euro | | | 463,026 | | | | (1,385 | ) |
| 8/24/2020 | | HSBC | | Japanese Yen | | | 12,572,925 | | | Euro | | | 106,399 | | | | (358 | ) |
| 8/25/2020 | | HSBC | | Japanese Yen | | | 12,899,443 | | | Euro | | | 106,399 | | | | 2,697 | |
| 9/30/2020 | | Citibank | | Japanese Yen | | | 92,193,483 | | | Euro | | | 771,694 | | | | 6,882 | |
| 5/26/2020 | | JP Morgan Chase | | Japanese Yen | | | 25,649,800 | | | U.S. Dollar | | | 238,869 | | | | 279 | |
| 6/8/2020 | | JP Morgan Chase | | Japanese Yen | | | 13,672,910 | | | U.S. Dollar | | | 129,777 | | | | (2,234 | ) |
| 6/8/2020 | | HSBC | | Japanese Yen | | | 14,396,350 | | | U.S. Dollar | | | 136,485 | | | | (2,193 | ) |
| 6/18/2020 | | HSBC | | Japanese Yen | | | 44,820,000 | | | U.S. Dollar | | | 413,373 | | | | 4,878 | |
| 6/22/2020 | | JP Morgan Chase | | Japanese Yen | | | 32,606,160 | | | U.S. Dollar | | | 305,906 | | | | (1,584 | ) |
| 6/24/2020 | | BNP Parabis | | Japanese Yen | | | 55,637,050 | | | U.S. Dollar | | | 531,399 | | | | (12,083 | ) |
| 8/27/2020 | | JP Morgan Chase | | Japanese Yen | | | 25,650,300 | | | U.S. Dollar | | | 234,191 | | | | 5,726 | |
| 8/31/2020 | | Citibank | | Japanese Yen | | | 31,227,000 | | | U.S. Dollar | | | 302,149 | | | | (10,035 | ) |
| 9/8/2020 | | HSBC | | Japanese Yen | | | 20,466,520 | | | U.S. Dollar | | | 191,294 | | | | 210 | |
| 9/9/2020 | | HSBC | | Japanese Yen | | | 14,396,340 | | | U.S. Dollar | | | 135,609 | | | | (899 | ) |
| 10/26/2020 | | BNP Parabis | | Japanese Yen | | | 37,740,000 | | | U.S. Dollar | | | 348,603 | | | | 5,032 | |
| 4/24/2020 | | Deutsche Bank | | Norwegian Krone | | | 876,000 | | | U.S. Dollar | | | 74,218 | | | | 10,056 | |
| 5/18/2020 | | Deutsche Bank | | Norwegian Krone | | | 476,000 | | | U.S. Dollar | | | 51,755 | | | | (5,959 | ) |
See notes to financial statements.
96
GuideMark® Opportunistic Fixed Income Fund
SCHEDULE OF OPEN FORWARD CURRENCY CONTRACTS (Continued)
March 31, 2020
| | | | | | | | | | | | | | | | | | |
Forward
Expiration Date
| | Counterparty
| | Currency to be received
| | Amount of
Currency to
be received
| | | Currency to be delivered
| | Amount of
Currency to
be delivered
| | | Unrealized
Appreciation
(Depreciation)
| |
| 5/19/2020 | | Deutsche Bank | | Norwegian Krone | | | 1,923,000 | | | U.S. Dollar | | | 211,630 | | | $ | (26,618 | ) |
| 5/27/2020 | | Deutsche Bank | | Norwegian Krone | | | 1,425,500 | | | U.S. Dollar | | | 156,502 | | | | (19,352 | ) |
| 6/19/2020 | | Deutsche Bank | | Norwegian Krone | | | 1,923,000 | | | U.S. Dollar | | | 213,569 | | | | (28,548 | ) |
| 6/30/2020 | | Deutsche Bank | | Norwegian Krone | | | 582,000 | | | U.S. Dollar | | | 65,064 | | | | (9,065 | ) |
| 7/10/2020 | | Deutsche Bank | | Norwegian Krone | | | 7,510,000 | | | U.S. Dollar | | | 847,907 | | | | (125,298 | ) |
| 8/26/2020 | | Deutsche Bank | | Norwegian Krone | | | 1,425,500 | | | U.S. Dollar | | | 152,653 | | | | (15,473 | ) |
| 9/24/2020 | | Deutsche Bank | | Norwegian Krone | | | 1,164,500 | | | U.S. Dollar | | | 129,059 | | | | (16,987 | ) |
| 11/16/2020 | | Deutsche Bank | | Norwegian Krone | | | 1,152,000 | | | U.S. Dollar | | | 126,012 | | | | (15,152 | ) |
| 4/29/2020 | | HSBC | | South Korea Won | | | 28,856,853 | | | U.S. Dollar | | | 23,589 | | | | 138 | |
| 5/6/2020 | | JP Morgan Chase | | South Korea Won | | | 400,000,000 | | | U.S. Dollar | | | 327,091 | | | | 1,886 | |
| 4/15/2020 | | Deutsche Bank | | Swedish Krona | | | 1,106,300 | | | Euro | | | 101,784 | | | | (447 | ) |
| 5/13/2020 | | Deutsche Bank | | Swedish Krona | | | 1,106,300 | | | Euro | | | 103,928 | | | | (2,876 | ) |
| 6/15/2020 | | Deutsche Bank | | Swedish Krona | | | 2,212,700 | | | Euro | | | 208,888 | | | | (7,008 | ) |
| 6/16/2020 | | Deutsche Bank | | Swedish Krona | | | 1,106,400 | | | Euro | | | 101,700 | | | | (465 | ) |
| 8/13/2020 | | Deutsche Bank | | Swedish Krona | | | 1,106,300 | | | Euro | | | 104,910 | | | | (4,132 | ) |
| 5/8/2020 | | UBS | | Swiss Franc | | | 197,966 | | | Euro | | | 180,318 | | | | 6,911 | |
| 5/12/2020 | | Goldman Sachs | | Swiss Franc | | | 194,284 | | | Euro | | | 177,024 | | | | 6,724 | |
| 8/10/2020 | | UBS | | Swiss Franc | | | 395,932 | | | Euro | | | 365,506 | | | | 8,739 | |
| 8/12/2020 | | Goldman Sachs | | Swiss Franc | | | 388,568 | | | Euro | | | 359,366 | | | | 7,856 | |
| 11/9/2020 | | UBS | | Swiss Franc | | | 197,965 | | | Euro | | | 180,599 | | | | 6,903 | |
| 11/12/2020 | | Goldman Sachs | | Swiss Franc | | | 194,284 | | | Euro | | | 177,299 | | | | 6,714 | |
| 4/17/2020 | | JP Morgan Chase | | U.S. Dollar | | | 226,150 | | | Brazilian Real | | | 1,082,300 | | | | 18,103 | |
| 5/5/2020 | | JP Morgan Chase | | U.S. Dollar | | | 225,616 | | | Brazilian Real | | | 935,200 | | | | 46,068 | |
| 6/2/2020 | | JP Morgan Chase | | U.S. Dollar | | | 192,538 | | | Brazilian Real | | | 824,600 | | | | 34,516 | |
| 7/2/2020 | | JP Morgan Chase | | U.S. Dollar | | | 214,543 | | | Brazilian Real | | | 1,078,300 | | | | 8,196 | |
| 8/4/2020 | | JP Morgan Chase | | U.S. Dollar | | | 228,942 | | | Brazilian Real | | | 1,033,900 | | | | 31,456 | |
| 4/8/2020 | | Bank of America | | U.S. Dollar | | | 344,631 | | | Euro | | | 310,152 | | | | 2,481 | |
| 4/14/2020 | | Citibank | | U.S. Dollar | | | 668,697 | | | Euro | | | 602,674 | | | | 3,667 | |
| 4/14/2020 | | Barclays | | U.S. Dollar | | | 210,119 | | | Euro | | | 189,000 | | | | 1,564 | |
| 4/23/2020 | | Goldman Sachs | | U.S. Dollar | | | 127,985 | | | Euro | | | 113,352 | | | | 2,855 | |
| 4/24/2020 | | UBS | | U.S. Dollar | | | 229,289 | | | Euro | | | 203,500 | | | | 4,632 | |
| 4/27/2020 | | Deutsche Bank | | U.S. Dollar | | | 23,992 | | | Euro | | | 21,315 | | | | 458 | |
| 4/29/2020 | | Goldman Sachs | | U.S. Dollar | | | 25,635 | | | Euro | | | 22,812 | | | | 445 | |
| 4/30/2020 | | HSBC | | U.S. Dollar | | | 38,376 | | | Euro | | | 34,118 | | | | 701 | |
| 5/4/2020 | | Citibank | | U.S. Dollar | | | 75,295 | | | Euro | | | 66,791 | | | | 1,530 | |
| 5/6/2020 | | BNP Parabis | | U.S. Dollar | | | 2,082,267 | | | Euro | | | 1,845,000 | | | | 44,453 | |
| 5/21/2020 | | Citibank | | U.S. Dollar | | | 1,815,356 | | | Euro | | | 1,620,000 | | | | 25,052 | |
| 5/26/2020 | | Deutsche Bank | | U.S. Dollar | | | 373,460 | | | Euro | | | 333,864 | | | | 4,430 | |
| 5/27/2020 | | Morgan Stanley | | U.S. Dollar | | | 98,695 | | | Euro | | | 88,500 | | | | 870 | |
| 5/29/2020 | | Bank of America | | U.S. Dollar | | | 207,890 | | | Euro | | | 186,500 | | | | 1,722 | |
| 7/23/2020 | | Citibank | | U.S. Dollar | | | 632,231 | | | Euro | | | 556,823 | | | | 15,559 | |
| 10/15/2020 | | Citibank | | U.S. Dollar | | | 71,747 | | | Euro | | | 63,594 | | | | 1,143 | |
| 4/7/2020 | | BNP Parabis | | U.S. Dollar | | | 13,004 | | | Indian Rupee | | | 951,400 | | | | 441 | |
| 4/15/2020 | | JP Morgan Chase | | U.S. Dollar | | | 156,273 | | | Indian Rupee | | | 11,220,000 | | | | 8,250 | |
| 4/16/2020 | | Citibank | | U.S. Dollar | | | 112,666 | | | Indian Rupee | | | 8,137,300 | | | | 5,324 | |
| 4/29/2020 | | JP Morgan Chase | | U.S. Dollar | | | 124,841 | | | Indian Rupee | | | 9,051,000 | | | | 5,620 | |
| 4/30/2020 | | HSBC | | U.S. Dollar | | | 168,813 | | | Indian Rupee | | | 12,161,294 | | | | 8,641 | |
| 5/4/2020 | | HSBC | | U.S. Dollar | | | 140,803 | | | Indian Rupee | | | 10,165,299 | | | | 6,979 | |
| 5/5/2020 | | HSBC | | U.S. Dollar | | | 197,113 | | | Indian Rupee | | | 14,268,000 | | | | 9,299 | |
| 5/14/2020 | | HSBC | | U.S. Dollar | | | 55,856 | | | Indian Rupee | | | 4,017,472 | | | | 3,026 | |
| 5/14/2020 | | JP Morgan Chase | | U.S. Dollar | | | 162,076 | | | Indian Rupee | | | 11,753,000 | | | | 7,524 | |
| 5/15/2020 | | Citibank | | U.S. Dollar | | | 91,095 | | | Indian Rupee | | | 6,805,700 | | | | 1,610 | |
| 5/18/2020 | | JP Morgan Chase | | U.S. Dollar | | | 76,738 | | | Indian Rupee | | | 5,651,000 | | | | 2,460 | |
| 5/18/2020 | | HSBC | | U.S. Dollar | | | 144,869 | | | Indian Rupee | | | 10,432,000 | | | | 7,749 | |
| 5/20/2020 | | Citibank | | U.S. Dollar | | | 329,946 | | | Indian Rupee | | | 23,780,000 | | | | 17,447 | |
| 5/26/2020 | | JP Morgan Chase | | U.S. Dollar | | | 245,620 | | | Japanese Yen | | | 25,649,800 | | | | 6,471 | |
| 6/8/2020 | | JP Morgan Chase | | U.S. Dollar | | | 130,652 | | | Japanese Yen | | | 13,672,910 | | | | 3,109 | |
| 6/8/2020 | | HSBC | | U.S. Dollar | | | 137,903 | | | Japanese Yen | | | 14,396,350 | | | | 3,611 | |
| 6/18/2020 | | HSBC | | U.S. Dollar | | | 429,543 | | | Japanese Yen | | | 44,820,000 | | | | 11,292 | |
| 6/22/2020 | | JP Morgan Chase | | U.S. Dollar | | | 311,979 | | | Japanese Yen | | | 32,606,160 | | | | 7,656 | |
See notes to financial statements.
97
GuideMark® Opportunistic Fixed Income Fund
SCHEDULE OF OPEN FORWARD CURRENCY CONTRACTS (Continued)
March 31, 2020
| | | | | | | | | | | | | | | | | | |
Forward
Expiration Date
| | Counterparty
| | Currency to be received
| | Amount of
Currency to
be received
| | | Currency to be delivered
| | Amount of
Currency to
be delivered
| | | Unrealized
Appreciation
(Depreciation)
| |
| 6/24/2020 | | BNP Parabis | | U.S. Dollar | | | 533,132 | | | Japanese Yen | | | 55,637,050 | | | $ | 13,816 | |
| 8/27/2020 | | JP Morgan Chase | | U.S. Dollar | | | 246,264 | | | Japanese Yen | | | 25,650,300 | | | | 6,348 | |
| 8/31/2020 | | Citibank | | U.S. Dollar | | | 296,363 | | | Japanese Yen | | | 31,227,000 | | | | 4,248 | |
| 9/8/2020 | | HSBC | | U.S. Dollar | | | 196,501 | | | Japanese Yen | | | 20,466,520 | | | | 4,997 | |
| 9/9/2020 | | HSBC | | U.S. Dollar | | | 138,227 | | | Japanese Yen | | | 14,396,340 | | | | 3,517 | |
| 10/26/2020 | | BNP Parabis | | U.S. Dollar | | | 362,787 | | | Japanese Yen | | | 37,740,000 | | | | 9,152 | |
| 4/6/2020 | | HSBC | | U.S. Dollar | | | 868,522 | | | Mexican Peso | | | 17,690,000 | | | | 123,820 | |
| 4/8/2020 | | Citibank | | U.S. Dollar | | | 78,075 | | | Mexican Peso | | | 1,568,000 | | | | 12,090 | |
| 6/17/2020 | | Citibank | | U.S. Dollar | | | 264,529 | | | Mexican Peso | | | 5,378,000 | | | | 40,456 | |
| 10/7/2020 | | HSBC | | U.S. Dollar | | | 632,090 | | | Mexican Peso | | | 13,190,000 | | | | 91,267 | |
| 10/8/2020 | | Citibank | | U.S. Dollar | | | 78,081 | | | Mexican Peso | | | 1,609,000 | | | | 12,117 | |
| 10/9/2020 | | Citibank | | U.S. Dollar | | | 58,586 | | | Mexican Peso | | | 1,209,000 | | | | 9,027 | |
| 10/13/2020 | | Citibank | | U.S. Dollar | | | 194,892 | | | Mexican Peso | | | 4,030,000 | �� | | | 29,791 | |
| 10/15/2020 | | Citibank | | U.S. Dollar | | | 287,908 | | | Mexican Peso | | | 5,932,000 | | | | 44,954 | |
| 10/16/2020 | | Citibank | | U.S. Dollar | | | 266,021 | | | Mexican Peso | | | 5,431,000 | | | | 43,617 | |
| 4/29/2020 | | HSBC | | U.S. Dollar | | | 24,852 | | | South Korea Won | | | 28,856,853 | | | | 1,125 | |
| 5/6/2020 | | JP Morgan Chase | | U.S. Dollar | | | 344,382 | | | South Korea Won | | | 400,000,000 | | | | 15,405 | |
| 7/29/2020 | | Citibank | | U.S. Dollar | | | 15,996 | | | South Korea Won | | | 18,558,803 | | | | 679 | |
| 8/26/2020 | | Citibank | | U.S. Dollar | | | 13,251 | | | South Korea Won | | | 15,718,394 | | | | 264 | |
| 8/31/2020 | | Citibank | | U.S. Dollar | | | 15,381 | | | South Korea Won | | | 18,558,803 | | | | 44 | |
| 9/9/2020 | | Goldman Sachs | | U.S. Dollar | | | 863,879 | | | South Korea Won | | | 1,037,000,000 | | | | 6,578 | |
| | | | | | | | | | | | | | | | |
|
|
|
| | | | | | | | | | | | | | | | | $ | 957,141 | |
| | | | | | | | | | | | | | | | |
|
|
|
See notes to financial statements.
98
GuidePath® Growth Allocation Fund
SCHEDULE OF INVESTMENTS
March 31, 2020
| | | | | | | | |
Number of
Shares
| | | | | Value
| |
| | | | | INVESTMENT COMPANIES - 98.68% | |
| | | | | Exchange Traded Funds - 69.96% | |
| | 986,410 | | | iShares Core MSCI Emerging Markets ETF (a) | | $ | 39,920,013 | |
| | 660,025 | | | iShares Core S&PSmall-Cap ETF (a) | | | 37,034,003 | |
| | 476,775 | | | iShares MSCI Canada ETF (a) | | | 10,417,534 | |
| | 181,404 | | | iShares MSCI Switzerland ETF (a) | | | 6,414,445 | |
| | 1,222,634 | | | Schwab U.S.Large-Cap ETF (a) | | | 74,886,332 | |
| | 463,245 | | | Schwab U.S.Large-Cap Growth ETF (a) | | | 36,897,464 | |
| | 373,088 | | | SPDR S&P 600 Small Cap Growth ETF | | | 17,229,204 | |
| | 137,488 | | | SPDR S&P China ETF (a) | | | 12,545,780 | |
| | 119,215 | | | Vanguard FTSE All Worldex-USSmall-Cap ETF (a) | | | 9,328,574 | |
| | 2,501,156 | | | Vanguard FTSE Developed Markets ETF (a) | | | 83,388,541 | |
| | 150,436 | | | Vanguard Globalex-U.S. Real Estate ETF | | | 6,455,209 | |
| | 150,837 | | | Vanguard Real Estate ETF (a) | | | 10,535,964 | |
| | 235,966 | | | Vanguard Russell 1000 Growth ETF (a) | | | 36,499,221 | |
| | 83,226 | | | Vanguard Russell 2000 Growth | | | 9,571,822 | |
| | 520,127 | | | Vanguard S&P 500 ETF (a) | | | 123,176,476 | |
| | 72,095 | | | Vanguard Value ETF | | | 6,420,781 | |
| | | | | | |
|
|
|
| | | | | | | | 520,721,363 | |
| | | | | | |
|
|
|
| | | | | Mutual Funds - 28.72% | |
| | 1,328,063 | | | AMCAP Fund - Class F3 | | | 36,959,987 | |
| | 1,295,239 | | | American Funds - EuroPacific Growth Fund - Class F3 | | | 55,863,662 | |
| | 758,114 | | | American Funds - Fundamental Investors - Class F3 | | | 37,018,689 | |
| | 406,451 | | | American Funds - SMALLCAP World Fund, Inc. - Class F3 | | | 18,745,504 | |
| | 861,278 | | | American Funds - The Growth Fund of America - Class F3 | | | 37,388,097 | |
| | 872,971 | | | American Funds - The Investment Company of America - Class F3 | | | 27,786,658 | |
| | | | | | |
|
|
|
| | | | | | | | 213,762,597 | |
| | | | | | |
|
|
|
| | | | | Total Investment Companies
(Cost $731,015,266) | | | 734,483,960 | |
| | | | | | |
|
|
|
| | | | | | | | |
Number of
Shares
| | | | | Value
| |
| | | | | SHORT TERM INVESTMENTS - 0.90% | |
| | | | | Money Market Funds - 0.90% | |
| | 6,730,813 | | | DWS Government Money Market Series -Institutional Shares
Effective Yield, 0.41%, (b) | | $ | 6,730,813 | |
| | | | | | |
|
|
|
| | | | | Total Short Term Investments
(Cost $6,730,813) | | | 6,730,813 | |
| | | | | | |
|
|
|
| | | | | INVESTMENTS PURCHASED WITH PROCEEDS FROM SECURITIES LENDING COLLATERAL - 18.73% | |
| | 139,438,379 | | | Mount Vernon Liquid Assets Portfolio, LLC
Effective Yield, 0.91% (b) | | | 139,438,379 | |
| | | | | | |
|
|
|
| | | | | Total Investments Purchased with Proceeds from Securities Lending Collateral
(Cost $139,438,379) | | | 139,438,379 | |
| | | | | | |
|
|
|
| | | | | Total Investments
(Cost $877,184,458) - 118.31% | | | 880,653,152 | |
| | | | | Liabilities in Excess of
Other Assets - (18.31)% | | | (136,300,544 | ) |
| | | | | | |
|
|
|
| | | | | TOTAL NET ASSETS - 100.00% | | $ | 744,352,608 | |
| | | | | | |
|
|
|
Percentages are stated as a percent of net assets.
| (a) | | All or portion of this security is on loan. |
| (b) | | Seven-day yield as of March 31, 2020. |
See notes to financial statements.
99
GuidePath® Conservative Allocation Fund
SCHEDULE OF INVESTMENTS
March 31, 2020
| | | | | | | | |
Number of
Shares
| | | | | Value
| |
| | | | | INVESTMENT COMPANIES - 98.78% | |
| | | | | Exchange Traded Funds - 70.90% | |
| | 67,231 | | | iShares1-3 Year Treasury Bond ETF (a) | | $ | 5,826,911 | |
| | 65,397 | | | iShares3-7 Year Treasury Bond ETF (a) | | | 8,720,036 | |
| | 75,290 | | | iShares7-10 Year Treasury Bond ETF (a) | | | 9,146,229 | |
| | 198,346 | | | iShares Broad USD Investment Grade Corporate Bond ETF | | | 11,111,343 | |
| | 336,603 | | | iShares Core Aggressive Allocation ETF (a) | | | 15,975,178 | |
| | 496,588 | | | iShares Core Growth Allocation ETF | | | 20,548,811 | |
| | 49,625 | | | iShares Core MSCI Emerging Markets ETF (a) | | | 2,008,324 | |
| | 84,365 | | | iShares Core MSCI Europe ETF | | | 3,128,254 | |
| | 189,446 | | | iShares Core S&PSmall-Cap ETF (a) | | | 10,629,815 | |
| | 161,274 | | | iShares Edge MSCI Min Vol USA ETF (a) | | | 8,710,409 | |
| | 18,928 | | | iShares iBoxx High Yield Corporate Bond ETF (a) | | | 1,458,781 | |
| | 21,148 | | | iShares J.P. Morgan USD Emerging Markets Bond ETF (a) | | | 2,044,589 | |
| | 75,759 | | | iShares Long-Term Corporate Bond ETF (a) | | | 4,819,788 | |
| | 80,183 | | | iShares MSCI Canada ETF (a) | | | 1,751,998 | |
| | 93,203 | | | iShares MSCI Switzerland ETF (a) | | | 3,295,658 | |
| | 130,473 | | | Principal Active Income ETF | | | 4,212,973 | |
| | 137,690 | | | SPDR Bloomberg Barclays High Yield Bond ETF (a) | | | 13,044,751 | |
| | 56,324 | | | SPDR Bloomberg Barclays International Treasury Bond ETF | | | 1,565,807 | |
| | 25,168 | | | SPDR Gold Shares (a) | | | 3,726,122 | |
| | 99,054 | | | SPDR Portfolio TIPS ETF (a) | | | 2,876,528 | |
| | 34,209 | | | SPDR S&P China ETF | | | 3,121,571 | |
| | 395,034 | | | Vanguard FTSE Developed Markets ETF (a) | | | 13,170,434 | |
| | 212,573 | | | Vanguard High Dividend Yield ETF | | | 15,039,540 | |
| | 94,330 | | | Vanguard Long-Term Treasury ETF | | | 9,528,273 | |
| | 443,640 | | | Vanguard Mortgage-Backed Securities ETF | | | 24,178,380 | |
| | 31,344 | | | Vanguard Real Estate ETF (a) | | | 2,189,378 | |
| | 72,891 | | | Vanguard S&P 500 ETF (a) | | | 17,262,047 | |
| | 11,139 | | | Vanguard Total Bond Market ETF | | | 950,714 | |
| | 50,116 | | | Vanguard Value ETF (a) | | | 4,463,331 | |
| | | | | | |
|
|
|
| | | | | | | | 224,505,973 | |
| | | | | | |
|
|
|
| | | | | Mutual Funds - 27.88% | |
| | 372,437 | | | American Funds - Capital Income Builder - Class F3 | | | 19,724,248 | |
| | 1,316,200 | | | American Funds - High-Income Trust - Class F3 | | | 11,385,134 | |
| | 439,971 | | | American Funds - Mutual Fund - Class F3 | | | 15,548,586 | |
| | 1,012,403 | | | American Funds - The Income Fund of America - Class F3 | | | 19,529,250 | |
| | 792,271 | | | American Funds - U.S. Government Securities Fund -Class F3 | | | 11,733,539 | |
| | 1,967,040 | | | Vanguard High-Yield Corporate Fund | | | 10,346,631 | |
| | | | | | |
|
|
|
| | | | | | | | 88,267,388 | |
| | | | | | |
|
|
|
| | | | | Total Investment Companies
(Cost $318,428,710) | | | 312,773,361 | |
| | | | | | |
|
|
|
| | | | | | | | |
Number of
Shares
| | | | | Value
| |
| | | | | SHORT TERM INVESTMENTS - 0.93% | |
| | | | | Money Market Funds - 0.93% | |
| | 2,958,664 | | | DWS Government Money Market Series - Institutional Shares
Effective Yield, 0.41% (b) | | $ | 2,958,664 | |
| | | | | | |
|
|
|
| | | | | Total Short Term Investments
(Cost $2,958,664) | | | 2,958,664 | |
| | | | | | |
|
|
|
| | | | | INVESTMENTS PURCHASED WITH PROCEEDS FROM SECURITIES LENDING COLLATERAL - 27.80% | |
| | 88,033,252 | | | Mount Vernon Liquid Assets Portfolio, LLC
Effective Yield, 0.91% (b) | | | 88,033,252 | |
| | | | | | |
|
|
|
| | | | | Total Investments Purchased with Proceeds from Securities Lending Collateral
(Cost $88,033,252) | | | 88,033,252 | |
| | | | | | |
|
|
|
| | | | | Total Investments
(Cost $409,420,626) - 127.51% | | | 403,765,277 | |
| | | | | Liabilities in Excess of
Other Assets - (27.51)% | | | (87,116,244 | ) |
| | | | | | |
|
|
|
| | | | | TOTAL NET ASSETS - 100.00% | | $ | 316,649,033 | |
| | | | | | |
|
|
|
Percentages are stated as a percent of net assets.
| (a) | | All or portion of this security is on loan. |
| (b) | | Seven-day yield as of March 31, 2020. |
See notes to financial statements.
100
GuidePath® Tactical Allocation Fund
SCHEDULE OF INVESTMENTS
March 31, 2020
| | | | | | | | |
Number of
Shares
| | | | | Value
| |
| | | | | COMMON STOCKS - 23.14% | |
| | | | | Airlines - 0.26% | |
| | 26,639 | | | United Airlines Holdings, Inc. (a)(b) | | $ | 840,461 | |
| | | | | | |
|
|
|
| | | | | Biotechnology - 0.35% | |
| | 15,023 | | | AbbVie, Inc. (a) | | | 1,144,602 | |
| | | | | | |
|
|
|
| | | | | Capital Markets - 2.12% | |
| | 16,078 | | | FactSet Research Systems, Inc. (a) | | | 4,191,213 | |
| | 8,060 | | | MarketAxess Holdings, Inc. | | | 2,680,514 | |
| | | | | | |
|
|
|
| | | | | | | | 6,871,727 | |
| | | | | | |
|
|
|
| | | | | Chemicals - 0.92% | |
| | 29,070 | | | Scotts Miracle Grow Co. | | | 2,976,768 | |
| | | | | | |
|
|
|
| | | | | Containers & Packaging - 0.26% | |
| | 29,361 | | | Silgan Holdings, Inc. | | | 852,056 | |
| | | | | | |
|
|
|
| | | | | Diversified Consumer Services - 0.25% | |
| | 23,328 | | | Frontdoor, Inc. (b) | | | 811,348 | |
| | | | | | |
|
|
|
| | | | | Electric Utilities - 2.82% | |
| | 19,165 | | | Alliant Energy Corp. | | | 925,478 | |
| | 36,239 | | | Avangrid, Inc. | | | 1,586,543 | |
| | 13,571 | | | Duke Energy Corp. (a) | | | 1,097,623 | |
| | 16,817 | | | Edison International | | | 921,403 | |
| | 27,576 | | | Evergy, Inc. | | | 1,518,059 | |
| | 20,367 | | | FirstEnergy Corp. | | | 816,106 | |
| | 20,355 | | | Hawaiian Electric Industries, Inc. | | | 876,283 | |
| | 26,410 | | | Southern Co. (a) | | | 1,429,837 | |
| | | | | | |
|
|
|
| | | | | | | | 9,171,332 | |
| | | | | | |
|
|
|
| | | | | Food Products - 0.81% | |
| | 19,800 | | | Hershey Co. | | | 2,623,500 | |
| | | | | | |
|
|
|
| | | | | Gas Utilities - 0.23% | |
| | 7,558 | | | Atmos Energy Corp. | | | 749,980 | |
| | | | | | |
|
|
|
| | | | | Health Care Equipment & Supplies - 1.18% | |
| | 28,376 | | | Boston Scientific Corp. (b) | | | 925,909 | |
| | 6,278 | | | Insulet Corp. (b) | | | 1,040,139 | |
| | 10,184 | | | Medtronic Plc | | | 918,393 | |
| | 9,481 | | | Zimmer Biomet Holdings, Inc. | | | 958,340 | |
| | | | | | |
|
|
|
| | | | | | | | 3,842,781 | |
| | | | | | |
|
|
|
| | | | | Health Care Providers & Services - 0.24% | |
| | 3,427 | | | Anthem, Inc. | | | 778,066 | |
| | | | | | |
|
|
|
| | | | | Hotels, Restaurants & Leisure - 0.26% | |
| | 12,601 | | | Hilton Worldwide Holdings, Inc. (a) | | | 859,892 | |
| | | | | | |
|
|
|
| | | | | Household Durables - 0.93% | |
| | 89,969 | | | PulteGroup, Inc. | | | 2,008,108 | |
| | 52,404 | | | Toll Brothers, Inc. | | | 1,008,777 | |
| | | | | | |
|
|
|
| | | | | | | | 3,016,885 | |
| | | | | | |
|
|
|
| | | | | Household Products - 1.11% | |
| | 20,760 | | | Clorox Co. | | | 3,596,670 | |
| | | | | | |
|
|
|
| | | | | Insurance - 2.17% | |
| | 67,354 | | | Aflac, Inc. | | | 2,306,201 | |
| | 4,738 | | | Erie Indemnity Co. - Class A | | | 702,361 | |
| | 17,223 | | | RenaissanceRe Holdings Ltd. | | | 2,571,738 | |
| | 28,085 | | | WR Berkley Corp. | | | 1,465,195 | |
| | | | | | |
|
|
|
| | | | | | | | 7,045,495 | |
| | | | | | |
|
|
|
| | | | | IT Services - 0.28% | |
| | 9,075 | | | Gartner, Inc. (b) | | | 903,598 | |
| | | | | | |
|
|
|
| | | | | | | | |
Number of
Shares
| | | | | Value
| |
| | | | | Media - 0.67% | |
| | 64,538 | | | Discovery, Inc. - Class A (a)(b) | | $ | 1,131,996 | |
| | 53,170 | | | Discovery, Inc. - Class C (b) | | | 1,033,625 | |
| | | | | | |
|
|
|
| | | | | | | | 2,165,621 | |
| | | | | | |
|
|
|
| | | | | Metals & Mining - 0.47% | |
| | 17,382 | | | Royal Gold, Inc. | | | 1,524,575 | |
| | | | | | |
|
|
|
| | | | | Multi-Utilities - 0.56% | |
| | 12,019 | | | Ameren Corp. | | | 875,344 | |
| | 10,035 | | | DTE Energy Co. | | | 953,024 | |
| | | | | | |
|
|
|
| | | | | | | | 1,828,368 | |
| | | | | | |
|
|
|
| | | | | Pharmaceuticals - 3.06% | |
| | 74,654 | | | Bristol-Myers Squibb Co. | | | 4,161,214 | |
| | 48,628 | | | Horizon Therapeutics Plc (b) | | | 1,440,361 | |
| | 10,967 | | | Merck & Co., Inc. | | | 843,801 | |
| | 29,637 | | | Zoetis, Inc. | | | 3,487,979 | |
| | | | | | |
|
|
|
| | | | | | | | 9,933,355 | |
| | | | | | |
|
|
|
| | | | | Professional Services - 0.47% | |
| | 6,098 | | | Equifax, Inc. | | | 728,406 | |
| | 5,644 | | | Verisk Analytics, Inc. | | | 786,661 | |
| | | | | | |
|
|
|
| | | | | | | | 1,515,067 | |
| | | | | | |
|
|
|
| | | | | Semiconductors & Semiconductor Equipment - 0.97% | |
| | 18,211 | | | Applied Materials, Inc. | | | 834,428 | |
| | 10,227 | | | Qorvo, Inc. (b) | | | 824,603 | |
| | 16,806 | | | Skyworks Solutions, Inc. | | | 1,502,120 | |
| | | | | | |
|
|
|
| | | | | | | | 3,161,151 | |
| | | | | | |
|
|
|
| | | | | Software - 1.18% | |
| | 34,455 | | | Cadence Design Systems, Inc. (b) | | | 2,275,408 | |
| | 9,875 | | | Microsoft Corp. | | | 1,557,387 | |
| | | | | | |
|
|
|
| | | | | | | | 3,832,795 | |
| | | | | | |
|
|
|
| | | | | Technology Hardware, Storage & Peripherals - 1.32% | |
| | 8,955 | | | Apple, Inc. (a) | | | 2,277,167 | |
| | 105,560 | | | Xerox Holdings Corp. | | | 1,999,306 | |
| | | | | | |
|
|
|
| | | | | | | | 4,276,473 | |
| | | | | | |
|
|
|
| | | | | Water Utilities - 0.25% | |
| | 20,404 | | | Essential Utilities, Inc. (a) | | | 830,443 | |
| | | | | | |
|
|
|
| | | | | Total Common Stocks
(Cost $89,948,369) | | | 75,153,009 | |
| | | | | | |
|
|
|
| | | | | INVESTMENT COMPANIES - 42.99% | |
| | | | | Exchange Traded Funds - 42.99% | |
| | 642,601 | | | Goldman Sachs Access Treasury0-1 Year ETF | | | 64,754,903 | |
| | 816,921 | | | SPDR Bloomberg Barclays1-3 MonthT-Bill ETF (a) | | | 74,854,471 | |
| | | | | | |
|
|
|
| | | | | Total Investment Companies
(Cost $139,392,666) | | | 139,609,374 | |
| | | | | | |
|
|
|
| | | | | REAL ESTATE INVESTMENT TRUSTS - 1.79% | |
| | | | | Real Estate Investment Trusts - 1.79% | |
| | 217,403 | | | AGNC Investment Corp. | | | 2,300,124 | |
| | 76,494 | | | Brookfield Property, Inc. (a) | | | 649,434 | |
| | 1,413 | | | Equinix, Inc. | | | 882,518 | |
| | 26,561 | | | Equity Commonwealth | | | 842,249 | |
| | 14,198 | | | Prologis, Inc. | | | 1,141,093 | |
| | | | | | |
|
|
|
| | | | | Total Real Estate Investment Trusts
(Cost $7,886,487) | | | 5,815,418 | |
| | | | | | |
|
|
|
See notes to financial statements.
101
GuidePath® Tactical Allocation Fund
SCHEDULE OF INVESTMENTS (Continued)
March 31, 2020
| | | | | | | | |
Number of
Shares
| | | | | Value
| |
| | | | | SHORT TERM INVESTMENTS - 31.68% | |
| | | | | Money Market Funds - 31.68% | |
| | 102,889,272 | | | DWS Government Money Market Series -Institutional Shares
Effective Yield, 0.41% (c) | | $ | 102,889,272 | |
| | | | | | |
|
|
|
| | | | | Total Short Term Investments
(Cost $102,889,272) | | | 102,889,272 | |
| | | | | | |
|
|
|
| | | | | INVESTMENTS PURCHASED WITH PROCEEDS FROM SECURITIES LENDING COLLATERAL - 22.47% | |
| | 72,959,037 | | | Mount Vernon Liquid Assets Portfolio, LLC
Effective Yield, 0.91% (c) | | | 72,959,037 | |
| | | | | | |
|
|
|
| | | | | Total Investments Purchased with Proceeds from Securities Lending Collateral
(Cost $72,959,037) | | | 72,959,037 | |
| | | | | | |
|
|
|
| | | | | Total Investments
(Cost $413,075,831) - 122.07% | | | 396,426,110 | |
| | | | | Liabilities in Excess of
Other Assets - (22.07)% | | | (71,673,553 | ) |
| | | | | | |
|
|
|
| | | | | TOTAL NET ASSETS - 100.00% | | $ | 324,752,557 | |
| | | | | | |
|
|
|
Percentages are stated as a percent of net assets.
| (a) | | All or portion of this security is on loan. |
| (b) | | Non-income producing security. |
| (c) | | Seven-day yield as of March 31, 2020. |
See notes to financial statements.
102
GuidePath® Absolute Return Allocation Fund
SCHEDULE OF INVESTMENTS
March 31, 2020
| | | | | | | | |
Number of
Shares
| | | | | Value
| |
| | | | | INVESTMENT COMPANIES - 99.10% | |
| | | | | Exchange Traded Funds - 59.06% | |
| | 19,069 | | | Invesco DB Agriculture Fund (a) | | $ | 268,301 | |
| | 3,062 | | | Invesco DB Base Metals Fund | | | 37,816 | |
| | 27,769 | | | Invesco DB Energy Fund (a) | | | 225,484 | |
| | 48,820 | | | iShares7-10 Year Treasury Bond ETF (a) | | | 5,930,653 | |
| | 7,693 | | | iShares Core MSCI Emerging Markets ETF (a) | | | 311,336 | |
| | 230,372 | | | iShares iBoxx $ Investment Grade Corporate Bond ETF (a) | | | 28,453,246 | |
| | 458,105 | | | ProShares Investment Grade-Interest Rate Hedged ETF (a)(c) | | | 29,836,379 | |
| | 303,567 | | | ProShares UltraShort 20+ Year Treasury (a) | | | 4,881,357 | |
| | 551,212 | | | Schwab Short-Term U.S. Treasury ETF | | | 28,514,197 | |
| | 10,729 | | | SPDR Bloomberg Barclays1-3 MonthT-Bill ETF (a) | | | 983,098 | |
| | 302,022 | | | Vanguard Emerging Markets Government Bond ETF | | | 21,262,349 | |
| | 22,294 | | | Vanguard FTSE Developed Markets ETF (a) | | | 743,282 | |
| | 236,984 | | | Vanguard Intermediate-Term Corporate Bond ETF | | | 20,638,936 | |
| | 1,435,034 | | | Vanguard Mortgage-Backed Securities ETF | | | 78,209,353 | |
| | 7,028 | | | Vanguard S&P 500 ETF (a) | | | 1,664,371 | |
| | 114,421 | | | Vanguard Total Bond Market ETF | | | 9,765,832 | |
| | | | | | |
|
|
|
| | | | | | | | 231,725,990 | |
| | | | | | |
|
|
|
| | | | | Mutual Funds - 40.04% | |
| | 4,015,763 | | | BlackRock Low Duration Bond Portfolio - Institutional Shares | | | 37,306,434 | |
| | 517,157 | | | DoubleLine Core Fixed Income Fund - Institutional Shares | | | 5,492,208 | |
| | 2,201,467 | | | DoubleLine Flexible Income Fund - Institutional Shares (d) | | | 18,492,323 | |
| | 3,802,306 | | | DoubleLine Low Duration Bond Fund - Institutional Shares | | | 36,159,934 | |
| | 845,277 | | | DoubleLine Shiller Enhanced CAPE - Institutional Shares | | | 9,881,293 | |
| | 3,781,688 | | | DoubleLine Total Return Bond Fund - Institutional Shares | | | 39,556,455 | |
| | 1,173,793 | | | T. Rowe Price Institutional Floating Rate Fund | | | 10,176,782 | |
| | | | | | |
|
|
|
| | | | | | | | 157,065,429 | |
| | | | | | |
|
|
|
| | | | | Total Investment Companies
(Cost $390,631,898) | | | 388,791,419 | |
| | | | | | |
|
|
|
| | | | | | | | |
Number of
Shares
| | | | | Value
| |
| | | | | SHORT TERM INVESTMENTS - 0.62% | |
| | | | | Money Market Funds - 0.62% | |
| | 2,425,231 | | | DWS Government Money Market Series - Institutional Shares
Effective Yield, 0.41% (b) | | $ | 2,425,231 | |
| | | | | | |
|
|
|
| | | | | Total Short Term Investments
(Cost $2,425,231) | | | 2,425,231 | |
| | | | | | |
|
|
|
| | | | | INVESTMENTS PURCHASED WITH PROCEEDS FROM SECURITIES LENDING COLLATERAL - 9.67% | |
| | 37,929,302 | | | Mount Vernon Liquid Assets Portfolio, LLC
Effective Yield, 0.91% (b) | | | 37,929,302 | |
| | | | | | |
|
|
|
| | | | | Total Investments Purchased with Proceeds from Securities Lending Collateral
(Cost $37,929,302) | | | 37,929,302 | |
| | | | | | |
|
|
|
| | | | | Total Investments
(Cost $430,986,431) - 109.39% | | | 429,145,952 | |
| | | | | Liabilities in Excess of
Other Assets - (9.39)% | | | (36,835,064 | ) |
| | | | | | |
|
|
|
| | | | | TOTAL NET ASSETS - 100.00% | | $ | 392,310,888 | |
| | | | | | |
|
|
|
Percentages are stated as a percent of net assets.
| (a) | | All or portion of this security is on loan. |
| (b) | | Seven-day yield as of March 31, 2020. |
| (c) | | Affiliated company as defined by the Investment Company Act of 1940. Please refer to Note 9 for further disclosures related to this affiliated security. |
| (d) | | Certain GuidePath® Funds invest in securities of unaffiliated underlying funds in accordance with Section 12(d)(1)(F) of the Investment Company Act of 1940. Such investments are potentially illiquid, because an unaffiliated underlying fund, under the terms of Section 12(d)(1)(F), is not obligated to redeem its shares in an amount exceeding 1% of its total outstanding shares during any period of less than thirty days. Investments made in accordance with Section 12(d)(1)(F) that exceed 1% of the outstanding shares of each underlying fund, and therefore are potentially illiquid, amount to $7,489,373 or 1.91% of total net assets as of March 31, 2020. |
See notes to financial statements.
103
GuidePath® Multi-Asset Income Allocation Fund
SCHEDULE OF INVESTMENTS
March 31, 2020
| | | | | | | | |
Number of
Shares
| | | | | Value
| |
| | | | | INVESTMENT COMPANIES - 97.65% | |
| | | | | Exchange Traded Funds - 81.48% | |
| | 194,350 | | | Global X US Preferred ETF | | $ | 4,252,378 | |
| | 21,155 | | | Goldman Sachs Access Treasury0-1 Year ETF | | | 2,131,789 | |
| | 168,374 | | | iShares0-5 Year High Yield Corporate Bond ETF (a) | | | 6,881,445 | |
| | 14,825 | | | iShares7-10 Year Treasury Bond ETF | | | 1,800,941 | |
| | 68,270 | | | iShares Broad USD High Yield Corporate Bond ETF (a) | | | 2,423,585 | |
| | 44,738 | | | iShares Currency Hedged MSCI Eurozone ETF (a) | | | 1,056,264 | |
| | 233,994 | | | iShares Emerging Markets Dividend ETF (a) | | | 6,586,931 | |
| | 21,004 | | | iShares iBoxx $ Investment Grade Corporate Bond ETF (a) | | | 2,594,204 | |
| | 215,457 | | | iShares International Select Dividend ETF | | | 4,869,328 | |
| | 81,874 | | | iShares Preferred & Income Securities ETF (a) | | | 2,606,868 | |
| | 68,675 | | | iShares Select Dividend ETF | | | 5,050,360 | |
| | 104,237 | | | Schwab US Dividend Equity ETF | | | 4,688,580 | |
| | 94,917 | | | SPDR Portfolio Aggregate Bond ETF | | | 2,868,392 | |
| | 91,405 | | | SPDR Portfolio Long Term Corporate Bond ETF | | | 2,602,300 | |
| | 87,997 | | | SPDR Portfolio S&P 500 High Dividend ETF | | | 2,164,726 | |
| | 22,653 | | | SPDR S&P Global Dividend ETF | | | 1,085,985 | |
| | 37,185 | | | SPDR S&P Global Infrastructure ETF | | | 1,451,702 | |
| | 210,043 | | | SPDR S&P International Dividend ETF (a) | | | 6,433,616 | |
| | 55,910 | | | VanEck Vectors Emerging Markets High Yield Bond ETF | | | 1,115,964 | |
| | 16,161 | | | Vanguard Emerging Markets Government Bond ETF | | | 1,137,734 | |
| | 57,080 | | | Vanguard Globalex-U.S. Real Estate ETF | | | 2,449,303 | |
| | 66,218 | | | Vanguard High Dividend Yield ETF | | | 4,684,924 | |
| | 42,972 | | | Vanguard Long-Term Treasury ETF | | | 4,340,602 | |
| | 84,877 | | | Vanguard Mortgage-Backed Securities ETF | | | 4,625,797 | |
| | 25,927 | | | Vanguard Real Estate ETF (a) | | | 1,811,001 | |
| | 2,847 | | | Vanguard S&P 500 ETF (a) | | | 674,227 | |
| | 62,607 | | | WisdomTree US LargeCap Dividend Fund (a) | | | 5,067,411 | |
| | 213,137 | | | WisdomTree U.S. SmallCap Dividend Fund | | | 3,840,729 | |
| | | | | | |
|
|
|
| | | | | | | | 91,297,086 | |
| | | | | | |
|
|
|
| | | | | | | | |
Number of
Shares
| | | | | Value
| |
| | | | | Mutual Funds - 16.17% | |
| | 150,243 | | | BlackRock Strategic Income Opportunities Portfolio | | $ | 1,401,771 | |
| | 261,897 | | | Loomis Sayles Global Allocation Fund | | | 5,539,119 | |
| | 786,631 | | | T. Rowe Price Institutional Floating Rate Fund | | | 6,820,087 | |
| | 827,646 | | | Vanguard High-Yield Corporate Fund | | | 4,353,416 | |
| | | | | | |
|
|
|
| | | | | | | | 18,114,393 | |
| | | | | | |
|
|
|
| | | | | Total Investment Companies
(Cost $114,992,075) | | | 109,411,479 | |
| | | | | | |
|
|
|
| | | | | SHORT TERM INVESTMENTS - 1.04% | | | | |
| | | | | Money Market Funds - 1.04% | | | | |
| | 1,162,374 | | | DWS Government Money Market Series - Institutional Shares
Effective Yield, 0.41% (b) | | | 1,162,374 | |
| | | | | | |
|
|
|
| | | | | Total Short Term Investments
(Cost $1,162,374) | | | 1,162,374 | |
| | | | | | |
|
|
|
| | | | | INVESTMENTS PURCHASED WITH PROCEEDS FROM SECURITIES LENDING COLLATERAL - 12.50% | |
| | 14,005,053 | | | Mount Vernon Liquid Assets Portfolio, LLC
Effective Yield, 0.91% (b) | | | 14,005,053 | |
| | | | | | |
|
|
|
| | | | | Total Investments Purchased with Proceeds from Securities Lending Collateral
(Cost $14,005,053) | | | 14,005,053 | |
| | | | | | |
|
|
|
| | | | | Total Investments
(Cost $130,159,502) - 111.19% | | | 124,578,906 | |
| | | | | Liabilities in Excess of
Other Assets - (11.19)% | | | (12,534,153 | ) |
| | | | | | |
|
|
|
| | | | | TOTAL NET ASSETS - 100.00% | | $ | 112,044,753 | |
| | | | | | |
|
|
|
Percentages are stated as a percent of net assets.
| (a) | | All or portion of this security is on loan. |
| (b) | | Seven-day yield as of March 31, 2020. |
See notes to financial statements.
104
GuidePath® Flexible Income Allocation Fund
SCHEDULE OF INVESTMENTS
March 31, 2020
| | | | | | | | |
Number of
Shares
| | | | | Value
| |
| | | | | INVESTMENT COMPANIES - 99.39% | |
| | | | | Exchange Traded Funds - 84.80% | |
| | 299,350 | | | iShares0-5 Year High Yield Corporate Bond ETF | | $ | 12,234,434 | |
| | 410,763 | | | iShares Broad USD High Yield Corporate Bond ETF | | | 14,582,087 | |
| | 298,939 | | | iShares iBoxx High Yield Corporate Bond ETF | | | 23,039,229 | |
| | 250,894 | | | SPDR Bloomberg Barclays High Yield Bond ETF | | | 23,769,697 | |
| | 225,504 | | | Xtrackers USD High Yield Corporate Bond ETF | | | 9,937,961 | |
| | | | | | |
|
|
|
| | | | | | | | 83,563,408 | |
| | | | | | |
|
|
|
| | | | | Mutual Funds - 14.59% | |
| | 1,454,734 | | | BlackRock High Yield Portfolio - Institutional Shares | | | 9,644,889 | |
| | 900,700 | | | Vanguard High-Yield Corporate Fund | | | 4,737,682 | |
| | | | | | |
|
|
|
| | | | | | | | 14,382,571 | |
| | | | | | |
|
|
|
| | | | | Total Investment Companies
(Cost $97,727,366) | | | 97,945,979 | |
| | | | | | |
|
|
|
| | | | | | | | |
Number of
Shares
| | | | | Value
| |
| | | | | SHORT TERM INVESTMENTS - 0.16% | |
| | | | | Money Market Funds - 0.16% | |
| | 160,182 | | | DWS Government Money Market Series - Institutional Shares
Effective Yield, 0.41% (a) | | $ | 160,182 | |
| | | | | | |
|
|
|
| | | | | Total Short Term Investments
(Cost $160,182) | | | 160,182 | |
| | | | | | |
|
|
|
| | | | | Total Investments
(Cost $97,887,548) - 99.55% | | | 98,106,161 | |
| | | | | Other Assets in
Excess of Liabilities - 0.45% | | | 444,372 | |
| | | | | | |
|
|
|
| | | | | TOTAL NET ASSETS - 100.00% | | $ | 98,550,533 | |
| | | | | | |
|
|
|
Percentages are stated as a percent of net assets.
| (a) | | Seven-day yield as of March 31, 2020. |
See notes to financial statements.
105
GuidePath® Managed Futures Strategy Fund
CONSOLIDATED SCHEDULE OF INVESTMENTS
March 31, 2020
| | | | | | | | |
Principal
Amount
| | | | | Value
| |
| | | | | SHORT TERM INVESTMENTS - 99.01% | |
| | | | | Certificates of Deposit - 73.26% | |
| $ | 6,500,000 | | | Bank of Montreal
1.695% (1 Month LIBOR USD + 0.180%), 04/03/2020 (a) | | $ | 6,500,000 | |
| | 8,000,000 | | | Bank Nova Scotia
0.730%, 09/10/2020 | | | 7,981,323 | |
| | 10,000,000 | | | CIBC
0.020%, 04/01/2020 | | | 10,000,000 | |
| | 7,000,000 | | | Credit Industriel ET Commercia
1.620%, 05/19/2020 | | | 7,000,000 | |
| | | | | DG Bank | | | | |
| | 5,000,000 | | | 1.000%, 06/10/2020 | | | 4,997,446 | |
| | 2,000,000 | | | 1.250%, 06/25/2020 | | | 2,000,123 | |
| | 7,000,000 | | | DNB Bank ASA
1.630%, 05/12/2020 | | | 7,000,000 | |
| | | | | Landesbank Hessen-Thuringen | | | | |
| | 3,000,000 | | | 1.300%, 04/27/2020 | | | 3,000,000 | |
| | 4,000,000 | | | 1.640%, 05/06/2020 | | | 4,000,000 | |
| | 9,500,000 | | | Landesbank Baden Wurttemberg
0.250%, 04/06/2020 | | | 9,500,000 | |
| | 7,500,000 | | | Mizuho Bank, Ltd.
0.950% (1 Month LIBOR USD + 0.200%), 04/20/2020 (a) | | | 7,500,000 | |
| | 7,000,000 | | | MUFG Bank, Ltd.
0.980%, 08/28/2020 | | | 6,987,647 | |
| | 6,500,000 | | | National Australia Bank, Ltd.
0.923% (1 Month LIBOR USD + 0.150%), 05/20/2020 (a) | | | 6,500,000 | |
| | | | | National Bank of Kuwait | | | | |
| | 6,000,000 | | | 1.400%, 04/01/2020 | | | 6,000,000 | |
| | 5,000,000 | | | 2.050%, 04/06/2020 | | | 5,000,515 | |
| | 6,500,000 | | | Nordea Bank
0.828% (3 Month LIBOR USD + 0.060%), 06/11/2020 (a) | | | 6,494,626 | |
| | | | | Norinchukin Bank | | | | |
| | 4,000,000 | | | 1.850%, 04/06/2020 | | | 4,000,359 | |
| | 5,000,000 | | | 1.640%, 06/18/2020 | | | 5,004,934 | |
| | 6,500,000 | | | Oversea-Chinese Banking Corp., Ltd.
0.811% (3 Month LIBOR USD + 0.070%), 06/16/2020 (a) | | | 6,494,384 | |
| | | | | Royal Bank of Canada | | | | |
| | 5,000,000 | | | 0.991% (1 Month LIBOR USD + 0.180%), 06/12/2020 (a) | | | 4,998,440 | |
| | 1,000,000 | | | 1.073% (1 Month LIBOR USD + 0.210%), 07/10/2020 (a) | | | 999,262 | |
| | 10,500,000 | | | SEB
0.030%, 04/01/2020 | | | 10,500,000 | |
| | 11,500,000 | | | Sumitomo Mitsui Trust Bank, Ltd.
1.763% (3 Month LIBOR USD + 0.070%), 05/19/2020 (a)(f) | | | 11,496,338 | |
| | 8,000,000 | | | Svenska Handelsbanken
0.802% (1 Month LIBOR USD + 0.190%), 05/18/2020 (a) | | | 8,000,000 | |
| | | | | Toronto-Dominion Bank | | | | |
| | 3,500,000 | | | 1.020%, 09/11/2020 | | | 3,492,986 | |
| | 8,000,000 | | | 1.083% (1 Month LIBOR USD + 0.310%), 10/20/2020 (a) | | | 7,990,935 | |
| | | | | | |
|
|
|
| | | | | | | | 163,439,318 | |
| | | | | | |
|
|
|
| | | | | | | | |
Principal
Amount
| | | | | Value
| |
| | | | | Commercial Papers - 17.02% | |
| | | | | Bank of America NA | | | | |
| $ | 2,000,000 | | | 1.840%, 06/15/2020 (f) | | $ | 2,007,446 | |
| | 5,000,000 | | | 1.155%, 07/08/2020 | | | 4,991,028 | |
| | | | | COFCO Capital Corp. | | | | |
| | 9,000,000 | | | 0.921%, 04/08/2020 | | | 8,997,534 | |
| | 500,000 | | | 1.103%, 06/02/2020 | | | 498,604 | |
| | 9,500,000 | | | Credit Agricole Corp.
0.090%, 04/03/2020 | | | 9,499,953 | |
| | 5,000,000 | | | ING US FDG LLC.
1.790%, 05/06/2020 | | | 4,991,347 | |
| | | | | Santander UK PLC | | | | |
| | 5,000,000 | | | 1.758%, 04/16/2020 | | | 4,996,354 | |
| | 2,000,000 | | | 1.722%, 04/21/2020 | | | 1,998,078 | |
| | | | | | |
|
|
|
| | | | | | | | 37,980,344 | |
| | | | | | |
|
|
|
| | |
Number of
Shares
| | | | | | |
| | | | | Money Market Funds - 0.82% | |
| | 1,820,304 | | | DWS Government Money Market Series - Institutional Shares
Effective Yield, 0.41% (b)(c) | | | 1,820,304 | |
| | | | | | |
|
|
|
Principal
Amount
| | | | | | |
| | | | | U.S. Treasury Bills - 7.91% | |
| $ | 3,600,000 | | | 1.485%, 04/02/2020 (c)(d)(e) | | | 3,599,850 | |
| | 8,050,000 | | | 1.530%, 05/07/2020 (c)(d)(e) | | | 8,037,684 | |
| | 6,000,000 | | | 1.502%, 06/11/2020 (d)(e) | | | 5,999,035 | |
| | | | | | |
|
|
|
| | | | | | | | 17,636,569 | |
| | | | | | |
|
|
|
| | | | | Total Short Term Investments
(Cost $220,919,824) | | | 220,876,535 | |
| | | | | | |
|
|
|
| | | | | Total Investments
(Cost $220,919,824) - 99.01% | | | 220,876,535 | |
| | | | | Other Assets in Excess of Liabilities - 0.99% | | | 2,212,293 | |
| | | | | | |
|
|
|
| | | | | TOTAL NET ASSETS - 100.00% | | $ | 223,088,828 | |
| | | | | | |
|
|
|
Percentages are stated as a percent of net assets.
| (a) | | Variable rate security based on a reference index and spread. The rate reported is the rate in effect as of March 31, 2020. |
| (b) | | Seven-day yield as of March 31, 2020. |
| (c) | | All or a portion of this security is held by GuidePath® Managed Futures Strategy Cayman Fund Ltd. |
| (d) | | Zero coupon bond. The effective yield is listed. |
| (e) | | All or a portion of these securities are held as collateral for certain futures contracts. The approximate value of the portion of these securities held as collateral is $17,636,569. |
| (f) | | These securities have been deemed illiquid according to the Fund’s liquidity guidelines. The value of these securities total $13,503,784, which represents 6.05% of total net assets. |
See notes to financial statements.
106
GuidePath® Managed Futures Strategy Fund
CONSOLIDATED SCHEDULE OF OPEN FUTURES CONTRACTS
March 31, 2020
| | | | | | | | | | | | | | |
Description
| | Number of
Contracts
Purchased / (Sold)
| | | Notional
Value
| | | Settlement
Month
| | Value /Unrealized
Appreciation
(Depreciation)
| |
Amsterdam IDX Futures | | | (3 | ) | | $ | (319,409 | ) | | Apr-20 | | $ | (49,920 | ) |
Australian10-Year Treasury Bond Futures | | | 116 | | | | 10,746,333 | | | Jun-20 | | | (18,302 | ) |
Australian3-Year Treasury Bond Futures | | | 512 | | | | 36,881,343 | | | Jun-20 | | | 94,136 | |
Australian Dollar Futures | | | (93 | ) | | | (5,712,990 | ) | | Jun-20 | | | 157,787 | |
Brazilian Real Futures | | | (21 | ) | | | (404,040 | ) | | Apr-20 | | | 3,915 | |
Brent Crude Futures (a) | | | (102 | ) | | | (3,025,320 | ) | | May-20 | | | 105,455 | |
British Pound Futures | | | (84 | ) | | | (6,539,400 | ) | | Jun-20 | | | (93,022 | ) |
Canadian10-Year Bond Futures | | | 101 | | | | 10,560,037 | | | Jun-20 | | | 420,936 | |
Canadian Dollar Futures | | | (147 | ) | | | (10,443,615 | ) | | Jun-20 | | | 339,451 | |
Cocoa Futures (a) | | | (3 | ) | | | (67,770 | ) | | Jul-20 | | | 412 | |
Coffee ‘C’ Futures (a) | | | (4 | ) | | | (180,525 | ) | | Jul-20 | | | (913 | ) |
Copper Futures (a) | | | (80 | ) | | | (4,456,000 | ) | | May-20 | | | 435,697 | |
Corn Futures (a) | | | (131 | ) | | | (2,266,300 | ) | | Jul-20 | | | 303,993 | |
Cotton No. 2 Futures (a) | | | (32 | ) | | | (814,400 | ) | | Jul-20 | | | 45,330 | |
DAX® Index Futures | | | (1 | ) | | | (273,175 | ) | | Jun-20 | | | (26,885 | ) |
DJIAE-Mini CBOT Futures | | | (5 | ) | | | (543,775 | ) | | Jun-20 | | | (34,547 | ) |
E-mini Nasdaq 100 Futures | | | 1 | | | | 155,725 | | | Jun-20 | | | (4,119 | ) |
E-mini Russell 2000 Futures | | | (15 | ) | | | (860,700 | ) | | Jun-20 | | | 1,002 | |
E-mini S&P 500 Futures | | | (2 | ) | | | (256,970 | ) | | Jun-20 | | | (22,650 | ) |
E-mini S&P Mid Cap 400 Futures | | | (4 | ) | | | (575,120 | ) | | Jun-20 | | | (14,370 | ) |
Euribor 3 Month Futures | | | (120 | ) | | | (33,209,441 | ) | | Jun-20 | | | (2,746 | ) |
Euro Fx Futures | | | (80 | ) | | | (11,049,500 | ) | | Jun-20 | | | 202,819 | |
Euro Stoxx 50® Index Futures | | | (11 | ) | | | (333,263 | ) | | Jun-20 | | | (33,253 | ) |
Euro-Bobl Futures | | | 131 | | | | 19,535,138 | | | Jun-20 | | | (154,503 | ) |
Euro-BTP Futures | | | 6 | | | | 935,767 | | | Jun-20 | | | (36,470 | ) |
Euro-BTP Futures—Short | | | 17 | | | | 2,091,673 | | | Jun-20 | | | (20,083 | ) |
Euro-Bund Futures | | | 63 | | | | 11,986,467 | | | Jun-20 | | | (124,764 | ) |
Euro-Buxl® 30 Year Futures | | | 18 | | | | 4,166,979 | | | Jun-20 | | | (125,888 | ) |
Eurodollar 90 Day Futures | | | 208 | | | | 51,727,000 | | | Jun-20 | | | 110,046 | |
Eurodollar 90 Day Futures | | | 395 | | | | 98,399,438 | | | Sep-20 | | | 40,244 | |
Euro-OATS Futures | | | 28 | | | | 5,163,648 | | | Jun-20 | | | (109,633 | ) |
Euro-Schatz Futures | | | 413 | | | | 51,102,316 | | | Jun-20 | | | (131,436 | ) |
FTSE 100 Index Futures | | | (9 | ) | | | (629,985 | ) | | Jun-20 | | | (75,068 | ) |
FTSE China A50 Index Futures | | | (20 | ) | | | (252,000 | ) | | Apr-20 | | | (2,104 | ) |
FTSE JSE Top 40 Futures | | | (9 | ) | | | (206,514 | ) | | Jun-20 | | | (28,649 | ) |
Gold 100 Oz. Futures (a) | | | 20 | | | | 3,193,200 | | | Jun-20 | | | (2,446 | ) |
Hang Seng Index Futures | | | (5 | ) | | | (764,890 | ) | | Apr-20 | | | (14,240 | ) |
HSCEI Index Futures | | | (11 | ) | | | (683,461 | ) | | Apr-20 | | | (14,434 | ) |
IBEX 35® Index Futures | | | (1 | ) | | | (74,596 | ) | | Apr-20 | | | (8,656 | ) |
Indian Rupee Futures | | | (131 | ) | | | (3,443,204 | ) | | Apr-20 | | | (53,479 | ) |
Japanese Yen Futures | | | (66 | ) | | | (7,688,588 | ) | | Jun-20 | | | (169,327 | ) |
Lean Hogs Futures (a) | | | (25 | ) | | | (603,250 | ) | | Jun-20 | | | 190,790 | |
Live Cattle Futures (a) | | | (31 | ) | | | (1,141,730 | ) | | Jun-20 | | | 96,773 | |
LME Aluminium Futures (a)(b) | | | 57 | | | | 2,169,563 | | | Jun-20 | | | (189,699 | ) |
LME Aluminium Futures (a)(b) | | | (143 | ) | | | (5,442,938 | ) | | Jun-20 | | | 701,591 | |
LME Copper Futures (a)(b) | | | 22 | | | | 2,722,913 | | | Jun-20 | | | (269,460 | ) |
LME Copper Futures (a)(b) | | | (36 | ) | | | (4,455,675 | ) | | Jun-20 | | | 591,832 | |
LME Nickel Futures (a)(b) | | | (32 | ) | | | (2,204,064 | ) | | Jun-20 | | | 237,461 | |
LME Nickel Futures (a)(b) | | | 14 | | | | 964,278 | | | Jun-20 | | | (88,140 | ) |
LME Zinc Futures (a)(b) | | | (62 | ) | | | (2,952,363 | ) | | Jun-20 | | | 348,829 | |
LME Zinc Futures (a)(b) | | | 37 | | | | 1,761,894 | | | Jun-20 | | | (56,966 | ) |
Long Gilt Futures | | | 61 | | | | 10,318,834 | | | Jun-20 | | | 139,334 | |
Low Sulphur Gas Oil Futures (a) | | | (68 | ) | | | (2,004,300 | ) | | May-20 | | | 266,096 | |
Mexican Peso Futures | | | (38 | ) | | | (796,290 | ) | | Jun-20 | | | 4,252 | |
MSCI EAFE Index Futures | | | (12 | ) | | | (935,580 | ) | | Jun-20 | | | (79,706 | ) |
MSCI Emerging Markets Index Futures | | | (22 | ) | | | (927,190 | ) | | Jun-20 | | | (19,669 | ) |
MSCI Singapore Index Futures | | | (35 | ) | | | (692,933 | ) | | Apr-20 | | | (8,110 | ) |
MSCI Taiwan Index Futures | | | (4 | ) | | | (148,400 | ) | | Apr-20 | | | 1,203 | |
Natural Gas Futures (a) | | | (92 | ) | | | (1,508,800 | ) | | Apr-20 | | | 232,397 | |
See notes to financial statements.
107
GuidePath® Managed Futures Strategy Fund
CONSOLIDATED SCHEDULE OF OPEN FUTURES CONTRACTS (Continued)
March 31, 2020
| | | | | | | | | | | | | | |
Description
| | Number of
Contracts
Purchased / (Sold)
| | | Notional
Value
| | | Settlement
Month
| | Value /Unrealized
Appreciation
(Depreciation)
| |
New Zealand Dollar Futures | | | (82 | ) | | $ | (4,878,180 | ) | | Jun-20 | | $ | 281,384 | |
Nikkei 225 Futures | | | (1 | ) | | | (175,959 | ) | | Jun-20 | | | (15,537 | ) |
NY Harbor ULSD Futures (a) | | | (30 | ) | | | (1,261,890 | ) | | Apr-20 | | | 258,213 | |
Platinum Futures (a) | | | (6 | ) | | | (218,970 | ) | | Jul-20 | | | (34,473 | ) |
RBOB Gasoline Futures (a) | | | (41 | ) | | | (1,020,629 | ) | | Apr-20 | | | 850,899 | |
S&P/TSX 60 Index Futures | | | (2 | ) | | | (231,422 | ) | | Jun-20 | | | (9,710 | ) |
Silver Futures (a) | | | (6 | ) | | | (424,680 | ) | | May-20 | | | (46,418 | ) |
South African Rand Futures | | | (80 | ) | | | (2,222,000 | ) | | Jun-20 | | | 155,678 | |
Soybean Futures (a) | | | (56 | ) | | | (2,490,600 | ) | | Jul-20 | | | 24,788 | |
Soybean Meal Futures (a) | | | (29 | ) | | | (924,810 | ) | | Jul-20 | | | (51,634 | ) |
Soybean Oil Futures (a) | | | (63 | ) | | | (1,034,208 | ) | | Jul-20 | | | 87,378 | |
SPI 200TM Index Futures | | | (3 | ) | | | (235,691 | ) | | Jun-20 | | | 4,902 | |
Sterling 90 Day Futures | | | 560 | | | | 86,564,235 | | | Jun-20 | | | 19,341 | |
Sugar No. 11 Futures (a) | | | (240 | ) | | | (2,822,400 | ) | | Jun-20 | | | 142,788 | |
Swiss Franc Futures | | | 6 | | | | 781,275 | | | Jun-20 | | | (34,584 | ) |
TOPIX Index Futures | | | (4 | ) | | | (521,925 | ) | | Jun-20 | | | (20,017 | ) |
U.S. Treasury10-Year Note Futures | | | 108 | | | | 14,978,250 | | | Jun-20 | | | 726,848 | |
U.S. Treasury2-Year Note Futures | | | 584 | | | | 128,703,562 | | | Jun-20 | | | 1,343,859 | |
U.S. Treasury5-Year Note Futures | | | 229 | | | | 28,707,297 | | | Jun-20 | | | 966,858 | |
U.S. Treasury Long Bond Futures | | | 25 | | | | 4,476,563 | | | Jun-20 | | | 344,499 | |
U.S. Treasury Ultra Bond Futures | | | 11 | | | | 2,440,625 | | | Jun-20 | | | 225,360 | |
Wheat Futures (a) | | | 13 | | | | 365,625 | | | Jul-20 | | | (2,117 | ) |
WTI Crude Futures (a) | | | (85 | ) | | | (2,083,350 | ) | | May-20 | | | (31,619 | ) |
| | | | | | | | | | | | |
|
|
|
| | | | | | | | | | | | | $ | 8,174,810 | |
| | | | | | | | | | | | |
|
|
|
| (a) | | All or a portion of this security is held by GuidePath® Managed Futures Strategy Cayman Fund Ltd. |
| (b) | | London Metal Exchange (“LME”) futures contracts settle on their respective maturity date, and do not have daily cash movements like other futures contracts. The unrealized appreciation on these contracts is a receivable for unsettled open futures contracts and the unrealized depreciation is a payable for unsettled open futures contracts on the Fund’s consolidated statement of assets and liabilities. |
GuidePath® Managed Futures Strategy Fund
CONSOLIDATED SCHEDULE OF OPEN FORWARD CURRENCY CONTRACTS
March 31, 2020
| | | | | | | | | | | | | | | | | | |
Forward
Expiration Date
| | Counterparty
| | Currency to be received
| | Amount of
Currency to
be received
| | | Currency to be delivered
| | Amount of
Currency to
be delivered
| | | Unrealized
Appreciation
(Depreciation)
| |
| 6/17/2020 | | NatWest | | New Turkish Lira | | | 4,800,000 | | | U.S. Dollar | | | 765,541 | | | $ | (55,936 | ) |
| 6/17/2020 | | NatWest | | Norwegian Krone | | | 26,000,000 | | | U.S. Dollar | | | 2,598,904 | | | | (97,316 | ) |
| 6/17/2020 | | NatWest | | Norwegian Krone | | | 20,000,000 | | | U.S. Dollar | | | 1,794,114 | | | | 130,184 | |
| 6/17/2020 | | NatWest | | Norwegian Krone | | | 10,000,000 | | | U.S. Dollar | | | 1,040,251 | | | | (78,102 | ) |
| 6/17/2020 | | NatWest | | Singapore Dollar | | | 9,125,000 | | | U.S. Dollar | | | 6,414,259 | | | | 13,436 | |
| 6/17/2020 | | NatWest | | Singapore Dollar | | | 2,625,000 | | | U.S. Dollar | | | 1,862,998 | | | | (13,935 | ) |
| 6/17/2020 | | NatWest | | Singapore Dollar | | | 3,125,000 | | | U.S. Dollar | | | 2,153,276 | | | | 47,989 | |
| 6/17/2020 | | NatWest | | Swedish Krona | | | 10,000,000 | | | U.S. Dollar | | | 1,049,274 | | | | (36,655 | ) |
| 6/17/2020 | | NatWest | | Swedish Krona | | | 8,000,000 | | | U.S. Dollar | | | 830,719 | | | | (20,624 | ) |
| 6/17/2020 | | NatWest | | U.S. Dollar | | | 1,396,053 | | | Chinese Yuan Renminbi | | | 10,000,000 | | | | (12,537 | ) |
| 6/17/2020 | | NatWest | | U.S. Dollar | | | 541,959 | | | New Turkish Lira | | | 3,600,000 | | | | 9,755 | |
| 6/17/2020 | | NatWest | | U.S. Dollar | | | 738,160 | | | New Turkish Lira | | | 4,800,000 | | | | 28,554 | |
| 6/17/2020 | | NatWest | | U.S. Dollar | | | 271,225 | | | New Turkish Lira | | | 1,800,000 | | | | 5,123 | |
| 6/17/2020 | | NatWest | | U.S. Dollar | | | 8,369,046 | | | Norwegian Krone | | | 80,000,001 | | | | 661,021 | |
| 6/17/2020 | | NatWest | | U.S. Dollar | | | 833,408 | | | Polish Zloty | | | 3,500,000 | | | | (12,381 | ) |
| 6/17/2020 | | NatWest | | U.S. Dollar | | | 2,718,658 | | | Polish Zloty | | | 10,500,000 | | | | 181,291 | |
| 6/17/2020 | | NatWest | | U.S. Dollar | | | 26,822,875 | | | Singapore Dollar | | | 37,250,000 | | | | 583,792 | |
| 6/17/2020 | | NatWest | | U.S. Dollar | | | 5,909,705 | | | Swedish Krona | | | 56,000,000 | | | | 239,036 | |
| | | | | | | | | | | | | | | | |
|
|
|
| | | | | | | | | | | | | | | | | $ | 1,572,695 | |
| | | | | | | | | | | | | | | | |
|
|
|
See notes to financial statements.
108
GuidePath® Conservative Income Fund
SCHEDULE OF INVESTMENTS
March 31, 2020
| | | | | | | | |
Number of
Shares
| | | | | Value
| |
| | | | | INVESTMENT COMPANIES - 52.61% | | | | |
| | | | | Exchange Traded Funds - 52.61% | | | | |
| | 68,396 | | | Schwab Short-Term U.S. Treasury ETF (a) | | $ | 3,538,125 | |
| | | | | | |
|
|
|
| | | | | Total Investment Companies
(Cost $3,519,642) | | | 3,538,125 | |
| | | | | | |
|
|
|
| | | | | SHORT TERM INVESTMENTS - 45.28% | | | | |
| | | | | Money Market Funds - 36.45% | |
| | 2,450,970 | | | DWS Government Money Market Series - Institutional Shares
Effective Yield, 0.41% (a)(b) | | | 2,450,970 | |
| | | | | | |
|
|
|
| | |
Principal
Amount
| | | | | | |
| | | | | U.S. Treasury Notes - 8.83% | | | | |
| $ | 85,000 | | | 1.500%, 06/15/2020 | | | 85,247 | |
| | 100,000 | | | 1.375%, 09/15/2020 | | | 100,586 | |
| | 200,000 | | | 2.500%, 12/31/2020 | | | 203,672 | |
| | 200,000 | | | 2.250%, 03/31/2021 | | | 204,266 | |
| | | | | | |
|
|
|
| | | | | | | | 593,771 | |
| | | | | | |
|
|
|
| | | | | Total Short Term Investments
(Cost $3,038,652) | | | 3,044,741 | |
| | | | | | |
|
|
|
| | | | | Total Investments
(Cost $6,558,294) - 97.89% | | | 6,582,866 | |
| | | | | Other Assets in Excess of Liabilities - 2.11% | | | 141,952 | |
| | | | | | |
|
|
|
| | | | | TOTAL NET ASSETS - 100.00% | | $ | 6,724,818 | |
| | | | | | |
|
|
|
Percentages are stated as a percent of net assets.
| (a) | | Fair value of these securities exceeds 25% of the Fund’s net assets. Additional information for these securities, including financial statements, is available from the SEC’s EDGAR datatbase at www.sec.gov. |
| (b) | | Seven-day yield as of March 31, 2020. |
See notes to financial statements.
109
GuidePath® Income Fund
SCHEDULE OF INVESTMENTS
March 31, 2020
| | | | | | | | |
Number of
Shares
| | | | | Value
| |
| | | | | INVESTMENT COMPANIES - 97.61% | | | | |
| | | | | Exchange Traded Funds - 97.61% | | | | |
| | 142,963 | | | iShares Core U.S. Aggregate Bond ETF (b) | | $ | 16,493,641 | |
| | 258,990 | | | Schwab Intermediate-Term U.S. Treasury ETF (b) | | | 15,223,432 | |
| | | | | | |
|
|
|
| | | | | Total Investment Companies
(Cost $30,638,071) | | | 31,717,073 | |
| | | | | | |
|
|
|
| | | | | SHORT TERM INVESTMENTS - 0.91% | | | | |
| | | | | Money Market Funds - 0.91% | | | | |
| | 296,189 | | | DWS Government Money Market Series - Institutional Shares
Effective Yield, 0.41% (a) | | | 296,189 | |
| | | | | | |
|
|
|
| | | | | Total Short Term Investments
(Cost $296,189) | | | 296,189 | |
| | | | | | |
|
|
|
| | | | | Total Investments
(Cost $30,934,260) - 98.52% | | | 32,013,262 | |
| | | | | Other Assets in Excess of Liabilities - 1.48% | | | 481,612 | |
| | | | | | |
|
|
|
| | | | | TOTAL NET ASSETS - 100.00% | | $ | 32,494,874 | |
| | | | | | |
|
|
|
Percentages are stated as a percent of net assets.
| (a) | | Seven-day yield as of March 31, 2020. |
| (b) | | Fair value of these securities exceeds 25% of the Fund’s net assets. Additional information for these securities, including the financial statements, is available from the SEC’s EDGAR database at www.sec.gov. |
See notes to financial statements.
110
GuidePath® Growth and Income Fund
SCHEDULE OF INVESTMENTS
March 31, 2020
| | | | | | | | |
Number of
Shares
| | | | | Value
| |
| | | | | COMMON STOCKS - 32.35% | |
| | | | | Aerospace & Defense - 1.16% | |
| | 1,550 | | | Boeing Co. | | $ | 231,168 | |
| | 492 | | | Lockheed Martin Corp. (a) | | | 166,763 | |
| | | | | | |
|
|
|
| | | | | | | | 397,931 | |
| | | | | | |
|
|
|
| | | | | Air Freight & Logistics - 0.54% | |
| | 1,945 | | | United Parcel Service, Inc. - Class B | | | 181,702 | |
| | | | | | |
|
|
|
| | | | | Auto Components - 0.06% | |
| | 443 | | | Autoliv, Inc. | | | 20,382 | |
| | | | | | |
|
|
|
| | | | | Banks - 0.69% | |
| | 2,956 | | | Citizens Financial Group, Inc. | | | 55,602 | |
| | 2,965 | | | East West Bancorp, Inc. | | | 76,319 | |
| | 5,305 | | | Regions Financial Corp. (a) | | | 47,586 | |
| | 1,629 | | | U.S. Bancorp | | | 56,119 | |
| | | | | | |
|
|
|
| | | | | | | | 235,626 | |
| | | | | | |
|
|
|
| | | | | Beverages - 2.06% | |
| | 7,358 | | | Coca-Cola Co. | | | 325,592 | |
| | 3,115 | | | PepsiCo, Inc. | | | 374,111 | |
| | | | | | |
|
|
|
| | | | | | | | 699,703 | |
| | | | | | |
|
|
|
| | | | | Biotechnology - 2.08% | |
| | 3,112 | | | AbbVie, Inc. (a) | | | 237,103 | |
| | 1,444 | | | Amgen, Inc. | | | 292,742 | |
| | 2,368 | | | Gilead Sciences, Inc. | | | 177,032 | |
| | | | | | |
|
|
|
| | | | | | | | 706,877 | |
| | | | | | |
|
|
|
| | | | | Capital Markets - 1.03% | |
| | 346 | | | BlackRock, Inc. | | | 152,229 | |
| | 549 | | | CME Group, Inc. | | | 94,928 | |
| | 741 | | | State Street Corp. | | | 39,473 | |
| | 635 | | | T. Rowe Price Group, Inc. | | | 62,008 | |
| | | | | | |
|
|
|
| | | | | | | | 348,638 | |
| | | | | | |
|
|
|
| | | | | Chemicals - 0.36% | |
| | 204 | | | Air Products & Chemicals, Inc. | | | 40,720 | |
| | 1,644 | | | LyondellBasell Industries NV - Class A | | | 81,592 | |
| | | | | | |
|
|
|
| | | | | | | | 122,312 | |
| | | | | | |
|
|
|
| | | | | Communications Equipment - 1.01% | |
| | 8,727 | | | Cisco Systems, Inc. | | | 343,058 | |
| | | | | | |
|
|
|
| | | | | Consumer Finance - 0.12% | |
| | 2,601 | | | Synchrony Financial | | | 41,850 | |
| | | | | | |
|
|
|
| | | | | Containers & Packaging - 0.16% | |
| | 1,762 | | | International Paper Co. | | | 54,851 | |
| | | | | | |
|
|
|
| | | | | Diversified Telecommunication Services - 2.15% | |
| | 10,816 | | | AT&T, Inc. | | | 315,286 | |
| | 7,690 | | | Verizon Communications, Inc. | | | 413,184 | |
| | | | | | |
|
|
|
| | | | | | | | 728,470 | |
| | | | | | |
|
|
|
| | | | | Electric Utilities - 2.14% | |
| | 872 | | | American Electric Power Co., Inc. | | | 69,743 | |
| | 1,581 | | | Duke Energy Corp. (a) | | | 127,871 | |
| | 492 | | | Eversource Energy (a) | | | 38,479 | |
| | 1,536 | | | NextEra Energy, Inc. (a) | | | 369,592 | |
| | 3,037 | | | PPL Corp. | | | 74,953 | |
| | 742 | | | Xcel Energy, Inc. (a) | | | 44,743 | |
| | | | | | |
|
|
|
| | | | | | | | 725,381 | |
| | | | | | |
|
|
|
| | | | | Electrical Equipment - 0.61% | |
| | 1,386 | | | Eaton Corp. PLC | | | 107,678 | |
| | 2,083 | | | Emerson Electric Co. | | | 99,255 | |
| | | | | | |
|
|
|
| | | | | | | | 206,933 | |
| | | | | | |
|
|
|
| | | | | | | | |
Number of
Shares
| | | | | Value
| |
| | | | | Electronic Equipment, Instruments & Components - 0.14% | |
| | 2,274 | | | Corning, Inc. | | $ | 46,708 | |
| | | | | | |
|
|
|
| | | | | Food & Staples Retailing - 0.45% | |
| | 1,259 | | | Sysco Corp. | | | 57,448 | |
| | 2,107 | | | Walgreens Boots Alliance, Inc. (a) | | | 96,395 | |
| | | | | | |
|
|
|
| | | | | | | | 153,843 | |
| | | | | | |
|
|
|
| | | | | Food Products - 0.75% | |
| | 1,797 | | | Archer-Daniels-Midland Co. | | | 63,218 | |
| | 1,502 | | | General Mills, Inc. | | | 79,261 | |
| | 840 | | | Hershey Co. (a) | | | 111,300 | |
| | | | | | |
|
|
|
| | | | | | | | 253,779 | |
| | | | | | |
|
|
|
| | | | | Health Care Providers & Services - 0.49% | |
| | 2,804 | | | CVS Health Corp. (a) | | | 166,361 | |
| | | | | | |
|
|
|
| | | | | Hotels, Restaurants & Leisure - 0.95% | |
| | 1,411 | | | Carnival Corp. | | | 18,583 | |
| | 1,278 | | | Las Vegas Sands Corp. | | | 54,277 | |
| | 1,512 | | | McDonald’s Corp. | | | 250,009 | |
| | | | | | |
|
|
|
| | | | | | | | 322,869 | |
| | | | | | |
|
|
|
| | | | | Household Products - 1.71% | |
| | 1,868 | | | Colgate-Palmolive Co. | | | 123,960 | |
| | 610 | | | Kimberly-Clark Corp. | | | 78,001 | |
| | 3,423 | | | Procter & Gamble Co. | | | 376,530 | |
| | | | | | |
|
|
|
| | | | | | | | 578,491 | |
| | | | | | |
|
|
|
| | | | | Industrial Conglomerates - 0.52% | |
| | 1,283 | | | 3M Co. | | | 175,142 | |
| | | | | | |
|
|
|
| | | | | Insurance - 0.35% | |
| | 2,609 | | | Aflac, Inc. | | | 89,333 | |
| | 287 | | | Travelers Cos., Inc. | | | 28,513 | |
| | | | | | |
|
|
|
| | | | | | | | 117,846 | |
| | | | | | |
|
|
|
| | | | | IT Services - 0.74% | |
| | 1,896 | | | International Business Machines Corp. | | | 210,324 | |
| | 647 | | | Paychex, Inc. | | | 40,709 | |
| | | | | | |
|
|
|
| | | | | | | | 251,033 | |
| | | | | | |
|
|
|
| | | | | Leisure Products - 0.19% | |
| | 901 | | | Hasbro, Inc. | | | 64,467 | |
| | | | | | |
|
|
|
| | | | | Machinery - 0.44% | |
| | 144 | | | Cummins, Inc. | | | 19,486 | |
| | 354 | | | Illinois Tool Works, Inc. | | | 50,310 | |
| | 1,286 | | | PACCAR, Inc. | | | 78,614 | |
| | | | | | |
|
|
|
| | | | | | | | 148,410 | |
| | | | | | |
|
|
|
| | | | | Metals & Mining - 0.15% | |
| | 1,430 | | | NUCOR Corp. | | | 51,509 | |
| | | | | | |
|
|
|
| | | | | Multiline Retail - 0.41% | |
| | 998 | | | Kohl’s Corp. | | | 14,561 | |
| | 1,350 | | | Target Corp. | | | 125,509 | |
| | | | | | |
|
|
|
| | | | | | | | 140,070 | |
| | | | | | |
|
|
|
| | | | | Multi-Utilities - 0.66% | |
| | 558 | | | Consolidated Edison, Inc. | | | 43,524 | |
| | 274 | | | DTE Energy Co. | | | 26,022 | |
| | 1,484 | | | Public Service Enterprise Group, Inc. (a) | | | 66,646 | |
| | 347 | | | Sempra Energy (a) | | | 39,208 | |
| | 547 | | | WEC Energy Group, Inc. (a) | | | 48,207 | |
| | | | | | |
|
|
|
| | | | | | | | 223,607 | |
| | | | | | |
|
|
|
See notes to financial statements.
111
GuidePath® Growth and Income Fund
SCHEDULE OF INVESTMENTS (Continued)
March 31, 2020
| | | | | | | | |
Number of
Shares
| | | | | Value
| |
| | | | | Oil, Gas & Consumable Fuels - 1.36% | |
| | 6,722 | | | Exxon Mobil Corp. | | $ | 255,234 | |
| | 2,159 | | | Marathon Petroleum Corp. | | | 50,996 | |
| | 1,656 | | | Phillips 66 | | | 88,844 | |
| | 1,442 | | | Valero Energy Corp. (a) | | | 65,409 | |
| | | | | | |
|
|
|
| | | | | | | | 460,483 | |
| | | | | | |
|
|
|
| | | | | Pharmaceuticals - 3.91% | |
| | 3,704 | | | Bristol-Myers Squibb Co. (a) | | | 206,461 | |
| | 2,816 | | | Johnson & Johnson (a) | | | 369,262 | |
| | 4,871 | | | Merck & Co., Inc. (a) | | | 374,776 | |
| | 11,466 | | | Pfizer, Inc. | | | 374,250 | |
| | | | | | |
|
|
|
| | | | | | | | 1,324,749 | |
| | | | | | |
|
|
|
| | | | | Semiconductors & Semiconductor Equipment - 2.52% | |
| | 535 | | | Analog Devices, Inc. | | | 47,963 | |
| | 823 | | | Broadcom, Inc. | | | 195,133 | |
| | 7,454 | | | Intel Corp. | | | 403,410 | |
| | 2,097 | | | Texas Instruments, Inc. | | | 209,553 | |
| | | | | | |
|
|
|
| | | | | | | | 856,059 | |
| | | | | | |
|
|
|
| | | | | Specialty Retail - 1.00% | |
| | 459 | | | Best Buy Co., Inc. | | | 26,163 | |
| | 1,658 | | | Home Depot Inc. (a) | | | 309,566 | |
| | | | | | |
|
|
|
| | | | | | | | 335,729 | |
| | | | | | |
|
|
|
| | | | | Technology Hardware, Storage & Peripherals - 0.19% | |
| | 3,713 | | | HP, Inc. | | | 64,458 | |
| | | | | | |
|
|
|
| | | | | Textiles, Apparel & Luxury Goods - 0.12% | |
| | 768 | | | VF Corp. | | | 41,533 | |
| | | | | | |
|
|
|
| | | | | Tobacco - 1.13% | |
| | 4,357 | | | Altria Group, Inc. | | | 168,485 | |
| | 2,967 | | | Philip Morris International, Inc. | | | 216,473 | |
| | | | | | |
|
|
|
| | | | | | | | 384,958 | |
| | | | | | |
|
|
|
| | | | | Total Common Stocks
(Cost $12,651,834) | | | 10,975,818 | |
| | | | | | |
|
|
|
| | | | | INVESTMENT COMPANIES - 32.87% | |
| | | | | Exchange Traded Funds - 32.87% | |
| | 178,805 | | | Schwab U.S.Large-Cap ETF | | | 10,951,806 | |
| | 2,156 | | | SPDR Bloomberg Barclays1-3 MonthT-Bill ETF | | | 197,554 | |
| | | | | | |
|
|
|
| | | | | Total Investment Companies
(Cost $12,004,440) | | | 11,149,360 | |
| | | | | | |
|
|
|
| | | | | | | | |
Number of
Shares
| | | | | Value
| |
| | | | | SHORT TERM INVESTMENTS - 31.31% | |
| | | | | Money Market Funds - 20.16% | |
| | | | | DWS Government Money Market
Series - Institutional Shares | | | | |
| | 6,839,739 | | | Effective Yield, 0.41% (b) | | $ | 6,839,739 | |
| | | | | | |
|
|
|
| | |
Principal
Amount
| | | | | | |
| | | | | U.S. Treasury Notes - 11.15% | |
| $ | 1,250,000 | | | 1.500%, 06/15/2020 (c) | | | 1,253,636 | |
| | 1,250,000 | | | 1.375%, 09/15/2020 (c) | | | 1,257,324 | |
| | 1,250,000 | | | 2.500%, 12/31/2020 (c) | | | 1,272,949 | |
| | | | | | |
|
|
|
| | | | | | | | 3,783,909 | |
| | | | | | |
|
|
|
| | | | | Total Short Term Investments
(Cost $10,594,925) | | | 10,623,648 | |
| | | | | | |
|
|
|
| | |
Number of
Shares
| | | | | | |
| | | | | INVESTMENTS PURCHASED WITH PROCEEDS FROM SECURITIES LENDING COLLATERAL - 6.47% | |
| | 2,196,737 | | | Mount Vernon Liquid Assets Portfolio, LLC
Effective Yield, 0.91% (b) | | | 2,196,737 | |
| | | | | | |
|
|
|
| | | | | Total Investments Purchased with Proceeds from Securities Lending Collateral
(Cost $2,196,737) | | | 2,196,737 | |
| | | | | | |
|
|
|
| | | | | Total Investments
(Cost $37,447,936) - 103.00% | | | 34,945,563 | |
| | | | | Liabilities in Excess of
Other Assets - (3.00)% | | | (1,017,904 | ) |
| | | | | | |
|
|
|
| | | | | TOTAL NET ASSETS - 100.00% | | $ | 33,927,659 | |
| | | | | | |
|
|
|
Percentages are stated as a percent of net assets.
| (a) | | All or portion of this security is on loan. |
| (b) | | Seven-day yield as of March 31, 2020. |
| (c) | | All or a portion of these securities are held as collateral for certain written options contracts. The approximate value of the portion of these securities held as collateral is $2,981,425. |
See notes to financial statements.
112
GuidePath® Growth and Income Fund
SCHEDULE OF OPEN FUTURES CONTRACTS
March 31, 2020
| | | | | | | | | | | | | | |
Description
| | Number of
Contracts
Purchased / (Sold)
| | | Notional
Value
| | | Settlement
Month
| | Value/Unrealized
Appreciation
(Depreciation)
| |
E-mini S&P 500 Futures | | | (30 | ) | | $ | (3,854,550 | ) | | Jun-20 | | $ | (39,567 | ) |
| | | | | | | | | | | | |
|
|
|
| | | | | | | | | | | | | $ | (39,567 | ) |
| | | | | | | | | | | | |
|
|
|
GuidePath® Growth and Income Fund
SCHEDULE OF OPTIONS WRITTEN
March 31, 2020
| | | | | | | | | | | | |
Notional
Amount
| | | Number of
Contracts
| | | | | Value
| |
| | | | | | | | | Put Options | | | | |
| | | | | | | | | Options on Equities | | | | |
| | 488,000 | | | | 2 | | | Cboe S&P 500 Index
Counterparty: NatWest Market Securities
Expiration: April 24, 2020
Exercise Price: $2,440.00 | | $ | (16,144 | ) |
| | 756,000 | | | | 3 | | | Cboe S&P 500 Index
Counterparty: NatWest Market Securities
Expiration: April 24, 2020
Exercise Price: $2,520.00 | | | (29,982 | ) |
| | 566,000 | | | | 2 | | | Cboe S&P 500 Index
Counterparty: NatWest Market Securities
Expiration: April 24, 2020
Exercise Price: $2,830.00 | | | (47,194 | ) |
| | 520,000 | | | | 2 | | | Cboe S&P 500 Index
Counterparty: NatWest Market Securities
Expiration: May 01, 2020
Exercise Price: $2,600.00 | | | (26,644 | ) |
| | 726,000 | | | | 3 | | | S&P 500 Index
Counterparty: NatWest Market Securities
Expiration: April 17, 2020
Exercise Price: $2,420.00 | | | (17,166 | ) |
| | 504,000 | | | | 2 | | | S&P 500 Index
Counterparty: NatWest Market Securities
Expiration: April 24, 2020
Exercise Price: $2,520.00 | | | (14,320 | ) |
| | 566,000 | | | | 2 | | | S&P 500 Index
Counterparty: NatWest Market Securities
Expiration: April 17, 2020
Exercise Price: $2,830.00 | | | (49,744 | ) |
| | 693,000 | | | | 3 | | | Cboe S&P 500 Index
Counterparty: NatWest Market Securities
Expiration: April 24, 2020
Exercise Price: $2,310.00 | | | (16,215 | ) |
| | 879,000 | | | | 3 | | | Cboe S&P 500 Index
Counterparty: NatWest Market Securities
Expiration: April 03, 2020
Exercise Price: $2,930.00 | | | (107,535 | ) |
| | 488,000 | | | | 2 | | | Cboe S&P 500 Index
Counterparty: NatWest Market Securities
Expiration: May 01, 2020
Exercise Price: $2,440.00 | | | (19,170 | ) |
| | 516,000 | | | | 2 | | | Cboe S&P 500 Index
Counterparty: NatWest Market Securities
Expiration: May 01, 2020
Exercise Price: $2,580.00 | | | (28,380 | ) |
| | 831,000 | | | | 3 | | | S&P 500 Index
Counterparty: NatWest Market Securities
Expiration: April 17, 2020
Exercise Price: $2,770.00 | | | (65,430 | ) |
| | | | | | | | | | |
|
|
|
| | | | | | | | | Total Written Options (Premiums Received $517,487) | | $ | (437,924 | ) |
| | | | | | | | | | |
|
|
|
See notes to financial statements.
113
GuideMark® Funds & GuidePath® Funds
STATEMENTS OF ASSETS & LIABILITIES
March 31, 2020
| | | | | | | | | | | | |
| | | Large Cap
Core Fund
| | | Emerging
Markets Fund
| | | Small/Mid Cap
Core Fund
| |
ASSETS: | | | | | | | | | | | | |
Investments, at value (cost $332,503,853, $65,401,880 and $64,226,027, respectively)1 | | $ | 368,513,167 | | | $ | 65,542,578 | | | $ | 62,184,828 | |
Foreign currencies (cost $0, $1,198, and $0, respectively) | | | — | | | | 1,153 | | | | — | |
Cash | | | 1,109 | | | | — | | | | — | |
Income receivable | | | 372,881 | | | | 214,781 | | | | 70,702 | |
Receivable for dividend reclaims | | | 14,645 | | | | 1,452 | | | | — | |
Receivable for fund shares sold | | | 4,675,883 | | | | 2,066,100 | | | | 983,177 | |
Other assets | | | 39,909 | | | | 16,326 | | | | 21,114 | |
| | |
|
|
| |
|
|
| |
|
|
|
Total Assets | | | 373,617,594 | | | | 67,842,390 | | | | 63,259,821 | |
| | |
|
|
| |
|
|
| |
|
|
|
LIABILITIES: | | | | | | | | | | | | |
Payable for collateral on securities loaned | | | 44,978,979 | | | | 3,496,618 | | | | 9,775,976 | |
Payable for fund shares redeemed | | | 537,423 | | | | 34,905 | | | | 451,488 | |
Payable to Investment Advisor | | | 474,722 | | | | 49,251 | | | | 82,932 | |
Payable to custodian | | | 8,102 | | | | 38,995 | | | | 5,101 | |
Accrued Trustee fees and expenses | | | 2,436 | | | | 427 | | | | 372 | |
Accrued distribution and shareholder servicing fees | | | 90,368 | | | | 22,291 | | | | 13,572 | |
Other accrued expenses | | | 92,796 | | | | 37,955 | | | | 25,769 | |
| | |
|
|
| |
|
|
| |
|
|
|
Total Liabilities | | | 46,184,826 | | | | 3,680,442 | | | | 10,355,210 | |
| | |
|
|
| |
|
|
| |
|
|
|
NET ASSETS | | $ | 327,432,768 | | | $ | 64,161,948 | | | $ | 52,904,611 | |
| | |
|
|
| |
|
|
| |
|
|
|
NET ASSETS CONSIST OF: | | | | | | | | | | | | |
Capital stock | �� | | 298,027,781 | | | | 65,359,653 | | | | 56,100,450 | |
Total distributable earnings (loss) | | | 29,404,987 | | | | (1,197,705 | ) | | | (3,195,839 | ) |
| | |
|
|
| |
|
|
| |
|
|
|
Total Net Assets | | $ | 327,432,768 | | | $ | 64,161,948 | | | $ | 52,904,611 | |
| | |
|
|
| |
|
|
| |
|
|
|
Institutional Shares | | | | | | | | | | | | |
Shares outstanding (unlimited shares of no par value authorized) | | | 29,350 | | | | 795 | | | | — | |
Net assets | | | 479,829 | | | | 8,097 | | | | — | |
Net asset value, offering and redemption price per share | | $ | 16.348 | 2 | | $ | 10.191 | 2 | | $ | — | |
| | |
|
|
| |
|
|
| |
|
|
|
Service Shares | | | | | | | | | | | | |
Shares outstanding (unlimited shares of no par value authorized) | | | 20,299,433 | | | | 6,100,818 | | | | 4,914,301 | |
Net assets | | | 326,952,939 | | | | 64,153,851 | | | | 52,904,611 | |
Net asset value, offering and redemption price per share | | $ | 16.106 | 2 | | $ | 10.516 | | | $ | 10.765 | |
| | |
|
|
| |
|
|
| |
|
|
|
1Includes loaned securities with a value of: | | $ | 43,249,583 | | | $ | 3,431,029 | | | $ | 9,350,779 | |
| | |
|
|
| |
|
|
| |
|
|
|
2Differences in actual and calculated net asset value shown are due to rounding. | | | | | | | | | | | | |
See notes to financial statements.
114
GuideMark® Funds & GuidePath® Funds
STATEMENTS OF ASSETS & LIABILITIES (Continued)
March 31, 2020
| | | | | | | | | | | | |
| | | World
ex-US Fund
| | | Core
Fixed Income
Fund
| | | Tax-Exempt
Fixed Income
Fund
| |
ASSETS: | | | | | | | | | | | | |
Investments, at value (cost $116,678,777, $158,830,595 and $22,612,830, respectively)1 | | $ | 111,750,414 | | | $ | 166,570,857 | | | $ | 23,460,476 | |
Foreign currencies (cost $159,252, $0, and $0, respectively) | | | 158,251 | | | | — | | | | — | |
Appreciation on swap agreements | | | — | | | | 31,342 | | | | — | |
Variation margin on futures | | | — | | | | 36,907 | | | | — | |
Income receivable | | | 433,789 | | | | 631,330 | | | | 318,662 | |
Receivable for dividend reclaims | | | 627,418 | | | | — | | | | — | |
Receivable for investment securities sold | | | — | | | | 14,357,812 | | | | — | |
Receivable for fund shares sold | | | 273,112 | | | | 697,042 | | | | 1,704 | |
Deposits with broker for swaps | | | — | | | | 1,511,345 | | | | — | |
Swap premiums paid | | | — | | | | 134,845 | | | | — | |
Other assets | | | 15,175 | | | | 14,794 | | | | 14,244 | |
| | |
|
|
| |
|
|
| |
|
|
|
Total Assets | | | 113,258,159 | | | | 183,986,274 | | | | 23,795,086 | |
| | |
|
|
| |
|
|
| |
|
|
|
LIABILITIES: | | | | | | | | | | | | |
Written options, at value (Premium received $0, $72,752 and $0, respectively) | | | — | | | | 120,319 | | | | — | |
Depreciation on swap agreements | | | — | | | | 1,414,229 | | | | — | |
Payable for collateral on securities loaned | | | 593,326 | | | | 2,079,473 | | | | — | |
Payable for investment securities purchased | | | — | | | | 41,487,709 | | | | 183,559 | |
Payable for fund shares redeemed | | | 1,767,220 | | | | 3,119,010 | | | | 1,099,988 | |
Payable to Investment Advisor | | | 163,696 | | | | 133,316 | | | | 23,352 | |
Payable to custodian | | | 12,870 | | | | 8,102 | | | | 211 | |
Accrued Trustee fees and expenses | | | 778 | | | | 744 | | | | 119 | |
Accrued distribution and shareholder servicing fees | | | 38,382 | | | | 36,086 | | | | 12,603 | |
Swap premiums received | | | — | | | | 140,660 | | | | — | |
Other accrued expenses | | | 42,490 | | | | 59,665 | | | | 12,649 | |
| | |
|
|
| |
|
|
| |
|
|
|
Total Liabilities | | | 2,618,762 | | | | 48,599,313 | | | | 1,332,481 | |
| | |
|
|
| |
|
|
| |
|
|
|
NET ASSETS | | $ | 110,639,397 | | | $ | 135,386,961 | | | $ | 22,462,605 | |
| | |
|
|
| |
|
|
| |
|
|
|
NET ASSETS CONSIST OF: | | | | | | | | | | | | |
Capital stock | | | 118,755,098 | | | | 127,500,100 | | | | 21,442,801 | |
Total distributable earnings (loss) | | | (8,115,701 | ) | | | 7,886,861 | | | | 1,019,804 | |
| | |
|
|
| |
|
|
| |
|
|
|
Total Net Assets | | $ | 110,639,397 | | | $ | 135,386,961 | | | $ | 22,462,605 | |
| | |
|
|
| |
|
|
| |
|
|
|
Institutional Shares | | | | | | | | | | | | |
Shares outstanding (unlimited shares of no par value authorized) | | | 10,380 | | | | — | | | | — | |
Net assets | | | 78,232 | | | | — | | | | — | |
Net asset value, offering and redemption price per share | | $ | 7.537 | | | $ | — | | | $ | — | |
| | |
|
|
| |
|
|
| |
|
|
|
Service Shares | | | | | | | | | | | | |
Shares outstanding (unlimited shares of no par value authorized) | | | 15,139,421 | | | | 13,816,624 | | | | 2,042,307 | |
Net assets | | | 110,561,165 | | | | 135,386,961 | | | | 22,462,605 | |
Net asset value, offering and redemption price per share | | $ | 7.303 | | | $ | 9.798 | 2 | | $ | 10.999 | |
| | |
|
|
| |
|
|
| |
|
|
|
1Includes loaned securities with a value of: | | $ | 568,157 | | | $ | 2,054,002 | | | $ | — | |
| | |
|
|
| |
|
|
| |
|
|
|
2Differences in actual and calculated net asset value shown are due to rounding. | | | | | | | | | |
See notes to financial statements.
115
GuideMark® Funds & GuidePath® Funds
STATEMENTS OF ASSETS & LIABILITIES (Continued)
March 31, 2020
| | | | | | | | | | | | |
| | | Opportunistic
Fixed Income
Fund
| | | Growth
Allocation
Fund
| | | Conservative
Allocation
Fund
| |
ASSETS: | | | | | | | | | | | | |
Investments, at value (cost $44,856,247, $877,184,458 and $409,420,626, respectively)1 | | $ | 37,635,523 | | | $ | 880,653,152 | | | $ | 403,765,277 | |
Foreign currencies (cost $1,579,086, $0, and $0, respectively) | | | 1,513,934 | | | | — | | | | — | |
Restricted cash | | | 340,000 | | | | — | | | | — | |
Cash pledged for forwards | | | 270,000 | | | | — | | | | — | |
Income receivable | | | 368,234 | | | | 5,647 | | | | 156,754 | |
Receivable for dividend reclaims | | | 516 | | | | — | | | | — | |
Receivable for investment securities sold | | | — | | | | 1,533,138 | | | | 669,089 | |
Receivable for fund shares sold | | | 158,540 | | | | 3,443,468 | | | | 916,082 | |
Appreciation of forward foreign currency contracts | | | 1,401,901 | | | | — | | | | — | |
Other assets | | | 24,368 | | | | 82,000 | | | | 65,494 | |
| | |
|
|
| |
|
|
| |
|
|
|
Total Assets | | | 41,713,016 | | | | 885,717,405 | | | | 405,572,696 | |
| | |
|
|
| |
|
|
| |
|
|
|
LIABILITIES: | | | | | | | | | | | | |
Depreciation of forward foreign currency contracts | | | 444,760 | | | | — | | | | — | |
Payable to brokers for collateral received for forwards | | | 340,000 | | | | — | | | | — | |
Payable for collateral on securities loaned | | | — | | | | 139,438,379 | | | | 88,033,252 | |
Payable for investment securities purchased | | | — | | | | 438,304 | | | | 317,395 | |
Payable for fund shares redeemed | | | 53,891 | | | | 352,089 | | | | 170,720 | |
Payable to Investment Advisor | | | 64,491 | | | | 697,567 | | | | 201,353 | |
Payable to custodian | | | 20,781 | | | | 21,008 | | | | 15,568 | |
Accrued Trustee fees and expenses | | | 268 | | | | 4,937 | | | | 2,084 | |
Accrued distribution and shareholder servicing fees | | | 11,753 | | | | 202,934 | | | | 91,666 | |
Other accrued expenses | | | 20,371 | | | | 209,579 | | | | 91,625 | |
| | |
|
|
| |
|
|
| |
|
|
|
Total Liabilities | | | 956,315 | | | | 141,364,797 | | | | 88,923,663 | |
| | |
|
|
| |
|
|
| |
|
|
|
NET ASSETS | | $ | 40,756,701 | | | $ | 744,352,608 | | | $ | 316,649,033 | |
| | |
|
|
| |
|
|
| |
|
|
|
NET ASSETS CONSIST OF: | | | | | | | | | | | | |
Capital stock | | | 66,906,441 | | | $ | 754,199,371 | | | | 326,310,769 | |
Total distributable (loss) | | | (26,149,740 | ) | | | (9,846,763 | ) | | | (9,661,736 | ) |
| | |
|
|
| |
|
|
| |
|
|
|
Total Net Assets | | $ | 40,756,701 | | | $ | 744,352,608 | | | $ | 316,649,033 | |
| | |
|
|
| |
|
|
| |
|
|
|
Institutional Shares | | | | | | | | | | | | |
Shares outstanding (unlimited shares of no par value authorized) | | | 58,055 | | | | 434,205 | | | | 186,141 | |
Net assets | | | 452,046 | | | | 4,402,611 | | | | 1,713,169 | |
Net asset value, offering and redemption price per share | | $ | 7.786 | | | $ | 10.139 | | | $ | 9.204 | |
| | |
|
|
| |
|
|
| |
|
|
|
Service Shares | | | | | | | | | | | | |
Shares outstanding (unlimited shares of no par value authorized) | | | 5,194,248 | | | | 73,538,513 | | | | 34,467,325 | |
Net assets | | | 40,304,655 | | | | 739,949,997 | | | | 314,935,864 | |
Net asset value, offering and redemption price per share | | $ | 7.759 | | | $ | 10.062 | | | $ | 9.137 | |
| | |
|
|
| |
|
|
| |
|
|
|
1Includes loaned securities with a value of: | | $ | — | | | $ | 135,081,115 | | | $ | 85,056,565 | |
| | |
|
|
| |
|
|
| |
|
|
|
See notes to financial statements.
116
GuideMark® Funds & GuidePath® Funds
STATEMENTS OF ASSETS & LIABILITIES (Continued)
March 31, 2020
| | | | | | | | | | | | |
| | | Tactical
Allocation
Fund
| | | Absolute
Return
Allocation
Fund
| | | Multi-Asset
Income
Allocation
Fund
| |
ASSETS: | | | | | | | | | | | | |
Investments, at value (cost $413,075,831, $400,466,782 and $130,159,502, respectively)1 | | $ | 396,426,110 | | | $ | 399,309,573 | | | $ | 124,578,906 | |
Investments in affiliates, at value (cost $0, $30,519,649, and $0 , respectively) | | | — | | | | 29,836,379 | | | | — | |
Income receivable | | | 200,227 | | | | 176,426 | | | | 55,108 | |
Receivable for dividend reclaims | | | 1,395 | | | | — | | | | — | |
Receivable for investment securities sold | | | 449,650 | | | | 2,023,117 | | | | 751,561 | |
Receivable for fund shares sold | | | 1,294,823 | | | | 1,339,018 | | | | 894,829 | |
Other assets | | | 59,998 | | | | 43,681 | | | | 42,866 | |
| | |
|
|
| |
|
|
| |
|
|
|
Total Assets | | | 398,432,203 | | | | 432,728,194 | | | | 126,323,270 | |
| | |
|
|
| |
|
|
| |
|
|
|
LIABILITIES: | | | | | | | | | | | | |
Payable for collateral on securities loaned | | | 72,959,037 | | | | 37,929,302 | | | | 14,005,053 | |
Payable for investment securities purchased | | | — | | | | 525,428 | | | | — | |
Payable for fund shares redeemed | | | 168,609 | | | | 1,559,437 | | | | 76,365 | |
Payable to Investment Advisor | | | 367,707 | | | | 213,421 | | | | 126,756 | |
Payable to custodian | | | 10,503 | | | | 10,201 | | | | 7,999 | |
Accrued Trustee fees and expenses | | | 2,106 | | | | 1,638 | | | | 730 | |
Accrued distribution and shareholder servicing fees | | | 90,522 | | | | 94,028 | | | | 30,500 | |
Other accrued expenses | | | 81,162 | | | | 83,851 | | | | 31,114 | |
| | |
|
|
| |
|
|
| |
|
|
|
Total Liabilities | | | 73,679,646 | | | | 40,417,306 | | | | 14,278,517 | |
| | |
|
|
| |
|
|
| |
|
|
|
NET ASSETS | | $ | 324,752,557 | | | $ | 392,310,888 | | | $ | 112,044,753 | |
| | |
|
|
| |
|
|
| |
|
|
|
NET ASSETS CONSIST OF: | | | | | | | | | | | | |
Capital stock | | | 332,594,311 | | | | 406,300,283 | | | | 130,396,134 | |
Total distributable earnings (loss) | | | (7,841,754 | ) | | | (13,989,395 | ) | | | (18,351,381 | ) |
| | |
|
|
| |
|
|
| |
|
|
|
Total Net Assets | | $ | 324,752,557 | | | $ | 392,310,888 | | | $ | 112,044,753 | |
| | |
|
|
| |
|
|
| |
|
|
|
Institutional Shares | | | | | | | | | | | | |
Shares outstanding (unlimited shares of no par value authorized) | | | 155,005 | | | | 113,302 | | | | — | |
Net assets | | | 1,553,075 | | | | 1,133,623 | | | | — | |
Net asset value, offering and redemption price per share | | $ | 10.019 | 2 | | $ | 10.005 | | | $ | — | |
| | |
|
|
| |
|
|
| |
|
|
|
Service Shares | | | | | | | | | | | | |
Shares outstanding (unlimited shares of no par value authorized) | | | 32,449,701 | | | | 39,079,407 | | | | 12,372,387 | |
Net assets | | | 323,199,482 | | | | 391,177,265 | | | | 112,044,753 | |
Net asset value, offering and redemption price per share | | $ | 9.960 | | | $ | 10.010 | | | $ | 9.056 | |
| | |
|
|
| |
|
|
| |
|
|
|
1Includes loaned securities with a value of: | | $ | 71,242,106 | | | $ | 37,011,543 | | | $ | 13,571,811 | |
| | |
|
|
| |
|
|
| |
|
|
|
2Differences in actual and calculated net asset value shown are due to rounding. | | | | | | | | | |
See notes to financial statements.
117
GuideMark® Funds & GuidePath® Funds
STATEMENTS OF ASSETS & LIABILITIES (Continued)
March 31, 2020
| | | | | | | | |
| | | Flexible
Income
Allocation
Fund
| | | Managed1
Futures
Strategy
Fund
| |
ASSETS: | | | | | | | | |
Investments, at value (cost $97,887,548 and $220,919,824, respectively) | | $ | 98,106,161 | | | $ | 220,876,535 | |
Restricted cash | | | — | | | | 1,690,000 | |
Income receivable | | | 48,785 | | | | 184,048 | |
Receivable for investment securities sold | | | 832,661 | | | | — | |
Receivable for fund shares sold | | | 412,504 | | | | 818,562 | |
Receivable for unsettled open futures contracts | | | — | | | | 1,879,713 | |
Appreciation on forward currency contracts | | | — | | | | 1,900,181 | |
Other assets | | | 19,671 | | | | 21,744 | |
| | |
|
|
| |
|
|
|
Total Assets | | | 99,419,782 | | | | 227,370,783 | |
| | |
|
|
| |
|
|
|
LIABILITIES: | | | | | | | | |
Depreciation on forward currency contracts | | | — | | | | 327,486 | |
Payable to brokers for collateral received for forwards | | | — | | | | 1,690,000 | |
Payable for fund shares redeemed | | | 760,624 | | | | 420,072 | |
Payable for unsettled open futures contracts | | | — | | | | 604,265 | |
Payable to Investment Advisor | | | 45,524 | | | | 472,947 | |
Payable to custodian | | | 2,992 | | | | 5,245 | |
Variation margin on futures | | | — | | | | 644,257 | |
Accrued Trustee fees and expenses | | | 509 | | | | 923 | |
Accrued distribution and shareholder servicing fees | | | 30,036 | | | | 60,716 | |
Other accrued expenses | | | 29,564 | | | | 56,044 | |
| | |
|
|
| |
|
|
|
Total Liabilities | | | 869,249 | | | | 4,281,955 | |
| | |
|
|
| |
|
|
|
NET ASSETS | | $ | 98,550,533 | | | $ | 223,088,828 | |
| | |
|
|
| |
|
|
|
NET ASSETS CONSIST OF: | | | | | | | | |
Capital stock | | | 109,960,048 | | | | 217,938,612 | |
Total distributable earnings (loss) | | | (11,409,515 | ) | | | 5,150,216 | |
| | |
|
|
| |
|
|
|
Total Net Assets | | $ | 98,550,533 | | | $ | 223,088,828 | |
| | |
|
|
| |
|
|
|
Institutional Shares | | | | | | | | |
Shares outstanding (unlimited shares of no par value authorized) | | | 3,646 | | | | 138,500 | |
Net assets | | | 34,154 | | | | 1,220,564 | |
Net asset value, offering and redemption price per share | | $ | 9.368 | | | $ | 8.813 | |
| | |
|
|
| |
|
|
|
Service Shares | | | | | | | | |
Shares outstanding (unlimited shares of no par value authorized) | | | 10,588,798 | | | | 25,655,354 | |
Net assets | | | 98,516,379 | | | | 221,868,264 | |
Net asset value, offering and redemption price per share | | $ | 9.304 | | | $ | 8.648 | |
| | |
|
|
| |
|
|
|
1 Consolidated Statement of Assets & Liabilities (see note 3b). | |
2Differences in actual and calculated net asset value shown are due to rounding. | |
See notes to financial statements.
118
GuideMark® Funds & GuidePath® Funds
STATEMENTS OF ASSETS & LIABILITIES (Continued)
March 31, 2020
| | | | | | | | | | | | |
| | | Conservative
Income
Fund
| | | Income
Fund
| | | Growth &
Income
Fund
| |
ASSETS: | | | | | | | | | | | | |
Investments, at value (cost $6,558,294, $30,934,260, and $37,447,936 respectively)1 | | $ | 6,582,866 | | | $ | 32,013,262 | | | $ | 34,945,563 | |
Variation margin on futures | | | — | | | | — | | | | 62,250 | |
Income receivable | | | 3,590 | | | | 320 | | | | 39,481 | |
Receivable for fund shares sold | | | 132,733 | | | | 516,050 | | | | 688,573 | |
Receivable from Investment Advisor | | | 1,250 | | | | — | | | | — | |
Deposits at broker for futures | | | — | | | | — | | | | 396,000 | |
Cash pledged for options written | | | — | | | | — | | | | 462,250 | |
Other assets | | | 12,802 | | | | 13,170 | | | | 15,055 | |
| | |
|
|
| |
|
|
| |
|
|
|
Total Assets | | | 6,733,241 | | | | 32,542,802 | | | | 36,609,172 | |
| | |
|
|
| |
|
|
| |
|
|
|
LIABILITIES: | | | | | | | | | | | | |
Written options, at value (premiums received $0, $0, and $517,487) | | | — | | | | — | | | | 437,924 | |
Payable for collateral on securities loaned | | | — | | | | — | | | | 2,196,737 | |
Payable for fund shares redeemed | | | 1,932 | | | | 2,205 | | | | 2,476 | |
Payable to Investment Advisor | | | — | | | | 32,376 | | | | 20,517 | |
Payable to custodian | | | 935 | | | | 1,044 | | | | 9,000 | |
Accrued Trustee fees and expenses | | | 53 | | | | 168 | | | | 203 | |
Other accrued expenses | | | 5,503 | | | | 12,135 | | | | 14,656 | |
| | |
|
|
| |
|
|
| |
|
|
|
Total Liabilities | | | 8,423 | | | | 47,928 | | | | 2,681,513 | |
| | |
|
|
| |
|
|
| |
|
|
|
NET ASSETS | | $ | 6,724,818 | | | $ | 32,494,874 | | | $ | 33,927,659 | |
| | |
|
|
| |
|
|
| |
|
|
|
NET ASSETS CONSIST OF: | | | | | | | | | | | | |
Capital stock | | | 6,800,244 | | | | 33,308,782 | | | | 38,542,182 | |
Total distributable (loss) | | | (75,426 | ) | | | (813,908 | ) | | | (4,614,523 | ) |
| | |
|
|
| |
|
|
| |
|
|
|
Total Net Assets | | $ | 6,724,818 | | | $ | 32,494,874 | | | $ | 33,927,659 | |
| | |
|
|
| |
|
|
| |
|
|
|
Shares outstanding (unlimited shares of no par value authorized) | | | 679,347 | | | | 3,296,692 | | | | 3,892,049 | |
Net assets | | | 6,724,818 | | | | 32,494,874 | | | | 33,927,659 | |
Net asset value, offering and redemption price per share | | $ | 9.899 | | | $ | 9.857 | | | $ | 8.717 | |
| | |
|
|
| |
|
|
| |
|
|
|
1Includes loaned securities with a value of: | | $ | — | | | $ | — | | | $ | 2,118,476 | |
| | |
|
|
| |
|
|
| |
|
|
|
See notes to financial statements.
119
GuideMark® Funds & GuidePath® Funds
STATEMENTS OF OPERATIONS
For the Year Ended March 31, 2020
| | | | | | | | | | | | |
| | | Large Cap
Core Fund
| | | Emerging
Markets Fund
| | | Small/Mid Cap
Core Fund
| |
INVESTMENT INCOME: | | | | | | | | | | | | |
Dividend income (net of withholding tax of $7,166, $313,477, and $561, respectively) | | $ | 6,798,183 | | | $ | 2,134,090 | | | $ | 863,342 | |
Dividends from affiliate investments | | | — | | | | 758 | | | | — | |
Non-cash dividends(1) | | | — | | | | 279,927 | | | | — | |
Interest income | | | 62,779 | | | | 8,692 | | | | 10,979 | |
| | |
|
|
| |
|
|
| |
|
|
|
Total investment income | | | 6,860,962 | | | | 2,423,467 | | | | 874,321 | |
| | |
|
|
| |
|
|
| |
|
|
|
EXPENSES: | | | | | | | | | | | | |
Investment advisory fees | | | 1,780,425 | | | | 478,494 | | | | 372,437 | |
Distribution(12b-1) fees – Service Shares | | | 987,153 | | | | 202,727 | | | | 163,349 | |
Administrative service fees – Service Shares | | | 971,761 | | | | 198,652 | | | | 161,482 | |
Shareholder servicing fees – Service Shares | | | 349,653 | | | | 65,284 | | | | 56,524 | |
Administration fees | | | 163,545 | | | | 50,154 | | | | 48,810 | |
Reports to shareholders | | | 80,905 | | | | 15,755 | | | | 15,892 | |
Legal fees | | | 80,590 | | | | 41,879 | | | | 12,673 | |
Fund accounting fees | | | 61,420 | | | | 89,581 | | | | 55,921 | |
Trustee fees and expenses | | | 45,739 | | | | 10,330 | | | | 8,197 | |
Federal and state registration fees | | | 38,780 | | | | 35,641 | | | | 35,702 | |
Custody fees | | | 27,648 | | | | 212,635 | | | | 15,379 | |
Audit and tax fees | | | 21,504 | | | | 28,782 | | | | 22,490 | |
Transfer agent fees and expenses | | | 18,972 | | | | 8,265 | | | | 7,752 | |
Compliance fees | | | 13,539 | | | | 2,857 | | | | 1,956 | |
Insurance fees | | | 9,851 | | | | 2,929 | | | | 1,861 | |
Miscellaneous expenses | | | 3,010 | | | | 2,455 | | | | 2,375 | |
Interest expenses | | | 91 | | | | 1,711 | | | | — | |
| | |
|
|
| |
|
|
| |
|
|
|
Total expenses | | | 4,654,586 | | | | 1,448,131 | | | | 982,800 | |
| | |
|
|
| |
|
|
| |
|
|
|
Net expense recapture (reimbursement) by Advisor (See Note 4) | | | — | | | | (94,683 | ) | | | 1,943 | |
Less securities lending credit (See Note 7) | | | (124,195 | ) | | | (14,580 | ) | | | (77,180 | ) |
| | |
|
|
| |
|
|
| |
|
|
|
Net expenses | | | 4,530,391 | | | | 1,338,868 | | | | 907,563 | |
| | |
|
|
| |
|
|
| |
|
|
|
Net investment income (loss) | | | 2,330,571 | | | | 1,084,599 | | | | (33,242 | ) |
| | |
|
|
| |
|
|
| |
|
|
|
NET REALIZED AND UNREALIZED LOSS ON INVESTMENTS: | | | | | | | | | | | | |
Net realized gain (loss) on: | | | | | | | | | | | | |
Investments | | | (8,017,009 | ) | | | (564,686 | ) | | | 456,752 | |
Investments in affiliates | | | — | | | | (18,078 | ) | | | — | |
Foreign currencies | | | — | | | | (36,706 | ) | | | — | |
| | |
|
|
| |
|
|
| |
|
|
|
Total | | | (8,017,009 | ) | | | (619,470 | ) | | | 456,752 | |
| | |
|
|
| |
|
|
| |
|
|
|
Net change in unrealized depreciation on: | | | | | | | | | | | | |
Investments | | | (46,491,017 | ) | | | (14,975,223 | ) | | | (15,970,798 | ) |
Investments in affiliates | | | — | | | | (9,268 | ) | | | — | |
Foreign currencies | | | — | | | | (10,778 | ) | | | — | |
| | |
|
|
| |
|
|
| |
|
|
|
Total | | | (46,491,017 | ) | | | (14,995,269 | ) | | | (15,970,798 | ) |
| | |
|
|
| |
|
|
| |
|
|
|
Net realized and unrealized loss | | | 54,508,026 | | | | (15,614,739 | ) | | | (15,514,046 | ) |
| | |
|
|
| |
|
|
| |
|
|
|
NET DECREASE IN NET ASSETS RESULTING FROM OPERATIONS | | ($ | 52,177,455 | ) | | ($ | 14,530,140 | ) | | ($ | 15,547,288 | ) |
| | |
|
|
| |
|
|
| |
|
|
|
(1) Non-cash dividends are recorded at the fair value of the securities received. | | | | | | | | | | | | |
See notes to financial statements.
120
GuideMark® Funds & GuidePath® Funds
STATEMENTS OF OPERATIONS (Continued)
For the Year Ended March 31, 2020
| | | | | | | | | | | | |
| | | World
ex-US Fund
| | | Core
Fixed Income
Fund
| | | Tax-Exempt
Fixed Income
Fund
| |
INVESTMENT INCOME: | | | | | | | | | | | | |
Dividend income (net of withholding tax of $546,560, $0, and $0, respectively) | | $ | 5,192,484 | | | $ | — | | | $ | — | |
Interest income | | | 23,803 | | | | 4,077,457 | | | | 962,416 | |
| | |
|
|
| |
|
|
| |
|
|
|
Total investment income | | | 5,216,287 | | | | 4,077,457 | | | | 962,416 | |
| | |
|
|
| |
|
|
| |
|
|
|
EXPENSES: | | | | | | | | | | | | |
Investment advisory fees | | | 888,840 | | | | 550,291 | | | | 124,454 | |
Distribution(12b-1) fees – Service Shares | | | 443,638 | | | | 343,932 | | | | 62,227 | |
Administrative service fees – Service Shares | | | 438,970 | | | | 336,198 | | | | 56,287 | |
Shareholder servicing fees – Service Shares | | | 159,067 | | | | 117,633 | | | | 18,416 | |
Administration fees | | | 102,789 | | | | 62,447 | | | | 11,547 | |
Reports to shareholders | | | 31,702 | | | | 22,687 | | | | 5,274 | |
Legal fees | | | 41,509 | | | | 26,643 | | | | 7,205 | |
Fund accounting fees | | | 107,226 | | | | 180,591 | | | | 20,149 | |
Trustee fees and expenses | | | 23,841 | | | | 15,938 | | | | 3,152 | |
Federal and state registration fees | | | 38,295 | | | | 35,851 | | | | 33,843 | |
Custody fees | | | 76,597 | | | | 33,991 | | | | 2,221 | |
Audit and tax fees | | | 27,835 | | | | 24,991 | | | | 24,980 | |
Transfer agent fees and expenses | | | 11,776 | | | | 10,175 | | | | 7,437 | |
Compliance fees | | | 6,360 | | | | 4,759 | | | | 727 | |
Insurance fees | | | 7,105 | | | | 5,246 | | | | 946 | |
Miscellaneous expenses | | | 2,605 | | | | 2,574 | | | | 2,304 | |
Interest expenses | | | 1,352 | | | | 557 | | | | — | |
| | |
|
|
| |
|
|
| |
|
|
|
Total expenses | | | 2,409,507 | | | | 1,774,504 | | | | 381,169 | |
| | |
|
|
| |
|
|
| |
|
|
|
Net expense recapture (reimbursement) by Advisor (See Note 4) | | | 13,953 | | | | (131,945 | ) | | | (60,079 | ) |
Less securities lending credit (See Note 7) | | | (26,327 | ) | | | (4,812 | ) | | | — | |
| | |
|
|
| |
|
|
| |
|
|
|
Net expenses | | | 2,397,133 | | | | 1,637,747 | | | | 321,090 | |
| | |
|
|
| |
|
|
| |
|
|
|
Net investment income | | | 2,819,154 | | | | 2,439,710 | | | | 641,326 | |
| | |
|
|
| |
|
|
| |
|
|
|
NET REALIZED AND UNREALIZED GAIN (LOSS) ON INVESTMENTS: | | | | | | | | | | | | |
Net realized gain (loss) on: | | | | | | | | | | | | |
Investments | | | (3,427,536 | ) | | | 2,329,289 | | | | 146,062 | |
Foreign currencies | | | 23,056 | | | | — | | | | — | |
Swaps | | | — | | | | (153,641 | ) | | | — | |
Net long-term capital gain distributions received | | | 187 | | | | — | | | | — | |
Futures contracts | | | — | | | | 422,847 | | | | — | |
Written options | | | — | | | | 86,115 | | | | — | |
| | |
|
|
| |
|
|
| |
|
|
|
Total | | | (3,404,293 | ) | | | 2,684,610 | | | | 146,062 | |
| | |
|
|
| |
|
|
| |
|
|
|
Net change in unrealized appreciation (depreciation) on: | | | | | | | | | | | | |
Investments | | | (22,881,273 | ) | | | 6,212,547 | | | | (475,939 | ) |
Foreign currencies | | | 20,851 | | | | — | | | | — | |
Swaps | | | — | | | | (1,597,063 | ) | | | — | |
Futures contracts | | | — | | | | (154,146 | ) | | | — | |
Written options | | | — | | | | (47,567 | ) | | | — | |
| | |
|
|
| |
|
|
| |
|
|
|
Total | | | (22,860,422 | ) | | | 4,413,771 | | | | (475,939 | ) |
| | |
|
|
| |
|
|
| |
|
|
|
Net realized and unrealized gain (loss) | | | (26,264,715 | ) | | | 7,098,381 | | | | (329,877 | ) |
| | |
|
|
| |
|
|
| |
|
|
|
NET INCREASE (DECREASE) IN NET ASSETS RESULTING FROM OPERATIONS | | $ | (23,445,561 | ) | | $ | 9,538,091 | | | $ | 311,449 | |
| | |
|
|
| |
|
|
| |
|
|
|
See notes to financial statements.
121
GuideMark® Funds & GuidePath® Funds
STATEMENTS OF OPERATIONS (Continued)
For the Year Ended March 31, 2020
| | | | | | | | | | | | |
| | | Opportunistic
Fixed Income
Fund
| | | Growth
Allocation
Fund
| | | Conservative
Allocation
Fund
| |
INVESTMENT INCOME: | | | | | | | | | | | | |
Dividend income | | $ | — | | | $ | 16,937,667 | | | $ | 10,684,221 | |
Interest income (net of withholding tax of $34,741, $0, and $0, respectively) | | | 2,757,139 | | | | 170,886 | | | | 74,266 | |
| | |
|
|
| |
|
|
| |
|
|
|
Total investment income | | | 2,757,139 | | | | 17,108,553 | | | | 10,758,487 | |
| | |
|
|
| |
|
|
| |
|
|
|
EXPENSES: | | | | | | | | | | | | |
Investment advisory fees | | | 354,193 | | | | 2,129,525 | | | | 905,971 | |
Distribution(12b-1) fees – Service Shares | | | 125,527 | | | | 2,115,831 | | | | 900,361 | |
Administrative service fees – Service Shares | | | 124,560 | | | | 2,114,984 | | | | 900,031 | |
Shareholder servicing fees – Service Shares | | | 39,039 | | | | 829,406 | | | | 352,942 | |
Administration fees | | | 24,926 | | | | 329,461 | | | | 144,595 | |
Reports to shareholders | | | 10,438 | | | | 146,465 | | | | 65,496 | |
Legal fees | | | 18,595 | | | | 164,513 | | | | 70,239 | |
Fund accounting fees | | | 67,685 | | | | 91,660 | | | | 41,330 | |
Trustee fees and expenses | | | 6,424 | | | | 98,554 | | | | 42,733 | |
Federal and state registration fees | | | 33,455 | | | | 50,772 | | | | 41,637 | |
Custody fees | | | 101,983 | | | | 82,932 | | | | 62,254 | |
Audit and tax fees | | | 33,321 | | | | 15,500 | | | | 15,006 | |
Transfer agent fees and expenses | | | 7,226 | | | | 34,696 | | | | 17,843 | |
Compliance fees | | | 1,784 | | | | 29,323 | | | | 12,500 | |
Insurance fees | | | 1,373 | | | | 19,764 | | | | 8,783 | |
Miscellaneous expenses | | | 1,743 | | | | 3,732 | | | | 2,870 | |
Interest expenses | | | 442 | | | | 18,519 | | | | 10,859 | |
| | |
|
|
| |
|
|
| |
|
|
|
Total expenses | | | 952,714 | | | | 8,275,637 | | | | 3,595,450 | |
| | |
|
|
| |
|
|
| |
|
|
|
Net expense reimbursement by Advisor (See Note 4) | | | (170,317 | ) | | | — | | | | (774,816 | ) |
Less securities lending credit (See Note 7) | | | — | | | | (462,568 | ) | | | (283,442 | ) |
| | |
|
|
| |
|
|
| |
|
|
|
Net expenses | | | 782,397 | | | | 7,813,069 | | | | 2,537,192 | |
| | |
|
|
| |
|
|
| |
|
|
|
Net investment income | | | 1,974,742 | | | | 9,295,484 | | | | 8,221,295 | |
| | |
|
|
| |
|
|
| |
|
|
|
NET REALIZED AND UNREALIZED LOSS ON INVESTMENTS: | | | | | | | | | | | | |
Net realized gain (loss) on: | | | | | | | | | | | | |
Investments | | | (1,445,194 | ) | | | (7,771,359 | ) | | | 2,283,426 | |
Net long-term capital gain distributions received | | | — | | | | 10,727,266 | | | | 1,328,416 | |
Foreign currencies | | | (9,791 | ) | | | — | | | | — | |
Forward currency exchange contracts | | | 735,492 | | | | — | | | | — | |
Swaps | | | (3,144,948 | ) | | | — | | | | — | |
Written options | | | 17 | | | | — | | | | — | |
| | |
|
|
| |
|
|
| |
|
|
|
Total | | | (3,864,424 | ) | | | 2,955,907 | | | | 3,611,842 | |
| | |
|
|
| |
|
|
| |
|
|
|
Net change in unrealized appreciation (depreciation) on: | | | | | | | | | | | | |
Investments | | | (1,480,559 | ) | | | (106,645,627 | ) | | | (24,189,025 | ) |
Foreign currencies | | | (73,545 | ) | | | — | | | | — | |
Forward currency contracts | | | 645,810 | | | | — | | | | — | |
Swaps | | | 1,038,638 | | | | — | | | | — | |
| | |
|
|
| |
|
|
| |
|
|
|
Total | | | 130,344 | | | | (106,645,627 | ) | | | (24,189,025 | ) |
| | |
|
|
| |
|
|
| |
|
|
|
Net realized and unrealized loss | | | (3,734,080 | ) | | | (103,689,720 | ) | | | (20,577,183 | ) |
| | |
|
|
| |
|
|
| |
|
|
|
NET DECREASE IN NET ASSETS RESULTING FROM OPERATIONS | | $ | (1,759,338 | ) | | $ | (94,394,236 | ) | | $ | (12,355,888 | ) |
| | |
|
|
| |
|
|
| |
|
|
|
See notes to financial statements.
122
GuideMark® Funds & GuidePath® Funds
STATEMENTS OF OPERATIONS (Continued)
For the Year Ended March 31, 2020
| | | | | | | | | | | | |
| | | Tactical
Allocation
Fund
| | | Absolute
Return
Allocation
Fund
| | | Multi-Asset
Income
Allocation
Fund
| |
INVESTMENT INCOME: | | | | | | | | | | | | |
Dividend income | | $ | 5,789,516 | | | $ | 10,040,351 | | | $ | 5,540,147 | |
Dividends from affiliate investments | | | — | | | | 440,763 | | | | — | |
Interest income | | | 105,668 | | | | 63,730 | | | | 28,183 | |
| | |
|
|
| |
|
|
| |
|
|
|
Total investment income | | | 5,895,184 | | | | 10,544,844 | | | | 5,568,330 | |
| | |
|
|
| |
|
|
| |
|
|
|
EXPENSES: | | | | | | | | | | | | |
Investment advisory fees | | | 1,291,869 | | | | 1,109,240 | | | | 473,303 | |
Distribution(12b-1) fees – Service Shares | | | 918,512 | | | | 790,540 | | | | 338,074 | |
Administrative service fees – Service Shares | | | 918,113 | | | | 790,303 | | | | 337,960 | |
Shareholder servicing fees – Service Shares | | | 352,709 | | | | 311,486 | | | | 131,173 | |
Administration fees | | | 153,822 | | | | 116,614 | | | | 54,129 | |
Reports to shareholders | | | 97,699 | | | | 48,918 | | | | 19,017 | |
Legal fees | | | 97,915 | | | | 59,452 | | | | 23,515 | |
Fund accounting fees | | | 41,107 | | | | 35,470 | | | | 13,386 | |
Trustee fees and expenses | | | 44,105 | | | | 39,783 | | | | 16,219 | |
Federal and state registration fees | | | 42,620 | | | | 52,130 | | | | 35,149 | |
Custody fees | | | 36,080 | | | | 47,829 | | | | 35,131 | |
Audit and tax fees | | | 15,006 | | | | 15,006 | | | | 15,006 | |
Transfer agent fees and expenses | | | 18,089 | | | | 15,684 | | | | 7,204 | |
Compliance fees | | | 12,734 | | | | 10,890 | | | | 4,692 | |
Insurance fees | | | 8,388 | | | | 8,449 | | | | 3,263 | |
Miscellaneous expenses | | | 2,919 | | | | 2,829 | | | | 2,497 | |
Interest expenses | | | — | | | | 19,734 | | | | 1,512 | |
| | |
|
|
| |
|
|
| |
|
|
|
Total expenses | | | 4,051,687 | | | | 3,474,357 | | | | 1,511,230 | |
| | |
|
|
| |
|
|
| |
|
|
|
Net expense reimbursement by Advisor (See Note 4) | | | — | | | | (845,563 | ) | | | — | |
Less securities lending credit (See Note 7) | | | (160,742 | ) | | | (64,226 | ) | | | (284,021 | ) |
| | |
|
|
| |
|
|
| |
|
|
|
Net expenses | | | 3,890,945 | | | | 2,564,568 | | | | 1,227,209 | |
| | |
|
|
| |
|
|
| |
|
|
|
Net investment income | | | 2,004,239 | | | | 7,980,276 | | | | 4,341,121 | |
| | |
|
|
| |
|
|
| |
|
|
|
NET REALIZED AND UNREALIZED LOSS ON INVESTMENTS: | | | | | | | | | | | | |
Net realized gain (loss) on: | | | | | | | | | | | | |
Investments | | | 27,802,208 | | | | 415,549 | | | | (11,029,406 | ) |
Investments in affiliates | | | — | | | | (781,425 | ) | | | — | |
Net long-term capital gain distributions received | | | — | | | | 187,758 | | | | 181,131 | |
| | |
|
|
| |
|
|
| |
|
|
|
Total | | | 27,802,208 | | | | (178,118 | ) | | | (10,848,275 | ) |
| | |
|
|
| |
|
|
| |
|
|
|
Net change in unrealized depreciation on: | | | | | | | | | | | | |
Investments | | | (47,253,237 | ) | | | (5,935,284 | ) | | | (9,697,818 | ) |
Investments in affiliates | | | — | | | | (1,977,593 | ) | | | — | |
| | |
|
|
| |
|
|
| |
|
|
|
Total | | | (47,253,237 | ) | | | (7,912,877 | ) | | | (9,697,818 | ) |
| | |
|
|
| |
|
|
| |
|
|
|
Net realized and unrealized loss | | | (19,451,029 | ) | | | (8,090,995 | ) | | | (20,546,093 | ) |
| | |
|
|
| |
|
|
| |
|
|
|
NET DECREASE IN NET ASSETS RESULTING FROM OPERATIONS | | $ | (17,446,790 | ) | | $ | (110,719 | ) | | $ | (16,204,972 | ) |
| | |
|
|
| |
|
|
| |
|
|
|
See notes to financial statements.
123
GuideMark® Funds & GuidePath® Funds
STATEMENTS OF OPERATIONS (Continued)
For the Year Ended March 31, 2020
| | | | | | | | |
| | | Flexible
Income
Allocation
Fund
| | | Managed1
Futures
Strategy
Fund
| |
INVESTMENT INCOME: | | | | | | | | |
Dividend income | | $ | 3,472,562 | | | $ | — | |
Interest income | | | 17,906 | | | | 3,874,204 | |
| | |
|
|
| |
|
|
|
Total investment income | | | 3,490,468 | | | | 3,874,204 | |
| | |
|
|
| |
|
|
|
EXPENSES: | | | | | | | | |
Investment advisory fees | | | 204,971 | | | | 2,007,700 | |
Distribution(12b-1) fees – Service Shares | | | 204,891 | | | | 475,188 | |
Administrative service fees – Service Shares | | | 204,866 | | | | 474,999 | |
Shareholder servicing fees – Service Shares | | | 80,135 | | | | 185,656 | |
Administration fees | | | 32,497 | | | | 76,206 | |
Reports to shareholders | | | 18,653 | | | | 46,014 | |
Legal fees | | | 13,265 | | | | 69,454 | |
Fund accounting fees | | | 10,259 | | | | 40,886 | |
Trustee fees and expenses | | | 8,568 | | | | 26,417 | |
Federal and state registration fees | | | 42,168 | | | | 43,812 | |
Custody fees | | | 13,709 | | | | 22,056 | |
Audit and tax fees | | | 14,975 | | | | 31,507 | |
Transfer agent fees and expenses | | | 8,278 | | | | 11,741 | |
Compliance fees | | | 2,060 | | | | 6,654 | |
Insurance fees | | | 1,250 | | | | 4,055 | |
Miscellaneous expenses | | | 2,467 | | | | 2,524 | |
Interest expenses | | | 5,038 | | | | — | |
| | |
|
|
| |
|
|
|
Total expenses | | | 868,050 | | | | 3,524,869 | |
| | |
|
|
| |
|
|
|
Net expense recapture (reimbursement) by Advisor (See Note 4) | | | (205,707 | ) | | | 101,307 | |
Less securities lending credit (See Note 7) | | | (53,202 | ) | | | — | |
| | |
|
|
| |
|
|
|
Net expenses | | | 609,141 | | | | 3,626,176 | |
| | |
|
|
| |
|
|
|
Net investment income | | | 2,881,327 | | | | 248,028 | |
| | |
|
|
| |
|
|
|
NET REALIZED AND UNREALIZED (GAIN) LOSS ON INVESTMENTS: | | | | | | | | |
Net realized gain (loss) on: | | | | | | | | |
Investments | | | (1,482,272 | ) | | | 3,206 | |
Foreign currency translation | | | — | | | | (227,811 | ) |
Forward currency contracts | | | — | | | | (1,441,599 | ) |
Futures contracts | | | — | | | | 17,650,522 | |
| | |
|
|
| |
|
|
|
Total | | | (1,482,272 | ) | | | 15,984,318 | |
| | |
|
|
| |
|
|
|
Net change in unrealized appreciation (depreciation) on: | | | | | | | | |
Investments | | | (921,236 | ) | | | (64,710 | ) |
Foreign currencies | | | — | | | | (6,749 | ) |
Forward currency contracts | | | — | | | | 1,572,695 | |
Futures contracts | | | — | | | | 1,328,783 | |
| | |
|
|
| |
|
|
|
Total | | | (921,236 | ) | | | 2,830,019 | |
| | |
|
|
| |
|
|
|
Net realized and unrealized gain (loss) | | | (2,403,508 | ) | | | 18,814,337 | |
| | |
|
|
| |
|
|
|
NET INCREASE IN NET ASSETS RESULTING FROM OPERATIONS | | $ | 477,819 | | | $ | 19,062,365 | |
| | |
|
|
| |
|
|
|
1Consolidated Statement of Operations for the period (see note 3b). | | | | | | | | |
See notes to financial statements.
124
GuideMark® Funds & GuidePath® Funds
STATEMENTS OF OPERATIONS (Continued)
For the Year Ended March 31, 2020
| | | | | | | | | | | | |
| | | Conservative
Income
Fund
| | | Income
Fund
| | | Growth &
Income
Fund
| |
INVESTMENT INCOME: | | | | | | | | | | | | |
Dividend income | | $ | 71,533 | | | $ | 732,683 | | | $ | 517,262 | |
Interest income | | | 38,558 | | | | 8,374 | | | | 129,982 | |
| | |
|
|
| |
|
|
| |
|
|
|
Total investment income | | | 110,091 | | | | 741,057 | | | | 647,244 | |
| | |
|
|
| |
|
|
| |
|
|
|
EXPENSES: | | | | | | | | | | | | |
Investment advisory fees | | | 16,024 | | | | 93,259 | | | | 108,834 | |
Administrative service fees – Service Shares | | | 11,446 | | | | 51,810 | | | | 60,464 | |
Administration fees | | | 1,227 | | | | 7,668 | | | | 9,286 | |
Reports to shareholders | | | 853 | | | | 5,312 | | | | 6,567 | |
Legal fees | | | 4,278 | | | | 5,999 | | | | 7,880 | |
Fund accounting fees | | | 725 | | | | 1,640 | | | | 5,112 | |
Trustee fees and expenses | | | 102 | | | | 2,500 | | | | 2,315 | |
Federal and state registration fees | | | 34,800 | | | | 40,329 | | | | 46,150 | |
Custody fees | | | 1,995 | | | | 5,171 | | | | 37,706 | |
Audit and tax fees | | | 14,986 | | | | 15,040 | | | | 21,738 | |
Transfer agent fees and expenses | | | 4,982 | | | | 5,305 | | | | 5,305 | |
Compliance fees | | | 61 | | | | 1,319 | | | | 948 | |
Insurance fees | | | 31 | | | | 183 | | | | 275 | |
Miscellaneous expenses | | | 7,605 | | | | 6,722 | | | | 7,620 | |
Offering costs | | | 2,795 | | | | 2,763 | | | | 2,823 | |
| | |
|
|
| |
|
|
| |
|
|
|
Total expenses | | | 101,910 | | | | 245,020 | | | | 323,023 | |
| | |
|
|
| |
|
|
| |
|
|
|
Net expense reimbursement by Advisor (See Note 4) | | | (70,018 | ) | | | (72,623 | ) | | | (123,978 | ) |
Less securities lending credit (See Note 7) | | | (2,996 | ) | | | (9,774 | ) | | | (6,482 | ) |
| | |
|
|
| |
|
|
| |
|
|
|
Net expenses | | | 28,896 | | | | 162,623 | | | | 192,563 | |
| | |
|
|
| |
|
|
| |
|
|
|
Net investment income | | | 81,195 | | | | 578,434 | | | | 454,681 | |
| | |
|
|
| |
|
|
| |
|
|
|
NET REALIZED AND UNREALIZED LOSS ON INVESTMENTS: | | | | | | | | | | | | |
Net realized gain (loss) on: | | | | | | | | | | | | |
Investments | | | (99,937 | ) | | | (1,891,187 | ) | | | (1,903,942 | ) |
Written options | | | — | | | | — | | | | (1,255,245 | ) |
Futures contracts | | | — | | | | — | | | | 947,434 | |
| | |
|
|
| |
|
|
| |
|
|
|
Total | | | (99,937 | ) | | | (1,891,187 | ) | | | (2,211,753 | ) |
| | |
|
|
| |
|
|
| |
|
|
|
Net change in unrealized appreciation (depreciation) on: | | | | | | | | | | | | |
Investments | | | 23,476 | | | | 1,035,114 | | | | (2,524,863 | ) |
Written options | | | — | | | | — | | | | 79,563 | |
Futures contracts | | | — | | | | — | | | | (39,567 | ) |
| | |
|
|
| |
|
|
| |
|
|
|
Total | | | 23,476 | | | | 1,035,114 | | | | (2,484,867 | ) |
| | |
|
|
| |
|
|
| |
|
|
|
Net realized and unrealized loss | | | (76,461 | ) | | | (856,073 | ) | | | (4,696,620 | ) |
| | |
|
|
| |
|
|
| |
|
|
|
NET INCREASE (DECREASE) IN NET ASSETS RESULTING FROM OPERATIONS | | $ | 4,734 | | | $ | (277,639 | ) | | $ | (4,241,939 | ) |
| | |
|
|
| |
|
|
| |
|
|
|
See notes to financial statements.
125
GuideMark® Funds & GuidePath® Funds
STATEMENTS OF CHANGES IN NET ASSETS
| | | | | | | | | | | | | | | | |
| | | Large Cap Core Fund
| | | Emerging Markets Fund
| |
| | | Year Ended
March 31,
2020
| | | Year Ended
March 31,
2019
| | | Year Ended
March 31,
2020
| | | Year Ended
March 31,
2019
| |
OPERATIONS: | | | | | | | | | | | | | | | | |
Net investment income | | $ | 2,330,571 | | | $ | 1,238,778 | | | $ | 1,084,599 | | | $ | 676,170 | |
Net realized gain (loss) on investment transactions | | | (8,017,009 | ) | | | 4,916,153 | | | | (619,470 | ) | | | 4,609,679 | |
Net change in unrealized appreciation (depreciation) on investments | | | (46,491,017 | ) | | | 16,368,259 | | | | (14,995,269 | ) | | | (16,801,329 | ) |
| | |
|
|
| |
|
|
| |
|
|
| |
|
|
|
Net increase (decrease) in net assets resulting from operations | | | (52,177,455 | ) | | | 22,523,190 | | | | (14,530,140 | ) | | $ | (11,515,480 | ) |
| | |
|
|
| |
|
|
| |
|
|
| |
|
|
|
CAPITAL SHARE TRANSACTIONS: | | | | | | | | | | | | | | | | |
Institutional Shares | | | | | | | | | | | | | | | | |
Shares sold | | | 513,901 | | | | 337,214 | | | | — | | | | — | |
Shares issued to holders in reinvestment of dividends | | | 14,706 | | | | 8,622 | | | | 238 | | | | 1,287 | |
Shares redeemed | | | (450,346 | ) | | | (663,169 | ) | | | — | | | | — | |
| | |
|
|
| |
|
|
| |
|
|
| |
|
|
|
Net increase (decrease) | | | 78,261 | | | | (317,333 | ) | | | 238 | | | | 1,287 | |
| | |
|
|
| |
|
|
| |
|
|
| |
|
|
|
Service Shares | | | | | | | | | | | | | | | | |
Shares sold | | | 206,658,674 | | | | 140,537,107 | | | | 16,935,060 | | | | 26,674,640 | |
Shares issued to holders in reinvestment of dividends | | | 4,566,189 | | | | 5,619,505 | | | | 1,489,138 | | | | 11,273,295 | |
Shares redeemed | | | (160,145,611 | ) | | | (136,967,206 | ) | | | (23,876,328 | ) | | | (39,125,475 | ) |
| | |
|
|
| |
|
|
| |
|
|
| |
|
|
|
Net increase (decrease) | | | 51,079,252 | | | | 9,189,406 | | | | (5,452,130 | ) | | | (1,177,540 | ) |
| | |
|
|
| |
|
|
| |
|
|
| |
|
|
|
DIVIDENDS AND DISTRIBUTIONS TO SHAREHOLDERS: | | | | | | | | | | | | | | | | |
Net dividends and distributions – Institutional Shares | | | (14,706 | ) | | | (8,622 | ) | | | (238 | ) | | | (1,287 | ) |
Net dividends and distributions – Service Shares | | | (4,570,769 | ) | | | (5,619,505 | ) | | | (1,489,316 | ) | | | (11,274,112 | ) |
| | |
|
|
| |
|
|
| |
|
|
| |
|
|
|
Total dividends and distributions | | | (4,585,475 | ) | | | (5,628,127 | ) | | | (1,489,554 | ) | | | (11,275,399 | ) |
| | |
|
|
| |
|
|
| |
|
|
| |
|
|
|
INCREASE (DECREASE) IN NET ASSETS | | | (5,605,417 | ) | | | 25,767,136 | | | | (21,471,586 | ) | | | (23,967,132 | ) |
NET ASSETS: | | | | | | | | | | | | | | | | |
Beginning of year | | | 333,038,185 | | | | 307,271,049 | | | | 85,633,534 | | | | 109,600,666 | |
| | |
|
|
| |
|
|
| |
|
|
| |
|
|
|
End of year | | $ | 327,432,768 | | | $ | 333,038,185 | | | $ | 64,161,948 | | | $ | 85,633,534 | |
| | |
|
|
| |
|
|
| |
|
|
| |
|
|
|
CHANGES IN SHARES OUTSTANDING | | | | | | | | | | | | | | | | |
Institutional Shares | | | | | | | | | | | | | | | | |
Shares sold | | | 27,051 | | | | 18,355 | | | | — | | | | — | |
Shares issued to holders in reinvestment of dividends | | | 706 | | | | 528 | | | | 18 | | | | 111 | |
Shares redeemed | | | (27,255 | ) | | | (36,278 | ) | | | — | | | | — | |
| | |
|
|
| |
|
|
| |
|
|
| |
|
|
|
Net increase (decrease) | | | 502 | | | | (17,395 | ) | | | 18 | | | | 111 | |
| | |
|
|
| |
|
|
| |
|
|
| |
|
|
|
Service Shares | | | | | | | | | | | | | | | | |
Shares sold | | | 11,192,862 | | | | 7,781,714 | | | | 1,387,936 | | | | 1,877,763 | |
Shares issued to holders in reinvestment of dividends | | | 222,134 | | | | 348,172 | | | | 106,238 | | | | 941,639 | |
Shares redeemed | | | (9,185,190 | ) | | | (7,569,017 | ) | | | (1,842,829 | ) | | | (2,792,358 | ) |
| | |
|
|
| |
|
|
| |
|
|
| |
|
|
|
Net increase (decrease) | | | 2,229,806 | | | | 560,869 | | | | (348,655 | ) | | | 27,044 | |
| | |
|
|
| |
|
|
| |
|
|
| |
|
|
|
See notes to financial statements.
126
GuideMark® Funds & GuidePath® Funds
STATEMENTS OF CHANGES IN NET ASSETS (Continued)
| | | | | | | | | | | | | | | | |
| | | Small/Mid Cap Core Fund
| | | Worldex-US Fund
| |
| | | Year Ended
March 31,
2020
| | | Year Ended
March 31,
2019
| | | Year Ended
March 31,
2020
| | | Year Ended
March 31,
2019
| |
OPERATIONS: | | | | | | | | | | | | | | | | |
Net investment income (loss) | | $ | (33,242 | ) | | $ | (84,202 | ) | | $ | 2,819,154 | | | $ | 2,637,904 | |
Net realized gain (loss) on investment transactions | | | 456,752 | | | | 2,356,959 | | | | (3,404,293 | ) | | | (1,632,955 | ) |
Net change in unrealized depreciation on investments | | | (15,970,798 | ) | | | (627,519 | ) | | | (22,860,422 | ) | | | (12,195,387 | ) |
| | |
|
|
| |
|
|
| |
|
|
| |
|
|
|
Net increase (decrease) in net assets resulting from operations | | | (15,547,288 | ) | | | 1,645,238 | | | | (23,445,561 | ) | | | (11,190,438 | ) |
| | |
|
|
| |
|
|
| |
|
|
| |
|
|
|
CAPITAL SHARE TRANSACTIONS: | | | | | | | | | | | | | | | | |
Institutional Shares | | | | | | | | | | | | | | | | |
Shares sold | | | — | | | | — | | | | 42,416 | | | | 345,156 | |
Shares issued to holders in reinvestment of dividends | | | — | | | | — | | | | 2,574 | | | | 6,418 | |
Shares redeemed | | | — | | | | — | | | | (470,575 | ) | | | (599,096 | ) |
| | |
|
|
| |
|
|
| |
|
|
| |
|
|
|
Net decrease | | | — | | | | — | | | | (425,585 | ) | | | (247,522 | ) |
| | |
|
|
| |
|
|
| |
|
|
| |
|
|
|
Service Shares | | | | | | | | | | | | | | | | |
Shares sold | | | 24,717,091 | | | | 24,981,442 | | | | 44,121,495 | | | | 115,295,717 | |
Shares issued to holders in reinvestment of dividends | | | 986,422 | | | | 3,364,649 | | | | 2,534,791 | | | | 2,691,522 | |
Shares redeemed | | | (20,170,137 | ) | | | (17,193,095 | ) | | | (126,573,250 | ) | | | (99,754,051 | ) |
| | |
|
|
| |
|
|
| |
|
|
| |
|
|
|
Net increase (decrease) | | | 5,533,376 | | | | 11,152,996 | | | | (79,916,964 | ) | | | 18,233,188 | |
| | |
|
|
| |
|
|
| |
|
|
| |
|
|
|
DIVIDENDS AND DISTRIBUTIONS TO SHAREHOLDERS: | | | | | | | | | | | | | | | | |
Net dividends and distributions – Institutional Shares | | | — | | | | — | | | | (2,574 | ) | | | (6,418 | ) |
Net dividends and distributions – Service Shares | | | (986,422 | ) | | | (3,364,649 | ) | | | (2,539,718 | ) | | | (2,691,525 | ) |
| | |
|
|
| |
|
|
| |
|
|
| |
|
|
|
Total dividends and distributions | | | (986,422 | ) | | | (3,364,649 | ) | | | (2,542,292 | ) | | | (2,697,943 | ) |
| | |
|
|
| |
|
|
| |
|
|
| |
|
|
|
INCREASE (DECREASE) IN NET ASSETS | | | (11,000,334 | ) | | | 9,433,585 | | | | (106,330,402 | ) | | | 4,097,285 | |
NET ASSETS: | | | | | | | | | | | | | | | | |
Beginning of year | | | 63,904,945 | | | | 54,471,360 | | | | 216,969,799 | | | | 212,872,514 | |
| | |
|
|
| |
|
|
| |
|
|
| |
|
|
|
End of year | | $ | 52,904,611 | | | $ | 63,904,945 | | | $ | 110,639,397 | | | $ | 216,969,799 | |
| | |
|
|
| |
|
|
| |
|
|
| |
|
|
|
CHANGES IN SHARES OUTSTANDING | | | | | | | | | | | | | | | | |
Institutional Shares | | | | | | | | | | | | | | | | |
Shares sold | | | — | | | | — | | | | 4,693 | | | | 37,506 | |
Shares issued to holders in reinvestment of dividends | | | — | | | | — | | | | 263 | | | | 779 | |
Shares redeemed | | | — | | | | — | | | | (53,285 | ) | | | (63,890 | ) |
| | |
|
|
| |
|
|
| |
|
|
| |
|
|
|
Net decrease | | | — | | | | — | | | | (48,329 | ) | | | (25,605 | ) |
| | |
|
|
| |
|
|
| |
|
|
| |
|
|
|
Service Shares | | | | | | | | | | | | | | | | |
Shares sold | | | 1,868,502 | | | | 1,662,151 | | | | 5,127,561 | | | | 12,866,777 | |
Shares issued to holders in reinvestment of dividends | | | 64,012 | | | | 266,782 | | | | 267,439 | | | | 335,267 | |
Shares redeemed | | | (1,460,604 | ) | | | (1,140,342 | ) | | | (14,696,494 | ) | | | (11,064,674 | ) |
| | |
|
|
| |
|
|
| |
|
|
| |
|
|
|
Net increase (decrease) | | | 471,910 | | | | 788,591 | | | | (9,301,494 | ) | | | 2,137,370 | |
| | |
|
|
| |
|
|
| |
|
|
| |
|
|
|
See notes to financial statements.
127
GuideMark® Funds & GuidePath® Funds
STATEMENTS OF CHANGES IN NET ASSETS (Continued)
| | | | | | | | | | | | | | | | |
| | | Core Fixed Income Fund
| | | Tax-Exempt Fixed Income Fund
| |
| | | Year Ended
March 31,
2020
| | | Year Ended
March 31,
2019
| | | Year Ended
March 31,
2020
| | | Year Ended
March 31,
2019
| |
OPERATIONS: | | | | | | | | | | | | | | | | |
Net investment income | | $ | 2,439,710 | | | $ | 2,583,539 | | | $ | 641,326 | | | $ | 793,461 | |
Net realized gain (loss) on investment transactions | | | 2,684,610 | | | | (687,471 | ) | | | 146,062 | | | | 102,373 | |
Net change in unrealized appreciation (depreciation) on investments | | | 4,413,771 | | | | 2,581,293 | | | | (475,939 | ) | | | 24,362 | |
| | |
|
|
| |
|
|
| |
|
|
| |
|
|
|
Net increase in net assets resulting from operations | | | 9,538,091 | | | | 4,477,361 | | | | 311,449 | | | | 920,196 | |
| | |
|
|
| |
|
|
| |
|
|
| |
|
|
|
CAPITAL SHARE TRANSACTIONS: | | | | | | | | | | | | | | | | |
Service Shares | | | | | | | | | | | | | | | | |
Shares sold | | | 48,416,876 | | | | 36,418,311 | | | | 4,543,444 | | | | 3,618,363 | |
Shares issued to holders in reinvestment of dividends | | | 1,893,151 | | | | 2,660,730 | | | | 690,936 | | | | 838,420 | |
Shares redeemed | | | (55,360,113 | ) | | | (42,358,472 | ) | | | (7,702,675 | ) | | | (7,057,036 | ) |
| | |
|
|
| |
|
|
| |
|
|
| |
|
|
|
Net decrease | | | (5,050,086 | ) | | | (3,279,431 | ) | | | (2,468,295 | ) | | | (2,600,253 | ) |
| | |
|
|
| |
|
|
| |
|
|
| |
|
|
|
DIVIDENDS AND DISTRIBUTIONS TO SHAREHOLDERS: | | | | | | | | | | | | | | | | |
Net dividends and distributions – Service Shares | | | (1,893,282 | ) | | | (2,660,751 | ) | | | (690,999 | ) | | | (838,525 | ) |
| | |
|
|
| |
|
|
| |
|
|
| |
|
|
|
Total dividends and distributions | | | (1,893,282 | ) | | | (2,660,751 | ) | | | (690,999 | ) | | | (838,525 | ) |
| | |
|
|
| |
|
|
| |
|
|
| |
|
|
|
INCREASE (DECREASE) IN NET ASSETS | | | 2,594,723 | | | | (1,462,821 | ) | | | (2,847,845 | ) | | | (2,518,582 | ) |
NET ASSETS: | | | | | | | | | | | | | | | | |
Beginning of year | | | 132,792,238 | | | | 134,255,059 | | | | 25,310,450 | | | | 27,829,032 | |
| | |
|
|
| |
|
|
| |
|
|
| |
|
|
|
End of year | | $ | 135,386,961 | | | $ | 132,792,238 | | | $ | 22,462,605 | | | $ | 25,310,450 | |
| | |
|
|
| |
|
|
| |
|
|
| |
|
|
|
CHANGES IN SHARES OUTSTANDING | | | | | | | | | | | | | | | | |
Service Shares | | | | | | | | | | | | | | | | |
Shares sold | | | 5,049,690 | | | | 4,021,625 | | | | 398,701 | | | | 324,917 | |
Shares issued to holders in reinvestment of dividends | | | 197,922 | | | | 295,202 | | | | 62,474 | | | | 75,664 | |
Shares redeemed | | | (5,756,218 | ) | | | (4,685,544 | ) | | | (680,541 | ) | | | (636,054 | ) |
| | |
|
|
| |
|
|
| |
|
|
| |
|
|
|
Net decrease | | | (508,606 | ) | | | (368,717 | ) | | | (219,366 | ) | | | (235,473 | ) |
| | |
|
|
| |
|
|
| |
|
|
| |
|
|
|
See notes to financial statements.
128
GuideMark® Funds & GuidePath® Funds
STATEMENTS OF CHANGES IN NET ASSETS (Continued)
| | | | | | | | | | | | | | | | |
| | | Opportunistic Fixed
Income Fund
| | | Growth Allocation Fund
| |
| | | Year Ended
March 31,
2020
| | | Year Ended
March 31,
2019
| | | Year Ended
March 31,
2020
| | | Year Ended
March 31,
2019
| |
OPERATIONS: | | | | | | | | | | | | | | | | |
Net investment income | | $ | 1,974,742 | | | $ | 2,316,307 | | | $ | 9,295,484 | | | $ | 9,938,880 | |
Net realized gain (loss) on investment transactions | | | (3,864,424 | ) | | | 925,581 | | | | 2,955,907 | | | | (14,368,511 | ) |
Net change in unrealized appreciation (depreciation) on investments | | | 130,344 | | | | (2,915,482 | ) | | | (106,645,627 | ) | | | 7,074,045 | |
| | |
|
|
| |
|
|
| |
|
|
| |
|
|
|
Net increase (decrease) in net assets resulting from operations | | | (1,759,338 | ) | | | 326,406 | | | | (94,394,236 | ) | | | 2,644,414 | |
| | |
|
|
| |
|
|
| |
|
|
| |
|
|
|
CAPITAL SHARE TRANSACTIONS: | | | | | | | | | | | | | | | | |
Institutional Shares | | | | | | | | | | | | | | | | |
Shares sold | | | 185,093 | | | | 132,965 | | | | 1,182,389 | | | | 1,657,646 | |
Shares issued to holders in reinvestment of dividends | | | 19,564 | | | | 23,753 | | | | 92,823 | | | | 108,463 | |
Shares redeemed | | | (97,605 | ) | | | (120,924 | ) | | | (1,738,209 | ) | | | (2,871,708 | ) |
| | |
|
|
| |
|
|
| |
|
|
| |
|
|
|
Net increase (decrease) | | | 107,052 | | | | 35,794 | | | | (462,997 | ) | | | (1,105,599 | ) |
| | |
|
|
| |
|
|
| |
|
|
| |
|
|
|
Service Shares | | | | | | | | | | | | | | | | |
Shares sold | | | 18,324,155 | | | | 16,506,716 | | | | 359,009,853 | | | | 416,955,507 | |
Shares issued to holders in reinvestment of dividends | | | 2,221,909 | | | | 3,092,832 | | | | 10,362,363 | | | | 9,525,359 | |
Shares redeemed | | | (27,130,492 | ) | | | (20,519,156 | ) | | | (313,472,188 | ) | | | (243,196,676 | ) |
| | |
|
|
| |
|
|
| |
|
|
| |
|
|
|
Net increase (decrease) | | | (6,584,428 | ) | | | (919,608 | ) | | | 55,900,028 | | | | 183,284,190 | |
| | |
|
|
| |
|
|
| |
|
|
| |
|
|
|
DIVIDENDS AND DISTRIBUTIONS TO SHAREHOLDERS: | | | | | | | | | | | | | | | | |
Net dividends and distributions – Institutional Shares | | | (19,564 | ) | | | (23,753 | ) | | | (92,823 | ) | | | (108,463 | ) |
Net dividends and distributions – Service Shares | | | (2,221,909 | ) | | | (3,092,832 | ) | | | (10,362,363 | ) | | | (9,525,359 | ) |
| | |
|
|
| |
|
|
| |
|
|
| |
|
|
|
Total dividends and distributions | | | (2,241,473 | ) | | | (3,116,585 | ) | | | (10,455,186 | ) | | | (9,633,822 | ) |
| | |
|
|
| |
|
|
| |
|
|
| |
|
|
|
INCREASE (DECREASE) IN NET ASSETS | | | (10,478,187 | ) | | | (3,673,993 | ) | | | (49,412,391 | ) | | | 175,189,183 | |
NET ASSETS: | | | | | | | | | | | | | | | | |
Beginning of year | | | 51,234,888 | | | | 54,908,881 | | | | 793,764,999 | | | | 618,575,816 | |
| | |
|
|
| |
|
|
| |
|
|
| |
|
|
|
End of year | | $ | 40,756,701 | | | $ | 51,234,888 | | | $ | 744,352,608 | | | $ | 793,764,999 | |
| | |
|
|
| |
|
|
| |
|
|
| |
|
|
|
CHANGES IN SHARES OUTSTANDING | | | | | | | | | | | | | | | | |
Institutional Shares | | | | | | | | | | | | | | | | |
Shares sold | | | 22,959 | | | | 15,240 | | | | 103,712 | | | | 144,194 | |
Shares issued to holders in reinvestment of dividends | | | 2,380 | | | | 2,849 | | | | 7,252 | | | | 10,884 | |
Shares redeemed | | | (11,690 | ) | | | (13,830 | ) | | | (148,558 | ) | | | (259,582 | ) |
| | |
|
|
| |
|
|
| |
|
|
| |
|
|
|
Net increase (decrease) | | | 13,649 | | | | 4,259 | | | | (37,594 | ) | | | (104,504 | ) |
| | |
|
|
| |
|
|
| |
|
|
| |
|
|
|
Service Shares | | | | | | | | | | | | | | | | |
Shares sold | | | 2,199,049 | | | | 1,893,945 | | | | 31,144,526 | | | | 36,483,081 | |
Shares issued to holders in reinvestment of dividends | | | 270,885 | | | | 371,466 | | | | 814,523 | | | | 960,605 | |
Shares redeemed | | | (3,288,647 | ) | | | (2,365,797 | ) | | | (27,109,951 | ) | | | (22,161,406 | ) |
| | |
|
|
| |
|
|
| |
|
|
| |
|
|
|
Net increase (decrease) | | | (818,713 | ) | | | (100,386 | ) | | | 4,849,098 | | | | 15,282,280 | |
| | |
|
|
| |
|
|
| |
|
|
| |
|
|
|
See notes to financial statements.
129
GuideMark® Funds & GuidePath® Funds
STATEMENTS OF CHANGES IN NET ASSETS (Continued)
| | | | | | | | | | | | | | | | |
| | | Conservative Allocation Fund
| | | Tactical Allocation Fund
| |
| | | Year Ended
March 31,
2020
| | | Year Ended
March 31,
2019
| | | Year Ended
March 31,
2020
| | | Year Ended
March 31,
2019
| |
OPERATIONS: | | | | | | | | | | | | | | | | |
Net investment income | | $ | 8,221,295 | | | $ | 6,219,789 | | | $ | 2,004,239 | | | $ | 2,107,088 | |
Net realized gain (loss) on investment transactions | | | 3,611,842 | | | | (7,899,790 | ) | | | 27,802,208 | | | | 3,032,399 | |
Net change in unrealized appreciation (depreciation) on investments | | | (24,189,025 | ) | | | 9,575,254 | | | | (47,253,237 | ) | | | 8,881,098 | |
| | |
|
|
| |
|
|
| |
|
|
| |
|
|
|
Net increase (decrease) in net assets resulting from operations | | | (12,355,888 | ) | | | 7,895,253 | | | | (17,446,790 | ) | | | 14,020,585 | |
| | |
|
|
| |
|
|
| |
|
|
| |
|
|
|
CAPITAL SHARE TRANSACTIONS: | | | | | | | | | | | | | | | | |
Institutional Shares | | | | | | | | | | | | | | | | |
Shares sold | | | 413,237 | | | | 724,953 | | | | 479,802 | | | | 375,423 | |
Shares issued to holders in reinvestment of dividends | | | 58,660 | | | | 56,379 | | | | 87,971 | | | | 77,209 | |
Shares redeemed | | | (933,549 | ) | | | (1,670,585 | ) | | | (357,458 | ) | | | (633,920 | ) |
| | |
|
|
| |
|
|
| |
|
|
| |
|
|
|
Net increase (decrease) | | | (461,652 | ) | | | (889,253 | ) | | | 210,315 | | | | (181,288 | ) |
| | |
|
|
| |
|
|
| |
|
|
| |
|
|
|
Service Shares | | | | | | | | | | | | | | | | |
Shares sold | | | 156,817,005 | | | | 193,251,954 | | | | 107,782,906 | | | | 135,164,865 | |
Shares issued to holders in reinvestment of dividends | | | 8,068,043 | | | | 5,591,803 | | | | 16,363,574 | | | | 13,580,588 | |
Shares redeemed | | | (166,691,144 | ) | | | (132,023,074 | ) | | | (109,051,599 | ) | | | (78,722,126 | ) |
| | |
|
|
| |
|
|
| |
|
|
| |
|
|
|
Net increase (decrease) | | | (1,806,096 | ) | | | 66,820,683 | | | | 15,094,881 | | | | 70,023,327 | |
| | |
|
|
| |
|
|
| |
|
|
| |
|
|
|
DIVIDENDS AND DISTRIBUTIONS TO SHAREHOLDERS: | | | | | | | | | | | | | | | | |
Net dividends and distributions – Institutional Shares | | | (58,660 | ) | | | (56,380 | ) | | | (87,971 | ) | | | (77,548 | ) |
Net dividends and distributions – Service Shares | | | (8,068,043 | ) | | | (5,591,804 | ) | | | (16,363,574 | ) | | | (13,580,587 | ) |
| | |
|
|
| |
|
|
| |
|
|
| |
|
|
|
Total dividends and distributions | | | (8,126,703 | ) | | | (5,648,184 | ) | | | (16,451,545 | ) | | | (13,658,135 | ) |
| | |
|
|
| |
|
|
| |
|
|
| |
|
|
|
INCREASE (DECREASE) IN NET ASSETS | | | (22,750,339 | ) | | | 68,178,499 | | | | (18,593,139 | ) | | | 70,204,489 | |
NET ASSETS: | | | | | | | | | | | | | | | | |
Beginning of year | | | 339,399,372 | | | | 271,220,873 | | | | 343,345,696 | | | | 273,141,207 | |
| | |
|
|
| |
|
|
| |
|
|
| |
|
|
|
End of year | | $ | 316,649,033 | | | $ | 339,399,372 | | | $ | 324,752,557 | | | $ | 343,345,696 | |
| | |
|
|
| |
|
|
| |
|
|
| |
|
|
|
CHANGES IN SHARES OUTSTANDING | | | | | | | | | | | | | | | | |
Institutional Shares | | | | | | | | | | | | | | | | |
Shares sold | | | 40,748 | | | | 75,790 | | | | 42,127 | | | | 33,527 | |
Shares issued to holders in reinvestment of dividends | | | 5,696 | | | | 6,347 | | | | 7,518 | | | | 7,919 | |
Shares redeemed | | | (94,702 | ) | | | (177,029 | ) | | | (32,029 | ) | | | (57,572 | ) |
| | |
|
|
| |
|
|
| |
|
|
| |
|
|
|
Net increase (decrease) | | | (48,258 | ) | | | (94,892 | ) | | | 17,616 | | | | (16,126 | ) |
| | |
|
|
| |
|
|
| |
|
|
| |
|
|
|
Service Shares | | | | | | | | | | | | | | | | |
Shares sold | | | 15,754,381 | | | | 20,378,228 | | | | 9,631,859 | | | | 12,091,785 | |
Shares issued to holders in reinvestment of dividends | | | 787,818 | | | | 632,414 | | | | 1,404,719 | | | | 1,396,030 | |
Shares redeemed | | | (17,129,739 | ) | | | (14,227,224 | ) | | | (9,893,741 | ) | | | (7,070,209 | ) |
| | |
|
|
| |
|
|
| |
|
|
| |
|
|
|
Net increase (decrease) | | | (587,540 | ) | | | 6,783,418 | | | | 1,142,837 | | | | 6,417,606 | |
| | |
|
|
| |
|
|
| |
|
|
| |
|
|
|
See notes to financial statements.
130
GuideMark® Funds & GuidePath® Funds
STATEMENTS OF CHANGES IN NET ASSETS (Continued)
| | | | | | | | | | | | | | | | |
| | | Absolute Return
Allocation Fund
| | | Multi-Asset Income
Allocation Fund
| |
| | | Year Ended
March 31,
2020
| | | Year Ended
March 31,
2019
| | | Year Ended
March 31,
2020
| | | Year Ended
March 31,
2019
| |
OPERATIONS: | | | | | | | | | | | | | | | | |
Net investment income | | $ | 7,980,276 | | | $ | 9,166,581 | | | $ | 4,341,121 | | | $ | 4,225,503 | |
Net realized loss on investment transactions | | | (178,118 | ) | | | (7,243,675 | ) | | | (10,848,275 | ) | | | (1,773,110 | ) |
Net change in unrealized appreciation (depreciation) on investments | | | (7,912,877 | ) | | | 8,491,240 | | | | (9,697,818 | ) | | | 2,071,922 | |
| | |
|
|
| |
|
|
| |
|
|
| |
|
|
|
Net increase (decrease) in net assets resulting from operations | | | (110,719 | ) | | | 10,414,146 | | | | (16,204,972 | ) | | | 4,524,315 | |
| | |
|
|
| |
|
|
| |
|
|
| |
|
|
|
CAPITAL SHARE TRANSACTIONS: | | | | | | | | | | | | | | | | |
Institutional Shares | | | | | | | | | | | | | | | | |
Shares sold | | | 598,666 | | | | 1,170,515 | | | | — | | | | — | |
Shares issued to holders in reinvestment of dividends | | | 22,693 | | | | 39,085 | | | | — | | | | — | |
Shares redeemed | | | (148,461 | ) | | | (1,882,202 | ) | | | — | | | | — | |
| | |
|
|
| |
|
|
| |
|
|
| |
|
|
|
Net increase (decrease) | | | 472,898 | | | | (672,602 | ) | | | — | | | | — | |
| | |
|
|
| |
|
|
| |
|
|
| |
|
|
|
Service Shares | | | | | | | | | | | | | | | | |
Shares sold | | | 222,565,439 | | | | 234,362,254 | | | | 51,742,493 | | | | 61,005,347 | |
Shares issued to holders in reinvestment of dividends | | | 8,291,027 | | | | 8,665,826 | | | | 3,921,757 | | | | 4,391,358 | |
Shares redeemed | | | (144,128,580 | ) | | | (199,124,001 | ) | | | (55,752,860 | ) | | | (52,361,185 | ) |
| | |
|
|
| |
|
|
| |
|
|
| |
|
|
|
Net increase (decrease) | | | 86,727,886 | | | | 43,904,079 | | | | (88,610 | ) | | | 13,035,520 | |
| | |
|
|
| |
|
|
| |
|
|
| |
|
|
|
DIVIDENDS AND DISTRIBUTIONS TO SHAREHOLDERS: | | | | | | | | | | | | | | | | |
Net dividends and distributions – Institutional Shares | | | (22,693 | ) | | | (39,362 | ) | | | — | | | | — | |
Net dividends and distributions – Service Shares | | | (8,291,027 | ) | | | (8,665,825 | ) | | | (3,921,757 | ) | | | (4,391,358 | ) |
| | |
|
|
| |
|
|
| |
|
|
| |
|
|
|
Total dividends and distributions | | | (8,313,720 | ) | | | (8,705,187 | ) | | | (3,921,757 | ) | | | (4,391,358 | ) |
| | |
|
|
| |
|
|
| |
|
|
| |
|
|
|
INCREASE (DECREASE) IN NET ASSETS | | | 78,776,345 | | | | 44,940,436 | | | | (20,215,339 | ) | | | 13,168,477 | |
NET ASSETS: | | | | | | | | | | | | | | | | |
Beginning of year | | | 313,534,543 | | | | 268,594,107 | | | | 132,260,092 | | | | 119,091,615 | |
| | |
|
|
| |
|
|
| |
|
|
| |
|
|
|
End of year | | $ | 392,310,888 | | | $ | 313,534,543 | | | $ | 112,044,753 | | | $ | 132,260,092 | |
| | |
|
|
| |
|
|
| |
|
|
| |
|
|
|
CHANGES IN SHARES OUTSTANDING | | | | | | | | | | | | | | | | |
Institutional Shares | | | | | | | | | | | | | | | | |
Shares sold | | | 60,832 | | | | 113,305 | | | | — | | | | — | |
Shares issued to holders in reinvestment of dividends | | | 2,165 | | | | 3,920 | | | | — | | | | — | |
Shares redeemed | | | (13,904 | ) | | | (183,031 | ) | | | — | | | | — | |
| | |
|
|
| |
|
|
| |
|
|
| |
|
|
|
Net increase (decrease) | | | 49,093 | | | | (65,806 | ) | | | — | | | | — | |
| | |
|
|
| |
|
|
| |
|
|
| |
|
|
|
CHANGES IN SHARES OUTSTANDING | | | | | | | | | | | | | | | | |
Service Shares | | | | | | | | | | | | | | | | |
Shares sold | | | 21,905,893 | | | | 22,748,702 | | | | 4,878,457 | | | | 5,782,369 | |
Shares issued to holders in reinvestment of dividends | | | 789,546 | | | | 867,537 | | | | 363,964 | | | | 427,132 | |
Shares redeemed | | | (13,692,059 | ) | | | (19,363,624 | ) | | | (5,275,946 | ) | | | (5,041,791 | ) |
| | |
|
|
| |
|
|
| |
|
|
| |
|
|
|
Net increase (decrease) | | | 9,003,380 | | | | 4,252,615 | | | | (33,525 | ) | | | 1,167,710 | |
| | |
|
|
| |
|
|
| |
|
|
| |
|
|
|
See notes to financial statements.
131
GuideMark® Funds & GuidePath® Funds
STATEMENTS OF CHANGES IN NET ASSETS (Continued)
| | | | | | | | | | | | | | | | |
| | | Flexible Income
Allocation Fund
| | | Managed Futures
Strategy Fund1
| |
| | | Year Ended
March 31,
2020
| | | Year Ended
March 31,
2019
| | | Year Ended
March 31,
2020
| | | Year Ended
March 31,
2019
| |
OPERATIONS: | | | | | | | | | | | | | | | | |
Net investment income | | $ | 2,881,327 | | | $ | 1,939,884 | | | $ | 248,028 | | | $ | 726,192 | |
Net realized gain (loss) on investment transactions | | | (1,482,272 | ) | | | (1,770,670 | ) | | | 15,984,318 | | | | (15,738,545 | ) |
Net change in unrealized appreciation (depreciation) on investments | | | (921,236 | ) | | | 934,092 | | | | 2,830,019 | | | | 6,159,345 | |
| | |
|
|
| |
|
|
| |
|
|
| |
|
|
|
Net increase (decrease) in net assets resulting from operations | | | 477,819 | | | | 1,103,306 | | | | 19,062,365 | | | | (8,853,008 | ) |
| | |
|
|
| |
|
|
| |
|
|
| |
|
|
|
CAPITAL SHARE TRANSACTIONS: | | | | | | | | | | | | | | | | |
Institutional Shares | | | | | | | | | | | | | | | | |
Shares sold | | | 15,036 | | | | 9,093 | | | | 1,103,093 | | | | 1,442,410 | |
Shares issued to holders in reinvestment of dividends | | | 1,248 | | | | 3,453 | | | | 47,540 | | | | — | |
Shares redeemed | | | (7,977 | ) | | | (209,840 | ) | | | (962,837 | ) | | | (1,630,704 | ) |
| | |
|
|
| |
|
|
| |
|
|
| |
|
|
|
Net increase (decrease) | | | 8,307 | | | | (197,294 | ) | | | 187,796 | | | | (188,294 | ) |
| | |
|
|
| |
|
|
| |
|
|
| |
|
|
|
Service Shares | | | | | | | | | | | | | | | | |
Shares sold | | | 73,398,511 | | | | 30,258,355 | | | | 226,293,387 | | | | 238,690,777 | |
Shares issued to holders in reinvestment of dividends | | | 2,892,886 | | | | 2,012,768 | | | | 7,130,028 | | | | — | |
Shares redeemed | | | (35,100,214 | ) | | | (26,864,526 | ) | | | (179,766,240 | ) | | | (194,867,711 | ) |
| | |
|
|
| |
|
|
| |
|
|
| |
|
|
|
Net increase | | | 41,191,184 | | | | 5,406,597 | | | | 53,657,175 | | | | 43,823,066 | |
| | |
|
|
| |
|
|
| |
|
|
| |
|
|
|
DIVIDENDS AND DISTRIBUTIONS TO SHAREHOLDERS: | | | | | | | | | | | | | | | | |
Net dividends and distributions – Institutional Shares | | | (1,248 | ) | | | (3,453 | ) | | | (47,540 | ) | | | — | |
Net dividends and distributions – Service Shares | | | (2,892,886 | ) | | | (2,012,768 | ) | | | (7,130,028 | ) | | | — | |
| | |
|
|
| |
|
|
| |
|
|
| |
|
|
|
Total dividends and distributions | | | (2,894,134 | ) | | | (2,016,221 | ) | | | (7,177,568 | ) | | | — | |
| | |
|
|
| |
|
|
| |
|
|
| |
|
|
|
INCREASE IN NET ASSETS | | | 38,783,176 | | | | 4,296,388 | | | | 65,729,768 | | | | 34,781,764 | |
NET ASSETS: | | | | | | | | | | | | | | | | |
Beginning of year | | | 59,767,357 | | | | 55,470,969 | | | | 157,359,060 | | | | 122,577,296 | |
| | |
|
|
| |
|
|
| |
|
|
| |
|
|
|
End of year | | $ | 98,550,533 | | | $ | 59,767,357 | | | $ | 223,088,828 | | | $ | 157,359,060 | |
| | |
|
|
| |
|
|
| |
|
|
| |
|
|
|
CHANGES IN SHARES OUTSTANDING | | | | | | | | | | | | | | | | |
Institutional Shares | | | | | | | | | | | | | | | | |
Shares sold | | | 1,554 | | | | 956 | | | | 124,742 | | | | 184,502 | |
Shares issued to holders in reinvestment of dividends | | | 133 | | | | 365 | | | | 5,744 | | | | — | |
Shares redeemed | | | (830 | ) | | | (21,972 | ) | | | (111,224 | ) | | | (205,481 | ) |
| | |
|
|
| |
|
|
| |
|
|
| |
|
|
|
Net increase (decrease) | | | 857 | | | | (20,651 | ) | | | 19,262 | | | | (20,979 | ) |
| | |
|
|
| |
|
|
| |
|
|
| |
|
|
|
CHANGES IN SHARES OUTSTANDING | | | | | | | | | | | | | | | | |
Service Shares | | | | | | | | | | | | | | | | |
Shares sold | | | 7,620,555 | | | | 3,205,358 | | | | 26,297,941 | | | | 30,855,930 | |
Shares issued to holders in reinvestment of dividends | | | 309,366 | | | | 214,060 | | | | 876,571 | | | | — | |
Shares redeemed | | | (3,718,790 | ) | | | (2,841,102 | ) | | | (21,281,209 | ) | | | (25,285,394 | ) |
| | |
|
|
| |
|
|
| |
|
|
| |
|
|
|
Net increase | | | 4,211,131 | | | | 578,316 | | | | 5,893,303 | | | | 5,570,536 | |
| | |
|
|
| |
|
|
| |
|
|
| |
|
|
|
1Consolidated Statements of Changes in Net Assets (see note 3b). | | | | | | | | | | | | | | | | |
See notes to financial statements.
132
GuideMark® Funds & GuidePath® Funds
STATEMENTS OF CHANGES IN NET ASSETS (Continued)
| | | | | | | | | | | | | | | | |
| | | Conservative Income Fund
| | | Income Fund
| |
| | | Year Ended
March 31,
2020
| | | April 30, 20181
Through
March 31,
2019
| | | Year Ended
March 31,
2020
| | | April 30, 20181
Through
March 31,
2019
| |
OPERATIONS: | | | | | | | | | | | | | | | | |
Net investment income | | $ | 81,195 | | | $ | 2,172 | | | $ | 578,434 | | | $ | 3,295 | |
Net realized gain (loss) on investment transactions | | | (99,937 | ) | | | (468 | ) | | | (1,891,187 | ) | | | 9,932 | |
Net change in unrealized appreciation on investments | | | 23,476 | | | | 1,096 | | | | 1,035,114 | | | | 43,889 | |
| | |
|
|
| |
|
|
| |
|
|
| |
|
|
|
Net increase (decrease) in net assets resulting from operations | | | 4,734 | | | | 2,800 | | | | (277,639 | ) | | | 57,116 | |
| | |
|
|
| |
|
|
| |
|
|
| |
|
|
|
CAPITAL SHARE TRANSACTIONS: | | | | | | | | | | | | | | | | |
Shares sold | | | 9,021,060 | | | | 1,046,413 | | | | 31,868,029 | | | | 5,811,520 | |
Shares issued to holders in reinvestment of dividends | | | 81,578 | | | | 1,400 | | | | 589,863 | | | | 3,522 | |
Shares redeemed | | | (3,274,503 | ) | | | (75,686 | ) | | | (2,715,144 | ) | | | (2,249,008 | ) |
| | |
|
|
| |
|
|
| |
|
|
| |
|
|
|
Net increase | | | 5,828,135 | | | | 972,127 | | | | 29,742,748 | | | | 3,566,034 | |
| | |
|
|
| |
|
|
| |
|
|
| |
|
|
|
DIVIDENDS AND DISTRIBUTIONS TO SHAREHOLDERS: | | | | | | | | | | | | | | | | |
Net dividends and distributions | | | (81,578 | ) | | | (1,400 | ) | | | (589,863 | ) | | | (3,522 | ) |
| | |
|
|
| |
|
|
| |
|
|
| |
|
|
|
Total dividends and distributions | | | (81,578 | ) | | | (1,400 | ) | | | (589,863 | ) | | | (3,522 | ) |
| | |
|
|
| |
|
|
| |
|
|
| |
|
|
|
INCREASE IN NET ASSETS | | | 5,751,291 | | | | 973,527 | | | | 28,875,246 | | | | 3,619,628 | |
NET ASSETS: | | | | | | | | | | | | | | | | |
Beginning of year | | | 973,527 | | | | — | | | | 3,619,628 | | | | — | |
| | |
|
|
| |
|
|
| |
|
|
| |
|
|
|
End of year | | $ | 6,724,818 | | | $ | 973,527 | | | $ | 32,494,874 | | | $ | 3,619,628 | |
| | |
|
|
| |
|
|
| |
|
|
| |
|
|
|
CHANGES IN SHARES OUTSTANDING | | | | | | | | | | | | | | | | |
Shares sold | | | 900,671 | | | | 104,932 | | | | 3,142,291 | | | | 593,250 | |
Shares issued to holders in reinvestment of dividends | | | 8,153 | | | | 140 | | | | 58,174 | | | | 358 | |
Shares redeemed | | | (326,952 | ) | | | (7,597 | ) | | | (269,703 | ) | | | (227,678 | ) |
| | |
|
|
| |
|
|
| |
|
|
| |
|
|
|
Net increase | | | 581,872 | | | | 97,475 | | | | 2,930,762 | | | | 365,930 | |
| | |
|
|
| |
|
|
| |
|
|
| |
|
|
|
| 1 | | Commencement of Operations. |
See notes to financial statements.
133
GuideMark® Funds & GuidePath® Funds
STATEMENTS OF CHANGES IN NET ASSETS (Continued)
| | | | | | | | |
| | | Growth & Income Fund
| |
| | | Year Ended
March 31,
2020
| | | April 30, 20181
Through
March 31,
2019
| |
OPERATIONS: | | | | | | | | |
Net investment income | | $ | 454,681 | | | $ | 7,702 | |
Net realized loss on investment transactions | | | (2,211,753 | ) | | | (2,711 | ) |
Net change in unrealized appreciation (depreciation) on investments | | | (2,484,867 | ) | | | 21,917 | |
| | |
|
|
| |
|
|
|
Net increase (decrease) in net assets resulting from operations | | | (4,241,939 | ) | | | 26,908 | |
| | |
|
|
| |
|
|
|
CAPITAL SHARE TRANSACTIONS: | | | | | | | | |
Shares sold | | | 36,359,310 | | | | 4,494,615 | |
Shares issued to holders in reinvestment of dividends | | | 394,397 | | | | 5,095 | |
Shares redeemed | | | (2,708,772 | ) | | | (2,463 | ) |
| | |
|
|
| |
|
|
|
Net increase | | | 34,044,935 | | | | 4,497,247 | |
| | |
|
|
| |
|
|
|
DIVIDENDS AND DISTRIBUTIONS TO SHAREHOLDERS: | | | | | | | | |
Net dividends and distributions | | | (394,397 | ) | | | (5,095 | ) |
| | |
|
|
| |
|
|
|
Total dividends and distributions | | | (394,397 | ) | | | (5,095 | ) |
| | |
|
|
| |
|
|
|
INCREASE IN NET ASSETS | | | 29,408,599 | | | | 4,519,060 | |
NET ASSETS: | | | | | | | | |
Beginning of year | | | 4,519,060 | | | | — | |
| | |
|
|
| |
|
|
|
End of year | | $ | 33,927,659 | | | $ | 4,519,060 | |
| | |
|
|
| |
|
|
|
CHANGES IN SHARES OUTSTANDING | | | | | | | | |
Shares sold | | | 3,673,636 | | | | 462,166 | |
Shares issued to holders in reinvestment of dividends | | | 39,418 | | | | 523 | |
Shares redeemed | | | (283,441 | ) | | | (253 | ) |
| | |
|
|
| |
|
|
|
Net increase | | | 3,429,613 | | | | 462,436 | |
| | |
|
|
| |
|
|
|
| 1 | | Commencement of Operations. |
See notes to financial statements.
134
GuideMark® Funds & GuidePath® Funds
FINANCIAL HIGHLIGHTS
| | | | | | | | | | | | | | | | | | | | |
| | | Large Cap Core Fund
| |
| | | Institutional
| |
| | | Year Ended
March 31,
2020
| | | Year Ended
March 31,
2019
| | | Year Ended
March 31,
2018
| | | Year Ended
March 31,
2017
| | | Year Ended
March 31,
2016
| |
Per share data for a share of capital stock outstanding for the entire year and selected information for the year are as follows: | | | | | | | | | | | | | | | | | | | | |
Net asset value, beginning of year | | | $18.650 | | | | $17.755 | | | | $16.140 | | | | $14.85 | | | | $15.29 | |
Income from investment operations: | | | | | | | | | | | | | | | | | | | | |
Net investment income1 | | | 0.234 | | | | 0.175 | | | | 0.157 | | | | 0.20 | | | | 0.13 | |
Net realized and unrealized gains (losses) on investments | | | (2.234 | ) | | | 1.194 | | | | 2.280 | | | | 1.62 | | | | (0.06 | )2 |
| | |
|
|
| |
|
|
| |
|
|
| |
|
|
| |
|
|
|
Total from investment operations | | | (2.000 | ) | | | 1.369 | | | | 2.437 | | | | 1.82 | | | | 0.07 | |
| | |
|
|
| |
|
|
| |
|
|
| |
|
|
| |
|
|
|
Less distributions: | | | | | | | | | | | | | | | | | | | | |
Dividends from net investment income | | | (0.116 | ) | | | (0.191 | ) | | | (0.163 | ) | | | (0.19 | ) | | | (0.11 | ) |
Dividends from net realized gains | | | (0.186 | ) | | | (0.283 | ) | | | (0.659 | ) | | | (0.34 | ) | | | (0.40 | ) |
| | |
|
|
| |
|
|
| |
|
|
| |
|
|
| |
|
|
|
Total distributions | | | (0.302 | ) | | | (0.474 | ) | | | (0.822 | ) | | | (0.53 | ) | | | (0.51 | ) |
| | |
|
|
| |
|
|
| |
|
|
| |
|
|
| |
|
|
|
Net asset value, end of year | | | $16.348 | | | | $18.650 | | | | $17.755 | | | | $16.14 | | | | $14.85 | |
| | |
|
|
| |
|
|
| |
|
|
| |
|
|
| |
|
|
|
Total return | | | (11.07)% | | | | 8.09% | | | | 15.10% | | | | 12.46% | | | | 0.47% | |
Supplemental data and ratios: | | | | | | | | | | | | | | | | | | | | |
Net assets, end of year | | | $479,829 | | | | $538,016 | | | | $821,049 | | | | $42,855,994 | | | | $31,353,268 | |
Ratio of expenses to average net assets | | | | | | | | | | | | | | | | | | | | |
Before expense reimbursement (recapture) and securities lending credit including interest expense3 | | | 0.59% | | | | 0.63% | | | | 0.65% | | | | 0.66% | | | | 0.80% | |
After expense reimbursement (recapture) and securities lending credit including interest expense3 | | | 0.56% | | | | 0.60% | | | | 0.60% | | | | 0.59% | | | | 0.76% | |
Before expense reimbursement (recapture) and securities lending credit excluding interest expense | | | 0.59% | | | | 0.63% | | | | 0.65% | | | | 0.66% | | | | 0.80% | |
After expense reimbursement (recapture) and securities lending credit excluding interest expense | | | 0.56% | | | | 0.60% | | | | 0.60% | | | | 0.59% | | | | 0.76% | |
Ratio of net investment income to average net assets | | | | | | | | | | | | | | | | | | | | |
Before expense reimbursement (recapture) and securities lending credit | | | 1.16% | | | | 0.91% | | | | 0.91% | | | | 1.23% | | | | 0.79% | |
After expense reimbursement (recapture) and securities lending credit | | | 1.19% | | | | 0.94% | | | | 0.96% | | | | 1.30% | | | | 0.83% | |
Portfolio turnover rate | | | 28.54% | | | | 45.31% | | | | 55.07% | | | | 90.46% | | | | 115.67% | |
Portfolio Turnover is calculated for the Fund as a whole.
| 1 | | Net investment income per share has been calculated based on average shares outstanding during the year. |
| 2 | | Realized and unrealized gains and losses per share in this caption are balancing amounts necessary to reconcile the change in net asset value per share for the year, and may not reconcile with the aggregate gains and losses in the Statement of Operations due to share transactions for the year. |
| 3 | | Includes interest expense where applicable. See Note 6 in the Notes to the Financial Statements. |
See notes to financial statements.
135
GuideMark® Funds & GuidePath® Funds
FINANCIAL HIGHLIGHTS
| | | | | | | | | | | | | | | | | | | | |
| | | Large Cap Core Fund
| |
| | | Service
| |
| | | Year Ended
March 31,
2020
| | | Year Ended
March 31,
2019
| | | Year Ended
March 31,
2018
| | | Year Ended
March 31,
2017
| | | Year Ended
March 31,
2016
| |
Per share data for a share of capital stock outstanding for the entire year and selected information for the year are as follows: | | | | | | | | | | | | | | | | | | | | |
Net asset value, beginning of year | | | $18.401 | | | | $17.503 | | | | $15.930 | | | | $14.68 | | | | $15.14 | |
Income from investment operations: | | | | | | | | | | | | | | | | | | | | |
Net investment income1 | | | 0.114 | | | | 0.073 | | | | 0.074 | | | | 0.11 | | | | 0.07 | |
Net realized and unrealized gains (losses) on investments | | | (2.202 | ) | | | 1.184 | | | | 2.241 | | | | 1.59 | | | | (0.08 | )2 |
| | |
|
|
| |
|
|
| |
|
|
| |
|
|
| |
|
|
|
Total from investment operations | | | (2.088 | ) | | | 1.257 | | | | 2.315 | | | | 1.70 | | | | (0.01 | ) |
| | |
|
|
| |
|
|
| |
|
|
| |
|
|
| |
|
|
|
Less distributions: | | | | | | | | | | | | | | | | | | | | |
Dividends from net investment income | | | (0.021 | ) | | | (0.076 | ) | | | (0.083 | ) | | | (0.11 | ) | | | (0.05 | ) |
Dividends from net realized gains | | | (0.186 | ) | | | (0.283 | ) | | | (0.659 | ) | | | (0.34 | ) | | | (0.40 | ) |
| | |
|
|
| |
|
|
| |
|
|
| |
|
|
| |
|
|
|
Total distributions | | | (0.207 | ) | | | (0.359 | ) | | | (0.742 | ) | | | (0.45 | ) | | | (0.45 | ) |
| | |
|
|
| |
|
|
| |
|
|
| |
|
|
| |
|
|
|
Net asset value, end of year | | | $16.106 | | | | $18.401 | | | | $17.503 | | | | $15.93 | | | | $14.68 | |
| | |
|
|
| |
|
|
| |
|
|
| |
|
|
| |
|
|
|
Total return | | | (11.59)% | | | | 7.47% | | | | 14.53% | | | | 11.74% | | | | (0.08)% | |
Supplemental data and ratios: | | | | | | | | | | | | | | | | | | | | |
Net assets, end of year | | | $326,952,939 | | | | $332,500,169 | | | | $306,450,000 | | | | $159,857,853 | | | | $218,788,468 | |
Ratio of expenses to average net assets | | | | | | | | | | | | | | | | | | | | |
Before expense reimbursement (recapture) and securities lending credit including interest expense3 | | | 1.18% | | | | 1.22% | | | | 1.21% | | | | 1.23% | | | | 1.33% | |
After expense reimbursement (recapture) and securities lending credit including interest expense3 | | | 1.14% | | | | 1.19% | | | | 1.17% | | | | 1.16% | | | | 1.27% | |
Before expense reimbursement (recapture) and securities lending credit excluding interest expense | | | 1.18% | | | | 1.22% | | | | 1.21% | | | | 1.23% | | | | 1.33% | |
After expense reimbursement (recapture) and securities lending credit excluding interest expense | | | 1.14% | | | | 1.19% | | | | 1.17% | | | | 1.16% | | | | 1.27% | |
Ratio of net investment income to average net assets | | | | | | | | | | | | | | | | | | | | |
Before expense reimbursement (recapture) and securities lending credit | | | 0.55% | | | | 0.37% | | | | 0.40% | | | | 0.65% | | | | 0.41% | |
After expense reimbursement (recapture) and securities lending credit | | | 0.59% | | | | 0.40% | | | | 0.44% | | | | 0.72% | | | | 0.47% | |
Portfolio turnover rate | | | 28.54% | | | | 45.31% | | | | 55.07% | | | | 90.46% | | | | 115.67% | |
Portfolio Turnover is calculated for the Fund as a whole.
| 1 | | Net investment income per share has been calculated based on average shares outstanding during the year. |
| 2 | | Realized and unrealized gains and losses per share in this caption are balancing amounts necessary to reconcile the change in net asset value per share for the year, and may not reconcile with the aggregate gains and losses in the Statement of Operations due to share transactions for the year. |
| 3 | | Includes interest expense where applicable. See Note 6 in the Notes to the Financial Statements. |
See notes to financial statements.
136
GuideMark® Funds & GuidePath® Funds
FINANCIAL HIGHLIGHTS
| | | | | | | | | | | | | | | | | | | | |
| | | Emerging Markets Fund
| |
| | | Institutional
| |
| | | Year Ended
March 31,
2020
| | | Year Ended
March 31,
2019
| | | Year Ended
March 31,
2018
| | | Year Ended
March 31,
2017
| | | Year Ended
March 31,
2016
| |
Per share data for a share of capital stock outstanding for the entire year and selected information for the year are as follows: | | | | | | | | | | | | | | | | | | | | |
Net asset value, beginning of year | | | $12.851 | | | | $16.577 | | | | $13.460 | | | | $11.37 | | | | $12.46 | |
Income from investment operations: | | | | | | | | | | | | | | | | | | | | |
Net investment income1 | | | 0.244 | | | | 0.190 | | | | 0.254 | | | | 0.14 | | | | 0.16 | |
Net realized and unrealized gains (losses) on investments | | | (2.598 | ) | | | (1.983 | ) | | | 3.049 | | | | 2.05 | | | | (1.03 | ) |
| | |
|
|
| |
|
|
| |
|
|
| |
|
|
| |
|
|
|
Total from investment operations | | | (2.354 | ) | | | (1.793 | ) | | | 3.303 | | | | 2.19 | | | | (0.87 | ) |
| | |
|
|
| |
|
|
| |
|
|
| |
|
|
| |
|
|
|
Less distributions: | | | | | | | | | | | | | | | | | | | | |
Dividends from net investment income | | | (0.306 | ) | | | (1.263 | ) | | | (0.186 | ) | | | (0.10 | ) | | | (0.22 | ) |
Dividends from net realized gains | | | — | | | | (0.670 | ) | | | — | | | | — | | | | — | |
| | |
|
|
| |
|
|
| |
|
|
| |
|
|
| |
|
|
|
Total distributions | | | (0.306 | ) | | | (1.933 | ) | | | (0.186 | ) | | | (0.10 | ) | | | (0.22 | ) |
| | |
|
|
| |
|
|
| |
|
|
| |
|
|
| |
|
|
|
Net asset value, end of year | | | $10.191 | | | | $12.851 | | | | $16.577 | | | | $13.46 | | | | $11.37 | |
| | |
|
|
| |
|
|
| |
|
|
| |
|
|
| |
|
|
|
Total return | | | (18.91)% | | | | (9.53)% | | | | 24.52%3 | | | | 19.61% | | | | (6.98)% | |
Supplemental data and ratios: | | | | | | | | | | | | | | | | | | | | |
Net assets, end of year | | | $8,097 | | | | $9,985 | | | | $11,036 | | | | $11,925,354 | | | | $6,081,265 | |
Ratio of expenses to average net assets | | | | | | | | | | | | | | | | | | | | |
Before expense reimbursement (recapture) and securities lending credit including interest expense2 | | | 1.19% | | | | 1.09% | | | | 1.01%4 | | | | 1.06% | | | | 0.88% | |
After expense reimbursement (recapture) and securities lending credit including interest expense2 | | | 1.05% | | | | 1.06% | | | | 1.00%4 | | | | 1.05% | | | | 0.84% | |
Before expense reimbursement (recapture) and securities lending credit excluding interest expense | | | 1.19% | | | | 1.08% | | | | 1.01%4 | | | | 1.06% | | | | 0.88% | |
After expense reimbursement (recapture) and securities lending credit excluding interest expense | | | 1.05% | | | | 1.05% | | | | 1.00%4 | | | | 1.05% | | | | 0.84% | |
Ratio of net investment income to average net assets | | | | | | | | | | | | | | | | | | | | |
Before expense reimbursement (recapture) and securities lending credit | | | 1.78% | | | | 1.30% | | | | 2.13%4 | | | | 1.10% | | | | 1.25% | |
After expense reimbursement (recapture) and securities lending credit | | | 1.92% | | | | 1.33% | | | | 2.14%4 | | | | 1.11% | | | | 1.29% | |
Portfolio turnover rate | | | 42.60% | | | | 47.18% | | | | 30.97% | | | | 60.19% | | | | 152.82% | |
Portfolio Turnover is calculated for the Fund as a whole.
| 1 | | Net investment income per share has been calculated based on average shares outstanding during the year. |
| 2 | | Includes interest expense where applicable. See Note 6 in the Notes to the Financial Statements. |
| 3 | | During the period August 3, 2017 through September 25, 2017, there were no Institutional Shares of the Fund outstanding. Performance information provided for the Institutional Shares during that period reflects the last calculated net asset value of the Institutional Shares on August 2, 2017, without any adjustments. Had there been Institutional Shares outstanding during the period August 3, 2017 through September 25, 2017, their annual returns would have been substantially similar to those of the Service Shares of the Fund because they would have been invested in the same portfolio securities, but would have differed to the extent that the classes have different expenses. Because the Service Shares have higher expenses than the Institutional Shares, the returns of the Service Shares would have been lower than the returns of the Institutional Shares during the same period. |
See notes to financial statements.
137
GuideMark® Funds & GuidePath® Funds
FINANCIAL HIGHLIGHTS
| | | | | | | | | | | | | | | | | | | | |
| | | Emerging Markets Fund
| |
| | | Service
| |
| | | Year Ended
March 31,
2020
| | | Year Ended
March 31,
2019
| | | Year Ended
March 31,
2018
| | | Year Ended
March 31,
2017
| | | Year Ended
March 31,
2016
| |
Per share data for a share of capital stock outstanding for the entire year and selected information for the year are as follows: | | | | | | | | | | | | | | | | | | | | |
Net asset value, beginning of year | | | $13.278 | | | | $17.063 | | | | $13.600 | | | | $11.49 | | | | $12.57 | |
Income from investment operations: | | | | | | | | | | | | | | | | | | | | |
Net investment income1 | | | 0.175 | | | | 0.109 | | | | 0.096 | | | | 0.09 | | | | 0.06 | |
Net realized and unrealized gains (losses) on investments | | | (2.690 | ) | | | (2.028 | ) | | | 3.485 | | | | 2.06 | | | | (0.99 | ) |
| | |
|
|
| |
|
|
| |
|
|
| |
|
|
| |
|
|
|
Total from investment operations | | | (2.515 | ) | | | (1.919 | ) | | | 3.581 | | | | 2.15 | | | | (0.93 | ) |
| | |
|
|
| |
|
|
| |
|
|
| |
|
|
| |
|
|
|
Less distributions: | | | | | | | | | | | | | | | | | | | | |
Dividends from net investment income | | | (0.247 | ) | | | (1.196 | ) | | | (0.118 | ) | | | (0.04 | ) | | | (0.15 | ) |
Dividends from net realized gains | | | — | | | | (0.670 | ) | | | — | | | | — | | | | — | |
| | |
|
|
| |
|
|
| |
|
|
| |
|
|
| |
|
|
|
Total distributions | | | (0.247 | ) | | | (1.866 | ) | | | (0.118 | ) | | | (0.04 | ) | | | (0.15 | ) |
| | |
|
|
| |
|
|
| |
|
|
| |
|
|
| |
|
|
|
Net asset value, end of year | | | $10.516 | | | | $13.278 | | | | $17.063 | | | | $13.60 | | | | $11.49 | |
| | |
|
|
| |
|
|
| |
|
|
| |
|
|
| |
|
|
|
Total return | | | (19.40)% | | | | (10.05)% | | | | 26.37% | | | | 18.78% | | | | (7.38)% | |
Supplemental data and ratios: | | | | | | | | | | | | | | | | | | | | |
Net assets, end of year | | | $64,153,851 | | | | $85,623,549 | | | | $109,589,630 | | | | $106,077,974 | | | | $118,224,652 | |
Ratio of expenses to average net assets | | | | | | | | | | | | | | | | | | | | |
Before expense reimbursement (recapture) and securities lending credit including interest expense2 | | | 1.79% | | | | 1.69% | | | | 1.58% | | | | 1.64% | | | | 1.52% | |
After expense reimbursement (recapture) and securities lending credit including interest expense2 | | | 1.65% | | | | 1.66% | | | | 1.57% | | | | 1.63% | | | | 1.48% | |
Before expense reimbursement (recapture) and securities lending credit excluding interest expense | | | 1.79% | | | | 1.68% | | | | 1.58% | | | | 1.64% | | | | 1.52% | |
After expense reimbursement (recapture) and securities lending credit excluding interest expense | | | 1.65% | | | | 1.65% | | | | 1.57% | | | | 1.63% | | | | 1.48% | |
Ratio of net investment income to average net assets | | | | | | | | | | | | | | | | | | | | |
Before expense reimbursement (recapture) and securities lending credit | | | 1.20% | | | | 0.72% | | | | 0.61% | | | | 0.73% | | | | 0.44% | |
After expense reimbursement (recapture) and securities lending credit | | | 1.34% | | | | 0.75% | | | | 0.62% | | | | 0.74% | | | | 0.48% | |
Portfolio turnover rate | | | 42.60% | | | | 47.18% | | | | 30.97% | | | | 60.19% | | | | 152.82% | |
Portfolio Turnover is calculated for the Fund as a whole.
| 1 | | Net investment income per share has been calculated based on average shares outstanding during the year. |
| 2 | | Includes interest expense where applicable. See Note 6 in the Notes to the Financial Statements. |
See notes to financial statements.
138
GuideMark® Funds & GuidePath® Funds
FINANCIAL HIGHLIGHTS
| | | | | | | | | | | | | | | | | | | | |
| | | Small/Mid Cap Core Fund
| |
| | | Service
| |
| | | Year Ended
March 31,
2020
| | | Year Ended
March 31,
2019
| | | Year Ended
March 31,
2018
| | | Year Ended
March 31,
2017
| | | Year Ended
March 31,
2016
| |
Per share data for a share of capital stock outstanding for the entire year and selected information for the year are as follows: | | | | | | | | | | | | | | | | | | | | |
Net asset value, beginning of year | | | $14.385 | | | | $14.908 | | | | $17.860 | | | | $14.96 | | | | $17.31 | |
Income from investment operations: | | | | | | | | | | | | | | | | | | | | |
Net investment income (loss)1 | | | (0.007 | ) | | | (0.022 | ) | | | (0.022 | ) | | | 0.04 | | | | (0.03 | ) |
Net realized and unrealized gains (losses) on investments | | | (3.393 | ) | | | 0.348 | | | | 2.259 | | | | 2.91 | | | | (1.90 | ) |
| | |
|
|
| |
|
|
| |
|
|
| |
|
|
| |
|
|
|
Total from investment operations | | | (3.400 | ) | | | 0.326 | | | | 2.237 | | | | 2.95 | | | | (1.93 | ) |
| | |
|
|
| |
|
|
| |
|
|
| |
|
|
| |
|
|
|
Less distributions: | | | | | | | | | | | | | | | | | | | | |
Dividends from net investment income | | | (0.016 | ) | | | — | | | | (0.050 | ) | | | (0.05 | ) | | | — | |
Dividends from net realized gains | | | (0.204 | ) | | | (0.849 | ) | | | (5.139 | ) | | | — | | | | (0.42 | ) |
| | |
|
|
| |
|
|
| |
|
|
| |
|
|
| |
|
|
|
Total distributions | | | (0.220 | ) | | | (0.849 | ) | | | (5.189 | ) | | | (0.05 | ) | | | (0.42 | ) |
| | |
|
|
| |
|
|
| |
|
|
| |
|
|
| |
|
|
|
Net asset value, end of year | | | $10.765 | | | | $14.385 | | | | $14.908 | | | | $17.86 | | | | $14.96 | |
| | |
|
|
| |
|
|
| |
|
|
| |
|
|
| |
|
|
|
Total return | | | (24.10)% | | | | 2.99% | | | | 12.45% | | | | 19.71% | | | | (11.15)% | |
Supplemental data and ratios: | | | | | | | | | | | | | | | | | | | | |
Net assets, end of year | | | $52,904,611 | | | | $63,904,945 | | | | $54,471,360 | | | | $50,657,342 | | | | $48,196,975 | |
Ratio of expenses to average net assets | | | | | | | | | | | | | | | | | | | | |
Before expense reimbursement (recapture) and securities lending credit including interest expense2 | | | 1.50% | | | | 1.56% | | | | 1.55% | | | | 1.50% | | | | 1.58% | |
After expense reimbursement (recapture) and securities lending credit including interest expense2 | | | 1.39% | | | | 1.45% | | | | 1.39% | | | | 1.24% | | | | 1.41% | |
Before expense reimbursement (recapture) and securities lending credit excluding interest expense | | | 1.50% | | | | 1.56% | | | | 1.55% | | | | 1.50% | | | | 1.58% | |
After expense reimbursement (recapture) and securities lending credit excluding interest expense | | | 1.39% | | | | 1.45% | | | | 1.39% | | | | 1.24% | | | | 1.41% | |
Ratio of net investment income to average net assets | | | | | | | | | | | | | | | | | | | | |
Before expense reimbursement (recapture) and securities lending credit | | | (0.16)% | | | | (0.25)% | | | | (0.29)% | | | | 0.00% | | | | (0.32)% | |
After expense reimbursement (recapture) and securities lending credit | | | (0.05)% | | | | (0.14)% | | | | (0.13)% | | | | 0.26% | | | | (0.15)% | |
Portfolio turnover rate | | | 26.54% | | | | 39.01% | | | | 32.87% | | | | 42.22% | | | | 146.02% | |
| 1 | | Net investment income/(loss) per share has been calculated based on average shares outstanding during the year. |
| 2 | | Includes interest expense where applicable. See Note 6 in the Notes to the Financial Statements. |
See notes to financial statements.
139
GuideMark® Funds & GuidePath® Funds
FINANCIAL HIGHLIGHTS
| | | | | | | | | | | | | | | | | | | | |
| | | World ex-US Fund
| |
| | | Institutional
| |
| | | Year Ended
March 31,
2020
| | | Year Ended
March 31,
2019
| | | Year Ended
March 31,
2018
| | | Year Ended
March 31,
2017
| | | Year Ended
March 31,
2016
| |
Per share data for a share of capital stock outstanding for the entire year and selected information for the year are as follows: | | | | | | | | | | | | | | | | | | | | |
Net asset value, beginning of year | | | $9.100 | | | | $9.759 | | | | $8.380 | | | | $7.74 | | | | $8.75 | |
Income from investment operations: | | | | | | | | | | | | | | | | | | | | |
Net investment income1 | | | 0.222 | | | | 0.194 | | | | 0.243 | | | | 0.15 | | | | 0.13 | |
Net realized and unrealized gains (losses) on investments | | | (1.610 | ) | | | (0.680 | ) | | | 1.305 | | | | 0.65 | | | | (0.91 | ) |
| | |
|
|
| |
|
|
| |
|
|
| |
|
|
| |
|
|
|
Total from investment operations | | | (1.388 | ) | | | (0.486 | ) | | | 1.548 | | | | 0.80 | | | | (0.78 | ) |
| | |
|
|
| |
|
|
| |
|
|
| |
|
|
| |
|
|
|
Less distributions: | | | | | | | | | | | | | | | | | | | | |
Dividends from net investment income | | | (0.175 | ) | | | (0.173 | ) | | | (0.169 | ) | | | (0.16 | ) | | | (0.23 | ) |
| | |
|
|
| |
|
|
| |
|
|
| |
|
|
| |
|
|
|
Total distributions | | | (0.175 | ) | | | (0.173 | ) | | | (0.169 | ) | | | (0.16 | ) | | | (0.23 | ) |
| | |
|
|
| |
|
|
| |
|
|
| |
|
|
| |
|
|
|
Net asset value, end of year | | | $7.537 | | | | $9.100 | | | | $9.759 | | | | $8.38 | | | | $7.74 | |
| | |
|
|
| |
|
|
| |
|
|
| |
|
|
| |
|
|
|
Total return | | | (15.69)% | | | | (4.79)% | | | | 18.49%3 | | | | 10.48% | | | | (9.00)% | |
Supplemental data and ratios: | | | | | | | | | | | | | | | | | | | | |
Net assets, end of year | | | $78,232 | | | | $534,233 | | | | $822,817 | | | | $75,295,608 | | | | $52,879,582 | |
Ratio of expenses to average net assets | | | | | | | | | | | | | | | | | | | | |
Before expense reimbursement (recapture) and securities lending credit including interest expense2 | | | 0.77% | | | | 0.80% | | | | 0.83%4 | | | | 0.84% | | | | 0.95% | |
After expense reimbursement (recapture) and securities lending credit including interest expense2 | | | 0.79% | | | | 0.79% | | | | 0.79%4 | | | | 0.79% | | | | 0.90% | |
Before expense reimbursement (recapture) and securities lending credit excluding interest expense | | | 0.77% | | | | 0.80% | | | | 0.83%4 | | | | 0.84% | | | | 0.95% | |
After expense reimbursement (recapture) and securities lending credit excluding interest expense | | | 0.79% | | | | 0.79% | | | | 0.79%4 | | | | 0.79% | | | | 0.90% | |
Ratio of net investment income to average net assets | | | | | | | | | | | | | | | | | | | | |
Before expense reimbursement (recapture) and securities lending credit | | | 2.43% | | | | 2.04% | | | | 3.01%4 | | | | 1.83% | | | | 1.54% | |
After expense reimbursement (recapture) and securities lending credit | | | 2.41% | | | | 2.05% | | | | 3.05%4 | | | | 1.88% | | | | 1.59% | |
Portfolio turnover rate | | | 25.52% | | | | 59.18% | | | | 84.22% | | | | 60.68% | | | | 114.74% | |
Portfolio Turnover is calculated for the Fund as a whole.
| 1 | | Net investment income per share has been calculated based on average shares outstanding during the year. |
| 2 | | Includes interest expense where applicable. See Note 6 in the Notes to the Financial Statements. |
| 3 | | During the year August 3, 2017 through September 5, 2017 there were no Insttutional Shares of the Fund outstanding. Perfomance information provided for the Institutional Shares during that year reflects the last calculated net asset value of the Institutional Shares on August 2, 2017, without any adjustments. Had there been Institutional Shares outstanding during the year August 3, 2017 through September 5, 2017, their annual returns would have been substantially smilar to those of the Service Shares of the Fund because they would have been invested in the same portfolio securities, but would have differed to the extent that the classes have different expenses. Because the Service Shares have higher expenses than the Institutional Shares, the returns of the Service Shares would have been lower than the returns of the Institutional Shares during the same period. |
See notes to financial statements.
140
GuideMark® Funds & GuidePath® Funds
FINANCIAL HIGHLIGHTS
| | | | | | | | | | | | | | | | | | | | |
| | | World ex-US Fund
| |
| | | Service
| |
| | | Year Ended
March 31,
2020
| | | Year Ended
March 31,
2019
| | | Year Ended
March 31,
2018
| | | Year Ended
March 31,
2017
| | | Year Ended
March 31,
2016
| |
Per share data for a share of capital stock outstanding for the entire year and selected information for the year are as follows: | | | | | | | | | | | | | | | | | | | | |
Net asset value, beginning of year | | | $8.856 | | | | $9.507 | | | | $8.260 | | | | $7.66 | | | | $8.70 | |
Income from investment operations: | | | | | | | | | | | | | | | | | | | | |
Net investment income1 | | | 0.142 | | | | 0.121 | | | | 0.087 | | | | 0.11 | | | | 0.08 | |
Net realized and unrealized gains (losses) on investments | | | (1.538 | ) | | | (0.643 | ) | | | 1.296 | | | | 0.63 | | | | (0.91 | ) |
| | |
|
|
| |
|
|
| |
|
|
| |
|
|
| |
|
|
|
Total from investment operations | | | (1.396 | ) | | | (0.522 | ) | | | 1.383 | | | | 0.74 | | | | (0.83 | ) |
| | |
|
|
| |
|
|
| |
|
|
| |
|
|
| |
|
|
|
Less distributions: | | | | | | | | | | | | | | | | | | | | |
Dividends from net investment income | | | (0.157 | ) | | | (0.129 | ) | | | (0.136 | ) | | | (0.14 | ) | | | (0.21 | ) |
| | |
|
|
| |
|
|
| |
|
|
| |
|
|
| |
|
|
|
Total distributions | | | (0.157 | ) | | | (0.129 | ) | | | (0.136 | ) | | | (0.14 | ) | | | (0.21 | ) |
| | |
|
|
| |
|
|
| |
|
|
| |
|
|
| |
|
|
|
Net asset value, end of year | | | $7.303 | | | | $8.856 | | | | $9.507 | | | | $8.26 | | | | $7.66 | |
| | |
|
|
| |
|
|
| |
|
|
| |
|
|
| |
|
|
|
Total return | | | (16.16)% | | | | (5.36)% | | | | 16.76% | | | | 9.85% | | | | (9.59)% | |
Supplemental data and ratios: | | | | | | | | | | | | | | | | | | | | |
Net assets, end of year | | | $110,561,165 | | | | $216,435,566 | | | | $212,049,697 | | | | $112,737,823 | | | | $135,305,242 | |
Ratio of expenses to average net assets | | | | | | | | | | | | | | | | | | | | |
Before expense reimbursement (recapture) and securities lending credit including interest expense2 | | | 1.36% | | | | 1.40% | | | | 1.38% | | | | 1.42% | | | | 1.52% | |
After expense reimbursement (recapture) and securities lending credit including interest expense2 | | | 1.35% | | | | 1.39% | | | | 1.39% | | | | 1.39% | | | | 1.52% | |
Before expense reimbursement (recapture) and securities lending credit excluding interest expense | | | 1.36% | | | | 1.40% | | | | 1.38% | | | | 1.42% | | | | 1.52% | |
After expense reimbursement (recapture) and securities lending credit excluding interest expense | | | 1.35% | | | | 1.39% | | | | 1.39% | | | | 1.39% | | | | 1.52% | |
Ratio of net investment income to average net assets | | | | | | | | | | | | | | | | | | | | |
Before expense reimbursement (recapture) and securities lending credit | | | 1.58% | | | | 1.32% | | | | 0.95% | | | | 1.36% | | | | 0.92% | |
After expense reimbursement (recapture) and securities lending credit | | | 1.59% | | | | 1.33% | | | | 0.94% | | | | 1.39% | | | | 0.92% | |
Portfolio turnover rate | | | 25.52% | | | | 59.18% | | | | 84.22% | | | | 60.68% | | | | 114.74% | |
Portfolio Turnover is calculated for the Fund as a whole.
| 1 | | Net investment income per share has been calculated based on average shares outstanding during the year. |
| 2 | | Includes interest expense where applicable. See Note 6 in the Notes to the Financial Statements. |
See notes to financial statements.
141
GuideMark® Funds & GuidePath® Funds
FINANCIAL HIGHLIGHTS
| | | | | | | | | | | | | | | | | | | | |
| | | Core Fixed Income Fund
| |
| | | Service
| |
| | | Year Ended
March 31,
2020
| | | Year Ended
March 31,
2019
| | | Year Ended
March 31,
2018
| | | Year Ended
March 31,
2017
| | | Year Ended
March 31,
2016
| |
Per share data for a share of capital stock outstanding for the entire year and selected information for the year are as follows: | | | | | | | | | | | | | | | | | | | | |
Net asset value, beginning of year | | | $9.270 | | | | $9.131 | | | | $9.320 | | | | $9.54 | | | | $9.69 | |
Income from investment operations: | | | | | | | | | | | | | | | | | | | | |
Net investment income1 | | | 0.170 | | | | 0.176 | | | | 0.133 | | | | 0.12 | | | | 0.12 | |
Net realized and unrealized gains (losses) on investments | | | 0.490 | | | | 0.144 | | | | (0.098 | ) | | | (0.11 | ) | | | (0.03 | ) |
| | |
|
|
| |
|
|
| |
|
|
| |
|
|
| |
|
|
|
Total from investment operations | | | 0.660 | | | | 0.320 | | | | 0.035 | | | | 0.01 | | | | 0.09 | |
| | |
|
|
| |
|
|
| |
|
|
| |
|
|
| |
|
|
|
Less distributions: | | | | | | | | | | | | | | | | | | | | |
Dividends from net investment income | | | (0.108 | ) | | | (0.181 | ) | | | (0.168 | ) | | | (0.17 | ) | | | (0.13 | ) |
Dividends from net realized gains | | | (0.024 | ) | | | — | | | | (0.056 | ) | | | (0.06 | ) | | | (0.11 | ) |
| | |
|
|
| |
|
|
| |
|
|
| |
|
|
| |
|
|
|
Total distributions | | | (0.132 | ) | | | (0.181 | ) | | | (0.224 | ) | | | (0.23 | ) | | | (0.24 | ) |
| | |
|
|
| |
|
|
| |
|
|
| |
|
|
| |
|
|
|
Net asset value, end of year | | | $9.798 | | | | $9.270 | | | | $9.131 | | | | $9.32 | | | | $9.54 | |
| | |
|
|
| |
|
|
| |
|
|
| |
|
|
| |
|
|
|
Total return | | | 7.16% | | | | 3.57% | | | | 0.35% | | | | 0.02% | | | | 1.01% | |
Supplemental data and ratios: | | | | | | | | | | | | | | | | | | | | |
Net assets, end of year | | | $135,386,961 | | | | $132,792,238 | | | | $134,255,059 | | | | $137,358,236 | | | | $209,252,288 | |
Ratio of expenses to average net assets | | | | | | | | | | | | | | | | | | | | |
Before expense reimbursement (recapture) and securities lending credit including interest expense2 | | | 1.29% | | | | 1.34% | | | | 1.38% | | | | 1.36% | | | | 1.31% | |
After expense reimbursement (recapture) and securities lending credit including interest expense2 | | | 1.19% | | | | 1.19% | | | | 1.26% | | | | 1.29% | | | | 1.29% | |
Before expense reimbursement (recapture) and securities lending credit excluding interest expense | | | 1.29% | | | | 1.34% | | | | 1.38% | | | | 1.36% | | | | 1.31% | |
After expense reimbursement (recapture) and securities lending credit excluding interest expense | | | 1.19% | | | | 1.19% | | | | 1.26% | | | | 1.29% | | | | 1.29% | |
Ratio of net investment income to average net assets | | | | | | | | | | | | | | | | | | | | |
Before expense reimbursement (recapture) and securities lending credit | | | 1.67% | | | | 1.80% | | | | 1.30% | | | | 1.14% | | | | 1.22% | |
After expense reimbursement (recapture) and securities lending credit | | | 1.77% | | | | 1.95% | | | | 1.42% | | | | 1.21% | | | | 1.24% | |
Portfolio turnover rate | | | 278.67% | | | | 239.11% | | | | 193.12% | | | | 164.81% | | | | 157.49% | |
| 1 | | Net investment income per share has been calculated based on average shares outstanding during the year. |
| 2 | | Includes interest expense where applicable. See Note 6 in the Notes to the Financial Statements. |
See notes to financial statements.
142
GuideMark® Funds & GuidePath® Funds
FINANCIAL HIGHLIGHTS
| | | | | | | | | | | | | | | | | | | | |
| | | Tax-Exempt Fixed Income Fund
| |
| | | Service
| |
| | | Year Ended
March 31,
2020
| | | Year Ended
March 31,
2019
| | | Year Ended
March 31,
2018
| | | Year Ended
March 31,
2017
| | | Year Ended
March 31,
2016
| |
Per share data for a share of capital stock outstanding for the entire year and selected information for the year are as follows: | | | | | | | | | | | | | | | | | | | | |
Net asset value, beginning of year | | | $11.191 | | | | $11.145 | | | | $11.220 | | | | $11.62 | | | | $11.58 | |
Income from investment operations: | | | | | | | | | | | | | | | | | | | | |
Net investment income1 | | | 0.295 | | | | 0.335 | | | | 0.321 | | | | 0.30 | | | | 0.31 | |
Net realized and unrealized gains (losses) on investments | | | (0.164 | ) | | | 0.072 | | | | (0.074 | ) | | | (0.38 | ) | | | 0.06 | |
| | |
|
|
| |
|
|
| |
|
|
| |
|
|
| |
|
|
|
Total from investment operations | | | 0.131 | | | | 0.407 | | | | 0.247 | | | | (0.08 | ) | | | 0.37 | |
| | |
|
|
| |
|
|
| |
|
|
| |
|
|
| |
|
|
|
Less distributions: | | | | | | | | | | | | | | | | | | | | |
Dividends from net investment income | | | (0.287 | ) | | | (0.347 | ) | | | (0.322 | ) | | | (0.32 | ) | | | (0.33 | ) |
Dividends from net realized gains | | | (0.036 | ) | | | (0.014 | ) | | | — | | | | — | | | | — | |
| | |
|
|
| |
|
|
| |
|
|
| |
|
|
| |
|
|
|
Total distributions | | | (0.323 | ) | | | (0.361 | ) | | | (0.322 | ) | | | (0.32 | ) | | | (0.33 | ) |
| | |
|
|
| |
|
|
| |
|
|
| |
|
|
| |
|
|
|
Net asset value, end of year | | | $10.999 | | | | $11.191 | | | | $11.145 | | | | $11.22 | | | | $11.62 | |
| | |
|
|
| |
|
|
| |
|
|
| |
|
|
| |
|
|
|
Total return | | | 1.16% | | | | 3.72% | | | | 2.28% | | | | (0.82)% | | | | 3.22% | |
Supplemental data and ratios: | | | | | | | | | | | | | | | | | | | | |
Net assets, end of year | | | $22,462,605 | | | | $25,310,450 | | | | $27,829,032 | | | | $30,317,261 | | | | $49,084,900 | |
Ratio of expenses to average net assets | | | | | | | | | | | | | | | | | | | | |
Before expense reimbursement (recapture) and securities lending credit including interest expense2 | | | 1.53% | | | | 1.54% | | | | 1.48% | | | | 1.43% | | | | 1.42% | |
After expense reimbursement (recapture) and securities lending credit including interest expense2 | | | 1.29% | | | | 1.29% | | | | 1.29% | | | | 1.29% | | | | 1.28% | |
Before expense reimbursement (recapture) and securities lending credit excluding interest expense | | | 1.53% | | | | 1.54% | | | | 1.48% | | | | 1.43% | | | | 1.42% | |
After expense reimbursement (recapture) and securities lending credit excluding interest expense | | | 1.29% | | | | 1.29% | | | | 1.29% | | | | 1.29% | | | | 1.28% | |
Ratio of net investment income to average net assets | | | | | | | | | | | | | | | | | | | | |
Before expense reimbursement (recapture) | | | 2.34% | | | | 2.77% | | | | 2.64% | | | | 2.43% | | | | 2.53% | |
After expense reimbursement (recapture) | | | 2.58% | | | | 3.02% | | | | 2.83% | | | | 2.57% | | | | 2.67% | |
Portfolio turnover rate | | | 35.73% | | | | 34.57% | | | | 56.73% | | | | 14.50% | | | | 12.47% | |
| 1 | | Net investment income per share has been calculated based on average shares outstanding during the year. |
| 2 | | Includes interest expense where applicable. See Note 6 in the Notes to the Financial Statements. |
See notes to financial statements.
143
GuideMark® Funds & GuidePath® Funds
FINANCIAL HIGHLIGHTS
| | | | | | | | | | | | | | | | | | | | |
| | | Opportunistic Fixed Income Fund
| |
| | | Institutional
| |
| | | Year Ended
March 31,
2020
| | | Year Ended
March 31,
2019
| | | Year Ended
March 31,
2018
| | | Year Ended
March 31,
2017
| | | Year Ended
March 31,
2016
| |
Per share data for a share of capital stock outstanding for the entire year and selected information for the year are as follows: | | | | | | | | | | | | | | | | | | | | |
Net asset value, beginning of year | | | $8.484 | | | | $8.835 | | | | $9.460 | | | | $9.05 | | | | $9.53 | |
Income from investment operations: | | | | | | | | | | | | | | | | | | | | |
Net investment income1 | | | 0.377 | | | | 0.437 | | | | 0.427 | | | | 0.46 | | | | 0.36 | |
Net realized and unrealized gains (losses) on investments | | | (0.654 | ) | | | (0.213 | ) | | | (0.250 | ) | | | 0.30 | | | | (0.76 | ) |
| | |
|
|
| |
|
|
| |
|
|
| |
|
|
| |
|
|
|
Total from investment operations | | | (0.277 | ) | | | 0.224 | | | | 0.177 | | | | 0.76 | | | | (0.40 | ) |
| | |
|
|
| |
|
|
| |
|
|
| |
|
|
| |
|
|
|
Less distributions: | | | | | | | | | | | | | | | | | | | | |
Dividends from net investment income | | | (0.421 | ) | | | (0.575 | ) | | | (0.802 | ) | | | (0.35 | ) | | | (0.08 | ) |
| | |
|
|
| |
|
|
| |
|
|
| |
|
|
| |
|
|
|
Total distributions | | | (0.421 | ) | | | (0.575 | ) | | | (0.802 | ) | | | (0.35 | ) | | | (0.08 | ) |
| | |
|
|
| |
|
|
| |
|
|
| |
|
|
| |
|
|
|
Net asset value, end of year | | | $7.786 | | | | $8.484 | | | | $8.835 | | | | $9.46 | | | | $9.05 | |
| | |
|
|
| |
|
|
| |
|
|
| |
|
|
| |
|
|
|
Total return | | | (3.30)% | | | | 2.65% | | | | 1.81% | | | | 8.77% | | | | (4.22)% | |
Supplemental data and ratios: | | | | | | | | | | | | | | | | | | | | |
Net assets, end of year | | | $452,046 | | | | $376,752 | | | | $354,392 | | | | $9,316,917 | | | | $8,572,900 | |
Ratio of expenses to average net assets | | | | | | | | | | | | | | | | | | | | |
Before expense reimbursement (recapture) including interest expense2 | | | 1.31% | | | | 1.33% | | | | 1.34% | | | | 1.21% | | | | 1.13% | |
After expense reimbursement (recapture) including interest expense2 | | | 0.95% | | | | 0.95% | | | | 0.95% | | | | 0.95% | | | | 0.99% | |
Before expense reimbursement (recapture) excluding interest expense | | | 1.31% | | | | 1.33% | | | | 1.34% | | | | 1.21% | | | | 1.13% | |
After expense reimbursement (recapture) excluding interest expense | | | 0.95% | | | | 0.95% | | | | 0.95% | | | | 0.95% | | | | 0.99% | |
Ratio of net investment income to average net assets | | | | | | | | | | | | | | | | | | | | |
Before expense reimbursement (recapture) | | | 4.14% | | | | 4.63% | | | | 4.16% | | | | 4.78% | | | | 3.71% | |
After expense reimbursement (recapture) | | | 4.50% | | | | 5.01% | | | | 4.55% | | | | 5.04% | | | | 3.85% | |
Portfolio turnover rate | | | 71.24% | | | | 24.46% | | | | 33.85% | | | | 33.77% | | | | 41.12% | |
Portfolio Turnover is calculated for the Fund as a whole.
| 1 | | Net investment income per share has been calculated based on average shares outstanding during the year. |
| 2 | | Includes interest expense where applicable. See Note 6 in the Notes to the Financial Statements. |
See notes to financial statements.
144
GuideMark® Funds & GuidePath® Funds
FINANCIAL HIGHLIGHTS
| | | | | | | | | | | | | | | | | | | | |
| | | Opportunistic Fixed Income Fund
| |
| | | Service
| |
| | | Year Ended
March 31,
2020
| | | Year Ended
March 31,
2019
| | | Year Ended
March 31,
2018
| | | Year Ended
March 31,
2017
| | | Year Ended
March 31,
2016
| |
Per share data for a share of capital stock outstanding for the entire year and selected information for the year are as follows: | | | | | | | | | | | | | | | | | | | | |
Net asset value, beginning of year | | | $8.458 | | | | $8.932 | | | | $9.560 | | | | $9.05 | | | | $9.55 | |
Income from investment operations: | | | | | | | | | | | | | | | | | | | | |
Net investment income1 | | | 0.326 | | | | 0.371 | | | | 0.391 | | | | 0.40 | | | | 0.30 | |
Net realized and unrealized gains (losses) on investments | | | (0.652 | ) | | | (0.322 | ) | | | (0.259 | ) | | | 0.32 | | | | (0.72 | ) |
| | |
|
|
| |
|
|
| |
|
|
| |
|
|
| |
|
|
|
Total from investment operations | | | (0.326 | ) | | | 0.049 | | | | 0.132 | | | | 0.72 | | | | (0.42 | ) |
| | |
|
|
| |
|
|
| |
|
|
| |
|
|
| |
|
|
|
Less distributions: | | | | | | | | | | | | | | | | | | | | |
Dividends from net investment income | | | (0.373 | ) | | | (0.523 | ) | | | (0.760 | ) | | | (0.21 | ) | | | (0.08 | ) |
| | |
|
|
| |
|
|
| |
|
|
| |
|
|
| |
|
|
|
Total distributions | | | (0.373 | ) | | | (0.523 | ) | | | (0.760 | ) | | | (0.21 | ) | | | (0.08 | ) |
| | |
|
|
| |
|
|
| |
|
|
| |
|
|
| |
|
|
|
Net asset value, end of year | | | $7.759 | | | | $8.458 | | | | $8.932 | | | | $9.56 | | | | $9.05 | |
| | |
|
|
| |
|
|
| |
|
|
| |
|
|
| |
|
|
|
Total return | | | (3.89)% | | | | 0.64% | | | | 1.29% | | | | 8.20% | | | | (4.44)% | |
Supplemental data and ratios: | | | | | | | | | | | | | | | | | | | | |
Net assets, end of year | | | $40,304,655 | | | | $50,858,136 | | | | $54,554,489 | | | | $57,384,791 | | | | $78,168,300 | |
Ratio of expenses to average net assets | | | | | | | | | | | | | | | | | | | | |
Before expense reimbursement (recapture) including interest expense2 | | | 1.89% | | | | 1.90% | | | | 1.90% | | | | 1.78% | | | | 1.68% | |
After expense reimbursement (recapture) including interest expense2 | | | 1.55% | | | | 1.55% | | | | 1.55% | | | | 1.55% | | | | 1.55% | |
Before expense reimbursement (recapture) excluding interest expense | | | 1.89% | | | | 1.90% | | | | 1.90% | | | | 1.78% | | | | 1.68% | |
After expense reimbursement (recapture) excluding interest expense | | | 1.55% | | | | 1.55% | | | | 1.55% | | | | 1.55% | | | | 1.55% | |
Ratio of net investment income to average net assets | | | | | | | | | | | | | | | | | | | | |
Before expense reimbursement (recapture) | | | 3.56% | | | | 3.91% | | | | 3.87% | | | | 4.17% | | | | 3.08% | |
After expense reimbursement (recapture) | | | 3.90% | | | | 4.26% | | | | 4.22% | | | | 4.40% | | | | 3.21% | |
Portfolio turnover rate | | | 71.24% | | | | 24.46% | | | | 33.85% | | | | 33.77% | | | | 41.12% | |
Portfolio Turnover is calculated for the Fund as a whole.
| 1 | | Net investment income per share has been calculated based on average shares outstanding during the year. |
| 2 | | Includes interest expense where applicable. See Note 6 in the Notes to the Financial Statements. |
See notes to financial statements.
145
GuideMark® Funds & GuidePath® Funds
FINANCIAL HIGHLIGHTS
| | | | | | | | | | | | | | | | | | | | |
| | | Growth Allocation Fund
| |
| | | Institutional
| |
| | | Year Ended
March 31,
2020
| | | Year Ended
March 31,
2019
| | | Year Ended
March 31,
2018
| | | Year Ended
March 31,
2017
| | | Year Ended
March 31,
2016
| |
Per share data for a share of capital stock outstanding for the entire year and selected information for the year are as follows: | | | | | | | | | | | | | | | | | | | | |
Net asset value, beginning of year | | | $11.553 | | | | $11.534 | | | | $11.340 | | | | $10.46 | | | | $11.65 | |
Income from investment operations: | | | | | | | | | | | | | | | | | | | | |
Net investment income1 | | | 0.199 | | | | 0.227 | | | | 0.236 | | | | 0.19 | | | | 0.20 | |
Net realized and unrealized gains (losses) on investments | | | (1.407 | ) | | | (0.003 | )5 | | | 1.466 | | | | 1.20 | | | | (1.02 | ) |
| | |
|
|
| |
|
|
| |
|
|
| |
|
|
| |
|
|
|
Total from investment operations | | | (1.208 | ) | | | 0.224 | | | | 1.702 | | | | 1.39 | | | | (0.82 | ) |
| | |
|
|
| |
|
|
| |
|
|
| |
|
|
| |
|
|
|
Less distributions: | | | | | | | | | | | | | | | | | | | | |
Dividends from net investment income | | | (0.206 | ) | | | (0.193 | ) | | | (0.210 | ) | | | (0.20 | ) | | | (0.16 | ) |
Dividends from net realized gains | | | — | | | | (0.012 | ) | | | (1.298 | ) | | | (0.31 | ) | | | (0.21 | ) |
| | |
|
|
| |
|
|
| |
|
|
| |
|
|
| |
|
|
|
Total distributions | | | (0.206 | ) | | | (0.205 | ) | | | (1.508 | ) | | | (0.51 | ) | | | (0.37 | ) |
| | |
|
|
| |
|
|
| |
|
|
| |
|
|
| |
|
|
|
Net asset value, end of year | | | $10.139 | | | | $11.553 | | | | $11.534 | | | | $11.34 | | | | $10.46 | |
| | |
|
|
| |
|
|
| |
|
|
| |
|
|
| |
|
|
|
Total return | | | (10.82)% | | | | 2.22% | | | | 14.90% | | | | 13.54% | | | | (7.11)% | |
Supplemental data and ratios: | | | | | | | | | | | | | | | | | | | | |
Net assets, end of year | | | $4,402,611 | | | | $5,450,557 | | | | $6,646,937 | | | | $13,176,782 | | | | $10,968,769 | |
Ratio of expenses to average net assets2 | | | | | | | | | | | | | | | | | | | | |
Before expense reimbursement (recapture) and securities lending credit including interest expense3 | | | 0.38% | | | | 0.40% | | | | 0.40% | | | | 0.42% | | | | 0.43% | |
After expense reimbursement (recapture) and securities lending credit including interest expense3 | | | 0.33% | | | | 0.35% | | | | 0.35% | | | | 0.32% | | | | 0.31% | |
Before expense reimbursement (recapture) and securities lending credit excluding interest expense | | | 0.38% | | | | 0.39% | | | | 0.40% | | | | 0.42% | | | | 0.43% | |
After expense reimbursement (recapture) and securities lending credit excluding interest expense | | | 0.33% | | | | 0.34% | | | | 0.35% | | | | 0.32% | | | | 0.31% | |
Ratio of net investment income to average net assets4 | | | | | | | | | | | | | | | | | | | | |
Before expense reimbursement (recapture) and securities lending credit | | | 1.60% | | | | 1.92% | | | | 1.91% | | | | 1.64% | | | | 1.67% | |
After expense reimbursement (recapture) and securities lending credit | | | 1.65% | | | | 1.97% | | | | 1.96% | | | | 1.74% | | | | 1.79% | |
Portfolio turnover rate | | | 37.80% | | | | 53.89% | | | | 70.47% | | | | 42.81% | | | | 84.98% | |
Portfolio Turnover is calculated for the Fund as a whole.
| 1 | | Net investment income per share has been calculated based on average shares outstanding during the year. |
| 2 | | These ratios exclude the impact of the expenses of the underlying investment companies and exchange-traded funds in which the Fund invests. |
| 3 | | Includes interest expense where applicable. See Note 6 in the Notes to the Financial Statements. |
| 4 | | Recognition of the net investment income by the Fund is affected by the timing of the declaration of dividends by the underlying investment companies and exchange-traded funds in which the Fund invests. |
| 5 | | Realized and unrealized gains and losses per shares in this caption are balancing amounts necessary to reconcile the change in net asset value per share for the year, and may not reconcile with aggregate gains and losses in the Statement of Operations due to share transactions for the year. |
See notes to financial statements.
146
GuideMark® Funds & GuidePath® Funds
FINANCIAL HIGHLIGHTS
| | | | | | | | | | | | | | | | | | | | |
| | | Growth Allocation Fund
| |
| | | Service
| |
| | | Year Ended
March 31,
2020
| | | Year Ended
March 31,
2019
| | | Year Ended
March 31,
2018
| | | Year Ended
March 31,
2017
| | | Year Ended
March 31,
2016
| |
Per share data for a share of capital stock outstanding for the entire year and selected information for the year are as follows: | | | | | | | | | | | | | | | | | | | | |
Net asset value, beginning of year | | | $11.477 | | | | $11.458 | | | | $11.290 | | | | $10.42 | | | | $11.62 | |
Income from investment operations: | | | | | | | | | | | | | | | | | | | | |
Net investment income1 | | | 0.128 | | | | 0.160 | | | | 0.152 | | | | 0.12 | | | | 0.13 | |
Net realized and unrealized gains (losses) on investments | | | (1.402 | ) | | | 0.003 | 5 | | | 1.467 | | | | 1.20 | | | | (1.02 | ) |
| | |
|
|
| |
|
|
| |
|
|
| |
|
|
| |
|
|
|
Total from investment operations | | | (1.274 | ) | | | 0.163 | | | | 1.619 | | | | 1.32 | | | | (0.89 | ) |
| | |
|
|
| |
|
|
| |
|
|
| |
|
|
| |
|
|
|
Less distributions: | | | | | | | | | | | | | | | | | | | | |
Dividends from net investment income | | | (0.141 | ) | | | (0.132 | ) | | | (0.153 | ) | | | (0.14 | ) | | | (0.10 | ) |
Dividends from net realized gains | | | — | | | | (0.012 | ) | | | (1.298 | ) | | | (0.31 | ) | | | (0.21 | ) |
| | |
|
|
| |
|
|
| |
|
|
| |
|
|
| |
|
|
|
Total distributions | | | (0.141 | ) | | | (0.144 | ) | | | (1.451 | ) | | | (0.45 | ) | | | (0.31 | ) |
| | |
|
|
| |
|
|
| |
|
|
| |
|
|
| |
|
|
|
Net asset value, end of year | | | $10.062 | | | | $11.477 | | | | $11.458 | | | | $11.29 | | | | $10.42 | |
| | |
|
|
| |
|
|
| |
|
|
| |
|
|
| |
|
|
|
Total return | | | (11.35)% | | | | 1.61% | | | | 14.22% | | | | 12.91% | | | | (7.67)% | |
Supplemental data and ratios: | | | | | | | | | | | | | | | | | | | | |
Net assets, end of year | | | $739,949,997 | | | | $788,314,442 | | | | $611,928,879 | | | | $551,141,139 | | | | $383,423,651 | |
Ratio of expenses to average net assets2 | | | | | | | | | | | | | | | | | | | | |
Before expense reimbursement (recapture) and securities lending credit including interest expense3 | | | 0.97% | | | | 1.00% | | | | 1.00% | | | | 1.01% | | | | 1.02% | |
After expense reimbursement (recapture) and securities lending credit including interest expense3 | | | 0.93% | | | | 0.95% | | | | 0.95% | | | | 0.92% | | | | 0.91% | |
Before expense reimbursement (recapture) and securities lending credit excluding interest expense | | | 0.97% | | | | 0.99% | | | | 0.99% | | | | 1.01% | | | | 1.02% | |
After expense reimbursement (recapture) and securities lending credit excluding interest expense | | | 0.93% | | | | 0.94% | | | | 0.94% | | | | 0.92% | | | | 0.91% | |
Ratio of net investment income to average net assets4 | | | | | | | | | | | | | | | | | | | | |
Before expense reimbursement (recapture) and securities lending credit | | | 1.03% | | | | 1.35% | | | | 1.22% | | | | 0.99% | | | | 1.05% | |
After expense reimbursement (recapture) and securities lending credit | | | 1.07% | | | | 1.40% | | | | 1.27% | | | | 1.08% | | | | 1.16% | |
Portfolio turnover rate | | | 37.80% | | | | 53.89% | | | | 70.47% | | | | 42.81% | | | | 84.98% | |
Portfolio Turnover is calculated for the Fund as a whole.
| 1 | | Net investment income per share has been calculated based on average shares outstanding during the year. |
| 2 | | These ratios exclude the impact of the expenses of the underlying investment companies and exchange-traded funds in which the Fund invests. |
| 3 | | Includes interest expense where applicable. See Note 6 in the Notes to the Financial Statements. |
| 4 | | Recognition of the net investment income by the Fund is affected by the timing of the declaration of dividends by the underlying investment companies and exchange-traded funds in which the Fund invests. |
| 5 | | Realized and unrealized gains and losses per shares in this caption are balancing amounts necessary to reconcile the change in net asset value per share for the year, and may not reconcile with aggregate gains and losses in the Statement of Operations due to share transactions for the year. |
See notes to financial statements.
147
GuideMark® Funds & GuidePath® Funds
FINANCIAL HIGHLIGHTS
| | | | | | | | | | | | | | | | | | | | |
| | | Conservative Allocation Fund
| |
| | | Institutional
| |
| | | Year Ended
March 31,
2020
| | | Year Ended
March 31,
2019
| | | Year Ended
March 31,
2018
| | | Year Ended
March 31,
2017
| | | Year Ended
March 31,
2016
| |
Per share data for a share of capital stock outstanding for the entire year and selected information for the year are as follows: | | | | | | | | | | | | | | | | | | | | |
Net asset value, beginning of year | | | $9.677 | | | | $9.538 | | | | $9.100 | | | | $9.51 | | | | $11.26 | |
Income from investment operations: | | | | | | | | | | | | | | | | | | | | |
Net investment income1 | | | 0.288 | | | | 0.255 | | | | 0.204 | | | | 0.19 | | | | 0.16 | |
Net realized and unrealized gains (losses) on investments | | | (0.491 | ) | | | 0.104 | | | | 0.442 | | | | 0.35 | | | | (0.89 | ) |
| | |
|
|
| |
|
|
| |
|
|
| |
|
|
| |
|
|
|
Total from investment operations | | | (0.203 | ) | | | 0.359 | | | | 0.646 | | | | 0.54 | | | | (0.73 | ) |
| | |
|
|
| |
|
|
| |
|
|
| |
|
|
| |
|
|
|
Less distributions: | | | | | | | | | | | | | | | | | | | | |
Dividends from net investment income | | | (0.270 | ) | | | (0.205 | ) | | | (0.187 | ) | | | — | | | | (0.14 | ) |
Dividends from net realized gains | | | — | | | | (0.015 | ) | | | (0.021 | ) | | | (0.95 | ) | | | (0.88 | ) |
| | |
|
|
| |
|
|
| |
|
|
| |
|
|
| |
|
|
|
Total distributions | | | (0.270 | ) | | | (0.220 | ) | | | (0.208 | ) | | | (0.95 | ) | | | (1.02 | ) |
| | |
|
|
| |
|
|
| |
|
|
| |
|
|
| |
|
|
|
Net asset value, end of year | | | $9.204 | | | | $9.677 | | | | $9.538 | | | | $9.10 | | | | $9.51 | |
| | |
|
|
| |
|
|
| |
|
|
| |
|
|
| |
|
|
|
Total return | | | (2.41)% | | | | 3.97% | | | | 7.07% | | | | 6.09% | | | | (6.65)% | |
Supplemental data and ratios: | | | | | | | | | | | | | | | | | | | | |
Net assets, end of year | | | $1,713,169 | | | | $2,268,382 | | | | $3,140,896 | | | | $4,966,270 | | | | $4,220,428 | |
Ratio of expenses to average net assets2 | | | | | | | | | | | | | | | | | | | | |
Before expense reimbursement (recapture) and securities lending credit including interest expense3 | | | 0.40% | | | | 0.42% | | | | 0.44% | | | | 0.51% | | | | 0.47% | |
After expense reimbursement (recapture) and securities lending credit including interest expense3 | | | 0.10% | | | | 0.10% | | | | 0.27% | | | | 0.30% | | | | 0.37% | |
Before expense reimbursement (recapture) and securities lending credit excluding interest expense | | | 0.40% | | | | 0.42% | | | | 0.44% | | | | 0.51% | | | | 0.47% | |
After expense reimbursement (recapture) and securities lending credit excluding interest expense | | | 0.10% | | | | 0.10% | | | | 0.27% | | | | 0.30% | | | | 0.37% | |
Ratio of net investment income to average net assets4 | | | | | | | | | | | | | | | | | | | | |
Before expense reimbursement (recapture) and securities lending credit | | | 2.57% | | | | 2.35% | | | | 1.97% | | | | 1.78% | | | | 1.39% | |
After expense reimbursement (recapture) and securities lending credit | | | 2.87% | | | | 2.67% | | | | 2.14% | | | | 1.99% | | | | 1.49% | |
Portfolio turnover rate | | | 58.96% | | | | 69.19% | | | | 30.27% | | | | 44.43% | | | | 130.77% | |
Portfolio Turnover is calculated for the Fund as a whole.
| 1 | Net investment income per share has been calculated based on average shares outstanding during the year. |
| 2 | These ratios exclude the impact of the expenses of the underlying investment companies and exchange-traded funds in which the Fund invests. |
| 3 | Includes interest expense where applicable. See Note 6 in the Notes to the Financial Statements. |
| 4 | Recognition of the net investment income by the Fund is affected by the timing of the declaration of dividends by the underlying investment companies and exchange-traded funds in which the Fund invests. |
See notes to financial statements.
148
GuideMark® Funds & GuidePath® Funds
FINANCIAL HIGHLIGHTS
| | | | | | | | | | | | | | | | | | | | |
| | | Conservative Allocation Fund
| |
| | | Service
| |
| | | Year Ended
March 31,
2020
| | | Year Ended
March 31,
2019
| | | Year Ended
March 31,
2018
| | | Year Ended
March 31,
2017
| | | Year Ended
March 31,
2016
| |
Per share data for a share of capital stock outstanding for the entire year and selected information for the year are as follows: | | | | | | | | | | | | | | | | | | | | |
Net asset value, beginning of year | | | $9.617 | | | | $9.482 | | | | $9.060 | | | | $9.53 | | | | $11.29 | |
Income from investment operations: | | | | | | | | | | | | | | | | | | | | |
Net investment income1 | | | 0.226 | | | | 0.196 | | | | 0.143 | | | | 0.12 | | | | 0.09 | |
Net realized and unrealized gains (losses) on investments | | | (0.490 | ) | | | 0.107 | | | | 0.438 | | | | 0.36 | | | | (0.89 | ) |
| | |
|
|
| |
|
|
| |
|
|
| |
|
|
| |
|
|
|
Total from investment operations | | | (0.264 | ) | | | 0.303 | | | | 0.581 | | | | 0.48 | | | | (0.80 | ) |
| | |
|
|
| |
|
|
| |
|
|
| |
|
|
| |
|
|
|
Less distributions: | | | | | | | | | | | | | | | | | | | | |
Dividends from net investment income | | | (0.216 | ) | | | (0.153 | ) | | | (0.138 | ) | | | — | | | | (0.08 | ) |
Dividends from net realized gains | | | — | | | | (0.015 | ) | | | (0.021 | ) | | | (0.95 | ) | | | (0.88 | ) |
| | |
|
|
| |
|
|
| |
|
|
| |
|
|
| |
|
|
|
Total distributions | | | (0.216 | ) | | | (0.168 | ) | | | (0.159 | ) | | | (0.95 | ) | | | (0.96 | ) |
| | |
|
|
| |
|
|
| |
|
|
| |
|
|
| |
|
|
|
Net asset value, end of year | | | $9.137 | | | | $9.617 | | | | $9.482 | | | | $9.06 | | | | $9.53 | |
| | |
|
|
| |
|
|
| |
|
|
| |
|
|
| |
|
|
|
Total return | | | (2.99)% | | | | 3.35% | | | | 6.39% | | | | 5.44% | | | | (7.18)% | |
Supplemental data and ratios: | | | | | | | | | | | | | | | | | | | | |
Net assets, end of year | | | $314,935,864 | | | | $337,130,990 | | | | $268,079,977 | | | | $110,985,447 | | | | $51,768,546 | |
Ratio of expenses to average net assets2 | | | | | | | | | | | | | | | | | | | | |
Before expense reimbursement (recapture) and securities lending credit including interest expense3 | | | 0.99% | | | | 1.02% | | | | 1.03% | | | | 1.10% | | | | 1.05% | |
After expense reimbursement (recapture) and securities lending credit including interest expense3 | | | 0.70% | | | | 0.70% | | | | 0.83% | | | | 0.89% | | | | 0.99% | |
Before expense reimbursement (recapture) and securities lending credit excluding interest expense | | | 0.99% | | | | 1.02% | | | | 1.03% | | | | 1.10% | | | | 1.05% | |
After expense reimbursement (recapture) and securities lending credit excluding interest expense | | | 0.70% | | | | 0.70% | | | | 0.83% | | | | 0.89% | | | | 0.99% | |
Ratio of net investment income to average net assets4 | | | | | | | | | | | | | | | | | | | | |
Before expense reimbursement (recapture) and securities lending credit | | | 1.98% | | | | 1.75% | | | | 1.31% | | | | 1.10% | | | | 0.79% | |
After expense reimbursement (recapture) and securities lending credit | | | 2.27% | | | | 2.07% | | | | 1.51% | | | | 1.31% | | | | 0.85% | |
Portfolio turnover rate | | | 58.96% | | | | 69.19% | | | | 30.27% | | | | 44.43% | | | | 130.77% | |
Portfolio Turnover is calculated for the Fund as a whole.
| 1 | | Net investment income per share has been calculated based on average shares outstanding during the year. |
| 2 | | These ratios exclude the impact of the expenses of the underlying investment companies and exchange-traded funds in which the Fund invests. |
| 3 | | Includes interest expense where applicable. See Note 6 in the Notes to the Financial Statements. |
| 4 | | Recognition of the net investment income by the Fund is affected by the timing of the declaration of dividends by the underlying investment companies and exchange-traded funds in which the Fund invests. |
See notes to financial statements.
149
GuideMark® Funds & GuidePath® Funds
FINANCIAL HIGHLIGHTS
| | | | | | | | | | | | | | | | | | | | |
| | | Tactical Allocation Fund
| |
| | | Institutional
| |
| | | Year Ended
March 31,
2020
| | | Year Ended
March 31,
2019
| | | Year Ended
March 31,
2018
| | | Year Ended
March 31,
2017
| | | Year Ended
March 31,
2016
| |
Per share data for a share of capital stock outstanding for the entire year and selected information for the year are as follows: | | | | | | | | | | | | | | | | | | | | |
Net asset value, beginning of year | | | $10.962 | | | | $10.950 | | | | $10.250 | | | | $9.38 | | | | $10.34 | |
Income from investment operations: | | | | | | | | | | | | | | | | | | | | |
Net investment income1 | | | 0.129 | | | | 0.138 | | | | 0.142 | | | | 0.18 | | | | 0.13 | |
Net realized and unrealized gains (losses) on investments | | | (0.517 | ) | | | 0.408 | | | | 1.078 | | | | 0.81 | | | | (0.97 | ) |
| | |
|
|
| |
|
|
| |
|
|
| |
|
|
| |
|
|
|
Total from investment operations | | | (0.388 | ) | | | 0.546 | | | | 1.220 | | | | 0.99 | | | | (0.84 | ) |
| | |
|
|
| |
|
|
| |
|
|
| |
|
|
| |
|
|
|
Less distributions: | | | | | | | | | | | | | | | | | | | | |
Dividends from net investment income | | | (0.108 | ) | | | (0.128 | ) | | | (0.393 | ) | | | (0.12 | ) | | | (0.02 | ) |
Dividends from net realized gains | | | (0.447 | ) | | | (0.406 | ) | | | (0.127 | ) | | | — | | | | (0.10 | ) |
| | |
|
|
| |
|
|
| |
|
|
| |
|
|
| |
|
|
|
Total distributions | | | (0.555 | ) | | | (0.534 | ) | | | (0.520 | ) | | | (0.12 | ) | | | (0.12 | ) |
| | |
|
|
| |
|
|
| |
|
|
| |
|
|
| |
|
|
|
Net asset value, end of year | | | $10.019 | | | | $10.962 | | | | $10.950 | | | | $10.25 | | | | $9.38 | |
| | |
|
|
| |
|
|
| |
|
|
| |
|
|
| |
|
|
|
Total return | | | (4.27)% | | | | 5.59% | | | | 11.83% | | | | 10.63% | | | | (8.18)% | |
Supplemental data and ratios: | | | | | | | | | | | | | | | | | | | | |
Net assets, end of year | | | $1,553,075 | | | | $1,506,030 | | | | $1,681,043 | | | | $3,767,220 | | | | $5,005,303 | |
Ratio of expenses to average net assets2 | | | | | | | | | | | | | | | | | | | | |
Before expense reimbursement (recapture) and securities lending credit including interest expense3 | | | 0.50% | | | | 0.51% | | | | 0.52% | | | | 0.53% | | | | 0.51% | |
After expense reimbursement (recapture) and securities lending credit including interest expense3 | | | 0.46% | | | | 0.43% | | | | 0.45% | | | | 0.40% | | | | 0.41% | |
Before expense reimbursement (recapture) and securities lending credit excluding interest expense | | | 0.50% | | | | 0.51% | | | | 0.52% | | | | 0.53% | | | | 0.51% | |
After expense reimbursement (recapture) and securities lending credit excluding interest expense | | | 0.46% | | | | 0.43% | | | | 0.45% | | | | 0.40% | | | | 0.41% | |
Ratio of net investment income to average net assets4 | | | | | | | | | | | | | | | | | | | | |
Before expense reimbursement (recapture) and securities lending credit | | | 1.10% | | | | 1.15% | | | | 1.25% | | | | 1.69% | | | | 1.20% | |
After expense reimbursement (recapture) and securities lending credit | | | 1.14% | | | | 1.23% | | | | 1.32% | | | | 1.82% | | | | 1.30% | |
Portfolio turnover rate | | | 500.28% | | | | 336.60% | | | | 369.57% | | | | 336.50% | | | | 348.05% | |
Portfolio Turnover is calculated for the Fund as a whole.
| 1 | Net investment income per share has been calculated based on average shares outstanding during the year. |
| 2 | These ratios exclude the impact of the expenses of the underlying investment companies and exchange-traded funds in which the Fund invests. |
| 3 | Includes interest expense where applicable. See Note 6 in the Notes to the Financial Statements. |
| 4 | Recognition of the net investment income by the Fund is affected by the timing of the declaration of dividends by the underlying investment companies and exchange-traded funds in which the Fund invests. |
See notes to financial statements.
150
GuideMark® Funds & GuidePath® Funds
FINANCIAL HIGHLIGHTS
| | | | | | | | | | | | | | | | | | | | |
| | | Tactical Allocation Fund
| |
| | | Service
| |
| | | Year Ended
March 31,
2020
| | | Year Ended
March 31,
2019
| | | Year Ended
March 31,
2018
| | | Year Ended
March 31,
2017
| | | Year Ended
March 31,
2016
| |
Per share data for a share of capital stock outstanding for the entire year and selected information for the year are as follows: | | | | | | | | | | | | | | | | | | | | |
Net asset value, beginning of year | | | $10.919 | | | | $10.907 | | | | $10.150 | | | | $9.32 | | | | $10.32 | |
Income from investment operations: | | | | | | | | | | | | | | | | | | | | |
Net investment income1 | | | 0.061 | | | | 0.074 | | | | 0.082 | | | | 0.11 | | | | 0.07 | |
Net realized and unrealized gains (losses) on investments | | | (0.515 | ) | | | 0.410 | | | | 1.054 | | | | 0.82 | | | | (0.97 | ) |
| | |
|
|
| |
|
|
| |
|
|
| |
|
|
| |
|
|
|
Total from investment operations | | | (0.454 | ) | | | 0.484 | | | | 1.136 | | | | 0.93 | | | | (0.90 | ) |
| | |
|
|
| |
|
|
| |
|
|
| |
|
|
| |
|
|
|
Less distributions: | | | | | | | | | | | | | | | | | | | | |
Dividends from net investment income | | | (0.058 | ) | | | (0.066 | ) | | | (0.252 | ) | | | (0.10 | ) | | | — | * |
Dividends from net realized gains | | | (0.447 | ) | | | (0.406 | ) | | | (0.127 | ) | | | — | | | | (0.10 | ) |
| | |
|
|
| |
|
|
| |
|
|
| |
|
|
| |
|
|
|
Total distributions | | | (0.505 | ) | | | (0.472 | ) | | | (0.379 | ) | | | (0.10 | ) | | | (0.10 | ) |
| | |
|
|
| |
|
|
| |
|
|
| |
|
|
| |
|
|
|
Net asset value, end of year | | | $9.960 | | | | $10.919 | | | | $10.907 | | | | $10.15 | | | | $9.32 | |
| | |
|
|
| |
|
|
| |
|
|
| |
|
|
| |
|
|
|
Total return | | | (4.83)% | | | | 4.96% | | | | 11.14% | | | | 10.05% | | | | (8.74)% | |
Supplemental data and ratios: | | | | | | | | | | | | | | | | | | | | |
Net assets, end of year | | | $323,199,482 | | | | $341,839,666 | | | | $271,460,164 | | | | $304,159,564 | | | | $393,657,458 | |
Ratio of expenses to average net assets2 | | | | | | | | | | | | | | | | | | | | |
Before expense reimbursement (recapture) and securities lending credit including interest expense3 | | | 1.10% | | | | 1.11% | | | | 1.11% | | | | 1.12% | | | | 1.11% | |
After expense reimbursement (recapture) and securities lending credit including interest expense3 | | | 1.06% | | | | 1.03% | | | | 1.03% | | | | 1.00% | | | | 1.01% | |
Before expense reimbursement (recapture) and securities lending credit excluding interest expense | | | 1.10% | | | | 1.11% | | | | 1.11% | | | | 1.12% | | | | 1.11% | |
After expense reimbursement (recapture) and securities lending credit excluding interest expense | | | 1.06% | | | | 1.03% | | | | 1.03% | | | | 1.00% | | | | 1.01% | |
Ratio of net investment income to average net assets4 | | | | | | | | | | | | | | | | | | | | |
Before expense reimbursement (recapture) and securities lending credit | | | 0.50% | | | | 0.58% | | | | 0.69% | | | | 1.07% | | | | 0.62% | |
After expense reimbursement (recapture) and securities lending credit | | | 0.54% | | | | 0.66% | | | | 0.77% | | | | 1.19% | | | | 0.72% | |
Portfolio turnover rate | | | 500.28% | | | | 336.60% | | | | 369.57% | | | | 336.50% | | | | 348.05% | |
Portfolio Turnover is calculated for the Fund as a whole.
| 1 | | Net investment income per share has been calculated based on average shares outstanding during the year. |
| 2 | | These ratios exclude the impact of the expenses of the underlying investment companies and exchange-traded funds in which the Fund invests. |
| 3 | | Includes interest expense where applicable. See Note 6 in the Notes to the Financial Statements. |
| 4 | | Recognition of the net investment income by the Fund is affected by the timing of the declaration of dividends by the underlying investment companies and exchange-traded funds in which the Fund invests. |
| * | | Amount represents less than $0.01 per share |
See notes to financial statements.
151
GuideMark® Funds & GuidePath® Funds
FINANCIAL HIGHLIGHTS
| | | | | | | | | | | | | | | | | | | | |
| | | Absolute Return Allocation Fund
| |
| | | Institutional
| |
| | | Year Ended
March 31,
2020
| | | Year Ended
March 31,
2019
| | | Year Ended
March 31,
2018
| | | Year Ended
March 31,
2017
| | | Year Ended
March 31,
2016
| |
Per share data for a share of capital stock outstanding for the entire year and selected information for the year are as follows: | | | | | | | | | | | | | | | | | | | | |
Net asset value, beginning of year | | | $10.402 | | | | $10.335 | | | | $10.290 | | | | $9.80 | | | | $10.02 | |
Income from investment operations: | | | | | | | | | | | | | | | | | | | | |
Net investment income1 | | | 0.329 | | | | 0.346 | | | | 0.292 | | | | 0.37 | | | | 0.26 | |
Net realized and unrealized gains (losses) on investments | | | (0.367 | ) | | | (0.003 | )2 | | | (0.037 | ) | | | 0.52 | | | | (0.21 | ) |
| | |
|
|
| |
|
|
| |
|
|
| |
|
|
| |
|
|
|
Total from investment operations | | | (0.038 | ) | | | 0.343 | | | | 0.255 | | | | 0.89 | | | | 0.05 | |
| | |
|
|
| |
|
|
| |
|
|
| |
|
|
| |
|
|
|
Less distributions: | | | | | | | | | | | | | | | | | | | | |
Dividends from net investment income | | | (0.359 | ) | | | (0.276 | ) | | | (0.210 | ) | | | (0.40 | ) | | | (0.27 | ) |
| | |
|
|
| |
|
|
| |
|
|
| |
|
|
| |
|
|
|
Total distributions | | | (0.359 | ) | | | (0.276 | ) | | | (0.210 | ) | | | (0.40 | ) | | | (0.27 | ) |
| | |
|
|
| |
|
|
| |
|
|
| |
|
|
| |
|
|
|
Net asset value, end of year | | | $10.005 | | | | $10.402 | | | | $10.335 | | | | $10.29 | | | | $9.80 | |
| | |
|
|
| |
|
|
| |
|
|
| |
|
|
| |
|
|
|
Total return | | | (0.53)% | | | | 3.43% | | | | 2.47% | | | | 9.14% | | | | 0.56% | |
Supplemental data and ratios: | | | | | | | | | | | | | | | | | | | | |
Net assets, end of year | | | $1,133,623 | | | | $667,898 | | | | $1,343,813 | | | | $921,609 | | | | $1,107,629 | |
Ratio of expenses to average net assets3 | | | | | | | | | | | | | | | | | | | | |
Before expense reimbursement (recapture) and securities lending credit including interest expense4 | | | 0.50% | | | | 0.51% | | | | 0.53% | | | | 0.58% | | | | 0.53% | |
After expense reimbursement (recapture) and securities lending credit including interest expense4 | | | 0.21% | | | | 0.20% | | | | 0.37% | | | | 0.50% | | | | 0.39% | |
Before expense reimbursement (recapture) and securities lending credit excluding interest expense | | | 0.49% | | | | 0.51% | | | | 0.53% | | | | 0.58% | | | | 0.53% | |
After expense reimbursement (recapture) and securities lending credit excluding interest expense | | | 0.20% | | | | 0.20% | | | | 0.37% | | | | 0.50% | | | | 0.39% | |
Ratio of net investment income to average net assets5 | | | | | | | | | | | | | | | | | | | | |
Before expense reimbursement (recapture) and securities lending credit | | | 2.82% | | | | 3.04% | | | | 2.64% | | | | 3.58% | | | | 2.49% | |
After expense reimbursement (recapture) and securities lending credit | | | 3.11% | | | | 3.35% | | | | 2.80% | | | | 3.66% | | | | 2.63% | |
Portfolio turnover rate | | | 161.00% | | | | 146.82% | | | | 154.33% | | | | 41.66% | | | | 200.13% | |
Portfolio Turnover is calculated for the Fund as a whole.
| 1 | | Net investment income per share has been calculated based on average shares outstanding during the year. |
| 2 | | Realized and unrealized gains and losses per share in this caption are balancing amounts necessary to reconcile the change in net asset value per share for the year, and may not reconcile with the aggregate gains and losses in the Statement of Operations due to share transactions for the year. |
| 3 | | These ratios exclude the impact of the expenses of the underlying investment companies and exchange-traded funds in which the Fund invests. |
| 4 | | Includes interest expense where applicable. See Note 6 in the Notes to the Financial Statements. |
| 5 | | Recognition of the net investment income by the Fund is affected by the timing of the declaration of dividends by the underlying investment companies and exchange-traded funds in which the Fund invests. |
See notes to financial statements.
152
GuideMark® Funds & GuidePath® Funds
FINANCIAL HIGHLIGHTS
| | | | | | | | | | | | | | | | | | | | |
| | | Absolute Return Allocation Fund
| |
| | | Service
| |
| | | Year Ended
March 31,
2020
| | | Year Ended
March 31,
2019
| | | Year Ended
March 31,
2018
| | | Year Ended
March 31,
2017
| | | Year Ended
March 31,
2016
| |
Per share data for a share of capital stock outstanding for the entire year and selected information for the year are as follows: | | | | | | | | | | | | | | | | | | | | |
Net asset value, beginning of year | | | $10.402 | | | | $10.348 | | | | 10.320 | | | | $9.81 | | | | $10.04 | |
Income from investment operations: | | | | | | | | | | | | | | | | | | | | |
Net investment income1 | | | 0.266 | | | | 0.283 | | | | 0.231 | | | | 0.30 | | | | 0.20 | |
Net realized and unrealized gains (losses) on investments | | | (0.368 | ) | | | (0.001 | )5 | | | (0.036 | ) | | | 0.53 | | | | (0.22 | ) |
| | |
|
|
| |
|
|
| |
|
|
| |
|
|
| |
|
|
|
Total from investment operations | | | (0.102 | ) | | | 0.282 | | | | 0.195 | | | | 0.83 | | | | (0.02 | ) |
| | |
|
|
| |
|
|
| |
|
|
| |
|
|
| |
|
|
|
Less distributions: | | | | | | | | | | | | | | | | | | | | |
Dividends from net investment income | | | (0.290 | ) | | | (0.228 | ) | | | (0.167 | ) | | | (0.32 | ) | | | (0.21 | ) |
| | |
|
|
| |
|
|
| |
|
|
| |
|
|
| |
|
|
|
Total distributions | | | (0.290 | ) | | | (0.228 | ) | | | (0.167 | ) | | | (0.32 | ) | | | (0.21 | ) |
| | |
|
|
| |
|
|
| |
|
|
| |
|
|
| |
|
|
|
Net asset value, end of year | | | $10.010 | | | | $10.402 | | | | $10.348 | | | | $10.32 | | | | $9.81 | |
| | |
|
|
| |
|
|
| |
|
|
| |
|
|
| |
|
|
|
Total return | | | (1.11)% | | | | 2.81% | | | | 1.88% | | | | 8.54% | | | | (0.19)% | |
Supplemental data and ratios: | | | | | | | | | | | | | | | | | | | | |
Net assets, end of year | | | $391,177,265 | | | | $312,866,645 | | | | 267,250,294 | | | | $128,948,108 | | | | $145,830,207 | |
Ratio of expenses to average net assets2 | | | | | | | | | | | | | | | | | | | | |
Before expense reimbursement (recapture) and securities lending credit including interest expense3 | | | 1.10% | | | | 1.11% | | | | 1.12% | | | | 1.18% | | | | 1.13% | |
After expense reimbursement (recapture) and securities lending credit including interest expense3 | | | 0.81% | | | | 0.80% | | | | 0.96% | | | | 1.10% | | | | 0.99% | |
Before expense reimbursement (recapture) and securities lending credit excluding interest expense | | | 1.09% | | | | 1.11% | | | | 1.12% | | | | 1.18% | | | | 1.13% | |
After expense reimbursement (recapture) and securities lending credit excluding interest expense | | | 0.80% | | | | 0.80% | | | | 0.96% | | | | 1.10% | | | | 0.99% | |
Ratio of net investment income to average net assets4 | | | | | | | | | | | | | | | | | | | | |
Before expense reimbursement (recapture) and securities lending credit | | | 2.22% | | | | 2.44% | | | | 2.04% | | | | 2.91% | | | | 1.92% | |
After expense reimbursement (recapture) and securities lending credit | | | 2.51% | | | | 2.75% | | | | 2.20% | | | | 2.99% | | | | 2.06% | |
Portfolio turnover rate | | | 161.00% | | | | 146.82% | | | | 154.33% | | | | 41.66% | | | | 200.13% | |
Portfolio Turnover is calculated for the Fund as a whole.
| 1 | | Net investment income per share has been calculated based on average shares outstanding during the year. |
| 2 | | These ratios exclude the impact of the expenses of the underlying investment companies and exchange-traded funds in which the Fund invests. |
| 3 | | Includes interest expense where applicable. See Note 6 in the Notes to the Financial Statements. |
| 4 | | Recognition of the net investment income by the Fund is affected by the timing of the declaration of dividends by the underlying investment companies and exchange-traded funds in which the Fund invests. |
| 5 | | Realized and unrealized gains and losses per share in this caption are balancing amounts necessary to reconcile the change in net asset value per share for the year, and may not reconcile with the aggregate gains and losses in the Statement of Operations due to share transactions for the year. |
See notes to financial statements.
153
GuideMark® Funds & GuidePath® Funds
FINANCIAL HIGHLIGHTS
| | | | | | | | | | | | | | | | | | | | |
| | | Multi-Asset Income Allocation Fund
| |
| | | Service
| |
| | | Year Ended
March 31,
2020
| | | Year Ended
March 31,
2019
| | | Year Ended
March 31,
2018
| | | Year Ended
March 31,
2017
| | | Year Ended
March 31,
2016
| |
Per share data for a share of capital stock outstanding for the entire year and selected information for the year are as follows: | | | | | | | | | | | | | | | | | | | | |
Net asset value, beginning of year | | | $10.660 | | | | $10.603 | | | | $10.460 | | | | $9.94 | | | | $10.62 | |
Income from investment operations: | | | | | | | | | | | | | | | | | | | | |
Net investment income1 | | | 0.344 | | | | 0.358 | | | | 0.287 | | | | 0.29 | | | | 0.34 | |
Net realized and unrealized gains (losses) on investments | | | (1.632 | ) | | | 0.062 | | | | 0.137 | | | | 0.52 | | | | (0.61 | ) |
| | |
|
|
| |
|
|
| |
|
|
| |
|
|
| |
|
|
|
Total from investment operations | | | (1.288 | ) | | | 0.420 | | | | 0.424 | | | | 0.81 | | | | (0.27 | ) |
| | |
|
|
| |
|
|
| |
|
|
| |
|
|
| |
|
|
|
Less distributions: | | | | | | | | | | | | | | | | | | | | |
Dividends from net investment income | | | (0.313 | ) | | | (0.363 | ) | | | (0.281 | ) | | | (0.29 | ) | | | (0.37 | ) |
Dividends from net realized gains | | | (0.003 | ) | | | — | | | | — | | | | — | | | | (0.04 | ) |
| | |
|
|
| |
|
|
| |
|
|
| |
|
|
| |
|
|
|
Total distributions | | | (0.316 | ) | | | (0.363 | ) | | | (0.281 | ) | | | (0.29 | ) | | | (0.41 | ) |
| | |
|
|
| |
|
|
| |
|
|
| |
|
|
| |
|
|
|
Net asset value, end of year | | | $9.056 | | | | $10.660 | | | | $10.603 | | | | $10.46 | | | | $9.94 | |
| | |
|
|
| |
|
|
| |
|
|
| |
|
|
| |
|
|
|
Total return | | | (12.53)% | | | | 4.13% | | | | 4.05% | | | | 8.24% | | | | (2.49)% | |
Supplemental data and ratios: | | | | | | | | | | | | | | | | | | | | |
Net assets, end of year | | | $112,044,753 | | | | $132,260,092 | | | | $119,091,615 | | | | $119,817,129 | | | | $106,901,424 | |
Ratio of expenses to average net assets2 | | | | | | | | | | | | | | | | | | | | |
Before expense reimbursement (recapture) and securities lending credit including interest expense3 | | | 1.12% | | | | 1.15% | | | | 1.13% | | | | 1.17% | | | | 1.17% | |
After expense reimbursement (recapture) and securities lending credit including interest expense3 | | | 0.92% | | | | 0.82% | | | | 0.98% | | | | 0.97% | | | | 0.96% | |
Before expense reimbursement (recapture) and securities lending credit excluding interest expense | | | 1.12% | | | | 1.15% | | | | 1.13% | | | | 1.17% | | | | 1.17% | |
After expense reimbursement (recapture) and securities lending credit excluding interest expense | | | 0.92% | | | | 0.82% | | | | 0.98% | | | | 0.97% | | | | 0.96% | |
Ratio of net investment income to average net assets4 | | | | | | | | | | | | | | | | | | | | |
Before expense reimbursement (recapture) and securities lending credit | | | 2.99% | | | | 3.08% | | | | 2.52% | | | | 2.66% | | | | 3.15% | |
After expense reimbursement (recapture) and securities lending credit | | | 3.19% | | | | 3.41% | | | | 2.67% | | | | 2.86% | | | | 3.36% | |
Portfolio turnover rate | | | 85.15% | | | | 44.77% | | | | 131.23% | | | | 61.25% | | | | 145.43% | |
| 1 | | Net investment income per share has been calculated based on average shares outstanding during the year. |
| 2 | | These ratios exclude the impact of the expenses of the underlying investment companies and exchange-traded funds in which the Fund invests. |
| 3 | | Includes interest expense where applicable. See Note 6 in the Notes to the Financial Statements. |
| 4 | | Recognition of the net investment income by the Fund is affected by the timing of the declaration of dividends by the underlying investment companies and exchange-traded funds in which the Fund invests. |
See notes to financial statements.
154
GuideMark® Funds & GuidePath® Funds
FINANCIAL HIGHLIGHTS
| | | | | | | | | | | | | | | | | | | | |
| | | Flexible Income Allocation Fund
| |
| | | Institutional
| |
| | | Year Ended
March 31,
2020
| | | Year Ended
March 31,
2019
| | | Year Ended
March 31,
2018
| | | Year Ended
March 31,
2017
| | | Year Ended
March 31,
2016
| |
Per share data for a share of capital stock outstanding for the entire year and selected information for the year are as follows: | | | | | | | | | | | | | | | | | | | | |
Net asset value, beginning of year | | | $9.422 | | | | $9.577 | | | | $9.670 | | | | $9.62 | | | | $9.76 | |
Income from investment operations: | | | | | | | | | | | | | | | | | | | | |
Net investment income1 | | | 0.391 | | | | 0.426 | | | | 0.543 | | | | 0.24 | | | | 0.18 | |
Net realized and unrealized gains (losses) on investments | | | (0.076 | )2 | | | (0.183 | ) | | | (0.158 | )2 | | | 0.07 | | | | (0.11 | ) |
| | |
|
|
| |
|
|
| |
|
|
| |
|
|
| |
|
|
|
Total from investment operations | | | 0.315 | | | | 0.243 | | | | 0.385 | | | | 0.31 | | | | 0.07 | |
| | |
|
|
| |
|
|
| |
|
|
| |
|
|
| |
|
|
|
Less distributions: | | | | | | | | | | | | | | | | | | | | |
Dividends from net investment income | | | (0.369 | ) | | | (0.398 | ) | | | (0.478 | ) | | | (0.26 | ) | | | (0.21 | ) |
| | |
|
|
| |
|
|
| |
|
|
| |
|
|
| |
|
|
|
Total distributions | | | (0.369 | ) | | | (0.398 | ) | | | (0.478 | ) | | | (0.26 | ) | | | (0.21 | ) |
| | |
|
|
| |
|
|
| |
|
|
| |
|
|
| |
|
|
|
Net asset value, end of year | | | $9.368 | | | | $9.422 | | | | $9.577 | | | | $9.67 | | | | $9.62 | |
| | |
|
|
| |
|
|
| |
|
|
| |
|
|
| |
|
|
|
Total return | | | 3.38% | | | | 2.58% | | | | 3.99% | | | | 3.23% | | | | 0.70% | |
Supplemental data and ratios: | | | | | | | | | | | | | | | | | | | | |
Net assets, end of year | | | $34,154 | | | | $26,280 | | | | $224,505 | | | | $52,492 | | | | $49,872 | |
Ratio of expenses to average net assets3 | | | | | | | | | | | | | | | | | | | | |
Before expense reimbursement (recapture) and securities lending credit including interest expense4 | | | 0.45% | | | | 0.56% | | | | 0.52% | | | | 0.50% | | | | 0.44% | |
After expense reimbursement (recapture) and securities lending credit including interest expense4 | | | 0.15% | | | | 0.16% | | | | 0.27% | | | | 0.37% | | | | 0.36% | |
Before expense reimbursement (recapture) and securities lending credit excluding interest expense | | | 0.45% | | | | 0.55% | | | | 0.52% | | | | 0.50% | | | | 0.44% | |
After expense reimbursement (recapture) and securities lending credit excluding interest expense | | | 0.15% | | | | 0.15% | | | | 0.27% | | | | 0.37% | | | | 0.36% | |
Ratio of net investment income to average net assets5 | | | | | | | | | | | | | | | | | | | | |
Before expense reimbursement (recapture) and securities lending credit | | | 3.81% | | | | 4.07% | | | | 5.27% | | | | 2.32% | | | | 1.76% | |
After expense reimbursement (recapture) and securities lending credit | | | 4.11% | | | | 4.47% | | | | 5.52% | | | | 2.45% | | | | 1.84% | |
Portfolio turnover rate | | | 517.05% | | | | 380.48% | | | | 232.11% | | | | 114.68% | | | | 147.81% | |
Portfolio Turnover is calculated for the Fund as a whole.
| 1 | | Net investment income per share has been calculated based on average shares outstanding during the year. |
| 2 | | Realized and unrealized gains and losses per share in this caption are balancing amounts necessary to reconcile the change in net asset value per share for the year, and may not reconcile with the aggregate gains and losses in the Statement of Operations due to share transactions for the year. |
| 3 | | These ratios exclude the impact of the expenses of the underlying investment companies and exchange-traded funds in which the Fund invests. |
| 4 | | Includes interest expense where applicable. See Note 6 in the Notes to the Financial Statements. |
| 5 | | Recognition of the net investment income by the Fund is affected by the timing of the declaration of dividends by the underlying investment companies and exchange-traded funds in which the Fund invests. |
See notes to financial statements.
155
GuideMark® Funds & GuidePath® Funds
FINANCIAL HIGHLIGHTS
| | | | | | | | | | | | | | | | | | | | |
| | | Flexible Income Allocation Fund
| |
| | | Service
| |
| | | Year Ended
March 31,
2020
| | | Year Ended
March 31,
2019
| | | Year Ended
March 31,
2018
| | | Year Ended
March 31,
2017
| | | Year Ended
March 31,
2016
| |
Per share data for a share of capital stock outstanding for the entire year and selected information for the year are as follows: | | | | | | | | | | | | | | | | | | | | |
Net asset value, beginning of year | | | $9.366 | | | | $9.525 | | | | $9.610 | | | | $9.55 | | | | $9.77 | |
Income from investment operations: | | | | | | | | | | | | | | | | | | | | |
Net investment income1 | | | 0.331 | | | | 0.361 | | | | 0.340 | | | | 0.18 | | | | 0.14 | |
Net realized and unrealized gains (losses) on investments | | | (0.076 | )2 | | | (0.173 | ) | | | (0.018 | )2 | | | 0.08 | | | | (0.21 | ) |
| | |
|
|
| |
|
|
| |
|
|
| |
|
|
| |
|
|
|
Total from investment operations | | | 0.255 | | | | 0.188 | | | | 0.322 | | | | 0.26 | | | | (0.07 | ) |
| | |
|
|
| |
|
|
| |
|
|
| |
|
|
| |
|
|
|
Less distributions: | | | | | | | | | | | | | | | | | | | | |
Dividends from net investment income | | | (0.317 | ) | | | (0.347 | ) | | | (0.407 | ) | | | (0.20 | ) | | | (0.15 | ) |
| | |
|
|
| |
|
|
| |
|
|
| |
|
|
| |
|
|
|
Total distributions | | | (0.317 | ) | | | (0.347 | ) | | | (0.407 | ) | | | (0.20 | ) | | | (0.15 | ) |
| | |
|
|
| |
|
|
| |
|
|
| |
|
|
| |
|
|
|
Net asset value, end of year | | | $9.304 | | | | $9.366 | | | | $9.525 | | | | $9.61 | | | | $9.55 | |
| | |
|
|
| |
|
|
| |
|
|
| |
|
|
| |
|
|
|
Total return | | | 2.76% | | | | 2.00% | | | | 3.35% | | | | 2.73% | | | | (0.75)% | |
Supplemental data and ratios: | | | | | | | | | | | | | | | | | | | | |
Net assets, end of year | | | $98,516,379 | | | | $59,741,077 | | | | $55,246,464 | | | | $99,575,144 | | | | $114,740,157 | |
Ratio of expenses to average net assets3 | | | | | | | | | | | | | | | | | | | | |
Before expense reimbursement (recapture) and securities lending credit including interest expense4 | | | 1.05% | | | | 1.15% | | | | 1.12% | | | | 1.09% | | | | 1.04% | |
After expense reimbursement (recapture) and securities lending credit including interest expense4 | | | 0.75% | | | | 0.77% | | | | 0.93% | | | | 0.91% | | | | 0.93% | |
Before expense reimbursement (recapture) and securities lending credit excluding interest expense | | | 1.05% | | | | 1.13% | | | | 1.12% | | | | 1.09% | | | | 1.04% | |
After expense reimbursement (recapture) and securities lending credit excluding interest expense | | | 0.75% | | | | 0.75% | | | | 0.93% | | | | 0.91% | | | | 0.93% | |
Ratio of net investment income to average net assets5 | | | | | | | | | | | | | | | | | | | | |
Before expense reimbursement (recapture) and securities lending credit | | | 3.20% | | | | 3.45% | | | | 3.30% | | | | 1.72% | | | | 1.32% | |
After expense reimbursement (recapture) and securities lending credit | | | 3.50% | | | | 3.83% | | | | 3.49% | | | | 1.90% | | | | 1.43% | |
Portfolio turnover rate | | | 517.05% | | | | 380.48% | | | | 232.21% | | | | 114.68% | | | | 147.81% | |
Portfolio Turnover is calculated for the Fund as a whole.
| 1 | | Net investment income per share has been calculated based on average shares outstanding during the year. |
| 2 | | Realized and unrealized gains and losses per share in this caption are balancing amounts necessary to reconcile the change in net asset value per share for the year, and may not reconcile with the aggregate gains and losses in the Statement of Operations due to share transactions for the year. |
| 3 | | These ratios exclude the impact of the expenses of the underlying investment companies and exchange-traded funds in which the Fund invests. |
| 4 | | Includes interest expense where applicable. See Note 6 in the Notes to the Financial Statements. |
| 5 | | Recognition of the net investment income by the Fund is affected by the timing of the declaration of dividends by the underlying investment companies and exchange-traded funds in which the Fund invests. |
See notes to financial statements.
156
GuideMark® Funds & GuidePath® Funds
FINANCIAL HIGHLIGHTS
| | | | | | | | | | | | | | | | | | | | |
| | | Managed Futures Strategy Fund (Consolidated)
| |
| | | Institutional
| |
| | | Year Ended
March 31,
2020
| | | Year Ended
March 31,
2019
| | | Year Ended
March 31,
2018
| | | Year Ended
March 31,
2017
| | | January 19, 20161
Through
March 31,
2016
| |
Per share data for a share of capital stock outstanding for the entire year and selected information for the year are as follows: | | | | | | | | | | | | | | | | | | | | |
Net asset value, beginning of year | | | $8.067 | | | | $8.665 | | | | $8.700 | | | | $9.75 | | | | $10.00 | |
Income from investment operations: | | | | | | | | | | | | | | | | | | | | |
Net investment income (loss)2 | | | 0.063 | | | | 0.081 | | | | (0.002 | ) | | | (0.06 | ) | | | (0.02 | ) |
Net realized and unrealized losses on investments | | | 1.097 | | | | (0.679 | ) | | | (0.033 | ) | | | (0.83 | ) | | | (0.23 | ) |
| | |
|
|
| |
|
|
| |
|
|
| |
|
|
| |
|
|
|
Total from investment operations | | | 1.160 | | | | (0.598 | ) | | | (0.035 | ) | | | (0.89 | ) | | | (0.25 | ) |
| | |
|
|
| |
|
|
| |
|
|
| |
|
|
| |
|
|
|
Less distributions: | | | | | | | | | | | | | | | | | | | | |
Dividends from net investment income | | | (0.131 | ) | | | — | | | | — | | | | — | | | | — | |
Dividends from net realized gains | | | (0.283 | ) | | | — | | | | — | | | | (0.16 | ) | | | — | |
| | |
|
|
| |
|
|
| |
|
|
| |
|
|
| |
|
|
|
Total distributions | | | (0.414 | ) | | | — | | | | — | | | | (0.16 | ) | | | — | |
| | |
|
|
| |
|
|
| |
|
|
| |
|
|
| |
|
|
|
Net asset value, end of year | | | $8.813 | | | | $8.067 | | | | $8.665 | | | | $8.70 | | | | $9.75 | |
| | |
|
|
| |
|
|
| |
|
|
| |
|
|
| |
|
|
|
Total return | | | 14.70% | | | | (6.90)% | | | | (0.40)% | | | | (9.17)% | | | | (2.50)%3 | |
Supplemental data and ratios: | | | | | | | | | | | | | | | | | | | | |
Net assets, end of year | | | $1,220,564 | | | | $961,919 | | | | $1,215,018 | | | | $1,478,880 | | | | $4,338,706 | |
Ratio of expenses to average net assets | | | | | | | | | | | | | | | | | | | | |
Before expense reimbursement (recapture) and fees waived including interest expense5 | | | 1.25% | | | | 1.27% | | | | 1.38% | | | | 1.37% | | | | 1.61%4 | |
After expense reimbursement (recapture) and fees waived including interest expense5 | | | 1.30% | | | | 1.30% | | | | 1.34% | | | | 1.34% | | | | 1.30%4 | |
Before expense reimbursement (recapture) and fees waived excluding interest expense | | | 1.25% | | | | 1.27% | | | | 1.34% | | | | 1.33% | | | | 1.61%4 | |
After expense reimbursement (recapture) and fees waived excluding interest expense | | | 1.30% | | | | 1.30% | | | | 1.30% | | | | 1.30% | | | | 1.30%4 | |
Ratio of net investment gain (loss) to average net assets | | | | | | | | | | | | | | | | | | | | |
Before expense reimbursement (recapture) and fees waived | | | 0.79% | | | | 1.03% | | | | (0.07)% | | | | (0.69)% | | | | (1.12)%4 | |
After expense reimbursement (recapture) and fees waived | | | 0.74% | | | | 1.00% | | | | (0.03)% | | | | (0.66)% | | | | (0.81)%4 | |
Portfolio turnover rate | | | 0.00% | | | | 0.00% | | | | 0.00% | | | | 0.00% | | | | 0.00%3 | |
Portfolio Turnover is calculated for the Fund as a whole.
| 1 | | Commencement of operations. |
| 2 | | Net investment income (loss) per share has been calculated based on average shares outstanding during the year. |
| 5 | | Includes interest expense where applicable. See Note 6 in the Notes to Financial Statements. |
See notes to financial statements.
157
GuideMark® Funds & GuidePath® Funds
FINANCIAL HIGHLIGHTS
| | | | | | | | | | | | | | | | | | | | |
| | | Managed Futures Strategy Fund (Consolidated)
| |
| | | Service
| |
| | | Year Ended
March 31,
2020
| | | Year Ended
March 31,
2019
| | | Year Ended
March 31,
2018
| | | Year Ended
March 31,
2017
| | | January 19, 20161
Through
March 31,
2016
| |
Per share data for a share of capital stock outstanding for the entire year and selected information for the year are as follows: | | | | | | | | | | | | | | | | | | | | |
Net asset value, beginning of year | | | $7.914 | | | | $8.551 | | | | $8.640 | | | | $9.73 | | | | $10.00 | |
Income from investment operations: | | | | | | | | | | | | | | | | | | | | |
Net investment income (loss)2 | | | 0.011 | | | | 0.035 | | | | (0.050 | ) | | | (0.11 | ) | | | (0.03 | ) |
Net realized and unrealized losses on investments | | | 1.077 | | | | (0.672 | ) | | | (0.039 | ) | | | (0.82 | ) | | | (0.24 | ) |
| | |
|
|
| |
|
|
| |
|
|
| |
|
|
| |
|
|
|
Total from investment operations | | | 1.088 | | | | (0.637 | ) | | | (0.089 | ) | | | (0.93 | ) | | | (0.27 | ) |
| | |
|
|
| |
|
|
| |
|
|
| |
|
|
| |
|
|
|
Less distributions: | | | | | | | | | | | | | | | | | | | | |
Dividends from net investment income | | | (0.071 | ) | | | — | | | | — | | | | — | | | | — | |
Dividends from net realized gains | | | (0.283 | ) | | | — | | | | — | | | | (0.16 | ) | | | — | |
| | |
|
|
| |
|
|
| |
|
|
| |
|
|
| |
|
|
|
Total distributions | | | (0.354 | ) | | | — | | | | — | | | | (0.16 | ) | | | — | |
| | |
|
|
| |
|
|
| |
|
|
| |
|
|
| |
|
|
|
Net asset value, end of year | | | $8.648 | | | | $7.914 | | | | $8.551 | | | | $8.64 | | | | $9.73 | |
| | |
|
|
| |
|
|
| |
|
|
| |
|
|
| |
|
|
|
Total return | | | 14.03% | | | | (7.45)% | | | | (0.92)% | | | | (9.70)% | | | | (2.70)%3 | |
Supplemental data and ratios: | | | | | | | | | | | | | | | | | | | | |
Net assets, end of year | | | $221,868,264 | | | | $156,397,141 | | | | $121,362,278 | | | | $81,212,945 | | | | $183,020,093 | |
Ratio of expenses to average net assets | | | | | | | | | | | | | | | | | | | | |
Before expense reimbursement (recapture) and fees waived including interest expense5 | | | 1.85% | | | | 1.87% | | | | 1.97% | | | | 1.97% | | | | 2.20%4 | |
After expense reimbursement (recapture) and fees waived including interest expense5 | | | 1.90% | | | | 1.90% | | | | 1.94% | | | | 1.94% | | | | 1.90%4 | |
Before expense reimbursement (recapture) and fees waived excluding interest expense | | | 1.85% | | | | 1.87% | | | | 1.93% | | | | 1.93% | | | | 2.20%4 | |
After expense reimbursement (recapture) and fees waived excluding interest expense | | | 1.90% | | | | 1.90% | | | | 1.90% | | | | 1.90% | | | | 1.90%4 | |
Ratio of net investment gain (loss) to average net assets | | | | | | | | | | | | | | | | | | | | |
Before expense reimbursement (recapture) and fees waived | | | 0.18% | | | | 0.47% | | | | (0.61)% | | | | (1.27)% | | | | (1.71)%4 | |
After expense reimbursement (recapture) and fees waived | | | 0.13% | | | | 0.44% | | | | (0.58)% | | | | (1.24)% | | | | (1.41)%4 | |
Portfolio turnover rate | | | 0.00% | | | | 0.00% | | | | 0.00% | | | | 0.00% | | | | 0.00%3 | |
Portfolio Turnover is calculated for the Fund as a whole.
| 1 | | Commencement of operations. |
| 2 | | Net investment income (loss) per share has been calculated based on average shares outstanding during the year. |
| 5 | | Includes interest expense where applicable. See Note 6 in the Notes to Financial Statements. |
See notes to financial statements.
158
GuideMark® Funds & GuidePath® Funds
FINANCIAL HIGHLIGHTS
| | | | | | | | |
| | | Conservative Income Fund
| |
| | | Year Ended
March 31,
2020
| | | April 30, 20181
through
March 31,
2019
| |
Per share data for a share of capital stock outstanding for the entire year and selected information for the year are as follows: | | | | | | | | |
Net asset value, beginning of year | | | $9.987 | | | | $10.000 | |
Income from investment operations: | | | | | | | | |
Net investment income2 | | | 0.177 | | | | 0.153 | |
Net realized and unrealized losses on investments | | | (0.092 | ) | | | (0.020 | )7 |
| | |
|
|
| |
|
|
|
Total from investment operations | | | 0.085 | | | | 0.133 | |
| | |
|
|
| |
|
|
|
Less distributions: | | | | | | | | |
Dividends from net investment income | | | (0.173 | ) | | | (0.144 | ) |
Dividends from net realized gains | | | — | | | | (0.002 | ) |
| | |
|
|
| |
|
|
|
Total distributions | | | (0.173 | ) | | | (0.146 | ) |
| | |
|
|
| |
|
|
|
Net asset value, end of year | | | $9.899 | | | | $9.987 | |
| | |
|
|
| |
|
|
|
Total return | | | 0.85% | | | | 1.34%3 | |
Supplemental data and ratios: | | | | | | | | |
Net assets, end of year | | | $6,724,818 | | | | $973,527 | |
Ratio of expenses to average net assets4 | | | | |
Before expense reimbursement (recapture) and securities lending credit | | | 2.23% | | | | 43.40%5 | |
After expense reimbursement (recapture) and securities lending credit | | | 0.64% | | | | 0.64%5 | |
Ratio of net investment income to average net assets6 | | | | |
Before expense reimbursement (recapture) and fees waived | | | 0.18% | | | | (41.09)%5 | |
After expense reimbursement (recapture) and fees waived | | | 1.77% | | | | 1.67%5 | |
Portfolio turnover rate | | | 190.99% | | | | 388.79%3 | |
| 1 | | Commencement of operations. |
| 2 | | Net investment income per share has been calculated based on average shares outstanding during the year. |
| 4 | | These ratios exclude the impact of the expenses of the underlying investment companies and exchange-traded funds in which the Fund invests. |
| 6 | | Recognition of the net investment income by the Fund is affected by the timing of the declaration of dividends by the underlying investment companies and exchange-traded funds in which the Fund invests. |
| 7 | | Realized and unrealized gains and losses per shares in this caption are balancing amounts necessary to reconcile the change in net asset value per share for the period, and may not reconcile with aggregate gains and losses in the Statement of Operations due to share transactions for the period. |
See notes to financial statements.
159
GuideMark® Funds & GuidePath® Funds
FINANCIAL HIGHLIGHTS
| | | | | | | | |
| | | Income Fund
| |
| | | Year Ended
March 31,
2020
| | | April 30, 20181
through
March 31,
2019
| |
Per share data for a share of capital stock outstanding for the entire year and selected information for the year are as follows: | | | | | | | | |
Net asset value, beginning of year | | | $9.892 | | | | $10.000 | |
Income from investment operations: | | | | | | | | |
Net investment income2 | | | 0.284 | | | | 0.079 | |
Net realized and unrealized gains on investments | | | (0.048 | )7 | | | 0.0167 | |
| | |
|
|
| |
|
|
|
Total from investment operations | | | 0.236 | | | | 0.095 | |
| | |
|
|
| |
|
|
|
Less distributions: | | | | | | | | |
Dividends from net investment income | | | (0.266 | ) | | | (0.203 | ) |
Dividends from net realized gains | | | (0.005 | ) | | | — | |
| | |
|
|
| |
|
|
|
Total distributions | | | (0.271 | ) | | | (0.203 | ) |
| | |
|
|
| |
|
|
|
Net asset value, end of year | | | $9.857 | | | | $9.892 | |
| | |
|
|
| |
|
|
|
Total return | | | 2.34% | | | | 0.99%3 | |
Supplemental data and ratios: | | | | | | | | |
Net assets, end of year | | | $32,494,874 | | | | $3,619,628 | |
Ratio of expenses to average net assets4 | | | | |
Before expense reimbursement (recapture) and securities lending credit | | | 1.18% | | | | 16.23%5 | |
After expense reimbursement (recapture) and securities lending credit | | | 0.79% | | | | 0.79%5 | |
Ratio of net investment income to average net assets6 | | | | |
Before expense reimbursement (recapture) and fees waived | | | 2.39% | | | | (14.57)%5 | |
After expense reimbursement (recapture) and fees waived | | | 2.79% | | | | 0.87%5 | |
Portfolio turnover rate | | | 247.58% | | | | 801.50%3 | |
| 1 | | Commencement of operations. |
| 2 | | Net investment income per share has been calculated based on average shares outstanding during the year. |
| 4 | | These ratios exclude the impact of the expenses of the underlying investment companies and exchange-traded funds in which the Fund invests. |
| 6 | | Recognition of the net investment income by the Fund is affected by the timing of the declaration of dividends by the underlying investment companies and exchange-traded funds in which the Fund invests. |
| 7 | | Realized and unrealized gains and losses per shares in this caption are balancing amounts necessary to reconcile the change in net asset value per share for the period, and may not reconcile with aggregate gains and losses in the Statement of Operations due to share transactions for the period. |
See notes to financial statements.
160
GuideMark® Funds & GuidePath® Funds
FINANCIAL HIGHLIGHTS
| | | | | | | | |
| | | Growth & Income Fund
| |
| | | Year Ended
March 31,
2020
| | | April 30, 20181
through
March 31,
2019
| |
Per share data for a share of capital stock outstanding for the entire year and selected information for the year are as follows: | | | | | | | | |
Net asset value, beginning of year | | | $9.772 | | | | $10.000 | |
Income from investment operations: | | | | | | | | |
Net investment income2 | | | 0.189 | | | | 0.331 | |
Net realized and unrealized losses on investments | | | (1.094 | ) | | | (0.320 | )7 |
| | |
|
|
| |
|
|
|
Total from investment operations | | | (0.905 | ) | | | 0.011 | |
| | |
|
|
| |
|
|
|
Less distributions: | | | | | | | | |
Dividends from net investment income | | | (0.146 | ) | | | (0.239 | ) |
Dividends from net realized gains | | | (0.004 | ) | | | — | |
| | |
|
|
| |
|
|
|
Total distributions | | | (0.150 | ) | | | (0.239 | ) |
| | |
|
|
| |
|
|
|
Net asset value, end of year | | | $8.717 | | | | $9.772 | |
| | |
|
|
| |
|
|
|
Total return | | | (9.45)% | | | | 0.14%3 | |
Supplemental data and ratios: | | | | | | | | |
Net assets, end of year | | | $33,927,659 | | | | $4,519,060 | |
Ratio of expenses to average net assets4 | | | | |
Before expense reimbursement (recapture) and securities lending credit | | | 1.34% | | | | 27.58%5 | |
After expense reimbursement (recapture) and securities lending credit | | | 0.79% | | | | 0.79%5 | |
Ratio of net investment income to average net assets6 | | | | |
Before expense reimbursement (recapture) and fees waived | | | 1.34% | | | | (23.11)%5 | |
After expense reimbursement (recapture) and fees waived | | | 1.89% | | | | 3.68%5 | |
Portfolio turnover rate | | | 159.34% | | | | 123.50%3 | |
| 1 | | Commencement of operations. |
| 2 | | Net investment income per share has been calculated based on average shares outstanding during the year. |
| 4 | | These ratios exclude the impact of the expenses of the underlying investment companies and exchange-traded funds in which the Fund invests. |
| 6 | | Recognition of the net investment income by the Fund is affected by the timing of the declaration of dividends by the underlying investment companies and exchange-traded funds in which the Fund invests. |
| 7 | | Realized and unrealized gains and losses per shares in this caption are balancing amounts necessary to reconcile the change in net asset value per share for the period, and may not reconcile with aggregate gains and losses in the Statement of Operations due to share transactions for the period. |
See notes to financial statements.
161
GuideMark® Funds & GuidePath® Funds
NOTES TO FINANCIAL STATEMENTS
March 31, 2020
GPS Funds I and GPS Funds II (the “Trusts”) are organized as Delaware statutory trusts under Declarations of Trusts dated January 2, 2001 and October 20, 2010, respectively. The Trusts are registered under the Investment Company Act of 1940, as amended (the “1940 Act”), asopen-end management investment companies. GPS Funds I is comprised of the following 6 funds: GuideMark® Large Cap Core Fund, GuideMark® Emerging Markets Fund, GuideMark® Small/Mid Cap Core Fund, GuideMark® Worldex-US Fund, GuideMark® Core Fixed Income Fund and GuideMark®Tax-Exempt Fixed Income Fund. GPS Funds II is comprised of the following 11 funds: GuideMark® Opportunistic Fixed Income Fund, GuidePath® Growth Allocation Fund, GuidePath® Conservative Allocation Fund, GuidePath® Tactical Allocation Fund, GuidePath® Absolute Return Allocation Fund, GuidePath®Multi-Asset Income Allocation Fund, GuidePath® Flexible Income Allocation Fund, GuidePath®Managed Futures Strategy Fund, GuidePath® Conservative Income Fund, GuidePath® Income Fund and GuidePath® Growth and Income Fund (collectively, the “Funds”). All of the Funds are classified and operate as diversified funds under the 1940 Act. Each Fund represents a distinct portfolio with its own investment objectives and policies. The assets of each Fund are segregated, and a shareholder’s interest is limited to the Fund in which shares are held. The GuideMark® Opportunistic Fixed Income Fund, GuidePath® Growth Allocation Fund, GuidePath® Conservative Allocation Fund, GuidePath® Tactical Allocation Fund and GuidePath® Absolute Return Allocation Fund were seeded on March 4, 2011 and the prospectus went effective on April 1, 2011. The GuideMark® Opportunistic Fixed Income Fund commenced operations on April 1, 2011. The GuidePath® Growth Allocation Fund, GuidePath® Conservative Allocation Fund, GuidePath® Tactical Allocation Fund and GuidePath® Absolute Return Allocation Fund commenced operations on April 29, 2011. The GuidePath®Multi-Asset Income Allocation Fund and GuidePath® Flexible Income Allocation Fund commenced operations on August 31, 2012. The GuidePath®Managed Futures Strategy Fund commenced operations on January 19, 2016. The GuidePath® Conservative Income Fund, GuidePath® Income Fund and GuidePath® Growth and Income Fund commenced operations on April 30, 2018. Each Fund offers two classes of shares: Service Shares and Institutional Shares, except GuidePath® Conservative Income Fund, GuidePath® Income Fund and GuidePath® Growth and Income Fund, which are only offered with a single share class. Certain Fund classes were without shares as of the period end; any share activity related to those classes is presented in the Statement of Changes in Net Assets. The Funds are investment companies and accordingly follow the investment company accounting and reporting guidance of the Financial Accounting Standards Board (“FASB”) Accounting Standards Codification Topic 946 Financial Services – Investment Companies.
The GuidePath® Growth Allocation Fund, GuidePath® Conservative Allocation Fund, GuidePath® Tactical Allocation Fund, GuidePath® Absolute Return Allocation Fund, GuidePath®Multi-Asset Income Allocation Fund, GuidePath® Flexible Income Allocation Fund, GuidePath® Conservative Income Fund, GuidePath® Income Fund and GuidePath® Growth and Income
Fund each operate as a “Fund of Funds,” investing primarily (or, in the case of the GuidePath® Tactical Allocation Fund, between 10% and 100% of its assets) in registered investment companies, including mutual funds and exchange-traded funds (“ETFs”). The funds in which the Fund of Funds may invest are referred to herein as the “Underlying Funds.” The Advisor believes that investing in Underlying Funds provides each Fund of Funds with an efficient means of creating a portfolio that provides investors with indirect exposure to a broad range of securities. By investing in a Fund of Funds, you will indirectly bear fees and expenses of the Underlying Funds in addition to the Fund’s direct fees and expenses. In order to obtain exposure to certain markets, asset classes or active management styles, each Fund of Funds may buy Underlying Funds managed by the Advisor or its affiliates, which in turn, invest in various securities, including ETFs. The Fund of Funds may also invest directly in securities and other exchange-traded products, such as exchange-traded notes.
| 3. | | Significant Accounting Policies |
The following is a summary of significant accounting policies consistently followed by the Funds in the preparation of the financial statements. These policies are in conformity with U.S. generally accepted accounting principles (“GAAP”).
Portfolio securities listed on a national or foreign securities exchange, except those listed on NASDAQ, for which market quotations are available are valued at the last quoted sale price on each business day. Portfolio securities traded on NASDAQ are valued at the NASDAQ Official Closing Price (“NOCP”) on each business day. If there is no reported sale on an exchange or NASDAQ, the portfolio security will be valued at the mean between the most recent quoted bid and asked price. Price information on listed securities is taken from the exchange where the security is primarily traded.
All equity securities that are not traded on a listed exchange are valued at the last sale price in theover-the-counter market. If anon-exchange traded security does not trade on a particular day, then the mean between the last quoted closing bid and asked price will be used.Non-exchange traded ADRs are priced with an evaluated price as determined by the current evaluated pricing procedures of, and provided by, the pricing vendor.
Fixed income securities that have a maturity of greater than 60 days are generally valued on the basis of evaluations obtained from third party pricing services, which take into account appropriate factors such asinstitutional-sized trading in similar groups of securities, yield, quality, coupon rate, maturity, type of issue, trading characteristics and other market data. Short term investments having a maturity of less than 60 days are generally valued at amortized cost, which approximates fair value.
Investments in mutual funds are valued at the closing net asset value per share of each mutual fund on the day of valuation. These investments in mutual funds may include investments in affiliated mutual funds. Investments in mutual funds are generally priced using values supplied by the underlying funds themselves.
162
GuideMark® Funds & GuidePath® Funds
NOTES TO FINANCIAL STATEMENTS (Continued)
March 31, 2020
To assess the continuing appropriateness of security valuation, the Advisor regularly compares prior day prices with current day prices and transaction prices. When the comparison results exceedpre-defined thresholds, the Advisor challenges the prices exceeding tolerance levels with the pricing service or broker. Securities for which no market quotations are readily available or when a significant event has occurred between the time of the security’s last close and the time that a Fund next calculates its net asset value will be valued at their fair value as determined by the applicable Fund’s Valuation Committee. Securities for which no market prices are readily available will be valued at their fair value as determined by the Valuation Committee under procedures adopted by the applicable Board of Trustees (the “Board”).
The Funds have adopted authoritative fair valuation accounting standards which establish an authoritative definition of fair value and set out a hierarchy for measuring fair value. These standards require additional disclosures about the various inputs and valuation techniques used to develop the measurements of fair value and a discussion in changes in valuation techniques and related inputs, if any, during the year. In addition, these standards require expanded disclosure for each major category of assets. These inputs are summarized in the three broad levels listed below:
Level 1 – Quoted prices in active markets for identical securities.
Level 2 – Other significant observable inputs (including quoted prices for similar securities, interest rates, prepayment speeds, credit risk, etc.).
Level 3 – Significant unobservable inputs (including the Funds’ own assumptions in determining the fair value of investments).
During the year certain securities and other instruments held by the Funds were categorized as Level 2 or Level 3 based upon the inputs and methodologies used to determine the fair value of the security or instrument. Descriptions of the inputs and valuation methodologies used to determine the fair values of each class of investments within Level 2 and Level 3 are set forth below.
Level 2 Investments. The Funds’ investments that were categorized as Level 2 include: (1) certain fixed income securities, including asset-backed securities, collateralized mortgage obligations, corporate obligations, U.S. and foreign government obligations, mortgage-backed securities and municipal debt obligations; (2) certain foreign common stocks, preferred stocks, participatory notes, and real estate investment trusts; and (3) certain derivative instruments, including forward currency contracts, written options, and swaps.
Fixed income securities are normally valued by pricing vendors that use broker-dealer quotations, reported trades or valuation estimates from their internal pricing models. The service providers’ internal models typically use inputs that are observable such asinstitutional-sized trading in similar groups of securities, yield, credit quality, coupon rate, maturity, type of issue, trading characteristics and other market data.
Certain common stocks that trade on foreign exchanges are subject to valuation adjustments. These valuation adjustments are applied to the foreign exchange-traded common stocks to account for the market movement between the close of the foreign market in which the security is traded and the close of the New York Stock Exchange. These securities are valued using pricing vendors that consider the correlation patterns of price movements of the foreign security to the intraday trading in the U.S. markets.
Forward currency contracts, swaps and options derive their value from underlying asset prices, indices, reference rates, and other inputs or a combination of these factors. These instruments are normally valued using pricing vendors. Depending upon the instrument, its value may be provided by a pricing vendor using a series of techniques, including pricing models. The pricing models typically use inputs that are observed from active markets such as indices, spreads, interest rates, curves, dividends and exchange rates.
Level 3 Investments. The Funds’ investments that were categorized as Level 3 include: fair valued securities.
Fair valued securities are normally valued by pricing vendors using relevant observable inputs, as described above. In certain circumstances, the types of observable inputs that are typically used by a pricing service may be unavailable or deemed by the pricing service to be unreliable. In these instances, the pricing vendor may value the security based upon significant unobservable inputs, or the pricing vendor may not provide a value for the security. To the extent that a pricing vendor does not provide a value for a particular security, or the pricing vendor provides a value that the Valuation Committee does not believe accurately reflects the value of the security, the security will be valued by the Valuation Committee based upon the information available to the Committee at the time of valuation and in accordance with procedures adopted by the Board. These methodologies may require subjective judgments and determinations about the value of a particular security. When significant unobservable inputs are used to value a security, the security is categorized as Level 3.
To verify Level 3 unobservable inputs, the Valuation Committee uses a variety of techniques as appropriate to substantiate these valuation approaches including a regular review of key inputs and assumptions, transaction back-testing or disposition analysis and review of related market activity.
The inputs or methodology used for valuing securities are not an indication of the risk associated with investing in those securities.
163
GuideMark® Funds & GuidePath® Funds
NOTES TO FINANCIAL STATEMENTS (Continued)
March 31, 2020
The following is a summary of the inputs used to value the Funds’ net assets as of March 31, 2020:
GuideMark® Large Cap Core Fund
| | | | | | | | | | | | | | | | |
| | | Level 1
| | | Level 2
| | | Level 3
| | | Total
| |
Common Stocks | | $ | 296,752,645 | | | $ | — | | | $ | — | | | $ | 296,752,645 | |
Investment Companies | | | 12,203,571 | | | | — | | | | — | | | | 12,203,571 | |
Real Estate Investment Trusts | | | 12,929,747 | | | | — | | | | — | | | | 12,929,747 | |
Short Term Investments | | | 1,648,225 | | | | — | | | | — | | | | 1,648,225 | |
Investments Purchased with Proceeds from Securities Lending Collateral* | | | — | | | | — | | | | — | | | | 44,978,979 | |
| | |
|
|
| |
|
|
| |
|
|
| |
|
|
|
Total Investments in Securities | | $ | 323,534,188 | | | $ | — | | | $ | — | | | $ | 368,513,167 | |
| | |
|
|
| |
|
|
| |
|
|
| |
|
|
|
| | * | | Certain investments that are measured at fair value using the net asset value per share (or its equivalent) practical expedient have not been categorized in the fair value hierarchy. The fair value amounts presented in the table are intended to permit reconciliation of the fair value hierarchy to the amounts presented in the Statement of Assets and Liabilities. |
For further information regarding security characteristics, see the Schedule of Investments.
GuideMark® Emerging Markets Fund
| | | | | | | | | | | | | | | | |
| | | Level 1
| | | Level 2
| | | Level 3
| | | Total
| |
Common Stocks | | | | | | | | | | | | | | | | |
Communication Services | | $ | 1,302,339 | | | $ | 5,321,255 | | | $ | — | | | $ | 6,623,594 | |
Consumer Discretionary | | | 5,543,579 | | | | 3,573,526 | | | | — | | | | 9,117,105 | |
Consumer Staples | | | 1,276,577 | | | | 4,040,166 | | | | — | | | | 5,316,743 | |
Energy | | | 1,276,680 | | | | 1,743,941 | | | | — | | | | 3,020,621 | |
Financials | | | 1,136,798 | | | | 9,407,798 | | | | — | | | | 10,544,596 | |
Health Care | | | 246,448 | | | | 1,017,435 | | | | — | | | | 1,263,883 | |
Industrials | | | 248,967 | | | | 2,111,303 | | | | — | | | | 2,360,270 | |
Information Technology | | | 81,904 | | | | 10,161,059 | | | | — | | | | 10,242,963 | |
Materials | | | 757,256 | | | | 2,510,926 | | | | — | | | | 3,268,182 | |
Real Estate | | | 36,574 | | | | 804,725 | | | | — | | | | 841,299 | |
Utilities | | | 301,370 | | | | 480,773 | | | | — | | | | 782,143 | |
| | |
|
|
| |
|
|
| |
|
|
| |
|
|
|
Total Common Stocks | | | 12,208,492 | | | | 41,172,907 | | | | — | | | | 53,381,399 | |
Investment Companies | | | 6,307,145 | | | | — | | | | — | | | | 6,307,145 | |
Preferred Stocks | | | | | | | | | | | | | | | | |
Communication Services | | | 57,550 | | | | — | | | | — | | | | 57,550 | |
Consumer Staples | | | — | | | | 313,978 | | | | — | | | | 313,978 | |
Energy | | | 178,656 | | | | — | | | | — | | | | 178,656 | |
Financials | | | 615,645 | | | | — | | | | — | | | | 615,645 | |
Information Technology | | | — | | | | 476,529 | | | | — | | | | 476,529 | |
Utilities | | | 110,281 | | | | — | | | | — | | | | 110,281 | |
| | |
|
|
| |
|
|
| |
|
|
| |
|
|
|
Total Preferred Stocks | | | 962,132 | | | | 790,507 | | | | — | | | | 1,752,639 | |
Real Estate Investment Trusts | | | 41,653 | | | | — | | | | — | | | | 41,653 | |
Short Term Investments | | | 563,124 | | | | — | | | | — | | | | 563,124 | |
Investments Purchased with Proceeds from Securities Lending Collateral* | | | — | | | | — | | | | — | | | | 3,496,618 | |
| | |
|
|
| |
|
|
| |
|
|
| |
|
|
|
Total Investments in Securities | | $ | 20,082,546 | | | $ | 41,963,414 | | | $ | — | | | $ | 65,542,578 | |
| | |
|
|
| |
|
|
| |
|
|
| |
|
|
|
| | * | | Certain investments that are measured at fair value using the net asset value per share (or its equivalent) practical expedient have not been categorized in the fair value hierarchy. The fair value amounts presented in the table are intended to permit reconciliation of the fair value hierarchy to the amounts presented in the Statement of Assets and Liabilities. |
For further information regarding security characteristics, see the Schedule of Investments.
164
GuideMark® Funds & GuidePath® Funds
NOTES TO FINANCIAL STATEMENTS (Continued)
March 31, 2020
Below is a reconciliation of Level 3 assets for which significant unobservable inputs were used to determine fair value.
| | | | |
Description
| | Common Stocks
| |
Balance as of April 1, 2019 | | $ | 217,188 | |
Purchases | | | — | |
Sales proceeds and paydowns | | | (34,712 | ) |
Accreted discounts, net | | | — | |
Corporate Actions | | | — | |
Realized gain (loss) | | | (199,041 | ) |
Change in unrealized appreciation (depreciation) | | | 16,565 | |
Transfers into/(out of) Level 3 | | | — | |
| | |
|
|
|
Balance as of March 31, 2020 | | $ | — | |
| | |
|
|
|
Change in unrealized appreciation (depreciation) during the year for Level 3 investments held at March 31, 2020. | | $ | — | |
| | |
|
|
|
GuideMark® Small/Mid Cap Core Fund
| | | | | | | | | | | | | | | | |
| | | Level 1
| | | Level 2
| | | Level 3
| | | Total
| |
Common Stock | | $ | 46,336,093 | | | $ | — | | | $ | 9,708 | | | $ | 46,345,801 | |
Investment Companies | | | 2,130,949 | | | | — | | | | — | | | | 2,130,949 | |
Real Estate Investment Trusts | | | 3,516,818 | | | | — | | | | — | | | | 3,516,818 | |
Rights | | | — | | | | — | | | | 0 | | | | 0 | |
Short Term Investments | | | 415,284 | | | | — | | | | — | | | | 415,284 | |
Investments Purchased with Proceeds from Securities Lending Collateral* | | | — | | | | — | | | | — | | | | 9,775,976 | |
| | |
|
|
| |
|
|
| |
|
|
| |
|
|
|
Total Investments in Securities | | $ | 52,399,144 | | | $ | — | | | $ | 9,708 | | | $ | 62,184,828 | |
| | |
|
|
| |
|
|
| |
|
|
| |
|
|
|
| | * | | Certain investments that are measured at fair value using the net asset value per share (or its equivalent) practical expedient have not been categorized in the fair value hierarchy. The fair value amounts presented in the table are intended to permit reconciliation of the fair value hierarchy to the amounts presented in the Statement of Assets and Liabilities. |
For further information regarding security characteristics, see the Schedule of Investments.
Below is a reconciliation of Level 3 assets for which significant unobservable inputs were used to determine fair value.
| | | | | | | | |
Description
| | Common Stocks
| | | Rights
| |
Balance as of April 1, 2019 | | $ | 0 | | | $ | 0 | |
Purchases | | | — | | | | — | |
Sales proceeds and paydowns | | | — | | | | — | |
Accreted discounts, net | | | — | | | | — | |
Corporate Actions | | | 9,708 | | | | — | |
Realized gain (loss) | | | — | | | | — | |
Change in unrealized appreciation (depreciation) | | | — | | | | — | |
Transfers into/(out of) Level 3 | | | — | | | | — | |
| | |
|
|
| |
|
|
|
Balance as of March 31, 2020 | | $ | 9,708 | | | $ | 0 | |
| | |
|
|
| |
|
|
|
Change in unrealized appreciation (depreciation) during the year for Level 3 investments held at March 31, 2020. | | $ | — | | | $ | — | |
| | |
|
|
| |
|
|
|
165
GuideMark® Funds & GuidePath® Funds
NOTES TO FINANCIAL STATEMENTS (Continued)
March 31, 2020
GuideMark® Worldex-US Fund
| | | | | | | | | | | | | | | | |
| | | Level 1
| | | Level 2
| | | Level 3
| | | Total
| |
Common Stocks | | | | | | | | | | | | | | | | |
Communication Services | | $ | 94,218 | | | $ | 5,806,820 | | | $ | — | | | $ | 5,901,038 | |
Consumer Discretionary | | | 418,705 | | | | 13,584,470 | | | | — | | | | 14,003,175 | |
Consumer Staples | | | 1,561,057 | | | | 14,572,903 | | | | — | | | | 16,133,960 | |
Energy | | | 818,897 | | | | 3,021,114 | | | | — | | | | 3,840,011 | |
Financials | | | 3,212,265 | | | | 16,496,372 | | | | — | | | | 19,708,637 | |
Health Care | | | 299,804 | | | | 15,656,733 | | | | — | | | | 15,956,537 | |
Industrials | | | 923,457 | | | | 11,426,357 | | | | — | | | | 12,349,814 | |
Information Technology | | | 1,426,708 | | | | 5,709,186 | | | | — | | | | 7,135,894 | |
Materials | | | 781,665 | | | | 4,677,653 | | | | — | | | | 5,459,318 | |
Real Estate | | | — | | | | 492,390 | | | | — | | | | 492,390 | |
Utilities | | | 730,806 | | | | 3,094,991 | | | | — | | | | 3,825,797 | |
| | |
|
|
| |
|
|
| |
|
|
| |
|
|
|
Total Common Stocks | | | 10,267,582 | | | | 94,538,989 | | | | — | | | | 104,806,571 | |
Investment Companies | | | 3,630,134 | | | | — | | | | — | | | | 3,630,134 | |
Participatory Notes | | | — | | | | 120,551 | | | | — | | | | 120,551 | |
Preferred Stocks | | | — | | | | 187,663 | | | | — | | | | 187,663 | |
Real Estate Investment Trusts | | | 33,986 | | | | 1,927,996 | | | | — | | | | 1,961,982 | |
Short Term Investments | | | 450,187 | | | | — | | | | — | | | | 450,187 | |
Investments Purchased with Proceeds from Securities Lending Collateral* | | | — | | | | — | | | | — | | | | 593,326 | |
| | |
|
|
| |
|
|
| |
|
|
| |
|
|
|
Total Investments in Securities | | $ | 14,381,889 | | | $ | 96,775,199 | | | $ | — | | | $ | 111,750,414 | |
| | |
|
|
| |
|
|
| |
|
|
| |
|
|
|
| | * | | Certain investments that are measured at fair value using the net asset value per share (or its equivalent) practical expedient have not been categorized in the fair value hierarchy. The fair value amounts presented in the table are intended to permit reconciliation of the fair value hierarchy to the amounts presented in the Statement of Assets and Liabilities. |
For further information regarding security characteristics, see the Schedule of Investments.
GuideMark® Core Fixed Income Fund
| | | | | | | | | | | | | | | | |
| | | Level 1
| | | Level 2
| | | Level 3
| | | Total
| |
Fixed Income | | | | | | | | | | | | | | | | |
Asset Backed Securities | | $ | — | | | $ | 8,050,646 | | | $ | — | | | $ | 8,050,646 | |
Collateralized Mortgage Obligations | | | — | | | | 19,142,948 | | | | — | | | | 19,142,948 | |
Corporate Obligations | | | — | | | | 41,956,467 | | | | — | | | | 41,956,467 | |
Foreign Government Debt Obligations | | | — | | | | 455,808 | | | | — | | | | 455,808 | |
Mortgage Backed Securities – U.S. Government Agency | | | — | | | | 55,381,037 | | | | — | | | | 55,381,037 | |
Municipal Debt Obligations | | | — | | | | 930,127 | | | | — | | | | 930,127 | |
U.S. Treasury Obligations | | | — | | | | 30,525,293 | | | | — | | | | 30,525,293 | |
| | |
|
|
| |
|
|
| |
|
|
| |
|
|
|
Total Fixed Income | | | — | | | | 156,442,326 | | | | — | | | | 156,442,326 | |
Purchased Options | | | — | | | | 918 | | | | — | | | | 918 | |
Short Term Investments | | | 8,048,140 | | | | — | | | | — | | | | 8,048,140 | |
Investments Purchased with Proceeds from Securities Lending Collateral* | | | — | | | | — | | | | — | | | | 2,079,473 | |
| | |
|
|
| |
|
|
| |
|
|
| |
|
|
|
Total Investments in Securities | | $ | 8,048,140 | | | $ | 155,068,074 | | | $ | — | | | $ | 166,570,857 | |
| | |
|
|
| |
|
|
| |
|
|
| |
|
|
|
Other Financial Instruments** | | | | | | | | | | | | | | | | |
Futures | | $ | (43,870 | ) | | $ | — | | | $ | — | | | $ | (43,870 | ) |
Options Written | | | — | | | | (120,319 | ) | | | — | | | | (120,319 | ) |
Swaps | | | — | | | | (1,382,877 | ) | | | — | | | | (1,382,877 | ) |
| | * | | Certain investments that are measured at fair value using the net asset value per share (or its equivalent) practical expedient have not been categorized in the fair value hierarchy. The fair value amounts presented in the table are intended to permit reconciliation of the fair value hierarchy to the amounts presented in the Statement of Assets and Liabilities. |
| | ** | | Other financial instruments are derivative instruments not reflected in the Schedule of Investments, such as futures, written options, and swaps. Futures and swaps are reflected as the unrealized appreciation (depreciation) on the instrument, while written options are reflected at value. |
166
GuideMark® Funds & GuidePath® Funds
NOTES TO FINANCIAL STATEMENTS (Continued)
March 31, 2020
GuideMark®Tax-Exempt Fixed Income Fund
| | | | | | | | | | | | | | | | |
| | | Level 1
| | | Level 2
| | | Level 3
| | | Total
| |
Municipal Debt Obligations | | $ | — | | | $ | 23,393,873 | | | $ | — | | | $ | 23,393,873 | |
Short Term Investments | | | 66,603 | | | | — | | | | — | | | | 66,603 | |
| | |
|
|
| |
|
|
| |
|
|
| |
|
|
|
Total Investments in Securities | | $ | 66,603 | | | $ | 23,393,873 | | | $ | — | | | $ | 23,460,476 | |
| | |
|
|
| |
|
|
| |
|
|
| |
|
|
|
For further information regarding security characteristics, see the Schedule of Investments.
GuideMark® Opportunistic Fixed Income Fund
| | | | | | | | | | | | | | | | |
| | | Level 1
| | | Level 2
| | | Level 3
| | | Total
| |
Common Stock | | $ | — | | | $ | — | | | $ | 0 | | | $ | 0 | |
Fixed Income | | | | | | | | | | | | | | | | |
Asset Backed Securities | | | — | | | | 436,320 | | | | — | | | | 436,320 | |
Collateralized Mortgage Obligations | | | — | | | | 5,952,220 | | | | — | | | | 5,952,220 | |
Corporate Obligations | | | — | | | | 23,806 | | | | — | | | | 23,806 | |
Foreign Government Debt Obligations | | | — | | | | 8,504,301 | | | | — | | | | 8,504,301 | |
Mortgage Backed Securities – U.S. Government Agency | | | — | | | | 9,727,594 | | | | — | | | | 9,727,594 | |
U.S. Treasury Obligations | | | — | | | | 4,166,054 | | | | — | | | | 4,166,054 | |
| | |
|
|
| |
|
|
| |
|
|
| |
|
|
|
Total Fixed Income | | | — | | | | 28,810,295 | | | | 0 | | | | 28,810,295 | |
Short Term Investments | | | 2,741,169 | | | | 6,084,059 | | | | — | | | | 8,825,228 | |
| | |
|
|
| |
|
|
| |
|
|
| |
|
|
|
Total Investments in Securities | | $ | 2,741,169 | | | $ | 34,894,354 | | | | 0 | | | $ | 37,635,523 | |
| | |
|
|
| |
|
|
| |
|
|
| |
|
|
|
Other Financial Instruments* | | | | | | | | | | | | | | | | |
Forward Currency Contracts | | $ | — | | | $ | 957,141 | | | $ | — | | | $ | 957,141 | |
| | * | | Other financial instruments are derivative instruments not reflected in the Schedule of Investments, such as forward currency contracts. Forward currency contracts are reflected as the unrealized appreciation (depreciation) on the instrument. |
For further information regarding security characteristics, see the Schedule of Investments.
Below is a reconciliation of Level 3 assets for which significant unobservable inputs were used to determine fair value.
| | | | | | | | |
Description
| | Common Stocks
| | | Warrants
| |
Balance as of April 1, 2019 | | $ | 0 | | | $ | 0 | |
Purchases | | | — | | | | — | |
Sales proceeds and paydowns | | | — | | | | (0 | ) |
Accreted discounts, net | | | — | | | | — | |
Amortization, net | | | — | | | | — | |
Corporate Actions | | | — | | | | — | |
Realized gain (loss) | | | — | | | | — | |
Change in unrealized appreciation (depreciation) | | | — | | | | — | |
Transfers into/(out of) Level 3 | | | — | | | | — | |
| | |
|
|
| |
|
|
|
Balance as of March 31, 2020 | | $ | 0 | | | $ | — | |
| | |
|
|
| |
|
|
|
Change in unrealized appreciation (depreciation) during the period for Level 3 investments held at March 31, 2020. | | $ | — | | | $ | — | |
| | |
|
|
| |
|
|
|
GuidePath® Growth Allocation Fund
| | | | | | | | | | | | | | | | |
| | | Level 1
| | | Level 2
| | | Level 3
| | | Total
| |
Investment Companies | | $ | 734,483,960 | | | $ | — | | | $ | — | | | $ | 734,483,960 | |
Short Term Investments | | | 6,730,813 | | | | — | | | | — | | | | 6,730,813 | |
Investments Purchased with Proceeds from Securities Lending Collateral* | | | — | | | | — | | | | — | | | | 139,438,379 | |
| | |
|
|
| |
|
|
| |
|
|
| |
|
|
|
Total Investments in Securities | | $ | 741,214,773 | | | $ | — | | | $ | — | | | $ | 880,653,152 | |
| | |
|
|
| |
|
|
| |
|
|
| |
|
|
|
| | * | | Certain investments that are measured at fair value using the net asset value per share (or its equivalent) practical expedient have not been categorized in the fair value hierarchy. The fair value amounts presented in the table are intended to permit reconciliation of the fair value hierarchy to the amounts presented in the Statement of Assets and Liabilities. |
For further information regarding security characteristics, see the Schedule of Investments.
167
GuideMark® Funds & GuidePath® Funds
NOTES TO FINANCIAL STATEMENTS (Continued)
March 31, 2020
GuidePath® Conservative Allocation Fund
| | | | | | | | | | | | | | | | |
| | | Level 1
| | | Level 2
| | | Level 3
| | | Total
| |
Investment Companies | | $ | 312,773,361 | | | $ | — | | | $ | — | | | $ | 312,773,361 | |
Short Term Investments | | | 2,958,664 | | | | — | | | | — | | | | 2,958,664 | |
Investments Purchased with Proceeds from Securities Lending Collateral* | | | — | | | | — | | | | — | | | | 88,033,252 | |
| | |
|
|
| |
|
|
| |
|
|
| |
|
|
|
Total Investments in Securities | | $ | 315,732,025 | | | $ | — | | | $ | — | | | $ | 403,765,277 | |
| | |
|
|
| |
|
|
| |
|
|
| |
|
|
|
| | * | | Certain investments that are measured at fair value using the net asset value per share (or its equivalent) practical expedient have not been categorized in the fair value hierarchy. The fair value amounts presented in the table are intended to permit reconciliation of the fair value hierarchy to the amounts presented in the Statement of Assets and Liabilities. |
For further information regarding security characteristics, see the Schedule of Investments.
GuidePath® Tactical Allocation Fund
| | | | | | | | | | | | | | | | |
| | | Level 1
| | | Level 2
| | | Level 3
| | | Total
| |
Common Stocks | | $ | 75,153,009 | | | $ | — | | | $ | — | | | $ | 75,153,009 | |
Investment Companies | | | 139,609,374 | | | | — | | | | — | | | | 139,609,374 | |
Real Estate Investment Trusts | | | 5,815,418 | | | | — | | | | — | | | | 5,815,418 | |
Short Term Investments | | | 102,889,272 | | | | — | | | | — | | | | 102,889,272 | |
Investments Purchased with Proceeds from Securities Lending Collateral* | | | — | | | | — | | | | — | | | | 72,959,037 | |
| | |
|
|
| |
|
|
| |
|
|
| |
|
|
|
Total Investments in Securities | | $ | 323,467,073 | | | $ | — | | | $ | — | | | $ | 396,426,110 | |
| | |
|
|
| |
|
|
| |
|
|
| |
|
|
|
| | * | | Certain investments that are measured at fair value using the net asset value per share (or its equivalent) practical expedient have not been categorized in the fair value hierarchy. The fair value amounts presented in the table are intended to permit reconciliation of the fair value hierarchy to the amounts presented in the Statement of Assets and Liabilities. |
For further information regarding security characteristics, see the Schedule of Investments.
GuidePath® Absolute Return Allocation Fund
| | | | | | | | | | | | | | | | |
| | | Level 1
| | | Level 2
| | | Level 3
| | | Total
| |
Investment Companies | | $ | 388,791,419 | | | $ | — | | | $ | — | | | $ | 388,791,419 | |
Short Term Investments | | | 2,425,231 | | | | — | | | | — | | | | 2,425,231 | |
Investments Purchased with Proceeds from Securities Lending Collateral* | | | — | | | | — | | | | — | | | | 37,929,302 | |
| | |
|
|
| |
|
|
| |
|
|
| |
|
|
|
Total Investments in Securities | | $ | 391,216,650 | | | $ | — | | | $ | — | | | $ | 429,145,952 | |
| | |
|
|
| |
|
|
| |
|
|
| |
|
|
|
| | * | | Certain investments that are measured at fair value using the net asset value per share (or its equivalent) practical expedient have not been categorized in the fair value hierarchy. The fair value amounts presented in the table are intended to permit reconciliation of the fair value hierarchy to the amounts presented in the Statement of Assets and Liabilities. |
For further information regarding security characteristics, see the Schedule of Investments.
GuidePath® Multi-Asset Income Allocation Fund
| | | | | | | | | | | | | | | | |
| | | Level 1
| | | Level 2
| | | Level 3
| | | Total
| |
Investment Companies | | $ | 109,411,479 | | | $ | — | | | $ | — | | | $ | 109,411,479 | |
Short Term Investments | | | 1,162,374 | | | | — | | | | — | | | | 1,162,374 | |
Investments Purchased with Proceeds from Securities Lending Collateral* | | | — | | | | — | | | | — | | | | 14,005,053 | |
| | |
|
|
| |
|
|
| |
|
|
| |
|
|
|
Total Investments in Securities | | $ | 110,573,853 | | | $ | — | | | $ | — | | | $ | 124,578,906 | |
| | |
|
|
| |
|
|
| |
|
|
| |
|
|
|
| | * | | Certain investments that are measured at fair value using the net asset value per share (or its equivalent) practical expedient have not been categorized in the fair value hierarchy. The fair value amounts presented in the table are intended to permit reconciliation of the fair value hierarchy to the amounts presented in the Statement of Assets and Liabilities. |
For further information regarding security characteristics, see the Schedule of Investments.
168
GuideMark® Funds & GuidePath® Funds
NOTES TO FINANCIAL STATEMENTS (Continued)
March 31, 2020
GuidePath® Flexible Income Allocation Fund
| | | | | | | | | | | | | | | | |
| | | Level 1
| | | Level 2
| | | Level 3
| | | Total
| |
Investment Companies | | $ | 97,945,979 | | | $ | — | | | $ | — | | | $ | 97,945,979 | |
Short Term Investments | | | 160,182 | | | | — | | | | — | | | | 160,182 | |
| | |
|
|
| |
|
|
| |
|
|
| |
|
|
|
Total Investments in Securities | | $ | 98,106,161 | | | $ | — | | | $ | — | | | $ | 98,106,161 | |
| | |
|
|
| |
|
|
| |
|
|
| |
|
|
|
For further information regarding security characteristics, see the Schedule of Investments.
GuidePath®Managed Futures Strategy Fund
| | | | | | | | | | | | | | | | |
| | | Level 1
| | | Level 2
| | | Level 3
| | | Total
| |
Short Term Investments | | $ | 1,820,304 | | | $ | 219,056,231 | | | $ | — | | | $ | 220,876,535 | |
| | |
|
|
| |
|
|
| |
|
|
| |
|
|
|
Total Investments in Securities | | $ | 1,820,304 | | | $ | 219,056,231 | | | $ | — | | | $ | 220,876,535 | |
| | |
|
|
| |
|
|
| |
|
|
| |
|
|
|
Other Financial Instruments* | | | | | | | | | | | | | | | | |
Futures | | $ | 8,174,810 | | | $ | — | | | $ | — | | | $ | 8,174,810 | |
Forward Currency Contracts | | $ | — | | | $ | 1,572,695 | | | $ | — | | | $ | 1,572,695 | |
| | * | | Other financial instruments are derivative instruments not reflected in the Consolidated Schedule of Investments, such as futures and forward currency contracts. Futures and forward currency contracts are reflected as the unrealized appreciation (depreciation) on the instrument. |
For further information regarding security characteristics, see the Consolidated Schedule of Investments.
GuidePath® Conservative Income Fund
| | | | | | | | | | | | | | | | |
| | | Level 1
| | | Level 2
| | | Level 3
| | | Total
| |
Investment Companies | | $ | 3,538,125 | | | $ | — | | | $ | — | | | $ | 3,538,125 | |
Short Term Investments | | | 2,450,970 | | | | 593,771 | | | | — | | | | 3,044,741 | |
| | |
|
|
| |
|
|
| |
|
|
| |
|
|
|
Total Investments in Securities | | $ | 5,989,095 | | | $ | 593,771 | | | $ | — | | | $ | 6,582,866 | |
| | |
|
|
| |
|
|
| |
|
|
| |
|
|
|
For further information regarding security characteristics, see the Schedule of Investments.
GuidePath® Income Fund
| | | | | | | | | | | | | | | | |
| | | Level 1
| | | Level 2
| | | Level 3
| | | Total
| |
Investment Companies | | $ | 31,717,073 | | | $ | — | | | $ | — | | | $ | 31,717,073 | |
Short Term Investments | | | 296,189 | | | | — | | | | — | | | | 296,189 | |
| | |
|
|
| |
|
|
| |
|
|
| |
|
|
|
Total Investments in Securities | | $ | 32,013,262 | | | $ | — | | | $ | — | | | $ | 32,013,262 | |
| | |
|
|
| |
|
|
| |
|
|
| |
|
|
|
For further information regarding security characteristics, see the Schedule of Investments.
GuidePath® Growth & Income Fund
| | | | | | | | | | | | | | | | |
| | | Level 1
| | | Level 2
| | | Level 3
| | | Total
| |
Common Stock | | $ | 10,975,818 | | | $ | — | | | $ | — | | | $ | 10,975,818 | |
Investment Companies | | | 11,149,360 | | | | — | | | | — | | | | 11,149,360 | |
Short Term Investments | | | 6,839,739 | | | | 3,783,909 | | | | — | | | | 10,623,648 | |
Investments Purchased with Proceeds from Securities Lending Collateral* | | | — | | | | — | | | | — | | | | 2,196,737 | |
| | |
|
|
| |
|
|
| |
|
|
| |
|
|
|
Total Investments in Securities | | $ | 28,964,917 | | | $ | 3,783,909 | | | $ | — | | | $ | 34,945,563 | |
| | |
|
|
| |
|
|
| |
|
|
| |
|
|
|
Other Financial Instruments** | | | | | | | | | | | | | | | | |
Futures | | $ | (39,567 | ) | | $ | — | | | $ | — | | | $ | (39,567 | ) |
Options Written | | | (201,194 | ) | | | (236,730 | ) | | | — | | | | (437,924 | ) |
| | * | | Certain investments that are measured at fair value using the net asset value per share (or its equivalent) practical expedient have not been categorized in the fair value hierarchy. The fair value amounts presented in the table are intended to permit reconciliation of the fair value hierarchy to the amounts presented in the Statement of Assets and Liabilities. |
| | ** | | Other financial instruments are derivative instruments not reflected in the Schedule of Investments, such as futures and written options. Futures are reflected as unrealized appreciation (depreciation) on the instrument, while written options are reflected at value. |
For further information regarding security characteristics, see the Schedule of Investments.
169
GuideMark® Funds & GuidePath® Funds
NOTES TO FINANCIAL STATEMENTS (Continued)
March 31, 2020
| | (b) | | Consolidation of Subsidiary |
The GuidePath®Managed Futures Strategy Fund may invest up to 25% of its total assets in GuidePath® Managed Futures Strategy Cayman Fund Ltd. (the “Subsidiary”). The Subsidiary, which is organized under the laws of the Cayman Islands, is wholly-owned and controlled by GuidePath®Managed Futures Strategy Fund. The financial statements of the GuidePath®Managed Futures Strategy Fund include the operations of the Subsidiary. All intercompany accounts and transactions have been eliminated in consolidation. The Subsidiary acts as an investment vehicle in order to invest in commodity-linked derivative instruments consistent with the Fund’s investment objectives and policies. The GuidePath®Managed Futures Strategy Fund had 3.20% of its total assets invested in the Subsidiary as of March 31, 2020.
The Subsidiary is an exempted Cayman Islands investment company and as such is not subject to Cayman Islands taxes at the present time. For U.S. income tax purposes, the Subsidiary is a Controlled Foreign Corporation (“CFC”) not subject to U.S. income taxes. As a wholly-owned CFC, however, the Subsidiary’s net income and capital gains, if any, will be included each year in the Fund’s investment company taxable income.
| | (c) | | Subsequent Events Evaluation |
In preparing these financial statements, the Funds have evaluated events and transactions through the date of issuance for potential recognition or disclosure resulting from subsequent events. See Note 10.
| | (d) | | Repurchase Agreements |
Each Fund may enter into repurchase agreements with banks and securities dealers. These transactions involve the purchase of securities with a simultaneous commitment to sell the securities to the bank or the dealer at an agreed-upon date and price. A repurchase agreement is accounted for as an investment by the Fund, collateralized by securities, which are delivered to the Fund’s Custodian or to an agent bank under atri-party agreement. The securities aremarked-to-market daily and additional securities are acquired as needed, to ensure that their value equals or exceeds the repurchase price plus accrued interest.
The Funds intend to continue to comply with the requirements ofsub-chapter M of the Internal Revenue Code necessary to qualify as regulated investment companies and to make the requisite distributions of income and capital gains to shareholders sufficient to relieve the Funds from all or substantially all Federal income taxes. Therefore, no Federal income tax provision is required.
The Funds have adopted financial reporting rules regarding recognition and measurement of tax positions taken or expected to be taken on a tax return. In order to avoid imposition of the excise tax applicable to regulated investment companies, it is also each Fund’s intention to declare as dividends in each calendar year at least 98% of its net investment income (earned during the calendar year) and 98.2% of its net realized capital gains (earned during the twelve months ended October 31) plus undistributed amounts from prior years. The Funds have reviewed all open tax years and major jurisdictions and
concluded that no provision for income tax is required in the Funds’ financial statements. As of and during the fiscal year ended March 31, 2020, the Funds did not have any tax positions that did not meet the“more-likely-than-not” threshold of being sustained by the applicable tax authority and did not have liabilities for any unrecognized tax benefits. The Funds recognize interest and penalties, if any, related to unrecognized tax benefits as income tax expense on the Statements of Operations. During the fiscal year ended March 31, 2020, the Funds did not incur any interest or penalties. The Funds’ Federal and state income and Federal excise tax returns for tax years for which the applicable statutes of limitations have not expired are subject to examination by the Internal Revenue Service and state departments of revenue.
The preparation of financial statements in conformity with GAAP requires management to make estimates and assumptions that affect the reported amounts of assets and liabilities and disclosure of contingent assets and liabilities at the date of the financial statements and the reported amounts of revenues and expenses during the reported period. Actual results could differ from those estimates.
Under each Trust’s organizational documents, its officers and trustees are indemnified against certain liability arising out of their performance of their duties to the Funds. In addition, in the normal course of business, the Funds enter into contracts that contain a variety of representations and warranties that provide general indemnifications. The Funds’ maximum exposure under these arrangements is unknown as this would involve future claims that may be made against the Funds that have not yet occurred. However, the Funds expect the risk of loss to be remote.
Many expenses of the Funds can be directly attributed to a specific Fund. Additionally, some expenses can be directly attributed to a specific Trust, in which case the expense is apportioned among the Funds within that Trust based on relative net assets. Expenses that cannot be directly attributed to a specific Fund or Trust are apportioned among all the Funds based on relative net assets.
| | (i) | | Organization and Offering Costs |
Organization costs consist of costs incurred to establish a Fund and enable it legally to do business. The Funds expense organizational costs as incurred. These expenses were advanced by the Advisor, and the Advisor has agreed to reimburse the Funds for these expenses, subject to potential recovery (see Note 4). Offering costs are accounted for as deferred costs until operations begin. Offering costs include legal fees regarding the preparation of the initial registration statement. Offering costs are then amortized to expense over twelve months on a straight-line basis.
| | (j) | | Security Transactions and Income Recognition |
Security transactions are accounted for on trade date. Dividend income is recognized on theex-dividend date, and the interest income recorded using the effective yield method is accrued daily. Withholding taxes on foreign dividends and taxes on
170
GuideMark® Funds & GuidePath® Funds
NOTES TO FINANCIAL STATEMENTS (Continued)
March 31, 2020
capital gains, which are included as a component of net investment income and realized gain (loss) on investments, respectively, have been provided in accordance with the Trusts’ understanding of the applicable country’s tax rules and rates. Realized gains and losses on investment transactions are determined using the high cost method. Proceeds received from litigation for securities not held are disclosed as realized gains on investments. Return of capital distributions received from REIT securities are recorded as an adjustment to the cost of the security and thus may impact unrealized or realized gains or losses on the security. Gains and losses from paydowns on mortgage and asset backed securities are recorded as adjustments to interest income. Distributions from underlying investment companies are classified as investment income or realized gains based on the U.S. income tax characteristics of the distribution.
| | (k) | | Distributions to Shareholders |
The Funds, with the exception of the GuideMark® Core Fixed Income Fund, GuideMark® Tax-Exempt Fixed Income Fund, GuideMark® Opportunistic Fixed Income Fund, GuidePath® Multi-Asset Income Allocation Fund, GuidePath® Flexible Income Allocation Fund, GuidePath® Conservative Income Fund, GuidePath® Income Fund and GuidePath® Growth and GuidePath® Income Fund will distribute any net investment income at least annually. The GuideMark® Core Fixed Income Fund, GuideMark® Tax-Exempt Fixed Income Fund, GuideMark® Opportunistic Fixed Income Fund, GuidePath® Multi-Asset Income Allocation Fund and GuidePath® Flexible Income Allocation Fund will distribute any net investment income quarterly. The GuidePath® Conservative Income Fund, GuidePath® Income Fund and GuidePath® Growth and Income Fund will generally distribute any net investment income monthly. All of the Funds will generally distribute any net realized long or short-term capital gains at least annually. Certain Funds also utilize earnings and profits distributed to shareholders on redemptions of shares as part of the dividends paid deduction. Distributions to shareholders are recorded on the ex-dividend date. The Funds may also pay a special distribution at the end of the calendar year to comply with Federal tax requirements.
Each Fund may invest in derivative securities including call and put options, futures, forward currency contracts and swaps. These instruments may be used by a Fund for hedging purposes as well as direct investment.
Forward Currency Contracts
The Funds may enter into forward currency contracts, obligating the Funds to deliver and receive currency at a specified future date. Transactions involving forward currency contracts may serve as long hedges (for example, if a Fund seeks to buy a security denominated in a foreign security, it may purchase a forward currency contract to lock in the U.S. dollar price of the security) or as short hedges (if a Fund anticipates selling a security denominated in a foreign currency, it may sell a forward currency contract to lock in the U.S. dollar equivalent of the anticipated sales proceeds). Forward contracts are valued daily and unrealized appreciation or depreciation is recorded daily as the difference between the contract exchange rate and the closing forward rate applied to the face amount of the contract.
Options
The Funds may purchase and write call or put options on securities and indices and enter into related closing transactions. All of the Funds may invest in options that are listed on U.S. exchanges or traded over the counter. Exchange-traded options are valued at the last reported sale price on the exchange on which the security underlying the option is principally traded. If no sales are reported on a particular day for exchange-traded options, or the options are not exchange-traded, the options are valued at the mean between the most recent quoted bid and asked quotations at the close of the exchange. The premium that a Fund pays when purchasing a call option or receives when writing a call option will reflect, among other things, the market price of the security, the relationship of the exercise price to the market price of the security, the relationship of the exercise price to the volatility of the security, the length of the option period and supply and demand factors. The premium is the value of an option at the date of purchase.
A purchaser (holder) of a put option pays anon-refundable premium to the seller (writer) of a put option to obtain the right to sell a specified amount of a security at a fixed price (the exercise price) during a specified period (exercise period). Conversely, the seller (writer) of a put option, upon payment by the holder of the premium, has the obligation to buy the security from the holder of the put option at the exercise price during the exercise period.
Futures
Each Fund has the ability to buy and sell stock index futures contracts traded on domestic stock exchanges to hedge the value of its portfolio against changes in market conditions. A stock index futures contract is an agreement between two parties to take or make delivery of an amount of cash equal to a specified dollar amount, times the difference between stock index value at the close of the last trading day of the contract and the price at which the futures contract is originally struck. A stock index futures contract does not involve the physical delivery of the underlying stocks in the index. Although stock index futures contracts call for the actual taking of delivery of cash, in most cases a Fund expects to liquidate its stock index futures positions through offsetting transactions, which may result in a gain or loss, before cash settlement is required.
The Funds may purchase or sell other types of futures contracts, including those based on particular interest rates, securities, foreign currencies, securities indices and other financial instruments and indices. The Funds may also purchase and write call and put options on such futures contracts, in order to seek to increase total return or to hedge against changes in interest rates, securities prices, or currency exchange rates, or, to the extent permitted by its investment policies, to otherwise manage its portfolio of investments.
Futures contracts are valued at the daily quoted settlement prices.
Swaps
The Funds may enter into interest rate, mortgage, credit, currency and total return swaps, interest rate caps, floors and collars. The Funds may also purchase and write (sell) options contracts on swaps, referred to as “swaptions”. The Funds may
171
GuideMark® Funds & GuidePath® Funds
NOTES TO FINANCIAL STATEMENTS (Continued)
March 31, 2020
enter into swap transactions for hedging purposes or to seek to increase total return. Since interest rate, mortgage, credit and currency swaps and interest rate caps, floors and collars are individually negotiated, the Funds expect to achieve an acceptable degree of correlation between their portfolio investments and their swap, cap, floor and collar positions.
Swap agreements are valued using the daily mean and unrealized appreciation or depreciation is recorded daily as the difference between the prior day and current day closing price.
Derivative Instruments and Hedging Activities
Each Trust has adopted derivative instruments disclosure standards, in order to enable the investor to understand how and why an entity used derivatives, how derivatives are accounted for, and how derivative instruments affect an entity’s results of operations and financial position.
In general, the use of derivatives may increase the risk within the Funds. The use ofover-the-counter derivatives involves the risk that the counterparty to the contract will fail to make required payments or otherwise comply with the terms of the contract. The results achieved by the use of derivatives in the Funds may not match or fully offset changes in the value of the underlying financial assets being hedged or the investment opportunity the Funds were pursuing, thereby failing to achieve, to an extent, the original purpose for using the derivatives. Certain types of derivatives may create leverage insofar as the Funds may receive returns (or suffer losses) exceeding the initial amounts the Funds committed in connection with the derivatives. The use of derivatives can result in losses or gains to the Funds exceeding the amount the Funds would have experienced in the absence of using derivatives. A relatively small price movement in a derivative may result in an immediate and substantial loss, or gain, to the Funds.
GuideMark® Core Fixed Income Fund
During the period, the Fund used fixed income derivatives including U.S. Treasury futures and credit default swaps on investment grade fixed income indices (CDX and CMBX), for both hedging and investment purposes, primarily duration management, risk management, and the pursuit of relative value opportunities. Futures contracts used in the Fund during the period included those based on short, medium, and long-term U.S. Treasury debt.
The Fund used futures contracts during the period primarily to manage interest rate risk. The Fund used investment grade CDX, CMBX, IR, and purchased/written options to efficiently manage investment grade credit exposure.
Statement of Assets and Liabilities – Values of Derivative Instruments as of March 31, 2020
| | | | | | | | | | | | |
| | | Asset Derivatives
| | | Liability Derivatives
| |
| | | Statement of Assets and
Liabilities Location | | Value | | | Statement of Assets and
Liabilities Location | | Value | |
| Credit Contracts – Swaps | | Appreciation on swap agreements | | $ | 30,618 | | | Depreciation on swap agreements | | $ | 131,220 | |
| | | | |
| Interest Rate Contracts – Swaps | | Appreciation on swap agreements | | | 724 | | | Depreciation on swap agreements | | | 1,283,009 | |
| | | | |
| Interest Rate Contracts – Futures* | | Unrealized appreciation on futures contracts** | | | 246,328 | | | Unrealized depreciation on futures contracts** | | | 290,198 | |
| | | | |
| Interest Rate Contracts – Options | | Investments, at Value | | | 918 | | | Options Written, at Value | | | — | |
| | | | |
| Credit Contracts – Options | | Investments, at Value | | | — | | | Options Written, at Value | | | 120,319 | |
| Total | | | | $ | 278,588 | | | | | $ | 1,824,746 | |
| | * | | Includes cumulative appreciation/depreciation as reported on the Schedule of Open Futures Contracts. |
| | ** | | Included in total distributable earnings on the Statement of Assets and Liabilities. |
| | | | | | | | | | | | | | | | | | | | |
| The Effect of Derivative Instruments on the Statement of Operations for the year ended March 31, 2020 | |
|
| Amount of Realized Gain or (Loss) on Derivatives | |
| | | Futures
Contracts | | | Swaps | | | Written
Options | | | Purchased
Options* | | | Total | |
| Credit Contracts | | $ | — | | | $ | (152,416 | ) | | $ | 86,115 | | | $ | — | | | $ | (66,301 | ) |
| Interest Rate Contracts | | | 422,847 | | | | (1,225 | ) | | | — | | | | (53,551 | ) | | | 368,071 | |
| | | | | |
| Total | | $ | 422,847 | | | $ | (153,641 | ) | | $ | 86,115 | | | $ | (53,551 | ) | | $ | 301,770 | |
| | * | | Included in net realized gain (loss) on investments as reported in the Statement of Operations. |
172
GuideMark® Funds & GuidePath® Funds
NOTES TO FINANCIAL STATEMENTS (Continued)
March 31, 2020
| | | | | | | | | | | | | | | | | | | | |
| Change in Unrealized Appreciation or (Depreciation) on Derivatives | |
| | | Futures
Contracts | | | Swaps | | | Written
Options | | | Purchased
Options* | | | Total | |
| Credit Contracts | | $ | — | | | $ | (111,628 | ) | | $ | (47,567 | ) | | $ | — | | | $ | (159,195 | ) |
| Interest Rate Contracts | | | (154,146 | ) | | | (1,485,435 | ) | | | — | | | | 38,694 | | | | (1,600,887 | ) |
| | | | | |
| Total | | $ | (154,146 | ) | | $ | (1,597,063 | ) | | $ | (47,567 | ) | | $ | 38,694 | | | $ | (1,760,082 | ) |
| | * | | Included in net change in unrealized appreciation (depreciation) on investments as reported in the Statement of Operations. |
GuideMark® Opportunistic Fixed Income Fund
The Fund invested in derivatives in order to manage risk or gain exposure to various other investments or markets. Derivatives may contain various risks, including the potential inability of the counterparty to fulfill their obligations under the terms of the contract, the potential for an illiquid secondary market, and the potential for market movements which may expose the Fund to gains or losses.
The Fund seeks to maximize total investment returns through exposure to investments in fixed-income securities, equity securities, and currency instruments. The Fund entered into swap agreements to manage and/or gain exposures to credit risk. The Fund entered into forward exchange contracts primarily to manage and/or gain exposure to certain foreign currencies.
The Fund used currency forwards during the period for the purpose of hedging exposures within the Fund tonon-dollar-denominated assets. In general, the use of currency derivative contracts for hedging may reduce the overall risk level of the Fund, albeit at a cost that may lower overall performance. In general, the use of currency derivatives for hedging purposes will not lead to leverage within the Fund.
Statement of Assets and Liabilities – Values of Derivative Instruments as of March 31, 2020
| | | | | | | | | | | | |
| | | Asset Derivatives
| | | Liability Derivatives
| |
| | | Statement of Assets and
Liabilities Location | | Value | | | Statement of Assets and
Liabilities Location | | Value | |
| Foreign Exchange Contracts – Forward Currency Contracts | | Appreciation of forward currency contracts | | $ | 1,401,901 | | | Depreciation of forward currency contracts | | $ | 444,760 | |
| Total | | | | $ | 1,401,901 | | | | | $ | 444,760 | |
| | | | | | | | | | | | | | | | | | | | |
| The Effect of Derivative Instruments on the Statement of Operations for the year ended March 31, 2020 | |
|
| Amount of Realized Gain or (Loss) on Derivatives | |
| | | Forward
Currency
Contracts | | | Swaps | | | Written
Options | | | Purchased
Options* | | | Total | |
| Foreign Exchange Contracts | | $ | 735,492 | | | $ | — | | | $ | 17 | | | $ | 6 | | | $ | 735,515 | |
| Interest Rate Contracts | | | — | | | | (3,144,948 | ) | | | — | | | | — | | | | (3,144,948 | ) |
| | | | | |
| Total | | $ | 735,492 | | | $ | (3,144,948 | ) | | $ | 17 | | | $ | 6 | | | $ | (2,409,433 | ) |
| | * | | Included in net realized gain (loss) on investments as reported on the Statement of Operations. |
| | | | | | | | | | | | |
| Change in Unrealized Appreciation (Depreciation) on Derivatives | |
| | | Forward
Currency
Contracts | | | Swaps | | | Total | |
| Foreign Exchange Contracts | | $ | 645,810 | | | $ | — | | | $ | 645,810 | |
| Interest Rate Contracts | | | — | | | | 1,038,638 | | | | 1,038,638 | |
| | | |
| Total | | $ | 645,810 | | | $ | 1,038,638 | | | $ | 1,684,448 | |
GuidePath® Managed Futures Strategy Fund
The Fund uses a set of proprietary quantitative models to identify price trends in equity, fixed income, currency and commodity instruments, and may have both short and long exposures within an asset class based on an analysis of asset price trends. Under normal market conditions, the Fund will make extensive use of derivative instruments, in particular futures contracts, to capture the exposures suggested by its absolute return strategy while also adding value through volatility management. These market exposures, which are expected to change over time, may include exposures to global equity and fixed income securities, securities indices, currencies, commodities and other instruments. During the year ended March 31, 2020, the Fund used long and short contracts on U.S. and foreign government bonds, U.S. and foreign equity market indices, foreign currencies, commodities (through investments in the subsidiary) and short-term interest rates to capture the exposures suggested by the quantitative investment models.
173
GuideMark® Funds & GuidePath® Funds
NOTES TO FINANCIAL STATEMENTS (Continued)
March 31, 2020
Statement of Assets and Liabilities – Values of Derivative Instruments as of March 31, 2020
| | | | | | | | | | | | |
| | | Asset Derivatives
| | | Liability Derivatives
| |
| | | Statement of Assets and Liabilities
Location | | Value | | | Statement of Assets and Liabilities
Location | | Value | |
| Commodity Contracts – Futures* | | Unrealized appreciation on futures contracts** | | $ | 4,920,722 | | | Unrealized depreciation on futures contracts** | | $ | 773,885 | |
| | | | |
| Equity Contracts – Futures* | | Unrealized appreciation on futures contracts** | | | 7,107 | | | Unrealized depreciation on futures contracts** | | | 481,644 | |
| | | | |
| Foreign Exchange Contracts – Forward Currency Contracts | | Unrealized appreciation on forward currency contracts | | | 1,900,181 | | | Unrealized depreciation on forward currency contracts | | | 327,486 | |
| | | | |
| Foreign Exchange Contracts – Futures* | | Unrealized appreciation on futures contracts** | | | 1,145,286 | | | Unrealized depreciation on futures contracts** | | | 350,412 | |
| | | | |
| Interest Rate Contracts – Futures* | | Unrealized appreciation on futures contracts** | | | 4,431,461 | | | Unrealized depreciation on futures contracts** | | | 723,825 | |
| Total | | | | | $12,404,757 | | | | | | $2,657,252 | |
| | * | | Includes cumulative appreciation/depreciation as reported on the Consolidated Schedule of Open Futures Contracts. |
| | ** | | Included in total distributable earnings on the Consolidated Statement of Assets and Liabilities. |
| | | | | | | | | | | | |
| The Effect of Derivative Instruments on the Statement of Operations for the year ended March 31, 2020 | |
|
| Amount of Realized Gain (Loss) on Derivatives | |
| | | Forward
Currency
Contracts | | | Futures
Contracts | | | Total | |
| Commodity Contracts | | $ | — | | | $ | (4,205,443 | ) | | $ | (4,205,443 | ) |
| Equity Contracts | | | — | | | | (10,762,542 | ) | | | (10,762,542 | ) |
| Foreign Exchange Contracts | | | (1,441,599 | ) | | | (3,573,808 | ) | | | (5,015,407 | ) |
| Interest Rate Contracts | | | — | | | | 36,192,315 | | | | 36,192,315 | |
| | | |
| Total | | $ | (1,441,599 | ) | | $ | 17,650,522 | | | $ | 16,208,923 | |
| | | | | | | | | | | | |
| Change in Unrealized Appreciation (Depreciation) on Derivatives | |
| | | Forward
Currency
Contracts | | | Futures
Contracts | | | Total | |
| Commodity Contracts | | $ | — | | | $ | 3,966,692 | | | $ | 3,966,692 | |
| Equity Contracts | | | — | | | | (1,526,397 | ) | | | (1,526,397 | ) |
| Foreign Exchange Contracts | | | 1,572,695 | | | | 1,092,181 | | | | 2,664,876 | |
| Interest Rate Contracts | | | — | | | | (2,203,693 | ) | | | (2,203,693 | ) |
| | | |
| Total | | $ | 1,572,695 | | | $ | 1,328,783 | | | | 2,901,478 | |
GuidePath® Growth and Income Fund
During the period, the Fund used equity derivatives including S&P 500 Index futures and S&P 500 Index and exchange trade funds (“ETFs”) options, for both hedging and investment purposes, primarily risk management, and the pursuit of excess premium opportunities. The Fund used futures contracts during the period primarily to manage portfolio risk (volatility). The Fund wrote collateralized put options in an attempt to generate returns through receiving the option premiums; together with investments in fixed income instruments, it intended to lower the volatility relative to as if the Fund held the S&P 500 index.
Statement of Assets and Liabilities – Values of Derivative Instruments as of March 31, 2020
| | | | | | | | | | | | |
| | | Asset Derivatives
| | | Liability Derivatives
| |
| | | Statement of Assets and Liabilities Location | | Value | | | Statement of Assets and Liabilities Location | | Value | |
| Equity Contracts �� Futures* | | Unrealized appreciation on futures contracts** | | $ | — | | | Unrealized depreciation on futures contracts** | | $ | 39,567 | |
| | | | |
| Equity Contracts – Options | | Investments, at Value | | | — | | | Options Written, at Value | | | 437,924 | |
| Total | | | | $ | — | | | | | $ | 477,491 | |
| | * | | Includes cumulative appreciation/depreciation as reported on the Schedule of Open Futures Contracts. |
| | ** | | Included in total distributable earnings on the Statement of Assets and Liabilities. |
174
GuideMark® Funds & GuidePath® Funds
NOTES TO FINANCIAL STATEMENTS (Continued)
March 31, 2020
| | | | | | | | | | | | |
| The Effect of Derivative Instruments on the Statement of Operations for the year ended March 31, 2020 | |
|
| Amount of Realized Gain (Loss) on Derivatives | |
| | | Futures
Contracts | | | Written
Options | | | Total | |
| Equity Contracts | | $ | 947,434 | | | $ | (1,255,245 | ) | | $ | (307,811 | ) |
| | | |
| Total | | $ | 947,434 | | | $ | (1,255,245 | ) | | $ | (307,811 | ) |
| | | | | | | | | | | | |
| Change in Unrealized Appreciation (Depreciation) on Derivatives | |
| | | Futures
Contracts | | | Written
Options | | | Total | |
| Equity Contracts | | $ | (39,567 | ) | | $ | 79,563 | | | $ | 39,996 | |
| | | |
| Total | | $ | (39,567 | ) | | $ | 79,563 | | | $ | 39,996 | |
Volume Disclosures
The average monthly value outstanding of purchased and written options during the year ended March 31, 2020 were as follows:
| | | | | | | | | | | | | | | | |
| | | GuideMark®
Core Fixed
Income Fund | | | GuideMark®
Opportunistic Fixed
Income Fund | | | GuidePath®
Managed Futures
Strategy Fund | | | GuidePath®
Growth and
Income Fund | |
| Purchased Options | | $ | 5,232 | | | $ | 4 | | | $ | — | | | $ | — | |
| Written Options | | $ | (18,592 | ) | | $ | (4 | ) | | $ | — | | | $ | (137,457 | ) |
The average monthly notional amount outstanding of futures, forwards and swaps during the year ended March 31, 2020 were as follows:
| | | | | | | | | | | | | | | | |
| Long Positions | | GuideMark®
Core Fixed
Income Fund | | | GuideMark®
Opportunistic Fixed
Income Fund | | | GuidePath®
Managed Futures
Strategy Fund | | | GuidePath®
Growth and
Income Fund | |
| Futures | | $ | 18,656,159 | | | $ | — | | | $ | 1,188,964,540 | | | $ | 3,603,014 | |
| Forwards | | $ | — | | | $ | 21,046,781 | | | $ | 60,139,339 | | | $ | — | |
| Swaps | | $ | 15,316,154 | | | $ | 4,188,000 | | | $ | — | | | $ | — | |
| | | | |
| Short Positions | | GuideMark®
Core Fixed
Income Fund | | | GuideMark®
Opportunistic Fixed
Income Fund | | | GuidePath®
Managed Futures
Strategy Fund | | | GuidePath®
Growth and
Income Fund | |
| Futures | | $ | (5,585,737 | ) | | $ | — | | | $ | (263,806,385 | ) | | $ | (704,713 | ) |
| Forwards | | $ | — | | | $ | (8,827,709 | ) | | $ | (37,050,869 | ) | | $ | — | |
| | | | |
| Cross Currency | | GuideMark®
Core Fixed
Income Fund | | | GuideMark®
Opportunistic Fixed
Income Fund | | | GuidePath®
Managed Futures
Strategy Fund | | | GuidePath®
Growth and
Income Fund | |
| Forwards | | $ | — | | | $ | 7,326,358 | | | $ | — | | | $ | — | |
Derivative Risks
The risks of using the various types of derivatives in which the Funds may engage include: the risk that movements in the value of the derivative may not fully offset or complement instruments currently held in the Funds in the manner intended by the Advisor orsub-advisor; the risk that the counterparty to a derivative contract may fail to comply with its obligations to the Funds; the risk that there may not be a liquid secondary market for the derivative at a time when the Funds would look to disengage the position; the risk that additional capital from the Funds may be called upon to fulfill the conditions of the derivative contract; the risk that the use of derivatives in the Funds may induce leverage in the Funds, and the risk that the cost of the derivative contracts may reduce the overall returns experienced by the Funds.
Offsetting Assets and Liabilities
GuideMark® Core Fixed Income Fund
The Fund is subject to various Master Netting Arrangements, which govern the terms of certain transactions with select counterparties. The Master Netting Arrangements allow the Fund to close out and net its total exposure to a counterparty in the event of a default with respect to all the transactions governed under a single agreement with a counterparty. The Master Netting Arrangements also specify collateral posting arrangements atpre-arranged exposure levels. Under the Master Netting Arrangements, collateral is routinely transferred if the total net exposure to certain transactions (net of existing collateral already in place) governed under the relevant Master Netting Arrangement with a counterparty in a given account exceeds a specified threshold depending on the counterparty and the type of Master Netting Arrangement.
175
GuideMark® Funds & GuidePath® Funds
NOTES TO FINANCIAL STATEMENTS (Continued)
March 31, 2020
The table below, as of March 31, 2020, discloses both gross information and net information about instruments and transactions eligible for offset in the Statements of Assets and Liabilities, and instruments and transactions that are subject to an agreement similar to a master netting agreement as well as amounts related to collateral held at clearing brokers and counterparties. For financial reporting purposes, the Fund does not offset derivative assets and liabilities, and any related collateral received or pledged, on the Statement of Assets and Liabilities, except in the case of futures contracts.
| | | | | | | | | | | | | | | | | | | | | | | | |
| Assets | | | | | | | | | | | Gross Amounts not offset
in the Statement of
Assets and Liabilities
| | | | |
| | | Gross Amounts
of Recognized
Assets
| | | Gross Amounts
Offset in the
Statement of
Assets and Liabilities
| | | Net Amounts
Presented in the
Statement of
Assets and Liabilities
| | | Financial
Instruments
| | | Collateral
Received
| | | Net
Amount
| |
Description /Counterparty | | | | | | | | | | | | | | | | | | | | | | | | |
Futures | | | | | | | | | | | | | | | | | | | | | | | | |
Credit Suisse | | $ | 42,281 | | | $ | (5,374 | ) | | $ | 36,907 | | | $ | — | | | $ | — | | | $ | 36,907 | |
Purchased Options* | | | | | | | | | | | | | | | | | | | | | | | | |
Bank of America | | | 918 | | | | — | | | | 918 | | | | — | | | | — | | | | 918 | |
Swaps | | | | | | | | | | | | | | | | | | | | | | | | |
Morgan Stanley | | | 31,342 | | | | — | | | | 31,342 | | | | (31,342 | ) | | | — | | | | — | |
| | |
|
|
| |
|
|
| |
|
|
| |
|
|
| |
|
|
| |
|
|
|
| | | $ | 74,541 | | | $ | (5,374 | ) | | $ | 69,167 | | | $ | (31,342 | ) | | $ | — | | | $ | 37,825 | |
| | |
|
|
| |
|
|
| |
|
|
| |
|
|
| |
|
|
| |
|
|
|
| * | | Included in investments, at value as reported on the Statement of Assets and Liabilities. |
| | | | | | | | | | | | | | | | | | | | | | | | |
| Liabilities | | | | | | | | | | | Gross Amounts not offset
in the Statement of
Assets and Liabilities
| | | | |
| | | Gross Amounts
of Recognized
Liabilities
| | | Gross Amounts
Offset in the
Statement of
Assets and Liabilities
| | | Net Amounts
Presented in the
Statement of
Assets and Liabilities
| | | Financial
Instruments
| | | Collateral
Pledged
| | | Net
Amount
| |
Description / Counterparty | | | | | | | | | | | | | | | | | | | | | | | | |
Futures | | | | | | | | | | | | | | | | | | | | | | | | |
Credit Suisse | | $ | 5,374 | | | $ | (5,374 | ) | | $ | — | | | $ | — | | | $ | — | | | $ | — | |
Options Written | | | | | | | | | | | | | | | | | | | | | | | | |
Morgan Stanley | | | 120,319 | | | | — | | | | 120,319 | | | | — | | | | — | | | | 120,319 | |
Swaps | | | | | | | | | | | | | | | | | | | | | | | | |
Morgan Stanley | | | 1,414,229 | | | | — | | | | 1,414,229 | | | | (31,342 | ) | | | (1,382,887 | ) | | | — | |
| | |
|
|
| |
|
|
| |
|
|
| |
|
|
| |
|
|
| |
|
|
|
| | | $ | 1,539,922 | | | $ | (5,374 | ) | | $ | 1,534,548 | | | $ | (31,342 | ) | | $ | (1,382,887 | ) | | $ | 120,319 | |
| | |
|
|
| |
|
|
| |
|
|
| |
|
|
| |
|
|
| |
|
|
|
GuideMark® Opportunistic Fixed Income Fund
The Fund attempts to reduce its exposure to counterparty credit risk onover-the counter (“OTC”) derivatives, whenever possible, by entering into International Swaps and Derivatives Association, Inc. (“ISDA”) agreements with certain counterparties. These agreements typically contain various provisions, including but not limited to, collateral requirements and master netting provisions in the event of a default or other termination event. Collateral is posted by the Fund or the counterparty to the extent of the netmark-to-market exposure to the other party of all open contracts under the agreement, subject to minimum transfer requirements. The Fund is required to deposit financial collateral in the form of cash and/or securities at the clearing brokers and counterparties to continually meet the original and maintenance requirement established by the clearing brokers and counterparties. Master netting provisions allow the Fund and the counterparty, in the event of a default or other termination event, to offset amounts owed by each related to derivative contracts, including any posted collateral, to one net amount payable by either the Fund or the counterparty. The Fund’s ISDA agreements typically contain provisions that allow a counterparty to terminate open contracts early if the net asset value of a Fund declines beyond a certain threshold. For financial reporting purposes, the Fund does not offset derivative assets and liabilities, and any related collateral received or pledged, on the Statements of Assets and Liabilities.
176
GuideMark® Funds & GuidePath® Funds
NOTES TO FINANCIAL STATEMENTS (Continued)
March 31, 2020
The table below, as of March 31, 2020, discloses both gross information and net information about instruments and transactions eligible for offset in the Statement of Assets and Liabilities, and instruments and transactions that are subject to an agreement similar to a master netting agreement as well as amounts related to collateral held at clearing brokers and counterparties.
| | | | | | | | | | | | | | | | | | | | | | | | |
| Assets | | | | | | | | | | | Gross Amounts not offset
in the Statement of
Assets and Liabilities
| | | | |
| | | Gross Amounts
of Recognized
Assets
| | | Gross Amounts
Offset in the
Statement of
Assets and Liabilities
| | | Net Amounts
Presented in the
Statement of
Assets and Liabilities
| | | Financial
Instruments
| | | Collateral
Received
| | | Net
Amount
| |
| Description / Counterparty | | | | | | | | | | | | | | | | | | |
Forward Currency Contracts | | | | | | | | | | | | | | | | | | | | | | | | |
Bank of America | | $ | 7,168 | | | $ | — | | | $ | 7,168 | | | $ | (4,822 | ) | | $ | — | | | $ | 2,346 | |
Barclays | | | 1,564 | | | | — | | | | 1,564 | | | | (1,564 | ) | | | — | | | | — | |
BNP Paribas | | | 72,909 | | | | — | | | | 72,909 | | | | (66,838 | ) | | | — | | | | 6,071 | |
Citibank | | | 382,668 | | | | — | | | | 382,668 | | | | (74,060 | ) | | | (280,000 | ) | | | 28,608 | |
Deutsche Bank | | | 72,157 | | | | — | | | | 72,157 | | | | (72,157 | ) | | | — | | | | — | |
Goldman Sachs | | | 31,172 | | | | — | | | | 31,172 | | | | (2,134 | ) | | | (29,038 | ) | | | — | |
HSBC | | | 334,716 | | | | — | | | | 334,716 | | | | (4,468 | ) | | | (328,760 | ) | | | 1,488 | |
JP Morgan Chase | | | 471,052 | | | | — | | | | 471,052 | | | | (8,409 | ) | | | (462,643 | ) | | | — | |
Morgan Stanley | | | 1,310 | | | | — | | | | 1,310 | | | | — | | | | — | | | | 1,310 | |
UBS | | | 27,185 | | | | — | | | | 27,185 | | | | (3,482 | ) | | | — | | | | 23,703 | |
| | |
|
|
| |
|
|
| |
|
|
| |
|
|
| |
|
|
| |
|
|
|
| | | $ | 1,401,901 | | | $ | — | | | $ | 1,401,901 | | | $ | (237,934 | ) | | $ | (1,100,441 | ) | | $ | 63,526 | |
| | |
|
|
| |
|
|
| |
|
|
| |
|
|
| |
|
|
| |
|
|
|
| | | | | | | | | | | | | | | | | | | | | | | | |
| Liabilities | | | | | | | | | | | Gross Amounts not offset
in the Statement of
Assets and Liabilities
| | | | |
| | | Gross Amounts
of Recognized
Liabilities
| | | Gross Amounts
Offset in the
Statement of
Assets and Liabilities
| | | Net Amounts
Presented in the
Statement of
Assets and Liabilities
| | | Financial
Instruments
| | | Collateral
Pledged
| | | Net
Amount
| |
Description / Counterparty | | | | | | | | | | | | | | | | | | | | | | | | |
Forward Currency Contracts | | | | | | | | | | | | | | | | | | | | | | | | |
Bank of America | | $ | 4,822 | | | $ | — | | | $ | 4,822 | | | $ | (4,822 | ) | | $ | — | | | $ | — | |
Barclays | | | 2,845 | | | | — | | | | 2,845 | | | | (1,564 | ) | | | — | | | | 1,281 | |
BNP Paribas | | | 66,838 | | | | — | | | | 66,838 | | | | (66,838 | ) | | | — | | | | — | |
Citibank | | | 74,060 | | | | — | | | | 74,060 | | | | (74,060 | ) | | | — | | | | — | |
Deutsche Bank | | | 277,702 | | | | — | | | | 277,702 | | | | (72,157 | ) | | | (205,545 | ) | | | — | |
Goldman Sachs | | | 2,134 | | | | — | | | | 2,134 | | | | (2,134 | ) | | | — | | | | — | |
HSBC | | | 4,468 | | | | — | | | | 4,468 | | | | (4,468 | ) | | | — | | | | — | |
JP Morgan Chase | | | 8,409 | | | | — | | | | 8,409 | | | | (8,409 | ) | | | — | | | | — | |
UBS | | | 3,482 | | | | — | | | | 3,482 | | | | (3,482 | ) | | | — | | | | — | |
| | |
|
|
| |
|
|
| |
|
|
| |
|
|
| |
|
|
| |
|
|
|
| | | $ | 444,760 | | | $ | — | | | $ | 444,760 | | | $ | (237,934 | ) | | $ | (205,545 | ) | | $ | 1,281 | |
| | |
|
|
| |
|
|
| |
|
|
| |
|
|
| |
|
|
| |
|
|
|
GuidePath® Managed Futures Strategy Fund
The Fund is subject to various Master Netting Arrangements, which govern the terms of certain transactions with select counterparties. The Master Netting Arrangements allow the Fund to close out and net its total exposure to a counterparty in the event of a default with respect to all the transactions governed under a single agreement with a counterparty. The Master Netting Arrangements also specify collateral posting arrangements atpre-arranged exposure levels. Under the Master Netting Arrangements, collateral is routinely transferred if the total net exposure to certain transactions (net of existing collateral already in place) governed under the relevant Master Netting Arrangement with a counterparty in a given account exceeds a specified threshold depending on the counterparty and the type of Master Netting Arrangement.
177
GuideMark® Funds & GuidePath® Funds
NOTES TO FINANCIAL STATEMENTS (Continued)
March 31, 2020
The table below, as of March 31, 2020, discloses both gross information and net information about instruments and transactions eligible for offset in the Consolidated Statement of Assets and Liabilities, and instruments and transactions that are subject to an agreement similar to a master netting agreement as well as amounts related to collateral held at clearing brokers and counterparties. For financial reporting purposes, the Fund does not offset derivative assets and liabilities, and any related collateral received or pledged, on the Consolidated Statement of Assets and Liabilities, except in the case of futures contracts.
| | | | | | | | | | | | | | | | | | | | | | | | |
| Assets | | | | | | | | | | | Gross Amounts not offset in
the Consolidated Statement of
Assets and Liabilities
| | | | |
| | | Gross Amounts
of Recognized
Assets
| | | Gross Amounts
Offset in the
Consolidated
Statement of
Assets and Liabilities
| | | Net Amounts
Presented in the
Consolidated
Statement of
Assets and Liabilities
| | | Financial
Instruments
| | | Collateral
Received
| | | Net
Amount
| |
Description / Counterparty | | | | | | | | | | | | | | | | | | | | | | | | |
Forward | | | | | | | | | | | | | | | | | | | | | | | | |
NatWest | | $ | 1,900,181 | | | $ | — | | | $ | 1,900,181 | | | $ | (327,486 | ) | | $ | (1,572,695 | ) | | $ | — | |
Futures* | | | | | | | | | | | | | | | | | | | | | | | | |
Goldman Sachs | | | 2,298,388 | | | | (1,062,932 | ) | | | 1,235,456 | | | | (604,265 | ) | | | — | | | | 631,191 | |
| | |
|
|
| |
|
|
| |
|
|
| |
|
|
| |
|
|
| |
|
|
|
| | | $ | 4,198,569 | | | $ | (1,062,932 | ) | | $ | 3,135,637 | | | $ | (931,751 | ) | | $ | (1,572,695 | ) | | $ | 631,191 | |
| | |
|
|
| |
|
|
| |
|
|
| |
|
|
| |
|
|
| |
|
|
|
| | | | | | | | | | | | | | | | | | | | | | | | |
| Liabilities | | | | | | | | | | | Gross Amounts not offset in
the Consolidated Statement
of Assets and Liabilities
| | | | |
| | | Gross Amounts
of Recognized
Liabilities
| | | Gross Amounts
Offset in the
Consolidated
Statement of
Assets and Liabilities
| | | Net Amounts
Presented in the
Consolidated
Statement of
Assets and Liabilities
| | | Financial
Instruments
| | | Collateral
Pledged
| | | Net
Amount
| |
Description / Counterparty | | | | | | | | | | | | | | | | | | | | | | | | |
Forward | | | | | | | | | | | | | | | | | | | | | | | | |
NatWest | | $ | 327,486 | | | $ | — | | | $ | 327,486 | | | $ | (327,486 | ) | | $ | — | | | $ | — | |
Futures* | | | | | | | | | | | | | | | | | | | | | | | | |
Goldman Sachs | | | 1,667,197 | | | | (1,062,932 | ) | | | 604,265 | | | | (604,265 | ) | | | — | | | | — | |
| | |
|
|
| |
|
|
| |
|
|
| |
|
|
| |
|
|
| |
|
|
|
| | | $ | 1,994,683 | | | $ | (1,062,932 | ) | | $ | 931,751 | | | $ | (931,751 | ) | | $ | — | | | $ | — | |
| | |
|
|
| |
|
|
| |
|
|
| |
|
|
| |
|
|
| |
|
|
|
| * | | Cumulative appreciation/ depreciation on futures contracts is reported in the Consolidated Schedule of Open Futures Contracts – variation margin and recievable/payable for unsettled open futures contracts presented above is presented in the Consolidated Statement of Assets and Liabilities. |
GuidePath® Growth and Income Fund
The Fund is subject to various Master Netting Arrangements, which govern the terms of certain transactions with select counterparties. The Master Netting Arrangements allow the Fund to close out and net its total exposure to a counterparty in the event of a default with respect to all the transactions governed under a single agreement with a counterparty. The Master Netting Arrangements also specify collateral posting arrangements atpre-arranged exposure levels. Under the Master Netting Arrangements, collateral is routinely transferred if the total net exposure to certain transactions (net of existing collateral already in place) governed under the relevant Master Netting Arrangement with a counterparty in a given account exceeds a specified threshold depending on the counterparty and the type of Master Netting Arrangement.
The table below, as of March 31, 2020, discloses both gross information and net information about instruments and transactions eligible for offset in the Statements of Assets and Liabilities, and instruments and transactions that are subject to an agreement similar to a master netting agreement as well as amounts related to collateral held at clearing brokers and counterparties. For financial reporting purposes, the Fund does not offset derivative assets and liabilities, and any related collateral received or pledged, on the Statement of Assets and Liabilities, except in the case of futures contracts.
| | | | | | | | | | | | | | | | | | | | | | | | |
| Assets | | | | | | | | | | | Gross Amounts not offset
in the Statement of
Assets and Liabilities
| | | | |
| | | Gross Amounts
of Recognized
Assets
| | | Gross Amounts
Offset in the
Statement of
Assets and Liabilities
| | | Net Amounts
Presented in the
Statement of
Assets and Liabilities
| | | Financial
Instruments
| | | Collateral
Received
| | | Net
Amount
| |
Description / Counterparty | | | | | | | | | | | | | | | | | | | | | | | | |
Futures | | | | | | | | | | | | | | | | | | | | | | | | |
NatWest | | $ | 62,250 | | | $ | — | | | $ | 62,250 | | | $ | — | | | $ | — | | | $ | 62,250 | |
| | |
|
|
| |
|
|
| |
|
|
| |
|
|
| |
|
|
| |
|
|
|
| | | $ | 62,250 | | | $ | — | | | $ | 62,250 | | | $ | — | | | $ | — | | | $ | 62,250 | |
| | |
|
|
| |
|
|
| |
|
|
| |
|
|
| |
|
|
| |
|
|
|
178
GuideMark® Funds & GuidePath® Funds
NOTES TO FINANCIAL STATEMENTS (Continued)
March 31, 2020
| | | | | | | | | | | | | | | | | | | | | | | | |
| Liabilities | | | | | | | | | | | Gross Amounts not offset
in the Statement of
Assets and Liabilities
| | | | |
| | | Gross Amounts
of Recognized
Liabilities
| | | Gross Amounts
Offset in the
Statement of
Assets and Liabilities
| | | Net Amounts
Presented in the
Statement of
Assets and Liabilities
| | | Financial
Instruments
| | | Collateral
Pledged
| | | Net
Amount
| |
Description / Counterparty | | | | | | | | | | | | | | | | | | | | | | | | |
Options Written | | | | | | | | | | | | | | | | | | | | | | | | |
NatWest | | $ | 437,924 | | | $ | — | | | $ | 437,924 | | | $ | — | | | $ | (437,924 | ) | | $ | — | |
| | |
|
|
| |
|
|
| |
|
|
| |
|
|
| |
|
|
| |
|
|
|
| | | $ | 437,924 | | | $ | — | | | $ | 437,924 | | | $ | — | | | $ | (437,924 | ) | | $ | — | |
| | |
|
|
| |
|
|
| |
|
|
| |
|
|
| |
|
|
| |
|
|
|
In some instances, the collateral amounts disclosed in the tables were adjusted due to the requirement to limit the collateral amounts to avoid the effect of overcollateralization. Actual collateral received/pledged may be more than the amounts disclosed herein.
Due to the absence of a master netting agreement relating to the Funds’ participation in securities lending, no additional disclosures have been made on behalf of the Funds. Please reference Note 7 for collateral related to securities on loan.
| | (m) | | Securities Purchased or Sold on a Forward-Commitment Basis |
The Funds may enter into when-issued or other purchase or sale transactions that specify forward delivery of a financial security. In connection with this ability, the Funds may enter into mortgage “dollar rolls” in which a Fund sells securities in the current month for delivery and simultaneously contracts with the same counterparty to repurchase similar (same type, coupon and maturity), but not identical securities on a specified future date. The party that is obligated to buy a security in the future will retain the use of their funds, and will benefit from any interest that is earned on those funds from the day that they enter into the forward contract until the day that they take delivery and pay for the security. Each Fund designates and maintains cash and/or marketable securities at least equal in value to commitments for securities purchased on a forward-commitment basis.
| | (n) | | Foreign Securities – For purposes of these financial statements, foreign securities are defined as securities issued by companies that are organized outside the United States. Investing in these types of securities make a fund more susceptible to additional risks. These risks include currency fluctuations, political and economic instability, less government regulation, less publicly available information, limited trading markets, differences in financial reporting standards, fewer protections for passive investors and less stringent regulation of securities markets. Moreover, securities of many foreign companies and foreign governments and their markets may be less liquid and their prices more volatile than those of securities of comparable U.S. companies and the U.S. government. Occasionally, events that affect these values and exchange rates may occur after the close of the exchange on which such securities are traded. If such events materially affect the value of a Fund’s securities, these securities may be valued at their fair value pursuant to procedures adopted by the Board. |
| | (o) | | Foreign Currency Translation |
The accounting records of the Funds are maintained in U.S. dollars. Investment securities and all other assets and liabilities of the Funds denominated in a foreign currency are translated into U.S. dollars at current exchange rates. Purchases and sales of securities, income receipts, and expense payments are translated into U.S. dollars at the exchange rate in effect on the dates of the respective transactions. The Funds do not isolate the
portion of the fluctuations on investments resulting from changes in foreign currency exchange rates from the fluctuations in market prices of investments held. Such fluctuations are included with the net realized and unrealized gain or loss in the Statement of Operations.
Net realized gain (loss) on foreign currencies include those gains and losses arising from the sale of foreign currencies, currency gains or losses realized between the trade and settlement dates on foreign currency transactions, the differences between the amounts of dividends, and foreign withholding taxes recorded on a Fund’s books, and the U.S. dollar equivalent of the amounts actually received or paid. Net unrealized appreciation (depreciation) on investments includes changes in the value of investments resulting from exchange rates.
The value of the Funds’ foreign holdings as measured in U.S. dollars may be affected unfavorably by changes in foreign currency exchange rates, as a change in the value of a foreign currency against the U.S. dollar generally will result in a corresponding change in the U.S. dollar value of securities denominated in that currency held by a Fund. In addition to the risks of foreign currency exchange rates generally, trading in the currencies of certain countries may face periods of limited liquidity or the political risk of exchange controls or currency repatriation restrictions, which may in turn make such holdings denominated in those currencies difficult to value. The Funds may also incur losses in connection with conversions between various currencies.
| | (p) | | Restricted and Illiquid Securities |
No Fund may acquire any illiquid investment if, immediately after the acquisition, the Fund would have invested more than 15% of it’s net assets in illiquid investments that are assets. The Advisor, with the assistance of thesub-advisors and/or pricing services, will determine the value of such securities in good faith pursuant to procedures adopted by the applicable Board of Trustees. Illiquid securities present the risks that a Fund may have difficulty valuing these holdings and/or may be unable to sell these holdings at the time or price desired. There are no restrictions on each Fund’s ability to invest in restricted securities (that is, securities that are not registered pursuant to the Securities Act of 1933), except to the extent such securities
179
GuideMark® Funds & GuidePath® Funds
NOTES TO FINANCIAL STATEMENTS (Continued)
March 31, 2020
may be considered illiquid. Securities issued pursuant to Rule 144A of the Securities Act of 1933 will be considered liquid if determined to be so under the Funds’ liquidity guidelines.
| | (q) | | Auction Rate Securities |
The Core Fixed Income Fund,Tax-Exempt Fixed Income Fund, and each of the GPS Funds II portfolios may invest in auction rate municipal securities. Auction rate securities usually permit the holder to sell the securities in an auction at par value at specified intervals. The dividend is reset by “Dutch” auction in which bids are made by broker-dealers and other institutions for a certain amount of securities at a specified minimum yield. The dividend rate set by the auction is the lowest interest or dividend rate that covers all securities offered for sale. While this process is designed to permit auction rate securities to be traded at par value, there is a risk that an auction will fail due to insufficient demand for the securities.
Although not currently part of any Fund’s principal investment strategy, each Fund has the ability to make equity short sales. Short sales are transactions where a Fund sells securities it does not own in anticipation of a decline in the value of the securities.
Effective April 1, 2020, for the services performed as Trustees of the consolidated Board of GPS Funds I, GPS Funds II, and Savos Investments Trust, which currently consists of one fund, the Independent Trustees receive a retainer fee of $87,500 per year, $5,000 for each quarterly meeting and annual agreement renewal review meeting, whether heldin-person or telephonically, $5,000 for each special meeting attended in person and $2,000 for each special meeting attended telephonically, as well as reimbursement for expenses incurred in connection with attendance at such meetings. The fees are allocated proportionally to each Fund within the Trusts based on total assets under management.
The “interested persons” who serve as Trustees of the Trusts receive no compensation from the Trusts for their services as Trustees. The Funds reimburse the Advisor an allocated amount for the compensation and related expenses of certain officers of the Trusts who provide compliance services to the Funds. The aggregate amount of all such reimbursements is determined by the Trustees. No other compensation or retirement benefits are received by any Trustee or officer from the Funds.
The Funds are subject to claims and suits that arise from time to time in the ordinary course of business (for example, in The Tribune Company Bankruptcy, certain creditors have filed actions against all shareholders of The Tribune Company, which included the GuideMark® Emerging Markets Fund, who tendered shares when the Tribune Company went private in 2007 in a leveragedbuy-out transaction, seeking the return of proceeds received by the shareholders). Although management currently believes that resolving claims against us, individually or in aggregate, will not have a material adverse impact on financial position, results of operations, or cash flows, these matters are subject to inherent uncertainties and management’s view of these matters may change in the future.
| | (u) | | Participatory Notes (“participation notes”) |
Each Fund may invest in participation notes. Participation notes are unsecured, bearer securities typically issued by financial institutions, the return of which is generally linked to the performance of the underlying listed shares of a company in an emerging market (for example, the shares in a company incorporated in India and listed on the Bombay Stock Exchange). Participation notes are often used to gain exposure to securities of companies in the markets that restrict foreign ownership of local companies.
The terms of participation notes vary widely. Investors in participation notes do not have or receive any rights relating to the underlying shares, and the issuers of the notes may not be obligated to hold any shares in the underlying companies. Participation notes are not currently regulated by the governments of the countries upon which securities the notes are based. These instruments, issued by brokers with global registration, bear counterparty risk and may bear additional liquidity risk. These securities have been deemed to be liquid as of March 31, 2020.
Each Trust has an Investment Advisory Agreement (the “Agreement”) with AssetMark, Inc. (the “Advisor” or “AssetMark”), with whom certain officers and trustees of the Trust are affiliated, to furnish investment advisory services to the Funds. Under the terms of the Agreement, the Funds compensate the Advisor for its management services at the following contractual rates, based on each Fund’s average daily net assets:
| | | | |
Large Cap Core Fund | | | 0.45% | |
Emerging Markets Fund | | | 0.59% | |
Small/Mid Cap Core Fund | | | 0.57% | |
Worldex-US Fund | | | 0.50% | |
Core Fixed Income Fund | | | 0.40% | |
Tax-Exempt Fixed Income Fund | | | 0.50% | |
Opportunistic Fixed Income Fund | | | 0.70% | |
Growth Allocation Fund | | | 0.25% | |
Conservative Allocation Fund | | | 0.25% | |
Tactical Allocation Fund | | | 0.35% | |
Absolute Return Allocation Fund | | | 0.35% | |
Multi-Asset Income Allocation Fund | | | 0.35% | |
Flexible Income Allocation Fund | | | 0.25% | |
Managed Futures Strategy Fund | | | 1.05% | |
Conservative Income Fund | | | 0.35% | |
Income Fund | | | 0.45% | |
Growth and Income Fund | | | 0.45% | |
AssetMark also provides certain administrative services to the shares of the Conservative Income Fund, Income Fund and Growth and Income Fund, and to the Service Shares of the remaining Funds, pursuant to Administrative Services Agreements between the Funds and AssetMark, for which AssetMark receives a fee of 0.25% of the average daily net assets of the applicable class of shares of each Fund. AssetMark also receives an advisory fee of 1.05% for the Guidemark Managed Futures Strategy Cayman Fund Ltd., all of which is being waived by the Advisor. The administrative services may include development and maintenance of aweb-based software platform for both investment advisers and shareholders; creation of a customized full-color client quarterly performance review for each
180
GuideMark® Funds & GuidePath® Funds
NOTES TO FINANCIAL STATEMENTS (Continued)
March 31, 2020
individual client; facilitating the initiation and setup of new account and related asset transfers; reviewing and following up on custodial paperwork; attending to shareholder correspondence, requests and inquiries, and other communications with shareholders and their representatives; assisting with the processing of purchases and redemptions of shares; and monitoring and overseeingnon-advisory relationships with entities providing services to the applicable class of shares of each Fund; including the transfer agent and custodian.
In addition, GPS Funds I and the Advisor have also entered into a Fee Waiver Agreement designed to provide Fund shareholders with the economic benefits of economies of scale that may be realized as Fund assets increase. Under the Fee Waiver Agreement, the Advisor has contractually agreed to waive, 0.025% of each Fund’s annual advisory fee on GPS Funds I assets in excess of $6 billion and an additional 0.025% of each Fund’s annual advisory fee on GPS Funds I assets in excess of $12 billion.
Each Fund and the Advisor have also entered into an Expense Limitation Agreement under which the Advisor has agreed to waive, through July 31, 2021, its management fee and/or reimburse each Fund’s other expenses to the extent necessary to ensure that the Fund’s net annual operating expenses (excluding taxes, interest, trading costs, acquired fund expenses, expenses paid with securities lending expense offset credits andnon-routine expenses) do not exceed the following rates (“Expense Limits”), based on daily net assets of each class of each Fund:
| | | | | | | | | | | | |
| | | Service
Class
| | | Institutional
Class
| | | Single
Class
| |
Large Cap Core Fund | | | 1.24% | | | | 0.64% | | | | — | |
Emerging Markets Fund | | | 1.65% | | | | 1.05% | | | | — | |
Small/Mid Cap Core Fund | | | 1.45% | | | | 0.85% | | | | — | |
| | | | | | | | | | | | |
| | | Service
Class
| | | Institutional
Class
| | | Single
Class
| |
Worldex-US Fund | | | 1.39% | | | | 0.79% | | | | — | |
Core Fixed Income Fund | | | 1.19% | | | | 0.59% | | | | — | |
Tax-Exempt Fixed Income Fund | | | 1.29% | | | | 0.69% | | | | — | |
Opportunistic Fixed Income Fund | | | 1.55% | | | | 0.95% | | | | — | |
Growth Allocation Fund | | | 1.00% | | | | 0.40% | | | | — | |
Conservative Allocation Fund | | | 0.70% | | | | 0.10% | | | | — | |
Tactical Allocation Fund | | | 1.10% | | | | 0.50% | | | | — | |
Absolute Return Allocation Fund | | | 0.80% | | | | 0.20% | | | | — | |
Multi-Asset Income Allocation Fund | | | 1.10% | | | | 0.50% | | | | — | |
Flexible Income Allocation Fund | | | 0.75% | | | | 0.15% | | | | — | |
Managed Futures Strategy Fund | | | 1.90% | | | | 1.30% | | | | — | |
Conservative Income Fund | | | — | | | | — | | | | 0.64% | |
Income Fund | | | — | | | | — | | | | 0.79% | |
Growth and Income Fund | | | — | | | | — | | | | 0.79% | |
Any such contractual waiver or reimbursement is subject to later adjustment to allow the Advisor to recoup amounts waived or reimbursed to the extent actual fees and expenses for a fiscal period are less than each Fund’s Expense Limits at the time of the waiver, provided, however, that the Advisor shall only be entitled to recoup such amounts for a period of three years after the end of the calendar month in which the fee or expense was waived or reimbursed. As of March 31, 2020, Large Cap Core Fund, Small/Mid Cap Core Fund, Worldex-US Fund (service class shares), Growth Allocation Fund, Tactical Allocation Fund and Multi-Asset Income Allocation Fund have recouped all potential recoverable waived fees or reimbursed expenses.
The Advisor is currently waiving fees and, in some cases, reimbursing expenses in the Funds listed below in order to keep these Funds at their Expense Limits. Waived expenses subject to potential recovery are as follows:
| | | | | | | | | | | | |
| | | Year of
Expiration
03/31/2021
| | | Year of
Expiration
03/31/2022
| | | Year of
Expiration
03/31/2023
| |
Emerging Markets Fund | | $ | — | | | $ | — | | | $ | 103,392 | |
Worldex-US Fund | | | 4,462 | | | | 53 | | | | 3 | |
Core Fixed Income Fund | | | 140,476 | | | | 187,844 | | | | 132,507 | |
Tax-Exempt Fixed Income Fund | | | 53,567 | | | | 64,590 | | | | 60,079 | |
Opportunistic Fixed Income Fund | | | 197,441 | | | | 192,137 | | | | 171,719 | |
Conservative Allocation Fund | | | 123,290 | | | | 461,910 | | | | 778,668 | |
Absolute Return Allocation Fund | | | 152,010 | | | | 735,890 | | | | 847,340 | |
Flexible Income Allocation Fund | | | 15,949 | | | | 67,053 | | | | 205,738 | |
Managed Futures Strategy Fund | | | 821 | | | | 17,700 | | | | 8,555 | |
Conservative Income Fund | | | — | | | | 55,574 | | | | 70,018 | |
Income Fund | | | — | | | | 58,315 | | | | 72,623 | |
Growth and Income Fund | | | — | | | | 56,091 | | | | 124,031 | |
Sub-advisory services are provided to certain of the Funds, pursuant to agreements between the Advisor and varioussub-advisors. Under the terms of thesesub-advisory agreements, the Advisor compensates eachsub-advisor based on the portion of each Fund’s average daily net assets that is allocated to thesub-advisor.
Each Trust, on behalf of the Service Shares class of its Funds, as applicable, has adopted a distribution plan pursuant to Rule12b-1 under the 1940 Act (the“12b-1 Plan”), which provides for each
Fund to pay distribution fees at an annual rate of 0.25% of the average daily net assets of the Funds’ Service Shares. Payments under the12b-1 Plan shall be used to compensate persons (including affiliates of the Trust) who provide support services in connection with the distribution of the Funds’ Service Shares class and
181
GuideMark® Funds & GuidePath® Funds
NOTES TO FINANCIAL STATEMENTS (Continued)
March 31, 2020
servicing of the Funds’ Service Shares class shareholders. For example, these amounts are paid to financial intermediaries that perform back office shareholder servicing and recordkeeping services that facilitate the operation of the AssetMark Program through which the Funds are primarily distributed. The Advisor (and its affiliates) similarly receive portions of such payments for their services provided to facilitate the operation of the program. These financial intermediaries and affiliates of the Trust also receive payments from the Trust outside of the12b-1 Plan for shareholder services that are unrelated to distribution services. AssetMark BrokerageTM, LLC (“Distributor”), an affiliate of the Advisor, serves as the Funds principal underwriter and distributor. The Funds did not pay any commissions or other compensation, other than12b-1 fees, to the Distributor during the Funds’ most recent fiscal year ended March 31, 2020.
| 6. | | Service, Custody, and Line of Credit Agreements |
The Funds have entered into Service Agreements with U.S. Bancorp Fund Services, LLC, doing business as U.S. Bank Global Fund Services (“Fund Services”) and a Custody Agreement with U.S.
Bank, N.A. (“USB” or the “Custodian”), an affiliate of Fund Services. Under these agreements, Fund Services and the Custodian provide certain transfer agency, administrative, accounting and custody services.
The Funds have established a line of credit (“LoC”) with USB to be used for temporary or emergency purposes, primarily for financing redemption payments, using the securities in the Funds’ portfolios as collateral. Savos Investments Trust, which is also managed by AssetMark, is also party to the same LoC agreement. The LoC was renewed August 1, 2019 and will mature, unless renewed, on July 31, 2020. Borrowing under the LoC is limited to the lesser of 20% of the gross market value of a Fund, 20% of specific marketable securities acceptable to USB, or $250,000,000 for all Funds. The interest rate paid by the Funds on outstanding borrowings is equal to the prime rate, which was 3.25% at March 31, 2020. The Funds have authorized USB to charge any of the custody accounts of the Funds for any missed payments by the Funds. Interest expense incurred for the Funds is disclosed on the Statements of Operations.
During the year April 1, 2019 to March 31, 2020, the details of the borrowings were as follows:
| | | | | | | | | | | | |
Fund
| | Average Daily Borrowings
| | | Weighted Average Annualized
Interest Rate
| | | Maximum Borrowings
| |
Large Cap Core Fund | | $ | 8,301 | | | | 3.25 | % | | $ | 1,010,000 | |
Emerging Markets Fund | | | 33,474 | | | | 5.04 | % | | | 1,194,000 | |
Small/Mid Cap Core Fund | | | — | | | | — | | | | — | |
Worldex-US Fund | | | 21,101 | | | | 4.94 | % | | | 1,718,000 | |
Core Fixed Income Fund | | | 12,915 | | | | 3.95 | % | | | 1,331,000 | |
Tax-Exempt Fixed Income Fund | | | — | | | | — | | | | — | |
Opportunistic Fixed Income Fund | | | 10,268 | | | | 3.44 | % | | | 3,052,000 | |
Growth Allocation Fund | | | 361,776 | | | | 5.25 | % | | | 74,171,000 | |
Conservative Allocation Fund | | | 225,508 | | | | 4.74 | % | | | 33,161,000 | |
Tactical Allocation Fund | | | — | | | | — | | | | — | |
Absolute Return Allocation Fund | | | 470,014 | | | | 4.14 | % | | | 28,945,000 | |
Multi-Asset Income Allocation Fund | | | 30,571 | | | | 4.87 | % | | | 4,086,000 | |
Flexible Income Allocation Fund | | | 112,746 | | | | 4.40 | % | | | 22,117,000 | |
Managed Futures Strategy Fund | | | — | | | | — | | | | — | |
Conservative Income Fund | | | — | | | | — | | | | — | |
Income Fund | | | — | | | | — | | | | — | |
Growth and Income Fund | | | — | | | | — | | | | — | |
The Trusts, on behalf of certain of the Funds, entered into securities lending arrangements with the Custodian. Under the terms of the agreement, the Custodian is authorized to loan securities on behalf of the Funds to approved brokers. In exchange, under normal market conditions, the Funds receive cash collateral in the amount of at least 102% of the value of securities loaned for domestic securities, and 105% of the value of securities loaned with respect to foreign securities. The cash collateral is invested in the Mount Vernon Liquid Assets Portfolio, LLC of which the investment objective is to seek to maximize income to the extent consistent with the preservation of capital and liquidity and maintain a stable Net Asset Value (“NAV”) of $1.00. Although risk is mitigated by the collateral, the Funds could experience a delay in recovering their securities and possible loss of income or value if the borrower fails to return the borrowed securities. In addition, the Funds bear the risk of loss associated with the investment of cash collateral received. After predetermined rebates to brokers, a percentage of the net securities lending revenue is credited to the Funds to be used as an offset against costs and other charges
incurred by the Funds with the Custodian or its affiliates or, as directed in writing by the Funds, other service providers. The Custodian is paid a fee for administering the securities lending program for the Funds, equal to the remaining percentage of the net securities lending revenues generated under the agreement.
During the year ended March 31, 2020, the Funds (excluding theTax-Exempt Fixed Income Fund, Opportunistic Fixed Income Fund, and Managed Futures Strategy Fund) had loaned securities that were collateralized by cash. The Funds continue to receive interest payments or dividends on the securities loaned during the borrowing year. The cash collateral received was invested in securities as listed in each Fund’s Schedule of Investments. Income earned from these investments is allocated to each Fund based on each Fund’s portion of total cash collateral received. The Funds also receive compensation in the form of fees which depend on a number of factors including the type of security and length of the loan. Securities lending income is disclosed in each Fund’s Statement of Operations as a securities lending credit.
182
GuideMark® Funds & GuidePath® Funds
NOTES TO FINANCIAL STATEMENTS (Continued)
March 31, 2020
Secured Borrowings
| | | | |
Securities Lending Transactions
| | | |
Overnight and Continuous
| | Investments Purchased with
Proceeds from Securities
Lending Collateral
| |
Large Cap Core Fund | | $ | 44,978,979 | |
Emerging Markets Fund | | | 3,496,618 | |
Small/Mid Cap Core Fund | | | 9,775,976 | |
Worldex-US Fund | | | 593,326 | |
Core Fixed Income Fund | | | 2,079,473 | |
Tax-Exempt Fixed Income Fund* | | | — | |
Opportunistic Fixed Income Fund* | | | — | |
Growth Allocation Fund | | | 139,438,379 | |
Conservative Allocation Fund | | | 88,033,252 | |
Tactical Allocation Fund | | | 72,959,037 | |
Absolute Return Allocation Fund | | | 37,929,302 | |
Multi-Asset Income Allocation Fund | | | 14,005,053 | |
Flexible Income Allocation Fund | | | — | |
Managed Futures Strategy Fund | | | — | |
Conservative Income Fund | | | — | |
Income Fund | | | — | |
Growth & Income Fund | | | 2,196,737 | |
| |
Amounts reported above related to agreements not included in offsetting disclosure in Note 3 (Offsetting Assets and Liabilities): | | $ | 415,486,132 | |
| | * | | Not eligible to participate in securities lending. |
| 8. | | Investment Transactions |
The aggregate purchases and sales of securities, excluding short-term investments, for the year ended March 31, 2020 are summarized below.
| | | | | | | | |
| | | Purchases
| | | Sales
| |
Large Cap Core Fund | | $ | 155,725,069 | | | $ | 109,262,460 | |
Emerging Markets Fund | | | 33,803,903 | | | | 40,390,347 | |
Small/Mid Cap Core Fund | | | 22,510,243 | | | | 16,971,502 | |
Worldex-US Fund | | | 44,971,175 | | | | 124,102,902 | |
Core Fixed Income Fund* | | | 437,453,892 | | | | 431,039,158 | |
Tax-Exempt Fixed Income Fund | | | 8,771,453 | | | | 9,673,644 | |
Opportunistic Fixed Income Fund** | | | 26,978,303 | | | | 29,080,017 | |
Growth Allocation Fund | | | 378,975,347 | | | | 314,848,831 | |
Conservative Allocation Fund | | | 209,420,929 | | | | 209,995,108 | |
| | | | | | | | |
| | | Purchases
| | | Sales
| |
Tactical Allocation Fund | | $ | 1,762,632,618 | | | $ | 1,862,202,053 | |
Absolute Return Allocation Fund | | | 598,330,594 | | | | 511,335,100 | |
Multi-Asset Income Allocation Fund | | | 112,914,675 | | | | 113,854,204 | |
Flexible Income Allocation Fund | | | 453,553,736 | | | | 412,321,255 | |
Managed Futures Strategy Fund | | | — | | | | — | |
Conservative Income Fund | | | 8,043,818 | | | | 4,596,240 | |
Income Fund | | | 79,429,657 | | | | 50,234,375 | |
Growth and Income Fund*** | | | 52,510,777 | | | | 27,947,100 | |
| | * | | Included in these amounts were $398,407,609 of purchases and $383,554,107 of sales of U.S. Government Securities. |
| | ** | | Included in these amounts were $28,015,414 of purchases and $28,664,545 of sales of U.S. Government Securities. |
| | *** | | Included in these amounts were $2,158,203 of purchases and $0 of sales of U.S. Government Securities |
| 9. | | Transactions with Affiliates |
The GuideMark® Emerging Markets Fund owned 5% or more of the voting securities of the following company during the year ended March 31, 2020. As a result, this company was deemed to be an affiliated company during the year. The below table represents fair value:
| | | | | | | | | | | | | | | | |
Issuer
| | Value as of
April 1, 2019
| | | Purchases
| | | Sales
| | | Realized Gain
(Loss)1
| |
Sihuan Pharmaceutical Holdings Group, Ltd.2 | | $ | 97,680 | | | $ | — | | | $ | 70,360 | | | $ | (18,052 | ) |
| | |
|
|
| |
|
|
| |
|
|
| |
|
|
|
| | | $ | 97,680 | | | $ | — | | | $ | 70,360 | | | $ | (18,052 | ) |
| | |
|
|
| |
|
|
| |
|
|
| |
|
|
|
| | | | |
Issuer
| | Change in
Unrealized
Appreciation
(Depreciation)
| | | Dividend
Income
| | | Fair Value as
of
March 31, 2020
| | | Share Balance
as of
March 31, 2020
| |
Sihuan Pharmaceutical Holdings Group, Ltd.2 | | $ | (9,268 | ) | | $ | 758 | | | $ | — | | | | — | |
| | |
|
|
| |
|
|
| |
|
|
| |
|
|
|
| | | $ | (9,268 | ) | | $ | 758 | | | $ | — | | | | — | |
| | |
|
|
| |
|
|
| |
|
|
| |
|
|
|
| | 1 | | $27 due to currency translation. |
| | 2 | | No longer an affiliate as of March 31, 2020. |
183
GuideMark® Funds & GuidePath® Funds
NOTES TO FINANCIAL STATEMENTS (Continued)
March 31, 2020
The GuidePath® Absolute Return Allocation Fund owned 5% or more of the voting securities of the following company during the year ended March 31, 2020. As a result, this company is deemed to be an affiliated company. The below table represents fair value:
| | | | | | | | | | | | | | | | |
Issuer
| | Value as of
April 1, 2019
| | | Purchases
| | | Sales
| | | Realized Gain
(Loss)
| |
ProShares Investment Grade-Interest Rate Hedged ETF | | $ | 46,966,684 | | | $ | 60,838,867 | | | $ | 75,210,154 | | | $ | (781,425 | ) |
| | |
|
|
| |
|
|
| |
|
|
| |
|
|
|
| | | $ | 46,966,684 | | | $ | 60,838,867 | | | $ | 75,210,154 | | | $ | (781,425 | ) |
| | |
|
|
| |
|
|
| |
|
|
| |
|
|
|
| | | | |
Issuer
| | Change in
Unrealized
Appreciation
(Depreciation)
| | | Dividend
Income
| | | Fair Value as
of
March 31, 2020
| | | Share Balance
as of
March 31, 2020
| |
ProShares Investment Grade-Interest Rate Hedged ETF | | $ | (1,977,593 | ) | | $ | 440,763 | | | $ | 29,836,379 | | | | 458,105 | |
| | |
|
|
| |
|
|
| |
|
|
| |
|
|
|
| | | $ | (1,977,593 | ) | | $ | 440,763 | | | $ | 29,836,379 | | | | 458,105 | |
| | |
|
|
| |
|
|
| |
|
|
| |
|
|
|
The recent global outbreakof COVID-19 has disrupted economic markets and the prolonged economic impact is uncertain. The operational and financial performance of the issuers of securities in which the Funds invest depends on future developments, including the duration and spread of the outbreak, and such uncertainty may in turn impact the value of the Funds’ investments.
| 11. | | New Accounting Pronouncements |
In August 2018, FASB issued Accounting Standards Update (“ASU”)2018-13,Fair Value Measurement (Topic 820): Disclosure Framework – Changes to the Disclosure Requirements for Fair Value Measurement (“ASU2018-13”). The primary focus of ASU2018-13 is to improve the effectiveness of the disclosure requirements for fair value measurements. The changes affect all companies that are required to include fair value measurement disclosures. In general, the amendments in ASU2018-13 are effective for all entities for fiscal years and interim periods within those fiscal years, beginning after December 15, 2019. An entity is permitted to early adopt the removed or modified disclosures upon the issuance of ASU2018-13 and may delay adoption of the additional disclosures, which are required for
public companies only, until their effective date. Management has evaluated ASU2018-13 and has early adopted the relevant provisions of the disclosure framework.
In March 2017, FASB issued ASU 2017-08,Receivables – Nonrefundable Fees and Other Costs (Subtopic 310-20): Premium Amortization on Purchased Callable Debt Securities (“ASU 2017-08”). Theamendments in the ASU 2017-08 shorten the amortization period for certain callable debt securities, heldat a premium, to be amortized to the earliest call date. ASU 2017-08 is effective for fiscal years and interimperiods within those fiscal years beginning after December 15, 2018. Effective April 1, 2019, the Fundsadopted ASU 2017-08 and the adoption did not have a material impact on the financial statements.
| 12. | | Other Tax Information |
Net investment income and realized gains and losses for Federal income tax purposes may differ from that reported on the financial statements because of permanent book-to-tax differences. GAAP requires that permanent differences between financial reporting and tax reporting be reclassified between various components of net assets.
These differences are primarily due to the differing book and tax treatments of income from the CFC, net operating losses, partnerships, excise tax, and taxable overdistributions.
| | | | | | | | |
| | | Total Distrubutable
Earnings (Loss)
| | | Capital
Stock
| |
Large Cap Core Fund | | $ | 463 | | | $ | (463 | ) |
Emerging Markets Fund | | | 60,343 | | | | (60,343 | ) |
Small/Mid Cap Core Fund | | | 45,901 | | | | (45,901 | ) |
Worldex-US Fund | | | 4 | | | | (4 | ) |
Core Fixed Income Fund | | | 16 | | | | (16 | ) |
Tax-Exempt Fixed Income Fund | | | — | | | | — | |
Opportunistic Fixed Income Fund | | | 1,789 | | | | (1,789 | ) |
Growth Allocation Fund | | | 417 | | | | (417 | ) |
Conservative Allocation Fund | | | (83,474 | ) | | | 83,474 | |
Tactical Allocation Fund | | | (42 | ) | | | 42 | |
Absolute Return Allocation Fund | | | (8,143 | ) | | | 8,143 | |
Multi-Asset Income Allocation Fund | | | 59 | | | | (59 | ) |
Flexible Income Allocation Fund | | | 303 | | | | (303 | ) |
Managed Futures Strategy Fund | | | 1,231,466 | | | | (1,231,466 | ) |
Conservative Income Fund | | | 18 | | | | (18 | ) |
Income Fund | | | — | | | | — | |
Growth and Income Fund | | | — | | | | — | |
184
GuideMark® Funds & GuidePath® Funds
NOTES TO FINANCIAL STATEMENTS (Continued)
March 31, 2020
The Funds intend to utilize capital loss carryforwards to offset future realized capital gains. Losses are carried forward indefinitely and any corresponding loss character is retained. Capital loss carryforwards available for Federal income tax purposes are as follows:
| | | | | | | | | | | | |
| | | Capital losses
| | | | |
| | | Short Term
| | | Long Term
| | | Utilized
| |
Large Cap Core Fund | | $ | 4,279,873 | | | $ | 2,132,503 | | | $ | — | |
Emerging Markets Fund | | | 479,613 | | | | — | | | | — | |
Small/Mid Cap Core Fund | | | — | | | | — | | | | — | |
Worldex-US Fund | | | 2,998,080 | | | | 1,307,719 | | | | — | |
Core Fixed Income Fund | | | — | | | | — | | | | (1,215,605 | ) |
Tax-Exempt Fixed Income Fund | | | — | | | | — | | | | — | |
Opportunistic Fixed Income Fund | | | 13,406,605 | | | | 8,411,636 | | | | — | |
Growth Allocation Fund | | | 1,788,501 | | | | — | | | | — | |
Conservative Allocation Fund | | | 691,182 | | | | — | | | | (5,466,483 | ) |
Tactical Allocation Fund | | | — | | | | — | | | | — | |
Absolute Return Allocation Fund | | | 5,785,855 | | | | 4,370,636 | | | | (198,515 | ) |
Multi-Asset Income Allocation Fund | | | — | | | | — | | | | (591,247 | ) |
Flexible Income Allocation Fund | | | 1,417,518 | | | | 7,857,209 | | | | (913,650 | ) |
Managed Futures Strategy Fund | | | — | | | | — | | | | (10,712,577 | ) |
Conservative Income Fund | | | 100,387 | | | | — | | | | — | |
Income Fund | | | 1,889,437 | | | | — | | | | — | |
Growth and Income Fund | | | 1,178,671 | | | | — | | | | — | |
Additionally, at March 31, 2020, the Funds deferred on a tax basis losses as follows:
| | | | | | | | |
| | | Ordinary Late
Year Loss
| | | Capital Loss
| |
Large Cap Core Fund | | $ | — | | | $ | — | |
Emerging Markets Fund | | | 356,958 | | | | — | |
Small/Mid Cap Core Fund | | | 5,190 | | | | 438,451 | |
Worldex-US Fund | | | — | | | | — | |
Core Fixed Income Fund | | | — | | | | — | |
Tax-Exempt Fixed Income Fund | | | — | | | | — | |
Opportunistic Fixed Income Fund | | | — | | | | — | |
Growth Allocation Fund | | | — | | | | — | |
Conservative Allocation Fund | | | — | | | | — | |
Tactical Allocation Fund | | | — | | | | 7,065,536 | |
Absolute Return Allocation Fund | | | — | | | | — | |
Multi-Asset Income Allocation Fund | | | — | | | | 10,895,219 | |
Flexible Income Allocation Fund | | | — | | | | — | |
Managed Futures Strategy Fund | | | 1,001,138 | | | | — | |
Conservative Income Fund | | | — | | | | — | |
Income Fund | | | — | | | | — | |
Growth and Income Fund | | | — | | | | — | |
A regulated investment company may elect for any taxable year to treat any portion of the qualified late year loss as arising on the first day of the next taxable year. Qualified late year losses are certain capital and ordinary losses which occur during the portion of the taxable year subsequent to October 31 and December 31, respectively.
185
GuideMark® Funds & GuidePath® Funds
NOTES TO FINANCIAL STATEMENTS (Continued)
March 31, 2020
The character of distributions for tax purposes paid during the fiscal years ended March 31, 2020 and March 31, 2019 are as follows:
| | | | | | | | |
| | | Year Ended March 31, 2020
| |
| | | Ordinary
Income
Distributions
| | | Long-Term
Capital Gain
Distributions
| |
Large Cap Core Fund | | $ | 460,107 | | | $ | 4,125,368 | |
Emerging Markets Fund | | | 1,489,554 | | | | — | |
Small/Mid Cap Core Fund | | | 23,201 | | | | 963,221 | |
Worldex-US Fund | | | 2,542,292 | | | | — | |
Core Fixed Income Fund | | | 1,893,282 | | | | — | |
Tax-Exempt Fixed Income Fund | | | 619,833 | * | | | 71,166 | |
Opportunistic Fixed Income Fund | | | 2,241,473 | | | | — | |
Growth Allocation Fund | | | 10,455,186 | | | | — | |
Conservative Allocation Fund | | | 8,126,703 | | | | — | |
Tactical Allocation Fund | | | 3,986,966 | | | | 12,464,579 | |
Absolute Return Allocation Fund | | | 8,313,720 | | | | — | |
Multi-Asset Income Allocation Fund | | | 3,881,432 | | | | 40,325 | |
Flexible Income Allocation Fund | | | 2,894,134 | | | | — | |
Managed Futures Strategy Fund | | | 2,629,756 | | | | 4,547,812 | |
Conservative Income Fund | | | 81,578 | | | | — | |
Income Fund | | | 589,175 | | | | 688 | |
Growth and Income Fund | | | 394,397 | | | | — | |
| | * | | Contains $610,917 oftax-exempt income for year ended March 31, 2020. |
| | | | | | | | |
| | | Year Ended March 31, 2019
| |
| | | Ordinary
Income
Distributions
| | | Long-Term
Capital Gain
Distributions
| |
Large Cap Core Fund | | $ | 3,453,165 | | | $ | 2,174,962 | |
Emerging Markets Fund | | | 6,612,553 | | | | 4,662,846 | |
Small/Mid Cap Core Fund | | | — | | | | 3,364,649 | |
Worldex-US Fund | | | 2,697,943 | | | | — | |
Core Fixed Income Fund | | | 2,660,751 | | | | — | |
Tax-Exempt Fixed Income Fund | | | 807,310 | * | | | 31,215 | |
Opportunistic Fixed Income Fund | | | 3,116,585 | | | | — | |
Growth Allocation Fund | | | 9,592,301 | | | | 41,521 | |
Conservative Allocation Fund | | | 5,144,892 | | | | 503,292 | |
Tactical Allocation Fund | | | 12,448,559 | | | | 1,209,576 | |
Absolute Return Allocation Fund | | | 8,705,187 | | | | — | |
Multi-Asset Income Allocation Fund | | | 4,391,358 | | | | — | |
Flexible Income Allocation Fund | | | 2,016,221 | | | | — | |
Managed Futures Strategy Fund | | | — | | | | — | |
Conservative Income Fund | | | 1,400 | | | | — | |
Income Fund | | | 3,522 | | | | — | |
Growth and Income Fund | | | 5,095 | | | | — | |
| | * | | Contains $802,230 oftax-exempt income for year ended March 31, 2019. |
186
GuideMark® Funds & GuidePath® Funds
NOTES TO FINANCIAL STATEMENTS (Continued)
March 31, 2020
At March 31, 2020, the components of accumulated earnings (losses) on a tax basis were as follows:
| | | | | | | | | | | | | | | | | | | | | | | | |
| | | Large Cap
Core
Fund
| | | Emerging
Markets
Fund
| | | Small/Mid
Cap Core
Fund
| | | World
ex-US
Fund
| | | Core
Fixed Income
Fund
| | | Tax-Exempt
Fixed Income
Fund
| |
Cost of Portfolio* | | $ | 334,702,516 | | | $ | 65,890,288 | | | $ | 64,937,026 | | | $ | 118,432,426 | | | $ | 157,505,800 | | | $ | 22,612,830 | |
| | |
|
|
| |
|
|
| |
|
|
| |
|
|
| |
|
|
| |
|
|
|
Gross Unrealized Appreciation | | $ | 83,854,280 | | | $ | 12,359,500 | | | $ | 11,375,419 | | | $ | 16,329,354 | | | $ | 9,127,975 | | | $ | 1,113,466 | |
Gross Unrealized Depreciation | | | (50,043,629 | ) | | | (12,720,634 | ) | | | (14,127,617 | ) | | | (22,855,258 | ) | | | (1,609,994 | ) | | | (265,820 | ) |
| | |
|
|
| |
|
|
| |
|
|
| |
|
|
| |
|
|
| |
|
|
|
Net Unrealized Appreciation/(Depreciation) | | | 33,810,651 | | | | (361,134 | ) | | | (2,752,198 | ) | | | (6,525,904 | ) | | | 7,517,981 | | | | 847,646 | |
| | |
|
|
| |
|
|
| |
|
|
| |
|
|
| |
|
|
| |
|
|
|
UndistributedTax-Exempt Ordinary Income | | | — | | | | — | | | | — | | | | — | | | | — | | | | — | |
Undistributed Ordinary Income | | | 2,006,712 | | | | — | | | | — | | | | 2,716,002 | | | | 368,880 | | | | 38,371 | |
Undistributed Long-Term Cap Gains | | | — | | | | — | | | | — | | | | — | | | | — | | | | 133,787 | |
| | |
|
|
| |
|
|
| |
|
|
| |
|
|
| |
|
|
| |
|
|
|
Distributable Earnings | | | 2,006,712 | | | | — | | | | — | | | | 2,716,002 | | | | 368,880 | | | | 172,158 | |
| | |
|
|
| |
|
|
| |
|
|
| |
|
|
| |
|
|
| |
|
|
|
Other Accumulated Gains/(Losses) | | | (6,412,376 | ) | | | (836,571 | ) | | | (443,641 | ) | | | (4,305,799 | ) | | | — | | | | — | |
| | |
|
|
| |
|
|
| |
|
|
| |
|
|
| |
|
|
| |
|
|
|
Total Distributable Earnings/(Loss) | | | 29,404,987 | | | | (1,197,705 | ) | | | (3,195,839 | ) | | | (8,115,701 | ) | | | 7,886,861 | | | | 1,019,804 | |
| | |
|
|
| |
|
|
| |
|
|
| |
|
|
| |
|
|
| |
|
|
|
| | * | | Portfolio includes investments and derivative contracts |
| | | | | | | | | | | | | | | | | | | | | | | | |
| | | Opportunistic
Fixed Income
Fund
| | | Growth
Allocation
Fund
| | | Conservative
Allocation
Fund
| | | Tactical
Allocation
Fund
| | | Absolute
Return
Allocation
Fund
| | | Multi-Asset
Income
Allocation
Fund
| |
Cost of Portfolio* | | $ | 45,637,856 | | | $ | 888,964,477 | | | $ | 414,379,984 | | | $ | 415,359,438 | | | $ | 434,304,774 | | | $ | 132,541,071 | |
| | |
|
|
| |
|
|
| |
|
|
| |
|
|
| |
|
|
| |
|
|
|
Gross Unrealized Appreciation | | $ | 2,482,783 | | | $ | 43,726,179 | | | $ | 13,446,252 | | | $ | 692,220 | | | $ | 8,176,365 | | | $ | 1,545,445 | |
Gross Unrealized Depreciation | | | (8,041,875 | ) | | | (52,037,504 | ) | | | (24,060,959 | ) | | | (19,625,548 | ) | | | (13,335,187 | ) | | | (9,507,610 | ) |
| | |
|
|
| |
|
|
| |
|
|
| |
|
|
| |
|
|
| |
|
|
|
Net Unrealized Appreciation/(Depreciation) | | | (5,559,092 | ) | | | (8,311,325 | ) | | | (10,614,707 | ) | | | (18,933,328 | ) | | | (5,158,822 | ) | | | (7,962,165 | ) |
| | |
|
|
| |
|
|
| |
|
|
| |
|
|
| |
|
|
| |
|
|
|
UndistributedTax-Exempt Ordinary Income | | | — | | | | — | | | | — | | | | — | | | | — | | | | — | |
Undistributed Ordinary Income | | | 1,244,210 | | | | 267,454 | | | | 1,658,544 | | | | — | | | | 1,340,309 | | | | 506,003 | |
Undistributed Long-Term Cap Gains | | | — | | | | — | | | | — | | | | 18,171,501 | | | | — | | | | — | |
| | |
|
|
| |
|
|
| |
|
|
| |
|
|
| |
|
|
| |
|
|
|
Distributable Earnings | | | 1,244,210 | | | | 267,454 | | | | 1,658,544 | | | | 18,171,501 | | | | 1,340,309 | | | | 506,003 | |
| | |
|
|
| |
|
|
| |
|
|
| |
|
|
| |
|
|
| |
|
|
|
Other Accumulated Gains/(Losses) | | | (21,834,858 | ) | | | (1,802,892 | ) | | | (705,573 | ) | | | (7,079,927 | ) | | | (10,170,882 | ) | | | (10,895,219 | ) |
| | |
|
|
| |
|
|
| |
|
|
| |
|
|
| |
|
|
| |
|
|
|
Total Distributable Earnings/(Loss) | | | (26,149,740 | ) | | | (9,846,763 | ) | | | (9,661,736 | ) | | | (7,841,754 | ) | | | (13,989,395 | ) | | | (18,351,381 | ) |
| | |
|
|
| |
|
|
| |
|
|
| |
|
|
| |
|
|
| |
|
|
|
| | * | | Portfolio includes investments and derivative contracts |
| | | | | | | | | | | | | | | | | | | | |
| | | Flexible
Income
Allocation
Fund
| | | Managed
Futures
Strategy
Fund
| | | Conservative
Income
Fund
| | | Income
Fund
| | | Growth
and Income
Fund
| |
Cost of Portfolio* | | $ | 100,283,981 | | | $ | 220,919,824 | | | $ | 6,558,294 | | | $ | 30,940,036 | | | $ | 38,443,733 | |
| | |
|
|
| |
|
|
| |
|
|
| |
|
|
| |
|
|
|
Gross Unrealized Appreciation | | $ | 310,591 | | | $ | 1,170,934 | | | $ | 24,572 | | | $ | 1,079,003 | | | $ | 224,382 | |
Gross Unrealized Depreciation | | | (2,488,411 | ) | | | (315,753 | ) | | | — | | | | (5,776 | ) | | | (3,723,125 | ) |
| | |
|
|
| |
|
|
| |
|
|
| |
|
|
| |
|
|
|
Net Unrealized Appreciation/(Depreciation) | | | (2,177,820 | ) | | | 855,181 | | | | 24,572 | | | | 1,073,227 | | | | (3,498,743 | ) |
| | |
|
|
| |
|
|
| |
|
|
| |
|
|
| |
|
|
|
UndistributedTax-Exempt Ordinary Income | | | — | | | | — | | | | — | | | | — | | | | — | |
Undistributed Ordinary Income | | | 43,032 | | | | — | | | | 389 | | | | 2,302 | | | | 62,891 | |
Undistributed Long-Term Cap Gains | | | — | | | | 4,051,633 | | | | — | | | | — | | | | — | |
| | |
|
|
| |
|
|
| |
|
|
| |
|
|
| |
|
|
|
Distributable Earnings | | | 43,032 | | | | 4,051,633 | | | | 389 | | | | 2,302 | | | | 62,891 | |
| | |
|
|
| |
|
|
| |
|
|
| |
|
|
| |
|
|
|
Other Accumulated Gains/(Losses) | | | (9,274,727 | ) | | | 243,402 | | | | (100,387 | ) | | | (1,889,437 | ) | | | (1,178,671 | ) |
| | |
|
|
| |
|
|
| |
|
|
| |
|
|
| |
|
|
|
Total Distributable Earnings/(Loss) | | | (11,409,515 | ) | | | 5,150,216 | | | | (75,426 | ) | | | (813,908 | ) | | | (4,614,523 | ) |
| | |
|
|
| |
|
|
| |
|
|
| |
|
|
| |
|
|
|
The differences between book-basis andtax-basis unrealized appreciation and depreciation is primarily attributable to the tax deferral of losses on wash sales and other temporary differences, such as debt restructuring and mark-to-market on 1256 contracts.
| | * | | Portfolio includes investments and derivative contracts |
187
GuideMark® Funds & GuidePath® Funds
REPORT OF INDEPENDENT REGISTERED PUBLIC ACCOUNTING FIRM
To the Shareholders and Board of Trustees of GPS Funds I and GPS Funds II
Opinion on the Financial Statements
We have audited the accompanying statements of assets and liabilities, including the schedules of investments, open futures contracts, options written, open swap contracts, and open forward currency contracts (including the consolidated statement of assets and liabilities and consolidated schedules of investments, open futures contracts, and forward currency contracts of GuidePath Managed Futures Strategy Fund), of GPS Funds I and GPS Funds II comprising the funds listed below (the “Funds”) as of March 31, 2020, the related statements of operations, the statements of changes in net assets, and the financial highlights for each of the periods indicated below, including the related notes (collectively referred to as the “financial statements”). In our opinion, the financial statements present fairly, in all material respects, the financial position of each of the Funds as of March 31, 2020, the results of their operations, the changes in their net assets,and the financial highlights for each of the periods indicated below in conformity with accounting principles generally accepted in the United States of America.
| | | | | | |
| Fund Name | | Statements of Operations | | Statement(s) of Changes in
Net Assets | | Financial Highlights |
GuideMark Large Cap Core Fund, GuideMark Emerging Markets Fund, GuideMark Small/Mid Cap Core Fund, GuideMark Worldex-US Fund, GuideMark Core Fixed Income Fund, GuideMarkTax-Exempt Fixed Income Fund, GuideMark Opportunistic Fixed Income Fund, GuidePath Growth Allocation Fund, GuidePath Conservative Allocation Fund, GuidePath Tactical Allocation Fund, GuidePath Absolute Return Allocation Fund, GuidePath Multi-Asset Income Allocation Fund, and GuidePath Flexible Income Allocation Fund | | For the year ended March 31, 2020 | | For the years ended March 31, 2020 and 2019 | | For the years ended March 31, 2020, 2019, 2018, 2017, and 2016 |
| | | |
| GuidePath Managed Futures Strategy Fund | | Consolidated for the year ended March 31, 2020 | | Consolidated for the years ended March 31, 2020 and 2019 | | Consolidated for the years ended March 31, 2020, 2019, 2018, 2017 and for the period from January 19, 2016 (commencement of operations) through March 31, 2016 |
| | |
GuidePath Conservative Income Fund, GuidePath Income Fund, and GuidePath Growth and Income Fund | | For the year ended March 31, 2020 | | For the year ended March 31, 2020 and for the period from April 30, 2018 (commencement of operations) through March 31, 2019 |
Basis for Opinion
These financial statements are the responsibility of the Funds’ management. Our responsibility is to express an opinion on the Funds’ financial statements based on our audits. We are a public accounting firm registered with the Public Company Accounting Oversight Board (United States) (“PCAOB”) and are required to be independent with respect to the Funds in accordance with the U.S. federal securities laws and the applicable rules and regulations of the Securities and Exchange Commission and the PCAOB.
We conducted our audits in accordance with the standards of the PCAOB. Those standards require that we plan and perform the audit to obtain reasonable assurance about whether the financial statements are free of material misstatement whether due to error or fraud.
Our audits included performing procedures to assess the risks of material misstatement of the financial statements, whether due to error or fraud, and performing procedures that respond to those risks. Such procedures included examining, on a test basis, evidence regarding the amounts and disclosures in the financial statements. Our procedures included confirmation of securities owned as of March 31, 2020, by correspondence with the custodian and brokers or by other appropriate auditing procedures where replies from brokers or counterparties were not received. Our audits also included evaluating the accounting principles used and significant estimates made by management, as well as evaluating the overall presentation of the financial statements. We believe that our audits provide a reasonable basis for our opinion.
We have served as the Funds’ auditor since 2014.
/s/ COHEN & COMPANY, LTD.
Milwaukee, Wisconsin
May 29, 2020
188
GuideMark® Funds & GuidePath® Funds
ADDITIONAL INFORMATION
March 31, 2020
Additional Information
| 1. | | Shareholder Notification of Federal Tax Status (Unaudited) |
The Funds designated the following percentages of dividends during the fiscal year ended March 31, 2020 as dividends qualifying for the dividends received deduction available to corporate shareholders and as dividends from net investment income that are qualifying income under the Jobs and Growth Tax Relief Reconciliation Act of 2003, respectively:
| | | | | | | | |
| | | Dividends received
deduction % for
corporate shareholders
| | | % of dividends as
qualified income
| |
Large Cap Core Fund | | | 100.00% | | | | 100.00% | |
Emerging Markets Fund | | | 1.17% | | | | 100.00% | |
Small/Mid Cap Core Fund | | | 100.00% | | | | 100.00% | |
Worldex-US Fund | | | 0.64% | | | | 100.00% | |
Core Fixed Income Fund | | | 0.00% | | | | 0.00% | |
Tax-Exempt Fixed Income Fund | | | 0.00% | | | | 0.00% | |
Opportunistic Fixed Income Fund | | | 0.00% | | | | 0.00% | |
Growth Allocation Fund | | | 49.49% | | | | 100.00% | |
Conservative Allocation Fund | | | 16.87% | | | | 41.24% | |
Tactical Allocation Fund | | | 34.74% | | | | 61.34% | |
Absolute Return Allocation Fund | | | 0.04% | | | | 2.64% | |
Multi-Asset Income Allocation Fund | | | 32.22% | | | | 50.73% | |
Flexible Income Allocation Fund | | | 0.25% | | | | 0.54% | |
Managed Futures Strategy Fund | | | 0.00% | | | | 0.00% | |
Conservative Income Fund | | | 0.00% | | | | 0.00% | |
Income Fund | | | 0.00% | | | | 0.00% | |
Growth and Income Fund | | | 0.00% | | | | 0.33% | |
| 2. | | Foreign Tax Credit Pass Through (Unaudited) |
Pursuant to Section 853 of the Internal Revenue Code, the following Fundsdesignated the following amounts as foreign taxes paid for the year ended March 31, 2020. Foreign taxes paid for purposes of Section 853 may be less than actual foreign taxes paid for financial statement purposes.
| | | | | | | | | | | | |
| | | Creditable Foreign
Taxes Paid
| | | Per Share
Amount
| | | Portion of Ordinary Income
Distribution Derived from
Foreign Sourced Income*
| |
Emerging Markets Fund | | $ | 274,121 | | | $ | 0.0287 | | | | 94.05 | % |
Worldex-US Fund | | | 435,026 | | | | 0.0449 | | | | 96.70 | % |
| | * | | The Funds listed above did not derive any income from “ineligible foreign sources” as defined under Section 901(j) of the Internal Revenue Code. |
Foreign taxes paid or withheld should be included in taxable income with an offsetting deduction from gross income or as a credit for taxes paid to foreign governments.
Above figures may differ from those cited elsewhere in this report due to differences in the calculation of income and gains under U.S. generally accepted accounting principles (book) purposes and Internal Revenue Service (tax) purposes.
Shareholders are strongly advised to consult their own tax advisers with respect to the tax consequences of their investments in the Funds. In January, shareholders, excluding corporate shareholders, receive an IRS1099-DIV regarding the Federal tax status of the dividends and distributions they received in the calendar year.
189
GuideMark® Funds & GuidePath® Funds
ADDITIONAL INFORMATION (Continued)
March 31, 2020
| 3. | | Disclosure Regarding Fund Trustees and Officers (Unaudited) |
| | | | | | | | | | | | |
Name, Address and Year of Birth
| | Position(s) Held
with the Trusts
| | Term of Office and
Length of Time Served
| | Principal Occupation
During Past Five Years or Longer
| | # of
Portfolios
in Fund
Complex
Overseen
by Trustee
| | | Other Director/ Trustee Positions
|
GPS Funds I and GPS Funds II |
|
Independent Trustees |
| | | | | |
David M. Dunford Year of Birth: 1949 c/o AssetMark, Inc. 1655 Grant Street, 10th Floor Concord, CA 94520 | | Lead Independent Trustee | | Indefinite Term (since 2013 for GPS Funds I and since 2011 for GPS Funds II) | | Retired; formerly, Senior Vice President, Merrill Lynch Insurance Group (1989-2001). | | | 18 | | | Trustee, Savos Investments Trust (2015-present); Director, New England Bancorp (2006-2016); |
| | | | | |
Paul S. Feinberg Year of Birth: 1942 c/o AssetMark, Inc. 1655 Grant Street, 10th Floor Concord, CA 94520 | | Independent Trustee | | Indefinite Term (since 2013 for GPS Funds I and since 2011 for GPS Funds II) | | Retired; formerly, President, CitiStreet Funds, Inc. (2000-2005); Executive Vice President and General Counsel, CitiStreet Associates LLC (insurance agency), CitiStreet Equities LLC (broker- dealer), CitiStreet Financial Services LLC (registered investment advisor) and CitiStreet Funds Management LLC (registered investment advisor) (1990-2005). | | | 18 | | | Trustee, Savos Investments Trust (2015-present); |
| | | | | |
Dennis G. Schmal Year of Birth: 1947 c/o AssetMark, Inc. 1655 Grant Street, 10th Floor Concord, CA 94520 | | Independent Trustee | | Indefinite Term (since 2007 for GPS Funds I and since 2013 for GPS Funds II) | | Self-employed consultant (1999-present); formerly, Partner, Arthur Andersen LLP (audit services) (1972-1999). | | | 18 | | | Trustee, Savos Investments Trust (2015-present); Trustee, Cambria ETF Series Trust (2013-present); Director, Owens Realty Mortgage Inc (2014-2019); Trustee, Wells Fargo Registered Hedge Funds (2008-2019); Director, Blue Calypso Inc. (2015-2019); Director, Merriman Holdings, Inc. (financial services) (2003-2016); |
Interested Trustee | | | | | | | | | | | | |
| | | | | |
Carrie E. Hansen* Year of Birth: 1970 c/o AssetMark, Inc. 1655 Grant Street, 10th Floor Concord, CA 94520 | | Interested Trustee and Chairperson President | | Indefinite Term
since 2014 Renewed1-Year Term since 2008 | | President, GPS Funds I (2007-present) and GPS Funds II (2011-present); President, Savos Investments Trust (“Savos”) (2008-present); Executive Vice President and Chief Operating Officer, AssetMark (2008-present); President, AssetMark Brokerage™, LLC (2013-present). | | | 18 | | | Trustee, Savos Investments Trust (2014-present); Chairperson, AssetMark Trust Co.(2008-present); |
190
GuideMark® Funds & GuidePath® Funds
ADDITIONAL INFORMATION (Continued)
March 31, 2020
| | | | | | |
Name, Address and Year of Birth
| | Position(s) Held
with the Trusts
| | Term of Office and
Length of Time Served
| | Principal Occupation During Past Five Years
|
Officers of the Trusts** |
| | | |
John Koval Year of Birth: 1966 c/o AssetMark, Inc. 1655 Grant Street, 10th Floor Concord, CA 94520 | | Chief Compliance Officer and AML Compliance Officer | | Renewed1-Year Term since 2013 | | Chief Compliance Officer, GPS Funds I, GPS Funds II, and Savos (2013-present); Interim Chief Compliance Officer, GPS Funds I, GPS Funds II, and Savos (September 2012-January 2013); Senior Compliance Officer, AssetMark (2011-2012); Chief Operating Officer, SEAL Capital, Inc. (2009-2010); Chief Compliance Officer, Cliffwood Partners LLC (2004-2009). |
| | | |
Patrick R. Young Year of Birth: 1982 c/o AssetMark, Inc. 1655 Grant Street, 10th Floor Concord, CA 94520 | | Vice President and Treasurer | | Renewed1-Year Term since 2014 | | Vice President and Treasurer, GPS Funds I, GPS Funds II, and Savos (May 2014-present); Director of Mutual Fund Operations and Finance, AssetMark (February 2016-present); Manager of Fund Administration, AssetMark (May 2014-February 2016); Senior Fund Administration Officer, AssetMark(2008-May 2014). |
| | | |
Christine Villas-Chernak Year of Birth: 1968 c/o AssetMark, Inc. 1655 Grant Street, 10th Floor Concord, CA 94520 | | Secretary | | Renewed1-Year Term since 2014 | | Secretary, GPS Funds I (2006-2013 and May 2014-present), GPS Funds II (2011-2013 and May 2014- present), Savos (2009-2010 and May 2014-present) Deputy Chief Compliance Officer, GPS Funds I (2009-present), GPS Funds II (2011-present) and GVIT (2009-2012); Senior Compliance Officer, AssetMark (2005-2009). |
| * | | Ms. Hansen is a Trustee who is an “interested person” of the Trusts as defined in the 1940 Act because she is an officer of AssetMark or certain of its affiliates. |
| ** | | Each Officer of the Trusts serves at the pleasure of the Board. |
The Statement of Additional Information includes additional information about the Funds’ Trustees and is available free of charge upon request by calling the Funds toll free at (888)278-5809.
| 4. | | Proxy Voting Policies and Procedures and Proxy Voting Record (Unaudited) |
A description of the policies and procedures that the Funds use to determine how to vote proxies related to the Funds’ portfolio securities as well as information regarding how the Funds voted proxies relating to portfolio securities during the most recent12-month period ended June 30 is available without charge, upon request, by calling (888)278-5809. Furthermore, you can obtain the Funds’ proxy voting records on the SEC’s website at http://www.sec.gov.
| 5. | | Availability of Quarterly Portfolio Holdings Schedules (Unaudited) |
The Funds file their complete schedules of portfolio holdings with the SEC for their first and third fiscal quarters as an exhibit to their reports on FormN-PORT. The Funds’ filings on FormN-PORT are available without charge, upon request on the SEC’s website (http://www.sec.gov) and by calling (888)278-5809.
| 6. | | Statement Regarding the Basis for Approval of Investment Advisory Agreement and Sub-Advisory Agreements (Unaudited) |
GPS FUNDS I and GPS FUNDS II: Annual Consideration and Approval of Investment Advisoryand Sub-Advisory Agreements
At a meeting held on December 12, 2019 (the “Meeting”), the Board of Trustees (the “Board” or the “Trustees”) of GPS Funds I and GPS Funds II (collectively, the “Trusts”) conducted its annual review and consideration of the renewal of the investment advisory agreements between AssetMark, Inc. (“AssetMark”) and each Trust on behalf of its respective series (each, a “Fund” and collectively, the “Funds”) and the renewal of the investment advisory agreement between AssetMark and the wholly-owned Cayman Islands subsidiary of the GuidePath® Managed Futures Strategy Fund, GuidePath® Managed Futures Strategy Cayman Fund Ltd. (the “Cayman Subsidiary”) (each such agreement, an “Advisory Agreement,” and collectively, the “Advisory Agreements”). Additionally, the Board considered the renewal of theinvestment sub-advisory agreements between (i) Goldman Sachs Asset Management, L.P. (“GSAM”) and AssetMark, on behalf of GuideMark® Large Cap Core Fund, GuideMark® Emerging Markets Fund, GuideMark® Small/Mid Cap Core Fund, and GuideMark® World ex-US Fund; (ii) Wellington Management Company LLP (“Wellington”) and AssetMark, on behalf of the GuideMark® Core Fixed Income Fund; (iii) Delaware Investments Fund Advisers (“Delaware”) and AssetMark, on behalf of the GuideMark® Tax-Exempt Fixed Income Fund; (iv) Franklin Advisers, Inc. (“Franklin Advisers”) and AssetMark, on behalf of the GuideMark® Opportunistic Fixed Income Fund; (v) DoubleLine Capital LP (“DoubleLine”) and AssetMark, on behalf of the GuideMark® Opportunistic Fixed Income Fund; and (vi) AlphaSimplex Group, LLC (“ASG”) and AssetMark, on behalf of the GuidePath® Managed Futures Strategy Fund and the Cayman Subsidiary (each,a “Sub-Advisory Agreement, and collectively,the “Sub-Advisory Agreements”).
Hereinafter, GSAM, Wellington, Delaware, Franklin Advisers, DoubleLine, and ASG are collectively referred to asthe “Sub-Advisors” and the above-listed Funds are collectively referred to asthe “Sub-Advised Funds.” The Advisory Agreementsand Sub-Advisory Agreements are collectively referred to herein as the “Agreements.”The Sub-Advised Funds are managed usinga “manager-of-managers” structure that generally involves the use of one ormore sub-advisors to manage allocated portions ofthe Sub-Advised Funds’ portfolios. Forthose Sub-Advised Funds,
191
GuideMark® Funds & GuidePath® Funds
ADDITIONAL INFORMATION (Continued)
March 31, 2020
AssetMark is responsible for evaluating andselecting sub-advisors on an ongoing basis and making any decisions to recommend hiring, retaining, orreplacing sub-advisors. The Board is engaged in monitoring this process in connection with its meetings held throughout the year, and underthe manager-of-managers structure, all parties understandthat sub-advisors are being monitored and evaluated, and are subject to replacement, at all times.
The Board – including a majority of the Trustees who are not “interested persons” of the Funds or AssetMark as that term is defined in the Investment Company Act of 1940, as amended (the “Independent Trustees”) – determined to approve the continuance of the Advisory Agreements andthe Sub-Advisory Agreements. The material factors considered and the conclusions that formed the basis of the Board’s approval of the renewal of the Agreements are described below. This summary describes the most significant, but not all, of the factors evaluated by the Board. Prior to considering the approval of the renewal of the Agreements, the Trustees requested, received, and reviewed information relevant to their consideration of the Agreements. The Trustees also received assistance and advice regarding legal and industry standards from independent legal counsel to the Independent Trustees (“Independent Counsel”). The determination to approve the renewal of the Agreements was based on a comprehensive evaluation of all of the information available to the Trustees and was not the result of any particular information or any single factor. Moreover, each Trustee may have afforded different weight to various information and factors in reaching his conclusions with respect to the renewal of the Agreements.
The Advisory Agreements
Materials Reviewed and the Review Process
Prior to voting to approve the renewal of the Advisory Agreements, the Trustees – assisted by Independent Counsel – specifically requested and were furnished with materials for purposes of their review of each Advisory Agreement. The materials provided to the Board with regard to the Funds related to, among other things: (1) a copy of each Advisory Agreement; (2) information describing each Fund’s performance compared to a peer group of other investment companies with investment objectives similar to the investment objective(s) of the Fund selected by an independent provider of investment company data; (3) information describing the nature, quality and extent of the services that AssetMark provides to the Funds, and the fees AssetMark charges to the Funds for such services, and a comparison of those fees to the fees paid by a peer group of other investment companies having objectives similar to the objectives of the respective Funds; (4) information regarding AssetMark’s business and operations, investment team, compliance program and internal procedures; (5) information describing each Fund’s expense ratio compared to the Fund’s peer group of other registered investment companies with investment objectives similar to the investment objective(s) of the Fund; (6) information regarding the financial condition of AssetMark; (7) information regarding AssetMark’s profitability with respect to each Fund; (8) reports on AssetMark’s evaluation ofthe Sub-Advisors, including reports relating to the monitoring ofeach Sub-Advisor’s trading and brokerage practices; (9) reports relating to the distribution, sales and redemptions of Fund shares and related shareholder services; (10) reports relating to the monitoring of the other service providers; and (11) other information relevant to an evaluation of the nature, extent and quality of the services provided by AssetMark, all of which was provided in response to a series of detailed questions posed by Independent Counsel on behalf of the Independent Trustees. The Trustees met with representatives of AssetMark. The Trustees also considered their discussions with representatives of AssetMark throughout the course of the Meeting, and discussions with AssetMark at prior meetings of the Board and its Committees and other communications throughout the year.
The Trustees received assistance and advice regarding legal and industry standards from both Independent Counsel and from counsel to the Trusts, which included detailed memoranda that described the Trustees’ legal duties and obligations in considering whether to approve the continuation of the Advisory Agreements. The Independent Trustees discussed the Advisory Agreements in communications prior to the Meeting and during the course of their meeting in executive session with Independent Counsel, at which no representatives of AssetMark were present.
Factors Considered
The Trustees considered and reached conclusions on a number of factors that they deemed relevant in making the decision to approve the renewal of each Advisory Agreement. These factors and conclusions are described below.
Nature, Quality and Extent of Services
The Trustees considered the nature, extent and quality of the services that AssetMark provides to the Funds. With respect tothe Sub-Advised Funds, the Board considered the fact that, as an investment advisor operating withina manager-of-managers structure, AssetMark maintains a primary focus on the selection, evaluation and oversight ofthe Sub-Advisors and considered each Advisory Agreement in this context. In this regard, the Board evaluated information about the nature and extent of responsibilities retained and risks assumed by the AssetMark that were not delegated to, or assumed by,the Sub-Advisors. The Trustees also considered the information provided to them throughout the course of the year during regular meetings of the Board, which included meetings with the Trusts’ CCO at which the Trustees are provided with details regarding AssetMark’s compliance functions.
The Trustees considered AssetMark’s investment team and its capabilities, including with respect to the responsibilities that AssetMark has for the Funds that pursue their investment objectives through investments in other funds (eacha “Fund-of-Funds”). The Trustees also considered AssetMark’s capabilities with respect to the administrative and compliance services provided to the Funds. The Trustees considered the experience, capability and integrity of AssetMark’s management and other personnel, the role of AssetMark’s senior management and the extent of its involvement with the Funds, and AssetMark’s willingness to add personnel over time in order to ensure that appropriate staffing levels are
192
GuideMark® Funds & GuidePath® Funds
ADDITIONAL INFORMATION (Continued)
March 31, 2020
maintained. With respect tothe Sub-Advised Funds, the Trustees noted the responsibilities that AssetMark has under certain Funds’manager-of-managers structure, including: selecting and oversight of theFunds’ Sub-Advisors; maintaining a comprehensive compliance and administration program; and implementing Fund policies.
The Trustees also considered (a) the financial position of AssetMark; (b) the quality of AssetMark’s regulatory and legal compliance policies, procedures and systems and the resources dedicated by AssetMark in support of the Funds’ obligations pursuant to Rule38a-1 under the 1940 Act and the Funds’ liquidity risk management program; (c) the nature, extent and quality of administrative and shareholder services provided by AssetMark to the Funds; and (d) AssetMark’s supervision of the Funds’ third-party service providers.
The Board considered the breadth and quality of services that AssetMark provides to the Funds. The Trustees also considered that the Funds are an integral part of AssetMark’s program of asset allocation and shareholder services. Additionally, with respect tothe Sub-Advised Funds, the Trustees considered AssetMark’s ability to provide administrative and compliance-related services in connection with AssetMark’s (a) oversight ofthe Sub-Advisors’ compliance with the Funds’ respective investment objectives, policies, and restrictions; (b) review of trading and brokerage matters; and (c) other oversight activities.
Based on the factors described above, among other factors, as well as the information provided to the Board throughout the year, the Trustees concluded that they were satisfied with the nature, extent and quality of the services provided by AssetMark, which will continue to be provided to each Fund.
Investment Performance
The Trustees considered the overall investment performance of the Funds, and, with respect tothe Sub-Advised Funds, evaluated the Funds’ performance in the context ofthe manager-of-managers structure. The Trustees considered whether the Funds operated in a manner consistent with their investment objectives and styles and considered each Fund’s record of compliance with its respective investment restrictions.
The Trustees also considered each Fund’s investment performance relative to its respective benchmark index and relative to the performance of funds with comparable investment strategies selected by a third-party information provider. The Trustees also considered performance-related data received throughout the past year at and in connection with meetings of the Board. With respect toeach Fund-of-Funds, the Trustees reviewed the performance of AssetMark in selecting the underlying funds for the Fund.
The Trustees considered that, as applicable, AssetMark continued to be proactive in seeking to replace and/oradd Sub-Advisors or underlying funds, to reallocate assetsamong Sub-Advisors or underlying funds and to implement new investment strategies when warranted, with a view to improving Fund performance over the long term.
The Trustees concluded that AssetMark’s performance record in managing each of the Funds was satisfactory and supported a decision to approve the renewal of the Advisory Agreements.
Advisory Fees and Total Expenses
The Trustees considered a detailed analysis of each Fund’s fees and expenses. The materials provided to the Board included (i) a comparison of the advisory fees and total expenses of each Fund (as a percentage of average net assets) with the fees and expenses of a group of funds selected by an independent third-party information provider; (ii) comparisons of each Fund’s expenses to industry averages; and (iii) fee schedules for theFunds’ Sub-Advisors and the amount of the advisory fee retained by AssetMark, as applicable.
The Trustees considered expense limitation arrangements under which AssetMark has agreed to limit the Funds’ expenses. With respect toeach Fund-of-Funds, the Trustees considered the indirect expenses borne by the Funds as shareholders of certain underlying funds. The Trustees also considered other efforts by AssetMark to reduce overall Fund expenses, including by attempting to improve asset flows, implementing programs such as securities lending and negotiating strategic contracts with service providers.
In analyzing the Funds’ fee levels as compared to other similar funds, the Trustees considered the Funds’ fee levels in light of the Funds’ special distribution structure, under which the Funds were distributed as part of a suite of products and services with asset allocation modeling, full performance reporting and other services that are not typically provided with mutual funds. In this regard, while the Board recognized that comparisons between a Fund and its peer group may be imprecise given the Funds’ special distribution structure, among other differences, the comparative information assisted the Board in evaluating the reasonableness of each Fund’s fees and expenses.
After comparing each Fund’s fees with other comparable funds and industry averages, and in light of the nature, extent and quality of services provided to the Funds by AssetMark, as well as the costs incurred by AssetMark in rendering those services, the Trustees concluded that the level of fees paid to AssetMark with respect to each Fund was reasonable. In addition, the Trustees, including all of the Independent Trustees, determined that the fees to be charged by AssetMark pursuant to the Advisory Agreements are for services provided in addition to, rather than duplicative of, services provided under any underlying fund’s investment advisory agreement.
Profitability, Economies of Scale and Ancillary Benefits
The Trustees reviewed and discussed the financial information presented by AssetMark, including information relating to the financial stability of AssetMark and its historical and anticipated profitability with respect to its management of the Funds. The Trustees discussed the methods used by AssetMark to allocate expenses to the Funds under its profitability analysis, and the Trustees considered the individual profitability of AssetMark with respect to each Fund under this methodology.
193
GuideMark® Funds & GuidePath® Funds
ADDITIONAL INFORMATION (Continued)
March 31, 2020
In evaluating AssetMark’s profitability, the Trustees acknowledged that the Funds are distributed in connection with AssetMark providing a package of administrative and other services as the sponsor of AssetMark’s investment platform and considered the benefits that flow to Fund shareholders as a result of these services. Additionally, the Trustees considered AssetMark’s existing agreements to waive advisory fees received from certain Funds and/or pay certain Fund expenses to the extent necessary to ensure that the Funds’ overall expenses do not exceed certain levels.
The Trustees considered ancillary benefits received by AssetMark as a result of its relationship with the Funds, including the benefits of offering an integrated set of investment options as an integral part of AssetMark’s asset allocation investment programs and the related marketing rebates received by AssetMark. The Trustees concluded that these benefits were reasonable.
The Trustees considered AssetMark’s profitability in managing each Fund, the anticipated effect of asset growth on each Fund’s expenses, and other information that might suggest the potential for realizing economies of scale that could be shared with Fund shareholders. The Trustees considered the fee waiver agreements under which AssetMark had agreed to waive expenses based upon the achievement of certain breakpoints listed in the agreement.
The Trustees concluded, in light of the foregoing factors, that AssetMark’s level of profitability with respect to each Fund is reasonable. Additionally, the Trustees concluded that the economies of scale being realized by AssetMark, if any, do not mandate the implementation of new or amended breakpoints or other changes in the fee structure for any Fund at this time.
Conclusion
After consideration of the foregoing factors, and such other matters as were deemed relevant, and with no single factor being determinative to their decision, the Trustees, including all of the Independent Trustees, concluded to approve the renewal of each Advisory Agreement with, and the fee to be paid to, AssetMark for each of the Funds.
The Sub-Advisory Agreements
Materials Reviewed and the Review Process
Prior to voting to approve the renewal ofthe Sub-Advisory Agreements, the Trustees – assisted by Independent Counsel – specifically requested and were furnished with materials for purposes of their review. The materials provided to the Board related to, among other things: (1) a copy ofeach Sub-Advisory Agreement; (2) information regarding the nature, quality and scope of the services to be provided bythe Sub-Advisors; (3) the investment performance ofeach Sub-Advisor in managing their respective Fund compared to an industry peer group, appropriate benchmark, andcomparable Sub-Advisor client accounts, to the extent applicable; (4) AssetMark’s evaluation of the nature, extent and quality of the services provided byeach Sub-Advisor; (5) information regarding any benefits toeach Sub-Advisor, such as receipt of research from brokers, that might result fromthe Sub-Advisor’s relationship with aSub-Advised Fund; (6) information concerningeach Sub-Advisor’s personnel, business, operations and investment team, including biographical information for the investment professionals that are responsible forthe day-to-day management of the applicableSub-Advised Fund’s portfolio; (7) information regardingeach Sub-Advisor’s compliance policies and other internal procedures, includingthe Sub-Advisor’s brokerage practices; (8) information regarding the financial condition ofeach Sub-Advisor or its parent company; and (9) other information relevant to an evaluation of the nature, extent and quality of the services provided byeach Sub-Advisor, all of which was provided in response to a series of detailed questions posed by Independent Counsel on behalf of the Independent Trustees. The Trustees also considered the recommendations of AssetMark with respect toeach Sub-Advisor and the methods and resources AssetMark utilized in its efforts to identify andengage Sub-Advisors for theSub-Advised Funds.
In connection with their consideration ofthe Sub-Advisory Agreements, the Trustees considered several factors that they deemed relevant to this process, including: (1) the nature, quality and extent of the services to be provided to eachSub-Advised Fund by therespective Sub-Advisor; (2) the quantitative performance ofeach Sub-Advisor; (3) AssetMark’s evaluation, in accordance with its role asa “manager-of-managers,” of the nature, extent and quality of the services provided byeach Sub-Advisor; (4) information that might suggest the potential for realizing economies of scale that could potentially be shared with Fund shareholders; and (5) anypotential “fall-out” or ancillary benefits toa Sub-Advisor or its affiliates. Prior to approving the continuation of theSub-Advisory Agreements, the Independent Trustees met in executive session with Independent Counsel. The Independent Trustees were assisted by Independent Counsel throughout the review process. The Independent Trustees relied upon the advice of Independent Counsel and their own business judgment in determining the material factors to be considered in evaluatingeach Sub-Advisory Agreement and the weight to be given to each such factor. The conclusions reached by the Independent Trustees were based on a comprehensive evaluation of all of the information provided and were not the result of any one factor. Moreover, each Independent Trustee may have afforded different weight to the various factors in reaching his conclusions with respect toeach Sub-Advisory Agreement. A more detailed summary of the important, but not necessarily all, of the factors the Independent Trustees considered with respect to their approval of the continuation of theSub-Advisory Agreements is provided below.
Nature, Quality and Extent of Services
The Trustees consideredeach Sub-Advisor’s investment management process, including (a) the experience, capability and integrity ofthe Sub-Advisor’s management, investment professionals and other personnel; (b) the financial position ofthe Sub-Advisor; (c) the quality and commitment ofthe Sub-Advisor’s regulatory and legal compliance policies, procedures and systems;(d) the Sub-Advisor’s brokerage and trading practices; and (e) and AssetMark’s evaluation of the nature, quality and extent of services performed byeach Sub-Advisor.
194
GuideMark® Funds & GuidePath® Funds
ADDITIONAL INFORMATION (Continued)
March 31, 2020
The Trustees specifically considered the qualifications, experience and track record of the individuals and portfolio management teams ateach Sub-Advisor that are responsible forthe day-to-day management of eachSub-Advised Fund’s portfolio. The Trustees also considered, with respect toeach Sub-Advisor, the specific investment approach and level of expertise within its particular asset class. The Trustees considered whethereach Sub-Advisor operated within its respective Fund’s investment objective and style and consideredeach Sub-Advisor’s record of compliance with applicable investment restrictions. The Trustees also consideredeach Sub-Advisor’s performance record with respect to the relevant benchmark(s).
The Trustees concluded that the nature, extent and quality of the services provided byeach Sub-Advisor to itsrespective Sub-Advised Fund is satisfactory.
Sub-Advisor Investment Performance
The Trustees considered whethereach Sub-Advisor operated within itsrespective Sub-Advised Fund’s investment objective and style and consideredeach Sub-Advisor’s record of compliance with applicable investment restrictions. The Trustees also consideredeach Sub-Advisor’s investment performance relative to benchmark indices.
The Trustees considered that they had reviewedeach Sub-Advisor, including the primary contributors to and detractors from performance, with AssetMark and concluded thateach Sub-Advisor’s performance record is satisfactory.
Sub-Advisory Fees, Economies of Scale, Profitability and Ancillary Benefits
The Trustees considered the fee paid toeach Sub-Advisor by AssetMark for providing services to itsrelevant Sub-Advised Fund. The Trustees considered management’s representation that AssetMark’s focus innegotiating sub-advisory arrangements is on negotiating the best possible fee structures for each Fund, and thatthe sub-advisory fees are paid by AssetMark out of the investment advisory fees received and not the Funds. The Trustees also considered individual reports prepared with regard toeach Sub-Advisor, containing comparative information regarding fees. The Trustees noted thateach Sub-Advisor’s fees were generally similar to or less than the fees charged byeach Sub-Advisor to other comparable funds and accounts, if any.
The Trustees consideredeach Sub-Advisor’s fee schedule, the anticipated effect of asset growth on each Fund’s expenses, and other information that might suggest the potential for realizing economies of scale that could be shared with Fund shareholders. In this regard, the Trustees noted that certain ofthe Sub-Advisory Agreements’ fee schedules contain breakpoints that present potential economies of scale that could potentially be shared withthe Sub-Advised Funds’ shareholders as assets ofthe Sub-Advised Funds grow.
The Trustees concluded that the fees to be paid toeach Sub-Advisor by AssetMark are reasonable in light of the services performed forthe Sub-Advised Funds bythe Sub-Advisors and that the economies of scale being realized bythe Sub-Advisors, if any, do not mandate the implementation of any new or amended breakpoints or other changes in the fee structure forany Sub-Advised Fund at this time.
The Trustees did not consider the profitability ofthe Sub-Advisors to be a material factor based on representations from AssetMark and theSub-Advisors thatthe sub-advisory fees are negotiated onan arm’s-length basis and reports regarding any relationships betweenthe Sub-Advisors and AssetMark.
The Trustees considered the allocation (if any) of Fund brokerage to brokers affiliated witha Sub-Advisor, and benefits tothe Sub-Advisors from the use of “soft dollar” commissions (if any) to pay for research and brokerage services. The Trustees also considered any other ancillary benefits that accrue toa Sub-Advisor or any affiliate by virtue ofthe Sub-Advisor’s relationship with the Fund, and concluded that such benefits, if any, were reasonable.
Conclusion
After consideration of the foregoing factors, and such other matters as were deemed relevant, and with no single factor being determinative to their decision, the Trustees, including all of the Independent Trustees, determined to approve the renewal ofthe Sub-Advisory Agreement with, and the fees to be paid to, each ofthe Sub-Advisors for each of therelevant Sub-Advised Funds.
| 7. | | Statement Regarding the Trusts’ Liquidity Risk Management Program (Unaudited) |
This section discusses the operation and effectiveness of the Liquidity Risk Management Program (the “Program”) of GPS Funds I and GPS Funds II Trust (each, a “Trust” and collectively, the “Trusts”), including each of their respective series (each, a “Fund” and collectively, the “Funds”), established in accordance with Rule22e-4 under the Investment Company Act of 1940, as amended (the “Liquidity Rule”). The Board of Trustees of each Trust (the “Board”), including a majority of the Trustees who are not “interested persons” as defined in the 1940 Act, approved the Program on behalf of each Fund, as required pursuant to the Liquidity Rule. The Board also approved the designation of AssetMark, Inc. (“AssetMark”), the investment adviser to each Fund, as the Program Administrator for the Program. AssetMark administersday-to-day implementation of the Program through a Liquidity Risk Management Committee (the “Committee”), as set forth in the Program.
At the meeting of the Board held on February 27, 2020, AssetMark, as Program Administrator, provided the Board with a report addressing the operation of the Program and assessing its adequacy and effectiveness of implementation, including, if applicable, the operation of any highly liquid investments minimum (“HLIM”) and any material changes to the Program (the “Report”).
195
GuideMark® Funds & GuidePath® Funds
ADDITIONAL INFORMATION (Continued)
March 31, 2020
The Report covered the period from December 1, 2018 through December 31, 2019 (the “Review Period”).
I. Key Conclusions of the Report
The Report concluded that (i) the Program is reasonably designed to assess and manage each Fund’s liquidity risk, taking into account the Fund’s particular risks and circumstances, and includes policies and procedures reasonably designed to implement each required component of the Liquidity Rule; (ii) each Fund’s investment strategy is appropriate for anopen-end fund; (iii) each Fund was able to meet requests for redemptions without significant dilution of remaining investors’ interests in the Fund during the Review Period; and (iv) the Program was implemented and operated effectively to assess and manage each Fund’s liquidity risk during the Review Period.
There were no material changes to the Program during the Review Period.
II. Summary of the Review
A. Liquidity Risk Assessment and Review
Throughout the Review Period, the Program Administrator, in consultation with the Funds’sub-advisers, as applicable, and portfolio management teams, monitored the Funds’ portfolio liquidity and liquidity risk on an ongoing basis, as described in the Program and in quarterly Board reporting.
The Program Administrator also conducted an annual review assessing each Fund’s liquidity risk as described in the Report, in accordance with the requirements of the Program and the Liquidity Rule, taking into account the following factors enumerated in the Liquidity Rule and identified in the Program, as applicable:
a. Each Fund’s investment strategy and liquidity of portfolio investments during both normal and reasonably foreseeable stressed conditions, including: (i) whether the Fund’s investment strategy is appropriate for anopen-end fund; (ii) the extent to which the Fund’s strategy involves a relatively concentrated portfolio or large positions in particular issuers; (iii) the Fund’s use of borrowings for investment purposes; and (iv) the Fund’s use of derivatives (including for hedging purposes);
b. Short-term and long-term cash flow projections during both normal and reasonably foreseeable stressed conditions; and
c. Holdings of cash and cash equivalents, as well as borrowing arrangements and other funding sources.
In addition, in connection with the review of the Funds’ liquidity risks and the operation of the Program and the adequacy and effectiveness of its implementation, the Program Administrator also reviewed:
| | • | | Reasonably Anticipated Trade Size and Significant Value Impact metrics for each Fund |
| | • | | Process for identifying and monitoring illiquid investments |
| | • | | Responsibilities and operations of the Committee |
| | • | | Effectiveness of third-party liquidity classification vendor |
In light of the assessment and review as discussed above, the Program Administrator did not recommend any changes in the management of the Funds’ liquidity risk.
B. Portfolio Holdings Classifications
During the Review Period, each Fund’s portfolio holdings (including derivative investments) were classified monthly as Highly Liquid Investments, Moderately Liquid Investments, Less Liquid Investments and Illiquid Investments pursuant to the Program, as required by the Liquidity Rule. Upon the Committee’s review and approval, the classifications were recorded for reporting in each Fund’s FormN-PORT filings during the Review Period.
C. HLIM
Pursuant to the review, there were no changes recommended in the Report with respect to the status of any Fund as a Primarily Highly Liquid Fund (“PHLF”) and each Fund qualified as a PHLF on an ongoing basis during the Review Period as described in the Report. Accordingly, an HLIM was not required for any Fund during the Review Period pursuant to the relevant provisions of the Program.
D. Compliance with the 15% Limitation on Illiquid Investments
Pursuant to the Liquidity Rule, no Fund may acquire any illiquid investment if, after the acquisition, the Fund would have invested more than 15% of its assets in illiquid investments that are assets (the “15% Limit”). All Funds were monitored daily for compliance with the 15% Limit during the Review Period. During the Review Period, the Funds operated in accordance with the relevant provisions of the Program addressing the 15% Limit, including with respect to temporary investment illiquidity as a result of extended market closures. The Report also addressed significant liquidity matters which occurred or were reported during the Review Period applicable to the Funds, if any, and actions to address such matters as applicable.
196
GuideMark® Funds
GuidePath® Funds
GUIDEMARK® FUNDS & GUIDEPATH® FUNDS
GuideMark® Large Cap Core Fund
GuideMark® Emerging Markets Fund
GuideMark® Small/Mid Cap Core Fund
GuideMark® World ex-US Fund
GuideMark® Core Fixed Income Fund
GuideMark® Tax-Exempt Fixed Income Fund
GuideMark® Opportunistic Fixed Income Fund
GuidePath® Growth Allocation Fund
GuidePath® Conservative Allocation Fund
GuidePath® Tactical Allocation Fund
GuidePath® Absolute Return Allocation Fund
GuidePath® Multi-Asset Income Allocation Fund
GuidePath® Flexible Income Allocation Fund
GuidePath® Managed Futures Strategy Fund
GuidePath® Conservative Income Fund
GuidePath® Income Fund
GuidePath® Growth and Income Fund
Investment Advisor
AssetMark, Inc.
1655 Grant Street, 10th Floor
Concord, CA 94520
Legal Counsel
Stradley Ronon Stevens & Young, LLP
2005 Market Street, Suite 2600
Philadelphia, PA 19103
Independent Registered Public Accounting Firm
Cohen & Company, Ltd.
342 North Water St.
Suite 830
Milwaukee, WI 53202
Transfer Agent, Fund Accountant and Fund Administrator
U.S. Bancorp Fund Services, LLC,
doing business as U.S. Bank Global Fund Services
615 East Michigan Street
Milwaukee, WI 53202
Custodian
U.S. Bank, N.A.
1555 North RiverCenter Drive, Suite 302
Milwaukee, WI 53212
Distributor
AssetMark BrokerageTM, LLC
1655 Grant Street, 10th Floor
Concord, CA 94520
This document must be preceded or accompanied by a free prospectus. Investors should consider the Funds’ investment objectives, risks, charges and expenses carefully before investing. The prospectus contains this and other important information about the Funds. Please read the prospectus carefully before you invest or send money.
Annual Report
March 31, 2020
Item 2. Code of Ethics.
The registrant has adopted a code of ethics that applies to the registrant’s principal executive officer and principal financial officer. The registrant has not made any amendments to its code of ethics during the period covered by this report. The registrant has not granted any waivers from any provisions of the code of ethics during the period covered by this report.
A copy of the registrant’s Code of Ethics is filed herewith.
Item 3. Audit Committee Financial Expert.
The registrant’s board of trustees has determined that there is at least one audit committee financial expert serving on its audit committee. Dennis Schmal is the “audit committee financial expert” and is considered to be “independent” as each term is defined in Item 3 ofForm N-CSR.
Item 4. Principal Accountant Fees and Services.
For the fiscal year ended March 31, 2020, the registrant’s principal accountant billed the registrant $110,000 for professional services rendered for the audit of the registrant’s annual financial statements or services that are normally provided by the principal accountant in connection with statutory and regulatory filings or engagements.
For the fiscal year ended March 31, 2019, the registrant’s principal accountant billed the registrant $110,000 for professional services rendered for the audit of the registrant’s annual financial statements or services that are normally provided by the principal accountant in connection with statutory and regulatory filings or engagements.
None.
For the fiscal year ended March 31, 2020, the registrant’s principal accountant billed the registrant $30,000 for professional services rendered for tax compliance, tax advice and tax planning.
For the fiscal year ended March 31, 2019, the registrant’s principal accountant billed the registrant $30,000 for professional services rendered for tax compliance, tax advice and tax planning.
None.
| (e)(1) | The registrant’s audit committee charter provides that the audit committee is responsible for the approval, prior to appointment, of the engagement of auditors annually to audit and to provide their opinion on the registrant’s financial statements. The audit committee charter also provides that the audit committee is responsible for the approval, prior to appointment, of the engagement of the auditor to provide other audit services to the registrant or to providenon-audit services to the registrant, its investment adviser or any entity controlling, controlled by, or under common control with the investment adviser that provides ongoing services to the registrant, if the engagement relates directly to the operations and financial reporting of the registrant. |
| (e)(2) | There were no services in paragraphs (b) through (d) above (including services required to be approved by the audit committee pursuant to paragraph (c)(7)(ii) of Rule2-01 of RegulationS-X) that were approved pursuant to the waiver provision of paragraph (c)(7)(i)(C) of Rule2-01 of RegulationS-X. |
| (f) | None of the hours expended on the principal accountant’s engagement to audit the registrant’s financial statements for the fiscal year ended March 31, 2020 were attributable to work performed by persons other than the principal accountant’s full-time, permanent employees. |
| (g) | The aggregatenon-audit fees billed by the registrant’s principal accountant for services rendered to the registrant’s investment adviser and any entity controlling, controlled by, or under common control with the investment adviser that provides ongoing services to the registrant for the fiscal years ended March 31, 2020 and March 31, 2019, were $0 and $0, respectively. |
| (h) | The registrant’s audit committee has considered whether the provision ofnon-audit services that were rendered to the registrant’s investment adviser, and any entity controlling, controlled by, or under common control with the investment adviser that provides ongoing services to the registrant, that were notpre-approved pursuant to paragraph (c)(7)(ii) of Rule2-01 of RegulationS-X is compatible with maintaining the principal accountant’s independence. |
Item 5. Audit Committee of Listed Registrants.
Not applicable to registrants who are not listed issuers (as defined in Rule10A-3 under the Securities Exchange Act of 1934).
Item 6. Investments.
Schedule of Investments is included as part of the report to shareholders filed under Item 1 of this Form.
Item 7. Disclosure of Proxy Voting Policies and Procedures forClosed-End Management Investment Companies.
Not applicable toopen-end investment companies.
Item 8. Portfolio Managers ofClosed-End Management Investment Companies.
Not applicable toopen-end investment companies.
Item 9. Purchases of Equity Securities byClosed-End Management Investment Company and Affiliated Purchasers.
Not applicable toopen-end investment companies.
Item 10. Submission of Matters to a Vote of Security Holders.
None.
Item 11. Controls and Procedures.
| (a) | The Registrant’s President/Principal Executive Officer and Treasurer/Principal Financial Officer have reviewed the Registrant’s disclosure controls and procedures (as defined in Rule30a-3(c) under the Investment Company Act of 1940 (the “Act”)) as of a date within 90 days of the filing of this report, as required by Rule30a-3(b) under the Act and Rules13a-15(b) or15d-15(b) under the Securities Exchange Act of 1934. Based on their review, such officers have concluded that the disclosure controls and procedures are effective in ensuring that information required to be disclosed in this report is appropriately recorded, processed, summarized and reported and made known to them by others within the Registrant and by the Registrant’s service provider. |
| (b) | There were no changes in the Registrant’s internal control over financial reporting (as defined in Rule30a-3(d) under the Act) that occurred during the second fiscal quarter of the period covered by this report that has materially affected, or is reasonably likely to materially affect, the Registrant’s internal control over financial reporting. |
Item 12. Disclosure of Securities Lending Activities forClosed-End Management Investment Companies
Not applicable toopen-end investment companies.
Item 13. Exhibits.
SIGNATURES
Pursuant to the requirements of the Securities Exchange Act of 1934 and the Investment Company Act of 1940, the registrant has duly caused this report to be signed on its behalf by the undersigned, thereunto duly authorized.
|
(Registrant) GPS Funds I |
|
By (Signature and Title)/s/ Carrie E. Hansen |
Carrie E. Hansen, Principal Executive Officer/President |
|
Date 05/29/2020 |
Pursuant to the requirements of the Securities Exchange Act of 1934 and the Investment Company Act of 1940, this report has been signed below by the following persons on behalf of the registrant and in the capacities and on the dates indicated.
| | |
| By (Signature and Title)/s/ Carrie E. Hansen | | |
| Carrie E. Hansen, Principal Executive Officer/President | | |
| |
| Date 05/29/2020 | | |
| |
| By (Signature and Title)/s/ Patrick R Young | | |
| Patrick R Young, Vice President/Treasurer | | |
| |
| Date 05/29/2020 | | |