As filed with the Securities and Exchange Commission on 06/01/17
UNITED STATES
SECURITIES AND EXCHANGE COMMISSION
Washington, D.C. 20549
FORM N-CSR
CERTIFIED SHAREHOLDER REPORT OF REGISTERED
MANAGEMENT INVESTMENT COMPANIES
Investment Company Act file number 811-10267
GPS Funds I
(Exact name of registrant as specified in charter)
1655 Grant Street, 10th Floor
Concord, CA 94520
(Address of principal executive offices) (Zip code)
Patrick R Young
AssetMark, Inc.
1655 Grant Street, 10th Floor
Concord, CA 94520
(Name and address of agent for service)
800-664-5345
Registrant’s telephone number, including area code
Date of fiscal year end: March 31, 2017
Date of reporting period: April 1, 2016 through March 31, 2017
Item 1. Reports to Stockholders.
GuideMark® Funds
GuidePath® Funds
Investment Advisor
AssetMark, Inc.
ANNUAL REPORT
March 31, 2017
GUIDEMARK® LARGE CAP CORE FUND
GUIDEMARK® EMERGING MARKETS FUND
GUIDEMARK® SMALL/MID CAP CORE FUND
GUIDEMARK® WORLD EX-US FUND
GUIDEMARK® OPPORTUNISTIC EQUITY FUND
GUIDEMARK® CORE FIXED INCOME FUND
GUIDEMARK® TAX-EXEMPT FIXED INCOME FUND
GUIDEMARK® OPPORTUNISTIC FIXED INCOME FUND
GUIDEPATH® GROWTH ALLOCATION FUND
GUIDEPATH® CONSERVATIVE ALLOCATION FUND
GUIDEPATH® TACTICAL ALLOCATION FUND
GUIDEPATH® ABSOLUTE RETURN ALLOCATION FUND
GUIDEPATH® MULTI-ASSET INCOME ALLOCATION FUND
GUIDEPATH® FLEXIBLE INCOME ALLOCATION FUND
GUIDEPATH® MANAGED FUTURES STRATEGY FUND
May 26, 2017
Dear Shareholder:
Enclosed is the Annual Report for the GuideMark® and GuidePath® Funds covering the period from April 1, 2016 to March 31, 2017.
Market Review
Apart from short-lived periods of market reversals, the global equity markets generally maintained a steady upward march throughout the 12-month period ended March 31, 2017. Over the period, the U.S. equity market outperformed the international developed equity markets but marginally trailed the emerging equity markets, returning 17.2%, 12.3% and 17.7%, respectively.1
During the 12-month period, U.S. stocks rallied alongside an increasingly positive market environment. The risk of recession, according to leading economic indicators, plummeted in the fourth quarter of 2016, GDP growth in the third quarter was strong at 3.5%2, unemployment continued to fall and the number of unfilled jobs rose throughout the period, and investor sentiment jumped in December to the highest level since 2001. President Trump’s promise of infrastructure spending, de-regulation and corporate tax cuts made an already positive environment even more fertile.
Internationally, political uncertainty in Europe, including Brexit and other potential populist actions in elections, weighed down returns in the developed equity markets. However, as the uncertainty lessened and expectations for stronger economic growth and supportive policy from central banks grew, international developed equity markets gained positive traction. Currency movements impacted international returns over the period and eroded returns for U.S. investors. In local currency terms, international developed equity markets outperformed the U.S. equity market with a return of 18.6%3.
Bond markets experienced weaker relative returns over the 12-month period, primarily driven by negative returns in the fourth quarter of 2016, when the U.S. bond market hit a 35-year low4. During the fourth quarter, the U.S. Federal Reserve increased the Fed Funds Rate, only the second increase in the last 10 years, and committed to future increases in 2017. This announcement and general investor anxiety around inflation impacted bond returns and resulted in foreign investors liquidating treasury positons. For the 12-month period ended March 31, 2017, U.S. bonds returned 0.4% while global bonds returned 1.9%. The differential between U.S. and global bonds widened in the fourth quarter of 2016 as the dollar rallied significantly and U.S. bonds returned -2.9% while global bonds returned -7.1%.
GuideMark® and GuidePath® Fund Review
Over the 12-month period ended March 31, 2017, the GuideMark® Funds generally trailed their respective benchmarks. The multi-factor investment approach and industry neutrality were headwinds within developed markets as the quality and momentum factors became highly correlated and negatively impacted the returns of the GuideMark® Large Cap Core, GuideMark® Small/Mid Cap Core and GuideMark® World ex-US Funds. Within emerging markets, both the value and momentum factors lifted returns allowing the GuideMark® Emerging Markets Fund to outperform its benchmark. Security selection within the healthcare sector was a headwind early in the period for the GuideMark® Opportunistic Equity Fund and while these positions rallied in the second half of the period, it wasn’t enough to erase prior losses. Credit selection and duration positioning drove the GuideMark® Core Fixed Income and GuideMark® Tax-Exempt Fixed Income Funds’ weaker relative returns. The GuideMark® Opportunistic Fixed Income Fund outperformed its benchmark due to currency and duration positioning.
The GuidePath® Funds experienced mixed results, with the lower risk funds (i.e., the GuidePath® Absolute Return Allocation and GuidePath® Flexible Income Allocation Funds) producing the strongest relative returns primarily from small equity exposures and a credit emphasis. The GuidePath® Growth Allocation and GuidePath® Conservative Allocation Funds’ returns nearly tracked their respective benchmarks, the biggest headwind being larger exposures to international markets. The GuidePath® Tactical Allocation and GuidePath® Multi-Asset Income Allocation Funds experienced the weakest relative returns and trailed their respective benchmarks. The low volatility environment created a headwind for the GuidePath® Tactical Allocation Fund, which at times had less than 100% of its assets allocated to equities. The GuidePath® Multi-Asset Income Allocation Fund trailed its benchmark due to more diversified exposures across sectors and lower exposure to high yield securities, which outperformed core bonds by approximately 16%.
Looking Ahead
The outlook for the market is highly dependent on future policy initiatives. Taking into account the number of simmering political and geopolitical issues with the potential to impact the market, this is the wrong environment to take positions dependent on the adoption of a highly specific policy agenda. Broad-based portfolio diversification across assets, strategies and geographies is prudent and appropriate.
| 1 | | Returns for: U.S. stocks are represented by the S&P 500® Index, international developed stocks are represented by the MSCI EAFE Index and emerging market stocks are represented by the MSCI Emerging Markets Index. Source: Morningstar, Inc., as of March 31, 2017. |
| 2 | | Bureau of Economic Analysis, as of February 28, 2017 |
| 3 | | Morningstar, as of March 31, 2017 |
| 4 | | Zephyr Style Advisor, as of December 31, 2016 |
1
Please contact your financial advisor to discuss any questions about your investment strategy or changes in your financial goals. We thank you for including the Funds in your portfolio and appreciate the trust you have placed in us.
Sincerely,

Carrie E. Hansen
Trustee, Chairperson and President of the Funds
Important Information
All index returns are sourced from Morningstar. It is not possible to make an investment in any index.
The AssetMark platform provides fee-based investment advisory programs. Investors are advised to refer to the appropriate Disclosure Brochure, which can be obtained from your financial advisor, for a full description of services provided, including all applicable fees.
AssetMark, Inc. is an investment advisor registered with the Securities and Exchange Commission. Principal Underwriter GuideMark® and GuidePath® Funds: AssetMark Brokerage™, LLC, a member of the Financial Industry Regulatory Authority, is an affiliate of AssetMark, Inc. and shares its address. ©2016 AssetMark, Inc. All rights reserved.
Mutual funds are sold by prospectus. The prospectus contains information on the investment objectives, risk factors, fees and charges as well as other important information about the product and investment company that should be carefully read and considered before investing. You can obtain a prospectus by contacting your registered representative.
Past performance is no guarantee of future results.
Investment Terms
Correlation is a statistical measure of the interdependence of two random variables that range in value from -1 to +1, indicating perfect negative correlation at -1, absence of correlation at zero and perfect positive correlation at +1.
Gross domestic product (GDP) is the monetary value of all the finished goods and services produced by a country in a given year. GDP is a common method for measuring the size and activity of a country’s economy.
Volatility is a statistical measure of the dispersion of returns for a given security or market index.
Index Definitions
MSCI EAFE (Europe, Australasia, Far East) Index measures the equity market performance of countries considered to represent developed markets, excluding the U.S. and Canada.
MSCI Emerging Markets Index measures the equity market performance of countries considered to represent emerging markets.
S&P 500® Index focuses on the large-cap segment of the U.S. equity market. It includes 500 leading companies in leading industries of the U.S. economy, capturing approximately 75% coverage of U.S. equities.
FX 2017-0504-0488/E
2
GuideMark® Large Cap Core Fund
MANAGER’S DISCUSSION OF FUND PERFORMANCE (Unaudited)
TOTAL RETURN BASED ON A $10,000 INVESTMENT
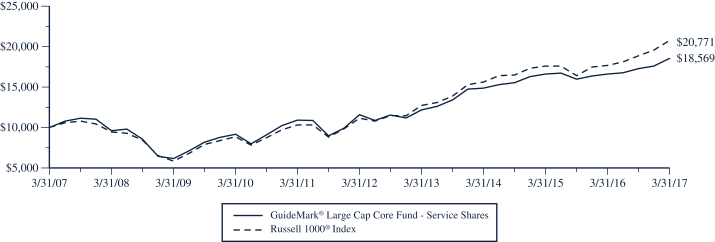
This chart assumes an initial gross investment of $10,000 made on March 31, 2007. Returns shown include the reinvestment of all dividends. Returns shown do not reflect the deduction of taxes that a shareholder would pay on Fund distributions or the redemption of Fund shares. In the absence of fee waivers and reimbursements, when they are necessary to keep expenses at the expense cap, total return would be reduced. Past performance is not predictive of future performance. Investment return and principal value will fluctuate so that your shares, when redeemed, may be worth more or less than the original cost. Index returns do not reflect the effects of fees or expenses. It is not possible to invest directly in an index.
RUSSELL 1000® INDEX – The Russell 1000® Index measures the performance of the large-cap segment of the U.S. equity universe. As of May 27, 2016, the market capitalization of the companies in the Russell 1000® Index ranged from $2.0 billion to $549.7 billion.
| | | | | | | | | | | | | | | | |
| AVERAGE ANNUAL TOTAL RETURN (for periods ended March 31) | |
| | | One Year
| | | Five Year
| | | Ten Year
| | | Since Inception(1)
| |
GuideMark® Large Cap Core Fund | | | | | | | | | | | | | | | | |
Service Shares | | | 11.74 | % | | | 9.87 | % | | | 6.38 | % | | | 3.92 | % |
Institutional Shares | | | 12.46 | % | | | 10.50 | % | | | N/A | | | | 9.43 | % |
Russell 1000® Index | | | 17.43 | % | | | 13.26 | % | | | 7.58 | % | | | 6.64 | %(2) |
| (1) | | Inception date is 6/29/01 for Service Shares and 4/29/11 for Institutional Shares. |
| (2) | | The return shown for the Russell 1000® Index is from the inception date of the Service Shares. The Russell 1000® Index return from the inception date of the Institutional Shares is 11.95%. |
3
GuideMark® Large Cap Core Fund
MANAGER’S DISCUSSION OF FUND PERFORMANCE (Continued) (Unaudited)
| • | | For the 12 months ended March 2017, the Fund’s Service Shares returned 11.74%, underperforming the Russell 1000® Index at 17.43%. |
| • | | High correlation between the quality and momentum factors was a significant headwind over the period especially since these two factors are normally negatively correlated. |
| • | | Maintaining equal exposure across the quality, value, and momentum factors was a detractor to relative performance as all three factors underperformed. |
| • | | Security selection within the Industrials and Materials sectors contributed to performance. Security selection is purely driven from a systematic factor based process. |
Components of Portfolio Holdings*
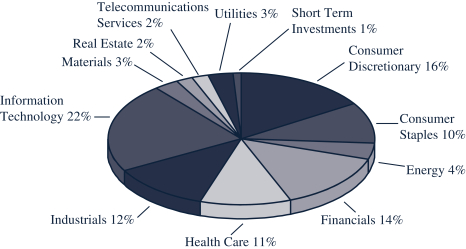
* Pie chart represents percentages of total portfolio, less securities lending collateral.
Top Ten Holdings
| | | | | | | | |
| Rank | | | Security/Holding | | % of Net
Assets | |
| | 1 | | | Apple, Inc. | | | 3.21 | |
| | 2 | | | Microsoft Corp. | | | 1.92 | |
| | 3 | | | Vanguard S&P 500 ETF | | | 1.59 | |
| | 4 | | | JPMorgan Chase & Co. | | | 1.55 | |
| | 5 | | | Johnson & Johnson | | | 1.40 | |
| | 6 | | | Amazon.com, Inc. | | | 1.24 | |
| | 7 | | | Berkshire Hathaway, Inc. – Class B | | | 1.13 | |
| | 8 | | | Facebook, Inc. – Class A | | | 1.05 | |
| | 9 | | | AT&T, Inc. | | | 0.97 | |
| | 10 | | | Alphabet, Inc. – Class A | | | 0.90 | |
The Global Industry Classification Standard (“GICS®”) was developed by and/or is the exclusive property of MSCI, Inc. (“MSCI”) and Standard & Poor’s Financial Services LLC (“S&P”). GICS is a service mark of MSCI and S&P, and has been licensed for use by U.S. Bancorp Fund Services, LLC.
4
GuideMark® Emerging Markets Fund
MANAGER’S DISCUSSION OF FUND PERFORMANCE (Unaudited)
TOTAL RETURN BASED ON A $10,000 INVESTMENT
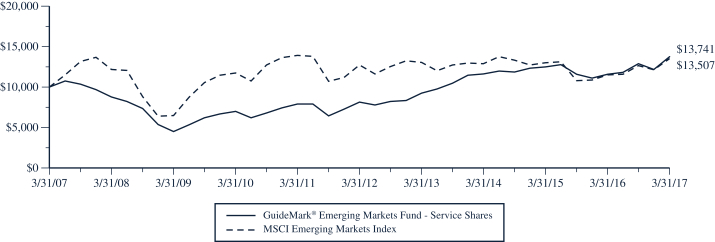
This chart assumes an initial gross investment of $10,000 made on March 31, 2007. Returns shown include the reinvestment of all dividends. Returns shown do not reflect the deduction of taxes that a shareholder would pay on Fund distributions or the redemption of Fund shares. In the absence of fee waivers and reimbursements, when they are necessary to keep expenses at the expense cap, total return would be reduced. Past performance is not predictive of future performance. Investment return and principal value will fluctuate so that your shares, when redeemed, may be worth more or less than the original cost. Index returns do not reflect the effects of fees or expenses. It is not possible to invest directly in an index.
MSCI EMERGING MARKETS INDEX – The MSCI Emerging Markets Index measures the equity market performance of global emerging markets. As of July 31, 2016 the MSCI Emerging Markets Index consisted of the following 23 emerging market country indices: Brazil, Chile, China, Colombia, Czech Republic, Egypt, Greece, Hungary, India, Indonesia, Korea, Malaysia, Mexico, Peru, Philippines, Poland, Russia, Qatar, South Africa, Taiwan, Thailand, Turkey and the United Arab Emirates.
| | | | | | | | | | | | | | | | |
| AVERAGE ANNUAL TOTAL RETURN (for periods ended March 31) | |
| | | One Year
| | | Five Year
| | | Ten Year
| | | Since Inception(1)
| |
GuideMark® Emerging Markets Fund | | | | | | | | | | | | | | | | |
Service Shares | | | 18.78 | % | | | 11.10 | % | | | 3.23 | % | | | 4.51 | % |
Institutional Shares | | | 19.61 | % | | | 11.76 | % | | | N/A | | | | 9.97 | % |
MSCI Emerging Markets Index | | | 17.65 | % | | | 1.17 | % | | | 3.05 | % | | | 10.06 | %(2) |
| (1) | | Inception date is 6/29/01 for Service Shares and 4/29/11 for Institutional Shares. |
| (2) | | The return shown for the MSCI Emerging Markets Index is from the inception date of the Service Shares. The MSCI Emerging Markets Index return from the inception date of the Institutional Shares is -1.04%. |
5
GuideMark® Emerging Markets Fund
MANAGER’S DISCUSSION OF FUND PERFORMANCE (Continued) (Unaudited)
| • | | For the 12 months ended March 2017, the Fund’s Service Shares returned 18.78%, outperforming the MSCI Emerging Markets Index at 17.65%. |
| • | | Emerging markets experienced positive momentum over the past 12 months and greater differentiation between the value, quality and momentum factors. |
| • | | Exposure to the value factor benefited returns and offset the negative impact from exposure to the quality factor. |
| • | | Security selection within the Utilities and Technology sectors and China lifted returns. All three factors helped security selection within Technology and China, while momentum drove the positive security selection within Utilities. |
Components of Portfolio Holdings*
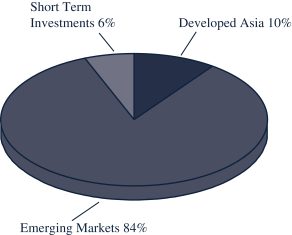
* Pie chart represents percentages of total portfolio, less securities lending collateral.
Top Ten Holdings
| | | | | | | | |
| Rank | | | Security/Holding | | % of Net
Assets | |
| | 1 | | | iShares MSCI India ETF | | | 8.92 | |
| | 2 | | | Samsung Electronics Co., Ltd. | | | 4.15 | |
| | 3 | | | iShares Core MSCI Emerging Markets ETF | | | 3.54 | |
| | 4 | | | Tencent Holdings Ltd. | | | 3.49 | |
| | 5 | | | Taiwan Semiconductor Manufacturing Co., Ltd. | | | 3.16 | |
| | 6 | | | Alibaba Group Holding Ltd. – ADR | | | 2.13 | |
| | 7 | | | China Construction Bank Corp. – Series H | | | 1.56 | |
| | 8 | | | China Mobile Ltd. | | | 1.34 | |
| | 9 | | | Industrial & Commercial Bank of China Ltd. – Series H | | | 1.05 | |
| | 10 | | | Naspers Ltd. – N Shares | | | 1.01 | |
6
GuideMark® Small/Mid Cap Core Fund
MANAGER’S DISCUSSION OF FUND PERFORMANCE (Unaudited)
TOTAL RETURN BASED ON A $10,000 INVESTMENT
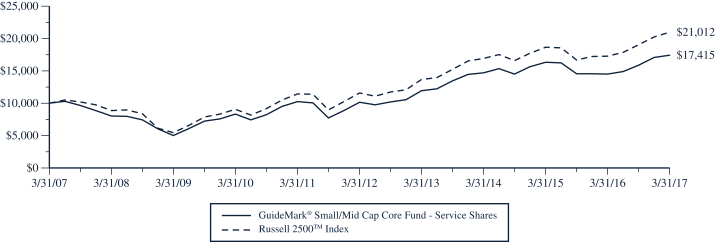
This chart assumes an initial gross investment of $10,000 made on March 31, 2007. Returns shown include the reinvestment of all dividends. Returns shown do not reflect the deduction of taxes that a shareholder would pay on Fund distributions or the redemption of Fund shares. In the absence of fee waivers and reimbursements, when they are necessary to keep expenses at the expense cap, total return would be reduced. Past performance is not predictive of future performance. Investment return and principal value will fluctuate so that your shares, when redeemed, may be worth more or less than the original cost. Index returns do not reflect the effects of fees or expenses. It is not possible to invest directly in an index.
RUSSELL 2500TM INDEX – The Russell 2500TM Index measures the performance of the small- to mid-cap segment of the U.S. equity universe, commonly referred to as “smid” cap. The Russell 2500TM Index includes approximately 2,500 of the smallest securities based on a combination of their market cap and current index membership. As of May 27, 2016, the market capitalization of the companies in the Russell 2500TM Index ranged from $133 million to $9.9 billion.
| | | | | | | | | | | | | | | | |
| AVERAGE ANNUAL TOTAL RETURN (for periods ended March 31) | | | | | | | |
| | | One Year
| | | Five Year
| | | Ten Year
| | | Since Inception(1)
| |
GuideMark® Small/Mid Cap Core Fund | | | | | | | | | | | | | | | | |
Service Shares | | | 19.71 | % | | | 11.37 | % | | | 5.71 | % | | | 7.18 | % |
Institutional Shares | | | 20.45 | % | | | 12.05 | % | | | N/A | | | | 9.40 | % |
Russell 2500TM Index | | | 21.53 | % | | | 12.60 | % | | | 7.71 | % | | | 8.79 | %(2) |
| (1) | | Inception date is 6/29/01 for Service Shares and 4/29/11 for Institutional Shares. |
| (2) | | The return shown for the Russell 2500TM Index is from the inception date of the Service Shares. The Russell 2500TM Index return from the inception date of the Institutional Shares is 10.25%. |
7
GuideMark® Small/Mid Cap Core Fund
MANAGER’S DISCUSSION OF FUND PERFORMANCE (Continued) (Unaudited)
| • | | For the 12 months ended March 2017, the Fund’s Service Shares returned 19.71%, underperforming the Russell 2500™ Index at 21.53%. |
| • | | High correlation between the quality and momentum factors was a significant headwind over the period especially since these two factors are normally negatively correlated. |
| • | | While exposure to the momentum and quality factors was the dominant detractor from returns, some of the weakness was offset by the value factor which positively contributed to returns. |
| • | | Security selection within the Real Estate and Technology sectors was additive to returns; however, performance was dampened by security selection and overweight positions within the Consumer Discretionary sector. |
Components of Portfolio Holdings*
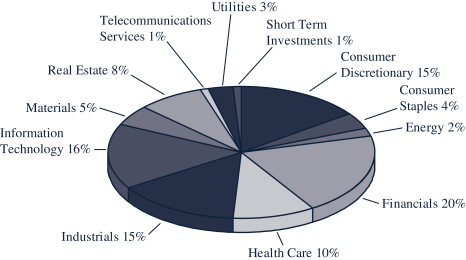
* Pie chart represents percentages of total portfolio, less securities lending collateral.
Top Ten Holdings
| | | | | | | | |
| Rank | | | Security/Holding | | % of Net
Assets | |
| | 1 | | | Vanguard Extended Market ETF | | | 3.14 | |
| | 2 | | | IDEXX Laboratories, Inc. | | | 0.30 | |
| | 3 | | | Synopsys, Inc. | | | 0.27 | |
| | 4 | | | Foot Locker, Inc. | | | 0.24 | |
| | 5 | | | Domino’s Pizza, Inc. | | | 0.23 | |
| | 6 | | | Cadence Design System, Inc. | | | 0.22 | |
| | 7 | | | Torchmark Corp. | | | 0.22 | |
| | 8 | | | Quintiles Transnational Holdings, Inc. | | | 0.22 | |
| | 9 | | | Advanced Micro Devices, Inc. | | | 0.22 | |
| | 10 | | | MSCI, Inc. | | | 0.21 | |
8
GuideMark® World ex-US Fund
MANAGER’S DISCUSSION OF FUND PERFORMANCE (Unaudited)
TOTAL RETURN BASED ON A $10,000 INVESTMENT
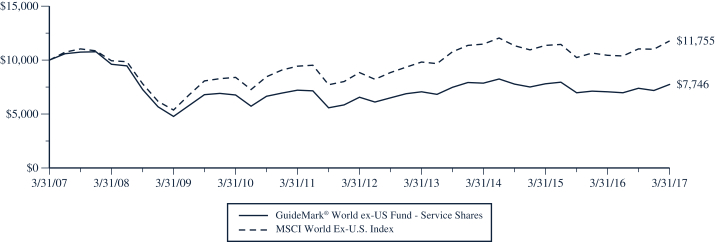
This chart assumes an initial gross investment of $10,000 made on March 31, 2007. Returns shown include the reinvestment of all dividends. Returns shown do not reflect the deduction of taxes that a shareholder would pay on Fund distributions or the redemption of Fund shares. In the absence of fee waivers and reimbursements, when they are necessary to keep expenses at the expense cap, total return would be reduced. Past performance is not predictive of future performance. Investment return and principal value will fluctuate so that your shares, when redeemed, may be worth more or less than the original cost. Index returns do not reflect the effects of fees or expenses. It is not possible to invest directly in an index.
MSCI WORLD EX-US INDEX – The MSCI World ex-US Index measures the equity market performance of developed markets excluding the United States. As of July 31, 2016 the MSCI World ex-US Index consisted of 45 country indices comprising 22 developed market country indices. The developed market country indices included are: Australia, Austria, Belgium, Canada, Denmark, Finland, France, Germany, Hong Kong, Ireland, Israel, Italy, Japan, Netherlands, New Zealand, Norway, Portugal, Singapore, Spain, Sweden, Switzerland and the United Kingdom.
| | | | | | | | | | | | | | | | |
| AVERAGE ANNUAL TOTAL RETURN (for periods ended March 31) | | | | | | | |
| | | One Year
| | | Five Year
| | | Ten Year
| | | Since Inception(1)
| |
GuideMark® World ex-US Fund | | | | | | | | | | | | | | | | |
Service Shares | | | 9.85 | % | | | 3.41 | % | | | -2.52 | % | | | 2.26 | % |
Institutional Shares | | | 10.48 | % | | | 4.01 | % | | | N/A | | | | 1.10 | % |
MSCI World ex-US Index | | | 12.52 | % | | | 5.89 | % | | | 1.63 | % | | | 5.54 | %(2) |
| (1) | | Inception date is 6/29/01 for Service Shares and 4/29/11 for Institutional Shares. |
| (2) | | The return shown for the MSCI World ex-US Index is from the inception date of the Service Shares. The MSCI World ex-US Index return from the inception date of the Institutional Shares is 2.89%. |
9
GuideMark® World ex-US Fund
MANAGER’S DISCUSSION OF FUND PERFORMANCE (Continued) (Unaudited)
| • | | For the 12 months ended March 2017, the Fund’s Service Shares returned 9.85%, underperforming the MSCI World ex-US Index at 12.52%. |
| • | | High correlation between the quality and momentum factors was a significant headwind over the period especially since these two factors are normally negatively correlated. |
| • | | While exposure to the momentum and quality factors was the dominant detractor from returns, some of the weakness was offset by the value factor which positively contributed to returns. |
| • | | Overweight exposure to the Consumer Staples sector and underweight exposure to the Financials sector, driven by the quality and momentum factors, detracted from returns. |
Components of Portfolio Holdings*
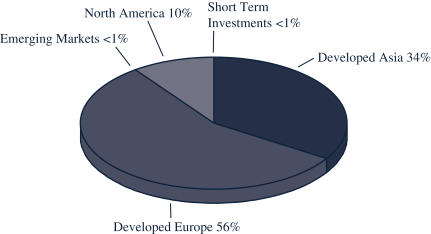
* Pie chart represents percentages of total portfolio, less securities lending collateral.
Top Ten Holdings
| | | | | | | | |
| Rank | | | Security/Holding | | % of Net
Assets | |
| | 1 | | | iShares MSCI EAFE ETF | | | 1.68 | |
| | 2 | | | Nestle SA | | | 1.46 | |
| | 3 | | | Roche Holding AG | | | 1.06 | |
| | 4 | | | Glencore Plc | | | 0.82 | |
| | 5 | | | Novartis AG | | | 0.82 | |
| | 6 | | | Atos SA | | | 0.81 | |
| | 7 | | | HSBC Holdings Plc | | | 0.79 | |
| | 8 | | | adidas AG | | | 0.72 | |
| | 9 | | | Bayer AG | | | 0.66 | |
| | 10 | | | British American Tobacco Plc | | | 0.60 | |
10
GuideMark® Opportunistic Equity Fund
MANAGER’S DISCUSSION OF FUND PERFORMANCE (Unaudited)
TOTAL RETURN BASED ON A $10,000 INVESTMENT
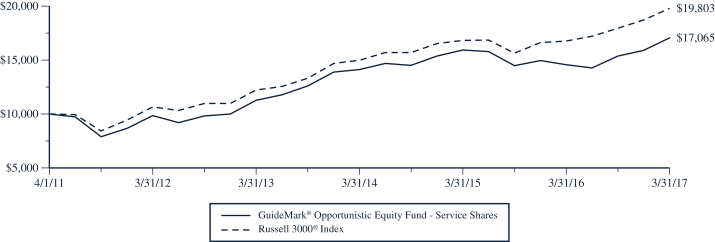
This chart assumes an initial gross investment of $10,000 made on April 1, 2011. Returns shown include the reinvestment of all dividends. Returns shown do not reflect the deduction of taxes that a shareholder would pay on Fund distributions or the redemption of Fund shares. In the absence of fee waivers and reimbursements, when they are necessary to keep expenses at the expense cap, total return would be reduced. Past performance is not predictive of future performance. Investment return and principal value will fluctuate so that your shares, when redeemed, may be worth more or less than the original cost. Index returns do not reflect the effects of fees or expenses. It is not possible to invest directly in an index.
RUSSELL 3000® INDEX – The Russell 3000® Index is an unmanaged index which measures the performance of the 3,000 largest U.S. Companies, based on total market capitalization, which represents approximately 98% of the investable U.S. equity market.
| | | | | | | | | | | | |
| AVERAGE ANNUAL TOTAL RETURN (for periods ended March 31) | |
| | | One Year
| | | Five Year
| | | Since Inception(1)
| |
GuideMark® Opportunistic Equity Fund | | | | | | | | | | | | |
Service Shares | | | 17.01 | % | | | 11.60 | % | | | 9.32 | % |
Russell 3000® Index | | | 18.07 | % | | | 13.18 | % | | | 12.06 | % |
| (1) | | Inception date is 4/1/11. |
11
GuideMark® Opportunistic Equity Fund
MANAGER’S DISCUSSION OF FUND PERFORMANCE (Continued) (Unaudited)
| • | | For the 12 months ended March 2017, the Fund’s Service Shares returned 17.01%, underperforming the Russell 3000® Index at 18.07%. |
| • | | Sector positioning, which results from bottom-up security selection, was the dominant driver of the underperformance as security selection positively contributed to returns. |
| • | | Underweight exposure to the Technology and Consumer Staples sectors detracted from relative performance. Cyclical stocks mounted a strong rally based on an improving economic outlook in the U.S., including a reflationary environment post election of the U.S. President. |
| • | | Security selection within the Industrials and Financials sectors was beneficial to returns. A higher interest rate environment created a tailwind for Financials and an improving infrastructure and construction environment lifted Industrials. |
Components of Portfolio Holdings*
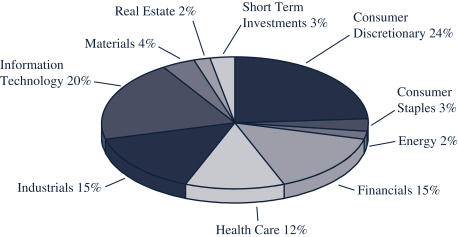
* Pie chart represents percentages of total portfolio, less securities lending collateral.
Top Ten Holdings
| | | | | | | | |
| Rank | | | Security/Holding | | % of Net
Assets | |
| | 1 | | | Apple, Inc. | | | 4.43 | |
| | 2 | | | Abbott Laboratories | | | 3.15 | |
| | 3 | | | Alphabet, Inc. – Class A | | | 3.09 | |
| | 4 | | | United Continental Holdings, Inc. | | | 2.75 | |
| | 5 | | | Twenty-First Century Fox, Inc. – Class B | | | 2.58 | |
| | 6 | | | Berkshire Hathaway, Inc. – Class B | | | 2.06 | |
| | 7 | | | MetLife, Inc. | | | 1.86 | |
| | 8 | | | Vail Resorts, Inc. | | | 1.85 | |
| | 9 | | | Hub Group, Inc. – Class A | | | 1.73 | |
| | 10 | | | Microsoft Corp. | | | 1.70 | |
12
GuideMark® Core Fixed Income Fund
MANAGER’S DISCUSSION OF FUND PERFORMANCE (Unaudited)
TOTAL RETURN BASED ON A $10,000 INVESTMENT
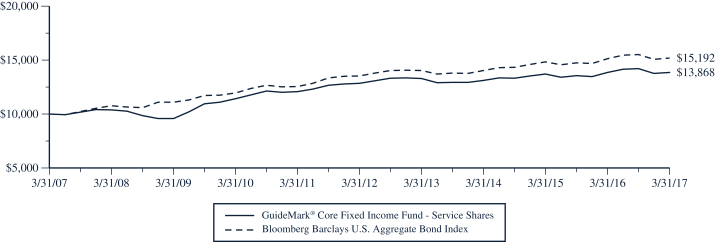
This chart assumes an initial gross investment of $10,000 made on March 31, 2007. Returns shown include the reinvestment of all dividends. Returns shown do not reflect the deduction of taxes that a shareholder would pay on Fund distributions or the redemption of Fund shares. In the absence of fee waivers and reimbursements, when they are necessary to keep expenses at the expense cap, total return would be reduced. Past performance is not predictive of future performance. Investment return and principal value will fluctuate so that your shares, when redeemed, may be worth more or less than the original cost. Index returns do not reflect the effects of fees or expenses. It is not possible to invest directly in an index.
BLOOMBERG BARCLAYS U.S. AGGREGATE BOND INDEX – The Bloomberg Barclays U.S. Aggregate Bond Index is a broad-based benchmark that measures the investment-grade, U.S. dollar-denominated, fixed-rate taxable bond market, including Treasuries, government-related and corporate debt securities, mortgage- and asset-backed securities. All securities contained in the Bloomberg Barclays U.S. Aggregate Bond Index have a minimum term to maturity of one year.
| | | | | | | | | | | | | | | | |
| AVERAGE ANNUAL TOTAL RETURN (for periods ended March 31) | |
| | | One Year
| | | Five Year
| | | Ten Year
| | | Since Inception(1)
| |
GuideMark® Core Fixed Income Fund | | | | | | | | | | | | | | | | |
Service Shares | | | 0.02 | % | | | 1.55 | % | | | 3.32 | % | | | 3.90 | % |
Institutional Shares | | | 0.74 | % | | | 2.05 | % | | | N/A | | | | 2.66 | % |
Bloomberg Barclays U.S. Aggregate Bond Index | | | 0.44 | % | | | 2.34 | % | | | 4.27 | % | | | 4.71 | %(2) |
| (1) | | Inception date is 6/29/01 for Service Shares and 4/29/11 for Institutional Shares. |
| (2) | | The return shown for the Bloomberg Barclays U.S. Aggregate Bond Index is from the inception date of the Service Shares. The Bloomberg Barclays U.S. Aggregate Bond Index return from the inception date of the Institutional Shares is 3.04%. |
13
GuideMark® Core Fixed Income Fund
MANAGER’S DISCUSSION OF FUND PERFORMANCE (Continued) (Unaudited)
| • | | For the 12 months ended March 2017, the Fund’s Service Shares returned 0.02%, underperforming the Bloomberg Barclays U.S. Aggregate Bond Index at 0.44%. |
| • | | Bias to corporate credit was additive to returns but preference for higher quality holdings tempered return potential as, for much of the period, lower quality credit outperformed higher quality corporate bonds. |
| • | | Maintaining a more neutral duration position tempered returns for much of the year with the Federal Reserve System’s more dovish interest rate stance. |
| • | | Overweight exposure to commercial mortgage-backed securities, agency mortgage-backed securities and mortgage passthroughs were headwinds as the mortgage sector was a laggard for the period. |
Components of Portfolio Holdings*
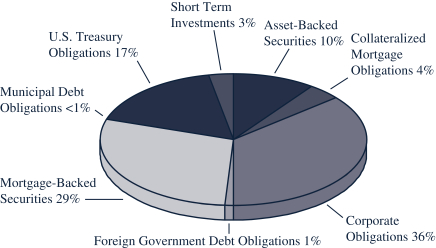
* Pie chart represents percentages of total portfolio, less securities lending collateral.
Top Ten Holdings
| | | | | | | | |
| Rank | | | Security/Holding | | % of Net
Assets | |
| | 1 | | | U.S. Treasury Bond, 3.125%, 11/15/2041 | | | 2.76 | |
| | 2 | | | Federal Home Loan Mortgage Corp., Pool #TBA, 3.500%, 04/15/2042 | | | 2.58 | |
| | 3 | | | U.S. Treasury Note, 2.000%, 11/15/2021 | | | 2.34 | |
| | 4 | | | U.S. Treasury Note, 2.000%, 02/15/2022 | | | 2.16 | |
| | 5 | | | Federal Home Loan Mortgage Corp., Pool #TBA, 3.000%, 04/15/2043 | | | 1.83 | |
| | 6 | | | U.S. Treasury Bond, 0.125%, 07/15/2024 | | | 1.79 | |
| | 7 | | | U.S. Treasury Note, 2.375%, 08/15/2024 | | | 1.45 | |
| | 8 | | | Federal National Mortgage Association, Pool #TBA, 2.500%, 04/15/2028 | | | 1.37 | |
| | 9 | | | U.S. Treasury Bond, 2.500%, 05/15/2046 | | | 1.25 | |
| | 10 | | | U.S. Treasury Note, 0.750%, 07/15/2019 | | | 1.23 | |
14
GuideMark® Tax-Exempt Fixed Income Fund
MANAGER’S DISCUSSION OF FUND PERFORMANCE (Unaudited)
TOTAL RETURN BASED ON A $10,000 INVESTMENT
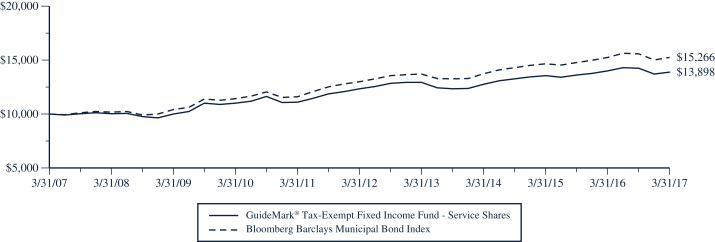
This chart assumes an initial gross investment of $10,000 made on March 31, 2007. Returns shown include the reinvestment of all dividends. Returns shown do not reflect the deduction of taxes that a shareholder would pay on Fund distributions or the redemption of Fund shares. In the absence of fee waivers and reimbursements, when they are necessary to keep expenses at the expense cap, total return would be reduced. Past performance is not predictive of future performance. Investment return and principal value will fluctuate so that your shares, when redeemed, may be worth more or less than the original cost. Index returns do not reflect the effects of fees or expenses. It is not possible to invest directly in an index.
BLOOMBERG BARCLAYS MUNICIPAL BOND INDEX – The Bloomberg Barclays Municipal Bond Index is a market-value-weighted index for the long-term tax-exempt bond market. The index has four main sectors: state and local general obligation bonds, revenue bonds, insured bonds, and pre-refunded bonds.
| | | | | | | | | | | | | | | | |
| AVERAGE ANNUAL TOTAL RETURN (for periods ended March 31) | |
| | | One Year
| | | Five Year
| | | Ten Year
| | | Since Inception(1)
| |
GuideMark® Tax-Exempt Fixed Income Fund | | | | | | | | | | | | | | | | |
Service Shares | | | -0.82 | % | | | 2.41 | % | | | 3.35 | % | | | 3.43 | % |
Bloomberg Barclays Municipal Bond Index | | | 0.15 | % | | | 3.24 | % | | | 4.33 | % | | | 4.69 | % |
| (1) | | Inception date is 6/29/01. |
15
GuideMark® Tax-Exempt Fixed Income Fund
MANAGER’S DISCUSSION OF FUND PERFORMANCE (Continued) (Unaudited)
| • | | For the 12 months ended March 2017, the Fund’s Service Shares returned -0.82%, underperforming the Bloomberg Barclays Municipal Bond Index at 0.15%. |
| • | | The Fund’s exposure to A-rated securities and relative curve positioning detracted from returns. |
| • | | Exposure to BBB-rated bonds and below investment grade bonds was generally additive to overall returns. |
| • | | Security selection within 5-year maturities created some performance lag relative to the Fund’s benchmark. |
Components of Portfolio Holdings*
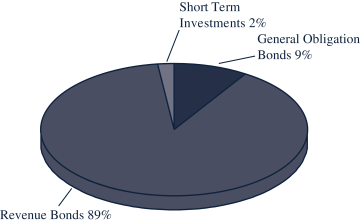
* Pie chart represents percentages of total portfolio.
Top Ten Holdings
| | | | | | | | |
| Rank | | | Security/Holding | | % of Net
Assets | |
| | 1 | | | New York Environmental Facilities Corporation, Series B, Revenue Bond, 5.500%, 10/15/2027 | | | 2.11 | |
| | 2 | | | Kansas Department of Transportation Highway Revenue, Series A, Revenue Bond, 5.000%, 09/01/2029 | | | 1.94 | |
| | 3 | | | Wisconsin, Series 2, Refunding, GO, 5.000%, 05/01/2025 | | | 1.90 | |
| | 4 | | | Regional Transportation District, Series A, Revenue Bond, 5.000%, 11/01/2027 | | | 1.90 | |
| | 5 | | | California Statewide Community Development Authority, Series A, Revenue Bond, CMI Insured, 5.000%, 08/01/2034 | | | 1.90 | |
| | 6 | | | Utah Associated Municipal Power Systems San Juan Project, Refunding, Revenue Bond, 5.500%, 06/01/2022 | | | 1.89 | |
| | 7 | | | Ohio Higher Education Facilities Commission, Refunding, Revenue Bond, 5.000%, 01/01/2026 | | | 1.88 | |
| | 8 | | | Omaha Public Power District, Series B, Prerefunded, Revenue Bond, 5.000%, 02/01/2027 | | | 1.87 | |
| | 9 | | | California, GO, 6.500%, 04/01/2033 | | | 1.82 | |
| | 10 | | | Fishers Industry Redevelopment District, Revenue Bond, 5.250%, 07/15/2034 | | | 1.82 | |
16
GuideMark® Opportunistic Fixed Income Fund
MANAGER’S DISCUSSION OF FUND PERFORMANCE (Unaudited)
TOTAL RETURN BASED ON A $10,000 INVESTMENT
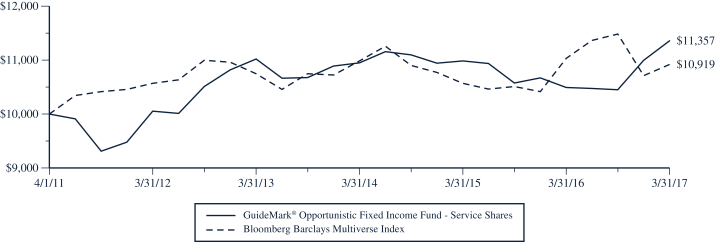
This chart assumes an initial gross investment of $10,000 made on April 1, 2011 (commencement of the Fund’s Service Shares operations). Returns shown include the reinvestment of all dividends. Returns shown do not reflect the deduction of taxes that a shareholder would pay on Fund distributions or the redemption of Fund shares. In the absence of fee waivers and reimbursements, when they are necessary to keep expenses at the expense cap, total return would be reduced. Past performance is not predictive of future performance. Investment return and principal value will fluctuate so that your shares, when redeemed, may be worth more or less than the original cost. Index returns do not reflect the effects of fees or expenses. It is not possible to invest directly in an index.
BLOOMBERG BARCLAYS MULTIVERSE INDEX – The Bloomberg Barclays Multiverse Index provides a broad-based measure of the global fixed-income bond market, and captures investment grade and high yield securities in all eligible currencies.
| | | | | | | | | | | | |
| AVERAGE ANNUAL TOTAL RETURN (for periods ended March 31) | |
| | | One Year
| | | Five Year
| | | Since Inception(1)
| |
GuideMark® Opportunistic Fixed Income Fund | | | | | | | | | | | | |
Service Shares | | | 8.20 | % | | | 2.46 | % | | | 2.14 | % |
Institutional Shares | | | 8.77 | % | | | 2.96 | % | | | 2.54 | % |
Bloomberg Barclays Multiverse Index | | | -1.02 | % | | | 0.65 | % | | | 1.48 | %(2) |
| (1) | | Inception date is 4/1/11 for Service Shares and 4/29/11 for Institutional Shares. |
| (2) | | The return shown for the Bloomberg Barclays Multiverse Index is from the inception date of the Service Shares. The Bloomberg Barclays Multiverse Index return from the inception date of the Institutional Shares is 0.91%. |
17
GuideMark® Opportunistic Fixed Income Fund
MANAGER’S DISCUSSION OF FUND PERFORMANCE (Continued) (Unaudited)
| • | | For the 12 months ended March 2017, the Fund’s Service Shares returned 8.20%, outperforming the Bloomberg Barclays Multiverse Index at -1.02%. |
| • | | Strong performance resulted from currency positioning and defensive duration positioning in the second half of the period. |
| • | | Net long exposure to select Latin American currencies including the Brazilian Real and the Uruguayan Peso along with an underweight exposure to the Euro benefited returns over the period. |
| • | | A significant underweight exposure in longer-dated U.S. Treasury bonds was rewarded as rates moved higher in the second half of the period after being a headwind for the first six months of the period. |
Components of Portfolio Holdings*
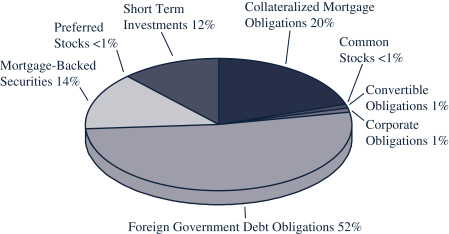
* Pie chart represents percentages of total portfolio.
Top Ten Holdings
| | | | | | | | |
| Rank | | | Security/Holding | | % of Net
Assets | |
| | 1 | | | Brazil Letras do Tesouro Nacional, 0.000% (yielding 9.538%), 01/01/2019 | | | 7.29 | |
| | 2 | | | Indonesia Treasury Bond, 8.375%, 09/15/2026 | | | 5.04 | |
| | 3 | | | Mexican Bonos, 4.750%, 06/14/2018 | | | 3.89 | |
| | 4 | | | Argentine Bonos del Tesoro, 15.500%, 10/17/2026 | | | 3.28 | |
| | 5 | | | Mexican Bonos, 5.000%, 12/11/2019 | | | 2.87 | |
| | 6 | | | Colombian TES, 7.750%, 09/18/2030 | | | 2.50 | |
| | 7 | | | India Government Bond, 8.125%, 09/21/2022 | | | 2.17 | |
| | 8 | | | Federal National Mortgage Association, Pool #2014-95, 3.000%, 04/25/2041 | | | 2.08 | |
| | 9 | | | Philippine Government Bond, 3.875%, 11/22/2019 | | | 1.89 | |
| | 10 | | | Indonesia Treasury Bond, 8.375%, 03/15/2024 | | | 1.82 | |
18
GuidePath® Growth Allocation Fund
MANAGER’S DISCUSSION OF FUND PERFORMANCE (Unaudited)
TOTAL RETURN BASED ON A $10,000 INVESTMENT
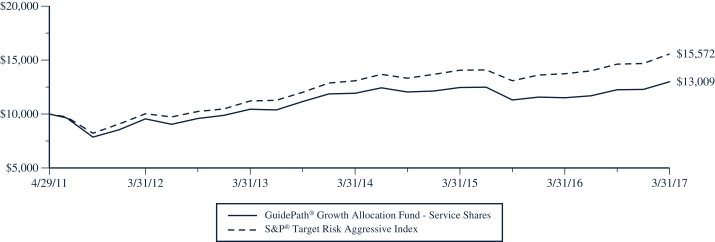
This chart assumes an initial gross investment of $10,000 made on April 29, 2011 (commencement of the Fund’s Service Shares operations). Returns shown include the reinvestment of all dividends. Returns shown do not reflect the deduction of taxes that a shareholder would pay on Fund distributions or the redemption of Fund shares. In the absence of fee waivers and reimbursements, when they are necessary to keep expenses at the expense cap, total return would be reduced. Past performance is not predictive of future performance. Investment return and principal value will fluctuate so that your shares, when redeemed, may be worth more or less than the original cost. Index returns do not reflect the effects of fees or expenses. It is not possible to invest directly in an index.
S&P® TARGET RISK AGGRESSIVE INDEX – The S&P® Target Risk Aggressive Index is designed to measure the performance of an investment benchmark strategy which seeks to emphasize exposure to equity securities, maximizing opportunities for long-term capital accumulation, while also allocating a portion of exposure to fixed income to enhance portfolio efficiency.
| | | | | | | | | | | | |
| AVERAGE ANNUAL TOTAL RETURN (for periods ended March 31) | |
| | | One Year
| | | Five Year
| | | Since Inception(1)
| |
GuidePath® Growth Allocation Fund | | | | | | | | | | | | |
Service Shares | | | 12.91 | % | | | 6.33 | % | | | 4.54 | % |
Institutional Shares | | | 13.54 | % | | | N/A | | | | 7.20 | % |
S&P® Target Risk Aggressive Index | | | 13.22 | % | | | 9.16 | % | | | 7.76 | %(2) |
| (1) | | Inception date is 4/29/11 for Service Shares and 9/13/12 for Institutional Shares. |
| (2) | | The return shown for the S&P® Target Risk Aggressive Index is annualized from the inception date of the Service Shares. The S&P Target Risk Aggressive Index average annual return from the inception date of the Institutional Shares is 9.25%. |
19
GuidePath® Growth Allocation Fund
MANAGER’S DISCUSSION OF FUND PERFORMANCE (Continued) (Unaudited)
| • | | For the 12 months ended March 2017, the Fund’s Service Shares returned 12.91% performing mostly inline with the S&P® Target Risk Aggressive Index at 13.22%. |
| • | | Returns benefited from exposure to small and mid cap equities as risk appetites increased and were further fueled by the potential growth initiatives of the administration of the newly elected U.S. President. Emerging market equities added to gains helped by higher commodity prices. |
| • | | Small exposures to both global REITs and to long-dated Treasuries tempered performance as yields rose over the period. |
| • | | Exposure to high yield bonds benefited returns from tightening credit spreads as did exposure to emerging market debt on strengthening commodity prices. |
Components of Portfolio Holdings*
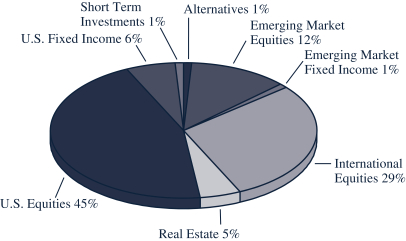
* Pie chart represents percentages of total portfolio, less securities lending collateral.
Top Ten Holdings
| | | | | | | | |
| Rank | | | Security/Holding | | % of Net
Assets | |
| | 1 | | | Vanguard S&P 500 ETF | | | 22.85 | |
| | 2 | | | GuideMark® World ex-US Fund – Institutional Shares | | | 12.43 | |
| | 3 | | | Vanguard FTSE Developed Markets ETF | | | 12.37 | |
| | 4 | | | GuideMark® Small/Mid Cap Core Fund – Institutional Shares | | | 10.29 | |
| | 5 | | | GuideMark® Large Cap Core Fund – Institutional Shares | | | 7.05 | |
| | 6 | | | iShares Core MSCI Emerging Markets ETF | | | 6.14 | |
| | 7 | | | SPDR S&P China ETF | | | 3.93 | |
| | 8 | | | Vanguard REIT ETF | | | 3.21 | |
| | 9 | | | iShares 20+ Year Treasury Bond ETF | | | 2.59 | |
| | 10 | | | SPDR S&P 600 Small Cap Growth ETF | | | 2.40 | |
20
GuidePath® Conservative Allocation Fund
MANAGER’S DISCUSSION OF FUND PERFORMANCE (Unaudited)
TOTAL RETURN BASED ON A $10,000 INVESTMENT
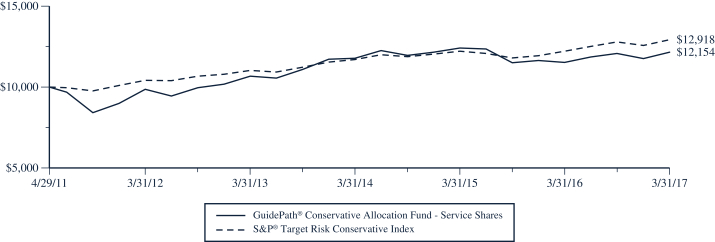
This chart assumes an initial gross investment of $10,000 made on April 29, 2011 (commencement of the Fund’s Service Shares operations). Returns shown include the reinvestment of all dividends. Returns shown do not reflect the deduction of taxes that a shareholder would pay on Fund distributions or the redemption of Fund shares. In the absence of fee waivers and reimbursements, when they are necessary to keep expenses at the expense cap, total return would be reduced. Past performance is not predictive of future performance. Investment return and principal value will fluctuate so that your shares, when redeemed, may be worth more or less than the original cost. Index returns do not reflect the effects of fees or expenses. It is not possible to invest directly in an index.
S&P® TARGET RISK CONSERVATIVE INDEX – The S&P® Target Risk Conservative Index seeks to emphasize exposure to fixed income securities in order to produce a current income stream and avoid excessive volatility of returns. Equity securities are included to protect long-term purchasing power.
| | | | | | | | | | | | |
| AVERAGE ANNUAL TOTAL RETURN (for periods ended March 31) | |
| | | One Year
| | | Five Year
| | | Since Inception(1)
| |
GuidePath® Conservative Allocation Fund | | | | | | | | | | | | |
Service Shares | | | 5.44 | % | | | 4.28 | % | | | 3.35 | % |
Institutional Shares | | | 6.09 | % | | | N/A | | | | 4.85 | % |
S&P® Target Risk Conservative Index | | | 5.73 | % | | | 4.42 | % | | | 4.42 | %(2) |
| (1) | | Inception date is 4/29/11 for Service Shares and 9/13/12 for Institutional Shares. |
| (2) | | The return shown for the S&P® Target Risk Conservative Index is annualized from the inception date of the Service Shares. The S&P® Target Risk Conservative Index average annual return from the inception date of the Institutional Shares is 4.21%. |
21
GuidePath® Conservative Allocation Fund
MANAGER’S DISCUSSION OF FUND PERFORMANCE (Continued) (Unaudited)
| • | | For the 12 months ended March 2017, the Fund’s Service Shares returned 5.44% performing mostly inline with the S&P® Target Risk Conservative Index at 5.73%. |
| • | | Returns benefited from exposure to small and mid cap equities as risk appetites increased and were further fueled by the potential growth initiatives of the administration of the newly elected U.S. President. A small exposure to emerging market equities added to gains helped by higher commodity prices. |
| • | | Exposure to long-dated Treasuries tempered performance as yields rose over the period. A small exposure to international Treasury bonds also dragged on returns. |
| • | | Exposure to high yield bonds benefited returns from tightening credit spreads as did exposure to emerging market debt on strengthening commodity prices. |
Components of Portfolio Holdings*
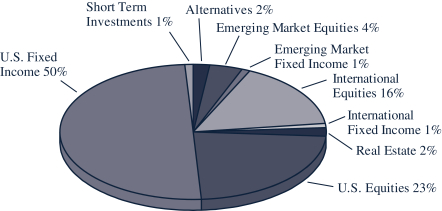
* Pie chart represents percentages of total portfolio, less securities lending collateral.
Top Ten Holdings
| | | | | | | | |
| Rank | | | Security/Holding | | % of Net
Assets | |
| | 1 | | | iShares 7-10 Year Treasury Bond ETF | | | 12.37 | |
| | 2 | | | Vanguard Mortgage-Backed Securities ETF | | | 9.21 | |
| | 3 | | | iShares 20+ Year Treasury Bond ETF | | | 8.25 | |
| | 4 | | | Vanguard S&P 500 ETF | | | 8.03 | |
| | 5 | | | Vanguard FTSE Developed Markets ETF | | | 7.21 | |
| | 6 | | | SPDR Bloomberg Barclays High Yield Bond ETF | | | 6.12 | |
| | 7 | | | GuideMark® Small/Mid Cap Core Fund – Institutional Shares | | | 5.84 | |
| | 8 | | | iShares 1-3 Year Treasury Bond ETF | | | 5.03 | |
| | 9 | | | iShares Edge MSCI Min Vol USA ETF | | | 5.00 | |
| | 10 | | | GuideMark® World ex-US Fund – Institutional Shares | | | 4.42 | |
22
GuidePath® Tactical Allocation Fund
MANAGER’S DISCUSSION OF FUND PERFORMANCE (Unaudited)
TOTAL RETURN BASED ON A $10,000 INVESTMENT
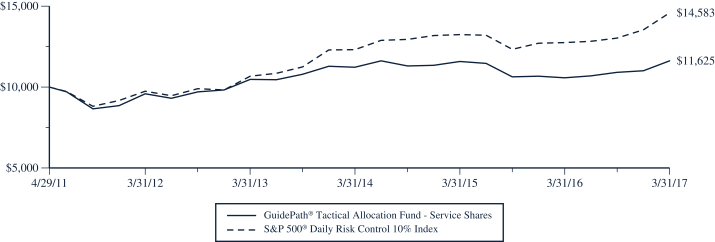
This chart assumes an initial gross investment of $10,000 made on April 29, 2011 (commencement of the Fund’s Service Shares operations). Returns shown include the reinvestment of all dividends. Returns shown do not reflect the deduction of taxes that a shareholder would pay on Fund distributions or the redemption of Fund shares. In the absence of fee waivers and reimbursements, when they are necessary to keep expenses at the expense cap, total return would be reduced. Past performance is not predictive of future performance. Investment return and principal value will fluctuate so that your shares, when redeemed, may be worth more or less than the original cost. Index returns do not reflect the effects of fees or expenses. It is not possible to invest directly in an index.
S&P 500® DAILY RISK CONTROL 10% INDEX – The S&P 500® Daily Risk Control 10% Index represents a portfolio of the S&P 500® Low Volatility Index plus an interest accruing cash component. The index is dynamically rebalanced to target a 10% level of volatility. Volatility is calculated as a function of historical returns.
| | | | | | | | | | | | |
| AVERAGE ANNUAL TOTAL RETURN (for periods ended March 31) | |
| | | One Year
| | | Five Year
| | | Since Inception(1)
| |
GuidePath® Tactical Allocation Fund | | | | | | | | | | | | |
Service Shares | | | 10.05 | % | | | 3.92 | % | | | 2.57 | % |
Institutional Shares | | | 10.63 | % | | | N/A | | | | 4.43 | % |
S&P 500® Daily Risk Control 10% Index | | | 14.40 | % | | | 8.39 | % | | | 6.58 | %(2) |
| (1) | | Inception date is 4/29/11 for Service Shares and 9/13/12 for Institutional Shares. |
| (2) | | The return shown for the S&P 500® Daily Risk Control 10% Index is annualized from the inception date of the Service Shares. The S&P 500® Daily Risk Control 10% Index average annual return from the inception date of the Institutional Shares is 8.66%. |
23
GuidePath® Tactical Allocation Fund
MANAGER’S DISCUSSION OF FUND PERFORMANCE (Continued) (Unaudited)
| • | | For the 12 months ended March 2017, the Fund’s Service Shares returned 10.05% underperforming the S&P 500 Daily Risk Control 10% Index at 14.40%. |
| • | | Lower relative equity exposure was a key driver of the underperformance during a time when equities were strong. |
| • | | Exposure to international developed markets, particularly Europe, dampened performance on the strength of the U.S. dollar. Exposure to global REITs and global infrastructure equity also tempered returns. |
| • | | Positioning in U.S. value oriented equities across capitalizations proved beneficial to returns as value stocks were favored and outperformed growth stocks during the period. Exposure to floating rate notes helped performance. |
Components of Portfolio Holdings*
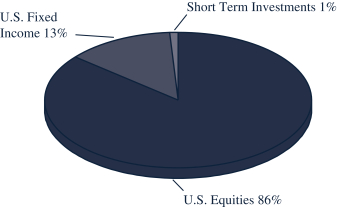
* Pie chart represents percentages of total portfolio, less securities lending collateral.
Top Ten Holdings
| | | | | | | | |
| Rank | | | Security/Holding | | % of Net
Assets | |
| | 1 | | | Vanguard S&P 500 ETF | | | 53.81 | |
| | 2 | | | iShares TIPS Bond ETF | | | 13.08 | |
| | 3 | | | Vanguard Extended Market ETF | | | 9.84 | |
| | 4 | | | Vanguard Value ETF | | | 5.28 | |
| | 5 | | | Vanguard Growth ETF | | | 4.04 | |
| | 6 | | | Vanguard Mid-Cap Value ETF | | | 3.78 | |
| | 7 | | | Technology Select Sector SPDR Fund | | | 3.40 | |
| | 8 | | | Vanguard Small-Cap Value ETF | | | 2.88 | |
| | 9 | | | Vanguard Small-Cap Growth ETF | | | 2.80 | |
24
GuidePath® Absolute Return Allocation Fund
MANAGER’S DISCUSSION OF FUND PERFORMANCE (Unaudited)
TOTAL RETURN BASED ON A $10,000 INVESTMENT
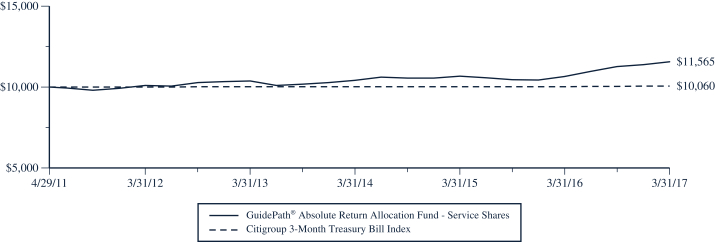
This chart assumes an initial gross investment of $10,000 made on April 29, 2011 (commencement of the Fund’s Service Shares operations). Returns shown include the reinvestment of all dividends. Returns shown do not reflect the deduction of taxes that a shareholder would pay on Fund distributions or the redemption of Fund shares. In the absence of fee waivers and reimbursements, when they are necessary to keep expenses at the expense cap, total return would be reduced. Past performance is not predictive of future performance. Investment return and principal value will fluctuate so that your shares, when redeemed, may be worth more or less than the original cost. Index returns do not reflect the effects of fees or expenses. It is not possible to invest directly in an index.
CITIGROUP 3-MONTH TREASURY BILL INDEX – The Citigroup 3-Month Treasury Bill Index tracks the performance of U.S. Treasury Bills with a remaining maturity of three months.
| | | | | | | | | | | | |
| AVERAGE ANNUAL TOTAL RETURN (for periods ended March 31) | | | | | | | | | |
| | | One Year
| | | Five Year
| | | Since Inception(1)
| |
GuidePath® Absolute Return Allocation Fund | | | | | | | | | | | | |
Service Shares | | | 8.54 | % | | | 2.75 | % | | | 2.49 | % |
Institutional Shares | | | 9.14 | % | | | N/A | | | | 3.33 | % |
Citigroup 3-Month Treasury Bill Index | | | 0.34 | % | | | 0.11 | % | | | 0.10 | %(2) |
| (1) | | Inception date is 4/29/11 for Service Shares and 9/13/12 for Institutional Shares. |
| (2) | | The return shown for the Citigroup 3-Month Treasury Bill Index is annualized from the inception date of the Service Shares. The Citigroup 3-Month Treasury Bill Index average annual return from the inception date of the Institutional Shares is 0.12%. |
25
GuidePath® Absolute Return Allocation Fund
MANAGER’S DISCUSSION OF FUND PERFORMANCE (Continued) (Unaudited)
| • | | For the 12 months ended March 2017, the Fund’s Service Shares returned 8.54% outperforming the Citigroup 3-Month Treasury Bill Index at 0.34%. |
| • | | The primary driver of outperformance was a sizable allocation to high yield bonds which benefited from tightening credit spreads. |
| • | | The flexibility to diversify beyond fixed income proved beneficial. A small exposure to U.S. value equities lifted returns as value stocks were favored and led the strong gains seen in the broader equity markets. |
| • | | Exposure to opportunistic fixed income added to returns helped by the rise of emerging market debt on strengthening commodity prices. |
Components of Portfolio Holdings*
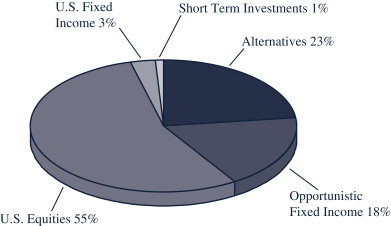
* Pie chart represents percentages of total portfolio, less securities lending collateral.
Top Ten Holdings
| | | | | | | | |
| Rank | | | Security/Holding | | % of Net
Assets | |
| | 1 | | | SPDR Bloomberg Barclays High Yield Bond ETF | | | 22.74 | |
| | 2 | | | BlackRock High Yield Portfolio – Institutional Shares | | | 14.60 | |
| | 3 | | | JPMorgan Unconstrained Debt Fund – Select Shares | | | 8.22 | |
| | 4 | | | Oppenheimer Fundamental Alternatives Fund – Institutional Shares | | | 8.14 | |
| | 5 | | | JPMorgan Systematic Alpha Fund – Institutional Shares | | | 5.46 | |
| | 6 | | | Vanguard High – Yield Corporate Fund – Admiral Shares | | | 5.42 | |
| | 7 | | | Navigator Tactical Fixed Income Fund – Institutional Shares | | | 4.96 | |
| | 8 | | | GuideMark® Core Fixed Income Fund – Institutional Shares | | | 4.40 | |
| | 9 | | | T. Rowe Price Institutional Floating Rate Fund | | | 4.38 | |
| | 10 | | | Gateway Fund – Class Y | | | 3.74 | |
26
GuidePath® Multi-Asset Income Allocation Fund
MANAGER’S DISCUSSION OF FUND PERFORMANCE (Unaudited)
TOTAL RETURN BASED ON A $10,000 INVESTMENT
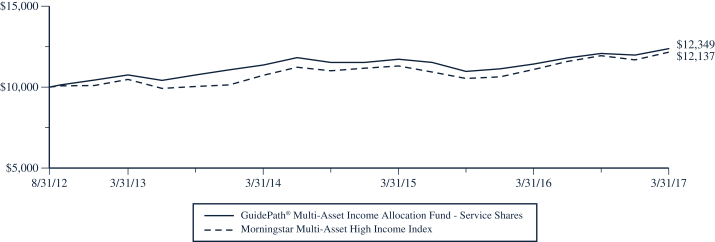
This chart assumes an initial gross investment of $10,000 made on August 31, 2012 (commencement of the Fund’s operations). Returns shown include the reinvestment of all dividends. Returns shown do not reflect the deduction of taxes that a shareholder would pay on Fund distributions or the redemption of Fund shares. In the absence of fee waivers and reimbursements, when they are necessary to keep expenses at the expense cap, total return would be reduced. Past performance is not predictive of future performance. Investment return and principal value will fluctuate so that your shares, when redeemed, may be worth more or less than the original cost. Index returns do not reflect the effects of fees or expenses. It is not possible to invest directly in an index.
MORNINGSTAR MULTI-ASSET HIGH INCOME INDEX – The Morningstar Multi-Asset High Income Index is a broadly diversified index that seeks to deliver high current income while maintaining long-term capital appreciation.
| | | | | | | | |
| AVERAGE ANNUAL TOTAL RETURN (for periods ended March 31) | |
| | | One Year
| | | Since Inception(1)
| |
GuidePath® Multi-Asset Income Allocation Fund | | | | | | | | |
Service Shares | | | 8.24 | % | | | 4.72 | % |
Morningstar Multi-Asset High Income Index | | | 9.45 | % | | | 4.32 | % |
| (1) | | Inception date is 8/31/12. |
27
GuidePath® Multi-Asset Income Allocation Fund
MANAGER’S DISCUSSION OF FUND PERFORMANCE (Continued) (Unaudited)
| • | | For the 12 months ended March 2017, the Fund’s Service Shares returned 8.24% underperforming the Morningstar Multi-Asset High Income Index at 9.45%. |
| • | | Lower relative exposure to high yield bonds which saw double digit returns on tightening credit spreads dampened performance. Small exposures to both global REITs and to long-dated Treasuries tempered performance as yields rose over the period. |
| • | | Returns benefited from exposure to small cap dividend equities as risk appetites increased and were further fueled by the potential growth initiatives of the administration of the newly elected U.S. President. Emerging market dividend equities added to gains, along with a country specific exposure to Australian equity, both helped by strengthening commodity prices. |
| • | | Exposure to preferred stocks which lagged the broader markets tempered returns. |
Components of Portfolio Holdings*
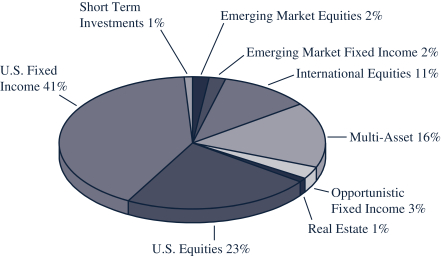
* Pie chart represents percentages of total portfolio, less securities lending collateral.
Top Ten Holdings
| | | | | | | | |
| Rank | | | Security/Holding | | % of Net
Assets | |
| | 1 | | | WisdomTree High Dividend Fund | | | 12.56 | |
| | 2 | | | BlackRock Global Dividend Portfolio – Institutional Shares | | | 10.42 | |
| | 3 | | | T. Rowe Price Institutional Floating Rate Fund | | | 9.52 | |
| | 4 | | | Vanguard High-Yield Corporate Fund – Admiral Shares | | | 8.05 | |
| | 5 | | | iShares International Select Dividend ETF | | | 8.02 | |
| | 6 | | | iShares U.S. Preferred Stock ETF | | | 6.91 | |
| | 7 | | | SPDR Bloomberg Barclays Short Term Corporate Bond ETF | | | 6.10 | |
| | 8 | | | Loomis Sayles Global Equity and Income Fund – Institutional Shares | | | 5.45 | |
| | 9 | | | GuideMark® Opportunistic Fixed Income Fund – Institutional Shares | | | 3.50 | |
| | 10 | | | Vanguard Total Bond Market ETF | | | 2.65 | |
28
GuidePath® Flexible Income Allocation Fund
MANAGER’S DISCUSSION OF FUND PERFORMANCE (Unaudited)
TOTAL RETURN BASED ON A $10,000 INVESTMENT
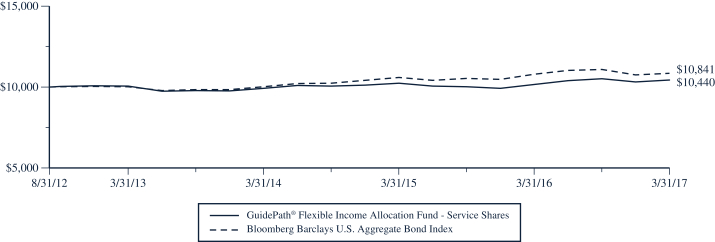
This chart assumes an initial gross investment of $10,000 made on August 31, 2012 (commencement of the Fund’s Service Shares operations). Returns shown include the reinvestment of all dividends. Returns shown do not reflect the deduction of taxes that a shareholder would pay on Fund distributions or the redemption of Fund shares. In the absence of fee waivers and reimbursements, when they are necessary to keep expenses at the expense cap, total return would be reduced. Past performance is not predictive of future performance. Investment return and principal value will fluctuate so that your shares, when redeemed, may be worth more or less than the original cost. Index returns do not reflect the effects of fees or expenses. It is not possible to invest directly in an index.
BLOOMBERG BARCLAYS U.S. AGGREGATE BOND INDEX – The Bloomberg Barclays U.S. Aggregate Bond Index is a broad-based benchmark that measures the investment-grade U.S. dollar-denominated, fixed-rate taxable bond market, including Treasuries, government-related and corporate debt securities, mortgage- and asset-backed securities. All securities contained in the Bloomberg Barclays U.S. Aggregate Bond Index have a minimum term to maturity of one year.
| | | | | | | | |
| AVERAGE ANNUAL TOTAL RETURN (for periods ended March 31) | | | | | | |
| | | One Year
| | | Since Inception(1)
| |
GuidePath® Flexible Income Allocation Fund | | | | | | | | |
Service Shares | | | 2.73 | % | | | 0.95 | % |
Institutional Shares | | | 3.23 | % | | | 1.69 | % |
Bloomberg Barclays U.S. Aggregate Bond Index | | | 0.44 | % | | | 1.78 | %(2) |
| (1) | | Inception date is 8/31/12 for Service Shares and 9/13/12 for Institutional Shares. |
| (2) | | The return shown for the Bloomberg Barclays U.S. Aggregate Bond Index is from the inception date of the Service Shares. The Bloomberg Barclays U.S. Aggregate Bond Index return from the inception date of the Institutional Shares is 1.88%. |
29
GuidePath® Flexible Income Allocation Fund
MANAGER’S DISCUSSION OF FUND PERFORMANCE (Continued) (Unaudited)
| • | | For the 12 months ended March 2017, the Fund’s Service Shares returned 2.73% outperforming the Bloomberg Barclays US Aggregate Bond Index at 0.44%. |
| • | | Fixed income exposure to high yield bonds benefited returns from tightening credit spreads as did exposure to emerging market debt on strengthening commodity prices. Exposure to floating rate notes also added to performance. |
| • | | Exposure to mortgage-backed securities and positioning in short-to-intermediate term Treasury securities tempered performance as yields rose over the period. |
| • | | The flexibility to diversify beyond traditional fixed income proved beneficial. Modest exposure to broad market global equities lifted performance on strong returns. |
Components of Portfolio Holdings*
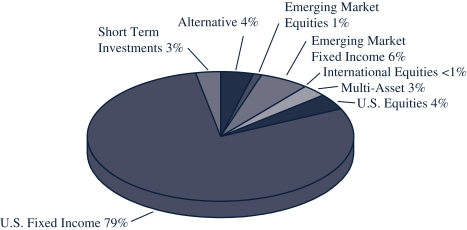
* Pie chart represents percentages of total portfolio, less securities lending collateral.
Top Ten Holdings
| | | | | | | | |
| Rank | | | Security/Holding | | % of Net
Assets | |
| | 1 | | | DoubleLine Total Return Bond Fund – Institutional Shares | | | 12.00 | |
| | 2 | | | iShares 7-10 Year Treasury Bond ETF | | | 9.88 | |
| | 3 | | | Vanguard Intermediate-Term Corporate Bond ETF | | | 9.87 | |
| | 4 | | | T. Rowe Price Institutional Floating Rate Fund | | | 8.86 | |
| | 5 | | | Vanguard High-Yield Corporate Fund – Admiral Shares | | | 7.40 | |
| | 6 | | | Vanguard Mortgage-Backed Securities ETF | | | 7.38 | |
| | 7 | | | iShares 3-7 Year Treasury Bond ETF | | | 7.36 | |
| | 8 | | | iShares J.P. Morgan USD Emerging Markets Bond ETF | | | 5.58 | |
| | 9 | | | DoubleLine Low Duration Bond Fund – Institutional Shares | | | 5.07 | |
| | 10 | | | BlackRock Low Duration Bond Portfolio – Institutional Shares | | | 3.80 | |
30
GuidePath® Managed Futures Strategy Fund
MANAGER’S DISCUSSION OF FUND PERFORMANCE (Unaudited)
TOTAL RETURN BASED ON A $10,000 INVESTMENT
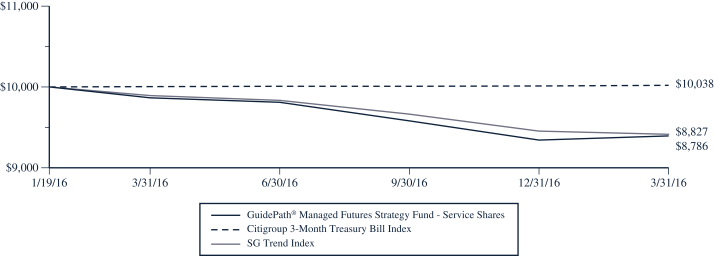
This chart assumes an initial gross investment of $10,000 made on January 19, 2016 (commencement of the Fund’s operations). Returns shown include the reinvestment of all dividends. Returns shown do not reflect the deduction of taxes that a shareholder would pay on Fund distributions or the redemption of Fund shares. In the absence of fee waivers and reimbursements, when they are necessary to keep expenses at the expense cap, total return would be reduced. Past performance is not predictive of future performance. Investment return and principal value will fluctuate so that your shares, when redeemed, may be worth more or less than the original cost. Index returns do not reflect the effects of fees or expenses. It is not possible to invest directly in an index.
CITIGROUP 3-MONTH TREASURY BILL INDEX – The Citigroup 3-Month Treasury Bill Index tracks the performance of U.S. Treasury Bills with a remaining maturity of three months.
SG TREND INDEX – The SG Trend Index is designed to track the 10 largest (by AUM) trend following commodity trading advisors and be representative of the trend followers in the managed futures space. Managers must meet the following criteria: must be open to new investment, must report returns on a daily basis, must be an industry recognized trend follower as determined at the discretion of the SG Index Committee, and must exhibit significant correlation to trend following peers and the SG Trend Indicator.
| | | | | | | | |
| AVERAGE ANNUAL TOTAL RETURN (for periods ended March 31) | |
| | | One Year
| | | Since Inception(1)
| |
GuidePath® Managed Futures Strategy Fund | | | | | | | | |
Service Shares | | | -9.70 | % | | | -10.25 | % |
Institutional Shares | | | -9.17 | % | | | -9.65 | % |
Citigroup 3-Month Treasury Bill Index | | | 0.34 | % | | | 0.32 | % |
SG Trend Index | | | -9.82 | % | | | -9.93 | % |
| (1) | | Inception date is 1/19/16 for Service Shares and Institutional Shares. |
31
GuidePath® Managed Futures Strategy Fund
MANAGER’S DISCUSSION OF FUND PERFORMANCE (Continued) (Unaudited)
| • | | For the 12 months ended March 31, 2017, the Fund’s Service Shares returned -9.70%, underperforming the Citigroup 3-Month Treasury Bill Index at 0.34% and outperforming the SG Trend Index at -9.82%. |
| • | | Long exposure to global equities contributed positively as pro-growth policies in the U.S. helped lift the performance of global equities. |
| • | | Long positions in longer dated Treasuries dampened returns as the trends in interest rates reversed and rose in the second half of the period. |
| • | | Long positions in commodities combined with short positions in currencies including the Mexican Peso hurt returns as shorter term trends reversed over the period. |
Components of Portfolio Holdings*
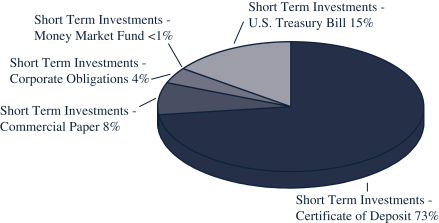
* Pie chart represents percentages of total portfolio.
Top Ten Holdings
| | | | | | |
| Rank | | Security/Holding | | % of Net
Assets | |
| | | The GuidePath® Managed Futures Strategy Fund did not hold any long term investments as of March 31, 2017. | | | | |
32
GuideMark® Funds & GuidePath® Funds
EXPENSE EXAMPLE (Unaudited)
March 31, 2017
As a shareholder of the GuideMark® & GuidePath® Funds (the “Funds”), you incur ongoing costs, including management fees, distribution and/or service fees, and other Fund expenses. The Expense Example shown in this section is intended to help you understand your ongoing costs (in dollars) of investing in the Funds and to compare these costs with the ongoing costs of investing in other mutual funds.
The Expense Examples are based on an investment of $1,000 invested at the beginning of a six-month period and held for the entire period, which for all Funds is from October 1, 2016 to March 31, 2017.
Actual Expenses
The first line of the Expense Example table provides information about actual account values and actual expenses. You may use the information in this line, together with the amount you invested, to estimate the expenses that you paid over the period. Simply divide your account value by $1,000 (for example, an $8,600 account value divided by $1,000 = 8.6), then multiply the result by the number in the first line under the heading entitled “Expenses Paid During Period” to estimate the expenses you paid on your account during this period.
The example includes, but is not limited to, management fees, shareholder servicing fees, distribution fees, fund accounting fees, custody fees and transfer agent fees. However, the example below does not include portfolio trading commissions and related expenses, interest expense or dividends on short positions taken by a Fund and other extraordinary expenses as determined under U.S. generally accepted accounting principles. To the extent that a Fund invests in shares of other investment companies as part of its investment strategy, you will indirectly bear your proportionate share of any fees and expenses charged by the underlying funds in which a Fund invests in addition to the expenses of the Fund. Actual expenses of the underlying funds are expected to vary among the various underlying funds. These expenses are not included in the example below.
Hypothetical Example for Comparison Purposes
The second line of the table below provides information about hypothetical account values and hypothetical expenses based on each Fund’s actual expenses ratios and an assumed rate of return of 5% per year before expenses, which is not the Fund’s actual return. The hypothetical account values and expenses may not be used to estimate the actual ending account balance or expenses you paid for the period. You may use this information to compare the ongoing costs of investing in the Funds and other funds. To do so, compare this 5% hypothetical example with the 5% hypothetical examples that appear in the shareholder reports of the other funds.
33
GuideMark® Funds & GuidePath® Funds
EXPENSE EXAMPLE (Continued) (Unaudited)
March 31, 2017
| | | | | | | | | | | | | | | | | | |
| Fund | | | | Beginning
Account Value
October 1, 2016 | | | Ending
Account Value
March 31, 2017 | | | Annualized
Expense Ratio1
based on the period
October 1, 2016 –
March 31, 2017 | | | Expenses Paid
During Period2
October 1, 2016 –
March 31, 2017 | |
| INSTITUTIONAL SHARES | | | | | | | | | | | | | | | | | | |
GuideMark® Large Cap Core Fund | | Actual | | $ | 1,000.00 | | | $ | 1,076.10 | | | | 0.67% | | | $ | 3.47 | |
| | Hypothetical3 | | $ | 1,000.00 | | | $ | 1,021.59 | | | | 0.67% | | | $ | 3.38 | |
GuideMark® Emerging Markets Fund | | Actual | | $ | 1,000.00 | | | $ | 1,071.60 | | | | 1.07% | | | $ | 5.53 | |
| | Hypothetical3 | | $ | 1,000.00 | | | $ | 1,019.60 | | | | 1.07% | | | $ | 5.39 | |
GuideMark® Small/Mid Cap Core Fund | | Actual | | $ | 1,000.00 | | | $ | 1,097.10 | | | | 0.90% | | | $ | 4.71 | |
| | Hypothetical3 | | $ | 1,000.00 | | | $ | 1,020.44 | | | | 0.90% | | | $ | 4.53 | |
GuideMark® World ex-US Fund | | Actual | | $ | 1,000.00 | | | $ | 1,054.40 | | | | 0.81% | | | $ | 4.15 | |
| | Hypothetical3 | | $ | 1,000.00 | | | $ | 1,020.89 | | | | 0.81% | | | $ | 4.08 | |
GuideMark® Core Fixed Income Fund | | Actual | | $ | 1,000.00 | | | $ | 979.40 | | | | 0.71% | | | $ | 3.50 | |
| | Hypothetical3 | | $ | 1,000.00 | | | $ | 1,021.39 | | | | 0.71% | | | $ | 3.58 | |
GuideMark® Opportunistic Fixed Income Fund | | Actual | | $ | 1,000.00 | | | $ | 1,089.60 | | | | 0.95% | | | $ | 4.95 | |
| | Hypothetical3 | | $ | 1,000.00 | | | $ | 1,020.19 | | | | 0.95% | | | $ | 4.78 | |
GuidePath® Growth Allocation Fund | | Actual | | $ | 1,000.00 | | | $ | 1,064.20 | | | | 0.42% | | | $ | 2.16 | |
| | Hypothetical3 | | $ | 1,000.00 | | | $ | 1,022.84 | | | | 0.42% | | | $ | 2.12 | |
GuidePath® Conservative Allocation Fund | | Actual | | $ | 1,000.00 | | | $ | 1,007.90 | | | | 0.50% | | | $ | 2.50 | |
| | Hypothetical3 | | $ | 1,000.00 | | | $ | 1,022.44 | | | | 0.50% | | | $ | 2.52 | |
GuidePath® Tactical Allocation Fund | | Actual | | $ | 1,000.00 | | | $ | 1,068.70 | | | | 0.53% | | | $ | 2.73 | |
| | Hypothetical3 | | $ | 1,000.00 | | | $ | 1,022.29 | | | | 0.53% | | | $ | 2.67 | |
GuidePath® Absolute Return Allocation Fund | | Actual | | $ | 1,000.00 | | | $ | 1,029.40 | | | | 0.62% | | | $ | 3.14 | |
| | Hypothetical3 | | $ | 1,000.00 | | | $ | 1,021.84 | | | | 0.62% | | | $ | 3.13 | |
GuidePath® Flexible Income Allocation Fund | | Actual | | $ | 1,000.00 | | | $ | 996.70 | | | | 0.49% | | | $ | 2.44 | |
| | Hypothetical3 | | $ | 1,000.00 | | | $ | 1,022.49 | | | | 0.49% | | | $ | 2.47 | |
GuidePath® Managed Futures Strategy Fund | | Actual | | $ | 1,000.00 | | | $ | 962.60 | | | | 1.30% | | | $ | 6.36 | |
| | Hypothetical3 | | $ | 1,000.00 | | | $ | 1,018.45 | | | | 1.30% | | | $ | 6.54 | |
| 1 | | The expense ratio excludes the securities lending credit. |
| 2 | | Expenses are equal to the Fund’s annualized expense ratio, multiplied by the average account value over the period, multiplied by 182/365 to reflect the one-half year period. |
| 3 | | 5% annualized return before expenses. |
34
GuideMark® Funds & GuidePath® Funds
EXPENSE EXAMPLE (Continued) (Unaudited)
March 31, 2017
| | | | | | | | | | | | | | | | | | |
| Fund | | | | Beginning
Account Value
October 1, 2016 | | | Ending
Account Value
March 31, 2017 | | | Annualized
Expense Ratio1
based on the period
October 1, 2016 –
March 31, 2017 | | | Expenses Paid
During Period2
October 1, 2016 –
March 31, 2017 | |
| SERVICE SHARES | | | | | | | | | | | | | | | | | | |
| GuideMark® Large Cap | | Actual | | $ | 1,000.00 | | | $ | 1,072.90 | | | | 1.24% | | | $ | 6.41 | |
| Core Fund | | Hypothetical3 | | $ | 1,000.00 | | | $ | 1,018.75 | | | | 1.24% | | | $ | 6.24 | |
| GuideMark® Emerging | | Actual | | $ | 1,000.00 | | | $ | 1,067.90 | | | | 1.65% | | | $ | 8.51 | |
| Markets Fund | | Hypothetical3 | | $ | 1,000.00 | | | $ | 1,016.70 | | | | 1.65% | | | $ | 8.30 | |
| GuideMark® Small/Mid Cap | | Actual | | $ | 1,000.00 | | | $ | 1,094.00 | | | | 1.48% | | | $ | 7.73 | |
| Core Fund | | Hypothetical3 | | $ | 1,000.00 | | | $ | 1,017.55 | | | | 1.48% | | | $ | 7.44 | |
| GuideMark® World | | Actual | | $ | 1,000.00 | | | $ | 1,051.80 | | | | 1.41% | | | $ | 7.21 | |
| ex-US Fund | | Hypothetical3 | | $ | 1,000.00 | | | $ | 1,017.90 | | | | 1.41% | | | $ | 7.09 | |
| GuideMark® Opportunistic | | Actual | | $ | 1,000.00 | | | $ | 1,110.10 | | | | 1.64% | | | $ | 8.63 | |
| Equity Fund | | Hypothetical3 | | $ | 1,000.00 | | | $ | 1,016.75 | | | | 1.64% | | | $ | 8.25 | |
| GuideMark® Core | | Actual | | $ | 1,000.00 | | | $ | 975.50 | | | | 1.31% | | | $ | 6.45 | |
| Fixed Income Fund | | Hypothetical3 | | $ | 1,000.00 | | | $ | 1,018.40 | | | | 1.31% | | | $ | 6.59 | |
| GuideMark® Tax-Exempt | | Actual | | $ | 1,000.00 | | | $ | 975.50 | | | | 1.29% | | | $ | 6.35 | |
| Fixed Income Fund | | Hypothetical3 | | $ | 1,000.00 | | | $ | 1,018.50 | | | | 1.29% | | | $ | 6.49 | |
| GuideMark® Opportunistic | | Actual | | $ | 1,000.00 | | | $ | 1,086.90 | | | | 1.55% | | | $ | 8.06 | |
| Fixed Income Fund | | Hypothetical3 | | $ | 1,000.00 | | | $ | 1,017.20 | | | | 1.55% | | | $ | 7.80 | |
| GuidePath® Growth | | Actual | | $ | 1,000.00 | | | $ | 1,060.90 | | | | 1.02% | | | $ | 5.24 | |
| Allocation Fund | | Hypothetical3 | | $ | 1,000.00 | | | $ | 1,019.85 | | | | 1.02% | | | $ | 5.14 | |
| GuidePath® Conservative | | Actual | | $ | 1,000.00 | | | $ | 1,005.80 | | | | 1.09% | | | $ | 5.45 | |
| Allocation Fund | | Hypothetical3 | | $ | 1,000.00 | | | $ | 1,019.50 | | | | 1.09% | | | $ | 5.49 | |
| GuidePath® Tactical | | Actual | | $ | 1,000.00 | | | $ | 1,066.20 | | | | 1.12% | | | $ | 5.77 | |
| Allocation Fund | | Hypothetical3 | | $ | 1,000.00 | | | $ | 1,019.35 | | | | 1.12% | | | $ | 5.64 | |
| GuidePath® Absolute Return | | Actual | | $ | 1,000.00 | | | $ | 1,026.70 | | | | 1.22% | | | $ | 6.16 | |
| Allocation Fund | | Hypothetical3 | | $ | 1,000.00 | | | $ | 1,018.85 | | | | 1.22% | | | $ | 6.14 | |
| GuidePath® Multi-Asset Income | | Actual | | $ | 1,000.00 | | | $ | 1,024.30 | | | | 1.16% | | | $ | 5.85 | |
| Allocation Fund | | Hypothetical3 | | $ | 1,000.00 | | | $ | 1,019.15 | | | | 1.16% | | | $ | 5.84 | |
| GuidePath® Flexible Income | | Actual | | $ | 1,000.00 | | | $ | 993.60 | | | | 1.09% | | | $ | 5.42 | |
| Allocation Fund | | Hypothetical3 | | $ | 1,000.00 | | | $ | 1,019.50 | | | | 1.09% | | | $ | 5.49 | |
| GuidePath® Managed Futures | | Actual | | $ | 1,000.00 | | | $ | 959.20 | | | | 1.90% | | | $ | 9.28 | |
| Strategy Fund | | Hypothetical3 | | $ | 1,000.00 | | | $ | 1,015.46 | | | | 1.90% | | | $ | 9.55 | |
| 1 | | The expense ratio excludes the securities lending credit. |
| 2 | | Expenses are equal to the Fund’s annualized expense ratio, multiplied by the average account value over the period, multiplied by 182/365 to reflect the one-half year period. |
| 3 | | 5% annualized return before expenses. |
35
GuideMark® Large Cap Core Fund
SCHEDULE OF INVESTMENTS
March 31, 2017
| | | | | | | | |
Number of
Shares
| | | | | Value
| |
| | | | | COMMON STOCKS - 95.17% | |
| | | | | Aerospace & Defense - 1.41% | |
| | 2,489 | | | BE Aerospace, Inc. | | $ | 159,570 | |
| | 1,805 | | | Boeing Co. | | | 319,232 | |
| | 1,017 | | | BWX Technologies, Inc. | | | 48,409 | |
| | 980 | | | General Dynamics Corp. | | | 183,456 | |
| | 2,635 | | | HEICO Corp. (a) | | | 229,772 | |
| | 3,151 | | | HEICO Corp. - Class A | | | 236,325 | |
| | 3,322 | | | Honeywell International, Inc. | | | 414,818 | |
| | 1,496 | | | Huntington Ingalls Industries, Inc. | | | 299,559 | |
| | 1,399 | | | L3 Technologies, Inc. | | | 231,241 | |
| | 314 | | | Lockheed Martin Corp. | | | 84,026 | |
| | 962 | | | Northrop Grumman Corp. | | | 228,802 | |
| | 767 | | | Raytheon Co. | | | 116,968 | |
| | 2,265 | | | Spirit AeroSystems Holdings, Inc. - Class A | | | 131,189 | |
| | 1,488 | | | United Technologies Corp. | | | 166,968 | |
| | | | | | |
|
|
|
| | | | | | | | 2,850,335 | |
| | | | | | |
|
|
|
| | | | | Air Freight & Logistics - 0.35% | |
| | 4,512 | | | C.H. Robinson Worldwide, Inc. (a) | | | 348,732 | |
| | 1,887 | | | Expeditors International of Washington (a) | | | 106,597 | |
| | 541 | | | FedEx Corp. | | | 105,576 | |
| | 1,424 | | | United Parcel Service, Inc. - Class B | | | 152,795 | |
| | | | | | |
|
|
|
| | | | | | | | 713,700 | |
| | | | | | |
|
|
|
| | | | | Airlines - 0.91% | |
| | 607 | | | Alaska Air Group, Inc. | | | 55,978 | |
| | 2,401 | | | Copa Holdings SA - Class A (a) | | | 269,512 | |
| | 7,787 | | | Delta Air Lines, Inc. | | | 357,890 | |
| | 20,080 | | | JetBlue Airways Corp. (b) | | | 413,849 | |
| | 2,866 | | | Southwest Airlines Co. (a) | | | 154,076 | |
| | 8,405 | | | United Continental Holdings, Inc. (b) | | | 593,729 | |
| | | | | | |
|
|
|
| | | | | | | | 1,845,034 | |
| | | | | | |
|
|
|
| | | | | Auto Components - 0.07% | |
| | 936 | | | Lear Corp. | | | 132,519 | |
| | | | | | |
|
|
|
| | | | | Automobiles - 0.36% | |
| | 39,503 | | | Ford Motor Co. | | | 459,815 | |
| | 2,781 | | | Thor Industries, Inc. | | | 267,337 | |
| | | | | | |
|
|
|
| | | | | | | | 727,152 | |
| | | | | | |
|
|
|
| | | | | Banks - 4.74% | |
| | 646 | | | Bank Hawaii Corp. | | | 53,205 | |
| | 73,731 | | | Bank of America Corp. | | | 1,739,314 | |
| | 2,588 | | | BB&T Corp. (a) | | | 115,684 | |
| | 6,100 | | | CIT Group, Inc. | | | 261,873 | |
| | 18,563 | | | Citigroup, Inc. | | | 1,110,439 | |
| | 3,447 | | | Citizens Financial Group, Inc. | | | 119,094 | |
| | 978 | | | Commerce Bancshares, Inc. (a) | | | 54,924 | |
| | 639 | | | Cullen Frost Bankers, Inc. (a) | | | 56,852 | |
| | 1,149 | | | East West Bancorp, Inc. (a) | | | 59,300 | |
| | 8,301 | | | Fifth Third Bancorp | | | 210,845 | |
| | 35,811 | | | JPMorgan Chase & Co. | | | 3,145,638 | |
| | 6,646 | | | KeyCorp | | | 118,166 | |
| | 790 | | | M&T Bank Corp. | | | 122,237 | |
| | 1,849 | | | PNC Financial Services Group, Inc. | | | 222,324 | |
| | 6,121 | | | Popular, Inc. | | | 249,308 | |
| | 11,489 | | | Regions Financial Corp. | | | 166,935 | |
| | 2,485 | | | SunTrust Banks, Inc. | | | 137,420 | |
| | 258 | | | SVB Financial Group (b) | | | 48,011 | |
| | 5,421 | | | U.S. Bancorp (a) | | | 279,182 | |
| | | | | | | | |
Number of
Shares
| | | | | Value
| |
| | | | | Banks (Continued) | |
| | 24,059 | | | Wells Fargo & Co. | | $ | 1,339,124 | |
| | | | | | |
|
|
|
| | | | | | | | 9,609,875 | |
| | | | | | |
|
|
|
| | | | | Beverages - 1.13% | |
| | 2,127 | | | Brown-Forman Corp. - Class A | | | 100,118 | |
| | 2,484 | | | Brown-Forman Corp. - Class B | | | 114,711 | |
| | 1,656 | | | Dr. Pepper Snapple Group, Inc. | | | 162,155 | |
| | 3,169 | | | Monster Beverage Corp. (b) | | | 146,313 | |
| | 11,081 | | | PepsiCo, Inc. | | | 1,239,521 | |
| | 12,516 | | | The Coca-Cola Co. | | | 531,179 | |
| | | | | | |
|
|
|
| | | | | | | | 2,293,997 | |
| | | | | | |
|
|
|
| | | | | Biotechnology - 1.53% | |
| | 2,782 | | | Amgen, Inc. | | | 456,443 | |
| | 2,366 | | | Biogen, Inc. (b) | | | 646,912 | |
| | 3,662 | | | Celgene Corp. (b) | | | 455,663 | |
| | 11,221 | | | Gilead Sciences, Inc. | | | 762,130 | |
| | 1,745 | | | Seattle Genetics, Inc. (b) | | | 109,691 | |
| | 2,859 | | | United Therapeutics Corp. (b) | | | 387,051 | |
| | 2,506 | | | Vertex Pharmaceuticals, Inc. (b) | | | 274,031 | |
| | | | | | |
|
|
|
| | | | | | | | 3,091,921 | |
| | | | | | |
|
|
|
| | | | | Building Products - 0.81% | |
| | 4,746 | | | A. O. Smith Corp. (a) | | | 242,805 | |
| | 1,407 | | | Allegion Plc | | | 106,510 | |
| | 1,377 | | | Fortune Brands Home & Security, Inc. | | | 83,790 | |
| | 2,250 | | | Lennox International, Inc. (a) | | | 376,425 | |
| | 4,731 | | | Masco Corp. | | | 160,807 | |
| | 7,591 | | | Owens Corning, Inc. | | | 465,860 | |
| | 6,552 | | | USG Corp. (a)(b) | | | 208,354 | |
| | | | | | |
|
|
|
| | | | | | | | 1,644,551 | |
| | | | | | |
|
|
|
| | | | | Capital Markets - 0.93% | |
| | 362 | | | Ameriprise Financial, Inc. | | | 46,944 | |
| | 7,543 | | | Artisan Partners Asset Management, Inc. - Class A | | | 208,187 | |
| | 11,907 | | | Donnelley Financial Solutions, Inc. (b) | | | 229,686 | |
| | 5,735 | | | Eaton Vance Corp. | | | 257,846 | |
| | 4,177 | | | Federated Investors, Inc. - Class B | | | 110,022 | |
| | 3,866 | | | Lazard Ltd. - Class A - ADR | | | 177,797 | |
| | 1,703 | | | LPL Financial Holdings, Inc. | | | 67,830 | |
| | 7,664 | | | Morgan Stanley | | | 328,326 | |
| | 838 | | | Raymond James Financial, Inc. | | | 63,906 | |
| | 1,590 | | | SEI Investments Co. | | | 80,200 | |
| | 1,520 | | | T. Rowe Price Group, Inc. | | | 103,588 | |
| | 1,748 | | | The Bank of New York Mellon Corp. | | | 82,558 | |
| | 3,111 | | | The Charles Schwab Corp. | | | 126,960 | |
| | | | | | |
|
|
|
| | | | | | | | 1,883,850 | |
| | | | | | |
|
|
|
| | | | | Chemicals - 1.64% | |
| | 3,566 | | | AdvanSix, Inc. (b) | | | 97,423 | |
| | 2,508 | | | Albemarle Corp. (a) | | | 264,945 | |
| | 3,923 | | | Cabot Corp. | | | 235,027 | |
| | 1,731 | | | E.I. du Pont de Nemours & Co. | | | 139,051 | |
| | 2,008 | | | Eastman Chemical Co. | | | 162,247 | |
| | 882 | | | Ecolab, Inc. | | | 110,550 | |
| | 778 | | | FMC Corp. | | | 54,141 | |
| | 27,974 | | | Huntsman Corp. (a) | | | 686,482 | |
| | 357 | | | International Flavors & Fragrances, Inc. (a) | | | 47,313 | |
| | 465 | | | LyondellBasell Industries NV - Class A | | | 42,403 | |
| | 1,331 | | | Monsanto Co. | | | 150,669 | |
| | 367 | | | NewMarket Corp. (a) | | | 166,336 | |
See notes to financial statements.
36
GuideMark® Large Cap Core Fund
SCHEDULE OF INVESTMENTS (Continued)
March 31, 2017
| | | | | | | | |
Number of
Shares
| | | | | Value
| |
| | | | | COMMON STOCKS (Continued) | |
| | | | | Chemicals (Continued) | |
| | 10,258 | | | Platform Specialty Products Corp. (b) | | $ | 133,559 | |
| | 1,924 | | | PPG Industries, Inc. | | | 202,174 | |
| | 3,943 | | | RPM International, Inc. | | | 216,983 | |
| | 3,386 | | | The Dow Chemical Co. | | | 215,147 | |
| | 2,394 | | | The Scotts Miracle-Gro Co. - Class A (a) | | | 223,576 | |
| | 1,627 | | | Valspar Corp. | | | 180,499 | |
| | | | | | |
|
|
|
| | | | | | | | 3,328,525 | |
| | | | | | |
|
|
|
| | | | | Commercial Services & Supplies - 1.02% | |
| | 578 | | | Avery Dennison Corp. | | | 46,587 | |
| | 2,921 | | | Cintas Corp. | | | 369,623 | |
| | 3,988 | | | Copart, Inc. (b) | | | 246,977 | |
| | 16,501 | | | LSC Communications, Inc. | | | 415,165 | |
| | 4,905 | | | Republic Services, Inc. | | | 308,083 | |
| | 8,373 | | | Rollins, Inc. (a) | | | 310,890 | |
| | 5,194 | | | Waste Management, Inc. | | | 378,746 | |
| | | | | | |
|
|
|
| | | | | | | | 2,076,071 | |
| | | | | | |
|
|
|
| | | | | Communications Equipment - 1.38% | |
| | 1,756 | | | Arista Networks, Inc. (a)(b) | | | 232,266 | |
| | 12,290 | | | ARRIS International Plc (b) | | | 325,070 | |
| | 12,107 | | | Brocade Communications Systems, Inc. | | | 151,095 | |
| | 27,846 | | | Cisco Systems, Inc. | | | 941,195 | |
| | 2,194 | | | F5 Networks, Inc. (b) | | | 312,799 | |
| | 1,221 | | | Harris Corp. | | | 135,861 | |
| | 1,496 | | | Juniper Networks, Inc. | | | 41,634 | |
| | 1,008 | | | Motorola Solutions, Inc. | | | 86,910 | |
| | 9,945 | | | QUALCOMM, Inc. | | | 570,246 | |
| | | | | | |
|
|
|
| | | | | | | | 2,797,076 | |
| | | | | | |
|
|
|
| | | | | Construction & Engineering - 1.17% | |
| | 15,074 | | | AECOM (a)(b) | | | 536,484 | |
| | 17,554 | | | Chicago Bridge & Iron Co. NV | | | 539,785 | |
| | 3,746 | | | Fluor Corp. | | | 197,115 | |
| | 11,618 | | | Jacobs Engineering Group, Inc. (a) | | | 642,243 | |
| | 12,325 | | | Quanta Services, Inc. (b) | | | 457,381 | |
| | | | | | |
|
|
|
| | | | | | | | 2,373,008 | |
| | | | | | |
|
|
|
| | | | | Construction Materials - 0.13% | |
| | 554 | | | Eagle Materials, Inc. | | | 53,816 | |
| | 993 | | | Martin Marietta Materials, Inc. | | | 216,722 | |
| | | | | | |
|
|
|
| | | | | | | | 270,538 | |
| | | | | | |
|
|
|
| | | | | Consumer Finance - 1.47% | |
| | 25,107 | | | Ally Financial, Inc. | | | 510,425 | |
| | 5,505 | | | American Express Co. | | | 435,501 | |
| | 7,093 | | | Capital One Financial Corp. | | | 614,679 | |
| | 540 | | | Credit Acceptance Corp. (a)(b) | | | 107,682 | |
| | 2,540 | | | Discover Financial Services | | | 173,711 | |
| | 35,754 | | | Navient Corp. | | | 527,729 | |
| | 41,182 | | | Santander Consumer USA Holdings, Inc. (a)(b) | | | 548,544 | |
| | 1,658 | | | Synchrony Financial | | | 56,869 | |
| | | | | | |
|
|
|
| | | | | | | | 2,975,140 | |
| | | | | | |
|
|
|
| | | | | Containers & Packaging - 0.34% | |
| | 840 | | | Bemis Co., Inc. (a) | | | 41,043 | |
| | 1,308 | | | Berry Plastics Group, Inc. (b) | | | 63,530 | |
| | 4,436 | | | Graphic Packaging Holding Co. | | | 57,091 | |
| | 3,914 | | | Owens-Illinois, Inc. (b) | | | 79,767 | |
| | 2,636 | | | Packaging Corp. of America | | | 241,510 | |
| | 775 | | | Sonoco Products Co. (a) | | | 41,013 | |
| | | | | | | | |
Number of
Shares
| | | | | Value
| |
| | | | | Containers & Packaging (Continued) | |
| | 3,241 | | | WestRock Co. | | $ | 168,629 | |
| | | | | | |
|
|
|
| | | | | | | | 692,583 | |
| | | | | | |
|
|
|
| | | | | Distributors - 0.16% | |
| | 2,101 | | | Genuine Parts Co. | | | 194,153 | |
| | 4,615 | | | LKQ Corp. (b) | | | 135,081 | |
| | | | | | |
|
|
|
| | | | | | | | 329,234 | |
| | | | | | |
|
|
|
| | | | | Diversified Consumer Services - 0.28% | |
| | 492 | | | Graham Holdings Co. - Class B | | | 294,979 | |
| | 9,286 | | | H&R Block, Inc. | | | 215,899 | |
| | 1,224 | | | ServiceMaster Global Holdings, Inc. (b) | | | 51,102 | |
| | | | | | |
|
|
|
| | | | | | | | 561,980 | |
| | | | | | |
|
|
|
| | | | | Diversified Financial Services - 0.82% | |
| | 4,610 | | | CBOE Holdings, Inc. | | | 373,733 | |
| | 1,483 | | | CME Group, Inc. | | | 176,180 | |
| | 1,992 | | | Leucadia National Corp. | | | 51,792 | |
| | 2,097 | | | MarketAxess Holdings, Inc. | | | 393,166 | |
| | 2,778 | | | MSCI, Inc. | | | 269,994 | |
| | 3,108 | | | S&P Global, Inc. | | | 406,340 | |
| | | | | | |
|
|
|
| | | | | | | | 1,671,205 | |
| | | | | | |
|
|
|
| | | | | Diversified Telecommunication Services - 1.71% | |
| | 47,108 | | | AT&T, Inc. (a) | | | 1,957,338 | |
| | 13,707 | | | CenturyLink, Inc. (a) | | | 323,074 | |
| | 2,279 | | | Level 3 Communications, Inc. (b) | | | 130,404 | |
| | 19,648 | | | Verizon Communications, Inc. | | | 957,840 | |
| | 3,048 | | | Zayo Group Holdings, Inc. (b) | | | 100,279 | |
| | | | | | |
|
|
|
| | | | | | | | 3,468,935 | |
| | | | | | |
|
|
|
| | | | | Electric Utilities - 0.92% | |
| | 9,631 | | | AES Corp. | | | 107,675 | |
| | 659 | | | American Electric Power Co., Inc. | | | 44,239 | |
| | 1,603 | | | Avangrid, Inc. | | | 68,512 | |
| | 540 | | | Duke Energy Corp. | | | 44,285 | |
| | 2,356 | | | Edison International | | | 187,561 | |
| | 582 | | | Entergy Corp. (a) | | | 44,209 | |
| | 5,973 | | | Exelon Corp. | | | 214,909 | |
| | 2,025 | | | FirstEnergy Corp. (a) | | | 64,435 | |
| | 2,713 | | | Hawaiian Electric Industries, Inc. | | | 90,370 | |
| | 1,970 | | | NextEra Energy, Inc. | | | 252,889 | |
| | 5,966 | | | OGE Energy Corp. | | | 208,691 | |
| | 2,127 | | | Pinnacle West Capital Corp. | | | 177,349 | |
| | 854 | | | Southern Co. | | | 42,512 | |
| | 3,982 | | | Westar Energy, Inc. | | | 216,103 | |
| | 2,382 | | | Xcel Energy, Inc. (a) | | | 105,880 | |
| | | | | | |
|
|
|
| | | | | | | | 1,869,619 | |
| | | | | | |
|
|
|
| | | | | Electrical Equipment - 0.63% | |
| | 844 | | | Acuity Brands, Inc. (a) | | | 172,176 | |
| | 856 | | | Agilent Technologies, Inc. (a) | | | 45,257 | |
| | 2,056 | | | Eaton Corp. Plc | | | 152,452 | |
| | 730 | | | Emerson Electric Co. | | | 43,698 | |
| | 7,905 | | | Regal Beloit Corp. (a) | | | 598,013 | |
| | 1,653 | | | Rockwell Automation, Inc. | | | 257,389 | |
| | | | | | |
|
|
|
| | | | | | | | 1,268,985 | |
| | | | | | |
|
|
|
| | | | | Electronic Equipment, Instruments & Components - 0.92% | |
| | 3,783 | | | Amphenol Corp. - Class A | | | 269,236 | |
| | 2,162 | | | Arrow Electronics, Inc. (b) | | | 158,712 | |
| | 1,476 | | | CDW Corp. (a) | | | 85,180 | |
| | 3,706 | | | Cognex Corp. | | | 311,119 | |
See notes to financial statements.
37
GuideMark® Large Cap Core Fund
SCHEDULE OF INVESTMENTS (Continued)
March 31, 2017
| | | | | | | | |
Number of
Shares
| | | | | Value
| |
| | | | | COMMON STOCKS (Continued) | |
| | | | | Electronic Equipment, Instruments & Components (Continued) | |
| | 12,337 | | | Corning, Inc. (a) | | $ | 333,099 | |
| | 3,019 | | | Dolby Laboratories, Inc. - Class A | | | 158,226 | |
| | 14,937 | | | Fitbit, Inc. - Class A (a)(b) | | | 88,427 | |
| | 3,391 | | | Keysight Technologies, Inc. (b) | | | 122,551 | |
| | 6,720 | | | National Instruments Corp. | | | 218,803 | |
| | 1,914 | | | Trimble Navigation Ltd. (b) | | | 61,267 | |
| | 685 | | | Zebra Technologies Corp. - Class A (b) | | | 62,506 | |
| | | | | | |
|
|
|
| | | | | | | | 1,869,126 | |
| | | | | | |
|
|
|
| | | | | Energy Equipment & Services - 1.33% | |
| | 3,683 | | | Baker Hughes, Inc. | | | 220,317 | |
| | 42,486 | | | Ensco Plc - Class A | | | 380,250 | |
| | 5,204 | | | Halliburton Co. | | | 256,089 | |
| | 69,651 | | | Noble Corp. Plc (a) | | | 431,140 | |
| | 12,292 | | | Oceaneering International, Inc. (a) | | | 332,867 | |
| | 4,891 | | | Patterson-UTI Energy, Inc. (a) | | | 118,704 | |
| | 33,778 | | | Rowan Cos., Inc. - Class A (a)(b) | | | 526,261 | |
| | 2,615 | | | RPC, Inc. (a) | | | 47,881 | |
| | 649 | | | Schlumberger Ltd. - ADR | | | 50,687 | |
| | 26,525 | | | Transocean, Ltd. - ADR (a)(b) | | | 330,236 | |
| | | | | | |
|
|
|
| | | | | | | | 2,694,432 | |
| | | | | | |
|
|
|
| | | | | Food & Staples Retailing - 2.52% | |
| | 1,448 | | | Casey’s General Stores, Inc. (a) | | | 162,538 | |
| | 3,261 | | | Costco Wholesale Corp. | | | 546,837 | |
| | 10,893 | | | CVS Caremark Corp. | | | 855,101 | |
| | 9,562 | | | Kroger Co. | | | 281,983 | |
| | 27,628 | | | Rite Aid Corp. (b) | | | 117,419 | |
| | 13,209 | | | Sprouts Farmers Market, Inc. (a)(b) | | | 305,392 | |
| | 8,790 | | | SYSCO Corp. | | | 456,377 | |
| | 3,897 | | | US Foods Holding Corp. (b) | | | 109,038 | |
| | 7,499 | | | Walgreens Boots Alliance, Inc. | | | 622,792 | |
| | 18,941 | | | Wal-Mart Stores, Inc. | | | 1,365,267 | |
| | 9,622 | | | Whole Foods Market, Inc. (a) | | | 285,966 | |
| | | | | | |
|
|
|
| | | | | | | | 5,108,710 | |
| | | | | | |
|
|
|
| | | | | Food Products - 2.72% | |
| | 5,406 | | | Archer Daniels Midland Co. | | | 248,892 | |
| | 10,209 | | | Blue Buffalo Pet Products, Inc. (a)(b) | | | 234,807 | |
| | 7,220 | | | Bunge Ltd. | | | 572,257 | |
| | 967 | | | Campbell Soup Co. (a) | | | 55,351 | |
| | 6,256 | | | ConAgra Foods, Inc. | | | 252,367 | |
| | 24,165 | | | Flowers Foods, Inc. (a) | | | 469,043 | |
| | 683 | | | General Mills, Inc. (a) | | | 40,304 | |
| | 2,152 | | | Hershey Co. | | | 235,106 | |
| | 3,066 | | | Ingredion, Inc. | | | 369,238 | |
| | 584 | | | Kellogg Co. | | | 42,404 | |
| | 1,120 | | | Lamb Weston Holdings, Inc. | | | 47,107 | |
| | 771 | | | McCormick & Co, Inc. - Non Voting | | | 75,211 | |
| | 1,315 | | | Mondelez International, Inc. - Class A | | | 56,650 | |
| | 3,648 | | | Pinnacle Foods, Inc. | | | 211,110 | |
| | 4,402 | | | Post Holdings, Inc. (a)(b) | | | 385,263 | |
| | 6,282 | | | The Hain Celestial Group, Inc. (b) | | | 233,690 | |
| | 1,843 | | | The J.M. Smucker Co. | | | 241,581 | |
| | 1,425 | | | The Kraft Heinz Co. | | | 129,404 | |
| | 2,663 | | | The WhiteWave Foods Co. (b) | | | 149,528 | |
| | 7,916 | | | TreeHouse Foods, Inc. (a)(b) | | | 670,169 | |
| | 12,929 | | | Tyson Foods, Inc. - Class A (a) | | | 797,849 | |
| | | | | | |
|
|
|
| | | | | | | | 5,517,331 | |
| | | | | | |
|
|
|
| | | | | | | | |
Number of
Shares
| | | | | Value
| |
| | | | | Gas Utilities - 0.42% | |
| | 2,383 | | | National Fuel Gas Co. | | $ | 142,075 | |
| | 5,614 | | | ONEOK, Inc. (a) | | | 311,240 | |
| | 7,870 | | | UGI Corp. | | | 388,778 | |
| | | | | | |
|
|
|
| | | | | | | | 842,093 | |
| | | | | | |
|
|
|
| | | | | Health Care Equipment & Supplies - 1.65% | |
| | 2,443 | | | ABIOMED, Inc. (a)(b) | | | 305,863 | |
| | 4,115 | | | Align Technology, Inc. (b) | | | 472,032 | |
| | 898 | | | Baxter International, Inc. (a) | | | 46,570 | |
| | 240 | | | Becton, Dickinson & Co. | | | 44,026 | |
| | 1,750 | | | Boston Scientific Corp. (b) | | | 43,522 | |
| | 879 | | | C.R. Bard, Inc. | | | 218,467 | |
| | 3,434 | | | DexCom, Inc. (a)(b) | | | 290,963 | |
| | 2,059 | | | Edwards Lifesciences Corp. (b) | | | 193,690 | |
| | 691 | | | Hill-Rom Holdings, Inc. | | | 48,785 | |
| | 4,193 | | | IDEXX Laboratories, Inc. (a)(b) | | | 648,280 | |
| | 63 | | | Intuitive Surgical, Inc. (a)(b) | | | 48,288 | |
| | 555 | | | Medtronic Plc | | | 44,711 | |
| | 3,512 | | | Stryker Corp. | | | 462,355 | |
| | 246 | | | Teleflex, Inc. | | | 47,657 | |
| | 978 | | | The Cooper Companies, Inc. (a) | | | 195,492 | |
| | 2,769 | | | West Pharmaceutical Services, Inc. (a) | | | 225,978 | |
| | | | | | |
|
|
|
| | | | | | | | 3,336,679 | |
| | | | | | |
|
|
|
| | | | | Health Care Providers & Services - 2.70% | |
| | 3,553 | | | Aetna, Inc. (a) | | | 453,185 | |
| | 2,345 | | | Anthem, Inc. | | | 387,816 | |
| | 1,734 | | | Cardinal Health, Inc. (a) | | | 141,408 | |
| | 5,237 | | | Centene Corp. (b) | | | 373,189 | |
| | 812 | | | Cerner Corp. (a)(b) | | | 47,786 | |
| | 2,462 | | | CIGNA Corp. | | | 360,658 | |
| | 2,921 | | | Davita, Inc. (b) | | | 198,540 | |
| | 5,419 | | | Express Scripts Holding Co. (a)(b) | | | 357,166 | |
| | 525 | | | HCA Holdings, Inc. (a)(b) | | | 46,720 | |
| | 1,152 | | | Henry Schein, Inc. (b) | | | 195,805 | |
| | 614 | | | Laboratory Corporation of America Holdings (a)(b) | | | 88,091 | |
| | 1,990 | | | McKesson Corp. | | | 295,037 | |
| | 1,385 | | | Patterson Cos., Inc. (a) | | | 62,644 | |
| | 1,157 | | | PerkinElmer, Inc. | | | 67,175 | |
| | 1,439 | | | Premier, Inc. - Class A (b) | | | 45,803 | |
| | 1,720 | | | Quest Diagnostics, Inc. (a) | | | 168,887 | |
| | 9,446 | | | UnitedHealth Group, Inc. | | | 1,549,239 | |
| | 1,051 | | | VCA, Inc. (b) | | | 96,167 | |
| | 3,825 | | | WellCare Health Plans, Inc. (b) | | | 536,303 | |
| | | | | | |
|
|
|
| | | | | | | | 5,471,619 | |
| | | | | | |
|
|
|
| | | | | Health Care Technology - 0.42% | |
| | 18,859 | | | Allscripts Healthcare Solutions, Inc. (a)(b) | | | 239,132 | |
| | 2,823 | | | athenahealth, Inc. (a)(b) | | | 318,124 | |
| | 5,638 | | | Veeva Systems, Inc. - Class A (a)(b) | | | 289,117 | |
| | | | | | |
|
|
|
| | | | | | | | 846,373 | |
| | | | | | |
|
|
|
| | | | | Hotels, Restaurants & Leisure - 1.79% | |
| | 2,246 | | | Aramark | | | 82,810 | |
| | 3,814 | | | Brinker International, Inc. (a) | | | 167,663 | |
| | 2,935 | | | Carnival Corp. - ADR | | | 172,901 | |
| | 2,476 | | | Choice Hotels International, Inc. | | | 154,998 | |
| | 1,386 | | | Darden Restaurants, Inc. (a) | | | 115,967 | |
| | 3,233 | | | Domino’s Pizza, Inc. | | | 595,842 | |
| | 1,046 | | | Dunkin’ Brands Group, Inc. | | | 57,195 | |
See notes to financial statements.
38
GuideMark® Large Cap Core Fund
SCHEDULE OF INVESTMENTS (Continued)
March 31, 2017
| | | | | | | | |
Number of
Shares
| | | | | Value
| |
| | | | | COMMON STOCKS (Continued) | |
| | | | | Hotels, Restaurants & Leisure (Continued) | |
| | 2,669 | | | Extended Stay America, Inc. | | $ | 42,544 | |
| | 931 | | | Hilton Worldwide Holdings, Inc. | | | 54,426 | |
| | 3,600 | | | Hyatt Hotels Corp. - Class A (a)(b) | | | 194,328 | |
| | 17,547 | | | International Game Technology Plc | | | 415,864 | |
| | 749 | | | Las Vegas Sands Corp. | | | 42,745 | |
| | 989 | | | Marriott International, Inc. - Class A (a) | | | 93,144 | |
| | 3,964 | | | McDonald’s Corp. | | | 513,774 | |
| | 530 | | | Panera Bread Co. - Class A (a)(b) | | | 138,791 | |
| | 5,697 | | | Starbucks Corp. | | | 332,648 | |
| | 3,951 | | | The Wendy’s Co. | | | 53,773 | |
| | 253 | | | Vail Resorts, Inc. | | | 48,551 | |
| | 1,443 | | | Wyndham Worldwide Corp. | | | 121,630 | |
| | 2,320 | | | Yum Brands, Inc. | | | 148,248 | |
| | 2,839 | | | Yum China Holdings, Inc. (a)(b) | | | 77,221 | |
| | | | | | |
|
|
|
| | | | | | | | 3,625,063 | |
| | | | | | |
|
|
|
| | | | | Household Durables - 0.28% | |
| | 1,086 | | | Garmin Ltd. (a) | | | 55,506 | |
| | 38 | | | NVR, Inc. (a)(b) | | | 80,061 | |
| | 2,174 | | | Tempur Sealy International, Inc. (a)(b) | | | 101,004 | |
| | 5,182 | | | Tupperware Brands Corp. (a) | | | 325,015 | |
| | | | | | |
|
|
|
| | | | | | | | 561,586 | |
| | | | | | |
|
|
|
| | | | | Household Products - 1.35% | |
| | 1,833 | | | Church & Dwight, Inc. (a) | | | 91,412 | |
| | 2,013 | | | Clorox Co. (a) | | | 271,413 | |
| | 6,329 | | | Colgate-Palmolive Co. | | | 463,219 | |
| | 1,918 | | | Energizer Holdings, Inc. (a) | | | 106,928 | |
| | 2,690 | | | Kimberly-Clark Corp. | | | 354,085 | |
| | 14,775 | | | Procter & Gamble Co. | | | 1,327,534 | |
| | 862 | | | Spectrum Brands Holdings, Inc. (a) | | | 119,827 | |
| | | | | | |
|
|
|
| | | | | | | | 2,734,418 | |
| | | | | | |
|
|
|
| | | | | Independent Power and Renewable Electricity Producers - 0.76% | |
| | 66,146 | | | Calpine Corp. (a)(b) | | | 730,913 | |
| | 43,277 | | | NRG Energy, Inc. (a) | | | 809,280 | |
| | | | | | |
|
|
|
| | | | | | | | 1,540,193 | |
| | | | | | |
|
|
|
| | | | | Industrial Conglomerates - 0.90% | |
| | 4,571 | | | 3M Co. | | | 874,569 | |
| | 858 | | | Carlisle Companies, Inc. (a) | | | 91,300 | |
| | 29,097 | | | General Electric Co. | | | 867,091 | |
| | | | | | |
|
|
|
| | | | | | | | 1,832,960 | |
| | | | | | |
|
|
|
| | | | | Insurance - 3.66% | |
| | 2,734 | | | Aflac, Inc. | | | 197,996 | |
| | 3,587 | | | Allied World Assurance Co. Holdings, Ltd. | | | 190,470 | |
| | 643 | | | Allstate Corp. | | | 52,398 | |
| | 474 | | | American Financial Group, Inc. | | | 45,229 | |
| | 1,991 | | | Aon Plc | | | 236,312 | |
| | 463 | | | Arch Capital Group, Ltd. - ADR (b) | | | 43,878 | |
| | 1,688 | | | Arthur J. Gallagher & Co. | | | 95,439 | |
| | 2,515 | | | Aspen Insurance Holdings, Ltd. | | | 130,906 | |
| | 2,533 | | | Assurant, Inc. | | | 242,332 | |
| | 4,441 | | | Assured Guaranty, Ltd. | | | 164,805 | |
| | 1,395 | | | Axis Capital Holdings, Ltd. | | | 93,507 | |
| | 13,742 | | | Berkshire Hathaway, Inc. - Class B (b) | | | 2,290,516 | |
| | 2,479 | | | Brown & Brown, Inc. | | | 103,424 | |
| | 320 | | | Chubb Limited (a) | | | 43,600 | |
| | 2,216 | | | Erie Indemnity Co. - Class A | | | 271,903 | |
| | | | | | | | |
Number of
Shares
| | | | | Value
| |
| | | | | Insurance (Continued) | |
| | 614 | | | Everest Re Group, Ltd. | | $ | 143,559 | |
| | 3,277 | | | First American Financial Corp. | | | 128,721 | |
| | 4,137 | | | Lincoln National Corp. | | | 270,767 | |
| | 8,685 | | | Marsh & McLennan Cos., Inc. | | | 641,735 | |
| | 3,028 | | | MetLife, Inc. | | | 159,939 | |
| | 6,137 | | | Old Republic International Corp. | | | 125,686 | |
| | 2,213 | | | Principal Financial Group, Inc. (a) | | | 139,662 | |
| | 5,126 | | | Prudential Financial, Inc. | | | 546,842 | |
| | 3,567 | | | Reinsurance Group of America | | | 452,938 | |
| | 584 | | | RenaissanceRe Holdings, Ltd. | | | 84,476 | |
| | 1,506 | | | The Travelers Cos., Inc. | | | 181,533 | |
| | 1,266 | | | Torchmark Corp. | | | 97,533 | |
| | 5,299 | | | Unum Group | | | 248,470 | |
| | | | | | |
|
|
|
| | | | | | | | 7,424,576 | |
| | | | | | |
|
|
|
| | | | | Internet & Direct Marketing Retail - 2.21% | |
| | 2,842 | | | Amazon.com, Inc. (b) | | | 2,519,547 | |
| | 830 | | | Expedia, Inc. | | | 104,721 | |
| | 84,532 | | | Groupon, Inc. (a)(b) | | | 332,211 | |
| | 5,855 | | | Liberty Expedia Holdings, Inc. - Class A (b) | | | 266,285 | |
| | 3,108 | | | Netflix, Inc. (b) | | | 459,394 | |
| | 353 | | | The Priceline Group, Inc. (b) | | | 628,329 | |
| | 3,725 | | | TripAdvisor, Inc. (b) | | | 160,771 | |
| | | | | | |
|
|
|
| | | | | | | | 4,471,258 | |
| | | | | | |
|
|
|
| | | | | Internet Software & Services - 3.91% | |
| | 1,565 | | | Akamai Technologies, Inc. (b) | | | 93,431 | |
| | 2,163 | | | Alphabet, Inc. - Class A (b) | | | 1,833,791 | |
| | 2,186 | | | Alphabet, Inc. - Class C (b) | | | 1,813,418 | |
| | 12,957 | | | CommerceHub, Inc. - Series A (b) | | | 200,574 | |
| | 18,059 | | | CommerceHub, Inc. - Series C (b) | | | 280,456 | |
| | 9,070 | | | eBay, Inc. (b) | | | 304,480 | |
| | 14,974 | | | Facebook, Inc. - Class A (b) | | | 2,127,057 | |
| | 5,024 | | | IAC/InterActiveCorp (b) | | | 370,369 | |
| | 9,534 | | | Match Group, Inc. (a)(b) | | | 155,690 | |
| | 9,629 | | | Pandora Media, Inc. (a)(b) | | | 113,719 | |
| | 1,990 | | | Twilio, Inc. - Class A (a)(b) | | | 57,451 | |
| | 951 | | | VeriSign, Inc. (a)(b) | | | 82,842 | |
| | 986 | | | Yahoo!, Inc. (b) | | | 45,760 | |
| | 9,544 | | | Yelp, Inc. - Class A (a)(b) | | | 312,566 | |
| | 1,469 | | | Zillow Group, Inc. - Class A (b) | | | 49,667 | |
| | 2,243 | | | Zillow Group, Inc. - Class C (a)(b) | | | 75,522 | |
| | | | | | |
|
|
|
| | | | | | | | 7,916,793 | |
| | | | | | |
|
|
|
| | | | | IT Services - 2.83% | |
| | 5,137 | | | Accenture Plc - Class A - ADR (a) | | | 615,824 | |
| | 906 | | | Alliance Data Systems Corp. | | | 225,594 | |
| | 2,670 | | | Amdocs Ltd. | | | 162,843 | |
| | 4,723 | | | Booz Allen Hamilton Holding Corp. - Class A | | | 167,147 | |
| | 2,275 | | | Broadridge Financial Solutions, Inc. | | | 154,586 | |
| | 4,973 | | | Cognizant Technology Solutions Corp. - Class A (b) | | | 295,993 | |
| | 3,987 | | | Computer Sciences Corp. | | | 275,143 | |
| | 2,984 | | | Conduent, Inc. (b) | | | 50,072 | |
| | 6,591 | | | CoreLogic, Inc. (b) | | | 268,386 | |
| | 1,782 | | | CSRA, Inc. | | | 52,195 | |
| | 1,035 | | | DST Systems, Inc. | | | 126,787 | |
| | 571 | | | Euronet Worldwide, Inc. (a)(b) | | | 48,832 | |
| | 2,909 | | | Fidelity National Information Services, Inc. | | | 231,615 | |
| | 12,388 | | | First Data Corp. - Class A (b) | | | 192,014 | |
| | 583 | | | Fiserv, Inc. (a)(b) | | | 67,226 | |
See notes to financial statements.
39
GuideMark® Large Cap Core Fund
SCHEDULE OF INVESTMENTS (Continued)
March 31, 2017
| | | | | | | | |
Number of
Shares
| | | | | Value
| |
| | | | | COMMON STOCKS (Continued) | |
| | | | | IT Services (Continued) | |
| | 2,741 | | | Gartner, Inc. (b) | | $ | 296,001 | |
| | 9,715 | | | Genpact, Ltd. | | | 240,543 | |
| | 988 | | | Leidos Holdings, Inc. | | | 50,526 | |
| | 2,513 | | | MasterCard, Inc. - Class A | | | 282,637 | |
| | 2,690 | | | Paychex, Inc. | | | 158,441 | |
| | 4,970 | | | PayPal Holdings, Inc. (a)(b) | | | 213,809 | |
| | 15,447 | | | Square, Inc. - Class A (b) | | | 266,924 | |
| | 6,080 | | | The Western Union Co. (a) | | | 123,728 | |
| | 3,396 | | | T-Mobile USA, Inc. (a)(b) | | | 219,348 | |
| | 2,435 | | | Total System Services, Inc. | | | 130,175 | |
| | 5,650 | | | VeriFone Holdings, Inc. (a)(b) | | | 105,824 | |
| | 1,639 | | | Visa, Inc. - Class A (a) | | | 145,658 | |
| | 458 | | | WEX, Inc. (a)(b) | | | 47,403 | |
| | 69,783 | | | Xerox Corp. | | | 512,207 | |
| | | | | | |
|
|
|
| | | | | | | | 5,727,481 | |
| | | | | | |
|
|
|
| | | | | Leisure Products - 0.52% | |
| | 745 | | | Brunswick Corp. | | | 45,594 | |
| | 2,226 | | | Hasbro, Inc. (a) | | | 222,199 | |
| | 3,592 | | | Mattel, Inc. | | | 91,991 | |
| | 1,228 | | | Polaris Industries, Inc. (a) | | | 102,907 | |
| | 3,659 | | | Pool Corp. (a) | | | 436,629 | |
| | 7,709 | | | Vista Outdoor, Inc. (b) | | | 158,728 | |
| | | | | | |
|
|
|
| | | | | | | | 1,058,048 | |
| | | | | | |
|
|
|
| | | | | Life Sciences Tools & Services - 0.83% | |
| | 313 | | | Bio-Rad Laboratories, Inc. - Class A (b) | | | 62,393 | |
| | 11,030 | | | Bruker Corp. | | | 257,330 | |
| | 1,060 | | | Charles River Laboratories (b) | | | 95,347 | |
| | 738 | | | Illumina, Inc. (b) | | | 125,932 | |
| | 611 | | | Mettler-Toledo International, Inc. (b) | | | 292,614 | |
| | 1,417 | | | QIAGEN NV | | | 41,037 | |
| | 1,525 | | | Quintiles Transnational Holdings, Inc. (a)(b) | | | 122,808 | |
| | 1,398 | | | Thermo Fisher Scientific, Inc. | | | 214,733 | |
| | 15,295 | | | VWR Corp. (b) | | | 431,319 | |
| | 295 | | | Waters Corp. (b) | | | 46,112 | |
| | | | | | |
|
|
|
| | | | | | | | 1,689,625 | |
| | | | | | |
|
|
|
| | | | | Machinery - 2.76% | |
| | 1,274 | | | Allison Transmission Holdings, Inc. | | | 45,940 | |
| | 3,110 | | | Caterpillar, Inc. | | | 288,484 | |
| | 5,158 | | | Colfax Corp. (a)(b) | | | 202,503 | |
| | 1,073 | | | Crane Co. | | | 80,293 | |
| | 2,334 | | | Cummins, Inc. | | | 352,901 | |
| | 512 | | | Danaher Corp. (a) | | | 43,791 | |
| | 4,784 | | | Donaldson Co., Inc. | | | 217,768 | |
| | 2,099 | | | Fortive Corp. | | | 126,402 | |
| | 1,861 | | | Graco, Inc. (a) | | | 175,194 | |
| | 445 | | | IDEX Corp. | | | 41,612 | |
| | 3,838 | | | Illinois Tool Works, Inc. | | | 508,420 | |
| | 4,077 | | | Ingersoll-Rand Plc | | | 331,542 | |
| | 3,641 | | | Lincoln Electric Holdings, Inc. | | | 316,257 | |
| | 2,501 | | | Nordson Corp. | | | 307,223 | |
| | 5,952 | | | Oshkosh Corp. | | | 408,248 | |
| | 1,990 | | | PACCAR, Inc. | | | 133,728 | |
| | 2,286 | | | Parker-Hannifin Corp. | | | 366,491 | |
| | 646 | | | Snap On, Inc. (a) | | | 108,961 | |
| | 349 | | | Stanley Black & Decker, Inc. | | | 46,372 | |
| | 16,887 | | | Terex Corp. (a) | | | 530,252 | |
| | 4,872 | | | The Timken Co. | | | 220,214 | |
| | | | | | | | |
Number of
Shares
| | | | | Value
| |
| | | | | Machinery (Continued) | |
| | 9,286 | | | Toro Co. | | $ | 580,003 | |
| | 3,309 | | | Xylem, Inc. | | | 166,178 | |
| | | | | | |
|
|
|
| | | | | | | | 5,598,777 | |
| | | | | | |
|
|
|
| | | | | Marine - 0.03% | |
| | 929 | | | Kirby Corp. (a)(b) | | | 65,541 | |
| | | | | | |
|
|
|
| | | | | Media - 2.39% | |
| | 406 | | | Cable One, Inc. | | | 253,535 | |
| | 898 | | | Charter Communications, Inc. - Class A (b) | | | 293,933 | |
| | 8,596 | | | Clear Channel Outdoor Holdings, Inc. - Class A | | | 52,006 | |
| | 22,108 | | | Comcast Corp. - Class A | | | 831,040 | |
| | 2,069 | | | Discovery Communications, Inc. - Series C (b) | | | 58,573 | |
| | 1,963 | | | John Wiley & Sons, Inc. - Class A | | | 105,609 | |
| | 1,193 | | | Liberty Broadband Corp. - Class A (b) | | | 101,512 | |
| | 2,324 | | | Liberty Broadband Corp. - Class C (a)(b) | | | 200,794 | |
| | 14,293 | | | Liberty Interactive Corp. QVC Group - Class A (b) | | | 286,146 | |
| | 6,728 | | | Liberty Media Corp. - Class A (b) | | | 261,854 | |
| | 8,854 | | | Liberty Media Corp. - Class C (b) | | | 343,358 | |
| | 2,387 | | | Lions Gate Entertainment Corp. - Class A (b) | | | 63,399 | |
| | 2,739 | | | Lions Gate Entertainment Corp. - Class B (b) | | | 66,777 | |
| | 557 | | | Morningstar, Inc. | | | 43,780 | |
| | 14,276 | | | News Corp. - Class A | | | 185,588 | |
| | 13,070 | | | News Corp. - Class B | | | 176,445 | |
| | 1,919 | | | Regal Entertainment Group - Class A (a) | | | 43,331 | |
| | 533 | | | Scripps Networks Interactive, Inc. - Class A (a) | | | 41,771 | |
| | 3,465 | | | TEGNA, Inc. | | | 88,773 | |
| | 7,737 | | | The Walt Disney Co. | | | 877,299 | |
| | 4,089 | | | Time Warner, Inc. | | | 399,536 | |
| | 2,357 | | | Twenty-First Century Fox, Inc. - Class A | | | 76,343 | |
| | | | | | |
|
|
|
| | | | | | | | 4,851,402 | |
| | | | | | |
|
|
|
| | | | | Metals & Mining - 1.07% | |
| | 12,320 | | | Freeport-McMoRan, Inc. (a)(b) | | | 164,595 | |
| | 11,603 | | | Newmont Mining Corp. | | | 382,435 | |
| | 2,641 | | | Nucor Corp. | | | 157,721 | |
| | 7,123 | | | Reliance Steel & Aluminum Co. | | | 569,982 | |
| | 1,868 | | | Royal Gold, Inc. (a) | | | 130,853 | |
| | 13,522 | | | Steel Dynamics, Inc. | | | 470,025 | |
| | 8,942 | | | United States Steel Corp. | | | 302,329 | |
| | | | | | |
|
|
|
| | | | | | | | 2,177,940 | |
| | | | | | |
|
|
|
| | | | | Multiline Retail - 1.62% | |
| | 5,237 | | | Burlington Stores, Inc. (a)(b) | | | 509,508 | |
| | 10,696 | | | Dillard’s, Inc. - Class A (a) | | | 558,759 | |
| | 3,360 | | | Dollar General Corp. (a) | | | 234,293 | |
| | 1,909 | | | Dollar Tree, Inc. (a)(b) | | | 149,780 | |
| | 17,382 | | | J.C. Penney Co., Inc. (a)(b) | | | 107,073 | |
| | 15,708 | | | Kohl’s Corp. | | | 625,336 | |
| | 15,127 | | | Macy’s, Inc. | | | 448,364 | |
| | 5,425 | | | Nordstrom, Inc. (a) | | | 252,642 | |
| | 7,189 | | | Target Corp. (a) | | | 396,761 | |
| | | | | | |
|
|
|
| | | | | | | | 3,282,516 | |
| | | | | | |
|
|
|
| | | | | Multi-Utilities - 0.88% | |
| | 3,039 | | | Alliant Energy Corp. | | | 120,375 | |
| | 3,248 | | | Ameren Corp. | | | 177,308 | |
| | 10,610 | | | CenterPoint Energy, Inc. (a) | | | 292,518 | |
| | 3,170 | | | CMS Energy Corp. | | | 141,826 | |
| | 1,576 | | | Consolidated Edison, Inc. (a) | | | 122,392 | |
| | 629 | | | Dominion Resources, Inc. | | | 48,791 | |
See notes to financial statements.
40
GuideMark® Large Cap Core Fund
SCHEDULE OF INVESTMENTS (Continued)
March 31, 2017
| | | | | | | | |
Number of
Shares
| | | | | Value
| |
| | | | | COMMON STOCKS (Continued) | |
| | | | | Multi-Utilities (Continued) | |
| | 1,880 | | | DTE Energy Co. | | $ | 191,967 | |
| | 10,168 | | | MDU Resources Group, Inc. (a) | | | 278,298 | |
| | 2,641 | | | PG&E Corp. | | | 175,257 | |
| | 410 | | | Sempra Energy | | | 45,305 | |
| | 2,555 | | | Vectren Corp. | | | 149,749 | |
| | 710 | | | WEC Energy Group, Inc. (a) | | | 43,047 | |
| | | | | | |
|
|
|
| | | | | | | | 1,786,833 | |
| | | | | | |
|
|
|
| | | | | Oil, Gas & Consumable Fuels - 2.61% | |
| | 1,654 | | | Anadarko Petroleum Corp. | | | 102,548 | |
| | 7,658 | | | Chevron Corp. | | | 822,239 | |
| | 431 | | | Concho Resources, Inc. (b) | | | 55,315 | |
| | 12,600 | | | CONSOL Energy, Inc. (a)(b) | | | 211,428 | |
| | 1,049 | | | EOG Resources, Inc. | | | 102,330 | |
| | 18,668 | | | Exxon Mobil Corp. | | | 1,530,963 | |
| | 3,844 | | | Laredo Petroleum, Inc. (b) | | | 56,122 | |
| | 3,333 | | | Parsley Energy, Inc. - Class A (b) | | | 108,356 | |
| | 24,661 | | | PBF Energy, Inc. - Class A (a) | | | 546,734 | |
| | 639 | | | Pioneer Natural Resources Co. (a) | | | 119,001 | |
| | 11,172 | | | Rice Energy, Inc. (a)(b) | | | 264,776 | |
| | 4,878 | | | Targa Resources Corp. | | | 292,192 | |
| | 3,435 | | | The Williams Companies, Inc. | | | 101,642 | |
| | 6,955 | | | Valero Energy Corp. | | | 461,047 | |
| | 9,969 | | | World Fuel Services Corp. | | | 361,376 | |
| | 11,076 | | | WPX Energy, Inc. (a)(b) | | | 148,308 | |
| | | | | | |
|
|
|
| | | | | | | | 5,284,377 | |
| | | | | | |
|
|
|
| | | | | Paper & Forest Products - 0.10% | |
| | 4,012 | | | International Paper Co. (a) | | | 203,729 | |
| | | | | | |
|
|
|
| | | | | Personal Products - 0.82% | |
| | 8,516 | | | Herbalife, Ltd. (a)(b) | | | 495,120 | |
| | 3,217 | | | Mead Johnson Nutrition Co. | | | 286,570 | |
| | 9,583 | | | Nu Skin Enterprises, Inc. - Class A (a) | | | 532,240 | |
| | 4,077 | | | The Estee Lauder Cos., Inc. - Class A | | | 345,689 | |
| | | | | | |
|
|
|
| | | | | | | | 1,659,619 | |
| | | | | | |
|
|
|
| | | | | Pharmaceuticals - 3.87% | |
| | 908 | | | Abbott Laboratories | | | 40,324 | |
| | 4,696 | | | AbbVie, Inc. | | | 305,991 | |
| | 846 | | | Allergan Plc | | | 202,126 | |
| | 7,738 | | | Bristol-Myers Squibb Co. | | | 420,793 | |
| | 3,947 | | | Eli Lilly & Co. | | | 331,982 | |
| | 62,343 | | | Endo International Plc (b) | | | 695,748 | |
| | 22,830 | | | Johnson & Johnson | | | 2,843,477 | |
| | 13,292 | | | Mallinckrodt Plc (a)(b) | | | 592,425 | |
| | 14,337 | | | Merck & Co., Inc. | | | 910,973 | |
| | 10,905 | | | Mylan NV (a)(b) | | | 425,186 | |
| | 27,009 | | | Pfizer, Inc. | | | 923,978 | |
| | 2,817 | | | Zoetis, Inc. | | | 150,343 | |
| | | | | | |
|
|
|
| | | | | | | | 7,843,346 | |
| | | | | | |
|
|
|
| | | | | Professional Services - 0.47% | |
| | 347 | | | Equifax, Inc. | | | 47,449 | |
| | 2,533 | | | ManpowerGroup, Inc. | | | 259,810 | |
| | 8,386 | | | Robert Half International, Inc. (a) | | | 409,488 | |
| | 2,101 | | | The Dun & Bradstreet Corp. | | | 226,782 | |
| | | | | | |
|
|
|
| | | | | | | | 943,529 | |
| | | | | | |
|
|
|
| | | | | Real Estate Management & Development - 0.51% | |
| | 3,269 | | | CBRE Group, Inc. - Class A (b) | | | 113,729 | |
| | 390 | | | Jones Lang LaSalle, Inc. (a) | | | 43,465 | |
| | | | | | | | |
Number of
Shares
| | | | | Value
| |
| | | | | Real Estate Management & Development (Continued) | |
| | 29,608 | | | Realogy Holdings Corp. (a) | | $ | 882,022 | |
| | | | | | |
|
|
|
| | | | | | | | 1,039,216 | |
| | | | | | |
|
|
|
| | | | | Road & Rail - 0.60% | |
| | 6,996 | | | CSX Corp. | | | 325,664 | |
| | 434 | | | J.B. Hunt Transport Services, Inc. | | | 39,815 | |
| | 3,458 | | | Landstar System, Inc. | | | 296,178 | |
| | 773 | | | Norfolk Southern Corp. | | | 86,553 | |
| | 969 | | | Old Dominion Freight Line, Inc. (a) | | | 82,917 | |
| | 3,729 | | | Union Pacific Corp. | | | 394,976 | |
| | | | | | |
|
|
|
| | | | | | | | 1,226,103 | |
| | | | | | |
|
|
|
| | | | | Semiconductors & Semiconductor Equipment - 3.20% | |
| | 2,494 | | | Analog Devices, Inc. | | | 204,407 | |
| | 16,344 | | | Applied Materials, Inc. | | | 635,782 | |
| | 869 | | | Broadcom Ltd. | | | 190,276 | |
| | 8,449 | | | Cree, Inc. (a)(b) | | | 225,842 | |
| | 40,159 | | | Intel Corp. (a) | | | 1,448,535 | |
| | 3,623 | | | KLA-Tencor Corp. (a) | | | 344,439 | |
| | 1,498 | | | Lam Research Corp. (a) | | | 192,283 | |
| | 7,708 | | | Marvell Technology Group, Ltd. - ADR | | | 117,624 | |
| | 1,005 | | | Maxim Integrated Products, Inc. | | | 45,185 | |
| | 4,505 | | | Microchip Technology, Inc. (a) | | | 332,379 | |
| | 2,521 | | | Micron Technology, Inc. (a)(b) | | | 72,857 | |
| | 6,016 | | | NVIDIA Corp. | | | 655,323 | |
| | 17,521 | | | ON Semiconductor Corp. (b) | | | 271,400 | |
| | 2,707 | | | Qorvo, Inc. (a)(b) | | | 185,592 | |
| | 2,503 | | | Skyworks Solutions, Inc. | | | 245,244 | |
| | 8,941 | | | Teradyne, Inc. | | | 278,065 | |
| | 11,938 | | | Texas Instruments, Inc. (a) | | | 961,725 | |
| | 1,218 | | | Xilinx, Inc. (a) | | | 70,510 | |
| | | | | | |
|
|
|
| | | | | | | | 6,477,468 | |
| | | | | | |
|
|
|
| | | | | Software - 5.26% | |
| | 4,122 | | | Activision Blizzard, Inc. | | | 205,523 | |
| | 2,058 | | | Adobe Systems, Inc. (b) | | | 267,808 | |
| | 1,987 | | | Atlassian Corp. Plc (a)(b) | | | 59,511 | |
| | 1,433 | | | Autodesk, Inc. (b) | | | 123,912 | |
| | 16,498 | | | Cadence Design System, Inc. (a)(b) | | | 518,037 | |
| | 3,820 | | | CDK Global, Inc. | | | 248,338 | |
| | 2,980 | | | Citrix Systems, Inc. (b) | | | 248,502 | |
| | 1,353 | | | Dell Technologies, Inc. - Class V (b) | | | 86,700 | |
| | 2,624 | | | Electronic Arts, Inc. (a)(b) | | | 234,901 | |
| | 1,474 | | | FactSet Research Systems, Inc. (a) | | | 243,077 | |
| | 6,571 | | | Fortinet, Inc. (a)(b) | | | 251,998 | |
| | 3,434 | | | Intuit, Inc. | | | 398,310 | |
| | 775 | | | Jack Henry & Associates, Inc. | | | 72,153 | |
| | 5,077 | | | Manhattan Associates, Inc. (b) | | | 264,258 | |
| | 59,141 | | | Microsoft Corp. | | | 3,895,026 | |
| | 22,687 | | | Nuance Communications, Inc. (b) | | | 392,712 | |
| | 13,121 | | | Oracle Corp. (a) | | | 585,328 | |
| | 2,441 | | | PTC, Inc. (b) | | | 128,275 | |
| | 2,519 | | | Red Hat, Inc. (b) | | | 217,894 | |
| | 2,856 | | | salesforce.com, Inc. (b) | | | 235,591 | |
| | 2,311 | | | ServiceNow, Inc. (a)(b) | | | 202,143 | |
| | 2,212 | | | Splunk, Inc. (a)(b) | | | 137,785 | |
| | 1,931 | | | SS&C Technologies Holdings, Inc. | | | 68,357 | |
| | 10,246 | | | Symantec Corp. | | | 314,347 | |
| | 7,617 | | | Synopsys, Inc. (b) | | | 549,414 | |
| | 4,186 | | | Tableau Software, Inc. - Class A (b) | | | 207,416 | |
| | 508 | | | Ultimate Software Group, Inc. (b) | | | 99,167 | |
See notes to financial statements.
41
GuideMark® Large Cap Core Fund
SCHEDULE OF INVESTMENTS (Continued)
March 31, 2017
| | | | | | | | |
Number of
Shares
| | | | | Value
| |
| | | | | COMMON STOCKS (Continued) | |
| | | | | Software (Continued) | |
| | 3,796 | | | VMware, Inc. (a)(b) | | $ | 349,763 | |
| | 761 | | | Workday, Inc. - Class A (a)(b) | | | 63,376 | |
| | | | | | |
|
|
|
| | | | | | | | 10,669,622 | |
| | | | | | |
|
|
|
| | | | | Specialty Retail - 4.49% | |
| | 1,524 | | | Advance Auto Parts, Inc. (a) | | | 225,948 | |
| | 357 | | | AutoZone, Inc. (a)(b) | | | 258,129 | |
| | 13,437 | | | Bed Bath & Beyond, Inc. (a) | | | 530,224 | |
| | 12,547 | | | Best Buy Co., Inc. (a) | | | 616,685 | |
| | 4,019 | | | Cabela’s, Inc. (b) | | | 213,449 | |
| | 6,203 | | | Dick’s Sporting Goods, Inc. | | | 301,838 | |
| | 4,100 | | | Foot Locker, Inc. | | | 306,721 | |
| | 13,334 | | | GameStop Corp. - Class A (a) | | | 300,682 | |
| | 8,169 | | | Home Depot, Inc. | | | 1,199,454 | |
| | 5,446 | | | L Brands, Inc. (a) | | | 256,507 | |
| | 5,979 | | | Lowe’s Cos., Inc. | | | 491,534 | |
| | 1,116 | | | O’Reilly Automotive, Inc. (a)(b) | | | 301,141 | |
| | 7,810 | | | Ross Stores, Inc. | | | 514,445 | |
| | 14,276 | | | Sally Beauty Holdings, Inc. (b) | | | 291,801 | |
| | 1,590 | | | Sherwin-Williams Co. | | | 493,202 | |
| | 1,421 | | | Signet Jewelers Ltd. | | | 98,433 | |
| | 41,133 | | | Staples, Inc. | | | 360,736 | |
| | 12,604 | | | The Gap, Inc. | | | 306,151 | |
| | 12,726 | | | The Michaels Cos., Inc. (a)(b) | | | 284,935 | |
| | 5,157 | | | The TJX Companies, Inc. (a) | | | 407,816 | |
| | 1,988 | | | Tiffany & Co. (a) | | | 189,456 | |
| | 3,589 | | | Tractor Supply Co. (a) | | | 247,533 | |
| | 1,058 | | | Ulta Salon, Cosmetics & Fragrance, Inc. (b) | | | 301,773 | |
| | 13,772 | | | Urban Outfitters, Inc. (b) | | | 327,223 | |
| | 5,122 | | | Williams Sonoma, Inc. (a) | | | 274,642 | |
| | | | | | |
|
|
|
| | | | | | | | 9,100,458 | |
| | | | | | |
|
|
|
| | | | | Technology Hardware, Storage & Peripherals - 4.72% | |
| | 45,316 | | | Apple, Inc. | | | 6,510,096 | |
| | 19,064 | | | Hewlett Packard Enterprise Co. | | | 451,817 | |
| | 12,120 | | | HP, Inc. | | | 216,706 | |
| | 9,527 | | | International Business Machines Corp. (a) | | | 1,659,032 | |
| | 2,038 | | | NCR Corp. (b) | | | 93,096 | |
| | 2,873 | | | NetApp, Inc. (a) | | | 120,235 | |
| | 15,293 | | | Teradata Corp. (a)(b) | | | 475,918 | |
| | 587 | | | Western Digital Corp. | | | 48,445 | |
| | | | | | |
|
|
|
| | | | | | | | 9,575,345 | |
| | | | | | |
|
|
|
| | | | | Textiles, Apparel & Luxury Goods - 1.74% | |
| | 3,364 | | | Carter’s, Inc. (a) | | | 302,087 | |
| | 6,842 | | | Coach, Inc. | | | 282,780 | |
| | 12,829 | | | Kate Spade & Co. (b) | | | 298,018 | |
| | 4,070 | | | lululemon athletica, Inc. (b) | | | 211,111 | |
| | 6,915 | | | Michael Kors Holdings Ltd. (b) | | | 263,531 | |
| | 8,168 | | | NIKE, Inc. - Class B (a) | | | 455,202 | |
| | 4,383 | | | PVH Corp. | | | 453,509 | |
| | 4,774 | | | Ralph Lauren Corp. (a) | | | 389,654 | |
| | 9,976 | | | Skechers U.S.A., Inc. - Class A (a)(b) | | | 273,841 | |
| | 7,081 | | | Under Armour, Inc. - Class A (a)(b) | | | 140,062 | |
| | 11,151 | | | Under Armour, Inc. - Class C (a)(b) | | | 204,063 | |
| | 4,471 | | | VF Corp. (a) | | | 245,771 | |
| | | | | | |
|
|
|
| | | | | | | | 3,519,629 | |
| | | | | | |
|
|
|
| | | | | Tobacco - 1.04% | |
| | 13,643 | | | Altria Group, Inc. | | | 974,383 | |
| | 8,163 | | | Philip Morris International, Inc. (a) | | | 921,603 | |
| | | | | | | | |
Number of
Shares
| | | | | Value
| |
| | | | | Tobacco (Continued) | |
| | 3,321 | | | Reynolds American, Inc. | | $ | 209,289 | |
| | | | | | |
|
|
|
| | | | | | | | 2,105,275 | |
| | | | | | |
|
|
|
| | | | | Trading Companies & Distributors - 1.11% | |
| | 6,874 | | | Fastenal Co. (a) | | | 354,011 | |
| | 2,875 | | | HD Supply Holdings, Inc. (b) | | | 118,234 | |
| | 5,321 | | | MSC Industrial Direct Co., Inc. - Class A (a) | | | 546,786 | |
| | 1,448 | | | W.W. Grainger, Inc. (a) | | | 337,037 | |
| | 1,641 | | | Watsco, Inc. | | | 234,958 | |
| | 9,436 | | | WESCO International, Inc. (b) | | | 656,274 | |
| | | | | | |
|
|
|
| | | | | | | | 2,247,300 | |
| | | | | | |
|
|
|
| | | | | Water Utilities - 0.03% | |
| | 904 | | | American Water Works Co., Inc. | | | 70,304 | |
| | | | | | |
|
|
|
| | | | | Wireless Telecommunication Services - 0.22% | |
| | 6,846 | | | Sprint Corp. (a)(b) | | | 59,423 | |
| | 14,812 | | | Telephone & Data Systems, Inc. | | | 392,666 | |
| | | | | | |
|
|
|
| | | | | | | | 452,089 | |
| | | | | | |
|
|
|
| | | | | Total Common Stocks
(Cost $153,929,445) | | | 192,924,615 | |
| | | | | | |
|
|
|
| | | | | INVESTMENT COMPANIES - 1.59% | |
| | | | | Exchange Traded Funds - 1.59% | |
| | 14,890 | | | Vanguard S&P 500 ETF | | | 3,221,451 | |
| | | | | | |
|
|
|
| | | | | Total Investment Companies
(Cost $3,084,780) | | | 3,221,451 | |
| | | | | | |
|
|
|
| | | | | REAL ESTATE INVESTMENT TRUSTS - 2.59% | |
| | | | | Real Estate Investment Trusts - 2.59% | |
| | 6,835 | | | AGNC Investment Corp. | | | 135,948 | |
| | 1,873 | | | Alexandria Real Estate Equities, Inc. (a) | | | 207,004 | |
| | 1,179 | | | American Campus Communities, Inc. | | | 56,109 | |
| | 17,549 | | | American Homes 4 Rent - Class A | | | 402,925 | |
| | 403 | | | American Tower Corp. | | | 48,981 | |
| | 24,992 | | | Annaly Capital Management, Inc. | | | 277,661 | |
| | 2,609 | | | Brandywine Realty Trust | | | 42,344 | |
| | 2,071 | | | Camden Property Trust | | | 166,633 | |
| | 26,673 | | | Chimera Investment Corp. | | | 538,261 | |
| | 9,347 | | | Corporate Office Properties Trust | | | 309,386 | |
| | 852 | | | CyrusOne, Inc. | | | 43,852 | |
| | 3,685 | | | DCT Industrial Trust, Inc. | | | 177,322 | |
| | 1,765 | | | Digital Realty Trust, Inc. (a) | | | 187,778 | |
| | 1,129 | | | Douglas Emmett, Inc. | | | 43,354 | |
| | 8,719 | | | Duke Realty Corp. | | | 229,048 | |
| | 5,766 | | | Empire State Realty Trust, Inc. - Class A (a) | | | 119,010 | |
| | 2,452 | | | EPR Properties | | | 180,541 | |
| | 111 | | | Equinix, Inc. | | | 44,441 | |
| | 2,215 | | | Equity Commonwealth (b) | | | 69,152 | |
| | 6,451 | | | Hospitality Property Trust (a) | | | 203,400 | |
| | 15,827 | | | Host Hotels & Resorts, Inc. (a) | | | 295,332 | |
| | 3,375 | | | Iron Mountain, Inc. (a) | | | 120,386 | |
| | 1,078 | | | Lamar Advertising Co. - Class A | | | 80,570 | |
| | 4,045 | | | Liberty Property Trust | | | 155,935 | |
| | 27,628 | | | MFA Financial, Inc. (a) | | | 223,234 | |
| | 2,916 | | | Omega Healthcare Investors, Inc. | | | 96,199 | |
| | 7,520 | | | Piedmont Office Realty Trust, Inc. - Class A (a) | | | 160,778 | |
| | 3,123 | | | Prologis, Inc. | | | 162,021 | |
| | 2,602 | | | Quality Care Properties, Inc. (b) | | | 49,074 | |
| | 2,170 | | | Senior Housing Properties Trust | | | 43,942 | |
| | 510 | | | SL Green Realty Corp. | | | 54,376 | |
| | 2,951 | | | Starwood Property Trust, Inc. | | | 66,634 | |
See notes to financial statements.
42
GuideMark® Large Cap Core Fund
SCHEDULE OF INVESTMENTS (Continued)
March 31, 2017
| | | | | | | | |
Number of
Shares
| | | | | Value
| |
| | | | | REAL ESTATE INVESTMENT TRUSTS (Continued) | |
| | | | | Real Estate Investment Trusts (Continued) | |
| | 535 | | | Sun Communities, Inc. | | $ | 42,977 | |
| | 6,356 | | | Two Harbors Investment Corp. (a) | | | 60,954 | |
| | 3,278 | | | Uniti Group, Inc. | | | 84,736 | |
| | 9,898 | | | VEREIT, Inc. | | | 84,034 | |
| | | | | | |
|
|
|
| | | | | Total Real Estate Investment Trusts
(Cost $4,856,391) | | | 5,264,332 | |
| | | | | | |
|
|
|
| | | | | SHORT TERM INVESTMENTS - 0.68% | |
| | | | | Money Market Funds - 0.68% | |
| | 1,373,130 | | | Deutsche Government Money Market Series - Institutional Shares
Effective Yield, 0.63% (c) | | | 1,373,130 | |
| | | | | | |
|
|
|
| | | | | Total Short Term Investments
(Cost $1,373,130) | | | 1,373,130 | |
| | | | | | |
|
|
|
| | | | | | | | |
Number of
Shares
| | | | | Value
| |
| | | | | INVESTMENTS PURCHASED AS SECURITIES
LENDING COLLATERAL - 24.60% | |
| | | | | Investment Companies - 24.60% | |
| | 49,865,866 | | | Mount Vernon Liquid Assets Portfolio, LLC Effective Yield, 1.17% (c) | | $ | 49,865,866 | |
| | | | | | |
|
|
|
| | | | | Total Investments Purchased as Securities Lending Collateral
(Cost $49,865,866) | | | 49,865,866 | |
| | | | | | |
|
|
|
| | | | | Total Investments
(Cost $213,109,612) - 124.63% | | | 252,649,394 | |
| | | | | Liabilities in Excess of
Other Assets - (24.63)% | | | (49,935,547 | ) |
| | | | | | |
|
|
|
| | | | | TOTAL NET ASSETS - 100.00% | | $ | 202,713,847 | |
| | | | | | |
|
|
|
Percentages are stated as a percent of net assets.
ADR - American Depositary Receipt
| (a) | | All or portion of this security is on loan. |
| (b) | | Non-income producing security. |
| (c) | | Seven-day yield as of March 31, 2017. |
See notes to financial statements.
43
GuideMark® Emerging Markets Fund
SCHEDULE OF INVESTMENTS
March 31, 2017
| | | | | | | | |
Number of
Shares
| | | | | Value
| |
| | | | | COMMON STOCKS - 81.15% | |
| | | | | Brazil - 4.91% | |
| | 72,007 | | | Ambev SA | | $ | 418,158 | |
| | 20,170 | | | Banco Bradesco SA | | | 207,138 | |
| | 50,652 | | | Banco do Brasil SA | | | 545,416 | |
| | 32,630 | | | Banco Santander Brasil SA | | | 289,653 | |
| | 38,220 | | | BB Seguridade Participacoes SA | | | 357,954 | |
| | 23,510 | | | BM&F Bovespa SA | | | 144,864 | |
| | 52,664 | | | Centrais Eletricas Brasileiras SA (a) | | | 289,512 | |
| | 26,532 | | | Cia de Saneamento Basico do Estado de Sao Paulo | | | 277,219 | |
| | 11,274 | | | Cosan SA Industria e Comercio | | | 139,548 | |
| | 22,451 | | | CPFL Energia SA | | | 185,024 | |
| | 39,371 | | | EDP - Energias do Brasil SA | | | 174,809 | |
| | 19,444 | | | Equatorial Energia SA | | | 365,204 | |
| | 39,191 | | | Lojas Renner SA | | | 348,019 | |
| | 6,653 | | | M Dias Branco SA | | | 271,042 | |
| | 19,736 | | | Natura Cosmeticos SA | | | 183,705 | |
| | 32,551 | | | Odontoprev SA | | | 117,286 | |
| | 48,493 | | | Petroleo Brasileiro SA (a) | | | 236,068 | |
| | 23,394 | | | Raia Drogasil SA | | | 440,665 | |
| | 81,318 | | | Sul America SA (b) | | | 433,785 | |
| | 6,841 | | | Ultrapar Participacoes SA | | | 156,242 | |
| | 22,966 | | | Vale SA | | | 218,539 | |
| | | | | | |
|
|
|
| | | | | | | | 5,799,850 | |
| | | | | | |
|
|
|
| | | | | Chile - 1.00% | |
| | 1,193,542 | | | Banco de Chile | | | 143,994 | |
| | 4,560 | | | Banco de Credito e Inversiones | | | 250,889 | |
| | 76,387 | | | Cencosud SA | | | 234,738 | |
| | 25,380 | | | Cia Cervecerias Unidas SA | | | 319,945 | |
| | 9,679 | | | Empresa Nacional de Telecomunicaciones SA (a) | | | 116,994 | |
| | 557,470 | | | Enel Americas SA | | | 115,807 | |
| | | | | | |
|
|
|
| | | | | | | | 1,182,367 | |
| | | | | | |
|
|
|
| | | | | China - 15.62% | |
| | 1,095,251 | | | Agricultural Bank of China Ltd. - Series H | | | 505,106 | |
| | 23,299 | | | Alibaba Group Holding Ltd. - ADR (a) | | | 2,512,331 | |
| | 244,807 | | | Aluminum Corp. of China Ltd. - Series H (a) | | | 119,702 | |
| | 113,209 | | | ANTA Sports Products Ltd. | | | 313,215 | |
| | 5,264 | | | Baidu, Inc. - ADR (a) | | | 908,145 | |
| | 2,068,656 | | | Bank of China Ltd. - Series H | | | 1,028,705 | |
| | 384,000 | | | Bank of Communications Co., Ltd. - Series H | | | 298,912 | |
| | 569,672 | | | China Cinda Asset Management Co., Ltd. - Series H | | | 221,558 | |
| | 420,000 | | | China CITIC Bank Corp. Ltd. - Series H | | | 278,665 | |
| | 886,000 | | | China Communications Services Corp. Ltd. - Series H | | | 580,248 | |
| | 2,291,110 | | | China Construction Bank Corp. - Series H | | | 1,845,965 | |
| | 347,000 | | | China Everbright Bank Co., Ltd. - Series H | | | 169,712 | |
| | 288,414 | | | China Huarong Asset Management Co., Ltd. - Series H (a) | | | 118,015 | |
| | 38,375 | | | China Life Insurance Company Ltd. - Series H | | | 117,769 | |
| | 82,346 | | | China Mengniu Dairy Co., Ltd. | | | 170,754 | |
| | 124,289 | | | China Merchants Bank Co., Ltd. - Series H | | | 328,915 | |
| | 191,873 | | | China Minsheng Banking Corp., Ltd. - Series H | | | 205,106 | |
| | 835,981 | | | China Petroleum & Chemical Corp. - Series H | | | 680,460 | |
| | 325,187 | | | China Southern Airlines Co., Ltd. - Series H | | | 225,223 | |
| | 592,413 | | | Chongqing Rural Commercial Bank Co., Ltd. - Series H | | | 400,227 | |
| | 619,647 | | | Country Garden Holdings Co., Ltd. | | | 557,229 | |
| | 143,566 | | | Great Wall Motor Co., Ltd. - Series H | | | 163,490 | |
| | | | | | | | |
Number of
Shares
| | | | | Value
| |
| | | | | China (Continued) | |
| | 143,501 | | | Guangzhou Automobile Group Co., Ltd. - Series H | | $ | 229,832 | |
| | 114,484 | | | Haier Electronics Group Co., Ltd. | | | 262,392 | |
| | 3,394 | | | NetEase.com, Inc. - ADR | | | 963,896 | |
| | 25,079 | | | New China Life Insurance Co., Ltd. - Series H | | | 119,401 | |
| | 10,528 | | | New Oriental Education & Technology Group, Inc. - ADR (a) | | | 635,681 | |
| | 879,049 | | | People’s Insurance Co. of China, Ltd. - Series H | | | 364,595 | |
| | 306,000 | | | PetroChina Co. - Series H | | | 224,169 | |
| | 193,025 | | | PICC Property & Casualty Co., Ltd. - Series H | | | 297,921 | |
| | 108,097 | | | Ping An Insurance Group Co. of China, Ltd. - Series H | | | 605,825 | |
| | 92,849 | | | Semiconductor Manufacturing International Corp. (a) | | | 114,934 | |
| | 236,647 | | | Shanghai Electric Group Co., Ltd. - Series H | | | 117,235 | |
| | 20,768 | | | Shenzhou International Group Holdings Ltd. | | | 131,071 | |
| | 1,615 | | | Sina Corp. (a) | | | 116,474 | |
| | 376,500 | | | Sino-Ocean Land Holdings Ltd. | | | 176,894 | |
| | 378,622 | | | Sinopec Shanghai Petrochemical Co., Ltd. - Series H | | | 210,135 | |
| | 377,072 | | | Sun Art Retail Group Ltd. | | | 353,516 | |
| | 4,302 | | | TAL Education Group - ADR (a) | | | 458,464 | |
| | 23,886 | | | Vipshop Holdings Ltd. - ADR (a) | | | 318,639 | |
| | 283,799 | | | Want Want China Holdings, Ltd. | | | 196,541 | |
| | 8,245 | | | Weibo Corp. - ADR (a)(c) | | | 430,224 | |
| | 12,894 | | | Yum China Holdings, Inc. (a)(c) | | | 350,717 | |
| | | | | | |
|
|
|
| | | | | | | | 18,428,008 | |
| | | | | | |
|
|
|
| | | | | Colombia - 0.20% | |
| | 57,026 | | | Interconexion Electrica SA ESP | | | 230,089 | |
| | | | | | |
|
|
|
| | | | | Czech Republic - 0.15% | |
| | 15,385 | | | O2 Czech Republic AS | | | 171,890 | |
| | | | | | |
|
|
|
| | | | | Egypt - 0.15% | |
| | 43,369 | | | Commercial International Bank Egypt SAE (b) | | | 181,516 | |
| | | | | | |
|
|
|
| | | | | Hong Kong - 10.24% | |
| | 44,239 | | | AAC Technologies Holdings, Inc. | | | 517,996 | |
| | 658,079 | | | Belle International Holdings Ltd. | | | 428,021 | |
| | 143,979 | | | China Mobile Ltd. | | | 1,583,410 | |
| | 66,466 | | | China Overseas Land & Investment Ltd. | | | 189,958 | |
| | 81,360 | | | China Resources Land Ltd. | | | 220,050 | |
| | 346,338 | | | China Telecom Corp. Ltd. - Series H | | | 169,178 | |
| | 89,911 | | | China Unicom Hong Kong Ltd. | | | 120,762 | |
| | 234,800 | | | CSPC Pharmaceutical Group Ltd. | | | 307,615 | |
| | 674,178 | | | Fullshare Holdings Ltd. | | | 298,617 | |
| | 398,461 | | | Geely Automobile Holdings Ltd. | | | 610,664 | |
| | 1,894,492 | | | Industrial & Commercial Bank of China Ltd. - Series H | | | 1,239,658 | |
| | 310,000 | | | Kunlun Energy Co., Ltd. | | | 287,255 | |
| | 110,331 | | | Longfor Properties Co., Ltd. | | | 181,640 | |
| | 261,609 | | | Nine Dragons Paper Holdings Ltd. | | | 281,450 | |
| | 503,592 | | | Sino Biopharmaceutical Ltd. | | | 414,709 | |
| | 320,144 | | | Sinotrans Ltd. - Series H | | | 149,604 | |
| | 329,548 | | | Sunac China Holdings Ltd. | | | 427,760 | |
| | 49,479 | | | Sunny Optical Technology Group Co., Ltd. | | | 362,106 | |
| | 142,873 | | | Tencent Holdings Ltd. | | | 4,116,103 | |
| | 136,824 | | | Tingyi Holding Corp. | | | 171,827 | |
| | | | | | |
|
|
|
| | | | | | | | 12,078,383 | |
| | | | | | |
|
|
|
See notes to financial statements.
44
GuideMark® Emerging Markets Fund
SCHEDULE OF INVESTMENTS (Continued)
March 31, 2017
| | | | | | | | |
Number of
Shares
| | | | | Value
| |
| | | | | COMMON STOCKS (Continued) | |
| | | | | Hungary - 0.47% | |
| | 5,335 | | | MOL Hungarian Oil and Gas Plc | | $ | 365,294 | |
| | 6,747 | | | OTP Bank Plc | | | 188,507 | |
| | | | | | |
|
|
|
| | | | | | | | 553,801 | |
| | | | | | |
|
|
|
| | | | | Indonesia - 2.03% | |
| | 4,919,951 | | | Adaro Energy Tbk PT | | | 646,247 | |
| | 94,701 | | | Bank Central Asia Tbk PT | | | 117,617 | |
| | 52,072 | | | Gudang Garam Tbk PT | | | 256,078 | |
| | 441,599 | | | Hanjaya Mandala Sampoerna Tbk PT | | | 129,285 | |
| | 1,215,482 | | | Kalbe Farma Tbk PT | | | 140,468 | |
| | 177,812 | | | Matahari Department Store Tbk PT | | | 175,833 | |
| | 656,400 | | | Surya Citra Media Tbk PT | | | 133,035 | |
| | 1,167,838 | | | Telekomunikasi Indonesia Persero Tbk PT | | | 363,016 | |
| | 80,879 | | | Unilever Indonesia Tbk PT | | | 262,968 | |
| | 87,110 | | | United Tractors Tbk PT | | | 173,233 | |
| | | | | | |
|
|
|
| | | | | | | | 2,397,780 | |
| | | | | | |
|
|
|
| | | | | Malaysia - 1.89% | |
| | 482,887 | | | AirAsia Bhd | | | 342,585 | |
| | 289,307 | | | Astro Malaysia Holdings Bhd | | | 179,064 | |
| | 27,976 | | | British American Tobacco Malaysia Bhd | | | 288,131 | |
| | 293,412 | | | DiGi.Com Bhd | | | 340,120 | |
| | 290,520 | | | Felda Global Ventures Holdings Bhd | | | 137,190 | |
| | 67,006 | | | Genting Bhd | | | 145,238 | |
| | 65,123 | | | HAP Seng Consolidated Bhd | | | 132,233 | |
| | 100,451 | | | Maxis Communications Bhd | | | 146,151 | |
| | 51,145 | | | Public Bank Bhd | | | 229,922 | |
| | 691,771 | | | SapuraKencana Petroleum Bhd | | | 284,524 | |
| | | | | | |
|
|
|
| | | | | | | | 2,225,158 | |
| | | | | | |
|
|
|
| | | | | Mexico - 3.62% | |
| | 86,522 | | | Alfa SAB de CV - Series A | | | 126,394 | |
| | 570,545 | | | America Movil SAB de CV - Series L | | | 405,002 | |
| | 22,075 | | | Arca Continental SAB de CV | | | 153,280 | |
| | 449,294 | | | Cemex SAB de CV (a) | | | 407,003 | |
| | 17,078 | | | Coca-Cola Femsa SAB de CV - Series L | | | 122,378 | |
| | 46,848 | | | Fomento Economico Mexicano SAB de CV | | | 415,976 | |
| | 102,459 | | | Gentera SAB de CV | | | 169,212 | |
| | 25,451 | | | Gruma SAB de CV - Series B | | | 359,643 | |
| | 14,058 | | | Grupo Aeroportuario del Pacifico SAB de CV - Series B | | | 136,523 | |
| | 7,131 | | | Grupo Aeroportuario del Sureste SAB de CV - Series B | | | 123,544 | |
| | 168,733 | | | Grupo Bimbo SAB de CV - Series A | | | 419,529 | |
| | 39,714 | | | Grupo Financiero Banorte SAB de CV - Series O | | | 228,540 | |
| | 74,876 | | | Grupo Mexico SAB de CV - Series B | | | 224,641 | |
| | 11,969 | | | Industrias Penoles SAB de CV | | | 308,146 | |
| | 25,369 | | | Infraestructura Energetica Nova SAB de CV | | | 120,895 | |
| | 86,163 | | | Kimberly-Clark de Mexico SAB de CV - Series A | | | 187,078 | |
| | 158,916 | | | Wal-Mart de Mexico SAB de CV | | | 366,685 | |
| | | | | | |
|
|
|
| | | | | | | | 4,274,469 | |
| | | | | | |
|
|
|
| | | | | Peru - 0.43% | |
| | 16,556 | | | Cia de Minas Buenaventura SAA - ADR | | | 199,334 | |
| | 1,882 | | | CREDICORP Ltd. | | | 307,331 | |
| | | | | | |
|
|
|
| | | | | | | | 506,665 | |
| | | | | | |
|
|
|
| | | | | Philippines - 0.22% | |
| | 6,395 | | | Globe Telecom, Inc. | | | 258,959 | |
| | | | | | |
|
|
|
| | | | | Poland - 1.80% | |
| | 4,779 | | | CCC SA | | | 286,597 | |
| | | | | | | | |
Number of
Shares
| | | | | Value
| |
| | | | | Poland (Continued) | |
| | 15,043 | | | Eurocash SA | | $ | 121,019 | |
| | 38,396 | | | Grupa Lotos SA (a) | | | 529,421 | |
| | 15,005 | | | Jastrzebska Spolka Weglowa SA (a) | | | 237,616 | |
| | 5,124 | | | KGHM Polska Miedz SA | | | 149,623 | |
| | 174 | | | LPP SA | | | 297,988 | |
| | 11,140 | | | Polski Koncern Naftowy Orlen SA | | | 280,973 | |
| | 99,348 | | | Polskie Gornictwo Naftowe i Gazownictwo SA | | | 148,238 | |
| | 55,469 | | | Synthos SA | | | 73,433 | |
| | | | | | |
|
|
|
| | | | | | | | 2,124,908 | |
| | | | | | |
|
|
|
| | | | | Qatar - 0.16% | |
| | 7,211 | | | Ooredoo QSC | | | 191,453 | |
| | | | | | |
|
|
|
| | | | | Republic of Korea - 13.78% | |
| | 1,263 | | | Amorepacific Corp. | | | 317,042 | |
| | 2,112 | | | AMOREPACIFIC Group | | | 225,773 | |
| | 2,200 | | | BGF retail Co., Ltd. | | | 206,630 | |
| | 31,898 | | | BNK Financial Group, Inc. | | | 261,703 | |
| | 11,244 | | | Cheil Worldwide, Inc. | | | 191,084 | |
| | 4,346 | | | Coway Co., Ltd. | | | 374,157 | |
| | 10,113 | | | Daewoo International Corp. | | | 215,746 | |
| | 35,743 | | | DGB Financial Group, Inc. | | | 346,508 | |
| | 2,158 | | | Dongbu Insurance Co., Ltd. | | | 123,530 | |
| | 10,988 | | | Hana Financial Group, Inc. | | | 362,582 | |
| | <1 | | | Hanmi Pharm Co., Ltd. | | | 24 | |
| | 1,449 | | | Hanssem Co., Ltd. | | | 285,071 | |
| | 5,061 | | | Hanwha Chemical Corp. | | | 119,476 | |
| | 8,478 | | | Hanwha Corp. | | | 272,201 | |
| | 24,749 | | | Hanwha Life Insurance Co., Ltd. | | | 133,666 | |
| | 3,430 | | | Hanwha Techwin Co., Ltd. | | | 144,423 | |
| | 991 | | | Hyosung Corp. | | | 120,076 | |
| | 4,203 | | | Hyundai Engineering & Construction Co., Ltd. | | | 186,200 | |
| | 1,041 | | | Hyundai Heavy Industries Co., Ltd. (a)(b) | | | 153,546 | |
| | 3,916 | | | Hyundai Marine & Fire Insurance Co., Ltd. | | | 122,561 | |
| | 2,843 | | | Hyundai Steel Co. | | | 148,722 | |
| | 20,385 | | | Industrial Bank of Korea | | | 222,214 | |
| | 10,053 | | | KB Financial Group, Inc. | | | 440,587 | |
| | 5,817 | | | Kia Motors Corp. | | | 192,791 | |
| | 8,759 | | | Korea Electric Power Corp. | | | 364,596 | |
| | 10,976 | | | Korea Gas Corp. | | | 441,714 | |
| | 10,058 | | | Korean Air Lines Co., Ltd. (a) | | | 283,886 | |
| | 4,092 | | | KT Corp. | | | 116,804 | |
| | 4,150 | | | LG Electronics, Inc. | | | 252,111 | |
| | 531 | | | LG Household & Health Care Ltd. | | | 385,220 | |
| | 952 | | | LG Innotek Co., Ltd. | | | 116,201 | |
| | 47,914 | | | LG Uplus Corp. | | | 613,221 | |
| | 438 | | | Lotte Chemical Co. | | | 145,140 | |
| | 899 | | | Naver Corp. | | | 687,432 | |
| | 2,736 | | | POSCO | | | 710,610 | |
| | 2,412 | | | S-1 Corp. | | | 193,522 | |
| | 2,664 | | | Samsung Electronics Co., Ltd. | | | 4,902,866 | |
| | 949 | | | Samsung SDI Co., Ltd. | | | 117,108 | |
| | 4,764 | | | Shinhan Financial Group Co., Ltd. | | | 198,502 | |
| | 10,119 | | | SK Hynix, Inc. | | | 457,045 | |
| | 3,011 | | | SK Innovation Co., Ltd. | | | 448,660 | |
| | 981 | | | SK Telecom Co., Ltd. | | | 221,657 | |
| | 37,917 | | | Woori Bank | | | 440,483 | |
| | | | | | |
|
|
|
| | | | | | | | 16,263,091 | |
| | | | | | |
|
|
|
| | | | | Russian Federation - 3.12% | |
| | 83,146 | | | Gazprom PAO - ADR (c) | | | 372,227 | |
| | 12,133 | | | Lukoil PJSC - ADR | | | 643,777 | |
See notes to financial statements.
45
GuideMark® Emerging Markets Fund
SCHEDULE OF INVESTMENTS (Continued)
March 31, 2017
| | | | | | | | |
Number of
Shares
| | | | | Value
| |
| | | | | COMMON STOCKS (Continued) | |
| | | | | Russian Federation (Continued) | |
| | 3,985 | | | Magnit PJSC - GDR | | $ | 152,227 | |
| | 29,266 | | | Mobile TeleSystems PJSC - ADR | | | 322,804 | |
| | 2,077 | | | NovaTek PJSC - ADR
(Acquired 03/31/2017, Cost $265,022) (d) | | | 259,856 | |
| | 73,101 | | | RusHydro PJSC - ADR | | | 121,041 | |
| | 90,824 | | | Sberbank of Russia PJSC - ADR (c) | | | 1,049,254 | |
| | 14,293 | | | Severstal PJSC - GDR
(Acquired 10/05/2015, Cost $151,957) (d) | | | 205,723 | |
| | 23,404 | | | Sistema PJSC FC - GDR
(Acquired 11/30/2016 and 03/31/2017, Cost $199,510) (d) | | | 209,466 | |
| | 8,915 | | | Tatneft PAO | | | 328,254 | |
| | 507 | | | Tatneft PAO - ADR | | | 19,007 | |
| | | | | | |
|
|
|
| | | | | | | | 3,683,636 | |
| | | | | | |
|
|
|
| | | | | South Africa - 5.64% | |
| | 18,731 | | | AngloGold Ashanti Ltd. | | | 200,159 | |
| | 16,466 | | | Barclays Africa Group Ltd. | | | 171,237 | |
| | 2,639 | | | Capitec Bank Holdings Ltd. | | | 149,817 | |
| | 54,617 | | | Coronation Fund Managers Ltd. | | | 257,640 | |
| | 35,359 | | | Exxaro Resources Ltd. | | | 310,567 | |
| | 54,410 | | | FirstRand Ltd. | | | 188,263 | |
| | 102,306 | | | Gold Fields Ltd. | | | 356,498 | |
| | 16,826 | | | Liberty Holdings Ltd. | | | 135,334 | |
| | 19,915 | | | Massmart Holdings Ltd. | | | 202,130 | |
| | 25,646 | | | Mr. Price Group Ltd. | | | 305,270 | |
| | 6,932 | | | Naspers Ltd. - N Shares | | | 1,194,469 | |
| | 8,316 | | | Nedbank Group Ltd. | | | 149,423 | |
| | 57,012 | | | Pick n Pay Stores Ltd. | | | 282,738 | |
| | 10,980 | | | Pioneer Foods Group Ltd. | | | 144,539 | |
| | 5,815 | | | PSG Group Ltd. | | | 107,057 | |
| | 48,768 | | | Sappi Ltd. | | | 330,362 | |
| | 15,975 | | | Shoprite Holdings Ltd. | | | 231,043 | |
| | 20,668 | | | Standard Bank Group Ltd. | | | 221,634 | |
| | 26,291 | | | Steinhoff International Holdings NV | | | 125,766 | |
| | 46,929 | | | Telkom SA SOC Ltd. | | | 262,601 | |
| | 24,851 | | | The Bidvest Group Ltd. | | | 284,843 | |
| | 14,064 | | | The SPAR Group Ltd. | | | 182,461 | |
| | 6,241 | | | Tiger Brands Ltd. | | | 186,200 | |
| | 27,942 | | | Truworths International Ltd. | | | 180,352 | |
| | 23,315 | | | Vodacom Group Ltd. | | | 263,919 | |
| | 43,825 | | | Woolworths Holdings Ltd. | | | 228,594 | |
| | | | | | |
|
|
|
| | | | | | | | 6,652,916 | |
| | | | | | |
|
|
|
| | | | | Taiwan - 11.76% | |
| | 625,399 | | | Acer, Inc. | | | 296,784 | |
| | 40,671 | | | Advantech Co., Ltd. | | | 340,468 | |
| | 21,840 | | | Asustek Computer, Inc. | | | 215,935 | |
| | 17,632 | | | Catcher Technology Co., Ltd. | | | 174,259 | |
| | 94,186 | | | Cathay Financial Holding Co., Ltd. | | | 151,169 | |
| | 1,085,261 | | | China Airlines Ltd. | | | 377,306 | |
| | 50,969 | | | Chunghwa Telecom Co., Ltd. | | | 173,085 | |
| | 191,657 | | | CTBC Financial Holding Co., Ltd. | | | 118,433 | |
| | 31,079 | | | Delta Electronics, Inc. | | | 166,454 | |
| | 19,985 | | | Eclat Textile Co., Ltd. | | | 200,318 | |
| | 448,589 | | | Eva Airways Corp. | | | 238,012 | |
| | 71,617 | | | Far EasTone Telecommunications Co., Ltd. | | | 175,838 | |
| | 69,847 | | | Feng TAY Enterprise Co., Ltd. | | | 278,332 | |
| | 494,273 | | | First Financial Holding Co., Ltd. | | | 301,360 | |
| | 68,729 | | | Formosa Chemicals & Fibre Corp. | | | 213,819 | |
| | 45,887 | | | Formosa Petrochemical Corp. | | | 160,285 | |
| | | | | | | | |
Number of
Shares
| | | | | Value
| |
| | | | | Taiwan (Continued) | |
| | 38,807 | | | Formosa Plastics Corp. | | $ | 115,746 | |
| | 40,978 | | | Foxconn Technology Co., Ltd. | | | 124,939 | |
| | 103,394 | | | Fubon Financial Holding Co., Ltd. | | | 168,640 | |
| | 353,550 | | | Hon Hai Precision Industry Co., Ltd. | | | 1,060,327 | |
| | 172,059 | | | Inventec Corp. | | | 129,012 | |
| | 2,964 | | | Largan Precision Co., Ltd. | | | 466,830 | |
| | 135,042 | | | Lite-On Technology Corp. | | | 232,767 | |
| | 18,648 | | | MediaTek, Inc. | | | 132,135 | |
| | 82,003 | | | Micro-Star International Co., Ltd. | | | 190,832 | |
| | 80,091 | | | Nan Ya Plastics Corp. | | | 189,750 | |
| | 44,520 | | | Nien Made Enterprise Co., Ltd. | | | 415,243 | |
| | 41,878 | | | Novatek Microelectronics Corp. | | | 162,183 | |
| | 64,216 | | | Pegatron Corp. | | | 190,101 | |
| | 107,426 | | | Pou Chen Corp. | | | 148,678 | |
| | 57,781 | | | Powertech Technology, Inc. | | | 168,146 | |
| | 65,925 | | | President Chain Store Corp. | | | 543,091 | |
| | 61,632 | | | Quanta Computer, Inc. | | | 125,310 | |
| | 69,764 | | | Realtek Semiconductor Corp. | | | 249,443 | |
| | 74,937 | | | Standard Foods Corp. | | | 186,223 | |
| | 130,691 | | | Synnex Technology International Corp. | | | 140,630 | |
| | 48,927 | | | Taiwan Mobile Co. | | | 179,750 | |
| | 595,555 | | | Taiwan Semiconductor Manufacturing Co., Ltd. | | | 3,734,507 | |
| | 241,433 | | | Uni-President Enterprises Corp. | | | 452,625 | |
| | 74,239 | | | Vanguard International Semiconductor Corp. | | | 141,374 | |
| | 584,870 | | | Wistron Corp. | | | 535,909 | |
| | 93,097 | | | WPG Holdings, Ltd. | | | 116,899 | |
| | | | | | |
|
|
|
| | | | | | | | 13,882,947 | |
| | | | | | |
|
|
|
| | | | | Thailand - 2.39% | |
| | 27,971 | | | Advanced Info Service PCL - NVDR | | | 144,891 | |
| | 380,886 | | | Banpu PCL - NVDR | | | 219,470 | |
| | 270,672 | | | BEC World PCL - NVDR | | | 137,068 | |
| | 86,117 | | | Berli Jucker PCL - NVDR | | | 116,535 | |
| | 25,077 | | | Bumrungrad Hospital PCL - NVDR | | | 133,545 | |
| | 97,065 | | | CP ALL PCL - NVDR | | | 166,659 | |
| | 20,961 | | | Electricity Generating PCL - NVDR | | | 130,513 | |
| | 808,815 | | | Home Product Center PCL - NVDR | | | 227,098 | |
| | 127,649 | | | Indorama Ventures PCL - NVDR | | | 130,946 | |
| | 55,228 | | | KCE Electronics PCL - NVDR | | | 167,970 | |
| | 150,459 | | | Minor International PCL - NVDR | | | 160,933 | |
| | 66,750 | | | PTT Exploration & Production PCL - NVDR | | | 180,673 | |
| | 81,744 | | | PTT Global Chemical PCL - NVDR | | | 174,240 | |
| | 35,675 | | | PTT PCL - NVDR | | | 401,769 | |
| | 97,635 | | | Robinson Department Store PCL - NVDR | | | 181,768 | |
| | 65,998 | | | Thai Oil PCL - NVDR | | | 145,024 | |
| | | | | | |
|
|
|
| | | | | | | | 2,819,102 | |
| | | | | | |
|
|
|
| | | | | Turkey - 1.38% | |
| | 21,806 | | | BIM Birlesik Magazalar AS | | | 335,291 | |
| | 82,905 | | | Eregli Demir ve Celik Fabrikalari TAS | | | 134,630 | |
| | 48,716 | | | Turkiye Garanti Bankasi AS | | | 118,759 | |
| | 76,198 | | | Turkiye Halk Bankasi AS | | | 217,456 | |
| | 177,923 | | | Turkiye Is Bankasi - Series C | | | 324,720 | |
| | 165,783 | | | Turkiye Vakiflar Bankasi TAO | | | 244,609 | |
| | 236,618 | | | Yapi ve Kredi Bankasi AS (a) | | | 247,283 | |
| | | | | | |
|
|
|
| | | | | | | | 1,622,748 | |
| | | | | | |
|
|
|
| | | | | United Arab Emirates - 0.19% | |
| | 46,658 | | | Emirates Telecommunications Group Co. PJSC | | | 229,413 | |
| | | | | | |
|
|
|
| | | | | Total Common Stocks
(Cost $79,266,222) | | | 95,759,149 | |
| | | | | | |
|
|
|
See notes to financial statements.
46
GuideMark® Emerging Markets Fund
SCHEDULE OF INVESTMENTS (Continued)
March 31, 2017
| | | | | | | | |
Number of
Shares
| | | | | Value
| |
| | | | | INVESTMENT COMPANIES - 12.46% | |
| | | | | China - 3.54% | |
| | 87,388 | | | iShares Core MSCI Emerging Markets ETF | | $ | 4,176,273 | |
| | | | | | |
|
|
|
| | | | | India - 8.92% | |
| | 334,201 | | | iShares MSCI India ETF | | | 10,522,318 | |
| | | | | | |
|
|
|
| | | | | Total Investment Companies
(Cost $13,855,158) | | | 14,698,591 | |
| | | | | | |
|
|
|
| | | | | PREFERRED STOCKS - 4.77% | |
| | | | | Brazil - 3.27% | |
| | 59,365 | | | Banco Bradesco SA - Preference Shares | | | 612,120 | |
| | 81,555 | | | Centrais Eletricas Brasileiras SA - Preference Shares (a) | | | 579,633 | |
| | 96,522 | | | Cia Energetica de Minas Gerais - Preference Shares | | | 320,651 | |
| | 15,942 | | | Cia Paranaense de Energia - Series B - Preference Shares | | | 165,093 | |
| | 98,706 | | | Gerdau SA - Preference Shares | | | 343,671 | |
| | 73,638 | | | Itau Unibanco Holding SA - Preference Shares | | | 893,836 | |
| | 41,705 | | | Itausa - Investimentos Itau SA - Preference Shares | | | 126,556 | |
| | 97,539 | | | Petroleo Brasileiro SA - Preference Shares (a) | | | 453,952 | |
| | 40,217 | | | Vale SA - Preference Shares | | | 363,810 | |
| | | | | | |
|
|
|
| | | | | | | | 3,859,322 | |
| | | | | | |
|
|
|
| | | | | Chile - 0.23% | |
| | 8,067 | | | Sociedad Quimica y Minera de Chile SA - Preference Shares | | | 276,644 | |
| | | | | | |
|
|
|
| | | | | Colombia - 0.15% | |
| | 426,265 | | | Grupo Aval Acciones y Valores SA - Preference Shares | | | 173,473 | |
| | | | | | |
|
|
|
| | | | | Republic of Korea - 1.12% | |
| | 1,691 | | | Amorepacific Corp. - Preference Shares | | | 252,539 | |
| | 812 | | | LG Household & Health Care Ltd. - Preference Shares | | | 370,442 | |
| | 485 | | | Samsung Electronics Co., Ltd. - Preference Shares | | | 694,709 | |
| | | | | | |
|
|
|
| | | | | | | | 1,317,690 | |
| | | | | | |
|
|
|
| | | | | Total Preferred Stocks
(Cost $3,810,304) | | | 5,627,129 | |
| | | | | | |
|
|
|
| | | | | REAL ESTATE INVESTMENT TRUSTS - 0.10% | |
| | | | | South Africa - 0.10% | |
| | 91,405 | | | Fortress Income Fund Ltd. - Class A | | | 114,390 | |
| | | | | | |
|
|
|
| | | | | Total Real Estate Investment Trusts
(Cost $113,393) | | | 114,390 | |
| | | | | | |
|
|
|
| | | | | | | | |
Number of
Shares
| | | | | Value
| |
| | | | | SHORT TERM INVESTMENTS - 5.87% | |
| | | | | Money Market Funds - 5.87% | |
| | 6,930,284 | | | Deutsche Government Money Market Series - Institutional Shares
Effective Yield, 0.63% (e) | | $ | 6,930,284 | |
| | | | | | |
|
|
|
| | | | | Total Short Term Investments
(Cost $6,930,284) | | | 6,930,284 | |
| | | | | | |
|
|
|
| | | | | INVESTMENTS PURCHASED AS SECURITIES LENDING
COLLATERAL - 0.71% | |
| | | | | Investment Companies - 0.71% | |
| | 838,995 | | | Mount Vernon Liquid Assets Portfolio, LLC Effective Yield, 1.17% (e) | | | 838,995 | |
| | | | | | |
|
|
|
| | | | | Total Investments Purchased as Securities Lending Collateral
(Cost $838,995) | | | 838,995 | |
| | | | | | |
|
|
|
| | | | | Total Investments
(Cost $104,814,356) - 105.06% | | | 123,968,538 | |
| | | | | Liabilities in Excess of
Other Assets - (5.06)% | | | (5,965,210 | ) |
| | | | | | |
|
|
|
| | | | | TOTAL NET ASSETS - 100.00% | | $ | 118,003,328 | |
| | | | | | |
|
|
|
Percentages are stated as a percent of net assets.
| | | | |
| ADR | | | | American Depositary Receipt |
| GDR | | | | Global Depositary Receipt |
| NVDR | | | | Non-Voting Depositary Receipt |
| (a) | | Non-income producing security. |
| (b) | | These securities have been deemed illiquid according to the Fund’s liquidity guidelines. The value of these securities total $768,847, which represents 0.65% of total net assets. |
| (c) | | All or portion of this security is on loan. |
| (d) | | Restricted securities as defined in Regulation S under the Securities Act of 1933. Such securities are treated as liquid securities according to the Fund’s liquidity guidelines. The value of these securities total $675,045, which represents 0.57% of total net assets. |
| (e) | | Seven-day yield as of March 31, 2017. |
See notes to financial statements.
47
GuideMark® Emerging Markets Fund
SCHEDULE OF INVESTMENTS BY INDUSTRY
March 31, 2017
| | | | |
COMMON STOCKS | | | | |
Aerospace & Defense | | | 0.12% | |
Air Freight & Logistics | | | 0.13% | |
Airlines | | | 1.24% | |
Automobiles | | | 1.01% | |
Banks | | | 12.35% | |
Beverages | | | 1.21% | |
Capital Markets | | | 0.51% | |
Chemicals | | | 1.26% | |
Commercial Services & Supplies | | | 0.16% | |
Construction & Engineering | | | 0.16% | |
Construction Materials | | | 0.35% | |
Consumer Finance | | | 0.14% | |
Diversified Consumer Services | | | 0.93% | |
Diversified Financial Services | | | 0.52% | |
Diversified Telecommunication Services | | | 2.42% | |
Electric Utilities | | | 1.56% | |
Electrical Equipment | | | 0.10% | |
Electronic Equipment, Instruments & Components | | | 2.74% | |
Energy Equipment & Services | | | 0.24% | |
Food & Staples Retailing | | | 3.24% | |
Food Products | | | 2.29% | |
Gas Utilities | | | 0.10% | |
Health Care Providers & Services | | | 0.21% | |
Hotels, Restaurants & Leisure | | | 0.56% | |
Household Durables | | | 1.83% | |
Household Products | | | 0.33% | |
Independent Power and Renewable Electricity Producers | | | 0.11% | |
Industrial Conglomerates | | | 0.79% | |
Insurance | | | 2.51% | |
Internet & Direct Marketing Retail | | | 0.27% | |
Internet Software & Services | | | 8.25% | |
Machinery | | | 0.13% | |
Media | | | 1.55% | |
Metals & Mining | | | 2.72% | |
Multiline Retail | | | 0.79% | |
Oil, Gas & Consumable Fuels | | | 6.61% | |
Paper & Forest Products | | | 0.52% | |
Personal Products | | | 0.62% | |
Pharmaceuticals | | | 0.73% | |
Real Estate Management & Development | | | 1.74% | |
Semiconductors & Semiconductor Equipment | | | 8.53% | |
Specialty Retail | | | 1.21% | |
| | | | |
Technology Hardware, Storage & Peripherals | | | 2.17% | |
Textiles, Apparel & Luxury Goods | | | 1.16% | |
Thrifts & Mortgage | | | 0.24% | |
Tobacco | | | 0.33% | |
Trading Companies & Distributors | | | 0.18% | |
Transportation Infrastructure | | | 0.22% | |
Water Utilities | | | 0.24% | |
Wireless Telecommunication Services | | | 3.82% | |
| | |
|
|
|
TOTAL COMMON STOCKS | | | 81.15% | |
| | |
|
|
|
INVESTMENT COMPANIES | | | | |
Exchange Traded Funds | | | 12.46% | |
| | |
|
|
|
TOTAL INVESTMENT COMPANIES | | | 12.46% | |
| | |
|
|
|
PREFERRED STOCKS | | | | |
Banks | | | 1.53% | |
Chemicals | | | 0.23% | |
Electric Utilities | | | 0.90% | |
Metals & Mining | | | 0.60% | |
Oil, Gas & Consumable Fuels | | | 0.39% | |
Personal Products | | | 0.53% | |
Semiconductors & Semiconductor Equipment | | | 0.59% | |
| | |
|
|
|
TOTAL PREFERRED STOCKS | | | 4.77% | |
| | |
|
|
|
REAL ESTATE INVESTMENT TRUSTS | | | | |
Real Estate Investment Trusts | | | 0.10% | |
| | |
|
|
|
TOTAL REAL ESTATE INVESTMENT TRUSTS | | | 0.10% | |
| | |
|
|
|
SHORT TERM INVESTMENTS | | | | |
Money Market Funds | | | 5.87% | |
| | |
|
|
|
TOTAL SHORT TERM INVESTMENTS | | | 5.87% | |
| | |
|
|
|
INVESTMENTS PURCHASED AS SECURITIES LENDING COLLATERAL | | | | |
Investment Companies | | | 0.71% | |
| | |
|
|
|
TOTAL INVESTMENTS PURCHASED AS SECURITIES LENDING COLLATERAL | | | 0.71% | |
| | |
|
|
|
TOTAL INVESTMENTS | | | 105.06% | |
Liabilities in Excess of Other Assets | | | (5.06)% | |
| | |
|
|
|
TOTAL NET ASSETS | | | 100.00% | |
| | |
|
|
|
Percentages are stated as a percent of net assets.
GuideMark® Emerging Markets Fund
SCHEDULE OF OPEN FORWARD CURRENCY CONTRACTS
March 31, 2017
| | | | | | | | | | | | | | | | | | |
Forward
expiration date
| | Counterparty
| | Currency to be received
| | Amount of
Currency to
be received
| | | Currency to be delivered
| | Amount of
Currency to
be delivered
| | | Unrealized
Appreciation
(Depreciation)
| |
| 4/5/2017 | | Bank of America | | South African Rand | | | 3,762,358 | | | U.S. Dollars | | | 282,083 | | | $ | (1,885 | ) |
| | | | | | | | | | | | | | | | |
|
|
|
| | | | | | | | | | | | | | | | | $ | (1,885 | ) |
| | | | | | | | | | | | | | | | |
|
|
|
See notes to financial statements.
48
GuideMark® Small/Mid Cap Core Fund
SCHEDULE OF INVESTMENTS
March 31, 2017
| | | | | | | | |
Number of
Shares
| | | | | Value
| |
| | | | | COMMON STOCKS - 87.61% | |
| | | | | Aerospace & Defense - 1.28% | |
| | 709 | | | AAR Corp. | | $ | 23,844 | |
| | 595 | | | Astronics Corp. (a) | | | 18,879 | |
| | 1,770 | | | BE Aerospace, Inc. | | | 113,475 | |
| | 1,992 | | | BWX Technologies, Inc. | | | 94,819 | |
| | 500 | | | Cubic Corp. | | | 26,400 | |
| | 988 | | | Curtiss-Wright Corp. | | | 90,165 | |
| | 1,748 | | | DigitalGlobe, Inc. (a) | | | 57,247 | |
| | 1,244 | | | Ducommun, Inc. (a) | | | 35,815 | |
| | 1,837 | | | Engility Holdings, Inc. (a)(b) | | | 53,163 | |
| | 598 | | | Esterline Technologies Corp. (a)(b) | | | 51,458 | |
| | 437 | | | HEICO Corp. (b) | | | 38,106 | |
| | 532 | | | HEICO Corp. - Class A | | | 39,900 | |
| | 899 | | | Huntington Ingalls Industries, Inc. | | | 180,016 | |
| | 1,251 | | | KLX, Inc. (a)(b) | | | 55,920 | |
| | 6,936 | | | Kratos Defense & Security Solutions, Inc. (a) | | | 53,962 | |
| | 693 | | | Moog, Inc. - Class A (a) | | | 46,673 | |
| | 1,195 | | | Orbital ATK, Inc. | | | 117,110 | |
| | 1,057 | | | Sparton Corp. (a) | | | 22,186 | |
| | 2,259 | | | Spirit AeroSystems Holdings, Inc. - Class A | | | 130,841 | |
| | 2,318 | | | TASER International, Inc. (a)(b) | | | 52,827 | |
| | 886 | | | Teledyne Technologies, Inc. (a) | | | 112,044 | |
| | 947 | | | Triumph Group, Inc. (b) | | | 24,385 | |
| | 1,673 | | | Vectrus, Inc. (a) | | | 37,392 | |
| | | | | | |
|
|
|
| | | | | | | | 1,476,627 | |
| | | | | | |
|
|
|
| | | | | Air Freight & Logistics - 0.31% | |
| | 2,400 | | | Air Transport Services Group, Inc. (a) | | | 38,520 | |
| | 2,482 | | | Echo Global Logistics, Inc. (a) | | | 52,991 | |
| | 778 | | | Forward Air Corp. | | | 37,009 | |
| | 1,141 | | | Hub Group, Inc. - Class A (a) | | | 52,942 | |
| | 1,026 | | | Park-Ohio Holdings Corp. | | | 36,885 | |
| | 16,504 | | | Radiant Logistics, Inc. (a) | | | 82,520 | |
| | 1,150 | | | XPO Logistics, Inc. (a)(b) | | | 55,074 | |
| | | | | | |
|
|
|
| | | | | | | | 355,941 | |
| | | | | | |
|
|
|
| | | | | Airlines - 0.40% | |
| | 1,635 | | | Alaska Air Group, Inc. | | | 150,780 | |
| | 184 | | | Allegiant Travel Co. (b) | | | 29,486 | |
| | 581 | | | Copa Holdings SA - Class A (b) | | | 65,217 | |
| | 1,770 | | | Hawaiian Holdings, Inc. (a) | | | 82,216 | |
| | 4,308 | | | JetBlue Airways Corp. (a) | | | 88,788 | |
| | 1,200 | | | SkyWest, Inc. | | | 41,100 | |
| | | | | | |
|
|
|
| | | | | | | | 457,587 | |
| | | | | | |
|
|
|
| | | | | Auto Components - 1.00% | |
| | 1,700 | | | American Axle & Manufacturing Holdings, Inc. (a) | | | 31,926 | |
| | 1,065 | | | Cooper Tire & Rubber Co. | | | 47,233 | |
| | 567 | | | Cooper-Standard Holding, Inc. (a) | | | 62,897 | |
| | 1,754 | | | Dana Holding Corp. | | | 33,870 | |
| | 1,075 | | | Dorman Products, Inc. (a)(b) | | | 88,290 | |
| | 1,166 | | | Fox Factory Holding Corp. (a) | | | 33,464 | |
| | 3,185 | | | Gentex Corp. (b) | | | 67,936 | |
| | 985 | | | Gentherm, Inc. (a)(b) | | | 38,661 | |
| | 3,240 | | | Goodyear Tire & Rubber Co. | | | 116,640 | |
| | 2,222 | | | Horizon Global Corp. (a) | | | 30,841 | |
| | 1,042 | | | LCI Industries (b) | | | 103,992 | |
| | 1,439 | | | Lear Corp. | | | 203,734 | |
| | 1,305 | | | Metaldyne Performance Group, Inc. | | | 29,819 | |
| | 6,368 | | | Spartan Motors, Inc. | | | 50,944 | |
| | | | | | | | |
Number of
Shares
| | | | | Value
| |
| | | | | Auto Components (Continued) | |
| | 1,181 | | | Standard Motor Products, Inc. | | $ | 58,034 | |
| | 2,913 | | | Stoneridge, Inc. (a) | | | 52,842 | |
| | 948 | | | Superior Industries International, Inc. | | | 24,032 | |
| | 704 | | | Tenneco, Inc. (b) | | | 43,944 | |
| | 337 | | | WABCO Holdings, Inc. (a) | | | 39,570 | |
| | | | | | |
|
|
|
| | | | | | | | 1,158,669 | |
| | | | | | |
|
|
|
| | | | | Automobiles - 0.15% | |
| | 1,522 | | | Thor Industries, Inc. | | | 146,310 | |
| | 1,006 | | | Winnebago Industries, Inc. (b) | | | 29,425 | |
| | | | | | |
|
|
|
| | | | | | | | 175,735 | |
| | | | | | |
|
|
|
| | | | | Banks - 6.58% | |
| | 726 | | | 1st Source Corp. | | | 34,086 | |
| | 1,035 | | | Access National Corp. (b) | | | 31,071 | |
| | 833 | | | ACNB Corp. | | | 24,032 | |
| | 786 | | | Allegiance Bancshares, Inc. (a) | | | 29,239 | |
| | 665 | | | American National Bankshares, Inc. | | | 24,771 | |
| | 784 | | | Ameris Bancorp | | | 36,142 | |
| | 1,124 | | | Arrow Financial Corp. | | | 38,104 | |
| | 2,775 | | | Associated Banc-Corp. | | | 67,710 | |
| | 2,750 | | | Banc of California, Inc. (b) | | | 56,925 | |
| | 246 | | | BancFirst Corp. | | | 22,115 | |
| | 1,100 | | | Banco Latinoamericano de Comercio Exterior SA - Class E | | | 30,514 | |
| | 929 | | | BancorpSouth, Inc. | | | 28,102 | |
| | 1,192 | | | Bank of Hawaii Corp. (b) | | | 98,173 | |
| | 439 | | | Bank of the Ozarks, Inc. | | | 22,832 | |
| | 2,467 | | | BankUnited, Inc. | | | 92,044 | |
| | 1,089 | | | Bankwell Financial Group, Inc. | | | 37,451 | |
| | 1,800 | | | Bar Harbor Bankshares | | | 59,544 | |
| | 373 | | | BOK Financial Corp. (b) | | | 29,195 | |
| | 623 | | | Bridge Bancorp, Inc. | | | 21,805 | |
| | 571 | | | Bryn Mawr Bank Corp. | | | 22,554 | |
| | 701 | | | C&F Financial Corp. | | | 32,456 | |
| | 1,011 | | | Camden National Corp. | | | 44,524 | |
| | 680 | | | Capital Bank Financial Corp. - Class A | | | 29,512 | |
| | 1,621 | | | Capital City Bank Group, Inc. | | | 34,673 | |
| | 1,618 | | | Cardinal Financial Corp. | | | 48,443 | |
| | 1,089 | | | Carolina Financial Corp. | | | 32,670 | |
| | 2,872 | | | Cascade Bancorp (a) | | | 22,143 | |
| | 806 | | | Cathay General Bancorp | | | 30,370 | |
| | 1,300 | | | CenterState Banks, Inc. (b) | | | 33,670 | |
| | 881 | | | Central Pacific Financial Corp. | | | 26,906 | |
| | 1,445 | | | Central Valley Community Bancorp | | | 29,622 | |
| | 497 | | | Century Bancorp, Inc. - Class A | | | 30,230 | |
| | 1,322 | | | Chemical Financial Corp. | | | 67,620 | |
| | 683 | | | Chemung Financial Corp. | | | 26,978 | |
| | 1,222 | | | Citizens & Northern Corp. | | | 28,448 | |
| | 587 | | | City Holding Co. | | | 37,850 | |
| | 1,400 | | | CNB Financial Corp. | | | 33,446 | |
| | 1,090 | | | Codorus Valley Bancorp, Inc. | | | 28,242 | |
| | 668 | | | Columbia Banking System, Inc. (b) | | | 26,045 | |
| | 2,443 | | | Commerce Bancshares, Inc. | | | 137,199 | |
| | 632 | | | Community Bank Systems, Inc. | | | 34,747 | |
| | 800 | | | Community Trust Bancorp, Inc. | | | 36,600 | |
| | 1,280 | | | ConnectOne Bancorp, Inc. | | | 31,040 | |
| | 1,066 | | | CU Bancorp (a) | | | 42,267 | |
| | 827 | | | Cullen Frost Bankers, Inc. | | | 73,578 | |
| | 1,666 | | | Customers Bancorp, Inc. (a)(b) | | | 52,529 | |
| | 1,000 | | | CVB Financial Corp. | | | 22,090 | |
See notes to financial statements.
49
GuideMark® Small/Mid Cap Core Fund
SCHEDULE OF INVESTMENTS (Continued)
March 31, 2017
| | | | | | | | |
Number of
Shares
| | | | | Value
| |
| | | | | COMMON STOCKS (Continued) | |
| | | | | Banks (Continued) | |
| | 503 | | | Eagle Bancorp, Inc. (a) | | $ | 30,029 | |
| | 2,785 | | | East West Bancorp, Inc. (b) | | | 143,734 | |
| | 1,279 | | | Enterprise Financial Services Corp. | | | 54,230 | |
| | 701 | | | Equity Bancshares, Inc. - Class A (a) | | | 22,271 | |
| | 6,661 | | | F.N.B. Corp. | | | 99,044 | |
| | 800 | | | Farmers Capital Bank Corp. | | | 32,320 | |
| | 2,033 | | | Farmers National Banc Corp. | | | 29,174 | |
| | 800 | | | FCB Financial Holdings, Inc. - Class A (a)(b) | | | 39,640 | |
| | 1,216 | | | Fidelity Southern Corp. | | | 27,214 | |
| | 1,064 | | | Financial Institutions, Inc. | | | 35,059 | |
| | 1,382 | | | First Bancorp | | | 40,479 | |
| | 6,534 | | | First BanCorp. (a) | | | 36,917 | |
| | 1,236 | | | First Busey Corp. (b) | | | 36,338 | |
| | 1,459 | | | First Business Financial Services, Inc. | | | 37,876 | |
| | 161 | | | First Citizens BancShares, Inc. - Class A | | | 53,995 | |
| | 2,248 | | | First Commonwealth Financial Corp. | | | 29,808 | |
| | 1,300 | | | First Community Bancshares, Inc. | | | 32,461 | |
| | 2,145 | | | First Community Financial Partners, Inc. (a) | | | 27,349 | |
| | 1,635 | | | First Financial Bancorp | | | 44,881 | |
| | 1,552 | | | First Financial Bankshares | | | 62,235 | |
| | 532 | | | First Financial Corp. | | | 25,270 | |
| | 698 | | | First Hawaiian, Inc. | | | 20,884 | |
| | 3,357 | | | First Horizon National Corp. | | | 62,104 | |
| | 904 | | | First Internet Bancorp | | | 26,668 | |
| | 980 | | | First Interstate BancSystem, Inc. - Class A (b) | | | 38,857 | |
| | 805 | | | First Merchants Corp. | | | 31,653 | |
| | 816 | | | First Mid-Illinois Bancshares, Inc. | | | 27,613 | |
| | 1,084 | | | First Midwest Bancorp, Inc. | | | 25,669 | |
| | 700 | | | Franklin Financial Network, Inc. (a) | | | 27,125 | |
| | 3,916 | | | Fulton Financial Corp. | | | 69,901 | |
| | 708 | | | German American Bancorp, Inc. | | | 33,517 | |
| | 957 | | | Glacier Bancorp, Inc. (b) | | | 32,471 | |
| | 541 | | | Great Southern Bancorp, Inc. | | | 27,320 | |
| | 1,000 | | | Hancock Holding Co. | | | 45,550 | |
| | 1,199 | | | Hanmi Financial Corp. | | | 36,869 | |
| | 844 | | | Heartland Financial U.S.A., Inc. | | | 42,158 | |
| | 2,719 | | | Heritage Commerce Corp. | | | 38,338 | |
| | 1,495 | | | Hilltop Holdings, Inc. | | | 41,068 | |
| | 3,562 | | | Home Bancshares, Inc. | | | 96,423 | |
| | 859 | | | Horizon Bancorp | | | 22,523 | |
| | 17,203 | | | Huntington Bancshares, Inc. | | | 230,348 | |
| | 780 | | | IBERIABANK Corp. | | | 61,698 | |
| | 1,941 | | | Independent Bank Corp. | | | 40,179 | |
| | 373 | | | Independent Bank Group, Inc. | | | 23,984 | |
| | 1,540 | | | International Bancshares Corp. | | | 54,516 | |
| | 2,615 | | | Investors Bancorp, Inc. | | | 37,604 | |
| | 2,249 | | | Lakeland Bancorp, Inc. (b) | | | 44,080 | |
| | 1,050 | | | Lakeland Financial Corp. (b) | | | 45,276 | |
| | 1,210 | | | LCNB Corp. | | | 28,859 | |
| | 545 | | | LegacyTexas Financial Group, Inc. | | | 21,745 | |
| | 1,216 | | | Live Oak Bancshares, Inc. | | | 26,326 | |
| | 2,819 | | | Macatawa Bank Corp. | | | 27,852 | |
| | 1,100 | | | MainSource Financial Group, Inc. | | | 36,223 | |
| | 4,057 | | | MBT Financial Corp. | | | 46,047 | |
| | 1,152 | | | Mercantile Bank Corp. | | | 39,629 | |
| | 447 | | | Merchants Bancshares, Inc. | | | 21,769 | |
| | 625 | | | Middleburg Financial Corp. | | | 25,025 | |
| | 720 | | | MidWestOne Financial Group, Inc. | | | 24,689 | |
| | 776 | | | MutualFirst Financial, Inc. | | | 24,483 | |
| | | | | | | | |
Number of
Shares
| | | | | Value
| |
| | | | | Banks (Continued) | |
| | 744 | | | National Bank Holdings Corp. - Class A | | $ | 24,180 | |
| | 798 | | | National Bankshares, Inc. | | | 29,965 | |
| | 625 | | | National Commerce Corp. (a) | | | 22,875 | |
| | 1,135 | | | NBT Bancorp, Inc. | | | 42,074 | |
| | 1,144 | | | NorthRim Bancorp, Inc. | | | 34,377 | |
| | 2,093 | | | OFG Bancorp | | | 24,697 | |
| | 1,155 | | | Old Line Bancshares, Inc. | | | 32,894 | |
| | 2,454 | | | Old National Bancorp | | | 42,577 | |
| | 2,325 | | | Old Second Bancorp, Inc. | | | 26,156 | |
| | 1,064 | | | Orrstown Financial Services, Inc. | | | 23,780 | |
| | 1,267 | | | Pacific Continental Corp. | | | 31,042 | |
| | 917 | | | Pacific Premier Bancorp, Inc. (a) | | | 35,350 | |
| | 1,378 | | | PacWest Bancorp | | | 73,392 | |
| | 502 | | | Park National Corp. | | | 52,810 | |
| | 2,696 | | | Park Sterling Corp. (b) | | | 33,188 | |
| | 1,098 | | | Peapack-Gladstone Financial Corp. | | | 32,490 | |
| | 889 | | | Peoples Bancorp, Inc. (b) | | | 28,146 | |
| | 1,110 | | | People’s Utah Bancorp | | | 29,360 | |
| | 3,359 | | | Popular, Inc. | | | 136,812 | |
| | 790 | | | Preferred Bank | | | 42,391 | |
| | 1,713 | | | Premier Financial Bancorp, Inc. | | | 36,024 | |
| | 1,232 | | | PrivateBancorp, Inc. | | | 73,144 | |
| | 879 | | | Prosperity Bancshares, Inc. | | | 61,275 | |
| | 1,076 | | | QCR Holdings, Inc. | | | 45,569 | |
| | 517 | | | Renasant Corp. | | | 20,520 | |
| | 756 | | | Republic Bancorp, Inc. - Class A | | | 25,999 | |
| | 785 | | | S&T Bancorp, Inc. | | | 27,161 | |
| | 952 | | | Sandy Spring Bancorp, Inc. | | | 39,022 | |
| | 1,068 | | | Seacoast Banking Corp. of Florida (a) | | | 25,611 | |
| | 2,420 | | | ServisFirst Bancshares, Inc. (b) | | | 88,040 | |
| | 1,465 | | | Shore Bancshares, Inc. | | | 24,480 | |
| | 1,493 | | | Sierra Bancorp | | | 40,953 | |
| | 792 | | | Signature Bank (a) | | | 117,525 | |
| | 479 | | | Simmons First National Corp. - Class A | | | 26,417 | |
| | 1,216 | | | Southern First Bancshares, Inc. (a) | | | 39,702 | |
| | 654 | | | Southside Bancshares, Inc. | | | 21,955 | |
| | 1,428 | | | Southwest Bancorp, Inc. | | | 37,342 | |
| | 2,098 | | | Sterling Bancorp | | | 49,723 | |
| | 1,261 | | | Stock Yards Bancorp, Inc. | | | 51,260 | |
| | 758 | | | Stonegate Bank | | | 35,694 | |
| | 1,820 | | | Summit Financial Group, Inc. | | | 39,203 | |
| | 800 | | | SVB Financial Group (a)(b) | | | 148,872 | |
| | 2,289 | | | Synovus Financial Corp. | | | 93,895 | |
| | 2,951 | | | TCF Financial Corp. | | | 50,226 | |
| | 611 | | | Texas Capital Bancshares, Inc. (a)(b) | | | 50,988 | |
| | 722 | | | The Bank of N.T. Butterfield & Son Ltd. | | | 23,039 | |
| | 1,473 | | | The First Bancorp, Inc. | | | 40,139 | |
| | 1,014 | | | The First of Long Island Corp. | | | 27,429 | |
| | 500 | | | Tompkins Financial Corp. | | | 40,275 | |
| | 1,300 | | | TowneBank | | | 42,120 | |
| | 930 | | | TriCo Bancshares | | | 33,043 | |
| | 1,410 | | | TriState Capital Holdings, Inc. (a) | | | 32,924 | |
| | 1,224 | | | Triumph Bancorp, Inc. (a) | | | 31,579 | |
| | 1,715 | | | Trustmark Corp. | | | 54,520 | |
| | 562 | | | UMB Financial Corp. | | | 42,324 | |
| | 2,276 | | | Umpqua Holdings Corp. (b) | | | 40,376 | |
| | 1,661 | | | Union Bankshares Corp. | | | 58,434 | |
| | 981 | | | Union Bankshares, Inc. (b) | | | 42,134 | |
| | 514 | | | United Bankshares, Inc. (b) | | | 21,717 | |
| | 1,281 | | | United Community Banks, Inc. | | | 35,471 | |
See notes to financial statements.
50
GuideMark® Small/Mid Cap Core Fund
SCHEDULE OF INVESTMENTS (Continued)
March 31, 2017
| | | | | | | | |
Number of
Shares
| | | | | Value
| |
| | | | | COMMON STOCKS (Continued) | |
| | | | | Banks (Continued) | |
| | 1,351 | | | Univest Corp. of Pennsylvania | | $ | 34,991 | |
| | 2,243 | | | Valley National Bancorp | | | 26,467 | |
| | 880 | | | Veritex Holdings, Inc. (a) | | | 24,746 | |
| | 600 | | | Washington Trust Bancorp | | | 29,580 | |
| | 995 | | | WashingtonFirst Bankshares, Inc. | | | 27,860 | |
| | 547 | | | Wesbanco, Inc. | | | 20,846 | |
| | 1,523 | | | West Bancorporation, Inc. | | | 34,953 | |
| | 608 | | | WestAmerica Bancorporation | | | 33,945 | |
| | 1,555 | | | Western Alliance Bancorp (a) | | | 76,335 | |
| | 979 | | | Wintrust Financial Corp. (b) | | | 67,668 | |
| | 1,897 | | | Xenith Bankshares, Inc. (a) | | | 48,127 | |
| | 2,646 | | | Zions Bancorporation (b) | | | 111,132 | |
| | | | | | |
|
|
|
| | | | | | | | 7,599,004 | |
| | | | | | |
|
|
|
| | | | | Beverages - 0.33% | |
| | 432 | | | Boston Beer Co., Inc. - Class A (a)(b) | | | 62,489 | |
| | 351 | | | Coca-Cola Bottling Co. | | | 72,313 | |
| | 790 | | | MGP Ingredients, Inc. (b) | | | 42,842 | |
| | 1,597 | | | National Beverage Corp. (b) | | | 134,994 | |
| | 5,412 | | | Primo Water Corp. (a) | | | 73,495 | |
| | | | | | |
|
|
|
| | | | | | | | 386,133 | |
| | | | | | |
|
|
|
| | | | | Biotechnology - 1.61% | |
| | 2,347 | | | Acorda Therapeutics, Inc. (a)(b) | | | 49,287 | |
| | 1,699 | | | Alkermes Plc (a) | | | 99,391 | |
| | 3,243 | | | AMAG Pharmaceuticals, Inc. (a)(b) | | | 73,130 | |
| | 389 | | | ANI Pharmaceuticals, Inc. (a) | | | 19,259 | |
| | 9,500 | | | Array BioPharma, Inc. (a)(b) | | | 84,930 | |
| | 5,224 | | | BioCryst Pharmaceuticals, Inc. (a) | | | 43,882 | |
| | 396 | | | Bluebird Bio, Inc. (a)(b) | | | 35,996 | |
| | 3,000 | | | ChemoCentryx, Inc. (a) | | | 21,840 | |
| | 484 | | | Eagle Pharmaceuticals, Inc. (a)(b) | | | 40,143 | |
| | 3,200 | | | Emergent BioSolutions, Inc. (a) | | | 92,928 | |
| | 1,170 | | | Enanta Pharmaceuticals, Inc. (a) | | | 36,036 | |
| | 1,592 | | | Exact Sciences Corp. (a)(b) | | | 37,603 | |
| | 3,034 | | | Exelixis, Inc. (a)(b) | | | 65,747 | |
| | 3,037 | | | Five Prime Therapeutics, Inc. (a) | | | 109,787 | |
| | 2,375 | | | Genomic Health, Inc. (a)(b) | | | 74,789 | |
| | 8,484 | | | Insys Therapeutics, Inc. (a)(b) | | | 89,167 | |
| | 1,502 | | | Ironwood Pharmaceuticals, Inc. - Class A (a) | | | 25,624 | |
| | 1,639 | | | Lexicon Pharmaceuticals, Inc. (a)(b) | | | 23,503 | |
| | 2,960 | | | MediciNova, Inc. (a)(b) | | | 17,730 | |
| | 9,079 | | | MiMedx Group, Inc. (a)(b) | | | 86,523 | |
| | 6,530 | | | Myriad Genetics, Inc. (a) | | | 125,376 | |
| | 32,430 | | | PDL BioPharma, Inc. (b) | | | 73,616 | |
| | 21,335 | | | PharmAthene, Inc. | | | 17,313 | |
| | 1,055 | | | Sarepta Therapeutics, Inc. (a) | | | 31,228 | |
| | 2,088 | | | Seattle Genetics, Inc. (a)(b) | | | 131,252 | |
| | 2,118 | | | Seres Therapeutics, Inc. (a) | | | 23,870 | |
| | 192 | | | TESARO, Inc. (a)(b) | | | 29,543 | |
| | 1,491 | | | United Therapeutics Corp. (a) | | | 201,852 | |
| | 2,913 | | | Vanda Pharmaceuticals, Inc. (a) | | | 40,782 | |
| | 3,009 | | | Veracyte, Inc. (a) | | | 27,623 | |
| | 1,051 | | | Xencor, Inc. (a) | | | 25,140 | |
| | | | | | |
|
|
|
| | | | | | | | 1,854,890 | |
| | | | | | |
|
|
|
| | | | | Building Products - 1.51% | |
| | 3,417 | | | A. O. Smith Corp. (b) | | | 174,814 | |
| | 2,327 | | | AAON, Inc. | | | 82,259 | |
| | 2,157 | | | Allegion Plc | | | 163,285 | |
| | | | | | | | |
Number of
Shares
| | | | | Value
| |
| | | | | Building Products (Continued) | |
| | 781 | | | American Woodmark Corp. (a) | | $ | 71,696 | |
| | 688 | | | Apogee Enterprises, Inc. (b) | | | 41,012 | |
| | 544 | | | Armstrong World Industries, Inc. (a) | | | 25,051 | |
| | 4,743 | | | Builders FirstSource, Inc. (a)(b) | | | 70,671 | |
| | 787 | | | Caesarstone Ltd. (a) | | | 28,529 | |
| | 1,143 | | | Continental Building Products, Inc. (a) | | | 28,003 | |
| | 3,124 | | | Fortune Brands Home & Security, Inc. (b) | | | 190,095 | |
| | 900 | | | Insteel Industries, Inc. | | | 32,526 | |
| | 1,083 | | | Lennox International, Inc. (b) | | | 181,186 | |
| | 400 | | | Masonite International Corp. (a)(b) | | | 31,700 | |
| | 2,376 | | | NCI Building Systems, Inc. (a) | | | 40,748 | |
| | 2,404 | | | Owens Corning, Inc. | | | 147,533 | |
| | 745 | | | Patrick Industries, Inc. (a) | | | 52,821 | |
| | 1,942 | | | Ply Gem Holdings, Inc. (a) | | | 38,257 | |
| | 1,492 | | | Quanex Building Products Corp. | | | 30,213 | |
| | 1,408 | | | Simpson Manufacturing Co., Inc. | | | 60,671 | |
| | 1,527 | | | Trex Co., Inc. (a) | | | 105,959 | |
| | 848 | | | Universal Forest Products, Inc. | | | 83,562 | |
| | 1,925 | | | USG Corp. (a)(b) | | | 61,215 | |
| | | | | | |
|
|
|
| | | | | | | | 1,741,806 | |
| | | | | | |
|
|
|
| | | | | Capital Markets - 2.01% | |
| | 1,521 | | | Arlington Asset Investment Corp. - Class A (b) | | | 21,492 | |
| | 2,256 | | | Artisan Partners Asset Management, Inc. - Class A | | | 62,266 | |
| | 1,201 | | | B. Riley Financial, Inc. | | | 18,015 | |
| | 8,124 | | | BGC Partners, Inc. - Class A | | | 92,289 | |
| | 1,654 | | | Cohen & Steers, Inc. (b) | | | 66,110 | |
| | 1,771 | | | Cowen Group, Inc. - Class A (a)(b) | | | 26,476 | |
| | 300 | | | Diamond Hill Investment Group, Inc. | | | 58,365 | |
| | 2,561 | | | Donnelley Financial Solutions, Inc. (a) | | | 49,402 | |
| | 3,469 | | | E*TRADE Financial Corp. (a) | | | 121,033 | |
| | 3,120 | | | Eaton Vance Corp. | | | 140,275 | |
| | 1,140 | | | Evercore Partners, Inc. - Class A | | | 88,806 | |
| | 3,177 | | | Federated Investors, Inc. - Class B | | | 83,682 | |
| | 904 | | | Greenhill & Co., Inc. | | | 26,487 | |
| | 2,512 | | | Hennessy Advisors, Inc. | | | 42,227 | |
| | 1,882 | | | INTL. FCStone, Inc. (a) | | | 71,441 | |
| | 3,462 | | | Investment Technology Group | | | 70,105 | |
| | 2,166 | | | Janus Capital Group, Inc. (b) | | | 28,591 | |
| | 3,214 | | | KCG Holdings, Inc. - Class A (a) | | | 57,306 | |
| | 4,184 | | | Lazard Ltd. - Class A - ADR | | | 192,422 | |
| | 3,112 | | | LPL Financial Holdings, Inc. | | | 123,951 | |
| | 1,379 | | | Moelis & Co. - Class A | | | 53,092 | |
| | 3,770 | | | OM Asset Management Plc | | | 57,002 | |
| | 600 | | | Piper Jaffray Cos. | | | 38,310 | |
| | 2,417 | | | PJT Partners, Inc. - Class A | | | 84,813 | |
| | 5,786 | | | Pzena Investment Management, Inc. - Class A | | | 56,934 | |
| | 2,965 | | | Raymond James Financial, Inc. | | | 226,111 | |
| | 2,232 | | | SEI Investments Co. | | | 112,582 | |
| | 433 | | | Stifel Financial Corp. (a)(b) | | | 21,732 | |
| | 3,641 | | | Virtu Financial, Inc. - Class A (b) | | | 61,897 | |
| | 4,874 | | | Waddell & Reed Financial, Inc. - Class A (b) | | | 82,858 | |
| | 593 | | | Westwood Holdings Group, Inc. | | | 31,672 | |
| | 99 | | | Wins Finance Holdings, Inc. (a)(b) | | | 14,354 | |
| | 4,912 | | | WisdomTree Investments, Inc. (b) | | | 44,601 | |
| | | | | | |
|
|
|
| | | | | | | | 2,326,699 | |
| | | | | | |
|
|
|
| | | | | Chemicals - 2.28% | |
| | 775 | | | A. Schulman, Inc. | | | 24,374 | |
| | 8,334 | | | AgroFresh Solutions, Inc. (a) | | | 36,420 | |
See notes to financial statements.
51
GuideMark® Small/Mid Cap Core Fund
SCHEDULE OF INVESTMENTS (Continued)
March 31, 2017
| | | | | | | | |
Number of
Shares
| | | | | Value
| |
| | | | | COMMON STOCKS (Continued) | |
| | | | | Chemicals (Continued) | |
| | 1,355 | | | Albemarle Corp. (b) | | $ | 143,142 | |
| | 2,491 | | | American Vanguard Corp. | | | 41,351 | |
| | 1,053 | | | Ashland Global Holdings, Inc. | | | 130,372 | |
| | 1,876 | | | Axalta Coating Systems, Ltd. (a) | | | 60,407 | |
| | 277 | | | Balchem Corp. | | | 22,830 | |
| | 1,650 | | | Cabot Corp. | | | 98,851 | |
| | 633 | | | Chase Corp. | | | 60,388 | |
| | 666 | | | Chemtura Corp. (a) | | | 22,244 | |
| | 4,673 | | | Codexis, Inc. (a) | | | 22,430 | |
| | 1,858 | | | FutureFuel Corp. (b) | | | 26,346 | |
| | 2,925 | | | GCP Applied Technologies, Inc. (a) | | | 95,501 | |
| | 1,290 | | | H.B. Fuller Co. (b) | | | 66,512 | |
| | 4,661 | | | Huntsman Corp. (b) | | | 114,381 | |
| | 713 | | | Ingevity Corp. (a) | | | 43,386 | |
| | 745 | | | Innophos Holdings, Inc. | | | 40,208 | |
| | 974 | | | Innospec, Inc. | | | 63,066 | |
| | 1,910 | | | KMG Chemicals, Inc. | | | 87,994 | |
| | 1,206 | | | Koppers Holdings, Inc. (a) | | | 51,074 | |
| | 1,229 | | | Kraton Corp. (a) | | | 38,001 | |
| | 1,785 | | | Kronos Worldwide, Inc. | | | 29,328 | |
| | 821 | | | Minerals Technologies, Inc. | | | 62,889 | |
| | 205 | | | NewMarket Corp. (b) | | | 92,912 | |
| | 3,320 | | | Olin Corp. | | | 109,128 | |
| | 3,500 | | | OMNOVA Solutions, Inc. (a) | | | 34,650 | |
| | 4,384 | | | Platform Specialty Products Corp. (a) | | | 57,080 | |
| | 1,162 | | | PolyOne Corp. | | | 39,613 | |
| | 404 | | | Quaker Chemical Corp. | | | 53,191 | |
| | 2,300 | | | Rayonier Advanced Materials, Inc. | | | 30,935 | |
| | 3,421 | | | RPM International, Inc. | | | 188,258 | |
| | 460 | | | Sensient Technologies Corp. | | | 36,460 | |
| | 400 | | | Stepan Co. | | | 31,524 | |
| | 3,470 | | | The Chemours Company | | | 133,595 | |
| | 767 | | | The Scotts Miracle-Gro Co. - Class A (b) | | | 71,630 | |
| | 1,560 | | | Trinseo SA | | | 104,676 | |
| | 3,430 | | | Tronox, Ltd. - Class A | | | 63,284 | |
| | 1,663 | | | Valspar Corp. | | | 184,493 | |
| | 333 | | | W.R. Grace & Co. | | | 23,213 | |
| | | | | | |
|
|
|
| | | | | | | | 2,636,137 | |
| | | | | | |
|
|
|
| | | | | Commercial Services & Supplies - 1.94% | |
| | 1,528 | | | ABM Industries, Inc. | | | 66,621 | |
| | 4,285 | | | ACCO Brands Corp. (a) | | | 56,348 | |
| | 2,309 | | | Aqua Metals, Inc. (a)(b) | | | 45,118 | |
| | 12,575 | | | ARC Document Solutions, Inc. (a) | | | 43,384 | |
| | 2,243 | | | Avery Dennison Corp. | | | 180,786 | |
| | 920 | | | Barrett Business Services, Inc. | | | 50,250 | |
| | 3,491 | | | Casella Waste Systems, Inc. - Class A (a) | | | 49,258 | |
| | 2,396 | | | CECO Environmental Corp. (b) | | | 25,182 | |
| | 510 | | | Clean Harbors, Inc. (a) | | | 28,366 | |
| | 2,222 | | | Comfort Systems U.S.A., Inc. | | | 81,436 | |
| | 1,706 | | | Copart, Inc. (a) | | | 105,653 | |
| | 1,680 | | | Deluxe Corp. | | | 121,246 | |
| | 2,143 | | | Ennis, Inc. | | | 36,431 | |
| | 1,123 | | | Essendant, Inc. | | | 17,013 | |
| | 2,013 | | | Healthcare Services Group, Inc. (b) | | | 86,740 | |
| | 1,912 | | | HNI Corp. | | | 88,124 | |
| | 3,731 | | | InnerWorkings, Inc. (a) | | | 37,161 | |
| | 3,464 | | | Interface, Inc. | | | 65,989 | |
| | 885 | | | KAR Auction Services, Inc. (b) | | | 38,648 | |
| | | | | | | | |
Number of
Shares
| | | | | Value
| |
| | | | | Commercial Services & Supplies (Continued) | |
| | 4,861 | | | Kimball International, Inc. - Class B | | $ | 80,207 | |
| | 2,509 | | | Knoll, Inc. | | | 59,739 | |
| | 847 | | | LSC Communications, Inc. | | | 21,311 | |
| | 713 | | | McGrath RentCorp | | | 23,935 | |
| | 3,123 | | | Miller Herman, Inc. | | | 98,531 | |
| | 802 | | | MSA Safety, Inc. | | | 56,693 | |
| | 292 | | | Multi-Color Corp. | | | 20,732 | |
| | 2,792 | | | NL Industries, Inc. (a) | | | 18,008 | |
| | 2,857 | | | Pitney Bowes, Inc. | | | 37,455 | |
| | 2,463 | | | Quad/Graphics, Inc. | | | 62,166 | |
| | 3,285 | | | Rollins, Inc. (b) | | | 121,972 | |
| | 1,208 | | | SP Plus Corp. (a) | | | 40,770 | |
| | 3,814 | | | Steelcase, Inc. - Class A | | | 63,885 | |
| | 3,075 | | | Sykes Enterprises, Inc. (a) | | | 90,405 | |
| | 1,551 | | | Tetra Tech, Inc. (b) | | | 63,358 | |
| | 761 | | | The Brinks Co. (b) | | | 40,675 | |
| | 2,805 | | | TRC Cos., Inc. (a) | | | 48,947 | |
| | 610 | | | Viad Corp. | | | 27,572 | |
| | 1,456 | | | West Corp. | | | 35,556 | |
| | | | | | |
|
|
|
| | | | | | | | 2,235,671 | |
| | | | | | |
|
|
|
| | | | | Communications Equipment - 1.67% | |
| | 2,839 | | | ADTRAN, Inc. | | | 58,909 | |
| | 1,084 | | | Applied Optoelectronics, Inc. (a)(b) | | | 60,867 | |
| | 883 | | | Arista Networks, Inc. (a)(b) | | | 116,794 | |
| | 2,694 | | | ARRIS International Plc (a) | | | 71,256 | |
| | 1,584 | | | Bel Fuse, Inc. - Class B | | | 40,471 | |
| | 5,789 | | | Black Box Corp. (b) | | | 51,812 | |
| | 10,151 | | | Brocade Communications Systems, Inc. | | | 126,684 | |
| | 6,352 | | | Calix, Inc. (a) | | | 46,052 | |
| | 3,967 | | | Ciena Corp. (a)(b) | | | 93,661 | |
| | 2,568 | | | Clearfield, Inc. (a) | | | 42,244 | |
| | 1,805 | | | CommScope Holding Co., Inc. (a) | | | 75,287 | |
| | 3,015 | | | Digi International, Inc. (a) | | | 35,878 | |
| | 438 | | | EchoStar Corp. - Class A (a) | | | 24,944 | |
| | 22,488 | | | Extreme Networks, Inc. (a) | | | 168,885 | |
| | 1,722 | | | Finisar Corp. (a) | | | 47,079 | |
| | 4,628 | | | Harmonic, Inc. (a) | | | 27,537 | |
| | 3,753 | | | Infinera Corp. (a)(b) | | | 38,393 | |
| | 502 | | | InterDigital, Inc. | | | 43,323 | |
| | 4,240 | | | Ixia (a) | | | 83,316 | |
| | 4,359 | | | KVH Industries, Inc. (a) | | | 36,616 | |
| | 2,090 | | | Lumentum Holdings, Inc. (a) | | | 111,502 | |
| | 1,506 | | | NETGEAR, Inc. (a) | | | 74,622 | |
| | 1,216 | | | NetScout Systems, Inc. (a) | | | 46,147 | |
| | 6,300 | | | Oclaro, Inc. (a)(b) | | | 61,866 | |
| | 1,204 | | | Plantronics, Inc. | | | 65,148 | |
| | 2,365 | | | Quantenna Communications, Inc. (a)(b) | | | 49,263 | |
| | 8,419 | | | ShoreTel, Inc. (a) | | | 51,777 | |
| | 9,381 | | | Sonus Networks, Inc. (a) | | | 61,821 | |
| | 1,274 | | | Ubiquiti Networks, Inc. (a)(b) | | | 64,031 | |
| | 4,465 | | | Viavi Solutions, Inc. (a) | | | 47,865 | |
| | | | | | |
|
|
|
| | | | | | | | 1,924,050 | |
| | | | | | |
|
|
|
| | | | | Construction & Engineering - 0.96% | |
| | 2,451 | | | AECOM (a)(b) | | | 87,231 | |
| | 2,006 | | | Aegion Corp. (a)(b) | | | 45,958 | |
| | 563 | | | Argan, Inc. | | | 37,242 | |
| | 1,563 | | | Chicago Bridge & Iron Co. NV | | | 48,062 | |
| | 1,586 | | | EMCOR Group, Inc. | | | 99,839 | |
| | 718 | | | Granite Construction, Inc. (b) | | | 36,036 | |
See notes to financial statements.
52
GuideMark® Small/Mid Cap Core Fund
SCHEDULE OF INVESTMENTS (Continued)
March 31, 2017
| | | | | | | | |
Number of
Shares
| | | | | Value
| |
| | | | | COMMON STOCKS (Continued) | |
| | | | | Construction & Engineering (Continued) | |
| | 4,826 | | | HC2 Holdings, Inc. (a) | | $ | 29,921 | |
| | 4,545 | | | IES Holdings, Inc. (a) | | | 82,265 | |
| | 2,680 | | | Jacobs Engineering Group, Inc. (b) | | | 148,150 | |
| | 1,997 | | | KBR, Inc. | | | 30,015 | |
| | 2,182 | | | Layne Christensen Co. (a) | | | 19,289 | |
| | 2,253 | | | MasTec, Inc. (a) | | | 90,233 | |
| | 1,109 | | | MYR Group, Inc. (a) | | | 45,469 | |
| | 2,183 | | | NV5 Global, Inc. (a) | | | 82,081 | |
| | 3,930 | | | Orion Group Holdings, Inc. (a) | | | 29,357 | |
| | 4,122 | | | Quanta Services, Inc. (a) | | | 152,967 | |
| | 1,284 | | | Tutor Perini Corp. (a) | | | 40,831 | |
| | | | | | |
|
|
|
| | | | | | | | 1,104,946 | |
| | | | | | |
|
|
|
| | | | | Construction Materials - 0.08% | |
| | 489 | | | Eagle Materials, Inc. | | | 47,501 | |
| | 700 | | | US Concrete, Inc. (a)(b) | | | 45,185 | |
| | | | | | |
|
|
|
| | | | | | | | 92,686 | |
| | | | | | |
|
|
|
| | | | | Consumer Finance - 0.80% | |
| | 343 | | | Credit Acceptance Corp. (a)(b) | | | 68,398 | |
| | 6,753 | | | Enova International, Inc. (a) | | | 100,282 | |
| | 1,995 | | | EZCORP, Inc. - Class A (a)(b) | | | 16,259 | |
| | 1,111 | | | FirstCash, Inc. | | | 54,606 | |
| | 1,340 | | | Green Dot Corp. - Class A (a)(b) | | | 44,702 | |
| | 13,376 | | | Navient Corp. | | | 197,430 | |
| | 1,688 | | | Nelnet, Inc. - Class A | | | 74,036 | |
| | 2,566 | | | PRA Group, Inc. (a)(b) | | | 85,063 | |
| | 2,727 | | | Regional Management Corp. (a) | | | 52,985 | |
| | 6,432 | | | Santander Consumer USA Holdings, Inc. (a)(b) | | | 85,674 | |
| | 12,062 | | | SLM Corp. (a) | | | 145,950 | |
| | | | | | |
|
|
|
| | | | | | | | 925,385 | |
| | | | | | |
|
|
|
| | | | | Containers & Packaging - 0.80% | |
| | 308 | | | AptarGroup, Inc. (b) | | | 23,713 | |
| | 1,567 | | | Bemis Co., Inc. | | | 76,564 | |
| | 2,399 | | | Berry Plastics Group, Inc. (a) | | | 116,519 | |
| | 2,274 | | | Crown Holdings, Inc. (a)(b) | | | 120,408 | |
| | 4,158 | | | Graphic Packaging Holding Co. | | | 53,514 | |
| | 804 | | | Greif, Inc. - Class A | | | 44,292 | |
| | 363 | | | Greif, Inc. - Class B | | | 23,704 | |
| | 1,608 | | | Multi Packaging Solutions International Ltd. (a) | | | 28,864 | |
| | 2,215 | | | Myers Industries, Inc. | | | 35,108 | |
| | 2,144 | | | Owens-Illinois, Inc. (a)(b) | | | 43,695 | |
| | 1,695 | | | Packaging Corp. of America | | | 155,296 | |
| | 2,873 | | | Sealed Air Corp. | | | 125,205 | |
| | 1,483 | | | Sonoco Products Co. (b) | | | 78,480 | |
| | | | | | |
|
|
|
| | | | | | | | 925,362 | |
| | | | | | |
|
|
|
| | | | | Distributors - 0.04% | |
| | 1,536 | | | Core-Mark Holding Co., Inc. | | | 47,908 | |
| | | | | | |
|
|
|
| | | | | Diversified Consumer Services - 1.19% | |
| | 4,057 | | | American Public Education, Inc. (a) | | | 92,905 | |
| | 5,636 | | | Bridgepoint Education, Inc. (a) | | | 60,136 | |
| | 5,937 | | | Cambium Learning Group, Inc. (a) | | | 29,091 | |
| | 1,149 | | | Capella Education Co. | | | 97,694 | |
| | 11,200 | | | Career Education Corp. (a)(b) | | | 97,440 | |
| | 7,874 | | | Chegg, Inc. (a)(b) | | | 66,457 | |
| | 3,069 | | | Collectors Universe, Inc. | | | 80,101 | |
| | 3,599 | | | DeVry Education Group, Inc. (b) | | | 127,585 | |
| | 1,100 | | | Grand Canyon Ed, Inc. (a) | | | 78,771 | |
| | | | | | | | |
Number of
Shares
| | | | | Value
| |
| | | | | Diversified Consumer Services (Continued) | |
| | 3,931 | | | H&R Block, Inc. | | $ | 91,396 | |
| | 1,275 | | | Hillenbrand, Inc. | | | 45,709 | |
| | 2,289 | | | Houghton Mifflin Harcourt Co. (a) | | | 23,233 | |
| | 5,526 | | | K12, Inc. (a) | | | 105,823 | |
| | 1,747 | | | Liberty Tax, Inc. | | | 24,895 | |
| | 305 | | | Matthews International Corp. - Class A | | | 20,633 | |
| | 2,300 | | | Regis Corp. (a) | | | 26,956 | |
| | 856 | | | Service Corp. International | | | 26,433 | |
| | 2,023 | | | ServiceMaster Global Holdings, Inc. (a) | | | 84,460 | |
| | 751 | | | Sotheby’s (a) | | | 34,155 | |
| | 1,024 | | | Strayer Education, Inc. | | | 82,422 | |
| | 4,753 | | | Weight Watchers International, Inc. (a)(b) | | | 74,004 | |
| | | | | | |
|
|
|
| | | | | | | | 1,370,299 | |
| | | | | | |
|
|
|
| | | | | Diversified Financial Services - 0.72% | |
| | 1,967 | | | CBOE Holdings, Inc. | | | 159,465 | |
| | 1,400 | | | Encore Capital Group, Inc. (a) | | | 43,120 | |
| | 2,143 | | | Fidelity National Financial, Inc. (a) | | | 28,395 | |
| | 4,284 | | | GAIN Capital Holdings, Inc. | | | 35,686 | |
| | 1,084 | | | MarketAxess Holdings, Inc. | | | 203,239 | |
| | 2,507 | | | MSCI, Inc. | | | 243,655 | |
| | 3,683 | | | Tiptree Financial, Inc. - Class A | | | 26,886 | |
| | 1,726 | | | World Acceptance Corp. (a) | | | 89,372 | |
| | | | | | |
|
|
|
| | | | | | | | 829,818 | |
| | | | | | |
|
|
|
| | | | | Diversified Telecommunication Services - 0.53% | |
| | 4,975 | | | 8x8, Inc. (a) | | | 75,869 | |
| | 1,123 | | | Cincinnati Bell, Inc. (a) | | | 19,877 | |
| | 1,318 | | | Cogent Communications Group, Inc. | | | 56,740 | |
| | 1,146 | | | Consolidated Communications Holdings, Inc. (b) | | | 26,839 | |
| | 2,154 | | | FairPoint Communications, Inc. (a) | | | 35,757 | |
| | 6,224 | | | Frontier Communications Corp. (b) | | | 13,319 | |
| | 1,789 | | | General Communication, Inc. - Class A (a) | | | 37,211 | |
| | 976 | | | Hawaiian Telcom Holdco, Inc. (a) | | | 22,360 | |
| | 3,119 | | | IDT Corp. - Class B | | | 39,674 | |
| | 995 | | | Straight Path Communications, Inc. -
Class B (a)(b) | | | 35,790 | |
| | 18,694 | | | Vonage Holdings Corp. (a)(b) | | | 118,146 | |
| | 13,916 | | | Windstream Holdings, Inc. (b) | | | 75,842 | |
| | 1,773 | | | Zayo Group Holdings, Inc. (a) | | | 58,332 | |
| | | | | | |
|
|
|
| | | | | | | | 615,756 | |
| | | | | | |
|
|
|
| | | | | Electric Utilities - 0.91% | |
| | 1,165 | | | ALLETE, Inc. | | | 78,882 | |
| | 642 | | | El Paso Electric Co. | | | 32,421 | |
| | 9,218 | | | Genie Energy Ltd. - Class B | | | 66,738 | |
| | 4,063 | | | Great Plains Energy, Inc. | | | 118,721 | |
| | 3,162 | | | Hawaiian Electric Industries, Inc. | | | 105,326 | |
| | 700 | | | IDACORP, Inc. | | | 58,072 | |
| | 538 | | | MGE Energy, Inc. | | | 34,970 | |
| | 3,626 | | | OGE Energy Corp. | | | 126,838 | |
| | 1,352 | | | Pinnacle West Capital Corp. | | | 112,730 | |
| | 1,116 | | | PNM Resources, Inc. | | | 41,292 | |
| | 1,198 | | | Portland General Electric Co. | | | 53,215 | |
| | 2,712 | | | Spark Energy, Inc. - Class A (b) | | | 86,648 | |
| | 600 | | | Unitil Corp. | | | 27,018 | |
| | 1,984 | | | Westar Energy, Inc. | | | 107,672 | |
| | | | | | |
|
|
|
| | | | | | | | 1,050,543 | |
| | | | | | |
|
|
|
| | | | | Electrical Equipment - 0.79% | |
| | 1,581 | | | Allied Motion Technologies, Inc. | | | 31,778 | |
| | 771 | | | AZZ, Inc. | | | 45,875 | |
See notes to financial statements.
53
GuideMark® Small/Mid Cap Core Fund
SCHEDULE OF INVESTMENTS (Continued)
March 31, 2017
| | | | | | | | |
Number of
Shares
| | | | | Value
| |
| | | | | COMMON STOCKS (Continued) | |
| | | | | Electrical Equipment (Continued) | |
| | 1,418 | | | Babcock & Wilcox Enterprises, Inc. (a) | | $ | 13,244 | |
| | 622 | | | Belden, Inc. (b) | | | 43,036 | |
| | 2,440 | | | Brady Corp. - Class A | | | 94,306 | |
| | 767 | | | Encore Wire Corp. | | | 35,282 | |
| | 1,776 | | | Energous Corp. (a)(b) | | | 27,706 | |
| | 722 | | | EnerSys | | | 56,995 | |
| | 680 | | | Franklin Electric Co., Inc. | | | 29,274 | |
| | 630 | | | Generac Holdings, Inc. (a)(b) | | | 23,486 | |
| | 2,151 | | | General Cable Corp. | | | 38,610 | |
| | 981 | | | Hubbell, Inc. | | | 117,769 | |
| | 1,216 | | | II-VI, Inc. (a) | | | 43,837 | |
| | 3,169 | | | InvenSense, Inc. (a) | | | 40,024 | |
| | 3,702 | | | LSI Industries, Inc. | | | 37,353 | |
| | 908 | | | Powell Industries, Inc. | | | 31,272 | |
| | 945 | | | Regal Beloit Corp. (b) | | | 71,489 | |
| | 3,600 | | | Vicor Corp. (a) | | | 57,960 | |
| | 1,102 | | | Woodward Governor Co. | | | 74,848 | |
| | | | | | |
|
|
|
| | | | | | | | 914,144 | |
| | | | | | |
|
|
|
| | | | | Electronic Equipment, Instruments & Components - 2.57% | |
| | 1,019 | | | Anixter International, Inc. (a) | | | 80,807 | |
| | 1,979 | | | Arrow Electronics, Inc. (a) | | | 145,278 | |
| | 1,658 | | | Avnet, Inc. | | | 75,870 | |
| | 1,544 | | | AVX Corp. | | | 25,291 | |
| | 2,294 | | | Benchmark Electronics, Inc. (a) | | | 72,949 | |
| | 4,104 | | | CDW Corp. (b) | | | 236,842 | |
| | 1,963 | | | Cognex Corp. (b) | | | 164,794 | |
| | 577 | | | Coherent, Inc. (a) | | | 118,654 | |
| | 5,417 | | | Control4 Corp. (a) | | | 85,534 | |
| | 3,790 | | | Daktronics, Inc. | | | 35,816 | |
| | 1,694 | | | Dolby Laboratories, Inc. - Class A | | | 88,783 | |
| | 6,787 | | | Electro Scientific Industries (a) | | | 47,305 | |
| | 800 | | | Fabrinet (a) | | | 33,624 | |
| | 968 | | | FARO Technologies, Inc. (a) | | | 34,606 | |
| | 5,164 | | | Fitbit, Inc. - Class A (a)(b) | | | 30,571 | |
| | 1,302 | | | FLIR Systems, Inc. | | | 47,237 | |
| | 2,648 | | | Insight Enterprises, Inc. (a) | | | 108,806 | |
| | 408 | | | IPG Photonics Corp. (a)(b) | | | 49,246 | |
| | 1,050 | | | Itron, Inc. (a) | | | 63,735 | |
| | 1,288 | | | Jabil Circuit, Inc. (b) | | | 37,249 | |
| | 3,258 | | | Keysight Technologies, Inc. (a) | | | 117,744 | |
| | 1,936 | | | Kimball Electronics, Inc. (a) | | | 32,815 | |
| | 1,326 | | | Knowles Corp. (a)(b) | | | 25,128 | |
| | 306 | | | Littelfuse, Inc. | | | 48,933 | |
| | 1,100 | | | Mercury Computer Systems (a) | | | 42,955 | |
| | 774 | | | Methode Electronics, Inc. (b) | | | 35,294 | |
| | 460 | | | MTS Systems Corp. | | | 25,323 | |
| | 2,699 | | | National Instruments Corp. | | | 87,880 | |
| | 2,000 | | | Novanta, Inc. (a) | | | 53,100 | |
| | 1,500 | | | PC Connection, Inc. (b) | | | 44,685 | |
| | 1,135 | | | Plexus Corp. (a) | | | 65,603 | |
| | 10,273 | | | Radisys Corp. (a) | | | 41,092 | |
| | 375 | | | Rogers Corp. (a) | | | 32,201 | |
| | 2,444 | | | Sanmina Corp. (a) | | | 99,226 | |
| | 929 | | | ScanSource, Inc. (a) | | | 36,463 | |
| | 813 | | | SYNNEX Corp. | | | 91,007 | |
| | 1,030 | | | Tech Data Corp. (a) | | | 96,717 | |
| | 5,123 | | | Trimble Navigation Ltd. (a) | | | 163,987 | |
| | 3,500 | | | TTM Technologies, Inc. (a)(b) | | | 56,455 | |
| | | | | | | | |
Number of
Shares
| | | | | Value
| |
| | | | | Electronic Equipment, Instruments & Components (Continued) | |
| | 394 | | | Universal Display Corp. (b) | | $ | 33,923 | |
| | 3,404 | | | Vishay Intertechnology, Inc. (b) | | | 55,996 | |
| | 1,577 | | | Vishay Precision Group, Inc. (a) | | | 24,917 | |
| | 747 | | | Zebra Technologies Corp. - Class A (a) | | | 68,164 | |
| | | | | | |
|
|
|
| | | | | | | | 2,962,605 | |
| | | | | | |
|
|
|
| | | | | Energy Equipment & Services - 1.12% | |
| | 3,792 | | | Archrock, Inc. | | | 47,021 | |
| | 4,176 | | | Atwood Oceanics, Inc. (a)(b) | | | 39,797 | |
| | 6,756 | | | Dawson Geophysical Co. (a)(b) | | | 37,563 | |
| | 1,833 | | | Diamond Offshore Drilling, Inc. (a)(b) | | | 30,629 | |
| | 605 | | | Dril-Quip, Inc. (a)(b) | | | 33,003 | |
| | 7,202 | | | Ensco Plc - Class A (b) | | | 64,458 | |
| | 4,550 | | | Era Group, Inc. (a) | | | 60,333 | |
| | 1,111 | | | Exterran Corp. (a) | | | 34,941 | |
| | 2,948 | | | Fairmount Santrol Holdings, Inc. (a) | | | 21,609 | |
| | 2,300 | | | Forum Energy Technologies, Inc. (a) | | | 47,610 | |
| | 1,073 | | | Geospace Technologies Corp. (a) | | | 17,415 | |
| | 2,280 | | | Helix Energy Solutions Group, Inc. (a) | | | 17,716 | |
| | 1,213 | | | Matrix Service Co. (a) | | | 20,014 | |
| | 4,812 | | | Nabors Industries, Ltd. | | | 62,893 | |
| | 1,371 | | | Natural Gas Services Group, Inc. (a) | | | 35,715 | |
| | 2,817 | | | Newpark Resources, Inc. (a)(b) | | | 22,818 | |
| | 7,378 | | | Noble Corp. Plc (b) | | | 45,670 | |
| | 1,900 | | | Oceaneering International, Inc. (b) | | | 51,452 | |
| | 1,300 | | | Oil States International, Inc. (a) | | | 43,095 | |
| | 13,682 | | | Parker Drilling Co. (a) | | | 23,943 | |
| | 2,968 | | | Patterson-UTI Energy, Inc. (b) | | | 72,033 | |
| | 3,798 | | | Pioneer Energy Services Corp. (a) | | | 15,192 | |
| | 1,826 | | | RigNet, Inc. (a) | | | 39,168 | |
| | 3,414 | | | Rowan Cos., Inc. - Class A (a)(b) | | | 53,190 | |
| | 2,044 | | | RPC Energy Services, Inc. (b) | | | 37,426 | |
| | 15,976 | | | Seadrill, Ltd. (a)(b) | | | 26,360 | |
| | 2,900 | | | Superior Energy Services, Inc. (a) | | | 41,354 | |
| | 2,561 | | | TechnipFMC Plc (a) | | | 83,232 | |
| | 5,479 | | | Tetra Technologies, Inc. (a)(b) | | | 22,300 | |
| | 11,009 | | | Tidewater, Inc. (a)(b) | | | 12,660 | |
| | 5,469 | | | Transocean, Ltd. - ADR (a)(b) | | | 68,089 | |
| | 873 | | | Unit Corp. (a) | | | 21,092 | |
| | 958 | | | US Silica Holdings, Inc. (b) | | | 45,974 | |
| | | | | | |
|
|
|
| | | | | | | | 1,295,765 | |
| | | | | | |
|
|
|
| | | | | Food & Staples Retailing - 0.90% | |
| | 1,070 | | | Casey’s General Stores, Inc. (b) | | | 120,107 | |
| | 2,472 | | | Diplomat Pharmacy, Inc. (a) | | | 39,428 | |
| | 1,135 | | | Ingles Markets, Inc. - Class A | | | 48,975 | |
| | 4,287 | | | Natural Grocers by Vitamin Cottage, Inc. (a)(b) | | | 44,542 | |
| | 2,457 | | | Performance Food Group Co. (a)(b) | | | 58,477 | |
| | 528 | | | PriceSmart, Inc. | | | 48,682 | |
| | 21,245 | | | Rite Aid Corp. (a) | | | 90,291 | |
| | 2,848 | | | SpartanNash Co. | | | 99,652 | |
| | 4,759 | | | Sprouts Farmers Market, Inc. (a)(b) | | | 110,028 | |
| | 13,897 | | | SUPERVALU, Inc. (a) | | | 53,642 | |
| | 3,825 | | | The Chefs’ Warehouse, Inc. (a) | | | 53,168 | |
| | 2,234 | | | United Natural Foods, Inc. (a)(b) | | | 96,576 | |
| | 1,281 | | | US Foods Holding Corp. (a) | | | 35,842 | |
| | 2,428 | | | Village Super Market, Inc. - Class A | | | 64,342 | |
| | 1,200 | | | Weis Markets, Inc. | | | 71,580 | |
| | | | | | |
|
|
|
| | | | | | | | 1,035,332 | |
| | | | | | |
|
|
|
See notes to financial statements.
54
GuideMark® Small/Mid Cap Core Fund
SCHEDULE OF INVESTMENTS (Continued)
March 31, 2017
| | | | | | | | |
Number of
Shares
| | | | | Value
| |
| | | | | COMMON STOCKS (Continued) | |
| | | | | Food Products - 1.54% | |
| | 1,003 | | | Alico, Inc. | | $ | 26,479 | |
| | 503 | | | B&G Foods, Inc. | | | 20,246 | |
| | 2,923 | | | Blue Buffalo Pet Products, Inc. (a)(b) | | | 67,229 | |
| | 708 | | | Cal Maine Foods, Inc. (b) | | | 26,054 | |
| | 3,474 | | | Darling International, Inc. (a) | | | 50,442 | |
| | 6,617 | | | Dean Foods Co. | | | 130,090 | |
| | 1,493 | | | Farmer Brothers Co. (a) | | | 52,778 | |
| | 5,415 | | | Flowers Foods, Inc. (b) | | | 105,105 | |
| | 1,214 | | | Fresh Del Monte Produce, Inc. (b) | | | 71,905 | |
| | 2,944 | | | Freshpet, Inc. (a)(b) | | | 32,384 | |
| | 1,692 | | | Ingredion, Inc. | | | 203,768 | |
| | 3,643 | | | Inventure Foods, Inc. (a) | | | 16,102 | |
| | 389 | | | J&J Snack Foods Corp. | | | 52,733 | |
| | 660 | | | John B. Sanfilippo & Son, Inc. (b) | | | 48,305 | |
| | 722 | | | Lancaster Colony Corp. | | | 93,022 | |
| | 2,686 | | | Lifeway Foods, Inc. (a) | | | 28,821 | |
| | 1,767 | | | Omega Protein Corp. | | | 35,428 | |
| | 1,227 | | | Pilgrim’s Pride Corp. (b) | | | 27,614 | |
| | 1,303 | | | Pinnacle Foods, Inc. | | | 75,405 | |
| | 1,549 | | | Post Holdings, Inc. (a)(b) | | | 135,568 | |
| | 900 | | | Sanderson Farms, Inc. (b) | | | 93,456 | |
| | 1,208 | | | Seneca Foods Corp. - Class A (a) | | | 43,609 | |
| | 1,087 | | | Snyder’s-Lance, Inc. (b) | | | 43,817 | |
| | 1,019 | | | The Hain Celestial Group, Inc. (a) | | | 37,907 | |
| | 2,472 | | | The WhiteWave Foods Co. (a) | | | 138,803 | |
| | 851 | | | Tootsie Roll Industries, Inc. | | | 31,777 | |
| | 1,010 | | | TreeHouse Foods, Inc. (a)(b) | | | 85,507 | |
| | | | | | |
|
|
|
| | | | | | | | 1,774,354 | |
| | | | | | |
|
|
|
| | | | | Gas Utilities - 0.78% | |
| | 1,334 | | | Atmos Energy Corp. | | | 105,373 | |
| | 1,235 | | | Delta Natural Gas Co., Inc. | | | 37,482 | |
| | 750 | | | National Fuel Gas Co. | | | 44,715 | |
| | 1,390 | | | New Jersey Resources Corp. (b) | | | 55,044 | |
| | 1,328 | | | Northwest Natural Gas Co. | | | 78,485 | |
| | 1,261 | | | ONE Gas, Inc. | | | 85,243 | |
| | 989 | | | South Jersey Industries, Inc. | | | 35,258 | |
| | 1,269 | | | Southwest Gas Corp. | | | 105,213 | |
| | 953 | | | Spire, Inc. | | | 64,327 | |
| | 4,875 | | | UGI Corp. | | | 240,825 | |
| | 600 | | | WGL Holdings, Inc. | | | 49,518 | |
| | | | | | |
|
|
|
| | | | | | | | 901,483 | |
| | | | | | |
|
|
|
| | | | | Health Care Equipment & Supplies - 3.95% | |
| | 909 | | | Abaxis, Inc. | | | 44,086 | |
| | 1,296 | | | ABIOMED, Inc. (a)(b) | | | 162,259 | |
| | 1,262 | | | Alere, Inc. (a) | | | 50,139 | |
| | 2,007 | | | Align Technology, Inc. (a)(b) | | | 230,223 | |
| | 303 | | | Analogic Corp. | | | 22,998 | |
| | 3,112 | | | AngioDynamics, Inc. (a) | | | 53,993 | |
| | 511 | | | Anika Therapeutics, Inc. (a)(b) | | | 22,198 | |
| | 1,564 | | | AtriCure, Inc. (a) | | | 29,951 | |
| | 100 | | | Atrion Corp. | | | 46,820 | |
| | 3,077 | | | AxoGen, Inc. (a) | | | 32,155 | |
| | 1,192 | | | Cantel Medical Corp. | | | 95,479 | |
| | 3,459 | | | Cardiovascular Systems, Inc. (a) | | | 97,803 | |
| | 2,300 | | | CryoLife, Inc. (a) | | | 38,295 | |
| | 3,910 | | | Cutera, Inc. (a) | | | 80,937 | |
| | 2,192 | | | DexCom, Inc. (a)(b) | | | 185,728 | |
| | 2,230 | | | Entellus Medical, Inc. (a) | | | 30,774 | |
| | | | | | | | |
Number of
Shares
| | | | | Value
| |
| | | | | Health Care Equipment & Supplies (Continued) | |
| | 2,680 | | | Exactech, Inc. (a) | | $ | 67,536 | |
| | 3,536 | | | GenMark Diagnostics, Inc. (a) | | | 45,332 | |
| | 1,898 | | | Glaukos Corp. (a)(b) | | | 97,367 | |
| | 1,993 | | | Globus Medical, Inc. - Class A (a)(b) | | | 59,033 | |
| | 1,166 | | | Haemonetics Corp. (a) | | | 47,305 | |
| | 1,628 | | | Halyard Health, Inc. (a) | | | 62,011 | |
| | 1,294 | | | Hill-Rom Holdings, Inc. | | | 91,356 | |
| | 4,264 | | | Hologic, Inc. (a) | | | 181,433 | |
| | 200 | | | ICU Med, Inc. (a) | | | 30,540 | |
| | 2,250 | | | IDEXX Laboratories, Inc. (a)(b) | | | 347,873 | |
| | 1,135 | | | Inogen, Inc. (a) | | | 88,031 | |
| | 2,553 | | | Insulet Corp. (a)(b) | | | 110,009 | |
| | 1,184 | | | Integra Lifesciences Holdings Corp. (a)(b) | | | 49,882 | |
| | 7,210 | | | iRadimed Corp. (a)(b) | | | 64,169 | |
| | 4,197 | | | IRIDEX Corp. (a) | | | 49,818 | |
| | 1,652 | | | K2M Group Holdings, Inc. (a) | | | 33,883 | |
| | 3,800 | | | LeMaitre Vascular, Inc. | | | 93,594 | |
| | 2,041 | | | Masimo Corp. (a) | | | 190,344 | |
| | 2,917 | | | Meridian Bioscience, Inc. | | | 40,255 | |
| | 1,179 | | | Merit Medical Systems, Inc. (a) | | | 34,073 | |
| | 1,424 | | | Natus Medical, Inc. (a) | | | 55,892 | |
| | 391 | | | Neogen Corp. (a) | | | 25,630 | |
| | 1,472 | | | NuVasive, Inc. (a)(b) | | | 109,929 | |
| | 3,356 | | | NxStage Medical, Inc. (a) | | | 90,041 | |
| | 9,635 | | | OraSure Technologies, Inc. (a) | | | 124,581 | |
| | 2,392 | | | Orthofix International NV (a) | | | 91,255 | |
| | 1,754 | | | Oxford Immunotec Global Plc (a) | | | 27,169 | |
| | 1,078 | | | Penumbra, Inc. (a) | | | 89,959 | |
| | 2,724 | | | ResMed, Inc. (b) | | | 196,046 | |
| | 11,041 | | | RTI Surgical, Inc. (a) | | | 44,164 | |
| | 8,212 | | | STAAR Surgical Co. (a)(b) | | | 80,478 | |
| | 1,468 | | | SurModics, Inc. (a) | | | 35,305 | |
| | 2,855 | | | Tactile Systems Technology, Inc. (a) | | | 54,102 | |
| | 565 | | | Teleflex, Inc. (b) | | | 109,457 | |
| | 583 | | | The Cooper Companies, Inc. (b) | | | 116,536 | |
| | 2,123 | | | The Spectranetics Corp. (a) | | | 61,832 | |
| | 444 | | | Utah Medical Products, Inc. | | | 27,661 | |
| | 1,115 | | | West Pharmaceutical Services, Inc. (b) | | | 90,995 | |
| | 2,125 | | | Zeltiq Aesthetics, Inc. (a) | | | 118,171 | |
| | | | | | |
|
|
|
| | | | | | | | 4,556,885 | |
| | | | | | |
|
|
|
| | | | | Health Care Providers & Services - 2.50% | |
| | 1,042 | | | Addus HomeCare Corp. (a) | | | 33,344 | |
| | 664 | | | Air Methods Corp. (a) | | | 28,552 | |
| | 2,086 | | | Almost Family, Inc. (a) | | | 101,380 | |
| | 2,409 | | | Amedisys, Inc. (a) | | | 123,076 | |
| | 1,262 | | | American Renal Associates Holdings, Inc. (a) | | | 21,303 | |
| | 2,010 | | | AMN Healthcare Services, Inc. (a)(b) | | | 81,606 | |
| | 14,215 | | | BioScrip, Inc. (a) | | | 24,165 | |
| | 4,533 | | | BioTelemetry, Inc. (a)(b) | | | 131,230 | |
| | 1,466 | | | Brookdale Senior Living, Inc. (a) | | | 19,688 | |
| | 577 | | | Chemed Corp. | | | 105,412 | |
| | 1,870 | | | Civitas Solutions, Inc. (a) | | | 34,314 | |
| | 6,875 | | | Community Health Systems, Inc. (a) | | | 60,981 | |
| | 1,448 | | | CorVel Corp. (a) | | | 62,988 | |
| | 6,563 | | | Cross Country Healthcare, Inc. (a) | | | 94,245 | |
| | 1,864 | | | Envision Healthcare Corp. (a)(b) | | | 114,300 | |
| | 1,020 | | | HealthEquity, Inc. (a) | | | 43,299 | |
| | 1,527 | | | HealthSouth Corp. (b) | | | 65,371 | |
| | 2,244 | | | HMS Holdings Corp. (a) | | | 45,621 | |
See notes to financial statements.
55
GuideMark® Small/Mid Cap Core Fund
SCHEDULE OF INVESTMENTS (Continued)
March 31, 2017
| | | | | | | | |
Number of
Shares
| | | | | Value
| |
| | | | | COMMON STOCKS (Continued) | |
| | | | | Health Care Providers & Services (Continued) | |
| | 3,194 | | | Kindred Healthcare, Inc. (b) | | $ | 26,670 | |
| | 820 | | | Landauer, Inc. | | | 39,975 | |
| | 1,900 | | | LHC Group, Inc. (a) | | | 102,410 | |
| | 1,191 | | | LifePoint Hospitals, Inc. (a) | | | 78,011 | |
| | 799 | | | Magellan Health Services, Inc. (a) | | | 55,171 | |
| | 1,302 | | | MEDNAX, Inc. (a)(b) | | | 90,333 | |
| | 1,457 | | | Molina Healthcare, Inc. (a)(b) | | | 66,439 | |
| | 303 | | | National Healthcare Corp. | | | 21,604 | |
| | 1,763 | | | National Research Corp. - Class A | | | 34,731 | |
| | 25,993 | | | Nobilis Health Corp. (a)(b) | | | 44,188 | |
| | 2,539 | | | Owens & Minor, Inc. (b) | | | 87,849 | |
| | 1,418 | | | Patterson Cos., Inc. (b) | | | 64,136 | |
| | 2,473 | | | PerkinElmer, Inc. | | | 143,582 | |
| | 1,519 | | | PharMerica Corp. (a) | | | 35,545 | |
| | 815 | | | Premier, Inc. - Class A (a) | | | 25,941 | |
| | 8,486 | | | Quorum Health Corp. (a) | | | 46,164 | |
| | 6,707 | | | RadNet, Inc. (a) | | | 39,571 | |
| | 4,735 | | | Select Medical Holdings Corp. (a)(b) | | | 63,212 | |
| | 1,273 | | | Surgery Partners, Inc. (a) | | | 24,824 | |
| | 2,635 | | | Tenet Healthcare Corp. (a) | | | 46,666 | |
| | 1,627 | | | Tivity Health, Inc. (a) | | | 47,346 | |
| | 2,522 | | | Triple-S Management Corp. - Class B (a) | | | 44,312 | |
| | 2,065 | | | Trupanion, Inc. (a)(b) | | | 29,364 | |
| | 327 | | | UnitedHealth Group, Inc. | | | 53,644 | |
| | 3,500 | | | Universal American Corp. (a) | | | 34,895 | |
| | 372 | | | US Physical Therapy, Inc. | | | 24,292 | |
| | 1,192 | | | VCA, Inc. (a) | | | 109,068 | |
| | 1,536 | | | WellCare Health Plans, Inc. (a) | | | 215,363 | |
| | | | | | |
|
|
|
| | | | | | | | 2,886,181 | |
| | | | | | |
|
|
|
| | | | | Health Care Technology - 0.44% | |
| | 4,680 | | | Allscripts Healthcare Solutions, Inc. (a)(b) | | | 59,342 | |
| | 834 | | | athenahealth, Inc. (a)(b) | | | 93,983 | |
| | 1,388 | | | Medidata Solutions, Inc. (a)(b) | | | 80,074 | |
| | 869 | | | Omnicell, Inc. (a) | | | 35,325 | |
| | 3,700 | | | Quality Systems, Inc. (a) | | | 56,388 | |
| | 2,350 | | | Veeva Systems, Inc. - Class A (a)(b) | | | 120,508 | |
| | 2,347 | | | Vocera Communications, Inc. (a) | | | 58,276 | |
| | | | | | |
|
|
|
| | | | | | | | 503,896 | |
| | | | | | |
|
|
|
| | | | | Hotels, Restaurants & Leisure - 2.16% | |
| | 4,002 | | | Aramark | | | 147,554 | |
| | 75 | | | Biglari Holdings, Inc. (a) | | | 32,398 | |
| | 614 | | | BJ’s Restaurants, Inc. (a) | | | 24,806 | |
| | 2,135 | | | Bloomin’ Brands, Inc. (b) | | | 42,123 | |
| | 478 | | | Bob Evans Farms, Inc. | | | 31,008 | |
| | 2,440 | | | Boyd Gaming Corp. (a) | | | 53,704 | |
| | 1,253 | | | Brinker International, Inc. (b) | | | 55,082 | |
| | 397 | | | Buffalo Wild Wings, Inc. (a)(b) | | | 60,642 | |
| | 2,918 | | | Caesars Acquisition Co. - Class A (a) | | | 44,937 | |
| | 3,818 | | | Caesars Entertainment Corp. (a)(b) | | | 36,462 | |
| | 5,900 | | | Callaway Golf Co. | | | 65,313 | |
| | 1,700 | | | Carrols Restaurant Group, Inc. (a) | | | 24,055 | |
| | 3,294 | | | Century Casinos, Inc. (a) | | | 24,903 | |
| | 504 | | | Cheesecake Factory, Inc. (b) | | | 31,933 | |
| | 801 | | | Choice Hotels International, Inc. | | | 50,143 | |
| | 208 | | | Churchill Downs, Inc. | | | 33,041 | |
| | 186 | | | Cracker Barrel Old Country Store, Inc. (b) | | | 29,620 | |
| | 421 | | | Dave & Buster’s Entertainment, Inc. (a)(b) | | | 25,719 | |
| | 1,563 | | | Del Frisco’s Restaurant Group, Inc. (a) | | | 28,212 | |
| | | | | | | | |
Number of
Shares
| | | | | Value
| |
| | | | | Hotels, Restaurants & Leisure (Continued) | |
| | 1,582 | | | Del Taco Restaurants, Inc. (a)(b) | | $ | 20,977 | |
| | 3,398 | | | Denny’s Corp. (a) | | | 42,033 | |
| | 1,417 | | | Domino’s Pizza, Inc. | | | 261,153 | |
| | 853 | | | Dunkin’ Brands Group, Inc. | | | 46,642 | |
| | 2,525 | | | Eldorado Resorts, Inc. (a)(b) | | | 47,786 | |
| | 978 | | | Fiesta Restaurant Group, Inc. (a) | | | 23,668 | |
| | 1,906 | | | Fogo De Chao, Inc. (a) | | | 30,972 | |
| | 2,022 | | | Golden Entertainment, Inc. | | | 26,751 | |
| | 626 | | | Hyatt Hotels Corp. - Class A (a)(b) | | | 33,791 | |
| | 628 | | | International Speedway Corp. - Class A | | | 23,205 | |
| | 1,502 | | | Intrawest Resorts Holdings, Inc. (a) | | | 37,565 | |
| | 2,100 | | | Isle of Capri Casinos, Inc. (a) | | | 55,356 | |
| | 736 | | | Jack in the Box, Inc. | | | 74,866 | |
| | 3,356 | | | Jamba, Inc. (a)(b) | | | 30,372 | |
| | 2,240 | | | La Quinta Holdings, Inc. (a) | | | 30,285 | |
| | 1,259 | | | Marcus Corp. | | | 40,414 | |
| | 330 | | | Marriott Vacations Worldwide Corp. | | | 32,977 | |
| | 1,143 | | | Nathan’s Famous, Inc. (a) | | | 71,609 | |
| | 431 | | | Panera Bread Co. - Class A (a)(b) | | | 112,866 | |
| | 1,092 | | | Papa John’s International, Inc. | | | 87,404 | |
| | 2,120 | | | Penn National Gaming, Inc. (a) | | | 39,072 | |
| | 1,882 | | | Pinnacle Entertainment, Inc. (a) | | | 36,737 | |
| | 4,980 | | | Potbelly Corp. (a) | | | 69,222 | |
| | 7,492 | | | Ruby Tuesday, Inc. (a) | | | 21,052 | |
| | 2,500 | | | Ruth’s Hospitality Group, Inc. | | | 50,125 | |
| | 875 | | | Six Flags Entertainment Corp. | | | 52,054 | |
| | 1,187 | | | Sonic Corp. | | | 30,102 | |
| | 1,800 | | | Speedway Motorsports, Inc. | | | 33,912 | |
| | 800 | | | Texas Roadhouse, Inc. | | | 35,624 | |
| | 1,941 | | | The Wendy’s Co. | | | 26,417 | |
| | 442 | | | Vail Resorts, Inc. | | | 84,820 | |
| | 1,398 | | | Wingstop, Inc. (b) | | | 39,535 | |
| | | | | | |
|
|
|
| | | | | | | | 2,491,019 | |
| | | | | | |
|
|
|
| | | | | Household Durables - 1.68% | |
| | 2,898 | | | Bassett Furniture Industries, Inc. | | | 77,956 | |
| | 3,163 | | | Beazer Homes USA, Inc. (a) | | | 38,367 | |
| | 686 | | | CalAtlantic Group, Inc. | | | 25,691 | |
| | 300 | | | Cavco Industries, Inc. (a) | | | 34,920 | |
| | 1,045 | | | CSS Industries, Inc. | | | 27,086 | |
| | 2,290 | | | Ethan Allen Interiors, Inc. | | | 70,188 | |
| | 1,189 | | | Flexsteel Industries, Inc. | | | 59,926 | |
| | 5,378 | | | GoPro, Inc. - Class A (a)(b) | | | 46,789 | |
| | 899 | | | Helen of Troy, Ltd. (a) | | | 84,686 | |
| | 1,300 | | | Hooker Furniture Corp. | | | 40,365 | |
| | 12,219 | | | Hovnanian Enterprises, Inc. (a) | | | 27,737 | |
| | 2,076 | | | Installed Building Products, Inc. (a) | | | 109,509 | |
| | 2,355 | | | iRobot Corp. (a)(b) | | | 155,760 | |
| | 3,255 | | | KB Home (b) | | | 64,709 | |
| | 3,618 | | | La-Z-Boy, Inc. (b) | | | 97,686 | |
| | 2,036 | | | Leggett & Platt, Inc. (b) | | | 102,452 | |
| | 2,027 | | | Lennar Corp. - Class A (b) | | | 103,762 | |
| | 638 | | | Lennar Corp. - Class B | | | 26,668 | |
| | 809 | | | LGI Homes, Inc. (a)(b) | | | 27,433 | |
| | 1,643 | | | Libbey, Inc. | | | 23,955 | |
| | 4,145 | | | Lifetime Brands, Inc. | | | 83,314 | |
| | 216 | | | National Presto Industries, Inc. | | | 22,075 | |
| | 74 | | | NVR, Inc. (a)(b) | | | 155,909 | |
| | 1,330 | | | Pulte Homes, Inc. (b) | | | 31,321 | |
| | 1,180 | | | Tempur Sealy International, Inc. (a)(b) | | | 54,823 | |
See notes to financial statements.
56
GuideMark® Small/Mid Cap Core Fund
SCHEDULE OF INVESTMENTS (Continued)
March 31, 2017
| | | | | | | | |
Number of
Shares
| | | | | Value
| |
| | | | | COMMON STOCKS (Continued) | |
| | | | | Household Durables (Continued) | |
| | 1,016 | | | Toll Brothers, Inc. (a) | | $ | 36,688 | |
| | 623 | | | TopBuild Corp. (a) | | | 29,281 | |
| | 2,777 | | | Tri Pointe Group, Inc. (a)(b) | | | 34,824 | |
| | 2,112 | | | Tupperware Brands Corp. (b) | | | 132,465 | |
| | 2,814 | | | UCP, Inc. - Class A (a) | | | 28,562 | |
| | 400 | | | Universal Electronics, Inc. (a) | | | 27,400 | |
| | 7,538 | | | ZAGG, Inc. (a) | | | 54,274 | |
| | | | | | |
|
|
|
| | | | | | | | 1,936,581 | |
| | | | | | |
|
|
|
| | | | | Household Products - 0.51% | |
| | 2,211 | | | Central Garden & Pet Co. (a)(b) | | | 81,962 | |
| | 3,759 | | | Central Garden & Pet Co. - Class A (a) | | | 130,513 | |
| | 1,804 | | | Energizer Holdings, Inc. (b) | | | 100,573 | |
| | 4,272 | | | HRG Group, Inc. (a) | | | 82,535 | |
| | 1,034 | | | Oil-Dri Corp. of America | | | 38,537 | |
| | 537 | | | Spectrum Brands Holdings, Inc. (b) | | | 74,648 | |
| | 776 | | | WD-40 Co. | | | 84,545 | |
| | | | | | |
|
|
|
| | | | | | | | 593,313 | |
| | | | | | |
|
|
|
| | | | | Independent Power and Renewable Electricity Producers - 0.60% | |
| | 38,845 | | | Atlantic Power Corp. (a) | | | 102,939 | |
| | 9,447 | | | Calpine Corp. (a)(b) | | | 104,390 | |
| | 8,498 | | | Dynegy, Inc. (a) | | | 66,794 | |
| | 9,757 | | | NRG Energy, Inc. (b) | | | 182,456 | |
| | 5,052 | | | NRG Yield, Inc. - Class A | | | 87,854 | |
| | 6,300 | | | NRG Yield, Inc. - Class C | | | 111,510 | |
| | 747 | | | Ormat Technologies, Inc. | | | 42,639 | |
| | | | | | |
|
|
|
| | | | | | | | 698,582 | |
| | | | | | |
|
|
|
| | | | | Industrial Conglomerates - 0.28% | |
| | 1,218 | | | Carlisle Companies, Inc. (b) | | | 129,607 | |
| | 6,240 | | | McDermott International, Inc. (a)(b) | | | 42,120 | |
| | 650 | | | Otter Tail Corp. | | | 24,635 | |
| | 1,060 | | | Raven Industries, Inc. (b) | | | 30,793 | |
| | 9 | | | Seaboard Corp. | | | 37,525 | |
| | 430 | | | Standex International Corp. | | | 43,065 | |
| | 1,183 | | | Tredegar Corp. | | | 20,762 | |
| | | | | | |
|
|
|
| | | | | | | | 328,507 | |
| | | | | | |
|
|
|
| | | | | Insurance - 3.99% | |
| | 254 | | | Alleghany Corp. (a) | | | 156,124 | |
| | 1,249 | | | Allied World Assurance Co. Holdings, Ltd. | | | 66,322 | |
| | 2,870 | | | Ambac Financial Group, Inc. (a) | | | 54,128 | |
| | 1,252 | | | American Equity Investment Life Holding Co. | | | 29,585 | |
| | 1,326 | | | American Financial Group, Inc. | | | 126,527 | |
| | 290 | | | American National Insurance Co. | | | 34,229 | |
| | 1,119 | | | AMERISAFE, Inc. (b) | | | 72,623 | |
| | 3,604 | | | AmTrust Financial Services, Inc. (b) | | | 66,530 | |
| | 2,458 | | | Arch Capital Group, Ltd. - ADR (a) | | | 232,945 | |
| | 962 | | | Argo Group International Holdings, Ltd. | | | 65,224 | |
| | 4,261 | | | Arthur J. Gallagher & Co. | | | 240,917 | |
| | 1,146 | | | Aspen Insurance Holdings, Ltd. | | | 59,649 | |
| | 1,462 | | | Assurant, Inc. | | | 139,870 | |
| | 5,412 | | | Assured Guaranty, Ltd. | | | 200,839 | |
| | 1,685 | | | Atlas Financial Holdings, Inc. (a) | | | 23,000 | |
| | 1,935 | | | Axis Capital Holdings, Ltd. | | | 129,703 | |
| | 854 | | | Baldwin & Lyons, Inc. - Class B | | | 20,880 | |
| | 1,201 | | | Blue Capital Reinsurance Holdings Ltd. | | | 23,179 | |
| | 2,715 | | | Brown & Brown, Inc. | | | 113,270 | |
| | 2,083 | | | CNO Financial Group, Inc. | | | 42,701 | |
| | | | | | | | |
Number of
Shares
| | | | | Value
| |
| | | | | Insurance (Continued) | |
| | 1,909 | | | Crawford & Co. - Class B | | $ | 19,147 | |
| | 1,360 | | | Donegal Group, Inc. - Class A | | | 23,963 | |
| | 2,116 | | | eHealth, Inc. (a) | | | 25,477 | |
| | 960 | | | EMC Insurance Group, Inc. | | | 26,938 | |
| | 1,373 | | | Employers Holdings, Inc. | | | 52,105 | |
| | 988 | | | Erie Indemnity Co. - Class A | | | 121,228 | |
| | 1,014 | | | Everest Re Group, Ltd. | | | 237,083 | |
| | 457 | | | FBL Financial Group, Inc. - Class A | | | 29,911 | |
| | 2,163 | | | Federated National Holding Co. - Class C | | | 37,701 | |
| | 2,655 | | | First American Financial Corp. | | | 104,288 | |
| | 716 | | | Global Indemnity Ltd. (a) | | | 27,559 | |
| | 1,574 | | | HCI Group, Inc. (b) | | | 71,743 | |
| | 3,882 | | | Heritage Insurance Holdings, Inc. | | | 49,573 | |
| | 574 | | | Horace Mann Educators Corp. | | | 23,563 | |
| | 300 | | | Infinity Property & Casualty Corp. | | | 28,650 | |
| | 245 | | | Investors Title Co. | | | 38,747 | |
| | 600 | | | James River Group Holdings, Ltd. | | | 25,716 | |
| | 521 | | | Kemper Corp. | | | 20,788 | |
| | 3,500 | | | Maiden Holdings, Ltd. (b) | | | 49,000 | |
| | 3,083 | | | MBIA, Inc. (a)(b) | | | 26,113 | |
| | 1,434 | | | National General Holdings Corp. (b) | | | 34,072 | |
| | 101 | | | National Western Life Group, Inc. - Class A (b) | | | 30,720 | |
| | 800 | | | Navigators Group, Inc. | | | 43,440 | |
| | 4,213 | | | Old Republic International Corp. | | | 86,282 | |
| | 4,868 | | | Patriot National, Inc. (a)(b) | | | 13,728 | |
| | 1,933 | | | Primerica, Inc. (b) | | | 158,893 | |
| | 590 | | | ProAssurance Corp. (b) | | | 35,548 | |
| | 1,299 | | | Reinsurance Group of America | | | 164,947 | |
| | 1,013 | | | RenaissanceRe Holdings, Ltd. | | | 146,530 | |
| | 1,339 | | | RLI Corp. | | | 80,367 | |
| | 319 | | | Safety Insurance Group, Inc. | | | 22,362 | |
| | 2,100 | | | Selective Insurance Group, Inc. (b) | | | 99,015 | |
| | 2,571 | | | State National Cos., Inc. | | | 37,022 | |
| | 523 | | | Stewart Information Services Corp. (b) | | | 23,106 | |
| | 555 | | | The Hanover Insurance Group, Inc. | | | 49,983 | |
| | 3,336 | | | Torchmark Corp. (b) | | | 257,005 | |
| | 469 | | | United Fire Group, Inc. | | | 20,059 | |
| | 2,370 | | | United Insurance Holdings Corp. | | | 37,802 | |
| | 3,166 | | | Universal Insurance Holdings, Inc. (b) | | | 77,567 | |
| | 2,369 | | | W.R. Berkley Corp. (b) | | | 167,322 | |
| | 99 | | | White Mountains Insurance Group, Ltd. - ADR | | | 87,108 | |
| | | | | | |
|
|
|
| | | | | | | | 4,610,416 | |
| | | | | | |
|
|
|
| | | | | Internet & Direct Marketing Retail - 0.80% | |
| | 7,579 | | | 1-800-Flowers.Com, Inc. - Class A (a) | | | 77,306 | |
| | 2,926 | | | Etsy, Inc. (a) | | | 31,103 | |
| | 2,443 | | | FTD Cos., Inc. (a)(b) | | | 49,202 | |
| | 17,469 | | | Groupon, Inc. (a)(b) | | | 68,653 | |
| | 1,850 | | | HSN, Inc. | | | 68,635 | |
| | 2,234 | | | Lands’ End, Inc. (a) | | | 47,919 | |
| | 1,364 | | | Liberty Expedia Holdings, Inc. - Class A (a) | | | 62,035 | |
| | 1,252 | | | Liberty TripAdvisor Holdings, Inc. - Class A (a) | | | 17,653 | |
| | 2,470 | | | Nutrisystem, Inc. | | | 137,085 | |
| | 3,295 | | | Overstock.com, Inc. (a) | | | 56,674 | |
| | 3,690 | | | PetMed Express, Inc. | | | 74,317 | |
| | 1,775 | | | Shutterfly, Inc. (a) | | | 85,715 | |
| | 342 | | | Stamps.com, Inc. (a)(b) | | | 40,476 | |
| | 3,200 | | | Travelport Worldwide, Ltd. | | | 37,664 | |
| | 1,796 | | | Wayfair, Inc. - Class A (a)(b) | | | 72,720 | |
| | | | | | |
|
|
|
| | | | | | | | 927,157 | |
| | | | | | |
|
|
|
See notes to financial statements.
57
GuideMark® Small/Mid Cap Core Fund
SCHEDULE OF INVESTMENTS (Continued)
March 31, 2017
| | | | | | | | |
Number of
Shares
| | | | | Value
| |
| | | | | COMMON STOCKS (Continued) | |
| | | | | Internet Software & Services - 2.63% | |
| | 1,771 | | | 2U, Inc. (a)(b) | | $ | 70,238 | |
| | 10,117 | | | Aerohive Networks, Inc. (a) | | | 42,593 | |
| | 2,306 | | | Alarm.com Holdings, Inc. (a) | | | 70,886 | |
| | 2,212 | | | Amber Road, Inc. (a) | | | 17,077 | |
| | 10,776 | | | Angie’s List, Inc. (a) | | | 61,423 | |
| | 2,250 | | | Appfolio, Inc. - Class A (a) | | | 61,200 | |
| | 3,483 | | | Autobytel, Inc. (a) | | | 43,642 | |
| | 5,618 | | | Bankrate, Inc. (a) | | | 54,214 | |
| | 5,242 | | | Bazaarvoice, Inc. (a) | | | 22,541 | |
| | 4,181 | | | Blucora, Inc. (a) | | | 72,331 | |
| | 3,881 | | | Box, Inc. - Class A (a)(b) | | | 63,299 | |
| | 7,536 | | | Brightcove, Inc. (a) | | | 67,070 | |
| | 924 | | | BroadSoft, Inc. (a)(b) | | | 37,145 | |
| | 5,633 | | | Carbonite, Inc. (a) | | | 114,350 | |
| | 8,239 | | | Care.com, Inc. (a) | | | 103,070 | |
| | 3,925 | | | ChannelAdvisor Corp. (a) | | | 43,764 | |
| | 1,204 | | | Cimpress NV (a) | | | 103,773 | |
| | 3,187 | | | CommerceHub, Inc. - Series A (a) | | | 49,335 | |
| | 3,205 | | | CommerceHub, Inc. - Series C (a) | | | 49,774 | |
| | 1,355 | | | comScore, Inc. (a) | | | 29,254 | |
| | 2,064 | | | Cornerstone OnDemand, Inc. (a) | | | 80,269 | |
| | 117 | | | CoStar Group, Inc. (a)(b) | | | 24,245 | |
| | 12,468 | | | DHI Group, Inc. (a) | | | 49,249 | |
| | 7,700 | | | Five9, Inc. (a)(b) | | | 126,742 | |
| | 751 | | | GrubHub, Inc. (a)(b) | | | 24,700 | |
| | 812 | | | GTT Communications, Inc. (a) | | | 19,772 | |
| | 2,489 | | | Hortonworks, Inc. (a) | | | 24,417 | |
| | 1,900 | | | IAC InterActive Corp. (a) | | | 140,068 | |
| | 1,654 | | | Instructure, Inc. (a) | | | 38,704 | |
| | 782 | | | j2 Global, Inc. (b) | | | 65,618 | |
| | 7,350 | | | Liquidity Services, Inc. (a) | | | 58,800 | |
| | 5,702 | | | LivePerson, Inc. (a) | | | 39,059 | |
| | 894 | | | LogMeIn, Inc. | | | 87,165 | |
| | 10,174 | | | Marchex, Inc. - Class B (a) | | | 27,673 | |
| | 1,583 | | | Match Group, Inc. (a)(b) | | | 25,850 | |
| | 6,052 | | | MeetMe, Inc. (a) | | | 35,646 | |
| | 2,056 | | | MINDBODY, Inc. - Class A (a)(b) | | | 56,437 | |
| | 1,507 | | | New Relic, Inc. (a) | | | 55,864 | |
| | 3,276 | | | NIC, Inc. | | | 66,175 | |
| | 761 | | | Nutanix, Inc. - Class A (a)(b) | | | 14,284 | |
| | 5,816 | | | Pandora Media, Inc. (a)(b) | | | 68,687 | |
| | 4,749 | | | Quotient Technology, Inc. (a) | | | 45,353 | |
| | 4,525 | | | RealNetworks, Inc. (a) | | | 21,901 | |
| | 6,622 | | | RetailMeNot, Inc. (a) | | | 53,638 | |
| | 3,389 | | | Rightside Group Ltd. (a) | | | 33,619 | |
| | 1,237 | | | Shutterstock, Inc. (a)(b) | | | 51,150 | |
| | 518 | | | SPS Commerce, Inc. (a) | | | 30,298 | |
| | 6,343 | | | TechTarget, Inc. (a) | | | 57,277 | |
| | 6,500 | | | TrueCar, Inc. (a)(b) | | | 100,555 | |
| | 829 | | | Twilio, Inc. - Class A (a)(b) | | | 23,933 | |
| | 2,469 | | | Web.com Group, Inc. (a)(b) | | | 47,652 | |
| | 560 | | | WebMD Health Corp. (a) | | | 29,501 | |
| | 4,616 | | | Xactly Corp. (a) | | | 54,930 | |
| | 2,769 | | | XO Group, Inc. (a) | | | 47,654 | |
| | 2,570 | | | Yelp, Inc. - Class A (a)(b) | | | 84,167 | |
| | 610 | | | Zillow Group, Inc. - Class A (a) | | | 20,624 | |
| | 913 | | | Zillow Group, Inc. - Class C (a)(b) | | | 30,741 | |
| | | | | | |
|
|
|
| | | | | | | | 3,039,396 | |
| | | | | | |
|
|
|
| | | | | | | | |
Number of
Shares
| | | | | Value
| |
| | | | | IT Services - 2.23% | |
| | 2,658 | | | Acxiom Corp. (a) | | $ | 75,673 | |
| | 10,543 | | | ALJ Regional Holdings, Inc. (a) | | | 39,220 | |
| | 833 | | | Black Knight Financial Services, Inc. - Class A (a) | | | 31,904 | |
| | 3,176 | | | Blackhawk Network Holdings, Inc. (a)(b) | | | 128,946 | |
| | 2,453 | | | Booz Allen Hamilton Holding Corp. - Class A | | | 86,812 | |
| | 2,475 | | | Broadridge Financial Solutions, Inc. | | | 168,176 | |
| | 903 | | | CACI International, Inc. - Class A (a)(b) | | | 105,922 | |
| | 1,277 | | | Cardtronics Plc - Class A (a)(b) | | | 59,700 | |
| | 4,400 | | | Convergys Corp. | | | 93,060 | |
| | 1,646 | | | CoreLogic, Inc. (a) | | | 67,025 | |
| | 2,167 | | | CSG Systems International, Inc. | | | 81,934 | |
| | 400 | | | DST Systems, Inc. | | | 49,000 | |
| | 952 | | | EPAM Systems, Inc. (a) | | | 71,895 | |
| | 933 | | | Euronet Worldwide, Inc. (a)(b) | | | 79,790 | |
| | 1,315 | | | EVERTEC, Inc. | | | 20,909 | |
| | 800 | | | ExlService Holdings, Inc. (a) | | | 37,888 | |
| | 1,489 | | | Forrester Research, Inc. | | | 59,188 | |
| | 1,360 | | | Gartner, Inc. (a) | | | 146,866 | |
| | 3,660 | | | Genpact, Ltd. | | | 90,622 | |
| | 20,083 | | | Information Services Group, Inc. (a) | | | 63,261 | |
| | 1,482 | | | Leidos Holdings, Inc. | | | 75,790 | |
| | 1,980 | | | ManTech International Corp. - Class A | | | 68,567 | |
| | 1,500 | | | Maximus, Inc. (b) | | | 93,300 | |
| | 3,075 | | | NCI, Inc. - Class A (a) | | | 46,279 | |
| | 3,007 | | | NeuStar, Inc. - Class A (a) | | | 99,682 | |
| | 2,675 | | | Perficient, Inc. (a)(b) | | | 46,438 | |
| | 5,355 | | | PFSweb, Inc. (a) | | | 34,968 | |
| | 19,183 | | | Planet Payment, Inc. (a) | | | 76,348 | |
| | 1,400 | | | Science Applications International Corp. (b) | | | 104,160 | |
| | 3,623 | | | Square, Inc. - Class A (a) | | | 62,605 | |
| | 1,727 | | | Teletech Holdings, Inc. | | | 51,119 | |
| | 4,946 | | | The Hackett Group, Inc. | | | 96,398 | |
| | 3,754 | | | Unisys Corp. (a) | | | 52,368 | |
| | 1,399 | | | VeriFone Holdings, Inc. (a)(b) | | | 26,203 | |
| | 839 | | | Virtusa Corp. (a) | | | 25,355 | |
| | 617 | | | WEX, Inc. (a)(b) | | | 63,860 | |
| | | | | | |
|
|
|
| | | | | | | | 2,581,231 | |
| | | | | | |
|
|
|
| | | | | Leisure Products - 0.73% | |
| | 3,523 | | | American Outdoor Brands Corp. (a)(b) | | | 69,791 | |
| | 1,644 | | | Brunswick Corp. | | | 100,613 | |
| | 8,356 | | | JAKKS Pacific, Inc. (a)(b) | | | 45,958 | |
| | 2,512 | | | Johnson Outdoors, Inc. - Class A | | | 91,688 | |
| | 1,342 | | | Malibu Boats, Inc. - Class A (a) | | | 30,128 | |
| | 2,523 | | | Marine Products Corp. | | | 27,425 | |
| | 4,608 | | | MCBC Holdings, Inc. | | | 74,511 | |
| | 3,504 | | | Nautilus, Inc. (a)(b) | | | 63,948 | |
| | 1,018 | | | Polaris Industries, Inc. (b) | | | 85,308 | |
| | 1,342 | | | Pool Corp. (b) | | | 160,141 | |
| | 1,241 | | | Sturm, Ruger & Company, Inc. (b) | | | 66,456 | |
| | 1,314 | | | Vista Outdoor, Inc. (a) | | | 27,055 | |
| | | | | | |
|
|
|
| | | | | | | | 843,022 | |
| | | | | | |
|
|
|
| | | | | Life Sciences Tools & Services - 1.11% | |
| | 261 | | | Bio-Rad Laboratories, Inc. - Class A (a) | | | 52,028 | |
| | 387 | | | Bio-Techne Corp. | | | 39,338 | |
| | 4,070 | | | Bruker Corp. | | | 94,953 | |
| | 613 | | | Cambrex Corp. (a)(b) | | | 33,746 | |
| | 1,282 | | | Charles River Laboratories (a)(d) | | | 115,316 | |
| | 18,816 | | | ChromaDex Corp. (a)(b) | | | 50,615 | |
See notes to financial statements.
58
GuideMark® Small/Mid Cap Core Fund
SCHEDULE OF INVESTMENTS (Continued)
March 31, 2017
| | | | | | | | |
Number of
Shares
| | | | | Value
| |
| | | | | COMMON STOCKS (Continued) | |
| | | | | Life Sciences Tools & Services (Continued) | |
| | 18,974 | | | Enzo Biochem, Inc. (a) | | $ | 158,812 | |
| | 957 | | | INC Research Holdings, Inc. - Class A (a) | | | 43,878 | |
| | 3,447 | | | Luminex Corp. | | | 63,321 | |
| | 1,062 | | | Medpace Holdings, Inc. (a) | | | 31,701 | |
| | 1,765 | | | NanoString Technologies, Inc. (a) | | | 35,071 | |
| | 1,076 | | | PAREXEL International Corp. (a) | | | 67,906 | |
| | 1,225 | | | PRA Health Sciences, Inc. (a)(b) | | | 79,907 | |
| | 2,543 | | | QIAGEN NV | | | 73,676 | |
| | 3,124 | | | Quintiles Transnational Holdings, Inc. (a)(b) | | | 251,576 | |
| | 3,014 | | | VWR Corp. (a) | | | 84,995 | |
| | | | | | |
|
|
|
| | | | | | | | 1,276,839 | |
| | | | | | |
|
|
|
| | | | | Machinery - 3.52% | |
| | 1,580 | | | Actuant Corp. - Class A | | | 41,633 | |
| | 1,232 | | | AGCO Corp. | | | 74,142 | |
| | 335 | | | Alamo Group, Inc. | | | 25,524 | |
| | 1,888 | | | Allison Transmission Holdings, Inc. | | | 68,081 | |
| | 1,187 | | | Altra Industrial Motion Corp. (b) | | | 46,234 | |
| | 539 | | | American Railcar Industries, Inc. (b) | | | 22,153 | |
| | 478 | | | Astec Industries, Inc. | | | 29,395 | |
| | 1,282 | | | Badger Meter, Inc. | | | 47,113 | |
| | 1,013 | | | Barnes Group, Inc. (b) | | | 52,007 | |
| | 2,617 | | | Blue Bird Corp. (a)(b) | | | 44,882 | |
| | 2,469 | | | Briggs & Stratton Corp. (b) | | | 55,429 | |
| | 1,570 | | | Chart Industries, Inc. (a) | | | 54,856 | |
| | 360 | | | CIRCOR International, Inc. | | | 21,398 | |
| | 1,721 | | | Colfax Corp. (a)(b) | | | 67,566 | |
| | 1,434 | | | Columbus McKinnon Corp. (b) | | | 35,592 | |
| | 569 | | | Crane Co. | | | 42,578 | |
| | 1,600 | | | DMC Global, Inc. | | | 19,840 | |
| | 3,256 | | | Donaldson Co., Inc. | | | 148,213 | |
| | 840 | | | Douglas Dynamics, Inc. | | | 25,746 | |
| | 2,261 | | | Energy Recovery, Inc. (a) | | | 18,812 | |
| | 372 | | | EnPro Industries, Inc. | | | 26,472 | |
| | 514 | | | ESCO Technologies, Inc. | | | 29,863 | |
| | 1,354 | | | Federal Signal Corp. | | | 18,699 | |
| | 968 | | | Flowserve Corp. | | | 46,871 | |
| | 1,939 | | | Gencor Industries, Inc. (a) | | | 28,988 | |
| | 1,932 | | | Global Brass & Copper Holdings, Inc. | | | 66,461 | |
| | 1,010 | | | Gorman Rupp Co. | | | 31,714 | |
| | 1,400 | | | Graco, Inc. (b) | | | 131,796 | |
| | 4,130 | | | Hardinge, Inc. | | | 46,421 | |
| | 2,353 | | | Harsco Corp. (a) | | | 30,001 | |
| | 500 | | | Hyster-Yale Materials Handling, Inc. | | | 28,195 | |
| | 996 | | | IDEX Corp. | | | 93,136 | |
| | 766 | | | ITT, Inc. (b) | | | 31,421 | |
| | 895 | | | John Bean Technologies Corp. | | | 78,715 | |
| | 2,325 | | | Joy Global, Inc. | | | 65,681 | |
| | 1,000 | | | Kadant, Inc. | | | 59,350 | |
| | 1,705 | | | Kennametal, Inc. (b) | | | 66,887 | |
| | 1,574 | | | Lincoln Electric Holdings, Inc. | | | 136,718 | |
| | 687 | | | Lydall, Inc. (a) | | | 36,823 | |
| | 4,253 | | | Manitowoc, Inc. (a) | | | 24,242 | |
| | 1,696 | | | Meritor, Inc. (a)(b) | | | 29,052 | |
| | 606 | | | Middleby Corp. (a)(b) | | | 82,689 | |
| | 1,153 | | | Mueller Industries, Inc. | | | 39,467 | |
| | 3,270 | | | Mueller Water Products, Inc. - Class A | | | 38,651 | |
| | 700 | | | NACCO Industries, Inc. - Class A | | | 48,860 | |
| | 972 | | | Navistar International Corp. (a) | | | 23,931 | |
| | 1,301 | | | Nordson Corp. | | | 159,815 | |
| | | | | | | | |
Number of
Shares
| | | | | Value
| |
| | | | | Machinery (Continued) | |
| | 1,269 | | | Omega Flex, Inc. | | $ | 60,646 | |
| | 1,464 | | | Oshkosh Corp. | | | 100,416 | |
| | 804 | | | Proto Labs, Inc. (a) | | | 41,084 | |
| | 253 | | | RBC Bearings, Inc. (a)(b) | | | 24,564 | |
| | 1,400 | | | Rexnord Corp. (a) | | | 32,312 | |
| | 986 | | | Snap On, Inc. (b) | | | 166,309 | |
| | 1,100 | | | SPX Corp. (a) | | | 26,675 | |
| | 1,274 | | | SPX FLOW, Inc. (a) | | | 44,221 | |
| | 3,727 | | | Supreme Industries, Inc. - Class A | | | 75,509 | |
| | 1,336 | | | Tennant Co. | | | 97,060 | |
| | 2,162 | | | Terex Corp. | | | 67,887 | |
| | 1,133 | | | The Greenbrier Companies, Inc. (b) | | | 48,832 | |
| | 1,360 | | | The Timken Co. | | | 61,472 | |
| | 5,652 | | | Titan International, Inc. | | | 58,442 | |
| | 3,364 | | | Toro Co. | | | 210,115 | |
| | 1,720 | | | TriMas Corp. (a) | | | 35,690 | |
| | 2,504 | | | Trinity Industries, Inc. (b) | | | 66,481 | |
| | 431 | | | Valmont Industries, Inc. | | | 67,020 | |
| | 3,102 | | | Wabash National Corp. (b) | | | 64,180 | |
| | 810 | | | Wabtec Corp. (b) | | | 63,180 | |
| | 483 | | | Watts Water Technologies, Inc. - Class A | | | 30,115 | |
| | 1,266 | | | Welbilt, Inc. (a) | | | 24,852 | |
| | 3,020 | | | Xylem, Inc. | | | 151,664 | |
| | | | | | |
|
|
|
| | | | | | | | 4,060,839 | |
| | | | | | |
|
|
|
| | | | | Marine - 0.08% | |
| | 5,439 | | | Costamare, Inc. (b) | | | 36,224 | |
| | 849 | | | Kirby Corp. (a)(b) | | | 59,897 | |
| | | | | | |
|
|
|
| | | | | | | | 96,121 | |
| | | | | | |
|
|
|
| | | | | Media - 1.27% | |
| | 524 | | | AMC Networks, Inc. - Class A (a)(b) | | | 30,748 | |
| | 2,455 | | | Ascent Capital Group, Inc. - Class A (a) | | | 34,689 | |
| | 98 | | | Cable One, Inc. | | | 61,198 | |
| | 12,454 | | | Central European Media Enterprises Ltd. - Class A (a) | | | 38,607 | |
| | 818 | | | Cinemark Holdings, Inc. (b) | | | 36,270 | |
| | 3,300 | | | Entercom Communications Corp. - Class A (b) | | | 47,190 | |
| | 1,686 | | | Eros International Plc (a)(b) | | | 17,366 | |
| | 5,607 | | | Gannett Co., Inc. | | | 46,987 | |
| | 2,916 | | | Global Sources, Ltd. (a) | | | 24,057 | |
| | 2,625 | | | Gray Television, Inc. (a) | | | 38,063 | |
| | 1,708 | | | John Wiley & Sons, Inc. - Class A | | | 91,890 | |
| | 1,047 | | | Liberty Media Group - Class A (a) | | | 34,237 | |
| | 1,056 | | | Liberty Media Group - Class C (a) | | | 36,062 | |
| | 1,298 | | | Live Nation, Inc. (a)(b) | | | 39,420 | |
| | 978 | | | Meredith Corp. (b) | | | 63,179 | |
| | 835 | | | Morningstar, Inc. | | | 65,631 | |
| | 2,151 | | | MSG Networks, Inc. - Class A (a) | | | 50,226 | |
| | 3,120 | | | New Media Investment Group, Inc. (b) | | | 44,335 | |
| | 2,915 | | | New York Times Co. - Class A | | | 41,976 | |
| | 1,379 | | | Regal Entertainment Group - Class A (b) | | | 31,138 | |
| | 4,768 | | | Salem Media Group, Inc. | | | 35,522 | |
| | 1,473 | | | Scholastic Corp. (b) | | | 62,706 | |
| | 1,152 | | | Sinclair Broadcast Group, Inc. - Class A (b) | | | 46,656 | |
| | 3,383 | | | TEGNA, Inc. | | | 86,673 | |
| | 1,330 | | | The E.W. Scripps Co. - Class A (a) | | | 31,175 | |
| | 5,983 | | | The Interpublic Group of Companies, Inc. (b) | | | 147,002 | |
| | 1,928 | | | Time, Inc. | | | 37,307 | |
| | 2,294 | | | Townsquare Media, Inc. - Class A (a)(b) | | | 27,941 | |
| | 890 | | | Tribune Media Co. - Class A | | | 33,170 | |
See notes to financial statements.
59
GuideMark® Small/Mid Cap Core Fund
SCHEDULE OF INVESTMENTS (Continued)
March 31, 2017
| | | | | | | | |
Number of
Shares
| | | | | Value
| |
| | | | | COMMON STOCKS (Continued) | |
| | | | | Media (Continued) | |
| | 1,709 | | | tronc, Inc. (a) | | $ | 23,789 | |
| | 2,903 | | | World Wrestling Entertainment, Inc. - Class A | | | 64,505 | |
| | | | | | |
|
|
|
| | | | | | | | 1,469,715 | |
| | | | | | |
|
|
|
| | | | | Metals & Mining - 1.25% | |
| | 10,451 | | | AK Steel Holding Corp. (a)(b) | | | 75,143 | |
| | 1,134 | | | Carpenter Technology Corp. (b) | | | 42,298 | |
| | 3,761 | | | Century Aluminum Co. (a) | | | 47,727 | |
| | 5,944 | | | Cliffs Natural Resources, Inc. (a) | | | 48,800 | |
| | 3,610 | | | Coeur D’Alene Mines Corp. (a) | | | 29,169 | |
| | 3,698 | | | Commercial Metals Co. | | | 70,743 | |
| | 3,195 | | | Ferroglobe Plc (b) | | | 33,004 | |
| | 3,195 | | | Ferroglobe Representation & Warranty Insurance Trust (a)(c) | | | 0 | |
| | 1,200 | | | Gibraltar Industries, Inc. (a) | | | 49,440 | |
| | 4,372 | | | Gold Resource Corp. | | | 19,762 | |
| | 1,036 | | | Handy & Harman Ltd. (a) | | | 28,179 | |
| | 588 | | | Haynes International, Inc. | | | 22,415 | |
| | 6,752 | | | Hecla Mining Co. | | | 35,718 | |
| | 1,069 | | | Materion Corp. | | | 35,865 | |
| | 3,197 | | | Olympic Steel, Inc. | | | 59,336 | |
| | 4,327 | | | Real Industry, Inc. (a) | | | 12,332 | |
| | 1,849 | | | Reliance Steel & Aluminum Co. | | | 147,957 | |
| | 825 | | | Royal Gold, Inc. (b) | | | 57,791 | |
| | 3,788 | | | Ryerson Holding Corp. (a) | | | 47,729 | |
| | 2,404 | | | Schnitzer Steel Industries, Inc. - Class A | | | 49,643 | |
| | 5,674 | | | Steel Dynamics, Inc. (b) | | | 197,228 | |
| | 1,601 | | | Stillwater Mining Co. (a) | | | 27,649 | |
| | 5,282 | | | SunCoke Energy, Inc. (a) | | | 47,327 | |
| | 3,105 | | | Tahoe Resources, Inc. | | | 24,933 | |
| | 3,182 | | | TimkenSteel Corp. (a) | | | 60,172 | |
| | 3,224 | | | United States Steel Corp. | | | 109,003 | |
| | 1,538 | | | Worthington Industries, Inc. | | | 69,348 | |
| | | | | | |
|
|
|
| | | | | | | | 1,448,711 | |
| | | | | | |
|
|
|
| | | | | Multiline Retail - 0.56% | |
| | 2,738 | | | Big Lots, Inc. (b) | | | 133,286 | |
| | 2,063 | | | Burlington Stores, Inc. (a)(b) | | | 200,709 | |
| | 1,415 | | | Dillard’s, Inc. - Class A (b) | | | 73,920 | |
| | 5,710 | | | Fred’s, Inc. - Class A (b) | | | 74,801 | |
| | 8,786 | | | J.C. Penney Co., Inc. (a)(b) | | | 54,122 | |
| | 969 | | | Ollie’s Bargain Outlet Holdings, Inc. (a)(b) | | | 32,461 | |
| | 2,983 | | | Sears Holdings Corp. (a)(b) | | | 34,275 | |
| | 10,234 | | | Tuesday Morning Corp. (a) | | | 38,377 | |
| | | | | | |
|
|
|
| | | | | | | | 641,951 | |
| | | | | | |
|
|
|
| | | | | Multi-Utilities - 0.35% | |
| | 3,109 | | | Alliant Energy Corp. | | | 123,148 | |
| | 944 | | | Avista Corp. | | | 36,863 | |
| | 715 | | | Black Hills Corp. (b) | | | 47,526 | |
| | 3,474 | | | MDU Resources Group, Inc. | | | 95,083 | |
| | 751 | | | Northwestern Corp. | | | 44,084 | |
| | 981 | | | Vectren Corp. | | | 57,496 | |
| | | | | | |
|
|
|
| | | | | | | | 404,200 | |
| | | | | | |
|
|
|
| | | | | Oil, Gas & Consumable Fuels - 1.29% | |
| | 579 | | | Adams Resources & Energy, Inc. | | | 21,626 | |
| | 2,766 | | | Callon Petroleum Co. (a)(b) | | | 36,401 | |
| | 3,333 | | | Chesapeake Energy Corp. (a)(b) | | | 19,798 | |
| | 223 | | | Clayton Williams Energy, Inc. (a) | | | 29,454 | |
| | 5,400 | | | CONSOL Energy, Inc. (a)(b) | | | 90,612 | |
| | | | | | | | |
Number of
Shares
| | | | | Value
| |
| | | | | Oil, Gas & Consumable Fuels (Continued) | |
| | 1,487 | | | Delek U.S. Holdings, Inc. | | $ | 36,090 | |
| | 11,433 | | | Denbury Resources, Inc. (a) | | | 29,497 | |
| | 745 | | | Diamondback Energy, Inc. (a)(b) | | | 77,268 | |
| | 611 | | | Energen Corp. (a)(b) | | | 33,263 | |
| | 8,168 | | | EP Energy Corp. - Class A (a)(b) | | | 38,798 | |
| | 2,491 | | | Evolution Petroleum Corp. | | | 19,928 | |
| | 4,895 | | | Frontline Ltd. (b) | | | 32,992 | |
| | 1,608 | | | GasLog, Ltd. | | | 24,683 | |
| | 834 | | | Green Plains, Inc. | | | 20,642 | |
| | 1,200 | | | HollyFrontier Corp. (b) | | | 34,008 | |
| | 1,844 | | | Laredo Petroleum, Inc. (a) | | | 26,922 | |
| | 1,178 | | | Murphy Oil Corp. (b) | | | 33,679 | |
| | 16,709 | | | Navios Maritime Acquisition Corp. | | | 28,739 | |
| | 1,846 | | | Newfield Exploration Co. (a)(b) | | | 68,136 | |
| | 9,054 | | | Northern Oil and Gas, Inc. (a) | | | 23,540 | |
| | 2,355 | | | Oasis Petroleum, Inc. (a)(b) | | | 33,582 | |
| | 7,211 | | | Overseas Shipholding Group, Inc. -
Class A (a)(b) | | | 27,834 | |
| | 2,037 | | | Parsley Energy, Inc. - Class A (a) | | | 66,223 | |
| | 1,907 | | | PBF Energy, Inc. - Class A (b) | | | 42,278 | |
| | 468 | | | PDC Energy, Inc. (a) | | | 29,180 | |
| | 1,563 | | | QEP Resources, Inc. (a)(b) | | | 19,866 | |
| | 3,241 | | | Renewable Energy Group, Inc. (a)(b) | | | 33,868 | |
| | 1,597 | | | Rice Energy, Inc. (a)(b) | | | 37,849 | |
| | 1,745 | | | Ring Energy, Inc. (a) | | | 18,881 | |
| | 870 | | | RSP Permian, Inc. (a)(b) | | | 36,044 | |
| | 2,061 | | | Sanchez Energy Corp. (a)(b) | | | 19,662 | |
| | 5,059 | | | Scorpio Tankers, Inc. (b) | | | 22,462 | |
| | 578 | | | SemGroup Corp. - Class A | | | 20,808 | |
| | 699 | | | SM Energy Co. | | | 16,790 | |
| | 3,796 | | | Southwestern Energy Co. (a)(b) | | | 31,013 | |
| | 1,816 | | | Targa Resources Corp. | | | 108,778 | |
| | 15,243 | | | Teekay Tankers Ltd. - Class A | | | 31,248 | |
| | 575 | | | Western Refining, Inc. | | | 20,165 | |
| | 2,343 | | | Westmoreland Coal Co. (a) | | | 34,020 | |
| | 1,893 | | | Whiting Petroleum Corp. (a) | | | 17,908 | |
| | 1,344 | | | World Fuel Services Corp. | | | 48,720 | |
| | 3,709 | | | WPX Energy, Inc. (a) | | | 49,664 | |
| | | | | | |
|
|
|
| | | | | | | | 1,492,919 | |
| | | | | | |
|
|
|
| | | | | Paper & Forest Products - 0.21% | |
| | 935 | | | Boise Cascade Co. (a) | | | 24,964 | |
| | 398 | | | Clearwater Paper Corp. (a) | | | 22,288 | |
| | 911 | | | Domtar Corp. | | | 33,270 | |
| | 3,055 | | | KapStone Paper and Packaging Corp. | | | 70,571 | |
| | 1,200 | | | Louisiana-Pacific Corp. (a) | | | 29,784 | |
| | 300 | | | Neenah Paper, Inc. | | | 22,410 | |
| | 942 | | | P.H. Glatfelter Co. | | | 20,479 | |
| | 605 | | | Schweitzer-Mauduit International, Inc. | | | 25,059 | |
| | | | | | |
|
|
|
| | | | | | | | 248,825 | |
| | | | | | |
|
|
|
| | | | | Personal Products - 0.78% | |
| | 17,920 | | | Avon Products, Inc. (a) | | | 78,848 | |
| | 4,451 | | | Coty, Inc. - Class A (b) | | | 80,697 | |
| | 2,356 | | | Herbalife, Ltd. (a)(b) | | | 136,978 | |
| | 1,073 | | | Inter Parfums, Inc. | | | 39,218 | |
| | 9,178 | | | Lifevantage Corp. (a) | | | 49,286 | |
| | 1,800 | | | Medifast, Inc. | | | 79,866 | |
| | 3,184 | | | Natural Health Trends Corp. (b) | | | 92,017 | |
| | 3,398 | | | Nature’s Sunshine Products, Inc. | | | 33,980 | |
| | 2,440 | | | Nu Skin Enterprises, Inc. - Class A (b) | | | 135,518 | |
See notes to financial statements.
60
GuideMark® Small/Mid Cap Core Fund
SCHEDULE OF INVESTMENTS (Continued)
March 31, 2017
| | | | | | | | |
Number of
Shares
| | | | | Value
| |
| | | | | COMMON STOCKS (Continued) | |
| | | | | Personal Products (Continued) | |
| | 2,643 | | | Nutraceutical International Corp. | | $ | 82,329 | |
| | 1,118 | | | Revlon, Inc. - Class A (a) | | | 31,136 | |
| | 1,000 | | | USANA Health Sciences, Inc. (a) | | | 57,600 | |
| | | | | | |
|
|
|
| | | | | | | | 897,473 | |
| | | | | | |
|
|
|
| | | | | Pharmaceuticals - 0.95% | |
| | 845 | | | Aclaris Therapeutics, Inc. (a)(b) | | | 25,198 | |
| | 595 | | | Aerie Pharmaceuticals, Inc. (a)(b) | | | 26,983 | |
| | 1,319 | | | Akorn, Inc. (a) | | | 31,762 | |
| | 12,374 | | | Corcept Therapeutics, Inc. (a) | | | 135,619 | |
| | 3,086 | | | Depomed, Inc. (a)(b) | | | 38,729 | |
| | 941 | | | Dermira, Inc. (a) | | | 32,097 | |
| | 6,781 | | | Endo International Plc (a) | | | 75,676 | |
| | 800 | | | Heska Corp. (a) | | | 83,984 | |
| | 4,769 | | | Horizon Pharma Plc (a) | | | 70,486 | |
| | 5,727 | | | Impax Laboratories, Inc. (a) | | | 72,447 | |
| | 1,736 | | | Intersect ENT, Inc. (a) | | | 29,772 | |
| | 3,599 | | | Lannett Co., Inc. (a)(b) | | | 80,438 | |
| | 959 | | | Pacira Pharmaceuticals, Inc. (a)(b) | | | 43,730 | |
| | 1,300 | | | Phibro Animal Health Corp. - Class A | | | 36,530 | |
| | 1,739 | | | Prestige Brands Holdings, Inc. (a) | | | 96,619 | |
| | 9,525 | | | SciClone Pharmaceuticals, Inc. (a) | | | 93,345 | |
| | 2,932 | | | Supernus Pharmaceuticals, Inc. (a) | | | 91,772 | |
| | 943 | | | Theravance Biopharma, Inc. (a) | | | 34,721 | |
| | | | | | |
|
|
|
| | | | | | | | 1,099,908 | |
| | | | | | |
|
|
|
| | | | | Professional Services - 1.41% | |
| | 3,737 | | | Acacia Research Corp. (a) | | | 21,488 | |
| | 2,929 | | | CBIZ, Inc. (a) | | | 39,688 | |
| | 653 | | | CEB, Inc. | | | 51,326 | |
| | 816 | | | CRA International, Inc. | | | 28,829 | |
| | 483 | | | Exponent, Inc. | | | 28,763 | |
| | 4,102 | | | Franklin Covey Co. (a) | | | 82,860 | |
| | 1,438 | | | FTI Consulting, Inc. (a)(b) | | | 59,202 | |
| | 954 | | | GP Strategies Corp. (a) | | | 24,136 | |
| | 1,155 | | | Heidrick & Struggles International, Inc. | | | 30,434 | |
| | 9,244 | | | Hill International, Inc. (a) | | | 38,363 | |
| | 455 | | | Huron Consulting Group, Inc. (a) | | | 19,156 | |
| | 1,202 | | | ICF International, Inc. (a) | | | 49,643 | |
| | 1,034 | | | Insperity, Inc. | | | 91,664 | |
| | 3,982 | | | Kelly Services, Inc. - Class A | | | 87,047 | |
| | 3,644 | | | Kforce, Inc. | | | 86,545 | |
| | 2,002 | | | ManpowerGroup, Inc. | | | 205,345 | |
| | 1,730 | | | Mistras Group, Inc. (a) | | | 36,987 | |
| | 1,639 | | | Navigant Consulting, Inc. (a) | | | 37,468 | |
| | 1,511 | | | On Assignment, Inc. (a) | | | 73,329 | |
| | 3,293 | | | Resources Connection, Inc. | | | 55,158 | |
| | 3,403 | | | Robert Half International, Inc. (b) | | | 166,168 | |
| | 3,580 | | | RPX Corp. (a) | | | 42,960 | |
| | 947 | | | The Dun & Bradstreet Corp. | | | 102,219 | |
| | 3,729 | | | TrueBlue, Inc. (a) | | | 101,988 | |
| | 724 | | | VSE Corp. | | | 29,539 | |
| | 503 | | | WageWorks, Inc. (a) | | | 36,367 | |
| | | | | | |
|
|
|
| | | | | | | | 1,626,672 | |
| | | | | | |
|
|
|
| | | | | Real Estate Management & Development - 0.80% | |
| | 4,526 | | | Altisource Portfolio Solutions SA (a)(b) | | | 166,557 | |
| | 5,468 | | | AV Homes, Inc. (a) | | | 89,949 | |
| | 1,022 | | | Community Healthcare Trust, Inc. | | | 24,426 | |
| | 6,764 | | | Forestar Group, Inc. (a) | | | 92,329 | |
| | | | | | | | |
Number of
Shares
| | | | | Value
| |
| | | | | Real Estate Management & Development (Continued) | |
| | 765 | | | Jones Lang LaSalle, Inc. (b) | | $ | 85,259 | |
| | 4,478 | | | Marcus & Millichap, Inc. (a) | | | 110,069 | |
| | 1,472 | | | RE/MAX Holdings, Inc. - Class A | | | 87,510 | |
| | 4,422 | | | Realogy Holdings Corp. (b) | | | 131,731 | |
| | 1,090 | | | Stratus Properties, Inc. (a) | | | 29,866 | |
| | 1,774 | | | The RMR Group, Inc. - Class A | | | 87,813 | |
| | 2,224 | | | Trinity Place Holdings, Inc. (a)(b) | | | 16,258 | |
| | | | | | |
|
|
|
| | | | | | | | 921,767 | |
| | | | | | |
|
|
|
| | | | | Road & Rail - 0.48% | |
| | 1,825 | | | ArcBest Corp. (b) | | | 47,450 | |
| | 757 | | | Genesee & Wyoming, Inc. - Class A (a) | | | 51,370 | |
| | 1,228 | | | Hertz Global Holdings, Inc. (a)(b) | | | 21,539 | |
| | 798 | | | Knight Transportation, Inc. (b) | | | 25,017 | |
| | 1,736 | | | Landstar System, Inc. | | | 148,689 | |
| | 1,112 | | | Marten Transport, Ltd. | | | 26,076 | |
| | 729 | | | Old Dominion Freight Line, Inc. (b) | | | 62,381 | |
| | 3,597 | | | Roadrunner Transportation Systems, Inc. (a) | | | 24,711 | |
| | 301 | | | Ryder System, Inc. | | | 22,708 | |
| | 948 | | | Saia, Inc. (a) | | | 41,996 | |
| | 1,476 | | | Swift Transportation Co. (a)(b) | | | 30,317 | |
| | 1,790 | | | Universal Truckload Services, Inc. | | | 25,687 | |
| | 2,093 | | | YRC Worldwide, Inc. (a)(b) | | | 23,044 | |
| | | | | | |
|
|
|
| | | | | | | | 550,985 | |
| | | | | | |
|
|
|
| | | | | Semiconductors & Semiconductor Equipment - 2.66% | |
| | 1,096 | | | Acacia Communications, Inc. (a)(b) | | | 64,248 | |
| | 2,192 | | | Advanced Energy Industries, Inc. (a) | | | 150,284 | |
| | 17,207 | | | Advanced Micro Devices, Inc. (a)(b) | | | 250,362 | |
| | 2,744 | | | Alpha & Omega Semiconductor, Ltd. (a) | | | 47,169 | |
| | 860 | | | Ambarella, Inc. (a)(b) | | | 47,051 | |
| | 3,987 | | | Amkor Technology, Inc. (a)(b) | | | 46,209 | |
| | 1,340 | | | Brooks Automation, Inc. | | | 30,016 | |
| | 612 | | | Cabot Microelectronics Corp. | | | 46,885 | |
| | 900 | | | CEVA, Inc. (a) | | | 31,950 | |
| | 2,604 | | | Cirrus Logic, Inc. (a)(b) | | | 158,037 | |
| | 2,673 | | | Cohu, Inc. | | | 49,344 | |
| | 2,614 | | | Cree, Inc. (a)(b) | | | 69,872 | |
| | 2,808 | | | Cypress Semiconductor Corp. (b) | | | 38,638 | |
| | 3,927 | | | DSP Group, Inc. (a) | | | 47,124 | |
| | 3,435 | | | Entegris, Inc. (a) | | | 80,379 | |
| | 2,325 | | | Exar Corp. (a) | | | 30,248 | |
| | 900 | | | First Solar, Inc. (a)(b) | | | 24,390 | |
| | 2,596 | | | FormFactor, Inc. (a) | | | 30,763 | |
| | 1,554 | | | Impinj, Inc. (a)(b) | | | 47,040 | |
| | 1,038 | | | Inphi Corp. (a)(b) | | | 50,675 | |
| | 4,274 | | | Integrated Device Technology, Inc. (a) | | | 101,166 | |
| | 3,167 | | | IXYS Corp. | | | 46,080 | |
| | 1,341 | | | MACOM Technology Solutions Holdings, Inc. (a) | | | 64,770 | |
| | 4,800 | | | Marvell Technology Group, Ltd. - ADR | | | 73,248 | |
| | 4,138 | | | MaxLinear, Inc. - Class A (a) | | | 116,071 | |
| | 1,685 | | | Microsemi Corp. (a)(b) | | | 86,828 | |
| | 1,266 | | | MKS Instrument, Inc. (b) | | | 87,037 | |
| | 1,199 | | | Monolithic Power Systems, Inc. (b) | | | 110,428 | |
| | 1,241 | | | Nanometrics, Inc. (a)(b) | | | 37,801 | |
| | 2,938 | | | NeoPhotonics Corp. (a) | | | 26,471 | |
| | 322 | | | NVE Corp. | | | 26,658 | |
| | 9,074 | | | ON Semiconductor Corp. (a)(b) | | | 140,556 | |
| | 1,203 | | | PDF Solutions, Inc. (a) | | | 27,212 | |
| | 5,223 | | | Photronics, Inc. (a)(b) | | | 55,886 | |
See notes to financial statements.
61
GuideMark® Small/Mid Cap Core Fund
SCHEDULE OF INVESTMENTS (Continued)
March 31, 2017
| | | | | | | | |
Number of
Shares
| | | | | Value
| |
| | | | | COMMON STOCKS (Continued) | |
| | | | | Semiconductors & Semiconductor Equipment (Continued) | |
| | 755 | | | Power Integrations, Inc. | | $ | 49,641 | |
| | 3,807 | | | Rambus, Inc. (a) | | | 50,024 | |
| | 2,535 | | | Rudolph Technologies, Inc. (a) | | | 56,784 | |
| | 1,971 | | | Semtech Corp. (a) | | | 66,620 | |
| | 6,800 | | | Sigma Designs, Inc. (a) | | | 42,500 | |
| | 1,194 | | | Silicon Laboratories, Inc. (a) | | | 87,819 | |
| | 6,974 | | | Teradyne, Inc. | | | 216,891 | |
| | 3,800 | | | Ultra Clean Holdings, Inc. (a)(b) | | | 64,106 | |
| | 846 | | | Veeco Instruments, Inc. (a)(b) | | | 25,253 | |
| | 5,500 | | | Xcerra Corp. (a) | | | 48,895 | |
| | 526 | | | Xperi Corp. | | | 17,858 | |
| | | | | | |
|
|
|
| | | | | | | | 3,067,287 | |
| | | | | | |
|
|
|
| | | | | Software - 4.24% | |
| | 8,585 | | | A10 Networks, Inc. (a) | | | 78,553 | |
| | 1,454 | | | ACI Worldwide, Inc. (a) | | | 31,101 | |
| | 3,332 | | | American Software, Inc. - Class A (b) | | | 34,253 | |
| | 1,080 | | | ANSYS, Inc. (a)(b) | | | 115,420 | |
| | 2,583 | | | Aspen Technology, Inc. (a)(b) | | | 152,190 | |
| | 861 | | | Atlassian Corp. Plc (a) | | | 25,787 | |
| | 2,443 | | | Barracuda Networks, Inc. (a) | | | 56,458 | |
| | 926 | | | Blackbaud, Inc. (b) | | | 70,996 | |
| | 8,261 | | | Cadence Design System, Inc. (a)(b) | | | 259,395 | |
| | 2,631 | | | Callidus Software, Inc. (a) | | | 56,172 | |
| | 2,014 | | | CommVault Systems, Inc. (a) | | | 102,311 | |
| | 561 | | | Ebix, Inc. (b) | | | 34,361 | |
| | 1,007 | | | Ellie Mae, Inc. (a) | | | 100,972 | |
| | 8,315 | | | EnerNOC, Inc. (a) | | | 49,890 | |
| | 381 | | | ePlus, Inc. (a) | | | 51,454 | |
| | 4,937 | | | Exa Corp. (a) | | | 62,700 | |
| | 811 | | | FactSet Research Systems, Inc. (b) | | | 133,742 | |
| | 899 | | | Fair Isaac Corp. | | | 115,926 | |
| | 2,007 | | | Fortinet, Inc. (a)(b) | | | 76,968 | |
| | 2,247 | | | Gigamon, Inc. (a) | | | 79,881 | |
| | 1,163 | | | Globant SA (a) | | | 42,333 | |
| | 9,426 | | | Guidance Software, Inc. (a) | | | 55,613 | |
| | 764 | | | Guidewire Software, Inc. (a)(b) | | | 43,036 | |
| | 1,380 | | | HubSpot, Inc. (a) | | | 83,559 | |
| | 929 | | | Imperva, Inc. (a)(b) | | | 38,135 | |
| | 1,678 | | | Jack Henry & Associates, Inc. | | | 156,222 | |
| | 12,815 | | | Jive Software, Inc. (a) | | | 55,104 | |
| | 2,260 | | | Manhattan Associates, Inc. (a)(b) | | | 117,633 | |
| | 359 | | | MicroStrategy, Inc. - Class A (a)(b) | | | 67,420 | |
| | 9,489 | | | Mitek Systems, Inc. (a) | | | 63,102 | |
| | 17,785 | | | MobileIron, Inc. (a) | | | 77,365 | |
| | 4,345 | | | Model N, Inc. (a) | | | 45,405 | |
| | 1,129 | | | Monotype Imaging Holdings, Inc. | | | 22,693 | |
| | 4,435 | | | Nuance Communications, Inc. (a) | | | 76,770 | |
| | 600 | | | Paycom Software, Inc. (a) | | | 34,506 | |
| | 2,749 | | | Pegasystems, Inc. | | | 120,544 | |
| | 2,476 | | | Progress Software Corp. | | | 71,928 | |
| | 500 | | | Proofpoint, Inc. (a)(b) | | | 37,180 | |
| | 1,164 | | | PROS Holdings, Inc. (a) | | | 28,157 | |
| | 2,180 | | | PTC, Inc. (a)(b) | | | 114,559 | |
| | 1,710 | | | QAD, Inc. - Class A | | | 47,623 | |
| | 1,100 | | | Qualys, Inc. (a)(b) | | | 41,690 | |
| | 1,767 | | | Rapid7, Inc. (a) | | | 26,470 | |
| | 2,118 | | | RealPage, Inc. (a) | | | 73,918 | |
| | 3,781 | | | RingCentral, Inc. - Class A (a)(b) | | | 107,002 | |
| | 7,676 | | | Rosetta Stone, Inc. (a) | | | 74,841 | |
| | | | | | | | |
Number of
Shares
| | | | | Value
| |
| | | | | Software (Continued) | |
| | 2,266 | | | Sapiens International Corp. NV | | $ | 29,186 | |
| | 2,257 | | | Silver Spring Networks, Inc. (a) | | | 25,482 | |
| | 2,706 | | | Splunk, Inc. (a)(b) | | | 168,557 | |
| | 1,271 | | | SS&C Technologies Holdings, Inc. | | | 44,993 | |
| | 516 | | | Synchronoss Technologies, Inc. (a)(b) | | | 12,590 | |
| | 4,383 | | | Synopsys, Inc. (a) | | | 316,146 | |
| | 1,285 | | | Tableau Software, Inc. - Class A (a) | | | 63,672 | |
| | 1,708 | | | Take-Two Interactive Software, Inc. (a)(b) | | | 101,233 | |
| | 7,182 | | | Tangoe, Inc. (a) | | | 38,065 | |
| | 3,715 | | | Telenav, Inc. (a) | | | 32,135 | |
| | 9,455 | | | The Rubicon Project, Inc. (a) | | | 55,690 | |
| | 3,360 | | | TiVo Corp. (b) | | | 63,000 | |
| | 357 | | | Tyler Technologies, Inc. (a) | | | 55,178 | |
| | 337 | | | Ultimate Software Group, Inc. (a)(b) | | | 65,786 | |
| | 2,681 | | | Varonis Systems, Inc. (a) | | | 85,256 | |
| | 3,245 | | | VASCO Data Security International, Inc. (a)(b) | | | 43,807 | |
| | 1,124 | | | Verint Systems, Inc. (a) | | | 48,754 | |
| | 4,387 | | | Workiva, Inc. (a) | | | 68,657 | |
| | 2,722 | | | Zendesk, Inc. (a) | | | 76,325 | |
| | 11,848 | | | Zix Corp. (a) | | | 56,989 | |
| | 10,254 | | | Zynga, Inc. - Class A (a) | | | 29,224 | |
| | | | | | |
|
|
|
| | | | | | | | 4,892,063 | |
| | | | | | |
|
|
|
| | | | | Specialty Retail - 3.91% | |
| | 4,603 | | | Aaron’s, Inc. (b) | | | 136,893 | |
| | 6,753 | | | Abercrombie & Fitch Co. - Class A (b) | | | 80,563 | |
| | 6,830 | | | American Eagle Outfitters (b) | | | 95,825 | |
| | 1,358 | | | America’s Car-Mart, Inc. (a) | | | 49,499 | |
| | 600 | | | Asbury Automotive Group, Inc. (a) | | | 36,060 | |
| | 16,498 | | | Ascena Retail Group, Inc. (a)(b) | | | 70,281 | |
| | 838 | | | AutoNation, Inc. (a) | | | 35,439 | |
| | 2,337 | | | Barnes & Noble Education, Inc. (a)(b) | | | 22,412 | |
| | 4,112 | | | Barnes & Noble, Inc. | | | 38,036 | |
| | 5,219 | | | Big 5 Sporting Goods Corp. (b) | | | 78,807 | |
| | 4,640 | | | Build-A-Bear Workshop, Inc. (a) | | | 41,064 | |
| | 586 | | | Cabela’s, Inc. (a) | | | 31,122 | |
| | 3,502 | | | Caleres, Inc. | | | 92,523 | |
| | 1,505 | | | Camping World Holdings, Inc. - Class A | | | 48,521 | |
| | 1,637 | | | Cato Corp. - Class A | | | 35,949 | |
| | 7,388 | | | Chico’s FAS, Inc. | | | 104,910 | |
| | 3,705 | | | Citi Trends, Inc. (b) | | | 62,985 | |
| | 1,837 | | | Conns, Inc. (a) | | | 16,074 | |
| | 667 | | | CST Brands, Inc. | | | 32,076 | |
| | 11,247 | | | Destination XL Group, Inc. (a) | | | 32,054 | |
| | 2,598 | | | Dick’s Sporting Goods, Inc. | | | 126,419 | |
| | 1,998 | | | DSW, Inc. - Class A (b) | | | 41,319 | |
| | 2,379 | | | Duluth Holdings, Inc. - Class B (a)(b) | | | 50,649 | �� |
| | 7,716 | | | Express, Inc. (a)(b) | | | 70,293 | |
| | 2,313 | | | Five Below, Inc. (a)(b) | | | 100,176 | |
| | 3,644 | | | Foot Locker, Inc. | | | 272,608 | |
| | 5,734 | | | Francesca’s Holdings Corp. (a) | | | 88,017 | |
| | 3,502 | | | GameStop Corp. - Class A (b) | | | 78,970 | |
| | 1,725 | | | Genesco, Inc. (a)(b) | | | 95,651 | |
| | 2,520 | | | GNC Holdings, Inc. - Class A (b) | | | 18,547 | |
| | 487 | | | Group 1 Automotive, Inc. (b) | | | 36,077 | |
| | 2,447 | | | Guess?, Inc. | | | 27,284 | |
| | 3,374 | | | Haverty Furniture Cos., Inc. | | | 82,157 | |
| | 1,883 | | | Hibbett Sports, Inc. (a)(b) | | | 55,549 | |
| | 4,086 | | | KirkLands, Inc. (a) | | | 50,666 | |
| | 300 | | | Lithia Motors, Inc. - Class A (b) | | | 25,695 | |
See notes to financial statements.
62
GuideMark® Small/Mid Cap Core Fund
SCHEDULE OF INVESTMENTS (Continued)
March 31, 2017
| | | | | | | | |
Number of
Shares
| | | | | Value
| |
| | | | | COMMON STOCKS (Continued) | |
| | | | | Specialty Retail (Continued) | |
| | 2,939 | | | Lumber Liquidators Holdings, Inc. (a)(b) | | $ | 61,690 | |
| | 1,239 | | | MarineMax, Inc. (a) | | | 26,824 | |
| | 644 | | | Monro Muffler Brake, Inc. (b) | | | 33,552 | |
| | 25,465 | | | Office Depot, Inc. (b) | | | 118,794 | |
| | 1,478 | | | Party City Holdco, Inc. (a)(b) | | | 20,766 | |
| | 570 | | | Penske Automotive Group, Inc. | | | 26,682 | |
| | 16,191 | | | Pier 1 Imports, Inc. | | | 115,928 | |
| | 8,089 | | | Rent-A-Center, Inc. (b) | | | 71,749 | |
| | 579 | | | REX American Resourses Corp. (a)(b) | | | 52,394 | |
| | 798 | | | RH (a)(b) | | | 36,915 | |
| | 3,794 | | | Sally Beauty Holdings, Inc. (a) | | | 77,549 | |
| | 10,362 | | | Sears Hometown and Outlet Stores, Inc. (a) | | | 40,412 | |
| | 3,100 | | | Select Comfort Corp. (a) | | | 76,849 | |
| | 2,300 | | | Shoe Carnival, Inc. | | | 56,511 | |
| | 1,189 | | | Sonic Automotive, Inc. - Class A | | | 23,839 | |
| | 5,493 | | | Sportsman’s Warehouse Holdings, Inc. (a)(b) | | | 26,257 | |
| | 16,403 | | | Staples, Inc. | | | 143,854 | |
| | 7,892 | | | Stein Mart, Inc. | | | 23,755 | |
| | 4,630 | | | Systemax, Inc. | | | 51,347 | |
| | 3,749 | | | Tailored Brands, Inc. (b) | | | 56,010 | |
| | 2,515 | | | The Buckle, Inc. (b) | | | 46,779 | |
| | 1,324 | | | The Children’s Place Retail Stores, Inc. (b) | | | 158,946 | |
| | 8,748 | | | The Container Store Group, Inc. (a) | | | 37,004 | |
| | 3,163 | | | The Finish Line, Inc. - Class A | | | 45,009 | |
| | 3,720 | | | The Michaels Cos., Inc. (a)(b) | | | 83,291 | |
| | 3,714 | | | Tile Shop Holdings, Inc. | | | 71,495 | |
| | 8,166 | | | Tilly’s, Inc. - Class A | | | 73,657 | |
| | 3,525 | | | Urban Outfitters, Inc. (a) | | | 83,754 | |
| | 2,609 | | | Vitamin Shoppe, Inc. (a)(b) | | | 52,571 | |
| | 7,208 | | | West Marine, Inc. (a) | | | 68,764 | |
| | 2,651 | | | Williams Sonoma, Inc. (b) | | | 142,147 | |
| | 600 | | | Winmark Corp. | | | 67,800 | |
| | 4,291 | | | Zumiez, Inc. (a)(b) | | | 78,525 | |
| | | | | | |
|
|
|
| | | | | | | | 4,512,589 | |
| | | | | | |
|
|
|
| | | | | Technology Hardware, Storage & Peripherals - 0.54% | |
| | 2,305 | | | 3D Systems Corp. (a)(b) | | | 34,483 | |
| | 11,028 | | | Avid Technology, Inc. (a) | | | 51,391 | |
| | 5,326 | | | CPI Card Group, Inc. (b) | | | 22,369 | |
| | 608 | | | Electronics for Imaging, Inc. (a)(b) | | | 29,689 | |
| | 2,527 | | | NCR Corp. (a) | | | 115,433 | |
| | 5,914 | | | Nimble Storage, Inc. (a) | | | 73,925 | |
| | 2,519 | | | Pure Storage, Inc. - Class A (a)(b) | | | 24,762 | |
| | 895 | | | Super Micro Computer, Inc. (a) | | | 22,688 | |
| | 1,936 | | | Synaptics, Inc. (a) | | | 95,851 | |
| | 4,850 | | | Teradata Corp. (a)(b) | | | 150,932 | |
| | | | | | |
|
|
|
| | | | | | | | 621,523 | |
| | | | | | |
|
|
|
| | | | | Textiles, Apparel & Luxury Goods - 1.21% | |
| | 1,128 | | | Carter’s, Inc. (b) | | | 101,295 | |
| | 935 | | | Columbia Sportswear Co. | | | 54,931 | |
| | 6,303 | | | Crocs, Inc. (a) | | | 44,562 | |
| | 980 | | | Culp, Inc. | | | 30,576 | |
| | 1,266 | | | Deckers Outdoor Corp. (a)(b) | | | 75,618 | |
| | 2,200 | | | Delta Apparel, Inc. (a) | | | 38,786 | |
| | 3,611 | | | Fossil Group, Inc. (a)(b) | | | 63,012 | |
| | 2,790 | | | G-III Apparel Group, Ltd. (a)(b) | | | 61,073 | |
| | 3,965 | | | Kate Spade & Co. (a) | | | 92,107 | |
| | 2,834 | | | lululemon athletica, Inc. (a) | | | 147,000 | |
| | 2,797 | | | Movado Group, Inc. (b) | | | 69,785 | |
| | | | | | | | |
Number of
Shares
| | | | | Value
| |
| | | | | Textiles, Apparel & Luxury Goods (Continued) | |
| | 980 | | | Oxford Industries, Inc. | | $ | 56,115 | |
| | 3,194 | | | Perry Ellis International, Inc. (a)(b) | | | 68,607 | |
| | 4,438 | | | Skechers U.S.A., Inc. - Class A (a)(b) | | | 121,823 | |
| | 2,243 | | | Steven Madden, Ltd. (a)(b) | | | 86,468 | |
| | 1,536 | | | Superior Uniform Group, Inc. | | | 28,570 | |
| | 759 | | | Unifi, Inc. (a) | | | 21,548 | |
| | 312 | | | UniFirst Corp. | | | 44,132 | |
| | 5,258 | | | Vera Bradley, Inc. (a) | | | 48,952 | |
| | 5,355 | | | Vince Holding Corp. (a)(b) | | | 8,300 | |
| | 1,663 | | | Weyco Group, Inc. | | | 46,697 | |
| | 3,535 | | | Wolverine World Wide, Inc. | | | 88,269 | |
| | | | | | |
|
|
|
| | | | | | | | 1,398,226 | |
| | | | | | |
|
|
|
| | | | | Thrifts & Mortgage Finance - 1.51% | |
| | 3,146 | | | Bank Mutual Corp. | | | 29,572 | |
| | 1,664 | | | Beneficial Bancorp, Inc. | | | 26,624 | |
| | 1,016 | | | Berkshire Hills Bancorp, Inc. | | | 36,627 | |
| | 3,256 | | | BofI Holding, Inc. (a)(b) | | | 85,079 | |
| | 2,400 | | | Brookline Bancorp, Inc. | | | 37,560 | |
| | 1,080 | | | BSB Bancorp, Inc. (a) | | | 30,510 | |
| | 2,557 | | | Capitol Federal Financial, Inc. | | | 37,409 | |
| | 3,082 | | | Dime Community Bancshares | | | 62,565 | |
| | 1,992 | | | Federal Agricultural Mortgage Corp. - Class C | | | 114,679 | |
| | 700 | | | First Defiance Financial Corp. | | | 34,657 | |
| | 1,514 | | | First Financial Northwest, Inc. | | | 26,752 | |
| | 2,357 | | | Flagstar Bancorp, Inc. (a)(b) | | | 66,444 | |
| | 1,762 | | | Flushing Financial Corp. | | | 47,345 | |
| | 271 | | | Hingham Institution for Savings | | | 47,926 | |
| | 648 | | | Home Bancorp, Inc. | | | 21,870 | |
| | 1,272 | | | HomeStreet, Inc. (a) | | | 35,552 | |
| | 2,018 | | | Kearny Financial Corp. | | | 30,371 | |
| | 574 | | | LendingTree, Inc. (a)(b) | | | 71,951 | |
| | 1,934 | | | Meridian Bancorp, Inc. | | | 35,392 | |
| | 375 | | | Meta Financial Group, Inc. | | | 33,188 | |
| | 2,239 | | | NMI Holdings, Inc. - Class A (a) | | | 25,525 | |
| | 1,220 | | | Northfield Bancorp, Inc. | | | 21,984 | |
| | 2,085 | | | Northwest Bancshares, Inc. | | | 35,111 | |
| | 1,266 | | | OceanFirst Financial Corp. | | | 35,670 | |
| | 1,285 | | | Oritani Financial Corp. | | | 21,845 | |
| | 1,900 | | | PennyMac Financial Services, Inc. - Class A (a) | | | 32,395 | |
| | 6,045 | | | People’s United Financial, Inc. (b) | | | 110,019 | |
| | 1,127 | | | Provident Financial Holdings, Inc. | | | 21,019 | |
| | 1,869 | | | Provident Financial Services, Inc. | | | 48,314 | |
| | 4,463 | | | Radian Group, Inc. (b) | | | 80,156 | |
| | 1,149 | | | Southern Missouri Bancorp, Inc. | | | 40,812 | |
| | 682 | | | Territorial Bancorp, Inc. | | | 21,258 | |
| | 4,174 | | | TrustCo Bank Corp. | | | 32,766 | |
| | 4,748 | | | United Community Financial Corp. | | | 39,598 | |
| | 2,679 | | | United Financial Bancorp, Inc. | | | 45,570 | |
| | 2,143 | | | Walker & Dunlop, Inc. (a) | | | 89,342 | |
| | 2,194 | | | Washington Federal, Inc. (b) | | | 72,621 | |
| | 1,715 | | | Waterstone Financial, Inc. | | | 31,299 | |
| | 497 | | | WSFS Financial Corp. | | | 22,837 | |
| | | | | | |
|
|
|
| | | | | | | | 1,740,214 | |
| | | | | | |
|
|
|
| | | | | Tobacco - 0.14% | |
| | 2,124 | | | Alliance One International, Inc. (a) | | | 27,293 | |
| | 1,740 | | | Turning Point Brands, Inc. (a) | | | 27,144 | |
| | 974 | | | Universal Corp. (b) | | | 68,911 | |
| | 2,069 | | | Vector Group, Ltd. | | | 43,035 | |
| | | | | | |
|
|
|
| | | | | | | | 166,383 | |
| | | | | | |
|
|
|
See notes to financial statements.
63
GuideMark® Small/Mid Cap Core Fund
SCHEDULE OF INVESTMENTS (Continued)
March 31, 2017
| | | | | | | | |
Number of
Shares
| | | | | Value
| |
| | | | | COMMON STOCKS (Continued) | |
| | | | | Trading Companies & Distributors - 1.62% | |
| | 1,652 | | | Aceto Corp. | | $ | 26,118 | |
| | 2,301 | | | Applied Industrial Technologies, Inc. (b) | | | 142,317 | |
| | 1,618 | | | Beacon Roofing Supply, Inc. (a) | | | 79,541 | |
| | 1,651 | | | BMC Stock Holdings, Inc. (a) | | | 37,313 | |
| | 2,458 | | | DXP Enterprises, Inc. (a) | | | 93,085 | |
| | 401 | | | GATX Corp. (b) | | | 24,445 | |
| | 785 | | | GMS, Inc. (a) | | | 27,506 | |
| | 1,318 | | | H&E Equipment Services, Inc. (b) | | | 32,317 | |
| | 5,302 | | | HD Supply Holdings, Inc. (a) | | | 218,045 | |
| | 2,322 | | | Lawson Products, Inc. (a) | | | 52,129 | |
| | 2,700 | | | MRC Global, Inc. (a) | | | 49,491 | |
| | 1,782 | | | MSC Industrial Direct Co., Inc. - Class A (b) | | | 183,118 | |
| | 3,461 | | | Neff Corp. - Class A (a) | | | 67,316 | |
| | 2,525 | | | NOW, Inc. (a) | | | 42,824 | |
| | 1,346 | | | Rush Enterprises, Inc. - Class A (a) | | | 44,526 | |
| | 1,390 | | | Rush Enterprises, Inc. - Class B (a) | | | 43,340 | |
| | 1,499 | | | SiteOne Landscape Supply, Inc. (a) | | | 72,567 | |
| | 2,989 | | | Titan Machinery, Inc. (a)(b) | | | 45,851 | |
| | 1,215 | | | Triton International Ltd. | | | 31,335 | |
| | 1,645 | | | United Rentals, Inc. (a) | | | 205,707 | |
| | 1,078 | | | Univar, Inc. (a) | | | 33,052 | |
| | 2,008 | | | Veritiv Corp. (a) | | | 104,014 | |
| | 827 | | | Watsco, Inc. | | | 118,410 | |
| | 1,153 | | | WESCO International, Inc. (a) | | | 80,191 | |
| | 989 | | | Willis Lease Finance Corp. (a) | | | 22,104 | |
| | | | | | |
|
|
|
| | | | | | | | 1,876,662 | |
| | | | | | |
|
|
|
| | | | | Transportation Infrastructure - 0.07% | |
| | 734 | | | Macquarie Infrastructure Corp. | | | 59,146 | |
| | 2,400 | | | Wesco Aircraft Holdings, Inc. (a)(b) | | | 27,360 | |
| | | | | | |
|
|
|
| | | | | | | | 86,506 | |
| | | | | | |
|
|
|
| | | | | Water Utilities - 0.21% | |
| | 1,332 | | | Aqua America, Inc. | | | 42,824 | |
| | 1,069 | | | California Water Service Group | | | 38,324 | |
| | 427 | | | Connecticut Water Service, Inc. | | | 22,695 | |
| | 3,544 | | | Consolidated Water Co., Ltd. - Ordinary Shares | | | 41,288 | |
| | 992 | | | Middlesex Water Co. | | | 36,654 | |
| | 559 | | | SJW Corp. | | | 26,955 | |
| | 960 | | | The York Water Co. | | | 33,648 | |
| | | | | | |
|
|
|
| | | | | | | | 242,388 | |
| | | | | | |
|
|
|
| | | | | Wireless Telecommunication Services - 0.14% | |
| | 1,876 | | | Boingo Wireless, Inc. (a) | | | 24,369 | |
| | 1,209 | | | Shenandoah Telecommunications Co. | | | 33,913 | |
| | 1,631 | | | Spok Holdings, Inc. | | | 30,989 | |
| | 1,994 | | | Telephone & Data Systems, Inc. | | | 52,861 | |
| | 521 | | | United States Cellular Corp. (a) | | | 19,449 | |
| | | | | | |
|
|
|
| | | | | | | | 161,581 | |
| | | | | | |
|
|
|
| | | | | Total Common Stocks
(Cost $81,828,260) | | | 101,173,868 | |
| | | | | | |
|
|
|
| | |
Principal
Amount
| | | | | | |
| | | | | CORPORATE OBLIGATIONS - 0.00% | |
| | | | | Machinery - 0.00% | |
| | 5,000 | | | Mueller Industries, Inc.
6.000%, 03/01/2027 | | | 4,988 | |
| | | | | | |
|
|
|
| | | | | Total Corporate Obligations
(Cost $5,000) | | | 4,988 | |
| | | | | | |
|
|
|
| | | | | | | | |
Number of
Shares
| | | | | Value
| |
| | | | | INVESTMENT COMPANIES - 3.14% | |
| | | | | Exchange Traded Funds - 3.14% | |
| | 36,339 | | | Vanguard Extended Market ETF (b) | | $ | 3,629,903 | |
| | | | | | |
|
|
|
| | | | | Total Investment Companies
(Cost $3,349,404) | | | 3,629,903 | |
| | | | | | |
|
|
|
| | | | | REAL ESTATE INVESTMENT TRUSTS - 8.02% | |
| | | | | Real Estate Investment Trusts - 8.02% | |
| | 662 | | | Acadia Realty Trust | | | 19,900 | |
| | 1,996 | | | AG Mortgage Investment Trust, Inc. | | | 36,028 | |
| | 4,171 | | | AGNC Investment Corp. | | | 82,961 | |
| | 676 | | | Agree Realty Corp. | | | 32,421 | |
| | 861 | | | Alexandria Real Estate Equities, Inc. (b) | | | 95,158 | |
| | 1,586 | | | American Campus Communities, Inc. | | | 75,478 | |
| | 4,513 | | | American Homes 4 Rent - Class A | | | 103,618 | |
| | 4,405 | | | Anworth Mortgage Asset Corp. | | | 24,448 | |
| | 3,195 | | | Apartment Investment & Management Co. - Class A (b) | | | 141,698 | |
| | 4,424 | | | Apollo Commercial Real Estate Finance, Inc. | | | 83,215 | |
| | 2,661 | | | Apple Hospitality REIT, Inc. | | | 50,825 | |
| | 3,860 | | | Ares Commercial Real Estate Corp. | | | 51,647 | |
| | 5,216 | | | Armada Hoffler Properties, Inc. | | | 72,450 | |
| | 4,848 | | | Ashford Hospitality Prime, Inc. | | | 51,437 | |
| | 12,590 | | | Ashford Hospitality Trust, Inc. | | | 80,198 | |
| | 2,475 | | | Brandywine Realty Trust | | | 40,169 | |
| | 1,871 | | | Camden Property Trust | | | 150,541 | |
| | 6,987 | | | Capstead Mortgage Corp. | | | 73,643 | |
| | 886 | | | Care Capital Properties, Inc. (b) | | | 23,807 | |
| | 1,500 | | | CareTrust REIT, Inc. (b) | | | 25,230 | |
| | 3,713 | | | CatchMark Timber Trust, Inc. - Class A | | | 42,774 | |
| | 7,096 | | | CBL & Associates Properties, Inc. | | | 67,696 | |
| | 3,176 | | | Chatham Lodging Trust | | | 62,726 | |
| | 2,362 | | | Chesapeake Lodging Trust | | | 56,594 | |
| | 7,441 | | | Chimera Investment Corp. | | | 150,159 | |
| | 13,889 | | | Colony NorthStar, Inc. - Class A | | | 179,307 | |
| | 986 | | | Colony Starwood Homes | | | 33,475 | |
| | 1,103 | | | Columbia Property Trust, Inc. (b) | | | 24,542 | |
| | 1,660 | | | CoreCivic, Inc. | | | 52,157 | |
| | 2,771 | | | CorEnergy Infrastructure Trust, Inc. (b) | | | 93,604 | |
| | 850 | | | CoreSite Realty Corp. (b) | | | 76,542 | |
| | 3,711 | | | Corporate Office Properties Trust | | | 122,834 | |
| | 9,164 | | | Cousins Properties, Inc. (b) | | | 75,786 | |
| | 993 | | | CyrusOne, Inc. | | | 51,110 | |
| | 6,061 | | | CYS Investments, Inc. (b) | | | 48,185 | |
| | 1,154 | | | DCT Industrial Trust, Inc. | | | 55,530 | |
| | 3,896 | | | DDR Corp. | | | 48,817 | |
| | 8,148 | | | DiamondRock Hospitality Co. (b) | | | 90,850 | |
| | 1,704 | | | Douglas Emmett, Inc. | | | 65,434 | |
| | 4,018 | | | Duke Realty Corp. | | | 105,553 | |
| | 1,210 | | | DuPont Fabros Technology, Inc. (b) | | | 60,004 | |
| | 4,017 | | | Dynex Capital, Inc. (b) | | | 28,481 | |
| | 1,552 | | | Easterly Government Properties, Inc. (b) | | | 30,714 | |
| | 749 | | | EastGroup Properties, Inc. | | | 55,074 | |
| | 875 | | | Education Realty Trust, Inc. | | | 35,744 | |
| | 2,098 | | | Empire State Realty Trust, Inc. - Class A (b) | | | 43,303 | |
| | 925 | | | EPR Properties | | | 68,108 | |
| | 2,579 | | | Equity Commonwealth (a) | | | 80,516 | |
| | 1,162 | | | Equity LifeStyle Properties, Inc. (b) | | | 89,544 | |
| | 9,201 | | | Felcor Lodging Trust, Inc. (b) | | | 69,100 | |
| | 1,762 | | | First Industrial Realty Trust | | | 46,922 | |
| | 6,096 | | | First Potomac Realty Trust | | | 62,667 | |
See notes to financial statements.
64
GuideMark® Small/Mid Cap Core Fund
SCHEDULE OF INVESTMENTS (Continued)
March 31, 2017
| | | | | | | | |
Number of
Shares
| | | | | Value
| |
| | | | | REAL ESTATE INVESTMENT TRUSTS (Continued) | |
| | | | | Real Estate Investment Trusts (Continued) | |
| | 3,584 | | | Forest City Realty Trust, Inc. - Class A | | $ | 78,060 | |
| | 3,863 | | | Four Corners Property Trust, Inc. | | | 88,192 | |
| | 1,798 | | | Franklin Street Properties Corp. (b) | | | 21,828 | |
| | 1,896 | | | Gaming and Leisure Properties, Inc. | | | 63,364 | |
| | 1,948 | | | Getty Realty Corp. | | | 49,226 | |
| | 1,194 | | | Gladstone Commercial Corp. (b) | | | 24,680 | |
| | 1,499 | | | Government Properties Income Trust | | | 31,374 | |
| | 1,945 | | | Gramercy Property Trust (b) | | | 51,153 | |
| | 5,660 | | | Great Ajax Corp. | | | 73,863 | |
| | 1,498 | | | Health Care Realty Trust | | | 48,685 | |
| | 1,572 | | | Healthcare Trust of America, Inc. - Class A | | | 49,455 | |
| | 3,622 | | | Hersha Hospitality Trust | | | 68,057 | |
| | 1,082 | | | Highwoods Properties, Inc. | | | 53,159 | |
| | 3,924 | | | Hospitality Property Trust (b) | | | 123,724 | |
| | 682 | | | Hudson Pacific Properties, Inc. | | | 23,624 | |
| | 5,465 | | | Independence Realty Trust, Inc. | | | 51,207 | |
| | 3,470 | | | InfraREIT, Inc. | | | 62,460 | |
| | 4,804 | | | Impac Mortgage Holdings, Inc. (a) | | | 59,858 | |
| | 3,972 | | | Invesco Mortgage Capital, Inc. | | | 61,248 | |
| | 3,276 | | | Iron Mountain, Inc. (b) | | | 116,855 | |
| | 2,046 | | | iStar Financial, Inc. (a) | | | 24,143 | |
| | 1,450 | | | Kilroy Realty Corp. (b) | | | 104,516 | |
| | 1,337 | | | Kite Realty Group Trust | | | 28,745 | |
| | 1,235 | | | Lamar Advertising Co. - Class A (b) | | | 92,304 | |
| | 3,216 | | | LaSalle Hotel Properties | | | 93,103 | |
| | 6,304 | | | Lexington Realty Trust | | | 62,914 | |
| | 2,684 | | | Liberty Property Trust | | | 103,468 | |
| | 860 | | | LTC Properties, Inc. | | | 41,194 | |
| | 3,513 | | | Mack-Cali Realty Corp. | | | 94,640 | |
| | 4,242 | | | Medical Properties Trust, Inc. | | | 54,679 | |
| | 18,281 | | | MFA Financial, Inc. (b) | | | 147,710 | |
| | 1,621 | | | Mid-American Apartment Communities, Inc. | | | 164,921 | |
| | 1,583 | | | Monmouth Real Estate Investment Corp. - Class A | | | 22,589 | |
| | 2,519 | | | Monogram Residential Trust, Inc. | | | 25,114 | |
| | 2,081 | | | MTGE Investment Corp. | | | 34,857 | |
| | 800 | | | National Health Investors, Inc. | | | 58,104 | |
| | 1,617 | | | National Retail Properties, Inc. (b) | | | 70,534 | |
| | 2,426 | | | National Storage Affiliates Trust (b) | | | 57,981 | |
| | 10,694 | | | New Residential Investment Corp. | | | 181,584 | |
| | 2,827 | | | New Senior Investment Group, Inc. (b) | | | 28,835 | |
| | 12,689 | | | New York Mortgage Trust, Inc. (b) | | | 78,291 | |
| | 1,582 | | | NexPoint Residential Trust, Inc. | | | 38,221 | |
| | 2,025 | | | Omega Healthcare Investors, Inc. | | | 66,805 | |
| | 1,354 | | | One Liberty Properties, Inc. | | | 31,629 | |
| | 2,926 | | | Orchid Island Capital, Inc. (b) | | | 29,231 | |
| | 906 | | | Outfront Media, Inc. | | | 24,054 | |
| | 4,424 | | | Owens Realty Mortgage, Inc. | | | 78,747 | |
| | 1,312 | | | Parkway, Inc. | | | 26,096 | |
| | 2,188 | | | Pebblebrook Hotel Trust | | | 63,911 | |
| | 2,544 | | | Pennsylvania Real Estate Investment Trust | | | 38,516 | |
| | 5,165 | | | PennyMac Mortgage Investment Trust | | | 91,679 | |
| | 2,040 | | | Physicians Realty Trust (b) | | | 40,535 | |
| | 4,176 | | | Piedmont Office Realty Trust, Inc. - Class A (b) | | | 89,283 | |
| | 1,112 | | | Potlatch Corp. | | | 50,818 | |
| | 3,695 | | | Preferred Apartment Communities, Inc. - Class A | | | 48,811 | |
| | 723 | | | PS Business Parks, Inc. | | | 82,971 | |
| | 676 | | | QTS Realty Trust, Inc. - Class A | | | 32,955 | |
| | 21,947 | | | RAIT Financial Trust | | | 70,230 | |
| | | | | | | | |
Number of
Shares
| | | | | Value
| |
| | | | | Real Estate Investment Trusts (Continued) | |
| | 1,570 | | | Ramco-Gershenson Properties Trust | | $ | 22,011 | |
| | 1,116 | | | Rayonier, Inc. | | | 31,627 | |
| | 5,067 | | | Redwood Trust, Inc. | | | 84,163 | |
| | 2,221 | | | Regency Centers Corp. (b) | | | 147,452 | |
| | 4,040 | | | Resource Capital Corp. | | | 39,471 | |
| | 1,895 | | | Retail Opportunity Investments Corp. | | | 39,852 | |
| | 4,152 | | | Retail Properties of America, Inc. - Class A | | | 59,872 | |
| | 1,554 | | | Rexford Industrial Realty, Inc. | | | 34,996 | |
| | 3,772 | | | RLJ Lodging Trust (b) | | | 88,680 | |
| | 1,325 | | | Ryman Hospitality Properties, Inc. | | | 81,925 | |
| | 906 | | | Sabra Health Care REIT, Inc. (b) | | | 25,305 | |
| | 577 | | | Saul Centers, Inc. | | | 35,555 | |
| | 2,544 | | | Select Income REIT | | | 65,610 | |
| | 3,167 | | | Senior Housing Properties Trust | | | 64,132 | |
| | 468 | | | Seritage Growth Properties (b) | | | 20,194 | |
| | 1,900 | | | Silver Bay Realty Trust Corp. | | | 40,793 | |
| | 5,795 | | | Spirit Realty Capital, Inc. | | | 58,703 | |
| | 970 | | | STAG Industrial, Inc. | | | 24,269 | |
| | 6,400 | | | Starwood Property Trust, Inc. | | | 144,512 | |
| | 1,832 | | | STORE Capital Corp. | | | 43,748 | |
| | 7,842 | | | Summit Hotel Properties, Inc. (b) | | | 125,315 | |
| | 769 | | | Sun Communities, Inc. | | | 61,774 | |
| | 6,101 | | | Sunstone Hotel Investors, Inc. | | | 93,528 | |
| | 1,430 | | | Tanger Factory Outlet Centers, Inc. (b) | | | 46,861 | |
| | 829 | | | Terreno Realty Corp. | | | 23,212 | |
| | 596 | | | The Geo Group, Inc. | | | 27,637 | |
| | 2,060 | | | Tier REIT, Inc. | | | 35,762 | |
| | 5,859 | | | Two Harbors Investment Corp. (b) | | | 56,188 | |
| | 1,813 | | | UMH Properties, Inc. | | | 27,576 | |
| | 1,816 | | | Uniti Group, Inc. | | | 46,944 | |
| | 476 | | | Universal Health Realty Income Trust | | | 30,702 | |
| | 1,653 | | | Urban Edge Properties | | | 43,474 | |
| | 1,151 | | | Urstadt Biddle Properties, Inc. - Class A | | | 23,665 | |
| | 2,473 | | | Washington Prime Group, Inc. (b) | | | 21,490 | |
| | 977 | | | Washington Real Estate Investment Trust | | | 30,561 | |
| | 1,550 | | | Weingarten Realty Investors | | | 51,755 | |
| | 2,034 | | | Whitestone REIT | | | 28,151 | |
| | 1,309 | | | WP Carey, Inc. | | | 81,446 | |
| | 4,970 | | | Xenia Hotels & Resorts, Inc. | | | 84,838 | |
| | | | | | |
|
|
|
| | | | | Total Real Estate Investment Trusts
(Cost $8,150,582) | | | 9,257,263 | |
| | | | | | |
|
|
|
| | | | | RIGHTS - 0.00% | |
| | | | | Biotechnology - 0.00% | |
| | 1,600 | | | Dyax Corp. (c)(d) | | | 0 | |
| | | | | | |
|
|
|
| | | | | Real Estate Management & Development - 0.00% | |
| | 280 | | | Trinity Place Holdings, Inc. (c)(d) | | | 0 | |
| | | | | | |
|
|
|
| | | | | Total Rights
(Cost $604) | | | 0 | |
| | | | | | |
|
|
|
| | | | | SHORT TERM INVESTMENTS - 1.11% | |
| | | | | Money Market Funds - 1.11% | |
| | 1,276,523 | | | Deutsche Government Money Market Series - Institutional Shares Effective Yield, 0.63% (e) | | | 1,276,523 | |
| | | | | | |
|
|
|
| | | | | Total Short Term Investments
(Cost $1,276,523) | | | 1,276,523 | |
| | | | | | |
|
|
|
See notes to financial statements.
65
GuideMark® Small/Mid Cap Core Fund
SCHEDULE OF INVESTMENTS (Continued)
March 31, 2017
| | | | | | | | |
Number of
Shares
| | | | | Value
| |
| | | | | INVESTMENTS PURCHASED AS SECURITIES LENDING COLLATERAL - 28.33% | |
| | | | | Investment Companies - 28.33% | |
| | 32,709,937 | | | Mount Vernon Liquid Assets Portfolio, LLC Effective Yield, 1.17% (e) | | $ | 32,709,937 | |
| | | | | | |
|
|
|
| | | | | Total Investments Purchased as Securities Lending Collateral
(Cost $32,709,937) | | | 32,709,937 | |
| | | | | | |
|
|
|
| | | | | Total Investments
(Cost $127,320,310) - 128.21% | | | 148,052,482 | |
| | | | | Liabilities in Excess of
Other Assets - (28.21)% | | | (32,575,908 | ) |
| | | | | | |
|
|
|
| | | | | TOTAL NET ASSETS - 100.00% | | $ | 115,476,574 | |
| | | | | | |
|
|
|
Percentages are stated as a percent of net assets.
ADR American Depositary Receipt
| (a) | | Non-income producing security. |
| (b) | | All or portion of this security is on loan. |
| (c) | | As of March 31, 2017, the Valuation Committee has fair valued these securities. The value of these securities was $0, which represents 0.00% of total net assets. |
| (d) | | These securities have been deemed illiquid according to the Fund’s liquidity guidelines. The value of these securities is $115,316, which represents 0.10% of total net assets. |
| (e) | | Seven-day yield as of March 31, 2017. |
See notes to financial statements.
66
GuideMark® World ex-US Fund
SCHEDULE OF INVESTMENTS
March 31, 2017
| | | | | | | | |
Number of
Shares
| | | | | Value
| |
| | | | | COMMON STOCKS - 96.24% | |
| | | | | Australia - 5.38% | |
| | 10,137 | | | AGL Energy, Ltd. | | $ | 204,191 | |
| | 58,676 | | | Alumina Ltd. | | | 80,281 | |
| | 21,624 | | | Aristocrat Leisure, Ltd. | | | 296,823 | |
| | 3,716 | | | ASX, Ltd. | | | 143,308 | |
| | 41,116 | | | Aurizon Holdings Ltd. | | | 164,872 | |
| | 43,149 | | | AusNet Services | | | 55,545 | |
| | 21,186 | | | Australia and New Zealand Banking Group, Ltd. | | | 514,411 | |
| | 28,330 | | | Bendigo & Adelaide Bank, Ltd. | | | 262,474 | |
| | 14,211 | | | BHP Billiton Ltd. | | | 258,444 | |
| | 13,920 | | | BHP Billiton Plc | | | 214,700 | |
| | 27,456 | | | Challenger, Ltd./Australia | | | 263,152 | |
| | 12,572 | | | CIMIC Group, Ltd. | | | 344,959 | |
| | 7,230 | | | Cochlear, Ltd. | | | 746,877 | |
| | 14,515 | | | Commonwealth Bank of Australia | | | 951,822 | |
| | 3,547 | | | Computershare Ltd. | | | 38,094 | |
| | 5,820 | | | CSL, Ltd. | | | 557,241 | |
| | 48,347 | | | DUET Group | | | 103,032 | |
| | 17,168 | | | Flight Centre Travel Group, Ltd. | | | 378,703 | |
| | 131,168 | | | Fortescue Metals Group, Ltd. | | | 624,775 | |
| | 37,984 | | | Harvey Norman Holdings Ltd. | | | 131,379 | |
| | 22,348 | | | Insurance Australia Group, Ltd. | | | 103,262 | |
| | 3,120 | | | Macquarie Group, Ltd. | | | 214,958 | |
| | 79,341 | | | Medibank Private, Ltd. | | | 170,892 | |
| | 10,434 | | | National Australia Bank Ltd. | | | 265,674 | |
| | 12,128 | | | Newcrest Mining, Ltd. | | | 206,728 | |
| | 5,250 | | | Orica Ltd. | | | 70,566 | |
| | 8,925 | | | Origin Energy Ltd. (a) | | | 48,009 | |
| | 110,587 | | | Qantas Airways, Ltd. | | | 328,649 | |
| | 2,718 | | | REA Group Ltd. | | | 123,256 | |
| | 189,611 | | | South32, Ltd. | | | 399,731 | |
| | 17,044 | | | Suncorp Group, Ltd. | | | 172,000 | |
| | 46,014 | | | Telstra Corp., Ltd. | | | 163,734 | |
| | 11,579 | | | Wesfarmers Ltd. | | | 398,641 | |
| | 18,270 | | | Westpac Banking Corp. | | | 488,400 | |
| | 30,456 | | | Woolworths, Ltd. | | | 616,613 | |
| | | | | | |
|
|
|
| | | | | | | | 10,106,196 | |
| | | | | | |
|
|
|
| | | | | Austria - 0.53% | |
| | 3,328 | | | ANDRITZ AG | | | 166,445 | |
| | 4,072 | | | Erste Group Bank AG | | | 132,592 | |
| | 4,025 | | | Mondi Plc | | | 97,249 | |
| | 3,035 | | | OMV AG | | | 119,608 | |
| | 18,876 | | | Raiffeisen Bank International AG (a) | | | 425,688 | |
| | 1,288 | | | voestalpine AG | | | 50,655 | |
| | | | | | |
|
|
|
| | | | | | | | 992,237 | |
| | | | | | |
|
|
|
| | | | | Belgium - 0.16% | |
| | 905 | | | KBC Group NV | | | 59,995 | |
| | 605 | | | Solvay SA | | | 73,817 | |
| | 3,067 | | | Umicore SA | | | 174,663 | |
| | | | | | |
|
|
|
| | | | | | | | 308,475 | |
| | | | | | |
|
|
|
| | | | | Canada - 7.83% | |
| | 1,840 | | | Agnico Eagle Mines, Ltd. | | | 78,063 | |
| | 7,266 | | | Alimentation Couche-Tard, Inc. - Series B | | | 328,264 | |
| | 4,607 | | | Bank of Montreal | | | 344,109 | |
| | 9,300 | | | Barrick Gold Corp. | | | 176,650 | |
| | 2,641 | | | BCE, Inc. | | | 116,932 | |
| | 28,553 | | | Bombardier, Inc. - Class B (a) | | | 43,800 | |
| | 3,720 | | | Brookfield Asset Management, Inc. - Class A | | | 135,530 | |
| | | | | | | | |
Number of
Shares
| | | | | Value
| |
| | | | | Canada (Continued) | |
| | 7,495 | | | CAE, Inc. | | $ | 114,523 | |
| | 12,532 | | | Cameco Corp. | | | 138,716 | |
| | 4,058 | | | Canadian Imperial Bank of Commerce | | | 349,912 | |
| | 2,442 | | | Canadian National Railway Co. | | | 180,251 | |
| | 3,331 | | | Canadian Natural Resources, Ltd. | | | 109,059 | |
| | 200 | | | CCL Industries, Inc. - Class B | | | 43,635 | |
| | 1,324 | | | CGI Group, Inc. - Class A (a) | | | 63,440 | |
| | 22,188 | | | CI Financial Corp. (b) | | | 440,974 | |
| | 1,765 | | | Constellation Software, Inc. | | | 867,336 | |
| | 11,501 | | | Crescent Point Energy Corp. | | | 124,277 | |
| | 8,434 | | | Dollarama, Inc. | | | 698,959 | |
| | 31,235 | | | Empire Co., Ltd. - Series A | | | 477,268 | |
| | 3,530 | | | Enbridge, Inc. | | | 147,879 | |
| | 13,232 | | | Encana Corp. | | | 155,021 | |
| | 20,473 | | | Finning International, Inc. | | | 382,411 | |
| | 7,252 | | | First Capital Realty, Inc. | | | 109,228 | |
| | 9,365 | | | First Quantum Minerals Ltd. | | | 99,506 | |
| | 1,746 | | | Fortis, Inc. | | | 57,861 | |
| | 6,292 | | | George Weston, Ltd. | | | 548,980 | |
| | 2,900 | | | Great-West Lifeco, Inc. | | | 80,359 | |
| | 5,742 | | | Husky Energy, Inc. (a) | | | 64,810 | |
| | 2,000 | | | IGM Financial, Inc. | | | 59,646 | |
| | 8,022 | | | Industrial Alliance Insurance & Financial Services, Inc. | | | 347,639 | |
| | 48,741 | | | Kinross Gold Corp. (a) | | | 171,895 | |
| | 3,744 | | | Linamar Corp. | | | 170,301 | |
| | 6,193 | | | Loblaw Cos., Ltd. | | | 336,043 | |
| | 10,206 | | | Manulife Financial Corp. | | | 181,043 | |
| | 9,958 | | | Metro, Inc. | | | 305,887 | |
| | 3,300 | | | National Bank of Canada | | | 138,566 | |
| | 8,827 | | | Onex Corp. | | | 633,558 | |
| | 4,224 | | | Open Text Corp. | | | 143,569 | |
| | 2,168 | | | Pembina Pipeline Corp. | | | 68,699 | |
| | 15,610 | | | Power Corp. of Canada | | | 366,700 | |
| | 10,727 | | | Power Financial Corp. | | | 283,693 | |
| | 1,612 | | | PrairieSky Royalty Ltd. | | | 34,013 | |
| | 888 | | | Restaurant Brands International, Inc. | | | 49,466 | |
| | 1,229 | | | Rogers Communications, Inc. - Class B | | | 54,341 | |
| | 15,074 | | | Royal Bank of Canada | | | 1,098,259 | |
| | 9,233 | | | Saputo, Inc. | | | 318,609 | |
| | 8,153 | | | Seven Generations Energy, Ltd. - Class A (a) | | | 148,978 | |
| | 4,294 | | | Shaw Communications, Inc. | | | 89,022 | |
| | 6,225 | | | Silver Wheaton Corp. | | | 129,710 | |
| | 2,306 | | | SNC-Lavalin Group, Inc. | | | 90,482 | |
| | 4,114 | | | Sun Life Financial, Inc. | | | 150,224 | |
| | 4,580 | | | Suncor Energy, Inc. | | | 140,618 | |
| | 8,568 | | | Teck Resources. Ltd. - Class B | | | 187,358 | |
| | 9,576 | | | The Bank of Nova Scotia (b) | | | 560,223 | |
| | 14,457 | | | The Jean Coutu Group PJC, Inc. - Class A | | | 227,533 | |
| | 16,434 | | | The Toronto-Dominion Bank | | | 823,152 | |
| | 2,357 | | | Thomson Reuters Corp. | | | 101,930 | |
| | 6,372 | | | TransCanada Corp. | | | 294,055 | |
| | 20,676 | | | Valeant Pharmaceuticals International, Inc. (a) | | | 228,394 | |
| | 20,249 | | | Veresen, Inc. | | | 223,830 | |
| | 915 | | | Vermilion Energy, Inc. | | | 34,313 | |
| | 21,929 | | | Yamana Gold, Inc. | | | 60,518 | |
| | | | | | |
|
|
|
| | | | | | | | 14,730,020 | |
| | | | | | |
|
|
|
| | | | | Cayman Islands - 0.28% | |
| | 13,000 | | | Cheung Kong Property Holdings, Ltd. | | | 87,696 | |
See notes to financial statements.
67
GuideMark® World ex-US Fund
SCHEDULE OF INVESTMENTS (Continued)
March 31, 2017
| | | | | | | | |
Number of
Shares
| | | | | Value
| |
| | | | | COMMON STOCKS (Continued) | |
| | | | | Cayman Islands (Continued) | |
| | 499,980 | | | WH Group, Ltd. | | $ | 431,143 | |
| | | | | | |
|
|
|
| | | | | | | | 518,839 | |
| | | | | | |
|
|
|
| | | | | Denmark - 1.33% | |
| | 5,027 | | | Carlsberg AS - Series B | | | 464,206 | |
| | 2,774 | | | Coloplast AS - Series B | | | 216,637 | |
| | 1,618 | | | Danske Bank AS | | | 55,167 | |
| | 1,366 | | | Genmab AS (a) | | | 262,859 | |
| | 21,569 | | | Novo Nordisk AS - Series B | | | 740,657 | |
| | 2,460 | | | Pandora AS | | | 272,269 | |
| | 29,800 | | | TDC AS | | | 153,478 | |
| | 3,165 | | | Vestas Wind Systems AS | | | 257,442 | |
| | 3,826 | | | William Demant Holding A/S (a) | | | 79,951 | |
| | | | | | |
|
|
|
| | | | | | | | 2,502,666 | |
| | | | | | |
|
|
|
| | | | | Finland - 0.84% | |
| | 5,796 | | | Fortum OYJ | | | 91,740 | |
| | 2,020 | | | Metso OYJ | | | 61,128 | |
| | 7,795 | | | Neste OYJ (b) | | | 304,807 | |
| | 9,633 | | | Orion OYJ - Class B | | | 502,501 | |
| | 889 | | | Sampo OYJ - Series A | | | 42,184 | |
| | 5,137 | | | Stora Enso OYJ | | | 60,741 | |
| | 22,132 | | | UPM-Kymmene OYJ | | | 519,640 | |
| | | | | | |
|
|
|
| | | | | | | | 1,582,741 | |
| | | | | | |
|
|
|
| | | | | France - 9.96% | |
| | 8,927 | | | Accor SA | | | 371,312 | |
| | 2,335 | | | Arkema SA | | | 229,860 | |
| | 12,259 | | | Atos SA | | | 1,514,980 | |
| | 23,621 | | | AXA SA | | | 610,269 | |
| | 16,676 | | | BNP Paribas SA | | | 1,109,692 | |
| | 4,717 | | | Cap Gemini SA | | | 435,407 | |
| | 11,954 | | | Carrefour SA | | | 281,651 | |
| | 773 | | | Casino Guichard Perrachon SA | | | 43,190 | |
| | 2,861 | | | Christian Dior SA | | | 664,118 | |
| | 24,666 | | | CNP Assurances | | | 501,596 | |
| | 4,976 | | | Compagnie de Saint-Gobain SA | | | 255,304 | |
| | 39,710 | | | Credit Agricole SA | | | 536,749 | |
| | 8,439 | | | Danone SA | | | 574,064 | |
| | 2,826 | | | Dassault Systemes SA | | | 244,426 | |
| | 5,140 | | | Eiffage SA | | | 402,254 | |
| | 2,333 | | | Essilor International SA | | | 283,253 | |
| | 1,656 | | | Etablissements Michelin | | | 201,234 | |
| | 1,711 | | | Hermes International SA | | | 809,964 | |
| | 2,215 | | | Imerys SA | | | 187,859 | |
| | 717 | | | Ingenico Group SA | | | 67,625 | |
| | 579 | | | Kering SA | | | 149,652 | |
| | 3,604 | | | Legrand SA | | | 216,953 | |
| | 4,269 | | | L’Oreal SA | | | 821,092 | |
| | 3,516 | | | LVMH Moet Hennessy Louis Vuitton SA | | | 772,793 | |
| | 20,260 | | | Natixis SA | | | 124,724 | |
| | 349 | | | Pernod-Ricard SA | | | 41,259 | |
| | 47,823 | | | Peugeot SA | | | 961,126 | |
| | 1,495 | | | Publicis Groupe SA | | | 104,382 | |
| | 417 | | | Remy Cointreau SA | | | 40,795 | |
| | 39,267 | | | Rexel SA | | | 711,427 | |
| | 2,145 | | | Safran SA | | | 160,090 | |
| | 12,131 | | | Sanofi-Aventis SA | | | 1,096,589 | |
| | 4,510 | | | Schneider Electric SA | | | 331,345 | |
| | 12,777 | | | SCOR SE | | | 482,883 | |
| | | | | | | | |
Number of
Shares
| | | | | Value
| |
| | | | | France (Continued) | |
| | 3,238 | | | SEB SA | | $ | 452,276 | |
| | 1,324 | | | Societe BIC SA | | | 164,952 | |
| | 17,871 | | | Societe Generale SA | | | 905,443 | |
| | 458 | | | Sodexo SA | | | 53,813 | |
| | 2,680 | | | Suez Environnement Co. SA | | | 42,296 | |
| | 4,036 | | | Thales SA | | | 389,863 | |
| | 12,021 | | | Total SA | | | 607,825 | |
| | 1,575 | | | Valeo SA | | | 104,772 | |
| | 2,899 | | | Veolia Environnement SA | | | 54,362 | |
| | 5,822 | | | Vinci SA | | | 462,318 | |
| | 1,247 | | | Wendel SA | | | 157,905 | |
| | | | | | |
|
|
|
| | | | | | | | 18,735,742 | |
| | | | | | |
|
|
|
| | | | | Germany - 7.03% | |
| | 7,153 | | | adidas AG | | | 1,360,734 | |
| | 4,557 | | | Allianz SE | | | 845,082 | |
| | 6,008 | | | BASF SE | | | 594,876 | |
| | 10,832 | | | Bayer AG | | | 1,247,997 | |
| | 4,886 | | | Beiersdorf AG | | | 462,359 | |
| | 1,875 | | | Brenntag AG | | | 105,088 | |
| | 560 | | | Continental AG | | | 122,781 | |
| | 4,234 | | | Covestro AG | | | 326,183 | |
| | 2,719 | | | Deutsche Boerse AG | | | 249,160 | |
| | 35,793 | | | Deutsche Lufthansa AG | | | 580,667 | |
| | 24,894 | | | Deutsche Post AG | | | 851,963 | |
| | 29,449 | | | Deutsche Telekom AG | | | 516,026 | |
| | 4,636 | | | Deutsche Wohnen AG | | | 152,671 | |
| | 26,813 | | | E.ON SE | | | 213,167 | |
| | 2,490 | | | Evonik Industries AG | | | 81,160 | |
| | 706 | | | Fresenius Medical Care AG & Co. KGaA | | | 59,531 | |
| | 3,772 | | | Fresenius SE & Co. KGaA | | | 303,104 | |
| | 452 | | | Hannover Rueck SE | | | 52,085 | |
| | 2,949 | | | HeidelbergCement AG | | | 276,169 | |
| | 849 | | | Henkel AG & Co. KGaA | | | 94,416 | |
| | 1,907 | | | HOCHTIEF AG | | | 315,148 | |
| | 8,951 | | | HUGO BOSS AG | | | 652,739 | |
| | 13,254 | | | Infineon Technologies AG | | | 271,275 | |
| | 3,056 | | | LANXESS AG | | | 205,005 | |
| | 1,247 | | | MAN SE | | | 128,538 | |
| | 2,955 | | | Merck KGaA | | | 336,733 | |
| | 2,827 | | | Metro AG | | | 90,330 | |
| | 2,558 | | | Muenchener Rueckversicherungs-Gesellschaft AG | | | 500,736 | |
| | 843 | | | OSRAM Licht AG | | | 52,866 | |
| | 1,098 | | | ProSiebenSat.1 Media AG | | | 48,620 | |
| | 7,601 | | | SAP AG | | | 745,721 | |
| | 5,290 | | | Siemens AG | | | 724,585 | |
| | 1,519 | | | thyssenkrupp AG | | | 37,212 | |
| | 4,751 | | | TUI AG | | | 65,793 | |
| | 2,150 | | | United Internet AG | | | 95,098 | |
| | 11,422 | | | Zalando SE (a) | | | 461,647 | |
| | | | | | |
|
|
|
| | | | | | | | 13,227,265 | |
| | | | | | |
|
|
|
| | | | | Hong Kong - 2.87% | |
| | 61,519 | | | AIA Group, Ltd. | | | 388,305 | |
| | 6,800 | | | ASM Pacific Technology, Ltd. | | | 92,506 | |
| | 126,513 | | | BOC Hong Kong Holdings, Ltd. | | | 517,099 | |
| | 202,195 | | | Cathay Pacific Airways Ltd. | | | 293,535 | |
| | 14,852 | | | CLP Holdings, Ltd. | | | 155,478 | |
| | 18,251 | | | Hang Lung Group Ltd. | | | 77,848 | |
| | 7,715 | | | Hang Seng Bank, Ltd. | | | 156,510 | |
| | 315,212 | | | HK Electric Investments & HK Electric Investments Ltd. | | | 290,511 | |
See notes to financial statements.
68
GuideMark® World ex-US Fund
SCHEDULE OF INVESTMENTS (Continued)
March 31, 2017
| | | | | | | | |
Number of
Shares
| | | | | Value
| |
| | | | | COMMON STOCKS (Continued) | |
| | | | | Hong Kong (Continued) | |
| | 104,312 | | | HKT Trust and HKT, Ltd. | | $ | 134,498 | |
| | 15,674 | | | Hong Kong Exchange & Clearing, Ltd. | | | 395,517 | |
| | 1,440 | | | Jardine Strategic Holdings Ltd. | | | 60,495 | |
| | 28,844 | | | MTR Corp. Ltd. | | | 162,058 | |
| | 163,180 | | | New World Development Co., Ltd. | | | 201,066 | |
| | 105,731 | | | NWS Holdings, Ltd. | | | 193,037 | |
| | 174,388 | | | PCCW, Ltd. | | | 102,876 | |
| | 62,000 | | | Sino Land Co., Ltd. | | | 108,726 | |
| | 891,933 | | | SJM Holdings, Ltd. | | | 725,949 | |
| | 5,000 | | | Sun Hung Kai Properties, Ltd. | | | 73,501 | |
| | 38,960 | | | Techtronic Industries Co., Ltd. | | | 157,721 | |
| | 24,566 | | | The Wharf Holdings, Ltd. | | | 211,121 | |
| | 113,614 | | | Wheelock & Co., Ltd. | | | 898,721 | |
| | | | | | |
|
|
|
| | | | | | | | 5,397,078 | |
| | | | | | |
|
|
|
| | | | | Ireland - 0.35% | |
| | 521,786 | | | Bank of Ireland (a) | | | 130,527 | |
| | 10,066 | | | CRH Plc | | | 354,718 | |
| | 3,831 | | | James Hardie Industries Plc | | | 60,190 | |
| | 1,316 | | | Kerry Group Plc - Series A | | | 104,341 | |
| | | | | | |
|
|
|
| | | | | | | | 649,776 | |
| | | | | | |
|
|
|
| | | | | Israel - 0.83% | |
| | 45,934 | | | Bank Hapoalim BM | | | 279,930 | |
| | 48,098 | | | Bank Leumi Le-Israel BM (a) | | | 212,342 | |
| | 126,258 | | | Bezeq the Israel Telecommunication Corp., Ltd. | | | 226,752 | |
| | 316 | | | Elbit Systems Ltd. | | | 36,145 | |
| | 5,523 | | | Mizrahi Tefahot Bank, Ltd. | | | 93,613 | |
| | 2,883 | | | NICE-Systems, Ltd. | | | 195,716 | |
| | 701 | | | Taro Pharmaceutical Industries Ltd. (a)(b) | | | 81,751 | |
| | 13,690 | | | Teva Pharmaceutical Industries, Ltd. - ADR | | | 439,312 | |
| | | | | | |
|
|
|
| | | | | | | | 1,565,561 | |
| | | | | | |
|
|
|
| | | | | Italy - 2.39% | |
| | 9,747 | | | Assicurazioni Generali SpA | | | 154,648 | |
| | 82,769 | | | Enel SpA | | | 389,468 | |
| | 4,350 | | | Eni SpA | | | 71,224 | |
| | 3,081 | | | Ferrari NV | | | 229,631 | |
| | 35,598 | | | Intesa Sanpaolo SpA | | | 96,831 | |
| | 25,855 | | | Leonardo SpA | | | 366,638 | |
| | 11,173 | | | Luxottica Group SpA | | | 616,600 | |
| | 11,561 | | | Poste Italiane SpA | | | 77,006 | |
| | 29,574 | | | Prysmian SpA | | | 781,862 | |
| | 1,049,037 | | | Saipem SpA (a) | | | 476,474 | |
| | 27,403 | | | Snam SpA | | | 118,434 | |
| | 431,567 | | | Telecom Italia SpA (a) | | | 388,492 | |
| | 498,456 | | | Telecom Italia SpA - Savings Share | | | 363,915 | |
| | 1 | | | UniCredit SpA | | | 12 | |
| | 168,010 | | | UnipolSai SpA | | | 371,122 | |
| | | | | | |
|
|
|
| | | | | | | | 4,502,357 | |
| | | | | | |
|
|
|
| | | | | Japan - 22.10% | |
| | 3,800 | | | ABC-Mart, Inc. | | | 222,724 | |
| | 2,620 | | | Aeon Co., Ltd. | | | 38,363 | |
| | 13,532 | | | Alfresa Holdings Corp. | | | 235,241 | |
| | 16,998 | | | Asahi Glass Co., Ltd. | | | 137,915 | |
| | 20,610 | | | Asahi Kasei Corp. | | | 200,256 | |
| | 7,664 | | | Asics Corp. | | | 123,311 | |
| | 35,044 | | | Astellas Pharma, Inc. | | | 462,193 | |
| | 12,338 | | | Bandai Namco Holdings, Inc. | | | 369,840 | |
| | | | | | | | |
Number of
Shares
| | | | | Value
| |
| | | | | Japan (Continued) | |
| | 4,117 | | | Benesse Holdings, Inc. | | $ | 128,871 | |
| | 1,600 | | | Bridgestone Corp. | | | 64,949 | |
| | 22,900 | | | Brother Industries, Ltd. | | | 478,889 | |
| | 10,181 | | | Calbee, Inc. | | | 347,744 | |
| | 4,980 | | | Canon, Inc. | | | 155,519 | |
| | 700 | | | Central Japan Railway Co. | | | 114,338 | |
| | 34,268 | | | Chubu Electric Power Co., Inc. | | | 460,320 | |
| | 5,072 | | | Dai-ichi Life Insurance Co., Ltd. | | | 90,786 | |
| | 6,939 | | | Daiichi Sankyo Co., Ltd. | | | 156,551 | |
| | 2,034 | | | Daikin Industries Ltd. | | | 205,105 | |
| | 1,025 | | | Daito Trust Construction Co., Ltd. | | | 140,934 | |
| | 8,147 | | | DeNA Co., Ltd. | | | 165,857 | |
| | 2,857 | | | FamilyMart Co., Ltd. | | | 170,469 | |
| | 281 | | | FANUC Corp. | | | 57,850 | |
| | 1,399 | | | Fast Retailing Co., Ltd. | | | 440,242 | |
| | 16,810 | | | Fuji Electric Co., Ltd. | | | 100,105 | |
| | 3,324 | | | Fuji Heavy Industries, Ltd. | | | 121,919 | |
| | 6,396 | | | FUJIFILM Holdings Corp. | | | 250,709 | |
| | 50,805 | | | Fujitsu, Ltd. | | | 311,860 | |
| | 6,241 | | | Hikari Tsushin, Inc. | | | 609,380 | |
| | 1,218 | | | Hisamitsu Pharmaceutical Co., Inc. | | | 69,734 | |
| | 5,819 | | | Hitachi Chemical Co., Ltd. | | | 161,644 | |
| | 18,586 | | | Hitachi Construction Machinery Co., Ltd. | | | 465,064 | |
| | 5,063 | | | Hitachi High-Technologies Corp. | | | 206,822 | |
| | 19,252 | | | Honda Motor Co., Ltd. | | | 581,199 | |
| | 1,176 | | | Hoshizaki Electric Co., Ltd. | | | 92,953 | |
| | 11,060 | | | Hoya Corp. | | | 534,317 | |
| | 24,131 | | | Idemitsu Kosan Co., Ltd. | | | 839,983 | |
| | 21,701 | | | Iida Group Holdings Co., Ltd. | | | 333,949 | |
| | 35,672 | | | ITOCHU Corp. | | | 507,839 | |
| | 1,786 | | | Japan Tobacco, Inc. | | | 58,130 | |
| | 3,357 | | | JTEKT Corp. | | | 52,225 | |
| | 114,045 | | | JX Holdings, Inc. | | | 561,506 | |
| | 23,285 | | | Kajima Corp. | | | 152,308 | |
| | 33,378 | | | Kakaku.com, Inc. | | | 455,662 | |
| | 6,753 | | | Kansai Paint Co., Ltd. | | | 144,118 | |
| | 12,894 | | | Kao Corp. | | | 708,094 | |
| | 2,959 | | | KDDI Corp. | | | 77,824 | |
| | 5,137 | | | Keikyu Corp. | | | 56,511 | |
| | 874 | | | Keyence Corp. | | | 350,625 | |
| | 6,954 | | | Kikkoman Corp. | | | 207,832 | |
| | 1,421 | | | Koito Manufacturing Co., Ltd. | | | 74,060 | |
| | 5,770 | | | Komatsu Ltd. | | | 151,135 | |
| | 5,930 | | | Konami Corp. | | | 251,874 | |
| | 43,571 | | | Konica Minolta, Inc. | | | 390,814 | |
| | 6,203 | | | Kose Corp. | | | 563,734 | |
| | 8,183 | | | Kuraray Co., Ltd. | | | 124,485 | |
| | 3,748 | | | Lawson, Inc. | | | 254,848 | |
| | 4,242 | | | LINE Corp. | | | 163,501 | |
| | 29,591 | | | Lion Corp. | | | 533,290 | |
| | 11,210 | | | M3, Inc. | | | 279,381 | |
| | 31,285 | | | Marubeni Corp. | | | 193,246 | |
| | 3,216 | | | Maruichi Steel Tube, Ltd. | | | 91,779 | |
| | 25,532 | | | Mazda Motor Corp. | | | 368,552 | |
| | 6,236 | | | McDonald’s Holdings Co. Japan, Ltd. | | | 182,114 | |
| | 6,265 | | | MEIJI Holdings Co., Ltd. | | | 522,779 | |
| | 3,753 | | | MISUMI Group, Inc. | | | 68,133 | |
| | 44,800 | | | Mitsubishi Chemical Holdings Corp. | | | 347,824 | |
| | 27,726 | | | Mitsubishi Corp. | | | 600,894 | |
| | 14,982 | | | Mitsubishi Electric Corp. | | | 215,865 | |
See notes to financial statements.
69
GuideMark® World ex-US Fund
SCHEDULE OF INVESTMENTS (Continued)
March 31, 2017
| | | | | | | | |
Number of
Shares
| | | | | Value
| |
| | | | | COMMON STOCKS (Continued) | |
| | | | | Japan (Continued) | |
| | 15,647 | | | Mitsubishi Gas Chemical Co., Inc. | | $ | 325,891 | |
| | 5,900 | | | Mitsubishi Materials Corp. | | | 179,082 | |
| | 83,096 | | | Mitsubishi UFJ Financial Group, Inc. | | | 523,436 | |
| | 74,423 | | | Mitsubishi UFJ Lease & Finance Co., Ltd. | | | 371,923 | |
| | 21,343 | | | Mitsui & Co., Ltd. | | | 309,944 | |
| | 19,458 | | | Mitsui Chemicals, Inc. | | | 96,400 | |
| | 187,913 | | | Mitsui OSK Lines, Ltd. | | | 590,546 | |
| | 16,543 | | | Mixi, Inc. | | | 800,212 | |
| | 312,391 | | | Mizuho Financial Group, Inc. | | | 573,418 | |
| | 2,797 | | | MS & AD Insurance Group Holdings | | | 89,338 | |
| | 326 | | | Murata Manufacturing Co., Ltd. | | | 46,444 | |
| | 18,343 | | | Nagoya Railroad Co., Ltd. | | | 82,721 | |
| | 1,614 | | | NH Foods Ltd. | | | 43,359 | |
| | 1,288 | | | Nidec Corp. | | | 123,010 | |
| | 25,707 | | | Nikon Corp. | | | 373,571 | |
| | 513 | | | Nintendo Co., Ltd. | | | 119,036 | |
| | 8,919 | | | Nippon Electric Glass Co., Ltd. | | | 54,029 | |
| | 27,681 | | | Nippon Express Co., Ltd. | | | 142,482 | |
| | 1,423 | | | Nippon Paint Holdings Co., Ltd. | | | 49,701 | |
| | 15,800 | | | Nippon Steel & Sumitomo Metal Corp. | | | 365,033 | |
| | 10,165 | | | Nippon Telegraph & Telephone Corp. | | | 434,587 | |
| | 3,884 | | | Nissan Chemical Industries, Ltd. | | | 113,304 | |
| | 6,885 | | | Nisshin Seifun Group, Inc. | | | 102,931 | |
| | 5,220 | | | Nitori Holdings Co., Ltd. | | | 662,936 | |
| | 1,456 | | | NKSJ Holdings, Inc. | | | 53,491 | |
| | 3,075 | | | NOK Corp. | | | 71,824 | |
| | 6,686 | | | Nomura Holdings, Inc. | | | 41,389 | |
| | 2,980 | | | NTT Data Corp. | | | 141,510 | |
| | 9,641 | | | NTT DoCoMo, Inc. | | | 225,139 | |
| | 19,000 | | | Obayashi Corp. | | | 178,159 | |
| | 27,521 | | | Oji Holdings Corp. | | | 129,069 | |
| | 8,121 | | | Olympus Corp. | | | 313,443 | |
| | 7,079 | | | OMRON Corp. | | | 311,043 | |
| | 2,061 | | | Oracle Corp. | | | 118,155 | |
| | 30,558 | | | ORIX Corp. | | | 453,558 | |
| | 10,220 | | | Osaka Gas Co., Ltd. | | | 38,969 | |
| | 1,710 | | | Otsuka Holdings Co., Ltd. | | | 77,395 | |
| | 7,278 | | | Panasonic Corp. | | | 82,367 | |
| | 11,845 | | | Park24 Co., Ltd. | | | 311,218 | |
| | 20,744 | | | Pola Orbis Holdings, Inc. | | | 501,228 | |
| | 13,344 | | | Recruit Holdings Co., Ltd. | | | 682,487 | |
| | 52,200 | | | Resona Holdings, Inc. | | | 280,621 | |
| | 845 | | | Rohm Co. Ltd. | | | 56,256 | |
| | 2,445 | | | Ryohin Keikaku Co., Ltd. | | | 537,474 | |
| | 28,693 | | | SBI Holdings, Inc. | | | 400,926 | |
| | 10,679 | | | Sega Sammy Holdings, Inc. | | | 143,633 | |
| | 9,869 | | | Seiko Epson Corp. | | | 208,226 | |
| | 13,055 | | | Sekisui Chemical Co., Ltd. | | | 220,082 | |
| | 5,200 | | | Seven & I Holdings Co., Ltd. - Series A | | | 204,275 | |
| | 42,184 | | | Sharp Corp. (b) | | | 177,450 | |
| | 2,911 | | | Shimadzu Corp. | | | 46,328 | |
| | 1,630 | | | Shimamura Co., Ltd. | | | 216,080 | |
| | 3,093 | | | Shin-Etsu Chemical Co., Ltd. | | | 268,842 | |
| | 3,592 | | | Shionogi & Co., Ltd. | | | 185,949 | |
| | 13,363 | | | Shiseido Co., Ltd. | | | 351,723 | |
| | 5,359 | | | SoftBank Group Corp. | | | 380,034 | |
| | 17,361 | | | Sony Corp. | | | 585,907 | |
| | 37,242 | | | Start Today Co., Ltd. | | | 827,657 | |
| | 24,982 | | | Sumitomo Chemical Co., Ltd. | | | 139,927 | |
| | | | | | | | |
Number of
Shares
| | | | | Value
| |
| | | | | Japan (Continued) | |
| | 29,980 | | | Sumitomo Corp. | | $ | 404,456 | |
| | 11,455 | | | Sumitomo Dainippon Pharma Co., Ltd. | | | 189,550 | |
| | 5,116 | | | Sumitomo Heavy Industries, Ltd. | | | 35,767 | |
| | 15,012 | | | Sumitomo Mitsui Financial Group, Inc. | | | 546,418 | |
| | 5,500 | | | Sumitomo Mitsui Trust Holdings, Inc. | | | 190,586 | |
| | 15,389 | | | Sumitomo Rubber Industries, Ltd. | | | 262,568 | |
| | 7,968 | | | Sundrug Co., Ltd. | | | 268,082 | |
| | 8,383 | | | Suntory Beverage & Food Ltd. | | | 354,142 | |
| | 6,157 | | | Suzuken Co., Ltd. | | | 202,326 | |
| | 3,497 | | | Suzuki Motor Corp. | | | 145,243 | |
| | 7,997 | | | Sysmex Corp. | | | 486,547 | |
| | 13,185 | | | T&D Holdings, Inc. | | | 191,112 | |
| | 25,960 | | | Taiheiyo Cement Corp. | | | 87,114 | |
| | 7,745 | | | Takashimaya Co., Ltd. | | | 67,888 | |
| | 6,647 | | | Teijin, Ltd. | | | 125,512 | |
| | 16,379 | | | The Kansai Electric Power Co., Inc. | | | 201,539 | |
| | 11,444 | | | The Yokohama Rubber Co., Ltd. | | | 224,289 | |
| | 11,354 | | | Toho Gas Co., Ltd. | | | 80,530 | |
| | 1,030 | | | Tokio Marine Holdings, Inc. | | | 43,532 | |
| | 3,777 | | | Tokyo Electron, Ltd. | | | 413,492 | |
| | 9,609 | | | Tokyo Gas Co., Ltd. | | | 43,885 | |
| | 16,000 | | | TonenGeneral Sekiyu KK | | | 187,080 | |
| | 10,324 | | | Toppan Printing Co., Ltd. | | | 105,523 | |
| | 60,768 | | | Toshiba Corp. | | | 130,987 | |
| | 2,462 | | | TOTO Ltd. | | | 93,136 | |
| | 6,500 | | | Toyo Seikan Group Holdings, Ltd. | | | 105,771 | |
| | 5,422 | | | Toyoda Gosei Co., Ltd. | | | 138,289 | |
| | 8,081 | | | Toyota Motor Corp. | | | 438,619 | |
| | 11,054 | | | Toyota Tsusho Corp. | | | 335,518 | |
| | 988 | | | Trend Micro, Inc. | | | 43,976 | |
| | 1,696 | | | Tsuruha Holdings, Inc. | | | 157,303 | |
| | 5,062 | | | Unicharm Corp. | | | 121,653 | |
| | 60,846 | | | Yamada Denki Co., Ltd. | | | 304,176 | |
| | 31,775 | | | Yamazaki Baking Co., Ltd. | | | 654,235 | |
| | 4,705 | | | Yaskawa Electric Corp. | | | 94,751 | |
| | 11,287 | | | Yokogawa Electric Corp. | | | 178,005 | |
| | | | | | |
|
|
|
| | | | | | | | 41,547,655 | |
| | | | | | |
|
|
|
| | | | | Jersey - 1.85% | |
| | 392,047 | | | Glencore Plc | | | 1,538,213 | |
| | 18,870 | | | Petrofac, Ltd. | | | 217,973 | |
| | 1,262 | | | Randgold Resources, Ltd. | | | 110,274 | |
| | 6,637 | | | Shire Plc | | | 386,718 | |
| | 10,356 | | | Wolseley Plc | | | 652,028 | |
| | 25,823 | | | WPP Plc | | | 566,015 | |
| | | | | | |
|
|
|
| | | | | | | | 3,471,221 | |
| | | | | | |
|
|
|
| | | | | Luxembourg - 0.39% | |
| | 27,956 | | | ArcelorMittal SA (a) | | | 233,883 | |
| | 1,330 | | | Millicom International Cellular SA | | | 74,162 | |
| | 3,490 | | | RTL Group SA | | | 280,805 | |
| | 8,287 | | | Tenaris SA | | | 143,302 | |
| | | | | | |
|
|
|
| | | | | | | | 732,152 | |
| | | | | | |
|
|
|
| | | | | Macau - 0.02% | |
| | 21,015 | | | MGM China Holdings Ltd. | | | 43,822 | |
| | | | | | |
|
|
|
| | | | | Mexico - 0.06% | |
| | 6,090 | | | Fresnillo Plc | | | 118,660 | |
| | | | | | |
|
|
|
| | | | | Netherlands - 3.73% | |
| | 1,604 | | | ABN AMRO Group NV | | | 38,895 | |
| | 702 | | | Akzo Nobel NV | | | 58,114 | |
See notes to financial statements.
70
GuideMark® World ex-US Fund
SCHEDULE OF INVESTMENTS (Continued)
March 31, 2017
| | | | | | | | |
Number of
Shares
| | | | | Value
| |
| | | | | COMMON STOCKS (Continued) | |
| | | | | Netherlands (Continued) | |
| | 2,264 | | | ASML Holding NV | | $ | 300,418 | |
| | 4,777 | | | Boskalis Westminster | | | 164,581 | |
| | 15,690 | | | CNH Industrial NV | | | 151,018 | |
| | 9,142 | | | EXOR NV | | | 472,714 | |
| | 75,293 | | | Fiat Chrysler Automobiles NV (a) | | | 822,603 | |
| | 1,565 | | | Gemalto NV | | | 87,305 | |
| | 4,567 | | | Heineken Holding NV | | | 362,757 | |
| | 1,033 | | | Heineken NV | | | 87,907 | |
| | 39,932 | | | ING Groep NV | | | 603,146 | |
| | 25,274 | | | Koninklijke Ahold Delhaize NV | | | 540,103 | |
| | 2,953 | | | Koninklijke DSM NV | | | 199,710 | |
| | 5,050 | | | Koninklijke Philips Electronics NV | | | 162,228 | |
| | 12,614 | | | NN Group NV | | | 409,668 | |
| | 7,895 | | | QIAGEN NV | | | 229,185 | |
| | 9,810 | | | Randstad Holding NV | | | 565,529 | |
| | 12,469 | | | Reed Elsevier NV | | | 231,315 | |
| | 26,661 | | | STMicroelectronics NV | | | 410,250 | |
| | 16,555 | | | Unilever NV | | | 822,469 | |
| | 6,906 | | | Wolters Kluwer NV | | | 286,616 | |
| | | | | | |
|
|
|
| | | | | | | | 7,006,531 | |
| | | | | | |
|
|
|
| | | | | New Zealand - 0.21% | |
| | 26,671 | | | Fletcher Building Ltd. | | | 155,373 | |
| | 25,501 | | | Mercury NZ Ltd. | | | 56,312 | |
| | 32,102 | | | Meridian Energy, Ltd. | | | 62,995 | |
| | 46,868 | | | Telecom Corp. | | | 114,889 | |
| | | | | | |
|
|
|
| | | | | | | | 389,569 | |
| | | | | | |
|
|
|
| | | | | Norway - 0.61% | |
| | 4,791 | | | DNB ASA | | | 76,074 | |
| | 9,022 | | | Gjensidige Forsikring ASA | | | 137,442 | |
| | 15,316 | | | Marine Harvest ASA | | | 233,637 | |
| | 30,997 | | | Norsk Hydro ASA | | | 180,642 | |
| | 9,469 | | | Schibsted ASA - Class A | | | 243,752 | |
| | 10,053 | | | Schibsted ASA - Class B | | | 230,342 | |
| | 2,858 | | | Telenor ASA | | | 47,544 | |
| | | | | | |
|
|
|
| | | | | | | | 1,149,433 | |
| | | | | | |
|
|
|
| | | | | Portugal - 0.46% | |
| | 95,208 | | | EDP - Energias de Portugal SA | | | 321,915 | |
| | 8,919 | | | Galp Energia SGPS SA | | | 135,278 | |
| | 22,926 | | | Jeronimo Martins SGPS SA | | | 409,672 | |
| | | | | | |
|
|
|
| | | | | | | | 866,865 | |
| | | | | | |
|
|
|
| | | | | Singapore - 1.30% | |
| | 20,900 | | | DBS Group Holdings, Ltd. | | | 289,505 | |
| | 3,212 | | | Jardine Cycle & Carriage, Ltd. | | | 100,606 | |
| | 46,400 | | | Oversea-Chinese Banking Corp. Ltd. | | | 322,295 | |
| | 44,343 | | | SATS Ltd. | | | 154,694 | |
| | 76,800 | | | Singapore Exchange, Ltd. | | | 422,738 | |
| | 144,287 | | | StarHub Ltd. | | | 297,042 | |
| | 14,936 | | | United Overseas Bank, Ltd. | | | 235,918 | |
| | 84,597 | | | Wilmar International, Ltd. | | | 213,482 | |
| | 504,600 | | | Yangzijiang Shipbuilding Holdings, Ltd. | | | 407,387 | |
| | | | | | |
|
|
|
| | | | | | | | 2,443,667 | |
| | | | | | |
|
|
|
| | | | | Spain - 2.99% | |
| | 17,899 | | | ACS, Actividades de Construccion y Servicios SA | | | 608,436 | |
| | 1,929 | | | Aena SA | | | 304,898 | |
| | 8,569 | | | Amadeus IT Holding SA - Class A | | | 434,181 | |
| | 37,441 | | | Banco Bilbao Vizcaya Argentaria SA | | | 290,643 | |
| | | | | | | | |
Number of
Shares
| | | | | Value
| |
| | | | | Spain (Continued) | |
| | 196,350 | | | Banco de Sabadell SA | | $ | 359,767 | |
| | 143,280 | | | Banco Santander Central Hispano SA | | | 877,064 | |
| | 48,998 | | | Bankia SA | | | 55,775 | |
| | 4,868 | | | Bankinter SA | | | 40,819 | |
| | 15,537 | | | CaixaBank SA | | | 66,801 | |
| | 66,709 | | | Distribuidora Internacional de Alimentación SA | | | 385,586 | |
| | 7,509 | | | Endesa SA | | | 176,234 | |
| | 50,287 | | | Iberdrola SA | | | 359,296 | |
| | 14,627 | | | Inditex de Diseno Textil SA | | | 515,114 | |
| | 108,785 | | | Mapfre SA | | | 372,601 | |
| | 42,363 | | | Repsol SA | | | 656,328 | |
| | 9,828 | | | Telefonica SA | | | 110,009 | |
| | | | | | |
|
|
|
| | | | | | | | 5,613,552 | |
| | | | | | |
|
|
|
| | | | | Sweden - 1.86% | |
| | 4,196 | | | Assa Abloy AB - Series B | | | 86,260 | |
| | 6,326 | | | Atlas Copco AB - Class A | | | 222,986 | |
| | 3,625 | | | Atlas Copco AB - Class B | | | 115,151 | |
| | 10,055 | | | Boliden AB | | | 299,290 | |
| | 5,760 | | | Electrolux AB - Series B | | | 159,908 | |
| | 23,405 | | | Hennes & Mauritz AB - Series B | | | 597,314 | |
| | 4,466 | | | Hexagon AB - Class B | | | 179,242 | |
| | 18,887 | | | Husqvarna AB - Class B (b) | | | 165,596 | |
| | 1,855 | | | Industrivarden AB | | | 40,142 | |
| | 919 | | | Investor AB - B Shares | | | 38,641 | |
| | 2,481 | | | L E Lundbergforetagen AB - Series B | | | 168,155 | |
| | 7,933 | | | Nordea Bank AB | | | 90,506 | |
| | 16,467 | | | Sandvik AB | | | 245,967 | |
| | 12,166 | | | Securitas AB - Series B | | | 189,926 | |
| | 9,323 | | | Skanska AB - Class B (b) | | | 219,420 | |
| | 3,267 | | | Svenska Handelsbanken AB - Class A | | | 44,771 | |
| | 5,475 | | | Swedbank AB - A Shares | | | 126,683 | |
| | 6,179 | | | Swedish Match AB | | | 200,811 | |
| | 11,966 | | | Telefonaktiebolaget LM Ericsson - Series B | | | 79,889 | |
| | 15,566 | | | Volvo AB - Class B (b) | | | 229,630 | |
| | | | | | |
|
|
|
| | | | | | | | 3,500,288 | |
| | | | | | |
|
|
|
| | | | | Switzerland - 7.93% | |
| | 17,412 | | | ABB, Ltd. | | | 407,537 | |
| | 3,584 | | | Actelion, Ltd. | | | 1,011,215 | |
| | 3,510 | | | Adecco SA | | | 249,225 | |
| | 19,061 | | | Aryzta AG | | | 612,029 | |
| | 306 | | | Baloise Holding AG | | | 42,048 | |
| | 105 | | | Barry Callebaut AG | | | 137,289 | |
| | 819 | | | Cie Financiere Richemont SA | | | 64,752 | |
| | 255 | | | Dufry AG (a) | | | 38,826 | |
| | 934 | | | EMS-Chemie Holding AG | | | 543,951 | |
| | 189 | | | Galenica AG | | | 199,253 | |
| | 484 | | | Geberit AG | | | 208,561 | |
| | 31 | | | Givaudan SA | | | 55,832 | |
| | 4,042 | | | Kuehne & Nagel International AG | | | 570,743 | |
| | 978 | | | LafargeHolcim Ltd. | | | 57,701 | |
| | 1,688 | | | Lonza Group AG | | | 319,068 | |
| | 35,735 | | | Nestle SA | | | 2,742,724 | |
| | 20,654 | | | Novartis AG | | | 1,533,716 | |
| | 1,869 | | | Partners Group Holding AG | | | 1,004,425 | |
| | 7,775 | | | Roche Holding AG | | | 1,988,330 | |
| | 467 | | | Schindler Holding AG | | | 88,603 | |
| | 227 | | | SGS SA | | | 484,105 | |
| | 51 | | | Sika AG | | | 305,883 | |
| | 885 | | | Sonova Holding AG | | | 122,763 | |
See notes to financial statements.
71
GuideMark® World ex-US Fund
SCHEDULE OF INVESTMENTS (Continued)
March 31, 2017
| | | | | | | | |
Number of
Shares
| | | | | Value
| |
| | | | | COMMON STOCKS (Continued) | |
| | | | | Switzerland (Continued) | |
| | 1,628 | | | Swiss Life Holding AG | | $ | 524,970 | |
| | 4,572 | | | Swiss Re AG | | | 410,639 | |
| | 467 | | | Syngenta AG | | | 206,246 | |
| | 587 | | | The Swatch Group AG - Group I | | | 210,162 | |
| | 2,717 | | | The Swatch Group AG - Group N | | | 189,202 | |
| | 14,819 | | | UBS Group AG | | | 236,876 | |
| | 1,308 | | | Zurich Insurance Group AG | | | 349,054 | |
| | | | | | |
|
|
|
| | | | | | | | 14,915,728 | |
| | | | | | |
|
|
|
| | | | | United Kingdom - 12.95% | |
| | 61,623 | | | 3i Group Plc | | | 578,581 | |
| | 32,776 | | | Admiral Group Plc | | | 816,676 | |
| | 15,220 | | | Anglo American Plc (a) | | | 232,546 | |
| | 9,641 | | | Ashtead Group Plc | | | 199,561 | |
| | 2,039 | | | Associated British Foods Plc | | | 66,605 | |
| | 12,172 | | | AstraZeneca Plc | | | 748,419 | |
| | 96,003 | | | Auto Trader Group Plc | | | 471,169 | |
| | 13,927 | | | BAE Systems Plc | | | 112,087 | |
| | 113,716 | | | Barclays Plc | | | 320,995 | |
| | 44,151 | | | Barratt Developments Plc | | | 302,435 | |
| | 114,200 | | | BP Plc | | | 657,347 | |
| | 16,957 | | | British American Tobacco Plc | | | 1,125,028 | |
| | 26,654 | | | British Sky Broadcasting Group Plc | | | 325,972 | |
| | 37,236 | | | BT Group Plc | | | 148,688 | |
| | 3,612 | | | Bunzl Plc | | | 104,984 | |
| | 34,058 | | | Burberry Group Plc | | | 734,994 | |
| | 3,940 | | | Carnival Plc | | | 225,831 | |
| | 21,321 | | | Coca-Cola HBC AG | | | 550,424 | |
| | 16,048 | | | Compass Group Plc | | | 302,989 | |
| | 914 | | | Croda International Plc | | | 40,825 | |
| | 1,575 | | | DCC Plc | | | 138,651 | |
| | 12,021 | | | Diageo Plc | | | 344,223 | |
| | 28,300 | | | Direct Line Insurance Group Plc | | | 123,128 | |
| | 11,522 | | | Experian Plc | | | 235,063 | |
| | 45,041 | | | GlaxoSmithKline Plc | | | 936,533 | |
| | 39,918 | | | Hargreaves Lansdown Plc | | | 650,229 | |
| | 181,971 | | | HSBC Holdings Plc | | | 1,484,307 | |
| | 7,622 | | | Imperial Tobacco Group Plc | | | 369,389 | |
| | 3,973 | | | InterContinental Hotels Group Plc | | | 194,593 | |
| | 36,574 | | | International Consolidated Airlines Group SA | | | 241,582 | |
| | 2,674 | | | Intertek Group | | | 131,621 | |
| | 35,456 | | | J. Sainsbury Plc | | | 117,437 | |
| | 1,345 | | | Johnson Matthey Plc | | | 51,893 | |
| | 83,189 | | | Kingfisher Plc | | | 340,375 | |
| | 38,937 | | | Legal & General Group Plc | | | 120,566 | |
| | 3,953 | | | London Stock Exchange Group Plc | | | 157,268 | |
| | 71,969 | | | Marks & Spencer Group Plc | | | 303,987 | |
| | 19,262 | | | Mediclinic International Plc | | | 172,042 | |
| | 26,161 | | | Meggitt Plc | | | 146,012 | |
| | 16,812 | | | Merlin Entertainments Plc | | | 101,057 | |
| | 7,394 | | | Next Plc | | | 399,991 | |
| | 7,150 | | | Persimmon Plc | | | 187,591 | |
| | 11,806 | | | Provident Financial Plc | | | 443,597 | |
| | 15,618 | | | Prudential Plc | | | 329,903 | |
| | 5,555 | | | Reckitt Benckiser Group Plc | | | 507,124 | |
| | 13,922 | | | Reed Elsevier Plc | | | 272,566 | |
| | 2,457 | | | Rio Tinto Ltd. | | | 113,446 | |
| | 10,503 | | | Rio Tinto Plc | | | 422,931 | |
| | 7,516 | | | Rolls-Royce Holdings Plc (a) | | | 71,004 | |
| | | | | | | | |
Number of
Shares
| | | | | Value
| |
| | | | | United Kingdom (Continued) | |
| | 24,586 | | | Royal Dutch Shell Plc - Class A | | $ | 648,043 | |
| | 20,639 | | | Royal Dutch Shell Plc - Class B | | | 567,353 | |
| | 134,880 | | | Royal Mail Plc | | | 718,375 | |
| | 11,948 | | | RSA Insurance Group Plc | | | 87,745 | |
| | 1,486 | | | Schroders Plc | | | 56,396 | |
| | 23,711 | | | Smith & Nephew Plc | | | 361,018 | |
| | 10,632 | | | Smiths Group Plc | | | 216,025 | |
| | 15,840 | | | St. James’s Place Plc | | | 210,845 | |
| | 15,830 | | | Standard Chartered Plc (a) | | | 151,412 | |
| | 19,213 | | | Tate & Lyle | | | 184,111 | |
| | 237,231 | | | Tesco Plc (a) | | | 552,122 | |
| | 71,369 | | | The Sage Group Plc | | | 563,774 | |
| | 7,839 | | | The Weir Group Plc | | | 188,568 | |
| | 17,477 | | | Unilever Plc | | | 862,091 | |
| | 156,416 | | | Vodafone Group Plc | | | 407,617 | |
| | 136,239 | | | William Hill Plc | | | 496,839 | |
| | 276,283 | | | Wm Morrison Supermarkets Plc | | | 831,411 | |
| | 17,451 | | | Worldpay Group Plc | | | 64,520 | |
| | | | | | |
|
|
|
| | | | | | | | 24,342,530 | |
| | | | | | |
|
|
|
| | | | | Total Common Stocks
(Cost $157,613,324) | | | 180,960,626 | |
| | | | | | |
|
|
|
| | | | | INVESTMENT COMPANIES - 1.84% | |
| | | | | Canada - 0.16% | |
| | 11,001 | | | iShares MSCI Canada ETF | | | 295,707 | |
| | | | | | |
|
|
|
| | | | | Japan - 1.68% | |
| | 50,731 | | | iShares MSCI EAFE ETF (b) | | | 3,160,034 | |
| | | | | | |
|
|
|
| | | | | Total Investment Companies
(Cost $3,296,830) | | | 3,455,741 | |
| | | | | | |
|
|
|
| | | | | PARTICIPATORY NOTES - 0.06% | |
| | | | | Switzerland - 0.06% | |
| | 549 | | | Schindler Holding AG (c) | | | 106,197 | |
| | | | | | |
|
|
|
| | | | | Total Participatory Notes
(Cost $80,980) | | | 106,197 | |
| | | | | | |
|
|
|
| | | | | PREFERRED STOCKS - 0.40% | |
| | | | | Germany - 0.40% | |
| | 10,451 | | | FUCHS PETROLUB SE - Preference Shares | | | 509,487 | |
| | 1,474 | | | Henkel AG & Co. KGaA - Preference Shares | | | 188,931 | |
| | 408 | | | Volkswagen AG - Preference Shares | | | 59,478 | |
| | | | | | |
|
|
|
| | | | | Total Preferred Stocks
(Cost $693,595) | | | 757,896 | |
| | | | | | |
|
|
|
| | | | | REAL ESTATE INVESTMENT TRUSTS - 0.34% | |
| | | | | Australia - 0.06% | |
| | 14,868 | | | Dexus Property Group | | | 110,969 | |
| | | | | | |
|
|
|
| | | | | Canada - 0.04% | |
| | 4,188 | | | H&R Real Estate Investment Trust (a) | | | 72,653 | |
| | | | | | |
|
|
|
| | | | | Hong Kong - 0.09% | | | | |
| | 24,764 | | | Link REIT | | | 173,565 | |
| | | | | | |
|
|
|
| | | | | Japan - 0.13% | |
| | 60 | | | Daiwa House REIT Investment Corp. | | | 156,250 | |
| | 55 | | | Nomura Real Estate Master Fund, Inc. | | | 85,542 | |
| | | | | | |
|
|
|
| | | | | | | | 241,792 | |
| | | | | | |
|
|
|
| | | | | United Kingdom - 0.02% | |
| | 3,361 | | | Land Securities Group Plc | | | 44,638 | |
| | | | | | |
|
|
|
| | | | | Total Real Estate Investment Trusts
(Cost $648,906) | | | 643,617 | |
| | | | | | |
|
|
|
See notes to financial statements.
72
GuideMark® World ex-US Fund
SCHEDULE OF INVESTMENTS (Continued)
March 31, 2017
| | | | | | | | |
Number of
Shares
| | | | | Value
| |
| | | | | SHORT TERM INVESTMENTS - 0.40% | |
| | | | | Money Market Funds - 0.40% | |
| | 760,253 | | | Deutsche Government Money Market Series - Institutional Shares
Effective Yield, 0.63% (d) | | $ | 760,253 | |
| | | | | | |
|
|
|
| | | | | Total Short Term Investments
(Cost $760,253) | | | 760,253 | |
| | | | | | |
|
|
|
| | | | | INVESTMENTS PURCHASED AS SECURITIES LENDING COLLATERAL - 1.59% | |
| | | | | Investment Companies - 1.59% | |
| | 2,977,876 | | | Mount Vernon Liquid Assets Portfolio, LLC Effective Yield, 1.17% (d) | | | 2,977,876 | |
| | | | | | |
|
|
|
| | | | | Total Investments Purchased as Securities Lending Collateral
(Cost $2,977,876) | | | 2,977,876 | |
| | | | | | |
|
|
|
| | | | | Total Investments
(Cost $166,071,764) - 100.87% | | | 189,662,206 | |
| | | | | Liabilities in Excess of
Other Assets - (0.87)% | | | (1,628,775 | ) |
| | | | | | |
|
|
|
| | | | | TOTAL NET ASSETS - 100.00% | | $ | 188,033,431 | |
| | | | | | |
|
|
|
Percentages are stated as a percent of net assets.
ADR American Depositary Receipt
| (a) | | Non-income producing security. |
| (b) | | All or portion of this security is on loan. |
| (c) | | Represents the value of the underlying security. See note 3t of the Notes to Financial Statements. |
| (d) | | Seven-day yield as of March 31, 2017. |
See notes to financial statements.
73
GuideMark® World ex-US Fund
SCHEDULE OF INVESTMENTS BY INDUSTRY
March 31, 2017
| | | | |
COMMON STOCKS | | | | |
Aerospace & Defense | | | 0.77% | |
Air Freight & Logistics | | | 0.84% | |
Airlines | | | 0.77% | |
Auto Components | | | 0.76% | |
Automobiles | | | 1.95% | |
Banks | | | 9.70% | |
Beverages | | | 1.19% | |
Biotechnology | | | 0.97% | |
Building Products | | | 0.52% | |
Capital Markets | | | 2.61% | |
Chemicals | | | 3.49% | |
Commercial Services & Supplies | | | 0.54% | |
Communications Equipment | | | 0.04% | |
Construction & Engineering | | | 1.56% | |
Construction Materials | | | 0.63% | |
Consumer Finance | | | 0.48% | |
Containers & Packaging | | | 0.08% | |
Distributors | | | 0.05% | |
Diversified Consumer Services | | | 0.07% | |
Diversified Financial Services | | | 1.22% | |
Diversified Telecommunication Services | | | 1.65% | |
Electric Utilities | | | 1.50% | |
Electrical Equipment | | | 1.32% | |
Electronic Equipment, Instruments & Components | | | 1.23% | |
Energy Equipment & Services | | | 0.45% | |
Food & Staples Retailing | | | 3.86% | |
Food Products | | | 4.88% | |
Gas Utilities | | | 0.15% | |
Health Care Equipment & Supplies | | | 1.39% | |
Health Care Providers & Services | | | 0.52% | |
Health Care Technology | | | 0.15% | |
Hotels, Restaurants & Leisure | | | 1.86% | |
Household Durables | | | 1.50% | |
Household Products | | | 1.04% | |
Independent Power and Renewable Electricity Producers | | | 0.03% | |
Industrial Conglomerates | | | 0.86% | |
Insurance | | | 5.47% | |
Internet & Direct Marketing Retail | | | 0.69% | |
Internet Software & Services | | | 1.06% | |
IT Services | | | 1.60% | |
Leisure Products | | | 0.47% | |
Life Sciences Tools & Services | | | 0.29% | |
Machinery | | | 1.52% | |
Marine | | | 0.62% | |
Media | | | 1.39% | |
Metals & Mining | | | 3.54% | |
Multiline Retail | | | 0.77% | |
Multi-Utilities | | | 0.21% | |
| | | | |
Oil, Gas & Consumable Fuels | | | 3.77% | |
Paper & Forest Products | | | 0.43% | |
Personal Products | | | 1.44% | |
Pharmaceuticals | | | 5.52% | |
Professional Services | | | 1.28% | |
Real Estate Management & Development | | | 1.17% | |
Road & Rail | | | 0.48% | |
Semiconductors & Semiconductor Equipment | | | 0.82% | |
Software | | | 1.88% | |
Specialty Retail | | | 2.65% | |
Technology Hardware, Storage & Peripherals | | | 0.66% | |
Textiles, Apparel & Luxury Goods | | | 3.52% | |
Tobacco | | | 0.93% | |
Trading Companies & Distributors | | | 2.43% | |
Transportation Infrastructure | | | 0.24% | |
Wireless Telecommunication Services | | | 0.76% | |
| | |
|
|
|
TOTAL COMMON STOCKS | | | 96.24% | |
| | |
|
|
|
INVESTMENT COMPANIES | | | | |
Exchange Traded Funds | | | 1.84% | |
| | |
|
|
|
TOTAL INVESTMENT COMPANIES | | | 1.84% | |
| | |
|
|
|
PARTICIPATORY NOTES | | | | |
Machinery | | | 0.06% | |
| | |
|
|
|
TOTAL PARTICIPATORY NOTES | | | 0.06% | |
| | |
|
|
|
PREFERRED STOCKS | | | | |
Automobiles | | | 0.03% | |
Chemicals | | | 0.27% | |
Household Products | | | 0.10% | |
| | |
|
|
|
TOTAL PREFERRED STOCKS | | | 0.40% | |
| | |
|
|
|
REAL ESTATE INVESTMENT TRUSTS | | | | |
Real Estate Investment Trusts | | | 0.34% | |
| | |
|
|
|
TOTAL REAL ESTATE INVESTMENT TRUSTS | | | 0.34% | |
| | |
|
|
|
SHORT TERM INVESTMENTS | | | | |
Money Market Funds | | | 0.40% | |
| | |
|
|
|
TOTAL SHORT TERM INVESTMENTS | | | 0.40% | |
| | |
|
|
|
INVESTMENTS PURCHASED AS SECURITIES
LENDING COLLATERAL | | | | |
Investment Companies | | | 1.59% | |
| | |
|
|
|
TOTAL INVESTMENTS PURCHASED AS SECURITIES LENDING COLLATERAL | | | 1.59% | |
| | |
|
|
|
TOTAL INVESTMENTS | | | 100.87% | |
Liabilities in Excess of Other Assets | | | (0.87)% | |
| | |
|
|
|
TOTAL NET ASSETS | | | 100.00% | |
| | |
|
|
|
Percentages are stated as a percent of net assets.
See notes to financial statements.
74
GuideMark® Opportunistic Equity Fund
SCHEDULE OF INVESTMENTS
March 31, 2017
| | | | | | | | |
Number of
Shares
| | | | | Value
| |
| | | | | COMMON STOCKS - 94.94% | |
| | | | | Aerospace & Defense - 1.55% | |
| | 1,604 | | | TransDigm Group, Inc. (a) | | $ | 353,137 | |
| | 6,036 | | | United Technologies Corp. | | | 677,299 | |
| | | | | | |
|
|
|
| | | | | | | | 1,030,436 | |
| | | | | | |
|
|
|
| | | | | Air Freight & Logistics - 2.76% | |
| | 24,714 | | | Hub Group, Inc. - Class A (b) | | | 1,146,730 | |
| | 6,370 | | | United Parcel Service, Inc. - Class B | | | 683,501 | |
| | | | | | |
|
|
|
| | | | | | | | 1,830,231 | |
| | | | | | |
|
|
|
| | | | | Airlines - 2.75% | |
| | 25,828 | | | United Continental Holdings, Inc. (b) | | | 1,824,490 | |
| | | | | | |
|
|
|
| | | | | Auto Components - 2.13% | |
| | 23,294 | | | BorgWarner, Inc. (a) | | | 973,456 | |
| | 5,480 | | | Delphi Automotive Plc (a) | | | 441,085 | |
| | | | | | |
|
|
|
| | | | | | | | 1,414,541 | |
| | | | | | |
|
|
|
| | | | | Automobiles - 1.06% | |
| | 60,133 | | | Ford Motor Co. | | | 699,948 | |
| | | | | | |
|
|
|
| | | | | Banks - 3.66% | |
| | 28,884 | | | BankUnited, Inc. | | | 1,077,662 | |
| | 17,257 | | | Citigroup, Inc. | | | 1,032,314 | |
| | 6,160 | | | East West Bancorp, Inc. (a) | | | 317,917 | |
| | | | | | |
|
|
|
| | | | | | | | 2,427,893 | |
| | | | | | |
|
|
|
| | | | | Beverages - 1.97% | |
| | 3,125 | | | Constellation Brands, Inc. - Class A (a) | | | 506,469 | |
| | 7,156 | | | PepsiCo, Inc. | | | 800,470 | |
| | | | | | |
|
|
|
| | | | | | | | 1,306,939 | |
| | | | | | |
|
|
|
| | | | | Biotechnology - 3.25% | |
| | 2,099 | | | Biogen, Inc. (b) | | | 573,909 | |
| | 3,400 | | | Bioverativ, Inc. (b) | | | 185,164 | |
| | 7,980 | | | Celgene Corp. (b) | | | 992,951 | |
| | 3,700 | | | Vertex Pharmaceuticals, Inc. (b) | | | 404,595 | |
| | | | | | |
|
|
|
| | | | | | | | 2,156,619 | |
| | | | | | |
|
|
|
| | | | | Capital Markets - 0.87% | |
| | 14,160 | | | The Charles Schwab Corp. (a) | | | 577,870 | |
| | | | | | |
|
|
|
| | | | | Chemicals - 2.68% | |
| | 31,037 | | | Axalta Coating Systems, Ltd. (b) | | | 999,391 | |
| | 12,190 | | | The Dow Chemical Co. (a) | | | 774,553 | |
| | | | | | |
|
|
|
| | | | | | | | 1,773,944 | |
| | | | | | |
|
|
|
| | | | | Communications Equipment - 0.50% | |
| | 6,150 | | | Lumentum Holdings, Inc. (b) | | | 328,102 | |
| | | | | | |
|
|
|
| | | | | Consumer Finance - 1.35% | |
| | 13,045 | | | Discover Financial Services | | | 892,148 | |
| | | | | | |
|
|
|
| | | | | Containers & Packaging - 0.76% | |
| | 10,370 | | | Berry Plastics Group, Inc. (b) | | | 503,671 | |
| | | | | | |
|
|
|
| | | | | Diversified Financial Services - 1.26% | |
| | 3,915 | | | CME Group, Inc. | | | 465,102 | |
| | 2,810 | | | S&P Global, Inc. | | | 367,379 | |
| | | | | | |
|
|
|
| | | | | | | | 832,481 | |
| | | | | | |
|
|
|
| | | | | Electrical Equipment - 0.90% | |
| | 11,010 | | | AMETEK, Inc. (a) | | | 595,421 | |
| | | | | | |
|
|
|
| | | | | Energy Equipment & Services - 0.50% | |
| | 5,550 | | | Baker Hughes, Inc. (a) | | | 332,001 | |
| | | | | | |
|
|
|
| | | | | Food Products - 1.42% | |
| | 6,330 | | | Kellogg Co. (a) | | | 459,621 | |
| | | | | | | | |
Number of
Shares
| | | | | Value
| |
| | | | | Food Products (Continued) | |
| | 5,470 | | | Post Holdings, Inc. (a)(b) | | $ | 478,735 | |
| | | | | | |
|
|
|
| | | | | | | | 938,356 | |
| | | | | | |
|
|
|
| | | | | Health Care Equipment & Supplies - 1.91% | |
| | 8,700 | | | Hill-Rom Holdings, Inc. | | | 614,220 | |
| | 9,370 | | | STERIS Plc (a) | | | 650,840 | |
| | | | | | |
|
|
|
| | | | | | | | 1,265,060 | |
| | | | | | |
|
|
|
| | | | | Health Care Providers & Services - 0.98% | |
| | 5,088 | | | Aetna, Inc. (a) | | | 648,974 | |
| | | | | | |
|
|
|
| | | | | Hotels, Restaurants & Leisure - 4.10% | |
| | 5,420 | | | Marriott International, Inc. - Class A (a) | | | 510,455 | |
| | 3,900 | | | McDonald’s Corp. | | | 505,479 | |
| | 21,445 | | | Red Rock Resorts, Inc. - Class A | | | 475,650 | |
| | 6,394 | | | Vail Resorts, Inc. | | | 1,227,009 | |
| | | | | | |
|
|
|
| | | | | | | | 2,718,593 | |
| | | | | | |
|
|
|
| | | | | Household Durables - 4.19% | |
| | 9,720 | | | Installed Building Products, Inc. (b) | | | 512,730 | |
| | 14,790 | | | Newell Rubbermaid, Inc. (a) | | | 697,645 | |
| | 391 | | | NVR, Inc. (a)(b) | | | 823,790 | |
| | 4,352 | | | Whirlpool Corp. (a) | | | 745,628 | |
| | | | | | |
|
|
|
| | | | | | | | 2,779,793 | |
| | | | | | |
|
|
|
| | | | | Industrial Conglomerates - 0.61% | |
| | 13,620 | | | General Electric Co. (a) | | | 405,876 | |
| | | | | | |
|
|
|
| | | | | Insurance - 6.52% | |
| | 8,186 | | | Berkshire Hathaway, Inc. - Class B (b) | | | 1,364,442 | |
| | 22,402 | | | Loews Corp. | | | 1,047,742 | |
| | 23,320 | | | MetLife, Inc. (a) | | | 1,231,762 | |
| | 5,203 | | | Willis Towers Watson Plc | | | 681,021 | |
| | | | | | |
|
|
|
| | | | | | | | 4,324,967 | |
| | | | | | |
|
|
|
| | | | | Internet & Direct Marketing Retail - 1.64% | |
| | 1,225 | | | Amazon.com, Inc. (b) | | | 1,086,011 | |
| | | | | | |
|
|
|
| | | | | Internet Software & Services - 6.10% | |
| | 2,416 | | | Alphabet, Inc. - Class A (b) | | | 2,048,285 | |
| | 1,171 | | | Alphabet, Inc. - Class C (b) | | | 971,415 | |
| | 7,220 | | | Facebook, Inc. - Class A (b) | | | 1,025,601 | |
| | | | | | |
|
|
|
| | | | | | | | 4,045,301 | |
| | | | | | |
|
|
|
| | | | | IT Services - 3.28% | |
| | 1,804 | | | Alliance Data Systems Corp. | | | 449,196 | |
| | 11,290 | | | PayPal Holdings, Inc. (a)(b) | | | 485,696 | |
| | 5,700 | | | Vantiv, Inc. - Class A (a)(b) | | | 365,484 | |
| | 9,840 | | | Visa, Inc. - Class A (a) | | | 874,481 | |
| | | | | | |
|
|
|
| | | | | | | | 2,174,857 | |
| | | | | | |
|
|
|
| | | | | Life Sciences Tools & Services - 0.85% | |
| | 1,175 | | | Mettler-Toledo International, Inc. (b) | | | 562,719 | |
| | | | | | |
|
|
|
| | | | | Machinery - 2.55% | |
| | 8,691 | | | Colfax Corp. (a)(b) | | | 341,209 | |
| | 5,840 | | | Danaher Corp. (a) | | | 499,495 | |
| | 7,780 | | | Deere & Co. (a) | | | 846,931 | |
| | | | | | |
|
|
|
| | | | | | | | 1,687,635 | |
| | | | | | |
|
|
|
| | | | | Media - 7.40% | |
| | 2,180 | | | Charter Communications, Inc. - Class A (a)(b) | | | 713,558 | |
| | 27,543 | | | Liberty Global Plc - Class A (b) | | | 987,967 | |
| | 12,310 | | | Lions Gate Entertainment Corp. - Class B (b) | | | 300,118 | |
| | 7,530 | | | The Walt Disney Co. | | | 853,827 | |
| | 10,460 | | | Twenty-First Century Fox, Inc. - Class A | | | 338,799 | |
See notes to financial statements.
75
GuideMark® Opportunistic Equity Fund
SCHEDULE OF INVESTMENTS (Continued)
March 31, 2017
| | | | | | | | |
Number of
Shares
| | | | | Value
| |
| | | | | COMMON STOCKS (Continued) | |
| | | | | Media (Continued) | |
| | 53,904 | | | Twenty-First Century Fox, Inc. - Class B | | $ | 1,713,069 | |
| | | | | | |
|
|
|
| | | | | | | | 4,907,338 | |
| | | | | | |
|
|
|
| | | | | Multiline Retail - 1.45% | |
| | 13,760 | | | Dollar General Corp. | | | 959,485 | |
| | | | | | |
|
|
|
| | | | | Oil, Gas & Consumable Fuels - 1.12% | |
| | 3,421 | | | Cimarex Energy Co. (a) | | | 408,775 | |
| | 4,150 | | | Tesoro Corp. | | | 336,399 | |
| | | | | | |
|
|
|
| | | | | | | | 745,174 | |
| | | | | | |
|
|
|
| | | | | Pharmaceuticals - 5.20% | |
| | 47,053 | | | Abbott Laboratories (a) | | | 2,089,624 | |
| | 6,450 | | | Bristol-Myers Squibb Co. | | | 350,751 | |
| | 3,345 | | | Jazz Pharmaceuticals Plc (a)(b) | | | 485,460 | |
| | 14,690 | | | Nektar Therapeutics (b) | | | 344,774 | |
| | 3,870 | | | Pacira Pharmaceuticals, Inc. (a)(b) | | | 176,472 | |
| | | | | | |
|
|
|
| | | | | | | | 3,447,081 | |
| | | | | | |
|
|
|
| | | | | Road & Rail - 2.14% | |
| | 34,177 | | | Avis Budget Group (a)(b) | | | 1,010,956 | |
| | 5,380 | | | Ryder System, Inc. | | | 405,867 | |
| | | | | | |
|
|
|
| | | | | | | | 1,416,823 | |
| | | | | | |
|
|
|
| | | | | Semiconductors & Semiconductor Equipment - 1.08% | |
| | 7,240 | | | Applied Materials, Inc. | | | 281,636 | |
| | 6,050 | | | Cavium, Inc. (a)(b) | | | 433,543 | |
| | | | | | |
|
|
|
| | | | | | | | 715,179 | |
| | | | | | |
|
|
|
| | | | | Software - 4.68% | |
| | 2,810 | | | Adobe Systems, Inc. (b) | | | 365,665 | |
| | 17,110 | | | Microsoft Corp. | | | 1,126,865 | |
| | 6,120 | | | Red Hat, Inc. (a)(b) | | | 529,380 | |
| | 8,690 | | | salesforce.com, Inc. (a)(b) | | | 716,838 | |
| | 4,190 | | | ServiceNow, Inc. (b) | | | 366,499 | |
| | | | | | |
|
|
|
| | | | | | | | 3,105,247 | |
| | | | | | |
|
|
|
| | | | | Specialty Retail - 1.05% | |
| | 8,773 | | | The TJX Companies, Inc. (a) | | | 693,769 | |
| | | | | | |
|
|
|
| | | | | Technology Hardware, Storage & Peripherals - 4.43% | |
| | 20,455 | | | Apple, Inc. | | | 2,938,565 | |
| | | | | | |
|
|
|
| | | | | Textiles, Apparel & Luxury Goods - 0.49% | |
| | 5,800 | | | NIKE, Inc. - Class B | | | 323,234 | |
| | | | | | |
|
|
|
| | | | | | | | |
Number of
Shares
| | | | | Value
| |
| | | | | Thrifts & Mortgage - 1.69% | |
| | 71,067 | | | Nationstar Mortgage Holdings, Inc. (a)(b) | | $ | 1,120,016 | |
| | | | | | |
|
|
|
| | | | | Trading Companies & Distributors - 2.11% | |
| | 10,395 | | | Fastenal Co. (a) | | | 535,342 | |
| | 10,350 | | | HD Supply Holdings, Inc. (b) | | | 425,644 | |
| | 69,540 | | | Wolseley Plc - ADR (a) | | | 440,884 | |
| | | | | | |
|
|
|
| | | | | | | | 1,401,870 | |
| | | | | | |
|
|
|
| | | | | Total Common Stocks
(Cost $48,077,697) | | | 62,938,658 | |
| | | | | | |
|
|
|
| | | | | REAL ESTATE INVESTMENT TRUSTS - 1.44% | |
| | | | | Real Estate Investment Trusts - 1.44% | |
| | 20,253 | | | CubeSmart (a) | | | 525,768 | |
| | 17,220 | | | STAG Industrial, Inc. | | | 430,845 | |
| | | | | | |
|
|
|
| | | | | Total Real Estate Investment Trusts
(Cost $902,788) | | | 956,613 | |
| | | | | | |
|
|
|
| | | | | SHORT TERM INVESTMENTS - 3.36% | |
| | | | | Money Market Funds - 3.36% | |
| | 2,228,609 | | | Deutsche Government Money Market Series - Institutional Shares Effective Yield, 0.63% (c) | | | 2,228,609 | |
| | | | | | |
|
|
|
| | | | | Total Short Term Investments
(Cost $2,228,609) | | | 2,228,609 | |
| | | | | | |
|
|
|
| | | | | INVESTMENTS PURCHASED AS SECURITIES LENDING COLLATERAL - 29.17% | |
| | | | | Investment Companies - 29.17% | |
| | 19,335,822 | | | Mount Vernon Liquid Assets Portfolio, LLC Effective Yield, 1.17% (c) | | | 19,335,822 | |
| | | | | | |
|
|
|
| | | | | Total Investments Purchased as Securities Lending Collateral
(Cost $19,335,822) | | | 19,335,822 | |
| | | | | | |
|
|
|
| | | | | Total Investments
(Cost $70,544,916) - 128.91% | | | 85,459,702 | |
| | | | | Liabilities in Excess of
Other Assets - (28.91)% | | | (19,166,167 | ) |
| | | | | | |
|
|
|
| | | | | TOTAL NET ASSETS - 100.00% | | $ | 66,293,535 | |
| | | | | | |
|
|
|
Percentages are stated as a percent of net assets.
ADR American Depositary Receipt
| (a) | | All or portion of this security is on loan. |
| (b) | | Non-income producing security. |
| (c) | | Seven-day yield as of March 31, 2017. |
See notes to financial statements.
76
GuideMark® Core Fixed Income Fund
SCHEDULE OF INVESTMENTS
March 31, 2017
| | | | | | | | |
Principal
Amount
| | | | | Value
| |
| | | | | ASSET BACKED SECURITIES - 10.19% | |
| | | | | Ally Master Owner Trust | | | | |
| | 795,000 | | | Series 2012-5, 1.540%, 09/15/2019 | | $ | 795,640 | |
| | 305,000 | | | Series 2014-5, 1.600%, 10/15/2019 | | | 305,312 | |
| | 250,000 | | | Americredit Automobile Receivables Trust
Series 2016-4, 1.530%, 07/08/2021 | | | 248,726 | |
| | 305,000 | | | AMMC CLO XIV Ltd. | | | | |
| | | | | Series 2014-14A, 2.488%, 07/27/2026 (Acquired 06/12/2014, Cost $304,372) (a)(b) | | | 305,032 | |
| | 47,802 | | | Angel Oak Mortgage Trust LLC | | | | |
| | | | | Series 2017-1, 2.810%, 01/25/2047 (Acquired 03/03/2017, Cost $47,801) (a)(b) | | | 47,801 | |
| | 500,000 | | | Apidos CLO XII | | | | |
| | | | | Series 2013-12A, 2.123%, 04/15/2025 (Acquired 03/15/2013, Cost $500,000) (a)(b) | | | 500,811 | |
| | 260,000 | | | ARI Fleet Lease Trust | | | | |
| | | | | Series 2014-A, 1.550%, 11/15/2022 (Acquired 04/01/2014, Cost $259,928) (b) | | | 259,889 | |
| | 270,000 | | | Atlas Senior Loan Fund Ltd. | | | | |
| | | | | Series 2014-6A, 2.284%, 10/15/2026 (Acquired 02/02/2017, Cost $270,000) (a)(b) | | | 270,040 | |
| | 575,000 | | | Babson CLO Ltd. | | | | |
| | | | | Series 2013-IA, 2.130%, 04/20/2025 (Acquired 05/03/2013, Cost $575,000) (a)(b) | | | 575,489 | |
| | 120,000 | | | Bayview Opportunity Master Fund IVa Trust | | | | |
| | | | | Series 2017-SPL1, 4.000%, 10/28/2064 (Acquired 03/22/2017, Cost $124,060) (a)(b) | | | 124,063 | |
| | 735,000 | | | Capital One Multi-Asset Execution Trust | | | | |
| | | | | Series 2016-3A, 1.340%, 04/15/2022 | | | 728,637 | |
| | 555,000 | | | Carlyle Global Market Strategies CLO | | | | |
| | | | | Series 2013-3A, 2.143%, 07/15/2025 (Acquired 06/10/2013, Cost $553,834) (a)(b) | | | 555,106 | |
| | 169,018 | | | CarMax Auto Owner Trust | | | | |
| | | | | Series 2013-3, 1.490%, 01/15/2019 | | | 169,127 | |
| | 325,000 | | | Cent CLO 23 Ltd. | | | | |
| | | | | Series 2015-23A, 2.513%, 04/17/2026 (Acquired 03/19/2015, Cost $325,000) (a)(b) | | | 325,030 | |
| | 645,000 | | | Chase Issuance Trust | | | | |
| | | | | Series 2016-2, 1.370%, 06/15/2021 | | | 640,861 | |
| | 365,000 | | | CIFC Funding Ltd. | | | | |
| | | | | Series 2013-1A, 2.173%, 04/16/2025 (Acquired 02/22/2013, Cost $365,000) (a)(b) | | | 365,628 | |
| | 61,840 | | | Conseco Finance Securitizations Corp. | | | | |
| | | | | Series 2000-4, 8.310%, 05/01/2032 (a) | | | 35,617 | |
| | | | | CPS Auto Receivables Trust | | | | |
| | 22,462 | | | Series 2012-D, 1.480%, 03/16/2020 (Acquired 12/07/2012, Cost $22,459) (b) | | | 22,458 | |
| | 33,021 | | | Series 2013-A, 1.310%, 06/15/2020 (Acquired 03/12/2013, Cost $33,016) (b) | | | 32,951 | |
| | 105,642 | | | Credit Acceptance Auto Loan Trust | | | | |
| | | | | Series 2014-2A, 1.880%, 03/15/2022 (Acquired 09/18/2014, Cost $105,623) (b) | | | 105,773 | |
| | 1,143 | | | Drive Auto Receivables Trust | | | | |
| | | | | Series 2015-BA, 2.120%, 06/17/2019 (Acquired 05/20/2015, Cost $1,143) (b) | | | 1,143 | |
| | 270,000 | | | Dryden 38 Senior Loan Fund | | | | |
| | | | | Series 2015-38A, 2.453%, 07/15/2027 (Acquired 03/25/2015, Cost $270,000) (a)(b) | | | 270,926 | |
| | 485,000 | | | Ford Credit Auto Owner Trust | | | | |
| | | | | Series 2015-A, 2.030%, 08/15/2020 | | | 487,952 | |
| | | | | | | | |
Principal
Amount
| | | | | Value
| |
| | | | | ASSET BACKED SECURITIES (Continued) | |
| | 400,000 | | | Galaxy XV CLO, Ltd. | | | | |
| | | | | Series 2013-15A, 2.273%, 04/15/2025 (Acquired 01/29/2016, Cost $392,600) (a)(b) | | $ | 400,679 | |
| | 370,000 | | | Galaxy XIX CLO, Ltd. | | | | |
| | | | | Series 2015-19A, 2.593%, 01/24/2027 (Acquired 01/29/2015, Cost $369,441) (a)(b) | | | 370,035 | |
| | 295,000 | | | Galaxy XXII CLO, Ltd. | | | | |
| | | | | Series 2016-22A, 2.800%, 07/16/2028 (Acquired 06/13/2016, Cost $295,000) (b) | | | 287,424 | |
| | 100,000 | | | GCO Education Loan Funding Trust | | | | |
| | | | | Series 2006-1, 1.282%, 05/25/2036 (a) | | | 91,006 | |
| | 570,000 | | | GM Financial Automobile Leasing Trust | | | | |
| | | | | Series 2017-1, 2.060%, 05/20/2020 | | | 570,662 | |
| | 300,000 | | | GTP Acquisition Partners I LLC | | | | |
| | | | | Series 2015-2, 3.482%, 06/15/2050 (Acquired 05/20/2015, Cost $300,000) (b) | | | 300,489 | |
| | 515,000 | | | Honda Auto Receivables Owner Trust | | | | |
| | | | | Series 2016-2, 1.390%, 04/15/2020 | | | 513,795 | |
| | 100,000 | | | Lendmark Funding Trust | | | | |
| | | | | Series 2016-A, 3.260%, 04/21/2025 (Acquired 10/26/2016, Cost $99,989) (c) | | | 99,640 | |
| | 261,165 | | | Madison Park Funding XI Ltd. | | | | |
| | | | | Series 2013-11A, 2.321%, 10/23/2025 (Acquired 10/29/2015, Cost $256,542) (a)(b) | | | 261,375 | |
| | 288,473 | | | Morgan Stanley ABS Capital I, Inc. Trust | | | | |
| | | | | Series 2003-NC10, 2.002%, 10/25/2033 (a) | | | 277,497 | |
| | | | | NRZ Advance Receivables Trust | | | | |
| | 147,000 | | | Series 2016-T2, 2.575%, 10/15/2049 (Acquired 10/14/2016, Cost $147,000) (b) | | | 146,598 | |
| | 136,000 | | | Series 2015-ON1, 3.107%, 12/15/2050 (Acquired 11/22/2016, Cost $136,000) (b) | | | 134,852 | |
| | 120,000 | | | Series 2017-T1, 3.214%, 02/15/2051 (Acquired 02/01/2017, Cost $119,999) (a)(b) | | | 119,352 | |
| | 325,000 | | | Oaktree EIF II Ltd. | | | | |
| | | | | Series 2015-B1A, 2.589%, 02/15/2026 (Acquired 02/20/2015, Cost $325,000) (a)(b) | | | 325,123 | |
| | 275,000 | | | OCP CLO Ltd. | | | | |
| | | | | Series 2015-8A, 2.553%, 04/17/2027 (Acquired 04/10/2015, Cost $274,725) (a)(b) | | | 275,019 | |
| | 410,000 | | | Octagon Investment Partners XVI Ltd. | | | | |
| | | | | Series 2013-1A, 2.143%, 07/17/2025 (Acquired 05/15/2013, Cost $409,344) (a)(b) | | | 410,364 | |
| | 280,000 | | | OHA Credit Partners VIII, Ltd. | | | | |
| | | | | Series 2013-8A, 2.150%, 04/20/2025 (Acquired 04/17/2013, Cost $280,000) (a)(b) | | | 280,288 | |
| | 450,000 | | | OZLM Funding V Ltd. | | | | |
| | | | | Series 2013-5A, 2.673%, 01/17/2026 (Acquired 02/23/2017, Cost $450,000) (a)(b) | | | 450,207 | |
| | 300,000 | | | OZLM XII Ltd. | | | | |
| | | | | Series 2015-12A, 2.489%, 04/30/2027 (Acquired 04/24/2015, Cost $299,130) (a)(b) | | | 300,584 | |
| | 135,000 | | | Prestige Auto Receivables Trust | | | | |
| | | | | Series 2014-1A, 1.910%, 04/15/2020 (Acquired 06/25/2014, Cost $135,009) (b) | | | 135,105 | |
| | 300,000 | | | Santander Drive Auto Receivables Trust | | | | |
| | | | | Series 2015-2, 1.830%, 01/15/2020 | | | 300,462 | |
| | 250,000 | | | Shackleton 2014-VI CLO Ltd. | | | | |
| | | | | Series 2014-6A, 2.503%, 07/17/2026 (Acquired 06/12/2014, Cost $248,475) (a)(b) | | | 250,018 | |
See notes to financial statements.
77
GuideMark® Core Fixed Income Fund
SCHEDULE OF INVESTMENTS (Continued)
March 31, 2017
| | | | | | | | |
Principal
Amount
| | | | | Value
| |
| | | | | ASSET BACKED SECURITIES (Continued) | |
| | 83,672 | | | SoFi Consumer Loan Program LLC | | | | |
| | | | | Series 2016-2, 3.090%, 10/27/2025 (Acquired 07/26/2016, Cost $83,659) (c) | | $ | 83,669 | |
| | 257,000 | | | Sound Point CLO IV Ltd. | | | | |
| | | | | Series 2013-3A, 2.411%, 01/21/2026 (Acquired 03/27/2015, Cost $255,587) (a)(b) | | | 257,490 | |
| | 315,000 | | | Sound Point CLO VIII Ltd. | | | | |
| | | | | Series 2015-1A, 2.553%, 03/13/2027 (Acquired 03/05/2015, Cost $314,213) (a)(b) | | | 316,933 | |
| | | | | Towd Point Mortgage Trust | | | | |
| | 108,128 | | | Series 2016-2, 2.750%, 08/25/2055 (Acquired 05/20/2016, Cost $108,127) (a)(b) | | | 107,850 | |
| | 123,883 | | | Series 2016-3, 2.250%, 08/25/2055 (Acquired 07/22/2016, Cost $123,705) (a)(b) | | | 122,985 | |
| | 236,497 | | | Series 2017-1, 2.750%, 10/25/2056 (Acquired 02/07/2017, Cost $236,808) (a)(b) | | | 236,756 | |
| | 324,219 | | | Volkswagen Auto Lease Trust | | | | |
| | | | | Series 2015-A, 1.250%, 12/20/2017 | | | 324,177 | |
| | | | | | |
|
|
|
| | | | | Total Asset Backed Securities
(Cost $14,937,143) | | | 14,924,446 | |
| | | | | | |
|
|
|
| | | | | COLLATERALIZED MORTGAGE OBLIGATIONS - 4.58% | |
| | 160,000 | | | Aventura Mall Trust | | | | |
| | | | | Series 2013-AVM, 3.743%, 12/07/2032 (Acquired 12/10/2013, Cost $163,485) (a)(b) | | | 168,437 | |
| | 96,000 | | | BBCMS Mortgage Trust | | | | |
| | | | | Series 2017-C1, 3.674%, 02/17/2050 | | | 98,750 | |
| | 150,000 | | | BB-UBS Trust | | | | |
| | | | | Series 2012-SHOW, 3.430%, 11/07/2036 (Acquired 12/05/2012, Cost $154,171) (b) | | | 153,720 | |
| | 61,560 | | | Chase Mortgage Finance Trust | | | | |
| | | | | Series 2007-A1, 3.409%, 02/25/2037 (a) | | | 59,754 | |
| | 145,000 | | | Citigroup Commercial Mortgage Trust | | | | |
| | | | | Series 2014-GC21, 3.855%, 05/10/2047 | | | 152,281 | |
| | 2,733 | | | COBALT CMBS Commercial Mortgage Trust | | | | |
| | | | | Series 2007-C2, 5.484%, 04/15/2047 (a) | | | 2,730 | |
| | | | | COMM Mortgage Trust | | | | |
| | 120,000 | | | Series 2013-300P, 4.353%, 08/12/2030 (Acquired 08/15/2013, Cost $121,728) (b) | | | 130,207 | |
| | 295,267 | | | Series 2014-CR21, 3.528%, 12/10/2047 | | | 303,003 | |
| | 300,000 | | | Series 2015-CR26, 3.630%, 10/13/2048 | | | 308,535 | |
| | 130,000 | | | Series 2016-CR28, 3.762%, 02/12/2049 | | | 134,557 | |
| | 134,776 | | | Commercial Mortgage Loan Trust | | | | |
| | | | | Series 2008-LS1, 6.101%, 12/10/2049 (a) | | | 136,126 | |
| | | | | Countrywide Home Loans, Inc. | | | | |
| | 15,622 | | | Series 2004-HYB6, 3.124%, 11/20/2034 (a) | | | 15,413 | |
| | 90,211 | | | Series 2005-11, 1.582%, 03/25/2035 (a) | | | 78,021 | |
| | 396,998 | | | Four Times Square Trust | | | | |
| | | | | Series 2006-4TS, 5.401%, 12/13/2028 (Acquired 11/06/2012, Cost $432,561) (b) | | | 436,354 | |
| | | | | GS Mortgage Securities Trust | | | | |
| | 145,000 | | | Series 2012-ALOH, 3.551%, 04/12/2034 (Acquired 03/08/2013, Cost $148,758) (b) | | | 151,884 | |
| | 145,000 | | | Series 2012-BWTR, 2.954%, 11/07/2034 (Acquired 12/11/2012, Cost $147,082) (b) | | | 146,705 | |
| | 580,000 | | | Series 2013-GC16, 3.033%, 11/13/2046 | | | 589,911 | |
| | | | | JP Morgan Chase Commercial Mortgage Securities Trust | | | | |
| | 236,190 | | | Series 2012-WLDN, 3.905%, 05/07/2030 (Acquired 05/07/2013 through 01/04/2017, Cost $240,737) (b) | | | 245,981 | |
| | | | | | | | |
Principal
Amount
| | | | | Value
| |
| | | | | COLLATERALIZED MORTGAGE OBLIGATIONS (Continued) | |
| | 48,555 | | | Series 2007-CB19, 5.829%, 02/12/2049 (a) | | $ | 48,511 | |
| | 705,000 | | | JPMBB Commercial Mortgage Securities Trust | | | | |
| | | | | Series 2013-C12, 3.157%, 07/17/2045 | | | 725,557 | |
| | 102,849 | | | Lehman Brothers-UBS Commercial Mortgage Trust | | | | |
| | | | | Series 2007-C6, 5.858%, 07/15/2040 (a) | | | 103,101 | |
| | 124,031 | | | ML-CFC Commercial Mortgage Trust | | | | |
| | | | | Series 2007-9, 5.700%, 09/12/2049 | | | 125,180 | |
| | 195,000 | | | Morgan Stanley Bank of America Merrill Lynch Trust | | | | |
| | | | | Series 2015-C24, 3.732%, 08/15/2047 | | | 202,605 | |
| | | | | Morgan Stanley Capital I Trust | | | | |
| | 185,000 | | | Series 2014-MP, 3.469%, 08/11/2033 (Acquired 11/13/2014, Cost $188,995) (b) | | | 192,002 | |
| | 98,292 | | | Series 2007-IQ16, 5.809%, 12/12/2049 | | | 98,886 | |
| | | | | New Residential Mortgage Loan Trust | | | | |
| | 149,491 | | | Series 2016-2, 3.750%, 11/25/2035 (Acquired 05/25/2016, Cost $153,857) (a)(b) | | | 151,433 | |
| | 120,576 | | | Series 2016-4, 3.750%, 11/25/2056 (Acquired 12/01/2016, Cost $124,118) (a)(b) | | | 124,704 | |
| | 212,290 | | | Series 2017-1, 4.000%, 02/25/2057 (Acquired 03/06/2017, Cost $218,499) (a)(b) | | | 220,013 | |
| | 130,000 | | | OBP Depositor LLC Trust | | | | |
| | | | | Series 2010-OBP, 4.646%, 07/17/2045 (Acquired 08/15/2012, Cost $143,921) (b) | | | 138,583 | |
| | | | | SBA Tower Trust | | | | |
| | 210,000 | | | Series 2013-1-2, 3.598%, 04/15/2043 (Acquired 04/04/2013, Cost $210,000) (b) | | | 210,126 | |
| | 155,000 | | | Series 2014-1-2, 2.898%, 10/15/2044 (Acquired 10/07/2014, Cost $155,000) (b) | | | 155,577 | |
| | 75,000 | | | SG Commercial Mortgage Securities Trust | | | | |
| | | | | Series 2016-C5, 3.055%, 10/13/2048 | | | 73,002 | |
| | | | | Springleaf Mortgage Loan Trust | | | | |
| | 102,792 | | | Series 2013-2A, 1.780%, 12/25/2065 (Acquired 07/03/2013, Cost $101,749) (a)(b) | | | 103,135 | |
| | 155,171 | | | Series 2013-2A, 3.520%, 12/25/2065 (Acquired 07/03/2013, Cost $149,465) (a)(b) | | | 155,441 | |
| | 540,000 | | | Wells Fargo-RBS Commercial Mortgage Trust | | | | |
| | | | | Series 2014-C19, 3.660%, 03/15/2047 | | | 561,626 | |
| | | | | | |
|
|
|
| | | | | Total Collateralized Mortgage Obligations
(Cost $6,721,023) | | | 6,701,851 | |
| | | | | | |
|
|
|
| | | | | CORPORATE OBLIGATIONS - 38.35% | |
| | | | | Aerospace & Defense - 0.42% | |
| | 85,000 | | | Embraer Netherlands Finance BV | | | | |
| | | | | 5.400%, 02/01/2027 | | | 87,782 | |
| | 185,000 | | | Hexcel Corp. | | | | |
| | | | | 3.950%, 02/15/2027 | | | 187,087 | |
| | | | | Lockheed Martin Corp. | | | | |
| | 20,000 | | | 2.500%, 11/23/2020 | | | 20,155 | |
| | 45,000 | | | 4.700%, 05/15/2046 | | | 48,940 | |
| | 285,000 | | | Northrop Grumman Corp. | | | | |
| | | | | 3.850%, 04/15/2045 | | | 269,420 | |
| | | | | | |
|
|
|
| | | | | | | | 613,384 | |
| | | | | | |
|
|
|
| | | | | Air Freight & Logistics - 0.07% | |
| | | | | FedEx Corp. | | | | |
| | 50,000 | | | 4.100%, 02/01/2045 | | | 46,494 | |
| | 30,000 | | | 4.550%, 04/01/2046 | | | 30,098 | |
| | 20,000 | | | 4.400%, 01/15/2047 | | | 19,524 | |
| | | | | | |
|
|
|
| | | | | | | | 96,116 | |
| | | | | | |
|
|
|
See notes to financial statements.
78
GuideMark® Core Fixed Income Fund
SCHEDULE OF INVESTMENTS (Continued)
March 31, 2017
| | | | | | | | |
Principal
Amount
| | | | | Value
| |
| | | | | CORPORATE OBLIGATIONS (Continued) | |
| | | | | Airlines - 0.09% | |
| | 130,000 | | | Delta Air Lines, Inc. | | | | |
| | | | | 3.625%, 03/15/2022 | | $ | 132,852 | |
| | | | | | |
|
|
|
| | | | | Auto Components - 0.21% | |
| | 300,000 | | | Delphi Corp. | | | | |
| | | | | 4.150%, 03/15/2024 | | | 313,724 | |
| | | | | | |
|
|
|
| | | | | Automobiles - 0.15% | |
| | | | | Ford Motor Co. | | | | |
| | 10,000 | | | 4.346%, 12/08/2026 | | | 10,217 | |
| | 85,000 | | | 5.291%, 12/08/2046 | | | 85,120 | |
| | | | | General Motors Co. | | | | |
| | 110,000 | | | 5.000%, 04/01/2035 | | | 109,164 | |
| | 15,000 | | | 6.250%, 10/02/2043 | | | 16,576 | |
| | | | | | |
|
|
|
| | | | | | | | 221,077 | |
| | | | | | |
|
|
|
| | | | | Banks - 5.91% | |
| | | | | Bank of America Corp. | | | | |
| | 565,000 | | | 2.250%, 04/21/2020 | | | 563,915 | |
| | 20,000 | | | 2.625%, 04/19/2021 | | | 19,970 | |
| | 175,000 | | | 2.503%, 10/21/2022 | | | 170,808 | |
| | 65,000 | | | 3.124%, 01/20/2023 (a) | | | 65,406 | |
| | 190,000 | | | 4.100%, 07/24/2023 | | | 199,296 | |
| | 135,000 | | | 4.000%, 01/22/2025 (d) | | | 135,082 | |
| | 85,000 | | | 4.183%, 11/25/2027 | | | 85,477 | |
| | 100,000 | | | 6.110%, 01/29/2037 | | | 117,181 | |
| | 545,000 | | | 5.000%, 01/21/2044 | | | 596,208 | |
| | 200,000 | | | Barclays Plc | | | | |
| | | | | 3.684%, 01/10/2023 | | | 201,166 | |
| | 405,000 | | | BB&T Corp.
2.750%, 04/01/2022 | | | 407,759 | |
| | | | | Citigroup, Inc. | | | | |
| | 335,000 | | | 4.400%, 06/10/2025 | | | 341,921 | |
| | 360,000 | | | 3.700%, 01/12/2026 | | | 361,004 | |
| | 45,000 | | | 3.200%, 10/21/2026 | | | 43,133 | |
| | 310,000 | | | 4.300%, 11/20/2026 | | | 313,585 | |
| | 175,000 | | | 4.450%, 09/29/2027 | | | 177,177 | |
| | 180,000 | | | Fifth Third Bancorp
2.875%, 07/27/2020 | | | 183,314 | |
| | 480,000 | | | HSBC Holdings Plc
3.262%, 03/13/2023 (a) | | | 483,000 | |
| | | | | JPMorgan Chase & Co. | | | | |
| | 25,000 | | | 2.295%, 08/15/2021 | | | 24,756 | |
| | 130,000 | | | 4.500%, 01/24/2022 | | | 140,191 | |
| | 80,000 | | | 2.273%, 10/24/2023 (a) | | | 81,907 | |
| | 170,000 | | | 3.300%, 04/01/2026 | | | 166,531 | |
| | 90,000 | | | 2.950%, 10/01/2026 | | | 85,674 | |
| | 105,000 | | | 4.250%, 10/01/2027 | | | 107,802 | |
| | 310,000 | | | 3.782%, 02/01/2028 (a) | | | 313,308 | |
| | 5,000 | | | 5.600%, 07/15/2041 | | | 5,976 | |
| | 170,000 | | | KeyCorp
5.100%, 03/24/2021 (d) | | | 185,687 | |
| | 290,000 | | | PNC Funding Corp.
3.300%, 03/08/2022 | | | 298,846 | |
| | 350,000 | | | Royal Bank of Canada
2.125%, 03/02/2020 | | | 350,162 | |
| | 100,000 | | | Santander Holdings USA, Inc.
3.700%, 03/28/2022
(Acquired 03/22/2017, Cost $99,842) (b) | | | 100,457 | |
| | 55,000 | | | Santander UK Plc
2.350%, 09/10/2019 | | | 55,317 | |
| | | | | | | | |
Principal
Amount
| | | | | Value
| |
| | | | | Banks (Continued) | |
| | 405,000 | | | Toronto-Dominion Bank
2.625%, 09/10/2018 | | $ | 410,686 | |
| | 625,000 | | | U.S. Bancorp
1.950%, 11/15/2018 | | | 628,886 | |
| | | | | Wells Fargo & Co. | | | | |
| | 195,000 | | | 2.150%, 01/30/2020 | | | 195,492 | |
| | 240,000 | | | 2.550%, 12/07/2020 | | | 241,343 | |
| | 120,000 | | | 3.000%, 04/22/2026 | | | 115,302 | |
| | 135,000 | | | 3.000%, 10/23/2026 | | | 129,415 | |
| | 55,000 | | | 4.300%, 07/22/2027 | | | 57,224 | |
| | 206,000 | | | 5.606%, 01/15/2044 | | | 236,510 | |
| | 35,000 | | | 4.900%, 11/17/2045 | | | 36,577 | |
| | 35,000 | | | 4.400%, 06/14/2046 | | | 33,979 | |
| | 180,000 | | | 4.750%, 12/07/2046 | | | 184,333 | |
| | | | | | |
|
|
|
| | | | | | | | 8,651,763 | |
| | | | | | |
|
|
|
| | | | | Beverages - 0.34% | |
| | 150,000 | | | Anheuser-Busch InBev Worldwide, Inc.
8.200%, 01/15/2039 | | | 228,676 | |
| | 275,000 | | | Molson Coors Brewing Co.
3.000%, 07/15/2026 | | | 262,030 | |
| | | | | | |
|
|
|
| | | | | | | | 490,706 | |
| | | | | | |
|
|
|
| | | | | Biotechnology - 0.62% | |
| | | | | AbbVie, Inc. | | | | |
| | 155,000 | | | 2.900%, 11/06/2022 | | | 154,617 | |
| | 40,000 | | | 3.200%, 05/14/2026 | | | 38,526 | |
| | 180,000 | | | 4.300%, 05/14/2036 | | | 175,005 | |
| | 200,000 | | | Amgen, Inc.
4.400%, 05/01/2045 | | | 194,899 | |
| | 115,000 | | | Celgene Corp.
5.250%, 08/15/2043 | | | 121,297 | |
| | 180,000 | | | Genzyme Corp.
5.000%, 06/15/2020 | | | 195,901 | |
| | 35,000 | | | Gilead Sciences, Inc.
2.500%, 09/01/2023 | | | 33,892 | |
| | | | | | |
|
|
|
| | | | | | | | 914,137 | |
| | | | | | |
|
|
|
| | | | | Building Products - 0.12% | |
| | 165,000 | | | Johnson Controls International Plc
4.500%, 02/15/2047 | | | 168,154 | |
| | | | | | |
|
|
|
| | | | | Capital Markets - 3.49% | |
| | 545,000 | | | Bear Stearns Companies, Inc.
7.250%, 02/01/2018 | | | 569,661 | |
| | 245,000 | | | CBOE Holdings, Inc.
3.650%, 01/12/2027 | | | 246,804 | |
| | | | | Morgan Stanley | | | | |
| | 150,000 | | | 5.950%, 12/28/2017 | | | 154,701 | |
| | 55,000 | | | 2.500%, 01/24/2019 | | | 55,567 | |
| | 75,000 | | | 2.625%, 11/17/2021 | | | 74,586 | |
| | 10,000 | | | 4.875%, 11/01/2022 | | | 10,826 | |
| | 430,000 | | | 3.700%, 10/23/2024 | | | 436,895 | |
| | 540,000 | | | 3.125%, 07/27/2026 | | | 516,445 | |
| | 135,000 | | | 4.350%, 09/08/2026 | | | 138,544 | |
| | 50,000 | | | 3.950%, 04/23/2027 | | | 49,621 | |
| | 275,000 | | | Raymond James Financial, Inc.
3.625%, 09/15/2026 | | | 271,270 | |
| | 130,000 | | | State Street Corp.
2.550%, 08/18/2020 | | | 131,809 | |
| | | | | The Bank of New York Mellon Corp. | | | | |
| | 415,000 | | | 1.300%, 01/25/2018 | | | 414,638 | |
| | 410,000 | | | 2.200%, 03/04/2019 | | | 413,150 | |
See notes to financial statements.
79
GuideMark® Core Fixed Income Fund
SCHEDULE OF INVESTMENTS (Continued)
March 31, 2017
| | | | | | | | |
Principal
Amount
| | | | | Value
| |
| | | | | CORPORATE OBLIGATIONS (Continued) | |
| | | | | Capital Markets (Continued) | |
| | | | | The Goldman Sachs Group, Inc. | | | | |
| | 375,000 | | | 5.950%, 01/18/2018 | | $ | 387,327 | |
| | 95,000 | | | 2.750%, 09/15/2020 | | | 95,864 | |
| | 80,000 | | | 2.600%, 12/27/2020 | | | 80,065 | |
| | 305,000 | | | 2.875%, 02/25/2021 | | | 307,251 | |
| | 90,000 | | | 2.350%, 11/15/2021 | | | 88,240 | |
| | 155,000 | | | 4.000%, 03/03/2024 | | | 160,944 | |
| | 140,000 | | | 3.500%, 01/23/2025 | | | 139,697 | |
| | 140,000 | | | 6.750%, 10/01/2037 | | | 173,271 | |
| | 55,000 | | | 6.250%, 02/01/2041 | | | 69,306 | |
| | 115,000 | | | 5.150%, 05/22/2045 | | | 121,292 | |
| | 5,000 | | | 4.750%, 10/21/2045 | | | 5,289 | |
| | | | | | |
|
|
|
| | | | | | | | 5,113,063 | |
| | | | | | |
|
|
|
| | | | | Chemicals - 0.59% | |
| | 250,000 | | | LYB International Finance BV
4.000%, 07/15/2023 | | | 260,922 | |
| | 180,000 | | | Monsanto Co.
1.150%, 06/30/2017 | | | 179,862 | |
| | 185,000 | | | Potash Corp. of Saskatchewan, Inc.
4.000%, 12/15/2026 (d) | | | 189,768 | |
| | 225,000 | | | The Dow Chemical Co.
3.500%, 10/01/2024 | | | 229,057 | |
| | | | | | |
|
|
|
| | | | | | | | 859,609 | |
| | | | | | |
|
|
|
| | | | | Commercial Services & Supplies - 0.07% | |
| | | | | ERAC USA Finance LLC | | | | |
| | 40,000 | | | 2.600%, 12/01/2021
(Acquired 05/23/2016, Cost $39,945) (b) | | | 39,367 | |
| | 55,000 | | | 7.000%, 10/15/2037
(Acquired 10/09/2015, Cost $67,048) (b) | | | 69,722 | |
| | | | | | |
|
|
|
| | | | | | | | 109,089 | |
| | | | | | |
|
|
|
| | | | | Communications Equipment - 0.08% | |
| | 120,000 | | | QUALCOMM, Inc.
3.000%, 05/20/2022 | | | 121,524 | |
| | | | | | |
|
|
|
| | | | | Consumer Finance - 1.66% | |
| | 217,000 | | | American Express Co.
4.050%, 12/03/2042 | | | 213,613 | |
| | | | | American Express Credit Corp. | | | | |
| | 440,000 | | | 2.125%, 03/18/2019 | | | 442,284 | |
| | 130,000 | | | 2.200%, 03/03/2020 | | | 130,250 | |
| | 285,000 | | | Capital One Financial Corp.
2.450%, 04/24/2019 | | | 286,778 | |
| | 400,000 | | | Capital One NA
1.650%, 02/05/2018 | | | 400,015 | |
| | 250,000 | | | Caterpillar Financial Services Corp.
1.350%, 05/18/2019 | | | 247,055 | |
| | | | | PACCAR Financial Corp. | | | | |
| | 140,000 | | | 1.300%, 05/10/2019 | | | 138,868 | |
| | 165,000 | | | 2.200%, 09/15/2019 | | | 166,296 | |
| | | | | Toyota Motor Credit Corp. | | | | |
| | 275,000 | | | 2.125%, 07/18/2019 | | | 277,275 | |
| | 130,000 | | | 2.600%, 01/11/2022 (d) | | | 130,724 | |
| | | | | | |
|
|
|
| | | | | | | | 2,433,158 | |
| | | | | | |
|
|
|
| | | | | Diversified Financial Services - 2.61% | |
| | | | | American Honda Finance Corp. | | | | |
| | 290,000 | | | 1.700%, 02/22/2019 | | | 289,764 | |
| | 95,000 | | | 1.700%, 09/09/2021 | | | 92,104 | |
| | | | | | | | |
Principal
Amount
| | | | | Value
| |
| | | | | Diversified Financial Services (Continued) | |
| | | | | Anheuser-Busch InBev Finance, Inc. | | | | |
| | 50,000 | | | 1.900%, 02/01/2019 | | $ | 50,095 | |
| | 355,000 | | | 2.650%, 02/01/2021 | | | 357,986 | |
| | 410,000 | | | 3.650%, 02/01/2026 (d) | | | 415,351 | |
| | 120,000 | | | 4.700%, 02/01/2036 | | | 127,350 | |
| | 230,000 | | | 4.900%, 02/01/2046 (d) | | | 249,548 | |
| | 65,000 | | | BAT International Finance Plc
2.750%, 06/15/2020
(Acquired 06/10/2015, Cost $64,897) (b) | | | 65,610 | |
| | 380,000 | | | Credit Suisse
1.375%, 05/26/2017 | | | 379,890 | |
| | 175,000 | | | Daimler Finance North America LLC
2.450%, 05/18/2020
(Acquired 05/11/2015, Cost $174,657) (b) | | | 175,299 | |
| | 180,000 | | | Ford Motor Credit Co. LLC
3.810%, 01/09/2024 | | | 180,836 | |
| | | | | General Motors Financial Co., Inc. | | | | |
| | 35,000 | | | 3.100%, 01/15/2019 | | | 35,580 | |
| | 90,000 | | | 4.300%, 07/13/2025 | | | 91,555 | |
| | 200,000 | | | Hutchison Whampoa International Ltd.
1.625%, 10/31/2017
(Acquired 10/28/2014, Cost $199,540) (b) | | | 199,935 | |
| | 155,000 | | | Intercontinental Exchange, Inc.
2.750%, 12/01/2020 | | | 157,651 | |
| | 30,000 | | | Kinder Morgan Finance Co. LLC
6.000%, 01/15/2018
(Acquired 01/08/2015, Cost $30,720) (b) | | | 30,943 | |
| | 20,000 | | | Nasdaq, Inc.
3.850%, 06/30/2026 | | | 19,931 | |
| | | | | National Rural Utilities Cooperative Finance Corp. | | | | |
| | 190,000 | | | 1.650%, 02/08/2019 | | | 189,961 | |
| | 170,000 | | | 2.950%, 02/07/2024 | | | 170,506 | |
| | | | | Shell International Finance BV | | | | |
| | 320,000 | | | 1.625%, 11/10/2018 | | | 319,721 | |
| | 50,000 | | | 4.375%, 05/11/2045 | | | 50,828 | |
| | 180,000 | | | 4.000%, 05/10/2046 | | | 172,735 | |
| | | | | | |
|
|
|
| | | | | | | | 3,823,179 | |
| | | | | | |
|
|
|
| | | | | Diversified Telecommunication Services - 1.15% | |
| | | | | AT&T, Inc. | | | | |
| | 70,000 | | | 1.750%, 01/15/2018 | | | 70,039 | |
| | 175,000 | | | 4.450%, 04/01/2024 | | | 183,669 | |
| | 235,000 | | | 4.500%, 05/15/2035 | | | 222,519 | |
| | 125,000 | | | 6.350%, 03/15/2040 | | | 142,435 | |
| | 210,000 | | | 4.750%, 05/15/2046 | | | 196,695 | |
| | 215,000 | | | TELUS Corp.
2.800%, 02/16/2027 | | | 202,172 | |
| | | | | Verizon Communications, Inc. | | | | |
| | 25,000 | | | 2.946%, 03/15/2022
(Acquired 02/15/2017, Cost $24,757) (b)(d) | | | 24,929 | |
| | 385,000 | | | 4.125%, 03/16/2027 (d) | | | 392,318 | |
| | 20,000 | | | 4.812%, 03/15/2039
(Acquired 02/14/2017, Cost $19,556) (b) | | | 19,544 | |
| | 120,000 | | | 4.862%, 08/21/2046 | | | 115,810 | |
| | 5,000 | | | 5.500%, 03/16/2047 | | | 5,260 | |
| | 125,000 | | | 4.672%, 03/15/2055 | | | 112,090 | |
| | | | | | |
|
|
|
| | | | | | | | 1,687,480 | |
| | | | | | |
|
|
|
| | | | | Electric Utilities - 2.51% | |
| | 90,000 | | | Alabama Power Co.
2.450%, 03/30/2022 | | | 89,135 | |
See notes to financial statements.
80
GuideMark® Core Fixed Income Fund
SCHEDULE OF INVESTMENTS (Continued)
March 31, 2017
| | | | | | | | |
Principal
Amount
| | | | | Value
| |
| | | | | CORPORATE OBLIGATIONS (Continued) | |
| | | | | Electric Utilities (Continued) | |
| | 190,000 | | | Consolidated Edison Company of New York, Inc.
4.625%, 12/01/2054 | | $ | 202,718 | |
| | 45,000 | | | Duke Energy Carolinas LLC
2.500%, 03/15/2023 | | | 44,590 | |
| | 375,000 | | | Duke Energy Corp.
3.550%, 09/15/2021 | | | 389,179 | |
| | 60,000 | | | Duke Energy Florida LLC
3.400%, 10/01/2046 | | | 54,072 | |
| | 60,000 | | | Duke Energy Indiana, Inc.
4.900%, 07/15/2043 | | | 67,486 | |
| | 235,000 | | | Duke Energy Progress LLC
4.150%, 12/01/2044 | | | 239,220 | |
| | | | | Edison International | | | | |
| | 35,000 | | | 3.750%, 09/15/2017 | | | 35,352 | |
| | 160,000 | | | 2.950%, 03/15/2023 | | | 160,020 | |
| | 80,000 | | | Electricite de France SA
4.950%, 10/13/2045
(Acquired 10/07/2015, Cost $79,802) (b) | | | 81,062 | |
| | | | | Emera US Finance LP | | | | |
| | 15,000 | | | 2.700%, 06/15/2021 | | | 14,930 | |
| | 20,000 | | | 4.750%, 06/15/2046 | | | 20,260 | |
| | 65,000 | | | Exelon Corp.
2.450%, 04/15/2021 | | | 64,283 | |
| | | | | Fortis, Inc. | | | | |
| | 30,000 | | | 2.100%, 10/04/2021
(Acquired 09/29/2016, Cost $29,924) (b) | | | 29,099 | |
| | 40,000 | | | 3.055%, 10/04/2026
(Acquired 09/29/2016 and 10/19/2016,
Cost $39,665) (b) | | | 37,493 | |
| | | | | Georgia Power Co. | | | | |
| | 120,000 | | | 1.950%, 12/01/2018 | | | 120,241 | |
| | 85,000 | | | 2.400%, 04/01/2021 | | | 84,762 | |
| | | | | Great Plains Energy, Inc. | | | | |
| | 30,000 | | | 3.150%, 04/01/2022 | | | 30,326 | |
| | 25,000 | | | 3.900%, 04/01/2027 | | | 25,294 | |
| | 245,000 | | | MidAmerican Energy Co.
3.100%, 05/01/2027 | | | 244,691 | |
| | 30,000 | | | NextEra Energy Capital Holdings, Inc.
1.649%, 09/01/2018 | | | 29,921 | |
| | 100,000 | | | Northeast Utilities
2.800%, 05/01/2023 | | | 99,138 | |
| | 20,000 | | | Oncor Electric Delivery Co. LLC
7.000%, 09/01/2022 | | | 24,155 | |
| | | | | Pacific Gas & Electric Co. | | | | |
| | 60,000 | | | 4.750%, 02/15/2044 | | | 66,162 | |
| | 225,000 | | | 4.250%, 03/15/2046 | | | 231,272 | |
| | 150,000 | | | Progress Energy, Inc.
3.150%, 04/01/2022 | | | 151,765 | |
| | 66,000 | | | South Carolina Electric & Gas Co.
5.100%, 06/01/2065 | | | 68,493 | |
| | | | | Southern Power Co. | | | | |
| | 180,000 | | | 4.150%, 12/01/2025 | | | 186,347 | |
| | 180,000 | | | 4.950%, 12/15/2046 | | | 178,668 | |
| | | | | The Southern Co. | | | | |
| | 30,000 | | | 1.850%, 07/01/2019 | | | 29,853 | |
| | 260,000 | | | 2.150%, 09/01/2019 | | | 260,109 | |
| | 20,000 | | | 2.950%, 07/01/2023 | | | 19,496 | |
| | 25,000 | | | 4.400%, 07/01/2046 | | | 23,991 | |
| | | | | | | | |
Principal
Amount
| | | | | Value
| |
| | | | | Electric Utilities (Continued) | |
| | 245,000 | | | Union Electric Co.
6.700%, 02/01/2019 | | $ | 265,518 | |
| | | | | | |
|
|
|
| | | | | | | | 3,669,101 | |
| | | | | | |
|
|
|
| | | | | Food & Staples Retailing - 0.65% | |
| | | | | CVS Health Corp. | | | | |
| | 220,000 | | | 2.125%, 06/01/2021 | | | 216,007 | |
| | 59,000 | | | 3.875%, 07/20/2025 | | | 60,895 | |
| | 100,000 | | | 2.875%, 06/01/2026 | | | 95,558 | |
| | 105,000 | | | 5.125%, 07/20/2045 | | | 116,293 | |
| | 70,000 | | | Sysco Corp.
2.500%, 07/15/2021 | | | 69,837 | |
| | | | | The Kroger Co. | | | | |
| | 25,000 | | | 2.650%, 10/15/2026 (d) | | | 23,077 | |
| | 5,000 | | | 3.875%, 10/15/2046 | | | 4,506 | |
| | 325,000 | | | Walgreens Boots Alliance, Inc.
2.600%, 06/01/2021 | | | 325,705 | |
| | 30,000 | | | Wal-Mart Stores, Inc.
6.500%, 08/15/2037 | | | 40,290 | |
| | | | | | |
|
|
|
| | | | | | | | 952,168 | |
| | | | | | |
|
|
|
| | | | | Food Products - 0.34% | |
| | | | | Kraft Heinz Foods Co. | | | | |
| | 55,000 | | | 2.000%, 07/02/2018 | | | 55,154 | |
| | 40,000 | | | 2.800%, 07/02/2020 | | | 40,575 | |
| | 175,000 | | | 3.500%, 07/15/2022 (d) | | | 179,017 | |
| | 185,000 | | | 5.000%, 07/15/2035 | | | 192,706 | |
| | 35,000 | | | 4.375%, 06/01/2046 | | | 32,975 | |
| | | | | | |
|
|
|
| | | | | | | | 500,427 | |
| | | | | | |
|
|
|
| | | | | Gas Utilities - 0.01% | |
| | 10,000 | | | Southern Co. Gas Capital Corp.
2.450%, 10/01/2023 | | | 9,606 | |
| | | | | | |
|
|
|
| | | | | Health Care Equipment & Supplies - 1.07% | |
| | | | | Abbott Laboratories | | | | |
| | 180,000 | | | 2.350%, 11/22/2019 | | | 180,861 | |
| | 75,000 | | | 2.800%, 09/15/2020 | | | 75,713 | |
| | 180,000 | | | 4.900%, 11/30/2046 (d) | | | 187,189 | |
| | 205,000 | | | Becton Dickinson & Co.
3.125%, 11/08/2021 | | | 209,316 | |
| | | | | Medtronic, Inc. | | | | |
| | 105,000 | | | 2.500%, 03/15/2020 | | | 106,558 | |
| | 56,000 | | | 4.375%, 03/15/2035 | | | 58,816 | |
| | 170,000 | | | 4.625%, 03/15/2045 | | | 182,971 | |
| | | | | Shire Acquisitions Investments Ireland Designated Activity Co. | | | | |
| | 90,000 | | | 2.400%, 09/23/2021 | | | 88,105 | |
| | 220,000 | | | 2.875%, 09/23/2023 | | | 213,783 | |
| | 260,000 | | | Zimmer Holdings, Inc. | | | | |
| | | | | 3.550%, 04/01/2025 | | | 257,534 | |
| | | | | | |
|
|
|
| | | | | | | | 1,560,846 | |
| | | | | | |
|
|
|
| | | | | Health Care Providers & Services - 0.99% | |
| | 100,000 | | | Anthem, Inc.
5.850%, 01/15/2036 | | | 116,194 | |
| | | | | Cardinal Health, Inc. | | | | |
| | 20,000 | | | 1.950%, 06/15/2018 | | | 20,067 | |
| | 280,000 | | | 3.200%, 03/15/2023 | | | 283,644 | |
| | | | | Catholic Health Initiatives | | | | |
| | 45,000 | | | 1.600%, 11/01/2017 | | | 44,960 | |
| | 95,000 | | | 2.600%, 08/01/2018 | | | 95,604 | |
| | 275,000 | | | Humana, Inc.
3.150%, 12/01/2022 | | | 276,550 | |
See notes to financial statements.
81
GuideMark® Core Fixed Income Fund
SCHEDULE OF INVESTMENTS (Continued)
March 31, 2017
| | | | | | | | |
Principal
Amount
| | | | | Value
| |
| | | | | CORPORATE OBLIGATIONS (Continued) | |
| | | | | Health Care Providers & Services (Continued) | |
| | | | | UnitedHealth Group, Inc. | | | | |
| | 95,000 | | | 1.700%, 02/15/2019 | | $ | 95,033 | |
| | 240,000 | | | 1.625%, 03/15/2019 | | | 239,318 | |
| | 70,000 | | | 3.350%, 07/15/2022 | | | 72,477 | |
| | 135,000 | | | 3.950%, 10/15/2042 | | | 131,569 | |
| | 55,000 | | | 4.750%, 07/15/2045 (d) | | | 60,419 | |
| | 10,000 | | | 4.250%, 04/15/2047 | | | 10,236 | |
| | | | | | |
|
|
|
| | | | | | | | 1,446,071 | |
| | | | | | |
|
|
|
| | | | | Hotels, Restaurants & Leisure - 0.25% | |
| | | | | McDonald’s Corp. | | | | |
| | 315,000 | | | 3.700%, 01/30/2026 | | | 322,771 | |
| | 25,000 | | | 4.600%, 05/26/2045 | | | 25,511 | |
| | 20,000 | | | 4.875%, 12/09/2045 | | | 21,355 | |
| | | | | | |
|
|
|
| | | | | | | | 369,637 | |
| | | | | | |
|
|
|
| | | | | Household Durables - 0.14% | |
| | 180,000 | | | Newell Rubbermaid, Inc.
5.500%, 04/01/2046 (d) | | | 204,750 | |
| | | | | | |
|
|
|
| | | | | Insurance - 0.97% | |
| | | | | American International Group, Inc. | | | | |
| | 105,000 | | | 4.125%, 02/15/2024 | | | 107,866 | |
| | 120,000 | | | 4.500%, 07/16/2044 | | | 114,953 | |
| | 140,000 | | | Chubb INA Holdings, Inc.
3.350%, 05/03/2026 | | | 141,836 | |
| | 265,000 | | | CNA Financial Corp.
7.350%, 11/15/2019 | | | 299,255 | |
| | 235,000 | | | Liberty Mutual Group, Inc.
4.250%, 06/15/2023
(Acquired 11/18/2016, Cost $247,112) (b) | | | 247,136 | |
| | | | | Marsh & McLennan Cos., Inc. | | | | |
| | 80,000 | | | 2.300%, 04/01/2017 | | | 80,000 | |
| | 20,000 | | | 4.050%, 10/15/2023 | | | 21,140 | |
| | 13,000 | | | Massachusetts Mutual Life Insurance Co.
8.875%, 06/01/2039
(Acquired 04/06/2016, Cost $18,925) (b) | | | 21,147 | |
| | | | | New York Life Global Funding | | | | |
| | 160,000 | | | 1.950%, 02/11/2020
(Acquired 02/04/2015, Cost $159,970) (b) | | | 159,446 | |
| | 40,000 | | | 2.000%, 04/13/2021
(Acquired 04/06/2016, Cost $39,941) (b) | | | 39,394 | |
| | 180,000 | | | Trinity Acquisition Plc
4.400%, 03/15/2026 | | | 184,836 | |
| | | | | | |
|
|
|
| | | | | | | | 1,417,009 | |
| | | | | | |
|
|
|
| | | | | Internet & Direct Marketing Retail - 0.05% | |
| | 65,000 | | | Amazon.com, Inc.
4.950%, 12/05/2044 | | | 73,715 | |
| | | | | | |
|
|
|
| | | | | IT Services - 0.98% | |
| | 205,000 | | | Broadridge Financial Solutions, Inc.
3.400%, 06/27/2026 | | | 200,227 | |
| | 230,000 | | | MasterCard, Inc.
3.375%, 04/01/2024 | | | 238,059 | |
| | | | | Visa, Inc. | | | | |
| | 410,000 | | | 1.200%, 12/14/2017 | | | 409,658 | |
| | 245,000 | | | 2.800%, 12/14/2022 | | | 247,319 | |
| | 285,000 | | | 3.150%, 12/14/2025 | | | 286,301 | |
| | 55,000 | | | 4.300%, 12/14/2045 | | | 57,863 | |
| | | | | | |
|
|
|
| | | | | | | | 1,439,427 | |
| | | | | | |
|
|
|
| | | | | | | | |
Principal
Amount
| | | | | Value
| |
| | | | | Life Sciences Tools & Services - 0.06% | |
| | | | | Thermo Fisher Scientific, Inc. | | | | |
| | 80,000 | | | 3.000%, 04/15/2023 | | $ | 79,383 | |
| | 10,000 | | | 2.950%, 09/19/2026 | | | 9,541 | |
| | | | | | |
|
|
|
| | | | | | | | 88,924 | |
| | | | | | |
|
|
|
| | | | | Machinery - 0.54% | |
| | | | | Eaton Corp. | | | | |
| | 175,000 | | | 5.600%, 05/15/2018 | | | 182,337 | |
| | 230,000 | | | 2.750%, 11/02/2022 | | | 228,691 | |
| | 50,000 | | | Fortive Corp.
2.350%, 06/15/2021
(Acquired 06/06/2016, Cost $49,989) (b) | | | 49,437 | |
| | 330,000 | | | Stanley Black & Decker, Inc.
2.451%, 11/17/2018 | | | 333,570 | |
| | | | | | |
|
|
|
| | | | | | | | 794,035 | |
| | | | | | |
|
|
|
| | | | | Media - 1.30% | |
| | | | | 21st Century Fox America, Inc. | | | | |
| | 175,000 | | | 4.500%, 02/15/2021 | | | 186,845 | |
| | 10,000 | | | 3.375%, 11/15/2026
(Acquired 11/15/2016, Cost $9,981) (b) | | | 9,814 | |
| | 90,000 | | | 6.150%, 02/15/2041 | | | 107,829 | |
| | 10,000 | | | 4.950%, 10/15/2045 | | | 10,390 | |
| | 5,000 | | | 4.750%, 11/15/2046 | | | 5,032 | |
| | 10,000 | | | CBS Corp.
4.000%, 01/15/2026 | | | 10,258 | |
| | | | | Charter Communications Operating LLC / Charter Communications Operating Capital | | | | |
| | 50,000 | | | 3.579%, 07/23/2020 | | | 51,471 | |
| | 115,000 | | | 4.464%, 07/23/2022 (d) | | | 121,410 | |
| | 5,000 | | | 4.908%, 07/23/2025 | | | 5,292 | |
| | 85,000 | | | 6.484%, 10/23/2045 | | | 98,203 | |
| | | | | Comcast Corp. | | | | |
| | 345,000 | | | 5.875%, 02/15/2018 | | | 358,149 | |
| | 75,000 | | | 2.750%, 03/01/2023 | | | 74,788 | |
| | 15,000 | | | 3.375%, 08/15/2025 | | | 15,151 | |
| | 295,000 | | | 3.150%, 03/01/2026 | | | 290,583 | |
| | 65,000 | | | 4.750%, 03/01/2044 | | | 68,734 | |
| | 50,000 | | | 3.400%, 07/15/2046 | | | 42,894 | |
| | | | | Cox Communications, Inc. | | | | |
| | 50,000 | | | 3.250%, 12/15/2022
(Acquired 09/17/2015 and 10/06/2015,
Cost $47,392) (b)(d) | | | 49,171 | |
| | 140,000 | | | 2.950%, 06/30/2023
(Acquired 04/24/2013, Cost $139,384) (b) | | | 133,850 | |
| | 5,000 | | | 3.350%, 09/15/2026
(Acquired 09/08/2016, Cost $4,992) (b) | | | 4,847 | |
| | | | | Time Warner Cable, Inc. | | | | |
| | 81,000 | | | 5.850%, 05/01/2017 | | | 81,170 | |
| | 50,000 | | | 5.500%, 09/01/2041 | | | 51,449 | |
| | 50,000 | | | 4.500%, 09/15/2042 | | | 45,478 | |
| | 60,000 | | | Time Warner, Inc.
2.950%, 07/15/2026 | | | 55,982 | |
| | 30,000 | | | Viacom, Inc.
4.375%, 03/15/2043 | | | 26,098 | |
| | | | | | |
|
|
|
| | | | | | | | 1,904,888 | |
| | | | | | |
|
|
|
| | | | | Metals & Mining - 0.39% | |
| | | | | Nucor Corp. | | | | |
| | 195,000 | | | 4.125%, 09/15/2022 | | | 209,427 | |
| | 125,000 | | | 4.000%, 08/01/2023 | | | 132,319 | |
See notes to financial statements.
82
GuideMark® Core Fixed Income Fund
SCHEDULE OF INVESTMENTS (Continued)
March 31, 2017
| | | | | | | | |
Principal
Amount
| | | | | Value
| |
| | | | | CORPORATE OBLIGATIONS (Continued) | |
| | | | | Metals & Mining (Continued) | |
| | 195,000 | | | Rio Tinto Finance USA Ltd.
3.750%, 06/15/2025 | | $ | 202,924 | |
| | | | | Vale Overseas Ltd. | | | | |
| | 15,000 | | | 6.250%, 08/10/2026 | | | 16,331 | |
| | 15,000 | | | 6.875%, 11/10/2039 | | | 16,116 | |
| | | | | | |
|
|
|
| | | | | | | | 577,117 | |
| | | | | | |
|
|
|
| | | | | Multi-Utilities - 0.71% | |
| | 105,000 | | | Berkshire Hathaway Energy Co.
6.125%, 04/01/2036 | | | 131,481 | |
| | 285,000 | | | Delmarva Power & Light Co.
3.500%, 11/15/2023 | | | 295,192 | |
| | | | | Dominion Resources, Inc. | | | | |
| | 240,000 | | | 1.400%, 09/15/2017 | | | 239,792 | |
| | 35,000 | | | 2.850%, 08/15/2026 | | | 32,748 | |
| | 60,000 | | | DTE Energy Co.
1.500%, 10/01/2019 | | | 59,029 | |
| | 270,000 | | | WEC Energy Group, Inc.
3.550%, 06/15/2025 | | | 275,511 | |
| | | | | | |
|
|
|
| | | | | | | | 1,033,753 | |
| | | | | | |
|
|
|
| | | | | Oil, Gas & Consumable Fuels - 3.23% | |
| | | | | Anadarko Petroleum Corp. | | | | |
| | 80,000 | | | 8.700%, 03/15/2019 | | | 89,780 | |
| | 15,000 | | | 6.950%, 06/15/2019 | | | 16,504 | |
| | 20,000 | | | 3.450%, 07/15/2024 | | | 19,532 | |
| | 45,000 | | | 4.500%, 07/15/2044 | | | 42,611 | |
| | 50,000 | | | 6.600%, 03/15/2046 | | | 60,700 | |
| | 5,000 | | | Apache Corp.
4.250%, 01/15/2044 | | | 4,708 | |
| | | | | BP Capital Markets Plc | | | | |
| | 20,000 | | | 2.521%, 01/15/2020 | | | 20,264 | |
| | 60,000 | | | 2.112%, 09/16/2021 | | | 58,961 | |
| | 70,000 | | | 3.062%, 03/17/2022 | | | 71,014 | |
| | 60,000 | | | 3.588%, 04/14/2027 | | | 60,478 | |
| | 170,000 | | | Buckeye Partners LP
4.875%, 02/01/2021 | | | 180,501 | |
| | | | | Canadian Natural Resources Ltd. | | | | |
| | 80,000 | | | 3.800%, 04/15/2024 | | | 80,658 | |
| | 170,000 | | | 3.900%, 02/01/2025 | | | 171,661 | |
| | 30,000 | | | 6.500%, 02/15/2037 | | | 34,618 | |
| | 160,000 | | | Chevron Corp.
1.790%, 11/16/2018 | | | 160,486 | |
| | 225,000 | | | Columbia Pipeline Group, Inc.
4.500%, 06/01/2025 | | | 236,123 | |
| | 80,000 | | | ConocoPhillips Co.
4.950%, 03/15/2026 | | | 88,953 | |
| | 35,000 | | | Devon Energy Corp.
3.250%, 05/15/2022 | | | 34,713 | |
| | 20,000 | | | Devon Financing Co. LLC
7.875%, 09/30/2031 | | | 25,892 | |
| | 50,000 | | | Encana Corp.
3.900%, 11/15/2021 (d) | | | 51,132 | |
| | | | | Energy Transfer Partners LP | | | | |
| | 20,000 | | | 5.200%, 02/01/2022 | | | 21,452 | |
| | 25,000 | | | 3.600%, 02/01/2023 | | | 24,881 | |
| | 15,000 | | | 5.950%, 10/01/2043 | | | 15,583 | |
| | 105,000 | | | 5.300%, 04/15/2047 | | | 100,846 | |
| | | | | Enterprise Products Operating LLC | | | | |
| | 40,000 | | | 3.950%, 02/15/2027 | | | 40,868 | |
| | 155,000 | | | 6.125%, 10/15/2039 | | | 180,668 | |
| | | | | | | | |
Principal
Amount
| | | | | Value
| |
| | | | | Oil, Gas & Consumable Fuels (Continued) | |
| | 20,000 | | | EOG Resources, Inc.
4.150%, 01/15/2026 | | $ | 20,931 | |
| | | | | Hess Corp. | | | | |
| | 75,000 | | | 5.600%, 02/15/2041 | | | 75,362 | |
| | 60,000 | | | 5.800%, 04/01/2047 | | | 62,230 | |
| | 270,000 | | | Husky Energy, Inc.
3.950%, 04/15/2022 | | | 279,999 | |
| | 85,000 | | | Kinder Morgan, Inc.
5.050%, 02/15/2046 | | | 82,820 | |
| | 140,000 | | | Magellan Midstream Partners LP
5.000%, 03/01/2026 | | | 154,386 | |
| | | | | Marathon Oil Corp. | | | | |
| | 35,000 | | | 2.700%, 06/01/2020 | | | 34,780 | |
| | 45,000 | | | 2.800%, 11/01/2022 | | | 43,292 | |
| | 25,000 | | | 3.850%, 06/01/2025 (d) | | | 24,621 | |
| | 175,000 | | | Marathon Petroleum Corp.
3.625%, 09/15/2024 | | | 172,570 | |
| | | | | MPLX LP | | | | |
| | 180,000 | | | 4.875%, 12/01/2024 | | | 189,643 | |
| | 30,000 | | | 4.125%, 03/01/2027 | | | 29,930 | |
| | 100,000 | | | 5.200%, 03/01/2047 (d) | | | 101,006 | |
| | | | | Petroleos Mexicanos | | | | |
| | 45,000 | | | 6.375%, 02/04/2021 | | | 48,925 | |
| | 45,000 | | | 5.500%, 06/27/2044 | | | 39,940 | |
| | 42,000 | | | 6.750%, 09/21/2047 | | | 42,710 | |
| | | | | Phillips 66 | | | | |
| | 230,000 | | | 2.950%, 05/01/2017 | | | 230,318 | |
| | 120,000 | | | 4.300%, 04/01/2022 | | | 127,367 | |
| | 115,000 | | | Phillips 66 Partners LP
3.550%, 10/01/2026 | | | 110,061 | |
| | | | | Pioneer Natural Resources Co. | | | | |
| | 145,000 | | | 3.450%, 01/15/2021 | | | 148,561 | |
| | 35,000 | | | 4.450%, 01/15/2026 | | | 36,969 | |
| | 25,000 | | | Plains All American Pipeline LP
4.500%, 12/15/2026 | | | 25,543 | |
| | | | | Regency Energy Partners LP | | | | |
| | 15,000 | | | 5.875%, 03/01/2022 | | | 16,503 | |
| | 40,000 | | | 4.500%, 11/01/2023 | | | 41,101 | |
| | 130,000 | | | Spectra Energy Partners LP
3.375%, 10/15/2026 (d) | | | 123,998 | |
| | 65,000 | | | Statoil ASA
3.950%, 05/15/2043 | | | 63,017 | |
| | 130,000 | | | Suncor Energy, Inc.
6.100%, 06/01/2018 | | | 136,870 | |
| | | | | Sunoco Logistics Partners Operations LP | | | | |
| | 135,000 | | | 4.250%, 04/01/2024 | | | 137,630 | |
| | 5,000 | | | 3.900%, 07/15/2026 | | | 4,840 | |
| | 105,000 | | | Valero Energy Corp.
3.400%, 09/15/2026 | | | 100,506 | |
| | 125,000 | | | Williams Partners LP
3.600%, 03/15/2022 | | | 126,936 | |
| | | | | | |
|
|
|
| | | | | | | | 4,726,952 | |
| | | | | | |
|
|
|
| | | | | Pharmaceuticals - 1.18% | |
| | | | | Actavis Funding SCS | | | | |
| | 150,000 | | | 2.350%, 03/12/2018 | | | 150,689 | |
| | 80,000 | | | 3.000%, 03/12/2020 | | | 81,421 | |
| | 55,000 | | | 3.450%, 03/15/2022 | | | 56,221 | |
| | 35,000 | | | 4.550%, 03/15/2035 | | | 35,200 | |
| | 180,000 | | | Baxalta, Inc.
4.000%, 06/23/2025 | | | 183,714 | |
See notes to financial statements.
83
GuideMark® Core Fixed Income Fund
SCHEDULE OF INVESTMENTS (Continued)
March 31, 2017
| | | | | | | | |
Principal
Amount
| | | | | Value
| |
| | | | | CORPORATE OBLIGATIONS (Continued) | |
| | | | | Pharmaceuticals (Continued) | |
| | | | | EMD Finance LLC | | | | |
| | 110,000 | | | 2.950%, 03/19/2022
(Acquired 03/16/2015, Cost $109,806) (b) | | $ | 110,430 | |
| | 85,000 | | | 3.250%, 03/19/2025
(Acquired 10/13/2015, Cost $83,246) (b) | | | 84,144 | |
| | | | | Johnson & Johnson | | | | |
| | 25,000 | | | 3.550%, 03/01/2036 | | | 24,856 | |
| | 55,000 | | | 3.625%, 03/03/2037 | | | 54,657 | |
| | | | | Mylan NV | | | | |
| | 55,000 | | | 3.000%, 12/15/2018 | | | 55,661 | |
| | 60,000 | | | 3.750%, 12/15/2020 | | | 61,599 | |
| | 45,000 | | | 3.150%, 06/15/2021 | | | 45,209 | |
| | | | | Sanofi-Aventis SA | | | | |
| | 155,000 | | | 1.250%, 04/10/2018 | | | 154,829 | |
| | 210,000 | | | 4.000%, 03/29/2021 | | | 222,752 | |
| | | | | Teva Pharmaceutical Finance Netherlands III BV | | | | |
| | 85,000 | | | 1.700%, 07/19/2019 | | | 84,078 | |
| | 120,000 | | | 2.200%, 07/21/2021 | | | 115,925 | |
| | 225,000 | | | 3.150%, 10/01/2026 (d) | | | 207,758 | |
| | | | | | |
|
|
|
| | | | | | | | 1,729,143 | |
| | | | | | |
|
|
|
| | | | | Real Estate Management & Development - 1.16% | |
| | | | | American Tower Corp. | | | | |
| | 25,000 | | | 3.450%, 09/15/2021 | | | 25,477 | |
| | 75,000 | | | 2.250%, 01/15/2022 | | | 72,459 | |
| | 320,000 | | | Boston Properties LP
3.650%, 02/01/2026 | | | 319,347 | |
| | 90,000 | | | Brandywine Operating Partnership LP
4.100%, 10/01/2024 | | | 89,913 | |
| | 180,000 | | | Crown Castle International Corp.
3.400%, 02/15/2021 | | | 183,259 | |
| | 170,000 | | | ERP Operating LP
3.000%, 04/15/2023 | | | 168,510 | |
| | 40,000 | | | HCP, Inc.
4.000%, 12/01/2022 | | | 41,311 | |
| | 55,000 | | | Kimco Realty Corp.
3.200%, 05/01/2021 | | | 55,666 | |
| | 495,000 | | | Simon Property Group LP
2.200%, 02/01/2019 | | | 498,102 | |
| | | | | Ventas Realty LP | | | | |
| | 5,000 | | | 2.000%, 02/15/2018 | | | 5,008 | |
| | 90,000 | | | 2.700%, 04/01/2020 | | | 90,809 | |
| | 125,000 | | | 5.700%, 09/30/2043 | | | 142,109 | |
| | | | | | |
|
|
|
| | | | | | | | 1,691,970 | |
| | | | | | |
|
|
|
| | | | | Road & Rail - 0.38% | |
| | | | | Burlington Northern Santa Fe, LLC | | | | |
| | 135,000 | | | 3.650%, 09/01/2025 | | | 140,773 | |
| | 10,000 | | | 3.250%, 06/15/2027 | | | 10,087 | |
| | 20,000 | | | 3.900%, 08/01/2046 | | | 19,246 | |
| | 55,000 | | | 4.125%, 06/15/2047 | | | 54,987 | |
| | 120,000 | | | Penske Truck Leasing Co., LP
4.875%, 07/11/2022
(Acquired 07/16/2013 and 10/14/2015,
Cost $124,954) (b) | | | 129,693 | |
| | 100,000 | | | Ryder Systems, Inc.
2.450%, 09/03/2019 | | | 100,580 | |
| | 110,000 | | | Union Pacific Corp.
3.375%, 02/01/2035 | | | 106,287 | |
| | | | | | |
|
|
|
| | | | | | | | 561,653 | |
| | | | | | |
|
|
|
| | | | | | | | |
Principal
Amount
| | | | | Value
| |
| | | | | Semiconductors & Semiconductor Equipment - 1.01% | |
| | 200,000 | | | Analog Devices, Inc.
3.900%, 12/15/2025 | | $ | 205,232 | |
| | | | | Applied Materials, Inc. | | | | |
| | 15,000 | | | 3.300%, 04/01/2027 | | | 15,079 | |
| | 10,000 | | | 4.350%, 04/01/2047 | | | 10,149 | |
| | | | | Broadcom Corp. / Broadcom Cayman Finance Ltd. | | | | |
| | 80,000 | | | 2.375%, 01/15/2020
(Acquired 01/11/2017, Cost $79,819) (b) | | | 80,044 | |
| | 190,000 | | | 3.000%, 01/15/2022
(Acquired 01/11/2017, Cost $189,225) (b) | | | 189,968 | |
| | 570,000 | | | 3.625%, 01/15/2024
(Acquired 01/11/2017, Cost $569,407) (b) | | | 575,040 | |
| | | | | Intel Corp. | | | | |
| | 40,000 | | | 1.700%, 05/19/2021 | | | 39,182 | |
| | 185,000 | | | 3.300%, 10/01/2021 | | | 192,451 | |
| | 75,000 | | | 4.900%, 07/29/2045 | | | 84,297 | |
| | 10,000 | | | 4.100%, 05/19/2046 | | | 9,998 | |
| | 80,000 | | | Lam Research Corp.
2.800%, 06/15/2021 | | | 80,369 | |
| | | | | | |
|
|
|
| | | | | | | | 1,481,809 | |
| | | | | | |
|
|
|
| | | | | Software - 0.82% | |
| | | | | Microsoft Corp. | | | | |
| | 70,000 | | | 1.550%, 08/08/2021 | | | 68,253 | |
| | 65,000 | | | 2.375%, 02/12/2022 | | | 65,219 | |
| | 20,000 | | | 2.650%, 11/03/2022 | | | 20,191 | |
| | 15,000 | | | 3.300%, 02/06/2027 | | | 15,249 | |
| | 295,000 | | | 4.450%, 11/03/2045 | | | 312,105 | |
| | 90,000 | | | 3.700%, 08/08/2046 | | | 84,705 | |
| | | | | Oracle Corp. | | | | |
| | 310,000 | | | 2.500%, 05/15/2022 | | | 309,362 | |
| | 280,000 | | | 4.300%, 07/08/2034 | | | 291,154 | |
| | 40,000 | | | 3.900%, 05/15/2035 | | | 39,577 | |
| | | | | | |
|
|
|
| | | | | | | | 1,205,815 | |
| | | | | | |
|
|
|
| | | | | Specialty Retail - 0.40% | |
| | 85,000 | | | AutoZone, Inc.
4.000%, 11/15/2020 | | | 89,451 | |
| | | | | Home Depot, Inc. | | | | |
| | 185,000 | | | 2.700%, 04/01/2023 | | | 186,881 | |
| | 140,000 | | | 3.350%, 09/15/2025 | | | 144,136 | |
| | 80,000 | | | 5.875%, 12/16/2036 | | | 101,402 | |
| | 5,000 | | | 3.500%, 09/15/2056 | | | 4,378 | |
| | | | | Lowe’s Cos., Inc. | | | | |
| | 5,000 | | | 4.375%, 09/15/2045 | | | 5,194 | |
| | 60,000 | | | 3.700%, 04/15/2046 | | | 55,903 | |
| | | | | | |
|
|
|
| | | | | | | | 587,345 | |
| | | | | | |
|
|
|
| | | | | Technology Hardware, Storage & Peripherals - 0.87% | |
| | | | | Apple, Inc. | | | | |
| | 470,000 | | | 2.400%, 05/03/2023 | | | 462,532 | |
| | 10,000 | | | 3.000%, 02/09/2024 | | | 10,095 | |
| | 20,000 | | | 3.350%, 02/09/2027 | | | 20,264 | |
| | 95,000 | | | 3.450%, 02/09/2045 | | | 84,895 | |
| | 5,000 | | | 3.850%, 08/04/2046 | | | 4,782 | |
| | | | | Diamond 1 Finance Corp / Diamond 2 Finance Corp. | | | | |
| | 255,000 | | | 3.480%, 06/01/2019
(Acquired 05/17/2016, Cost $254,936) (b) | | | 261,437 | |
| | 245,000 | | | 4.420%, 06/15/2021
(Acquired 05/17/2016 and 12/01/2016, Cost $250,947) (b) | | | 256,448 | |
See notes to financial statements.
84
GuideMark® Core Fixed Income Fund
SCHEDULE OF INVESTMENTS (Continued)
March 31, 2017
| | | | | | | | |
Principal
Amount
| | | | | Value
| |
| | | | | CORPORATE OBLIGATIONS (Continued) | |
| | | | | Technology Hardware, Storage & Peripherals (Continued) | |
| | | | | Hewlett Packard Enterprise Co. | | | | |
| | 65,000 | | | 2.850%, 10/05/2018 | | $ | 65,807 | |
| | 110,000 | | | 3.600%, 10/15/2020 (d) | | | 113,213 | |
| | | | | | |
|
|
|
| | | | | | | | 1,279,473 | |
| | | | | | |
|
|
|
| | | | | Tobacco - 0.36% | |
| | | | | Altria Group, Inc. | | | | |
| | 40,000 | | | 4.250%, 08/09/2042 | | | 39,146 | |
| | 30,000 | | | 3.875%, 09/16/2046 | | | 27,928 | |
| | 220,000 | | | Philip Morris International, Inc.
2.750%, 02/25/2026 (d) | | | 211,719 | |
| | | | | Reynolds American, Inc. | | | | |
| | 65,000 | | | 2.300%, 06/12/2018 | | | 65,409 | |
| | 160,000 | | | 5.850%, 08/15/2045 | | | 188,600 | |
| | | | | | |
|
|
|
| | | | | | | | 532,802 | |
| | | | | | |
|
|
|
| | | | | Wireless Telecommunication Services - 0.40% | |
| | 255,000 | | | Rogers Communications, Inc.
2.900%, 11/15/2026 | | | 240,667 | |
| | 200,000 | | | Sprint Spectrum Co. LLC
3.360%, 03/20/2023
(Acquired 10/20/2016, Cost $199,997) (b) | | | 199,510 | |
| | 150,000 | | | Telefonica Emisiones SAU
4.103%, 03/08/2027 | | | 151,365 | |
| | | | | | |
|
|
|
| | | | | | | | 591,542 | |
| | | | | | |
|
|
|
| | | | | Total Corporate Obligations
(Cost $55,442,643) | | | 56,178,993 | |
| | | | | | |
|
|
|
| | | | | FOREIGN GOVERNMENT DEBT OBLIGATIONS - 0.95% | |
| | 280,000 | | | European Investment Bank
2.375%, 06/15/2022 | | | 282,699 | |
| | 200,000 | | | Kuwait International Government Bond
3.500%, 03/20/2027
(Acquired 03/13/2017, Cost $198,052) (b) | | | 202,395 | |
| | 100,000 | | | Mexico Government International Bond
5.750%, 10/12/2110 | | | 100,000 | |
| | 230,000 | | | Oman Government International Bond
5.375%, 03/08/2027
(Acquired 03/01/2017, Cost $229,121) (b) | | | 240,874 | |
| | 325,000 | | | Province of Ontario Canada
2.500%, 04/27/2026 | | | 317,989 | |
| | 240,000 | | | Province of Quebec Canada
2.375%, 01/31/2022 | | | 241,473 | |
| | | | | | |
|
|
|
| | | | | Total Foreign Government Debt Obligations
(Cost $1,372,484) | | | 1,385,430 | |
| | | | | | |
|
|
|
| | | | | MORTGAGE BACKED SECURITIES - U.S. GOVERNMENT AGENCY - 31.35% | |
| | | | | Federal Home Loan Mortgage Corp. | | | | |
| | 49,130 | | | Series 2590, 5.000%, 03/15/2018 | | | 49,704 | |
| | 786,333 | | | Series K703, 2.699%, 05/25/2018 | | | 795,402 | |
| | 1,283 | | | Pool #E9-9763 4.500%, 09/01/2018 | | | 1,315 | |
| | 763 | | | Pool #E9-9764 4.500%, 09/01/2018 | | | 782 | |
| | 600,000 | | | Series K705, 2.303%, 09/25/2018 | | | 605,147 | |
| | 893,069 | | | Series K706, 2.323%, 10/25/2018 | | | 901,818 | |
| | 600,000 | | | Series K709, 2.086%, 03/25/2019 | | | 603,807 | |
| | 57,222 | | | Pool #D9-6291 4.500%, 09/01/2023 | | | 61,285 | |
| | 133,116 | | | Pool #G1-3624 5.000%, 08/01/2024 | | | 142,673 | |
| | 218,818 | | | Series 2329, 6.500%, 06/15/2031 | | | 247,027 | |
| | 109,809 | | | Series 2338, 6.500%, 07/15/2031 | | | 128,188 | |
| | | | | | | | |
Principal
Amount
| | | | | Value
| |
| | | | | MORTGAGE BACKED SECURITIES - U.S. GOVERNMENT AGENCY (Continued) | |
| | 165,301 | | | Pool #78-0447 2.828%, 04/01/2033 (a) | | $ | 174,462 | |
| | 824,571 | | | Pool #U8-9032 3.000%, 07/01/2033 | | | 835,160 | |
| | 1,204,404 | | | Pool #C9-1849 3.500%, 09/01/2035 | | | 1,250,196 | |
| | 135 | | | Pool #A4-3129 5.500%, 02/01/2036 | | | 151 | |
| | 400,000 | | | Pool #TBA 4.000%, 05/15/2041 (e) | | | 418,687 | |
| | 3,700,000 | | | Pool #TBA 3.500%, 04/15/2042 (e) | | | 3,784,117 | |
| | 634,305 | | | Pool #U9-0688 4.000%, 05/01/2042 | | | 671,340 | |
| | 2,700,000 | | | Pool #TBA 3.000%, 04/15/2043 (e) | | | 2,675,320 | |
| | 776,610 | | | Pool #G0-8635 3.000%, 04/01/2045 | | | 770,236 | |
| | | | | Federal National Mortgage Association | | | | |
| | 248 | | | Pool #685505 5.000%, 05/01/2018 | | | 255 | |
| | 256 | | | Pool #705709 5.000%, 05/01/2018 | | | 263 | |
| | 86,551 | | | Series 2014-C01, 2.582%, 01/25/2024 (a) | | | 87,443 | |
| | 85,611 | | | Series 2014-C02, 1.932%, 05/28/2024 (a) | | | 85,692 | |
| | 795,580 | | | Pool #AI4868 4.000%, 06/01/2026 | | | 838,479 | |
| | 704,505 | | | Pool #AJ8325 3.000%, 12/01/2026 | | | 725,102 | |
| | 200,000 | | | Pool #TBA 3.000%, 04/15/2027 (e) | | | 205,081 | |
| | 200,000 | | | Pool #TBA 3.000%, 05/15/2027 (e) | | | 204,784 | |
| | 314,914 | | | Pool #AB5907 3.000%, 08/01/2027 | | | 324,107 | |
| | 581,793 | | | Pool #AL2877 3.500%, 01/01/2028 | | | 606,760 | |
| | 2,000,000 | | | Pool #TBA 2.500%, 04/15/2028 (e) | | | 2,001,094 | |
| | 21,616 | | | Pool #544859 2.391%, 08/01/2029 (a) | | | 22,007 | |
| | 95,369 | | | Pool #BC4938 2.500%, 04/01/2031 | | | 95,507 | |
| | 162,896 | | | Pool #786848 7.000%, 10/01/2031 | | | 188,727 | |
| | 98,268 | | | Pool #MA2868 2.500%, 01/01/2032 | | | 98,479 | |
| | 5,114 | | | Pool #727181 5.000%, 08/01/2033 | | | 5,663 | |
| | 2,602 | | | Pool #730727 5.000%, 08/01/2033 | | | 2,882 | |
| | 730 | | | Pool #741862 5.500%, 09/01/2033 | | | 820 | |
| | 853 | | | Pool #766197 5.500%, 02/01/2034 | | | 956 | |
| | 171 | | | Pool #776974 5.500%, 04/01/2034 | | | 194 | |
| | 178,675 | | | Pool #888504 2.600%, 04/01/2034 (a) | | | 188,156 | |
| | 402,103 | | | Pool #MA1870 4.500%, 04/01/2034 | | | 433,818 | |
| | 8,084 | | | Pool #775776 5.500%, 05/01/2034 | | | 9,065 | |
| | 158,065 | | | Pool #802783 3.021%, 10/01/2034 (a) | | | 166,514 | |
| | 6,095 | | | Pool #781629 5.500%, 12/01/2034 | | | 6,819 | |
| | 7,148 | | | Pool #822815 5.500%, 04/01/2035 | | | 8,014 | |
| | 6,267 | | | Pool #357850 5.500%, 07/01/2035 | | | 7,041 | |
| | 3,815 | | | Pool #820242 5.000%, 07/01/2035 | | | 4,221 | |
| | 1,145 | | | Pool #838452 5.500%, 09/01/2035 | | | 1,292 | |
| | 7,048 | | | Pool #865854 6.000%, 03/01/2036 | | | 8,035 | |
| | 9,371 | | | Pool #891474 6.000%, 04/01/2036 | | | 10,657 | |
| | 8,281 | | | Pool #906000 6.000%, 01/01/2037 | | | 9,362 | |
| | 74 | | | Pool #928062 5.500%, 02/01/2037 | | | 82 | |
| | 159 | | | Pool #899119 5.500%, 04/01/2037 | | | 177 | |
| | 230 | | | Pool #970131 5.500%, 03/01/2038 | | | 258 | |
| | 219 | | | Pool #981313 5.500%, 06/01/2038 | | | 244 | |
| | 169 | | | Pool #985108 5.500%, 07/01/2038 | | | 189 | |
| | 55 | | | Pool #964930 5.500%, 08/01/2038 | | | 61 | |
| | 105 | | | Pool #987032 5.500%, 08/01/2038 | | | 117 | |
| | 120 | | | Pool #968371 5.500%, 09/01/2038 | | | 134 | |
| | 56 | | | Pool #993050 5.500%, 12/01/2038 | | | 63 | |
| | 25,274 | | | Pool #993579 4.000%, 05/01/2039 | | | 26,559 | |
| | 5,027 | | | Pool #AA5840 4.000%, 06/01/2039 | | | 5,284 | |
| | 70,963 | | | Pool #AA8715 4.000%, 06/01/2039 | | | 75,434 | |
| | 259,403 | | | Pool #AD0586 4.500%, 12/01/2039 | | | 280,700 | |
| | 758,000 | | | Pool #AD4062 5.000%, 05/01/2040 | | | 830,407 | |
| | 641,942 | | | Pool #AD6929 5.000%, 06/01/2040 | | | 705,285 | |
| | 15,201 | | | Pool #AD9896 4.000%, 08/01/2040 | | | 16,006 | |
| | 18,744 | | | Pool #AB1500 4.000%, 09/01/2040 | | | 19,733 | |
See notes to financial statements.
85
GuideMark® Core Fixed Income Fund
SCHEDULE OF INVESTMENTS (Continued)
March 31, 2017
| | | | | | | | |
Principal
Amount
| | | | | Value
| |
| | | | | MORTGAGE BACKED SECURITIES - U.S. GOVERNMENT AGENCY (Continued) | |
| | 14,910 | | | Pool #AD9856 4.000%, 09/01/2040 | | $ | 15,678 | |
| | 11,165 | | | Pool #AE2559 4.000%, 09/01/2040 | | | 11,753 | |
| | 4,036 | | | Pool #AE2562 4.000%, 09/01/2040 | | | 4,244 | |
| | 5,538 | | | Pool #AE2566 4.000%, 09/01/2040 | | | 5,830 | |
| | 35,409 | | | Pool #AE4124 4.000%, 10/01/2040 | | | 37,227 | |
| | 18,726 | | | Pool #AE4888 4.000%, 10/01/2040 | | | 19,689 | |
| | 30,637 | | | Pool #AE3916 4.000%, 11/01/2040 | | | 32,226 | |
| | 3,899 | | | Pool #AE5147 4.000%, 11/01/2040 | | | 4,105 | |
| | 48,715 | | | Pool #AE8715 4.000%, 11/01/2040 | | | 51,293 | |
| | 5,576 | | | Pool #AH0006 4.000%, 12/01/2040 | | | 5,871 | |
| | 15,008 | | | Pool #AH0020 4.000%, 12/01/2040 | | | 15,803 | |
| | 30,567 | | | Pool #AH0599 4.000%, 12/01/2040 | | | 32,170 | |
| | 10,352 | | | Pool #AH0601 4.000%, 12/01/2040 | | | 10,901 | |
| | 22,349 | | | Pool #AH1263 4.000%, 01/01/2041 | | | 23,537 | |
| | 86,283 | | | Pool #AL5233 4.000%, 01/01/2041 | | | 90,599 | |
| | 6,670 | | | Pool #AH4659 4.000%, 02/01/2041 | | | 7,024 | |
| | 93,915 | | | Pool #AH5653 4.000%, 02/01/2041 | | | 98,902 | |
| | 142,196 | | | Pool #AL0934 5.000%, 02/01/2041 | | | 155,647 | |
| | 201,206 | | | Pool #AD1889 4.500%, 03/01/2041 | | | 215,993 | |
| | 11,585 | | | Pool #AH6150 4.000%, 03/01/2041 | | | 12,201 | |
| | 121,368 | | | Pool #AL0215 4.500%, 04/01/2041 | | | 130,708 | |
| | 700,000 | | | Pool #TBA 3.500%, 04/15/2041 (e) | | | 716,078 | |
| | 400,000 | | | Pool #TBA 4.500%, 04/15/2041 (e) | | | 428,938 | |
| | 108,146 | | | Pool #AL0187 5.000%, 05/01/2041 | | | 118,323 | |
| | 18,731 | | | Pool #AL0456 5.000%, 06/01/2041 | | | 20,499 | |
| | 683,673 | | | Pool #AB3395 4.500%, 08/01/2041 | | | 736,380 | |
| | 93,086 | | | Pool #AI8842 4.500%, 08/01/2041 | | | 100,261 | |
| | 42,003 | | | Pool #AL0815 4.000%, 09/01/2041 | | | 44,670 | |
| | 15,014 | | | Pool #AJ1562 4.000%, 10/01/2041 | | | 15,967 | |
| | 14,309 | | | Pool #AJ1972 4.000%, 10/01/2041 | | | 15,217 | |
| | 790,360 | | | Pool #AJ2212 4.500%, 10/01/2041 | | | 852,599 | |
| | 22,627 | | | Pool #AJ4756 4.000%, 10/01/2041 | | | 24,062 | |
| | 19,169 | | | Pool #AJ3330 4.000%, 11/01/2041 | | | 20,381 | |
| | 19,931 | | | Pool #AJ4549 4.000%, 11/01/2041 | | | 21,194 | |
| | 14,123 | | | Pool #AJ4698 4.000%, 11/01/2041 | | | 15,019 | |
| | 29,292 | | | Pool #AJ5424 4.000%, 11/01/2041 | | | 31,148 | |
| | 11,843 | | | Pool #AJ7840 4.000%, 11/01/2041 | | | 12,589 | |
| | 19,442 | | | Pool #AB3995 4.000%, 12/01/2041 | | | 20,669 | |
| | 18,741 | | | Pool #AI0848 4.000%, 12/01/2041 | | | 19,925 | |
| | 16,728 | | | Pool #AJ4187 4.000%, 12/01/2041 | | | 17,791 | |
| | 20,523 | | | Pool #AJ5736 4.000%, 12/01/2041 | | | 21,826 | |
| | 12,564 | | | Pool #AJ5968 4.000%, 12/01/2041 | | | 13,236 | |
| | 23,770 | | | Pool #AJ6061 4.000%, 12/01/2041 | | | 25,266 | |
| | 15,546 | | | Pool #AJ7868 4.000%, 12/01/2041 | | | 16,527 | |
| | 34,188 | | | Pool #AJ8104 4.000%, 12/01/2041 | | | 36,356 | |
| | 21,237 | | | Pool #AJ8109 4.000%, 12/01/2041 | | | 22,582 | |
| | 13,810 | | | Pool #AJ8171 4.000%, 12/01/2041 | | | 14,680 | |
| | 24,220 | | | Pool #AJ8341 4.000%, 12/01/2041 | | | 25,752 | |
| | 37,616 | | | Pool #AJ8436 4.000%, 12/01/2041 | | | 40,001 | |
| | 14,713 | | | Pool #AJ8912 4.000%, 12/01/2041 | | | 15,627 | |
| | 20,572 | | | Pool #AJ9248 4.000%, 12/01/2041 | | | 21,872 | |
| | 18,894 | | | Pool #AJ2446 4.000%, 01/01/2042 | | | 19,902 | |
| | 22,789 | | | Pool #AJ7538 4.000%, 01/01/2042 | | | 24,205 | |
| | 8,135 | | | Pool #AJ8001 4.000%, 01/01/2042 | | | 8,564 | |
| | 22,095 | | | Pool #AJ8369 4.000%, 01/01/2042 | | | 23,500 | |
| | 21,082 | | | Pool #AJ9162 4.000%, 01/01/2042 | | | 22,414 | |
| | 115,918 | | | Pool #AJ9330 4.000%, 01/01/2042 | | | 123,247 | |
| | 13,387 | | | Pool #AJ9779 4.000%, 01/01/2042 | | | 14,144 | |
| | 20,604 | | | Pool #AK0170 4.000%, 01/01/2042 | | | 21,905 | |
| | | | | | | | |
Principal
Amount
| | | | | Value
| |
| | | | | MORTGAGE BACKED SECURITIES - U.S. GOVERNMENT AGENCY (Continued) | |
| | 41,012 | | | Pool #AK0543 4.000%, 01/01/2042 | | $ | 43,585 | |
| | 15,895 | | | Pool #AK0563 4.000%, 01/01/2042 | | | 16,897 | |
| | 35,250 | | | Pool #AK1827 4.000%, 01/01/2042 | | | 37,476 | |
| | 483,668 | | | Pool #AL2752 5.000%, 03/01/2042 | | | 530,214 | |
| | 105,334 | | | Pool #AB5529 4.000%, 07/01/2042 | | | 111,385 | |
| | 228,207 | | | Pool #AB6228 3.500%, 09/01/2042 | | | 234,618 | |
| | 447,453 | | | Pool #AQ9316 2.500%, 01/01/2043 | | | 428,671 | |
| | 1,256,060 | | | Pool #AT2720 3.000%, 05/01/2043 | | | 1,252,567 | |
| | 930,367 | | | Pool #AT5900 3.000%, 06/01/2043 | | | 927,679 | |
| | 528,869 | | | Pool #AU1625 3.500%, 07/01/2043 | | | 544,039 | |
| | 870,020 | | | Pool #AS5469 4.000%, 07/01/2045 | | | 916,742 | |
| | 1,678,460 | | | Pool #AZ0832 4.000%, 07/01/2045 | | | 1,761,874 | |
| | 182,387 | | | Pool #AS5597 3.500%, 08/01/2045 | | | 186,788 | |
| | 767,854 | | | Pool #AS6196 3.500%, 11/01/2045 | | | 786,131 | |
| | 1,069,609 | | | Pool #AS7170 3.500%, 05/01/2046 | | | 1,095,068 | |
| | 1,085,601 | | | Pool #AS7242 3.500%, 05/01/2046 | | | 1,111,441 | |
| | 776,846 | | | Pool #BC9468 3.000%, 06/01/2046 | | | 770,825 | |
| | 1,028,529 | | | Pool #AS7492 4.000%, 07/01/2046 | | | 1,080,795 | |
| | 918,889 | | | Pool #AS8299 3.000%, 11/01/2046 | | | 913,620 | |
| | 197,874 | | | Pool #BD2377 4.500%, 12/01/2046 | | | 212,728 | |
| | | | | Government National Mortgage Association | | | | |
| | 12,808 | | | Pool #614436 5.000%, 08/15/2033 | | | 14,001 | |
| | 38,879 | | | Pool #736686 5.000%, 02/15/2039 | | | 42,909 | |
| | 816,564 | | | Pool #723248 5.000%, 10/15/2039 | | | 912,182 | |
| | 456,168 | | | Pool #733724 4.500%, 06/15/2040 | | | 492,898 | |
| | 443,968 | | | Pool #752631 4.500%, 10/20/2040 | | | 483,709 | |
| | 500,000 | | | Pool #TBA 3.500%, 04/15/2041 (e) | | | 518,080 | |
| | 443,324 | | | Pool #783403 3.500%, 09/15/2041 | | | 459,979 | |
| | 778,288 | | | Pool #AD8801 3.500%, 03/15/2043 | | | 811,093 | |
| | 357,684 | | | Pool #AL9364 3.500%, 03/20/2045 | | | 371,923 | |
| | 400,000 | | | Pool #TBA 3.500%, 04/15/2045 (e) | | | 414,781 | |
| | 607,391 | | | Pool #AQ0562X 4.000%, 12/15/2046 | | | 642,376 | |
| | 179,156 | | | Pool #MA4197 4.000%, 01/20/2047 | | | 189,484 | |
| | 423,781 | | | Pool #MA4264 4.500%, 02/20/2047 | | | 453,541 | |
| | | | | | |
|
|
|
| | | | | Total Mortgage Backed Securities - U.S. Government Agency
(Cost $45,448,341) | | | 45,919,655 | |
| | | | | | |
|
|
|
| | | | | MUNICIPAL DEBT OBLIGATIONS - 0.48% | |
| | | | | California, GO, | | | | |
| | 95,000 | | | 7.550%, 04/01/2039 | | | 139,421 | |
| | 80,000 | | | 7.350%, 11/01/2039 | | | 112,954 | |
| | 75,000 | | | 7.600%, 11/01/2040 | | | 111,870 | |
| | 160,000 | | | Chicago Transit Authority Sales & Transfer Tax Receipts,
Series B, Revenue Bond, 6.899%, 12/01/2040 | | | 199,536 | |
| | 45,000 | | | Illinois, GO,
5.100%, 06/01/2033 | | | 41,104 | |
| | 70,000 | | | New Jersey State Turnpike Authority,
Series F, Revenue Bond, 7.414%, 01/01/2040 | | | 100,772 | |
| | | | | | |
|
|
|
| | | | | Total Municipal Debt Obligations
(Cost $697,072) | | | 705,657 | |
| | | | | | |
|
|
|
| | | | | U.S. TREASURY OBLIGATIONS - 17.78% | |
| | | | | U.S. Treasury Bonds - 5.80% | |
| | 2,646,773 | | | 0.125%, 07/15/2024 (f)(g) | | | 2,624,300 | |
| | 3,945,000 | | | 3.125%, 11/15/2041 | | | 4,038,153 | |
| | 2,040,000 | | | 2.500%, 05/15/2046 | | | 1,827,075 | |
See notes to financial statements.
86
GuideMark® Core Fixed Income Fund
SCHEDULE OF INVESTMENTS (Continued)
March 31, 2017
| | | | | | | | |
Principal
Amount
| | | | | Value
| |
| | | | | U.S. TREASURY OBLIGATIONS (Continued) | |
| | | | | U.S. Treasury Notes - 11.98% | |
| | 1,360,000 | | | 0.750%, 02/28/2018 | | $ | 1,356,282 | |
| | 1,825,000 | | | 0.750%, 07/15/2019 | | | 1,801,189 | |
| | 975,000 | | | 1.625%, 03/15/2020 | | | 978,599 | |
| | 841,000 | | | 1.125%, 09/30/2021 | | | 813,668 | |
| | 3,405,000 | | | 2.000%, 11/15/2021 | | | 3,421,160 | |
| | 3,145,000 | | | 2.000%, 02/15/2022 | | | 3,158,697 | |
| | 2,105,000 | | | 2.375%, 08/15/2024 (d) | | | 2,122,227 | |
| | 1,603,000 | | | 2.000%, 08/15/2025 (d)(g) | | | 1,561,234 | |
| | 801,000 | | | 1.625%, 05/15/2026 (d)(g) | | | 751,485 | |
| | 810,000 | | | 1.500%, 08/15/2026 (d) | | | 749,535 | |
| | 455,000 | | | 2.000%, 11/15/2026 (d) | | | 439,608 | |
| | 400,000 | | | 2.250%, 02/15/2027 | | | 394,945 | |
| | | | | | |
|
|
|
| | | | | Total U.S. Treasury Obligations
(Cost $26,199,930) | | | 26,038,157 | |
| | | | | | |
|
|
|
| | |
Number of
Shares
| | | | | | |
| | | | | SHORT TERM INVESTMENTS - 3.48% | |
| | | | | Money Market Funds - 3.48% | |
| | 5,098,863 | | | Deutsche Government Money Market
Series - Institutional Shares
Effective Yield, 0.63% (h) | | | 5,098,863 | |
| | | | | | |
|
|
|
| | | | | Total Short Term Investments
(Cost $5,098,863) | | | 5,098,863 | |
| | | | | | |
|
|
|
| | | | | INVESTMENTS PURCHASED AS SECURITIES LENDING COLLATERAL - 4.88% | |
| | | | | Investment Companies - 4.88% | |
| | 7,147,649 | | | Mount Vernon Liquid Assets Portfolio, LLC Effective Yield, 1.17% (h) | | | 7,147,649 | |
| | | | | | |
|
|
|
| | | | | Total Investments Purchased as Securities Lending Collateral
(Cost $7,147,649) | | | 7,147,649 | |
| | | | | | |
|
|
|
| | | | | Total Investments
(Cost $163,065,148) - 112.04% | | | 164,100,701 | |
| | | | | Liabilities in Excess of
Other Assets - (12.04)% | | | (17,631,874 | ) |
| | | | | | |
|
|
|
| | | | | TOTAL NET ASSETS - 100.00% | | $ | 146,468,827 | |
| | | | | | |
|
|
|
Percentages are stated as a percent of net assets.
Principal amounts are denominated in the currency in which the security was purchased.
| (a) | | Variable Rate Security. The rate shown is the rate in effect on March 31, 2017. |
| (b) | | Restricted securities as defined in Rule 144(a) under the Securities Act of 1933. Such securities are treated as liquid securities according to the Fund’s liquidity guidelines. The value of these securities total $16,053,653, which represents 10.96% of total net assets. |
| (c) | | Restricted securities as defined in Rule 144(a) under the Securities Act of 1933. Such securities are treated as illiquid securities according to the Fund’s liquidity guidelines. The value of these securities total $183,309, which represents 0.13% of total net assets. |
| (d) | | All or portion of this security is on loan. |
| (e) | | Security purchased on a when-issued basis. On March 31, 2017, the total value of investments purchased on a when-issued basis was $11,366,960 or 7.76% of total net assets. |
| (f) | | Represents a U.S. Treasury Inflation Protected Security. |
| (g) | | All or a portion of this security is held as collateral for certain swap and futures contracts. |
| (h) | | Seven-day yield as of March 31, 2017. |
See notes to financial statements.
87
GuideMark® Core Fixed Income Fund
SCHEDULE OF OPEN FUTURES CONTRACTS
March 31, 2017
| | | | | | | | | | | | | | |
Description
| | Number of
Contracts
Purchased / (Sold)
| | | Notional
Value
| | | Settlement
Month
| | Unrealized
Appreciation
(Depreciation)
| |
U.S. Treasury 2 - Year Note Futures | | | (1 | ) | | $ | (216,453 | ) | | Jun-17 | | $ | (96 | ) |
U.S. Treasury 5 - Year Note Futures | | | 42 | | | | 4,944,516 | | | Jun-17 | | | 10,342 | |
U.S. Treasury 10 - Year Note Futures | | | (30 | ) | | | (3,736,875 | ) | | Jun-17 | | | (12,476 | ) |
U.S. Treasury Ultra 10 - Year Note Futures | | | 8 | | | | 1,071,125 | | | Jun-17 | | | 4,153 | |
U.S. Treasury Ultra Bond Futures | | | 12 | | | | 1,927,500 | | | Jun-17 | | | 18,414 | |
| | | | | | | | | | | | |
|
|
|
| | | | | | | | | | | | | $ | 20,337 | |
| | | | | | | | | | | | |
|
|
|
GuideMark® Core Fixed Income Fund
SCHEDULE OF OPEN SWAP CONTRACTS
CREDIT DEFAULT SWAPS ON CREDIT INDICES — SELL PROTECTION(1)
March 31, 2017
| | | | | | | | | | | | | | | | | | | | | | | | | | | | |
Reference Obligation
| | Implied
Credit
Spread at
March 31, 2017(2)
| | | Fixed
Pay
Rate
| | | Maturity
Date
| | Counterparty
| | Notional
Amount(3)
| | | Fair
Value
| | | Upfront
Premiums
Paid
(Received)
| | | Unrealized
Appreciation
(Depreciation)
| |
CDX.NA.IG.27 Index* | | | 0.59% | | | | 1.000% | | | 12/20/2021 | | Morgan Stanley | | $ | 4,030,000 | | | $ | 74,618 | | | $ | 60,439 | | | $ | 14,179 | |
| | | | | | | | | | | | | | | | | | |
|
|
| |
|
|
| |
|
|
|
| | | | | | | | | | | | | | | | | | | $ | 74,618 | | | $ | 60,439 | | | $ | 14,179 | |
| | | | | | | | | | | | | | | | | | |
|
|
| |
|
|
| |
|
|
|
GuideMark® Core Fixed Income Fund
INTEREST RATE SWAPS
March 31, 2017
| | | | | | | | | | | | | | | | | | | | | | | | | | | | |
Pay/Receive Floating Rate
| | Floating
Rate Index
| | | Fixed
Pay
Rate
| | | Maturity
Date
| | Counterparty
| | Notional
Amount
| | | Fair
Value
| | | Upfront
Premiums
Paid
(Received)
| | | Unrealized
Appreciation
(Depreciation)
| |
Pay | | | 3-MO-USD-LIBOR | ** | | | 2.250% | | | 9/21/2026 | | Morgan Stanley | | $ | 4,143,000 | | | $ | 39,973 | | | $ | (181,289 | ) | | $ | 221,262 | |
| | | | | | | | | | | | | | | | | | |
|
|
| |
|
|
| |
|
|
|
| | | | | | | | | | | | | | | | | | | $ | 39,973 | | | $ | (181,289 | ) | | $ | 221,262 | |
| | | | | | | | | | | | | | | | | | |
|
|
| |
|
|
| |
|
|
|
| 1) | | If the Fund is a seller of protection and a credit event occurs, as defined under the terms of that particular swap agreement, the Fund will either (i) pay to the buyer of protection an amount equal to the notional amount of the swap and take delivery of the referenced obligation or underlying securities comprising the referenced index or (ii) pay a net settlement amount in the form of cash or securities equal to the notional amount of the swap less the recovery value of the referenced obligation or underlying securities comprising the referenced index. |
| 2) | | Implied credit spreads, represented in absolute terms, utilized in determining the market value of credit default swap agreements on U.S. municipal issues, corporate issues or sovereign issues of an emerging country as of period end serve as an indicator of the current status of the payment/performance risk and represent the likelihood or risk of default for the credit derivative. The implied credit spread of a particular referenced entity reflects the cost of buying/selling protection and may include upfront payments required to be made to enter into the agreement. Wider credit spreads represent a deterioration of the referenced entity’s credit soundness and a greater likelihood or risk of default or other credit event occurring as defined under the terms of the agreement. A credit spread identified as “Defaulted” indicates a credit event has occurred for the referenced entity or obligation. |
| 3) | | The maximum potential amount the Fund could be required to pay as seller of credit protection or receive as a buyer of credit protection if a credit event occurs as defined under the terms of that particular swap agreement. |
| * | | Centrally cleared swap, clearing agent: Intercontinental Exchange |
| ** | | Centrally cleared swap, clearing agent: Clearnet |
See notes to financial statements.
88
GuideMark® Tax-Exempt Fixed Income Fund
SCHEDULE OF INVESTMENTS
March 31, 2017
| | | | | | | | |
Principal
Amount
| | | | | Value
| |
| | | | | MUNICIPAL DEBT OBLIGATIONS - 98.11% | |
| | | | | Alabama - 0.38% | |
| $ | 100,000 | | | The Lower Alabama Gas District,
Series A, Revenue Bond, | | | | |
| | | | | 5.000%, 09/01/2034 | | $ | 115,175 | |
| | | | | | |
|
|
|
| | | | | Arizona - 2.08% | |
| | 400,000 | | | Arizona University System Board of Regents,
Series A, Refunding, Revenue Bond, | | | | |
| | | | | 5.000%, 07/01/2028 | | | 456,612 | |
| | 150,000 | | | Salt Verde Financial Corp., Revenue Bond, | | | | |
| | | | | 5.000%, 12/01/2037 | | | 173,947 | |
| | | | | | |
|
|
|
| | | | | | | | 630,559 | |
| | | | | | |
|
|
|
| | | | | Arkansas - 1.76% | |
| | 500,000 | | | University of Arkansas,
Series A, Revenue Bond, | | | | |
| | | | | 4.125%, 11/01/2030 | | | 534,000 | |
| | | | | | |
|
|
|
| | | | | California - 16.38% | |
| | 500,000 | | | California, GO, | | | | |
| | | | | 6.500%, 04/01/2033 | | | 553,180 | |
| | 400,000 | | | California, Refunding, GO, | | | | |
| | | | | 5.000%, 11/01/2043 | | | 447,388 | |
| | 100,000 | | | California Health Facilities Financing Authority, Series A, Revenue Bond, | | | | |
| | | | | 4.000%, 10/01/2047 | | | 100,471 | |
| | 100,000 | | | California Municipal Finance Authority, Community Medical Centers,
Series A, Refunding, Revenue Bond, | | | | |
| | | | | 5.000%, 02/01/2042 | | | 109,070 | |
| | 200,000 | | | California Municipal Finance Authority, Mobile Home Park,
Series A, Refunding, Revenue Bond, | | | | |
| | | | | 6.400%, 08/15/2045 | | | 218,230 | |
| | | | | California State University,
Series A, Refunding, Revenue Bond, | | | | |
| | 400,000 | | | 5.000%, 11/01/2031 | | | 462,616 | |
| | 100,000 | | | 5.000%, 11/01/2042 | | | 114,927 | |
| | 200,000 | | | California Statewide Communities Development Authority, Prerefunded, Revenue Bond, | | | | |
| | | | | 6.125%, 07/01/2046 | | | 217,258 | |
| | | | | California Statewide Communities Development Authority,
Series A, Revenue Bond, | | | | |
| | 160,000 | | | 6.125%, 11/01/2033 | | | 168,560 | |
| | 150,000 | | | 5.250%, 12/01/2056 | | | 157,782 | |
| | 500,000 | | | California Statewide Communities Development Authority,
Series A, Revenue Bond, CMI Insured, | | | | |
| | | | | 5.000%, 08/01/2034 | | | 575,285 | |
| | 100,000 | | | Golden State Tobacco Securitization Corp.,
Series A, Revenue Bond, | | | | |
| | | | | 4.000%, 06/01/2031 | | | 104,311 | |
| | 300,000 | | | Golden State Tobacco Securitization Corp.,
Series A-1, Refunding, Revenue Bond, | | | | |
| | | | | 5.000%, 06/01/2024 | | | 348,927 | |
| | 500,000 | | | Los Angeles Department of Airports,
Series A, Refunding, Revenue Bond, | | | | |
| | | | | 5.250%, 05/15/2029 | | | 542,520 | |
| | 300,000 | | | San Mateo Joint Powers Financing Authority,
Series A, Refunding, Revenue Bond, | | | | |
| | | | | 5.250%, 07/15/2025 | | | 331,179 | |
| | | | | | | | |
Principal
Amount
| | | | | Value
| |
| | | | | California (Continued) | |
| $ | 250,000 | | | Southern California Public Power Authority,
Revenue Bond, | | | | |
| | | | | 5.250%, 07/01/2028 | | $ | 287,135 | |
| | 200,000 | | | University of California,
Series G, Refunding, Revenue Bond, | | | | |
| | | | | 5.000%, 05/15/2037 | | | 227,550 | |
| | | | | | |
|
|
|
| | | | | | | | 4,966,389 | |
| | | | | | |
|
|
|
| | | | | Colorado - 3.57% | |
| | 350,000 | | | Castle Pines North Metropolitan District, Refunding, Revenue Bond, | | | | |
| | | | | 4.000%, 12/01/2044 | | | 361,245 | |
| | 130,000 | | | Colorado Health Facilities Authority, Revenue Bond, | | | | |
| | | | | 8.000%, 08/01/2043 | | | 144,749 | |
| | 500,000 | | | Regional Transportation District,
Series A, Revenue Bond, | | | | |
| | | | | 5.000%, 11/01/2027 | | | 575,580 | |
| | | | | | |
|
|
|
| | | | | | | | 1,081,574 | |
| | | | | | |
|
|
|
| | | | | Connecticut - 1.73% | |
| | 500,000 | | | Connecticut Health & Educational Facilities Authority, Series A, Refunding, Revenue Bond, | | | | |
| | | | | 5.000%, 07/01/2025 | | | 524,685 | |
| | | | | | |
|
|
|
| | | | | Florida - 3.64% | |
| | 300,000 | | | Brevard County Health Facilities Authority, Prerefunded, Revenue Bond, | | | | |
| | | | | 7.000%, 04/01/2039 | | | 334,473 | |
| | 225,000 | | | Miami-Dade County Educational Facilities,
Series A, Refunding, Revenue Bond, | | | | |
| | | | | 5.000%, 04/01/2040 | | | 246,047 | |
| | 430,000 | | | Miami-Dade County Health Facilities,
Series A, Refunding, Revenue Bond, | | | | |
| | | | | 5.250%, 08/01/2021 | | | 463,845 | |
| | 40,000 | | | Palm Beach County Florida Health Facilities Authority, Series A, Refunding, Revenue Bond, | | | | |
| | | | | 7.500%, 06/01/2049 | | | 46,542 | |
| | 10,000 | | | Palm Beach County Florida Health Facilities Authority, Series A, Revenue Bond, | | | | |
| | | | | 7.250%, 06/01/2034 | | | 11,556 | |
| | | | | | |
|
|
|
| | | | | | | | 1,102,463 | |
| | | | | | |
|
|
|
| | | | | Georgia - 1.92% | |
| | 300,000 | | | Atlanta Water & Wastewater, Refunding, Revenue Bond, | | | | |
| | | | | 5.000%, 11/01/2040 | | | 338,595 | |
| | 125,000 | | | Atlanta Water & Wastewater,
Series A, Prerefunded, Revenue Bond, | | | | |
| | | | | 6.250%, 11/01/2039 | | | 140,975 | |
| | 100,000 | | | Marietta Development Authority, Revenue Bond, | | | | |
| | | | | 7.000%, 06/15/2039 | | | 102,281 | |
| | | | | | |
|
|
|
| | | | | | | | 581,851 | |
| | | | | | |
|
|
|
| | | | | Hawaii - 0.96% | |
| | 250,000 | | | Hawaii,
Series A, Revenue Bond, | | | | |
| | | | | 5.000%, 01/01/2033 | | | 290,065 | |
| | | | | | |
|
|
|
| | | | | Illinois - 5.18% | |
| | 65,000 | | | Chicago,
Series A, Refunding, GO, | | | | |
| | | | | 5.250%, 01/01/2029 | | | 64,545 | |
| | 70,000 | | | Chicago Waterworks, Revenue Bond, | | | | |
| | | | | 5.000%, 11/01/2028 | | | 78,054 | |
See notes to financial statements.
89
GuideMark® Tax-Exempt Fixed Income Fund
SCHEDULE OF INVESTMENTS (Continued)
March 31, 2017
| | | | | | | | |
Principal
Amount
| | | | | Value
| |
| | | | | MUNICIPAL DEBT OBLIGATIONS (Continued) | |
| | | | | Illinois (Continued) | |
| $ | 225,000 | | | Illinois Finance Authority, Prerefunded, Revenue Bond, | | | | |
| | | | | 7.000%, 08/15/2044 | | $ | 255,060 | |
| | 200,000 | | | Illinois Toll Highway Authority,
Series D, Refunding, Revenue Bond, | | | | |
| | | | | 5.000%, 01/01/2025 | | | 235,746 | |
| | 100,000 | | | O’Hare International Airport,
Series B, Refunding, Revenue Bond, | | | | |
| | | | | 5.000%, 01/01/2032 | | | 112,030 | |
| | 150,000 | | | O’Hare International Airport,
Series D, Refunding, Revenue Bond, | | | | |
| | | | | 5.250%, 01/01/2030 | | | 170,459 | |
| | 500,000 | | | Railsplitter Tobacco Settlement Authority, Revenue Bond, | | | | |
| | | | | 6.250%, 06/01/2024 | | | 501,165 | |
| | 120,000 | | | Southwestern Illinois Development Authority Health Care Facilities, Refunding, Revenue Bond, | | | | |
| | | | | 7.125%, 11/01/2043 | | | 152,358 | |
| | | | | | |
|
|
|
| | | | | | | | 1,569,417 | |
| | | | | | |
|
|
|
| | | | | Indiana - 4.06% | |
| | 500,000 | | | Fishers Industry Redevelopment District, Revenue Bond, | | | | |
| | | | | 5.250%, 07/15/2034 | | | 550,525 | |
| | 100,000 | | | Indiana Health Facility Financing Authority,
Series 2001A-1, Revenue Bond, | | | | |
| | | | | 5.000%, 11/15/2034 | | | 112,969 | |
| | 250,000 | | | Indiana Municipal Power Agency,
Series A, Refunding, Revenue Bond, | | | | |
| | | | | 5.250%, 01/01/2032 | | | 288,853 | |
| | 125,000 | | | Shoals Exempt Facilities, Revenue Bond, | | | | |
| | | | | 7.250%, 11/01/2043 | | | 142,156 | |
| | 115,000 | | | Valparaiso Exempt Facilities, Revenue Bond, | | | | |
| | | | | 7.000%, 01/01/2044 | | | 135,640 | |
| | | | | | |
|
|
|
| | | | | | | | 1,230,143 | |
| | | | | | |
|
|
|
| | | | | Kansas - 1.94% | |
| | 500,000 | | | Kansas Department of Transportation Highway Revenue,
Series A, Revenue Bond, | | | | |
| | | | | 5.000%, 09/01/2029 | | | 587,340 | |
| | | | | | |
|
|
|
| | | | | Kentucky - 0.33% | |
| | 100,000 | | | Kentucky Public Transportation Infrastructure Authority,
Series A, Revenue Bond, | | | | |
| | | | | 5.000%, 07/01/2017 | | | 100,809 | |
| | | | | | |
|
|
|
| | | | | Louisiana - 2.03% | |
| | 200,000 | | | Louisiana Highway Improvement,
Series A, Revenue Bond, | | | | |
| | | | | 5.000%, 06/15/2029 | | | 231,162 | |
| | 360,000 | | | Louisiana State Citizens Property Insurance Corp., Prerefunded, Revenue Bond, AGC Insured, | | | | |
| | | | | 6.750%, 06/01/2026 | | | 383,933 | |
| | | | | | |
|
|
|
| | | | | | | | 615,095 | |
| | | | | | |
|
|
|
| | | | | Maryland - 0.69% | |
| | 200,000 | | | Westminster Project Revenue, Lutheran Village at Miller’s Grant,
Series A, Revenue Bond, | | | | |
| | | | | 6.000%, 07/01/2034 | | | 210,146 | |
| | | | | | |
|
|
|
| | | | | | | | |
Principal
Amount
| | | | | Value
| |
| | | | | Massachusetts - 0.67% | |
| $ | 190,000 | | | Massachusetts Development Finance Agency,
Series A, Prerefunded, Revenue Bond, | | | | |
| | | | | 5.500%, 11/15/2036 | | $ | 203,724 | |
| | | | | | |
|
|
|
| | | | | Michigan - 0.72% | |
| | 100,000 | | | Michigan Finance Authority, Revenue Bond, | | | | |
| | | | | 5.000%, 11/15/2041 | | | 107,910 | |
| | 100,000 | | | Royal Oak Hospital Finance Authority,
Series D, Refunding, Revenue Bond, | | | | |
| | | | | 5.000%, 09/01/2033 | | | 109,642 | |
| | | | | | |
|
|
|
| | | | | | | | 217,552 | |
| | | | | | |
|
|
|
| | | | | Minnesota - 2.99% | |
| | 100,000 | | | Apple Valley Senior Living,
Series D, Revenue Bond, | | | | |
| | | | | 7.250%, 01/01/2052 | | | 99,356 | |
| | 160,000 | | | Minneapolis-St. Paul Metropolitan Airports Commission,
Series A, Refunding, Revenue Bond, | | | | |
| | | | | 5.000%, 01/01/2030 | | | 183,803 | |
| | 100,000 | | | Minnesota,
Series A, GO, | | | | |
| | | | | 5.000%, 08/01/2023 | | | 118,973 | |
| | 150,000 | | | Rochester Health Care & Housing Facility,
Series A, Refunding, Revenue Bond, | | | | |
| | | | | 6.875%, 12/01/2048 | | | 168,632 | |
| | 300,000 | | | Rochester Health Care Facilities Mayo Clinic,
Series C, Revenue Bond, | | | | |
| | | | | 4.500%, 11/15/2038 (a) | | | 337,383 | |
| | | | | | |
|
|
|
| | | | | | | | 908,147 | |
| | | | | | |
|
|
|
| | | | | Missouri - 1.27% | |
| | 350,000 | | | St. Louis Airport, Revenue Bond, | | | | |
| | | | | 6.625%, 07/01/2034 | | | 385,907 | |
| | | | | | |
|
|
|
| | | | | Nebraska - 2.36% | |
| | 130,000 | | | Douglas County Hospital Authority No. 3,
Refunding, Revenue Bond, | | | | |
| | | | | 5.000%, 11/01/2024 | | | 149,582 | |
| | 500,000 | | | Omaha Public Power District,
Series B, Prerefunded, Revenue Bond, | | | | |
| | | | | 5.000%, 02/01/2027 | | | 566,555 | |
| | | | | | |
|
|
|
| | | | | | | | 716,137 | |
| | | | | | |
|
|
|
| | | | | New Hampshire - 0.43% | |
| | 120,000 | | | New Hampshire Health & Educational Facilities Authority, Refunding, Revenue Bond, | | | | |
| | | | | 5.000%, 07/01/2027 | | | 129,976 | |
| | | | | | |
|
|
|
| | | | | New Jersey - 0.83% | |
| | 150,000 | | | New Jersey Economic Development Authority, Refunding, Revenue Bond, | | | | |
| | | | | 5.250%, 06/15/2030 | | | 155,237 | |
| | 100,000 | | | Tobacco Settlement Financing Corp.,
Series 1A, Refunding, Revenue Bond, | | | | |
| | | | | 5.000%, 06/01/2041 | | | 97,529 | |
| | | | | | |
|
|
|
| | | | | | | | 252,766 | |
| | | | | | |
|
|
|
| | | | | New York - 10.48% | |
| | 325,000 | | | Brooklyn Arena Local Development Corp., Prerefunded, Revenue Bond, | | | | |
| | | | | 6.500%, 07/15/2030 | | | 372,008 | |
| | 200,000 | | | New York,
Series E, GO, | | | | |
| | | | | 4.000%, 12/15/2027 | | | 217,366 | |
See notes to financial statements.
90
GuideMark® Tax-Exempt Fixed Income Fund
SCHEDULE OF INVESTMENTS (Continued)
March 31, 2017
| | | | | | | | |
Principal
Amount
| | | | | Value
| |
| | | | | MUNICIPAL DEBT OBLIGATIONS (Continued) | |
| | | | | New York (Continued) | |
| $ | 270,000 | | | New York City,
Series I, Unrefunded, GO, | | | | |
| | | | | 5.375%, 04/01/2036 | | $ | 291,254 | |
| | 40,000 | | | New York City Industrial Development Agency,
Series A, Refunding, Revenue Bond, | | | | |
| | | | | 5.000%, 07/01/2022 | | | 44,197 | |
| | 325,000 | | | New York Dormitory Authority, Prerefunded, Revenue Bond, | | | | |
| | | | | 6.125%, 12/01/2029 | | | 351,995 | |
| | 100,000 | | | New York Dormitory Authority, Refunding, Revenue Bond, | | | | |
| | | | | 5.000%, 12/01/2035 | | | 106,980 | |
| | 250,000 | | | New York Dormitory Authority,
Series B, Refunding, Revenue Bond, | | | | |
| | | | | 5.000%, 07/01/2038 | | | 283,920 | |
| | 250,000 | | | New York Environmental Facilities Corp.,
Series A, Revenue Bond, | | | | |
| | | | | 5.000%, 06/15/2034 | | | 269,265 | |
| | 500,000 | | | New York Environmental Facilities Corp.,
Series B, Revenue Bond, | | | | |
| | | | | 5.500%, 10/15/2027 | | | 638,675 | |
| | 175,000 | | | New York Liberty Development Corp., Refunding, Revenue Bond, | | | | |
| | | | | 5.250%, 10/01/2035 | | | 210,563 | |
| | 100,000 | | | New York Transportation Development Corp.,
Series A, Revenue Bond, | | | | |
| | | | | 5.250%, 01/01/2050 | | | 107,523 | |
| | 250,000 | | | Port Authority of New York and New Jersey, Refunding, Revenue Bond, | | | | |
| | | | | 5.000%, 10/15/2041 | | | 282,158 | |
| | | | | | |
|
|
|
| | | | | | | | 3,175,904 | |
| | | | | | |
|
|
|
| | | | | North Carolina - 1.23% | |
| | 320,000 | | | North Carolina Eastern Municipal Power Agency Power Systems,
Series A, Prerefunded, Revenue Bond, | | | | |
| | | | | 5.000%, 01/01/2025 | | | 372,358 | |
| | | | | | |
|
|
|
| | | | | Ohio - 3.46% | |
| | 500,000 | | | Buckeye Tobacco Settlement Financial Authority,
Series A, Revenue Bond, | | | | |
| | | | | 5.875%, 06/01/2047 | | | 479,215 | |
| | 500,000 | | | Ohio Higher Education Facilities Commission, Refunding, Revenue Bond, | | | | |
| | | | | 5.000%, 01/01/2026 | | | 571,130 | |
| | | | | | |
|
|
|
| | | | | | | | 1,050,345 | |
| | | | | | |
|
|
|
| | | | | Pennsylvania - 3.41% | |
| | 350,000 | | | Butler County Hospital Authority, Prerefunded, Revenue Bond, | | | | |
| | | | | 7.125%, 07/01/2029 | | | 394,999 | |
| | 250,000 | | | Delaware Valley Pennsylvania Regional Finance Authority,
Series A, Revenue Bond, AMBAC Insured, | | | | |
| | | | | 5.500%, 08/01/2028 | | | 298,205 | |
| | 100,000 | | | Lancaster County Hospital Authority, Refunding, Revenue Bond, | | | | |
| | | | | 5.000%, 08/15/2033 | | | 112,903 | |
| | | | | | | | |
Principal
Amount
| | | | | Value
| |
| | | | | Pennsylvania (Continued) | |
| $ | 200,000 | | | Pennsylvania Higher Educational Facilities Authority, Prerefunded, Revenue Bond, | | | | |
| | | | | 5.800%, 07/01/2030 | | $ | 228,108 | |
| | | | | | |
|
|
|
| | | | | | | | 1,034,215 | |
| | | | | | |
|
|
|
| | | | | South Carolina - 1.53% | |
| | 400,000 | | | Charleston Educational Excellence Financing Corp., Refunding, Revenue Bond, | | | | |
| | | | | 5.000%, 12/01/2025 | | | 462,808 | |
| | | | | | |
|
|
|
| | | | | South Dakota - 0.36% | |
| | 100,000 | | | South Dakota Educational Enhancement Funding Corp. Tobaccos Settlement,
Series B, Refunding, Revenue Bond, | | | | |
| | | | | 5.000%, 06/01/2026 | | | 110,687 | |
| | | | | | |
|
|
|
| | | | | Texas - 10.50% | |
| | 200,000 | | | Central Texas Regional Mobility Authority,
Series A, Prerefunded, Revenue Bond, | | | | |
| | | | | 6.000%, 01/01/2041 | | | 232,282 | |
| | 100,000 | | | Central Texas Turnpike System,
Series C, Refunding, Revenue Bond, | | | | |
| | | | | 5.000%, 08/15/2029 | | | 112,136 | |
| | 200,000 | | | Dallas-Fort Worth International Airport,
Series B, Revenue Bond, | | | | |
| | | | | 5.000%, 11/01/2026 | | | 228,536 | |
| | 515,000 | | | Frisco Texas Independent School District,
Series A, GO, PSF-GTD Insured, | | | | |
| | | | | 6.000%, 08/15/2038 | | | 548,918 | |
| | 150,000 | | | Harris County Industrial Development, Revenue Bond, | | | | |
| | | | | 5.000%, 02/01/2023 | | | 161,335 | |
| | 200,000 | | | New Hope Cultural Education Facilities Corp.,
Series A-1, Revenue Bond, | | | | |
| | | | | 5.000%, 07/01/2046 | | | 216,596 | |
| | 350,000 | | | North Texas Tollway Authority,
Series A, Refunding, Revenue Bond, | | | | |
| | | | | 4.000%, 01/01/2038 | | | 351,141 | |
| | 100,000 | | | North Texas Tollway Authority,
Series B, Refunding, Revenue Bond, | | | | |
| | | | | 5.000%, 01/01/2029 | | | 115,208 | |
| | 150,000 | | | San Antonio Water System,
Series A, Refunding, Revenue Bond, | | | | |
| | | | | 5.000%, 05/15/2037 | | | 173,162 | |
| | 300,000 | | | Texas A & M Permanent University Fund,
Series A, Revenue Bond, | | | | |
| | | | | 5.250%, 07/01/2030 | | | 356,646 | |
| | | | | Texas Private Activity Surface Transportation Corp., Revenue Bond, | | | | |
| | 200,000 | | | 7.500%, 12/31/2031 | | | 228,418 | |
| | 200,000 | | | 7.500%, 06/30/2033 | | | 231,364 | |
| | 85,000 | | | 7.000%, 12/31/2038 | | | 97,113 | |
| | 115,000 | | | 6.750%, 06/30/2043 | | | 129,119 | |
| | | | | | |
|
|
|
| | | | | | | | 3,181,974 | |
| | | | | | |
|
|
|
| | | | | Utah - 2.26% | |
| | 100,000 | | | Salt Lake City Corp. Airport,
Series B, Revenue Bond, | | | | |
| | | | | 5.000%, 07/01/2042 | | | 113,918 | |
| | 500,000 | | | Utah Associated Municipal Power Systems San Juan Project, Refunding, Revenue Bond, | | | | |
| | | | | 5.500%, 06/01/2022 | | | 571,800 | |
| | | | | | |
|
|
|
| | | | | | | | 685,718 | |
| | | | | | |
|
|
|
See notes to financial statements.
91
GuideMark® Tax-Exempt Fixed Income Fund
SCHEDULE OF INVESTMENTS (Continued)
March 31, 2017
| | | | | | | | |
Principal
Amount
| | | | | Value
| |
| | | | | MUNICIPAL DEBT OBLIGATIONS (Continued) | |
| | | | | Virginia - 1.71% | |
| $ | 400,000 | | | Virginia College Building Authority Educational Facilities, Revenue Bond, | | | | |
| | | | | 5.750%, 01/01/2034 | | $ | 519,556 | |
| | | | | | |
|
|
|
| | | | | Washington - 2.10% | |
| | 325,000 | | | Central Puget Sound Regional Transit Authority,
Series P-1, Refunding, Revenue Bond, | | | | |
| | | | | 5.000%, 02/01/2027 | | | 372,336 | |
| | 250,000 | | | Washington Health Care Facilities Authority, Refunding, Revenue Bond, | | | | |
| | | | | 6.375%, 10/01/2036 | | | 263,995 | |
| | | | | | |
|
|
|
| | | | | | | | 636,331 | |
| | | | | | |
|
|
|
| | | | | Wisconsin - 5.15% | |
| | 500,000 | | | Wisconsin,
Series 2, Refunding, GO, | | | | |
| | | | | 5.000%, 05/01/2025 | | | 576,700 | |
| | 50,000 | | | Wisconsin,
Series A, Prerefunded, Revenue Bond, | | | | |
| | | | | 6.000%, 05/01/2033 | | | 54,951 | |
| | 450,000 | | | Wisconsin,
Series A, Unrefunded, Revenue Bond, | | | | |
| | | | | 6.000%, 05/01/2033 | | | 493,781 | |
| | 100,000 | | | Wisconsin Health & Educational Facilities Authority, Refunding, Revenue Bond, | | | | |
| | | | | 5.000%, 05/01/2025 | | | 109,651 | |
| | | | | Wisconsin Public Finance Authority, Refunding, Revenue Bond, | | | | |
| | 165,000 | | | 5.000%, 07/01/2022 | | | 175,372 | |
| | 150,000 | | | 5.750%, 10/01/2031 | | | 150,979 | |
| | | | | | |
|
|
|
| | | | | | | | 1,561,434 | |
| | | | | | |
|
|
|
| | | | | Total Municipal Debt Obligations
(Cost $27,929,344) | | | 29,745,250 | |
| | | | | | |
|
|
|
| | | | | | | | |
Number of
Shares
| | | | | Value
| |
| | | | | SHORT TERM INVESTMENTS - 1.85% | | | | |
| | | | | Money Market Funds - 1.85% | | | | |
| | 559,642 | | | Treasury Obligations Portfolio - Institutional Shares Effective Yield, 0.50% (b) | | $ | 559,642 | |
| | | | | | |
|
|
|
| | | | | Total Short Term Investments
(Cost $559,642) | | | 559,642 | |
| | | | | | |
|
|
|
| | | | | Total Investments
(Cost $28,488,986) - 99.96% | | | 30,304,892 | |
| | | | | Other Assets in Excess of Liabilities - 0.04% | | | 12,369 | |
| | | | | | |
|
|
|
| | | | | TOTAL NET ASSETS - 100.00% | | $ | 30,317,261 | |
| | | | | | |
|
|
|
Percentages are stated as a percent of net assets.
| (a) | | Variable Rate Security. The rate shown is the rate in effect on March 31, 2017. |
| (b) | | Seven-day yield as of March 31, 2017. |
Glossary of Terms
| | | | |
| AGC | | | | Assured Guaranty Corp. |
| AMBAC | | | | Ambac Financial Group, Inc. |
| CMI | | | | California Mortgage Insurance |
| GO | | | | General Obligation |
| PSF-GTD | | | | Texas Permanent School Fund |
See notes to financial statements.
92
GuideMark® Opportunistic Fixed Income Fund
SCHEDULE OF INVESTMENTS
March 31, 2017
| | | | | | | | |
Principal
Amount
| | | | | Value
| |
| | | | | COLLATERALIZED MORTGAGE OBLIGATIONS - 18.49% | |
| | 844,226 | | | Alternative Loan Trust
Series 2007-15CB, 6.000%, 07/25/2037 | | $ | 750,419 | |
| | 833,873 | | | Banc of America Funding Corp.
Series 2007-3, 5.831%, 04/25/2037 (a) | | | 722,357 | |
| | 831,150 | | | Chase Mortgage Finance Trust
Series 2007-S3, 6.000%, 05/25/2037 | | | 657,268 | |
| | | | | Credit Suisse Mortgage Capital Mortgage-Backed Trust | | | | |
| | 316,969 | | | Series 2006-9, 6.000%, 11/25/2036 | | | 308,350 | |
| | 426,296 | | | Series 2007-1, 6.000%, 02/25/2037 | | | 364,482 | |
| | 399,075 | | | Deutsche Alt-A Securities, Inc. Mortgage Loan Trust
Series 2006-AR1, 3.376%, 02/25/2036 (a) | | | 325,493 | |
| | 402,797 | | | First Horizon Alternative Mortgage Securities Trust
Series 2007-FA4, 6.250%, 08/25/2037 | | | 321,204 | |
| | 437,124 | | | First Horizon Mortgage Pass-Through Trust
Series 2007-4, 6.000%, 08/25/2037 | | | 365,245 | |
| | | | | GSR Mortgage Loan Trust | | | | |
| | 720,853 | | | Series 2006-9F, 6.500%, 10/25/2036 | | | 604,346 | |
| | 321,627 | | | Series 2007-4F, 6.000%, 07/25/2037 | | | 290,556 | |
| | 586,187 | | | IndyMac IMJA Mortgage Loan Trust
Series 2007-A3, 6.250%, 11/25/2037 | | | 470,665 | |
| | 441,430 | | | IndyMac INDX Mortgage Loan Trust
Series 2005-AR1, 3.182%, 03/25/2035 (a) | | | 442,397 | |
| | | | | JP Morgan Chase Commercial Mortgage Securities Trust | | | | |
| | 6,473,258 | | | Series 2012-C8, 1.930%, 10/17/2045 (a)(g) | | | 490,897 | |
| | 23,711 | | | Series 2007-LDP10,
5.464%, 01/15/2049 (a) | | | 23,692 | |
| | 540,528 | | | Lehman Mortgage Trust
Series 2006-2, 5.750%, 04/25/2036 | | | 546,961 | |
| | 486,923 | | | MASTR Adjustable Rate Mortgages Trust
Series 2006-2, 3.215%, 01/25/2036 (a) | | | 483,010 | |
| | | | | Morgan Stanley Mortgage Loan Trust | | | | |
| | 943,863 | | | Series 2005-10, 6.000%, 12/25/2035 | | | 744,138 | |
| | 704,639 | | | Series 2007-12, 6.250%, 08/25/2037 | | | 609,025 | |
| | | | | Residential Asset Securitization Trust | | | | |
| | 807,356 | | | Series 2007-A2, 6.000%, 04/25/2037 | | | 711,662 | |
| | 623,081 | | | Series 2007-A6, 6.000%, 06/25/2037 | | | 567,599 | |
| | 964,737 | | | Series 2007-A7, 6.000%, 07/25/2037 | | | 657,183 | |
| | 893,296 | | | Sequoia Mortgage Trust
Series 2013-3, 2.500%, 03/25/2043 (a) | | | 859,015 | |
| | 949,607 | | | TBW Mortgage-Backed Trust
Series 2006-6, 5.630%, 01/25/2037 (a) | | | 569,515 | |
| | 234,691 | | | Washington Mutual Mortgage Pass-Through Certificates Trust
Series 2006-5, 6.000%, 07/25/2036 | | | 202,352 | |
| | 276,036 | | | Wells Fargo Alternative Loan Trust
Series 2007-PA1, 6.000%, 03/25/2037 | | | 245,578 | |
| | | | | | |
|
|
|
| | | | | Total Collateralized Mortgage Obligations
(Cost $13,841,307) | | | 12,333,409 | |
| | | | | | |
|
|
|
| | |
Number of
Shares
| | | | | | |
| | | | | COMMON STOCKS - 0.01% | | | | |
| | | | | Metals & Mining - 0.00% | | | | |
| | 12,305,675 | | | K2016470219 - Class A (b)(c)(f) | | | 0 | |
| | 1,336,186 | | | K2016470219 - Class B (b)(c)(f) | | | 0 | |
| | | | | | |
|
|
|
| | | | | | | | 0 | |
| | | | | | |
|
|
|
| | | | | | | | |
Number of
Shares
| | | | | Value
| |
| | | | | Transportation - 0.01% | | | | |
| | 22 | | | CEVA Holdings LLC (b)(c) | | $ | 4,486 | |
| | | | | | |
|
|
|
| | | | | Total Common Stocks
(Cost $29,791) | | | 4,486 | |
| | | | | | |
|
|
|
| | |
Principal
Amount
| | | | | | |
| | | | | CONVERTIBLE OBLIGATIONS - 1.25% | |
| | | | | Metals & Mining - 1.25% | | | | |
| | 780,000 | | | B2Gold Corp.
3.250%, 10/01/2018 | | | 833,633 | |
| | | | | | |
|
|
|
| | | | | Total Convertible Obligations
(Cost $780,000) | | | 833,633 | |
| | | | | | |
|
|
|
| | | | | CORPORATE OBLIGATIONS - 0.56% | |
| | | | | Specialty Retail - 0.56% | | | | |
| | | | | K2016470219 South Africa, Ltd. | | | | |
| | 907,612 | | | 0.000% Cash or 3.000% PIK, 12/31/2022 (Acquired 02/01/2017, Cost $1,113,684) (d) | | | 116,492 | |
| | 155,835 | | | 0.000% Cash or 8.000% PIK, 12/31/2022 (Acquired 12/30/2016, Cost $862,073) (d) | | | 62,239 | |
| | 143,046 | | | K2016470260 South Africa, Ltd.
0.000% Cash or 25.000% PIK, 12/31/2022
(Acquired 02/01/2017, Cost $143,046) (d) | | | 197,582 | |
| | | | | | |
|
|
|
| | | | | | | | 376,313 | |
| | | | | | |
|
|
|
| | | | | Total Corporate Obligations
(Cost $2,118,803) | | | 376,313 | |
| | | | | | |
|
|
|
| | | | | FOREIGN GOVERNMENT DEBT OBLIGATIONS - 47.19% | |
| | | | | Argentine Bonos del Tesoro | | | | |
| | 5,738,000 | | | 18.200%, 10/03/2021 | | | 400,868 | |
| | 1,743,900 | | | 16.000%, 10/17/2023 | | | 128,632 | |
| | 30,130,100 | | | 15.500%, 10/17/2026 | | | 2,212,641 | |
| | | | | Brazil Letras do Tesouro Nacional | | | | |
| | 18,000,000 | | | 9.538%, 01/01/2019 (e) | | | 4,912,425 | |
| | 334,000 | | | 9.865%, 07/01/2020 (e) | | | 78,863 | |
| | | | | Brazil Notas do Tesouro Nacional - Serie F | | | | |
| | 2,065,000 | | | 9.839%, 01/01/2021 (e) | | | 680,950 | |
| | 120,000 | | | 10.000%, 01/01/2023 | | | 39,452 | |
| | 70,000 | | | 10.000%, 01/01/2025 | | | 22,943 | |
| | 160,000,000 | | | Colombia Government International Bond | | | | |
| | | | | 7.750%, 04/14/2021 | | | 59,259 | |
| | | | | Colombian TES | | | | |
| | 583,000,000 | | | 10.000%, 07/24/2024 | | | 243,727 | |
| | 296,500,000 | | | 7.500%, 08/26/2026 | | | 109,334 | |
| | 342,500,000 | | | 6.000%, 04/28/2028 | | | 112,635 | |
| | 4,455,000,000 | | | 7.750%, 09/18/2030 | | | 1,682,407 | |
| | | | | Ghana Government Bond | | | | |
| | 30,000 | | | 25.480%, 04/24/2017 | | | 6,997 | |
| | 50,000 | | | 26.000%, 06/05/2017 | | | 11,779 | |
| | 520,000 | | | 25.400%, 07/31/2017 | | | 123,982 | |
| | 1,610,000 | | | 23.230%, 02/19/2018 | | | 387,137 | |
| | 150,000 | | | 22.490%, 04/23/2018 | | | 36,023 | |
| | 1,810,000 | | | 23.470%, 05/21/2018 | | | 439,326 | |
| | 990,000 | | | 19.040%, 09/24/2018 | | | 229,644 | |
| | 99,000 | | | 24.500%, 10/22/2018 | | | 24,338 | |
| | 50,000 | | | 24.500%, 06/21/2021 | | | 13,352 | |
| | 250,000 | | | 24.750%, 07/19/2021 | | | 67,273 | |
| | | | | Ghana Treasury Note | | | | |
| | 170,000 | | | 22.500%, 12/10/2018 | | | 40,712 | |
| | 340,000 | | | 21.000%, 01/07/2019 | | | 80,213 | |
See notes to financial statements.
93
GuideMark® Opportunistic Fixed Income Fund
SCHEDULE OF INVESTMENTS (Continued)
March 31, 2017
| | | | | | | | |
Principal
Amount
| | | | | Value
| |
| | | | | FOREIGN GOVERNMENT DEBT OBLIGATIONS (Continued) | |
| | 90,000,000 | | | India Government Bond
8.130%, 09/21/2022 | | $ | 1,465,224 | |
| | | | | Indonesia Treasury Bond | | | | |
| | 232,000,000 | | | 7.875%, 04/15/2019 | | | 17,837 | |
| | 209,000,000 | | | 12.800%, 06/15/2021 | | | 19,009 | |
| | 218,000,000 | | | 8.250%, 07/15/2021 | | | 17,218 | |
| | 209,000,000 | | | 7.000%, 05/15/2022 | | | 15,818 | |
| | 37,000,000 | | | 12.900%, 06/15/2022 | | | 3,491 | |
| | 104,000,000 | | | 10.250%, 07/15/2022 | | | 9,010 | |
| | 78,000,000 | | | 5.625%, 05/15/2023 | | | 5,491 | |
| | 15,288,000,000 | | | 8.375%, 03/15/2024 | | | 1,224,043 | |
| | 41,591,000,000 | | | 8.375%, 09/15/2026 | | | 3,397,381 | |
| | 937,000,000 | | | 7.000%, 05/15/2027 | | | 70,316 | |
| | 606,000,000 | | | 9.000%, 03/15/2029 | | | 50,533 | |
| | 140,000,000 | | | 10.500%, 08/15/2030 | | | 13,133 | |
| | 1,689,000,000 | | | 8.750%, 05/15/2031 | | | 140,850 | |
| | 7,580,000,000 | | | 8.375%, 03/15/2034 | | | 604,102 | |
| | 469,600,000 | | | Korea Monetary Stabilization Bond
1.560%, 10/02/2017 | | | 420,285 | |
| | | | | Korea Treasury Bond | | | | |
| | 1,300,400,000 | | | 2.000%, 12/10/2017 | | | 1,167,488 | |
| | 437,200,000 | | | 1.500%, 06/10/2019 | | | 390,077 | |
| | 98,700,000 | | | 1.375%, 09/10/2021 | | | 86,688 | |
| | | | | Mexican Bonos | | | | |
| | 501,000 | | | 4.750%, 06/14/2018 | | | 2,622,602 | |
| | 27,100 | | | 8.500%, 12/13/2018 | | | 148,957 | |
| | 378,200 | | | 5.000%, 12/11/2019 | | | 1,936,688 | |
| | | | | Mexican Udibonos | | | | |
| | 25,245 | | | 3.500%, 12/14/2017 (h) | | | 134,924 | |
| | 15,170 | | | 4.000%, 06/13/2019 (h) | | | 82,733 | |
| | 12,536 | | | 2.500%, 12/10/2020 (h) | | | 65,433 | |
| | | | | Philippine Government Bond | | | | |
| | 70,000 | | | 2.875%, 05/22/2017 | | | 1,396 | |
| | 1,990,000 | | | 2.125%, 05/23/2018 | | | 39,256 | |
| | 64,400,000 | | | 3.875%, 11/22/2019 | | | 1,276,311 | |
| | 15,690,000 | | | 3.375%, 08/20/2020 | | | 305,394 | |
| | 802,000 | | | Portugal Government International Bond
5.125%, 10/15/2024
(Acquired 07/02/2014, Cost $795,752) (d) | | | 779,037 | |
| | | | | Republic of South Africa Government Bond | | | | |
| | 2,206,000 | | | 10.500%, 12/21/2026 | | | 181,972 | |
| | 1,707,000 | | | 8.000%, 01/31/2030 | | | 115,568 | |
| | 390,000 | | | 7.000%, 02/28/2031 | | | 23,959 | |
| | 1,154,000 | | | 8.250%, 03/31/2032 | | | 78,123 | |
| | 1,119,000 | | | 8.875%, 02/28/2035 | | | 78,602 | |
| | 237,000 | | | 6.250%, 03/31/2036 | | | 12,587 | |
| | 220,000 | | | 8.500%, 01/31/2037 | | | 14,716 | |
| | | | | Serbia Treasury Bonds | | | | |
| | 38,510,000 | | | 10.000%, 08/21/2019 | | | 371,466 | |
| | 5,860,000 | | | 10.000%, 09/11/2021 | | | 59,871 | |
| | 62,780,000 | | | 10.000%, 02/05/2022 | | | 648,009 | |
| | | | | Ukraine Government International Bond | | | | |
| | 265,000 | | | 7.750%, 09/01/2025
(Acquired 04/15/2011 through 02/06/2014,
Cost $273,520) (d) | | | 245,785 | |
| | 359,000 | | | 7.750%, 09/01/2026
(Acquired 04/05/2011 through 07/29/2013,
Cost $381,711) (d) | | | 330,379 | |
| | | | | | | | |
Principal
Amount
| | | | | Value
| |
| | | | | FOREIGN GOVERNMENT DEBT OBLIGATIONS (Continued) | |
| | 259,000 | | | 7.750%, 09/01/2027
(Acquired 04/11/2011 through 07/29/2013,
Cost $264,768) (d) | | $ | 238,153 | |
| | 1,120,000 | | | 2.661%, 05/31/2040
(Acquired 04/05/2011 through 02/06/2014,
Cost $643,978) (a)(d)(e) | | | 419,440 | |
| | | | | | |
|
|
|
| | | | | Total Foreign Government Debt Obligations
(Cost $29,829,190) | | | 31,474,267 | |
| | | | | | |
|
|
|
| | | | | MORTGAGE BACKED SECURITIES - U.S. GOVERNMENT AGENCY - 12.55% | |
| | | | | Federal Home Loan Mortgage Corp. | | | | |
| | 697,000 | | | Pool #4050, 3.500%, 05/15/2032 | | | 717,728 | |
| | 1,015,301 | | | Pool #4062, 3.500%, 06/15/2042 | | | 1,011,649 | |
| | 775,996 | | | Pool #4171, 3.000%, 02/15/2043 | | | 725,444 | |
| | 1,213,199 | | | Pool #4413, 3.500%, 11/15/2044 | | | 1,221,733 | |
| | | | | Federal National Mortgage Association | | | | |
| | 751,692 | | | Pool #1201, 3.500%, 10/01/2032 | | | 785,243 | |
| | 417,441 | | | Pool #2005-56, 6.000%, 08/25/2033 (a) | | | 457,705 | |
| | 131,350 | | | Pool #2011-113, 4.000%, 03/25/2040 | | | 133,609 | |
| | 682,865 | | | Pool #2012-63, 2.000%, 08/25/2040 | | | 684,020 | |
| | 1,382,822 | | | Pool #2014-95, 3.000%, 04/25/2041 | | | 1,404,230 | |
| | | | | Government National Mortgage Association | | | | |
| | 836,758 | | | Pool #2010-62, 4.772%, 05/20/2040 (a)(g) | | | 126,204 | |
| | 853,842 | | | Pool #2011-72, 4.402%, 05/20/2041 (a)(g) | | | 115,579 | |
| | 700,000 | | | Pool #2012-40, 4.000%, 01/20/2042 | | | 743,192 | |
| | 1,700,970 | | | Pool #2013-113, 5.272%, 03/20/2043 (a)(g) | | | 245,759 | |
| | | | | | |
|
|
|
| | | | | Total Mortgage Backed Securities - U.S. Government Agency
(Cost $8,213,976) | | | 8,372,095 | |
| | | | | | |
|
|
|
| | |
Number of
Shares
| | | | | | |
| | | | | PREFERRED STOCKS - 0.02% | | | | |
| | | | | Transportation - 0.02% | | | | |
| | 49 | | | CEVA Holdings LLC (b)(c) | | | 12,138 | |
| | | | | | |
|
|
|
| | | | | Total Preferred Stocks
(Cost $64,483) | | | 12,138 | |
| | | | | | |
|
|
|
| | | | | WARRANTS - 0.00% | | | | |
| | | | | Textiles, Apparel & Luxury Goods - 0.00% | | | | |
| | | | | Edcon Holdings, Ltd. | | | | |
| | 361 | | | F - Expiration: December, 2049 (b)(c)(f) | | | 0 | |
| | 6,464,770 | | | F1 - Expiration: December, 2049 (b)(c)(f) | | | 0 | |
| | 523,517 | | | F2 - Expiration: December, 2049 (b)(c)(f) | | | 0 | |
| | | | | | |
|
|
|
| | | | | Total Warrants
(Cost $0) | | | 0 | |
| | | | | | |
|
|
|
| | |
Principal
Amount
| | | | | | |
| | | | | SHORT TERM INVESTMENTS - 11.04% | | | | |
| | | | | Foreign Government Debt Obligation - 2.34% | |
| | 8,910,000 | | | Philippine Treasury Bill
2.705%, 09/27/2017 (e) | | | 175,177 | |
| | | | | Mexico Cetes | | | | |
| | 344,150 | | | 7.058%, 05/25/2017 (e) | | | 182,568 | |
| | 91,720 | | | 6.509%, 06/01/2017 (e) | | | 48,441 | |
| | 329,370 | | | 6.895%, 07/06/2017 (e) | | | 172,819 | |
| | 563,800 | | | 6.564%, 07/20/2017 (e) | | | 295,044 | |
| | 112,280 | | | 6.472%, 08/17/2017 (e) | | | 58,473 | |
See notes to financial statements.
94
GuideMark® Opportunistic Fixed Income Fund
SCHEDULE OF INVESTMENTS (Continued)
March 31, 2017
| | | | | | | | |
Principal
Amount
| | | | | Value
| |
| | | | | SHORT TERM INVESTMENTS (Continued) | |
| | | | | Foreign Government Debt Obligation (Continued) | |
| | 10,180 | | | 6.572%, 08/31/2017 (e) | | $ | 5,286 | |
| | 570,620 | | | 6.854%, 09/14/2017 (e) | | | 295,449 | |
| | 643,730 | | | 6.553%, 11/09/2017 (e) | | | 329,875 | |
| | | | | | |
|
|
|
| | | | | | | | 1,563,132 | |
| | | | | | |
|
|
|
| | |
Number of
Shares
| | | | | | |
| | | | | Money Market Funds - 8.32% | | | | |
| | 5,547,102 | | | Deutsche Government Money Market Series - Institutional Shares
Effective Yield, 0.63% (i) | | | 5,547,102 | |
| | | | | | |
|
|
|
| | |
Principal
Amount
| | | | | | |
| | | | | U.S. Government Agency Issue - 0.38% | | | | |
| | 255,000 | | | Federal Home Loan Bank Discount Note
0.450%, 04/03/2017 (e) | | | 254,994 | |
| | | | | | |
|
|
|
| | | | | Total Short Term Investments
(Cost $7,345,312) | | | 7,365,228 | |
| | | | | | |
|
|
|
| | | | | Total Investments
(Cost $62,222,862) - 91.11% | | | 60,771,569 | |
| | | | | Other Assets in Excess of
Liabilities - 8.89% | | | 5,930,139 | |
| | | | | | |
|
|
|
| | | | | TOTAL NET ASSETS - 100.00% | | $ | 66,701,708 | |
| | | | | | |
|
|
|
Percentages are stated as a percent of net assets.
Principal amounts are denominated in the currency in which the security was purchased.
| (a) | | Variable Rate Security. The rate shown is the rate in effect on March 31, 2017. |
| (b) | | These securities have been deemed illiquid according to the Fund’s liquidity guidelines. The value of these securities total $16,624, which represents 0.02% of total net assets. |
| (c) | | Non-income producing. |
| (d) | | Restricted securities as defined in Rule 144(a) under the Securities Act of 1933. Such securities are treated as liquid securities according to the Fund’s liquidity guidelines. The value of these securities total $2,389,107, which represents 3.58% of total net assets. |
| (e) | | Zero coupon bond. The effective yield is listed. |
| (f) | | As of March 31, 2017, the Valuation Committee has fair valued these securities. The value of these securities total $0, which represents 0.00% of total net assets. |
| (g) | | Represents an interest-only security that entitles holders to receive only interest payments on the underlying mortgages. The yield-to-maturity of an interest-only security is extremely sensitive to the rate of principal payments on the underlying mortgage assets. A rapid (slow) rate of principal repayments may have an adverse (positive) effect on yield to maturity. The principal amount shown is the underlying mortgages. Interest rate disclosed represents yield upon the estimated timing and amount of future cash flows at March 31, 2017. The securities are liquid and the value of these securities total $978,439 which represents 1.47% of total net assets. |
| (h) | | Represents an inflation protected security. |
| (i) | | Seven-day yield as of March 31, 2017. |
Glossary of Terms
See notes to financial statements.
95
GuideMark® Opportunistic Fixed Income Fund
SCHEDULE OF OPEN FORWARD CURRENCY CONTRACTS
March 31, 2017
| | | | | | | | | | | | | | | | | | |
Forward
expiration date
| | Counterparty
| | Currency to be received
| | Amount of
Currency to
be received
| | | Currency to be delivered
| | Amount of
Currency to
be delivered
| | | Unrealized
Appreciation
(Depreciation)
| |
| 9/27/2017 | | Citibank | | Brazilian Real | | | 3,300,000 | | | Euro | | | 930,757 | | | $ | 11,154 | |
| 4/17/2017 | | Deutsche Bank | | Chilean Peso | | | 164,147,000 | | | U.S. Dollars | | | 244,813 | | | | 3,727 | |
| 4/20/2017 | | Deutsche Bank | | Chilean Peso | | | 162,131,000 | | | U.S. Dollars | | | 244,449 | | | | 1,001 | |
| 4/24/2017 | | Deutsche Bank | | Chilean Peso | | | 166,162,750 | | | U.S. Dollars | | | 251,762 | | | | (259 | ) |
| 5/18/2017 | | Deutsche Bank | | Chilean Peso | | | 164,146,750 | | | U.S. Dollars | | | 254,136 | | | | (5,962 | ) |
| 4/3/2017 | | Deutsche Bank | | Euro | | | 65,866 | | | U.S. Dollars | | | 70,318 | | | | (44 | ) |
| 4/13/2017 | | Barclays | | Ghanaian Cedi | | | 484,117 | | | U.S. Dollars | | | 102,828 | | | | 8,842 | |
| 4/25/2017 | | JP Morgan Chase | | Indian Rupee | | | 96,000,000 | | | Euro | | | 1,292,773 | | | | 92,593 | |
| 4/7/2017 | | JP Morgan Chase | | Japanese Yen | | | 253,557,611 | | | Malaysian Ringgit | | | 9,974,729 | | | | 24,784 | |
| 4/17/2017 | | Deutsche Bank | | Japanese Yen | | | 266,043,000 | | | U.S. Dollars | | | 2,337,237 | | | | 54,011 | |
| 4/18/2017 | | HSBC | | Malaysian Ringgit | | | 1,652,011 | | | Euro | | | 352,234 | | | | (3,032 | ) |
| 4/7/2017 | | JP Morgan Chase | | Malaysian Ringgit | | | 9,974,729 | | | Japanese Yen | | | 244,982,635 | | | | 52,257 | |
| 4/18/2017 | | Citibank | | Mexican Peso | | | 46,884,480 | | | Euro | | | 2,250,892 | | | | 94,046 | |
| 7/13/2017 | | Citibank | | Mexican Peso | | | 7,476,600 | | | Euro | | | 310,426 | | | | 60,111 | |
| 1/16/2018 | | Citibank | | Mexican Peso | | | 9,384,000 | | | Euro | | | 377,663 | | | | 70,500 | |
| 4/25/2017 | | HSBC | | South Korean Won | | | 1,099,000,000 | | | U.S. Dollars | | | 939,662 | | | | 43,413 | |
| 4/26/2017 | | HSBC | | South Korean Won | | | 306,000,000 | | | U.S. Dollars | | | 278,220 | | | | (4,494 | ) |
| 5/15/2017 | | JP Morgan Chase | | U.S. Dollars | | | 901,270 | | | Australian Dollar | | | 1,178,000 | | | | 2,018 | |
| 5/22/2017 | | Citibank | | U.S. Dollars | | | 283,094 | | | Australian Dollar | | | 370,000 | | | | 685 | |
| 6/13/2017 | | Citibank | | U.S. Dollars | | | 495,994 | | | Australian Dollar | | | 654,000 | | | | (2,973 | ) |
| 6/13/2017 | | JP Morgan Chase | | U.S. Dollars | | | 741,023 | | | Australian Dollar | | | 982,000 | | | | (8,189 | ) |
| 6/20/2017 | | JP Morgan Chase | | U.S. Dollars | | | 2,611,588 | | | Australian Dollar | | | 3,399,000 | | | | 18,683 | |
| 4/3/2017 | | Deutsche Bank | | U.S. Dollars | | | 69,950 | | | Euro | | | 65,866 | | | | (325 | ) |
| 4/10/2017 | | Bank of America | | U.S. Dollars | | | 460,687 | | | Euro | | | 434,000 | | | | (2,505 | ) |
| 4/13/2017 | | Citibank | | U.S. Dollars | | | 70,523 | | | Euro | | | 66,790 | | | | (769 | ) |
| 4/21/2017 | | Barclays | | U.S. Dollars | | | 343,578 | | | Euro | | | 319,000 | | | | 2,950 | |
| 4/24/2017 | | Deutsche Bank | | U.S. Dollars | | | 443,908 | | | Euro | | | 413,923 | | | | 1,860 | |
| 4/27/2017 | | Goldman Sachs | | U.S. Dollars | | | 197,428 | | | Euro | | | 183,000 | | | | 1,967 | |
| 4/28/2017 | | Deutsche Bank | | U.S. Dollars | | | 717,623 | | | Euro | | | 667,597 | | | | 4,535 | |
| 4/28/2017 | | HSBC | | U.S. Dollars | | | 36,687 | | | Euro | | | 34,118 | | | | 245 | |
| 5/2/2017 | | JP Morgan Chase | | U.S. Dollars | | | 281,235 | | | Euro | | | 263,000 | | | | 260 | |
| 5/8/2017 | | Barclays | | U.S. Dollars | | | 219,622 | | | Euro | | | 204,000 | | | | 1,615 | |
| 5/8/2017 | | Deutsche Bank | | U.S. Dollars | | | 460,600 | | | Euro | | | 424,000 | | | | 7,487 | |
| 5/8/2017 | | Goldman Sachs | | U.S. Dollars | | | 601,795 | | | Euro | | | 559,081 | | | | 4,326 | |
| 5/15/2017 | | Deutsche Bank | | U.S. Dollars | | | 1,114,701 | | | Euro | | | 1,045,000 | | | | (2,438 | ) |
| 5/16/2017 | | Deutsche Bank | | U.S. Dollars | | | 34,087 | | | Euro | | | 32,000 | | | | (124 | ) |
| 5/22/2017 | | Deutsche Bank | | U.S. Dollars | | | 191,056 | | | Euro | | | 179,000 | | | | (368 | ) |
| 5/22/2017 | | JP Morgan Chase | | U.S. Dollars | | | 378,559 | | | Euro | | | 354,000 | | | | (10 | ) |
| 6/8/2017 | | Bank of America | | U.S. Dollars | | | 461,917 | | | Euro | | | 434,000 | | | | (2,610 | ) |
| 6/14/2017 | | Morgan Stanley | | U.S. Dollars | | | 94,608 | | | Euro | | | 88,500 | | | | (147 | ) |
| 6/15/2017 | | Citibank | | U.S. Dollars | | | 234,187 | | | Euro | | | 218,594 | | | | 131 | |
| 6/19/2017 | | UBS | | U.S. Dollars | | | 217,170 | | | Euro | | | 203,500 | | | | (771 | ) |
| 6/30/2017 | | Barclays | | U.S. Dollars | | | 671,922 | | | Euro | | | 623,917 | | | | 3,342 | |
| 7/5/2017 | | Deutsche Bank | | U.S. Dollars | | | 70,631 | | | Euro | | | 65,866 | | | | 32 | |
| 4/17/2017 | | Deutsche Bank | | U.S. Dollars | | | 5,059,971 | | | Japanese Yen | | | 520,185,270 | | | | 384,441 | |
| 4/18/2017 | | Bank of America | | U.S. Dollars | | | 279,236 | | | Japanese Yen | | | 30,030,000 | | | | 9,309 | |
| 4/21/2017 | | JP Morgan Chase | | U.S. Dollars | | | 358,025 | | | Japanese Yen | | | 38,610,000 | | | | 10,931 | |
| 4/24/2017 | | Barclays | | U.S. Dollars | | | 190,082 | | | Japanese Yen | | | 19,600,000 | | | | 13,860 | |
| 6/2/2017 | | Deutsche Bank | | U.S. Dollars | | | 739,302 | | | Japanese Yen | | | 80,680,000 | | | | 12,864 | |
| 6/5/2017 | | JP Morgan Chase | | U.S. Dollars | | | 318,804 | | | Japanese Yen | | | 34,284,478 | | | | 10,064 | |
| 6/8/2017 | | Citibank | | U.S. Dollars | | | 243,454 | | | Japanese Yen | | | 25,700,000 | | | | 11,987 | |
| 6/9/2017 | | HSBC | | U.S. Dollars | | | 340,708 | | | Japanese Yen | | | 38,500,000 | | | | (6,060 | ) |
| 6/13/2017 | | HSBC | | U.S. Dollars | | | 416,499 | | | Japanese Yen | | | 47,460,000 | | | | (11,054 | ) |
| 6/16/2017 | | HSBC | | U.S. Dollars | | | 778,947 | | | Japanese Yen | | | 88,800,000 | | | | (21,139 | ) |
| 6/16/2017 | | JP Morgan Chase | | U.S. Dollars | | | 177,367 | | | Japanese Yen | | | 18,500,000 | | | | 10,682 | |
| 6/19/2017 | | Deutsche Bank | | U.S. Dollars | | | 848,933 | | | Japanese Yen | | | 88,660,000 | | | | 49,994 | |
| 6/20/2017 | | Citibank | | U.S. Dollars | | | 568,895 | | | Japanese Yen | | | 58,390,000 | | | | 42,702 | |
| 6/22/2017 | | Deutsche Bank | | U.S. Dollars | | | 863,000 | | | Japanese Yen | | | 88,820,000 | | | | 62,504 | |
| 7/11/2017 | | Barclays | | U.S. Dollars | | | 386,416 | | | Japanese Yen | | | 44,560,000 | | | | (15,551 | ) |
See notes to financial statements.
96
GuideMark® Opportunistic Fixed Income Fund
SCHEDULE OF OPEN FORWARD CURRENCY CONTRACTS (Continued)
March 31, 2017
| | | | | | | | | | | | | | | | | | |
Forward
expiration date
| | Counterparty
| | Currency to be received
| | Amount of
Currency to
be received
| | | Currency to be delivered
| | Amount of
Currency to
be delivered
| | | Unrealized
Appreciation
(Depreciation)
| |
| 7/11/2017 | | Goldman Sachs | | U.S. Dollars | | | 170,903 | | | Japanese Yen | | | 19,732,000 | | | $ | (7,095 | ) |
| 7/13/2017 | | Barclays | | U.S. Dollars | | | 597,893 | | | Japanese Yen | | | 68,630,000 | | | | (21,263 | ) |
| 7/14/2017 | | JP Morgan Chase | | U.S. Dollars | | | 435,985 | | | Japanese Yen | | | 44,610,000 | | | | 33,510 | |
| 7/25/2017 | | Citibank | | U.S. Dollars | | | 347,754 | | | Japanese Yen | | | 36,309,000 | | | | 19,999 | |
| 7/25/2017 | | JP Morgan Chase | | U.S. Dollars | | | 498,400 | | | Japanese Yen | | | 56,000,000 | | | | (7,103 | ) |
| 7/27/2017 | | JP Morgan Chase | | U.S. Dollars | | | 173,603 | | | Japanese Yen | | | 19,500,000 | | | | (2,437 | ) |
| 8/2/2017 | | JP Morgan Chase | | U.S. Dollars | | | 1,773,993 | | | Japanese Yen | | | 200,000,000 | | | | (32,067 | ) |
| 8/14/2017 | | Citibank | | U.S. Dollars | | | 104,590 | | | Japanese Yen | | | 11,770,000 | | | | (1,758 | ) |
| 8/16/2017 | | Goldman Sachs | | U.S. Dollars | | | 105,302 | | | Japanese Yen | | | 11,840,000 | | | | (1,689 | ) |
| 8/16/2017 | | JP Morgan Chase | | U.S. Dollars | | | 368,653 | | | Japanese Yen | | | 41,463,000 | | | | (6,022 | ) |
| 8/28/2017 | | Barclays | | U.S. Dollars | | | 52,851 | | | Japanese Yen | | | 5,910,000 | | | | (585 | ) |
| 8/31/2017 | | Barclays | | U.S. Dollars | | | 106,064 | | | Japanese Yen | | | 11,810,000 | | | | (733 | ) |
| 9/1/2017 | | Deutsche Bank | | U.S. Dollars | | | 35,399 | | | Japanese Yen | | | 3,936,000 | | | | (196 | ) |
| 9/11/2017 | | Barclays | | U.S. Dollars | | | 284,346 | | | Japanese Yen | | | 32,151,400 | | | | (6,549 | ) |
| 9/13/2017 | | Deutsche Bank | | U.S. Dollars | | | 138,065 | | | Japanese Yen | | | 15,700,000 | | | | (3,997 | ) |
| 9/21/2017 | | Barclays | | U.S. Dollars | | | 334,544 | | | Japanese Yen | | | 37,430,000 | | | | (4,273 | ) |
| 9/25/2017 | | Barclays | | U.S. Dollars | | | 164,320 | | | Japanese Yen | | | 18,110,000 | | | | 357 | |
| 10/11/2017 | | Deutsche Bank | | U.S. Dollars | | | 1,095,277 | | | Japanese Yen | | | 111,608,750 | | | | 83,898 | |
| 11/14/2017 | | Citibank | | U.S. Dollars | | | 105,103 | | | Japanese Yen | | | 11,770,000 | | | | (1,761 | ) |
| 12/12/2017 | | Citibank | | U.S. Dollars | | | 517,769 | | | Japanese Yen | | | 57,980,000 | | | | (9,492 | ) |
| 12/13/2017 | | JP Morgan Chase | | U.S. Dollars | | | 389,732 | | | Japanese Yen | | | 43,970,000 | | | | (10,146 | ) |
| 2/14/2018 | | Citibank | | U.S. Dollars | | | 106,494 | | | Japanese Yen | | | 11,860,000 | | | | (1,753 | ) |
| 2/16/2018 | | HSBC | | U.S. Dollars | | | 160,108 | | | Japanese Yen | | | 17,820,000 | | | | (2,556 | ) |
| 3/22/2018 | | Deutsche Bank | | U.S. Dollars | | | 160,517 | | | Japanese Yen | | | 17,733,000 | | | | (1,667 | ) |
| 3/23/2018 | | Citibank | | U.S. Dollars | | | 322,667 | | | Japanese Yen | | | 35,670,000 | | | | (3,587 | ) |
| 4/25/2017 | | HSBC | | U.S. Dollars | | | 964,162 | | | South Korean Won | | | 1,099,000,000 | | | | (18,912 | ) |
| 4/26/2017 | | HSBC | | U.S. Dollars | | | 267,027 | | | South Korean Won | | | 306,000,000 | | | | (6,698 | ) |
| 5/25/2017 | | HSBC | | U.S. Dollars | | | 703,291 | | | South Korean Won | | | 827,000,000 | | | | (36,715 | ) |
| 6/2/2017 | | HSBC | | U.S. Dollars | | | 853,231 | | | South Korean Won | | | 997,000,000 | | | | (38,971 | ) |
| 8/21/2017 | | Citibank | | U.S. Dollars | | | 1,310,385 | | | South Korean Won | | | 1,495,280,000 | | | | (29,353 | ) |
| 9/7/2017 | | Goldman Sachs | | U.S. Dollars | | | 916,037 | | | South Korean Won | | | 1,037,000,000 | | | | (13,359 | ) |
| 9/27/2017 | | HSBC | | U.S. Dollars | | | 735,347 | | | South Korean Won | | | 823,000,000 | | | | (2,505 | ) |
| | | | | | | | | | | | | | | | |
|
|
|
| | | | | | | | | | | | | | | | | $ | 961,611 | |
| | | | | | | | | | | | | | | | |
|
|
|
GuideMark® Opportunistic Fixed Income Fund
SCHEDULE OF OPEN SWAP CONTRACTS
INTEREST RATE SWAPS
March 31, 2017
| | | | | | | | | | | | | | | | | | | | | | | | | | | | |
Pay/Receive Floating Rate
| | Floating
Rate Index
| | | Fixed
Pay
Rate
| | | Maturity
Date
| | Counterparty
| | Notional
Amount
| | | Fair
Value
| | | Upfront
Premiums
Paid
(Received)
| | | Unrealized
Appreciation
(Depreciation)
| |
Receive | | | 3-MO-USD-LIBOR | | | | 3.018% | | | 8/22/2023 | | JP Morgan Chase | | | 3,990,000 | | | $ | (203,625 | ) | | $ | 0 | | | $ | (203,625 | ) |
Receive | | | 3-MO-USD-LIBOR | ** | | | 1.914% | | | 1/22/2025 | | Citibank | | | 490,000 | | | | 12,527 | | | | 0 | | | | 12,527 | |
Receive | | | 3-MO-USD-LIBOR | ** | | | 1.973% | | | 1/27/2025 | | Citibank | | | 360,000 | | | | 7,691 | | | | 0 | | | | 7,691 | |
Receive | | | 3-MO-USD-LIBOR | ** | | | 1.942% | | | 1/30/2025 | | Citibank | | | 80,000 | | | | 1,892 | | | | 0 | | | | 1,892 | |
Receive | | | 3-MO-USD-LIBOR | ** | | | 1.817% | | | 2/3/2025 | | Citibank | | | 120,000 | | | | 3,950 | | | | 0 | | | | 3,950 | |
Receive | | | 3-MO-USD-LIBOR | * | | | 1.978% | | | 3/27/2025 | | Citibank | | | 1,200,000 | | | | 26,440 | | | | 0 | | | | 26,440 | |
Receive | | | 3-MO-USD-LIBOR | | | | 3.848% | | | 8/22/2043 | | JP Morgan Chase | | | 4,170,000 | | | | (1,000,280 | ) | | | 0 | | | | (1,000,280 | ) |
| | | | | | | | | | | | | | | | | | |
|
|
| |
|
|
| |
|
|
|
| | | | | | | | | | | | | | | | | | | $ | (1,151,405 | ) | | $ | 0 | | | $ | (1,151,405 | ) |
| | | | | | | | | | | | | | | | | | |
|
|
| |
|
|
| |
|
|
|
| * | | Centrally cleared swap, clearing agent: Deutsche Bank |
| ** | | Centrally cleared swap, clearing agent: JP Morgan Chase |
See notes to financial statements.
97
GuidePath® Growth Allocation Fund
SCHEDULE OF INVESTMENTS
March 31, 2017
| | | | | | | | |
Number of
Shares
| | | | | Value
| |
| | | | | INVESTMENT COMPANIES - 98.77% | |
| | | | | Affiliated Mutual Funds - 31.81% | |
| | 857,339 | | | GuideMark® Emerging Markets Fund - Institutional Shares | | $ | 11,548,351 | |
| | 2,463,265 | | | GuideMark® Large Cap Core Fund - Institutional Shares | | | 39,757,095 | |
| | 3,165,311 | | | GuideMark® Small/Mid Cap Core Fund - Institutional Shares | | | 58,051,795 | |
| | 8,369,337 | | | GuideMark® World ex-US Fund - Institutional Shares | | | 70,135,046 | |
| | | | | | |
|
|
|
| | | | | | | | 179,492,287 | |
| | | | | | |
|
|
|
| | | | | Exchange Traded Funds - 66.96% | |
| | 58,832 | | | iShares 7-10 Year Treasury Bond ETF | | | 6,212,071 | |
| | 120,946 | | | iShares 20+ Year Treasury Bond ETF | | | 14,599,392 | |
| | 725,420 | | | iShares Core MSCI Emerging Markets ETF (a) | | | 34,667,822 | |
| | 61,077 | | | iShares Core U.S. Credit Bond ETF (a) | | | 6,712,973 | |
| | 123,115 | | | iShares Edge MSCI Min Vol USA ETF (a) | | | 5,875,048 | |
| | 49,689 | | | iShares J.P. Morgan USD Emerging Markets Bond ETF (a) | | | 5,649,639 | |
| | 500,984 | | | iShares MSCI Canada ETF | | | 13,466,450 | |
| | 361,685 | | | iShares MSCI Switzerland Capped ETF | | | 11,566,686 | |
| | 165,318 | | | SPDR Bloomberg Barclays High Yield Bond ETF (a) | | | 6,105,194 | |
| | 48,478 | | | SPDR Gold Shares (a)(b) | | | 5,755,308 | |
| | 63,727 | | | SPDR S&P 600 Small Cap Growth ETF | | | 13,554,096 | |
| | 270,308 | | | SPDR S&P China ETF | | | 22,178,771 | |
| | 1,776,455 | | | Vanguard FTSE Developed Markets ETF (a) | | | 69,814,682 | |
| | 200,903 | | | Vanguard Global ex-U.S. Real Estate ETF | | | 10,700,094 | |
| | 219,234 | | | Vanguard REIT ETF (a) | | | 18,106,536 | |
| | 595,954 | | | Vanguard S&P 500 ETF (a) | | | 128,934,648 | |
| | 6,916 | | | Vanguard Total Bond Market ETF | | | 560,749 | |
| | 36,101 | | | Vanguard Value ETF | | | 3,442,952 | |
| | | | | | |
|
|
|
| | | | | | | | 377,903,111 | |
| | | | | | |
|
|
|
| | | | | Total Investment Companies
(Cost $464,372,534) | | | 557,395,398 | |
| | | | | | |
|
|
|
| | | | | | | | |
Number of
Shares
| | | | | Value
| |
| | | | | SHORT TERM INVESTMENTS - 1.16% | |
| | | | | Money Market Funds - 1.16% | |
| | 6,552,272 | | | Deutsche Government Money Market
Series - Institutional Shares
Effective Yield, 0.63% (c) | | $ | 6,552,272 | |
| | | | | | |
|
|
|
| | | | | Total Short Term Investments
(Cost $6,552,272) | | | 6,552,272 | |
| | | | | | |
|
|
|
| | | | | INVESTMENTS PURCHASED AS SECURITIES LENDING COLLATERAL - 16.26% | |
| | | | | Investment Companies - 16.26% | |
| | 91,758,279 | | | Mount Vernon Liquid Assets Portfolio, LLC
Effective Yield, 1.17% (c) | | | 91,758,279 | |
| | | | | | |
|
|
|
| | | | | Total Investments Purchased as Securities
Lending Collateral
(Cost $91,758,279) | | | 91,758,279 | |
| | | | | | |
|
|
|
| | | | | Total Investments
(Cost $562,683,085) - 116.19% | | | 655,705,949 | |
| | | | | Liabilities in Excess of
Other Assets - (16.19)% | | | (91,388,028 | ) |
| | | | | | |
|
|
|
| | | | | TOTAL NET ASSETS - 100.00% | | $ | 564,317,921 | |
| | | | | | |
|
|
|
Percentages are stated as a percent of net assets.
| (a) | | All or portion of this security is on loan. |
| (b) | | Non-income producing security. |
| (c) | | Seven-day yield as of March 31, 2017. |
See notes to financial statements.
98
GuidePath® Conservative Allocation Fund
SCHEDULE OF INVESTMENTS
March 31, 2017
| | | | | | | | |
Number of
Shares
| | | | | Value
| |
| | | | | INVESTMENT COMPANIES - 98.73% | |
| | | | | Affiliated Mutual Funds - 13.13% | |
| | 28,624 | | | GuideMark® Emerging Markets Fund - Institutional Shares | | $ | 385,572 | |
| | 181,943 | | | GuideMark® Large Cap Core Fund - Institutional Shares | | | 2,936,555 | |
| | 369,315 | | | GuideMark® Small/Mid Cap Core Fund - Institutional Shares | | | 6,773,229 | |
| | 611,474 | | | GuideMark® World ex-US Fund - Institutional Shares | | | 5,124,148 | |
| | | | | | |
|
|
|
| | | | | | | | 15,219,504 | |
| | | | | | |
|
|
|
| | | | | Exchange Traded Funds - 85.60% | |
| | 68,952 | | | iShares 1-3 Year Treasury Bond ETF (a) | | | 5,827,823 | |
| | 135,844 | | | iShares 7-10 Year Treasury Bond ETF (a) | | | 14,343,768 | |
| | 41,063 | | | iShares 10+ Year Credit Bond ETF | | | 2,432,572 | |
| | 79,263 | | | iShares 20+ Year Treasury Bond ETF (a) | | | 9,567,837 | |
| | 24,010 | | | iShares Core MSCI Emerging Markets ETF | | | 1,147,438 | |
| | 26,663 | | | iShares Core U.S. Credit Bond ETF | | | 2,930,530 | |
| | 121,381 | | | iShares Edge MSCI Min Vol USA ETF (a) | | | 5,792,301 | |
| | 14,498 | | | iShares J.P. Morgan USD Emerging Markets Bond ETF | | | 1,648,423 | |
| | 44,066 | | | iShares MSCI Canada ETF | | | 1,184,494 | |
| | 118,619 | | | iShares MSCI Switzerland Capped ETF | | | 3,793,436 | |
| | 46,671 | | | PowerShares DB Gold Fund (a)(b) | | | 1,865,907 | |
| | 192,081 | | | SPDR Bloomberg Barclays High Yield Bond ETF (a) | | | 7,093,551 | |
| | 64,263 | | | SPDR Bloomberg Barclays International Treasury Bond ETF (a)(b) | | | 1,711,966 | |
| | 75,269 | | | SPDR Bloomberg Barclays TIPS ETF (a) | | | 4,288,075 | |
| | 199 | | | SPDR S&P 600 Small Cap Value ETF | | | 23,490 | |
| | 32,488 | | | SPDR S&P China ETF | | | 2,665,640 | |
| | 212,737 | | | Vanguard FTSE Developed Markets ETF | | | 8,360,564 | |
| | 203,239 | | | Vanguard Mortgage-Backed Securities ETF | | | 10,674,112 | |
| | 25,399 | | | Vanguard REIT ETF (a) | | | 2,097,704 | |
| | 43,046 | | | Vanguard S&P 500 ETF | | | 9,313,002 | |
| | 8,134 | | | Vanguard Total Bond Market ETF | | | 659,505 | |
| | 19,264 | | | Vanguard Value ETF | | | 1,837,208 | |
| | | | | | |
|
|
|
| | | | | | | | 99,259,346 | |
| | | | | | |
|
|
|
| | | | | Total Investment Companies
(Cost $106,045,634) | | | 114,478,850 | |
| | | | | | |
|
|
|
| | | | | | | | |
Number of
Shares
| | | | | Value
| |
| | | | | SHORT TERM INVESTMENTS - 1.09% | |
| | | | | Money Market Funds - 1.09% | |
| | 1,263,400 | | | Deutsche Government Money Market
Series - Institutional Shares
Effective Yield, 0.63% (c) | | $ | 1,263,400 | |
| | | | | | |
|
|
|
| | | | | Total Short Term Investments
(Cost $1,263,400) | | | 1,263,400 | |
| | | | | | |
|
|
|
| | | | | INVESTMENTS PURCHASED AS SECURITIES LENDING COLLATERAL - 27.75% | |
| | | | | Investment Companies - 27.75% | |
| | 32,173,173 | | | Mount Vernon Liquid Assets Portfolio, LLC
Effective Yield, 1.17% (c) | | | 32,173,173 | |
| | | | | | |
|
|
|
| | | | | Total Investments Purchased as Securities Lending Collateral
(Cost $32,173,173) | | | 32,173,173 | |
| | | | | | |
|
|
|
| | | | | Total Investments
(Cost $139,482,207) - 127.57% | | | 147,915,423 | |
| | | | | Liabilities in Excess of
Other Assets - (27.57)% | | | (31,963,706 | ) |
| | | | | | |
|
|
|
| | | | | TOTAL NET ASSETS - 100.00% | | $ | 115,951,717 | |
| | | | | | |
|
|
|
Percentages are stated as a percent of net assets.
| (a) | | All or portion of this security is on loan. |
| (b) | | Non-income producing security. |
| (c) | | Seven-day yield as of March 31, 2017. |
See notes to financial statements.
99
GuidePath® Tactical Allocation Fund
SCHEDULE OF INVESTMENTS
March 31, 2017
| | | | | | | | |
Number of
Shares
| | | | | Value
| |
| | | | | INVESTMENT COMPANIES - 98.90% | |
| | | | | Exchange Traded Funds - 98.90% | |
| | 351,200 | | | iShares TIPS Bond ETF | | $ | 40,265,080 | |
| | 196,629 | | | Technology Select Sector SPDR Fund (a) | | | 10,482,292 | |
| | 303,213 | | | Vanguard Extended Market ETF (a) | | | 30,287,946 | |
| | 102,318 | | | Vanguard Growth ETF | | | 12,448,008 | |
| | 114,232 | | | Vanguard Mid-Cap Value ETF | | | 11,642,525 | |
| | 765,854 | | | Vanguard S&P 500 ETF (b) | | | 165,692,513 | |
| | 61,192 | | | Vanguard Small-Cap Growth ETF (a) | | | 8,607,879 | |
| | 72,169 | | | Vanguard Small-Cap Value ETF (a) | | | 8,866,683 | |
| | 170,348 | | | Vanguard Value ETF | | | 16,246,089 | |
| | | | | | |
|
|
|
| | | | | | | | 304,539,015 | |
| | | | | | |
|
|
|
| | | | | Total Investment Companies
(Cost $281,046,728) | | | 304,539,015 | |
| | | | | | |
|
|
|
| | | | | SHORT TERM INVESTMENTS - 1.17% | |
| | | | | Money Market Funds - 1.17% | |
| | 3,594,112 | | | Deutsche Government Money Market
Series - Institutional Shares
Effective Yield, 0.63% (c) | | | 3,594,112 | |
| | | | | | |
|
|
|
| | | | | Total Short Term Investments
(Cost $3,594,112) | | | 3,594,112 | |
| | | | | | |
|
|
|
| | | | | | | | |
Number of
Shares
| | | | | Value
| |
| | | | | INVESTMENTS PURCHASED AS SECURITIES LENDING COLLATERAL - 7.89% | |
| | | | | Investment Companies - 7.89% | |
| | 24,291,888 | | | Mount Vernon Liquid Assets Portfolio, LLC
Effective Yield, 1.17% (c) | | $ | 24,291,888 | |
| | | | | | |
|
|
|
| | | | | Total Investments Purchased as Securities Lending Collateral
(Cost $24,291,888) | | | 24,291,888 | |
| | | | | | |
|
|
|
| | | | | Total Investments
(Cost $308,932,728) - 107.96% | | | 332,425,015 | |
| | | | | Liabilities in Excess of
Other Assets - (7.96)% | | | (24,498,231 | ) |
| | | | | | |
|
|
|
| | | | | TOTAL NET ASSETS - 100.00% | | $ | 307,926,784 | |
| | | | | | |
|
|
|
Percentages are stated as a percent of net assets.
| (a) | | All or portion of this security is on loan. |
| (b) | | Fair value of this security exceeds 25% of the Fund’s net assets. Additional information for this security, including the financial statements, is available from the SEC’s EDGAR database at www.sec.gov. |
| (c) | | Seven-day yield as of March 31, 2017. |
See notes to financial statements.
100
GuidePath® Absolute Return Allocation Fund
SCHEDULE OF INVESTMENTS
March 31, 2017
| | | | | | | | |
Number of
Shares
| | | | | Value
| |
| | | | | INVESTMENT COMPANIES - 98.83% | |
| | | | | Affiliated Mutual Funds - 8.10% | |
| | 617,227 | | | GuideMark® Core Fixed Income Fund - Institutional Shares | | $ | 5,709,349 | |
| | 508,071 | | | GuideMark® Opportunistic Fixed Income Fund - Institutional Shares | | | 4,811,432 | |
| | | | | | |
|
|
|
| | | | | | | | 10,520,781 | |
| | | | | | |
|
|
|
| | | | | Exchange Traded Funds - 28.45% | |
| | 799,833 | | | SPDR Bloomberg Barclays High Yield Bond ETF (a) | | | 29,537,833 | |
| | 92,820 | | | SPDR Bloomberg Barclays Short Term High Yield Bond ETF | | | 2,595,247 | |
| | 10,956 | | | Vanguard Mid-Cap Value ETF | | | 1,116,635 | |
| | 2,585 | | | Vanguard Small-Cap Value ETF (a) | | | 317,593 | |
| | 15,977 | | | Vanguard Total Bond Market ETF | | | 1,295,415 | |
| | 21,870 | | | Vanguard Value ETF | | | 2,085,742 | |
| | | | | | |
|
|
|
| | | | | | | | 36,948,465 | |
| | | | | | |
|
|
|
| | | | | Mutual Funds - 62.28% | |
| | 2,449,691 | | | BlackRock High Yield Portfolio - Institutional Shares | | | 18,960,612 | |
| | 153,581 | | | Gateway Fund - Class Y | | | 4,851,632 | |
| | 300,596 | | | John Hancock Funds II - Alternative Asset Allocation Fund - Institutional Shares | | | 4,271,468 | |
| | 204,609 | | | JPMorgan Hedged Equity Fund - Select Shares | | | 3,670,689 | |
| | 456,825 | | | JPMorgan Systematic Alpha Fund - Institutional Shares (b) | | | 7,094,496 | |
| | 1,076,539 | | | JPMorgan Unconstrained Debt Fund - Select Shares | | | 10,679,264 | |
| | 621,681 | | | Navigator Tactical Fixed Income Fund - Institutional Shares | | | 6,440,613 | |
| | 381,817 | | | Oppenheimer Fundamental Alternatives Fund - Institutional Shares | | | 10,576,339 | |
| | 149,699 | | | Pioneer Strategic Income Fund - Class Y | | | 1,603,281 | |
| | 565,399 | | | T. Rowe Price Institutional Floating Rate Fund | | | 5,687,917 | |
| | 1,197,089 | | | Vanguard High-Yield Corporate Fund - Admiral Shares | | | 7,038,882 | |
| | | | | | |
|
|
|
| | | | | | | | 80,875,193 | |
| | | | | | |
|
|
|
| | | | | Total Investment Companies
(Cost $120,178,560) | | | 128,344,439 | |
| | | | | | |
|
|
|
| | | | | | | | |
Number of
Shares
| | | | | Value
| |
| | | | | SHORT TERM INVESTMENTS - 1.01% | |
| | | | | Money Market Funds - 1.01% | |
| | 1,317,235 | | | Deutsche Government Money Market Series - Institutional Shares
Effective Yield, 0.63% (c) | | $ | 1,317,235 | |
| | | | | | |
|
|
|
| | | | | Total Short Term Investments
(Cost $1,317,235) | | | 1,317,235 | |
| | | | | | |
|
|
|
| | | | | INVESTMENTS PURCHASED AS SECURITIES LENDING COLLATERAL - 23.21% | |
| | | | | Investment Companies - 23.21% | | | | |
| | 30,145,575 | | | Mount Vernon Liquid Assets Portfolio, LLC
Effective Yield, 1.17% (c) | | | 30,145,575 | |
| | | | | | |
|
|
|
| | | | | Total Investments Purchased as Securities Lending Collateral
(Cost $30,145,575) | | | 30,145,575 | |
| | | | | | |
|
|
|
| | | | | Total Investments
(Cost $151,641,370) - 123.05% | | | 159,807,249 | |
| | | | | Liabilities in Excess of
Other Assets - (23.05)% | | | (29,937,532 | ) |
| | | | | | |
|
|
|
| | | | | TOTAL NET ASSETS - 100.00% | | $ | 129,869,717 | |
| | | | | | |
|
|
|
Percentages are stated as a percent of net assets.
| (a) | | All or portion of this security is on loan. |
| (b) | | Certain GPS Funds invest in securities of unaffiliated underlying funds in accordance with Section 12(d)(1)(F) of the Investment Company Act of 1940. Such investments are potentially illiquid, because an unaffiliated underlying fund, under the terms of Section 12(d)(1)(F), is not obligated to redeem its shares in an amount exceeding 1% of its total outstanding shares during any period of less than thirty days. Investments made in accordance with Section 12(d)(1)(F) that exceed 1% of the outstanding shares of each underlying fund, and therefore are potentially illiquid, amount to 2.52% of total net assets as of March 31, 2017. |
| (c) | | Seven-day yield as of March 31, 2017. |
See notes to financial statements.
101
GuidePath® Multi-Asset Income Allocation Fund
SCHEDULE OF INVESTMENTS
March 31, 2017
| | | | | | | | |
Number of
Shares
| | | | | Value
| |
| | | | | INVESTMENT COMPANIES - 98.86% | |
| | | | | Affiliated Mutual Funds - 5.81% | |
| | 299,116 | | | GuideMark® Core Fixed Income Fund - Institutional Shares | | $ | 2,766,827 | |
| | 443,310 | | | GuideMark® Opportunistic Fixed Income Fund - Institutional Shares | | | 4,198,150 | |
| | | | | | |
|
|
|
| | | | | | | | 6,964,977 | |
| | | | | | |
|
|
|
| | | | | Exchange Traded Funds - 59.61% | | | | |
| | 14,931 | | | iShares 7-10 Year Treasury Bond ETF (a) | | | 1,576,564 | |
| | 25,257 | | | iShares 10+ Year Credit Bond ETF | | | 1,496,225 | |
| | 23,307 | | | iShares 20+ Year Treasury Bond ETF (a) | | | 2,813,388 | |
| | 38,149 | | | iShares Global Infrastructure ETF (a) | | | 1,614,466 | |
| | 2,337 | | | iShares iBoxx $ Investment Grade Corporate Bond ETF (a) | | | 275,556 | |
| | 305,629 | | | iShares International Select Dividend ETF (a) | | | 9,615,088 | |
| | 16,067 | | | iShares J.P. Morgan USD Emerging Markets Bond ETF (a) | | | 1,826,818 | |
| | 72,562 | | | iShares MSCI Australia ETF | | | 1,640,627 | |
| | 213,804 | | | iShares U.S. Preferred Stock ETF (a) | | | 8,274,215 | |
| | 24,409 | | | PIMCO 0-5 Year High Yield Corporate Bond Index ETF | | | 2,466,774 | |
| | 72,931 | | | SPDR Bloomberg Barclays High Yield Bond ETF (a) | | | 2,693,342 | |
| | 238,672 | | | SPDR Bloomberg Barclays Short Term Corporate Bond ETF | | | 7,305,750 | |
| | 113,313 | | | SPDR Bloomberg Barclays Short Term High Yield Bond ETF | | | 3,168,231 | |
| | 4,331 | | | Vanguard Intermediate-Term Corporate Bond ETF | | | 374,112 | |
| | 18,833 | | | Vanguard REIT ETF (a) | | | 1,555,417 | |
| | 3,433 | | | Vanguard S&P 500 ETF | | | 742,730 | |
| | 39,228 | | | Vanguard Total Bond Market ETF | | | 3,180,606 | |
| | 63,250 | | | WisdomTree Emerging Markets High Dividend Fund (a) | | | 2,583,762 | |
| | 219,814 | | | WisdomTree High Dividend Fund | | | 15,050,664 | |
| | 39,303 | | | WisdomTree SmallCap Dividend Fund | | | 3,168,608 | |
| | | | | | |
|
|
|
| | | | | | | | 71,422,943 | |
| | | | | | |
|
|
|
| | | | | | | | |
Number of
Shares
| | | | | Value
| |
| | | | | Mutual Funds - 33.44% | | | | |
| | 974,750 | | | BlackRock Global Dividend Portfolio - Institutional Shares | | $ | 12,486,541 | |
| | 331,045 | | | Loomis Sayles Global Equity and Income Fund - Institutional Shares | | | 6,531,523 | |
| | 1,133,289 | | | T. Rowe Price Institutional Floating Rate Fund | | | 11,400,891 | |
| | 1,640,559 | | | Vanguard High-Yield Corporate Fund - Admiral Shares | | | 9,646,486 | |
| | | | | | |
|
|
|
| | | | | | | | 40,065,441 | |
| | | | | | |
|
|
|
| | | | | Total Investment Companies
(Cost $107,994,959) | | | 118,453,361 | |
| | | | | | |
|
|
|
| | | | | SHORT TERM INVESTMENTS - 1.41% | | | | |
| | | | | Money Market Funds - 1.41% | | | | |
| | 1,684,665 | | | Deutsche Government Money Market Series - Institutional Shares
Effective Yield, 0.63% (b) | | | 1,684,665 | |
| | | | | | |
|
|
|
| | | | | Total Short Term Investments
(Cost $1,684,665) | | | 1,684,665 | |
| | | | | | |
|
|
|
| | | | | INVESTMENTS PURCHASED AS SECURITIES LENDING COLLATERAL - 16.49% | |
| | | | | Investment Companies - 16.49% | | | | |
| | 19,755,971 | | | Mount Vernon Liquid Assets Portfolio, LLC Effective Yield, 1.17% (b) | | | 19,755,971 | |
| | | | | | |
|
|
|
| | | | | Total Investments Purchased as Securities Lending Collateral
(Cost $19,755,971) | | | 19,755,971 | |
| | | | | | |
|
|
|
| | | | | Total Investments
(Cost $129,435,595) - 116.76% | | | 139,893,997 | |
| | | | | Liabilities in Excess of
Other Assets - (16.76)% | | | (20,076,868 | ) |
| | | | | | |
|
|
|
| | | | | TOTAL NET ASSETS - 100.00% | | $ | 119,817,129 | |
| | | | | | |
|
|
|
Percentages are stated as a percent of net assets.
| (a) | | All or portion of this security is on loan. |
| (b) | | Seven-day yield as of March 31, 2017. |
See notes to financial statements.
102
GuidePath® Flexible Income Allocation Fund
SCHEDULE OF INVESTMENTS
March 31, 2017
| | | | | | | | |
Number of
Shares
| | | | | Value
| |
| | | | | INVESTMENT COMPANIES - 99.08% | |
| | | | | Affiliated Mutual Funds - 0.64% | |
| | 68,915 | | | GuideMark® Core Fixed Income Fund - Institutional Shares | | $ | 637,465 | |
| | | | | | |
|
|
|
| | | | | Exchange Traded Funds - 55.98% | | | | |
| | 59,595 | | | iShares 3-7 Year Treasury Bond ETF | | | 7,333,165 | |
| | 93,266 | | | iShares 7-10 Year Treasury Bond ETF (a) | | | 9,847,957 | |
| | 21,531 | | | iShares Core MSCI Emerging Markets ETF | | | 1,028,966 | |
| | 54,228 | | | iShares Floating Rate Bond ETF | | | 2,758,578 | |
| | 48,884 | | | iShares J.P. Morgan USD Emerging Markets Bond ETF (a) | | | 5,558,111 | |
| | 9,539 | | | PowerShares DB Agriculture Fund (b) | | | 188,681 | |
| | 5,019 | | | PowerShares DB Base Metals Fund (b) | | | 82,161 | |
| | 6,231 | | | PowerShares DB Energy Fund (b) | | | 78,448 | |
| | 6,058 | | | PowerShares DB Precious Metals Fund (b) | | | 230,567 | |
| | 46,507 | | | ProShares Investment Grade-Interest Rate Hedged ETF (a) | | | 3,544,298 | |
| | 43,181 | | | SPDR Bloomberg Barclays 1-3 Month T-Bill ETF (a) | | | 1,973,804 | |
| | 4,805 | | | Vanguard FTSE Developed Markets ETF | | | 188,837 | |
| | 113,860 | | | Vanguard Intermediate-Term Corporate Bond ETF | | | 9,835,227 | |
| | 139,952 | | | Vanguard Mortgage-Backed Securities ETF (a) | | | 7,350,279 | |
| | 16,856 | | | Vanguard S&P 500 ETF | | | 3,646,796 | |
| | 26,207 | | | Vanguard Total Bond Market ETF | | | 2,124,864 | |
| | | | | | |
|
|
|
| | | | | | | | 55,770,739 | |
| | | | | | |
|
|
|
| | | | | Mutual Funds - 42.46% | | | | |
| | 393,290 | | | BlackRock Low Duration Bond Portfolio - Institutional Shares | | | 3,783,454 | |
| | 162,294 | | | DoubleLine Core Fixed Income Fund - Institutional Shares | | | 1,762,510 | |
| | 502,871 | | | DoubleLine Low Duration Bond Fund - Institutional Shares | | | 5,048,827 | |
| | 361,299 | | | DoubleLine Multi-Asset Growth Fund - Institutional Shares (c) | | | 3,555,179 | |
| | 1,125,122 | | | DoubleLine Total Return Bond Fund - Institutional Shares | | | 11,960,051 | |
| | 877,099 | | | T. Rowe Price Institutional Floating Rate Fund | | | 8,823,616 | |
| | 1,252,984 | | | Vanguard High-Yield Corporate Fund - Admiral Shares | | | 7,367,545 | |
| | | | | | |
|
|
|
| | | | | | | | 42,301,182 | |
| | | | | | |
|
|
|
| | | | | Total Investment Companies
(Cost $96,637,868) | | | 98,709,386 | |
| | | | | | |
|
|
|
| | | | | | | | |
Number of
Shares
| | | | | Value
| |
| | | | | SHORT TERM INVESTMENTS - 1.01% | |
| | | | | Money Market Funds - 1.01% | |
| | 1,001,983 | | | Deutsche Government Money Market Series - Institutional Shares
Effective Yield, 0.63% (d) | | $ | 1,001,983 | |
| | | | | | |
|
|
|
| | | | | Total Short Term Investments
(Cost $1,001,983) | | | 1,001,983 | |
| | | | | | |
|
|
|
| | | | | INVESTMENTS PURCHASED AS SECURITIES LENDING COLLATERAL - 18.28% | |
| | | | | Investment Companies - 18.28% | |
| | 18,216,561 | | | Mount Vernon Liquid Assets Portfolio, LLC
Effective Yield, 1.17% (d) | | | 18,216,561 | |
| | | | | | |
|
|
|
| | | | | Total Investments Purchased as Securities Lending Collateral
(Cost $18,216,561) | | | 18,216,561 | |
| | | | | | |
|
|
|
| | | | | Total Investments
(Cost $115,856,412) - 118.37% | | | 117,927,930 | |
| | | | | Liabilities in Excess of
Other Assets - (18.37)% | | | (18,300,294 | ) |
| | | | | | |
|
|
|
| | | | | TOTAL NET ASSETS - 100.00% | | $ | 99,627,636 | |
| | | | | | |
|
|
|
Percentages are stated as a percent of net assets.
| (a) | | All or portion of this security is on loan. |
| (b) | | Non-income producing security. |
| (c) | | Certain GPS Funds invest in securities of unaffiliated underlying funds in accordance with Section 12(d)(1)(F) of the Investment Company Act of 1940. Such investments are potentially illiquid, because an unaffiliated underlying fund, under the terms of Section 12(d)(1)(F), is not obligated to redeem its shares in an amount exceeding 1% of its total outstanding shares during any period of less than thirty days. Investments made in accordance with Section 12(d)(1)(F) that exceed 1% of the outstanding shares of each underlying fund, and therefore are potentially illiquid, amount to 1.86% of total net assets as of March 31, 2017. |
| (d) | | Seven-day yield as of March 31, 2017. |
See notes to financial statements.
103
GuidePath® Managed Futures Strategy Fund
CONSOLIDATED SCHEDULE OF INVESTMENTS
March 31, 2017
| | | | | | | | |
Principal
Amount
| | | | | Value
| |
| | | | | SHORT TERM INVESTMENTS - 99.47% | |
| | | | | Certificate of Deposit - 72.34% | | | | |
| $ | 2,800,000 | | | Abbey National Treasury Services Plc
0.820%, 04/03/2017 | | $ | 2,800,000 | |
| | 2,500,000 | | | Banco Del Estado De Chile
1.310%, 07/05/2017 (a) | | | 2,502,347 | |
| | 2,000,000 | | | Bank of Montreal
1.434%, 05/12/2017 (a) | | | 2,000,183 | |
| | 2,500,000 | | | Bank of Nova Scotia
1.271%, 06/14/2017 (a) | | | 2,501,510 | |
| | 2,000,000 | | | Bank of Tokyo-Mitsubishi, Ltd.
1.300%, 04/21/2017 | | | 2,000,006 | |
| | 3,500,000 | | | CIBC
0.820%, 04/03/2017 | | | 3,500,000 | |
| | 1,500,000 | | | Commonwealth Bank of Australia
1.367%, 02/23/2018 (a) | | | 1,500,562 | |
| | 3,000,000 | | | Cooperatieve Rabobank UA
1.228%, 07/10/2017 (a) | | | 3,001,911 | |
| | 2,500,000 | | | Credit Agricole Corp. and Investment Bank
0.900%, 04/12/2017 | | | 2,500,000 | |
| | 2,500,000 | | | Credit Industriel et Commercial
1.050%, 06/20/2017 | | | 2,500,768 | |
| | | | | Dexia Credit Local SA | | | | |
| | 2,000,000 | | | 1.281%, 08/11/2017 (a) | | | 2,001,550 | |
| | 750,000 | | | 1.462%, 01/29/2018 (a) | | | 750,980 | |
| | 2,800,000 | | | DNB ASA
1.000%, 04/28/2017 | | | 2,800,000 | |
| | 2,500,000 | | | Landesbank Hessen-Thueringen
0.920%, 04/07/2017 | | | 2,500,000 | |
| | | | | Mizuho Bank, Ltd. | | | | |
| | 1,200,000 | | | 1.678%, 04/18/2017 (a) | | | 1,200,000 | |
| | 1,800,000 | | | 1.440%, 07/06/2017 (a) | | | 1,801,559 | |
| | 2,500,000 | | | National Australia Bank
1.080%, 08/08/2017 | | | 2,499,697 | |
| | 3,550,000 | | | National Bank of Kuwait
0.830%, 04/03/2017 | | | 3,550,000 | |
| | 2,000,000 | | | Oversea-Chinese Banking Corp., Ltd.
1.030%, 06/15/2017 | | | 1,999,801 | |
| | | | | Royal Bank of Canada | | | | |
| | 500,000 | | | 1.247%, 05/08/2017 (a) | | | 500,000 | |
| | 700,000 | | | 1.261%, 06/12/2017 (a) | | | 700,418 | |
| | 2,700,000 | | | Skandinaviska Enskilda Banken AB
1.433%, 06/02/2017 (a) | | | 2,701,355 | |
| | | | | Sumitomo Mitsui Trust Bank, Ltd. | | | | |
| | 500,000 | | | 1.511%, 04/03/2017 (a) | | | 500,007 | |
| | 2,500,000 | | | 0.960%, 04/07/2017 | | | 2,500,000 | |
| | 1,500,000 | | | Swedbank AB
0.880%, 04/05/2017 | | | 1,500,000 | |
| | 2,000,000 | | | The Norinchukin Bank
1.300%, 06/19/2017 | | | 2,000,993 | |
| | | | | The Toronto-Dominion Bank | | | | |
| | 500,000 | | | 1.060%, 04/05/2017 | | | 500,000 | |
| | 2,500,000 | | | 1.534%, 08/10/2017 (a) | | | 2,504,120 | |
| | 2,500,000 | | | Westpac Banking Corp.
1.378%, 01/10/2018 (a) | | | 2,504,415 | |
| | | | | | |
|
|
|
| | | | | | | | 59,822,182 | |
| | | | | | |
|
|
|
| | | | | | | | |
Principal
Amount
| | | | | Value
| |
| | | | | Commercial Paper - 8.33% | | | | |
| $ | 2,900,000 | | | COFCO Capital Corp.
1.040%, 04/27/2017 (b) | | $ | 2,897,822 | |
| | 2,000,000 | | | ING US Funding LLC
1.000%, 04/20/2017 (b) | | | 1,998,944 | |
| | 2,000,000 | | | Swedbank AB
1.000%, 05/30/2017 (b) | | | 1,996,722 | |
| | | | | | |
|
|
|
| | | | | | | | 6,893,488 | |
| | | | | | |
|
|
|
| | | | | Corporate Obligations - 3.51% | |
| | 2,900,000 | | | Bank of America Corp.
1.060%, 06/09/2017 | | | 2,899,327 | |
| | | | | | |
|
|
|
| | | | | | | | 2,899,327 | |
| | | | | | |
|
|
|
| | |
Number of
Shares
| | | | | | |
| | | | | Money Market Funds - 0.31% | |
| | 254,234 | | | Deutsche Government Money Market
Series - Institutional Shares
Effective Yield, 0.63% (c)(e) | | | 254,234 | |
| | | | | | |
|
|
|
| | | | | | | | 254,234 | |
| | | | | | |
|
|
|
| |
Principal
Amount
| | | | |
| | | | | U.S. Treasury Bill - 14.98% | | | | |
| | | | | United States Treasury Bill | | | | |
| $ | 1,000,000 | | | 0.525%, 04/06/2017 (b)(d)(e) | | | 999,924 | |
| | 2,050,000 | | | 0.718%, 04/20/2017 (b)(d)(e) | | | 2,049,437 | |
| | 3,050,000 | | | 0.708%, 05/11/2017 (b)(d)(e) | | | 3,048,286 | |
| | 3,000,000 | | | 0.698%, 06/08/2017 (b)(d)(e) | | | 2,996,121 | |
| | 800,000 | | | 0.738%, 07/06/2017 (b)(d)(e) | | | 798,415 | |
| | 2,000,000 | | | 0.753%, 07/13/2017 (b)(d) | | | 1,995,680 | |
| | 500,000 | | | 0.763%, 08/03/2017 (b)(d) | | | 498,670 | |
| | | | | | |
|
|
|
| | | | | | | | 12,386,533 | |
| | | | | | |
|
|
|
| | | | | Total Short Term Investments
(Cost $82,237,400) | | | 82,255,764 | |
| | | | | | |
|
|
|
| | | | | Total Investments
(Cost $82,237,400) - 99.47% | | | 82,255,764 | |
| | | | | Other Assets in Excess of
Liabilities - 0.53% | | | 436,061 | |
| | | | | | |
|
|
|
| | | | | TOTAL NET ASSETS - 100.00% | | $ | 82,691,825 | |
| | | | | | |
|
|
|
Percentages are stated as a percent of net assets.
| (a) | | Variable Rate Security. The rate shown is the rate in effect on March 31, 2017. |
| (b) | | Zero coupon bond. The effective yield is listed. |
| (c) | | Seven-day yield as of March 31, 2017. |
| (d) | | All or a portion of this security is held as collateral for certain futures contracts. |
| (e) | | All or a portion of this security is held by GuidePath® Managed Futures Strategy Cayman Fund Ltd. |
See notes to financial statements.
104
GuidePath® Managed Futures Strategy Fund
CONSOLIDATED SCHEDULE OF OPEN FUTURES CONTRACTS
March 31, 2017
| | | | | | | | | | | | | | | | |
Description
| | Number of
Contracts
Purchased / (Sold)
| | | Notional
Value
| | | Settlement
Month
| | | Unrealized
Appreciation
(Depreciation)
| |
Amsterdam IDX Futures | | | 45 | | | $ | 4,946,553 | | | | Apr-17 | | | $ | 59,433 | |
Australian 3-Year Treasury Bond Futures | | | 13 | | | | 973,833 | | | | Jun-17 | | | | 218 | |
Australian 10-Year Treasury Bond Futures | | | (47 | ) | | | (3,492,773 | ) | | | Jun-17 | | | | (97,602 | ) |
Australian Dollar Futures | | | 114 | | | | 8,705,040 | | | | Jun-17 | | | | 29,129 | |
Brent Crude Futures (a) | | | (14 | ) | | | (749,420 | ) | | | Jun-17 | | | | (38,262 | ) |
British Pound Futures | | | (60 | ) | | | (4,708,500 | ) | | | Jun-17 | | | | (133,378 | ) |
CAC40 Index Futures | | | 54 | | | | 2,946,905 | | | | Apr-17 | | | | 74,751 | |
Canadian 10-Year Bond Futures | | | 3 | | | | 309,779 | | | | Jun-17 | | | | (350 | ) |
Canadian Dollar Futures | | | (53 | ) | | | (3,992,490 | ) | | | Jun-17 | | | | (58,674 | ) |
Cocoa Futures (a) | | | (51 | ) | | | (1,069,980 | ) | | | Jul-17 | | | | 35,184 | |
Coffee ‘C’ Futures (a) | | | 10 | | | | 531,188 | | | | Jul-17 | | | | (221 | ) |
Copper Futures (a) | | | 28 | | | | 1,856,750 | | | | May-17 | | | | (53,350 | ) |
Corn Futures (a) | | | (163 | ) | | | (3,029,763 | ) | | | Jul-17 | | | | (3,436 | ) |
Cotton No. 2 Futures (a) | | | 39 | | | | 1,507,935 | | | | May-17 | | | | 13,455 | |
DAX® Index Futures | | | 12 | | | | 3,945,945 | | | | Jun-17 | | | | 97,279 | |
DJIA E-Mini CBOT Futures | | | 54 | | | | 5,563,080 | | | | Jun-17 | | | | (60,500 | ) |
E-mini Nasdaq 100 Futures | | | 57 | | | | 6,199,890 | | | | Jun-17 | | | | 77,139 | |
E-mini S&P 500 Futures | | | 35 | | | | 4,128,600 | | | | Jun-17 | | | | (22,728 | ) |
Euribor 3 Month Futures | | | 90 | | | | 24,073,881 | | | | Sep-17 | | | | 6,711 | |
Euro Fx Futures | | | (99 | ) | | | (13,268,475 | ) | | | Jun-17 | | | | (144,397 | ) |
Euro Stoxx 50® Index Futures | | | 126 | | | | 4,605,133 | | | | Jun-17 | | | | 112,506 | |
Euro-Bobl Futures | | | 137 | | | | 19,262,839 | | | | Jun-17 | | | | (64,697 | ) |
Euro-BTP Futures | | | (35 | ) | | | (4,879,718 | ) | | | Jun-17 | | | | (40,556 | ) |
Euro-Bund Futures | | | 69 | | | | 11,882,033 | | | | Jun-17 | | | | 9,787 | |
Eurodollar 90 Day Futures | | | (377 | ) | | | (92,902,225 | ) | | | Sep-17 | | | | 14,692 | |
Euro-OATS Futures | | | (32 | ) | | | (5,019,608 | ) | | | Jun-17 | | | | (36,828 | ) |
Euro-Schatz Futures | | | 291 | | | | 34,845,308 | | | | Jun-17 | | | | (36,713 | ) |
FTSE 100 Index Futures | | | 38 | | | | 3,463,873 | | | | Jun-17 | | | | (8,907 | ) |
FTSE MIB Index Futures | | | 22 | | | | 2,352,952 | | | | Jun-17 | | | | 93,107 | |
FTSE/JSE Top 40 Index Futures | | | (29 | ) | | | (989,302 | ) | | | Jun-17 | | | | (9,658 | ) |
Gold 100 Oz. Futures (a) | | | (7 | ) | | | (875,840 | ) | | | Jun-17 | | | | (155 | ) |
Hang Seng Index Futures | | | 26 | | | | 4,036,582 | | | | Apr-17 | | | | (31,788 | ) |
IBEX 35® Index Futures | | | 54 | | | | 5,998,541 | | | | Apr-17 | | | | 241,775 | |
Japanese Yen Futures | | | 27 | | | | 3,041,381 | | | | Jun-17 | | | | (8,282 | ) |
Live Cattle Futures (a) | | | 50 | | | | 2,217,500 | | | | Jun-17 | | | | 3,628 | |
LME Aluminium Futures (a)(b) | | | 56 | | | | 2,749,950 | | | | Jun-17 | | | | 35,106 | |
LME Copper Futures (a)(b) | | | 17 | | | | 2,481,681 | | | | Jun-17 | | | | (73,349 | ) |
LME Nickel Futures (a)(b) | | | 21 | | | | 1,262,268 | | | | Jun-17 | | | | (129,091 | ) |
LME Nickel Futures (a)(b) | | | (6 | ) | | | (360,648 | ) | | | Jun-17 | | | | 3,985 | |
LME Zinc Futures (a)(b) | | | 24 | | | | 1,662,600 | | | | Jun-17 | | | | (46,989 | ) |
Long Gilt Futures | | | 72 | | | | 11,508,814 | | | | Jun-17 | | | | 107,240 | |
Low Sulphur Gas Oil Futures (a) | | | 1 | | | | 47,100 | | | | May-17 | | | | (251 | ) |
Mexican Peso Futures | | | 59 | | | | 1,555,830 | | | | Jun-17 | | | | 12,845 | |
MSCI Singapore Index Futures | | | 69 | | | | 1,723,212 | | | | Apr-17 | | | | 23,316 | |
MSCI Taiwan Index Futures | | | 99 | | | | 3,590,730 | | | | Apr-17 | | | | (34,453 | ) |
Natural Gas Futures (a) | | | (15 | ) | | | (478,500 | ) | | | May-17 | | | | (12,493 | ) |
New Zealand Dollar Futures | | | 36 | | | | 2,519,640 | | | | Jun-17 | | | | 3,365 | |
Nifty 50 Index Futures | | | 199 | | | | 3,660,804 | | | | Apr-17 | | | | 26,111 | |
Nikkei 225 Futures | | | 18 | | | | 3,057,397 | | | | Jun-17 | | | | (55,250 | ) |
OMXS30 Futures | | | 276 | | | | 4,873,542 | | | | Apr-17 | | | | 90,872 | |
RBOB Gasoline Futures (a) | | | (23 | ) | | | (1,645,098 | ) | | | May-17 | | | | (84,971 | ) |
Russell 2000 Mini Index Futures | | | 53 | | | | 3,668,660 | | | | Jun-17 | | | | 47,177 | |
S&P/TSX 60 Index Futures | | | 37 | | | | 5,075,415 | | | | Jun-17 | | | | (1,659 | ) |
Silver Futures (a) | | | 17 | | | | 1,551,760 | | | | May-17 | | | | 24,472 | |
Soybean Futures (a) | | | (66 | ) | | | (3,158,100 | ) | | | Jul-17 | | | | 161,155 | |
Soybean Meal Futures (a) | | | (57 | ) | | | (1,777,260 | ) | | | Jul-17 | | | | 42,174 | |
Soybean Oil Futures (a) | | | (112 | ) | | | (2,155,104 | ) | | | Jul-17 | | | | 74,455 | |
SPI 200TM Index Futures | | | 41 | | | | 4,579,571 | | | | Jun-17 | | | | 85,795 | |
Sterling LIBOR 90 Day Futures | | | 734 | | | | 114,470,526 | | | | Sep-17 | | | | 31,774 | |
See notes to financial statements.
105
GuidePath® Managed Futures Strategy Fund
CONSOLIDATED SCHEDULE OF OPEN FUTURES CONTRACTS (Continued)
March 31, 2017
| | | | | | | | | | | | | | | | |
Description
| | Number of
Contracts
Purchased / (Sold)
| | | Notional
Value
| | | Settlement
Month
| | | Unrealized
Appreciation
(Depreciation)
| |
Sugar No. 11 Futures (a) | | | (42 | ) | | $ | (794,035 | ) | | | Jul-17 | | | $ | (143 | ) |
Swiss Franc Futures | | | (19 | ) | | | (2,384,500 | ) | | | Jun-17 | | | | (28,223 | ) |
TOPIX Index Futures | | | 25 | | | | 3,396,434 | | | | Jun-17 | | | | (62,030 | ) |
U.S. Treasury 2-Year Note Futures | | | (60 | ) | | | (12,987,188 | ) | | | Jun-17 | | | | (41,474 | ) |
U.S. Treasury 5-Year Note Futures | | | (43 | ) | | | (5,062,242 | ) | | | Jun-17 | | | | (46,427 | ) |
U.S. Treasury 10-Year Note Futures | | | (26 | ) | | | (3,238,625 | ) | | | Jun-17 | | | | (42,429 | ) |
U.S. Treasury Long Bond Futures | | | (14 | ) | | | (2,111,813 | ) | | | Jun-17 | | | | (48,663 | ) |
U.S. Treasury Ultra Bond Futures | | | (14 | ) | | | (2,248,750 | ) | | | Jun-17 | | | | (35,449 | ) |
Wheat Futures (a) | | | (102 | ) | | | (2,238,900 | ) | | | Jul-17 | | | | (2,762 | ) |
WTI Crude Futures (a) | | | (36 | ) | | | (1,821,600 | ) | | | May-17 | | | | (99,400 | ) |
| | | | | | | | | | | | | | |
|
|
|
| | | | | | | | | | | | | | | $ | (57,352 | ) |
| | | | | | | | | | | | | | |
|
|
|
| (a) | | All or a portion of this security is held by GuidePath® Managed Futures Strategy Cayman Fund Ltd. |
| (b) | | London Metal Exchange (“LME”) futures contracts settle on their respective maturity date, and do not have daily cash movements like other futures contracts. The unrealized appreciation on these contracts is a receivable for unsettled open futures contracts and the unrealized depreciation is a payable for unsettled open futures contracts on the Fund’s consolidated statement of assets and liabilities. |
See notes to financial statements.
106
GuideMark® Funds & GuidePath® Funds
STATEMENTS OF ASSETS & LIABILITIES
March 31, 2017
| | | | | | | | | | | | |
| | | Large Cap
Core Fund
| | | Emerging
Markets Fund
| | | Small/Mid Cap
Core Fund
| |
ASSETS: | | | | | | | | | | | | |
Investments, at value (cost $213,109,612, $104,814,356, and $127,320,310, respectively)1 | | $ | 252,649,394 | | | $ | 123,968,538 | | | $ | 148,052,482 | |
Foreign currencies (cost $0, $86,701, and $0, respectively) | | | — | | | | 85,386 | | | | — | |
Cash | | | 4,528 | | | | — | | | | — | |
Income receivable | | | 212,079 | | | | 302,384 | | | | 133,446 | |
Receivable for dividend reclaims | | | 3,667 | | | | 38,417 | | | | — | |
Receivable for investment securities sold | | | — | | | | 2,496,536 | | | | 76,554 | |
Receivable for fund shares sold | | | 159,603 | | | | 377,835 | | | | 102,429 | |
Other assets | | | 32,215 | | | | 27,899 | | | | 37,031 | |
| | |
|
|
| |
|
|
| |
|
|
|
Total Assets | | | 253,061,486 | | | | 127,296,995 | | | | 148,401,942 | |
| | |
|
|
| |
|
|
| |
|
|
|
LIABILITIES: | | | | | | | | | | | | |
Payable for collateral on securities loaned | | | 49,865,866 | | | | 838,995 | | | | 32,709,937 | |
Payable for investment securities purchased | | | — | | | | 8,062,347 | | | | — | |
Payable for fund shares redeemed | | | 218,763 | | | | 165,925 | | | | 56,597 | |
Payable to Investment Advisor | | | 112,385 | | | | 77,007 | | | | 65,966 | |
Accrued Trustee fees and expenses | | | 2,969 | | | | 1,244 | | | | 1,309 | |
Depreciation on forward currency contracts | | | — | | | | 1,885 | | | | — | |
Other accrued expenses | | | 147,656 | | | | 146,264 | | | | 91,559 | |
| | |
|
|
| |
|
|
| |
|
|
|
Total Liabilities | | | 50,347,639 | | | | 9,293,667 | | | | 32,925,368 | |
| | |
|
|
| |
|
|
| |
|
|
|
NET ASSETS | | $ | 202,713,847 | | | $ | 118,003,328 | | | $ | 115,476,574 | |
| | |
|
|
| |
|
|
| |
|
|
|
NET ASSETS CONSIST OF: | | | | | | | | | | | | |
Capital stock | | | 157,544,852 | | | | 190,280,669 | | | | 93,970,059 | |
Unrealized appreciation (depreciation) on: | | | | | | | | | | | | |
Investments | | | 39,539,782 | | | | 19,154,182 | | | | 20,732,172 | |
Foreign currencies | | | — | | | | 12,061 | | | | — | |
Forward currency contracts | | | — | | | | (1,885 | ) | | | — | |
Accumulated undistributed net investment income (loss) | | | 355,378 | | | | (188,840 | ) | | | 59,283 | |
Accumulated undistributed net realized gain (loss) | | | 5,273,835 | | | | (91,252,859 | ) | | | 715,060 | |
| | |
|
|
| |
|
|
| |
|
|
|
Total Net Assets | | $ | 202,713,847 | | | $ | 118,003,328 | | | $ | 115,476,574 | |
| | |
|
|
| |
|
|
| |
|
|
|
Institutional Shares | | | | | | | | | | | | |
Shares outstanding (unlimited shares of no par value authorized) | | | 2,655,343 | | | | 885,963 | | | | 3,534,626 | |
Net assets | | | 42,855,994 | | | | 11,925,354 | | | | 64,819,232 | |
Net asset value, offering and redemption price per share | | $ | 16.14 | | | $ | 13.46 | | | $ | 18.34 | |
| | |
|
|
| |
|
|
| |
|
|
|
Service Shares | | | | | | | | | | | | |
Shares outstanding (unlimited shares of no par value authorized) | | | 10,032,760 | | | | 7,801,632 | | | | 2,835,701 | |
Net assets | | | 159,857,853 | | | | 106,077,974 | | | | 50,657,342 | |
Net asset value, offering and redemption price per share | | $ | 15.93 | | | $ | 13.60 | | | $ | 17.86 | |
| | |
|
|
| |
|
|
| |
|
|
|
1Includes loaned securities with a value of: | | $ | 48,747,250 | | | $ | 816,080 | | | $ | 31,961,820 | |
| | |
|
|
| |
|
|
| |
|
|
|
See notes to financial statements.
107
GuideMark® Funds & GuidePath® Funds
STATEMENTS OF ASSETS & LIABILITIES (Continued)
March 31, 2017
| | | | | | | | | | | | |
| | | World
ex-US Fund
| | | Opportunistic
Equity Fund
| | | Core
Fixed Income
Fund
| |
ASSETS: | | | | | | | | | | | | |
Investments, at value (cost $166,071,764, $70,544,916 and $163,065,148, respectively)1 | | $ | 189,662,206 | | | $ | 85,459,702 | | | $ | 164,100,701 | |
Foreign currencies (cost $339,197, $0, and $0, respectively) | | | 338,852 | | | | — | | | | — | |
Cash | | | — | | | | — | | | | 15,333 | |
Appreciation on swap agreements | | | — | | | | — | | | | 235,441 | |
Variation margin on futures contracts | | | — | | | | — | | | | 6,375 | |
Income receivable | | | 643,327 | | | | 41,904 | | | | 785,761 | |
Receivable for dividend reclaims | | | 638,884 | | | | 552 | | | | — | |
Receivable for investment securities sold | | | — | | | | 219,586 | | | | 884,305 | |
Receivable for fund shares sold | | | 144,599 | | | | 88,517 | | | | 108,064 | |
Swap premiums paid | | | — | | | | — | | | | 60,439 | |
Other assets | | | 28,813 | | | | 31,576 | | | | 32,538 | |
| | |
|
|
| |
|
|
| |
|
|
|
Total Assets | | | 191,456,681 | | | | 85,841,837 | | | | 166,228,957 | |
| | |
|
|
| |
|
|
| |
|
|
|
LIABILITIES: | | | | | | | | | | | | |
Payable for collateral on securities loaned | | | 2,977,876 | | | | 19,335,822 | | | | 7,147,649 | |
Payable for investment securities purchased | | | — | | | | 4,184 | | | | 11,914,657 | |
Payable for fund shares redeemed | | | 171,544 | | | | 86,653 | | | | 146,701 | |
Payable to Investment Advisor | | | 108,919 | | | | 59,060 | | | | 91,191 | |
Accrued Trustee fees and expenses | | | 2,123 | | | | 746 | | | | 1,843 | |
Swap premiums received | | | — | | | | — | | | | 181,289 | |
Payable for deposits with broker for swaps | | | — | | | | — | | | | 120,629 | |
Other accrued expenses | | | 162,788 | | | | 61,837 | | | | 156,171 | |
| | |
|
|
| |
|
|
| |
|
|
|
Total Liabilities | | | 3,423,250 | | | | 19,548,302 | | | | 19,760,130 | |
| | |
|
|
| |
|
|
| |
|
|
|
NET ASSETS | | $ | 188,033,431 | | | $ | 66,293,535 | | | $ | 146,468,827 | |
| | |
|
|
| |
|
|
| |
|
|
|
NET ASSETS CONSIST OF: | | | | | | | | | | | | |
Capital stock | | | 317,534,431 | | | | 51,856,878 | | | | 145,495,065 | |
Unrealized appreciation (depreciation) on: | | | | | | | | | | | | |
Investments | | | 23,590,442 | | | | 14,914,786 | | | | 1,035,562 | |
Foreign currencies | | | (51,505 | ) | | | — | | | | — | |
Swaps | | | — | | | | — | | | | 235,441 | |
Futures contracts | | | — | | | | — | | | | 20,337 | |
Accumulated undistributed net investment income (loss) | | | 2,624,397 | | | | (56,230 | ) | | | 59,210 | |
Accumulated undistributed net realized gain (loss) | | | (155,664,334 | ) | | | (421,899 | ) | | | (376,788 | ) |
| | |
|
|
| |
|
|
| |
|
|
|
Total Net Assets | | $ | 188,033,431 | | | $ | 66,293,535 | | | $ | 146,468,827 | |
| | |
|
|
| |
|
|
| |
|
|
|
Institutional Shares | | | | | | | | | | | | |
Shares outstanding (unlimited shares of no par value authorized) | | | 8,980,810 | | | | — | | | | 985,259 | |
Net assets | | | 75,295,608 | | | | — | | | | 9,110,591 | |
Net asset value, offering and redemption price per share | | $ | 8.38 | | | $ | — | | | $ | 9.25 | |
| | |
|
|
| |
|
|
| |
|
|
|
Service Shares | | | | | | | | | | | | |
Shares outstanding (unlimited shares of no par value authorized) | | | 13,647,071 | | | | 5,872,151 | | | | 14,731,698 | |
Net assets | | | 112,737,823 | | | | 66,293,535 | | | | 137,358,236 | |
Net asset value, offering and redemption price per share | | $ | 8.26 | | | $ | 11.29 | | | $ | 9.32 | |
| | |
|
|
| |
|
|
| |
|
|
|
1Includes loaned securities with a value of: | | $ | 2,825,396 | | | $ | 18,869,841 | | | $ | 7,004,983 | |
| | |
|
|
| |
|
|
| |
|
|
|
See notes to financial statements.
108
GuideMark® Funds & GuidePath® Funds
STATEMENTS OF ASSETS & LIABILITIES (Continued)
March 31, 2017
| | | | | | | | | | | | |
| | | Tax-Exempt
Fixed Income
Fund
| | | Opportunistic
Fixed Income
Fund
| | | Growth
Allocation
Fund
| |
ASSETS: | | | | | | | | | | | | |
Investments, at value (cost $28,488,986, $62,222,862, and $421,826,053, respectively)1 | | $ | 30,304,892 | | | $ | 60,771,569 | | | $ | 476,213,662 | |
Investments in affiliates, at value (cost $0, $0 and $140,857,032, respectively) | | | — | | | | — | | | | 179,492,287 | |
Foreign currencies (cost $0, $884,722, and $0, respectively) | | | — | | | | 899,085 | | | | — | |
Cash | | | — | | | | 2,096 | | | | — | |
Deposits with brokers for forwards and swaps | | | — | | | | 2,203,917 | | | | — | |
Income receivable | | | 432,039 | | | | 647,549 | | | | 2,793 | |
Receivable for investment securities and foreign currencies sold | | | — | | | | 2,802,408 | | | | 220,671 | |
Receivable for fund shares sold | | | 1,226 | | | | 37,871 | | | | 2,115,301 | |
Appreciation of forward foreign currency contracts | | | — | | | | 1,323,677 | | | | — | |
Appreciation of swap agreements | | | — | | | | 52,500 | | | | — | |
Other assets | | | 17,297 | | | | 24,675 | | | | 60,441 | |
| | |
|
|
| |
|
|
| |
|
|
|
Total Assets | | | 30,755,454 | | | | 68,765,347 | | | | 658,105,155 | |
| | |
|
|
| |
|
|
| |
|
|
|
LIABILITIES: | | | | | | | | | | | | |
Depreciation of forward foreign currency contracts | | | — | | | | 362,066 | | | | — | |
Depreciation on swap agreements | | | — | | | | 1,203,905 | | | | — | |
Payable for collateral on securities loaned | | | — | | | | — | | | | 91,758,279 | |
Payable for investment securities and foreign currencies purchased | | | 347,439 | | | | 95,538 | | | | 1,183,520 | |
Payable for fund shares redeemed | | | 5,893 | | | | 78,721 | | | | 292,812 | |
Payable to broker for collateral received | | | — | | | | 200,000 | | | | — | |
Payable to Investment Advisor | | | 22,639 | | | | 28,999 | | | | 234,939 | |
Accrued Trustee fees and expenses | | | 385 | | | | 803 | | | | 6,281 | |
Other accrued expenses | | | 61,837 | | | | 93,607 | | | | 311,403 | |
| | |
|
|
| |
|
|
| |
|
|
|
Total Liabilities | | | 438,193 | | | | 2,063,639 | | | | 93,787,234 | |
| | |
|
|
| |
|
|
| |
|
|
|
NET ASSETS | | $ | 30,317,261 | | | $ | 66,701,708 | | | $ | 564,317,921 | |
| | |
|
|
| |
|
|
| |
|
|
|
NET ASSETS CONSIST OF: | | | | | | | | | | | | |
Capital stock | | | 30,213,755 | | | | 82,739,783 | | | | 469,833,330 | |
Unrealized appreciation (depreciation) on: | | | | | | | | | | | | |
Investments | | | 1,815,906 | | | | (1,451,293 | ) | | | 54,387,609 | |
Investments in affiliates | | | — | | | | — | | | | 38,635,255 | |
Foreign currencies | | | — | | | | 18,122 | | | | — | |
Swaps | | | — | | | | (1,151,405 | ) | | | — | |
Forward currency exchange contracts | | | — | | | | 961,611 | | | | — | |
Accumulated undistributed net investment income (loss) | | | 17,169 | | | | 12,504,155 | | | | (21,489 | ) |
Accumulated undistributed net realized gain (loss) | | | (1,729,569 | ) | | | (26,919,265 | ) | | | 1,483,216 | |
| | |
|
|
| |
|
|
| |
|
|
|
Total Net Assets | | $ | 30,317,261 | | | $ | 66,701,708 | | | $ | 564,317,921 | |
| | |
|
|
| |
|
|
| |
|
|
|
Institutional Shares | | | | | | | | | | | | |
Shares outstanding (unlimited shares of no par value authorized) | | | — | | | | 984,358 | | | | 1,162,164 | |
Net assets | | | — | | | | 9,316,917 | | | | 13,176,782 | |
Net asset value, offering and redemption price per share | | $ | — | | | $ | 9.46 | | | $ | 11.34 | |
| | |
|
|
| |
|
|
| |
|
|
|
Service Shares | | | | | | | | | | | | |
Shares outstanding (unlimited shares of no par value authorized) | | | 2,703,163 | | | | 6,000,347 | | | | 48,826,759 | |
Net assets | | | 30,317,261 | | | | 57,384,791 | | | | 551,141,139 | |
Net asset value, offering and redemption price per share | | $ | 11.22 | | | $ | 9.56 | | | $ | 11.29 | |
| | |
|
|
| |
|
|
| |
|
|
|
1Includes loaned securities with a value of: | | $ | — | | | $ | — | | | $ | 89,776,267 | |
| | |
|
|
| |
|
|
| |
|
|
|
See notes to financial statements.
109
GuideMark® Funds & GuidePath® Funds
STATEMENTS OF ASSETS & LIABILITIES (Continued)
March 31, 2017
| | | | | | | | | | | | |
| | | Conservative
Allocation
Fund
| | | Tactical
Allocation
Fund
| | | Absolute
Return
Allocation
Fund
| |
ASSETS: | | | | | | | | | | | | |
Investments, at value (cost $128,068,003, $308,932,728 and $141,178,248, respectively)1 | | $ | 132,695,919 | | | $ | 332,425,015 | | | $ | 149,286,468 | |
Investments in affiliates, at value (cost $11,414,204, $0, and $10,463,122, respectively) | | | 15,219,504 | | | | — | | | | 10,520,781 | |
Income receivable | | | 547 | | | | 1,311 | | | | 106,190 | |
Receivable for investment securities sold | | | — | | | | 409,185 | | | | 55,970 | |
Receivable for fund shares sold | | | 477,895 | | | | 783,541 | | | | 320,402 | |
Other assets | | | 42,463 | | | | 47,391 | | | | 58,435 | |
| | |
|
|
| |
|
|
| |
|
|
|
Total Assets | | | 148,436,328 | | | | 333,666,443 | | | | 160,348,246 | |
| | |
|
|
| |
|
|
| |
|
|
|
LIABILITIES: | | | | | | | | | | | | |
Payable for collateral on securities loaned | | | 32,173,173 | | | | 24,291,888 | | | | 30,145,575 | |
Payable for investment securities purchased | | | 118,347 | | | | 954,597 | | | | 89,293 | |
Payable for fund shares redeemed | | | 63,319 | | | | 117,726 | | | | 31,445 | |
Payable to Investment Advisor | | | 47,872 | | | | 156,985 | | | | 107,558 | |
Accrued Trustee fees and expenses | | | 1,309 | | | | 3,527 | | | | 1,464 | |
Other accrued expenses | | | 80,591 | | | | 214,936 | | | | 103,194 | |
| | |
|
|
| |
|
|
| |
|
|
|
Total Liabilities | | | 32,484,611 | | | | 25,739,659 | | | | 30,478,529 | |
| | |
|
|
| |
|
|
| |
|
|
|
NET ASSETS | | $ | 115,951,717 | | | $ | 307,926,784 | | | $ | 129,869,717 | |
| | |
|
|
| |
|
|
| |
|
|
|
NET ASSETS CONSIST OF: | | | | | | | | | | | | |
Capital stock | | | 111,579,116 | | | | 301,767,295 | | | | 134,931,899 | |
Unrealized appreciation on: | | | | | | | | | | | | |
Investments | | | 4,627,916 | | | | 23,492,287 | | | | 8,108,220 | |
Investments in affiliates | | | 3,805,300 | | | | — | | | | 57,659 | |
Accumulated undistributed net investment income | | | 1,203,281 | | | | 4,003,285 | | | | 612,562 | |
Accumulated undistributed net realized loss | | | (5,263,896 | ) | | | (21,336,083 | ) | | | (13,840,623 | ) |
| | |
|
|
| |
|
|
| |
|
|
|
Total Net Assets | | $ | 115,951,717 | | | $ | 307,926,784 | | | $ | 129,869,717 | |
| | |
|
|
| |
|
|
| |
|
|
|
Institutional Shares | | | | | | | | | | | | |
Shares outstanding (unlimited shares of no par value authorized) | | | 545,527 | | | | 367,591 | | | | 89,572 | |
Net assets | | | 4,966,270 | | | | 3,767,220 | | | | 921,609 | |
Net asset value, offering and redemption price per share | | $ | 9.10 | | | $ | 10.25 | | | $ | 10.29 | |
| | |
|
|
| |
|
|
| |
|
|
|
Service Shares | | | | | | | | | | | | |
Shares outstanding (unlimited shares of no par value authorized) | | | 12,250,224 | | | | 29,980,822 | | | | 12,493,366 | |
Net assets | | | 110,985,447 | | | | 304,159,564 | | | | 128,948,108 | |
Net asset value, offering and redemption price per share | | $ | 9.06 | | | $ | 10.15 | | | $ | 10.32 | |
| | |
|
|
| |
|
|
| |
|
|
|
1Includes loaned securities with a value of: | | $ | 31,544,061 | | | $ | 23,816,222 | | | $ | 29,491,600 | |
| | |
|
|
| |
|
|
| |
|
|
|
See notes to financial statements.
110
GuideMark® Funds & GuidePath® Funds
STATEMENTS OF ASSETS & LIABILITIES (Continued)
March 31, 2017
| | | | | | | | | | | | |
| | | Multi-Asset
Income
Allocation
Fund
| | | Flexible Income
Allocation
Fund
| | | Managed2
Futures
Strategy Fund
| |
ASSETS: | | | | | | | | | | | | |
Investments, at value (cost $122,634,200, $115,219,227, and $82,237,400, respectively)1 | | $ | 132,929,020 | | | $ | 117,290,465 | | | $ | 82,255,764 | |
Investments in affiliates, at value (cost $6,801,395, $637,185, and $0, respectively) | | | 6,964,977 | | | | 637,465 | | | | — | |
Deposits with brokers for futures | | | — | | | | — | | | | 414,751 | |
Variation margin on futures | | | — | | | | — | | | | 9,865 | |
Income receivable | | | 91,749 | | | | 8,840 | | | | 68,940 | |
Receivable for investment securities sold | | | — | | | | 57,407 | | | | — | |
Receivable for fund shares sold | | | 208,320 | | | | 75,186 | | | | 348,883 | |
Receivable from broker for futures | | | — | | | | — | | | | 527 | |
Receivable for unsettled open futures contracts | | | — | | | | — | | | | 39,104 | |
Other assets | | | 14,062 | | | | 11,409 | | | | 25,167 | |
| | |
|
|
| |
|
|
| |
|
|
|
Total Assets | | | 140,208,128 | | | | 118,080,772 | | | | 83,163,001 | |
| | |
|
|
| |
|
|
| |
|
|
|
LIABILITIES: | | | | | | | | | | | | |
Payable for collateral on securities loaned | | | 19,755,971 | | | | 18,216,561 | | | | — | |
Payable for investment securities purchased | | | 430,988 | | | | 73,837 | | | | — | |
Payable for fund shares redeemed | | | 49,072 | | | | 28,346 | | | | 32,124 | |
Payable for unsettled open futures contracts | | | — | | | | — | | | | 249,442 | |
Payable to Investment Advisor | | | 60,753 | | | | 42,654 | | | | 96,226 | |
Accrued Trustee fees and expenses | | | 1,361 | | | | 1,159 | | | | 993 | |
Other accrued expenses | | | 92,854 | | | | 90,579 | | | | 92,391 | |
| | |
|
|
| |
|
|
| |
|
|
|
Total Liabilities | | | 20,390,999 | | | | 18,453,136 | | | | 471,176 | |
| | |
|
|
| |
|
|
| |
|
|
|
NET ASSETS | | $ | 119,817,129 | | | $ | 99,627,636 | | | $ | 82,691,825 | |
| | |
|
|
| |
|
|
| |
|
|
|
NET ASSETS CONSIST OF: | | | | | | | | | | | | |
Capital stock | | | 119,764,590 | | | | 108,183,666 | | | | 86,810,146 | |
Unrealized appreciation (depreciation) on: | | | | | | | | | | | | |
Investments | | | 10,294,820 | | | | 2,071,238 | | | | 18,364 | |
Investments in affiliates | | | 163,582 | | | | 280 | | | | — | |
Foreign currency translation | | | — | | | | — | | | | (3,487 | ) |
Futures contracts | | | — | | | | — | | | | (57,352 | ) |
Accumulated undistributed net investment income gain (loss) | | | 112,867 | | | | 38,394 | | | | (167,523 | ) |
Accumulated undistributed net realized loss | | | (10,518,730 | ) | | | (10,665,942 | ) | | | (3,908,323 | ) |
| | |
|
|
| |
|
|
| |
|
|
|
Total Net Assets | | $ | 119,817,129 | | | $ | 99,627,636 | | | $ | 82,691,825 | |
| | |
|
|
| |
|
|
| |
|
|
|
Institutional Shares | | | | | | | | | | | | |
Shares outstanding (unlimited shares of no par value authorized) | | | — | | | | 5,429 | | | | 169,985 | |
Net assets | | | — | | | | 52,492 | | | | 1,478,880 | |
Net asset value, offering and redemption price per share | | $ | — | | | $ | 9.67 | | | $ | 8.70 | |
| | |
|
|
| |
|
|
| |
|
|
|
Service Shares | | | | | | | | | | | | |
Shares outstanding (unlimited shares of no par value authorized) | | | 11,450,167 | | | | 10,362,428 | | | | 9,402,473 | |
Net assets | | | 119,817,129 | | | | 99,575,144 | | | | 81,212,945 | |
Net asset value, offering and redemption price per share | | $ | 10.46 | | | $ | 9.61 | | | $ | 8.64 | |
| | |
|
|
| |
|
|
| |
|
|
|
1Includes loaned securities with a value of: | | $ | 19,367,389 | | | $ | 17,804,860 | | | $ | — | |
| | |
|
|
| |
|
|
| |
|
|
|
2Consolidated Statement of Assets & Liabilities (see note 3b). | | | | | | | | | | | | |
See notes to financial statements.
111
GuideMark® Funds & GuidePath® Funds
STATEMENTS OF OPERATIONS
For the Year Ended March 31, 2017
| | | | | | | | | | | | |
| | | Large Cap
Core Fund
| | | Emerging
Markets Fund
| | | Small/Mid Cap
Core Fund
| |
INVESTMENT INCOME: | | | | | | | | | | | | |
Dividend income (net of withholding tax of $1,444, $343,466, and $694, respectively) | | $ | 4,558,929 | | | $ | 2,666,805 | | | $ | 1,560,382 | |
Interest income | | | 10,598 | | | | 790 | | | | 3,488 | |
| | |
|
|
| |
|
|
| |
|
|
|
Total investment income | | | 4,569,527 | | | | 2,667,595 | | | | 1,563,870 | |
| | |
|
|
| |
|
|
| |
|
|
|
EXPENSES: | | | | | | | | | | | | |
Investment advisory fees | | | 1,091,699 | | | | 668,790 | | | | 590,513 | |
Distribution (12b-1) fees – Service Shares | | | 509,726 | | | | 264,221 | | | | 127,391 | |
Administrative service fees – Service Shares | | | 493,293 | | | | 259,154 | | | | 124,912 | |
Shareholder servicing fees – Service Shares | | | 169,920 | | | | 85,797 | | | | 42,803 | |
Administration fees | | | 113,093 | | | | 57,528 | | | | 67,808 | |
Fund accounting fees | | | 86,976 | | | | 123,430 | | | | 111,777 | |
Legal fees | | | 80,026 | | | | 52,310 | | | | 32,831 | |
Custody fees | | | 43,255 | | | | 182,382 | | | | 29,895 | |
Trustee fees and expenses | | | 40,978 | | | | 19,396 | | | | 17,111 | |
Federal and state registration fees | | | 37,068 | | | | 33,958 | | | | 31,580 | |
Reports to shareholders | | | 28,365 | | | | 14,222 | | | | 23,369 | |
Audit and tax fees | | | 20,523 | | | | 20,454 | | | | 21,490 | |
Transfer agent fees and expenses | | | 17,310 | | | | 11,197 | | | | 10,817 | |
Compliance fees | | | 14,518 | | | | 6,982 | | | | 6,501 | |
Insurance fees | | | 9,423 | | | | 7,332 | | | | 4,195 | |
Miscellaneous expenses | | | 3,098 | | | | 3,577 | | | | 2,329 | |
Interest expenses | | | 1,643 | | | | 1,558 | | | | 5 | |
| | |
|
|
| |
|
|
| |
|
|
|
Total expenses | | | 2,760,914 | | | | 1,812,288 | | | | 1,245,327 | |
| | |
|
|
| |
|
|
| |
|
|
|
Less securities lending credit (See Note 7) | | | (158,681 | ) | | | (11,847 | ) | | | (265,806 | ) |
| | |
|
|
| |
|
|
| |
|
|
|
Net expenses | | | 2,602,233 | | | | 1,800,441 | | | | 979,521 | |
| | |
|
|
| |
|
|
| |
|
|
|
Net investment income | | | 1,967,294 | | | | 867,154 | | | | 584,349 | |
| | |
|
|
| |
|
|
| |
|
|
|
NET REALIZED AND UNREALIZED GAIN ON INVESTMENTS: | | | | | | | | | | | | |
Net realized gain (loss) on: | | | | | | | | | | | | |
Investments | | | 11,575,308 | | | | 3,686,633 | | | | 2,596,131 | |
Foreign currencies | | | — | | | | (67,099 | ) | | | — | |
Forward currency contracts | | | — | | | | (21,022 | ) | | | — | |
| | |
|
|
| |
|
|
| |
|
|
|
Total | | | 11,575,308 | | | | 3,598,512 | | | | 2,596,131 | |
| | |
|
|
| |
|
|
| |
|
|
|
Net change in unrealized appreciation (depreciation) on: | | | | | | | | | | | | |
Investments | | | 9,712,500 | | | | 14,908,940 | | | | 16,860,179 | |
Foreign currencies | | | — | | | | 9,187 | | | | — | |
Forward currency contracts | | | — | | | | (1,885 | ) | | | — | |
| | |
|
|
| |
|
|
| |
|
|
|
Total | | | 9,712,500 | | | | 14,916,242 | | | | 16,860,179 | |
| | |
|
|
| |
|
|
| |
|
|
|
Net realized and unrealized gain | | | 21,287,808 | | | | 18,514,754 | | | | 19,456,310 | |
| | |
|
|
| |
|
|
| |
|
|
|
NET INCREASE IN NET ASSETS RESULTING FROM OPERATIONS | | $ | 23,255,102 | | | $ | 19,381,908 | | | $ | 20,040,659 | |
| | |
|
|
| |
|
|
| |
|
|
|
See notes to financial statements.
112
GuideMark® Funds & GuidePath® Funds
STATEMENTS OF OPERATIONS (Continued)
For the Year Ended March 31, 2017
| | | | | | | | | | | | |
| | | World
ex-US Fund
| | | Opportunistic
Equity Fund
| | | Core
Fixed Income
Fund
| |
INVESTMENT INCOME: | | | | | | | | | | | | |
Dividend income (net of withholding tax of $411,199, $1,761, and $0, respectively) | | $ | 5,056,247 | | | $ | 759,146 | | | $ | — | |
Interest income | | | 3,689 | | | | 9,497 | | | | 4,486,407 | |
| | |
|
|
| |
|
|
| |
|
|
|
Total investment income | | | 5,059,936 | | | | 768,643 | | | | 4,486,407 | |
| | |
|
|
| |
|
|
| |
|
|
|
EXPENSES: | | | | | | | | | | | | |
Investment advisory fees | | | 923,865 | | | | 526,409 | | | | 896,797 | |
Distribution (12b-1) fees – Service Shares | | | 304,239 | | | | 164,348 | | | | 432,230 | |
Administrative service fees – Service Shares | | | 297,373 | | | | 161,299 | | | | 416,270 | |
Shareholder servicing fees – Service Shares | | | 99,790 | | | | 52,977 | | | | 145,229 | |
Administration fees | | | 97,430 | | | | 23,228 | | | | 84,605 | |
Fund accounting fees | | | 181,432 | | | | 18,837 | | | | 193,948 | |
Legal fees | | | 59,552 | | | | 24,408 | | | | 40,619 | |
Custody fees | | | 136,109 | | | | 21,404 | | | | 44,875 | |
Trustee fees and expenses | | | 31,368 | | | | 11,373 | | | | 31,974 | |
Federal and state registration fees | | | 33,308 | | | | 31,391 | | | | 32,553 | |
Reports to shareholders | | | 21,370 | | | | 13,350 | | | | 19,003 | |
Audit and tax fees | | | 26,210 | | | | 20,990 | | | | 23,983 | |
Transfer agent fees and expenses | | | 14,497 | | | | 8,799 | | | | 14,304 | |
Compliance fees | | | 11,415 | | | | 4,016 | | | | 10,641 | |
Insurance fees | | | 12,323 | | | | 4,624 | | | | 12,743 | |
Miscellaneous expenses | | | 2,773 | | | | 2,314 | | | | 2,324 | |
Interest expenses | | | 641 | | | | 182 | | | | 751 | |
| | |
|
|
| |
|
|
| |
|
|
|
Total expenses | | | 2,253,695 | | | | 1,089,949 | | | | 2,402,849 | |
| | |
|
|
| |
|
|
| |
|
|
|
Net expense recapture (reimbursement) by Advisor (See Note 4) | | | (15,038 | ) | | | (6 | ) | | | (108,257 | ) |
Less securities lending credit (See Note 7) | | | (48,136 | ) | | | (46,884 | ) | | | (18,910 | ) |
| | |
|
|
| |
|
|
| |
|
|
|
Net expenses | | | 2,190,521 | | | | 1,043,059 | | | | 2,275,682 | |
| | |
|
|
| |
|
|
| |
|
|
|
Net investment income (loss) | | | 2,869,415 | | | | (274,416 | ) | | | 2,210,725 | |
| | |
|
|
| |
|
|
| |
|
|
|
NET REALIZED AND UNREALIZED GAIN (LOSS) ON INVESTMENTS: | | | | | | | | | | | | |
Net realized gain (loss) on: | | | | | | | | | | | | |
Investments | | | 1,630,887 | | | | 3,442,012 | | | | 2,490,604 | |
Foreign currencies | | | (175,775 | ) | | | — | | | | (20 | ) |
Forward currency contracts | | | 13,851 | | | | — | | | | — | |
Swaps | | | — | | | | — | | | | (35,652 | ) |
Futures contracts | | | — | | | | — | | | | (27,497 | ) |
Written options | | | — | | | | — | | | | (13,945 | ) |
| | |
|
|
| |
|
|
| |
|
|
|
Total | | | 1,468,963 | | | | 3,442,012 | | | | 2,413,490 | |
| | |
|
|
| |
|
|
| |
|
|
|
Net change in unrealized appreciation (depreciation) on: | | | | | | | | | | | | |
Investments | | | 13,720,044 | | | | 6,836,600 | | | | (4,244,425 | ) |
Foreign currencies | | | (35,605 | ) | | | — | | | | — | |
Swaps | | | — | | | | — | | | | 240,667 | |
Futures contracts | | | — | | | | — | | | | 8,080 | |
| | |
|
|
| |
|
|
| |
|
|
|
Total | | | 13,684,439 | | | | 6,836,600 | | | | (3,995,678 | ) |
| | |
|
|
| |
|
|
| |
|
|
|
Net realized and unrealized gain (loss) | | | 15,153,402 | | | | 10,278,612 | | | | (1,582,188 | ) |
| | |
|
|
| |
|
|
| |
|
|
|
NET INCREASE IN NET ASSETS RESULTING FROM OPERATIONS | | $ | 18,022,817 | | | $ | 10,004,196 | | | $ | 628,537 | |
| | |
|
|
| |
|
|
| |
|
|
|
See notes to financial statements.
113
GuideMark® Funds & GuidePath® Funds
STATEMENTS OF OPERATIONS (Continued)
For the Year Ended March 31, 2017
| | | | | | | | | | | | |
| | | Tax-Exempt
Fixed Income
Fund
| | | Opportunistic
Fixed Income
Fund
| | | Growth
Allocation
Fund
| |
INVESTMENT INCOME: | | | | | | | | | | | | |
Dividend income | | $ | — | | | $ | — | | | $ | 7,395,546 | |
Dividends from affiliate investments | | | — | | | | — | | | | 2,039,984 | |
Interest income (net of withholding tax of $0, $150,643, and $0, respectively) | | | 1,510,747 | | | | 4,543,411 | | | | 23,480 | |
| | |
|
|
| |
|
|
| |
|
|
|
Total investment income | | | 1,510,747 | | | | 4,543,411 | | | | 9,459,010 | |
| | |
|
|
| |
|
|
| |
|
|
|
EXPENSES: | | | | | | | | | | | | |
Investment advisory fees | | | 195,468 | | | | 533,875 | | | | 1,181,168 | |
Distribution (12b-1) fees – Service Shares | | | 97,734 | | | | 169,485 | | | | 1,150,468 | |
Administrative service fees – Service Shares | | | 89,085 | | | | 166,569 | | | | 1,149,974 | |
Shareholder servicing fees – Service Shares | | | 30,338 | | | | 49,489 | | | | 446,382 | |
Administration fees | | | 17,743 | | | | 33,620 | | | | 208,893 | |
Fund accounting fees | | | 31,660 | | | | 85,274 | | | | 106,406 | |
Legal fees | | | 15,574 | | | | 36,017 | | | | 122,266 | |
Custody fees | | | 4,602 | | | | 123,011 | | | | 98,674 | |
Trustee fees and expenses | | | 7,197 | | | | 13,612 | | | | 77,905 | |
Federal and state registration fees | | | 30,420 | | | | 30,480 | | | | 30,720 | |
Reports to shareholders | | | 3,544 | | | | 18,196 | | | | 58,757 | |
Audit and tax fees | | | 24,004 | | | | 28,493 | | | | 13,992 | |
Transfer agent fees and expenses | | | 6,532 | | | | 9,401 | | | | 28,051 | |
Compliance fees | | | 2,244 | | | | 2,995 | | | | 19,943 | |
Insurance fees | | | 2,494 | | | | 3,937 | | | | 10,364 | |
Miscellaneous expenses | | | 2,178 | | | | 1,903 | | | | 3,490 | |
Interest expenses | | | 292 | | | | — | | | | 2,234 | |
| | |
|
|
| |
|
|
| |
|
|
|
Total expenses | | | 561,109 | | | | 1,306,357 | | | | 4,709,687 | |
| | |
|
|
| |
|
|
| |
|
|
|
Net expense reimbursement by Advisor (See Note 4) | | | (56,510 | ) | | | (175,049 | ) | | | — | |
Less securities lending credit (See Note 7) | | | — | | | | — | | | | (444,989 | ) |
| | |
|
|
| |
|
|
| |
|
|
|
Net expenses | | | 504,599 | | | | 1,131,308 | | | | 4,264,698 | |
| | |
|
|
| |
|
|
| |
|
|
|
Net investment income | | | 1,006,148 | | | | 3,412,103 | | | | 5,194,312 | |
| | |
|
|
| |
|
|
| |
|
|
|
NET REALIZED AND UNREALIZED GAIN (LOSS) ON INVESTMENTS: | | | | | | | | | | | | |
Net realized gain (loss) on: | | | | | | | | | | | | |
Investments | | | 1,133,091 | | | | (4,791,389 | ) | | | 5,331,012 | |
Investments in affiliates | | | — | | | | — | | | | 1,780,678 | |
Net long-term capital gain distributions received | | | — | | | | — | | | | 56 | |
Net long-term capital gain distributions received from affiliates | | | — | | | | — | | | | 807,927 | |
Foreign currencies | | | — | | | | (170,533 | ) | | | — | |
Forward currency exchange contracts | | | — | | | | (1,979,287 | ) | | | — | |
Swaps | | | — | | | | (582,164 | ) | | | — | |
| | |
|
|
| |
|
|
| |
|
|
|
Total | | | 1,133,091 | | | | (7,523,373 | ) | | | 7,919,673 | |
| | |
|
|
| |
|
|
| |
|
|
|
Net change in unrealized appreciation (depreciation) on: | | | | | | | | | | | | |
Investments | | | (2,319,469 | ) | | | 5,263,986 | | | | 31,950,454 | |
Investments in affiliates | | | — | | | | — | | | | 17,912,800 | |
Foreign currencies | | | — | | | | 12,040 | | | | — | |
Forward currency contracts | | | — | | | | 2,993,489 | | | | — | |
Swaps | | | — | | | | 1,401,951 | | | | — | |
| | |
|
|
| |
|
|
| |
|
|
|
Total | | | (2,319,469 | ) | | | 9,671,466 | | | | 49,863,254 | |
| | |
|
|
| |
|
|
| |
|
|
|
Net realized and unrealized gain (loss) | | | (1,186,378 | ) | | | 2,148,093 | | | | 57,782,927 | |
| | |
|
|
| |
|
|
| |
|
|
|
NET INCREASE (DECREASE) IN NET ASSETS RESULTING FROM OPERATIONS | | $ | (180,230 | ) | | $ | 5,560,196 | | | $ | 62,977,239 | |
| | |
|
|
| |
|
|
| |
|
|
|
See notes to financial statements.
114
GuideMark® Funds & GuidePath® Funds
STATEMENTS OF OPERATIONS (Continued)
For the Year Ended March 31, 2017
| | | | | | | | | | | | |
| | | Conservative
Allocation
Fund
| | | Tactical
Allocation
Fund
| | | Absolute
Return
Allocation
Fund
| |
INVESTMENT INCOME: | | | | | | | | | | | | |
Dividend income | | $ | 1,847,061 | | | $ | 7,398,874 | | | $ | 5,117,750 | |
Dividends from affiliate investments | | | 156,319 | | | | — | | | | 335,307 | |
Interest income | | | 5,393 | | | | 10,293 | | | | 5,249 | |
| | |
|
|
| |
|
|
| |
|
|
|
Total investment income | | | 2,008,773 | | | | 7,409,167 | | | | 5,458,306 | |
| | |
|
|
| |
|
|
| |
|
|
|
EXPENSES: | | | | | | | | | | | | |
Investment advisory fees | | | 227,440 | | | | 1,185,279 | | | | 467,006 | |
Distribution (12b-1) fees – Service Shares | | | 215,282 | | | | 835,657 | | | | 331,046 | |
Administrative service fees – Service Shares | | | 214,862 | | | | 835,299 | | | | 330,797 | |
Shareholder servicing fees – Service Shares | | | 82,669 | | | | 317,550 | | | | 129,770 | |
Administration fees | | | 45,531 | | | | 156,628 | | | | 56,755 | |
Fund accounting fees | | | 21,550 | | | | 76,556 | | | | 30,633 | |
Legal fees | | | 25,368 | | | | 108,650 | | | | 48,166 | |
Custody fees | | | 37,479 | | | | 61,502 | | | | 59,065 | |
Trustee fees and expenses | | | 14,665 | | | | 59,599 | | | | 24,328 | |
Federal and state registration fees | | | 30,932 | | | | 31,848 | | | | 31,814 | |
Reports to shareholders | | | 20,706 | | | | 36,039 | | | | 16,266 | |
Audit and tax fees | | | 13,992 | | | | 13,992 | | | | 13,984 | |
Transfer agent fees and expenses | | | 10,152 | | | | 21,566 | | | | 12,000 | |
Compliance fees | | | 3,845 | | | | 13,856 | | | | 5,160 | |
Insurance fees | | | 2,802 | | | | 11,955 | | | | 6,123 | |
Miscellaneous expenses | | | 2,408 | | | | 3,491 | | | | 2,788 | |
Interest expenses | | | 53 | | | | 518 | | | | 2,054 | |
| | |
|
|
| |
|
|
| |
|
|
|
Total expenses | | | 969,736 | | | | 3,769,985 | | | | 1,567,755 | |
| | |
|
|
| |
|
|
| |
|
|
|
Net expense recapture by Advisor (See Note 4) | | | — | | | | — | | | | (11,972 | ) |
Less securities lending credit (See Note 7) | | | (188,104 | ) | | | (414,321 | ) | | | (92,067 | ) |
| | |
|
|
| |
|
|
| |
|
|
|
Net expenses | | | 781,632 | | | | 3,355,664 | | | | 1,463,716 | |
| | |
|
|
| |
|
|
| |
|
|
|
Net investment income | | | 1,227,141 | | | | 4,053,503 | | | | 3,994,590 | |
| | |
|
|
| |
|
|
| |
|
|
|
NET REALIZED AND UNREALIZED GAIN ON INVESTMENTS: | | | | | | | | | | | | |
Net realized gain (loss) on: | | | | | | | | | | | | |
Investments | | | (432,720 | ) | | | 8,717,010 | | | | 1,514,951 | |
Investments in affiliates | | | 196,589 | | | | — | | | | (99,366 | ) |
Net long-term capital gain distributions received | | | 379 | | | | — | | | | 71,576 | |
Net long-term capital gain distributions received from affiliates | | | 54,217 | | | | — | | | | — | |
| | |
|
|
| |
|
|
| |
|
|
|
Total | | | (181,535 | ) | | | 8,717,010 | | | | 1,487,161 | |
| | |
|
|
| |
|
|
| |
|
|
|
Net change in unrealized appreciation on: | | | | | | | | | | | | |
Investments | | | 2,275,472 | | | | 16,899,104 | | | | 5,151,666 | |
Investments in affiliates | | | 1,751,174 | | | | — | | | | 81,116 | |
| | |
|
|
| |
|
|
| |
|
|
|
Total | | | 4,026,646 | | | | 16,899,104 | | | | 5,232,782 | |
| | |
|
|
| |
|
|
| |
|
|
|
Net realized and unrealized gain | | | 3,845,111 | | | | 25,616,114 | | | | 6,719,943 | |
| | |
|
|
| |
|
|
| |
|
|
|
NET INCREASE IN NET ASSETS RESULTING FROM OPERATIONS | | $ | 5,072,252 | | | $ | 29,669,617 | | | $ | 10,714,533 | |
| | |
|
|
| |
|
|
| |
|
|
|
See notes to financial statements.
115
GuideMark® Funds & GuidePath® Funds
STATEMENTS OF OPERATIONS (Continued)
For the Year Ended March 31, 2017
| | | | | | | | | | | | |
| | | Multi-Asset
Income
Allocation
Fund
| | | Flexible Income
Allocation
Fund
| | | Managed1
Futures Strategy
Fund
| |
INVESTMENT INCOME: | | | | | | | | | | | | |
Dividend income | | $ | 4,021,849 | | | $ | 2,967,402 | | | $ | — | |
Dividends from affiliate investments | | | 167,057 | | | | 19,648 | | | | — | |
Interest income | | | 4,213 | | | | 3,395 | | | | 891,845 | |
| | |
|
|
| |
|
|
| |
|
|
|
Total investment income | | | 4,193,119 | | | | 2,990,445 | | | | 891,845 | |
| | |
|
|
| |
|
|
| |
|
|
|
EXPENSES: | | | | | | | | | | | | |
Investment advisory fees | | | 383,674 | | | | 265,616 | | | | 1,345,964 | |
Distribution (12b-1) fees – Service Shares | | | 274,053 | | | | 265,489 | | | | 313,763 | |
Administrative service fees – Service Shares | | | 274,044 | | | | 265,383 | | | | 313,744 | |
Shareholder servicing fees – Service Shares | | | 104,140 | | | | 102,327 | | | | 119,230 | |
Administration fees | | | 48,734 | | | | 45,270 | | | | 36,105 | |
Fund accounting fees | | | 21,238 | | | | 24,566 | | | | 40,021 | |
Legal fees | | | 35,083 | | | | 43,121 | | | | 106,020 | |
Custody fees | | | 48,262 | | | | 48,523 | | | | 40,581 | |
Trustee fees and expenses | | | 18,717 | | | | 18,854 | | | | 23,943 | |
Federal and state registration fees | | | 33,660 | | | | 34,575 | | | | 43,310 | |
Reports to shareholders | | | 7,784 | | | | 10,840 | | | | 13,818 | |
Audit and tax fees | | | 13,984 | | | | 13,984 | | | | 33,002 | |
Transfer agent fees and expenses | | | 7,330 | | | | 10,853 | | | | 9,576 | |
Compliance fees | | | 4,515 | | | | 4,198 | | | | 5,204 | |
Insurance fees | | | 3,224 | | | | 3,285 | | | | 3,640 | |
Miscellaneous expenses | | | 2,412 | | | | 2,461 | | | | 3,445 | |
Interest expenses | | | 396 | | | | 1,494 | | | | 55,087 | |
Offering costs | | | — | | | | — | | | | 876 | |
| | |
|
|
| |
|
|
| |
|
|
|
Total expenses | | | 1,281,250 | | | | 1,160,839 | | | | 2,507,329 | |
| | |
|
|
| |
|
|
| |
|
|
|
Net expense reimbursement by Advisor (See Note 4) | | | — | | | | — | | | | (32,780 | ) |
Less securities lending credit (See Note 7) | | | (220,058 | ) | | | (194,082 | ) | | | — | |
| | |
|
|
| |
|
|
| |
|
|
|
Net expenses | | | 1,061,192 | | | | 966,757 | | | | 2,474,549 | |
| | |
|
|
| |
|
|
| |
|
|
|
Net investment income (loss) | | | 3,131,927 | | | | 2,023,688 | | | | (1,582,704 | ) |
| | |
|
|
| |
|
|
| |
|
|
|
NET REALIZED AND UNREALIZED GAIN (LOSS) ON INVESTMENTS: | | | | | | | | | | | | |
Net realized gain (loss) on: | | | | | | | | | | | | |
Investments | | | 1,009,499 | | | | 1,311,819 | | | | 10,234 | |
Investments in affiliates | | | (11,651 | ) | | | 2,579 | | | | — | |
Net long-term capital gain distributions received | | | 421 | | | | 748 | | | | — | |
Foreign currency translation | | | — | | | | — | | | | 214,354 | |
Futures contracts | | | — | | | | — | | | | (9,209,044 | ) |
| | |
|
|
| |
|
|
| |
|
|
|
Total | | | 998,269 | | | | 1,315,146 | | | | (8,984,456 | ) |
| | |
|
|
| |
|
|
| |
|
|
|
Net change in unrealized appreciation (depreciation) on: | | | | | | | | | | | | |
Investments | | | 4,490,005 | | | | (388,666 | ) | | | (12,574 | ) |
Investments in affiliates | | | 141,726 | | | | (16,045 | ) | | | — | |
Foreign currencies | | | — | | | | — | | | | 1,893 | |
Futures contracts | | | — | | | | — | | | | (2,417,948 | ) |
| | |
|
|
| |
|
|
| |
|
|
|
Total | | | 4,631,731 | | | | (404,711 | ) | | | (2,428,629 | ) |
| | |
|
|
| |
|
|
| |
|
|
|
Net realized and unrealized gain (loss) | | | 5,630,000 | | | | 910,435 | | | | (11,413,085 | ) |
| | |
|
|
| |
|
|
| |
|
|
|
NET INCREASE (DECREASE) IN NET ASSETS RESULTING FROM OPERATIONS | | $ | 8,761,927 | | | $ | 2,934,123 | | | $ | (12,995,789 | ) |
| | |
|
|
| |
|
|
| |
|
|
|
1Consolidated Statement of Operations for the year (see note 3b). | | | | | | | | | | | | |
See notes to financial statements.
116
GuideMark® Funds & GuidePath® Funds
STATEMENTS OF CHANGES IN NET ASSETS
| | | | | | | | | | | | | | | | |
| | | Large Cap Core Fund
| | | Emerging Markets Fund
| |
| | | Year Ended
March 31,
2017
| | | Year Ended
March 31,
2016
| | | Year Ended
March 31,
2017
| | | Year Ended
March 31,
2016
| |
OPERATIONS: | | | | | | | | | | | | | | | | |
Net investment income | | $ | 1,967,294 | | | $ | 1,183,967 | | | $ | 867,154 | | | $ | 1,117,365 | |
Net realized gain on investment transactions | | | 11,575,308 | | | | 28,870,387 | | | | 3,598,512 | | | | 39,565,775 | |
Net change in unrealized appreciation (depreciation) on investments | | | 9,712,500 | | | | (27,634,600 | ) | | | 14,916,242 | | | | (57,941,013 | ) |
| | |
|
|
| |
|
|
| |
|
|
| |
|
|
|
Net increase (decrease) in net assets resulting from operations | | | 23,255,102 | | | | 2,419,754 | | | | 19,381,908 | | | | (17,257,873 | ) |
| | |
|
|
| |
|
|
| |
|
|
| |
|
|
|
CAPITAL SHARE TRANSACTIONS: | | | | | | | | | | | | | | | | |
Institutional Shares | | | | | | | | | | | | | | | | |
Shares sold | | | 27,172,126 | | | | 24,340,109 | | | | 7,059,500 | | | | 8,943,117 | |
Shares issued to holders in reinvestment of dividends | | | 1,397,913 | | | | 962,982 | | | | 64,639 | | | | 343,573 | |
Shares redeemed | | | (20,862,812 | ) | | | (37,651,694 | ) | | | (2,680,771 | ) | | | (57,624,315 | ) |
| | |
|
|
| |
|
|
| |
|
|
| |
|
|
|
Net increase (decrease) | | | 7,707,227 | | | | (12,348,603 | ) | | | 4,443,368 | | | | (48,337,625 | ) |
| | |
|
|
| |
|
|
| |
|
|
| |
|
|
|
Service Shares | | | | | | | | | | | | | | | | |
Shares sold | | | 199,930,027 | | | | 159,568,384 | | | | 22,239,137 | | | | 69,441,913 | |
Shares issued to holders in reinvestment of dividends | | | 6,951,634 | | | | 7,244,241 | | | | 325,406 | | | | 1,631,712 | |
Shares redeemed | | | (276,922,332 | ) | | | (111,678,118 | ) | | | (52,302,305 | ) | | | (101,036,005 | ) |
| | |
|
|
| |
|
|
| |
|
|
| |
|
|
|
Net increase (decrease) | | | (70,040,671 | ) | | | 55,134,507 | | | | (29,737,762 | ) | | | (29,962,380 | ) |
| | |
|
|
| |
|
|
| |
|
|
| |
|
|
|
DIVIDENDS AND DISTRIBUTIONS TO SHAREHOLDERS: | | | | | | | | | | | | | | | | |
Net investment income – Institutional Shares | | | (492,125 | ) | | | (207,479 | ) | | | (64,639 | ) | | | (343,573 | ) |
Net investment income – Service Shares | | | (1,630,366 | ) | | | (773,830 | ) | | | (325,464 | ) | | | (1,632,424 | ) |
Net realized gains – Institutional Shares | | | (905,788 | ) | | | (755,503 | ) | | | — | | | | — | |
Net realized gains – Service Shares | | | (5,321,268 | ) | | | (6,471,426 | ) | | | — | | | | — | |
| | |
|
|
| |
|
|
| |
|
|
| |
|
|
|
Total dividends and distributions | | | (8,349,547 | ) | | | (8,208,238 | ) | | | (390,103 | ) | | | (1,975,997 | ) |
| | |
|
|
| |
|
|
| |
|
|
| |
|
|
|
INCREASE (DECREASE) IN NET ASSETS | | | (47,427,889 | ) | | | 36,997,420 | | | | (6,302,589 | ) | | | (97,533,875 | ) |
NET ASSETS: | | | | | | | | | | | | | | | | |
Beginning of year | | | 250,141,736 | | | | 213,144,316 | | | | 124,305,917 | | | | 221,839,792 | |
| | |
|
|
| |
|
|
| |
|
|
| |
|
|
|
End of year (including accumulated undistributed net investment income (loss) of $355,378, $482,811, $(188,840) and $(627,462), respectively) | | $ | 202,713,847 | | | $ | 250,141,736 | | | $ | 118,003,328 | | | $ | 124,305,917 | |
| | |
|
|
| |
|
|
| |
|
|
| |
|
|
|
CHANGES IN SHARES OUTSTANDING | | | | | | | | | | | | | | | | |
Institutional Shares | | | | | | | | | | | | | | | | |
Shares sold | | | 1,782,172 | | | | 1,743,722 | | | | 564,774 | | | | 741,488 | |
Shares issued to holders in reinvestment of dividends | | | 91,129 | | | | 65,420 | | | | 5,501 | | | | 31,149 | |
Shares redeemed | | | (1,329,010 | ) | | | (2,620,228 | ) | | | (219,419 | ) | | | (5,101,953 | ) |
| | |
|
|
| |
|
|
| |
|
|
| |
|
|
|
Net increase (decrease) | | | 544,291 | | | | (811,086 | ) | | | 350,856 | | | | (4,329,316 | ) |
| | |
|
|
| |
|
|
| |
|
|
| |
|
|
|
Service Shares | | | | | | | | | | | | | | | | |
Shares sold | | | 12,920,906 | | | | 10,840,713 | | | | 1,767,998 | | | | 5,864,650 | |
Shares issued to holders in reinvestment of dividends | | | 458,249 | | | | 497,202 | | | | 27,368 | | | | 146,080 | |
Shares redeemed | | | (18,252,615 | ) | | | (7,558,252 | ) | | | (4,287,240 | ) | | | (8,539,930 | ) |
| | |
|
|
| |
|
|
| |
|
|
| |
|
|
|
Net increase (decrease) | | | (4,873,460 | ) | | | 3,779,663 | | | | (2,491,874 | ) | | | (2,529,200 | ) |
| | |
|
|
| |
|
|
| |
|
|
| |
|
|
|
See notes to financial statements.
117
GuideMark® Funds & GuidePath® Funds
STATEMENTS OF CHANGES IN NET ASSETS (Continued)
| | | | | | | | | | | | | | | | |
| | | Small/Mid Cap Core Fund
| | | World ex-US Fund
| |
| | | Year Ended
March 31,
2017
| | | Year Ended
March 31,
2016
| | | Year Ended
March 31,
2017
| | | Year Ended
March 31,
2016
| |
OPERATIONS: | | | | | | | | | | | | | | | | |
Net investment income | | $ | 584,349 | | | $ | 60,196 | | | $ | 2,869,415 | | | $ | 3,286,603 | |
Net realized gain (loss) on investment transactions | | | 2,596,131 | | | | (680,700 | ) | | | 1,468,963 | | | | (15,872,067 | ) |
Net change in unrealized appreciation (depreciation) on investments | | | 16,860,179 | | | | (6,055,710 | ) | | | 13,684,439 | | | | (26,980,516 | ) |
| | |
|
|
| |
|
|
| |
|
|
| |
|
|
|
Net increase (decrease) in net assets resulting from operations | | | 20,040,659 | | | | (6,676,214 | ) | | | 18,022,817 | | | | (39,565,980 | ) |
| | |
|
|
| |
|
|
| |
|
|
| |
|
|
|
CAPITAL SHARE TRANSACTIONS: | | | | | | | | | | | | | | | | |
Institutional Shares | | | | | | | | | | | | | | | | |
Shares sold | | | 33,144,087 | | | | 25,069,973 | | | | 38,691,905 | | | | 35,455,730 | |
Shares issued to holders in reinvestment of dividends | | | 388,573 | | | | 631,404 | | | | 1,274,678 | | | | 1,643,942 | |
Shares redeemed | | | (19,767,896 | ) | | | (22,339,071 | ) | | | (23,473,550 | ) | | | (85,413,165 | ) |
| | |
|
|
| |
|
|
| |
|
|
| |
|
|
|
Net increase (decrease) | | | 13,764,764 | | | | 3,362,306 | | | | 16,493,033 | | | | (48,313,493 | ) |
| | |
|
|
| |
|
|
| |
|
|
| |
|
|
|
Service Shares | | | | | | | | | | | | | | | | |
Shares sold | | | 20,701,621 | | | | 35,927,062 | | | | 32,189,333 | | | | 100,982,818 | |
Shares issued to holders in reinvestment of dividends | | | 145,119 | | | | 1,463,257 | | | | 2,057,665 | | | | 4,193,334 | |
Shares redeemed | | | (27,463,485 | ) | | | (21,214,203 | ) | | | (65,581,894 | ) | | | (165,420,650 | ) |
| | |
|
|
| |
|
|
| |
|
|
| |
|
|
|
Net increase (decrease) | | | (6,616,745 | ) | | | 16,176,116 | | | | (31,334,896 | ) | | | (60,244,498 | ) |
| | |
|
|
| |
|
|
| |
|
|
| |
|
|
|
DIVIDENDS AND DISTRIBUTIONS TO SHAREHOLDERS: | | | | | | | | | | | | | | | | |
Net investment income – Institutional Shares | | | (388,573 | ) | | | — | | | | (1,274,678 | ) | | | (1,643,942 | ) |
Net investment income – Service Shares | | | (145,119 | ) | | | — | | | | (2,057,669 | ) | | | (4,195,923 | ) |
Net realized gains – Institutional Shares | | | — | | | | (631,404 | ) | | | — | | | | — | |
Net realized gains – Service Shares | | | — | | | | (1,463,257 | ) | | | — | | | | — | |
| | |
|
|
| |
|
|
| |
|
|
| |
|
|
|
Total dividends and distributions | | | (533,692 | ) | | | (2,094,661 | ) | | | (3,332,347 | ) | | | (5,839,865 | ) |
| | |
|
|
| |
|
|
| |
|
|
| |
|
|
|
INCREASE (DECREASE) IN NET ASSETS | | | 26,654,986 | | | | 10,767,547 | | | | (151,393 | ) | | | (153,963,836 | ) |
NET ASSETS: | | | | | | | | | | | | | | | | |
Beginning of year | | | 88,821,588 | | | | 78,054,041 | | | | 188,184,824 | | | | 342,148,660 | |
| | |
|
|
| |
|
|
| |
|
|
| |
|
|
|
End of year (including accumulated undistributed net investment income of
$59,283, $0, $2,624,397 and $3,133,154, respectively) | | $ | 115,476,574 | | | $ | 88,821,588 | | | $ | 188,033,431 | | | $ | 188,184,824 | |
| | |
|
|
| |
|
|
| |
|
|
| |
|
|
|
CHANGES IN SHARES OUTSTANDING | | | | | | | | | | | | | | | | |
Institutional Shares | | | | | | | | | | | | | | | | |
Shares sold | | | 2,006,770 | | | | 1,772,382 | | | | 4,951,526 | | | | 4,512,185 | |
Shares issued to holders in reinvestment of dividends | | | 21,587 | | | | 40,815 | | | | 165,543 | | | | 209,686 | |
Shares redeemed | | | (1,143,672 | ) | | | (1,438,094 | ) | | | (2,965,934 | ) | | | (10,835,369 | ) |
| | |
|
|
| |
|
|
| |
|
|
| |
|
|
|
Net increase (decrease) | | | 884,685 | | | | 375,103 | | | | 2,151,135 | | | | (6,113,498 | ) |
| | |
|
|
| |
|
|
| |
|
|
| |
|
|
|
Service Shares | | | | | | | | | | | | | | | | |
Shares sold | | | 1,297,027 | | | | 2,321,172 | | | | 4,135,180 | | | | 11,531,894 | |
Shares issued to holders in reinvestment of dividends | | | 8,264 | | | | 96,776 | | | | 270,745 | | | | 539,682 | |
Shares redeemed | | | (1,691,174 | ) | | | (1,390,162 | ) | | | (8,418,202 | ) | | | (20,706,517 | ) |
| | |
|
|
| |
|
|
| |
|
|
| |
|
|
|
Net increase (decrease) | | | (385,883 | ) | | | 1,027,786 | | | | (4,012,277 | ) | | | (8,634,941 | ) |
| | |
|
|
| |
|
|
| |
|
|
| |
|
|
|
See notes to financial statements.
118
GuideMark® Funds & GuidePath® Funds
STATEMENTS OF CHANGES IN NET ASSETS (Continued)
| | | | | | | | | | | | | | | | |
| | | Opportunistic Equity Fund
| | | Core Fixed Income Fund
| |
| | | Year Ended
March 31,
2017
| | | Year Ended
March 31,
2016
| | | Year Ended
March 31,
2017
| | | Year Ended
March 31,
2016
| |
OPERATIONS: | | | | | | | | | | | | | | | | |
Net investment income (loss) | | $ | (274,416 | ) | | $ | 127,549 | | | $ | 2,210,725 | | | $ | 3,588,452 | |
Net realized gain on investment transactions | | | 3,442,012 | | | | 9,526,734 | | | | 2,413,490 | | | | 1,436,685 | |
Net change in unrealized appreciation (depreciation) on investments | | | 6,836,600 | | | | (21,499,157 | ) | | | (3,995,678 | ) | | | (3,760,589 | ) |
| | |
|
|
| |
|
|
| |
|
|
| |
|
|
|
Net increase (decrease) in net assets resulting from operations | | | 10,004,196 | | | | (11,844,874 | ) | | | 628,537 | | | | 1,264,548 | |
| | |
|
|
| |
|
|
| |
|
|
| |
|
|
|
CAPITAL SHARE TRANSACTIONS: | | | | | | | | | | | | | | | | |
Institutional Shares | | | | | | | | | | | | | | | | |
Shares sold | | | 11,036 | | | | 12,821,121 | | | | 9,216,113 | | | | 7,863,630 | |
Shares issued to holders in reinvestment of dividends | | | — | | | | 8,716,858 | | | | 205,332 | | | | 1,058,527 | |
Shares redeemed | | | (235,506 | ) | | | (67,240,595 | ) | | | (1,989,593 | ) | | | (81,194,484 | ) |
| | |
|
|
| |
|
|
| |
|
|
| |
|
|
|
Net increase (decrease) | | | (224,470 | ) | | | (45,702,616 | ) | | | 7,431,852 | | | | (72,272,327 | ) |
| | |
|
|
| |
|
|
| |
|
|
| |
|
|
|
Service Shares | | | | | | | | | | | | | | | | |
Shares sold | | | 29,513,216 | | | | 42,145,976 | | | | 43,254,342 | | | | 83,102,415 | |
Shares issued to holders in reinvestment of dividends | | | 2,207,160 | | | | 7,756,296 | | | | 3,820,498 | | | | 5,306,114 | |
Shares redeemed | | | (43,129,998 | ) | | | (43,177,278 | ) | | | (115,863,777 | ) | | | (112,072,105 | ) |
| | |
|
|
| |
|
|
| |
|
|
| |
|
|
|
Net increase (decrease) | | | (11,409,622 | ) | | | 6,724,994 | | | | (68,788,937 | ) | | | (23,663,576 | ) |
| | |
|
|
| |
|
|
| |
|
|
| |
|
|
|
DIVIDENDS AND DISTRIBUTIONS TO SHAREHOLDERS: | | | | | | | | | | | | | | | | |
Net investment income – Institutional Shares | | | — | | | | (298,762 | ) | | | (152,091 | ) | | | (811,674 | ) |
Net investment income – Service Shares | | | (9,175 | ) | | | — | | | | (2,879,314 | ) | | | (3,132,368 | ) |
Net realized gains – Institutional Shares | | | — | | | | (8,418,096 | ) | | | (53,241 | ) | | | (246,854 | ) |
Net realized gains – Service Shares | | | (2,197,985 | ) | | | (7,756,296 | ) | | | (941,209 | ) | | | (2,566,989 | ) |
| | |
|
|
| |
|
|
| |
|
|
| |
|
|
|
Total dividends and distributions | | | (2,207,160 | ) | | | (16,473,154 | ) | | | (4,025,855 | ) | | | (6,757,885 | ) |
| | |
|
|
| |
|
|
| |
|
|
| |
|
|
|
DECREASE IN NET ASSETS | | | (3,837,056 | ) | | | (67,295,650 | ) | | | (64,754,403 | ) | | | (101,429,240 | ) |
NET ASSETS: | | | | | | | | | | | | | | | | |
Beginning of year | | | 70,130,591 | | | | 137,426,241 | | | | 211,223,230 | | | | 312,652,470 | |
| | |
|
|
| |
|
|
| |
|
|
| |
|
|
|
End of year (including accumulated undistributed net investment income (loss) of
$(56,230), $(105,707), $59,210, and $277,519, respectively) | | $ | 66,293,535 | | | $ | 70,130,591 | | | $ | 146,468,827 | | | $ | 211,223,230 | |
| | |
|
|
| |
|
|
| |
|
|
| |
|
|
|
CHANGES IN SHARES OUTSTANDING | | | | | | | | | | | | | | | | |
Institutional Shares | | | | | | | | | | | | | | | | |
Shares sold | | | 1,118 | | | | 1,063,359 | | | | 966,027 | | | | 830,734 | |
Shares issued to holders in reinvestment of dividends | | | — | | | | 843,839 | | | | 22,096 | | | | 112,778 | |
Shares redeemed | | | (24,419 | ) | | | (6,843,142 | ) | | | (211,192 | ) | | | (8,581,015 | ) |
| | |
|
|
| |
|
|
| |
|
|
| |
|
|
|
Net increase (decrease) | | | (23,301 | ) | | | (4,935,944 | ) | | | 776,931 | | | | (7,637,503 | ) |
| | |
|
|
| |
|
|
| |
|
|
| |
|
|
|
Service Shares | | | | | | | | | | | | | | | | |
Shares sold | | | 2,883,831 | | | | 4,174,591 | | | | 4,539,007 | | | | 8,748,872 | |
Shares issued to holders in reinvestment of dividends | | | 208,616 | | | | 755,238 | | | | 405,506 | | | | 566,730 | |
Shares redeemed | | | (4,216,309 | ) | | | (3,720,257 | ) | | | (12,156,705 | ) | | | (11,818,973 | ) |
| | |
|
|
| |
|
|
| |
|
|
| |
|
|
|
Net increase (decrease) | | | (1,123,862 | ) | | | 1,209,572 | | | | (7,212,192 | ) | | | (2,503,371 | ) |
| | |
|
|
| |
|
|
| |
|
|
| |
|
|
|
See notes to financial statements.
119
GuideMark® Funds & GuidePath® Funds
STATEMENTS OF CHANGES IN NET ASSETS (Continued)
| | | | | | | | | | | | | | | | |
| | | Tax-Exempt Fixed Income Fund
| | | Opportunistic Fixed Income Fund
| |
| | | Year Ended
March 31,
2017
| | | Year Ended
March 31,
2016
| | | Year Ended
March 31,
2017
| | | Year Ended
March 31,
2016
| |
OPERATIONS: | | | | | | | | | | | | | | | | |
Net investment income | | $ | 1,006,148 | | | $ | 1,580,382 | | | $ | 3,412,103 | | | $ | 5,511,090 | |
Net realized gain (loss) on investment transactions | | | 1,133,091 | | | | 1,058,932 | | | | (7,523,373 | ) | | | (7,221,374 | ) |
Net change in unrealized appreciation (depreciation) on investments | | | (2,319,469 | ) | | | (938,709 | ) | | | 9,671,466 | | | | (6,148,662 | ) |
| | |
|
|
| |
|
|
| |
|
|
| |
|
|
|
Net increase (decrease) in net assets resulting from operations | | | (180,230 | ) | | | 1,700,605 | | | | 5,560,196 | | | | (7,858,946 | ) |
| | |
|
|
| |
|
|
| |
|
|
| |
|
|
|
CAPITAL SHARE TRANSACTIONS: | | | | | | | | | | | | | | | | |
Institutional Shares | | | | | | | | | | | | | | | | |
Shares sold | | | — | | | | — | | | | 3,816,196 | | | | 38,429,060 | |
Shares issued to holders in reinvestment of dividends | | | — | | | | — | | | | 331,065 | | | | 417,968 | |
Shares redeemed | | | — | | | | — | | | | (3,798,705 | ) | | | (78,572,465 | ) |
| | |
|
|
| |
|
|
| |
|
|
| |
|
|
|
Net increase (decrease) | | | — | | | | — | | | | 348,556 | | | | (39,725,437 | ) |
| | |
|
|
| |
|
|
| |
|
|
| |
|
|
|
Service Shares | | | | | | | | | | | | | | | | |
Shares sold | | | 3,874,625 | | | | 12,979,454 | | | | 16,100,897 | | | | 43,428,974 | |
Shares issued to holders in reinvestment of dividends | | | 1,010,136 | | | | 1,456,714 | | | | 1,633,885 | | | | 600,010 | |
Shares redeemed | | | (22,461,531 | ) | | | (31,117,120 | ) | | | (41,718,076 | ) | | | (110,508,644 | ) |
| | |
|
|
| |
|
|
| |
|
|
| |
|
|
|
Net decrease | | | (17,576,770 | ) | | | (16,680,952 | ) | | | (23,983,294 | ) | | | (66,479,660 | ) |
| | |
|
|
| |
|
|
| |
|
|
| |
|
|
|
DIVIDENDS AND DISTRIBUTIONS TO SHAREHOLDERS: | | | | | | | | | | | | | | | | |
Net investment income – Institutional Shares | | | — | | | | — | | | | (331,065 | ) | | | (417,968 | ) |
Net investment income – Service Shares | | | (1,010,639 | ) | | | (1,616,922 | ) | | | (1,633,885 | ) | | | (1,253,003 | ) |
| | |
|
|
| |
|
|
| |
|
|
| |
|
|
|
Total dividends and distributions | | | (1,010,639 | ) | | | (1,616,922 | ) | | | (1,964,950 | ) | | | (1,670,971 | ) |
| | |
|
|
| |
|
|
| |
|
|
| |
|
|
|
DECREASE IN NET ASSETS | | | (18,767,639 | ) | | | (16,597,269 | ) | | | (20,039,492 | ) | | | (115,735,014 | ) |
NET ASSETS: | | | | | | | | | | | | | | | | |
Beginning of year | | | 49,084,900 | | | | 65,682,169 | | | | 86,741,200 | | | | 202,476,214 | |
| | |
|
|
| |
|
|
| |
|
|
| |
|
|
|
End of year (including accumulated undistributed net investment income of $17,169, $21,660, $12,504,155 and $6,372,002, respectively) | | $ | 30,317,261 | | | $ | 49,084,900 | | | $ | 66,701,708 | | | $ | 86,741,200 | |
| | |
|
|
| |
|
|
| |
|
|
| |
|
|
|
CHANGES IN SHARES OUTSTANDING | | | | | | | | | | | | | | | | |
Institutional Shares | | | | | | | | | | | | | | | | |
Shares sold | | | — | | | | — | | | | 423,674 | | | | 4,194,821 | |
Shares issued to holders in reinvestment of dividends | | | — | | | | — | | | | 37,026 | | | | 44,276 | |
Shares redeemed | | | — | | | | — | | | | (423,729 | ) | | | (8,599,533 | ) |
| | |
|
|
| |
|
|
| |
|
|
| |
|
|
|
Net increase (decrease) | | | — | | | | — | | | | 36,971 | | | | (4,360,436 | ) |
| | |
|
|
| |
|
|
| |
|
|
| |
|
|
|
Service Shares | | | | | | | | | | | | | | | | |
Shares sold | | | 336,913 | | | | 1,129,170 | | | | 1,778,727 | | | | 4,666,895 | |
Shares issued to holders in reinvestment of dividends | | | 88,393 | | | | 127,229 | | | | 182,229 | | | | 63,426 | |
Shares redeemed | | | (1,947,665 | ) | | | (2,702,338 | ) | | | (4,594,338 | ) | | | (11,992,065 | ) |
| | |
|
|
| |
|
|
| |
|
|
| |
|
|
|
Net decrease | | | (1,522,359 | ) | | | (1,445,939 | ) | | | (2,633,382 | ) | | | (7,261,744 | ) |
| | |
|
|
| |
|
|
| |
|
|
| |
|
|
|
See notes to financial statements.
120
GuideMark® Funds & GuidePath® Funds
STATEMENTS OF CHANGES IN NET ASSETS (Continued)
| | | | | | | | | | | | | | | | |
| | | Growth
Allocation Fund
| | | Conservative
Allocation Fund
| |
| | | Year Ended
March 31,
2017
| | | Year Ended
March 31,
2016
| | | Year Ended
March 31,
2017
| | | Year Ended
March 31,
2016
| |
OPERATIONS: | | | | | | | | | | | | | | | | |
Net investment income | | $ | 5,194,312 | | | $ | 3,178,364 | | | $ | 1,227,141 | | | $ | 1,265,104 | |
Net realized gain (loss) on investment transactions | | | 7,919,673 | | | | 9,905,335 | | | | (181,535 | ) | | | 14,270,781 | |
Net change in unrealized appreciation (depreciation) on investments | | | 49,863,254 | | | | (17,689,519 | ) | | | 4,026,646 | | | | (32,999,442 | ) |
| | |
|
|
| |
|
|
| |
|
|
| |
|
|
|
Net increase (decrease) in net assets resulting from operations | | | 62,977,239 | | | | (4,605,820 | ) | | | 5,072,252 | | | | (17,463,557 | ) |
| | |
|
|
| |
|
|
| |
|
|
| |
|
|
|
CAPITAL SHARE TRANSACTIONS: | | | | | | | | | | | | | | | | |
Institutional Shares | | | | | | | | | | | | | | | | |
Shares sold | | | 8,303,858 | | | | 7,247,081 | | | | 2,865,702 | | | | 2,989,958 | |
Shares issued to holders in reinvestment of dividends | | | 609,074 | | | | 241,183 | | | | 525,473 | | | | 564,569 | |
Shares redeemed | | | (7,695,013 | ) | | | (3,669,741 | ) | | | (2,385,391 | ) | | | (4,408,250 | ) |
| | |
|
|
| |
|
|
| |
|
|
| |
|
|
|
Net increase (decrease) | | | 1,217,919 | | | | 3,818,523 | | | | 1,005,784 | | | | (853,723 | ) |
| | |
|
|
| |
|
|
| |
|
|
| |
|
|
|
Service Shares | | | | | | | | | | | | | | | | |
Shares sold | | | 443,722,149 | | | | 296,989,947 | | | | 116,123,492 | | | | 65,990,766 | |
Shares issued to holders in reinvestment of dividends | | | 19,098,534 | | | | 6,257,780 | | | | 9,383,008 | | | | 13,499,064 | |
Shares redeemed | | | (337,382,732 | ) | | | (169,145,419 | ) | | | (61,713,312 | ) | | | (171,431,528 | ) |
| | |
|
|
| |
|
|
| |
|
|
| |
|
|
|
Net increase (decrease) | | | 125,437,951 | | | | 134,102,308 | | | | 63,793,188 | | | | (91,941,698 | ) |
| | |
|
|
| |
|
|
| |
|
|
| |
|
|
|
DIVIDENDS AND DISTRIBUTIONS TO SHAREHOLDERS: | | | | | | | | | | | | | | | | |
Net investment income – Institutional Shares | | | (238,018 | ) | | | (104,283 | ) | | | — | | | | (76,097 | ) |
Net investment income – Service Shares | | | (5,978,596 | ) | | | (2,091,759 | ) | | | — | | | | (1,188,165 | ) |
From net realized gains – Institutional Shares | | | (371,056 | ) | | | (136,899 | ) | | | (525,473 | ) | | | (488,473 | ) |
From net realized gains – Service Shares | | | (13,119,938 | ) | | | (4,166,021 | ) | | | (9,383,008 | ) | | | (12,310,898 | ) |
| | |
|
|
| |
|
|
| |
|
|
| |
|
|
|
Total dividends and distributions | | | (19,707,608 | ) | | | (6,498,962 | ) | | | (9,908,481 | ) | | | (14,063,633 | ) |
| | |
|
|
| |
|
|
| |
|
|
| |
|
|
|
INCREASE (DECREASE) IN NET ASSETS | | | 169,925,501 | | | | 126,816,049 | | | | 59,962,743 | | | | (124,322,611 | ) |
NET ASSETS: | | | | | | | | | | | | | | | | |
Beginning of year | | | 394,392,420 | | | | 267,576,371 | | | | 55,988,974 | | | | 180,311,585 | |
| | |
|
|
| |
|
|
| |
|
|
| |
|
|
|
End of year (including undistributed net investment income (loss) of
$(21,489), $804,411, $1,203,281, and $(23,855), respectively) | | $ | 564,317,921 | | | $ | 394,392,420 | | | $ | 115,951,717 | | | $ | 55,988,974 | |
| | |
|
|
| |
|
|
| |
|
|
| |
|
|
|
CHANGES IN SHARES OUTSTANDING | | | | | | | | | | | | | | | | |
Institutional Shares | | | | | | | | | | | | | | | | |
Shares sold | | | 762,936 | | | | 709,710 | | | | 298,501 | | | | 295,998 | |
Shares issued to holders in reinvestment of dividends | | | 56,923 | | | | 22,753 | | | | 59,781 | | | | 58,505 | |
Shares redeemed | | | (706,774 | ) | | | (347,870 | ) | | | (256,488 | ) | | | (459,229 | ) |
| | |
|
|
| |
|
|
| |
|
|
| |
|
|
|
Net increase (decrease) | | | 113,085 | | | | 384,593 | | | | 101,794 | | | | (104,726 | ) |
| | |
|
|
| |
|
|
| |
|
|
| |
|
|
|
Service Shares | | | | | | | | | | | | | | | | |
Shares sold | | | 41,175,115 | | | | 30,307,654 | | | | 12,164,490 | | | | 6,694,655 | |
Shares issued to holders in reinvestment of dividends | | | 1,789,928 | | | | 592,032 | | | | 1,071,120 | | | | 1,394,531 | |
Shares redeemed | | | (30,940,749 | ) | | | (16,466,202 | ) | | | (6,419,892 | ) | | | (18,079,390 | ) |
| | |
|
|
| |
|
|
| |
|
|
| |
|
|
|
Net increase (decrease) | | | 12,024,294 | | | | 14,433,484 | | | | 6,815,718 | | | | (9,990,204 | ) |
| | |
|
|
| |
|
|
| |
|
|
| |
|
|
|
See notes to financial statements.
121
GuideMark® Funds & GuidePath® Funds
STATEMENTS OF CHANGES IN NET ASSETS (Continued)
| | | | | | | | | | | | | | | | |
| | | Tactical
Allocation Fund
| | | Absolute Return
Allocation Fund
| |
| | | Year Ended
March 31,
2017
| | | Year Ended
March 31,
2016
| | | Year Ended
March 31,
2017
| | | Year Ended
March 31,
2016
| |
OPERATIONS: | | | | | | | | | | | | | | | | |
Net investment income | | $ | 4,053,503 | | | $ | 3,227,953 | | | $ | 3,994,590 | | | $ | 6,533,346 | |
Net realized gain (loss) on investment transactions | | | 8,717,010 | | | | (24,709,832 | ) | | | 1,487,161 | | | | (10,151,865 | ) |
Net change in unrealized appreciation (depreciation) on investments | | | 16,899,104 | | | | (20,479,455 | ) | | | 5,232,782 | | | | (2,371,514 | ) |
| | |
|
|
| |
|
|
| |
|
|
| |
|
|
|
Net increase (decrease) in net assets resulting from operations | | | 29,669,617 | | | | (41,961,334 | ) | | | 10,714,533 | | | | (5,990,033 | ) |
| | |
|
|
| |
|
|
| |
|
|
| |
|
|
|
CAPITAL SHARE TRANSACTIONS: | | | | | | | | | | | | | | | | |
Institutional Shares | | | | | | | | | | | | | | | | |
Shares sold | | | 1,267,953 | | | | 2,608,481 | | | | 484,903 | | | | 1,549,885 | |
Shares issued to holders in reinvestment of dividends | | | 55,523 | | | | 65,620 | | | | 42,389 | | | | 65,508 | |
Shares redeemed | | | (2,912,491 | ) | | | (3,048,776 | ) | | | (760,732 | ) | | | (3,094,449 | ) |
| | |
|
|
| |
|
|
| |
|
|
| |
|
|
|
Net decrease | | | (1,589,015 | ) | | | (374,675 | ) | | | (233,440 | ) | | | (1,479,056 | ) |
| | |
|
|
| |
|
|
| |
|
|
| |
|
|
|
Service Shares | | | | | | | | | | | | | | | | |
Shares sold | | | 111,320,764 | | | | 158,653,333 | | | | 60,737,268 | | | | 168,309,046 | |
Shares issued to holders in reinvestment of dividends | | | 3,141,480 | | | | 4,361,910 | | | �� | 3,893,353 | | | | 7,023,975 | |
Shares redeemed | | | (230,081,819 | ) | | | (204,058,598 | ) | | | (88,244,091 | ) | | | (383,480,825 | ) |
| | |
|
|
| |
|
|
| |
|
|
| |
|
|
|
Net decrease | | | (115,619,575 | ) | | | (41,043,355 | ) | | | (23,613,470 | ) | | | (208,147,804 | ) |
| | |
|
|
| |
|
|
| |
|
|
| |
|
|
|
DIVIDENDS AND DISTRIBUTIONS TO SHAREHOLDERS: | | | | | | | | | | | | | | | | |
Net investment income – Institutional Shares | | | (55,523 | ) | | | (10,007 | ) | | | (42,389 | ) | | | (65,508 | ) |
Net investment income – Service Shares | | | (3,141,480 | ) | | | (62,408 | ) | | | (3,893,353 | ) | | | (7,023,975 | ) |
Net realized gains – Institutional Shares | | | — | | | | (55,613 | ) | | | — | | | | — | |
Net realized gains – Service Shares | | | — | | | | (4,299,503 | ) | | | — | | | | — | |
| | |
|
|
| |
|
|
| |
|
|
| |
|
|
|
Total dividends and distributions | | | (3,197,003 | ) | | | (4,427,531 | ) | | | (3,935,742 | ) | | | (7,089,483 | ) |
| | |
|
|
| |
|
|
| |
|
|
| |
|
|
|
DECREASE IN NET ASSETS | | | (90,735,976 | ) | | | (87,806,895 | ) | | | (17,068,119 | ) | | | (222,706,376 | ) |
NET ASSETS: | | | | | | | | | | | | | | | | |
Beginning of year | | | 398,662,760 | | | | 486,469,655 | | | | 146,937,836 | | | | 369,644,212 | |
| | |
|
|
| |
|
|
| |
|
|
| |
|
|
|
End of year (including undistributed net investment income of
$4,003,285, $3,173,148, $612,562, and $545,324, respectively) | | $ | 307,926,784 | | | $ | 398,662,760 | | | $ | 129,869,717 | | | $ | 146,937,836 | |
| | |
|
|
| |
|
|
| |
|
|
| |
|
|
|
CHANGES IN SHARES OUTSTANDING | | | | | | | | | | | | | | | | |
Institutional Shares | | | | | | | | | | | | | | | | |
Shares sold | | | 130,536 | | | | 266,833 | | | | 47,168 | | | | 160,370 | |
Shares issued to holders in reinvestment of dividends | | | 5,712 | | | | 6,900 | | | | 4,197 | | | | 6,845 | |
Shares redeemed | | | (302,323 | ) | | | (318,035 | ) | | | (74,836 | ) | | | (320,845 | ) |
| | |
|
|
| |
|
|
| |
|
|
| |
|
|
|
Net decrease | | | (166,075 | ) | | | (44,302 | ) | | | (23,471 | ) | | | (153,630 | ) |
| | |
|
|
| |
|
|
| |
|
|
| |
|
|
|
CHANGES IN SHARES OUTSTANDING | | | | | | | | | | | | | | | | |
Service Shares | | | | | | | | | | | | | | | | |
Shares sold | | | 11,613,580 | | | | 16,487,396 | | | | 5,951,803 | | | | 17,242,674 | |
Shares issued to holders in reinvestment of dividends | | | 325,879 | | | | 460,603 | | | | 383,582 | | | | 730,903 | |
Shares redeemed | | | (24,187,866 | ) | | | (21,259,984 | ) | | | (8,701,541 | ) | | | (39,665,602 | ) |
| | |
|
|
| |
|
|
| |
|
|
| |
|
|
|
Net decrease | | | (12,248,407 | ) | | | (4,311,985 | ) | | | (2,366,156 | ) | | | (21,692,025 | ) |
| | |
|
|
| |
|
|
| |
|
|
| |
|
|
|
See notes to financial statements.
122
GuideMark® Funds & GuidePath® Funds
STATEMENTS OF CHANGES IN NET ASSETS (Continued)
| | | | | | | | | | | | | | | | |
| | | Multi-Asset Income
Allocation Fund
| | | Flexible Income
Allocation Fund
| |
| | | Year Ended
March 31,
2017
| | | Year Ended
March 31,
2016
| | | Year Ended
March 31,
2017
| | | Year Ended
March 31,
2016
| |
OPERATIONS: | | | | | | | | | | | | | | | | |
Net investment income | | $ | 3,131,927 | | | $ | 4,106,330 | | | $ | 2,023,688 | | | $ | 1,903,245 | |
Net realized gain (loss) on investment transactions | | | 998,269 | | | | (9,901,619 | ) | | | 1,315,146 | | | | (4,134,999 | ) |
Net change in unrealized appreciation (depreciation) on investments | | | 4,631,731 | | | | 1,638,638 | | | | (404,711 | ) | | | 862,884 | |
| | |
|
|
| |
|
|
| |
|
|
| |
|
|
|
Net increase (decrease) in net assets resulting from operations | | | 8,761,927 | | | | (4,156,651 | ) | | | 2,934,123 | | | | (1,368,870 | ) |
| | |
|
|
| |
|
|
| |
|
|
| |
|
|
|
CAPITAL SHARE TRANSACTIONS: | | | | | | | | | | | | | | | | |
Institutional Shares | | | | | | | | | | | | | | | | |
Shares sold | | | — | | | | — | | | | 6,780 | | | | 611,956 | |
Shares issued to holders in reinvestment of dividends | | | — | | | | — | | | | 1,379 | | | | 26,216 | |
Shares redeemed | | | — | | | | — | | | | (5,866 | ) | | | (2,767,273 | ) |
| | |
|
|
| |
|
|
| |
|
|
| |
|
|
|
Net increase (decrease) | | | — | | | | — | | | | 2,293 | | | | (2,129,101 | ) |
| | |
|
|
| |
|
|
| |
|
|
| |
|
|
|
Service Shares | | | | | | | | | | | | | | | | |
Shares sold | | | 74,271,420 | | | | 39,307,466 | | | | 36,522,245 | | | | 144,421,094 | |
Shares issued to holders in reinvestment of dividends | | | 3,068,620 | | | | 3,983,275 | | | | 2,157,347 | | | | 1,549,347 | |
Shares redeemed | | | (70,117,642 | ) | | | (67,882,712 | ) | | | (54,619,675 | ) | | | (171,926,473 | ) |
| | |
|
|
| |
|
|
| |
|
|
| |
|
|
|
Net increase (decrease) | | | 7,222,398 | | | | (24,591,971 | ) | | | (15,940,083 | ) | | | (25,956,032 | ) |
| | |
|
|
| |
|
|
| |
|
|
| |
|
|
|
DIVIDENDS AND DISTRIBUTIONS TO SHAREHOLDERS: | | | | | | | | | | | | | | | | |
Net investment income – Institutional Shares | | | — | | | | — | | | | (1,379 | ) | | | (26,216 | ) |
Net investment income – Service Shares | | | (3,068,620 | ) | | | (4,413,612 | ) | | | (2,157,347 | ) | | | (1,891,583 | ) |
Net realized gains – Service Shares | | | — | | | | (434,279 | ) | | | — | | | | — | |
| | |
|
|
| |
|
|
| |
|
|
| |
|
|
|
Total dividends and distributions | | | (3,068,620 | ) | | | (4,847,891 | ) | | | (2,158,726 | ) | | | (1,917,799 | ) |
| | |
|
|
| |
|
|
| |
|
|
| |
|
|
|
INCREASE (DECREASE) IN NET ASSETS | | | 12,915,705 | | | | (33,596,513 | ) | | | (15,162,393 | ) | | | (31,371,802 | ) |
NET ASSETS: | | | | | | | | | | | | | | | | |
Beginning of year | | | 106,901,424 | | | | 140,497,937 | | | | 114,790,029 | | | | 146,161,831 | |
| | |
|
|
| |
|
|
| |
|
|
| |
|
|
|
End of year (including undistributed accumulated net investment income of
$112,867, $49,560, $38,394, and $173,432, respectively) | | $ | 119,817,129 | | | $ | 106,901,424 | | | $ | 99,627,636 | | | $ | 114,790,029 | |
| | |
|
|
| |
|
|
| |
|
|
| |
|
|
|
CHANGES IN SHARES OUTSTANDING | | | | | | | | | | | | | | | | |
Institutional Shares | | | | | | | | | | | | | | | | |
Shares sold | | | — | | | | — | | | | 698 | | | | 64,263 | |
Shares issued to holders in reinvestment of dividends | | | — | | | | — | | | | 142 | | | | 2,758 | |
Shares redeemed | | | — | | | | — | | | | (597 | ) | | | (293,089 | ) |
| | |
|
|
| |
|
|
| |
|
|
| |
|
|
|
Net increase (decrease) | | | — | | | | — | | | | 243 | | | | (226,068 | ) |
| | |
|
|
| |
|
|
| |
|
|
| |
|
|
|
CHANGES IN SHARES OUTSTANDING | | | | | | | | | | | | | | | | |
Service Shares | | | | | | | | | | | | | | | | |
Shares sold | | | 7,247,038 | | | | 3,932,161 | | | | 3,781,892 | | | | 15,314,531 | |
Shares issued to holders in reinvestment of dividends | | | 298,763 | | | | 402,220 | | | | 223,758 | | | | 163,097 | |
Shares redeemed | | | (6,846,481 | ) | | | (6,815,040 | ) | | | (5,653,805 | ) | | | (18,202,837 | ) |
| | |
|
|
| |
|
|
| |
|
|
| |
|
|
|
Net increase (decrease) | | | 699,320 | | | | (2,480,659 | ) | | | (1,648,155 | ) | | | (2,725,209 | ) |
| | |
|
|
| |
|
|
| |
|
|
| |
|
|
|
See notes to financial statements.
123
GuideMark® Funds & GuidePath® Funds
STATEMENTS OF CHANGES IN NET ASSETS (Continued)
| | | | | | | | |
| | | Managed Futures Strategy Fund1
| |
| | | Year Ended
March 31,
2017
| | | January 19, 20162
Ended
March 31, 2016
| |
OPERATIONS: | | | | | | | | |
Net investment loss | | $ | (1,582,704 | ) | | $ | (505,223 | ) |
Net realized loss on investment transactions | | | (8,984,456 | ) | | | (6,759,925 | ) |
Net change in unrealized appreciation (depreciation) on investments | | | (2,428,629 | ) | | | 2,386,154 | |
| | |
|
|
| |
|
|
|
Net decrease in net assets resulting from operations | | | (12,995,789 | ) | | | (4,878,994 | ) |
| | |
|
|
| |
|
|
|
CAPITAL SHARE TRANSACTIONS: | | | | | | | | |
Institutional Shares | | | | | | | | |
Shares sold | | | 967,128 | | | | 4,636,463 | |
Shares issued to holders in reinvestment of dividends | | | 31,103 | | | | — | |
Shares redeemed | | | (3,553,995 | ) | | | (191,272 | ) |
| | |
|
|
| |
|
|
|
Net increase (decrease) | | | (2,555,764 | ) | | | 4,445,191 | |
| | |
|
|
| |
|
|
|
Service Shares | | | | | | | | |
Shares sold | | | 80,280,173 | | | | 201,420,675 | |
Shares issued to holders in reinvestment of dividends | | | 1,458,638 | | | | — | |
Shares redeemed | | | (169,364,491 | ) | | | (13,628,073 | ) |
| | |
|
|
| |
|
|
|
Net increase (decrease) | | | (87,625,680 | ) | | | 187,792,602 | |
| | |
|
|
| |
|
|
|
DIVIDENDS AND DISTRIBUTIONS TO SHAREHOLDERS: | | | | | | | | |
Net realized gains – Institutional Shares | | | (31,103 | ) | | | — | |
Net realized gains – Service Shares | | | (1,458,638 | ) | | | — | |
| | |
|
|
| |
|
|
|
Total dividends and distributions | | | (1,489,741 | ) | | | — | |
| | |
|
|
| |
|
|
|
INCREASE (DECREASE) IN NET ASSETS | | | (104,666,974 | ) | | | 187,358,799 | |
NET ASSETS: | | | | | | | | |
Beginning of year | | | 187,358,799 | | | | — | |
| | |
|
|
| |
|
|
|
End of year (including accumulated undistributed net investment income (loss) of
$(167,523), and $0, respectively) | | $ | 82,691,825 | | | $ | 187,358,799 | |
| | |
|
|
| |
|
|
|
CHANGES IN SHARES OUTSTANDING | | | | | | | | |
Institutional Shares | | | | | | | | |
Shares sold | | | 104,954 | | | | 464,739 | |
Shares issued to holders in reinvestment of dividends | | | 3,612 | | | | — | |
Shares redeemed | | | (383,824 | ) | | | (19,496 | ) |
| | |
|
|
| |
|
|
|
Net increase (decrease) | | | (275,258 | ) | | | 445,243 | |
| | |
|
|
| |
|
|
|
CHANGES IN SHARES OUTSTANDING | | | | | | | | |
Service Shares | | | | | | | | |
Shares sold | | | 8,679,693 | | | | 20,197,403 | |
Shares issued to holders in reinvestment of dividends | | | 170,402 | | | | — | |
Shares redeemed | | | (18,252,001 | ) | | | (1,393,024 | ) |
| | |
|
|
| |
|
|
|
Net increase (decrease) | | | (9,401,906 | ) | | | 18,804,379 | |
| | |
|
|
| |
|
|
|
| 1 | | Consolidated Statements of Changes in Net Assets (see note 3b). |
| 2 | | Commencement of Operations. |
See notes to financial statements.
124
GuideMark® Funds & GuidePath® Funds
FINANCIAL HIGHLIGHTS
| | | | | | | | | | | | | | | | | | | | |
| | | Large Cap Core Fund
| |
| | | Institutional
| |
| | | Year Ended
March 31,
2017
| | | Year Ended
March 31,
2016
| | | Year Ended
March 31,
2015
| | | Year Ended
March 31,
2014
| | | Year Ended
March 31,
2013
| |
Per share data for a share of capital stock outstanding for the entire year and selected information for the year are as follows: | | | | | | | | | | | | | | | | | | | | |
Net asset value, beginning of year | | | $14.85 | | | | $15.29 | | | | $13.67 | | | | $11.20 | | | | $10.68 | |
Income from investment operations: | | | | | | | | | | | | | | | | | | | | |
Net investment income | | | 0.20 | 1 | | | 0.13 | 1 | | | 0.14 | | | | 0.09 | | | | 0.08 | |
Net realized and unrealized gains on investments | | | 1.62 | | | | (0.06 | )2 | | | 1.57 | | | | 2.46 | | | | 0.51 | |
| | |
|
|
| |
|
|
| |
|
|
| |
|
|
| |
|
|
|
Total from investment operations | | | 1.82 | | | | 0.07 | | | | 1.71 | | | | 2.55 | | | | 0.59 | |
| | |
|
|
| |
|
|
| |
|
|
| |
|
|
| |
|
|
|
Less distributions: | | | | | | | | | | | | | | | | | | | | |
Dividends from net investment income | | | (0.19 | ) | | | (0.11 | ) | | | (0.09 | ) | | | (0.08 | ) | | | (0.07 | ) |
Dividends from net realized gains | | | (0.34 | ) | | | (0.40 | ) | | | — | | | | — | | | | — | |
| | |
|
|
| |
|
|
| |
|
|
| |
|
|
| |
|
|
|
Total distributions | | | (0.53 | ) | | | (0.51 | ) | | | (0.09 | ) | | | (0.08 | ) | | | (0.07 | ) |
| | |
|
|
| |
|
|
| |
|
|
| |
|
|
| |
|
|
|
Net asset value, end of year | | | $16.14 | | | | $14.85 | | | | $15.29 | | | | $13.67 | | | | $11.20 | |
| | |
|
|
| |
|
|
| |
|
|
| |
|
|
| |
|
|
|
Total return | | | 12.46% | | | | 0.47% | | | | 12.51% | | | | 22.81% | | | | 5.54% | |
Supplemental data and ratios: | | | | | | | | | | | | | | | | | | | | |
Net assets, end of year | | | $42,855,994 | | | | $31,353,268 | | | | $44,686,597 | | | | $44,827,864 | | | | $44,994,114 | |
Ratio of expenses to average net assets3 | | | | | | | | | | | | | | | | | | | | |
Before expense reimbursement (recapture) and securities lending credit4 | | | 0.66% | | | | 0.80% | | | | 0.87% | | | | 0.90% | | | | 0.92% | |
After expense reimbursement (recapture) and securities lending credit5 | | | 0.59% | | | | 0.76% | | | | 0.85% | | | | 0.89% | | | | 0.89% | |
Ratio of net investment income to average net assets | | | | | | | | | | | | | | | | | | | | |
Before expense reimbursement (recapture) and securities lending credit | | | 1.23% | | | | 0.79% | | | | 0.88% | | | | 0.63% | | | | 0.81% | |
After expense reimbursement (recapture) and securities lending credit | | | 1.30% | | | | 0.83% | | | | 0.90% | | | | 0.64% | | | | 0.84% | |
Portfolio turnover rate | | | 90.46% | | | | 115.67% | | | | 53.23% | | | | 55.81% | | | | 60.92% | |
Portfolio Turnover is calculated for the Fund as a whole. 1 Net investment income per share has been calculated based on average shares outstanding during the year. 2 Realized and unrealized gains and losses per share in this caption are balancing amounts necessary to reconcile the change in net asset value per share for the year, and may not reconcile with the aggregate gains and losses in the Statement of Operations due to share transactions for the year. 3 The ratio of expenses to average net assets includes interest expense where applicable. See Note 6 in the Notes to the Financial Statements. | |
4 Before expense reimbursement (recapture) and securities lending credit
excluding interest expense. | | 0.66% | | | 0.80% | | | 0.87% | | | 0.90% | | | 0.92% | |
5 After expense reimbursement (recapture) and securities lending credit
excluding interest expense. | | 0.59% | | | 0.76% | | | 0.85% | | | 0.89% | | | 0.89% | |
See notes to financial statements.
125
GuideMark® Funds & GuidePath® Funds
FINANCIAL HIGHLIGHTS
| | | | | | | | | | | | | | | | | | | | |
| | | Large Cap Core Fund
| |
| | | Service
| |
| | | Year Ended
March 31,
2017
| | | Year Ended
March 31,
2016
| | | Year Ended
March 31,
2015
| | | Year Ended
March 31,
2014
| | | Year Ended
March 31,
2013
| |
Per share data for a share of capital stock outstanding for the entire year and selected information for the year are as follows: | | | | | | | | | | | | | | | | | | | | |
Net asset value, beginning of year | | | $14.68 | | | | $15.14 | | | | $13.56 | | | | $11.12 | | | | $10.61 | |
Income from investment operations: | | | | | | | | | | | | | | | | | | | | |
Net investment income | | | 0.11 | 1 | | | 0.07 | 1 | | | 0.05 | | | | — | | | | 0.02 | |
Net realized and unrealized gains on investments | | | 1.59 | | | | (0.08 | )2 | | | 1.56 | | | | 2.45 | | | | 0.51 | |
| | |
|
|
| |
|
|
| |
|
|
| |
|
|
| |
|
|
|
Total from investment operations | | | 1.70 | | | | (0.01 | ) | | | 1.61 | | | | 2.45 | | | | 0.53 | |
| | |
|
|
| |
|
|
| |
|
|
| |
|
|
| |
|
|
|
Less distributions: | | | | | | | | | | | | | | | | | | | | |
Dividends from net investment income | | | (0.11 | ) | | | (0.05 | ) | | | (0.03 | ) | | | (0.01 | ) | | | (0.02 | ) |
Dividends from net realized gains | | | (0.34 | ) | | | (0.40 | ) | | | — | | | | — | | | | — | |
| | |
|
|
| |
|
|
| |
|
|
| |
|
|
| |
|
|
|
Total distributions | | | (0.45 | ) | | | (0.45 | ) | | | (0.03 | ) | | | (0.01 | ) | | | (0.02 | ) |
| | |
|
|
| |
|
|
| |
|
|
| |
|
|
| |
|
|
|
Net asset value, end of year | | | $15.93 | | | | $14.68 | | | | $15.14 | | | | $13.56 | | | | $11.12 | |
| | |
|
|
| |
|
|
| |
|
|
| |
|
|
| |
|
|
|
Total return | | | 11.74% | | | | (0.08)% | | | | 11.87% | | | | 22.04% | | | | 5.00% | |
Supplemental data and ratios: | | | | | | | | | | | | | | | | | | | | |
Net assets, end of year | | | $159,857,853 | | | | $218,788,468 | | | | $168,457,719 | | | | $138,902,683 | | | | $136,196,479 | |
Ratio of expenses to average net assets3 | | | | | | | | | | | | | | | | | | | | |
Before expense reimbursement (recapture) and securities lending credit4 | | | 1.23% | | | | 1.33% | | | | 1.44% | | | | 1.48% | | | | 1.52% | |
After expense reimbursement (recapture) and securities lending credit5 | | | 1.16% | | | | 1.27% | | | | 1.45% | | | | 1.49% | | | | 1.49% | |
Ratio of net investment income (loss) to average net assets | | | | | | | | | | | | | | | | | | | | |
Before expense reimbursement (recapture) and securities lending credit | | | 0.65% | | | | 0.41% | | | | 0.32% | | | | 0.05% | | | | 0.18% | |
After expense reimbursement (recapture) and securities lending credit | | | 0.72% | | | | 0.47% | | | | 0.31% | | | | 0.04% | | | | 0.21% | |
Portfolio turnover rate | | | 90.46% | | | | 115.67% | | | | 53.23% | | | | 55.81% | | | | 60.92% | |
Portfolio Turnover is calculated for the Fund as a whole. 1 Net investment income per share has been calculated based on average shares outstanding during the year. 2 Realized and unrealized gains and losses per share in this caption are balancing amounts necessary to reconcile the change in net asset value per share for the year, and may not reconcile with the aggregate gains and losses in the Statement of Operations due to share transactions for the year. 3 The ratio of expenses to average net assets includes interest expense where applicable. See Note 6 in the Notes to the Financial Statements. | |
4 Before expense reimbursement (recapture) and securities lending credit excluding interest expense. | | | 1.23% | | | | 1.33% | | | | 1.44% | | | | 1.48% | | | | 1.52% | |
5 After expense reimbursement (recapture) and securities lending credit excluding interest expense. | | | 1.16% | | | | 1.27% | | | | 1.45% | | | | 1.49% | | | | 1.49% | |
See notes to financial statements.
126
GuideMark® Funds & GuidePath® Funds
FINANCIAL HIGHLIGHTS
| | | | | | | | | | | | | | | | | | | | |
| | | Emerging Markets Fund
| |
| | | Institutional
| |
| | | Year Ended
March 31,
2017
| | | Year Ended
March 31,
2016
| | | Year Ended
March 31,
2015
| | | Year Ended
March 31,
2014
| | | Year Ended
March 31,
2013
| |
Per share data for a share of capital stock outstanding for the entire year and selected information for the year are as follows: | | | | | | | | | | | | | | | | | | | | |
Net asset value, beginning of year | | | $11.37 | | | | $12.46 | | | | $11.73 | | | | $9.43 | | | | $8.39 | |
Income from investment operations: | | | | | | | | | | | | | | | | | | | | |
Net investment income | | | 0.14 | 1 | | | 0.16 | 1 | | | 0.21 | | | | 0.17 | | | | 0.18 | |
Net realized and unrealized gains (losses) on investments | | | 2.05 | | | | (1.03 | ) | | | 0.74 | | | | 2.31 | | | | 1.03 | |
| | |
|
|
| |
|
|
| |
|
|
| |
|
|
| |
|
|
|
Total from investment operations | | | 2.19 | | | | (0.87 | ) | | | 0.95 | | | | 2.48 | | | | 1.21 | |
| | |
|
|
| |
|
|
| |
|
|
| |
|
|
| |
|
|
|
Less distributions: | | | | | | | | | | | | | | | | | | | | |
Dividends from net investment income | | | (0.10 | ) | | | (0.22 | ) | | | (0.22 | ) | | | (0.18 | ) | | | (0.17 | ) |
| | |
|
|
| |
|
|
| |
|
|
| |
|
|
| |
|
|
|
Total distributions | | | (0.10 | ) | | | (0.22 | ) | | | (0.22 | ) | | | (0.18 | ) | | | (0.17 | ) |
| | |
|
|
| |
|
|
| |
|
|
| |
|
|
| |
|
|
|
Net asset value, end of year | | | $13.46 | | | | $11.37 | | | | $12.46 | | | | $11.73 | | | | $9.43 | |
| | |
|
|
| |
|
|
| |
|
|
| |
|
|
| |
|
|
|
Total return | | | 19.61% | | | | (6.98)% | | | | 8.08% | | | | 26.38% | | | | 14.70% | |
Supplemental data and ratios: | | | | | | | | | | | | | | | | | | | | |
Net assets, end of year | | | $11,925,354 | | | | $6,081,265 | | | | $60,596,893 | | | | $62,007,800 | | | | $60,452,681 | |
Ratio of expenses to average net assets2 | | | | | | | | | | | | | | | | | | | | |
Before expense reimbursement (recapture) and securities lending credit3 | | | 1.06% | | | | 0.88% | | | | 0.86% | | | | 0.89% | | | | 0.92% | |
After expense reimbursement (recapture) and securities lending credit4 | | | 1.05% | | | | 0.84% | | | | 0.84% | | | | 0.88% | | | | 0.91% | |
Ratio of net investment income to average net assets | | | | | | | | | | | | | | | | | | | | |
Before expense reimbursement (recapture) and securities lending credit | | | 1.10% | | | | 1.25% | | | | 1.87% | | | | 1.57% | | | | 1.89% | |
After expense reimbursement (recapture) and securities lending credit | | | 1.11% | | | | 1.29% | | | | 1.89% | | | | 1.58% | | | | 1.90% | |
Portfolio turnover rate | | | 60.19% | | | | 152.82% | | | | 31.33% | | | | 29.10% | | | | 27.02% | |
Portfolio Turnover is calculated for the Fund as a whole. 1 Net investment income per share has been calculated based on average shares outstanding during the year. 2 The ratio of expenses to average net assets includes interest expense where applicable. See Note 6 in the Notes to the Financial Statements. | |
3 Before expense reimbursement (recapture) and securities lending credit excluding interest expense. | | | 1.06% | | | | 0.88% | | | | 0.86% | | | | 0.89% | | | | 0.92% | |
4 After expense reimbursement (recapture) and securities lending credit excluding interest expense. | | | 1.05% | | | | 0.84% | | | | 0.84% | | | | 0.88% | | | | 0.91% | |
See notes to financial statements.
127
GuideMark® Funds & GuidePath® Funds
FINANCIAL HIGHLIGHTS
| | | | | | | | | | | | | | | | | | | | |
| | | Emerging Markets Fund
| |
| | | Service
| |
| | | Year Ended
March 31,
2017
| | | Year Ended
March 31,
2016
| | | Year Ended
March 31,
2015
| | | Year Ended
March 31,
2014
| | | Year Ended
March 31,
2013
| |
Per share data for a share of capital stock outstanding for the entire year and selected information for the year are as follows: | | | | | | | | | | | | | | | | | | | | |
Net asset value, beginning of year | | | $11.49 | | | | $12.57 | | | | $11.84 | | | | $9.52 | | | | $8.47 | |
Income from investment operations: | | | | | | | | | | | | | | | | | | | | |
Net investment income | | | 0.09 | 1 | | | 0.06 | 1 | | | 0.15 | | | | 0.13 | | | | 0.14 | |
Net realized and unrealized gains (losses) on investments | | | 2.06 | | | | (0.99 | ) | | | 0.73 | | | | 2.31 | | | | 1.03 | |
| | |
|
|
| |
|
|
| |
|
|
| |
|
|
| |
|
|
|
Total from investment operations | | | 2.15 | | | | (0.93 | ) | | | 0.88 | | | | 2.44 | | | | 1.17 | |
| | |
|
|
| |
|
|
| |
|
|
| |
|
|
| |
|
|
|
Less distributions: | | | | | | | | | | | | | | | | | | | | |
Dividends from net investment income | | | (0.04 | ) | | | (0.15 | ) | | | (0.15 | ) | | | (0.12 | ) | | | (0.12 | ) |
| | |
|
|
| |
|
|
| |
|
|
| |
|
|
| |
|
|
|
Total distributions | | | (0.04 | ) | | | (0.15 | ) | | | (0.15 | ) | | | (0.12 | ) | | | (0.12 | ) |
| | |
|
|
| |
|
|
| |
|
|
| |
|
|
| |
|
|
|
Net asset value, end of year | | | $13.60 | | | | $11.49 | | | | $12.57 | | | | $11.84 | | | | $9.52 | |
| | |
|
|
| |
|
|
| |
|
|
| |
|
|
| |
|
|
|
Total return | | | 18.78% | | | | (7.38)% | | | | 7.46% | | | | 25.63% | | | | 13.96% | |
Supplemental data and ratios: | | | | | | | | | | | | | | | | | | | | |
Net assets, end of year | | | $106,077,974 | | | | $118,224,652 | | | | $161,242,899 | | | | $137,835,903 | | | | $139,072,035 | |
Ratio of expenses to average net assets2 | | | | | | | | | | | | | | | | | | | | |
Before expense reimbursement (recapture) and securities lending credit3 | | | 1.64% | | | | 1.52% | | | | 1.43% | | | | 1.46% | | | | 1.49% | |
After expense reimbursement (recapture) and securities lending credit4 | | | 1.63% | | | | 1.48% | | | | 1.41% | | | | 1.45% | | | | 1.49% | |
Ratio of net investment income to average net assets | | | | | | | | | | | | | | | | | | | | |
Before expense reimbursement (recapture) and securities lending credit | | | 0.73% | | | | 0.44% | | | | 1.30% | | | | 1.01% | | | | 1.33% | |
After expense reimbursement (recapture) and securities lending credit | | | 0.74% | | | | 0.48% | | | | 1.32% | | | | 1.02% | | | | 1.33% | |
Portfolio turnover rate | | | 60.19% | | | | 152.82% | | | | 31.33% | | | | 29.10% | | | | 27.02% | |
Portfolio Turnover is calculated for the Fund as a whole. 1 Net investment income per share has been calculated based on average shares outstanding during the year. 2 The ratio of expenses to average net assets includes interest expense where applicable. See Note 6 in the Notes to the Financial Statements. | |
3 Before expense reimbursement (recapture) and securities lending credit excluding interest expense. | | | 1.64% | | | | 1.52% | | | | 1.43% | | | | 1.46% | | | | 1.49% | |
4 After expense reimbursement (recapture) and securities lending credit excluding interest expense. | | | 1.63% | | | | 1.48% | | | | 1.41% | | | | 1.45% | | | | 1.49% | |
See notes to financial statements.
128
GuideMark® Funds & GuidePath® Funds
FINANCIAL HIGHLIGHTS
| | | | | | | | | | | | | | | | | | | | |
| | | Small/Mid Cap Core Fund
| |
| | | Institutional
| |
| | | Year Ended
March 31,
2017
| | | Year Ended
March 31,
2016
| | | Year Ended
March 31,
2015
| | | Year Ended
March 31,
2014
| | | Year Ended
March 31,
2013
| |
Per share data for a share of capital stock outstanding for the entire year and selected information for the year are as follows: | | | | | | | | | | | | | | | | | | | | |
Net asset value, beginning of year | | | $15.33 | | | | $17.62 | | | | $16.77 | | | | $13.51 | | | | $11.56 | |
Income from investment operations: | | | | | | | | | | | | | | | | | | | | |
Net investment income | | | 0.15 | 1 | | | 0.06 | 1 | | | 0.01 | | | | — | | | | 0.07 | |
Net realized and unrealized gains (losses) on investments | | | 2.98 | | | | (1.93 | ) | | | 1.96 | | | | 3.27 | | | | 1.99 | |
| | |
|
|
| |
|
|
| |
|
|
| |
|
|
| |
|
|
|
Total from investment operations | | | 3.13 | | | | (1.87 | ) | | | 1.97 | | | | 3.27 | | | | 2.06 | |
| | |
|
|
| |
|
|
| |
|
|
| |
|
|
| |
|
|
|
Less distributions: | | | | | | | | | | | | | | | | | | | | |
Dividends from net investment income | | | (0.12 | ) | | | — | | | | — | | | | (0.01 | ) | | | (0.11 | ) |
Dividends from net realized gains | | | — | | | | (0.42 | ) | | | (1.12 | ) | | | — | | | | — | |
| | |
|
|
| |
|
|
| |
|
|
| |
|
|
| |
|
|
|
Total distributions | | | (0.12 | ) | | | (0.42 | ) | | | (1.12 | ) | | | (0.01 | ) | | | (0.11 | ) |
| | |
|
|
| |
|
|
| |
|
|
| |
|
|
| |
|
|
|
Net asset value, end of year | | | $18.34 | | | | $15.33 | | | | $17.62 | | | | $16.77 | | | | $13.51 | |
| | |
|
|
| |
|
|
| |
|
|
| |
|
|
| |
|
|
|
Total return | | | 20.45% | | | | (10.61)% | | | | 11.99% | | | | 24.19% | | | | 17.95% | |
Supplemental data and ratios: | | | | | | | | | | | | | | | | | | | | |
Net assets, end of year | | | $64,819,232 | | | | $40,624,613 | | | | $40,075,963 | | | | $44,695,002 | | | | $44,361,656 | |
Ratio of expenses to average net assets2 | | | | | | | | | | | | | | | | | | | | |
Before expense reimbursement (recapture) and securities lending credit3 | | | 0.92% | | | | 1.02% | | | | 1.02% | | | | 1.05% | | | | 1.09% | |
After expense reimbursement (recapture) and securities lending credit4 | | | 0.66% | | | | 0.82% | | | | 0.91% | | | | 1.02% | | | | 1.05% | |
Ratio of net investment income (loss) to average net assets | | | | | | | | | | | | | | | | | | | | |
Before expense reimbursement (recapture) and securities lending credit | | | 0.60% | | | | 0.18% | | | | (0.08)% | | | | (0.04)% | | | | 0.61% | |
After expense reimbursement (recapture) and securities lending credit | | | 0.86% | | | | 0.38% | | | | 0.03% | | | | (0.01)% | | | | 0.65% | |
Portfolio turnover rate | | | 42.22% | | | | 146.02% | | | | 96.24% | | | | 241.55% | | | | 143.14% | |
Portfolio Turnover is calculated for the Fund as a whole. 1 Net investment income per share has been calculated based on average shares outstanding during the year. 2 The ratio of expenses to average net assets includes interest expense where applicable. See Note 6 in the Notes to the Financial Statements. | |
3 Before expense reimbursement (recapture) and securities lending credit excluding interest expense. | | | 0.92% | | | | 1.02% | | | | 1.02% | | | | 1.05% | | | | 1.09% | |
4 After expense reimbursement (recapture) and securities lending credit excluding interest expense. | | | 0.66% | | | | 0.82% | | | | 0.91% | | | | 1.02% | | | | 1.05% | |
See notes to financial statements.
129
GuideMark® Funds & GuidePath® Funds
FINANCIAL HIGHLIGHTS
| | | | | | | | | | | | | | | | | | | | |
| | | Small/Mid Cap Core Fund
| |
| | | Service
| |
| | | Year Ended
March 31,
2017
| | | Year Ended
March 31,
2016
| | | Year Ended
March 31,
2015
| | | Year Ended
March 31,
2014
| | | Year Ended
March 31,
2013
| |
Per share data for a share of capital stock outstanding for the entire year and selected information for the year are as follows: | | | | | | | | | | | | | | | | | | | | |
Net asset value, beginning of year | | | $14.96 | | | | $17.31 | | | | $16.61 | | | | $13.45 | | | | $11.50 | |
Income from investment operations: | | | | | | | | | | | | | | | | | | | | |
Net investment income (loss) | | | 0.04 | 1 | | | (0.03 | )1 | | | (0.09 | ) | | | (0.12 | ) | | | — | |
Net realized and unrealized gains (losses) on investments | | | 2.91 | | | | (1.90 | ) | | | 1.91 | | | | 3.28 | | | | 1.99 | |
| | |
|
|
| |
|
|
| |
|
|
| |
|
|
| |
|
|
|
Total from investment operations | | | 2.95 | | | | (1.93 | ) | | | 1.82 | | | | 3.16 | | | | 1.99 | |
| | |
|
|
| |
|
|
| |
|
|
| |
|
|
| |
|
|
|
Less distributions: | | | | | | | | | | | | | | | | | | | | |
Dividends from net investment income | | | (0.05 | ) | | | — | | | | — | | | | — | | | | (0.04 | ) |
Dividends from net realized gains | | | — | | | | (0.42 | ) | | | (1.12 | ) | | | — | | | | — | |
| | |
|
|
| |
|
|
| |
|
|
| |
|
|
| |
|
|
|
Total distributions | | | (0.05 | ) | | | (0.42 | ) | | | (1.12 | ) | | | — | | | | (0.04 | ) |
| | |
|
|
| |
|
|
| |
|
|
| |
|
|
| |
|
|
|
Net asset value, end of year | | | $17.86 | | | | $14.96 | | | | $17.31 | | | | $16.61 | | | | $13.45 | |
| | |
|
|
| |
|
|
| |
|
|
| |
|
|
| |
|
|
|
Total return | | | 19.71% | | | | (11.15)% | | | | 11.19% | | | | 23.49% | | | | 17.32% | |
Supplemental data and ratios: | | | | | | | | | | | | | | | | | | | | |
Net assets, end of year | | | $50,657,342 | | | | $48,196,975 | | | | $37,978,078 | | | | $32,592,001 | | | | $40,621,412 | |
Ratio of expenses to average net assets2 | | | | | | | | | | | | | | | | | | | | |
Before expense reimbursement (recapture) and securities lending credit3 | | | 1.50% | | | | 1.58% | | | | 1.58% | | | | 1.60% | | | | 1.66% | |
After expense reimbursement (recapture) and securities lending credit4 | | | 1.24% | | | | 1.41% | | | | 1.59% | | | | 1.59% | | | | 1.59% | |
Ratio of net investment income (loss) to average net assets | | | | | | | | | | | | | | | | | | | | |
Before expense reimbursement (recapture) and securities lending credit | | | 0.00% | | | | (0.32)% | | | | (0.62)% | | | | (0.62)% | | | | 0.01% | |
After expense reimbursement (recapture) and securities lending credit | | | 0.26% | | | | (0.15)% | | | | (0.63)% | | | | (0.61)% | | | | 0.08% | |
Portfolio turnover rate | | | 42.22% | | | | 146.02% | | | | 96.24% | | | | 241.55% | | | | 143.14% | |
Portfolio Turnover is calculated for the Fund as a whole. 1 Net investment income/(loss) per share has been calculated based on average shares outstanding during the year. 2 The ratio of expenses to average net assets includes interest expense where applicable. See Note 6 in the Notes to the Financial Statements. | |
3 Before expense reimbursement (recapture) and securities lending credit excluding interest expense. | | | 1.50% | | | | 1.58% | | | | 1.58% | | | | 1.60% | | | | 1.66% | |
4 After expense reimbursement (recapture) and securities lending credit excluding interest expense. | | | 1.24% | | | | 1.41% | | | | 1.59% | | | | 1.59% | | | | 1.59% | |
See notes to financial statements.
130
GuideMark® Funds & GuidePath® Funds
FINANCIAL HIGHLIGHTS
| | | | | | | | | | | | | | | | | | | | |
| | | World ex-US Fund
| |
| | | Institutional
| |
| | | Year Ended
March 31,
2017
| | | Year Ended
March 31,
2016
| | | Year Ended
March 31,
2015
| | | Year Ended
March 31,
2014
| | | Year Ended
March 31,
2013
| |
Per share data for a share of capital stock outstanding for the entire year and selected information for the year are as follows: | | | | | | | | | | | | | | | | | | | | |
Net asset value, beginning of year | | | $7.74 | | | | $8.75 | | | | $8.94 | | | | $8.06 | | | | $7.52 | |
Income from investment operations: | | | | | | | | | | | | | | | | | | | | |
Net investment income | | | 0.15 | 1 | | | 0.13 | 1 | | | 0.25 | | | | 0.11 | | | | 0.13 | |
Net realized and unrealized gains (losses) on investments | | | 0.65 | | | | (0.91 | ) | | | (0.26 | ) | | | 0.86 | | | | 0.48 | |
| | |
|
|
| |
|
|
| |
|
|
| |
|
|
| |
|
|
|
Total from investment operations | | | 0.80 | | | | (0.78 | ) | | | (0.01 | ) | | | 0.97 | | | | 0.61 | |
| | |
|
|
| |
|
|
| |
|
|
| |
|
|
| |
|
|
|
Less distributions: | | | | | | | | | | | | | | | | | | | | |
Dividends from net investment income | | | (0.16 | ) | | | (0.23 | ) | | | (0.18 | ) | | | (0.09 | ) | | | (0.07 | ) |
| | |
|
|
| |
|
|
| |
|
|
| |
|
|
| |
|
|
|
Total distributions | | | (0.16 | ) | | | (0.23 | ) | | | (0.18 | ) | | | (0.09 | ) | | | (0.07 | ) |
| | |
|
|
| |
|
|
| |
|
|
| |
|
|
| |
|
|
|
Net asset value, end of year | | | $8.38 | | | | $7.74 | | | | $8.75 | | | | $8.94 | | | | $8.06 | |
| | |
|
|
| |
|
|
| |
|
|
| |
|
|
| |
|
|
|
Total return | | | 10.48% | | | | (9.00)% | | | | (0.10)% | | | | 12.09% | | | | 8.09% | |
Supplemental data and ratios: | | | | | | | | | | | | | | | | | | | | |
Net assets, end of year | | | $75,295,608 | | | | $52,879,582 | | | | $113,316,485 | | | | $130,537,695 | | | | $85,157,441 | |
Ratio of expenses to average net assets2 | | | | | | | | | | | | | | | | | | | | |
Before expense reimbursement (recapture) and securities lending credit3 | | | 0.84% | | | | 0.95% | | | | 0.98% | | | | 1.03% | | | | 1.09% | |
After expense reimbursement (recapture) and securities lending credit4 | | | 0.79% | | | | 0.90% | | | | 0.98% | | | | 1.03% | | | | 1.09% | |
Ratio of net investment income to average net assets | | | | | | | | | | | | | | | | | | | | |
Before expense reimbursement (recapture) and securities lending credit | | | 1.83% | | | | 1.54% | | | | 2.68% | | | | 1.44% | | | | 1.44% | |
After expense reimbursement (recapture) and securities lending credit | | | 1.88% | | | | 1.59% | | | | 2.68% | | | | 1.44% | | | | 1.44% | |
Portfolio turnover rate | | | 60.68% | | | | 114.74% | | | | 61.84% | | | | 75.22% | | | | 75.34% | |
Portfolio Turnover is calculated for the Fund as a whole. 1 Net investment income per share has been calculated based on average shares outstanding during the year. 2 The ratio of expenses to average net assets includes interest expense where applicable. See Note 6 in the Notes to the Financial Statements. | |
3 Before expense reimbursement (recapture) and securities lending credit excluding interest expense. | | | 0.84% | | | | 0.95% | | | | 0.98% | | | | 1.03% | | | | 1.09% | |
4 After expense reimbursement (recapture) and securities lending credit excluding interest expense. | | | 0.79% | | | | 0.90% | | | | 0.98% | | | | 1.03% | | | | 1.09% | |
See notes to financial statements.
131
GuideMark® Funds & GuidePath® Funds
FINANCIAL HIGHLIGHTS
| | | | | | | | | | | | | | | | | | | | |
| | | World ex-US Fund
| |
| | | Service
| |
| | | Year Ended
March 31,
2017
| | | Year Ended
March 31,
2016
| | | Year Ended
March 31,
2015
| | | Year Ended
March 31,
2014
| | | Year Ended
March 31,
2013
| |
Per share data for a share of capital stock outstanding for the entire year and selected information for the year are as follows: | | | | | | | | | | | | | | | | | | | | |
Net asset value, beginning of year | | | $7.66 | | | | $8.70 | | | | $8.89 | | | | $8.05 | | | | $7.54 | |
Income from investment operations: | | | | | | | | | | | | | | | | | | | | |
Net investment income | | | 0.11 | 1 | | | 0.08 | 1 | | | 0.17 | | | | 0.07 | | | | 0.08 | |
Net realized and unrealized gains (losses) on investments | | | 0.63 | | | | (0.91 | ) | | | (0.23 | ) | | | 0.85 | | | | 0.49 | |
| | |
|
|
| |
|
|
| |
|
|
| |
|
|
| |
|
|
|
Total from investment operations | | | 0.74 | | | | (0.83 | ) | | | (0.06 | ) | | | 0.92 | | | | 0.57 | |
| | |
|
|
| |
|
|
| |
|
|
| |
|
|
| |
|
|
|
Less distributions: | | | | | | | | | | | | | | | | | | | | |
Dividends from net investment income | | | (0.14 | ) | | | (0.21 | ) | | | (0.13 | ) | | | (0.08 | ) | | | (0.06 | ) |
| | |
|
|
| |
|
|
| |
|
|
| |
|
|
| |
|
|
|
Total distributions | | | (0.14 | ) | | | (0.21 | ) | | | (0.13 | ) | | | (0.08 | ) | | | (0.06 | ) |
| | |
|
|
| |
|
|
| |
|
|
| |
|
|
| |
|
|
|
Net asset value, end of year | | | $8.26 | | | | $7.66 | | | | $8.70 | | | | $8.89 | | | | $8.05 | |
| | |
|
|
| |
|
|
| |
|
|
| |
|
|
| |
|
|
|
Total return | | | 9.85% | | | | (9.59)% | | | | (0.68)% | | | | 11.47% | | | | 7.53% | |
Supplemental data and ratios: | | | | | | | | | | | | | | | | | | | | |
Net assets, end of year | | | $112,737,823 | | | | $135,305,242 | | | | $228,832,175 | | | | $238,149,375 | | | | $197,252,920 | |
Ratio of expenses to average net assets2 | | | | | | | | | | | | | | | | | | | | |
Before expense reimbursement (recapture) and securities lending credit3 | | | 1.42% | | | | 1.52% | | | | 1.55% | | | | 1.60% | | | | 1.66% | |
After expense reimbursement (recapture) and securities lending credit4 | | | 1.39% | | | | 1.52% | | | | 1.59% | | | | 1.59% | | | | 1.59% | |
Ratio of net investment income to average net assets | | | | | | | | | | | | | | | | | | | | |
Before expense reimbursement (recapture) and securities lending credit | | | 1.36% | | | | 0.92% | | | | 1.96% | | | | 0.94% | | | | 0.93% | |
After expense reimbursement (recapture) and securities lending credit | | | 1.39% | | | | 0.92% | | | | 1.92% | | | | 0.95% | | | | 1.00% | |
Portfolio turnover rate | | | 60.68% | | | | 114.74% | | | | 61.84% | | | | 75.22% | | | | 75.34% | |
Portfolio Turnover is calculated for the Fund as a whole. 1 Net investment income per share has been calculated based on average shares outstanding during the year. 2 The ratio of expenses to average net assets includes interest expense where applicable. See Note 6 in the Notes to the Financial Statements. | |
3 Before expense reimbursement (recapture) and securities lending credit excluding interest expense. | | | 1.42% | | | | 1.52% | | | | 1.55% | | | | 1.60% | | | | 1.66% | |
4 After expense reimbursement (recapture) and securities lending credit excluding interest expense. | | | 1.39% | | | | 1.52% | | | | 1.59% | | | | 1.59% | | | | 1.59% | |
See notes to financial statements.
132
GuideMark® Funds & GuidePath® Funds
FINANCIAL HIGHLIGHTS
| | | | | | | | | | | | | | | | | | | | |
| | | Opportunistic Equity Fund
| |
| | | Service
| |
| | | Year Ended
March 31,
2017
| | | Year Ended
March 31,
2016
| | | Year Ended
March 31,
2015
| | | Year Ended
March 31,
2014
| | | Year Ended
March 31,
2013
| |
Per share data for a share of capital stock outstanding for the entire year and selected information for the year are as follows: | | | | | | | | | | | | | | | | | | | | |
Net asset value, beginning of year | | | $9.99 | | | | $12.75 | | | | $13.42 | | | | $11.27 | | | | $9.86 | |
Income from investment operations: | | | | | | | | | | | | | | | | | | | | |
Net investment income (loss) | | | (0.04 | )1 | | | (0.02 | )1 | | | 0.04 | | | | 0.04 | | | | 0.03 | |
Net realized and unrealized gains (losses) on investments | | | 1.71 | | | | (1.01 | ) | | | 1.60 | | | | 2.79 | | | | 1.40 | |
| | |
|
|
| |
|
|
| |
|
|
| |
|
|
| |
|
|
|
Total from investment operations | | | 1.67 | | | | (1.03 | ) | | | 1.64 | | | | 2.83 | | | | 1.43 | |
| | |
|
|
| |
|
|
| |
|
|
| |
|
|
| |
|
|
|
Less distributions: | | | | | | | | | | | | | | | | | | | | |
Dividends from net investment income | | | — | * | | | — | | | | (0.06 | ) | | | (0.03 | ) | | | (0.02 | ) |
Dividends from net realized gains | | | (0.37 | ) | | | (1.73 | ) | | | (2.25 | ) | | | (0.65 | ) | | | — | |
| | |
|
|
| |
|
|
| |
|
|
| |
|
|
| |
|
|
|
Total distributions | | | (0.37 | ) | | | (1.73 | ) | | | (2.31 | ) | | | (0.68 | ) | | | (0.02 | ) |
| | |
|
|
| |
|
|
| |
|
|
| |
|
|
| |
|
|
|
Net asset value, end of year | | | $11.29 | | | | $9.99 | | | | $12.75 | | | | $13.42 | | | | $11.27 | |
| | |
|
|
| |
|
|
| |
|
|
| |
|
|
| |
|
|
|
Total return | | | 17.01% | | | | (8.42)% | | | | 12.61% | | | | 25.20% | | | | 14.56% | |
Supplemental data and ratios: | | | | | | | | | | | | | | | | | | | | |
Net assets, end of year | | | $66,293,535 | | | | $69,901,093 | | | | $73,803,768 | | | | $72,351,978 | | | | $87,142,873 | |
Ratio of expenses to average net assets2 | | | | | | | | | | | | | | | | | | | | |
Before expense reimbursement (recapture) and securities lending credit3 | | | 1.66% | | | | 1.59% | | | | 1.57% | | | | 1.58% | | | | 1.63% | |
After expense reimbursement (recapture) and securities lending credit4 | | | 1.59% | | | | 1.56% | | | | 1.56% | | | | 1.59% | | | | 1.60% | |
Ratio of net investment income (loss) to average net assets | | | | | | | | | | | | | | | | | | | | |
Before expense reimbursement (recapture) and securities lending credit | | | (0.49)% | | | | (0.20)% | | | | 0.25% | | | | 0.27% | | | | 0.26% | |
After expense reimbursement (recapture) and securities lending credit | | | (0.42)% | | | | (0.17)% | | | | 0.26% | | | | 0.26% | | | | 0.29% | |
Portfolio turnover rate | | | 76.37% | | | | 92.64% | | | | 59.70% | | | | 59.12% | | | | 78.58% | |
1 Net investment loss per share has been calculated based on average shares outstanding during the year. 2 The ratio of expenses to average net assets includes interest expense where applicable. See Note 6 in the Notes to the Financial Statements. | |
3 Before expense reimbursement (recapture) and securities lending credit excluding interest expense. | | | 1.66% | | | | 1.59% | | | | 1.57% | | | | 1.58% | | | | 1.63% | |
4 After expense reimbursement (recapture) and securities lending credit excluding interest expense. | | | 1.59% | | | | 1.56% | | | | 1.56% | | | | 1.59% | | | | 1.60% | |
* Amount represents less than $0.01 per share. | |
See notes to financial statements.
133
GuideMark® Funds & GuidePath® Funds
FINANCIAL HIGHLIGHTS
| | | | | | | | | | | | | | | | | | | | |
| | | Core Fixed Income Fund
| |
| | | Institutional
| |
| | | Year Ended
March 31,
2017
| | | Year Ended
March 31,
2016
| | | Year Ended
March 31,
2015
| | | Year Ended
March 31,
2014
| | | Year Ended
March 31,
2013
| |
Per share data for a share of capital stock outstanding for the entire year and selected information for the year are as follows: | | | | | | | | | | | | | | | | | | | | |
Net asset value, beginning of year | | | $9.46 | | | | $9.67 | | | | $9.37 | | | | $9.86 | | | | $9.77 | |
Income from investment operations: | | | | | | | | | | | | | | | | | | | | |
Net investment income | | | 0.17 | 1 | | | 0.17 | 1 | | | 0.15 | | | | 0.16 | | | | 0.17 | |
Net realized and unrealized gains (losses) on investments | | | (0.10 | ) | | | (0.08 | ) | | | 0.33 | | | | (0.24 | ) | | | 0.23 | |
| | |
|
|
| |
|
|
| |
|
|
| |
|
|
| |
|
|
|
Total from investment operations | | | 0.07 | | | | 0.09 | | | | 0.48 | | | | (0.08 | ) | | | 0.40 | |
| | |
|
|
| |
|
|
| |
|
|
| |
|
|
| |
|
|
|
Less distributions: | | | | | | | | | | | | | | | | | | | | |
Dividends from net investment income | | | (0.22 | ) | | | (0.19 | ) | | | (0.17 | ) | | | (0.20 | ) | | | (0.21 | ) |
Dividends from net realized gains | | | (0.06 | ) | | | (0.11 | ) | | | (0.01 | ) | | | (0.03 | ) | | | (0.10 | ) |
Return of capital | | | — | | | | — | | | | — | | | | (0.18 | ) | | | — | |
| | |
|
|
| |
|
|
| |
|
|
| |
|
|
| |
|
|
|
Total distributions | | | (0.28 | ) | | | (0.30 | ) | | | (0.18 | ) | | | (0.41 | ) | | | (0.31 | ) |
| | |
|
|
| |
|
|
| |
|
|
| |
|
|
| |
|
|
|
Net asset value, end of year | | | $9.25 | | | | $9.46 | | | | $9.67 | | | | $9.37 | | | | $9.86 | |
| | |
|
|
| |
|
|
| |
|
|
| |
|
|
| |
|
|
|
Total return | | | 0.74% | | | | 0.97% | | | | 5.25% | | | | (0.72)% | | | | 4.12% | |
Supplemental data and ratios: | | | | | | | | | | | | | | | | | | | | |
Net assets, end of year | | | $9,110,591 | | | | $1,970,942 | | | | $75,832,786 | | | | $88,702,582 | | | | $134,362,492 | |
Ratio of expenses to average net assets2 | | | | | | | | | | | | | | | | | | | | |
Before expense reimbursement (recapture) and securities lending credit3 | | | 0.79% | | | | 0.73% | | | | 0.70% | | | | 0.70% | | | | 0.72% | |
After expense reimbursement (recapture) and securities lending credit4 | | | 0.69% | | | | 0.71% | | | | 0.69% | | | | 0.70% | | | | 0.72% | |
Ratio of net investment income to average net assets | | | | | | | | | | | | | | | | | | | | |
Before expense reimbursement (recapture) and securities lending credit | | | 1.70% | | | | 1.73% | | | | 1.71% | | | | 1.68% | | | | 1.53% | |
After expense reimbursement (recapture) and securities lending credit | | | 1.80% | | | | 1.75% | | | | 1.72% | | | | 1.68% | | | | 1.53% | |
Portfolio turnover rate | | | 164.81% | | | | 157.49% | | | | 185.11% | | | | 112.86% | | | | 213.80% | |
Portfolio Turnover is calculated for the Fund as a whole. 1 Net investment income per share has been calculated based on average shares outstanding during the year. 2 The ratio of expenses to average net assets includes interest expense where applicable. See Note 6 in the Notes to the Financial Statements. | |
3 Before expense reimbursement (recapture) and securities lending credit excluding interest expense. | | | 0.79% | | | | 0.73% | | | | 0.70% | | | | 0.70% | | | | 0.72% | |
4 After expense reimbursement (recapture) and securities lending credit excluding interest expense. | | | 0.69% | | | | 0.71% | | | | 0.69% | | | | 0.70% | | | | 0.72% | |
See notes to financial statements.
134
GuideMark® Funds & GuidePath® Funds
FINANCIAL HIGHLIGHTS
| | | | | | | | | | | | | | | | | | | | |
| | | Core Fixed Income Fund
| |
| | | Service
| |
| | | Year Ended
March 31,
2017
| | | Year Ended
March 31,
2016
| | | Year Ended
March 31,
2015
| | | Year Ended
March 31,
2014
| | | Year Ended
March 31,
2013
| |
Per share data for a share of capital stock outstanding for the entire year and selected information for the year are as follows: | | | | | | | | | | | | | | | | | | | | |
Net asset value, beginning of year | | | $9.54 | | | | $9.69 | | | | $9.39 | | | | $9.88 | | | | $9.78 | |
Income from investment operations: | | | | | | | | | | | | | | | | | | | | |
Net investment income | | | 0.12 | 1 | | | 0.12 | 1 | | | 0.10 | | | | 0.11 | | | | 0.11 | |
Net realized and unrealized gains (losses) on investments | | | (0.11 | ) | | | (0.03 | ) | | | 0.33 | | | | (0.25 | ) | | | 0.24 | |
| | |
|
|
| |
|
|
| |
|
|
| |
|
|
| |
|
|
|
Total from investment operations | | | 0.01 | | | | 0.09 | | | | 0.43 | | | | (0.14 | ) | | | 0.35 | |
| | |
|
|
| |
|
|
| |
|
|
| |
|
|
| |
|
|
|
Less distributions: | | | | | | | | | | | | | | | | | | | | |
Dividends from net investment income | | | (0.17 | ) | | | (0.13 | ) | | | (0.12 | ) | | | (0.14 | ) | | | (0.15 | ) |
Dividends from net realized gains | | | (0.06 | ) | | | (0.11 | ) | | | (0.01 | ) | | | (0.03 | ) | | | (0.10 | ) |
Return of capital | | | — | | | | — | | | | — | | | | (0.18 | ) | | | — | |
| | |
|
|
| |
|
|
| |
|
|
| |
|
|
| |
|
|
|
Total distributions | | | (0.23 | ) | | | (0.24 | ) | | | (0.13 | ) | | | (0.35 | ) | | | (0.25 | ) |
| | |
|
|
| |
|
|
| |
|
|
| |
|
|
| |
|
|
|
Net asset value, end of year | | | $9.32 | | | | $9.54 | | | | $9.69 | | | | $9.39 | | | | $9.88 | |
| | |
|
|
| |
|
|
| |
|
|
| |
|
|
| |
|
|
|
Total return | | | 0.02% | | | | 1.01% | | | | 4.64% | | | | (1.33)% | | | | 3.55% | |
Supplemental data and ratios: | | | | | | | | | | | | | | | | | | | | |
Net assets, end of year | | | $137,358,236 | | | | $209,252,288 | | | | $236,819,684 | | | | $231,285,162 | | | | $281,180,497 | |
Ratio of expenses to average net assets2 | | | | | | | | | | | | | | | | | | | | |
Before expense reimbursement (recapture) and securities lending credit3 | | | 1.36% | | | | 1.31% | | | | 1.29% | | | | 1.29% | | | | 1.30% | |
After expense reimbursement (recapture) and securities lending credit4 | | | 1.29% | | | | 1.29% | | | | 1.29% | | | | 1.29% | | | | 1.29% | |
Ratio of net investment income to average net assets | | | | | | | | | | | | | | | | | | | | |
Before expense reimbursement (recapture) and securities lending credit | | | 1.14% | | | | 1.22% | | | | 1.11% | | | | 1.10% | | | | 1.02% | |
After expense reimbursement (recapture) and securities lending credit | | | 1.21% | | | | 1.24% | | | | 1.11% | | | | 1.10% | | | | 1.03% | |
Portfolio turnover rate | | | 164.81% | | | | 157.49% | | | | 185.11% | | | | 112.86% | | | | 213.80% | |
Portfolio Turnover is calculated for the Fund as a whole. 1 Net investment income per share has been calculated based on average shares outstanding during the year. 2 The ratio of expenses to average net assets includes interest expense where applicable. See Note 6 in the Notes to the Financial Statements. | |
3 Before expense reimbursement (recapture) and securities lending credit excluding interest expense. | | | 1.36% | | | | 1.31% | | | | 1.29% | | | | 1.29% | | | | 1.30% | |
4 After expense reimbursement (recapture) and securities lending credit excluding interest expense. | | | 1.29% | | | | 1.29% | | | | 1.29% | | | | 1.29% | | | | 1.29% | |
See notes to financial statements.
135
GuideMark® Funds & GuidePath® Funds
FINANCIAL HIGHLIGHTS
| | | | | | | | | | | | | | | | | | | | |
| | | Tax-Exempt Fixed Income Fund
| |
| | | Service
| |
| | | Year Ended
March 31,
2017
| | | Year Ended
March 31,
2016
| | | Year Ended
March 31,
2015
| | | Year Ended
March 31,
2014
| | | Year Ended
March 31,
2013
| |
Per share data for a share of capital stock outstanding for the entire year and selected information for the year are as follows: | | | | | | | | | | | | | | | | | | | | |
Net asset value, beginning of year | | | $11.62 | | | | $11.58 | | | | $11.18 | | | | $11.70 | | | | $11.47 | |
Income from investment operations: | | | | | | | | | | | | | | | | | | | | |
Net investment income | | | 0.30 | 1 | | | 0.31 | 1 | | | 0.32 | | | | 0.34 | | | | 0.33 | |
Net realized and unrealized gains (losses) on investments | | | (0.38 | ) | | | 0.06 | | | | 0.40 | | | | (0.52 | ) | | | 0.23 | |
| | |
|
|
| |
|
|
| |
|
|
| |
|
|
| |
|
|
|
Total from investment operations | | | (0.08 | ) | | | 0.37 | | | | 0.72 | | | | (0.18 | ) | | | 0.56 | |
| | |
|
|
| |
|
|
| |
|
|
| |
|
|
| |
|
|
|
Less distributions: | | | | | | | | | | | | | | | | | | | | |
Dividends from net investment income | | | (0.32 | ) | | | (0.33 | ) | | | (0.32 | ) | | | (0.34 | ) | | | (0.33 | ) |
| | |
|
|
| |
|
|
| |
|
|
| |
|
|
| |
|
|
|
Total distributions | | | (0.32 | ) | | | (0.33 | ) | | | (0.32 | ) | | | (0.34 | ) | | | (0.33 | ) |
| | |
|
|
| |
|
|
| |
|
|
| |
|
|
| |
|
|
|
Net asset value, end of year | | | $11.22 | | | | $11.62 | | | | $11.58 | | | | $11.18 | | | | $11.70 | |
| | |
|
|
| |
|
|
| |
|
|
| |
|
|
| |
|
|
|
Total return | | | (0.82)% | | | | 3.22% | | | | 6.45% | | | | (1.48)% | | | | 4.93% | |
Supplemental data and ratios: | | | | | | | | | | | | | | | | | | | | |
Net assets, end of year | | | $30,317,261 | | | | $49,084,900 | | | | $65,682,169 | | | | $63,429,577 | | | | $75,739,873 | |
Ratio of expenses to average net assets2 | | | | | | | | | | | | | | | | | | | | |
Before expense reimbursement (recapture)3 | | | 1.43% | | | | 1.42% | | | | 1.38% | | | | 1.38% | | | | 1.36% | |
After expense reimbursement (recapture)4 | | | 1.29% | | | | 1.28% | | | | 1.29% | | | | 1.29% | | | | 1.29% | |
Ratio of net investment income to average net assets | | | | | | | | | | | | | | | | | | | | |
Before expense reimbursement (recapture) | | | 2.43% | | | | 2.53% | | | | 2.64% | | | | 2.90% | | | | 2.72% | |
After expense reimbursement (recapture) | | | 2.57% | | | | 2.67% | | | | 2.73% | | | | 2.99% | | | | 2.79% | |
Portfolio turnover rate | | | 14.50% | | | | 12.47% | | | | 33.29% | | | | 35.08% | | | | 30.36% | |
1 Net investment income per share has been calculated based on average shares outstanding during the year. 2 The ratio of expenses to average net assets includes interest expense where applicable. See Note 6 in the Notes to the Financial Statements. | |
3 Before expense reimbursement (recapture) and securities lending credit excluding interest expense. | | | 1.43% | | | | 1.42% | | | | 1.38% | | | | 1.38% | | | | 1.36% | |
4 After expense reimbursement (recapture) and securities lending credit excluding interest expense. | | | 1.29% | | | | 1.28% | | | | 1.29% | | | | 1.29% | | | | 1.29% | |
See notes to financial statements.
136
GuideMark® Funds & GuidePath® Funds
FINANCIAL HIGHLIGHTS
| | | | | | | | | | | | | | | | | | | | |
| | | Opportunistic Fixed Income Fund
| |
| | | Institutional
| |
| | | Year Ended
March 31,
2017
| | | Year Ended
March 31,
2016
| | | Year Ended
March 31,
2015
| | | Year Ended
March 31,
2014
| | | Year Ended
March 31,
2013
| |
Per share data for a share of capital stock outstanding for the entire year and selected information for the year are as follows: | | | | | | | | | | | | | | | | | | | | |
Net asset value, beginning of year | | | $9.05 | | | | $9.53 | | | | $9.94 | | | | $10.27 | | | | $9.70 | |
Income from investment operations: | | | | | | | | | | | | | | | | | | | | |
Net investment income | | | 0.46 | 1 | | | 0.36 | 1 | | | 0.41 | | | | 0.34 | | | | 0.42 | |
Net realized and unrealized gains (losses) on investments | | | 0.30 | | | | (0.76 | ) | | | (0.32 | ) | | | (0.37 | ) | | | 0.57 | |
| | |
|
|
| |
|
|
| |
|
|
| |
|
|
| |
|
|
|
Total from investment operations | | | 0.76 | | | | (0.40 | ) | | | 0.09 | | | | (0.03 | ) | | | 0.99 | |
| | |
|
|
| |
|
|
| |
|
|
| |
|
|
| |
|
|
|
Less distributions: | | | | | | | | | | | | | | | | | | | | |
Dividends from net investment income | | | (0.35 | ) | | | (0.08 | ) | | | (0.50 | ) | | | (0.28 | ) | | | (0.42 | ) |
Dividends from net realized gains | | | — | | | | — | | | | — | | | | (0.02 | ) | | | — | |
| | |
|
|
| |
|
|
| |
|
|
| |
|
|
| |
|
|
|
Total distributions | | | (0.35 | ) | | | (0.08 | ) | | | (0.50 | ) | | | (0.30 | ) | | | (0.42 | ) |
| | |
|
|
| |
|
|
| |
|
|
| |
|
|
| |
|
|
|
Net asset value, end of year | | | $9.46 | | | | $9.05 | | | | $9.53 | | | | $9.94 | | | | $10.27 | |
| | |
|
|
| |
|
|
| |
|
|
| |
|
|
| |
|
|
|
Total return | | | 8.77% | | | | (4.22)% | | | | 0.88% | | | | (0.21)% | | | | 10.33% | |
Supplemental data and ratios: | | | | | | | | | | | | | | | | | | | | |
Net assets, end of year | | | $9,316,917 | | | | $8,572,900 | | | | $50,593,107 | | | | $65,181,311 | | | | $104,141,739 | |
Ratio of expenses to average net assets | | | | | | | | | | | | | | | | | | | | |
Before expense reimbursement (recapture) | | | 1.21% | | | | 1.13% | | | | 1.08% | | | | 1.01% | | | | 1.03% | |
After expense reimbursement (recapture) | | | 0.95% | | | | 0.99% | | | | 1.05% | | | | 1.01% | | | | 1.05% | |
Ratio of net investment income to average net assets | | | | | | | | | | | | | | | | | | | | |
Before expense reimbursement (recapture) | | | 4.78% | | | | 3.71% | | | | 3.84% | | | | 4.10% | | | | 4.17% | |
After expense reimbursement (recapture) | | | 5.04% | | | | 3.85% | | | | 3.87% | | | | 4.10% | | | | 4.15% | |
Portfolio turnover rate | | | 33.77% | | | | 41.12% | | | | 39.66% | | | | 66.49% | | | | 101.49% | |
Portfolio Turnover is calculated for the Fund as a whole.
| 1 | | Net investment income per share has been calculated based on average shares outstanding during the year. |
See notes to financial statements.
137
GuideMark® Funds & GuidePath® Funds
FINANCIAL HIGHLIGHTS
| | | | | | | | | | | | | | | | | | | | |
| | | Opportunistic Fixed Income Fund
| |
| | | Service
| |
| | | Year Ended
March 31,
2017
| | | Year Ended
March 31,
2016
| | | Year Ended
March 31,
2015
| | | Year Ended
March 31,
2014
| | | Year Ended
March 31,
2013
| |
Per share data for a share of capital stock outstanding for the entire year and selected information for the year are as follows: | | | | | | | | | | | | | | | | | | | | |
Net asset value, beginning of year | | | $9.05 | | | | $9.55 | | | | $9.93 | | | | $10.28 | | | | $9.70 | |
Income from investment operations: | | | | | | | | | | | | | | | | | | | | |
Net investment income | | | 0.40 | 1 | | | 0.30 | 1 | | | 0.33 | | | | 0.35 | | | | 0.36 | |
Net realized and unrealized gains (losses) on investments | | | 0.32 | | | | (0.72 | ) | | | (0.29 | ) | | | (0.43 | ) | | | 0.58 | |
| | |
|
|
| |
|
|
| |
|
|
| |
|
|
| |
|
|
|
Total from investment operations | | | 0.72 | | | | (0.42 | ) | | | 0.04 | | | | (0.08 | ) | | | 0.94 | |
| | |
|
|
| |
|
|
| |
|
|
| |
|
|
| |
|
|
|
Less distributions: | | | | | | | | | | | | | | | | | | | | |
Dividends from net investment income | | | (0.21 | ) | | | (0.08 | ) | | | (0.42 | ) | | | (0.25 | ) | | | (0.36 | ) |
Dividends from net realized gains | | | — | | | | — | | | | — | | | | (0.02 | ) | | | — | |
| | |
|
|
| |
|
|
| |
|
|
| |
|
|
| |
|
|
|
Total distributions | | | (0.21 | ) | | | (0.08 | ) | | | (0.42 | ) | | | (0.27 | ) | | | (0.36 | ) |
| | |
|
|
| |
|
|
| |
|
|
| |
|
|
| |
|
|
|
Net asset value, end of year | | | $9.56 | | | | $9.05 | | | | $9.55 | | | | $9.93 | | | | $10.28 | |
| | |
|
|
| |
|
|
| |
|
|
| |
|
|
| |
|
|
|
Total return | | | 8.20% | | | | (4.44)% | | | | 0.33% | | | | (0.71)% | | | | 9.64% | |
Supplemental data and ratios: | | | | | | | | | | | | | | | | | | | | |
Net assets, end of year | | | $57,384,791 | | | | $78,168,300 | | | | $151,883,107 | | | | $147,493,694 | | | | $150,493,389 | |
Ratio of expenses to average net assets | | | | | | | | | | | | | | | | | | | | |
Before expense reimbursement (recapture) | | | 1.78% | | | | 1.68% | | | | 1.66% | | | | 1.59% | | | | 1.61% | |
After expense reimbursement (recapture) | | | 1.55% | | | | 1.55% | | | | 1.55% | | | | 1.55% | | | | 1.55% | |
Ratio of net investment income to average net assets | | | | | | | | | | | | | | | | | | | | |
Before expense reimbursement (recapture) | | | 4.17% | | | | 3.08% | | | | 3.28% | | | | 3.51% | | | | 3.52% | |
After expense reimbursement (recapture) | | | 4.40% | | | | 3.21% | | | | 3.39% | | | | 3.55% | | | | 3.58% | |
Portfolio turnover rate | | | 33.77% | | | | 41.12% | | | | 39.66% | | | | 66.49% | | | | 101.49% | |
Portfolio Turnover is calculated for the Fund as a whole.
| 1 | | Net investment income per share has been calculated based on average shares outstanding during the year. |
See notes to financial statements.
138
GuideMark® Funds & GuidePath® Funds
FINANCIAL HIGHLIGHTS
| | | | | | | | | | | | | | | | | | | | |
| | | Growth Allocation Fund
| |
| | | Institutional
| |
| | | Year Ended
March 31,
2017
| | | Year Ended
March 31,
2016
| | | Year Ended
March 31,
2015
| | | Year Ended
March 31,
2014
| | | September 13, 20121
Through
March 31,
2013
| |
Per share data for a share of capital stock outstanding for the entire year and selected information for the year are as follows: | | | | | | | | | | | | | | | | | | | | |
Net asset value, beginning of year | | | $10.46 | | | | $11.65 | | | | $11.45 | | | | $10.25 | | | | $9.63 | |
Income from investment operations: | | | | | | | | | | | | | | | | | | | | |
Net investment income (loss) | | | 0.19 | 2 | | | 0.20 | 2 | | | 0.16 | | | | (0.03 | ) | | | 0.11 | |
Net realized and unrealized gains (losses) on investments | | | 1.20 | | | | (1.02 | ) | | | 0.41 | | | | 1.56 | | | | 0.62 | |
| | |
|
|
| |
|
|
| |
|
|
| |
|
|
| |
|
|
|
Total from investment operations | | | 1.39 | | | | (0.82 | ) | | | 0.57 | | | | 1.53 | | | | 0.73 | |
| | |
|
|
| |
|
|
| |
|
|
| |
|
|
| |
|
|
|
Less distributions: | | | | | | | | | | | | | | | | | | | | |
Dividends from net investment income | | | (0.20 | ) | | | (0.16 | ) | | | (0.19 | ) | | | (0.11 | ) | | | (0.11 | ) |
Dividends from net realized gains | | | (0.31 | ) | | | (0.21 | ) | | | (0.18 | ) | | | (0.22 | ) | | | — | |
| | |
|
|
| |
|
|
| |
|
|
| |
|
|
| |
|
|
|
Total distributions | | | (0.51 | ) | | | (0.37 | ) | | | (0.37 | ) | | | (0.33 | ) | | | (0.11 | ) |
| | |
|
|
| |
|
|
| |
|
|
| |
|
|
| |
|
|
|
Net asset value, end of year | | | $11.34 | | | | $10.46 | | | | $11.65 | | | | $11.45 | | | | $10.25 | |
| | |
|
|
| |
|
|
| |
|
|
| |
|
|
| |
|
|
|
Total return | | | 13.54% | | | | (7.11)% | | | | 5.04% | | | | 15.00% | | | | 7.68%3 | |
Supplemental data and ratios: | | | | | | | | | | | | | | | | | | | | |
Net assets, end of year | | | $13,176,782 | | | | $10,968,769 | | | | $7,737,997 | | | | $3,534,178 | | | | $884,658 | |
Ratio of expenses to average net assets4,5 | | | | | | | | | | | | | | | | | | | | |
Before expense reimbursement (recapture) and securities lending credit6 | | | 0.42% | | | | 0.43% | | | | 0.41% | | | | 0.40% | | | | 0.42%8 | |
After expense reimbursement (recapture) and securities lending credit7 | | | 0.32% | | | | 0.31% | | | | 0.34% | | | | 0.36% | | | | 0.40%8 | |
Ratio of net investment income to average net assets9 | | | | | | | | | | | | | | | | | | | | |
Before expense reimbursement (recapture) and securities lending credit | | | 1.64% | | | | 1.67% | | | | 1.63% | | | | 1.42% | | | | 1.84%8 | |
After expense reimbursement (recapture) and securities lending credit | | | 1.74% | | | | 1.79% | | | | 1.70% | | | | 1.46% | | | | 1.86%8 | |
Portfolio turnover rate | | | 42.81% | | | | 84.98% | | | | 11.96% | | | | 30.35% | | | | 18.44% | |
Portfolio Turnover is calculated for the Fund as a whole. 1 Commencement of operations. 2 Net investment income per share has been calculated based on average shares outstanding during the year. 3 Not annualized. 4 These ratios exclude the impact of the expenses of the underlying investment companies and exchange-traded funds in which the Fund invests. 5 The ratio of expenses to average net assets includes interest expense where applicable. See Note 6 in the Notes to the Financial Statements. | |
6 Before expense reimbursement (recapture) and securities lending credit excluding interest expense. | | | 0.42% | | | | 0.43% | | | | 0.41% | | | | 0.40% | | | | 0.42%8 | |
7 After expense reimbursement (recapture) and securities lending credit excluding interest expense. | | | 0.32% | | | | 0.31% | | | | 0.34% | | | | 0.36% | | | | 0.40%8 | |
8 Annualized. 9 Recognition of the net investment income by the Fund is affected by the timing of the declaration of dividends by the underlying investment companies and exchange-traded funds in which the Fund invests. | |
See notes to financial statements.
139
GuideMark® Funds & GuidePath® Funds
FINANCIAL HIGHLIGHTS
| | | | | | | | | | | | | | | | | | | | |
| | | Growth Allocation Fund
| |
| | | Service
| |
| | | Year Ended
March 31,
2017
| | | Year Ended
March 31,
2016
| | | Year Ended
March 31,
2015
| | | Year Ended
March 31,
2014
| | | Year Ended
March 31,
2013
| |
Per share data for a share of capital stock outstanding for the entire year and selected information for the year are as follows: | | | | | | | | | | | | | | | | | | | | |
Net asset value, beginning of year | | | $10.42 | | | | $11.62 | | | | $11.43 | | | | $10.26 | | | | $9.46 | |
Income from investment operations: | | | | | | | | | | | | | | | | | | | | |
Net investment income | | | 0.12 | 1 | | | 0.13 | 1 | | | 0.12 | | | | 0.07 | | | | 0.07 | |
Net realized and unrealized gains (losses) on investments | | | 1.20 | | | | (1.02 | ) | | | 0.38 | | | | 1.38 | | | | 0.80 | |
| | |
|
|
| |
|
|
| |
|
|
| |
|
|
| |
|
|
|
Total from investment operations | | | 1.32 | | | | (0.89 | ) | | | 0.50 | | | | 1.45 | | | | 0.87 | |
| | |
|
|
| |
|
|
| |
|
|
| |
|
|
| |
|
|
|
Less distributions: | | | | | | | | | | | | | | | | | | | | |
Dividends from net investment income | | | (0.14 | ) | | | (0.10 | ) | | | (0.13 | ) | | | (0.06 | ) | | | (0.07 | ) |
Dividends from net realized gains | | | (0.31 | ) | | | (0.21 | ) | | | (0.18 | ) | | | (0.22 | ) | | | — | |
| | |
|
|
| |
|
|
| |
|
|
| |
|
|
| |
|
|
|
Total distributions | | | (0.45 | ) | | | (0.31 | ) | | | (0.31 | ) | | | (0.28 | ) | | | (0.07 | ) |
| | |
|
|
| |
|
|
| |
|
|
| |
|
|
| |
|
|
|
Net asset value, end of year | | | $11.29 | | | | $10.42 | | | | $11.62 | | | | $11.43 | | | | $10.26 | |
| | |
|
|
| |
|
|
| |
|
|
| |
|
|
| |
|
|
|
Total return | | | 12.91% | | | | (7.67)% | | | | 4.47% | | | | 14.20% | | | | 9.30% | |
Supplemental data and ratios: | | | | | | | | | | | | | | | | | | | | |
Net assets, end of year | | | $551,141,139 | | | | $383,423,651 | | | | $259,838,374 | | | | $288,401,436 | | | | $248,122,395 | |
Ratio of expenses to average net assets2,3 | | | | | | | | | | | | | | | | | | | | |
Before expense reimbursement (recapture) and securities lending credit4 | | | 1.01% | | | | 1.02% | | | | 1.00% | | | | 1.00% | | | | 1.04% | |
After expense reimbursement (recapture) and securities lending credit5 | | | 0.92% | | | | 0.91% | | | | 0.95% | | | | 1.00% | | | | 1.00% | |
Ratio of net investment income to average net assets6 | | | | | | | | | | | | | | | | | | | | |
Before expense reimbursement (recapture) and securities lending credit | | | 0.99% | | | | 1.05% | | | | 0.94% | | | | 0.61% | | | | 0.76% | |
After expense reimbursement (recapture) and securities lending credit | | | 1.08% | | | | 1.16% | | | | 0.99% | | | | 0.61% | | | | 0.80% | |
Portfolio turnover rate | | | 42.81% | | | | 84.98% | | | | 11.96% | | | | 30.35% | | | | 18.44% | |
Portfolio Turnover is calculated for the Fund as a whole. 1 Net investment income per share has been calculated based on average shares outstanding during the year. 2 These ratios exclude the impact of the expenses of the underlying investment companies and exchange-traded funds in which the Fund invests. 3 The ratio of expenses to average net assets includes interest expense where applicable. See Note 6 in the Notes to the Financial Statements. | |
4 Before expense reimbursement (recapture) and securities lending credit excluding interest expense. | | | 1.01% | | | | 1.02% | | | | 1.00% | | | | 1.00% | | | | 1.04% | |
5 After expense reimbursement (recapture) and securities lending credit excluding interest expense. | | | 0.92% | | | | 0.91% | | | | 0.95% | | | | 1.00% | | | | 1.00% | |
6 Recognition of the net investment income by the Fund is affected by the timing of the declaration of dividends by the underlying investment companies and exchange-traded funds in which the Fund invests. | |
See notes to financial statements.
140
GuideMark® Funds & GuidePath® Funds
FINANCIAL HIGHLIGHTS
| | | | | | | | | | | | | | | | | | | | |
| | | Conservative Allocation Fund
| |
| | | Institutional
| |
| | | Year Ended
March 31,
2017
| | | Year Ended
March 31,
2016
| | | Year Ended
March 31,
2015
| | | Year Ended
March 31,
2014
| | | September 13, 20121
Through
March 31,
2013
| |
Per share data for a share of capital stock outstanding for the entire year and selected information for the year are as follows: | | | | | | | | | | | | | | | | | | | | |
Net asset value, beginning of year | | | $9.51 | | | | $11.26 | | | | $11.39 | | | | $10.43 | | | | $9.98 | |
Income from investment operations: | | | | | | | | | | | | | | | | | | | | |
Net investment income | | | 0.19 | 2 | | | 0.16 | 2 | | | 0.26 | | | | 0.18 | | | | 0.14 | |
Net realized and unrealized gains (losses) on investments | | | 0.35 | | | | (0.89 | ) | | | 0.41 | | | | 0.98 | | | | 0.48 | |
| | |
|
|
| |
|
|
| |
|
|
| |
|
|
| |
|
|
|
Total from investment operations | | | 0.54 | | | | (0.73 | ) | | | 0.67 | | | | 1.16 | | | | 0.62 | |
| | |
|
|
| |
|
|
| |
|
|
| |
|
|
| |
|
|
|
Less distributions: | | | | | | | | | | | | | | | | | | | | |
Dividends from net investment income | | | — | | | | (0.14 | ) | | | (0.25 | ) | | | (0.14 | ) | | | (0.14 | ) |
Dividends from net realized gains | | | (0.95 | ) | | | (0.88 | ) | | | (0.55 | ) | | | (0.06 | ) | | | (0.03 | ) |
| | |
|
|
| |
|
|
| |
|
|
| |
|
|
| |
|
|
|
Total distributions | | | (0.95 | ) | | | (1.02 | ) | | | (0.80 | ) | | | (0.20 | ) | | | (0.17 | ) |
| | |
|
|
| |
|
|
| |
|
|
| |
|
|
| |
|
|
|
Net asset value, end of year | | | $9.10 | | | | $9.51 | | | | $11.26 | | | | $11.39 | | | | $10.43 | |
| | |
|
|
| |
|
|
| |
|
|
| |
|
|
| |
|
|
|
Total return | | | 6.09% | | | | (6.65)% | | | | 6.01% | | | | 11.13% | | | | 6.29% | 3 |
Supplemental data and ratios: | | | | | | | | | | | | | | | | | | | | |
Net assets, end of year | | | $4,966,270 | | | | $4,220,428 | | | | $6,173,168 | | | | $2,680,327 | | | | $879,348 | |
Ratio of expenses to average net assets4,5 | | | | | | | | | | | | | | | | | | | | |
Before expense reimbursement (recapture) and securities lending credit6 | | | 0.51% | | | | 0.47% | | | | 0.42% | | | | 0.43% | | | | 0.43% | 8 |
After expense reimbursement (recapture) and securities lending credit7 | | | 0.30% | | | | 0.37% | | | | 0.37% | | | | 0.38% | | | | 0.38% | 8 |
Ratio of net investment income to average net assets9 | | | | | | | | | | | | | | | | | | | | |
Before expense reimbursement (recapture) and securities lending credit | | | 1.78% | | | | 1.39% | | | | 1.96% | | | | 1.42% | | | | 2.10% | 8 |
After expense reimbursement (recapture) and securities lending credit | | | 1.99% | | | | 1.49% | | | | 2.01% | | | | 1.47% | | | | 2.15% | 8 |
Portfolio turnover rate | | | 44.43% | | | | 130.77% | | | | 38.36% | | | | 69.17% | | | | 67.22% | |
Portfolio Turnover is calculated for the Fund as a whole. 1 Commencement of operations. 2 Net investment income per share has been calculated based on average shares outstanding during the year. 3 Not annualized. 4 These ratios exclude the impact of the expenses of the underlying investment companies and exchange-traded funds in which the Fund invests. 5 The ratio of expenses to average net assets includes interest expense where applicable. See Note 6 in the Notes to the Financial Statements. | |
6 Before expense reimbursement (recapture) and securities lending credit excluding interest expense. | | | 0.51% | | | | 0.47% | | | | 0.42% | | | | 0.43% | | | | 0.43%9 | |
7 After expense reimbursement (recapture) and securities lending credit excluding interest expense. | | | 0.30% | | | | 0.37% | | | | 0.37% | | | | 0.38% | | | | 0.38%9 | |
8 Annualized. 9 Recognition of the net investment income by the Fund is affected by the timing of the declaration of dividends by the underlying investment companies and exchange-traded funds in which the Fund invests. | |
See notes to financial statements.
141
GuideMark® Funds & GuidePath® Funds
FINANCIAL HIGHLIGHTS
| | | | | | | | | | | | | | | | | | | | |
| | | Conservative Allocation Fund
| |
| | | Service
| |
| | | Year Ended
March 31,
2017
| | | Year Ended
March 31,
2016
| | | Year Ended
March 31,
2015
| | | Year Ended
March 31,
2014
| | | Year Ended
March 31,
2013
| |
Per share data for a share of capital stock outstanding for the entire year and selected information for the year are as follows: | | | | | | | | | | | | | | | | | | | | |
Net asset value, beginning of year | | | $9.53 | | | | $11.29 | | | | $11.39 | | | | $10.44 | | | | $9.76 | |
Income from investment operations: | | | | | | | | | | | | | | | | | | | | |
Net investment income | | | 0.12 | 1 | | | 0.09 | 1 | | | 0.15 | | | | 0.08 | | | | 0.09 | |
Net realized and unrealized gains (losses) on investments | | | 0.36 | | | | (0.89 | ) | | | 0.46 | | | | 1.01 | | | | 0.71 | |
| | |
|
|
| |
|
|
| |
|
|
| |
|
|
| |
|
|
|
Total from investment operations | | | 0.48 | | | | (0.80 | ) | | | 0.61 | | | | 1.09 | | | | 0.80 | |
| | |
|
|
| |
|
|
| |
|
|
| |
|
|
| |
|
|
|
Less distributions: | | | | | | | | | | | | | | | | | | | | |
Dividends from net investment income | | | — | | | | (0.08 | ) | | | (0.16 | ) | | | (0.08 | ) | | | (0.09 | ) |
Dividends from net realized gains | | | (0.95 | ) | | | (0.88 | ) | | | (0.55 | ) | | | (0.06 | ) | | | (0.03 | ) |
| | |
|
|
| |
|
|
| |
|
|
| |
|
|
| |
|
|
|
Total distributions | | | (0.95 | ) | | | (0.96 | ) | | | (0.71 | ) | | | (0.14 | ) | | | (0.12 | ) |
| | |
|
|
| |
|
|
| |
|
|
| |
|
|
| |
|
|
|
Net asset value, end of year | | | $9.06 | | | | $9.53 | | | | $11.29 | | | | $11.39 | | | | $10.44 | |
| | |
|
|
| |
|
|
| |
|
|
| |
|
|
| |
|
|
|
Total return | | | 5.44% | | | | (7.18)% | | | | 5.42% | | | | 10.40% | | | | 8.25% | |
Supplemental data and ratios: | | | | | | | | | | | | | | | | | | | | |
Net assets, end of year | | | $110,985,447 | | | | $51,768,546 | | | | $174,138,417 | | | | $195,498,995 | | | | $228,905,423 | |
Ratio of expenses to average net assets2,3 | | | | | | | | | | | | | | | | | | | | |
Before expense reimbursement (recapture) and securities lending credit4 | | | 1.10% | | | | 1.05% | | | | 1.01% | | | | 1.02% | | | | 1.05% | |
After expense reimbursement (recapture) and securities lending credit5 | | | 0.89% | | | | 0.99% | | | | 1.00% | | | | 1.00% | | | | 1.00% | |
Ratio of net investment income to average net assets6 | | | | | | | | | | | | | | | | | | | | |
Before expense reimbursement (recapture) and securities lending credit | | | 1.10% | | | | 0.79% | | | | 1.17% | | | | 0.67% | | | | 0.94% | |
After expense reimbursement (recapture) and securities lending credit | | | 1.31% | | | | 0.85% | | | | 1.18% | | | | 0.69% | | | | 0.99% | |
Portfolio turnover rate | | | 44.43% | | | | 130.77% | | | | 38.36% | | | | 69.17% | | | | 67.22% | |
Portfolio Turnover is calculated for the Fund as a whole. 1 Net investment income per share has been calculated based on average shares outstanding during the year. 2 �� These ratios exclude the impact of the expenses of the underlying investment companies and exchange-traded funds in which the Fund invests. 3 The ratio of expenses to average net assets includes interest expense where applicable. See Note 6 in the Notes to the Financial Statements. | |
4 Before expense reimbursement (recapture) and securities lending credit excluding interest expense. | | | 1.10% | | | | 1.05% | | | | 1.01% | | | | 1.02% | | | | 1.05% | |
5 After expense reimbursement (recapture) and securities lending credit excluding interest expense. | | | 0.89% | | | | 0.99% | | | | 1.00% | | | | 1.00% | | | | 1.00% | |
6 Recognition of the net investment income by the Fund is affected by the timing of the declaration of dividends by the underlying investment companies and exchange-traded funds in which the Fund invests. | |
See notes to financial statements.
142
GuideMark® Funds & GuidePath® Funds
FINANCIAL HIGHLIGHTS
| | | | | | | | | | | | | | | | | | | | |
| | | Tactical Allocation Fund
| |
| | | Institutional
| |
| | | Year Ended
March 31,
2017
| | | Year Ended
March 31,
2016
| | | Year Ended
March 31,
2015
| | | Year Ended
March 31,
2014
| | | September 13, 20121
Through
March 31,
2013
| |
Per share data for a share of capital stock outstanding for the entire year and selected information for the year are as follows: | | | | | | | | | | | | | | | | | | | | |
Net asset value, beginning of year | | | $9.38 | | | | $10.34 | | | | $10.80 | | | | $10.25 | | | | $9.75 | |
Income from investment operations: | | | | | | | | | | | | | | | | | | | | |
Net investment income | | | 0.18 | 2 | | | 0.13 | 2 | | | 0.17 | | | | 0.07 | | | | 0.13 | |
Net realized and unrealized gains on investments | | | 0.81 | | | | (0.97 | ) | | | 0.21 | | | | 0.75 | | | | 0.55 | |
| | |
|
|
| |
|
|
| |
|
|
| |
|
|
| |
|
|
|
Total from investment operations | | | 0.99 | | | | (0.84 | ) | | | 0.38 | | | | 0.82 | | | | 0.68 | |
| | |
|
|
| |
|
|
| |
|
|
| |
|
|
| |
|
|
|
Less distributions: | | | | | | | | | | | | | | | | | | | | |
Dividends from net investment income | | | (0.12 | ) | | | (0.02 | ) | | | (0.20 | ) | | | (0.09 | ) | | | (0.14 | ) |
Dividends from net realized gains | | | — | | | | (0.10 | ) | | | (0.64 | ) | | | (0.18 | ) | | | (0.04 | ) |
| | |
|
|
| |
|
|
| |
|
|
| |
|
|
| |
|
|
|
Total distributions | | | (0.12 | ) | | | (0.12 | ) | | | (0.84 | ) | | | (0.27 | ) | | | (0.18 | ) |
| | |
|
|
| |
|
|
| |
|
|
| |
|
|
| |
|
|
|
Net asset value, end of year | | | $10.25 | | | | $9.38 | | | | $10.34 | | | | $10.80 | | | | $10.25 | |
| | |
|
|
| |
|
|
| |
|
|
| |
|
|
| |
|
|
|
Total return | | | 10.63% | | | | (8.18)% | | | | 3.63% | | | | 8.01% | | | | 7.11%3 | |
Supplemental data and ratios: | | | | | | | | | | | | | | | | | | | | |
Net assets, end of year | | | $3,767,220 | | | | $5,005,303 | | | | $5,977,217 | | | | $1,496,066 | | | | $810,333 | |
Ratio of expenses to average net assets4,5 | | | | | | | | | | | | | | | | | | | | |
Before expense reimbursement (recapture) and securities lending credit6 | | | 0.53% | | | | 0.51% | | | | 0.51% | | | | 0.51% | | | | 0.52%8 | |
After expense reimbursement (recapture) and securities lending credit7 | | | 0.40% | | | | 0.41% | | | | 0.36% | | | | 0.46% | | | | 0.46%8 | |
Ratio of net investment income to average net assets9 | | | | | | | | | | | | | | | | | | | | |
Before expense reimbursement (recapture) and securities lending credit | | | 1.69% | | | | 1.20% | | | | 2.01% | | | | 1.14% | | | | 1.89%8 | |
After expense reimbursement (recapture) and securities lending credit | | | 1.82% | | | | 1.30% | | | | 2.16% | | | | 1.19% | | | | 1.95%8 | |
Portfolio turnover rate | | | 336.50% | | | | 348.05% | | | | 214.84% | | | | 244.90% | | | | 195.89% | |
Portfolio Turnover is calculated for the Fund as a whole. 1 Commencement of operations. 2 Net investment income per share has been calculated based on average shares outstanding during the year. 3 Not annualized. 4 These ratios exclude the impact of the expenses of the underlying investment companies and exchange-traded funds in which the Fund invests. 5 The ratio of expenses to average net assets includes interest expense where applicable. See Note 6 in the Notes to the Financial Statements. | |
6 Before expense reimbursement (recapture) and securities lending credit excluding interest expense. | | | 0.53% | | | | 0.51% | | | | 0.51% | | | | 0.51% | | | | 0.52%8 | |
7 After expense reimbursement (recapture) and securities lending credit excluding interest expense. | | | 0.40% | | | | 0.41% | | | | 0.36% | | | | 0.46% | | | | 0.46%8 | |
8 Annualized. 9 Recognition of the net investment income by the Fund is affected by the timing of the declaration of dividends by the underlying investment companies and exchange-traded funds in which the Fund invests. | |
|
See notes to financial statements.
143
GuideMark® Funds & GuidePath® Funds
FINANCIAL HIGHLIGHTS
| | | | | | | | | | | | | | | | | | | | |
| | | Tactical Allocation Fund
| |
| | | Service
| |
| | | Year Ended
March 31,
2017
| | | Year Ended
March 31,
2016
| | | Year Ended
March 31,
2015
| | | Year Ended
March 31,
2014
| | | Year Ended
March 31,
2013
| |
Per share data for a share of capital stock outstanding for the entire year and selected information for the year are as follows: | | | | | | | | | | | | | | | | | | | | |
Net asset value, beginning of year | | | $9.32 | | | | $10.32 | | | | $10.79 | | | | $10.27 | | | | $9.54 | |
Income from investment operations: | | | | | | | | | | | | | | | | | | | | |
Net investment income | | | 0.11 | 1 | | | 0.07 | 1 | | | 0.15 | | | | 0.05 | | | | 0.09 | |
Net realized and unrealized gains (losses) on investments | | | 0.82 | | | | (0.97 | ) | | | 0.17 | | | | 0.70 | | | | 0.78 | |
| | |
|
|
| |
|
|
| |
|
|
| |
|
|
| |
|
|
|
Total from investment operations | | | 0.93 | | | | (0.90 | ) | | | 0.32 | | | | 0.75 | | | | 0.87 | |
| | |
|
|
| |
|
|
| |
|
|
| |
|
|
| |
|
|
|
Less distributions: | | | | | | | | | | | | | | | | | | | | |
Dividends from net investment income | | | (0.10 | ) | | | — | * | | | (0.15 | ) | | | (0.05 | ) | | | (0.10 | ) |
Dividends from net realized gains | | | — | | | | (0.10 | ) | | | (0.64 | ) | | | (0.18 | ) | | | (0.04 | ) |
| | |
|
|
| |
|
|
| |
|
|
| |
|
|
| |
|
|
|
Total distributions | | | (0.10 | ) | | | (0.10 | ) | | | (0.79 | ) | | | (0.23 | ) | | | (0.14 | ) |
| | |
|
|
| |
|
|
| |
|
|
| |
|
|
| |
|
|
|
Net asset value, end of year | | | $10.15 | | | | $9.32 | | | | $10.32 | | | | $10.79 | | | | $10.27 | |
| | |
|
|
| |
|
|
| |
|
|
| |
|
|
| |
|
|
|
Total return | | | 10.05% | | | | (8.74)% | | | | 3.08% | | | | 7.27% | | | | 9.15% | |
Supplemental data and ratios: | | | | | | | | | | | | | | | | | | | | |
Net assets, end of year | | | $304,159,564 | | | | $393,657,458 | | | | $480,492,438 | | | | $377,469,190 | | | | $310,316,243 | |
Ratio of expenses to average net assets2,3 | | | | | | | | | | | | | | | | | | | | |
Before expense reimbursement (recapture) and securities lending credit4 | | | 1.12% | | | | 1.11% | | | | 1.10% | | | | 1.10% | | | | 1.15% | |
After expense reimbursement (recapture) and securities lending credit5 | | | 1.00% | | | | 1.01% | | | | 0.97% | | | | 1.10% | | | | 1.10% | |
Ratio of net investment income to average net assets6 | | | | | | | | | | | | | | | | | | | | |
Before expense reimbursement (recapture) and securities lending credit | | | 1.07% | | | | 0.62% | | | | 1.30% | | | | 0.51% | | | | 0.90% | |
After expense reimbursement (recapture) and securities lending credit | | | 1.19% | | | | 0.72% | | | | 1.43% | | | | 0.51% | | | | 0.95% | |
Portfolio turnover rate | | | 336.50% | | | | 348.05% | | | | 214.84% | | | | 244.90% | | | | 195.89% | |
Portfolio Turnover is calculated for the Fund as a whole. 1 Net investment income per share has been calculated based on average shares outstanding during the year. 2 These ratios exclude the impact of the expenses of the underlying investment companies and exchange-traded funds in which the Fund invests. 3 The ratio of expenses to average net assets includes interest expense where applicable. See Note 6 in the Notes to the Financial Statements. | |
4 Before expense reimbursement (recapture) and securities lending credit excluding interest expense. | | | 1.12% | | | | 1.11% | | | | 1.10% | | | | 1.10% | | | | 1.15% | |
5 After expense reimbursement (recapture) and securities lending credit excluding interest expense. | | | 1.00% | | | | 1.01% | | | | 0.97% | | | | 1.10% | | | | 1.10% | |
6 Recognition of the net investment income by the Fund is affected by the timing of the declaration of dividends by the underlying investment companies and exchange-traded funds in which the Fund invests. * Amount represents less than $0.01 per share. | |
See notes to financial statements.
144
GuideMark® Funds & GuidePath® Funds
FINANCIAL HIGHLIGHTS
| | | | | | | | | | | | | | | | | | | | |
| | | Absolute Return Allocation Fund
| |
| | | Institutional
| |
| | | Year Ended
March 31,
2017
| | | Year Ended
March 31,
2016
| | | Year Ended
March 31,
2015
| | | Year Ended
March 31,
2014
| | | September 13, 20121
Through
March 31,
2013
| |
Per share data for a share of capital stock outstanding for the entire year and selected information for the year are as follows: | | | | | | | | | | | | | | | | | | | | |
Net asset value, beginning of year | | | $9.80 | | | | $10.02 | | | | $10.00 | | | | $10.16 | | | | $10.19 | |
Income from investment operations: | | | | | | | | | | | | | | | | | | | | |
Net investment income | | | 0.37 | 2 | | | 0.26 | 2 | | | 0.40 | | | | 0.41 | | | | 0.18 | |
Net realized and unrealized gains (losses) on investments | | | 0.52 | | | | (0.21 | ) | | | (0.10 | )3 | | | (0.31 | ) | | | (0.02 | ) |
| | |
|
|
| |
|
|
| |
|
|
| |
|
|
| |
|
|
|
Total from investment operations | | | 0.89 | | | | 0.05 | | | | 0.30 | | | | 0.10 | | | | 0.16 | |
| | |
|
|
| |
|
|
| |
|
|
| |
|
|
| |
|
|
|
Less distributions: | | | | | | | | | | | | | | | | | | | | |
Dividends from net investment income | | | (0.40 | ) | | | (0.27 | ) | | | (0.28 | ) | | | (0.26 | ) | | | (0.18 | ) |
Dividends from net realized gains | | | — | | | | — | | | | — | | | | — | | | | (0.01 | ) |
| | |
|
|
| |
|
|
| |
|
|
| |
|
|
| |
|
|
|
Total distributions | | | (0.40 | ) | | | (0.27 | ) | | | (0.28 | ) | | | (0.26 | ) | | | (0.19 | ) |
| | |
|
|
| |
|
|
| |
|
|
| |
|
|
| |
|
|
|
Net asset value, end of year | | | $10.29 | | | | $9.80 | | | | $10.02 | | | | $10.00 | | | | $10.16 | |
| | |
|
|
| |
|
|
| |
|
|
| |
|
|
| |
|
|
|
Total return | | | 9.14% | | | | 0.56% | | | | 3.05% | | | | 1.08% | | | | 1.53%4 | |
Supplemental data and ratios: | | | | | | | | | | | | | | | | | | | | |
Net assets, end of year | | | $921,609 | | | | $1,107,629 | | | | $2,673,347 | | | | $1,014,889 | | | | $569,773 | |
Ratio of expenses to average net assets5,6 | | | | | | | | | | | | | | | | | | | | |
Before expense reimbursement (recapture) and securities lending credit7 | | | 0.58% | | | | 0.53% | | | | 0.51% | | | | 0.51% | | | | 0.51%9 | |
After expense reimbursement (recapture) and securities lending credit8 | | | 0.50% | | | | 0.39% | | | | 0.34% | | | | 0.36% | | | | 0.47%9 | |
Ratio of net investment income to average net assets10 | | | | | | | | | | | | | | | | | | | | |
Before expense reimbursement (recapture) and securities lending credit | | | 3.58% | | | | 2.49% | | | | 2.64% | | | | 2.24% | | | | 2.59%9 | |
After expense reimbursement (recapture) and securities lending credit | | | 3.66% | | | | 2.63% | | | | 2.81% | | | | 2.39% | | | | 2.63%9 | |
Portfolio turnover rate | | | 41.66% | | | | 200.13% | | | | 91.93% | | | | 134.44% | | | | 64.86% | |
Portfolio Turnover is calculated for the Fund as a whole. 1 Commencement of operations. 2 Net investment income per share has been calculated based on average shares outstanding during the year. 3 Realized and unrealized gains and losses per share in this caption are balancing amounts necessary to reconcile the change in net asset value per share for the year, and may not reconcile with the aggregate gains and losses in the Statement of Operations due to share transactions for the period. 4 Not annualized. 5 These ratios exclude the impact of the expenses of the underlying investment companies and exchange-traded funds in which the Fund invests. 6 The ratio of expenses to average net assets includes interest expense where applicable. See Note 6 in the Notes to the Financial Statements. | |
7 Before expense reimbursement (recapture) and securities lending credit excluding interest expense. | | | 0.58% | | | | 0.53% | | | | 0.51% | | | | 0.51% | | | | 0.51%9 | |
8 After expense reimbursement (recapture) and securities lending credit excluding interest expense. | | | 0.50% | | | | 0.39% | | | | 0.34% | | | | 0.36% | | | | 0.47%9 | |
| 10 | | Recognition of the net investment income by the Fund is affected by the timing of the declaration of dividends by the underlying investment companies and exchange-traded funds in which the Fund invests. |
See notes to financial statements.
145
GuideMark® Funds & GuidePath® Funds
FINANCIAL HIGHLIGHTS
| | | | | | | | | | | | | | | | | | | | |
| | | Absolute Return Allocation Fund
| |
| | | Service
| |
| | | Year Ended
March 31,
2017
| | | Year Ended
March 31,
2016
| | | Year Ended
March 31,
2015
| | | Year Ended
March 31,
2014
| | | Year Ended
March 31,
2013
| |
Per share data for a share of capital stock outstanding for the entire year and selected information for the year are as follows: | | | | | | | | | | | | | | | | | | | | |
Net asset value, beginning of year | | | $9.81 | | | | $10.04 | | | | $10.01 | | | | $10.17 | | | | $10.04 | |
Income from investment operations: | | | | | | | | | | | | | | | | | | | | |
Net investment income | | | 0.30 | 1 | | | 0.20 | 1 | | | 0.23 | | | | 0.19 | | | | 0.14 | |
Net realized and unrealized gains (losses) on investments | | | 0.53 | | | | (0.22 | ) | | | 0.02 | | | | (0.15 | ) | | | 0.13 | |
| | |
|
|
| |
|
|
| |
|
|
| |
|
|
| |
|
|
|
Total from investment operations | | | 0.83 | | | | (0.02 | ) | | | 0.25 | | | | 0.04 | | | | 0.27 | |
| | |
|
|
| |
|
|
| |
|
|
| |
|
|
| |
|
|
|
Less distributions: | | | | | | | | | | | | | | | | | | | | |
Dividends from net investment income | | | (0.32 | ) | | | (0.21 | ) | | | (0.22 | ) | | | (0.20 | ) | | | (0.13 | ) |
Dividends from net realized gains | | | — | | | | — | | | | — | | | | — | | | | (0.01 | ) |
| | |
|
|
| |
|
|
| |
|
|
| |
|
|
| |
|
|
|
Total distributions | | | (0.32 | ) | | | (0.21 | ) | | | (0.22 | ) | | | (0.20 | ) | | | (0.14 | ) |
| | |
|
|
| |
|
|
| |
|
|
| |
|
|
| |
|
|
|
Net asset value, end of year | | | $10.32 | | | | $9.81 | | | | $10.04 | | | | $10.01 | | | | $10.17 | |
| | |
|
|
| |
|
|
| |
|
|
| |
|
|
| |
|
|
|
Total return | | | 8.54% | | | | (0.19)% | | | | 2.47% | | | | 0.43% | | | | 2.71% | |
Supplemental data and ratios: | | | | | | | | | | | | | | | | | | | | |
Net assets, end of year | | | $128,948,108 | | | | $145,830,207 | | | | $366,970,865 | | | | $449,186,398 | | | | $509,704,884 | |
Ratio of expenses to average net assets2,3 | | | | | | | | | | | | | | | | | | | | |
Before expense reimbursement (recapture) and securities lending credit4 | | | 1.18% | | | | 1.13% | | | | 1.11% | | | | 1.10% | | | | 1.13% | |
After expense reimbursement (recapture) and securities lending credit5 | | | 1.10% | | | | 0.99% | | | | 0.93% | | | | 1.00% | | | | 1.10% | |
Ratio of net investment income to average net assets6 | | | | | | | | | | | | | | | | | | | | |
Before expense reimbursement (recapture) and securities lending credit | | | 2.91% | | | | 1.92% | | | | 1.92% | | | | 1.64% | | | | 1.80% | |
After expense reimbursement (recapture) and securities lending credit | | | 2.99% | | | | 2.06% | | | | 2.10% | | | | 1.74% | | | | 1.83% | |
Portfolio turnover rate | | | 41.66% | | | | 200.13% | | | | 91.93% | | | | 134.44% | | | | 64.86% | |
Portfolio Turnover is calculated for the Fund as a whole. 1 Net investment income per share has been calculated based on average shares outstanding during the year. 2 These ratios exclude the impact of the expenses of the underlying investment companies and exchange-traded funds in which the Fund invests. 3 The ratio of expenses to average net assets includes interest expense where applicable. See Note 6 in the Notes to the Financial Statements. | |
4 Before expense reimbursement (recapture) and securities lending credit excluding interest expense. | | | 1.18% | | | | 1.13% | | | | 1.11% | | | | 1.10% | | | | 1.13% | |
5 After expense reimbursement (recapture) and securities lending credit excluding interest expense. | | | 1.10% | | | | 0.99% | | | | 0.93% | | | | 1.00% | | | | 1.10% | |
| 6 | | Recognition of the net investment income by the Fund is affected by the timing of the declaration of dividends by the underlying investment companies and exchange-traded funds in which the Fund invests. |
See notes to financial statements.
146
GuideMark® Funds & GuidePath® Funds
FINANCIAL HIGHLIGHTS
| | | | | | | | | | | | | | | | | | | | |
| | | Multi-Asset Income Allocation Fund
| |
| | | Service
| |
| | | Year Ended
March 31,
2017
| | | Year Ended
March 31,
2016
| | | Year Ended
March 31,
2015
| | | Year Ended
March 31,
2014
| | | August 31, 20121
Through
March 31,
2013
| |
Per share data for a share of capital stock outstanding for the entire year and selected information for the year are as follows: | | | | | | | | | | | | | | | | | | | | |
Net asset value, beginning of year | | | $9.94 | | | | $10.62 | | | | $10.76 | | | | $10.58 | | | | $10.00 | |
Income from investment operations: | | | | | | | | | | | | | | | | | | | | |
Net investment income | | | 0.29 | 2 | | | 0.34 | 2 | | | 0.36 | | | | 0.38 | | | | 0.22 | |
Net realized and unrealized gains (losses) on investments | | | 0.52 | | | | (0.61 | ) | | | (0.05 | ) | | | 0.21 | | | | 0.53 | |
| | |
|
|
| |
|
|
| |
|
|
| |
|
|
| |
|
|
|
Total from investment operations | | | 0.81 | | | | (0.27 | ) | | | 0.31 | | | | 0.59 | | | | 0.75 | |
| | |
|
|
| |
|
|
| |
|
|
| |
|
|
| |
|
|
|
Less distributions: | | | | | | | | | | | | | | | | | | | | |
Dividends from net investment income | | | (0.29 | ) | | | (0.37 | ) | | | (0.38 | ) | | | (0.40 | ) | | | (0.17 | ) |
Dividends from net realized gains | | | — | | | | (0.04 | ) | | | (0.07 | ) | | | (0.01 | ) | | | — | |
| | |
|
|
| |
|
|
| |
|
|
| |
|
|
| |
|
|
|
Total distributions | | | (0.29 | ) | | | (0.41 | ) | | | (0.45 | ) | | | (0.41 | ) | | | (0.17 | ) |
| | |
|
|
| |
|
|
| |
|
|
| |
|
|
| |
|
|
|
Net asset value, end of year | | | $10.46 | | | | $9.94 | | | | $10.62 | | | | $10.76 | | | | $10.58 | |
| | |
|
|
| |
|
|
| |
|
|
| |
|
|
| |
|
|
|
Total return | | | 8.24% | | | | (2.49)% | | | | 3.01% | | | | 5.63% | | | | 7.55%3 | |
Supplemental data and ratios: | | | | | | | | | | | | | | | | | | | | |
Net assets, end of year | | | $119,817,129 | | | | $106,901,424 | | | | $140,497,937 | | | | $115,477,776 | | | | $73,269,622 | |
Ratio of expenses to average net assets4,5 | | | | | | | | | | | | | | | | | | | | |
Before expense reimbursement (recapture) and securities lending credit6 | | | 1.17% | | | | 1.17% | | | | 1.14% | | | | 1.18% | | | | 1.33%8 | |
After expense reimbursement (recapture) and securities lending credit7 | | | 0.97% | | | | 0.96% | | | | 0.88% | | | | 0.88% | | | | 1.10%8 | |
Ratio of net investment income to average net assets9 | | | | | | | | | | | | | | | | | | | | |
Before expense reimbursement (recapture) and securities lending credit | | | 2.66% | | | | 3.15% | | | | 3.23% | | | | 3.66% | | | | 3.66%8 | |
After expense reimbursement (recapture) and securities lending credit | | | 2.86% | | | | 3.36% | | | | 3.49% | | | | 3.96% | | | | 3.89%8 | |
Portfolio turnover rate | | | 61.25% | | | | 145.43% | | | | 66.76% | | | | 100.40% | | | | 21.35%3 | |
|
1 Commencement of operations. 2 Net investment income per share has been calculated based on average shares outstanding during the year. 3 Not annualized. 4 These ratios exclude the impact of the expenses of the underlying investment companies and exchange-traded funds in which the Fund invests. 5 The ratio of expenses to average net assets includes interest expense where applicable. See Note 6 in the Notes to the Financial Statements. | |
6 Before expense reimbursement (recapture) and securities lending credit excluding interest expense. | | | 1.17% | | | | 1.17% | | | | 1.14% | | | | 1.18% | | | | 1.33%8 | |
7 After expense reimbursement (recapture) and securities lending credit excluding interest expense. | | | 0.97% | | | | 0.96% | | | | 0.88% | | | | 0.88% | | | | 1.10%8 | |
| 9 | | Recognition of the net investment income by the Fund is affected by the timing of the declaration of dividends by the underlying investment companies and exchange-traded funds in which the Fund invests. |
See notes to financial statements.
147
GuideMark® Funds & GuidePath® Funds
FINANCIAL HIGHLIGHTS
| | | | | | | | | | | | | | | | | | | | |
| | | Flexible Income Allocation Fund
| |
| | | Institutional
| |
| | | Year Ended
March 31,
2017
| | | Year Ended
March 31,
2016
| | | Year Ended
March 31,
2015
| | | Year Ended
March 31,
2014
| | | September 13, 20121
Through
March 31,
2013
| |
Per share data for a share of capital stock outstanding for the entire year and selected information for the year are as follows: | | | | | | | | | | | | | | | | | | | | |
Net asset value, beginning of year | | | $9.62 | | | | $9.76 | | | | $9.65 | | | | $10.00 | | | | $10.01 | |
Income from investment operations: | | | | | | | | | | | | | | | | | | | | |
Net investment income | | | 0.24 | 2 | | | 0.18 | 2 | | | 0.25 | | | | 0.19 | | | | 0.13 | |
Net realized and unrealized gains (losses) on investments | | | 0.07 | | | | (0.11 | ) | | | 0.11 | | | | (0.27 | ) | | | (0.04 | ) |
| | |
|
|
| |
|
|
| |
|
|
| |
|
|
| |
|
|
|
Total from investment operations | | | 0.31 | | | | 0.07 | | | | 0.36 | | | | (0.08 | ) | | | 0.09 | |
| | |
|
|
| |
|
|
| |
|
|
| |
|
|
| |
|
|
|
Less distributions: | | | | | | | | | | | | | | | | | | | | |
Dividends from net investment income | | | (0.26 | ) | | | (0.21 | ) | | | (0.25 | ) | | | (0.24 | ) | | | (0.10 | ) |
Dividends from net realized gains | | | — | | | | — | | | | — | | | | (0.03 | ) | | | — | * |
| | |
|
|
| |
|
|
| |
|
|
| |
|
|
| |
|
|
|
Total distributions | | | (0.26 | ) | | | (0.21 | ) | | | (0.25 | ) | | | (0.27 | ) | | | (0.10 | ) |
| | |
|
|
| |
|
|
| |
|
|
| |
|
|
| |
|
|
|
Net asset value, end of year | | | $9.67 | | | | $9.62 | | | | $9.76 | | | | $9.65 | | | | $10.00 | |
| | |
|
|
| |
|
|
| |
|
|
| |
|
|
| |
|
|
|
Total return | | | 3.23% | | | | 0.70% | | | | 3.75% | | | | (0.83)% | | | | 0.88%3 | |
Supplemental data and ratios: | | | | | | | | | | | | | | | | | | | | |
Net assets, end of year | | | $52,492 | | | | $49,872 | | | | $2,257,327 | | | | $960,185 | | | | $503,918 | |
Ratio of expenses to average net assets4,5 | | | | | | | | | | | | | | | | | | | | |
Before expense reimbursement (recapture) and securities lending credit6 | | | 0.50% | | | | 0.44% | | | | 0.42% | | | | 0.41% | | | | 0.50%8 | |
After expense reimbursement (recapture) and securities lending credit7 | | | 0.37% | | | | 0.36% | | | | 0.31% | | | | 0.32% | | | | 0.43%8 | |
Ratio of net investment income to average net assets9 | | | | | | | | | | | | | | | | | | | | |
Before expense reimbursement (recapture) and securities lending credit | | | 2.32% | | | | 1.76% | | | | 2.66% | | | | 1.98% | | | | 2.44%8 | |
After expense reimbursement (recapture) and securities lending credit | | | 2.45% | | | | 1.84% | | | | 2.77% | | | | 2.07% | | | | 2.51%8 | |
Portfolio turnover rate | | | 114.68% | | | | 147.81% | | | | 22.67% | | | | 67.82% | | | | 18.75%3 | |
Portfolio Turnover is calculated for the Fund as a whole. 1 Commencement of operations. 2 Net investment income per share has been calculated based on average shares outstanding during the year. 3 Annualized. 4 These ratios exclude the impact of the expenses of the underlying investment companies and exchange-traded funds in which the Fund invests. 5 The ratio of expenses to average net assets includes interest expense where applicable. See Note 6 in the Notes to the Financial Statements. | |
6 Before expense reimbursement (recapture) and securities lending credit excluding interest expense. | | | 0.50% | | | | 0.44% | | | | 0.42% | | | | 0.41% | | | | 0.50%8 | |
7 After expense reimbursement (recapture) and securities lending credit excluding interest expense. | | | 0.37% | | | | 0.36% | | | | 0.31% | | | | 0.32% | | | | 0.43%8 | |
| 9 | | Recognition of the net investment income by the Fund is affected by the timing of the declaration of dividends by the underlying investment companies and exchange-traded funds in which the Fund invests. |
| * | | Amount represents less than $0.01 per share. |
See notes to financial statements.
148
GuideMark® Funds & GuidePath® Funds
FINANCIAL HIGHLIGHTS
| | | | | | | | | | | | | | | | | | | | |
| | | Flexible Income Allocation Fund
| |
| | | Service
| |
| | | Year Ended
March 31,
2017
| | | Year Ended
March 31,
2016
| | | Year Ended
March 31,
2015
| | | Year Ended
March 31,
2014
| | | August 31, 20121
Through
March 31,
2013
| |
Per share data for a share of capital stock outstanding for the entire year and selected information for the year are as follows: | | | | | | | | | | | | | | | | | | | | |
Net asset value, beginning of year | | | $9.55 | | | | $9.77 | | | | $9.64 | | | | $9.98 | | | | $10.00 | |
Income from investment operations: | | | | | | | | | | | | | | | | | | | | |
Net investment income | | | 0.18 | 2 | | | 0.14 | 2 | | | 0.19 | | | | 0.15 | | | | 0.10 | |
Net realized and unrealized gains (losses) on investments | | | 0.08 | | | | (0.21 | ) | | | 0.13 | | | | (0.30 | ) | | | (0.04 | ) |
| | |
|
|
| |
|
|
| |
|
|
| |
|
|
| |
|
|
|
Total from investment operations | | | 0.26 | | | | (0.07 | ) | | | 0.32 | | | | (0.15 | ) | | | 0.06 | |
| | |
|
|
| |
|
|
| |
|
|
| |
|
|
| |
|
|
|
Less distributions: | | | | | | | | | | | | | | | | | | | | |
Dividends from net investment income | | | (0.20 | ) | | | (0.15 | ) | | | (0.19 | ) | | | (0.16 | ) | | | (0.08 | ) |
Dividends from net realized gains | | | — | | | | — | | | | — | | | | (0.03 | ) | | | — | * |
| | |
|
|
| |
|
|
| |
|
|
| |
|
|
| |
|
|
|
Total distributions | | | (0.20 | ) | | | (0.15 | ) | | | (0.19 | ) | | | (0.19 | ) | | | (0.08 | ) |
| | |
|
|
| |
|
|
| |
|
|
| |
|
|
| |
|
|
|
Net asset value, end of year | | | $9.61 | | | | $9.55 | | | | $9.77 | | | | $9.64 | | | | $9.98 | |
| | |
|
|
| |
|
|
| |
|
|
| |
|
|
| |
|
|
|
Total return | | | 2.73% | | | | (0.75)% | | | | 3.32% | | | | (1.47)% | | | | 0.59%3 | |
Supplemental data and ratios: | | | | | | | | | | | | | | | | | | | | |
Net assets, end of year | | | $99,575,144 | | | | $114,740,157 | | | | $143,904,504 | | | | $213,499,393 | | | | $227,815,865 | |
Ratio of expenses to average net assets4,5 | | | | | | | | | | | | | | | | | | | | |
Before expense reimbursement (recapture) and securities lending credit6 | | | 1.09% | | | | 1.04% | | | | 1.02% | | | | 1.01% | | | | 1.09%8 | |
After expense reimbursement (recapture) and securities lending credit7 | | | 0.91% | | | | 0.93% | | | | 0.92% | | | | 0.92% | | | | 1.03%8 | |
Ratio of net investment income to average net assets9 | | | | | | | | | | | | | | | | | | | | |
Before expense reimbursement (recapture) and securities lending credit | | | 1.72% | | | | 1.32% | | | | 1.72% | | | | 1.40% | | | | 1.78%8 | |
After expense reimbursement (recapture) and securities lending credit | | | 1.90% | | | | 1.43% | | | | 1.82% | | | | 1.49% | | | | 1.84%8 | |
Portfolio turnover rate | | | 114.68% | | | | 147.81% | | | | 22.67% | | | | 67.82% | | | | 18.75%3 | |
Portfolio Turnover is calculated for the Fund as a whole. 1 Commencement of operations. 2 Net investment income per share has been calculated based on average shares outstanding during the year. 3 Not annualized. 4 These ratios exclude the impact of the expenses of the underlying investment companies and exchange-traded funds in which the Fund invests. 5 The ratio of expenses to average net assets includes interest expense where applicable. See Note 6 in the Notes to the Financial Statements. | |
6 Before expense reimbursement (recapture) and securities lending credit excluding interest expense. | | | 1.09% | | | | 1.04% | | | | 1.02% | | | | 1.01% | | | | 1.09%8 | |
7 After expense reimbursement (recapture) and securities lending credit excluding interest expense. | | | 0.91% | | | | 0.93% | | | | 0.92% | | | | 0.92% | | | | 1.03%8 | |
| 9 | | Recognition of the net investment income by the Fund is affected by the timing of the declaration of dividends by the underlying investment companies and exchange-traded funds in which the Fund invests. |
| * | | Amount represents less than $0.01 per share. |
See notes to financial statements.
149
GuideMark® Funds & GuidePath® Funds
FINANCIAL HIGHLIGHTS
| | | | | | | | | | | | | | | | |
| | | Managed Futures Strategy Fund (Consolidated)
| |
| | | Institutional
| | | Service
| |
| | | Year Ended
March 31,
2017
| | | January 19, 20161
Through
March 31,
2016
| | | Year Ended
March 31,
2017
| | | January 19, 20161
Through
March 31,
2016
| |
Per share data for a share of capital stock outstanding for the entire year and selected information for the year are as follows: | | | | | | | | | | | | | | | | |
Net asset value, beginning of year | | | 9.75 | | | | $10.00 | | | | 9.73 | | | | $10.00 | |
Income from investment operations: | | | | | | | | | | | | | | | | |
Net investment loss | | | (0.06 | )2 | | | (0.02 | )2 | | | (0.11 | )2 | | | (0.03 | )2 |
Net realized and unrealized losses on investments | | | (0.83 | ) | | | (0.23 | ) | | | (0.82 | ) | | | (0.24 | ) |
| | |
|
|
| |
|
|
| |
|
|
| |
|
|
|
Total from investment operations | | | (0.89 | ) | | | (0.25 | ) | | | (0.93 | ) | | | (0.27 | ) |
| | |
|
|
| |
|
|
| |
|
|
| |
|
|
|
Less distributions: | | | | | | | | | | | | | | | | |
Dividends from net investment income | | | — | | | | — | | | | — | | | | — | |
Dividends from net realized gains | | | (0.16 | ) | | | — | | | | (0.16 | ) | | | — | |
| | |
|
|
| |
|
|
| |
|
|
| |
|
|
|
Total distributions | | | (0.16 | ) | | | — | | | | (0.16 | ) | | | — | |
| | |
|
|
| |
|
|
| |
|
|
| |
|
|
|
Net asset value, end of year | | | 8.70 | | | | 9.75 | | | | 8.64 | | | | 9.73 | |
| | |
|
|
| |
|
|
| |
|
|
| |
|
|
|
Total return | | | (9.17)% | | | | (2.50)%3 | | | | (9.70)% | | | | (2.70)%3 | |
Supplemental data and ratios: | | | | | | | | | | | | | | | | |
Net assets, end of year | | | $1,478,880 | | | | $4,338,706 | | | | $81,212,945 | | | | $183,020,093 | |
Ratio of expenses to average net assets | | | | | | | | | | | | | | | | |
Before expense reimbursement (recapture) and securities lending credit4 | | | 1.37% | | | | 1.61%6 | | | | 1.97% | | | | 2.20%6 | |
After expense reimbursement (recapture) and securities lending credit5 | | | 1.34% | | | | 1.30%6 | | | | 1.94% | | | | 1.90%6 | |
Ratio of net investment loss to average net assets | | | | | | | | | | | | | | | | |
Before expense reimbursement (recapture) and securities lending credit | | | (0.69)% | | | | (1.12)%6 | | | | (1.27)% | | | | (1.71)%6 | |
After expense reimbursement (recapture) and securities lending credit | | | (0.66)% | | | | (0.81)%6 | | | | (1.24)% | | | | (1.41)%6 | |
Portfolio turnover rate | | | 0.00% | | | | 0.00%3 | | | | 0.00% | | | | 0.00%3 | |
Portfolio Turnover is calculated for the Fund as a whole. 1 Commencement of operations. 2 Net investment loss per share has been calculated based on average shares outstanding during the year. 3 Not annualized. | |
4 Before expense reimbursement (recapture) and securities lending credit excluding interest expense. | | | 1.33% | | | | 1.61%6 | | | | 1.93% | | | | 2.20%6 | |
5 After expense reimbursement (recapture) and securities lending credit excluding interest expense. | | | 1.30% | | | | 1.30%6 | | | | 1.90% | | | | 1.90%6 | |
See notes to financial statements.
150
GuideMark® Funds & GuidePath® Funds
NOTES TO FINANCIAL STATEMENTS
March 31, 2017
GPS Funds I and GPS Funds II (the “Trusts”) are organized as Delaware statutory trusts under Declarations of Trusts dated January 2, 2001 and October 20, 2010, respectively. The Trusts are registered under the Investment Company Act of 1940, as amended (the “1940 Act”), as open-end management investment companies. GPS Funds I is comprised of the following 7 funds: GuideMark® Large Cap Core Fund, GuideMark® Emerging Markets Fund, GuideMark® Small/Mid Cap Core Fund, GuideMark® World ex-US Fund, GuideMark® Opportunistic Equity Fund, GuideMark® Core Fixed Income Fund and GuideMark® Tax-Exempt Fixed Income Fund. GPS Funds II is comprised of the following 8 funds: GuideMark® Opportunistic Fixed Income Fund, GuidePath® Growth Allocation Fund, GuidePath® Conservative Allocation Fund, GuidePath® Tactical Allocation Fund, GuidePath® Absolute Return Allocation Fund, GuidePath® Multi-Asset Income Allocation Fund, GuidePath® Flexible Income Allocation Fund and GuidePath® Managed Futures Strategy Fund (collectively, the “Funds”). All of the Funds are classified and operate as diversified funds under the 1940 Act. Each Fund represents a distinct portfolio with its own investment objectives and policies. The assets of each Fund are segregated, and a shareholder’s interest is limited to the Fund in which shares are held. The GuideMark® Opportunistic Fixed Income Fund, GuidePath® Growth Allocation Fund, GuidePath® Conservative Allocation Fund, GuidePath® Tactical Allocation Fund and GuidePath® Absolute Return Allocation Fund were seeded on March 4, 2011 and the prospectus went effective on April 1, 2011. The GuideMark® Opportunistic Equity Fund and GuideMark® Opportunistic Fixed Income Fund commenced operations on April 1, 2011. The GuidePath® Growth Allocation Fund, GuidePath® Conservative Allocation Fund, GuidePath® Tactical Allocation Fund and GuidePath® Absolute Return Allocation Fund commenced operations on April 29, 2011. The GuidePath® Multi-Asset Income Allocation Fund and GuidePath® Flexible Income Allocation Fund commenced operations on August 31, 2012. The GuidePath® Managed Futures Strategy Fund commenced operations on January 19, 2016. Each Fund offers two classes of shares: Service Shares and Institutional Shares. The Funds are investment companies and accordingly follow the investment company accounting and reporting guidance of the Financial Accounting Standards Board (“FASB”) Accounting Standards Codification Topic 946 Financial Services – Investment Companies.
The GuidePath® Growth Allocation Fund, GuidePath® Conservative Allocation Fund, GuidePath® Tactical Allocation Fund, GuidePath® Absolute Return Allocation Fund, GuidePath® Multi-Asset Income Allocation Fund and GuidePath® Flexible Income Allocation Fund each operate as a “Fund of Funds,” investing primarily in registered mutual funds, including exchange-traded funds (“ETFs”). The funds in which the Fund of Funds may invest are referred to herein as the “Underlying Funds.” The Advisor believes that investing in Underlying Funds provides each Fund of Funds with an efficient means of creating a portfolio that provides investors with indirect exposure to a broad range of securities. By investing in a Fund of Funds, you will indirectly bear fees and expenses of the Underlying Funds in addition to the Fund’s direct fees and expenses. In order to obtain exposure to certain
markets, asset classes or active management styles, each Fund of Funds may buy Underlying Funds managed by the Advisor or its affiliates, which in turn, invest in various securities, including ETFs. The Fund of Funds may also invest directly in securities and other exchange-traded products, such as exchange-traded notes.
| 3. | | Significant Accounting Policies |
The following is a summary of significant accounting policies consistently followed by the Funds in the preparation of the financial statements. These policies are in conformity with U.S. generally accepted accounting principles (“GAAP”).
Portfolio securities listed on a national or foreign securities exchange, except those listed on NASDAQ, for which market quotations are available are valued at the last quoted sale price on each business day. Portfolio securities traded on NASDAQ are valued at the NASDAQ Official Closing Price (“NOCP”) on each business day. If there is no reported sale on an exchange or NASDAQ, the portfolio security will be valued at the mean between the most recent quoted bid and asked price. Price information on listed securities is taken from the exchange where the security is primarily traded.
All equity securities that are not traded on a listed exchange are valued at the last sale price in the over-the-counter market. If a non-exchange traded security does not trade on a particular day, then the mean between the last quoted closing bid and asked price will be used. Non-exchange traded ADRs are priced with an evaluated price as determined by the current evaluated pricing procedures of, and provided by, the pricing vendor.
Fixed income securities that have a maturity of greater than 60 days are generally valued on the basis of evaluations obtained from third party pricing services, which take into account appropriate factors such as institutional-sized trading in similar groups of securities, yield, quality, coupon rate, maturity, type of issue, trading characteristics and other market data. Short term investments having a maturity of less than 60 days are generally valued at amortized cost, which approximates fair value.
Investments in mutual funds are valued at the closing net asset value per share of each mutual fund on the day of valuation. These investments in mutual funds may include investments in affiliated mutual funds. Investments in mutual funds are generally priced using values supplied by the underlying funds themselves.
To assess the continuing appropriateness of security valuation, the Advisor regularly compares prior day prices with current day prices and transaction prices. When the comparison results exceed pre-defined thresholds, the Advisor challenges the prices exceeding tolerance levels with the pricing service or broker. Securities for which no market quotations are readily available or when a significant event has occurred between the time of the security’s last close and the time that a Fund next calculates its net asset value will be valued at their fair value as determined by the applicable Fund’s Valuation Committee. Securities for which no market prices are readily available will be valued at their fair value as determined by the Valuation Committee under procedures adopted by the applicable Board of Trustees (the “Board”).
151
GuideMark® Funds & GuidePath® Funds
NOTES TO FINANCIAL STATEMENTS (Continued)
March 31, 2017
The Funds have adopted authoritative fair valuation accounting standards which establish an authoritative definition of fair value and set out a hierarchy for measuring fair value. These standards require additional disclosures about the various inputs and valuation techniques used to develop the measurements of fair value and a discussion in changes in valuation techniques and related inputs, if any, during the period. In addition, these standards require expanded disclosure for each major category of assets. These inputs are summarized in the three broad levels listed below:
Level 1 – Quoted prices in active markets for identical securities.
Level 2 – Other significant observable inputs (including quoted prices for similar securities, interest rates, prepayment speeds, credit risk, etc.).
Level 3 – Significant unobservable inputs (including the Funds’ own assumptions in determining the fair value of investments).
During the period, certain of the securities and other instruments held by the Funds were categorized as Level 2 or Level 3 based upon the inputs and methodologies used to determine the fair value of the security or instrument. Descriptions of the inputs and valuation methodologies used to determine the fair values of each class of investments within Level 2 and Level 3 are set forth below.
Level 2 Investments. The Funds’ investments that were categorized as Level 2 include: (1) certain fixed income securities, including asset-backed securities, collateralized mortgage obligations, convertible obligations, corporate obligations, U.S. and foreign government obligations, mortgage-backed securities and municipal bonds; (2) certain foreign common stocks, preferred stocks, participatory notes, and real estate investment trusts; and (3) certain over-the-counter derivative instruments, including forward currency contracts and swaps.
Fixed income securities are normally valued by pricing vendors that use broker-dealer quotations, reported trades or valuation estimates from their internal pricing models. The service providers’ internal models typically use inputs that are observable such as institutional-sized trading in similar groups of securities, yield, credit quality, coupon rate, maturity, type of issue, trading characteristics and other market data.
Certain common stocks that trade on foreign exchanges are subject to valuation adjustments. These valuation adjustments are applied to the foreign exchange-traded common stocks to
account for the market movement between the close of the foreign market in which the security is traded and the close of the New York Stock Exchange. These securities are valued using pricing vendors that consider the correlation patterns of price movements of the foreign security to the intraday trading in the U.S. markets.
Foreign currency contracts and swaps derive their value from underlying asset prices, indices, reference rates, and other inputs or a combination of these factors. These instruments are normally valued using pricing vendors. Depending upon the instrument, its value may be provided by a pricing vendor using a series of techniques, including pricing models. The pricing models typically use inputs that are observed from active markets such as indices, spreads, interest rates, curves, dividends and exchange rates.
Level 3 Investments. The Funds’ investments that were categorized as Level 3 include: fair valued securities.
Fair valued securities are normally valued by pricing vendors using relevant observable inputs, as described above. In certain circumstances, the types of observable inputs that are typically used by a pricing service may be unavailable or deemed by the pricing service to be unreliable. In these instances, the pricing vendor may value the security based upon significant unobservable inputs, or the pricing vendor may not provide a value for the security. To the extent that a pricing vendor does not provide a value for a particular security, or the pricing vendor provides a value that the Valuation Committee does not believe accurately reflects the value of the security, the security will be valued by the Valuation Committee based upon the information available to the Committee at the time of valuation and in accordance with procedures adopted by the Board. These methodologies may require subjective judgments and determinations about the value of a particular security. When significant unobservable inputs are used to value a security, the security is categorized as Level 3.
To verify Level 3 unobservable inputs, the Valuation Committee uses a variety of techniques as appropriate to substantiate these valuation approaches including a regular review of key inputs and assumptions, transaction back-testing or disposition analysis and review of related market activity.
The inputs or methodology used for valuing securities are not an indication of the risk associated with investing in those securities.
The following is a summary of the inputs used to value the Funds’ net assets as of March 31, 2017:
GuideMark® Large Cap Core Fund
| | | | | | | | | | | | | | | | |
| | | Level 1
| | | Level 2
| | | Level 3
| | | Total
| |
Common Stocks | | $ | 192,924,615 | | | $ | — | | | $ | — | | | $ | 192,924,615 | |
Investment Companies | | | 3,221,451 | | | | — | | | | — | | | | 3,221,451 | |
Real Estate Investment Trusts | | | 5,264,332 | | | | — | | | | — | | | | 5,264,332 | |
Short Term Investments | | | 1,373,130 | | | | — | | | | — | | | | 1,373,130 | |
Investments Purchased as Securities Lending Collateral* | | | — | | | | — | | | | — | | | | 49,865,866 | |
| | |
|
|
| |
|
|
| |
|
|
| |
|
|
|
Total Investments in Securities | | $ | 202,783,528 | | | $ | — | | | $ | — | | | $ | 252,649,394 | |
| | |
|
|
| |
|
|
| |
|
|
| |
|
|
|
| | * | | Certain investments that are measured at fair value using the net asset value per share (or its equivalent) practical expedient have not been categorized in the fair value hierarchy. The fair value amounts presented in the table are intended to permit reconciliation of the fair value hierarchy to the amounts presented in the Statement of Assets and Liabilities. |
152
GuideMark® Funds & GuidePath® Funds
NOTES TO FINANCIAL STATEMENTS (Continued)
March 31, 2017
For further information regarding security characteristics, see the Schedule of Investments. There were no transfers in or out of Levels 1, 2 or 3. Transfers between levels are recognized at the end of the reporting period.
GuideMark® Emerging Markets Fund
| | | | | | | | | | | | | | | | |
| | | Level 1
| | | Level 2
| | | Level 3
| | | Total
| |
Common Stocks | | | | | | | | | | | | | | | | |
Consumer Discretionary | | $ | 2,275,010 | | | $ | 7,856,810 | | | $ | — | | | $ | 10,131,820 | |
Consumer Staples | | | 4,558,377 | | | | 5,333,516 | | | | — | | | | 9,891,893 | |
Energy | | | 1,414,112 | | | | 6,495,610 | | | | — | | | | 7,909,722 | |
Financials | | | 4,375,114 | | | | 14,829,834 | | | | — | | | | 19,204,948 | |
Health Care | | | 117,286 | | | | 996,361 | | | | — | | | | 1,113,647 | |
Industrials | | | 793,464 | | | | 3,614,574 | | | | — | | | | 4,408,038 | |
Information Technology | | | 5,752,777 | | | | 19,833,298 | | | | — | | | | 25,586,075 | |
Materials | | | 2,573,002 | | | | 3,152,516 | | | | — | | | | 5,725,518 | |
Real Estate | | | — | | | | 2,052,147 | | | | — | | | | 2,052,147 | |
Telecommunication Services | | | 1,566,276 | | | | 5,794,356 | | | | — | | | | 7,360,632 | |
Utilities | | | 1,758,559 | | | | 616,150 | | | | — | | | | 2,374,709 | |
| | |
|
|
| |
|
|
| |
|
|
| |
|
|
|
Total Common Stocks | | | 25,183,977 | | | | 70,575,172 | | | | — | | | | 95,759,149 | |
Preferred Stocks | | | | | | | | | | | | | | | | |
Consumer Staples | | | — | | | | 622,981 | | | | — | | | | 622,981 | |
Energy | | | 453,952 | | | | — | | | | — | | | | 453,952 | |
Financials | | | 1,805,985 | | | | — | | | | — | | | | 1,805,985 | |
Information Technology | | | — | | | | 694,709 | | | | — | | | | 694,709 | |
Materials | | | 707,481 | | | | 276,644 | | | | — | | | | 984,125 | |
Utilities | | | 1,065,377 | | | | — | | | | — | | | | 1,065,377 | |
| | |
|
|
| |
|
|
| |
|
|
| |
|
|
|
Total Preferred Stocks | | | 4,032,795 | | | | 1,594,334 | | | | — | | | | 5,627,129 | |
Investment Companies | | | 14,698,591 | | | | — | | | | — | | | | 14,698,591 | |
Real Estate Investment Trusts | | | 114,390 | | | | — | | | | — | | | | 114,390 | |
Short Term Investments | | | 6,930,284 | | | | — | | | | — | | | | 6,930,284 | |
Investments Purchased as Securities Lending Collateral* | | | — | | | | — | | | | — | | | | 838,995 | |
| | |
|
|
| |
|
|
| |
|
|
| |
|
|
|
Total Investments in Securities | | $ | 50,960,037 | | | $ | 72,169,506 | | | $ | — | | | $ | 123,968,538 | |
| | |
|
|
| |
|
|
| |
|
|
| |
|
|
|
Other Financial Instruments** | | | | | | | | | | | | | | | | |
Forward Currency Contracts | | $ | — | | | $ | (1,885 | ) | | $ | — | | | $ | (1,885 | ) |
| | * | | Certain investments that are measured at fair value using the net asset value per share (or its equivalent) practical expedient have not been categorized in the fair value hierarchy. The fair value amounts presented in the table are intended to permit reconciliation of the fair value hierarchy to the amounts presented in the Statement of Assets and Liabilities. |
| | ** | | Other financial instruments are derivative instruments not reflected in the Schedule of Investments, such as forwards. Forwards are reflected as the unrealized appreciation (depreciation) on the instrument. |
For further information regarding security characteristics, see the Schedule of Investments.
Below is a reconciliation that details the transfer of securities between Level 1 and Level 2 during the reporting period:
| | | | |
Description
| | Investments in Securities
| |
Transfers into Level 1 | | $ | 1,662,109 | |
Transfers out of Level 1 | | | (1,013,754 | ) |
| | |
|
|
|
Net Transfers into/(out of) Level 1 | | $ | 648,355 | |
| | |
|
|
|
Transfers into Level 2 | | $ | 1,013,754 | |
Transfers out of Level 2 | | | (1,662,109 | ) |
| | |
|
|
|
Net Transfers into/(out of) Level 2 | | $ | (648,355 | ) |
| | |
|
|
|
Transfers between Level 1 and Level 2 were made due to valuation adjustments for certain foreign common stocks applied at the beginning or end of the reporting period when correlation patterns of price movements of foreign securities to the intraday trading in the U.S. markets reached the Fund’s predetermined threshold.
153
GuideMark® Funds & GuidePath® Funds
NOTES TO FINANCIAL STATEMENTS (Continued)
March 31, 2017
Below is a reconciliation of Level 3 assets for which significant unobservable inputs were used to determine fair value.
| | | | |
Description
| | Rights
| |
Balance as of April 1, 2016 | | $ | 0 | |
Purchases | | | — | |
Sales proceeds and paydowns | | | 0 | |
Accreted discounts, net | | | — | |
Realized gain (loss) | | | 0 | |
Change in unrealized appreciation (depreciation) | | | — | |
Transfers into/(out of) Level 3 | | | — | |
| | |
|
|
|
Balance as of March 31, 2017 | | $ | — | |
| | |
|
|
|
Change in unrealized appreciation (depreciation) during the period for Level 3 investments held at March 31, 2017. | | $ | — | |
| | |
|
|
|
GuideMark® Small/Mid Cap Core Fund
| | | | | | | | | | | | | | | | |
| | | Level 1
| | | Level 2
| | | Level 3
| | | Total
| |
Equity | | | | | | | | | | | | | | | | |
Common Stock | | $ | 101,173,868 | | | $ | — | | | $ | 0 | | | $ | 101,173,868 | |
Investment Companies | | | 3,629,903 | | | | — | | | | — | | | | 3,629,903 | |
Real Estate Investment Trusts | | | 9,257,263 | | | | — | | | | — | | | | 9,257,263 | |
| | |
|
|
| |
|
|
| |
|
|
| |
|
|
|
Total Equity | | | 114,061,034 | | | | — | | | | 0 | | | | 114,061,034 | |
Fixed Income | | | | | | | | | | | | | | | | |
Corporate Obligations | | | — | | | | 4,988 | | | | — | | | | 4,988 | |
| | |
|
|
| |
|
|
| |
|
|
| |
|
|
|
Total Fixed Income | | | — | | | | 4,988 | | | | — | | | | 4,988 | |
Rights | | | — | | | | — | | | | 0 | | | | 0 | |
Short Term Investments | | | 1,276,523 | | | | — | | | | — | | | | 1,276,523 | |
Investments Purchased as Securities Lending Collateral* | | | — | | | | — | | | | — | | | | 32,709,937 | |
| | |
|
|
| |
|
|
| |
|
|
| |
|
|
|
Total Investments in Securities | | $ | 115,337,557 | | | $ | 4,988 | | | $ | — | | | $ | 148,052,482 | |
| | |
|
|
| |
|
|
| |
|
|
| |
|
|
|
| | * | | Certain investments that are measured at fair value using the net asset value per share (or its equivalent) practical expedient have not been categorized in the fair value hierarchy. The fair value amounts presented in the table are intended to permit reconciliation of the fair value hierarchy to the amounts presented in the Statement of Assets and Liabilities. |
For further information regarding security characteristics, see the Schedule of Investments. There were no transfers in or out of Levels 1, 2 or 3. Transfers between levels are recognized at the end of the reporting period.
Below is a reconciliation of Level 3 assets for which significant unobservable inputs were used to determine fair value.
| | | | | | | | | | | | |
Description
| | Common Stocks
| | | Rights
| | | Real Estate
Investment Trusts
| |
Balance as of April 1, 2016 | | $ | — | | | $ | 0 | | | $ | 0 | |
Purchases | | | 0 | | | | 0 | | | | — | |
Sales proceeds and paydowns | | | — | | | | — | | | | (14,130 | ) |
Accreted discounts, net | | | — | | | | — | | | | — | |
Realized gain (loss) | | | — | | | | — | | | | (61,709 | ) |
Change in unrealized appreciation (depreciation) | | | — | | | | — | | | | 75,839 | |
Transfers into/(out of) Level 3 | | | — | | | | — | | | | — | |
| | |
|
|
| |
|
|
| |
|
|
|
Balance as of March 31, 2017 | | $ | 0 | | | $ | 0 | | | $ | — | |
| | |
|
|
| |
|
|
| |
|
|
|
Change in unrealized appreciation (depreciation) during the year for Level 3 investments held at March 31, 2017. | | $ | — | | | $ | — | | | $ | — | |
| | |
|
|
| |
|
|
| |
|
|
|
154
GuideMark® Funds & GuidePath® Funds
NOTES TO FINANCIAL STATEMENTS (Continued)
March 31, 2017
GuideMark® World ex-US Fund
| | | | | | | | | | | | | | | | |
| | | Level 1
| | | Level 2
| | | Level 3
| | | Total
| |
Common Stocks | | | | | | | | | | | | | | | | |
Consumer Discretionary | | $ | 1,388,475 | | | $ | 28,206,464 | | | $ | — | | | $ | 29,594,939 | |
Consumer Staples | | | 3,086,257 | | | | 22,064,276 | | | | — | | | | 25,150,533 | |
Energy | | | 1,684,267 | | | | 6,242,140 | | | | — | | | | 7,926,407 | |
Financials | | | 6,102,815 | | | | 31,949,889 | | | | — | | | | 38,052,704 | |
Health Care | | | 749,457 | | | | 15,852,501 | | | | — | | | | 16,601,958 | |
Industrials | | | 811,467 | | | | 24,731,978 | | | | — | | | | 25,543,445 | |
Information Technology | | | 1,074,345 | | | | 12,473,654 | | | | — | | | | 13,547,999 | |
Materials | | | 947,335 | | | | 14,414,384 | | | | — | | | | 15,361,719 | |
Real Estate | | | — | | | | 1,064,265 | | | | — | | | | 1,064,265 | |
Telecommunication Services | | | 171,273 | | | | 4,367,305 | | | | — | | | | 4,538,578 | |
Utilities | | | 57,861 | | | | 3,520,218 | | | | — | | | | 3,578,079 | |
| | |
|
|
| |
|
|
| |
|
|
| |
|
|
|
Total Common Stocks | | | 16,073,552 | | | | 164,887,074 | | | | — | | | | 180,960,626 | |
Investment Companies | | | 3,455,741 | | | | — | | | | — | | | | 3,455,741 | |
Participatory Notes | | | — | | | | 106,197 | | | | — | | | | 106,197 | |
Preferred Stocks | | | | | | | | | | | | | | | | |
Consumer Discretionary | | | — | | | | 59,478 | | | | — | | | | 59,478 | |
Consumer Staples | | | — | | | | 188,931 | | | | — | | | | 188,931 | |
Materials | | | — | | | | 509,487 | | | | — | | | | 509,487 | |
| | |
|
|
| |
|
|
| |
|
|
| |
|
|
|
Total Preferred Stocks | | | — | | | | 757,896 | | | | — | | | | 757,896 | |
Real Estate Investment Trusts | | | 72,653 | | | | 570,964 | | | | — | | | | 643,617 | |
Short Term Investments | | | 760,253 | | | | — | | | | — | | | | 760,253 | |
Investments Purchased as Securities Lending Collateral* | | | — | | | | — | | | | — | | | | 2,977,876 | |
| | |
|
|
| |
|
|
| |
|
|
| |
|
|
|
Total Investments in Securities | | $ | 20,362,199 | | | $ | 166,322,131 | | | $ | — | | | $ | 189,662,206 | |
| | |
|
|
| |
|
|
| |
|
|
| |
|
|
|
| | * | | Certain investments that are measured at fair value using the net asset value per share (or its equivalent) practical expedient have not been categorized in the fair value hierarchy. The fair value amounts presented in the table are intended to permit reconciliation of the fair value hierarchy to the amounts presented in the Statement of Assets and Liabilities. |
For further information regarding security characteristics, see the Schedule of Investments.
Below is a reconciliation that details the transfer of securities between Level 1 and Level 2 during the reporting period:
| | | | |
Description
| | Investments in Securities
| |
Transfers into Level 1 | | $ | 822,469 | |
Transfers out of Level 1 | | | (229,631 | ) |
| | |
|
|
|
Net Transfers into/(out of) Level 1 | | $ | 592,838 | |
| | |
|
|
|
Transfers into Level 2 | | $ | 229,631 | |
Transfers out of Level 2 | | | (822,469 | ) |
| | |
|
|
|
Net Transfers into/(out of) Level 2 | | $ | (592,838 | ) |
| | |
|
|
|
Transfers between Level 1 and Level 2 were made due to valuation adjustments for certain foreign common stocks applied at the beginning or end of the reporting period when correlation patterns of price movements of foreign securities to the intraday trading in the U.S. markets reached the Fund’s predetermined threshold.
There were no transfers in or out of Level 3. Transfers between levels are recognized at the end of the reporting period.
GuideMark® Opportunistic Equity Fund
| | | | | | | | | | | | | | | | |
| | | Level 1
| | | Level 2
| | | Level 3
| | | Total
| |
Common Stocks | | $ | 62,938,658 | | | $ | — | | | $ | — | | | $ | 62,938,658 | |
Real Estate Investment Trusts | | | 956,613 | | | | — | | | | — | | | | 956,613 | |
Short Term Investments | | | 2,228,609 | | | | — | | | | — | | | | 2,228,609 | |
Investments Purchased as Securities Lending Collateral* | | | — | | | | — | | | | — | | | | 19,335,822 | |
| | |
|
|
| |
|
|
| |
|
|
| |
|
|
|
Total Investments in Securities | | $ | 66,123,880 | | | $ | — | | | $ | — | | | $ | 85,459,702 | |
| | |
|
|
| |
|
|
| |
|
|
| |
|
|
|
| | * | | Certain investments that are measured at fair value using the net asset value per share (or its equivalent) practical expedient have not been categorized in the fair value hierarchy. The fair value amounts presented in the table are intended to permit reconciliation of the fair value hierarchy to the amounts presented in the Statement of Assets and Liabilities. |
155
GuideMark® Funds & GuidePath® Funds
NOTES TO FINANCIAL STATEMENTS (Continued)
March 31, 2017
For further information regarding security characteristics, see the Schedule of Investments. There were no transfers in or out of Levels 1, 2 or 3. Transfers between levels are recognized at the end of the reporting period.
GuideMark® Core Fixed Income Fund
| | | | | | | | | | | | | | | | |
| | | Level 1
| | | Level 2
| | | Level 3
| | | Total
| |
Fixed Income | | | | | | | | | | | | | | | | |
Asset Backed Securities | | $ | — | | | $ | 14,924,446 | | | $ | — | | | $ | 14,924,446 | |
Collateralized Mortgage Obligations | | | — | | | | 6,701,851 | | | | — | | | | 6,701,851 | |
Corporate Obligations | | | — | | | | 56,178,993 | | | | — | | | | 56,178,993 | |
Foreign Government Debt Obligations | | | — | | | | 1,385,430 | | | | — | | | | 1,385,430 | |
Mortgage Backed Securities – U.S. Government Agency | | | — | | | | 45,919,655 | | | | — | | | | 45,919,655 | |
Municipal Debt Obligations | | | — | | | | 705,657 | | | | — | | | | 705,657 | |
U.S. Treasury Obligations | | | — | | | | 26,038,157 | | | | — | | | | 26,038,157 | |
| | |
|
|
| |
|
|
| |
|
|
| |
|
|
|
Total Fixed Income | | | — | | | | 151,854,189 | | | | — | | | | 151,854,189 | |
Short Term Investments | | | 5,098,863 | | | | — | | | | — | | | | 5,098,863 | |
Investments Purchased as Securities Lending Collateral* | | | — | | | | — | | | | — | | | | 7,147,649 | |
| | |
|
|
| |
|
|
| |
|
|
| |
|
|
|
Total Investments in Securities | | $ | 5,098,863 | | | $ | 151,854,189 | | | $ | — | | | $ | 164,100,701 | |
| | |
|
|
| |
|
|
| |
|
|
| |
|
|
|
Other Financial Instruments** | | | | | | | | | | | | | | | | |
Futures | | $ | 20,337 | | | $ | — | | | $ | — | | | $ | 20,337 | |
Swaps | | | — | | | | 235,441 | | | | — | | | | 235,441 | |
| | * | | Certain investments that are measured at fair value using the net asset value per share (or its equivalent) practical expedient have not been categorized in the fair value hierarchy. The fair value amounts presented in the table are intended to permit reconciliation of the fair value hierarchy to the amounts presented in the Statement of Assets and Liabilities. |
| | ** | | Other financial instruments are derivative instruments not reflected in the Schedule of Investments, such as futures and swaps. Futures and swaps are reflected as the unrealized appreciation (depreciation) on the instrument. |
For further information regarding security characteristics, see the Schedule of Investments. There were no transfers in or out of Levels 1, 2 or 3. Transfers between levels are recognized at the end of the reporting period.
GuideMark® Tax-Exempt Fixed Income Fund
| | | | | | | | | | | | | | | | |
| | | Level 1
| | | Level 2
| | | Level 3
| | | Total
| |
Municipal Debt Obligations | | $ | — | | | $ | 29,745,250 | | | $ | — | | | $ | 29,745,250 | |
Short Term Investments | | | 559,642 | | | | — | | | | — | | | | 559,642 | |
| | |
|
|
| |
|
|
| |
|
|
| |
|
|
|
Total Investments in Securities | | $ | 559,642 | | | $ | 29,745,250 | | | $ | — | | | $ | 30,304,892 | |
| | |
|
|
| |
|
|
| |
|
|
| |
|
|
|
For further information regarding security characteristics, see the Schedule of Investments. There were no transfers in or out of Levels 1, 2 or 3. Transfers between levels are recognized at the end of the reporting period.
GuideMark® Opportunistic Fixed Income Fund
| | | | | | | | | | | | | | | | |
| | | Level 1
| | | Level 2
| | | Level 3
| | | Total
| |
Equity | | | | | | | | | | | | | | | | |
Common Stock | | $ | — | | | $ | 4,486 | | | $ | 0 | | | $ | 4,486 | |
Preferred Stock | | | — | | | | 12,138 | | | | — | | | | 12,138 | |
| | |
|
|
| |
|
|
| |
|
|
| |
|
|
|
Total Equity | | | — | | | $ | 16,624 | | | | — | | | | 16,624 | |
Fixed Income | | | | | | | | | | | | | | | | |
Collateralized Mortgage Obligations | | | — | | | | 12,333,409 | | | | — | | | | 12,333,409 | |
Convertible Obligations | | | — | | | | 833,633 | | | | — | | | | 833,633 | |
Corporate Obligations | | | — | | | | 376,313 | | | | — | | | | 376,313 | |
Foreign Government Obligations | | | — | | | | 31,474,267 | | | | — | | | | 31,474,267 | |
Mortgage Backed Securities – U.S. Government Agency | | | — | | | | 8,372,095 | | | | — | | | | 8,372,095 | |
| | |
|
|
| |
|
|
| |
|
|
| |
|
|
|
Total Fixed Income | | | — | | | | 53,389,717 | | | | — | | | | 53,389,717 | |
Warrants | | | — | | | | — | | | | 0 | | | | 0 | |
Short Term Investments | | | 5,547,102 | | | | 1,818,126 | | | | — | | | | 7,365,228 | |
| | |
|
|
| |
|
|
| |
|
|
| |
|
|
|
Total Investments in Securities | | $ | 5,547,102 | | | $ | 55,224,467 | | | $ | 0 | | | $ | 60,771,569 | |
| | |
|
|
| |
|
|
| |
|
|
| |
|
|
|
Other Financial Instruments* | | | | | | | | | | | | | | | | |
Forward Currency Contracts | | $ | — | | | $ | 961,611 | | | $ | — | | | $ | 961,611 | |
Swaps | | | — | | | | (1,151,405 | ) | | | — | | | | (1,151,405 | ) |
| | * | | Other financial instruments are derivative instruments not reflected in the Schedule of Investments, such as forward currency contracts and swaps. Forward currency contracts and swaps are reflected as the unrealized appreciation (depreciation) on the instrument. |
For further information regarding security characteristics, see the Schedule of Investments. There were no transfers in or out of Levels 1, 2 or 3. Transfers between levels are recognized at the end of the reporting period.
156
GuideMark® Funds & GuidePath® Funds
NOTES TO FINANCIAL STATEMENTS (Continued)
March 31, 2017
Level 3 Reconciliation Disclosure
Below is a reconciliation of Level 3 assets for which significant unobservable inputs were used to determine fair value.
| | | | | | | | |
Description
| | Common Stocks
| | | Warrants
| |
Balance as of April 1, 2016 | | $ | — | | | $ | — | |
Purchases | | | 0 | | | | 0 | |
Sales proceeds and paydowns | | | — | | | | — | |
Accreted discounts, net | | | — | | | | — | |
Realized gain (loss) | | | — | | | | — | |
Change in unrealized appreciation (depreciation) | | | — | | | | — | |
Transfers into/(out of) Level 3 | | | — | | | | — | |
| | |
|
|
| |
|
|
|
Balance as of March 31, 2017 | | $ | 0 | | | $ | 0 | |
| | |
|
|
| |
|
|
|
Change in unrealized appreciation (depreciation) during the year for Level 3 investments held at March 31, 2017. | | $ | — | | | $ | — | |
| | |
|
|
| |
|
|
|
GuidePath® Growth Allocation Fund
| | | | | | | | | | | | | | | | |
| | | Level 1
| | | Level 2
| | | Level 3
| | | Total
| |
Investment Companies | | $ | 557,395,398 | | | $ | — | | | $ | — | | | $ | 557,395,398 | |
Short Term Investments | | | 6,552,272 | | | | — | | | | — | | | | 6,552,272 | |
Investments Purchased as Securities Lending Collateral* | | | — | | | | — | | | | — | | | | 91,758,279 | |
| | |
|
|
| |
|
|
| |
|
|
| |
|
|
|
Total Investments in Securities | | $ | 563,947,670 | | | $ | — | | | $ | — | | | $ | 655,705,949 | |
| | |
|
|
| |
|
|
| |
|
|
| |
|
|
|
| | * | | Certain investments that are measured at fair value using the net asset value per share (or its equivalent) practical expedient have not been categorized in the fair value hierarchy. The fair value amounts presented in the table are intended to permit reconciliation of the fair value hierarchy to the amounts presented in the Statement of Assets and Liabilities. |
For further information regarding security characteristics, see the Schedule of Investments. There were no transfers in or out of Levels 1, 2 or 3. Transfers between levels are recognized at the end of the reporting period.
GuidePath® Conservative Allocation Fund
| | | | | | | | | | | | | | | | |
| | | Level 1
| | | Level 2
| | | Level 3
| | | Total
| |
Investment Companies | | $ | 114,478,850 | | | $ | — | | | $ | — | | | $ | 114,478,850 | |
Short Term Investments | | | 1,263,400 | | | | — | | | | — | | | | 1,263,400 | |
Investments Purchased as Securities Lending Collateral* | | | — | | | | — | | | | — | | | | 32,173,173 | |
| | |
|
|
| |
|
|
| |
|
|
| |
|
|
|
Total Investments in Securities | | $ | 115,742,250 | | | $ | — | | | $ | — | | | $ | 147,915,423 | |
| | |
|
|
| |
|
|
| |
|
|
| |
|
|
|
| | * | | Certain investments that are measured at fair value using the net asset value per share (or its equivalent) practical expedient have not been categorized in the fair value hierarchy. The fair value amounts presented in the table are intended to permit reconciliation of the fair value hierarchy to the amounts presented in the Statement of Assets and Liabilities. |
For further information regarding security characteristics, see the Schedule of Investments. There were no transfers in or out of Levels 1, 2 or 3. Transfers between levels are recognized at the end of the reporting period.
GuidePath® Tactical Allocation Fund
| | | | | | | | | | | | | | | | |
| | | Level 1
| | | Level 2
| | | Level 3
| | | Total
| |
Investment Companies | | $ | 304,539,015 | | | $ | — | | | $ | — | | | $ | 304,539,015 | |
Short Term Investments | | | 3,594,112 | | | | — | | | | — | | | | 3,594,112 | |
Investments Purchased as Securities Lending Collateral* | | | — | | | | — | | | | — | | | | 24,291,888 | |
| | |
|
|
| |
|
|
| |
|
|
| |
|
|
|
Total Investments in Securities | | $ | 308,133,127 | | | $ | — | | | $ | — | | | $ | 332,425,015 | |
| | |
|
|
| |
|
|
| |
|
|
| |
|
|
|
| | * | | Certain investments that are measured at fair value using the net asset value per share (or its equivalent) practical expedient have not been categorized in the fair value hierarchy. The fair value amounts presented in the table are intended to permit reconciliation of the fair value hierarchy to the amounts presented in the Statement of Assets and Liabilities. |
For further information regarding security characteristics, see the Schedule of Investments. There were no transfers in or out of Levels 1, 2 or 3. Transfers between levels are recognized at the end of the reporting period.
157
GuideMark® Funds & GuidePath® Funds
NOTES TO FINANCIAL STATEMENTS (Continued)
March 31, 2017
GuidePath® Absolute Return Allocation Fund
| | | | | | | | | | | | | | | | |
| | | Level 1
| | | Level 2
| | | Level 3
| | | Total
| |
Investment Companies | | $ | 128,344,439 | | | $ | — | | | $ | — | | | $ | 128,344,439 | |
Short Term Investments | | | 1,317,235 | | | | — | | | | — | | | | 1,317,235 | |
Investments Purchased as Securities Lending Collateral* | | | — | | | | — | | | | — | | | | 30,145,575 | |
| | |
|
|
| |
|
|
| |
|
|
| |
|
|
|
Total Investments in Securities | | $ | 129,661,674 | | | $ | — | | | $ | — | | | $ | 159,807,249 | |
| | |
|
|
| |
|
|
| |
|
|
| |
|
|
|
| | * | | Certain investments that are measured at fair value using the net asset value per share (or its equivalent) practical expedient have not been categorized in the fair value hierarchy. The fair value amounts presented in the table are intended to permit reconciliation of the fair value hierarchy to the amounts presented in the Statement of Assets and Liabilities. |
For further information regarding security characteristics, see the Schedule of Investments. There were no transfers in or out of Levels 1, 2 or 3. Transfers between levels are recognized at the end of the reporting period.
GuidePath® Multi-Asset Income Allocation Fund
| | | | | | | | | | | | | | | | |
| | | Level 1
| | | Level 2
| | | Level 3
| | | Total
| |
Investment Companies | | $ | 118,453,361 | | | $ | — | | | $ | — | | | $ | 118,453,361 | |
Short Term Investments | | | 1,684,665 | | | | — | | | | — | | | | 1,684,665 | |
Investments Purchased as Securities Lending Collateral* | | | — | | | | — | | | | — | | | | 19,755,971 | |
| | |
|
|
| |
|
|
| |
|
|
| |
|
|
|
Total Investments in Securities | | $ | 120,138,026 | | | $ | — | | | $ | — | | | $ | 139,893,997 | |
| | |
|
|
| |
|
|
| |
|
|
| |
|
|
|
| | * | | Certain investments that are measured at fair value using the net asset value per share (or its equivalent) practical expedient have not been categorized in the fair value hierarchy. The fair value amounts presented in the table are intended to permit reconciliation of the fair value hierarchy to the amounts presented in the Statement of Assets and Liabilities. |
For further information regarding security characteristics, see the Schedule of Investments. There were no transfers in or out of Levels 1, 2 or 3. Transfers between levels are recognized at the end of the reporting period.
GuidePath® Flexible Income Allocation Fund
| | | | | | | | | | | | | | | | |
| | | Level 1
| | | Level 2
| | | Level 3
| | | Total
| |
Investment Companies | | $ | 98,709,386 | | | $ | — | | | $ | — | | | $ | 98,709,386 | |
Short Term Investments | | | 1,001,983 | | | | — | | | | — | | | | 1,001,983 | |
Investments Purchased as Securities Lending Collateral* | | | — | | | | — | | | | — | | | | 18,216,561 | |
| | |
|
|
| |
|
|
| |
|
|
| |
|
|
|
Total Investments in Securities | | $ | 99,711,369 | | | $ | — | | | $ | — | | | $ | 117,927,930 | |
| | |
|
|
| |
|
|
| |
|
|
| |
|
|
|
| | * | | Certain investments that are measured at fair value using the net asset value per share (or its equivalent) practical expedient have not been categorized in the fair value hierarchy. The fair value amounts presented in the table are intended to permit reconciliation of the fair value hierarchy to the amounts presented in the Statement of Assets and Liabilities. |
For further information regarding security characteristics, see the Schedule of Investments. There were no transfers in or out of Levels 1, 2 or 3. Transfers between levels are recognized at the end of the reporting period.
GuidePath® Managed Futures Strategy Fund
| | | | | | | | | | | | | | | | |
| | | Level 1
| | | Level 2
| | | Level 3
| | | Total
| |
Short Term Investments | | $ | 254,234 | | | $ | 82,001,530 | | | $ | — | | | $ | 82,255,764 | |
| | |
|
|
| |
|
|
| |
|
|
| |
|
|
|
Total Investments in Securities | | $ | 254,234 | | | $ | 82,001,530 | | | $ | — | | | $ | 82,255,764 | |
| | |
|
|
| |
|
|
| |
|
|
| |
|
|
|
Other Financial Instruments* | | | | | | | | | | | | | | | | |
Futures | | $ | (57,352 | ) | | $ | — | | | $ | — | | | $ | (57,352 | ) |
| | * | | Other financial instruments are derivative instruments not reflected in the Schedule of Investments, such as futures. Futures are reflected as the unrealized appreciation (depreciation) on the instrument. |
For further information regarding security characteristics, see the Schedule of Investments. There were no transfers in or out of Levels 1, 2 or 3. Transfers between levels are recognized at the end of the reporting period.
| | (b) | | Consolidation of Subsidiary |
The GuidePath® Managed Futures Strategy Fund may invest up to 25% of its total assets in GuidePath Managed Futures Strategy Cayman Fund Ltd. (the “Subsidiary”). The Subsidiary, which is organized under the laws of the Cayman Islands, is wholly-owned and controlled by GuidePath® Managed Futures Strategy Fund. The financial statements of the GuidePath®
Managed Futures Strategy Fund include the operations of the Subsidiary. All intercompany accounts and transactions have been eliminated in consolidation. The Subsidiary acts as an investment vehicle in order to invest in commodity-linked derivative instruments consistent with the Fund’s investment objectives and policies.
158
GuideMark® Funds & GuidePath® Funds
NOTES TO FINANCIAL STATEMENTS (Continued)
March 31, 2017
The Subsidiary is an exempted Cayman Islands investment company and as such is not subject to Cayman Islands taxes at the present time. For U.S. income tax purposes, the Subsidiary is a Controlled Foreign Corporation (“CFC”) not subject to U.S. income taxes. As a wholly-owned CFC, however, the Subsidiary’s net income and capital gains, if any, will be included each year in the Fund’s investment company taxable income.
| | (c) | | Subsequent Events Evaluation |
In preparing these financial statements, the Funds have evaluated events and transactions through the date of issuance for potential recognition or disclosure resulting from subsequent events. This evaluation did not result in any subsequent events that necessitated disclosures and/or adjustments to the financial statements other than the below.
On May 25, 2017 the Board of Trustees approved the liquidation of the GuideMark Opportunistic Equity Fund. The Fund will be liquidated on or about July 31, 2017. Shareholders of the Fund will receive a supplement to the Prospectus dated July 31, 2016.
| | (d) | | Repurchase Agreements |
Each Fund may enter into repurchase agreements with banks and securities dealers. These transactions involve the purchase of securities with a simultaneous commitment to sell the securities to the bank or the dealer at an agreed-upon date and price. A repurchase agreement is accounted for as an investment by the Fund, collateralized by securities, which are delivered to the Fund’s Custodian or to an agent bank under a tri-party agreement. The securities are marked-to-market daily and additional securities are acquired as needed, to ensure that their value equals or exceeds the repurchase price plus accrued interest.
The Funds intend to continue to comply with the requirements of sub-chapter M of the Internal Revenue Code necessary to qualify as regulated investment companies and to make the requisite distributions of income and capital gains to shareholders sufficient to relieve the Funds from all or substantially all Federal income taxes. Therefore, no Federal income tax provision is required.
The Funds have adopted financial reporting rules regarding recognition and measurement of tax positions taken or expected to be taken on a tax return. In order to avoid imposition of the excise tax applicable to regulated investment companies, it is also each Fund’s intention to declare as dividends in each calendar year at least 98% of its net investment income (earned during the calendar year) and 98.2% of its net realized capital gains (earned during the twelve months ended October 31) plus undistributed amounts from prior years. The Funds have reviewed all open tax years and major jurisdictions and concluded that no provision for income tax is required in the Funds’ financial statements. The Funds recognize interest and penalties, if any, related to unrecognized tax benefits as income tax expense on the Statement of Operations. During the fiscal year ended March 31, 2017, the Funds did not incur any interest or penalties. The Funds’ Federal and state income and Federal
excise tax returns for tax years for which the applicable statutes of limitations have not expired are subject to examination by the Internal Revenue Service and state departments of revenue.
The preparation of financial statements in conformity with GAAP requires management to make estimates and assumptions that affect the reported amounts of assets and liabilities and disclosure of contingent assets and liabilities at the date of the financial statements and the reported amounts of revenues and expenses during the reported period. Actual results could differ from those estimates.
Under each Trust’s organizational documents, its officers and trustees are indemnified against certain liability arising out of their performance of their duties to the Funds. In addition, in the normal course of business, the Funds enter into contracts that contain a variety of representations and warranties that provide general indemnifications. The Funds’ maximum exposure under these arrangements is unknown as this would involve future claims that may be made against the Funds that have not yet occurred. However, the Funds expect the risk of loss to be remote.
Many expenses of the Funds can be directly attributed to a specific Fund. Additionally, some expenses can be directly attributed to a specific Trust, in which case the expense is apportioned among the Funds within that Trust based on relative net assets. Expenses that cannot be directly attributed to a specific Fund or Trust are apportioned among all the Funds based on relative net assets.
| | (i) | | Organization and Offering Costs |
Organization costs consist of costs incurred to establish a Trust and enable it legally to do business. The Fund expenses organizational costs as incurred. These expenses were advanced by the Advisor, and the Advisor has agreed to reimburse the Funds for these expenses, subject to potential recovery (see Note 4). Offering costs are accounted for as deferred costs until operations begin. Offering costs include legal fees regarding the preparation of the initial registration statement. Offering costs are then amortized to expense over twelve months on a straight-line basis.
| | (j) | | Security Transactions and Income Recognition |
Security transactions are accounted for on trade date. Dividend income is recognized on the ex-dividend date, and the interest income recorded using the effective yield method is accrued daily. Withholding taxes on foreign dividends and capital gains, which are included as a component of net investment income and realized gain (loss) on investments, respectively, have been provided in accordance with the Trusts’ understanding of the applicable country’s tax rules and rates. Realized gains and losses on investment transactions are determined using the high cost method. Return of capital distributions received from REIT securities are recorded as an adjustment to the cost of the security and thus may impact unrealized or realized gains or losses on the security. Gains and losses from paydowns on mortgage and asset backed securities are recorded as
159
GuideMark® Funds & GuidePath® Funds
NOTES TO FINANCIAL STATEMENTS (Continued)
March 31, 2017
adjustments to interest income. Distributions from underlying investment companies are classified as investment income or realized gains based on the U.S. income tax characteristics of the distribution.
| | (k) | | Distributions to Shareholders |
The Funds, with the exception of the Core Fixed Income Fund, Tax-Exempt Fixed Income Fund, Opportunistic Fixed Income Fund, Multi-Asset Income Allocation Fund and Flexible Income Allocation Fund will distribute any net investment income at least annually. The Core Fixed Income Fund, Tax-Exempt Fixed Income Fund, Opportunistic Fixed Income Fund, Multi-Asset Income Allocation Fund and Flexible Income Allocation Fund will distribute any net investment income quarterly. All of the Funds will distribute any net realized long or short-term capital gains at least annually. Certain Funds also utilize earnings and profits distributed to shareholders on redemptions of shares as part of the dividends paid deduction. Distributions to shareholders are recorded on the ex-dividend date. The Funds may also pay a special distribution at the end of the calendar year to comply with Federal tax requirements.
Each Fund may invest in derivative securities including call and put options, futures, forward currency contracts and swaps. These instruments may be used by a Fund for hedging purposes as well as direct investment.
Forward Currency Contracts
The Funds may enter into forward currency contracts, obligating the Funds to deliver and receive currency at a specified future date. Transactions involving forward currency contracts may serve as long hedges (for example, if a Fund seeks to buy a security denominated in a foreign security, it may purchase a forward currency contract to lock in the U.S. dollar price of the security) or as short hedges (if a Fund anticipates selling a security denominated in a foreign currency, it may sell a forward currency contract to lock in the U.S. dollar equivalent of the anticipated sales proceeds). Forward contracts are valued daily and unrealized appreciation or depreciation is recorded daily as the difference between the contract exchange rate and the closing forward rate applied to the face amount of the contract.
Options
Exchange-traded options are valued at the last reported sale price on the exchange on which the security underlying the option is principally traded. If no sales are reported on a particular day for exchange-traded options, or the options are not exchange-traded, the options are valued at the mean between the most recent quoted bid and asked quotations at the close of the exchange.
The premium that a Fund pays when purchasing a call option or receives when writing a call option will reflect, among other things, the market price of the security, the relationship of the exercise price to the market price of the security, the relationship of the exercise price to the volatility of the security,
the length of the option period and supply and demand factors. The premium is the value of an option at the date of purchase. A purchaser (holder) of a put option pays a non-refundable premium to the seller (writer) of a put option to obtain the right to sell a specified amount of a security at a fixed price (the exercise price) during a specified period (exercise period). Conversely, the seller (writer) of a put option, upon payment by the holder of the premium, has the obligation to buy the security from the holder of the put option at the exercise price during the exercise period.
Futures
Each Fund has the ability to buy and sell stock index futures contracts traded on domestic stock exchanges to hedge the value of its portfolio against changes in market conditions. A stock index futures contract is an agreement between two parties to take or make delivery of an amount of cash equal to a specified dollar amount, times the difference between stock index value at the close of the last trading day of the contract and the price at which the futures contract is originally struck. A stock index futures contract does not involve the physical delivery of the underlying stocks in the index. Although stock index futures contracts call for the actual taking of delivery of cash, in most cases a Fund expects to liquidate its stock index futures positions through offsetting transactions, which may result in a gain or loss, before cash settlement is required.
The Funds may purchase or sell other types of futures contracts, including those based on particular interest rates, securities, foreign currencies, securities indices and other financial instruments and indices. The Funds may also purchase and write call and put options on such future contracts, in order to seek to increase total return or to hedge against changes in interest rates, securities prices, or currency exchange rates, or, to the extent permitted by its investment policies, to otherwise manage its portfolio of investments.
Futures contracts are valued at the daily quoted settlement prices.
Swaps
The Funds may enter into interest rate, mortgage, credit, currency and total return swaps, interest rate caps, floors and collars. The Funds may also purchase and write (sell) options contracts on swaps, referred to as “swaptions”. The Funds may enter into swap transactions for hedging purposes or to seek to increase total return. Since interest rate, mortgage, credit and currency swaps and interest rate caps, floors and collars are individually negotiated, the Funds expect to achieve an acceptable degree of correlation between their portfolio investments and their swap, cap, floor and collar positions.
Swap agreements are valued using the daily mean and unrealized appreciation or depreciation is recorded daily as the difference between the prior day and current day closing price.
Derivative Instruments and Hedging Activities
Each Trust has adopted derivative instruments disclosure standards, in order to enable the investor to understand how and why an entity used derivatives, how derivatives are accounted for, and how derivative instruments affect an entity’s results of operations and financial position.
160
GuideMark® Funds & GuidePath® Funds
NOTES TO FINANCIAL STATEMENTS (Continued)
March 31, 2017
In general, the use of derivatives may increase the risk within the Funds. The use of over-the-counter derivatives involves the risk that the counterparty to the contract will fail to make required payments or otherwise comply with the terms of the contract. The results achieved by the use of derivatives in the Funds may not match or fully offset changes in the value of the underlying financial assets being hedged or the investment opportunity the Funds were pursuing, thereby failing to achieve, to an extent, the original purpose for using the derivatives. Certain types of derivatives may create leverage insofar as the Funds may receive returns (or suffer losses) exceeding the initial amounts the Funds committed in connection with the derivatives. The use of derivatives can result in losses or gains to the Funds exceeding the amount the Funds would have experienced in the absence of using derivatives. A relatively small price movement in a derivative may result in an immediate and substantial loss, or gain, to the Funds.
GuideMark® Emerging Markets Fund
The Fund entered into forward exchange contracts primarily to manage and/or gain exposure to certain foreign currencies.
Balance Sheet – Values of Derivative Instruments as of March 31, 2017
| | | | | | | | | | | | |
| | | Asset Derivatives
| | | Liability Derivatives
| |
| | | Statement of Assets and
Liabilities Location | | Value | | | Statement of Assets and
Liabilities Location | | Value | |
| Foreign Exchange Contracts – Forward Currency Contracts | | Appreciation of forward currency contracts | | $ | — | | | Depreciation of forward currency contracts | | $ | 1,885 | |
| Total | | | | $ | — | | | | | $ | 1,885 | |
| | | | | | | | |
| The Effect of Derivative Instruments on the Statement of Operations for the Year Ended March 31, 2017 | |
|
| Amount of Realized Loss on Derivatives Recognized in Income | |
| | | Forward
Currency
Contracts | | | Total | |
| Foreign Exchange Contracts | | $ | (21,022 | ) | | $ | (21,022 | ) |
| Total | | $ | (21,022 | ) | | $ | (21,022 | ) |
| | | | | | | | |
| Change in Unrealized Depreciation on Derivatives Recognized in Income | |
| | | Forward
Currency
Contracts | | | Total | |
| Foreign Exchange Contracts | | $ | (1,885 | ) | | $ | (1,885 | ) |
| Total | | $ | (1,885 | ) | | $ | (1,885 | ) |
GuideMark® World ex-US Fund
The Fund entered into forward exchange contracts primarily to manage and/or gain exposure to certain foreign currencies. The Fund was not invested in these instruments at March 31, 2017. The Fund was not invested in these instruments at March 31, 2016 and has no change in unrealized at the end of the period.
| | | | | | | | |
| The Effect of Derivative Instruments on the Statement of Operations for the Year Ended March 31, 2017 | |
|
| Amount of Realized gain on Derivatives Recognized in Income | |
| | | Forward
Currency
Contracts | | | Total | |
| Foreign Exchange Contracts | | $ | 13,851 | | | $ | 13,851 | |
| Total | | $ | 13,851 | | | $ | 13,851 | |
GuideMark® Core Fixed Income Fund
During the period, the Fund used fixed income derivatives including U.S. Treasury futures and credit default swaps on investment grade fixed income indices (CDX), for both hedging and investment purposes, primarily duration management, risk management, and the pursuit of relative value opportunities. Futures contracts used in the Fund during the period included those based on short, medium, and long-term U.S. Treasury debt.
The Fund used futures contracts during the period primarily to manage interest rate risk. The Fund used investment grade CDX to efficiently manage investment grade credit exposure.
161
GuideMark® Funds & GuidePath® Funds
NOTES TO FINANCIAL STATEMENTS (Continued)
March 31, 2017
Statement of Assets and Liabilities – Values of Derivative Instruments as of March 31, 2017
| | | | | | | | | | | | |
| | | Asset Derivatives
| | | Liability Derivatives
| |
| | | Statement of Assets and
Liabilities Location | | Value | | | Statement of Assets and
Liabilities Location | | Value | |
| Credit Contracts – Swaps | | Appreciation on swap agreements | | $ | 14,179 | | | Depreciation on swap agreements | | $ | — | |
| | | | |
| Interest Rate Contracts – Swaps | | Appreciation on swap agreements | | | 221,262 | | | Depreciation on swap agreements | | | — | |
| | | | |
| Interest Rate Contracts – Futures* | | Unrealized appreciation on futures contracts | | | 32,909 | | | Unrealized depreciation on futures contracts | | | 12,572 | |
| Total | | | | $ | 268,350 | | | | | $ | 12,572 | |
| | * | | Includes cumulative appreciation/depreciation as reported on the Schedule of Open Futures Contracts. |
| | | | | | | | | | | | | | | | | | | | |
| The Effect of Derivative Instruments on the Statement of Operations for the Year Ended March 31, 2017 | |
|
| Amount of Realized Gain or (Loss) on Derivatives Recognized in Income | |
| | | Futures
Contracts | | | Swaps | | | Purchased
Options* | | | Written
Options | | | Total | |
| Credit Contracts | | $ | — | | | $ | (95,671 | ) | | $ | — | | | $ | — | | | $ | (95,671 | ) |
| Foreign Exchange Contracts | | | — | | | | — | | | | (317 | ) | | | (13,945 | ) | | | (14,262 | ) |
| Interest Rate Contracts | | | (27,497 | ) | | | 60,019 | | | | — | | | | — | | | | 32,522 | |
| Total | | $ | (27,497 | ) | | $ | (35,652 | ) | | $ | (317 | ) | | $ | (13,945 | ) | | $ | (77,411 | ) |
| | * | | Included in net realized gain (loss) on investments as reported in the Statement of Operations. |
| | | | | | | | | | | | |
| Change in Unrealized Appreciation or (Depreciation) on Derivatives Recognized in Income | |
| | | Futures
Contracts | | | Swaps | | | Total | |
| Credit Contracts | | $ | — | | | $ | 14,179 | | | $ | 14,179 | |
| Interest Rate Contracts | | | 8,080 | | | | 226,488 | | | | 234,568 | |
| Total | | $ | 8,080 | | | $ | 240,667 | | | $ | 248,747 | |
GuideMark® Opportunistic Fixed Income Fund
The Fund invested in derivatives in order to manage risk or gain exposure to various other investments or markets. Derivatives may contain various risks, including the potential inability of the counterparty to fulfill their obligations under the terms of the contract, the potential for an illiquid secondary market, and the potential for market movements which may expose the Fund to gains or losses.
The Fund seeks to maximize total investment returns through exposure to investments in fixed-income securities, equity securities, and currency instruments. The Fund expects that its exposure to these asset classes will often be obtained substantially through the use of swap agreements. The Fund entered into swap agreements to manage and/or gain exposures to credit risk. The Fund entered into forward exchange contracts primarily to manage and/or gain exposure to certain foreign currencies.
The Fund used currency forwards during the period for the purpose of hedging exposures within the Fund to non-dollar-denominated assets. In general, the use of currency derivative contracts for hedging may reduce the overall risk level of the Fund, albeit at a cost that may lower overall performance. In general, the use of currency derivatives for hedging purposes will not lead to leverage within the Fund.
Statement of Assets and Liabilities – Values of Derivative Instruments as of March 31, 2017
| | | | | | | | | | | | |
| | | Asset Derivatives
| | | Liability Derivatives
| |
| | | Statement of Assets and
Liabilities Location | | Value | | | Statement of Assets and
Liabilities Location | | Value | |
| Interest Rate Contracts – Swaps | | Appreciation on swap agreements | | $ | 52,500 | | | Depreciation on swap agreements | | $ | 1,203,905 | |
| | | | |
| Foreign Exchange Contracts – Forward Currency Contracts | | Appreciation of forward currency contracts | | | 1,323,677 | | | Depreciation of forward currency contracts | | | 362,066 | |
| Total | | | | $ | 1,376,177 | | | | | $ | 1,565,971 | |
162
GuideMark® Funds & GuidePath® Funds
NOTES TO FINANCIAL STATEMENTS (Continued)
March 31, 2017
| | | | | | | | | | | | |
| The Effect of Derivative Instruments on the Statement of Operations for the Year Ended March 31, 2017 | |
|
| Amount of Realized Gain or (Loss) on Derivatives Recognized in Income | |
| | | Forward
Currency
Contracts | | | Swaps | | | Total | |
| Foreign Exchange Contracts | | $ | (1,979,287 | ) | | $ | — | | | $ | (1,979,287 | ) |
| Interest Rate Contracts | | | — | | | | (582,164 | ) | | | (582,164 | ) |
| Total | | $ | (1,979,287 | ) | | $ | (582,164 | ) | | $ | (2,561,451 | ) |
|
| Change in Unrealized Appreciation (Depreciation) on Derivatives Recognized in Income | |
| | | Forward
Currency
Contracts | | | Swaps | | | Total | |
| Foreign Exchange Contracts | | $ | 2,993,489 | | | $ | — | | | $ | 2,993,489 | |
| Interest Rate Contracts | | | — | | | | 1,401,951 | | | | 1,401,951 | |
| Total | | $ | 2,993,489 | | | $ | 1,401,951 | | | $ | 4,395,440 | |
GuidePath® Managed Futures Strategy Fund
The Fund uses a set of proprietary quantitative models to identify price trends in equity, fixed income, currency and commodity instruments, and may have both short and long exposures within an asset class based on an analysis of asset price trends. Under normal market conditions, the Fund will make extensive use of derivative instruments, in particular futures contracts, to capture the exposures suggested by its absolute return strategy while also adding value through volatility management. These market exposures, which are expected to change over time, may include exposures to global equity and fixed income securities, securities indices, currencies, commodities and other instruments. During the year ended March 31, 2017, the Fund used long and short contracts on U.S. and foreign government bonds, U.S. and foreign equity market indices, foreign currencies, commodities (through investments in the subsidiary) and short-term interest rates to capture the exposures suggested by the quantitative investment models.
Statement of Assets and Liabilities – Values of Derivative Instruments as of March 31, 2017
| | | | | | | | | | | | |
| | | Asset Derivatives
| | | Liability Derivatives
| |
| | | Statement of Assets and
Liabilities Location | | Value | | | Statement of Assets and
Liabilities Location | | Value | |
| Commodity Contracts – Futures* | | Unrealized appreciation on futures contracts | | $ | 393,627 | | | Unrealized depreciation on futures contracts | | $ | 544,886 | |
| | | | |
| Equity Contracts – Futures* | | Unrealized appreciation on futures contracts | | | 1,029,261 | | | Unrealized depreciation on futures contracts | | | 286,973 | |
| | | | |
| Foreign Exchange Contracts – Futures* | | Unrealized appreciation on futures contracts | | | 45,339 | | | Unrealized depreciation on futures contracts | | | 372,954 | |
| | | | |
| Interest Rate Contracts – Futures* | | Unrealized appreciation on futures contracts | | | 170,422 | | | Unrealized depreciation on futures contracts | | | 491,188 | |
| Total | | | | $ | 1,638,649 | | | | | $ | 1,696,001 | |
| | * | | Includes cumulative appreciation/depreciation as reported on the Schedule of Open Futures Contracts. |
| | | | | | | | | | | | |
| The Effect of Derivative Instruments on the Statement of Operations for the Year Ended March 31, 2017 | |
| | |
Amount of Realized Gain (Loss) on Derivatives
Recognized in Income | | | | | Change in Unrealized Appreciation (Depreciation) on Derivatives
Recognized in Income | |
| | | Futures Contracts | | | | | | | Futures Contracts | |
| Commodity Contracts | | $ | (8,248,030 | ) | | | | Commodity Contracts | | $ | 1,038,759 | |
| Equity Contracts | | | 449,364 | | | | | Equity Contracts | | | (886,098 | ) |
| Foreign Exchange Contracts | | | (1,826,316 | ) | | | | Foreign Exchange Contracts | | | (1,454,408 | ) |
| Interest Rate Contracts | | | 415,938 | | | | | Interest Rate Contracts | | | (1,116,201 | ) |
| Total | | $ | (9,209,044 | ) | | | | Total | | $ | (2,417,948 | ) |
The average monthly value outstanding of written options during the year ended March 31, 2017 were as follows:
| | | | | | | | | | | | | | | | |
| | | GuideMark®
Emerging
Markets Fund | | | GuideMark®
Core Fixed
Income Fund^ | | | GuideMark®
Opportunistic Fixed
Income Fund | | | GuidePath®
Managed Futures
Strategy Fund | |
| Written Options | | $ | — | | | $ | (3,244 | ) | | $ | — | | | $ | — | |
163
GuideMark® Funds & GuidePath® Funds
NOTES TO FINANCIAL STATEMENTS (Continued)
March 31, 2017
The average monthly notional amount outstanding of futures, forwards and swaps during the year ended March 31, 2017 were as follows:
| | | | | | | | | | | | | | | | |
| Long Positions | | GuideMark®
Emerging
Markets Fund | | | GuideMark®
Core Fixed
Income Fund | | | GuideMark®
Opportunistic Fixed
Income Fund | | | GuidePath®
Managed Futures
Strategy Fund | |
| Futures | | $ | — | | | $ | 12,906,506 | | | $ | — | | | $ | 739,061,719 | |
| Forwards* | | $ | 105,435 | | | $ | — | | | $ | 44,278,260 | | | $ | — | |
| Swaps | | $ | — | | | $ | 7,932,692 | | | $ | 14,609,231 | | | $ | — | |
| | | | |
| Short Positions | | GuideMark®
Emerging
Markets Fund | | | GuideMark®
Core Fixed
Income Fund | | | GuideMark®
Opportunistic Fixed
Income Fund | | | GuidePath®
Managed Futures
Strategy Fund | |
| Futures | | $ | — | | | $ | (9,794,448 | ) | | $ | — | | | $ | (141,908,278 | ) |
| Forwards* | | $ | (21,699 | ) | | $ | — | | | $ | (6,269,459 | ) | | $ | — | |
| | | | |
| Cross Currency | | GuideMark®
Emerging
Markets Fund | | | GuideMark®
Core Fixed
Income Fund | | | GuideMark®
Opportunistic
Fixed Income Fund | | | GuidePath®
Managed Futures
Strategy Fund | |
| Forwards* | | $ | — | | | $ | — | | | $ | 14,005,318 | | | $ | — | |
| | ^ | | The GuideMark® Core Fixed Income Fund had purchased options during the year ended March 31, 2017, however due to the timing of these transactions the average monthly value for the Fund was $0. For more information about the purchased option activity of this Fund, see the Statement of Operations for this Fund. |
| | * | | The GuideMark® World ex-US Fund had forward transactions during the year ended March 31, 2017, however due to the timing of these transactions the average monthly notional amount for the Fund was $0. For more information about the forward activity of this Fund, see the Statement of Operations for this Fund. |
Derivative Risks
The risks of using the various types of derivatives in which the Funds may engage include: the risk that movements in the value of the derivative may not fully offset or complement instruments currently held in the Funds in the manner intended by the Advisor or sub-advisor; the risk that the counterparty to a derivative contract may fail to comply with its obligations to the Funds; the risk that there may not be a liquid secondary market for the derivative at a time when the Funds would look to disengage the position; the risk that additional capital from the Funds may be called upon to fulfill the conditions of the derivative contract; the risk that the use of derivatives in the Funds may induce leverage in the Funds, and the risk that the cost of the derivative contracts may reduce the overall returns experienced by the Funds. See note 9 for options written.
Offsetting Assets and Liabilities
GuideMark® Emerging Markets Fund
The Fund is subject to various Master Netting Arrangements, which govern the terms of certain transactions with select counterparties. The Master Netting Arrangements allow the Fund to close out and net its total exposure to a counterparty in the event of a default with respect to all the transactions governed under a single agreement with a counterparty. The Master Netting Arrangements also specify collateral posting arrangements at pre-arranged exposure levels. Under the Master Netting Arrangements, collateral is routinely transferred if the total net exposure to certain transactions (net of existing collateral already in place) governed under the relevant Master Netting Arrangement with a counterparty in a given account exceeds a specified threshold depending on the counterparty and the type of Master Netting Arrangement.
The table below, as of March 31, 2017, discloses both gross information and net information about instruments and transactions eligible for offset in the Statements of Assets and Liabilities’ and instruments and transactions that are subject to an agreement similar to a master netting agreement as well as amounts related to collateral held at clearing brokers and counterparties. For financial reporting purposes, the Fund does not offset derivative assets and liabilities, and any related collateral received or pledged, on the Statements of Assets and Liabilities, except in the case of futures contracts.
| | | | | | | | | | | | | | | | | | | | | | | | |
| Liabilities | | | | | | | | | | | Gross Amounts not offset in
the Statement of
Assets and Liabilities
| | | | |
| | | Gross Amounts
of Recognized
Liabilities
| | | Gross Amounts
Offset in the
Statement of
Assets and Liabilities
| | | Net Amounts
Presented in the
Statement of
Assets and Liabilities
| | | Financial
Instruments
| | | Collateral
Pledged
| | | Net
Amount
| |
Description / Counterparty | | | | | | | | | | | | | | | | | | | | | | | | |
Forward Currency Contracts | | | | | | | | | | | | | | | | | | | | | | | | |
Bank of America | | $ | 1,885 | | | $ | — | | | $ | 1,885 | | | $ | — | | | $ | — | | | $ | 1,885 | |
| | |
|
|
| |
|
|
| |
|
|
| |
|
|
| |
|
|
| |
|
|
|
164
GuideMark® Funds & GuidePath® Funds
NOTES TO FINANCIAL STATEMENTS (Continued)
March 31, 2017
GuideMark® Core Fixed Income Fund
The Fund is subject to various Master Netting Arrangements, which govern the terms of certain transactions with select counterparties. The Master Netting Arrangements allow the Fund to close out and net its total exposure to a counterparty in the event of a default with respect to all the transactions governed under a single agreement with a counterparty. The Master Netting Arrangements also specify collateral posting arrangements at pre-arranged exposure levels. Under the Master Netting Arrangements, collateral is routinely transferred if the total net exposure to certain transactions (net of existing collateral already in place) governed under the relevant Master Netting Arrangement with a counterparty in a given account exceeds a specified threshold depending on the counterparty and the type of Master Netting Arrangement.
The table below, as of March 31, 2017, discloses both gross information and net information about instruments and transactions eligible for offset in the Statements of Assets and Liabilities, and instruments and transactions that are subject to an agreement similar to a master netting agreement as well as amounts related to collateral held at clearing brokers and counterparties. For financial reporting purposes, the Fund does not offset derivative assets and liabilities, and any related collateral received or pledged, on the Statements of Assets and Liabilities, except in the case of futures contracts.
| | | | | | | | | | | | | | | | | | | | | | | | |
| Assets | | | | | | | | | | | Gross Amounts not offset
in the Statement of
Assets and Liabilities
| | | | |
| | | Gross Amounts
of Recognized
Assets
| | | Gross Amounts
Offset in the
Statement of
Assets and Liabilities
| | | Net Amounts
Presented in the
Statement of
Assets and Liabilities
| | | Financial
Instruments
| | | Collateral
Received
| | | Net
Amount
| |
Description / Counterparty | | | | | | | | | | | | | | | | | | | | | | | | |
Futures* | | | | | | | | | | | | | | | | | | | | | | | | |
Credit Suisse | | $ | 32,909 | | | $ | (12,572 | ) | | $ | 20,337 | | | $ | — | | | $ | — | | | $ | 20,337 | |
Swaps | | | | | | | | | | | | | | | | | | | | | | | | |
Morgan Stanley | | | 235,441 | | | | — | | | | 235,441 | | | | — | | | | — | | | | 235,441 | |
| | |
|
|
| |
|
|
| |
|
|
| |
|
|
| |
|
|
| |
|
|
|
| | | $ | 268,350 | | | $ | (12,572 | ) | | $ | 255,778 | | | $ | — | | | $ | — | | | $ | 255,778 | |
| | |
|
|
| |
|
|
| |
|
|
| |
|
|
| |
|
|
| |
|
|
|
| | | | | | | | | | | | | | | | | | | | | | | | |
| Liabilities | | | | | | | | | | | Gross Amounts not offset
in the Statement of
Assets and Liabilities
| | | | |
| | | Gross Amounts
of Recognized
Liabilities
| | | Gross Amounts
Offset in the
Statement of
Assets and Liabilities
| | | Net Amounts
Presented in the
Statement of
Assets and Liabilities
| | | Financial
Instruments
| | | Collateral
Pledged
| | | Net
Amount
| |
Description / Counterparty | | | | | | | | | | | | | | | | | | | | | | | | |
Futures* | | | | | | | | | | | | | | | | | | | | | | | | |
Credit Suisse | | $ | 12,572 | | | $ | (12,572 | ) | | $ | — | | | $ | — | | | $ | — | | | $ | — | |
Swaps | | | | | | | | | | | | | | | | | | | | | | | | |
Morgan Stanley | | | — | | | | — | | | | — | | | | — | | | | — | | | | — | |
| | |
|
|
| |
|
|
| |
|
|
| |
|
|
| |
|
|
| |
|
|
|
| | | $ | 12,572 | | | $ | (12,572 | ) | | $ | — | | | $ | — | | | $ | — | | | $ | — | |
| | |
|
|
| |
|
|
| |
|
|
| |
|
|
| |
|
|
| |
|
|
|
| | * | | Includes cumulative appreciation/depreciation on futures contracts as reported in the Schedule of Open Futures Contracts. Variation margin is presented on the Statement of Assets and Liabilities. |
GuideMark® Opportunistic Fixed Income Fund
The Fund attempts to reduce its exposure to counterparty credit risk on over-the counter (“OTC”) derivatives, whenever possible, by entering into International Swaps and Derivatives Association, Inc. (“ISDA”) agreements with certain counterparties. These agreements typically contain various provisions, including but not limited to, collateral requirements and master netting provisions in the event of a default or other termination event. Collateral is posted by the Fund or the counterparty to the extent of the net mark-to-market exposure to the other party of all open contracts under the agreement, subject to minimum transfer requirements. The Fund is required to deposit financial collateral in the form of cash and/or securities at the clearing brokers and counterparties to continually meet the original and maintenance requirement established by the clearing brokers and counterparties. Master netting provisions allow the Fund and the counterparty, in the event of a default or other termination event, to offset amounts owed by each related to derivative contracts, including any posted collateral, to one net amount payable by either the Fund or the counterparty. The Fund’s ISDA agreements typically contain provisions that allow a counterparty to terminate open contracts early if the net asset value of a Fund declines beyond a certain threshold. For financial reporting purposes, the Fund does not offset derivative assets and liabilities, and any related collateral received or pledged, on the Statements of Assets and Liabilities, except in the case of futures contracts.
165
GuideMark® Funds & GuidePath® Funds
NOTES TO FINANCIAL STATEMENTS (Continued)
March 31, 2017
The table below, as of March 31, 2017, discloses both gross information and net information about instruments and transactions eligible for offset in the Statements of Assets and Liabilities, and instruments and transactions that are subject to an agreement similar to a master netting agreement as well as amounts related to collateral held at clearing brokers and counterparties.
| | | | | | | | | | | | | | | | | | | | | | | | |
| Assets | | | | | | | | | | | Gross Amounts not offset
in the Statement of
Assets and Liabilities
| | | | |
| | | Gross Amounts
of Recognized
Assets
| | | Gross Amounts
Offset in the
Statement of
Assets and Liabilities
| | | Net Amounts
Presented in the
Statement of
Assets and Liabilities
| | | Financial
Instruments
| | | Collateral
Received
| | | Net
Amount
| |
Description / Counterparty | | | | | | | | | | | | | | | | | | | | | | | | |
Forward Currency Contracts | | | | | | | | | | | | | | | | | | | | | | | | |
Bank of America | | $ | 9,309 | | | $ | — | | | $ | 9,309 | | | $ | (5,115 | ) | | $ | — | | | $ | 4,194 | |
Barclays | | | 30,966 | | | | — | | | | 30,966 | | | | (30,966 | ) | | | — | | | | — | |
Citibank | | | 311,315 | | | | — | | | | 311,315 | | | | (51,446 | ) | | | — | | | | 259,869 | |
Deutsche Bank | | | 666,354 | | | | — | | | | 666,354 | | | | (15,380 | ) | | | — | | | | 650,974 | |
Goldman Sachs | | | 6,293 | | | | — | | | | 6,293 | | | | (6,293 | ) | | | — | | | | — | |
HSBC | | | 43,658 | | | | — | | | | 43,658 | | | | (43,658 | ) | | | — | | | | — | |
JP Morgan Chase | | | 255,782 | | | | — | | | | 255,782 | | | | (65,974 | ) | | | — | | | | 189,808 | |
Morgan Stanley | | | — | | | | — | | | | — | | | | — | | | | — | | | | — | |
UBS | | | — | | | | — | | | | — | | | | — | | | | — | | | | — | |
Swaps | | | | | | | | | | | | | | | | | | | | | | | | |
Citibank | | | 52,500 | | | | — | | | | 52,500 | | | | — | | | | — | | | | 52,500 | |
JP Morgan Chase | | | — | | | | — | | | | — | | | | — | | | | — | | | | — | |
| | |
|
|
| |
|
|
| |
|
|
| |
|
|
| |
|
|
| |
|
|
|
| | | $ | 1,376,177 | | | $ | — | | | $ | 1,376,177 | | | $ | (218,832 | ) | | $ | — | | | $ | 1,157,345 | |
| | |
|
|
| |
|
|
| |
|
|
| |
|
|
| |
|
|
| |
|
|
|
| | | | | | | | | | | | | | | | | | | | | | | | |
| Liabilities | | | | | | | | | | | Gross Amounts not offset
in the Statement of
Assets and Liabilities
| | | | |
| | | Gross Amounts
of Recognized
Liabilities
| | | Gross Amounts
Offset in the
Statement of
Assets and Liabilities
| | | Net Amounts
Presented in the
Statement of
Assets and Liabilities
| | | Financial
Instruments
| | | Collateral
Pledged
| | | Net
Amount
| |
Description / Counterparty | | | | | | | | | | | | | | | | | | | | | | | | |
Forward Currency Contracts | | | | | | | | | | | | | | | | | | | | | | | | |
Bank of America | | $ | 5,115 | | | $ | — | | | $ | 5,115 | | | $ | (5,115 | ) | | $ | — | | | $ | — | |
Barclays | | | 48,954 | | | | — | | | | 48,954 | | | | (30,966 | ) | | | — | | | | 17,988 | |
Citibank | | | 51,446 | | | | — | | | | 51,446 | | | | (51,446 | ) | | | — | | | | — | |
Deutsche Bank | | | 15,380 | | | | — | | | | 15,380 | | | | (15,380 | ) | | | — | | | | — | |
Goldman Sachs | | | 22,143 | | | | — | | | | 22,143 | | | | (6,293 | ) | | | — | | | | 15,850 | |
HSBC | | | 152,136 | | | | — | | | | 152,136 | | | | (43,658 | ) | | | — | | | | 108,478 | |
JP Morgan Chase | | | 65,974 | | | | — | | | | 65,974 | | | | (65,974 | ) | | | — | | | | — | |
Morgan Stanley | | | 147 | | | | — | | | | 147 | | | | — | | | | — | | | | 147 | |
UBS | | | 771 | | | | — | | | | 771 | | | | — | | | | — | | | | 771 | |
Swaps | | | | | | | | | | | | | | | | | | | | | | | | |
Citibank | | | — | | | | — | | | | — | | | | — | | | | — | | | | — | |
JP Morgan Chase | | | 1,203,905 | | | | — | | | | 1,203,905 | | | | — | | | | (1,203,905 | ) | | | — | |
| | |
|
|
| |
|
|
| |
|
|
| |
|
|
| |
|
|
| |
|
|
|
| | | $ | 1,565,971 | | | $ | — | | | $ | 1,565,971 | | | $ | (218,832 | ) | | $ | (1,203,905 | ) | | $ | 143,234 | |
| | |
|
|
| |
|
|
| |
|
|
| |
|
|
| |
|
|
| |
|
|
|
GuidePath® Managed Futures Strategy Fund
The Fund is subject to various Master Netting Arrangements, which govern the terms of certain transactions with select counterparties. The Master Netting Arrangements allow the Fund to close out and net its total exposure to a counterparty in the event of a default with respect to all the transactions governed under a single agreement with a counterparty. The Master Netting Arrangements also specify collateral posting arrangements at pre-arranged exposure levels. Under the Master Netting Arrangements, collateral is routinely transferred if the total net exposure to certain transactions (net of existing collateral already in place) governed under the relevant Master Netting Arrangement with a counterparty in a given account exceeds a specified threshold depending on the counterparty and the type of Master Netting Arrangement.
166
GuideMark® Funds & GuidePath® Funds
NOTES TO FINANCIAL STATEMENTS (Continued)
March 31, 2017
The table below, as of March 31, 2017, discloses both gross information and net information about instruments and transactions eligible for offset in the Statements of Assets and Liabilities, and instruments and transactions that are subject to an agreement similar to a master netting agreement as well as amounts related to collateral held at clearing brokers and counterparties. For financial reporting purposes, the Fund does not offset derivative assets and liabilities, and any related collateral received or pledged, on the Statements of Assets and Liabilities, except in the case of futures contracts.
| | | | | | | | | | | | | | | | | | | | | | | | |
| Assets | | | | | | | | | | | Gross Amounts not offset
in the Statement of
Assets and Liabilities
| | | | |
| | | Gross Amounts
of Recognized
Assets
| | | Gross Amounts
Offset in the
Statement of
Assets and Liabilities
| | | Net Amounts
Presented in the
Statement of
Assets and Liabilities
| | | Financial
Instruments
| | | Collateral
Received
| | | Net
Amount
| |
Description / Counterparty | | | | | | | | | | | | | | | | | | | | | | | | |
Futures* | | | | | | | | | | | | | | | | | | | | | | | | |
Goldman Sachs | | $ | 1,638,636 | | | $ | (1,638,636 | ) | | $ | — | | | $ | — | | | $ | — | | | $ | �� — | |
| | |
|
|
| |
|
|
| |
|
|
| |
|
|
| |
|
|
| |
|
|
|
| | | $ | 1,638,636 | | | $ | (1,638,636 | ) | | $ | — | | | $ | — | | | $ | — | | | $ | — | |
| | |
|
|
| |
|
|
| |
|
|
| |
|
|
| |
|
|
| |
|
|
|
| | | | | | | | | | | | | | | | | | | | | | | | |
| Liabilities | | | | | | | | | | | Gross Amounts not offset
in the Statement of
Assets and Liabilities
| | | | |
| | | Gross Amounts
of Recognized
Liabilities
| | | Gross Amounts
Offset in the
Statement of
Assets and Liabilities
| | | Net Amounts
Presented in the
Statement of
Assets and Liabilities
| | | Financial
Instruments
| | | Collateral
Pledged
| | | Net
Amount
| |
Description / Counterparty | | | | | | | | | | | | | | | | | | | | | | | | |
Futures* | | | | | | | | | | | | | | | | | | | | | | | | |
Goldman Sachs | | $ | 1,695,988 | | | $ | (1,638,636 | ) | | $ | 57,352 | | | $ | — | | | $ | (57,352 | ) | | $ | — | |
| | |
|
|
| |
|
|
| |
|
|
| |
|
|
| |
|
|
| |
|
|
|
| | | $ | 1,695,988 | | | $ | (1,638,636 | ) | | $ | 57,352 | | | $ | — | | | $ | (57,352 | ) | | $ | — | |
| | |
|
|
| |
|
|
| |
|
|
| |
|
|
| |
|
|
| |
|
|
|
| | * | | Includes cumulative appreciation/depreciation on futures contracts as reported in the Consolidated Schedule of Open Futures Contracts. Variation Margin is presented on the Consolidated Statement of Assets and Liabilities. |
In some instances, the collateral amounts disclosed in the tables were adjusted due to the requirement to limit the collateral amounts to avoid the effect of overcollateralization. Actual collateral received/pledged may be more than the amounts disclosed herein.
Due to the absence of a master netting agreement relating to the Funds’ participation in securities lending, no additional disclosures have been made on behalf of the Funds. Please reference Note 7 for collateral related to securities on loan.
| | (m) | | Securities Purchased or Sold on a Forward-Commitment Basis |
The Funds may enter into when-issued or other purchase or sale transactions that specify forward delivery of a financial security. In connection with this ability, the Funds may enter into mortgage “dollar rolls” in which a Fund sells securities in the current month for delivery and simultaneously contracts with the same counterparty to repurchase similar (same type, coupon and maturity), but not identical securities on a specified future date. The party that is obligated to buy a security in the future will retain the use of their funds, and will benefit from any interest that is earned on those funds from the day that they enter into the forward contract until the day that they take delivery and pay for the security.
| | (n) | | Foreign Currency Translation |
The accounting records of the Funds are maintained in U.S. dollars. Investment securities and all other assets and liabilities of the Funds denominated in a foreign currency are translated into U.S. dollars at current exchange rates. Purchases and sales of securities, income receipts, and expense payments are translated into U.S. dollars at the exchange rate in effect on the dates of the respective transactions. The Funds do not isolate the portion of the fluctuations on investments resulting from changes in foreign currency exchange rates from the fluctuations in market prices of investments held. Such
fluctuations are included with the net realized and unrealized gain or loss from investments.
| | (o) | | Restricted and Illiquid Securities |
Each Fund may invest up to 15% of its net assets in securities that are illiquid, which includes securities with legal or contractual restrictions on their disposition, and securities for which there are no readily available market quotations. The Advisor, with the assistance of the sub-advisors and/or pricing services, will determine the value of such securities in good faith pursuant to procedures adopted by the applicable Board of Trustees. Illiquid securities present the risks that a Fund may have difficulty valuing these holdings and/or may be unable to sell these holdings at the time or price desired. There are no restrictions on each Fund’s ability to invest in restricted securities (that is, securities that are not registered pursuant to the Securities Act of 1933), except to the extent such securities may be considered illiquid. Securities issued pursuant to Rule 144A of the Securities Act of 1933 will be considered liquid if determined to be so under procedures adopted by the Board of Trustees.
| | (p) | | Auction Rate Securities |
The Core Fixed Income Fund, Tax-Exempt Fixed Income Fund, and each of the GPS Funds II portfolios may invest in auction rate municipal securities. Auction rate securities usually permit
167
GuideMark® Funds & GuidePath® Funds
NOTES TO FINANCIAL STATEMENTS (Continued)
March 31, 2017
the holder to sell the securities in an auction at par value at specified intervals. The dividend is reset by “Dutch” auction in which bids are made by broker-dealers and other institutions for a certain amount of securities at a specified minimum yield. The dividend rate set by the auction is the lowest interest or dividend rate that covers all securities offered for sale. While this process is designed to permit auction rate securities to be traded at par value, there is a risk that an auction will fail due to insufficient demand for the securities.
Although not currently part of any Fund’s principal investment strategy, each Fund has the ability to make equity short sales. Short sales are transactions where a Fund sells securities it does not own in anticipation of a decline in the value of the securities.
Effective April 1, 2016, for the services performed as Trustees of the consolidated Board of Trustees of GPS Funds I, GPS Funds II, and Savos Investments Trust, which currently consists of one fund, the Independent Trustees receive a retainer fee of $80,000 per year, $4,500 for each quarterly meeting and annual agreement renewal review meeting, whether held in-person or telephonically, $4,500 for each special meeting attended in person and $2,000 for each special meeting attended telephonically, as well as reimbursement for expenses incurred in connection with attendance at such meetings. The fees are allocated proportionally to each Fund within the Trusts based on total assets under management.
The “interested persons” who serve as Trustees of the Trusts receive no compensation from the Trusts for their services as Trustees. The Funds reimburse the Advisor an allocated amount for the compensation and related expenses of certain officers of the Trusts who provide compliance services to the Funds. The aggregate amount of all such reimbursements is determined by the Trustees. No other compensation or retirement benefits are received by any Trustee or officer from the Funds.
The Funds are subject to claims and suits that arise from time to time in the ordinary course of business (for example, in The Tribune Company Bankruptcy, certain creditors have filed actions against all shareholders of The Tribune Company, which included the GuideMark® Emerging Markets Fund, who tendered shares when the Tribune Company went private in 2007 in a leveraged buy-out transaction, seeking the return of proceeds received by the shareholders). Although management currently believes that resolving claims against us, individually or in aggregate, will not have a material adverse impact on financial position, results of operations, or cash flows, these matters are subject to inherent uncertainties and management’s view of these matters may change in the future.
| | (t) | | Participatory Notes (“participation notes”) |
Each Fund may invest in participation notes. Participation notes are unsecured, bearer securities typically issued by financial institutions, the return of which is generally linked to the performance of the underlying listed shares of a company in an emerging market (for example, the shares in a company incorporated in India and listed on the Bombay Stock
Exchange). Participation notes are often used to gain exposure to securities of companies in the markets that restrict foreign ownership of local companies.
The terms of participation notes vary widely. Investors in participation notes do not have or receive any rights relating to the underlying shares, and the issuers of the notes may not be obligated to hold any shares in the underlying companies. Participation notes are not currently regulated by the governments of the countries upon which securities the notes are based. These instruments, issued by brokers with global registration, bear counterparty risk and may bear additional liquidity risk. These securities have been deemed to be liquid as of March 31, 2017.
Each Trust has an Investment Advisory Agreement (the “Agreement”) with AssetMark, Inc. (the “Advisor” or “AssetMark”), with whom certain officers and trustees of the Trust are affiliated, to furnish investment advisory services to the Funds. Under the terms of the Agreement, the Funds compensate the Advisor for its management services at the following contractual rates, based on each Fund’s average daily net assets:
| | | | |
Large Cap Core Fund | | | 0.45% | |
Emerging Markets Fund | | | 0.59% | |
Small/Mid Cap Core Fund | | | 0.57% | |
World ex-US Fund | | | 0.50% | |
Opportunistic Equity Fund | | | 0.80% | |
Core Fixed Income Fund | | | 0.50% | |
Tax-Exempt Fixed Income Fund | | | 0.50% | |
Opportunistic Fixed Income Fund | | | 0.70% | |
Growth Allocation Fund | | | 0.25% | |
Conservative Allocation Fund | | | 0.25% | |
Tactical Allocation Fund | | | 0.35% | |
Absolute Return Allocation Fund | | | 0.35% | |
Multi-Asset Income Allocation Fund | | | 0.35% | |
Flexible Income Allocation Fund | | | 0.25% | |
Managed Futures Strategy Fund | | | 1.05% | |
AssetMark also provides certain administrative services to the Service Shares of the Funds, pursuant to Administrative Services Agreements between the Funds and AssetMark, for which AssetMark receives a fee of 0.25% of the average daily net assets of the Service Shares of the Funds. The administrative services may include development and maintenance of a web-based software platform for both investment advisers and shareholders; creation of a customized full-color client quarterly performance review for each individual client; facilitating the initiation and setup of new account and related asset transfers; reviewing and following up on custodial paperwork; attending to shareholder correspondence, requests and inquiries, and other communications with shareholders and their representatives; assisting with the processing of purchases and redemptions of shares; and monitoring and overseeing non-advisory relationships with entities providing services to the Service Shares; including the transfer agent and custodian.
In addition, GPS Funds I and the Advisor have also entered into a Fee Waiver Agreement designed to provide Fund shareholders with the economic benefits of economies of scale that may be realized as Fund assets increase. Under the Fee Waiver Agreement, the Advisor
168
GuideMark® Funds & GuidePath® Funds
NOTES TO FINANCIAL STATEMENTS (Continued)
March 31, 2017
has contractually agreed to waive, through July 31, 2017, 0.025% of each Fund’s annual advisory fee on assets in GPS Funds I collectively in excess of $6 billion, and an additional 0.025% of each Fund’s annual advisory fee on assets in GPS Funds I collectively in excess of $12 billion.
Each Fund and the Advisor have also entered into an Expense Limitation Agreement under which the Advisor has agreed to waive, through July 31, 2017, its management fee and/or reimburse each Fund’s other expenses to the extent necessary to ensure that the Fund’s net annual operating expenses (excluding taxes, interest, trading costs, acquired fund expenses, expenses paid with securities lending expense offset credits and non-routine expenses) do not exceed the following rates, based on daily net assets of each class of each Fund:
| | | | | | | | |
| | | Service
Class
| | | Institutional
Class
| |
Large Cap Core Fund | | | 1.24% | | | | 0.64% | |
Emerging Markets Fund | | | 1.65% | | | | 1.05% | |
Small/Mid Cap Core Fund | | | 1.45% | | | | 0.85% | |
World ex-US Fund | | | 1.39% | | | | 0.79% | |
Opportunistic Equity Fund | | | 1.60% | | | | 1.00% | |
Core Fixed Income Fund | | | 1.29% | | | | 0.69% | |
Tax-Exempt Fixed Income Fund | | | 1.29% | | | | 0.69% | |
| | | | | | | | |
| | | Service
Class
| | | Institutional
Class
| |
Opportunistic Fixed Income Fund | | | 1.55% | | | | 0.95% | |
Growth Allocation Fund | | | 1.00% | | | | 0.40% | |
Conservative Allocation Fund | | | 1.00% | | | | 0.40% | |
Tactical Allocation Fund | | | 1.10% | | | | 0.50% | |
Absolute Return Allocation Fund | | | 1.10% | | | | 0.50% | |
Multi-Asset Income Allocation Fund | | | 1.10% | | | | 0.50% | |
Flexible Income Allocation Fund | | | 1.05% | | | | 0.45% | |
Managed Futures Strategy Fund | | | 1.90% | | | | 1.30% | |
Any such contractual waiver or reimbursement is subject to later adjustment to allow the Advisor to recoup amounts waived or reimbursed to the extent actual fees and expenses for a fiscal period are less than each Fund’s expense limitation cap at the time of the waiver, provided, however, that the Advisor shall only be entitled to recoup such amounts for a period of three years after the end of the fiscal year in which the fee or expense was waived or reimbursed. As of March 31, 2017, Large Cap Core Fund, Emerging Markets Fund, Small/Mid Cap Core Fund, Growth Allocation Fund, Conservative Allocation Fund, Tactical Allocation Fund, Multi-Asset Income Allocation Fund and Flexible Income Allocation Fund have recouped all potential recoverable waivers or reimbursed expenses.
The Advisor is currently waiving fees and, in some cases, reimbursing expenses in the Funds listed below in order to keep these Funds at their expense cap. Waived expenses subject to potential recovery are as follows:
| | | | | | | | | | | | |
| | | Year of
Expiration
03/31/2018
| | | Year of
Expiration
03/31/2019
| | | Year of
Expiration
03/31/2020
| |
World ex-US Fund | | $ | — | | | $ | 53,461 | | | $ | 36,238 | |
Opportunistic Equity Fund | | | — | | | | — | | | | 6 | |
Core Fixed Income Fund | | | — | | | | 56,910 | | | | 109,659 | |
Tax-Exempt Fixed Income Fund | | | 58,715 | | | | 82,292 | | | | 60,304 | |
Opportunistic Fixed Income Fund | | | 186,297 | | | | 242,737 | | | | 175,049 | |
Absolute Return Allocation Fund | | | — | | | | — | | | | 11,972 | |
Managed Futures Strategy Fund | | | — | | | | 78,883 | | | | 62,978 | |
Sub-advisory services are provided to certain of the Funds, pursuant to agreements between the Advisor and various sub-advisors. Under the terms of these sub-advisory agreements, the Advisor compensates each sub-advisor based on the portion of each Fund’s average daily net assets that is allocated to the sub-advisor.
In April, 2016 – Aquiline Capital Partners, LLC and Genstar Capital Management, LLC the parent companies of AssetMark agreed to enter into a transaction (the “Transaction”) whereby Huatai Securities Co., Ltd. would acquire AssetMark. The closing of the Transaction occurred on October 31, 2016.
Each Trust, on behalf of the Service Shares class of its Funds, has adopted a distribution plan pursuant to Rule 12b-1 under the 1940 Act (the “12b-1 Plan”), which provides for each Fund to pay distribution fees at an annual rate of 0.25% of the average daily net assets of the Funds. Payments under the 12b-1 Plan shall be used to compensate persons (including affiliates of the Trust) who provide support services in connection with the distribution of the Funds’ Service Shares class and servicing of the Funds’ Service Shares class shareholders. For example, these amounts are paid to financial intermediaries that perform back office shareholder servicing and recordkeeping services that facilitate the operation of the AssetMark Program through which the Funds are primarily distributed. The Advisor (and its affiliates) similarly receive portions of such
payments for their services provided to facilitate the operation of the program. These financial intermediaries and affiliates of the Trust also receive payments from the Trust outside of the 12b-1 Plan for shareholder services that are unrelated to distribution services. AssetMark BrokerageTM, LLC (“Distributor”), an affiliate of the Advisor, serves as the Funds principal underwriter and distributor. The Funds did not pay any commissions or other compensation, other than 12b-1 fees, to the Distributor during the Funds’ most recent year ended March 31, 2017.
| 6. | | Service and Custody Agreements |
The Funds have entered into Service Agreements with U.S. Bancorp Fund Services, LLC (“USBFS”) and a Custody Agreement with U.S. Bank, N.A. (the “Custodian”), an affiliate of USBFS. Under
169
GuideMark® Funds & GuidePath® Funds
NOTES TO FINANCIAL STATEMENTS (Continued)
March 31, 2017
these agreements, USBFS and U.S. Bank, N.A. provide certain transfer agency, administrative, accounting and custody services.
Additionally, the Opportunistic Fixed Income Fund has entered into a Custody Agreement with the Bank of New York Mellon for certain custody services.
The Funds, excluding Opportunistic Fixed Income Fund, have established a line of credit (“LoC”) with U.S. Bank, N.A. (“USB”) to be used for temporary or emergency purposes, primarily for financing redemption payments, using the securities in the Funds’ portfolios as collateral. Savos Investments Trust, which is also managed by AssetMark, is also party to the same LoC agreement. The LoC was effective August 1, 2016 and will mature, unless renewed, on July 31, 2017. Borrowing under the LoC is limited to the lesser of 20% of the gross market value of a Fund, 20% of the net market value of the unencumbered assets of a Fund, or $250,000,000 for all Funds. The interest rate paid by the Funds on outstanding borrowings is equal to the prime rate, which was 4% at March 31, 2017. The Funds have authorized USB to charge any of the custody accounts of the Funds for any missed payments by the GPS Funds. Interest expense incurred for the Funds is disclosed on the Statements of Operations.
During the period August 1, 2016 to March 31, 2017, the details of the borrowings were as follows:
| | | | | | | | | | | | |
Fund
| | Average
daily
borrowings
| | | Weighted
average
annualized
interest rate
| | | Maximum
borrowings
| |
Large Cap Core Fund | | $ | 65,189 | | | | 3.75 | % | | $ | 11,412,000 | |
Emerging Markets Fund | | $ | 64,802 | | | | 3.53 | % | | $ | 750,000 | |
Small/Mid Cap Core Fund | | $ | 741 | | | | 3.75 | % | | $ | 45,000 | |
World ex-US Fund | | $ | 27,202 | | | | 3.63 | % | | $ | 1,718,000 | |
Opportunistic Equity Fund | | $ | 7,687 | | | | 3.50 | % | | $ | 333,000 | |
Core Fixed Income Fund | | $ | 29,753 | | | | 3.92 | % | | $ | 4,802,000 | |
Tax-Exempt Fixed Income Fund | | $ | 12,152 | | | | 3.83 | % | | $ | 468,000 | |
Growth Allocation Fund | | $ | 94,580 | | | | 3.50 | % | | $ | 12,140,000 | |
Conservative Allocation Fund | | $ | 2,218 | | | | 3.50 | % | | $ | 402,000 | |
Tactical Allocation Fund | | $ | 21,922 | | | | 3.50 | % | | $ | 1,674,000 | |
Absolute Return Allocation Fund | | $ | 76,938 | | | | 3.67 | % | | $ | 2,696,000 | |
Multi-Asset Income Allocation Fund | | $ | 16,774 | | | | 3.50 | % | | $ | 2,277,000 | |
Flexible Income Allocation Fund | | $ | 77,794 | | | | 3.72 | % | | $ | 2,558,000 | |
Managed Futures Strategy Fund | | $ | 0 | | | | 0.00 | % | | $ | 0 | |
The Trusts, on behalf of certain of the Funds, entered into securities lending arrangements with U.S. Bank, N.A. Under the terms of the
agreement, the Custodian is authorized to loan securities on behalf of the Funds to approved brokers. In exchange, under normal market conditions, the Funds receive cash collateral in the amount of at least 102% of the value of securities loaned for domestic securities, and 105% of the value of securities loaned with respect to foreign securities. The cash collateral is invested in short term instruments as noted in the Schedule of Investments. Although risk is mitigated by the collateral, the Funds could experience a delay in recovering their securities and possible loss of income or value if the borrower fails to return the borrowed securities. In addition, the Funds bear the risk of loss associated with the investment of cash collateral received. After predetermined rebates to brokers, a percentage of the net securities lending revenue is credited to the Funds to be used as an offset against custody costs and other charges incurred by the Funds. The Custodian is paid a fee for administering a securities lending program for the Funds, equal to the remaining percentage of the net securities lending revenues generated under the agreement.
During the year ended March 31, 2017, the Funds (excluding the Tax-Exempt Fixed Income Fund, Opportunistic Fixed Income Fund and Managed Futures Strategy Fund) had loaned securities that were collateralized by cash. The cash collateral received was invested in securities as listed in each Fund’s Schedule of Investments. Income earned from these investments is allocated to each Fund based on each Fund’s portion of total cash collateral received. Securities lending income is disclosed in each Fund’s Statement of Operations as a securities lending credit.
Secured Borrowings
| | | | |
Securities Lending Transactions
| | | |
Overnight and Continuous
| | Investment Company*
| |
Large Cap Core Fund | | $ | 49,865,866 | |
Emerging Markets Fund | | | 838,995 | |
Small/Mid Cap Core Fund | | | 32,709,937 | |
World ex-US Fund | | | 2,977,876 | |
Opportunistic Equity Fund | | | 19,335,822 | |
Core Fixed Income Fund | | | 7,147,649 | |
Tax-Exempt Fixed Income Fund | | | — | |
Opportunistic Fixed Income Fund | | | — | |
Growth Allocation Fund | | | 91,758,279 | |
Conservative Allocation Fund | | | 32,173,173 | |
Tactical Allocation Fund | | | 24,291,888 | |
Absolute Return Allocation Fund | | | 30,145,575 | |
Multi-Asset Income Allocation Fund | | | 19,755,971 | |
Flexible Income Allocation Fund | | | 18,216,561 | |
Managed Futures Strategy Fund | | | — | |
| |
Amounts related to agreements not included in offsetting disclosure in footnote 3 (Offsetting Assets and Liabilities). | | $ | 329,217,592 | |
| | * | | Proceeds from securities lending (Investment Company collateral). |
170
GuideMark® Funds & GuidePath® Funds
NOTES TO FINANCIAL STATEMENTS (Continued)
March 31, 2017
| 8. | | Investment Transactions |
The aggregate purchases and sales of securities, excluding short-term investments, for the year ended March 31, 2017 are summarized below.
| | | | | | | | |
| | | Purchases
| | | Sales
| |
Large Cap Core Fund | | $ | 214,312,144 | | | $ | 275,093,482 | |
Emerging Markets Fund | | | 68,353,979 | | | | 94,143,658 | |
Small/Mid Cap Core Fund | | | 51,963,193 | | | | 43,716,667 | |
World ex-US Fund | | | 111,607,839 | | | | 128,573,008 | |
Opportunistic Equity Fund | | | 48,372,593 | | | | 63,032,642 | |
Core Fixed Income Fund* | | | 311,175,389 | | | | 377,720,203 | |
Tax-Exempt Fixed Income Fund | | | 5,506,467 | | | | 22,098,042 | |
Opportunistic Fixed Income Fund | | | 20,704,455 | | | | 39,551,115 | |
| | | | | | | | |
| | | Purchases
| | | Sales
| |
Growth Allocation Fund | | $ | 312,813,144 | | | $ | 202,393,345 | |
Conservative Allocation Fund | | | 95,835,043 | | | | 40,683,703 | |
Tactical Allocation Fund | | | 1,126,719,715 | | | | 1,242,687,290 | |
Absolute Return Allocation Fund | | | 54,792,426 | | | | 78,533,912 | |
Multi-Asset Income Allocation Fund | | | 74,210,437 | | | | 66,982,091 | |
Flexible Income Allocation Fund | | | 120,590,139 | | | | 136,638,151 | |
Managed Futures Strategy Fund | | | — | | | | — | |
| | * | | Included in these amounts were $38,587,175 of purchases and $35,484,377 of sales of U.S. Government Securities. |
| 9. | | Transactions with Affiliates |
The Funds’ transactions with affiliates represent holdings for which the respective Fund and the underlying investee fund have the same investment advisor.
The GuidePath® Funds had the following transactions during the year ended March 31, 2017, with affiliates:
| | | | | | | | | | | | | | | | | | | | | | | | | | | | |
| | | Share Activity
| | | Year Ended March 31, 2017
| |
Security Name
| | Balance
March 31, 2016
| | | Purchases
| | | Sales
| | | Balance
March 31, 2017
| | | Fair
Value
| | | Dividends
Credited
to Income
| | | Amount of Gain*
(Loss) realized on
Sale of Shares
| |
Growth Allocation Fund | | | | | | | | | | | | | | | | | | | | | | | | | | | | |
GuideMark® Large Cap Core Fund - Institutional Shares | | | 2,012,839 | | | | 1,456,300 | | | | 1,005,874 | | | | 2,463,265 | | | $ | 39,757,095 | | | $ | 438,955 | | | $ | 1,386,098 | |
GuideMark® Emerging Markets Fund - Institutional Shares | | | 522,148 | | | | 546,730 | | | | 211,539 | | | | 857,339 | | | | 11,548,351 | | | | 62,047 | | | | 37,386 | |
GuideMark® Small/Mid Cap Core Fund - Institutional Shares | | | 2,444,870 | | | | 1,707,750 | | | | 987,309 | | | | 3,165,311 | | | | 58,051,795 | | | | 348,444 | | | | 1,017,050 | |
GuideMark® World ex-US Fund - Institutional Shares | | | 6,501,923 | | | | 4,595,480 | | | | 2,728,066 | | | | 8,369,337 | | | | 70,135,046 | | | | 1,190,538 | | | | 148,071 | |
| | | | | | | | | | | | | | | | | | |
|
|
|
| | | | | | | | | | | | | | | | | | | $ | 179,492,287 | | | $ | 2,039,984 | | | $ | 2,588,605 | |
| | | | | | | | | | | | | | | | | | |
|
|
|
| | | | | | | |
Conservative Allocation Fund | | | | | | | | | | | | | | | | | | | | | | | | | | | | |
GuideMark® Large Cap Core Fund - Institutional Shares | | | 98,213 | | | | 157,787 | | | | 74,057 | | | | 181,943 | | | $ | 2,936,555 | | | $ | 29,457 | | | $ | 92,910 | |
GuideMark® Emerging Markets Fund - Institutional Shares | | | 12,959 | | | | 23,545 | | | | 7,880 | | | | 28,624 | | | | 385,572 | | | | 2,592 | | | | 774 | |
GuideMark® Small/Mid Cap Core Fund - Institutional Shares | | | 205,071 | | | | 320,554 | | | | 156,310 | | | | 369,315 | | | | 6,773,229 | | | | 40,129 | | | | 159,340 | |
GuideMark® World ex-US Fund - Institutional Shares | | | 327,752 | | | | 521,590 | | | | 237,868 | | | | 611,474 | | | | 5,124,148 | | | | 84,141 | | | | (2,218 | ) |
| | | | | | | | | | | | | | | | | | |
|
|
|
| | | | | | | | | | | | | | | | | | | $ | 15,219,504 | | | $ | 156,319 | | | $ | 250,806 | |
| | | | | | | | | | | | | | | | | | |
|
|
|
| | | | | | | |
Absolute Return Allocation Fund | | | | | | | | | | | | | | | | | | | | | | | | | | | | |
GuideMark® Core Fixed Income Fund - Institutional Shares | | | — | | | | 713,655 | | | | 96,428 | | | | 617,227 | | | $ | 5,709,349 | | | $ | 118,797 | | | $ | (27,661 | ) |
GuideMark® Opportunistic Fixed Income Fund - Institutional Shares | | | 670,635 | | | | 111,038 | | | | 273,602 | | | | 508,071 | | | | 4,811,432 | | | | 216,510 | | | | (71,705 | ) |
| | | | | | | | | | | | | | | | | | |
|
|
|
| | | | | | | | | | | | | | | | | | | $ | 10,520,781 | | | $ | 335,307 | | | $ | (99,366 | ) |
| | | | | | | | | | | | | | | | | | |
|
|
|
| | | | | | | |
Multi-Asset Income Allocation Fund | | | | | | | | | | | | | | | | | | | | | | | | | | | | |
GuideMark® Core Fixed Income Fund - Institutional Shares | | | 130,657 | | | | 262,846 | | | | 94,387 | | | | 299,116 | | | $ | 2,766,827 | | | $ | 66,887 | | | $ | (13,857 | ) |
GuideMark® Opportunistic Fixed Income Fund - Institutional Shares | | | 229,279 | | | | 334,228 | | | | 120,197 | | | | 443,310 | | | | 4,198,150 | | | | 100,170 | | | | 2,206 | |
| | | | | | | | | | | | | | | | | | |
|
|
|
| | | | | | | | | | | | | | | | | | | $ | 6,964,977 | | | $ | 167,057 | | | $ | (11,651 | ) |
| | | | | | | | | | | | | | | | | | |
|
|
|
| | * | | Includes long-term capital gain distributions received from affiliates. |
171
GuideMark® Funds & GuidePath® Funds
NOTES TO FINANCIAL STATEMENTS (Continued)
March 31, 2017
| | | | | | | | | | | | | | | | | | | | | | | | | | | | |
| | | Share Activity
| | | Year Ended March 31, 2017
| |
Security Name
| | Balance
March 31, 2016
| | | Purchases
| | | Sales
| | | Balance
March 31, 2017
| | | Fair
Value
| | | Dividends
Credited
to Income
| | | Amount of Gain
(Loss) realized on
Sale of Shares
| |
| | | | | | | |
Flexible Income Allocation Fund | | | | | | | | | | | | | | | | | | | | | | | | | | | | |
GuideMark® Core Fixed Income Fund - Institutional Shares | | | 77,671 | | | | 11,622 | | | | 20,378 | | | | 68,915 | | | $ | 637,465 | | | $ | 19,648 | | | $ | 2,579 | |
| | | | | | | | | | | | | | | | | | |
|
|
|
| | | | | | | | | | | | | | | | | | | $ | 637,465 | | | $ | 19,648 | | | $ | 2,579 | |
| | | | | | | | | | | | | | | | | | |
|
|
|
| 10. | | Option Contracts Written |
The premium amount and number of option contracts written during the year ended March 31, 2017 were as follows:
Core Fixed Income Fund
| | | | | | | | | | | | |
| | | Amount of
Premiums
| | | Number of
Contracts
| | | Notional
Amount
| |
Outstanding at 3/31/16 | | $ | — | | | | — | | | | — | |
Options written | | | 20,569 | | | | — | | | | 8,164,000 | |
Options expired | | | (11,432 | ) | | | — | | | | (4,234,000 | ) |
Options exercised | | | — | | | | — | | | | — | |
Options closed | | | (9,137 | ) | | | — | | | | (3,930,000 | ) |
| | |
|
|
|
Outstanding at 3/31/17 | | $ | — | | | | — | | | | — | |
| | |
|
|
|
No other Fund held written option contracts at any time during the year ended March 31, 2017.
| 11. | | Other Tax Information |
Net investment income and realized gains and losses for Federal income tax purposes may differ from that reported on the financial statements because of permanent book-to-tax differences. GAAP requires that permanent differences between financial reporting and tax reporting be reclassified between various components of net assets.
These differences are primarily due to foreign currency, Passive Foreign Investment Companies, capital loss carryforwards, CFC income reversal, net operating loss lost, Partnerships and paydown reclassifications. On the Statements of Assets and Liabilities, the following adjustments were made:
| | | | | | | | | | | | |
| | | Accumulated
Net Investment
Income or (Loss)
| | | Accumulated
Realized
Gain or (Loss)
| | | Capital
Stock
| |
Large Cap Core Fund | | $ | 27,764 | | | $ | (27,716 | ) | | $ | (48 | ) |
Emerging Markets Fund | | | (38,429 | ) | | | 36,003 | | | | 2,426 | |
Small/Mid Cap Core Fund | | | 8,626 | | | | (8,606 | ) | | | (20 | ) |
World ex-US Fund | | | (45,817 | ) | | | 62,652,904 | | | | (62,607,087 | ) |
Opportunistic Equity Fund | | | 333,068 | | | | (158,272 | ) | | | (174,796 | ) |
Core Fixed Income Fund | | | 602,371 | | | | (602,367 | ) | | | (4 | ) |
Tax-Exempt Fixed Income Fund | | | — | | | | — | | | | — | |
Opportunistic Fixed Income Fund | | | 4,685,000 | | | | (4,685,000 | ) | | | — | |
Growth Allocation Fund | | | 196,402 | | | | (196,355 | ) | | | (47 | ) |
Conservative Allocation Fund | | | (5 | ) | | | 27 | | | | (22 | ) |
Tactical Allocation Fund | | | (26,363 | ) | | | 26,399 | | | | (36 | ) |
Absolute Return Allocation Fund | | | 8,390 | | | | 579 | | | | (8,969 | ) |
Multi-Asset Income Allocation Fund | | | — | | | | 17 | | | | (17 | ) |
Flexible Income Allocation Fund | | | — | | | | 14 | | | | (14 | ) |
Managed Futures Strategy Fund | | | 1,415,181 | | | | 8,176,237 | | | | (9,591,418 | ) |
The Funds intend to utilize capital loss carryforwards to offset future realized capital gains. Indefinite carryovers must be used first, resulting in a greater likelihood that pre-enactment losses may expire. Capital loss carryforwards available for Federal income tax purposes are as follows:
| | | | | | | | | | | | | | | | | | | | |
| | | Capital losses expiring:
| | | Utilized
| |
| | | | | | | | | Indefinite*
| | | | |
| | | 3/31/2018
| | | 3/31/2019
| | | Short Term
| | | Long Term
| | | | |
Large Cap Core Fund | | $ | — | | | $ | — | | | $ | — | | | $ | — | | | $ | — | |
Emerging Markets Fund | | | 91,067,928 | | | | — | | | | — | | | | — | | | | (3,672,896 | ) |
172
GuideMark® Funds & GuidePath® Funds
NOTES TO FINANCIAL STATEMENTS (Continued)
March 31, 2017
| | | | | | | | | | | | | | | | | | | | |
| | | Capital losses expiring:
| | | Utilized
| |
| | | | | | | | | Indefinite*
| | | | |
| | | 3/31/2018
| | | 3/31/2019
| | | Short Term
| | | Long Term
| | | | |
Small/Mid Cap Core Fund | | $ | — | | | $ | — | | | $ | — | | | $ | — | | | $ | — | |
World ex-US Fund | | | 139,582,037 | | | | — | | | | 15,471,584 | | | | | | | | (1,156,555 | ) |
Opportunistic Equity Fund | | | — | | | | — | | | | — | | | | — | | | | — | |
Core Fixed Income Fund | | | — | | | | — | | | | — | | | | — | | | | — | |
Tax-Exempt Fixed Income Fund | | | 1,729,569 | | | | — | | | | — | | | | — | | | | (1,133,091 | ) |
Opportunistic Fixed Income Fund | | | — | | | | — | | | | 23,108,367 | | | | 3,810,898 | | | | — | |
Growth Allocation Fund | | | — | | | | — | | | | — | | | | — | | | | — | |
Conservative Allocation Fund | | | — | | | | — | | | | 4,244,624 | | | | — | | | | — | |
Tactical Allocation Fund | | | — | | | | — | | | | 8,232,370 | | | | 6,346,962 | | | | — | |
Absolute Return Allocation Fund | | | — | | | | — | | | | 1,305,928 | | | | 9,473,636 | | | | — | |
Multi-Asset Income Allocation Fund | | | — | | | | — | | | | 611,582 | | | | 5,594,420 | | | | — | |
Flexible Income Allocation Fund | | | — | | | | — | | | | 1,058,977 | | | | 9,108,885 | | | | — | |
Managed Futures Strategy Fund | | | — | | | | — | | | | 3,290,164 | | | | 926,841 | | | | — | |
| | * | | The Regulated Investment Company Modernization Act of 2010 (the “Act”) provides an unlimited carryforward period for newly generated capital losses and their character is retained as short-term or long-term losses. |
Additionally, at March 31, 2017, the Funds deferred on a tax basis losses as follows:
| | | | | | | | |
| | | Ordinary Late
Year Loss
| | | Capital
Loss
| |
Large Cap Core Fund | | $ | — | | | $ | — | |
Emerging Markets Fund | | | 149,819 | | | | — | |
Small/Mid Cap Core Fund | | | — | | | | — | |
World ex-US Fund | | | — | | | | — | |
Opportunistic Equity Fund | | | 56,230 | | | | — | |
Core Fixed Income Fund | | | — | | | | 468,268 | |
Tax-Exempt Fixed Income Fund | | | — | | | | — | |
Opportunistic Fixed Income Fund | | | — | | | | — | |
Growth Allocation Fund | | | — | | | | — | |
Conservative Allocation Fund | | | — | | | | — | |
Tactical Allocation Fund | | | — | | | | 3,827,714 | |
Absolute Return Allocation Fund | | | — | | | | 2,285,746 | |
Multi-Asset Income Allocation Fund | | | — | | | | 2,528,450 | |
Flexible Income Allocation Fund | | | — | | | | 207,908 | |
Managed Futures Strategy Fund | | | 167,523 | | | | — | |
A regulated investment company may elect for any taxable year to treat any portion of the qualified late year loss as arising on the first day of the next taxable year. Qualified late year losses are certain capital and ordinary losses which occur during the portion of the taxable year subsequent to October 31 and December 31, respectively.
The character of distributions for tax purposes paid during the fiscal years ended March 31, 2017 and March 31, 2016 are as follows:
| | | | | | | | | | | | |
| | | Year Ended March 31, 2017
| |
| | | Ordinary
Income
Distributions
| | | Long-Term
Capital Gain
Distributions
| | | Return of
Capital
| |
Large Cap Core Fund | | $ | 2,122,491 | | | $ | 6,227,056 | | | $ | — | |
Emerging Markets Fund | | | 390,103 | | | | — | | | | — | |
Small/Mid Cap Core Fund | | | 533,692 | | | | — | | | | — | |
World ex-US Fund | | | 3,332,347 | | | | — | | | | — | |
Opportunistic Equity Fund | | | — | | | | 2,207,160 | | | | — | |
Core Fixed Income Fund | | | 4,025,855 | | | | — | | | | — | |
Tax-Exempt Fixed Income Fund | | | 1,010,639 | * | | | — | | | | — | |
Opportunistic Fixed Income Fund | | | 1,964,950 | | | | — | | | | — | |
Growth Allocation Fund | | | 9,730,472 | | | | 9,977,136 | | | | — | |
Conservative Allocation Fund | | | 5 | | | | 9,908,476 | | | | — | |
Tactical Allocation Fund | | | 3,197,003 | | | | — | | | | — | |
Absolute Return Allocation Fund | | | 3,935,742 | | | | — | | | | — | |
173
GuideMark® Funds & GuidePath® Funds
NOTES TO FINANCIAL STATEMENTS (Continued)
March 31, 2017
| | | | | | | | | | | | |
| | | Year Ended March 31, 2017
| |
| | | Ordinary
Income
Distributions
| | | Long-Term
Capital Gain
Distributions
| | | Return of
Capital
| |
Multi-Asset Income Allocation Fund | | $ | 3,068,620 | | | $ | — | | | $ | — | |
Flexible Income Allocation Fund | | | 2,158,726 | | | | — | | | | — | |
Managed Futures Strategy Fund | | | — | | | | 1,489,705 | | | | — | |
| | * | | Contains $1,008,839 of tax-exempt income for year ended 3/31/2017 |
| | | | | | | | | | | | |
| | | Year Ended March 31, 2016
| |
| | | Ordinary
Income
Distributions
| | | Long-Term
Capital Gain
Distributions
| | | Return of
Capital
| |
Large Cap Core Fund | | $ | 981,309 | | | $ | 7,226,929 | | | $ | — | |
Emerging Markets Fund | | | 1,975,997 | | | | — | | | | — | |
Small/Mid Cap Core Fund | | | 293,891 | | | | 1,800,770 | | | | — | |
World ex-US Fund | | | 5,839,865 | | | | — | | | | — | |
Opportunistic Equity Fund | | | 632,301 | | | | 15,840,853 | | | | — | |
Core Fixed Income Fund | | | 4,565,466 | | | | 2,192,419 | | | | — | |
Tax-Exempt Fixed Income Fund | | | 1,616,922 | * | | | — | | | | — | |
Opportunistic Fixed Income Fund | | | 1,670,971 | | | | — | | | | — | |
Growth Allocation Fund | | | 2,196,042 | | | | 4,302,920 | | | | — | |
Conservative Allocation Fund | | | 1,381,571 | | | | 12,682,062 | | | | — | |
Tactical Allocation Fund | | | 658,835 | | | | 3,768,696 | | | | — | |
Absolute Return Allocation Fund | | | 7,089,483 | | | | — | | | | — | |
Multi-Asset Income Allocation Fund | | | 4,413,652 | | | | 434,239 | | | | — | |
Flexible Income Allocation Fund | | | 1,917,799 | | | | — | | | | — | |
Managed Futures Strategy Fund** | | | — | | | | — | | | | — | |
| | * | | Contains $1,585,965 of tax-exempt income for year ended 3/31/2016. |
| | ** | | For the period January 19, 2016 (commencement of operations) through March 31, 2016. |
At March 31, 2017, the components of accumulated earnings (losses) on a tax basis were as follows:
| | | | | | | | | | | | | | | | | | | | | | | | |
| | | Large Cap
Core
Fund
| | | Emerging
Markets
Fund
| | | Small/Mid
Cap Core
Fund
| | | World
ex-US
Fund
| | | Opportunistic
Equity
Fund
| | | Core
Fixed Income
Fund
| |
Cost of Investments | | | 213,596,470 | | | | 105,040,193 | | | | 127,914,835 | | | | 166,959,915 | | | | 71,849,539 | | | | 163,302,584 | |
Gross Unrealized Appreciation | | | 45,655,758 | | | | 22,839,450 | | | | 25,391,583 | | | | 30,288,239 | | | | 15,254,091 | | | | 2,534,046 | |
Gross Unrealized Depreciation | | | (6,602,834 | ) | | | (3,911,105 | ) | | | (5,253,936 | ) | | | (7,585,948 | ) | | | (1,643,928 | ) | | | (1,735,929 | ) |
| | |
|
|
| |
|
|
| |
|
|
| |
|
|
| |
|
|
| |
|
|
|
Net Unrealized Appreciation/(Depreciation) | | | 39,052,924 | | | | 18,928,345 | | | | 20,137,647 | | | | 22,702,291 | | | | 13,610,163 | | | | 798,117 | |
| | |
|
|
| |
|
|
| |
|
|
| |
|
|
| |
|
|
| |
|
|
|
Undistributed Tax-Exempt Ordinary Income | | | — | | | | — | | | | — | | | | — | | | | — | | | | — | |
Undistributed Ordinary Income | | | 355,378 | | | | — | | | | 293,042 | | | | 2,901,835 | | | | — | | | | 294,651 | |
Undistributed Long-Term Cap Gains | | | 5,760,693 | | | | — | | | | 1,075,826 | | | | — | | | | 882,724 | | | | 349,253 | |
| | |
|
|
| |
|
|
| |
|
|
| |
|
|
| |
|
|
| |
|
|
|
Total Distributable Earnings | | | 6,116,071 | | | | — | | | | 1,368,868 | | | | 2,901,835 | | | | 882,724 | | | | 643,904 | |
| | |
|
|
| |
|
|
| |
|
|
| |
|
|
| |
|
|
| |
|
|
|
Other Accumulated Gains/(Losses) | | | — | | | | (91,205,686 | ) | | | — | | | | (155,105,126 | ) | | | (56,230 | ) | | | (468,259 | ) |
| | |
|
|
| |
|
|
| |
|
|
| |
|
|
| |
|
|
| |
|
|
|
Total Accumulated Earnings/(Losses) | | | 45,168,995 | | | | (72,277,341 | ) | | | 21,506,515 | | | | (129,501,000 | ) | | | 14,436,657 | | | | 973,762 | |
| | |
|
|
| |
|
|
| |
|
|
| |
|
|
| |
|
|
| |
|
|
|
174
GuideMark® Funds & GuidePath® Funds
NOTES TO FINANCIAL STATEMENTS (Continued)
March 31, 2017
| | | | | | | | | | | | | | | | | | | | | | | | |
| | | Tax-Exempt
Fixed Income
Fund
| | | Opportunistic
Fixed Income
Fund
| | | Growth
Allocation
Fund
| | | Conservative
Allocation
Fund
| | | Tactical
Allocation
Fund
| | | Absolute Return
Allocation
Fund
| |
Cost of Investments | | | 28,488,986 | | | | 62,222,862 | | | | 565,944,588 | | | | 140,501,479 | | | | 311,861,765 | | | | 152,416,683 | |
Gross Unrealized Appreciation | | | 1,847,698 | | | | 4,951,275 | | | | 93,741,327 | | | | 9,665,414 | | | | 23,874,885 | | | | 8,339,487 | |
Gross Unrealized Depreciation | | | (31,792 | ) | | | (6,402,568 | ) | | | (3,979,966 | ) | | | (2,251,470 | ) | | | (3,311,635 | ) | | | (948,921 | ) |
| | |
|
|
| |
|
|
| |
|
|
| |
|
|
| |
|
|
| |
|
|
|
Net Unrealized Appreciation/(Depreciation) | | | 1,815,906 | | | | (1,451,293 | ) | | | 89,761,361 | | | | 7,413,944 | | | | 20,563,250 | | | | 7,390,566 | |
| | |
|
|
| |
|
|
| |
|
|
| |
|
|
| |
|
|
| |
|
|
|
Undistributed Tax-Exempt Ordinary Income | | | 15,015 | | | | — | | | | — | | | | — | | | | — | | | | — | |
Undistributed Ordinary Income | | | 2,154 | | | | 12,274,176 | | | | 1,948,396 | | | | 1,224,770 | | | | 4,024,774 | | | | 634,051 | |
Undistributed Long-Term Cap Gains | | | — | | | | — | | | | 2,796,323 | | | | — | | | | — | | | | — | |
| | |
|
|
| |
|
|
| |
|
|
| |
|
|
| |
|
|
| |
|
|
|
Total Distributable Earnings | | | 17,169 | | | | 12,274,176 | | | | 4,744,719 | | | | 1,224,770 | | | | 4,024,774 | | | | 634,051 | |
| | |
|
|
| |
|
|
| |
|
|
| |
|
|
| |
|
|
| |
|
|
|
Other Accumulated Gains/(Losses) | | | (1,729,569 | ) | | | (26,860,958 | ) | | | (21,489 | ) | | | (4,266,113 | ) | | | (18,428,535 | ) | | | (13,086,799 | ) |
| | |
|
|
| |
|
|
| |
|
|
| |
|
|
| |
|
|
| |
|
|
|
Total Accumulated Earnings/(Losses) | | | 103,506 | | | | (16,038,075 | ) | | | 94,484,591 | | | | 4,372,601 | | | | 6,159,489 | | | | (5,062,182 | ) |
| | |
|
|
| |
|
|
| |
|
|
| |
|
|
| |
|
|
| |
|
|
|
| | | | | | | | | | | | | | | | | | | | | | | | |
| | | | | | | | | | | | Multi-Asset
Income
Allocation
Fund
| | | Flexible
Income
Allocation
Fund
| | | Managed
Futures Strategy
Fund
| |
Cost of Investments | | | | | | | | | | | | | | | 131,219,873 | | | | 116,146,584 | | | | 82,237,400 | |
Gross Unrealized Appreciation | | | | | | | | | | | | | | | 8,814,693 | | | | 2,344,852 | | | | 21,582 | |
Gross Unrealized Depreciation | | | | | | | | | | | | | | | (140,569 | ) | | | (563,506 | ) | | | (3,218 | ) |
| | |
|
|
| |
|
|
| |
|
|
| |
|
|
| |
|
|
| |
|
|
|
Net Unrealized Appreciation/(Depreciation) | | | | | | | | | | | | | | | 8,674,124 | | | | 1,781,346 | | | | 18,364 | |
| | |
|
|
| |
|
|
| |
|
|
| |
|
|
| |
|
|
| |
|
|
|
Undistributed Tax-Exempt Ordinary Income | | | | | | | | | | | | | | | — | | | | — | | | | — | |
Undistributed Ordinary Income | | | | | | | | | | | | | | | 112,867 | | | | 38,394 | | | | — | |
Undistributed Long-Term Cap Gains | | | | | | | | | | | | | | | — | | | | — | | | | — | |
| | |
|
|
| |
|
|
| |
|
|
| |
|
|
| |
|
|
| |
|
|
|
Total Distributable Earnings | | | | | | | | | | | | | | | 112,867 | | | | 38,394 | | | | — | |
| | |
|
|
| |
|
|
| |
|
|
| |
|
|
| |
|
|
| |
|
|
|
Other Accumulated Gains/(Losses) | | | | | | | | | | | | | | | (8,734,452 | ) | | | (10,375,770 | ) | | | (4,136,685 | ) |
| | |
|
|
| |
|
|
| |
|
|
| |
|
|
| |
|
|
| |
|
|
|
Total Accumulated Earnings/(Losses) | | | | | | | | | | | | | | | 52,539 | | | | (8,556,030 | ) | | | (4,118,321 | ) |
| | |
|
|
| |
|
|
| |
|
|
| |
|
|
| |
|
|
| |
|
|
|
The differences between book-basis and tax-basis unrealized appreciation and depreciation is primarily attributable to the tax deferral of losses on wash sales and other temporary differences.
175
GuideMark® Funds & GuidePath® Funds
REPORT OF INDEPENDENT REGISTERED PUBLIC ACCOUNTING FIRM
To the Shareholders and Board of Trustees of GPS Funds I and GPS Funds II
We have audited the accompanying statements of assets and liabilities, including the schedules of investments, open futures contracts, open swap contracts, and open forward currency contracts, of GPS Funds I and GPS Funds II comprising GuideMark Large Cap Core Fund, GuideMark Emerging Markets Fund, GuideMark Small/Mid Cap Core Fund, GuideMark World ex-US Fund, GuideMark Opportunistic Equity Fund, GuideMark Core Fixed Income Fund, GuideMark Tax-Exempt Fixed Income Fund, GuideMark Opportunistic Fixed Income Fund, GuidePath Growth Allocation Fund, GuidePath Conservative Allocation Fund, GuidePath Tactical Allocation Fund, GuidePath Absolute Return Allocation Fund, GuidePath Multi-Asset Income Allocation Fund, GuidePath Flexible Income Allocation Fund, and the consolidated schedules of investments and open futures contracts and the accompanying consolidated statement of assets and liabilities of GuidePath Managed Futures Strategy Fund (the “Funds”) as of March 31, 2017, and the related consolidated statement of operations for the year ended March 31, 2017, consolidated statements of changes in net assets and consolidated financial highlights for each of the two periods in the period then ended March 31, 2017, for GuidePath Managed Futures Strategy Fund, and the related statements of operations for the year ended March 31, 2017, changes in net assets for each of the two years in the period then ended March 31, 2017, and the financial highlights for each of the four years in the period then ended March 31, 2017, for the remainder of the Funds (collectively, for all Funds presented, the “financial statements”). These financial statements and financial highlights are the responsibility of the Funds’ management. Our responsibility is to express an opinion on these financial statements and financial highlights based on our audits. The financial highlights for the period ended March 31, 2013, were audited by other auditors whose report dated May 30, 2013, expressed an unqualified opinion on those highlights.
We conducted our audits in accordance with the standards of the Public Company Accounting Oversight Board (United States). Those standards require that we plan and perform the audit to obtain reasonable assurance about whether the financial statements and financial highlights are free of material misstatement. An audit includes examining, on a test basis, evidence supporting the amounts and disclosures in the financial statements. Our procedures included confirmation of securities owned as of March 31, 2017, by correspondence with the custodian and brokers, or by other appropriate auditing procedures where replies from brokers or counterparties were not received. An audit also includes assessing the accounting principles used and significant estimates made by management, as well as evaluating the overall financial statement presentation. We believe that our audits provide a reasonable basis for our opinion.
In our opinion, the financial statements and financial highlights referred to above present fairly, in all material respects, the financial position of each of the Funds constituting GPS Funds I and GPS Funds II as of March 31, 2017, the results of their operations, the changes in their net assets and the financial highlights for each of the periods indicated above, in conformity with accounting principles generally accepted in the United States of America.
As discussed within Note 3 to the financial statements, on May 25, 2017, the Board of Trustees approved the liquidation of GuideMark Opportunistic Equity Fund.
COHEN & COMPANY, LTD.
Cleveland, Ohio
May 26, 2017
176
GuideMark® Funds & GuidePath® Funds
ADDITIONAL INFORMATION
March 31, 2017
Additional Information
| 1. | | Shareholder Notification of Federal Tax Status (Unaudited) |
The Funds designated the following percentages of dividends during the fiscal year 2017 as dividends qualifying for the dividends received deduction available to corporate shareholders and as dividends from net investment income that are qualifying income under the Jobs and Growth Tax Relief Reconciliation Act of 2003, respectively:
| | | | | | | | |
| | | Dividends received
deduction % for
corporate shareholders
| | | % of dividends as
qualified income
| |
Large Cap Core Fund | | | 100.00% | | | | 100.00% | |
Emerging Markets Fund | | | 3.65% | | | | 100.00% | |
Small/Mid Cap Core Fund | | | 100.00% | | | | 100.00% | |
World ex-US Fund | | | 0.69% | | | | 100.00% | |
Opportunistic Equity Fund | | | 0.00% | | | | 0.00% | |
Core Fixed Income Fund | | | 0.00% | | | | 0.00% | |
Tax-Exempt Fixed Income Fund | | | 0.00% | | | | 0.00% | |
Opportunistic Fixed Income Fund | | | 0.93% | | | | 1.12% | |
Growth Allocation Fund | | | 10.47% | | | | 68.09% | |
Conservative Allocation Fund | | | 0.00% | | | | 0.00% | |
Tactical Allocation Fund | | | 26.68% | | | | 100.00% | |
Absolute Return Allocation Fund | | | 5.05% | | | | 8.21% | |
Multi-Asset Income Allocation Fund | | | 26.30% | | | | 52.38% | |
Flexible Income Allocation Fund | | | 0.00% | | | | 5.84% | |
Managed Futures Strategy Fund | | | 0.00% | | | | 0.00% | |
| 2. | | Foreign Tax Credit Pass Through (Unaudited) |
Pursuant to Section 853 of the Internal Revenue Code, the following Funds designate the following amounts as foreign taxes paid for the year ended March 31, 2017. Foreign taxes paid for purposes of Section 853 may be less than actual foreign taxes paid for financial statement purposes.
| | | | | | | | | | | | |
| | | Creditable Foreign
Taxes Paid
| | | Per Share
Amount
| | | Portion of Ordinary Income
Distribution Derived from
Foreign Sourced Income*
| |
Emerging Markets | | $ | 283,611 | | | $ | 0.0326 | | | | 96.49 | % |
World ex-US Fund | | | 363,630 | | | | 0.0161 | | | | 97.20 | % |
Growth Allocation Fund | | | 141,363 | | | | 0.0028 | | | | 1.57 | % |
Conservative Allocation Fund | | | 9,415 | | | | 0.0007 | | | | 0.00 | % |
| | * | | The Funds listed above did not derive any income from “ineligible foreign sources” as defined under Section 901(j) of the Internal Revenue Code. |
Foreign taxes paid or withheld should be included in taxable income with an offsetting deduction from gross income or as a credit for taxes paid to foreign governments.
Above figures may differ from those cited elsewhere in this report due to differences in the calculation of income and gains under U.S. generally accepted accounting principles (book) purposes and Internal Revenue Service (tax) purposes.
Shareholders are strongly advised to consult their own tax advisers with respect to the tax consequences of their investments in the Funds. In January, shareholders, excluding corporate shareholders, receive an IRS 1099-DIV regarding the Federal tax status of the dividends and distributions they received in the calendar year.
177
GuideMark® Funds & GuidePath® Funds
ADDITIONAL INFORMATION (Continued)
March 31, 2017
| 3. | | Disclosure Regarding Fund Trustees and Officers (Unaudited) |
| | | | | | | | | | |
Name, Address
and Year of Birth
| | Position(s) Held
with the Trusts
| | Term of Office and
Length of Time Served
| | Principal Occupation
During Past Five Years
| | # of
Portfolios
in Fund
Complex
Overseen
by Trustee
| | Other Director/
Trustee Positions
|
GPS Funds I and GPS Funds II |
|
Independent Trustees |
| | | | | |
David M. Dunford
Year of Birth: 1949
c/o AssetMark, Inc.
1655 Grant Street,
10th Floor
Concord, CA 94520 | | Lead Independent Trustee | | Indefinite Term (since 2013 for GPS Funds I and since 2011 for GPS Funds II) | | Retired; formerly, Senior Vice President, Merrill Lynch Insurance Group (1989-2001). | | 16 | | Trustee, Savos Investments Trust (2015-present); Director, New England Bancorp (2006-2016); Trustee, Genworth Variable Insurance Trust (“GVIT”) (2008-2012); Director, Hospice and Palliative Care of Cape Cod (2006-2011). |
| | | | | |
Paul S. Feinberg
Year of Birth: 1942
c/o AssetMark, Inc.
1655 Grant Street,
10th Floor
Concord, CA 94520 | | Independent Trustee | | Indefinite Term (since 2013 for GPS Funds I and since 2011 for GPS Funds II) | | Retired; formerly, President, CitiStreet Funds, Inc. (2000-2005); Executive Vice President and General Counsel, CitiStreet Associates LLC (insurance agency), CitiStreet Equities LLC (broker- dealer), CitiStreet Financial Services LLC (registered investment advisor) and CitiStreet Funds Management LLC (registered investment advisor) (1990-2005). | | 16 | | Trustee, Savos Investments Trust (2015-present); Trustee, GVIT (2008-2012). |
| | | | | |
Dennis G. Schmal
Year of Birth: 1947
c/o AssetMark, Inc.
1655 Grant Street,
10th Floor
Concord, CA 94520 | | Independent Trustee | | Indefinite Term (since 2007 for GPS Funds I and since 2013 for GPS Funds II) | | Self-employed consultant (1999-present); formerly, Partner, Arthur Andersen LLP (audit services) (1972-1999). | | 16 | | Trustee, Savos Investments Trust (2015-present); Director, Blue Calypso, Inc. (2015-present); Director, Owens Realty Mortgage Inc. (2013-present); Director, Cambria ETF Series Trust (2013-present) Director/Chairman, Sitoa Global Inc. (2011-2013); Director, Wells Fargo GAI Hedge Funds (closed-end hedge funds) (2008- present); Director/Chairman, Pacific Metrics Corp. (educational services) (2005- 2014); Director, Merriman Holdings, Inc. (financial services) (2003-2016); Director, Grail Advisors ETF Trust (2009-2011); Director, Varian Semiconductor Equipment Associates, Inc. (2004-2011); Director, North Bay Bancorp (2006-2007). |
178
GuideMark® Funds & GuidePath® Funds
ADDITIONAL INFORMATION (Continued)
March 31, 2017
| | | | | | | | | | | | |
Name, Address
and Year of Birth
| | Position(s) Held
with the Trusts
| | Term of Office and
Length of Time Served
| | Principal Occupation
During Past Five Years
| | # of
Portfolios
in Fund
Complex
Overseen
by Trustee
| | | Other Director/
Trustee Positions
|
Interested Trustee | | | | | | | | | | | | |
| | | | | |
Carrie E. Hansen* Year of Birth: 1970 c/o AssetMark, Inc. 1655 Grant Street, 10th Floor Concord, CA 94520 | | Interested Trustee and Chairperson President | | Indefinite Term since 2014 Renewed 1-Year Term since 2008 | | President, GPS Funds I (2007-present) and GPS Funds II (2011-present); President, Savos Investments Trust (“Savos”) (2008-present); and GVIT (2008-2012); Executive Vice President and Chief Operating Officer, AssetMark (2008-present); President, AssetMark Brokerage™, LLC (2013-present). | | | 16 | | | Trustee, Savos Investments Trust (2014-present); Chairperson, AssetMark Trust Co. (2008-present); Treasurer, Acalanes Booster Club (Feb 2017-present); Director, Lamorinda Soccer Club (2011-2013). |
| | | | | | |
Name, Address
and Year of Birth
| | Position(s) Held
with the Trusts
| | Term of Office and
Length of Time Served
| | Principal Occupation During Past Five Years
|
Officers of the Trusts** |
| | | |
John Koval Year of Birth: 1966 c/o AssetMark, Inc. 1655 Grant Street, 10th Floor Concord, CA 94520 | | Chief Compliance Officer and AML Compliance Officer | | Renewed 1-Year Term since 2013 | | Chief Compliance Officer, GPS Funds I, GPS Funds II, and Savos (2013-present); Interim Chief Compliance Officer, GPS Funds I, GPS Funds II, and Savos (September 2012-January 2013); Senior Compliance Officer, AssetMark (2011-2012); Chief Operating Officer, SEAL Capital, Inc. (2009-2010); Chief Compliance Officer, Cliffwood Partners LLC (2004-2009). |
| | | |
Patrick R. Young Year of Birth: 1982 c/o AssetMark, Inc. 1655 Grant Street, 10th Floor Concord, CA 94520 | | Treasurer | | Renewed 1-Year Term since 2014 | | Treasurer, GPS Funds I, GPS Funds II, and Savos (May 2014-present); Director of Mutual Fund Operations and Finance, AssetMark (February 2016-present); Manager of Fund Administration, AssetMark (May 2014-February 2016); Senior Fund Administration Officer, AssetMark (2008-May 2014). |
| | | |
Christine Villas-Chernak Year of Birth: 1968 c/o AssetMark, Inc. 1655 Grant Street, 10th Floor Concord, CA 94520 | | Secretary | | Renewed 1-Year Term since 2014 | | Secretary, GPS Funds I (2006-2013 and May 2014-present), GPS Funds II (2011-2013 and May 2014- present), Savos (2009-2010 and May 2014-present) and GVIT (2008-2010); Deputy Chief Compliance Officer, GPS Funds I (2009-present), GPS Funds II (2011-present) and GVIT (2009-2012); Senior Compliance Officer, AssetMark (2005-2009). |
| * | | Ms. Hansen is a Trustee who is an “interested person” of the Trusts as defined in the 1940 Act because she is an officer of AssetMark or certain of its affiliates. |
| ** | | Each Officer of the Trusts serves at the pleasure of the Board. |
The Statement of Additional Information includes additional information about the Funds’ Trustees and is available free of charge upon request by calling the Funds toll free at (888) 278-5809.
| 4. | | Proxy Voting Policies and Procedures and Proxy Voting Record (Unaudited) |
A description of the policies and procedures that the Funds use to determine how to vote proxies related to the Funds’ portfolio securities as well as information regarding how the Funds voted proxies relating to portfolio securities during the most recent 12-month period ended June 30 is available without charge, upon request, by calling (888) 278-5809. Furthermore, you can obtain the Fund’s proxy voting records on the SEC’s website at http://www.sec.gov.
| 5. | | Availability of Quarterly Portfolio Holdings Schedules (Unaudited) |
The Funds file their complete schedules of portfolio holdings with the SEC for their first and third fiscal quarters on Form N-Q. Once filed, the Funds’ Form N-Q is available without charge, upon request on the SEC’s website (http://www.sec.gov) and is available by calling (888) 278-5809. You can also obtain copies of Form N-Q by (i) visiting the SEC’s Public Reference Room in Washington, D.C. (information on the operation of the Public Reference Room may be obtained by calling 1-800-SEC-0330); (ii) sending your request and a duplicating fee to the SEC’s Public Reference Room, Washington, D.C. 20549-0102; or (iii) sending your request electronically to publicinfo@sec.gov.
179
GuideMark® Funds & GuidePath® Funds
ADDITIONAL INFORMATION (Continued)
March 31, 2017
| 6. | | Statement Regarding the Basis for Approval of Investment Advisory Agreement and Sub-Advisory Agreements (Unaudited) |
GPS FUNDS I and GPS FUNDS II:
Annual Consideration and Approval of Investment Advisory and Sub-Advisory Agreements
At the meeting of the Board of Trustees (the “Board” or the “Trustees”) of GPS Funds I and GPS Funds II (collectively, the “Trusts”) held on December 9, 2016 (the “Meeting”), the Board considered the renewal of the investment advisory agreements between AssetMark, Inc. (the “Advisor” or “AssetMark”) and each Trust on behalf of the series of each Trust (collectively, the “Funds”) (the “Advisory Agreements”). Additionally, the Board considered the renewal of the investment sub-advisory agreements between (i) Goldman Sachs Asset Management, L.P. (“GSAM”) and AssetMark, on behalf of GuideMark® Large Cap Core Fund, GuideMark® Emerging Markets Fund, GuideMark® Small/Mid Cap Core Fund, and GuideMark® World ex-US Fund; (ii) Wellington Management Company (“Wellington”) and AssetMark, on behalf of the GuideMark® Core Fixed Income Fund; (iii) Barrow, Hanley, Mewhinney & Strauss, LLC (“Barrow Hanley”) and AssetMark, on behalf of the GuideMark® Core Fixed Income Fund; (iv) Diamond Hill Capital Management, Inc. (“Diamond Hill”) and AssetMark, on behalf of the GuideMark® Opportunistic Equity Fund; (v) Westfield Capital Management Company, L.P. (“Westfield”) and AssetMark, on behalf of the GuideMark® Opportunistic Equity Fund; (vi) Delaware Management Company (“Delaware”) and AssetMark, on behalf of the GuideMark® Tax-Exempt Fixed Income Fund; (vii) Franklin Advisers, Inc. (“Franklin Advisers”) and AssetMark, on behalf of the GuideMark® Opportunistic Fixed Income Fund; (viii) DoubleLine Capital LP (“DoubleLine”) and AssetMark, on behalf of the GuideMark® Opportunistic Fixed Income Fund; and (ix) AlphaSimplex Group, LLC (“ASG”) and AssetMark, on behalf of the GuidePath® Managed Futures Strategy Fund (collectively, the “Sub-Advisory Agreements”).
Hereinafter, GSAM, Wellington, Barrow Hanley, Diamond Hill, Westfield, Delaware, Franklin, DoubleLine, and ASG are collectively referred to as the “Sub-Advisors” and the above-listed Funds are collectively referred to as the “Sub-Advised Funds.” The Advisory Agreements and Sub-Advisory Agreements are collectively referred to herein as the “Agreements.”
The Sub-Advised Funds are managed using a “manager-of-managers” structure that generally involves the use of one or more sub-advisors to manage allocated portions of the Sub-Advised Funds’ portfolios. For those Sub-Advised Funds, AssetMark is responsible for evaluating and selecting sub-advisors on an ongoing basis and making any decisions to recommend hiring, retaining, or replacing sub-advisors. The Board is engaged in monitoring this process in connection with its meetings held throughout the year, and under the manager-of-managers structure, all parties understand that sub-advisors are being monitored and evaluated, and are subject to replacement, at all times.
The Board – including a majority of the independent Trustees – determined to approve the continuance of the Advisory Agreements and the Sub-Advisory Agreements. The material factors considered and the conclusions that formed the basis of the Board’s approval of the renewal of the Agreements are described below. This summary describes the most significant, but not all, of the factors evaluated by the Board. Prior to considering the approval of the renewal of the Agreements, the Trustees requested, received, and reviewed information relevant to their consideration of the Agreements. The Trustees also received assistance and advice regarding legal and industry standards from independent legal counsel to the independent Trustees (“Independent Counsel”). The determination to approve the renewal of the Agreements was based on a comprehensive evaluation of all of the information available to the Trustees and was not the result of any particular information or any single factor. Moreover, each Trustee may have afforded different weight to various information and factors in reaching his conclusions with respect to the renewal of the Agreements.
The Advisory Agreements
Materials Reviewed and the Review Process
Prior to voting to approve the renewal of the Advisory Agreements, the Trustees – assisted by Independent Counsel – specifically requested and were furnished with materials for purposes of their review of each Advisory Agreement. The materials provided to the Board with regard to the Funds related to, among other things: (1) a copy of each Advisory Agreement; (2) information describing each Fund’s performance compared to the Fund’s peer group of other investment companies with investment objectives similar to the investment objective(s) of the Fund; (3) information describing the nature, quality and extent of the services that AssetMark provides to the Funds, and the fees AssetMark charges to the Funds for such services, and a comparison of those fees to the fees paid by a peer group of other investment companies having investment objectives similar to the investment objectives of the Funds; (4) information regarding AssetMark’s business and operations, investment team, compliance program and internal procedures; (5) information describing each Fund’s expense ratio compared to the Fund’s peer group of other registered investment companies with investment objectives similar to the investment objective(s) of the Fund; (6) information regarding the financial condition of AssetMark; (7) information regarding AssetMark’s profitability with respect to each Fund within the Trusts; (8) reports on AssetMark’s evaluation of sub-advisors, including reports relating to the monitoring of each sub-advisors’ trading and brokerage practices; (9) reports relating to the distribution, sales and redemptions of Fund shares and related shareholder services; (10) reports relating to the monitoring of the other service providers; and (11) other information relevant to an evaluation of the nature, extent and quality of the services provided by AssetMark in response to a series of detailed questions posed by Independent Counsel. The Trustees met with representatives of AssetMark. The Trustees also considered their discussions with representatives of AssetMark throughout the course of the Meeting, at other meetings of the Board and its committees and other communications throughout the year.
180
GuideMark® Funds & GuidePath® Funds
ADDITIONAL INFORMATION (Continued)
March 31, 2017
The Trustees received assistance and advice regarding legal and industry standards from both Independent Counsel and from counsel to the Trusts, which included detailed memoranda that described the Trustees’ legal duties and obligations in considering whether to approve the Advisory Agreements. The independent Trustees discussed the Advisory Agreements in communications prior to their meeting and during the course of their meeting in executive session with Independent Counsel, at which no representatives of AssetMark were present.
Factors Considered
The Trustees considered and reached conclusions on a number of factors in making the decision to approve the Advisory Agreement. These factors and conclusions are described below.
Nature, Quality and Extent of Services
The Trustees considered the nature, extent and quality of the services that AssetMark provides to the Funds. With respect to the Sub-Advised Funds, the Board considered the fact that, as an investment advisor operating within a manager-of-managers structure, AssetMark maintains a primary focus on the selection, evaluation and oversight of the Funds’ Sub-Advisors and considered each Advisory Agreement in this context. In this regard, the Trustees considered the information provided to them throughout the course of the year during regular meetings of the Board, which included meetings with the Trusts’ CCO at which the Trustees are provided with details regarding AssetMark’s compliance functions.
The Trustees considered AssetMark’s investment team and its capabilities, including with respect to the responsibilities that AssetMark has for the Funds that pursue their investment objectives through investments in other funds (each a “Fund-of-Funds”). The Trustees also considered AssetMark’s capabilities with respect to the administrative and compliance services provided to the Funds. The Trustees considered the experience, capability and integrity of AssetMark’s management and other personnel, the role of AssetMark’s senior management and the extent of its involvement with the Funds, and AssetMark’s willingness to add personnel over time in order to ensure that appropriate staffing levels are maintained. With respect to the Sub-Advised Funds, the Trustees noted the responsibilities that AssetMark has under certain Funds’ manager-of-managers structure, including: selecting and oversight of the Funds’ Sub-Advisors; maintaining a comprehensive compliance and administration program; and implementing Fund policies.
The Trustees also considered (a) the financial position of AssetMark; (b) the quality of AssetMark’s regulatory and legal compliance policies, procedures and systems; (c) the nature, extent and quality of administrative and shareholder services provided by AssetMark to the Funds; and (d) AssetMark’s supervision of the Funds’ third-party service providers.
The Board considered the breadth and quality of services that AssetMark provides to the Funds. The Trustees also considered that the Funds are an integral part of AssetMark’s program of asset allocation and shareholder services. Additionally, with respect to the Sub-Advised Funds, the Trustees considered AssetMark’s ability to provide administrative and compliance-related services in connection with AssetMark’s (a) oversight of the Sub-Advisors’ compliance with the Funds’ respective investment objectives, policies, and restrictions; (b) review of trading and brokerage matters; and (c) other oversight activities.
Based on the factors described above, among other factors, as well as the information provided to the Board throughout the year, the Trustees concluded that it was satisfied with the nature, extent and quality of the services provided by AssetMark, which will continue to be provided to each Fund.
Investment Performance
The Trustees considered the overall investment performance of the Funds, and, with respect to the Sub-Advised Funds, evaluated the Funds’ performance in the context of the manager-of-managers structure. The Trustees considered whether the Funds operated in a manner consistent with their investment objectives and styles and considered each Fund’s record of compliance with its respective investment restrictions.
The Trustees also considered each Fund’s investment performance relative to its respective benchmark index and relative to the performance of funds with comparable investment strategies selected by a third-party information provider. The Trustees also considered performance-related data received throughout the past year at and in connection with meetings of the Board. With respect to each Fund-of-Funds, the Trustees reviewed the performance of AssetMark in selecting the underlying funds for the Fund.
The Trustees considered that, as applicable, AssetMark continued to be proactive in seeking to replace and/or add Sub-Advisors or underlying funds, to reallocate assets among Sub-Advisors or underlying funds and to implement new investment strategies, with a view to improving Fund performance over the long term.
The Trustees concluded that AssetMark’s performance record in managing each of the Funds was satisfactory and supported a decision to approve the renewal of the Advisory Agreements.
Advisory Fees and Total Expenses
The Trustees considered a detailed analysis of each Fund’s fees and expenses. The materials provided to the Board included (i) a comparison of the advisory fees and total expenses of each Fund (as a percentage of average net assets) with the fees and expenses of a group of funds selected by a third-party information provider; (ii) comparisons of each Fund’s expenses to industry averages; and (iii) fee schedules for the Funds’ Sub-Advisors, as applicable.
181
GuideMark® Funds & GuidePath® Funds
ADDITIONAL INFORMATION (Continued)
March 31, 2017
The Trustees considered expense limitation arrangements under which AssetMark has agreed to limit the Funds’ expenses. With respect to each Fund-of-Funds, the Trustees considered the indirect expenses borne by the Funds as shareholders of certain underlying funds. The Trustees also considered other efforts by AssetMark to reduce overall Fund expenses, including attempts to improve asset flows, implementing programs such as securities lending and negotiating strategic contracts with service providers.
In analyzing the Funds’ fee levels as compared to other similar funds, the Trustees considered the Funds’ fee levels in light of the Funds’ special distribution structure, under which the Funds were distributed as part of a suite of products and services with asset allocation modeling, full performance reporting and other services that are not typically provided with mutual funds.
After comparing each Fund’s fees with other comparable funds and industry averages, and in light of the nature, extent and quality of services provided to the Funds by AssetMark, as well as the costs incurred by AssetMark in rendering those services, the Trustees concluded that the level of fees paid to AssetMark with respect to each Fund was reasonable. In addition, the Trustees, including all of the independent Trustees, determined that the fees to be charged by AssetMark pursuant to the Advisory Agreements are for services provided in addition to, rather than duplicative of, services provided under any underlying fund’s investment advisory agreement.
Profitability, Economies of Scale and Ancillary Benefits
The Trustees reviewed and discussed the financial information presented by AssetMark, including information relating to the financial stability of AssetMark and its historical and anticipated profitability with respect to its management of the Funds. The Trustees discussed the methods used by AssetMark to allocate expenses to the Funds under its profitability analysis, and the Trustees considered the individual profitability of AssetMark with respect to each Fund under this methodology.
In evaluating AssetMark’s profitability, the Trustees acknowledged that the Funds are distributed in connection with AssetMark providing a package of administrative and other services as the sponsor of AssetMark’s investment platform and considered the benefits that flow to Fund shareholders as a result of these services. Additionally, the Trustees considered AssetMark’s existing agreements to waive advisory fees received from certain Funds and/or pay certain Fund expenses to the extent necessary to ensure that the Funds’ overall expenses do not exceed certain levels.
The Trustees considered ancillary benefits received by AssetMark as a result of its relationship with the Funds, including the benefits of offering an integrated set of investment options as an integral part of AssetMark’s asset allocation investment programs and the related marketing rebates received by the Advisor. The Trustees concluded that these benefits were reasonable.
The Trustees considered AssetMark’s profitability in managing each Fund within the Trusts, the anticipated effect of asset growth on each Fund’s expenses, and other information that might suggest the potential for realizing economies of scale that could be shared with Fund shareholders. The Trustees considered the fee waiver agreements under which AssetMark had agreed to waive expenses based upon the achievement of certain breakpoints listed in the agreement.
The Trustees concluded, in light of the foregoing factors, that AssetMark’s level of profitability is reasonable. Additionally, the Trustees concluded that the economies of scale being realized by AssetMark, if any, do not mandate the implementation of new or amended breakpoints or other changes in the fee structure for any Fund at this time.
Conclusion
After consideration of the foregoing factors, and such other matters as were deemed relevant, and with no single factor being determinative to their decision, the Trustees, including all of the independent Trustees, concluded to approve the renewal of each Advisory Agreement with, and the fee to be paid to, AssetMark for each of the Funds.
The Sub-Advisory Agreements
Materials Reviewed and the Review Process
Assisted by Independent Counsel, the Trustees specifically requested and were furnished with materials for purposes of their review of each Sub-Advisory Agreement. The materials provided to the Board related to, among other things: (1) a copy of each Sub-Advisory Agreement; (2) information regarding the nature, quality and scope of the services to be provided by the Sub-Advisors; (3) the investment performance of each Sub-Advisor in managing their respective Fund compared to an industry peer group, appropriate benchmark, and comparable Sub-Advisor client accounts, to the extent applicable; (4) AssetMark’s evaluation of the nature, extent and quality of the services provided by each Sub-Advisor; (5) information regarding any benefits to each Sub-Advisor, such as receipt of research from brokers, that might result from the Sub-Advisor’s relationship with a Fund; (6) information concerning each Sub-Advisor’s personnel, business, operations and investment team, including biographical information for the investment professionals that are responsible for the day-to-day management of the applicable Fund’s portfolio; (7) information regarding each Sub-Advisor’s compliance policies and other internal procedures, including the Sub-Advisor’s brokerage practices; (8) information regarding the financial condition of each Sub-Advisor or its parent company; and (9) other information relevant to an evaluation of the nature, extent and quality of the services provided by each Sub-Advisor in response to a series of detailed questions posed by Independent on behalf of the independent Trustees. The Trustees also considered the recommendations of AssetMark with respect to each Sub-Advisor and the methods and resources AssetMark utilized in its efforts to identify and engage Sub-Advisors for the Funds.
182
GuideMark® Funds & GuidePath® Funds
ADDITIONAL INFORMATION (Continued)
March 31, 2017
The Trustees received assistance and advice regarding legal and industry standards from both Independent Counsel and from counsel to the Trusts, which included detailed memoranda that described the Trustees’ legal duties and obligations in considering the renewal of the Sub-Advisory Agreements. The Trustees discussed the approval of the Sub-Advisory Agreements in communications prior to their meeting and, during the course of their meeting, in executive session with Independent Counsel at which no representatives of AssetMark or the Sub-Advisors were present.
Factors Considered
The Trustees considered and reached conclusions on a number of factors in making the decision to approve the Sub-Advisory Agreements. In so doing, the Trustees considered AssetMark’s role as a “manager-of-managers,” which includes, among other functions, monitoring and evaluating the performance of the Sub-Advisors, recommending that any Sub-Advisor not performing as expected be replaced, and negotiating advantageous fee arrangements that could permit the Funds to realize economies of scale without compromising the quality of services. These factors and the Board’s conclusions are set forth below.
Nature, Quality and Extent of Services
The Trustees considered each Sub-Advisor’s investment management process, including (a) the experience, capability and integrity of the Sub-Advisor’s management, investment professionals and other personnel; (b) the financial position of the Sub-Advisor; (c) the quality and commitment of the Sub-Advisor’s regulatory and legal compliance policies, procedures and systems; (d) the Sub-Advisor’s brokerage and trading practices; and (e) and AssetMark’s evaluation of the nature, quality and extent of services performed by each Sub-Advisor.
The Trustees specifically considered the qualifications, experience and track record of the individuals and portfolio management teams at each Sub-Advisor that are responsible for the day-to-day management of each Fund’s portfolio. The Trustees also considered, with respect to each Sub-Advisor, the specific investment approach and level of expertise within its particular asset class. The Trustees considered whether each Sub-Advisor operated within its respective Fund’s investment objective and style and considered each Sub-Advisor’s record of compliance with applicable investment restrictions. The Trustees also considered each Sub-Advisor’s performance record with respect to the relevant benchmark(s).
The Trustees concluded that the nature, extent and quality of the services provided by each Sub-Advisor to its respective Sub-Advised Fund is satisfactory.
Sub-Advisor Investment Performance
The Trustees considered whether each Sub-Advisor operated within its respective Sub-Advised Fund’s investment objective and style and considered each Sub-Advisor’s record of compliance with applicable investment restrictions. The Trustees also considered each Sub-Advisor’s investment performance relative to benchmark indices.
The Trustees considered that they had reviewed each Sub-Advisor, including the primary contributors to and detractors from performance, with the Advisor and concluded that each Sub-Advisor’s performance record is satisfactory.
Sub-Advisory Fees, Economies of Scale, Profitability and Ancillary Benefits
The Trustees considered the fee paid to each Sub-Advisor by AssetMark for providing services to its relevant Sub-Advised Fund. The Trustees considered management’s representation that AssetMark’s focus in negotiating sub-advisory arrangements is on negotiating the best possible fee structures for each Fund, and that the sub-advisory fees are paid by AssetMark out of the investment advisory fees received.
The Trustees also considered individual reports prepared with regard to each Sub-Advisor, containing comparative information regarding fees. The Trustees noted that each Sub-Advisor’s fees were generally similar to or less than the fees charged by each Sub-Advisor to other comparable funds and accounts.
The Trustees considered each sub-advisor’s fee schedule, the anticipated effect of asset growth on each Fund’s expenses, and other information that might suggest the potential for realizing economies of scale that could be shared with Fund shareholders. In this regard, the Trustees noted that certain of the Sub-Advisory Agreements’ fee schedules contain breakpoints that present potential economies of scale that could potentially be shared with the Sub-Advised Funds’ shareholders as assets of the Sub-Advised Funds grow.
The Trustees concluded that the fees to be paid to each Sub-Advisor by AssetMark are reasonable in light of the services performed for the Sub-Advised Funds by the Sub-Advisors and that the economies of scale being realized by the Sub-Advisors, if any, do not mandate the implementation of any new or amended breakpoints or other changes in the fee structure for any Sub-Advised Fund at this time.
The Trustees did not consider the profitability of the Sub-Advisors to be a material factor based on representations from AssetMark that it negotiates sub-advisory fees with the Sub-Advisors on an arm’s-length basis.
The Trustees considered the allocation (if any) of Fund brokerage to brokers affiliated with a Sub-Advisor, and benefits to the Sub-Advisors from the use of “soft dollar” commissions (if any) to pay for research and brokerage services. The Trustees also considered any other ancillary benefits that accrue to a Sub-Advisor or any affiliate by virtue of the Sub-Advisor’s relationship with the Fund, and concluded that such benefits, if any, were reasonable.
183
GuideMark® Funds & GuidePath® Funds
ADDITIONAL INFORMATION (Continued)
March 31, 2017
Conclusion
After consideration of the foregoing factors, and such other matters as were deemed relevant, and with no single factor being determinative to their decision, the Trustees, including all of the independent Trustees, concluded to approve the renewal of the Sub-Advisory Agreement with, and the fees to be paid to, each of the Sub-Advisors for each of the relevant Sub-Advised Funds.
184
GuideMark® Funds
GuidePath® Funds
GUIDEMARK® FUNDS & GUIDEPATH® FUNDS
GuideMark® Large Cap Core Fund
GuideMark® Emerging Markets Fund
GuideMark® Small/Mid Cap Core Fund
GuideMark® World ex-US Fund
GuideMark® Opportunistic Equity Fund
GuideMark® Core Fixed Income Fund
GuideMark® Tax-Exempt Fixed Income Fund
GuideMark® Opportunistic Fixed Income Fund
GuidePath® Growth Allocation Fund
GuidePath® Conservative Allocation Fund
GuidePath® Tactical Allocation Fund
GuidePath® Absolute Return Allocation Fund
GuidePath® Multi-Asset Income Allocation Fund
GuidePath® Flexible Income Allocation Fund
GuidePath® Managed Futures Strategy Fund
Investment Advisor
AssetMark, Inc.
1655 Grant Street, 10th Floor
Concord, CA 94520
Legal Counsel
Stradley Ronon Stevens & Young, LLP
2005 Market Street, Suite 2600
Philadelphia, PA 19103
Independent Registered Public Accounting Firm
Cohen & Company, Ltd.
1350 Euclid Avenue, Suite 800
Cleveland, OH 44115
Transfer Agent, Fund Accountant and Fund Administrator
U.S. Bancorp Fund Services, LLC
615 East Michigan Street
Milwaukee, WI 53202
Custodians
U.S. Bank, N.A.
1555 North RiverCenter Drive, Suite 302
Milwaukee, WI 53212
BNY Mellon Asset Servicing
One Wall Street
New York, NY 10286
Distributor
AssetMark BrokerageTM, LLC
1655 Grant Street, 10th Floor
Concord, CA 94520
This document must be preceded or accompanied by a free prospectus. Investors should consider the Funds’ investment objectives, risks, charges and expenses carefully before investing. The prospectus contains this and other important information about the Funds. Please read the prospectus carefully before you invest or send money.
Annual Report
March 31, 2017
Item 2. Code of Ethics.
The registrant has adopted a code of ethics that applies to the registrant’s principal executive officer and principal financial officer. The registrant has not made any amendments to its code of ethics during the period covered by this report. The registrant has not granted any waivers from any provisions of the code of ethics during the period covered by this report.
A copy of the registrant’s Code of Ethics is filed herewith.
Item 3. Audit Committee Financial Expert.
The registrant’s board of trustees has determined that there is at least one audit committee financial expert serving on its audit committee. Dennis Schmal is the “audit committee financial expert” and is considered to be “independent” as each term is defined in Item 3 of Form N-CSR.
Item 4. Principal Accountant Fees and Services.
For the fiscal year ended March 31, 2017, the registrant’s principal accountant billed the registrant $124,000 for professional services rendered for the audit of the registrant’s annual financial statements or services that are normally provided by the principal accountant in connection with statutory and regulatory filings or engagements.
For the fiscal year ended March 31, 2016, the registrant’s principal accountant billed the registrant $124,000 for professional services rendered for the audit of the registrant’s annual financial statements or services that are normally provided by the principal accountant in connection with statutory and regulatory filings or engagements.
None.
For the fiscal year ended March 31, 2017, the registrant’s principal accountant billed the registrant $31,000 for professional services rendered for tax compliance, tax advice and tax planning.
For the fiscal year ended March 31, 2016, the registrant’s principal accountant billed the registrant $31,000 for professional services rendered for tax compliance, tax advice and tax planning.
None.
1
| | |
| (e) (1) | | The registrant’s audit committee charter provides that the audit committee is responsible for the approval, prior to appointment, of the engagement of auditors annually to audit and to provide their opinion on the registrant’s financial statements. The audit committee charter also provides that the audit committee is responsible for the approval, prior to appointment, of the engagement of the auditor to provide other audit services to the registrant or to provide non-audit services to the registrant, its investment adviser or any entity controlling, controlled by, or under common control with the investment adviser that provides ongoing services to the registrant, if the engagement relates directly to the operations and financial reporting of the registrant. |
| |
| (e) (2) | | There were no services in paragraphs (b) through (d) above (including services required to be approved by the audit committee pursuant to paragraph (c)(7)(ii) of Rule 2-01 of Regulation S-X) that were approved pursuant to the waiver provision of paragraph (c)(7)(i)(C) of Rule 2-01 of Regulation S-X. |
| (f) | None of the hours expended on the principal accountant’s engagement to audit the registrant’s financial statements for the fiscal year ended March 31, 2017 were attributable to work performed by persons other than the principal accountant’s full-time, permanent employees. |
| (g) | The aggregate non-audit fees billed by the registrant’s principal accountant for services rendered to the registrant’s investment adviser and any entity controlling, controlled by, or under common control with the investment adviser that provides ongoing services to the registrant for the fiscal years ended March 31, 2017 and March 31, 2016, were $0 and $0, respectively. |
| (h) | The registrant’s audit committee has considered whether the provision of non-audit services that were rendered to the registrant’s investment adviser, and any entity controlling, controlled by, or under common control with the investment adviser that provides ongoing services to the registrant, that were not pre-approved pursuant to paragraph (c)(7)(ii) of Rule 2-01 of Regulation S-X is compatible with maintaining the principal accountant’s independence. |
Item 5. Audit Committee of Listed Registrants.
Not applicable to registrants who are not listed issuers (as defined in Rule 10A-3 under the Securities Exchange Act of 1934).
Item 6. Investments.
Schedule of Investments is included as part of the report to shareholders filed under Item 1 of this Form.
Item 7. Disclosure of Proxy Voting Policies and Procedures for Closed-End Management Investment Companies.
Not applicable to open-end investment companies.
Item 8. Portfolio Managers of Closed-End Management Investment Companies.
Not applicable to open-end investment companies.
2
Item 9. Purchases of Equity Securities by Closed-End Management Investment Company and Affiliated Purchasers.
Not applicable to open-end investment companies.
Item 10. Submission of Matters to a Vote of Security Holders.
None.
Item 11. Controls and Procedures.
| (a) | The Registrant’s President/Principal Executive Officer and Treasurer/Principal Financial Officer have reviewed the Registrant’s disclosure controls and procedures (as defined in Rule 30a-3(c) under the Investment Company Act of 1940 (the “Act”)) as of a date within 90 days of the filing of this report, as required by Rule 30a-3(b) under the Act and Rules 13a-15(b) or 15d-15(b) under the Securities Exchange Act of 1934. Based on their review, such officers have concluded that the disclosure controls and procedures are effective in ensuring that information required to be disclosed in this report is appropriately recorded, processed, summarized and reported and made known to them by others within the Registrant and by the Registrant’s service provider. |
| (b) | There were no changes in the Registrant’s internal control over financial reporting (as defined in Rule 30a-3(d) under the Act) that occurred during the second fiscal quarter of the period covered by this report that has materially affected, or is reasonably likely to materially affect, the Registrant’s internal control over financial reporting. |
Item 12. Exhibits.
| (a) | (1) Any code of ethics or amendment thereto, that is the subject of the disclosure required by Item 2, to the extent that the registrant intends to satisfy Item 2 requirements through filing an exhibit. Filed herewith. |
(2) A separate certification for each principal executive and principal financial officer pursuant to Section 302 of the Sarbanes-Oxley Act of 2002. Filed herewith.
(3) Any written solicitation to purchase securities under Rule 23c-1 under the Investment Company Act of 1940 sent or given during the period covered by the report by or on behalf of the registrant to 10 or more persons. Not applicable.
| (b) | Certifications pursuant to Section 906 of the Sarbanes-Oxley Act of 2002. Furnished herewith. |
3
SIGNATURES
Pursuant to the requirements of the Securities Exchange Act of 1934 and the Investment Company Act of 1940, the registrant has duly caused this report to be signed on its behalf by the undersigned, thereunto duly authorized.
| | | | |
| |
| By (Signature and Title) | | /s/ Carrie Hansen |
| | Carrie E. Hansen, Principal Executive Officer/President |
Pursuant to the requirements of the Securities Exchange Act of 1934 and the Investment Company Act of 1940, this report has been signed below by the following persons on behalf of the registrant and in the capacities and on the dates indicated.
| | | | |
| By (Signature and Title) | | /s/ Carrie Hansen | | |
| | Carrie E. Hansen, Principal Executive Officer/President | | |
| | | | |
| By (Signature and Title) | | /s/ Patrick Young | | |
| | Patrick R Young, Principal Financial Officer/Treasurer | | |
4