As filed with the Securities and Exchange Commission on June 5, 2014
UNITED STATES
SECURITIES AND EXCHANGE COMMISSION
Washington, D.C. 20549
FORM N-CSR
CERTIFIED SHAREHOLDER REPORT OF REGISTERED
MANAGEMENT INVESTMENT COMPANIES
Investment Company Act file number 811-10267
GPS Funds I
(Exact name of registrant as specified in charter)
1655 Grant Street, 10th Floor
Concord, CA 94520
(Address of principal executive offices) (Zip code)
Patrick R. Young
AssetMark, Inc.
1655 Grant Street, 10th Floor
Concord, CA 94520
(Name and address of agent for service)
800-664-5345
Registrant’s telephone number, including area code
Date of fiscal year end: March 31, 2014
Date of reporting period: April 1, 2013 through March 31, 2014
Item 1. Reports to Stockholders.
| | | | | |
| | | GuideMarkSM Funds | |
| | | GuidePathSM Funds | |
| | | | |
| | | Investment Advisor | |
| | | AssetMark, Inc. | |
| | | | | |
| | | | | |
| | ANNUAL REPORT | | | |
| | | | | |
| | | | | |
| | March 31, 2014 | | | |
| | | | | |
| | | | | |
| | | | | |
| | GUIDEMARKSM LARGE CAP GROWTH FUND | | | |
| | | | | |
| | GUIDEMARKSM LARGE CAP VALUE FUND | | | |
| | | | | |
| | GUIDEMARKSM SMALL/MID CAP CORE FUND | | | |
| | | | | |
| | GUIDEMARKSM WORLD EX-US FUND | | | |
| | | | | |
| | GUIDEMARKSM OPPORTUNISTIC EQUITY FUND | | | |
| | | | | |
| | GUIDEMARKSM GLOBAL REAL RETURN FUND | | | |
| | | | | |
| | GUIDEMARKSM CORE FIXED INCOME FUND | | | |
| | | | | |
| | GUIDEMARKSM TAX-EXEMPT FIXED INCOME FUND | | | |
| | | | | |
| | GUIDEMARKSM OPPORTUNISTIC FIXED INCOME FUND | | | |
| | | | | |
| | GUIDEPATHSM STRATEGIC ASSET ALLOCATION FUND | | | |
| | | | | |
| | GUIDEPATHSM TACTICAL CONSTRAINEDSM ASSET ALLOCATION FUND | | |
| | | | | |
| | GUIDEPATHSM TACTICAL UNCONSTRAINEDSM ASSET ALLOCATION FUND | | |
| | | | | |
| | GUIDEPATHSM ABSOLUTE RETURN ASSET ALLOCATION FUND | | |
| | | | | |
| | GUIDEPATHSM MULTI-ASSET INCOME ASSET ALLOCATION FUND | | |
| | | | | |
| | GUIDEPATHSM FIXED INCOME ALLOCATION FUND | | |
| | | | | |
| | GUIDEPATHSM ALTEGRIS® DIVERSIFIED ALTERNATIVES ALLOCATION FUND | | |
| | | | | |
| | | | | |
May 29, 2014
Dear Shareholder:
Enclosed is the Annual Report for the GuideMark® and GuidePath® Funds covering the period from April 1, 2013 through March 31, 2014.
Market Review
The last twelve-month period started off with great attention being paid to Federal Reserve Chair Ben Bernanke’s comments regarding a potential change in quantitative easing policy. His comments had a significant impact on the fixed income markets as the yield on the 10-year Treasury note rose over 60 basis points1 immediately following his announcement, impacting fixed income sectors around the globe. As we closed the period, attention again was focused on the Federal Reserve as Janet Yellen took over as Chair. The markets perceived a somewhat more hawkish stance, especially when Ms. Yellen indicated that the Fed could incorporate a slightly more aggressive timeline for interest rate increases. These comments initially triggered a decline in equity markets and a rise in shorter-term bond yields. However, markets responded more favorably on March 31, as Ms. Yellen reiterated the Fed’s commitment to keeping interest rates low to support the economy and labor market.
Over the twelve months ended March 31, 2014 we saw more than a 20 percentage point difference in performance between equities and fixed income. This was significant and unusual. The S&P 500® Index, a broad measure of US equities, was up 21.9% versus the Barclays US Aggregate Bond Index, a broad measure of US fixed income market, which was down -0.1%.2
2013 was quite an extraordinary year for the US equity market. The Dow Jones Industrial Average, for example, hit 52 all-time highs in 2013 — the most since 1996 when reviewed across its 100-year history.3 The S&P® 500 had its best year since 2000, and its 11th best year since 1926.4 The strength seen in the US equity market was broad-based for the twelve-month period ended March 2014. Regardless of style or market cap, all the major US equity indices were up over 20%, including the Russell 3000,® the broadest market indicator, returning 22.6% for the period. Continued recovery in the US economy, combined with improved investor sentiment, helped drive stocks higher.
The strength of the US market was a large driver of the returns achieved globally. The international developed market equities, as represented by the MSCI EAFE Index, were up 18.1% for the twelve months ended March 31, 2014, lagging the US markets. Europe benefited from signs of continued economic recovery, as well as the potential for additional stimulus from the European Central Bank. Conversely, Japan weighed on international markets amid concerns about the effectiveness of policy measures, in light of a strengthening yen and an increase in the sales tax. Emerging markets, as represented by the MSCI Emerging Markets Index, saw a negative return of -1.1% over the twelve months. Capital flow and inflation concerns weighed more heavily on certain countries, such as Brazil and India. Slowing economic growth in China and the heightened tensions between Russia and Ukraine over Crimea also weighed on the emerging markets.
Currency shifts relative to the US dollar affected the returns achieved internationally. In the developed markets, a weakening US dollar helped returns by adding over 2% for the period, while in the emerging markets a strengthening US dollar hurt returns by detracting over 4% for the period.5
Real estate and commodities rebounded strongly in the first quarter of 2014, but weakness in 2013 led to lower returns over the full twelve months. The FTSE NAREIT All Equity Index returned 3.3% for the period as a result of the Fed’s announced pullback from bond purchases, which caused a rise in interest rates, as well as the tame inflation readings in the US. The Dow UBS Commodity Index returned -2.1%, impacted by higher supplies and lower demand, especially with the slowing growth in China. Gold was also a large drag to commodities, plummeting nearly -30% in 2013.6
In 2013, the fixed income markets saw one of their worst years since 1999. This weakness significantly impacted the twelve-month return. The “taper tantrum” that occurred in the summer was the key driver of the rise in yields that weighed heavily on government-related sectors. The Barclays US Treasury Index returned -1.3% for the twelve months, while the Barclays US Credit Index returned 1.0% as corporate credit benefited from the improving economic environment. Lower quality credit, as represented by the Barclays US Corporate High Yield Index, provided the strongest return at 7.5%, aided by the improving
fundamentals and the sector’s equity market sensitivity. Treasury inflation protected securities (TIPS) were significantly impacted by both the increase in yields, due to their longer-maturities and the benign inflation environment, returning -6.5% for the twelve-month period.
International bonds outperformed the US domestic bond market over the twelve months due to a strong start to 2014. The Barclays Global Treasury ex-US Index gained 3.1% on strength in the yen in the first quarter of 2014, boosting the twelve-month return to 3.2%. Emerging market bonds also rebounded during the first quarter, with gains in several countries and currencies, allowing the BofA Merrill Lynch Emerging Market Sovereign and Corporate Index twelve-month return to move into positive territory at 2.7%.
The municipal bond market outperformed the taxable fixed income market by almost 50 basis points, with the Barclays Municipal Bond Index returning 0.4% for the twelve months. A strong start to 2014 moved the index into positive territory, following weakness seen in 2013 as a result of fears related to Puerto Rico’s financial troubles and Detroit’s filing for bankruptcy.
GuideMark and GuidePath Funds Review
The turbulence of the first quarter of 2014 created some headwinds for several GuideMark Funds following strong returns in 2013 as the focus of the market moved toward rewarding fundamentals. The Large Cap Value and Opportunistic Equity Funds were lifted by solid stock selection across multiple sectors. The Large Cap Growth and Small/Mid Cap Core Funds’ returns were dampened by their exposure to companies with market capitalizations towards the higher end of their respective ranges. Exposure to Russia in particular hurt the returns of the World ex-US Fund, as did security selection. Maintaining some exposure to longer-term Treasuries and TIPS weakened the results of the Core Fixed Income Fund, while exposure to below investment grade securities detracted from the results for the Tax-Exempt Fixed Income Fund. Currency positioning was the largest drag on the returns achieved by the Opportunistic Fixed Income Fund, outweighing the positive contribution from credit selection. The Global Real Return Fund benefited from its more diversified exposure to commodities, global natural resources and REITs.
The GuidePath Funds faced some challenges over the period, especially with the strength seen in the US equity market. Diversification into international equities, including emerging markets, led to weakness in performance by the Strategic, Tactical Constrained® and Multi-Asset Income Funds. The Tactical Unconstrained® Fund suffered with the turbulent market environment and rapid reversals that were an issue for trend-following strategies. The Absolute Return Fund benefited with some equity sensitivity along with its favoring of the credit sensitive sectors within fixed income, while the Fixed Income Fund saw returns dampened from its longer duration positions and exposure to TIPS. The Altegris® Diversified Alternatives Fund experienced weakness due to its exposure to trend-following managed futures strategies and global macro strategies.
Looking Ahead
Entering 2014, the outlook for equities was somewhat mixed, given the extended rising market and elevated valuations in US stocks. Volatility spiked in late January and early February as equity markets declined in view of an uncertain global growth outlook, particularly for China. At the same time, current account deficits contributed to a broader selloff in emerging markets. What followed, however, confounded many market observers who were bracing for a significant market correction. Global equity markets rebounded later in February and March, lifting broad equity indices into positive territory for the year.
The outlook for bonds and inflation-oriented assets was also uncertain following a weak 2013, where long-term Treasuries and commodities were among the worst performing asset classes. Similarly, REITs lagged equities by wide margins during 2013 due, in part, to concerns over their interest-rate sensitivity. Nonetheless, market leadership shifted during the first quarter as long-term Treasuries, commodities and REITs all posted strong gains to start the year. This reversal provided a reminder of the value of diversification, and the potential benefits of holding a portion of one’s portfolio more defensive-oriented asset classes in view of market uncertainties.
Looking ahead, there are bright spots, with continued economic progress across many developed markets, led by the US. This progress has served to lessen some of the downside risks, as we are now five years removed from the market bottom of March 2009. The past five years saw an extraordinary rally in the US equity markets, resulting in the second best five-year return since World War II.7 Some question whether this trend can continue, especially given the level of valuations. Additionally, new risks have emerged with the Crimean crisis and intensifying concerns over China’s longer-term growth prospects.
Please contact your financial advisor to discuss any questions about your investment strategy or changes in your financial goals. We thank you for including the Funds in your portfolio and appreciate the trust you have placed in us.
Sincerely,

Carrie E. Hansen
Trustee, Chairperson and President of the Funds
The AssetMark platform provides fee-based investment advisory programs. Investors are advised to refer to the appropriate Disclosure Brochure, which can be obtained from your financial advisor, for a full description of services provided, including all applicable fees.
AssetMark, Inc. is an investment advisor registered with the Securities and Exchange Commission.
Index Definitions
The Barclays Global Treasury ex-US Index tracks fixed-rate, local currency government debt of investment grade countries, including both developed and emerging markets excluding the US.
The Barclays US Aggregate Bond Index is a broad-based index that measures the investment grade, US dollar-denominated, fixed rate taxable bond market, including Treasuries, government-related and corporate securities, mortgage- and asset-backed securities. All securities contained in the Barclays US Aggregate Bond Index have a minimum term to maturity of one year.
The Barclays US Corporate High Yield Index measures the market of US dollar-denominated, non-investment grade, fixed-rate, taxable corporate bonds.
The Barclays US Credit Index comprises the US Corporate Index and a non-corporate component that includes foreign agencies, sovereigns, supranationals and local authorities.
The Barclays US Treasury Index includes public obligations of the US Treasury. Treasury bills are excluded by the maturity constraint. In addition, certain special issues, TIPS, and STRIPS are excluded.
The Barclays US TIPS Index includes all publicly issued US Treasury inflation-protected securities that have at least one year remaining to maturity, are rated investment grade, and have $250 million or more of outstanding face value.
The Barclays Municipal Bond Index is a market-value-weighted index for the long-term tax-exempt bond market. The index has four main sectors: state and local general obligation bonds, revenue bonds, insured bonds, and pre-refunded bonds.
The BofA Merrill Lynch Emerging Market Sovereign and Corporate Index tracks the performance of US dollar and euro denominated emerging market and crossover sovereign, quasi-government and corporate debt.
The Dow Jones Industrial Average is a price-weighted measure of 30 US blue chip companies, covering all industries with the exception of transportation and utilities.
The Dow Jones UBS Commodity Index is composed of futures contracts of physical commodities traded on US exchanges, with the exception of aluminum, nickel and zinc, which trade on the London Metal Exchange (LME). Weighting restrictions on individual commodities and commodity groups promote diversification.
The FTSE NAREIT All Equity REITs Index includes US publicly traded REITs. Equity REITs include those firms that own, manage and lease investment-grade commercial real estate. Specifically, a company is classified as an equity REIT if 75% or more of its gross invested book assets are invested in real property.
The MSCI EAFE (Europe, Australasia, Far East) Index measures the equity market performance of countries considered to represent developed markets, excluding the US and Canada.
The MSCI Emerging Markets Index measures the equity market performance of countries considered to represent emerging markets.
The Russell 3000® Index is an unmanaged index that measures the performance of the largest 3000 US companies, representing approximately 98% of the investable US equity market.
The S&P 500® Index focuses on the large cap segment of the US equity market. It includes 500 leading companies in leading industries of the US economy, capturing approximately 75% coverage of US equities.
| 1 | Source: Ned Davis Research |
| | |
| 2 | All index returns are sourced from Morningstar |
| | |
| 3 | Source: Ned Davis Research |
| | |
| 4 | Source: Ned Davis Research |
| | |
| 5 | Source: MSCI Barra |
| | |
| 6 | Source: Morningstar |
| | |
| 7 | Source: Ned Davis Research |
FX 2014-0522-0255
GuideMarkSM Large Cap Growth Fund
MANAGER’S DISCUSSION OF FUND PERFORMANCE (Unaudited)
TOTAL RETURN BASED ON A $10,000 INVESTMENT
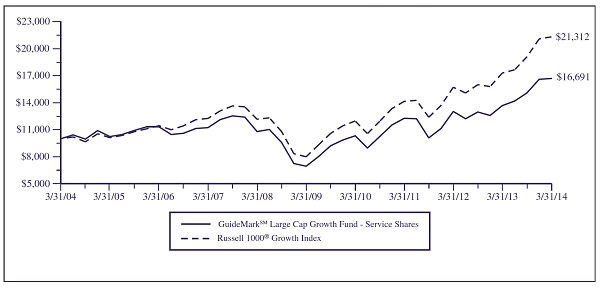
This chart assumes an initial gross investment of $10,000 made on March 31, 2004. Returns shown include the reinvestment of all dividends. Returns shown do not reflect the deduction of taxes that a shareholder would pay on Fund distributions or the redemption of Fund shares. In the absence of fee waivers and reimbursements, when they are necessary to keep expenses at the expense cap, total return would be reduced. Past performance is not predictive of future performance. Investment return and principal value will fluctuate so that your shares, when redeemed, may be worth more or less than the original cost. Index returns do not reflect the effects of fees or expenses. It is not possible to invest directly in an index.
RUSSELL 1000® GROWTH INDEX – An unmanaged index which measures the performance of those Russell 1000® companies with higher price-to-book ratios and higher forecasted growth values. The Russell 1000® Index is an unmanaged index which measures the performance of the 1,000 largest companies in the Russell 3000® Index. The Russell 3000® Index is an unmanaged index which measures the performance of the 3,000 largest US Companies, based on total market capitalization, which represents approximately 98% of the investable US equity market.
AVERAGE ANNUAL TOTAL RETURN (for periods ended March 31)
| | | One Year | | Five Year | | Ten Year | | Since Inception(1) | |
| GuideMarkSM Large Cap Growth Fund | | | | | | | | | | | | | |
| Service Shares | | 22.04 | % | | 19.16 | % | | 5.26 | % | | 3.05 | % | |
| Institutional Shares | | 22.81 | % | | N/A | | | N/A | | | 10.58 | % | |
| Russell 1000® Growth Index | | 23.22 | % | | 21.68 | % | | 7.86 | % | | 5.01 | %(2) | |
| (1) | Inception date is 6/29/01 for Service Shares and 4/29/11 for Institutional Shares. |
| | |
| (2) | The return shown for the Russell 1000® Growth Index is from the inception date of the Service Shares. The Russell 1000® Growth Index return from the inception date of the Institutional Shares is 13.75%. |
GuideMarkSM Large Cap Growth Fund
MANAGER’S DISCUSSION OF FUND PERFORMANCE (Continued) (Unaudited)
| • | For the 12 months ended March 2014, the Fund returned 22.04%, underperforming the Russell 1000® Growth Index at 23.22%. |
| | |
| • | The Fund underperformed its benchmark over the period due to security selection across multiple sectors. The Fund’s larger market capitalization was also a headwind as smaller companies continued to gain momentum over the trailing 12-month period. |
| | |
| • | An overweight to Technology combined with security selection within the sector was a significant driver of the relative performance over the period. Among the worst performers, two were semiconductor companies – Altera Corp. and Broadcom Corporation. Shares of Altera Corp. traded lower due to increasing competitive pressure while Broadcom Corporation reported lower margins. |
| | |
| • | One of the top performing securities in the portfolio was also within the Technology sector – IAC/InterActive Corp., a media and internet company. Shares of IAC/InterActive Corp. rose after the company announced it was reorganizing the firm, which could unlock shareholder value going forward. |
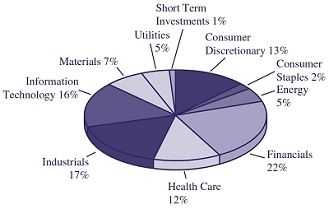
Components of Portfolio Holdings*
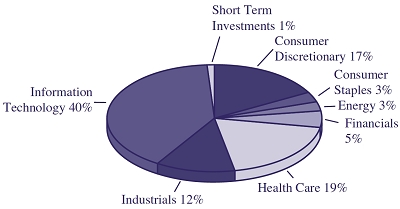
*Pie chart represents percentages of total portfolio, less securities lending collateral.
Top Ten Holdings
| Rank | | Security/Holding | | % of Net Assets |
| 1 | | | Microsoft Corp. | | 5.22 | |
| 2 | | | Google, Inc. | | 4.24 | |
| 3 | | | Oracle Corp. | | 3.40 | |
| 4 | | | QUALCOMM, Inc. | | 2.43 | |
| 5 | | | Amgen, Inc. | | 2.28 | |
| 6 | | | Apple, Inc. | | 2.05 | |
| 7 | | | United Technologies Corp. | | 1.91 | |
| 8 | | | Visa, Inc. | | 1.89 | |
| 9 | | | Facebook, Inc. | | 1.89 | |
| 10 | | | Comcast Corp. | | 1.70 | |
The Global Industry Classification Standard (“GICS®”) was developed by and/or is the exclusive property of MSCI, Inc. (“MSCI”) and Standard & Poor’s Financial Services LLC (“S&P”). GICS is a service mark of MSCI and S&P, and has been licensed for use by U.S. Bancorp Fund Services, LLC.
GuideMarkSM Large Cap Value Fund
MANAGER’S DISCUSSION OF FUND PERFORMANCE (Unaudited)
TOTAL RETURN BASED ON A $10,000 INVESTMENT
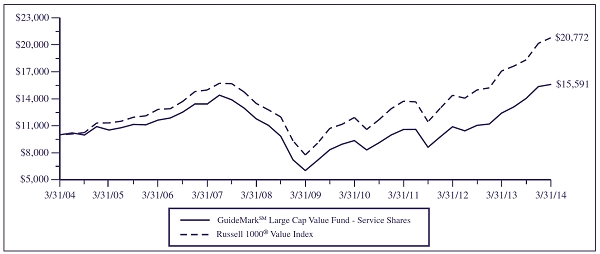
This chart assumes an initial gross investment of $10,000 made on March 31, 2004. Returns shown include the reinvestment of all dividends. Returns shown do not reflect the deduction of taxes that a shareholder would pay on Fund distributions or the redemption of Fund shares. In the absence of fee waivers and reimbursements, when they are necessary to keep expenses at the expense cap, total return would be reduced. Past performance is not predictive of future performance. Investment return and principal value will fluctuate so that your shares, when redeemed, may be worth more or less than the original cost. Index returns do not reflect the effects of fees or expenses. It is not possible to invest directly in an index.
RUSSELL 1000® VALUE INDEX – An unmanaged index which measures the performance of those Russell 1000® companies with lower price-to-book ratios and lower forecasted growth values. The Russell 1000® Index is an unmanaged index which measures the performance of the 1,000 largest companies in the Russell 3000® Index. The Russell 3000® Index is an unmanaged index which measures the performance of the 3,000 largest US Companies, based on total market capitalization, which represents approximately 98% of the investable US equity market.
AVERAGE ANNUAL TOTAL RETURN (for periods ended March 31)
| | | One Year | | Five Year | | Ten Year | | Since Inception(1) | |
| GuideMarkSM Large Cap Value Fund | | | | | | | | | | | | | |
| Service Shares | | 25.63 | % | | 20.96 | % | | 4.54 | % | | 4.22 | % | |
| Institutional Shares | | 26.38 | % | | N/A | | | N/A | | | 13.83 | % | |
| Russell 1000® Value Index | | 21.57 | % | | 21.75 | % | | 7.58 | % | | 6.56 | % | |
| (1) | Inception date is 6/29/01 for Service Shares and 4/29/11 for Institutional Shares. |
| | |
| (2) | The return shown for the Russell 1000® Value Index is from the inception date of the Service Shares. The Russell 1000® Value Index return from the inception date of the Institutional Shares is 14.19%. |
GuideMarkSM Large Cap Value Fund
MANAGER’S DISCUSSION OF FUND PERFORMANCE (Continued) (Unaudited)
| • | For the 12 months ended March 2014, the Fund returned 25.63%, outperforming the Russell 1000® Value Index at 21.57%. |
| | |
| • | A combination of security selection was the primary factor in the outperformance over the period. Sector positioning, the result of bottom up security selection rather than any top-down decisions, was also additive. |
| | |
| • | Security selection within the Financials sector was the largest driver of the relative outperformance over the period. Exposure to consumer related financials such as Capital One Financial Corp. was beneficial as these financial companies benefited from the deleveraging of U.S. households. |
| | |
| • | An underweight allocation to the Utilities sector was a positive contributor to the Fund’s performance for the period. Higher yielding and more defensive sectors fell out of favor with investors as a result of improving market sentiment and economic outlook for the U.S. |
Components of Portfolio Holdings*
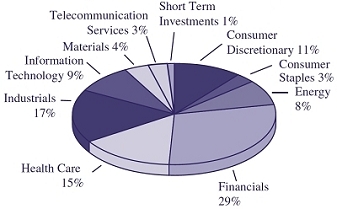
*Pie chart represents percentages of total portfolio, less securities lending collateral.
Top Ten Holdings
| Rank | | Security/Holding | | % of Net Assets |
| 1 | | | Citigroup, Inc. | | 2.45 | |
| 2 | | | Capital One Financial Corp. | | 2.42 | |
| 3 | | | Bank of America Corp. | | 2.35 | |
| 4 | | | JPMorgan Chase & Co. | | 2.28 | |
| 5 | | | Wells Fargo & Co. | | 2.20 | |
| 6 | | | SLM Corp. | | 1.94 | |
| 7 | | | Medtronic, Inc. | | 1.87 | |
| 8 | | | Verizon Communications, Inc. | | 1.75 | |
| 9 | | | Royal Caribbean Cruises Ltd. | | 1.69 | |
| 10 | | | Texas Instruments, Inc. | | 1.67 | |
GuideMarkSM Small/Mid Cap Core Fund
MANAGER’S DISCUSSION OF FUND PERFORMANCE (Unaudited)
TOTAL RETURN BASED ON A $10,000 INVESTMENT
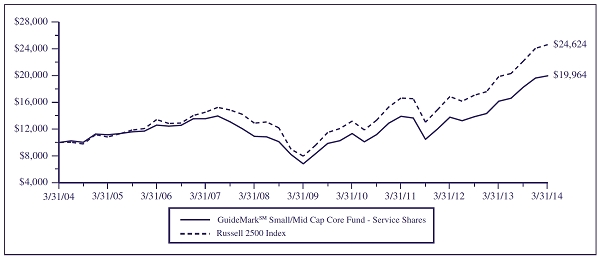
This chart assumes an initial gross investment of $10,000 made on March 31, 2004. Returns shown include the reinvestment of all dividends. Returns shown do not reflect the deduction of taxes that a shareholder would pay on Fund distributions or the redemption of Fund shares. In the absence of fee waivers and reimbursements, when they are necessary to keep expenses at the expense cap, total return would be reduced. Past performance is not predictive of future performance. Investment return and principal value will fluctuate so that your shares, when redeemed, may be worth more or less than the original cost. Index returns do not reflect the effects of fees or expenses. It is not possible to invest directly in an index.
RUSSELL 2500TM INDEX – Measures the performance of the small- to mid-cap segment of the US equity universe, commonly referred to as “smid” cap. The Russell 2500TM Index is a subset of the Russell 3000® Index. The Russell 2500TM Index includes approximately 2,500 of the smallest securities based on a combination of their market cap and current index membership.
AVERAGE ANNUAL TOTAL RETURN (for periods ended March 31)
| | | One Year | | Five Year | | Ten Year | | Since Inception(1) | |
| GuideMarkSM Small/Mid Cap Core Fund | | | | | | | | | | | | | |
| Service Shares | | 23.49 | % | | 23.99 | % | | 7.16 | % | | 7.51 | % | |
| Institutional Shares | | 24.19 | % | | N/A | | | N/A | | | 12.55 | % | |
| Russell 2500TM Index | | 24.01 | % | | 25.33 | % | | 9.43 | % | | 9.11 | %(2) | |
| (1) | Inception date is 6/29/01 for Service Shares and 4/29/11 for Institutional Shares. |
| | |
| (2) | The return shown for the Russell 2500TM Index is from the inception date of the Service Shares. The Russell 2500TM Index return from the inception date of the Institutional Shares is 13.23%. |
GuideMarkSM Small/Mid Cap Core Fund
MANAGER’S DISCUSSION OF FUND PERFORMANCE (Continued) (Unaudited)
| • | For the 12 months ended March 2014, the Fund returned 23.49%, underperforming the Russell 2500TM Index at 24.01%. |
| | |
| • | Exposure to higher quality companies with larger market capitalizations was a detractor over the period, as the market tilted in favor of the smaller companies with more momentum. Security selection in the second half of the period dampened relative performance. |
| | |
| • | In the second half of the period, exposure to homebuilders within the Consumer Discretionary sector and indirect exposure to homebuilders within the Industrials sector detracted from performance. Not owning Tesla Motors, Inc., a manufacturer of luxury electric cars, was a detractor as the stock continued to trade higher due to better than expected financial results. |
| | |
| • | Not owning REITs within the Financials sector was additive to performance as REITs traded lower due to concerns that an increasing interest rate environment could slow margin growth in the future. |
Components of Portfolio Holdings*
*Pie chart represents percentages of total portfolio, less securities lending collateral.
Top Ten Holdings
| Rank | | Security/Holding | | % of Net Assets |
| 1 | | | Clean Harbors, Inc. | | 1.32 | |
| 2 | | | Graphic Packaging Holding Co. | | 1.15 | |
| 3 | | | Armstrong World Industries, Inc. | | 0.95 | |
| 4 | | | Owens Corning | | 0.94 | |
| 5 | | | Superior Energy Services, Inc. | | 0.88 | |
| 6 | | | Cheniere Energy, Inc. | | 0.86 | |
| 7 | | | Envision Healthcare Holdings, Inc. | | 0.84 | |
| 8 | | | WEX, Inc. | | 0.83 | |
| 9 | | | Rogers Corp. | | 0.81 | |
| 10 | | | Zions Bancorporation | | 0.80 | |
GuideMarkSM World ex-US Fund
MANAGER’S DISCUSSION OF FUND PERFORMANCE (Unaudited)
TOTAL RETURN BASED ON A $10,000 INVESTMENT
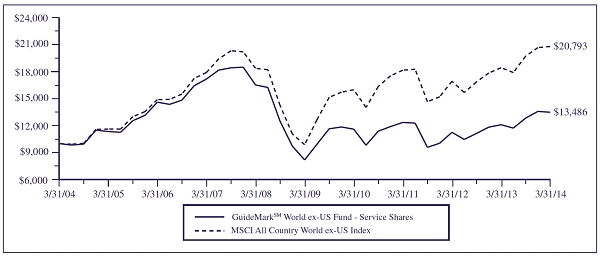
This chart assumes an initial gross investment of $10,000 made on March 31, 2004. Returns shown include the reinvestment of all dividends. Returns shown do not reflect the deduction of taxes that a shareholder would pay on Fund distributions or the redemption of Fund shares. In the absence of fee waivers and reimbursements, when they are necessary to keep expenses at the expense cap, total return would be reduced. Past performance is not predictive of future performance. Investment return and principal value will fluctuate so that your shares, when redeemed, may be worth more or less than the original cost. Index returns do not reflect the effects of fees or expenses. It is not possible to invest directly in an index.
MSCI ALL COUNTRY WORLD EX-US INDEX – The MSCI All Country World ex-USA index captures large and mid cap representation across 22 of 23 Developed Markets countries (excluding the US) and 21 Emerging Markets countries. With 1,824 constituents, the index covers approximately 85% of the global equity opportunity set outside the US. The Developed Markets countries include: Australia, Austria, Belgium, Canada, Denmark, Finland, France, Germany, Hong Kong, Ireland, Israel, Italy, Japan, Netherlands, New Zealand, Norway, Portugal, Singapore, Spain, Sweden, Switzerland and the UK. Emerging Markets countries include: Brazil, Chile, China, Columbia, Czech Republic, Egypt, Greece, Hungary, India, Indonesia, Korea, Malaysia, Mexico, Peru, Philippines, Poland, Russia, South Africa, Taiwan, Thailand and Turkey.
AVERAGE ANNUAL TOTAL RETURN (for periods ended March 31)
| | | One Year | | Five Year | | Ten Year | | Since Inception(1) | |
| GuideMarkSM World ex-US Fund | | | | | | | | | | | | | |
| Service Shares | | 11.47 | % | | 10.49 | % | | 3.04 | % | | 2.90 | % | |
| Institutional Shares | | 12.09 | % | | N/A | | | N/A | | | 2.08 | % | |
| MSCI All Country World ex-US Index | | 12.80 | % | | 16.04 | % | | 7.59 | % | | 7.25 | % | |
| (1) | Inception date is 6/29/01 for Service Shares and 4/29/11 for Institutional Shares. |
| | |
| (2) | The return shown for the MSCI All Country World ex-US Index is from the inception date of the Service Shares. The MSCI All Country World ex-US Index return from the inception date of the Institutional Shares is 3.03%. |
GuideMarkSM World ex-US Fund
MANAGER’S DISCUSSION OF FUND PERFORMANCE (Continued) (Unaudited)
| • | For the 12 months ended March 2014, the Fund returned 11.47%, underperforming the MSCI All Country World ex-US Index at 12.80%. |
| | |
| • | Six of the ten sectors contributed to performance, but that contribution was dampened by negative performance in the other four sectors, including Energy and Utilities. |
| | |
| • | An underweight exposure to the Spanish bank, Banco Santander, contributed to the relative underperformance. Banco Santander Brasil SA rallied during the period due to improving earnings as a result of lower write downs which offset some weakness in its Brazil segment. |
| | |
| • | Although exposures to Canada and Japan were additive over the period, some of that gain was dampened by the Fund’s exposures to Russia and Germany. In particular, the geopolitical risk in Crimea weighed heavily on Russian stocks towards the end of the period. |
Components of Portfolio Holdings*
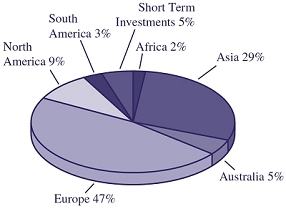
*Pie chart represents percentages of total portfolio, less securities lending collateral.
Top Ten Holdings
| Rank | | Security/Holding | | % of Net Assets |
| 1 | | | PowerShares India Portfolio | | 1.60 | |
| 2 | | | Roche Holding AG | | 1.40 | |
| 3 | | | Total SA | | 1.26 | |
| 4 | | | Nestle SA | | 1.16 | |
| 5 | | | Royal Dutch Shell Plc, Class A | | 1.14 | |
| 6 | | | Bayer AG | | 1.03 | |
| 7 | | | UBS AG | | 1.02 | |
| 8 | | | Toyota Motor Corp. | | 1.00 | |
| 9 | | | Rio Tinto Plc | | 0.96 | |
| 10 | | | Anheuser-Busch InBev SA | | 0.92 | |
GuideMarkSM Opportunistic Equity Fund
MANAGER’S DISCUSSION OF FUND PERFORMANCE (Unaudited)
TOTAL RETURN BASED ON A $10,000 INVESTMENT
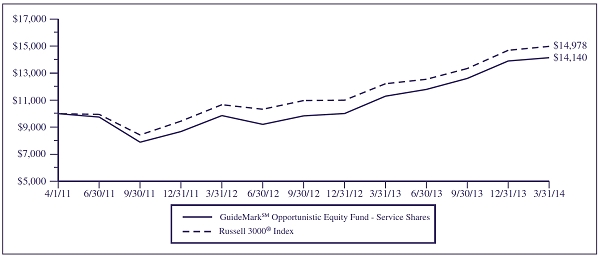
This chart assumes an initial gross investment of $10,000 made on April 1, 2011 (commencement of the Fund’s Service Shares operations). Returns shown include the reinvestment of all dividends. Returns shown do not reflect the deduction of taxes that a shareholder would pay on Fund distributions or the redemption of Fund shares. In the absence of fee waivers and reimbursements, when they are necessary to keep expenses at the expense cap, total return would be reduced. Past performance is not predictive of future performance. Investment return and principal value will fluctuate so that your shares, when redeemed, may be worth more or less than the original cost. Index returns do not reflect the effects of fees or expenses. It is not possible to invest directly in an index.
RUSSELL 3000® INDEX – Measures the performance of the largest 3,000 US companies representing approximately 98% of the investable US equity market.
AVERAGE ANNUAL TOTAL RETURN (for periods ended March 31)
| | | | | | | | | One Year | | Since Inception(1) | |
| GuideMarkSM Opportunistic Equity Fund | | | | | | | | | | | | | |
| Service Shares | | | | | | | | 25.20 | % | | 12.24 | % | |
| Institutional Shares | | | | | | | | 25.92 | % | | 12.43 | % | |
| Russell 3000® Index | | | | | | | | 22.61 | % | | 14.42 | %(2) | |
| (1) | Inception date is 4/1/11 for Service Shares and 4/29/11 for Institutional Shares. |
| | |
| (2) | The return shown for the Russell 3000® Index is from the inception date of the Service Shares. The Russell 3000® Index return from the inception date of the Institutional Shares is 13.88%. |
GuideMarkSM Opportunistic Equity Fund
MANAGER’S DISCUSSION OF FUND PERFORMANCE (Continued) (Unaudited)
| • | For the 12 months ended March 2014, the Fund returned 25.20%, outperforming the Russell 3000® Index at 22.61%. |
| | |
| • | Security selection was the primary driver of the relative performance for the 12-month period. The Fund’s modestly lower average market capitalization also contributed to the Fund’s performance. |
| | |
| • | The Fund’s overweight to the Financials sector, combined with security selection within the sector, contributed to relative performance. Specifically, exposure to large insurance companies that benefit from a rising rate environment and consumer related financials was beneficial. |
| | |
| • | Security selection within the Health Care sector contributed to relative outperformance for the period. The positive impact was broad based and included large pharmaceuticals as well as medical device manufacturers. |
Components of Portfolio Holdings*
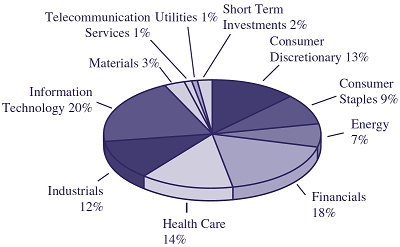
*Pie chart represents percentages of total portfolio, less securities lending collateral.
Top Ten Holdings
| Rank | | Security/Holding | | % of Net Assets |
| 1 | | | Apple, Inc. | | 3.00 | |
| 2 | | | International Business Machines Corp. | | 2.83 | |
| 3 | | | Microsoft Corp. | | 2.34 | |
| 4 | | | American International Group, Inc. | | 2.24 | |
| 5 | | | Willis Group Holdings Plc | | 2.20 | |
| 6 | | | Teva Pharmaceutical Industries Ltd. – ADR | | 2.13 | |
| 7 | | | United Technologies Corp. | | 2.09 | |
| 8 | | | Boston Scientific Corp. | | 1.86 | |
| 9 | | | Cimarex Energy Co. | | 1.84 | |
| 10 | | | PepsiCo, Inc. | | 1.80 | |
GuideMarkSM Global Real Return Fund
MANAGER’S DISCUSSION OF FUND PERFORMANCE (Unaudited)
TOTAL RETURN BASED ON A $10,000 INVESTMENT
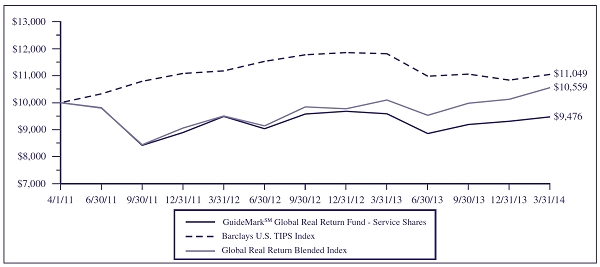
This chart assumes an initial gross investment of $10,000 made on April 1, 2011 (commencement of the Fund’s Service Shares operations). Returns shown include the reinvestment of all dividends. Returns shown do not reflect the deduction of taxes that a shareholder would pay on Fund distributions or the redemption of Fund shares. In the absence of fee waivers and reimbursements, when they are necessary to keep expenses at the expense cap, total return would be reduced. Past performance is not predictive of future performance. Investment return and principal value will fluctuate so that your shares, when redeemed, may be worth more or less than the original cost. Index returns do not reflect the effects of fees or expenses. It is not possible to invest directly in an index.
BARCLAYS US TIPS INDEX – Includes all publicly-issued, US Treasury inflation-protected securities that have at least one year remaining to maturity, are rated investment grade, and have $250 million or more of outstanding face value.
GLOBAL REAL RETURN BLENDED INDEX – A weighted combination of 20% of the total return from the Dow Jones-UBS Commodities Index, 35% of the total return from the S&P Natural Resources North American Index, 20% of the total return from the Dow Jones Global Select RESI Index and 25% of the total return from the Barclays Global Inflation Linked Bond Index. Returns are weighted on a 20/35/20/25 basis for each historical month and then the longer-term Blended Index returns are geometrically combined from these historical monthly returns to create aggregate returns (1-year, 3-years, 5-years, etc.) for the Blended Index.
AVERAGE ANNUAL TOTAL RETURN (for periods ended March 31)
| | | | | | | | | One Year | | Since Inception(1) | |
| GuideMarkSM Global Real Return Fund | | | | | | | | | | | | | |
| Service Shares | | | | | | | | -1.19 | % | | -1.78 | % | |
| Institutional Shares | | | | | | | | -0.66 | % | | -2.27 | % | |
| Barclays US TIPS Index | | | | | | | | -6.49 | % | | 3.38 | %(2) | |
| Global Real Return Blended Index | | | | | | | | 4.56 | % | | 1.83 | %(3) | |
| (1) | Inception date is 4/1/11 for Service Shares and 4/29/11 for Institutional Shares. |
| | |
| (2) | The return shown for the Barclays US TIPS Index is from the inception date of the Service Shares. The Barclays US TIPS Index return from the inception date of the Institutional Shares is 2.72%. |
| | |
| (3) | The return shown for the Global Real Return Blended Index is from the inception date of the Service Shares. The Global Real Return Blended Index return from the inception date of the Institutional Shares is 0.86%. |
GuideMarkSM Global Real Return Fund
MANAGER’S DISCUSSION OF FUND PERFORMANCE (Continued) (Unaudited)
| • | For the 12 months ended March 2014, the Fund returned -1.19%, outperforming the Barclays U.S. TIPS Index at -6.49% but underperforming its blended benchmark of 20% Dow Jones-UBS Commodities Index, 35% S&P North American Natural Resources Sector Index, 20% Dow Jones Global Select RESI Index, and 25% Barclays Global Inflation Linked Bonds Index, which returned 4.56%. |
| | |
| • | The Fund’s relative outperformance against its primary benchmark for the period was primarily the result of its underweight exposure to U.S. TIPS over the period. U.S. TIPS were one of the worst performing asset classes over the period due to a benign inflationary environment. |
| | |
| • | The Fund’s exposure to gold miners detracted from performance relative to both its primary and secondary benchmarks over much of the period. The spread between gold metal and gold miners remained above its historic average as a result of higher production costs and continued geopolitical risk in Africa. |
Components of Portfolio Holdings*
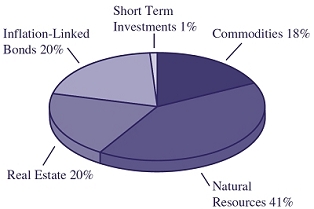
*Pie chart represents percentages of total portfolio, less securities lending collateral.
Top Ten Holdings
| Rank | | Security/Holding | | % of Net Assets |
| 1 | | | SPDR S&P Global Natural Resources ETF | | 29.17 | |
| 2 | | | PowerShares DB Commodity Index Tracking Fund | | 18.22 | |
| 3 | | | SPDR Barclays TIPS ETF | | 12.95 | |
| 4 | | | SPDR Dow Jones International Real Estate ETF | | 10.49 | |
| 5 | | | SPDR Dow Jones REIT ETF | | 9.52 | |
| 6 | | | SPDR DB International Government Inflation-Protected Bond ETF | | 7.53 | |
| 7 | | | SPDR Metals and Mining ETF | | 3.04 | |
| 8 | | | PowerShares Global Agriculture Portfolio | | 3.01 | |
| 9 | | | Energy Select Sector SPDR Fund | | 3.01 | |
| 10 | | | SPDR S&P International Energy Sector ETF | | 1.98 | |
GuideMarkSM Core Fixed Income Fund
MANAGER’S DISCUSSION OF FUND PERFORMANCE (Unaudited)
TOTAL RETURN BASED ON A $10,000 INVESTMENT
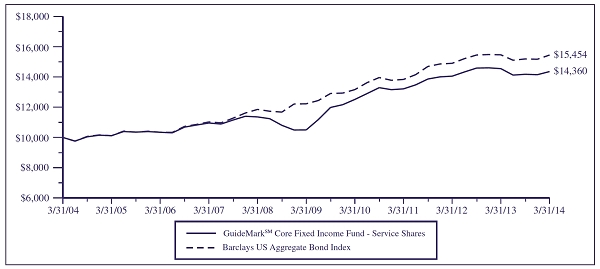
This chart assumes an initial gross investment of $10,000 made on March 31, 2004. Returns shown include the reinvestment of all dividends. Returns shown do not reflect the deduction of taxes that a shareholder would pay on Fund distributions or the redemption of Fund shares. In the absence of fee waivers and reimbursements, when they are necessary to keep expenses at the expense cap, total return would be reduced. Past performance is not predictive of future performance. Investment return and principal value will fluctuate so that your shares, when redeemed, may be worth more or less than the original cost. Index returns do not reflect the effects of fees or expenses. It is not possible to invest directly in an index.
BARCLAYS US AGGREGATE BOND INDEX – A broad-based benchmark that measures the investment-grade, US dollar-denominated fixed-rate taxable bond market, including US Treasuries, government-related and corporate debt securities, and mortgage- and asset-backed securities. All securities contained in the Barclays US Aggregate Bond Index have a minimum term to maturity of one year.
AVERAGE ANNUAL TOTAL RETURN (for periods ended March 31)
| | | One Year | | Five Year | | Ten Year | | Since Inception(1) | |
| GuideMarkSM Core Fixed Income Fund | | | | | | | | | | | | | |
| Service Shares | | -1.33 | % | | 6.46 | % | | 3.69 | % | | 4.38 | % | |
| Institutional Shares | | -0.72 | % | | N/A | | | N/A | | | 3.03 | % | |
| Barclays US Aggregate Bond Index | | -0.10 | % | | 4.80 | % | | 4.46 | % | | 5.20 | % | |
| (1) | Inception date is 6/29/01 for Service Shares and 4/29/11 for Institutional Shares. |
| | |
| (2) | The return shown for the Barclays US Aggregate Bond Index is from the inception date of the Service Shares. The Barclays US Aggregate Bond Index return from the inception date of the Institutional Shares is 3.40%. |
GuideMarkSM Core Fixed Income Fund
MANAGER’S DISCUSSION OF FUND PERFORMANCE (Continued) (Unaudited)
| • | For the 12 months ended March 2014, the Fund returned -1.33%, underperforming the Barclays US Aggregate Bond Index at -0.10%. |
| | |
| • | While the Fund’s duration was largely in line with its benchmark index, it maintained some exposure to longer duration U.S. Treasury Securities. The position is used to hedge against a potential “flight to safety” scenario. Although the exposure benefited performance in the first quarter of 2014, it harmed returns for most of the period. |
| | |
| • | A modest allocation to U.S. TIPS also dampened performance as the low inflationary environment led U.S. TIPS to trade lower over the period. |
Components of Portfolio Holdings*
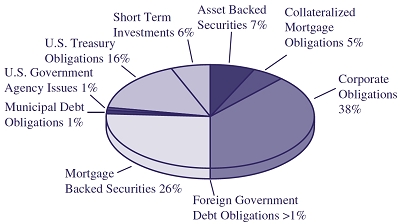
*Pie chart represents percentages of total portfolio, less securities lending collateral.
Top Ten Holdings
| Rank | | Security/Holding | | % of Net Assets |
| 1 | | | U.S. Treasury Note, 2.000%, 11/15/2021 | | 3.23 | |
| 2 | | | U.S. Treasury Note, 2.000%, 02/15/2022 | | 2.85 | |
| 3 | | | U.S. Treasury Note, 0.125%, 04/15/2018 | | 2.43 | |
| 4 | | | U.S. Treasury Note, 0.875%, 01/31/2017 | | 2.15 | |
| 5 | | | U.S. Treasury Bond, 3.125%, 11/15/2041 | | 1.73 | |
| 6 | | | Federal National Mortgage Association,
Pool #TBA, 3.000%, 04/15/2043 | | 1.72 | |
| 7 | | | U.S. Treasury Note, 1.625%, 03/31/2019 | | 1.54 | |
| 8 | | | U.S. Treasury Bond, 0.625%, 01/15/2024 | | 1.31 | |
| 9 | | | Federal Home Loan Mortgage Corp.,
Pool #J2-5769, 3.500%, 09/01/2028 | | 1.26 | |
| 10 | | | Bear Stearns Commercial Mortgage Securities
Trust, Series 2006-PW13, 5.540%, 09/11/2041 | | 1.00 | |
GuideMarkSM Tax-Exempt Fixed Income Fund
MANAGER’S DISCUSSION OF FUND PERFORMANCE (Unaudited)
TOTAL RETURN BASED ON A $10,000 INVESTMENT
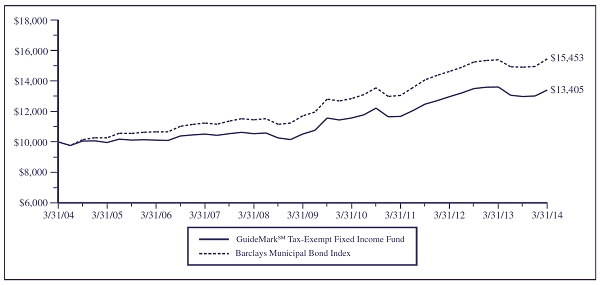
This chart assumes an initial gross investment of $10,000 made on March 31, 2004. Returns shown include the reinvestment of all dividends. Returns shown do not reflect the deduction of taxes that a shareholder would pay on Fund distributions or the redemption of Fund shares. In the absence of fee waivers and reimbursements, when they are necessary to keep expenses at the expense cap, total return would be reduced. Past performance is not predictive of future performance. Investment return and principal value will fluctuate so that your shares, when redeemed, may be worth more or less than the original cost. Index returns do not reflect the effects of fees or expenses. It is not possible to invest directly in an index.
BARCLAYS MUNICIPAL BOND INDEX – The Barclays Municipal Bond Index is a market-value-weighted index for the long-term tax-exempt bond market. The index has four main sectors: state and local general obligation bonds, revenue bonds, insured bonds, and pre-refunded bonds.
AVERAGE ANNUAL TOTAL RETURN (for periods ended March 31)
| | | One Year | | Five Year | | Ten Year | | Since Inception(1) | |
| GuideMarkSM Tax-Exempt Fixed Income Fund | | -1.48 | % | | 4.98 | % | | 2.98 | % | | 3.55 | % | |
| Barclays Municipal Bond Index | | 0.39 | % | | 5.71 | % | | 4.45 | % | | 4.96 | % | |
| (1) | Inception date is 6/29/01. |
GuideMarkSM Tax-Exempt Fixed Income Fund
MANAGER’S DISCUSSION OF FUND PERFORMANCE (Continued) (Unaudited)
| • | For the 12 months ended March 2014, the Fund returned -1.48%, underperforming the Barclays Municipal Index at 0.39%. |
| | |
| • | The Fund’s modest exposure to below investment grade rated securities contributed to the relative underperformance for the period. |
| | |
| • | The Fund’s overweight to BBB-rated credit benefited performance over the period due primarily to the underweight exposure to Puerto Rico credit. The Fund maintained a small position in pre-funded Puerto Rico bonds. |
| | |
| • | A modestly shorter duration contributed to the relative underperformance as the long end of the yield curve significantly outperformed the shorter end at the end of the period. |
Components of Portfolio Holdings*
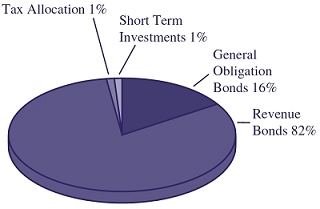
*Pie chart represents percentages of total portfolio.
Top Ten Holdings
| Rank | | Security/Holding | | % of Net Assets |
| 1 | | | California, GO, 6.500%, 04/01/2033 | | 1.92 | |
| 2 | | | Los Angeles Department of Airports, Series A,
Refunding, Revenue Bond, 5.250%, 05/15/2029 | | 1.80 | |
| 3 | | | Henry County Public Service Authority Water & Sewer,
Refunding, Revenue Bond, FSA Insured, 5.500%, 11/15/2019 | | 1.79 | |
| 4 | | | Wisconsin, Series A, Refunding, Revenue Bond,
6.000%, 05/01/2033 | | 1.79 | |
| 5 | | | Boise-Kuna District, Revenue Bond, 7.375%, 06/01/2034 | | 1.73 | |
| 6 | | | New York City, GO, 5.375%, 04/01/2036 | | 1.60 | |
| 7 | | | Louisiana Citizens Property, Revenue Bond,
6.750%, 06/01/2026 | | 1.48 | |
| 8 | | | Massachusetts Health & Educational Facilities Authority,
Series A, Refunding, Revenue Bond, 5.500%, 11/15/2036 | | 1.43 | |
| 9 | | | North Texas Tollway Authority, Series E, Refunding,
Revenue Bond, 5.750%, 01/01/2038 | | 1.31 | |
| 10 | | | Tobacco Settlement Financing Corp., Series B,
Refunding, Revenue Bond, 5.000%, 06/01/2022 | | 1.23 | |
GuideMarkSM Opportunistic Fixed Income Fund
MANAGER’S DISCUSSION OF FUND PERFORMANCE (Unaudited)
TOTAL RETURN BASED ON A $10,000 INVESTMENT
This chart assumes an initial gross investment of $10,000 made on April 1, 2011 (commencement of the Fund’s Service Shares operations). Returns shown include the reinvestment of all dividends. Returns shown do not reflect the deduction of taxes that a shareholder would pay on Fund distributions or the redemption of Fund shares. In the absence of fee waivers and reimbursements, when they are necessary to keep expenses at the expense cap, total return would be reduced. Past performance is not predictive of future performance. Investment return and principal value will fluctuate so that your shares, when redeemed, may be worth more or less than the original cost. Index returns do not reflect the effects of fees or expenses. It is not possible to invest directly in an index.
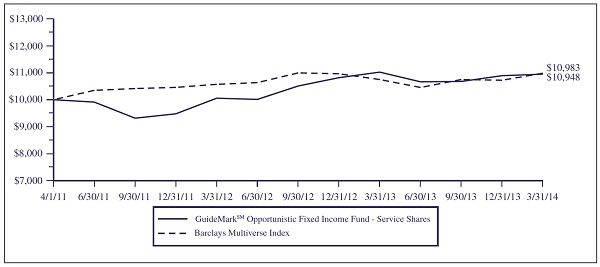
BARCLAYS MULTIVERSE INDEX – The Barclays Multiverse Index is a broad-based index that provides a measure of the global fixed income market.
AVERAGE ANNUAL TOTAL RETURN (for periods ended March 31)
| | | | | | | | | One Year | | Since Inception(1) | |
| GuideMarkSM Opportunistic Fixed Income Fund | | | | | | | | | | | | | |
| Service Shares | | | | | | | | -0.71 | % | | 3.06 | % | |
| Institutional Shares | | | | | | | | -0.21 | % | | 3.45 | % | |
| Barclays Multiverse Index | | | | | | | | 2.19 | % | | 3.18 | %(2) | |
| (1) | Inception date is 4/1/11 for Service Shares and 4/29/11 for Institutional Shares. |
| | |
| (2) | The return shown for the Barclays Multiverse Index is from the inception date of the Service Shares. The Barclays Multiverse Index return from the inception date of the Institutional Shares is 2.06%. |
GuideMarkSM Opportunistic Fixed Income Fund
MANAGER’S DISCUSSION OF FUND PERFORMANCE (Continued) (Unaudited)
| • | For the 12 months ended March 2014, the Fund returned -0.71%, underperforming the Barclays Multiverse Index at 2.19%. |
| | |
| • | Currency positioning, including an underweight to the Euro and an overweight to a basket of peripheral European currencies and Latin American currencies, more than offset the gains generated by high yield and corporate credit exposure. |
| | |
| • | The Fund’s more defensive duration positioning benefited performance for much of the period, but the underweight exposure dampened relative returns in the first quarter of 2014. Long bonds mounted a rally following comments made by Fed Chair Janet Yellen that led the market to believe short rates would increase sooner than expected. |
| | |
| • | Exposure to agency mortgages and use of defensive hedges to lower risk detracted from returns over the period. The market continued to favor risk assets and non-agency mortgages due to improving outlook for housing and the general market. |
Components of Portfolio Holdings*

*Pie chart represents percentages of total portfolio.
Top Ten Holdings
| Rank | | Security/Holding | | % of Net Assets |
| 1 | | | Korea Monetary Stabilization Bond, 2.900%, 12/02/2015 | | 2.70 | |
| 2 | | | Petroleos de Venezuela SA, 4.900%, 10/28/2014 | | 2.09 | |
| 3 | | | Malaysia Government Bond, 4.720%, 09/30/2015 | | 1.78 | |
| 4 | | | Ireland Government Bond, 5.000%, 10/18/2020 | | 1.69 | |
| 5 | | | Hungary Government Bond, 6.750%, 02/24/2017 | | 1.65 | |
| 6 | | | Hungary Government International Bond, 6.375%, 03/29/2021 | | 1.37 | |
| 7 | | | Poland Government Bond, 2.710%, 01/25/2021 | | 1.34 | |
| 8 | | | Federal National Mortagege Association,
Pool #1200, 3.000%, 10/01/2032 | | 1.23 | |
| 9 | | | Ireland Government Bond, 5.400%, 03/13/2025 | | 1.22 | |
| 10 | | | Mexican Bonos, 6.000%, 06/18/2015 | | 1.20 | |
GuidePathSM Strategic Asset Allocation Fund
MANAGER’S DISCUSSION OF FUND PERFORMANCE (Unaudited)
TOTAL RETURN BASED ON A $10,000 INVESTMENT
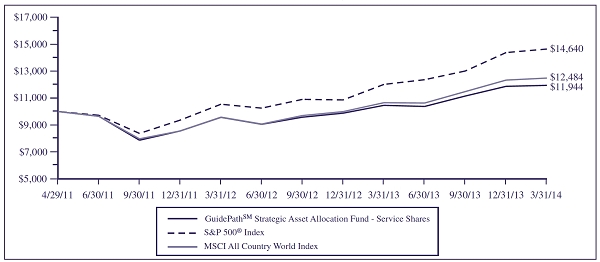
This chart assumes an initial gross investment of $10,000 made on April 29, 2011 (commencement of the Fund’s Service Shares operations). Returns shown include the reinvestment of all dividends. Returns shown do not reflect the deduction of taxes that a shareholder would pay on Fund distributions or the redemption of Fund shares. In the absence of fee waivers and reimbursements, when they are necessary to keep expenses at the expense cap, total return would be reduced. Past performance is not predictive of future performance. Investment return and principal value will fluctuate so that your shares, when redeemed, may be worth more or less than the original cost. Index returns do not reflect the effects of fees or expenses. It is not possible to invest directly in an index.
S&P 500® INDEX – An index of 500 stocks chosen for market size, liquidity and industry grouping, among other factors. It is designed to be a leading indicator of U.S. equities and is meant to reflect the risk/return characteristics of the large cap universe.
MSCI ALL COUNTRY WORLD INDEX – A free float-adjusted market capitalization weighted index that is designed to measure the equity market performance of developed and emerging markets. It consists of 44 country indices comprising 23 developed and 21 emerging market country indexes. The developed market country indexes included are: Australia, Austria, Belgium, Canada, Denmark, Finland, France, Germany, Hong Kong, Ireland, Israel, Italy, Japan, Netherlands, New Zealand, Norway, Portugal, Singapore, Spain, Sweden, Switzerland, the United Kingdom and the United States. The emerging market country indexes included are: Brazil, Chile, China, Colombia, Czech Republic, Egypt, Greece, Hungary, India, Indonesia, Korea, Malaysia, Mexico, Peru, Philippines, Poland, Russia, South Africa, Taiwan, Thailand, and Turkey.
AVERAGE ANNUAL TOTAL RETURN (for periods ended March 31)
| | | | | | | | | One Year | | Since Inception(1) | |
| GuidePathSM Strategic Asset Allocation Fund | | | | | | | | | | | | | |
| Service Shares | | | | | | | | 14.20 | % | | 6.27 | % | |
| Institutional Shares | | | | | | | | 15.00 | % | | 14.84 | % | |
| S&P 500® Index | | | | | | | | 21.86 | % | | 13.93 | %(2) | |
| MSCI All Country World Index | | | | | | | | 17.17 | % | | 7.88 | %(3) | |
| (1) | Inception date is 4/29/11 for Service Shares and 9/13/12 for Institutional Shares. |
| | |
| (2) | The return shown for the S&P 500® Index is annualized from the inception date of the Service Shares. The S&P 500® Index cumulative return from the inception date of the Institutional Shares is 20.02%. |
| | |
| (3) | The return shown for the MSCI All Country World Index is annualized from the inception date of the Service Shares. The MSCI All Country World Index cumulative return from the inception date of the Institutional Shares is 17.14%. |
GuidePathSM Strategic Asset Allocation Fund
MANAGER’S DISCUSSION OF FUND PERFORMANCE (Continued) (Unaudited)
| • | For the 12 months ended March 2014, the Fund returned 14.20%, underperforming the S&P 500® Index at 21.86%. The Fund trailed the MSCI All Country World Index at 17.17%. |
| | |
| • | Exposure to emerging market equities was a large driver of underperformance to the S&P 500 Index with negative returns on concerns of international economic growth challenges — particularly in China, Federal Reserve stimulus pullback, and geopolitical tensions over Crimea. |
| | |
| • | A general increase in exposure to international developed equity markets from U.S. equities over the year also harmed returns. The U.S. equity market rallied strongly over the period outpacing the international developed markets. |
| | |
| • | Exposure to global real return assets, specifically U.S. TIPS and commodities, detracted from performance given the benign inflationary environment and slowing growth prospects in China. |
Components of Portfolio Holdings*
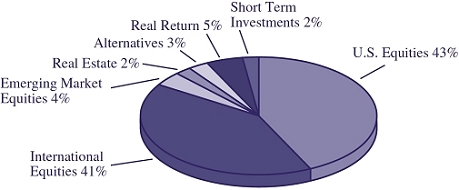
*Pie chart represents percentages of total portfolio, less securities lending collateral.
Top Ten Holdings
| Rank | | Security/Holding | | % of Net Assets |
| 1 | | | GuideMarkSM World ex-US Fund – Institutional Shares | | 18.78 | |
| 2 | | | Vanguard FTSE All-World ex-US Index Fund | | 18.75 | |
| 3 | | | SPDR S&P 500 ETF Trust | | 14.09 | |
| 4 | | | GuideMarkSM Small/Mid Cap Core Fund – Institutional Shares | | 7.57 | |
| 5 | | | GuideMarkSM Large Cap Value Fund – Institutional Shares | | 7.49 | |
| 6 | | | GuideMarkSM Large Cap Growth Fund – Institutional Shares | | 6.49 | |
| 7 | | | GuideMarkSM Opportunistic Equity Fund – Institutional Shares | | 5.03 | |
| 8 | | | GuideMarkSM Global Real Return Fund – Institutional Shares | | 4.52 | |
| 9 | | | SPDR S&P 600 Small Cap Growth ETF | | 2.66 | |
| 10 | | | iShares MSCI Canada Index ETF | | 2.35 | |
GuidePathSM Tactical ConstrainedSM Asset Allocation Fund
MANAGER’S DISCUSSION OF FUND PERFORMANCE (Unaudited)
TOTAL RETURN BASED ON A $10,000 INVESTMENT
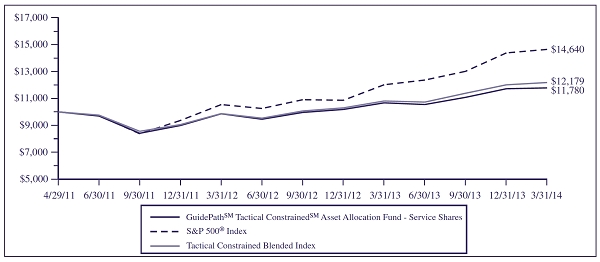
This chart assumes an initial gross investment of $10,000 made on April 29, 2011 (commencement of the Fund’s Service Shares operations). Returns shown include the reinvestment of all dividends. Returns shown do not reflect the deduction of taxes that a shareholder would pay on Fund distributions or the redemption of Fund shares. In the absence of fee waivers and reimbursements, when they are necessary to keep expenses at the expense cap, total return would be reduced. Past performance is not predictive of future performance. Investment return and principal value will fluctuate so that your shares, when redeemed, may be worth more or less than the original cost. Index returns do not reflect the effects of fees or expenses. It is not possible to invest directly in an index.
S&P 500® INDEX – Focuses on the large-cap segment of the US equities market. It includes 500 leading companies in leading industries of the US economy, capturing approximately 75% coverage of US equities.
TACTICAL CONSTRAINED BLENDED INDEX – A weighted combination of 75% of the total return from the MSCI All Country World Index with 25% of the total return from the Barclays US Aggregate Bond Index. Returns are weighted on a 75/25 basis for each historical month and then the longer-term Blended Index returns are geometrically combined from these historical monthly returns to create aggregate returns (1-year, 3-years, 5-years, etc.) for the Blended Index.
AVERAGE ANNUAL TOTAL RETURN (for periods ended March 31)
| | | | | | | | | One Year | | Since Inception(1) | |
| GuidePathSM Tactical ConstrainedSM Asset Allocation Fund | | | | | | | | | | | | | |
| Service Shares | | | | | | | | 10.40 | % | | 5.77 | % | |
| Institutional Shares | | | | | | | | 11.13 | % | | 11.38 | % | |
| S&P 500® Index | | | | | | | | 21.86 | % | | 13.93 | %(2) | |
| Tactical Constrained Blended Index | | | | | | | | 12.71 | % | | 6.98 | %(3) | |
| (1) | Inception date is 4/29/11 for Service Shares and 9/13/12 for Institutional Shares. |
| | |
| (2) | The return shown for the S&P 500® Index is annualized from the inception date of the Service Shares. The S&P 500® Index cumulative return from the inception date of the Institutional Shares is 20.02%. |
| | |
| (3) | The return shown for the Tactical Constrained Blended Index is annualized from the inception date of the Service Shares. The Tactical Constrained Blended Index cumulative return from the inception date of the Institutional Shares is 12.80%. |
GuidePathSM Tactical ConstrainedSM Asset Allocation Fund
MANAGER’S DISCUSSION OF FUND PERFORMANCE (Continued) (Unaudited)
| • | For the 12 months ended March 2014, the Fund returned 10.40% underperforming the S&P 500® Index at 21.86%. The Fund trailed the blended benchmark of 75% MSCI All Country World Index and 25% Barclays US Aggregate Bond Index at 12.71%. |
| | |
| • | Exposure to core fixed income and emerging market equities were the largest drivers of underperformance relative to the S&P 500 Index. An overweight to agency MBS combined with security selection within core fixed income harmed returns. Emerging market equities tempered returns on concerns of international economic growth challenges and geopolitical tension over Crimea. |
| | |
| • | A general increase in equity exposure from fixed income over the period aided returns. The bias towards developed markets and especially U.S. equities lifted returns given the better relative performance of developed markets. |
| | |
| • | Exposure to opportunistic fixed income harmed returns as currency positioning more than offset gains generated by high yield and corporate credit exposure. Positions in emerging market fixed income hindered performance due to uncertain Chinese growth expectations and Federal Reserve stimulus pullback. |
Components of Portfolio Holdings*
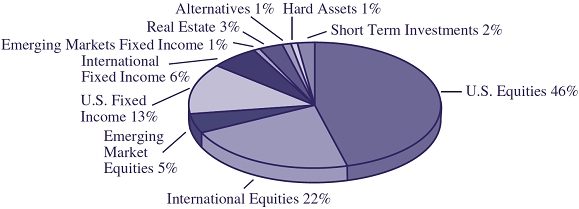
*Pie chart represents percentages of total portfolio, less securities lending collateral.
Top Ten Holdings
| Rank | | Security/Holding | | % of Net Assets |
| 1 | | | GuideMarkSM World ex-US Fund – Institutional Shares | | 20.14 | |
| 2 | | | SPDR S&P 500 ETF Trust | | 13.31 | |
| 3 | | | GuideMarkSM Opportunistic Equity Fund – Institutional Shares | | 10.55 | |
| 4 | | | GuideMarkSM Core Fixed Income Fund – Institutional Shares | | 8.28 | |
| 5 | | | GuideMarkSM Small/Mid Cap Core Fund – Institutional Shares | | 7.63 | |
| 6 | | | GuideMarkSM Large Cap Value Fund – Institutional Shares | | 6.74 | |
| 7 | | | GuideMarkSM Large Cap Growth Fund – Institutional Shares | | 6.56 | |
| 8 | | | GuideMarkSM Opportunistic Fixed Income Fund –
Institutional Shares | | 5.64 | |
| 9 | | | iShares Core MSCI Emerging Markets ETF | | 4.61 | |
| 10 | | | Vanguard REIT ETF | | 1.75 | |
GuidePathSM Tactical UnconstrainedSM Asset Allocation Fund
MANAGER’S DISCUSSION OF FUND PERFORMANCE (Unaudited)
TOTAL RETURN BASED ON A $10,000 INVESTMENT
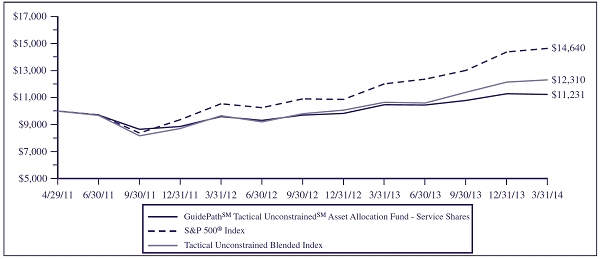
This chart assumes an initial gross investment of $10,000 made on April 29, 2011 (commencement of the Fund’s Service Shares operations). Returns shown include the reinvestment of all dividends. Returns shown do not reflect the deduction of taxes that a shareholder would pay on Fund distributions or the redemption of Fund shares. In the absence of fee waivers and reimbursements, when they are necessary to keep expenses at the expense cap, total return would be reduced. Past performance is not predictive of future performance. Investment return and principal value will fluctuate so that your shares, when redeemed, may be worth more or less than the original cost. Index returns do not reflect the effects of fees or expenses. It is not possible to invest directly in an index.
S&P 500® INDEX – Focuses on the large-cap segment of the US equities market. It includes 500 leading companies in leading industries of the US economy, capturing approximately 75% coverage of US equities.
TACTICAL UNCONSTRAINED BLENDED INDEX – A weighted combination of 90% of the total return from the MSCI All Country World Index with 10% of the total return from the Barclays Multiverse Index. Returns are weighted on a 90/10 basis for each historical month and then the longer-term Blended Index returns are geometrically combined from these historical monthly returns to create aggregate returns (1-year, 3-years, 5-years, etc.) for the Blended Index.
AVERAGE ANNUAL TOTAL RETURN (for periods ended March 31)
| | | | | | | | | One Year | | Since Inception(1) | |
| GuidePathSM Tactical UnconstrainedSM Asset Allocation Fund | | | | | | | | | | | | | |
| Service Shares | | | | | | | | 7.27 | % | | 4.05 | % | |
| Institutional Shares | | | | | | | | 8.01 | % | | 9.89 | % | |
| S&P 500® Index | | | | | | | | 21.86 | % | | 13.93 | %(2) | |
| Tactical Unconstrained Blended Index | | | | | | | | 15.62 | % | | 7.37 | %(3) | |
| (1) | Inception date is 4/29/11 for Service Shares and 9/13/12 for Institutional Shares. |
| | |
| (2) | The return shown for the S&P 500® Index is annualized from the inception date of the Service Shares. The S&P 500® Index cumulative return from the inception date of the Institutional Shares is 20.02%. |
| | |
| (3) | The return shown for the Tactical Unconstrained Blended Index is annualized from the inception date of the Service Shares. The Tactical Unconstrained Blended Index cumulative return from the inception date of the Institutional Shares is 15.36%. |
GuidePathSM Tactical UnconstrainedSM Asset Allocation Fund
MANAGER’S DISCUSSION OF FUND PERFORMANCE (Continued) (Unaudited)
| • | For the 12 months ended March 2014, the Fund returned 7.27% underperforming the S&P 500® Index at 21.86%. The Fund lagged the blended benchmark of 90% MSCI All Country World Index and 10% Barclays Multiverse Index at 15.62%. |
| | |
| • | Defensive positioning and higher cash allocations within the Fund detracted from returns as market reversals impacted trend following strategies. |
| | |
| • | Exposure to opportunistic fixed income harmed returns as currency positioning more than offset gains generated by high yield and corporate credit exposure. However, exposure to high yield, floating rate notes and core fixed income benefited performance. |
| | |
| • | Security selection within the Financials sector of the large cap value and opportunistic equity strategies contributed positively to returns. The Fund also benefited from small- and mid-cap equity exposure, which modestly outperformed large caps, as investors leaned toward riskier assets on improving US economic data. |
Components of Portfolio Holdings*
*Pie chart represents percentages of total portfolio, less securities lending collateral.
Top Ten Holdings
| Rank | | Security/Holding | | % of Net Assets |
| 1 | | | Virtus Premium AlphaSector Fund – Institutional Shares | | 11.95 | |
| 2 | | | GuideMarkSM World ex-US Fund – Institutional Shares | | 7.82 | |
| 3 | | | GuideMarkSM Opportunistic Equity Fund – Institutional Shares | | 6.41 | |
| 4 | | | GuideMarkSM Large Cap Value Fund – Institutional Shares | | 5.67 | |
| 5 | | | GuideMarkSM Opportunistic Fixed Income Fund –
Institutional Shares | | 5.25 | |
| 6 | | | iShares MSCI ACWI ex U.S. ETF | | 4.09 | |
| 7 | | | GuideMarkSM Large Cap Growth Fund – Institutional Shares | | 3.40 | |
| 8 | | | Virtus Allocator Premium AlphaSector Fund – Institutional Shares | | 3.25 | |
| 9 | | | Eaton Vance Global Macro Absolute Return Advantage Fund – Institutional Shares | | 2.58 | |
| 10 | | | Stadion Managed Portfolio Trust – Institutional Shares | | 2.49 | |
GuidePathSM Absolute Return Asset Allocation Fund
MANAGER’S DISCUSSION OF FUND PERFORMANCE (Unaudited)
TOTAL RETURN BASED ON A $10,000 INVESTMENT
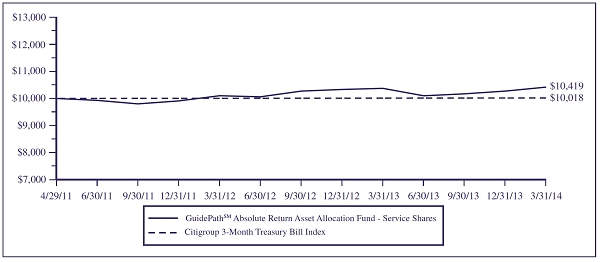
This chart assumes an initial gross investment of $10,000 made on April 29, 2011 (commencement of the Fund’s Service Shares operations). Returns shown include the reinvestment of all dividends. Returns shown do not reflect the deduction of taxes that a shareholder would pay on Fund distributions or the redemption of Fund shares. In the absence of fee waivers and reimbursements, when they are necessary to keep expenses at the expense cap, total return would be reduced. Past performance is not predictive of future performance. Investment return and principal value will fluctuate so that your shares, when redeemed, may be worth more or less than the original cost. Index returns do not reflect the effects of fees or expenses. It is not possible to invest directly in an index.
CITIGROUP 3-MONTH TREASURY BILL INDEX – Tracks the performance of US Treasury Bills with a remaining maturity of three months.
AVERAGE ANNUAL TOTAL RETURN (for periods ended March 31)
| | | | | | | | | One Year | | Since Inception(1) | |
| GuidePathSM Absolute Return Asset Allocation Fund | | | | | | | | | | | | | |
| Service Shares | | | | | | | | 0.43 | % | | 1.41 | % | |
| Institutional Shares | | | | | | | | 1.08 | % | | 1.69 | % | |
| Citigroup 3-Month Treasury Bill Index | | | | | | | | 0.05 | % | | 0.06 | %(2) | |
| (1) | Inception date is 4/29/11 for Service Shares and 9/13/12 for Institutional Shares. |
| | |
| (2) | The return shown for the Citigroup 3-Month Treasury Bill Index is annualized from the inception date of the Service Shares. The Citigroup 3-Month Treasury Bill Index cumulative return from the inception date of the Institutional Shares is 0.06%. |
GuidePathSM Absolute Return Asset Allocation Fund
MANAGER’S DISCUSSION OF FUND PERFORMANCE (Continued) (Unaudited)
| • | For the 12 months ended March 2014, the Fund returned 0.43% outperforming the Citigroup 3-month Treasury Bill Index at 0.05%. |
| | |
| • | An increase to the small exposure to domestic and international equities benefited the Fund as those markets experienced strong gains. |
| | |
| • | Within fixed income, an increase in exposure to U.S. dollar-denominated emerging market bonds proved beneficial over the period. Favoring the more credit sensitive sectors, including high yield and long-term corporates, was additive to returns. |
| | |
| • | An overweight to agency MBS combined with currency positioning within opportunistic fixed income negatively impacted returns. |
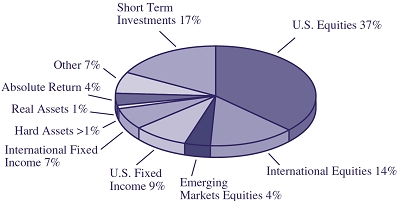
Components of Portfolio Holdings*
*Pie chart represents percentages of total portfolio, less securities lending collateral.
Top Ten Holdings
| Rank | | Security/Holding | | % of Net Assets |
| 1 | | | Pioneer Strategic Income Fund – Class Y | | 14.20 | |
| 2 | | | DoubleLine Total Return Bond Fund – Institutional Shares | | 6.18 | |
| 3 | | | iShares JPMorgan USD Emerging Markets Bond ETF | | 5.62 | |
| 4 | | | SPDR Barclays High Yield Bond ETF | | 5.52 | |
| 5 | | | Vanguard Mortgage-Backed Securities ETF | | 5.44 | |
| 6 | | | Vanguard Long-Term Corporate Bond Fund | | 4.74 | |
| 7 | | | iShares Floating Rate Bond ETF | | 4.73 | |
| 8 | | | JPMorgan Multi-Sector Income Fund – Select Shares | | 3.75 | |
| 9 | | | GuideMarkSM Core Fixed Income Fund – Institutional Shares | | 3.11 | |
| 10 | | | iShares 1-3 Year Treasury Bond ETF | | 3.06 | |
GuidePathSM Multi-Asset Income Asset Allocation Fund
MANAGER’S DISCUSSION OF FUND PERFORMANCE (Unaudited)
TOTAL RETURN BASED ON A $10,000 INVESTMENT
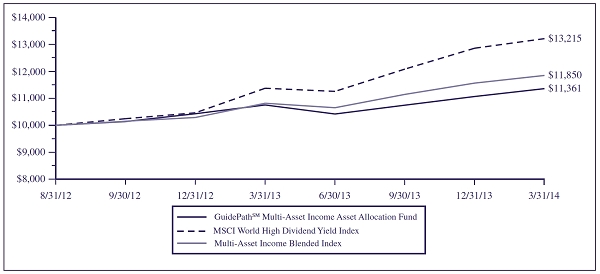
This chart assumes an initial gross investment of $10,000 made on August 31, 2012 (commencement of the Fund’s operations). Returns shown include the reinvestment of all dividends. Returns shown do not reflect the deduction of taxes that a shareholder would pay on Fund distributions or the redemption of Fund shares. In the absence of fee waivers and reimbursements, when they are necessary to keep expenses at the expense cap, total return would be reduced. Past performance is not predictive of future performance. Investment return and principal value will fluctuate so that your shares, when redeemed, may be worth more or less than the original cost. Index returns do not reflect the effects of fees or expenses. It is not possible to invest directly in an index.
MSCI WORLD HIGH DIVIDEND YIELD INDEX – An index that is based on the MSCI World Index, its parent index, and includes large and mid cap stocks across 23 developed market countries. The Index is designed to reflect the performance of equities (excluding REITs) with higher than average dividend yields that are both sustainable and persistent.
MULTI-ASSET INCOME BLENDED INDEX – A weighted combination of 60% of the total return from the MSCI World High Dividend Yield Index with 40% of the total return from the Barclays US Aggregate Bond Index. Returns are weighted on a 60/40 basis for each historical month and then the longer-term Blended Index returns are geometrically combined from these historical monthly returns to create aggregate returns (1-year, 3-years, 5-years, etc.) for the Blended Index.
CUMULATIVE TOTAL RETURN (for periods ended March 31)
| | | | | | | | | One Year | | Since Inception(1) | |
GuidePathSM Multi-Asset Income
Asset Allocation Fund | | | | | | | | 5.63 | % | | 8.40 | % | |
| MSCI World High Dividend Yield Index | | | | | | | | 16.17 | % | | 19.28 | % | |
| Multi-Asset Income Blended Index | | | | | | | | 9.53 | % | | 11.34 | % | |
| (1) | Inception date is 8/31/12. |
GuidePathSM Multi-Asset Income Asset Allocation Fund
MANAGER’S DISCUSSION OF FUND PERFORMANCE (Continued) (Unaudited)
| • | For the 12 months ended March 2014, the Fund returned 5.63% underperforming the MSCI World High Dividend Yield Index at 16.17%. The Fund trailed the blended benchmark of 60% MSCI World High Dividend Yield Index and 40% Barclays US Aggregate Bond Index at 9.53%. |
| | |
| • | Exposure and positioning within fixed income was the largest driver of underperformance. Allocations to local currency emerging markets debt, long-dated Treasuries and U.S. TIPS detracted from returns on concerns of international economic growth challenges — particularly in China, and Federal Reserve stimulus pullback. |
| | |
| • | Positions in internationally diversified dividend securities benefited returns, lifted higher by improved economic conditions for the European region. A small exposure to global infrastructure equity boosted performance. |
| | |
| • | An increased exposure to REITs and preferred securities, especially in the first quarter of 2014, proved beneficial. These securities rebounded strongly with the slight drop in long-term interest rates. |
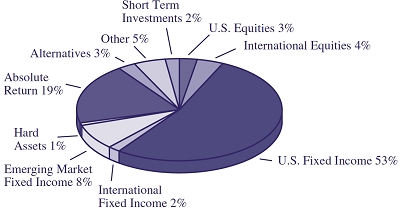
Components of Portfolio Holdings*
*Pie chart represents percentages of total portfolio, less securities lending collateral.
Top Ten Holdings
| Rank | | Security/Holding | | % of Net Assets |
| 1 | | | BlackRock Multi-Asset Income Fund – Institutional Shares | | 24.24 | |
| 2 | | | WisdomTree Equity Income Fund | | 7.23 | |
| 3 | | | Forward Select Income Fund – Institutional Shares | | 6.02 | |
| 4 | | | iShares iBoxx $ High Yield Corporate Bond ETF | | 5.00 | |
| 5 | | | JPMorgan Global Equity Income Fund – Select Shares | | 4.33 | |
| 6 | | | PowerShares International Dividend Achievers Portfolio | | 4.29 | |
| 7 | | | iShares JPMorgan USD Emerging Markets Bond ETF | | 4.04 | |
| 8 | | | JPMorgan High Yield Fund – Select Shares | | 3.90 | |
| 9 | | | JPMorgan Income Builder Fund – Select Shares | | 3.73 | |
| 10 | | | iShares U.S. Real Estate ETF | | 3.63 | |
GuidePathSM Fixed Income Allocation Fund
MANAGER’S DISCUSSION OF FUND PERFORMANCE (Unaudited)
TOTAL RETURN BASED ON A $10,000 INVESTMENT
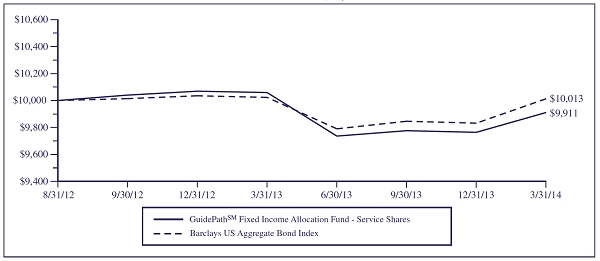
This chart assumes an initial gross investment of $10,000 made on August 31, 2012 (commencement of the Fund’s Service Shares operations). Returns shown include the reinvestment of all dividends. Returns shown do not reflect the deduction of taxes that a shareholder would pay on Fund distributions or the redemption of Fund shares. In the absence of fee waivers and reimbursements, when they are necessary to keep expenses at the expense cap, total return would be reduced. Past performance is not predictive of future performance. Investment return and principal value will fluctuate so that your shares, when redeemed, may be worth more or less than the original cost. Index returns do not reflect the effects of fees or expenses. It is not possible to invest directly in an index.
BARCLAYS US AGGREGATE BOND INDEX – A broad-based benchmark that measures the investment-grade, US dollar-denominated fixed-rate taxable bond market, including US Treasuries, government-related and corporate debt securities, and mortgage- and asset-backed securities. All securities contained in the Barclays US Aggregate Bond Index have a minimum term to maturity of one year.
CUMULATIVE TOTAL RETURN (for periods ended March 31)
| | | | | | | | | One Year | | Since Inception(1) | |
| GuidePathSM Fixed Income Allocation Fund | | | | | | | | | | | | | |
| Service Shares | | | | | | | | -1.47 | % | | -0.56 | % | |
| Institutional Shares | | | | | | | | -0.83 | % | | 0.03 | % | |
| Barclays US Aggregate Bond Index | | | | | | | | -0.10 | % | | 0.08 | %(2) | |
| (1) | Inception date is 8/31/12 for Service Shares and 9/13/12 for Institutional Shares. |
| | |
| (2) | The return shown for the Barclays US Aggregate Bond Index is from the inception date of the Service Shares. The Barclays US Aggregate Bond Index return from the inception date of the Institutional Shares is 0.34%. |
GuidePathSM Fixed Income Allocation Fund
MANAGER’S DISCUSSION OF FUND PERFORMANCE (Continued) (Unaudited)
| • | For the 12 months ended March 2014, the Fund returned -1.47% underperforming the Barclays US Aggregate Bond Index at -0.10%. |
| | |
| • | Exposure to U.S. TIPS and long-dated U.S. Treasuries were the largest detractors of performance. U.S. TIPS were one of the worst performing asset classes over the period due to a benign inflationary environment. Long-dated Treasuries gained ground in the first quarter of 2014, but failed to overcome losses from earlier in the 12-month period. |
| | |
| • | An overweight to agency MBS combined with security selection within core fixed income negatively impacted returns. Local currency emerging market bonds dampened performance as they were harmed by currency effects, uncertain Chinese growth expectations and Federal Reserve stimulus pullback. |
| | |
| • | Exposure to high yield bonds and short-term Treasuries benefited performance due to their greater resilience to Federal Reserve actions throughout the period. A growing exposure to international bonds also contributed positively over the period, helped by the strengthening of currencies, especially the Euro, against the U.S. dollar. |
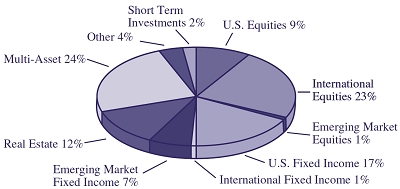
Components of Portfolio Holdings*
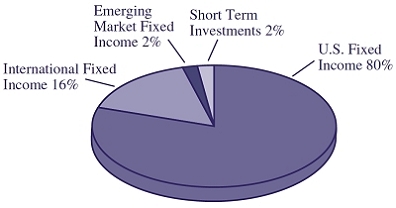
*Pie chart represents percentages of total portfolio, less securities lending collateral.
Top Ten Holdings
| Rank | | Security/Holding | | % of Net Assets |
| 1 | | | Vanguard Total Bond Market Index Fund | | 22.80 | |
| 2 | | | GuideMarkSM Core Fixed Income Fund – Institutional Shares | | 22.78 | |
| 3 | | | GuideMarkSM Opportunistic Fixed Income Fund –
Institutional Shares | | 12.61 | |
| 4 | | | iShares 7-10 Year Treasury Bond ETF | | 6.36 | |
| 5 | | | Vanguard Mortgage-Backed Securities ETF | | 5.08 | |
| 6 | | | iShares 1-3 Year Treasury Bond ETF | | 4.38 | |
| 7 | | | SPDR Barclays TIPS ETF | | 3.53 | |
| 8 | | | SPDR Barclays High Yield Bond ETF | | 3.47 | |
| 9 | | | PowerShares Senior Loan Portfolio | | 3.19 | |
| 10 | | | iShares Credit Bond ETF | | 2.93 | |
GuidePathSM Altegris® Diversified Alternatives Allocation Fund
MANAGER’S DISCUSSION OF FUND PERFORMANCE (Unaudited)
TOTAL RETURN BASED ON A $10,000 INVESTMENT
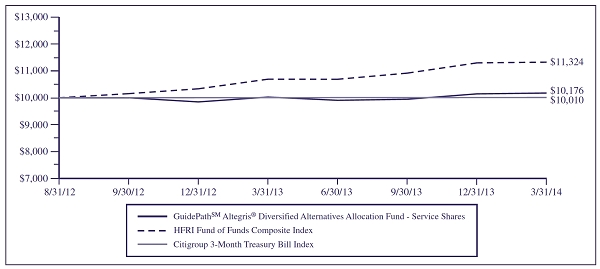
This chart assumes an initial gross investment of $10,000 made on August 31, 2012 (commencement of the Fund’s Service Shares operations). Returns shown include the reinvestment of all dividends. Returns shown do not reflect the deduction of taxes that a shareholder would pay on Fund distributions or the redemption of Fund shares. In the absence of fee waivers and reimbursements, when they are necessary to keep expenses at the expense cap, total return would be reduced. Past performance is not predictive of future performance. Investment return and principal value will fluctuate so that your shares, when redeemed, may be worth more or less than the original cost. Index returns do not reflect the effects of fees or expenses. It is not possible to invest directly in an index.
HFRI FUND OF FUNDS COMPOSITE INDEX – The HFRI Fund of Funds Composite Index is an equally weighted hedge fund index including over 650 domestic and off-shore funds of funds.
CITIGROUP 3-MONTH TREASURY BILL INDEX – Tracks the performance of US Treasury Bills with a remaining maturity of three months.
CUMULATIVE TOTAL RETURN (for periods ended March 31)
| | | | | | | | | One Year | | Since Inception(1) | |
| GuidePathSM Altegris® Diversifed Alternatives Allocation Fund | | | | | | | | | | | | | |
| Service Shares | | | | | | | | 1.50 | % | | 1.12 | % | |
| Institutional Shares | | | | | | | | 1.76 | % | | 1.01 | % | |
| HFRI Fund of Funds Composite Index | | | | | | | | 5.71 | % | | 7.20 | %(2) | |
| Citigroup 3-Month Treasury Bill Index | | | | | | | | 0.05 | % | | 0.06 | %(3) | |
| (1) | Inception date is 8/31/12 for Service Shares and 9/13/12 for Institutional Shares. |
| | |
| (2) | Reflects index performance since the date closest to the Class’ inception for which data is available. The HFRI Fund of Funds Composite Index is calculated from August 31, 2012, the inception date of the Service Shares. |
| | |
| (2) | The return shown for the Citigroup 3-Month Treasury Bill Index is annualized from the inception date of the Service Shares. The Citigroup 3-Month Treasury Bill Index cumulative return from the inception date of the Institutional Shares is 0.06%. |
GuidePathSM Altegris® Diversified Alternatives Allocation Fund
MANAGER’S DISCUSSION OF FUND PERFORMANCE (Continued) (Unaudited)
| • | For the 12 months ended March 2014, the Fund returned 1.50% underperforming the HFRI Fund of Funds Composite Index at 5.71%. |
| | |
| • | Currency positioning was the main factor that adversely impacted returns from the Fund’s systematic global macro managers and to some degree from the Fund’s specialized trend following managers. |
| | |
| • | Given the low net exposure of the equity allocations, equities were successful, but not as successful as higher beta positioning found in the benchmark. Fundamental equity long/short exposure contributed positively to performance, particularly within the consumer cyclical and non-cyclical sectors. |
| | |
| • | The steepening yield curve in the U.S. caused losses for both fundamental and trend-based long positions in fixed income. An increase in exposure to long/short fixed income proved beneficial and eroded some of the losses from trend following managers. |
Components of Portfolio Holdings*
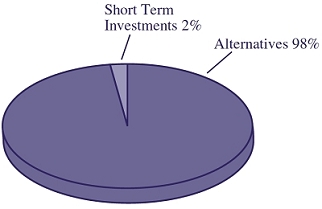
*Pie chart represents percentages of total portfolio, less securities lending collateral.
Top Ten Holdings
| Rank | | Security/Holding | | % of Net Assets |
| 1 | | | Altegris® Equity Long Short Fund – Institutional Shares | | 42.06 | % |
| 2 | | | Altegris® Fixed Income Long Short Fund – Institutional Shares | | 29.74 | % |
| 3 | | | Altegris® Macro Strategy Fund – Institutional Shares | | 14.15 | % |
| 4 | | | Altegris® Futures Evolution Strategy Fund – Institutional Shares | | 7.47 | % |
| 5 | | | Altegris® Managed Futures Strategy Fund – Institutional Shares | | 4.86 | % |
GuideMarkSM Funds & GuidePathSM Funds
EXPENSE EXAMPLE (Unaudited)
March 31, 2014
As a shareholder of the GuideMarkSM & GuidePathSM Funds (the “Funds”), you incur ongoing costs, including management fees, distribution and/or service fees, and other Fund expenses. The Expense Example shown in this section is intended to help you understand your ongoing costs (in dollars) of investing in the Funds and to compare these costs with the ongoing costs of investing in other mutual funds.
The Expense Examples are based on an investment of $1,000 invested at the beginning of a six-month period and held for the entire period, which for all Funds is from October 1, 2013 to March 31, 2014.
Actual Expenses
The first line of the Expense Example table provides information about actual account values and actual expenses. You may use the information in this line, together with the amount you invested, to estimate the expenses that you paid over the period. Simply divide your account value by $1,000 (for example, an $8,600 account value divided by $1,000 = 8.6), then multiply the result by the number in the first line under the heading entitled “Expenses Paid During Period” to estimate the expenses you paid on your account during this period.
The example includes, but is not limited to, management fees, shareholder servicing fees, distribution fees, fund accounting fees, custody fees and transfer agent fees. However, the example below does not include portfolio trading commissions and related expenses, interest expense or dividends on short positions taken by a Fund and other extraordinary expenses as determined under U.S. generally accepted accounting principles. To the extent that a Fund invests in shares of other investment companies as part of its investment strategy, you will indirectly bear your proportionate share of any fees and expenses charged by the underlying funds in which a Fund invests in addition to the expenses of the Fund. Actual expenses of the underlying funds are expected to vary among the various underlying funds. These expenses are not included in the example below.
Hypothetical Example for Comparison Purposes
The second line of the table below provides information about hypothetical account values and hypothetical expenses based on each Fund’s actual expenses ratios and an assumed rate of return of 5% per year before expenses, which is not the Fund’s actual return. The hypothetical account values and expenses may not be used to estimate the actual ending account balance or expenses you paid for the period. You may use this information to compare the ongoing costs of investing in the Funds and other funds. To do so, compare this 5% hypothetical example with the 5% hypothetical examples that appear in the shareholder reports of the other funds.
GuideMarkSM & GuidePathSM Funds
EXPENSE EXAMPLE (Continued) (Unaudited)
March 31, 2014
| Fund | | | | Beginning
Account
Value
October 1,
2013 | | Ending
Account
Value
March 31,
2014 | | Annualized
Expense Ratio1
based on
the period
October 1, 2013–
March 31, 2014 | | Expenses Paid
During Period2
October 1, 2013–
March 31, 2014 |
| INSTITUTIONAL SHARES | | | | | | | | | | | | | | | | | | | | | | |
| GuideMarkSM Large Cap | | | Actual | | | $ | 1,000.00 | | | | $ | 1,110.10 | | | | 0.87 | % | | | $ | 4.58 | |
| Growth Fund | | | Hypothetical3 | | | $ | 1,000.00 | | | | $ | 1,020.59 | | | | 0.87 | % | | | $ | 4.38 | |
| GuideMarkSM Large Cap | | | Actual | | | $ | 1,000.00 | | | | $ | 1,114.80 | | | | 0.87 | % | | | $ | 4.59 | |
| Value Fund | | | Hypothetical3 | | | $ | 1,000.00 | | | | $ | 1,020.59 | | | | 0.87 | % | | | $ | 4.38 | |
| GuideMarkSM Small/Mid Cap | | | Actual | | | $ | 1,000.00 | | | | $ | 1,095.90 | | | | 1.05 | % | | | $ | 5.49 | |
| Core Fund | | | Hypothetical3 | | | $ | 1,000.00 | | | | $ | 1,019.70 | | | | 1.05 | % | | | $ | 5.29 | |
| GuideMarkSM World | | | Actual | | | $ | 1,000.00 | | | | $ | 1,054.20 | | | | 1.01 | % | | | $ | 5.17 | |
| ex-US Fund | | | Hypothetical3 | | | $ | 1,000.00 | | | | $ | 1,019.90 | | | | 1.01 | % | | | $ | 5.09 | |
| GuideMarkSM Opportunistic | | | Actual | | | $ | 1,000.00 | | | | $ | 1,125.20 | | | | 1.00 | % | | | $ | 5.30 | |
| Equity Fund | | | Hypothetical3 | | | $ | 1,000.00 | | | | $ | 1,019.95 | | | | 1.00 | % | | | $ | 5.04 | |
| GuideMarkSM Global | | | Actual | | | $ | 1,000.00 | | | | $ | 1,034.20 | | | | 0.82 | % | | | $ | 4.16 | |
| Real Return Fund | | | Hypothetical3 | | | $ | 1,000.00 | | | | $ | 1,020.84 | | | | 0.82 | % | | | $ | 4.13 | |
| GuideMarkSM Core | | | Actual | | | $ | 1,000.00 | | | | $ | 1,016.80 | | | | 0.65 | % | | | $ | 3.27 | |
| Fixed Income Fund | | | Hypothetical3 | | | $ | 1,000.00 | | | | $ | 1,021.69 | | | | 0.65 | % | | | $ | 3.28 | |
| GuideMarkSM Opportunistic | | | Actual | | | $ | 1,000.00 | | | | $ | 1,028.40 | | | | 1.02 | % | | | $ | 5.16 | |
| Fixed Income Fund | | | Hypothetical3 | | | $ | 1,000.00 | | | | $ | 1,019.85 | | | | 1.02 | % | | | $ | 5.14 | |
| GuidePathSM Strategic | | | Actual | | | $ | 1,000.00 | | | | $ | 1,075.50 | | | | 0.40 | % | | | $ | 2.07 | |
| Asset Allocation Fund | | | Hypothetical3 | | | $ | 1,000.00 | | | | $ | 1,022.94 | | | | 0.40 | % | | | $ | 2.02 | |
| GuidePathSM Tactical ConstrainedSM | | | Actual | | | $ | 1,000.00 | | | | $ | 1,067.30 | | | | 0.43 | % | | | $ | 2.22 | |
| Asset Allocation Fund | | | Hypothetical3 | | | $ | 1,000.00 | | | | $ | 1,022.79 | | | | 0.43 | % | | | $ | 2.17 | |
| GuidePathSM Tactical UnconstrainedSM | | | Actual | | | $ | 1,000.00 | | | | $ | 1,045.50 | | | | 0.47 | % | | | $ | 2.40 | |
| Asset Allocation Fund | | | Hypothetical3 | | | $ | 1,000.00 | | | | $ | 1,022.59 | | | | 0.47 | % | | | $ | 2.37 | |
| GuidePathSM Absolute Return | | | Actual | | | $ | 1,000.00 | | | | $ | 1,026.90 | | | | 0.51 | % | | | $ | 2.58 | |
| Asset Allocation Fund | | | Hypothetical3 | | | $ | 1,000.00 | | | | $ | 1,022.39 | | | | 0.51 | % | | | $ | 2.57 | |
| GuidePathSM Fixed Income | | | Actual | | | $ | 1,000.00 | | | | $ | 1,017.90 | | | | 0.40 | % | | | $ | 2.01 | |
| Allocation Fund | | | Hypothetical3 | | | $ | 1,000.00 | | | | $ | 1,022.94 | | | | 0.40 | % | | | $ | 2.02 | |
| GuidePathSM Altegris® Diversified | | | Actual | | | $ | 1,000.00 | | | | $ | 1,023.70 | | | | 0.16 | % | | | $ | 0.81 | |
| Alternatives Allocation Fund | | | Hypothetical3 | | | $ | 1,000.00 | | | | $ | 1,024.13 | | | | 0.16 | % | | | $ | 0.81 | |
| 1 | The expense ratio excludes the securities lending credit. |
| 2 | Expenses are equal to the Fund’s annualized expense ratio, multiplied by the average account value over the period, multiplied by 182/365 to reflect the one-half year period. |
| 3 | 5% return before expenses. |
GuideMarkSM & GuidePathSM Funds
EXPENSE EXAMPLE (Continued) (Unaudited)
March 31, 2014
| Fund | | | | Beginning
Account
Value
October 1,
2013 | | Ending
Account
Value
March 31,
2014 | | Annualized
Expense Ratio1
based on
the period
October 1, 2013–
March 31, 2014 | | Expenses Paid
During Period2
October 1, 2013–
March 31, 2014 |
| SERVICE SHARES | | | | | | | | | | | | | |
| GuideMarkSM Large Cap | | | Actual | | | $ | 1,000.00 | | | | $ | 1,107.00 | | | | 1.49 | % | | | $ | 7.83 | |
| Growth Fund | | | Hypothetical3 | | | $ | 1,000.00 | | | | $ | 1,017.50 | | | | 1.49 | % | | | $ | 7.49 | |
| GuideMarkSM Large Cap | | | Actual | | | $ | 1,000.00 | | | | $ | 1,110.50 | | | | 1.45 | % | | | $ | 7.63 | |
| Value Fund | | | Hypothetical3 | | | $ | 1,000.00 | | | | $ | 1,017.70 | | | | 1.45 | % | | | $ | 7.29 | |
| GuideMarkSM Small/Mid Cap | | | Actual | | | $ | 1,000.00 | | | | $ | 1,093.50 | | | | 1.63 | % | | | $ | 8.51 | |
| Core Fund | | | Hypothetical3 | | | $ | 1,000.00 | | | | $ | 1,016.80 | | | | 1.63 | % | | | $ | 8.20 | |
| GuideMarkSM World | | | Actual | | | $ | 1,000.00 | | | | $ | 1,121.60 | | | | 1.59 | % | | | $ | 8.13 | |
| ex-US Fund | | | Hypothetical3 | | | $ | 1,000.00 | | | | $ | 1,017.00 | | | | 1.59 | % | | | $ | 8.00 | |
| GuideMarkSM Opportunistic | | | Actual | | | $ | 1,000.00 | | | | $ | 1,121.60 | | | | 1.58 | % | | | $ | 8.36 | |
| Equity Fund | | | Hypothetical3 | | | $ | 1,000.00 | | | | $ | 1,017.05 | | | | 1.58 | % | | | $ | 7.95 | |
| GuideMarkSM Global | | | Actual | | | $ | 1,000.00 | | | | $ | 1,030.80 | | | | 1.38 | % | | | $ | 6.99 | |
| Real Return Fund | | | Hypothetical3 | | | $ | 1,000.00 | | | | $ | 1,018.05 | | | | 1.38 | % | | | $ | 6.94 | |
| GuideMarkSM Core | | | Actual | | | $ | 1,000.00 | | | | $ | 1,012.70 | | | | 1.29 | % | | | $ | 6.47 | |
| Fixed Income Fund | | | Hypothetical3 | | | $ | 1,000.00 | | | | $ | 1,018.50 | | | | 1.29 | % | | | $ | 6.49 | |
| GuideMarkSM Tax-Exempt | | | Actual | | | $ | 1,000.00 | | | | $ | 1,032.70 | | | | 1.29 | % | | | $ | 6.54 | |
| Fixed Income Fund | | | Hypothetical3 | | | $ | 1,000.00 | | | | $ | 1,018.50 | | | | 1.29 | % | | | $ | 6.49 | |
| GuideMarkSM Opportunistic | | | Actual | | | $ | 1,000.00 | | | | $ | 1,025.20 | | | | 1.55 | % | | | $ | 7.83 | |
| Fixed Income Fund | | | Hypothetical3 | | | $ | 1,000.00 | | | | $ | 1,017.20 | | | | 1.55 | % | | | $ | 7.80 | |
| GuidePathSM Strategic | | | Actual | | | $ | 1,000.00 | | | | $ | 1,071.00 | | | | 1.00 | % | | | $ | 5.16 | |
| Asset Allocation Fund | | | Hypothetical3 | | | $ | 1,000.00 | | | | $ | 1,019.95 | | | | 1.00 | % | | | $ | 5.04 | |
| GuidePathSM Tactical ConstrainedSM | | | Actual | | | $ | 1,000.00 | | | | $ | 1,063.30 | | | | 1.00 | % | | | $ | 5.14 | |
| Asset Allocation Fund | | | Hypothetical3 | | | $ | 1,000.00 | | | | $ | 1,019.95 | | | | 1.00 | % | | | $ | 5.04 | |
| GuidePathSM Tactical UnconstrainedSM | | | Actual | | | $ | 1,000.00 | | | | $ | 1,041.30 | | | | 1.10 | % | | | $ | 5.60 | |
| Asset Allocation Fund | | | Hypothetical3 | | | $ | 1,000.00 | | | | $ | 1,019.45 | | | | 1.10 | % | | | $ | 5.54 | |
| GuidePathSM Absolute Return | | | Actual | | | $ | 1,000.00 | | | | $ | 1,024.40 | | | | 1.10 | % | | | $ | 5.55 | |
| Asset Allocation Fund | | | Hypothetical3 | | | $ | 1,000.00 | | | | $ | 1,019.45 | | | | 1.10 | % | | | $ | 5.54 | |
GuideMarkSM & GuidePathSM Funds
EXPENSE EXAMPLE (Continued) (Unaudited)
March 31, 2014
| Fund | | | | Beginning
Account
Value
October 1,
2013 | | Ending
Account
Value
March 31,
2014 | | Annualized
Expense Ratio1
based on
the period
October 1, 2013–
March 31, 2014 | | Expenses Paid
During Period2
October 1, 2013–
March 31, 2014 |
| GuidePathSM Multi-Asset Income | | | Actual | | | $ | 1,000.00 | | | | $ | 1,057.10 | | | | 1.10 | % | | | $ | 5.64 | |
| Asset Allocation Fund | | | Hypothetical3 | | | $ | 1,000.00 | | | | $ | 1,019.45 | | | | 1.10 | % | | | $ | 5.54 | |
| GuidePathSM Fixed Income | | | Actual | | | $ | 1,000.00 | | | | $ | 1,013.80 | | | | 1.00 | % | | | $ | 5.02 | |
| Allocation Fund | | | Hypothetical3 | | | $ | 1,000.00 | | | | $ | 1,019.95 | | | | 1.00 | % | | | $ | 5.04 | |
| GuidePathSM Altegris® Diversified | | | Actual | | | $ | 1,000.00 | | | | $ | 1,023.20 | | | | 0.50 | % | | | $ | 2.52 | |
| Alternatives Allocation Fund | | | Hypothetical3 | | | $ | 1,000.00 | | | | $ | 1,022.44 | | | | 0.50 | % | | | $ | 2.52 | |
| 1 | The expense ratio excludes the securities lending credit. |
| 2 | Expenses are equal to the Fund’s annualized expense ratio, multiplied by the average account value over the period, multiplied by 182/365 to reflect the one-half year period. |
| 3 | 5% return before expenses. |
GuideMarkSM Large Cap Growth Fund
SCHEDULE OF INVESTMENTS
March 31, 2014
Number of
Shares | | | | | Value | |
| | | | | COMMON STOCKS - 98.48% | | | | |
| | | | | Aerospace & Defense - 4.71% | | | | |
| | 23,002 | | | Boeing Co. | | $ | 2,886,521 | |
| | 24,308 | | | Honeywell International, Inc. | | | 2,254,810 | |
| | 30,065 | | | United Technologies Corp. | | | 3,512,795 | |
| | | | | | | | 8,654,126 | |
| | | | | Air Freight & Logistics - 0.97% | | | | |
| | 18,356 | | | United Parcel Service, Inc. -
Class B | | | 1,787,507 | |
| | | | | Beverages - 0.61% | | | | |
| | 10,647 | | | Anheuser-Busch InBev NV - ADR (a) | | | 1,121,129 | |
| | | | | Biotechnology - 6.76% | | | | |
| | 33,963 | | | Amgen, Inc. | | | 4,188,996 | |
| | 8,304 | | | Biogen Idec, Inc. (b) | | | 2,539,945 | |
| | 19,530 | | | Celgene Corp. (b) | | | 2,726,388 | |
| | 41,820 | | | Gilead Sciences, Inc. (a)(b) | | | 2,963,365 | |
| | | | | | | | 12,418,694 | |
| | | | | Capital Markets - 0.64% | | | | |
| | 15,879 | | | Waddell & Reed Financial, Inc. -
Class A | | | 1,169,012 | |
| | | | | Commercial Banks - 1.13% | | | | |
| | 120,973 | | | Bank of America Corp. | | | 2,080,736 | |
| | | | | Communications Equipment - 3.92% | | | | |
| | 54,476 | | | Cisco Systems, Inc. | | | 1,220,807 | |
| | 14,303 | | | F5 Networks, Inc. (b) | | | 1,525,129 | |
| | 56,534 | | | QUALCOMM, Inc. | | | 4,458,271 | |
| | | | | | | | 7,204,207 | |
| | | | | Computers & Peripherals - 5.08% | | | | |
| | 7,031 | | | Apple, Inc. | | | 3,773,819 | |
| | 39,003 | | | NetApp, Inc. | | | 1,439,211 | |
| | 27,896 | | | SanDisk Corp. | | | 2,264,876 | |
| | 20,229 | | | Western Digital Corp. | | | 1,857,427 | |
| | | | | | | | 9,335,333 | |
| | | | | Consumer Finance - 1.58% | | | | |
| | 32,133 | | | American Express Co. | | | 2,892,934 | |
| | | | | Diversified Financial Services - 1.34% | | | | |
| | 7,671 | | | IntercontinentalExchange Group, Inc. | | | 1,517,554 | |
| | 15,549 | | | JPMorgan Chase & Co. | | | 943,980 | |
| | | | | | | | 2,461,534 | |
Number of
Shares | | | | | Value | |
| | | | | Electrical Equipment - 1.09% | | | | |
| | 16,128 | | | Rockwell Automation, Inc. | | $ | 2,008,742 | |
| | | | | Electronic Equipment, Instruments
& Components - 0.12% | | | | |
| | 7,130 | | | Knowles Corp. (b) | | | 225,094 | |
| | | | | Energy Equipment & Services - 1.24% | | | | |
| | 19,905 | | | National-Oilwell Varco, Inc. | | | 1,550,002 | |
| | 10,209 | | | Oceaneering International, Inc. | | | 733,619 | |
| | | | | | | | 2,283,621 | |
| | | | | Food & Staples Retailing - 2.05% | | | | |
| | 14,986 | | | Costco Wholesale Corp. | | | 1,673,637 | |
| | 28,040 | | | CVS Caremark Corp. | | | 2,099,074 | |
| | | | | | | | 3,772,711 | |
| | | | | Food Products - 0.67% | | | | |
| | 11,647 | | | Keurig Green Mountain, Inc. (a) | | | 1,229,807 | |
| | | | | Health Care Equipment & Supplies - 4.48% | | | | |
| | 16,549 | | | Becton, Dickinson & Co. | | | 1,937,557 | |
| | 13,741 | | | C.R. Bard, Inc. | | | 2,033,393 | |
| | 37,596 | | | Medtronic, Inc. | | | 2,313,658 | |
| | 20,557 | | | Zimmer Holdings, Inc. | | | 1,944,281 | |
| | | | | | | | 8,228,889 | |
| | | | | Health Care Providers & Services - 3.57% | | | | |
| | 23,505 | | | Aetna, Inc. | | | 1,762,170 | |
| | 29,651 | | | Express Scripts Holding Co. (b) | | | 2,226,493 | |
| | 15,303 | | | HCA Holdings, Inc. (b) | | | 803,407 | |
| | 9,973 | | | McKesson Corp. | | | 1,760,933 | |
| | | | | | | | 6,553,003 | |
| | | | | Hotels, Restaurants & Leisure - 3.09% | | | | |
| | 1,551 | | | Chipotle Mexican Grill, Inc. (b) | | | 881,046 | |
| | 21,705 | | | Starwood Hotels & Resorts
Worldwide, Inc. | | | 1,727,718 | |
| | 23,805 | | | Wyndham Worldwide Corp. | | | 1,743,240 | |
| | 5,963 | | | Wynn Resorts Ltd. | | | 1,324,680 | |
| | | | | | | | 5,676,684 | |
| | | | | Household Durables - 0.92% | | | | |
| | 88,088 | | | Pulte Homes, Inc. | | | 1,690,409 | |
| | | | | Industrial Conglomerates - 1.36% | | | | |
| | 9,355 | | | 3M Co. | | | 1,269,099 | |
| | 28,774 | | | Tyco International Ltd. - ADR | | | 1,220,018 | |
| | | | | | | | 2,489,117 | |
See notes to financial statements.
GuideMarkSM Large Cap Growth Fund
SCHEDULE OF INVESTMENTS (Continued)
March 31, 2014
Number of
Shares | | | | | Value | |
| | | | | COMMON STOCKS (Continued) | | | | |
| | | | | Internet & Catalog Retail - 2.65% | | | | |
| | 2,002 | | | Amazon.com, Inc. (b) | | $ | 673,713 | |
| | 19,192 | | | Expedia, Inc. | | | 1,391,420 | |
| | 19,692 | | | HomeAway, Inc. (b) | | | 741,798 | |
| | 1,737 | | | Priceline.com, Inc. (b) | | | 2,070,313 | |
| | | | | | | | 4,877,244 | |
| | | | | Internet Software & Services - 7.72% | | | | |
| | 57,605 | | | Facebook, Inc. - Class A (b) | | | 3,470,125 | |
| | 6,984 | | | Google, Inc. - Class A (b) | | | 7,783,738 | |
| | 30,384 | | | IAC/InterActiveCorp | | | 2,169,114 | |
| | 21,283 | | | Yahoo, Inc. (b) | | | 764,059 | �� |
| | | | | | | | 14,187,036 | |
| | | | | IT Services - 3.92% | | | | |
| | 6,673 | | | Alliance Data Systems Corp. (b) | | | 1,818,059 | |
| | 27,154 | | | Paychex, Inc. | | | 1,156,760 | |
| | 24,481 | | | Vantiv, Inc. - Class A (b) | | | 739,816 | |
| | 16,117 | | | Visa, Inc. - Class A | | | 3,479,016 | |
| | | | | | | | 7,193,651 | |
| | | | | Machinery - 3.68% | | | | |
| | 35,586 | | | Danaher Corp. | | | 2,668,950 | |
| | 13,978 | | | Dover Corp. | | | 1,142,701 | |
| | 15,687 | | | Illinois Tool Works, Inc. | | | 1,275,824 | |
| | 14,036 | | | Parker Hannifin Corp. | | | 1,680,250 | |
| | | | | | | | 6,767,725 | |
| | | | | Media - 5.30% | | | | |
| | 62,296 | | | Comcast Corp. - Class A | | | 3,116,046 | |
| | 18,370 | | | DIRECTV (b) | | | 1,403,835 | |
| | 13,878 | | | Discovery Communications, Inc. (b) | | | 1,147,711 | |
| | 19,002 | | | Omnicom Group, Inc. | | | 1,379,545 | |
| | 14,887 | | | Scripps Networks Interactive, Inc. -
Class A | | | 1,130,072 | |
| | 48,528 | | | Twenty-First Century Fox, Inc. -
Class A | | | 1,551,440 | |
| | | | | | | | 9,728,649 | |
| | | | | Oil & Gas - 1.98% | | | | |
| | 15,747 | | | Apache Corp. | | | 1,306,214 | |
| | 20,773 | | | Cabot Oil & Gas Corp. | | | 703,789 | |
| | 9,141 | | | Devon Energy Corp. | | | 611,807 | |
| | 19,047 | | | Valero Energy Corp. | | | 1,011,396 | |
| | | | | | | | 3,633,206 | |
Number of
Shares | | | | | Value | |
| | | | | Pharmaceuticals - 4.56% | | | | |
| | 4,023 | | | Allergan, Inc. | | $ | 499,254 | |
| | 23,520 | | | Bristol-Myers Squibb Co. | | | 1,221,864 | |
| | 38,957 | | | Eli Lilly & Co. | | | 2,293,009 | |
| | 19,244 | | | Johnson & Johnson | | | 1,890,338 | |
| | 34,140 | | | Merck & Co., Inc. | | | 1,938,128 | |
| | 5,118 | | | Salix Pharmaceuticals Ltd. (a)(b) | | | 530,276 | |
| | | | | | | | 8,372,869 | |
| | | | | Semiconductor & Semiconductor
Equipment - 5.42% | | | | |
| | 69,318 | | | Altera Corp. | | | 2,512,084 | |
| | 19,423 | | | Linear Technology Corp. (a) | | | 945,706 | |
| | 43,455 | | | Maxim Integrated Products, Inc. | | | 1,439,230 | |
| | 32,051 | | | Microchip Technology, Inc. (a) | | | 1,530,756 | |
| | 41,198 | | | Skyworks Solutions, Inc. (b) | | | 1,545,749 | |
| | 36,671 | | | Xilinx, Inc. | | | 1,990,135 | |
| | | | | | | | 9,963,660 | |
| | | | | Software - 13.19% | | | | |
| | 40,157 | | | Check Point Software Technologies
Ltd. - ADR (b) | | | 2,715,818 | |
| | 21,817 | | | Informatica Corp. (b) | | | 824,246 | |
| | 23,173 | | | Intuit, Inc. | | | 1,801,237 | |
| | 233,850 | | | Microsoft Corp. | | | 9,585,511 | |
| | 7,681 | | | NetSuite, Inc. (b) | | | 728,389 | |
| | 152,727 | | | Oracle Corp. | | | 6,248,062 | |
| | 15,057 | | | Red Hat, Inc. (b) | | | 797,720 | |
| | 26,899 | | | Salesforce.com, Inc. (a)(b) | | | 1,535,664 | |
| | | | | | | | 24,236,647 | |
| | | | | Specialty Retail - 4.73% | | | | |
| | 36,730 | | | Home Depot, Inc. | | | 2,906,445 | |
| | 49,863 | | | Lowe’s Companies, Inc. | | | 2,438,301 | |
| | 11,263 | | | O’Reilly Automotive, Inc. (b) | | | 1,671,317 | |
| | 4,147 | | | Sherwin-Williams Co. | | | 817,498 | |
| | 14,233 | | | The TJX Companies, Inc. | | | 863,231 | |
| | | | | | | | 8,696,792 | |
| | | | | Total Common Stocks
(Cost $126,543,780) | | | 180,940,768 | |
See notes to financial statements.
GuideMarkSM Large Cap Growth Fund
SCHEDULE OF INVESTMENTS (Continued)
March 31, 2014
Number of
Shares | | | | | Value | |
| | | | | SHORT TERM INVESTMENTS - 1.19% | | | | |
| | | | | Money Market Funds - 1.19% | | | | |
| | 2,179,887 | | | Federated Prime Obligations Fund | | $ | 2,179,887 | |
| | | | | Total Short Term Investments
(Cost $2,179,887) | | | 2,179,887 | |
| | | | | INVESTMENTS PURCHASED
AS SECURITIES LENDING
COLLATERAL - 4.46% | | | | |
| | | | | Money Market Funds - 4.43% | | | | |
| | 8,147,999 | | | First American Government
Obligations Fund | | | 8,147,999 | |
| | 20,508 | | | Reserve Primary Fund (c) | | | 792 | |
| | | | | Total Money Market Funds
(Cost $8,165,691) | | | 8,148,791 | |
Principal
Amount | | | | | Value | |
| | | | | Cash - 0.03% | | | | |
| $ | 56,736 | | | Cash | | $ | 56,736 | |
| | | | | Total Cash (Cost $56,736) | | | 56,736 | |
| | | | | Total Investments Purchased as
Securities Lending Collateral
(Cost $8,222,427) | | | 8,205,527 | |
| | | | | Total Investments
(Cost $136,946,094) - 104.13% | | | 191,326,182 | |
| | | | | Liabilities in Excess of
Other Assets - (4.13)% | | | (7,595,635 | ) |
| | | | | TOTAL NET | | | | |
| | | | | ASSETS - 100.00% | | $ | 183,730,547 | |
Percentages are stated as a percent of net assets.
ADR - American Depositary Receipt
| (a) | All or portion of this security is on loan. |
| (b) | Non-income producing security. |
| (c) | As of March 31, 2014, the Fund has fair valued this security and deemed it illiquid. The value of this security was $792, which represents 0.00% of total net assets. |
See notes to financial statements.
GuideMarkSM Large Cap Value Fund
SCHEDULE OF INVESTMENTS
March 31, 2014
Number of
Shares | | | | | Value | |
| | | | | COMMON STOCKS - 99.22% | | | | |
| | | | | Aerospace & Defense - 3.77% | | | | |
| | 20,500 | | | General Dynamics Corp. | | $ | 2,232,860 | |
| | 22,700 | | | Honeywell International, Inc. | | | 2,105,652 | |
| | 32,300 | | | Raytheon Co. | | | 3,190,917 | |
| | | | | | | | 7,529,429 | |
| | | | | Auto Components - 1.64% | | | | |
| | 48,400 | | | Delphi Automotive Plc | | | 3,284,424 | |
| | | | | Automobiles - 0.98% | | | | |
| | 4,000 | | | Daimler AG - ADR | | | 379,800 | |
| | 46,000 | | | General Motors Co. | | | 1,583,320 | |
| | | | | | | | 1,963,120 | |
| | | | | Capital Markets - 3.22% | | | | |
| | 24,300 | | | Ameriprise Financial, Inc. | | | 2,674,701 | |
| | 63,700 | | | E*TRADE Financial Corp. (a) | | | 1,466,374 | |
| | 33,000 | | | State Street Corp. | | | 2,295,150 | |
| | | | | | | | 6,436,225 | |
| | | | | Chemicals - 2.21% | | | | |
| | 30,500 | | | E.I. du Pont de Nemours & Co. | | | 2,046,550 | |
| | 31,800 | | | Rockwood Holdings, Inc. | | | 2,365,920 | |
| | | | | | | | 4,412,470 | |
| | | | | Commercial Banks - 8.91% | | | | |
| | 272,900 | | | Bank of America Corp. | | | 4,693,880 | |
| | 141,800 | | | Fifth Third Bancorp | | | 3,254,310 | |
| | 227,800 | | | First Niagara Financial Group, Inc. | | | 2,152,710 | |
| | 38,000 | | | PNC Financial Services Group, Inc. | | | 3,306,000 | |
| | 88,300 | | | Wells Fargo & Co. | | | 4,392,042 | |
| | | | | | | | 17,798,942 | |
| | | | | Construction & Engineering - 1.46% | | | | |
| | 109,100 | | | KBR, Inc. | | | 2,910,788 | |
| | | | | Construction Materials - 1.60% | | | | |
| | 113,600 | | | CRH Plc - ADR | | | 3,202,384 | |
| | | | | Consumer Finance - 6.98% | | | | |
| | 28,500 | | | American Express Co. | | | 2,565,855 | |
| | 62,600 | | | Capital One Financial Corp. | | | 4,830,216 | |
| | 46,000 | | | Discover Financial Services | | | 2,676,740 | |
| | 158,600 | | | SLM Corp. | | | 3,882,528 | |
| | | | | | | | 13,955,339 | |
| | | | | Diversified Financial Services - 5.89% | | | | |
| | 47,100 | | | CIT Group, Inc. | | | 2,308,842 | |
| | 102,980 | | | Citigroup, Inc. | | | 4,901,848 | |
| | 75,000 | | | JPMorgan Chase & Co. | | | 4,553,250 | |
| | | | | | | | 11,763,940 | |
Number of
Shares | | | | | Value | |
| | | | | Diversified Telecommunication Services - 1.75% | | | | |
| | 73,670 | | | Verizon Communications, Inc. | | $ | 3,504,482 | |
| | | | | Electrical Equipment - 2.58% | | | | |
| | 41,600 | | | Eaton Corp. Plc | | | 3,124,992 | |
| | 30,500 | | | Emerson Electric Co. | | | 2,037,400 | |
| | | | | | | | 5,162,392 | |
| | | | | Energy Equipment & Services - 2.81% | | | | |
| | 35,800 | | | National-Oilwell Varco, Inc. | | | 2,787,746 | |
| | 80,300 | | | SeaDrill Ltd. (b) | | | 2,823,348 | |
| | | | | | | | 5,611,094 | |
| | | | | Food & Staples Retailing - 0.65% | | | | |
| | 17,400 | | | CVS Caremark Corp. | | | 1,302,564 | |
| | | | | Health Care Equipment & Supplies - 1.87% | | | | |
| | 60,600 | | | Medtronic, Inc. | | | 3,729,324 | |
| | | | | Health Care Providers & Services - 6.30% | | | | |
| | 43,700 | | | Cardinal Health, Inc. | | | 3,058,126 | |
| | 22,600 | | | CIGNA Corp. | | | 1,892,298 | |
| | 49,800 | | | Omnicare, Inc. | | | 2,971,566 | |
| | 32,400 | | | UnitedHealth Group, Inc. | | | 2,656,476 | |
| | 20,300 | | | WellPoint, Inc. | | | 2,020,865 | |
| | | | | | | | 12,599,331 | |
| | | | | Hotels, Restaurants & Leisure - 3.35% | | | | |
| | 73,500 | | | Carnival Corp. - ADR | | | 2,782,710 | |
| | 38,800 | | | International Game Technology | | | 545,528 | |
| | 61,800 | | | Royal Caribbean Cruises Ltd. | | | 3,371,808 | |
| | | | | | | | 6,700,046 | |
| | | | | Household Durables - 2.41% | | | | |
| | 1,969 | | | NVR, Inc. (a) | | | 2,258,443 | |
| | 31,500 | | | Stanley Black & Decker, Inc. | | | 2,559,060 | |
| | | | | | | | 4,817,503 | |
| | | | | Industrial Conglomerates - 1.53% | | | | |
| | 72,000 | | | Tyco International Ltd. - ADR | | | 3,052,800 | |
| | | | | Insurance - 1.53% | | | | |
| | 61,000 | | | American International Group, Inc. | | | 3,050,610 | |
| | | | | Machinery - 6.12% | | | | |
| | 26,100 | | | Illinois Tool Works, Inc. | | | 2,122,713 | |
| | 28,250 | | | ITT Corp. | | | 1,207,970 | |
| | 51,600 | | | Joy Global, Inc. (b) | | | 2,992,800 | |
| | 38,089 | | | Pentair Ltd. | | | 3,021,981 | |
| | 29,400 | | | SPX Corp. | | | 2,890,314 | |
| | | | | | | | 12,235,778 | |
See notes to financial statements.
GuideMarkSM Large Cap Value Fund
SCHEDULE OF INVESTMENTS (Continued)
March 31, 2014
Number of
Shares | | | | | Value | |
| | | | | COMMON STOCKS (Continued) | | | | |
| | | | | Media - 0.99% | | | | |
| | 25,800 | | | DIRECTV (a) | | $ | 1,971,636 | |
| | | | | Multiline Retail - 1.34% | | | | |
| | 44,100 | | | Target Corp. | | | 2,668,491 | |
| | | | | Oil & Gas - 5.64% | | | | |
| | 59,500 | | | BP Plc - ADR | | | 2,861,950 | |
| | 38,200 | | | ConocoPhillips | | | 2,687,370 | |
| | 82,200 | | | Marathon Oil Corp. | | | 2,919,744 | |
| | 29,400 | | | Occidental Petroleum Corp. | | | 2,801,526 | |
| | | | | | | | 11,270,590 | |
| | | | | Pharmaceuticals - 6.70% | | | | |
| | 30,600 | | | Johnson & Johnson | | | 3,005,838 | |
| | 43,800 | | | Merck & Co., Inc. | | | 2,486,526 | |
| | 89,300 | | | Pfizer, Inc. | | | 2,868,316 | |
| | 47,000 | | | Sanofi Aventis - ADR | | | 2,457,160 | |
| | 48,800 | | | Teva Pharmaceutical Industries
Ltd. - ADR | | | 2,578,592 | |
| | | | | | | | 13,396,432 | |
| | | | | Semiconductor & Semiconductor | | | | |
| | | | | Equipment - 4.54% | | | | |
| | 185,100 | | | Fairchild Semiconductor
International, Inc. (a)(b) | | | 2,552,529 | |
| | 66,600 | | | Microchip Technology, Inc. (b) | | | 3,180,816 | |
| | 70,900 | | | Texas Instruments, Inc. | | | 3,342,935 | |
| | | | | | | | 9,076,280 | |
| | | | | Software - 4.09% | | | | |
| | 90,800 | | | CA, Inc. | | | 2,812,076 | |
| | 80,200 | | | Microsoft Corp. | | | 3,287,398 | |
| | 50,500 | | | Oracle Corp. | | | 2,065,955 | |
| | | | | | | | 8,165,429 | |
| | | | | Textiles, Apparel & Luxury Goods - 2.08% | | | | |
| | 17,500 | | | Coach, Inc. | | | 869,050 | |
| | 43,100 | | | Hanesbrands, Inc. | | | 3,296,288 | |
| | | | | | | | 4,165,338 | |
| | | | | Thrifts & Mortgage Finance - 2.86% | | | | |
| | 180,000 | | | New York Community Bancorp, Inc. (b) | | | 2,892,600 | |
| | 189,500 | | | People’s United Financial, Inc. | | | 2,817,865 | |
| | | | | | | | 5,710,465 | |
Number of
Shares | | | | | Value | |
| | | | | Tobacco - 2.53% | | | | |
| | 68,400 | | | Altria Group, Inc. | | $ | 2,560,212 | |
| | 30,600 | | | Philip Morris International, Inc. | | | 2,505,222 | |
| | | | | | | | 5,065,434 | |
| | | | | Wireless Telecommunication Services - 0.89% | | | | |
| | 48,218 | | | Vodafone Group Plc - ADR | | | 1,774,905 | |
| | | | | Total Common Stocks
(Cost $132,997,877) | | | 198,287,985 | |
| | | | | SHORT TERM INVESTMENTS - 0.72% | | | | |
| | | | | Money Market Funds - 0.72% | | | | |
| | 1,429,921 | | | Federated Prime Obligations Fund | | | 1,429,921 | |
| | | | | Total Short Term Investments
(Cost $1,429,921) | | | 1,429,921 | |
| | | | | INVESTMENTS PURCHASED
AS SECURITIES LENDING
COLLATERAL - 6.07% | | | | |
| | | | | Money Market Funds - 6.03% | | | | |
| | 12,041,710 | | | First American Government
Obligations Fund | | | 12,041,710 | |
| | 23,460 | | | Reserve Primary Fund (c) | | | 906 | |
| | | | | Total Money Market Funds
(Cost $12,061,953) | | | 12,042,616 | |
Principal
Amount | | | | | | |
| | | | | Cash - 0.04% | | | | |
| $ | 83,850 | | | Cash | | | 83,850 | |
| | | | | Total Cash (Cost $83,850) | | | 83,850 | |
| | | | | Total Investments Purchased as
Securities Lending Collateral
(Cost $12,145,803) | | | 12,126,466 | |
| | | | | Total Investments
(Cost $146,573,601) - 106.01% | | | 211,844,372 | |
| | | | | Liabilities in Excess of
Other Assets - (6.01)% | | | (12,000,669 | ) |
| | | | | TOTAL NET
ASSETS - 100.00% | | $ | 199,843,703 | |
Percentages are stated as a percent of net assets.
ADR - American Depositary Receipt
| (a) | Non-income producing security. |
| (b) | All or portion of this security is on loan. |
| (c) | As of March 31, 2014, the Fund has fair valued this security and deemed it illiquid. The value of this security was $906, which represents 0.00% of total net assets. |
See notes to financial statements.
GuideMarkSM Small/Mid Cap Core Fund
SCHEDULE OF INVESTMENTS
March 31, 2014
Number of
Shares | | | | | Value | |
| | | | | COMMON STOCKS - 91.21% | | | | |
| | | | | Aerospace & Defense - 2.62% | | | | |
| | 4,085 | | | Curtiss-Wright Corp. | | $ | 259,561 | |
| | 12,713 | | | DigitalGlobe, Inc. (a) | | | 368,804 | |
| | 1,895 | | | Esterline Technologies Corp. (a) | | | 201,893 | |
| | 5,525 | | | HEICO Corp. - Class A | | | 239,840 | |
| | 5,645 | | | Moog, Inc. - Class A (a) | | | 369,804 | |
| | 8,420 | | | Orbital Sciences Corp. (a) | | | 234,918 | |
| | 3,245 | | | Teledyne Technologies, Inc. (a) | | | 315,836 | |
| | 2,000 | | | The KEYW Holding Corp. (a)(b) | | | 37,420 | |
| | | | | | | | 2,028,076 | |
| | | | | Air Freight & Logistics - 0.10% | | | | |
| | 975 | | | Echo Global Logistics, Inc. (a)(b) | | | 17,862 | |
| | 2,000 | | | XPO Logistics, Inc. (a)(b) | | | 58,820 | |
| | | | | | | | 76,682 | |
| | | | | Airlines - 0.66% | | | | |
| | 1,370 | | | Copa Holdings SA - Class A | | | 198,910 | |
| | 5,250 | | | Spirit Airlines, Inc. (a) | | | 311,850 | |
| | | | | | | | 510,760 | |
| | | | | Auto Components - 0.63% | | | | |
| | 7,900 | | | Fox Factory Holding Corp. (a) | | | 149,310 | |
| | 5,825 | | | Tenneco, Inc. (a) | | | 338,258 | |
| | | | | | | | 487,568 | |
| | | | | Biotechnology - 4.70% | | | | |
| | 2,690 | | | Agios Pharmaceuticals, Inc. (a)(b) | | | 105,313 | |
| | 4,915 | | | Alkermes Plc (a) | | | 216,702 | |
| | 2,700 | | | Alnylam Pharmaceuticals, Inc. (a) | | | 181,278 | |
| | 5,960 | | | Anacor Pharmaceuticals, Inc. (a) | | | 119,260 | |
| | 800 | | | Auspex Pharmaceuticals, Inc. (a) | | | 24,608 | |
| | 23,515 | | | BioCryst Pharmaceuticals, Inc. (a) | | | 248,789 | |
| | 6,615 | | | Cepheid (a)(b) | | | 341,202 | |
| | 2,655 | | | Cubist Pharmaceuticals, Inc. (a) | | | 194,213 | |
| | 4,235 | | | Epizyme, Inc. (a)(b) | | | 96,431 | |
| | 24,855 | | | Exelixis, Inc. (a)(b) | | | 87,987 | |
| | 4,690 | | | Five Prime Therapeutics, Inc. (a)(b) | | | 92,205 | |
| | 3,500 | | | Foundation Medicine, Inc. (a)(b) | | | 113,295 | |
| | 2,900 | | | Genocea Biosciences, Inc. (a) | | | 52,751 | |
| | 12,300 | | | GlycoMimetics, Inc. (a) | | | 200,859 | |
| | 4,705 | | | Hyperion Therapeutics, Inc. (a) | | | 121,389 | |
| | 3,985 | | | ImmunoGen, Inc. (a)(b) | | | 59,496 | |
| | 3,950 | | | Incyte Corp. (a) | | | 211,404 | |
| | 6,100 | | | Ironwood Pharmaceuticals, Inc. (a) | | | 75,152 | |
| | 2,665 | | | Karyopharm Therapeutics, Inc. (a)(b) | | | 82,322 | |
Number of
Shares | | | | | Value | |
| | | | | Biotechnology (Continued) | | | | |
| | 30,565 | | | Navidea Biopharmaceuticals,
Inc. (a)(b) | | $ | 56,545 | |
| | 24,025 | | | Novavax, Inc. (a)(b) | | | 108,833 | |
| | 5,315 | | | NPS Pharmaceuticals, Inc. (a) | | | 159,078 | |
| | 3,140 | | | PTC Therapeutics, Inc. (a) | | | 82,080 | |
| | 1,500 | | | Puma Biotechnology, Inc. (a) | | | 156,210 | |
| | 3,040 | | | Seattle Genetics, Inc. (a)(b) | | | 138,502 | |
| | 875 | | | Synageva BioPharma Corp. (a) | | | 72,599 | |
| | 5,400 | | | TESARO, Inc. (a) | | | 159,192 | |
| | 5,300 | | | Trevena, Inc. (a) | | | 41,658 | |
| | 400 | | | Ultragenyx Pharmaceutical, Inc. (a) | | | 19,556 | |
| | 400 | | | Versartis, Inc. (a) | | | 12,020 | |
| | | | | | | | 3,630,929 | |
| | | | | Building Products - 2.84% | | | | |
| | 4,565 | | | A. O. Smith Corp. | | | 210,081 | |
| | 11,230 | | | American Woodmark Corp. (a) | | | 378,002 | |
| | 13,815 | | | Armstrong World Industries,
Inc. (a)(b) | | | 735,649 | |
| | 8,440 | | | NCI Building Systems, Inc. (a) | | | 147,362 | |
| | 16,750 | | | Owens Corning | | | 723,097 | |
| | | | | | | | 2,194,191 | |
| | | | | Capital Markets - 1.74% | | | | |
| | 1,100 | | | Artisan Partners Asset | | | | |
| | | | | Management, Inc. - Class A | | | 70,675 | |
| | 7,330 | | | Lazard Ltd. - ADR | | | 345,170 | |
| | 5,415 | | | LPL Financial Holdings, Inc. | | | 284,504 | |
| | 905 | | | Virtus Investment Partners, Inc. (a)(b) | | | 156,719 | |
| | 4,320 | | | Waddell & Reed Financial, Inc.
- Class A | | | 318,038 | |
| | 13,135 | | | WisdomTree Investments, Inc. (a) | | | 172,331 | |
| | | | | | | | 1,347,437 | |
| | | | | Chemicals - 1.35% | | | | |
| | 10,245 | | | Cabot Corp. | | | 605,070 | |
| | 7,955 | | | Celanese Corp. | | | 441,582 | |
| | | | | | | | 1,046,652 | |
| | | | | Commercial Banks - 7.31% | | | | |
| | 4,950 | | | BankUnited, Inc. | | | 172,112 | |
| | 15,700 | | | Cathay General Bancorp | | | 395,483 | |
| | 60,156 | | | First Busey Corp. | | | 348,905 | |
| | 17,265 | | | International Bancshares Corp. | | | 433,006 | |
| | 38,475 | | | Lakeland Bancorp, Inc. | | | 432,844 | |
| | 15,405 | | | MB Financial, Inc. | | | 476,939 | |
| | 17,700 | | | Metro Bancorp, Inc. (a) | | | 374,178 | |
See notes to financial statements.
GuideMarkSM Small/Mid Cap Core Fund
SCHEDULE OF INVESTMENTS (Continued)
March 31, 2014
Number of
Shares | | | | | Value | |
| | | | | COMMON STOCKS (Continued) | | | | |
| | | | | Commercial Banks (Continued) | | | | |
| | 11,100 | | | PacWest Bancorp (b) | | $ | 477,411 | |
| | 28,815 | | | Sterling Bancorp | | | 364,798 | |
| | 22,291 | | | Talmer Bancorp, Inc. (a) | | | 326,340 | |
| | 5,800 | | | TriCo Bancshares (b) | | | 150,394 | |
| | 7,700 | | | Union First Market Bankshares Corp. | | | 195,734 | |
| | 19,700 | | | United Community Banks, Inc. (a) | | | 382,377 | |
| | 10,300 | | | Wintrust Financial Corp. (b) | | | 501,198 | |
| | 19,900 | | | Zions Bancorporation | | | 616,502 | |
| | | | | | | | 5,648,221 | |
| | | | | Commercial Services & Supplies - 1.32% | | | | |
| | 18,575 | | | Clean Harbors, Inc. (a)(b) | | | 1,017,724 | |
| | | | | Communications Equipment - 1.75% | | | | |
| | 10,755 | | | Aruba Networks, Inc. (a) | | | 201,656 | |
| | 4,045 | | | F5 Networks, Inc. (a) | | | 431,318 | |
| | 10,765 | | | Juniper Networks, Inc. (a) | | | 277,307 | |
| | 2,800 | | | Palo Alto Networks, Inc. (a) | | | 192,080 | |
| | 29,300 | | | ShoreTel, Inc. (a) | | | 251,980 | |
| | | | | | | | 1,354,341 | |
| | | | | Construction & Engineering - 0.75% | | | | |
| | 21,745 | | | KBR, Inc. | | | 580,157 | |
| | | | | Construction Materials - 0.90% | | | | |
| | 3,390 | | | Eagle Materials, Inc. | | | 300,558 | |
| | 29,935 | | | Headwaters, Inc. (a) | | | 395,441 | |
| | | | | | | | 695,999 | |
| | | | | Consumer Finance - 0.26% | | | | |
| | 8,400 | | | Santander Consumer USA | | | | |
| | | | | Holdings, Inc. (a) | | | 202,272 | |
| | | | | Containers & Packaging - 3.03% | | | | |
| | 8,140 | | | Ball Corp. | | | 446,153 | |
| | 12,360 | | | Crown Holdings, Inc. (a) | | | 552,987 | |
| | 87,310 | | | Graphic Packaging Holding Co. (a) | | | 887,070 | |
| | 13,440 | | | Owens-Illinois, Inc. (a) | | | 454,675 | |
| | | | | | | | 2,340,885 | |
| | | | | Diversified Financial Services - 0.19% | | | | |
| | 3,335 | | | MSCI, Inc. (a) | | | 143,472 | |
| | | | | Electric Utilities - 2.17% | | | | |
| | 6,855 | | | IDACORP, Inc. | | | 380,247 | |
| | 8,300 | | | NRG Yield, Inc. - Class A (b) | | | 328,099 | |
| | 16,470 | | | OGE Energy Corp. | | | 605,437 | |
| | 6,700 | | | Pinnacle West Capital Corp. | | | 366,222 | |
| | | | | | | | 1,680,005 | |
Number of
Shares | | | | | Value | |
| | | | | Electrical Equipment - 1.00% | | | | |
| | 2,100 | | | Generac Holdings, Inc. | | $ | 123,837 | |
| | 16,410 | | | GrafTech International Ltd. (a)(b) | | | 179,197 | |
| | 3,950 | | | Hubbell, Inc. - Class B | | | 473,487 | |
| | | | | | | | 776,521 | |
| | | | | Electronic Equipment & Instruments - 1.11% | | | | |
| | 600 | | | Measurement Specialties, Inc. (a) | | | 40,710 | |
| | 6,720 | | | National Instruments Corp. | | | 192,797 | |
| | 9,990 | | | Rogers Corp. (a) | | | 623,576 | |
| | | | | | | | 857,083 | |
| | | | | Energy Equipment & Services - 1.76% | | | | |
| | 3,955 | | | Nabors Industries Ltd. | | | 97,491 | |
| | 3,825 | | | Nuverra Environmental Solutions,
Inc. (a) | | | 77,609 | |
| | 15,950 | | | Patterson-UTI Energy, Inc. | | | 505,296 | |
| | 22,115 | | | Superior Energy Services, Inc. | | | 680,257 | |
| | | | | | | | 1,360,653 | |
| | | | | Food & Staples Retailing - 0.23% | | | | |
| | 4,900 | | | Sprouts Farmers Market, Inc. (a) | | | 176,547 | |
| | | | | Food Products - 0.84% | | | | |
| | 9,800 | | | Chiquita Brands International, Inc. (a) | | | 122,010 | |
| | 4,875 | | | Hillshire Brands Co. | | | 181,643 | |
| | 5,130 | | | Ingredion, Inc. | | | 349,250 | |
| | | | | | | | 652,903 | |
| | | | | Gas Utilities - 0.30% | | | | |
| | 4,400 | | | Southwest Gas Corp. | | | 235,180 | |
| | | | | Health Care Equipment & Supplies - 3.41% | | | | |
| | 2,510 | | | Analogic Corp. | | | 206,096 | |
| | 8,200 | | | AtriCure, Inc. (a) | | | 154,242 | |
| | 12,250 | | | CareFusion Corp. (a) | | | 492,695 | |
| | 5,450 | | | DENTSPLY International, Inc. | | | 250,918 | |
| | 20,840 | | | Globus Medical, Inc. - Class A (a) | | | 554,136 | |
| | 4,620 | | | HeartWare International, Inc. (a) | | | 433,264 | |
| | 4,915 | | | Hologic, Inc. (a) | | | 105,672 | |
| | 15,925 | | | Quidel Corp. (a)(b) | | | 434,752 | |
| | | | | | | | 2,631,775 | |
| | | | | Health Care Providers & Services - 2.05% | | | | |
| | 5,800 | | | Community Health Systems, Inc. (a) | | | 227,186 | |
| | 19,115 | | | Envision Healthcare Holdings, Inc. (a) | | | 646,661 | |
| | 7,055 | | | LifePoint Hospitals, Inc. (a) | | | 384,850 | |
| | 5,085 | | | WellCare Health Plans, Inc. (a) | | | 322,999 | |
| | | | | | | | 1,581,696 | |
See notes to financial statements.
GuideMarkSM Small/Mid Cap Core Fund
SCHEDULE OF INVESTMENTS (Continued)
March 31, 2014
Number of
Shares | | | | | Value | |
| | | | | COMMON STOCKS (Continued) | | | | |
| | | | | Health Technology - 0.54% | | | | |
| | 23,045 | | | Allscripts Healthcare Solutions, Inc. (a) | | $ | 415,501 | |
| | | | | Hotels, Restaurants & Leisure - 2.85% | | | | |
| | 9,100 | | | Bloomin’ Brands, Inc. (a) | | | 219,310 | |
| | 3,870 | | | Brinker International, Inc. (b) | | | 202,981 | |
| | 1,495 | | | Buffalo Wild Wings, Inc. (a) | | | 222,606 | |
| | 3,975 | | | Cheesecake Factory, Inc. | | | 189,329 | |
| | 3,250 | | | Churchill Downs, Inc. (b) | | | 296,725 | |
| | 5,950 | | | Hyatt Hotels Corp. - Class A (a) | | | 320,169 | |
| | 2,100 | | | Noodles & Co. - Class A (a)(b) | | | 82,887 | |
| | 9,000 | | | Norwegian Cruise Line Holdings Ltd. (a) | | | 290,430 | |
| | 1,600 | | | Panera Bread Co. - Class A (a) | | | 282,352 | |
| | 1,345 | | | Red Robin Gourmet Burgers, Inc. (a) | | | 96,410 | |
| | | | | | | | 2,203,199 | |
| | | | | Household Durables - 2.83% | | | | |
| | 18,400 | | | Blyth, Inc. (b) | | | 197,432 | |
| | 12,835 | | | Lennar Corp. - Class A | | | 508,523 | |
| | 18,185 | | | M/I Homes, Inc. (a) | | | 407,708 | |
| | 32,065 | | | Standard Pacific Corp. (a) | | | 266,460 | |
| | 21,320 | | | Taylor Morrison Home Corp.
- Class A (a) | | | 501,020 | |
| | 6,100 | | | Tempur Sealy International, Inc. (a) | | | 309,087 | |
| | | | | | | | 2,190,230 | |
| | | | | Household Products - 0.44% | | | | |
| | 4,240 | | | Spectrum Brands Holdings, Inc. | | | 337,928 | |
| | | | | Independent Power & Renewable | | | | |
| | | | | Electricity Producers - 0.35% | | | | |
| | 9,910 | | | Pattern Energy Group, Inc.
- Class A | | | 268,858 | |
| | | | | Insurance - 3.93% | | | | |
| | 8,045 | | | Argo Group International
Holdings, Ltd. | | | 369,265 | |
| | 21,415 | | | Assured Guaranty Ltd. | | | 542,228 | |
| | 17,430 | | | Brown & Brown, Inc. | | | 536,147 | |
| | 4,500 | | | Fidelity & Guaranty Life | | | 106,200 | |
| | 9,865 | | | Primerica, Inc. | | | 464,740 | |
| | 9,800 | | | Protective Life Corp. | | | 515,382 | |
| | 16,155 | | | XL Group Plc | | | 504,844 | |
| | | | | | | | 3,038,806 | |
| | | | | Internet & Catalog Retail - 0.60% | | | | |
| | 7,725 | | | HSN, Inc. | | | 461,414 | |
Number of
Shares | | | | | Value | |
| | | | | Internet Software & Services - 1.47% | | | | |
| | 5,700 | | | Aerohive Networks, Inc. (a) | | $ | 60,135 | |
| | 7,600 | | | Bankrate, Inc. (a) | | | 128,744 | |
| | 6,060 | | | Demandware, Inc. (a) | | | 388,204 | |
| | 510 | | | Envestnet, Inc. (a) | | | 20,492 | |
| | 1,800 | | | Everyday Health, Inc. (a) | | | 25,182 | |
| | 6,070 | | | Pandora Media, Inc. (a) | | | 184,042 | |
| | 3,765 | | | Zillow, Inc. - Class A (a)(b) | | | 331,696 | |
| | | | | | | | 1,138,495 | |
| | | | | IT Services - 3.92% | | | | |
| | 1,575 | | | Alliance Data Systems Corp. (a) | | | 429,109 | |
| | 3,670 | | | CACI International, Inc. - Class A (a) | | | 270,846 | |
| | 7,955 | | | Cardtronics, Inc. (a) | | | 309,052 | |
| | 3,900 | | | Forrester Research, Inc. | | | 139,815 | |
| | 17,500 | | | Genpact Ltd. (a) | | | 304,850 | |
| | 4,980 | | | Global Payments, Inc. (b) | | | 354,128 | |
| | 13,855 | | | Heartland Payment Systems, Inc. (b) | | | 574,289 | |
| | 6,780 | | | WEX, Inc. (a) | | | 644,439 | |
| | | | | | | | 3,026,528 | |
| | | | | Leisure Products - 0.46% | | | | |
| | 3,780 | | | Arctic Cat, Inc. | | | 180,646 | |
| | 3,925 | | | Brunswick Corp. | | | 177,763 | |
| | | | | | | | 358,409 | |
| | | | | Life Sciences Tools & Services - 1.08% | | | | |
| | 4,865 | | | Covance, Inc. (a) | | | 505,473 | |
| | 6,540 | | | Quintiles Transnational Holdings,
Inc. (a) | | | 332,036 | |
| | | | | | | | 837,509 | |
| | | | | Machinery - 2.11% | | | | |
| | 5,335 | | | Colfax Corp. (a) | | | 380,546 | |
| | 4,240 | | | EnPro Industries, Inc. (a)(b) | | | 308,121 | |
| | 8,970 | | | Global Brass & Copper Holdings, Inc. | | | 141,457 | |
| | 5,470 | | | IDEX Corp. | | | 398,708 | |
| | 11,700 | | | Luxfer Holdings Plc - ADR | | | 229,086 | |
| | 3,000 | | | Watts Water Technologies,
Inc. - Class A (b) | | | 176,070 | |
| | | | | | | | 1,633,988 | |
| | | | | Media - 1.37% | | | | |
| | 11,810 | | | DreamWorks Animation SKG, Inc.
- Class A (a) | | | 313,556 | |
| | 10,775 | | | IMAX Corp. (a)(b) | | | 294,481 | |
| | 26,275 | | | Interpublic Group of Cos., Inc. | | | 450,353 | |
| | | | | | | | 1,058,390 | |
See notes to financial statements.
GuideMarkSM Small/Mid Cap Core Fund
SCHEDULE OF INVESTMENTS (Continued)
March 31, 2014
Number of
Shares | | | | | Value | |
| | | | | COMMON STOCKS (Continued) | | | | |
| | | | | Metals & Mining - 0.92% | | | | |
| | 13,200 | | | AK Steel Holding Corp. (a)(b) | | $ | 95,304 | |
| | 8,200 | | | Allegheny Technologies, Inc. | | | 308,976 | |
| | 2,300 | | | Carpenter Technology Corp. | | | 151,892 | |
| | 2,200 | | | Reliance Steel & Aluminum Co. | | | 155,452 | |
| | | | | | | | 711,624 | |
| | | | | Multi-Utilities - 1.04% | | | | |
| | 7,135 | | | Alliant Energy Corp. | | | 405,340 | |
| | 9,690 | | | Ameren Corp. | | | 399,228 | |
| | | | | | | | 804,568 | |
| | | | | Oil & Gas - 4.03% | | | | |
| | 6,725 | | | Athlon Energy, Inc. (a) | | | 238,401 | |
| | 5,040 | | | Bonanza Creek Energy, Inc. (a) | | | 223,776 | |
| | 12,070 | | | Cheniere Energy, Inc. (a) | | | 668,074 | |
| | 4,700 | | | CONSOL Energy, Inc. | | | 187,765 | |
| | 5,190 | | | Diamondback Energy, Inc. (a) | | | 349,339 | |
| | 4,565 | | | Energen Corp. | | | 368,898 | |
| | 2,960 | | | Gulfport Energy Corp. (a) | | | 210,693 | |
| | 16,395 | | | Laredo Petroleum, Inc. (a) | | | 423,975 | |
| | 2,720 | | | RSP Permian, Inc. (a) | | | 78,581 | |
| | 5,605 | | | SemGroup Corp. - Class A | | | 368,136 | |
| | | | | | | | 3,117,638 | |
| | | | | Paper & Forest Products - 0.56% | | | | |
| | 15,190 | | | Boise Cascade Co. (a) | | | 435,042 | |
| | | | | Personal Products - 0.26% | | | | |
| | 2,410 | | | Nu Skin Enterprises, Inc. - Class A | | | 199,668 | |
| | | | | Pharmaceuticals - 0.58% | | | | |
| | 4,000 | | | Achaogen, Inc. (a) | | | 61,840 | |
| | 8,665 | | | Aerie Pharmaceuticals, Inc. (a)(b) | | | 183,611 | |
| | 6,835 | | | Relypsa, Inc. (a) | | | 203,752 | |
| | | | | | | | 449,203 | |
| | | | | Professional Services - 3.02% | | | | |
| | 7,295 | | | Equifax, Inc. | | | 496,279 | |
| | 8,390 | | | Huron Consulting Group, Inc. (a) | | | 531,758 | |
| | 7,620 | | | ManpowerGroup, Inc. | | | 600,684 | |
| | 13,680 | | | Robert Half International, Inc. | | | 573,876 | |
| | 6,000 | | | TriNet Group, Inc. (a) | | | 127,860 | |
| | | | | | | | 2,330,457 | |
| | | | | Real Estate Management &
Development - 0.29% | | | | |
| | 9,785 | | | Kennedy-Wilson Holdings, Inc. | | | 220,260 | |
Number of
Shares | | | | | Value | |
| | | | | Road & Rail - 1.59% | | | | |
| | 5,370 | | | Avis Budget Group (a)(b) | | $ | 261,519 | |
| | 1,915 | | | Con-Way, Inc. | | | 78,668 | |
| | 2,200 | | | Genesee & Wyoming, Inc.
- Class A (a) | | | 214,104 | |
| | 2,900 | | | J.B. Hunt Transport Services, Inc. | | | 208,568 | |
| | 2,755 | | | Landstar System, Inc. | | | 163,151 | |
| | 1,800 | | | Old Dominion Freight Line, Inc. (a) | | | 102,132 | |
| | 8,025 | | | Swift Transportation Co.
- Class A (a)(b) | | | 198,619 | |
| | | | | | | | 1,226,761 | |
| | | | | Semiconductor & Semiconductor | | | | |
| | | | | Equipment - 4.79% | | | | |
| | 21,900 | | | Applied Micro Circuits Corp. (a) | | | 216,810 | |
| | 16,700 | | | Exar Corp. (a) | | | 199,565 | |
| | 2,360 | | | First Solar, Inc. (a) | | | 164,705 | |
| | 21,510 | | | Freescale Semiconductor Ltd. (a)(b) | | | 525,059 | |
| | 9,085 | | | GT Advanced Technologies, Inc. (a) | | | 154,899 | |
| | 1,800 | | | Hittite Microwave Corp. | | | 113,472 | |
| | 5,810 | | | International Rectifier Corp. (a) | | | 159,194 | |
| | 4,800 | | | Lam Research Corp. (a) | | | 264,000 | |
| | 30,635 | | | Lattice Semiconductor Corp. (a) | | | 240,178 | |
| | 4,920 | | | Maxim Integrated Products, Inc. | | | 162,950 | |
| | 5,950 | | | Microsemi Corp. (a) | | | 148,929 | |
| | 7,700 | | | Silicon Laboratories, Inc. (a) | | | 402,325 | |
| | 13,940 | | | Skyworks Solutions, Inc. (a) | | | 523,029 | |
| | 9,135 | | | SunEdison, Inc. (a) | | | 172,103 | |
| | 3,200 | | | SunPower Corp. (a)(b) | | | 103,232 | |
| | 5,300 | | | Ultratech, Inc. (a) | | | 154,707 | |
| | | | | | | | 3,705,157 | |
| | | | | Software - 3.08% | | | | |
| | 16,800 | | | Cadence Design System, Inc. (a) | | | 261,072 | |
| | 2,800 | | | Concur Technologies, Inc. (a)(b) | | | 277,396 | |
| | 7,355 | | | Guidewire Software, Inc. (a) | | | 360,763 | |
| | 2,200 | | | Imperva, Inc. (a) | | | 122,540 | |
| | 16,300 | | | Mavenir Systems, Inc. (a) | | | 291,770 | |
| | 4,205 | | | MICROS Systems, Inc. (a) | | | 222,571 | |
| | 5,495 | | | Tableau Software, Inc. - Class A (a) | | | 418,059 | |
| | 9,005 | | | Verint Systems, Inc. (a) | | | 422,605 | |
| | | | | | | | 2,376,776 | |
| | | | | Specialty Retail - 2.51% | | | | |
| | 10,635 | | | Five Below, Inc. (a)(b) | | | 451,775 | |
| | 5,900 | | | Foot Locker, Inc. | | | 277,182 | |
| | 9,730 | | | Francesca’s Holdings Corp. (a)(b) | | | 176,502 | |
See notes to financial statements.
GuideMarkSM Small/Mid Cap Core Fund
SCHEDULE OF INVESTMENTS (Continued)
March 31, 2014
Number of
Shares | | | | | Value | |
| | | | | COMMON STOCKS (Continued) | | | | |
| | | | | Specialty Retail (Continued) | | | | |
| | 11,405 | | | GNC Holdings, Inc. - Class A | | $ | 502,048 | |
| | 3,121 | | | Signet Jewelers Ltd. | | | 330,389 | |
| | 5,435 | | | Urban Outfitters, Inc. (a) | | | 198,215 | |
| | | | | | | | 1,936,111 | |
| | | | | Technology Hardware, Storage & | | | | |
| | | | | Peripherals - 0.32% | | | | |
| | 2,300 | | | Stratasys Ltd. (a)(b) | | | 244,007 | |
| | | | | Textiles, Apparel & Luxury Goods - 1.85% | | | | |
| | 3,250 | | | Hanesbrands, Inc. | | | 248,560 | |
| | 7,210 | | | Kate Spade & Co. (a) | | | 267,419 | |
| | 1,900 | | | PVH Corp. | | | 237,063 | |
| | 6,365 | | | Steven Madden Ltd. (a) | | | 229,012 | |
| | 3,500 | | | Tumi Holdings, Inc. (a) | | | 79,205 | |
| | 10,000 | | | Vera Bradley, Inc. (a)(b) | | | 269,900 | |
| | 3,780 | | | Vince Holding Corp. (a) | | | 99,641 | |
| | | | | | | | 1,430,800 | |
| | | | | Thrifts & Mortgage Finance - 0.27% | | | | |
| | 8,000 | | | Berkshire Hills Bancorp, Inc. | | | 207,040 | |
| | | | | Trading Companies & Distributors - 0.50% | | | | |
| | 4,655 | | | WESCO International, Inc. (a)(b) | | | 387,389 | |
| | | | | Water Utilities - 0.63% | | | | |
| | 10,725 | | | American Water Works Co., Inc. | | | 486,915 | |
| | | | | Total Common Stocks
(Cost $67,453,505) | | | 70,496,400 | |
| | | | | INVESTMENT COMPANIES - 0.29% | | | | |
| | | | | Capital Markets - 0.29% | | | | |
| | 22,100 | | | GSV Capital Corp. (a) | | | 224,094 | |
| | | | | Total Investment Companies
(Cost $225,221) | | | 224,094 | |
| | | | | REAL ESTATE INVESTMENT TRUSTS - 7.41% | | | | |
| | | | | Real Estate Investment Trusts - 7.41% | | | | |
| | 895 | | | Alexander’s, Inc. | | | 323,086 | |
| | 28,270 | | | Cousins Properties, Inc. | | | 324,257 | |
| | 22,240 | | | Douglas Emmett, Inc. | | | 603,594 | |
| | 9,835 | | | Equity Lifestyle Properties, Inc. | | | 399,793 | |
| | 2,885 | | | Essex Property Trust, Inc. | | | 490,594 | |
| | 4,905 | | | Federal Realty Investment Trust | | | 562,702 | |
| | 24,670 | | | First Industrial Realty Trust | | | 476,624 | |
| | 29,200 | | | MFA Financial, Inc. | | | 226,300 | |
| | 16,695 | | | Pebblebrook Hotel Trust (b) | | | 563,790 | |
| | 6,810 | | | PS Business Parks, Inc. | | | 569,452 | |
Number of
Shares | | | | | Value | |
| | | | | Real Estate Investment Trusts (Continued) | | | | |
| | 14,820 | | | RLJ Lodging Trust | | $ | 396,287 | |
| | 4,075 | | | SL Green Realty Corp. | | | 410,026 | |
| | 5,130 | | | Sovran Self Storage, Inc. | | | 376,799 | |
| | | | | Total Real Estate Investment Trusts
(Cost $5,036,704) | | | 5,723,304 | |
| | | | | SHORT TERM INVESTMENTS - 0.19% | | | | |
| | | | | Money Market Funds - 0.19% | | | | |
| | 148,982 | | | Federated Prime Obligations Fund | | | 148,982 | |
| | | | | Total Short Term Investments
(Cost $148,982) | | | 148,982 | |
| | | | | INVESTMENTS PURCHASED | | | | |
| | | | | AS SECURITIES LENDING | | | | |
| | | | | COLLATERAL - 9.71% | | | | |
| | | | | Money Market Funds - 9.64% | | | | |
| | 7,451,780 | | | First American Government
Obligations Fund | | | 7,451,780 | |
| | 6,386 | | | Reserve Primary Fund (c) | | | 247 | |
| | | | | Total Money Market Funds
(Cost $7,457,287) | | | 7,452,027 | |
| | | | | | | | | |
Principal
Amount | | | | | | |
| | | | | Cash - 0.07% | | | | |
| $ | 51,888 | | | Cash | | | 51,888 | |
| | | | | Total Cash (Cost $51,888) | | | 51,888 | |
| | | | | Total Investments Purchased as
Securities Lending Collateral
(Cost $7,509,175) | | | 7,503,915 | |
| | | | | Total Investments
(Cost $80,373,587) - 108.81% | | | 84,096,695 | |
| | | | | Liabilities in Excess of
Other Assets - (8.81)% | | | (6,809,692 | ) |
| | | | | TOTAL NET | | | | |
| | | | | ASSETS - 100.00% | | $ | 77,287,003 | |
Percentages are stated as a percent of net assets.
ADR - American Depositary Receipt
| (a) | Non-income producing security. |
| (b) | All or portion of this security is on loan. |
| (c) | As of March 31, 2014, the Fund has fair valued this security and deemed it illiquid. The value of this security was $247, which represents 0.00% of total net assets. |
See notes to financial statements.
GuideMarkSM World ex-US Fund
SCHEDULE OF INVESTMENTS
March 31, 2014
Number of
Shares | | | | | Value | |
| | | | | COMMON STOCKS - 90.04% | | | | |
| | | | | Australia - 4.93% | | | | |
| | 30,606 | | | Ansell Ltd. | | $ | 522,925 | |
| | 109,508 | | | Australia and New Zealand Banking
Group Ltd. | | | 3,368,800 | |
| | 25,005 | | | Commonwealth Bank of Australia | | | 1,800,103 | |
| | 21,353 | | | CSL Ltd. | | | 1,379,230 | |
| | 7,635 | | | Flight Centre Travel Group Ltd. | | | 372,492 | |
| | 199,468 | | | Mirvac Group | | | 315,217 | |
| | 109,276 | | | Oil Search Ltd. | | | 857,750 | |
| | 43,159 | | | Rio Tinto Ltd. | | | 2,545,643 | |
| | 1 | | | SCA Property Group | | | 1 | |
| | 31,932 | | | Seek Ltd. | | | 522,088 | |
| | 93,059 | | | Suncorp Group Ltd. | | | 1,113,678 | |
| | 126,098 | | | Sydney Airport | | | 490,646 | |
| | 215,641 | | | Telstra Corp. Ltd. | | | 1,016,846 | |
| | 30,302 | | | Wesfarmers Ltd. | | | 1,161,040 | |
| | 138,387 | | | Westfield Group | | | 1,318,174 | |
| | 13,922 | | | Westpac Banking Corp. | | | 447,630 | |
| | 28,984 | | | Woolworths Ltd. | | | 961,168 | |
| | | | | | | | 18,193,431 | |
| | | | | Austria - 0.41% | | | | |
| | 9,600 | | | Andritz AG | | | 593,584 | |
| | 26,900 | | | Erste Group Bank AG | | | 920,241 | |
| | | | | | | | 1,513,825 | |
| | | | | Belgium - 1.89% | | | | |
| | 32,377 | | | Anheuser-Busch InBev SA | | | 3,409,812 | |
| | 43,709 | | | KBC Groep NV | | | 2,691,878 | |
| | 10,600 | | | UCB SA | | | 850,399 | |
| | | | | | | | 6,952,089 | |
| | | | | Brazil - 1.36% | | | | |
| | 71,200 | | | Ambev SA | | | 529,685 | |
| | 115,800 | | | BM&FBovespa SA | | | 574,662 | |
| | 41,700 | | | Cia de Saneamento Basico do | | | | |
| | | | | Estado de Sao Paulo | | | 386,860 | |
| | 21,800 | | | Cielo SA | | | 691,182 | |
| | 25,600 | | | Cosan SA Industria e Comercio | | | 396,354 | |
| | 32,600 | | | Kroton Educacional SA | | | 707,746 | |
| | 29,100 | | | Petroleo Brasileiro SA | | | 191,734 | |
| | 43,500 | | | Qualicorp SA (a) | | | 437,492 | |
| | 35,000 | | | Smiles SA | | | 556,391 | |
| | 39,100 | | | WEG SA | | | 545,574 | |
| | | | | | | | 5,017,680 | |
Number of
Shares | | | | | Value | |
| | | | | Canada - 6.92% | | | | |
| | 6,900 | | | Agrium, Inc. (a) | | $ | 672,399 | |
| | 33,000 | | | Alamos Gold, Inc. (a) | | | 298,209 | |
| | 7,100 | | | Alimentation Couche-Tard, Inc. (a) | | | 574,230 | |
| | 43,200 | | | Canadian Natural Resources Ltd. | | | 1,655,707 | |
| | 8,400 | | | Canadian Pacific Railway Ltd. | | | 1,258,670 | |
| | 23,800 | | | Catamaran Corp. | | | 1,064,810 | |
| | 30,900 | | | CGI Group, Inc. - Class A (a) | | | 953,973 | |
| | 18,700 | | | Franco Nevada Corp. | | | 859,303 | |
| | 11,600 | | | Gildan Activewear, Inc. | | | 584,564 | |
| | 20,100 | | | Goldcorp, Inc. | | | 490,364 | |
| | 6,500 | | | Intact Financial Corp. | | | 404,523 | |
| | 12,200 | | | Keyera Corp. | | | 773,494 | |
| | 17,100 | | | Magna International, Inc. | | | 1,643,951 | |
| | 71,200 | | | Manulife Financial Corp. | | | 1,373,120 | |
| | 3,900 | | | Methanex Corp. | | | 249,558 | |
| | 5,200 | | | NovaTek OAO | | | 572,910 | |
| | 18,400 | | | Peyto Exploration & Development
Corp. | | | 627,814 | |
| | 10,900 | | | Quebecor, Inc. - Class B | | | 266,214 | |
| | 43,100 | | | Royal Bank of Canada | | | 2,841,754 | |
| | 22,800 | | | Sun Life Financial, Inc. | | | 789,493 | |
| | 61,800 | | | Suncor Energy, Inc. | | | 2,158,388 | |
| | 65,700 | | | Toronto-Dominion Bank | | | 3,080,263 | |
| | 11,600 | | | Tourmaline Oil Corp. | | | 548,364 | |
| | 6,100 | | | Valeant Pharmaceuticals
International, Inc. | | | 802,518 | |
| | 10,700 | | | Vermilion Energy, Inc. | | | 668,327 | |
| | 6,300 | | | West Fraser Timber Co., Ltd. | | | 287,788 | |
| | | | | | | | 25,500,708 | |
| | | | | Cayman Islands - 1.30% | | | | |
| | 9,000 | | | Ginko International Co., Ltd. | | | 155,503 | |
| | 183,000 | | | Lifestyle International Holdings Ltd. | | | 372,650 | |
| | 14,100 | | | Qunar Cayman Islands
Ltd. - ADR (a)(b) | | | 431,319 | |
| | 158,200 | | | Sands China Ltd. | | | 1,186,491 | |
| | 360,000 | | | Sino Biopharmaceutical | | | 307,299 | |
| | 33,600 | | | Tencent Holdings Ltd. | | | 2,345,286 | |
| | | | | | | | 4,798,548 | |
| | | | | Chile - 0.14% | | | | |
| | 1,432,646 | | | Banco de Chile | | | 180,787 | |
| | 5,842,521 | | | Banco Santander Chile | | | 343,067 | |
| | | | | | | | 523,854 | |
See notes to financial statements.
GuideMarkSM World ex-US Fund
SCHEDULE OF INVESTMENTS (Continued)
March 31, 2014
Number of
Shares | | | | | Value | |
| | | | | COMMON STOCKS (Continued) | | | | |
| | | | | China - 2.01% | | | | |
| | 133,500 | | | Anhui Conch Cement Co., Ltd. | | $ | 574,225 | |
| | 1,378,000 | | | Bank of China Ltd. | | | 612,208 | |
| | 1,320,000 | | | Beijing Jingneng Clean Energy
Co., Ltd. | | | 606,285 | |
| | 1,290,000 | | | China Construction Bank Corp. | | | 905,505 | |
| | 182,000 | | | China Mengniu Dairy Co., Ltd. | | | 913,400 | |
| | 304,000 | | | China Pacific Insurance Group
Co., Ltd. | | | 1,088,381 | |
| | 589,000 | | | China Petroleum & Chemical Corp. | | | 526,838 | |
| | 123,000 | | | Great Wall Motor Co., Ltd. | | | 619,660 | |
| | 94,000 | | | Kingsoft Corp., Ltd. | | | 372,277 | |
| | 91,600 | | | MGM China Holdings Ltd. | | | 323,627 | |
| | 280,000 | | | Petrochina Co. | | | 304,145 | |
| | 67,500 | | | Ping An Insurance Group Co. of
China, Ltd. | | | 560,984 | |
| | | | | | | | 7,407,535 | |
| | | | | Czech Republic - 0.17% | | | | |
| | 2,646 | | | Komercni Banka AS | | | 632,276 | |
| | | | | Denmark - 1.46% | | | | |
| | 78 | | | A.P. Moller - Maersk Group | | | 933,563 | |
| | 68,260 | | | Novo Nordisk AS | | | 3,108,033 | |
| | 88,400 | | | TDC AS | | | 817,227 | |
| | 12,900 | | | Vestas Wind Systems AS (a) | | | 517,213 | |
| | | | | | | | 5,376,036 | |
| | | | | Finland - 0.59% | | | | |
| | 68,200 | | | Nokia OYJ (a) | | | 501,778 | |
| | 22,500 | | | Sampo OYJ | | | 1,167,975 | |
| | 47,200 | | | Stora Enso OYJ | | | 505,152 | |
| | | | | | | | 2,174,905 | |
| | | | | France - 7.41% | | | | |
| | 5,200 | | | Air Liquide SA | | | 704,189 | |
| | 8,500 | | | Arkema SA | | | 961,573 | |
| | 6,237 | | | Atos SA | | | 563,633 | |
| | 60,800 | | | AXA SA | | | 1,579,516 | |
| | 23,603 | | | BNP Paribas SA | | | 1,819,781 | |
| | 32,082 | | | Carrefour SA | | | 1,241,078 | |
| | 64,200 | | | GDF Suez SA | | | 1,756,200 | |
| | 2,075 | | | Iliad SA | | | 598,313 | |
| | 2,850 | | | Kering SA | | | 581,104 | |
| | 17,200 | | | Legrand SA | | | 1,068,470 | |
Number of
Shares | | | | | Value | |
| | | | | France (Continued) | | | | |
| | 3,672 | | | LVMH Moet Hennessy Louis
Vuitton SA | | $ | 665,415 | |
| | 61,000 | | | Orange SA | | | 901,082 | |
| | 6,200 | | | Publicis Groupe SA | | | 559,746 | |
| | 6,000 | | | Renault SA | | | 582,806 | |
| | 18,830 | | | Safran SA | | | 1,304,541 | |
| | 31,978 | | | Sanofi-Aventis SA | | | 3,341,692 | |
| | 22,428 | | | Societe Generale SA | | | 1,380,576 | |
| | 6,400 | | | Sodexo SA | | | 670,797 | |
| | 35,400 | | | Suez Environnement Co. | | | 719,100 | |
| | 7,200 | | | Technip SA | | | 742,214 | |
| | 70,815 | | | Total SA | | | 4,661,393 | |
| | 12,480 | | | Vinci SA | | | 926,387 | |
| | | | | | | | 27,329,606 | |
| | | | | Germany - 4.91% | | | | |
| | 7,700 | | | Adidas AG | | | 832,600 | |
| | 14,300 | | | Altice SA (a) | | | 637,114 | |
| | 27,917 | | | Bayer AG | | | 3,780,645 | |
| | 74,400 | | | Commerzbank AG (a) | | | 1,368,529 | |
| | 4,900 | | | Continental AG | | | 1,175,112 | |
| | 6,300 | | | Fresenius SE & Co. KGaA | | | 988,908 | |
| | 19,372 | | | GEA Group AG | | | 885,057 | |
| | 14,232 | | | HeidelbergCement AG | | | 1,219,851 | |
| | 6,677 | | | Henkel AG & Co. KGaA | | | 671,497 | |
| | 11,021 | | | Lanxess AG | | | 831,892 | |
| | 16,307 | | | Osram Licht AG (a) | | | 1,057,380 | |
| | 21,300 | | | RWE AG | | | 864,351 | |
| | 14,962 | | | SAP AG | | | 1,213,658 | |
| | 13,964 | | | Siemens AG | | | 1,883,232 | |
| | 79,200 | | | Sky Deutschland AG (a) | | | 683,438 | |
| | | | | | | | 18,093,264 | |
| | | | | Hong Kong - 3.04% | | | | |
| | 343,600 | | | AIA Group Ltd. | | | 1,634,213 | |
| | 221,000 | | | BOC Hong Kong Holdings Ltd. | | | 631,049 | |
| | 380,000 | | | Brilliance China Automotive
Holdings Ltd. | | | 581,311 | |
| | 34,000 | | | Cheung Kong Infrastructure
Holdings Ltd. | | | 217,442 | |
| | 350,000 | | | China Longyuan Power Group Corp. | | | 352,689 | |
| | 88,500 | | | China Mobile Ltd. | | | 812,557 | |
| | 308,000 | | | CNOOC Ltd. | | | 466,319 | |
| | 509,000 | | | CSR Corp. Ltd. | | | 428,873 | |
See notes to financial statements.
GuideMarkSM World ex-US Fund
SCHEDULE OF INVESTMENTS (Continued)
March 31, 2014
Number of
Shares | | | | | Value | |
| | | | | COMMON STOCKS (Continued) | | | | |
| | | | | Hong Kong (Continued) | | | | |
| | 1,483,000 | | | GCL-Poly Energy Holdings Ltd. (a) | | $ | 536,488 | |
| | 14,500 | | | Hengan International Group Co., Ltd. | | | 150,533 | |
| | 391,000 | | | HKT Trust and HKT Ltd. | | | 413,536 | |
| | 99,000 | | | Hongkong Land Holdings Ltd. | | | 641,228 | |
| | 422,000 | | | Huadian Fuxin Energy Corp. Ltd. | | | 230,691 | |
| | 79,000 | | | Hysan Development Co., Ltd. | | | 344,733 | |
| | 1,129,000 | | | Industrial & Commercial Bank
of China | | | 696,006 | |
| | 244,000 | | | Kunlun Energy Co., Ltd. | | | 408,857 | |
| | 416,000 | | | Noble Group Ltd. | | | 393,286 | |
| | 50,500 | | | Orient Overseas International Ltd. | | | 232,472 | |
| | 499,000 | | | PCCW Ltd. | | | 250,668 | |
| | 831,000 | | | Sinotrans Ltd. | | | 418,461 | |
| | 12,500 | | | Swire Pacific Ltd. | | | 146,001 | |
| | 52,992 | | | Wing Hang Bank Ltd. | | | 840,329 | |
| | 113,500 | | | Yue Yuen Industrial Holdings Ltd. | | | 369,851 | |
| | | | | | | | 11,197,593 | |
| | | | | Indonesia - 0.58% | | | | |
| | 1,593,000 | | | PT Bank Rakyat Indonesia
(Persero) Tbk | | | 1,354,336 | |
| | 149,500 | | | PT Semen Indonesia (Persero) Tbk | | | 210,154 | |
| | 2,999,000 | | | PT Telekomunikasi Indonesia
(Persero) Tbk | | | 586,217 | |
| | | | | | | | 2,150,707 | |
| | | | | Ireland - 0.65% | | | | |
| | 1,794,100 | | | Bank of Ireland (a) | | | 768,890 | |
| | 13,900 | | | CRH Plc | | | 388,943 | |
| | 94,112 | | | James Hardie Industries Plc | | | 1,257,158 | |
| | | | | | | | 2,414,991 | |
| | | | | Israel - 0.32% | | | | |
| | 184,100 | | | Bezeq the Israel Telecommunication
Corp. Ltd. | | | 328,177 | |
| | 1,300 | | | Teva Pharmaceutical Industries Ltd. | | | 68,511 | |
| | 15,000 | | | Teva Pharmaceutical Industries
Ltd. - ADR | | | 792,600 | |
| | | | | | | | 1,189,288 | |
| | | | | Italy - 0.96% | | | | |
| | 114,052 | | | Enel SpA | | | 645,102 | |
| | 116,700 | | | Finmeccanica SpA (a) | | | 1,152,491 | |
| | 223,400 | | | Intesa Sanpaolo SpA | | | 758,044 | |
| | 108,700 | | | UniCredit SpA | | | 993,636 | |
| | | | | | | | 3,549,273 | |
Number of
Shares | | | | | Value | |
| | | | | Japan - 13.08% | | | | |
| | 57,700 | | | Acom Co., Ltd. | | $ | 184,360 | |
| | 15,510 | | | AEON Mall Co., Ltd. | | | 397,359 | |
| | 21,000 | | | Ajinomoto Co., Inc. | | | 300,554 | |
| | 53,000 | | | Asahi Kasei Corp. | | | 359,372 | |
| | 111,500 | | | Astellas Pharma, Inc. | | | 1,323,792 | |
| | 21,000 | | | Chiyoda Corp. | | | 270,962 | |
| | 14,400 | | | Daikin Industries Ltd. | | | 807,544 | |
| | 12,900 | | | Dentsu, Inc. | | | 488,498 | |
| | 7,300 | | | Don Quijote Co., Ltd. | | | 376,889 | |
| | 18,600 | | | East Japan Railway Co. | | | 1,370,030 | |
| | 11,300 | | | Fuji Heavy Industries Ltd. | | | 306,003 | |
| | 20,700 | | | Fuji Media Holdings, Inc. | | | 379,852 | |
| | 98,000 | | | Fujitsu Ltd. | | | 592,364 | |
| | 170,000 | | | Hitachi Ltd. | | | 1,258,350 | |
| | 28,000 | | | Hitachi Metals Ltd. | | | 398,849 | |
| | 41,100 | | | Honda Motor Co., Ltd. | | | 1,446,172 | |
| | 17,900 | | | Hoya Corp. | | | 559,930 | |
| | 25,700 | | | Iida Group Holdings Co., Ltd. | | | 355,863 | |
| | 43,200 | | | Inpex Corp. | | | 560,964 | |
| | 69,900 | | | ITOCHU Corp. | | | 817,860 | |
| | 49,600 | | | Japan Tobacco, Inc. | | | 1,556,816 | |
| | 23,300 | | | JFE Holdings, Inc. | | | 437,821 | |
| | 25,300 | | | JSR Corp. | | | 468,071 | |
| | 36,900 | | | JTEKT Corp. | | | 547,778 | |
| | 70,500 | | | JX Holdings, Inc. | | | 339,883 | |
| | 24,100 | | | Kakaku.com, Inc. | | | 391,812 | |
| | 132,000 | | | Kawasaki Heavy Industries Ltd. | | | 486,316 | |
| | 30,000 | | | KDDI Corp. | | | 1,741,950 | |
| | 1,600 | | | Keyence Corp. | | | 659,147 | |
| | 32,300 | | | Komatsu Ltd. | | | 677,155 | |
| | 39,500 | | | Konica Minolta Holdings, Inc. | | | 369,548 | |
| | 157,000 | | | Mazda Motor Corp. | | | 697,489 | |
| | 8,900 | | | Miraca Holdings, Inc. | | | 389,878 | |
| | 127,000 | | | Mitsubishi Electric Corp. | | | 1,429,613 | |
| | 261,800 | | | Mitsubishi UFJ Financial Group, Inc. | | | 1,441,676 | |
| | 83,100 | | | Mitsubishi UFJ Lease & Finance
Co., Ltd. | | | 407,945 | |
| | 38,000 | | | Mitsui Fudosan Co., Ltd. | | | 1,159,312 | |
| | 9,600 | | | Murata Manufacturing Co., Ltd. | | | 907,401 | |
| | 19,000 | | | NGK Insulators Ltd. | | | 396,372 | |
| | 11,200 | | | Nidec Corp. | | | 686,756 | |
| | 1,200 | | | Nintendo Co., Ltd. | | | 143,448 | |
| | 107,400 | | | Nomura Holdings, Inc. | | | 688,958 | |
| | 14,500 | | | Olympus Corp. | | | 462,995 | |
See notes to financial statements.
GuideMarkSM World ex-US Fund
SCHEDULE OF INVESTMENTS (Continued)
March 31, 2014
Number of
Shares | | | | | Value | |
| | | | | COMMON STOCKS (Continued) | | | | |
| | | | | Japan (Continued) | | | | |
| | 22,100 | | | OMRON Corp. | | $ | 914,426 | |
| | 102,000 | | | ORIX Corp. | | | 1,437,586 | |
| | 67,800 | | | Rakuten, Inc. | | | 905,648 | |
| | 20,000 | | | Rohto Pharmaceutical Co., Ltd. | | | 353,165 | |
| | 4,700 | | | Santen Pharmaceutical Co., Ltd. | | | 207,962 | |
| | 31,000 | | | Sega Sammy Holdings, Inc. | | | 695,913 | |
| | 14,100 | | | Seiko Epson Corp. | | | 440,579 | |
| | 34,600 | | | Seven & I Holdings Co., Ltd. | | | 1,318,415 | |
| | 95,100 | | | Seven Bank Ltd. | | | 373,210 | |
| | 12,600 | | | Shin-Etsu Chemical Co., Ltd. | | | 718,275 | |
| | 20,600 | | | Softbank Corp. | | | 1,556,706 | |
| | 29,000 | | | Sony Financial Holdings, Inc. | | | 474,205 | |
| | 72,000 | | | Sumitomo Heavy Industries Ltd. | | | 292,840 | |
| | 47,500 | | | Sumitomo Mitsui Financial
Group, Inc. | | | 2,036,037 | |
| | 173,000 | | | Sumitomo Mitsui Trust Holdings, Inc. | | | 782,747 | |
| | 18,000 | | | Sumitomo Realty & Development
Co., Ltd. | | | 704,498 | |
| | 22,400 | | | Suzuki Motor Corp. | | | 584,026 | |
| | 13,500 | | | TDK Corp. | | | 562,978 | |
| | 27,200 | | | Tohoku Electric Power Co., Inc. | | | 279,722 | |
| | 18,500 | | | Tokio Marine Holdings, Inc. | | | 554,822 | |
| | 70,000 | | | Toshiba Corp. | | | 296,700 | |
| | 65,500 | | | Toyota Motor Corp. | | | 3,693,797 | |
| | | | | | | | 48,227,964 | |
| | | | | Jersey - 0.97% | | | | |
| | 94,400 | | | Resolution Ltd. | | | 470,314 | |
| | 51,500 | | | Shire Plc | | | 2,549,506 | |
| | 10,011 | | | Wolseley Plc | | | 570,395 | |
| | | | | | | | 3,590,215 | |
| | | | | Luxembourg - 0.38% | | | | |
| | 20,100 | | | Acergy SA | | | 373,022 | |
| | 2,500 | | | Millicom International Cellular SA | | | 254,630 | |
| | 6,700 | | | RTL Group SA | | | 763,067 | |
| | | | | | | | 1,390,719 | |
| | | | | Malaysia - 0.39% | | | | |
| | 267,300 | | | DiGi.Com Bhd | | | 441,572 | |
| | 370,400 | | | Gamuda Bhd | | | 534,618 | |
| | 150,573 | | | Malayan Banking Berhad | | | 446,925 | |
| | | | | | | | 1,423,115 | |
Number of
Shares | | | | | Value | |
| | | | | Mexico - 0.84% | | | | |
| | 739,000 | | | America Movil SAB de CV | | $ | 736,991 | |
| | 71,300 | | | Fomento Economico Mexicano
SAB de CV | | | 664,968 | |
| | 17,400 | | | Fresnillo Plc | | | 245,285 | |
| | 87,700 | | | Gruma SAB de CV (a) | | | 725,487 | |
| | 146,900 | | | Grupo Mexico SAB de CV | | | 463,581 | |
| | 18,100 | | | Promotora y Operadora de
Infraestructura SAB de CV (a) | | | 243,131 | |
| | | | | | | | 3,079,443 | |
| | | | | Netherlands - 2.84% | | | | |
| | 167,900 | | | AEGON NV | | | 1,546,554 | |
| | 17,900 | | | European Aeronautic Defense &
Space Co. NV | | | 1,282,023 | |
| | 82,300 | | | ING Groep NV (a) | | | 1,170,451 | |
| | 14,800 | | | Koninklijke DSM NV | | | 1,015,102 | |
| | 223,580 | | | Koninklijke KPN NV (a) | | | 789,260 | |
| | 55,722 | | | Koninklijke Philips Electronics NV | | | 1,960,263 | |
| | 23,049 | | | Reed Elsevier NV | | | 498,704 | |
| | 54,049 | | | Unilever NV | | | 2,223,296 | |
| | | | | | | | 10,485,653 | |
| | | | | Norway - 0.27% | | | | |
| | 45,520 | | | Telenor ASA | | | 1,007,487 | |
| | | | | Philippines - 0.31% | | | | |
| | 1,767,000 | | | Alliance Global Group, Inc. | | | 1,125,649 | |
| | | | | Poland - 0.22% | | | | |
| | 21,260 | | | Bank Handlowy w Warszawie SA | | | 800,268 | |
| | | | | Republic of Korea - 2.87% | | | | |
| | 1,723 | | | CJ Korea Express Co., Ltd. (a) | | | 183,271 | |
| | 13,500 | | | Hyundai Development Co.-
Engineering & Construction | | | 381,816 | |
| | 6,795 | | | Hyundai Motor Co. | | | 1,606,687 | |
| | 2,051 | | | Hyundai Wia Corp. | | | 330,593 | |
| | 19,320 | | | KB Financial Group, Inc. | | | 677,882 | |
| | 17,490 | | | Korea Electric Power Corp. | | | 600,348 | |
| | 47,637 | | | Korean Reinsurance Co. | | | 462,122 | |
| | 3,549 | | | LG Chemical Ltd. | | | 849,250 | |
| | 494 | | | LG Household & Health Care Ltd. | | | 213,564 | |
| | 1,286 | | | Naver Corp. | | | 939,643 | |
| | 2,825 | | | POSCO | | | 788,712 | |
| | 2,336 | | | Samsung Electronics Co., Ltd. | | | 2,953,109 | |
| | 8,710 | | | Samsung Heavy Industries Co., Ltd. | | | 261,840 | |
| | 9,470 | | | SK Hynix, Inc. (a) | | | 321,325 | |
| | | | | | | | 10,570,162 | |
See notes to financial statements.
GuideMarkSM World ex-US Fund
SCHEDULE OF INVESTMENTS (Continued)
March 31, 2014
Number of
Shares | | | | | Value | |
| | | | | COMMON STOCKS (Continued) | | | | |
| | | | | Russian Federation - 1.04% | | | | |
| | 23,690 | | | Eurasia Drilling Co., Ltd. | | $ | 607,175 | |
| | 15,700 | | | Gazprom OAO | | | 106,100 | |
| | 74,591 | | | Gazprom OAO - ADR (a) | | | 579,572 | |
| | 2,190 | | | Magnit OJSC | | | 504,326 | |
| | 5,400 | | | Mail.ru Group Ltd. (a) | | | 191,502 | |
| | 6,900 | | | MegaFon OAO | | | 194,496 | |
| | 10,600 | | | MMC Norilsk Nickel OJSC | | | 176,628 | |
| | 25,860 | | | Mobile TeleSystems OJSC - ADR | | | 452,291 | |
| | 421,270 | | | Sberbank of Russia | | | 1,008,011 | |
| | | | | | | | 3,820,101 | |
| | | | | Singapore - 0.74% | | | | |
| | 188,000 | | | Global Logistic Properties Ltd. | | | 396,762 | |
| | 65,000 | | | Keppel Corp. Ltd. | | | 563,917 | |
| | 103,000 | | | Singapore Telecommunications Ltd. | | | 299,392 | |
| | 84,581 | | | United Overseas Bank Ltd. | | | 1,458,975 | |
| | | | | | | | 2,719,046 | |
| | | | | South Africa - 1.56% | | | | |
| | 94,000 | | | Gold Fields Ltd. | | | 355,636 | |
| | 16,500 | | | MTN Group Ltd. | | | 337,705 | |
| | 303,000 | | | Nampak Ltd. | | | 1,035,561 | |
| | 9,290 | | | Naspers Ltd. | | | 1,023,693 | |
| | 214,300 | | | Netcare Ltd. | | | 475,525 | |
| | 12,900 | | | Sasol Ltd. | | | 721,441 | |
| | 58,200 | | | Standard Bank Group Ltd. | | | 766,769 | |
| | 117,200 | | | Steinhoff International Holdings | | | 566,840 | |
| | 144,200 | | | Telkom SA SOC Ltd. (a) | | | 461,925 | |
| | | | | | | | 5,745,095 | |
| | | | | Spain - 2.00% | | | | |
| | 35,300 | | | Amadeus IT Holding SA | | | 1,466,903 | |
| | 215,295 | | | CaixaBank SA | | | 1,385,872 | |
| | 24,877 | | | Grifols SA - ADR | | | 1,027,420 | |
| | 193,838 | | | Iberdrola SA | | | 1,356,382 | |
| | 6,615 | | | Inditex SA | | | 992,449 | |
| | 103,800 | | | International Consolidated Airlines
Group SA (a) | | | 724,324 | |
| | 26,061 | | | Telefonica SA | | | 412,984 | |
| | | | | | | | 7,366,334 | |
| | | | | Sweden - 2.06% | | | | |
| | 23,800 | | | Assa Abloy AB | | | 1,267,748 | |
| | 44,100 | | | H & M Hennes & Mauritz AB | | | 1,880,876 | |
| | 140,800 | | | Nordea Bank AB | | | 1,997,334 | |
Number of
Shares | | | | | Value | |
| | | | | Sweden (Continued) | | | | |
| | 37,400 | | | Svenska Cellulosa AB | | $ | 1,101,473 | |
| | 17,300 | | | Svenska Handelsbanken AB | | | 869,352 | |
| | 17,500 | | | Swedbank AB | | | 469,800 | |
| | | | | | | | 7,586,583 | |
| | | | | Switzerland - 5.39% | | | | |
| | 9,530 | | | Adecco SA | | | 793,146 | |
| | 12,863 | | | Cie Financiere Richemont SA | | | 1,228,907 | |
| | 56,973 | | | Nestle SA | | | 4,288,338 | |
| | 10,509 | | | Novartis AG | | | 892,297 | |
| | 17,219 | | | Roche Holding AG | | | 5,178,852 | |
| | 310 | | | SGS SA | | | 764,545 | |
| | 2,390 | | | Swisscom AG | | | 1,468,357 | |
| | 3,996 | | | Syngenta AG | | | 1,516,983 | |
| | 181,507 | | | UBS AG | | | 3,755,989 | |
| | | | | | | | 19,887,414 | |
| | | | | Taiwan - 1.97% | | | | |
| | 649,816 | | | Cathay Financial Holding Co., Ltd. | | | 949,861 | |
| | 135,000 | | | Delta Electronics, Inc. | | | 836,087 | |
| | 40,180 | | | Eclat Textile Co., Ltd. | | | 465,853 | |
| | 358,000 | | | Fubon Financial Holding Co., Ltd. | | | 486,736 | |
| | 14,000 | | | Hermes Microvision, Inc. | | | 562,071 | |
| | 57,000 | | | MediaTek, Inc. | | | 843,696 | |
| | 84,000 | | | Merida Industry Co., Ltd. | | | 558,583 | |
| | 648,000 | | | Taiwan Semiconductor
Manufacturing Co., Ltd. | | | 2,549,585 | |
| | | | | | | | 7,252,472 | |
| | | | | Thailand - 0.20% | | | | |
| | 97,800 | | | Kasikornbank PCL | | | 559,790 | |
| | 51,500 | | | Total Access Communication PCL | | | 185,420 | |
| | | | | | | | 745,210 | |
| | | | | Turkey - 0.64% | | | | |
| | 76,811 | | | Aygaz AS | | | 302,324 | |
| | 22,400 | | | Coca-Cola Icecek AS | | | 538,917 | |
| | 250,000 | | | Turk Hava Yollari Anonim Ortakligi | | | 769,871 | |
| | 119,900 | | | Turkiye Halk Bankasi AS | | | 742,632 | |
| | | | | | | | 2,353,744 | |
| | | | | United Kingdom - 13.22% | | | | |
| | 20,036 | | | AstraZeneca Plc | | | 1,298,866 | |
| | 107,600 | | | Aviva Plc | | | 858,501 | |
| | 30,500 | | | Babcock International Group Plc | | | 684,918 | |
| | 83,900 | | | BAE Systems Plc | | | 582,850 | |
| | 496,981 | | | Barclays Plc | | | 1,933,981 | |
See notes to financial statements.
GuideMarkSM World ex-US Fund
SCHEDULE OF INVESTMENTS (Continued)
March 31, 2014
Number of
Shares | | | | | Value | |
| | | | | COMMON STOCKS (Continued) | | | | |
| | | | | United Kingdom (Continued) | | | | |
| | 181,133 | | | BG Group Plc | | $ | 3,381,606 | |
| | 36,590 | | | British American Tobacco Plc | | | 2,041,187 | |
| | 269,700 | | | BT Group Plc | | | 1,715,209 | |
| | 15,000 | | | Bunzl Plc | | | 399,939 | |
| | 20,300 | | | Burberry Group Plc | | | 471,958 | |
| | 26,300 | | | Capita Plc | | | 480,891 | |
| | 23,520 | | | Diageo Plc | | | 730,505 | |
| | 126,200 | | | Direct Line Insurance Group Plc | | | 499,905 | |
| | 40,700 | | | Drax Group Plc | | | 520,385 | |
| | 42,100 | | | Experian Plc | | | 759,721 | |
| | 25,157 | | | Hikma Pharmaceuticals Plc | | | 696,510 | |
| | 123,022 | | | HSBC Holdings Plc | | | 1,245,641 | |
| | 40,760 | | | Imperial Tobacco Group Plc | | | 1,648,226 | |
| | 16,100 | | | Intercontinental Hotels Group PLC | | | 518,257 | |
| | 446,300 | | | ITV Plc | | | 1,425,928 | |
| | 5,915 | | | Johnson Matthey Plc | | | 322,950 | |
| | 107,800 | | | Kingfisher Plc | | | 757,913 | |
| | 1,162,500 | | | Lloyds Banking Group Plc (a) | | | 1,454,301 | |
| | 17,800 | | | London Stock Exchange Group Plc | | | 585,096 | |
| | 48,700 | | | Meggitt Plc | | | 390,567 | |
| | 25,000 | | | Mondi Plc | | | 438,089 | |
| | 112,370 | | | Prudential Plc | | | 2,379,358 | |
| | 7,500 | | | Randgold Resources Ltd. | | | 562,972 | |
| | 29,700 | | | Reckitt Benckiser Group Plc | | | 2,423,652 | |
| | 33,200 | | | Reed Elsevier Plc | | | 507,343 | |
| | 63,500 | | | Rio Tinto Plc | | | 3,541,229 | |
| | 53,900 | | | Rolls-Royce Holdings Plc (a) | | | 964,877 | |
| | 114,551 | | | Royal Dutch Shell Plc, Class A | | | 4,185,413 | |
| | 6,019 | | | Royal Dutch Shell Plc, Class B | | | 234,983 | |
| | 23,789 | | | SABMiller Plc | | | 1,189,496 | |
| | 16,200 | | | SSE Plc | | | 396,801 | |
| | 90,401 | | | Standard Chartered Plc | | | 1,890,328 | |
| | 438,700 | | | Taylor Wimpey Plc | | | 862,352 | |
| | 24,640 | | | Unilever Plc | | | 1,053,836 | |
| | 1 | | | Verizon Communications, Inc. | | | 39 | |
| | 577,324 | | | Vodafone Group Plc | | | 2,122,993 | |
| | 8,594 | | | Whitbread Plc | | | 596,518 | |
| | | | | | | | 48,756,090 | |
| | | | | Total Common Stocks
(Cost $279,942,166) | | | 331,948,373 | |
Number of
Shares | | | | | Value | |
| | | | | INVESTMENT COMPANIES - 1.60% | | | | |
| | | | | India - 1.60% | | | | |
| | 316,000 | | | PowerShares India Portfolio (b) | | $ | 5,906,040 | |
| | | | | Total Investment Companies
(Cost $6,226,255) | | | 5,906,040 | |
| | | | | PREFERRED STOCKS - 1.77% | | | | |
| | | | | Brazil - 1.03% | | | | |
| | 43,870 | | | Banco Bradesco SA | | | 600,917 | |
| | 77,000 | | | Braskem SA | | | 604,394 | |
| | 8,200 | | | Cia Brasileira de Distribuicao
Grupo Pao de Acucar | | | 358,610 | |
| | 122,490 | | | Itau Unibanco Holding SA | | | 1,826,823 | |
| | 57,700 | | | Petroleo Brasileiro SA | | | 399,246 | |
| | | | | | | | 3,789,990 | |
| | | | | Germany - 0.74% | | | | |
| | 10,529 | | | Volkswagen AG | | | 2,730,140 | |
| | | | | Total Preferred Stocks
(Cost $6,123,718) | | | 6,520,130 | |
| | | | | REAL ESTATE INVESTMENT TRUSTS - 0.40% | | | | |
| | | | | France - 0.27% | | | | |
| | 3,900 | | | Unibail-Rodamco SE | | | 1,012,165 | |
| | | | | United Kingdom - 0.13% | | | | |
| | 44,403 | | | British Land Co. Plc | | | 484,491 | |
| | | | | Total Real Estate Investment Trusts
(Cost $1,327,647) | | | 1,496,656 | |
| | | | | SHORT TERM INVESTMENTS - 5.86% | | | | |
| | | | | Money Market Funds - 5.64% | | | | |
| | 20,787,585 | | | Federated Prime Obligations Fund | | | 20,787,585 | |
| | | | | | | | | |
Principal
Amount | | | | | | | |
| | | | | U.S. Treasury Bill - 0.22% | | | | |
| | | | | United States Treasury Bill | | | | |
| $ | 60,000 | | | 0.02%, 04/10/2014 (c) | | | 59,999 | |
| | 480,000 | | | 0.04%, 05/08/2014 (c) | | | 479,974 | |
| | 280,000 | | | 0.02%, 05/29/2014 (c) | | | 279,980 | |
| | | | | | | | 819,953 | |
| | | | | Total Short Term Investments
(Cost $21,607,538) | | | 21,607,538 | |
See notes to financial statements.
GuideMarkSM World ex-US Fund
SCHEDULE OF INVESTMENTS (Continued)
March 31, 2014
Number of
Shares | | | | | Value | |
| | | | | INVESTMENTS PURCHASED
AS SECURITIES LENDING
COLLATERAL - 0.60% | | | | |
| | | | | Money Market Funds - 0.60% | | | | |
| | 2,197,806 | | | First American Government
Obligations Fund | | $ | 2,197,806 | |
| | 5,588 | | | Reserve Primary Fund (d) | | | 216 | |
| | | | | Total Money Market Funds
(Cost $2,202,629) | | | 2,198,022 | |
Principal
Amount | | | | | Value | |
| | | | Cash - 0.00% | | | |
| $ | 15,304 | | | Cash | | $ | 15,304 | |
| | | | | Total Cash (Cost $15,304) | | | 15,304 | |
| | | | | Total Investments Purchased as
Securities Lending Collateral
(Cost $2,217,933) | | | 2,213,326 | |
| | | | | Total Investments
(Cost $317,445,257) - 100.27% | | | 369,692,063 | |
| | | | | Liabilities in Excess of
Other Assets - (0.27)% | | | (1,004,993 | ) |
| | | | | TOTAL NET
ASSETS - 100.00% | | $ | 368,687,070 | |
Percentages are stated as a percent of net assets.
ADR - American Depositary Receipt
| (a) | Non-income producing security. |
| (b) | All or portion of this security is on loan. |
| (c) | Partially assigned as collateral for certain futures contracts. |
| (d) | As of March 31, 2014, the Fund has fair valued this security and deemed it illiquid. The value of this security was $216, which represents 0.00% of total net assets. |
Schedule of Open Futures Contracts
| Description | | Number of Contracts
Purchased | | | Notional Value | | | | Settlement Month | | | Unrealized
Appreciation/Depreciation | |
| mini MSCI EAFE Index Futures | | | 115 | | | | 10,896,250 | | | | Jun-14 | | | | $171,460 | | |
| mini MSCI Emerging Markets Index Futures | | | 63 | | | | 3,106,215 | | | | Jun-14 | | | | 179,627 | | |
| S&P / TSX 60 Index Futures | | | 7 | | | | 1,035,911 | | | | Jun-14 | | | | (1,537 | ) | |
| | | | | | | | | | | | | | | | $349,550 | | |
See notes to financial statements.
GuideMarkSM Opportunistic Equity Fund
SCHEDULE OF INVESTMENTS
March 31, 2014
Number of
Shares | | | | | Value | |
| | | | | COMMON STOCKS - 95.73% | | | | |
| | | | | Aerospace & Defense - 3.58% | | | | |
| | 6,750 | | | BE Aerospace, Inc. (a) | | $ | 585,833 | |
| | 7,173 | | | General Dynamics Corp. | | | 781,283 | |
| | 13,870 | | | Hexcel Corp. (a) | | | 603,900 | |
| | 23,630 | | | United Technologies Corp. | | | 2,760,929 | |
| | | | | | | | 4,731,945 | |
| | | | | Air Freight & Logistics - 1.91% | | | | |
| | 45,715 | | | Hub Group, Inc. - Class A (a) | | | 1,828,143 | |
| | 7,168 | | | United Parcel Service, Inc. - Class B | | | 698,020 | |
| | | | | | | | 2,526,163 | |
| | | | | Beverages - 2.80% | | | | |
| | 15,280 | | | Dr. Pepper Snapple Group, Inc. | | | 832,149 | |
| | 8,218 | | | Molson Coors Brewing Co. - Class B | | | 483,711 | |
| | 28,568 | | | PepsiCo, Inc. | | | 2,385,428 | |
| | | | | | | | 3,701,288 | |
| | | | | Biotechnology - 1.78% | | | | |
| | 3,350 | | | Alkermes Plc (a) | | | 147,701 | |
| | 920 | | | Amgen, Inc. | | | 113,473 | |
| | 9,685 | | | Celgene Corp. (a) | | | 1,352,026 | |
| | 10,200 | | | Cubist Pharmaceuticals, Inc. (a) | | | 746,130 | |
| | | | | | | | 2,359,330 | |
| | | | | Capital Markets - 3.06% | | | | |
| | 6,570 | | | Ameriprise Financial, Inc. | | | 723,160 | |
| | 1,787 | | | BlackRock, Inc. | | | 561,976 | |
| | 28,595 | | | Franklin Resources, Inc. | | | 1,549,277 | |
| | 38,895 | | | Morgan Stanley | | | 1,212,357 | |
| | | | | | | | 4,046,770 | |
| | | | | Chemicals - 2.00% | | | | |
| | 6,630 | | | Eastman Chemical Co. | | | 571,572 | |
| | 2,790 | | | Huntsman Corp. | | | 68,132 | |
| | 2,972 | | | Innophos Holdings, Inc. | | | 168,512 | |
| | 7,050 | | | Monsanto Co. | | | 802,079 | |
| | 2,430 | | | PPG Industries, Inc. | | | 470,108 | |
| | 7,580 | | | Rockwood Holdings, Inc. | | | 563,952 | |
| | | | | | | | 2,644,355 | |
| | | | | Commercial Banks - 2.82% | | | | |
| | 9,297 | | | PNC Financial Services Group, Inc. | | | 808,839 | |
| | 73,865 | | | Popular, Inc. (a) | | | 2,289,076 | |
| | 14,847 | | | U.S. Bancorp | | | 636,343 | |
| | | | | | | | 3,734,258 | |
Number of
Shares | | | | | Value | |
| | | | | Commercial Services & Supplies - 1.51% | | | | |
| | 6,166 | | | ABM Industries, Inc. | | $ | 177,211 | |
| | 16,051 | | | Iron Mountain, Inc. | | | 442,526 | |
| | 14,480 | | | Republic Services, Inc. | | | 494,637 | |
| | 13,750 | | | The ADT Corp. (b) | | | 411,813 | |
| | 14,389 | | | The Geo Group, Inc. | | | 463,901 | |
| | | | | | | | 1,990,088 | |
| | | | | Communications Equipment - 3.86% | | | | |
| | 19,640 | | | Aruba Networks, Inc. (a)(b) | | | 368,250 | |
| | 95,250 | | | Cisco Systems, Inc. | | | 2,134,553 | |
| | 57,115 | | | Juniper Networks, Inc. (a) | | | 1,471,282 | |
| | 14,244 | | | QUALCOMM, Inc. | | | 1,123,282 | |
| | | | | | | | 5,097,367 | |
| | | | | Computers & Peripherals - 5.83% | | | | |
| | 7,395 | | | Apple, Inc. | | | 3,969,192 | |
| | 19,435 | | | International Business Machines | | | | |
| | | | | Corp. (b) | | | 3,741,043 | |
| | | | | | | | 7,710,235 | |
| | | | | Containers & Packaging - 0.28% | | | | |
| | 9,548 | | | Bemis Company, Inc. | | | 374,663 | |
| | | | | Diversified Financial Services - 1.36% | | | | |
| | 24,500 | | | Citigroup, Inc. | | | 1,166,200 | |
| | 8,483 | | | CME Group, Inc. | | | 627,827 | |
| | | | | | | | 1,794,027 | |
| | | | | Diversified Telecommunication Services - 0.63% | | | | |
| | 17,617 | | | Verizon Communications, Inc. | | | 838,041 | |
| | | | | Electrical Equipment - 0.77% | | | | |
| | 9,260 | | | AMETEK, Inc. | | | 476,798 | |
| | 8,064 | | | Emerson Electric Co. | | | 538,675 | |
| | | | | | | | 1,015,473 | |
| | | | | Electronic Equipment & Instruments - 0.66% | | | | |
| | 42,131 | | | Corning, Inc. | | | 877,167 | |
| | | | | Energy Equipment & Services - 1.25% | | | | |
| | 8,247 | | | Ensco Plc - Class A | | | 435,277 | |
| | 10,660 | | | Halliburton Co. | | | 627,767 | |
| | 7,540 | | | National-Oilwell Varco, Inc. | | | 587,140 | |
| | | | | | | | 1,650,184 | |
| | | | | Food & Staples Retailing - 1.22% | | | | |
| | 5,770 | | | Costco Wholesale Corp. | | | 644,394 | |
| | 17,525 | | | SYSCO Corp. (b) | | | 633,178 | |
| | 4,451 | | | Wal-Mart Stores, Inc. | | | 340,190 | |
| | | | | | | | 1,617,762 | |
See notes to financial statements.
GuideMarkSM Opportunistic Equity Fund
SCHEDULE OF INVESTMENTS (Continued)
March 31, 2014
Number of
Shares | | | | | Value | |
| | | | | COMMON STOCKS (Continued) | | | | |
| | | | | Food Products - 2.42% | | | | |
| | 15,370 | | | B&G Foods, Inc. | | $ | 462,791 | |
| | 24,225 | | | General Mills, Inc. | | | 1,255,340 | |
| | 7,300 | | | Hershey Co. | | | 762,120 | |
| | 20,990 | | | Mondelez International, Inc. - Class A (b) | | | 725,204 | |
| | | | | | | | 3,205,455 | |
| | | | | Gas Utilities - 0.88% | | | | |
| | 7,004 | | | AmeriGas Partners, L.P. | | | 295,919 | |
| | 12,390 | | | National Fuel Gas Co. | | | 867,796 | |
| | | | | | | | 1,163,715 | |
| | | | | Health Care Equipment & Supplies - 4.66% | | | | |
| | 17,950 | | | ArthroCare Corp. (a) | | | 865,011 | |
| | 22,780 | | | Baxter International, Inc. | | | 1,676,152 | |
| | 4,181 | | | Becton, Dickinson & Co. | | | 489,511 | |
| | 182,230 | | | Boston Scientific Corp. (a) | | | 2,463,750 | |
| | 4,860 | | | The Cooper Companies, Inc. | | | 667,570 | |
| | | | | | | | 6,161,994 | |
| | | | | Health Care Providers & Services - 0.60% | | | | |
| | 11,484 | | | Owens & Minor, Inc. (b) | | | 402,284 | |
| | 6,805 | | | Quest Diagnostics, Inc. | | | 394,146 | |
| | | | | | | | 796,430 | |
| | | | | Hotels, Restaurants & Leisure - 0.91% | | | | |
| | 7,086 | | | Bob Evans Farms, Inc. | | | 354,513 | |
| | 9,056 | | | Darden Restaurants, Inc. (b) | | | 459,682 | |
| | 5,320 | | | Starbucks Corp. | | | 390,382 | |
| | | | | | | | 1,204,577 | |
| | | | | Household Durables - 2.84% | | | | |
| | 27,520 | | | Jarden Corp. (a) | | | 1,646,521 | |
| | 14,080 | | | Whirlpool Corp. | | | 2,104,397 | |
| | | | | | | | 3,750,918 | |
| | | | | Household Products - 1.17% | | | | |
| | 4,245 | | | Energizer Holdings, Inc. | | | 427,641 | |
| | 6,233 | | | Kimberly-Clark Corp. | | | 687,188 | |
| | 5,366 | | | Procter & Gamble Co. | | | 432,500 | |
| | | | | | | | 1,547,329 | |
| | | | | Insurance - 8.14% | | | | |
| | 59,305 | | | American International Group, Inc. | | | 2,965,843 | |
| | 50,120 | | | Brown & Brown, Inc. | | | 1,541,691 | |
| | 28,950 | | | Endurance Specialty Holdings Ltd. | | | 1,558,378 | |
| | 19,885 | | | Navigators Group, Inc. (a) | | | 1,220,740 | |
| | 5,569 | | | PartnerRe Ltd. | | | 576,392 | |
Number of
Shares | | | | | Value | |
| | | | | Insurance (Continued) | | | | |
| | 65,860 | | | Willis Group Holdings Plc | | $ | 2,906,402 | |
| | | | | | | | 10,769,446 | |
| | | | | Internet & Catalog Retail - 1.00% | | | | |
| | 660 | | | Priceline.com, Inc. (a) | | | 786,647 | |
| | 12,550 | | | Shutterfly, Inc. (a)(b) | | | 535,634 | |
| | | | | | | | 1,322,281 | |
| | | | | Internet Software & Services - 2.12% | | | | |
| | 6,260 | | | eBay, Inc. (a) | | | 345,802 | |
| | 9,010 | | | Facebook, Inc. - Class A (a) | | | 542,763 | |
| | 1,315 | | | Google, Inc. - Class A (a) | | | 1,465,581 | |
| | 8,883 | | | J2 Global, Inc. (b) | | | 444,594 | |
| | | | | | | | 2,798,740 | |
| | | | | IT Services - 2.01% | | | | |
| | 2,560 | | | Alliance Data Systems Corp. (a)(b) | | | 697,472 | |
| | 34,867 | | | The Western Union Co. | | | 570,424 | |
| | 13,500 | | | VeriFone Holdings, Inc. (a) | | | 456,570 | |
| | 4,320 | | | Visa, Inc. | | | 932,515 | |
| | | | | | | | 2,656,981 | |
| | | | | Leisure Products - 0.56% | | | | |
| | 13,223 | | | Hasbro, Inc. | | | 735,463 | |
| | | | | Life Sciences Tools & Services - 0.73% | | | | |
| | 8,050 | | | Thermo Fisher Scientific, Inc. | | | 967,932 | |
| | | | | Machinery - 2.51% | | | | |
| | 5,440 | | | Caterpillar, Inc. | | | 540,573 | |
| | 8,310 | | | Danaher Corp. | | | 623,250 | |
| | 15,585 | | | Dover Corp. | | | 1,274,073 | |
| | 7,390 | | | Parker Hannifin Corp. | | | 884,657 | |
| | | | | | | | 3,322,553 | |
| | | | | Media - 2.15% | | | | |
| | 5,750 | | | Cinemark Holdings, Inc. | | | 166,808 | |
| | 10,940 | | | Comcast Corp. - Class A | | | 547,219 | |
| | 6,750 | | | Liberty Global Plc - Class A (a) | | | 280,800 | |
| | 6,750 | | | Liberty Global Plc - Class C (a) | | | 274,792 | |
| | 14,981 | | | Shaw Communications, Inc.
- Class B (b) | | | 358,046 | |
| | 8,220 | | | The Walt Disney Co. | | | 658,175 | |
| | 16,215 | | | Thomson Reuters Corp. (b) | | | 554,553 | |
| | | | | | | | 2,840,393 | |
| | | | | Metals & Mining - 0.45% | | | | |
| | 1,768 | | | Compass Minerals International, Inc. | | | 145,895 | |
| | 8,835 | | | Nucor Corp. | | | 446,521 | |
| | | | | | | | 592,416 | |
See notes to financial statements.
GuideMarkSM Opportunistic Equity Fund
SCHEDULE OF INVESTMENTS (Continued)
March 31, 2014
Number of
Shares | | | | | Value | |
| | | | | COMMON STOCKS (Continued) | | | | |
| | | | | Multiline Retail - 0.99% | | | | |
| | 12,872 | | | Kohl’s Corp. (b) | | $ | 731,129 | |
| | 9,586 | | | Target Corp. | | | 580,049 | |
| | | | | | | | 1,311,178 | |
| | | | | Multi-Utilities - 0.10% | | | | |
| | 4,289 | | | Avista Corp. | | | 131,458 | |
| | | | | Oil & Gas - 5.70% | | | | |
| | 4,808 | | | Chevron Corp. | | | 571,719 | |
| | 20,410 | | | Cimarex Energy Co. | | | 2,431,035 | |
| | 15,820 | | | Consol Energy, Inc. | | | 632,009 | |
| | 6,550 | | | EOG Resources, Inc. | | | 1,284,914 | |
| | 7,043 | | | Memorial Production Partners LP | | | 158,679 | |
| | 9,596 | | | Occidental Petroleum Corp. | | | 914,403 | |
| | 13,470 | | | Suncor Energy, Inc. - ADR | | | 470,911 | |
| | 7,350 | | | Valero Energy Corp. | | | 390,285 | |
| | 13,518 | | | Williams Partners L.P. (b) | | | 688,607 | |
| | | | | | | | 7,542,562 | |
| | | | | Pharmaceuticals - 6.01% | | | | |
| | 5,020 | | | Actavis Plc (a) | | | 1,033,367 | |
| | 14,540 | | | Bristol-Myers Squibb Co. | | | 755,353 | |
| | 28,705 | | | GlaxoSmithKline Plc - ADR (b) | | | 1,533,708 | |
| | 56,380 | | | Pfizer, Inc. | | | 1,810,926 | |
| | 53,355 | | | Teva Pharmaceutical Industries | | | | |
| | | | | Ltd. - ADR | | | 2,819,278 | |
| | | | | | | | 7,952,632 | |
| | | | | Professional Services - 0.46% | | | | |
| | 4,995 | | | IHS, Inc. - Class A (a) | | | 606,892 | |
| | | | | Real Estate Management & | | | | |
| | | | | Development - 1.01% | | | | |
| | 15,880 | | | Alexander & Baldwin, Inc. | | | 675,853 | |
| | 24,160 | | | CBRE Group, Inc. - Class A (a) | | | 662,709 | |
| | | | | | | | 1,338,562 | |
| | | | | Road & Rail - 0.81% | | | | |
| | 10,955 | | | Norfolk Southern Corp. | | | 1,064,497 | |
| | | | | Semiconductor & Semiconductor | | | | |
| | | | | Equipment - 1.04% | | | | |
| | 7,370 | | | Cavium, Inc. (a) | | | 322,290 | |
| | 40,585 | | | Intel Corp. | | | 1,047,499 | |
| | | | | | | | 1,369,789 | |
| | | | | Software - 4.46% | | | | |
| | 5,660 | | | Autodesk, Inc. (a) | | | 278,359 | |
| | 15,959 | | | CA, Inc. | | | 494,250 | |
Number of
Shares | | | | | Value | |
| | | | | Software (Continued) | | | | |
| | 1,460 | | | Citrix Systems, Inc. (a) | | $ | 83,848 | |
| | 75,595 | | | Microsoft Corp. | | | 3,098,639 | |
| | 11,430 | | | Oracle Corp. | | | 467,601 | |
| | 13,320 | | | Qlik Technologies, Inc. (a) | | | 354,179 | |
| | 7,420 | | | Red Hat, Inc. (a) | | | 393,111 | |
| | 6,880 | | | Salesforce.com, Inc. (a)(b) | | | 392,779 | |
| | 5,680 | | | ServiceNow, Inc. (a) | | | 340,346 | |
| | | | | | | | 5,903,112 | |
| | | | | Specialty Retail - 2.53% | | | | |
| | 7,910 | | | Home Depot, Inc. | | | 625,918 | |
| | 5,680 | | | Signet Jewelers Ltd. (b) | | | 601,285 | |
| | 33,711 | | | Staples, Inc. | | | 382,283 | |
| | 21,500 | | | The TJX Companies, Inc. | | | 1,303,975 | |
| | 6,410 | | | Williams Sonoma, Inc. | | | 427,162 | |
| | | | | | | | 3,340,623 | |
| | | | | Textiles, Apparel & Luxury Goods - 1.67% | | | | |
| | 9,524 | | | Coach, Inc. | | | 472,962 | |
| | 27,960 | | | VF Corp. | | | 1,730,165 | |
| | | | | | | | 2,203,127 | |
| | | | | Tobacco - 1.44% | | | | |
| | 23,240 | | | Philip Morris International, Inc. | | | 1,902,659 | |
| | | | | Trading Companies & Distributors - 0.24% | | | | |
| | 16,345 | | | Aircastle Ltd. | | | 316,766 | |
| | | | | Wireless Telecommunication Services - 0.80% | | | | |
| | 18,320 | | | Rogers Communications, Inc. - Class B | | | 759,181 | |
| | 7,982 | | | Vodafone Group Plc - ADR | | | 293,817 | |
| | | | | | | | 1,052,998 | |
| | | | | Total Common Stocks
(Cost $98,473,827) | | | 126,582,594 | |
| | | | | REAL ESTATE INVESTMENT TRUSTS - 1.41% | | | | |
| | | | | Real Estate Investment Trusts - 1.41% | | | | |
| | 97,575 | | | iStar Financial, Inc. (a) | | | 1,440,207 | |
| | 18,020 | | | Starwood Property Trust, Inc. | | | 425,092 | |
| | | | | Total Real Estate Investment Trusts
(Cost $1,108,439) | | | 1,865,299 | |
| | | | | SHORT TERM INVESTMENTS - 2.22% | | | | |
| | | | | Money Market Funds - 2.22% | | | | |
| | 2,938,513 | | | Federated Prime Obligations Fund | | | 2,938,513 | |
| | | | | Total Short Term Investments
(Cost $2,938,513) | | | 2,938,513 | |
See notes to financial statements.
GuideMarkSM Opportunistic Equity Fund
SCHEDULE OF INVESTMENTS (Continued)
March 31, 2014
Number of
Shares | | | | | Value | |
| | | | | INVESTMENTS PURCHASED
AS SECURITIES LENDING
COLLATERAL - 6.81% | | | | |
| | | | | Money Market Funds - 6.81% | | | | |
| | 8,998,359 | | | First American Government
Obligations Fund | | $ | 8,998,359 | |
| | | | | Total Investments Purchased as
Securities Lending Collateral
(Cost $8,998,359) | | | 8,998,359 | |
| | | | | Total Investments
(Cost $111,519,138) - 106.17% | | | 140,384,765 | |
| | | | | Liabilities in Excess of
Other Assets - (6.17)% | | | (8,155,319 | ) |
| | | | | TOTAL NET
ASSETS - 100.00% | | $ | 132,229,446 | |
Percentages are stated as a percent of net assets.
ADR - American Depositary Receipt
| (a) | Non-income producing security. |
| (b) | All or portion of this security is on loan. |
See notes to financial statements.
GuideMarkSM Global Real Return Fund
SCHEDULE OF INVESTMENTS
March 31, 2014
Number of
Shares | | | | | Value | |
| | | | | INVESTMENT COMPANIES - 99.44% | | | | |
| | | | | Exchange Traded Funds - 99.44% | | | | |
| | 26,185 | | | Energy Select Sector SPDR Fund (a) | | $ | 2,332,036 | |
| | 17,581 | | | Market Vectors Gold Miners ETF (a) | | | 414,912 | |
| | 11 | | | PowerShares DB Agriculture Fund (b) | | | 312 | |
| | 540,822 | | | PowerShares DB Commodity Index
Tracking Fund (a)(b) | | | 14,131,679 | |
| | 76,566 | | | PowerShares Global Agriculture
Portfolio (a) | | | 2,336,794 | |
| | 180,698 | | | SPDR Barclays TIPS ETF (a) | | | 10,043,195 | |
| | 97,149 | | | SPDR DB International Government
Inflation-Protected Bond ETF | | | 5,837,683 | |
| | 197,618 | | | SPDR Dow Jones International Real Estate ETF | | | 8,135,933 | |
| | 94,603 | | | SPDR Dow Jones REIT ETF (a) | | | 7,381,872 | |
| | 56,592 | | | SPDR Metals and Mining ETF (a) | | | 2,361,584 | |
| | 449,584 | | | SPDR S&P Global Natural
Resources ETF (a)(c) | | | 22,632,059 | |
| | 57,734 | | | SPDR S&P International Energy
Sector ETF (a) | | | 1,534,627 | |
| | | | | | | | 77,142,686 | |
| | | | | Total Investment Companies
(Cost $74,599,554) | | | 77,142,686 | |
Number of
Shares | | | | | Value | |
| | | | | SHORT TERM INVESTMENTS - 0.68% | | | | |
| | | | | Money Market Funds - 0.68% | | | | |
| | 531,056 | | | Federated Prime Obligations Fund | | $ | 531,056 | |
| | | | | Total Short Term Investments
(Cost $531,056) | | | 531,056 | |
| | | | | INVESTMENTS PURCHASED
AS SECURITIES LENDING
COLLATERAL - 37.26% | | | | |
| | | | | Money Market Funds - 37.26% | | | | |
| | 28,902,100 | | | First American Government
Obligations Fund | | | 28,902,100 | |
| | | | | Total Investments Purchased as
Securities Lending Collateral
(Cost $28,902,100) | | | 28,902,100 | |
| | | | | Total Investments
(Cost $104,032,710) - 137.38% | | | 106,575,842 | |
| | | | | Liabilities in Excess of
Other Assets - (37.38)% | | | (28,998,929 | ) |
| | | | | TOTAL NET
ASSETS - 100.00% | | $ | 77,576,913 | |
| Percentages are stated as a percent of net assets. |
| (a) | All or portion of this security is on loan. |
| (b) | Non-income producing security. |
| (c) | Fair value of this security exceeds 25% of the Fund’s net assets. Additional information for this security, including the financial statements, is available from the SEC’s EDGAR database at www.sec.gov. |
See notes to financial statements.
GuideMarkSM Core Fixed Income Fund
SCHEDULE OF INVESTMENTS
March 31, 2014
| Principal | | | | | | |
| Amount | | | | | Value | |
| | | | | ASSET BACKED SECURITIES - 7.37% | | | | |
| | 105,883 | | | Accredited Mortgage Loan Trust | | | | |
| | | | | Series 2005-3, 0.390%, | | | | |
| | | | | 09/25/2035 (a) | | $ | 105,414 | |
| | | | | Ally Master Owner Trust | | | | |
| | 255,000 | | | Series 2013-1, 1.000%, | | | | |
| | | | | 02/15/2018 | | | 255,969 | |
| | 420,000 | | | Series 2013-2, 0.602%, | | | | |
| | | | | 04/15/2018 (a) | | | 421,061 | |
| | 535,000 | | | Series 2012-5, 1.540%, | | | | |
| | | | | 09/15/2019 | | | 533,313 | |
| | | | | American Credit Acceptance | | | | |
| | | | | Receivables Trust | | | | |
| | 257,375 | | | Series 2012-3, 1.640%, 11/15/2016 | | | | |
| | | | | (Acquired 11/27/2012 and | | | | |
| | | | | 06/21/2013, Cost $257,366) (b) | | | 258,035 | |
| | 201,098 | | | Series 2013-2, 1.320%, 02/15/2017 | | | | |
| | | | | (Acquired 07/31/2013, | | | | |
| | | | | Cost $201,092) (b) | | | 201,428 | |
| | 87,801 | | | Series 2014-1, 1.140%, | | | | |
| | | | | 03/12/2018 (Acquired 01/07/2014, | | | | |
| | | | | Cost $87,796) (b) | | | 87,844 | |
| | 211,474 | | | Series 2013-1, 1.450%, 04/16/2018 | | | | |
| | | | | (Acquired 03/20/2013 and | | | | |
| | | | | 02/27/2014, Cost $211,483) (b) | | | 212,384 | |
| | | | | AmeriCredit Automobile | | | | |
| | | | | Receivables Trust | | | | |
| | 250,451 | | | Series 2013-4, 0.740%, | | | | |
| | | | | 11/08/2016 | | | 250,792 | |
| | 315,000 | | | Series 2012-5, 1.120%, | | | | |
| | | | | 11/08/2017 | | | 316,296 | |
| | 500,000 | | | Apidos CDO | | | | |
| | | | | Series 2013-12A, 1.339%, | | | | |
| | | | | 04/15/2025 (Acquired 03/15/2013, | | | | |
| | | | | Cost $500,000) (a)(b) | | | 491,898 | |
| | 138,828 | | | ARI Fleet Lease Trust | | | | |
| | | | | Series 2012-B, 0.452%, 01/15/2021 | | | | |
| | | | | (Acquired 10/16/2012, | | | | |
| | | | | Cost $138,828) (a)(b) | | | 138,700 | |
| | 500,000 | | | Atrium IX | | | | |
| | | | | Series 9-A, 1.533%, 02/28/2024 | | | | |
| | | | | (Acquired 01/24/2013, | | | | |
| | | | | Cost $500,000) (a)(b) | | | 495,792 | |
| Principal | | | | | | |
| Amount | | | | | Value | |
| | | | | ASSET BACKED SECURITIES (Continued) | | | | |
| | 500,000 | | | Atrium X | | | | |
| | | | | Series 10-A, 1.349%, 07/16/2025 | | | | |
| | | | | (Acquired 04/25/2013, | | | | |
| | | | | Cost $499,250) (a)(b) | | $ | 493,920 | |
| | 360,000 | | | Avery Point CLO Ltd. | | | | |
| | | | | 1.754%, 04/25/2026 | | | | |
| | | | | (Acquired 03/19/2014, | | | | |
| | | | | Cost $360,000) (a)(b)(i) | | | 360,000 | |
| | 825,000 | | | Babson CLO Ltd. | | | | |
| | | | | Series 2013-IA, 1.337%, | | | | |
| | | | | 04/20/2025 (Acquired 05/03/2013, | | | | |
| | | | | Cost $825,000) (a)(b) | | | 811,403 | |
| | | | | Capital Auto Receivables Asset Trust | | | | |
| | 1,240,000 | | | Series 2013-4, 1.090%, | | | | |
| | | | | 03/20/2018 | | | 1,238,696 | |
| | 315,000 | | | Series 2014-1, 1.320%, | | | | |
| | | | | 06/20/2018 | | | 315,323 | |
| | 43,017 | | | CarFinance Capital LLC | | | | |
| | | | | Series 2013-1A, 1.650%, | | | | |
| | | | | 07/17/2017 (Acquired 05/21/2013, | | | | |
| | | | | Cost $43,016) (b) | | | 43,176 | |
| | 555,000 | | | Carlyle Global Market Strategies | | | | |
| | | | | Series 2013-3A, 1.359%, | | | | |
| | | | | 07/15/2025 (Acquired 06/10/2013, | | | | |
| | | | | Cost $553,835) (a)(b) | | | 547,935 | |
| | 235,000 | | | CarMax Auto Owner Trust | | | | |
| | | | | Series 2013-3, 1.490%, | | | | |
| | | | | 01/15/2019 | | | 236,845 | |
| | 325,000 | | | Cent CLO LP | | | | |
| | | | | Series 2013-20A, 1.724%, | | | | |
| | | | | 01/25/2026 (Acquired 12/18/2013, | | | | |
| | | | | Cost $325,000) (a)(b) | | | 325,003 | |
| | 365,000 | | | CIFC Funding Ltd. | | | | |
| | | | | Series 2013-1A, 1.387%, 04/16/2025 | | | | |
| | | | | (Acquired 02/22/2013, | | | | |
| | | | | Cost $365,000) (a)(b) | | | 360,167 | |
| | 2,190,000 | | | Citibank Credit Card Issuance Trust | | | | |
| | | | | Series 2013-A3, 1.110%, | | | | |
| | | | | 07/23/2018 | | | 2,200,873 | |
| | 67,055 | | | Conseco Finance Securitizations Corp. | | | | |
| | | | | Series 2000-4, 8.310%, | | | | |
| | | | | 05/01/2032 | | | 49,050 | |
See notes to financial statements.
GuideMarkSM Core Fixed Income Fund
SCHEDULE OF INVESTMENTS (Continued)
March 31, 2014
| Principal | | | | | | |
| Amount | | | | | Value | |
| | | | | ASSET BACKED SECURITIES (Continued) | | | | |
| | 46,541 | | | Countrywide Asset-Backed Certificates | | | | |
| | | | | Series 2005-4, 4.456%, | | | | |
| | | | | 10/25/2035 (a) | | $ | 46,760 | |
| | | | | CPS Auto Receivables Trust | | | | |
| | 331,719 | | | Series 2013-C, 1.640%, 04/16/2018 | | | | |
| | | | | (Acquired 09/24/2013, | | | | |
| | | | | Cost $331,680) (b) | | | 333,322 | |
| | 113,692 | | | Series 2013-D, 1.540%, 07/16/2018 | | | | |
| | | | | (Acquired 12/10/2013, | | | | |
| | | | | Cost $113,681) (b) | | | 114,188 | |
| | 120,000 | | | Series 2014-A, 1.210%, 08/15/2018 | | | | |
| | | | | (Acquired 03/10/2014, | | | | |
| | | | | Cost $119,988) (b) | | | 120,036 | |
| | 174,992 | | | Series 2013-A, 1.310%, 06/15/2020 | | | | |
| | | | | (Acquired 03/12/2013, | | | | |
| | | | | Cost $174,969) (b) | | | 174,735 | |
| | | | | CPS Auto Trust | | | | |
| | 88,496 | | | Series 2012-C, 1.820%, 12/16/2019 | | | | |
| | | | | (Acquired 09/11/2012, | | | | |
| | | | | Cost $88,493) (b) | | | 89,208 | |
| | 137,635 | | | Series 2012-D, 1.480%, 03/16/2020 | | | | |
| | | | | (Acquired 12/07/2012, | | | | |
| | | | | Cost $137,618) (b) | | | 138,110 | |
| | 501,116 | | | Series 2013-B, 1.820%, 09/15/2020 | | | | |
| | | | | (Acquired 06/13/2013, | | | | |
| | | | | Cost $501,107) (b) | | | 502,384 | |
| | | | | Credit Acceptance Auto Loan Trust | | | | |
| | 265,000 | | | Series 2011-1B, 3.960%, 09/15/2019 | | | | |
| | | | | (Acquired 02/07/2013, | | | | |
| | | | | Cost $272,031) (b) | | | 269,241 | |
| | 356,000 | | | Series 2012-2, 1.520%, 03/16/2020 | | | | |
| | | | | (Acquired 09/11/2012, | | | | |
| | | | | Cost $355,938) (b) | | | 357,982 | |
| | 425,000 | | | Dryden XXVI Senior Loan Fund | | | | |
| | | | | Series 2013-26A, 1.326%, | | | | |
| | | | | 07/15/2025 (Acquired 02/20/2013, | | | | |
| | | | | Cost $425,000) (a)(b) | | | 417,886 | |
| | 147,527 | | | DT Auto Owner Trust | | | | |
| | | | | Series 2014-1, 0.660%, 07/17/2017 | | | | |
| | | | | (Acquired 01/14/2014, | | | | |
| | | | | Cost $147,524) (b) | | | 147,568 | |
| | 70,656 | | | Education Funding Capital Trust I | | | | |
| | | | | Series 2004-1, 0.393%, | | | | |
| | | | | 12/15/2022 (a) | | | 70,630 | |
| Principal | | | | | | |
| Amount | | | | | Value | |
| | | | | ASSET BACKED SECURITIES (Continued) | | | | |
| | 215,000 | | | Enterprise Fleet Financing LLC | | | | |
| | | | | Series 2012-1, 1.410%, 11/20/2017 | | | | |
| | | | | (Acquired 11/02/2012, | | | | |
| | | | | Cost $216,112) (b) | | $ | 216,252 | |
| | 403,976 | | | First Investors Auto Owner Trust | | | | |
| | | | | Series 2013-2A, 1.230%, | | | | |
| | | | | 03/15/2019 (Acquired 06/13/2013, | | | | |
| | | | | Cost $403,928) (b) | | | 405,273 | |
| | | | | Ford Credit Auto Lease Trust | | | | |
| | 650,000 | | | Series 2013-A, 0.600%, | | | | |
| | | | | 03/15/2016 | | | 650,888 | |
| | 580,000 | | | Series 2014-A, 0.900%, | | | | |
| | | | | 06/15/2017 | | | 579,303 | |
| | 100,000 | | | GCO Education Loan Funding Trust | | | | |
| | | | | Series 2006-1, 0.465%, | | | | |
| | | | | 05/25/2036 (a) | | | 88,258 | |
| | 210,000 | | | Hertz Fleet Lease Funding LP | | | | |
| | | | | Series 2013-3, 0.700%, 12/10/2027 | | | | |
| | | | | (Acquired 11/20/2013, | | | | |
| | | | | Cost $210,000) (a)(b) | | | 210,533 | |
| | | | | HLSS Servicer Advance Receivables | | | | |
| | | | | Backed Note | | | | |
| | 435,000 | | | Series 2013-T3, 1.793%, 05/15/2046 | | | | |
| | | | | (Acquired 05/17/2013 and | | | | |
| | | | | 08/28/2013, Cost $431,753) (b) | | | 428,313 | |
| | 370,000 | | | Series 2013-T1, 1.495%, | | | | |
| | | | | 01/16/2046 (Acquired 01/16/2013 | | | | |
| | | | | through 01/29/2014, | | | | |
| | | | | Cost $370,868) (b) | | | 369,763 | |
| | 175,000 | | | Series 2013-T1, 2.289%, | | | | |
| | | | | 01/15/2048 (Acquired 01/16/2013, | | | | |
| | | | | Cost $175,000) (b) | | | 173,384 | |
| | 585,000 | | | Hyundai Auto Receivables Trust | | | | |
| | | | | Series 2014-A, 0.790%, | | | | |
| | | | | 07/16/2018 | | | 584,049 | |
| | 395,000 | | | ING Investment Management Co. | | | | |
| | | | | Series 2013-3A, 1.686%, | | | | |
| | | | | 01/18/2026 (Acquired 11/26/2013, | | | | |
| | | | | Cost $395,000) (a)(b) | | | 394,400 | |
| | 390,000 | | | Limerock CLO | | | | |
| | | | | Series 2014-2A, 1.735%, | | | | |
| | | | | 04/18/2026 (Acquired 02/26/2014, | | | | |
| | | | | Cost $389,581) (a)(b) | | | 390,389 | |
See notes to financial statements.
GuideMarkSM Core Fixed Income Fund
SCHEDULE OF INVESTMENTS (Continued)
March 31, 2014
| Principal | | | | | | |
| Amount | | | | | Value | |
| | | | | ASSET BACKED SECURITIES (Continued) | | | | |
| | 575,000 | | | Madison Park Funding XI Ltd. | | | | |
| | | | | Series 2013-11A, 1.600%, | | | | |
| | | | | 10/23/2025 (Acquired 08/16/2013, | | | | |
| | | | | Cost $574,425) (a)(b) | | $ | 570,984 | |
| | 525,000 | | | Mercedes Benz Auto Lease Trust | | | | |
| | | | | Series 2013-B, 0.760%, | | | | |
| | | | | 07/15/2019 | | | 525,084 | |
| | 477,641 | | | Morgan Stanley | | | | |
| | | | | Series 2003-N, 1.174%, | | | | |
| | | | | 10/25/2033 (a) | | | 451,586 | |
| | 285,000 | | | Neuberger Berman CLO Ltd. | | | | |
| | | | | Series 2014-16A, 1.741%, | | | | |
| | | | | 04/15/2026 (Acquired 02/11/2014, | | | | |
| | | | | Cost $283,803) (b) | | | 284,823 | |
| | 53,210 | | | Northstar Education Finance, Inc. | | | | |
| | | | | Series 2005-1, 0.335%, | | | | |
| | | | | 10/28/2026 (a) | | | 53,243 | |
| | 425,000 | | | Northwoods Capital X Ltd. | | | | |
| | | | | Series 2013-10A, 1.637%, | | | | |
| | | | | 11/04/2025 (Acquired 09/12/2013, | | | | |
| | | | | Cost $422,790) (a)(b) | | | 424,333 | |
| | 280,000 | | | Oak Hill Credit Partners | | | | |
| | | | | Series 2013-8A, 1.357%, | | | | |
| | | | | 04/20/2025 (Acquired 04/17/2013, | | | | |
| | | | | Cost $280,000) (a)(b) | | | 276,005 | |
| | 410,000 | | | Octagon Investment Partners XVI Ltd. | | | | |
| | | | | Series 2013-1A, 1.358%, 07/17/2025 | | | | |
| | | | | (Acquired 05/15/2013, | | | | |
| | | | | Cost $409,344) (a)(b) | | | 404,228 | |
| | 450,000 | | | OZLM Funding Ltd. | | | | |
| | | | | Series 2013-5A, 1.778%, 01/17/2026 | | | | |
| | | | | (Acquired 11/22/2013, | | | | |
| | | | | Cost $449,775) (a)(b) | | | 450,471 | |
| | | | | Prestige Auto Receivables Trust | | | | |
| | 220,000 | | | Series 2013-1A, 1.330%, | | | | |
| | | | | 05/15/2019 (Acquired 04/03/2013, | | | | |
| | | | | Cost $219,948) (b) | | | 220,346 | |
| | 120,000 | | | Series 2014-1A, 1.520%, | | | | |
| | | | | 04/15/2020 (Acquired 03/18/2014, | | | | |
| | | | | Cost $119,993) (b) | | | 119,738 | |
| | 695,000 | | | Race Point VIII CLO Ltd. | | | | |
| | | | | Series 2013-8, 1.485%, | | | | |
| | | | | 02/20/2025 (Acquired 02/06/2013, | | | | |
| | | | | Cost $695,000) (a)(b) | | | 690,615 | |
| Principal | | | | | | |
| Amount | | | | | Value | |
| | | | | ASSET BACKED SECURITIES (Continued) | | | | |
| | 137,759 | | | Residential Asset Mortgage | | | | |
| | | | | Products, Inc. | | | | |
| | | | | Series 2004-R, 0.634%, | | | | |
| | | | | 03/25/2034 (a) | | $ | 133,678 | |
| | 290,000 | | | Santander Drive Auto | | | | |
| | | | | Receivables Trust | | | | |
| | | | | Series 2012-5, 1.560%, | | | | |
| | | | | 08/15/2018 | | | 292,511 | |
| | 75,268 | | | SNAAC Auto Receivables Trust | | | | |
| | | | | Series 2013-1A, 1.140%, | | | | |
| | | | | 07/16/2018 (Acquired 04/02/2013, | | | | |
| | | | | Cost $75,265) (b) | | | 75,428 | |
| | 225,000 | | | Springleaf Funding Trust | | | | |
| | | | | Series 2014-AA, 2.410%, | | | | |
| | | | | 12/15/2022 (Acquired 03/19/2014, | | | | |
| | | | | Cost $224,963) (b)(i) | | | 225,000 | |
| | 92,553 | | | U.S. Education Loan Trust, LLC | | | | |
| | | | | Series 2006-1, 0.366%, 03/01/2025 | | | | |
| | | | | (Acquired 08/06/2010, | | | | |
| | | | | Cost $90,470) (a)(b) | | | 92,300 | |
| | | | | Westlake Automobile | | | | |
| | | | | Receivables Trust | | | | |
| | 36,463 | | | Series 2012-1, 1.030%, 03/15/2016 | | | | |
| | | | | (Acquired 09/19/2012, | | | | |
| | | | | Cost $36,462) (b) | | | 36,497 | |
| | 245,000 | | | Series 2013-1, 1.120%, | | | | |
| | | | | 01/15/2018 (Acquired 09/18/2013, | | | | |
| | | | | Cost $244,973) (b) | | | 245,969 | |
| | | | | Total Asset Backed Securities | | | | |
| | | | | (Cost $23,643,775) | | | 23,597,011 | |
| | | | | COLLATERALIZED MORTGAGE | | | | |
| | | | | OBLIGATIONS - 5.12% | | | | |
| | 160,000 | | | Aventura Mall Trust | | | | |
| | | | | Series 2013-AVM, 3.867%, | | | | |
| | | | | 12/05/2032 (Acquired 12/10/2013, | | | | |
| | | | | Cost $165,310) (a)(b) | | | 166,925 | |
| | | | | Banc of America Commercial | | | | |
| | | | | Mortgage Trust | | | | |
| | 230,000 | | | Series 2006-2, 5.919%, | | | | |
| | | | | 05/10/2045 (a) | | | 249,125 | |
| | 6,671 | | | Series 2007-5, 5.620%, | | | | |
| | | | | 02/10/2051 | | | 6,663 | |
See notes to financial statements.
GuideMarkSM Core Fixed Income Fund
SCHEDULE OF INVESTMENTS (Continued)
March 31, 2014
| Principal | | | | | | |
| Amount | | | | | Value | |
| | | | | COLLATERALIZED MORTGAGE | | | | |
| | | | | OBLIGATIONS (Continued) | | | | |
| | 150,000 | | | BB-UBS Trust | | | | |
| | | | | Series 2012-SHOW, 3.430%, | | | | |
| | | | | 11/07/2036 (Acquired 12/05/2012, | | | | |
| | | | | Cost $155,979) (b) | | $ | 144,060 | |
| | | | | Bear Stearns Commercial Mortgage | | | | |
| | | | | Securities Trust | | | | |
| | 160,000 | | | Series 2006-PW14, 5.201%, | | | | |
| | | | | 12/11/2038 | | | 174,739 | |
| | 225,000 | | | Series 2005-PW10, 5.405%, | | | | |
| | | | | 12/11/2040 (a) | | | 236,262 | |
| | 3,250,000 | | | Series 2006-PW13, 5.540%, | | | | |
| | | | | 09/11/2041 | | | 3,527,888 | |
| | 125,864 | | | Chase Mortgage Financial Trust | | | | |
| | | | | Series 2007-A1, 2.667%, | | | | |
| | | | | 02/25/2037 (a) | | | 120,639 | |
| | | | | Citigroup Commercial Mortgage Trust | | | | |
| | 190,000 | | | Series 2013-GC17, 4.131%, | | | | |
| | | | | 11/10/2046 | | | 198,620 | |
| | 265,000 | | | Series 2014-GC19, 4.023%, | | | | |
| | | | | 03/10/2047 | | | 273,583 | |
| | 87,332 | | | Series 2006-C4, 5.783%, | | | | |
| | | | | 03/15/2049 (a) | | | 94,567 | |
| | | | | COMM Mortgage Trust | | | | |
| | 120,000 | | | Series 2013-300P, 4.353%, | | | | |
| | | | | 08/12/2030 (Acquired 08/15/2013, | | | | |
| | | | | Cost $122,747) (b) | | | 128,072 | |
| | 110,000 | | | Series 2013-LC6, 2.941%, | | | | |
| | | | | 01/10/2046 (a) | | | 105,839 | |
| | 265,000 | | | Series 2014-UBS2, 3.961%, | | | | |
| | | | | 03/10/2047 | | | 272,796 | |
| | 240,000 | | | Commercial Mortgage Loan Trust | | | | |
| | | | | Series 2008-LS1, 6.213%, | | | | |
| | | | | 12/10/2049 (a) | | | 266,354 | |
| | 95,000 | | | Commercial Mortgage Pass-Through | | | | |
| | | | | Certificate | | | | |
| | | | | Series 2012-CCRE3, 2.822%, | | | | |
| | | | | 10/17/2045 | | | 91,181 | |
| | | | | Countrywide Home Loans, Inc. | | | | |
| | 27,400 | | | Series 2004-HYB6, 2.527%, | | | | |
| | | | | 11/20/2034 (a) | | | 26,081 | |
| | 125,842 | | | Series 2005-11, 0.754%, | | | | |
| | | | | 03/25/2035 (a) | | | 111,899 | |
| Principal | | | | | | |
| Amount | | | | | Value | |
| | | | | COLLATERALIZED MORTGAGE | | | | |
| | | | | OBLIGATIONS (Continued) | | | | |
| | 120,745 | | | Credit Suisse Commercial | | | | |
| | | | | Mortgage Trust | | | | |
| | | | | Series 2006-C4, 5.467%, | | | | |
| | | | | 09/15/2039 | | $ | 131,002 | |
| | 407,763 | | | Credit Suisse First Boston Mortgage | | | | |
| | | | | Securities Corp. | | | | |
| | | | | Series 2005-C1, 5.014%, | | | | |
| | | | | 02/18/2038 | | | 416,672 | |
| | 130,000 | | | DBUBS Mortgage Trust | | | | |
| | | | | Series 2011-LC1, 5.002%, | | | | |
| | | | | 11/13/2046 (Acquired 05/13/2013, | | | | |
| | | | | Cost $151,777) (b) | | | 145,411 | |
| | 400,000 | | | Four Times Square Trust | | | | |
| | | | | Series 2006-4TS, 5.401%, | | | | |
| | | | | 12/13/2028 (Acquired 11/06/2012, | | | | |
| | | | | Cost $459,533) (b) | | | 450,946 | |
| | | | | GS Mortgage Securities Corp. | | | | |
| | 145,000 | | | Series 2012-ALOH, 3.551%, | | | | |
| | | | | 04/12/2034 (Acquired 03/08/2013, | | | | |
| | | | | Cost $150,577) (b) | | | 146,498 | |
| | 685,000 | | | Series 2012-GCJ7, 3.377%, | | | | |
| | | | | 05/12/2045 | | | 694,338 | |
| | | | | GS Mortgage Securities Corp. II | | | | |
| | 145,000 | | | Series 2012-BWTR, 2.954%, | | | | |
| | | | | 11/07/2034 (Acquired 12/11/2012, | | | | |
| | | | | Cost $148,095) (b) | | | 138,521 | |
| | 424,356 | | | Series 2005-GG4, 4.751%, | | | | |
| | | | | 07/10/2039 | | | 436,487 | |
| | 130,000 | | | GS Mortgage Securities Trust | | | | |
| | | | | Series 2013-GC14, 4.243%, | | | | |
| | | | | 08/10/2046 | | | 137,385 | |
| | 125,000 | | | GSMS Mortgage Securities Trust | | | | |
| | | | | Series 2014-GC20, 3.998%, | | | | |
| | | | | 04/10/2047 (i) | | | 128,750 | |
| | 110,000 | | | Hilton USA Trust | | | | |
| | | | | Series 2013-HLT, 2.662%, | | | | |
| | | | | 11/07/2030 (Acquired 11/22/2013, | | | | |
| | | | | Cost $110,000) (b) | | | 110,483 | |
| | 1,205,000 | | | JPMBB Commercial Mortgage | | | | |
| | | | | Securities Trust | | | | |
| | | | | Series 2013-C12, 3.157%, | | | | |
| | | | | 07/15/2045 | | | 1,223,406 | |
See notes to financial statements.
GuideMarkSM Core Fixed Income Fund
SCHEDULE OF INVESTMENTS (Continued)
March 31, 2014
| Principal | | | | | | |
| Amount | | | | | Value | |
| | | | | COLLATERALIZED MORTGAGE | | | | |
| | | | | OBLIGATIONS (Continued) | | | | |
| | | | | JPMorgan Commercial Mortgage | | | | |
| | | | | Securities Trust | | | | |
| | 145,000 | | | Series 2012-WLDN, 3.905%, | | | | |
| | | | | 05/05/2030 (Acquired 05/07/2013 | | | | |
| | | | | and 06/25/2013, | | | | |
| | | | | Cost $146,507) (b) | | $ | 146,515 | |
| | 130,000 | | | Series 2012-HSBC, 3.093%, | | | | |
| | | | | 07/08/2032 (Acquired 03/11/2013, | | | | |
| | | | | Cost $131,961) (b) | | | 127,609 | |
| | 415,000 | | | Series 2005-LDP2, 4.738%, | | | | |
| | | | | 07/15/2042 | | | 429,172 | |
| | | | | Lehman Brothers-UBS Commercial | | | | |
| | | | | Mortgage Trust | | | | |
| | 240,675 | | | Series 2006-C4, 5.833%, | | | | |
| | | | | 06/15/2038 (a) | | | 262,465 | |
| | 625,000 | | | Series 2007-C1, 5.424%, | | | | |
| | | | | 02/15/2040 | | | 686,658 | |
| | 53,553 | | | Series 2007-C2, 5.430%, | | | | |
| | | | | 02/15/2040 | | | 59,068 | |
| | 243,145 | | | Series 2007-C6, 5.858%, | | | | |
| | | | | 07/15/2040 (a) | | | 261,089 | |
| | 280,000 | | | Merrill Lynch Mortgage Trust | | | | |
| | | | | Series 2006-C1, 5.863%, | | | | |
| | | | | 05/12/2039 (a) | | | 302,187 | |
| | 301,782 | | | ML-CFC Commercial | | | | |
| | | | | Mortgage Trust | | | | |
| | | | | Series 2007-5, 5.378%, | | | | |
| | | | | 08/12/2048 | | | 326,904 | |
| | 160,000 | | | Morgan Stanley | | | | |
| | | | | Series 2007-IQ14, 5.692%, | | | | |
| | | | | 04/15/2049 (a) | | | 177,096 | |
| | 165,000 | | | Morgan Stanley Capital I Trust | | | | |
| | | | | Series 2007-IQ16, 5.809%, | | | | |
| | | | | 12/12/2049 | | | 183,803 | |
| | 130,000 | | | OBP Depositor LLC Trust | | | | |
| | | | | Series 2010-OBP, 4.646%, | | | | |
| | | | | 07/17/2045 (Acquired 08/15/2012, | | | | |
| | | | | Cost $148,401) (b) | | | 143,135 | |
| | | | | Springleaf Mortgage Loan Trust | | | | |
| | 189,880 | | | Series 2013-1A, 1.270%, | | | | |
| | | | | 06/25/2058 (Acquired 04/03/2013, | | | | |
| | | | | Cost $189,865) (a)(b) | | | 189,612 | |
| Principal | | | | | | |
| Amount | | | | | Value | |
| | | | | COLLATERALIZED MORTGAGE | | | | |
| | | | | OBLIGATIONS (Continued) | | | | |
| | 325,605 | | | Series 2013-2, 1.780%, | | | | |
| | | | | 12/25/2065 (Acquired 07/03/2013, | | | | |
| | | | | Cost $322,301) (a)(b) | | $ | 325,859 | |
| | 155,171 | | | Series 2013-2, 3.520%, 12/25/2065 | | | | |
| | | | | (Acquired 07/03/2013, | | | | |
| | | | | Cost $149,465) (a)(b) | | | 155,963 | |
| | 225,194 | | | TIAA Seasoned Commercial | | | | |
| | | | | Mortgage Trust | | | | |
| | | | | Series 2007-C4, 5.551%, | | | | |
| | | | | 08/15/2039 (a) | | | 229,895 | |
| | | | | UBS-Barclays Commercial | | | | |
| | | | | Mortgage Trust | | | | |
| | 250,000 | | | Series 2012-C4, 2.850%, | | | | |
| | | | | 12/10/2045 (a) | | | 238,729 | |
| | 145,000 | | | Series 2012-C2, 3.525%, | | | | |
| | | | | 05/10/2063 | | | 146,141 | |
| | 280,000 | | | Wachovia Bank Commercial | | | | |
| | | | | Mortgage Trust | | | | |
| | | | | Series 2005-C18, 4.935%, | | | | |
| | | | | 04/15/2042 | | | 287,792 | |
| | | | | Wells Fargo-RBS Commercial | | | | |
| | | | | Mortgage Trust | | | | |
| | 115,000 | | | Series 2011-C2, 4.869%, | | | | |
| | | | | 02/15/2044 (Acquired 05/09/2013 | | | | |
| | | | | and 09/19/2013, | | | | |
| | | | | Cost $129,814) (a)(b) | | | 126,874 | |
| | 180,000 | | | Series 2011-C3, 4.375%, | | | | |
| | | | | 03/17/2044 (Acquired 11/29/2012, | | | | |
| | | | | Cost $203,296) (b) | | | 192,953 | |
| | 805,000 | | | Series 2014-C19, 3.660%, | | | | |
| | | | | 03/15/2047 | | | 830,958 | |
| | 200,000 | | | Series 2014-C19, 4.101%, | | | | |
| | | | | 03/15/2047 | | | 207,368 | |
| | | | | Total Collateralized Mortgage | | | | |
| | | | | Obligations (Cost $16,409,296) | | | 16,393,037 | |
| | | | | CORPORATE OBLIGATIONS - 39.34% |
| | | | | Aerospace & Defense - 0.54% | | | | |
| | 405,000 | | | Precision Castparts Corp. | | | | |
| | | | | 0.700%, 12/20/2015 | | | 405,654 | |
| | 1,300,000 | | | United Technologies Corp. | | | | |
| | | | | 1.800%, 06/01/2017 | | | 1,322,741 | |
| | | | | | | | 1,728,395 | |
See notes to financial statements.
GuideMarkSM Core Fixed Income Fund
SCHEDULE OF INVESTMENTS (Continued)
March 31, 2014
| Principal | | | | | | |
| Amount | | | | | Value | |
| | | | | CORPORATE OBLIGATIONS (Continued) |
| | | | | Agricultural Products - 0.05% | | | | |
| | 175,000 | | | Cargill, Inc. | | | | |
| | | | | 4.100%, 11/01/2042 (Acquired | | | | |
| | | | | 10/24/2012, Cost $174,669) (b) | | $ | 161,917 | |
| | | | | Auto Parts & Equipment - 0.19% | | | | |
| | 610,000 | | | Delphi Corp. | | | | |
| | | | | 4.150%, 03/15/2024 | | | 610,497 | |
| | | | | Banks - 6.42% | | | | |
| | | | | Bank of America Corp. | | | | |
| | 550,000 | | | 2.600%, 01/15/2019 | | | 552,788 | |
| | 535,000 | | | 7.625%, 06/01/2019 | | | 659,187 | |
| | 175,000 | | | 5.875%, 01/05/2021 | | | 202,199 | |
| | 640,000 | | | 4.100%, 07/24/2023 | | | 650,413 | |
| | 210,000 | | | 4.000%, 04/01/2024 | | | 210,181 | |
| | 500,000 | | | 6.110%, 01/29/2037 | | | 560,986 | |
| | 110,000 | | | 7.750%, 05/14/2038 | | | 145,502 | |
| | 1,185,000 | | | 5.000%, 01/21/2044 (c) | | | 1,214,470 | |
| | 705,000 | | | Bank of Nova Scotia | | | | |
| | | | | 0.750%, 10/09/2015 | | | 707,179 | |
| | 300,000 | | | Barclays Bank Plc | | | | |
| | | | | 2.500%, 02/20/2019 | | | 300,867 | |
| | 400,000 | | | BNP Paribas SA | | | | |
| | | | | 2.375%, 09/14/2017 | | | 410,032 | |
| | | | | BPCE SA | | | | |
| | 415,000 | | | 2.500%, 12/10/2018 | | | 417,437 | |
| | 220,000 | | | 5.150%, 07/21/2024 (Acquired | | | | |
| | | | | 01/13/2014, Cost $219,593) (b) | | | 219,298 | |
| | 805,000 | | | Branch Banking & Trust Co. | | | | |
| | | | | 1.450%, 10/03/2016 | | | 814,563 | |
| | 750,000 | | | Canadian Imperial Bank of Commerce | | | | |
| | | | | 2.350%, 12/11/2015 | | | 772,124 | |
| | | | | Citigroup, Inc. | | | | |
| | 350,000 | | | 5.000%, 09/15/2014 | | | 356,818 | |
| | 535,000 | | | 1.700%, 07/25/2016 | | | 541,381 | |
| | 180,000 | | | 4.450%, 01/10/2017 | | | 194,532 | |
| | 1,115,000 | | | 8.500%, 05/22/2019 | | | 1,422,137 | |
| | 325,000 | | | 3.875%, 10/25/2023 | | | 323,340 | |
| | 125,000 | | | 6.125%, 08/25/2036 | | | 137,184 | |
| | 285,000 | | | 6.675%, 09/13/2043 | | | 334,905 | |
| | 285,000 | | | Cooperatieve Centrale Raiffeisen- | | | | |
| | | | | Boerenleenbank BA | | | | |
| | | | | 2.125%, 10/13/2015 | | | 291,885 | |
| Principal | | | | | | |
| Amount | | | | | Value | |
| | | | | Banks (Continued) | | | | |
| | 760,000 | | | Glitnir Bank | | | | |
| | | | | 6.693%, 06/15/2016 (Acquired | | | | |
| | | | | 06/14/2006 and 06/21/2006, | | | | |
| | | | | Cost $758,848) (a)(d)(e) | | $ | 3,952 | |
| | 400,000 | | | HSBC Holdings Plc | | | | |
| | | | | 6.800%, 06/01/2038 | | | 493,094 | |
| | | | | JPMorgan Chase & Co. | | | | |
| | 260,000 | | | 1.350%, 02/15/2017 | | | 259,971 | |
| | 415,000 | | | 4.250%, 10/15/2020 | | | 444,382 | |
| | 400,000 | | | 4.500%, 01/24/2022 | | | 431,946 | |
| | 130,000 | | | 3.375%, 05/01/2023 | | | 123,298 | |
| | 280,000 | | | 5.625%, 08/16/2043 | | | 302,190 | |
| | 250,000 | | | Kaupthing Bank Hf | | | | |
| | | | | 7.125%, 05/19/2016 (Acquired | | | | |
| | | | | 05/12/2006, Cost $248,680) (d)(e) | | | 5,313 | |
| | 230,000 | | | KeyCorp | | | | |
| | | | | 5.100%, 03/24/2021 | | | 257,106 | |
| | | | | PNC Funding Corp. | | | | |
| | 495,000 | | | 4.250%, 09/21/2015 | | | 519,812 | |
| | 535,000 | | | 3.300%, 03/08/2022 | | | 539,447 | |
| | | | | Royal Bank of Canada | | | | |
| | 375,000 | | | 1.150%, 03/13/2015 | | | 378,118 | |
| | 970,000 | | | 0.625%, 12/04/2015 | | | 970,964 | |
| | 230,000 | | | Royal Bank of Scotland Group Plc | | | | |
| | | | | 2.550%, 09/18/2015 | | | 234,962 | |
| | 625,000 | | | SunTrust Banks, Inc. | | | | |
| | | | | 3.500%, 01/20/2017 | | | 660,274 | |
| | | | | The Bank of Tokyo- | | | | |
| | | | | Mitsubishi UFJ Ltd. | | | | |
| | 200,000 | | | 2.300%, 03/10/2019 | | | | |
| | | | | (Acquired 03/04/2014, | | | | |
| | | | | Cost $199,680) (b) | | | 199,567 | |
| | 200,000 | | | 3.750%, 03/10/2024 | | | | |
| | | | | (Acquired 03/04/2014, | | | | |
| | | | | Cost $199,570) (b) | | | 201,661 | |
| | 295,000 | | | Toronto-Dominion Bank | | | | |
| | | | | 2.625%, 09/10/2018 | | | 302,452 | |
| | | | | U.S. Bancorp | | | | |
| | 730,000 | | | 1.650%, 05/15/2017 | | | 739,453 | |
| | 570,000 | | | 1.950%, 11/15/2018 | | | 568,581 | |
See notes to financial statements.
GuideMarkSM Core Fixed Income Fund
SCHEDULE OF INVESTMENTS (Continued)
March 31, 2014
| Principal | | | | | | |
| Amount | | | | | Value | |
| | | | | CORPORATE OBLIGATIONS (Continued) |
| | | | | Banks (Continued) | | | | |
| | | | | Wells Fargo & Co. | | | | |
| | 400,000 | | | 2.150%, 01/15/2019 | | $ | 399,515 | |
| | 155,000 | | | 3.450%, 02/13/2023 | | | 150,725 | |
| | 445,000 | | | 4.125%, 08/15/2023 | | | 451,052 | |
| | 80,000 | | | 5.375%, 11/02/2043 | | | 84,590 | |
| | 341,000 | | | 5.606%, 01/15/2044 | | | 370,482 | |
| | | | | | | | 20,532,315 | |
| | | | | Beverages - 0.40% | | | | |
| | 1,270,000 | | | Diageo Capital Plc | | | | |
| | | | | 1.500%, 05/11/2017 | | | 1,279,487 | |
| | | | | Biotechnology - 0.55% | | | | |
| | 375,000 | | | Amgen, Inc. | | | | |
| | | | | 4.950%, 10/01/2041 | | | 380,029 | |
| | 270,000 | | | Celgene Corp. | | | | |
| | | | | 5.250%, 08/15/2043 | | | 289,854 | |
| | 230,000 | | | Genzyme Corp. | | | | |
| | | | | 5.000%, 06/15/2020 | | | 257,960 | |
| | | | | Gilead Sciences, Inc. | | | | |
| | 155,000 | | | 3.700%, 04/01/2024 | | | 155,387 | |
| | 640,000 | | | 4.800%, 04/01/2044 | | | 661,444 | |
| | | | | | | | 1,744,674 | |
| | | | | Capital Markets - 3.52% | | | | |
| | 355,000 | | | Ameriprise Financial, Inc. | | | | |
| | | | | 4.000%, 10/15/2023 | | | 366,965 | |
| | 2,210,000 | | | Bear Stearns Companies, Inc. | | | | |
| | | | | 7.250%, 02/01/2018 | | | 2,633,023 | |
| | | | | Goldman Sachs Group, Inc. | | | | |
| | 835,000 | | | 5.950%, 01/18/2018 | | | 946,439 | |
| | 125,000 | | | 5.750%, 01/24/2022 | | | 141,966 | |
| | 510,000 | | | 4.000%, 03/03/2024 | | | 508,771 | |
| | 290,000 | | | 6.750%, 10/01/2037 | | | 333,239 | |
| | | | | Morgan Stanley | | | | |
| | 605,000 | | | 1.750%, 02/25/2016 | | | 613,091 | |
| | 350,000 | | | 5.950%, 12/28/2017 | | | 399,873 | |
| | 150,000 | | | 2.125%, 04/25/2018 | | | 149,816 | |
| | 525,000 | | | 2.500%, 01/24/2019 | | | 524,128 | |
| | 70,000 | | | 4.875%, 11/01/2022 | | | 73,684 | |
| | 570,000 | | | 3.750%, 02/25/2023 | | | 567,449 | |
| | 1,130,000 | | | State Street Corp. | | | | |
| | | | | 2.875%, 03/07/2016 | | | 1,176,865 | |
| Principal | | | | | | |
| Amount | | | | | Value | |
| | | | | Capital Markets (Continued) | | | | |
| | | | | The Bank of New York Mellon Corp. | | | | |
| | 985,000 | | | 2.300%, 07/28/2016 | | $ | 1,018,534 | |
| | 880,000 | | | 2.200%, 03/04/2019 | | | 878,489 | |
| | 805,000 | | | Wachovia Corp. | | | | |
| | | | | 5.750%, 02/01/2018 | | | 922,517 | |
| | | | | | | | 11,254,849 | |
| | | | | Chemicals - 0.43% | | | | |
| | | | | Dow Chemical Co. | | | | |
| | 445,000 | | | 4.250%, 11/15/2020 | | | 472,065 | |
| | 315,000 | | | 3.000%, 11/15/2022 | | | 299,985 | |
| | 595,000 | | | LYB International Finance BV | | | | |
| | | | | 4.000%, 07/15/2023 | | | 607,979 | |
| | | | | | | | 1,380,029 | |
| | | | | Commercial Services & Supplies - 0.22% |
| | 650,000 | | | International Lease Finance Corp. | | | | |
| | | | | 5.750%, 05/15/2016 | | | 700,784 | |
| | | | | Communications Equipment - 0.18% |
| | 590,000 | | | Cisco Systems Inc. | | | | |
| | | | | 1.100%, 03/03/2017 | | | 591,625 | |
| | | | | Computers & Peripherals - 0.63% | | | | |
| | 1,075,000 | | | Apple, Inc. | | | | |
| | | | | 2.400%, 05/03/2023 | | | 998,830 | |
| | 800,000 | | | EMC Corp. | | | | |
| | | | | 1.875%, 06/01/2018 | | | 800,263 | |
| | 200,000 | | | Hewlett-Packard Co. | | | | |
| | | | | 3.000%, 09/15/2016 | | | 208,937 | |
| | | | | | | | 2,008,030 | |
| | | | | Consumer Finance - 2.25% | | | | |
| | 457,000 | | | American Express Co. | | | | |
| | | | | 4.050%, 12/03/2042 | | | 421,200 | |
| | | | | American Express Credit Corp. | | | | |
| | 1,305,000 | | | 1.750%, 06/12/2015 | | | 1,323,492 | |
| | 535,000 | | | 1.300%, 07/29/2016 | | | 539,473 | |
| | 1,185,000 | | | Capital One Financial Corp. | | | | |
| | | | | 2.150%, 03/23/2015 | | | 1,203,115 | |
| | | | | Caterpillar Financial Services Corp. | | | | |
| | 550,000 | | | 1.100%, 05/29/2015 | | | 553,892 | |
| | 715,000 | | | 1.625%, 06/01/2017 | | | 721,418 | |
| | | | | John Deere Capital Corp. | | | | |
| | 565,000 | | | 1.050%, 10/11/2016 | | | 567,319 | |
| | 675,000 | | | 1.300%, 03/12/2018 | | | 665,853 | |
See notes to financial statements.
GuideMarkSM Core Fixed Income Fund
SCHEDULE OF INVESTMENTS (Continued)
March 31, 2014
| Principal | | | | | | |
| Amount | | | | | Value | |
| | | | | CORPORATE OBLIGATIONS (Continued) |
| | | | | Consumer Finance (Continued) | | | | |
| | 565,000 | | | PACCAR Financial Corp. | | | | |
| | | | | 1.150%, 08/16/2016 | | $ | 568,633 | |
| | 605,000 | | | Toyota Motor Credit Corp. | | | | |
| | | | | 2.050%, 01/12/2017 | | | 621,435 | |
| | | | | | | | 7,185,830 | |
| | | | | Diversified Financial Services - 1.42% |
| | | | | Ford Motor Credit Co. LLC | | | | |
| | 325,000 | | | 2.750%, 05/15/2015 | | | 331,718 | |
| | 200,000 | | | 5.875%, 08/02/2021 (c) | | | 230,476 | |
| | | | | General Electric Capital Corp. | | | | |
| | 200,000 | | | 4.625%, 01/07/2021 | | | 220,527 | |
| | 210,000 | | | 5.300%, 02/11/2021 | | | 236,540 | |
| | 310,000 | | | 4.650%, 10/17/2021 | | | 340,998 | |
| | 950,000 | | | 3.150%, 09/07/2022 | | | 940,307 | |
| | 685,000 | | | 5.875%, 01/14/2038 | | | 810,312 | |
| | 450,000 | | | Hutchison Whampoa International Ltd. | | | | |
| | | | | 3.500%, 01/13/2017 (Acquired | | | | |
| | | | | 09/06/2012, Cost $466,441) (b) | | | 473,880 | |
| | 585,000 | | | National Rural Utilities Cooperative | | | | |
| | | | | Finance Corp. | | | | |
| | | | | 5.450%, 04/10/2017 | | | 655,473 | |
| | 300,000 | | | NCUA Guaranteed Notes | | | | |
| | | | | Series 2011-M1, 3.000%, 06/12/2019 | | | 315,342 | |
| | | | | | | | 4,555,573 | |
| | | | | Diversified Manufacturing - 0.41% | | | | |
| | 575,000 | | | Cooper U.S., Inc. | | | | |
| | | | | 3.875%, 12/15/2020 | | | 602,232 | |
| | | | | Tyco Electronics Group SA | | | | |
| | 230,000 | | | 1.600%, 02/03/2015 | | | 232,253 | |
| | 405,000 | | | 6.550%, 10/01/2017 | | | 468,704 | |
| | | | | | | | 1,303,189 | |
| | | | | Diversified Telecommunication | | | | |
| | | | | Services - 1.17% | | | | |
| | 805,000 | | | AT&T, Inc. | | | | |
| | | | | 0.800%, 12/01/2015 | | | 805,860 | |
| | | | | Verizon Communications, Inc. | | | | |
| | 235,000 | | | 3.650%, 09/14/2018 | | | 250,423 | |
| | 250,000 | | | 3.500%, 11/01/2021 | | | 252,163 | |
| | 1,225,000 | | | 5.150%, 09/15/2023 | | | 1,343,073 | |
| | 515,000 | | | 6.400%, 09/15/2033 | | | 613,239 | |
| | 400,000 | | | 6.550%, 09/15/2043 | | | 488,534 | |
| | | | | | | | 3,753,292 | |
| Principal | | | | | | |
| Amount | | | | | Value | |
| | | | | Electric Utilities - 0.84% | | | | |
| | 100,000 | | | American Electric Power Co., Inc. | | | | |
| | | | | 1.650%, 12/15/2017 | | $ | 99,451 | |
| | 355,000 | | | Duke Energy Corp. | | | | |
| | | | | 3.550%, 09/15/2021 | | | 363,188 | |
| | 160,000 | | | Duke Energy Indiana, Inc. | | | | |
| | | | | 4.900%, 07/15/2043 | | | 172,231 | |
| | 100,000 | | | Massachusetts Electric Co. | | | | |
| | | | | 5.900%, 11/15/2039 | | | | |
| | | | | (Acquired 07/09/2013, | | | | |
| | | | | Cost $114,439) (b) | | | 118,075 | |
| | 325,000 | | | Nevada Power Co. | | | | |
| | | | | 5.875%, 01/15/2015 | | | 338,521 | |
| | 150,000 | | | Progress Energy, Inc. | | | | |
| | | | | 3.150%, 04/01/2022 | | | 147,607 | |
| | 535,000 | | | PSI Energy, Inc. | | | | |
| | | | | 6.050%, 06/15/2016 | | | 593,200 | |
| | 285,000 | | | Sierra Pacific Power Co. | | | | |
| | | | | 3.375%, 08/15/2023 | | | 283,307 | |
| | 485,000 | | | Union Electric Co. | | | | |
| | | | | 6.700%, 02/01/2019 | | | 581,313 | |
| | | | | | | | 2,696,893 | |
| | | | | Energy Equipment & Services - 0.37% |
| | 770,000 | | | Halliburton Co. | | | | |
| | | | | 3.250%, 11/15/2021 | | | 784,716 | |
| | 335,000 | | | Pride International, Inc. | | | | |
| | | | | 6.875%, 08/15/2020 | | | 400,446 | |
| | | | | | | | 1,185,162 | |
| | | | | Engineering Construction - 0.12% | | | | |
| | 400,000 | | | ABB Finance USA, Inc. | | | | |
| | | | | 2.875%, 05/08/2022 | | | 389,684 | |
| | | | | Food & Staples Retailing - 0.32% | | | | |
| | 300,000 | | | CVS Caremark Corp. | | | | |
| | | | | 6.250%, 06/01/2027 | | | 367,512 | |
| | 265,000 | | | Walgreen Co. | | | | |
| | | | | 3.100%, 09/15/2022 | | | 255,053 | |
| | 300,000 | | | Wal-Mart Stores, Inc. | | | | |
| | | | | 6.500%, 08/15/2037 | | | 389,751 | |
| | | | | | | | 1,012,316 | |
| | | | | Food Products - 0.28% | | | | |
| | | | | ConAgra Foods, Inc. | | | | |
| | 85,000 | | | 1.350%, 09/10/2015 | | | 85,660 | |
| | 200,000 | | | 3.200%, 01/25/2023 (c) | | | 191,377 | |
See notes to financial statements.
GuideMarkSM Core Fixed Income Fund
SCHEDULE OF INVESTMENTS (Continued)
March 31, 2014
| Principal | | | | | | |
| Amount | | | | | Value | |
| | | | | CORPORATE OBLIGATIONS (Continued) |
| | | | | Food Products (Continued) | | | | |
| | | | | Kraft Foods Group, Inc. | | | | |
| | 295,000 | | | 1.625%, 06/04/2015 | | $ | 298,397 | |
| | 325,000 | | | 3.500%, 06/06/2022 | | | 327,537 | |
| | | | | | | | 902,971 | |
| | | | | Health Care Equipment & Supplies - 0.69% |
| | 630,000 | | | Baxter International Inc. | | | | |
| | | | | 1.850%, 06/15/2018 | | | 627,048 | |
| | 480,000 | | | Becton, Dickinson & Co. | | | | |
| | | | | 3.250%, 11/12/2020 | | | 492,749 | |
| | 375,000 | | | Covidien International Finance SA | | | | |
| | | | | 2.800%, 06/15/2015 | | | 384,551 | |
| | 680,000 | | | St. Jude Medical, Inc. | | | | |
| | | | | 2.500%, 01/15/2016 | | | 697,918 | |
| | | | | | | | 2,202,266 | |
| | | | | Health Care Providers & Services - 1.47% |
| | | | | Aetna Inc. | | | | |
| | 130,000 | | | 2.200%, 03/15/2019 | | | 129,053 | |
| | 445,000 | | | 4.750%, 03/15/2044 | | | 453,441 | |
| | 550,000 | | | Cardinal Health, Inc. | | | | |
| | | | | 3.200%, 03/15/2023 | | | 535,781 | |
| | | | | Express Scripts Holding Co. | | | | |
| | 325,000 | | | 3.125%, 05/15/2016 | | | 338,764 | |
| | 50,000 | | | 3.500%, 11/15/2016 (c) | | | 52,973 | |
| | 730,000 | | | Humana, Inc. | | | | |
| | | | | 3.150%, 12/01/2022 | | | 695,787 | |
| | 320,000 | | | McKesson Corp. | | | | |
| | | | | 1.292%, 03/10/2017 | | | 319,431 | |
| | | | | UnitedHealth Group, Inc. | | | | |
| | 490,000 | | | 1.625%, 03/15/2019 | | | 477,156 | |
| | 305,000 | | | 3.950%, 10/15/2042 | | | 277,230 | |
| | | | | WellPoint, Inc. | | | | |
| | 875,000 | | | 4.350%, 08/15/2020 | | | 931,141 | |
| | 325,000 | | | 3.125%, 05/15/2022 | | | 311,564 | |
| | 150,000 | | | 5.850%, 01/15/2036 | | | 170,222 | |
| | | | | | | | 4,692,543 | |
| | | | | Industrial Conglomerates - 0.20% | | | | |
| | 555,000 | | | Koninklijke Philips Electronics NV | | | | |
| | | | | 5.750%, 03/11/2018 | | | 632,726 | |
| | | | | Insurance - 1.69% | | | | |
| | 225,000 | | | American International Group, Inc. | | | | |
| | | | | 4.125%, 02/15/2024 | | | 230,228 | |
| Principal | | | | | | |
| Amount | | | | | Value | |
| | | | | Insurance (Continued) | | | | |
| | 565,000 | | | Berkshire Hathaway Finance Corp. | | | | |
| | | | | 0.950%, 08/15/2016 | | $ | 568,241 | |
| | 605,000 | | | CNA Financial Corp. | | | | |
| | | | | 7.350%, 11/15/2019 | | | 742,832 | |
| | 430,000 | | | Liberty Mutual Group, Inc. | | | | |
| | | | | 5.000%, 06/01/2021 | | | | |
| | | | | (Acquired 04/16/2012, | | | | |
| | | | | Cost $434,566) (b) | | | 463,478 | |
| | 220,000 | | | Lincoln National Corp. | | | | |
| | | | | 4.000%, 09/01/2023 | | | 224,157 | |
| | 1,365,000 | | | Loews Corp. | | | | |
| | | | | 5.250%, 03/15/2016 | | | 1,478,265 | |
| | | | | Marsh & McLennan Cos., Inc. | | | | |
| | 100,000 | | | 2.300%, 04/01/2017 | | | 102,260 | |
| | 200,000 | | | 4.050%, 10/15/2023 | | | 202,487 | |
| | 405,000 | | | MetLife, Inc. | | | | |
| | | | | 4.368%, 09/15/2023 | | | 432,188 | |
| | 425,000 | | | New York Life Global Funding | | | | |
| | | | | 3.000%, 05/04/2015 | | | | |
| | | | | (Acquired 03/19/2012, | | | | |
| | | | | Cost $432,931) (b) | | | 436,095 | |
| | 105,000 | | | Prudential Financial, Inc. | | | | |
| | | | | 5.100%, 08/15/2043 | | | 110,592 | |
| | 405,000 | | | Trinity Acquisition Plc | | | | |
| | | | | 4.625%, 08/15/2023 | | | 413,806 | |
| | | | | | | | 5,404,629 | |
| | | | | Internet Software & Services - 0.16% |
| | 520,000 | | | eBay, Inc. | | | | |
| | | | | 1.350%, 07/15/2017 | | | 520,266 | |
| | | | | IT Services - 0.15% | | | | |
| | 495,000 | | | Mastercard, Inc. | | | | |
| | | | | 3.375%, 04/01/2024 | | | 495,233 | |
| | | | | Machinery - 0.44% | | | | |
| | 615,000 | | | Cummins, Inc. | | | | |
| | | | | 3.650%, 10/01/2023 | | | 624,712 | |
| | | | | Eaton Corp. | | | | |
| | 450,000 | | | 5.600%, 05/15/2018 | | | 507,308 | |
| | 290,000 | | | 2.750%, 11/02/2022 | | | 275,042 | |
| | | | | | | | 1,407,062 | |
| | | | | Media - 1.59% | | | | |
| | 175,000 | | | CBS Corp. | | | | |
| | | | | 7.875%, 07/30/2030 | | | 229,948 | |
See notes to financial statements.
GuideMarkSM Core Fixed Income Fund
SCHEDULE OF INVESTMENTS (Continued)
March 31, 2014
| Principal | | | | | | |
| Amount | | | | | Value | |
| | | | | CORPORATE OBLIGATIONS (Continued) |
| | | | | Media (Continued) | | | | |
| | | | | Comcast Corp. | | | | |
| | 1,040,000 | | | 5.875%, 02/15/2018 | | $ | 1,191,860 | |
| | 250,000 | | | 2.850%, 01/15/2023 (c) | | | 241,486 | |
| | 265,000 | | | COX Communications, Inc. | | | | |
| | | | | 2.950%, 06/30/2023 | | | | |
| | | | | (Acquired 04/24/2013, | | | | |
| | | | | Cost $263,834) (b)(c) | | | 242,330 | |
| | | | | DIRECTV Holdings, LLC | | | | |
| | 625,000 | | | 3.800%, 03/15/2022 (c) | | | 619,514 | |
| | 285,000 | | | 6.350%, 03/15/2040 | | | 309,886 | |
| | 275,000 | | | News America, Inc. | | | | |
| | | | | 4.500%, 02/15/2021 | | | 298,827 | |
| | | | | Time Warner Cable, Inc. | | | | |
| | 246,000 | | | 5.850%, 05/01/2017 | | | 276,768 | |
| | 250,000 | | | 6.750%, 07/01/2018 | | | 293,332 | |
| | 40,000 | | | 5.000%, 02/01/2020 | | | 43,740 | |
| | 100,000 | | | 5.500%, 09/01/2041 | | | 104,636 | |
| | | | | Time Warner, Inc. | | | | |
| | 400,000 | | | 4.700%, 01/15/2021 | | | 438,112 | |
| | 225,000 | | | 7.625%, 04/15/2031 | | | 300,564 | |
| | 135,000 | | | 6.500%, 11/15/2036 | | | 160,571 | |
| | | | | Viacom, Inc. | | | | |
| | 165,000 | | | 2.200%, 04/01/2019 | | | 163,788 | |
| | 145,000 | | | 5.850%, 09/01/2043 | | | 159,912 | |
| | | | | | | | 5,075,274 | |
| | | | | Metals & Mining - 0.51% | | | | |
| | 420,000 | | | BHP Billiton Finance USA Ltd. | | | | |
| | | | | 1.625%, 02/24/2017 (c) | | | 426,331 | |
| | | | | Freeport-McMoRan Copper & Gold, Inc. | | | | |
| | 70,000 | | | 3.100%, 03/15/2020 | | | 68,189 | |
| | 20,000 | | | 3.550%, 03/01/2022 | | | 19,133 | |
| | 250,000 | | | 3.875%, 03/15/2023 | | | 239,488 | |
| | 430,000 | | | Rio Tinto Finance USA Ltd. | | | | |
| | | | | 2.500%, 05/20/2016 | | | 444,160 | |
| | 165,000 | | | Teck Resources Ltd. | | | | |
| | | | | 6.000%, 08/15/2040 | | | 165,398 | |
| | | | | Xstrata Finance Canada Ltd. | | | | |
| | 140,000 | | | 2.700%, 10/25/2017 | | | | |
| | | | | (Acquired 10/18/2012, | | | | |
| | | | | Cost $139,765) (a)(b) | | | 141,814 | |
| Principal | | | | | | |
| Amount | | | | | Value | |
| | | | | Metals & Mining (Continued) | | | | |
| | 135,000 | | | 4.000%, 10/25/2022 | | | | |
| | | | | (Acquired 10/18/2012, | | | | |
| | | | | Cost $134,658) (b) | | $ | 131,876 | |
| | | | | | | | 1,636,389 | |
| | | | | Multi-Utilities - 0.72% | | | | |
| | 550,000 | | | Dominion Resources, Inc. | | | | |
| | | | | 1.400%, 09/15/2017 | | | 542,601 | |
| | 395,000 | | | Sempra Energy | | | | |
| | | | | 6.500%, 06/01/2016 | | | 439,926 | |
| | 1,175,000 | | | Xcel Energy, Inc. | | | | |
| | | | | 5.613%, 04/01/2017 | | | 1,311,092 | |
| | | | | | | | 2,293,619 | |
| | | | | Oil & Gas - 3.91% | | | | |
| | 150,000 | | | Anadarko Petroleum Corp. | | | | |
| | | | | 8.700%, 03/15/2019 | | | 190,348 | |
| | | | | BP Capital Markets Plc | | | | |
| | 605,000 | | | 4.500%, 10/01/2020 | | | 659,064 | |
| | 835,000 | | | 2.500%, 11/06/2022 | | | 780,032 | |
| | | | | Canadian Natural Resources Ltd. | | | | |
| | 690,000 | | | 3.450%, 11/15/2021 | | | 697,395 | |
| | 105,000 | | | 3.800%, 04/15/2024 | | | 105,744 | |
| | 200,000 | | | Cenovus Energy, Inc. | | | | |
| | | | | 5.200%, 09/15/2043 | | | 210,874 | |
| | 200,000 | | | CNOOC Finance 2013 Ltd. | | | | |
| | | | | 3.000%, 05/09/2023 | | | 181,299 | |
| | 910,000 | | | ConocoPhillips | | | | |
| | | | | 6.650%, 07/15/2018 | | | 1,080,512 | |
| | | | | Energy Transfer Partners LP | | | | |
| | 803,000 | | | 8.500%, 04/15/2014 | | | 804,566 | |
| | 505,000 | | | 4.150%, 10/01/2020 | | | 521,865 | |
| | 175,000 | | | 5.200%, 02/01/2022 | | | 189,211 | |
| | 150,000 | | | 5.950%, 10/01/2043 | | | 161,994 | |
| | 690,000 | | | Husky Energy, Inc. | | | | |
| | | | | 3.950%, 04/15/2022 | | | 709,167 | |
| | 150,000 | | | Kinder Morgan Energy Partners LP | | | | |
| | | | | 3.500%, 03/01/2021 | | | 149,636 | |
| | 365,000 | | | LUKOIL International Finance B.V. | | | | |
| | | | | 3.416%, 04/24/2018 | | | | |
| | | | | (Acquired 04/17/2013, | | | | |
| | | | | Cost $365,000) (b) | | | 355,966 | |
See notes to financial statements.
GuideMarkSM Core Fixed Income Fund
SCHEDULE OF INVESTMENTS (Continued)
March 31, 2014
| Principal | | | | | | |
| Amount | | | | | Value | |
| | | | | CORPORATE OBLIGATIONS (Continued) |
| | | | | Oil & Gas (Continued) | | | | |
| | | | | Nexen, Inc. | | | | |
| | 100,000 | | | 5.875%, 03/10/2035 | | $ | 109,475 | |
| | 100,000 | | | 7.500%, 07/30/2039 | | | 130,445 | |
| | | | | Petrobras International Finance Co. | | | | |
| | 260,000 | | | 3.500%, 02/06/2017 | | | 263,459 | |
| | 280,000 | | | 7.875%, 03/15/2019 | | | 320,756 | |
| | 310,000 | | | 5.375%, 01/27/2021 | | | 315,059 | |
| | 250,000 | | | 6.875%, 01/20/2040 | | | 248,873 | |
| | 325,000 | | | Petroleos Mexicanos | | | | |
| | | | | 8.000%, 05/03/2019 | | | 398,125 | |
| | | | | Phillips 66 | | | | |
| | 330,000 | | | 1.950%, 03/05/2015 | | | 333,922 | |
| | 545,000 | | | 4.300%, 04/01/2022 | | | 577,149 | |
| | 960,000 | | | Schlumberger Investment SA | | | | |
| | | | | 3.650%, 12/01/2023 | | | 975,678 | |
| | 925,000 | | | Shell International Finance BV | | | | |
| | | | | 0.625%, 12/04/2015 | | | 926,025 | |
| | 230,000 | | | Spectra Energy Partners LP | | | | |
| | | | | 4.600%, 06/15/2021 | | | 246,734 | |
| | 345,000 | | | Statoil ASA | | | | |
| | | | | 1.950%, 11/08/2018 | | | 345,655 | |
| | 250,000 | | | Valero Energy Corp. | | | | |
| | | | | 9.375%, 03/15/2019 | | | 325,662 | |
| | 180,000 | | | Williams Partners LP | | | | |
| | | | | 4.300%, 03/04/2024 | | | 181,161 | |
| | | | | | | | 12,495,851 | |
| | | | | Pharmaceuticals - 1.23% | | | | |
| | | | | AbbVie, Inc. | | | | |
| | 455,000 | | | 1.750%, 11/06/2017 | | | 456,834 | |
| | 330,000 | | | 2.900%, 11/06/2022 | | | 318,282 | |
| | 895,000 | | | GlaxoSmithKline Capital Plc | | | | |
| | | | | 1.500%, 05/08/2017 | | | 900,852 | |
| | 430,000 | | | Novartis Capital Corp. | | | | |
| | | | | 2.900%, 04/24/2015 | | | 441,999 | |
| | | | | Sanofi-Aventis SA | | | | |
| | 875,000 | | | 1.250%, 04/10/2018 | | | 856,869 | |
| | 445,000 | | | 4.000%, 03/29/2021 | | | 478,407 | |
| | 480,000 | | | Teva Pharmaceutical Finance | | | | |
| | | | | 3.000%, 06/15/2015 | | | 493,254 | |
| | | | | | | | 3,946,497 | |
| Principal | | | | | | |
| Amount | | | | | Value | |
| | | | | Pipelines - 0.93% | | | | |
| | | | | DCP Midstream Operating LP | | | | |
| | 320,000 | | | 2.700%, 04/01/2019 | | $ | 319,600 | |
| | 320,000 | | | 5.600%, 04/01/2044 | | | 335,256 | |
| | | | | Enterprise Products Operating LLC | | | | |
| | 255,000 | | | 3.350%, 03/15/2023 | | | 249,212 | |
| | 490,000 | | | 6.125%, 10/15/2039 | | | 573,636 | |
| | 645,000 | | | Spectra Energy Capital LLC | | | | |
| | | | | 5.650%, 03/01/2020 | | | 714,219 | |
| | 560,000 | | | TransCanada Pipelines Ltd. | | | | |
| | | | | 7.625%, 01/15/2039 | | | 784,591 | |
| | | | | | | | 2,976,514 | |
| | | | | Real Estate - 1.84% | | | | |
| | 445,000 | | | Boston Properties LP | | | | |
| | | | | 3.125%, 09/01/2023 | | | 418,396 | |
| | | | | Duke Realty LP | | | | |
| | 145,000 | | | 3.875%, 02/15/2021 | | | 145,469 | |
| | 200,000 | | | 4.375%, 06/15/2022 | | | 203,977 | |
| | 285,000 | | | ERP Operating LP | | | | |
| | | | | 3.000%, 04/15/2023 | | | 269,599 | |
| | | | | HCP, Inc. | | | | |
| | 250,000 | | | 2.625%, 02/01/2020 | | | 244,537 | |
| | 445,000 | | | 5.375%, 02/01/2021 (c) | | | 498,934 | |
| | 75,000 | | | Health Care Property Investments, Inc. | | | | |
| | | | | 6.000%, 01/30/2017 | | | 84,424 | |
| | | | | Health Care REIT, Inc. | | | | |
| | 195,000 | | | 2.250%, 03/15/2018 | | | 195,760 | |
| | 465,000 | | | 4.125%, 04/01/2019 | | | 493,195 | |
| | 430,000 | | | 5.250%, 01/15/2022 | | | 474,406 | |
| | | | | Liberty Property LP | | | | |
| | 275,000 | | | 5.500%, 12/15/2016 | | | 302,877 | |
| | 25,000 | | | 4.125%, 06/15/2022 | | | 25,399 | |
| | 25,000 | | | 3.375%, 06/15/2023 | | | 23,641 | |
| | 155,000 | | | Mid-America Apartments LP | | | | |
| | | | | 4.300%, 10/15/2023 | | | 156,668 | |
| | 500,000 | | | ProLogis LP | | | | |
| | | | | 4.250%, 08/15/2023 | | | 509,492 | |
| | 161,000 | | | Realty Income Corp. | | | | |
| | | | | 3.250%, 10/15/2022 | | | 153,697 | |
| | 950,000 | | | Simon Property Group LP | | | | |
| | | | | 2.200%, 02/01/2019 | | | 948,404 | |
| | 65,000 | | | UDR, Inc. | | | | |
| | | | | 3.700%, 10/01/2020 | | | 66,067 | |
See notes to financial statements.
GuideMarkSM Core Fixed Income Fund
SCHEDULE OF INVESTMENTS (Continued)
March 31, 2014
| Principal | | | | | | |
| Amount | | | | | Value | |
| | | | | CORPORATE OBLIGATIONS (Continued) |
| | | | | Real Estate (Continued) | | | | |
| | | | | Ventas Realty LP | | | | |
| | 260,000 | | | 2.000%, 02/15/2018 | | $ | 259,646 | |
| | 150,000 | | | 2.700%, 04/01/2020 | | | 146,206 | |
| | 250,000 | | | 5.700%, 09/30/2043 | | | 283,272 | |
| | | | | | | | 5,904,066 | |
| | | | | Road & Rail - 0.73% | | | | |
| | | | | Burlington Northern Santa Fe LLC | | | | |
| | 355,000 | | | 7.950%, 08/15/2030 | | | 482,662 | |
| | 275,000 | | | 5.150%, 09/01/2043 | | | 292,588 | |
| | | | | Canadian Pacific Railway Ltd. | | | | |
| | 309,000 | | | 4.500%, 01/15/2022 | | | 328,809 | |
| | 25,000 | | | 4.450%, 03/15/2023 | | | 26,497 | |
| | | | | CSX Corp. | | | | |
| | 895,000 | | | 3.700%, 11/01/2023 | | | 887,891 | |
| | 275,000 | | | 6.150%, 05/01/2037 | | | 329,432 | |
| | | | | | | | 2,347,879 | |
| | | | | Semiconductor & Semiconductor | | | | |
| | | | | Equipment - 1.06% | | | | |
| | | | | Altera Corp. | | | | |
| | 245,000 | | | 1.750%, 05/15/2017 | | | 246,828 | |
| | 300,000 | | | 2.500%, 11/15/2018 | | | 300,822 | |
| | 430,000 | | | Analog Devices, Inc. | | | | |
| | | | | 3.000%, 04/15/2016 | | | 446,779 | |
| | 480,000 | | | Applied Materials, Inc. | | | | |
| | | | | 2.650%, 06/15/2016 | | | 497,987 | |
| | | | | Intel Corp. | | | | |
| | 960,000 | | | 1.350%, 12/15/2017 | | | 954,354 | |
| | 400,000 | | | 3.300%, 10/01/2021 | | | 409,910 | |
| | 225,000 | | | TSMC Global Ltd. | | | | |
| | | | | 1.625%, 04/03/2018 | | | | |
| | | | | (Acquired 03/27/2013, | | | | |
| | | | | Cost $224,849) (b) | | | 218,685 | |
| | 315,000 | | | Xilinx, Inc. | | | | |
| | | | | 2.125%, 03/15/2019 | | | 311,609 | |
| | | | | | | | 3,386,974 | |
| | | | | Software - 0.21% | | | | |
| | 675,000 | | | Oracle Corp. | | | | |
| | | | | 1.200%, 10/15/2017 | | | 670,272 | |
| Principal | | | | | | |
| Amount | | | | | Value | |
| | | | | Specialty Retail - 0.64% | | | | |
| | 260,000 | | | AutoZone, Inc. | | | | |
| | | | | 4.000%, 11/15/2020 | | $ | 271,416 | |
| | | | | Home Depot, Inc. | | | | |
| | 285,000 | | | 2.700%, 04/01/2023 | | | 271,798 | |
| | 250,000 | | | 5.875%, 12/16/2036 | | | 302,138 | |
| | 1,180,000 | | | Lowe’s Cos., Inc. | | | | |
| | | | | 3.875%, 09/15/2023 | | | 1,218,381 | |
| | | | | | | | 2,063,733 | |
| | | | | Telecommunications - 0.06% | | | | |
| | 210,000 | | | SBA Tower Trust | | | | |
| | | | | Series 2013-1-2, 3.598%, | | | | |
| | | | | 04/15/2043 (Acquired 04/04/2013, | | | | |
| | | | | Cost $210,000) (b) | | | 205,926 | |
| | | | | Thrifts & Mortgage Finance - 0.02% |
| | 60,000 | | | Santander Holdings USA, Inc. | | | | |
| | | | | 4.625%, 04/19/2016 | | | 64,036 | |
| | | | | Tobacco - 0.14% | | | | |
| | | | | Altria Group, Inc. | | | | |
| | 34,000 | | | 9.700%, 11/10/2018 | | | 44,672 | |
| | 425,000 | | | 2.850%, 08/09/2022 | | | 399,552 | |
| | | | | | | | 444,224 | |
| | | | | Trucking - 0.14% | | | | |
| | | | | Penske Truck Leasing Co., L.P. | | | | |
| | 400,000 | | | 3.125%, 05/11/2015 | | | | |
| | | | | (Acquired 05/08/2012, | | | | |
| | | | | Cost $399,827) (b) | | | 409,968 | |
| | 35,000 | | | 4.875%, 07/11/2022 | | | | |
| | | | | (Acquired 07/16/2013, | | | | |
| | | | | Cost $35,937) (b) | | | 37,138 | |
| | | | | | | | 447,106 | |
| | | | | Wireless Telecommunication Services - 0.50% |
| | 680,000 | | | Rogers Communications, Inc. | | | | |
| | | | | 5.000%, 03/15/2044 | | | 687,269 | |
| | 915,000 | | | Vodafone Group Plc | | | | |
| | | | | 1.500%, 02/19/2018 | | | 900,479 | |
| | | | | | | | 1,587,748 | |
| | | | | Total Corporate Obligations | | | | |
| | | | | (Cost $124,085,867) | | | 125,878,345 | |
See notes to financial statements.
GuideMarkSM Core Fixed Income Fund
SCHEDULE OF INVESTMENTS (Continued)
March 31, 2014
| Principal | | | | | | |
| Amount | | | | | Value | |
| | | | | FOREIGN GOVERNMENT DEBT | | | | |
| | | | | OBLIGATIONS - 0.24% | | | | |
| | | | | Federal Government of Mexico | | | | |
| | 222,000 | | | 4.750%, 03/08/2044 | | $ | 212,010 | |
| | 300,000 | | | 5.750%, 10/12/2110 | | | 296,250 | |
| | 250,000 | | | Republic of Colombia | | | | |
| | | | | 4.375%, 07/12/2021 | | | 260,625 | |
| | | | | Total Foreign Government Debt | | | | |
| | | | | Obligations (Cost $707,105) | | | 768,885 | |
| | | | | MORTGAGE BACKED SECURITY - | | | | |
| | | | | U.S. GOVERNMENT AGENCY - 26.79% |
| | | | | Federal Home Loan Mortgage Corp. | | | | |
| | 442,008 | | | Series 2590, 5.000%, | | | | |
| | | | | 03/15/2018 | | | 467,330 | |
| | 800,000 | | | Series K-703, 2.699%, | | | | |
| | | | | 05/25/2018 (a) | | | 830,045 | |
| | 6,637 | | | Pool #E9-9763 4.500%, | | | | |
| | | | | 09/01/2018 | | | 7,032 | |
| | 6,151 | | | Pool #E9-9764 4.500%, | | | | |
| | | | | 09/01/2018 | | | 6,517 | |
| | 600,000 | | | Series K-705, 2.303%, | | | | |
| | | | | 09/25/2018 (a) | | | 611,034 | |
| | 900,000 | | | Series K-706, 2.323%, | | | | |
| | | | | 10/25/2018 | | | 916,040 | |
| | 600,000 | | | Series K-709, 2.086%, | | | | |
| | | | | 03/25/2019 | | | 601,117 | |
| | 131,744 | | | Pool #D9-6291 4.500%, | | | | |
| | | | | 09/01/2023 | | | 140,454 | |
| | 338,472 | | | Pool #G1-3624 5.000%, | | | | |
| | | | | 08/01/2024 | | | 366,700 | |
| | 3,830,553 | | | Pool #J2-5769 3.500%, | | | | |
| | | | | 09/01/2028 | | | 4,027,973 | |
| | 410,429 | | | Series 2329, 6.500%, | | | | |
| | | | | 06/15/2031 | | | 455,804 | |
| | 207,847 | | | Series 2338, 6.500%, | | | | |
| | | | | 07/15/2031 | | | 234,081 | |
| | 351,611 | | | Pool #78-0447 2.375%, | | | | |
| | | | | 04/01/2033 (a) | | | 373,399 | |
| | 261 | | | Pool #A4-3129 5.500%, | | | | |
| | | | | 02/01/2036 | | | 288 | |
| | 1,188,429 | | | Pool #C0-3815 3.500%, | | | | |
| | | | | 03/01/2042 | | | 1,195,814 | |
| | 924,604 | | | Pool #U9-0688 4.000%, | | | | |
| | | | | 05/01/2042 | | | 954,043 | |
| Principal | | | | | | |
| Amount | | | | | Value | |
| | | | | MORTGAGE BACKED SECURITY - | | | | |
| | | | | U.S. GOVERNMENT AGENCY | | | | |
| | | | | (Continued) | | | | |
| | 2,116,599 | | | Pool #Q0-9949 3.000%, | | | | |
| | | | | 08/01/2042 | | $ | 2,047,422 | |
| | | | | Federal National Mortgage Association | | | | |
| | 528,000 | | | Pool #468123 3.840%, | | | | |
| | | | | 05/01/2018 | | | 571,655 | |
| | 2,102 | | | Pool #685505 5.000%, | | | | |
| | | | | 05/01/2018 | | | 2,240 | |
| | 1,999 | | | Pool #705709 5.000%, | | | | |
| | | | | 05/01/2018 | | | 2,130 | |
| | 1,559,339 | | | Pool #AI4868 4.000%, | | | | |
| | | | | 06/01/2026 | | | 1,658,241 | |
| | 1,272,199 | | | Pool #AJ8325 3.000%, | | | | |
| | | | | 12/01/2026 | | | 1,308,617 | |
| | 1,349,664 | | | Pool #AB5907 3.000%, | | | | |
| | | | | 08/01/2027 | | | 1,388,383 | |
| | 1,698,140 | | | Pool #AQ5095 3.000%, | | | | |
| | | | | 11/01/2027 | | | 1,747,463 | |
| | 984,025 | | | Pool #AL2877 3.500%, | | | | |
| | | | | 01/01/2028 | | | 1,034,336 | |
| | 223,908 | | | Pool #544859 2.526%, | | | | |
| | | | | 08/01/2029 (a) | | | 234,104 | |
| | 314,816 | | | Pool #786848 7.000%, | | | | |
| | | | | 10/01/2031 | | | 364,653 | |
| | 10,584 | | | Pool #727181 5.000%, | | | | |
| | | | | 08/01/2033 | | | 11,628 | |
| | 5,360 | | | Pool #730727 5.000%, | | | | |
| | | | | 08/01/2033 | | | 5,884 | |
| | 1,502 | | | Pool #741862 5.500%, | | | | |
| | | | | 09/01/2033 | | | 1,672 | |
| | 157,171 | | | Pool #MA1689 4.000%, | | | | |
| | | | | 12/01/2033 | | | 165,350 | |
| | 2,021 | | | Pool #766197 5.500%, | | | | |
| | | | | 02/01/2034 | | | 2,235 | |
| | 343 | | | Pool #776974 5.500%, | | | | |
| | | | | 04/01/2034 | | | 384 | |
| | 291,452 | | | Pool #888504 2.193%, | | | | |
| | | | | 04/01/2034 (a) | | | 311,018 | |
| | 12,273 | | | Pool #775776 5.500%, | | | | |
| | | | | 05/01/2034 | | | 13,587 | |
| | 301,574 | | | Pool #802783 2.237%, | | | | |
| | | | | 10/01/2034 (a) | | | 320,583 | |
| | 13,150 | | | Pool #781629 5.500%, | | | | |
| | | | | 12/01/2034 | | | 14,607 | |
See notes to financial statements.
GuideMarkSM Core Fixed Income Fund
SCHEDULE OF INVESTMENTS (Continued)
March 31, 2014
| Principal | | | | | | |
| Amount | | | | | Value | |
| | | | | MORTGAGE BACKED SECURITY - | | | | |
| | | | | U.S. GOVERNMENT AGENCY | | | | |
| | | | | (Continued) | | | | |
| | 358 | | | Pool #806098 6.000%, | | | | |
| | | | | 12/01/2034 | | $ | 399 | |
| | 197,571 | | | Pool #735504 6.000%, | | | | |
| | | | | 04/01/2035 | | | 222,487 | |
| | 12,810 | | | Pool #822815 5.500%, | | | | |
| | | | | 04/01/2035 | | | 14,123 | |
| | 12,440 | | | Pool #357850 5.500%, | | | | |
| | | | | 07/01/2035 | | | 13,827 | |
| | 11,191 | | | Pool #820242 5.000%, | | | | |
| | | | | 07/01/2035 | | | 12,272 | |
| | 2,565 | | | Pool #838452 5.500%, | | | | |
| | | | | 09/01/2035 | | | 2,850 | |
| | 11,719 | | | Pool #865854 6.000%, | | | | |
| | | | | 03/01/2036 | | | 13,083 | |
| | 24,327 | | | Pool #891474 6.000%, | | | | |
| | | | | 04/01/2036 | | | 27,185 | |
| | 20,151 | | | Pool #906000 6.000%, | | | | |
| | | | | 01/01/2037 | | | 22,467 | |
| | 177 | | | Pool #928062 5.500%, | | | | |
| | | | | 02/01/2037 | | | 196 | |
| | 327 | | | Pool #899119 5.500%, | | | | |
| | | | | 04/01/2037 | | | 362 | |
| | 280 | | | Pool #938488 5.500%, | | | | |
| | | | | 05/01/2037 | | | 310 | |
| | 426 | | | Pool #970131 5.500%, | | | | |
| | | | | 03/01/2038 | | | 472 | |
| | 477 | | | Pool #981313 5.500%, | | | | |
| | | | | 06/01/2038 | | | 530 | |
| | 494 | | | Pool #985108 5.500%, | | | | |
| | | | | 07/01/2038 | | | 548 | |
| | 226 | | | Pool #964930 5.500%, | | | | |
| | | | | 08/01/2038 | | | 251 | |
| | 226 | | | Pool #987032 5.500%, | | | | |
| | | | | 08/01/2038 | | | 251 | |
| | 315 | | | Pool #968371 5.500%, | | �� | | |
| | | | | 09/01/2038 | | | 350 | |
| | 116,270 | | | Pool #AD0095 6.000%, | | | | |
| | | | | 11/01/2038 | | | 129,562 | |
| | 155 | | | Pool #993050 5.500%, | | | | |
| | | | | 12/01/2038 | | | 170 | |
| | 52,263 | | | Pool #993579 4.000%, | | | | |
| | | | | 05/01/2039 | | | 54,425 | |
| Principal | | | | | | |
| Amount | | | | | Value | |
| | | | | MORTGAGE BACKED SECURITY - | | | | |
| | | | | U.S. GOVERNMENT AGENCY | | | | |
| | | | | (Continued) | | | | |
| | 13,332 | | | Pool #AA5840 4.000%, | | | | |
| | | | | 06/01/2039 | | $ | 13,880 | |
| | 164,407 | | | Pool #AA7670 4.500%, | | | | |
| | | | | 06/01/2039 | | | 175,589 | |
| | 113,920 | | | Pool #AA8715 4.000%, | | | | |
| | | | | 06/01/2039 | | | 118,935 | |
| | 13,697 | | | Pool #AA9133 4.500%, | | | | |
| | | | | 08/01/2039 | | | 14,739 | |
| | 30,478 | | | Pool #AC2861 4.500%, | | | | |
| | | | | 08/01/2039 | | | 32,787 | |
| | 65,679 | | | Pool #AC6121 4.500%, | | | | |
| | | | | 11/01/2039 | | | 70,599 | |
| | 11,002 | | | Pool #AC8372 4.500%, | | | | |
| | | | | 12/01/2039 | | | 11,832 | |
| | 480,940 | | | Pool #AD0586 4.500%, | | | | |
| | | | | 12/01/2039 | | | 517,357 | |
| | 440,331 | | | Pool #AD5574 5.000%, | | | | |
| | | | | 04/01/2040 | | | 480,831 | |
| | 1,385,098 | | | Pool #AD4062 5.000%, | | | | |
| | | | | 05/01/2040 | | | 1,510,783 | |
| | 1,969,947 | | | Pool #AD5661 5.000%, | | | | |
| | | | | 05/01/2040 | | | 2,154,890 | |
| | 2,667,342 | | | Pool #AD6929 5.000%, | | | | |
| | | | | 06/01/2040 | | | 2,914,560 | |
| | 2,289,421 | | | Pool #AB1231 5.000%, | | | | |
| | | | | 07/01/2040 | | | 2,498,419 | |
| | 90,358 | | | Pool #AD7793 4.500%, | | | | |
| | | | | 07/01/2040 | | | 96,624 | |
| | 28,699 | | | Pool #AD9896 4.000%, | | | | |
| | | | | 08/01/2040 | | | 29,886 | |
| | 978,250 | | | Pool #AE0217 4.500%, | | | | |
| | | | | 08/01/2040 | | | 1,045,685 | |
| | 35,853 | | | Pool #AB1500 4.000%, | | | | |
| | | | | 09/01/2040 | | | 37,339 | |
| | 28,035 | | | Pool #AD9856 4.000%, | | | | |
| | | | | 09/01/2040 | | | 29,192 | |
| | 32,684 | | | Pool #AE2559 4.000%, | | | | |
| | | | | 09/01/2040 | | | 34,033 | |
| | 10,861 | | | Pool #AE2562 4.000%, | | | | |
| | | | | 09/01/2040 | | | 11,306 | |
| | 13,182 | | | Pool #AE2566 4.000%, | | | | |
| | | | | 09/01/2040 | | | 13,725 | |
See notes to financial statements.
GuideMarkSM Core Fixed Income Fund
SCHEDULE OF INVESTMENTS (Continued)
March 31, 2014
| Principal | | | | | | |
| Amount | | | | | Value | |
| | | | | MORTGAGE BACKED SECURITY - | | | | |
| | | | | U.S. GOVERNMENT AGENCY | | | | |
| | | | | (Continued) | | | | |
| | 76,474 | | | Pool #AE4124 4.000%, | | | | |
| | | | | 10/01/2040 | | $ | 79,632 | |
| | 44,158 | | | Pool #AE4888 4.000%, | | | | |
| | | | | 10/01/2040 | | | 45,962 | |
| | 49,417 | | | Pool #AE3916 4.000%, | | | | |
| | | | | 11/01/2040 | | | 51,445 | |
| | 8,155 | | | Pool #AE5147 4.000%, | | | | |
| | | | | 11/01/2040 | | | 8,493 | |
| | 93,580 | | | Pool #AE8715 4.000%, | | | | |
| | | | | 11/01/2040 | | | 97,391 | |
| | 976,219 | | | Pool #AE0698 4.500%, | | | | |
| | | | | 12/01/2040 | | | 1,043,748 | |
| | 182,877 | | | Pool #AE8893 4.000%, | | | | |
| | | | | 12/01/2040 | | | 190,441 | |
| | 10,142 | | | Pool #AH0006 4.000%, | | | | |
| | | | | 12/01/2040 | | | 10,560 | |
| | 28,956 | | | Pool #AH0020 4.000%, | | | | |
| | | | | 12/01/2040 | | | 30,160 | |
| | 58,264 | | | Pool #AH0599 4.000%, | | | | |
| | | | | 12/01/2040 | | | 60,686 | |
| | 24,454 | | | Pool #AH0601 4.000%, | | | | |
| | | | | 12/01/2040 | | | 25,466 | |
| | 94,089 | | | Pool #AE7893 4.000%, | | | | |
| | | | | 01/01/2041 | | | 97,981 | |
| | 39,142 | | | Pool #AH1263 4.000%, | | | | |
| | | | | 01/01/2041 | | | 40,765 | |
| | 190,632 | | | Pool #AH2999 4.000%, | | | | |
| | | | | 01/01/2041 | | | 198,523 | |
| | 603,419 | | | Pool #AB2265 4.000%, | | | | |
| | | | | 02/01/2041 | | | 629,624 | |
| | 12,322 | | | Pool #AH4659 4.000%, | | | | |
| | | | | 02/01/2041 | | | 12,833 | |
| | 179,814 | | | Pool #AH5653 4.000%, | | | | |
| | | | | 02/01/2041 | | | 186,974 | |
| | 78,112 | | | Pool #AH5783 4.000%, | | | | |
| | | | | 02/01/2041 | | | 81,213 | |
| | 310,301 | | | Pool #AL0934 5.000%, | | | | |
| | | | | 02/01/2041 | | | 344,462 | |
| | 1,530,870 | | | Pool #AB2537 5.000%, | | | | |
| | | | | 03/01/2041 | | | 1,679,493 | |
| | 390,297 | | | Pool #AD1889 4.500%, | | | | |
| | | | | 03/01/2041 | | | 417,314 | |
| Principal | | | | | | |
| Amount | | | | | Value | |
| | | | | MORTGAGE BACKED SECURITY - | | | | |
| | | | | U.S. GOVERNMENT AGENCY | | | | |
| | | | | (Continued) | | | | |
| | 22,067 | | | Pool #AH6150 4.000%, | | | | |
| | | | | 03/01/2041 | | $ | 22,973 | |
| | 73,496 | | | Pool #AH6583 4.000%, | | | | |
| | | | | 03/01/2041 | | | 76,526 | |
| | 535,032 | | | Pool #AH4246 4.500%, | | | | |
| | | | | 04/01/2041 | | | 572,121 | |
| | 1,265,764 | | | Pool #AH8854 4.500%, | | | | |
| | | | | 04/01/2041 | | | 1,352,441 | |
| | 222,800 | | | Pool #AL0215 4.500%, | | | | |
| | | | | 04/01/2041 | | | 238,013 | |
| | 1,778,718 | | | Pool #AL0247 4.000%, | | | | |
| | | | | 04/01/2041 | | | 1,856,191 | |
| | 2,700,000 | | | Pool #TBA 4.000%, | | | | |
| | | | | 04/15/2041 (f) | | | 2,807,156 | |
| | 973,999 | | | Pool #AI1856 4.500%, | | | | |
| | | | | 05/01/2041 | | | 1,045,636 | |
| | 230,070 | | | Pool #AL0187 5.000%, | | | | |
| | | | | 05/01/2041 | | | 251,119 | |
| | 2,383,113 | | | Pool #AL0208 4.500%, | | | | |
| | | | | 05/01/2041 | | | 2,546,173 | |
| | 35,488 | | | Pool #AL0456 5.000%, | | | | |
| | | | | 06/01/2041 | | | 38,746 | |
| | 540,843 | | | Pool #AI7368 4.500%, | | | | |
| | | | | 07/01/2041 | | | 577,925 | |
| | 1,231,630 | | | Pool #AB3395 4.500%, | | | | |
| | | | | 08/01/2041 | | | 1,315,623 | |
| | 189,833 | | | Pool #AI8154 4.000%, | | | | |
| | | | | 08/01/2041 | | | 197,717 | |
| | 164,582 | | | Pool #AI8842 4.500%, | | | | |
| | | | | 08/01/2041 | | | 175,921 | |
| | 37,288 | | | Pool #AJ1080 4.500%, | | | | |
| | | | | 09/01/2041 | | | 39,838 | |
| | 61,876 | | | Pool #AL0815 4.000%, | | | | |
| | | | | 09/01/2041 | | | 64,646 | |
| | 21,307 | | | Pool #AJ1562 4.000%, | | | | |
| | | | | 10/01/2041 | | | 22,255 | |
| | 23,721 | | | Pool #AJ1972 4.000%, | | | | |
| | | | | 10/01/2041 | | | 24,776 | |
| | 3,145,004 | | | Pool #AJ2212 4.500%, | | | | |
| | | | | 10/01/2041 | | | 3,372,096 | |
| | 43,061 | | | Pool #AJ3146 4.500%, | | | | |
| | | | | 10/01/2041 | | | 46,015 | |
See notes to financial statements.
GuideMarkSM Core Fixed Income Fund
SCHEDULE OF INVESTMENTS (Continued)
March 31, 2014
| Principal | | | | | | |
| Amount | | | | | Value | |
| | | | | MORTGAGE BACKED SECURITY - | | | | |
| | | | | U.S. GOVERNMENT AGENCY | | | | |
| | | | | (Continued) | | | | |
| | 226,378 | | | Pool #AJ4044 4.000%, | | | | |
| | | | | 10/01/2041 | | $ | 236,475 | |
| | 32,422 | | | Pool #AJ4756 4.000%, | | | | |
| | | | | 10/01/2041 | | | 33,864 | |
| | 1,718,912 | | | Pool #AL0933 5.000%, | | | | |
| | | | | 10/01/2041 | | | 1,885,913 | |
| | 1,279,220 | | | Pool #AB3876 4.000%, | | | | |
| | | | | 11/01/2041 | | | 1,330,701 | |
| | 26,113 | | | Pool #AJ3330 4.000%, | | | | |
| | | | | 11/01/2041 | | | 27,277 | |
| | 29,398 | | | Pool #AJ4549 4.000%, | | | | |
| | | | | 11/01/2041 | | | 30,711 | |
| | 22,275 | | | Pool #AJ4698 4.000%, | | | | |
| | | | | 11/01/2041 | | | 23,267 | |
| | 44,566 | | | Pool #AJ5424 4.000%, | | | | |
| | | | | 11/01/2041 | | | 46,553 | |
| | 22,558 | | | Pool #AJ7840 4.000%, | | | | |
| | | | | 11/01/2041 | | | 23,561 | |
| | 27,678 | | | Pool #AB3995 4.000%, | | | | |
| | | | | 12/01/2041 | | | 28,910 | |
| | 229,641 | | | Pool #AB4054 4.000%, | | | | |
| | | | | 12/01/2041 | | | 239,869 | |
| | 29,008 | | | Pool #AI0848 4.000%, | | | | |
| | | | | 12/01/2041 | | | 30,303 | |
| | 26,167 | | | Pool #AJ4187 4.000%, | | | | |
| | | | | 12/01/2041 | | | 27,332 | |
| | 33,987 | | | Pool #AJ5736 4.000%, | | | | |
| | | | | 12/01/2041 | | | 35,509 | |
| | 24,524 | | | Pool #AJ5968 4.000%, | | | | |
| | | | | 12/01/2041 | | | 25,539 | |
| | 34,176 | | | Pool #AJ6061 4.000%, | | | | |
| | | | | 12/01/2041 | | | 35,705 | |
| | 23,811 | | | Pool #AJ7868 4.000%, | | | | |
| | | | | 12/01/2041 | | | 24,872 | |
| | 47,839 | | | Pool #AJ8104 4.000%, | | | | |
| | | | | 12/01/2041 | | | 49,978 | |
| | 28,259 | | | Pool #AJ8109 4.000%, | | | | |
| | | | | 12/01/2041 | | | 29,518 | |
| | 22,305 | | | Pool #AJ8171 4.000%, | | | | |
| | | | | 12/01/2041 | | | 23,297 | |
| | 33,950 | | | Pool #AJ8341 4.000%, | | | | |
| | | | | 12/01/2041 | | | 35,470 | |
| Principal | | | | | | |
| Amount | | | | | Value | |
| | | | | MORTGAGE BACKED SECURITY - | | | | |
| | | | | U.S. GOVERNMENT AGENCY | | | | |
| | | | | (Continued) | | | | |
| | 55,961 | | | Pool #AJ8436 4.000%, | | | | |
| | | | | 12/01/2041 | | $ | 58,462 | |
| | 23,263 | | | Pool #AJ8912 4.000%, | | | | |
| | | | | 12/01/2041 | | | 24,308 | |
| | 26,968 | | | Pool #AJ9248 4.000%, | | | | |
| | | | | 12/01/2041 | | | 28,171 | |
| | 37,933 | | | Pool #AJ2446 4.000%, | | | | |
| | | | | 01/01/2042 | | | 39,515 | |
| | 35,066 | | | Pool #AJ7538 4.000%, | | | | |
| | | | | 01/01/2042 | | | 36,637 | |
| | 15,124 | | | Pool #AJ8001 4.000%, | | | | |
| | | | | 01/01/2042 | | | 15,749 | |
| | 34,864 | | | Pool #AJ8369 4.000%, | | | | |
| | | | | 01/01/2042 | | | 36,421 | |
| | 30,392 | | | Pool #AJ9162 4.000%, | | | | |
| | | | | 01/01/2042 | | | 31,748 | |
| | 171,464 | | | Pool #AJ9330 4.000%, | | | | |
| | | | | 01/01/2042 | | | 179,143 | |
| | 20,055 | | | Pool #AJ9779 4.000%, | | | | |
| | | | | 01/01/2042 | | | 20,947 | |
| | 27,960 | | | Pool #AK0170 4.000%, | | | | |
| | | | | 01/01/2042 | | | 29,206 | |
| | 58,684 | | | Pool #AK0543 4.000%, | | | | |
| | | | | 01/01/2042 | | | 61,301 | |
| | 22,208 | | | Pool #AK0563 4.000%, | | | | |
| | | | | 01/01/2042 | | | 23,197 | |
| | 50,943 | | | Pool #AK1827 4.000%, | | | | |
| | | | | 01/01/2042 | | | 53,219 | |
| | 2,849,445 | | | Pool #AT3202 3.500%, | | | | |
| | | | | 05/01/2042 | | | 2,871,018 | |
| | 181,932 | | | Pool #AB5529 4.000%, | | | | |
| | | | | 07/01/2042 | | | 187,856 | |
| | 319,227 | | | Pool #AB6228 3.500%, | | | | |
| | | | | 09/01/2042 | | | 321,486 | |
| | 304,039 | | | Pool #AL3896 4.500%, | | | | |
| | | | | 01/01/2043 | | | 324,959 | |
| | 581,452 | | | Pool #AQ9316 2.500%, | | | | |
| | | | | 01/01/2043 | | | 539,171 | |
| | 5,700,000 | | | Pool #TBA 3.000%, | | | | |
| | | | | 04/15/2043 (f) | | | 5,503,172 | |
| | 2,409,592 | | | Pool #MA1510 4.000%, | | | | |
| | | | | 07/01/2043 | | | 2,487,188 | |
See notes to financial statements.
GuideMarkSM Core Fixed Income Fund
SCHEDULE OF INVESTMENTS (Continued)
March 31, 2014
| Principal | | | | | | |
| Amount | | | | | Value | |
| | | | | MORTGAGE BACKED SECURITY - | | | | |
| | | | | U.S. GOVERNMENT AGENCY | | | | |
| | | | | (Continued) | | | | |
| | | | | Government National Mortgage Association |
| | 226,752 | | | Pool #752842X 3.950%, | | | | |
| | | | | 07/15/2025 | | $ | 235,175 | |
| | 31,566 | | | Pool #614436X 5.000%, | | | | |
| | | | | 08/15/2033 | | | 34,576 | |
| | 476,740 | | | Pool #618907X 5.000%, | | | | |
| | | | | 09/15/2033 | | | 526,897 | |
| | 55,960 | | | Pool #605098X 5.000%, | | | | |
| | | | | 03/15/2034 | | | 61,803 | |
| | 59,955 | | | Pool #520279X 5.000%, | | | | |
| | | | | 11/15/2034 | | | 66,114 | |
| | 1,035,656 | | | Pool #688021X 6.000%, | | | | |
| | | | | 10/15/2038 | | | 1,162,838 | |
| | 81,511 | | | Pool #736686X 5.000%, | | | | |
| | | | | 02/15/2039 | | | 89,384 | |
| | 1,347,028 | | | Pool #723248 5.000%, | | | | |
| | | | | 10/15/2039 | | | 1,485,782 | |
| | 814,054 | | | Pool #726382 5.000%, | | | | |
| | | | | 10/15/2039 | | | 897,901 | |
| | 327,757 | | | Pool #782916X 5.500%, | | | | |
| | | | | 02/15/2040 | | | 363,138 | |
| | 1,156,031 | | | Pool #752599C 4.000%, | | | | |
| | | | | 10/20/2040 | | | 1,217,744 | |
| | 1,646,634 | | | Pool #752631C 4.500%, | | | | |
| | | | | 10/20/2040 | | | 1,784,180 | |
| | 1,800,000 | | | Pool #TBA 4.000%, | | | | |
| | | | | 04/15/2042 (f) | | | 1,891,969 | |
| | 2,062,805 | | | Pool #AD8801X 3.500%, | | | | |
| | | | | 03/15/2043 | | | 2,112,021 | |
| | | | | Total Mortgage Backed Security - | | | | |
| | | | | U.S.Government Agency | | | | |
| | | | | (Cost $84,494,006) | | | 85,727,067 | |
| | | | | MUNICIPAL DEBT OBLIGATIONS - 0.51% |
| | | | | California, GO, | | | | |
| | 230,000 | | | 7.500%, 04/01/2034 | | | 310,454 | |
| | 175,000 | | | 7.950%, 03/01/2036 | | | 206,120 | |
| | 375,000 | | | 7.550%, 04/01/2039 | | | 521,430 | |
| | 60,000 | | | New York City Transitional Finance | | | | |
| | | | | Authority, Revenue Bond, | | | | |
| | | | | 5.000%, 05/01/2042 | | | 64,622 | |
| Principal | | | | | | |
| Amount | | | | | Value | |
| | | | | MUNICIPAL DEBT OBLIGATIONS |
| | | | | (Continued) | | | | |
| | | | | University of California, Refunding, | | | | |
| | | | | Revenue Bond, | | | | |
| | 205,000 | | | 4.601%, 05/15/2031 | | $ | 218,012 | |
| | 275,000 | | | 5.000%, 05/15/2038 | | | 298,889 | |
| | | | | Total Municipal Debt Obligations | | | | |
| | | | | (Cost $1,449,656) | | | 1,619,527 | |
| | | | | U.S. GOVERNMENT AGENCY ISSUES - 1.50% |
| | | | | Federal Home Loan Mortgage Corp. | | | | |
| | 1,300,000 | | | 1.000%, 03/08/2017 | | | 1,304,129 | |
| | 400,000 | | | 1.250%, 05/12/2017 (c) | | | 403,403 | |
| | 1,200,000 | | | 1.000%, 06/29/2017 (c) | | | 1,196,593 | |
| | | | | Federal National Mortgage Association | | | | |
| | 200,000 | | | 4.125%, 04/15/2014 | | | 200,277 | |
| | 1,700,000 | | | 0.625%, 10/30/2014 | | | 1,704,900 | |
| | | | | Total U.S. Government Agency | | | | |
| | | | | Issues (Cost $4,789,943) | | | 4,809,302 | |
| | | | | U.S. TREASURY OBLIGATIONS - 16.77% |
| | | | | U.S. Treasury Bonds - 3.82% | | | | |
| | 4,160,417 | | | 0.625%, 01/15/2024 (g) | | | 4,177,969 | |
| | 5,985,000 | | | 3.125%, 11/15/2041 | | | 5,549,220 | |
| | 690,000 | | | 3.750%, 11/15/2043 | | | 714,474 | |
| | 705,000 | | | 3.625%, 02/15/2044 (c) | | | 713,262 | |
| | 1,028,772 | | | 1.375%, 02/15/2044 (g) | | | 1,052,241 | |
| | | | | U.S. Treasury Notes - 12.95% | | | | |
| | 2,405,000 | | | 0.875%, 09/15/2016 | | | 2,418,622 | |
| | 6,870,000 | | | 0.875%, 01/31/2017 | | | 6,879,391 | |
| | 7,589,400 | | | 0.125%, 04/15/2018 (g) | | | 7,768,464 | |
| | 4,950,000 | | | 1.625%, 03/31/2019 | | | 4,925,057 | |
| | 10,665,000 | | | 2.000%, 11/15/2021 | | | 10,350,052 | |
| | 9,415,000 | | | 2.000%, 02/15/2022 | | | 9,104,597 | |
| | | | | Total U.S. Treasury Obligations | | | | |
| | | | | (Cost $53,629,266) | | | 53,653,349 | |
| | | | | | | | | |
| Number of | | | | | | | |
| Shares | | | | | | | |
| | | | | SHORT TERM INVESTMENTS - 6.61% |
| | | | | Money Market Funds - 6.61% | | | | |
| | 21,137,712 | | | Federated Prime Obligations Fund | | | 21,137,712 | |
| | | | | Total Short Term Investments | | | | |
| | | | | (Cost $21,137,712) | | | 21,137,712 | |
See notes to financial statements.
GuideMarkSM Core Fixed Income Fund
SCHEDULE OF INVESTMENTS (Continued)
March 31, 2014
| Number of | | | | | | |
| Shares | | | | | Value | |
| | | | | INVESTMENTS PURCHASED AS | | | | |
| | | | | SECURITIES LENDING | | | | |
| | | | | COLLATERAL - 1.43% | | | | |
| | | | | Money Market Funds - 1.42% | | | | |
| | 4,554,257 | | | First American Government | | | | |
| | | | | Obligations Fund | | $ | 4,554,257 | |
| | 4,931 | | | Reserve Primary Fund (h) | | | 191 | |
| | | | | Total Money Market Funds | | | | |
| | | | | (Cost $4,558,512) | | | 4,554,448 | |
| | | | | | | | | |
| Principal | | | | | | | |
| Amount | | | | | | | |
| | | | | Cash - 0.01% | | | | |
| | 31,712 | | | Cash | | | 31,712 | |
| | | | | Total Cash (Cost $31,712) | | | 31,712 | |
| | | | | Total Investments Purchased as | | | | |
| | | | | Securities Lending Collateral | | | | |
| | | | | (Cost $4,590,224) | | | 4,586,160 | |
| | | | | Total Investments | | | | |
| | | | | (Cost $334,936,850) - 105.68% | | | 338,170,395 | |
| | | | | Liabilities in Excess | | | | |
| | | | | of Other Assets - (5.68)% | | | (18,182,651 | ) |
| | | | | TOTAL NET | | | | |
| | | | | ASSETS - 100.00% | | $ | 319,987,744 | |
Percentages are stated as a percent of net assets.
Principal amounts are denominated in the currency in which the security was purchased.
| (a) | Variable Rate Security. The rate shown is the rate in effect on March 31, 2014. |
| (b) | Restricted securities as defined in Rule 144(a) under the Securities Act of 1933. Such securities are treated as liquid securities according to the Fund’s liquidity guidelines. The value of these securities total $21,054,499, which represents 6.58% of total net assets. |
| (c) | All or portion of this security is on loan. |
| (d) | Non-income producing. Item identified as in default as to payment of interest. |
| (e) | Restricted securities as defined in Rule 144(a) under the Securities Act of 1933. Such securities are treated as illiquid securities according to the Fund’s liquidity guidelines. The value of these securities total $9,265, which represents 0.00% of total net assets. |
| (f) | Security purchased on a when-issued basis. On March 31, 2014, the total value of investments purchased on a when-issued basis was $10,202,297 or 3.19% of total net assets. |
| (g) | Represents a U.S. Treasury Inflation Protected Security. |
| (h) | As of March 31, 2014, the Fund has fair valued this security and deemed it illiquid. The value of this security was $191, which represents 0.00% of total net assets. |
| (i) | As of March 31, 2014, the Fund has fair valued these securities. The value of these securities were $713,750, which represents 0.22% of total net assets. |
See notes to financial statements.
GuideMarkSM Tax-Exempt Fixed Income Fund
SCHEDULE OF INVESTMENTS
March 31, 2014
Principal
Amount | | | | | Value | |
| | | | | MUNICIPAL DEBT OBLIGATIONS - 97.16% | | | | |
| | | | | Alaska - 1.13% | | | | |
| $ | 195,000 | | | Northern Tobacco Securitization Corp.,
Series A, Refunding, Revenue Bond,
5.000%, 06/01/2046 | | $ | 136,777 | |
| | 500,000 | | | Valdez Marine Terminal - BP Pipelines,
Series B, Refunding, Revenue Bond,
BP Plc Insured,
5.000%, 01/01/2021 | | | 579,810 | |
| | | | | | | | 716,587 | |
| | | | | Arizona - 2.71% | | | | |
| | 590,000 | | | Arizona University System Board of
Regents, Series A, Refunding,
Revenue Bond,
5.000%, 07/01/2028 | | | 661,402 | |
| | 450,000 | | | Phoenix Civic Improvement
Wastewater System, Refunding,
Revenue Bond,
5.000%, 07/01/2020 | | | 493,830 | |
| | 500,000 | | | Salt River Project, Series A,
Revenue Bond,
5.000%, 01/01/2021 | | | 562,115 | |
| | | | | | | | 1,717,347 | |
| | | | | Arkansas - 0.82% | | | | |
| | 500,000 | | | University of Arkansas, Series A,
Revenue Bond,
4.125%, 11/01/2030 | | | 517,935 | |
| | | | | California - 9.85% | | | | |
| | 445,000 | | | California Economic Recovery,
Series A, Refunding, GO,
5.250%, 07/01/2021 | | | 527,614 | |
| | 395,000 | | | California Municipal Finance
Authority, Mobile Home Park,
Series A, Refunding, Revenue Bond,
6.400%, 08/15/2045 | | | 422,366 | |
| | 250,000 | | | California Pollution Control Financing
Authority Water Furnishing,
Revenue Bond,
5.000%, 11/21/2045 | | | 237,438 | |
| | 350,000 | | | California Statewide Community
Development Authority, Refunding,
Revenue Bond,
6.125%, 07/01/2046 | | | 344,159 | |
Principal
Amount | | | | | Value | |
| | | | | California (Continued) | | | | |
| $ | 160,000 | | | California Statewide Community | | | | |
| | | | | Development Authority, Series A, | | | | |
| | | | | Revenue Bond, | | | | |
| | | | | 6.125%, 11/01/2033 | | $ | 164,126 | |
| | 1,000,000 | | | California, GO, | | | | |
| | | | | 6.500%, 04/01/2033 | | | 1,220,860 | |
| | | | | California, Refunding, GO, | | | | |
| | 100,000 | | | 5.000%, 09/01/2022 | | | 118,025 | |
| | 500,000 | | | 5.000%, 11/01/2043 | | | 534,515 | |
| | | | | Golden State Tobacco Securitization, | | | | |
| | | | | Series A, Refunding, Revenue Bond, | | | | |
| | 250,000 | | | 5.000%, 06/01/2045 | | | 250,067 | |
| | 200,000 | | | 5.750%, 06/01/2047 | | | 161,868 | |
| | 1,000,000 | | | Los Angeles Department of Airports, | | | | |
| | | | | Series A, Refunding, Revenue Bond, | | | | |
| | | | | 5.250%, 05/15/2029 | | | 1,140,050 | |
| | 275,000 | | | San Joaquin Delta Community | | | | |
| | | | | College District, Series B, GO, | | | | |
| | | | | 5.000%, 08/01/2014 | | | 279,406 | |
| | 500,000 | | | San Mateo Joint Powers Financing | | | | |
| | | | | Authority, Series A, Refunding, | | | | |
| | | | | Revenue Bond, | | | | |
| | | | | 5.250%, 07/15/2025 | | | 561,840 | |
| | 250,000 | | | Southern California Public Power | | | | |
| | | | | Authority, Revenue Bond, | | | | |
| | | | | 5.250%, 07/01/2028 | | | 287,952 | |
| | | | | | | | 6,250,286 | |
| | | | | Colorado - 3.08% | | | | |
| | 130,000 | | | Colorado Health Facilities Authority, | | | | |
| | | | | Revenue Bond, | | | | |
| | | | | 8.000%, 08/01/2043 | | | 133,533 | |
| | 125,000 | | | Colorado Health Facilities Authority, | | | | |
| | | | | Series A, Revenue Bond, | | | | |
| | | | | 5.750%, 02/01/2044 | | | 125,969 | |
| | 500,000 | | | Colorado Regional Transportation | | | | |
| | | | | District, Series A, Revenue Bond, | | | | |
| | | | | 5.000%, 11/01/2027 | | | 566,630 | |
| | 310,000 | | | Denver Airport, Series B, Refunding, | | | | |
| | | | | Revenue Bond, | | | | |
| | | | | 5.000%, 11/15/2024 | | | 357,467 | |
| | 700,000 | | | Regional Transportation District, | | | | |
| | | | | Revenue Bond, | | | | |
| | | | | 6.000%, 01/15/2026 | | | 767,683 | |
| | | | | | | | 1,951,282 | |
See notes to financial statements.
GuideMarkSM Tax-Exempt Fixed Income Fund
SCHEDULE OF INVESTMENTS (Continued)
March 31, 2014
Principal
Amount | | | | | Value | |
| | | | | MUNICIPAL DEBT OBLIGATIONS (Continued) | | | | |
| | | | | Connecticut - 0.90% | | | | |
| $ | 500,000 | | | Connecticut Health & Educational | | | | |
| | | | | Facilities Authority, Series A, | | | | |
| | | | | Refunding, Revenue Bond, | | | | |
| | | | | 5.000%, 07/01/2025 | | $ | 568,155 | |
| | | | | District of Columbia - 0.65% | | | | |
| | 380,000 | | | District of Columbia, Series A, | | | | |
| | | | | Revenue Bond, | | | | |
| | | | | 5.000%, 10/01/2029 | | | 410,085 | |
| | | | | Florida - 2.25% | | | | |
| | 300,000 | | | Brevard County Health Facilities | | | | |
| | | | | Authority, Revenue Bond, | | | | |
| | | | | 7.000%, 04/01/2039 | | | 331,662 | |
| | 500,000 | | | Florida Board of Education, | | | | |
| | | | | Series C, Refunding, GO, | | | | |
| | | | | 4.000%, 06/01/2025 | | | 536,315 | |
| | 500,000 | | | Miami-Dade County Health Facilities, | | | | |
| | | | | Series A, Refunding, Revenue Bond, | | | | |
| | | | | 5.250%, 08/01/2021 | | | 556,455 | |
| | | | | | | | 1,424,432 | |
| | | | | Georgia - 1.15% | | | | |
| | 350,000 | | | Atlanta Water & Wastewater, | | | | |
| | | | | Revenue Bond, | | | | |
| | | | | 6.250%, 11/01/2039 | | | 402,199 | |
| | 325,000 | | | Marietta Development Authority, | | | | |
| | | | | Revenue Bond, | | | | |
| | | | | 7.000%, 06/15/2039 | | | 328,828 | |
| | | | | | | | 731,027 | |
| | | | | Hawaii - 1.59% | | | | |
| | 85,000 | | | Hawaii, Series CW, Refunding, GO, | | | | |
| | | | | 5.000%, 04/01/2024 | | | 93,549 | |
| | 415,000 | | | Hawaii, Series DJ, GO, | | | | |
| | | | | 5.000%, 04/01/2024 | | | 467,655 | |
| | 400,000 | | | Hawaii, Series DZ, GO, | | | | |
| | | | | 5.000%, 12/01/2030 | | | 450,004 | |
| | | | | | | | 1,011,208 | |
| | | | | Idaho - 1.73% | | | | |
| | 1,000,000 | | | Boise-Kuna District, Revenue Bond, | | | | |
| | | | | 7.375%, 06/01/2034 | | | 1,095,200 | |
Principal
Amount | | | | | Value | |
| | | | | Illinois - 3.02% | | | | |
| $ | 225,000 | | | Illinois Financial Authority, | | | | |
| | | | | Revenue Bond, | | | | |
| | | | | 7.000%, 08/15/2044 | | $ | 246,710 | |
| | 250,000 | | | Metropolitan Pier & Exposition | | | | |
| | | | | Authority, Series B, Refunding, | | | | |
| | | | | Revenue Bond, | | | | |
| | | | | 5.000%, 06/15/2023 | | | 283,375 | |
| | 150,000 | | | O’Hare International Airport, | | | | |
| | | | | Series D, Refunding, Revenue Bond, | | | | |
| | | | | 5.250%, 01/01/2030 | | | 162,789 | |
| | 500,000 | | | Railsplitter Tobacco Settlement | | | | |
| | | | | Authority, Revenue Bond, | | | | |
| | | | | 6.250%, 06/01/2024 | | | 551,435 | |
| | 120,000 | | | Southwestern Illinois Development | | | | |
| | | | | Authority Health Care Facilities, | | | | |
| | | | | Refunding, Revenue Bond, | | | | |
| | | | | 7.125%, 11/01/2043 | | | 120,527 | |
| | 500,000 | | | University of Illinois, Series C, | | | | |
| | | | | Revenue Bond, | | | | |
| | | | | 5.000%, 04/01/2026 | | | 551,840 | |
| | | | | | | | 1,916,676 | |
| | | | | Indiana - 3.21% | | | | |
| | 500,000 | | | Fishers Industry Redevelopment | | | | |
| | | | | District, Saxony Project, | | | | |
| | | | | Revenue Bond, | | | | |
| | | | | 5.250%, 07/15/2034 | | | 530,100 | |
| | 250,000 | | | Indiana Municipal Power Agency, | | | | |
| | | | | Series A, Refunding, Revenue Bond, | | | | |
| | | | | 5.250%, 01/01/2032 | | | 274,950 | |
| | 400,000 | | | Sheridan Community School’s | | | | |
| | | | | Building Corporation, | | | | |
| | | | | Revenue Bond, FSA Insured, | | | | |
| | | | | 5.500%, 07/15/2020 | | | 439,896 | |
| | 125,000 | | | Shoals Exempt Facilities, | | | | |
| | | | | Revenue Bond, | | | | |
| | | | | 7.250%, 11/01/2043 | | | 128,549 | |
| | 500,000 | | | Tri-Creek Middle School Building | | | | |
| | | | | Corp., Revenue Bond, FSA Insured, | | | | |
| | | | | 5.250%, 07/15/2021 | | | 540,075 | |
| | 115,000 | | | Valparaiso Exempt Facilities, | | | | |
| | | | | Revenue Bond, | | | | |
| | | | | 7.000%, 01/01/2044 | | | 122,505 | |
| | | | | | | | 2,036,075 | |
See notes to financial statements.
GuideMarkSM Tax-Exempt Fixed Income Fund
SCHEDULE OF INVESTMENTS (Continued)
March 31, 2014
Principal
Amount | | | | | Value | |
| | | | | MUNICIPAL DEBT OBLIGATIONS (Continued) | | | | |
| | | | | Iowa - 0.96% | | | | |
| $ | 600,000 | | | Iowa Finance Authority Pollution | | | | |
| | | | | Control, Revenue Bond, | | | | |
| | | | | FGIC Insured, | | | | |
| | | | | 5.000%, 07/01/2014 | | $ | 606,702 | |
| | | | | Kansas - 0.39% | | | | |
| | 365,000 | | | Wyandotte County/Kansas City | | | | |
| | | | | Unified Government, Series B, | | | | |
| | | | | Refunding, Revenue Bond, | | | | |
| | | | | 0.000%, 06/01/2021 (a) | | | 250,755 | |
| | | | | Kentucky - 0.17% | | | | |
| | 100,000 | | | Kentucky Public Transportation | | | | |
| | | | | Infrastructure Authority, Series A, | | | | |
| | | | | Revenue Bond, | | | | |
| | | | | 5.000%, 07/01/2017 | | | 111,075 | |
| | | | | Louisiana - 2.24% | | | | |
| | 800,000 | | | Louisiana Citizens Property, | | | | |
| | | | | Revenue Bond, | | | | |
| | | | | 6.750%, 06/01/2026 | | | 936,304 | |
| | 200,000 | | | Louisiana Highway Improvement, | | | | |
| | | | | Series A, Revenue Bond, | | | | |
| | | | | 5.000%, 06/15/2029 | | | 228,118 | |
| | 125,000 | | | Louisiana Public Facilities Authority, | | | | |
| | | | | Series A, Revenue Bond, | | | | |
| | | | | 8.375%, 12/15/2043 | | | 127,590 | |
| | 125,000 | | | Saint John Baptist Parish Louisiana | | | | |
| | | | | Revenue Marathon Oil Corp., | | | | |
| | | | | Series A, Revenue Bond, | | | | |
| | | | | 5.125%, 06/01/2037 | | | 130,886 | |
| | | | | | | | 1,422,898 | |
| | | | | Maryland - 3.29% | | | | |
| | 325,000 | | | Anne Arundel County, Tax Allocation, | | | | |
| | | | | 6.100%, 07/01/2040 | | | 341,455 | |
| | 600,000 | | | Maryland Department of | | | | |
| | | | | Transportation County T | | | | |
| | | | | Construction, Revenue Bond, | | | | |
| | | | | 5.500%, 02/01/2017 | | | 679,950 | |
| | 400,000 | | | Maryland Department of | | | | |
| | | | | Transportation, Revenue Bond, | | | | |
| | | | | 5.000%, 02/15/2026 | | | 457,836 | |
| | 180,000 | | | Maryland Economic Development | | | | |
| | | | | Corporation, Refunding, Revenue | | | | |
| | | | | Bond, Consol Energy, Inc. Insured, | | | | |
| | | | | 5.750%, 09/01/2025 | | | 190,757 | |
Principal
Amount | | | | | Value | |
| | | | | Maryland (Continued) | | | | |
| $ | 400,000 | | | Maryland Student Housing Economic | | | | |
| | | | | Development, Revenue Bond, | | | | |
| | | | | 5.750%, 06/01/2033 | | $ | 416,904 | |
| | | | | | | | 2,086,902 | |
| | | | | Massachusetts - 3.39% | | | | |
| | 250,000 | | | Cambridge, GO, | | | | |
| | | | | 3.000%, 02/15/2018 | | | 268,422 | |
| | 430,000 | | | Massachusetts Development Finance | | | | |
| | | | | Agency, Series A, Revenue Bond, | | | | |
| | | | | 5.450%, 04/15/2014 | | | 427,635 | |
| | 785,000 | | | Massachusetts Health & Educational | | | | |
| | | | | Facilities Authority, Series A, | | | | |
| | | | | Refunding, Revenue Bond, | | | | |
| | | | | 5.500%, 11/15/2036 | | | 906,322 | |
| | 500,000 | | | Massachusetts Health & Educational | | | | |
| | | | | Facilities Authority, Series B, | | | | |
| | | | | Revenue Bond, | | | | |
| | | | | 5.000%, 10/01/2038 | | | 550,740 | |
| | | | | | | | 2,153,119 | |
| | | | | Michigan - 0.73% | | | | |
| | 400,000 | | | Michigan Finance Authority, | | | | |
| | | | | Series B, Refunding, Revenue Bond, | | | | |
| | | | | 5.000%, 07/01/2021 | | | 461,812 | |
| | | | | Minnesota - 1.25% | | | | |
| | 150,000 | | | Rochester Health Care & Housing | | | | |
| | | | | Facility, Series A, Refunding, | | | | |
| | | | | Revenue Bond, | | | | |
| | | | | 6.875%, 12/01/2048 | | | 153,324 | |
| | 560,000 | | | Rochester Health Care Facilities | | | | |
| | | | | Mayo Clinic, Series C, Revenue Bond, | | | | |
| | | | | 4.500%, 11/15/2038 (b) | | | 640,147 | |
| | | | | | | | 793,471 | |
| | | | | Missouri - 2.77% | | | | |
| | 500,000 | | | Missouri Health & Educational | | | | |
| | | | | Facilities Authority, Series A, | | | | |
| | | | | Revenue Bond, | | | | |
| | | | | 5.375%, 03/15/2039 | | | 543,525 | |
| | 500,000 | | | Missouri Highway & Transportation | | | | |
| | | | | Commission, Series B, Revenue Bond, | | | | |
| | | | | 5.000%, 05/01/2024 | | | 542,750 | |
| | 250,000 | | | Sikeston Electric, Refunding, | | | | |
| | | | | Revenue Bond, | | | | |
| | | | | 5.000%, 06/01/2018 | | | 274,235 | |
See notes to financial statements.
GuideMarkSM Tax-Exempt Fixed Income Fund
SCHEDULE OF INVESTMENTS (Continued)
March 31, 2014
Principal
Amount | | | | | Value | |
| | | | | MUNICIPAL DEBT OBLIGATIONS (Continued) | | | | |
| | | | | Missouri (Continued) | | | | |
| $ | 350,000 | | | St. Louis Airport, Revenue Bond, | | | | |
| | | | | 6.625%, 07/01/2034 | | $ | 398,909 | |
| | | | | | | | 1,759,419 | |
| | | | | Nebraska - 0.88% | | | | |
| | 500,000 | | | Omaha Public Power Distributors, | | | | |
| | | | | Series B, Revenue Bond, | | | | |
| | | | | 5.000%, 02/01/2027 | | | 561,305 | |
| | | | | New Hampshire - 0.20% | | | | |
| | 120,000 | | | New Hampshire Health & Educational | | | | |
| | | | | Facilities Authority, Refunding, | | | | |
| | | | | Revenue Bond, | | | | |
| | | | | 5.000%, 07/01/2027 | | | 126,539 | |
| | | | | New Jersey - 2.56% | | | | |
| | 150,000 | | | City of Paterson, Refunding, GO, | | | | |
| | | | | 5.000%, 01/15/2024 | | | 166,880 | |
| | 90,000 | | | New Jersey Economic Development | | | | |
| | | | | Authority, Series B, Revenue Bond, | | | | |
| | | | | 5.625%, 11/15/2030 | | | 91,035 | |
| | 500,000 | | | New Jersey State Transportation | | | | |
| | | | | Trust Fund Authority, Series A, | | | | |
| | | | | Refunding, Revenue Bond, | | | | |
| | | | | 5.500%, 12/15/2021 | | | 595,190 | |
| | 300,000 | | | New Jersey Turnpike Authority, | | | | |
| | | | | Series B, Refunding, Revenue Bond, | | | | |
| | | | | 5.000%, 01/01/2022 | | | 348,600 | |
| | 555,000 | | | Tobacco Settlement Financing Corp., | | | | |
| | | | | Series 1A, Refunding, Revenue Bond, | | | | |
| | | | | 5.000%, 06/01/2041 | | | 419,219 | |
| | | | | | | | 1,620,924 | |
| | | | | New York - 9.43% | | | | |
| | 325,000 | | | Brooklyn Arena Local Development | | | | |
| | | | | Corp., Revenue Bond, | | | | |
| | | | | 6.500%, 07/15/2030 | | | 356,879 | |
| | 500,000 | | | Build NYC Resource Corp., | | | | |
| | | | | Refunding, Revenue Bond, | | | | |
| | | | | 5.000%, 08/01/2020 | | | 546,075 | |
| | 95,000 | | | Nassau County Local Economic | | | | |
| | | | | Assistance Corp., Refunding, | | | | |
| | | | | Revenue Bond, | | | | |
| | | | | 5.000%, 07/01/2019 | | | 107,400 | |
Principal
Amount | | | | | Value | |
| | | | | New York (Continued) | | | | |
| $ | 40,000 | | | New York City Industrial Development | | | | |
| | | | | Agency, Series A, Refunding, | | | | |
| | | | | Revenue Bond, | | | | |
| | | | | 5.000%, 07/01/2022 | | $ | 43,221 | |
| | 250,000 | | | New York City Municipal Water | | | | |
| | | | | Finance Authority, Series BB, | | | | |
| | | | | Refunding, Revenue Bond | | | | |
| | | | | 5.000%, 06/15/2046 | | | 264,530 | |
| | 500,000 | | | New York City Transitional Finance | | | | |
| | | | | Authority, Series A-1, Revenue Bond, | | | | |
| | | | | 5.000%, 11/01/2042 | | | 540,270 | |
| | 900,000 | | | New York City, GO, | | | | |
| | | | | 5.375%, 04/01/2036 | | | 1,015,371 | |
| | 325,000 | | | New York Dormitory Authority, | | | | |
| | | | | Revenue Bond, | | | | |
| | | | | 6.125%, 12/01/2029 | | | 326,076 | |
| | 250,000 | | | New York Dormitory Authority, | | | | |
| | | | | Series B, Refunding, Revenue Bond, | | | | |
| | | | | 5.000%, 07/01/2038 | | | 274,015 | |
| | 500,000 | | | New York Environmental Facilities | | | | |
| | | | | Corporation, Revenue Bond, | | | | |
| | | | | 5.500%, 10/15/2027 | | | 632,445 | |
| | 500,000 | | | New York Environmental Facilities | | | | |
| | | | | Corporation, Series A, Revenue Bond, | | | | |
| | | | | 5.000%, 06/15/2034 | | | 548,550 | |
| | 165,000 | | | New York Thruway Authority General | | | | |
| | | | | Revenue Junior Indebtedness, | | | | |
| | | | | Series A, Refunding, Revenue Bond, | | | | |
| | | | | 5.000%, 05/01/2019 | | | 190,684 | |
| | 200,000 | | | New York, Series E, GO, | | | | |
| | | | | 4.000%, 12/15/2027 | | | 212,098 | |
| | 125,000 | | | New York, Series E, Refunding, GO, | | | | |
| | | | | 5.000%, 08/01/2020 | | | 146,129 | |
| | 700,000 | | | Tobacco Settlement Financing Corp., | | | | |
| | | | | Series B, Refunding, Revenue Bond, | | | | |
| | | | | 5.000%, 06/01/2022 | | | 779,023 | |
| | | | | | | | 5,982,766 | |
| | | | | North Carolina - 2.64% | | | | |
| | 115,000 | | | Gaston County Industrial Facilities | | | | |
| | | | | & Pollution Control Financing | | | | |
| | | | | Authority, Revenue Bond, | | | | |
| | | | | 5.750%, 08/01/2035 | | | 104,128 | |
See notes to financial statements.
GuideMarkSM Tax-Exempt Fixed Income Fund
SCHEDULE OF INVESTMENTS (Continued)
March 31, 2014
Principal
Amount | | | | | Value | |
| | | | | MUNICIPAL DEBT OBLIGATIONS (Continued) | | | | |
| | | | | North Carolina (Continued) | | | | |
| $ | 500,000 | | | North Carolina Capital Facilities | | | | |
| | | | | Finance Agency, Series B, | | | | |
| | | | | Refunding, Revenue Bond, | | | | |
| | | | | 5.000%, 10/01/2038 | | $ | 530,565 | |
| | 320,000 | | | North Carolina Eastern Municipal | | | | |
| | | | | Power Agency Power Systems, | | | | |
| | | | | Series A, Revenue Bond, | | | | |
| | | | | 5.000%, 01/01/2025 | | | 358,969 | |
| | 250,000 | | | North Carolina Eastern Municipal | | | | |
| | | | | Power Agency Power Systems, | | | | |
| | | | | Series B, Refunding, Revenue Bond, | | | | |
| | | | | 6.250%, 01/01/2023 | | | 310,550 | |
| | 305,000 | | | North Carolina, Series C, | | | | |
| | | | | Refunding, GO, | | | | |
| | | | | 5.000%, 05/01/2022 | | | 367,382 | |
| | | | | | | | 1,671,594 | |
| | | | | North Dakota - 1.03% | | | | |
| | 500,000 | | | University of North Dakota, | | | | |
| | | | | Refunding, Revenue Bond, | | | | |
| | | | | 5.000%, 04/01/2032 | | | 542,825 | |
| | 110,000 | | | Williston Multi-Family Housing, | | | | |
| | | | | Revenue Bond, | | | | |
| | | | | 7.750%, 09/01/2038 | | | 109,976 | |
| | | | | | | | 652,801 | |
| | | | | Ohio - 2.24% | | | | |
| | 375,000 | | | Buckeye Tobacco Settlement | | | | |
| | | | | Financial Authority, Series A, | | | | |
| | | | | Revenue Bond, | | | | |
| | | | | 5.875%, 06/01/2047 | | | 303,071 | |
| | 500,000 | | | Ohio Air Quality Development | | | | |
| | | | | Authority, Series A, Revenue Bond, | | | | |
| | | | | 5.700%, 08/01/2020 | | | 558,320 | |
| | 500,000 | | | Ohio Higher Education Facilities | | | | |
| | | | | Commission, Refunding, | | | | |
| | | | | Revenue Bond, | | | | |
| | | | | 5.000%, 01/01/2026 | | | 556,565 | |
| | | | | | | | 1,417,956 | |
| | | | | Oregon - 0.68% | | | | |
| | 400,000 | | | Clackamas County School | | | | |
| | | | | District, GO, | | | | |
| | | | | 5.000%, 06/15/2021 (b) | | | 434,284 | |
Principal
Amount | | | | | Value | |
| | | | | Pennsylvania - 5.87% | | | | |
| $ | 500,000 | | | Allegheny County Hospital | | | | |
| | | | | Development Authority, Series A, | | | | |
| | | | | Revenue Bond, | | | | |
| | | | | 5.000%, 09/01/2014 | | $ | 510,065 | |
| | 180,000 | | | Allegheny County Industrial | | | | |
| | | | | Development Authority, Refunding, | | | | |
| | | | | Revenue Bond, | | | | |
| | | | | 6.500%, 05/01/2017 | | | 192,312 | |
| | 350,000 | | | Butler County Hospital Authority, | | | | |
| | | | | Revenue Bond, | | | | |
| | | | | 7.125%, 07/01/2029 | | | 414,333 | |
| | 200,000 | | | Montgomery County Industrial | | | | |
| | | | | Development Authority, | | | | |
| | | | | Revenue Bond, | | | | |
| | | | | 6.000%, 02/01/2021 | | | 204,230 | |
| | 400,000 | | | Pennsylvania Economic Development | | | | |
| | | | | Financing Authority, Albert Einstein | | | | |
| | | | | Health Care, Series A, Refunding, | | | | |
| | | | | Revenue Bond, | | | | |
| | | | | 6.250%, 10/15/2023 | | | 444,064 | |
| | | | | Pennsylvania Higher Educational | | | | |
| | | | | Facilities Authority, Revenue Bond, | | | | |
| | 500,000 | | | 5.250%, 07/01/2019 | | | 536,115 | |
| | 400,000 | | | 5.800%, 07/01/2030 | | | 406,652 | |
| | 250,000 | | | Pennsylvania Higher Educational | | | | |
| | | | | Facilities Authority, Series E, | | | | |
| | | | | Refunding, Revenue Bond, | | | | |
| | | | | 5.000%, 05/15/2019 | | | 287,745 | |
| | 500,000 | | | Philadelphia Gas Works, Refunding, | | | | |
| | | | | Revenue Bond, | | | | |
| | | | | 5.250%, 08/01/2017 | | | 560,630 | |
| | 150,000 | | | University of Pittsburgh of the | | | | |
| | | | | Commonwealth System of Higher | | | | |
| | | | | Education, Series B, Revenue Bond, | | | | |
| | | | | 5.000%, 09/15/2028 | | | 166,397 | |
| | | | | | | | 3,722,543 | |
| | | | | Puerto Rico - 1.08% | | | | |
| | 620,000 | | | Puerto Rico Commonwealth, | | | | |
| | | | | Series B, Prerefunded, GO, | | | | |
| | | | | 5.250%, 07/01/2032 | | | 686,972 | |
See notes to financial statements.
GuideMarkSM Tax-Exempt Fixed Income Fund
SCHEDULE OF INVESTMENTS (Continued)
March 31, 2014
Principal
Amount | | | | | Value | |
| | | | | MUNICIPAL DEBT OBLIGATIONS (Continued) | | | | |
| | | | | South Carolina - 0.72% | | | | |
| $ | 400,000 | | | Charleston Educational Excellence | | | | |
| | | | | Financing Corp., Refunding, | | | | |
| | | | | Revenue Bond, | | | | |
| | | | | 5.000%, 12/01/2025 | | $ | 459,412 | |
| | | | | South Dakota - 0.80% | | | | |
| | 500,000 | | | South Dakota Housing Development | | | | |
| | | | | Authority, Series A, Revenue Bond, | | | | |
| | | | | 4.250%, 05/01/2015 | | | 510,780 | |
| | | | | Texas - 11.19% | | | | |
| | 430,000 | | | Central Texas Regional Mobility | | | | |
| | | | | Authority, Series A, Refunding, | | | | |
| | | | | Revenue Bond, | | | | |
| | | | | 6.000%, 01/01/2041 | | | 456,849 | |
| | 635,000 | | | Clifton Texas Higher Education | | | | |
| | | | | Finance Corp., Series A, Refunding, | | | | |
| | | | | Revenue Bond, | | | | |
| | | | | 4.000%, 12/01/2015 | | | 646,538 | |
| | 200,000 | | | Dallas-Fort Worth International | | | | |
| | | | | Airport, Series B, Revenue Bond, | | | | |
| | | | | 5.000%, 11/01/2026 | | | 224,738 | |
| | 515,000 | | | Frisco Texas Independent School | | | | |
| | | | | District, Series A, GO, | | | | |
| | | | | 6.000%, 08/15/2038 | | | 591,637 | |
| | 425,000 | | | Harris County Industrial Development, | | | | |
| | | | | Revenue Bond, | | | | |
| | | | | 5.000%, 02/01/2023 | | | 456,110 | |
| | 500,000 | | | Houston, GO, | | | | |
| | | | | 5.250%, 03/01/2028 | | | 555,255 | |
| | 580,000 | | | La Porte Independent School | | | | |
| | | | | District, GO, | | | | |
| | | | | 5.250%, 02/15/2024 | | | 637,020 | |
| | 250,000 | | | North Texas Tollway Authority, | | | | |
| | | | | Series A, Revenue Bond, | | | | |
| | | | | 5.000%, 09/01/2020 | | | 294,090 | |
| | 770,000 | | | North Texas Tollway Authority, | | | | |
| | | | | Series E, Refunding, Revenue Bond, | | | | |
| | | | | 5.750%, 01/01/2038 (b) | | | 833,363 | |
| | 155,000 | | | San Antonio Electric & Gas, | | | | |
| | | | | Refunding, Revenue Bond, | | | | |
| | | | | 5.000%, 02/01/2022 | | | 183,720 | |
Principal
Amount | | | | | Value | |
| | | | | Texas (Continued) | | | | |
| | | | | Texas Private Activity Surface | | | | |
| | | | | Transportation Corp., Revenue Bond, | | | | |
| $ | 445,000 | | | 7.500%, 12/31/2031 | | $ | 518,234 | |
| | 400,000 | | | 7.500%, 06/30/2033 | | | 468,428 | |
| | 85,000 | | | 7.000%, 12/31/2038 | | | 96,607 | |
| | 115,000 | | | 6.750%, 06/30/2043 | | | 127,674 | |
| | 500,000 | | | Texas Transportation Commission, | | | | |
| | | | | Revenue Bond, | | | | |
| | | | | 5.000%, 04/01/2018 | | | 562,170 | |
| | 400,000 | | | Texas, Series A, GO, | | | | |
| | | | | 5.000%, 04/01/2022 | | | 447,084 | |
| | | | | | | | 7,099,517 | |
| | | | | Utah - 0.90% | | | | |
| | 500,000 | | | Utah Associated Municipal Power | | | | |
| | | | | Systems San Juan Project, | | | | |
| | | | | Refunding, Revenue Bond, | | | | |
| | | | | 5.500%, 06/01/2022 | | | 568,260 | |
| | | | | Virginia - 2.60% | | | | |
| | 1,000,000 | | | Henry County Public Service | | | | |
| | | | | Authority Water & Sewer, Refunding, | | | | |
| | | | | Revenue Bond, FSA Insured, | | | | |
| | | | | 5.500%, 11/15/2019 | | | 1,136,050 | |
| | 400,000 | | | Virginia College Building Authority | | | | |
| | | | | Educational Facilities, Revenue Bond, | | | | |
| | | | | 5.750%, 01/01/2034 | | | 511,516 | |
| | | | | | | | 1,647,566 | |
| | | | | Washington - 2.72% | | | | |
| | 325,000 | | | Central Puget Sound Regional | | | | |
| | | | | Transit Authority, Series P-1, | | | | |
| | | | | Refunding, Revenue Bond, | | | | |
| | | | | 5.000%, 02/01/2027 | | | 369,792 | |
| | 500,000 | | | Energy Northwest Washington | | | | |
| | | | | Electric, Series D, Revenue Bond, | | | | |
| | | | | 5.000%, 07/01/2035 | | | 541,360 | |
| | 500,000 | | | King County Hospital, Refunding, | | | | |
| | | | | GO, MBIA Insured, | | | | |
| | | | | 5.000%, 12/01/2021 | | | 531,175 | |
| | 250,000 | | | Washington Health Care Facilities | | | | |
| | | | | Authority, Refunding, Revenue Bond, | | | | |
| | | | | 6.375%, 10/01/2036 | | | 281,422 | |
| | | | | | | | 1,723,749 | |
See notes to financial statements.
GuideMarkSM Tax-Exempt Fixed Income Fund
SCHEDULE OF INVESTMENTS (Continued)
March 31, 2014
Principal
Amount | | | | | Value | |
| | | | | MUNICIPAL DEBT OBLIGATIONS (Continued) | | | | |
| | | | | Wisconsin - 4.34% | | | | |
| $ | 500,000 | | | Southeast Wisconsin Professional | | | | |
| | | | | Baseball Park Sales Tax, Series A, | | | | |
| | | | | Revenue Bond, MBIA Insured, | | | | |
| | | | | 5.500%, 12/15/2026 | | $ | 586,600 | |
| | 70,000 | | | Wisconsin Health & Educational | | | | |
| | | | | Facilities Authority, Series A, | | | | |
| | | | | Revenue Bond, | | | | |
| | | | | 5.125%, 02/01/2038 | | | 63,682 | |
| | | | | Wisconsin Public Finance Authority, | | | | |
| | | | | Refunding, Revenue Bond, | | | | |
| | 220,000 | | | 5.000%, 07/01/2022 | | | 243,778 | |
| | 150,000 | | | 5.750%, 10/01/2031 | | | 142,072 | |
| | 500,000 | | | Wisconsin, Series 2, Refunding, GO, | | | | |
| | | | | 5.000%, 05/01/2025 | | | 579,805 | |
| | 1,000,000 | | | Wisconsin, Series A, Refunding, | | | | |
| | | | | Revenue Bond, | | | | |
| | | | | 6.000%, 05/01/2033 | | | 1,134,750 | |
| | | | | | | | 2,750,687 | |
| | | | | Total Municipal Debt Obligations | | | | |
| | | | | (Cost $58,453,105) | | | 61,630,103 | |
Number
of Shares | | | | | Value | |
| | | | SHORT TERM INVESTMENTS - 1.47% | | | |
| | | | Money Market Funds - 1.47% | | | |
| | 931,487 | | | Fidelity Tax Exempt Portfolio | | $ | 931,487 | |
| | | | | Total Short Term Investments | | | | |
| | | | | (Cost $931,487) | | | 931,487 | |
| | | | | Total Investments | | | | |
| | | | | (Cost $59,384,592) - 98.63% | | | 62,561,590 | |
| | | | | Other Assets in Excess | | | | |
| | | | | of Liabilities - 1.37% | | | 867,987 | |
| | | | | TOTAL NET | | | | |
| | | | | ASSETS - 100.00% | | $ | 63,429,577 | |
Percentages are stated as a percent of net assets.
| (a) | Zero coupon bond. |
| (b) | Variable Rate Security. The rate shown is the rate in effect on March 31, 2014. |
Glossary of Terms
| FGIC | - Financial Guaranty Insurance Corp. |
| FSA | - Financial Security Assurance, Inc. |
| GO | - General Obligation |
| MBIA | - Municipal Bond Investors Assurance Corp. |
See notes to financial statements.
GuideMarkSM Opportunistic Fixed Income Fund
SCHEDULE OF INVESTMENTS
March 31, 2014
Principal
Amount | | | | | Value | |
| | | | | ASSET BACKED SECURITIES - 1.26% | |
| | 175,000 | | | Ally Master Owner Trust | | | | |
| | | | | Series 2014-2, 0.522%, | | | | |
| | | | | 01/16/2018 (a) | | $ | 175,071 | |
| | | | | American Express Credit Account | | | | |
| | | | | Master Trust | | | | |
| | 100,000 | | | Series 2013-3A, 0.980%, | | | | |
| | | | | 05/15/2019 | | | 99,893 | |
| | 200,000 | | | Series 2013-1A, 0.572%, | | | | |
| | | | | 02/16/2021 (a) | | | 201,071 | |
| | 90,000 | | | BA Credit Card Trust | | | | |
| | | | | Series 2014-A1, 0.532%, | | | | |
| | | | | 06/15/2021 (a) | | | 90,235 | |
| | 125,000 | | | Capital One Multi-Asset Execution | | | | |
| | | | | Trust | | | | |
| | | | | Series 2013-A3, 0.960%, | | | | |
| | | | | 09/16/2019 | | | 124,606 | |
| | | | | Citibank Credit Card Issuance Trust | | | | |
| | 125,000 | | | Series 2014-A3, 0.356%, | | | | |
| | | | | 05/09/2018 (a) | | | 125,054 | |
| | 145,000 | | | Series 2013-A6, 1.320%, | | | | |
| | | | | 09/07/2018 | | | 146,258 | |
| | 130,000 | | | Series 2014-A2, 1.020%, | | | | |
| | | | | 02/22/2019 | | | 129,424 | |
| | 255,000 | | | Series 2013-A7, 0.580%, | | | | |
| | | | | 09/10/2020 (a) | | | 256,130 | |
| | | | | Nissan Auto Receivables Owner Trust | | | | |
| | 259,152 | | | Series 2013-B, 0.520%, 04/15/2016 | | | 259,336 | |
| | 205,000 | | | Series 2013-C, 0.670%, 08/15/2018 | | | 205,372 | |
| | | | | Sierra Receivables Funding Co. LLC | | | | |
| | 52,449 | | | Series 2013-1A, 1.590%, 11/20/2029 | | | | |
| | | | | (Acquired 10/22/2013, | | | | |
| | | | | Cost $52,332) (b) | | | 52,672 | |
| | 225,943 | | | Series 2013-3A, 2.200%, | | | | |
| | | | | 10/20/2030 (Acquired 10/29/2013 | | | | |
| | | | | and 03/12/2014, Cost $226,460) (b) | | | 226,943 | |
| | 100,000 | | | Springleaf Funding Trust | | | | |
| | | | | Series 2014-A, 2.410%, 12/15/2022 | | | | |
| | | | | (Acquired 03/19/2014, | | | | |
| | | | | Cost $99,984) (b)(c) | | | 100,000 | |
| | 169,167 | | | TAL Advantage V LLC | | | | |
| | | | | Series 2013-2A, 3.550%, | | | | |
| | | | | 11/20/2038 (Acquired 10/31/2013, | | | | |
| | | | | Cost $169,094) (b) | | | 169,998 | |
Principal
Amount | | | | | Value | |
| | | | | ASSET BACKED SECURITIES (Continued) | |
| | 35,000 | | | United Airlines Pass Through Trust | | | | |
| | | | | Series 2014-1B, 4.750%, 10/11/2023 | | $ | 35,350 | |
| | 65,000 | | | USAA Auto Owner Trust | | | | |
| | | | | Series 2012-1, 0.570%, 08/15/2017 | | | 65,124 | |
| | 115,000 | | | Virgin Australia | | | | |
| | | | | Series 2013-1, 6.000%, 10/23/2020 | | | | |
| | | | | (Acquired 10/07/2013, | | | | |
| | | | | Cost $115,000) (b) | | | 118,450 | |
| | 100,000 | | | World Financial Network Credit | | | | |
| | | | | Card Master Trust | | | | |
| | | | | Series 2014-A, 0.535%, | | | | |
| | | | | 12/15/2019 (a) | | | 100,057 | |
| | | | | Total Asset Backed Securities | | | | |
| | | | | (Cost $2,673,808) | | | 2,681,044 | |
| | | | | BANK LOANS - 4.63% | |
| | 84,575 | | | Acosta, Inc. | | | | |
| | | | | 4.250%, 03/02/2018 | | | 85,196 | |
| | 63,563 | | | Activision Blizzard, Inc. | | | | |
| | | | | 3.250%, 10/11/2020 | | | 63,652 | |
| | 104,586 | | | Affinion Group Holdings, Inc. | | | | |
| | | | | 6.750%, 10/09/2016 | | | 103,264 | |
| | 58,000 | | | Akorn, Inc. | | | | |
| | | | | 3.741%, 11/13/2020 | | | 58,815 | |
| | 542,225 | | | Alcatel-Lucent USA, Inc. | | | | |
| | | | | 4.500%, 01/30/2019 | | | 545,711 | |
| | 74,625 | | | Allflex Holdings III, Inc. | | | | |
| | | | | 4.250%, 06/03/2020 | | | 74,975 | |
| | 104,738 | | | American Beacon Advisors, Inc. | | | | |
| | | | | 4.750%, 11/22/2019 | | | 105,785 | |
| | 33,324 | | | American Tire Distributors, Inc. | | | | |
| | | | | 4.984%, 06/01/2018 | | | 33,532 | |
| | 99,750 | | | Amneal Pharmaceuticals, LLC | | | | |
| | | | | 5.753%, 11/01/2019 | | | 100,623 | |
| | 128,376 | | | AmWINS Group, Inc. | | | | |
| | | | | 5.000%, 09/06/2019 | | | 129,499 | |
| | 4,042 | | | AOT Bedding Super Holdings, LLC | | | | |
| | | | | 4.250%, 10/01/2019 | | | 4,062 | |
| | 125,000 | | | Aptean Holdings, Inc. | | | | |
| | | | | 5.250%, 02/05/2020 | | | 125,547 | |
| | 115,000 | | | Aramark Corp. | | | | |
| | | | | 3.250%, 02/19/2021 | | | 114,257 | |
| | | | | Ardagh Group S.A. | | | | |
| | 20,000 | | | 3.238%, 12/17/2019 | | | 20,069 | |
| | 29,925 | | | 4.250%, 12/17/2019 | | | 30,081 | |
See notes to financial statements.
GuideMarkSM Opportunistic Fixed Income Fund
SCHEDULE OF INVESTMENTS (Continued)
March 31, 2014
Principal
Amount | | | | | Value | |
| | | | | BANK LOANS (Continued) | |
| | 223,312 | | | Arysta LifeScience Corp. | | | | |
| | | | | 4.500%, 05/29/2020 | | $ | 224,429 | |
| | 235,200 | | | Ascend Performance Materials LLC | | | | |
| | | | | 6.750%, 04/10/2018 | | | 231,672 | |
| | 67,966 | | | Asurion Corp. | | | | |
| | | | | 5.000%, 05/24/2019 | | | 68,216 | |
| | 50,000 | | | Audio Visual Services Corp. | | | | |
| | | | | 4.500%, 01/22/2021 | | | 50,375 | |
| | 74,082 | | | Axalta Coatings Systems, LLC | | | | |
| | | | | 4.000%, 02/01/2020 | | | 74,280 | |
| | 95,879 | | | Blackboard, Inc. | | | | |
| | | | | 4.750%, 10/04/2018 | | | 96,790 | |
| | | | | BMC Software, Inc. | | | | |
| | 185,361 | | | 5.000%, 09/10/2020 | | | 185,013 | |
| | 92,526 | | | 5.000%, 09/10/2020 | | | 93,500 | |
| | 79,600 | | | Boyd Gaming Corp. | | | | |
| | | | | 4.000%, 08/14/2020 | | | 79,779 | |
| | 134,587 | | | Brand Energy, Inc. | | | | |
| | | | | 4.750%, 11/08/2020 | | | 135,292 | |
| | 21,613 | | | Calpine Corp. | | | | |
| | | | | 4.000%, 10/30/2020 | | | 21,707 | |
| | 17,839 | | | Chemtura Corp. | | | | |
| | | | | 3.500%, 08/27/2016 | | | 17,969 | |
| | 27,401 | | | CHS/Community Health Systems, Inc. | | | | |
| | | | | 4.250%, 01/15/2021 | | | 27,667 | |
| | 54,725 | | | Cincinnati Bell, Inc. | | | | |
| | | | | 4.000%, 09/10/2020 | | | 54,821 | |
| | 49,750 | | | Coinmach Corp. | | | | |
| | | | | 4.250%, 11/14/2019 | | | 49,819 | |
| | 24,938 | | | Connolly, LLC | | | | |
| | | | | 5.000%, 01/24/2021 | | | 25,234 | |
| | 85,000 | | | Cooper Gay Swett & Crawford Ltd. | | | | |
| | | | | 8.250%, 10/16/2020 | | | 83,087 | |
| | 99,750 | | | Crosby Worldwide Ltd. | | | | |
| | | | | 4.000%, 11/23/2020 | | | 99,625 | |
| | 203,463 | | | Crown Castle International Corp. | | | | |
| | | | | 3.250%, 01/31/2019 | | | 203,527 | |
| | 139,298 | | | CSC Holdings LLC | | | | |
| | | | | 2.652%, 04/17/2020 | | | 137,894 | |
| | 39,883 | | | Cumulus Media, Inc. | | | | |
| | | | | 4.250%, 12/23/2020 | | | 40,248 | |
| | 40,825 | | | DealerTrack Technologies, Inc. | | | | |
| | | | | 3.500%, 02/25/2021 | | | 41,063 | |
Principal
Amount | | | | | Value | |
| | | | | BANK LOANS (Continued) | |
| | | | | Del Monte Corp. | | | | |
| | 220,000 | | | 3.500%, 02/21/2020 | | $ | 219,003 | |
| | 45,000 | | | 4.250%, 11/26/2020 | | | 45,045 | |
| | 23,555 | | | Dematic Corp. | | | | |
| | | | | 4.250%, 12/18/2019 | | | 23,599 | |
| | 155,000 | | | Digital Cinema Implementation | | | | |
| | | | | Partners, LLC | | | | |
| | | | | 3.250%, 05/17/2021 | | | 154,903 | |
| | 6,778 | | | Drew Marine, Inc. | | | | |
| | | | | 4.500%, 11/19/2020 | | | 6,829 | |
| | 169,150 | | | DS Waters of America, Inc. | | | | |
| | | | | 5.250%, 08/30/2020 | | | 171,793 | |
| | 80,000 | | | Energy Transfer Equity L.P. | | | | |
| | | | | 3.250%, 12/02/2019 | | | 79,927 | |
| | 55,000 | | | Entegris, Inc. | | | | |
| | | | | 2.984%, 03/25/2021 | | | 55,000 | |
| | 39,900 | | | Filtration Group Corporation | | | | |
| | | | | 4.500%, 11/21/2020 | | | 40,249 | |
| | 69,125 | | | FleetPride Corp. | | | | |
| | | | | 5.250%, 11/19/2019 | | | 68,491 | |
| | 57,857 | | | Fogo de Chão Churrascaria | | | | |
| | | | | Holdings, LLC | | | | |
| | | | | 11.000%, 01/20/2020 | | | 58,255 | |
| | | | | Garda World Security Corporation | | | | |
| | 49,247 | | | 4.000%, 11/08/2020 | | | 49,370 | |
| | 12,598 | | | 4.000%, 11/08/2020 | | | 12,630 | |
| | 189,050 | | | Gardner Denver, Inc. | | | | |
| | | | | 4.250%, 07/30/2020 | | | 189,204 | |
| | 153,063 | | | Getty Images, Inc. | | | | |
| | | | | 4.750%, 10/18/2019 | | | 147,179 | |
| | 140,000 | | | Grifols, S.A. | | | | |
| | | | | 3.236%, 03/06/2021 | | | 140,088 | |
| | 49,875 | | | Grosvenor Capital Management, L.P. | | | | |
| | | | | 3.750%, 11/25/2020 | | | 49,750 | |
| | 44,775 | | | Harbor Freight Tools USA, Inc. | | | | |
| | | | | 4.750%, 07/26/2019 | | | 45,286 | |
| | 30,319 | | | HarbourVest Partners, LLC | | | | |
| | | | | 3.250%, 02/03/2021 | | | 30,167 | |
| | 128,000 | | | IMG Worldwide, Inc. | | | | |
| | | | | 4.483%, 03/12/2021 | | | 127,520 | |
| | 40,000 | | | IMS Health Holdings, Inc. | | | | |
| | | | | 3.750%, 03/07/2021 | | | 39,981 | |
| | 142,003 | | | Infor Global Solutions, Inc. | | | | |
| | | | | 3.750%, 06/03/2020 | | | 141,790 | |
See notes to financial statements.
GuideMarkSM Opportunistic Fixed Income Fund
SCHEDULE OF INVESTMENTS (Continued)
March 31, 2014
Principal
Amount | | | | | Value | |
| | | | | BANK LOANS (Continued) | |
| | 109,496 | | | Inmar, Inc. | | | | |
| | | | | 4.250%, 01/27/2021 | | $ | 108,675 | |
| | 34,650 | | | Integra Telecom, Inc. | | | | |
| | | | | 5.250%, 02/22/2019 | | | 34,867 | |
| | 130,000 | | | International Lease Finance Corp. | | | | |
| | | | | 3.500%, 02/27/2021 | | | 130,255 | |
| | 46,667 | | | iQor, Inc. | | | | |
| | | | | 5.236%, 02/14/2021 | | | 45,520 | |
| | 95,000 | | | J. Crew Group, Inc. | | | | |
| | | | | 4.000%, 02/28/2021 | | | 94,926 | |
| | 40,000 | | | La Quinta Holdings, Inc. | | | | |
| | | | | 3.234%, 02/21/2021 | | | 40,069 | |
| | 118,583 | | | Las Vegas Sands Corp. | | | | |
| | | | | 3.250%, 12/19/2020 | | | 118,536 | |
| | | | | Level 3 Communications, Inc. | | | | |
| | 32,678 | | | 4.000%, 08/01/2019 | | | 32,787 | |
| | 110,442 | | | 4.000%, 01/15/2020 | | | 110,787 | |
| | 91,782 | | | Lightower Fiber Networks, LLC | | | | |
| | | | | 4.000%, 04/11/2020 | | | 91,839 | |
| | 80,000 | | | Mallinckrodt, LLC | | | | |
| | | | | 3.500%, 03/06/2021 | | | 80,144 | |
| | 89,325 | | | Matrix Acquisition Corp. | | | | |
| | | | | 4.000%, 06/07/2020 | | | 89,753 | |
| | 94,526 | | | Microsemi Corporation | | | | |
| | | | | 4.204%, 02/19/2020 | | | 94,703 | |
| | 72,295 | | | Murray Energy Corporation | | | | |
| | | | | 5.250%, 11/21/2019 | | | 73,044 | |
| | 39,551 | | | National Mentor Holdings, Inc. | | | | |
| | | | | 4.750%, 01/29/2021 | | | 39,889 | |
| | | | | Nexeo Solutions Holdings, LLC | | | | |
| | 99,561 | | | 5.000%, 09/08/2017 | | | 99,810 | |
| | 36,522 | | | 5.000%, 09/08/2017 | | | 36,590 | |
| | 50,000 | | | Nine West Holdings, Inc. | | | | |
| | | | | 3.734%, 06/19/2019 | | | 50,344 | |
| | 59,700 | | | NXP Semiconductors N.V. | | | | |
| | | | | 3.750%, 01/11/2020 | | | 59,588 | |
| | 79,800 | | | Open Text Corporation | | | | |
| | | | | 3.250%, 12/19/2020 | | | 80,041 | |
| | 41,973 | | | Orascom Construction Industries Co. | | | | |
| | | | | 6.250%, 08/20/2019 | | | 42,497 | |
| | 218,350 | | | Pacific Drilling Co. | | | | |
| | | | | 4.500%, 06/04/2018 | | | 219,524 | |
| | 90,000 | | | Paradigm Ltd. | | | | |
| | | | | 10.500%, 07/24/2020 | | | 91,575 | |
Principal
Amount | | | | | Value | |
| | | | | BANK LOANS (Continued) | |
| | 70,000 | | | Patheon, Inc. | | | | |
| | | | | 4.250%, 01/23/2021 | | $ | 69,752 | |
| | 38,024 | | | PharMEDium Services, LLC | | | | |
| | | | | 4.250%, 01/23/2021 | | | 38,143 | |
| | 118,206 | | | Pinnacle Agriculture Holdings, LLC | | | | |
| | | | | 4.750%, 11/15/2018 | | | 118,649 | |
| | 60,309 | | | Pinnacle Foods, Inc. | | | | |
| | | | | 3.250%, 04/29/2020 | | | 60,120 | |
| | 61,920 | | | Planet Fitness (Pty) Ltd. | | | | |
| | | | | 3.984%, 03/25/2021 | | | 62,462 | |
| | | | | PowerTeam Services, LLC | | | | |
| | 39,700 | | | 4.250%, 05/06/2020 | | | 39,601 | |
| | 4,950 | | | 4.250%, 05/06/2020 | | | 4,937 | |
| | 111,021 | | | Quintiles Transnational Holdings, Inc. | | | | |
| | | | | 3.750%, 06/08/2018 | | | 111,229 | |
| | 14,963 | | | Realogy Holdings Corp. | | | | |
| | | | | 3.750%, 03/05/2020 | | | 15,056 | |
| | 54,724 | | | Reddy Ice Holdings, Inc. | | | | |
| | | | | 6.750%, 05/01/2019 | | | 54,450 | |
| | 129,350 | | | Renaissance Learning, Inc. | | | | |
| | | | | 6.250%, 10/16/2020 | | | 130,051 | |
| | 105,000 | | | Rocket Software, Inc. | | | | |
| | | | | 10.250%, 02/08/2019 | | | 105,700 | |
| | 68,198 | | | Salix Pharmaceuticals, Ltd. | | | | |
| | | | | 4.250%, 01/02/2020 | | | 68,901 | |
| | | | | SBA Communications Corp. | | | | |
| | 30,000 | | | 3.250%, 02/05/2021 | | | 29,944 | |
| | 30,000 | | | 3.250%, 02/05/2021 | | | 29,944 | |
| | 135,243 | | | Sedgwick CMS Holdings, Inc. | | | | |
| | | | | 3.750%, 02/10/2021 | | | 134,060 | |
| | 88,875 | | | Sequa Corp. | | | | |
| | | | | 5.250%, 06/18/2017 | | | 87,153 | |
| | 139,298 | | | Sinclair Broadcast Group, Inc. | | | | |
| | | | | 3.000%, 04/09/2020 | | | 138,183 | |
| | 80,936 | | | Sprouts Farmers Market, Inc. | | | | |
| | | | | 4.000%, 04/23/2020 | | | 81,062 | |
| | 48,479 | | | Stallion Oilfield Services, Inc. | | | | |
| | | | | 8.000%, 06/19/2018 | | | 49,661 | |
| | 81,819 | | | Talbots, Inc. | | | | |
| | | | | 3.985%, 03/14/2020 | | | 81,921 | |
| | 59,850 | | | Taminco Group Holdings | | | | |
| | | | | 3.250%, 02/15/2019 | | | 59,925 | |
| | 44,663 | | | Tata Chemicals Ltd. | | | | |
| | | | | 3.750%, 08/07/2020 | | | 44,914 | |
See notes to financial statements.
GuideMarkSM Opportunistic Fixed Income Fund
SCHEDULE OF INVESTMENTS (Continued)
March 31, 2014
Principal
Amount | | | | | Value | |
| | | | | BANK LOANS (Continued) | |
| | 49,875 | | | The Brickman Group, Ltd. | | | | |
| | | | | 4.003%, 12/18/2020 | | $ | 50,044 | |
| | 107,826 | | | TNT Crane and Rigging, Inc. | | | | |
| | | | | 5.500%, 11/26/2020 | | | 108,971 | |
| | 49,623 | | | Transdigm Group, Inc. | | | | |
| | | | | 3.750%, 02/28/2020 | | | 49,716 | |
| | 119,700 | | | Tribune Company | | | | |
| | | | | 4.000%, 12/27/2020 | | | 119,880 | |
| | | | | TriZetto Corp. | | | | |
| | 137,155 | | | 4.750%, 05/02/2018 | | | 136,949 | |
| | 35,000 | | | 8.500%, 03/28/2019 | | | 35,263 | |
| | 34,274 | | | VAT Vakuumventile AG | | | | |
| | | | | 4.750%, 01/28/2021 | | | 34,595 | |
| | 75,000 | | | Verint Systems, Inc. | | | | |
| | | | | 3.500%, 09/06/2019 | | | 75,084 | |
| | 12,482 | | | WESCO International, Inc. | | | | |
| | | | | 3.750%, 12/12/2019 | | | 12,559 | |
| | 217,498 | | | Wilsonart International, Inc. | | | | |
| | | | | 4.000%, 10/31/2019 | | | 217,226 | |
| | | | | Total Bank Loans | | | | |
| | | | | (Cost $9,788,867) | | | 9,855,002 | |
| | | | | COLLATERALIZED MORTGAGE
OBLIGATIONS - 13.01% | |
| | | | | Adjustable Rate Mortgage | | | | |
| | 50,033 | | | Series 2004-4, 2.685%, | | | | |
| | | | | 03/25/2035 (a) | | | 47,561 | |
| | 58,554 | | | Series 2004-5, 2.556%, | | | | |
| | | | | 04/25/2035 (a) | | | 57,175 | |
| | 109,052 | | | Series 2004-5, 2.617%, | | | | |
| | | | | 04/25/2035 (a) | | | 108,046 | |
| | | | | Alternative Loan Trust | | | | |
| | 115,986 | | | Series 2005-J1, 5.500%, | | | | |
| | | | | 02/25/2025 | | | 118,571 | |
| | 42,020 | | | Series 2003-9T1, 5.500%, | | | | |
| | | | | 07/25/2033 | | | 42,999 | |
| | 51,223 | | | Series 2003-20CB, 5.750%, | | | | |
| | | | | 10/25/2033 | | | 54,162 | |
| | 93,695 | | | Series 2004-14T2, 5.500%, | | | | |
| | | | | 08/25/2034 | | | 98,011 | |
| | 88,667 | | | Series 2006-4CB, 5.500%, | | | | |
| | | | | 04/25/2036 | | | 82,526 | |
| | 228,708 | | | Series 2006-J4, 6.250%, | | | | |
| | | | | 07/25/2036 | | | 157,305 | |
Principal
Amount | | | | | Value | |
| | | | | COLLATERALIZED MORTGAGE
OBLIGATIONS (Continued) | |
| | 215,012 | | | Series 2007-4CB, 5.750%, | | | | |
| | | | | 04/25/2037 | | $ | 194,193 | |
| | | | | Banc of America Alternative Loan | | | | |
| | | | | Trust | | | | |
| | 69,353 | | | Series 2003-8, 5.500%, | | | | |
| | | | | 10/25/2033 | | | 71,830 | |
| | 144,770 | | | Series 2003-10, 5.500%, | | | | |
| | | | | 12/25/2033 | | | 149,211 | |
| | 84,548 | | | Series 2013-10, 5.500%, | | | | |
| | | | | 12/25/2033 | | | 87,435 | |
| | | | | Banc of America Funding Corp. | | | | |
| | 191,100 | | | Series 2004-B, 2.580%, | | | | |
| | | | | 11/20/2034 (a) | | | 182,742 | |
| | 44,542 | | | Series 2005-5, 5.500%, | | | | |
| | | | | 09/25/2035 | | | 46,895 | |
| | 1,997,180 | | | Series 2006-3, 5.750%, | | | | |
| | | | | 03/25/2036 | | | 1,879,249 | |
| | 115,894 | | | Series 2008-R4, 0.604%, | | | | |
| | | | | 07/25/2037 (Acquired 10/17/2012, | | | | |
| | | | | Cost $80,507) (a)(b) | | | 74,182 | |
| | 127,095 | | | Bank of America Mortgage | | | | |
| | | | | Securities, Inc. | | | | |
| | | | | Series 2005-A, 2.725%, | | | | |
| | | | | 02/25/2035 (a) | | | 127,384 | |
| | 240,000 | | | Bear Stearns Commercial Mortgage | | | | |
| | | | | Securities Trust | | | | |
| | | | | Series 2003-PWR2, 6.618%, | | | | |
| | | | | 05/11/2039 (Acquired 03/06/2012, | | | | |
| | | | | Cost $245,693) (a)(b) | | | 246,867 | |
| | 835,000 | | | CFCRE Commercial Mortgage Trust | | | | |
| | | | | Series 2011-C1, 5.730%, 04/15/2044 | | | | |
| | | | | (Acquired 04/19/2011 and 05/17/2011, | | | | |
| | | | | Cost $828,225) (a)(b) | | | 912,703 | |
| | | | | Chase Mortgage Finance Trust | | | | |
| | 97,741 | | | Series 2007-A1, 2.646%, | | | | |
| | | | | 02/25/2037 (a) | | | 96,569 | |
| | 1,318,030 | | | Series 2007-S3, 6.000%, | | | | |
| | | | | 05/25/2037 | | | 1,140,108 | |
| | | | | CHL Mortgage Pass-Through Trust | | | | |
| | 66,569 | | | Series 2003-57, 5.500%, | | | | |
| | | | | 01/25/2034 | | | 69,910 | |
| | 68,654 | | | Series 2004-HYB4, 2.501%, | | | | |
| | | | | 09/20/2034 (a) | | | 67,273 | |
See notes to financial statements.
GuideMarkSM Opportunistic Fixed Income Fund
SCHEDULE OF INVESTMENTS (Continued)
March 31, 2014
Principal
Amount | | | | | Value | |
| | | | | COLLATERALIZED MORTGAGE
OBLIGATIONS (Continued) | |
| | 301,602 | | | Series 2004-HYB8, 3.368%, | | | | |
| | | | | 01/20/2035 (a) | | $ | 297,275 | |
| | 96,162 | | | Series 2005-11, 0.424%, | | | | |
| | | | | 04/25/2035 (a) | | | 79,498 | |
| | 86,639 | | | Series 2005-21, 5.500%, | | | | |
| | | | | 10/25/2035 | | | 80,525 | |
| | 191,359 | | | Series 2006-10, 6.000%, | | | | |
| | | | | 05/25/2036 | | | 178,319 | |
| | 175,049 | | | Series 2006-20, 6.000%, | | | | |
| | | | | 02/25/2037 | | | 162,218 | |
| | 120,530 | | | Citicorp Mortgage Securities Trust | | | | |
| | | | | Series 2006-4, 6.000%, | | | | |
| | | | | 08/25/2036 | | | 123,709 | |
| | 225,000 | | | Citigroup Commercial Mortgage Trust | | | | |
| | | | | Series 2013-375P, 3.635%, 05/10/2035 | | | | |
| | | | | (Acquired 05/16/2013, | | | | |
| | | | | Cost $211,145) (a)(b) | | | 207,430 | |
| | | | | Citigroup Mortgage Loan Trust | | | | |
| | 18,669 | | | Series 2005-2, 2.618%, | | | | |
| | | | | 05/25/2035 (a) | | | 18,082 | |
| | 512,573 | | | Series 2010-8, 4.000%, | | | | |
| | | | | 11/25/2036 (Acquired 11/01/2012, | | | | |
| | | | | Cost $525,675) (b) | | | 531,003 | |
| | | | | CitiMortgage Alternative Loan Trust | | | | |
| | 160,366 | | | Series 2006-A3, 6.000%, | | | | |
| | | | | 07/25/2036 | | | 144,303 | |
| | 132,862 | | | Series 2006-A3, 6.000%, | | | | |
| | | | | 09/25/2036 | | | 116,573 | |
| | 301,051 | | | Series 2007-A6, 6.000%, | | | | |
| | | | | 06/25/2037 | | | 256,859 | |
| | 145,023 | | | Series 2007-A6, 6.000%, | | | | |
| | | | | 06/25/2037 | | | 123,734 | |
| | | | | Credit Suisse First Boston Mortgage | | | | |
| | | | | Securities Corp. | | | | |
| | 59,066 | | | Series 2005-1, 5.250%, | | | | |
| | | | | 05/25/2028 | | | 60,240 | |
| | 43,668 | | | Series 2003-AR26, 2.672%, | | | | |
| | | | | 11/25/2033 (a) | | | 42,116 | |
| | 37,122 | | | Series 2003-AR28, 2.603%, | | | | |
| | | | | 12/25/2033 (a) | | | 35,927 | |
| | 116,595 | | | Series 2004-AR4, 2.573%, | | | | |
| | | | | 05/25/2034 (a) | | | 113,545 | |
Principal
Amount | | | | | Value | |
| | | | | COLLATERALIZED MORTGAGE
OBLIGATIONS (Continued) | |
| | 165,356 | | | Series 2005-10, 5.500%, | | | | |
| | | | | 11/25/2035 | | $ | 148,325 | |
| | 188,353 | | | Credit Suisse Mortgage Capital | | | | |
| | | | | Certificates | | | | |
| | | | | Series 2006-8, 6.500%, | | | | |
| | | | | 10/25/2021 | | | 157,344 | |
| | | | | Credit Suisse Mortgage Capital | | | | |
| | | | | Mortgage-Backed Securities | | | | |
| | 717,092 | | | Series 2006-9, 6.000%, | | | | |
| | | | | 11/25/2036 | | | 696,772 | |
| | 758,145 | | | Series 2007-1, 6.000%, | | | | |
| | | | | 02/25/2037 | | | 670,086 | |
| | 100,000 | | | Del Coronado Trust | | | | |
| | | | | Series 2013-HDMZ, 5.152%, | | | | |
| | | | | 03/15/2018 (Acquired 04/01/2013, | | | | |
| | | | | Cost $100,086) (a)(b) | | | 100,280 | |
| | | | | Deutsche Alt-A Securities, Inc. | | | | |
| | 72,338 | | | Series 2005-3, 5.250%, | | | | |
| | | | | 06/25/2035 | | | 74,159 | |
| | 61,598 | | | Series 2005-5, 5.500%, | | | | |
| | | | | 11/25/2035 (a) | | | 57,771 | |
| | 895,651 | | | Series 2006-AR1, 5.104%, | | | | |
| | | | | 02/25/2036 (a) | | | 756,719 | |
| | 381,000 | | | Extended Stay America Trust | | | | |
| | | | | Series 2013-ESH, 5.521%, | | | | |
| | | | | 12/05/2031 (Acquired 01/31/2013, | | | | |
| | | | | Cost $396,992) (a)(b) | | | 396,337 | |
| | 81,910 | | | FDIC Trust | | | | |
| | | | | Series 2013-N1, 4.500%, 10/25/2018 | | | | |
| | | | | (Acquired 11/08/2013, | | | | |
| | | | | Cost $82,584) (a)(b) | | | 83,348 | |
| | 663,334 | | | First Horizon Alternative Mortgage | | | | |
| | | | | Securities | | | | |
| | | | | Series 2007-FA4, 6.250%, | | | | |
| | | | | 08/25/2037 | | | 579,098 | |
| | 794,644 | | | First Horizon Mortgage Pass-Through | | | | |
| | | | | Trust | | | | |
| | | | | Series 2007-4, 6.000%, | | | | |
| | | | | 08/25/2037 | | | 681,972 | |
| | 19,349 | | | GMAC Mortgage Loan Trust | | | | |
| | | | | Series 2003-J7, 5.000%, | | | | |
| | | | | 11/25/2033 | | | 20,075 | |
See notes to financial statements.
GuideMarkSM Opportunistic Fixed Income Fund
SCHEDULE OF INVESTMENTS (Continued)
March 31, 2014
Principal
Amount | | | | | Value | |
| | | | | COLLATERALIZED MORTGAGE
OBLIGATIONS (Continued) | |
| | | | | GSR Mortgage Loan Trust | | | | |
| | 151,653 | | | Series 2004-14, 2.753%, | | | | |
| | | | | 12/25/2034 (a) | | $ | 151,947 | |
| | 58,716 | | | Series 2004-14, 2.761%, | | | | |
| | | | | 12/25/2034 (a) | | | 52,947 | |
| | 173,730 | | | Series 2005-AR4, 2.710%, | | | | |
| | | | | 07/25/2035 (a) | | | 162,196 | |
| | 233,922 | | | Series 2006-8F, 6.000%, | | | | |
| | | | | 09/25/2036 | | | 200,693 | |
| | 1,293,586 | | | Series 2006-9F, 6.500%, | | | | |
| | | | | 10/25/2036 | | | 1,143,432 | |
| | 635,839 | | | Series 2007-4F, 6.000%, | | | | |
| | | | | 07/25/2037 | | | 583,291 | |
| | | | | Hilton USA Trust | | | | |
| | 100,000 | | | Series 2013-HLT, 3.714%, | | | | |
| | | | | 11/07/2030 (Acquired 11/22/2013, | | | | |
| | | | | Cost $100,479) (b) | | | 101,583 | |
| | 100,000 | | | Series 2013-HLT, 4.407%, | | | | |
| | | | | 11/07/2030 (Acquired 11/22/2013, | | | | |
| | | | | Cost $100,479) (b) | | | 102,065 | |
| | 100,000 | | | Series 2013-HLT, 4.453%, | | | | |
| | | | | 11/07/2030 (Acquired 11/22/2013, | | | | |
| | | | | Cost $100,480) (b) | | | 101,601 | |
| | 902,158 | | | IndyMac IMJA Mortgage Loan Trust | | | | |
| | | | | Series A-1, 6.250%, | | | | |
| | | | | 11/25/2037 | | | 798,993 | |
| | | | | IndyMac INDX Mortgage Loan Trust | | | | |
| | 883,568 | | | Series 2005-AR1, 2.459%, | | | | |
| | | | | 03/25/2035 (a) | | | 885,352 | |
| | 51,996 | | | Series 2005-AR16IP, 0.794%, | | | | |
| | | | | 07/25/2045 (a) | | | 47,511 | |
| | 145,640 | | | JPMorgan Alternative Loan Trust | | | | |
| | | | | Series 2006-A1, 2.440%, | | | | |
| | | | | 03/25/2036 (a) | | | 127,649 | |
| | | | | JPMorgan Chase Commercial | | | | |
| | | | | Mortgage Securities Trust | | | | |
| | 98,906 | | | Series 2013-JWMZ, 6.152%, | | | | |
| | | | | 04/15/2018 (Acquired 05/23/2013, | | | | |
| | | | | Cost $99,702) (a)(b) | | | 99,865 | |
| | 8,625,005 | | | Series 2012-C8, 2.301%, | | | | |
| | | | | 10/15/2045 (a)(d) | | | 959,338 | |
Principal
Amount | | | | | Value | |
| | | | | COLLATERALIZED MORTGAGE
OBLIGATIONS (Continued) | |
| | | | | JPMorgan Mortgage Trust | | | | |
| | 94,091 | | | Series 2005-A5, 2.858%, | | | | |
| | | | | 08/25/2035 (a) | | $ | 94,847 | |
| | 202,357 | | | Series 2005-S3, 6.000% | | | | |
| | | | | 01/25/2036 | | | 179,682 | |
| | 149,421 | | | Series 2006-A7, 2.526%, | | | | |
| | | | | 01/25/2037 (a) | | | 132,993 | |
| | 183,337 | | | Series 2007-S1, 5.750%, | | | | |
| | | | | 03/25/2037 | | | 151,909 | |
| | | | | MASTR Adjustable Rate Mortgages | | | | |
| | | | | Trust | | | | |
| | 147,966 | | | Series 2004-7, 2.496%, | | | | |
| | | | | 07/25/2034 (a) | | | 146,540 | |
| | 963,754 | | | Series 2006-2, 2.633%, | | | | |
| | | | | 01/25/2036 (a) | | | 946,010 | |
| | | | | MASTR Alternative Loan Trust | | | | |
| | 61,347 | | | Series 2003-9, 5.250%, | | | | |
| | | | | 11/25/2033 | | | 63,886 | |
| | 69,985 | | | Series 2004-5, 5.500%, | | | | |
| | | | | 06/25/2034 | | | 73,720 | |
| | 76,400 | | | Series 2004-5, 6.000%, | | | | |
| | | | | 06/25/2034 | | | 81,259 | |
| | 177,156 | | | Series 2004-8, 6.000%, | | | | |
| | | | | 09/25/2034 | | | 182,216 | |
| | 24,130 | | | Series 2004-12, 5.250%, | | | | |
| | | | | 12/25/2034 | | | 24,367 | |
| | 118,931 | | | Merrill Lynch Mortgage Investors | | | | |
| | | | | Trust | | | | |
| | | | | Series 2006-2, 2.106%, | | | | |
| | | | | 05/25/2036 (a) | | | 119,646 | |
| | 400,000 | | | Morgan Stanley Capital I Trust | | | | |
| | | | | Series 2011-C2, 5.482%, | | | | |
| | | | | 06/15/2044 (Acquired 06/22/2011, | | | | |
| | | | | Cost $348,517) (a)(b) | | | 412,258 | |
| | 1,332,319 | | | Morgan Stanley Mortgage Loan Trust | | | | |
| | | | | Series 2005-10, 6.000%, | | | | |
| | | | | 12/25/2035 | | | 1,107,914 | |
| | 200,000 | | | Motel 6 Trust | | | | |
| | | | | Series 2012-MTL6, 3.781%, | | | | |
| | | | | 10/05/2025 (Acquired 11/02/2012, | | | | |
| | | | | Cost $199,999) (a)(b) | | | 201,941 | |
See notes to financial statements.
GuideMarkSM Opportunistic Fixed Income Fund
SCHEDULE OF INVESTMENTS (Continued)
March 31, 2014
Principal
Amount | | | | | Value | |
| | | | | COLLATERALIZED MORTGAGE
OBLIGATIONS (Continued) | |
| | 108,972 | | | New York Mortgage Trust | | | | |
| | | | | Series 2006-1, 2.676%, | | | | |
| | | | | 05/25/2036 (a) | | $ | 98,263 | |
| | | | | Residential Asset Securitization Trust | | | | |
| | 1,232,165 | | | Series 2007-A2, 6.000%, | | | | |
| | | | | 04/25/2037 | | | 1,096,671 | |
| | 976,706 | | | Series 2007-A6, 6.000%, | | | | |
| | | | | 06/25/2037 | | | 875,416 | |
| | 1,282,307 | | | Series 2007-A7, 6.000%, | | | | |
| | | | | 07/25/2037 | | | 1,054,456 | |
| | 159,986 | | | Residential Funding Mortgage | | | | |
| | | | | Securities I | | | | |
| | | | | Series 2006-S1, 5.750%, | | | | |
| | | | | 01/25/2036 | | | 165,462 | |
| | 91,614 | | | Structured Adjustable Rate Mortgage | | | | |
| | | | | Loan Trust | | | | |
| | | | | Series 2005-14, 0.464%, | | | | |
| | | | | 07/25/2035 (a) | | | 76,174 | |
| | | | | WaMu Mortgage Pass-Through | | | | |
| | | | | Certificates | | | | |
| | 49,198 | | | Series 2004-CB2, 5.500%, | | | | |
| | | | | 07/25/2034 | | | 52,272 | |
| | 260,604 | | | Series 2006-AR19, 2.034%, | | | | |
| | | | | 01/25/2047 (a) | | | 236,801 | |
| | 92,726 | | | Series 2007-OA3, 0.889%, | | | | |
| | | | | 04/25/2047 (a) | | | 83,655 | |
| | 367,439 | | | Washington Mutual Mortgage | | | | |
| | | | | Pass-Through Certificates | | | | |
| | | | | Series 2006-5, 6.000%, | | | | |
| | | | | 07/25/2036 | | | 304,742 | |
| | 499,338 | | | Wells Fargo Alternative Loan Trust | | | | |
| | | | | Series 2007-PA1, 6.000%, | | | | |
| | | | | 03/25/2037 | | | 446,704 | |
| | | | | Wells Fargo Mortgage Backed | | | | |
| | | | | Securities Trust | | | | |
| | 51,405 | | | Series 2003-J, 2.612%, | | | | |
| | | | | 10/25/2033 (a) | | | 52,446 | |
| | 131,407 | | | Series 2004-A, 2.634%, | | | | |
| | | | | 02/25/2034 (a) | | | 134,353 | |
| | 49,888 | | | Series 2005-AR10, 2.614%, | | | | |
| | | | | 06/25/2035 (a) | | | 50,654 | |
| | 160,094 | | | Series 2005-11, 5.500%, | | | | |
| | | | | 11/25/2035 | | | 168,507 | |
Principal
Amount | | | | | Value | |
| | | | | COLLATERALIZED MORTGAGE
OBLIGATIONS (Continued) | |
| | 115,000 | | | Series 2005-16, 6.000%, | | | | |
| | | | | 12/25/2035 | | $ | 114,262 | |
| | 100,659 | | | Series 2005-17, 5.500%, | | | | |
| | | | | 01/25/2036 | | | 104,193 | |
| | | | | Total Collateralized Mortgage | | | | |
| | | | | Obligations (Cost $27,656,356) | | | 27,659,231 | |
| | | | | | | | | |
Number of
Shares | | | | | | | |
| | | | | COMMON STOCKS - 1.45% | |
| | | | | Automobiles - 0.14% | |
| | 5,576 | | | General Motors Co. | | | 191,926 | |
| | 850 | | | Toyota Motor Corp. - ADR | | | 95,965 | |
| | | | | | | | 287,891 | |
| | | | | Banks - 0.02% | |
| | 1,059 | | | HSBC Holdings Plc - ADR | | | 53,829 | |
| | | | | Chemicals - 0.17% | |
| | 1,281 | | | Rockwood Holdings, Inc. | | | 95,307 | |
| | 3,631 | | | The Dow Chemical Co. | | | 176,430 | |
| | 3,455 | | | Tronox Ltd. | | | 82,125 | |
| | | | | | | | 353,862 | |
| | | | | Computers & Peripherals - 0.04% | |
| | 3,460 | | | EMC Corp. | | | 94,839 | |
| | | | | Diversified Telecommunication Services - 0.13% | |
| | 2,511 | | | AT&T, Inc. | | | 88,061 | |
| | 4,037 | | | Verizon Communications, Inc. | | | 192,040 | |
| | | | | | | | 280,101 | |
| | | | | Food & Staples Retailing - 0.10% | |
| | 1,629 | | | CVS Caremark Corp. | | | 121,947 | |
| | 1,079 | | | Wal-Mart Stores, Inc. | | | 82,468 | |
| | | | | | | | 204,415 | |
| | | | | Gas Utilities - 0.02% | |
| | 2,485 | | | Tokyo Gas Co., Ltd. - ADR (e) | | | 50,893 | |
| | | | | Industrial Conglomerates - 0.04% | |
| | 634 | | | Siemens AG - ADR | | | 85,685 | |
| | | | | Office Electronics - 0.02% | |
| | 1,139 | | | Canon, Inc. - ADR | | | 35,377 | |
| | | | | Oil & Gas - 0.09% | |
| | 1,317 | | | Exxon Mobil Corp. | | | 128,645 | |
| | 2,493 | | | Statoil ASA - ADR | | | 70,352 | |
| | | | | | | | 198,997 | |
See notes to financial statements.
GuideMarkSM Opportunistic Fixed Income Fund
SCHEDULE OF INVESTMENTS (Continued)
March 31, 2014
Number of
Shares | | | | | Value | |
| | | | | COMMON STOCKS (Continued) | |
| | | | | Pharmaceuticals - 0.38% | |
| | 988 | | | Bayer AG - ADR | | $ | 133,637 | |
| | 2,739 | | | Eli Lilly & Co. | | | 161,218 | |
| | 1,662 | | | GlaxoSmithKline Plc - ADR | | | 88,801 | |
| | 1,237 | | | Johnson & Johnson | | | 121,510 | |
| | 2,936 | | | Pfizer, Inc. | | | 94,304 | |
| | 3,238 | | | Roche Holdings Ltd. - ADR | | | 122,137 | |
| | 1,674 | | | Sanofi - ADR | | | 87,517 | |
| | | | | | | | 809,124 | |
| | | | | Semiconductor & Semiconductor | |
| | | | | Equipment - 0.06% | |
| | 932 | | | KLA-Tencor Corp. | | | 64,438 | |
| | 1,370 | | | Texas Instruments, Inc. | | | 64,596 | |
| | | | | | | | 129,034 | |
| | | | | Tobacco - 0.11% | |
| | 2,434 | | | Altria Group, Inc. | | | 91,105 | |
| | 545 | | | British American Tobacco Plc - ADR | | | 60,729 | |
| | 965 | | | Philip Morris International, Inc. | | | 79,004 | |
| | | | | | | | 230,838 | |
| | | | | Trading Companies & Distributors - 0.07% | |
| | 2,030 | | | Mitsubishi Corp. - ADR (e) | | | 75,354 | |
| | 288 | | | Mitsui & Co., Ltd. - ADR (e) | | | 81,236 | |
| | | | | | | | 156,590 | |
| | | | | Transportation - 0.02% | |
| | 22 | | | CEVA Holdings, LLC (e) | | | 37,458 | |
| | | | | Wireless Telecommunication Services - 0.04% | |
| | 2,161 | | | Vodafone Group Plc - ADR | | | 79,546 | |
| | | | | Total Common Stocks | | | | |
| | | | | (Cost $2,633,600) | | | 3,088,479 | |
| | | | | | | | | |
Principal
Amount | | | | | | | |
| | | | | CONVERTIBLE OBLIGATIONS - 1.42% | |
| | | | | Auto Components - 0.04% | |
| | 30,000 | | | TRW Automotive, Inc. | | | | |
| | | | | 3.500%, 12/01/2015 | | | 83,344 | |
| | | | | Automobiles - 0.12% | |
| | 140,000 | | | Ford Motor Co. | | | | |
| | | | | 4.250%, 11/15/2016 | | | 254,187 | |
| | | | | Biotechnology - 0.17% | |
| | 100,000 | | | Gilead Sciences, Inc. | | | | |
| | | | | 1.625%, 05/01/2016 | | | 311,250 | |
Principal
Amount | | | | | Value | |
| | | | | Biotechnology (Continued) | |
| | | | | BioMarin Pharmaceutical, Inc. | | | | |
| | 20,000 | | | 0.750%, 10/15/2018 | | $ | 22,013 | |
| | 28,000 | | | 1.500%, 10/15/2020 | | | 31,220 | |
| | | | | | | | 364,483 | |
| | | | | Communications Equipment - 0.05% | |
| | 75,000 | | | Ciena Corp. | | | | |
| | | | | 3.750%, 10/15/2018 (Acquired | | | | |
| | | | | 01/17/2012 and 11/04/2013, | | | | |
| | | | | Cost $84,504) (b) | | | 105,328 | |
| | | | | Computers & Peripherals - 0.06% | |
| | 80,000 | | | SanDisk Corp. | | | | |
| | | | | 1.500%, 08/15/2017 | | | 131,950 | |
| | | | | Energy Equipment & Services - 0.05% | |
| | 85,000 | | | Hornbeck Offshore Services, Inc. | | | | |
| | | | | 1.500%, 09/01/2019 | | | 96,953 | |
| | | | | Health Care Equipment & Supplies - 0.07% | |
| | 135,000 | | | Hologic, Inc. | | | | |
| | | | | 2.000%, 03/01/2042 | | | 138,291 | |
| | | | | Internet & Catalog Retail - 0.14% | |
| | | | | Priceline.com, Inc. | | | | |
| | 63,000 | | | 1.000%, 03/15/2018 | | | 89,499 | |
| | 183,000 | | | 0.350%, 06/15/2020 (Acquired | | | | |
| | | | | 08/07/2013 through 09/13/2013, | | | | |
| | | | | Cost $185,683) (b) | | | 216,970 | |
| | | | | | | | 306,469 | |
| | | | | Metals & Mining - 0.43% | |
| | 780,000 | | | B2Gold Corp. | | | | |
| | | | | 3.250%, 10/01/2018 (Acquired | | | | |
| | | | | 08/19/2013, Cost $780,000) (b) | | | 819,492 | |
| | 74,000 | | | United States Steel Corp. | | | | |
| | | | | 2.750%, 04/01/2019 | | | 96,246 | |
| | | | | | | | 915,738 | |
| | | | | Oil & Gas - 0.06% | |
| | 50,000 | | | Chesapeake Energy Corp. | | | | |
| | | | | 2.750%, 11/15/2035 | | | 52,344 | |
| | 90,000 | | | Peabody Energy Corp. | | | | |
| | | | | 4.750%, 12/15/2041 | | | 73,237 | |
| | | | | | | | 125,581 | |
| | | | | Pharmaceuticals - 0.06% | |
| | 35,000 | | | Mylan, Inc. | | | | |
| | | | | 3.750%, 09/15/2015 | | | 128,822 | |
See notes to financial statements.
GuideMarkSM Opportunistic Fixed Income Fund
SCHEDULE OF INVESTMENTS (Continued)
March 31, 2014
Principal
Amount | | | | | Value | |
| | | | CONVERTIBLE OBLIGATIONS (Continued) | |
| | | | | Semiconductor & Semiconductor Equipment - 0.13% | |
| | 90,000 | | | Intel Corp. | | | | |
| | | | | 3.250%, 08/01/2039 | | $ | 126,000 | |
| | 15,000 | | | Micron Technology, Inc. | | | | |
| | | | | 3.125%, 05/01/2032 | | | 37,322 | |
| | 65,000 | | | Xilinx, Inc. | | | | |
| | | | | 2.625%, 06/15/2017 | | | 122,200 | |
| | | | | | | | 285,522 | |
| | | | | Software - 0.04% | |
| | 85,000 | | | Nuance Communications, Inc. | | | | |
| | | | | 2.750%, 11/01/2031 | | | 85,584 | |
| | | | | Total Convertible Obligations | | | | |
| | | | | (Cost $2,510,053) | | | 3,022,252 | |
| | | | | | | | | |
Number of
Shares | | | | | | | |
| | | | | CONVERTIBLE PREFERRED STOCKS - 0.54% | |
| | | | | Electric Utilities - 0.01% | |
| | 400 | | | NextEra Energy, Inc. | | | 24,532 | |
| | | | | Metals & Mining - 0.09% | |
| | 7,595 | | | ArcelorMittal SA | | | 182,128 | |
| | | | | Multi-Utilities - 0.02% | |
| | 698 | | | Dominion Resources, Inc. | | | 40,135 | |
| | | | | Oil & Gas - 0.05% | |
| | 91 | | | Chesapeake Energy Corp. (Acquired | | | | |
| | | | | 10/19/2012, Cost $91,288) (b) | | | 101,977 | |
| | | | | Real Estate - 0.28% | |
| | 3,046 | | | iStar Financial, Inc. | | | 196,467 | |
| | 7,500 | | | Weyerhaeuser Co. | | | 409,500 | |
| | | | | | | | 605,967 | |
| | | | | Wireless Telecommunication Services - 0.09% | |
| | 1,828 | | | Crown Castle International Corp. | | | 185,341 | |
| | | | | Total Convertible Preferred Stocks | | | | |
| | | | | (Cost $1,020,165) | | | 1,140,080 | |
| | | | | | | | | |
Principal
Amount | | | | | | | |
| | | | | CORPORATE OBLIGATIONS - 16.88% | |
| | | | | Aerospace & Defense - 0.15% | |
| | 305,000 | | | Meccanica Holdings USA, Inc. | | | | |
| | | | | 6.250%, 01/15/2040 | | | | |
| | | | | (Acquired 11/29/2012 and | | | | |
| | | | | 12/07/2012, Cost $268,182) (b) | | $ | 277,550 | |
| | | | | | | | | |
Principal
Amount | | | | | Value | |
| | | | | Aerospace & Defense (Continued) | |
| | 35,000 | | | Rockwell Collins, Inc. | | | | |
| | | | | 0.583%, 12/15/2016 (a) | | $ | 35,043 | |
| | | | | | | | 312,593 | |
| | | | | Auto Components - 0.07% | |
| | 100,000 | | | The Goodyear Tire & Rubber Co. | | | | |
| | | | | 6.500%, 03/01/2021 | | | 109,500 | |
| | 30,000 | | | Lear Corp. | | | | |
| | | | | 5.375%, 03/15/2024 | | | 30,675 | |
| | | | | | | | 140,175 | |
| | | | | Automobiles - 0.22% | |
| | 260,000 | | | Nissan Motor Acceptance Corp. | | | | |
| | | | | 0.786%, 03/03/2017 (Acquired | | | | |
| | | | | 02/25/2014, Cost $260,000) (a)(b) | | | 260,641 | |
| | 200,000 | | | Volkswagen International Finance NV | | | | |
| | | | | 0.676%, 11/18/2016 (Acquired | | | | |
| | | | | 11/13/2013, Cost $200,000) (a)(b) | | | 200,444 | |
| | | | | | | | 461,085 | |
| | | | | Banks - 1.94% | |
| | 630,000 | | | Banco Santander Brasil SA | | | | |
| | | | | 8.000%, 03/18/2016 (Acquired | | | | |
| | | | | 05/02/2013, Cost $316,348) (b) | | | 259,261 | |
| | | | | Bank of America Corp. | | | | |
| | 140,000 | | | 1.266%, 01/15/2019 (a) | | | 141,731 | |
| | 385,000 | | | 2.650%, 04/01/2019 | | | 386,677 | |
| | | | | CIT Group, Inc. | | | | |
| | 100,000 | | | 5.375%, 05/15/2020 | | | 107,750 | |
| | 100,000 | | | 5.000%, 08/15/2022 | | | 104,188 | |
| | 1,000,000 | | | Halyk Savings Bank of Kazakhstan JSC | | | | |
| | | | | 7.250%, 01/28/2021 (Acquired | | | | |
| | | | | 04/05/2011 and 04/11/2011, | | | | |
| | | | | Cost $1,015,390) (b) | | | 1,054,000 | |
| | | | | JPMorgan Chase & Co. | | | | |
| | 100,000 | | | 6.000%, 12/29/2049 (a) | | | 99,000 | |
| | 800,000 | | | 4.250%, 11/02/2018 | | | 664,763 | |
| | | | | Royal Bank of Scotland Group Plc | | | | |
| | 675,000 | | | 6.125%, 12/15/2022 | | | 709,299 | |
| | 200,000 | | | 6.934%, 04/09/2018 | | | 315,257 | |
| | 275,000 | | | Societe Generale SA | | | | |
| | | | | 5.000%, 01/17/2024 | | | | |
| | | | | (Acquired 01/14/2014, | | | | |
| | | | | Cost $272,506) (b) | | | 274,571 | |
| | | | | | | | 4,116,497 | |
See notes to financial statements.
GuideMarkSM Opportunistic Fixed Income Fund
SCHEDULE OF INVESTMENTS (Continued)
March 31, 2014
Principal
Amount | | | | | Value | |
| | | | | CORPORATE OBLIGATIONS (Continued) | |
| | | | | Beverages - 0.19% | |
| | 315,000 | | | Coca-Cola Co. | | | | |
| | | | | 0.338%, 11/01/2016 (a) | | $ | 315,366 | |
| | 90,000 | | | Crestview DS Merger Sub II, Inc. | | | | |
| | | | | 10.000%, 09/01/2021 (Acquired | | | | |
| | | | | 02/11/2014, Cost $99,078) (b) | | | 100,350 | |
| | | | | | | | 415,716 | |
| | | | | Business Services - 0.54% | |
| | 1,120,000 | | | Alfa Bond OJSC Via Alfa Bond | | | | |
| | | | | Issuance Plc | | | | |
| | | | | 7.750%, 04/28/2021 (Acquired | | | | |
| | | | | 04/19/2011, Cost $1,120,000) (b) . | | | 1,150,800 | |
| | | | | Chemicals - 0.48% | |
| | 660,000 | | | Hercules, Inc. | | | | |
| | | | | 6.500%, 06/30/2029 | | | 587,400 | |
| | | | | INEOS Group Holdings SA | | | | |
| | 100,000 | | | 6.500%, 08/15/2018 (Acquired | | | | |
| | | | | 05/02/2013, Cost $130,659) (b) | | | 145,009 | |
| | 100,000 | | | 5.750%, 02/15/2019 (Acquired | | | | |
| | | | | 02/11/2014, Cost $136,400) (b) | | | 141,538 | |
| | 140,000 | | | Monsanto Co. | | | | |
| | | | | 0.436%, 11/07/2016 (a) | | | 140,308 | |
| | | | | | | | 1,014,255 | |
| | | | | Commercial Services & Supplies - 0.12% | |
| | 250,000 | | | ServiceMaster Co. | | | | |
| | | | | 7.000%, 08/15/2020 | | | 265,937 | |
| | | | | Communications - 0.10% | |
| | 200,000 | | | Univision Communications, Inc. | | | | |
| | | | | 7.875%, 11/01/2020 (Acquired | | | | |
| | | | | 04/20/2011, Cost $210,427) (b) | | | 222,000 | |
| | | | | Construction & Engineering - 0.05% | |
| | 300,000 | | | Odebrecht Finance Ltd. | | | | |
| | | | | 8.250%, 04/25/2018 (Acquired | | | | |
| | | | | 04/17/2013, Cost $149,348) (b) | | | 111,062 | |
| | | | | Construction Materials - 0.17% | |
| | 100,000 | | | Cemex Finance LLC | | | | |
| | | | | 5.250%, 04/01/2021 (Acquired | | | | |
| | | | | 03/25/2014, Cost $138,265) (b)(c) | | | 137,766 | |
| | 200,000 | | | Cemex S.A.B. de C.V. | | | | |
| | | | | 9.000%, 01/11/2018 (Acquired | | | | |
| | | | | 07/06/2011 and 07/13/2012, | | | | |
| | | | | Cost $192,733) (b) | | | 218,500 | |
| | | | | | | | 356,266 | |
Principal
Amount | | | | | Value | |
| | | | | Consumer Finance - 0.29% | |
| | 200,000 | | | Ally Financial, Inc. | | | | |
| | | | | 7.500%, 09/15/2020 | | $ | 238,500 | |
| | 150,000 | | | Caterpillar Financial Services Corp. | | | | |
| | | | | 0.466%, 03/03/2017 (a) | | | 150,024 | |
| | | | | SLM Corp. | | | | |
| | 100,000 | | | 8.450%, 06/15/2018 | | | 118,125 | |
| | 100,000 | | | 5.500%, 01/15/2019 | | | 106,125 | |
| | | | | | | | 612,774 | |
| | | | | Containers & Packaging - 0.10% | |
| | 200,000 | | | Ardagh Packaging Finance Plc | | | | |
| | | | | 9.125%, 10/15/2020 (Acquired | | | | |
| | | | | 11/26/2013, Cost $215,694) (b) | | | 224,000 | |
| | | | | Diversified Financial Services - 0.88% | |
| | 200,000 | | | Ford Motor Credit Co. LLC | | | | |
| | | | | 1.006%, 01/17/2017 (a) | | | 201,241 | |
| | | | | General Electric Capital Corp. | | | | |
| | 300,000 | | | 7.125%, 06/15/2022 (a) | | | 342,542 | |
| | 145,000 | | | 0.457%, 01/14/2016 (a) | | | 145,167 | |
| | 100,000 | | | General Motors Financial Co., Inc. | | | | |
| | | | | 3.250%, 05/15/2018 | | | 101,250 | |
| | 250,000 | | | Hyundai Capital Services, Inc. | | | | |
| | | | | 1.035%, 03/18/2017 (Acquired | | | | |
| | | | | 03/11/2014, Cost $250,000) (a)(b) | | | 250,472 | |
| | | | | Icahn Enterprises LP | | | | |
| | 236,000 | | | 4.875%, 03/15/2019 (Acquired | | | | |
| | | | | 01/08/2014, Cost $236,000) (b) | | | 240,720 | |
| | 200,000 | | | 5.875%, 02/01/2022 (Acquired | | | | |
| | | | | 01/22/2014, Cost $200,000) (b) | | | 203,500 | |
| | 100,000 | | | Nuveen Investments, Inc. | | | | |
| | | | | 9.500%, 10/15/2020 (Acquired | | | | |
| | | | | 09/12/2012, Cost $100,000) (b) | | | 107,000 | |
| | 100,000 | | | PNK Finance Corp. | | | | |
| | | | | 6.375%, 08/01/2021 (Acquired | | | | |
| | | | | 07/30/2013, Cost $100,000) (b) | | | 104,500 | |
| | 185,733 | | | Schahin II Finance Co. SPV Ltd. | | | | |
| | | | | 5.875%, 09/25/2022 (Acquired | | | | |
| | | | | 03/21/2012, Cost $185,733) (b) | | | 179,465 | |
| | | | | | | | 1,875,857 | |
| | | | | Diversified Telecommunication Services - 0.35% | |
| | 100,000 | | | Cricket Communications, Inc. | | | | |
| | | | | 7.750%, 10/15/2020 | | | 114,475 | |
| | 100,000 | | | Frontier Communications Corp. | | | | |
| | | | | 7.875%, 01/15/2027 | | | 101,250 | |
See notes to financial statements.
GuideMarkSM Opportunistic Fixed Income Fund
SCHEDULE OF INVESTMENTS (Continued)
March 31, 2014
Principal
Amount | | | | | Value | |
| | | | | CORPORATE OBLIGATIONS (Continued) | |
| | | | | Diversified Telecommunication Services
(Continued) | |
| | 525,000 | | | Verizon Communications, Inc. | | | | |
| | | | | 4.150%, 03/15/2024 | | $ | 534,455 | |
| | | | | | | | 750,180 | |
| | | | | Electric Utilities - 0.51% | |
| | 580,000 | | | Cia de Eletricidade do Estado da Bahia | | | | |
| | | | | 11.750%, 04/27/2016 (Acquired | | | | |
| | | | | 04/19/2011, Cost $367,321) (b) | | | 244,755 | |
| | 60,000 | | | Duke Energy Progress, Inc. | | | | |
| | | | | 0.435%, 03/06/2017 (a) | | | 59,992 | |
| | 500,000 | | | Enel SpA | | | | |
| | | | | 8.750%, 09/24/2073 (Acquired | | | | |
| | | | | 09/17/2013 and 01/27/2014, | | | | |
| | | | | Cost $515,853) (b) | | | 562,300 | |
| | 200,000 | | | InterGen NV | | | | |
| | | | | 7.000%, 06/30/2023 (Acquired | | | | |
| | | | | 06/07/2013, Cost $196,463) (b) | | | 211,000 | |
| | | | | | | | 1,078,047 | |
| | | | | Energy Equipment & Services - 0.10% | |
| | 200,000 | | | CGG | | | | |
| | | | | 7.750%, 05/15/2017 | | | 203,500 | |
| | 13,000 | | | Pioneer Energy Services Corp. | | | | |
| | | | | 6.125%, 03/15/2022 (Acquired | | | | |
| | | | | 03/04/2014, Cost $13,000) (b) | | | 13,260 | |
| | | | | | | | 216,760 | |
| | | | | Food Distributors - 0.02% | |
| | 50,000 | | | KeHE Distributors LLC / KeHE | | | | |
| | | | | Finance Corp. | | | | |
| | | | | 7.625%, 08/15/2021 (Acquired | | | | |
| | | | | 07/30/2013, Cost $50,000) (b) | | | 53,844 | |
| | | | | Food Products - 0.30% | |
| | 445,000 | | | BRF SA | | | | |
| | | | | 7.750%, 05/22/2018 (Acquired | | | | |
| | | | | 05/15/2013, Cost $219,889) (b) | | | 162,487 | |
| | 142,000 | | | Del Monte Corp. | | | | |
| | | | | 7.625%, 02/15/2019 | | | 148,124 | |
| | 200,000 | | | JBS USA, LLC / JBS USA Finance, Inc. | | | | |
| | | | | 8.250%, 02/01/2020 (Acquired | | | | |
| | | | | 01/25/2012 and 05/17/2012, | | | | |
| | | | | Cost $197,069) (b) | | | 220,000 | |
Principal
Amount | | | | | Value | |
| | | | | Food Products (Continued) | |
| | 100,000 | | | Sun Merger Sub, Inc. | | | | |
| | | | | 5.875%, 08/01/2021 (Acquired | | | | |
| | | | | 07/19/2013, Cost $100,000) (b) | | $ | 104,000 | |
| | | | | | | | 634,611 | |
| | | | | Health Care Providers & Services - 0.61% | |
| | 105,000 | | | BioScrip, Inc. | | | | |
| | | | | 8.875%, 02/15/2021 (Acquired | | | | |
| | | | | 02/06/2014 and 02/07/2014, | | | | |
| | | | | Cost $105,700) (b) | | | 109,594 | |
| | 75,000 | | | Catamaran Corp. | | | | |
| | | | | 4.750%, 03/15/2021 | | | 76,219 | |
| | | | | CHS/Community Health Systems, Inc. | | | | |
| | 200,000 | | | 8.000%, 11/15/2019 | | | 220,750 | |
| | 115,000 | | | 6.875%, 02/01/2022 (Acquired | | | | |
| | | | | 01/15/2014, Cost $115,000) (b) | | | 120,750 | |
| | | | | HCA, Inc. | | | | |
| | 200,000 | | | 7.875%, 02/15/2020 | | | 213,400 | |
| | 215,000 | | | 5.000%, 03/15/2024 | | | 215,940 | |
| | | | | Tenet Healthcare Corp. | | | | |
| | 100,000 | | | 8.125%, 04/01/2022 | | | 112,000 | |
| | 100,000 | | | 5.000%, 03/01/2019 (Acquired | | | | |
| | | | | 03/05/2014, Cost $100,000) (b) | | | 100,125 | |
| | 117,000 | | | WellCare Health Plans, Inc. | | | | |
| | | | | 5.750%, 11/15/2020 | | | 123,435 | |
| | | | | | | | 1,292,213 | |
| | | | | Holding Companies-Diversified - 0.17% | |
| | 100,000 | | | Faenza GmbH | | | | |
| | | | | 8.250%, 08/15/2021 (Acquired | | | | |
| | | | | 07/25/2013, Cost $132,850) (b) | | | 152,231 | |
| | 200,000 | | | Stena AB | | | | |
| | | | | 7.000%, 02/01/2024 (Acquired | | | | |
| | | | | 01/17/2014, Cost $200,000) (b) | | | 204,000 | |
| | | | | | | | 356,231 | |
| | | | | Hotels, Restaurants & Leisure - 0.22% | |
| | 250,000 | | | Caesars Entertainment Operating Co., Inc. | | | | |
| | | | | 11.250%, 06/01/2017 | | | 241,250 | |
| | 200,000 | | | MGM Resorts International | | | | |
| | | | | 7.500%, 06/01/2016 | | | 223,750 | |
| | | | | | | | 465,000 | |
See notes to financial statements.
GuideMarkSM Opportunistic Fixed Income Fund
SCHEDULE OF INVESTMENTS (Continued)
March 31, 2014
Principal
Amount | | | | | Value | |
| | | | | CORPORATE OBLIGATIONS (Continued) | |
| | | | | Household Durables - 0.07% | |
| | 145,000 | | | Desarrolladora Homex SAB de CV | | | | |
| | | | | 9.750%, 03/25/2020 (Acquired | | | | |
| | | | | 04/12/13 through 04/17/2013, | | | | |
| | | | | Cost $85,866) (b)(f) | | $ | 16,856 | |
| | 125,000 | | | KB Home | | | | |
| | | | | 7.000%, 12/15/2021 | | | 134,844 | |
| | | | | | | | 151,700 | |
| | | | | Household Products - 0.20% | |
| | 145,000 | | | Procter & Gamble Co. | | | | |
| | | | | 0.317%, 11/04/2016 (a) | | | 145,057 | |
| | 250,000 | | | Reynolds Group Issuer LLC | | | | |
| | | | | 8.250%, 02/15/2021 | | | 274,062 | |
| | | | | | | | 419,119 | |
| | | | | Independent Power & Renewable Electricity | |
| | | | | Producers - 0.10% | |
| | 15,000 | | | AES Corp. | | | | |
| | | | | 5.500%, 03/15/2024 | | | 14,925 | |
| | | | | Calpine Corp. | | | | |
| | 100,000 | | | 6.000%, 01/15/2022 (Acquired | | | | |
| | | | | 10/17/2013, Cost $99,193) (b) | | | 105,500 | |
| | 100,000 | | | 5.875%, 01/15/2024 (Acquired | | | | |
| | | | | 10/29/2013, Cost $100,000) (b) | | | 102,000 | |
| | | | | | | | 222,425 | |
| | | | | Insurance - 0.54% | |
| | 700,000 | | | Assicurazioni Generali SpA | | | | |
| | | | | 7.750%, 12/12/2042 (a) | | | 1,154,956 | |
| | | | | Internet Software & Services - 0.05% | |
| | 100,000 | | | Equinix, Inc. | | | | |
| | | | | 5.375%, 04/01/2023 | | | 102,500 | |
| | | | | IT Services - 0.06% | |
| | 120,000 | | | iGATE Corp. | | | | |
| | | | | 4.750%, 04/15/2019 (Acquired | | | | |
| | | | | 03/19/2014, Cost $120,000) (b) | | | 121,050 | |
| | | | | Machinery - 0.11% | |
| | 22,000 | | | BlueLine Rental Finance Corp. | | | | |
| | | | | 7.000%, 02/01/2019 (Acquired | | | | |
| | | | | 01/16/2014, Cost $22,000) (b) | | | 23,320 | |
| | 200,000 | | | Navistar International Corp. | | | | |
| | | | | 8.250%, 11/01/2021 | | | 204,750 | |
| | | | | | | | 228,070 | |
Principal
Amount | | | | | Value | |
| | | | | Media - 0.56% | |
| | 100,000 | | | CCO Holdings LLC / CCO Holdings | | | | |
| | | | | Capital Corp. | | | | |
| | | | | 5.250%, 09/30/2022 | | $ | 99,125 | |
| | 200,000 | | | Clear Channel Communications, Inc. | | | | |
| | | | | 9.000%, 03/01/2021 | | | 209,750 | |
| | | | | Clear Channel Worldwide Holdings, Inc. | | | | |
| | 85,000 | | | 7.625%, 03/15/2020 | | | 92,225 | |
| | 100,000 | | | 6.500%, 11/15/2022 | | | 107,375 | |
| | 200,000 | | | Columbus International, Inc. | | | | |
| | | | | 7.375%, 03/30/2021 (Acquired | | | | |
| | | | | 03/24/14, Cost $200,000) (b) | | | 206,250 | |
| | 150,000 | | | DISH DBS Corp. | | | | |
| | | | | 7.125%, 02/01/2016 | | | 164,250 | |
| | 100,000 | | | Gannett Co., Inc. | | | | |
| | | | | 5.125%, 07/15/2020 (Acquired | | | | |
| | | | | 07/24/2013, Cost $98,566) (b) | | | 103,250 | |
| | 200,000 | | | VTR Finance BV | | | | |
| | | | | 6.875%, 01/15/2024 (Acquired | | | | |
| | | | | 01/17/2017, Cost $200,000) (b) | | | 208,500 | |
| | | | | | | | 1,190,725 | |
| | | | | Metals & Mining - 0.36% | |
| | 45,000 | | | Allegheny Technologies, Inc. | | | | |
| | | | | 5.950%, 01/15/2021 | | | 47,564 | |
| | 200,000 | | | Arcelormittal SA | | | | |
| | | | | 6.000%, 03/01/2021 | | | 214,250 | |
| | | | | First Quantum Minerals Ltd. | | | | |
| | 115,000 | | | 6.750%, 02/15/2020 (Acquired | | | | |
| | | | | 05/15/2012, Cost $98,858) (b) | | | 117,013 | |
| | 115,000 | | | 7.000%, 02/15/2021 (Acquired | | | | |
| | | | | 05/15/2012, Cost $98,807) (b) | | | 117,587 | |
| | 250,000 | | | FMG Resources Ltd. | | | | |
| | | | | 6.875%, 02/01/2018 (Acquired | | | | |
| | | | | 04/26/2011, Cost $262,587) (b) | | | 264,062 | |
| | | | | | | | 760,476 | |
| | | | | Multi-Utilities - 0.09% | |
| | 250,000 | | | Texas Competitive Electric | | | | |
| | | | | Holdings Co., LLC | | | | |
| | | | | 11.500%, 10/01/2020 (Acquired | | | | |
| | | | | 04/14/2011 and 11/09/2011, | | | | |
| | | | | Cost $242,815) (b) | | | 193,125 | |
See notes to financial statements.
GuideMarkSM Opportunistic Fixed Income Fund
SCHEDULE OF INVESTMENTS (Continued)
March 31, 2014
Principal
Amount | | | | | Value | |
| | | | | CORPORATE OBLIGATIONS (Continued) | |
| | | | | Oil & Gas - 3.78% | |
| | 125,000 | | | BP Capital Markets Plc | | | | |
| | | | | 0.656%, 11/07/2016 (a) | | $ | 125,597 | |
| | 200,000 | | | Chaparral Energy, Inc. | | | | |
| | | | | 8.250%, 09/01/2021 | | | 221,000 | |
| | 200,000 | | | Chesapeake Energy Corp. | | | | |
| | | | | 6.125%, 02/15/2021 | | | 219,000 | |
| | 100,000 | | | Clayton Williams Energy, Inc. | | | | |
| | | | | 7.750%, 04/01/2019 | | | 106,750 | |
| | 280,000 | | | Continental Resources, Inc. | | | | |
| | | | | 5.000%, 09/15/2022 | | | 294,350 | |
| | 100,000 | | | Halcon Resources Corp. | | | | |
| | | | | 9.250%, 02/15/2022 (Acquired | | | | |
| | | | | 08/08/2013, Cost $100,000) (b) | | | 104,750 | |
| | 75,000 | | | Jones Energy Holdings LLC | | | | |
| | | | | 6.750%, 04/01/2022 (Acquired | | | | |
| | | | | 03/27/2014, Cost $75,000) (b) | | | 76,500 | |
| | 250,000 | | | Linn Energy LLC / Linn Energy | | | | |
| | | | | Finance Corp. | | | | |
| | | | | 7.750%, 02/01/2021 | | | 270,000 | |
| | 200,000 | | | Offshore Group Investment Ltd. | | | | |
| | | | | 7.500%, 11/01/2019 | | | 214,000 | |
| | 100,000 | | | Penn Virginia Corporation | | | | |
| | | | | 8.500%, 05/01/2020 | | | 111,750 | |
| | 340,000 | | | Petrobras Global Finance BV | | | | |
| | | | | 6.250%, 03/17/2024 | | | 351,139 | |
| | | | | Petroleos de Venezuela SA | | | | |
| | 485,000 | | | 5.500%, 04/12/2037 | | | 253,412 | |
| | 4,650,000 | | | 4.900%, 10/28/2014 | | | 4,452,375 | |
| | 43,000 | | | Petroleos Mexicanos | | | | |
| | | | | 7.650%, 11/24/2021 (Acquired | | | | |
| | | | | 12/01/2011, Cost $316,078) (b) | | | 345,250 | |
| | 250,000 | | | Plains Exploration & Production Co. | | | | |
| | | | | 6.625%, 05/01/2021 | | | 275,000 | |
| | | | | OGX Austria GmbH | | | | |
| | 200,000 | | | 8.500%, 06/01/2018 (Acquired | | | | |
| | | | | 04/17/2013, Cost $117,896) (b)(f) | | | 11,000 | |
| | 800,000 | | | 8.375%, 04/01/2022 (Acquired | | | | |
| | | | | 03/27/2012 through 06/29/2012, | | | | |
| | | | | Cost $770,692) (b)(f) | | | 40,000 | |
| | 200,000 | | | Quicksilver Resources, Inc. | | | | |
| | | | | 9.125%, 08/15/2019 | | | 200,000 | |
Principal
Amount | | | | | Value | |
| | | | | Oil & Gas (Continued) | |
| | 200,000 | | | Samson Investment Co. | | | | |
| | | | | 10.750%, 02/15/2020 (Acquired | | | | |
| | | | | 02/06/2012, Cost $200,000) (b) | | $ | 219,000 | |
| | 145,000 | | | Shell International Finance BV | | | | |
| | | | | 0.446%, 11/15/2016 (a) | | | 145,246 | |
| | | | | | | | 8,036,119 | |
| | | | | Pharmaceuticals - 0.27% | |
| | 200,000 | | | Grifols Worldwide Operations Ltd. | | | | |
| | | | | 5.250%, 04/01/2022 (Acquired | | | | |
| | | | | 03/05/2014, Cost $200,000) (b) | | | 205,000 | |
| | 135,000 | | | Johnson & Johnson | | | | |
| | | | | 0.303%, 11/28/2016 (a) | | | 135,234 | |
| | 200,000 | | | VPII Escrow Corp. | | | | |
| | | | | 7.500%, 07/15/2021 (Acquired | | | | |
| | | | | 06/27/2013, Cost $200,000) (b) | | | 226,000 | |
| | | | | | | | 566,234 | |
| | | | | Pipelines - 0.14% | |
| | 100,000 | | | Regency Energy Partners LP | | | | |
| | | | | 5.875%, 03/01/2022 | | | 104,000 | |
| | | | | Sabine Pass Liquefaction LLC | | | | |
| | 100,000 | | | 5.625%, 04/15/2023 | | | 99,875 | |
| | 100,000 | | | 5.625%, 02/01/2021 | | | 103,625 | |
| | | | | | | | 307,500 | |
| | | | | Publishing - 0.05% | |
| | 100,000 | | | Visant Corp. | | | | |
| | | | | 10.000%, 10/01/2017 | | | 100,125 | |
| | | | | Real Estate - 0.26% | |
| | 150,000 | | | Host Hotels & Resorts LP | | | | |
| | | | | 5.250%, 03/15/2022 | | | 163,472 | |
| | 375,000 | | | Rialto Holdings LLC / Rialto Corp. | | | | |
| | | | | 7.000%, 12/01/2018 (Acquired | | | | |
| | | | | 11/08/2013 through 03/06/2014, | | | | |
| | | | | Cost $377,700) (b) | | | 386,953 | |
| | | | | | | | 550,425 | |
| | | | | Road & Rail - 0.14% | |
| | 195,000 | | | Canadian National Railway Co. | | | | |
| | | | | 0.436%, 11/06/2015 (a) | | | 195,079 | |
| | 100,000 | | | PBF Holding Co. LLC / PBF | | | | |
| | | | | Finance Corp. | | | | |
| | | | | 8.250%, 02/15/2020 | | | 109,000 | |
| | | | | | | | 304,079 | |
See notes to financial statements.
GuideMarkSM Opportunistic Fixed Income Fund
SCHEDULE OF INVESTMENTS (Continued)
March 31, 2014
Principal
Amount | | | | | Value | |
| | | | | CORPORATE OBLIGATIONS (Continued) | |
| | | | | Semiconductor & Semiconductor Equipment - 0.21% | |
| | 250,000 | | | Abengoa Finance SAU
8.875%, 11/01/2017 (Acquired
04/12/2011, Cost $252,698) (b) | | $ | 281,875 | |
| | 94,000 | | | Freescale Semiconductor, Inc.
8.050%, 02/01/2020 | | | 103,752 | |
| | 40,000 | | | Novellus Systems, Inc.
2.625%, 05/15/2041 | | | 68,475 | |
| | | | | | | | 454,102 | |
| | | | | Software - 0.29% | | | | |
| | 210,000 | | | Blackboard, Inc.
7.750%, 11/15/2019 (Acquired
10/24/2013, Cost $210,000) (b) | | | 221,025 | |
| | 100,000 | | | BMC Software Finance, Inc.
8.125%, 07/15/2021 (Acquired
08/07/2013, Cost $100,000) (b) | | | 105,750 | |
| | | | | First Data Corp. | | | | |
| | 150,000 | | | 8.250%, 01/15/2021 (Acquired
02/17/2012 and 04/24/2012,
Cost $146,987) (b) | | | 163,500 | |
| | 100,000 | | | 12.625%, 01/15/2021 | | | 119,500 | |
| | | | | | | | 609,775 | |
| | | | | Telecommunication Services - 0.86% | |
| | 200,000 | | | Digicel Group Ltd.
8.250%, 09/30/2020 (Acquired
09/05/2012, Cost $200,000) (b) | | | 214,500 | |
| | 250,000 | | | Intelsat Jackson Holdings SA
7.500%, 04/01/2021 | | | 275,625 | |
| | 200,000 | | | Lynx II Corp.
6.375%, 04/15/2023 (Acquired
02/07/2013, Cost $200,000) (b) | | | 213,000 | |
| | 100,000 | | | Nokia Siemens Networks Finance BV
7.125%, 04/15/2020 (Acquired
03/22/2013, Cost $129,845) (b) | | | 158,568 | |
| | 155,000 | | | Telecom Italia Capital SA
6.000%, 09/30/2034 | | | 145,313 | |
| | | | | T Mobile USA, Inc. | | | | |
| | 100,000 | | | 6.542%, 04/28/2020 | | | 108,000 | |
| | 100,000 | | | 6.500%, 01/15/2024 | | | 105,000 | |
| | 100,000 | | | UPC Holding B.V.
6.750%, 03/15/2023 (Acquired
03/21/2013, Cost $128,966) (b) | | | 150,991 | |
Principal
Amount | | | | | Value | |
| | | | | Telecommunication Services (Continued) | |
| | 200,000 | | | Virgin Media Secured Finance Plc
5.500%, 01/15/2025 (Acquired
03/14/2014, Cost $200,000) (b) | | $ | 203,000 | |
| | 250,000 | | | Wind Acquisition Finance SA
11.750%, 07/15/2017 (Acquired
02/27/2012, Cost $256,875) (b) | | | 263,750 | |
| | | | | | | | 1,837,747 | |
| | | | | Textiles, Apparel & Luxury Goods - 0.88% | |
| | | | | Edcon Holdings (Pty) Limited | | | | |
| | 1,120,000 | | | 9.500%, 03/01/2018 (Acquired
04/05/2011 and 04/12/2011,
Cost $1,125,950) (b) | | | 1,097,600 | |
| | 300,000 | | | 9.500%, 03/01/2018 (Acquired
08/18/2011 through 08/24/2011,
Cost $377,587) (b) | | | 406,065 | |
| | 150,000 | | | 13.375%, 06/30/2019 (Acquired
11/08/2013, Cost $200,393) (b) | | | 187,046 | |
| | 100,000 | | | New Look Bondco I Plc
8.750%, 05/14/2018 (Acquired
05/03/2013, Cost $155,659) (b) | | | 179,644 | |
| | | | | | | | 1,870,355 | |
| | | | | Transportation - 0.09% | |
| | 180,000 | | | CHC Helicopter SA
9.250%, 10/15/2020 | | | 196,425 | |
| | | | | Wireless Telecommunication Services - 0.19% | |
| | 100,000 | | | Crown Castle International Corp.
5.250%, 01/15/2023 | | | 102,125 | |
| | | | | Sprint Communications, Inc. | | | | |
| | 150,000 | | | 9.000%, 11/15/2018 (Acquired
11/04/2011, Cost $150,000) (b) | | | 183,750 | |
| | 100,000 | | | 7.000%, 03/01/2020 (Acquired
02/28/2012, Cost $100,000) (b) | | | 115,750 | |
| | | | | | | | 401,625 | |
| | | | | Total Corporate Obligations
(Cost $35,584,630) | | | 35,904,560 | |
See notes to financial statements.
GuideMarkSM Opportunistic Fixed Income Fund
SCHEDULE OF INVESTMENTS (Continued)
March 31, 2014
Principal
Amount | | | | | Value | |
| | | | | FOREIGN GOVERNMENT DEBT
OBLIGATIONS - 29.78% | | | | |
| | | | | Canadian Government Bond | | | | |
| | 754,000 | | | 2.250%, 08/01/2014 | | $ | 685,113 | |
| | 1,147,000 | | | 1.000%, 11/01/2014 | | | 1,037,934 | |
| | | | | Financing of Infrastructural Projects
State Enterprise | | | | |
| | 100,000 | | | 8.375%, 11/03/2017 (Acquired
05/10/2011, Cost $103,663) (b) | | | 88,500 | |
| | 1,180,000 | | | 7.400%, 04/20/2018 (Acquired
04/15/2011, Cost $1,180,000) (b) | | | 1,029,550 | |
| | | | | Ghana Government Bond | | | | |
| | 2,530,000 | | | 12.390%, 04/28/2014 | | | 940,084 | |
| | 860,000 | | | 13.000%, 06/02/2014 | | | 314,174 | |
| | 10,000 | | | 14.000%, 10/13/2014 | | | 3,557 | |
| | 1,470,000 | | | 14.990%, 02/23/2015 | | | 500,251 | |
| | 1,780,000 | | | 24.000%, 05/25/2015 | | | 648,056 | |
| | 100,000 | | | 21.000%, 10/26/2015 | | | 35,125 | |
| | 75,000 | | | 19.240%, 05/30/2016 | | | 25,496 | |
| | 40,000 | | | 26.000%, 06/05/2017 | | | 15,259 | |
| | 396,000 | | | 23.000%, 08/21/2017 | | | 141,600 | |
| | 990,000 | | | 19.040%, 09/24/2018 | | | 308,198 | |
| | | | | Hungary Government Bond | | | | |
| | 373,600,000 | | | 6.750%, 08/22/2014 | | | 1,699,304 | |
| | 1,800,000 | | | 8.000%, 02/12/2015 | | | 8,402 | |
| | 9,000,000 | | | 7.750%, 08/24/2015 | | | 42,784 | |
| | 8,800,000 | | | 5.500%, 02/12/2016 | | | 40,823 | |
| | 135,000,000 | | | 5.500%, 12/22/2016 | | | 628,355 | |
| | 731,080,000 | | | 6.750%, 02/24/2017 | | | 3,516,046 | |
| | 227,610,000 | | | 6.750%, 11/24/2017 | | | 1,101,535 | |
| | 42,180,000 | | | 4.000%, 04/25/2018 | | | 185,248 | |
| | 22,680,000 | | | 5.500%, 12/20/2018 | | | 105,439 | |
| | 20,540,000 | | | 6.500%, 06/24/2019 | | | 99,131 | |
| | 4,380,000 | | | 7.500%, 11/12/2020 | | | 22,323 | |
| | 3,310,000 | | | 7.000%, 06/24/2022 | | | 16,465 | |
| | 17,900,000 | | | 6.000%, 11/24/2023 | | | 83,896 | |
| | 6,080,000 | | | 5.500%, 06/24/2025 | | | 27,037 | |
| | | | | Hungary Government International
Bond | | | | |
| | 440,000 | | | 4.375%, 07/04/2017 (g) | | | 637,369 | |
| | 150,000 | | | 5.750%, 06/11/2018 (g) | | | 229,471 | |
| | 2,650,000 | | | 6.375%, 03/29/2021 | | | 2,911,687 | |
Principal
Amount | | | | | Value | |
| | | | | FOREIGN GOVERNMENT DEBT
OBLIGATIONS (Continued) | | | | |
| | 200,000 | | | Iceland Government International
Bond
5.875%, 05/11/2022 (Acquired
05/03/2012, Cost $198,140) (b) | | $ | 217,102 | |
| | | | | Ireland Government Bond | | | | |
| | 1,019,000 | | | 4.400%, 06/18/2019 | | | 1,596,617 | |
| | 220,000 | | | 5.900%, 10/18/2019 | | | 368,856 | |
| | 750,000 | | | 4.500%, 04/18/2020 | | | 1,177,380 | |
| | 2,224,000 | | | 5.000%, 10/18/2020 | | | 3,595,253 | |
| | 1,563,000 | | | 5.400%, 03/13/2025 | | | 2,585,900 | |
| | | | | Korea Treasury Bond | | | | |
| | 93,200,000 | | | 3.250%, 06/10/2015 | | | 88,135 | |
| | 2,684,400,000 | | | 2.750%, 12/10/2015 | | | 2,521,651 | |
| | 2,058,200,000 | | | 2.750%, 06/10/2016 | | | 1,931,216 | |
| | 1,846,100,000 | | | 3.000%, 12/10/2016 | | | 1,741,031 | |
| | | | | Malaysia Government Bond | | | | |
| | 220,000 | | | 3.434%, 08/15/2014 | | | 67,473 | |
| | 10,000 | | | 3.741%, 02/27/2015 | | | 3,080 | |
| | 2,015,000 | | | 3.835%, 08/12/2015 | | | 622,895 | |
| | 12,104,000 | | | 4.720%, 09/30/2015 | | | 3,792,765 | |
| | 1,610,000 | | | 3.197%, 10/15/2015 | | | 493,706 | |
| | | | | Mexican Bonos | | | | |
| | 325,090 | | | 6.000%, 06/18/2015 | | | 2,561,262 | |
| | 11,460 | | | 8.000%, 12/17/2015 | | | 93,637 | |
| | 8,600 | | | 6.250%, 06/16/2016 | | | 69,096 | |
| | 8,760 | | | 7.250%, 12/15/2016 | | | 72,341 | |
| | 20,000 | | | 7.750%, 12/14/2017 | | | 169,182 | |
| | 100,000 | | | 8.500%, 12/13/2018 | | | 874,866 | |
| | 235,000 | | | 6.500%, 06/10/2021 | | | 1,886,275 | |
| | | | | Mexican Udibonos | | | | |
| | 10,394 | | | 4.500%, 12/18/2014 (j) | | | 81,831 | |
| | 26,552 | | | 5.000%, 06/16/2016 (j) | | | 220,655 | |
| | 22,692 | | | 3.500%, 12/14/2017 (j) | | | 185,839 | |
| | 13,636 | | | 4.000%, 06/13/2019 (j) | | | 115,228 | |
| | 11,269 | | | 2.500%, 12/10/2020 (j) | | | 88,153 | |
| | 47,800,000 | | | Philippine Government Bond
1.625%, 04/25/2016 | | | 1,051,436 | |
| | | | | Poland Government Bond | | | | |
| | 5,658,000 | | | 2.720%, 01/25/2017 (a) | | | 1,868,549 | |
| | 8,783,000 | | | 2.720%, 01/25/2021 (a) | | | 2,849,435 | |
See notes to financial statements.
GuideMarkSM Opportunistic Fixed Income Fund
SCHEDULE OF INVESTMENTS (Continued)
March 31, 2014
Principal
Amount | | | | | Value | |
| | | | | FOREIGN GOVERNMENT DEBT
OBLIGATIONS (Continued) | | | | |
| | 400,000 | | | Republic of Ghana
7.875%, 08/07/2023 (Acquired
07/25/2013, Cost $396,604) (b) | | $ | 369,000 | |
| | 1,060,000 | | | Republic of Serbia
7.250%, 09/28/2021 (Acquired
09/21/2011, Cost $1,041,588) (b) | | | 1,191,281 | |
| | | | | Serbia Treasury Bonds | | | | |
| | 55,000,000 | | | 10.000%, 03/01/2015 | | | 668,103 | |
| | 20,200,000 | | | 10.000%, 04/27/2015 | | | 244,969 | |
| | 2,320,000 | | | 10.000%, 01/30/2016 | | | 28,101 | |
| | 4,330,000 | | | 10.000%, 06/27/2016 | | | 51,941 | |
| | 1,700,000 | | | 10.000%, 08/15/2016 | | | 20,327 | |
| | 990,000 | | | 10.000%, 10/17/2016 | | | 11,822 | |
| | 10,400,000 | | | 10.000%, 12/19/2016 | | | 123,998 | |
| | 18,170,000 | | | 10.000%, 11/08/2017 | | | 210,942 | |
| | 890,000 | | | 10.000%, 11/21/2018 | | | 10,024 | |
| | 310,000 | | | Singapore Government Bond
1.125%, 04/01/2016 | | | 249,643 | |
| | 610,000 | | | Slovenia Government International
Bond
5.850%, 05/10/2023 (Acquired
05/02/2013 and 08/02/2013,
Cost $594,402) (b) | | | 667,950 | |
| | | | | Sri Lanka Government Bonds | | | | |
| | 37,900,000 | | | 11.000%, 09/01/2015 | | | 304,300 | |
| | 1,900,000 | | | 8.500%, 11/01/2015 (c) | | | 14,738 | |
| | 132,300,000 | | | 8.000%, 06/01/2016 | | | 1,021,175 | |
| | 16,500,000 | | | 5.800%, 07/15/2017 | | | 119,360 | |
| | 11,130,000 | | | 8.500%, 04/01/2018 | | | 84,067 | |
| | 140,000 | | | 8.500%, 06/01/2018 | | | 1,052 | |
| | 710,000 | | | 7.500%, 08/15/2018 | | | 5,143 | |
| | 8,660,000 | | | 8.000%, 11/15/2018 | | | 63,892 | |
| | 500,000 | | | 10.600%, 07/01/2019 | | | 4,024 | |
| | 340,000 | | | 9.000%, 05/01/2021 | | | 2,468 | |
| | 1,900,000 | | | 11.200%, 07/01/2022 | | | 15,295 | |
| | | | | Ukraine Government International
Bond | | | | |
| | 620,000 | | | 9.250%, 07/24/2017 (Acquired
07/17/2012, Cost $620,000) (b) | | | 613,800 | |
| | 200,000 | | | 9.250%, 07/24/2017 | | | 198,000 | |
Principal
Amount | | | | | Value | |
| | | | | FOREIGN GOVERNMENT DEBT
OBLIGATIONS (Continued) | | | | |
| | 2,300,000 | | | 7.950%, 02/23/2021 (Acquired
04/05/2011 and 04/11/2011,
Cost $2,389,489) (b) | | $ | 2,185,000 | |
| | 1,200,000 | | | 7.500%, 04/17/2023 (Acquired
07/18/2013 through 07/29/2013,
Cost $1,072,134) (b) | | | 1,122,000 | |
| | | | | Uruguay Government International
Bond | | | | |
| | 3,149,010 | | | 5.000%, 09/14/2018 (j) | | | 146,234 | |
| | 4,382,783 | | | 4.250%, 04/05/2027 (j) | | | 201,511 | |
| | 36,524,160 | | | 4.375%, 12/15/2028 (j) | | | 1,694,495 | |
| | 1,007,954 | | | 3.700%, 06/26/2037 (j) | | | 42,285 | |
| | | | | Uruguay Notas del Tesoro | | | | |
| | 96,000 | | | 9.750%, 06/14/2014 | | | 4,193 | |
| | 393,370 | | | 7.000%, 12/23/2014 (j) | | | 17,689 | |
| | 16,480,000 | | | 10.500%, 03/15/2015 | | | 698,890 | |
| | 1,069,740 | | | 4.000%, 06/14/2015 (j) | | | 46,130 | |
| | 2,465,000 | | | 10.250%, 08/22/2015 | | | 102,375 | |
| | 222,000 | | | 9.500%, 01/27/2016 | | | 8,952 | |
| | 3,328,080 | | | 2.750%, 06/16/2016 (j) | | | 137,862 | |
| | 84,900 | | | 4.250%, 01/05/2017 (j) | | | 3,691 | |
| | 310,000 | | | 11.000%, 03/21/2017 | | | 12,171 | |
| | 53,770 | | | 2.250%, 08/23/2017 (j) | | | 2,187 | |
| | 16,980 | | | 3.250%, 01/27/2019 (j) | | | 728 | |
| | 5,971,300 | | | 4.000%, 06/10/2020 (j) | | | 246,950 | |
| | 4,143,120 | | | 4.000%, 06/10/2020 (j) | | | 177,908 | |
| | 1,239,540 | | | 2.500%, 09/27/2022 (j) | | | 48,697 | |
| | 707,500 | | | 4.000%, 05/25/2025 (j) | | | 27,975 | |
| | | | | Total Foreign Government Debt
Obligations (Cost $63,096,558) | | | 63,342,395 | |
| | | | | | | | | |
| | Number of
Shares | | | | | | | |
| | | | | INVESTMENT COMPANIES - 0.24% | |
| | | | | Exchange Traded Funds - 0.24% | |
| | 10,755 | | | WisdomTree Japan Hedged
Equity Fund | | | 509,142 | |
| | | | | Total Investment Companies
(Cost $516,363) | | | 509,142 | |
See notes to financial statements.
GuideMarkSM Opportunistic Fixed Income Fund
SCHEDULE OF INVESTMENTS (Continued)
March 31, 2014
Principal
Amount | | | | | Value | |
| | | | | MORTGAGE BACKED SECURITIES - 11.64% | | | | |
| | | | | Federal Home Loan Mortgage Corp. | | | | |
| | 697,000 | | | Pool # 4050,
3.500%, 05/15/2032 | | $ | 654,085 | |
| | 914,240 | | | Pool # 4062,
3.500%, 06/15/2042 | | | 798,197 | |
| | 1,858,297 | | | Pool # 274,
3.000%, 08/15/2042 | | | 1,778,353 | |
| | 2,113,791 | | | Pool # 4097,
3.500%, 08/15/2042 | | | 1,882,053 | |
| | 2,274,986 | | | Pool #T60853,
3.500%, 09/01/2042 | | | 2,269,342 | |
| | 2,179,524 | | | Pool #T60854,
3.500%, 09/01/2042 | | | 2,174,110 | |
| | 2,367,877 | | | Pool # 284,
3.000%, 10/15/2042 | | | 2,287,010 | |
| | | | | Federal National Mortgage
Association | | | | |
| | 2,628,433 | | | Pool # 1200,
3.000%, 10/01/2032 | | | 2,624,832 | |
| | 1,253,925 | | | Pool # 1201,
3.500%, 10/01/2032 | | | 1,292,731 | |
| | 850,872 | | | Pool # 2005-56,
6.000%, 08/25/2033 (a) | | | 918,863 | |
| | 704,731 | | | Pool # 2011-113,
4.000%, 03/25/2040 | | | 725,767 | |
| | 1,482,093 | | | Pool # 2012-63,
2.000%, 08/25/2040 | | | 1,463,042 | |
| | 2,000,000 | | | Pool # 2011-131,
4.500%, 12/25/2041 | | | 2,171,607 | |
| | 1,859,721 | | | Pool # 2012-125,
3.000%, 11/25/2042 | | | 1,857,712 | |
| | 324,507 | | | Pool # 2013-6,
1.500%, 02/25/2043 | | | 237,600 | |
| | | | | Government National Mortgage
Association | | | | |
| | 1,873,767 | | | Pool # 2010-62,
5.598%, 05/20/2040 (a)(d) | | | 303,882 | |
| | 1,951,407 | | | Pool # 2011-72,
5.228%, 05/20/2041 (a)(d) | | | 257,262 | |
| | 700,000 | | | Pool # 2012-40,
4.000%, 01/20/2042 | | | 710,635 | |
Principal
Amount | | | | | Value | |
| | | | | MORTGAGE BACKED
SECURITIES (Continued) | | | | |
| | 554,017 | | | Pool # 2102-78,
1.061%, 06/16/2052 (a)(d) | | $ | 39,107 | |
| | 3,823,134 | | | Pool # 2012-135,
1.046%, 01/16/2053 (a)(d) | | | 304,367 | |
| | | | | Total Mortgage Backed Securities
(Cost $26,075,485) | | | 24,750,557 | |
| | | | | | | | | |
Number of
Shares | | | | | | | |
| | | | | PREFERRED STOCKS - 0.21% | | | | |
| | | | | Consumer Finance - 0.13% | | | | |
| | 289 | | | Ally Financial, Inc. (Acquired
05/03/2012 through 06/20/2012,
Cost $248,598) (b) | | | 286,887 | |
| | | | | Metal Ore Mining - 0.04% | | | | |
| | 3,692 | | | Cliffs Natural Resources, Inc. | | | 76,535 | |
| | | | | Multi -Utilities - 0.01% | | | | |
| | 547 | | | Dominion Resources, Inc. | | | 31,600 | |
| | | | | Transportation - 0.03% | | | | |
| | 49 | | | CEVA Holdings LLC (e) | | | 60,687 | |
| | | | | Total Preferred Stocks
(Cost $405,885) | | | 455,709 | |
| | | | | | | | | |
Notional
Amount | | | | | | | |
| | | | | PURCHASED OPTIONS - 0.01% | | | | |
| | | | | Call Option | | | | |
| | | | | U.S. Dollar - South Korean Won | | | | |
| | 1,800,000 | | | Expiration: May, 2014,
Exercise Price: $1,099.00 | | | 4,331 | |
| | | | | Put Option | | | | |
| | | | | U.S. Dollar - Chilean Peso | | | | |
| | 1,600,000 | | | Expiration: May, 2014,
Exercise Price: $549.50 | | | 20,035 | |
| | | | | Total Purchased Options
(Cost $19,960) | | | 24,366 | |
See notes to financial statements.
GuideMarkSM Opportunistic Fixed Income Fund
SCHEDULE OF INVESTMENTS (Continued)
March 31, 2014
Principal
Amount | | | | | Value | |
| | | | | SHORT TERM INVESTMENTS - 17.33% | |
| | | | | Foreign Government Debt Obligations - 8.31% | |
| | | | | Bank Negara Malaysia Monetary
Notes | | | | |
| | 2,230,000 | | | 1.841%, 04/03/2014 (h) | | $ | 682,792 | |
| | 990,000 | | | 2.524%, 04/10/2014 (h) | | | 302,957 | |
| | 20,000 | | | 2.565%, 04/15/2014 (h) | | | 6,118 | |
| | 990,000 | | | 2.949%, 04/24/2014 (h) | | | 302,636 | |
| | 1,510,000 | | | 2.983%, 05/15/2014 (h) | | | 460,854 | |
| | 20,000 | | | 2.956%, 05/20/2014 (h) | | | 6,102 | |
| | 70,000 | | | 2.958%, 05/27/2014 (h) | | | 21,345 | |
| | 1,230,000 | | | 2.961%, 06/05/2014 (h) | | | 374,690 | |
| | 10,000 | | | 2.971%, 06/12/2014 (h) | | | 3,044 | |
| | 400,000 | | | 2.966%, 06/19/2014 (h) | | | 121,713 | |
| | 330,000 | | | 2.966%, 06/24/2014 (h) | | | 100,373 | |
| | 20,000 | | | 2.992%, 07/03/2014 (h) | | | 6,079 | |
| | 10,000 | | | 2.972%, 07/10/2014 (h) | | | 3,038 | |
| | 170,000 | | | 2.974%, 07/15/2014 (h) | | | 51,620 | |
| | 10,000 | | | 2.975%, 07/17/2014 (h) | | | 3,036 | |
| | 30,000 | | | 2.978%, 07/24/2014 (h) | | | 9,103 | |
| | 310,000 | | | 2.983%, 08/05/2014 (h) | | | 93,971 | |
| | 340,000 | | | 2.997%, 09/09/2014 (h) | | | 102,775 | |
| | 1,290,000 | | | 3.000%, 09/18/2014 (h) | | | 389,657 | |
| | 1,005,000 | | | 3.017%, 10/28/2014 (h) | | | 302,593 | |
| | 330,000 | | | 3.027%, 11/18/2014 (h) | | | 99,187 | |
| | 330,000 | | | 3.028%, 12/02/2014 (h) | | | 99,143 | |
| | 200,000 | | | 3.038%, 12/16/2014 (h) | | | 59,973 | |
| | 330,000 | | | 3.048%, 01/08/2015 (h) | | | 98,767 | |
| | 1,020,000 | | | 3.073%, 03/05/2015 (h) | | | 303,886 | |
| | 23,240,000 | | | Hungary Treasury Bills
2.860%, 06/25/2014 (h) | | | 103,670 | |
| | | | | Korea Monetary Stabilization
Bond | | | | |
| | 333,000,000 | | | 2.570%, 06/09/2014 | | | 312,835 | |
| | 328,000,000 | | | 2.720%, 09/09/2014 | | | 308,298 | |
| | 443,460,000 | | | 2.740%, 02/02/2015 | | | 416,979 | |
| | 1,604,340,000 | | | 2.470%, 04/02/2015 | | | 1,504,560 | |
| | 6,092,200,000 | | | 2.900%, 12/02/2015 | | | 5,738,927 | |
Principal
Amount | | | | | Value | |
| | | | | Foreign Government Debt
Obligations (Continued) | | | | |
| | | | | Mexico Cetes | | | | |
| | 12,800 | | | 2.469%, 04/03/2014 (h) | | $ | 9,802 | |
| | 72,300 | | | 3.310%, 04/30/2014 (h) | | | 55,208 | |
| | 32,300 | | | 3.387%, 07/10/2014 (h) | | | 24,510 | |
| | 100,900 | | | 3.458%, 09/18/2014 (h) | | | 76,016 | |
| | 803,030 | | | 3.463%, 10/16/2014 (h) | | | 603,520 | |
| | 1,205,800 | | | 3.567%, 12/11/2014 (h) | | | 901,198 | |
| | 310,000 | | | Singapore Treasury Bill
0.243%, 04/04/2014 (h) | | | 246,436 | |
| | | | | Uruguay Treasury Bills | | | | |
| | 1,160,000 | | | 14.260%, 05/16/2014 (h) | | | 50,306 | |
| | 1,360,000 | | | 14.930%, 06/20/2014 (h) | | | 58,117 | |
| | 20,000 | | | 15.210%, 07/24/2014 (h) | | | 843 | |
| | 4,853,000 | | | 15.540%, 08/29/2014 (h) | | | 201,437 | |
| | 280,000 | | | 15.420%, 09/11/2014 (h) | | | 11,569 | |
| | 2,870,000 | | | 14.940%, 12/18/2014 (h) | | | 120,368 | |
| | 4,230,000 | | | 15.160%, 02/05/2015 (h) | | | 171,635 | |
| | 625,430 | | | 13.601%, 03/26/2015 (h)(j) | | | 23,910 | |
| | 23,784,000 | | | 15.310%, 03/26/2015 (h) | | | 962,124 | |
| | 5,471,000 | | | 15.440%, 05/14/2015 (h) | | | 219,186 | |
| | 8,688,000 | | | 15.490%, 07/02/2015 (h) | | | 342,731 | |
| | 26,039,000 | | | 15.530%, 08/20/2015 (h) | | | 943,673 | |
| | 2,840,000 | | | 15.580%, 10/08/2015 (h) | | | 102,607 | |
| | 1,070,000 | | | 15.620%, 11/26/2015 (h) | | | 37,470 | |
| | 90,000 | | | 15.100%, 01/16/2015 (h) | | | 3,536 | |
| | 2,510,000 | | | 15.170%, 02/20/2015 (h) | | | 97,801 | |
| | 277,000 | | | 15.700%, 01/14/2016 (h) | | | 10,213 | |
| | | | | | | | 17,664,937 | |
| | Number of
Shares | | | | | | | |
| | | | | Money Market Funds - 8.27% | | | | |
| | 17,582,588 | | | Federated Prime Obligations Fund | | | 17,582,588 | |
See notes to financial statements.
GuideMarkSM Opportunistic Fixed Income Fund
SCHEDULE OF INVESTMENTS (Continued)
March 31, 2014
Principal
Amount | | | | | Value | |
| | | | | U.S. Treasury Bill - 0.75% | | | | |
| | 1,600,000 | | | United States Treasury Bill
0.058%, 08/21/2014 (i) | | $ | 1,599,661 | |
| | | | | Total Short Term Investments
(Cost $37,159,345) | | | 36,847,186 | |
| | | | | Total Investments
(Cost $209,141,075) - 98.40% | | | 209,280,003 | |
| | | | | Other Assets in Excess
of Liabilities - 1.60% | | | 3,395,002 | |
| | | | | TOTAL NET
ASSETS - 100.00% | | $ | 212,675,005 | |
Percentages are stated as a percent of net assets.
Principal amounts are denominated in the currency in which the security was purchased.
ADR - American Depositary Receipt
| (a) | Variable Rate Security. The rate shown is the rate in effect on March 31, 2014. |
| (b) | Restricted securities as defined in Rule 144(a) under the Securities Act of 1933. Such securities are treated as liquid securities according to the Fund’s liquidity guidelines. The value of these securities total $28,714,638, which represents 13.50% of total net assets. |
| (c) | As of March 31, 2014, the Fund has fair valued these securities. The value of these securities were $252,504, which represents 0.12% of total net assets. |
| (d) | Represents an interest-only security that entitles holders to receive only interest payments on the underlying mortgages. The yield-to-maturity of an interest-only security is extremely sensitive to the rate of principal payments on the underlying mortgage assets. A rapid (slow) rate of principal repayments may have an adverse (positive) effect on yield to maturity. The principal amount shown is the notional amount of the underlying mortgages. Interest rate disclosed represents yield upon the estimated timing and amount of future cash flows at March 31, 2014. The securities are liquid and the value of these securities total $1,863,956, which represents 0.88% of total net assets. |
| (e) | Non-income producing. |
| (f) | Non-income producing. Item identified as in default as to payment of interest. |
| (g) | Restricted securities as defined in Regulation S under the Securities Act of 1933. Such securities are treated as liquid securities according to the Fund’s liquidity guidelines. The value of these securities total $866,840, which represents 0.41% of total net assets. |
| (h) | Zero coupon bond. The effective yield is listed. |
| (i) | Partially assigned as collateral for certain futures contracts. |
| (j) | Represents an inflation protected security. |
See notes to financial statements.
GuideMarkSM Opportunistic Fixed Income Fund
SCHEDULE OF OPEN FORWARD CURRENCY CONTRACTS
March 31, 2014
Forward
expiration date | | Currency to be received | | Amount of
Currency to
be received | | | Currency to
be delivered | | Amount of
Currency to
be delivered | | | Unrealized
Appreciation
(Depreciation) |
| 4/3/2014 | | Australian Dollar | | | 580,000 | | | U.S. Dollars | | | 517,153 | | | | $ | 20,627 | |
| 11/21/2014 | | Brazilian Real | | | 1,440,000 | | | U.S. Dollars | | | 584,416 | | | | 10,579 | |
| 4/14/2014 | | Chilean Peso | | | 672,012,500 | | | U.S. Dollars | | | 1,377,075 | | | | (153,444 | ) |
| 4/15/2014 | | Chilean Peso | | | 1,884,575,000 | | | U.S. Dollars | | | 3,848,428 | | | | (417,279 | ) |
| 4/25/2014 | | Chilean Peso | | | 297,500,000 | | | U.S. Dollars | | | 528,232 | | | | 12,827 | |
| 3/10/2015 | | Ghanaian Cedi | | | 120,000 | | | U.S. Dollars | | | 38,710 | | | | (1,514 | ) |
| 4/3/2014 | | Hungarian Forint | | | 35,900,000 | | | U.S. Dollars | | | 146,872 | | | | 14,041 | |
| 4/11/2014 | | Indian Rupee | | | 32,400,000 | | | U.S. Dollars | | | 527,687 | | | | 13,291 | |
| 4/15/2014 | | Indian Rupee | | | 117,200,000 | | | U.S. Dollars | | | 1,858,371 | | | | 96,330 | |
| 4/17/2014 | | Indian Rupee | | | 117,575,000 | | | U.S. Dollars | | | 1,874,049 | | | | 85,819 | |
| 4/2/2014 | | Malaysian Ringgit | | | 2,355,000 | | | U.S. Dollars | | | 720,735 | | | | 336 | |
| 5/30/2014 | | Malaysian Ringgit | | | 2,827,440 | | | U.S. Dollars | | | 871,510 | | | | (9,341 | ) |
| 7/2/2014 | | Malaysian Ringgit | | | 2,355,000 | | | U.S. Dollars | | | 717,769 | | | | (1,165 | ) |
| 9/26/2014 | | Malaysian Ringgit | | | 377,000 | | | U.S. Dollars | | | 115,273 | | | | (1,184 | ) |
| 10/3/2014 | | Malaysian Ringgit | | | 1,845,500 | | | U.S. Dollars | | | 557,941 | | | | 298 | |
| 1/8/2015 | | Malaysian Ringgit | | | 13,700 | | | U.S. Dollars | | | 4,089 | | | | 30 | |
| 1/9/2015 | | Malaysian Ringgit | | | 7,000 | | | U.S. Dollars | | | 2,091 | | | | 13 | |
| 1/12/2015 | | Malaysian Ringgit | | | 2,000 | | | U.S. Dollars | | | 598 | | | | 3 | |
| 2/18/2015 | | Malaysian Ringgit | | | 1,024,011 | | | U.S. Dollars | | | 303,034 | | | | 3,967 | |
| 3/11/2015 | | Malaysian Ringgit | | | 2,414,589 | | | U.S. Dollars | | | 727,527 | | | | (4,603 | ) |
| 3/12/2015 | | Malaysian Ringgit | | | 612,600 | | | U.S. Dollars | | | 183,183 | | | | 217 | |
| 3/26/2015 | | Malaysian Ringgit | | | 514,000 | | | U.S. Dollars | | | 152,582 | | | | 1,161 | |
| 4/2/2015 | | Malaysian Ringgit | | | 2,355,000 | | | U.S. Dollars | | | 706,549 | | | | — | |
| 5/15/2014 | | Mexican Peso | | | 7,364,734 | | | U.S. Dollars | | | 590,000 | | | | (27,867 | ) |
| 5/16/2014 | | Mexican Peso | | | 2,378,648 | | | U.S. Dollars | | | 190,000 | | | | (8,458 | ) |
| 8/6/2014 | | Mexican Peso | | | 1,597,390 | | | U.S. Dollars | | | 121,845 | | | | (709 | ) |
| 8/8/2014 | | Mexican Peso | | | 1,605,500 | | | U.S. Dollars | | | 122,857 | | | | (1,125 | ) |
| 9/10/2014 | | Mexican Peso | | | 11,784,520 | | | U.S. Dollars | | | 883,397 | | | | 7,822 | |
| 10/14/2014 | | Mexican Peso | | | 18,798,000 | | | U.S. Dollars | | | 1,388,331 | | | | 29,425 | |
| 12/19/2014 | | Mexican Peso | | | 9,598,100 | | | U.S. Dollars | | | 719,201 | | | | 796 | |
| 2/17/2015 | | Mexican Peso | | | 67,745,080 | | | U.S. Dollars | | | 4,947,063 | | | | 110,060 | |
| 4/10/2014 | | Polish Zloty | | | 4,746,256 | | | Euro | | | 1,120,060 | | | | 25,600 | |
| 4/15/2014 | | Polish Zloty | | | 4,578,308 | | | Euro | | | 1,084,213 | | | | 19,007 | |
| 8/6/2014 | | Polish Zloty | | | 963,300 | | | Euro | | | 221,994 | | | | 10,190 | |
| 2/10/2015 | | Polish Zloty | | | 847,724 | | | Euro | | | 198,321 | | | | 1,549 | |
| 2/24/2015 | | Polish Zloty | | | 2,950,000 | | | Euro | | | 690,947 | | | | 3,418 | |
| 3/12/2015 | | Polish Zloty | | | 4,450,638 | | | Euro | | | 1,038,946 | | | | 8,477 | |
| 4/7/2014 | | Polish Zloty | | | 3,450,000 | | | U.S. Dollars | | | 1,135,503 | | | | 4,926 | |
| 3/31/2015 | | Serbian Dinar | | | 31,310,564 | | | Euro | | | 251,693 | | | | (97,115 | ) |
| 4/11/2014 | | Singapore Dollar | | | 2,419,882 | | | U.S. Dollars | | | 1,935,488 | | | | (11,741 | ) |
| 5/30/2014 | | Singapore Dollar | | | 1,411,379 | | | U.S. Dollars | | | 1,115,891 | | | | 6,152 | |
| 6/5/2014 | | Singapore Dollar | | | 405,248 | | | U.S. Dollars | | | 322,367 | | | | (195 | ) |
| 7/31/2014 | | Singapore Dollar | | | 1,428,700 | | | U.S. Dollars | | | 1,131,913 | | | | 3,995 | |
| 8/6/2014 | | Singapore Dollar | | | 917,603 | | | U.S. Dollars | | | 719,886 | | | | 9,675 | |
See notes to financial statements.
GuideMarkSM Opportunistic Fixed Income Fund
SCHEDULE OF OPEN FORWARD CURRENCY CONTRACTS (Continued)
March 31, 2014
Forward
expiration date | | Currency to be received | | Amount of
Currency to
be received | | | Currency to
be delivered | | Amount of
Currency to
be delivered | | | Unrealized
Appreciation
(Depreciation) |
| 8/12/2014 | | Singapore Dollar | | | 917,160 | | | U.S. Dollars | | | 722,060 | | | | $ | 7,158 | |
| 12/10/2014 | | Singapore Dollar | | | 2,188,625 | | | U.S. Dollars | | | 1,746,638 | | | | (6,129 | ) |
| 3/11/2015 | | Singapore Dollar | | | 1,387,980 | | | U.S. Dollars | | | 1,099,042 | | | | 4,928 | |
| 4/15/2014 | | South Korean Won | | | 636,801,620 | | | U.S. Dollars | | | 556,937 | | | | 40,867 | |
| 6/27/2014 | | South Korean Won | | | 606,000,000 | | | U.S. Dollars | | | 518,702 | | | | 48,080 | |
| 9/26/2014 | | South Korean Won | | | 608,000,000 | | | U.S. Dollars | | | 556,267 | | | | 9,999 | |
| 10/14/2014 | | South Korean Won | | | 536,797,500 | | | U.S. Dollars | | | 491,618 | | | | 7,998 | |
| 3/12/2015 | | South Korean Won | | | 636,720,000 | | | U.S. Dollars | | | 588,031 | | | | 1,362 | |
| 4/10/2014 | | Swedish Krona | | | 8,075,858 | | | Euro | | | 954,537 | | | | (67,426 | ) |
| 4/15/2014 | | Swedish Krona | | | 43,466,148 | | | Euro | | | 5,167,836 | | | | (405,091 | ) |
| 9/8/2014 | | Swedish Krona | | | 1,010,000 | | | Euro | | | 113,903 | | | | (1,229 | ) |
| 10/3/2014 | | Swedish Krona | | | 7,620,000 | | | Euro | | | 873,994 | | | | (29,877 | ) |
| 11/20/2014 | | Uruguayan Peso | | | 2,200,000 | | | U.S. Dollars | | | 93,697 | | | | (2,726 | ) |
| 11/25/2014 | | Uruguayan Peso | | | 2,200,000 | | | U.S. Dollars | | | 93,537 | | | | (2,693 | ) |
| 12/1/2014 | | Uruguayan Peso | | | 3,240,000 | | | U.S. Dollars | | | 138,521 | | | | (4,956 | ) |
| 4/28/2014 | | U.S. Dollars | | | 772,136 | | | Brazilian Real | | | 1,799,000 | | | | (14,947 | ) |
| 5/9/2014 | | U.S. Dollars | | | 154,630 | | | British Pound | | | 100,000 | | | | (12,036 | ) |
| 4/3/2014 | | U.S. Dollars | | | 891,428 | | | Euro | | | 650,000 | | | | (4,041 | ) |
| 4/15/2014 | | U.S. Dollars | | | 2,179,413 | | | Euro | | | 1,612,000 | | | | (41,288 | ) |
| 4/28/2014 | | U.S. Dollars | | | 138,233 | | | Euro | | | 100,000 | | | | 476 | |
| 4/30/2014 | | U.S. Dollars | | | 541,669 | | | Euro | | | 408,000 | | | | (20,376 | ) |
| 5/5/2014 | | U.S. Dollars | | | 270,781 | | | Euro | | | 204,295 | | | | (10,646 | ) |
| 5/9/2014 | | U.S. Dollars | | | 131,275 | | | Euro | | | 100,000 | | | | (6,480 | ) |
| 5/16/2014 | | U.S. Dollars | | | 375,558 | | | Euro | | | 283,000 | | | | (14,284 | ) |
| 5/20/2014 | | U.S. Dollars | | | 3,083,885 | | | Euro | | | 2,380,000 | | | | (194,623 | ) |
| 6/9/2014 | | U.S. Dollars | | | 570,334 | | | Euro | | | 434,350 | | | | (27,981 | ) |
| 6/13/2014 | | U.S. Dollars | | | 622,715 | | | Euro | | | 469,000 | | | | (23,329 | ) |
| 7/15/2014 | | U.S. Dollars | | | 616,454 | | | Euro | | | 470,000 | | | | (30,958 | ) |
| 7/16/2014 | | U.S. Dollars | | | 986,448 | | | Euro | | | 755,000 | | | | (53,544 | ) |
| 7/18/2014 | | U.S. Dollars | | | 397,206 | | | Euro | | | 302,000 | | | | (18,791 | ) |
| 7/22/2014 | | U.S. Dollars | | | 288,358 | | | Euro | | | 220,000 | | | | (14,686 | ) |
| 7/23/2014 | | U.S. Dollars | | | 234,874 | | | Euro | | | 178,745 | | | | (11,342 | ) |
| 7/25/2014 | | U.S. Dollars | | | 484,308 | | | Euro | | | 366,000 | | | | (19,846 | ) |
| 7/29/2014 | | U.S. Dollars | | | 917,232 | | | Euro | | | 691,917 | | | | (35,862 | ) |
| 7/31/2014 | | U.S. Dollars | | | 542,401 | | | Euro | | | 408,000 | | | | (19,607 | ) |
| 8/1/2014 | | U.S. Dollars | | | 882,698 | | | Euro | | | 664,000 | | | | (31,942 | ) |
| 8/4/2014 | | U.S. Dollars | | | 3,083,986 | | | Euro | | | 2,323,287 | | | | (116,270 | ) |
| 8/5/2014 | | U.S. Dollars | | | 1,217,762 | | | Euro | | | 919,023 | | | | (48,164 | ) |
| 8/6/2014 | | U.S. Dollars | | | 741,378 | | | Euro | | | 559,081 | | | | (28,739 | ) |
| 8/11/2014 | | U.S. Dollars | | | 106,668 | | | Euro | | | 80,000 | | | | (3,529 | ) |
| 8/15/2014 | | U.S. Dollars | | | 117,439 | | | Euro | | | 88,500 | | | | (4,467 | ) |
| 8/19/2014 | | U.S. Dollars | | | 422,723 | | | Euro | | | 319,000 | | | | (16,689 | ) |
| 8/20/2014 | | U.S. Dollars | | | 712,020 | | | Euro | | | 533,000 | | | | (22,170 | ) |
| 8/25/2014 | | U.S. Dollars | | | 311,131 | | | Euro | | | 232,085 | | | | (8,558 | ) |
See notes to financial statements.
GuideMarkSM Opportunistic Fixed Income Fund
SCHEDULE OF OPEN FORWARD CURRENCY CONTRACTS (Continued)
March 31, 2014
Forward
expiration date | | Currency to be received | | Amount of
Currency to
be received | | | Currency to
be delivered | | Amount of
Currency to
be delivered | | | Unrealized
Appreciation
(Depreciation) |
| 8/28/2014 | | U.S. Dollars | | | 132,707 | | | Euro | | | 100,331 | | | | $ | (5,495 | ) |
| 9/5/2014 | | U.S. Dollars | | | 573,207 | | | Euro | | | 434,350 | | | | (25,094 | ) |
| 9/23/2014 | | U.S. Dollars | | | 259,153 | | | Euro | | | 191,000 | | | | (3,942 | ) |
| 9/26/2014 | | U.S. Dollars | | | 120,099 | | | Euro | | | 89,000 | | | | (2,495 | ) |
| 10/31/2014 | | U.S. Dollars | | | 105,781 | | | Euro | | | 76,597 | | | | 267 | |
| 11/10/2014 | | U.S. Dollars | | | 180,062 | | | Euro | | | 133,000 | | | | (3,152 | ) |
| 11/14/2014 | | U.S. Dollars | | | 336,297 | | | Euro | | | 250,000 | | | | (8,092 | ) |
| 11/17/2014 | | U.S. Dollars | | | 119,102 | | | Euro | | | 88,500 | | | | (2,812 | ) |
| 11/20/2014 | | U.S. Dollars | | | 236,836 | | | Euro | | | 175,000 | | | | (4,238 | ) |
| 12/8/2014 | | U.S. Dollars | | | 1,119,808 | | | Euro | | | 826,000 | | | | (18,094 | ) |
| 12/15/2014 | | U.S. Dollars | | | 189,101 | | | Euro | | | 137,000 | | | | 367 | |
| 1/7/2015 | | U.S. Dollars | | | 661,926 | | | Euro | | | 485,308 | | | | (6,667 | ) |
| 1/9/2015 | | U.S. Dollars | | | 136,760 | | | Euro | | | 100,000 | | | | (1,007 | ) |
| 1/21/2015 | | U.S. Dollars | | | 170,375 | | | Euro | | | 125,000 | | | | (1,837 | ) |
| 2/9/2015 | | U.S. Dollars | | | 277,230 | | | Euro | | | 200,000 | | | | 1,683 | |
| 2/20/2015 | | U.S. Dollars | | | 388,862 | | | Euro | | | 283,000 | | | | (1,044 | ) |
| 2/27/2015 | | U.S. Dollars | | | 90,282 | | | Euro | | | 65,866 | | | | (466 | ) |
| 3/9/2015 | | U.S. Dollars | | | 867,080 | | | Euro | | | 631,123 | | | | (2,477 | ) |
| 3/17/2015 | | U.S. Dollars | | | 285,204 | | | Euro | | | 204,474 | | | | 3,478 | |
| 3/23/2015 | | U.S. Dollars | | | 101,102 | | | Euro | | | 72,605 | | | | 1,066 | |
| 4/10/2014 | | U.S. Dollars | | | 5,024,008 | | | Japanese Yen | | | 493,608,750 | | | | 241,403 | |
| 4/15/2014 | | U.S. Dollars | | | 7,128,144 | | | Japanese Yen | | | 706,185,270 | | | | 285,688 | |
| 4/21/2014 | | U.S. Dollars | | | 493,899 | | | Japanese Yen | | | 48,070,000 | | | | 28,119 | |
| 4/22/2014 | | U.S. Dollars | | | 210,132 | | | Japanese Yen | | | 20,570,000 | | | | 10,815 | |
| 6/3/2014 | | U.S. Dollars | | | 800,000 | | | Japanese Yen | | | 80,680,000 | | | | 18,061 | |
| 6/4/2014 | | U.S. Dollars | | | 340,000 | | | Japanese Yen | | | 34,284,478 | | | | 7,718 | |
| 6/9/2014 | | U.S. Dollars | | | 907,128 | | | Japanese Yen | | | 90,000,000 | | | | 34,835 | |
| 6/10/2014 | | U.S. Dollars | | | 1,275,567 | | | Japanese Yen | | | 124,200,000 | | | | 71,796 | |
| 6/11/2014 | | U.S. Dollars | | | 621,287 | | | Japanese Yen | | | 59,670,000 | | | | 42,950 | |
| 6/17/2014 | | U.S. Dollars | | | 195,798 | | | Japanese Yen | | | 18,500,000 | | | | 16,486 | |
| 6/20/2014 | | U.S. Dollars | | | 864,462 | | | Japanese Yen | | | 88,820,000 | | | | 3,557 | |
| 7/24/2014 | | U.S. Dollars | | | 927,045 | | | Japanese Yen | | | 92,309,000 | | | | 32,141 | |
| 7/25/2014 | | U.S. Dollars | | | 196,721 | | | Japanese Yen | | | 19,500,000 | | | | 7,674 | |
| 10/22/2014 | | U.S. Dollars | | | 200,984 | | | Japanese Yen | | | 19,600,000 | | | | 10,847 | |
| 12/22/2014 | | U.S. Dollars | | | 1,728,833 | | | Japanese Yen | | | 177,460,000 | | | | 6,310 | |
| 12/26/2014 | | U.S. Dollars | | | 924,054 | | | Japanese Yen | | | 95,820,000 | | | | (6,063 | ) |
| 1/8/2015 | | U.S. Dollars | | | 190,259 | | | Japanese Yen | | | 19,732,000 | | | | (1,301 | ) |
| 1/15/2015 | | U.S. Dollars | | | 1,091,911 | | | Japanese Yen | | | 113,240,000 | | | | (7,510 | ) |
| 2/12/2015 | | U.S. Dollars | | | 349,814 | | | Japanese Yen | | | 35,633,000 | | | | 3,769 | |
| 2/13/2015 | | U.S. Dollars | | | 347,371 | | | Japanese Yen | | | 35,430,000 | | | | 3,295 | |
| 2/17/2015 | | U.S. Dollars | | | 115,543 | | | Japanese Yen | | | 11,790,000 | | | | 1,041 | |
| 2/18/2015 | | U.S. Dollars | | | 233,142 | | | Japanese Yen | | | 23,670,000 | | | | 3,261 | |
| 2/25/2015 | | U.S. Dollars | | | 57,701 | | | Japanese Yen | | | 5,910,000 | | | | 300 | |
| 2/26/2015 | | U.S. Dollars | | | 115,482 | | | Japanese Yen | | | 11,810,000 | | | | 776 | |
See notes to financial statements.
GuideMarkSM Opportunistic Fixed Income Fund
SCHEDULE OF OPEN FORWARD CURRENCY CONTRACTS (Continued)
March 31, 2014
Forward
expiration date | | Currency to be received | | Amount of
Currency to
be received | | | Currency to
be delivered | | Amount of
Currency to
be delivered | | | Unrealized
Appreciation
(Depreciation) |
| 2/27/2015 | | U.S. Dollars | | | 38,615 | | | Japanese Yen | | | 3,936,000 | | | | $ | 385 | |
| 3/9/2015 | | U.S. Dollars | | | 314,413 | | | Japanese Yen | | | 32,151,400 | | | | 2,105 | |
| 3/19/2015 | | U.S. Dollars | | | 351,380 | | | Japanese Yen | | | 35,670,000 | | | | 4,860 | |
| 3/24/2015 | | U.S. Dollars | | | 173,655 | | | Japanese Yen | | | 17,733,000 | | | | 1,378 | |
| 3/25/2015 | | U.S. Dollars | | | 177,288 | | | Japanese Yen | | | 18,110,000 | | | | 1,347 | |
| 4/2/2014 | | U.S. Dollars | | | 720,624 | | | Malaysian Ringgit | | | 2,355,000 | | | | (446 | ) |
| 4/30/2014 | | U.S. Dollars | | | 1,633,151 | | | Mexican Peso | | | 21,400,000 | | | | (2,215 | ) |
| 4/3/2014 | | U.S. Dollars | | | 525,515 | | | New Zealand Dollar | | | 630,000 | | | | (21,108 | ) |
| 4/10/2014 | | U.S. Dollars | | | 647,869 | | | New Zealand Dollar | | | 765,000 | | | | (15,519 | ) |
| 4/7/2014 | | U.S. Dollars | | | 1,090,495 | | | Polish Zloty | | | 3,450,000 | | | | (49,935 | ) |
| 4/7/2014 | | U.S. Dollars | | | 1,117,189 | | | Swiss Franc | | | 991,000 | | | | | (3,852 | ) |
| | | | | | | | | | | | | | | | $ | (836,646 | ) |
GuideMarkSM Opportunistic Fixed Income Fund
SCHEDULE OF OPEN FUTURES CONTRACTS
March 31, 2014
| Description | | Number of
Contracts Sold | | Notional
Value | | | Settlement
Month | | Unrealized
Appreciation
(Depreciation) |
| Euro-Bund Futures | | | (20 | ) | | | (3,950,570 | ) | | Jun-14 | | | $ | 1,387 | |
| Euro Stoxx Futures | | | (10 | ) | | | (427,074 | ) | | Jun-14 | | | (11,320 | ) |
| Nikkei 225 Futures | | | (4 | ) | | | (297,100 | ) | | Jun-14 | | | (1,764 | ) |
| E-mini S&P 500 Futures | | | (30 | ) | | | (2,796,900 | ) | | Jun-14 | | | (1,422 | ) |
| U.S. Treasury 5-Year Note Futures | | | (10 | ) | | | (1,189,531 | ) | | Jun-14 | | | (1,737 | ) |
| U.S. Treasury 10-Year Note Futures | | | (7 | ) | | | (864,500 | ) | | Jun-14 | | | (1,325 | ) |
| U.S. Treasury Long Bond Futures | | | (4 | ) | | | (532,875 | ) | | Jun-14 | | | | (4,757 | ) |
| | | | | | | | | | | | | | $ | (20,938 | ) |
See notes to financial statements.
GuideMarkSM Opportunistic Fixed Income Fund
CREDIT DEFAULT SWAPS ON CORPORATE, INDICES, AND SOVEREIGN — BUY PROTECTION(1)
March 31, 2014
Reference
Obligation | | Implied
Credit
Spread at
March, 31,
2014(3) | | Fixed
Pay
Rate | | Maturity
Date | | Counterparty | | Notional
Amount(4) | | | Fair
Value | | Upfront
Premiums
Paid
(Received) | | Unrealized
Appreciation
(Depreciation) |
Bolivarian Republic
of Venezuela | | 12.77% | | 5.000% | | 6/20/2019 | | Deutsche Bank | | | 250,000 | | | $ | 65,564 | | | $ | 62,927 | | | | $ | 2,637 | |
Federative Republic
of Brazil | | 1.69% | | 1.000% | | 6/20/2019 | | Merrill Lynch | | | 1,100,000 | | | | 37,359 | | | | 42,835 | | | | | (5,476 | ) |
iTraxx Europe Crossover
Series 18 Index | | 1.62% | | 5.000% | | 12/20/2017 | | Merrill Lynch | | | 245,000 | | | | (39,675 | ) | | | (7,585 | ) | | | | (32,090 | ) |
| | | | | | | | | | | | | | | $ | 63,248 | | | $ | 98,177 | | | | $ | (34,929 | ) |
GuideMarkSM Opportunistic Fixed Income Fund
CREDIT DEFAULT SWAPS ON CORPORATE, INDICES, AND SOVEREIGN — SELL PROTECTION(2)
March 31, 2014
Reference
Obligation | | Implied
Credit
Spread at
March 31,
2014(3) | | Fixed
Receive
Rate | | Maturity
Date | | Counterparty | | Notional
Amount(4) | | | Fair
Value | | Upfront
Premiums
Received | | Unrealized
Appreciation
(Depreciation) |
| TXU Energy | | 43.67% | | 5.000% | | 6/20/2015 | | Credit Suisse | | | 450,000 | | | $ | (141,750 | ) | | $ | (28,292 | ) | | | $ | (113,458 | ) |
| | | | | | | | | | | | | | | $ | (141,750 | ) | | $ | (28,292 | ) | | | $ | (113,458 | ) |
See notes to financial statements.
GuideMarkSM Opportunistic Fixed Income Fund
OVER-THE-COUNTER INTEREST RATE SWAPS
March 31, 2014
Pay/Receive
Floating Rate | | Floating
Rate Index | | Fixed
Pay
Rate | | Maturity
Date | | Counterparty | | Notional
Amount(4) | | | Fair
Value | | Upfront
Premiums
Paid
(Received) | | Unrealized
Appreciation
(Depreciation) |
| Receive | | 3-MO-USD-LIBOR | | 3.018% | | 8/22/2023 | | JP Morgan Chase | | | 7,290,000 | | | $ | (158,013 | ) | | $ | 0 | | | | $ | (158,013 | ) |
| Receive | | 3-MO-USD-LIBOR | | 3.848% | | 8/22/2043 | | JP Morgan Chase | | | 4,170,000 | | | | (249,745 | ) | | | 0 | | | | | (249,745 | ) |
| | | | | | | | | | | | | | | $ | (407,758 | ) | | $ | 0 | | | | $ | (407,758 | ) |
| 1) | If the Fund is a buyer of protection and a credit event occurs, as defined under the terms of that particular swap agreement, the Fund will either (i) receive from the seller of protection an amount equal to the notional amount of the swap and take delivery of the referenced obligation or underlying securities comprising the referenced index or (ii) pay a net settlement amount in the form of cash or securities equal to the notional amount of the swap less the recovery value of the referenced obligation or underlying securities comprising the referenced index. |
| 2) | If the Fund is a seller of protection and a credit event occurs, as defined under the terms of that particular swap agreement, the Fund will either (i) pay to the buyer of protection an amount equal to the notional amount of the swap and take delivery of the referenced obligation or underlying securities comprising the referenced index or (ii) pay a net settlement amount in the form of cash or securities equal to the notional amount of the swap less the recovery value of the referenced obligation or underlying securities comprising the referenced index. |
| 3) | Implied credit spreads, represented in absolute terms, utilized in determining the market value of credit default swap agreements on U.S. municipal issues, corporate issues or sovereign issues of an emerging country as of period end serve as an indicator of the current status of the payment/performance risk and represent the likelihood or risk of default for the credit derivative. The implied credit spread of a particular referenced entity reflects the cost of buying/selling protection and may include upfront payments required to be made to enter into the agreement. Wider credit spreads represent a deterioration of the referenced entity’s credit soundness and a greater likelihood or risk of default or other credit event occurring as defined under the terms of the agreement. A credit spread identified as “Defaulted” indicates a credit event has occurred for the referenced entity or obligation. |
| 4) | The maximum potential amount the Fund could be required to pay as seller of credit protection or receive as a buyer of credit protection if a credit event occurs as defined under the terms of that particular swap agreement. |
See notes to financial statements.
GuidePathSM Strategic Asset Allocation Fund
SCHEDULE OF INVESTMENTS
March 31, 2014
Number of
Shares | | | | | Value | |
| | | | | INVESTMENT COMPANIES - 97.84% | | | | |
| | | | | Affiliated Mutual Funds - 52.83% | | | | |
| | 352,945 | | | Altegris® Macro Strategy Fund - | | | | |
| | | | | Institutional Shares (a) | | $ | 2,834,151 | |
| | 584,654 | | | Altegris® Multi-Strategy | | | | |
| | | | | Alternatives Fund - Institutional | | | | |
| | | | | Shares | | | 5,793,917 | |
| | 1,432,429 | | | GuideMarkSM Global Real Return | | | | |
| | | | | Fund - Institutional Shares | | | 13,207,000 | |
| | 1,384,954 | | | GuideMarkSM Large Cap Growth | | | | |
| | | | | Fund - Institutional Shares | | | 18,932,316 | |
| | 1,864,665 | | | GuideMarkSM Large Cap Value | | | | |
| | | | | Fund - Institutional Shares | | | 21,872,519 | |
| | 1,087,491 | | | GuideMarkSM Opportunistic Equity | | | | |
| | | | | Fund - Institutional Shares | | | 14,670,253 | |
| | 1,318,004 | | | GuideMarkSM Small/Mid Cap Core | | | | |
| | | | | Fund - Institutional Shares | | | 22,102,933 | |
| | 6,133,056 | | | GuideMarkSM World ex-US Fund - | | | | |
| | | | | Institutional Shares | | | 54,829,523 | |
| | | | | | | | 154,242,612 | |
| | | | | Exchange Traded Funds - 45.01% | | | | |
| | 114,787 | | | iShares Core MSCI Emerging | | | | |
| | | | | Markets ETF | | | 5,633,746 | |
| | 232,279 | | | iShares MSCI Canada Index ETF (b) | | | 6,863,844 | |
| | 122,750 | | | iShares MSCI Switzerland | | | | |
| | | | | Capped ETF (b) | | | 4,215,235 | |
| | 219,847 | | | SPDR S&P 500 ETF Trust | | | 41,120,183 | |
| | 43,370 | | | SPDR S&P 600 Small Cap | | | | |
| | | | | Growth ETF (b) | | | 7,756,291 | |
| | 66,204 | | | SPDR S&P China ETF (b) | | | 4,813,693 | |
| | 1,088,090 | | | Vanguard FTSE All-World ex-US | | | | |
| | | | | Index Fund (b) | | | 54,741,808 | |
| | 34,494 | | | Vanguard Global ex-US Real | | | | |
| | | | | Estate ETF | | | 1,865,090 | |
| | 62,114 | | | Vanguard REIT ETF (b) | | | 4,386,491 | |
| | | | | | | | 131,396,381 | |
| | | | | Total Investment Companies | | | | |
| | | | | (Cost $226,712,706) | | | 285,638,993 | |
Number of
Shares | | | | | Value | |
| | | | | SHORT TERM INVESTMENTS - 1.91% | | | | |
| | | | | Money Market Funds - 1.91% | | | | |
| | 5,569,507 | | | Federated Prime Obligations Fund | | $ | 5,569,507 | |
| | | | | Total Short Term Investments | | | | |
| | | | | (Cost $5,569,507) | | | 5,569,507 | |
| | | | | INVESTMENTS PURCHASED | | | | |
| | | | | AS SECURITIES LENDING | | | | |
| | | | | COLLATERAL - 13.13% | | | | |
| | | | | Money Market Funds - 13.13% | | | | |
| | 38,325,716 | | | First American Government | | | | |
| | | | | Obligations Fund | | | 38,325,716 | |
| | | | | Total Investments Purchased as | | | | |
| | | | | Securities Lending Collateral | | | | |
| | | | | (Cost $38,325,716) | | | 38,325,716 | |
| | | | | Total Investments | | | | |
| | | | | (Cost $270,607,929) - 112.88% | | | 329,534,216 | |
| | | | | Liabilities in Excess of Other | | | | |
| | | | | Assets - (12.88)% | | | (37,598,602 | ) |
| | | | | TOTAL NET ASSETS - 100.00% | | $ | 291,935,614 | |
| | | | | | | | | |
Percentages are stated as a percent of net assets.
| (a) | Non-income producing security. |
| (b) | All or portion of this security is on loan. |
See notes to financial statements.
GuidePathSM Tactical ConstrainedSM Asset Allocation Fund
SCHEDULE OF INVESTMENTS
March 31, 2014
Number of
Shares | | | | | Value | |
| | | | | INVESTMENT COMPANIES - 97.78% | | | | |
| | | | | Affiliated Mutual Funds - 65.55% | | | | |
| | 1,752,287 | | | GuideMarkSM Core Fixed Income | | | | |
| | | | | Fund - Institutional Shares | | $ | 16,418,929 | |
| | 951,143 | | | GuideMarkSM Large Cap Growth | | | | |
| | | | | Fund - Institutional Shares | | | 13,002,131 | |
| | 1,137,975 | | | GuideMarkSM Large Cap Value | | | | |
| | | | | Fund - Institutional Shares | | | 13,348,445 | |
| | 1,550,382 | | | GuideMarkSM Opportunistic Equity | | | | |
| | | | | Fund - Institutional Shares | | | 20,914,647 | |
| | 1,125,032 | | | GuideMarkSM Opportunistic Fixed | | | | |
| | | | | Income Fund - Institutional Shares | | | 11,182,821 | |
| | 902,101 | | | GuideMarkSM Small/Mid Cap Core | | | | |
| | | | | Fund - Institutional Shares | | | 15,128,230 | |
| | 4,465,174 | | | GuideMarkSM World ex-US Fund - | | | | |
| | | | | Institutional Shares | | | 39,918,653 | |
| | | | | | | | 129,913,856 | |
| | | | | Exchange Traded Funds - 27.79% | | | | |
| | 8,664 | | | iShares 10+Year Credit Bond ETF (a) | | | 503,552 | |
| | 186,183 | | | iShares Core MSCI Emerging | | | | |
| | | | | Markets ETF (a) | | | 9,137,862 | |
| | 11,336 | | | iShares Credit Bond ETF | | | 1,241,405 | |
| | 28,300 | | | iShares Global Infrastructure ETF (a) | | | 1,178,695 | |
| | 25,212 | | | iShares International Select | | | | |
| | | | | Dividend ETF (a) | | | 974,192 | |
| | 8,363 | | | iShares TIPS ETF (b) | | | 937,492 | |
| | 65,221 | | | iShares U.S. Home Construction | | | | |
| | | | | ETF (a) | | | 1,579,653 | |
| | 68,454 | | | Market Vectors Unconventional | | | | |
| | | | | Oil & Gas ETF (a) | | | 2,032,125 | |
| | 10,897 | | | PowerShares DB Gold Fund (a)(b) | | | 468,582 | |
| | 59,972 | | | SPDR Barclays High Yield Bond | | | | |
| | | | | ETF (a) | | | 2,477,443 | |
| | 8,346 | | | SPDR DB International Government | | | | |
| | | | | Inflation-Protected Bond ETF | | | 501,511 | |
| | 141,031 | | | SPDR S&P 500 ETF Trust (a) | | | 26,378,438 | |
| | 13,374 | | | SPDR S&P Dividend ETF | | | 984,059 | |
| | 20,913 | | | Vanguard FTSE Pacific ETF (a) | | | 1,235,958 | |
| | 36,832 | | | Vanguard Global ex-US Real Estate | | | | |
| | | | | ETF | | | 1,991,506 | |
| | 49,009 | | | Vanguard REIT ETF (a) | | | 3,461,016 | |
| | | | | | | | 55,083,489 | |
Number of
Shares | |
| | | Value | |
| | | | | Mutual Funds - 4.44% | | | | |
| | 111,632 | | | AQR Diversified Arbitrage Fund - | | | | |
| | | | | Institutional Shares | | $ | 1,230,185 | |
| | 120,005 | | | Arbitrage Event Driven Fund - | | | | |
| | | | | Institutional Shares | | | 1,228,848 | |
| | 135,856 | | | DoubleLine Total Return Bond | | | | |
| | | | | Fund - Institutional Shares | | | 1,480,835 | |
| | 199,067 | | | Iron Strategic Income Fund - | | | | |
| | | | | Institutional Shares | | | 2,323,117 | |
| | 269,974 | | | PIMCO Emerging Local Bond | | | | |
| | | | | Fund - Institutional Shares | | | 2,535,058 | |
| | | | | | | | 8,798,043 | |
| | | | | Total Investment Companies | | | | |
| | | | | (Cost $155,180,230) | | | 193,795,388 | |
| | | | | SHORT TERM INVESTMENTS - 2.14% | | | | |
| | | | | Money Market Funds - 2.14% | | | | |
| | 4,233,190 | | | Federated Prime Obligations Fund | | | 4,233,190 | |
| | | | | Total Short Term Investments | | | | |
| | | | | (Cost $4,233,190) | | | 4,233,190 | |
| | | | | INVESTMENTS PURCHASED | | | | |
| | | | | AS SECURITIES LENDING | | | | |
| | | | | COLLATERAL - 11.39% | | | | |
| | | | | Money Market Funds - 11.39% | | | | |
| | 22,574,143 | | | First American Government | | | | |
| | | | | Obligations Fund | | | 22,574,143 | |
| | | | | Total Investments Purchased as | | | | |
| | | | | Securities Lending Collateral | | | | |
| | | | | (Cost $22,574,143) | | | 22,574,143 | |
| | | | | Total Investments | | | | |
| | | | | (Cost $181,987,563) - 111.31% | | | 220,602,721 | |
| | | | | Liabilities in Excess of Other | | | | |
| | | | | Assets - (11.31)% | | | (22,423,399 | ) |
| | | | | TOTAL NET ASSETS - 100.00% | | | $198,179,322 | |
Percentages are stated as a percent of net assets.
| (a) | All or portion of this security is on loan. |
| (b) | Non-income producing security. |
See notes to financial statements.
GuidePathSM Tactical UnconstrainedSM Asset Allocation Fund
SCHEDULE OF INVESTMENTS
March 31, 2014
Number of
Shares | | | | | Value | |
| | | | | INVESTMENT COMPANIES - 73.22% | | | | |
| | | | | Affiliated Mutual Funds - 33.02% | | | | |
| | 1,005,157 | | | GuideMarkSM Core Fixed Income | | | | |
| | | | | Fund - Institutional Shares | | $ | 9,418,323 | |
| | 943,735 | | | GuideMarkSM Large Cap Growth | | | | |
| | | | | Fund - Institutional Shares | | | 12,900,856 | |
| | 1,831,514 | | | GuideMarkSM Large Cap Value | | | | |
| | | | | Fund - Institutional Shares | | | 21,483,661 | |
| | 1,801,537 | | | GuideMarkSM Opportunistic Equity | | | | |
| | | | | Fund - Institutional Shares | | | 24,302,733 | |
| | 2,002,358 | | | GuideMarkSM Opportunistic Fixed | | | | |
| | | | | Income Fund - Institutional Shares | | | 19,903,443 | |
| | 444,762 | | | GuideMarkSM Small/Mid Cap Core | | | | |
| | | | | Fund - Institutional Shares | | | 7,458,665 | |
| | 3,316,549 | | | GuideMarkSM World ex-US Fund - | | | | |
| | | | | Institutional Shares | | | 29,649,951 | |
| | | | | | | | 125,117,632 | |
| | | | | Exchange Traded Funds - 14.17% | | | | |
| | 14,894 | | | iShares CMBS ETF | | | 761,381 | |
| | 72,627 | | | iShares Core MSCI Emerging | | | | |
| | | | | Markets ETF | | | 3,564,533 | |
| | 333,141 | | | iShares MSCI ACWI ex-US ETF (a) | | | 15,514,377 | |
| | 7,390 | | | PowerShares DB Gold Fund (a)(b) | | | 317,778 | |
| | 159,749 | | | SPDR Barclays High Yield | | | | |
| | | | | Bond ETF (a) | | | 6,599,231 | |
| | 104,764 | | | SPDR Barclays Short Term | | | | |
| | | | | International Treasury Bond ETF (a) | | | 3,773,599 | |
| | 21,833 | | | SPDR S&P 500 ETF Trust | | | 4,083,644 | |
| | 109,817 | | | SPDR S&P Emerging Asia | | | | |
| | | | | Pacific ETF (a) | | | 8,469,087 | |
| | 120,246 | | | Vanguard High Dividend | | | | |
| | | | | Yield ETF (a) | | | 7,589,928 | |
| | 37,237 | | | Vanguard Total Bond Market ETF | | | 3,023,272 | |
| | | | | | | | 53,696,830 | |
Number of
Shares | | |
| | Value | |
| | | | | Mutual Funds - 26.03% | | | | |
| | 686,838 | | | Eaton Vance Floating-Rate Fund - | | | | |
| | | | | Institutional Shares | | $ | 6,291,440 | |
| | 1,003,714 | | | Eaton Vance Global Macro Absolute | | | | |
| | | | | Return Advantage Fund - | | | | |
| | | | | Institutional Shares (b) | | | 9,766,138 | |
| | 14,181 | | | Eaton Vance Global Macro Absolute | | | | |
| | | | | Return Fund - Institutional Shares | | | 132,312 | |
| | 57,410 | | | Eaton Vance Government | | | | |
| | | | | Obligations Fund - Institutional | | | | |
| | | | | Shares | | | 396,128 | |
| | 457,064 | | | Eaton Vance Income Fund of | | | | |
| | | | | Boston - Institutional Shares | | | 2,797,231 | |
| | 45,491 | | | Eaton Vance Multi-Strategy | | | | |
| | | | | Absolute Return Fund - Institutional | | | | |
| | | | | Shares | | | 396,683 | |
| | 292,496 | | | Parametric Absolute Return Fund - | | | | |
| | | | | Institutional Shares | | | 2,828,435 | |
| | 43,023 | | | Parametric Emerging Markets Fund - | | | | |
| | | | | Institutional Shares (b) | | | 646,633 | |
| | 420,456 | | | PIMCO CommoditiesPLUS | | | | |
| | | | | Strategy Fund - Institutional Shares | | | 4,704,907 | |
| | 143,116 | | | Pioneer Strategic Income Fund - | | | | |
| | | | | Class Y | | | 1,572,847 | |
| | 941,833 | | | Stadion Managed Risk 100 Fund - | | | | |
| | | | | Institutional Shares (b) | | | 9,418,328 | |
| | 1,046,487 | | | Virtus Allocator Premium | | | | |
| | | | | AlphaSector Fund - Institutional | | | | |
| | | | | Shares | | | 12,306,689 | |
| | 170,264 | | | Virtus Global Premium AlphaSector | | | | |
| | | | | Fund - Institutional Shares | | | 2,089,140 | |
| | 2,691,585 | | | Virtus Premium AlphaSector Fund - | | | | |
| | | | | Institutional Shares | | | 45,299,368 | |
| | | | | | | | 98,646,279 | |
| | | | | Total Investment Companies | | | | |
| | | | | (Cost $234,239,106) | | | 277,460,741 | |
See notes to financial statements.
GuidePathSM Tactical UnconstrainedSM Asset Allocation Fund
SCHEDULE OF INVESTMENTS (Continued)
March 31, 2014
Number of
Shares | | | | | Value | |
| | | | | SHORT TERM INVESTMENTS - 15.33% | | | | |
| | | | | Money Market Funds - 15.33% | | | | |
| | 58,111,772 | | | Federated Prime Obligations Fund | | $ | 58,111,772 | |
| | | | | Total Short Term Investments | | | | |
| | | | | (Cost $58,111,772) | | | 58,111,772 | |
| | | | | INVESTMENTS PURCHASED | | | | |
| | | | | AS SECURITIES LENDING | | | | |
| | | | | COLLATERAL - 6.22% | | | | |
| | | | | Money Market Funds - 6.22% | | | | |
| | 23,559,185 | | | First American Government | | | | |
| | | | | Obligations Fund | | | 23,559,185 | |
| | | | | Total Investments Purchased as | | | | |
| | | | | Securities Lending Collateral | | | | |
| | | | | (Cost $23,559,185) | | | 23,559,185 | |
| | | | | Total Investments | | | | |
| | | | | (Cost $315,910,063) - 94.77% | | | 359,131,698 | |
| | | | | Other Assets in Excess of | | | | |
| | | | | Liabilities - 5.23% | | | 19,833,558 | |
| | | | | TOTAL NET ASSETS - 100.00% | | $ | 378,965,256 | |
Percentages are stated as a percent of net assets.
| (a) | All or portion of this security is on loan. |
| (b) | Non-income producing security. |
See notes to financial statements.
GuidePathSM Absolute Return Asset Allocation Fund
SCHEDULE OF INVESTMENTS
March 31, 2014
Number of
Shares | | | | | Value | |
| | | | | INVESTMENT COMPANIES - 98.07% | | | | |
| | | | | Affiliated Mutual Funds - 6.83% | | | | |
| | 1,495,920 | | | GuideMarkSM Core Fixed Income | | | | |
| | | | | Fund - Institutional Shares | | $ | 14,016,770 | |
| | 453,064 | | | GuideMarkSM Large Cap Value | | | | |
| | | | | Fund - Institutional Shares | | | 5,314,443 | |
| | 690,445 | | | GuideMarkSM Opportunistic Fixed | | | | |
| | | | | Income Fund - Institutional Shares | | | 6,863,025 | |
| | 512,410 | | | GuideMarkSM World ex-US Fund - | | | | |
| | | | | Institutional Shares | | | 4,580,945 | |
| | | | | | | | 30,775,183 | |
| | | | | Exchange Traded Funds - 43.69% | | | | |
| | 163,230 | | | iShares 1-3 Year Treasury | | | | |
| | | | | Bond ETF (a) | | | 13,784,774 | |
| | 420,225 | | | iShares Floating Rate Bond ETF (a) | | | 21,309,610 | |
| | 227,238 | | | iShares JPMorgan USD Emerging | | | | |
| | | | | Markets Bond ETF (a) | | | 25,318,858 | |
| | 105,403 | | | iShares MBS ETF (a) | | | 11,186,420 | |
| | 76,910 | | | iShares MSCI ACWI Index ETF (a) | | | 4,471,547 | |
| | 41,781 | | | PowerShares DB Agriculture | | | | |
| | | | | Fund (b) | | | 1,183,656 | |
| | 7,239 | | | PowerShares DB Base Metals | | | | |
| | | | | Fund (a)(b) | | | 114,883 | |
| | 24,605 | | | PowerShares DB Energy Fund (a)(b) | | | 720,188 | |
| | 6,075 | | | PowerShares DB Precious Metals | | | | |
| | | | | Fund (a)(b) | | | 251,383 | |
| | 250,819 | | | SPDR Barclays 1-3 Month T-Bill | | | | |
| | | | | ETF (a)(b) | | | 11,479,986 | |
| | 10,555 | | | SPDR Barclays Convertible | | | | |
| | | | | Securities ETF | | | 510,756 | |
| | 601,129 | | | SPDR Barclays High Yield | | | | |
| | | | | Bond ETF (a) | | | 24,832,639 | |
| | 426,570 | | | SPDR Barclays Short Term | | | | |
| | | | | Corporate Bond ETF (a) | | | 13,117,027 | |
| | 22,083 | | | SPDR S&P 500 ETF Trust | | | 4,130,404 | |
| | 162,266 | | | Vanguard FTSE All-World ex-US | | | | |
| | | | | Index Fund | | | 8,163,602 | |
| | 244,429 | | | Vanguard Long-Term Corporate | | | | |
| | | | | Bond ETF (a) | | | 21,328,875 | |
| | 26,337 | | | Vanguard Mid-Cap Value ETF | | | 2,181,494 | |
| | 473,618 | | | Vanguard Mortgage-Backed | | | | |
| | | | | Securities ETF | | | 24,486,051 | |
| | 4,693 | | | Vanguard Small-Cap Value ETF | | | 472,304 | |
| | 94,179 | | | Vanguard Total Bond Market ETF | | | 7,646,393 | |
| | | | | | | | 196,690,850 | |
Number of
Shares | | |
| | Value | |
| | | | | Mutual Funds - 47.55% | | | | |
| | 899,116 | | | Aberdeen Equity Long-Short | | | | |
| | | | | Fund - Institutional Shares | | $ | 10,897,283 | |
| | 573,753 | | | BlackRock Low Duration Bond | | | | |
| | | | | Portfolio - Institutional Shares | | | 5,605,562 | |
| | 217,137 | | | DoubleLine Core Fixed Income | | | | |
| | | | | Fund - Institutional Shares | | | 2,362,445 | |
| | 954,664 | | | DoubleLine Emerging Markets | | | | |
| | | | | Fixed Income Bond Fund - | | | | |
| | | | | Institutional Shares | | | 10,004,877 | |
| | 1,099,768 | | | DoubleLine Low Duration Bond | | | | |
| | | | | Fund - Institutional Shares | | | 11,206,636 | |
| | 362,492 | | | DoubleLine Multi-Asset Growth | | | | |
| | | | | Fund - Institutional Shares | | | 3,661,172 | |
| | 2,553,428 | | | DoubleLine Total Return Bond | | | | |
| | | | | Fund - Institutional Shares | | | 27,832,363 | |
| | 855,808 | | | Eaton Vance Floating-Rate Fund - | | | | |
| | | | | Institutional Shares | | | 7,839,201 | |
| | 872,245 | | | Eaton Vance Global Macro Absolute | | | | |
| | | | | Return Advantage Fund - | | | | |
| | | | | Institutional Shares (b) | | | 8,486,943 | |
| | 683,832 | | | Eaton Vance Multi-Strategy | | | | |
| | | | | Absolute Return Fund - | | | | |
| | | | | Institutional Shares | | | 5,963,014 | |
| | 1,276,889 | | | JPMorgan Floating Rate Income | | | | |
| | | | | Fund - Select Shares | | | 12,909,353 | |
| | 1,623,552 | | | JPMorgan Multi-Sector Income | | | | |
| | | | | Fund - Select Shares | | | 16,868,704 | |
| | 57,287 | | | JPMorgan Research Equity Long | | | | |
| | | | | Short Fund - Select Shares | | | 963,562 | |
| | 282,442 | | | JPMorgan Strategic Income | | | | |
| | | | | Opportunities Fund - Select Shares | | | 3,369,531 | |
| | 747,401 | | | JPMorgan Strategic Preservation | | | | |
| | | | | Fund - Select Shares | | | 11,121,331 | |
| | 291,652 | | | Parametric Absolute Return Fund - | | | | |
| | | | | Institutional Shares | | | 2,820,273 | |
| | 443,873 | | | Parametric Market Neutral Fund - | | | | |
| | | | | Institutional Shares | | | 4,349,956 | |
| | 5,815,677 | | | Pioneer Strategic Income Fund - | | | | |
| | | | | Class Y | | | 63,914,286 | |
| | 264,610 | | | Robeco Boston Partners Long/Short | | | | |
| | | | | Research Fund- Institutional Shares | | | 3,879,188 | |
| | | | | | | | 214,055,680 | |
| | | | | Total Investment Companies | | | | |
| | | | | (Cost $433,380,815) | | | 441,521,713 | |
See notes to financial statements.
GuidePathSM Absolute Return Asset Allocation Fund
SCHEDULE OF INVESTMENTS (Continued)
March 31, 2014
Number of
Shares | | | | | Value | |
| | | | | SHORT TERM INVESTMENTS - 1.84% | | | | |
| | | | | Money Market Funds - 1.84% | | | | |
| | 8,292,774 | | | Federated Prime Obligations Fund | | $ | 8,292,774 | |
| | | | | Total Short Term Investments | | | | |
| | | | | (Cost $8,292,774) | | | 8,292,774 | |
| | | | | INVESTMENTS PURCHASED | | | | |
| | | | | AS SECURITIES LENDING | | | | |
| | | | | COLLATERAL - 20.91% | | | | |
| | | | | Money Market Funds - 20.91% | | | | |
| | 94,128,733 | | | First American Government | | | | |
| | | | | Obligations Fund | | | 94,128,733 | |
| | | | | Total Investments Purchased as | | | | |
| | | | | Securities Lending Collateral | | | | |
| | | | | (Cost $94,128,733) | | | 94,128,733 | |
| | | | | Total Investments | | | | |
| | | | | (Cost $535,802,322) - 120.82% | | | 543,943,220 | |
| | | | | Liabilities in Excess of Other | | | | |
| | | | | Assets - (20.82)% | | | (93,741,934 | ) |
| | | | | TOTAL NET ASSETS - 100.00% | | $ | 450,201,286 | |
| | | | | | | | | |
Percentages are stated as a percent of net assets.
| (a) | All or portion of this security is on loan. |
| (b) | Non-income producing security. |
See notes to financial statements.
GuidePathSM Multi-Asset Income Asset Allocation Fund
CHEDULE OF INVESTMENTS
March 31, 2014
Number of
Shares | | | | | Value | |
| | | | | INVESTMENT COMPANIES - 97.27% | | | | |
| | | | | Affiliated Mutual Funds - 1.33% | | | | |
| | 172,407 | | | GuideMarkSM World ex-US Fund - | | | | |
| | | | | Institutional Shares | | $ | 1,541,323 | |
| | | | | Exchange Traded Funds - 46.60% | | | | |
| | 11,260 | | | iShares 7-10 Year Treasury | | | | |
| | | | | Bond ETF (a) | | | 1,145,480 | |
| | 16,028 | | | iShares 10+Year Credit Bond ETF | | | 931,547 | |
| | 27,926 | | | iShares 20+ Year Treasury | | | | |
| | | | | Bond ETF (a) | | | 3,046,727 | |
| | 71,102 | | | iShares Global Infrastructure ETF (a) | | | 2,961,398 | |
| | 61,118 | | | iShares iBoxx $ High Yield | | | | |
| | | | | Corporate Bond ETF (a) | | | 5,768,928 | |
| | 3,215 | | | iShares iBoxx $ Investment Grade | | | | |
| | | | | Corporate Bond ETF (a) | | | 376,059 | |
| | 100,702 | | | iShares International Select | | | | |
| | | | | Dividend ETF (a) | | | 3,891,125 | |
| | 41,824 | | | iShares JPMorgan USD Emerging | | | | |
| | | | | Markets Bond ETF (a) | | | 4,660,030 | |
| | 39,151 | | | iShares MSCI Australia ETF (a) | | | 1,012,836 | |
| | 2,532 | | | iShares TIPS ETF (b) | | | 283,837 | |
| | 31,184 | | | iShares U.S. Preferred Stock | | | | |
| | | | | ETF (a) | | | 1,217,112 | |
| | 61,933 | | | iShares U.S. Real Estate ETF (a) | | | 4,191,006 | |
| | 271,608 | | | PowerShares International Dividend | | | | |
| | | | | Achievers Portfolio (a) | | | 4,951,414 | |
| | 28,531 | | | PowerShares Senior Loan | | | | |
| | | | | Portfolio (a) | | | 707,854 | |
| | 45,426 | | | SPDR Barclays High Yield | | | | |
| | | | | Bond ETF (a) | | | 1,876,548 | |
| | 4,831 | | | SPDR Barclays International | | | | |
| | | | | Treasury Bond ETF | | | 286,865 | |
| | 22,007 | | | SPDR Dow Jones International Real | | | | |
| | | | | Estate ETF | | | 906,028 | |
| | 15,915 | | | Vanguard Global ex-US Real | | | | |
| | | | | Estate ETF | | | 860,524 | |
| | 12,822 | | | Vanguard REIT ETF (a) | | | 905,490 | |
| | 15,099 | | | WisdomTree Emerging Markets | | | | |
| | | | | Equity Income Fund (a) | | | 740,908 | |
| | 147,627 | | | WisdomTree Equity Income Fund (a) | | | 8,351,259 | |
| | 53,995 | | | WisdomTree International SmallCap | | | | |
| | | | | Dividend Fund (a) | | | 3,511,295 | |
| | 18,046 | | | WisdomTree SmallCap Dividend | | | | |
| | | | | Fund (a) | | | 1,231,820 | |
| | | | | | | | 53,816,090 | |
Number of
Shares | | | | | Value | |
| | | | | Mutual Funds - 49.34% | | | | |
| | 2,455,637 | | | BlackRock Multi-Asset Income | | | | |
| | | | | Fund - Institutional Shares | | $ | 27,994,264 | |
| | 383,165 | | | Forward EM Corporate Debt Fund - | | | | |
| | | | | Institutional Shares | | | 3,540,441 | |
| | 433,034 | | | Forward International Dividend | | | | |
| | | | | Fund - Institutional Shares | | | 3,520,570 | |
| | 279,266 | | | Forward Select Income Fund - | | | | |
| | | | | Institutional Shares | | | 6,950,928 | |
| | 295,224 | | | JPMorgan Global Equity Income | | | | |
| | | | | Fund - Select Shares | | | 5,004,052 | |
| | 557,401 | | | JPMorgan High Yield Fund - Select | | | | |
| | | | | Shares | | | 4,503,802 | |
| | 412,410 | | | JPMorgan Income Builder Fund - | | | | |
| | | | | Select Shares | | | 4,309,687 | |
| | 110,189 | | | JPMorgan Multi-Sector Income | | | | |
| | | | | Fund - Select Shares | | | 1,144,868 | |
| | | | | | | | 56,968,612 | |
| | | | | Total Investment Companies | | | | |
| | | | | (Cost $106,770,199) | | | 112,326,025 | |
| | | | | SHORT TERM INVESTMENTS - 2.02% | | | | |
| | | | | Money Market Funds - 2.02% | | | | |
| | 2,332,056 | | | Federated Prime Obligations Fund | | | 2,332,056 | |
| | | | | Total Short Term Investments | | | | |
| | | | | (Cost $2,332,056) | | | 2,332,056 | |
| | | | | INVESTMENTS PURCHASED | | | | |
| | | | | AS SECURITIES LENDING | | | | |
| | | | | COLLATERAL - 29.58% | | | | |
| | | | | Money Market Funds - 29.58% | | | | |
| | 34,155,152 | | | First American Government | | | | |
| | | | | Obligations Fund | | | 34,155,152 | |
| | | | | Total Investments Purchased as | | | | |
| | | | | Securities Lending Collateral | | | | |
| | | | | (Cost $34,155,152) | | | 34,155,152 | |
| | | | | Total Investments | | | | |
| | | | | (Cost $143,257,407) - 128.87% | | | 148,813,233 | |
| | | | | Liabilities in Excess of Other | | | | |
| | | | | Assets - (28.87)% | | | (33,335,457 | ) |
| | | | | TOTAL NET ASSETS - 100.00% | | $ | 115,477,776 | |
| | | | | | | | | |
Percentages are stated as a percent of net assets.
| (a) | All or portion of this security is on loan. |
| (b) | Non-income producing security. |
See notes to financial statements.
GuidePathSM Fixed Income Allocation Fund
SCHEDULE OF INVESTMENTS
March 31, 2014
Number of
Shares | | | | | Value | |
| | | | | INVESTMENT COMPANIES - 98.19% | | | | |
| | | | | Affiliated Mutual Funds - 35.39% | | | | |
| | 5,214,813 | | | GuideMarkSM Core Fixed Income | | | | |
| | | | | Fund - Institutional Shares | | $ | 48,862,801 | |
| | 2,720,118 | | | GuideMarkSM Opportunistic Fixed | | | | |
| | | | | Income Fund - Institutional Shares | | | 27,037,975 | |
| | | | | | | | 75,900,776 | |
| | | | | Exchange Traded Funds - 55.10% | | | | |
| | 111,238 | | | iShares 1-3 Year Treasury Bond | | | | |
| | | | | ETF (a) | | | 9,394,049 | |
| | 134,156 | | | iShares 7-10 Year Treasury | | | | |
| | | | | Bond ETF (a) | | | 13,647,690 | |
| | 20,009 | | | iShares 10+ Year Credit Bond ETF | | | 1,162,923 | |
| | 24,559 | | | iShares 20+ Year Treasury Bond | | | | |
| | | | | ETF (a) | | | 2,679,387 | |
| | 57,390 | | | iShares Credit Bond ETF | | | 6,284,779 | |
| | 13,952 | | | iShares JPMorgan USD Emerging | | | | |
| | | | | Markets Bond ETF (a) | | | 1,554,532 | |
| | 275,632 | | | PowerShares Senior Loan | | | | |
| | | | | Portfolio (a) | | | 6,838,430 | |
| | 180,324 | | | SPDR Barclays High Yield Bond | | | | |
| | | | | ETF (a) | | | 7,449,184 | |
| | 136,226 | | | SPDR Barclays TIPS ETF (a) | | | 7,571,441 | |
| | 30,003 | | | SPDR DB International Government | | | | |
| | | | | Inflation-Protected Bond ETF | | | 1,802,880 | |
| | 210,568 | | | Vanguard Mortgage-Backed | | | | |
| | | | | Securities ETF | | | 10,886,366 | |
| | 602,335 | | | Vanguard Total Bond Market Index | | | | |
| | | | | Fund (a) | | | 48,903,579 | |
| | | | | | | | 118,175,240 | |
Number of
Shares | | | | | Value | |
| | | | | Mutual Funds - 7.70% | | | | |
| | 480,690 | | | DoubleLine Total Return Bond | | | | |
| | | | | Fund - Institutional Shares | | $ | 5,239,526 | |
| | 230,950 | | | Loomis Sayles Bond Fund - | | | | |
| | | | | Institutional Shares | | | 3,570,492 | |
| | 160,394 | | | PIMCO Emerging Local Bond | | | | |
| | | | | Fund - Institutional Shares | | | 1,506,102 | |
| | 554,821 | | | PIMCO Unconstrained Bond | | | | |
| | | | | Fund - Institutional Shares | | | 6,197,356 | |
| | | | | | | | 16,513,476 | |
| | | | | Total Investment Companies | | | | |
| | | | | (Cost $213,657,176) | | | 210,589,492 | |
| | | | | SHORT TERM INVESTMENTS - 1.90% | | | | |
| | | | | Money Market Funds - 1.90% | | | | |
| | 4,066,373 | | | Federated Prime Obligations Fund | | | 4,066,373 | |
| | | | | Total Short Term Investments | | | | |
| | | | | (Cost $4,066,373) | | | 4,066,373 | |
| | | | | INVESTMENTS PURCHASED | | | | |
| | | | | AS SECURITIES LENDING | | | | |
| | | | | COLLATERAL - 14.39% | | | | |
| | | | | Money Market Funds - 14.39% | | | | |
| | 30,860,329 | | | First American Government | | | | |
| | | | | Obligations Fund | | | 30,860,329 | |
| | | | | Total Investments Purchased as | | | | |
| | | | | Securities Lending Collateral | | | | |
| | | | | (Cost $30,860,329) | | | 30,860,329 | |
| | | | | Total Investments | | | | |
| | | | | (Cost $248,583,878) - 114.48% | | | 245,516,194 | |
| | | | | Liabilities in Excess of Other | | | | |
| | | | | Assets - (14.48)% | | | (31,056,616 | ) |
| | | | | TOTAL NET ASSETS - 100.00% | | $ | 214,459,578 | |
| | | | | | | | | |
Percentages are stated as a percent of net assets.
| (a) | All or portion of this security is on loan. |
See notes to financial statements.
GuidePathSM Altegris® Diversified Alternatives Allocation Fund
SCHEDULE OF INVESTMENTS
March 31, 2014
Number of
Shares | | | | | Value | |
| | | | | INVESTMENT COMPANIES - 98.28% | | | | |
| | | | | Affiliated Mutual Funds - 98.28% | | | | |
| | 5,052,277 | | | Altegris® Equity Long Short | | | | |
| | | | | Fund - Institutional Shares (b) | | $ | 54,362,498 | |
| | 3,644,281 | | | Altegris® Fixed Income Long Short | | | | |
| | | | | Fund - Institutional Shares (b) | | | 38,447,164 | |
| | 985,558 | | | Altegris® Futures Evolution Strategy | | | | |
| | | | | Fund - Institutional Shares | | | 9,658,469 | |
| | 2,278,428 | | | Altegris® Macro Strategy Fund - | | | | |
| | | | | Institutional Shares (a) | | | 18,295,775 | |
| | 710,954 | | | Altegris® Managed Futures Strategy | | | | |
| | | | | Fund - Institutional Shares (a) | | | 6,277,720 | |
| | | | | | | | 127,041,626 | |
| | | | | Total Investment Companies | | | | |
| | | | | (Cost $124,910,916) | | | 127,041,626 | |
| | | | | SHORT TERM INVESTMENTS - 1.91% | | | | |
| | | | | Money Market Funds - 1.91% | | | | |
| | 2,465,179 | | | Federated Prime Obligations Fund | | | 2,465,179 | |
| | | | | Total Short Term Investments | | | | |
| | | | | (Cost $2,465,179) | | | 2,465,179 | |
| | | | | Total Investments | | | | |
| | | | | (Cost $127,376,095) - 100.19% | | | 129,506,805 | |
| | | | | Liabilities in Excess of Other | | | | |
| | | | | Assets - (0.19)% | | | (248,679 | ) |
| | | | | TOTAL NET ASSETS - 100.00% | | $ | 129,258,126 | |
Percentages are stated as a percent of net assets.
| (a) | Non-income producing security. |
| (b) | Fair value of this security exceeds 25% of the Fund’s net assets. Additional information for this security, including the financial statements, is available from the SEC’s EDGAR database at www.sec.gov. |
See notes to financial statements.
GuideMarkSM Funds & GuidePathSM Funds
STATEMENTS OF ASSETS & LIABILITIES
March 31, 2014
| | | Large Cap
Growth Fund | | Large Cap
Value Fund | | Small/Mid Cap
Core Fund | |
| ASSETS: | | | | | | | | | | |
Investments, at value (cost $136,946,094, $146,573,601,
and $80,373,587, respectively)1 | | $ | 191,326,182 | | $ | 211,844,372 | | $ | 84,096,695 | |
| Cash | | | — | | | — | | | 3,340 | |
| Income receivable | | | 74,854 | | | 277,867 | | | 47,573 | |
| Receivable for dividend reclaims | | | — | | | 42,212 | | | — | |
| Receivable for investment securities sold | | | 1,493,544 | | | 1,143,252 | | | 2,401,256 | |
| Receivable for fund shares sold | | | 503,834 | | | 471,815 | | | 302,660 | |
| Receivable from securities lending agent (See Note 6) | | | — | | | — | | | 6,803 | |
| Other assets | | | 28,007 | | | 29,528 | | | 19,337 | |
| Total Assets | | | 193,426,421 | | | 213,809,046 | | | 86,877,664 | |
| LIABILITIES: | | | | | | | | | | |
| Payable for collateral on securities loaned | | | 8,219,156 | | | 12,146,872 | | | 7,516,857 | |
| Payable to securities lending agent (See Note 6) | | | 6,087 | | | 2,148 | | | — | |
| Payable for investment securities purchased | | | 1,106,878 | | | 1,480,522 | | | 1,932,497 | |
| Payable for fund shares redeemed | | | 72,216 | | | 63,322 | | | 17,504 | |
| Payable to Investment Advisor | | | 158,056 | | | 146,419 | | | 55,615 | |
| Other accrued expenses | | | 133,481 | | | 126,060 | | | 68,188 | |
| Total Liabilities | | | 9,695,874 | | | 13,965,343 | | | 9,590,661 | |
| NET ASSETS | | $ | 183,730,547 | | $ | 199,843,703 | | $ | 77,287,003 | |
| NET ASSETS CONSIST OF: | | | | | | | | | | |
| Capital stock | | | 170,104,202 | | | 284,501,356 | | | 70,004,046 | |
| Unrealized appreciation on investments | | | 54,380,088 | | | 65,270,771 | | | 3,723,108 | |
| Accumulated undistributed net investment income (loss) | | | 6,873 | | | 544,756 | | | (88,635 | ) |
| Accumulated undistributed net realized gain (loss) | | | (40,760,616 | ) | | (150,473,180 | ) | | 3,648,484 | |
| Total Net Assets | | $ | 183,730,547 | | $ | 199,843,703 | | $ | 77,287,003 | |
| Institutional Shares | | | | | | | | | | |
| Shares outstanding (unlimited shares of no par value authorized) | | | 3,279,832 | | | 5,287,218 | | | 2,664,868 | |
| Net assets | | | 44,827,864 | | | 62,007,800 | | | 44,695,002 | |
| Net asset value, offering and redemption price per share | | $ | 13.67 | | $ | 11.73 | | $ | 16.77 | |
| Service Shares | | | | | | | | | | |
| Shares outstanding (unlimited shares of no par value authorized) | | | 10,244,828 | | | 11,637,947 | | | 1,962,363 | |
| Net assets | | | 138,902,683 | | | 137,835,903 | | | 32,592,001 | |
| Net asset value, offering and redemption price per share | | $ | 13.56 | | $ | 11.84 | | $ | 16.61 | |
| 1Includes loaned securities with a value of: | | $ | 8,181,940 | | $ | 11,796,113 | | $ | 7,358,422 | |
See notes to financial statements.
GuideMarkSM Funds & GuidePathSM Funds
STATEMENTS OF ASSETS & LIABILITIES (Continued)
March 31, 2014
| | | World
ex-US Fund | | Opportunistic
Equity Fund | | Global Real
Return Fund | |
| ASSETS: | | | | | | | | | | |
Investments, at value (cost $317,445,257, $111,519,138,
and $104,032,710, respectively)1 | | $ | 369,692,063 | | $ | 140,384,765 | | $ | 106,575,842 | |
| Foreign currencies (cost $660,646, $0, and $0, respectively) | | | 659,741 | | | — | | | — | |
| Cash | | | 162,179 | | | 9,843 | | | 80,660 | |
| Variation margin on futures contracts | | | 79,960 | | | — | | | — | |
| Income receivable | | | 1,151,117 | | | 143,499 | | | 57,515 | |
| Receivable for dividend reclaims | | | 384,814 | | | 758 | | | — | |
| Receivable for investment securities and foreign currencies sold | | | 1,498,609 | | | 3,111,339 | | | — | |
| Receivable for fund shares sold | | | 351,014 | | | 351,586 | | | 86,004 | |
| Other assets | | | 39,764 | | | 31,921 | | | 34,354 | |
| Total Assets | | | 374,019,261 | | | 144,033,711 | | | 106,834,375 | |
| LIABILITIES: | | | | | | | | | | |
| Payable for collateral on securities loaned | | | 2,217,000 | | | 8,998,359 | | | 28,902,100 | |
| Payable to securities lending agent (See Note 6) | | | 1,698 | | | — | | | — | |
| Payable for investment securities and foreign currencies purchased | | | 1,825,828 | | | 2,524,824 | | | 209,485 | |
| Payable for fund shares redeemed | | | 714,788 | | | 84,801 | | | 36,454 | |
| Payable to Investment Advisor | | | 296,052 | | | 104,814 | | | 55,848 | |
| Other accrued expenses | | | 276,825 | | | 91,467 | | | 53,575 | |
| Total Liabilities | | | 5,332,191 | | | 11,804,265 | | | 29,257,462 | |
| NET ASSETS | | $ | 368,687,070 | | $ | 132,229,446 | | $ | 77,576,913 | |
| NET ASSETS CONSIST OF: | | | | | | | | | | |
| Capital stock | | | 522,987,482 | | | 91,264,003 | | �� | 88,235,824 | |
| Unrealized appreciation on: | | | | | | | | | | |
| Investments | | | 52,246,806 | | | 28,865,654 | | | 2,543,132 | |
| Foreign currencies | | | 9,866 | | | — | | | — | |
| Futures contracts | | | 349,550 | | | — | | | — | |
| Accumulated undistributed net investment income | | | 3,150,602 | | | 169,134 | | | 245,321 | |
| Accumulated undistributed net realized gain (loss) | | | (210,057,236 | ) | | 11,930,655 | | | (13,447,364 | ) |
| Total Net Assets | | $ | 368,687,070 | | $ | 132,229,446 | | $ | 77,576,913 | |
| Institutional Shares | | | | | | | | | | |
| Shares outstanding (unlimited shares of no par value authorized) | | | 14,599,597 | | | 4,439,409 | | | 1,432,429 | |
| Net assets | | | 130,537,695 | | | 59,877,468 | | | 13,204,913 | |
| Net asset value, offering and redemption price per share | | $ | 8.94 | | $ | 13.49 | | $ | 9.22 | |
| Service Shares | | | | | | | | | | |
| Shares outstanding (unlimited shares of no par value authorized) | | | 26,784,476 | | | 5,390,801 | | | 6,965,370 | |
| Net assets | | | 238,149,375 | | | 72,351,978 | | | 64,372,000 | |
| Net asset value, offering and redemption price per share | | $ | 8.89 | | $ | 13.42 | | $ | 9.24 | |
| 1Includes loaned securities with a value of: | | $ | 2,083,130 | | $ | 8,795,468 | | $ | 28,433,508 | |
See notes to financial statements.
GuideMarkSM Funds & GuidePathSM Funds
STATEMENTS OF ASSETS & LIABILITIES (Continued)
March 31, 2014
| | | Core
Fixed Income
Fund | | Tax-Exempt
Fixed Income
Fund | | Opportunistic
Fixed Income
Fund | |
| ASSETS: | | | | | | | | | | |
Investments, at value (cost $334,936,850, $59,384,592,
and $209,141,075, respectively)1 | | $ | 338,170,395 | | $ | 62,561,590 | | $ | 209,280,003 | |
| Appreciation of swap agreements | | | — | | | — | | | 2,637 | |
| Foreign currencies (cost $0, $0, and $3,053,378, respectively) | | | — | | | — | | | 3,056,805 | |
| Cash | | | 123,794 | | | — | | | 9,058 | |
| Variation margin on swaps | | | — | | | — | | | 144 | |
| Income receivable | | | 1,691,854 | | | 907,446 | | | 1,791,982 | |
| Receivable for dividend reclaims | | | — | | | — | | | 711 | |
| Receivable for investment securities and foreign currencies sold | | | 5,404,593 | | | 4,688 | | | 1,411,141 | |
| Receivable for fund shares sold | | | 558,216 | | | 49,999 | | | 210,857 | |
| Swap premiums paid | | | — | | | — | | | 105,762 | |
| Deposits with brokers for forwards and swaps | | | — | | | — | | | 1,020,000 | |
| Appreciation of forward foreign currency contracts | | | — | | | — | | | 1,469,277 | |
| Receivable from securities lending agent (See Note 6) | | | 3,130 | | | — | | | — | |
| Other assets | | | 53,375 | | | 29,068 | | | 25,364 | |
| Total Assets | | | 346,005,357 | | | 63,552,791 | | | 218,383,741 | |
| LIABILITIES: | | | | | | | | | | |
| Depreciation of forward foreign currency contracts | | | — | | | — | | | 2,305,923 | |
| Depreciation on swap agreements | | | — | | | — | | | 558,782 | |
| Payable for collateral on securities loaned | | | 4,594,030 | | | — | | | — | |
| Payable for investment securities and foreign currencies purchased | | | 20,799,817 | | | — | | | 2,249,027 | |
| Payable for fund shares redeemed | | | 146,421 | | | 2,862 | | | 182,699 | |
| Payable to Investment Advisor | | | 259,145 | | | 47,319 | | | 166,966 | |
| Swap premiums received | | | — | | | — | | | 35,877 | |
| Variation margin on futures contracts | | | — | | | — | | | 20,538 | |
| Other accrued expenses | | | 218,200 | | | 73,033 | | | 188,924 | |
| Total Liabilities | | | 26,017,613 | | | 123,214 | | | 5,708,736 | |
| NET ASSETS | | $ | 319,987,744 | | $ | 63,429,577 | | $ | 212,675,005 | |
| NET ASSETS CONSIST OF: | | | | | | | | | | |
| Capital stock | | | 319,690,210 | | | 64,642,494 | | | 214,751,726 | |
| Unrealized appreciation (depreciation) on: | | | | | | | | | | |
| Investments | | | 3,233,553 | | | 3,176,998 | | | 138,928 | |
| Foreign currencies | | | — | | | — | | | (4,424 | ) |
| Swaps | | | — | | | — | | | (556,145 | ) |
| Forward currency exchange contracts | | | — | | | — | | | (836,646 | ) |
| Futures contracts | | | — | | | — | | | (20,938 | ) |
| Accumulated undistributed net investment income (loss) | | | (1,950 | ) | | 58,795 | | | 2,378,876 | |
| Accumulated undistributed net realized loss | | | (2,934,069 | ) | | (4,448,710 | ) | | (3,176,372 | ) |
| Total Net Assets | | $ | 319,987,744 | | $ | 63,429,577 | | $ | 212,675,005 | |
| Institutional Shares | | | | | | | | | | |
| Shares outstanding (unlimited shares of no par value authorized) | | | 9,468,178 | | | — | | | 6,560,084 | |
| Net assets | | | 88,702,582 | | | — | | | 65,181,311 | |
| Net asset value, offering and redemption price per share | | $ | 9.37 | | $ | — | | $ | 9.94 | |
| Service Shares | | | | | | | | | | |
| Shares outstanding (unlimited shares of no par value authorized) | | | 24,625,983 | | | 5,676,012 | | | 14,860,707 | |
| Net assets | | | 231,285,162 | | | 63,429,577 | | | 147,493,694 | |
| Net asset value, offering and redemption price per share | | $ | 9.39 | | $ | 11.18 | | $ | 9.93 | |
| 1Includes loaned securities with a value of: | | $ | 4,481,147 | | $ | — | | $ | — | |
See notes to financial statements.
GuideMarkSM Funds & GuidePathSM Funds
STATEMENTS OF ASSETS & LIABILITIES (Continued)
March 31, 2014
| | | Strategic
Asset Allocation
Fund | | Tactical
ConstrainedSM Asset Allocation
Fund | | Tactical
UnconstrainedSM Asset Allocation
Fund | | Absolute
Return
Asset Allocation
Fund | |
| ASSETS: | | | | | | | | | | | | | |
Investments, at value (cost $151,119,647, $80,723,090, $216,558,714,
and $506,782,436, respectively)1 | | $ | 175,291,604 | | $ | 90,688,865 | | $ | 234,014,066 | | $ | 513,168,037 | |
Investments in affiliates, at value (cost $119,488,282, $101,264,473,
$99,351,349 and $29,019,886, respectively) | | | 154,242,612 | | | 129,913,856 | | | 125,117,632 | | | 30,775,183 | |
| Cash | | | 439,468 | | | 1,176 | | | — | | | 617 | |
| Income receivable | | | 181,453 | | | 142,450 | | | 294,130 | | | 537,473 | |
| Receivable for investment securities sold | | | 165,123 | | | 133,228 | | | 44,405,631 | | | 650,900 | |
| Receivable for fund shares sold | | | 503,566 | | | 338,403 | | | 959,711 | | | 739,849 | |
| Other assets | | | 36,937 | | | 30,707 | | | 37,859 | | | 80,921 | |
| Total Assets | | | 330,860,763 | | | 221,248,685 | | | 404,829,029 | | | 545,952,980 | |
| LIABILITIES: | | | | | | | | | | | | | |
| Payable for collateral on securities loaned | | | 38,325,716 | | | 22,574,143 | | | 23,559,185 | | | 94,128,733 | |
| Payable for investment securities purchased | | | — | | | 6,072 | | | 1,571,421 | | | 249,787 | |
| Payable for fund shares redeemed | | | 297,823 | | | 263,152 | | | 311,321 | | | 867,882 | |
| Payable to Investment Advisor | | | 133,556 | | | 81,628 | | | 198,581 | | | 230,463 | |
| Other accrued expenses | | | 168,054 | | | 144,368 | | | 223,265 | | | 274,829 | |
| Total Liabilities | | | 38,925,149 | | | 23,069,363 | | | 25,863,773 | | | 95,751,694 | |
| NET ASSETS | | $ | 291,935,614 | | $ | 198,179,322 | | $ | 378,965,256 | | $ | 450,201,286 | |
| NET ASSETS CONSIST OF: | | | | | | | | | | | | | |
| Capital stock | | | 234,498,827 | | | 156,214,523 | | | 332,838,336 | | | 450,608,604 | |
| Unrealized appreciation on: | | | | | | | | | | | | | |
| Investments | | | 24,171,957 | | | 9,965,775 | | | 17,455,352 | | | 6,385,601 | |
| Investments in affiliates | | | 34,754,330 | | | 28,649,383 | | | 25,766,283 | | | 1,755,297 | |
| Accumulated undistributed net investment income (loss) | | | (28,587 | ) | | 17,673 | | | (28,587 | ) | | 1,183,290 | |
| Accumulated undistributed net realized gain (loss) | | | (1,460,913 | ) | | 3,331,968 | | | 2,933,872 | | | (9,731,506 | ) |
| Total Net Assets | | $ | 291,935,614 | | $ | 198,179,322 | | $ | 378,965,256 | | $ | 450,201,286 | |
| Institutional Shares | | | | | | | | | | | | | |
| Shares outstanding (unlimited shares of no par value authorized) | | | 308,783 | | | 235,393 | | | 138,544 | | | 101,506 | |
| Net assets | | | 3,534,178 | | | 2,680,327 | | | 1,496,066 | | | 1,014,888 | |
| Net asset value, offering and redemption price per share | | $ | 11.45 | | $ | 11.39 | | $ | 10.80 | | $ | 10.00 | |
| Service Shares | | | | | | | | | | | | | |
| Shares outstanding (unlimited shares of no par value authorized) | | | 25,231,728 | | | 17,157,133 | | | 34,968,576 | | | 44,882,550 | |
| Net assets | | | 288,401,436 | | | 195,498,995 | | | 377,469,190 | | | 449,186,398 | |
| Net asset value, offering and redemption price per share | | $ | 11.43 | | $ | 11.39 | | $ | 10.79 | | $ | 10.01 | |
| 1Includes loaned securities with a value of: | | $ | 37,776,866 | | $ | 22,099,590 | | $ | 23,129,805 | | $ | 91,330,450 | |
See notes to financial statements.
GuideMarkSM Funds & GuidePathSM Funds
STATEMENTS OF ASSETS & LIABILITIES (Continued)
March 31, 2014
| | | Multi-Asset
Income
Asset Allocation
Fund | | Fixed Income
Allocation
Fund | | Altegris®
Diversified
Alternatives
Allocation Fund | |
| ASSETS: | | | | | | | | | | |
Investments, at value (cost $141,992,535, $171,350,344,
and $2,465,179, respectively)1 | | $ | 147,271,910 | | $ | 169,615,418 | | $ | 2,465,179 | |
Investments in affiliates, at value (cost $1,264,872,
$77,233,534, and $124,910,916, respectively) | | | 1,541,323 | | | 75,900,776 | | | 127,041,626 | |
| Cash | | | 130,057 | | | 23,057 | | | — | |
| Income receivable | | | 219,449 | | | 33,121 | | | 45 | |
| Receivable for investment securities sold | | | — | | | 226,124 | | | 83,270 | |
| Receivable for fund shares sold | | | 777,318 | | | 437,127 | | | 169,536 | |
| Other assets | | | 43,197 | | | 28,819 | | | 13,364 | |
| Total Assets | | | 149,983,254 | | | 246,264,442 | | | 129,773,020 | |
| LIABILITIES: | | | | | | | | | | |
| Payable for collateral on securities loaned | | | 34,155,152 | | | 30,860,329 | | | — | |
| Payable for investment securities purchased | | | 111,884 | | | 75,118 | | | — | |
| Payable for fund shares redeemed | | | 99,413 | | | 637,890 | | | 414,868 | |
| Payable to Investment Advisor | | | 57,791 | | | 91,830 | | | — | |
| Other accrued expenses | | | 81,238 | | | 139,697 | | | 100,026 | |
| Total Liabilities | | | 34,505,478 | | | 31,804,864 | | | 514,894 | |
| NET ASSETS | | $ | 115,477,776 | | $ | 214,459,578 | | $ | 129,258,126 | |
| NET ASSETS CONSIST OF: | | | | | | | | | | |
| Capital stock | | | 110,178,232 | | | 222,887,250 | | | 131,214,642 | |
| Unrealized appreciation (depreciation) on: | | | | | | | | | | |
| Investments | | | 5,279,375 | | | (1,734,926 | ) | | — | |
| Investments in affiliates | | | 276,451 | | | (1,332,758 | ) | | 2,130,710 | |
| Accumulated undistributed net investment income | | | 430,235 | | | 221,674 | | | 25,117 | |
| Accumulated undistributed net realized loss | | | (686,517 | ) | | (5,581,662 | ) | | (4,112,343 | ) |
| Total Net Assets | | $ | 115,477,776 | | $ | 214,459,578 | | | 129,258,126 | |
| Institutional Shares | | | | | | | | | | |
| Shares outstanding (unlimited shares of no par value authorized) | | | — | | | 99,546 | | | 74,535 | |
| Net assets | | | — | | | 960,185 | | | 737,302 | |
| Net asset value, offering and redemption price per share | | $ | — | | $ | 9.65 | | $ | 9.89 | |
| Service Shares | | | | | | | | | | |
| Shares outstanding (unlimited shares of no par value authorized) | | | 10,736,707 | | | 22,138,764 | | | 12,997,288 | |
| Net assets | | | 115,477,776 | | | 213,499,393 | | | 128,520,824 | |
| Net asset value, offering and redemption price per share | | $ | 10.76 | | $ | 9.64 | | $ | 9.89 | |
| 1Includes loaned securities with a value of: | | $ | 33,251,218 | | $ | 29,891,467 | | $ | — | |
See notes to financial statements.
GuideMarkSM Funds & GuidePathSM Funds
STATEMENTS OF OPERATIONS
For the Year Ended March 31, 2014
| | | Large Cap
Growth Fund | | Large Cap
Value Fund | | Small/Mid Cap
Core Fund | |
| INVESTMENT INCOME: | | | | | | | | | | |
Dividend income (net of withholding tax of $11,761, $35,997,
and $0, respectively) | | $ | 2,743,030 | | $ | 4,872,265 | | $ | 791,040 | |
| Interest income | | | 436 | | | 549 | | | 433 | |
| Total investment income | | | 2,743,466 | | | 4,872,814 | | | 791,473 | |
| EXPENSES: | | | | | | | | | | |
| Investment advisory fees | | | 1,254,133 | | | 1,384,218 | | | 595,395 | |
| Distribution (12b-1) fees – Service Shares | | | 330,876 | | | 334,264 | | | 81,838 | |
| Administrative service fees – Service Shares | | | 330,876 | | | 334,264 | | | 81,838 | |
| Shareholder servicing fees – Service Shares | | | 105,880 | | | 96,904 | | | 16,368 | |
| Custody fees | | | 75,944 | | | 32,221 | | | 61,652 | |
| Administration fees | | | 68,728 | | | 76,072 | | | 30,511 | |
| Legal fees | | | 48,266 | | | 75,917 | | | 31,783 | |
| Fund accounting fees | | | 39,500 | | | 42,816 | | | 21,468 | |
| Federal and state registration fees | | | 37,653 | | | 39,991 | | | 36,007 | |
| Audit and tax fees | | | 24,055 | | | 24,055 | | | 23,713 | |
| Directors’ fees and expenses | | | 19,336 | | | 21,636 | | | 8,527 | |
| Reports to shareholders | | | 17,190 | | | 19,593 | | | 8,364 | |
| Transfer agent fees and expenses | | | 13,440 | | | 14,352 | | | 9,345 | |
| Insurance fees | | | 10,752 | | | 11,852 | | | 4,750 | |
| Compliance fees | | | 7,321 | | | 8,148 | | | 3,397 | |
| Total expenses | | | 2,383,950 | | | 2,516,303 | | | 1,014,956 | |
| Net expense recapture by Advisor (See Note 3) | | | 21,984 | | | — | | | 6,403 | |
| Less securities lending credit (See Note 6) | | | (14,959 | ) | | (18,193 | ) | | (24,999 | ) |
| Net expenses | | | 2,390,975 | | | 2,498,110 | | | 996,360 | |
| Net investment income (loss) | | | 352,491 | | | 2,374,704 | | | (204,887 | ) |
NET REALIZED AND UNREALIZED
GAIN ON INVESTMENTS: | | | | | | | | | | |
| Net realized gain on investments | | | 21,092,764 | | | 22,276,535 | | | 28,603,873 | |
Net change in unrealized appreciation (depreciation)
on investments | | | 13,913,996 | | | 20,243,163 | | | (11,964,634 | ) |
| Net realized and unrealized gain | | | 35,006,760 | | | 42,519,698 | | | 16,639,239 | |
NET INCREASE IN NET ASSETS
RESULTING FROM OPERATIONS | | $ | 35,359,251 | | $ | 44,894,402 | | $ | 16,434,352 | |
See notes to financial statements.
GuideMarkSM Funds & GuidePathSM Funds
STATEMENTS OF OPERATIONS (Continued)
For the Year Ended March 31, 2014
| | | World
ex-US Fund | | Opportunistic
Equity Fund | | Global
Real
Return Fund | |
| INVESTMENT INCOME: | | | | | | | | | | |
Dividend income (net of withholding tax of $1,017,513, $13,201,
and $0), respectively) | | $ | 8,467,318 | | $ | 2,596,432 | | $ | 1,678,407 | |
| Interest income | | | 2,991 | | | 1,286 | | | 108 | |
| Total investment income | | | 8,470,309 | | | 2,597,718 | | | 1,678,515 | |
| EXPENSES: | | | | | | | | | | |
| Investment advisory fees | | | 2,353,871 | | | 1,127,620 | | | 504,342 | |
| Distribution (12b-1) fees – Service Shares | | | 563,992 | | | 191,856 | | | 163,005 | |
| Administrative service fees – Service Shares | | | 563,992 | | | 191,856 | | | 163,005 | |
| Shareholder servicing fees – Service Shares | | | 169,198 | | | 43,984 | | | 42,381 | |
| Custody fees | | | 529,674 | | | 44,383 | | | 13,636 | |
| Administration fees | | | 129,406 | | | 55,462 | | | 30,488 | |
| Legal fees | | | 86,650 | | | 47,543 | | | 15,329 | |
| Fund accounting fees | | | 163,229 | | | 34,139 | | | 12,662 | |
| Federal and state registration fees | | | 51,299 | | | 36,781 | | | 38,270 | |
| Audit and tax fees | | | 26,954 | | | 31,084 | | | 17,323 | |
| Directors’ fees and expenses | | | 35,360 | | | 15,433 | | | 8,302 | |
| Reports to shareholders | | | 31,018 | | | 18,849 | | | 6,846 | |
| Transfer agent fees and expenses | | | 19,933 | | | 11,664 | | | 8,542 | |
| Insurance fees | | | 18,505 | | | 8,711 | | | 1,492 | |
| Compliance fees | | | 13,883 | | | 5,687 | | | 1,945 | |
| Total expenses | | | 4,756,964 | | | 1,865,052 | | | 1,027,568 | |
| Net expense recapture (reimbursement) by Advisor (See Note 3) . | | | (31,019 | ) | | 20,181 | | | — | |
| Less securities lending credit (See Note 6) | | | (1,015 | ) | | (19,656 | ) | | (181,727 | ) |
| Net expenses | | | 4,724,930 | | | 1,865,577 | | | 845,841 | |
| Net investment income | | | 3,745,379 | | | 732,141 | | | 832,674 | |
NET REALIZED AND UNREALIZED GAIN (LOSS)
ON INVESTMENTS: | | | | | | | | | | |
| Net realized gain (loss) on: | | | | | | | | | | |
| Investments | | | 10,673,040 | | | 25,954,638 | | | (4,526,174 | ) |
| Foreign currencies | | | (172,571 | ) | | — | | | — | |
| Futures contracts | | | (165,695 | ) | | — | | | — | |
| Total | | | 10,334,774 | | | 25,954,638 | | | (4,526,174 | ) |
| Net change in unrealized appreciation on: | | | | | | | | | | |
| Investments | | | 23,324,359 | | | 5,016,555 | | | 2,683,251 | |
| Foreign currencies | | | 21,479 | | | — | | | — | |
| Futures contracts | | | 349,550 | | | — | | | — | |
| Total | | | 23,695,388 | | | 5,016,555 | | | 2,683,251 | |
| Net realized and unrealized gain (loss) | | | 34,030,162 | | | 30,971,193 | | | (1,842,923 | ) |
NET INCREASE (DECREASE) IN NET ASSETS
RESULTING FROM OPERATIONS | | $ | 37,775,541 | | $ | 31,703,334 | | $ | (1,010,249 | ) |
See notes to financial statements.
GuideMarkSM Funds & GuidePathSM Funds
STATEMENTS OF OPERATIONS (Continued)
For the Year Ended March 31, 2014
| | | | Core
Fixed Income
Fund | | | Tax-Exempt
Fixed Income
Fund | | | Opportunistic
Fixed Income
Fund | |
| INVESTMENT INCOME: | | | | | | | | | | |
| Dividend income (net of withholding tax of $0, $0, $5,065) | | $ | — | | $ | 60 | | $ | 288,009 | |
| Interest income (net of withholding tax of $0, $0, $52,552) | | | 8,619,161 | | | 2,752,040 | | | 11,935,085 | |
| Total investment income | | | 8,619,161 | | | 2,752,100 | | | 12,223,094 | |
| EXPENSES: | | | | | | | | | | |
| Investment advisory fees | | | 1,805,896 | | | 321,415 | | | 1,675,419 | |
| Distribution (12b-1) fees – Service Shares | | | 612,160 | | | 160,707 | | | 375,695 | |
| Administrative service fees – Service Shares | | | 612,160 | | | 160,707 | | | 375,695 | |
| Shareholder servicing fees – Service Shares | | | 244,864 | | | 64,283 | | | 120,222 | |
| Custody fees | | | 58,106 | | | 9,415 | | | 208,113 | |
| Administration fees | | | 137,929 | | | 24,675 | | | 94,731 | |
| Legal fees | | | 98,317 | | | 20,356 | | | 64,559 | |
| Fund accounting fees | | | 206,746 | | | 36,940 | | | 230,716 | |
| Federal and state registration fees | | | 47,374 | | | 38,648 | | | 44,710 | |
| Audit and tax fees | | | 29,542 | | | 27,489 | | | 37,430 | |
| Directors’ fees and expenses | | | 41,006 | | | 6,414 | | | 27,533 | |
| Reports to shareholders | | | 21,415 | | | 4,405 | | | 19,638 | |
| Transfer agent fees and expenses | | | 20,617 | | | 6,779 | | | 13,939 | |
| Insurance fees | | | 26,009 | | | 4,600 | | | 4,645 | |
| Compliance fees | | | 14,069 | | | 2,510 | | | 6,485 | |
| Total expenses | | | 3,976,210 | | | 889,343 | | | 3,299,530 | |
| Net expense reimbursement by Advisor (See Note 3) | | | (2,475 | ) | | (60,093 | ) | | (66,915 | ) |
| Less securities lending credit (See Note 6) | | | (3,119 | ) | | — | | | — | |
| Net expenses | | | 3,970,616 | | | 829,250 | | | 3,232,615 | |
| Net investment income | | | 4,648,545 | | | 1,922,850 | | | 8,990,479 | |
NET REALIZED AND UNREALIZED LOSS
ON INVESTMENTS: | | | | | | | | | | |
| Net realized gain (loss) on: | | | | | | | | | | |
| Investments | | | (2,082,111 | ) | | (120,481 | ) | | (2,141,813 | ) |
| Foreign currencies | | | — | | | — | | | 38,016 | |
| Forward currency exchange contracts | | | — | | | — | | | 2,882,982 | |
| Swaps | | | — | | | — | | | (1,300,761 | ) |
| Futures contracts | | | — | | | — | | | (1,047,206 | ) |
| Total | | | (2,082,111 | ) | | (120,481 | ) | | (1,568,782 | ) |
| Net change in unrealized appreciation (depreciation) on: | | | | | | | | | | |
| Investments | | | (8,003,981 | ) | | (3,026,236 | ) | | (5,250,532 | ) |
| Foreign currencies | | | — | | | — | | | 26,613 | |
| Forward currency contracts | | | — | | | — | | | (4,689,733 | ) |
| Swaps | | | — | | | — | | | (489,205 | ) |
| Futures contracts | | | — | | | — | | | 109,565 | |
| Total | | | (8,003,981 | ) | | (3,026,236 | ) | | (10,293,292 | ) |
| Net realized and unrealized loss | | | (10,086,092 | ) | | (3,146,717 | ) | | (11,862,074 | ) |
NET DECREASE IN NET ASSETS
RESULTING FROM OPERATIONS | | $ | (5,437,547 | ) | $ | (1,223,867 | ) | $ | (2,871,595 | ) |
See notes to financial statements.
GuideMarkSM Funds & GuidePathSM Funds
STATEMENTS OF OPERATIONS (Continued)
For the Year Ended March 31, 2014
| | | | Strategic
Asset Allocation
Fund | | | Tactical ConstrainedSM
Asset Allocation
Fund | | | Tactical UnconstrainedSM
Asset Allocation
Fund | | | Absolute Return
Asset Allocation
Fund | |
| INVESTMENT INCOME: | | | | | | | | | | | | | |
| Dividend income | | $ | 2,993,832 | | $ | 1,937,769 | | $ | 4,224,684 | | $ | 11,599,504 | |
| Dividends from affiliate investments | | | 1,215,302 | | | 1,988,835 | | | 1,372,970 | | | 1,586,550 | |
| Interest income | | | 1,916 | | | 1,709 | | | 11,525 | | | 3,566 | |
| Total investment income | | | 4,211,050 | | | 3,928,313 | | | 5,609,179 | | | 13,189,620 | |
| EXPENSES: | | | | | | | | | | | | | |
| Investment advisory fees | | | 653,551 | | | 579,957 | | | 1,215,112 | | | 1,683,249 | |
| Distribution (12b-1) fees – Service Shares | | | 649,542 | | | 576,282 | | | 865,355 | | | 1,200,580 | |
| Administrative service fees – Service Shares | | | 649,542 | | | 576,282 | | | 865,355 | | | 1,200,580 | |
| Shareholder servicing fees – Service Shares | | | 237,200 | | | 210,071 | | | 316,981 | | | 438,899 | |
| Custody fees | | | 70,773 | | | 89,047 | | | 123,711 | | | 181,481 | |
| Administration fees | | | 103,578 | | | 93,409 | | | 140,135 | | | 191,493 | |
| Legal fees | | | 58,013 | | | 53,879 | | | 79,667 | | | 109,618 | |
| Fund accounting fees | | | 41,168 | | | 38,483 | | | 55,636 | | | 77,874 | |
| Federal and state registration fees | | | 41,244 | | | 42,691 | | | 40,007 | | | 48,591 | |
| Audit and tax fees | | | 18,793 | | | 18,793 | | | 18,793 | | | 18,793 | |
| Directors’ fees and expenses | | | 29,034 | | | 26,032 | | | 37,739 | | | 53,939 | |
| Reports to shareholders | | | 25,973 | | | 26,505 | | | 37,048 | | | 45,508 | |
| Transfer agent fees and expenses | | | 14,597 | | | 13,974 | | | 18,131 | | | 22,051 | |
| Insurance fees | | | 4,394 | | | 4,054 | | | 5,489 | | | 9,074 | |
| Compliance fees | | | 7,161 | | | 6,706 | | | 9,794 | | | 12,990 | |
| Total expenses | | | 2,604,563 | | | 2,356,165 | | | 3,828,953 | | | 5,294,720 | |
| Net expense recapture by Advisor (See Note 3) | | | 107,925 | | | 78,020 | | | 157,386 | | | 178,178 | |
| Less securities lending credit (See Note 6) | | | (108,477 | ) | | (123,456 | ) | | (173,989 | ) | | (645,207 | ) |
| Net expenses | | | 2,604,011 | | | 2,310,729 | | | 3,812,350 | | | 4,827,691 | |
| Net investment income | | | 1,607,039 | | | 1,617,584 | | | 1,796,829 | | | 8,361,929 | |
NET REALIZED AND UNREALIZED GAIN (LOSS)
ON INVESTMENTS: | | | | | | | | | | | | | |
| Net realized gain (loss) on: | | | | | | | | | | | | | |
| Investments | | | 1,314,749 | | | 642,222 | | | 2,418,887 | | | (6,435,319 | ) |
| Investments in affiliates | | | 3,578,477 | | | 4,598,743 | | | 7,316,695 | | | (421,917 | ) |
| Total | | | 4,893,226 | | | 5,240,965 | | | 9,735,582 | | | (6,857,236 | ) |
Net change in unrealized appreciation
(depreciation) on: | | | | | | | | | | | | | |
| Investments | | | 12,535,204 | | | 2,983,879 | | | 2,849,534 | | | 542,444 | |
| Investments in affiliates | | | 16,497,856 | | | 12,321,801 | | | 10,111,433 | | | (1,183,950 | ) |
| Total | | | 29,033,060 | | | 15,305,680 | | | 12,960,967 | | | (641,506 | ) |
| Net realized and unrealized gain (loss) | | | 33,926,286 | | | 20,546,645 | | | 22,696,549 | | | (7,498,742 | ) |
NET INCREASE IN NET ASSETS
RESULTING FROM OPERATIONS | | $ | 35,533,325 | | $ | 22,164,229 | | $ | 24,493,378 | | $ | 863,187 | |
See notes to financial statements.
GuideMarkSM Funds & GuidePathSM Funds
STATEMENTS OF OPERATIONS (Continued)
For the Year Ended March 31, 2014
| | | | Multi-Asset
Income
Asset Allocation
Fund | | | Fixed Income
Allocation
Fund | | | Altegris®
Diversified
Alternatives
Allocation Fund | |
| INVESTMENT INCOME: | | | | | | | | | | |
| Dividend income | | $ | 4,498,674 | | $ | 3,564,062 | | $ | — | |
| Dividends from affiliate investments | | | 48,836 | | | 1,705,644 | | | 4,859,302 | |
| Interest income | | | 788 | | | 1,546 | | | 1,171 | |
| Payment from Affiliated Parties | | | — | | | — | | | 65,641 | |
| Total investment income | | | 4,548,298 | | | 5,271,252 | | | 4,926,114 | |
| EXPENSES: | | | | | | | | | | |
| Investment advisory fees | | | 329,019 | | | 546,247 | | | 237,489 | |
| Distribution (12b-1) fees – Service Shares | | | 235,013 | | | 544,724 | | | 394,273 | |
| Administrative service fees – Service Shares | | | 235,013 | | | 544,724 | | | 394,273 | |
| Shareholder servicing fees – Service Shares | | | 85,656 | | | 200,291 | | | 144,009 | |
| Custody fees | | | 62,809 | | | 68,463 | | | 44,035 | |
| Administration fees | | | 36,915 | | | 85,907 | | | 65,297 | |
| Legal fees | | | 23,807 | | | 54,358 | | | 47,736 | |
| Fund accounting fees | | | 11,657 | | | 29,538 | | | 21,587 | |
| Federal and state registration fees | | | 45,606 | | | 43,846 | | | 45,859 | |
| Audit and tax fees | | | 17,016 | | | 16,916 | | | 17,088 | |
| Directors’ fees and expenses | | | 9,635 | | | 24,294 | | | 17,979 | |
| Reports to shareholders | | | 8,960 | | | 19,930 | | | 15,257 | |
| Transfer agent fees and expenses | | | 6,254 | | | 12,359 | | | 10,608 | |
| Insurance fees | | | 676 | | | 3,043 | | | 1,825 | |
| Compliance fees | | | 2,694 | | | 5,794 | | | 4,466 | |
| Total expenses | | | 1,110,730 | | | 2,200,434 | | | 1,461,781 | |
| Expense recapture by Advisor (See Note 3) | | | 20,380 | | | — | | | — | |
| Fees waived by Advisor (See Note 3) | | | — | | | — | | | (631,762 | ) |
| Less securities lending credit (See Note 6) | | | (306,484 | ) | | (197,900 | ) | | — | |
| Net expenses | | | 824,626 | | | 2,002,534 | | | 830,019 | |
| Net investment income | | | 3,723,672 | | | 3,268,718 | | | 4,096,095 | |
NET REALIZED AND UNREALIZED GAIN (LOSS)
ON INVESTMENTS: | | | | | | | | | | |
| Net realized loss on: | | | | | | | | | | |
| Investments | | | (562,799 | ) | | (3,996,675 | ) | | — | |
| Investments in affiliates | | | (90,912 | ) | | (1,381,686 | ) | | (3,921,888 | ) |
| Total | | | (653,711 | ) | | (5,378,361 | ) | | (3,921,888 | ) |
| Net change in unrealized appreciation (depreciation) on: | | | | | | | | | | |
| Investments | | | 2,574,474 | | | (737,690 | ) | | — | |
| Investments in affiliates | | | 137,732 | | | (900,838 | ) | | 1,864,478 | |
| Total | | | 2,712,206 | | | (1,638,528 | ) | | 1,864,478 | |
| Net realized and unrealized gain (loss) | | | 2,058,495 | | | (7,016,889 | ) | | (2,057,410 | ) |
NET INCREASE (DECREASE) IN NET ASSETS
RESULTING FROM OPERATIONS | | $ | 5,782,167 | | $ | (3,748,171 | ) | $ | 2,038,685 | |
See notes to financial statements.
GuideMarkSM Funds & GuidePathSM Funds
STATEMENTS OF CHANGES IN NET ASSETS
| | | Large Cap Growth Fund | | Large Cap Value Fund | |
| | | Year Ended
March 31,
2014 | | Year Ended
March 31,
2013 | | Year Ended
March 31,
2014 | | Year Ended
March 31,
2013 | |
| OPERATIONS: | | | | | | | | | | | | | |
| Net investment income | | $ | 352,491 | | $ | 615,990 | | $ | 2,374,704 | | $ | 2,778,763 | |
| Net realized gain on investment transactions | | | 21,092,764 | | | 12,907,901 | | | 22,276,535 | | | 1,243,514 | |
Change in unrealized appreciation (depreciation)
on investments | | | 13,913,996 | | | (6,127,721 | ) | | 20,243,163 | | | 19,933,765 | |
| Net increase in net assets resulting from operations | | | 35,359,251 | | | 7,396,170 | | | 44,894,402 | | | 23,956,042 | |
| CAPITAL SHARE TRANSACTIONS: | | | | | | | | | | | | | |
| Institutional Shares | | | | | | | | | | | | | |
| Shares sold | | | 12,335,208 | | | 21,114,514 | | | 19,156,635 | | | 28,863,915 | |
| Shares issued to holders in reinvestment of dividends | | | 291,957 | | | 245,969 | | | 1,001,117 | | | 973,550 | |
| Shares redeemed | | | (22,023,140 | ) | | (10,260,736 | ) | | (32,457,127 | ) | | (15,604,223 | ) |
| Net increase (decrease) | | | (9,395,975 | ) | | 11,099,747 | | | (12,299,375 | ) | | 14,233,242 | |
| Service Shares | | | | | | | | | | | | | |
| Shares sold | | | 38,921,597 | | | 21,361,024 | | | 39,000,087 | | | 20,957,853 | |
| Shares issued to holders in reinvestment of dividends | | | 71,448 | | | 236,843 | | | 813,710 | | | 1,840,459 | |
| Shares redeemed | | | (62,008,635 | ) | | (58,405,005 | ) | | (69,734,060 | ) | | (61,447,421 | ) |
| Net decrease | | | (23,015,590 | ) | | (36,807,138 | ) | | (29,920,263 | ) | | (38,649,109 | ) |
DIVIDENDS AND DISTRIBUTIONS TO
SHAREHOLDERS: | | | | | | | | | | | | | |
| Net investment income – Institutional Shares | | | (291,957 | ) | | (245,969 | ) | | (1,001,117 | ) | | (973,550 | ) |
| Net investment income – Service Shares | | | (115,775 | ) | | (236,885 | ) | | (1,354,660 | ) | | (1,840,687 | ) |
| Total dividends and distributions | | | (407,732 | ) | | (482,854 | ) | | (2,355,777 | ) | | (2,814,237 | ) |
| INCREASE (DECREASE) IN NET ASSETS | | | 2,539,954 | | | (18,794,075 | ) | | 318,987 | | | (3,274,062 | ) |
| NET ASSETS: | | | | | | | | | | | | | |
| Beginning of year | | | 181,190,593 | | | 199,984,668 | | | 199,524,716 | | | 202,798,778 | |
End of year (including accumulated undistributed net
investment income of $6,873, $62,114, $544,756
and $525,829, respectively) | | $ | 183,730,547 | | $ | 181,190,593 | | $ | 199,843,703 | | $ | 199,524,716 | |
| CHANGES IN SHARES OUTSTANDING | | | | | | | | | | | | | |
| Institutional Shares | | | | | | | | | | | | | |
| Shares sold | | | 994,052 | | | 2,048,776 | | | 1,813,516 | | | 3,437,991 | |
| Shares issued to holders in reinvestment of dividends | | | 21,642 | | | 24,044 | | | 87,281 | | | 115,350 | |
| Shares redeemed | | | (1,751,779 | ) | | (991,010 | ) | | (3,023,543 | ) | | (1,875,144 | ) |
| Net increase (decrease) | | | (736,085 | ) | | 1,081,810 | | | (1,122,746 | ) | | 1,678,197 | |
| Service Shares | | | | | | | | | | | | | |
| Shares sold | | | 3,101,659 | | | 2,059,739 | | | 3,573,671 | | | 2,429,746 | |
| Shares issued to holders in reinvestment of dividends | | | 5,328 | | | 23,288 | | | 70,148 | | | 215,763 | |
| Shares redeemed | | | (5,108,167 | ) | | (5,725,792 | ) | | (6,610,413 | ) | | (7,295,530 | ) |
| Net decrease | | | (2,001,180 | ) | | (3,642,765 | ) | | (2,966,594 | ) | | (4,650,021 | ) |
See notes to financial statements.
GuideMarkSM Funds & GuidePathSM Funds
STATEMENTS OF CHANGES IN NET ASSETS (Continued)
| | | | Small/Mid Cap Core Fund | | | World ex-US Fund | |
| | | | Year Ended
March 31,
2014 | | | Year Ended
March 31,
2013 | | | Year Ended
March 31,
2014 | | | Year Ended
March 31,
2013 | |
| OPERATIONS: | | | | | | | | | | | | | |
| Net investment income (loss) | | $ | (204,887 | ) | $ | 273,437 | | $ | 3,745,379 | | $ | 2,903,141 | |
| Net realized gain (loss) on investment transactions | | | 28,603,873 | | | 5,068,942 | | | 10,334,774 | | | (4,179,666 | ) |
Change in unrealized appreciation (depreciation)
on investments | | | (11,964,634 | ) | | 7,546,233 | | | 23,695,388 | | | 25,818,039 | |
| Net increase in net assets resulting from operations | | | 16,434,352 | | | 12,888,612 | | $ | 37,775,541 | | | 24,541,514 | |
| CAPITAL SHARE TRANSACTIONS: | | | | | | | | | | | | | |
| Institutional Shares | | | | | | | | | | | | | |
| Shares sold | | | 21,158,768 | | | 22,445,768 | | | 69,617,181 | | | 52,506,550 | |
| Shares issued to holders in reinvestment of dividends | | | 23,111 | | | 341,432 | | | 1,297,000 | | | 644,419 | |
| Shares redeemed | | | (30,790,156 | ) | | (14,900,622 | ) | | (36,583,493 | ) | | (14,909,881 | ) |
| Net increase (decrease) | | | (9,608,277 | ) | | 7,886,578 | | | 34,330,688 | | | 38,241,088 | |
| Service Shares | | | | | | | | | | | | | |
| Shares sold | | | 8,445,132 | | | 5,372,925 | | | 94,242,807 | | | 68,395,204 | |
| Shares issued to holders in reinvestment of dividends | | | — | | | 126,113 | | | 1,431,722 | | | 1,440,442 | |
| Shares redeemed | | | (22,944,161 | ) | | (18,874,352 | ) | | (78,040,049 | ) | | (74,045,567 | ) |
| Net increase (decrease) | | | (14,499,029 | ) | | (13,375,314 | ) | | 17,634,480 | | | (4,209,921 | ) |
DIVIDENDS AND DISTRIBUTIONS TO
SHAREHOLDERS: | | | | | | | | | | | | | |
| Net investment income – Institutional Shares | | | (23,111 | ) | | (341,432 | ) | | (1,297,000 | ) | | (644,419 | ) |
| Net investment income – Service Shares | | | — | | | (126,133 | ) | | (2,167,000 | ) | | (1,441,139 | ) |
| Total dividends and distributions | | | (23,111 | ) | | (467,565 | ) | | (3,464,000 | ) | | (2,085,558 | ) |
| INCREASE (DECREASE) IN NET ASSETS | | | (7,696,065 | ) | | 6,932,311 | | | 86,276,709 | | | 56,487,123 | |
| NET ASSETS: | | | | | | | | | | | | | |
| Beginning of year | | | 84,983,068 | | | 78,050,757 | | | 282,410,361 | | | 225,923,238 | |
End of year (including accumulated undistributed net
investment income (loss) of $(88,635), $(62,048),
$3,150,602 and $2,777,603, respectively) | | $ | 77,287,003 | | $ | 84,983,068 | | $ | 368,687,070 | | $ | 282,410,361 | |
| CHANGES IN SHARES OUTSTANDING | | | | | | | | | | | | | |
| Institutional Shares | | | | | | | | | | | | | |
| Shares sold | | | 1,390,413 | | | 1,934,772 | | | 8,180,960 | | | 7,113,356 | |
| Shares issued to holders in reinvestment of dividends | | | 1,413 | | | 28,862 | | | 145,404 | | | 82,301 | |
| Shares redeemed | | | (2,010,523 | ) | | (1,284,015 | ) | | (4,292,169 | ) | | (2,030,934 | ) |
| Net increase (decrease) | | | (618,697 | ) | | 679,619 | | | 4,034,195 | | | 5,164,723 | |
| Service Shares | | | | | | | | | | | | | |
| Shares sold | | | 554,743 | | | 456,562 | | | 11,329,390 | | | 9,665,692 | |
| Shares issued to holders in reinvestment of dividends | | | — | | | 10,697 | | | 161,049 | | | 183,965 | |
| Shares redeemed | | | (1,612,743 | ) | | (1,615,250 | ) | | (9,210,010 | ) | | (9,919,664 | ) |
| Net increase (decrease) | | | (1,058,000 | ) | | (1,147,991 | ) | | 2,280,429 | | | (70,007 | ) |
See notes to financial statements.
GuideMarkSM Funds & GuidePathSM Funds
STATEMENTS OF CHANGES IN NET ASSETS (Continued)
| | | Opportunistic Equity Fund | | | Global Real Return Fund | |
| | | Year Ended
March 31,
2014 | | | Year Ended
March 31,
2013 | | | Year Ended
March 31,
2014 | | | Year Ended
March 31,
2013 | |
| OPERATIONS: | | | | | | | | | | | | | |
| Net investment income | | $ | 732,141 | | $ | 746,058 | | $ | 832,674 | | $ | 897,253 | |
| Net realized gain (loss) on investment transactions | | | 25,954,638 | | | 4,854,198 | | | (4,526,174 | ) | | (4,756,580 | ) |
| Change in unrealized appreciation on investments | | | 5,016,555 | | | 13,201,143 | | | 2,683,251 | | | 4,879,279 | |
| Net increase (decrease) in net assets resulting from operations | | | 31,703,334 | | | 18,801,399 | | | (1,010,249 | ) | | 1,019,952 | |
| CAPITAL SHARE TRANSACTIONS: | | | | | | | | | | | | | |
| Institutional Shares | | | | | | | | | | | | | |
| Shares sold | | | 12,740,679 | | | 29,457,609 | | | 4,555,454 | | | 8,619,468 | |
| Shares issued to holders in reinvestment of dividends | | | 3,505,113 | | | 394,887 | | | 147,042 | | | 134,336 | |
| Shares redeemed | | | (34,980,702 | ) | | (17,215,858 | ) | | (3,027,315 | ) | | (7,635,480 | ) |
| Net increase (decrease) | | | (18,734,910 | ) | | 12,636,638 | | | 1,675,181 | | | 1,118,324 | |
| Service Shares | | | | | | | | | | | | | |
| Shares sold | | | 12,445,930 | | | 9,325,458 | | | 18,626,087 | | | 11,349,361 | |
| Shares issued to holders in reinvestment of dividends | | | 3,535,605 | | | 191,398 | | | 343,729 | | | 733,867 | |
| Shares redeemed | | | (44,363,925 | ) | | (46,106,624 | ) | | (23,902,642 | ) | | (44,895,468 | ) |
| Net decrease | | | (28,382,390 | ) | | (36,589,768 | ) | | (4,932,826 | ) | | (32,812,240 | ) |
DIVIDENDS AND DISTRIBUTIONS TO
SHAREHOLDERS: | | | | | | | | | | | | | |
| Net investment income – Institutional Shares | | | (554,826 | ) | | (394,887 | ) | | (147,042 | ) | | (134,336 | ) |
| Net investment income – Service Shares | | | (137,451 | ) | | (191,398 | ) | | (469,321 | ) | | (733,867 | ) |
| Net realized gains – Institutional Shares | | | (2,950,288 | ) | | — | | | — | | | — | |
| Net realized gains – Service Shares | | | (3,431,406 | ) | | — | | | — | | | — | |
| Total dividends and distributions | | | (7,073,971 | ) | | (586,285 | ) | | (616,363 | ) | | (868,203 | ) |
| DECREASE IN NET ASSETS | | | (22,487,937 | ) | | (5,738,016 | ) | | (4,884,257 | ) | | (31,542,167 | ) |
| NET ASSETS: | | | | | | | | | | | | | |
| Beginning of year | | | 154,717,383 | | | 160,455,399 | | | 82,461,170 | | | 114,003,337 | |
End of year (including accumulated undistributed
net investment income of $169,134, $159,773,
$245,321 and $14,888, respectively) | | $ | 132,229,446 | | $ | 154,717,383 | | $ | 77,576,913 | | $ | 82,461,170 | |
| CHANGES IN SHARES OUTSTANDING | | | | | | | | | | | | | |
| Institutional Shares | | | | | | | | | | | | | |
| Shares sold | | | 1,020,666 | | | 3,050,070 | | | 503,548 | | | 938,852 | |
| Shares issued to holders in reinvestment of dividends | | | 265,740 | | | 39,568 | | | 16,284 | | | 14,261 | |
| Shares redeemed | | | (2,808,384 | ) | | (1,795,557 | ) | | (331,558 | ) | | (823,384 | ) |
| Net increase (decrease) | | | (1,521,978 | ) | | 1,294,081 | | | 188,274 | | | 129,729 | |
| Service Shares | | | | | | | | | | | | | |
| Shares sold | | | 981,103 | | | 938,744 | | | 2,046,056 | | | 1,216,621 | |
| Shares issued to holders in reinvestment of dividends | | | 269,072 | | | 19,255 | | | 37,897 | | | 77,494 | |
| Shares redeemed | | | (3,592,246 | ) | | (4,813,453 | ) | | (2,628,584 | ) | | (4,803,833 | ) |
| Net decrease | | | (2,342,071 | ) | | (3,855,454 | ) | | (544,631 | ) | | (3,509,718 | ) |
See notes to financial statements.
GuideMarkSM Funds & GuidePathSM Funds
STATEMENTS OF CHANGES IN NET ASSETS (Continued)
| | | Core Fixed Income Fund | | Tax-Exempt Fixed Income Fund | |
| | | Year Ended
March 31,
2014 | | Year Ended
March 31,
2013 | | Year Ended
March 31,
2014 | | Year Ended
March 31,
2013 | |
| OPERATIONS: | | | | | | | | | | | | | |
| Net investment income | | $ | 4,648,545 | | $ | 5,023,485 | | $ | 1,922,850 | | $ | 2,257,558 | |
| Net realized gain (loss) on investment transactions | | | (2,082,111 | ) | | 8,953,451 | | | (120,481 | ) | | 1,992,488 | |
Change in unrealized appreciation (depreciation)
on investments | | | (8,003,981 | ) | | 3,790,201 | | | (3,026,236 | ) | | (279,838 | ) |
| Net increase (decrease) in net assets resulting from operations | | | (5,437,547 | ) | | 17,767,137 | | | (1,223,867 | ) | | 3,970,208 | |
| CAPITAL SHARE TRANSACTIONS: | | | | | | | | | | | | | |
| Institutional Shares | | | | | | | | | | | | | |
| Shares sold | | | 99,243,948 | | | 126,671,176 | | | — | | | — | |
| Shares issued to holders in reinvestment of dividends | | | 4,131,927 | | | 3,059,578 | | | — | | | — | |
| Shares redeemed | | | (143,287,217 | ) | | (26,205,403 | ) | | — | | | — | |
| Net increase (decrease) | | | (39,911,342 | ) | | 103,525,351 | | | — | | | — | |
| Service Shares | | | | | | | | | | | | | |
| Shares sold | | | 82,207,966 | | | 119,713,756 | | | 21,167,435 | | | 22,814,112 | |
| Shares issued to holders in reinvestment of dividends | | | 5,662,109 | | | 7,857,792 | | | 1,305,670 | | | 2,125,734 | |
| Shares redeemed | | | (125,108,533 | ) | | (289,441,078 | ) | | (31,627,332 | ) | | (32,323,200 | ) |
| Net decrease | | | (37,238,458 | ) | | (161,869,530 | ) | | (9,154,227 | ) | | (7,383,354 | ) |
DIVIDENDS AND DISTRIBUTIONS TO
SHAREHOLDERS: | | | | | | | | | | | | | |
| Net investment income – Institutional Shares | | | (2,106,585 | ) | | (1,990,436 | ) | | — | | | — | |
| Net investment income – Service Shares | | | (3,464,351 | ) | | (5,184,619 | ) | | (1,932,202 | ) | | (2,255,871 | ) |
| Net realized gains – Institutional Shares | | | (329,777 | ) | | (1,069,143 | ) | | — | | | — | |
| Net realized gains – Service Shares | | | (873,296 | ) | | (2,916,872 | ) | | — | | | — | |
| Return of capital – Institutional Shares | | | (1,695,565 | ) | | — | | | — | | | — | |
| Return of capital – Service Shares | | | (4,498,324 | ) | | — | | | — | | | — | |
| Total dividends and distributions | | | (12,967,898 | ) | | (11,161,070 | ) | | (1,932,202 | ) | | (2,255,871 | ) |
| DECREASE IN NET ASSETS | | | (95,555,245 | ) | | (51,738,112 | ) | | (12,310,296 | ) | | (5,669,017 | ) |
| NET ASSETS: | | | | | | | | | | | | | |
| Beginning of year | | | 415,542,989 | | | 467,281,101 | | | 75,739,873 | | | 81,408,890 | |
End of year (including accumulated undistributed
net investment income (loss) of $(1,950),
$176,482, $58,795 and $68,147, respectively) | | $ | 319,987,744 | | $ | 415,542,989 | | $ | 63,429,577 | | $ | 75,739,873 | |
| CHANGES IN SHARES OUTSTANDING | | | | | | | | | | | | | |
| Institutional Shares | | | | | | | | | | | | | |
| Shares sold | | | 10,359,602 | | | 12,665,350 | | | — | | | — | |
| Shares issued to holders in reinvestment of dividends | | | 439,400 | | | 308,449 | | | — | | | — | |
| Shares redeemed | | | (14,958,623 | ) | | (2,622,197 | ) | | — | | | — | |
| Net increase (decrease) | | | (4,159,621 | ) | | 10,351,602 | | | — | | | — | |
| Service Shares | | | | | | | | | | | | | |
| Shares sold | | | 8,539,880 | | | 12,019,198 | | | 1,888,895 | | | 1,938,340 | |
| Shares issued to holders in reinvestment of dividends | | | 601,091 | | | 789,690 | | | 118,057 | | | 181,911 | |
| Shares redeemed | | | (12,966,663 | ) | | (28,860,816 | ) | | (2,805,719 | ) | | (2,745,670 | ) |
| Net decrease | | | (3,825,692 | ) | | (16,051,928 | ) | | (798,767 | ) | | (625,419 | ) |
See notes to financial statements.
GuideMarkSM Funds & GuidePathSM Funds
STATEMENTS OF CHANGES IN NET ASSETS (Continued)
| | | Opportunistic Fixed Income Fund | | Strategic Asset Allocation Fund | |
| | | Year Ended
March 31,
2014 | | Year Ended
March 31,
2013 | | Year Ended
March 31,
2014 | | Year Ended
March 31,
2013 | |
| OPERATIONS: | | | | | | | | | | | | | |
| Net investment income | | $ | 8,990,479 | | $ | 9,763,909 | | $ | 1,607,039 | | $ | 1,555,251 | |
| Net realized gain (loss) on investment transactions | | | (1,568,782 | ) | | 3,938,357 | | | 4,893,226 | | | (106,631 | ) |
Change in unrealized appreciation (depreciation)
on investments | | | (10,293,292 | ) | | 11,212,581 | | | 29,033,060 | | | 20,464,754 | |
| Net increase (decrease) in net assets resulting from operations | | | (2,871,595 | ) | | 24,914,847 | | | 35,533,325 | | | 21,913,374 | |
| CAPITAL SHARE TRANSACTIONS: | | | | | | | | | | | | | |
| Institutional Shares | | | | | | | | | | | | | |
| Shares sold | | | 40,385,667 | | | 97,626,601 | | | 3,468,920 | | | 923,730 | |
| Shares issued to holders in reinvestment of dividends | | | 3,161,115 | | | 3,893,635 | | | 56,529 | | | 5,179 | |
| Shares redeemed | | | (78,137,254 | ) | | (40,949,711 | ) | | (1,062,912 | ) | | (88,985 | ) |
| Net increase (decrease) | | | (34,590,472 | ) | | 60,570,525 | | | 2,462,537 | | | 839,924 | |
| Service Shares | | | | | | | | | | | | | |
| Shares sold | | | 68,707,575 | | | 59,196,660 | | | 144,347,332 | | | 138,739,675 | |
| Shares issued to holders in reinvestment of dividends | | | 2,709,952 | | | 5,215,889 | | | 5,261,997 | | | 1,635,557 | |
| Shares redeemed | | | (68,566,490 | ) | | (127,923,371 | ) | | (138,207,839 | ) | | (57,129,975 | ) |
| Net increase (decrease) | | | 2,851,037 | | | (63,510,822 | ) | | 11,401,490 | | | 83,245,257 | |
DIVIDENDS AND DISTRIBUTIONS TO
SHAREHOLDERS: | | | | | | | | | | | | | |
| Net investment income – Institutional Shares | | | (2,977,841 | ) | | (3,893,635 | ) | | (18,875 | ) | | (5,179 | ) |
| Net investment income – Service Shares | | | (3,814,577 | ) | | (5,953,564 | ) | | (1,395,712 | ) | | (1,635,557 | ) |
| From net realized gains – Institutional Shares | | | (183,274 | ) | | — | | | (37,654 | ) | | — | |
| From net realized gains – Service Shares | | | (373,401 | ) | | — | | | (5,016,550 | ) | | — | |
| Total dividends and distributions | | | (7,349,093 | ) | | (9,847,199 | ) | | (6,468,791 | ) | | (1,640,736 | ) |
| INCREASE (DECREASE) IN NET ASSETS | | | (41,960,123 | ) | | 12,127,351 | | | 42,928,561 | | | 104,357,819 | |
| NET ASSETS: | | | | | | | | | | | | | |
| Beginning of year | | | 254,635,128 | | | 242,507,777 | | | 249,007,053 | | | 144,649,234 | |
End of year (including distributions in excess of net investment
income (loss) of $2,378,876, $(1,481,815),$(28,587)
and $(292,420), respectively) | | $ | 212,675,005 | | $ | 254,635,128 | | $ | 291,935,614 | | $ | 249,007,053 | |
| CHANGES IN SHARES OUTSTANDING | | | | | | | | | | | | | |
| Institutional Shares | | | | | | | | | | | | | |
| Shares sold | | | 4,033,572 | | | 9,870,100 | | | 313,095 | | | 94,646 | |
| Shares issued to holders in reinvestment of dividends | | | 322,958 | | | 387,161 | | | 4,998 | | | 544 | |
| Shares redeemed | | | (7,938,298 | ) | | (4,072,647 | ) | | (95,592 | ) | | (8,908 | ) |
| Net increase (decrease) | | | (3,581,768 | ) | | 6,184,614 | | | 222,501 | | | 86,282 | |
| Service Shares | | | | | | | | | | | | | |
| Shares sold | | | 6,865,249 | | | 5,969,660 | | | 13,277,241 | | | 14,796,202 | |
| Shares issued to holders in reinvestment of dividends | | | 276,273 | | | 525,275 | | | 464,841 | | | 171,442 | |
| Shares redeemed | | | (6,919,201 | ) | | (12,887,729 | ) | | (12,692,004 | ) | | (6,078,952 | ) |
| Net increase (decrease) | | | 222,321 | | | (6,392,794 | ) | | 1,050,078 | | | 8,888,692 | |
See notes to financial statements.
GuideMarkSM Funds & GuidePathSM Funds
STATEMENTS OF CHANGES IN NET ASSETS (Continued)
| | | Tactical ConstrainedSM
Asset Allocation Fund | | Tactical UnconstrainedSM
Asset Allocation Fund | |
| | | Year Ended
March 31,
2014 | | Year Ended
March 31,
2013 | | Year Ended
March 31,
2014 | | Year Ended
March 31,
2013 | |
| OPERATIONS: | | | | | | | | | | | | | |
| Net investment income | | $ | 1,617,584 | | $ | 1,843,422 | | $ | 1,796,829 | | $ | 2,359,870 | |
| Net realized gain on investment transactions | | | 5,240,965 | | | 1,312,731 | | | 9,735,582 | | | 4,089,310 | |
| Change in unrealized appreciation on investments | | | 15,305,680 | | | 14,384,272 | | | 12,960,967 | | | 19,251,032 | |
| Net increase in net assets resulting from operations | | | 22,164,229 | | | 17,540,425 | | | 24,493,378 | | | 25,700,212 | |
| CAPITAL SHARE TRANSACTIONS: | | | | | | | | | | | | | |
| Institutional Shares | | | | | | | | | | | | | |
| Shares sold | | | 2,761,832 | | | 927,302 | | | 1,261,607 | | | 846,923 | |
| Shares issued to holders in reinvestment of dividends | | | 34,002 | | | 7,493 | | | 28,934 | | | 7,543 | |
| Shares redeemed | | | (1,120,373 | ) | | (88,557 | ) | | (659,809 | ) | | (83,079 | ) |
| Net increase | | | 1,675,461 | | | 846,238 | | | 630,732 | | | 771,387 | |
| Service Shares | | | | | | | | | | | | | |
| Shares sold | | | 84,656,660 | | | 134,707,886 | | | 177,825,472 | | | 183,929,465 | |
| Shares issued to holders in reinvestment of dividends | | | 1,537,801 | | | 2,344,322 | | | 6,278,348 | | | 3,611,304 | |
| Shares redeemed | | | (138,713,361 | ) | | (66,447,400 | ) | | (133,748,253 | ) | | (83,970,383 | ) |
| Net increase (decrease) | | | (52,518,900 | ) | | 70,604,808 | | | 50,355,567 | | | 103,570,386 | |
DIVIDENDS AND DISTRIBUTIONS
TO SHAREHOLDERS: | | | | | | | | | | | | | |
| Net investment income – Institutional Shares | | | (23,970 | ) | | (6,307 | ) | | (9,973 | ) | | (6,002 | ) |
| Net investment income – Service Shares | | | (1,634,037 | ) | | (1,820,997 | ) | | (1,652,507 | ) | | (2,613,278 | ) |
| Net realized gains – Institutional Shares | | | (10,033 | ) | | (1,186 | ) | | (18,961 | ) | | (1,541 | ) |
| Net realized gains – Service Shares | | | (1,258,199 | ) | | (523,324 | ) | | (5,959,556 | ) | | (998,026 | ) |
| Total dividends and distributions | | | (2,926,239 | ) | | (2,351,814 | ) | | (7,640,997 | ) | | (3,618,847 | ) |
| INCREASE (DECREASE) IN NET ASSETS | | | (31,605,449 | ) | | 86,639,657 | | | 67,838,680 | | | 126,423,138 | |
| NET ASSETS: | | | | | | | | | | | | | |
| Beginning of year | | | 229,784,771 | | | 143,145,114 | | | 311,126,576 | | | 184,703,438 | |
End of year (including undistributed net investment
income (loss) of $17,673, $65,093, $(28,587)
and $(30,953), respectively) | | $ | 198,179,322 | | $ | 229,784,771 | | $ | 378,965,256 | | $ | 311,126,576 | |
| CHANGES IN SHARES OUTSTANDING | | | | | | | | | | | | | |
| Institutional Shares | | | | | | | | | | | | | |
| Shares sold | | | 249,754 | | | 92,258 | | | 118,987 | | | 86,652 | |
| Shares issued to holders in reinvestment of dividends | | | 3,017 | | | 764 | | | 2,682 | | | 794 | |
| Shares redeemed | | | (101,714 | ) | | (8,686 | ) | | (62,213 | ) | | (8,358 | ) |
| Net increase | | | 151,057 | | | 84,336 | | | 59,456 | | | 79,088 | |
| CHANGES IN SHARES OUTSTANDING | | | | | | | | | | | | | |
| Service Shares | | | | | | | | | | | | | |
| Shares sold | | | 7,801,114 | | | 13,855,679 | | | 16,793,957 | | | 19,247,387 | |
| Shares issued to holders in reinvestment of dividends | | | 136,209 | | | 238,244 | | | 580,791 | | | 378,941 | |
| Shares redeemed | | | (12,703,740 | ) | | (6,831,572 | ) | | (12,632,765 | ) | | (8,763,079 | ) |
| Net increase | | | (4,766,417 | ) | | 7,262,351 | | | 4,741,983 | | | 10,863,249 | |
See notes to financial statements.
GuideMarkSM Funds & GuidePathSM Funds
STATEMENTS OF CHANGES IN NET ASSETS (Continued)
| | | Absolute Return
Asset Allocation Fund | | Multi-Asset Income
Asset Allocation Fund | |
| | | Year Ended
March 31,
2014 | | Year Ended
March 31,
2013 | | Year Ended
March 31,
2014 | | August 31, 20121
Ended March 31,
2013 | |
| OPERATIONS: | | | | | | | | | | | | | |
| Net investment income | | $ | 8,361,929 | | $ | 7,295,580 | | $ | 3,723,672 | | $ | 1,297,866 | |
| Net realized gain (loss) on investment transactions | | | (6,857,236 | ) | | (2,028,557 | ) | | (653,711 | ) | | 79,148 | |
Change in unrealized appreciation (depreciation)
on investments | | | (641,506 | ) | | 6,221,621 | | | 2,712,206 | | | 2,843,620 | |
| Net increase in net assets resulting from operations | | | 863,187 | | | 11,488,644 | | | 5,782,167 | | | 4,220,634 | |
| CAPITAL SHARE TRANSACTIONS: | | | | | | | | | | | | | |
| Institutional Shares | | | | | | | | | | | | | |
| Shares sold | | | 910,116 | | | 632,867 | | | — | | | — | |
| Shares issued to holders in reinvestment of dividends | | | 19,543 | | | 5,204 | | | — | | | — | |
| Shares redeemed | | | (478,434 | ) | | (66,753 | ) | | — | | | — | |
| Net increase | | | 451,225 | | | 571,318 | | | — | | | — | |
| Service Shares | | | | | | | | | | | | | |
| Shares sold | | | 197,736,481 | | | 389,126,244 | | | 84,116,586 | | | 78,226,314 | |
| Shares issued to holders in reinvestment of dividends | | | 1,562,579 | | | 6,375,492 | | | 859,152 | | | 920,397 | |
| Shares redeemed | | | (251,559,445 | ) | | (129,561,042 | ) | | (44,766,891 | ) | | (9,177,326 | ) |
| Net increase (decrease) | | | (52,260,385 | ) | | 265,940,694 | | | 40,208,847 | | | 69,969,385 | |
DIVIDENDS AND DISTRIBUTIONS TO
SHAREHOLDERS: | | | | | | | | | | | | | |
| Net investment income – Institutional Shares | | | (19,543 | ) | | (5,017 | ) | | — | | | — | |
| Net investment income – Service Shares | | | (9,107,855 | ) | | (6,075,492 | ) | | (3,670,842 | ) | | (920,397 | ) |
| Net realized gains – Institutional Shares | | | — | | | (187 | ) | | — | | | — | |
| Net realized gains – Service Shares | | | — | | | (300,000 | ) | | (112,018 | ) | | — | |
| Total dividends and distributions | | | (9,127,398 | ) | | (6,380,696 | ) | | (3,782,860 | ) | | (920,397 | ) |
| INCREASE (DECREASE) IN NET ASSETS | | | (60,073,371 | ) | | 271,619,960 | | | 42,208,154 | | | 73,269,622 | |
| NET ASSETS: | | | | | | | | | | | | | |
| Beginning of year | | | 510,274,657 | | | 238,654,697 | | | 73,269,622 | | | — | |
End of year (including accumulated undistributed
net investment income of $1,183,290, $1,979,089,
$430,235 and $377,469, respectively) | | $ | 450,201,286 | | $ | 510,274,657 | | $ | 115,477,776 | | $ | 73,269,622 | |
| CHANGES IN SHARES OUTSTANDING | | | | | | | | | | | | | |
| Institutional Shares | | | | | | | | | | | | | |
| Shares sold | | | 91,636 | | | 62,118 | | | — | | | — | |
| Shares issued to holders in reinvestment of dividends | | | 1,986 | | | 515 | | | — | | | — | |
| Shares redeemed | | | (48,184 | ) | | (6,565 | ) | | — | | | — | |
| Net increase | | | 45,438 | | | 56,068 | | | — | | | — | |
| CHANGES IN SHARES OUTSTANDING | | | | | | | | | | | | | |
| Service Shares | | | | | | | | | | | | | |
| Shares sold | | | 19,735,570 | | | 38,501,638 | | | 7,984,824 | | | 7,722,970 | |
| Shares issued to holders in reinvestment of dividends | | | 158,316 | | | 629,989 | | | 81,731 | | | 90,324 | |
| Shares redeemed | | | (25,137,707 | ) | | (12,779,147 | ) | | (4,252,068 | ) | | (891,074 | ) |
| Net increase (decrease) | | | (5,243,821 | ) | | 26,352,480 | | | 3,814,487 | | | 6,922,220 | |
1 Commencement of operations.
See notes to financial statements.
GuideMarkSM Funds & GuidePathSM Funds
STATEMENTS OF CHANGES IN NET ASSETS (Continued)
| | | Fixed Income
Allocation Fund | | Altegris® Diversified
Alternatives Allocation Fund | |
| | | Year Ended
March 31,
2014 | | August 31, 20121
Ended March 31,
2013 | | Year Ended
March 31,
2014 | | August 31, 20121
Ended March 31,
2013 | |
| OPERATIONS: | | | | | | | | | | | | | |
| Net investment income | | $ | 3,268,718 | | $ | 2,330,764 | | $ | 4,096,095 | | $ | 414,511 | |
| Net realized gain (loss) on investment transactions | | | (5,378,361 | ) | | 381,638 | | | (3,921,888 | ) | | (139,006 | ) |
Change in unrealized appreciation (depreciation)
on investments | | | (1,638,528 | ) | | (1,429,156 | ) | | 1,864,478 | | | 266,232 | |
| Net increase (decrease) in net assets resulting from operations | | | (3,748,171 | ) | | 1,283,246 | | | 2,038,685 | | | 541,737 | |
| CAPITAL SHARE TRANSACTIONS: | | | | | | | | | | | | | |
| Institutional Shares | | | | | | | | | | | | | |
| Shares sold | | | 915,879 | | | 573,305 | | | 689,003 | | | 564,274 | |
| Shares issued to holders in reinvestment of dividends | | | 17,674 | | | 2,558 | | | 20,739 | | | 1,070 | |
| Shares redeemed | | | (458,138 | ) | | (70,389 | ) | | (478,352 | ) | | (54,444 | ) |
| Net increase | | | 475,415 | | | 505,474 | | | 231,390 | | | 510,900 | |
| Service Shares | | | | | | | | | | | | | |
| Shares sold | | | 115,835,263 | | | 272,311,878 | | | 57,897,860 | | | 185,187,805 | |
| Shares issued to holders in reinvestment of dividends | | | 1,080,786 | | | 1,762,362 | | | 707,742 | | | 395,082 | |
| Shares redeemed | | | (123,305,671 | ) | | (45,778,257 | ) | | (89,214,319 | ) | | (24,501,818 | ) |
| Net increase (decrease) | | | (6,389,622 | ) | | 228,295,983 | | | (30,608,717 | ) | | 161,081,069 | |
DIVIDENDS AND DISTRIBUTIONS TO
SHAREHOLDERS: | | | | | | | | | | | | | |
| Net investment income – Institutional Shares | | | (16,037 | ) | | (2,522 | ) | | (20,512 | ) | | (1,070 | ) |
| Net investment income – Service Shares | | | (3,627,266 | ) | | (1,731,753 | ) | | (4,068,805 | ) | | (395,082 | ) |
| Net realized gains – Institutional Shares | | | (1,637 | ) | | (36 | ) | | (227 | ) | | — | |
| Net realized gains – Service Shares | | | (552,887 | ) | | (30,609 | ) | | (51,242 | ) | | — | |
| Total dividends and distributions | | | (4,197,827 | ) | | (1,764,920 | ) | | (4,140,786 | ) | | (396,152 | ) |
| INCREASE (DECREASE) IN NET ASSETS | | | (13,860,205 | ) | | 228,319,783 | | | (32,479,428 | ) | | 161,737,554 | |
| NET ASSETS: | | | | | | | | | | | | | |
| Beginning of year | | | 228,319,783 | | | — | | | 161,737,554 | | | — | |
End of year (including accumulated undistributed
net investment income of $221,674, $596,489,
$25,117 and $18,359, respectively) | | $ | 214,459,578 | | $ | 228,319,783 | | $ | 129,258,126 | | $ | 161,737,554 | |
| CHANGES IN SHARES OUTSTANDING | | | | | | | | | | | | | |
| Institutional Shares | | | | | | | | | | | | | |
| Shares sold | | | 94,769 | | | 57,171 | | | 69,757 | | | 56,750 | |
| Shares issued to holders in reinvestment of dividends | | | 1,846 | | | 256 | | | 2,105 | | | 109 | |
| Shares redeemed | | | (47,460 | ) | | (7,036 | ) | | (48,709 | ) | | (5,477 | ) |
| Net increase | | | 49,155 | | | 50,391 | | | 23,153 | | | 51,382 | |
| CHANGES IN SHARES OUTSTANDING | | | | | | | | | | | | | |
| Service Shares | | | | | | | | | | | | | |
| Shares sold | | | 11,927,709 | | | 27,217,672 | | | 5,820,067 | | | 18,551,917 | |
| Shares issued to holders in reinvestment of dividends | | | 113,096 | | | 176,236 | | | 71,779 | | | 40,315 | |
| Shares redeemed | | | (12,722,815 | ) | | (4,573,134 | ) | | (9,017,243 | ) | | (2,469,547 | ) |
| Net increase (decrease) | | | (682,010 | ) | | 22,820,774 | | | (3,125,397 | ) | | 16,122,685 | |
1 Commencement of operations.
See notes to financial statements.
GuideMarkSM Funds & GuidePathSM Funds
FINANCIAL HIGHLIGHTS
| | | Large Cap Growth Fund | |
| | | Institutional | |
| | | Year Ended
March 31,
2014 | | | Year Ended
March 31,
2013 | | | April 29, 20111
Through
March 31,
2012 | |
Per share data for a share of capital stock
outstanding for the entire year and
selected information for the year
are as follows: | | | | | | | | | | | | |
| Net asset value, beginning of year | | | $11.20 | | | | $10.68 | | | | $10.32 | |
| Income from investment operations: | | | | | | | | | | | | |
| Net investment income | | | 0.09 | | | | 0.08 | | | | 0.01 | |
Net realized and unrealized gains
on investments | | | 2.46 | | | | 0.51 | | | | 0.35 | |
| Total from investment operations | | | 2.55 | | | | 0.59 | | | | 0.36 | |
| Less distributions: | | | | | | | | | | | | |
| Dividends from net investment income | | | (0.08 | ) | | | (0.07 | ) | | | — | |
| Total distributions | | | (0.08 | ) | | | (0.07 | ) | | | — | |
| Net asset value, end of year | | | $13.67 | | | | $11.20 | | | | $10.68 | |
| Total return | | | 22.81 | % | | | 5.54 | % | | | 3.49 | %2 |
| Supplemental data and ratios: | | | | | | | | | | | | |
| Net assets, end of year | | | $44,827,864 | | | | $44,994,114 | | | | $31,330,264 | |
| Ratio of expenses to average net assets | | | | | | | | | | | | |
Before expense reimbursement
(recapture) and securities lending
credit | | | 0.90 | % | | | 0.92 | % | | | 0.93 | %3 |
After expense reimbursement
(recapture) and securities lending
credit | | | 0.89 | % | | | 0.89 | % | | | 0.92 | %3 |
Ratio of net investment income
to average net assets | | | | | | | | | | | | |
Before expense reimbursement
(recapture) and securities lending
credit | | | 0.63 | % | | | 0.81 | % | | | 0.33 | %3 |
After expense reimbursement
(recapture) and securities lending
credit | | | 0.64 | % | | | 0.84 | % | | | 0.34 | %3 |
| Portfolio turnover rate | | | 55.81 | % | | | 60.92 | % | | | 126.61 | % |
Portfolio Turnover is calculated for the Fund as a whole.
| 1 | Commencement of operations. |
| 2 | Not annualized. |
| 3 | Annualized. |
See notes to financial statements.
GuideMarkSM Funds & GuidePathSM Funds
FINANCIAL HIGHLIGHTS
| | | Large Cap Growth Fund | |
| | | Service | |
| | | Year Ended
March 31,
2014 | | | Year Ended
March 31,
2013 | | | Year Ended
March 31,
2012 | | | Year Ended
March 31,
2011 | | | Year Ended
March 31,
2010 | |
Per share data for a share of capital stock
outstanding for the entire year and
selected information for the year
are as follows: | | | | | | | | | | | | | | | | | | | | |
| Net asset value, beginning of year | | | $11.12 | | | | $10.61 | | | | $9.99 | | | | $8.41 | | | | $5.67 | |
| Income from investment operations: | | | | | | | | | | | | | | | | | | | | |
| Net investment income (loss) | | | 0.00 | | | | 0.02 | | | | (0.03 | ) | | | (0.01 | ) | | | 0.01 | |
Net realized and unrealized gains
on investments | | | 2.45 | | | | 0.51 | | | | 0.65 | | | | 1.59 | | | | 2.75 | |
| Total from investment operations | | | 2.45 | | | | 0.53 | | | | 0.62 | | | | 1.58 | | | | 2.76 | |
| Less distributions: | | | | | | | | | | | | | | | | | | | | |
| Dividends from net investment income | | | (0.01 | ) | | | (0.02 | ) | | | — | | | | — | | | | (0.01 | ) |
| Return of capital | | | — | | | | — | | | | — | | | | — | | | | (0.01 | ) |
| Total distributions | | | (0.01 | ) | | | (0.02 | ) | | | — | | | | — | | | | (0.02 | ) |
| Net asset value, end of year | | | $13.56 | | | | $11.12 | | | | $10.61 | | | | $9.99 | | | | $8.41 | |
| Total return | | | 22.04 | % | | | 5.00 | % | | | 6.21 | % | | | 18.79 | % | | | 48.60 | % |
| Supplemental data and ratios: | | | | | | | | | | | | | | | | | | | | |
| Net assets, end of year | | | $138,902,683 | | | | $136,196,479 | | | | $168,654,404 | | | | $211,129,188 | | | | $207,928,223 | |
| Ratio of expenses to average net assets | | | | | | | | | | | | | | | | | | | | |
Before expense reimbursement
(recapture) and securities lending
credit | | | 1.48 | % | | | 1.52 | % | | | 1.54 | % | | | 1.45 | % | | | 1.46 | % |
After expense reimbursement
(recapture) and securities lending
credit | | | 1.49 | % | | | 1.49 | % | | | 1.49 | % | | | 1.43 | % | | | 1.41 | % |
Ratio of net investment income (loss)
to average net assets | | | | | | | | | | | | | | | | | | | | |
Before expense reimbursement
(recapture) and securities lending
credit | | | 0.05 | % | | | 0.18 | % | | | -0.32 | % | | | -0.13 | % | | | 0.09 | % |
After expense reimbursement
(recapture) and securities lending
credit | | | 0.04 | % | | | 0.21 | % | | | -0.27 | % | | | -0.11 | % | | | 0.14 | % |
| Portfolio turnover rate | | | 55.81 | % | | | 60.92 | % | | | 126.61 | % | | | 63.33 | % | | | 69.83 | % |
Portfolio Turnover is calculated for the Fund as a whole.
See notes to financial statements.
GuideMarkSM Funds & GuidePathSM Funds
FINANCIAL HIGHLIGHTS
| | | Large Cap Value Fund | |
| | | Institutional | |
| | | Year Ended
March 31,
2014 | | | Year Ended
March 31,
2013 | | | | April 29, 20111
Through
March 31,
2012 | |
Per share data for a share of capital stock
outstanding for the entire year and
selected information for the year
are as follows: | | | | | | | | | | | | |
| Net asset value, beginning of year | | | $9.43 | | | | $8.39 | | | | $8.54 | |
| Income from investment operations: | | | | | | | | | | | | |
| Net investment income | | | 0.17 | | | | 0.18 | | | | 0.13 | |
Net realized and unrealized gains (losses)
on investments | | | 2.31 | | | | 1.03 | | | | (0.09 | ) |
| Total from investment operations | | | 2.48 | | | | 1.21 | | | | 0.04 | |
| Less distributions: | | | | | | | | | | | | |
| Dividends from net investment income | | | (0.18 | ) | | | (0.17 | ) | | | (0.19 | ) |
| Total distributions | | | (0.18 | ) | | | (0.17 | ) | | | (0.19 | ) |
| Net asset value, end of year | | | $11.73 | | | | $9.43 | | | | $8.39 | |
| Total return | | | 26.38 | % | | | 14.70 | % | | | 0.70 | %2 |
| Supplemental data and ratios: | | | | | | | | | | | | |
| Net assets, end of year | | | $62,007,800 | | | | $60,452,681 | | | | $39,721,680 | |
| Ratio of expenses to average net assets | | | | | | | | | | | | |
Before expense reimbursement
(recapture) and securities lending
credit | | | 0.89 | % | | | 0.92 | % | | | 0.93 | %3 |
After expense reimbursement
(recapture) and securities lending
credit | | | 0.88 | % | | | 0.91 | % | | | 0.92 | %3 |
Ratio of net investment income to
average net assets | | | | | | | | | | | | |
Before expense reimbursement
(recapture) and securities lending
credit | | | 1.57 | % | | | 1.89 | % | | | 1.89 | %3 |
After expense reimbursement
(recapture) and securities lending
credit | | | 1.58 | % | | | 1.90 | % | | | 1.90 | %3 |
| Portfolio turnover rate | | | 29.10 | % | | | 27.02 | % | | | 95.12 | % |
Portfolio Turnover is calculated for the Fund as a whole.
| 1 | Commencement of operations. |
| 2 | Not annualized. |
| 3 | Annualized. |
See notes to financial statements.
GuideMarkSM Funds & GuidePathSM Funds
FINANCIAL HIGHLIGHTS
| | | Large Cap Value Fund | |
| | | Service | |
| | | Year Ended
March 31,
2014 | | | Year Ended
March 31,
2013 | | | Year Ended
March 31,
2012 | | | Year Ended
March 31,
2011 | | | Year Ended
March 31,
2010 | |
Per share data for a share of capital stock
outstanding for the entire year and
selected information for the year
are as follows: | | | | | | | | | | | | | | | | | | | | |
| Net asset value, beginning of year | | | $9.52 | | | | $8.47 | | | | $8.32 | | | | $7.44 | | | | $4.85 | |
| Income from investment operations: | | | | | | | | | | | | | | | | | | | | |
| Net investment income | | | 0.13 | | | | 0.14 | | | | 0.10 | | | | 0.09 | | | | 0.10 | |
Net realized and unrealized gains
on investments | | | 2.31 | | | | 1.03 | | | | 0.13 | | | | 0.88 | | | | 2.60 | |
| Total from investment operations | | | 2.44 | | | | 1.17 | | | | 0.23 | | | | 0.97 | | | | 2.70 | |
| Less distributions: | | | | | | | | | | | | | | | | | | | | |
| Dividends from net investment income | | | (0.12 | ) | | | (0.12 | ) | | | (0.08 | ) | | | (0.09 | ) | | | (0.11 | ) |
| Total distributions | | | (0.12 | ) | | | (0.12 | ) | | | (0.08 | ) | | | (0.09 | ) | | | (0.11 | ) |
| Net asset value, end of year | | | $11.84 | | | | $9.52 | | | | $8.47 | | | | $8.32 | | | | $7.44 | |
| Total return | | | 25.63 | % | | | 13.96 | % | | | 2.87 | % | | | 13.15 | % | | | 55.37 | % |
| Supplemental data and ratios: | | | | | | | | | | | | | | | | | | | | |
| Net assets, end of year | | | $137,835,903 | | | | $139,072,035 | | | | $163,077,098 | | | | $200,132,341 | | | | $200,627,939 | |
| Ratio of expenses to average net assets | | | | | | | | | | | | | | | | | | | | |
Before expense reimbursement
(recapture) and securities lending
credit | | | 1.46 | % | | | 1.49 | % | | | 1.51 | % | | | 1.44 | % | | | 1.44 | % |
After expense reimbursement
(recapture) and securities lending
credit | | | 1.45 | % | | | 1.49 | % | | | 1.49 | % | | | 1.42 | % | | | 1.40 | % |
| Ratio of net investment income to average net assets | | | | | | | | | | | | | | | | | | | | |
Before expense reimbursement
(recapture) and securities lending
credit | | | 1.01 | % | | | 1.33 | % | | | 1.13 | % | | | 1.13 | % | | | 1.27 | % |
After expense reimbursement
(recapture) and securities lending
credit | | | 1.02 | % | | | 1.33 | % | | | 1.15 | % | | | 1.15 | % | | | 1.31 | % |
| Portfolio turnover rate | | | 29.10 | % | | | 27.02 | % | | | 95.12 | % | | | 16.35 | % | | | 26.85 | % |
Portfolio Turnover is calculated for the Fund as a whole.
See notes to financial statements.
GuideMarkSM Funds & GuidePathSM Funds
FINANCIAL HIGHLIGHTS
| | | Small/Mid Cap Core Fund | |
| | | Institutional | |
| | | Year Ended
March 31,
2014 | | | Year Ended
March 31,
2013 | | | April 29, 20111
Through
March 31,
2012 | |
Per share data for a share of capital stock
outstanding for the entire year and
selected information for the year
are as follows: | | | | | | | | | | | | |
| Net asset value, beginning of year | | | $13.51 | | | | $11.56 | | | | $11.99 | |
| Income from investment operations: | | | | | | | | | | | | |
| Net investment income | | | — | | | | 0.07 | | | | — | |
Net realized and unrealized gains (losses)
on investments | | | 3.27 | | | | 1.99 | | | | (0.43 | ) |
| Total from investment operations | | | 3.27 | | | | 2.06 | | | | (0.43 | ) |
| Less distributions: | | | | | | | | | | | | |
| Dividends from net investment income | | | (0.01 | ) | | | (0.11 | ) | | | — | |
| Total distributions | | | (0.01 | ) | | | (0.11 | ) | | | — | |
| Net asset value, end of year | | | $16.77 | | | | $13.51 | | | | $11.56 | |
| Total return | | | 24.19 | % | | | 17.95 | % | | | -3.59 | %2 |
| Supplemental data and ratios: | | | | | | | | | | | | |
| Net assets, end of year | | | $44,695,002 | | | | $44,361,656 | | | | $30,106,471 | |
| Ratio of expenses to average net assets | | | | | | | | | | | | |
Before expense reimbursement
(recapture) and securities lending
credit | | | 1.05 | % | | | 1.09 | % | | | 1.22 | %3 |
After expense reimbursement
(recapture) and securities lending
credit | | | 1.02 | % | | | 1.05 | % | | | 1.09 | %3 |
Ratio of net investment income (loss)
to average net assets | | | | | | | | | | | | |
Before expense reimbursement
(recapture) and securities lending
credit | | | -0.04 | % | | | 0.61 | % | | | -0.10 | %3 |
After expense reimbursement
(recapture) and securities lending
credit | | | -0.01 | % | | | 0.65 | % | | | 0.03 | %3 |
| Portfolio turnover rate | | | 241.55 | % | | | 143.14 | % | | | 245.95 | % |
Portfolio Turnover is calculated for the Fund as a whole.
| 1 | Commencement of operations. |
| 2 | Not annualized. |
| 3 | Annualized. |
See notes to financial statements.
GuideMarkSM Funds & GuidePathSM Funds
FINANCIAL HIGHLIGHTS
| | | Small/Mid Cap Core Fund | |
| | | Service | |
| | | Year Ended
March 31,
2014 | | | Year Ended
March 31,
2013 | | | Year Ended
March 31,
2012 | | | Year Ended
March 31,
2011 | | | Year Ended
March 31,
2010 | |
Per share data for a share of capital stock
outstanding for the entire year and
selected information for the year
are as follows: | | | | | | | | | | | | | | | | | | | | |
| Net asset value, beginning of year | | | $13.45 | | | | $11.50 | | | | $11.61 | | | | $9.46 | | | | $5.69 | |
| Income from investment operations: | | | | | | | | | | | | | | | | | | | | |
| Net investment income (loss) | | | (0.12 | ) | | | — | | | | (0.09 | ) | | | (0.05 | ) | | | 0.01 | |
Net realized and unrealized gains (losses)
on investments | | | 3.28 | | | | 1.99 | | | | (0.02 | ) | | | 2.20 | | | | 3.78 | |
| Total from investment operations | | | 3.16 | | | | 1.99 | | | | (0.11 | ) | | | 2.15 | | | | 3.79 | |
| Less distributions: | | | | | | | | | | | | | | | | | | | | |
| Dividends from net investment income | | | — | | | | (0.04 | ) | | | — | | | | — | | | | — | * |
| Return of capital | | | — | | | | — | | | | — | | | | — | | | | (0.02 | ) |
| Total distributions | | | — | | | | (0.04 | ) | | | — | | | | — | | | | (0.02 | ) |
| Net asset value, end of year | | | $16.61 | | | | $13.45 | | | | $11.50 | | | | $11.61 | | | | $9.46 | |
| Total return | | | 23.49 | % | | | 17.32 | % | | | -0.95 | % | | | 22.73 | % | | | 66.39 | % |
| Supplemental data and ratios: | | | | | | | | | | | | | | | | | | | | |
| Net assets, end of year | | | $32,592,001 | | | | $40,621,412 | | | | $47,944,286 | | | | $42,748,789 | | | | $42,649,488 | |
| Ratio of expenses to average net assets | | | | | | | | | | | | | | | | | | | | |
Before expense reimbursement
(recapture) and securities lending
credit | | | 1.60 | % | | | 1.66 | % | | | 1.74 | % | | | 1.71 | % | | | 1.67 | % |
After expense reimbursement
(recapture) and securities lending
credit | | | 1.59 | % | | | 1.59 | % | | | 1.59 | % | | | 1.59 | % | | | 1.59 | % |
Ratio of net investment income (loss)
to average net assets | | | | | | | | | | | | | | | | | | | | |
Before expense reimbursement
(recapture) and securities lending
credit | | | -0.62 | % | | | 0.01 | % | | | -0.82 | % | | | -0.66 | % | | | -0.06 | % |
After expense reimbursement
(recapture) and securities lending
credit | | | -0.61 | % | | | 0.08 | % | | | -0.67 | % | | | -0.54 | % | | | 0.02 | % |
| Portfolio turnover rate | | | 241.55 | % | | | 143.14 | % | | | 245.95 | % | | | 44.75 | % | | | 52.31 | % |
Portfolio Turnover is calculated for the Fund as a whole.
| * | Amount represents less than $0.01 per share. |
See notes to financial statements.
GuideMarkSM Funds & GuidePathSM Funds
FINANCIAL HIGHLIGHTS
| | | World ex-US Fund | |
| | | Institutional | |
| | | Year Ended
March 31,
2014 | | | Year Ended
March 31,
2013 | | | April 29, 20111
Through
March 31,
2012 | |
Per share data for a share of capital stock
outstanding for the entire year and
selected information for the year
are as follows: | | | | | | | | | | | | |
| Net asset value, beginning of year | | | $8.06 | | | | $7.52 | | | | $8.75 | |
| Income from investment operations: | | | | | | | | | | | | |
| Net investment income | | | 0.11 | | | | 0.13 | | | | 0.07 | |
Net realized and unrealized gains (losses)
on investments | | | 0.86 | | | | 0.48 | | | | (1.17 | ) |
| Total from investment operations | | | 0.97 | | | | 0.61 | | | | (1.10 | ) |
| Less distributions: | | | | | | | | | | | | |
| Dividends from net investment income | | | (0.09 | ) | | | (0.07 | ) | | | (0.13 | ) |
| Total distributions | | | (0.09 | ) | | | (0.07 | ) | | | (0.13 | ) |
| Net asset value, end of year | | | $8.94 | | | | $8.06 | | | | $7.52 | |
| Total return | | | 12.09 | % | | | 8.09 | % | | | -12.34 | %2 |
| Supplemental data and ratios: | | | | | | | | | | | | |
| Net assets, end of year | | | $130,537,695 | | | | $85,157,441 | | | | $40,623,156 | |
| Ratio of expenses to average net assets | | | | | | | | | | | | |
Before expense reimbursement
(recapture) and securities lending
credit | | | 1.03 | % | | | 1.09 | % | | | 1.08 | %3 |
After expense reimbursement
(recapture) and securities lending
credit | | | 1.03 | % | | | 1.09 | % | | | 1.08 | %3 |
Ratio of net investment income to
average net assets | | | | | | | | | | | | |
Before expense reimbursement
(recapture) and securities lending
credit | | | 1.44 | % | | | 1.44 | % | | | 1.13 | %3 |
After expense reimbursement
(recapture) and securities lending
credit | | | 1.44 | % | | | 1.44 | % | | | 1.13 | %3 |
| Portfolio turnover rate | | | 75.22 | % | | | 75.34 | % | | | 164.90 | % |
Portfolio Turnover is calculated for the Fund as a whole.
| 1 | Commencement of operations. |
| 2 | Not annualized. |
| 3 | Annualized. |
See notes to financial statements.
GuideMarkSM Funds & GuidePathSM Funds
FINANCIAL HIGHLIGHTS
| | | World ex-US Fund | |
| | | Service | |
| | | Year Ended
March 31,
2014 | | | Year Ended
March 31,
2013 | | | Year Ended
March 31,
2012 | | | Year Ended
March 31,
2011 | | | Year Ended
March 31,
2010 | |
Per share data for a share of capital stock
outstanding for the entire year and
selected information for the year
are as follows: | | | | | | | | | | | | | | | | | | | | |
| Net asset value, beginning of year | | | $8.05 | | | | $7.54 | | | | $8.39 | | | | $8.01 | | | | $5.80 | |
| Income from investment operations: | | | | | | | | | | | | | | | | | | | | |
| Net investment income | | | 0.07 | | | | 0.08 | | | | 0.12 | | | | 0.11 | | | | 0.20 | |
Net realized and unrealized gains (losses)
on investments | | | 0.85 | | | | 0.49 | | | | (0.88 | ) | | | 0.40 | | | | 2.22 | |
| Total from investment operations | | | 0.92 | | | | 0.57 | | | | (0.76 | ) | | | 0.51 | | | | 2.42 | |
| Less distributions: | | | | | | | | | | | | | | | | | | | | |
| Dividends from net investment income . | | | (0.08 | ) | | | (0.06 | ) | | | (0.09 | ) | | | (0.13 | ) | | | (0.21 | ) |
| Total distributions | | | (0.08 | ) | | | (0.06 | ) | | | (0.09 | ) | | | (0.13 | ) | | | (0.21 | ) |
| Net asset value, end of year | | | $8.89 | | | | $8.05 | | | | $7.54 | | | | $8.39 | | | | $8.01 | |
| Total return | | | 11.47 | % | | | 7.53 | % | | | -8.92 | % | | | 6.48 | % | | | 41.68 | % |
| Supplemental data and ratios: | | | | | | | | | | | | | | | | | | | | |
| Net assets, end of year | | | $238,149,375 | | | | $197,252,920 | | | | $185,300,082 | | | | $269,702,069 | | | | $269,621,569 | |
| Ratio of expenses to average net assets | | | | | | | | | | | | | | | | | | | | |
Before expense reimbursement
(recapture) and securities lending
credit | | | 1.60 | % | | | 1.66 | % | | | 1.66 | % | | | 1.50 | % | | | 1.53 | % |
After expense reimbursement
(recapture) and securities lending
credit | | | 1.59 | % | | | 1.59 | % | | | 1.59 | % | | | 1.50 | % | | | 1.53 | % |
| Ratio of net investment income to average net assets | | | | | | | | | | | | | | | | | | | | |
Before expense reimbursement
(recapture) and securities lending
credit | | | 0.94 | % | | | 0.93 | % | | | 1.11 | % | | | 1.34 | % | | | 2.01 | % |
After expense reimbursement
(recapture) and securities lending
credit | | | 0.95 | % | | | 1.00 | % | | | 1.18 | % | | | 1.34 | % | | | 2.01 | % |
| Portfolio turnover rate | | | 75.22 | % | | | 75.34 | % | | | 164.90 | % | | | 47.34 | % | | | 65.33 | % |
Portfolio Turnover is calculated for the Fund as a whole.
See notes to financial statements.
GuideMarkSM Funds & GuidePathSM Funds
FINANCIAL HIGHLIGHTS
| | | Opportunistic Equity Fund | |
| | | Institutional | | | Service | |
| | | Year Ended
March 31,
2014 | | | Year Ended
March 31,
2013 | | | April 29, 20111
Through
March 31,
2012 | | | Year Ended
March 31,
2014 | | | Year Ended
March 31,
2013 | | | Year Ended
March 31,
2012 | |
Per share data for a share of capital stock
outstanding for the entire year and
selected information for the year
are as follows: | | | | | | | | | | | | | | | | | | | | | | | | |
| Net asset value, beginning of year | | | $11.34 | | | | $9.91 | | | | $10.21 | | | | $11.27 | | | | $9.86 | | | | $10.00 | |
| Income from investment operations: | | | | | | | | | | | | | | | | | | | | | | | | |
| Net investment income (loss) | | | 0.13 | | | | 0.08 | | | | 0.02 | | | | 0.04 | | | | 0.03 | | | | (0.02 | ) |
Net realized and unrealized gains (losses)
on investments | | | 2.79 | | | | 1.42 | | | | (0.32 | ) | | | 2.79 | | | | 1.40 | | | | (0.12 | ) |
| Total from investment operations | | | 2.92 | | | | 1.50 | | | | (0.30 | ) | | | 2.83 | | | | 1.43 | | | | (0.14 | ) |
| Less distributions: | | | | | | | | | | | | | | | | | | | | | | | | |
| Dividends from net investment income | | | (0.12 | ) | | | (0.07 | ) | | | — | | | | (0.03 | ) | | | (0.02 | ) | | | — | |
| Dividends from net realized gains | | | (0.65 | ) | | | — | | | | — | | | | (0.65 | ) | | | — | | | | — | |
| Total distributions | | | (0.77 | ) | | | (0.07 | ) | | | — | | | | (0.68 | ) | | | (0.02 | ) | | | — | |
| Net asset value, end of year | | | $13.49 | | | | $11.34 | | | | $9.91 | | | | $13.42 | | | | $11.27 | | | | $9.86 | |
| Total return | | | 25.92 | % | | | 15.22 | % | | | -2.94 | %2 | | | 25.20 | % | | | 14.56 | % | | | -1.40 | % |
| Supplemental data and ratios: | | | | | | | | | | | | | | | | | | | | | | | | |
| Net assets, end of year | | | $59,877,468 | | | | $67,574,510 | | | | $46,233,165 | | | | $72,351,978 | | | | $87,142,873 | | | | $114,222,234 | |
| Ratio of expenses to average net assets | | | | | | | | | | | | | | | | | | | | | | | | |
Before expense reimbursement
(recapture) and securities lending
credit | | | 1.02 | % | | | 1.06 | % | | | 1.05 | %3 | | | 1.58 | % | | | 1.63 | % | | | 1.63 | % |
After expense reimbursement
(recapture) and securities lending
credit | | | 1.01 | % | | | 1.05 | % | | | 1.03 | %3 | | | 1.59 | % | | | 1.60 | % | | | 1.60 | % |
Ratio of net investment income (loss)
to average net assets | | | | | | | | | | | | | | | | | | | | | | | | |
Before expense reimbursement
(recapture) and securities lending
credit | | | 0.82 | % | | | 0.86 | % | | | 0.45 | %3 | | | 0.27 | % | | | 0.26 | % | | | -0.19 | % |
After expense reimbursement
(recapture) and securities lending
credit | | | 0.83 | % | | | 0.87 | % | | | 0.47 | %3 | | | 0.26 | % | | | 0.29 | % | | | -0.16 | % |
| Portfolio turnover rate | | | 59.12 | % | | | 78.58 | % | | | 91.59 | % | | | 59.12 | % | | | 78.58 | % | | | 91.59 | % |
Portfolio Turnover is calculated for the Fund as a whole.
| 1 | Commencement of operations. |
| 2 | Not annualized. |
| 3 | Annualized. |
See notes to financial statements.
GuideMarkSM Funds & GuidePathSM Funds
FINANCIAL HIGHLIGHTS
| | | Global Real Return Fund | |
| | | Institutional | | | Service | |
| | | Year Ended
March 31,
2014 | | | Year Ended
March 31,
2013 | | | April 29, 20111
Through
March 31,
2012 | | | Year Ended
March 31,
2014 | | | Year Ended
March 31,
2013 | | | Year Ended
March 31,
2012 | |
Per share data for a share of capital stock
outstanding for the entire year and
selected information for the year
are as follows: | | | | | | | | | | | | | | | | | | | | | | | | |
| Net asset value, beginning of year | | | $9.39 | | | | $9.35 | | | | $10.31 | | | | $9.42 | | | | $9.40 | | | | $10.00 | |
| Income from investment operations: | | | | | | | | | | | | | | | | | | | | | | | | |
| Net investment income | | | 0.14 | | | | 0.14 | | | | 0.10 | | | | 0.09 | | | | 0.08 | | | | 0.07 | |
Net realized and unrealized gains (losses)
on investments | | | (0.20 | ) | | | 0.02 | | | | (0.88 | ) | | | (0.20 | ) | | | 0.02 | | | | (0.59 | ) |
| Total from investment operations | | | (0.06 | ) | | | 0.16 | | | | (0.78 | ) | | | (0.11 | ) | | | 0.10 | | | | (0.52 | ) |
| Less distributions: | | | | | | | | | | | | | | | | | | | | | | | | |
| Dividends from net investment income | | | (0.11 | ) | | | (0.12 | ) | | | (0.17 | ) | | | (0.07 | ) | | | (0.08 | ) | | | (0.08 | ) |
| Return of capital | | | — | | | | — | | | | (0.01 | ) | | | — | | | | — | | | | — | * |
| Total distributions | | | (0.11 | ) | | | (0.12 | ) | | | (0.18 | ) | | | (0.07 | ) | | | (0.08 | ) | | | (0.08 | ) |
| Net asset value, end of year | | | $9.22 | | | | $9.39 | | | | $9.35 | | | | $9.24 | | | | $9.42 | | | | $9.40 | |
| Total return | | | -0.66 | % | | | 1.73 | % | | | -7.48 | %2 | | | -1.19 | % | | | 1.05 | % | | | -5.09 | % |
| Supplemental data and ratios: | | | | | | | | | | | | | | | | | | | | | | | | |
| Net assets, end of year | | | $13,204,913 | | | | $11,681,383 | | | | $10,423,221 | | | | $64,372,000 | | | | $70,779,787 | | | | $103,580,116 | |
| Ratio of expenses to average net assets4 | | | | | | | | | | | | | | | | | | | | | | | | |
Before expense reimbursement
(recapture) and securities lending
credit | | | 0.85 | % | | | 0.88 | % | | | 0.89 | %3 | | | 1.41 | % | | | 1.45 | % | | | 1.47 | % |
After expense reimbursement
(recapture) and securities lending
credit | | | 0.61 | % | | | 0.80 | % | | | 0.82 | %3 | | | 1.18 | % | | | 1.37 | % | | | 1.44 | % |
Ratio of net investment income to
average net assets5 | | | | | | | | | | | | | | | | | | | | | | | | |
Before expense reimbursement
(recapture) and securities lending
credit | | | 1.30 | % | | | 1.22 | % | | | 1.08 | %3 | | | 0.75 | % | | | 0.76 | % | | | 0.72 | % |
After expense reimbursement
(recapture) and securities lending
credit | | | 1.54 | % | | | 1.30 | % | | | 1.15 | %3 | | | 0.98 | % | | | 0.84 | % | | | 0.75 | % |
| Portfolio turnover rate | | | 36.72 | % | | | 35.26 | % | | | 55.11 | % | | | 36.72 | % | | | 35.26 | % | | | 55.11 | % |
Portfolio Turnover is calculated for the Fund as a whole.
| 1 | Commencement of operations. |
| 2 | Not annualized. |
| 3 | Annualized. |
| 4 | These ratios exclude the impact of the expenses of the underlying investment companies and exchange-traded funds in which the Fund invests. |
| 5 | Recognition of the net investment income by the Fund is affected by the timing of the declaration of dividends by the underlying investment companies and exchange-traded funds in which the Fund invests. |
| * | Amount represents less than $0.01 per share. |
See notes to financial statements.
GuideMarkSM Funds & GuidePathSM Funds
FINANCIAL HIGHLIGHTS
| | | Core Fixed Income Fund | |
| | | Institutional | |
| | | Year Ended
March 31,
2014 | | | Year Ended
March 31,
2013 | | | April 29, 20111
Through
March 31,
2012 | |
Per share data for a share of capital stock
outstanding for the entire year and
selected information for the year
are as follows: | | | | | | | | | |
| Net asset value, beginning of year | | $9.86 | | | $9.77 | | | $9.48 | |
| Income from investment operations: | | | | | | | | | |
| Net investment income | | 0.16 | | | 0.17 | | | 0.21 | |
| Net realized and unrealized gains (losses) on investments | | (0.24 | ) | | 0.23 | | | 0.31 | |
| Total from investment operations | | (0.08 | ) | | 0.40 | | | 0.52 | |
| Less distributions: | | | | | | | | | |
| Dividends from net investment income | | (0.20 | ) | | (0.21 | ) | | (0.23 | ) |
| Dividends from net realized gains | | (0.03 | ) | | (0.10 | ) | | — | |
| Return of capital | | (0.18 | ) | | — | | | — | |
| Total distributions | | (0.41 | ) | | (0.31 | ) | | (0.23 | ) |
| Net asset value, end of year | | $9.37 | | | $9.86 | | | $9.77 | |
| Total return | | -0.72 | % | | 4.12 | % | | 5.56 | %2 |
| Supplemental data and ratios: | | | | | | | | | |
| Net assets, end of year | | $88,702,582 | | | $134,362,492 | | | $31,999,581 | |
| Ratio of expenses to average net assets | | | | | | | | | |
Before expense reimbursement
(recapture) and securities lending
credit | | 0.70 | % | | 0.72 | % | | 0.70 | %3 |
After expense reimbursement
(recapture) and securities lending
credit | | 0.70 | % | | 0.72 | % | | 0.69 | %3 |
Ratio of net investment income to
average net assets | | | | | | | | | |
Before expense reimbursement
(recapture) and securities lending
credit | | 1.68 | % | | 1.53 | % | | 2.14 | %3 |
After expense reimbursement
(recapture) and securities lending
credit | | 1.68 | % | | 1.53 | % | | 2.15 | %3 |
| Portfolio turnover rate | | 112.86 | % | | 213.80 | % | | 427.36 | % |
Portfolio Turnover is calculated for the Fund as a whole.
| 1 | Commencement of operations. |
| 2 | Not annualized. |
| 3 | Annualized. |
See notes to financial statements.
GuideMarkSM Funds & GuidePathSM Funds
FINANCIAL HIGHLIGHTS
| | | Core Fixed Income Fund | |
| | | Service | |
| | | Year Ended
March 31,
2014 | | | Year Ended
March 31,
2013 | | | Year Ended
March 31,
2012 | | | Year Ended
March 31,
2011 | | | Year Ended
March 31,
2010 | |
Per share data for a share of capital stock
outstanding for the entire year and
selected information for the year
are as follows: | | | | | | | | | | | | | | | |
| Net asset value, beginning of year | | $9.88 | | | $9.78 | | | $9.36 | | | $9.10 | | | $7.92 | |
| Income from investment operations: | | | | | | | | | | | | | | | |
| Net investment income | | 0.11 | | | 0.11 | | | 0.17 | | | 0.21 | | | 0.33 | |
Net realized and unrealized gains (losses)
on investments | | (0.25 | ) | | 0.24 | | | 0.42 | | | 0.29 | | | 1.17 | |
| Total from investment operations | | (0.14 | ) | | 0.35 | | | 0.59 | | | 0.50 | | | 1.50 | |
| Less distributions: | | | | | | | | | | | | | | | |
| Dividends from net investment income | | (0.14 | ) | | (0.15 | ) | | (0.17 | ) | | (0.24 | ) | | (0.32 | ) |
| Dividends from net realized gains | | (0.03 | ) | | (0.10 | ) | | — | | | — | | | — | |
| Return of capital | | (0.18 | ) | | — | | | — | | | — | | | — | |
| Total distributions | | (0.35 | ) | | (0.25 | ) | | (0.17 | ) | | (0.24 | ) | | (0.32 | ) |
| Net asset value, end of year | | $9.39 | | | $9.88 | | | $9.78 | | | $9.36 | | | $9.10 | |
| Total return | | -1.33 | % | | 3.55 | % | | 6.35 | % | | 5.58 | % | | 19.21 | % |
| Supplemental data and ratios: | | | | | | | | | | | | | | | |
| Net assets, end of year | | $231,285,162 | | | $281,180,497 | | | $435,281,520 | | | $581,940,962 | | | $547,963,751 | |
| Ratio of expenses to average net assets | | | | | | | | | | | | | | | |
Before expense reimbursement
(recapture) and securities lending
credit | | 1.29 | % | | 1.30 | % | | 1.28 | % | | 1.25 | % | | 1.28 | % |
After expense reimbursement
(recapture) and securities lending
credit | | 1.29 | % | | 1.29 | % | | 1.26 | % | | 1.24 | % | | 1.25 | % |
Ratio of net investment income to
average net assets | | | | | | | | | | | | | | | |
Before expense reimbursement
(recapture) and securities lending
credit | | 1.10 | % | | 1.02 | % | | 1.68 | % | | 2.23 | % | | 3.71 | % |
After expense reimbursement
(recapture) and securities lending
credit | | 1.10 | % | | 1.03 | % | | 1.70 | % | | 2.24 | % | | 3.74 | % |
| Portfolio turnover rate | | 112.86 | % | | 213.80 | % | | 427.36 | % | | 485.40 | % | | 224.89 | % |
Portfolio Turnover is calculated for the Fund as a whole.
See notes to financial statements.
GuideMarkSM Funds & GuidePathSM Funds
FINANCIAL HIGHLIGHTS
| | | Tax-Exempt Fixed Income Fund | |
| | | Service | |
| | | Year Ended
March 31,
2014 | | | Year Ended
March 31,
2013 | | | Year Ended
March 31,
2012 | | | Year Ended
March 31,
2011 | | | Year Ended
March 31,
2010 | |
Per share data for a share of capital stock
outstanding for the entire year and
selected information for the year
are as follows: | | | | | | | | | | | | | | | |
| Net asset value, beginning of year | | $11.70 | | | $11.47 | | | $10.67 | | | $10.94 | | | $10.27 | |
| Income from investment operations: | | | | | | | | | | | | | | | |
| Net investment income | | 0.34 | | | 0.33 | | | 0.37 | | | 0.36 | | | 0.36 | |
Net realized and unrealized gains (losses)
on investments | | (0.52 | ) | | 0.23 | | | 0.80 | | | (0.26 | ) | | 0.66 | |
| Total from investment operations | | (0.18 | ) | | 0.56 | | | 1.17 | | | 0.10 | | | 1.02 | |
| Less distributions: | | | | | | | | | | | | | | | |
| Dividends from net investment income | | (0.34 | ) | | (0.33 | ) | | (0.37 | ) | | (0.37 | ) | | (0.35 | ) |
| Total distributions | | (0.34 | ) | | (0.33 | ) | | (0.37 | ) | | (0.37 | ) | | (0.35 | ) |
| Net asset value, end of year | | $11.18 | | | $11.70 | | | $11.47 | | | $10.67 | | | $10.94 | |
| Total return | | -1.48 | % | | 4.93 | % | | 11.10 | % | | 0.89 | % | | 10.06 | % |
| Supplemental data and ratios: | | | | | | | | | | | | | | | |
| Net assets, end of year | | $63,429,577 | | | $75,739,873 | | | $81,408,890 | | | $170,330,144 | | | $195,328,951 | |
| Ratio of expenses to average net assets | | | | | | | | | | | | | | | |
Before expense reimbursement
(recapture) | | 1.38 | % | | 1.36 | % | | 1.31 | % | | 1.29 | % | | 1.30 | % |
After expense reimbursement
(recapture) | | 1.29 | % | | 1.29 | % | | 1.29 | % | | 1.29 | % | | 1.29 | % |
Ratio of net investment income to
average net assets | | | | | | | | | | | | | | | |
Before expense reimbursement
(recapture) | | 2.90 | % | | 2.72 | % | | 3.16 | % | | 3.25 | % | | 3.30 | % |
After expense reimbursement
(recapture) | | 2.99 | % | | 2.79 | % | | 3.18 | % | | 3.25 | % | | 3.31 | % |
| Portfolio turnover rate | | 35.08 | % | | 30.36 | % | | 38.80 | % | | 38.01 | % | | 57.44 | % |
See notes to financial statements.
GuideMarkSM Funds & GuidePathSM Funds
FINANCIAL HIGHLIGHTS
| | | Opportunistic Fixed Income Fund | |
| | | Institutional | | | Service | |
| | | Year Ended
March 31,
2014 | | | Year Ended
March 31,
2013 | | | April 29, 20111
Through
March 31,
2012 | | | Year Ended
March 31,
2014 | | | Year Ended
March 31,
2013 | | | Year Ended
March 31,
2012 | |
Per share data for a share of capital stock
outstanding for the entire year and
selected information for the year
are as follows: | | | | | | | | | | | | | | | | | | |
| Net asset value, beginning of year | | $10.27 | | | $9.70 | | | $10.07 | | | $10.28 | | | $9.70 | | | $10.00 | |
| Income from investment operations: | | | | | | | | | | | | | | | | | | |
| Net investment income | | 0.34 | | | 0.42 | | | 0.35 | | | 0.35 | | | 0.36 | | | 0.34 | |
Net realized and unrealized gains (losses)
on investments | | (0.37 | ) | | 0.57 | | | (0.34 | ) | | (0.43 | ) | | 0.58 | | | (0.31 | ) |
| Total from investment operations | | (0.03 | ) | | 0.99 | | | 0.01 | | | (0.08 | ) | | 0.94 | | | 0.03 | |
| Less distributions: | | | | | | | | | | | | | | | | | | |
| Dividends from net investment income | | (0.28 | ) | | (0.42 | ) | | (0.38 | ) | | (0.25 | ) | | (0.36 | ) | | (0.33 | ) |
| Dividends from net realized gains | | (0.02 | ) | | — | | | — | | | (0.02 | ) | | — | | | — | |
| Total distributions | | (0.30 | ) | | (0.42 | ) | | (0.38 | ) | | (0.27 | ) | | (0.36 | ) | | (0.33 | ) |
| Net asset value, end of year | | $9.94 | | | $10.27 | | | $9.70 | | | $9.93 | | | $10.28 | | | $9.70 | |
| Total return | | -0.21 | % | | 10.33 | % | | 0.29 | %2 | | -0.71 | % | | 9.64 | % | | 0.56 | % |
| Supplemental data and ratios: | | | | | | | | | | | | | | | | | | |
| Net assets, end of year | | $65,181,311 | | | $104,141,739 | | | $38,403,168 | | | $147,493,694 | | | $150,493,389 | | | $204,104,609 | |
| Ratio of expenses to average net assets | | | | | | | | | | | | | | | | | | |
Before expense reimbursement
(recapture) | | 1.01 | % | | 1.03 | % | | 1.13 | %3 | | 1.59 | % | | 1.61 | % | | 1.63 | % |
After expense reimbursement
(recapture) | | 1.01 | % | | 1.05 | % | | 1.05 | %3 | | 1.55 | % | | 1.55 | % | | 1.55 | % |
Ratio of net investment income to
average net assets | | | | | | | | | | | | | | | | | | |
Before expense reimbursement
(recapture) | | 4.10 | % | | 4.17 | % | | 4.20 | %3 | | 3.51 | % | | 3.52 | % | | 3.49 | % |
After expense reimbursement
(recapture) | | 4.10 | % | | 4.15 | % | | 4.28 | %3 | | 3.55 | % | | 3.58 | % | | 3.57 | % |
| Portfolio turnover rate | | 66.49 | % | | 101.49 | % | | 86.54 | % | | 66.49 | % | | 101.49 | % | | 86.54 | % |
Portfolio Turnover is calculated for the Fund as a whole.
| 1 | Commencement of operations. |
| 2 | Not annualized. |
| 3 | Annualized. |
See notes to financial statements.
GuideMarkSM Funds & GuidePathSM Funds
FINANCIAL HIGHLIGHTS
| | | Strategic Asset Allocation Fund | |
| | | Institutional | | | Service | |
| | | Year Ended
March 31,
2014 | | | September 13,
20121
Through
March 31,
2013 | | | Year Ended
March 31,
2014 | | | Year Ended
March 31,
2013 | | | April 29, 20111
Through
March 31,
2012 | |
Per share data for a share of capital stock
outstanding for the entire year and
selected information for the year
are as follows: | | | | | | | | | | | | | | | |
| Net asset value, beginning of year | | $10.25 | | | $9.63 | | | $10.26 | | | $9.46 | | | $10.00 | |
| Income from investment operations: | | | | | | | | | | | | | | | |
| Net investment income (loss) | | (0.03 | ) | | 0.11 | | | 0.07 | | | 0.07 | | | 0.08 | |
Net realized and unrealized gains (losses)
on investments | | 1.56 | | | 0.62 | | | 1.38 | | | 0.80 | | | (0.52 | ) |
| Total from investment operations | | 1.53 | | | 0.73 | | | 1.45 | | | 0.87 | | | (0.44 | ) |
| Less distributions: | | | | | | | | | | | | | | | |
| Dividends from net investment income | | (0.11 | ) | | (0.11 | ) | | (0.06 | ) | | (0.07 | ) | | (0.10 | ) |
| Dividends from net realized gains | | (0.22 | ) | | — | | | (0.22 | ) | | — | | | — | |
| Return of capital | | — | | | — | | | — | | | — | | | — | * |
| Total distributions | | (0.33 | ) | | (0.11 | ) | | (0.28 | ) | | (0.07 | ) | | (0.10 | ) |
| Net asset value, end of year | | $11.45 | | | $10.25 | | | $11.43 | | | $10.26 | | | $9.46 | |
| Total return | | 15.00 | % | | 7.68 | %2 | | 14.20 | % | | 9.30 | % | | -4.30 | %2 |
| Supplemental data and ratios: | | | | | | | | | | | | | | | |
| Net assets, end of year | | $3,534,178 | | | $884,658 | | | $288,401,436 | | | $248,122,395 | | | $144,649,234 | |
| Ratio of expenses to average net assets4 | | | | | | | | | | | | | | | |
Before expense reimbursement
(recapture) and securities lending
credit | | 0.40 | % | | 0.42 | %3 | | 1.00 | % | | 1.04 | % | | 1.22 | %3 |
After expense reimbursement
(recapture) and securities lending
credit | | 0.36 | % | | 0.40 | %3 | | 1.00 | % | | 1.00 | % | | 1.00 | %3 |
Ratio of net investment income to
average net assets5 | | | | | | | | | | | | | | | |
Before expense reimbursement
(recapture) and securities lending
credit | | 1.42 | % | | 1.84 | %3 | | 0.61 | % | | 0.76 | % | | 1.12 | %3 |
After expense reimbursement
(recapture) and securities lending
credit | | 1.46 | % | | 1.86 | %3 | | 0.61 | % | | 0.80 | % | | 1.34 | %3 |
| Portfolio turnover rate | | 30.35 | % | | 18.44 | % | | 30.35 | % | | 18.44 | % | | 14.40 | %2 |
Portfolio Turnover is calculated for the Fund as a whole.
| 1 | Commencement of operations. |
| 2 | Not annualized. |
| 3 | Annualized. |
| 4 | These ratios exclude the impact of the expenses of the underlying investment companies and exchange-traded funds in which the Fund invests. |
| 5 | Recognition of the net investment income by the Fund is affected by the timing of the declaration of dividends by the underlying investment companies and exchange-traded funds in which the Fund invests. |
| * | Amount represents less than $0.01 per share. |
See notes to financial statements.
GuideMarkSM Funds & GuidePathSM Funds
FINANCIAL HIGHLIGHTS
| | | Tactical ConstrainedSM Asset Allocation Fund | |
| | | Institutional | | | Service | |
| | | Year Ended
March 31,
2014 | | | September 13,
20121
Through
March 31,
2013 | | | Year Ended
March 31,
2014 | | | Year Ended
March 31,
2013 | | | April 29, 20111
Through
March 31,
2012 | |
Per share data for a share of capital stock
outstanding for the entire year and
selected information for the year
are as follows: | | | | | | | | | | | | | | | | | | | | |
| Net asset value, beginning of year | | | $10.43 | | | | $9.98 | | | | $10.44 | | | | $9.76 | | | | $10.00 | |
| Income from investment operations: | | | | | | | | | | | | | | | | | | | | |
| Net investment income | | | 0.18 | | | | 0.14 | | | | 0.08 | | | | 0.09 | | | | 0.09 | |
Net realized and unrealized gains (losses)
on investments | | | 0.98 | | | | 0.48 | | | | 1.01 | | | | 0.71 | | | | (0.24 | ) |
| Total from investment operations | | | 1.16 | | | | 0.62 | | | | 1.09 | | | | 0.80 | | | | (0.15 | ) |
| Less distributions: | | | | | | | | | | | | | | | | | | | | |
| Dividends from net investment income | | | (0.14 | ) | | | (0.14 | ) | | | (0.08 | ) | | | (0.09 | ) | | | (0.09 | ) |
| Dividends from net realized gains | | | (0.06 | ) | | | (0.03 | ) | | | (0.06 | ) | | | (0.03 | ) | | | — | |
| Total distributions | | | (0.20 | ) | | | (0.17 | ) | | | (0.14 | ) | | | (0.12 | ) | | | (0.09 | ) |
| Net asset value, end of year | | | $11.39 | | | | $10.43 | | | | $11.39 | | | | $10.44 | | | | $9.76 | |
| Total return | | | 11.13 | % | | | 6.29 | %2 | | | 10.40 | % | | | 8.25 | % | | | -1.43 | %2 |
| Supplemental data and ratios: | | | | | | | | | | | | | | | | | | | | |
| Net assets, end of year | | | $2,680,327 | | | | $879,348 | | | | $195,498,995 | | | | $228,905,423 | | | | $143,145,114 | |
| Ratio of expenses to average net assets4 | | | | | | | | | | | | | | | | | | | | |
Before expense reimbursement
(recapture) and securities lending
credit | | | 0.43 | % | | | 0.43 | %3 | | | 1.02 | % | | | 1.05 | % | | | 1.25 | %3 |
After expense reimbursement
(recapture) and securities lending
credit | | | 0.38 | % | | | 0.38 | %3 | | | 1.00 | % | | | 1.00 | % | | | 1.00 | %3 |
| Ratio of net investment income to average net assets5 | | | | | | | | | | | | | | | | | | | | |
Before expense reimbursement
(recapture) and securities lending
credit | | | 1.42 | % | | | 2.10 | %3 | | | 0.67 | % | | | 0.94 | % | | | 1.33 | %3 |
After expense reimbursement
(recapture) and securities lending
credit | | | 1.47 | % | | | 2.15 | %3 | | | 0.69 | % | | | 0.99 | % | | | 1.58 | %3 |
| Portfolio turnover rate | | | 69.17 | % | | | 67.22 | % | | | 69.17 | % | | | 67.22 | % | | | 50.86 | %2 |
Portfolio Turnover is calculated for the Fund as a whole.
| 1 | Commencement of operations. |
| 2 | Not annualized. |
| 3 | Annualized. |
| 4 | These ratios exclude the impact of the expenses of the underlying investment companies and exchange-traded funds in which the Fund invests. |
| 5 | Recognition of the net investment income by the Fund is affected by the timing of the declaration of dividends by the underlying investment companies and exchange-traded funds in which the Fund invests. |
See notes to financial statements.
GuideMarkSM Funds & GuidePathSM Funds
FINANCIAL HIGHLIGHTS
| | | Tactical UnconstrainedSM Asset Allocation Fund | |
| | | Institutional | | | Service | |
| | | Year Ended
March 31,
2014 | | | September 13,
20121
Through
March 31,
2013 | | | Year Ended
March 31,
2014 | | | Year Ended
March 31,
2013 | | | April 29, 20111
Through
March 31,
2012 | |
Per share data for a share of capital stock
outstanding for the entire year and
selected information for the year
are as follows: | | | | | | | | | | | | | | | | | | | | |
| Net asset value, beginning of year | | | $10.25 | | | | $9.75 | | | | $10.27 | | | | $9.54 | | | | $10.00 | |
| Income from investment operations: | | | | | | | | | | | | | | | | | | | | |
| Net investment income | | | 0.07 | | | | 0.13 | | | | 0.05 | | | | 0.09 | | | | 0.06 | |
Net realized and unrealized gains (losses)
on investments | | | 0.75 | | | | 0.55 | | | | 0.70 | | | | 0.78 | | | | (0.47 | ) |
| Total from investment operations | | | 0.82 | | | | 0.68 | | | | 0.75 | | | | 0.87 | | | | (0.41 | ) |
| Less distributions: | | | | | | | | | | | | | | | | | | | | |
| Dividends from net investment income | | | (0.09 | ) | | | (0.14 | ) | | | (0.05 | ) | | | (0.10 | ) | | | (0.05 | ) |
| Dividends from net realized gains | | | (0.18 | ) | | | (0.04 | ) | | | (0.18 | ) | | | (0.04 | ) | | | — | |
| Total distributions | | | (0.27 | ) | | | (0.18 | ) | | | (0.23 | ) | | | (0.14 | ) | | | (0.05 | ) |
| Net asset value, end of year | | | $10.80 | | | | $10.25 | | | | $10.79 | | | | $10.27 | | | | $9.54 | |
| Total return | | | 8.01 | % | | | 7.11 | %2 | | | 7.27 | % | | | 9.15 | % | | | -4.09 | %2 |
| Supplemental data and ratios: | | | | | | | | | | | | | | | | | | | | |
| Net assets, end of year | | | $1,496,066 | | | | $810,333 | | | | $377,469,190 | | | | $310,316,243 | | | | $184,703,438 | |
| Ratio of expenses to average net assets4 | | | | | | | | | | | | | | | | | | | | |
Before expense reimbursement
(recapture) and securities lending
credit | | | 0.51 | % | | | 0.52 | %3 | | | 1.10 | % | | | 1.15 | % | | | 1.32 | %3 |
After expense reimbursement
(recapture) and securities lending
credit | | | 0.46 | % | | | 0.46 | %3 | | | 1.10 | % | | | 1.10 | % | | | 1.10 | %3 |
| Ratio of net investment income to average net assets5 | | | | | | | | | | | | | | | | | | | | |
Before expense reimbursement
(recapture) and securities lending
credit | | | 1.14 | % | | | 1.89 | %3 | | | 0.51 | % | | | 0.90 | % | | | 0.90 | %3 |
After expense reimbursement
(recapture) and securities lending
credit | | | 1.19 | % | | | 1.95 | %3 | | | 0.51 | % | | | 0.95 | % | | | 1.12 | %3 |
| Portfolio turnover rate | | | 244.90 | % | | | 195.89 | % | | | 244.90 | % | | | 195.89 | % | | | 293.90 | %2 |
Portfolio Turnover is calculated for the Fund as a whole.
| 1 | Commencement of operations. |
| 2 | Not annualized. |
| 3 | Annualized. |
| 4 | These ratios exclude the impact of the expenses of the underlying investment companies and exchange-traded funds in which the Fund invests. |
| 5 | Recognition of the net investment income by the Fund is affected by the timing of the declaration of dividends by the underlying investment companies and exchange-traded funds in which the Fund invests. |
See notes to financial statements.
GuideMarkSM Funds & GuidePathSM Funds
FINANCIAL HIGHLIGHTS
| | | Absolute Return Asset Allocation Fund | |
| | | Institutional | | | Service | |
| | | Year Ended
March 31,
2014 | | | September 13,
20121
Through
March 31,
2013 | | | Year Ended
March 31,
2014 | | | Year Ended
March 31,
2013 | | | April 29, 20111
Through
March 31,
2012 | |
Per share data for a share of capital stock
outstanding for the entire year and
selected information for the year
are as follows: | | | | | | | | | | | | | | | | | | | | |
| Net asset value, beginning of year | | | $10.16 | | | | $10.19 | | | | $10.17 | | | | $10.04 | | | | $10.00 | |
| Income from investment operations: | | | | | | | | | | | | | | | | | | | | |
| Net investment income | | | 0.41 | | | | 0.18 | | | | 0.19 | | | | 0.14 | | | | 0.09 | |
Net realized and unrealized gains (losses)
on investments | | | (0.31 | ) | | | (0.02 | ) | | | (0.15 | ) | | | 0.13 | | | | 0.01 | |
| Total from investment operations | | | 0.10 | | | | 0.16 | | | | 0.04 | | | | 0.27 | | | | 0.10 | |
| Less distributions: | | | | | | | | | | | | | | | | | | | | |
| Dividends from net investment income | | | (0.26 | ) | | | (0.18 | ) | | | (0.20 | ) | | | (0.13 | ) | | | (0.06 | ) |
| Dividends from net realized gains | | | — | | | | (0.01 | ) | | | — | | | | (0.01 | ) | | | — | |
| Total distributions | | | (0.26 | ) | | | (0.19 | ) | | | (0.20 | ) | | | (0.14 | ) | | | (0.06 | ) |
| Net asset value, end of year | | | $10.00 | | | | $10.16 | | | | $10.01 | | | | $10.17 | | | | $10.04 | |
| Total return | | | 1.08 | % | | | 1.53 | %2 | | | 0.43 | % | | | 2.71 | % | | | 1.01 | %2 |
| Supplemental data and ratios: | | | | | | | | | | | | | | | | | | | | |
| Net assets, end of year | | | $1,014,889 | | | | $569,773 | | | | $449,186,398 | | | | $509,704,884 | | | | $238,654,697 | |
| Ratio of expenses to average net assets4 | | | | | | | | | | | | | | | | | | | | |
Before expense reimbursement
(recapture) and securities lending
credit | | | 0.51 | % | | | 0.51 | %3 | | | 1.10 | % | | | 1.13 | % | | | 1.28 | %3 |
After expense reimbursement
(recapture) and securities lending
credit | | | 0.36 | % | | | 0.47 | %3 | | | 1.00 | % | | | 1.10 | % | | | 1.10 | %3 |
| Ratio of net investment income to average net assets5 | | | | | | | | | | | | | | | | | | | | |
Before expense reimbursement
(recapture) and securities lending
credit | | | 2.24 | % | | | 2.59 | %3 | | | 1.64 | % | | | 1.80 | % | | | 1.54 | %3 |
After expense reimbursement
(recapture) and securities lending
credit | | | 2.39 | % | | | 2.63 | %3 | | | 1.74 | % | | | 1.83 | % | | | 1.72 | %3 |
| Portfolio turnover rate | | | 134.44 | % | | | 64.86 | % | | | 134.44 | % | | | 64.86 | % | | | 136.33 | %2 |
Portfolio Turnover is calculated for the Fund as a whole.
| 1 | Commencement of operations. |
| 2 | Not annualized. |
| 3 | Annualized. |
| 4 | These ratios exclude the impact of the expenses of the underlying investment companies and exchange-traded funds in which the Fund invests. |
| 5 | Recognition of the net investment income by the Fund is affected by the timing of the declaration of dividends by the underlying investment companies and exchange-traded funds in which the Fund invests. |
See notes to financial statements.
GuideMarkSM Funds & GuidePathSM Funds
FINANCIAL HIGHLIGHTS
| | | Multi-Asset Income
Asset Allocation Fund | | | Fixed Income
Allocation Fund | |
| | | Service | | | Institutional | | | Service | |
| | | Year Ended
March 31,
2014 | | | August 31,
20121
Through
March 31,
2013 | | | Year Ended
March 31,
2014 | | | September 13,
20121
Through
March 31,
2013 | | | Year Ended
March 31,
2014 | | | August 31,
20121
Through
March 31,
2013 | |
Per share data for a share of capital stock
outstanding for the entire year and
selected information for the year
are as follows: | | | | | | | | | | | | | | | | | | | | | | | | |
| Net asset value, beginning of year | | | $10.58 | | | | $10.00 | | | | $10.00 | | | | $10.01 | | | | $9.98 | | | | $10.00 | |
| Income from investment operations: | | | | | | | | | | | | | | | | | | | | | | | | |
| Net investment income | | | 0.38 | | | | 0.22 | | | | 0.19 | | | | 0.13 | | | | 0.15 | | | | 0.10 | |
Net realized and unrealized gains (losses)
on investments | | | 0.21 | | | | 0.53 | | | | (0.27 | ) | | | (0.04 | ) | | | (0.30 | ) | | | (0.04 | ) |
| Total from investment operations | | | 0.59 | | | | 0.75 | | | | (0.08 | ) | | | 0.09 | | | | (0.15 | ) | | | 0.06 | |
| Less distributions: | | | | | | | | | | | | | | | | | | | | | | | | |
| Dividends from net investment income | | | (0.40 | ) | | | (0.17 | ) | | | (0.24 | ) | | | (0.10 | ) | | | (0.16 | ) | | | (0.08 | ) |
| Dividends from net realized gains | | | (0.01 | ) | | | — | | | | (0.03 | ) | | | — | * | | | (0.03 | ) | | | — | * |
| Total distributions | | | (0.41 | ) | | | (0.17 | ) | | | (0.27 | ) | | | (0.10 | ) | | | (0.19 | ) | | | (0.08 | ) |
| Net asset value, end of year | | | $10.76 | | | | $10.58 | | | | $9.65 | | | | $10.00 | | | | $9.64 | | | | $9.98 | |
| Total return | | | 5.63 | % | | | 7.55 | %2 | | | -0.83 | % | | | 0.88 | %2 | | | -1.47 | % | | | 0.59 | %2 |
| Supplemental data and ratios: | | | | | | | | | | | | | | | | | | | | | | | | |
| Net assets, end of year | | $ | 115,477,776 | | | $ | 73,269,622 | | | $ | 960,185 | | | $ | 503,918 | | | $ | 213,499,393 | | | $ | 227,815,865 | |
| Ratio of expenses to average net assets4 | | | | | | | | | | | | | | | | | | | | | | | | |
Before expense reimbursement
(recapture) and securities lending
credit | | | 1.18 | % | | | 1.33 | %3 | | | 0.41 | % | | | 0.50 | %3 | | | 1.01 | % | | | 1.09 | %3 |
After expense reimbursement
(recapture) and securities lending
credit | | | 0.88 | % | | | 1.10 | %3 | | | 0.32 | % | | | 0.43 | %3 | | | 0.92 | % | | | 1.03 | %3 |
| Ratio of net investment income to average net assets5 | | | | | | | | | | | | | | | | | | | | | | | | |
Before expense reimbursement
(recapture) and securities lending
credit | | | 3.66 | % | | | 3.66 | %3 | | | 1.98 | % | | | 2.44 | %3 | | | 1.40 | % | | | 1.78 | %3 |
After expense reimbursement
(recapture) and securities lending
credit | | | 3.96 | % | | | 3.89 | %3 | | | 2.07 | % | | | 2.51 | %3 | | | 1.49 | % | | | 1.84 | %3 |
| Portfolio turnover rate | | | 100.40 | % | | | 21.35 | %2 | | | 67.82 | % | | | 18.75 | %2 | | | 67.82 | % | | | 18.75 | %2 |
Portfolio Turnover is calculated for the Fund as a whole.
| 1 | Commencement of operations. |
| 2 | Not annualized. |
| 3 | Annualized. |
| 4 | These ratios exclude the impact of the expenses of the underlying investment companies and exchange-traded funds in which the Fund invests. |
| 5 | Recognition of the net investment income by the Fund is affected by the timing of the declaration of dividends by the underlying investment companies and exchange-traded funds in which the Fund invests. |
| * | Amount represents less than $0.01 per share. |
See notes to financial statements.
GuideMarkSM Funds & GuidePathSM Funds
FINANCIAL HIGHLIGHTS
| | | Altegris® Diversified Alternatives Allocation Fund | |
| | | Institutional | | | Service | |
| | | Year Ended
March 31,
2014 | | | September 13,
20121
Through
March 31,
2013 | | | Year Ended
March 31,
2014 | | | August 31,
20121
Through
March 31,
2013 | |
Per share data for a share of capital stock
outstanding for the entire year and
selected information for the year
are as follows: | | | | | | | | | | | | | | | | |
| Net asset value, beginning of year | | | $10.01 | | | | $10.07 | | | | $10.00 | | | | $10.00 | |
| Income from investment operations: | | | | | | | | | | | | | | | | |
| Net investment income | | | 0.28 | | | | 0.05 | | | | 0.26 | | | | 0.03 | |
Net realized and unrealized gains (losses)
on investments | | | (0.11 | ) | | | (0.07 | ) | | | (0.11 | ) | | | 0.00 | |
| Total from investment operations | | | 0.17 | | | | (0.02 | ) | | | 0.15 | | | | 0.03 | |
| Less distributions: | | | | | | | | | | | | | | | | |
| Dividends from net investment income | | | (0.29 | ) | | | (0.04 | ) | | | (0.26 | ) | | | (0.03 | ) |
| Dividends from net realized gains | | | — | * | | | — | | | | — | * | | | — | |
| Total distributions | | | (0.29 | ) | | | (0.04 | ) | | | (0.26 | ) | | | (0.03 | ) |
| Net asset value, end of year | | | $9.89 | | | | $10.01 | | | | $9.89 | | | | $10.00 | |
| Total return | | | 1.76 | % | | | -0.19 | %2 | | | 1.50 | % | | | 0.26 | %2 |
| Supplemental data and ratios: | | | | | | | | | | | | | | | | |
| Net assets, end of year | | | $737,302 | | | | $514,104 | | | | $128,520,824 | | | | $161,223,450 | |
| Ratio of expenses to average net assets4 | | | | | | | | | | | | | | | | |
Before expense reimbursement
(recapture), fees waived and securities lending
credit | | | 0.33 | % | | | 0.30 | %3 | | | 0.93 | % | | | 0.72 | %3 |
After expense reimbursement
(recapture), fees waived and securities lending
credit | | | 0.18 | % | | | 0.30 | %3 | | | 0.53 | % | | | 0.72 | %3 |
| Ratio of net investment income to average net assets5 | | | | | | | | | | | | | | | | |
Before expense reimbursement
(recapture), fees waived and securities lending
credit | | | 3.10 | % | | | 0.84 | %3 | | | 2.18 | % | | | 0.47 | %3 |
After expense reimbursement
(recapture), fees waived and securities lending
credit | | | 3.25 | % | | | 0.84 | %3 | | | 2.58 | % | | | 0.47 | %3 |
| Portfolio turnover rate | | | 40.26 | % | | | 16.16 | %2 | | | 40.26 | % | | | 16.16 | %2 |
Portfolio Turnover is calculated for the Fund as a whole.
| 1 | Commencement of operations. |
| 2 | Not annualized. |
| 3 | Annualized. |
| 4 | These ratios exclude the impact of the expenses of the underlying investment companies and exchange-traded funds in which the Fund invests. |
| 5 | Recognition of the net investment income by the Fund is affected by the timing of the declaration of dividends by the underlying investment companies and exchange-traded funds in which the Fund invests. |
| * | Amount represents less than $0.01 per share. |
See notes to financial statements.
GuideMarkSM Funds & GuidePathSM Funds
NOTES TO FINANCIAL STATEMENTS
March 31, 2014
GPS Funds I and GPS Funds II (the “Trusts”) are organized as Delaware statutory trusts under Declarations of Trust dated January 2, 2001 and October 20, 2010, respectively. The Trusts are registered under the Investment Company Act of 1940, as amended (the “1940 Act”), as open-end management investment companies. GPS Funds I is comprised of the following 7 funds: GuideMarkSM Large Cap Growth Fund, GuideMarkSM Large Cap Value Fund, GuideMarkSM Small/Mid Cap Core Fund, GuideMarkSM World ex-US Fund, GuideMarkSM Opportunistic Equity Fund, GuideMarkSM Core Fixed Income Fund, and GuideMarkSM Tax-Exempt Fixed Income Fund. GPS Funds II is comprised of the following 9 funds: GuideMarkSM Global Real Return Fund, GuideMarkSM Opportunistic Fixed Income Fund, GuidePathSM Strategic Asset Allocation Fund, GuidePathSM Tactical ConstrainedSM Asset Allocation Fund, GuidePathSM Tactical UnconstrainedSM Asset Allocation Fund, GuidePathSM Absolute Return Asset Allocation Fund, GuidePathSM Multi-Asset Income Asset Allocation Fund, GuidePathSM Fixed Income Allocation Fund and GuidePathSM Altegris® Diversified Alternatives Allocation Fund (collectively, the “Funds”). All of the Funds, except for the GuideMarkSM Opportunistic Equity Fund and GuideMarkSM Opportunistic Fixed Income Fund are classified and operate as diversified funds under the 1940 Act. The GuideMarkSM Opportunistic Equity Fund and GuideMarkSM Opportunistic Fixed Income Fund are classified as non-diversified. Each Fund represents a distinct portfolio with its own investment objectives and policies. The assets of each Fund are segregated, and a shareholder’s interest is limited to the Fund in which shares are held. The GuideMarkSM Global Real Return Fund, GuideMarkSM Opportunistic Fixed Income Fund, GuidePathSM Strategic Asset Allocation Fund, GuidePathSM Tactical ConstrainedSM Asset Allocation Fund, GuidePathSM Tactical UnconstrainedSM Asset Allocation Fund and GuidePathSM Absolute Return Asset Allocation Fund were seeded on March 4, 2011 and the prospectus went effective on April 1, 2011. The GuideMarkSM Opportunistic Equity Fund, GuideMarkSM Global Real Return Fund and GuideMarkSM Opportunistic
Fixed Income Fund commenced operations on April 1, 2011. The GuidePathSM Strategic Asset Allocation Fund, GuidePathSM Tactical ConstrainedSM Asset Allocation Fund, GuidePathSM Tactical UnconstrainedSM Asset Allocation Fund and GuidePathSM Absolute Return Asset Allocation Fund commenced operations on April 29, 2011. The GuidePathSM Multi-Asset Income Asset Allocation Fund, GuidePathSM Fixed Income Allocation Fund and GuidePathSM Altegris® Diversified Alternatives Allocation Fund commenced operations on August 31, 2012. Each Fund offers two classes of shares: Service Shares and Institutional Shares.
| 2. | Significant Accounting Policies |
The following is a summary of significant accounting policies consistently followed by the Funds in the preparation of the financial statements. These policies are in conformity with U.S. generally accepted accounting principals (“GAAP”).
Portfolio securities listed on a national or foreign securities exchange, except those listed on NASDAQ, for which market quotations are available are valued at the last quoted sale price on each business day. Portfolio securities traded on NASDAQ are valued at the NASDAQ Official Closing Price (“NOCP”) on each business day. If there is no reported sale on an exchange or NASDAQ, the portfolio security will be valued at the mean between the most recent quoted bid and asked price. Price information on listed securities is taken from the exchange where the security is primarily traded.
All equity securities that are not traded on a listed exchange are valued at the last sale price in the over-the-counter market. If a non-exchange traded security does not trade on a particular day, then the mean between the last quoted closing bid and asked price will be used. Non-exchange traded ADRs are priced with an evaluated price as determined by the current evaluated pricing procedures of, and provided by, the pricing vendor.
GuideMarkSM Funds & GuidePathSM Funds
NOTES TO FINANCIAL STATEMENTS (Continued)
March 31, 2014
Fixed income securities that have a maturity of greater than 60 days are generally valued on the basis of evaluations obtained from third party pricing services, which take into account appropriate factors such as institutional-sized trading in similar groups of securities, yield, quality, coupon rate, maturity, type of issue, trading characteristics and other market data. Short term investments having a maturity of less than 60 days are valued at amortized cost.
Investments in mutual funds are valued at the closing net asset value per share of each mutual fund on the day of valuation.
To assess the continuing appropriateness of security valuation, the Advisor regularly compares prior day prices with current day prices and transaction prices. When the comparison results exceed pre-defined thresholds, the Advisor challenges the prices exceeding tolerance levels with the pricing service or broker. Securities for which no market quotations are readily available or when a significant event has occurred between the time of the security’s last close and the time that a Fund next calculates its net asset value will be valued at their fair value as determined by the applicable Fund’s Valuation Committee. Securities for which no market prices are readily available will be valued at their fair value as determined by the Valuation Committee under procedures adopted by the applicable Board of Trustees (the “Board”).
The Funds have adopted fair valuation accounting standards which establish an authoritative definition of fair value and set out a hierarchy for measuring fair value. These standards require additional disclosures about the various inputs and valuation techniques used to develop the measurements of fair value and a discussion of changes in valuation techniques and related inputs, if any, during the period. In addition, these standards require expanded disclosure for each major category of assets. These inputs are summarized in the three broad levels listed below:
Level 1 – Quoted prices in active markets for identical securities.
Level 2 – Other significant observable inputs (including quoted prices for similar securities, interest rates, prepayment speeds, credit risk, etc.).
Level 3 – Significant unobservable inputs (including the Fund’s own assumptions in determining the fair value of investments).
During the year, certain of the securities and other instruments held by the Funds were categorized as Level 2 or Level 3 based upon the inputs and methodologies used to determine the fair value of the security or instrument. Descriptions of the inputs and valuation methodologies used to determine the fair values of each class of investments within Level 2 and Level 3 are set forth below.
Level 2 Investments. The Funds’ investments that were categorized as Level 2 include: (1) certain fixed income securities, including asset-backed securities, bank loans, collateralized mortgage obligations, convertible obligations, corporate obligations, U.S. and foreign government obligations, mortgage-backed securities and municipal obligations; (2) certain common stocks, convertible preferred stocks, preferred stocks, and real estate investment trusts (3) certain over-the-counter derivative instruments, including forward currency contracts and swaps.
Fixed income securities are normally valued by pricing vendors that use broker-dealer quotations, reported trades or valuation estimates from their internal pricing models. The service providers’ internal models typically use inputs that are observable such as institutional-sized trading in similar groups of securities, yield, credit quality, coupon rate, maturity, type of issue, trading characteristics and other market data.
Certain common stocks that trade on foreign exchanges are subject to valuation adjustments. These valuation adjustments are applied to the foreign exchange-traded common stocks to account for the market movement between the close of the foreign market in which the security is traded and the close of the New York Stock Exchange. These
GuideMarkSM Funds & GuidePathSM Funds
NOTES TO FINANCIAL STATEMENTS (Continued)
March 31, 2014
securities are valued using pricing vendors that consider the correlation patterns of price movements of the foreign security to the intraday trading in the U.S. markets.
Foreign currency contracts derive their value from underlying asset prices, indices, reference rates, and other inputs or a combination of these factors. These instruments are normally valued using pricing vendors. Depending upon the instrument, its value may be provided by a pricing vendor using a series of techniques, including pricing models. The pricing models typically use inputs that are observed from active markets such as indices, spreads, interest rates, curves, dividends and exchange rates.
Level 3 Investments. The Funds’ investments that were categorized as Level 3 include: (1) fair valued securities and certain investments purchased as securities lending collateral.
Investments purchased as securities lending collateral are normally valued by pricing vendors using relevant observable inputs, as described above. Fair valued securities are normally valued by pricing vendors using relevant observable inputs, as described above. In certain circumstances, the types of observable inputs that are typically used by a pricing service may be unavailable or deemed by the pricing service to be unreliable. In these instances, the pricing vendor may value the security based upon significant unobservable inputs, or the pricing vendor may not provide a value for the security. To the extent that a pricing vendor does not provide a value for a particular security, or the pricing vendor provides a value that the Valuation Committee does not believe accurately reflects the value of the security, the security will be valued by the Valuation Committee based upon the information available at the time of valuation and in accordance with procedures adopted by the Board. These methodologies may require subjective judgments and determinations about the value of a particular security. When significant unobservable inputs are used to value a security, the security is categorized as Level 3.
To verify Level 3 unobservable inputs, the Valuation Committee uses a variety of techniques as appropriate to substantiate these valuation approaches including a regular review of key inputs and assumptions, transaction back-testing or disposition analysis and review of related market activity.
The inputs or methodology used for valuing securities are not an indication of the risk associated with investing in those securities. The following is a summary of the inputs used to value the Funds’ net assets as of March 31, 2014:
GuideMarkSM Large Cap Growth Fund
| | | Level 1 | | Level 2 | | Level 3 | | Total | |
| Common Stocks | | $ | 180,940,768 | | $ | — | | $ | — | | $ | 180,940,768 | |
| Short Term Investments | | | 2,179,887 | | | — | | | — | | | 2,179,887 | |
| Investments Purchased as Securities Lending Collateral | | | 8,204,735 | | | — | | | 792 | | | 8,205,527 | |
| Total Investments in Securities | | $ | 191,325,390 | | $ | — | | $ | 792 | | $ | 191,326,182 | |
For further information regarding security characteristics, see the Schedule of Investments. There were no transfers in or out of Levels 1, 2 or 3. Transfers between levels are recognized at the end of the reporting period.
There was no activity in the Level 3 assets during the year ended March 31, 2014. The ending balance as of March 31, 2014 was unchanged from the ending balance as of March 31, 2013. The Level 3 investments as of March 31, 2014 represented 0.00% of net assets and did not warrant a disclosure of significant unobservable valuations inputs.
GuideMarkSM Funds & GuidePathSM Funds
NOTES TO FINANCIAL STATEMENTS (Continued)
March 31, 2014
GuideMarkSM Large Cap Value Fund
| | | Level 1 | | Level 2 | | Level 3 | | Total | |
| Common Stocks | | $ | 198,287,985 | | $ | — | | $ | — | | $ | 198,287,985 | |
| Short Term Investments | | | 1,429,921 | | | — | | | — | | | 1,429,921 | |
| Investments Purchased as Securities Lending Collateral | | | 12,125,560 | | | — | | | 906 | | | 12,126,466 | |
| Total Investments in Securities | | $ | 211,843,466 | | $ | — | | $ | 906 | | $ | 211,844,372 | |
For further information regarding security characteristics, see the Schedule of Investments. There were no transfers in or out of Levels 1, 2 or 3. Transfers between levels are recognized at the end of the reporting period.
There was no activity in the Level 3 assets during the year ended March 31, 2014. The ending balance as of March 31, 2014 was unchanged from the ending balance as of March 31, 2013. The Level 3 investments as of March 31, 2014 represented 0.00% of net assets and did not warrant a disclosure of significant unobservable valuations inputs.
GuideMarkSM Small/Mid Cap Core Fund
| | | Level 1 | | Level 2 | | Level 3 | | Total | |
| Common Stocks | | $ | 70,496,400 | | $ | — | | $ | — | | $ | 70,496,400 | |
| Investment Companies | | | 224,094 | | | — | | | — | | | 224,094 | |
| Real Estate Investment Trusts | | | 5,723,304 | | | — | | | — | | | 5,723,304 | |
| Short Term Investments | | | 148,982 | | | — | | | — | | | 148,982 | |
| Investments Purchased as Securities Lending Collateral | | | 7,503,668 | | | — | | | 247 | | | 7,503,915 | |
| Total Investments in Securities | | $ | 84,096,448 | | $ | — | | $ | 247 | | $ | 84,096,695 | |
For further information regarding security characteristics, see the Schedule of Investments. There were no transfers in or out of Levels 1, 2 or 3. Transfers between levels are recognized at the end of the reporting period.
There was no activity in the Level 3 assets during the year ended March 31, 2014. The ending balance as of March 31, 2014 was unchanged from the ending balance as of March 31, 2013. The Level 3 investments as of March 31, 2014 represented 0.00% of net assets and did not warrant a disclosure of significant unobservable valuations inputs.
GuideMarkSM Funds & GuidePathSM Funds
NOTES TO FINANCIAL STATEMENTS (Continued)
March 31, 2014
GuideMarkSM World ex-US Fund
| | | Level 1 | | Level 2 | | Level 3 | | Total | |
| Common Stocks | | $ | 42,333,361 | | $ | 289,615,012 | | $ | — | | $ | 331,948,373 | |
| Investment Companies | | | 5,906,040 | | | — | | | — | | | 5,906,040 | |
| Preferred Stocks | | | 3,789,990 | | | 2,730,140 | | | — | | | 6,520,130 | |
| Real Estate Investment Trusts | | | — | | | 1,496,656 | | | — | | | 1,496,656 | |
| Short Term Investments | | | 20,787,585 | | | 819,953 | | | — | | | 21,607,538 | |
| Investments Purchased as Securities Lending Collateral | | | 2,213,110 | | | — | | | 216 | | | 2,213,326 | |
| Total Investments in Securities | | $ | 75,030,086 | | $ | 294,661,761 | | $ | 216 | | $ | 369,692,063 | |
| Other Financial Instruments* | | | | | | | | | | | | | |
| Futures | | $ | 349,550 | | $ | — | | $ | — | | $ | 349,550 | |
| Total | | $ | 349,550 | | $ | — | | $ | — | | $ | 349,550 | |
| * | Other financial instruments are derivative instruments not reflected in the Schedule of Investments, such as futures. These instruments are reflected at the unrealized appreciation (depreciation) on the instrument. |
For further information regarding security characteristics, see the Schedule of Investments.
Below is a reconciliation that details the transfer of securities between Level 1 and Level 2 during the reporting period:
| Description | | Investments
in Securities | |
| Transfers into Level 1 | | $ | 3,792,141 | |
| Transfers out of Level 1 | | | — | |
| Net Transfers into/(out of) Level 1 | | $ | 3,792,141 | |
| Transfers into Level 2 | | $ | — | |
| Transfers out of Level 2 | | | 3,792,141 | |
| Net Transfers into/(out of) Level 2 | | $ | 3,792,141 | |
Transfers were made due to an increase in the level of inputs utilized for such securities in accordance with the fair value hierarchy. Transfers between levels are recognized at the end of the reporting period.
There was no activity in the Level 3 assets during the year ended March 31, 2014. The ending balance as of March 31, 2014 was unchanged from the ending balance as of March 31, 2013. The Level 3 investments as of March 31, 2014 represented 0.00% of net assets and did not warrant a disclosure of significant unobservable valuations inputs.
GuideMarkSM Funds & GuidePathSM Funds
NOTES TO FINANCIAL STATEMENTS (Continued)
March 31, 2014
GuideMarkSM Opportunistic Equity Fund
| | | Level 1 | | Level 2 | | Level 3 | | Total | |
| Common Stocks | | $ | 126,582,594 | | $ | — | | $ | — | | $ | 126,582,594 | |
| Real Estate Investment Trusts | | | 1,865,299 | | | — | | | — | | | 1,865,299 | |
| Short Term Investments | | | 2,938,513 | | | — | | | — | | | 2,938,513 | |
| Investments Purchased as Securities Lending Collateral | | | 8,998,359 | | | — | | | — | | | 8,998,359 | |
| Total Investments in Securities | | $ | 140,384,765 | | $ | — | | $ | — | | $ | 140,384,765 | |
For further information regarding security characteristics, see the Schedule of Investments. There were no transfers in or out of Levels 1, 2 or 3. Transfers between levels are recognized at the end of the reporting period.
GuideMarkSM Global Real Return Fund
| | | Level 1 | | Level 2 | | Level 3 | | Total | |
| Investment Companies | | $ | 77,142,686 | | $ | — | | $ | — | | $ | 77,142,686 | |
| Short Term Investments | | | 531,056 | | | — | | | — | | | 531,056 | |
| Investments Purchased as Securities Lending Collateral | | | 28,902,100 | | | — | | | — | | | 28,902,100 | |
| Total Investments in Securities | | $ | 106,575,842 | | $ | — | | $ | — | | $ | 106,575,842 | |
For further information regarding security characteristics, see the Schedule of Investments. There were no transfers in or out of Levels 1, 2 or 3. Transfers between levels are recognized at the end of the reporting period.
GuideMarkSM Core Fixed Income Fund
| | | Level 1 | | Level 2 | | Level 3 | | Total | |
| Fixed Income | | | | | | | | | | | | | |
| Asset Backed Securities | | $ | — | | $ | 23,597,011 | | $ | — | | $ | 23,597,011 | |
| Collateralized Mortgage Obligations | | | — | | | 16,393,037 | | | — | | | 16,393,037 | |
| Corporate Obligations | | | — | | | 125,878,345 | | | — | | | 125,878,345 | |
| Foreign Government Debt Obligations | | | — | | | 768,885 | | | — | | | 768,885 | |
| Mortgage Backed Securities | | | — | | | 85,727,067 | | | — | | | 85,727,067 | |
| Municipal Debt Obligations | | | — | | | 1,619,527 | | | — | | | 1,619,527 | |
| U.S. Government Agency Issues | | | — | | | 4,809,302 | | | — | | | 4,809,302 | |
| U.S. Treasury Obligations | | | — | | | 53,653,349 | | | — | | | 53,653,349 | |
| Total Fixed Income | | | — | | | 312,446,523 | | | — | | | 312,446,523 | |
| Short Term Investments | | | 21,137,712 | | | — | | | — | | | 21,137,712 | |
| Investments Purchased as Securities Lending Collateral | | | 4,585,969 | | | — | | | 191 | | | 4,586,160 | |
| Total Investments in Securities | | $ | 25,723,681 | | $ | 312,446,523 | | $ | 191 | | $ | 338,170,395 | |
For further information regarding security characteristics, see the Schedule of Investments. There were no transfers in or out of Levels 1, 2 or 3. Transfers between levels are recognized at the end of the reporting period.
GuideMarkSM Funds & GuidePathSM Funds
NOTES TO FINANCIAL STATEMENTS (Continued)
March 31, 2014
There was no activity in the Level 3 assets during the year ended March 31, 2014. The ending balance as of March 31, 2014 was unchanged from the ending balance as of March 31, 2013. The Level 3 investments as of March 31, 2014 represented 0.00% of net assets and did not warrant a disclosure of significant unobservable valuations inputs.
GuideMarkSM Tax-Exempt Fixed Income Fund
| | | Level 1 | | Level 2 | | Level 3 | | Total | |
| Municipal Obligations | | $ | — | | $ | 61,630,103 | | $ | — | | $ | 61,630,103 | |
| Short Term Investments | | | 931,487 | | | — | | | — | | | 931,487 | |
| Total Investments in Securities | | $ | 931,487 | | $ | 61,630,103 | | $ | — | | $ | 62,561,590 | |
For further information regarding security characteristics, see the Schedule of Investments. There were no transfers in or out of Levels 1, 2 or 3. Transfers between levels are recognized at the end of the reporting period.
GuideMarkSM Opportunistic Fixed Income Fund
| | | Level 1 | | Level 2 | | Level 3 | | Total | |
| Equity | | | | | | | | | | | | | |
| Common Stock | | $ | 3,088,479 | | $ | — | | $ | — | | $ | 3,088,479 | |
| Convertible Preferred Stock | | | 841,636 | | | 298,444 | | | — | | | 1,140,080 | |
| Investment Companies | | | 509,142 | | | — | | | — | | | 509,142 | |
| Preferred Stock | | | 168,823 | | | 286,886 | | | — | | | 455,709 | |
| Total Equity | | | 4,608,080 | | | 585,330 | | | — | | | 5,193,410 | |
| Fixed Income | | | | | | | | | | | | | |
| Asset Backed Securities | | | — | | | 2,681,044 | | | — | | | 2,681,044 | |
| Bank Loans | | | — | | | 9,855,002 | | | — | | | 9,855,002 | |
| Collateralized Mortgage Obligations | | | — | | | 27,659,231 | | | — | | | 27,659,231 | |
| Convertible Obligations | | | — | | | 3,022,252 | | | — | | | 3,022,252 | |
| Corporate Obligations | | | — | | | 35,904,560 | | | — | | | 35,904,560 | |
| Foreign Government Obligations | | | — | | | 63,342,395 | | | — | | | 63,342,395 | |
| Mortgage Backed Securities | | | — | | | 24,750,557 | | | — | | | 24,750,557 | |
| Total Fixed Income | | | — | | | 167,215,041 | | | — | | | 167,215,041 | |
| Purchased Options | | | — | | | 24,366 | | | — | | | 24,366 | |
| Short Term Investments | | | 17,582,588 | | | 19,264,598 | | | — | | | 36,847,186 | |
| Total Investments in Securities | | $ | 22,190,668 | | $ | 187,089,335 | | $ | — | | $ | 209,280,003 | |
| Other Financial Instruments* | | | | | | | | | | | | | |
| Forward Currency Contracts | | $ | — | | $ | (836,646 | ) | $ | — | | $ | (836,646 | ) |
| Futures | | | (20,938 | ) | | — | | | — | | | (20,938 | ) |
| Swaps | | | — | | | (556,145 | ) | | — | | | (556,145 | ) |
| Total | | $ | (20,938 | ) | $ | (1,392,791 | ) | $ | — | | $ | (1,413,729 | ) |
| * | Other financial instruments are derivative instruments not reflected in the Schedule of Investments, such as forward currency contracts, futures, and swaps. These instruments are reflected at the unrealized appreciation (depreciation) on the instrument. |
For further information regarding security characteristics, see the Schedule of Investments.
GuideMarkSM Funds & GuidePathSM Funds
NOTES TO FINANCIAL STATEMENTS (Continued)
March 31, 2014
Below is a reconciliation that details the transfer of securities between Level 1 and Level 2 during the reporting period:
| Description | | Investments
in Securities | |
| Transfers into Level 1 | | $ | — | |
| Transfers out of Level 1 | | | 196,467 | |
| Net Transfers into/(out of) Level 1 | | $ | 196,467 | |
| Transfers into Level 2 | | $ | 196,467 | |
| Transfers out of Level 2 | | | — | |
| Net Transfers into/(out of) Level 2 | | $ | 196,467 | |
A Transfer was made out of Level 1 and into Level 2 due to consideration of other significant observable inputs with respect to the valuation of a security. Transfers between levels are recognized at the end of the reporting period.
GuidePathSM Strategic Asset Allocation Fund
| | | Level 1 | | Level 2 | | Level 3 | | Total | |
| Investment Companies | | $ | 285,638,993 | | $ | — | | $ | — | | $ | 285,638,993 | |
| Short Term Investments | | | 5,569,507 | | | — | | | — | | | 5,569,507 | |
| Investments Purchased as Securities Lending Collateral | | | 38,325,716 | | | — | | | — | | | 38,325,716 | |
| Total Investments in Securities | | $ | 329,534,216 | | $ | — | | $ | — | | $ | 329,534,216 | |
For further information regarding security characteristics, see the Schedule of Investments. There were no transfers in or out of Levels 1, 2 or 3. Transfers between levels are recognized at the end of the reporting period.
GuidePathSM Tactical ConstrainedSM Asset Allocation Fund
| | | Level 1 | | Level 2 | | Level 3 | | Total | |
| Investment Companies | | $ | 193,795,388 | | $ | — | | $ | — | | $ | 193,795,388 | |
| Short Term Investments | | | 4,233,190 | | | — | | | — | | | 4,233,190 | |
| Investments Purchased as Securities Lending Collateral | | | 22,574,143 | | | — | | | — | | | 22,574,143 | |
| Total Investments in Securities | | $ | 220,602,721 | | $ | — | | $ | — | | $ | 220,602,721 | |
For further information regarding security characteristics, see the Schedule of Investments. There were no transfers in or out of Levels 1, 2 or 3. Transfers between levels are recognized at the end of the reporting period.
GuideMarkSM Funds & GuidePathSM Funds
NOTES TO FINANCIAL STATEMENTS (Continued)
March 31, 2014
GuidePathSM Tactical UnconstrainedSM Asset Allocation Fund
| | | Level 1 | | Level 2 | | Level 3 | | Total | |
| Investment Companies | | $ | 277,460,741 | | $ | — | | $ | — | | $ | 277,460,741 | |
| Short Term Investments | | | 58,111,772 | | | — | | | — | | | 58,111,772 | |
| Investments Purchased as Securities Lending Collateral | | | 23,559,185 | | | — | | | — | | | 23,559,185 | |
| Total Investments in Securities | | $ | 359,131,698 | | $ | — | | $ | — | | $ | 359,131,698 | |
For further information regarding security characteristics, see the Schedule of Investments. There were no transfers in or out of Levels 1, 2 or 3. Transfers between levels are recognized at the end of the reporting period.
GuidePathSM Absolute Return Asset Allocation Fund
| | | Level 1 | | Level 2 | | Level 3 | | Total | |
| Investment Companies | | $ | 441,521,713 | | $ | — | | $ | — | | $ | 441,521,713 | |
| Short Term Investments | | | 8,292,774 | | | — | | | — | | | 8,292,774 | |
| Investments Purchased as Securities Lending Collateral | | | 94,128,733 | | | — | | | — | | | 94,128,733 | |
| Total Investments in Securities | | $ | 543,943,220 | | $ | — | | $ | — | | $ | 543,943,220 | |
For further information regarding security characteristics, see the Schedule of Investments. There were no transfers in or out of Levels 1, 2 or 3. Transfers between levels are recognized at the end of the reporting period.
GuidePathSM Multi-Asset Income Asset Allocation Fund
| | | Level 1 | | Level 2 | | Level 3 | | Total | |
| Investment Companies | | $ | 112,326,025 | | $ | — | | $ | — | | $ | 112,326,025 | |
| Short Term Investments | | | 2,332,056 | | | — | | | — | | | 2,332,056 | |
| Investments Purchased as Securities Lending Collateral | | | 34,155,152 | | | — | | | — | | | 34,155,152 | |
| Total Investments in Securities | | $ | 148,813,233 | | $ | — | | $ | — | | $ | 148,813,233 | |
For further information regarding security characteristics, see the Schedule of Investments. There were no transfers in or out of Levels 1, 2 or 3. Transfers between levels are recognized at the end of the reporting period.
GuidePathSM Fixed Income Allocation Fund
| | | Level 1 | | Level 2 | | Level 3 | | Total | |
| Investment Companies | | $ | 210,589,492 | | $ | — | | $ | — | | $ | 210,589,492 | |
| Short Term Investments | | | 4,066,373 | | | — | | | — | | | 4,066,373 | |
| Investments Purchased as Securities Lending Collateral | | | 30,860,329 | | | — | | | — | | | 30,860,329 | |
| Total Investments in Securities | | $ | 245,516,194 | | $ | — | | $ | — | | $ | 245,516,194 | |
For further information regarding security characteristics, see the Schedule of Investments. There were no transfers in or out of Levels 1, 2 or 3. Transfers between levels are recognized at the end of the reporting period.
GuideMarkSM Funds & GuidePathSM Funds
NOTES TO FINANCIAL STATEMENTS (Continued)
March 31, 2014
GuidePathSM Altegris® Diversified Alternatives Allocation Fund
| | | Level 1 | | | Level 2 | | | Level 3 | | | Total | |
| Investment Companies | | $ | 127,041,626 | | | $ | — | | | $ | — | | | $ | 127,041,626 | |
| Short Term Investments | | | 2,465,179 | | | | — | | | | — | | | | 2,465,179 | |
| Total Investments in Securities | | $ | 129,506,805 | | | $ | — | | | $ | — | | | $ | 129,506,805 | |
For further information regarding security characteristics, see the Schedule of Investments. There were no transfers in or out of Levels 1, 2 or 3. Transfers between levels are recognized at the end of the reporting period.
| | (b) | Subsequent Events Evaluation |
| | | In preparing these financial statements, the Funds have evaluated events and transactions for potential recognition or disclosure resulting from subsequent events. This evaluation did not result in any subsequent events that necessitated disclosures and/or adjustments other than the below. |
| | | |
| | | Effective April 23, 2014, the Advisor implemented a voluntary 0.10% waiver of its 0.65% Advisory Fee in the GuideMarkSM Global Real Return Fund. Due to this waiver not being contractual, the waived Advisory Fees cannot later be recouped and the Advisory Fee stated in the prospectus will not be changed. |
| | | |
| | (c) | Repurchase Agreements |
| | | Each Fund may enter into repurchase agreements with banks and securities dealers. These transactions involve the purchase of securities with a simultaneous commitment to sell the securities to the bank or the dealer at an agreed-upon date and price. A repurchase agreement is accounted for as an investment by the Fund, collateralized by securities, which are delivered to the Fund’s Custodian or to an agent bank under a tri-party agreement. The securities are marked-to-market daily and additional securities are acquired as needed, to ensure that their value equals or exceeds the repurchase price plus accrued interest. |
| | | |
| | (d) | Federal Income Taxes |
| | | The Funds intend to continue to comply with the requirements of sub-chapter M of the Internal Revenue Code necessary to qualify as regulated investment companies and to make the requisite distributions of income and capital gains to shareholders sufficient to relieve the Funds from all |
| | | or substantially all Federal income taxes. Therefore, no Federal income tax provision is required. |
| | | |
| | | The Funds have adopted financial reporting rules regarding recognition and measurement of tax positions taken or expected to be taken on a tax return. The Funds have reviewed all open tax years and major jurisdictions and concluded that no provision for income tax is required in the Funds’ financial statements. The Funds recognize interest and penalties, if any, related to unrecognized tax benefits as income tax expense on the Statement of Operations. During the fiscal year ended March 31, 2014, the Funds did not incur any interest or penalties. The Funds’ Federal and state income and Federal excise tax returns for tax years for which the applicable statutes of limitations have not expired are subject to examination by the Internal Revenue Service and state departments of revenue. The Funds are not subject to examination for tax years prior to 2010. |
| | | |
| | (e) | Use of Estimates |
| | | The preparation of financial statements in conformity with GAAP requires management to make estimates and assumptions that affect the reported amounts of assets and liabilities and disclosure of contingent assets and liabilities at the date of the financial statements and the reported amounts of revenues and expenses during the reported period. Actual results could differ from those estimates. |
| | | |
| | (f) | Indemnifications |
| | | Under each Trust’s organizational documents, its officers and trustees are indemnified against certain liability arising out of their performance of their duties to the Funds. In addition, in the normal course of |
GuideMarkSM Funds & GuidePathSM Funds
NOTES TO FINANCIAL STATEMENTS (Continued)
March 31, 2014
| | | business, the Funds enter into contracts that contain a variety of representations and warranties that provide general indemnifications. The Funds’ maximum exposure under these arrangements is unknown as this would involve future claims that may be made against the Funds that have not yet occurred. However, the Funds expect the risk of loss to be remote. |
| | | |
| | (g) | Expenses |
| | | Many expenses of the Funds can be directly attributed to a specific Fund. Additionally, some expenses can be directly attributed to a specific Trust, in which case the expense is apportioned among the Funds within that Trust based on relative net assets. Expenses that cannot be directly attributed to a specific Fund or Trust are apportioned among all the Funds based on relative net assets. |
| | | |
| | (h) | Organization and Offering Costs |
| | | Organization costs consist of costs incurred to establish a Trust and enable it legally to do business. The Fund expenses organizational costs as incurred. These expenses were advanced by the Advisor, and the Advisor has agreed to reimburse the Funds for these expenses, subject to potential recovery (see Note 3). Offering costs are accounted for as deferred costs until operations begin. Offering costs include legal fees regarding the preparation of the initial registration statement. Offering costs are then amortized to expense over twelve months on a straight-line basis. |
| | | |
| | (i) | Security Transactions and Income Recognition |
| | | Security transactions are accounted for on trade date. Dividend income is recognized on the ex-dividend date, and the interest income recorded using the effective yield method is accrued daily. Realized gains and losses on investment transactions are determined using the high cost method. Return of capital distributions received from REIT securities are recorded as an adjustment to the cost of the security and thus may impact unrealized or realized gains or losses on the security. Gains and losses from paydowns on mortgage and asset backed securities are recorded as adjustments to interest income. Distributions from |
| | | underlying investment companies are classified as investment income or realized gains based on the U.S. income tax characteristics of the distribution. |
| | | |
| | (j) | Distributions to Shareholders |
| | | The Funds, with the exception of the Core Fixed Income Fund, Tax-Exempt Fixed Income Fund, Opportunistic Fixed Income Fund, Multi-Asset Income Asset Allocation Fund, and Fixed Income Allocation Fund will distribute any net investment income at least annually. The Core Fixed Income Fund, Tax-Exempt Fixed Income Fund, Opportunistic Fixed Income Fund, Multi-Asset Income Asset Allocation Fund, and Fixed Income Allocation Fund will distribute any net investment income quarterly. All of the Funds will distribute any net realized long or short-term capital gains at least annually. Certain Funds also utilize earnings and profits distributed to shareholders on redemptions of shares as part of the dividends paid deduction. Distributions to shareholders are recorded on the ex-dividend date. The Funds may also pay a special distribution at the end of the calendar year to comply with Federal tax requirements. |
| | | |
| | (k) | Derivatives |
| | | Each Fund may invest in derivative securities including call and put options, futures, forward currency contracts and swaps. These instruments may be used by a Fund for hedging purposes as well as direct investment. |
| | | |
| | | Forward Currency Contracts |
| | | The Funds may enter into forward currency contracts, obligating the Funds to deliver and receive currency at a specified future date. Transactions involving forward currency contracts may serve as long hedges (for example, if a Fund seeks to buy a security denominated in a foreign security, it may purchase a forward currency contract to lock in the U.S. dollar price of the security) or as short hedges (if a Fund anticipates selling a security denominated in a foreign currency, it may sell a forward currency contract to lock in the U.S. dollar equivalent of the anticipated sales proceeds). Forward contracts are valued daily |
GuideMarkSM Funds & GuidePathSM Funds
NOTES TO FINANCIAL STATEMENTS (Continued)
March 31, 2014
| | and unrealized appreciation or depreciation is recorded daily as the difference between the contract exchange rate and the closing forward rate applied to the face amount of the contract. |
| | |
| | Options |
| | Exchange-traded options are valued at the last reported sale price on the exchange on which the security underlying the option is principally traded. If no sales are reported on a particular day for exchange-traded options, or the options are not exchange-traded, the options are valued at the mean between the most recent quoted bid and asked quotations at the close of the exchange. |
| | |
| | The premium that a Fund pays when purchasing a call option or receives when writing a call option will reflect, among other things, the market price of the security, the relationship of the exercise price to the market price of the security, the relationship of the exercise price to the volatility of the security, the length of the option period and supply and demand factors. The premium is the value of an option at the date of purchase. A purchaser (holder) of a put option pays a non-refundable premium to the seller (writer) of a put option to obtain the right to sell a specified amount of a security at a fixed price (the exercise price) during a specified period (exercise period). Conversely, the seller (writer) of a put option, upon payment by the holder of the premium, has the obligation to buy the security from the holder of the put option at the exercise price during the exercise period. |
| | |
| | Futures |
| | Each Fund has the ability to buy and sell stock index futures contracts traded on domestic stock exchanges to hedge the value of its portfolio against changes in market conditions. A stock index futures contract is an agreement between two parties to take or make delivery of an amount of cash equal to a specified dollar amount, times the difference between stock index value at the close of the last trading day of the contract and the price at which the futures contract is originally struck. A stock index futures contract does not involve the physical delivery of the |
| | underlying stocks in the index. Although stock index futures contracts call for the actual taking of delivery of cash, in most cases a Fund expects to liquidate its stock index futures positions through offsetting transactions, which may result in a gain or loss, before cash settlement is required. |
| | |
| | The World ex-US Fund, Core Fixed Income Fund and each of the GPS Funds II portfolios may purchase or sell other types of futures contracts, including those based on particular interest rates, securities, foreign currencies, securities indices and other financial instruments and indices. The Core Fixed Income Fund and each of the GPS Funds II portfolios may also purchase and write call and put options on such future contracts, in order to seek to increase total return or to hedge against changes in interest rates, securities prices, or currency exchange rates, or, to the extent permitted by its investment policies, to otherwise manage its portfolio of investments. |
| | |
| | Futures contracts are valued at the daily quoted settlement prices. |
| | |
| | Swaps |
| | The Core Fixed Income Fund and each of the GPS Funds II portfolios may enter into interest rate, mortgage, credit, currency and total return swaps, interest rate caps, floors and collars. The Core Fixed Income Fund and each of the GPS Funds II portfolios may also purchase and write (sell) options contracts on swaps, referred to as “swaptions”. The Funds may enter into swap transactions for hedging purposes or to seek to increase total return. Since interest rate, mortgage, credit and currency swaps and interest rate caps, floors and collars are individually negotiated, the Funds expect to achieve an acceptable degree of correlation between their portfolio investments and their swap, cap, floor and collar positions. |
| | |
| | Swap agreements are valued using the daily mean and unrealized appreciation or depreciation is recorded daily as the difference between the prior day and current day closing price. |
GuideMarkSM Funds & GuidePathSM Funds
NOTES TO FINANCIAL STATEMENTS (Continued)
March 31, 2014
Derivative Instruments and Hedging Activities
Each Trust has adopted derivative instruments disclosure standards, in order to enable the investor to understand how and why an entity used derivatives, how derivatives are accounted for, and how derivative instruments affect an entity’s results of operations and financial position.
GuideMarkSM World ex-US Fund
During the year the Fund utilized exchange traded equity index futures in order to equitize cash. At year end the portfolio had approximately 4.1% invested in these instruments.
Balance Sheet — Values of Derivative Instruments as of March 31, 2014
| | | Asset Derivatives | | | Liability Derivatives | |
| | | Balance Sheet Location | | Value | | | Balance Sheet Location | | Value | |
| Equity Contracts — Futures* | | Unrealized appreciation on
futures contracts | | | $351,087 | | | Unrealized depreciation on
futures contracts | | | $1,537 | |
| Total | | | | | $351,087 | | | | | | $1,537 | |
| * | Includes cumulative appreciation/depreciation as reported on the Schedule of Investments. |
| Amount of Realized Loss on Derivatives Recognized in Income |
| | | Futures Contracts |
| Equity Contracts | | $(165,695) |
| Total | | $(165,695) |
| Change in Unrealized Appreciation on Derivatives Recognized in Income |
| | | Futures Contracts |
| Equity Contracts | | $349,550 |
| Total | | $349,550 |
GuideMarkSM Opportunistic Fixed Income Fund
The Fund invested in derivatives in order to manage risk or gain exposure to various other investments or markets. Derivatives may contain various risks, including the potential inability of the counterparty to fulfill their obligations under the terms of the contract, the potential for an illiquid secondary market, and the potential for market movements which may expose the Fund to gains or losses.
The Fund seeks to maximize real returns through exposure to investments in fixed income securities, equity securities, and currency instruments. The Fund expects that its exposure to these asset classes will often be obtained substantially through the use of swap agreements. The Fund entered into swap agreements to manage and/or gain exposures to credit risk. The Fund entered into financial futures contracts primarily to manage interest rate risk. The Fund entered into forward exchange contracts primarily to manage and/or gain exposure to certain foreign currencies.
The Fund used currency forwards during the period for the purpose of hedging exposures within the Fund to non-dollar-denominated assets. In general, the use of currency derivative contracts for hedging may reduce the overall risk level of the
GuideMarkSM Funds & GuidePathSM Funds
NOTES TO FINANCIAL STATEMENTS (Continued)
March 31, 2014
Fund, albeit at a cost that may lower overall performance. In general, the use of currency derivatives for hedging purposes will not lead to leverage within the Fund.
Balance Sheet — Values of Derivative Instruments as of March 31, 2014
| | | Asset Derivatives | | | Liability Derivatives |
| | | Balance Sheet Location | | Value | | | Balance Sheet Location | | Value | |
| Credit Contracts — Swaps | | Appreciation on Swap | | | | | | Depreciation on Swap | | | | |
| | | Agreements | | $ | 2,637 | | | Agreements | | $ | 151,024 | |
| Interest Rate Contracts — Swaps | | Appreciation on Swap | | | | | | Depreciation on Swap | | | | |
| | | Agreements | | | — | | | Agreements | | | 407,758 | |
| Foreign Exchange Contracts — | | Appreciation of forward | | | | | | Depreciation of forward | | | | |
| Forward Currency Contracts | | currency contracts | | | 1,469,277 | | | currency contracts | | | 2,305,923 | |
| Foreign Exchange Contracts — Options | | Investments at Value | | | 24,366 | | | Options written, at Value | | | — | |
| Equity Contracts — Futures* | | Unrealized appreciation on | | | | | | Unrealized depreciation on | | | | |
| | | futures contracts | | | — | | | futures contracts | | | 14,506 | |
| Interest Rate Contracts — Futures* | | Unrealized appreciation on | | | | | | Unrealized depreciation on | | | | |
| | | futures contracts | | | 1,387 | | | futures contracts | | | 7,819 | |
| Total | | | | $ | 1,497,667 | | | | | $ | 2,887,030 | |
| * | Includes cumulative appreciation/depreciation as reported on the Schedule of Investments. |
The Effect of Derivative Instruments on the Statement of Operations for the Year Ended March 31, 2014
Amount of Realized Gain or (Loss) on Derivatives Recognized in Income
| | | Futures | | | Forward Currency | | Purchased | | | | | | | | | |
| | | Contracts | | | Contracts | | Options* | | | Swaps | | | Total | |
| Interest Rate Contracts | | $ | (64,195 | ) | | $ | — | | | $ | — | | | $ | (177,550 | ) | | $ | (241,745 | ) |
| Foreign Exchange Contracts | | | — | | | | 2,882,982 | | | | (16,830 | ) | | | — | | | | 2,866,152 | |
| Equity Contracts | | | (983,011 | ) | | | — | | | | (14,675 | ) | | | — | | | | (997,686 | ) |
| Credit Contracts | | | — | | | | — | | | | — | | | | (1,123,211 | ) | | | (1,123,211 | ) |
| Total | | $ | (1,047,206 | ) | | $ | 2,882,982 | | | $ | (31,505 | ) | | $ | (1,300,761 | ) | | $ | 503,510 | |
| * | Included in net realized gain (loss) on investments as reported on the Statement of Operations. |
GuideMarkSM Funds & GuidePathSM Funds
NOTES TO FINANCIAL STATEMENTS (Continued)
March 31, 2014
Change in Unrealized Appreciation or (Depreciation) on Derivatives Recognized in Income
| | | | | Forward Currency | | Purchased | | | | |
| | | Futures | | Contracts | | Options* | | Swaps | | Total |
| Interest Rate Contracts | | $ | 82,717 | | | $ | — | | | $ | — | | | $ | (407,758 | ) | | $ | (325,041 | ) |
| Foreign Exchange Contracts | | | — | | | | (4,689,733 | ) | | | 24,366 | | | | — | | | | (4,665,367 | ) |
| Equity Contracts | | | 26,848 | | | | — | | | | — | | | | — | | | | 26,848 | |
| Credit Contracts | | | — | | | | — | | | | — | | | | (81,447 | ) | | | (81,447 | ) |
| Total | | $ | 109,565 | | | $ | (4,689,733 | ) | | $ | 24,366 | | | $ | (489,205 | ) | | $ | (5,045,007 | ) |
| * Included in net change in unrealized appreciation (depreciation) on investments as reported on the Statement of Operations. |
The average monthly value of purchased and written options during the year ended March 31, 2014 were as follows:
| | | GuideMarkSM | | GuideMarkSM | |
| | | World | | Opportunistic | |
| | | ex-US | | Fixed Income | |
| | | Fund | | Fund | |
| Purchased Options | | $ | — | | $ | 6,173 | |
| Written Options | | $ | — | | $ | — | |
The average monthly notional amount of futures, forwards, and swaps during the year ended March 31, 2014 were as follows:
| | | GuideMarkSM | | GuideMarkSM | |
| | | World | | Opportunistic | |
| | | ex-US | | Fixed Income | |
| Long Positions | | Fund | | Fund | |
| Futures | | $ | 4,880,668 | | $ | 442,009 | |
| Forwards | | $ | — | | $ | 67,182,920 | |
| Swaps | | $ | — | | $ | 18,579,615 | |
| | | GuideMarkSM | | GuideMarkSM | |
| | | World | | Opportunistic | |
| | | ex-US | | Fixed Income | |
| Short Positions | | Fund | | Fund | |
| Futures | | $ | — | | $ | (13,070,407 | ) |
| Forwards | | $ | — | | $ | (45,415,245 | ) |
| | | | | | | | |
| | | GuideMarkSM | | GuideMarkSM | |
| | | World | | Opportunistic | |
| | | ex-US | | Fixed Income | |
| Cross | | Fund | | Fund | |
| Forwards | | $ | — | | $ | 18,686,366 | |
Derivative Risks
The risks of using the various types of derivatives in which the Funds may engage include: the risk that movements in the value of the derivative may not fully offset or complement instruments currently held in the Fund in the manner intended by the Advisor or sub-advisor; the risk that the counterparty to a derivative contract may fail to comply with its obligations to the Fund; the risk that there may not be a liquid secondary market for the derivative at a time when the Fund would look to disengage the position; the risk that additional capital from the Fund may be called upon to fulfill the conditions of the derivative contract; the risk that the use of derivatives in the Fund may induce leverage in the Fund, and the risk that the cost of the derivative contracts may reduce the overall returns experienced by the Fund.
GuideMarkSM Funds & GuidePathSM Funds
NOTES TO FINANCIAL STATEMENTS (Continued)
March 31, 2014
Offsetting Assets and Liabilities
GuideMarkSM World ex-US Fund
The Fund is subject to various Master Netting Arrangements, which govern the terms of certain transactions with select counterparties. The Master Netting Arrangements allow the Fund to close out and net its total exposure to a counterparty in the event of a default with respect to all the transactions governed under a single agreement with a counterparty. The Master Netting Arrangements also specify collateral posting arrangements at pre-arranged exposure levels. Under the Master Netting Arrangements, collateral is routinely transferred if the total net exposure to certain transactions (net of existing collateral already in place) governed under the relevant Master Netting Arrangement with a counterparty in a given account exceeds a specified threshold depending on the counterparty and the type of Master Netting Arrangement.
The table below, as of March 31, 2014, discloses both gross information and net information about instruments and transactions eligible for offset in the Statements of Assets and Liabilities’ and instruments and transactions that are subject to an agreement similar to a master netting agreement as well as amounts related to collateral held at clearing brokers and counterparties.
| | | | | | | Gross Amounts not offset in the |
| Assets | | | | | | Statement of Assets and Liabilities |
| | | | | Gross Amounts | | Net Amounts | | | | | | |
| | | | | Offset in the | | Presented in the | | | | | | |
| | | Gross Amounts | | Statement of | | Statement of | | | | | | |
| | | of Recognized | | Assets and | | Assets and | | Financial | | Collateral | | |
| | | Assets | | | Liabilities | | | Liabilities | | | Instruments | | | Received | | | Net Amount | |
| Description / Counterparty | | | | | | | | | | | | | | | | | | | | | |
| Futures | | | | | | | | | | | | | | | | | | | | | | | | |
| Goldman Sachs | | $ | 351,087 | | | $ | (1,537 | ) | | $ | 349,550 | | | $ | — | | | $ | — | | | $ | 349,550 | |
| | | | | | | |
| | | | | | | Gross Amounts not offset in the |
| Liabilities | | | | | | Statement of Assets and Liabilities |
| | | | | Gross Amounts | | Net Amounts | | | | | | |
| | | | | Offset in the | | Presented in the | | | | | | |
| | | Gross Amounts | | Statement of | | Statement of | | | | | | |
| | | of Recognized | | Assets and | | Assets and | | Financial | | Collateral | | |
| | | Liabilities | | | Liabilities | | | Liabilities | | | Instruments | | | Pledged | | | Net Amount | |
| Description / Counterparty | | | | | | | | | | | | | | | | | | | | | |
| Futures | | | | | | | | | | | | | | | | | | | | | | | | |
| Goldman Sachs | | $ | 1,537 | | | $ | (1,537 | ) | | $ | — | | | $ | — | | | $ | — | | | $ | — | |
GuideMarkSM Opportunistic Fixed Income Fund
The Fund attempts to reduce its exposure to counterparty credit risk on over-the counter (“OTC”) derivatives, whenever possible, by entering into International Swaps and Derivatives Association, Inc. (“ISDA”) agreements with certain counterparties. These agreements typically contain various provisions, including but not limited to, collateral requirements and master netting provisions in the event of a default or other termination event. Collateral is posted by the Fund or the counterparty to the extent of the net mark-to-market exposure to the other party of all open contracts under the agreement, subject to minimum transfer requirements. The Fund is required to deposit financial collateral in the form of cash and/or securities at the clearing brokers and counterparties to continually meet the original and maintenance requirement established by the clearing brokers and counterparties. Master netting provisions allow the Fund and the counterparty, in the event of a default or other termination event, to offset amounts owed by each related to derivative contracts, including any posted collateral, to one net amount payable by either the Fund or the counterparty. The Fund’s ISDA agreements typically contain provisions that allow a counterparty to
GuideMarkSM Funds & GuidePathSM Funds
NOTES TO FINANCIAL STATEMENTS (Continued)
March 31, 2014
terminate open contracts early if the net asset value of a Fund declines beyond a certain threshold. For financial reporting purposes, the Funds do not offset derivative assets and liabilities, and any related collateral received or pledged, on the Statements of Assets and Liabilities.
The table below, as of March 31, 2014, discloses both gross information and net information about instruments and transactions eligible for offset in the Statements of Assets and Liabilities’ and instruments and transactions that are subject to an agreement similar to a master netting agreement as well as amounts related to collateral held at clearing brokers and counterparties.
| | | | | | | Gross Amounts not offset in the |
| Assets | | | | | | Statement of Assets and Liabilities |
| | | | | Gross Amounts | | | Net Amounts | | | | | | | |
| | | | | Offset in the | | | Presented in the | | | | | | | |
| | | Gross Amounts | | | Statement of | | | Statement of | | | | | | | |
| | | of Recognized | | | Assets and | | | Assets and | | | Financial | | | Collateral | | | | | |
| | | Assets | | | Liabilities | | | Liabilities | | | Instruments | | | Received | | | Net Amount | |
| Description / Counterparty | | | | | | | | | | | | | | | | | | | | | |
| | | | | | | | | | | | | | | | | | | | | | |
| Forward Currency Contracts | | | | | | | | | | | | | | | | | | | |
| Barclays | | $ | 88,823 | | | $ | — | | | $ | 88,823 | | | $ | (88,823 | ) | | $ | — | | | $ | — | |
| Citibank | | | 124,680 | | | | — | | | | 124,680 | | | | (15,519 | ) | | | — | | | | 109,161 | |
| Citigroup | | | 24,316 | | | | — | | | | 24,316 | | | | (24,316 | ) | | | — | | | | — | |
| Credit Suisse | | | 47,956 | | | | — | | | | 47,956 | | | | (47,956 | ) | | | — | | | | — | |
| Deutsche Bank | | | 886,060 | | | | — | | | | 886,060 | | | | (886,060 | ) | | | — | | | | — | |
| Goldman Sachs | | | 1,651 | | | | — | | | | 1,651 | | | | (1,651 | ) | | | — | | | | — | |
| HSBC | | | 170,751 | | | | — | | | | 170,751 | | | | (27,071 | ) | | | — | | | | 143,680 | |
| JP Morgan Chase | | | 282,539 | | | | — | | | | 282,539 | | | | (54,532 | ) | | | — | | | | 228,007 | |
| Morgan Stanley | | | — | | | | — | | | | — | | | | — | | | | — | | | | — | |
| UBS | | | — | | | | — | | | | — | | | | — | | | | — | | | | — | |
| Futures | | | | | | | | | | | | | | | | | | | | | | | | |
| JP Morgan Chase | | | 1,387 | | | | (1,387 | ) | | | — | | | | — | | | | — | | | | — | |
| Swaps | | | | | | | | | | | | | | | | | | | | | | | | |
| Credit Suisse | | | — | | | | — | | | | — | | | | — | | | | — | | | | — | |
| Deutsche Bank | | | 2,637 | | | | — | | | | 2,637 | | | | — | | | | — | | | | 2,637 | |
| JP Morgan Chase | | | — | | | | — | | | | — | | | | — | | | | — | | | | — | |
| Merrill Lynch | | | — | | | | — | | | | — | | | | — | | | | — | | | | — | |
| | | $ | 1,630,800 | | | $ | (1,387 | ) | | $ | 1,629,413 | | | $ | (1,145,928 | ) | | $ | — | | | $ | 483,485 | |
GuideMarkSM Funds & GuidePathSM Funds
NOTES TO FINANCIAL STATEMENTS (Continued)
March 31, 2014
| | | | | | | Gross Amounts not offset in the |
| Liabilities | | | | | | Statement of Assets and Liabilities |
| | | | | Gross Amounts | | Net Amounts | | | | | | |
| | | | | Offset in the | | Presented in the | | | | | | |
| | | Gross Amounts | | | Statement of | | Statement of | | | | | | |
| | | of Recognized | | | Assets and | | Assets and | | Financial | | Collateral | | |
| | | Liabilities | | | Liabilities | | | Liabilities | | | Instruments | | | Pledged | | | Net Amount | |
| Description / Counterparty | | | | | | | | | | | | | | | | | | | | | |
| Forward Currency Contracts | | | | | | | | | | | | | | | | | | | | | |
| Barclays | | $ | 258,810 | | | $ | — | | | $ | 258,810 | | | $ | (88,823 | ) | | $ | (169,987 | ) | | $ | — | |
| Citibank | | | 15,519 | | | | — | | | | 15,519 | | | | (15,519 | ) | | | — | | | | — | |
| Citigroup | | | 51,752 | | | | — | | | | 51,752 | | | | (24,316 | ) | | | (20,000 | ) | | | 7,436 | |
| Credit Suisse | | | 96,098 | | | | — | | | | 96,098 | | | | (47,956 | ) | | | — | | | | 48,142 | |
| Deutsche Bank | | | 1,626,887 | | | | — | | | | 1,626,887 | | | | (886,060 | ) | | | — | | | | 740,827 | |
| Goldman Sachs | | | 234,474 | | | | — | | | | 234,474 | | | | (1,651 | ) | | | (220,000 | ) | | | 12,823 | |
| HSBC | | | 27,071 | | | | — | | | | 27,071 | | | | (27,071 | ) | | | — | | | | — | |
| JP Morgan Chase | | | 54,532 | | | | — | | | | 54,532 | | | | (54,532 | ) | | | — | | | | — | |
| Morgan Stanley | | | 63,918 | | | | — | | | | 63,918 | | | | — | | | | — | | | | 63,918 | |
| UBS | | | 34,361 | | | | — | | | | 34,361 | | | | — | | | | — | | | | 34,361 | |
| Futures | | | | | | | | | | | | | | | | | | | | | | | | |
| JP Morgan Chase | | | 22,325 | | | | (1,387 | ) | | | 20,938 | | | | — | | | | (20,938 | ) | | | — | |
| Swaps | | | | | | | | | | | | | | | | | | | | | | | | |
| Credit Suisse | | | 113,458 | | | | — | | | | 113,458 | | | | — | | | | (100,000 | ) | | | 13,458 | |
| Deutsche Bank | | | — | | | | — | | | | — | | | | — | | | | — | | | | — | |
| JP Morgan Chase | | | 407,758 | | | | — | | | | 407,758 | | | | — | | | | (407,758 | ) | | | — | |
| Merrill Lynch | | | 37,566 | | | | — | | | | 37,566 | | | | — | | | | — | | | | 37,566 | |
| | | $ | 3,044,529 | | | $ | (1,387 | ) | | $ | 3,043,142 | | | $ | (1,145,928 | ) | | $ | (938,683 | ) | | $ | 958,531 | |
In some instances, the collateral amounts disclosed in the tables were adjusted due to the requirement to limit the collateral amounts to avoid the effect of overcollateralization. Actual collateral received/pledged may be more than the amounts disclosed herein.
Due to the absence of a master netting agreement relating to the Funds’ participation in securities lending, no additional disclosures have been made on behalf of the Funds. Please reference Note 6 for collateral related to securities on loan.
| | (l) | Securities Purchased or Sold on a Forward-Commitment Basis |
| | | The Funds may enter into when-issued or other purchase or sale transactions that specify forward delivery of a financial security. In connection with this ability, the Funds may enter into mortgage “dollar rolls” in which a Fund sells securities in the current month for delivery and simultaneously contracts with the same counterparty to repurchase similar (same type, coupon and maturity) but not identical securities on a specified future date. The party that is obligated to buy a security in the future will retain the use of their funds, and will benefit from any interest that is |
| | | earned on those funds from the day that they enter into the forward contract until the day that they take delivery and pay for the security. |
| | | |
| | (m) | Foreign Currency Translation |
| | | The accounting records of the Funds are maintained in U.S. dollars. Investment securities and all other assets and liabilities of the Funds denominated in a foreign currency are translated into U.S. dollars at current exchange rates. Purchases and sales of securities, income receipts, and expense payments are translated into U.S. dollars at the exchange rate in effect on the dates of the respected transactions. |
GuideMarkSM Funds & GuidePathSM Funds
NOTES TO FINANCIAL STATEMENTS (Continued)
March 31, 2014
| | | The Funds do not isolate the portion of the fluctuations on investments resulting from changes in foreign currency exchange rates from the fluctuations in market prices of investments held. Such fluctuations are included with the net realized and unrealized gain or loss from investments. |
| | | |
| | (n) | Restricted and Illiquid Securities
Each Fund may invest up to 15% of its net assets in securities that are illiquid, which includes securities with legal or contractual restrictions on their disposition, and securities for which there are no readily available market quotations. The Advisor, with the assistance of the sub-advisors and/or pricing services, will determine the value of such securities in good faith pursuant to procedures adopted by the applicable Board of Trustees. Illiquid securities present the risks that a Fund may have difficulty valuing these holdings and/or may be unable to sell these holdings at the time or price desired. There are no restrictions on each Fund’s ability to invest in restricted securities (that is, securities that are not registered pursuant to the Securities Act of 1933), except to the extent such securities may be considered illiquid. Securities issued pursuant to Rule 144A of the Securities Act of 1933 will be considered liquid if determined to be so under procedures adopted by the Board of Trustees. |
| | | |
| | (o) | Auction Rate Securities |
| | | The Core Fixed Income Fund, Tax-Exempt Fixed Income Fund, and each of the GPS Funds II portfolios may invest in auction rate municipal securities. Auction rate securities usually permit the holder to sell the securities in an auction at par value at specified intervals. The dividend is reset by “Dutch” auction in which bids are made by broker-dealers and other institutions for a certain amount of securities at a specified minimum yield. The dividend rate set by the auction is the lowest interest or dividend rate that covers all securities offered for sale. While this process is designed to permit auction rate securities to be traded at par value, there is a risk that an auction will fail due to insufficient demand for the securities. |
| | (p) | Short Sales |
| | | Although not currently part of any Fund’s principal investment strategy, each Fund has the ability to make short sales. Short sales are transactions where a Fund sells securities it does not own in anticipation of a decline in the value of the securities. |
| | | |
| | (q) | Trustee Compensation |
| | | Effective July 11, 2013, for the services performed as Trustees of the consolidated Board of Trustees of GPS Funds I and GPS Funds II, the Independent Trustees receive a retainer fee of $65,000 per year, $4,500 per in-person meeting attended, and $2,000 per telephonic meeting attended, as well as reimbursement for expenses incurred in connection with attendance at such meetings. The fees are allocated proportionally to each Fund within the Trusts based on total assets under management. |
| | | |
| | | The “interested persons” who serve as Trustees of the Trusts receive no compensation from the Trusts for their services as Trustees. The Funds reimburse the Advisor an allocated amount for the compensation and related expenses of certain officers of the Trusts who provide compliance services to the Funds. The aggregate amount of all such reimbursements is determined by the Trustees. No other compensation or retirement benefits are received by any Trustee or officer from the Funds. |
| | | |
| | (r) | Pending Litigation |
| | | The Funds are subject to claims and suits that arise from time to time in the ordinary course of business (for example, in The Tribune Company Bankruptcy, certain creditors have filed actions against all shareholders of The Tribune Company, which included the GuideMarkSM Large Cap Value Fund, who tendered shares when the Tribune Company went private in 2007 in a leveraged buy-out transaction, seeking the return of proceeds received by the shareholders). Although management currently believes that resolving claims against us, individually or in aggregate, will not have a material adverse impact on financial position, results of operations, or cash flows, these matters are subject to |
GuideMarkSM Funds & GuidePathSM Funds
NOTES TO FINANCIAL STATEMENTS (Continued)
March 31, 2014
| | | inherent uncertainties and management’s view of these matters may change in the future. |
| | |
| 3. | Investment Advisor |
| | |
| | Each Trust has an Investment Advisory Agreement (the “Agreement”) with AssetMark, Inc. (the “Advisor” or “AssetMark”), with whom certain officers and trustees of the Trust are affiliated, to furnish investment advisory services to the Funds. Under the terms of the Agreement, the Funds compensate the Advisor for its management services at the following contractual rates, based on each Fund’s average daily net assets: |
| | Large Cap Growth Fund | | 0.70 | % |
| | Large Cap Value Fund | | 0.70 | % |
| | Small/Mid Cap Core Fund | | 0.75 | % |
| | World ex-US Fund | | 0.70 | % |
| | Opportunistic Equity Fund | | 0.80 | % |
| | Global Real Return Fund | | 0.65 | % |
| | Core Fixed Income Fund | | 0.50 | % |
| | Tax-Exempt Fixed Income Fund | | 0.50 | % |
| | Opportunistic Fixed Income Fund | | 0.70 | % |
| | Strategic Asset Allocation Fund | | 0.25 | % |
| | Tactical ConstrainedSM Asset Allocation Fund | | 0.25 | % |
| | Tactical UnconstrainedSM Asset Allocation Fund | | 0.35 | % |
| | Absolute Return Asset Allocation Fund | | 0.35 | % |
| | Multi-Asset Income Asset Allocation Fund | | 0.35 | % |
| | Fixed Income Allocation Fund | | 0.25 | % |
| | Altegris® Diversified Alternatives Allocation Fund | | 0.15 | % |
| | AssetMark also provides certain administrative services to the Service Shares of the Funds, pursuant to Administrative Services Agreements between the Funds and AssetMark, for which AssetMark receives a fee of 0.25% of the average daily net assets of the Service Shares of the Funds. The GuidePath® Altegris® Diversified Alternatives Allocation Fund and the Advisor have entered into a Fee Waiver Agreement under which the Adviser has agreed to waive, through July 31, 2015, the Investment Advisory Fee and Administrative Services Fee. These waived fees are not subject to recovery. The administrative services may include development and maintenance of a web-based software platform for both investment advisers and shareholders; |
| | creation of a customized full-color client quarterly performance review for each individual client; facilitating the initiation and setup of new account and related asset transfers; reviewing and following up on custodial paperwork; attending to shareholder correspondence, requests and inquiries, and other communications with shareholders and their representatives; assisting with the processing of purchases and redemptions of shares; and monitoring and overseeing non-advisory relationships with entities providing services to the Service Shares; including the transfer agent and custodian. |
| | |
| | In addition, GPS Funds I and the Advisor have also entered into a Fee Waiver Agreement designed to provide Fund shareholders with the economic benefits of economies of scale that may be realized as Fund assets increase. Under the Fee Waiver Agreement, the Advisor has contractually agreed to waive 0.025% of each Fund’s annual advisory fee on assets in GPS Funds I collectively in excess of $6 billion, and an additional 0.025% of each Fund’s annual advisory fee on assets in GPS Funds I collectively in excess of $12 billion. |
| | |
| | Each Fund and the Advisor have also entered into an Expense Waiver and Reimbursement Agreement under which the Advisor has agreed to waive, through July 31, 2015, its management fee and/or reimburse each Fund’s other expenses to the extent necessary to ensure that the Fund’s net annual operating expenses (excluding Distribution (12b-1) Fees, Administrative Service Fees, taxes, interest, trading costs, acquired fund expenses, expenses paid with securities lending expense offset credits and non-routine expenses) do not exceed the following rates, based on each Fund’s average daily net assets: |
| | |
| | Large Cap Growth Fund | | 0.99 | % |
| | Large Cap Value Fund | | 0.99 | % |
| | Small/Mid Cap Core Fund | | 1.09 | % |
| | World ex-US Fund | | 1.09 | % |
| | Opportunistic Equity Fund | | 1.10 | % |
| | Global Real Return Fund | | 1.05 | % |
| | Core Fixed Income Fund | | 0.79 | % |
| | Tax-Exempt Fixed Income Fund | | 0.79 | % |
| | Opportunistic Fixed Income Fund | | 1.05 | % |
| | Strategic Asset Allocation Fund | | 0.50 | % |
GuideMarkSM Funds & GuidePathSM Funds
NOTES TO FINANCIAL STATEMENTS (Continued)
March 31, 2014
| | Tactical ConstrainedSM Asset Allocation Fund | | 0.50 | % |
| | Tactical UnconstrainedSM Asset Allocation Fund | | 0.60 | % |
| | Absolute Return Asset Allocation Fund | | 0.60 | % |
| | Multi-Asset Income Asset Allocation Fund | | 0.60 | % |
| | Fixed Income Allocation Fund | | 0.55 | % |
| | Altegris® Diversified Alternatives Allocation Fund | | 0.50 | % |
| | Any such contractual waiver or reimbursement is subject to later adjustment to allow the Advisor to recoup amounts waived or reimbursed to the extent actual fees and expenses for a fiscal period are less than each Fund’s expense limitation cap at the time of the waiver, provided, however, that the Advisor shall only be entitled to recoup such amounts for a period of three years after the end of the fiscal year in which the fee or expense was waived or reimbursed. As of March 31, 2014, Large Cap Value Fund, Opportunistic Equity Fund, Global Real Return Fund, Absolute Return Asset Allocation Fund, Multi-Asset Income Asset Allocation Fund, Fixed Income Allocation Fund and Altegris® Diversified Alternatives Allocation Fund have recouped all potential recoverable waivers or reimbursed expenses. |
| | |
| | The Advisor is currently waiving fees and, in some cases, reimbursing expenses in the Funds listed below in order to keep these Funds at their expense cap. Waived expenses subject to potential recovery are as follows: |
| | | | Year of
Expiration
03/31/2015 | | | Year of
Expiration
03/31/2016 | | | Year of
Expiration
03/31/2017 | |
| | Large Cap Growth | | | — | | | | 17,372 | | | | 6,342 | |
| | Small/Mid Cap Core Fund | | | 46,007 | | | | 15,486 | | | | 2,363 | |
| | World ex-US Fund | | | 110,509 | | | | 141,168 | | | | 64,077 | |
| | Core Fixed Income Fund | | | — | | | | — | | | | 26,743 | |
| | Tax-Exempt Fixed Income Fund | | | 26,492 | | | | 53,717 | | | | 66,988 | |
| | Opportunistic Fixed Income Fund | | | 189,540 | | | | 100,926 | | | | 77,167 | |
| | Strategic Asset Allocation Fund | | | 30,022 | | | | 26,716 | | | | — | |
| | Tactical ConstrainedSM Asset Allocation Fund | | | 64,692 | | | | 33,542 | | | | 7,034 | |
| | Tactical UnconstrainedSM Asset Allocation Fund | | | — | | | | — | | | | 12,143 | |
| | Sub-advisory services are provided to certain of the Funds, pursuant to agreements between the Advisor and various sub-advisors. Under the terms of these sub-advisory agreements, the Advisor compensates each sub-advisor based on the portion of each Fund’s average daily net assets that is allocated to the sub-advisor. |
| | |
| 4. | Distribution Plan |
| | Each Trust, on behalf of the Service Shares class of its Funds, has adopted a distribution plan pursuant to Rule 12b-1 under the 1940 Act (the “12b-1 Plan”), which provides for each Fund to pay distribution fees at an annual rate of 0.25% of the average daily net assets of the Funds. Payments under the 12b-1 Plan shall be used to compensate persons (including affiliates of the Trust) who provide support services in connection with the distribution of the Funds’ Service Shares class and servicing of the Funds’ Service Shares class |
| | shareholders. For example, these amounts are paid to financial intermediaries that perform back office shareholder servicing and recordkeeping services that facilitate the operation of the AssetMark Program through which the Funds are primarily distributed. The Advisor (and its affiliates) similarly receive portions of such payments for their services provided to facilitate the operation of the program. These financial intermediaries and affiliates of the Trust also receive payments from the Trust outside of the 12b-1 Plan for shareholder services that are unrelated to distribution services. Capital Brokerage Corp. serves as principal underwriter and distributor for the Funds. The Advisor is currently setting up an affiliated limited-purpose broker/dealer to serve as the principal underwriter and distributor for the Funds and plans to complete the process by December 31, 2014. |
GuideMarkSM Funds & GuidePathSM Funds
NOTES TO FINANCIAL STATEMENTS (Continued)
March 31, 2014
| 5. | Service and Custody Agreements |
| | |
| | The Funds have entered into Service Agreements with U.S. Bancorp Fund Services, LLC (“USBFS”) and a Custody Agreement with U.S. Bank, N.A., an affiliate of USBFS. Under these agreements, USBFS and U.S. Bank, N.A. provide certain transfer agency, administrative, accounting and custody services. |
| | |
| | Additionally, the Opportunistic Fixed Income Fund has entered into a Custody Agreement with the Bank of New York Mellon for certain custody services. |
| | |
| 6. | Securities Lending |
| | |
| | The Trusts, on behalf of certain of the Funds, entered into securities lending arrangements with U.S. Bank, N.A. (the “Custodian”). Under the term of the agreement, the Custodian is authorized to loan securities on behalf of the Funds to approved brokers. In exchange, under normal market conditions, the Funds receive cash collateral in the amount of at least 102% of the value of securities loaned for U.S. securities, and 105% of the value of securities loaned with respect to foreign securities. The cash collateral is invested in short term instruments as noted in the Schedule of Investments. Although risk is mitigated by the collateral, the Funds could experience a delay in recovering their securities and possible loss of |
| | income or value if the borrower fails to return the borrowed securities. In addition, the Funds bear the risk of loss associated with the investment of cash collateral received. After predetermined rebates to brokers, a percentage of the net securities lending revenue is credited to the Funds to be used as an offset against custody costs and other charges incurred by the Funds. The Custodian is paid a fee for administering a securities lending program for the Funds, equal to the remaining percentage of the net securities lending revenues generated under the agreement. |
| | |
| | As of March 31, 2014, the Funds (excluding the Tax-Exempt Fixed Income Fund, Opportunistic Fixed Income Fund and Altegris® Diversified Alternatives Allocation Fund) had loaned securities that were collateralized by cash. The cash collateral received was invested in securities as listed in each Fund’s Schedule of Investments. Income earned from these investments is allocated to each Fund based on each Fund’s portion of total cash collateral received. Securities lending income is disclosed in each Fund’s Statement of Operations as a securities lending credit. |
GuideMarkSM Funds & GuidePathSM Funds
NOTES TO FINANCIAL STATEMENTS (Continued)
March 31, 2014
As of March 31, 2014, the values of securities loaned and collateral received were as follows:
| | | Value of
Securities
Loaned | | Payable for
Collateral
on Securities
Loaned | | Collateral
Excess
(Deficit) due
to (from)
Securities
Lending
Agent | | Cost of
Securities
Purchased
as Securities
Lending
Collateral | | Unrealized
Depreciation | | Value
of Securities
Purchased
as Securities
Lending
Collateral | |
Large Cap
Growth Fund | | $ | 8,181,940 | | $ | 8,219,156 | | $ | 6,087 | | $ | 8,222,427 | | $ | (16,900 | ) | $ | 8,205,527 | |
Large Cap
Value Fund | | | 11,796,113 | | | 12,146,872 | | | 2,148 | | | 12,145,803 | | | (19,337 | ) | | 12,126,466 | |
Small/Mid Cap
Core Fund | | | 7,358,422 | | | 7,516,857 | | | (6,803 | ) | | 7,509,175 | | | (5,260 | ) | | 7,503,915 | |
| World ex-US Fund | | | 2,083,130 | | | 2,217,000 | | | 1,698 | | | 2,217,933 | | | (4,607 | ) | | 2,213,326 | |
Opportunistic
Equity Fund | | | 8,795,468 | | | 8,998,359 | | | — | | | 8,998,359 | | | — | | | 8,998,359 | |
Global Real
Return Fund | | | 28,433,508 | | | 28,902,100 | | | — | | | 28,902,100 | | | — | | | 28,902,100 | |
Core Fixed
Income Fund | | | 4,481,147 | | | 4,594,030 | | | (3,130 | ) | | 4,590,224 | | | (4,064 | ) | | 4,586,160 | |
Strategic Asset
Allocation Fund | | | 37,776,866 | | | 38,325,716 | | | — | | | 38,325,716 | | | — | | | 38,325,716 | |
Tactical ConstrainedSM
Asset Allocation Fund | | | 22,099,590 | | | 22,574,143 | | | — | | | 22,574,143 | | | — | | | 22,574,143 | |
Tactical UnconstrainedSM
Asset Allocation Fund | | | 23,129,805 | | | 23,559,185 | | | — | | | 23,559,185 | | | — | | | 23,559,185 | |
Absolute Return Asset
Allocation Fund | | | 91,330,450 | | | 94,128,733 | | | — | | | 94,128,733 | | | — | | | 94,128,733 | |
Multi-Asset Income
Asset Allocation Fund | | | 33,251,218 | | | 34,155,152 | | | — | | | 34,155,152 | | | — | | | 34,155,152 | |
Fixed Income
Allocation Fund | | | 29,891,467 | | | 30,860,329 | | | — | | | 30,860,329 | | | — | | | 30,860,329 | |
| | | $ | 308,609,124 | | $ | 316,197,632 | | $ | — | | $ | 316,189,279 | | $ | (50,168 | ) | $ | 316,139,111 | |
GuideMarkSM Funds & GuidePathSM Funds
NOTES TO FINANCIAL STATEMENTS (Continued)
March 31, 2014
| 7. | Investment Transactions |
| | |
| | The aggregate purchases and sales of securities, excluding short-term investments, for the year ended March 31, 2014 are summarized below. |
| | | Purchases | | Sales | |
| Large Cap Growth Fund | | $ | 99,979,826 | | $ | 133,856,873 | |
| Large Cap Value Fund | | | 56,573,165 | | | 97,197,133 | |
Small/Mid Cap Core
Fund | | | 188,519,412 | | | 212,130,164 | |
| World ex-US Fund | | | 281,411,655 | | | 244,612,005 | |
Opportunistic Equity
Fund | | | 81,082,916 | | | 133,127,760 | |
| Global Real Return Fund | | | 28,461,466 | | | 31,831,745 | |
| Core Fixed Income Fund* | | | 396,159,918 | | | 470,932,303 | |
Tax-Exempt Fixed
Income Fund | | | 22,349,504 | | | 31,157,719 | |
Opportunistic Fixed Income
Fund | | | 138,054,629 | | | 173,402,653 | |
Strategic Asset Allocation
Fund | | | 87,481,259 | | | 77,427,584 | |
Tactical ConstrainedSM
Asset Allocation Fund | | | 156,382,346 | | | 205,047,929 | |
Tactical UnconstrainedSM
Asset Allocation Fund | | | 762,942,157 | | | 810,242,932 | |
Absolute Return Asset
Allocation Fund | | | 632,472,908 | | | 681,192,754 | |
Multi-Asset Income Asset
Allocation Fund | | | 131,082,894 | | | 91,752,625 | |
Fixed Income Allocation
Fund | | | 145,157,451 | | | 149,883,877 | |
Altegris® Diversified
Alternatives Allocation
Fund | | | 62,378,772 | | | 91,334,308 | |
| * | Included in these amounts were $175,427,560 of purchases and $205,876,379 of sales of U.S. Government Securities. |
GuideMarkSM Funds & GuidePathSM Funds
NOTES TO FINANCIAL STATEMENTS (Continued)
March 31, 2014
| 8. | Transactions with Affiliates |
The Funds’ transactions with affiliates represent holdings for which the respective Fund and the underlying investee fund have the same investment advisor or where the investee fund’s investment advisor is under common control with the Fund’s investment advisor.
The GuidePathSM Funds had the following transactions during the year ended March 31, 2014, with affiliates:
| | | Share Activity | | | Year Ended March 31, 2014 |
| Security Name | | Balance
March 31, 2013 | | | Purchases | | | Sales | | | Balance
March 31, 2014 | | | Fair
Value | | | Dividends
Credited to
Income | | | Amount of Gain
(Loss) realized on
Sale of Shares | |
| Strategic Asset Allocation Fund | | | | | | | | | | | | | | | | | | | | | | | | | | | | |
Altegris® Macro Strategy
Fund - Institutional Shares | | | 658,931 | | | | 318,769 | | | | 624,755 | | | | 352,945 | | | $ | 2,834,151 | | | $ | — | | | $ | (424,039 | ) |
Altegris® Multi-Strategy
Alternatives Fund -
Institutional Shares | | | — | | | | 586,707 | | | | 2,053 | | | | 584,654 | | | | 5,793,917 | | | | — | | | | (262 | ) |
GuideMarkSM Global Real
Return Fund - Institutional
Shares | | | 1,244,155 | | | | 519,831 | | | | 331,557 | | | | 1,432,429 | | | | 13,207,000 | | | | 147,042 | | | | (147,008 | ) |
GuideMarkSM Large Cap
Growth Fund - Institutional
Shares | | | 1,657,702 | | | | 288,397 | | | | 561,145 | | | | 1,384,954 | | | | 18,932,316 | | | | 110,752 | | | | 417,028 | |
GuideMarkSM Large Cap
Value Fund - Institutional
Shares | | | 2,215,495 | | | | 399,992 | | | | 750,822 | | | | 1,864,665 | | | | 21,872,519 | | | | 318,936 | | | | 666,856 | |
GuideMarkSM Opportunistic
Equity Fund - Institutional
Shares | | | 1,715,833 | | | | 277,494 | | | | 905,836 | | | | 1,087,491 | | | | 14,670,253 | | | | 119,006 | | | | 1,795,349 | |
GuideMarkSM Small/Mid Cap
Core Fund - Institutional
Shares | | | 1,660,595 | | | | 268,996 | | | | 611,587 | | | | 1,318,004 | | | | 22,102,933 | | | | 10,001 | | | | 1,004,554 | |
GuideMarkSM World ex-US
Fund - Institutional Shares | | | 4,651,171 | | | | 2,431,821 | | | | 949,936 | | | | 6,133,056 | | | | 54,829,523 | | | | 509,565 | | | | 265,999 | |
| | | | | | | | | | | | | | | | | | | $ | 154,242,612 | | | $ | 1,215,302 | | | $ | 3,578,477 | |
| Tactical ConstrainedSM Asset Allocation Fund | | | | | | | | | | | | | | | | | | |
GuideMarkSM Core Fixed
Income Fund - Institutional
Shares | | | 2,527,212 | | | | 2,366,397 | | | | 3,141,322 | | | | 1,752,287 | | | $ | 16,418,929 | | | $ | 470,210 | | | $ | (703,674 | ) |
GuideMarkSM Large Cap
Growth Fund - Institutional
Shares | | | 1,380,568 | | | | 383,206 | | | | 812,631 | | | | 951,143 | | | | 13,002,131 | | | | 99,443 | | | | 1,304,322 | |
GuideMarkSM Large Cap Value
Fund - Institutional Shares | | | 1,627,466 | | | | 485,633 | | | | 975,124 | | | | 1,137,975 | | | | 13,348,445 | | | | 254,999 | | | | 1,497,196 | |
GuideMarkSM Opportunistic
Equity Fund - Institutional
Shares | | | 2,139,399 | | | | 357,122 | | | | 946,139 | | | | 1,550,382 | | | | 20,914,647 | | | | 230,026 | | | | 2,930,242 | |
GuideMarkSM Funds & GuidePathSM Funds
NOTES TO FINANCIAL STATEMENTS (Continued)
March 31, 2014
| | | Share Activity | | Year Ended March 31, 2014 | |
| Security Name | | Balance
March 31, 2013 | | Purchases | | Sales | | Balance
March 31, 2014 | | | Fair
Value | | | Dividends
Credited to
Income | | | Amount of Gain
(Loss) realized on
Sale of Shares | |
| Tactical ConstrainedSM Asset Allocation Fund (continued) | | | | | | | | | | | | | |
| GuideMarkSM Opportunistic | | | | | | | | | | | | | | | | | | | | | | | | | |
| Fixed Income Fund - | | | | | | | | | | | | | | | | | | | | | | | | | |
| Institutional Shares | | | 1,337,971 | | | 439,780 | | | 652,719 | | | 1,125,032 | | | $ | 11,182,821 | | | $ | 398,656 | | | $ | (183,011 | ) |
| GuideMarkSM Small/Mid Cap | | | | | | | | | | | | | | | | | | | | | | | | | |
| Core Fund - Institutional | | | | | | | | | | | | | | | | | | | | | | | | | |
| Shares | | | 625,965 | | | 891,155 | | | 615,019 | | | 902,101 | | | | 15,128,230 | | | | 9,637 | | | | 52,187 | |
| GuideMarkSM World ex-US | | | | | | | | | | | | | | | | | | | | | | | | | |
| Fund - Institutional Shares | | | 4,766,673 | | | 2,212,430 | | | 2,513,929 | | | 4,465,174 | | | | 39,918,653 | | | | 525,864 | | | | (298,519 | ) |
| | | | | | | | | | | | | | | | $ | 129,913,856 | | | $ | 1,988,835 | | | $ | 4,598,743 | |
| Tactical UnconstrainedSM Asset Allocation Fund | | | | | | | | | | | | | | | | | | | | | | | | | |
| GuideMarkSM Core Fixed | | | | | | | | | | | | | | | | | | | | | | | | | |
| Income Fund - Institutional | | | | | | | | | | | | | | | | | | | | | | | | | |
| Shares | | | 156,438 | | | 1,349,044 | | | 500,325 | | | 1,005,157 | | | $ | 9,418,323 | | | $ | 109,010 | | | $ | 44,048 | |
| GuideMarkSM Large Cap | | | | | | | | | | | | | | | | | | | | | | | | | |
| Growth Fund - Institutional | | | | | | | | | | | | | | | | | | | | | | | | | |
| Shares | | | 977,647 | | | 344,091 | | | 378,003 | | | 943,735 | | | | 12,900,856 | | | | 81,762 | | | | 345,903 | |
| GuideMarkSM Large Cap Value | | | | | | | | | | | | | | | | | | | | | | | | | |
| Fund - Institutional Shares | | | 2,219,422 | | | 641,759 | | | 1,029,667 | | | 1,831,514 | | | | 21,483,661 | | | | 341,030 | | | | 1,262,587 | |
| GuideMarkSM Opportunistic | | | | | | | | | | | | | | | | | | | | | | | | | |
| Equity Fund - Institutional | | | | | | | | | | | | | | | | | | | | | | | | | |
| Shares | | | 2,106,155 | | | 651,790 | | | 956,408 | | | 1,801,537 | | | | 24,302,733 | | | | 205,793 | | | | 2,801,569 | |
| GuideMarkSM Opportunistic | | | | | | | | | | | | | | | | | | | | | | | | | |
| Fixed Income Fund - | | | | | | | | | | | | | | | | | | | | | | | | | |
| Institutional Shares | | | 1,353,926 | | | 1,115,718 | | | 467,286 | | | 2,002,358 | | | | 19,903,443 | | | | 438,072 | | | | (139,551 | ) |
| GuideMarkSM Small/Mid Cap | | | | | | | | | | | | | | | | | | | | | | | | | |
| Core Fund - Institutional | | | | | | | | | | | | | | | | | | | | | | | | | |
| Shares | | | 997,005 | | | 231,675 | | | 783,918 | | | 444,762 | | | | 7,458,665 | | | | 3,472 | | | | 3,024,139 | |
| GuideMarkSM World ex-US | | | | | | | | | | | | | | | | | | | | | | | | | |
| Fund - Institutional Shares | | | 888,234 | | | 2,838,006 | | | 409,691 | | | 3,316,549 | | | | 29,649,951 | | | | 193,831 | | | | (22,000 | ) |
| | | | | | | | | | | | | | | | $ | 125,117,632 | | | $ | 1,372,970 | | | $ | 7,316,695 | |
| Absolute Return Asset Allocation Fund | | | | | | | | | | | | | | | | | | | | | | | | | |
| GuideMarkSM Core Fixed | | | | | | | | | | | | | | | | | | | | | | | | | |
| Income Fund - Institutional | | | | | | | | | | | | | | | | | | | | | | | | | |
| Shares | | | 5,060,797 | | | 4,778,613 | | | 8,343,490 | | | 1,495,920 | | | $ | 14,016,770 | | | $ | 494,478 | | | $ | (1,202,656 | ) |
| GuideMarkSM Large Cap Value | | | | | | | | | | | | | | | | | | | | | | | | | |
| Fund - Institutional Shares | | | 347,581 | | | 373,412 | | | 267,929 | | | 453,064 | | | | 5,314,443 | | | | 86,151 | | | | 130,408 | |
| GuideMarkSM Opportunistic | | | | | | | | | | | | | | | | | | | | | | | | | |
| Fixed Income Fund - | | | | | | | | | | | | | | | | | | | | | | | | | |
| Institutional Shares | | | 3,862,066 | | | 602,628 | | | 3,774,249 | | | 690,445 | | | | 6,863,025 | | | | 956,803 | | | | 594,411 | |
| GuideMarkSM World ex-US | | | | | | | | | | | | | | | | | | | | | | | | | |
| Fund - Institutional Shares | | | — | | | 713,953 | | | 201,543 | | | 512,410 | | | | 4,580,945 | | | | 49,118 | | | | 55,920 | |
| | | | | | | | | | | | | | | | $ | 30,775,183 | | | $ | 1,586,550 | | | $ | (421,917 | ) |
GuideMarkSM Funds & GuidePathSM Funds
NOTES TO FINANCIAL STATEMENTS (Continued)
March 31, 2014
| | | Share Activity | | | Year Ended March 31, 2014 | |
| Security Name | | Balance
March 31, 2013 | | Purchases | | Sales | | Balance
March 31, 2014 | | | Fair
Value | | | Dividends
Credited to
Income | | | Amount of Gain
(Loss) realized on
Sale of Shares | |
| Multi-Asset Income Asset Allocation Fund | | | | | | | | | | | | | |
| GuideMarkSM Core Fixed | | | | | | | | | | | | | | | | | | | | | | | | | |
| Income Fund - Institutional | | | | | | | | | | | | | | | | | | | | | | | | | |
| Shares | | | 252,360 | | | 90,750 | | | 343,110 | | | — | | | $ | — | | | $ | 17,859 | | | $ | (147,842 | ) |
| GuideMarkSM Opportunistic | | | | | | | | | | | | | | | | | | | | | | | | | |
| Fixed Income Fund - | | | | | | | | | | | | | | | | | | | | | | | | | |
| Institutional Shares | | | — | | | 49,809 | | | 49,809 | | | — | | | | — | | | | 12,354 | | | | (26,043 | ) |
| GuideMarkSM World ex-US | | | | | | | | | | | | | | | | | | | | | | | | | |
| Fund - Institutional Shares | | | 259,325 | | | 130,152 | | | 217,070 | | | 172,407 | | | | 1,541,323 | | | | 18,623 | | | | 82,973 | |
| | | | | | | | | | | | | | | | $ | 1,541,323 | | | $ | 48,836 | | | $ | (90,912 | ) |
| Fixed Income Allocation Fund | | | | | | | | | | | | | | | | | | | | | | | | | |
| GuideMarkSM Core Fixed | | | | | | | | | | | | | | | | | | | | | | | | | |
| Income Fund - Institutional | | | | | | | | | | | | | | | | | | | | | | | | | |
| Shares | | | 5,630,992 | | | 2,214,198 | | | 2,630,377 | | | 5,214,813 | | | $ | 48,862,801 | | | $ | 1,033,570 | | | $ | (1,073,395 | ) |
| GuideMarkSM Opportunistic | | | | | | | | | | | | | | | | | | | | | | | | | |
| Fixed Income Fund - | | | | | | | | | | | | | | | | | | | | | | | | | |
| Institutional Shares | | | 1,599,071 | | | 1,874,246 | | | 753,199 | | | 2,720,118 | | | | 27,037,975 | | | | 672,074 | | | | (308,291 | ) |
| | | | | | | | | | | | | | | | $ | 75,900,776 | | | $ | 1,705,644 | | | $ | (1,381,686 | ) |
| Altegris® Diversified Alternatives Allocation Fund | | | | | | | | | | | | | | | | | | | | | | | | | |
| Altegris® Equity Long Short | | | | | | | | | | | | | | | | | | | | | | | | | |
| Fund - Institutional Shares | | | 6,441,197 | | | 1,059,969 | | | 2,448,889 | | | 5,052,277 | | | $ | 54,362,498 | | | $ | 3,539,502 | | | $ | 495,495 | |
| Altegris® Fixed Income Long | | | | | | | | | | | | | | | | | | | | | | | | | |
| Short Fund - Institutional | | | | | | | | | | | | | | | | | | | | | | | | | |
| Shares | | | 1,097,163 | | | 3,695,927 | | | 1,148,809 | | | 3,644,281 | | | | 38,447,164 | | | | 566,742 | | | | (13,812 | ) |
| Altegris® Futures Evolution | | | | | | | | | | | | | | | | | | | | | | | | | |
| Strategy Fund - Institutional | | | | | | | | | | | | | | | | | | | | | | | | | |
| Shares | | | 1,391,288 | | | 272,004 | | | 677,734 | | | 985,558 | | | | 9,658,469 | | | | 177,924 | | | | (329,547 | ) |
| Altegris® Macro Strategy Fund - | | | | | | | | | | | | | | | | | | | | | | | | | |
| Institutional Shares | | | 3,557,734 | | | 622,359 | | | 1,901,665 | | | 2,278,428 | | | | 18,295,775 | | | | — | | | | (2,732,593 | ) |
| Altegris® Managed Futures | | | | | | | | | | | | | | | | | | | | | | | | | |
| Strategy Fund - Institutional | | | | | | | | | | | | | | | | | | | | | | | | | |
| Shares | | | 1,449,997 | | | 303,217 | | | 1,042,260 | | | 710,954 | | | | 6,277,720 | | | | — | | | | (1,000,482 | ) |
| GuideMarkSM Opportunistic | | | | | | | | | | | | | | | | | | | | | | | | | |
| Fixed Income Fund - | | | | | | | | | | | | | | | | | | | | | | | | | |
| Institutional Shares | | | 1,988,818 | | | 251,552 | | | 2,240,370 | | | — | | | | — | | | | 575,134 | | | | (340,949 | ) |
| | | | | | | | | | | | | | | | $ | 127,041,626 | | | $ | 4,859,302 | | | $ | (3,921,888 | ) |
GuideMarkSM Funds & GuidePathSM Funds
NOTES TO FINANCIAL STATEMENTS (Continued)
March 31, 2014
| 9. | Option Contracts Written |
| | |
| | There were no written option contracts held at any time during the year ended March 31, 2014. |
| | |
| 10. | Other Tax Information |
| | |
| | Net investment income and realized gains and losses for Federal income tax purposes may differ from that reported |
| | on the financial statements because of permanent book-to-tax differences. GAAP requires that permanent differences between financial reporting and tax reporting be reclassified between various components of net assets. |
| | These differences are primarily due to foreign currency, Passive Foreign Investment Companies, Partnerships and paydown reclassifications. On the Statement of Assets and Liabilities, the following adjustments were made: |
| | | Accumulated
Net
Investment
Income
or (Loss) | | | Accumulated
Realized
Gain or
(Loss) | | | Capital
Stock | |
| Large Cap Growth Fund | | $ | — | | | $ | — | | | $ | — | |
| Large Cap Value Fund | | | — | | | | — | | | | — | |
| Small/Mid Cap Core Fund | | | 201,411 | | | | (23,111 | ) | | | (178,300 | ) |
| World ex-US Fund | | | 91,568 | | | | (91,568 | ) | | | — | |
| Opportunistic Equity Fund | | | (30,503 | ) | | | 30,503 | | | | — | |
| Global Real Return Fund | | | 14,122 | | | | 890 | | | | (15,012 | ) |
| Core Fixed Income Fund | | | 6,937,848 | | | | (743,962 | ) | | | (6,193,886 | ) |
| Tax-Exempt Fixed Income Fund | | | — | | | | — | | | | — | |
| Opportunistic Fixed Income Fund | | | 1,665,024 | | | | (1,665,024 | ) | | | — | |
| Strategic Asset Allocation Fund | | | 71,381 | | | | (71,381 | ) | | | — | |
| Tactical ConstrainedSM Asset Allocation Fund | | | (6,997 | ) | | | 6,997 | | | | — | |
| Tactical UnconstrainedSM Asset Allocation Fund | | | (131,983 | ) | | | 131,983 | | | | — | |
| Absolute Return Asset Allocation Fund | | | (30,330 | ) | | | 31,778 | | | | (1,448 | ) |
| Multi-Asset Income Asset Allocation Fund | | | (64 | ) | | | 64 | | | | — | |
| Fixed Income Allocation Fund | | | (230 | ) | | | 230 | | | | — | |
| Altegris® Diversified Alternatives Allocation Fund | | | (20 | ) | | | 20 | | | | — | |
GuideMarkSM Funds & GuidePathSM Funds
NOTES TO FINANCIAL STATEMENTS (Continued)
March 31, 2014
The Funds intend to utilize capital loss carryforwards to offset future realized capital gains. Indefinite carryovers must be used first, resulting in a greater likelihood that pre-enactment losses may expire. Capital loss carryforwards available for Federal income tax purposes are as follows:
| | | Capital losses expiring: | |
| | | | | | | | Indefinite* | |
| | | 3/31/2017 | | 3/31/2018 | | 3/31/2019 | | Short Term | | | Long Term | |
| Large Cap Growth Fund | | $ | — | | $ | 39,442,053 | | $ | — | | $ | — | | | $ | — | |
| Large Cap Value Fund | | | 1,580,658 | | | 146,948,668 | | | — | | | — | | | | — | |
| Small/Mid Cap Core Fund | | | — | | | — | | | — | | | — | | | | — | |
| World ex-US Fund | | | 63,053,726 | | | 139,582,037 | | | — | | | 1,071,408 | | | | 4,218,522 | |
| Opportunistic Equity Fund | | | — | | | — | | | — | | | — | | | | — | |
| Global Real Return Fund | | | — | | | — | | | — | | | 2,481,719 | | | | 4,245,143 | |
| Core Fixed Income Fund | | | — | | | — | | | — | | | 2,005,368 | | | | — | |
| Tax-Exempt Fixed Income Fund | | | 1,973,444 | | | 2,354,785 | | | — | | | 120,481 | | | | — | |
| Opportunistic Fixed Income Fund | | | — | | | — | | | — | | | 2,236,131 | | | | 834,567 | |
| Strategic Asset Allocation Fund | | | — | | | — | | | — | | | — | | | | — | |
| Tactical Constrained Asset | | | | | | | | | | | | | | | | | |
| Allocation Fund | | | — | | | — | | | — | | | — | | | | — | |
| Tactical Unconstrained Asset | | | | | | | | | | | | | | | | | |
| Allocation Fund | | | — | | | — | | | — | | | — | | | | — | |
| Absolute Return Asset Allocation Fund | | | — | | | — | | | — | | | (5,378,126 | ) | | | (994,929 | ) |
| Multi-Asset Income Asset Allocation Fund | | | — | | | — | | | — | | | — | | | | — | |
| Fixed Income Allocation Fund | | | — | | | — | | | — | | | (1,521,565 | ) | | | (643,019 | ) |
| Altegris® Diversified Alternatives | | | | | | | | | | | | | | | | | |
| Allocation Fund | | | — | | | — | | | — | | | — | | | | (89,500 | ) |
| * | The Regulated Investment Company Modernization Act of 2010 (the “Act”) provides an unlimited carryforward period for newly generated capital losses and their character is retained as short-term or long-term losses. |
Additionally, at March 31, 2014, the Funds deferred on a tax basis post-October losses as follows:
| | | Ordinary Late Year Loss* | | | Capital Loss | |
| Large Cap Growth Fund | | $ | — | | | $ | — | |
| Large Cap Value Fund | | | — | | | | — | |
| Small/Mid Cap Core Fund | | | 88,635 | | | | — | |
| World ex-US Fund | | | — | | | | — | |
| Opportunistic Equity Fund | | | — | | | | — | |
| Global Real Return Fund | | | 130,898 | | | | 1,455,299 | |
| Core Fixed Income Fund | | | — | | | | — | |
| Tax-Exempt Fixed Income Fund | | | — | | | | — | |
| Opportunistic Fixed Income Fund | | | — | | | | 112,648 | |
| Strategic Asset Allocation Fund | | | — | | | | — | |
| Tactical ConstrainedSM Asset Allocation Fund | | | — | | | | — | |
| Tactical UnconstrainedSM Asset Allocation Fund | | | — | | | | — | |
| Absolute Return Asset Allocation Fund | | | — | | | | 463,310 | |
| Multi-Asset Income Asset Allocation Fund | | | — | | | | — | |
| Fixed Income Allocation Fund | | | — | | | | 277,216 | |
| Altegris® Diversified Alternatives Allocation Fund | | | — | | | | 3,069,800 | |
GuideMarkSM Funds & GuidePathSM Funds
NOTES TO FINANCIAL STATEMENTS (Continued)
March 31, 2014
The qualified late year ordinary loss is the excess of the sum of the specified losses attributable to the portion of the taxable year after October 31st, and the ordinary losses attributable to the portion of the taxable year after December 31st, over the sum of the specified gains attributable to the portion of the taxable year after October 31st, and other ordinary income attributable to the portion of the taxable year after December 31st.
The tax components of distributions paid during the fiscal years ended March 31, 2014 and March 31, 2013 are as follows:
| | | Year Ended March 31, 2014 | |
| | | Ordinary | | | Long-Term | | | | |
| | | Income | | | Capital Gain | | | Return of | |
| | | Distributions | | | Distributions | | | Capital | |
| Large Cap Growth Fund | | $ | 407,732 | | | $ | — | | | $ | — | |
| Large Cap Value Fund | | | 2,355,777 | | | | — | | | | — | |
| Small/Mid Cap Core Fund | | | — | | | | 23,111 | | | | — | |
| World ex-US Fund | | | 3,464,000 | | | | — | | | | — | |
| Opportunistic Equity Fund | | | 692,277 | | | | 6,381,694 | | | | — | |
| Global Real Return Fund | | | 601,351 | | | | — | | | | 15,012 | |
| Core Fixed Income Fund | | | 5,638,679 | | | | 1,135,333 | | | | 6,193,886 | |
| Tax-Exempt Fixed Income Fund* | | | 1,932,202 | | | | — | | | | — | |
| Opportunistic Fixed Income Fund | | | 7,025,818 | | | | 323,275 | | | | — | |
| Strategic Asset Allocation Fund | | | 3,262,576 | | | | 3,206,215 | | | | — | |
| Tactical ConstrainedSM Asset Allocation Fund | | | 2,608,371 | | | | 317,868 | | | | — | |
| Tactical UnconstrainedSM Asset Allocation Fund | | | 7,263,491 | | | | 377,506 | | | | — | |
| Absolute Return Asset Allocation Fund | | | 9,127,398 | | | | — | | | | — | |
| Multi-Asset Income Asset Allocation Fund | | | 3,768,827 | | | | 14,033 | | | | — | |
| Fixed Income Allocation Fund | | | 3,801,218 | | | | 396,609 | | | | — | |
| Altegris® Diversified Alternatives Allocation Fund | | | 4,140,786 | | | | — | | | | — | |
| | * Contains $1,880,729 of tax-exempt income for year ended 3/31/2014 and $2,218,936 of tax-exempt income for year ended 3/31/2013. |
GuideMarkSM Funds & GuidePathSM Funds
NOTES TO FINANCIAL STATEMENTS (Continued)
March 31, 2014
| | | Year Ended March 31, 2013 | |
| | | Ordinary | | | Long-Term | | | | |
| | | Income | | | Capital Gain | | | Return of | |
| | | Distributions | | | Distributions | | | Capital | |
| Large Cap Growth Fund | | $ | 482,854 | | | $ | — | | | $ | — | |
| Large Cap Value Fund | | | 2,814,237 | | | | — | | | | — | |
| Small/Mid Cap Core Fund | | | 467,565 | | | | — | | | | — | |
| World ex-US Fund | | | 2,085,558 | | | | — | | | | — | |
| Opportunistic Equity Fund | | | 586,285 | | | | — | | | | — | |
| Global Real Return Fund | | | 826,381 | | | | — | | | | 41,822 | |
| Core Fixed Income Fund | | | 9,154,978 | | | | 2,006,092 | | | | — | |
| Tax-Exempt Fixed Income Fund* | | | 2,255,871 | | | | — | | | | — | |
| Opportunistic Fixed Income Fund | | | 9,847,199 | | | | — | | | | — | |
| Strategic Asset Allocation Fund | | | 1,640,736 | | | | — | | | | — | |
| Tactical ConstrainedSM Asset Allocation Fund | | | 2,351,814 | | | | — | | | | — | |
| Tactical UnconstrainedSM Asset Allocation Fund | | | 3,618,847 | | | | — | | | | — | |
| Absolute Return Asset Allocation Fund | | | 6,299,046 | | | | 81,650 | | | | — | |
| Multi-Asset Income Asset Allocation Fund | | | 920,397 | | | | — | | | | — | |
| Fixed Income Allocation Fund | | | 1,764,920 | | | | — | | | | — | |
| Altegris® Diversified Alternatives Allocation Fund | | | 396,152 | | | | — | | | | — | |
* Contains $2,218,936 of tax-exempt income for year ended 3/31/2013 and $2,931,871 of tax-exempt income for year ended 3/31/2012.
GuideMarkSM Funds & GuidePathSM Funds
NOTES TO FINANCIAL STATEMENTS (Continued)
March 31, 2014
At March 31, 2014, the components of accumulated earnings (losses) on a tax basis were as follows:
| | | Large Cap | | | Large Cap | | | Small/Mid | | | World | | | Opportunistic | | | Global | |
| | | Growth | | | Value | | | Cap Core | | | ex-US | | | Equity | | | Real Return | |
| | | Fund | | | Fund | | | Fund | | | Fund | | | Fund | | | Fund | |
| Cost of Investments | | $ | 138,264,657 | | | $ | 148,517,455 | | | $ | 80,602,753 | | | $ | 319,718,742 | | | $ | 112,176,880 | | | $ | 108,889,026 | |
| Gross Unrealized Appreciation | | | 55,455,188 | | | | 66,412,411 | | | | 5,827,683 | | | | 60,588,240 | | | | 30,176,452 | | | | 3,930,895 | |
| Gross Unrealized Depreciation | | | (2,393,663 | ) | | | (3,085,494 | ) | | | (2,333,741 | ) | | | (10,614,919 | ) | | | (1,968,567 | ) | | | (6,244,079 | ) |
| Net Unrealized Appreciation/ (Depreciation) | | | 53,061,525 | | | | 63,326,917 | | | | 3,493,942 | | | | 49,973,321 | | | | 28,207,885 | | | | (2,313,184 | ) |
| Undistributed Tax-Exempt Ordinary Income | | | — | | | | — | | | | — | | | | — | | | | — | | | | — | |
| Undistributed Ordinary Income | | | 6,873 | | | | 544,756 | | | | — | | | | 3,642,094 | | | | 3,877,719 | | | | — | |
| Undistributed Long-Term Cap Gains | | | — | | | | — | | | | 3,877,650 | | | | — | | | | 8,991,216 | | | | — | |
| Total Distributable Earnings | | | 6,873 | | | | 544,756 | | | | 3,877,650 | | | | 3,642,094 | | | | 12,868,935 | | | | — | |
| Other Accumulated Gains/(Losses) | | | (39,442,053 | ) | | | (148,529,326 | ) | | | (88,635 | ) | | | (207,915,827 | ) | | | (111,377 | ) | | | (8,345,727 | ) |
| Total Accumulated Earnings/(Losses) | | | 13,626,345 | | | | (84,657,653 | ) | | | 7,282,957 | | | | (154,300,412 | ) | | | 40,965,443 | | | | (10,658,911 | ) |
The differences between book-basis and tax-basis unrealized appreciation and depreciation is primarily attributable to the tax deferral of losses on wash sales and other temporary differences.
GuideMarkSM Funds & GuidePathSM Funds
NOTES TO FINANCIAL STATEMENTS (Continued)
March 31, 2014
| | | | | | | | | | | | | | | Tactical | | | Tactical | |
| | | | | | | | | | | | Strategic | | | ConstrainedSM | | | UnconstrainedSM | |
| | | Core | | | Tax-Exempt | | | Opportunistic | | | Asset | | | Asset | | | Asset | |
| | | Fixed Income | | | Fixed Income | | | Fixed Income | | | Allocation | | | Allocation | | | Allocation | |
| | | Fund | | | Fund | | | Fund | | | Fund | | | Fund | | | Fund | |
| Cost of Investments | | $ | 335,865,551 | | | $ | 59,384,592 | | | $ | 209,181,468 | | | $ | 273,158,151 | | | $ | 184,479,554 | | | $ | 319,147,833 | |
| Gross Unrealized Appreciation | | | 6,154,709 | | | | 3,501,558 | | | | 8,192,162 | | | | 59,353,454 | | | | 38,813,715 | | | | 43,576,246 | |
| Gross Unrealized Depreciation | | | (3,849,865 | ) | | | (324,560 | ) | | | (8,093,627 | ) | | | (2,977,389 | ) | | | (2,690,548 | ) | | | (3,592,381 | ) |
| Net Unrealized Appreciation/ (Depreciation) | | | 2,304,844 | | | | 3,176,998 | | | | 98,535 | | | | 56,376,065 | | | | 36,123,167 | | | | 39,983,865 | |
| Undistributed Tax-Exempt Ordinary Income | | | — | | | | — | | | | — | | | | — | | | | — | | | | — | |
| Undistributed Ordinary Income | | | — | | | | 58,795 | | | | 1,611,143 | | | | 367,001 | | | | 46,260 | | | | — | |
| Undistributed Long-Term Cap Gains | | | — | | | | — | | | | — | | | | 722,308 | | | | 5,823,959 | | | | 6,171,642 | |
| Total Distributable Earnings | | | — | | | | 58,795 | | | | 1,611,143 | | | | 1,089,309 | | | | 5,870,219 | | | | 6,171,642 | |
| Other Accumulated Gains/(Losses) | | | (2,007,310 | ) | | | (4,448,710 | ) | | | (3,786,399 | ) | | | (28,587 | ) | | | (28,587 | ) | | | (28,587 | ) |
| Total Accumulated Earnings/(Losses) | | | 297,534 | | | | (1,212,917 | ) | | | (2,076,721 | ) | | | 57,436,787 | | | | 41,964,799 | | | | 46,126,920 | |
The differences between book-basis and tax-basis unrealized appreciation and depreciation is primarily attributable to the tax deferral of losses on wash sales and other temporary differences.
GuideMarkSM Funds & GuidePathSM Funds
NOTES TO FINANCIAL STATEMENTS (Continued)
March 31, 2014
| | | Absolute | | | | | | | | | Altegris® | |
| | | Return | | | Multi-Asset | | | | | | Diversified | |
| | | Asset | | | Income Asset | | | Fixed Income | | | Alternatives | |
| | | Allocation | | | Allocation | | | Allocation | | | Allocation | |
| | | Fund | | | Fund | | | Fund | | | Fund | |
| Cost of Investments | | $ | 538,697,463 | | | $ | 144,250,415 | | | $ | 251,723,740 | | | $ | 128,329,138 | |
| Gross Unrealized Appreciation | | | 10,318,094 | | | | 5,911,442 | | | | 1,131,761 | | | | 5,347,307 | |
| Gross Unrealized Depreciation | | | (5,072,337 | ) | | | (1,348,624 | ) | | | (7,339,307 | ) | | | (4,169,640 | ) |
| Net Unrealized Appreciation/ (Depreciation) | | | 5,245,757 | | | | 4,562,818 | | | | (6,207,546 | ) | | | 1,177,667 | |
| Undistributed Tax-Exempt Ordinary Income | | | — | | | | — | | | | — | | | | — | |
| Undistributed Ordinary Income | | | 1,211,877 | | | | 430,235 | | | | 221,674 | | | | 25,117 | |
| Undistributed Long-Term Cap Gains | | | — | | | | 306,491 | | | | — | | | | — | |
| Total Distributable Earnings | | | 1,211,877 | | | | 736,726 | | | | 221,674 | | | | 25,117 | |
| Other Accumulated Gains/(Losses) | | | (6,864,952 | ) | | | — | | | | (2,441,800 | ) | | | (3,159,300 | ) |
| Total Accumulated Earnings/(Losses) | | | (407,318 | ) | | | 5,299,544 | | | | (8,427,672 | ) | | | (1,956,516 | ) |
The differences between book-basis and tax-basis unrealized appreciation and depreciation is primarily attributable to the tax deferral of losses on wash sales and other temporary differences.
GuideMarkSM Funds & GuidePathSM Funds
REPORT OF INDEPENDENT REGISTERED PUBLIC ACCOUNTING FIRM
To the Shareholders and Board of Trustees of GPS Funds I and GPS Funds II
We have audited the accompanying statements of assets and liabilities, including the schedules of investments, of GPS Funds I and GPS Funds II comprising GuideMark Large Cap Growth Fund, GuideMark Large Cap Value Fund, GuideMark Small/Mid Cap Core Fund, GuideMark World ex-US Fund, GuideMark Opportunistic Equity Fund, GuideMark Global Real Return Fund, GuideMark Core Fixed Income Fund, GuideMark Tax-Exempt Fixed Income Fund, GuideMark Opportunistic Fixed Income Fund, GuidePath Strategic Asset Allocation Fund, GuidePath Tactical Constrained Asset Allocation Fund, GuidePath Tactical Unconstrained Asset Allocation Fund, GuidePath Absolute Return Asset Allocation Fund, GuidePath Multi-Asset Income Asset Allocation Fund, GuidePath Fixed Income Allocation Fund, and GuidePath Altegris Diversified Alternatives Allocation Fund (the “Funds”) as of March 31, 2014, and the related statements of operations for the year then ended, the statements of changes in net assets for the year then ended, and the financial highlights for the year then ended. These financial statements and financial highlights are the responsibility of the Funds’ management. Our responsibility is to express an opinion on these financial statements and financial highlights based on our audits. The statements of changes in net assets and financial highlights for the periods ended prior to March 31, 2014, were audited by other auditors whose report dated May 30, 2013, expressed an unqualified opinion on those statements and highlights.
We conducted our audits in accordance with the standards of the Public Company Accounting Oversight Board (United States). Those standards require that we plan and perform the audit to obtain reasonable assurance about whether the financial statements and financial highlights are free of material misstatement. An audit includes examining, on a test basis, evidence supporting the amounts and disclosures in the financial statements. Our procedures included confirmation of securities owned as of March 31, 2014, by correspondence with the custodians and brokers, or by other appropriate auditing procedures where replies from brokers or counterparties were not received. An audit also includes assessing the accounting principles used and significant estimates made by management, as well as evaluating the overall financial statement presentation. We believe that our audit provides a reasonable basis for our opinion.
In our opinion, the financial statements and financial highlights referred to above present fairly, in all material respects, the financial position of each of the Funds constituting GPS Funds I and GPS Funds II as of March 31, 2014, the results of their operations, the changes in their net assets, and the financial highlights for the year then ended, in conformity with accounting principles generally accepted in the United States of America.
COHEN FUND AUDIT SERVICES, LTD.
Cleveland, Ohio
May 29, 2014
GuideMarkSM Funds & GuidePathSM Funds
ADDITIONAL INFORMATION
March 31, 2014
Additional Information
| 1. | Section 19(a) Notice (Unaudited) |
| | The GuideMarkSM Core Fixed Income Fund’s (the “Fund”) previous estimate of the sources from which its distributions of $0.21757961 per share for Service Shares and $0.23071982 per share for Institutional Shares, which were paid on March 20, 2014, have been revised to reflect that $0.03499902 and $0.04813923 of such amounts represented a distribution of net investment income for Service Shares and Institutional Shares, respectively; and for each class, $0.18258059 of such amounts represented a return of capital. |
| | |
| | The Fund estimates that it has distributed more than the amount of earned income and net realized gains; therefore, a portion of the distribution may be a return of capital. A return of capital may occur, for example, when some or all of the shareholder’s investment in the Fund is returned to the shareholder. A return of capital does not necessarily reflect the Fund’s investment performance and should not be confused with yield or income. The amounts and sources of distributions provided are estimates and are not being provided for tax reporting purposes. The actual amounts and sources for tax reporting purposes will depend upon the Fund’s investment experience during the year and may be subject to change. The Fund will send a Form 1099-DIV for the calendar year that will explain the character of the distribution for federal income tax purposes. |
| | |
| 2. | Shareholder Notification of Federal Tax Status (Unaudited) |
| | The Funds designated the following percentages of dividends during the fiscal year 2014 as dividends qualifying for the dividends received deduction available to corporate shareholders and as dividends from net investment income that are qualifying income under the Jobs and Growth Tax Relief Reconciliation Act of 2003, respectively: |
| | | Dividends received
deduction % for
corporate shareholders | | % of dividends as
qualified income | |
| Large Cap Growth Fund | | 100.00 | % | | 100.00 | % | |
| Large Cap Value Fund | | 100.00 | % | | 100.00 | % | |
| Small/Mid Cap Core Fund | | 0.00 | % | | 0.00 | % | |
| World ex-US Fund | | 0.00 | % | | 100.00 | % | |
| Opportunistic Equity Fund | | 100.00 | % | | 100.00 | % | |
| Global Real Return Fund | | 35.88 | % | | 100.00 | % | |
| Core Fixed Income Fund | | 0.00 | % | | 0.00 | % | |
| Tax-Exempt Fixed Income Fund | | 0.00 | % | | 0.00 | % | |
| Opportunistic Fixed Income Fund | | 4.74 | % | | 3.62 | % | |
| Strategic Asset Allocation Fund | | 29.70 | % | | 85.41 | % | |
| Tactical ConstrainedSM Asset Allocation Fund | | 74.87 | % | | 95.02 | % | |
| Tactical UnconstrainedSM Asset Allocation Fund | | 25.33 | % | | 40.08 | % | |
| Absolute Return Asset Allocation Fund | | 6.97 | % | | 12.80 | % | |
| Multi-Asset Income Asset Allocation Fund | | 6.21 | % | | 31.43 | % | |
| Fixed Income Allocation Fund | | 1.10 | % | | 0.96 | % | |
| Altegris® Diversified Alternatives Allocation Fund | | 0.72 | % | | 0.60 | % | |
GuideMarkSM Funds & GuidePathSM Funds
ADDITIONAL INFORMATION (Continued)
March 31, 2014
| 3. | Foreign Tax Credit Pass Through (Unaudited) |
| | Pursuant to Section 853 of the Internal Revenue Code, the GuideMarkSM World ex-US Fund designates the following amount as foreign taxes paid for the year ended March 31, 2014. Foreign taxes paid for purposes of Section 853 may be less than actual foreign taxes paid for financial statement purposes. |
| | | Creditable Foreign
Taxes Paid | | Per Share
Amount | | Portion of Ordinary Income Distribution
Derived from Foreign Sourced Income* | |
| World ex-US Fund | | $ | 659,347 | | | $ | 0.0159 | | | 99.40% | |
| Strategic Asset Allocation Fund | | | 85,846 | | | | 0.0034 | | | 2.91% | |
Tactical ConstrainedSM
Asset Allocation Fund | | | 88,591 | | | | 0.0051 | | | 5.37% | |
Tactical UnconstrainedSM
Asset Allocation Fund | | | 32,654 | | | | 0.0009 | | | 0.59% | |
Absolute Return
Asset Allocation Fund | | | 8,275 | | | | 0.0002 | | | 0.12% | |
Multi-Asset Income
Asset Allocation Fund | | | 3,137 | | | | 0.0003 | | | 0.10% | |
| * | The Funds listed above did not derive any income from “ineligible foreign sources” as defined under Section 901(j) of the Internal Revenue Code. |
| | Foreign taxes paid or withheld should be included in taxable income with an offsetting deduction from gross income or as a credit for taxes paid to foreign governments. |
| | |
| | Above figures may differ from those cited elsewhere in this report due to differences in the calculation of income and gains under U.S. generally accepted accounting principles (book) purposes and Internal Revenue Service (tax) purposes. |
| | |
| | Shareholders are strongly advised to consult their own tax advisers with respect to the tax consequences of their investments in the Funds. In January, shareholders, excluding corporate shareholders, receive an IRS 1099-DIV regarding the Federal tax status of the dividends and distributions they received in the calendar year. |
GuideMarkSM Funds & GuidePathSM Funds
ADDITIONAL INFORMATION (Continued)
March 31, 2014
| 4. | Disclosure Regarding Fund Trustees and Officers (Unaudited) |
Name, Address
and Year of Birth | | Position(s)
Held with
the Trusts | | Term of Office
and Length of
Time Served | | Principal
Occupation During Past Five Years | | # of
Portfolios
in Fund
Complex
Overseen
by Trustee | | Other
Director/
Trustee
Positions |
| | | | | | | | | | | |
| GPS Funds I and GPS Funds II | | | | | | | | |
| | | | | | | | | | | |
| Independent Trustees | | | | | | | | |
| | | | | | | | | | | |
David M. Dunford
Year of Birth: 1949
c/o AssetMark, Inc.
1655 Grant Street
10th Floor
Concord, CA 94520 | | Independent Trustee | | Indefinite Term (since 2013 for GPS Funds I and since 2011 for GPS Funds II). | | Retired; formerly, Senior Vice President, Merrill Lynch Insurance Group (1989-2001). | | 16 | | Director, New England Bancorp (2006-present); Trustee, Genworth Variable Insurance Trust (“GVIT”) (2008-2012); Director, Hospice and Palliative Care of Cape Cod (2006-2011). |
| | | | | | | | | | | |
Paul S. Feinberg
Year of Birth: 1942
c/o AssetMark, Inc.
1655 Grant Street
10th Floor
Concord, CA 94520 | | Independent Trustee | | Indefinite Term (since 2013 for GPS Funds I and since 2011 for GPS Funds II). | | Retired; formerly, President, CitiStreet Funds, Inc. (2000-2005); Executive Vice President and General Counsel, CitiStreet Associates LLC (insurance agency), CitiStreet Equities LLC (broker-dealer), CitiStreet Financial Services LLC (registered investment advisor) and CitiStreet Funds Management LLC (registered investment advisor) (1990-2005) | | 16 | | Trustee, GVIT (2008-2012); Trustee, Blue Fund Group (2006- 2008). |
| | | | | | | | | | | |
Dennis G. Schmal
Year of Birth: 1947
c/o AssetMark, Inc.
1655 Grant Street
10th Floor
Concord, CA 94520 | | Independent Trustee | | Indefinite Term (since 2007 for GPS Funds I and since 2013 for GPS Funds II). | | Self-employed consultant (1999-present); formerly, Partner, Arthur Andersen LLP (audit services) (1972-1999). | | 16 | | Director, Sitoa Global Inc. (2011-present); Director, Wells Fargo ASGI Hedge Funds (closed-end hedge funds) (2008-present); Director/Chairman, Pacific Metrics Corp. (educational services) (2005-present); Director, Merriman Holdings, Inc. (financial services) (2003-present); Director, Grail Advisors ETF Trust (2009-2011); Director, Varian Semiconductor Equipment Associates, Inc. (2004-2011); Director, North Bay Bancorp (2006-2007). |
GuideMarkSM Funds & GuidePathSM Funds
ADDITIONAL INFORMATION (Continued)
March 31, 2014
Name, Address
and Year of Birth | | Position(s)
Held with
the Trusts | | Term of Office
and Length of
Time Served | | Principal
Occupation During Past Five Years | | # of
Portfolios
in Fund
Complex
Overseen
by Trustee | | Other
Director/
Trustee
Positions |
| | | | | | | | | | | |
| Interested Trustee | | | | | | | | |
| | | | | | | | | | | |
Carrie E. Hansen*
Year of Birth: 1970
AssetMark, Inc.
1655 Grant Street
10th Floor
Concord, CA 94520 | | Interested Trustee and Chairman
President | | Indefinite Term since 2014
Renewed 1-Year Term since 2007 | | President, GPS Funds I (2007 to present) and GPS Funds II (2011 to present); President, Contra Fund (2008 to present); and President, GVIT (2008 to 2012); Executive Vice President and Chief Operations Officer, AssetMark (2008 to present); President, AssetMark Brokerage, LLC (2013 to present). | | 17 | | Director, Lamorinda Soccer Club (2011 to 2013), Chairman, AssetMark Trust Co. (2008 to present). |
Name, Address
and Year of Birth | | Position(s)
Held with
the Trusts | | Term of Office
and Length of
Time Served | | Principal Occupation During Past Five Years |
| | | | | | | |
| Officers of the Trusts** | | | | |
| | | | | | | |
John Koval
Year of Birth: 1966
AssetMark, Inc.
1655 Grant Street
10th Floor
Concord, CA 94520 | | Chief Compliance Officer and AML Compliance Officer | | Renewed 1-Year Term since January 2013 | | Chief Compliance Officer, GPS Funds I, GPS Funds II, and Contra Fund (2013-present); Interim Chief Compliance Officer, GPS Funds I, GPS Funds II, and Contra Fund (September 2012-January 2013); Senior Compliance Officer, AssetMark (2011-2012); Chief Operating Officer, SEAL Capital, Inc. (2009-2010); Chief Compliance Officer, Cliffwood Partners LLC (2004-2009). |
| | | | | | | |
Patrick R. Young
Year of Birth: 1982
AssetMark, Inc.
1655 Grant Street
10th Floor
Concord, CA 94520 | | Treasurer | | Renewed 1-Year Term since 2014 | | Treasurer, GPS Funds I, GPS Funds II and Contra Fund (May 2014-present); Manager of Fund Administration, AssetMark (May 2014-present); Senior Fund Administration Officer, AssetMark (2008-present). |
| | | | | | | |
Christine Villas-Chernak
Year of Birth: 1968
AssetMark, Inc.
1655 Grant Street
10th Floor
Concord, CA 94520 | | Deputy Chief
Compliance Officer
Secretary | | Since 2009
Renewed 1-Year Term since 2014 | | Secretary, GPS Funds I (2006 to 2013 and May 2014 to present), GPS Funds II (2011 to 2013 and May 2014 to-present), Contra Fund (2009 to 2010 and May 2014 to present) and GVIT (2008 to 2010); Deputy Chief Compliance Officer, GPS Funds I (2009 to present), GPS Funds II (2011 to present) and GVIT (2009 to 2012); Senior Compliance Officer, AssetMark (2005-2009). |
| * | Ms. Hansen is a Trustee who is an “interested person” of the Trust as defined in the 1940 Act because she is an officer of AssetMark or certain of its affiliates. |
| | |
| ** | Each Officer of the Trust serves at the pleasure of the Board. |
The Statement of Additional Information includes additional information about the Funds’ Trustees and is available free of charge upon request by calling the Funds toll free at (888) 278-5809.
| 5. | Proxy Voting Policies and Procedures and Proxy Voting Record (Unaudited) |
| | A description of the policies and procedures that the Funds use to determine how to vote proxies related to the Funds’ portfolio securities as well as information regarding how the Funds voted proxies relating to portfolio securities during the most recent |
GuideMarkSM Funds & GuidePathSM Funds
ADDITIONAL INFORMATION (Continued)
March 31, 2014
| | 12-month period ended June 30 is available without charge, upon request, by calling (888) 278-5809. Furthermore, you can obtain the Fund’s proxy voting records on the SEC’s website at http://www.sec.gov. |
| | |
| 6. | Availability of Quarterly Portfolio Holdings Schedules (Unaudited) |
| | The Funds file their complete schedules of portfolio holdings with the SEC for their first and third fiscal quarters on Form N-Q. Once filed, the Funds’ Form N-Q is available without charge, upon request on the SEC’s website (http://www.sec.gov) and is available by calling (888) 278-5809. You can also obtain copies of Form N-Q by (i) visiting the SEC’s Public Reference Room in Washington, D.C. (information on the operation of the Public Reference Room may be obtained by calling 1-800-SEC-0330); (ii) sending your request and a duplicating fee to the SEC’s Public Reference Room, Washington, D.C. 20549-0102; or (iii) sending your request electronically to publicinfo@sec.gov. |
| | |
| 7. | Change in Independent Registered Public Accounting Firm (Unaudited) |
| | KPMG LLP was previously the principal accountants for GPS Funds I and GPS Funds II. On January 17, 2014, that firm resigned and Cohen Fund Audit Services, LTD was engaged as principal accountants. The decision to change accountants was approved by the audit committee of the board of trustees. |
| | |
| | During the two fiscal years ended March 31, 2013, and the subsequent interim period through January 17, 2014, there were no: (1) disagreements with KPMG LLP on any matter of accounting principles or practices, financial statement disclosure or auditing scope or procedures, which disagreements if not resolved to their satisfaction would have caused them to make reference in connection with their opinion to the subject matter of the disagreement, or (2) reportable events. |
| | |
| | The audit reports of KPMG LLP on the financial statements of GPS Funds I and GPS Funds II as of and for the years ended March 31, 2013 and March 31, 2012 did not contain any adverse opinion or disclaimer of opinion, nor were they qualified or modified as to uncertainty, audit scope or accounting principles. |
| | |
| 8. | Statement Regarding the Basis for Approval of Investment Sub-Advisory Agreement (Unaudited) |
| | |
| | Consideration and Approval of a New Sub-Advisory Agreement with Wellington Management |
| | |
| | At the meeting of the Board of the Trust on December 18, 2013, the Board approved a new sub-advisory agreement (the “Wellington Sub-Advisory Agreement”) between Wellington Management Company, LLP (“Wellington Management”) and AssetMark, on behalf of the GuideMarkSM Small/Mid Cap Core Fund. |
| | |
| | As noted above, the GuideMarkSM Small/Mid Cap Core Fund is managed using a “manager-of-managers” structure that generally involves the use of one or more sub-advisors to manage allocated portions of the Fund’s portfolio. Under this structure, AssetMark is responsible for evaluating and selecting sub-advisors on an ongoing basis and making any decisions to recommend hiring, retaining, or replacing sub-advisors. The Board is engaged in monitoring this process in connection with its meetings held throughout the year and, under the manager-of-managers structure, all parties understand that sub-advisors are being monitored and evaluated, and are subject to replacement, at all times. |
| | |
| | The Board — including a majority of the independent Trustees — determined to approve the Wellington Sub-Advisory Agreement. The material factors considered and the conclusions that formed the basis of the Board’s approval of the agreement are described below. This summary describes the most significant, but not all, of the factors evaluated by the Board. In preparation for their meeting, the Trustees requested, received, and reviewed information relevant to their consideration of the Wellington Sub-Advisory Agreement. The Trustees also received assistance and advice regarding legal and industry standards from independent counsel to the independent Trustees. In deciding to approve the agreement, the Board did not identify any particular information or any single factor or conclusion that was controlling. |
GuideMarkSM Funds & GuidePathSM Funds
NOTES TO FINANCIAL STATEMENTS (Continued)
March 31, 2014
| | Materials Reviewed and the Review Process |
| | |
| | The Trustees, including the independent Trustees, considered various materials requested by counsel on behalf of the independent Trustees related to the Wellington Sub-Advisory Agreement, including (1) a copy of the proposed form of sub-advisory agreement between Wellington Management and AssetMark, on behalf of the Fund; (2) Wellington Management’s responses to AssetMark’s due diligence questionnaire, including information on Wellington Management’s investment process; (3) Wellington Management’s Form ADV disclosures; (4) a description of AssetMark’s selection and recommendation process with respect to Wellington Management, and the reasons for such recommendation; (5) information describing the nature, quality and extent of services that Wellington Management would provide to the Fund, and the proposed sub-advisory fee payable to Wellington Management; (6) information concerning Wellington Management’s business and operations, investment team, compliance program and internal procedures, including biographical information for the investment professionals that would be responsible for the day-to-day management of Wellington Management’s allocated portion of the Fund’s portfolio; and (7) information regarding the financial condition of Wellington Management. The Trustees also considered the recommendations of AssetMark with respect to Wellington Management and the methods and resources AssetMark utilizes in its efforts to identify and engage sub-advisors for the Funds. |
| | |
| | Factors Considered |
| | |
| | In considering the Wellington Sub-Advisory Agreement, the Trustees considered the following factors, to the extent they were applicable: (1) the nature, quality and extent of the services to be provided by Wellington Management; (2) the investment performance of Wellington Management; (3) the costs of the services to be provided and profits to be realized by Wellington Management and its affiliates from the relationship with the Fund, including any “fall-out” benefits; (4) the extent to which economies of scale would be realized as the Fund grows; and (5) whether fee levels reflect those economies of scale for the benefit of Fund investors. |
| | |
| | The independent Trustees were assisted by independent counsel throughout the review process. The independent Trustees relied upon the advice of independent counsel and their own business judgment in determining the material factors to be considered in evaluating the Wellington Sub-Advisory Agreement and the weight to be given to each such factor. The conclusions reached by the independent Trustees were based on a comprehensive evaluation of all of the information provided and were not the result of any one factor. Moreover, each independent Trustee may have afforded different weight to the various factors in reaching his conclusions with respect to the Wellington Sub-Advisory Agreement. |
| | |
| | Nature, Quality and Extent of Services |
| | |
| | The Trustees considered the nature, quality and extent of services that Wellington Management would provide to the Fund. The Trustees discussed the specific investment process to be employed by Wellington Management in managing the Fund, the qualifications of Wellington Management’s portfolio management team with regard to implementing the Fund’s investment mandate and Wellington Management’s performance record as compared to a relevant benchmark. The Trustees considered Wellington Management’s organization, personnel and operations. The Trustees also considered AssetMark’s review and selection process with respect to Wellington Management and AssetMark’s favorable assessment as to the nature and quality of the sub-advisory services expected to be provided by Wellington Management. |
| | |
| | Based on their consideration and review of the foregoing factors, the Trustees concluded that the nature, quality and extent of the sub-advisory services to be provided by Wellington Management, as well as Wellington Management’s ability to render such services based on its experience, organization and resources, were appropriate for the Fund in light of the Fund’s investment objective, policies and strategies. |
GuideMarkSM Funds & GuidePathSM Funds
NOTES TO FINANCIAL STATEMENTS (Continued)
March 31, 2014
| | Sub-Advisory Fees |
| | |
| | The Trustees considered the compensation to be paid to Wellington Management by AssetMark in conjunction with the services that would be rendered to the Fund. The Trustees also considered comparisons of the fees to be paid by AssetMark to Wellington Management with fees charged by Wellington Management to its other clients. In addition, the Trustees considered the recommendation of AssetMark with respect to Wellington Management and AssetMark’s representation that the fees to be paid to each sub-advisor were the result of an arms-length negotiation. The Trustees considered that the sub-advisory fees would be paid by AssetMark to Wellington Management and would not be additional fees borne by the Fund. The Trustees concluded that, in light of the quality and extent of the services to be provided, the proposed fees to be paid to Wellington Management were reasonable. |
| | |
| | The Trustees also considered “fall-out” or ancillary benefits that may potentially accrue to Wellington Management or its affiliates in the future because of its relationship with the Fund. The Trustees concluded that the benefits that might accrue to Wellington Management or its affiliates were reasonable. |
| | |
| | Investment Performance |
| | |
| | Because Wellington Management had not commenced providing sub-advisory services to the Fund at the time of the Trustees’ consideration of the Wellington Sub-Advisory Agreement, the Trustees could not consider Wellington Management’s investment performance with respect to its management of the Fund as a factor in evaluating the Wellington Sub-Advisory Agreement. However, the Trustees did consider Wellington Management’s historical performance record in managing other funds and accounts, and the Trustees also considered Wellington Management’s historical performance records compared to a relevant benchmark. |
| | |
| | The Trustees concluded that the historical performance record for Wellington Management, viewed together with the other relevant factors considered by the Trustees, supported a decision to approve the Wellington Sub-Advisory Agreement. |
| | |
| | Profitability and Economies of Scale |
| | |
| | The Trustees did not consider the profitability of Wellington Management to be a material factor based on representations from AssetMark that it negotiated the Wellington Sub-Advisory Agreement, including the sub-advisory fees, with Wellington Management on an arm’s-length basis. |
| | |
| | The Trustees concluded that it was appropriate to revisit the potential for economies of scale in connection with future annual reviews of the Wellington Sub-Advisory Agreement. |
| | |
| | Conclusion |
| | |
| | After consideration of the foregoing factors, and such other matters as were deemed relevant, and with no single factor being determinative to their decision, the Trustees — including a majority of the independent Trustees — with the assistance of independent counsel concluded to approve the Wellington Sub-Advisory Agreement, including the fees payable thereunder, with Wellington Management for the Fund. |
GuideMarkSM Funds
GuidePathSM Funds
| |
| GuideMarkSM Funds & GuidePathSM Funds |
| |
| | | |
GuideMarkSM Large Cap Growth Fund
GuideMarkSM Large Cap Value Fund
GuideMarkSM Small/Mid Cap Core Fund
GuideMarkSM World ex-US Fund
GuideMarkSM Opportunistic Equity Fund
GuideMarkSM Global Real Return Fund
GuideMarkSM Core Fixed Income Fund
GuideMarkSM Tax-Exempt Fixed Income Fund
GuideMarkSM Opportunistic Fixed Income Fund
GuidePathSM Strategic Asset Allocation Fund
GuidePathSM Tactical ConstrainedSM Asset Allocation Fund
GuidePathSM Tactical UnconstrainedSM Asset Allocation Fund
GuidePathSM Absolute Return Asset Allocation Fund
GuidePathSM Multi-Asset Income Asset Allocation Fund
GuidePathSM Fixed Income Allocation Fund
GuidePathSM Altegris® Diversified Alternatives Allocation Fund
Investment Advisor AssetMark, Inc. 1655 Grant Street, 10th Floor
Concord, CA 94520 Legal Counsel | |
Stradley Ronon Stevens & Young, LLP
2005 Market Street, Suite 2600
Philadelphia, PA 19103 Independent Registered Public Accounting Firm Cohen Fund Audit Services, Ltd.
1350 Euclid Avenue, Suite 800
Cleveland, OH 44115 Transfer Agent, Fund Accountant
and Fund Administrator U.S. Bancorp Fund Services, LLC
615 East Michigan Street
Milwaukee, WI 53202 Custodians | This document must be preceded or accompanied by a free prospectus. Investors should consider the Fund’s investment objectives, risks, charges and expenses carefully before investing. The prospectus contains this and other important information about the Fund. Please read the prospectus carefully before you invest or send money. |
U.S. Bank, N.A.
1555 North RiverCenter Drive, Suite 302
Milwaukee, WI 53212 | BNY Mellon Asset Servicing
One Wall Street
New York, NY 10286 | |
Distributor Capital Brokerage Corporation
6620 West Broad Street Building 2
Richmond, VA 23230
Member FINRA | | Annual Report March 31, 2014 |
| | | |
| | | |
| | | |
Item 2. Code of Ethics.
The registrant has adopted a code of ethics that applies to the registrant’s principal executive officer and principal financial officer. The registrant has not made any amendments to its code of ethics during the period covered by this report. The registrant has not granted any waivers from any provisions of the code of ethics during the period covered by this report.
A copy of the registrant’s Code of Ethics is filed herewith.
Item 3. Audit Committee Financial Expert.
The registrant’s board of trustees has determined that there is at least one audit committee financial expert serving on its audit committee. Dennis Schmal is the “audit committee financial expert” and is considered to be “independent” as each term is defined in Item 3 of Form N-CSR.
Item 4. Principal Accountant Fees and Services.
(a) Audit Fees
For the fiscal year ended March 31, 2014, the registrant’s principal accountant billed the registrant $143,829 for professional services rendered for the audit of the registrant’s annual financial statements or services that are normally provided by the principal accountant in connection with statutory and regulatory filings or engagements.
For the fiscal year ended March 31, 2013, the registrant’s principal accountant billed the registrant $182,900 for professional services rendered for the audit of the registrant’s annual financial statements or services that are normally provided by the principal accountant in connection with statutory and regulatory filings or engagements.
(b) Audit-Related Fees
None.
c) Tax Fees
For the fiscal year ended March 31, 2014, the registrant’s principal accountant billed the registrant $39,206 for professional services rendered for tax compliance, tax advice and tax planning.
For the fiscal year ended March 31, 2013, the registrant’s principal accountant billed the registrant $38,570 for professional services rendered for tax compliance, tax advice and tax planning.
(d) All Other Fees
None.
| (e)(1) | The registrant’s audit committee charter provides that the audit committee is responsible for the approval, prior to appointment, of the engagement of auditors annually to audit and to provide their opinion on the registrant’s financial statements. The audit |
| committee charter also provides that the audit committee is responsible for the approval, prior to appointment, of the engagement of the auditor to provide other audit services to the registrant or to provide non-audit services to the registrant, its investment adviser or any entity controlling, controlled by, or under common control with the investment adviser that provides ongoing services to the registrant, if the engagement relates directly to the operations and financial reporting of the registrant. |
| (e)(2) | There were no services in paragraphs (b) through (d) above (including services required to be approved by the audit committee pursuant to paragraph (c)(7)(ii) of Rule 2-01 of Regulation S-X) that were approved pursuant to the waiver provision of paragraph (c)(7)(i)(C) of Rule 2-01 of Regulation S-X. |
| (f) | None of the hours expended on the principal accountant’s engagement to audit the registrant’s financial statements for the fiscal year ended March 31, 2014 were attributable to work performed by persons other than the principal accountant’s full-time, permanent employees. |
| (g) | The aggregate non-audit fees billed by the registrant’s principal accountant for services rendered to the registrant’s investment adviser and any entity controlling, controlled by, or under common control with the investment adviser that provides ongoing services to the registrant for the fiscal years ended March 31, 2014 and March 31, 2013, were $0 and $0, respectively. |
| (h) | The registrant’s audit committee has considered whether the provision of non-audit services that were rendered to the registrant’s investment adviser, and any entity controlling, controlled by, or under common control with the investment adviser that provides ongoing services to the registrant, that were not pre-approved pursuant to paragraph (c)(7)(ii) of Rule 2-01 of Regulation S-X is compatible with maintaining the principal accountant’s independence. |
Item 5. Audit Committee of Listed Registrants.
Not applicable to registrants who are not listed issuers (as defined in Rule 10A-3 under the Securities Exchange Act of 1934).
Item 6. Investments.
Schedule of Investments is included as part of the report to shareholders filed under Item 1 of this Form.
Item 7. Disclosure of Proxy Voting Policies and Procedures for Closed-End Management Investment Companies.
Not applicable to open-end investment companies.
Item 8. Portfolio Managers of Closed-End Management Investment Companies.
Not applicable to open-end investment companies.
Item 9. Purchases of Equity Securities by Closed-End Management Investment Company and Affiliated Purchasers.
Not applicable to open-end investment companies.
Item 10. Submission of Matters to a Vote of Security Holders.
None.
Item 11. Controls and Procedures.
| (a) | The Registrant’s President/Principal Executive Officer and Treasurer/Principal Financial Officer have reviewed the Registrant’s disclosure controls and procedures (as defined in Rule 30a-3(c) under the Investment Company Act of 1940 (the “Act”)) as of a date within 90 days of the filing of this report, as required by Rule 30a-3(b) under the Act and Rules 13a-15(b) or 15d-15(b) under the Securities Exchange Act of 1934. Based on their review, such officers have concluded that the disclosure controls and procedures are effective in ensuring that information required to be disclosed in this report is appropriately recorded, processed, summarized and reported and made known to them by others within the Registrant and by the Registrant’s service provider. |
| (b) | There were no changes in the Registrant’s internal control over financial reporting (as defined in Rule 30a-3(d) under the Act) that occurred during the second fiscal quarter of the period covered by this report that has materially affected, or is reasonably likely to materially affect, the Registrant’s internal control over financial reporting. |
Item 12. Exhibits.
| (a) | (1) Any code of ethics or amendment thereto, that is the subject of the disclosure required by Item 2, to the extent that the registrant intends to satisfy Item 2 requirements through filing an exhibit. Filed herewith. |
| | (2) A separate certification for each principal executive and principal financial officer pursuant to Section 302 of the Sarbanes-Oxley Act of 2002. Filed herewith. |
| (3) Any written solicitation to purchase securities under Rule 23c-1 under the Investment Company Act of 1940 sent or given during the period covered by the report by or on behalf of the registrant to 10 or more persons. Not applicable. |
| (b) | Certifications pursuant to Section 906 of the Sarbanes-Oxley Act of 2002. Furnished herewith. |
SIGNATURES
Pursuant to the requirements of the Securities Exchange Act of 1934 and the Investment Company Act of 1940, the registrant has duly caused this report to be signed on its behalf by the undersigned, thereunto duly authorized.
| | (Registrant) | GPS Funds I | |
| | | | | | |
| | By (Signature and Title) | /s/ Carrie E. Hansen | |
| | | | | Carrie E. Hansen, Principal Executive Officer/President | |
| | | | | | |
| | Date | 05/30/2014 | |
Pursuant to the requirements of the Securities Exchange Act of 1934 and the Investment Company Act of 1940, this report has been signed below by the following persons on behalf of the registrant and in the capacities and on the dates indicated.
| | By (Signature and Title) | /s/ Carrie E. Hansen | |
| | | | | Carrie E. Hansen, Principal Executive Officer/President | |
| | | | | | |
| | Date | 05/30/2014 | |
| | | | | | |
| | By (Signature and Title) | /s/ Patrick R. Young | |
| | | | | Patrick R. Young, Principal Financial Officer/Treasurer | |
| | | | | | |
| | Date | 05/30/2014 | |