May 9, 2011
Dear Shareholder:
Enclosed is the Annual Report of the GuideMarkSM Funds (formerly, the AssetMark Funds) covering the period from April 1, 2010 through March 31, 2011. The year ended March 31 delivered positive results for the global markets, albeit with significant equity market volatility at several points. Notwithstanding a range of macroeconomic challenges, we believe the overarching upward trend reflected deepening optimism about the two-year-old recovery from the global financial crisis.
The S&P 500® Index1 rose 15.65% over the fiscal year, while the world ex-U.S., as represented by the MSCI All Country World ex-U.S. Index2, returned 13.61% for the 12-month period. Fixed income markets also moved higher for the year, with the Barclays Capital U.S. Aggregate Bond Index3 netting 5.12%, and the Barclays Capital Euro Aggregate Index4 returning 3.63%.
Finally, REIT market performance, as measured by the FTSE National Association of Real Estate Investment Trusts Equity Index5, generated a strong full year gain of 23.68%.
A Year of Contrasts and Optimism
Over the past year, high unemployment in Europe plagued countries such as Ireland and Greece, while Germany experienced the lowest unemployment in two decades and strong export growth. Commodity markets rallied, while U.S. core inflation rates touched 50-year lows. The residential housing market in the U.S. continued to struggle, yet corporate earnings were strong. And, overall, developing China and India continued to grow much faster than the developed economies.
Residential housing continued to drag, and climbing food prices threatened to erode discretionary spending not only domestically but around the world. Government debt levels remained elevated in many European countries, as well as in the U.S. and Japan. Yet, corporate earnings were strong, with companies continuing to hold record-high levels of cash. In the U.S., employment figures continued to slowly improve, and by March 31, 2011, the unemployment rate had dropped to a two-year low. All in all, as the financial crisis continued to recede, markets preferred to concentrate virtually all of their attention on the positives.
Potential Game Changers
Recent world events – the Japanese earthquake and tsunami, as well as political uprisings in the Middle East and North Africa – provided a backdrop for significant market volatility in the latter part of the fiscal year. Generally speaking, however, the markets responded by continuing to advance despite those setbacks, and yet either could impact the environment for investors as the year continues to unfold.
Events in Egypt and Libya took the spotlight in an unstable region during the year. By the end of March 2011, the price of oil had reached a 30-month high, leading to worries that oil could be a game changer for the U.S. economy and markets.6 Although oil prices could spike if inventories dry up, some analysts believe this is unlikely to happen unless supply from a major oil producing country, such as Saudi Arabia, is disrupted.7 In contrast to this view, other observers think that the political transformation taking place in the Middle East and North Africa will very likely lead to persistent increases in the price of oil, if only to compensate for elevated risk in an uncertain market.8
It is widely believed by investment professionals that the Japanese disaster will not have a major impact on global markets and that recovery will likely take place quickly. However, if leaks at the damaged nuclear power plants lead to a Chernobyl-sized disaster, the negative economic impact will more likely spread beyond Japan and persist for a longer period of time.9
Looking Ahead
Positive surprises thus far in 2011 include accelerating employment and GDP growth. Quantitative easing is scheduled to end mid-2011, in our opinion, this leaves questions as to whether a relapse into recession will follow or whether the economy will
be strong enough to move ahead without government support. In addition, we feel the possibility of interest rate increases in China and debt downgrades in Europe are areas to watch.
Ned Davis Research observes that “macro factors typically give way to company-specific factors as the bull [market] matures.” But with the unusually impactful macro events following the financial crisis – such as the Japanese disaster and burgeoning unrest in oil-producing countries, as well as continuing sovereign debt problems, particularly in Europe – macro factors may continue to drive markets.10 This perspective on the possibility for continuing macro-driven markets is compatible with views of other analysts and market observers who anticipate more modest stock gains and a “choppier ride” as 2011 continues to unfold.11 Of course, we believe a return to recession cannot be ruled out until the economy has recovered fully from the financial crisis. And, at the other extreme, investors could continue to ignore bad news, as they have preferred to do in the recent past, and markets could continue to forge their way upward.
As you are aware, effective April 1, the Funds completed a restructuring to become the GuideMarkSM Funds. We are confident that this restructuring will better position the Funds to meet the challenges and opportunities that lie ahead. We recognize the trust you have placed in us and thank you for including the Funds in your portfolio.
Sincerely,

Carrie E. Hansen
President
GuideMarkSM Funds
| | |
| | |
1 | The S&P 500® Index, a registered trademark of the McGraw Hill Companies, is an unmanaged basket of 500 stocks that are considered to be widely held and thus believed to be a good indicator of overall market performance. You cannot invest directly into an index. |
| | |
2 | The MSCI All Country World ex-U.S. Index is a free float-adjusted market capitalization index designed to measure the combined equity market performance of developed and emerging markets countries, excluding the United States. This index consists of 44 country indices comprising 23 developed and 21 emerging market country indices. |
| | |
3 | The Barclays Capital U.S. Aggregate Bond Index is a broad-based benchmark that measures the investment grade, U.S. dollar-denominated, fixed-rate taxable bond market, including Treasuries, government-related and corporate securities, MBS (agency fixed-rate and hybrid ARM passthroughs), ABS, and CMBS. |
| | |
4 | The Barclays Capital Euro Aggregate Bond Index is designed to track fixed-rate, investment grade Euro-denominated securities. Inclusion in the Benchmark Index is based on the currency of the issue, and not the domicile of the issuer. The principal sectors in the Benchmark Index are treasury, corporate, government-related and securitized. |
| | |
5 | The FTSE NAREIT Equity REIT Index is a broad measure of the performance of publicly traded U.S. real estate securities, such as Real Estate Investment Trusts (REITs) and Real Estate Operating Companies. |
| | |
6 | “Oil climbs to highest since 2008 on Libya conflict,” Associated Press, March 31, 2011. |
| | |
7 | Tom Fahey, Ryan McGrail, Richard Skaggs and Joseph Taylor, “middle east politics & oil: the influences on global interest rates, credit spreads & stock prices,” Loomis Sayles, March 18, 2011. |
| | |
8 | Javier Blas, “The politics of oil: Wells of anxiety,” Financial Times, March 29, 2011. |
2
| | |
9 | “Following Japanese disaster, long-term investment outlook remains positive,” Natixis Global Associates, March 2011. |
| | |
10 | Ed Clissold, CFA, “What to Expect in the Third Year of Bull Market,” Ned Davis Research Inc. Chart of the Day, March 10, 2011. |
| | |
11 | Barbara Kollmeyer, “International stock fund investors’ dizzying spin,” MarketWatch, April 1, 2011. Also see footnote 2. |
Past performance is not indicative of future results. You cannot invest directly into an index.
Investments in the Funds will fluctuate, and when redeemed may be worth more or less than originally invested.
Investors should consider the Funds’ Investment objectives, risks, charges and expenses carefully before investing. The prospectus contains this and other important information about the Funds. Please read the prospectus carefully before you invest or send money. The prospectus is available upon request, without charge, by calling 1-800-238-0810.
FINRA 116789 051211
3
|
GuideMarkSM Large Cap Growth Fund |
MANAGER’S DISCUSSION OF FUND PERFORMANCE (Unaudited) |
| |
|
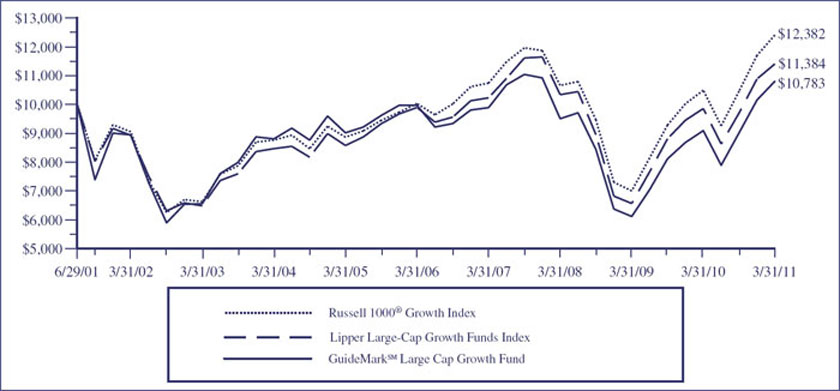
TOTAL RETURN BASED ON A $10,000 INVESTMENT
This chart assumes an initial gross investment of $10,000 made on June 29, 2001 (commencement of the Fund’s operations). Returns shown include the reinvestment of all dividends. Returns shown do not reflect the deduction of taxes that a shareholder would pay on Fund distributions or the redemption of Fund shares. In the absence of fee waivers and reimbursements, total return would be reduced. Past performance is not predictive of future performance. Investment return and principal value will fluctuate, so that your shares, when redeemed, may be worth more or less than the original cost. Index returns do not reflect the effects of fees or expenses (excluding the Lipper Index). It is not possible to invest directly in an index.
RUSSELL 1000® GROWTH INDEX – An unmanaged index which measures the performance of those Russell 1000® companies with higher price-to-book ratios and higher forecasted growth values. The Russell 1000® Index is an unmanaged index which measures the performance of the 1,000 largest companies in the Russell 3000® Index. The Russell 3000® Index is an unmanaged index which measures the performance of the 3,000 largest U.S. Companies, based on total market capitalization, which represents approximately 98% of the investable U.S. equity market.
LIPPER LARGE-CAP GROWTH FUNDS INDEX – The Lipper Large-Cap Growth Funds Index is the average of the 30 largest funds in the Lipper Large-Cap Growth Funds Category. These funds, by portfolio practice, invest at least 75% of their assets in companies with market capitalizations (on a three-year weighted basis) greater than 300% of the dollar-weighted median market capitalization of the middle 1,000 securities of the Standard & Poor’s Super Composite 1500® Index. These funds typically invest in securities that have an above average price-to-earnings ratio, price-to-book ratio and three-year sales-per-share growth value, compared to the Standard & Poor’s 500 Composite Index.
| | | | | | | | | | |
AVERAGE ANNUAL TOTAL RETURN (for the period ended March 31) | |
| | |
| | One Year | | Five Year | | Since Inception (6/29/01) | |
| | | | | | | |
GuideMarkSM Large Cap Growth Fund | | 18.79 | % | | 1.62 | % | | 0.77 | % | |
Russell 1000® Growth Index | | 18.26 | % | | 4.34 | % | | 2.22 | % | |
Lipper Large-Cap Growth Funds Index | | 15.68 | % | | 2.87 | % | | 1.34 | % | |
4
|
GuideMarkSM Large Cap Growth Fund |
MANAGER’S DISCUSSION OF FUND PERFORMANCE (Continued) (Unaudited) |
| |
For the 12 months ended March 31, 2011, the Fund returned 18.79%, outperforming the Russell 1000® Growth Index at 18.26% and the Lipper Large-Cap Growth Funds Index at 15.68%.
| |
• | Security selection was the primary driver of the outperformance, with exposure to consumer oriented stocks including Apple, Inc., Priceline.Com Inc. and Netflix.Com Inc. being the largest contributors to performance over the full year. |
| |
• | The Fund benefited from fundamental factor exposure, specifically exposure to securities with greater momentum, lower price/earnings ratios and higher beta relative to the Russell 1000® Growth Index. |
| |
• | Negative sector positioning, primarily driven by underweight exposures to materials and energy, offset the benefit from fundamental factors. |
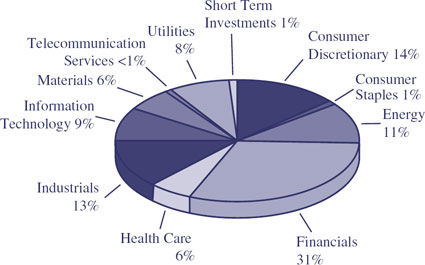
Components of Portfolio Holdings*
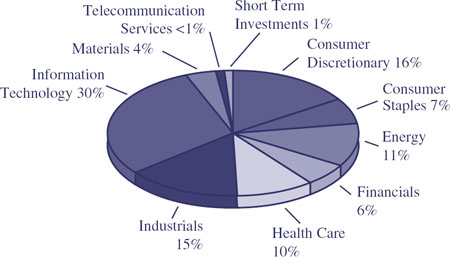
| |
* | Pie chart represents percentages of total portfolio, less securities lending collateral. |
Top Ten Holdings
| | | | |
Rank | | Security/Holding | % of Net
Assets |
1 | | | Apple, Inc. | 5.36 |
2 | | | Exxon Mobil Corp. | 3.32 |
3 | | | Google, Inc. | 2.37 |
4 | | | Qualcomm, Inc. | 2.32 |
5 | | | Oracle Corp. | 2.26 |
6 | | | International Business Machines Corp. | 1.98 |
7 | | | Amazon.com, Inc. | 1.80 |
8 | | | EMC Corp. | 1.66 |
9 | | | Netflix, Inc. | 1.51 |
10 | | | Schlumberger Ltd. | 1.43 |
| | | | |
The Global Industry Classification Standard (“GICS®”) was developed by and/or is the exclusive property of MSCI, Inc. (“MSCI”) and Standard & Poor Financial Services LLC (“S&P”). GICS is a service mark of MSCI and S&P and has been licensed for use by U.S. Bancorp Fund Services, LLC. |
5
|
GuideMarkSM Large Cap Value Fund |
MANAGER’S DISCUSSION OF FUND PERFORMANCE (Unaudited) |
| |
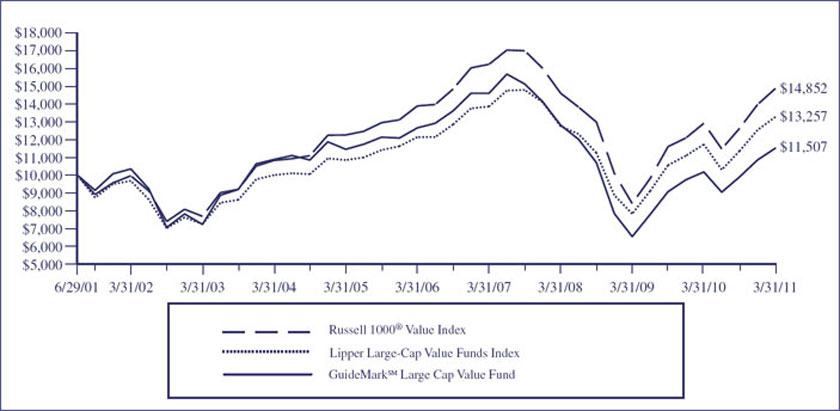
TOTAL RETURN BASED ON A $10,000 INVESTMENT
This chart assumes an initial gross investment of $10,000 made on June, 29, 2001 (commencement of the Fund’s operations). Returns shown include the reinvestment of all dividends. Returns shown do not reflect the deduction of taxes that a shareholder would pay on Fund distributions or the redemption of Fund shares. In the absence of fee waivers and reimbursements, total return would be reduced. Past performance is not predictive of future performance. Investment return and principal value will fluctuate, so that your shares, when redeemed, may be worth more or less than the original cost. Index returns do not reflect the effects of fees or expenses (excluding the Lipper Index). It is not possible to invest directly in an index.
RUSSELL 1000® VALUE INDEX – An unmanaged index which measures the performance of those Russell 1000® companies with lower price-to-book ratios and lower forecasted growth values. The Russell 1000® Index is an unmanaged index which measures the performance of the 1,000 largest companies in the Russell 3000® Index. The Russell 3000® Index is an unmanaged index which measures the performance of the 3,000 largest U.S. Companies, based on total market capitalization, which represents approximately 98% of the investable U.S. equity market.
LIPPER LARGE-CAP VALUE FUNDS INDEX – The Lipper Large-Cap Value Funds Index is the average of the 30 largest funds in the Lipper Large-Cap Value Funds Category. These funds, by portfolio practice, invest at least 75% of their assets in companies with market capitalizations (on a three-year weighted basis) greater than 300% of the dollar-weighted median market capitalization of the middle 1,000 securities of the Standard & Poor’s Super Composite 1500® Index. Large-cap value funds typically invest in securities that have a below average price-to-earnings ratio, price-to-book ratio and three-year sales-per-share growth value, compared to the S&P 500® Index.
| | | | | | | | | | |
AVERAGE ANNUAL TOTAL RETURN (for the period ended March 31) | |
| | | | | | | | | | | |
| | One Year | | Five Year | | Since Inception (6/29/01) | |
| | | | | | | |
GuideMarkSM Large Cap Value Fund | | | 13.15% | | | -1.87% | | | 1.45% | |
Russell 1000® Value Index | | | 15.15% | | | 1.38% | | | 4.14% | |
Lipper Large-Cap Value Funds Index | | | 13.14% | | | 1.80% | | | 2.93% | |
6
|
GuideMarkSM Large Cap Value Fund |
MANAGER’S DISCUSSION OF FUND PERFORMANCE (Continued) (Unaudited) |
| |
For the 12 months ended March 31, 2011, the Fund returned 13.15%, underperforming the Russell 1000® Value Index at 15.15% but in line with the Lipper Large-Cap Value Funds Index at 13.14%.
| | |
| • | Over the period security selection was the largest detractor to performance, specifically positions in Diamond Offshore Drilling, Microsoft Corp. and Merck & Co Inc. were among the largest detractors. |
| | |
| • | Fundamental factor exposure also detracted from the Fund’s performance, specifically exposure to securities with higher market capitalization and less momentum relative to the Russell 1000® Value Index. |
| | |
| • | Sector positioning benefited returns primarily due to the Fund’s overweight exposures to energy and technology and underweight exposure to industrials. |
Components of Portfolio Holdings*
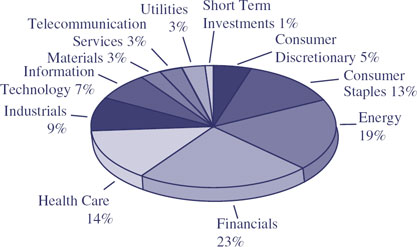
| |
* | Pie chart represents percentages of total portfolio, less securities lending collateral. |
Top Ten Holdings
| | | | | |
Rank | | Security/Holding | | % of Net
Assets | |
1 | | Pfizer, Inc. | | 3.02 | |
2 | | Wells Fargo & Co. | | 2.97 | |
3 | | Occidental Petroleum Corp. | | 2.56 | |
4 | | Johnson & Johnson | | 2.46 | |
5 | | Merck & Co., Inc. | | 2.19 | |
6 | | Chevron Corp. | | 2.03 | |
7 | | Devon Energy Corp. | | 1.97 | |
8 | | EOG Resources, Inc. | | 1.93 | |
9 | | CVS Caremark Corporation | | 1.93 | |
10 | | JPMorgan Chase & Co. | | 1.83 | |
7
|
GuideMarkSM Small/Mid Cap Core Fund |
MANAGER’S DISCUSSION OF FUND PERFORMANCE (Unaudited) |
| |
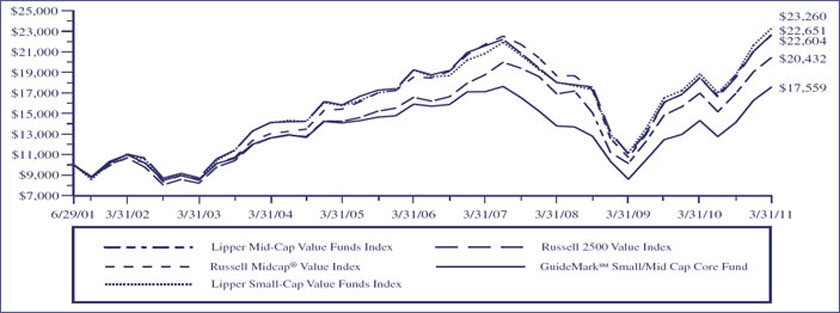
TOTAL RETURN BASED ON A $10,000 INVESTMENT
This chart assumes an initial gross investment of $10,000 made on June, 29, 2001 (commencement of the Fund’s operations). Returns shown include the reinvestment of all dividends. Returns shown do not reflect the deduction of taxes that a shareholder would pay on Fund distributions or the redemption of Fund shares. In the absence of fee waivers and reimbursements, total return would be reduced. Past performance is not predictive of future performance. Investment return and principal value will fluctuate, so that your shares, when redeemed, may be worth more or less than the original cost. Index returns do not reflect the effects of fees or expenses (excluding the Lipper Index). It is not possible to invest directly in an index.
RUSSELL 2500 VALUE INDEX – An unmanaged index which measures the performance of those Russell 2500 Index companies with lower price-to-book ratios and lower forecasted growth values. The Russell 2500 Index is an unmanaged index which measures the performance of the 2,500 smallest companies in the Russell 3000® Index. The Russell 3000® Index is an unmanaged index which measures the performance of the 3,000 largest U.S. Companies, based on total market capitalization, which represents approximately 98% of the investable U.S. equity market. RUSSELL MIDCAP® VALUE INDEX – Measures the performance of those Russell Midcap companies with lower price-to-book ratios and lower forecasted growth values. The stocks are also members of the Russell 1000® Value Index. The Russell 1000® Value Index contains those securites in the Russell 1000® Index with a less-than-average growth orientation.
LIPPER SMALL-CAP VALUE FUNDS INDEX – The Lipper Small-Cap Value Funds Index is the average of the 30 largest funds in the Lipper Small-Cap Value Funds Category. These funds, by portfolio practice, invest at least 75% of their assets in companies with market capitalizations (on a three-year weighted basis) less than 250% of the dollar-weighted median market capitalization of the smallest 500 of the middle 1,000 securities of the S&P Super Composite 1500® Index. These funds typically have a below average price-to-earnings ratio, price-to-book ratio and three-year sales-per-share growth value, compared to the S&P SmallCap 600 Index™.
LIPPER MID-CAP VALUE FUNDS INDEX – The Lipper Mid-Cap Value Funds Index includes funds that, by portfolio practice, invest at least 75% of their assets in companies with market capitalizations (on a three-year weighted basis) of less than 300% of the dollar-weighted median market capitalization of the S&P Mid-Cap 400 Index. Mid-Cap Value funds seek long-term growth of capital by investing in companies that are considered to be undervalued relative to a major unmanaged stock index based on price-to-current earnings, book value, asset value, or other factors. These funds will normally have a below average price-to-earnings ratio, price-to-book ratio and three-year earnings growth figure, compared to the U.S. diversified mid-cap funds universe average.
| | | | | | | | | | |
AVERAGE ANNUAL TOTAL RETURN (for the period ended March 31) | |
| | | | | | | | | | | |
| | One Year | | Five Year | | Since Inception (6/29/01) | |
| | | | | | | |
GuideMarkSM Small/Mid Cap Core Fund | | | 22.73% | | 2.01 | % | | | 5.94% | |
Russell 2500 Value Index | | | 22.67% | | 3.32 | % | | | 8.74% | |
Russell Midcap® Value Index | | | 22.26% | | 4.04 | % | | | 8.72% | |
Lipper Small-Cap Value Funds Index | | | 23.34% | | 3.88 | % | | | 9.26% | |
Lipper Mid-Cap Value Funds Index | | | 20.39% | | 4.29 | % | | | 7.60% | |
8
|
GuideMarkSM Small/Mid Cap Core Fund |
MANAGER’S DISCUSSION OF FUND PERFORMANCE (Continued) (Unaudited) |
| |
For the 12 months ended March 31, 2011, the Fund returned 22.73%, outperforming the Russell 2500 Value Index at 22.67% and the Lipper Mid-Cap Value Funds Index at 20.39% but underperforming the Lipper Small-Cap Value Funds Index at 23.34%.
| | |
| • | Strong security selection more than offset the negative impact from fundamental factor exposure and sector allocation. The takeover of ADC Telecommunication Inc. resulted in the security being the strongest performing stock, in addition to Leucadia National Co. and Discover Financial Services Inc. |
| | |
| • | Fundamental factor exposure dampened the Fund’s performance, specifically exposure to securities with larger market capitalization, higher volatility and higher price/book ratios relative to the Russell 2500 Value Index. |
| | |
| • | Sector positioning was also a slight negative due largely to the Fund’s underweight exposures to utilities, financials and consumer staples. In the aggregate, these underweight positions offset the gains from overweight exposures to industrials and consumer discretionary. |
Components of Portfolio Holdings*
| |
* | Pie chart represents percentages of total portfolio, less securities lending collateral. |
Top Ten Holdings
| | | | | |
Rank | | Security/Holding | | % of Net
Assets | |
1 | | Trinity Industries, Inc. | | 2.30 | |
2 | | Spirit AeroSystems Holdings, Inc. | | 2.02 | |
3 | | Cabot Oil & Gas Corp. | | 1.99 | |
4 | | Foot Locker, Inc. | | 1.85 | |
5 | | Plum Creek Timber Co., Inc. | | 1.80 | |
6 | | CIT Group, Inc. | | 1.75 | |
7 | | Leucadia National Corp. | | 1.72 | |
8 | | Discover Financial Services | | 1.66 | |
9 | | Avnet, Inc. | | 1.60 | |
10 | | Tech Data Corp. | | 1.56 | |
9
|
GuideMarkSM World ex-US Fund |
MANAGER’S DISCUSSION OF FUND PERFORMANCE (Unaudited) |
| |
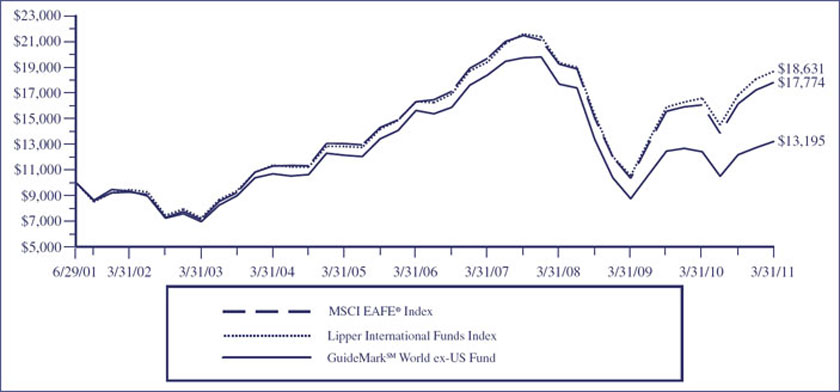
TOTAL RETURN BASED ON A $10,000 INVESTMENT
This chart assumes an initial gross investment of $10,000 made on June, 29, 2001 (commencement of the Fund’s operations). Returns shown include the reinvestment of all dividends. Returns shown do not reflect the deduction of taxes that a shareholder would pay on Fund distributions or the redemption of Fund shares. In the absence of fee waivers and reimbursements, total return would be reduced. Past performance is not predictive of future performance. Investment return and principal value will fluctuate, so that your shares, when redeemed, may be worth more or less than the original cost. Index returns do not reflect the effects of fees or expenses (excluding the Lipper Index). It is not possible to invest directly in an index.
MSCI EAFE® INDEX – The MSCI Europe, Australia, and Far East Index (MSCI EAFE®) is a free float-adjusted market capitalization index that is designed to measure the equity market performance of developed countries, excluding the U.S. & Canada.
LIPPER INTERNATIONAL FUNDS INDEX – An unmanaged index which measures the composite performance of the 30 largest “international” mutual funds, as categorized by Lipper Inc. These funds invest in securities with primary tradings markets outside of the United States.
| | | | | | | | | | |
AVERAGE ANNUAL TOTAL RETURN (for the period ended March 31) | |
| | | | | | | | | | | |
| | One Year | | Five Year | | Since Inception (6/29/01) | |
| | | | | | | |
GuideMarkSM World ex-US Fund | | 6.48 | % | | | -3.29% | | | 2.88% | |
MSCI EAFE® Index | | 10.90 | % | | | 1.78% | | | 6.08% | |
Lipper International Funds Index | | 12.57 | % | | | 2.75% | | | 6.60% | |
10
|
GuideMarkSM World ex-US Fund |
MANAGER’S DISCUSSION OF FUND PERFORMANCE (Continued) (Unaudited) |
| |
For the 12 months ended March 31, 2011, the Fund returned 6.48%, underperforming the MSCI EAFE® Index at 10.90% and the Lipper International Funds Index at 12.57%.
| | |
| • | The largest drivers of the relative underperformance were security selection and currency exposures, but sector positioning, fundamental factor exposure and country allocation also detracted from returns. |
| | |
| • | Positions in British Petroleum, RWE AG and Philips Electronics were amongst the worst performers for the period. Underweight exposure to Sweden and the Swedish Krona detracted from performance as Swedish stocks with energy exposure benefited from higher oil prices. |
| | |
| • | Large underweight exposure to materials, industrials and financials dampened returns as did higher exposures to securities with larger market capitalizations and lower price/earnings ratios relative to the MSCI EAFE® Index. |
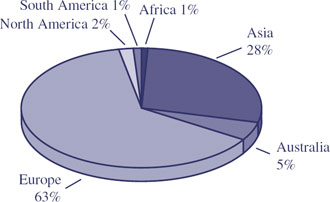
Components of Portfolio Holdings*
| |
* | Pie chart represents percentages of total portfolio, less securities lending collateral. |
Top Ten Holdings
| | | | | |
Rank | | Security/Holding | | % of Net
Assets | |
1 | | Sanofi-Aventis SA | | 2.87 | |
2 | | Telefonica SA | | 2.82 | |
3 | | Unilever Plc | | 2.00 | |
4 | | GlaxoSmithKline Plc | | 1.91 | |
5 | | Takeda Pharmaceutical Co., Ltd. | | 1.87 | |
6 | | Total SA | | 1.83 | |
7 | | Royal Dutch Shell Plc | | 1.81 | |
8 | | France Telecom SA | | 1.78 | |
9 | | Novartis AG | | 1.77 | |
10 | | Seven & i Holdings Co., Ltd. | | 1.68 | |
11
|
GuideMarkSM Tax-Exempt Fixed Income Fund |
MANAGER’S DISCUSSION OF FUND PERFORMANCE (Unaudited) |
| |
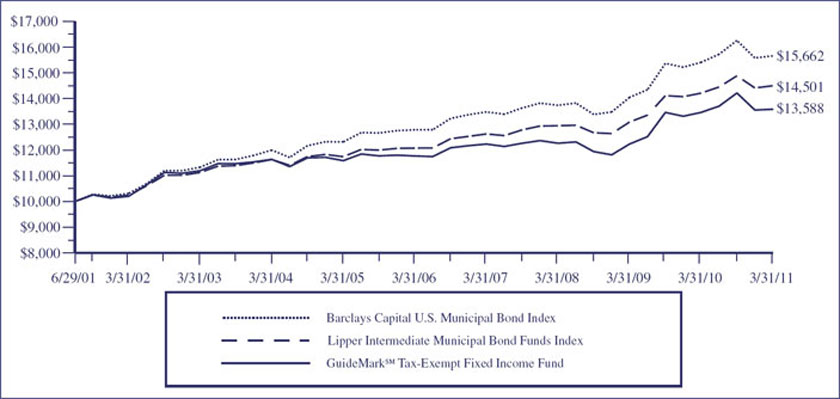
TOTAL RETURN BASED ON A $10,000 INVESTMENT
This chart assumes an initial gross investment of $10,000 made on June, 29, 2001 (commencement of the Fund’s operations). Returns shown include the reinvestment of all dividends. Returns shown do not reflect the deduction of taxes that a shareholder would pay on Fund distributions or the redemption of Fund shares. In the absence of fee waivers and reimbursements, total return would be reduced. Past performance is not predictive of future performance. Investment return and principal value will fluctuate, so that your shares, when redeemed, may be worth more or less than the original cost. Index returns do not reflect the effects of fees or expenses (excluding the Lipper Index). It is not possible to invest directly in an index.
BARCLAYS CAPITAL U.S. MUNICIPAL BOND INDEX – The Barclays Capital U.S. Municipal Bond Index is a market-value-weighted index for the long-term tax-exempt bond market. To be included in the index, bonds must have a minimum credit rating of Baa. They must have an outstanding par value of at least $7 million and be issued as part of a transaction of at least $75 million. The bonds must be fixed rate, have a date after December 31, 1990, and must be at least one year from their maturity date.
LIPPER INTERMEDIATE MUNICIPAL BOND FUNDS INDEX – The Lipper Intermediate Municipal Bond Funds Index is an index of funds that invest in municipal debt issues with dollar-weighted average maturities of five to ten years.
| | | | | | | | | | |
AVERAGE ANNUAL TOTAL RETURN (for the period ended March 31) | |
| | | | | | | | | | | |
| | One Year | | Five Year | | Since Inception (6/29/01) | |
| | | | | | | |
GuideMarkSM Tax-Exempt Fixed Income Fund | | | 0.89% | | | 2.91% | | | 3.19% | |
Barclays Capital U.S. Municipal Bond Index | | | 1.63% | | | 4.14% | | | 4.71% | |
Lipper Intermediate Municipal Bond Funds Index | | | 2.02% | | | 3.72% | | | 3.89% | |
12
|
GuideMarkSM Tax-Exempt Fixed Income Fund |
MANAGER’S DISCUSSION OF FUND PERFORMANCE (Continued) (Unaudited) |
| |
For the 12 months ended March 31, 2011, the Fund returned 0.89%, underperforming the Barclays Capital Municipal Index at 1.63% and the Lipper Intermediate Municipal Bond Funds Index at 2.02%.
| | |
| • | The Fund’s relative underperformance for the period was primarily due to its trailing performance during the latter half of the period. A panic induced sell off in the municipal bond market created a significant headwind. |
| | |
| • | The increase in rates at the long-end of the yield curve following the Fed’s second round of quantitative easing in the last quarter of 2010, increased headline risk and technical factors related to expiration of the ‘Build America Bond’ program created significant volatility in the municipal market. |
| | |
| • | Exposure to lower rated securities detracted from performance as spreads widened following a flight to quality. A more diversified exposure across the yield curve also dampened performance as the shorter-dated maturities significantly outperformed longer-dated maturities. |
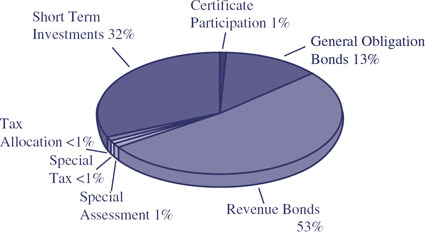
Components of Portfolio Holdings*
| |
* | Pie chart represents percentages of total portfolio. |
Top Ten Holdings
| | | | | |
Rank | | Security/Holding | | % of Net
Assets | |
1 | | Massachusetts Health & Educational Facilities Authority,
Series N, Revenue Bond, 0.150%, 08/15/2034 | | 3.11 | |
2 | | Massachusetts Health & Educational Facilities Authority,
Series R, Refunding, Revenue Bond, 0.150%, 11/01/2049 | | 2.94 | |
3 | | California Statewide Communities Development Authority,
Refunding, Revenue Bond, 0.170%, 12/01/2034 | | 2.94 | |
4 | | Capital Area Cultural Education Facilities Finance
Corporation, Refunding, Revenue Bond, 5.000%, 04/01/2018 | | 0.82 | |
5 | | Miami-Dade County Educational Facilities, Series A,
Revenue Bond, 5.000%, 04/01/2034 | | 0.82 | |
6 | | Allegheny County Hospital Development Authority,
Series A, Revenue Bond, 5.000%, 09/01/2014 | | 0.80 | |
7 | | Maryland Department of Transportation County T
Construction, Revenue Bond, 5.500%, 02/01/2017 | | 0.80 | |
8 | | New York City, Series A. GO, 5.000%, 08/01/2020 | | 0.78 | |
9 | | Pennsylvania Economic Development Financing Authority,
Albert Einstein Healthcare, Series A, Refunding, Revenue
Bond, 6.250%, 10/15/2023 | | 0.75 | |
10 | | San Francisco Steinhart Aquarium, Series F, GO,
5.000%, 06/15/2023 | | 0.72 | |
13
|
GuideMarkSM Core Fixed Income Fund |
MANAGER’S DISCUSSION OF FUND PERFORMANCE (Unaudited) |
| |
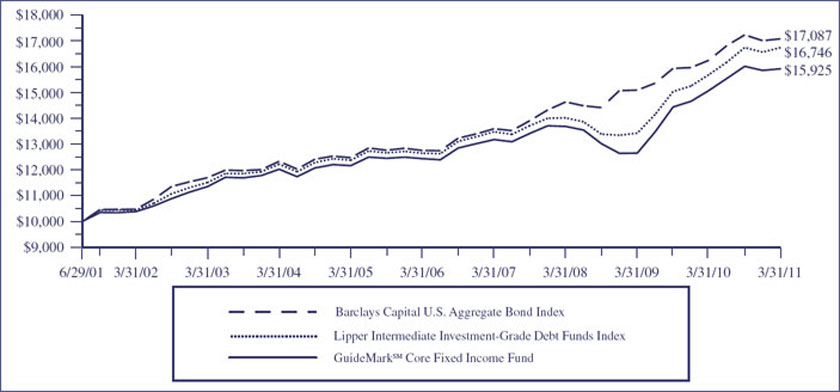
TOTAL RETURN BASED ON A $10,000 INVESTMENT
This chart assumes an initial gross investment of $10,000 made on June, 29, 2001 (commencement of the Fund’s operations). Returns shown include the reinvestment of all dividends. Returns shown do not reflect the deduction of taxes that a shareholder would pay on Fund distributions or the redemption of Fund shares. In the absence of fee waivers and reimbursements, total return would be reduced. Past performance is not predictive of future performance. Investment return and principal value will fluctuate, so that your shares, when redeemed, may be worth more or less than the original cost. Index returns do not reflect the effects of fees or expenses (excluding the Lipper Index). It is not possible to invest directly in an index.
BARCLAYS CAPITAL U.S. AGGREGATE BOND INDEX – An unmanaged index which measures the performance of securities from the Barclays Capital Government/Corporate Bond Index, Mortgage-Backed Securities Index and the Asset-Backed Securities Index. The Barclays Capital U.S. Aggregate Bond Index is a broad representation of the investment-grade fixed-income market in the U.S. and includes U.S. Government and corporate debt securities, mortgage and asset-backed securities and international U.S. dollar-denominated bonds. All securities contained in the Barclays Capital U.S. Aggregate Bond Index have a minimum term to maturity of one year.
LIPPER INTERMEDIATE INVESTMENT-GRADE DEBT FUNDS INDEX – The Lipper Intermediate Investment-Grade Debt Funds Index is an index of funds that invest at least 65% of their assets in investment-grade debt issues (rated in the top four grades) with dollar-weighted average maturities of five to ten years.
| | | | | | | | | | |
AVERAGE ANNUAL TOTAL RETURN (for the period ended March 31) | |
| | | | | | | | | | | |
| | One Year | | Five Year | | Since Inception (6/29/01) | |
| | | | | | | |
GuideMarkSM Core Fixed Income Fund | | | 5.58% | | | 5.04% | | | 4.87% | |
Barclays Capital U.S. Aggregate Bond Index | | | 5.12% | | | 6.03% | | | 5.65% | |
Lipper Intermediate Investment-Grade Debt Funds Index | | | 6.68% | | | 5.77% | | | 5.43% | |
14
|
GuideMarkSM Core Fixed Income Fund |
MANAGER’S DISCUSSION OF FUND PERFORMANCE (Continued) (Unaudited) |
| |
For the 12 months ended March 31, 2011, the Fund returned 5.58%, outperforming the Barclays Capital Aggregate Bond Index at 5.12% but underperforming the Lipper Intermediate Investment Grade Debt Funds Index at 6.68%.
| | |
| • | Overweight exposure to spread sectors and favorable security selection within corporates were the primary drivers of the outperformance over the period. Duration exposure and yield curve positioning were generally neutral to modestly negative for the period. |
| | |
| • | Exposure to structured securities including mortgage backed securities benefited performance as investors continued to favor higher spread sectors. However, an underweight exposure to commercial mortgage backed securities dampened returns for the period. |
| | |
| • | Overweight exposure to corporate credit bonds, particularly those rated below investment grade, benefited performance as investors continued to reward the higher yielding securities within the taxable fixed income market. |
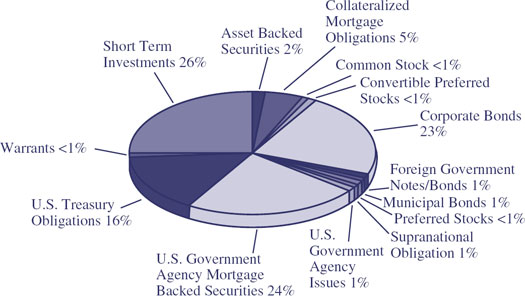
Components of Portfolio Holdings*
| |
* | Pie chart represents percentages of total portfolio, less securities lending collateral. |
Top Ten Holdings
| | | | | |
Rank | | Security/Holding | | % of Net
Assets | |
1 | | U.S. Treasury Note, 3.625%, 02/15/2021 | | 3.51 | |
2 | | U.S. Treasury Note, 2.000%, 01/31/2016 | | 2.67 | |
3 | | Federal National Mortgage Association, Pool# TBA,
6.000%, 04/15/2041 | | 2.43 | |
4 | | U.S. Treasury Note, 1.250%, 03/15/2014 | | 2.06 | |
5 | | Government National Mortgage Association, Pool# TBA
4.500%, 04/15/2040 | | 1.95 | |
6 | | Federal National Mortgage Association, Pool# TBA,
5.000%, 04/15/2041 | | 1.44 | |
7 | | U.S. Treasury Note, 2.125%, 02/29/2016 | | 1.30 | |
8 | | Federal National Mortgage Association, Pool# TBA,
5.000%, 04/15/2025 | | 1.28 | |
9 | | U.S. Treasury Note, 1.375%, 01/15/2013 | | 1.11 | |
10 | | Federal Home Loan Mortgage Corp. - Gold, Pool# TBA,
5.000%, 04/15/2040 | | 1.08 | |
15
|
GuideMarkSM Funds |
EXPENSE EXAMPLE (Unaudited) |
March 31, 2011 |
| |
As a shareholder of the GuideMarkSM Funds (the “Funds”), you incur ongoing costs, including management fees; distribution and/or service fees; and other Fund expenses. The Expense Example shown in this section is intended to help you understand your ongoing costs (in dollars) of investing in the Funds and to compare these costs with the ongoing costs of investing in other mutual funds.
The Expense Example is based on an investment of $1,000 invested at the beginning of a six month period and held for the entire period (October 1, 2010 – March 31, 2011) for the GuideMarkSM Large Cap Growth Fund, GuideMarkSM Large Cap Value Fund, GuideMarkSM Small/Mid Cap Core Fund, GuideMarkSM World ex-US Fund, GuideMarkSM Tax-Exempt Fixed Income Fund and GuideMarkSM Core Fixed Income Fund.
Actual Expenses
The first line of the Expense Example table provides information about actual account values and actual expenses. You may use the information in this line, together with the amount you invested, to estimate the expenses that you paid over the period. Simply divide your account value by $1,000 (for example, an $8,600 account value divided by $1,000 = 8.6), then multiply the result by the number in the first line under the heading entitled “Expenses Paid During Period” to estimate the expenses you paid on your account during this period.
The example includes, but is not limited to, management fees, shareholder servicing fees, distribution fees, fund accounting, custody and transfer agent fees. However, the example below does not include portfolio trading commissions and related expenses, interest expense or dividends on short positions taken by the Funds and other extraordinary expenses as determined under generally accepted accounting principles. To the extent that a Fund invests in shares of other investment companies as part of its investment strategy, you will indirectly bear your proportionate share of any fees and expenses charged by the underlying funds in which a Fund invests in addition to the expenses of the Fund. Actual expenses of the underlying funds are expected to vary among the various underlying funds. These expenses are not included in the example below.
Hypothetical Example for Comparison Purposes
The second line of the table below provides information about hypothetical account values and hypothetical expenses based on the Funds’ actual expenses ratios and an assumed rate of return of 5% per year before expenses, which is not the Funds’ actual return. The hypothetical account values and expenses may not be used to estimate the actual ending account balance or expenses you paid for the period. You may use this information to compare the ongoing costs of investing in the Funds and other funds. To do so, compare this 5% hypothetical example with the 5% hypothetical examples that appear in the shareholder reports of the other funds.
16
|
GuideMarkSM Funds |
EXPENSE EXAMPLE (Continued) (Unaudited) |
March 31, 2011 |
| |
| | | | | |
| | Beginning
Account
Value
October 1,
2010 | Ending
Account
Value
March 31,
2011 | Annualized
Expense Ratio1
based on
the period
October 1, 2010 –
March 31, 2011 | Expenses Paid
During Period2
October 1, 2010 –
March 31, 2011 |
| |
GuideMarkSM Large Cap | Actual | $1,000.00 | $1,197.80 | 1.43% | $7.84 |
Growth Fund | Hypothetical3 | $1,000.00 | $1,017.80 | 1.43% | $7.19 |
| |
GuideMarkSM Large Cap | Actual | $1,000.00 | $1,162.70 | 1.42% | $7.66 |
Value Fund | Hypothetical3 | $1,000.00 | $1,017.85 | 1.42% | $7.14 |
| |
GuideMarkSM Small/Mid Cap | Actual | $1,000.00 | $1,244.40 | 1.63% | $9.12 |
Core Fund | Hypothetical3 | $1,000.00 | $1,016.80 | 1.63% | $8.20 |
| |
GuideMarkSM World ex-US | Actual | $1,000.00 | $1,085.10 | 1.47% | $7.64 |
Fund | Hypothetical3 | $1,000.00 | $1,017.60 | 1.47% | $7.39 |
| |
GuideMarkSM Tax-Exempt | Actual | $1,000.00 | $ 955.50 | 1.29% | $6.29 |
Fixed Income Fund | Hypothetical3 | $1,000.00 | $1,018.50 | 1.29% | $6.49 |
| |
GuideMarkSM Core | Actual | $1,000.00 | $ 994.10 | 1.23% | $6.12 |
Fixed Income Fund | Hypothetical3 | $1,000.00 | $1,018.80 | 1.23% | $6.19 |
| |
| |
1 | The expense ratio excludes the securities lending credit. |
2 | Expenses are equal to the Fund’s annualized expense ratio, multiplied by the average account value over the period, multiplied by 182/365 to reflect the one-half year period. |
3 | 5% return before expenses. |
17
|
GuideMarkSM Large Cap Growth Fund |
SCHEDULE OF INVESTMENTS |
March 31, 2011 |
| |
| | | | | | |
Number of
Shares | | | | Value | |
| | | | | | |
| | COMMON STOCKS - 99.08% | | | | |
| | Aerospace & Defense - 2.77% | | | | |
12,900 | | Boeing Co. | | $ | 953,697 | |
21,300 | | Honeywell International, Inc. | | | 1,271,823 | |
7,540 | | Precision Castparts Corp. | | | 1,109,737 | |
7,500 | | TransDigm Group, Inc. (a) | | | 628,725 | |
22,200 | | United Technologies Corp. | | | 1,879,230 | |
| | | | | | |
| | | | | 5,843,212 | |
| | | | | | |
| | Air Freight & Logistics - 0.68% | | | | |
3,750 | | C.H. Robinson Worldwide, Inc. | | | 277,988 | |
22,950 | | Expeditors International of | | | | |
| | Washington | | | 1,150,713 | |
| | | | | | |
| | | | | 1,428,701 | |
| | | | | | |
| | Airlines - 0.23% | | | | |
50,600 | | Delta Air Lines, Inc. (a) | | | 495,880 | |
| | | | | | |
| | Auto Components - 1.34% | | | | |
29,500 | | Johnson Controls, Inc. | | | 1,226,315 | |
29,250 | | TRW Automotive Holdings | | | | |
| | Corp. (a) | | | 1,611,090 | |
| | | | | | |
| | | | | 2,837,405 | |
| | | | | | |
| | Automobiles - 1.21% | | | | |
125,840 | | Ford Motor Co. (a) | | | 1,876,274 | |
22,100 | | General Motors Co. (a) | | | 685,763 | |
| | | | | | |
| | | | | 2,562,037 | |
| | | | | | |
| | Beverages - 2.58% | | | | |
11,670 | | Anheuser-Busch InBev NV - ADR | | | 667,174 | |
19,260 | | Coca-Cola Enterprises, Inc. | | | 525,798 | |
21,100 | | Dr. Pepper Snapple Group, Inc. | | | 784,076 | |
7,910 | | Hansen Natural Corp. (a) | | | 476,419 | |
33,900 | | PepsiCo, Inc. | | | 2,183,499 | |
12,370 | | The Coca-Cola Company | | | 820,750 | |
| | | | | | |
| | | | | 5,457,716 | |
| | | | | | |
| | Biotechnology - 3.08% | | | | |
2,750 | | Alexion Pharmaceuticals, Inc. (a) | | | 271,370 | |
10,800 | | Amgen, Inc. (a) | | | 577,260 | |
26,220 | | Celgene Corp. (a) | | | 1,508,437 | |
51,330 | | Gilead Sciences, Inc. (a) | | | 2,178,445 | |
22,700 | | Regeneron Pharmaceuticals (a) | | | 1,020,138 | |
20,100 | | Vertex Pharmaceuticals, Inc. (a) | | | 963,393 | |
| | | | | | |
| | | | | 6,519,043 | |
| | | | | | |
| | | | | | |
Number of
Shares | | | | Value | |
| | | | | | |
| | Capital Markets - 2.56% | | | | |
18,200 | | Ameriprise Financial, Inc. | | $ | 1,111,656 | |
2,400 | | Blackrock, Inc. | | | 482,424 | |
3,280 | | Franklin Resources, Inc. | | | 410,262 | |
5,100 | | Goldman Sachs Group, Inc. | | | 808,197 | |
8,400 | | Lazard Ltd. - ADR | | | 349,272 | |
21,200 | | T. Rowe Price Group, Inc. | | | 1,408,104 | |
47,560 | | The Charles Schwab Corp. | | | 857,507 | |
| | | | | | |
| | | | | 5,427,422 | |
| | | | | | |
| | Chemicals - 2.30% | | | | |
5,400 | | CF Industries Holdings, Inc. | | | 738,666 | |
11,720 | | E.I. du Pont de Nemours & Co. | | | 644,248 | |
6,590 | | FMC Corp. | | | 559,689 | |
18,150 | | Monsanto Co. | | | 1,311,519 | |
13,670 | | Potash Corp., Inc. | | | 805,573 | |
21,000 | | The Dow Chemical Co. | | | 792,750 | |
| | | | | | |
| | | | | 4,852,445 | |
| | | | | | |
| | Commercial Banks - 1.31% | | | | |
87,500 | | Wells Fargo & Co. | | | 2,773,750 | |
| | | | | | |
| | Communications Equipment - 3.53% | | | | |
8,730 | | Acme Packet, Inc. (a) | | | 619,481 | |
3,590 | | F5 Networks, Inc. (a) | | | 368,226 | |
37,390 | | Juniper Networks, Inc. (a) | | | 1,573,371 | |
89,320 | | Qualcomm, Inc. | | | 4,897,416 | |
| | | | | | |
| | | | | 7,458,494 | |
| | | | | | |
| | Computers & Peripherals - 11.01% | | | | |
32,470 | | Apple, Inc. (a) | | | 11,314,171 | |
131,960 | | EMC Corp. (a) | | | 3,503,538 | |
63,810 | | Hewlett-Packard Co. | | | 2,614,296 | |
25,580 | | International Business Machines | | | | |
| | Corp. | | | 4,171,331 | |
8,950 | | NetApp, Inc. (a) | | | 431,211 | |
23,400 | | Teradata Corp. (a) | | | 1,186,380 | |
| | | | | | |
| | | | | 23,220,927 | |
| | | | | | |
| | Construction & Engineering - 0.38% | | | | |
11,000 | | Fluor Corp. | | | 810,260 | |
| | | | | | |
| | Consumer Finance - 0.39% | | | | |
18,160 | | American Express Co. | | | 820,832 | |
| | | | | | |
| | Diversified Financial Services - 0.80% | | | | |
4,400 | | IntercontinentalExchange, Inc. (a) | | | 543,576 | |
24,620 | | JPMorgan Chase & Co. | | | 1,134,982 | |
| | | | | | |
| | | | | 1,678,558 | |
| | | | | | |
See notes to financial statements.
18
|
GuideMarkSM Large Cap Growth Fund |
SCHEDULE OF INVESTMENTS (Continued) |
March 31, 2011 |
| |
| | | | | | |
Number of
Shares | | | | Value | |
| | | | | | |
| | COMMON STOCKS (Continued) | | | | |
| | Electrical Equipment - 2.60% | | | | |
37,330 | | Agilent Technologies, Inc. (a) | | $ | 1,671,637 | |
13,260 | | AMETEK, Inc. | | | 581,716 | |
21,700 | | Cooper Industries Plc - ADR | | | 1,408,330 | |
8,870 | | Emerson Electric Co. | | | 518,274 | |
36,300 | | GT Solar International, Inc. (a) | | | 386,958 | |
9,880 | | Rockwell Automation, Inc. | | | 935,142 | |
| | | | | | |
| | | | | 5,502,057 | |
| | | | | | |
| | Electronic Equipment & Instruments - 0.15% | | | | |
15,170 | | Corning, Inc. | | | 312,957 | |
| | | | | | |
| | Energy Equipment & Services - 3.56% | | | | |
10,710 | | Baker Hughes, Inc. | | | 786,435 | |
14,250 | | Halliburton Co. | | | 710,220 | |
23,380 | | National-Oilwell Varco, Inc. | | | 1,853,333 | |
25,200 | | Noble Corp. - ADR | | | 1,149,624 | |
32,440 | | Schlumberger Ltd. - ADR | | | 3,025,354 | |
| | | | | | |
| | | | | 7,524,966 | |
| | | | | | |
| | Food & Staples Retailing - 1.65% | | | | |
13,900 | | Costco Wholesale Corp. | | | 1,019,147 | |
20,590 | | CVS Caremark Corporation | | | 706,649 | |
24,900 | | Walgreen Co. | | | 999,486 | |
14,570 | | Wal-Mart Stores, Inc. | | | 758,369 | |
| | | | | | |
| | | | | 3,483,651 | |
| | | | | | |
| | Food Products - 0.44% | | | | |
14,230 | | Green Mountain Coffee Roasters, | | | | |
| | Inc. (a) | | | 919,400 | |
| | | | | | |
| | Health Care Equipment & Supplies - 1.81% | | | | |
35,300 | | Covidien Plc - ADR | | | 1,833,482 | |
1,450 | | Intuitive Surgical, Inc. (a) | | | 483,517 | |
15,800 | | St. Jude Medical, Inc. (a) | | | 809,908 | |
11,300 | | Stryker Corp. | | | 687,040 | |
| | | | | | |
| | | | | 3,813,947 | |
| | | | | | |
| | Health Care Providers & Services - 1.87% | | | | |
14,900 | | Aetna, Inc. | | | 557,707 | |
14,420 | | AmerisourceBergen Corp. | | | 570,455 | |
9,450 | | Express Scripts, Inc. (a) | | | 525,515 | |
8,090 | | HCA Holdings, Inc. (a) | | | 274,008 | |
10,100 | | McKesson Corp. | | | 798,405 | |
26,900 | | UnitedHealth Group, Inc. | | | 1,215,880 | |
| | | | | | |
| | | | | 3,941,970 | |
| | | | | | |
| | | | | | |
Number of
Shares | | | | Value | |
| | | | | | |
| | Health Care Technology - 0.18% | | | | |
6,840 | | SXC Health Solutions Corp. - | | | | |
| | ADR (a) | | $ | 374,832 | |
| | | | | | |
| | Hotels, Restaurants & Leisure - 1.70% | | | | |
16,700 | | Carnival Corp. - ADR | | | 640,612 | |
1,700 | | Chipotle Mexican Grill, Inc. (a) | | | 463,029 | |
16,570 | | Darden Restaurants, Inc. | | | 814,084 | |
6,230 | | Las Vegas Sands Corp. (a) | | | 263,031 | |
21,760 | | Marriott International, Inc. | | | 774,221 | |
8,260 | | McDonald’s Corp. | | | 628,503 | |
| | | | | | |
| | | | | 3,583,480 | |
| | | | | | |
| | Household Products - 0.30% | | | | |
10,200 | | Procter & Gamble Co. | | | 628,320 | |
| | | | | | |
| | Industrial Conglomerates - 1.65% | | | | |
29,800 | | 3M Co. | | | 2,786,300 | |
34,500 | | General Electric Co. | | | 691,725 | |
| | | | | | |
| | | | | 3,478,025 | |
| | | | | | |
| | Insurance - 0.74% | | | | |
10,950 | | Aflac, Inc. | | | 577,941 | |
36,200 | | Hartford Financial Services | | | | |
| | Group, Inc. | | | 974,866 | |
| | | | | | |
| | | | | 1,552,807 | |
| | | | | | |
| | Internet & Catalog Retail - 4.68% | | | | |
21,070 | | Amazon.com, Inc. (a) | | | 3,795,340 | |
13,440 | | Netflix, Inc. (a) | | | 3,189,715 | |
5,710 | | Priceline.com, Inc. (a) | | | 2,891,772 | |
| | | | | | |
| | | | | 9,876,827 | |
| | | | | | |
| | Internet Software & Services - 4.05% | | | | |
22,800 | | Akamai Technologies, Inc. (a) | | | 866,400 | |
43,600 | | eBay, Inc. (a) | | | 1,353,344 | |
8,520 | | Google, Inc. (a) | | | 4,994,509 | |
6,300 | | MercadoLibre, Inc. (a) | | | 514,269 | |
22,700 | | Verisign, Inc. | | | 821,967 | |
| | | | | | |
| | | | | 8,550,489 | |
| | | | | | |
| | IT Services - 1.94% | | | | |
26,400 | | Accenture Plc - ADR | | | 1,451,208 | |
14,220 | | Cognizant Technology Solutions | | | | |
| | Corp. (a) | | | 1,157,508 | |
42,200 | | The Western Union Co. | | | 876,494 | |
8,390 | | Visa, Inc. | | | 617,672 | |
| | | | | | |
| | | | | 4,102,882 | |
| | | | | | |
See notes to financial statements.
19
|
GuideMarkSM Large Cap Growth Fund |
SCHEDULE OF INVESTMENTS (Continued) |
March 31, 2011 |
| |
| | | | | | |
Number of
Shares | | | | Value | |
| | | | | | |
| | COMMON STOCKS (Continued) | | | | |
| | Leisure Equipment & Products - 0.37% | | | | |
31,600 | | Mattel, Inc. | | $ | 787,788 | |
| | | | | | |
| | Life Sciences Tools & Services - 0.69% | | | | |
13,600 | | Thermo Fisher Scientific, Inc. (a) | | | 755,480 | |
8,000 | | Waters Corp. (a) | | | 695,200 | |
| | | | | | |
| | | | | 1,450,680 | |
| | | | | | |
| | Machinery - 5.44% | | | | |
14,800 | | Caterpillar, Inc. | | | 1,647,980 | |
7,040 | | Cummins, Inc. | | | 771,725 | |
19,040 | | Deere & Co. | | | 1,844,785 | |
28,985 | | Dover Corp. | | | 1,905,473 | |
20,000 | | Illinois Tool Works, Inc. | | | 1,074,400 | |
5,760 | | Joy Global, Inc. | | | 569,146 | |
13,600 | | Navistar International Corp. (a) | | | 942,888 | |
16,810 | | Paccar, Inc. | | | 880,004 | |
11,600 | | Parker Hannifin Corp. | | | 1,098,288 | |
14,400 | | Timken Co. | | | 753,120 | |
| | | | | | |
| | | | | 11,487,809 | |
| | | | | | |
| | Media - 1.08% | | | | |
57,900 | | News Corp. | | | 1,016,724 | |
8,850 | | Omnicom Group, Inc. | | | 434,181 | |
19,070 | | The Walt Disney Co. | | | 821,726 | |
| | | | | | |
| | | | | 2,272,631 | |
| | | | | | |
| | Metals & Mining - 1.94% | | | | |
7,590 | | BHP Billiton Ltd. - ADR | | | 727,729 | |
27,900 | | Freeport-McMoran Copper & | | | | |
| | Gold, Inc. | | | 1,549,845 | |
10,810 | | Goldcorp, Inc. - ADR | | | 538,338 | |
13,100 | | Newmont Mining Corp. | | | 714,998 | |
4,230 | | Walter Energy, Inc. | | | 572,869 | |
| | | | | | |
| | | | | 4,103,779 | |
| | | | | | |
| | Multiline Retail - 1.99% | | | | |
25,500 | | Big Lots, Inc. (a) | | | 1,107,465 | |
26,190 | | Kohl’s Corp. | | | 1,389,118 | |
33,900 | | Target Corp. | | | 1,695,339 | |
| | | | | | |
| | | | | 4,191,922 | |
| | | | | | |
| | | | | | |
Number of
Shares | | | | Value | |
| | | | | | |
| | Oil & Gas - 7.54% | | | | |
11,420 | | Apache Corp. | | $ | 1,495,106 | |
10,400 | | Chevron Corp. | | | 1,117,272 | |
8,780 | | Concho Resources, Inc. (a) | | | 942,094 | |
83,300 | | Exxon Mobil Corp. | | | 7,008,030 | |
10,935 | | Hess Corp. | | | 931,771 | |
6,120 | | Noble Energy, Inc. | | | 591,498 | |
7,300 | | Occidental Petroleum Corp. | | | 762,777 | |
9,650 | | Pioneer Natural Resources Co. | | | 983,528 | |
26,600 | | Suncor Energy, Inc. - ADR | | | 1,192,744 | |
17,800 | | Ultra Petroleum Corp. - ADR (a) | | | 876,650 | |
| | | | | | |
| | | | | 15,901,470 | |
| | | | | | |
| | Pharmaceuticals - 2.42% | | | | |
21,420 | | Allergan, Inc. | | | 1,521,248 | |
39,300 | | Mylan Laboratories, Inc. (a) | | | 890,931 | |
5,790 | | Perrigo Co. | | | 460,421 | |
15,200 | | Salix Pharmaceuticals, Inc. (a) | | | 532,456 | |
6,220 | | Shire Plc - ADR | | | 541,762 | |
23,150 | | Teva Pharmaceutical Industries, | | | | |
| | Ltd. - ADR | | | 1,161,436 | |
| | | | | | |
| | | | | 5,108,254 | |
| | | | | | |
| | Road & Rail - 1.25% | | | | |
8,310 | | CSX Corp. | | | 653,166 | |
32,980 | | J.B. Hunt Transport Services, Inc. | | | 1,497,952 | |
5,000 | | Union Pacific Corp. | | | 491,650 | |
| | | | | | |
| | | | | 2,642,768 | |
| | | | | | |
| | Semiconductor & Semiconductor | | | | |
| | Equipment - 2.48% | | | | |
66,650 | | Broadcom Corp. | | | 2,624,677 | |
20,570 | | Marvell Technology Group Ltd. - | | | | |
| | ADR (a) | | | 319,864 | |
31,000 | | NVIDIA Corp. (a) | | | 572,260 | |
24,500 | | Skyworks Solutions, Inc. (a) | | | 794,290 | |
26,900 | | Texas Instruments, Inc. | | | 929,664 | |
| | | | | | |
| | | | | 5,240,755 | |
| | | | | | |
See notes to financial statements.
20
|
GuideMarkSM Large Cap Growth Fund |
SCHEDULE OF INVESTMENTS (Continued) |
March 31, 2011 |
| |
| | | | | | |
Number of
Shares | | | | Value | |
| | | | | | |
| | COMMON STOCKS (Continued) | | | | |
| | Software - 6.22% | | | | |
61,000 | | Activision Blizzard, Inc. (a) | | $ | 669,170 | |
11,270 | | Autodesk, Inc. (a) | | | 497,120 | |
18,200 | | BMC Software, Inc. (a) | | | 905,268 | |
17,500 | | Check Point Software Technologies | | | | |
| | Ltd. - ADR (a) | | | 893,375 | |
18,280 | | Citrix Systems, Inc. (a) | | | 1,342,849 | |
6,180 | | Factset Research Systems, Inc. | | | 647,231 | |
16,300 | | Informatica Corp. (a) | | | 851,349 | |
8,330 | | Intuit, Inc. (a) | | | 442,323 | |
19,600 | | Microsoft Corp. | | | 497,056 | |
142,940 | | Oracle Corp. | | | 4,769,909 | |
7,280 | | Salesforce.com, Inc. (a) | | | 972,462 | |
7,910 | | VMware, Inc. (a) | | | 644,981 | |
| | | | | | |
| | | | | 13,133,093 | |
| | | | | | |
| | Specialty Retail - 2.36% | | | | |
13,100 | | Abercrombie & Fitch Co. | | | 768,970 | |
17,660 | | CarMax, Inc. (a) | | | 566,886 | |
18,580 | | Limited Brands, Inc. | | | 610,910 | |
50,500 | | Lowe’s Companies, Inc. | | | 1,334,715 | |
14,400 | | Ross Stores, Inc. | | | 1,024,128 | |
5,200 | | Tiffany & Co. | | | 319,488 | |
11,990 | | Urban Outfitters, Inc. (a) | | | 357,662 | |
| | | | | | |
| | | | | 4,982,759 | |
| | | | | | |
| | Textiles, Apparel & Luxury Goods - 0.92% | | | | |
14,550 | | Nike, Inc. | | | 1,101,435 | |
8,500 | | VF Corp. | | | 837,505 | |
| | | | | | |
| | | | | 1,938,940 | |
| | | | | | |
| | Tobacco - 1.99% | | | | |
106,000 | | Altria Group, Inc. | | | 2,759,180 | |
22,000 | | Philip Morris International, Inc. | | | 1,443,860 | |
| | | | | | |
| | | | | 4,203,040 | |
| | | | | | |
| | Trading Companies & Distributors - 0.52% | | | | |
7,900 | | W.W. Grainger, Inc. | | | 1,087,672 | |
| | | | | | |
| | Wireless Telecommunication Services - 0.38% | | | | |
15,600 | | American Tower Corp. (a) | | | 808,392 | |
| | | | | | |
| | Total Common Stocks | | | | |
| | (Cost $150,277,707) | | | 209,175,044 | |
| | | | | | |
| | | | | | |
Number of
Shares | | | | Value | |
| | | | | | |
| | SHORT TERM INVESTMENTS - 1.00% | | | | |
| | Money Market Funds - 1.00% | | | | |
2,117,333 | | Federated Prime Obligations Fund | | | | |
| | Effective Yield, 0.17% | | $ | 2,117,333 | |
| | | | | | |
| | Total Short Term Investments | | | | |
| | (Cost $2,117,333) | | | 2,117,333 | |
| | | | | | |
| | INVESTMENTS PURCHASED | | | | |
| | AS SECURITIES LENDING | | | | |
| | COLLATERAL - 0.00% | | | | |
| | Money Market Funds - 0.00% | | | | |
20,508 | | Reserve Primary Fund (b) | | | 365 | |
| | | | | | |
| | Total Investments Purchased as | | | | |
| | Securities Lending Collateral | | | | |
| | (Cost $17,692) | | | 365 | |
| | | | | | |
| | Total Investments | | | | |
| | (Cost $152,412,732) - 100.08% | | | 211,292,742 | |
| | Liabilities in Excess of Other | | | | |
| | Assets - (0.08)% | | | (163,554) | |
| | | | | | |
| | TOTAL NET ASSETS - 100.00% | | $ | 211,129,188 | |
| | | | | | |
| |
Percentages are stated as a percent of net assets. |
ADR - American Depositary Receipt |
(a) | Non-income producing. |
(b) | As of March 31, 2011, the Advisor has fair valued this security and deemed it illiquid. (unaudited) The value of this security was $365 which represents 0.00% of total net assets. |
See notes to financial statements.
21
|
GuideMarkSM Large Cap Value Fund |
SCHEDULE OF INVESTMENTS |
March 31, 2011 |
| |
| | | | | | | |
Number of
Shares | | | | Value | |
| | | | | | |
| | | COMMON STOCKS - 97.32% | | | | |
| | | Aerospace & Defense - 3.05% | | | | |
| 7,150 | | Huntington Ingalls Industries,
Inc. (a) | | $ | 296,725 | |
| 5,190 | | Lockheed Martin Corp. | | | 417,276 | |
| 42,900 | | Northrop Grumman Corp. | | | 2,690,259 | |
| 13,985 | | Raytheon Co. | | | 711,417 | |
| 23,435 | | United Technologies Corp. | | | 1,983,773 | |
| | | | | | | |
| | | | | | 6,099,450 | |
| | | | | | | |
| | | Air Freight & Logistics - 0.52% | | | | |
| 11,100 | | FedEx Corp. | | | 1,038,405 | |
| | | | | | | |
| | | Automobiles - 0.57% | | | | |
| 26,990 | | Harley Davidson, Inc. | | | 1,146,805 | |
| | | | | | | |
| | | Beverages - 2.49% | | | | |
| 11,620 | | Diageo Plc - ADR | | | 885,676 | |
| 37,400 | | Molson Coors Brewing Co. | | | 1,753,686 | |
| 24,595 | | PepsiCo, Inc. | | | 1,584,164 | |
| 11,570 | | The Coca-Cola Company | | | 767,670 | |
| | | | | | | |
| | | | | | 4,991,196 | |
| | | | | | | |
| | | Biotechnology - 0.11% | | | | |
| 4,255 | | Amgen, Inc. (a) | | | 227,430 | |
| | | | | | | |
| | | Capital Markets - 3.06% | | | | |
| 8,890 | | Ameriprise Financial, Inc. | | | 543,001 | |
| 11,900 | | Goldman Sachs Group, Inc. | | | 1,885,793 | |
| 28,400 | | Morgan Stanley | | | 775,888 | |
| 18,000 | | State Street Corp. | | | 808,920 | |
| 70,645 | | The Bank of New York Mellon
Corp. | | | 2,110,166 | |
| | | | | | | |
| | | | | | 6,123,768 | |
| | | | | | | |
| | | Chemicals - 1.83% | | | | |
| 11,235 | | Air Products & Chemicals, Inc. | | | 1,013,172 | |
| 10,540 | | Monsanto Co. | | | 761,620 | |
| 19,835 | | PPG Industries, Inc. | | | 1,888,491 | |
| | | | | | | |
| | | | | | 3,663,283 | |
| | | | | | | |
| | | Commercial Banks - 4.61% | | | | |
| 36,380 | | PNC Financial Services Group,
Inc. | | | 2,291,576 | |
| 37,805 | | U.S. Bancorp | | | 999,186 | |
| 187,355 | | Wells Fargo & Co. | | | 5,939,154 | |
| | | | | | | |
| | | | | | 9,229,916 | |
| | | | | | | |
| | | | | | | |
Number of
Shares | | | | Value | |
| | | | | | |
| | | Commercial Services & Supplies - 0.56% | | | | |
| 36,045 | | Iron Mountain, Inc. | | $ | 1,125,685 | |
| | | | | | | |
| | | Communications Equipment - 0.26% | | | | |
| 30,635 | | Cisco Systems, Inc. (a) | | | 525,390 | |
| | | | | | | |
| | | Computers & Peripherals - 1.89% | | | | |
| 13,600 | | Hewlett-Packard Co. | | | 557,192 | |
| 19,645 | | International Business Machines
Corp. | | | 3,203,509 | |
| | | | | | | |
| | | | | | 3,760,701 | |
| | | | | | | |
| | | Construction & Engineering - 0.17% | | | | |
| 4,745 | | Fluor Corp. | | | 349,517 | |
| | | | | | | |
| | | Consumer Finance - 1.19% | | | | |
| 52,880 | | American Express Co. | | | 2,390,176 | |
| | | | | | | |
| | | Containers & Packaging - 0.67% | | | | |
| 50,450 | | Sealed Air Corp. | | | 1,344,997 | |
| | | | | | | |
| | | Diversified Financial Services - 2.21% | | | | |
| 57,400 | | Bank of America Corporation | | | 765,142 | |
| 79,410 | | JPMorgan Chase & Co. | | | 3,660,801 | |
| | | | | | | |
| | | | | | 4,425,943 | |
| | | | | | | |
| | | Diversified Telecommunication Services - 3.51% | | | | |
| 95,200 | | AT&T, Inc. | | | 2,913,120 | |
| 44,400 | | CenturyTel, Inc. | | | 1,844,820 | |
| 58,700 | | Verizon Communications, Inc. | | | 2,262,298 | |
| | | | | | | |
| | | | | | 7,020,238 | |
| | | | | | | |
| | | Electric Utilities - 2.22% | | | | |
| 48,700 | | American Electric Power | | | | |
| | | Company, Inc. | | | 1,711,318 | |
| 74,400 | | Edison International | | | 2,722,296 | |
| | | | | | | |
| | | | | | 4,433,614 | |
| | | | | | | |
| | | Electrical Equipment - 0.48% | | | | |
| 21,510 | | Agilent Technologies, Inc. (a) | | | 963,218 | |
| | | | | | | |
| | | Energy Equipment & Services - 1.32% | | | | |
| 27,100 | | Diamond Offshore Drilling, Inc. | | | 2,105,670 | |
| 6,842 | | Transocean Ltd. - ADR (a) | | | 533,334 | |
| | | | | | | |
| | | | | | 2,639,004 | |
| | | | | | | |
| | | Food & Staples Retailing - 5.25% | | | | |
| 42,230 | | Costco Wholesale Corp. | | | 3,096,304 | |
| 112,698 | | CVS Caremark Corporation | | | 3,867,795 | |
| 75,900 | | Safeway, Inc. | | | 1,786,686 | |
| 30,480 | | SYSCO Corp. | | | 844,296 | |
| 17,280 | | Wal-Mart Stores, Inc. | | | 899,424 | |
| | | | | | | |
| | | | | | 10,494,505 | |
| | | | | | | |
See notes to financial statements.
22
|
GuideMarkSM Large Cap Value Fund |
SCHEDULE OF INVESTMENTS (Continued) |
March 31, 2011 |
| |
| | | | | | | |
| | | | | | | |
Number of
Shares | | | | Value | |
| | | | | | |
| | | COMMON STOCKS (Continued) | | | | |
| | | Food Products - 1.63% | | | | |
| 81,905 | | Conagra Foods, Inc. | | $ | 1,945,244 | |
| 24,935 | | General Mills, Inc. | | | 911,374 | |
| 13,040 | | Kraft Foods, Inc. | | | 408,934 | |
| | | | | | | |
| | | | | | 3,265,552 | |
| | | | | | | |
| | | Health Care Equipment & Supplies - 2.15% | | | | |
| 23,215 | | Baxter International, Inc. | | | 1,248,271 | |
| 7,270 | | Becton Dickinson & Co. | | | 578,837 | |
| 63,025 | | Medtronic, Inc. | | | 2,480,034 | |
| | | | | | | |
| | | | | | 4,307,142 | |
| | | | | | | |
| | | Health Care Providers & Services - 2.18% | | | | |
| 29,500 | | CIGNA Corp. | | | 1,306,260 | |
| 17,940 | | Express Scripts, Inc. (a) | | | 997,643 | |
| 14,615 | | Quest Diagnostics, Inc. | | | 843,578 | |
| 26,880 | | UnitedHealth Group, Inc. | | | 1,214,976 | |
| | | | | | | |
| | | | | | 4,362,457 | |
| | | | | | | |
| | | Hotels, Restaurants & Leisure - 0.96% | | | | |
| 25,285 | | McDonald’s Corp. | | | 1,923,936 | |
| | | | | | | |
| | | Household Products - 2.17% | | | | |
| 34,850 | | Kimberly Clark Corp. | | | 2,274,660 | |
| 33,480 | | Procter & Gamble Co. | | | 2,062,368 | |
| | | | | | | |
| | | | | | 4,337,028 | |
| | | | | | | |
| | | Industrial Conglomerates - 1.67% | | | | |
| 10,835 | | 3M Co. | | | 1,013,073 | |
| 106,200 | | General Electric Co. | | | 2,129,309 | |
| 4,622 | | Tyco International Ltd. - ADR | | | 206,927 | |
| | | | | | | |
| | | | | | 3,349,309 | |
| | | | | | | |
| | | Insurance - 9.99% | | | | |
| 58,300 | | Allstate Corp. | | | 1,852,774 | |
| 12,990 | | Assurant, Inc. | | | 500,245 | |
| 24,280 | | Berkshire Hathaway, Inc. (a) | | | 2,030,536 | |
| 7,990 | | Chubb Corp. | | | 489,867 | |
| 67,880 | | Loews Corp. | | | 2,924,949 | |
| 65,750 | | Marsh & McLennan Cos., Inc. | | | 1,960,008 | |
| 43,200 | | MetLife, Inc. | | | 1,932,336 | |
| 71,050 | | Progressive Corp. | | | 1,501,287 | |
| 46,990 | | Prudential Financial, Inc. | | | 2,893,644 | |
| 12,511 | | Transatlantic Holdings, Inc. | | | 608,910 | |
| 55,295 | | Travelers Companies, Inc. | | | 3,288,947 | |
| | | | | | | |
| | | | | | 19,983,503 | |
| | | | | | | |
| | | | | | | |
|
Number of
Shares | | | | Value | |
| | | | | | |
| | | Internet Software & Services - 0.31% | | | | |
| 1,060 | | Google, Inc. (a) | | $ | 621,383 | |
| | | | | | | |
| | | IT Services - 0.21% | | | | |
| 4,885 | | Alliance Data Systems Corp. (a) | | | 419,573 | |
| | | | | | | |
| | | Leisure Equipment & Products - 0.07% | | | | |
| 5,570 | | Mattel, Inc. | | | 138,860 | |
| | | | | | | |
| | | Machinery - 2.32% | | | | |
| 18,405 | | Dover Corp. | | | 1,209,945 | |
| 19,665 | | Illinois Tool Works, Inc. | | | 1,056,404 | |
| 25,035 | | Parker Hannifin Corp. | | | 2,370,313 | |
| | | | | | | |
| | | | | | 4,636,662 | |
| | | | | | | |
| | | Media - 2.01% | | | | |
| 67,600 | | CBS Corp. | | | 1,692,704 | |
| 17,600 | | Grupo Televisa, SA - ADR (a) | | | 431,728 | |
| 52,900 | | Time Warner, Inc. | | | 1,888,529 | |
| | | | | | | |
| | | | | | 4,012,961 | |
| | | | | | | |
| | | Metals & Mining - 1.06% | | | | |
| 38,100 | | Freeport-McMoran Copper & | | | | |
| | | Gold, Inc. | | | 2,116,455 | |
| | | | | | | |
| | | Multi-Utilities - 0.46% | | | | |
| 20,800 | | Dominion Resources, Inc. | | | 929,760 | |
| | | | | | | |
| | | Office Electronics - 0.88% | | | | |
| 165,800 | | Xerox Corp. | | | 1,765,770 | |
| | | | | | | |
| | | Oil & Gas - 17.77% | | | | |
| 24,110 | | Anadarko Petroleum Corp. | | | 1,975,091 | |
| 27,595 | | Apache Corp. | | | 3,612,737 | |
| 38,280 | | Canadian Natural Resource Ltd. - | | | | |
| | | ADR | | | 1,892,180 | |
| 70,900 | | Chesapeake Energy Corp. | | | 2,376,568 | |
| 37,900 | | Chevron Corp. | | | 4,071,597 | |
| 37,900 | | ConocoPhillips | | | 3,026,694 | |
| 43,035 | | Devon Energy Corp. | | | 3,949,322 | |
| 32,660 | | EOG Resources, Inc. | | | 3,870,537 | |
| 12,015 | | Exxon Mobil Corp. | | | 1,010,822 | |
| 39,300 | | Marathon Oil Corp. | | | 2,095,083 | |
| 48,970 | | Occidental Petroleum Corp. | | | 5,116,876 | |
| 15,100 | | Peabody Energy Corp. | | | 1,086,596 | |
| 49,900 | | Valero Energy Corp. | | | 1,488,018 | |
| | | | | | | |
| | | | | | 35,572,121 | |
| | | | | | | |
See notes to financial statements.
23
|
GuideMarkSM Large Cap Value Fund |
SCHEDULE OF INVESTMENTS (Continued) |
March 31, 2011 |
| |
| | | | | | | |
Number of
Shares | | | | Value | |
| | | | | | |
| | | COMMON STOCKS (Continued) | | | | |
| | | Pharmaceuticals - 9.75% | | | | |
| 48,920 | | Abbott Laboratories | | $ | 2,399,526 | |
| 50,100 | | Eli Lilly & Co. | | | 1,762,017 | |
| 83,050 | | Johnson & Johnson | | | 4,920,713 | |
| 132,745 | | Merck & Co., Inc. | | | 4,381,912 | |
| 297,595 | | Pfizer, Inc. | | | 6,044,154 | |
| | | | | | | |
| | | | | | 19,508,322 | |
| | | | | | | |
| | | Professional Services - 0.57% | | | | |
| 14,150 | | The Dun & Bradstreet | | | | |
| | | Corporation | | | 1,135,396 | |
| | | | | | | |
| | | Semiconductor & Semiconductor | | | | |
| | | Equipment - 1.28% | | | | |
| 46,400 | | Intel Corp. | | | 935,888 | |
| 15,210 | | Linear Technology Corp. | | | 511,512 | |
| 32,430 | | Texas Instruments, Inc. | | | 1,120,781 | |
| | | | | | | |
| | | | | | 2,568,181 | |
| | | | | | | |
| | | Software - 1.63% | | | | |
| 128,910 | | Microsoft Corp. | | | 3,269,158 | |
| | | | | | | |
| | | Specialty Retail - 0.97% | | | | |
| 19,180 | | Bed Bath & Beyond, Inc. (a) | | | 925,819 | |
| 44,600 | | The Gap, Inc. | | | 1,010,636 | |
| | | | | | | |
| | | | | | 1,936,455 | |
| | | | | | | |
| | | Tobacco - 1.31% | | | | |
| 73,700 | | Altria Group, Inc. | | | 1,918,411 | |
| 10,800 | | Philip Morris International, Inc. | | | 708,804 | |
| | | | | | | |
| | | | | | 2,627,215 | |
| | | | | | | |
| | | Total Common Stocks | | | | |
| | | (Cost $142,062,953) | | | 194,780,440 | |
| | | | | | | |
| | | REAL ESTATE INVESTMENT TRUSTS - 1.82% | | | | |
| | | Real Estate Investment Trusts - 1.82% | | | | |
| 142,100 | | Annaly Capital Management, Inc. | | | 2,479,645 | |
| 10,831 | | Simon Property Group, Inc. | | | 1,160,650 | |
| | | | | | | |
| | | Total Real Estate Investment Trusts | | | | |
| | | (Cost $2,800,665) | | | 3,640,295 | |
| | | | | | | |
| | | SHORT TERM INVESTMENTS - 0.83% | | | | |
| | | Money Market Funds - 0.83% | | | | |
| 1,655,754 | | Federated Prime Obligations Fund | | | | |
| | | Effective Yield, 0.17% | | | 1,655,754 | |
| | | | | | | |
| | | Total Short Term Investments | | | | |
| | | (Cost $1,655,754) | | | 1,655,754 | |
| | | | | | | |
| | | | | | | |
Number of
Shares | | | | Value | |
| | | | | | |
| | | INVESTMENTS PURCHASED | | | | |
| | | AS SECURITIES LENDING | | | | |
| | | COLLATERAL - 0.00% | | | | |
| | | Money Market Funds - 0.00% | | | | |
| 23,460 | | Reserve Primary Fund (b) | | $ | 418 | |
| | | | | | | |
| | | Total Investments Purchased as | | | | |
| | | Securities Lending Collateral | | | | |
| | | (Cost $20,243) | | | 418 | |
| | | | | | | |
| | | Total Investments | | | | |
| | | (Cost $146,539,615) - 99.97% | | | 200,076,907 | |
| | | Other assets and Liabilities - | | | | |
| | | 0.03% | | | 55,434 | |
| | | | | | | |
| | | TOTAL NET ASSETS - 100.00% | | $ | 200,132,341 | |
| | | | | | | |
| |
Percentages are stated as a percent of net assets. |
ADR - American Depositary Receipt |
(a) | Non-income producing. |
(b) | As of March 31, 2011, the Advisor has fair valued this security and deemed it illiquid. (unaudited) The value of this security was $418 which represents 0.00% of total net assets. |
See notes to financial statements.
24
|
GuideMarkSM Small/Mid Cap Core Fund |
SCHEDULE OF INVESTMENTS |
March 31, 2011 |
| |
| | | | | | | |
Number of
Shares | | | | Value | |
| | | | | | |
| | | COMMON STOCKS - 91.33% | | | | |
| | | Aerospace & Defense - 3.97% | | | | |
| 8,215 | | BE Aerospace, Inc. (a) | | $ | 291,879 | |
| 4,644 | | Ceradyne, Inc. (a) | | | 209,352 | |
| 6,337 | | Curtiss Wright Corp. | | | 222,682 | |
| 5,588 | | Hexcel Corp. (a) | | | 110,028 | |
| 33,566 | | Spirit AeroSystems Holdings, Inc. (a) | | | 861,639 | |
| | | | | | | |
| | | | | | 1,695,580 | |
| | | | | | | |
| | | Auto Components - 1.23% | | | | |
| 4,486 | | Cooper Tire & Rubber Co. | | | 115,515 | |
| 4,617 | | Tenneco, Inc. (a) | | | 195,992 | |
| 3,854 | | TRW Automotive Holdings | | | | |
| | | Corp. (a) | | | 212,277 | |
| | | | | | | |
| | | | | | 523,784 | |
| | | | | | | |
| | | Building Products - 0.95% | | | | |
| 5,820 | | Ameron International, Inc. | | | 406,178 | |
| | | | | | | |
| | | Capital Markets - 3.32% | | | | |
| 13,470 | | Janus Capital Group, Inc. | | | 167,971 | |
| 18,020 | | Jefferies Group, Inc. | | | 449,419 | |
| 15,070 | | Raymond James Financial, Inc. | | | 576,276 | |
| 5,519 | | Waddell & Reed Financial, Inc. | | | 224,127 | |
| | | | | | | |
| | | | | | 1,417,793 | |
| | | | | | | |
| | | Chemicals - 2.38% | | | | |
| 3,891 | | Albemarle Corp. | | | 232,565 | |
| 5,088 | | Innophos Holdings, Inc. | | | 234,608 | |
| 8,132 | | Polyone Corp. | | | 115,556 | |
| 4,452 | | Rockwood Holdings, Inc. (a) | | | 219,127 | |
| 8,508 | | Solutia, Inc. (a) | | | 216,103 | |
| | | | | | | |
| | | | | | 1,017,959 | |
| | | | | | | |
| | | Commercial Banks - 8.71% | | | | |
| 14,007 | | BancorpSouth, Inc. | | | 216,408 | |
| 28,250 | | Fifth Third Bancorp | | | 392,110 | |
| 10,222 | | First Financial Bancorp | | | 170,605 | |
| 20,900 | | Huntington Bancshares, Inc. | | | 138,776 | |
| 31,610 | | Investors Bancorp, Inc. (a) | | | 470,673 | |
| 60,520 | | KeyCorp | | | 537,418 | |
| 24,637 | | National Penn Bancshares, Inc. | | | 190,690 | |
| 18,328 | | Susquehanna Bancshares, Inc. | | | 171,367 | |
| 45,500 | | Synovus Financial Corp. | | | 109,200 | |
| 5,015 | | Trustmark Corp. | | | 117,451 | |
| 9,310 | | UMB Financial Corp. | | | 347,775 | |
| 20,053 | | Western Alliance Bancorp (a) | | | 164,836 | |
| 15,537 | | Whitney Holding Corp. | | | 211,614 | |
| | | | | | | |
Number of
Shares | | | | Value | |
| | | | | | |
| | | Commercial Banks (Continued) | | | | |
| 8,091 | | Wintrust Financial Corp. | | $ | 297,344 | |
| 8,231 | | Zions Bancorporation | | | 189,807 | |
| | | | | | | |
| | | | | | 3,726,074 | |
| | | | | | | |
| | | Commercial Services & Supplies - 0.94% | | | | |
| 4,109 | | ABM Industries, Inc. | | | 104,328 | |
| 2,743 | | Consolidated Graphics, Inc. (a) | | | 149,850 | |
| 5,912 | | Tetra Tech, Inc. (a) | | | 145,967 | |
| | | | | | | |
| | | | | | 400,145 | |
| | | | | | | |
| | | Construction & Engineering - 0.91% | | | | |
| 10,333 | | Dycom Industries, Inc. (a) | | | 179,174 | |
| 6,765 | | EMCOR Group, Inc. (a) | | | 209,512 | |
| | | | | | | |
| | | | | | 388,686 | |
| | | | | | | |
| | | Consumer Finance - 1.66% | | | | |
| 29,380 | | Discover Financial Services | | | 708,646 | |
| | | | | | | |
| | | Diversified Financial Services - 3.86% | | | | |
| 17,630 | | CIT Group, Inc. (a) | | | 750,157 | |
| 19,560 | | Leucadia National Corp. | | | 734,282 | |
| 2,509 | | World Acceptance Corp. (a) | | | 163,587 | |
| | | | | | | |
| | | | | | 1,648,026 | |
| | | | | | | |
| | | Electric Utilities - 2.91% | | | | |
| 4,346 | | Cleco Corp. | | | 149,024 | |
| 7,150 | | El Paso Electric Co. (a) | | | 217,360 | |
| 4,960 | | IDACORP, Inc. | | | 188,976 | |
| 9,389 | | Northeast Utilities | | | 324,860 | |
| 14,860 | | NV Energy, Inc. | | | 221,265 | |
| 9,434 | | PNM Resources, Inc. | | | 140,755 | |
| | | | | | | |
| | | | | | 1,242,240 | |
| | | | | | | |
| | | Electrical Equipment - 1.35% | | | | |
| 2,557 | | A.O. Smith Corp. | | | 113,377 | |
| 18,970 | | Encore Wire Corp. | | | 461,730 | |
| | | | | | | |
| | | | | | 575,107 | |
| | | | | | | |
| | | Electronic Equipment & Instruments - 5.92% | | | | |
| 20,120 | | Avnet, Inc. (a) | | | 685,890 | |
| 7,982 | | Benchmark Electronics, Inc. (a) | | | 151,419 | |
| 10,880 | | Ingram Micro, Inc. (a) | | | 228,806 | |
| 18,960 | | Molex, Inc. | | | 392,282 | |
| 5,268 | | Plexus Corp. (a) | | | 184,696 | |
| 13,120 | | Tech Data Corp. (a) | | | 667,283 | |
| 11,924 | | TTM Technologies, Inc. (a) | | | 216,540 | |
| | | | | | | |
| | | | | | 2,526,916 | |
| | | | | | | |
See notes to financial statements.
25
|
GuideMarkSM Small/Mid Cap Core Fund |
SCHEDULE OF INVESTMENTS (Continued) |
March 31, 2011 |
| |
| | | | | | | |
Number of
Shares | | | | Value | |
| | | | | | |
| | | COMMON STOCKS (Continued) | | | | |
| | | Energy Equipment & Services - 2.16% | | | | |
| 7,826 | | Complete Production Services (a) | | $ | 248,945 | |
| 12,166 | | Helix Energy Solutions Group, | | | | |
| | | Inc. (a) | | | 209,255 | |
| 12,278 | | Key Energy Services, Inc. (a) | | | 190,923 | |
| 1,969 | | Lufkin Industries, Inc. | | | 184,042 | |
| 11,344 | | Newpark Resources, Inc. (a) | | | 89,164 | |
| | | | | | | |
| | | | | | 922,329 | |
| | | | | | | |
| | | Food & Staples Retailing - 0.74% | | | | |
| 8,110 | | Casey’s General Stores, Inc. | | | 316,290 | |
| | | | | | | |
| | | Food Products - 0.62% | | | | |
| 4,546 | | The Hain Celestial Group, Inc. (a) | | | 146,745 | |
| 2,112 | | TreeHouse Foods, Inc. (a) | | | 120,109 | |
| | | | | | | |
| | | | | | 266,854 | |
| | | | | | | |
| | | Gas Utilities - 2.58% | | | | |
| 3,020 | | Energen Corp. | | | 190,622 | |
| 9,150 | | Oneok, Inc. | | | 611,953 | |
| 9,168 | | UGI Corp. | | | 301,627 | |
| | | | | | | |
| | | | | | 1,104,202 | |
| | | | | | | |
| | | Health Care Equipment & Supplies - 0.95% | | | | |
| 5,198 | | Invacare Corp. | | | 161,762 | |
| 3,495 | | The Cooper Companies, Inc. | | | 242,728 | |
| | | | | | | |
| | | | | | 404,490 | |
| | | | | | | |
| | | Health Care Providers & Services - 4.33% | | | | |
| 2,062 | | Amerigroup Corp. (a) | | | 132,484 | |
| 11,188 | | Assisted Living Concepts, Inc. (a) | | | 437,897 | |
| 21,588 | | Health Management Associates, | | | | |
| | | Inc. (a) | | | 235,309 | |
| 7,737 | | Health Net, Inc. (a) | | | 253,000 | |
| 8,098 | | HealthSouth Corp. (a) | | | 202,288 | |
| 5,344 | | Lifepoint Hospitals, Inc. (a) | | | 214,722 | |
| 4,696 | | Magellan Health Services, Inc. (a) | | | 230,480 | |
| 3,483 | | Wellcare Health Plans, Inc. (a) | | | 146,112 | |
| | | | | | | |
| | | | | | 1,852,292 | |
| | | | | | | |
| | | Hotels, Restaurants & Leisure - 5.45% | | | | |
| 11,409 | | Callaway Golf Co. | | | 77,809 | |
| 5,079 | | CEC Entertainment, Inc. | | | 191,631 | |
| 5,601 | | Gaylord Entertainment Co. (a) | | | 194,243 | |
| 13,120 | | Hyatt Hotels Corp. (a) | | | 564,685 | |
| 6,253 | | Penn National Gaming, Inc. (a) | | | 231,736 | |
| 10,610 | | Ruby Tuesday, Inc. (a) | | | 139,097 | |
| | | | | | | |
Number of
Shares | | | | Value | |
| | | | | | |
| | | Hotels, Restaurants & Leisure (Continued) | | | | |
| 13,430 | | Vail Resorts, Inc. (a) | | $ | 654,847 | |
| 8,754 | | Wyndham Worldwide Corp. | | | 278,465 | |
| | | | | | | |
| | | | | | 2,332,513 | |
| | | | | | | |
| | | Household Durables - 0.62% | | | | |
| 9,350 | | D.R. Horton, Inc. | | | 108,928 | |
| 9,700 | | Ryland Group, Inc. | | | 154,230 | |
| | | | | | | |
| | | | | | 263,158 | |
| | | | | | | |
| | | Insurance - 4.41% | | | | |
| 7,188 | | American Financial Group, Inc. | | | 251,724 | |
| 3,042 | | Arch Capital Group Ltd. - ADR (a) | | | 301,736 | |
| 4,490 | | The Hanover Insurance Group, Inc. | | | 203,173 | |
| 15,350 | | W.R. Berkley Corp. | | | 494,424 | |
| 1,750 | | White Mountains Insurance Group | | | | |
| | | Ltd. - ADR | | | 637,349 | |
| | | | | | | |
| | | | | | 1,888,406 | |
| | | | | | | |
| | | IT Services - 0.24% | | | | |
| 9,146 | | Sapient Corp. (a) | | | 104,722 | |
| | | | | | | |
| | | Machinery - 4.60% | | | | |
| 9,781 | | Actuant Corp. | | | 283,649 | |
| 5,848 | | Crane Co. | | | 283,219 | |
| 1,947 | | Joy Global, Inc. | | | 192,383 | |
| 7,554 | | Meritor, Inc. (a) | | | 128,191 | |
| 22,553 | | Mueller Water Products, Inc. - | | | | |
| | | Class A | | | 101,037 | |
| 26,839 | | Trinity Industries, Inc. | | | 984,186 | |
| | | | | | | |
| | | | | | 1,972,665 | |
| | | | | | | |
| | | Media - 0.33% | | | | |
| 9,310 | | Gannett Co., Inc. | | | 141,791 | |
| | | | | | | |
| | | Metals & Mining - 3.74% | | | | |
| 5,172 | | Carpenter Technology Corp. | | | 220,896 | |
| 3,234 | | Coeur D’Alene Mines Corp. (a) | | | 112,479 | |
| 9,720 | | Kaiser Aluminum Corp. | | | 478,710 | |
| 6,792 | | Noranda Aluminum Holding | | | | |
| | | Corp. (a) | | | 109,012 | |
| 3,506 | | RTI International Metals, Inc. (a) | | | 109,212 | |
| 8,759 | | Schnitzer Steel Industries, Inc. | | | 569,422 | |
| | | | | | | |
| | | | | | 1,599,731 | |
| | | | | | | |
| | | Multiline Retail - 2.56% | | | | |
| 11,420 | | Family Dollar Stores, Inc. | | | 586,074 | |
| 14,190 | | J.C. Penney Co., Inc. | | | 509,563 | |
| | | | | | | |
| | | | | | 1,095,637 | |
| | | | | | | |
See notes to financial statements.
26
|
GuideMarkSM Small/Mid Cap Core Fund |
SCHEDULE OF INVESTMENTS (Continued) |
March 31, 2011 |
| |
| | | | | | | |
Number of
Shares | | | | Value | |
| | | | | | |
| | | COMMON STOCKS (Continued) | | | | |
| | | Multi-Utilities - 1.53% | | | | |
| 8,325 | | CMS Energy Corp. | | $ | 163,503 | |
| 6,697 | | MDU Resources Group, Inc. | | | 153,830 | |
| 7,660 | | NRG Energy, Inc. (a) | | | 164,996 | |
| 6,291 | | Vectren Corp. | | | 171,116 | |
| | | | | | | |
| | | | | | 653,445 | |
| | | | | | | |
| | | Oil & Gas - 9.34% | | | | |
| 4,217 | | Berry Petroleum Co. | | | 212,748 | |
| 16,040 | | Cabot Oil & Gas Corp. | | | 849,639 | |
| 26,746 | | Denbury Resources, Inc. (a) | | | 652,602 | |
| 30,552 | | Kodiak Oil & Gas Corp. - ADR (a) | | | 204,698 | |
| 4,127 | | Patriot Coal Corp. (a) | | | 106,600 | |
| 17,400 | | Petrohawk Energy Corp. (a) | | | 426,996 | |
| 3,261 | | Petroleum Development Corp. (a) | | | 156,561 | |
| 5,450 | | Plains All American Pipeline, L.P. | | | 347,329 | |
| 7,370 | | Range Resources Corp. | | | 430,850 | |
| 6,760 | | Ultra Petroleum Corp. - ADR (a) | | | 332,930 | |
| 3,724 | | Whiting Petroleum Corp. (a) | | | 273,528 | |
| | | | | | | |
| | | | | | 3,994,481 | |
| | | | | | | |
| | | Pharmaceuticals - 0.43% | | | | |
| 5,704 | | Medicis Pharmaceutical Corp. | | | 182,756 | |
| | | | | | | |
| | | Road & Rail - 0.88% | | | | |
| 2,140 | | AMERCO (a) | | | 207,580 | |
| 4,767 | | Old Dominion Freight Lines, Inc. (a) | | | 167,274 | |
| | | | | | | |
| | | | | | 374,854 | |
| | | | | | | |
| | | Semiconductor & Semiconductor | | | | |
| | | Equipment - 1.19% | | | | |
| 13,056 | | Fairchild Semiconductor | | | | |
| | | International (a) | | | 237,619 | |
| 24,481 | | Integrated Device Technology, | | | | |
| | | Inc. (a) | | | 180,425 | |
| 5,391 | | Kulicke & Soffa Industries, Inc. (a) | | | 50,406 | |
| 14,043 | | RF Micro Devices, Inc. (a) | | | 90,016 | |
| | | | | | | |
| | | | | | 558,466 | |
| | | | | | | |
| | | Software - 1.17% | | | | |
| 7,162 | | JDA Software Group, Inc. (a) | | | 216,723 | |
| 13,052 | | Lawson Software, Inc. (a) | | | 157,929 | |
| 5,668 | | Parametric Technology Corp. (a) | | | 127,473 | |
| | | | | | | |
| | | | | | 502,125 | |
| | | | | | | |
| | | | | | | |
Number of
Shares | | | | Value | |
| | | | | | |
| | | Specialty Retail - 3.62% | | | | |
| 3,871 | | Children’s Place Retail Stores, | | | | |
| | | Inc. (a) | | $ | 192,892 | |
| 40,070 | | Foot Locker, Inc. | | | 790,180 | |
| 16,400 | | The Men’s Wearhouse, Inc. | | | 443,784 | |
| 9,170 | | OfficeMax, Inc. (a) | | | 118,660 | |
| | | | | | | |
| | | | | | 1,545,516 | |
| | | | | | | |
| | | Textiles, Apparel & Luxury Goods - 0.27% | | | | |
| 8,476 | | Jones Apparel Group, Inc. | | | 116,545 | |
| | | | | | | |
| | | Thrifts & Mortgage Finance - 0.88% | | | | |
| 7,670 | | Bankunited, Inc. (a) | | | 220,206 | |
| 17,763 | | MGIC Investment Corp. (a) | | | 157,913 | |
| | | | | | | |
| | | | | | 378,119 | |
| | | | | | | |
| | | Wireless Telecommunication Services - 0.46% | | | | |
| 12,014 | | MetroPCS Communications, Inc. (a) | | | 195,107 | |
| | | | | | | |
| | | Total Common Stocks | | | | |
| | | (Cost $28,049,925) | | | 39,043,628 | |
| | | | | | | |
| | | REAL ESTATE INVESTMENT TRUSTS - 7.78% | | | | |
| | | Real Estate Investment Trusts - 7.78% | | | | |
| 10,920 | | CommonWealth REIT | | | 283,592 | |
| 12,598 | | Developers Diversified Realty Corp. | | | 176,372 | |
| 23,185 | | DiamondRock Hospitality Co. (a) | | | 258,976 | |
| 18,430 | | Education Realty Trust, Inc. | | | 147,993 | |
| 1,230 | | Federal Realty Investment Trust | | | 100,319 | |
| 3,346 | | Health Care REIT, Inc. | | | 175,464 | |
| 3,050 | | Highwoods Properties, Inc. | | | 106,781 | |
| 17,436 | | Inland Real Estate Corp. | | | 166,339 | |
| 17,594 | | Lexington Realty Trust | | | 164,504 | |
| 17,660 | | Plum Creek Timber Co., Inc. | | | 770,153 | |
| 4,232 | | Post Properties, Inc. | | | 166,106 | |
| 6,270 | | SL Green Realty Corp. | | | 471,504 | |
| 19,526 | | Sunstone Hotel Investors, Inc. (a) | | | 198,970 | |
| 13,280 | | U-Store-It Trust | | | 139,706 | |
| | | | | | | |
| | | Total Real Estate Investment Trusts | | | | |
| | | (Cost $2,512,269) | | | 3,326,779 | |
| | | | | | | |
| | | SHORT TERM INVESTMENTS - 1.01% | | | | |
| | | Money Market Funds - 1.01% | | | | |
| 430,763 | | Federated Prime Obligations Fund | | | | |
| | | Effective Yield, 0.17% | | | 430,763 | |
| | | | | | | |
| | | Total Short Term Investments | | | | |
| | | (Cost $430,763) | | | 430,763 | |
| | | | | | | |
See notes to financial statements.
27
|
GuideMarkSM Small/Mid Cap Core Fund |
SCHEDULE OF INVESTMENTS (Continued) |
March 31, 2011 |
| |
| | | | | | | |
Number of
Shares | | | | Value | |
| | | | | | |
| | | INVESTMENTS PURCHASED | | | | |
| | | AS SECURITIES LENDING | | | | |
| | | COLLATERAL - 0.00% | | | | |
| | | Money Market Funds - 0.00% | | | | |
| 6,386 | | Reserve Primary Fund (b) | | $ | 114 | |
| | | | | | | |
| | | Total Investments Purchased as | | | | |
| | | Securities Lending Collateral | | | | |
| | | (Cost $5,507) | | | 114 | |
| | | | | | | |
| | | Total Investments | | | | |
| | | (Cost $30,998,464) - 100.12% | | | 42,801,284 | |
| | | | | | | |
| | | Liabilities in Excess of Other | | | | |
| | | Assets - (0.12)% | | | (52,495 | ) |
| | | | | | | |
| | | TOTAL NET ASSETS - 100.00% | | $ | 42,748,789 | |
| | | | | | | |
| |
Percentages are stated as a percent of net assets. |
ADR - American Depositary Receipt |
(a) | Non-Income producing. |
(b) | As of March 31, 2011, the Advisor has fair valued this security and deemed it illiquid. (unaudited) The value of this security was $114 which represents 0.00% of total net assets. |
See notes to financial statements.
28
|
GuideMarkSM World ex-US Fund |
SCHEDULE OF INVESTMENTS |
March 31, 2011 |
| |
| | | | | | |
Number of
Shares | | | | Value | |
| | | | | | |
| | COMMON STOCKS - 98.78% | | | | |
| | Australia - 5.33% | | | | |
552,948 | | Incitec Pivot Ltd. | | $ | 2,475,364 | |
65,859 | | Leighton Holdings Ltd. | | | 2,008,024 | |
218,409 | | QBE Insurance Group Ltd. | | | 3,994,939 | |
1,260,810 | | Telstra Corp. Ltd. | | | 3,677,761 | |
67,901 | | Wesfarmers Ltd. | | | 2,230,881 | |
| | | | | | |
| | | | | 14,386,969 | |
| | | | | | |
| | Brazil - 0.57% | | | | |
85,000 | | Banco do Brasil SA | | | 1,533,244 | |
| | | | | | |
| | Canada - 1.87% | | | | |
56,500 | | Goldcorp, Inc. (a) | | | 2,817,133 | |
49,900 | | Suncor Energy, Inc. (a) | | | 2,237,908 | |
| | | | | | |
| | | | | 5,055,041 | |
| | | | | | |
| | China - 0.41% | | | | |
44,300 | | Mindray Medical International | | | | |
| | Ltd. - ADR (a) | | | 1,116,360 | |
| | | | | | |
| | Finland - 0.55% | | | | |
43,847 | | Fortum Oyj | | | 1,488,661 | |
| | | | | | |
| | France - 14.11% | | | | |
31,792 | | BNP Paribas SA | | | 2,324,134 | |
91,314 | | Carrefour SA | | | 4,034,220 | |
213,615 | | France Telecom SA | | | 4,796,419 | |
51,152 | | Rhodia SA | | | 1,498,103 | |
59,127 | | Saint-Gobain SA | | | 3,615,934 | |
110,652 | | Sanofi-Aventis SA | | | 7,753,863 | |
15,950 | | Schneider Electric | | | 2,724,115 | |
33,048 | | Societe Generale SA | | | 2,146,600 | |
20,382 | | Technip | | | 2,173,078 | |
80,923 | | Total SA | | | 4,930,906 | |
72,369 | | Vivendi SA | | | 2,064,488 | |
| | | | | | |
| | | | | 38,061,860 | |
| | | | | | |
| | Germany - 6.59% | | | | |
27,833 | | adidas AG | | | 1,749,904 | |
56,015 | | Aixtron AG | | | 2,455,825 | |
38,295 | | Daimler AG | | | 2,698,350 | |
22,993 | | Fresenius Medical Care AG & Co. | | | | |
| | KGaA | | | 1,542,533 | |
28,110 | | Henkel AG & Co. KGaA | | | 1,739,902 | |
53,646 | | RWE AG | | | 3,404,385 | |
30,580 | | Siemens AG | | | 4,182,974 | |
| | | | | | |
| | | | | 17,773,873 | |
| | | | | | |
| | | | | | |
Number of
Shares | | | | Value | |
| | | | | | |
| | Hong Kong - 1.39% | | | | |
262,000 | | Henderson Land Development Co. | | | | |
| | Ltd. | | $ | 1,815,536 | |
1,100,000 | | SJM Holdings Ltd. | | | 1,924,679 | |
| | | | | | |
| | | | | 3,740,215 | |
| | | | | | |
| | Italy - 2.42% | | | | |
141,270 | | Eni S.p.A. | | | 3,466,385 | |
1,035,799 | | Intesa Sanpaolo S.p.A. | | | 3,055,682 | |
| | | | | | |
| | | | | 6,522,067 | |
| | | | | | |
| | Japan - 20.01% | | | | |
85,700 | | Bridgestone Corp. | | | 1,792,057 | |
96,800 | | Canon, Inc. | | | 4,163,346 | |
1,210 | | Dai-ichi Life Insurance | | | 1,824,739 | |
316 | | Inpex Corp. | | | 2,390,728 | |
164,800 | | Kao Corp. | | | 4,112,107 | |
587 | | KDDI Corp. | | | 3,629,233 | |
172,000 | | Kirin Holdings Co. | | | 2,257,219 | |
452,900 | | Mitsubishi UFJ Financial Group, Inc. | | | 2,086,810 | |
136,700 | | Mitsui & Co. | | | 2,447,459 | |
94,000 | | Mitsui Fudosan Co., Ltd. | | | 1,545,214 | |
1,349 | | NTT DoCoMo, Inc. | | | 2,355,010 | |
125,000 | | Panasonic Corp. | | | 1,583,460 | |
181,000 | | Sekisui House Ltd. | | | 1,689,123 | |
177,900 | | Seven & i Holdings Co. Ltd. | | | 4,531,746 | |
5,300 | | Shin-Etsu Chemical Co., Ltd. | | | 263,783 | |
49,500 | | Sony Corp. | | | 1,578,854 | |
71,300 | | Suzuki Motor Corp. | | | 1,593,600 | |
108,200 | | Takeda Pharmaceutical Co., Ltd. | | | 5,048,140 | |
367,000 | | The Bank of Yokohama Ltd. | | | 1,744,494 | |
116,400 | | Tokio Marine Holdings, Inc. | | | 3,107,814 | |
105,800 | | Toyota Motor Corp. | | | 4,198,596 | |
| | | | | | |
| | | | | 53,943,532 | |
| | | | | | |
| | Jersey - 0.94% | | | | |
106,591 | | Petrofac Ltd. | | | 2,547,136 | |
| | | | | | |
| | Luxembourg - 1.00% | | | | |
105,094 | | SES SA | | | 2,705,816 | |
| | | | | | |
See notes to financial statements.
29
|
GuideMarkSM World ex-US Fund |
SCHEDULE OF INVESTMENTS (Continued) |
March 31, 2011 |
| |
| | | | | | |
Number of
Shares | | | | Value | |
| | | | | | |
| | COMMON STOCKS (Continued) | | | | |
| | Netherlands - 7.67% | | | | |
36,365 | | Gemalto NV | | $ | 1,790,427 | |
43,978 | | Heineken NV | | | 2,401,476 | |
212,782 | | ING Groep NV (a) | | | 2,701,004 | |
293,715 | | Koninklijke Ahold NV | | | 3,939,025 | |
75,647 | | Philips Electronics NV | | | 2,423,186 | |
198,318 | | Reed Elsevier NV | | | 2,558,452 | |
134,235 | | Royal Dutch Shell Plc | | | 4,883,216 | |
| | | | | | |
| | | | | 20,696,786 | |
| | | | | | |
| | Norway - 0.80% | | | | |
141,000 | | DnB NOR ASA | | | 2,161,923 | |
| | | | | | |
| | Republic of Korea - 0.74% | | | | |
4,682 | | Samsung Electronic (a) | | | 1,988,510 | |
| | | | | | |
| | Russian Federation - 0.84% | | | | |
69,893 | | Oao Gazprom ADR (a) | | | 2,262,436 | |
| | | | | | |
| | Singapore - 2.75% | | | | |
284,000 | | Oversea-Chinese Banking Corp. Ltd. | | | 2,158,375 | |
802,000 | | Singapore Telecommunications Ltd. | | | 1,920,288 | |
224,748 | | United Overseas Bank Ltd. | | | 3,350,898 | |
| | | | | | |
| | | | | 7,429,561 | |
| | | | | | |
| | South Africa - 0.93% | | | | |
143,500 | | Gold Fields Ltd. - ADR | | | 2,505,510 | |
| | | | | | |
| | Spain - 5.00% | | | | |
153,112 | | Banco Santander Central Hispano SA | | | 1,785,892 | |
471,583 | | Iberdrola SA | | | 4,100,744 | |
303,343 | | Telefonica SA | | | 7,609,233 | |
| | | | | | |
| | | | | 13,495,869 | |
| | | | | | |
| | Switzerland - 5.09% | | | | |
154,449 | | ABB Ltd. | | | 3,708,778 | |
60,434 | | Credit Suisse Group AG | | | 2,563,624 | |
88,261 | | Novartis AG | | | 4,779,421 | |
9,609 | | Zurich Financial Services AG | | | 2,686,071 | |
| | | | | | |
| | | | | 13,737,894 | |
| | | | | | |
| | Taiwan - 1.42% | | | | |
1,598,504 | | Taiwan Semiconductor | | | | |
| | Manufacturing Co., Ltd. | | | 3,830,439 | |
| | | | | | |
| | Thailand - 0.66% | | | | |
308,900 | | Bangkok Bank | | | 1,770,164 | |
| | | | | | |
| | | | | | |
Number of
Shares | | | | Value | |
| | | | | | |
| | United Kingdom - 17.69% | | | | |
529,923 | | Barclays Plc | | $ | 2,379,346 | |
553,586 | | BP Plc | | | 4,067,269 | |
212,640 | | Cairn Energy Plc (a) | | | 1,575,545 | |
292,379 | | Compass Group Plc | | | 2,628,162 | |
269,776 | | GlaxoSmithKline Plc | | | 5,140,523 | |
366,576 | | HSBC Holdings Plc | | | 3,786,426 | |
135,077 | | Pearson Plc | | | 2,386,318 | |
212,475 | | Persimmon Plc | | | 1,514,735 | |
197,831 | | Prudential Plc | | | 2,240,386 | |
108,039 | | Royal Dutch Shell Plc | | | 3,923,360 | |
156,334 | | Tate & Lyle | | | 1,447,136 | |
602,954 | | Tesco Plc | | | 3,683,265 | |
177,113 | | Unilever Plc | | | 5,395,730 | |
1,477,217 | | Vodafone Group Plc | | | 4,209,815 | |
141,450 | | Xstrata Plc | | | 3,300,271 | |
| | | | | | |
| | | | | 47,678,287 | |
| | | | | | |
| | Total Common Stocks | | | | |
| | (Cost $240,174,619) | | | 266,432,153 | |
| | | | | | |
| | PREFERRED STOCKS - 0.90% | | | | |
| | Brazil - 0.90% | | | | |
55,400 | | Tim Participacoes SA - ADR | | | 2,418,210 | |
| | | | | | |
| | Total Preferred Stocks | | | | |
| | (Cost $2,073,742) | | | 2,418,210 | |
| | | | | | |
| | INVESTMENTS PURCHASED | | | | |
| | AS SECURITIES LENDING | | | | |
| | COLLATERAL - 0.00% | | | | |
| | Money Market Funds - 0.00% | | | | |
5,588 | | Reserve Primary Fund (b) | | | 100 | |
| | | | | | |
| | Total Investments Purchased as | | | | |
| | Securities Lending Collateral | | | | |
| | (Cost $4,823) | | | 100 | |
| | | | | | |
| | Total Investments | | | | |
| | (Cost $242,253,184) - 99.68% | | | 268,850,463 | |
| | Other Assets and Liabilities - 0.32% | | | 851,606 | |
| | | | | | |
| | TOTAL NET ASSETS - 100.00% | | $ | 269,702,069 | |
| | | | | | |
| |
Percentages are stated as a percent of net assets. |
ADR – American Depositary Receipt |
(a) | Non-Income producing. |
(b) | As of March 31, 2011, the Advisor has fair valued this security and deemed it illiquid. (unaudited) The value of this security was $100 which represents 0.00% of total net assets. |
See notes to financial statements.
30
|
GuideMarkSM Tax-Exempt Fixed Income Fund |
SCHEDULE OF INVESTMENTS |
March 31, 2011 |
| |
| | | | | | | |
Principal
Amount | | | | Value | |
| | | | | | |
| | | MUNICIPAL BONDS - 67.58% | | | | |
| | | Alabama - 0.31% | | | | |
$ | 500,000 | | Mobile Industrial Development | | | | |
| | | Board Pollution Control, | | | | |
| | | Revenue Bond, | | | | |
| | | 4.875%, 06/01/2034 | | $ | 525,850 | |
| | | | | | | |
| | | Alaska - 0.49% | | | | |
| 925,000 | | Northern Tobacco Securitization | | | | |
| | | Corp., Series A, Refunding, | | | | |
| | | Revenue Bond, | | | | |
| | | 4.625%, 06/01/2023 | | | 831,066 | |
| | | | | | | |
| | | Arizona - 2.40% | | | | |
| 1,000,000 | | Phoenix Civic Improvement Corp., | | | | |
| | | Revenue Bond, | | | | |
| | | 5.500%, 07/01/2028 | | | 932,840 | |
| 1,000,000 | | Phoenix Civic Improvement | | | | |
| | | Wastewater System, Refunding, | | | | |
| | | Revenue Bond, | | | | |
| | | 5.000%, 07/01/2020 | | | 1,062,560 | |
| 1,000,000 | | Pinal County Industrial Development | | | | |
| | | Authority Correctional Facilities, | | | | |
| | | Revenue Bond, ACA Insured, | | | | |
| | | 5.250%, 10/01/2015 | | | 1,001,580 | |
| 1,000,000 | | Salt River Project, Series A, | | | | |
| | | Revenue Bond, | | | | |
| | | 5.000%, 01/01/2021 | | | 1,093,070 | |
| | | | | | | |
| | | | | | 4,090,050 | |
| | | | | | | |
| | | California - 9.52% | | | | |
| 1,000,000 | | California Department of Water | | | | |
| | | Resources Power Supply, Series L, | | | | |
| | | Refunding, Revenue Bond, | | | | |
| | | 5.000%, 05/01/2019 | | | 1,121,850 | |
| 445,000 | | California Economic Recovery, | | | | |
| | | Series A, Refunding, GO, | | | | |
| | | 5.250%, 07/01/2021 | | | 484,013 | |
| 710,000 | | California Municipal Finance | | | | |
| | | Authority, Mobile Home Park, | | | | |
| | | Series A, Refunding, Revenue Bond, | | | | |
| | | 6.400%, 08/15/2045 | | | 640,448 | |
| | | California Statewide Communities | | | | |
| | | Development Authority, Refunding, | | | | |
| | | Revenue Bond, | | | | |
| | | | | | | |
Principal
Amount | | | | Value | |
| | | | | | |
| | | California (Continued) | | | | |
$ | 5,000,000 | | 0.170%, 12/01/2034 (a) | | $ | 5,000,000 | |
| 860,000 | | 6.125%, 07/01/2046 | | | 792,241 | |
| 600,000 | | California Statewide Communities | | | | |
| | | Development Authority, Series A, | | | | |
| | | Revenue Bond, ACA Insured, | | | | |
| | | 5.625%, 08/01/2034 | | | 544,002 | |
| 1,000,000 | | California, GO, | | | | |
| | | 6.500%, 04/01/2033 | | | 1,080,710 | |
| 1,000,000 | | California, Refunding, GO, | | | | |
| | | 0.170%, 05/01/2034 (a) | | | 1,000,000 | |
| 1,000,000 | | Gilroy Unified School District, GO, | | | | |
| | | Assured Guaranty Insured, | | | | |
| | | 6.000%, 08/01/2025 | | | 1,104,550 | |
| 700,000 | | Golden State Tobacco Securitization, | | | | |
| | | Series A, Revenue Bond, | | | | |
| | | 5.000%, 06/01/2017 | | | 700,273 | |
| 1,000,000 | | Los Angeles Department of Airports, | | | | |
| | | Series A, Refunding, Revenue Bond, | | | | |
| | | 5.250%, 05/15/2029 | | | 1,022,470 | |
| 580,000 | | Los Angeles Unified School District, | | | | |
| | | Series F, GO, FGIC Insured, | | | | |
| | | 5.000%, 07/01/2021 | | | 598,676 | |
| 500,000 | | Roseville Westpark Community | | | | |
| | | Facilities, Special Tax, | | | | |
| | | 5.250%, 09/01/2037 | | | 374,630 | |
| 1,175,000 | | San Francisco Steinhart Aquarium, | | | | |
| | | Series F, GO, | | | | |
| | | 5.000%, 06/15/2023 | | | 1,229,273 | |
| 500,000 | | San Mateo Joint Powers Financing | | | | |
| | | Authority, Series A, Refunding, | | | | |
| | | Revenue Bond, | | | | |
| | | 5.250%, 07/15/2025 | | | 511,965 | |
| | | | | | | |
| | | | | | 16,205,101 | |
| | | | | | | |
| | | Colorado - 0.40% | | | | |
| 700,000 | | Regional Transportation District, | | | | |
| | | Revenue Bond, | | | | |
| | | 6.000%, 01/15/2026 | | | 679,917 | |
| | | | | | | |
| | | Connecticut - 0.63% | | | | |
| 1,000,000 | | Connecticut Health & Educational | | | | |
| | | Facilities Authority, Series A, | | | | |
| | | Refunding, Revenue Bond, | | | | |
| | | 5.000%, 07/01/2025 | | | 1,070,690 | |
| | | | | | | |
See notes to financial statements.
31
|
GuideMarkSM Tax-Exempt Fixed Income Fund |
SCHEDULE OF INVESTMENTS (Continued) |
March 31, 2011 |
| |
| | | | | | | |
Principal
Amount | | | | Value | |
| | | | | | |
| | | MUNICIPAL BONDS (Continued) | | | | |
| | | Delaware - 0.46% | | | | |
$ | 1,000,000 | | New Castle County, Revenue Bond, | | | | |
| | | 5.000%, 09/01/2036 | | $ | 779,650 | |
| | | | | | | |
| | | Florida - 2.31% | | | | |
| 315,000 | | Beacon Lakes Community | | | | |
| | | Development, Series A, | | | | |
| | | Special Assessment, | | | | |
| | | 6.000%, 05/01/2038 | | | 259,317 | |
| 240,000 | | Boynton Village Community | | | | |
| | | Development District, Series A, | | | | |
| | | Special Assessment, | | | | |
| | | 5.750%, 05/01/2037 | | | 167,808 | |
| 300,000 | | Brevard County Health Facilities | | | | |
| | | Authority, Revenue Bond, | | | | |
| | | 7.000%, 04/01/2039 | | | 318,036 | |
| 300,000 | | Gulf Breeze, Series J, Refunding, | | | | |
| | | Revenue Bond, | | | | |
| | | 2.600%, 12/01/2020 | | | 301,596 | |
| 1,250,000 | | Miami-Dade County Educational | | | | |
| | | Facilities, Series A, Revenue Bond, | | | | |
| | | 5.000%, 04/01/2034 | | | 1,389,825 | |
| 500,000 | | Miami-Dade County Health Facilities, | | | | |
| | | Series A, Refunding, Revenue Bond, | | | | |
| | | 5.250%, 08/01/2021 | | | 494,865 | |
| 500,000 | | Palm Beach County School Board, | | | | |
| | | Refunding, CP, Assured Guaranty | | | | |
| | | and AMBAC Insured, | | | | |
| | | 5.000%, 08/01/2020 | | | 527,090 | |
| 625,000 | | Tolomato Community Development | | | | |
| | | District, Special Assessment, | | | | |
| | | 6.375%, 05/01/2017 | | | 463,956 | |
| | | | | | | |
| | | | | | 3,922,493 | |
| | | | | | | |
| | | Georgia - 1.63% | | | | |
| 1,000,000 | | Atlanta Water & Wastewater, | | | | |
| | | Revenue Bond, | | | | |
| | | 6.250%, 11/01/2039 | | | 1,036,150 | |
| 1,000,000 | | Fulton County School District, | | | | |
| | | Refunding, GO, | | | | |
| | | 5.250%, 01/01/2014 | | | 1,111,650 | |
| 700,000 | | Marietta Development Authority, | | | | |
| | | Revenue Bond, | | | | |
| | | 7.000%, 06/15/2039 | | | 636,398 | |
| | | | | | | |
| | | | | | 2,784,198 | |
| | | | | | | |
| | | | | | | |
Principal
Amount | | | | Value | |
| | | | | | |
| | | Idaho - 0.63% | | | | |
$ | 1,000,000 | | Boise-Kuna District, Revenue Bond, | | | | |
| | | 7.375%, 06/01/2034 | | $ | 1,081,340 | |
| | | | | | | |
| | | Illinois - 2.98% | | | | |
| 1,000,000 | | Chicago Board of Education, | | | | |
| | | Series B, Refunding, GO, | | | | |
| | | 5.000%, 12/01/2023 | | | 979,740 | |
| 65,000 | | Chicago Wastewater Transmission, | | | | |
| | | Refunding, Revenue Bond, | | | | |
| | | FGIC Insured, | | | | |
| | | 5.375%, 01/01/2013 | | | 66,642 | |
| 850,000 | | Illinois Financial Authority, | | | | |
| | | Revenue Bond, | | | | |
| | | 7.000%, 08/15/2044 | | | 843,387 | |
| 400,000 | | Markham, Series A, GO, | | | | |
| | | 6.000%, 02/01/2025 | | | 397,364 | |
| 525,000 | | Markham, Series C, GO, | | | | |
| | | 4.750%, 02/01/2017 | | | 521,577 | |
| 500,000 | | Northlake, GO, FGIC Insured, | | | | |
| | | 5.000%, 12/01/2029 | | | 502,655 | |
| | | Railsplitter Tobacco Settlement | | | | |
| | | Authority, Revenue Bond, | | | | |
| 750,000 | | 5.000%, 06/01/2018 | | | 749,055 | |
| 500,000 | | 5.500%, 06/01/2023 | | | 480,265 | |
| 500,000 | | 6.250%, 06/01/2024 | | | 503,885 | |
| | | | | | | |
| | | | | | 5,044,570 | |
| | | | | | | |
| | | Indiana - 2.06% | | | | |
| 500,000 | | Fishers Industry Redevelopment | | | | |
| | | District, Saxony Project, | | | | |
| | | Revenue Bond, | | | | |
| | | 5.250%, 07/15/2034 | | | 497,300 | |
| 390,000 | | Indiana State Finance Authority, | | | | |
| | | Refunding, Revenue Bond, | | | | |
| | | 6.000%, 12/01/2026 | | | 380,695 | |
| 1,000,000 | | Indiana State Finance Authority, | | | | |
| | | Series A, Refunding, | | | | |
| | | Revenue Bond, | | | | |
| | | 5.000%, 02/01/2021 | | | 1,113,760 | |
| 655,000 | | Sheridan Community School’s | | | | |
| | | Building Corporation, Revenue | | | | |
| | | Bond, FSA Insured, | | | | |
| | | 5.500%, 07/15/2020 | | | 727,816 | |
See notes to financial statements.
32
|
GuideMarkSM Tax-Exempt Fixed Income Fund |
SCHEDULE OF INVESTMENTS (Continued) |
March 31, 2011 |
| |
| | | | | | | |
Principal
Amount | | | | Value | |
| | | | | | |
| | | MUNICIPAL BONDS (Continued) | | | | |
| | | Indiana (Continued) | | | | |
$ | 750,000 | | Tri-Creek Middle School Building | | | | |
| | | Corporation, Revenue Bond, | | | | |
| | | FSA Insured, | | | | |
| | | 5.250%, 07/15/2021 | | $ | 807,173 | |
| | | | | | | |
| | | | | | 3,526,744 | |
| | | | | | | |
| | | Iowa - 1.06% | | | | |
| 600,000 | | Iowa Finance Authority Pollution | | | | |
| | | Control, Revenue Bond, | | | | |
| | | FGIC Insured, | | | | |
| | | 5.000%, 07/01/2014 | | | 651,828 | |
| 1,000,000 | | Iowa Finance Authority, | | | | |
| | | Revenue Bond, | | | | |
| | | 5.000%, 08/01/2018 | | | 1,151,130 | |
| | | | | | | |
| | | | | | 1,802,958 | |
| | | | | | | |
| | | Kansas - 0.55% | | | | |
| 715,000 | | Wyandotte County, Revenue Bond, | | | | |
| | | 4.875%, 10/01/2028 | | | 517,746 | |
| 785,000 | | Wyandotte County/Kansas City | | | | |
| | | Unified Government, Series B, | | | | |
| | | Refunding, Revenue Bond, | | | | |
| | | 0.000%, 06/01/2021 (b) | | | 421,003 | |
| | | | | | | |
| | | | | | 938,749 | |
| | | | | | | |
| | | Louisiana - 0.88% | | | | |
| 800,000 | | Louisiana Citizens Property, | | | | |
| | | Revenue Bond, | | | | |
| | | 6.750%, 06/01/2026 | | | 914,800 | |
| 500,000 | | Louisiana Public Facilities Authority, | | | | |
| | | Revenue Bond, | | | | |
| | | 5.500%, 05/15/2032 | | | 573,975 | |
| | | | | | | |
| | | | | | 1,488,775 | |
| | | | | | | |
| | | Maryland - 2.42% | | | | |
| 550,000 | | Anne Arundel County, | | | | |
| | | Tax Allocation, | | | | |
| | | 6.100%, 07/01/2040 | | | 499,395 | |
| 1,160,000 | | Maryland Department of | | | | |
| | | Transportation County T | | | | |
| | | Construction, Revenue Bond, | | | | |
| | | 5.500%, 02/01/2017 | | | 1,365,308 | |
| | | | | | | |
Principal
Amount | | | | Value | |
| | | | | | |
| | | Maryland (Continued) | | | | |
$ | 485,000 | | Maryland Economic Development | | | | |
| | | Corporation, Refunding, Revenue | | | | |
| | | Bond, Consol Energy, Inc. Insured, | | | | |
| | | 5.750%, 09/01/2025 | | $ | 452,990 | |
| 500,000 | | Maryland Economic Development | | | | |
| | | Corporation, Series A, | | | | |
| | | Revenue Bond, | | | | |
| | | 5.750%, 06/01/2035 | | | 465,475 | |
| 750,000 | | Maryland Health & Higher Education | | | | |
| | | Facilities Authority, Revenue Bond, | | | | |
| | | 5.200%, 01/01/2024 | | | 679,005 | |
| 700,000 | | Maryland Student Housing Economic | | | | |
| | | Development, Revenue Bond, | | | | |
| | | 5.750%, 06/01/2033 | | | 669,564 | |
| | | | | | | |
| | | | | | 4,131,737 | |
| | | | | | | |
| | | Massachusetts - 8.68% | | | | |
| 430,000 | | Massachusetts Development Finance | | | | |
| | | Agency, Series A, Revenue Bond, | | | | |
| | | 5.450%, 04/15/2014 | | | 438,389 | |
| 1,000,000 | | Massachusetts Health & Educational | | | | |
| | | Facilities Authority, Revenue Bond, | | | | |
| | | 5.500%, 07/01/2032 | | | 1,135,790 | |
| | | Massachusetts Health & Educational | | | | |
| | | Facilities Authority, Series A, | | | | |
| | | Refunding, Revenue Bond, | | | | |
| 700,000 | | 5.000%, 12/15/2029 | | | 743,015 | |
| 785,000 | | 5.500%, 11/15/2036 | | | 829,894 | |
| 500,000 | | Massachusetts Health & Educational | | | | |
| | | Facilities Authority, Series B, | | | | |
| | | Revenue Bond, | | | | |
| | | 5.000%, 10/01/2038 | | | 504,960 | |
| 800,000 | | Massachusetts Health & Educational | | | | |
| | | Facilities Authority, Series C, | | | | |
| | | Revenue Bond, | | | | |
| | | 6.125%, 10/01/2029 | | | 808,000 | |
| 5,300,000 | | Massachusetts Health & Educational | | | | |
| | | Facilities Authority, Series N, | | | | |
| | | Revenue Bond, | | | | |
| | | 0.150%, 08/15/2034 (a) | | | 5,300,000 | |
See notes to financial statements.
33
|
GuideMarkSM Tax-Exempt Fixed Income Fund |
SCHEDULE OF INVESTMENTS (Continued) |
March 31, 2011 |
| |
| | | | | | | |
Principal
Amount | | | | Value | |
| | | | | | |
| | | MUNICIPAL BONDS (Continued) | | | | |
| | | Massachusetts (Continued) | | | | |
$ | 5,000,000 | | Massachusetts Health & Educational | | | | |
| | | Facilities Authority, Series R, | | | | |
| | | Refunding, Revenue Bond, | | | | |
| | | 0.150%, 11/01/2049 (a) | | $ | 5,000,000 | |
| | | | | | | |
| | | | | | 14,760,048 | |
| | | | | | | |
| | | Michigan - 0.93% | | | | |
| 800,000 | | Lansing School District, Refunding, | | | | |
| | | GO, Q-SBLF Insured, | | | | |
| | | 5.000%, 05/01/2017 | | | 858,528 | |
| 725,000 | | Michigan Building Authority, Series I, | | | | |
| | | Refunding, Revenue Bond, | | | | |
| | | 4.750%, 10/15/2025 | | | 724,949 | |
| | | | | | | |
| | | | | | 1,583,477 | |
| | | | | | | |
| | | Minnesota - 0.72% | | | | |
| 700,000 | | Minneapolis & St. Paul Housing and | | | | |
| | | Redevelopment Authority Health | | | | |
| | | Care, Revenue Bond, | | | | |
| | | 4.000%, 08/15/2015 | | | 738,367 | |
| 500,000 | | St. Paul Housing & Redevelopment | | | | |
| | | Authority, Refunding, | | | | |
| | | Revenue Bond, | | | | |
| | | 5.700%, 11/01/2015 | | | 499,775 | |
| | | | | | | |
| | | | | | 1,238,142 | |
| | | | | | | |
| | | Missouri - 2.56% | | | | |
| 810,000 | | Hannibal Industrial Development | | | | |
| | | Authority, Hannibal Regional | | | | |
| | | Hospital, Refunding, | | | | |
| | | Revenue Bond, | | | | |
| | | 5.250%, 09/01/2018 | | | 818,513 | |
| 900,000 | | Missouri Development Finance Board, | | | | |
| | | Revenue Bond, | | | | |
| | | 5.750%, 06/01/2034 | | | 914,688 | |
| 1,000,000 | | Missouri Health & Educational | | | | |
| | | Facilities Authority, Series A, | | | | |
| | | Revenue Bond, | | | | |
| | | 5.375%, 03/15/2039 | | | 1,035,980 | |
| 1,000,000 | | Missouri Highway & Transportation | | | | |
| | | Commission, Series B, | | | | |
| | | Revenue Bond, | | | | |
| | | 5.000%, 05/01/2024 | | | 1,065,780 | |
| | | | | | | |
Principal
Amount | | | | Value | |
| | | | | | |
| | | Missouri (Continued) | | | | |
$ | 500,000 | | St. Louis Airport, Revenue Bond, | | | | |
| | | 6.625%, 07/01/2034 | | $ | 506,095 | |
| | | | | | | |
| | | | | | 4,341,056 | |
| | | | | | | |
| | | New York - 5.47% | | | | |
| 740,000 | | Brooklyn Arena Local Development | | | | |
| | | Corporation, Revenue Bond, | | | | |
| | | 6.500%, 07/15/2030 | | | 748,865 | |
| 500,000 | | East Rochester Housing Authority | | | | |
| | | Senior Living, Revenue Bond, | | | | |
| | | 5.500%, 08/01/2033 | | | 401,070 | |
| 500,000 | | Long Island Power Authority, | | | | |
| | | Series A, Refunding, | | | | |
| | | Revenue Bond, | | | | |
| | | 6.000%, 05/01/2033 | | | 531,830 | |
| 1,000,000 | | Metropolitan Transportation Authority, | | | | |
| | | Series F, Revenue Bond, | | | | |
| | | 5.000%, 11/15/2014 | | | 1,097,030 | |
| 500,000 | | New York City Transit Authority, | | | | |
| | | Series A, CP, AMBAC Insured, | | | | |
| | | 5.625%, 01/01/2012 | | | 501,650 | |
| 1,250,000 | | New York City, Series A, GO, | | | | |
| | | 5.000%, 08/01/2020 | | | 1,336,438 | |
| 500,000 | | New York Dormitory Authority, | | | | |
| | | Revenue Bond, | | | | |
| | | 6.125%, 12/01/2029 | | | 471,615 | |
| 1,000,000 | | New York Dormitory Authority, | | | | |
| | | Series B, Revenue Bond, | | | | |
| | | 5.250%, 11/15/2023 | | | 1,046,830 | |
| 500,000 | | New York Environmental Facilities, | | | | |
| | | Revenue Bond, | | | | |
| | | 5.500%, 10/15/2027 | | | 574,310 | |
| 1,000,000 | | New York, GO, | | | | |
| | | 5.375%, 04/01/2036 | | | 1,015,230 | |
| | | Sales Tax Asset Receivable Corp., | | | | |
| | | Series A, Revenue Bond, | | | | |
| 500,000 | | 5.000%, 10/15/2017 | | | 551,565 | |
| 500,000 | | 5.250%, 10/15/2019 | | | 551,490 | |
| 500,000 | | Tobacco Settlement Financing, | | | | |
| | | Revenue Bond, | | | | |
| | | 5.250%, 06/01/2021 | | | 515,890 | |
| | | | | | | |
| | | | | | 9,343,813 | |
| | | | | | | |
See notes to financial statements.
34
|
GuideMarkSM Tax-Exempt Fixed Income Fund |
SCHEDULE OF INVESTMENTS (Continued) |
March 31, 2011 |
| |
| | | | | | | |
Principal
Amount | | | | Value | |
| | | | | | |
| | | MUNICIPAL BONDS (Continued) | | | | |
| | | North Carolina - 0.50% | | | | |
$ | 850,000 | | North Carolina Capital Facilities | | | | |
| | | Finance Agency, Series B, | | | | |
| | | Refunding, Revenue Bond, | | | | |
| | | 5.000%, 10/01/2038 | | $ | 856,673 | |
| | | | | | | |
| | | Ohio - 2.20% | | | | |
| 1,660,000 | | Buckeye Tobacco Settlement | | | | |
| | | Financial Authority, Series A, | | | | |
| | | Revenue Bond, | | | | |
| | | 5.875%, 06/01/2047 | | | 1,104,813 | |
| 750,000 | | Lorain, Refunding, GO, | | | | |
| | | 6.750%, 12/01/2023 | | | 807,383 | |
| 690,000 | | Ohio Air Quality Development | | | | |
| | | Authority, Series A, Revenue Bond, | | | | |
| | | 5.700%, 08/01/2020 | | | 711,576 | |
| 1,000,000 | | Ohio, Series A, GO, | | | | |
| | | 5.000%, 09/01/2015 | | | 1,131,310 | |
| | | | | | | |
| | | | | | 3,755,082 | |
| | | | | | | |
| | | Oklahoma - 0.38% | | | | |
| 650,000 | | Tulsa Industrial Authority, Series A, | | | | |
| | | Refunding, Revenue Bond, | | | | |
| | | NATL-RE Insured, | | | | |
| | | 5.000%, 10/01/2022 | | | 650,000 | |
| | | | | | | |
| | | Oregon - 0.62% | | | | |
| 1,000,000 | | Clackamas County School District, | | | | |
| | | GO, | | | | |
| | | 5.000%, 06/15/2021 | | | 1,054,340 | |
| | | | | | | |
| | | Pennsylvania - 6.97% | | | | |
| 1,250,000 | | Allegheny County Hospital | | | | |
| | | Development Authority, Series A, | | | | |
| | | Revenue Bond, | | | | |
| | | 5.000%, 09/01/2014 | | | 1,371,113 | |
| 370,000 | | Allegheny County Industrial | | | | |
| | | Development Authority, Refunding, | | | | |
| | | Revenue Bond, | | | | |
| | | 6.500%, 05/01/2017 | | | 392,189 | |
| 880,000 | | Blair County, Series A, Refunding, | | | | |
| | | GO, | | | | |
| | | 5.375%, 08/01/2015 | | | 964,841 | |
| 900,000 | | Butler County Hospital Authority, | | | | |
| | | Revenue Bond, | | | | |
| | | 7.125%, 07/01/2029 | | | 975,897 | |
| | | | | | | |
Principal
Amount | | | | Value | |
| | | | | | |
| | | Pennsylvania (Continued) | | | | |
$ | 1,000,000 | | Lackawanna County, Series B, | | | | |
| | | Refunding, GO, | | | | |
| | | 6.000%, 09/15/2032 | | $ | 1,020,520 | |
| 1,240,000 | | Pennsylvania Economic Development | | | | |
| | | Financing Authority, Albert Einstein | | | | |
| | | Healthcare, Series A, Refunding, | | | | |
| | | Revenue Bond, | | | | |
| | | 6.250%, 10/15/2023 | | | 1,270,392 | |
| 500,000 | | Pennsylvania Economic Development | | | | |
| | | Financing Authority, Allegheny | | | | |
| | | Energy Supply, Revenue Bond, | | | | |
| | | 7.000%, 07/15/2039 | | | 524,870 | |
| | | Pennsylvania Higher Educational | | | | |
| | | Facilities Authority, Revenue Bond, | | | | |
| 1,000,000 | | 5.250%, 07/01/2019 | | | 1,023,410 | |
| 500,000 | | 5.800%, 07/01/2030 | | | 478,190 | |
| 1,000,000 | | Pennsylvania, Refunding, GO, | | | | |
| | | 5.250%, 02/01/2014 | | | 1,114,700 | |
| 1,000,000 | | Pennsylvania, Series A, GO, | | | | |
| | | 5.000%, 08/01/2023 | | | 1,075,550 | |
| 1,000,000 | | Philadelphia Gas Works, Refunding, | | | | |
| | | Revenue Bond, | | | | |
| | | 5.250%, 08/01/2017 | | | 1,071,470 | |
| 625,000 | | Westmoreland County Industrial | | | | |
| | | Development Authority, | | | | |
| | | Revenue Bond, | | | | |
| | | 5.000%, 07/01/2025 | | | 600,931 | |
| | | | | | | |
| | | | | | 11,884,073 | |
| | | | | | | |
| | | Puerto Rico - 1.21% | | | | |
| 625,000 | | Puerto Rico Commonwealth, Series A, | | | | |
| | | Refunding, Revenue Bond, Assured | | | | |
| | | Guaranty Insured, | | | | |
| | | 5.000%, 07/01/2016 | | | 667,325 | |
| 620,000 | | Puerto Rico Commonwealth, | | | | |
| | | Series B, Prerefunded, | | | | |
| | | Refunding, GO, | | | | |
| | | 5.250%, 07/01/2032 | | | 729,176 | |
| 700,000 | | Puerto Rico Electric Power Authority, | | | | |
| | | Revenue Bond, | | | | |
| | | 5.750%, 07/01/2036 | | | 657,454 | |
| | | | | | | |
| | | | | | 2,053,955 | |
| | | | | | | |
See notes to financial statements.
35
|
GuideMarkSM Tax-Exempt Fixed Income Fund |
SCHEDULE OF INVESTMENTS (Continued) |
March 31, 2011 |
| |
| | | | | | | |
Principal
Amount | | | | Value | |
| | | | | | |
| | | MUNICIPAL BONDS (Continued) | | | | |
| | | South Dakota - 0.31% | | | | |
$ | 500,000 | | South Dakota Housing Development | | | | |
| | | Authority, Series A, Revenue Bond, | | | | |
| | | 4.250%, 05/01/2015 | | $ | 521,575 | |
| | | | | | | |
| | | Tennessee - 0.31% | | | | |
| 500,000 | | Memphis-Shelby County Airport | | | | |
| | | Authority Special Facilities, | | | | |
| | | Refunding, Revenue Bond, | | | | |
| | | 5.050%, 09/01/2012 | | | 522,160 | |
| | | | | | | |
| | | Texas - 4.45% | | | | |
| 1,370,000 | | Capital Area Cultural Education | | | | |
| | | Facilities Finance Corporation, | | | | |
| | | Refunding, Revenue Bond, | | | | |
| | | 5.000%, 04/01/2018 | | | 1,396,687 | |
| 635,000 | | Clifton Texas Higher Education | | | | |
| | | Finance Corporation, Series A, | | | | |
| | | Refunding, Revenue Bond, | | | | |
| | | 4.000%, 12/01/2015 | | | 621,246 | |
| 425,000 | | Harris County Industrial | | | | |
| | | Development, Revenue Bond, | | | | |
| | | 5.000%, 02/01/2023 | | | 427,941 | |
| 780,000 | | La Porte Independent School District, | | | | |
| | | GO, | | | | |
| | | 5.250%, 02/15/2024 | | | 825,022 | |
| 200,000 | | Lower Colorado River Authority, | | | | |
| | | Series B, Refunding, Revenue Bond, | | | | |
| | | FSA Insured, | | | | |
| | | 6.000%, 05/15/2013 | | | 200,662 | |
| 700,000 | | North Texas Tollway Authority, | | | | |
| | | Series A, Refunded, Revenue Bond, | | | | |
| | | 6.000%, 01/01/2019 | | | 781,060 | |
| 770,000 | | North Texas Tollway Authority, | | | | |
| | | Series E, Refunding, Revenue Bond, | | | | |
| | | 5.750%, 01/01/2038 | | | 847,832 | |
| 15,000 | | Socorro Independent School District, | | | | |
| | | Unrefunded, GO, PSF-GTD Insured, | | | | |
| | | 5.375%, 08/15/2013 | | | 15,246 | |
| 850,000 | | Texas Private Activity Surface | | | | |
| | | Transportation Corp., | | | | |
| | | Revenue Bond, | | | | |
| | | 7.500%, 12/31/2031 | | | 904,120 | |
| 500,000 | | Texas Transportation Commission, | | | | |
| | | Revenue Bond, | | | | |
| | | 5.000%, 04/01/2018 | | | 564,675 | |
| | | | | | | |
Principal
Amount | | | | Value | |
| | | | | | |
| | | Texas (Continued) | | | | |
$ | 500,000 | | Texas, GO, | | | | |
| | | 5.000%, 04/01/2016 | | $ | 572,160 | |
| 400,000 | | Texas, Series A, GO, | | | | |
| | | 5.000%, 04/01/2022 | | | 433,512 | |
| | | | | | | |
| | | | | | 7,590,163 | |
| | | | | | | |
| | | Utah - 0.42% | | | | |
| 630,000 | | Sandy City Utah Sales Tax, | | | | |
| | | Refunding, Revenue Bond, | | | | |
| | | 5.000%, 09/15/2016 | | | 716,228 | |
| | | | | | | |
| | | Virgin Islands - 0.57% | | | | |
| 1,000,000 | | Virgin Islands Public Finance | | | | |
| | | Authority, Refunding, | | | | |
| | | Revenue Bond, | | | | |
| | | 5.000%, 10/01/2025 | | | 969,920 | |
| | | | | | | |
| | | Virginia - 0.93% | | | | |
| 1,000,000 | | Henry County Public Service | | | | |
| | | Authority Water & Sewer, | | | | |
| | | Refunding, Revenue Bond, | | | | |
| | | FSA Insured, | | | | |
| | | 5.500%, 11/15/2019 | | | 1,137,980 | |
| 400,000 | | Virginia College Building Authority | | | | |
| | | Educational Facilities, | | | | |
| | | Revenue Bond, | | | | |
| | | 5.750%, 01/01/2034 | | | 441,024 | |
| | | | | | | |
| | | | | | 1,579,004 | |
| | | | | | | |
| | | Washington - 0.31% | | | | |
| 500,000 | | King County Hospital, Refunding, | | | | |
| | | GO, MBIA Insured, | | | | |
| | | 5.000%, 12/01/2021 | | | 526,090 | |
| | | | | | | |
| | | Wisconsin - 1.31% | | | | |
| 260,000 | | Badger Tobacco Asset Securitization, | | | | |
| | | Revenue Bond, | | | | |
| | | 6.125%, 06/01/2027 | | | 270,691 | |
| 500,000 | | Southeast Wisconsin Professional | | | | |
| | | Baseball Park Sales Tax, Series A, | | | | |
| | | Revenue Bond, MBIA Insured, | | | | |
| | | 5.500%, 12/15/2026 | | | 517,350 | |
| 400,000 | | Wisconsin Health & Educational | | | | |
| | | Facilities, Series A, Revenue Bond, | | | | |
| | | 5.000%, 02/15/2018 | | | 398,140 | |
See notes to financial statements.
36
|
GuideMarkSM Tax-Exempt Fixed Income Fund |
SCHEDULE OF INVESTMENTS (Continued) |
March 31, 2011 |
| |
| | | | | | | |
Principal
Amount | | | | Value | |
| | | | | | |
| | | MUNICIPAL BONDS (Continued) | | | | |
| | | Wisconsin (Continued) | | | | |
$ | 1,000,000 | | Wisconsin, Series A, Refunding, | | | | |
| | | Revenue Bond, | | | | |
| | | 6.000%, 05/01/2033 | | $ | 1,061,620 | |
| | | | | | | |
| | | | | | 2,247,801 | |
| | | | | | | |
| | | Total Municipal Bonds | | | | |
| | | (Cost $114,370,584) | | | 115,097,488 | |
| | | | | | | |
| | | | | | | |
Number of
Shares | | | | | | |
| | | | | | | |
| | | SHORT TERM INVESTMENTS - 31.12% | | | | |
| | | Money Market Funds - 31.12% | | | | |
| 53,015,102 | | Fidelity Tax Exempt Portfolio | | | | |
| | | Effective Yield, 0.08% | | | 53,015,102 | |
| | | | | | | |
| | | Total Short Term Investments | | | | |
| | | (Cost $53,015,102) | | | 53,015,102 | |
| | | | | | | |
| | | Total Investments | | | | |
| | | (Cost $167,385,686) - 98.70% | | | 168,112,590 | |
| | | Other Assets and Liabilities - 1.30% | | | 2,217,554 | |
| | | | | | | |
| | | TOTAL NET ASSETS - 100.00% | | $ | 170,330,144 | |
| | | | | | | |
| |
Percentages are stated as a percent of net assets. |
(a) | Variable Rate Security. The rate shown is the rate in effect on March 31, 2011. |
(b) | Zero coupon bond. |
| |
Glossary of Terms |
AMBAC | - American Municipal Bond Assurance Corp. |
ACA | - American Capital Access |
CP | - Certificate of Participation |
FGIC | - Financial Guaranty Insurance Corp. |
FSA | - Financial Security Assurance, Inc. |
GO | - General Obligation |
MBIA | - Municipal Bond Investors Assurance Corp. |
NATL-RE | - National Public Finance Guarantee Corporation |
PSF-GTD | - Permanent School Fund Guaranteed |
Q-SBLF | - Qualified School Board Loan |
See notes to financial statements.
37
|
GuideMarkSM Core Fixed Income Fund |
SCHEDULE OF INVESTMENTS |
March 31, 2011 |
| |
| | | | | | | |
Number of
Shares | | | | Value | |
| | | | | | |
| | | COMMON STOCKS - 0.00% | | | | |
| | | Oil & Gas - 0.00% | | | | |
| 259 | | Semgroup Corp. (a) | | $ | 7,293 | |
| | | | | | | |
| | | Total Common Stocks | | | | |
| | | (Cost $98,745) | | | 7,293 | |
| | | | | | | |
| | | CONVERTIBLE PREFERRED | | | | |
| | | STOCKS - 0.02% | | | | |
| | | Automobiles - 0.02% | | | | |
| 13,800 | | General Motors Corp. (a) | | | 101,633 | |
| | | | | | | |
| | | Total Convertible Preferred Stocks | | | | |
| | | (Cost $304,161) | | | 101,633 | |
| | | | | | | |
| | | PREFERRED STOCKS - 0.09% | | | | |
| | | Diversified Financial Services - 0.09% | | | | |
| 14,200 | | Citigroup Capital XII | | | 373,886 | |
| 44,650 | | Federal Home Loan Mortgage | | | | |
| | | Corp. (a) | | | 75,905 | |
| | | | | | | |
| 33,650 | | Federal National Mortgage | | | | |
| | | Association (a) | | | 58,895 | |
| | | | | | | |
| | | Total Preferred Stocks | | | | |
| | | (Cost $2,349,217) | | | 508,686 | |
| | | | | | | |
| | | | | | | |
Principal
Amount | | | | | | |
| | | | | | | |
| | | ASSET BACKED SECURITIES - 2.07% | | | | |
$ | 1,454,798 | | Brazos Higher Education Authority | | | | |
| | | Series 2005-3, 0.418%, | | | | |
| | | 09/25/2023 (e) | | | 1,439,350 | |
| 1,030,000 | | CNH Equipment Trust | | | | |
| | | Series 2010-C, 1.170%, 05/15/2015 | | | 1,028,937 | |
| 76,543 | | Conseco Finance Securitizations Corp. | | | | |
| | | Series 2000-4, 8.310%, 05/01/2032 | | | 59,236 | |
| 129,459 | | Countrywide Asset-Backed | | | | |
| | | Certificiates | | | | |
| | | Series 2005-4, 4.456%, | | | | |
| | | 10/25/2035 (e) | | | 128,452 | |
| | | Countrywide Home Equity | | | | |
| | | Loan Trust | | | | |
| 208,187 | | Series 2004-R, 0.505%, | | | | |
| | | 03/15/2030 (e) | | | 119,390 | |
| 288,572 | | Series 2004-N, 0.535%, | | | | |
| | | 02/15/2034 (e) | | | 172,129 | |
| | | | | | | |
Principal
Amount | | | | Value | |
| | | | | | |
| | | ASSET BACKED SECURITIES (Continued) | | | | |
$ | 310,083 | | Series 2004-O, 0.535%, | | | | |
| | | 02/15/2034 (e) | | $ | 186,220 | |
| 300,547 | | Series 2005-F, 0.495%, | | | | |
| | | 12/15/2035 (e) | | | 163,633 | |
| 473,034 | | Education Funding Capital Trust I | | | | |
| | | Series 2004-1, 0.470%, | | | | |
| | | 12/15/2022 (e) | | | 469,888 | |
| 473,586 | | Goal Capital Funding Trust | | | | |
| | | Series 2010-1, 1.012%, | | | | |
| | | 08/25/2048 (c)(e) | | | 472,642 | |
| 479,973 | | Knowledgeworks Foundation | | | | |
| | | Series 2010-1, 1.262%, | | | | |
| | | 02/25/2042 (e) | | | 472,811 | |
| 732,507 | | Morgan Stanley | | | | |
| | | Series 2003-N, 1.270%, | | | | |
| | | 10/25/2033 (e) | | | 636,871 | |
| 567,287 | | Nelnet Student Loan Trust | | | | |
| | | Series 2010-3, 1.083%, | | | | |
| | | 07/25/2048 (c)(e) | | | 567,248 | |
| 2,568,738 | | New Valley Generation | | | | |
| | | Series 2000-1, 7.299%, | | | | |
| | | 03/15/2019 | | | 2,968,033 | |
| 177,317 | | Northstar Education Finance, Inc. | | | | |
| | | Series 2005-1, 0.404%, | | | | |
| | | 10/28/2026 (e) | | | 176,374 | |
| 1,000,000 | | Panhandle-Plains Higher Education | | | | |
| | | Authority, Inc. | | | | |
| | | Series FLT, 1.286%, 10/01/2035 (e) | | | 902,620 | |
| 154,525 | | Residential Asset Mortgage | | | | |
| | | Products, Inc. | | | | |
| | | Series 2004-R, 0.730%, | | | | |
| | | 03/25/2034 (e) | | | 107,326 | |
| 1,000,000 | | South Carolina Student Loan Corp. | | | | |
| | | Series 2005-A, 0.411%, | | | | |
| | | 12/03/2018 (e) | | | 992,325 | |
| 251,860 | | U.S. Education Loan Trust, LLC | | | | |
| | | Series 2006-1, 0.441%, | | | | |
| | | 03/01/2025 (c)(e) | | | 251,179 | |
| 740,000 | | World Omni Auto Receivables Trust | | | | |
| | | Series 2011-A, 1.110%, 05/15/2015 | | | 740,441 | |
| | | | | | | |
| | | Total Asset Backed Securities | | | | |
| | | (Cost $12,419,737) | | | 12,055,105 | |
| | | | | | | |
See notes to financial statements.
38
|
GuideMarkSM Core Fixed Income Fund |
SCHEDULE OF INVESTMENTS (Continued) |
March 31, 2011 |
| |
| | | | | | | |
Principal
Amount | | | | Value | |
| | | | | | |
| | | COLLATERALIZED MORTGAGE | | | | |
| | | OBLIGATIONS - 5.66% | | | | |
$ | 320,301 | | Accredited Mortgage Loan Trust | | | | |
| | | Series 2005-3, 0.490%, | | | | |
| | | 09/25/2035 (e) | | $ | 295,300 | |
| | | Bank of America Corp. | | | | |
| 547,769 | | Series 2005-B, 2.948%, | | | | |
| | | 04/20/2035 (e) | | | 449,038 | |
| 110,000 | | Series 2007-5, 5.620%, 02/10/2051 | | | 116,172 | |
| 7,069 | | BCAP LLC Trust | | | | |
| | | Series 2006-RR1, 0.890%, | | | | |
| | | 11/25/2036 (e) | | | 6,972 | |
| | | Bear Stearns Commercial | | | | |
| | | Mortgage Securities | | | | |
| 3,250,000 | | Series 2006-pw13, 5.540%, | | | | |
| | | 09/11/2041 | | | 3,490,135 | |
| 3,075,000 | | Series 2004-PWR5, 4.831%, | | | | |
| | | 07/11/2042 | | | 3,189,704 | |
| | | Bear Stearns Trust | | | | |
| 386,664 | | Series 2004-9, 2.589%, | | | | |
| | | 09/25/2034 (e) | | | 331,146 | |
| 700,686 | | Series 2005-2, 2.758%, | | | | |
| | | 04/25/2035 (e) | | | 570,539 | |
| | | Chase Mortgage Financial Trust | | | | |
| 262,630 | | Series 2007-A1, 2.875%, | | | | |
| | | 02/25/2037 (e) | | | 266,209 | |
| 714,653 | | Series 2007-A1, 2.928%, | | | | |
| | | 02/25/2037 (e) | | | 714,283 | |
| | | CIT Mortgage Loan Trust | | | | |
| 368,254 | | Series 2007-1, 1.250%, 10/25/2037 | | | | |
| | | (Acquired 10/05/2007, | | | | |
| | | Cost $368,254) (d)(e) | | | 354,609 | |
| 550,000 | | Series 2007-1, 1.500%, 10/25/2037 | | | | |
| | | (Acquired 10/05/2007, | | | | |
| | | Cost $550,000) (d)(e) | | | 405,823 | |
| 2,265,000 | | Citigroup/Deutsche Bank | | | | |
| | | Commercial Mortgage Trust | | | | |
| | | Series 2007-CD5, 5.886%, | | | | |
| | | 11/15/2044 (e) | | | 2,453,986 | |
| 2,000,000 | | Commercial Mortgage Pass | | | | |
| | | Through Certificate | | | | |
| | | Series 2005-LP5, 4.982%, | | | | |
| | | 05/10/2043 (e) | | | 2,130,536 | |
| | | | | | | |
| | | | | | | |
Principal
Amount | | | | Value | |
| | | | | | |
| | | COLLATERALIZED MORTGAGE | | | | |
| | | OBLIGATIONS (Continued) | | | | |
| | | Countrywide Alternative Loan Trust | | | | |
$ | 1,185,228 | | Series 2005-27, 1.872%, | | | | |
| | | 08/25/2035 (e) | | $ | 794,629 | |
| 549,630 | | Series 2005-36, 2.970%, | | | | |
| | | 08/25/2035 (e) | | | 383,200 | |
| 2,045,571 | | Series 2007-16CB, | | | | |
| | | 6.000%, 08/25/2037 | | | 1,684,581 | |
| | | Countrywide Home Loans, Inc. | | | | |
| 107,007 | | Series 2003-52, 2.829%, | | | | |
| | | 02/19/2034 (e) | | | 100,035 | |
| 42,261 | | Series 2004-HYB6, | | | | |
| | | 3.079%, 11/20/2034 (e) | | | 36,459 | |
| 296,057 | | Series 2005-11, 0.550%, | | | | |
| | | 03/25/2035 (e) | | | 193,026 | |
| 625,161 | | Series 2005-R1, 0.610%, | | | | |
| | | 03/25/2035 (Acquired 03/04/2005, | | | | |
| | | Cost $625,161) (d)(e) | | | 538,214 | |
| 436,635 | | Series 2005-11, 3.291%, | | | | |
| | | 04/25/2035 (e) | | | 225,021 | |
| 23,719 | | First Horizon Mortgage Trust | | | | |
| | | Series 2004-AR6, 2.769%, | | | | |
| | | 12/25/2034 (e) | | | 22,719 | |
| 2,193,117 | | GMAC Mortgage, LLC | | | | |
| | | Series 2002-C1, 6.278%, | | | | |
| | | 11/15/2039 | | | 2,229,177 | |
| 624,495 | | GS Mortgage Securities Corp. | | | | |
| | | Series 2005-GG4, 4.680%, | | | | |
| | | 07/10/2039 | | | 648,930 | |
| 825,027 | | GSMPS Mortgage Loan Trust | | | | |
| | | Series 2005-RP1, 0.612%, | | | | |
| | | 01/25/2035 (Acquired 03/07/2005, | | | | |
| | | Cost $825,027) (d)(e) | | | 714,056 | |
| 490,680 | | IndyMac Mortgage Loan Trust | | | | |
| | | Series 2005-AR16IP, 0.570%, | | | | |
| | | 07/25/2045 (e) | | | 337,432 | |
| 500,000 | | JPMorgan Commercial Mortgage | | | | |
| | | Series 2006-LDP7, 5.863%, | | | | |
| | | 04/15/2045 (e) | | | 550,058 | |
| | | JPMorgan Mortgage Trust | | | | |
| 453,152 | | Series 2007-A1, 3.06, | | | | |
| | | 07/25/2035 (e) | | | 446,221 | |
See notes to financial statements.
39
|
GuideMarkSM Core Fixed Income Fund
SCHEDULE OF INVESTMENTS (Continued) |
March 31, 2011 |
| |
| | | | | | | |
Principal
Amount | | | | Value | |
| | | | | | |
| | | COLLATERALIZED MORTGAGE | | | | |
| | | OBLIGATIONS (Continued) | | | | |
$ | 401,236 | | Series 2007-A1, 2.980%, | | | | |
| | | 07/25/2035 (e) | | $ | 397,391 | |
| 429,320 | | Series 2007-A1, 2.967%, | | | | |
| | | 07/25/2035 (e) | | | 415,983 | |
| 475,703 | | Lehman Brothers-UBS Commercial | | | | |
| | | Mortgage Trust | | | | |
| | | Series 2005-C3, 4.664%, | | | | |
| | | 07/15/2030 | | | 493,452 | |
| 385,356 | | Master Reperforming Loan Trust | | | | |
| | | Series 2005-1, 7.000%, 08/25/2034 | | | | |
| | | (Acquired 03/09/2005, | | | | |
| | | Cost $398,857) (d) | | | 397,724 | |
| 1,000,000 | | Merrill Lynch Mortgage Trust | | | | |
| | | Series 2006-C1, 5.669%, | | | | |
| | | 05/12/2039 (e) | | | 1,086,788 | |
| | | MLCC Mortgage Investors, Inc. | | | | |
| 436,708 | | Series 2004-A3, 5.020%, | | | | |
| | | 05/25/2034 (e) | | | 448,114 | |
| 126,596 | | Series 2005-1, 2.208%, | | | | |
| | | 04/25/2035 (e) | | | 120,681 | |
| 1,285,444 | | NCUA Guaranteed Notes | | | | |
| | | Series 2010-C1, 2.650%, | | | | |
| | | 10/29/2020 (e) | | | 1,266,229 | |
| 1,908,985 | | Prime Mortgage Trust | | | | |
| | | Series 2006-DR1, 6.000%, | | | | |
| | | 05/25/2035 (Acquired 10/25/2006, | | | | |
| | | Cost $1,895,562) (d) | | | 1,771,861 | |
| 370,066 | | Residential Asset Mortgage | | | | |
| | | Products, Inc. | | | | |
| | | Series 2004-SL4, 7.500%, | | | | |
| | | 07/25/2032 | | | 375,925 | |
| 77,895 | | Structured Adjustable Rate | | | | |
| | | Mortgage Loan | | | | |
| | | Series 2004-5, 2.588%, | | | | |
| | | 05/25/2034 (e) | | | 74,582 | |
| 1,500,000 | | Wachovia Bank Commercial | | | | |
| | | Mortgage Trust | | | | |
| | | Series 2006-C29, 5.308%, | | | | |
| | | 11/15/2048 | | | 1,609,040 | |
| | | Washington Mutual | | | | |
| 89,070 | | Series 2004-AR3, 2.687%, | | | | |
| | | 06/25/2034 (e) | | | 89,603 | |
| | | | | | | |
Principal
Amount | | | | Value | |
| | | | | | |
| | | COLLATERALIZED MORTGAGE | | | | |
| | | OBLIGATIONS (Continued) | | | | |
$ | 867,538 | | Series 2005-AR8, 0.540%, | | | | |
| | | 07/25/2045 (e) | | $ | 721,559 | |
| | | | | | | |
| | | Total Collateralized Mortgage | | | | |
| | | Obligations (Cost $34,264,010) | | | 32,947,142 | |
| | | | | | | |
| | | CORPORATE BONDS - 25.19% | | | | |
| | | Aerospace & Defense - 0.18% | | | | |
| 960,000 | | Honeywell International, Inc. | | | | |
| | | 4.250%, 03/01/2013 | | | 1,018,899 | |
| | | Agricultural Products - 0.12% | | | | |
| 575,000 | | Lorillard Tobacco Co. | | | | |
| | | 8.125%, 06/23/2019 | | | 670,530 | |
| | | | | | | |
| | | Air Freight & Logistics - 0.23% | | | | |
| 1,460,000 | | United Parcel Service, Inc. | | | | |
| | | 3.125%, 01/15/2021 | | | 1,355,627 | |
| | | | | | | |
| | | Banks - 3.82% | | | | |
| 750,000 | | ANZ Capital Trust | | | | |
| | | 5.360%, 12/15/2053 (c) | | | 770,625 | |
| 3,400,000 | | Bank of Montreal | | | | |
| | | 2.625%, 01/25/2016 (c) | | | 3,387,596 | |
| 3,200,000 | | Bank of Nova Scotia | | | | |
| | | 1.450%, 07/26/2013 (c) | | | 3,209,408 | |
| 750,000 | | BBVA Bancomer Servicios SA | | | | |
| | | 7.250%, 04/22/2020 (c) | | | 759,052 | |
| 1,150,000 | | Canadian Imperial Bank | | | | |
| | | of Commerce | | | | |
| | | 1.450%, 09/13/2013 | | | 1,146,434 | |
| 400,000 | | Capital One Capital III | | | | |
| | | 7.686%, 08/15/2036 (e) | | | 415,500 | |
| 250,000 | | Capital One Financial Corp. | | | | |
| | | 8.800%, 07/15/2019 | | | 314,826 | |
| 262,358 | | CIT Group, Inc. | | | | |
| | | 7.000%, 05/01/2013 | | | 267,981 | |
| 755,000 | | Cooperatieve Centrale | | | | |
| | | Raiffeisen-Boerenleenbank | | | | |
| | | BA/Netherlands | | | | |
| | | 2.125%, 10/13/2015 | | | 729,259 | |
| 760,000 | | Glitnir Bank | | | | |
| | | 6.693%, 06/15/2016 | | | | |
| | | (Acquired 06/14/2006 | | | | |
| | | through 06/21/2006, | | | | |
| | | Cost $758,848) (d)(e)(f) | | | 6,998 | |
| 800,000 | | HSBC Capital Funding LP (c) | | | 776,482 | |
See notes to financial statements.
40
|
GuideMarkSM Core Fixed Income Fund |
SCHEDULE OF INVESTMENTS (Continued) |
March 31, 2011 |
| |
| | | | | | | |
Principal
Amount | | | | Value | |
| | | | | | |
| | | CORPORATE BONDS (Continued) | | | | |
| | | Banks (Continued) | | | | |
$ | 250,000 | | Kaupthing Bank Hf | | | | |
| | | 7.125%, 05/19/2016 | | | | |
| | | (Acquired 05/12/2006, | | | | |
| | | Cost $248,680) (d)(f) | | $ | 241 | |
| 400,000 | | KeyCorp | | | | |
| | | 5.100%, 03/24/2021 | | | 398,300 | |
| | | Lloyds TSB Bank PLC | | | | |
| 200,000 | | 6.500%, 09/14/2020 (c) | | | 196,963 | |
| 410,000 | | 6.375%, 01/21/2021 | | | 428,038 | |
| 900,000 | | North American Development Bank | | | | |
| | | 4.375%, 02/11/2020 | | | 918,598 | |
| 1,415,000 | | PNC Funding Corp. | | | | |
| | | 4.250%, 09/21/2015 | | | 1,489,547 | |
| | | Royal Bank of Scotland Group PLC | | | | |
| 3,000,000 | | 1.500%, 03/30/2012 (c) | | | 3,028,464 | |
| 140,000 | | 5.000%, 11/12/2013 | | | 143,276 | |
| 625,000 | | 4.875%, 08/25/2014 (c) | | | 649,458 | |
| 400,000 | | SunTrust Banks, Inc. | | | | |
| | | 3.600%, 04/15/2016 | | | 398,068 | |
| 1,120,000 | | U.S. Bancorp | | | | |
| | | 1.375%, 09/13/2013 | | | 1,118,597 | |
| 760,000 | | Wells Fargo & Company | | | | |
| | | 4.600%, 04/01/2021 | | | 753,058 | |
| | | Westpac Banking Corp | | | | |
| 300,000 | | 2.500%, 05/25/2012 (c) | | | 305,884 | |
| 600,000 | | 2.250%, 11/19/2012 | | | 610,574 | |
| | | | | | | |
| | | | | | 22,223,227 | |
| | | | | | | |
| | | Beverages - 0.58% | | | | |
| | | Anheuser-Busch InBev Worldwide, Inc. | | | | |
| 825,000 | | 3.000%, 10/15/2012 | | | 848,950 | |
| 400,000 | | 4.125%, 01/15/2015 | | | 422,873 | |
| 250,000 | | 7.750%, 01/15/2019 | | | 308,044 | |
| 1,825,000 | | The Coca-Cola Co. | | | | |
| | | 0.750%, 11/15/2013 | | | 1,799,811 | |
| | | | | | | |
| | | | | | 3,379,678 | |
| | | | | | | |
| | | Capital Markets - 1.80% | | | | |
| 1,955,000 | | Bear Stearns Companies, Inc. | | | | |
| | | 7.250%, 02/01/2018 | | | 2,280,972 | |
| | | Goldman Sachs Group, Inc. | | | | |
| 1,050,000 | | 5.950%, 01/18/2018 | | | 1,129,073 | |
| 400,000 | | 6.750%, 10/01/2037 | | | 404,697 | |
| | | | | | | |
Principal
Amount | | | | Value | |
| | | | | | |
| | | Capital Markets (Continued) | | | | |
| | | Merrill Lynch & Co, Inc. | | | | |
$ | 1,775,000 | | 6.400%, 08/28/2017 | | $ | 1,937,443 | |
| 800,000 | | 6.500%, 07/15/2018 | | | 865,374 | |
| | | Morgan Stanley | | | | |
| 600,000 | | 5.950%, 12/28/2017 | | | 645,380 | |
| 200,000 | | 6.625%, 04/01/2018 | | | 220,133 | |
| | | State Street Corp. | | | | |
| 595,000 | | 4.300%, 05/30/2014 | | | 637,839 | |
| 1,115,000 | | 2.875%, 03/07/2016 | | | 1,108,903 | |
| | | The Bank of New York Mellon Corp. | | | | |
| 475,000 | | 4.950%, 11/01/2012 | | | 505,072 | |
| 740,000 | | 1.500%, 01/31/2014 | | | 738,209 | |
| | | | | | | |
| | | | | | 10,473,095 | |
| | | | | | | |
| | | Chemicals - 0.47% | | | | |
| | | Dow Chemical Co. | | | | |
| 375,000 | | 7.600%, 05/15/2014 | | | 433,665 | |
| 305,000 | | 2.500%, 02/15/2016 | | | 294,251 | |
| 380,000 | | 4.250%, 11/15/2020 | | | 364,323 | |
| | | EI du Pont de Nemours & Co. | | | | |
| 128,000 | | 5.875%, 01/15/2014 | | | 141,983 | |
| 1,125,000 | | 3.250%, 01/15/2015 | | | 1,167,674 | |
| 380,000 | | PPG Industries, Inc. | | | | |
| | | 1.900%, 01/15/2016 | | | 360,446 | |
| | | | | | | |
| | | | | | 2,762,342 | |
| | | | | | | |
| | | Communications - 0.14% | | | | |
| 730,000 | | Rogers Cable, Inc. | | | | |
| | | 5.500%, 03/15/2014 | | | 801,904 | |
| | | | | | | |
| | | Communications Equipment - 0.19% | | | | |
| 1,115,000 | | Cisco Systems, Inc. | | | | |
| | | 1.625%, 03/14/2014 | | | 1,113,961 | |
| | | | | | | |
| | | Computers & Peripherals - 0.26% | | | | |
| 500,000 | | Dell, Inc. | | | | |
| | | 3.375%, 06/15/2012 | | | 514,888 | |
| 900,000 | | Hewlett-Packard Co. | | | | |
| | | 6.125%, 03/01/2014 | | | 1,008,761 | |
| | | | | | | |
| | | | | | 1,523,649 | |
| | | | | | | |
| | | Consumer Finance - 1.25% | | | | |
| 650,000 | | American Express Co. | | | | |
| | | 8.150%, 03/19/2038 | | | 871,918 | |
| 1,405,000 | | American Express Credit Corp. | | | | |
| | | 5.125%, 08/25/2014 | | | 1,516,753 | |
See notes to financial statements.
41
|
GuideMarkSM Core Fixed Income Fund |
SCHEDULE OF INVESTMENTS (Continued) |
March 31, 2011 |
| |
| | | | | | | |
Principal
Amount | | | | Value | |
| | | | | | |
| | | CORPORATE BONDS (Continued) | | | | |
| | | Consumer Finance (Continued) | | | | |
$ | 1,020,000 | | Caterpillar Financial Services Corp. | | | | |
| | | 6.125%, 02/17/2014 | | $ | 1,149,676 | |
| 1,350,000 | | John Deere Capital Corp. | | | | |
| | | 4.900%, 09/09/2013 | | | 1,466,489 | |
| | | SLM Corp. | | | | |
| 430,000 | | 5.000%, 10/01/2013 | | | 445,347 | |
| 1,140,000 | | 5.375%, 05/15/2014 | | | 1,183,010 | |
| 625,000 | | 6.250%, 01/25/2016 | | | 652,238 | |
| | | | | | | |
| | | | | | 7,285,431 | |
| | | | | | | |
| | | Containers & Packaging - 0.01% | | | | |
| 75,000 | | Rock-Tenn Co. | | | | |
| | | 5.625%, 03/15/2013 | | | 77,813 | |
| | | | | | | |
| | | Diversified Financial Services - 2.14% | | | | |
| | | Bank of America Corp. | | | | |
| 740,000 | | 4.500%, 04/01/2015 | | | 769,122 | |
| 1,200,000 | | 5.625%, 07/01/2020 | | | 1,234,222 | |
| | | Citigroup, Inc. | | | | |
| 450,000 | | 5.000%, 09/15/2014 | | | 470,263 | |
| 1,025,000 | | 6.010%, 01/15/2015 | | | 1,121,087 | |
| 650,000 | | 6.125%, 11/21/2017 | | | 709,247 | |
| 800,000 | | 5.375%, 08/09/2020 | | | 825,071 | |
| 300,000 | | Discover Bank | | | | |
| | | 8.700%, 11/18/2019 | | | 359,984 | |
| 350,000 | | First Niagara Financial Group, Inc. | | | | |
| | | 6.750%, 03/19/2020 | | | 382,438 | |
| | | General Electric Capital Corp. | | | | |
| 680,000 | | 5.900%, 05/13/2014 | | | 751,074 | |
| 960,000 | | 5.625%, 05/01/2018 | | | 1,039,396 | |
| 370,000 | | 5.300%, 02/11/2021 | | | 376,515 | |
| 1,215,000 | | 5.875%, 01/14/2038 | | | 1,203,545 | |
| 1,400,000 | | JPMorgan Chase | | | | |
| | | 3.700%, 01/20/2015 | | | 1,441,470 | |
| 500,000 | | JPMorgan Chase Capital XXV | | | | |
| | | 6.800%, 10/01/2037 | | | 504,109 | |
| 510,000 | | NASDAQ OMX Group, Inc. | | | | |
| | | 4.000%, 01/15/2015 | | | 506,867 | |
| 750,000 | | National Rural Utilities Cooperative | | | | |
| | | Finance Corp. | | | | |
| | | 1.125%, 11/01/2013 | | | 744,242 | |
| | | | | | | |
| | | | | | 12,438,652 | |
| | | | | | | |
| | | | | | | |
Principal
Amount | | | | Value | |
| | | | | | |
| | | Diversified Manufacturing - 0.65% | | | | |
| | | Cooper U.S., Inc. | | | | |
$ | 1,130,000 | | 2.375%, 01/15/2016 | | $ | 1,110,358 | |
| 485,000 | | 3.875%, 12/15/2020 | | | 471,584 | |
| 955,000 | | ITT Corp. | | | | |
| | | 4.900%, 05/01/2014 | | | 1,022,273 | |
| 500,000 | | Tyco Electronics Group SA | | | | |
| | | 6.550%, 10/01/2017 | | | 572,972 | |
| 500,000 | | Tyco International Finance SA | | | | |
| | | 8.500%, 01/15/2019 | | | 646,010 | |
| | | | | | | |
| | | | | | 3,823,197 | |
| | | | | | | |
| | | Diversified Telecommunication Services - 1.36% | | | | |
| 550,000 | | Alltel Corp. | | | | |
| | | 7.000%, 07/01/2012 | | | 589,239 | |
| 695,000 | | AT&T, Inc. | | | | |
| | | 5.350%, 09/01/2040 (c) | | | 624,715 | |
| 525,000 | | France Telecom SA | | | | |
| | | 4.375%, 07/08/2014 | | | 564,370 | |
| 143,000 | | Qwest Communications | | | | |
| | | International, Inc. | | | | |
| | | 8.000%, 10/01/2015 | | | 158,551 | |
| 425,000 | | Qwest Corp. | | | | |
| | | 8.375%, 05/01/2016 | | | 507,875 | |
| 1,610,000 | | SBC Communications, Inc. | | | | |
| | | 5.100%, 09/15/2014 | | | 1,762,024 | |
| 250,000 | | Sprint Capital Corp. | | | | |
| | | 8.375%, 03/15/2012 | | | 265,000 | |
| | | Telecom Italia Capital | | | | |
| 450,000 | | 6.200%, 07/18/2011 | | | 456,829 | |
| 380,000 | | 4.950%, 09/30/2014 | | | 396,209 | |
| | | Telefonica Emisiones SAU | | | | |
| 360,000 | | 4.949%, 01/15/2015 | | | 380,171 | |
| 275,000 | | 6.421%, 06/20/2016 | | | 305,921 | |
| 1,140,000 | | Verizon Wireless Capital LLC | | | | |
| | | 8.500%, 11/15/2018 | | | 1,466,844 | |
| 425,000 | | Windstream Corp. | | | | |
| | | 8.625%, 08/01/2016 | | | 452,625 | |
| | | | | | | |
| | | | | | 7,930,373 | |
| | | | | | | |
| | | Educational Services - 0.15% | | | | |
| 825,000 | | Rensselaer Polytechnic Institute | | | | |
| | | 5.600%, 09/01/2020 | | | 865,843 | |
| | | | | | | |
See notes to financial statements.
42
|
GuideMarkSM Core Fixed Income Fund |
SCHEDULE OF INVESTMENTS (Continued) |
March 31, 2011 |
| |
| | | | | | | |
Principal
Amount | | | | Value | |
| | | | | | |
| | | CORPORATE BONDS (Continued) | | | | |
| | | Electric Utilities - 0.73% | | | | |
$ | 275,000 | | Arizona Public Service Co. | | | | |
| | | 8.750%, 03/01/2019 | | $ | 347,213 | |
| 585,000 | | Columbus Southern Power Co. | | | | |
| | | 5.500%, 03/01/2013 | | | 628,444 | |
| 375,000 | | Nevada Power Co. | | | | |
| | | 5.875%, 01/15/2015 | | | 417,528 | |
| 400,000 | | Progress Energy, Inc. | | | | |
| | | 7.750%, 03/01/2031 | | | 497,216 | |
| 1,075,000 | | PSI Energy, Inc. | | | | |
| | | 6.050%, 06/15/2016 | | | 1,209,212 | |
| 700,000 | | Union Electric Co. | | | | |
| | | 6.700%, 02/01/2019 | | | 809,082 | |
| 300,000 | | Westar Energy, Inc. | | | | |
| | | 6.000%, 07/01/2014 | | | 329,649 | |
| | | | | | | |
| | | | | | 4,238,344 | |
| | | | | | | |
| | | Electrical Equipment - 0.05% | | | | |
| 274,000 | | L-3 Communications Holdings, Inc. | | | | |
| | | 6.375%, 10/15/2015 | | | 283,590 | |
| | | | | | | |
| | | Energy Equipment & Services - 0.16% | | | | |
| 340,000 | | Cameron International Corp. | | | | |
| | | 6.375%, 07/15/2018 | | | 382,323 | |
| 550,000 | | Ensco Plc | | | | |
| | | 4.700%, 03/15/2021 | | | 547,007 | |
| | | | | | | |
| | | | | | 929,330 | |
| | | | | | | |
| | | Food Products - 0.29% | | | | |
| 530,000 | | Archer Daniels Midland Co. | | | | |
| | | 4.700%, 03/01/2041 | | | 544,604 | |
| | | Kraft Foods, Inc. | | | | |
| 250,000 | | 6.125%, 08/23/2018 | | | 280,001 | |
| 825,000 | | 6.500%, 02/09/2040 | | | 884,138 | |
| | | | | | | |
| | | | | | 1,708,743 | |
| | | | | | | |
| | | Health Care Equipment & Supplies - 0.69% | | | | |
| 400,000 | | Baxter International, Inc. | | | | |
| | | 1.800%, 03/15/2013 | | | 405,278 | |
| 730,000 | | Becton Dickinson & Co. | | | | |
| | | 3.250%, 11/12/2020 | | | 681,962 | |
| 350,000 | | Boston Scientific Corp. | | | | |
| | | 4.500%, 01/15/2015 | | | 361,297 | |
| 775,000 | | Covidien International Finance SA | | | | |
| | | 2.800%, 06/15/2015 | | | 777,241 | |
| | | | | | | |
Principal
Amount | | | | Value | |
| | | | | | |
| | | Health Care Equipment & Supplies (Continued) | | | | |
| | | Hospira, Inc. | | | | |
$ | 490,000 | | 6.050%, 03/30/2017 | | $ | 543,704 | |
| 400,000 | | 5.600%, 09/15/2040 | | | 383,585 | |
| 825,000 | | Medtronic, Inc. | | | | |
| | | 3.000%, 03/15/2015 | | | 849,683 | |
| | | | | | | |
| | | | | | 4,002,750 | |
| | | | | | | |
| | | Health Care Providers & Services - 0.49% | | | | |
| 960,000 | | Express Scripts, Inc. | | | | |
| | | 6.250%, 06/15/2014 | | | 1,067,292 | |
| 500,000 | | HCA, Inc. | | | | |
| | | 7.875%, 02/15/2020 | | | 546,250 | |
| 1,150,000 | | UnitedHealth Group, Inc. | | | | |
| | | 4.875%, 02/15/2013 | | | 1,221,814 | |
| | | | | | | |
| | | | | | 2,835,356 | |
| | | | | | | |
| | | Independent Power Producers & | | | | |
| | | Energy Traders - 0.40% | | | | |
| | | Exelon Generation Co., LLC | | | | |
| 540,000 | | 5.200%, 10/01/2019 | | | 548,177 | |
| 550,000 | | 6.250%, 10/01/2039 | | | 539,740 | |
| 1,175,000 | | Southern Power Co. | | | | |
| | | 6.250%, 07/15/2012 | | | 1,247,198 | |
| | | | | | | |
| | | | | | 2,335,115 | |
| | | | | | | |
| | | Industrial Conglomerates - 0.16% | | | | |
| 275,000 | | General Electric Co. | | | | |
| | | 5.250%, 12/06/2017 | | | 299,899 | |
| 540,000 | | Koninklijke Philips Electronics NV | | | | |
| | | 5.750%, 03/11/2018 | | | 606,120 | |
| | | | | | | |
| | | | | | 906,019 | |
| | | | | | | |
| | | Insurance - 1.20% | | | | |
| 370,000 | | Aflac, Inc. | | | | |
| | | 8.500%, 05/15/2019 | | | 447,962 | |
| 150,000 | | Arch Capital Group Ltd. | | | | |
| | | 7.350%, 05/01/2034 | | | 156,254 | |
| 425,000 | | CNA Financial Corp. | | | | |
| | | 7.350%, 11/15/2019 | | | 480,769 | |
| 400,000 | | MetLife Capital Trust X | | | | |
| | | 9.250%, 04/08/2068 (c)(e) | | | 485,000 | |
| 960,000 | | Metlife, Inc. | | | | |
| | | 5.000%, 11/24/2013 | | | 1,034,422 | |
| 275,000 | | Northwestern Mutual Life Insurance Co. | | | | |
| | | 6.063%, 03/30/2040 (c) | | | 291,386 | |
See notes to financial statements.
43
|
GuideMarkSM Core Fixed Income Fund |
SCHEDULE OF INVESTMENTS (Continued) |
March 31, 2011 |
| |
| | | | | | | |
Principal
Amount | | | | Value | |
| | | | | | |
| | | CORPORATE BONDS (Continued) | | | | |
| | | Insurance (Continued) | | | | |
| | | Prudential Financial, Inc. | | | | |
$ | 750,000 | | 5.100%, 09/20/2014 | | $ | 806,727 | |
| 425,000 | | 4.500%, 11/15/2020 | | | 417,092 | |
| 650,000 | | Reinsurance Group of America, Inc. | | | | |
| | | 6.750%, 12/15/2065 (e) | | | 635,759 | |
| 375,000 | | Transatlantic Holdings, Inc. | | | | |
| | | 8.000%, 11/30/2039 | | | 394,938 | |
| 1,240,000 | | Travelers Property Casualty Corp. | | | | |
| | | 5.000%, 03/15/2013 | | | 1,325,499 | |
| 500,000 | | Willis North America, Inc. | | | | |
| | | 6.200%, 03/28/2017 | | | 533,538 | |
| | | | | | | |
| | | | | | 7,009,346 | |
| | | | | | | |
| | | Internet Software & Services - 0.09% | | | | |
| 515,000 | | Ebay, Inc. | | | | |
| | | 0.875%, 10/15/2013 | | | 509,687 | |
| | | | | | | |
| | | IT Services - 0.43% | | | | |
| | | International Business Machines Corp. | | | | |
| 1,000,000 | | 4.750%, 11/29/2012 | | | 1,063,153 | |
| 1,150,000 | | 7.625%, 10/15/2018 | | | 1,441,385 | |
| | | | | | | |
| | | | | | 2,504,538 | |
| | | | | | | |
| | | Life Sciences Tools & Services - 0.12% | | | | |
| 675,000 | | Life Technologies Corp. | | | | |
| | | 5.000%, 01/15/2021 | | | 676,204 | |
| | | | | | | |
| | | Machinery - 0.12% | | | | |
| 650,000 | | Eaton Corp. | | | | |
| | | 5.600%, 05/15/2018 | | | 721,824 | |
| | | | | | | |
| | | Media - 1.38% | | | | |
| 350,000 | | Charter Communications | | | | |
| | | Operating, LLC | | | | |
| | | 10.875%, 09/15/2014 (c) | | | 393,750 | |
| 400,000 | | Comcast Cable Communications | | | | |
| | | Holdings, Inc. | | | | |
| | | 9.455%, 11/15/2022 | | | 542,330 | |
| | | Comcast Corp. | | | | |
| 1,000,000 | | 6.300%, 11/15/2017 | | | 1,130,792 | |
| 670,000 | | 5.875%, 02/15/2018 | | | 739,659 | |
| 125,000 | | CSC Holdings, Inc. | | | | |
| | | 7.625%, 04/01/2011 | | | 125,000 | |
| | | | | | | |
Principal
Amount | | | | Value | |
| | | | | | |
| | | Media (Continued) | | | | |
| | | DIRECTV Holdings, LLC | | | | |
$ | 855,000 | | 3.550%, 03/15/2015 | | $ | 874,408 | |
| 425,000 | | 3.500%, 03/01/2016 | | | 426,400 | |
| 285,000 | | 6.350%, 03/15/2040 | | | 286,002 | |
| 500,000 | | Dish DBS Corp. | | | | |
| | | 7.125%, 02/01/2016 | | | 536,250 | |
| 350,000 | | NBC Universal, Inc. | | | | |
| | | 4.375%, 04/01/2021 (c) | | | 335,754 | |
| 375,000 | | News America, Inc. | | | | |
| | | 6.150%, 02/15/2041 (c) | | | 373,128 | |
| 1,725,000 | | Time Warner Cable, Inc. | | | | |
| | | 6.750%, 07/01/2018 | | | 1,962,488 | |
| 251,000 | | WPP Finance UK | | | | |
| | | 8.000%, 09/15/2014 | | | 292,794 | |
| | | | | | | |
| | | | | | 8,018,755 | |
| | | | | | | |
| | | Metals & Mining - 0.26% | | | | |
| 450,000 | | Cliffs Natural Resources, Inc. | | | | |
| | | 4.875%, 04/01/2021 | | | 444,734 | |
| 300,000 | | Freeport-McMoRan Copper & | | | | |
| | | Gold, Inc. | | | | |
| | | 8.375%, 04/01/2017 | | | 331,143 | |
| | | Teck Resources Ltd. | | | | |
| 225,000 | | 10.750%, 05/15/2019 | | | 287,738 | |
| 435,000 | | 6.000%, 08/15/2040 | | | 439,598 | |
| | | | | | | |
| | | | | | 1,503,213 | |
| | | | | | | |
| | | Multi-Utilities - 0.64% | | | | |
| 1,705,000 | | Dominion Resources, Inc. | | | | |
| | | 1.800%, 03/15/2014 | | | 1,703,242 | |
| 1,225,000 | | Midamerican Energy Holdings Co. | | | | |
| | | 5.875%, 10/01/2012 | | | 1,308,692 | |
| 600,000 | | Sempra Energy | | | | |
| | | 6.500%, 06/01/2016 | | | 685,540 | |
| | | | | | | |
| | | | | | 3,697,474 | |
| | | | | | | |
| | | Office Electronics - 0.14% | | | | |
| 775,000 | | Xerox Corp. | | | | |
| | | 4.250%, 02/15/2015 | | | 816,531 | |
| | | | | | | |
| | | Oil & Gas - 1.97% | | | | |
| 350,000 | | Anadarko Peteroleum Corp. | | | | |
| | | 6.375%, 09/15/2017 | | | 385,756 | |
| 700,000 | | Boardwalk Pipelines LP | | | | |
| | | 5.875%, 11/15/2016 | | | 764,971 | |
See notes to financial statements.
44
|
GuideMarkSM Core Fixed Income Fund |
SCHEDULE OF INVESTMENTS (Continued) |
March 31, 2011 |
| |
| | | | | | | |
Principal
Amount | | | | Value | |
| | | | | | |
| | | CORPORATE BONDS (Continued) | | | | |
| | | Oil & Gas (Continued) | | | | |
| | | BP Capital PLC | | | | |
$ | 1,395,000 | | 3.200%, 03/11/2016 | | $ | 1,390,416 | |
| 525,000 | | 4.500%, 10/01/2020 | | | 521,984 | |
| 1,000,000 | | ConocoPhillips | | | | |
| | | 4.600%, 01/15/2015 | | | 1,090,785 | |
| | | Energy Transfer Partners LP | | | | |
| 765,000 | | 8.500%, 04/15/2014 | | | 894,515 | |
| 300,000 | | 5.950%, 02/01/2015 | | | 329,187 | |
| 525,000 | | 9.000%, 04/15/2019 | | | 664,241 | |
| 375,000 | | Enterprise Products Operating LP | | | | |
| | | 8.375%, 08/01/2066 (e) | | | 405,436 | |
| 725,000 | | Marathon Oil Corp. | | | | |
| | | 6.000%, 10/01/2017 | | | 816,988 | |
| 400,000 | | Nexen, Inc. | | | | |
| | | 7.500%, 07/30/2039 | | | 451,824 | |
| 775,000 | | ONEOK Partners LP | | | | |
| | | 6.125%, 02/01/2041 | | | 777,247 | |
| | | Petrobras International Finance Co. | | | | |
| 310,000 | | 3.875%, 01/27/2016 | | | 313,622 | |
| 320,000 | | 5.375%, 01/27/2021 | | | 322,566 | |
| 235,000 | | 6.875%, 01/20/2040 | | | 247,268 | |
| 980,000 | | Petroleos Mexicanos | | | | |
| | | 8.000%, 05/03/2019 | | | 1,181,881 | |
| 250,000 | | Tennessee Gas Pipeline Co. | | | | |
| | | 7.500%, 04/01/2017 | | | 298,450 | |
| | | Valero Energy Corp. | | | | |
| 275,000 | | 9.375%, 03/15/2019 | | | 352,049 | |
| 275,000 | | 6.625%, 06/15/2037 | | | 278,050 | |
| | | | | | | |
| | | | | | 11,487,236 | |
| | | | | | | |
| | | Pharmaceuticals - 0.56% | | | | |
| 1,225,000 | | Novartis Capital Corp. | | | | |
| | | 2.900%, 04/24/2015 | | | 1,253,469 | |
| | | Sanofi-Aventis SA | | | | |
| 1,195,000 | | 1.625%, 03/28/2014 | | | 1,193,925 | |
| 795,000 | | 4.000%, 03/29/2021 | | | 783,476 | |
| | | | | | | |
| | | | | | 3,230,870 | |
| | | | | | | |
| | | Pipelines - 0.92% | | | | |
| 225,000 | | DCP Midstream LLC | | | | |
| | | 9.750%, 03/15/2019 (c) | | | 290,428 | |
| 600,000 | | Duke Energy, Inc. | | | | |
| | | 5.668%, 08/15/2014 | | | 657,932 | |
| | | | | | | |
Principal
Amount | | | | Value | |
| | | | | | |
| | | Pipelines (Continued) | | | | |
$ | 275,000 | | El Paso Pipeline Partners LP | | | | |
| | | 6.500%, 04/01/2020 | | $ | 303,774 | |
| | | Enterprise Products Operating LLC | | | | |
| 1,000,000 | | 5.650%, 04/01/2013 | | | 1,078,423 | |
| 525,000 | | 6.125%, 10/15/2039 | | | 524,284 | |
| 575,000 | | Spectra Energy Capital LLC | | | | |
| | | 5.650%, 03/01/2020 | | | 608,302 | |
| | | TransCanada Pipelines Ltd. | | | | |
| 775,000 | | 7.625%, 01/15/2039 | | | 963,525 | |
| 300,000 | | 6.350%, 05/15/2067 (e) | | | 301,600 | |
| 550,000 | | Transocean, Inc. | | | | |
| | | 6.500%, 11/15/2020 | | | 607,496 | |
| | | | | | | |
| | | | | | 5,335,764 | |
| | | | | | | |
| | | Real Estate - 0.76% | | | | |
| | | Developers Diversified Realty Corp. | | | | |
| 295,000 | | 9.625%, 03/15/2016 | | | 359,746 | |
| 275,000 | | 4.750%, 04/15/2018 | | | 268,082 | |
| 1,150,000 | | HCP, Inc. | | | | |
| | | 5.375%, 02/01/2021 | | | 1,163,566 | |
| | | Health Care REIT, Inc. | | | | |
| 475,000 | | 3.625%, 03/15/2016 | | | 471,048 | |
| 555,000 | | 5.250%, 01/15/2022 | | | 542,592 | |
| 450,000 | | ProLogis | | | | |
| | | 1.875%, 11/15/2037 | | | 448,313 | |
| | | Simon Property Group LP | | | | |
| 825,000 | | 5.750%, 12/01/2015 | | | 918,495 | |
| 275,000 | | 4.375%, 03/01/2021 | | | 269,575 | |
| | | | | | | |
| | | | | | 4,441,417 | |
| | | | | | | |
| | | Road & Rail - 0.09% | | | | |
| 400,000 | | Burlington Northern Santa Fe LLC | | | | |
| | | 7.950%, 08/15/2030 | | | 509,362 | |
| | | | | | | |
| | | Semiconductor & Semiconductor | | | | |
| | | Equipment - 0.06% | | | | |
| 340,000 | | Analog Devices, Inc. | | | | |
| | | 3.000%, 04/15/2016 | | | 339,029 | |
| | | | | | | |
| | | Tobacco - 0.13% | | | | |
| | | Altria Group, Inc. | | | | |
| 350,000 | | 9.700%, 11/10/2018 | | | 460,948 | |
| 240,000 | | 9.250%, 08/06/2019 | | | 313,701 | |
| | | | | | | |
| | | | | | 774,649 | |
| | | | | | | |
| | | Total Corporate Bonds | | | | |
| | | (Cost $144,429,264) | | | 146,559,367 | |
| | | | | | | |
See notes to financial statements.
45
|
GuideMarkSM Core Fixed Income Fund |
SCHEDULE OF INVESTMENTS (Continued) |
March 31, 2011 |
| |
| | | | | | | |
Principal
Amount | | | | Value | |
| | | | | | |
| | | FOREIGN GOVERNMENT | | | | |
| | | NOTES/BONDS - 0.57% | | | | |
$ | 90,000 | | Republic of Peru | | | | |
| | | 5.625%, 11/18/2050 | | $ | 81,900 | |
| 3,000,000 | | Swedish Housing Finance Corp. | | | | |
| | | 3.125%, 03/23/2012 (c) | | | 3,084,876 | |
| 156,000 | | United Mexican States | | | | |
| | | 6.750%, 09/27/2034 | | | 176,748 | |
| | | | | | | |
| | | Total Foreign Government | | | | |
| | | Notes/Bonds (Cost $3,283,495) | | | 3,343,524 | |
| | | | | | | |
| | | MORTGAGE BACKED SECURITIES - U.S. | | | | |
| | | GOVERNMENT AGENCY - 26.12% | | | | |
| | | Federal Home Loan Mortgage Corp. | | | | |
| 1,710,000 | | Series 3817, 4.000%, | | | | |
| | | 03/15/2026 | | | 1,799,066 | |
| 816 | | Pool #A4-3129, | | | | |
| | | 5.500%, 02/01/2036 | | | 876 | |
| 893,867 | | Pool #C0-3404, | | | | |
| | | 4.500%, 09/01/2039 | | | 914,422 | |
| 2,000,000 | | Pool #TBA, | | | | |
| | | 4.500%, 04/15/2041 (g) | | | 2,032,500 | |
| 2,000,000 | | Pool #TBA, | | | | |
| | | 5.500%, 04/15/2041(g) | | | 2,133,438 | |
| | | Federal Home Loan Mortgage Corp. | | | | |
| | | - Gold | | | | |
| 16,696 | | Pool #E9-9763, | | | | |
| | | 4.500%, 09/01/2018 | | | 17,671 | |
| 17,161 | | Pool #E9-9764, | | | | |
| | | 4.500%, 09/01/2018 | | | 18,163 | |
| 425,111 | | Pool #D9-6291, | | | | |
| | | 4.500%, 09/01/2023 | | | 447,683 | |
| 3,776,690 | | Pool #G1-3833, | | | | |
| | | 4.500%, 05/01/2025 | | | 3,973,679 | |
| 440,288 | | Pool #J1-3196, | | | | |
| | | 3.500%, 10/01/2025 | | | 442,408 | |
| 672,245 | | Pool #78-0447, | | | | |
| | | 2.610%, 04/01/2033 (e) | | | 699,705 | |
| 1,852,201 | | Pool #G0-8085, | | | | |
| | | 5.000%, 10/01/2035 | | | 1,942,837 | |
| 6,000,000 | | Pool #TBA, | | | | |
| | | 5.000%, 04/15/2040 (g) | | | 6,262,500 | |
| | | Federal National Mortgage Association | | | | |
| 5,220 | | Pool #685505, | | | | |
| | | 5.000%, 05/01/2018 | | | 5,590 | |
| | | | | | | |
Principal
Amount | | | | Value | |
| | | | | | |
| | | MORTGAGE BACKED SECURITIES - U.S. | | | | |
| | | GOVERNMENT AGENCY (Continued) | | | | |
$ | 6,226 | | Pool #705709, | | | | |
| | | 5.000%, 05/01/2018 | | $ | 6,667 | |
| 1,700,000 | | Pool #958815, | | | | |
| | | 4.506%, 06/01/2019 (i) | | | 1,767,268 | |
| 1,300,000 | | Pool #466216, | | | | |
| | | 3.540%, 10/01/2020 | | | 1,233,894 | |
| 2,095,444 | | Pool #FN0001, | | | | |
| | | 3.762%, 12/01/2020 (i) | | | 2,050,973 | |
| 1,959,289 | | Pool #257453, | | | | |
| | | 5.000%, 11/01/2023 | | | 2,083,414 | |
| 7,000,000 | | Pool #TBA, | | | | |
| | | 5.000%, 04/15/2025 (g) | | | 7,437,500 | |
| 2,000,000 | | Pool #TBA, | | | | |
| | | 4.000%, 04/15/2025 (g) | | | 2,055,624 | |
| 1,000,000 | | Pool #TBA, | | | | |
| | | 4.500%, 04/25/2025 (g) | | | 1,048,281 | |
| 967,946 | | Pool #AD5693, | | | | |
| | | 4.500%, 05/01/2025 | | | 1,017,375 | |
| 547,068 | | Pool #544859, | | | | |
| | | 3.260%, 08/01/2029 (e) | | | 567,641 | |
| 541,498 | | Pool #786848, | | | | |
| | | 7.000%, 10/01/2031 | | | 626,038 | |
| 42,725 | | Pool #727181, | | | | |
| | | 5.000%, 08/01/2033 | | | 45,044 | |
| 12,797 | | Pool #730727, | | | | |
| | | 5.000%, 08/01/2033 | | | 13,492 | |
| 3,155 | | Pool #741862, | | | | |
| | | 5.500%, 09/01/2033 | | | 3,398 | |
| 4,265 | | Pool #766197, | | | | |
| | | 5.500%, 02/01/2034 | | | 4,594 | |
| 678 | | Pool #776974, | | | | |
| | | 5.500%, 04/01/2034 | | | 733 | |
| 385,624 | | Pool #888504, | | | | |
| | | 2.442%, 04/01/2034 (e) | | | 400,852 | |
| 23,420 | | Pool #775776, | | | | |
| | | 5.500%, 05/01/2034 | | | 25,220 | |
| 640,870 | | Pool #725705, | | | | |
| | | 5.000%, 08/01/2034 | | | 675,889 | |
| 1,083,297 | | Pool #782284, | | | | |
| | | 6.000%, 09/01/2034 | | | 1,192,842 | |
| 806,097 | | Pool #791563, | | | | |
| | | 6.000%, 09/01/2034 | | | 885,684 | |
See notes to financial statements.
46
|
GuideMarkSM Core Fixed Income Fund |
SCHEDULE OF INVESTMENTS (Continued) |
March 31, 2011 |
| |
| | | | | | | |
Principal
Amount | | | | Value | |
| | | | | | |
| | | MORTGAGE BACKED SECURITIES - U.S. | | | | |
| | | GOVERNMENT AGENCY (Continued) | | | | |
$ | 19,412 | | Pool #794371, | | | | |
| | | 6.000%, 09/01/2034 | | $ | 21,353 | |
| 449,403 | | Pool #802783, | | | | |
| | | 2.663%, 10/01/2034 (e) | | | 473,334 | |
| 976,990 | | Pool #802493, | | | | |
| | | 6.000%, 11/01/2034 | | | 1,075,429 | |
| 40,721 | | Pool #781629, | | | | |
| | | 5.500%, 12/01/2034 | | | 43,842 | |
| 1,076 | | Pool #806098, | | | | |
| | | 6.000%, 12/01/2034 | | | 1,182 | |
| 4,276,313 | | Pool #735224, | | | | |
| | | 5.500%, 02/01/2035 | | | 4,605,487 | |
| 1,486,399 | | Pool #808057, | | | | |
| | | 6.000%, 02/01/2035 | | | 1,634,524 | |
| 537,555 | | Pool #735504, | | | | |
| | | 6.000%, 04/01/2035 | | | 591,973 | |
| 38,982 | | Pool #822815, | | | | |
| | | 5.500%, 04/01/2035 | | | 41,958 | |
| 32,780 | | Pool #357850, | | | | |
| | | 5.500%, 07/01/2035 | | | 35,283 | |
| 42,493 | | Pool #820242, | | | | |
| | | 5.000%, 07/01/2035 | | | 44,746 | |
| 3,037,984 | | Pool #820345, | | | | |
| | | 5.000%, 09/01/2035 | | | 3,197,674 | |
| 5,484 | | Pool #838452, | | | | |
| | | 5.500%, 09/01/2035 | | | 5,913 | |
| 59,282 | | Pool #745000, | | | | |
| | | 6.000%, 10/01/2035 | | | 65,176 | |
| 1,904,948 | | Pool #844158, | | | | |
| | | 5.000%, 11/01/2035 | | | 2,005,081 | |
| 838,597 | | Pool #745755, | | | | |
| | | 5.000%, 12/01/2035 | | | 883,202 | |
| 80,874 | | Pool #848939, | | | | |
| | | 6.500%, 01/01/2036 | | | 91,045 | |
| 33,565 | | Pool #851639, | | | | |
| | | 6.500%, 01/01/2036 | | | 37,744 | |
| 357,408 | | Pool #888022, | | | | |
| | | 5.000%, 02/01/2036 | | | 376,195 | |
| 40,178 | | Pool #865854, | | | | |
| | | 6.000%, 03/01/2036 | | | 44,018 | |
| 53,760 | | Pool #891474, | | | | |
| | | 6.000%, 04/01/2036 | | | 58,854 | |
| | | | | | | |
Principal
Amount | | | | Value | |
| | | | | | |
| | | MORTGAGE BACKED SECURITIES - U.S. | | | | |
| | | GOVERNMENT AGENCY (Continued) | | | | |
$ | 320,894 | | Pool #897776, | | | | |
| | | 6.500%, 09/01/2036 | | $ | 360,850 | |
| 580,299 | | Pool #893681, | | | | |
| | | 6.000%, 10/01/2036 | | | 635,054 | |
| 1,220,037 | | Pool #893923, | | | | |
| | | 6.000%, 10/01/2036 | | | 1,335,156 | |
| 1,399,901 | | Pool #894005, | | | | |
| | | 6.000%, 10/01/2036 | | | 1,531,991 | |
| 88,043 | | Pool #902468, | | | | |
| | | 6.000%, 11/01/2036 | | | 96,185 | |
| 248,560 | | Pool #897505, | | | | |
| | | 6.500%, 12/01/2036 | | | 279,509 | |
| 73,740 | | Pool #906000, | | | | |
| | | 6.000%, 01/01/2037 | | | 80,559 | |
| 606 | | Pool #928062, | | | | |
| | | 5.500%, 02/01/2037 | | | 652 | |
| 986 | | Pool #899119, | | | | |
| | | 5.500%, 04/01/2037 | | | 1,061 | |
| 1,016 | | Pool #938488, | | | | |
| | | 5.500%, 05/01/2037 | | | 1,090 | |
| 84,749 | | Pool #945069, | | | | |
| | | 6.500%, 08/01/2037 | | | 95,885 | |
| 1,485 | | Pool #970131, | | | | |
| | | 5.500%, 03/01/2038 | | | 1,598 | |
| 998 | | Pool #981313, | | | | |
| | | 5.500%, 06/01/2038 | | | 1,075 | |
| 80,074 | | Pool #889697, | | | | |
| | | 6.000%, 07/01/2038 | | | 87,229 | |
| 1,491 | | Pool #985108, | | | | |
| | | 5.500%, 07/01/2038 | | | 1,605 | |
| 694 | | Pool #964930, | | | | |
| | | 5.500%, 08/01/2038 | | | 748 | |
| 1,049 | | Pool #987032, | | | | |
| | | 5.500%, 08/01/2038 | | | 1,129 | |
| 911 | | Pool #968371, | | | | |
| | | 5.500%, 09/01/2038 | | | 981 | |
| 576 | | Pool #993050, | | | | |
| | | 5.500%, 12/01/2038 | | | 620 | |
| 281 | | Pool #MC0018, | | | | |
| | | 5.500%, 12/01/2038 | | | 305 | |
| 24,468 | | Pool #AA9133, | | | | |
| | | 4.500%, 08/01/2039 | | | 25,027 | |
See notes to financial statements.
47
|
GuideMarkSM Core Fixed Income Fund |
SCHEDULE OF INVESTMENTS (Continued) |
March 31, 2011 |
| |
| | | | | | | |
Principal
Amount | | | | Value | |
| | | | | | |
| | | MORTGAGE BACKED SECURITIES - U.S. | | | | |
| | | GOVERNMENT AGENCY (Continued) | | | | |
$ | 124,134 | | Pool #AC1246, | | | | |
| | | 4.500%, 08/01/2039 | | $ | 127,202 | |
| 274,722 | | Pool #AC1579, | | | | |
| | | 4.500%, 08/01/2039 | | | 281,512 | |
| 45,387 | | Pool #AC2861, | | | | |
| | | 4.500%, 08/01/2039 | | | 46,423 | |
| 38,769 | | Pool #934943, | | | | |
| | | 4.500%, 09/01/2039 | | | 39,727 | |
| 184,689 | | Pool #AC3246, | | | | |
| | | 4.500%, 09/01/2039 | | | 189,253 | |
| 180,935 | | Pool #AC3310, | | | | |
| | | 4.500%, 10/01/2039 | | | 185,407 | |
| 23,089 | | Pool #AC5107, | | | | |
| | | 4.500%, 10/01/2039 | | | 23,659 | |
| 93,579 | | Pool #AC6121, | | | | |
| | | 4.500%, 11/01/2039 | | | 95,717 | |
| 31,092 | | Pool #AC8372, | | | | |
| | | 4.500%, 12/01/2039 | | | 31,802 | |
| 24,779 | | Pool #AC8832, | | | | |
| | | 4.500%, 12/01/2039 | | | 25,391 | |
| 271,371 | | Pool #AD0585, | | | | |
| | | 4.500%, 12/01/2039 | | | 278,078 | |
| 839,355 | | Pool #AD0586, | | | | |
| | | 4.500%, 12/01/2039 | | | 858,526 | |
| 26,455 | | Pool #AC3946, | | | | |
| | | 4.500%, 01/01/2040 | | | 27,109 | |
| 26,306 | | Pool #AD1922, | | | | |
| | | 4.500%, 01/01/2040 | | | 26,956 | |
| 1,106,825 | | Pool #AD5574, | | | | |
| | | 5.000%, 04/01/2040 | | | 1,160,163 | |
| 3,928,507 | | Pool #AD5661, | | | | |
| | | 5.000%, 05/01/2040 | | | 4,117,820 | |
| 4,119,454 | | Pool #AD6949, | | | | |
| | | 5.500%, 06/01/2040 | | | 4,410,807 | |
| 3,729,738 | | Pool #AB1231, | | | | |
| | | 5.000%, 07/01/2040 | | | 3,909,472 | |
| 5,957,753 | | Pool #AD6943, | | | | |
| | | 5.000%, 07/01/2040 | | | 6,244,853 | |
| 2,730,805 | | Pool #AH3373, | | | | |
| | | 5.000%, 01/01/2041 | | | 2,862,400 | |
| 4,000,000 | | Pool #TBA, | | | | |
| | | 3.500%, 04/15/2041 (g) | | | 3,767,500 | |
| | | | | | | |
Principal
Amount | | | | Value | |
| | | | | | |
| | | MORTGAGE BACKED SECURITIES - U.S. | | | | |
| | | GOVERNMENT AGENCY (Continued) | | | | |
$ | 1,000,000 | | Pool #TBA, | | | | |
| | | 4.000%, 04/15/2041 (g) | | $ | 983,750 | |
| 3,000,000 | | Pool #TBA, | | | | |
| | | 5.500%, 04/15/2041 (g) | | | 3,208,595 | |
| 13,000,000 | | Pool #TBA, | | | | |
| | | 6.000%, 04/15/2041 (g) | | | 14,139,527 | |
| 8,000,000 | | Pool #TBA, | | | | |
| | | 5.000%, 04/15/2041 (g) | | | 8,370,000 | |
| 500,000 | | Pool #TBA, | | | | |
| | | 3.740%, 05/01/2041 (g) | | | 484,369 | |
| | | Government National Mortgage | | | | |
| | | Association | | | | |
| 296,384 | | Pool #752842X, | | | | |
| | | 3.950%, 07/15/2025 | | | 295,046 | |
| 49,806 | | Pool #614436X, | | | | |
| | | 5.000%, 08/15/2033 | | | 53,184 | |
| 844,567 | | Pool #618907X, | | | | |
| | | 5.000%, 09/15/2033 | | | 901,839 | |
| 132,966 | | Pool #605098X, | | | | |
| | | 5.000%, 03/15/2034 | | | 141,941 | |
| 105,107 | | Pool #520279X, | | | | |
| | | 5.000%, 11/15/2034 | | | 112,235 | |
| 1,766,019 | | Pool #644812X, | | | | |
| | | 6.000%, 05/15/2035 | | | 1,966,444 | |
| 298,255 | | Pool #736686X, | | | | |
| | | 5.000%, 02/15/2039 | | | 316,896 | |
| 547,349 | | Pool #720103X, | | | | |
| | | 4.500%, 06/15/2039 | | | 567,903 | |
| 2,097,862 | | Pool #723248, | | | | |
| | | 5.000%, 10/15/2039 | | | 2,240,123 | |
| 766,352 | | Pool #726382, | | | | |
| | | 5.000%, 10/15/2039 | | | 818,320 | |
| 2,186,507 | | Pool #752631C, | | | | |
| | | 4.500%, 10/20/2040 | | | 2,262,807 | |
| 2,156,894 | | Pool #004947M, | | | | |
| | | 5.000%, 02/20/2041 | | | 2,292,711 | |
| 11,000,000 | | Pool #TBA, | | | | |
| | | 4.500%, 04/15/2040 (g) | | | 11,348,909 | |
| 4,000,000 | | Pool #TBA, | | | | |
| | | 3.500%, 04/15/2041 (g) | | | 3,811,248 | |
| 1,000,000 | | Pool #TBA, | | | | |
| | | 4.500%, 04/15/2041 (g) | | | 1,030,000 | |
See notes to financial statements.
48
|
GuideMarkSM Core Fixed Income Fund |
SCHEDULE OF INVESTMENTS (Continued) |
March 31, 2011 |
| |
| | | | | | | |
Principal
Amount | | | | Value | |
| | | | | | |
| | | MORTGAGE BACKED SECURITIES - U.S. | | | | |
| | | GOVERNMENT AGENCY (Continued) | | | | |
$ | 2,000,000 | | Pool #TBA, | | | | |
| | | 5.000%, 04/15/2041 (g) | | $ | 2,121,250 | |
| 2,000,000 | | Pool #TBA, | | | | |
| | | 5.000%, 04/15/2041 (g) | | | 2,122,188 | |
| | | Total Mortgage Backed Securities - | | | | |
| | | U.S. Government Agency | | | | |
| | | (Cost $149,670,925) | | | 152,004,345 | |
| | | | | | | |
| | | MUNICIPAL BONDS - 1.16% | | | | |
| | | California, GO, | | | | |
| 725,000 | | 7.500%, 04/01/2034 | | | 780,927 | |
| 175,000 | | 7.950%, 03/01/2036 | | | 187,178 | |
| 600,000 | | 7.550%, 04/01/2039 | | | 652,794 | |
| 925,000 | | 7.625%, 03/01/2040 | | | 1,012,829 | |
| 300,000 | | Connecticut Health & Educational | | | | |
| | | Facilities Authority, Series Z-1, | | | | |
| | | Revenue Bond, | | | | |
| | | 5.000%, 07/01/2042 | | | 302,451 | |
| 225,000 | | Dallas Area Rapid Transit Sales, | | | | |
| | | Refunding, Revenue Bond, | | | | |
| | | 5.250%, 12/01/2048 | | | 220,995 | |
| 500,000 | | Illinois, GO, | | | | |
| | | 7.350%, 07/01/2035 | | | 511,400 | |
| 1,099,123 | | Missouri Higher Education | | | | |
| | | Loan Authority, Series A-1, | | | | |
| | | Revenue Bond, | | | | |
| | | 1.162%, 11/26/2032 (e) | | | 1,102,408 | |
| 225,000 | | New York City Municipal Water | | | | |
| | | Finance Authority, Refunding, | | | | |
| | | Revenue Bond, | | | | |
| | | 5.375%, 06/15/2043 | | | 227,950 | |
| 500,000 | | New York State Dormitory Authority, | | | | |
| | | Series A, Refunding, Revenue Bond, | | | | |
| | | 5.000%, 07/01/2040 | | | 500,330 | |
| 260,000 | | North Carolina Capital Facilities | | | | |
| | | Finance Agency, Series A, | | | | |
| | | Refunding, Revenue Bond, | | | | |
| | | 5.000%, 10/01/2044 | | | 259,579 | |
| 1,000,000 | | South Carolina Student Loan Corp., | | | | |
| | | Series A-1, Revenue Bond, | | | | |
| | | 0.401%, 12/02/2019 (e) | | | 984,080 | |
| | | | | | | |
| | | Total Municipal Bonds | | | | |
| | | (Cost $6,432,455) | | | 6,742,921 | |
| | | | | | | |
| | | | | | | |
Principal
Amount | | | | Value | |
| | | | | | |
| | | SUPRANATIONAL OBLIGATIONS - 0.66% | | | | |
$ | 4,000,000 | | Inter-American Development Bank | | | | |
| | | 0.500%, 05/29/2014 | | $ | 3,836,948 | |
| | | | | | | |
| | | Total Supranational Obligations | | | | |
| | | (Cost $3,501,832) | | | 3,836,948 | |
| | | | | | | |
| | | U.S. GOVERNMENT AGENCY ISSUES - 1.21% | | | | |
| 1,200,000 | | Federal Home Loan Banks | | | | |
| | | 5.625%, 06/11/2021 | | | 1,375,415 | |
| | | Federal Home Loan Mortgage Corp. | | | | |
| 1,000,000 | | Series 2590, 5.000%, 03/15/2018 | | | 1,082,153 | |
| 838,486 | | Series 2329, 6.500%, 06/15/2031 | | | 918,060 | |
| 469,927 | | Series 2338, 6.500%, 07/15/2031 | | | 522,966 | |
| | | Federal National Mortgage Association | | | | |
| 1,600,000 | | 5.375%, 06/12/2017 | | | 1,826,835 | |
| 317,953 | | Series 2004-71, 0.000%, | | | | |
| | | 04/25/2034 (Acquired 04/07/2006, | | | | |
| | | Cost $39,505) (d)(i)(k) | | | 3,233 | |
| 1,200,000 | | Tennessee Valley Authority | | | | |
| | | 4.375%, 06/15/2015 | | | 1,312,265 | |
| | | | | | | |
| | | Total U.S. Government Agency Issues | | | | |
| | | (Cost $6,840,650) | | | 7,040,927 | |
| | | | | | | |
| | | U.S. TREASURY OBLIGATIONS - 16.69% | | | | |
| | | U.S. Treasury Bonds - 3.17% | | | | |
| 2,102,958 | | 2.375%, 01/15/2025 (h) | | | 2,365,992 | |
| 1,965,654 | | 2.375%, 01/15/2027 (h) | | | 2,193,701 | |
| 700,000 | | 5.000%, 05/15/2037 | | | 760,703 | |
| 4,400,000 | | 4.375%, 05/15/2040 | | | 4,302,390 | |
| 6,615,000 | | 3.875%, 08/15/2040 | | | 5,920,425 | |
| 2,600,000 | | 4.250%, 11/15/2040 | | | 2,487,064 | |
| 402,252 | | 2.125%, 02/15/2041 (h) | | | 426,796 | |
| | | U.S. Treasury Notes - 13.52% | | | | |
| 1,886,167 | | 2.375%, 04/15/2011 (h) (l) | | | 1,887,571 | |
| 6,400,000 | | 1.375%, 01/15/2013 | | | 6,476,749 | |
| 5,300,000 | | 0.625%, 02/28/2013 | | | 5,287,789 | |
| 4,800,000 | | 1.250%, 02/15/2014 | | | 4,803,749 | |
| 12,000,000 | | 1.250%, 03/15/2014 | | | 11,998,152 | |
| 15,640,000 | | 2.000%, 01/31/2016 | | | 15,528,815 | |
| 7,600,000 | | 2.125%, 02/29/2016 | | | 7,577,436 | |
| 1,000,000 | | 2.625%, 01/31/2018 | | | 986,172 | |
| 3,400,000 | | 2.625%, 11/15/2020 | | | 3,173,155 | |
| 553,696 | | 1.125%, 01/15/2021 (h) | | | 562,477 | |
| 20,115,000 | | 3.625%, 02/15/2021 (b) | | | 20,404,153 | |
| | | | | | | |
| | | Total U.S. Treasury Obligations | | | | |
| | | (Cost $97,470,788) | | | 97,143,289 | |
| | | | | | | |
See notes to financial statements.
49
|
GuideMarkSM Core Fixed Income Fund |
SCHEDULE OF INVESTMENTS (Continued) |
March 31, 2011 |
| |
| | | | | | | |
Number of
Shares | | | | Value | |
| | | | | | |
| | | WARRANTS - 0.00% | | | | |
| | | Warrant - 0.00% | | | | |
| 272 | | Semgroup Corp. (a) | | | | |
| | | Expiration: November, 2014, | | | | |
| | | Exercise Price: $1.00 | | | | |
| | | (Acquired 12/07/2009, | | | | |
| | | Cost $0) (d) | | $ | 2,788 | |
| | | | | | | |
| | | Total Warrants (Cost $0) | | | 2,788 | |
| | | | | | | |
| | | SHORT TERM INVESTMENTS - 27.68% | | | | |
| | | Money Market Funds - 0.63% | | | | |
| 3,702,738 | | Federated Prime Obligations Fund | | | | |
| | | Effective Yield, 0.17% (e) | | | 3,702,738 | |
| | | | | | | |
| | | | | | | |
Principal
Amount | | | | | | |
| | | | | | | |
| | | Repurchase Agreement - 19.66% | | | | |
$ | 114,400,000 | | Merrill Lynch Repurchase Agreement | | | | |
| | | Agreement 04/01/2011 at 0.150% | | | | |
| | | (Collateralized by various U.S. | | | | |
| | | Government Agency Issues, | | | | |
| | | value $116,256,945, | | | | |
| | | 4.500% to 5.000%, | | | | |
| | | 01/01/2025 to 04/01/2041) | | | 114,400,000 | |
| | | | | | | |
| | | U.S. Treasury Bills - 7.39% | | | | |
| | | U.S. Treasury Bills | | | | |
| 13,000,000 | | Effective Yield, 0.035%, 06/16/20111 | | | 12,998,219 | |
| 30,000,000 | | Effective Yield, 0.030%, 06/23/2011 | | | 29,994,660 | |
| | | | | | | |
| | | Total Short Term Investments | | | | |
| | | (Cost $161,094,214) | | | 161,095,617 | |
| | | | | | | |
| | | | | | | |
Number of
Shares | | | | | | |
| | | | | | | |
| | | INVESTMENTS PURCHASED | | | | |
| | | AS SECURITIES LENDING | | | | |
| | | COLLATERAL - 0.06% | | | | |
| | | Money Market Funds - 0.02% | | | | |
| 79,316 | | Mount Vernon Prime Portfolio | | | 79,316 | |
| | | Effective Yield, 0.265% | | | | |
| 4,931 | | Reserve Primary Fund (j) | | | 88 | |
| | | | | | | |
| | | | | | 79,404 | |
| | | | | | | |
| | | | | | | |
Principal
Amount | | | | Value | |
| | | | | | |
| | | Cash - 0.04% | | | | |
$ | 258,373 | | Cash | | $ | 258,373 | |
| | | | | | | |
| | | Total Cash (Cost $258,373) | | | 258,373 | |
| | | | | | | |
| | | Total Investments Purchased as | | | | |
| | | Securities Lending Collateral | | | | |
| | | (Cost $341,944) | | | 337,777 | |
| | | | | | | |
| | | Total Investments | | | | |
| | | (Cost $622,501,437) - 107.18% | | | 623,727,362 | |
| | | Liabilities in Excess of | | | | |
| | | Other Assets - (7.18)% | | . | (41,786,400 | ) |
| | | | | | | |
| | | TOTAL NET ASSETS - 100.00% | | $ | 581,940,962 | |
| | | | | | | |
| |
| Percentages are stated as a percent of net assets. |
(a) | Non-Income producing. |
(b) | All or portion of this security is on loan. |
(c) | Restriced securities as defined in Rule 144(a) under the Securities Act of 1933. Such securities are treated as liquid securities according to the Fund’s liquidity guidelines. The value of these securities total $20,254,038, which represents 3.48% of total net assets. |
(d) | Restricted securities as defined in Rule 144(a) under the Securities Act of 1933. Such securities are treated as illiquid securities according to the Fund’s liquidity guidelines. The value of thses securities total $4,195,547, which represents 0.72% of total net assets. |
(e) | Variable Rate Security. The rate shown is the rate in effect on March 31, 2011. |
(f) | Non-income producing. Item identified as in default as to payment of interest. |
(g) | Security purchased on a when-issued basis. On March 31, 2011, the total value of investments purchased on a when-issued basis was $72,357,179 or 12.43% of total net assets. |
(h) | Represents a U.S. Treasury Inflation protected Security. |
(i) | Represents an interest only security that entitles holders to receive only interest payments on the underlying mortgages. The yield to maturity of an interest only security is extremely sensitive to the rate of principal payments on the underlying mortgage assets. A rapid (slow) rate of principal repayments may have an adverse (positive) effect on yield to maturity. The principal amount shown is the notional amount of the underlying mortgage. Interest rate disclosed represents yield upon the estimated timing and amount of future cash flows at March 31, 2011. The securities are illiquid and total $3,821,474, which represents 0.66% of net assets. |
See notes to financial statements.
50
|
GuideMarkSM Core Fixed Income Fund |
SCHEDULE OF INVESTMENTS (Continued) |
March 31, 2011 |
| |
| |
(j) | As of March 31, 2011, the Advisor has fair valued this security and deemed it illiquid. (unaudited) The value of this security was $88 which represents 0.00% of total net assets. |
(k) | Zero coupon bond. |
(l) | Partially assigned as collateral for certain futures contracts. |
See notes to financial statements.
51
|
GuideMarkSM Core Fixed Income Fund
SCHEDULE OF OPEN FORWARD CURRENCY CONTRACTS
March 31, 2011 |
| | | | | | | | | | | | | | |
Forward
expiration date | | Currency to
be received | | Amount of
Currency to
be received | | Currency to
be delivered | | Amount of
Currency to
be delivered | | Unrealized
Appreciation/
(Depreciation) |
| | | | | | | | | | | |
4/11/2011 | | U.S. Dollars | | 1,929,529 | | | Brazil Real | | 3,324,000 | | | $ | (101,883 | ) |
4/1/2011 | | U.S. Dollars | | 2,054,091 | | | European Monetary Unit | | 1,517,709 | | | | (96,779 | ) |
4/11/2011 | | Brazilian Real | | 2,737,064 | | | U.S. Dollars | | 1,637,000 | | | | 35,715 | |
4/1/2011 | | European Monetary Unit | | 1,517,709 | | | U.S. Dollars | | 2,139,366 | | | | 11,504 | |
5/12/2011 | | European Monetary Unit | | 71,119 | | | U.S. Dollars | | 100,100 | | | | 608 | |
| | | | | | | | | | | | | | |
| | | | | | | | | | | | $ | (150,835 | ) |
| | | | | | | | | | | | | | |
|
GuideMarkSM Core Fixed Income Fund
SCHEDULE OF OPEN FUTURES CONTRACTS
March 31, 2010 |
| | | | | | | | | | | | | | | | |
Description | | | Number of
Contracts
Purchased | | Notional
Value | | Settlement
Month | | Unrealized
Appreciation
(Depreciation) | |
| | | | | | | | | | | |
Eurodollar 90 Day Futures | | 5 | | | $ | 1,245,500 | | Jun-11 | | | | $ | 34,244 | | |
Eurodollar 90 Day Futures | | 5 | | | | 1,244,250 | | Sep-11 | | | | | 36,545 | | |
Eurodollar 90 Day Futures | | 5 | | | | 1,242,438 | | Dec-11 | | | | | 38,142 | | |
U.S. Treasury 2 Year Note Futures | | 131 | | | | 28,574,375 | | Jun-11 | | | | | 23,013 | | |
U.S. Treasury 5 Year Note Futures | | 325 | | | | 37,956,444 | | Jun-11 | | | | | (284,415 | ) | |
U.S. Treasury 10 Year Note Futures | | 202 | | | | 24,044,312 | | Jun-11 | | | | | (166,602 | ) | |
U.S. Treasury Long Bond Futures | | 12 | | | | 1,442,250 | | Jun-11 | | | | | (9,051 | ) | |
U.S. Treasury Ultra Bond Futures | | 87 | | | | 10,749,938 | | Jun-11 | | | | | 26,776 | | |
| | | | | | | | | | | | | | | |
| | | | | | | | | | | | $ | (301,348 | ) | |
| | | | | | | | | | | | | | | |
See notes to financial statements.
52
|
GuideMarkSM Funds |
STATEMENTS OF ASSETS & LIABILITIES |
March 31, 2011 |
| |
| | | | | | | | | | |
| | Large Cap
Growth Fund | | Large Cap
Value Fund | | Small/Mid Cap
Core Fund | |
| | | | | | | �� |
ASSETS: | | | | | | | | | | |
Investments, at value (cost $152,412,732, | | | | | | | | | | |
$146,539,615 and $30,998,464, | | | | | | | | | | |
respectively) | | $ | 211,292,742 | | $ | 200,076,907 | | $ | 42,801,284 | |
Cash | | | — | | | 3,217 | | | 879 | |
Income receivable | | | 169,225 | | | 380,499 | | | 32,564 | |
Receivable for fund shares sold | | | 7,682 | | | 7,480 | | | 3,066 | |
Other assets | | | 32,301 | | | 26,377 | | | 18,740 | |
| | | | | | | | | | |
Total Assets | | | 211,501,950 | | | 200,494,480 | | | 42,856,533 | |
| | | | | | | | | | |
LIABILITIES: | | | | | | | | | | |
Payable to securities lending agent (See Note 6) | | | 20,508 | | | 23,460 | | | 6,386 | |
Payable for fund shares redeemed | | | 4,364 | | | 118 | | | 27 | |
Payable to Investment Advisor | | | 156,577 | | | 163,590 | | | 25,255 | |
Payable to Custodian | | | 11,243 | | | 3,798 | | | 3,048 | |
Payable for dividend withholding tax | | | — | | | 533 | | | — | |
Other accrued expenses | | | 180,070 | | | 170,640 | | | 73,028 | |
| | | | | | | | | | |
Total Liabilities | | | 372,762 | | | 362,139 | | | 107,744 | |
| | | | | | | | | | |
NET ASSETS | | $ | 211,129,188 | | $ | 200,132,341 | | $ | 42,748,789 | |
| | | | | | | | | | |
NET ASSETS CONSIST OF: | | | | | | | | | | |
Capital stock | | | 252,388,675 | | | 353,931,790 | | | 63,862,101 | |
Unrealized appreciation on investments | | | 58,880,010 | | | 53,537,292 | | | 11,802,820 | |
Accumulated undistributed net investment income | | | 1,129 | | | 499,075 | | | 54,113 | |
Accumulated undistributed net realized loss | | | (100,140,626 | ) | | (207,835,816 | ) | | (32,970,245 | ) |
| | | | | | | | | | |
Total Net Assets | | $ | 211,129,188 | | $ | 200,132,341 | | $ | 42,748,789 | |
| | | | | | | | | | |
Shares outstanding (unlimited shares of no par | | | | | | | | | | |
value authorized) | | | 21,142,727 | | | 24,064,902 | | | 3,682,050 | |
Net asset value, offering and redemption price | | | | | | | | | | |
per share | | $ | 9.99 | | $ | 8.32 | | $ | 11.61 | |
| | | | | | | | | | |
See notes to financial statements.
53
|
GuideMarkSM Funds |
STATEMENTS OF ASSETS & LIABILITIES (Continued) |
March 31, 2011 |
| |
| | | | | | | | | | |
| | World
ex-US
Fund | | Tax-Exempt
Fixed Income
Fund | | Core
Fixed Income
Fund | |
| | | | | | | |
ASSETS: | | | | | | | | | | |
Investments, at value (cost $242,253,184, | | | | | | | | | | |
$167,385,686 and $508,101,437, respectively)1 | | $ | 268,850,463 | | $ | 168,112,590 | | $ | 509,327,362 | |
Repurchase Agreements (cost $0, $0 and | | | | | | | | | | |
$114,400,000, respectively) | | | — | | | — | | | 114,400,000 | |
Foreign currencies (cost $350,284, $0 and $0, | | | | | | | | | | |
respectively) | | | 350,231 | | | — | | | — | |
Cash | | | — | | | 948,259 | | | 117,159 | |
Income receivable | | | 939,207 | | | 1,502,994 | | | 2,763,481 | |
Receivable for dividend reclaims | | | 392,370 | | | — | | | — | |
Receivable for investment securities and foreign | | | | | | | | | | |
currencies sold | | | — | | | 9,212 | | | 40,743,212 | |
Receivable for fund shares sold | | | 9,846 | | | — | | | 30,700 | |
Receivable from securities lending agent (See Note 6) | | | — | | | — | | | 55,942 | |
Other assets | | | 31,853 | | | 53,900 | | | 115,233 | |
| | | | | | | | | | |
Total Assets | | | 270,573,970 | | | 170,626,955 | | | 667,553,089 | |
| | | | | | | | | | |
LIABILITIES: | | | | | | | | | | |
Depreciation of forward foreign currency contracts | | | — | | | — | | | 150,835 | |
Payable for collateral on securities loaned | | | 5,588 | | | — | | | 398,562 | |
Payable for investment securities purchased | | | — | | | — | | | 84,209,261 | |
Payable for fund shares redeemed | | | 124 | | | — | | | 23,690 | |
Payable for deposits with brokers for futures and | | | | | | | | | | |
options | | | — | | | — | | | 20,708 | |
Payable to Investment Advisor | | | 218,561 | | | 129,836 | | | 369,749 | |
Variation margin on futures contracts | | | — | | | — | | | 6,383 | |
Payable to Custodian | | | 348,357 | | | 4,489 | | | 21,959 | |
Payable for dividend withholding tax | | | 82,479 | | | — | | | — | |
Other accrued expenses | | | 216,792 | | | 162,486 | | | 410,980 | |
| | | | | | | | | | |
Total Liabilities | | | 871,901 | | | 296,811 | | | 85,612,127 | |
| | | | | | | | | | |
NET ASSETS | | $ | 269,702,069 | | $ | 170,330,144 | | $ | 581,940,962 | |
| | | | | | | | | | |
NET ASSETS CONSIST OF: | | | | | | | | | | |
Capital stock | | | 456,304,866 | | | 177,233,625 | | | 593,898,609 | |
Unrealized appreciation (depreciation) on: | | | | | | | | | | |
Investments | | | 26,597,279 | | | 726,904 | | | 1,225,926 | |
Foreign currencies | | | (53 | ) | | — | | | — | |
Forward currency exchange contracts | | | — | | | — | | | (150,835 | ) |
Futures contracts | | | — | | | — | | | (301,348 | ) |
Accumulated undistributed net investment income | | | 2,790,644 | | | 84,703 | | | 721,349 | |
Accumulated undistributed net realized loss | | | (215,990,667 | ) | | (7,715,088 | ) | | (13,452,739 | ) |
| | | | | | | | | | |
Total Net Assets | | $ | 269,702,069 | | $ | 170,330,144 | | $ | 581,940,962 | |
| | | | | | | | | | |
Shares outstanding (unlimited shares of no par value | | | | | | | | | | |
authorized) | | | 32,143,121 | | | 15,968,664 | | | 62,144,621 | |
Net asset value, offering and redemption price | | | | | | | | | | |
per share | | $ | 8.39 | | $ | 10.67 | | $ | 9.36 | |
| | | | | | | | | | |
1Includes loaned securities with a market value of: | | $ | — | | $ | — | | $ | 390,410 | |
| | | | | | | | | | |
See notes to financial statements.
54
|
GuideMarkSM Funds |
STATEMENTS OF OPERATIONS |
For the Year Ended March 31, 2011 |
| |
| | | | | | | | | | |
| | Large Cap
Growth Fund | | Large Cap
Value Fund | | Small/Mid Cap
Core Fund | |
| | | | | | | |
INVESTMENT INCOME: | | | | | | | | | | |
Dividend income (net of withholding tax of $2,977, | | | | | | | | | | |
$1,682 and $0, respectively) | | $ | 2,609,633 | | $ | 4,835,038 | | $ | 425,783 | |
Interest income | | | 4,065 | | | 7,524 | | | 1,669 | |
| | | | | | | | | | |
Total investment income | | | 2,613,698 | | | 4,842,562 | | | 427,452 | |
| | | | | | | | | | |
EXPENSES: | | | | | | | | | | |
Investment advisory fees | | | 1,879,381 | | | 1,787,830 | | | 405,110 | |
Distribution (12b-1) fees | | | 494,574 | | | 470,481 | | | 101,277 | |
Shareholder servicing fees | | | 118,698 | | | 112,916 | | | 24,307 | |
Administration fees | | | 75,258 | | | 70,747 | | | 15,481 | |
Legal fees | | | 77,927 | | | 68,985 | | | 29,046 | |
Custody fees | | | 38,252 | | | 23,890 | | | 19,930 | |
Directors’ fees and expenses | | | 31,237 | | | 29,284 | | | 6,149 | |
Reports to shareholders | | | 27,442 | | | 23,290 | | | 14,307 | |
Fund accounting fees | | | 38,224 | | | 34,998 | | | 12,649 | |
Audit and tax fees | | | 32,982 | | | 33,010 | | | 29,697 | |
Federal and state registration fees | | | 21,923 | | | 22,043 | | | 19,626 | |
Transfer agent fees and expenses | | | 15,426 | | | 15,436 | | | 12,726 | |
Insurance fees | | | 9,916 | | | 9,693 | | | 2,215 | |
Compliance fees | | | 6,123 | | | 5,865 | | | 1,256 | |
| | | | | | | | | | |
Total expenses | | | 2,867,363 | | | 2,708,468 | | | 693,776 | |
| | | | | | | | | | |
Expense reimbursement by Advisor (See Note 3) | | | — | | | — | | | (32,192 | ) |
Less securities lending credit (See Note 6) | | | (42,821 | ) | | (36,528 | ) | | (17,459 | ) |
| | | | | | | | | | |
Net expenses | | | 2,824,542 | | | 2,671,940 | | | 644,125 | |
| | | | | | | | | | |
Net investment income (loss) | | | (210,844 | ) | | 2,170,622 | | | (216,673 | ) |
| | | | | | | | | | |
NET REALIZED AND UNREALIZED GAIN (LOSS) | | | | | | | | | | |
ON INVESTMENTS: | | | | | | | | | | |
Net realized gain on investments | | | 14,403,372 | | | 3,487,047 | | | 4,229,166 | |
Net change in unrealized appreciation on investments | | | 19,790,807 | | | 17,203,674 | | | 4,286,200 | |
| | | | | | | | | | |
Net realized and unrealized gain | | | 34,194,179 | | | 20,690,721 | | | 8,515,366 | |
| | | | | | | | | | |
NET INCREASE IN NET ASSETS | | | | | | | | | | |
RESULTING FROM OPERATIONS | | $ | 33,983,335 | | $ | 22,861,343 | | $ | 8,298,693 | |
| | | | | | | | | | |
See notes to financial statements.
55
|
GuideMarkSM Funds |
STATEMENTS OF OPERATIONS (Continued) |
For the Year Ended March 31, 2011 |
| |
| | | | | | | | | | |
| | World
ex-US
Fund | | Tax-Exempt
Fixed Income
Fund | | Core
Fixed Income
Fund | |
| | | | | | | | | | |
INVESTMENT INCOME: | | | | | | | | | | |
Dividend income (net of withholding tax of $757,162,
$0 and $22,714, respectively) | | $ | 7,226,957 | | $ | — | | $ | 46,117 | |
Interest income | | | 12,743 | | | 8,557,061 | | | 19,731,841 | |
| | | | | | | | | | |
Total investment income | | | 7,239,700 | | | 8,557,061 | | | 19,777,958 | |
| | | | | | | | | | |
EXPENSES: | | | | | | | | | | |
Investment advisory fees | | | 2,417,908 | | | 1,507,982 | | | 4,260,381 | |
Distribution (12b-1) fees | | | 636,291 | | | 471,245 | | | 1,420,127 | |
Shareholder servicing fees | | | 162,353 | | | 120,104 | | | 362,316 | |
Administration fees | | | 95,209 | | | 72,791 | | | 214,937 | |
Legal fees | | | 98,860 | | | 63,410 | | | 191,759 | |
Custody fees | | | 166,730 | | | 22,989 | | | 123,091 | |
Directors’ fees and expenses | | | 40,427 | | | 27,274 | | | 85,410 | |
Reports to shareholders | | | 37,956 | | | 22,591 | | | 60,593 | |
Fund accounting fees | | | 74,412 | | | 51,534 | | | 244,992 | |
Audit and tax fees | | | 31,887 | | | 27,482 | | | 37,390 | |
Federal and state registration fees | | | 26,774 | | | 22,656 | | | 33,595 | |
Transfer agent fees and expenses | | | 15,165 | | | 14,918 | | | 21,619 | |
Insurance fees | | | 12,070 | | | 9,861 | | | 28,622 | |
Compliance fees | | | 8,152 | | | 5,053 | | | 18,754 | |
| | | | | | | | | | |
Total expenses | | | 3,824,194 | | | 2,439,890 | | | 7,103,586 | |
| | | | | | | | | | |
Expense reimbursement by Advisor (See Note 3) | | | — | | | (8,268 | ) | | — | |
Less securities lending credit (See Note 6) | | | — | | | — | | | (65,781 | ) |
| | | | | | | | | | |
Net expenses | | | 3,824,194 | | | 2,431,622 | | | 7,037,805 | |
| | | | | | | | | | |
Net investment income | | | 3,415,506 | | | 6,125,439 | | | 12,740,153 | |
| | | | | | | | | | |
NET REALIZED AND UNREALIZED GAIN (LOSS)
ON INVESTMENTS: | | | | | | | | | | |
Net realized gain (loss) on: | | | | | | | | | | |
Investments | | | 12,496,335 | | | (116,442 | ) | | (10,285,328 | ) |
Written options | | | — | | | — | | | 4,297 | |
Foreign currencies | | | (369,021 | ) | | — | | | 9,981 | |
Forward currency exchange contracts | | | (69,574 | ) | | — | | | (643,212 | ) |
Futures contracts | | | — | | | — | | | 1,841,162 | |
| | | | | | | | | | |
Total | | | 12,057,740 | | | (116,442 | ) | | (9,073,100 | ) |
| | | | | | | | | | |
Net change in unrealized appreciation
(depreciation) on: | | | | | | | | | | |
Investments | | | (328,896 | ) | | (4,266,163 | ) | | 27,311,829 | |
Written options | | | — | | | — | | | 2,671 | |
Foreign currencies | | | (23,864 | ) | | — | | | 13,171 | |
Forward currency contracts | | | — | | | — | | | (181,107 | ) |
Forward sale commitments | | | — | | | — | | | (1,827 | ) |
Futures contracts | | | — | | | — | | | (329,839 | ) |
| | | | | | | | | | |
Total | | | (352,760 | ) | | (4,266,163 | ) | | 26,814,898 | |
| | | | | | | | | | |
Net realized and unrealized gain (loss) | | | 11,704,980 | | | (4,382,605 | ) | | 17,741,798 | |
| | | | | | | | | | |
NET INCREASE IN NET ASSETS
RESULTING FROM OPERATIONS | | $ | 15,120,486 | | $ | 1,742,834 | | $ | 30,481,951 | |
| | | | | | | | | | |
See notes to financial statements.
56
|
GuideMarkSM Funds |
STATEMENTS OF CHANGES IN NET ASSETS |
|
| |
| | | | | | | | | | | | | |
| | Large Cap Growth Fund | | Large Cap Value Fund | |
| | | | | |
| | Year
Ended
March 31,
2011 | | Year
Ended
March 31,
2010 | | Year
Ended
March 31,
2011 | | Year
Ended
March 31,
2010 | |
| | | | | | | | | |
OPERATIONS: | | | | | | | | | | | | | |
Net investment income (loss) | | $ | (210,844 | ) | $ | 312,348 | | $ | 2,170,622 | | $ | 2,779,177 | |
Net realized gain (loss) on investment transactions | | | 14,403,372 | | | 4,409,401 | | | 3,487,047 | | | (2,108,925 | ) |
Change in unrealized appreciation on investments | | | 19,790,807 | | | 83,338,456 | | | 17,203,674 | | | 91,198,734 | |
| | | | | | | | | | | | | |
Net increase in net assets resulting from
operations | | | 33,983,335 | | | 88,060,205 | | | 22,861,343 | | | 91,868,986 | |
| | | | | | | | | | | | | |
CAPITAL SHARE TRANSACTIONS: | | | | | | | | | | | | | |
Shares sold | | | 34,064,790 | | | 44,507,131 | | | 35,157,092 | | | 47,486,766 | |
Shares issued to holders in reinvestment of
dividends | | | — | | | 436,737 | | | 2,263,928 | | | 3,205,994 | |
Shares redeemed | | | (64,847,160 | ) | | (128,118,332 | ) | | (58,513,846 | ) | | (118,909,177 | ) |
| | | | | | | | | | | | | |
Net decrease | | | (30,782,370 | ) | | (83,174,464 | ) | | (21,092,826 | ) | | (68,216,417 | ) |
| | | | | | | | | | | | | |
DIVIDENDS AND DISTRIBUTIONS TO
SHAREHOLDERS: | | | | | | | | | | | | | |
Net investment income | | | — | | | (312,348 | ) | | (2,264,115 | ) | | (3,205,994 | ) |
Return of capital | | | — | | | (124,389 | ) | | — | | | — | |
| | | | | | | | | | | | | |
Total dividends and distributions | | | — | | | (436,737 | ) | | (2,264,115 | ) | | (3,205,994 | ) |
| | | | | | | | | | | | | |
INCREASE (DECREASE) IN NET ASSETS | | | 3,200,965 | | | 4,449,004 | | | (495,598 | ) | | 20,446,575 | |
NET ASSETS: | | | | | | | | | | | | | |
Beginning of year | | $ | 207,928,223 | | $ | 203,479,219 | | $ | 200,627,939 | | $ | 180,181,364 | |
| | | | | | | | | | | | | |
End of year (including undistributed net investment
income of $1,129, $3,154, $499,075 and
$592,543, respectively) | | $ | 211,129,188 | | $ | 207,928,223 | | $ | 200,132,341 | | $ | 200,627,939 | |
| | | | | | | | | | | | | |
| | | | | | | | | | | | | |
CHANGES IN SHARES OUTSTANDING | | | | | | | | | | | | | |
Shares sold | | | 3,927,474 | | | 6,098,350 | | | 4,692,536 | | | 7,400,493 | |
Shares issued to holders in reinvestment of
dividends | | | — | | | 54,456 | | | 289,505 | | | 449,019 | |
Shares redeemed | | | (7,499,745 | ) | | (17,316,881 | ) | | (7,874,002 | ) | | (18,007,928 | ) |
| | | | | | | | | | | | | |
Net decrease | | | (3,572,271 | ) | | (11,164,075 | ) | | (2,891,961 | ) | | (10,158,416 | ) |
| | | | | | | | | | | | | |
See notes to financial statements.
57
|
GuideMarkSM Funds |
STATEMENTS OF CHANGES IN NET ASSETS (Continued) |
|
| |
| | | | | | | | | | | | | |
| | Small/Mid Cap Core Fund | | World ex-US Fund | |
| | | | | |
| | Year
Ended
March 31,
2011 | | Year
Ended
March 31,
2010 | | Year
Ended
March 31,
2011 | | Year
Ended
March 31,
2010 | |
| | | | | | | | | |
OPERATIONS: | | | | | | | | | | | | | |
Net investment income (loss) | | $ | (216,673 | ) | $ | 10,344 | | $ | 3,415,506 | | $ | 5,210,496 | |
Net realized gain (loss) on investment transactions | | | 4,229,166 | | | (3,476,667 | ) | | 12,057,740 | | | 8,671,862 | |
Change in unrealized appreciation (depreciation)
on investments | | | 4,286,200 | | | 29,747,497 | | | (352,760 | ) | | 74,687,118 | |
| | | | | | | | | | | | | |
Net increase in net assets resulting from
operations | | | 8,298,693 | | | 26,281,174 | | | 15,120,486 | | | 88,569,476 | |
| | | | | | | | | | | | | |
CAPITAL SHARE TRANSACTIONS: | | | | | | | | | | | | | |
Shares sold | | | 6,604,384 | | | 10,261,480 | | | 66,226,573 | | | 80,322,291 | |
Shares issued to holders in reinvestment of
dividends | | | — | | | 132,181 | | | 4,261,966 | | | 6,512,687 | |
Shares redeemed | | | (14,803,776 | ) | | (39,072,820 | ) | | (81,264,833 | ) | | (122,609,399 | ) |
| | | | | | | | | | | | | |
Net decrease | | | (8,199,392 | ) | | (28,679,159 | ) | | (10,776,294 | ) | | (35,774,421 | ) |
| | | | | | | | | | | | | |
DIVIDENDS AND DISTRIBUTIONS TO
SHAREHOLDERS: | | | | | | | | | | | | | |
Net investment income | | | — | | | (10,573 | ) | | (4,263,692 | ) | | (6,512,687 | ) |
Return of capital | | | — | | | (121,608 | ) | | — | | | — | |
| | | | | | | | | | | | | |
Total dividends and distributions | | | — | | | (132,181 | ) | | (4,263,692 | ) | | (6,512,687 | ) |
| | | | | | | | | | | | | |
INCREASE (DECREASE) IN NET ASSETS | | | 99,301 | | | (2,530,166 | ) | | 80,500 | | | 46,282,368 | |
NET ASSETS: | | | | | | | | | | | | | |
Beginning of year | | $ | 42,649,488 | | $ | 45,179,654 | | $ | 269,621,569 | | $ | 223,339,201 | |
| | | | | | | | | | | | | |
End of year (including undistributed net investment
income of $54,113, $124,604, $2,790,644 and
$4,075,917, respectively) | | $ | 42,748,789 | | $ | 42,649,488 | | $ | 269,702,069 | | $ | 269,621,569 | |
| | | | | | | | | | | | | |
CHANGES IN SHARES OUTSTANDING | | | | | | | | | | | | | |
Shares sold | | | 662,601 | | | 1,379,226 | | | 8,486,413 | | | 10,502,217 | |
Shares issued to holders in reinvestment of
dividends | | | — | | | 15,388 | | | 532,081 | | | 806,026 | |
Shares redeemed | | | (1,487,757 | ) | | (4,821,360 | ) | | (10,523,609 | ) | | (16,141,843 | ) |
| | | | | | | | | | | | | |
Net decrease | | | (825,156 | ) | | (3,426,746 | ) | | (1,505,115 | ) | | (4,833,600 | ) |
| | | | | | | | | | | | | |
See notes to financial statements.
58
|
GuideMarkSM Funds |
STATEMENTS OF CHANGES IN NET ASSETS (Continued) |
|
| |
| | | | | | | | | | | | | |
| | Tax-Exempt Fixed Income Fund | | Core Fixed Income Fund | |
| | | | | |
| | Year
Ended
March 31,
2011 | | Year
Ended
March 31,
2010 | | Year
Ended
March 31,
2011 | | Year
Ended
March 31,
2010 | |
| | | | | | | | | |
OPERATIONS: | | | | | | | | | | | | | |
Net investment income | | $ | 6,125,439 | | $ | 6,285,614 | | $ | 12,740,153 | | $ | 20,182,608 | |
Net realized gain (loss) on investment transactions | | | (116,442 | ) | | 277,209 | | | (9,073,100 | ) | | (1,787,494 | ) |
Change in unrealized appreciation (depreciation) on
investments | | | (4,266,163 | ) | | 11,510,912 | | | 26,814,898 | | | 75,677,641 | |
| | | | | | | | | | | | | |
Net increase in net assets resulting from
operations | | | 1,742,834 | | | 18,073,735 | | | 30,481,951 | | | 94,072,755 | |
| | | | | | | | | | | | | |
CAPITAL SHARE TRANSACTIONS: | | | | | | | | | | | | | |
Shares sold | | | 51,372,371 | | | 85,249,245 | | | 187,560,080 | | | 229,127,655 | |
Shares issued to holders in reinvestment of
dividends | | | 6,257,986 | | | 6,165,984 | | | 14,828,487 | | | 19,827,926 | |
Shares redeemed | | | (78,112,852 | ) | | (101,573,939 | ) | | (184,064,092 | ) | | (279,687,960 | ) |
| | | | | | | | | | | | | |
Net increase (decrease) | | | (20,482,495 | ) | | (10,158,710 | ) | | 18,324,475 | | | (30,732,379 | ) |
| | | | | | | | | | | | | |
DIVIDENDS AND DISTRIBUTIONS TO
SHAREHOLDERS: | | | | | | | | | | | | | |
Net investment income | | | (6,259,146 | ) | | (6,165,984 | ) | | (14,829,215 | ) | | (19,828,054 | ) |
| | | | | | | | | | | | | |
Total dividends and distributions | | | (6,259,146 | ) | | (6,165,984 | ) | | (14,829,215 | ) | | (19,828,054 | ) |
| | | | | | | | | | | | | |
INCREASE (DECREASE) IN NET ASSETS | | | (24,998,807 | ) | | 1,749,041 | | | 33,977,211 | | | 43,512,322 | |
NET ASSETS: | | | | | | | | | | | | | |
Beginning of year | | $ | 195,328,951 | | $ | 193,579,910 | | $ | 547,963,751 | | $ | 504,451,429 | |
| | | | | | | | | | | | | |
End of year (including undistributed net investment
income of $84,703, $218,410, $721,349 and
$2,289,729, respectively) | | $ | 170,330,144 | | $ | 195,328,951 | | $ | 581,940,962 | | $ | 547,963,751 | |
| | | | | | | | | | | | | |
CHANGES IN SHARES OUTSTANDING | | | | | | | | | | | | | |
Shares sold | | | 4,655,458 | | | 7,880,178 | | | 19,988,828 | | | 26,228,305 | |
Shares issued to holders in reinvestment of
dividends | | | 571,371 | | | 569,272 | | | 1,588,021 | | | 2,270,155 | |
Shares redeemed | | | (7,109,822 | ) | | (9,440,467 | ) | | (19,635,589 | ) | | (31,956,596 | ) |
| | | | | | | | | | | | | |
Net increase (decrease) | | | (1,882,993 | ) | | (991,017 | ) | | 1,941,260 | | | (3,458,136 | ) |
| | | | | | | | | | | | | |
See notes to financial statements.
59
|
GuideMarkSM Funds |
FINANCIAL HIGHLIGHTS |
|
| |
| | | | | | | | | | | | | | | | |
| | Large Cap Growth Fund | |
| | | |
| | Year Ended
March 31, 2011 | | Year Ended
March 31, 2010 | | Year Ended
March 31, 2009 | | Year Ended
March 31, 2008 | | Year Ended
March 31, 2007 | |
| | | | | | | | | | | |
Per share data for a share of capital stock
outstanding for the entire year and
selected information for the year are as follows: | | | | | | | | | | | | | | | | |
Net asset value, beginning of year | | | $ 8.41 | | | $ 5.67 | | | $ 8.81 | | | $ 9.62 | | | $ 9.95 | |
| | | | | | | | | | | | | | | | |
Income from investment operations: | | | | | | | | | | | | | | | | |
Net investment income (loss) | | | (0.01 | ) | | 0.01 | | | 0.00 | | | (0.01 | ) | | (0.02 | ) |
Net realized and unrealized
gains (losses) on investments | | | 1.59 | | | 2.75 | | | (3.14 | ) | | (0.30 | ) | | (0.06 | ) |
| | | | | | | | | | | | | | | | |
Total from investment operations | | | 1.58 | | | 2.76 | | | (3.14 | ) | | (0.31 | ) | | (0.08 | ) |
| | | | | | | | | | | | | | | | |
Less distributions: | | | | | | | | | | | | | | | | |
Dividends from net investment
income | | | — | | | (0.01 | ) | | — | | | — | | | — | |
Dividends from net realized gains | | | — | | | — | | | — | * | | (0.50 | ) | | (0.25 | ) |
Return of capital | | | — | | | (0.01 | ) | | — | | | — | | | — | |
| | | | | | | | | | | | | | | | |
Total distributions | | | — | | | (0.02 | ) | | — | | | (0.50 | ) | | (0.25 | ) |
| | | | | | | | | | | | | | | | |
Net asset value, end of year | | | $ 9.99 | | | $ 8.41 | | | $ 5.67 | | | $ 8.81 | | | $ 9.62 | |
| | | | | | | | | | | | | | | | |
| | | | | | | | | | | | | | | | |
Total return | | | 18.79 | % | | 48.60 | % | | –35.63 | % | | –3.88 | % | | –0.80 | % |
| | | | | | | | | | | | | | | | |
Supplemental data and ratios: | | | | | | | | | | | | | | | | |
Net assets, end of year | | | $211,129,188 | | | $207,928,223 | | | $203,479,219 | | | $649,307,452 | | | $753,638,303 | |
| | | | | | | | | | | | | | | | |
Ratio of expenses to average net
assets | | | | | | | | | | | | | | | | |
Before expense reimbursement
(recapture) and securities lending
credit | | | 1.45 | % | | 1.46 | % | | 1.40 | % | | 1.33 | % | | 1.33 | % |
After expense reimbursement
(recapture) and securities lending
credit | | | 1.43 | % | | 1.41 | % | | 1.27 | % | | 1.28 | % | | 1.31 | % |
| | | | | | | | | | | | | | | | |
Ratio of net investment income (loss)
to average net assets | | | | | | | | | | | | | | | | |
Before expense reimbursement
(recapture) and securities lending
credit | | | –0.13 | % | | 0.09 | % | | –0.15 | % | | –0.15 | % | | –0.27 | % |
After expense reimbursement
(recapture) and securities lending
credit | | | –0.11 | % | | 0.14 | % | | –0.02 | % | | –0.10 | % | | –0.25 | % |
| | | | | | | | | | | | | | | | |
Portfolio turnover rate | | | 63.33 | % | | 69.83 | % | | 98.67 | % | | 62.86 | % | | 142.66 | % |
| |
* | Amount represents less than $0.01 per share. |
See notes to financial statements.
60
|
GuideMarkSM Funds |
FINANCIAL HIGHLIGHTS |
|
| |
| | | | | | | | | | | | | | | | |
| | Large Cap Value Fund | |
| | | |
| | Year Ended
March 31, 2011 | | Year Ended
March 31, 2010 | | Year Ended
March 31, 2009 | | Year Ended
March 31, 2008 | | Year Ended
March 31, 2007 | |
| | | | | | | | | | | |
Per share data for a share of capital
stock outstanding for the entire year
and selected information for the year
are as follows: | | | | | | | | | | | | | | | | |
Net asset value, beginning of year | | | $ 7.44 | | | $ 4.85 | | | $ 9.85 | | | $ 12.34 | | | $ 11.77 | |
| | | | | | | | | | | | | | | | |
Income from investment operations: | | | | | | | | | | | | | | | | |
Net investment income | | | 0.09 | | | 0.10 | | | 0.19 | | | 0.15 | | | 0.14 | |
Net realized and unrealized
gains (losses) on investments | | | 0.88 | | | 2.60 | | | (4.99 | ) | | (1.55 | ) | | 1.67 | |
| | | | | | | | | | | | | | | | |
Total from investment operations | | | 0.97 | | | 2.70 | | | (4.80 | ) | | (1.40 | ) | | 1.81 | |
| | | | | | | | | | | | | | | | |
Less distributions: | | | | | | | | | | | | | | | | |
Dividends from net investment
income | | | (0.09 | ) | | (0.11 | ) | | (0.20 | ) | | (0.14 | ) | | (0.14 | ) |
Dividends from net realized gains | | | — | | | — | | | — | * | | (0.95 | ) | | (1.10 | ) |
| | | | | | | | | | | | | | | | |
Total distributions | | | (0.09 | ) | | (0.11 | ) | | (0.20 | ) | | (1.09 | ) | | (1.24 | ) |
| | | | | | | | | | | | | | | | |
Net asset value, end of year | | | $ 8.32 | | | $ 7.44 | | | $ 4.85 | | | $ 9.85 | | | $ 12.34 | |
| | | | | | | | | | | | | | | | |
| | | | | | | | | | | | | | | | |
Total return | | | 13.15 | % | | 55.37 | % | | –48.85 | % | | –12.23 | % | | 15.32 | % |
| | | | | | | | | | | | | | | | |
Supplemental data and ratios: | | | | | | | | | | | | | | | | |
Net assets, end of year | | | $200,132,341 | | | $200,627,939 | | | $180,181,364 | | | $574,388,589 | | | $682,408,978 | |
| | | | | | | | | | | | | | | | |
Ratio of expenses to average net
assets | | | | | | | | | | | | | | | | |
Before expense reimbursement
(recapture) and securities lending
credit | | | 1.44 | % | | 1.44 | % | | 1.38 | % | | 1.33 | % | | 1.32 | % |
After expense reimbursement
(recapture) and securities lending
credit | | | 1.42 | % | | 1.40 | % | | 1.22 | % | | 1.28 | % | | 1.28 | % |
| | | | | | | | | | | | | | | | |
Ratio of net investment income to
average net assets | | | | | | | | | | | | | | | | |
Before expense reimbursement
(recapture) and securities lending
credit | | | 1.13 | % | | 1.27 | % | | 1.60 | % | | 1.16 | % | | 1.00 | % |
After expense reimbursement
(recapture) and securities lending
credit | | | 1.15 | % | | 1.31 | % | | 1.76 | % | | 1.21 | % | | 1.04 | % |
| | | | | | | | | | | | | | | | |
Portfolio turnover rate | | | 16.35 | % | | 26.85 | % | | 58.45 | % | | 40.54 | % | | 30.25 | % |
| |
* | Amount represents less than $0.01 per share. |
See notes to financial statements.
61
|
GuideMarkSM Funds |
FINANCIAL HIGHLIGHTS |
|
| |
| | | | | | | | | | | | | | | | |
| | Small/Mid Cap Core Fund | |
| | | |
| | Year Ended
March 31, 2011 | | Year Ended
March 31, 2010 | | Year Ended
March 31, 2009 | | Year Ended
March 31, 2008 | | Year Ended
March 31, 2007 | |
| | | | | | | | | | | |
Per share data for a share of capital
stock outstanding for the entire year
and selected information for the year
are as follows: | | | | | | | | | | | | | | | | |
Net asset value, beginning of year | | | $ 9.46 | | | $ 5.69 | | | $ 9.24 | | | $ 11.95 | | | $ 14.41 | |
| | | | | | | | | | | | | | | | |
Income from investment operations: | | | | | | | | | | | | | | | | |
Net investment income (loss) | | | (0.05 | ) | | 0.01 | | | 0.08 | | | 0.08 | | | 0.31 | |
Net realized and unrealized
gains (losses) on investments | | | 2.20 | | | 3.78 | | | (3.56 | ) | | (2.36 | ) | | 0.81 | |
| | | | | | | | | | | | | | | | |
Total from investment operations | | | 2.15 | | | 3.79 | | | (3.48 | ) | | (2.28 | ) | | 1.12 | |
| | | | | | | | | | | | | | | | |
Less distributions: | | | | | | | | | | | | | | | | |
Dividends from net investment
income | | | — | | | — | * | | (0.07 | ) | | (0.08 | ) | | (0.31 | ) |
Dividends from net realized gains | | | — | | | — | | | — | | | (0.35 | ) | | (3.27 | ) |
Return of capital | | | — | | | (0.02 | ) | | — | * | | — | * | | — | |
| | | | | | | | | | | | | | | | |
Total distributions | | | — | | | (0.02 | ) | | (0.07 | ) | | (0.43 | ) | | (3.58 | ) |
| | | | | | | | | | | | | | | | |
Net asset value, end of year | | | $ 11.61 | | | $ 9.46 | | | $ 5.69 | | | $ 9.24 | | | $ 11.95 | |
| | | | | | | | | | | | | | | | |
| | | | | | | | | | | | | | | | |
| | | | | | | | | | | | | | | | |
Total return | | | 22.73 | % | | 66.39 | % | | –37.59 | % | | –19.47 | % | | 7.63 | % |
| | | | | | | | | | | | | | | | |
Supplemental data and ratios: | | | | | | | | | | | | | | | | |
Net assets, end of year | | | $42,748,789 | | | $42,649,488 | | | $45,179,654 | | | $99,548,384 | | | $110,079,540 | |
| | | | | | | | | | | | | | | | |
Ratio of expenses to average net
assets | | | | | | | | | | | | | | | | |
Before expense reimbursement
(recapture) and securities lending
credit | | | 1.71 | % | | 1.67 | % | | 1.59 | % | | 1.48 | % | | 1.47 | % |
After expense reimbursement
(recapture) and securities lending
credit | | | 1.59 | % | | 1.59 | % | | 1.28 | % | | 1.40 | % | | 1.41 | % |
| | | | | | | | | | | | | | | | |
Ratio of net investment income (loss)
to average net assets | | | | | | | | | | | | | | | | |
Before expense reimbursement
(recapture) and securities lending
credit | | | –0.66 | % | | –0.06 | % | | 0.58 | % | | 0.61 | % | | 1.68 | % |
After expense reimbursement
(recapture) and securities lending
credit | | | –0.54 | % | | 0.02 | % | | 0.89 | % | | 0.69 | % | | 1.75 | % |
| | | | | | | | | | | | | | | | |
Portfolio turnover rate | | | 44.75 | % | | 52.31 | % | | 65.97 | % | | 127.62 | % | | 174.94 | % |
| |
* | Amount represents less than $0.01 per share. |
See notes to financial statements.
62
|
GuideMarkSM Funds |
FINANCIAL HIGHLIGHTS |
|
| |
| | | | | | | | | | | | | | | | |
| | World ex-US Fund | |
| | | |
| | Year Ended
March 31, 2011 | | Year Ended
March 31, 2010 | | Year Ended
March 31, 2009 | | Year Ended
March 31, 2008 | | Year Ended
March 31, 2007 | |
| | | | | | | | | | | |
Per share data for a share of capital
stock outstanding for the entire year
and selected information for the year
are as follows: | | | | | | | | | | | | | | | | |
Net asset value, beginning of year | | | $ 8.01 | | | $ 5.80 | | | $ 11.96 | | | $ 14.73 | | | $ 14.06 | |
| | | | | | | | | | | | | | | | |
Income from investment operations: | | | | | | | | | | | | | | | | |
Net investment income | | | 0.11 | | | 0.20 | | | 0.25 | | | 0.13 | | | 0.16 | |
Net realized and unrealized
gains (losses) on investments | | | 0.40 | | | 2.22 | | | (6.26 | ) | | (0.44 | ) | | 2.24 | |
| | | | | | | | | | | | | | | | |
Total from investment operations | | | 0.51 | | | 2.42 | | | (6.01 | ) | | (0.31 | ) | | 2.40 | |
| | | | | | | | | | | | | | | | |
Less distributions: | | | | | | | | | | | | | | | | |
Dividends from net investment
income | | | (0.13 | ) | | (0.21 | ) | | (0.07 | ) | | (0.14 | ) | | (0.18 | ) |
Dividends from net realized gains | | | — | | | — | | | (0.08 | ) | | (2.32 | ) | | (1.55 | ) |
| | | | | | | | | | | | | | | | |
Total distributions | | | (0.13 | ) | | (0.21 | ) | | (0.15 | ) | | (2.46 | ) | | (1.73 | ) |
| | | | | | | | | | | | | | | | |
Net asset value, end of year | | | $ 8.39 | | | $ 8.01 | | | $ 5.80 | | | $ 11.96 | | | $ 14.73 | |
| | | | | | | | | | | | | | | | |
| | | | | | | | | | | | | | | | |
Total return | | | 6.48 | % | | 41.68 | % | | –50.42 | % | | –3.85 | % | | 17.65 | % |
| | | | | | | | | | | | | | | | |
Supplemental data and ratios: | | | | | | | | | | | | | | | | |
Net assets, end of year | | | $269,702,069 | | | $269,621,569 | | | $223,339,201 | | | $681,622,030 | | | $779,422,324 | |
| | | | | | | | | | | | | | | | |
Ratio of expenses to average net
assets | | | | | | | | | | | | | | | | |
Before expense reimbursement
(recapture) and securities lending
credit | | | 1.50 | % | | 1.53 | % | | 1.53 | % | | 1.43 | % | | 1.39 | % |
After expense reimbursement
(recapture) and securities lending
credit | | | 1.50 | % | | 1.53 | % | | 1.52 | % | | 1.42 | % | | 1.37 | % |
| | | | | | | | | | | | | | | | |
Ratio of net investment income to
average net assets | | | | | | | | | | | | | | | | |
Before expense reimbursement
(recapture) and securities lending
credit | | | 1.34 | % | | 2.01 | % | | 1.94 | % | | 0.87 | % | | 0.95 | % |
After expense reimbursement
(recapture) and securities lending
credit | | | 1.34 | % | | 2.01 | % | | 1.95 | % | | 0.88 | % | | 0.97 | % |
| | | | | | | | | | | | | | | | |
Portfolio turnover rate | | | 47.34 | % | | 65.33 | % | | 144.98 | % | | 119.13 | % | | 89.16 | % |
See notes to financial statements.
63
|
GuideMarkSM Funds |
FINANCIAL HIGHLIGHTS |
|
| |
| | | | | | | | | | | | | | | | |
| | Tax-Exempt Fixed Income Fund | |
| | | |
| | Year Ended
March 31, 2011 | | Year Ended
March 31, 2010 | | Year Ended
March 31, 2009 | | Year Ended
March 31, 2008 | | Year Ended
March 31, 2007 | |
| | | | | | | | | | | |
Per share data for a share of capital
stock outstanding for the entire year
and selected information for the year
are as follows: | | | | | | | | | | | | | | | | |
Net asset value, beginning of year | | | $ 10.94 | | | $ 10.27 | | | $ 10.64 | | | $ 10.92 | | | $ 10.77 | |
| | | | | | | | | | | | | | | | |
Income from investment operations: | | | | | | | | | | | | | | | | |
Net investment income | | | 0.36 | | | 0.36 | | | 0.34 | | | 0.31 | | | 0.27 | |
Net realized and unrealized
gains (losses) on investments | | | (0.26 | ) | | 0.66 | | | (0.37 | ) | | (0.28 | ) | | 0.15 | |
| | | | | | | | | | | | | | | | |
Total from investment operations | | | 0.10 | | | 1.02 | | | (0.03 | ) | | 0.03 | | | 0.42 | |
| | | | | | | | | | | | | | | | |
Less distributions: | | | | | | | | | | | | | | | | |
Dividends from net investment
income | | | (0.37 | ) | | (0.35 | ) | | (0.34 | ) | | (0.31 | ) | | (0.27 | ) |
Dividends from net realized gains | | | — | | | — | | | — | | | — | | | — | |
| | | | | | | | | | | | | | | | |
Total distributions | | | (0.37 | ) | | (0.35 | ) | | (0.34 | ) | | (0.31 | ) | | (0.27 | ) |
| | | | | | | | | | | | | | | | |
Net asset value, end of year | | | $ 10.67 | | | $ 10.94 | | | $ 10.27 | | | $ 10.64 | | | $ 10.92 | |
| | | | | | | | | | | | | | | | |
| | | | | | | | | | | | | | | | |
Total return | | | 0.89 | % | | 10.06 | % | | –0.25 | % | | 0.28 | % | | 3.92 | % |
| | | | | | | | | | | | | | | | |
Supplemental data and ratios: | | | | | | | | | | | | | | | | |
Net assets, end of year | | | $170,330,144 | | | $195,328,951 | | | $193,579,910 | | | $257,440,133 | | | $247,841,846 | |
| | | | | | | | | | | | | | | | |
Ratio of expenses to average net
assets | | | | | | | | | | | | | | | | |
Before expense reimbursement
(recapture) | | | 1.29 | % | | 1.30 | % | | 1.30 | % | | 1.23 | % | | 1.28 | % |
After expense reimbursement
(recapture) | | | 1.29 | % | | 1.29 | % | | 1.29 | % | | 1.23 | % | | 1.28 | % |
| | | | | | | | | | | | | | | | |
Ratio of net investment income to
average net assets | | | | | | | | | | | | | | | | |
Before expense reimbursement
(recapture) | | | 3.25 | % | | 3.30 | % | | 3.09 | % | | 2.93 | % | | 2.53 | % |
After expense reimbursement
(recapture) | | | 3.25 | % | | 3.31 | % | | 3.10 | % | | 2.93 | % | | 2.53 | % |
| | | | | | | | | | | | | | | | |
Portfolio turnover rate | | | 38.01 | % | | 57.44 | % | | 44.37 | % | | 66.26 | % | | 50.36 | % |
See notes to financial statements.
64
|
GuideMarkSM Funds |
FINANCIAL HIGHLIGHTS |
|
| |
| | | | | | | | | | | | | | | | |
| | Core Fixed Income Fund | |
| | | |
| | Year Ended
March 31, 2011 | | Year Ended
March 31, 2010 | | Year Ended
March 31, 2009 | | Year Ended
March 31, 2008 | | Year Ended
March 31, 2007 | |
| | | | | | | | | | | |
Per share data for a share of capital
stock outstanding for the entire year
and selected information for the year
are as follows: | | | | | | | | | | | | | | | | |
Net asset value, beginning of year | | | $ 9.10 | | | $ 7.92 | | | $ 9.20 | | | $ 9.27 | | | $ 9.11 | |
| | | | | | | | | | | | | | | | |
Income from investment operations: | | | | | | | | | | | | | | | | |
Net investment income | | | 0.21 | | | 0.33 | | | 0.41 | | | 0.41 | | | 0.38 | |
Net realized and unrealized
gains (losses) on investments | | | 0.29 | | | 1.17 | | | (1.11 | ) | | (0.06 | ) | | 0.15 | |
| | | | | | | | | | | | | | | | |
Total from investment operations | | | 0.50 | | | 1.50 | | | (0.70 | ) | | 0.35 | | | 0.53 | |
| | | | | | | | | | | | | | | | |
| | | | | | | | | | | | | | | | |
Less distributions: | | | | | | | | | | | | | | | | |
Dividends from net investment
income | | | (0.24 | ) | | (0.32 | ) | | (0.40 | ) | | (0.41 | ) | | (0.37 | ) |
Dividends from net realized gains | | | — | | | — | | | (0.18 | ) | | (0.01 | ) | | — | |
| | | | | | | | | | | | | | | | |
Total distributions | | | (0.24 | ) | | (0.32 | ) | | (0.58 | ) | | (0.42 | ) | | (0.37 | ) |
| | | | | | | | | | | | | | | | |
Net asset value, end of year | | | $ 9.36 | | | $ 9.10 | | | $ 7.92 | | | $ 9.20 | | | $ 9.27 | |
| | | | | | | | | | | | | | | | |
| | | | | | | | | | | | | | | | |
| | | | | | | | | | | | | | | | |
Total return | | | 5.58 | % | | 19.21 | % | | –7.57 | % | | 3.87 | % | | 5.96 | % |
| | | | | | | | | | | | | | | | |
Supplemental data and ratios: | | | | | | | | | | | | | | | | |
Net assets, end of year | | | $581,940,962 | | | $547,963,751 | | | $504,451,429 | | | $804,085,918 | | | $716,017,829 | |
| | | | | | | | | | | | | | | | |
Ratio of expenses to average net
assets | | | | | | | | | | | | | | | | |
Before expense reimbursement
(recapture) and securities lending
credit | | | 1.25 | % | | 1.28 | % | | 1.26 | % | | 1.18 | % | | 1.16 | % |
After expense reimbursement
(recapture) and securities lending
credit | | | 1.24 | % | | 1.25 | % | | 1.18 | % | | 1.13 | % | | 1.14 | % |
| | | | | | | | | | | | | | | | |
Ratio of net investment income to
average net assets | | | | | | | | | | | | | | | | |
Before expense reimbursement
(recapture) and securities lending
credit | | | 2.23 | % | | 3.71 | % | | 4.54 | % | | 4.37 | % | | 4.14 | % |
After expense reimbursement
(recapture) and securities lending
credit | | | 2.24 | % | | 3.74 | % | | 4.62 | % | | 4.42 | % | | 4.16 | % |
| | | | | | | | | | | | | | | | |
Portfolio turnover rate | | | 485.40 | % | | 224.89 | % | | 261.77 | % | | 307.52 | % | | 280.55 | % |
See notes to financial statements.
65
|
GuideMarkSM Funds |
NOTES TO FINANCIAL STATEMENTS |
March 31, 2011 |
| |
| | |
1. | Organization |
| |
| GuideMarkSM Funds (the “Trust”) (formerly, AssetMark Funds) is organized as a Delaware statutory trust under a Declaration of Trust dated January 2, 2001. The Trust is registered under the Investment Company Act of 1940, as amended (the “1940 Act”), as an open-end management investment company (the “Funds”). The following funds are diversified: GuideMarkSM Large Cap Growth Fund, GuideMarkSM Large Cap Value Fund, GuideMarkSM Small/Mid Cap Core Fund, GuideMarkSM World ex-US Fund, GuideMarkSM Tax-Exempt Fixed Income Fund, and GuideMarkSM Core Fixed Income Fund. Each Fund represents a distinct portfolio with its own investment objectives and policies. The assets of each Fund are segregated, and a shareholder’s interest is limited to the Fund in which shares are held. Effective April 1, 2011, the Funds completed a restructuring to become the GuideMarkSM Funds. As of March 31, 2011, the AssetMark Small/Mid Cap Growth Fund, AssetMark Real Estate Securities Fund, AssetMark Enhanced Fundamental Index® Large Company Growth Fund, AssetMark Enhanced Fundamental Index® Large Company Value Fund, AssetMark Enhanced Fundamental Index® Small Company Growth Fund and AssetMark Enhanced Fundamental Index® Small Company Value Fund were liquidated. As of April 1, 2011, the GuideMarkSM Opportunistic Equity Fund commenced operations. |
| |
2. | Significant Accounting Policies |
| |
| The following is a summary of significant accounting policies consistently followed by the Funds in the preparation of the financial statements. These policies are in conformity with U.S. generally accepted accounting principals (“GAAP”). |
| | |
| (a) | Investment Valuation |
| | |
| | Portfolio securities listed on a national or foreign securities exchange, except those listed on NASDAQ, for which market quotations are available are valued at the last quoted sale price on each business day. Portfolio securities traded on NASDAQ are valued at the NASDAQ Official Closing Price (“NOCP”) on each business day. If there is no reported sale on an exchange or NASDAQ, the portfolio security will be valued at the mean between the most recent |
| | |
| | quoted bid and asked price. Price information on listed securities is taken from the exchange where the security is primarily traded. |
| | |
| | All equity securities that are not traded on a listed exchange are valued at the last sale price in the over-the-counter market. If a non-exchange traded security does not trade on a particular day, then the mean between the last quoted closing bid and asked price will be used. Non-exchange traded ADRs are priced with an evaluated price as determined by the current evaluated pricing procedures of, and provided by, the pricing vendor. |
| | |
| | Fixed income securities that have a maturity of greater than 60 days are generally valued on the basis of evaluations obtained from third party pricing services, which take into account appropriate factors such as institutional sized trading in similar groups of securities, yield, quality, coupon rate, maturity, type of issue, trading characteristics and other market data. Short-term investments having a maturity of less than 60 days are valued at amortized cost. |
| | |
| | Investments in mutual funds are valued at the closing net asset value per share of each mutual fund on the day of valuation. |
| | |
| | Securities for which no market quotations are readily available or when a significant event has occurred between the time of the security’s last close and the time that a Fund next calculates its net asset value will be valued at their fair value as determined by the Valuation Committee. Securities for which no market prices are readily available will be valued at their fair value as determined by the Valuation Committee under procedures adopted by the Board of Trustees. |
| | |
| | Valuation Measurements |
| | |
| | The Trust has adopted authoritative fair valuation accounting standards which establish an authoritative definition of fair value and set out a hierarchy for measuring fair value. These standards require additional disclosures about the various inputs and valuation techniques used to develop the measurements of fair value and a discussion in changes in valuation techniques and related inputs, if any, during the period. In addition, these standards require expanded disclosure for each major |
66
|
GuideMarkSM Funds |
NOTES TO FINANCIAL STATEMENTS (Continued) |
March 31, 2011 |
| |
category of assets. These inputs are summarized in the three broad levels listed below:
Level 1 – Quoted prices in active markets for identical securities.
Level 2 – Other significant observable inputs (including quoted prices for similar securities, interest rates, prepayment speeds, credit risk, etc.).
Level 3 – Significant unobservable inputs (including the Fund’s own assumptions in determining the fair value of investments).
During the period, certain of the securities and other instruments held by the Funds were categorized as Level 2 or Level 3 based upon the inputs and methodologies used to determine the fair value of the security or instrument. Descriptions of the inputs and valuation methodologies used to determine the fair values of each class of investments within Level 2 and Level 3 are set forth below.
Level 2 Investments. The Funds’ investments that were categorized as Level 2 include: (1) certain fixed income securities, including asset-backed securities, collateralized mortgage obligations, corporate bonds, U.S. and foreign government obligations, mortgage-backed securities and municipal bonds; (2) certain common stocks and convertible preferred stocks; and (3) certain over-the-counter derivative instruments, including forward currency contracts.
Fixed income securities are normally valued by pricing vendors that use broker-dealer quotations, reported trades or valuation estimates from their internal pricing models. The service providers’ internal models typically use inputs that are observable such as institutional sized trading in similar groups of securities, yield, credit quality, coupon rate, maturity, type of issue, trading characteristics and other market data.
Certain common stocks that trade on foreign exchanges are subject to valuation adjustments. These valuation adjustments are applied to the foreign exchange-traded common stocks to account for the market movement between the close of the foreign market in which the security is traded and the close of the New York Stock Exchange. These securities are valued using pricing vendors that consider the correlation patterns of
price movements of the foreign security to the intraday trading in the U.S. markets.
Foreign currency contracts derive their value from underlying asset prices, indices, reference rates, and other inputs or a combination of these factors. These instruments are normally valued using pricing vendors. Depending upon the instrument, its value may be provided by a pricing vendor using a series of techniques, including pricing models. The pricing models typically use inputs that are observed from active markets such as indices, spreads, interest rates, curves, dividends and exchange rates.
Level 3 Investments. The Funds’ investments that were categorized as Level 3 include: (1) fair valued securities, including investments purchased as securities lending collateral and warrants.
Investments purchased as securities lending collateral and warrants are normally valued by pricing vendors using relevant observable inputs, as described above. In certain circumstances, the types of observable inputs that are typically used by a pricing service may be unavailable or deemed by the pricing service to be unreliable. In these instances, the pricing vendor may value the security based upon significant unobservable inputs, or the pricing vendor may not provide a value for the security. To the extent that a pricing vendor does not provide a value for a particular security, or the pricing vendor provides a value that the Valuation Committee does not believe accurately reflects the value of the security, the security will be valued by the Valuation Committee based upon the information available to the Committee at the time of valuation and in accordance with procedures adopted by the Board. These methodologies may require subjective judgments and determinations about the value of a particular security. When significant unobservable inputs are used to value a security, the security is categorized as Level 3.
The inputs or methodology used for valuing securities are not an indication of the risk associated with investing in those securities.
67
|
GuideMarkSM Funds |
NOTES TO FINANCIAL STATEMENTS (Continued) |
March 31, 2011 |
| |
The following is a summary of the inputs used to value the Funds’ net assets as of March 31, 2011:
GuideMarkSM Large Cap Growth Fund
| | | | | | | | | | | | | |
| | Level 1 | | Level 2 | | Level 3 | | Total | |
| | | | | | | | | |
Common Stocks | | $ | 209,175,044 | | | $— | | $ | — | | $ | 209,175,044 | |
Short Term Investments | | | 2,117,333 | | | — | | | — | | | 2,117,333 | |
Investments Purchased as Securities Lending Collateral | | | — | | | — | | | 365 | | | 365 | |
| | | | | | | | | | | | | |
Total Investments in Securities | | $ | 211,292,377 | | | $— | | $ | 365 | | $ | 211,292,742 | |
| | | | | | | | | | | | | |
There were no significant transfers in or out of Levels 1 and 2 during the year ended March 31, 2011.
Level 3 Reconciliation Disclosure
Following is a reconciliation of Level 3 assets for which significant unobservable inputs were used to determine fair value.
| | | | | |
Description | | | Investments
in Securities | |
| | | | | |
Balance as of March 31, 2010 | | $ | 6,799,634 | |
Accrued discounts/(amortization of premiums), net | | | — | |
Realized loss | | | (5,262,474 | ) |
Change in unrealized appreciation | | | 5,361,994 | |
Net sales | | | (6,898,789 | ) |
Transfers in (out) of Level 3 | | | — | |
| | | | |
Balance as of Mach 31, 2011 | | $ | 365 | |
| | | | |
Change in unrealized appreciation during the period | | | | |
for Level 3 investments held at March 31, 2011. | | $ | 99,520 | |
| | | | |
68
|
GuideMarkSM Funds |
NOTES TO FINANCIAL STATEMENTS (Continued) |
March 31, 2011 |
| |
GuideMarkSM Large Cap Value Fund
| | | | | | | | | | | | | |
| | Level 1 | | Level 2 | | Level 3 | | Total | |
| | | | | | | | | |
Common Stocks | | $ | 194,780,440 | | | $— | | $ | — | | $ | 194,780,440 | |
Real Estate Investment Trusts | | | 3,640,295 | | | — | | | — | | | 3,640,295 | |
Short Term Investments | | | 1,655,754 | | | — | | | — | | | 1,655,754 | |
Investments Purchased as Securities Lending Collateral | | | — | | | — | | | 418 | | | 418 | |
| | | | | | | | | | | | | |
Total Investments in Securities | | $ | 200,076,489 | | | $— | | $ | 418 | | $ | 200,076,907 | |
| | | | | | | | | | | | | |
There were no significant transfers in or out of Levels 1 and 2 during the year ended March 31, 2011.
Level 3 Reconciliation Disclosure
Following is a reconciliation of Level 3 assets for which significant unobservable inputs were used to determine fair value.
| | | | | |
Description | | | Investments
in Securities | |
| | | | | |
Balance as of March 31, 2010 | | $ | 6,234,228 | |
Accrued discounts/(amortization of premiums), net | | | — | |
Realized loss | | | (4,824,886 | ) |
Change in unrealized appreciation | | | 4,938,755 | |
Net sales | | | (6,347,679 | ) |
Transfers in (out) of Level 3 | | | — | |
| | | | |
Balance as of March 31, 2011 | | $ | 418 | |
| | | | |
Change in unrealized appreciation during the period | | | | |
for Level 3 investments held at March 31, 2011. | | $ | 113,869 | |
| | | | |
69
|
GuideMarkSM Funds |
NOTES TO FINANCIAL STATEMENTS (Continued) |
March 31, 2011 |
| |
GuideMarkSM Small/Mid Cap Core Fund
| | | | | | | | | | | | | |
| | Level 1 | | Level 2 | | Level 3 | | Total | |
| | | | | | | | | |
Common Stocks | | $ | 39,043,628 | | | $— | | $ | — | | $ | 39,043,628 | |
Real Estate Investment Trusts | | | 3,326,779 | | | — | | | — | | | 3,326,779 | |
Short Term Investments | | | 430,763 | | | — | | | — | | | 430,763 | |
Investments Purchased as Securities Lending Collateral | | | — | | | — | | | 114 | | | 114 | |
| | | | | | | | | | | | | |
Total Investments in Securities | | $ | 42,801,170 | | | $— | | $ | 114 | | $ | 42,801,284 | |
| | | | | | | | | | | | | |
There were no significant transfers in or out of Levels 1 and 2 during the year ended March 31, 2011.
Level 3 Reconciliation Disclosure
Following is a reconciliation of Level 3 assets for which significant unobservable inputs were used to determine fair value.
| | | | | |
Description | | | Investments
in Securities | |
| | | | | |
Balance as of March 31, 2010 | | $ | 971,026 | |
Accrued discounts/(amortization of premiums), net | | | — | |
Realized loss | | | (751,510 | ) |
Change in unrealized appreciation | | | 782,488 | |
Net sales | | | (1,001,890 | ) |
Transfers in (out) of Level 3 | | | — | |
| | | | |
Balance as of March 31, 2011 | | $ | 114 | |
| | | | |
Change in unrealized appreciation during the period | | | | |
for Level 3 investments held at March 31, 2011. | | $ | 30,978 | |
| | | | |
70
|
GuideMarkSM Funds |
NOTES TO FINANCIAL STATEMENTS (Continued) |
March 31, 2011 |
| |
GuideMarkSM World ex-US Fund
| | | | | | | | | | | | | |
| | Level 1 | | Level 2 | | Level 3 | | Total | |
| | | | | | | | | |
Common Stocks | | $ | 10,210,155 | | $ | 256,221,998 | | $ | — | | $ | 266,432,153 | |
Preferred Stocks | | | 2,418,210 | | | — | | | — | | | 2,418,210 | |
Investments Purchased as Securities Lending Collateral | | | — | | | — | | | 100 | | | 100 | |
| | | | | | | | | | | | | |
Total Investments in Securities | | $ | 12,628,365 | | $ | 256,221,998 | | $ | 100 | | $ | 268,850,463 | |
| | | | | | | | | | | | | |
There were no significant transfers in or out of Levels 1 and 2 during the year ended March 31, 2011.
Level 3 Reconciliation Disclosure
Following is a reconciliation of Level 3 assets for which significant unobservable inputs were used to determine fair value.
| | | | | | | | | | | | | | |
Description | | | Investments
in Securities | | | | | | | | | | |
| | | | | | | | | | | | | | |
Balance as of March 31, 2010 | | $ | 983,317 | | | | | | | | | | |
Accrued discounts/(amortization of premiums), net | | | — | | | | | | | | | | |
Realized loss | | | (761,023 | ) | | | | | | | | | |
Change in unrealized appreciation | | | 788,150 | | | | | | | | | | |
Net sales | | | (1,010,344 | ) | | | | | | | | | |
Transfers in (out) of Level 3 | | | — | | | | | | | | | | |
| | | | | | | | | | | | | |
Balance as of March 31, 2011 | | $ | 100 | | | | | | | | | | |
| | | | | | | | | | | | | |
Change in unrealized appreciation during the period
for Level 3 investments held at March 31, 2011. | | $ | 27,127 | | | | | | | | | | |
| | | | | | | | | | | | | |
| | | | | | | | | | | | | |
GuideMarkSM Tax-Exempt Fixed Income Fund | | | | | | | | | | | | | |
| | | | | | | | | |
| | Level 1 | | Level 2 | | Level 3 | | Total | |
| | | | | | | | | |
Municipal Bonds | | $ | — | | $ | 115,097,488 | | $ | — | | $ | 115,097,488 | |
Short Term Investments | | | 53,015,102 | | | — | | | — | | | 53,015,102 | |
| | | | | | | | | | | | | |
Total Investments in Securities | | $ | 53,015,102 | | $ | 115,097,488 | | $ | — | | $ | 168,112,590 | |
| | | | | | | | | | | | | |
There were no significant transfers in or out of Levels 1 and 2 during the year ended March 31, 2011.
71
|
GuideMarkSM Funds |
NOTES TO FINANCIAL STATEMENTS (Continued) |
March 31, 2011 |
| |
| | | | | | | | | | | | | |
GuideMarkSM Core Fixed Income Fund
| | Level 1 | | Level 2 | | Level 3 | | Total | |
| | | | | | | | | |
Equity | | | | | | | | | | | | | |
Common Stocks | | $ | 7,293 | | $ | — | | $ | — | | $ | 7,293 | |
Convertible Preferred Stocks | | | — | | | 101,633 | | | — | | | 101,633 | |
Preferred Stocks | | | 508,686 | | | — | | | — | | | 508,686 | |
| | | | | | | | | | | | | |
Total Equity | | | 515,979 | | | 101,633 | | | — | | | 617,612 | |
Fixed Income | | | | | | | | | | | | | |
Asset Backed Securities | | | — | | | 12,055,105 | | | — | | | 12,055,105 | |
Collateralized Mortgage Obligations | | | — | | | 32,947,142 | | | — | | | 32,947,142 | |
Corporate Bonds | | | — | | | 146,559,367 | | | — | | | 146,559,367 | |
Foreign Government Note/Bond | | | — | | | 3,343,524 | | | — | | | 3,343,524 | |
Mortgage Backed Securities - U.S. Government Agency | | | — | | | 152,004,345 | | | — | | | 152,004,345 | |
Municipal Bonds | | | — | | | 6,742,921 | | | — | | | 6,742,921 | |
Supranational Obligations | | | — | | | 3,836,948 | | | — | | | 3,836,948 | |
U.S. Government Agency Issues | | | — | | | 7,040,927 | | | — | | | 7,040,927 | |
U.S. Treasury Obligations | | | — | | | 97,143,289 | | | — | | | 97,143,289 | |
| | | | | | | | | | | | | |
Total Fixed Income | | | — | | | 461,673,568 | | | — | | | 461,673,568 | |
Warrants | | | 2,788 | | | — | | | — | | | 2,788 | |
Short Term Investments | | | 3,702,738 | | | 157,392,879 | | | — | | | 161,095,617 | |
Investments Purchased as Securities Lending Collateral | | | 337,689 | | | — | | | 88 | | | 337,777 | |
| | | | | | | | | | | | | |
Total Investments in Securities | | $ | 4,559,194 | | $ | 619,168,080 | | $ | 88 | | $ | 623,727,362 | |
| | | | | | | | | | | | | |
| | | | | | | | | | | | | |
Other Financial Instruments* | | | | | | | | | | | | | |
Forward Currency Contracts | | $ | — | | $ | (150,835 | ) | $ | — | | $ | (150,835 | ) |
Futures, net | | | (301,348 | ) | | — | | | — | | | (301,348 | ) |
| | | | | | | | | | | | | |
Total | | $ | (301,348 | ) | $ | (150,835 | ) | $ | — | | $ | (452,183 | ) |
| | | | | | | | | | | | | |
| |
* | Other financial instruments are derivative instruments not reflected in the Schedule of Investments, such as forward currency contracts and futures, which are reflected at the unrealized appreciation (depreciation) on the instrument. All derivatives are reflected at the unrealized appreciation (depreciation) on the instrument. |
72
|
GuideMarkSM Funds |
NOTES TO FINANCIAL STATEMENTS (Continued) |
March 31, 2011 |
| |
Level 3 Reconciliation Disclosure
Following is a reconciliation of Level 3 assets for which significant unobservable inputs were used to determine fair value.
| | | | | |
Description | | | Investments
in Securities | |
| | | | | |
Balance as of March 31, 2010 | | $ | 8,436,540 | |
Accrued discounts, net | | | — | |
Realized loss | | | (9,452,182 | ) |
Change in unrealized appreciation | | | 10,267,842 | |
Net sales | | | (8,491,680 | ) |
Transfers out of Level 3 | | | (760,432 | ) |
| | | | |
Balance as of March 31, 2011 | | $ | 88 | |
| | | | |
Change in unrealized appreciation during the period
for Level 3 investments held at March 31, 2011. | | $ | 517,232 | |
| | | | |
There were no significant transfers in or out of Levels 1 and 2 during the year ended March 31, 2011. Transfers were made out of Level 3 because observable inputs became available and reliable by the Fund’s pricing service.
Derivative Instruments and Hedging Activities
The Trust has adopted derivative instruments disclosure standards, in order to enable the investor to understand how and why an entity used derivatives, how derivatives are accounted for, and how derivative instruments affect an entity’s results of operations and financial position.
GuideMarkSM Core Fixed Income Fund
During the period, the Fund used money market and fixed income derivatives including futures, forwards, and options for both hedging and investment purposes, primarily duration management and the pursuit of relative value opportunities. Futures contracts used in the Fund during the period included those based on 90-day Eurodollars: short, medium, and long-term U.S. debt, medium and long-term German debt, long-term Australian debt, and long-term debt of the United Kingdom. Forward contracts were also used during the period, both on foreign currencies as well as forward purchase commitments, such as TBAs, on fixed income instruments. Option positions previously established in a prior period were present in the Fund during the period, but no new option contracts were entered into during the period. In addition, there were no outstanding option contracts at the Fund’s fiscal year-end.
In general, the use of derivatives may increase risk within the Fund. The use of over-the-counter derivatives such as forwards involves the risk that the counterparty to the contract will fail to make required payments or otherwise comply with the terms of the contract. The results achieved by the use of derivatives in the Fund may not match or fully offset changes in the value of the underlying financial assets being hedged or the investment opportunity the Fund was pursuing, thereby failing to achieve, to an extent, the original purpose for using the derivatives. Certain types of derivatives may create leverage insofar as a Fund may receive returns (or suffer losses) exceeding the initial amounts the Fund committed in connection with the derivatives. The use of derivatives can result in losses or gains to a Fund exceeding the amount the Fund would have experienced in the absence of using derivatives. A relatively small price movement in a derivative may result in an immediate and substantial loss, or gain, to the Fund.
73
|
GuideMarkSM Funds |
NOTES TO FINANCIAL STATEMENTS (Continued) |
March 31, 2011 |
| |
The Fund used currency forwards during the period for the purpose of hedging exposures within the Fund to non-dollar-denominated assets. In general, the use of currency derivative contracts for hedging may reduce the overall risk level of the Fund, albeit at a cost that may lower overall performance. In general, the use of currency derivatives for hedging purposes will not lead to leverage within the Fund.
Balance Sheet — Values of Derivative Instruments as of March 31, 2011
| | | | | | | | | |
| | Asset Derivatives | | Liability Derivatives | |
| | | | | |
Derivatives not accounted for as
hedging instruments | | Balance Sheet Location | | Value | | Balance Sheet Location | | Value | |
| | | | | | | | | | |
| | | | | | | | | |
Foreign Exchange Contracts — Forward
Currency Contracts | | Appreciation of forward
currency contracts | | $47,827 | | Depreciation of forward
currency contracts | | $198,662 | |
| | | | | | | | | | |
Interest Rate Contracts — Futures* | | Variation margin on
futures contracts | | $158,720 | | Variation margin on
futures contracts | | $460,068 | |
| | | | | | | | | | |
Total | | | | $206,547 | | | | $658,730 | |
| | | | | | | | | | |
* Includes cumulative appreciation/depreciation as reported in Schedule of Investments/footnotes. Only current day’s variation margin is reported within the Statement of Assets & Liabilities.
| | | | | | | | | | | | | | | | | |
The Effect of Derivative Instruments on the Statement of Operations for the Year Ended March 31, 2011 | |
| |
Amount of Realized Gain or (Loss) on Derivatives Recognized in Income | |
| | |
| | Written Options | | Futures | | Forward Currency
Contracts | | Total | |
| | | | | | | | | | | | | | | | | | |
Interest Rate Contracts | | | $ | 4,297 | | | $ | 1,841,162 | | | $ | — | | | $ | 1,845,459 | |
Foreign Exchange Contracts | | | | — | | | | — | | | | (643,212 | ) | | $ | (643,212 | ) |
| | | | | | | | | | | | | | | | | | |
Total | | | $ | 4,297 | | | $ | 1,841,162 | | | $ | (643,212 | ) | | $ | 1,202,247 | |
| | | | | | | | | | | | | | | | | | |
| | | | | | | | | | | | | | | | | |
Change in Unrealized Appreciation or (Depreciation) on Derivatives Recognized in Income | |
| | | | | | | | | | | | | | | | | | |
| | Written Options | | Futures | | Forward Currency
Contracts | | Total | |
| | | | | | | | | | |
Interest Rate Contracts | | | $ | 2,671 | | | $ | (329,839 | ) | | $ | — | | | $ | (327,168 | ) |
Foreign Exchange Contracts | | | | — | | | | — | | | $ | (181,107 | ) | | $ | (181,107 | ) |
| | | | | | | | | | | | | | | | | | |
Total | | | $ | 2,671 | | | $ | (329,839 | ) | | $ | (181,107 | ) | | $ | (508,275 | ) |
| | | | | | | | | | | | | | | | | | |
The average monthly market value of written options during the year ended March 31, 2011 for the Core Fixed Income Fund was $1,878.
74
|
GuideMarkSM Funds
NOTES TO FINANCIAL STATEMENTS (Continued)
March 31, 2011 |
| | |
| | The average monthly notional amount of futures and forwards during the year ended March 31, 2011 were as follows: |
| | | | |
Long Positions | | GuideMarkSM
Core
Fixed Income
Fund | |
| | | | |
Futures
| | | $81,919,687 | |
Forwards | | | $ 7,768,395 | |
| | | | |
| | | | |
Short Positions | | GuideMarkSM
Core
Fixed Income
Fund | |
| | | | |
Futures
| | | $(5,755,366 | ) |
Forwards | | | $(1,763,383 | ) |
| | |
Derivative Risks |
| | |
| | The risks of using the various types of derivatives in which the Fund may invest include: the risk that movements in the value of the derivative may not fully offset or complement instruments currently held in the Fund in the manner intended by the Advisor; the risk that the counterparty to a derivative contract may fail to comply with its obligations to the Fund; the risk that there may not be a liquid secondary market for the derivative at a time when the Fund would look to disengage the position; the risk that additional capital from the Fund may be called upon to fulfill the conditions of the derivative contract; the risk that the use of derivatives in the Fund may induce leverage in the Fund, and the risk that the cost of the derivative contracts may reduce the overall returns experienced by the Fund. |
| | |
| (b) | Subsequent Events Evaluation. |
| | In preparing these financial statements, the Trust has evaluated events and transactions for potential recognition or disclosure resulting from subsequent events. This evaluation did not result in any subsequent events that necessitated disclosures and/or adjustments. |
| | |
| (c) | Repurchase Agreements |
| | Each Fund may enter into repurchase agreements with banks and securities dealers. These transactions involve the purchase of securities with a simultaneous commitment to sell the securities to the bank or the dealer at an agreed-upon date and price. A repurchase agreement is accounted for as an investment by the Fund, collateralized by securities, which are delivered to the Fund’s Custodian or to an agent bank under a tri-party agreement. The securities are marked-to-market daily and additional securities are acquired as needed, to ensure that their value equals or exceeds the repurchase price plus accrued interest. The Core Fixed Income Fund entered into repurchase agreements at March 31, 2011. |
| | |
| (d) | Federal Income Taxes |
| | The Funds intend to continue to comply with the requirements of sub chapter M of the Internal Revenue Code necessary to qualify as regulated investment companies and to make the requisite distributions of income and capital gains to their shareholders sufficient to relieve the Funds from all or substantially all Federal income taxes. Therefore, no Federal income tax provision is required. |
| | |
| | The Trust has adopted financial reporting rules regarding recognition and measurement of tax positions taken or expected to be taken on a tax return. The Trust has reviewed all open tax years and major jurisdictions and concluded that no provision for income tax would be required in the Funds’ financial statements. The Funds’ Federal and state income and Federal excise tax returns for tax years for which the applicable statutes of limitations have not expired are subject to examination by the Internal Revenue Service and state departments of revenue. |
| | |
| (e) | Use of Estimates |
| | The preparation of financial statements in conformity with GAAP requires management to make estimates and assumptions that affect the reported amounts of assets and liabilities and disclosure of contingent assets and liabilities at the date of the financial statements and the reported amounts of revenues and expenses during the reported period. Actual results could differ from those estimates. |
75
|
GuideMarkSM Funds
NOTES TO FINANCIAL STATEMENTS (Continued)
March 31, 2011 |
| | |
| (f) | Indemnifications |
| | Under the Trust’s organizational documents, its officers and trustees are indemnified against certain liability arising out of their performance of their duties to the Trust. In addition, in the normal course of business, the Trust enters into contracts that contain a variety of representations and warranties which provide general indemnifications. The Trust’s maximum exposure under these arrangements are unknown as this would involve future claims that may be made against the Trust that have not yet occurred. However, the Trust expects the risk of loss to be remote. |
| | |
| (g) | Expenses |
| | Many expenses of the Trust can be directly attributed to a specific Fund. Expenses that cannot be directly attributed to a specific Fund are apportioned among all the Funds in the Trust based on relative net assets. |
| | |
| (h) | Security Transactions and Income Recognition |
| | Security transactions are accounted for on trade date. Dividend income is recognized on the ex-dividend date, and the interest income recorded using the effective yield method is accrued daily. Realized gains and losses on investment transactions are determined using the high cost method. Return of capital distributions received from REIT securities are recorded as an adjustment to the cost of the security and thus may impact unrealized or realized gains or losses on the security. Gains and losses from paydowns on mortgage and asset backed securities are recorded as adjustments to interest income. |
| | |
| (i) | Distributions to shareholders |
| | The Funds, with the exception of the Tax-Exempt Income Fund and Core Fixed Income Fund will distribute any net investment income at least annually. The Tax-Exempt Fixed Income Fund and Core Fixed Income Fund will distribute any net investment income quarterly. All of the Funds will distribute any net realized long or short-term capital gains at least annually. Distributions to shareholders are recorded on the ex-dividend date. The Funds may also pay a special distribution at the end of the calendar year to comply with Federal tax requirements. |
| | |
| (j) | Derivatives |
| | Each Fund may invest in derivative securities including call and put options, futures, forward currency contracts and swaps. These instruments may be used by a Fund for hedging purposes as well as direct investment. |
| | |
| | Forward Currency Contracts |
| | The Funds may enter into forward currency contracts, obligating the Funds to deliver and receive currency at a specified future date. Transactions involving forward currency contracts may serve as long hedges (for example, if a Fund seeks to buy a security denominated in a foreign security, it may purchase a forward currency contract to lock in the U.S. dollar price of the security) or as short hedges (if a Fund anticipates selling a security denominated in a foreign currency, it may sell a forward currency contract to lock in the U.S. dollar equivalent of the anticipated sales proceeds). Forward contracts are valued daily and unrealized appreciation or depreciation is recorded daily as the difference between the contract exchange rate and the closing forward rate applied to the face amount of the contract. |
| | |
| | Options |
| | Exchange-traded options are valued at the last reported sale price on the exchange on which the security underlying the option is principally traded. If no sales are reported on a particular day for exchange traded options, or the options are not exchange traded, the options are valued at the mean between the most recent quoted bid and asked quotations at the close of the exchange. |
| | |
| | The premium that a Fund pays when purchasing a call option or receives when writing a call option will reflect, among other things, the market price of the security, the relationship of the exercise price to the market price of the security, the relationship of the exercise price to the volatility of the security, the length of the option period and supply and demand factors. The premium is the value of an option at the date of purchase. |
| | |
| | A purchaser (holder) of a put option pays a non-refundable premium to the seller (writer) of a put option to obtain the right to sell a specified amount of a security at a fixed price |
76
|
GuideMarkSM Funds
NOTES TO FINANCIAL STATEMENTS (Continued)
March 31, 2011 |
| | |
| | (the exercise price) during a specified period (exercise period). Conversely, the seller (writer) of a put option, upon payment by the holder of the premium, has the obligation to buy the security from the holder of the put option at the exercise price during the exercise period. |
| | |
| | Futures |
| | Each Fund has the ability to buy and sell stock index futures contracts traded on domestic stock exchanges to hedge the value of its portfolio against changes in market conditions. A stock index futures contract is an agreement between two parties to take or make delivery of an amount of cash equal to a specified dollar amount, times the difference between stock index value at the close of the last trading day of the contract and the price at which the futures contract is originally struck. A stock index futures contract does not involve the physical delivery of the underlying stocks in the index. Although stock index futures contracts call for the actual taking of delivery of cash, in most cases a Fund expects to liquidate its stock index futures positions through offsetting transactions, which may result in a gain or loss, before cash settlement is required. |
| | |
| | The Core Fixed Income Fund may purchase or sell other types of futures contracts, including those based on particular interest rates, securities, foreign currencies, securities indices and other financial instruments and indices. The Core Fixed Income Fund may also purchase and write call and put options on such future contracts, in order to seek to increase total return or to hedge against changes in interest rates, securities prices, or currency exchange rates, or, to the extent permitted by its investment policies, to otherwise manage its portfolio of investments. |
| | |
| | Futures contracts are valued at the daily quoted settlement prices. |
| | |
| | Swaps |
| | The Core Fixed Income Fund may enter into interest rate, mortgage, credit, currency and total return swaps, interest rate caps, floors and collars. The Core Fixed Income Fund may also purchase and write (sell) options contracts on swaps, referred to as “swaptions”. The Fund may enter into swap transactions for hedging purposes or to seek to |
| | |
| | increase total return. Since interest rate, mortgage, credit and currency swaps and interest rate caps, floors and collars are individually negotiated, the Fund expects to achieve an acceptable degree of correlation between its portfolio investments and its swap, cap, floor and collar positions. |
| | |
| | Swap agreements are valued daily and unrealized appreciation or depreciation is recorded daily as the difference between the prior day and current day closing price. |
| | |
| | During the period ended March 31, 2011, the Funds had no open or outstanding swap contracts. |
| | |
| (k) | Securities Purchased or Sold on a Forward-Commitment Basis |
| | The Funds may enter into when-issued or other purchase or sale transactions that specify forward delivery of a financial security. In connection with this ability, the Funds may enter into mortgage “dollar rolls” in which a Fund sells securities in the current month for delivery and simultaneously contracts with the same counterparty to repurchase similar (same type, coupon and maturity) but not identical securities on a specified future date. The party that is obligated to buy a security in the future will retain the use of their funds, and will benefit from any interest that is earned on those funds from the day that they enter into the forward contract until the day that they take delivery and pay for the security. |
| | |
| (l) | Foreign Currency Translation |
| | The accounting records of the Funds are maintained in U.S. dollars. Investment securities and all other assets and liabilities of the Funds denominated in a foreign currency are translated into U.S. dollars at current exchange rates. Purchases and sales of securities, income receipts, and expense payments are translated into U.S. dollars at the exchange rate in effect on the dates of the respected transactions. The Funds do not isolate the portion of the fluctuations on investments resulting from changes in foreign currency exchange rates from the fluctuations in market prices of investments held. Such fluctuations are included with the net realized and unrealized gain or loss from investments. |
77
|
GuideMarkSM Funds
NOTES TO FINANCIAL STATEMENTS (Continued)
March 31, 2011 |
| | |
| (m) | Restricted and Illiquid Securities |
| | Each Fund may invest up to 15% of its net assets in securities that are illiquid at the time of purchase, which includes securities with legal or contractual restrictions on their disposition, and securities for which there are no readily available market quotations. The Advisor, with the assistance of the sub-advisors and/or pricing services, will determine the value of such securities in good faith pursuant to procedures adopted by the Board of Trustees. Illiquid securities present the risks that a Fund may have difficulty valuing these holdings and/or may be unable to sell these holdings at the time or price desired. There are no restrictions on each Fund’s ability to invest in restricted securities (that is, securities that are not registered pursuant to the Securities Act of 1933), except to the extent such securities may be considered illiquid. Securities issued pursuant to Rule 144A of the Securities Act of 1933 will be considered liquid if determined to be so under procedures adopted by the Board of Trustees. |
| | |
| (n) | Auction Rate Securities |
| | The Tax-Exempt Fixed Income Fund and the Core Fixed Income Fund each may invest in auction rate municipal securities. Auction rate securities usually permit the holder to sell the securities in an auction at par value at specified intervals. The dividend is reset by “Dutch” auction in which bids are made by broker-dealers and other institutions for a certain amount of securities at a specified minimum yield. The dividend rate set by the auction is the lowest interest or dividend rate that covers all securities offered for sale. While this progress is designed to permit auction rate securities to be traded at par value, there is a risk that an auction will fail due to insufficient demand for the securities. Neither Fund was invested in any auction rate securities at March 31, 2011. |
| | |
| (o) | Short Sales |
| | Although not currently part of any of the Fund’s investment strategies, each Fund has the ability to make short sales. Short sales are transactions where a Fund sells securities it does not own in anticipation of a decline in the value of the securities. |
| | |
| | |
| (p) | Trustee Compensation |
| | For their services as Trustees of the Trust, the Independent Trustees receive a retainer fee of $45,000 per year and $4,500 per in person meeting attended, as well as reimbursement for expenses incurred in connection with attendance at such meetings. The Lead Independent Trustee receives an additional retainer fee of $10,000 per year. The Audit Committee Chair receives an additional retainer fee of $5,000 per year. Telephonic meeting fees are determined according to the length of the meeting as follows: $2,000 for one to two hours, $3,000 for two to three hours and $4,000 for three hours or longer. The “interested persons” who serve as Trustees of the Trust receive no compensation from the Trust for their services as Trustees. The Funds reimburse the Advisor an allocated amount for the compensation and related expenses of certain officers of the Trust who provide compliance services to the Funds. The aggregate amount of all such reimbursements is determined by the Trustees. No other compensation or retirement benefits are received by any Trustee or officer from the Funds. |
| | |
3. | Investment Advisor |
| | |
| The Trust has an Investment Advisory Agreement (the “Agreement”) with Genworth Financial Wealth Management, Inc. (the “Advisor”), with whom certain officers and trustees of the Trust are affiliated, to furnish investment advisory services to the Funds. Under the terms of the Agreement, the Trust, on behalf of the Funds, compensates the Advisor for its management services at the following contractual rates, based on each Fund’s average daily net assets: |
| | | | | |
| Large Cap Growth Fund | | | 0.95 | % |
| Large Cap Value Fund | | | 0.95 | % |
| Small/Mid Cap Core Fund | | | 1.00 | % |
| World ex-US Fund | | | 0.95 | % |
| Tax-Exempt Fixed Income Fund | | | 0.80 | % |
| Core Fixed Income Fund | | | 0.75 | % |
| | |
| In addition, the Trust and the Advisor have also entered into a Fee Waiver Agreement designed to provide Fund shareholders with the economic benefits of economies of scale that may be realized as Fund assets increase. Under the Fee Waiver Agreement, the Advisor has contractually |
78
|
GuideMarkSM Funds
NOTES TO FINANCIAL STATEMENTS (Continued)
March 31, 2011 |
| | |
| agreed to: (1) waive 0.025% of each Fund’s annual advisory fee on Trust assets in excess of $6 billion, and an additional 0.025% of each Fund’s annual advisory fee on Trust assets in excess of $12 billion, and (2) waive portions of its advisory fee monthly on aggregate average assets of the Large Cap Growth Fund, Large Cap Value Fund, Small/Mid Cap Core Fund, World ex-US Fund, Tax-Exempt Fixed Income Fund and Core Fixed Income Fund in excess of $2.5 billion to pass on certain savings in the underlying sub-advisory fee arrangements. |
| | |
| The Trust and Advisor have also entered into an Expense Waiver and Reimbursement Agreement under which the Advisor has agreed to waive, through July 31, 2011, its management fee and/or reimburse each Fund’s other expenses to the extent necessary to ensure that the Fund’s operating expenses do not exceed the following rates, based on each Fund’s average daily net assets: |
| | | | | |
| Large Cap Growth Fund | | | 1.49 | % |
| Large Cap Value Fund | | | 1.49 | % |
| Small/Mid Cap Core Fund | | | 1.59 | % |
| World ex-US Fund | | | 1.59 | % |
| Tax-Exempt Fixed Income Fund | | | 1.29 | % |
| Core Fixed Income Fund | | | 1.29 | % |
| | |
| Any such waiver or reimbursement is subject to later adjustment to allow the Advisor to recoup amounts waived or reimbursed to the extend actual fees and expenses for a fiscal period are less than each Fund’s expense limitation cap, provided, however, that the Advisor shall only be entitled to recoup such amounts for a period of three years after the end of the fiscal year in which the fee or expense was waived or reimbursed. As of March 31, 2011, the Large Cap Growth Fund, Large Cap Value Fund, World ex-US Fund and Core Fixed Income Fund have recouped all potential recoverable waivers or reimbursed expenses. |
| | |
| The Advisor is currently waiving fees and, in some cases, reimbursing expenses in the Small/Mid Cap Core Fund and Tax-Exempt Fixed Income Fund in order to keep these Funds at their expense cap. Waived expenses subject to potential recovery are as follows: |
| | | | | | | | | | | |
| | | Year of
Expiration
03/31/2012 | | Year of
Expiration
03/31/2013 | | Year of
Expiration
03/31/2014 | |
| | | | | | | | |
| Small/Mid Cap | | | | | | | | | | |
| Core Fund | | | — | | | — | | | 32,192 | |
| Tax-Exempt Fixed | | | | | | | | | | |
| Income Fund | | | 12,723 | | | 32,625 | | | 21,611 | |
| |
| Sub-advisory services are provided to the Funds, pursuant to agreements between the Advisor and various sub-advisors. Under the terms of these sub-advisory agreements, the Advisor compensates each sub-advisor based on the portion of each Fund’s average daily net assets that is allocated to the sub-advisor. |
| |
| Effective April 1, 2011, the Funds began offering shares in multiple classes, made related changes to fee structures, and certain funds revised their investment policies. These changes are reflected in the Funds’ prospectus dated April 1, 2011. |
| |
4. | Distribution Plan |
| |
| The Trust, on behalf of the Funds, has adopted a distribution plan pursuant to Rule 12b-1 under the 1940 Act (the “12b-1 Plan”), which provides for each Fund to pay distribution fees at an annual rate of 0.25% of the average daily net assets of the Funds. Payments under the 12b-1 Plan shall be used to compensate persons (including affiliates of the Trust) who provide support services in connection with the distribution of the Fund’s shares and servicing of the Fund’s shareholders. For example, these amounts are paid to financial intermediaries that perform back office shareholder servicing and recordkeeping services that facilitate the operation of the Genworth Financial Wealth Management Program through which the Funds are primarily distributed. The Advisor (and its affiliates) similarly receive portions of such payments for their services provided that facilitate the operation of the program. These financial intermediaries and affiliates of the Trust also receive payments from the Trust outside of the |
79
|
GuideMarkSM Funds
NOTES TO FINANCIAL STATEMENTS (Continued)
March 31, 2011 |
| |
| 12b-1 Plan for shareholder services that are unrelated to distribution services. Capital Brokerage Corp., an affiliate of the Advisor, serves as principal underwriter and distributor for the Funds. Quasar Distributors, LLC serves as sub-distributor for the Funds. Quasar Distributors, LLC is an affiliated company of U.S. Bank, N.A. |
| |
5. | Service and Custody Agreements |
| |
| The Trust has entered into Service Agreements with U.S. Bancorp Fund Services, LLC (“USBFS”) and a Custody Agreement with U.S. Bank, N.A., an affiliate of USBFS. Under these agreements, USBFS and U.S. Bank, N.A. provide certain transfer agency, administrative, accounting and custody services. |
| |
6. | Securities Lending |
| |
| Effective July 1, 2003 the Funds entered into a collective securities lending arrangement with U.S. Bank, N.A. (the “Custodian”). Under the term of the agreement, the Custodian is authorized to loan securities on behalf of the Funds to approved brokers. In exchange, under normal market conditions, the Funds receive cash collateral in the amount of at least 102% of the value of securities loaned. The cash collateral is invested in short term instruments as noted in the Schedule of Investments. Although risk is mitigated by the collateral, the Funds could experience a |
| |
| delay in recovering their securities and possible loss of income or value if the borrower fails to return the borrowed securities. In addition, the Funds bear the risk of loss associated with the investment of cash collateral received. After predetermined rebates to brokers, a percentage of the net securities lending revenue is credited to the Funds to be used as an offset against custody costs and other charges incurred by the Funds. The Custodian is paid a fee for administering a securities lending program for the Funds, equal to the remaining percentage of the net securities lending revenues generated under the agreement. A portion of the fee to be paid to the Custodian in the fiscal year ended March 31, 2011 was waived. |
| |
| As of March 31, 2011, the Funds (excluding the World ex-US and Tax-Exempt Fund) had loaned securities which were collateralized by cash. The cash collateral received was invested in securities as listed in each Fund’s Schedule of Investments. Income earned from these investments is allocated to each Fund based on each Fund’s portion of total cash collateral received. Securities lending income is disclosed in each Fund’s Statement of Operations as a securities lending offset. |
| |
| As of March 31, 2011, the values of securities loaned and collateral received were as follows: |
80
|
GuideMarkSM Funds |
NOTES TO FINANCIAL STATEMENTS (Continued) |
March 31, 2011 |
| |
| | | | | | | | | | | | | �� | | | | | | |
| | Value of
Securities
Loaned | | Payable for
Collateral
on Securities
Loaned | | Collateral
Excess
(Deficit) due
to (from)
Securities
Lending
Agent | | Cost of
Securities
Purchased
as Securities
Lending
Collateral | | Unrealized
Depreciation | | Value
of Securities
Purchased
as Securities
Lending
Collateral | |
| | | | | | | | | | | | | |
| | | | | | | | | | | | | |
Large Cap | | | | | | | | | | | | | | | | | | | |
Growth Fund | | $ | — | | $ | — | | $ | 20,508 | | $ | 17,692 | | $ | (17,327 | ) | $ | 365 | |
Large Cap | | | | | | | | | | | | | | | | | | | |
Value Fund | | | — | | | — | | | 23,460 | | | 20,243 | | | (19,825 | ) | | 418 | |
Small/Mid Cap | | | | | | | | | | | | | | | | | | | |
Core Fund | | | — | | | — | | | 6,386 | | | 5,507 | | | (5,393 | ) | | 114 | |
World | | | | | | | | | | | | | | | | | | | |
ex-US Fund | | | — | | | — | | | 5,588 | | | 4,823 | | | (4,723 | ) | | 100 | |
Core Fixed | | | | | | | | | | | | | | | | | | | |
Income Fund | | | 390,410 | | | 398,562 | | | (55,942 | ) | | 341,944 | | | (4,167 | ) | | 337,777 | |
| | | | | | | | | | | | | | | | | | | |
| | $ | 390,410 | | $ | 398,562 | | $ | — | | $ | 390,209 | | $ | (51,435 | ) | $ | 338,774 | |
| | | | | | | | | | | | | | | | | | | |
| |
7. | Investment Transactions |
| |
| The aggregate purchases and sales of securities, excluding short-term investments, for the year ended March 31, 2011 are summarized below. |
| | | | | | | |
| | Purchases | | Sales | |
| | | | | |
Large Cap Growth Fund | | $ | 123,851,263 | | $ | 158,826,497 | |
Large Cap Value Fund | | | 30,081,860 | | | 49,968,996 | |
Small/Mid Cap Core Fund | | | 17,749,412 | | | 26,586,499 | |
World ex-US Fund | | | 117,929,780 | | | 127,004,552 | |
Tax-Exempt Fixed | | | | | | | |
Income Fund | | | 68,441,839 | | | 138,919,098 | |
Core Fixed | | | | | | | |
Income Fund* | | | 2,595,983,016 | | | 2,688,892,041 | |
| |
* | Included in these amounts were $608,529,408 of purchases and $577,956,068 of sales of U.S. Government Securities. |
| |
8. | Option Contracts Written |
| |
| The premium amount and number of option contracts written during the year ended March 31, 2011 in the Core Fixed Income Fund, were as follows: |
| | | | | | | |
| | Amount of
Premiums | | Number of
Contracts | |
| | | | | |
Outstanding at 3/31/10 | | $ | (11,060 | ) | | (20 | ) |
Options written | | | (30,451 | ) | | (44 | ) |
Options expired | | | — | | | — | |
Options exercised | | | — | | | — | |
Options closed | | | 41,511 | | | 64 | |
| | | | | | | |
Outstanding at 3/31/11 | | $ | —- | | | — | |
| | | | | | | |
| |
9. | Other Tax Information |
| |
| The Regulated Investment Company Modernization Act of 2010 (the “Act”) was enacted on December 22, 2010. The Act makes changes to several tax rules impacting the Funds. In general, the provisions of the Act will be effective for the Funds’ fiscal year ending March 31, 2012. Although the Act provides several benefits, including the unlimited carryover of future capital losses, there may be a greater likelihood that all or a portion of each Fund’s pre-enactment capital loss carryovers may expire without being utilized due to the fact that post-enactment capital losses get utilized before pre-enactment capital loss carryovers. |
81
|
GuideMarkSM Funds |
NOTES TO FINANCIAL STATEMENTS (Continued) |
March 31, 2011 |
| |
| |
| Relevant information regarding the impact of the Act on the Funds, if any, will be contained within the “Federal Income Taxes” section of the financial statement notes for the fiscal year ending March 31, 2012. |
| |
| Net Investment Income and realized gains and losses for Federal income tax purposes may differ from that reported on the financial statements because of permanent book-to-tax differences. GAAP requires that permanent differences between financial reporting and tax reporting be reclassified between various components of net assets. |
| |
| These differences are primarily due to net operating losses, foreign currency and the use of equalization. On the Statement of Assets and Liabilities, the following adjustments were made: |
| | | | | | | | | | |
| | Accumulated
Net
Investment
Income
or (Loss) | | Accumulated
Realized
Gain or
(Loss) | | Capital
Stock | |
| | | | | | | |
Large Cap | | | | | | | | | | |
Growth | | | | | | | | | | |
Fund | | $ | 208,819 | | $ | 3,453 | | $ | (212,272 | ) |
Large Cap | | | | | | | | | | |
Value Fund | | | 25 | | | (25 | ) | | — | |
Small/Mid | | | | | | | | | | |
Cap Core | | | | | | | | | | |
Fund | | | 146,182 | | | (146,598 | ) | | 416 | |
World ex-US | | | | | | | | | | |
Fund | | | (437,087 | ) | | 437,087 | | | — | |
Tax-Exempt | | | | | | | | | | |
Fixed | | | | | | | | | | |
Income | | | | | | | | | | |
Fund | | | — | | | — | | | — | |
Core | | | | | | | | | | |
Fixed | | | | | | | | | | |
Income | | | | | | | | | | |
Fund | | | 520,682 | | | (520,682 | ) | | — | |
The Funds intend to utilize provisions of the Federal income tax laws which allow the Funds to carry realized capital losses forward for eight years following the year of loss and offset such losses against any future realized capital gains. Capital loss carryforwards available for Federal income tax purposes are as follows:
| | | | | | | | | | | | | |
| | | Capital losses expiring: | |
| | | | |
| | | 3/31/16 | | 3/31/17 | | 3/31/18 | | 3/31/19 | |
| | | | | | | | | | |
| Large Cap Growth Fund | | | — | | $ | (36,044,202 | ) | $ | (59,171,144 | ) | — | |
| Large Cap Value Fund | | | — | | | (53,157,378 | ) | | (146,948,668 | ) | — | |
| Small/Mid Cap Core Fund | | | — | | | (19,729,958 | ) | | (12,866,943 | ) | — | |
| World ex-US Fund | | | — | | | (73,593,482 | ) | | (139,582,037 | ) | — | |
| Tax-Exempt Fixed Income Fund | | $ | (783,558 | ) | | (3,325,230 | ) | | (2,354,785 | ) | — | |
| Core Fixed Income Fund | | | — | | | — | | | (1,028,334 | ) | — | |
Additionally, at March 31, 2011, the Funds deferred on a tax basis post-October 2010 losses as follows:
| | | | | |
| Large Cap Growth Fund | | | — | |
| Large Cap Value Fund | | | — | |
| Small/Mid Cap Core Fund | | | — | |
| World ex-US Fund | | $ | 25,348 | * |
| Tax-Exempt Fixed Income Fund | | | 1,251,515 | |
| Core Fixed Income Fund | | | 12,329,171 | |
| | | | | |
* Post-October 2010 currency loss deferral. | | | | |
The tax components of distributions paid during the fiscal years ended March 31, 2011 and March 31, 2010 are as follows:
| | | | | | | | | | | |
| | | Year Ended March 31, 2011 | |
| | | | |
| | | Ordinary
Income
Distributions | | Long-Term
Capital Gain
Distributions | | Return of
Capital | |
| | | | | | | | |
| Large Cap | | | | | | | | | | |
| Growth Fund | | | — | | | — | | | — | |
| Large Cap | | | | | | | | | | |
| Value Fund | | $ | 2,264,115 | | | — | | | — | |
82
|
GuideMarkSM Funds |
NOTES TO FINANCIAL STATEMENTS (Continued) |
March 31, 2011 |
| |
| | | | | | | | | | | |
| | | Year Ended March 31, 2011 | |
| | | | |
| | | Ordinary
Income
Distributions | | Long-Term
Capital Gain
Distributions | | Return of
Capital | |
| | | | | | | | |
| Small/Mid Cap | | | | | | | | | | |
| Core Fund | | | — | | | — | | | — | |
| World ex-US | | | | | | | | | | |
| Fund | | $ | 4,263,692 | | | — | | | — | |
| Tax-Exempt Fixed | | | | | | | | | | |
| Income Fund* | | | 6,259,146 | | | — | | | — | |
| Core Fixed | | | | | | | | | | |
| Income Fund | | | 14,829,215 | | | — | | | — | |
| | | | | | | | | | | |
| * Contains $6,135,871 of tax-exempt income for year ended 3/31/2011. |
| |
The Funds designated as long-term capital gain dividend, pursuant to Internal Revenue Code Section 852(b)(3), the amount necessary to reduce the earnings and profits of the Fund related to net capital gain to zero for the tax year ended March 31, 2011. |
| | | | | | | | | | | |
| | | Year Ended March 31, 2010 | |
| | | | |
| | | Ordinary
Income
Distributions | | Long-Term
Capital Gain
Distributions | | Return of
Capital | |
| | | | | | | | |
| Large Cap | | | | | | | | | | |
| Growth Fund | | $ | 312,348 | | | — | | $ | 124,389 | |
| Large Cap | | | | | | | | | | |
| Value Fund | | | 3,205,994 | | | — | | | — | |
| Small/Mid Cap | | | | | | | | | | |
| Core Fund | | | 10,573 | | | — | | | 121,608 | |
| World ex-US | | | | | | | | | | |
| Fund | | | 6,512,687 | | | — | | | — | |
| Tax-Exempt Fixed | | | | | | | | | | |
| Income Fund* | | | 6,165,984 | | | — | | | — | |
| Core Fixed | | | | | | | | | | |
| Income Fund | | | 19,828,054 | | | — | | | — | |
| | | | | | | | | | | |
| * Contains $6,036,958 of tax-exempt income for year ended 3/31/2010. |
At March 31, 2011 the components of accumulated earnings (losses) on a tax basis were as follows:
| | | | | | | | | | | | | | | | | | | |
| | Large Cap
Growth
Fund | | Large Cap
Value
Fund | | Small/Mid
Cap Core
Fund | | World
ex-US
Fund | | Tax-Exempt
Fixed Income
Fund | | Core
Fixed Income
Fund | |
| | | | | | | | | | | | | |
Cost of | | | | | | | | | | | | | | | | | | | |
Investments | | $ | 157,336,883 | | $ | 154,269,385 | | $ | 31,317,695 | | $ | 245,068,332 | | $ | 167,385,686 | | $ | 508,606,950 | |
Gross Unrealized | | | | | | | | | | | | | | | | | | | |
Appreciation | | | 60,627,591 | | | 56,115,592 | | | 12,135,807 | | | 36,390,508 | | | 2,805,522 | | | 10,163,172 | |
Gross Unrealized | | | | | | | | | | | | | | | | | | | |
Depreciation | | | (6,671,732 | ) | | (10,308,070 | ) | | (652,218 | ) | | (12,608,377 | ) | | (2,078,618 | ) | | (9,442,759 | ) |
| | | | | | | | | | | | | | | | | | | |
Net Unrealized | | | | | | | | | | | | | | | | | | | |
Appreciation | | | 53,955,859 | | | 45,807,522 | | | 11,483,589 | | | 23,782,131 | | | 726,904 | | | 720,413 | |
| | | | | | | | | | | | | | | | | | | |
Undistributed | | | | | | | | | | | | | | | | | | | |
Tax-Exempt | | | | | | | | | | | | | | | | | | | |
Ordinary Income | | | — | | | — | | | — | | | — | | | 44,650 | | | — | |
Undistributed | | | | | | | | | | | | | | | | | | | |
Ordinary Income | | | — | | | 499,075 | | | — | | | — | | | 40,053 | | | 570,514 | |
Undistributed | | | | | | | | | | | | | | | | | | | |
Long-Term | | | | | | | | | | | | | | | | | | | |
Cap Gains | | | — | | | — | | | — | | | 2,815,992 | | | — | | | — | |
| | | | | | | | | | | | | | | | | | | |
Total Distributable | | | | | | | | | | | | | | | | | | | |
Earnings | | | — | | | 499,075 | | | — | | | 2,815,992 | | | 84,703 | | | 570,514 | |
| | | | | | | | | | | | | | | | | | | |
Other Accumulated | | | | | | | | | | | | | | | | | | | |
Losses | | | (95,215,346 | ) | | (200,106,046 | ) | | (32,596,901 | ) | | (213,200,920 | ) | | (7,715,088 | ) | | (13,248,574 | ) |
| | | | | | | | | | | | | | | | | | | |
Total Accumulated | | | | | | | | | | | | | | | | | | | |
Losses | | $ | (41,259,487 | ) | $ | (153,799,449 | ) | $ | (21,113,312 | ) | $ | (186,602,797 | ) | $ | (6,903,481 | ) | $ | (11,957,647 | ) |
| | | | | | | | | | | | | | | | | | | |
83
|
GuideMarkSM Funds |
REPORT OF INDEPENDENT REGISTERED PUBLIC ACCOUNTING FIRM |
|
| |
The Shareholders and Board of Trustees of the GuideMark Funds:
We have audited the accompanying statements of assets and liabilities, including the schedule of investments, of the GuideMark Large Cap Growth Fund, GuideMark Large Cap Value Fund, GuideMark Small/Mid Cap Core Fund, GuideMark World ex-US Fund, GuideMark Tax-Exempt Fixed Income Fund, and GuideMark Core Fixed Income Fund (collectively referred to as the “Funds”), as of March 31, 2011, and the related statements of operations for the year then ended, the statements of changes in net assets for the two-year period then ended, and the financial highlights for each of the years in the five-year period then ended. These financial statements and financial highlights are the responsibility of Fund management. Our responsibility is to express an opinion on these financial statements and financial highlights based on our audits.
We conducted our audits in accordance with the standards of the Public Company Accounting Oversight Board (United States). Those standards require that we plan and perform the audit to obtain reasonable assurance about whether the financial statements and financial highlights are free of material misstatement. An audit includes examining, on a test basis, evidence supporting the amounts and disclosures in the financial statements. Our procedures included confirmation of investments owned as of March 31, 2011, by correspondence with the custodian and brokers or by other appropriate auditing procedures. An audit also includes assessing the accounting principles used and significant estimates made by management, as well as evaluating the overall financial statement presentation. We believe that our audits provide a reasonable basis for our opinion.
In our opinion, the financial statements and financial highlights referred to above present fairly, in all material respects, the financial position of each the Funds as of March 31, 2011, and the results of their operations, the changes in their net assets and the financial highlights for the periods described in the first paragraph above, in conformity with U.S. generally accepted accounting principles.
[Signed] KPMG LLP
Milwaukee, WI
May 27, 2011
84
|
GuideMarkSM Funds |
ADDITIONAL INFORMATION |
March 31, 2011 |
| |
| |
1. | Shareholder Notification of Federal Tax Status (Unaudited) |
| The Large Cap Value Fund, World ex-US Fund and Core Fixed Income Fund designated 100%, 0% and 0%, respectively, of dividends during the fiscal year ended March 31, 2011, as dividends qualifying for the dividends received deduction available to corporate shareholders. |
| |
| The Large Cap Value Fund, World ex-US Fund and Core Fixed Income Fund designated 100%, 100% and 0%, respectively, of dividends declared from net investment income during the fiscal year ended March 31, 2011, as qualified income under the Jobs and Growth Tax Relief Reconciliation Act of 2003. |
| |
2. | Foreign Tax Credit Pass Through (Unaudited) |
| Pursuant to Section 853 of the Internal Revenue Code, the GuideMarkSM World ex-US Fund designates the following amounts as foreign taxes paid for the year ended March 31, 2011. Foreign taxes paid for purposes of Section 853 may be less than actual foreign taxes paid for financial statement purposes. |
| | | | | | | |
| | | Creditable Foreign
Taxes Paid | | Per Share
Amount | | Portion of Ordinary Income Distribution
derived from Foreign Sourced Income* |
| | | | | | | |
| GuideMarkSM World ex-US Fund | | $596,600 | | $0.0185 | | 92.5923% |
| | |
| * | None of the funds listed above derived any income from ineligible foreign sources as defined under Section 901(j) of the Internal Revenue Code. |
| | |
| Foreign taxes paid or withheld should be included in taxable income with an offsetting deduction from gross income or as a credit for taxes paid to foreign governments. |
| | |
| Above figures may differ from those cited elsewhere in this report due to differences in the calculation of income and gains under U.S. generally accepted accounting principles (book) purposes and Internal Revenue Service (tax) purposes. |
| | |
| Shareholders are strongly advised to consult their own tax advisers with respect to the tax consequences of their investments in the Funds. In January, shareholders, excluding corporate shareholders, receive an IRS 1099-DIV regarding the Federal tax status of the dividends and distributions they received in the calendar year. |
85
|
GuideMarkSM Funds |
ADDITIONAL INFORMATION (Continued) |
March 31, 2011 |
| |
| |
3. | Disclosure Regarding Fund Trustees and Officers (Unaudited) |
| | | | | | | | | | |
Name, Age
and Address | | Position(s)
Held with
the Trust | | Term of Office
and Length of
Time Served | | Principal
Occupation During Past Five Years | | # of
Portfolios
in Fund
Complex
Overseen
by Trustee | | Other
Director/
Trustee
Positions |
| | | | | | | | | | | |
| | | | | | | | | | |
Independent Trustees | | | | | | | | | | |
| | | | | | | | | | |
R. Thomas DeBerry
c/o Genworth Financial
Wealth Management, Inc.
2300 Contra Costa
Boulevard Ste 600
Pleasant Hill, CA 94523
Year of Birth: 1941 | | Trustee | | Indefinite Term
since January
2001. | | Retired, President, DeBerry Consulting (a securities consulting firm) (1998-present). | | 13 | | None |
| | | | | | | | | | |
William J. Klipp
c/o Genworth Financial
Wealth Management, Inc.
2300 Contra Costa
Boulevard Ste 600
Pleasant Hill, CA 94523
Year of Birth: 1955 | | Trustee | | Indefinite Term
since January
2001, Lead
Independent
Trustee since
May 2007. | | Retired; President and Chief Operating Officer, Charles Schwab Investment Management, Inc. and Executive Vice President, Schwab Funds (1993-1999). | | 13 | | None |
| | | | | | | | | | |
Dennis G. Schmal
c/o Genworth Financial
Wealth Management, Inc.
2300 Contra Costa
Boulevard Ste 600
Pleasant Hill, CA 94523
Year of Birth: 1947 | | Trustee | | Indefinite Term
since July 2007. | | Self-employed consultant (2003-present). | | 13 | | Trustee, Grail Advisors ETF Trust (2009-present); Trustee, Wells Fargo Multi-Strategy 100 Fund (closed-end hedge fund) (2008-present); Director/ Chairman, Pacific Metrics Corp. (Educational Services) (2005-present); Director, Varian Semiconductor Equipment Associates, Inc. (2004-present); Director, Merriman Curhan Ford Group, Inc. (Financial Services) (2003-present). |
86
|
GuideMarkSM Funds |
ADDITIONAL INFORMATION (Continued) |
March 31, 2011 |
| |
| | | | | | | | | | |
Name, Age
and Address | | Position(s)
Held with
the Trust | | Term of Office
and Length of
Time Served | | Principal
Occupation During Past Five Years | | # of
Portfolios
in Fund
Complex
Overseen
by Trustee | | Other
Director/
Trustee
Positions |
| | | | | | | | | | | |
| | | | | | | | | | |
Interested Trustees | | | | | | | | | | |
| | | | | | | | | | |
Ronald Cordes*
Genworth Financial
Wealth Management, Inc.
2300 Contra Costa
Boulevard Ste 600
Pleasant Hill, CA 94523
Year of Birth: 1959 | | Chairperson,
Trustee | | Indefinite Term
since January
2001. | | Principal, Genworth Financial Wealth Management (“GFWM”) (1994-present); President, GPS Funds I, formerly, AssetMark Funds (2001-2008). | | 13 | | ThinkImpact (non-profit organization) (2010-present); Transfair, USA (non-profit organization) (2010-present); Sarona Frontier General Partner, Inc. (investment fund) (2010-present); Microvest Fund I, Investment Committee (investment fund) (2009-present); University of the Pacific (2009-present); East Bay Community Foundation, (2007-present); Katalysis Bootstrap Fund (non-profit organization) (2005-present); Boys and Girls Clubs of Oakland (2002-present). |
| | | | | | | | | | |
Officers | | | | | | | | | | |
| | | | | | | | | | |
Carrie E. Hansen
Genworth Financial
Wealth Management, Inc.
2300 Contra Costa
Boulevard Ste 600
Pleasant Hill, CA 94523
Year of Birth: 1970 | | President | | Renewed
1-Year Term
since 2007 | | President, GPS Funds I (2007 to present), GPS Funds II (2011 to present) and Genworth Variable Insurance Trust (“GVIT”) (2008-present); Senior Vice President and Chief Operations Officer, GFWM (2008-present); Chairman, Genworth Financial Trust Company (2008-present); Senior Vice President and Managing Director, GPS Funds I, formerly, AssetMark Funds (2007-2008); Treasurer and Chief Compliance Officer, GFAM Funds (2007-2008); Chief Compliance Officer, GPS Funds I, formerly, AssetMark Funds (2005-2008); Treasurer, GPS Funds I, formerly, AssetMark Funds (2001-2008); Senior Vice President, Chief Financial Officer and Chief Compliance Officer, GFWM, formerly, AssetMark Investment Services, Inc. (2004-2007). | | N/A | | N/A |
| | | | | | | | | | |
Deborah Djeu
Genworth Financial
Wealth Management, Inc.
2300 Contra Costa
Boulevard Ste 600
Pleasant Hill, CA 94523
Year of Birth: 1962 | | Vice President,
Chief
Compliance
Officer and
AML
Compliance
Officer | | Renewed
1-Year Term
since
2008 | | Vice President, Chief Compliance Officer and AML Compliance Officer, GPS Funds I (2008 to present), GPS Funds II (2011 to present) and GVIT (2008-present); Deputy Chief Compliance Officer, GPS Funds I, formerly, Assetmark Funds (2007-2008); Compliance Manager, GE Money (2006-2007); Vice President, Wells Fargo Investments LLC (2004-2006). | | N/A | | N/A |
87
|
GuideMarkSM Funds |
ADDITIONAL INFORMATION (Continued) |
March 31, 2011 |
| |
| | | | | | | | | | |
Name, Age
and Address | | Position(s)
Held with
the Trust | | Term of Office
and Length of
Time Served | | Principal
Occupation During Past Five Years | | # of
Portfolios
in Fund
Complex
Overseen
by Trustee | | Other
Director/
Trustee
Positions |
| | | | | | | | | | | |
| | | | | | | | | | |
Starr E. Frohlich
Genworth Financial
Wealth Management, Inc.
2300 Contra Costa
Boulevard Ste 600
Pleasant Hill, CA 94523
Year of Birth: 1972 | | Vice
President,
Treasurer | | Since
2010 | | Vice President and Treasurer, GPS Funds I (2010 to present), GPS Funds II (2011 to present) and GVIT (2010-present); Director of Fund Administration, GFWM (2010-present); Vice President, U.S.Bancorp Fund Services, LLC (1997-2010). | | N/A | | N/A |
| | | | | | | | | | |
Christine Villas-Chernak
Genworth Financial
Wealth Management, Inc.
2300 Contra Costa
Boulevard Ste 600
Pleasant Hill, CA 94523
Year of Birth: 1968 | | Deputy
Chief
Compliance
Officer;
Secretary | | Renewed
1-Year Term
since
2006 | | Secretary, GPS Funds I (2009 to present) and GPS Funds II (2011 to present); Deputy Chief Compliance Officer, Secretary GVIT (2008-present); Senior Compliance Officer, GFWM (2005-2009); Fund Administration & Compliance Manager, GFWM, formerly, AssetMark Investment Services, Inc. (2004-2005); Fund Administration & Compliance Specialist, GFWM, formerly, AssetMark Investment Services, Inc. (2002-2004). | | N/A | | N/A |
| | | | | | | | | | |
Robert J. Bannon
Genworth Financial
Asset Management
16501 Ventura Boulevard
Ste 201
Encino, CA 91436
Year of Birth: 1957 | | Chief
Risk
Officer | | Since
2010 | | Chief Risk Officer, GFAM Funds (2010- present); GVIT Funds (2010-present); Senior Vice President and Chief Risk Officer, GFWM (2007-present); Senior Vice President and Chief Investment Officer, Bank of the West (formerly Sanwa Bank California) (2000-2005). | | N/A | | N/A |
| |
* | Ronald Cordes is an “interested person” of the Funds as defined in the 1940 Act due to his relationship with the Advisor. |
The Statement of Additional Information includes additional information about the Funds’ Trustees and is available free of charge upon request by calling the Funds toll free at (888) 278-5809.
| |
4. | Proxy Voting Policies and Procedures and Proxy Voting Record (Unaudited) |
| A description of the policies and procedures that the Funds use to determine how to vote proxies related to the Funds’ portfolio securities as well as information regarding how the Funds voted proxies relating to portfolio securities during the most recent 12-month period ended June 30 is available without charge, upon request, by calling (888) 278-5809. Furthermore, you can obtain the Fund’s proxy voting records on the SEC’s website at http://www.sec.gov. |
| |
5. | Availability of Quarterly Portfolio Holdings Schedules (Unaudited) |
| The Funds file their complete schedules of portfolio holdings with the SEC for their first and third fiscal quarters on Form N-Q. Once filed, the Funds’ Form N-Q is available without charge, upon request on the SEC’s website (http://www.sec.gov) and is available by calling (888) 278-5809. You can also obtain copies of Form N-Q by (i) visiting the SEC’s Public Reference Room in Washington, D.C. (information on the operation of the Public Reference Room may be obtained by calling 1-800-SEC-0330); (ii) sending your request and a duplicating fee to the SEC’s Public Reference Room, Washington, D.C. 20549-0102; or (iii) sending your request electronically to publicinfo@sec.gov. |
88
|
GuideMarkSM Funds |
ADDITIONAL INFORMATION (Continued) |
March 31, 2011 |
| |
| |
6. | Statement Regarding the Basis for Approval of Investment Advisory Agreement and Sub-Advisory Agreements (Unaudited) |
| |
| During the six-month period ended March 31, 2011, the Board of Trustees (the “Board” or the “Trustees”) of GPS Funds I (the “Trust”) approved a new advisory agreement for one series of the Trust and new sub-advisory agreements for several series of the Trust (collectively, the “Agreements”). These approvals were considered and approved in conjunction with three separate transactions that impacted the various series of the Trust (the “Funds”): (1) the change of control of Integrity Asset Management, LLC (“Integrity”), formerly a sub-advisor to AssetMark Small/Mid Cap Value Fund (later renamed the GuideMarkSM Small/Mid Cap Core Fund), which required the approval of a new sub-advisory agreement with Integrity; (2) the restructuring of the GuideMarkSM Large Cap Growth Fund (“Large Cap Growth Fund”), the GuideMarkSM Large Cap Value Fund (“Large Cap Value Fund”), the GuideMarkSM Small/Mid Cap Core Fund (“Small/Mid Cap Core Fund”), and the GuideMarkSM World ex-US Fund (“World ex-US Fund”), which required the approval of new sub-advisory agreements for each of these Funds; and (3) the creation of a new fund, the GuideMarkSM Opportunistic Equity Fund (“Opportunistic Equity Fund”), which required the approval of a new advisory agreement and sub-advisory agreements for that Fund. |
| |
| The Funds are managed using a “manager of managers” structure that generally involves the use of one or more sub-advisors to manage allocated portions of the Funds’ portfolios. In accordance with the terms of an exemptive order that the Advisor and the Trust has received from the U.S. Securities and Exchange Commission, the Agreements were not submitted to a vote of shareholders. |
| |
| Set forth below is a description of the process followed by the Board in considering approval of each of the Agreements, together with an explanation of many of the factors considered and related conclusions reached by the Board in approving each of the Agreements. |
| |
| Approval of New Sub-Advisory Agreement with Integrity |
| |
| At a meeting held on December 6, 2010 (the “December Meeting”), the Board considered and approved a new sub-advisory agreement between Integrity and the Genworth Financial Wealth Management, Inc. (the “Advisor”), on behalf of the AssetMark Small/Mid Cap Value Fund (the “New Integrity Sub-Advisory Agreement”), in the expectation that Integrity, a sub-advisor of that Fund, would undergo a change in ownership on or about December 31, 2010. Specifically, it was anticipated that Integrity would be acquired by Munder Capital Management and its parent company, Munder Capital Holdings, LLC, a registered investment advisor based in Birmingham, Michigan (the “Transaction”), which would constitute an assignment of, and result in the termination of, the existing sub-advisory agreement under its terms. The terms of the proposed New Integrity Sub-Advisory Agreement, other than the date, were identical in all respects to the then-existing sub-advisory agreement (the “Existing Integrity Sub-Advisory Agreement”) that had been considered and approved by the Board at the meeting held on May 27, 2010 (the “May Meeting”). In order to permit Integrity to continue to provide investment advisory services to the AssetMark Small/Mid Cap Value Fund following the Transaction, the Board considered and approved the New Integrity Sub-Advisory Agreement, to become effective following the Transaction. |
| |
| The material factors considered and the conclusions that formed the bases of the Board’s approval of the New Integrity Sub-Advisory Agreement are described below. This summary describes the most significant, but not all, of the factors evaluated by the Board. In deciding to approve the New Integrity Sub-Advisory Agreement, the Trustees did not identify any particular information or any single factor or conclusion that was controlling. |
89
|
GuideMarkSM Funds |
ADDITIONAL INFORMATION (Continued) |
March 31, 2011 |
| |
| |
| Materials Reviewed and the Review Process |
| |
| In considering the approval of the New Integrity Sub-Advisory Agreement, the Board was able to draw on its knowledge of the Trust, the Fund, the Advisor, and Integrity. At the May Meeting, the Board had considered the approval of the Existing Integrity Sub-Advisory Agreement, and had considered the nature, extent and quality of services provided by Integrity, Integrity’s investment performance with regard to the management of its allocated portion of the Fund, and the relevant sub-advisory fees. |
| |
| The Board reviewed a copy of the New Integrity Sub-Advisory Agreement. The Board considered that the New Integrity Sub-Advisory Agreement provided for the same services and fees as the Existing Integrity Sub-Advisory Agreement, and, most importantly, that the New Integrity Sub-Advisory Agreement was in all respects identical to the Existing Integrity Sub-Advisory Agreement, except for the effective date. Given that the services and fees provided under the New Integrity Sub-Advisory Agreement were identical to the services and fees under the Existing Integrity Sub-Advisory Agreement, the Board’s deliberations at the May Meeting, remained relevant. |
| |
| At the December Meeting, the Trustees considered several factors that they deemed relevant, including, but not limited to: (1) the nature, extent and quality of the services that Integrity provided to the Fund; (2) Integrity’s reputation, investment management business, personnel and operations; (3) Integrity’s brokerage and trading policies and practices; (4) the level of sub-advisory fees charged by Integrity and a comparison of those fees to: (a) Integrity’s fee schedule for comparable accounts, and (b) the fees paid by certain other registered investment companies (or their investment advisors) having investment objectives similar to that of the Fund; (5) Integrity’s compliance program; (6) Integrity’s performance returns managing the Fund, and such performance comparisons to a relevant index; and (7) Integrity’s financial condition. The Trustees also considered and analyzed Integrity’s management style, the qualifications and experience of the persons responsible for the day-to-day management of the Fund and Integrity’s staffing levels and overall resources. |
| |
| The Advisor recommended the approval of the New Integrity Sub-Advisory Agreement, pursuant to which Integrity would continue to serve as a sub-advisor of the AssetMark Small/Mid Cap Value Fund following the Transaction. The approval of the New Integrity Sub-Advisory Agreement was recommended by the Advisor because, among other factors, (i) the Transaction was not expected to have a material effect on the nature, extent or quality of the services provided by Integrity to the Fund; (ii) the Integrity personnel who have been responsible for managing Integrity’s allocated portion of the Fund would continue to serve in their respective capacities following the Transaction; (iii) the terms of the New Integrity Sub-Advisory Agreement were similar, in all material respects other than the effective date, to the Existing Integrity Sub-Advisory Agreement that was approved by the Board at May Meeting, as described above; and (iv) Integrity’s historical investment performance with respect to its management of the Fund had been satisfactory. |
| |
| Factors Considered |
| |
| The Trustees considered and reached conclusions on a number of factors in making the decision to approve the New Integrity Sub-Advisory Agreement. These factors and conclusions are described below. |
| |
| Nature, Quality and Extent of Services Provided |
| |
| The Trustees considered their analysis at the May Meeting of the nature, quality and extent of the services provided by Integrity to the AssetMark Small/Mid Cap Value Fund. The Trustees considered the specific investment process employed by Integrity in managing the assets of the Fund allocated to Integrity, the qualifications of Integrity’s investment management team for implementing the Fund’s investment mandate, and Integrity’s performance record as compared to the relevant benchmark. The Trustees considered Integrity’s infrastructure and whether Integrity appeared to support its |
90
|
GuideMarkSM Funds |
ADDITIONAL INFORMATION (Continued) |
March 31, 2011 |
| |
| |
| investment strategy adequately. The Trustees also considered the Advisor’s favorable assessment as to the nature and quality of the sub-advisory services provided by Integrity. |
| |
| Based on their consideration and review of the foregoing factors, the Trustees concluded that the nature, quality and extent of the sub-advisory services provided by Integrity to the AssetMark Small/Mid Cap Value Fund would likely continue to benefit the AssetMark Small/Mid Cap Value Fund and its shareholders. |
| |
| Investment Performance of the Fund |
| |
| The Trustees considered their analysis at the May Meeting regarding Integrity’s investment performance. In addition, the Trustees considered Integrity’s recent investment performance in managing the AssetMark Small/Mid Cap Value Fund as an important factor in evaluating the New Integrity Sub-Advisory Agreement. The Trustees compared this performance to a relevant benchmark. The Trustees concluded that the performance record for Integrity in managing the Fund supported a decision to approve the New Integrity Sub-Advisory Agreement. |
| |
| Sub-Advisory Fees and Economies of Scale |
| |
| The Trustees considered their analysis at the May Meeting of the services rendered by Integrity and the compensation to be paid to Integrity by the Advisor. The Trustees also considered comparisons of the fees to be paid to Integrity by the Advisor with the fees charged by Integrity to its other clients. In addition, the Trustees considered negligible ancillary benefits that may accrue to Integrity as a result of serving as sub-advisor to the Fund. |
| |
| Based on their discussion, the Trustees concluded that, in light of the quality and extent of the services to be provided, the fees to be paid to Integrity with respect to the assets to be allocated to Integrity appeared to be within a reasonable range. |
| |
| Conclusion |
| |
| After full consideration of the factors discussed above, with no single factor identified as being of paramount importance, the Board, including a majority of the independent Trustees, with the assistance of independent counsel, concluded that the approval of the New Integrity Sub-Advisory Agreement was in the best interests of the AssetMark Small/Mid Cap Value Fund, and approved the New Integrity Sub-Advisory Agreement with, and the fee to be paid to, Integrity for the Fund. |
| |
| Approval of New Sub-Advisory Agreements as a Result of Fund Restructuring |
| |
| At the December Meeting, the Board approved changes to the names and to certain of the investment strategies and policies of the Funds. In conjunction with these changes, the Board considered and approved new sub-advisory agreements between the Advisor, on behalf of each of the following Funds, and each of the following sub-advisors. |
| | |
| Fund | Sub-Advisor |
| | |
| Large Cap Growth Fund | Wellington Management Company, LLP |
| Large Cap Value Fund | Barrow, Hanley, Mewhinney and Strauss |
| Small/Mid Cap Core Fund | Pyramis Global Advisors |
| World ex-US Fund | Pyramis Global Advisors |
| |
| The material factors considered and the conclusions that formed the bases of the Board’s approval of each sub-advisory agreement are described below. This summary describes the most significant, but not all, of the factors evaluated by the Board. In deciding to approve each sub-advisory agreement, the Trustees did not identify any particular information or any single factor or conclusion that was controlling. |
91
|
GuideMarkSM Funds |
ADDITIONAL INFORMATION (Continued) |
March 31, 2011 |
| |
| |
| Materials Reviewed and the Review Process |
| |
| The Trustees reviewed and considered the materials related to the consideration of each recommended sub-advisor, including, but not limited to: (1) a copy of the proposed form of sub-advisory agreement; (2) each sub-advisor’s responses to the Advisor’s due diligence questionnaire; (3) each sub-advisor’s Form ADV; (4) a description of the Advisor’s selection and recommendation process with respect to each sub-advisor and the reasons for such recommendation; (5) information regarding the amount of the proposed sub-advisory fee payable to each sub-advisor; (6) biographical information for the investment professionals at each sub-advisor that would be responsible for the day-to-day management of each sub-advisor’s allocated portion of the respective Fund’s portfolio; (7) information regarding each sub-advisor’s financial condition; and (8) information regarding each sub-advisor’s compliance policies and other internal procedures. The Trustees considered the recommendations of the Advisor with respect to each sub-advisor and discussed the methods and resources the Advisor utilizes in its efforts to identify and engage high quality sub-advisors for each Fund. |
| |
| Factors Considered |
| |
| The Trustees considered and reached conclusions on a number of factors in making the decision to approve each sub-advisory agreement. These factors and conclusions are described below. |
| |
| Nature, Quality and Extent of Services Provided |
| |
| The Trustees considered the nature, quality and extent of services to be provided by each proposed sub-advisor. The Trustees also considered the qualifications, experience and track record of the individuals or portfolio management teams at each sub-advisor who would be responsible for the day-to-day management of each Fund’s portfolio. The Trustees further considered each proposed sub-advisor’s specific investment approach and level of expertise within its particular asset class. |
| |
| Investment Performance of each Fund |
| |
| The Trustees considered each sub-advisor’s historical performance record with respect to pooled investment products similar to the applicable Funds. |
| |
| Sub-Advisory Fees and Economies of Scale |
| |
| The Trustees reviewed comparisons of the fees to be paid to each of the proposed sub-advisors by the Advisor with the fees charged by each sub-advisor to its other clients. The Trustees also considered any negligible ancillary benefits that may accrue to the sub-advisors as a result of serving as sub-advisors to the Funds. |
| |
| Based on their discussion, the Trustees concluded that, in light of the quality and extent of the services to be provided, the fees to be paid to the proposed sub-advisors appeared to be within a reasonable range. |
| |
| Conclusion |
| |
| After consideration of the factors discussed above, and with no single factor identified as being of paramount importance, the Board, including a majority of the independent Trustees, with the assistance of independent counsel, concluded that the approval of each sub-advisory agreement was in the best interest of each Fund, and approved the sub-advisory agreements with, and the fee to be paid to, each sub-advisor. |
| |
| Approval of New Advisory Agreement and Sub-Advisory Agreements for the Opportunistic Equity Fund |
| |
| At the December Meeting, the Board considered and approved a new advisory agreement and sub-advisory agreements in connection with the creation of a new fund, the Opportunistic Equity Fund. The Board, including a majority of the |
92
|
GuideMarkSM Funds |
ADDITIONAL INFORMATION (Continued) |
March 31, 2011 |
| |
| |
| independent Trustees, determined to approve the advisory agreement between the Advisor and the Opportunistic Equity Fund, and sub-advisory agreements between the Advisor, on behalf of the Fund, and each of the following sub-advisors: Diamond Hill Capital Management, Inc., Knightsbridge Asset Management, LLC, Marsico Capital Management, LLC, and Westfield Management Company, LP. |
| |
| The material factors considered and the conclusions that formed the bases of the Board’s approval of the Agreements are described below. This summary describes the most significant, but not all, of the factors evaluated by the Board. In preparation for the Meeting, the Trustees requested, received, and considered information relevant to their consideration of the Agreements. In deciding to approve each Agreement, the Board did not identify any particular information or any single factor or conclusion that was controlling. |
| |
| The Advisory Agreement |
| |
| Materials Reviewed and the Review Process |
| |
| The Trustees specifically requested and were furnished with materials for purposes of their review. The materials provided to the Board related to, among other things: (1) the advisory agreement; (ii) information describing the nature, extent, and quality of the services that the Advisor provided to the Funds; (iii) the fees that the Advisor charged to the Funds for these services; (iv) information regarding the Advisor’s business and operations, financial position, investment team, and compliance program; (v) information describing the Opportunistic Equity Fund’s anticipated operating expenses; and (vi) information regarding the Advisor’s profitability in managing each Fund. |
| |
| Factors Considered |
| |
| The Trustees considered and reached conclusions on a number of factors in making the decision to approve the advisory agreement. These factors and conclusions are described below. |
| |
| Nature, Quality and Extent of Services Provided |
| |
| In evaluating the nature, quality and extent of the services that the Advisor provides to the Funds, the independent Trustees considered, among other things, the information presented at each Board meeting regarding the Advisor’s efforts in overseeing the sub-advisors. The Trustees considered the various services provided by the Advisor in connection with the Advisor’s oversight of the Funds’ sub-advisors, the resources that the Advisor commits to servicing the Funds, and the team that has been assembled over time. The Trustees also considered the breadth and quality of services that the Advisor provides to the Funds, particularly regarding the selection and monitoring of the sub-advisors. |
| |
| Based on the factors described above, among others, along with the information provided to the Trustees in advance of the Meeting and throughout the year, the Trustees concluded that the nature, quality and extent of the services to be provided by the Advisor to the Opportunistic Equity Fund would likely benefit the Fund and its shareholders. |
| |
| Investment Performance of the Fund |
| |
| Because the Opportunistic Equity Fund was newly created, the Trustees could not consider the investment performance with respect to the Advisor’s management of the Fund. However, because the Advisor serves as a manager-of-managers to all of the Funds, the Trustees were able to evaluate the Advisor’s performance by considering the performance of the Funds as a group. |
| |
| The Trustees also considered the performance-related data of the Advisor throughout the past year, and concluded that there was room for improvement in the performance of the Funds, that the Trustees were confident in the steps that the |
93
|
GuideMarkSM Funds |
ADDITIONAL INFORMATION (Continued) |
March 31, 2011 |
| |
| |
| Advisor was taking to improve the overall performance of the Funds, and that this factor weighed in favor of the approval of the advisory agreement for the Opportunistic Equity Fund. |
| |
| Advisory Fees, Profitability and Economies of Scale |
| |
| The Trustees considered the financial information detailing the Advisor’s profitability from its management of the Funds and the Advisor’s continued commitment to limit the Funds’ total expenses. The Trustees also considered the benefits received by the Advisor as a result of its relationship with the Funds. |
| |
| Because the Opportunistic Equity Fund had not commenced operations, specific information concerning the potential effect that asset growth and economies of scale may have had on the Fund’s expenses were not available. However, the Trustees did consider the Advisor’s efforts to pass along certain economies of scale to the Funds to the extent they are realized. |
| |
| The Trustees concluded that the Advisor’s cost structure and profitability indicated that its fees were reasonable, and that the foregoing factors weighed in favor of approving the advisory agreement for the Opportunistic Equity Fund. |
| |
| Conclusion |
| |
| After consideration of the factors discussed above, and with no single factor identified as being of paramount importance, the Board, including a majority of the independent Trustees, with the assistance of independent counsel, concluded that the approval of the advisory agreement was in the best interest of the Opportunistic Equity Fund, and approved the advisory agreement with, and the fee to be paid to, the Advisor pursuant to the advisory agreement with respect to the Fund. |
| |
| The Sub-Advisory Agreements |
| |
| Materials Reviewed and the Review Process |
| |
| The Trustees specifically requested and were furnished with materials for purposes of their review. The materials provided to the Board related to, among other things: (1) a copy of the proposed form of sub-advisory agreement; (2) each sub-advisor’s responses to the Advisor’s due diligence questionnaire; (3) each sub-advisor’s Form ADV; (4) a description of the Advisor’s selection and recommendation process with respect to each sub-advisor, and the reasons for such recommendation; (5) information regarding the amount of the proposed sub-advisory fee payable to each sub-advisor; (6) biographical information for the investment professionals at each sub-advisor that would be responsible for the day-to-day management of each sub-advisor’s allocated portion of the Opportunistic Equity Fund’s portfolio; (7) information regarding each sub-advisor’s financial condition; and (8) information regarding each sub-advisor’s compliance policies and other internal procedures. The Trustees considered the recommendations of the Advisor with respect to each sub-advisor and discussed the methods and resources the Advisor utilizes in its efforts to identify and engage high quality sub-advisors for the Opportunistic Equity Fund. |
| |
| Factors Considered |
| |
| The Trustees considered and reached conclusions on a number of factors in making the decision to approve the sub-advisory agreements. These factors and conclusions are described below. |
| |
| Nature, Quality and Extent of Services Provided |
| |
| The Trustees considered the nature, quality and extent of services to be provided by the proposed sub-advisors for the Opportunistic Equity Fund. The Trustees also considered the qualifications, experience and track record of the individuals or portfolio management teams at each sub-advisor who would be responsible for the day-to-day management of the |
94
|
GuideMarkSM Funds |
ADDITIONAL INFORMATION (Continued) |
March 31, 2011 |
| |
| |
| Opportunistic Equity Fund’s portfolio. The Trustees further considered each proposed sub-advisor’s specific investment approach and level of expertise within its particular asset class. |
| |
| Investment Performance of the Fund |
| |
| The Trustees considered each sub-advisor’s historical performance record with respect to pooled investment products similar to the Opportunistic Equity Fund. |
| |
| Sub-Advisory Fees and Economies of Scale |
| |
| The Trustees reviewed comparisons of the fees to be paid to each of the proposed sub-advisors by the Advisor with the fees charged by each sub-advisor to its other clients. The Trustees also considered any negligible ancillary benefits that may accrue to the sub-advisors as a result of serving as sub-advisors to the Funds. |
| |
| Based on their discussion, the Trustees concluded that, in light of the quality and extent of the services to be provided, the fees to be paid to the proposed sub-advisors appeared to be within a reasonable range. |
| |
| Conclusion |
| |
| After consideration of the factors discussed above, and with no single factor identified as being of paramount importance, the Board, including a majority of the independent Trustees, with the assistance of independent counsel, concluded that the approval of each sub-advisory agreement was in the best interest of the Opportunistic Equity Fund, and approved the sub-advisory agreements with, and the fee to be paid to, each sub-advisor. |
95
[This Page Intentionally Left Blank]

| | |
| GUIDEMARKSM FUNDS | |
| | |
| GuideMarkSM Large Cap Growth Fund | |
| GuideMarkSM Large Cap Value Fund | |
| GuideMarkSM Small/Mid Cap Core Fund | |
| GuideMarkSM World ex-US Fund | |
| GuideMarkSM Tax-Exempt Fixed Income Fund | |
| GuideMarkSM Core Fixed Income Fund | |
| | |
| Investment Advisor | |
| Genworth Financial Wealth Management, Inc. | |
| 2300 Contra Costa Blvd., Suite 600 | |
| Pleasant Hill, CA 94523 | |
| | |
| Legal Counsel | |
| Stradley Ronon Stevens & Young, LLP | |
| 2600 One Commerce Square | |
| Philadelphia, PA 19103 | |
| | |
| Independent Registered Public Accounting Firm | |
| KPMG LLP | |
| 777 East Wisconsin Avenue | |
| Milwaukee, WI 53202 | |
| | |
| Transfer Agent, Fund Accountant | |
| and Fund Administrator | |
| U.S. Bancorp Fund Services, LLC | |
| 615 East Michigan Street | |
| Milwaukee, WI 53202 | |
| | |
| Custodian | |
| U.S. Bank, N.A. | |
| 1555 North RiverCenter Drive, Suite 302 | |
| Milwaukee, WI 53212 | |
| | |
| Distributor | Annual Report
March 31, 2011 |
| Capital Brokerage Corporation |
| (dba Genworth Financial Brokerage Corporation in Indiana) |
| 6620 West Broad Street Building 2 |
| Richmond, VA 23230 |
| Member FINRA |
| | |

| |
|
| Investment Advisor | |
| Genworth Financial Wealth Management, Inc. | |
| | |
ANNUAL REPORT |
| | |
| March 31, 2011 | |
| | |
| | | |
| | |
| ASSETMARK SMALL/MID CAP GROWTH FUND | |
| | |
| ASSETMARK REAL ESTATE SECURITIES FUND | |
| | |
| ASSETMARK ENHANCED FUNDAMENTAL INDEX®
LARGE COMPANY GROWTH FUND | |
| | |
| ASSETMARK ENHANCED FUNDAMENTAL INDEX®
LARGE COMPANY VALUE FUND | |
| | |
| ASSETMARK ENHANCED FUNDAMENTAL INDEX®
SMALL COMPANY GROWTH FUND | |
| | |
| ASSETMARK ENHANCED FUNDAMENTAL INDEX®
SMALL COMPANY VALUE FUND | |
| | |
| | | |
| | |
May 9, 2011
Dear Shareholder:
Enclosed is the Annual Report of the GuideMarkSM Funds (formerly, the AssetMark Funds) covering the period from April 1, 2010 through March 31, 2011. The year ended March 31 delivered positive results for the global markets, albeit with significant equity market volatility at several points. Notwithstanding a range of macroeconomic challenges, we believe the overarching upward trend reflected deepening optimism about the two-year-old recovery from the global financial crisis.
The S&P 500® Index1 rose 15.65% over the fiscal year, while the world ex-U.S., as represented by the MSCI All Country World ex-U.S. Index2, returned 13.61% for the 12-month period. Fixed income markets also moved higher for the year, with the Barclays Capital U.S. Aggregate Bond Index3 netting 5.12%, and the Barclays Capital Euro Aggregate Index4 returning 3.63%.
Finally, REIT market performance, as measured by the FTSE National Association of Real Estate Investment Trusts Equity Index5, generated a strong full year gain of 23.68%.
A Year of Contrasts and Optimism
Over the past year, high unemployment in Europe plagued countries such as Ireland and Greece, while Germany experienced the lowest unemployment in two decades and strong export growth. Commodity markets rallied, while U.S. core inflation rates touched 50-year lows. The residential housing market in the U.S. continued to struggle, yet corporate earnings were strong. And, overall, developing China and India continued to grow much faster than the developed economies.
Residential housing continued to drag, and climbing food prices threatened to erode discretionary spending not only domestically but around the world. Government debt levels remained elevated in many European countries, as well as in the U.S. and Japan. Yet, corporate earnings were strong, with companies continuing to hold record-high levels of cash. In the U.S., employment figures continued to slowly improve, and by March 31, 2011, the unemployment rate had dropped to a two-year low. All in all, as the financial crisis continued to recede, markets preferred to concentrate virtually all of their attention on the positives.
Potential Game Changers
Recent world events—the Japanese earthquake and tsunami, as well as political uprisings in the Middle East and North Africa—provided a backdrop for significant market volatility in the latter part of the fiscal year. Generally speaking, however, the markets responded by continuing to advance despite those setbacks, and yet either could impact the environment for investors as the year continues to unfold.
Events in Egypt and Libya took the spotlight in an unstable region during the year. By the end of March 2011, the price of oil had reached a 30-month high, leading to worries that oil could be a game changer for the U.S. economy and markets.6 Although oil prices could spike if inventories dry up, some analysts believe this is unlikely to happen unless supply from a major oil producing country, such as Saudi Arabia, is disrupted.7 In contrast to this view, other observers think that the political transformation taking place in the Middle East and North Africa will very likely lead to persistent increases in the price of oil, if only to compensate for elevated risk in an uncertain market.8
It is widely believed by investment professionals that the Japanese disaster will not have a major impact on global markets and that recovery will likely take place quickly. However, if leaks at the damaged nuclear power plants lead to a Chernobyl-sized disaster, the negative economic impact will more likely spread beyond Japan and persist for a longer period of time.9
Looking Ahead
Positive surprises thus far in 2011 include accelerating employment and GDP growth. Quantitative easing is scheduled to end mid-2011, in our opinion, this leaves questions as to whether a relapse into recession will follow or whether the economy will
be strong enough to move ahead without government support. In addition, we feel the possibility of interest rate increases in China and debt downgrades in Europe are areas to watch.
Ned Davis Research observes that “macro factors typically give way to company-specific factors as the bull [market] matures.” But with the unusually impactful macro events following the financial crisis—such as the Japanese disaster and burgeoning unrest in oil-producing countries, as well as continuing sovereign debt problems, particularly in Europe—macro factors may continue to drive markets.10 This perspective on the possibility for continuing macro-driven markets is compatible with views of other analysts and market observers who anticipate more modest stock gains and a “choppier ride” as 2011 continues to unfold.11 Of course, we believe a return to recession cannot be ruled out until the economy has recovered fully from the financial crisis. And, at the other extreme, investors could continue to ignore bad news, as they have preferred to do in the recent past, and markets could continue to forge their way upward.
As you are aware, effective April 1, the Funds completed a restructuring to become the GuideMarkSM Funds. We are confident that this restructuring will better position the Funds to meet the challenges and opportunities that lie ahead. We recognize the trust you have placed in us and thank you for including the Funds in your portfolio.
Sincerely,

Carrie E. Hansen
President
GuideMarkSM Funds
| | |
| | | |
1 | The S&P 500® Index, a registered trademark of the McGraw Hill Companies, is an unmanaged basket of 500 stocks that are considered to be widely held and thus believed to be a good indicator of overall market performance. You cannot invest directly into an index. |
| |
2 | The MSCI All Country World ex-U.S.Index is a free float-adjusted market capitalization index designed to measure the combined equity market performance of developed and emerging markets countries, excluding the United States. This index consists of 44 country indices comprising 23 developed and 21 emerging market country indices. |
| |
3 | The Barclays Capital U.S. Aggregate Bond Index is a broad-based benchmark that measures the investment grade, U.S. dollar-denominated, fixed-rate taxable bond market, including Treasuries, government-related and corporate securities, MBS (agency fixed-rate and hybrid ARM passthroughs), ABS, and CMBS. |
| |
4 | The Barclays Capital Euro Aggregate Bond Index is designed to track fixed-rate, investment grade Euro-denominated securities. Inclusion in the Benchmark Index is based on the currency of the issue, and not the domicile of the issuer. The principal sectors in the Benchmark Index are treasury, corporate, government-related and securitized. |
| |
5 | The FTSE NAREIT Equity REIT Index is a broad measure of the performance of publicly traded U.S. real estate securities, such as Real Estate Investment Trusts (REITs) and Real Estate Operating Companies. |
| |
6 | “Oil climbs to highest since 2008 on Libya conflict,” Associated Press, March 31, 2011. |
| |
7 | Tom Fahey, Ryan McGrail, Richard Skaggs and Joseph Taylor, “middle east politics & oil: the influences on global interest rates, credit spreads & stock prices,” Loomis Sayles, March 18, 2011. |
| |
8 | Javier Blas, “The politics of oil: Wells of anxiety,” Financial Times, March 29, 2011. |
2
| |
9 | “Following Japanese disaster, long-term investment outlook remains positive,” Natixis Global Associates, March 2011. |
| |
10 | Ed Clissold, CFA, “What to Expect in the Third Year of Bull Market,” Ned Davis Research Inc. Chart of the Day, March 10, 2011. |
| |
11 | Barbara Kollmeyer, “International stock fund investors’ dizzying spin,” MarketWatch, April 1, 2011. Also see footnote 2. |
Past performance is not indicative of future results. You cannot invest directly into an index.
Investments in the Funds will fluctuate, and when redeemed may be worth more or less than originally invested.
Investors should consider the Funds’ Investment objectives, risks, charges and expenses carefully before investing. The prospectus contains this and other important information about the Funds. Please read the prospectus careful before you invest or send money. The prospectus is available upon request, without charge, by calling 1-800-238-0810.
FINRA 116789 051211
3
|
AssetMark Funds |
EXPENSE EXAMPLE (Unaudited) |
March 31, 2011 |
| |
As a shareholder of the AssetMark Funds (the “Funds”), you incur ongoing costs, including management fees; distribution and/or service fees; and other Fund expenses. The Expense Example shown in this section is intended to help you understand your ongoing costs (in dollars) of investing in the Funds and to compare these costs with the ongoing costs of investing in other mutual funds.
The Expense Example is based on an investment of $1,000 invested at the beginning of a six month period and held for the entire period (October 1, 2010 – March 31, 2011) for the AssetMark Small/Mid Cap Growth Fund, AssetMark Real Estate Securities Fund, AssetMark Enhanced Fundamental Index® Large Company Growth Fund, AssetMark Enhanced Fundamental Index® Large Company Value Fund, AssetMark Enhanced Fundamental Index® Small Company Growth Fund and AssetMark Enhanced Fundamental Index® Small Company Value Fund.
|
Actual Expenses |
The first line of the Expense Example table provides information about actual account values and actual expenses. You may use the information in this line, together with the amount you invested, to estimate the expenses that you paid over the period. Simply divide your account value by $1,000 (for example, an $8,600 account value divided by $1,000 = 8.6), then multiply the result by the number in the first line under the heading entitled “Expenses Paid During Period” to estimate the expenses you paid on your account during this period. |
The example includes, but is not limited to, management fees, shareholder servicing fees, distribution fees, fund accounting, custody and transfer agent fees. However, the example below does not include portfolio trading commissions and related expenses, interest expense or dividends on short positions taken by the Funds and other extraordinary expenses as determined under generally accepted accounting principles. To the extent that a Fund invests in shares of other investment companies as part of its investment strategy, you will indirectly bear your proportionate share of any fees and expenses charged by the underlying funds in which a Fund invests in addition to the expenses of the Fund. Actual expenses of the underlying funds are expected to vary among the various underlying funds. These expenses are not included in the example below.
|
Hypothetical Example for Comparison Purposes |
The second line of the table below provides information about hypothetical account values and hypothetical expenses based on the Funds’ actual expenses ratios and an assumed rate of return of 5% per year before expenses, which is not the Funds’ actual return. The hypothetical account values and expenses may not be used to estimate the actual ending account balance or expenses you paid for the period. You may use this information to compare the ongoing costs of investing in the Funds and other funds. To do so, compare this 5% hypothetical example with the 5% hypothetical examples that appear in the shareholder reports of the other funds. |
4
AssetMark Funds
EXPENSE EXAMPLE (Continued) (Unaudited)
March 31, 2011
| | | | | | | | | | | | | | | |
| |
|
| | | | Beginning
Account
Value
October 1,
2010 | | Ending
Account
Value
March 31,
2011 | | Annualized
Expense Ratio1
based on
the period
October 1, 2010 –
March 31, 2011 | | Expenses Paid
During Period2
October 1, 2010 –
March 31, 2011 | |
| |
AssetMark Small/Mid Cap | | Actual | | | $1,000.00 | | | $1,293.40 | | | 1.66% | | | $9.49 | |
Growth Fund | | Hypothetical3 | | | $1,000.00 | | | $1,016.65 | | | 1.66% | | | $8.35 | |
| |
AssetMark Real Estate | | Actual | | | $1,000.00 | | | $1,104.40 | | | 1.52% | | | $7.97 | |
Securities Fund | | Hypothetical3 | | | $1,000.00 | | | $1,017.35 | | | 1.52% | | | $7.64 | |
| |
AssetMark Enhanced Fundamental | | Actual | | | $1,000.00 | | | $1,148.80 | | | 1.24% | | | $6.64 | |
Index® Large Company Growth Fund | | Hypothetical3 | | | $1,000.00 | | | $1,018.75 | | | 1.24% | | | $6.24 | |
| |
AssetMark Enhanced Fundamental | | Actual | | | $1,000.00 | | | $1,186.30 | | | 1.36% | | | $7.41 | |
Index® Large Company Value Fund | | Hypothetical3 | | | $1,000.00 | | | $1,018.15 | | | 1.36% | | | $6.84 | |
| |
AssetMark Enhanced Fundamental | | Actual | | | $1,000.00 | | | $1,224.60 | | | 1.35% | | | $7.49 | |
Index® Small Company Growth Fund | | Hypothetical3 | | | $1,000.00 | | | $1,018.20 | | | 1.35% | | | $6.79 | |
| |
AssetMark Enhanced Fundamental | | Actual | | | $1,000.00 | | | $1,219.90 | | | 1.49% | | | $8.25 | |
Index® Small Company Value Fund | | Hypothetical3 | | | $1,000.00 | | | $1,017.50 | | | 1.49% | | | $7.49 | |
| |
| |
1 | The expense ratio excludes the securities lending credit. |
2 | Expenses are equal to the Fund’s annualized expense ratio, multiplied by the average account value over the period, multiplied by 182/365 to reflect the one-half year period. |
3 | 5% return before expenses. |
5
|
AssetMark Funds |
STATEMENTS OF ASSETS & LIABILITIES |
March 31, 2011 |
| |
| | | | | | | |
| | Small/Mid Cap
Growth Fund | | Real Estate
Securities Fund | |
| | | | | |
ASSETS: | | | | | | | |
Investments, at value (cost $0, and $0 respectively) | | $ | — | | $ | — | |
Cash | | | 42,260,578 | | | 51,174,435 | |
Income receivable | | | 3,934 | | | 21,260 | |
Receivable for fund shares sold | | | — | | | 1,028 | |
Other assets | | | 21,902 | | | 13,439 | |
| | | | | | | |
Total Assets | | | 42,286,414 | | | 51,210,162 | |
| | | | | | | |
LIABILITIES: | | | | | | | |
Payable for fund shares redeemed | | | 42,180,069 | | | 51,096,223 | |
Payable to Investment Advisor | | | 32,355 | | | 40,717 | |
Payable to Custodian | | | 5,177 | | | 2,298 | |
Other accrued expenses | | | 68,813 | | | 70,924 | |
| | | | | | | |
Total Liabilities | | | 42,286,414 | | | 51,210,162 | |
| | | | | | | |
NET ASSETS | | $ | 0 | | $ | 0 | |
| | | | | | | |
NET ASSETS CONSIST OF: | | | | | | | |
| | | | | | | |
Total Net Assets | | $ | 0 | | $ | 0 | |
| | | | | | | |
Shares outstanding (unlimited shares of no par value authorized) | | | — | | | — | |
Net asset value, offering and redemption price per share | | $ | 0.00 | | $ | 0.00 | |
| | | | | | | |
See notes to financial statements.
6
|
AssetMark Funds |
STATEMENTS OF ASSETS & LIABILITIES (Continued) |
March 31, 2011 |
| |
| | | | | | | | | | | | | |
| | Enhanced
Fundamental
Index®
Large Company
Growth Fund | | Enhanced
Fundamental
Index®
Large Company
Value Fund | | Enhanced
Fundamental
Index®
Small Company
Growth Fund | | Enhanced
Fundamental
Index®
Small Company
Value Fund | |
| | | | | | | | | |
ASSETS: | | | | | | | | | | | | | |
Investments, at value (cost $0, $0, $0 and $0, respectively) | | $ | — | | $ | — | | $ | — | | $ | — | |
Cash | | | 92,612,606 | | | 77,335,264 | | | 23,010,557 | | | 10,345,496 | |
Income receivable | | | 81,728 | | | 86,316 | | | 10,303 | | | 4,229 | |
Receivable for investment securities sold | | | — | | | — | | | 1,316 | | | — | |
Receivable for fund shares sold | | | — | | | 10,000 | | | — | | | — | |
Other assets | | | 18,593 | | | 24,375 | | | 9,004 | | | 6,309 | |
| | | | | | | | | | | | | |
Total Assets | | | 92,712,927 | | | 77,455,955 | | | 23,031,180 | | | 10,356,034 | |
| | | | | | | | | | | | | |
LIABILITIES: | | | | | | | | | | | | | |
Payable for fund shares redeemed | | | 92,558,917 | | | 77,329,780 | | | 22,974,800 | | | 10,320,431 | |
Payable to Investment Advisor | | | 54,440 | | | 45,450 | | | 12,647 | | | 1,303 | |
Payable to Custodian | | | 2,180 | | | 1,646 | | | 514 | | | 248 | |
Other accrued expenses | | | 97,390 | | | 79,079 | | | 43,219 | | | 34,052 | |
| | | | | | | | | | | | | |
Total Liabilities | | | 92,712,927 | | | 77,455,955 | | | 23,031,180 | | | 10,356,034 | |
| | | | | | | | | | | | | |
NET ASSETS | | $ | 0 | | $ | 0 | | $ | 0 | | $ | 0 | |
| | | | | | | | | | | | | |
NET ASSETS CONSIST OF: | | | | | | | | | | | | | |
| | | | | | | | | | | | | |
Total Net Assets | | $ | 0 | | $ | 0 | | $ | 0 | | $ | 0 | |
| | | | | | | | | | | | | |
Shares outstanding (unlimited shares of no par value authorized) | | | — | | | — | | | — | | | — | |
Net asset value, offering and redemption price per share | | $ | 0.00 | | $ | 0.00 | | $ | 0.00 | | $ | 0.00 | |
| | | | | | | | | | | | | |
See notes to financial statements.
7
|
AssetMark Funds |
STATEMENTS OF OPERATIONS |
For the Year Ended March 31, 2011 |
| |
| | | | | | | |
| | Small/Mid Cap
Growth Fund | | Real Estate
Securities Fund | |
| | | | | |
INVESTMENT INCOME: | | | | | |
Dividend income | | $ | 251,837 | | $ | 945,634 | |
Interest income | | | 2,701 | | | 2,457 | |
| | | | | | | |
Total investment income | | | 254,538 | | | 948,091 | |
| | | | | | | |
EXPENSES: | | | | | | | |
Investment advisory fees | | | 367,117 | | | 483,713 | |
Distribution (12b-1) fees | | | 96,610 | | | 127,293 | |
Shareholder servicing fees | | | 23,186 | | | 30,551 | |
Administration fees | | | 14,801 | | | 19,502 | |
Legal fees | | | 21,336 | | | 19,402 | |
Custody fees | | | 31,060 | | | 18,605 | |
Directors’ fees and expenses | | | 5,381 | | | 8,710 | |
Reports to shareholders | | | 11,067 | | | 13,665 | |
Fund accounting fees | | | 13,689 | | | 10,071 | |
Audit and tax fees | | | 28,614 | | | 27,482 | |
Federal and state registration fees | | | 19,350 | | | 20,238 | |
Transfer agent fees and expenses | | | 12,683 | | | 12,943 | |
Insurance fees | | | 2,068 | | | 2,377 | |
Compliance fees | | | 1,210 | | | 838 | |
| | | | | | | |
Total expenses | | | 648,172 | | | 795,390 | |
| | | | | | | |
Expense reimbursement by Advisor (See Note 3) | | | (1,977 | ) | | (19,713 | ) |
Less securities lending credit (See Note 6) | | | (31,757 | ) | | (17,011 | ) |
| | | | | | | |
Net expenses | | | 614,438 | | | 758,666 | |
| | | | | | | |
Net investment income (loss) | | | (359,900 | ) | | 189,425 | |
| | | | | | | |
NET REALIZED AND UNREALIZED GAIN (LOSS) ON INVESTMENTS: | | | | | | | |
Net realized gain on investments | | | 16,229,430 | | | 24,848,693 | |
Net change in unrealized depreciation on investments | | | (6,137,428 | ) | | (15,571,885 | ) |
| | | | | | | |
Net realized and unrealized gain | | | 10,092,002 | | | 9,276,808 | |
| | | | | | | |
NET INCREASE IN NET ASSETS RESULTING FROM OPERATIONS | | $ | 9,732,102 | | $ | 9,466,233 | |
| | | | | | | |
See notes to financial statements.
8
|
AssetMark Funds |
STATEMENTS OF OPERATIONS (Continued) |
For the Year Ended March 31, 2011 |
| |
| | | | | | | | | | | | | |
| | Enhanced
Fundamental
Index®
Large Company
Growth Fund | | Enhanced
Fundamental
Index®
Large Company
Value Fund | | Enhanced
Fundamental
Index®
Small Company
Growth Fund | | Enhanced
Fundamental
Index®
Small Company
Value Fund | |
| | | | | | | | | |
INVESTMENT INCOME: | | | | | | | | | | | | | |
Dividend income (net of withholding tax of $0, $0,
$9 and $4, respectively) | | $ | 1,520,905 | | $ | 1,459,180 | | $ | 224,550 | | $ | 124,415 | |
Interest income | | | 7,395 | | | 5,766 | | | 1,905 | | | 759 | |
| | | | | | | | | | | | | |
Total investment income | | | 1,528,300 | | | 1,464,946 | | | 226,455 | | | 125,174 | |
| | | | | | | | | | | | | |
EXPENSES: | | | | | | | | | | | | | |
Investment advisory fees | | | 602,724 | | | 479,837 | | | 137,204 | | | 63,967 | |
Distribution (12b-1) fees | | | 200,908 | | | 159,946 | | | 45,735 | | | 21,322 | |
Shareholder servicing fees | | | 54,499 | | | 43,367 | | | 12,421 | | | 5,768 | |
Administration fees | | | 84,198 | | | 67,188 | | | 19,134 | | | 8,908 | |
Legal fees | | | 32,891 | | | 30,559 | | | 8,176 | | | 3,013 | |
Custody fees | | | 15,487 | | | 12,664 | | | 3,944 | | | 3,466 | |
Directors’ fees and expenses | | | 11,975 | | | 8,789 | | | 2,394 | | | 1,238 | |
Reports to shareholders | | | 6,144 | | | 5,234 | | | 3,788 | | | 1,471 | |
Fund accounting fees | | | 65,747 | | | 52,327 | | | 14,703 | | | 7,048 | |
Audit and tax fees | | | 22,004 | | | 22,004 | | | 22,004 | | | 22,004 | |
Federal and state registration fees | | | 21,981 | | | 21,739 | | | 18,863 | | | 17,747 | |
Transfer agent fees and expenses | | | 13,054 | | | 12,483 | | | 12,113 | | | 12,048 | |
Insurance fees | | | 3,343 | | | 2,800 | | | 730 | | | 365 | |
Compliance fees | | | 1,847 | | | 1,969 | | | 463 | | | 334 | |
| | | | | | | | | | | | | |
Total expenses | | | 1,136,802 | | | 920,906 | | | 301,672 | | | 168,699 | |
| | | | | | | | | | | | | |
Expense reimbursement by Advisor (See Note 3) | | | (140,140 | ) | | (71,560 | ) | | (57,766 | ) | | (22,441 | ) |
Less securities lending credit (See Note 6) | | | (16,230 | ) | | (68,811 | ) | | (20,721 | ) | | (42,205 | ) |
| | | | | | | | | | | | | |
Net expenses | | | 980,432 | | | 780,535 | | | 223,185 | | | 104,053 | |
| | | | | | | | | | | | | |
Net investment income | | | 547,868 | | | 684,411 | | | 3,270 | | | 21,121 | |
| | | | | | | | | | | | | |
NET REALIZED AND UNREALIZED GAIN (LOSS)
ON INVESTMENTS: | | | | | | | | | | | | | |
Net realized gain on: | | | | | | | | | | | | | |
Investments | | | 20,168,622 | | | 20,821,852 | | | 7,295,971 | | | 3,080,477 | |
Futures contracts | | | 400,077 | | | 274,382 | | | 150,569 | | | 39,367 | |
| | | | | | | | | | | | | |
Total | | | 20,568,699 | | | 21,096,234 | | | 7,446,540 | | | 3,119,844 | |
| | | | | | | | | | | | | |
Net change in unrealized depreciation on: | | | | | | | | | | | | | |
Investments | | | (10,027,784 | ) | | (10,169,445 | ) | | (2,904,925 | ) | | (1,466,861 | ) |
Futures contracts | | | (110,732 | ) | | (90,163 | ) | | (3,607 | ) | | (3,130 | ) |
| | | | | | | | | | | | | |
Total | | | (10,138,516 | ) | | (10,259,608 | ) | | (2,908,532 | ) | | (1,469,991 | ) |
| | | | | | | | | | | | | |
Net realized and unrealized gain | | | 10,430,183 | | | 10,836,626 | | | 4,538,008 | | | 1,649,853 | |
| | | | | | | | | | | | | |
NET INCREASE IN NET ASSETS
RESULTING FROM OPERATIONS | | $ | 10,978,051 | | $ | 11,521,037 | | $ | 4,541,278 | | $ | 1,670,974 | |
| | | | | | | | | | | | | |
See notes to financial statements.
9
|
AssetMark Funds |
STATEMENTS OF CHANGES IN NET ASSETS |
|
| |
| | | | | | | | | | | | | |
| | Small/Mid Cap Growth Fund | | Real Estate Securities Fund | |
| | | | | |
| | Year
Ended
March 31,
2011 | | Year
Ended
March 31,
2010 | | Year
Ended
March 31,
2011 | | Year
Ended
March 31,
2010 | |
| | | | | | | | | |
OPERATIONS: | | | | | | | | | | | | | |
Net investment income (loss) | | $ | (359,900 | ) | $ | (235,330 | ) | $ | 189,425 | | $ | 751,911 | |
Net realized gain (loss) on investment transactions | | | 16,229,430 | | | 12,129,280 | | | 24,848,693 | | | (675,534 | ) |
Change in unrealized appreciation (depreciation)
on investments | | | (6,137,428 | ) | | 10,338,185 | | | (15,571,885 | ) | | 27,080,180 | |
| | | | | | | | | | | | | |
Net increase in net assets resulting from
operations | | | 9,732,102 | | | 22,232,135 | | | 9,466,233 | | | 27,156,557 | |
| | | | | | | | | | | | | |
CAPITAL SHARE TRANSACTIONS: | | | | | | | | | | | | | |
Shares sold | | | 5,889,765 | | | 8,347,866 | | | 8,562,326 | | | 19,760,246 | |
Shares issued to holders in reinvestment of
dividends | | | — | | | — | | | 13,908,652 | | | 744,733 | |
Shares redeemed | | | (55,872,053 | ) | | (36,927,371 | ) | | (69,005,633 | ) | | (42,120,324 | ) |
| | | | | | | | | | | | | |
Net decrease | | | (49,982,288 | ) | | (28,579,505 | ) | | (46,534,655 | ) | | (21,615,345 | ) |
| | | | | | | | | | | | | |
DIVIDENDS AND DISTRIBUTIONS TO
SHAREHOLDERS: | | | | | | | | | | | | | |
Net investment income | | | — | | | — | | | (235,437 | ) | | (744,733 | ) |
From net realized gains | | | — | | | — | | | (12,919,293 | ) | | — | |
Return of capital | | | — | | | — | | | (755,005 | ) | | — | |
| | | | | | | | | | | | | |
Total dividends and distributions | | | — | | | — | | | (13,909,735 | ) | | (744,733 | ) |
| | | | | | | | | | | | | |
INCREASE (DECREASE) IN NET ASSETS | | | (40,250,186 | ) | | (6,347,370 | ) | | (50,978,157 | ) | | 4,796,479 | |
NET ASSETS: | | | | | | | | | | | | | |
Beginning of year | | $ | 40,250,186 | | $ | 46,597,556 | | $ | 50,978,157 | | $ | 46,181,678 | |
| | | | | | | | | | | | | |
End of year (including undistributed net investment
income (loss) of ($0, $0, $0 and
$35,538, respectively) | | $ | 0 | | $ | 40,250,186 | | $ | 0 | | $ | 50,978,157 | |
| | | | | | | | | | | | | |
| | | | | | | | | | | | | |
CHANGES IN SHARES OUTSTANDING | | | | | | | | | | | | | |
Shares sold | | | 719,332 | | | 1,323,101 | | | 773,716 | | | 2,206,056 | |
Shares issued to holders in reinvestment of
dividends | | | — | | | — | | | 1,540,508 | | | 79,993 | |
Shares redeemed | | | (5,969,934 | ) | | (5,581,633 | ) | | (7,357,320 | ) | | (6,204,761 | ) |
| | | | | | | | | | | | | |
Net decrease | | | (5,250,602 | ) | | (4,258,532 | ) | | (5,043,096 | ) | | (3,918,712 | ) |
| | | | | | | | | | | | | |
See notes to financial statements.
10
|
AssetMark Funds |
STATEMENTS OF CHANGES IN NET ASSETS (Continued) |
|
| |
| | | | | | | | | | | | | |
| | Enhanced
Fundamental Index® Large
Company Growth Fund | | Enhanced
Fundamental Index® Large
Company Value Fund | |
| | | | | |
| | Year
Ended
March 31,
2011 | | Year
Ended
March 31,
2010 | | Year
Ended
March 31,
2011 | | Year
Ended
March 31,
2010 | |
| | | | | | | | | |
OPERATIONS: | | | | | | | | | | | | | |
Net investment income | | $ | 547,868 | | $ | 581,715 | | $ | 684,411 | | $ | 519,590 | |
Net realized gain (loss) on investment transactions | | | 20,568,699 | | | (3,974,385 | ) | | 21,096,234 | | | (2,107,423 | ) |
Change in unrealized appreciation (depreciation) on
investments | | | (10,138,516 | ) | | 24,908,983 | | | (10,259,608 | ) | | 28,148,147 | |
| | | | | | | | | | | | | |
Net increase in net assets resulting from
operations | | | 10,978,051 | | | 21,516,313 | | | 11,521,037 | | | 26,560,314 | |
| | | | | | | | | | | | | |
CAPITAL SHARE TRANSACTIONS: | | | | | | | | | | | | | |
Shares sold | | | 42,355,903 | | | 31,166,944 | | | 32,374,195 | | | 22,705,815 | |
Shares issued to holders in reinvestment of
dividends | | | 674,953 | | | 630,394 | | | 810,307 | | | 671,533 | |
Shares redeemed | | | (124,125,451 | ) | | (27,721,788 | ) | | (100,229,115 | ) | | (29,880,501 | ) |
| | | | | | | | | | | | | |
Net increase (decrease) | | | (81,094,595 | ) | | 4,075,550 | | | (67,044,613 | ) | | (6,503,153 | ) |
| | | | | | | | | | | | | |
DIVIDENDS AND DISTRIBUTIONS TO
SHAREHOLDERS: | | | | | | | | | | | | | |
Net investment income | | | (675,102 | ) | | (630,394 | ) | | (810,366 | ) | | (671,533 | ) |
| | | | | | | | | | | | | |
Total dividends and distributions | | | (675,102 | ) | | (630,394 | ) | | (810,366 | ) | | (671,533 | ) |
| | | | | | | | | | | | | |
INCREASE (DECREASE) IN NET ASSETS | | | (70,791,646 | ) | | 24,961,469 | | | (56,333,942 | ) | | 19,385,628 | |
NET ASSETS: | | | | | | | | | | | | | |
Beginning of year | | $ | 70,791,646 | | $ | 45,830,177 | | $ | 56,333,942 | | $ | 36,948,314 | |
| | | | | | | | | | | | | |
End of year (including undistributed net investment
income of $0, $127,297, $0 and
$126,000, respectively) | | $ | 0 | | $ | 70,791,646 | | $ | 0 | | $ | 56,333,942 | |
| | | | | | | | | | | | | |
| | | | | | | | | | | | | |
CHANGES IN SHARES OUTSTANDING | | | | | | | | | | | | | |
Shares sold | | | 4,471,361 | | | 3,781,334 | | | 4,014,058 | | | 3,437,719 | |
Shares issued to holders in reinvestment of
dividends | | | 67,087 | | | 70,751 | | | 94,421 | | | 94,316 | |
Shares redeemed | | | (12,174,373 | ) | | (3,400,284 | ) | | (11,403,811 | ) | | (4,659,346 | ) |
| | | | | | | | | | | | | |
Net increase (decrease) | | | (7,635,925 | ) | | 451,801 | | | (7,295,332 | ) | | (1,127,311 | ) |
| | | | | | | | | | | | | |
See notes to financial statements.
11
|
AssetMark Funds |
STATEMENTS OF CHANGES IN NET ASSETS (Continued) |
|
| |
| | | | | | | | | | | | | |
| | Enhanced
Fundamental Index® Small
Company Growth Fund | | Enhanced
Fundamental Index® Small
Company Value Fund | |
| | | | | |
| | Year
Ended
March 31,
2011 | | Year
Ended
March 31,
2010 | | Year
Ended
March 31,
2011 | | Year
Ended
March 31,
2010 | |
| | | | | | | | | |
OPERATIONS: | | | | | | | | | | | | | |
Net investment income (loss) | | $ | 3,270 | | $ | (2,474 | ) | $ | 21,121 | | $ | 310 | |
Net realized gain on investment transactions | | | 7,446,540 | | | 1,652,242 | | | 3,119,844 | | | 1,002,461 | |
Change in unrealized appreciation (depreciation) on
investments | | | (2,908,532 | ) | | 5,949,489 | | | (1,469,991 | ) | | 4,368,275 | |
| | | | | | | | | | | | | |
Net increase in net assets resulting from
operations | | | 4,541,278 | | | 7,599,257 | | | 1,670,974 | | | 5,371,046 | |
| | | | | | | | | | | | | |
CAPITAL SHARE TRANSACTIONS: | | | | | | | | | | | | | |
Shares sold | | | 10,028,719 | | | 6,273,047 | | | 3,689,484 | | | 3,034,857 | |
Shares issued to holders in reinvestment of
dividends | | | 5,698,604 | | | — | | | 1,420,017 | | | — | |
Shares redeemed | | | (29,620,817 | ) | | (9,421,747 | ) | | (13,207,855 | ) | | (6,402,256 | ) |
| | | | | | | | | | | | | |
Net decrease | | | (13,893,494 | ) | | (3,148,700 | ) | | (8,098,354 | ) | | (3,367,399 | ) |
| | | | | | | | | | | | | |
DIVIDENDS AND DISTRIBUTIONS TO
SHAREHOLDERS: | | | | | | | | | | | | | |
Net investment income | | | (41,058 | ) | | — | | | (18,164 | ) | | — | |
From net realized gains | | | (5,657,982 | ) | | — | | | (1,402,061 | ) | | — | |
| | | | | | | | | | | | | |
Total dividends and distributions | | | (5,699,040 | ) | | — | | | (1,420,225 | ) | | — | |
| | | | | | | | | | | | | |
INCREASE (DECREASE) IN NET ASSETS | | | (15,051,256 | ) | | 4,450,557 | | | (7,847,605 | ) | | 2,003,647 | |
NET ASSETS: | | | | | | | | | | | | | |
Beginning of year | | $ | 15,051,256 | | $ | 10,600,699 | | $ | 7,847,605 | | $ | 5,843,958 | |
| | | | | | | | | | | | | |
End of year (including undistributed net investment
income of $0, $203, $0 and
$2,321, respectively) | | $ | 0 | | $ | 15,051,256 | | $ | 0 | | $ | 7,847,605 | |
| | | | | | | | | | | | | |
| | | | | | | | | | | | | |
CHANGES IN SHARES OUTSTANDING | | | | | | | | | | | | | |
Shares sold | | | 905,717 | | | 735,301 | | | 416,543 | | | 449,545 | |
Shares issued to holders in reinvestment of
dividends | | | 589,046 | | | — | | | 164,140 | | | — | |
Shares redeemed | | | (2,967,300 | ) | | (1,083,105 | ) | | (1,529,234 | ) | | (915,553 | ) |
| | | | | | | | | | | | | |
Net decrease | | | (1,472,537 | ) | | (347,804 | ) | | (948,551 | ) | | (466,008 | ) |
| | | | | | | | | | | | | |
See notes to financial statements.
12
|
AssetMark Funds |
FINANCIAL HIGHLIGHTS |
|
| |
| | | | | | | | | | | | | | | | |
| | Small/Mid Cap Growth Fund | |
| | | |
| | Year Ended
March 31, 2011 | | Year Ended
March 31, 2010 | | Year Ended
March 31, 2009 | | Year Ended
March 31, 2008 | | Year Ended
March 31, 2007 | |
| | | | | | | | | | | |
Per share data for a share of capital
stock outstanding for the entire year
and selected information for the year
are as follows: | | | | | | | | | | | | | | | | |
Net asset value, beginning of year | | | $ 7.67 | | | $ 4.90 | | | $ 8.05 | | | $ 10.65 | | | $ 10.60 | |
| | | | | | | | | | | | | | | | |
Income from investment operations: | | | | | | | | | | | | | | | | |
Net investment loss | | | (0.08 | ) | | (0.04 | ) | | (0.06 | ) | | (0.09 | ) | | (0.07 | ) |
Net realized and unrealized
gains (losses) on investments
(includes liquidating return of
capital/redemption) | | | (7.59 | ) | | 2.81 | | | (3.08 | ) | | (0.69 | ) | | 0.56 | |
| | | | | | | | | | | | | | | | |
Total from investment operations | | | (7.67 | ) | | 2.77 | | | (3.14 | ) | | (0.78 | ) | | 0.49 | |
| | | | | | | | | | | | | | | | |
Less distributions: | | | | | | | | | | | | | | | | |
Dividends from net realized gains | | | — | | | — | | | (0.01 | ) | | (1.82 | ) | | (0.44 | ) |
| | | | | | | | | | | | | | | | |
Total distributions | | | — | | | — | | | (0.01 | ) | | (1.82 | ) | | (0.44 | ) |
| | | | | | | | | | | | | | | | |
Net asset value, end of year | | | $ 0.00 | | | $ 7.67 | | | $ 4.90 | | | $ 8.05 | | | $ 10.65 | |
| | | | | | | | | | | | | | | | |
| | | | | | | | | | | | | | | | |
Total return | | | 28.16 | % | | 56.53 | % | | –38.98 | % | | –10.31 | % | | 4.84 | % |
| | | | | | | | | | | | | | | | |
Supplemental data and ratios: | | | | | | | | | | | | | | | | |
Net assets, end of year | | | $0 | | | $40,250,186 | | | $46,597,556 | | | $126,534,805 | | | $171,403,932 | |
| | | | | | | | | | | | | | | | |
Ratio of expenses to average net
assets | | | | | | | | | | | | | | | | |
Before expense reimbursement
(recapture) and securities lending
credit | | | 1.68 | % | | 1.65 | % | | 1.54 | % | | 1.44 | % | | 1.43 | % |
After expense reimbursement
(recapture) and securities lending
credit | | | 1.59 | % | | 1.50 | % | | 1.26 | % | | 1.29 | % | | 1.37 | % |
| | | | | | | | | | | | | | | | |
Ratio of net investment loss to
average net assets | | | | | | | | | | | | | | | | |
Before expense reimbursement
(recapture) and securities lending
credit | | | –1.02 | % | | –0.62 | % | | –1.01 | % | | –0.99 | % | | –0.75 | % |
After expense reimbursement
(recapture) and securities lending
credit | | | –0.93 | % | | –0.47 | % | | –0.73 | % | | –0.84 | % | | –0.69 | % |
| | | | | | | | | | | | | | | | |
Portfolio turnover rate | | | 179.63 | % | | 209.03 | % | | 219.24 | % | | 209.64 | % | | 213.08 | % |
See notes to financial statements.
13
|
AssetMark Funds |
FINANCIAL HIGHLIGHTS |
|
| |
| | | | | | | | | | | | | | | | |
| | Real Estate Securities Fund | |
| | | |
| | Year Ended
March 31, 2011 | | Year Ended
March 31, 2010 | | Year Ended
March 31, 2009 | | Year Ended
March 31, 2008 | | Year Ended
March 31, 2007 | |
| | | | | | | | | | | |
Per share data for a share of capital
stock outstanding for the entire year
and selected information for the year
are as follows: | | | | | | | | | | | | | | | | |
Net asset value, beginning of year | | | $ 10.11 | | | $ 5.15 | | | $ 13.83 | | | $ 20.91 | | | $ 18.46 | |
| | | | | | | | | | | | | | | | |
Income from investment operations: | | | | | | | | | | | | | | | | |
Net investment income | | | 0.07 | | | 0.19 | | | 0.15 | | | 0.43 | | | 0.16 | |
Net realized and unrealized
gains (losses) on investments
(includes liquidating return of
capital/redemption) | | | (6.91 | ) | | 4.96 | | | (8.77 | ) | | (4.58 | ) | | 3.84 | |
| | | | | | | | | | | | | | | | |
Total from investment operations | | | (6.84 | ) | | 5.15 | | | (8.62 | ) | | (4.15 | ) | | 4.00 | |
| | | | | | | | | | | | | | | | |
Less distributions: | | | | | | | | | | | | | | | | |
Dividends from net investment
income | | | (0.05 | ) | | (0.19 | ) | | (0.06 | ) | | (0.21 | ) | | (0.25 | ) |
Dividends from net realized gains | | | (3.04 | ) | | — | | | — | | | (2.68 | ) | | (1.30 | ) |
Return of capital | | | (0.18 | ) | | — | | | — | | | (0.04 | ) | | — | |
| | | | | | | | | | | | | | | | |
Total distributions | | | (3.27 | ) | | (0.19 | ) | | (0.06 | ) | | (2.93 | ) | | (1.55 | ) |
| | | | | | | | | | | | | | | | |
Net asset value, end of year | | | $ 0.00 | | | $ 10.11 | | | $ 5.15 | | | $ 13.83 | | | $ 20.91 | |
| | | | | | | | | | | | | | | | |
| | | | | | | | | | | | | | | | |
Total return | | | 20.82 | % | | 100.30 | % | | –62.46 | % | | –19.74 | % | | 21.96 | % |
| | | | | | | | | | | | | | | | |
Supplemental data and ratios: | | | | | | | | | | | | | | | | |
Net assets, end of year | | | $0 | | | $50,978,157 | | | $46,181,678 | | | $82,124,778 | | | $117,462,121 | |
| | | | | | | | | | | | | | | | |
Ratio of expenses to average net
assets | | | | | | | | | | | | | | | | |
Before expense reimbursement
(recapture) and securities lending
credit | | | 1.56 | % | | 1.61 | % | | 1.69 | % | | 1.52 | % | | 1.49 | % |
After expense reimbursement
(recapture) and securities lending
credit | | | 1.49 | % | | 1.49 | % | | 1.49 | % | | 1.46 | % | | 1.46 | % |
| | | | | | | | | | | | | | | | |
Ratio of net investment income to
average net assets | | | | | | | | | | | | | | | | |
Before expense reimbursement
(recapture) and securities lending
credit | | | 0.30 | % | | 1.97 | % | | 2.52 | % | | 0.99 | % | | 0.67 | % |
After expense reimbursement
(recapture) and securities lending
credit | | | 0.37 | % | | 2.09 | % | | 2.72 | % | | 1.05 | % | | 0.70 | % |
| | | | | | | | | | | | | | | | |
Portfolio turnover rate | | | 40.70 | % | | 78.39 | % | | 126.60 | % | | 81.59 | % | | 43.86 | % |
See notes to financial statements.
14
|
AssetMark Funds |
FINANCIAL HIGHLIGHTS |
|
| |
| | | | | | | | | | | | | |
| | Enhanced Fundamental Index® Large Company Growth Fund | |
| | | |
| | Year Ended
March 31, 2011 | | Year Ended
March 31, 2010 | | Year Ended
March 31, 2009 | | August 9, 2007(1)
through
March 31, 2008 | |
| | | | | | | | | |
Per share data for a share of capital stock
outstanding for the entire period and
selected information for the period
are as follows: | | | | | | | | | | | | | |
Net asset value, beginning of period | | | $ 9.27 | | | $ 6.38 | | | $ 9.63 | | | $ 10.00 | |
| | | | | | | | | | | | | |
Income from investment operations: | | | | | | | | | | | | | |
Net investment income | | | 0.06 | | | 0.08 | | | 0.09 | | | 0.04 | |
Net realized and unrealized
gains (losses) on investments
(includes liquidating return of
capital/redemption) | | | (9.25 | ) | | 2.90 | | | (3.26 | ) | | (0.38 | ) |
| | | | | | | | | | | | | |
Total from investment operations | | | (9.19 | ) | | 2.98 | | | (3.17 | ) | | (0.34 | ) |
| | | | | | | | | | | | | |
Less distributions: | | | | | | | | | | | | | |
Dividends from net investment
income | | | (0.08 | ) | | (0.09 | ) | | (0.08 | ) | | (0.02 | ) |
Dividends from net realized gains | | | — | | | — | | | — | | | (0.01 | ) |
| | | | | | | | | | | | | |
Total distributions | | | (0.08 | ) | | (0.09 | ) | | (0.08 | ) | | (0.03 | ) |
| | | | | | | | | | | | | |
Net asset value, end of period | | | $ 0.00 | | | $ 9.27 | | | $ 6.38 | | | $ 9.63 | |
| | | | | | | | | | | | | |
| | | | | | | | | | | | | |
Total return | | | 13.02 | % | | 46.70 | % | | –32.99 | % | | –3.40 | %(2) |
| | | | | | | | | | | | | |
Supplemental data and ratios: | | | | | | | | | | | | | |
Net assets, end of period | | | $0 | | | $70,791,646 | | | $45,830,177 | | | $67,546,939 | |
| | | | | | | | | | | | | |
Ratio of expenses to average net
assets | | | | | | | | | | | | | |
Before expense reimbursement
(recapture) and securities lending
credit | | | 1.41 | % | | 1.50 | % | | 1.50 | % | | 1.82 | %(3) |
After expense reimbursement
(recapture) and before securities
lending credit | | | 1.24 | % | | 1.25 | % | | 1.26 | % | | 1.22 | %(3) |
After expense reimbursement
(recapture) and securities lending
credit | | | 1.22 | % | | 1.22 | % | | 1.22 | % | | 1.22 | %(3) |
| | | | | | | | | | | | | |
Ratio of net investment income (loss)
to average net assets | | | | | | | | | | | | | |
Before expense reimbursement
(recapture) and securities lending
credit | | | 0.49 | % | | 0.70 | % | | 0.73 | % | | 0.28 | %(3) |
After expense reimbursement
(recapture) and securities lending
credit | | | 0.68 | % | | 0.98 | % | | 1.01 | % | | 0.88 | %(3) |
Portfolio turnover rate | | | 76.74 | % | | 78.10 | % | | 98.22 | % | | 22.70 | % |
| |
(1) | Commencement of Operations. |
(2) | Not Annualized. |
(3) | Annualized. |
See notes to financial statements.
15
|
AssetMark Funds |
FINANCIAL HIGHLIGHTS |
|
| |
| | | | | | | | | | | | | |
| | Enhanced Fundamental Index® Large Company Value Fund | |
| | | |
| | Year Ended
March 31, 2011 | | Year Ended
March 31, 2010 | | Year Ended
March 31, 2009 | | August 9, 2007(1)
through
March 31, 2008 | |
| | | | | | | | | |
Per share data for a share of capital stock
outstanding for the entire period and
selected information for the period
are as follows: | | | | | | | | | | | | | |
Net asset value, beginning of period | | | $ 7.72 | | | $ 4.39 | | | $ 8.49 | | | $ 10.00 | |
| | | | | | | | | | | | | |
Income from investment operations: | | | | | | | | | | | | | |
Net investment income | | | 0.08 | | | 0.07 | | | 0.14 | | | 0.07 | |
Net realized and unrealized
gains (losses) on investments
(includes liquidating return of
capital/redemption) | | | (7.70 | ) | | 3.35 | | | (4.10 | ) | | (1.53 | ) |
| | | | | | | | | | | | | |
Total from investment operations | | | (7.62 | ) | | 3.42 | | | (3.96 | ) | | (1.46 | ) |
| | | | | | | | | | | | | |
Less distributions: | | | | | | | | | | | | | |
Dividends from net investment
income | | | (0.10 | ) | | (0.09 | ) | | (0.14 | ) | | (0.04 | ) |
Dividends from net realized gains | | | — | | | — | | | — | | | (0.01 | ) |
| | | | | | | | | | | | | |
Total distributions | | | (0.10 | ) | | (0.09 | ) | | (0.14 | ) | | (0.05 | ) |
| | | | | | | | | | | | | |
Net asset value, end of period | | | $ 0.00 | | | $ 7.72 | | | $ 4.39 | | | $ 8.49 | |
| | | | | | | | | | | | | |
| | | | | | | | | | | | | |
Total return | | | 18.01 | % | | 78.09 | % | | –46.83 | % | | –14.73 | %(2) |
| | | | | | | | | | | | | |
Supplemental data and ratios: | | | | | | | | | | | | | |
Net assets, end of period | | | $0 | | | $56,333,942 | | | $36,948,314 | | | $54,697,080 | |
| | | | | | | | | | | | | |
Ratio of expenses to average net
assets | | | | | | | | | | | | | |
Before expense reimbursement
(recapture) and securities lending
credit | | | 1.44 | % | | 1.52 | % | | 1.51 | % | | 1.92 | %(3) |
After expense reimbursement
(recapture) and before securities
lending credit | | | 1.33 | % | | 1.55 | % | | 1.40 | % | | 1.22 | %(3) |
After expense reimbursement
(recapture) and securities lending
credit | | | 1.22 | % | | 1.22 | % | | 1.22 | % | | 1.22 | %(3) |
|
Ratio of net investment income to
average net assets | | | | | | | | | | | | | |
Before expense reimbursement
(recapture) and securities lending
credit | | | 0.85 | % | | 0.75 | % | | 2.03 | % | | 1.21 | %(3) |
After expense reimbursement
(recapture) and securities lending
credit | | | 1.07 | % | | 1.05 | % | | 2.32 | % | | 1.91 | %(3) |
Portfolio turnover rate | | | 73.17 | % | | 83.43 | % | | 104.24 | % | | 7.67 | % |
| |
(1) | Commencement of Operations. |
(2) | Not Annualized. |
(3) | Annualized. |
See notes to financial statements.
16
|
AssetMark Funds |
FINANCIAL HIGHLIGHTS |
|
| |
| | | | | | | | | | | | | |
| | Enhanced Fundamental Index® Small Company Growth Fund | |
| | | |
| | Year Ended
March 31, 2011 | | Year Ended
March 31, 2010 | | Year Ended
March 31, 2009 | | August 9, 2007(1)
through
March 31, 2008 | |
| | | | | | | | | |
Per share data for a share of capital stock
outstanding for the entire period and
selected information for the period
are as follows: | | | | | | | | | | | | | |
Net asset value, beginning of period | | | $ 10.22 | | | $ 5.82 | | | $ 9.10 | | | $ 10.00 | |
| | | | | | | | | | | | | |
Income from investment operations: | | | | | | | | | | | | | |
Net investment income (loss) | | | 0.01 | | | — | | | (0.01 | ) | | (0.01 | ) |
Net realized and unrealized
gains (losses) on investments
(includes liquidating return of
capital/redemption) | | | (7.07 | ) | | 4.40 | | | (3.27 | ) | | (0.87 | ) |
| | | | | | | | | | | | | |
Total from investment operations | | | (7.06 | ) | | 4.40 | | | (3.28 | ) | | (0.88 | ) |
| | | | | | | | | | | | | |
Less distributions: | | | | | | | | | | | | | |
Dividends from net investment
income | | | (0.02 | ) | | — | | | — | | | — | |
Dividends from net realized gains | | | (3.14 | ) | | — | | | — | | | (0.02 | ) |
Return of capital | | | — | | | — | | | — | | | — | * |
| | | | | | | | | | | | | |
Total distributions | | | (3.16 | ) | | — | | | — | | | (0.02 | ) |
| | | | | | | | | | | | | |
Net asset value, end of period | | | $ 0.00 | | | $ 10.22 | | | $ 5.82 | | | $ 9.10 | |
| | | | | | | | | | | | | |
| | | | | | | | | | | | | |
Total return | | | 25.46 | % | | 75.60 | % | | –36.04 | % | | –8.80 | %(2) |
| | | | | | | | | | | | | |
Supplemental data and ratios: | | | | | | | | | | | | | |
Net assets, end of period | | | $0 | | | $15,051,256 | | | $10,600,699 | | | $12,610,898 | |
| | | | | | | | | | | | | |
Ratio of expenses to average net assets | | | | | | | | | | | | | |
Before expense reimbursement
(recapture) and securities lending
credit | | | 1.65 | % | | 1.85 | % | | 1.85 | % | | 3.55 | %(3) |
After expense reimbursement
(recapture) and before securities
lending credit | | | 1.33 | % | | 1.32 | % | | 1.36 | % | | 1.22 | %(3) |
After expense reimbursement
(recapture) and securities lending
credit | | | 1.22 | % | | 1.22 | % | | 1.22 | % | | 1.22 | %(3) |
| | | | | | | | | | | | | |
Ratio of net investment income (loss)
to average net assets | | | | | | | | | | | | | |
Before expense reimbursement
(recapture) and securities lending
credit | | | –0.41 | % | | –0.65 | % | | –0.79 | % | | –2.62 | %(3) |
After expense reimbursement
(recapture) and securities lending
credit | | | 0.02 | % | | –0.02 | % | | –0.16 | % | | –0.29 | %(3) |
Portfolio turnover rate | | | 105.74 | % | | 90.34 | % | | 122.95 | % | | 11.86 | % |
| |
(1) | Commencement of Operations. |
(2) | Not Annualized. |
(3) | Annualized. |
* | Amount represents less than $0.01 per share. |
See notes to financial statements.
17
|
AssetMark Funds |
FINANCIAL HIGHLIGHTS |
|
| |
| | | | | | | | | | | | | |
| | Enhanced Fundamental Index® Small Company Value Fund | |
| | | |
| | Year Ended
March 31, 2011 | | Year Ended
March 31, 2010 | | Year Ended
March 31, 2009 | | August 9, 2007(1)
through
March 31, 2008 | |
| | | | | | | | | |
Per share data for a share of capital stock
outstanding for the entire period and
selected information for the period
are as follows: | | | | | | | | | | | | | |
Net asset value, beginning of period | | | $ 8.27 | | | $ 4.13 | | | $ 8.33 | | | $ 10.00 | |
| | | | | | | | | | | | | |
Income from investment operations: | | | | | | | | | | | | | |
Net investment income | | | 0.02 | | | — | | | 0.05 | | | 0.05 | |
Net realized and unrealized
gains (losses) on investments
(includes liquidating return of
capital/redemption) | | | (6.91 | ) | | 4.14 | | | (4.17 | ) | | (1.67 | ) |
| | | | | | | | | | | | | |
Total from investment operations | | | (6.89 | ) | | 4.14 | | | (4.12 | ) | | (1.62 | ) |
| | | | | | | | | | | | | |
Less distributions: | | | | | | | | | | | | | |
Dividends from net investment
income | | | (0.02 | ) | | — | | | (0.07 | ) | | (0.03 | ) |
Dividends from net realized gains | | | (1.36 | ) | | — | | | — | | | (0.02 | ) |
Return of capital | | | — | | | — | | | (0.01 | ) | | — | |
| | | | | | | | | | | | | |
Total distributions | | | (1.38 | ) | | — | | | (0.08 | ) | | (0.05 | ) |
| | | | | | | | | | | | | |
Net asset value, end of period | | | $ 0.00 | | | $ 8.27 | | | $ 4.13 | | | $ 8.33 | |
| | | | | | | | | | | | | |
| | | | | | | | | | | | | |
Total return | | | 21.11 | % | | 100.24 | % | | –49.62 | % | | –16.27 | %(2) |
| | | | | | | | | | | | | |
Supplemental data and ratios: | | | | | | | | | | | | | |
Net assets, end of period | | | $0 | | | $7,847,605 | | | $5,843,958 | | | $6,045,461 | |
| | | | | | | | | | | | | |
Ratio of expenses to average net assets | | | | | | | | | | | | | |
Before expense reimbursement
(recapture) and securities lending
credit | | | 1.98 | % | | 2.04 | % | | 2.15 | % | | 6.30 | %(3) |
After expense reimbursement
(recapture) and before securities
lending credit | | | 1.71 | % | | 1.51 | % | | 1.42 | % | | 1.22 | % |
After expense reimbursement
(recapture) and securities lending
credit | | | 1.22 | % | | 1.22 | % | | 1.22 | % | | 1.22 | %(3) |
| | | | | | | | | | | | | |
Ratio of net investment income (loss)
to average net assets | | | | | | | | | | | | | |
Before expense reimbursement
(recapture) and securities lending
credit | | | –0.51 | % | | –0.82 | % | | 0.06 | % | | –3.72 | %(3) |
After expense reimbursement
(recapture) and securities lending
credit | | | 0.25 | % | | 0.00 | % | | 0.99 | % | | 1.36 | %(3) |
Portfolio turnover rate | | | 90.78 | % | | 110.46 | % | | 112.49 | % | | 16.18 | % |
| |
(1) | Commencement of Operations. |
(2) | Not Annualized. |
(3) | Annualized. |
See notes to financial statements.
18
|
AssetMark Funds |
NOTES TO FINANCIAL STATEMENTS |
March 31, 2011 |
| |
| | |
1. | Organization |
| | |
| AssetMark Funds (the “Trust”) is organized as a Delaware statutory trust under a Declaration of Trust dated January 2, 2001. The Trust is registered under the Investment Company Act of 1940, as amended (the “1940 Act”), as an open-end management investment company (the “Funds”). The following funds are diversified: AssetMark Small/Mid Cap Growth Fund, AssetMark Enhanced Fundamental Index® Large Company Growth Fund, AssetMark Enhanced Fundamental Index® Large Company Value Fund, AssetMark Enhanced Fundamental Index® Small Company Growth Fund, and AssetMark Enhanced Fundamental Index® Small Company Value Fund. The AssetMark Real Estate Securities Fund is non-diversified. Each Fund represents a distinct portfolio with its own investment objectives and policies. The assets of each Fund are segregated, and a shareholder’s interest is limited to the Fund in which shares are held. The Enhanced Fundamental Index® Funds commenced operations on August 9, 2007. The other two Funds commenced operations on June 29, 2001. As of March 31, 2011, the AssetMark Small/Mid Cap Growth Fund, AssetMark Real Estate Securities Fund, AssetMark Enhanced Fundamental Index® Large Company Growth Fund, AssetMark Enhanced Fundamental Index® Large Company Value Fund, AssetMark Enhanced Fundamental Index® Small Company Growth Fund and AssetMark Enhanced Fundamental Index® Small Company Value Fund were liquidated. All shares were redeemed and capital distributions were recorded prior to year end. |
| | |
2. | Significant Accounting Policies |
| | |
| The following is a summary of significant accounting policies consistently followed by the Funds in the preparation of the financial statements. These policies are in conformity with U.S. generally accepted accounting principals (“GAAP”). |
| | |
| (a) | Investment Valuation |
| | Portfolio securities listed on a national or foreign securities exchange, except those listed on NASDAQ, for which market quotations are |
| | |
| | available are valued at the last quoted sale price on each business day. Portfolio securities traded on NASDAQ are valued at the NASDAQ Official Closing Price (“NOCP”) on each business day. If there is no reported sale on an exchange or NASDAQ, the portfolio security will be valued at the mean between the most recent quoted bid and asked price. Price information on listed securities is taken from the exchange where the security is primarily traded. |
| | |
| | All equity securities that are not traded on a listed exchange are valued at the last sale price in the over-the-counter market. If a non-exchange traded security does not trade on a particular day, then the mean between the last quoted closing bid and asked price will be used. Non-exchange traded ADRs are priced with an evaluated price as determined by the current evaluated pricing procedures of, and provided by, the pricing vendor. |
| | |
| | Fixed-income securities that have a maturity of greater than 60 days are generally valued on the basis of evaluations obtained from third party pricing services, which take into account appropriate factors such as institutional sized trading in similar groups of securities, yield, quality, coupon rate, maturity, type of issue, trading characteristics and other market data. Short-term investments having a maturity of less than 60 days are valued at amortized cost. |
| | |
| | Investments in mutual funds are valued at the closing net asset value per share of each mutual fund on the day of valuation. |
| | |
| | Securities for which no market quotations are readily available or when a significant event has occurred between the time of the security’s last close and the time that a Fund next calculates its net asset value will be valued at their fair value as determined by the Valuation Committee. Securities for which no market prices are readily available will be valued at their fair value as determined by the Valuation Committee under procedures adopted by the Board of Trustees. |
19
|
AssetMark Funds |
NOTES TO FINANCIAL STATEMENTS (Continued) |
March 31, 2011 |
| |
Valuation Measurements
The Trust has adopted authoritative fair valuation accounting standards which establish an authoritative definition of fair value and set out a hierarchy for measuring fair value. These standards require additional disclosures about the various inputs and valuation techniques used to develop the measurements of fair value and a discussion in changes in valuation techniques and related inputs, if any, during the period. In addition, these standards require expanded disclosure for each major category of assets. These inputs are summarized in the three broad levels listed below:
Level 1 - Quoted prices in active markets for identical securities.
Level 2 - Other significant observable inputs (including quoted prices for similar securities, interest rates, prepayment speeds, credit risk, etc.).
Level 3 - Significant unobservable inputs (including the Fund’s own assumptions in determining the fair value of investments).
During the period, certain of the securities and other instruments held by the Funds were categorized as Level 2 or Level 3 based upon the inputs and methodologies used to determine the fair value of the security or instrument. Descriptions of the inputs and valuation methodologies used to determine the fair values of each class of investments within Level 2 and Level 3 are set forth below.
Level 2 Investments. The Funds’ investments that were categorized as Level 2 include: (1) certain fixed income securities, including asset-backed securities, collateralized mortgage obligations, corporate bonds, U.S. and foreign government obligations, mortgage-backed securities and municipal bonds; (2) certain common stocks, preferred stocks, and convertible preferred stocks; and (3) certain over-the-counter derivative instruments, including forward currency contracts.
Fixed income securities are normally valued by pricing vendors that use broker-dealer quotations, reported trades or valuation estimates from their internal pricing models. The service providers’ internal models typically use inputs that are observable such as institutional sized trading in similar groups of securities, yield, credit quality, coupon rate, maturity, type of issue, trading characteristics and other market data.
Certain common stocks that trade or foreign exchanges are subject to valuation adjustments. These valuation adjustments are applied to the foreign exchange-traded common stocks to account for the market movement between the close of the foreign market in which the security is traded and the close of the New York Stock Exchange. These securities are valued using pricing vendors that consider the correlation patterns of price movements of the foreign security to the intraday trading in the U.S. markets.
Foreign currency contracts derive their value from underlying asset prices, indices, reference rates, and other inputs or a combination of these factors. These instruments are normally valued using pricing vendors. Depending upon the instrument, its value may be provided by a pricing vendor using a series of techniques, including pricing models. The pricing models typically use inputs that are observed from active markets such as indices, spreads, interest rates, curves, dividends and exchange rates.
Level 3 Investments. The Funds’ investments that were categorized as Level 3 include: (1) investments purchased as securities lending collateral and warrants.
Investments purchased as securities lending collateral and warrants are normally valued by pricing vendors using relevant observable inputs, as described above. In certain circumstances, the types of observable inputs that are typically used by a pricing service may be unavailable or deemed by the pricing service to be unreliable. In these instances, the pricing vendor may value the security based upon significant unobservable inputs, or the pricing vendor may not provide a value for the security. To the extent that a pricing vendor does not provide a value for a particular security, or the pricing vendor provides a value that the Valuation Committee does not believe accurately reflects the value of the security, the security will be valued by the Valuation Committee based upon the information available to the Committee at the time of valuation and in accordance with
20
|
AssetMark Funds |
NOTES TO FINANCIAL STATEMENTS (Continued) |
March 31, 2011 |
| |
procedures adopted by the Board. These methodologies may require subjective judgments and determinations about the value of a particular security. When significant unobservable inputs are used to value a security, the security is categorized as Level 3.
The inputs or methodology used for valuing securities are not an indication of the risk associated with investing in those securities.
These funds did not hold any securities as of March 31, 2011.
AssetMark Small/Mid Cap Growth Fund
Level 3 Reconciliation Disclosure
Following is a reconciliation of Level 3 assets for which significant unobservable inputs were used to determine fair value.
| | | | | | | |
Description | | | Investments Purchased as
Securities Lending Collateral | |
| | | | | |
Balance as of March 31, 2010 | | | $ | 1,661,804 | | |
Accrued discounts/(amortization of premiums), net | | | | — | | |
Realized loss | | | | (1,286,129 | ) | |
Change in unrealized appreciation | | | | 1,310,422 | | |
Net sales | | | | (1,686,097 | ) | |
Transfers in and/or (out) of Level 3 | | | | — | | |
| | | | | | |
Balance as of Mach 31, 2011 | | | $ | — | | |
| | | | | | |
Change in unrealized appreciation during the period
for Level 3 investments held at March 31, 2011. | | | $ | — | | |
| | | | | | |
AssetMark Real Estate Securities Fund
Level 3 Reconciliation Disclosure
Following is a reconciliation of Level 3 assets for which significant unobservable inputs were used to determine fair value.
| | | | | | | |
Description | | | Investments Purchased as
Securities Lending Collateral | |
| | | | | |
Balance as of March 31, 2010 | | | $ | 914,484 | | |
Accrued discounts/(amortization of premiums), net | | | | — | | |
Realized loss | | | | (707,751 | ) | |
Change in unrealized appreciation | | | | 721,547 | | |
Net sales | | | | (928,280 | ) | |
Transfers in and/or (out) of Level 3 | | | | — | | |
| | | | | | |
Balance as of March 31, 2011 | | | $ | — | | |
| | | | | | |
Change in unrealized appreciation during the period
for Level 3 investments held at March 31, 2011. | | | $ | — | | |
| | | | | | |
21
|
AssetMark Funds |
NOTES TO FINANCIAL STATEMENTS (Continued) |
March 31, 2011 |
| |
Derivative Instruments and Hedging Activities
The Trust has adopted derivative instruments disclosure standards, in order to enable the investor to understand how and why an entity used derivatives, how derivatives are accounted for, and how derivative instruments affect an entity’s results of operations and financial position.
AssetMark Enhanced Fundamental Index® Large Company Growth Fund
The Fund uses exchange-traded stock index futures for the purposes of equitizing the ongoing cash holdings so as to fully maintain the Fund’s exposure to its benchmark. In general, the use of stock index futures for this purpose does not significantly increase the Fund’s risk and does not lead to leverage within the Fund. As of March 31, 2011, there were no open futures contracts.
| | | | | | | | | | | | | | | | |
The Effect of Derivative Instruments on the Statement of Operations for the Year Ended March 31, 2011 | |
| |
Amount of Realized Gain or (Loss) on Derivatives
Recognized in Income | | | Change in Unrealized Appreciation or (Depreciation)
on Derivatives Recognized in Income | |
| | | | | |
| | Futures | | Total | | | | | Futures | | Total | |
| | | | | | | | | | | | | |
Equity Contracts | | | $400,077 | | | $400,077 | | | Equity Contracts | | | $(110,732 | ) | | $(110,732 | ) |
| | | | | | | | | | | | | | | | | |
Total | | | $400,077 | | | $400,077 | | | Total | | | $(110,732 | ) | | $(110,732 | ) |
| | | | | | | | | | | | | | | | | |
AssetMark Enhanced Fundamental Index® Large Company Value Fund
The Fund uses exchange-traded stock index futures for the purposes of equitizing the ongoing cash holdings so as to fully maintain the Fund’s exposure to its benchmark. In general, the use of stock index futures for this purpose does not significantly increase the Fund’s risk and does not lead to leverage within the Fund. As of March 31, 2011, there were no open futures contracts.
| | | | | | | | | | | | | | | | |
The Effect of Derivative Instruments on the Statement of Operations for the Year Ended March 31, 2011 | |
| |
Amount of Realized Gain or (Loss) on Derivatives
Recognized in Income | | | Change in Unrealized Appreciation or (Depreciation)
on Derivatives Recognized in Income | |
| | | | | |
| | Futures | | Total | | | | | Futures | | Total | |
| | | | | | | | | | | | | | | | | |
Equity Contracts | | | $274,382 | | | $274,382 | | | Equity Contracts | | | $(90,163 | ) | | $(90,163 | ) |
| | | | | | | | | | | | | | | | | |
Total | | | $274,382 | | | $274,382 | | | Total | | | $(90,163 | ) | | $(90,163 | ) |
| | | | | | | | | | | | | | | | | |
22
|
AssetMark Funds |
NOTES TO FINANCIAL STATEMENTS (Continued) |
March 31, 2011 |
| |
AssetMark Enhanced Fundamental Index® Small Company Growth Fund
The Fund uses exchange-traded stock index futures for the purposes of equitizing the ongoing cash holdings so as to fully maintain the Fund’s exposure to its benchmark. In general, the use of stock index futures for this purpose does not significantly increase the Fund’s risk and does not lead to leverage within the Fund. As of March 31, 2011, there were no open futures contracts.
| | | | | | | | | | | | | | | | |
The Effect of Derivative Instruments on the Statement of Operations for the Year Ended March 31, 2011 | |
| | | | | | | | | | | | | | | | |
Amount of Realized Gain or (Loss) on Derivatives
Recognized in Income | | | Change in Unrealized Appreciation or (Depreciation)
on Derivatives Recognized in Income | |
| | | | | |
| | Futures | | Total | | | | | Futures | | Total | |
| | | | | | | | | | | | | | | | | |
Equity Contracts | | | $150,569 | | | $150,569 | | | Equity Contracts | | | $(3,607 | ) | | $(3,607 | ) |
| | | | | | | | | | | | | | | | | |
Total | | | $150,569 | | | $150,569 | | | Total | | | $(3,607 | ) | | $(3,607 | ) |
| | | | | | | | | | | | | | | | | |
AssetMark Enhanced Fundamental Index® Small Company Value Fund
The Fund uses exchange-traded stock index futures for the purposes of equitizing the ongoing cash holdings so as to fully maintain the Fund’s exposure to its benchmark. In general, the use of stock index futures for this purpose does not significantly increase the Fund’s risk and does not lead to leverage within the Fund. As of March 31, 2011, there were no open futures contracts.
| | | | | | | | | | | | | | | | |
The Effect of Derivative Instruments on the Statement of Operations for the Year Ended March 31, 2011 | |
| | | | | | | | | | | | | | | | |
Amount of Realized Gain or (Loss) on Derivatives
Recognized in Income | | | Change in Unrealized Appreciation or (Depreciation)
on Derivatives Recognized in Income | |
| | | | | |
| | Futures | | Total | | | | | Futures | | Total | |
| | | | | | | | | | | | | | | | | |
Equity Contracts | | | $39,367 | | | $39,367 | | | Equity Contracts | | | $(3,130 | ) | | $(3,130 | ) |
| | | | | | | | | | | | | | | | | |
Total | | | $39,367 | | | $39,367 | | | Total | | | $(3,130 | ) | | $(3,130 | ) |
| | | | | | | | | | | | | | | | | |
The average monthly notional amount of futures and forwards during the year ended March 31, 2011 were as follows:
| | | | | | | | | | | | | |
Long Positions | | AssetMark
Fundamental Index®
Large Company
Growth Fund | | AssetMark
Fundamental Index®
Large Company
Value Fund | | AssetMark
Fundamental Index®
Small Company
Growth Fund | | AssetMark
Fundamental Index®
Small Company
Value Fund | |
| | | | | | | | | | | | | | |
| | | | | | | | | | | | | |
Futures | | | $4,028,486 | | | $3,062,240 | | | $872,170 | | | $400,842 | |
Derivative Risks
The risks of using the various types of derivatives in which the Fund may engage include: the risk that movements in the value of the derivative may not fully offset or complement instruments currently held in the Fund in the manner intended by the Advisor; the risk that the counterparty to a derivative contract may fail to comply with its obligations to the Fund; the risk that there may not be a liquid secondary market for the derivative at a time when the Fund would look to disengage the position; the risk that additional capital from the Fund may be called upon to fulfill the conditions of the derivative contract; the risk that the use of derivatives in the Fund may induce leverage in the Fund, and the risk that the cost of the derivative contracts may reduce the overall returns experienced by the Fund.
23
|
AssetMark Funds |
NOTES TO FINANCIAL STATEMENTS (Continued) |
March 31, 2011 |
| |
| | |
| (b) | Subsequent Events Evaluation. |
| | In preparing these financial statements, the Trust has evaluated events and transactions for potential recognition or disclosure resulting from subsequent events. This evaluation did not result in any subsequent events that necessitated disclosures and/or adjustments. |
| | |
| (c) | Repurchase Agreements |
| | Each Fund may enter into repurchase agreements with banks and securities dealers. These transactions involve the purchase of securities with a simultaneous commitment to sell the securities to the bank or the dealer at an agreed-upon date and price. A repurchase agreement is accounted for as an investment by the Fund, collateralized by securities, which are delivered to the Fund’s Custodian or to an agent bank under a tri-party agreement. The securities are marked-to-market daily and additional securities are acquired as needed, to ensure that their value equals or exceeds the repurchase price plus accrued interest. There were no repurchase agreements entered into by the Funds at March 31, 2011. |
| | |
| (d) | Federal Income Taxes |
| | The Funds intend to continue to comply with the requirements of sub chapter M of the Internal Revenue Code necessary to qualify as regulated investment companies and to make the requisite distributions of income and capital gains to their shareholders sufficient to relieve the Funds from all or substantially all Federal income taxes. Therefore, no Federal income tax provision is required. |
| | |
| | The Trust has adopted financial reporting rules regarding recognition and measurement of tax positions taken or expected to be taken on a tax return. The Trust has reviewed all open tax years and major jurisdictions and concluded that no provision for income tax would be required in the Funds’ financial statements. The Funds’ Federal and state income and Federal excise tax returns for tax years for which the applicable statutes of limitations have not expired are subject to examination by the Internal Revenue Service and state departments of revenue. |
| | |
| (e) | Use of Estimates |
| | The preparation of financial statements in conformity with GAAP requires management to make estimates and assumptions that affect the reported amounts of assets and liabilities and disclosure of contingent assets and liabilities at the date of the financial statements and the reported amounts of revenues and expenses during the reported period. Actual results could differ from those estimates. |
| | |
| (f) | Indemnifications |
| | Under the Trust’s organizational documents, its officers and trustees are indemnified against certain liability arising out of their performance of their duties to the Trust. In addition, in the normal course of business, the Trust enters into contracts that contain a variety of representations and warranties which provide general indemnifications. The Trust’s maximum exposure under these arrangements are unknown as this would involve future claims that may be made against the Trust that have not yet occurred. However, the Trust expects the risk of loss to be remote. |
| | |
| (g) | Expenses |
| | Many expenses of the Trust can be directly attributed to a specific Fund. Expenses that cannot be directly attributed to a specific Fund are apportioned among all the Funds in the Trust based on relative net assets. |
| | |
| (h) | Security Transactions and Income Recognition
Security transactions are accounted for on trade date. Dividend income is recognized on the ex-dividend date, and the interest income recorded using the effective yield method is accrued daily. Realized gains and losses on investment transactions are determined using the high cost method. Return of capital distributions received from REIT securities are recorded as an adjustment to the cost of the security and thus may impact unrealized or realized gains or losses on the security. Gains and losses from paydowns on mortgage and asset backed securities are recorded as adjustments to interest income. |
24
|
AssetMark Funds |
NOTES TO FINANCIAL STATEMENTS (Continued) |
March 31, 2011 |
| |
| | |
| (i) | Distributions to shareholders |
| | The Funds will distribute any net investment income at least annually. The Funds will distribute any net realized long or short-term capital gains at least annually. Distributions to shareholders are recorded on the ex-dividend date. The Funds may also pay a special distribution at the end of the calendar year to comply with Federal tax requirements. |
| | |
| (j) | Derivatives |
| | Each Fund may invest in derivative securities including call and put options, futures, forward currency contracts and swaps. These instruments may be used by a Fund for hedging purposes as well as direct investment. |
| | |
| | Forward Currency Contracts |
| | The Funds may enter into forward currency contracts, obligating the Funds to deliver and receive currency at a specified future date. Transactions involving forward currency contracts may serve as long hedges (for example, if a Fund seeks to buy a security denominated in a foreign security, it may purchase a forward currency contract to lock in the U.S. dollar price of the security) or as short hedges (if a Fund anticipates selling a security denominated in a foreign currency, it may sell a forward currency contract to lock in the U.S. dollar equivalent of the anticipated sales proceeds). Forward contracts are valued daily and unrealized appreciation or depreciation is recorded daily as the difference between the contract exchange rate and the closing forward rate applied to the face amount of the contract. |
| | |
| | Options |
| | Exchange-traded options are valued at the last reported sale price on the exchange on which the security underlying the option is principally traded. If no sales are reported on a particular day for exchange traded options, or the options are not exchange traded, the options are valued at the mean between the most recent quoted bid and asked quotations at the close of the exchange. |
| | |
| | The premium that a Fund pays when purchasing a call option or receives when writing a call option will reflect, among other things, the market price of the security, the relationship of the exercise price to the market price of the security, the relationship of the exercise price to the volatility of the security, the length of the option period and supply and demand factors. The premium is the value of an option at the date of purchase. |
| | |
| | A purchaser (holder) of a put option pays a non-refundable premium to the seller (writer) of a put option to obtain the right to sell a specified amount of a security at a fixed price (the exercise price) during a specified period (exercise period). Conversely, the seller (writer) of a put option, upon payment by the holder of the premium, has the obligation to buy the security from the holder of the put option at the exercise price during the exercise period. |
| | |
| | Futures |
| | Each actively managed Fund has the ability to buy and sell stock index futures contracts traded on domestic stock exchanges to hedge the value of its portfolio against changes in market conditions. Each Fundamental Index® Fund will typically invest net cash inflows in stock index futures over the short term until the Fund can invest its assets in common stock in a cost effective manner in accordance with its principal investment strategies. A stock index futures contract is an agreement between two parties to take or make delivery of an amount of cash equal to a specified dollar amount, times the difference between stock index value at the close of the last trading day of the contract and the price at which the futures contract is originally struck. A stock index futures contract does not involve the physical delivery of the underlying stocks in the index. Although stock index futures contracts call for the actual taking of delivery of cash, in most cases a Fund expects to liquidate its stock index futures positions through offsetting transactions, which may result in a gain or loss, before cash settlement is required. |
25
|
AssetMark Funds |
NOTES TO FINANCIAL STATEMENTS (Continued) |
March 31, 2011 |
| |
| | |
| | Futures contracts are valued at the daily quoted settlement prices. |
| | |
| (k) | Securities Purchased or Sold on a Forward-Commitment Basis
The Funds may enter into when-issued or other purchase or sale transactions that specify forward delivery of a financial security. In connection with this ability, the Funds may enter into mortgage “dollar rolls” in which a Fund sells securities in the current month for delivery and simultaneously contracts with the same counterparty to repurchase similar (same type, coupon and maturity) but not identical securities on a specified future date. The party that is obligated to buy a security in the future will retain the use of their funds, and will benefit from any interest that is earned on those funds from the day that they enter into the forward contract until the day that they take delivery and pay for the security. |
| | |
| (l) | Foreign Currency Translation |
| | The accounting records of the Funds are maintained in U.S. dollars. Investment securities and all other assets and liabilities of the Funds denominated in a foreign currency are translated into U.S. dollars at current exchange rates. Purchases and sales of securities, income receipts, and expense payments are translated into U.S. dollars at the exchange rate in effect on the dates of the respected transactions. The Funds do not isolate the portion of the fluctuations on investments resulting from changes in foreign currency exchange rates from the fluctuations in market prices of investments held. Such fluctuations are included with the net realized and unrealized gain or loss from investments. |
| | |
| (m) | Restricted and Illiquid Securities |
| | Each Fund may invest up to 15% of its net assets in securities that are illiquid at the time of purchase, which includes securities with legal or contractual restrictions on their disposition, and securities for which there are no readily available market quotations. The Advisor, with the assistance of the sub-advisors and/or pricing services, will determine the value of such securities in good faith pursuant to procedures adopted by the Board of Trustees. Illiquid |
| | |
| | securities present the risks that a Fund may have difficulty valuing these holdings and/or may be unable to sell these holdings at the time or price desired. There are no restrictions on each Fund’s ability to invest in restricted securities (that is, securities that are not registered pursuant to the Securities Act of 1933), except to the extent such securities may be considered illiquid. Securities issued pursuant to Rule 144A of the Securities Act of 1933 will be considered liquid if determined to be so under procedures adopted by the Board of Trustees. |
| | |
| (n) | Short Sales |
| | Although not currently part of any of the Fund’s investment strategies, each Fund has the ability to make short sales. Short sales are transactions where a Fund sells securities it does not own in anticipation of a decline in the value of the securities. |
| | |
| (o) | Trustee Compensation |
| | For their services as Trustees of the Trust, the Independent Trustees receive a retainer fee of $45,000 per year and $4,500 per in person meeting attended, as well as reimbursement for expenses incurred in connection with attendance at such meetings. The Lead Independent Trustee receives an additional retainer fee of $10,000 per year. The Audit Committee Chair receives an additional retainer fee of $5,000 per year. Telephonic meeting fees are determined according to the length of the meeting as follows: $2,000 for one to two hours, $3,000 for two to three hours and $4,000 for three hours or longer. The “interested persons” who serve as Trustees of the Trust receive no compensation from the Trust for their services as Trustees. The Funds reimburse the Advisor an allocated amount for the compensation and related expenses of certain officers of the Trust who provide compliance services to the Funds. The aggregate amount of all such reimbursements is determined by the Trustees. No other compensation or retirement benefits are received by any Trustee or officer from the Funds. |
26
|
AssetMark Funds |
NOTES TO FINANCIAL STATEMENTS (Continued) |
March 31, 2011 |
| |
| |
3. | Investment Advisor |
| |
| The Trust has an Investment Advisory Agreement (the “Agreement”) with Genworth Financial Wealth Management, Inc. (the “Advisor”), with whom certain officers and trustees of the Trust are affiliated, to furnish investment advisory services to the Funds. Under the terms of the Agreement, the Trust, on behalf of the Funds, compensates the Advisor for its management services at the following contractual rates, based on each Fund’s average daily net assets: |
| | | | |
Small/Mid Cap Growth Fund | | | 0.95 | % |
Real Estate Securities Fund | | | 0.95 | % |
Enhanced Fundamental Index®
Large Company Growth Fund | | | 0.75 | % |
Enhanced Fundamental Index®
Large Company Value Fund | | | 0.75 | % |
Enhanced Fundamental Index®
Small Company Growth Fund | | | 0.75 | % |
Enhanced Fundamental Index®
Small Company Value Fund | | | 0.75 | % |
| |
| In addition, the Trust and the Advisor have also entered into a Fee Waiver Agreement designed to provide Fund shareholders with the economic benefits of economies of scale that may be realized as Fund assets increase. Under the Fee Waiver Agreement, the Advisor has contractually agreed to: (1) waive 0.025% of each Fund’s annual advisory fee on Trust assets in excess of $6 billion, and an additional 0.025% of each Fund’s annual advisory fee on Trust assets in excess of $12 billion, and (2) waive portions of its advisory fee monthly on aggregate average assets of the Funds in excess of $2.5 billion to pass on certain savings in the underlying sub-advisory fee arrangements. |
| |
| The Trust and Advisor have also entered into an Expense Waiver and Reimbursement Agreement under which the Advisor has agreed to waive, through July 31, 2011, its management fee and/or reimburse each Fund’s other expenses to the extent necessary to ensure that the Fund’s operating expenses do not exceed the following rates, based on each Fund’s average daily net assets: |
| | | | |
Small/Mid Cap Growth Fund | | | 1.59 | % |
Real Estate Securities Fund | | | 1.49 | % |
Enhanced Fundamental Index®
Large Company Growth Fund | | | 1.22 | % |
Enhanced Fundamental Index®
Large Company Value Fund | | | 1.22 | % |
Enhanced Fundamental Index®
Small Company Growth Fund | | | 1.22 | % |
Enhanced Fundamental Index®
Small Company Value Fund | | | 1.22 | % |
| |
| Any such waiver or reimbursement is subject to later adjustment to allow the Advisor to recoup amounts waived or reimbursed to the extend actual fees and expenses for a fiscal period are less than each Fund’s expense limitation cap, provided, however, that the Advisor shall only be entitled to recoup such amounts for a period of three years after the end of the fiscal year in which the fee or expense was waived or reimbursed. |
| |
| Sub-advisory services are provided to the Funds, pursuant to agreements between the Advisor and various sub-advisors. Under the terms of these sub-advisory agreements, the Advisor compensates each sub-advisor based on the portion of each Fund’s average daily net assets that is allocated to the sub-advisor. |
| |
4. | Distribution Plan |
| |
| The Trust, on behalf of the Funds, has adopted a distribution plan pursuant to Rule 12b-1 under the 1940 Act (the “12b-1 Plan”), which provides for each Fund to pay distribution fees at an annual rate of 0.25% of the average daily net assets of the Funds. Payments under the 12b-1 Plan shall be used to compensate persons (including affiliates of the Trust) who provide support services in connection with the distribution of the Fund’s shares and servicing of the Fund’s shareholders. For example, these amounts are paid to financial intermediaries that perform back office shareholder servicing and recordkeeping services that facilitate the operation of the Genworth Financial Wealth Management Program through which the Funds are primarily distributed. The Advisor (and its affiliates) similarly receive portions of such payments for their |
27
|
AssetMark Funds |
NOTES TO FINANCIAL STATEMENTS (Continued) |
March 31, 2011 |
| |
| |
| services provided that facilitate the operation of the program. These financial intermediaries and affiliates of the Trust also receive payments from the Trust outside of the 12b-1 Plan for shareholder services that are unrelated to distribution services. Capital Brokerage Corp., an affiliate of the Advisor, serves as principal underwriter and distributor for the Funds. Quasar Distributors, LLC serves as sub-distributor for the Funds. Quasar Distributors, LLC is an affiliated company of U.S. Bank, N.A. |
| |
5. | Service and Custody Agreements |
| |
| The Trust has entered into Service Agreements with U.S. Bancorp Fund Services, LLC (“USBFS”) and a Custody Agreement with U.S. Bank, N.A., an affiliate of USBFS. Under these agreements, USBFS and U.S. Bank, N.A. provide certain transfer agency, administrative, accounting and custody services. |
| |
6. | Securities Lending |
| |
| Effective July 1, 2003 the actively managed Funds entered into a collective securities lending arrangement with U.S. Bank, N.A. (the “Custodian”). Effective September 17, 2008, the Enhanced Fundamental Index® Funds entered into a collective securities lending arrangement with the custodian. Under the term of the agreement, the Custodian is authorized to loan securities on behalf of the Funds to approved brokers. In exchange, under normal market conditions, the Funds receive cash collateral in the amount of at least 102% of the value of securities loaned. The cash collateral is invested in short term instruments as noted in the Schedule of Investments. Although risk is mitigated by the collateral, the Funds could experience a delay in recovering their securities and possible loss of income or value if the borrower fails to return the borrowed securities. In addition, the Funds bear the risk of loss associated with the investment of cash collateral received. After predetermined rebates to brokers, a percentage of the net securities lending revenue is credited to the Funds to be used as an offset against custody costs and other charges incurred by the Funds. The Custodian is paid a fee for administering a securities lending program for the Funds, equal to the |
| |
| remaining percentage of the net securities lending revenues generated under the agreement. A portion of the fee to be paid to the Custodian in the fiscal year ended March 31, 2011 was waived. |
| |
| As of March 31, 2011, the values of securities loaned and collateral received were $0. |
| |
7. | Investment Transactions |
| |
| The aggregate purchases and sales of securities, excluding short-term investments, for the year ended March 31, 2011 are summarized below. |
| | | | | | | |
| | Purchases | | Sales | |
| | | | | |
Small/Mid Cap
Growth Fund | | $ | 63,115,699 | | $ | 114,456,199 | |
Real Estate Securities Fund | | | 18,835,311 | | | 77,750,198 | |
Enhanced Fundamental
Index® Large Company
Growth Fund | | | 52,682,254 | | | 127,608,190 | |
Enhanced Fundamental
Index® Large Company
Value Fund | | | 39,936,215 | | | 101,782,072 | |
Enhanced Fundamental
Index® Small Company
Growth Fund | | | 16,477,947 | | | 34,893,464 | |
Enhanced Fundamental
Index® Small Company
Value Fund | | | 6,625,411 | | | 15,333,574 | |
| |
8. | Other Tax Information |
| |
| Net Investment Income and realized gains and losses for federal income tax purposes may differ from that reported on the financial statements because of permanent book-to-tax differences. GAAP requires that permanent differences between financial reporting and tax reporting be reclassified between various components of net assets. |
28
|
AssetMark Funds |
NOTES TO FINANCIAL STATEMENTS (Continued) |
March 31, 2011 |
| |
| |
| These differences are primarily due to net operating losses, foreign currency and the use of equalization. On the Statement of Assets and Liabilities, the following adjustments were made: |
| | | | | | | | | | |
| | Accumulated
Net
Investment
Income
or (Loss) | | Accumulated
Realized
Gain or
(Loss) | | Capital
Stock | |
| | | | | | | |
Small/Mid
Cap Growth
Fund | | $ | 359,900 | | $ | 7,332,840 | | $ | (7,692,740 | ) |
Real Estate
Securities
Fund | | | 382,808 | | | (382,808 | ) | | — | |
Enhanced
Fundamental
Index®
Large
Company
Growth
Fund | | | (63 | ) | | 1,696,082 | | | (1,696,019 | ) |
Enhanced
Fundamental
Index®
Large
Company
Value
Fund | | | (45 | ) | | 5,477,265 | | | (5,477,220 | ) |
Enhanced
Fundamental
Index®
Small
Company
Growth
Fund | | | 37,585 | | | (34,422 | ) | | (3,163 | ) |
Enhanced
Fundamental
Index®
Small
Company
Value
Fund | | | (5,278 | ) | | 5,281 | | | (3 | ) |
| |
The tax components of distributions paid during the fiscal years ended March 31, 2011 and March 31, 2010 are as follows: |
| | | | | | | | | | |
| | Year Ended March 31, 2011 | |
| | | |
| | Ordinary
Income
Distributions | | Long-Term
Capital Gain
Distributions | | Return of
Capital | |
| | | | | | | |
Small/Mid Cap
Growth Fund | | | — | | | — | | | — | |
Real Estate
Securities Fund | | $ | 235,437 | | $ | 12,919,293 | | $ | 755,005 | |
Enhanced
Fundamental
Index® Large
Company
Growth Fund | | | 675,102 | | | — | | | — | |
Enhanced
Fundamental
Index® Large
Company
Value Fund | | | 810,366 | | | — | | | — | |
Enhanced
Fundamental
Index® Small
Company
Growth Fund | | | 1,609,856 | | | 4,089,184 | | | — | |
Enhanced
Fundamental
Index® Small
Company
Value Fund | | | 16.601 | | | 1,403,624 | | | — | |
29
|
AssetMark Funds |
NOTES TO FINANCIAL STATEMENTS (Continued) |
March 31, 2011 |
| |
The Fund designated as long-term capital gain dividend, pursuant to Internal Revenue Code Section 852(b)(3), the amount necessary to reduce the earnings and profits of the Fund related to net capital gain to zero for the tax year ended 3/31/11.
| | | | | | | | | | |
| | Year Ended March 31, 2010 | |
| | | |
| | Ordinary
Income
Distributions | | Long-Term
Capital Gain
Distributions | | Return of
Capital | |
| | | | | | | |
Small/Mid Cap
Growth Fund | | | — | | | — | | | — | |
Real Estate
Securities Fund | | $ | 744,733 | | | — | | | — | |
Enhanced
Fundamental
Index® Large
Company
Growth Fund | | | 630,394 | | | — | | | — | |
Enhanced
Fundamental
Index® Large
Company
Value Fund | | | 671,533 | | | — | | | — | |
Enhanced
Fundamental
Index® Small
Company
Growth Fund | | | — | | | — | | | — | |
Enhanced
Fundamental
Index® Small
Company
Value Fund | | | — | | | — | | | — | |
30
|
AssetMark Funds |
REPORT OF INDEPENDENT REGISTERED PUBLIC ACCOUNTING FIRM |
| |
The Shareholders and Board of Trustees of the AssetMark Funds:
We have audited the accompanying statements of assets and liabilities, including the schedule of investments, of the AssetMark Small/Mid Cap Growth Fund, the AssetMark Real Estate Securities Fund, the AssetMark Enhanced Fundamental Index Large Company Growth Fund, the AssetMark Enhanced Fundamental Index Large Company Value Fund, the AssetMark Enhanced Fundamental Index Small Company Growth Fund, and the AssetMark Enhanced Fundamental Index Small Company Value Fund (collectively referred to as the “Funds”), as of March 31, 2011, and the related statements of operations for the year then ended, the statements of changes in net assets for the two-year period then ended, and the financial highlights for each of the periods presented in the five-year period then ended. These financial statements and financial highlights are the responsibility of Fund management. Our responsibility is to express an opinion on these financial statements and financial highlights based on our audits.
We conducted our audits in accordance with the standards of the Public Company Accounting Oversight Board (United States). Those standards require that we plan and perform the audit to obtain reasonable assurance about whether the financial statements and financial highlights are free of material misstatement. An audit includes examining, on a test basis, evidence supporting the amounts and disclosures in the financial statements. Our procedures included confirmation of investments owned as of March 31, 2011, by correspondence with the custodian and brokers or by other appropriate auditing procedures. An audit also includes assessing the accounting principles used and significant estimates made by management, as well as evaluating the overall financial statement presentation. We believe that our audits provide a reasonable basis for our opinion.
In our opinion, the financial statements and financial highlights referred to above present fairly, in all material respects, the financial position of each the Funds as of March 31, 2011, and the results of their operations, the changes in their net assets and the financial highlights for the periods described in the first paragraph above, in conformity with U.S. generally accepted accounting principles.
As discussed in note 1 to the financial statements, the Funds’ Board of Trustees has decided to cease operations and liquidate the Funds no later than April 1, 2011. Our opinion has not been modified in respect to this matter.
[Signed] KPMG LLP
Milwaukee, WI
May 27, 2011
31
|
AssetMark Funds |
ADDITIONAL INFORMATION |
March 31, 2011 |
| |
| |
1. | Shareholder Notification of Federal Tax Status (Unaudited) |
| The Real Estate Securities Fund, Enhanced Fundamental Index® Large Company Growth Fund, Enhanced Fundamental Index® Large Company Value Fund, Enhanced Fundamental Index® Small Company Growth Fund and Enhanced Fundamental Index® Small Company Value Fund designates 1.7%, 100%, 100%, 16.8% and 100%, respectively, of dividends during the fiscal year ended March 31, 2011, as dividends qualifying for the dividends received deduction available to corporate shareholders. |
| |
| The Real Estate Securities Fund, Enhanced Fundamental Index® Large Company Growth Fund, Enhanced Fundamental Index® Large Company Value Fund, Enhanced Fundamental Index® Small Company Growth Fund and Enhanced Fundamental Index® Small Company Value Fund designates 8.3%, 100%, 100%, 18.2% and 100%, respectively, of dividends declared from net investment income during the fiscal year ended March 31, 2011, as qualified income under the Jobs and Growth Tax Relief Reconciliation Act of 2003. |
32
|
AssetMark Funds |
ADDITIONAL INFORMATION (Continued) |
March 31, 2011 |
| |
| |
2. | Disclosure Regarding Fund Trustees and Officers (Unaudited) |
| | | | | | | | | | |
Name, Age
and Address | | Position(s)
Held with
the Trust | | Term of Office
and Length of
Time Served | | Principal
Occupation During Past Five Years | | # of
Portfolios
in Fund
Complex
Overseen
by Trustee | | Other
Director/
Trustee
Positions |
| | | | | | | | | | | |
| | | | | | | | | | |
Independent Trustees | | | | | | | | | | |
| | | | | | | | | | |
R. Thomas DeBerry
c/o Genworth Financial
Wealth Management, Inc.
2300 Contra Costa
Boulevard Ste 600
Pleasant Hill, CA 94523
Year of Birth: 1941 | | Trustee | | Indefinite Term
since January
2001. | | Retired, President, DeBerry Consulting (a securities consulting firm) (1998-present). | | 13 | | None |
| | | | | | | | | | |
William J. Klipp
c/o Genworth Financial
Wealth Management, Inc.
2300 Contra Costa
Boulevard Ste 600
Pleasant Hill, CA 94523
Year of Birth: 1955 | | Trustee | | Indefinite Term
since January
2001, Lead
Independent
Trustee since
May 2007. | | Retired; President and Chief Operating Officer, Charles Schwab Investment Management, Inc. and Executive Vice President, Schwab Funds (1993-1999). | | 13 | | None |
| | | | | | | | | | |
Dennis G. Schmal
c/o Genworth Financial
Wealth Management, Inc.
2300 Contra Costa
Boulevard Ste 600
Pleasant Hill, CA 94523
Year of Birth: 1947 | | Trustee | | Indefinite Term
since July 2007. | | Self-employed consultant (2003-present). | | 13 | | Trustee, Grail Advisors ETF Trust (2009-present); Trustee, Wells Fargo Multi-Strategy 100 Fund (closed-end hedge fund) (2008-present); Director/ Chairman, Pacific Metrics Corp. (Educational Services) (2005-present); Director, Varian Semiconductor Equipment Associates, Inc. (2004-present); Director, Merriman Curhan Ford Group, Inc. (Financial Services) (2003-present). |
33
|
AssetMark Funds |
ADDITIONAL INFORMATION (Continued) |
March 31, 2011 |
| |
| | | | | | | | | | |
Name, Age
and Address | | Position(s)
Held with
the Trust | | Term of Office
and Length of
Time Served | | Principal
Occupation During Past Five Years | | # of
Portfolios
in Fund
Complex
Overseen
by Trustee | | Other
Director/
Trustee
Positions |
| | | | | | | | | | | |
| | | | | | | | | | |
Interested Trustees | | | | | | | | | | |
| | | | | | | | | | |
Ronald Cordes*
Genworth Financial
Wealth Management, Inc.
2300 Contra Costa
Boulevard Ste 600
Pleasant Hill, CA 94523
Year of Birth: 1959 | | Chairperson,
Trustee | | Indefinite Term
since January
2001. | | Principal, Genworth Financial Wealth Management (“GFWM”) (1994-present); President, AssetMark Funds (2001-2008). | | 13 | | ThinkImpact (non-profit organization) (2010-present); Transfair, USA (non-profit organization) (2010-present); Sarona Frontier General Partner, Inc. (investment fund) (2010-present); Microvest Fund I, Investment Committee (investment fund) (2009-present); University of the Pacific (2009-present); East Bay Community Foundation, (2007-present); Katalysis Bootstrap Fund (non-profit organization) (2005-present); Boys and Girls Clubs of Oakland (2002-present). |
| | | | | | | | | | |
Officers | | | | | | | | | | |
| | | | | | | | | | |
Carrie E. Hansen
Genworth Financial
Wealth Management, Inc.
2300 Contra Costa
Boulevard Ste 600
Pleasant Hill, CA 94523
Year of Birth: 1970 | | President | | Renewed
1-Year Term
since 2007 | | President, GPS Funds I (2007 to present), GPS Funds II (2011 to present) and Genworth Variable Insurance Trust (“GVIT”) (2008-present); Senior Vice President and Chief Operations Officer, GFWM (2008-present); Chairman, Genworth Financial Trust Company (2008-present); Senior Vice President and Managing Director, AssetMark Funds (2007-2008); Treasurer and Chief Compliance Officer, GFAM Funds (2007-2008); Chief Compliance Officer, AssetMark Funds (2005-2008); Treasurer, AssetMark Funds (2001-2008); Senior Vice President, Chief Financial Officer and Chief Compliance Officer, GFWM, formerly, AssetMark Investment Services, Inc. (2004-2007). | | N/A | | N/A |
| | | | | | | | | | |
Deborah Djeu
Genworth Financial
Wealth Management, Inc.
2300 Contra Costa
Boulevard Ste 600
Pleasant Hill, CA 94523
Year of Birth: 1962 | | Vice President,
Chief
Compliance
Officer and
AML
Compliance
Officer | | Renewed
1-Year Term
since
2008 | | Vice President, Chief Compliance Officer and AML Compliance Officer, GPS Funds I (2008 to present), GPS Funds II (2011 to present) and GVIT (2008-present); Deputy Chief Compliance Officer, Assetmark Funds (2007-2008); Compliance Manager, GE Money (2006- 2007); Vice President, Wells Fargo Investments LLC (2004-2006). | | N/A | | N/A |
34
|
AssetMark Funds |
ADDITIONAL INFORMATION (Continued) |
March 31, 2011 |
| |
| | | | | | | | | | |
Name, Age
and Address | | Position(s)
Held with
the Trust | | Term of Office
and Length of
Time Served | | Principal
Occupation During Past Five Years | | # of
Portfolios
in Fund
Complex
Overseen
by Trustee | | Other
Director/
Trustee
Positions |
| | | | | | | | | | | |
| | | | | | | | | | |
Starr E. Frohlich
Genworth Financial
Wealth Management, Inc.
2300 Contra Costa
Boulevard Ste 600
Pleasant Hill, CA 94523
Year of Birth: 1972 | | Vice
President,
Treasurer | | Since
2010 | | Vice President and Treasurer, GPS Funds I (2010 to present), GPS Funds II (2011 to present) and GVIT (2010-present); Director of Fund Administration, GFWM (2010-present); Vice President, U.S. Bancorp Fund Services,LLC (1997-2010). | | N/A | | N/A |
| | | | | | | | | | |
Christine Villas-Chernak
Genworth Financial
Wealth Management, Inc.
2300 Contra Costa
Boulevard Ste 600
Pleasant Hill, CA 94523
Year of Birth: 1968 | | Deputy
Chief
Compliance
Officer;
Secretary | | Renewed
1-Year Term
since
2006 | | Secretary, GPS Funds I (2009 to present) and GPS Funds II (2011 to present); Deputy Chief Compliance Officer, Secretary GVIT (2008-present); Senior Compliance Officer, GFWM (2005-2009); Fund Administration & e Complianc Manager, GFWM, formerly, AssetMark Investment Services, Inc. (2004-2005); Fund Administration & Compliance Specialist, GFWM, formerly, AssetMark Investment Services, Inc. (2002-2004). | | N/A | | N/A |
| | | | | | | | | | |
Robert J. Bannon
Genworth Financial
Asset Management
16501 Ventura Boulevard
Ste 201
Encino, CA 91436
Year of Birth: 1957 | | Chief
Risk
Officer | | Since
2010 | | Chief Risk Officer, GFAM Funds (2010- present); GVIT Funds (2010-present); Senior Vice President and Chief Risk Officer, GFWM (2007-present); Senior Vice President and Chief Investment Officer, Bank of the West (formerly Sanwa Bank California) (2000-2005). | | N/A | | N/A |
| |
* | Ronald Cordes is an “interested person” of the Funds as defined in the 1940 Act due to his relationship with the Advisor. |
The Statement of Additional Information includes additional information about the Funds’ Trustees and is available free of charge upon request by calling the Funds toll free at (888) 278-5809.
| |
3. | Proxy Voting Policies and Procedures and Proxy Voting Record (Unaudited) |
| A description of the policies and procedures that the Funds use to determine how to vote proxies related to the Funds’ portfolio securities as well as information regarding how the Funds voted proxies relating to portfolio securities during the most recent 12-month period ended June 30 is available without charge, upon request, by calling (888) 278-5809. Furthermore, you can obtain the Fund’s proxy voting records on the SEC’s website at http://www.sec.gov. |
| |
4. | Availability of Quarterly Portfolio Holdings Schedules (Unaudited) |
| The Funds file their complete schedules of portfolio holdings with the SEC for their first and third fiscal quarters on Form N-Q. Once filed, the Funds’ Form N-Q is available without charge, upon request on the SEC’s website (http://www.sec.gov) and is available by calling (888) 278-5809. You can also obtain copies of Form N-Q by (i) visiting the SEC’s Public Reference Room in Washington, D.C. (information on the operation of the Public Reference Room may be obtained by calling 1-800-SEC-0330); (ii) sending your request and a duplicating fee to the SEC’s Public Reference Room, Washington, D.C. 20549-0102; or (iii) sending your request electronically to publicinfo@sec.gov. |
35
[This Page Intentionally Left Blank]

| | |
| ASSETMARK FUNDS | |
| | |
| AssetMark Small/Mid Cap Growth Fund | |
| AssetMark Real Estate Securities Fund | |
| AssetMark Enhanced Fundamental Index® Large Company Growth Fund | |
| AssetMark Enhanced Fundamental Index® Large Company Value Fund | |
| AssetMark Enhanced Fundamental Index® Small Company Growth Fund | |
| AssetMark Enhanced Fundamental Index® Small Company Value Fund | |
| | |
| Investment Advisor | |
| Genworth Financial Wealth Management, Inc. | |
| 2300 Contra Costa Blvd., Suite 600 | |
| Pleasant Hill, CA 94523 | |
| | |
| Legal Counsel | |
| Stradley Ronon Stevens & Young, LLP | |
| 2600 One Commerce Square | |
| Philadelphia, PA 19103 | |
| | |
| Independent Registered Public Accounting Firm | |
| KPMG LLP | |
| 777 East Wisconsin Avenue | |
| Milwaukee, WI 53202 | |
| | |
| Transfer Agent, Fund Accountant
and Fund Administrator | |
| U.S. Bancorp Fund Services, LLC | |
| 615 East Michigan Street | |
| Milwaukee, WI 53202 | |
| | |
| Custodian | |
| U.S. Bank, N.A. | |
| 1555 North RiverCenter Drive, Suite 302 | |
| Milwaukee, WI 53212 | |
| | |
| Distributor | |
| Capital Brokerage Corporation | Annual Report
March 31, 2011 |
| (dba Genworth Financial Brokerage Corporation in Indiana) |
| 6620 West Broad Street Building 2 |
| Richmond, VA 23230 |
| Member FINRA |
Item 2. Code of Ethics.
As of the end of the period covered by this report, the registrant has adopted a code of ethics that applies to the registrant’s principal executive officer and principal financial officer. The registrant has not made any amendments to its code of ethics during the period covered by this report that apply to the registrant’s principal executive officer or principal financial officer. The registrant has not granted any waivers from any provisions of the code of ethics during the period covered by this report to the registrant’s principal executive officer or principal financial officer.
Item 3. Audit Committee Financial Expert.
The registrant’s board of trustees has determined that there is at least one audit committee financial expert serving on its audit committee. Dennis Schmal is the “audit committee financial expert” and is considered to be “independent” as each term is defined in Item 3 of Form N-CSR.
Item 4. Principal Accountant Fees and Services.
For the fiscal year ended March 31, 2011, the registrant’s principal accountant billed the registrant $229,045 for professional services rendered for the audit of the registrant’s annual financial statements or services that are normally provided by the principal accountant in connection with statutory and regulatory filings or engagements.
For the fiscal year ended March 31, 2010, the registrant’s principal accountant billed the registrant $285,029 for professional services rendered for the audit of the registrant’s annual financial statements or services that are normally provided by the principal accountant in connection with statutory and regulatory filings or engagements.
None.
For the fiscal year ended March 31, 2011, the registrant’s principal accountant billed the registrant $59,000 for professional services rendered for tax compliance, tax advice and tax planning.
For the fiscal year ended March 31, 2010, the registrant’s principal accountant billed the registrant $51,000 for professional services rendered for tax compliance, tax advice and tax planning.
1
None.
| |
(e)(1) | The registrant’s audit committee charter provides that the audit committee is responsible for the approval, prior to appointment, of the engagement of auditors annually to audit and to provide their opinion on the registrant’s financial statements. The audit committee charter also provides that the audit committee is responsible for the approval, prior to appointment, of the engagement of the auditor to provide other audit services to the registrant or to provide non-audit services to the registrant, its investment adviser or any entity controlling, controlled by, or under common control with the investment adviser that provides ongoing services to the registrant, if the engagement relates directly to the operations and financial reporting of the registrant. |
| |
(e)(2) | There were no services in paragraphs (b) through (d) above (including services required to be approved by the audit committee pursuant to paragraph (c)(7)(ii) of Rule 2-01 of Regulation S-X) that were approved pursuant to the waiver provision of paragraph (c)(7)(i)(C) of Rule 2-01 of Regulation S-X. |
| |
(f) | None of the hours expended on the principal accountant’s engagement to audit the registrant’s financial statements for the fiscal year ended March 31, 2011 were attributable to work performed by persons other than the principal accountant’s full-time, permanent employees. |
| |
(g) | The aggregate non-audit fees billed by the registrant’s principal accountant for services rendered to the registrant’s investment adviser and any entity controlling, controlled by, or under common control with the investment adviser that provides ongoing services to the registrant for the fiscal years ended March 31, 2011 and March 31, 2010, were $0 and $0, respectively. |
| |
(h) | The registrant’s audit committee has considered whether the provision of non-audit services that were rendered to the registrant’s investment adviser, and any entity controlling, controlled by, or under common control with the investment adviser that provides ongoing services to the registrant, that were not pre-approved pursuant to paragraph (c)(7)(ii) of Rule 2-01 of Regulation S-X is compatible with maintaining the principal accountant’s independence. |
Item 5. Audit Committee of Listed Registrants.
Not applicable to registrants who are not listed issuers (as defined in Rule 10A-3 under the Securities Exchange Act of 1934).
Item 6. Investments.
Schedule of Investments is included as part of the report to shareholders filed under Item 1 of this Form.
2
Item 7. Disclosure of Proxy Voting Policies and Procedures for Closed-End Management Investment Companies.
Not applicable to open-end investment companies.
Item 8. Portfolio Managers of Closed-End Management Investment Companies.
Not applicable to open-end investment companies.
Item 9. Purchases of Equity Securities by Closed-End Management Investment Company and Affiliated Purchasers.
Not applicable to open-end investment companies.
Item 10. Submission of Matters to a Vote of Security Holders.
None.
Item 11. Controls and Procedures.
| |
(a) | Based on their evaluation of the registrant’s disclosure controls and procedures as of a date within 90 days of the filing date of this Form N-CSR (the “Report”), the registrant’s President/Chief Executive Officer and Treasurer/Chief Financial Officer believe that the disclosure controls and procedures (as defined in Rule 30a-3(c) under the Investment Company Act of 1940, as amended (the “1940 Act”)) are effectively designed to ensure that information required to be disclosed by the registrant in the Report is recorded, processed, summarized and reported by the filing date, including ensuring that information required to be disclosed in the Report is accumulated and communicated to the registrant’s officers who are making certifications in the Report, as appropriate, to allow timely decisions regarding required disclosure. |
| |
(b) | There were no changes in the registrant’s internal control over financial reporting (as defined in Rule 30a-3(d) under the 1940 Act) that occurred during the registrant’s second fiscal quarter of the period covered by this report that have materially affected, or are reasonably likely to materially affect, the registrant’s internal control over financial reporting. |
Item 12. Exhibits.
| |
(a) | (1) Any code of ethics or amendment thereto, that is the subject of the disclosure required by Item 2, to the extent that the registrant intends to satisfy Item 2 requirements through filing an exhibit. Filed herewith. |
| |
| (2) A separate certification for each principal executive and principal financial officer pursuant to Rule 30a-2(a) of the 1940 Act. Filed herewith. |
| |
(b) | Certifications pursuant to Section 906 of the Sarbanes-Oxley Act of 2002. Furnished herewith. |
3
SIGNATURES
| | | | | | |
Pursuant to the requirements of the Securities Exchange Act of 1934 and the Investment Company Act of 1940, the registrant has duly caused this report to be signed on its behalf by the undersigned, thereunto duly authorized. |
|
| (Registrant) | GPS Funds I | | |
| | | | |
| | | | |
| By | /s/ Carrie E. Hansen | | |
| | | | |
| | Carrie E. Hansen, Principal Executive Officer/President | | |
| | | | |
| Date | 5/27/11 | | |
| | | | |
| | | | |
Pursuant to the requirements of the Securities Exchange Act of 1934 and the Investment Company Act of 1940, this report has been signed below by the following persons on behalf of the registrant and in the capacities and on the dates indicated. |
|
| By | /s/ Carrie E. Hansen | | |
| | | | |
| | Carrie E. Hansen, Principal Executive Officer/President | | |
| | | | |
| Date | 5/27/11 | | |
| | | | |
| | | | |
| By | /s/ Starr E. Frohlich | | |
| | | | |
| | Starr E. Frohlich, Principal Financial Officer/Treasurer | | |
| | | | |
| Date | 5/27/11 | | |
| | | | |
4