May 17, 2010
Dear Shareholder,
Enclosed is the Annual Report for the AssetMark Funds covering the one-year period from April 1, 2009 through March 31, 2010.
For the reporting period, the broad market, as measured by the S&P 500® Index1, gained 49.8%, reflecting one of the strongest cyclical bull markets in history. The period was characterized by a two-part recovery from the extreme market low reached on March 9, 2009.
The first six months of the reporting period were characterized by a sharp, but relatively narrowly led rally from significantly oversold conditions. This phase of the rally was generally led by lower-quality equities and was considered by many analysts to be rather speculative in nature. Investors were bolstered by the government’s efforts to recapitalize some of the larger and more well-known companies hard hit by the collapse of the housing market and the ensuing global financial crisis.
As the rally progressed into the second half of the reporting period, it changed in nature. As higher-quality equities were perceived as participating in the rally, market leadership was seen in a wider range of sectors. While lower-quality equities continued to outpace the broader market, fundamentals again became a focus in determining values.
Throughout the reporting period, the S&P 500® Index saw moderate volatility, but continued to trend upward as corporate earnings were stronger than many anticipated in the latter half of 2009. January and early February of 2010 saw another retreat, but this too was short lived, as the market began rallying again and continued gaining strength through the end of the reporting period.
Market Overview
The rising market strength seen during the reporting period was broad in scope. Small-cap stocks (as measured by the Russell 2000® Index2) rose 62.8%, while large-cap stocks (as measured by the Russell 1000® Index3) gained 51.6% for the one-year period ended March 31, 2010. While past performance is not indicative of future results, this is in line with historical trends, which show that small-cap stocks tend to outperform mid- and large-caps in the first year of a cyclical bull market.
The international developed equities market (as measured by the MSCI EAFE® Index4) grew 55.2% for the one-year period ended March 31, 2010. Weakness in the U.S. dollar relative to other currencies during most of the reporting period had a significant effect on international returns, adding 10% to returns. In local currency terms, the MSCI EAFE® Index returned 45.4%, trailing the broad U.S. markets. Emerging markets (as measured by the MSCI Emerging Markets Index5) showed particular strength, gaining 81.6% for the reporting period.
The real estate market (as measured by the FTSE NAREIT Equity REIT Index6) rode the upward momentum from the market low and achieved an outstanding return of 106.7% for the year ended March 31, 2010.
Within the fixed-income markets, the last 12 months saw a reversal of the prior 12-month period, with credit-related sectors experiencing strong returns and treasuries trailing. Investors’ risk appetite came back and they sought to benefit from the opportunities that were available due to wider than normal spreads and higher yields than those being offered in money markets. High yield (as measured by the Barclays Capital U.S. Corporate High Yield Index7) returned 56.2% for the one-year period ended March 31, 2010, as compared to intermediate-term treasuries (as measured by the Barclays Capital U.S. 7-10 Year Treasury Bond Index8), which returned -3.32% for the reporting period.
The Current Economy
We believe there are many indications that the recovery that began in the latter part of 2009 continues. The economy added jobs in March 2010, reversing the recent monthly job-loss trend. Additionally, business spending is experiencing an upswing and we feel the Federal Reserve appears committed to keeping interest rates low for the time being.
But, in our opinion, there are several economic factors that may weigh on the recovery. Even with the modest job growth in March, unemployment remains very high. Household spending continues to be constrained by flat income growth and tight credit, and this will likely affect retail sales, as consumers remain cautious. Meanwhile, sales of new single-family homes in the U.S. declined a seasonally adjusted 11.2% in January, which represents the lowest sales pace since these records began being maintained in 19639.
As the market absorbs new data on the strength of the broader economy, we can expect new opportunities to emerge. We will continue to manage the AssetMark Funds in order to capture value as an integral component of your diversified asset allocation portfolio.
We appreciate the trust you and your advisor have placed in us by including the AssetMark Funds as part of your portfolio. We look forward to the rest of 2010 as we face the opportunities and navigate the challenges that lie ahead.
Sincerely,

Carrie E. Hansen
President
AssetMark Funds
| |
|
1 | The S&P 500® Index, a registered trademark of the McGraw Hill Companies, is an unmanaged basket of 500 stocks that are considered to be widely held and thus believed to be a good indicator of overall market performance. You cannot invest directly into an index. |
| |
2 | The Russell 2000® Index is a subset of the Russell 3000® Index representing approximately 10% of the total market capitalization of that Index. It includes approximately 2000 of the smallest securities based on a combination of their market cap and current index membership. |
| |
3 | The Russell 1000® Index consists of the largest 1,000 companies in the Russell 3000® Index. This index represents the universe of large capitalization stocks from which most active money managers typically select. |
| |
4 | The MSCI Europe, Australia and Far East Index (MSCI EAFE®) is a free float-adjusted market capitalization Index that is designed to measure the equity market performance of developed markets, excluding the U.S. & Canada. |
| |
5 | The MSCI Emerging Markets Index is a free float-adjusted market capitalization Index that is designed to measure equity market performance of emerging markets. As of June 2009, the MSCI Emerging Markets Index consisted of the following 22 emerging market country indices: Brazil, Chile, China, Colombia, Czech Republic, Egypt, Hungary, India, Indonesia, Israel, Korea, Malaysia, Mexico, Morocco, Peru, Philippines, Poland, Russia, South Africa, Taiwan, Thailand, and Turkey. |
| |
6 | The FTSE NAREIT Equity REIT Index is a broad measure of the performance of publicly traded U.S. real estate securities, such as Real Estate Investment Trusts (REITs) and Real Estate Operating Companies. |
| |
7 | The Barclays Capital U.S. Corporate High-Yield Index covers the USD-denominated, non-investment grade, fixed-rate, taxable corporate bond market. Securities are classified as high-yield if the middle rating of Moody’s, Fitch, and S&P is Ba1/BB+/BB+ or below. The Index excludes emerging markets debt. The Index was created in 1986, with index history backfilled to January 1, 1983. |
| |
8 | The Barclays Capital U.S. 7-10 Year Treasury Bond Index is market capitalization weighted and includes all of the |
2
| |
| securities that meet the Index criteria. The Index includes all publicly issued, U.S. Treasury securities that have a remaining maturity of between 7 and 10 years, are non-convertible, are denominated in U.S. dollars, are rated Baa3 (or better) by Moody’s Investors Service or BBB- (or better) by S&P, are fixed rate, and have more than $250 million par outstanding. Excluded from the Index are certain special issues, such as flower bonds, targeted investor notes (TINs) and state and local government bonds (SLGs), and coupon issues that have been stripped from assets already included. |
| |
9 | Sara Murray, “New Home Sales Sag to ’63 Levels”, The Wall Street Journal, February 25, 2010. |
Past performance is not indicative of future results.
Investments in the Funds will fluctuate, and when redeemed may be worth more or less than originally invested.
Investors should consider the Funds’ Investment objectives, risks, charges and expenses carefully before investing. The prospectus contains this and other important information about the Funds. Please read the prospectus carefully before you invest or send money. The prospectus is available upon request, without charge, by calling 1-800-238-0810.
FINRA 106982 051710
3
|
AssetMark Large Cap Growth Fund |
MANAGER’S DISCUSSION OF FUND PERFORMANCE (Unaudited) |
| |
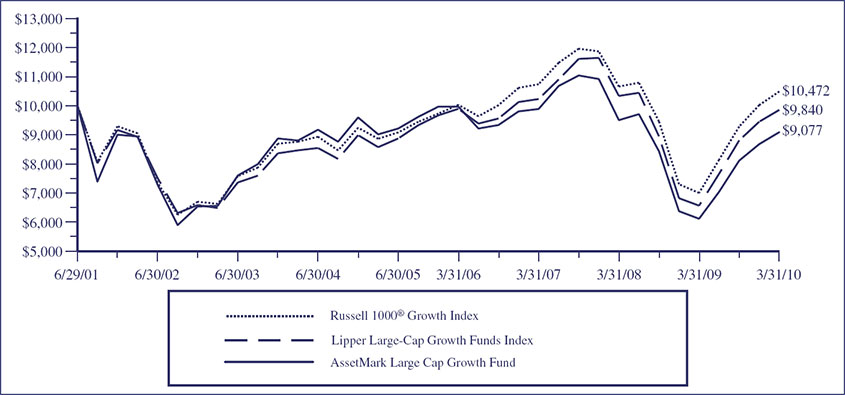
TOTAL RETURN BASED ON A $10,000 INVESTMENT
This chart assumes an initial gross investment of $10,000 made on June 29, 2001 (commencement of the Fund’s operations). Returns shown include the reinvestment of all dividends. Returns shown do not reflect the deduction of taxes that a shareholder would pay on Fund distributions or the redemption of Fund shares. In the absence of fee waivers and reimbursements, total return would be reduced. Past performance is not predictive of future performance. Investment return and principal value will fluctuate, so that your shares, when redeemed, may be worth more or less than the original cost. Index returns do not reflect the effects of fees or expenses (excluding Lipper). It is not possible to invest directly in an index.
RUSSELL 1000® GROWTH INDEX – An unmanaged index which measures the performance of those Russell 1000® companies with higher price-to-book ratios and higher forecasted growth values. The Russell 1000® Index is an unmanaged index which measures the performance of the 1,000 largest companies in the Russell 3000® Index. The Russell 3000® Index is an unmanaged index which measures the performance of the 3,000 largest U.S. Companies, based on total market capitalization, which represents approximately 98% of the investable U.S. equity market.
LIPPER LARGE-CAP GROWTH FUNDS INDEX – The Lipper Large-Cap Growth Funds Index is the average of the 30 largest funds in the Lipper Large-Cap Growth Funds Category. These funds, by portfolio practice, invest at least 75% of their equity assets in companies with market capitalizations (on a three-year weighted basis) greater than 300% of the dollar-weighted median market capitalization of the middle 1,000 securities of the Standard & Poor’s Super Composite 1500® Index. These funds typically invest in securities that have an above average price-to-earnings ratio, price-to-book ratio and three-year sales-per-share growth value, compared to the Standard & Poor’s 500 Composite Index.
| | | | | | | |
AVERAGE ANNUAL TOTAL RETURN (for the period ended March 31) |
| |
| | One Year | | Five Year | | Since Inception (6/29/01) | |
| | | | | | | |
AssetMark Large Cap Growth Fund | | 48.60% | | 0.17% | | -1.10% | |
Russell 1000® Growth Index | | 49.75% | | 3.42% | | 0.53% | |
Lipper Large-Cap Growth Funds Index | | 50.04% | | 2.82% | | -0.18% | |
4
|
AssetMark Large Cap Growth Fund |
MANAGER’S DISCUSSION OF FUND PERFORMANCE (Continued) (Unaudited) |
| |
For the 12 months ended March 31, 2010, the Fund returned 48.6%, trailing the Russell 1000® Growth Index at 49.8% and the Lipper Large-Cap Growth Funds Index at 50.0%.
| |
• | Security selection was the primary driver of the underperformance, with exposures to Qualcomm, Inc., Genzyme Corp. and Gilead Sciences being the largest detractors to performance over the full year. |
| |
• | The Fund benefited from its fundamental factor exposures, specifically, securities with lower price-to-book ratios significantly contributed to returns. Additionally the Fund’s holdings of slightly larger market cap securities with higher beta and greater momentum relative to the Russell 1000® Growth Index marginally added to performance. |
| |
• | A general underweight exposure to consumer staples was a large drag on returns and dampened the benefit from fundamental factors. |
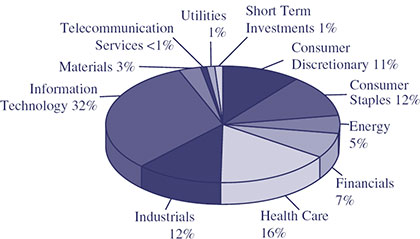
Components of Portfolio Holdings*
| | | |
| * | Pie chart represents percentages of total portfolio, less securities lending collateral. | |
Top Ten Holdings
| | | | |
Rank | Security/Holding | | % of Net
Assets |
1 | | Apple, Inc. | | 4.92 |
2 | | Microsoft Corp. | | 4.13 |
3 | | Cisco Systems, Inc. | | 2.88 |
4 | | Google, Inc. | | 2.71 |
5 | | Oracle Corp. | | 2.56 |
6 | | Qualcomm, Inc. | | 1.99 |
7 | | International Business Machines Corp. | | 1.95 |
8 | | Philip Morris International, Inc. | | 1.63 |
9 | | Amazon.com, Inc. | | 1.58 |
10 | | Amgen, Inc. | | 1.58 |
5
|
AssetMark Large Cap Value Fund |
MANAGER’S DISCUSSION OF FUND PERFORMANCE (Unaudited) |
| |
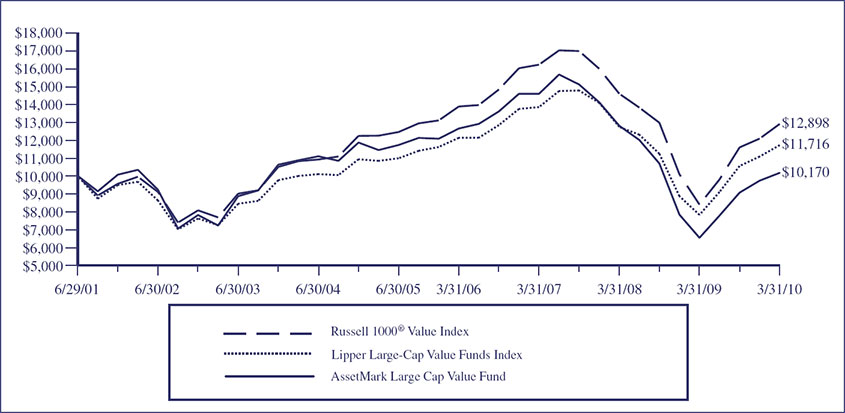
TOTAL RETURN BASED ON A $10,000 INVESTMENT
This chart assumes an initial gross investment of $10,000 made on June 29, 2001 (commencement of the Fund’s operations). Returns shown include the reinvestment of all dividends. Returns shown do not reflect the deduction of taxes that a shareholder would pay on Fund distributions or the redemption of Fund shares. In the absence of fee waivers and reimbursements, total return would be reduced. Past performance is not predictive of future performance. Investment return and principal value will fluctuate, so that your shares, when redeemed, may be worth more or less than the original cost. Index returns do not reflect the effects of fees or expenses (excluding Lipper). It is not possible to invest directly in an index.
RUSSELL 1000® VALUE INDEX – An unmanaged index which measures the performance of those Russell 1000® companies with lower price-to-book ratios and lower forecasted growth values. The Russell 1000® Index is an unmanaged index which measures the performance of the 1,000 largest companies in the Russell 3000® Index. The Russell 3000® Index is an unmanaged index which measures the performance of the 3,000 largest U.S. Companies, based on total market capitalization, which represents approximately 98% of the investable U.S. equity market.
LIPPER LARGE-CAP VALUE FUNDS INDEX – The Lipper Large-Cap Value Funds Index is the average of the 30 largest funds in the Lipper Large-Cap Value Funds Category. These funds, by portfolio practice, invest at least 75% of their equity assets in companies with market capitalizations (on a three-year weighted basis) greater than 300% of the dollar-weighted median market capitalization of the middle 1,000 securities of the S&P Super Composite 1500® Index. Large-cap value funds typically invest in securities that have a below-average price-to-earnings ratio, price-to-book ratio and three-year sales-per-share growth value, compared to the S&P 500® Index.
| | | | | | | |
AVERAGE ANNUAL TOTAL RETURN (for the period ended March 31) |
| |
| | One Year | | Five Year | | Since Inception (6/29/01) | |
| | | | | | | |
AssetMark Large Cap Value Fund | | 55.37% | | -2.33% | | 0.19% | |
Russell 1000® Value Index | | 53.56% | | 1.05% | | 2.95% | |
Lipper Large-Cap Value Funds Index | | 49.73% | | 1.57% | | 1.82% | |
6
|
AssetMark Large Cap Value Fund |
MANAGER’S DISCUSSION OF FUND PERFORMANCE (Continued) (Unaudited) |
| |
For the 12 months ended March 31, 2010, the Fund returned 55.4%, outperforming the Russell 1000® Value Index at 53.6% and the Lipper Large-Cap Value Funds Index at 49.7%.
| |
• | Over the period, security selection was the largest contributor to performance with positions in American Express Co., Prudential Financial Inc., and Occidental Petroleum Corp. being among the largest contributors. |
| |
• | Conversely, fundamental factor exposure detracted from the Fund’s performance, specifically exposure to securities with higher price-to-book ratios relative to the Russell 1000® Value Index. |
| |
• | While benefiting from overweight exposures to information technology, health care and consumer staples, the Fund was hurt from its underweight exposure to financials, industrials, and consumer discretionary. |
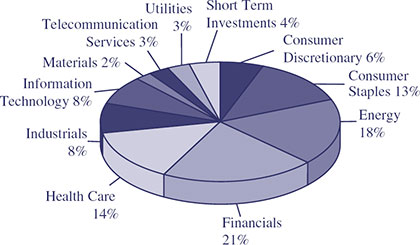
Components of Portfolio Holdings*
| | | |
| * | Pie chart represents percentages of total portfolio, less securities lending collateral. | |
Top Ten Holdings
| | | | |
Rank | Security/Holding | | % of Net
Assets |
1 | | Pfizer, Inc. | | 2.83 |
2 | | Apache Corp. | | 2.54 |
3 | | Occidental Petroleum Corp. | | 2.51 |
4 | | Merck & Co., Inc. | | 2.38 |
5 | | Johnson & Johnson | | 2.30 |
6 | | Microsoft Corp. | | 2.24 |
7 | | JPMorgan Chase & Co. | | 2.05 |
8 | | CVS Caremark Corporation | | 2.01 |
9 | | Chevron Corp. | | 2.00 |
10 | | Wells Fargo & Co. | | 1.98 |
7
|
AssetMark Small/Mid Cap Growth Fund |
MANAGER’S DISCUSSION OF FUND PERFORMANCE (Unaudited) |
| |
|
TOTAL RETURN BASED ON A $10,000 INVESTMENT |
|
This chart assumes an initial gross investment of $10,000 made on June 29, 2001 (commencement of the Fund’s operations). Returns shown include the reinvestment of all dividends. Returns shown do not reflect the deduction of taxes that a shareholder would pay on Fund distributions or the redemption of Fund shares. In the absence of fee waivers and reimbursements, total return would be reduced. Past performance is not predictive of future performance. Investment return and principal value will fluctuate, so that your shares, when redeemed, may be worth more or less than the original cost. Index returns do not reflect the effects of fees or expenses (excluding Lipper). It is not possible to invest directly in an index.
RUSSELL 2500 GROWTH INDEX – An unmanaged index which measures the performance of those Russell 2500 Index companies with higher price-to-book ratios and higher forecasted growth values. The Russell 2500 Index measures the performance of the 2,500 smallest companies in the Russell 3000® Index. The Russell 3000® Index is an unmanaged index which measures the performance of the 3,000 largest U.S. companies based on total market capitalization, which represents approximately 98% of the investable U.S. equity market.
RUSSELL MIDCAP® GROWTH INDEX – Measures the performance of those Russell Midcap companies with higher price-to-book ratios and higher forecasted growth values. The stocks are also members of the Russell 1000® Growth Index. The Russell 1000® Growth Index contains those securities in the Russell 1000® Index with a greater-than-average growth orientation.
LIPPER SMALL-CAP GROWTH FUNDS INDEX – The Lipper Small-Cap Growth Funds Index is the average of the 30 largest funds in the Lipper Small-Cap Growth Funds Category. These funds, by portfolio practice, invest 75% of their equity assets in companies with market capitalizations (on a three-year weighted basis) less than 250% of the dollar-weighted median market capitalization of the smallest 500 of the middle 1,000 securities of the S&P Super Composite 1500® Index. These funds typically invest in securities that have an above average price-to-earnings ratio, price-to-book ratio and three-year sales-per-share growth value, compared to the S&P SmallCap 600 IndexTM.
LIPPER MID-CAP GROWTH FUNDS INDEX – Funds that, by portfolio practice, invest at least 75% of their equity assets in companies with market capitalizations (on a three-year weighted basis) of less than 300% of the dollar-weighted median market capitalization of the S&P Mid-Cap 400 Index. Mid-Cap Growth funds normally invest in companies with long-term earnings expected to grow significantly faster than the earnings of the stocks represented in a major unmanaged stock index. These funds will normally invest in securities that have an above-average price-to-earnings ratio, price-to-book ratio and three-year earnings growth figure, compared to the U.S. diversified mid-cap funds universe average.
| | | | | | | |
AVERAGE ANNUAL TOTAL RETURN (for the period ended March 31) | |
| |
| | One Year | | Five Year | | Since Inception (6/29/01) | |
| | | | | | | |
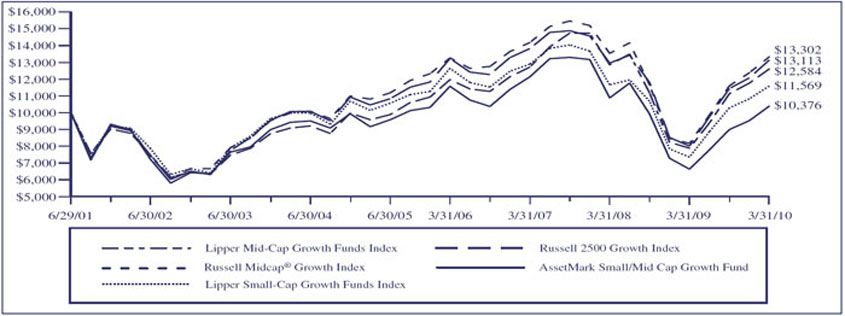
AssetMark Small/Mid Cap Growth Fund | | 56.53% | | 2.54% | | 0.42% | |
Russell 2500 Growth Index | | 63.92% | | 4.65% | | 3.14% | |
Russell Midcap® Growth Index | | 63.00% | | 4.27% | | 3.32% | |
Lipper Small-Cap Growth Funds Index | | 57.45% | | 2.71% | | 1.68% | |
Lipper Mid-Cap Growth Funds Index | | 59.86% | | 5.64% | | 2.66% | |
8
|
AssetMark Small/Mid Cap Growth Fund |
MANAGER’S DISCUSSION OF FUND PERFORMANCE (Continued) (Unaudited) |
| |
For the 12 months ended March 31, 2010, the Fund returned 56.5%, trailing the Russell 2500 Growth Index at 63.9%, the Lipper Mid-Cap Growth Funds Index at 59.9% and the Lipper Small-Cap Growth Funds Index at 57.5%.
| |
• | Security selection and sector allocation were the largest drivers of the relative underperformance. The Fund also suffered with its exposure to fundamental factors. |
| |
• | Underweight exposure to health care, financials, and consumer staples in addition to owning American Superconductor, Stec, Inc., Thq, Inc., and Huron Consulting Group detracted from returns. |
| |
• | Exposure to securities with longer-term momentum and larger market capitalizations relative to the Russell 2500 Growth Index were detrimental to the Fund’s returns. |
| |
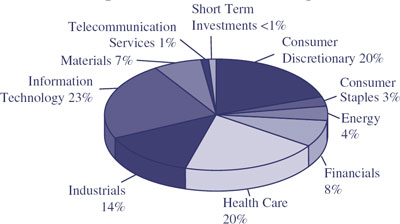
Components of Portfolio Holdings* |
|
|
*Pie chart represents percentages of total portfolio, less securities lending collateral. |
|
Top Ten Holdings |
| | | | | | |
Rank | | Security/Holding | | % of Net
Assets | |
1 | | | TransDigm Group, Inc. | | 2.20 | |
2 | | | Roper Industries, Inc. | | 1.97 | |
3 | | | Polycom, Inc. | | 1.97 | |
4 | | | MSCI, Inc. | | 1.81 | |
5 | | | Affiliated Managers Group | | 1.64 | |
6 | | | VCA Antech, Inc. | | 1.58 | |
7 | | | Dendreon Corp. | | 1.36 | |
8 | | | Alliance Data Systems Corp. | | 1.27 | |
9 | | | Flowserve Corp. | | 1.20 | |
10 | | | DeVry, Inc. | | 1.17 | |
9
|
AssetMark Small/Mid Cap Value Fund |
MANAGER’S DISCUSSION OF FUND PERFORMANCE (Unaudited) |
| |
|
TOTAL RETURN BASED ON A $10,000 INVESTMENT |
|
This chart assumes an initial gross investment of $10,000 made on June 29, 2001 (commencement of the Fund’s operations). Returns shown include the reinvestment of all dividends. Returns shown do not reflect the deduction of taxes that a shareholder would pay on Fund distributions or the redemption of Fund shares. In the absence of fee waivers and reimbursements, total return would be reduced. Past performance is not predictive of future performance. Investment return and principal value will fluctuate, so that your shares, when redeemed, may be worth more or less than the original cost. Index returns do not reflect the effects of fees or expenses (excluding Lipper). It is not possible to invest directly in an index.
RUSSELL 2500 VALUE INDEX – An unmanaged index which measures the performance of those Russell 2500 Index companies with lower price-to-book ratios and lower forecasted growth values. The Russell 2500 Index is an unmanaged index which measures the performance of the 2,500 smallest companies in the Russell 3000® Index. The Russell 3000® Index is an unmanaged index which measures the performance of the 3,000 largest U.S. companies based on total market capitalization, which represents approximately 98% of the investable U.S. equity market.
RUSSELL MIDCAP® VALUE INDEX – Measures the performance of those Russell Midcap companies with lower price-to-book ratios and lower forecasted growth values. The stocks are also members of the Russell 1000® Value Index. The Russell 1000® Value Index contains those securities in the Russell 1000® Index with a less-than-average growth orientation.
LIPPER SMALL-CAP VALUE FUNDS INDEX – The Lipper Small-Cap Value Funds Index is the average of the 30 largest funds in the Lipper Small-Cap Value Funds Category. These funds, by portfolio practice, invest 75% of their equity assets in companies with market capitalizations (on a three-year weighted basis) less than 250% of the dollar-weighted median market capitalization of the smallest 500 of the middle 1,000 securities of the S&P Super Composite 1500® Index. These funds typically have a below average price-to-earnings ratio, price-to-book ratio and three-year sales-per-share growth value, compared to the S&P SmallCap 600 IndexTM.
LIPPER MID-CAP VALUE FUNDS INDEX – Funds that, by portfolio practice, invest at least 75% of their equity assets in companies with market capitalizations (on a three-year weighted basis) of less than 300% of the dollar-weighted median market capitalization of the S&P Mid-Cap 400 Index. Mid-Cap Value funds seek long-term growth of capital by investing in companies that are considered to be undervalued relative to a major unmanaged stock index based on price-to-current earnings, book value, asset value, or other factors. These funds will normally have a below-average price-to-earnings ratio, price-to-book ratio and three-year earnings growth figure, compared to the U.S. diversified mid-cap funds universe average.
| | | | | | | |
AVERAGE ANNUAL TOTAL RETURN (for the period ended March 31) |
| |
| | One Year | | Five Year | | Since Inception (6/29/01) | |
| | | | | | | |
AssetMark Small/Mid Cap Value Fund | | 66.39% | | 0.32% | | 4.17% | |
Russell 2500 Value Index | | 67.17% | | 3.14% | | 7.26% | |
Russell Midcap® Value Index | | 72.41% | | 3.71% | | 7.27% | |
Lipper Small-Cap Value Funds Index | | 69.02% | | 3.65% | | 7.52% | |
Lipper Mid-Cap Value Funds Index | | 67.38% | | 3.58% | | 6.23% | |
10
|
AssetMark Small/Mid Cap Value Fund |
MANAGER’S DISCUSSION OF FUND PERFORMANCE (Continued) (Unaudited) |
| |
For the 12 months ended March 31, 2010, the Fund returned 66.4%, trailing the Russell 2500 Value Index at 67.2%, the Lipper Mid-Cap Value Funds Index at 67.4% and the Lipper Small-Cap Value Funds Index at 69.0%.
| |
• | While benefiting from strong stock selection, the Fund’s returns were dampened from its sector exposure and fundamental factor exposure. |
| |
• | Strong stock selection benefited performance as holdings of Oneok, Inc., Sothebys Holdings, Inc. and Solutia, Inc. rebounded from their lows. |
| |
• | Underweight exposure to consumer discretionary, health care and consumer staples, in addition to exposure to stocks with higher price-to-book ratios and larger market capitalizations relative to the Russell 2500 Value Index, detracted from returns. |
|
Components of Portfolio Holdings* |
|
|
*Pie chart represents percentages of total portfolio, less securities lending collateral. |
|
Top Ten Holdings |
| | | | | | |
Rank | | Security/Holding | | % of Net
Assets | |
1 | | | Plum Creek Timber Co., Inc. | | 1.79 | |
2 | | | White Mountains Insurance Group Ltd. | | 1.72 | |
3 | | | Denbury Resources, Inc. | | 1.71 | |
4 | | | Schnitzer Steel Industries, Inc. | | 1.64 | |
5 | | | Leucadia National Corp. | | 1.64 | |
6 | | | Foot Locker, Inc. | | 1.58 | |
7 | | | Avnet, Inc. | | 1.55 | |
8 | | | CenturyTel, Inc. | | 1.49 | |
9 | | | Hudson City Bancorp | | 1.49 | |
10 | | | Vail Resorts, Inc. | | 1.45 | |
11
|
AssetMark International Equity Fund |
MANAGER’S DISCUSSION OF FUND PERFORMANCE (Unaudited) |
| |
|
TOTAL RETURN BASED ON A $10,000 INVESTMENT |
|
This chart assumes an initial gross investment of $10,000 made on June 29, 2001 (commencement of the Fund’s operations). Returns shown include the reinvestment of all dividends. Returns shown do not reflect the deduction of taxes that a shareholder would pay on Fund distributions or the redemption of Fund shares. In the absence of fee waivers and reimbursements, total return would be reduced. Past performance is not predictive of future performance. Investment return and principal value will fluctuate, so that your shares, when redeemed, may be worth more or less than the original cost. Index returns do not reflect the effects of fees or expenses (excluding Lipper). It is not possible to invest directly in an index.
MSCI EAFE® INDEX – The MSCI Europe, Australia and Far East Index (MSCI EAFE®) is a free float-adjusted market capitalization index that is designed to measure the equity market performance of developed countries, excluding the US & Canada.
LIPPER INTERNATIONAL FUNDS INDEX – An unmanaged index which measures the composite performance of the 30 largest “international” mutual funds, as categorized by Lipper Inc. These funds invest assets in securities with primary trading markets outside of the United States.
| | | | | | |
AVERAGE ANNUAL TOTAL RETURN (for the period ended March 31) |
| | | | | | | |
| | One Year | | Five Year | | Since Inception (6/29/01) |
| | | | | | |
AssetMark International Equity Fund | | 41.68% | | 0.44% | | 2.48% |
MSCI EAFE® Index | | 55.20% | | 4.24% | | 5.54% |
Lipper International Funds Index | | 57.29% | | 5.28% | | 5.94% |
12
|
AssetMark International Equity Fund |
MANAGER’S DISCUSSION OF FUND PERFORMANCE (Continued) (Unaudited) |
| |
For the 12 months ended March 31, 2010, the Fund returned 41.7%, trailing the MSCI EAFE® Index at 55.2% and the Lipper International Funds Index at 57.3%.
| |
• | The largest driver of the lagging returns was exposure to fundamental factors. A bias towards securities with lower momentum, higher price-to-book ratios, larger market capitalization and lower volatility contributed to the significant underperformance. |
| |
• | Regional and country positioning dampened performance due to the Fund’s underweight exposure to Europe and Asia Pacific ex-Japan. Within Europe, underweight exposure to the UK and Sweden hurt returns as did an underweight exposure to Australia. |
| |
• | Overweight exposure to more defensive sectors such as telecom and health care hurt returns, as did the large underweight exposure to materials. Owning Japanese stocks, including Toyota Motors Corp. and Sumitomo Mitsui Financial, also dampened returns. |
|
Components of Portfolio Holdings* |
|
|
*Pie chart represents percentages of total portfolio, less securities lending collateral. |
|
Top Ten Holdings |
| | | | | |
| | | | | % of Net |
Rank | | Security/Holding | | Assets |
|
1 | | | BP Plc | | 3.37 |
2 | | | Novartis AG | | 2.14 |
3 | | | Unilever Plc | | 2.05 |
4 | | | Banco Santander Central Hispano, SA | | 1.99 |
5 | | | GlaxoSmithKline Plc | | 1.98 |
6 | | | Royal Dutch Shell Plc | | 1.98 |
7 | | | France Telecom SA | | 1.94 |
8 | | | Total SA | | 1.85 |
9 | | | Carrefour SA | | 1.82 |
10 | | | Canon, Inc. | | 1.79 |
13
|
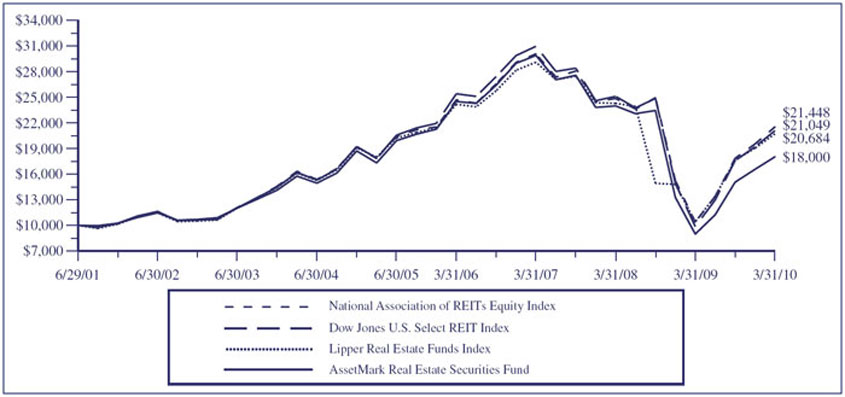
AssetMark Real Estate Securities Fund |
MANAGER’S DISCUSSION OF FUND PERFORMANCE (Unaudited) |
| |
|
TOTAL RETURN BASED ON A $10,000 INVESTMENT |
|
This chart assumes an initial gross investment of $10,000 made on June 29, 2001 (commencement of the Fund’s operations). Returns shown include the reinvestment of all dividends. Returns shown do not reflect the deduction of taxes that a shareholder would pay on Fund distributions or the redemption of Fund shares. In the absence of fee waivers and reimbursements, total return would be reduced. Past performance is not predictive of future performance. Investment return and principal value will fluctuate, so that your shares, when redeemed, may be worth more or less than the original cost. Index returns do not reflect the effects of fees or expenses (excluding Lipper). It is not possible to invest directly in an index.
DOW JONES U.S. SELECT REIT INDEX – The Dow Jones U.S. Select REIT Index (formerly known as the Dow Jones Wilshire REIT Index) measures U.S. publicly traded Real Estate Investment Trusts. The Index is comprised of companies whose charters are the equity ownership and operation of commercial real estate and that derive a minimum of 75% of revenue from stated operations. The Index is composed of 93 common stocks, selected for their market capitalization, source of revenue, and liquidity.
FTSE NATIONAL ASSOCIATION OF REITs EQUITY INDEX – The FTSE National Association of REITs Equity Index is an unmanaged index that measures the performance of all publicly traded real estate investment trusts traded on U.S. exchanges. The Fund is discontinuing the use of the Dow Jones U.S. Select REIT Index as the primary index and replacing it with the FTSE National Association of REITs Equity Index in future reports. The Fund believes that use of the FTSE National Association of REITs Equity Index provides a better comparative benchmark than the Dow Jones U.S. Select REIT Index since it is more representative of the universe of securities available for selection and is a broader index representative of the holdings of the Fund.
LIPPER REAL ESTATE FUNDS INDEX – An unmanaged index which measures the composite performance of the 30 largest “real estate” mutual funds, as categorized by Lipper Inc. The index is adjusted for the reinvestment of capital gains and income dividends.
| | | | | | |
AVERAGE ANNUAL TOTAL RETURN (for the period ended March 31) |
| | | | | | | |
| | One Year | | Five Year | | Since Inception (6/29/01) |
| | | | | | |
AssetMark Real Estate Securities Fund | | 100.30% | | 0.80% | | 6.94% |
Dow Jones U.S. Select REIT Index | | 113.71% | | 3.40% | | 8.89% |
FTSE National Association of REITs Equity Index | | 106.68% | | 3.80% | | 9.11% |
Lipper Real Estate Funds Index | | 98.68% | | 2.86% | | 8.66% |
14
|
AssetMark Real Estate Securities Fund |
MANAGER’S DISCUSSION OF FUND PERFORMANCE (Continued) (Unaudited) |
| |
For the 12 months ended March 31, 2010, the Fund returned 100.3%, trailing the FTSE NAREIT Equity REIT Index at 106.7% but outperforming the Lipper Real Estate Funds Index at 98.7%.
| |
• | Owning mall operators Simon Property Group, Inc. and Macerich Co., in addition to hotel company Host Hotels & Resorts, Inc., contributed to performance over the period. |
| |
• | Exposure to stocks with higher price-to-book ratios relative to the FTSE NAREIT Equity REIT Index detracted from performance as did exposure to larger market capitalizations. |
| |
• | On Feb. 17, 2010, Duff & Phelps became the sole sub-advisor on the Fund as Adelante was removed due to the small asset base and preference for broader REIT exposure. |
|
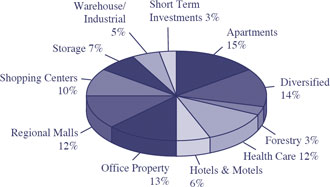
Components of Portfolio Holdings* |
|
|
*Pie chart represents percentages of total portfolio, less securities lending collateral. |
|
Top Ten Holdings |
| | | | | |
| | | | | % of Net |
Rank | | Security/Holding | | Assets |
|
1 | | | Simon Property Group, Inc. | | 9.93 |
2 | | | Equity Residential | | 5.95 |
3 | | | Public Storage, Inc. | | 5.39 |
4 | | | Vornado Realty Trust | | 5.28 |
5 | | | Host Hotels & Resorts, Inc. | | 4.74 |
6 | | | Boston Properties, Inc. | | 4.56 |
7 | | | HCP, Inc. | | 4.22 |
8 | | | Digital Realty Trust, Inc. | | 4.00 |
9 | | | Ventas, Inc. | | 3.53 |
10 | | | Kimco Realty Corp. | | 3.33 |
15
|
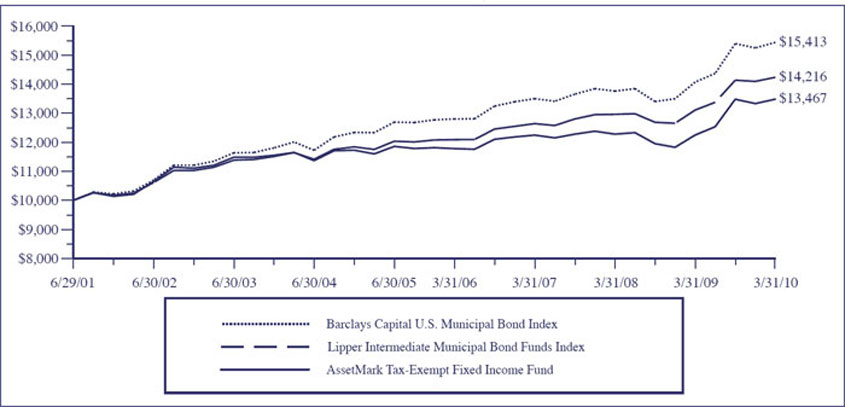
AssetMark Tax-Exempt Fixed Income Fund |
MANAGER’S DISCUSSION OF FUND PERFORMANCE (Unaudited) |
| |
TOTAL RETURN BASED ON A $10,000 INVESTMENT
This chart assumes an initial gross investment of $10,000 made on June 29, 2001 (commencement of the Fund’s operations). Returns shown include the reinvestment of all dividends. Returns shown do not reflect the deduction of taxes that a shareholder would pay on Fund distributions or the redemption of Fund shares. In the absence of fee waivers and reimbursements, total return would be reduced. Past performance is not predictive of future performance. Investment return and principal value will fluctuate, so that your shares, when redeemed, may be worth more or less than the original cost. Index returns do not reflect the effects of fees or expenses (excluding Lipper). It is not possible to invest directly in an index.
BARCLAYS CAPITAL U.S. MUNICIPAL BOND INDEX – The Barclays Capital U.S. Municipal Bond Index is a market-value-weighted index for the long-term tax-exempt bond market. To be included in the index, bonds must have a minimum credit rating of Baa. They must have an outstanding par value of at least $7 million and be issued as part of a transaction of at least $75 million. The bonds must be fixed rate, have a date after December 31, 1990, and must be at least one year from their maturity date.
LIPPER INTERMEDIATE MUNICIPAL BOND FUNDS INDEX – The Lipper Intermediate Municipal Bond Funds Index is an index of portfolios that invest in municipal debt issues with dollar-weighted average maturities of five to ten years.
| | | | | | | | | | |
AVERAGE ANNUAL TOTAL RETURN (for the period ended March 31) |
| | | | | | | | | | | |
| | One Year | | Five Year | | Since Inception (6/29/01) | |
| | | | | | | |
AssetMark Tax-Exempt Fixed Income Fund | | 10.06 | % | | 3.05 | % | | 3.46 | % | |
Barclays Capital U.S. Municipal Bond Index | | 9.69 | % | | 4.58 | % | | 5.07 | % | |
Lipper Intermediate Municipal Bond Funds Index | | 8.58 | % | | 3.90 | % | | 4.10 | % | |
16
|
AssetMark Tax-Exempt Fixed Income Fund |
MANAGER’S DISCUSSION OF FUND PERFORMANCE (Continued) (Unaudited) |
| |
For the 12 months ended March 31, 2010, the Fund returned 10.1%, outperforming the Barclays Capital U.S. Municipal Bond Index at 9.7% and the Lipper Intermediate Municipal Bond Funds Index at 8.6%.
| | |
| • | Security selection was a large driver of returns for the Fund. The Fund benefited from its exposure to lower quality credit as investors sought higher yielding bonds. |
| | |
| • | Exposure to longer dated maturities generally benefited performance as the municipal yield curve steepened over the period. |
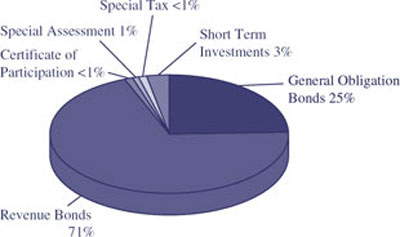
Components of Portfolio Holdings*
| | | | | | |
* Pie chart represents percentages of total portfolio. |
|
Top Ten Holdings |
| | | | | | |
Rank | | Security/Holding | | % of Net
Assets | |
1 | | | Golden West Schools Funding Authority, | | | |
| | | Refunding, GO, AMBAC Insured, 5.500%, 08/01/2019 | | 1.72 | |
2 | | | St. Clair County High School District No. 203, | | | |
| | | Series A, GO, AMBAC Insured, 5.750%, 12/01/2026 | | 1.70 | |
3 | | | Eastern Municipal Power Agency, Series B, | | | |
| | | Refunding Revenue Bond, FGIC Insured, 6.000%, 01/01/2022 | | 1.49 | |
4 | | | Illinois State Toll Highway Authority, Series A, | | | |
| | | Revenue Bond, FSA Insured, 5.000%, 01/01/2026 | | 1.48 | |
5 | | | Chicago, GO, 5.000%, 12/01/2024 | | 1.37 | |
6 | | | North East Independent School District, | | | |
| | | GO, 5.250%, 02/01/2027 | | 1.20 | |
7 | | | San Antonio Electric & Gas, Refunding, | | | |
| | | Revenue Bond, 5.375%, 02/01/2015 | | 1.18 | |
8 | | | Maryland, Refunding, GO, 5.000%, 03/01/2021 | | 1.18 | |
9 | | | Indiana State Finance Authority, Series A, Refunding, | | | |
| | | Revenue Bond, 5.000%, 02/01/2021 | | 1.16 | |
10 | | | Connecticut Health & Educational Facilities Authority, | | | |
| | | Series A, Refunding, Revenue Bond, 5.000%, 07/01/2025 | | 1.13 | |
17
|
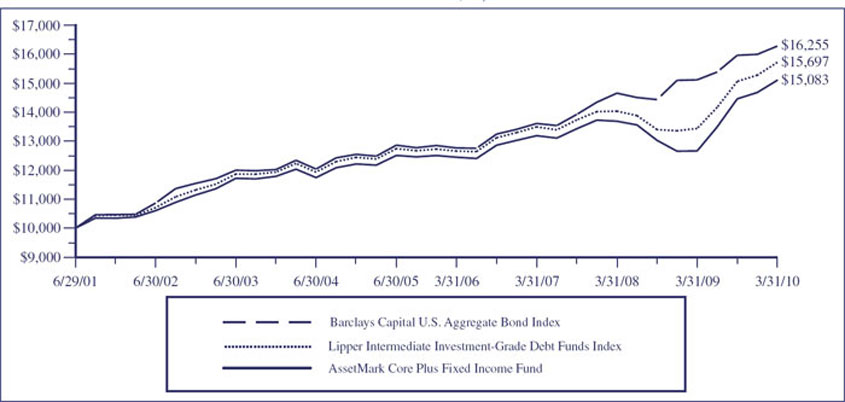
AssetMark Core Plus Fixed Income Fund |
MANAGER’S DISCUSSION OF FUND PERFORMANCE (Unaudited) |
| |
TOTAL RETURN BASED ON A $10,000 INVESTMENT
This chart assumes an initial gross investment of $10,000 made on June 29, 2001 (commencement of the Fund’s operations). Returns shown include the reinvestment of all dividends. Returns shown do not reflect the deduction of taxes that a shareholder would pay on Fund distributions or the redemption of Fund shares. In the absence of fee waivers and reimbursements, total return would be reduced. Past performance is not predictive of future performance. Investment return and principal value will fluctuate, so that your shares, when redeemed, may be worth more or less than the original cost. Index returns do not reflect the effects of fees or expenses (excluding Lipper). It is not possible to invest directly in an index.
BARCLAYS CAPITAL U.S. AGGREGATE BOND INDEX – An unmanaged index which measures the performance of securities from the Barclays Capital Government/Corporate Bond Index, Mortgage-Backed Securities Index and the Asset-Backed Securities Index. The Barclays Capital U.S. Aggregate Bond Index is a broad representation of the investment-grade fixed-income market in the U.S. and includes U.S. Government and corporate debt securities, mortgage- and asset-backed securities and international U.S. dollar-denominated bonds. All securities contained in the Barclays Capital U.S. Aggregate Bond Index have a minimum term to maturity of one year.
LIPPER INTERMEDIATE INVESTMENT-GRADE DEBT FUNDS INDEX – The Lipper Intermediate Investment-Grade Debt Funds Index is an index of portfolios that invest at least 65% of their assets in investment-grade debt issues (rated in the top four grades) with dollar-weighted average maturities of five to ten years.
| | | | | | | | | | |
AVERAGE ANNUAL TOTAL RETURN (for the period ended March 31) |
| | | | | | | | | | | |
| | One Year | | Five Year | | Since Inception (6/29/01) | |
| | | | | | | |
AssetMark Core Plus Fixed Income Fund | | 19.21 | % | | 4.37 | % | | 4.79 | % | |
Barclays Capital U.S. Aggregate Bond Index | | 7.69 | % | | 5.44 | % | | 5.71 | % | |
Lipper Intermediate Investment-Grade Debt Funds Index | | 16.91 | % | | 4.87 | % | | 5.29 | % | |
18
|
AssetMark Core Plus Fixed Income Fund |
MANAGER’S DISCUSSION OF FUND PERFORMANCE (Continued) (Unaudited) |
| |
For the 12 months ended March 31, 2010, the Fund returned 19.2%, outperforming the Barclays Capital U.S. Aggregate Bond Index at 7.7% and the Lipper Intermediate Investment-Grade Debt Funds Index at 16.9%.
| | |
| • | Overweight exposure to spread sectors and significantly underweight exposure to treasuries were the primary drivers of the outperformance over the period. |
| | |
| • | As risk appetite returned to the market and investors sought yield, overweight exposure to high yield and non-agency MBS benefited performance. |
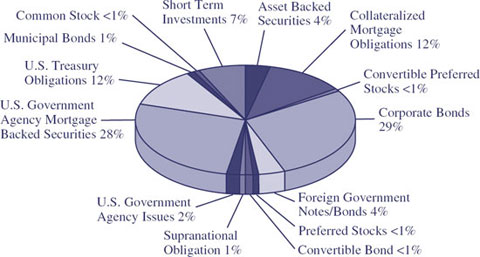
Components of Portfolio Holdings*
| | | | | | |
*Pie chart represents percentages of total portfolio, less securities lending collateral. |
| | | | | | |
Top Ten Holdings |
| | | | | | |
Rank | | Security/Holding | | % of Net
Assets | |
1 | | | U.S. Treasury Note, 2.500%, 03/31/2015 | | 1.47 | |
2 | | | New Valley Generation Series 2001-1, 5.572%, 05/01/2020 | | 1.41 | |
3 | | | Federal National Mortgage Association Pool# TBA, | | | |
| | | 6.000%, 05/15/2037 | | 1.36 | |
4 | | | U.S. Treasury Note, 2.750%, 11/30/2016 | | 1.22 | |
5 | | | Federal National Mortgage Association Pool# 735224, | | | |
| | | 5.500%, 02/01/2035 | | 1.14 | |
6 | | | U.S. Treasury Note, 3.625%, 02/15/2020 | | 1.11 | |
7 | | | U.S. Treasury Note, 0.875%, 04/15/2010 | | 1.11 | |
8 | | | U.S. Treasury Bond, 4.500%, 08/15/2039 | | 1.00 | |
9 | | | Federal National Mortgage Association Pool# TBA, | | | |
| | | 6.500%, 05/01/2029 | | 0.99 | |
10 | | | Federal National Mortgage Association Pool# TBA, | | | |
| | | 5.500%, 04/01/2039 | | 0.98 | |
19
|
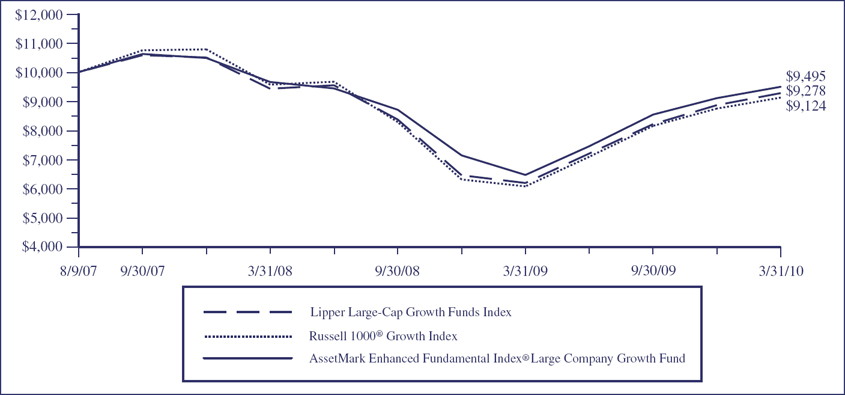
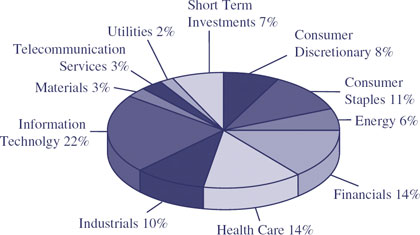
AssetMark Enhanced Fundamental Index® Large Company Growth Fund |
MANAGER’S DISCUSSION OF FUND PERFORMANCE (Unaudited) |
| |
TOTAL RETURN BASED ON A $10,000 INVESTMENT
This chart assumes an initial gross investment of $10,000 made on August 9, 2007 (commencement of the Fund’s operations). Returns shown include the reinvestment of all dividends. Returns shown do not reflect the deduction of taxes that a shareholder would pay on Fund distributions or the redemption of Fund shares. In the absence of fee waivers and reimbursements, total return would be reduced. Past performance is not predictive of future performance. Investment return and principal value will fluctuate, so that your shares, when redeemed, may be worth more or less than the original cost. Index returns do not reflect the effects of fees or expenses (excluding Lipper). It is not possible to invest directly in an index.
RUSSELL 1000® GROWTH INDEX – An unmanaged index which measures the performance of those Russell 1000® companies with higher price-to-book ratios and higher forecasted growth values. The Russell 1000® Index is an unmanaged index which measures the performance of the 1,000 largest companies in the Russell 3000® Index. The Russell 3000® Index is an unmanaged index which measures the performance of the 3,000 largest U.S. Companies, based on total market capitalization, which represents approximately 98% of the investable U.S. equity market.
LIPPER LARGE-CAP GROWTH FUNDS INDEX – The Lipper Large-Cap Growth Funds Index is the average of the 30 largest funds in the Lipper Large-Cap Growth Funds Category. These funds, by portfolio practice, invest at least 75% of their equity assets in companies with market capitalizations (on a three-year weighted basis) greater than 300% of the dollar-weighted median market capitalization of the middle 1,000 securities of the Standard & Poor’s Super Composite 1500® Index. These funds typically invest in securities that have an above average price-to-earnings ratio, price-to-book ratio and three-year sales-per-share growth value, compared to the S&P 500® Index.
|
AVERAGE ANNUAL TOTAL RETURN (for the period ended March 31) |
| |
| | | | | | |
| | One Year | | Since Inception
(8/9/07) |
| | | | |
AssetMark Enhanced Fundamental Index® Large Company Growth Fund | | 46.70 | % | | -1.94 | % |
Russell 1000® Growth Index | | 49.75 | % | | -2.79 | % |
Lipper Large-Cap Growth Funds Index | | 50.04 | % | | -3.41 | % |
20
|
AssetMark Enhanced Fundamental Index® Large Company Growth Fund |
MANAGER’S DISCUSSION OF FUND PERFORMANCE (Continued) (Unaudited) |
| |
For the 12 months ended March 31, 2010, the Fund returned 46.7%, underperforming the Russell 1000® Growth Index at 49.8% and the Lipper Large-Cap Growth Funds Index at 50.0%.
| |
• | Sector exposures were the largest drag on returns, specifically, underweight exposure to technology, the best performing sector within the Russell 1000® Growth Index, was the primary driver of the relative underperformance. |
| |
• | Security positioning was also detrimental to returns, with the biggest detractors being energy holdings, Exxon Mobil Corp. and Chevron Corp. |
| |
• | Fundamental factor exposure contributed positively to returns and the Fund benefited from exposure to securities with lower price-to-book ratio and lower long-term momentum relative to the Russell 1000® Growth Index. |
Components of Portfolio Holdings*
* Pie chart represents percentages of total portfolio, less securities lending collateral.
Top Ten Holdings
| | | | |
Rank | Security/Holding | | % of Net
Assets |
1 | | Microsoft Corp. | | 3.44 |
2 | | AT&T, Inc. | | 2.76 |
3 | | Johnson & Johnson | | 2.35 |
4 | | Procter & Gamble Co. | | 2.03 |
5 | | Google, Inc. | | 2.00 |
6 | | International Business Machines Corp. | | 1.95 |
7 | | Apple, Inc. | | 1.87 |
8 | | Pfizer, Inc. | | 1.78 |
9 | | Cisco Systems, Inc. | | 1.59 |
10 | | Intel Corp. | | 1.56 |
21
|
AssetMark Enhanced Fundamental Index® Large Company Value Fund |
MANAGER’S DISCUSSION OF FUND PERFORMANCE (Unaudited) |
| |
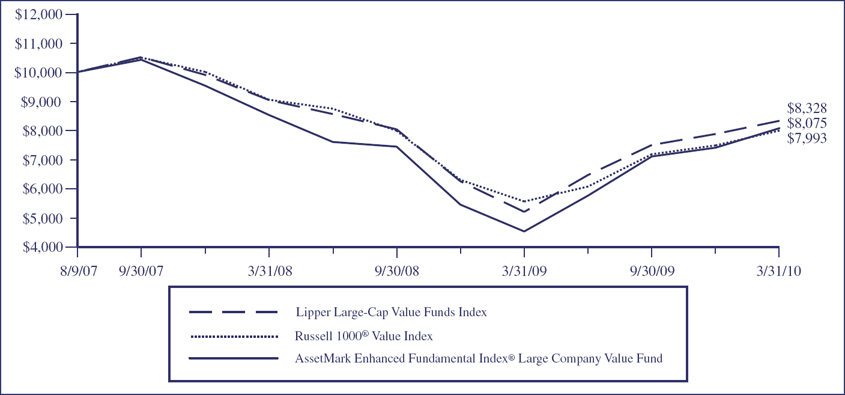
TOTAL RETURN BASED ON A $10,000 INVESTMENT
This chart assumes an initial gross investment of $10,000 made on August 9, 2007 (commencement of the Fund’s operations). Returns shown include the reinvestment of all dividends. Returns shown do not reflect the deduction of taxes that a shareholder would pay on Fund distributions or the redemption of Fund shares. In the absence of fee waivers and reimbursements, total return would be reduced. Past performance is not predictive of future performance. Investment return and principal value will fluctuate, so that your shares, when redeemed, may be worth more or less than the original cost. Index returns do not reflect the effects of fees or expenses (excluding Lipper). It is not possible to invest directly in an index.
RUSSELL 1000® VALUE INDEX – An unmanaged index which measures the performance of those Russell 1000® companies with lower price-to-book ratios and lower forecasted growth values. The Russell 1000® Index is an unmanaged index which measures the performance of the 1,000 largest companies in the Russell 3000® Index. The Russell 3000® Index is an unmanaged index which measures the performance of the 3,000 largest U.S. Companies, based on total market capitalization, which represents approximately 98% of the investable U.S. equity market.
LIPPER LARGE-CAP VALUE FUNDS INDEX – The Lipper Large-Cap Value Funds Index is the average of the 30 largest funds in the Lipper Large-Cap Value Funds Category. These funds, by portfolio practice, invest at least 75% of their equity assets in companies with market capitalizations (on a three-year weighted basis) greater than 300% of the dollar-weighted median market capitalization of the middle 1,000 securities of the S&P Super Composite 1500® Index. Large-cap value funds typically invest in securities that have a below-average price-to-earnings ratio, price-to-book ratio and three-year sales-per-share growth value, compared to the S&P 500® Index.
|
AVERAGE ANNUAL TOTAL RETURN (for the period ended March 31) |
| |
| | | | |
| | One Year | | Since Inception
(8/9/07) |
| | | | |
AssetMark Enhanced Fundamental Index® Large Company Value Fund | | 78.09% | | -7.77% |
Russell 1000® Value Index | | 53.56% | | -8.12% |
Lipper Large-Cap Value Funds Index | | 49.73% | | -6.69% |
22
|
AssetMark Enhanced Fundamental Index® Large Company Value Fund |
MANAGER’S DISCUSSION OF FUND PERFORMANCE (Continued) (Unaudited) |
| |
For the 12 months ended March 31, 2010, the Fund returned 78.1%, outperforming the Russell 1000® Value Index at 53.6% and the Lipper Large-Cap Value Funds Index at 49.7%.
| |
• | Fundamental factors were the largest driver of returns with exposure to securities with lower price-to-book ratios, lower long-term momentum and smaller market capitalization relative to the Russell 1000® Value Index being the most significant contributors for the period. |
| |
• | Security positioning contributed to performance as holdings of Avis Budget Group, Ford Motor Co. and Dow Chemicals Co. proved positive. The Fund had larger active exposure to some of the most depressed securities which rebounded from their lows. |
| |
• | Sector allocation was also positive and benefited returns overall with overweight exposure to consumer discretionary and underweight exposure to financials. An underweight exposure to energy dampened absolute returns. |
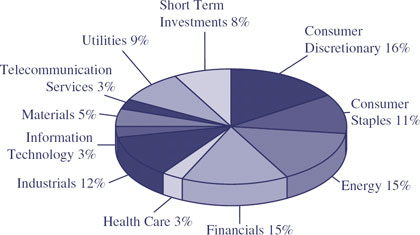
Components of Portfolio Holdings*
* Pie chart represents percentages of total portfolio, less securities lending collateral.
Top Ten Holdings
| | | | |
Rank | Security/Holding | | % of Net
Assets |
1 | | Exxon Mobil Corp. | | 6.46 |
2 | | Wal-Mart Stores, Inc. | | 3.77 |
3 | | Chevron Corp. | | 2.81 |
4 | | General Electric Co. | | 2.77 |
5 | | Bank of America Corporation | | 1.92 |
6 | | Verizon Communications, Inc. | | 1.75 |
7 | | ConocoPhillips | | 1.61 |
8 | | Citigroup, Inc. | | 1.22 |
9 | | Home Depot, Inc. | | 0.98 |
10 | | Altria Group, Inc. | | 0.97 |
23
|
AssetMark Enhanced Fundamental Index® Small Company Growth Fund |
MANAGER’S DISCUSSION OF FUND PERFORMANCE (Unaudited) |
| |
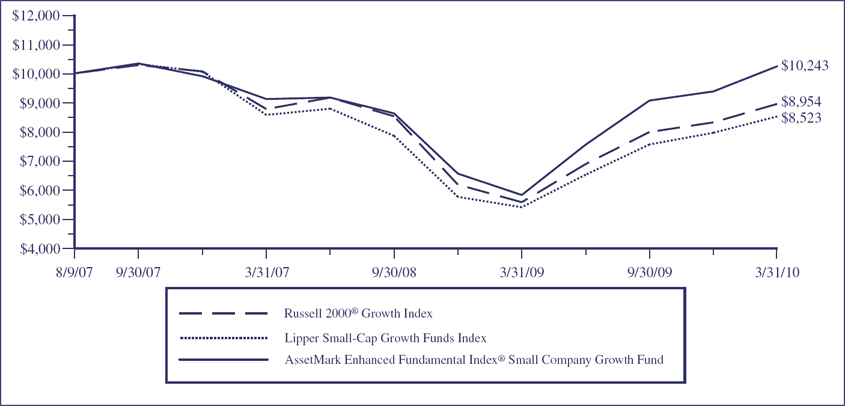
TOTAL RETURN BASED ON A $10,000 INVESTMENT
This chart assumes an initial gross investment of $10,000 made on August 9, 2007 (commencement of the Fund’s operations). Returns shown include the reinvestment of all dividends. Returns shown do not reflect the deduction of taxes that a shareholder would pay on Fund distributions or the redemption of Fund shares. In the absence of fee waivers and reimbursements, total return would be reduced. Past performance is not predictive of future performance. Investment return and principal value will fluctuate, so that your shares, when redeemed, may be worth more or less than the original cost. Index returns do not reflect the effects of fees or expenses (excluding Lipper). It is not possible to invest directly in an index.
RUSSELL 2000® GROWTH INDEX – An unmanaged index which measures the performance of those Russell 2000® Index companies with higher price-to-book ratios and higher forecasted growth values. The Russell 2000® Index measures the performance of the 2,000 smallest companies in the Russell 3000® Index. The Russell 3000® Index is an unmanaged index which measures the performance of the 3,000 largest U.S. companies based on total market capitalization, which represents approximately 98% of the investable U.S. equity market.
LIPPER SMALL-CAP GROWTH FUNDS INDEX – The Lipper Small-Cap Growth Funds Index is the average of the 30 largest funds in the Lipper Small-Cap Growth Funds Category. These funds, by portfolio practice, invest 75% of their equity assets in companies with market capitalizations (on a three-year weighted basis) less than 250% of the dollar-weighted median market capitalization of the smallest 500 of the middle 1,000 securities of the S&P Super Composite 1500® Index. These funds typically invest in securities that have an above average price-to-earnings ratio, price-to-book ratio and three-year sales-per-share growth value, compared to the S&P SmallCap 600 IndexTM.
|
AVERAGE ANNUAL TOTAL RETURN (for the period ended March 31) |
| |
| | | | | | | |
| | One Year | | Since Inception
(8/9/07) | |
| | | | | |
AssetMark Enhanced Fundamental Index® Small Company Growth Fund | | 75.60 | % | | 0.91 | % | |
Russell 2000® Growth Index | | 60.32 | % | | -4.09 | % | |
Lipper Small-Cap Growth Funds Index | | 57.45 | % | | -5.87 | % | |
24
|
AssetMark Enhanced Fundamental Index® Small Company Growth Fund |
MANAGER’S DISCUSSION OF FUND PERFORMANCE (Continued) (Unaudited) |
| |
For the 12 months ended March 31, 2010, the Fund returned 75.6%, outperforming the Russell 2000® Growth Index at 60.3% and the Lipper Small-Cap Growth Funds Index at 57.5%.
| |
• | Fundamental factors were the largest driver of returns with exposure to securities with lower long-term momentum and lower price-to-book ratios relative to the Russell 2000® Growth Index being the most significant contributors for the period. |
| |
• | Security positioning benefited returns, with positions in Sunrise Senior Living and Alpha Natural Resources being the strongest contributors. Securities more levered to consumer spending including Priceline.com and Bare Escentuals, Inc. also benefited returns. |
| |
• | Overweight exposure to financials and industrials were beneficial to returns over the period while an underweight exposure to health care and information technology dampened returns. |
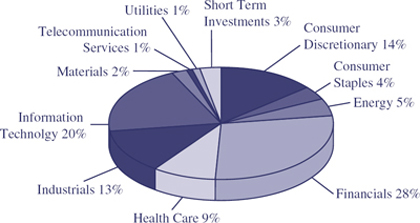
Components of Portfolio Holdings*
* Pie chart represents percentages of total portfolio, less securities lending collateral.
Top Ten Holdings
| | | | |
Rank | Security/Holding | | % of Net
Assets |
1 | | First Solar, Inc. | | 0.97 |
2 | | Mead Johnson Nutrition Co. | | 0.91 |
3 | | Intuitive Surgical, Inc. | | 0.81 |
4 | | Mettler-Toledo International, Inc. | | 0.66 |
5 | | Delphi Financial Group, Inc. | | 0.66 |
6 | | Salesforce.com, Inc. | | 0.64 |
7 | | Priceline.com, Inc. | | 0.58 |
8 | | Waters Corp. | | 0.56 |
9 | | TrustCo Bank Corp. | | 0.54 |
10 | | Potlatch Corp. | | 0.49 |
25
|
AssetMark Enhanced Fundamental Index® Small Company Value Fund |
MANAGER’S DISCUSSION OF FUND PERFORMANCE (Unaudited) |
| |
TOTAL RETURN BASED ON A $10,000 INVESTMENT
This chart assumes an initial gross investment of $10,000 made on August 9, 2007 (commencement of the Fund’s operations). Returns shown include the reinvestment of all dividends. Returns shown do not reflect the deduction of taxes that a shareholder would pay on Fund distributions or the redemption of Fund shares. In the absence of fee waivers and reimbursements, total return would be reduced. Past performance is not predictive of future performance. Investment return and principal value will fluctuate, so that your shares, when redeemed, may be worth more or less than the original cost. Index returns do not reflect the effects of fees or expenses (excluding Lipper). It is not possible to invest directly in an index.
RUSSELL 2000® VALUE INDEX – An unmanaged index which measures the performance of those Russell 2000® Index companies with lower price-to-book ratios and lower forecasted growth values. The Russell 2000® Index is an unmanaged index which measures the performance of the 2,000 smallest companies in the Russell 3000® Index. The Russell 3000® Index is an unmanaged index which measures the performance of the 3,000 largest U.S. companies based on total market capitalization, which represents approximately 98% of the investable U.S. equity market.
LIPPER SMALL-CAP VALUE FUNDS INDEX – The Lipper Small-Cap Value Funds Index is the average of the 30 largest funds in the Lipper Small-Cap Value Funds Category. These funds, by portfolio practice, invest 75% of equity assets in companies with market capitalizations (on a three-year weighted basis) less than 250% of the dollar-weighted median market capitalization of the smallest 500 of the middle 1,000 securities of the S&P Super Composite 1500® Index. These funds typically invest in securities that have a below average price-to-earnings ratio, price-to-book ratio and three-year sales-per-share growth value, compared to the S&P SmallCap 600 IndexTM.
|
AVERAGE ANNUAL TOTAL RETURN (for the period ended March 31) |
| |
| | | | | | | |
| | One Year | | Since Inception
(8/9/07) | |
| | | | | |
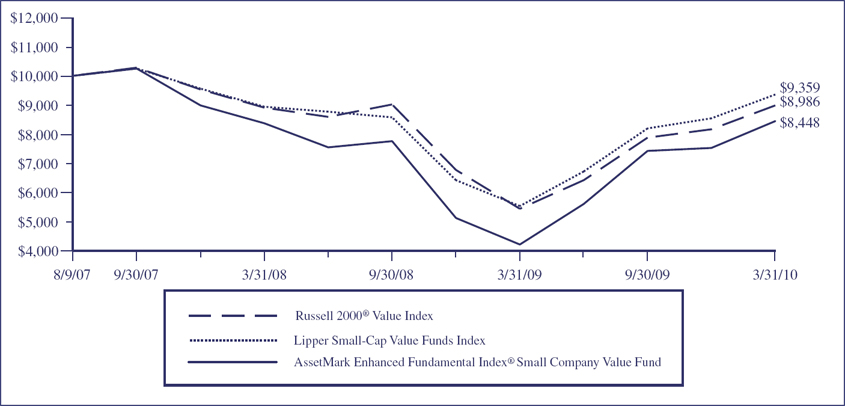
AssetMark Enhanced Fundamental Index® Small Company Value Fund | | 100.24 | % | | -6.18 | % | |
Russell 2000® Value Index | | 65.07 | % | | -3.96 | % | |
Lipper Small-Cap Value Funds Index | | 69.02 | % | | -2.48 | % | |
26
|
AssetMark Enhanced Fundamental Index® Small Company Value Fund |
MANAGER’S DISCUSSION OF FUND PERFORMANCE (Continued) (Unaudited) |
| |
For the 12 months ended March 31, 2010, the Fund returned 100.2%, outperforming the Russell 2000® Value Index at 65.1% and the Lipper Small-Cap Value Funds Index at 69.0%.
| |
• | Fundamental factors were the largest driver of returns with exposure to securities with lower price-to-book ratios, lower long-term momentum and smaller market capitalization relative to the Russell 2000® Value Index being the most significant contributors for the period. |
| |
• | Security positioning within the media and communications industries benefited performance as these securities rebounded from their significant low. Valasis Communication, Radion On, Inc. and Media General, Inc. were among the largest contributors to performance. |
| |
• | Sector allocation was also positive and benefited returns overall with a large overweight exposure to consumer discretionary. An underweight exposure to financials dampened absolute returns. |
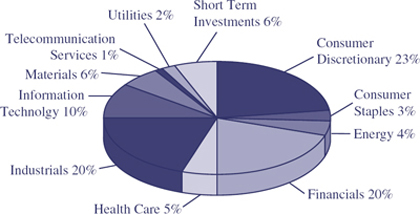
Components of Portfolio Holdings*
* Pie chart represents percentages of total portfolio, less securities lending collateral.
Top Ten Holdings
| | | | |
Rank | Security/Holding | | % of Net
Assets |
1 | | Quiksilver, Inc. | | 0.60 |
2 | | Resources Connection, Inc. | | 0.53 |
3 | | Arkansas Best Corp. | | 0.53 |
4 | | Mine Safety Appliances Co. | | 0.49 |
5 | | USA Mobility, Inc. | | 0.48 |
6 | | Harleysville Group, Inc. | | 0.46 |
7 | | Weight Watchers International, Inc. | | 0.44 |
8 | | The PMI Group, Inc. | | 0.44 |
9 | | HSN, Inc. | | 0.44 |
10 | | Tractor Supply Co. | | 0.43 |
27
|
AssetMark Funds |
EXPENSE EXAMPLE (Unaudited) |
March 31, 2010 |
| |
|
As a shareholder of the AssetMark Funds (the “Funds”), you incur ongoing costs, including management fees; distribution and/or service fees; and other Fund expenses. The Expense Example shown in this section is intended to help you understand your ongoing costs (in dollars) of investing in the Funds and to compare these costs with the ongoing costs of investing in other mutual funds. |
|
The Expense Example is based on an investment of $1,000 invested at the beginning of a six month period and held for the entire period (October 1, 2009 – March 31, 2010) for the AssetMark Large Cap Growth Fund, AssetMark Large Cap Value Fund, AssetMark Small/Mid Cap Growth Fund, AssetMark Small/Mid Cap Value Fund, AssetMark International Equity Fund, AssetMark Real Estate Securities Fund, AssetMark Tax-Exempt Fixed Income Fund, AssetMark Core Plus Fixed Income Fund, AssetMark Enhanced Fundamental Index® Large Company Growth Fund, AssetMark Enhanced Fundamental Index® Large Company Value Fund, AssetMark Enhanced Fundamental Index® Small Company Growth Fund and AssetMark Enhanced Fundamental Index® Small Company Value Fund. |
|
Actual Expenses |
The first line of the Expense Example table provides information about actual account values and actual expenses. You may use the information in this line, together with the amount you invested, to estimate the expenses that you paid over the period. Simply divide your account value by $1,000 (for example, an $8,600 account value divided by $1,000 = 8.6), then multiply the result by the number in the first line under the heading entitled “Expenses Paid During Period” to estimate the expenses you paid on your account during this period. |
|
The example includes, but is not limited to, management fees, shareholder servicing fees, distribution fees, fund accounting, custody and transfer agent fees. However, the example below does not include portfolio trading commissions and related expenses, interest expense or dividends on short positions taken by the Funds and other extraordinary expenses as determined under generally accepted accounting principles. To the extent that a Fund invests in shares of other investment companies as part of its investment strategy, you will indirectly bear your proportionate share of any fees and expenses charged by the underlying funds in which a Fund invests in addition to the expenses of the Fund. Actual expenses of the underlying funds are expected to vary among the various underlying funds. These expenses are not included in the example below. |
|
Hypothetical Example for Comparison Purposes |
The second line of the table below provides information about hypothetical account values and hypothetical expenses based on the Funds’ actual expenses ratios and an assumed rate of return of 5% per year before expenses, which is not the Funds’ actual return. The hypothetical account values and expenses may not be used to estimate the actual ending account balance or expenses you paid for the period. You may use this information to compare the ongoing costs of investing in the Funds and other funds. To do so, compare this 5% hypothetical example with the 5% hypothetical examples that appear in the shareholder reports of the other funds. |
28
|
AssetMark Funds |
EXPENSE EXAMPLE (Continued) (Unaudited) |
March 31, 2010 |
| |
| | | | | | | | | | | | | | | | | | | |
| | | | | Beginning
Account
Value
October 1,
2009 | | Ending
Account
Value
March 31,
2010 | | Annualized
Expense Ratio1
based on
the period
October 1, 2009 –
March 31, 2010 | | Expenses Paid
During Period2
October 1, 2009 –
March 31, 2010 | |
| | | | | | | | | | | | |
AssetMark Large Cap | | Actual | | $ | 1,000.00 | | $ | 1,120.50 | | | 1.44 | % | | | $ | 7.61 | | |
Growth Fund | | Hypothetical3 | | $ | 1,000.00 | | $ | 1,017.75 | | | 1.44 | % | | | $ | 7.24 | | |
| | | | | | | | | | | | | | | | | | | |
AssetMark Large Cap | | Actual | | $ | 1,000.00 | | $ | 1,122.00 | | | 1.43 | % | | | $ | 7.57 | | |
Value Fund | | Hypothetical3 | | $ | 1,000.00 | | $ | 1,017.80 | | | 1.43 | % | | | $ | 7.19 | | |
| | | | | | | | | | | | | | | | | | | |
AssetMark Small/Mid Cap | | Actual | | $ | 1,000.00 | | $ | 1,155.10 | | | 1.67 | % | | | $ | 8.97 | | |
Growth Fund | | Hypothetical3 | | $ | 1,000.00 | | $ | 1,016.60 | | | 1.67 | % | | | $ | 8.40 | | |
| | | | | | | | | | | | | | | | | | | |
AssetMark Small/Mid Cap | | Actual | | $ | 1,000.00 | | $ | 1,149.60 | | | 1.72 | % | | | $ | 9.22 | | |
Value Fund | | Hypothetical3 | | $ | 1,000.00 | | $ | 1,016.36 | | | 1.72 | % | | | $ | 8.65 | | |
| | | | | | | | | | | | | | | | | | | |
AssetMark International | | Actual | | $ | 1,000.00 | | $ | 996.10 | | | 1.48 | % | | | $ | 7.37 | | |
Equity Fund | | Hypothetical3 | | $ | 1,000.00 | | $ | 1,017.55 | | | 1.48 | % | | | $ | 7.44 | | |
| | | | | | | | | | | | | | | | | | | |
AssetMark Real Estate | | Actual | | $ | 1,000.00 | | $ | 1,196.70 | | | 1.55 | % | | | $ | 8.49 | | |
Securities Fund | | Hypothetical3 | | $ | 1,000.00 | | $ | 1,017.20 | | | 1.55 | % | | | $ | 7.80 | | |
| | | | | | | | | | | | | | | | | | | |
AssetMark Tax-Exempt | | Actual | | $ | 1,000.00 | | $ | 1,000.20 | | | 1.29 | % | | | $ | 6.43 | | |
Fixed Income Fund | | Hypothetical3 | | $ | 1,000.00 | | $ | 1,018.50 | | | 1.29 | % | | | $ | 6.49 | | |
| | | | | | | | | | | | | | | | | | | |
AssetMark Core Plus | | Actual | | $ | 1,000.00 | | $ | 1,044.40 | | | 1.28 | % | | | $ | 6.52 | | |
Fixed Income Fund | | Hypothetical3 | | $ | 1,000.00 | | $ | 1,018.55 | | | 1.28 | % | | | $ | 6.44 | | |
| | | | | | | | | | | | | | | | | | | |
AssetMark Enhanced Fundamental | | Actual | | $ | 1,000.00 | | $ | 1,111.60 | | | 1.23 | % | | | $ | 6.48 | | |
Index® Large Company Growth Fund | | Hypothetical3 | | $ | 1,000.00 | | $ | 1,018.80 | | | 1.23 | % | | | $ | 6.19 | | |
| | | | | | | | | | | | | | | | | | | |
AssetMark Enhanced Fundamental | | Actual | | $ | 1,000.00 | | $ | 1,136.40 | | | 1.27 | % | | | $ | 6.76 | | |
Index® Large Company Value Fund | | Hypothetical3 | | $ | 1,000.00 | | $ | 1,018.60 | | | 1.27 | % | | | $ | 6.39 | | |
| | | | | | | | | | | | | | | | | | | |
AssetMark Enhanced Fundamental | | Actual | | $ | 1,000.00 | | $ | 1,129.30 | | | 1.32 | % | | | $ | 7.01 | | |
Index® Small Company Growth Fund | | Hypothetical3 | | $ | 1,000.00 | | $ | 1,018.35 | | | 1.32 | % | | | $ | 6.64 | | |
| | | | | | | | | | | | | | | | | | | |
AssetMark Enhanced Fundamental | | Actual | | $ | 1,000.00 | | $ | 1,137.60 | | | 1.47 | % | | | $ | 7.83 | | |
Index® Small Company Value Fund | | Hypothetical3 | | $ | 1,000.00 | | $ | 1,017.60 | | | 1.47 | % | | | $ | 7.39 | | |
| | | | | | | | | | | | | | | | | | | |
1 | The expense ratio excludes the securities lending credit. |
| |
2 | Expenses are equal to the Fund’s annualized expense ratio, multiplied by the average account value over the period, multiplied by 182/365 to reflect the one-half year period. |
| |
3 | 5% return before expenses. |
29
|
AssetMark Large Cap Growth Fund |
SCHEDULE OF INVESTMENTS |
March 31, 2010 |
| |
| | | | | | | |
Number of
Shares | | | | Value | |
| | | | | | |
| | | COMMON STOCKS - 100.71% | | | | |
| | | Aerospace & Defense - 4.02% | | | | |
| 24,800 | | General Dynamics Corp. | | $ | 1,914,560 | |
| 20,700 | | Honeywell International, Inc. | | | 937,089 | |
| 19,520 | | Precision Castparts Corp. (b) | | | 2,473,379 | |
| 41,200 | | United Technologies Corp. | | | 3,032,732 | |
| | | | | | | |
| | | | | | 8,357,760 | |
| | | | | | | |
| | | Air Freight & Logistics - 0.40% | | | | |
| 10,520 | | Expeditors International of | | | | |
| | | Washington | | | 388,398 | |
| 7,000 | | United Parcel Service, Inc. | | | 450,870 | |
| | | | | | | |
| | | | | | 839,268 | |
| | | | | | | |
| | | Airlines - 0.22% | | | | |
| 31,900 | | Delta Air Lines, Inc. (a) | | | 465,421 | |
| | | | | | | |
| | | Beverages - 2.80% | | | | |
| 17,400 | | The Coca-Cola Company | | | 957,000 | |
| 31,100 | | Dr Pepper Snapple Group, Inc. | | | 1,093,787 | |
| 12,000 | | Molson Coors Brewing Co. | | | 504,720 | |
| 49,350 | | Pepsico, Inc. | | | 3,264,996 | |
| | | | | | | |
| | | | | | 5,820,503 | |
| | | | | | | |
| | | Biotechnology - 3.79% | | | | |
| 8,350 | | Alexion Pharmaceuticals, Inc. (a) | | | 453,989 | |
| 54,910 | | Amgen, Inc. (a) | | | 3,281,422 | |
| 19,080 | | Celgene Corp. (a) | | | 1,182,197 | |
| 58,790 | | Gilead Sciences, Inc. (a) | | | 2,673,769 | |
| 7,280 | | Vertex Pharmaceuticals, Inc. (a) | | | 297,534 | |
| | | | | | | |
| | | | | | 7,888,911 | |
| | | | | | | |
| | | Capital Markets - 3.75% | | | | |
| 25,400 | | Ameriprise Financial, Inc. | | | 1,152,144 | |
| 4,830 | | BlackRock, Inc. | | | 1,051,781 | |
| 27,900 | | The Charles Schwab Corp. | | | 521,451 | |
| 10,580 | | Franklin Resources, Inc. | | | 1,173,322 | |
| 14,910 | | Goldman Sachs Group, Inc. | | | 2,544,093 | |
| 23,700 | | Morgan Stanley | | | 694,173 | |
| 12,000 | | Northern Trust Corp. (b) | | | 663,120 | |
| | | | | | | |
| | | | | | 7,800,084 | |
| | | | | | | |
| | | Chemicals - 1.40% | | | | |
| 6,420 | | FMC Corp. (b) | | | 388,667 | |
| 9,200 | | Monsanto Co. | | | 657,064 | |
| 17,900 | | Mosaic Co. | | | 1,087,783 | |
| 9,460 | | Praxair, Inc. | | | 785,180 | |
| | | | | | | |
| | | | | | 2,918,694 | |
| | | | | | | |
| | | | | | | |
Number of
Shares | | | | Value | |
| | | | | | |
| | | Commercial Banks - 1.47% | | | | |
| 97,900 | | Wells Fargo & Co. | | $ | 3,046,648 | |
| | | | | | | |
| | | Commercial Services & Supplies - 0.25% | | | | |
| 9,700 | | Stericycle, Inc. (a)(b) | | | 528,650 | |
| | | | | | | |
| | | Communications Equipment - 5.31% | | | | |
| 229,840 | | Cisco Systems, Inc. (a) | | | 5,982,735 | |
| 16,360 | | Juniper Networks, Inc. (a)(b) | | | 501,925 | |
| 98,350 | | Qualcomm, Inc. | | | 4,129,716 | |
| 5,890 | | Research In Motion Ltd. (a)(b) | | | 435,566 | |
| | | | | | | |
| | | | | | 11,049,942 | |
| | | | | | | |
| | | Computers & Peripherals - 9.38% | | | | |
| 43,520 | | Apple, Inc. (a) | | | 10,224,153 | |
| 75,600 | | Dell, Inc. (a) | | | 1,134,756 | |
| 54,820 | | EMC Corp. (a) | | | 988,953 | |
| 31,400 | | Hewlett Packard Co. | | | 1,668,910 | |
| 31,580 | | International Business | | | | |
| | | Machines Corp. (b) | | | 4,050,135 | |
| 14,700 | | NetApp, Inc. (a) | | | 478,632 | |
| 52,400 | | Seagate Technology (a) | | | 956,824 | |
| | | | | | | |
| | | | | | 19,502,363 | |
| | | | | | | |
| | | Construction Materials - 0.08% | | | | |
| 3,500 | | Vulcan Materials Co. (b) | | | 165,340 | |
| | | | | | | |
| | | Diversified Consumer Services - 0.37% | | | | |
| 6,800 | | ITT Educational Services, Inc. (a) | | | 764,864 | |
| | | | | | | |
| | | Diversified Financial Services - 0.64% | | | | |
| 7,150 | | IntercontinentalExchange, Inc. (a) | | | 802,087 | |
| 11,680 | | JPMorgan Chase & Co. | | | 522,680 | |
| | | | | | | |
| | | | | | 1,324,767 | |
| | | | | | | |
| | | Electric Utilities - 0.74% | | | | |
| 39,980 | | AES Corp. (a) | | | 439,780 | |
| 13,600 | | Entergy Corp. | | | 1,106,360 | |
| | | | | | | |
| | | | | | 1,546,140 | |
| | | | | | | |
| | | Electrical Equipment - 0.73% | | | | |
| 20,270 | | ABB Ltd. - ADR (b) | | | 442,697 | |
| 10,400 | | AMETEK, Inc. | | | 431,184 | |
| 12,800 | | Emerson Electric Co. (b) | | | 644,352 | |
| | | | | | | |
| | | | | | 1,518,233 | |
| | | | | | | |
| | | Electronic Equipment & Instruments - 0.25% | | | | |
| 17,100 | | Avnet, Inc. (a) | | | 513,000 | |
| | | | | | | |
See notes to financial statements.
30
|
AssetMark Large Cap Growth Fund |
SCHEDULE OF INVESTMENTS (Continued) |
March 31, 2010 |
| |
| | | | | | | |
Number of
Shares | | | | Value | |
| | | | | | |
| | | COMMON STOCKS (Continued) | | | | |
| | | Energy Equipment & Services - 2.87% | | | | |
| 19,650 | | Cameron International Corp. (a)(b) | | $ | 842,199 | |
| 27,910 | | Halliburton Co. | | | 840,928 | |
| 50,800 | | Nabors Industries Ltd. (a)(b) | | | 997,204 | |
| 51,500 | | National-Oilwell Varco, Inc. | | | 2,089,870 | |
| 18,900 | | Schlumberger Ltd. | | | 1,199,394 | |
| | | | | | | |
| | | | | | 5,969,595 | |
| | | | | | | |
| | | Food & Staples Retailing - 2.65% | | | | |
| 42,400 | | CVS Caremark Corporation | | | 1,550,144 | |
| 27,000 | | Walgreen Co. | | | 1,001,430 | |
| 53,070 | | Wal-Mart Stores, Inc. | | | 2,950,692 | |
| | | | | | | |
| | | | | | 5,502,266 | |
| | | | | | | |
| | | Food Products - 1.21% | | | | |
| 36,400 | | Archer Daniels Midland Co. | | | 1,051,960 | |
| 7,740 | | General Mills, Inc. | | | 547,915 | |
| 21,900 | | Hormel Foods Corp. | | | 920,019 | |
| | | | | | | |
| | | | | | 2,519,894 | |
| | | | | | | |
| | | Health Care Equipment & Supplies - 3.18% | | | | |
| 31,600 | | Dentsply International, Inc. (b) | | | 1,101,260 | |
| 57,060 | | Medtronic, Inc. | | | 2,569,412 | |
| 35,200 | | St. Jude Medical, Inc. (a) | | | 1,444,960 | |
| 19,700 | | Stryker Corp. | | | 1,127,234 | |
| 6,500 | | Varian Medical Systems, Inc. (a) | | | 359,645 | |
| | | | | | | |
| | | | | | 6,602,511 | |
| | | | | | | |
| | | Health Care Providers & Services - 2.60% | | | | |
| 20,400 | | Aetna, Inc. | | | 716,244 | |
| 8,040 | | Express Scripts, Inc. (a) | | | 818,150 | |
| 6,600 | | Laboratory Corporation of America | | | | |
| | | Holdings (a)(b) | | | 499,686 | |
| 13,200 | | Mckesson Corp. | | | 867,504 | |
| 52,900 | | Unitedhealth Group, Inc. | | | 1,728,243 | |
| 12,100 | | Wellpoint, Inc. (a) | | | 778,998 | |
| | | | | | | |
| | | | | | 5,408,825 | |
| | | | | | | |
| | | Hotels, Restaurants & Leisure - 1.63% | | | | |
| 14,580 | | Carnival Corp. | | | 566,871 | |
| 16,100 | | Darden Restaurants, Inc. | | | 717,094 | |
| 13,700 | | Marriott International, Inc. | | | 431,824 | |
| 12,470 | | McDonald’s Corp. | | | 831,998 | |
| 33,100 | | Wyndham Worldwide Corp. | | | 851,663 | |
| | | | | | | |
| | | | | | 3,399,450 | |
| | | | | | | |
| | | | | | | |
Number of
Shares | | | | Value | |
| | | | | | |
| | | Household Products - 2.17% | | | | |
| 7,420 | | Church & Dwight, Inc. | | $ | 496,769 | |
| 9,820 | | Colgate Palmolive Co. | | | 837,253 | |
| 26,100 | | Kimberly Clark Corp. | | | 1,641,168 | |
| 24,350 | | Procter & Gamble Co. | | | 1,540,625 | |
| | | | | | | |
| | | | | | 4,515,815 | |
| | | | | | | |
| | | Industrial Conglomerates - 1.62% | | | | |
| 33,740 | | 3M Co. | | | 2,819,652 | |
| 30,300 | | General Electric Co. | | | 551,460 | |
| | | | | | | |
| | | | | | 3,371,112 | |
| | | | | | | |
| | | Insurance - 1.00% | | | | |
| 11,850 | | Aflac, Inc. | | | 643,336 | |
| 28,500 | | Hartford Financial | | | | |
| | | Services Group, Inc. | | | 809,970 | |
| 10,300 | | Prudential Financial, Inc. | | | 623,150 | |
| | | | | | | |
| | | | | | 2,076,456 | |
| | | | | | | |
| | | Internet & Catalog Retail - 1.83% | | | | |
| 24,210 | | Amazon.com, Inc. (a)(b) | | | 3,286,023 | |
| 7,000 | | Netflix, Inc. (a)(b) | | | 516,180 | |
| | | | | | | |
| | | | | | 3,802,203 | |
| | | | | | | |
| | | Internet Software & Services - 3.76% | | | | |
| 49,800 | | Ebay, Inc. (a) | | | 1,342,110 | |
| 9,920 | | Google, Inc. (a)(b) | | | 5,624,739 | |
| 2,500 | | Sohu.com, Inc. (a)(b) | | | 136,500 | |
| 27,200 | | Verisign, Inc. (a) | | | 707,472 | |
| | | | | | | |
| | | | | | 7,810,821 | |
| | | | | | | |
| | | IT Services - 2.57% | | | | |
| 21,700 | | Accenture Plc | | | 910,315 | |
| 12,530 | | Cognizant Technology | | | | |
| | | Solutions Corp. (a) | | | 638,780 | |
| 5,260 | | Mastercard, Inc. (b) | | | 1,336,040 | |
| 16,440 | | Visa, Inc. | | | 1,496,533 | |
| 56,300 | | The Western Union Co. | | | 954,848 | |
| | | | | | | |
| | | | | | 5,336,516 | |
| | | | | | | |
| | | Life Sciences Tools & Services - 0.50% | | | | |
| 15,640 | | QIAGEN N.V. (a)(b) | | | 359,564 | |
| 13,200 | | Thermo Fisher Scientific, Inc. (a) | | | 679,008 | |
| | | | | | | |
| | | | | | 1,038,572 | |
| | | | | | | |
See notes to financial statements.
31
|
AssetMark Large Cap Growth Fund |
SCHEDULE OF INVESTMENTS (Continued) |
March 31, 2010 |
| |
| | | | | | | |
Number of
Shares | | | | Value | |
| | | | | | |
| | | COMMON STOCKS (Continued) | | | | |
| | | Machinery - 3.42% | | | | |
| 17,800 | | Caterpillar, Inc. | | $ | 1,118,730 | |
| 15,140 | | Cummins, Inc. | | | 937,923 | |
| 8,700 | | Danaher Corp. | | | 695,217 | |
| 21,550 | | Deere & Co. (b) | | | 1,281,363 | |
| 46,485 | | Dover Corp. | | | 2,173,174 | |
| 13,900 | | Parker Hannifin Corp. | | | 899,886 | |
| | | | | | | |
| | | | | | 7,106,293 | |
| | | | | | | |
| | | Media - 1.68% | | | | |
| 18,100 | | DIRECTV (a) | | | 611,961 | |
| 11,030 | | DreamWorks Animation | | | | |
| | | SKG, Inc. (a) | | | 434,472 | |
| 13,000 | | Omnicom Group, Inc. | | | 504,530 | |
| 16,700 | | Scripps Networks Interactive, Inc. | | | 740,645 | |
| 18,140 | | Time Warner, Inc. | | | 567,238 | |
| 18,050 | | The Walt Disney Co. (b) | | | 630,125 | |
| | | | | | | |
| | | | | | 3,488,971 | |
| | | | | | | |
| | | Metals & Mining - 1.29% | | | | |
| 25,460 | | Freeport-McMoran | | | | |
| | | Copper & Gold, Inc. | | | 2,126,929 | |
| 6,060 | | Walter Energy, Inc. | | | 559,156 | |
| | | | | | | |
| | | | | | 2,686,085 | |
| | | | | | | |
| | | Multiline Retail - 2.08% | | | | |
| 30,700 | | Big Lots, Inc. (a) | | | 1,118,094 | |
| 10,060 | | Kohls Corp. (a) | | | 551,087 | |
| 38,300 | | Nordstrom, Inc. (b) | | | 1,564,555 | |
| 20,770 | | Target Corp. | | | 1,092,502 | |
| | | | | | | |
| | | | | | 4,326,238 | |
| | | | | | | |
| | | Oil & Gas - 2.25% | | | | |
| 12,000 | | Apache Corp. | | | 1,218,000 | |
| 19,175 | | Hess Corp. | | | 1,199,396 | |
| 12,300 | | Occidental Petroleum Corp. | | | 1,039,842 | |
| 14,700 | | Peabody Energy Corp. | | | 671,790 | |
| 28,300 | | Valero Energy Corp. | | | 557,510 | |
| | | | | | | |
| | | | | | 4,686,538 | |
| | | | | | | |
| | | Personal Products - 0.23% | | | | |
| 14,030 | | Avon Products, Inc. | | | 475,196 | |
| | | | | | | |
| | | | | | | |
Number of
Shares | | | | Value | |
| | | | | | |
| | | Pharmaceuticals - 6.02% | | | | |
| 59,590 | | Abbott Laboratories | | $ | 3,139,201 | |
| 6,830 | | Allergan, Inc. | | | 446,136 | |
| 25,200 | | Forest Labs, Inc. (a) | | | 790,272 | |
| 8,400 | | Genzyme Corp. (a) | | | 435,372 | |
| 11,600 | | Johnson & Johnson | | | 756,320 | |
| 45,810 | | Eli Lilly & Co. | | | 1,659,238 | |
| 71,569 | | Merck & Co., Inc. | | | 2,673,102 | |
| 18,000 | | Mylan Laboratories, Inc. (a)(b) | | | 408,780 | |
| 8,060 | | Shire PLC - ADR (b) | | | 531,638 | |
| 26,530 | | Teva Pharmaceutical | | | | |
| | | Industries, Ltd. - ADR | | | 1,673,512 | |
| | | | | | | |
| | | | | | 12,513,571 | |
| | | | | | | |
| | | Professional Services - 0.39% | | | | |
| 14,195 | | Manpower, Inc. | | | 810,818 | |
| | | | | | | |
| | | Road & Rail - 1.25% | | | | |
| 11,580 | | CSX Corp. (b) | | | 589,422 | |
| 33,100 | | J.B. Hunt Transport Services, Inc. | | | 1,187,628 | |
| 11,100 | | Union Pacific Corp. | | | 813,630 | |
| | | | | | | |
| | | | | | 2,590,680 | |
| | | | | | | |
| | | Semiconductor & Semiconductor | | | | |
| | | Equipment - 3.41% | | | | |
| 13,690 | | Broadcom Corp. | | | 454,234 | |
| 60,160 | | Intel Corp. | | | 1,339,162 | |
| 20,400 | | Linear Technology Corp. (b) | | | 576,912 | |
| 39,990 | | Marvell Technology Group Ltd. (a) | | | 814,996 | |
| 43,800 | | Maxim Integrated Products, Inc. | | | 849,282 | |
| 17,890 | | NVIDIA Corp. (a)(b) | | | 310,928 | |
| 128,900 | | ON Semiconductor Corp. (a)(b) | | | 1,031,200 | |
| 69,700 | | Texas Instruments, Inc. | | | 1,705,559 | |
| | | | | | | |
| | | | | | 7,082,273 | |
| | | | | | | |
| | | Software - 7.90% | | | | |
| 69,700 | | Activision Blizzard, Inc. | | | 840,582 | |
| 21,960 | | Adobe Systems, Inc. (a) | | | 776,725 | |
| 15,780 | | Check Point Software | | | | |
| | | Technologies Ltd. (a)(b) | | | 553,247 | |
| 7,280 | | Citrix Systems, Inc. (a)(b) | | | 345,582 | |
| 293,340 | | Microsoft Corp. | | | 8,586,062 | |
| 207,580 | | Oracle Corp. | | | 5,332,730 | |
| | | | | | | |
| | | | | | 16,434,928 | |
| | | | | | | |
See notes to financial statements.
32
|
AssetMark Large Cap Growth Fund |
SCHEDULE OF INVESTMENTS (Continued) |
March 31, 2010 |
| |
| | | | | | | |
Number of
Shares | | | | Value | |
| | | | | | | | |
| | | COMMON STOCKS (Continued) | | | | |
| | | Specialty Retail - 3.37% | | | | |
| 25,900 | | Best Buy Co., Inc. | | $ | 1,101,786 | |
| 83,300 | | The Gap, Inc. | | | 1,925,063 | |
| 24,800 | | Limited Brands, Inc. (b) | | | 610,576 | |
| 48,700 | | Lowe’s Companies, Inc. | | | 1,180,488 | |
| 87,900 | | Office Depot, Inc. (a) | | | 701,442 | |
| 17,300 | | Ross Stores, Inc. | | | 925,031 | |
| 11,650 | | Tiffany & Co. | | | 553,259 | |
| | | | | | | |
| | | | | | 6,997,645 | |
| | | | | | | |
| | | Textiles, Apparel & Luxury Goods - 0.94% | | | | |
| 17,150 | | Nike, Inc. (b) | | | 1,260,525 | |
| 8,700 | | VF Corp. | | | 697,305 | |
| | | | | | | |
| | | | | | 1,957,830 | |
| | | | | | | |
| | | Tobacco - 2.86% | | | | |
| 125,100 | | Altria Group, Inc. | | | 2,567,052 | |
| 64,990 | | Philip Morris International, Inc. | | | 3,389,878 | |
| | | | | | | |
| | | | | | 5,956,930 | |
| | | | | | | |
| | | Wireless Telecommunication Services - 0.43% | | | | |
| 20,970 | | American Tower Corp. (a)(b) | | | 893,532 | |
| | | Total Common Stocks | | | | |
| | | (Cost $164,809,641) | | | 209,412,152 | |
| | | | | | | |
| | | MANAGEMENT INVESTMENT | | | | |
| | | COMPANIES - 0.42% | | | | |
| | | Exchange Traded Fund - 0.42% | | | | |
| 16,700 | | iShares Russell 1000 Growth | | | | |
| | | Index Fund | | | 867,565 | |
| | | | | | | |
| | | Total Management Investment | | | | |
| | | Companies (Cost $841,493) | | | 867,565 | |
| | | | | | | |
| | | SHORT TERM INVESTMENTS - 1.51% | | | | |
| | | Money Market Funds - 1.51% | | | | |
| 3,131,418 | | Federated Prime Obligations Fund | | | | |
| | | Effective Yield, 0.11% | | | 3,131,418 | |
| | | | | | | |
| | | Total Short Term Investments | | | | |
| | | (Cost $3,131,418) | | | 3,131,418 | |
| | | | | | | |
| | | | | | | |
Principal
Amount | | | | Value | |
| | | | | | |
| | | INVESTMENTS PURCHASED | | | | |
| | | AS SECURITIES LENDING | | | | |
| | | COLLATERAL - 13.30% | | | | |
| | | Corporate Paydown Securities - 3.27% | | | | |
$ | 5,699,000 | | KKR Atlantic East Holding Group | | | | |
| | | Trust, 3.059%, 03/25/11 (c) | | $ | 3,522,631 | |
| 6,526,035 | | KKR Pacific West Holding Group | | | | |
| | | Trust, 3.059%, 03/25/11 (c) | | | 3,277,003 | |
| | | | | | | |
| | | Total Corporate Paydown Securities | | | | |
| | | (Cost $12,225,035) | | | 6,799,634 | |
| | | | | | | |
| | | | | | | |
Number of
Shares | | | | | | |
| | | |
| | | Money Market Funds - 10.03% | | | | |
| 20,861,263 | | Mount Vernon Prime Portfolio | | | | |
| | | Effective Yield, 0.24% | | | 20,861,263 | |
| 113,979 | | Reserve Primary Fund (c) | | | — | |
| | | | | | | |
| | | Total Money Market Funds | | | | |
| | | (Cost $20,975,242) | | | 20,861,263 | |
| | | | | | | |
| | | | | | | |
Principal
Amount | | | | | | |
| | | | | | | | |
| | | Cash - 0.00% | | | | |
$ | 6,079 | | Cash | | | 6,079 | |
| | | | | | | |
| | | Total Cash (Cost $6,079) | | | 6,079 | |
| | | | | | | |
| | | Total Investments Purchased as | | | | |
| | | Securities Lending Collateral | | | | |
| | | (Cost $33,206,356) | | | 27,666,976 | |
| | | | | | | |
| | | Total Investments | | | | |
| | | (Cost $201,988,908) - 115.94% | | | 241,078,111 | |
| | | Liabilities in Excess of Other | | | | |
| | | Assets - (15.94)% | | | (33,149,888 | ) |
| | | | | | | |
| | | TOTAL NET ASSETS - 100.00% | | $ | 207,928,223 | |
| | | | | | | |
| |
Percentages are stated as a percent of net assets.
ADR - American Depositary Receipt |
(a) | Non-income producing. |
(b) | All or a portion of this security is on loan. |
(c) | As of March 31, 2010, the Advisor has fair valued this security and deemed it illiquid. The value of these securities were $6,799,634 which represent 3.27% of total net assets. |
See notes to financial statements.
33
|
AssetMark Large Cap Value Fund |
SCHEDULE OF INVESTMENTS |
March 31, 2010 |
| |
| | | | | | | |
Number of
Shares | | | | Value | |
| | | | | | |
| | | COMMON STOCKS - 96.79% | | | | |
| | | Aerospace & Defense - 2.80% | | | | |
| 44,600 | | Northrop Grumman Corp. (b) | | $ | 2,924,422 | |
| 13,990 | | Raytheon Co. (b) | | | 799,109 | |
| 25,865 | | United Technologies Corp. | | | 1,903,923 | |
| | | | | | | |
| | | | | | 5,627,454 | |
| | | | | | | |
| | | Air Freight & Logistics - 0.69% | | | | |
| 11,100 | | FedEx Corp. (b) | | | 1,036,740 | |
| 5,260 | | United Parcel Service, Inc. | | | 338,797 | |
| | | | | | | |
| | | | | | 1,375,537 | |
| | | | | | | |
| | | Auto Components - 0.50% | | | | |
| 30,400 | | Johnson Controls, Inc. | | | 1,002,896 | |
| | | | | | | |
| | | Automobiles - 0.37% | | | | |
| 26,320 | | Harley Davidson, Inc. (b) | | | 738,802 | |
| | | | | | | |
| | | Beverages - 1.84% | | | | |
| 7,420 | | The Coca-Cola Company | | | 408,100 | |
| 11,620 | | Diageo PLC - ADR | | | 783,769 | |
| 21,100 | | Molson Coors Brewing Co. | | | 887,466 | |
| 24,495 | | Pepsico, Inc. | | | 1,620,589 | |
| | | | | | | |
| | | | | | 3,699,924 | |
| | | | | | | |
| | | Capital Markets - 2.68% | | | | |
| 11,960 | | Ameriprise Financial, Inc. | | | 542,505 | |
| 71,460 | | The Bank of New York | | | | |
| | | Mellon Corp. | | | 2,206,685 | |
| 5,800 | | Goldman Sachs Group, Inc. | | | 989,654 | |
| 28,400 | | Morgan Stanley | | | 831,836 | |
| 18,000 | | State Street Corp. | | | 812,520 | |
| | | | | | | |
| | | | | | 5,383,200 | |
| | | | | | | |
| | | Chemicals - 0.66% | | | | |
| 3,960 | | Monsanto Co. | | | 282,823 | |
| 15,900 | | PPG Industries, Inc. | | | 1,039,860 | |
| | | | | | | |
| | | | | | 1,322,683 | |
| | | | | | | |
| | | Commercial Banks - 2.68% | | | | |
| 31,205 | | Suntrust Banks, Inc. (b) | | | 835,982 | |
| 21,355 | | U.S. Bancorp | | | 552,667 | |
| 127,890 | | Wells Fargo & Co. | | | 3,979,937 | |
| | | | | | | |
| | | | | | 5,368,586 | |
| | | | | | | |
| | | Commercial Services & Supplies - 0.49% | | | | |
| 36,045 | | Iron Mountain, Inc. (a) | | | 987,633 | |
| | | | | | | |
| | | Communications Equipment - 0.26% | | | | |
| 20,305 | | Cisco Systems, Inc. (a) | | | 528,539 | |
| | | | | | | |
| | | | | | | |
Number of
Shares | | | | Value | |
| | | | | | |
| | | Computers & Peripherals - 2.41% | | | | |
| 56,280 | | Dell, Inc. (a) | | $ | 844,763 | |
| 37,310 | | Hewlett Packard Co. | | | 1,983,026 | |
| 15,700 | | International Business | | | | |
| | | Machines Corp. | | | 2,013,525 | |
| | | | | | | |
| | | | | | 4,841,314 | |
| | | | | | | |
| | | Construction & Engineering - 0.27% | | | | |
| 11,690 | | Fluor Corp. | | | 543,702 | |
| | | | | | | |
| | | Construction Materials - 0.16% | | | | |
| 6,841 | | Vulcan Materials Co. (b) | | | 323,169 | |
| | | | | | | |
| | | Consumer Finance - 1.28% | | | | |
| 62,330 | | American Express Co. | | | 2,571,736 | |
| | | | | | | |
| | | Containers & Packaging - 0.57% | | | | |
| 53,850 | | Sealed Air Corp. | | | 1,135,158 | |
| | | | | | | |
| | | Diversified Financial Services - 2.80% | | | | |
| 57,400 | | Bank of America Corporation | | | 1,024,590 | |
| 91,763 | | JPMorgan Chase & Co. | | | 4,106,394 | |
| 16,100 | | Moodys Corp. (b) | | | 478,975 | |
| | | | | | | |
| | | | | | 5,609,959 | |
| | | | | | | |
| | | Diversified Telecommunication Services - 3.42% | | | | |
| 112,600 | | AT&T, Inc. (b) | | | 2,909,584 | |
| 57,400 | | CenturyTel, Inc. (b) | | | 2,035,404 | |
| 61,700 | | Verizon Communications, Inc. | | | 1,913,934 | |
| | | | | | | |
| | | | | | 6,858,922 | |
| | | | | | | |
| | | Electric Utilities - 1.49% | | | | |
| 87,700 | | Edison International (b) | | | 2,996,709 | |
| | | | | | | |
| | | Electrical Equipment - 0.52% | | | | |
| 20,600 | | Emerson Electric Co. (b) | | | 1,037,004 | |
| | | | | | | |
| | | Electronic Equipment & Instruments - 0.41% | | | | |
| 24,180 | | Agilent Technologies, Inc. (a) | | | 831,550 | |
| | | | | | | |
| | | Energy Equipment & Services - 2.50% | | | | |
| 33,600 | | Diamond Offshore Drilling, Inc. (b) | | | 2,984,016 | |
| 32,500 | | Halliburton Co. | | | 979,225 | |
| 12,162 | | Transocean Ltd. (a) | | | 1,050,554 | |
| | | | | | | |
| | | | | | 5,013,795 | |
| | | | | | | |
| | | Food & Staples Retailing - 5.39% | | | | |
| 44,230 | | Costco Wholesale Corp. | | | 2,640,973 | |
| 110,187 | | CVS Caremark Corporation | | | 4,028,437 | |
| 79,900 | | Safeway, Inc. (b) | | | 1,986,314 | |
| 36,965 | | SYSCO Corp. | | | 1,090,468 | |
| 19,275 | | Wal-Mart Stores, Inc. | | | 1,071,690 | |
| | | | | | | |
| | | | | | 10,817,882 | |
| | | | | | | |
See notes to financial statements.
34
|
AssetMark Large Cap Value Fund |
SCHEDULE OF INVESTMENTS (Continued) |
March 31, 2010 |
| |
| | | | | | | |
Number of
Shares | | | | Value | |
| | | | | | |
| | | COMMON STOCKS (Continued) | | | | |
| | | Food Products - 2.01% | | | | |
| 119,700 | | Conagra Foods, Inc. | | $ | 3,000,879 | |
| 14,600 | | General Mills, Inc. | | | 1,033,534 | |
| | | | | | | |
| | | | | | 4,034,413 | |
| | | | | | | |
| | | Health Care Equipment & Supplies - 2.31% | | | | |
| 18,280 | | Baxter International, Inc. | | | 1,063,896 | |
| 7,270 | | Becton Dickinson & Co. | | | 572,367 | |
| 6,025 | | CareFusion Corp. (a) | | | 159,241 | |
| 62,950 | | Medtronic, Inc. | | | 2,834,638 | |
| | | | | | | |
| | | | | | 4,630,142 | |
| | | | | | | |
| | | Health Care Providers & Services - 2.42% | | | | |
| 63,780 | | Cardinal Health, Inc. | | | 2,297,994 | |
| 29,500 | | CIGNA Corp. | | | 1,079,110 | |
| 4,000 | | Express Scripts, Inc. (a) | | | 407,040 | |
| 32,900 | | UnitedHealth Group, Inc. | | | 1,074,843 | |
| | | | | | | |
| | | | | | 4,858,987 | |
| | | | | | | |
| | | Hotels, Restaurants & Leisure - 1.04% | | | | |
| 31,165 | | McDonald’s Corp. | | | 2,079,329 | |
| | | | | | | |
| | | Household Durables - 0.53% | | | | |
| 22,000 | | Fortune Brands, Inc. | | | 1,067,220 | |
| | | | | | | |
| | | Household Products - 2.86% | | | | |
| 49,690 | | Kimberly Clark Corp. | | | 3,124,507 | |
| 41,405 | | Procter & Gamble Co. | | | 2,619,695 | |
| | | | | | | |
| | | | | | 5,744,202 | |
| | | | | | | |
| | | Industrial Conglomerates - 0.98% | | | | |
| 19,255 | | 3M Co. | | | 1,609,140 | |
| 9,212 | | Tyco International Ltd. | | | 352,359 | |
| | | | | | | |
| | | | | | 1,961,499 | |
| | | | | | | |
| | | Insurance - 10.03% | | | | |
| 78,990 | | Allstate Corp. | | | 2,552,167 | |
| 35,160 | | Berkshire Hathaway, Inc. (a) | | | 2,857,453 | |
| 67,880 | | Loews Corp. | | | 2,530,566 | |
| 74,995 | | Marsh & McLennan Cos., Inc. | | | 1,831,378 | |
| 46,200 | | Metlife, Inc. | | | 2,002,308 | |
| 71,050 | | Progressive Corp. | | | 1,356,344 | |
| 54,075 | | Prudential Financial, Inc. | | | 3,271,538 | |
| 12,511 | | Transatlantic Holdings, Inc. | | | 660,581 | |
| 56,685 | | Travelers Companies, Inc. (b) | | | 3,057,589 | |
| | | | | | | |
| | | | | | 20,119,924 | |
| | | | | | | |
| | | | | | | |
Number of
Shares | | | | Value | |
| | | | | | |
| | | Internet Software & Services - 0.26% | | | | |
| 930 | | Google, Inc. (a) | | $ | 527,319 | |
| | | | | | | |
| | | IT Services - 0.23% | | | | |
| 7,060 | | Alliance Data Systems Corp. (a)(b) | | | 451,769 | |
| | | | | | | |
| | | Machinery - 1.62% | | | | |
| 22,895 | | Dover Corp. | | | 1,070,341 | |
| 23,220 | | Illinois Tool Works, Inc. | | | 1,099,699 | |
| 16,690 | | Parker Hannifin Corp. | | | 1,080,511 | |
| | | | | | | |
| | | | | | 3,250,551 | |
| | | | | | | |
| | | Media - 2.78% | | | | |
| 67,600 | | CBS Corp. (b) | | | 942,344 | |
| 17,600 | | Grupo Televisa, SA - ADR (b) | | | 369,952 | |
| 49,390 | | News Corporation | | | 711,710 | |
| 95,000 | | Time Warner, Inc. | | | 2,970,650 | |
| 16,690 | | The Walt Disney Co. (b) | | | 582,648 | |
| | | | | | | |
| | | | | | 5,577,304 | |
| | | | | | | |
| | | Metals & Mining - 1.03% | | | | |
| 12,000 | | Freeport-McMoran Copper & | | | | |
| | | Gold, Inc. | | | 1,002,480 | |
| 23,400 | | Nucor Corp. (b) | | | 1,061,892 | |
| | | | | | | |
| | | | | | 2,064,372 | |
| | | | | | | |
| | | Multi-Utilities - 1.20% | | | | |
| 58,365 | | Dominion Resources, Inc. | | | 2,399,385 | |
| | | | | | | |
| | | Office Electronics - 0.96% | | | | |
| 197,800 | | Xerox Corp. | | | 1,928,550 | |
| | | | | | | |
| | | Oil & Gas - 16.57% | | | | |
| 29,770 | | Anadarko Petroleum Corp. | | | 2,168,149 | |
| 50,245 | | Apache Corp. | | | 5,099,868 | |
| 18,820 | | Canadian Natural Resource Ltd. | | | 1,393,433 | |
| 75,900 | | Chesapeake Energy Corp. (b) | | | 1,794,276 | |
| 53,000 | | Chevron Corp. | | | 4,018,990 | |
| 61,872 | | ConocoPhillips | | | 3,165,990 | |
| 59,085 | | Devon Energy Corp. | | | 3,806,847 | |
| 21,400 | | EOG Resources, Inc. | | | 1,988,916 | |
| 94,600 | | Marathon Oil Corp. | | | 2,993,144 | |
| 59,560 | | Occidental Petroleum Corp. | | | 5,035,202 | |
| 49,900 | | Valero Energy Corp. | | | 983,030 | |
| 17,055 | | XTO Energy, Inc. | | | 804,655 | |
| | | | | | | |
| | | | | | 33,252,500 | |
| | | | | | | |
See notes to financial statements.
35
|
AssetMark Large Cap Value Fund |
SCHEDULE OF INVESTMENTS (Continued) |
March 31, 2010 |
| |
| | | | | | | |
Number of
Shares | | | | Value | |
| | | | | | |
| | | COMMON STOCKS (Continued) | | | | |
| | | Pharmaceuticals - 9.27% | | | | |
| 29,040 | | Abbott Laboratories | | $ | 1,529,827 | |
| 70,835 | | Johnson & Johnson | | | 4,618,442 | |
| 55,100 | | Eli Lilly & Co. | | | 1,995,722 | |
| 128,050 | | Merck & Co., Inc. | | | 4,782,668 | |
| 330,890 | | Pfizer, Inc. | | | 5,674,763 | |
| | | | | | | |
| | | | | | 18,601,422 | |
| | | | | | | |
| | | Professional Services - 0.53% | | | | |
| 14,150 | | The Dun & Bradstreet Corporation | | | 1,053,043 | |
| | | | | | | |
| | | Semiconductor & Semiconductor
Equipment - 1.03% | | | | |
| 37,670 | | KLA-Tencor Corp. (b) | | | 1,164,756 | |
| 36,800 | | Texas Instruments, Inc. | | | 900,496 | |
| | | | | | | |
| | | | | | 2,065,252 | |
| | | | | | | |
| | | Software - 2.24% | | | | |
| 153,445 | | Microsoft Corp. | | | 4,491,335 | |
| | | | | | | |
| | | Specialty Retail - 1.42% | | | | |
| 19,180 | | Bed Bath & Beyond, Inc. (a) | | | 839,317 | |
| 44,600 | | The Gap, Inc. | | | 1,030,706 | |
| 30,500 | | Home Depot, Inc. (b) | | | 986,675 | |
| | | | | | | |
| | | | | | 2,856,698 | |
| | | | | | | |
| | | Tobacco - 1.28% | | | | |
| 94,700 | | Altria Group, Inc. | | | 1,943,244 | |
| 11,920 | | Philip Morris International, Inc. | | | 621,747 | |
| | | | | | | |
| | | | | | 2,564,991 | |
| | | | | | | |
| | | Total Common Stocks
(Cost $153,325,359) | | | 194,196,361 | |
| | | | | | | |
| | | REAL ESTATE INVESTMENT TRUSTS - 1.93% | | | | |
| | | Real Estate Investment Trusts - 1.93% | | | | |
| 162,100 | | Annaly Capital
Management, Inc. (b) | | | 2,784,878 | |
| 13,031 | | Simon Property Group, Inc. (b) | | | 1,093,301 | |
| | | | | | | |
| | | | | | 3,878,179 | |
| | | | | | | |
| | | Total Real Estate Investment Trusts
(Cost $3,310,903) | | | 3,878,179 | |
| | | | | | | |
| | | SHORT TERM INVESTMENTS - 3.71% | | | | |
| | | Money Market Funds - 3.71% | | | | |
| 7,439,284 | | Federated Prime Obligations Fund
Effective Yield, 0.11% | | | 7,439,284 | |
| | | | | | | |
| | | Total Short Term Investments
(Cost $7,439,284) | | | 7,439,284 | |
| | | | | | | |
| | | | | | | |
Principal
Amount | | | | Value | |
| | | | | | |
| | | INVESTMENTS PURCHASED
AS SECURITIES LENDING
COLLATERAL - 14.10% | | | | |
| | | Corporate Paydown Securities - 3.11% | | | | |
$ | 5,225,114 | | KKR Atlantic East Holding Group
Trust, 3.059%, 03/25/11 (c) | | $ | 3,229,716 | |
| 5,983,378 | | KKR Pacific West Holding Group
Trust, 3.059%, 03/25/11 (c) | | | 3,004,512 | |
| | | | | | | |
| | | Total Corporate Paydown Securities
(Cost $11,208,492) | | | 6,234,228 | |
| | | | | | | |
Number of
Shares | | | | | | |
| | | | | | | |
| | | Money Market Funds - 10.99% | | | | |
| 22,034,458 | | Mount Vernon Prime Portfolio
Effective Yield, 0.24% | | | 22,034,458 | |
| 130,420 | | Reserve Primary Fund (c) | | | — | |
| | | | | | | |
| | | Total Money Market Funds
(Cost $22,164,878) | | | 22,034,458 | |
| | | | | | | |
Principal
Amount | | | | | | |
| | | | | | | |
| | | Cash - 0.00% | | | | |
$ | 6,421 | | Cash | | | 6,421 | |
| | | | | | | |
| | | Total Cash
(Cost $6,421) | | | 6,421 | |
| | | | | | | |
| | | Total Investments Purchased as
Securities Lending Collateral
(Cost $33,379,791) | | | 28,275,107 | |
| | | | | | | |
| | | Total Investments
(Cost $197,455,337) - 116.53% | | | 233,788,931 | |
| | | Liabilities in Excess of Other
Assets - (16.53)% | | | (33,160,992 | ) |
| | | | | | | |
| | | TOTAL NET ASSETS - 100.00% | | $ | 200,627,939 | |
| | | | | | | |
Percentages are stated as a percent of net assets.
ADR - American Depositary Receipt
| |
(a) | Non-income producing. |
(b) | All or a portion of this security is on loan. |
(c) | As of March 31, 2010, the Advisor has fair valued this security and deemed it illiquid. The value of these securities were $6,234,228 which represent 3.11% of total net assets. |
See notes to financial statements.
36
|
AssetMark Small/Mid Cap Growth Fund |
SCHEDULE OF INVESTMENTS |
March 31, 2010 |
| |
| | | | | | | |
Number of
Shares | | | | Value | |
| | | | | | |
| | | COMMON STOCKS - 100.39% | | | | |
| | | Aerospace & Defense - 3.23% | | | | |
| 1,400 | | Alliant Techsystems, Inc. (a) | | $ | 113,820 | |
| 1,600 | | American Science &
Engineering, Inc. | | | 119,872 | |
| 9,475 | | Orbital Sciences Corp. (a) | | | 180,120 | |
| 16,683 | | TransDigm Group, Inc. | | | 884,866 | |
| | | | | | | |
| | | | | | 1,298,678 | |
| | | | | | | |
| | | Air Freight & Logistics - 0.35% | | | | |
| 4,980 | | Hub Group, Inc. (a) | | | 139,340 | |
| | | | | | | |
| | | Airlines - 0.23% | | | | |
| 2,200 | | Alaska Air Group, Inc. (a) | | | 90,706 | |
| | | | | | | |
| | | Biotechnology - 4.91% | | | | |
| 3,462 | | Alexion Pharmaceuticals, Inc. (a) | | | 188,229 | |
| 7,067 | | Biomarin Pharmaceutical, Inc. (a)(b) | | | 165,156 | |
| 6,900 | | Cubist Pharmaceuticals, Inc. (a) | | | 155,526 | |
| 14,980 | | Dendreon Corp. (a)(b) | | | 546,321 | |
| 10,867 | | Human Genome Sciences, Inc. (a)(b) | | | 328,183 | |
| 5,010 | | Onyx Pharmaceuticals, Inc. (a) | | | 151,703 | |
| 2,957 | | OSI Pharmaceuticals, Inc. (a) | | | 176,089 | |
| 4,734 | | Regeneron Pharmaceuticals (a) | | | 125,404 | |
| 2,544 | | United Therapeutics Corp. (a) | | | 140,759 | |
| | | | | | | |
| | | | | | 1,977,370 | |
| | | | | | | |
| | | Capital Markets - 2.27% | | | | |
| 8,349 | | Affiliated Managers Group (a)(b) | | | 659,571 | |
| 3,088 | | Greenhill & Co, Inc. | | | 253,494 | |
| | | | | | | |
| | | | | | 913,065 | |
| | | | | | | |
| | | Chemicals - 3.45% | | | | |
| 5,200 | | Ashland, Inc. | | | 274,404 | |
| 6,400 | | International Flavors & Fragrances,
Inc. (b) | | | 305,088 | |
| 1,700 | | Lubrizol Corp. | | | 155,924 | |
| 28,197 | | Solutia, Inc. (a) | | | 454,254 | |
| 6,700 | | Valspar Corp. | | | 197,516 | |
| | | | | | | |
| | | | | | 1,387,186 | |
| | | | | | | |
| | | Commercial Banks - 0.48% | | | | |
| 5,255 | | Signature Bank (a) | | | 194,698 | |
| | | | | | | |
| | | | | | | |
Number of
Shares | | | | Value | |
| | | | | | |
| | | Commercial Services &
Supplies - 2.92% | | | | |
| 3,100 | | ATC Technology Corp. (a) | | $ | 53,196 | |
| 5,100 | | Avery Dennison Corp. | | | 185,691 | |
| 2,200 | | Cintas Corp. | | | 61,798 | |
| 2,100 | | Consolidated Graphics, Inc. (a) | | | 86,961 | |
| 12,966 | | Miller Herman, Inc. | | | 234,166 | |
| 11,200 | | R.R. Donnelley & Sons Co. | | | 239,120 | |
| 13,827 | | Sykes Enterprises, Inc. (a)(b) | | | 315,809 | |
| | | | | | | |
| | | | | | 1,176,741 | |
| | | | | | | |
| | | Communications Equipment - 4.35% | | | | |
| 26,671 | | Emulex Corp. (a) | | | 354,191 | |
| 5,203 | | F5 Networks, Inc. (a)(b) | | | 320,037 | |
| 14,243 | | Finisar Corp. (a)(b) | | | 223,757 | |
| 3,200 | | Oplink Communications, Inc. (a)(b) | | | 59,328 | |
| 25,886 | | Polycom, Inc. (a) | | | 791,594 | |
| | | | | | | |
| | | | | | 1,748,907 | |
| | | | | | | |
| | | Computers & Peripherals - 0.84% | | | | |
| 2,900 | | Lexmark International, Inc. (a) | | | 104,632 | |
| 5,000 | | Synaptics, Inc. (a)(b) | | | 138,050 | |
| 3,300 | | Teradata Corp. (a) | | | 95,337 | |
| | | | | | | |
| | | | | | 338,019 | |
| | | | | | | |
| | | Construction & Engineering - 0.71% | | | | |
| 8,300 | | Shaw Group, Inc. (a) | | | 285,686 | |
| | | | | | | |
| | | Construction Materials - 0.33% | | | | |
| 1,588 | | Martin Marietta Materials, Inc. | | | 132,677 | |
| | | | | | | |
| | | Consumer Finance - 0.25% | | | | |
| 8,000 | | SLM Corp. (a) | | | 100,160 | |
| | | | | | | |
| | | Containers & Packaging - 1.73% | | | | |
| 7,300 | | Bemis, Inc. | | | 209,656 | |
| 4,900 | | Crown Holdings, Inc. (a) | | | 132,104 | |
| 4,500 | | Sonoco Products Co. | | | 138,555 | |
| 10,600 | | Temple Inland, Inc. | | | 216,558 | |
| | | | | | | |
| | | | | | 696,873 | |
| | | | | | | |
| | | Diversified Consumer Services - 2.67% | | | | |
| 2,067 | | Capella Education Company (a) | | | 191,900 | |
| 7,200 | | DeVry, Inc. (b) | | | 469,440 | |
| 5,188 | | Sotheby’s (b) | | | 161,295 | |
| 1,032 | | Strayer Education, Inc. (b) | | | 251,313 | |
| | | | | | | |
| | | | | | 1,073,948 | |
| | | | | | | |
See notes to financial statements.
37
|
AssetMark Small/Mid Cap Growth Fund |
SCHEDULE OF INVESTMENTS (Continued) |
March 31, 2010 |
| |
| | | | | | | |
Number of
Shares | | | | Value | |
| | | | | | | | |
| | | COMMON STOCKS (Continued) | | | | |
| | | Diversified Financial Services - 2.36% | | | | |
| 20,140 | | MSCI, Inc. (a)(b) | | $ | 727,054 | |
| 4,032 | | Portfolio Recovery Associates, | | | | |
| | | Inc. (a)(b) | | | 221,236 | |
| | | | | | | |
| | | | | | 948,290 | |
| | | | | | | |
| | | Electrical Equipment - 3.12% | | | | |
| 6,282 | | American Superconductor | | | | |
| | | Corp. (a)(b) | | | 181,550 | |
| 4,400 | | Hubbell, Inc. | | | 221,892 | |
| 1,000 | | Regal Beloit Corp. | | | 59,410 | |
| 13,724 | | Roper Industries, Inc. (b) | | | 793,796 | |
| | | | | | | |
| | | | | | 1,256,648 | |
| | | | | | | |
| | | Electronic Equipment & Instruments - 1.02% | | | | |
| 8,200 | | Arrow Electronics, Inc. (a) | | | 247,066 | |
| 3,900 | | Tech Data Corp. (a) | | | 163,410 | |
| | | | | | | |
| | | | | | 410,476 | |
| | | | | | | |
| | | Energy Equipment & Services - 1.68% | | | | |
| 3,100 | | Atwood Oceanics, Inc. (a) | | | 107,353 | |
| 2,299 | | Dril-Quip, Inc. (a)(b) | | | 139,871 | |
| 2,900 | | Oil States International, Inc. (a) | | | 131,486 | |
| 10,224 | | Rowan Companies, Inc. (a)(b) | | | 297,621 | |
| | | | | | | |
| | | | | | 676,331 | |
| | | | | | | |
| | | Food & Staples Retailing - 0.34% | | | | |
| 3,822 | | Whole Foods Market, Inc. (a)(b) | | | 138,165 | |
| | | | | | | |
| | | Food Products - 2.63% | | | | |
| 21,000 | | Del Monte Foods Co. | | | 306,600 | |
| 4,483 | | Green Mountain Coffee | | | | |
| | | Roasters, Inc. (a)(b) | | | 434,044 | |
| 1,200 | | Lancaster Colony Corp. (b) | | | 70,752 | |
| 12,900 | | Tyson Foods, Inc. | | | 247,035 | |
| | | | | | | |
| | | | | | 1,058,431 | |
| | | | | | | |
| | | Health Care Equipment & | | | | |
| | | Supplies - 5.67% | | | | |
| 9,595 | | Align Technology, Inc. (a)(b) | | | 185,567 | |
| 16,400 | | American Medical Systems | | | | |
| | | Holdings, Inc. (a)(b) | | | 304,712 | |
| 3,777 | | Beckman Coulter, Inc. | | | 237,196 | |
| 15,726 | | Conceptus, Inc. (a)(b) | | | 313,891 | |
| 2,146 | | Edwards Lifesciences Corp. (a)(b) | | | 212,196 | |
| 9,760 | | EV3, Inc. (a)(b) | | | 154,794 | |
| | | | | | | |
Number of
Shares | | | | Value | |
| | | | | | | | |
| | | Health Care Equipment & Supplies (Continued) | | | | |
| 8,800 | | Hologic, Inc. (a) | | $ | 163,152 | |
| 7,700 | | Invacare Corp. | | | 204,358 | |
| 3,568 | | Nuvasive, Inc. (a)(b) | | | 161,274 | |
| 11,200 | | Symmetry Medical, Inc. (a)(b) | | | 112,448 | |
| 6,989 | | Thoratec Corp. (a)(b) | | | 233,782 | |
| | | | | | | |
| | | | | | 2,283,370 | |
| | | | | | | |
| | | Health Care Providers & Services - 6.20% | | | | |
| 1,100 | | Amedisys, Inc. (a)(b) | | | 60,742 | |
| 7,012 | | Catalyst Health Solutions, Inc. (a)(b) | | | 290,157 | |
| 1,954 | | Cerner Corp. (a)(b) | | | 166,207 | |
| 7,700 | | Coventry Health Care, Inc. (a) | | | 190,344 | |
| 2,600 | | Gentiva Health Services, Inc. (a)(b) | | | 73,528 | |
| 7,800 | | HealthSpring, Inc. (a) | | | 137,280 | |
| 4,501 | | IPC The Hospitalist Co, Inc. (a) | | | 158,030 | |
| 4,000 | | LHC Group, Inc. (a)(b) | | | 134,120 | |
| 4,439 | | Lincare Holdings, Inc. (a)(b) | | | 199,222 | |
| 2,100 | | Magellan Health Services, Inc. (a) | | | 91,308 | |
| 9,800 | | Omnicare, Inc. | | | 277,242 | |
| 2,900 | | RehabCare Group, Inc. (a)(b) | | | 79,083 | |
| 22,750 | | VCA Antech, Inc. (a)(b) | | | 637,683 | |
| | | | | | | |
| | | | | | 2,494,946 | |
| | | | | | | |
| | | Health Care Technology - 0.41% | | | | |
| 2,452 | | SXC Health Solutions Corp. (a) | | | 164,971 | |
| | | | | | | |
| | | Hotels, Restaurants & Leisure - 1.34% | | | | |
| 1,989 | | Chipotle Mexican Grill, Inc. (a)(b) | | | 224,100 | |
| 1,900 | | Cracker Barrel Old Country Store, | | | | |
| | | Inc. | | | 88,122 | |
| 595 | | Steak N Shake Co. (a)(b) | | | 226,856 | |
| | | | | | | |
| | | | | | 539,078 | |
| | | | | | | |
| | | Household Durables - 0.89% | | | | |
| 2,900 | | Jarden Corp. | | | 96,541 | |
| 8,659 | | Tempur Pedic International, | | | | |
| | | Inc. (a)(b) | | | 261,156 | |
| | | | | | | |
| | | | | | 357,697 | |
| | | | | | | |
| | | Industrial Conglomerates - 0.45% | | | | |
| 4,700 | | Carlisle Companies, Inc. | | | 179,070 | |
| | | | | | | |
| | | Insurance - 0.64% | | | | |
| 1,700 | | Reinsurance Group of America | | | 89,284 | |
| 1,900 | | Transatlantic Holdings, Inc. | | | 100,320 | |
| 2,500 | | Validus Holdings Ltd. | | | 68,825 | |
| | | | | | | |
| | | | | | 258,429 | |
| | | | | | | |
See notes to financial statements.
38
|
AssetMark Small/Mid Cap Growth Fund |
SCHEDULE OF INVESTMENTS (Continued) |
March 31, 2010 |
| |
| | | | | | | |
Number of
Shares | | | | Value | |
| | | | | | | | |
| | | COMMON STOCKS (Continued) | | | | |
| | | Internet & Catalog Retail - 0.77% | | | | |
| 708 | | Priceline.com, Inc. (a)(b) | | $ | 180,540 | |
| 5,380 | | Shutterfly, Inc. (a)(b) | | | 129,604 | |
| | | | | | | |
| | | | | | 310,144 | |
| | | | | | | |
| | | Internet Software & Services - 2.30% | | | | |
| 2,900 | | Akamai Technologies, Inc. (a) | | | 91,089 | |
| 7,014 | | DealerTrack Holdings, Inc. (a) | | | 119,799 | |
| 11,002 | | Rackspace Hosting, Inc. (a)(b) | | | 206,067 | |
| 10,100 | | Verisign, Inc. (a) | | | 262,701 | |
| 4,287 | | Vistaprint NV (a)(b) | | | 245,431 | |
| | | | | | | |
| | | | | | 925,087 | |
| | | | | | | |
| | | IT Services - 4.75% | | | | |
| 6,899 | | Acxiom Corp. (a) | | | 123,768 | |
| 7,987 | | Alliance Data Systems Corp. (a)(b) | | | 511,088 | |
| 13,500 | | Broadridge Financial Solutions, Inc. | | | 288,630 | |
| 7,835 | | Cybersource Corp. (a) | | | 138,209 | |
| 9,025 | | Gartner, Inc. (a) | | | 200,716 | |
| 1,400 | | ManTech International Corp. (a) | | | 68,362 | |
| 26,135 | | SAIC, Inc. (a) | | | 462,590 | |
| 3,100 | | Syntel, Inc. | | | 119,257 | |
| | | | | | | |
| | | | | | 1,912,620 | |
| | | | | | | |
| | | Leisure Equipment & Products - 0.55% | | | | |
| 4,350 | | Polaris Industries, Inc. (b) | | | 222,546 | |
| | | | | | | |
| | | Life Sciences Tools & Services - 0.24% | | | | |
| 900 | | Millipore Corp. (a)(b) | | | 95,040 | |
| | | | | | | |
| | | Machinery - 2.16% | | | | |
| 4,371 | | Flowserve Corp. | | | 481,990 | |
| 1,800 | | Joy Global, Inc. | | | 101,880 | |
| 7,100 | | Oshkosh Corp. (a) | | | 286,414 | |
| | | | | | | |
| | | | | | 870,284 | |
| | | | | | | |
| | | Media - 3.24% | | | | |
| 7,200 | | Discovery Communications, Inc. (a) | | | 243,288 | |
| 11,600 | | Dish Network Corp. | | | 241,512 | |
| 18,000 | | Gannett Co., Inc. (b) | | | 297,360 | |
| 6,600 | | New York Times Co. (a) | | | 73,458 | |
| 5,000 | | Scripps Networks Interactive, Inc. | | | 221,750 | |
| 8,200 | | Valassis Communications, | | | | |
| | | Inc. (a)(b) | | | 228,206 | |
| | | | | | | |
| | | | | | 1,305,574 | |
| | | | | | | |
| | | | | | | |
Number of
Shares | | | | Value | |
| | | | | | | | |
| | | Metals & Mining - 0.93% | | | | |
| 8,400 | | Steel Dynamics, Inc. | | $ | 146,748 | |
| 2,474 | | Walter Energy, Inc. | | | 228,276 | |
| | | | | | | |
| | | | | | 375,024 | |
| | | | | | | |
| | | Multiline Retail - 0.96% | | | | |
| 7,100 | | 99 Cents Only Stores (a) | | | 115,730 | |
| 4,600 | | Dollar Tree, Inc. (a) | | | 272,412 | |
| | | | | | | |
| | | | | | 388,142 | |
| | | | | | | |
| | | Oil & Gas - 2.42% | | | | |
| 7,204 | | Arena Resources, Inc. (a) | | | 240,614 | |
| 3,032 | | Concho Resources, Inc. (a)(b) | | | 152,691 | |
| 14,800 | | EXCO Resources, Inc. | | | 272,024 | |
| 3,526 | | Massey Energy Corp. (b) | | | 184,375 | |
| 2,900 | | Stone Energy Corp. (a) | | | 51,475 | |
| 2,700 | | World Fuel Services Corp. (b) | | | 71,928 | |
| | | | | | | |
| | | | | | 973,107 | |
| | | | | | | |
| | | Paper & Forest Products - 0.29% | | | | |
| 9,700 | | Kapstone Paper and | | | | |
| | | Packaging Corp. (a)(b) | | | 115,139 | |
| | | | | | | |
| | | Pharmaceuticals - 3.06% | | | | |
| 4,062 | | Auxilium Pharmaceuticals, Inc. (a)(b) | | | 126,572 | |
| 10,900 | | Endo Pharmaceuticals Holdings, | | | | |
| | | Inc. (a) | | | 258,221 | |
| 5,800 | | Mylan Laboratories, Inc. (a)(b) | | | 131,718 | |
| 3,400 | | Par Pharmaceutical Cos., Inc. (a) | | | 84,320 | |
| 7,468 | | Perrigo Co. (b) | | | 438,521 | |
| 4,500 | | Valeant Pharmaceuticals | | | | |
| | | International (a)(b) | | | 193,095 | |
| | | | | | | |
| | | | | | 1,232,447 | |
| | | | | | | |
| | | Professional Services - 1.26% | | | | |
| 15,300 | | Navigant Consulting, Inc. (a) | | | 185,589 | |
| 10,565 | | Robert Half International, Inc. (b) | | | 321,493 | |
| | | | | | | |
| | | | | | 507,082 | |
| | | | | | | |
See notes to financial statements.
39
|
AssetMark Small/Mid Cap Growth Fund |
SCHEDULE OF INVESTMENTS (Continued) |
March 31, 2010 |
| |
| | | | | | | |
Number of
Shares | | | | Value | |
| | | | | | |
| | | COMMON STOCKS (Continued) | | | | |
| | | Semiconductor & Semiconductor | | | | |
| | | Equipment - 4.02% | | | | |
| 9,464 | | Advanced Energy Industries,
Inc. (a) | | $ | 156,724 | |
| 10,700 | | Advanced Micro Devices, Inc. (a) | | | 99,189 | |
| 2,356 | | Cree, Inc. (a) | | | 165,438 | |
| 19,100 | | Cypress Semiconductor Corp. (a) | | | 219,650 | |
| 7,280 | | NetLogic Microsystems, Inc. (a)(b) | | | 214,250 | |
| 9,800 | | PMC-Sierra, Inc. (a) | | | 87,416 | |
| 30,600 | | RF Microdevices, Inc. (a) | | | 152,388 | |
| 3,298 | | Silicon Laboratories, Inc. (a) | | | 157,216 | |
| 14,525 | | Skyworks Solutions, Inc. (a) | | | 226,590 | |
| 19,900 | | TriQuint Semiconductor, Inc. (a) | | | 139,300 | |
| | | | | | | |
| | | | | | 1,618,161 | |
| | | | | | | |
| | | Software - 6.38% | | | | |
| 9,058 | | CommVault Systems, Inc. (a) | | | 193,389 | |
| 11,185 | | Informatica Corp. (a)(b) | | | 300,429 | |
| 10,881 | | MICROS Systems, Inc. (a)(b) | | | 357,767 | |
| 9,200 | | Red Hat, Inc. (a) | | | 269,284 | |
| 8,500 | | Rovi Corp. (a) | | | 315,605 | |
| 11,600 | | SonicWALL, Inc. (a) | | | 100,804 | |
| 5,805 | | SuccessFactors, Inc. (a)(b) | | | 110,527 | |
| 15,076 | | Tivo, Inc. (a) | | | 258,101 | |
| 10,757 | | Ultimate Software Group, Inc. (a) | | | 354,443 | |
| 8,366 | | VanceInfo Technologies, Inc. -
ADR (a)(b) | | | 186,478 | |
| 2,300 | | VMware, Inc. (a) | | | 122,590 | |
| | | | | | | |
| | | | | | 2,569,417 | |
| | | | | | | |
| | | Specialty Retail - 7.60% | | | | |
| 11,550 | | Aeropostale (a)(b) | | | 332,987 | |
| 3,000 | | AutoNation, Inc. (a)(b) | | | 54,240 | |
| 5,400 | | Cabelas, Inc. (a)(b) | | | 94,446 | |
| 19,000 | | Chico’s FAS, Inc. | | | 273,980 | |
| 8,000 | | DSW, Inc. (a)(b) | | | 204,240 | |
| 3,900 | | Genesco, Inc. (a) | | | 120,939 | |
| 4,938 | | Guess?, Inc. | | | 231,987 | |
| 5,491 | | Gymboree Corp. (a)(b) | | | 283,500 | |
| 5,111 | | J.Crew Group, Inc. (a)(b) | | | 234,595 | |
| 4,600 | | Kirklands, Inc. (a)(b) | | | 96,600 | |
| 10,200 | | Limited Brands, Inc. | | | 251,124 | |
| 33,200 | | Pier 1 Imports, Inc. (a)(b) | | | 211,484 | |
| | | | | | | |
Number of
Shares | | | | Value | |
| | | | | | |
| | | Specialty Retail (Continued) | | | | |
| 21,600 | | Select Comfort Corp. (a) | | $ | 172,152 | |
| 5,030 | | Tiffany & Co. | | | 238,875 | |
| 6,780 | | Urban Outfitters, Inc. (a) | | | 257,843 | |
| | | | | | | |
| | | | | | 3,058,992 | |
| | | | | | | |
| | | Textiles, Apparel & Luxury Goods - 3.08% | | | | |
| 1,800 | | Deckers Outdoor Corp. (a)(b) | | | 248,400 | |
| 2,900 | | Fossil, Inc. (a)(b) | | | 109,446 | |
| 3,700 | | Hanesbrands, Inc. (a) | | | 102,934 | |
| 8,500 | | Perry Ellis International, Inc. (a)(b) | | | 192,525 | |
| 4,800 | | Skechers U.S.A., Inc. (a) | | | 174,336 | |
| 1,700 | | UniFirst Corp. | | | 87,550 | |
| 6,820 | | Warnaco Group, Inc. (a) | | | 325,382 | |
| | | | | | | |
| | | | | | 1,240,573 | |
| | | | | | | |
| | | Wireless Telecommunication Services - 0.91% | | | | |
| 10,206 | | SBA Communications Corp. (a)(b) | | | 368,130 | |
| | | | | | | |
| | | Total Common Stocks
(Cost $32,945,814) | | | 40,407,465 | |
| | | | | | | |
| | | MANAGEMENT INVESTMENT
COMPANIES - 0.58% | | | | |
| | | Exchange Traded Funds - 0.58% | | | | |
| 1,115 | | iShares Russell 2000 Growth (b) | | | 81,662 | |
| 3,144 | | iShares Russell MidCap Growth (b) | | | 152,547 | |
| | | | | | | |
| | | | | | 234,209 | |
| | | | | | | |
| | | Total Management Investment
Companies (Cost $229,523) | | | 234,209 | |
| | | | | | | |
| | | REAL ESTATE INVESTMENT TRUSTS - 1.82% | | | | |
| | | Real Estate Investment Trusts - 1.82% | | | | |
| 2,190 | | Digital Realty Trust, Inc. (b) | | | 118,698 | |
| 27,100 | | MFA Financial, Inc. | | | 199,456 | |
| 2,600 | | Nationwide Health Properties, Inc. | | | 91,390 | |
| 7,300 | | Realty Income Corp. (b) | | | 224,037 | |
| 5,700 | | UDR, Inc. | | | 100,548 | |
| | | | | | | |
| | | | | | 734,129 | |
| | | | | | | |
| | | Total Real Estate Investment Trusts
(Cost $702,047) | | | 734,129 | |
| | | | | | | |
See notes to financial statements.
40
|
AssetMark Small/Mid Cap Growth Fund |
SCHEDULE OF INVESTMENTS (Continued) |
March 31, 2010 |
| |
| | | | | | | |
Number of
Shares | | | | Value | |
| | | | | | |
| | | SHORT TERM INVESTMENTS - 0.45% | | | | |
| | | Money Market Funds - 0.45% | | | | |
| 179,307 | | Federated Prime Obligations Fund | | | | |
| | | Effective Yield, 0.11% | | $ | 179,307 | |
| | | | | | | |
| | | Total Short Term Investments
(Cost $179,307) | | | 179,307 | |
| | | | | | | |
| | | | | | | |
Principal
Amount | | | | | | |
| | | | | | | |
| | | INVESTMENTS PURCHASED
AS SECURITIES LENDING
COLLATERAL - 28.26% | | | | |
| | | Corporate Paydown Securities - 4.13% | | | | |
$ | 1,392,814 | | KKR Atlantic East Holding Group
Trust, 3.059%, 03/25/11 (c) | | | 860,917 | |
| 1,594,938 | | KKR Pacific West Holding Group
Trust, 3.059%, 03/25/11 (c) | | | 800,887 | |
| | | | | | | |
| | | Total Corporate Paydown Securities
(Cost $2,987,752) | | | 1,661,804 | |
| | | | | | | |
| | | | | | | |
Number of
Shares | | | | | | |
| | | | | | | |
| | | Money Market Funds - 24.12% | | | | |
| 9,708,659 | | Mount Vernon Prime Portfolio
Effective Yield, 0.24% | | | 9,708,659 | |
| 35,043 | | Reserve Primary Fund (c) | | | — | |
| | | | | | | |
| | | Total Money Market Funds
(Cost $9,743,702) | | | 9,708,659 | |
| | | | | | | |
| | | | | | | |
Principal
Amount | | | | Value | |
| | | | | | |
| | | Cash - 0.01% | | | | |
$ | 2,829 | | Cash | | $ | 2,829 | |
| | | | | | | |
| �� | | Total Cash
(Cost $2,829) | | | 2,829 | |
| | | | | | | |
| | | Total Investments Purchased as
Securities Lending Collateral
(Cost $12,734,283) | | | 11,373,292 | |
| | | | | | | |
| | | Total Investments
(Cost $46,790,974) - 131.50% | | | 52,928,402 | |
| | | Liabilities in Excess of Other
Assets - (31.50)% | | | (12,678,216 | ) |
| | | | | | | |
| | | TOTAL NET ASSETS - 100.00% | | $ | 40,250,186 | |
| | | | | | | |
| |
Percentages are stated as a percent of net assets. |
ADR - American Depositary Receipt |
(a) | Non-income producing. |
(b) | All or a portion of this security is on loan. |
(c) | As of March 31, 2010, the Advisor has fair valued this security and deemed it illiquid. The value of these securities were $1,661,804 which represent 4.13% of total net assets. |
See notes to financial statements.
41
|
AssetMark Small/Mid Cap Value Fund |
SCHEDULE OF INVESTMENTS |
March 31, 2010 |
| |
| | | | | | | |
Number of
Shares | | | | Value | |
| | | | | | |
| | | COMMON STOCKS - 92.93% | | | | |
| | | Aerospace & Defense - 1.73% | | | | |
| 9,665 | | BE Aerospace, Inc. (a) | | $ | 294,299 | |
| 18,163 | | Hexcel Corp. (a) | | | 262,274 | |
| 2,570 | | Triumph Group, Inc. | | | 180,131 | |
| | | | | | | |
| | | | | | 736,704 | |
| | | | | | | |
| | | Airlines - 0.36% | | | | |
| 6,975 | | Continental Airlines, Inc. (a) | | | 153,241 | |
| | | | | | | |
| | | Auto Components - 1.44% | | | | |
| 7,892 | | ArvinMeritor, Inc. (a)(b) | | | 105,358 | |
| 5,886 | | Cooper Tire & Rubber Co. (b) | | | 111,952 | |
| 7,591 | | Tenneco, Inc. (a) | | | 179,527 | |
| 7,550 | | TRW Automotive Holdings
Corp. (a)(b) | | | 215,779 | |
| | | | | | | |
| | | | | | 612,616 | |
| | | | | | | |
| | | Building Products - 0.86% | | | | |
| 5,820 | | Ameron International, Inc. | | | 366,020 | |
| | | | | | | |
| | | Capital Markets - 2.54% | | | | |
| 19,670 | | Jefferies Group, Inc. (b) | | | 465,589 | |
| 2,880 | | KBW, Inc. (a) | | | 77,472 | |
| 8,920 | | Knight Capital Group, Inc. (a)(b) | | | 136,030 | |
| 15,070 | | Raymond James Financial, Inc. (b) | | | 402,972 | |
| | | | | | | |
| | | | | | 1,082,063 | |
| | | | | | | |
| | | Chemicals - 3.56% | | | | |
| 5,091 | | Albemarle Corp. | | | 217,029 | |
| 3,752 | | Ashland, Inc. | | | 197,993 | |
| 6,837 | | Celanese Corp. | | | 217,759 | |
| 1,439 | | CF Industries Holdings, Inc. (b) | | | 131,208 | |
| 8,868 | | Innophos Holdings, Inc. | | | 247,417 | |
| 4,021 | | Intrepid Potash, Inc. (a)(b) | | | 121,957 | |
| 7,368 | | Rockwood Holdings, Inc. (a) | | | 196,136 | |
| 11,608 | | Solutia, Inc. (a) | | | 187,005 | |
| | | | | | | |
| | | | | | 1,516,504 | |
| | | | | | | |
| | | Commercial Banks - 10.65% | | | | |
| 14,340 | | Associated Banc Corp. (b) | | | 197,892 | |
| 14,216 | | Cardinal Financial Corp. (b) | | | 151,827 | |
| 32,430 | | Fifth Third Bancorp (b) | | | 440,724 | |
| 14,272 | | First Financial Bancorp (b) | | | 253,899 | |
| 7,013 | | FirstMerit Corp. | | | 151,270 | |
| | | | | | | |
Number of
Shares | | | | Value | |
| | | | | | |
| | | Commercial Banks (Continued) | | | | |
| 4,616 | | Hancock Holding Co. | | $ | 192,995 | |
| 31,610 | | Investors Bancorp, Inc. (a) | | | 417,252 | |
| 26,500 | | KeyCorp (b) | | | 205,375 | |
| 33,587 | | National Penn Bancshares, Inc. (b) | | | 231,750 | |
| 58,730 | | Regions Financial Corporation (b) | | | 461,031 | |
| 25,328 | | Susquehanna Bancshares, Inc. (b) | | | 248,468 | |
| 8,415 | | Trustmark Corp. (b) | | | 205,578 | |
| 15,160 | | UMB Financial Corp. (b) | | | 615,496 | |
| 35,424 | | Western Alliance Bancorp (a)(b) | | | 201,563 | |
| 21,820 | | Whitney Holding Corp. | | | 300,898 | |
| 12,131 | | Zions Bancorporation (b) | | | 264,698 | |
| | | | | | | |
| | | | | | 4,540,716 | |
| | | | | | | |
| | | Commercial Services & Supplies - 0.65% | | | | |
| 4,889 | | ABM Industries, Inc. | | | 103,647 | |
| 3,893 | | Consolidated Graphics, Inc. (a) | | | 161,209 | |
| 642 | | Tetra Tech, Inc. (a) | | | 14,792 | |
| | | | | | | |
| | | | | | 279,648 | |
| | | | | | | |
| | | Communications Equipment - 2.72% | | | | |
| 77,347 | | ADC Telecommunications (a)(b) | | | 565,407 | |
| 4,331 | | Commscope, Inc. (a) | | | 121,355 | |
| 4,590 | | Comtech Telecommunications
Corp. (a) | | | 146,834 | |
| 42,950 | | Tellabs, Inc. | | | 325,131 | |
| | | | | | | |
| | | | | | 1,158,727 | |
| | | | | | | |
| | | Computers & Peripherals - 0.38% | | | | |
| 5,051 | | Diebold, Inc. (b) | | | 160,420 | |
| | | | | | | |
| | | Construction & Engineering - 0.86% | | | | |
| 13,783 | | Dycom Industries, Inc. (a) | | | 120,877 | |
| 3,290 | | Granite Construction, Inc. (b) | | | 99,424 | |
| 27,805 | | Great Lakes Dredge & Dock Corp. | | | 145,976 | |
| | | | | | | |
| | | | | | 366,277 | |
| | | | | | | |
| | | Consumer Finance - 1.25% | | | | |
| 22,530 | | AmeriCredit Corp. (a)(b) | | | 535,313 | |
| | | | | | | |
| | | Containers & Packaging - 0.43% | | | | |
| 8,901 | | Temple Inland, Inc. | | | 181,847 | |
| | | | | | | |
| | | Diversified Consumer Services - 0.98% | | | | |
| 13,410 | | Sotheby’s (b) | | | 416,917 | |
| | | | | | | |
See notes to financial statements.
42
|
AssetMark Small/Mid Cap Value Fund |
SCHEDULE OF INVESTMENTS (Continued) |
March 31, 2010 |
| |
| | | | | | | |
Number of
Shares | | | | Value | |
| | | | | | |
| | | COMMON STOCKS (Continued) | | | | |
| | | Diversified Financial Services - 3.01% | | | | |
| 7,560 | | CIT Group, Inc. (a) | | $ | 294,538 | |
| 28,250 | | Leucadia National Corp. (a)(b) | | | 700,882 | |
| 7,984 | | World Acceptance Corp. (a)(b) | | | 288,063 | |
| | | | | | | |
| | | | | | 1,283,483 | |
| | | | | | | |
| | | Diversified Telecommunication Services - 1.78% | | | | |
| 17,896 | | CenturyTel, Inc. | | | 634,592 | |
| 36,769 | | Cincinnati Bell, Inc. (a) | | | 125,382 | |
| | | | | | | |
| | | | | | 759,974 | |
| | | | | | | |
| | | Electric Utilities - 1.55% | | | | |
| 5,796 | | Cleco Corp. (b) | | | 153,884 | |
| 12,839 | | Northeast Utilities | | | 354,870 | |
| 12,334 | | PNM Resources, Inc. | | | 154,545 | |
| | | | | | | |
| | | | | | 663,299 | |
| | | | | | | |
| | | Electrical Equipment - 1.83% | | | | |
| 1,680 | | A.O. Smith Corp. | | | 88,318 | |
| 5,100 | | Baldor Electric Co. (b) | | | 190,740 | |
| 24,070 | | Encore Wire Corp. (b) | | | 500,656 | |
| | | | | | | |
| | | | | | 779,714 | |
| | | | | | | |
| | | Electronic Equipment & Instruments - 3.69% | | | | |
| 22,080 | | Avnet, Inc. (a) | | | 662,400 | |
| 8,882 | | Benchmark Electronics, Inc. (a) | | | 184,213 | |
| 10,510 | | Ingram Micro, Inc. (a) | | | 184,450 | |
| 17,030 | | Molex, Inc. | | | 300,579 | |
| 4,625 | | Plexus Corp. (a) | | | 166,639 | |
| 8,625 | | TTM Technologies, Inc. (a)(b) | | | 76,590 | |
| | | | | | | |
| | | | | | 1,574,871 | |
| | | | | | | |
| | | Energy Equipment & Services - 1.10% | | | | |
| 4,833 | | Hornbeck Offshore Services,
Inc. (a) | | | 89,749 | |
| 27,927 | | Key Energy Services, Inc. (a) | | | 266,703 | |
| 4,661 | | T-3 Energy Services, Inc. (a) | | | 114,474 | |
| | | | | | | |
| | | | | | 470,926 | |
| | | | | | | |
| | | Food & Staples Retailing - 2.00% | | | | |
| 12,960 | | Casey’s General Stores, Inc. (b) | | | 406,944 | |
| 35,780 | | Winn Dixie Stores, Inc. (a) | | | 446,892 | |
| | | | | | | |
| | | | | | 853,836 | |
| | | | | | | |
| | | Food Products - 0.77% | | | | |
| 1,729 | | The J.M. Smucker Co. | | | 104,189 | |
| 5,094 | | TreeHouse Foods, Inc. (a)(b) | | | 223,474 | |
| | | | | | | |
| | | | | | 327,663 | |
| | | | | | | |
| | | | | | | |
Number of
Shares | | | | Value | |
| | | | | | |
| | | Gas Utilities - 2.38% | | | | |
| 5,029 | | New Jersey Resources Corp. | | $ | 188,889 | |
| 13,210 | | Oneok, Inc. | | | 603,037 | |
| 8,434 | | UGI Corp. (b) | | | 223,838 | |
| | | | | | | |
| | | | | | 1,015,764 | |
| | | | | | | |
| | | Health Care Equipment & Supplies - 0.46% | | | | |
| 4,108 | | Kinetic Concepts, Inc. (a)(b) | | | 196,403 | |
| | | | | | | |
| | | Health Care Providers & Services - 3.25% | | | | |
| 4,105 | | Amerigroup Corp. (a) | | | 136,450 | |
| 9,908 | | Assisted Living Concepts, Inc. (a) | | | 325,379 | |
| 19,534 | | Health Management Associates,
Inc. (a) | | | 167,992 | |
| 4,103 | | Magellan Health Services, Inc. (a) | | | 178,398 | |
| 12,652 | | PerkinElmer, Inc. | | | 302,383 | |
| 7,808 | | Universal Health Services, Inc. | | | 273,983 | |
| | | | | | | |
| | | | | | 1,384,585 | |
| | | | | | | |
| | | Hotels, Restaurants & Leisure - 4.32% | | | | |
| 16,009 | | Callaway Golf Co. (b) | | | 141,199 | |
| 5,473 | | CEC Entertainment, Inc. (a) | | | 208,467 | |
| 2,700 | | Hyatt Hotels Corp. (a) | | | 105,192 | |
| 14,481 | | MGM MIRAGE (a)(b) | | | 173,772 | |
| 12,113 | | Penn National Gaming, Inc. (a)(b) | | | 336,741 | |
| 5,589 | | Starwood Hotels & Resorts
Worldwide, Inc. (b) | | | 260,671 | |
| 15,400 | | Vail Resorts, Inc. (a)(b) | | | 617,386 | |
| | | | | | | |
| | | | | | 1,843,428 | |
| | | | | | | |
| | | Household Durables - 0.68% | | | | |
| 12,450 | | D.R. Horton, Inc. (b) | | | 156,870 | |
| 5,996 | | Ryland Group, Inc. (b) | | | 134,550 | |
| | | | | | | |
| | | | | | 291,420 | |
| | | | | | | |
| | | | | | | |
| | | Independent Power Producers &
Energy Traders - 0.19% | | | | |
| 21,873 | | RRI Energy, Inc. (a) | | | 80,711 | |
| | | | | | | |
| | | Insurance - 4.52% | | | | |
| 9,988 | | American Financial Group, Inc. | | | 284,159 | |
| 4,392 | | Arch Capital Group Ltd. (a)(b) | | | 334,890 | |
| 6,090 | | The Hanover Insurance Group, Inc. | | | 265,585 | |
| 11,870 | | W.R. Berkley Corp. | | | 309,688 | |
| 2,070 | | White Mountains Insurance
Group Ltd. | | | 734,850 | |
| | | | | | | |
| | | | | | 1,929,172 | |
| | | | | | | |
See notes to financial statements.
43
|
AssetMark Small/Mid Cap Value Fund |
SCHEDULE OF INVESTMENTS (Continued) |
March 31, 2010 |
| |
| | | | | | | |
Number of
Shares | | | | Value | |
| | | | | | |
| | | COMMON STOCKS (Continued) | | | | |
| | | IT Services - 0.36% | | | | |
| 16,700 | | Sapient Corp. (a) | | $ | 152,638 | |
| | | | | | | |
| | | Machinery - 2.98% | | | | |
| 7,881 | | Actuant Corp. | | | 154,073 | |
| 4,400 | | Joy Global, Inc. | | | 249,040 | |
| 8,545 | | Manitowoc, Inc. | | | 111,085 | |
| 45,892 | | Mueller Water Products, Inc. - | | | | |
| | | Class A | | | 219,364 | |
| 27,030 | | Trinity Industries, Inc. (b) | | | 539,519 | |
| | | | | | | |
| | | | | | 1,273,081 | |
| | | | | | | |
| | | Media - 0.72% | | | | |
| 8,848 | | Entercom Communications | | | | |
| | | Corp. (a)(b) | | | 105,203 | |
| 12,110 | | Gannett Co., Inc. (b) | | | 200,057 | |
| | | | | | | |
| | | | | | 305,260 | |
| | | | | | | |
| | | Metals & Mining - 5.58% | | | | |
| 7,091 | | AK Steel Holding Corp. | | | 162,100 | |
| 7,610 | | Allegheny Technologies, Inc. | | | 410,864 | |
| 6,772 | | Carpenter Technology Corp. (b) | | | 247,855 | |
| 22,860 | | Commercial Metals Co. | | | 344,272 | |
| 8,380 | | Kaiser Aluminum Corp. (b) | | | 323,217 | |
| 13,351 | | Schnitzer Steel Industries, Inc. (b) | | | 701,328 | |
| 10,862 | | Steel Dynamics, Inc. (b) | | | 189,759 | |
| | | | | | | |
| | | | | | 2,379,395 | |
| | | | | | | |
| | | Multi-Utilities - 1.58% | | | | |
| 11,603 | | MDU Resources Group, Inc. | | | 250,393 | |
| 5,651 | | Vectren Corp. (b) | | | 139,692 | |
| 5,724 | | Wisconsin Energy Corp. (b) | | | 282,823 | |
| | | | | | | |
| | | | | | 672,908 | |
| | | | | | | |
| | | Oil & Gas - 8.60% | | | | |
| 4,677 | | Berry Petroleum Co. | | | 131,704 | |
| 21,644 | | BPZ Resources, Inc. (a)(b) | | | 159,083 | |
| 14,970 | | Cabot Oil & Gas Corp. (b) | | | 550,896 | |
| 4,849 | | Carrizo Oil & Co, Inc. (a)(b) | | | 111,285 | |
| 1,330 | | CNX Gas Corp. (a) | | | 50,607 | |
| 43,266 | | Denbury Resources, Inc. (a)(b) | | | 729,897 | |
| 7,730 | | Overseas Shipholding Group, | | | | |
| | | Inc. (b) | | | 303,248 | |
| 14,900 | | Petrohawk Energy Corp. (a) | | | 302,172 | |
| 9,220 | | Plains All American Pipeline, L.P. | | | 524,618 | |
| | | | | | | |
Number of
Shares | | | | Value | |
| | | | | | |
| | | Oil & Gas (Continued) | | | | |
| 4,920 | | Range Resources Corp. (b) | | $ | 230,600 | |
| 6,450 | | Ultra Petroleum Corp. (a) | | | 300,764 | |
| 7,886 | | Venoco, Inc. (a) | | | 101,177 | |
| 2,138 | | Whiting Petroleum Corp. (a) | | | 172,836 | |
| | | | | | | |
| | | | | | 3,668,887 | |
| | | | | | | |
| | | Pharmaceuticals - 0.73% | | | | |
| 26,471 | | King Pharmaceuticals, Inc. (a) | | | 311,299 | |
| | | | | | | |
| | | Road & Rail - 1.23% | | | | |
| 5,720 | | AMERCO (a)(b) | | | 310,539 | |
| 2,508 | | J.B. Hunt Transport Services, Inc. | | | 89,987 | |
| 3,673 | | Old Dominion Freight Lines, Inc. (a) | | | 122,641 | |
| | | | | | | |
| | | | | | 523,167 | |
| | | | | | | |
| | | Semiconductor & Semiconductor | | | | |
| | | Equipment - 2.21% | | | | |
| 22,379 | | Atmel Corp. (a) | | | 112,566 | |
| 8,878 | | Diodes, Inc. (a)(b) | | | 198,867 | |
| 32,190 | | Entegris, Inc. (a) | | | 162,238 | |
| 8,920 | | Fairchild Semiconductor | | | | |
| | | International (a) | | | 94,998 | |
| 33,931 | | Integrated Device Technology, | | | | |
| | | Inc. (a) | | | 207,997 | |
| 8,416 | | MKS Instrument, Inc. (a)(b) | | | 164,870 | |
| | | | | | | |
| | | | | | 941,536 | |
| | | | | | | |
| | | Software - 1.33% | | | | |
| 5,920 | | JDA Software Group, Inc. (a) | | | 164,694 | |
| 12,890 | | Parametric Technology Corp. (a) | | | 232,665 | |
| 5,402 | | Progress Software Corp. (a) | | | 169,785 | |
| | | | | | | |
| | | | | | 567,144 | |
| | | | | | | |
| | | Specialty Retail - 3.67% | | | | |
| 11,520 | | Brown Shoe Co., Inc. | | | 178,329 | |
| 44,868 | | Foot Locker, Inc. (b) | | | 674,815 | |
| 6,220 | | Genesco, Inc. (a)(b) | | | 192,882 | |
| 16,400 | | Mens Wearhouse, Inc. (b) | | | 392,616 | |
| 7,830 | | OfficeMax, Inc. (a)(b) | | | 128,569 | |
| | | | | | | |
| | | | | | 1,567,211 | |
| | | | | | | |
| | | Textiles, Apparel & Luxury | | | | |
| | | Goods - 0.42% | | | | |
| 9,426 | | Jones Apparel Group, Inc. | | | 179,283 | |
| | | | | | | |
See notes to financial statements.
44
|
AssetMark Small/Mid Cap Value Fund |
SCHEDULE OF INVESTMENTS (Continued) |
March 31, 2010 |
| |
| | | | | | | |
Number of
Shares | | | | Value | |
| | | | | | |
| | | COMMON STOCKS (Continued) | | | | |
| | | Thrifts & Mortgage Finance - 3.58% | | | | |
| 11,760 | | Capitol Federal Financial (b) | | $ | 440,530 | |
| 44,790 | | Hudson City Bancorp | | | 634,226 | |
| 18,454 | | MGIC Investment Corp. (a)(b) | | | 202,440 | |
| 16,107 | | Radian Group, Inc. (b) | | | 251,914 | |
| | | | | | | |
| | | | | | 1,529,110 | |
| | | | | | | |
| | | Total Common Stocks | | | | |
| | | (Cost $31,707,792) | | | 39,633,181 | |
| | | | | | | |
| | | REAL ESTATE INVESTMENT TRUSTS - 8.16% | |
| | | Real Estate Investment Trusts - 8.16% | | | | |
| 15,130 | | Cedar Shopping Centers, Inc. | | | 119,678 | |
| 11,120 | | Colonial Properties Trust | | | 143,226 | |
| 16,648 | | Developers Diversified Realty Corp. | | | 202,606 | |
| 2,880 | | Digital Realty Trust, Inc. (b) | | | 156,096 | |
| 25,480 | | Education Realty Trust, Inc. | | | 146,255 | |
| 1,630 | | Federal Realty Investment Trust | | | 118,680 | |
| 4,000 | | Health Care REIT, Inc. | | | 180,920 | |
| 6,550 | | Highwoods Properties, Inc. | | | 207,832 | |
| 12,236 | | Inland Real Estate Corp. (b) | | | 111,959 | |
| 17,261 | | Lexington Realty Trust | | | 112,369 | |
| 6,734 | | National Retail Properties, Inc. (b) | | | 153,737 | |
| 19,640 | | Plum Creek Timber Co., Inc. (b) | | | 764,192 | |
| 5,532 | | Post Properties, Inc. (b) | | | 121,815 | |
| 8,900 | | SL Green Realty Corp. | | | 509,703 | |
| 27,226 | | Sunstone Hotel Investors, Inc. (a)(b) | | | 304,115 | |
| 17,480 | | U-Store-It Trust | | | 125,856 | |
| | | | | | | |
| | | | | | 3,479,039 | |
| | | | | | | |
| | | Total Real Estate Investment Trusts | | | | |
| | | (Cost $3,077,555) | | | 3,479,039 | |
| | | | | | | |
| | | SHORT TERM INVESTMENTS - 1.51% | | | | |
| | | Money Market Funds - 1.51% | | | | |
| 645,606 | | Federated Prime Obligations Fund | | | | |
| | | Effective Yield, 0.11% | | | 645,606 | |
| | | | | | | |
| | | Total Short Term Investments | | | | |
| | | (Cost $645,606) | | | 645,606 | |
| | | | | | | |
| | | | | | | |
Principal
Amount | | | | Value | |
| | | | | | |
| | | INVESTMENTS PURCHASED | | | | |
| | | AS SECURITIES LENDING | | | | |
| | | COLLATERAL - 29.98% | | | | |
| | | Corporate Paydown | | | | |
| | | Securities - 2.27% | | | | |
$ | 813,849 | | KKR Atlantic East Holding Group | | | | |
| | | Trust, 3.059%, 03/25/11 (c) | | $ | 503,052 | |
| 931,954 | | KKR Pacific West Holding Group | | | | |
| | | Trust, 3.059%, 03/25/11 (c) | | | 467,974 | |
| | | | | | | |
| | | Total Corporate Paydown Securities | | | | |
| | | (Cost $1,745,803) | | | 971,026 | |
| | | | | | | |
| | | | | | | |
Number of
Shares | | | | | | |
| | | | | | | |
| | | Money Market Funds - 27.70% | | | | |
| 11,813,025 | | Mount Vernon Prime Portfolio | | | | |
| | | Effective Yield, 0.24% | | | 11,813,025 | |
| 35,476 | | Reserve Primary Fund (c) | | | — | |
| | | | | | | |
| | | Total Money Market Funds | | | | |
| | | (Cost $11,848,501) | | | 11,813,025 | |
| | | | | | | |
| | | | | | | |
Principal
Amount | | | | | | |
| | | | | | | |
| | | Cash - 0.01% | | | | |
$ | 3,442 | | Cash | | | 3,442 | |
| | | | | | | |
| | | Total Cash | | | | |
| | | (Cost $3,442) | | | 3,442 | |
| | | | | | | |
| | | Total Investments Purchased as | | | | |
| | | Securities Lending Collateral | | | | |
| | | (Cost $13,597,746) | | | 12,787,493 | |
| | | | | | | |
| | | Total Investments | | | | |
| | | (Cost $49,028,699) - 132.58% | | | 56,545,319 | |
| | | Liabilities in Excess of Other | | | | |
| | | Assets - (32.58)% | | | (13,895,831 | ) |
| | | | | | | |
| | | TOTAL NET ASSETS - 100.00% | | $ | 42,649,488 | |
| | | | | | | |
Percentages are stated as a percent of net assets.
| |
(a) | Non-income producing. |
(b) | All or a portion of this security is on loan. |
(c) | As of March 31, 2010, the Advisor has fair valued this security and deemed it illiquid. The value of these securities were $971,026 which represent 2.27% of total net assets. |
See notes to financial statements.
45
|
AssetMark International Equity Fund |
SCHEDULE OF INVESTMENTS |
March 31, 2010 |
| |
| | | | | | | |
Number of
Shares | | | | Value | |
| | | | | | |
| | | COMMON STOCKS - 97.67% | | | | |
| | | Australia - 5.68% | | | | |
| 727,021 | | Incitec Pivot Ltd. | | $ | 2,309,705 | |
| 48,531 | | Leighton Holdings | | | 1,733,406 | |
| 189,264 | | QBE Insurance Group Ltd. | | | 3,613,048 | |
| 1,460,222 | | Telstra Corp. Ltd. | | | 4,003,836 | |
| 125,726 | | Wesfarmers Ltd. | | | 3,663,497 | |
| | | | | | | |
| | | | | | 15,323,492 | |
| | | | | | | |
| | | Austria - 0.62% | | | | |
| 85,920 | | Wienerberger AG (a) | | | 1,668,497 | |
| | | | | | | |
| | | Canada - 1.41% | | | | |
| 20,900 | | First Quantum Minerals Ltd. | | | 1,719,700 | |
| 64,200 | | Suncor Energy, Inc. (a) | | | 2,087,851 | |
| | | | | | | |
| | | | | | 3,807,551 | |
| | | | | | | |
| | | China - 1.42% | | | | |
| 4,828,000 | | Bank of China Ltd. | | | 2,568,151 | |
| 34,700 | | Mindray Medical International | | | | |
| | | Ltd. - ADR | | | 1,263,774 | |
| | | | | | | |
| | | | | | 3,831,925 | |
| | | | | | | |
| | | Denmark - 0.99% | | | | |
| 31,850 | | Carlsberg AS | | | 2,670,155 | |
| | | | | | | |
| | | Finland - 0.47% | | | | |
| 95,520 | | UPM-Kymmene Corp. | | | 1,266,600 | |
| | | | | | | |
| | | France - 9.93% | | | | |
| 101,942 | | Carrefour SA | | | 4,911,828 | |
| 218,045 | | France Telecom SA | | | 5,222,794 | |
| 68,594 | | Saint-Gobain SA | | | 3,294,153 | |
| 44,094 | | Sanofi-Aventis SA | | | 3,290,681 | |
| 35,378 | | Societe Generale SA | | | 2,220,324 | |
| 35,216 | | Technip | | | 2,858,627 | |
| 85,869 | | Total SA | | | 4,983,687 | |
| | | | | | | |
| | | | | | 26,782,094 | |
| | | | | | | |
| | | Germany - 5.96% | | | | |
| 27,352 | | Adidas-Salomon AG | | | 1,462,319 | |
| 57,363 | | Aixtron AG | | | 2,061,781 | |
| 149,850 | | Deutsche Telekom AG | | | 2,025,039 | |
| 26,679 | | MAN SE | | | 2,231,558 | |
| 50,716 | | RWE AG | | | 4,499,147 | |
| 37,927 | | Siemens AG | | | 3,789,573 | |
| | | | | | | |
| | | | | | 16,069,417 | |
| | | | | | | |
| | | | | | | |
Number of
Shares | | | | Value | |
| | | | | | |
| | | Hong Kong - 2.74% | | | | |
| 9,400 | | CNOOC Ltd. - ADR | | $ | 1,551,752 | |
| 4,253,000 | | GOME Electrical Appliances | | | | |
| | | Holding Ltd. (a) | | | 1,426,505 | |
| 330,500 | | Hongkong Electric Holdings Ltd. | | | 1,960,325 | |
| 163,000 | | Sun Hung Kai Properties Ltd. | | | 2,445,977 | |
| | | | | | | |
| | | | | | 7,384,559 | |
| | | | | | | |
| | | Israel - 0.71% | | | | |
| 30,100 | | Teva Pharmaceutical | | | | |
| | | Industries, Ltd. - ADR | | | 1,898,708 | |
| | | | | | | |
| | | Italy - 0.93% | | | | |
| 671,825 | | Intesa Sanpaolo SpA | | | 2,501,934 | |
| | | | | | | |
| | | Japan - 18.95% | | | | |
| 376,000 | | The Bank of Yokohama Ltd. | | | 1,845,024 | |
| 136,900 | | Bridgestone Corp. | | | 2,342,896 | |
| 104,600 | | Canon, Inc. | | | 4,838,299 | |
| 1,027 | | Dai-ichi Life Insurance (a)(b) | | | 1,537,919 | |
| 188,400 | | Kao Corp. | | | 4,778,128 | |
| 683 | | KDDI Corp. | | | 3,535,765 | |
| 121,000 | | Mitsui Fudosan Co., Ltd. | | | 2,059,523 | |
| 107,000 | | Nikon Corp. | | | 2,339,345 | |
| 517,000 | | Nippon Yusen Kabushiki Kaisha | | | 2,044,735 | |
| 279,200 | | Nomura Holdings, Inc. | | | 2,048,671 | |
| 168,100 | | Panasonic Corp. | | | 2,577,147 | |
| 144,000 | | Ricoh Co. | | | 2,255,392 | |
| 164,700 | | Seven & i Holdings Co., Ltd. | | | 3,984,272 | |
| 49,200 | | Shin-etsu Chemical Co., Ltd. | | | 2,863,268 | |
| 109,100 | | Takeda Pharmaceutical Co., Ltd. | | | 4,804,102 | |
| 120,900 | | Tokio Marine Holdings, Inc. | | | 3,408,313 | |
| 95,200 | | Toyota Motor Corp. | | | 3,827,932 | |
| | | | | | | |
| | | | | | 51,090,731 | |
| | | | | | | |
| | | Netherlands - 6.14% | | | | |
| 75,842 | | ASML Holding NV | | | 2,688,993 | |
| 55,725 | | Heineken NV | | | 2,861,944 | |
| 219,891 | | Reed Elsevier NV | | | 2,668,573 | |
| 184,529 | | Royal Dutch Shell Plc | | | 5,336,316 | |
| 99,273 | | Unilever NV | | | 3,003,303 | |
| | | | | | | |
| | | | | | 16,559,129 | |
| | | | | | | |
| | | Norway - 1.26% | | | | |
| 179,200 | | DNB NOR ASA (a) | | | 2,049,572 | |
| 171,048 | | Storebrand ASA (a) | | | 1,353,507 | |
| | | | | | | |
| | | | | | 3,403,079 | |
| | | | | | | |
See notes to financial statements.
46
|
AssetMark International Equity Fund |
SCHEDULE OF INVESTMENTS (Continued) |
March 31, 2010 |
| |
| | | | | | | |
Number of
Shares | | | | Value | |
| | | | | | |
| | | COMMON STOCKS (Continued) | | | | |
| | | Republic of Korea - 1.67% | | | | |
| 92,300 | | KT Corp. - ADR (a) | | $ | 1,916,148 | |
| 7,036 | | Samsung Electronic (a) | | | 2,584,873 | |
| | | | | | | |
| | | | | | 4,501,021 | |
| | | | | | | |
| | | Singapore - 3.84% | | | | |
| 226,000 | | DBS Group Holdings Ltd. | | | 2,304,241 | |
| 487,698 | | Oversea-Chinese Banking | | | | |
| | | Corp. Ltd. | | | 3,030,908 | |
| 1,050,000 | | Singapore Telecommunications Ltd. | | | 2,375,150 | |
| 193,000 | | United Overseas Bank Ltd. | | | 2,644,778 | |
| | | | | | | |
| | | | | | 10,355,077 | |
| | | | | | | |
| | | Spain - 5.36% | | | | |
| 404,342 | | Banco Santander Central | | | | |
| | | Hispano, SA | | | 5,363,228 | |
| 376,056 | | Iberdrola Renovables | | | 1,559,635 | |
| 475,778 | | Iberdrola SA | | | 4,028,751 | |
| 147,901 | | Telefonica SA | | | 3,504,462 | |
| | | | | | | |
| | | | | | 14,456,076 | |
| | | | | | | |
| | | Switzerland - 7.51% | | | | |
| 158,167 | | ABB Ltd. | | | 3,457,637 | |
| 46,034 | | Credit Suisse Group AG | | | 2,369,481 | |
| 106,455 | | Novartis AG | | | 5,758,572 | |
| 86,514 | | Petroplus Holdings AG | | | 1,609,888 | |
| 24,791 | | Roche Holdings AG | | | 4,026,320 | |
| 11,827 | | Zurich Financial Services AG | | | 3,033,551 | |
| | | | | | | |
| | | | | | 20,255,449 | |
| | | | | | | |
| | | Taiwan - 1.90% | | | | |
| 1,804,504 | | Taiwan Semiconductor | | | | |
| | | Manufacturing Co., Ltd. | | | 3,496,662 | |
| 154,653 | | Taiwan Semiconductor | | | | |
| | | Manufacturing Co., Ltd. - ADR | | | 1,622,310 | |
| | | | | | | |
| | | | | | 5,118,972 | |
| | | | | | | |
| | | Thailand - 0.50% | | | | |
| 316,300 | | Bangkok Bank | | | 1,343,290 | |
| | | | | | | |
| | | United Kingdom - 19.68% | | | | |
| 396,250 | | Aviva Plc | | | 2,314,833 | |
| 542,680 | | Barclays Plc | | | 2,954,989 | |
| 960,387 | | BP Plc | | | 9,090,195 | |
| 106,453 | | British American Tobacco Plc | | | 3,670,012 | |
| 299,418 | | Compass Group Plc | | | 2,390,310 | |
| | | | | | | |
Number of
Shares | | | | Value | |
| | | | | | |
| | | United Kingdom (Continued) | | | | |
| 278,698 | | GlaxoSmithKline Plc | | $ | 5,349,534 | |
| 431,284 | | HSBC Holdings Plc | | | 4,370,585 | |
| 177,302 | | Pearson Plc | | | 2,779,581 | |
| 292,990 | | Persimmon Plc (a) | | | 2,074,043 | |
| 65,654 | | Rio Tinto Plc | | | 3,881,376 | |
| 189,192 | | Unilever Plc | | | 5,538,521 | |
| 1,524,051 | | Vodafone Group Plc | | | 3,524,999 | |
| 578,761 | | Wm Morrison Supermarkets Plc | | | 2,576,437 | |
| 134,448 | | Xstrata Plc | | | 2,544,601 | |
| | | | | | | |
| | | | | | 53,060,016 | |
| | | | | | | |
| | | Total Common Stocks | | | | |
| | | (Cost $235,813,051) | | | 263,347,772 | |
| | | | | | | |
| | | PREFERRED STOCKS - 0.91% | | | | |
| | | Brazil - 0.91% | | | | |
| 88,200 | | Vale SA | | | 2,448,432 | |
| | | | | | | |
| | | Total Preferred Stocks | | | | |
| | | (Cost $2,241,323) | | | 2,448,432 | |
| | | | | | | |
| | | SHORT TERM INVESTMENTS - 1.38% | | | | |
| | | Money Market Funds - 1.38% | | | | |
| 3,710,512 | | Federated Prime Obligations Fund | | | | |
| | | Effective Yield, 0.11% | | | 3,710,512 | |
| | | | | | | |
| | | Total Short Term Investments | | | | |
| | | (Cost $3,710,512) | | | 3,710,512 | |
| | | | | | | |
| | | | | | | |
Principal
Amount | | | | | | |
| | | | | | | |
| | | INVESTMENTS PURCHASED | | | | |
| | | AS SECURITIES LENDING | | | | |
| | | COLLATERAL - 0.36% | | | | |
| | | Corporate Paydown Securities - 0.36% | | | | |
$ | 824,150 | | KKR Atlantic East Holding Group | | | | |
| | | Trust, 3.059%, 03/25/11 (b) | | | 509,419 | |
| 943,750 | | KKR Pacific West Holding Group | | | | |
| | | Trust, 3.059%, 03/25/11 (b) | | | 473,898 | |
| | | | | | | |
| | | Total Corporate Paydown Securities | | | | |
| | | (Cost $1,767,900) | | | 983,317 | |
| | | | | | | |
See notes to financial statements.
47
|
AssetMark International Equity Fund |
SCHEDULE OF INVESTMENTS (Continued) |
March 31, 2010 |
| |
| | | | | | | |
Number of
Shares | | | | Value | |
| | | | | | |
| | | Money Market Funds - 0.00% | | | | |
| 31,072 | | Reserve Primary Fund (b) | | | — | |
| | | | | | | |
| | | Total Money Market Funds | | | | |
| | | (Cost $31,072) | | | — | |
| | | | | | | |
| | | Total Investments Purchased as | | | | |
| | | Securities Lending Collateral | | | | |
| | | (Cost $1,798,972) | | | 983,317 | |
| | | | | | | |
| | | Total Investments | | | | |
| | | (Cost $243,563,858) - 100.32% | | | 270,490,033 | |
| | | Liabilities in Excess of Other | | | | |
| | | Assets - (0.32)% | | | (868,464 | ) |
| | | | | | | |
| | | TOTAL NET ASSETS - 100.00% | | $ | 269,621,569 | |
| | | | | | | |
| |
Percentages are stated as a percent of net assets. |
ADR - American Depositary Receipt |
(a) | Non-income producing. |
(b) | As of March 31, 2010 the Advisor has fair valued this security and deemed it illiquid. The value of these securities were $2,521,236 which represent 0.94% of total net assets. |
See notes to financial statements.
48
|
AssetMark Real Estate Securities Fund
SCHEDULE OF INVESTMENTS
March 31, 2010 |
| |
| | | | | | | |
Number of
Shares | | | | Value | |
| | | | | | |
| | | REAL ESTATE INVESTMENT TRUSTS, | | | | |
| | | COMMON STOCKS - 98.71% | | | | |
| | | Apartments - 15.55% | | | | |
| 31,277 | | Apartment Investment & | | | | |
| | | Management Co. (a) | | $ | 575,809 | |
| 17,571 | | AvalonBay Communities, Inc. (a) | | | 1,517,256 | |
| 18,052 | | BRE Properties, Inc. | | | 645,359 | |
| 77,487 | | Equity Residential | | | 3,033,616 | |
| 10,259 | | Essex Property Trust, Inc. | | | 922,797 | |
| 9,350 | | Home Properties, Inc. (a) | | | 437,580 | |
| 45,040 | | UDR, Inc. | | | 794,506 | |
| | | | | | | |
| | | | | | 7,926,923 | |
| | | | | | | |
| | | Diversified - 14.28% | | | | |
| 6,630 | | American Campus | | | | |
| | | Communities, Inc. (a) | | | 183,386 | |
| 37,660 | | Digital Realty Trust, Inc. (a) | | | 2,041,172 | |
| 23,081 | | Duke Realty Corp. | | | 286,204 | |
| 11,422 | | Entertainment Properties Trust (a) | | | 469,787 | |
| 9,450 | | Equity Lifestyle Properties, Inc. | | | 509,166 | |
| 32,415 | | Liberty Property Trust | | | 1,100,165 | |
| 35,557 | | Vornado Realty Trust (a) | | | 2,691,665 | |
| | | | | | | |
| | | | | | 7,281,545 | |
| | | | | | | |
| | | Forestry - 2.46% | | | | |
| 15,666 | | Plum Creek Timber Co., Inc. (a) | | | 609,564 | |
| 14,130 | | Rayonier, Inc. (a) | | | 641,926 | |
| | | | | | | |
| | | | | | 1,251,490 | |
| | | | | | | |
| | | Health Care - 12.56% | | | | |
| 65,231 | | HCP, Inc. (a) | | | 2,152,623 | |
| 29,767 | | Health Care REIT, Inc. | | | 1,346,361 | |
| 31,520 | | Nationwide Health Properties, Inc. | | | 1,107,928 | |
| 37,862 | | Ventas, Inc. (a) | | | 1,797,688 | |
| | | | | | | |
| | | | | | 6,404,600 | |
| | | | | | | |
| | | Hotels & Motels - 6.42% | | | | |
| 164,951 | | Host Hotels & Resorts, Inc. (a) | | | 2,416,532 | |
| 36,785 | | Lasalle Hotel Properties | | | 857,091 | |
| | | | | | | |
| | | | | | 3,273,623 | |
| | | | | | | |
| | | | | | | |
Number of
Shares | | | | Value | |
| | | | | | |
| | | Office Property - 12.94% | | | | |
| 10,639 | | Alexandria Real Estate | | | | |
| | | Equities, Inc. (a) | | $ | 719,196 | |
| 41,829 | | Biomed Realty Trust, Inc. | | | 691,852 | |
| 30,828 | | Boston Properties, Inc. | | | 2,325,664 | |
| 14,681 | | Corporate Office Properties Trust | | | 589,149 | |
| 6,322 | | Douglas Emmett, Inc. (a) | | | 97,169 | |
| 22,148 | | Highwoods Properties, Inc. | | | 702,756 | |
| 21,375 | | Mack Cali Realty Corp. | | | 753,469 | |
| 12,528 | | SL Green Realty Corp. | | | 717,479 | |
| | | | | | | |
| | | | | | 6,596,734 | |
| | | | | | | |
| | | Regional Malls - 12.50% | | | | |
| 29,302 | | Macerich Co. (a) | | | 1,122,560 | |
| 60,346 | | Simon Property Group, Inc. (a) | | | 5,063,029 | |
| 4,695 | | Taubman Centers, Inc. (a) | | | 187,424 | |
| | | | | | | |
| | | | | | 6,373,013 | |
| | | | | | | |
| | | Shopping Centers - 10.20% | | | | |
| 42,504 | | Developers Diversified | | | | |
| | | Realty Corp. | | | 517,274 | |
| 14,509 | | Federal Realty Investment Trust | | | 1,056,400 | |
| 108,467 | | Kimco Realty Corp. | | | 1,696,424 | |
| 16,303 | | National Retail Properties, Inc. (a) | | | 372,197 | |
| 5,175 | | Regency Centers Corp. (a) | | | 193,907 | |
| 19,710 | | Tanger Factory Outlet | | | | |
| | | Centers, Inc. (a) | | | 850,684 | |
| 23,650 | | Weingarten Realty Investors (a) | | | 509,894 | |
| | | | | | | |
| | | | | | 5,196,780 | |
| | | | | | | |
| | | Storage - 7.31% | | | | |
| 77,326 | | Extra Space Storage, Inc. | | | 980,494 | |
| 29,860 | | Public Storage | | | 2,746,821 | |
| | | | | | | |
| | | | | | 3,727,315 | |
| | | | | | | |
| | | Warehouse/Industrial - 4.49% | | | | |
| 28,529 | | AMB Property Corp. | | | 777,130 | |
| 5,140 | | EastGroup Properties, Inc. | | | 193,983 | |
| 99,704 | | ProLogis (a) | | | 1,316,093 | |
| | | | | | | |
| | | | | | 2,287,206 | |
| | | | | | | |
| | | Total Real Estate Investment Trusts, | | | | |
| | | Common Stocks | | | | |
| | | (Cost $33,997,779) | | | 50,319,229 | |
| | | | | | | |
See notes to financial statements.
49
|
AssetMark Real Estate Securities Fund
SCHEDULE OF INVESTMENTS (Continued)
March 31, 2010 |
| |
| | | | | | | |
Number of
Shares | | | | Value | |
| | | | | | |
| | | SHORT TERM INVESTMENTS - 2.74% | | | | |
| | | Money Market Funds - 2.74% | | | | |
| 1,397,431 | | Federated Prime Obligations Fund | | | | |
| | | Effective Yield, 0.11% | | $ | 1,397,431 | |
| | | | | | | |
| | | Total Short Term Investments | | | | |
| | | (Cost $1,397,431) | | | 1,397,431 | |
| | | | | | | |
| | | | | | | |
Principal
Amount | | | | | | |
| | | | | | | |
| | | INVESTMENTS PURCHASED | | | | |
| | | AS SECURITIES LENDING | | | | |
| | | COLLATERAL - 20.38% | | | | |
| | | Corporate Paydown Securities - 1.79% | | | | |
$ | 766,460 | | KKR Atlantic East Holding Group | | | | |
| | | Trust, 3.059%, 03/25/11 (b) | | | 473,759 | |
| 877,688 | | KKR Pacific West Holding Group | | | | |
| | | Trust, 3.059%, 03/25/11 (b) | | | 440,725 | |
| | | | | | | |
| | | Total Corporate Paydown Securities | | | | |
| | | (Cost $1,644,148) | | | 914,484 | |
| | | | | | | |
| | | | | | | |
Number of
Shares | | | | | | |
| | | | | | | |
| | | Money Market Funds - 18.58% | | | | |
| 9,473,870 | | Mount Vernon Prime Portfolio | | | | |
| | | Effective Yield, 0.24% | | | 9,473,870 | |
| 19,901 | | Reserve Primary Fund (b) | | | — | |
| | | | | | | |
| | | Total Money Market Funds | | | | |
| | | (Cost $9,493,771) | | | 9,473,870 | |
| | | | | | | |
| | | | | | | |
Principal
Amount | | | | Value | |
| | | | | | |
| | | Cash - 0.01% | | | | |
$ | 2,761 | | Cash | | $ | 2,761 | |
| | | | | | | |
| | | Total Cash | | | | |
| | | (Cost $2,761) | | | 2,761 | |
| | | | | | | |
| | | Total Investments Purchased as | | | | |
| | | Securities Lending Collateral | | | | |
| | | (Cost $11,140,680) | | | 10,391,115 | |
| | | | | | | |
| | | Total Investments | | | | |
| | | (Cost $46,535,890) - 121.83% | | | 62,107,775 | |
| | | Liabilities in Excess of Other | | | | |
| | | Assets - (21.83)% | | | (11,129,618 | ) |
| | | | | | | |
| | | TOTAL NET ASSETS - 100.00% | | $ | 50,978,157 | |
| | | | | | | |
| |
Percentages are stated as a percent of net assets. |
(a) | All or a portion of this security is on loan. |
(b) | As of March 31, 2010, the Advisor has fair valued this security and deemed it illiquid. The value of these securities were $914,484 which represent 1.79% of total net assets. |
See notes to financial statements.
50
|
AssetMark Tax-Exempt Fixed Income Fund |
SCHEDULE OF INVESTMENTS |
March 31, 2010 |
| |
| | | | | | | |
Principal
Amount | | | | Value | |
| | | | | | |
| | | MUNICIPAL BONDS - 97.53% | | | | |
| | | Alabama - 0.55% | | | | |
$ | 1,000,000 | | Mobile Industrial Development
Board Pollution Control,
Revenue Bond,
4.875%, 06/01/2034 | | $ | 1,079,640 | |
| | | | | | | |
| | | Alaska - 0.50% | | | | |
| 1,000,000 | | Northern Tobacco Securitization
Corp., Series A, Refunding,
Revenue Bond,
4.625%, 06/01/2023 | | | 982,060 | |
| | | | | | | |
| | | Arizona - 3.29% | | | | |
| 135,000 | | Maricopa County Elementary School
District, Refunding, GO,
FSA Insured,
5.000%, 07/01/2012 | | | 145,256 | |
| 585,000 | | Maricopa County Industrial
Development Authority Health
Facilities, Series A, Refunding,
Revenue Bond,
6.000%, 07/01/2039 | | | 615,420 | |
| 955,000 | | Maricopa County Industrial
Development Authority Senior
Living Facilities, Refunding,
Revenue Bond,
3.650%, 09/15/2035 | | | 969,659 | |
| 1,000,000 | | Phoenix Civic Improvement Corp.,
Revenue Bond,
5.500%, 07/01/2028 | | | 940,260 | |
| 1,000,000 | | Phoenix Civic Improvement
Wastewater System, Refunding,
Revenue Bond,
5.000%, 07/01/2020 | | | 1,086,440 | |
| 1,000,000 | | Pinal County Industrial Development
Authority Correctional Facilities,
Revenue Bond, ACA Insured,
5.250%, 10/01/2015 | | | 1,012,810 | |
| 1,500,000 | | Salt River Project, Series A,
Revenue Bond,
5.000%, 01/01/2021 | | | 1,657,680 | |
| | | | | | | |
| | | | | | 6,427,525 | |
| | | | | | | |
| | | | | | | |
Principal
Amount | | | | Value | |
| | | | | | |
| | | California - 8.57% | | | | |
$ | 1,000,000 | | California Communities
Development Authority, Revenue
Bond,
5.500%, 07/01/2037 | | $ | 795,180 | |
| 445,000 | | California Economic Recovery,
Series A, Refunding, GO,
5.250%, 07/01/2021 | | | 489,091 | |
| 860,000 | | California Statewide Communities
Development Authority,
Refunding, Revenue Bond,
6.125%, 07/01/2046 | | | 837,339 | |
| 600,000 | | California Statewide Communities
Development Authority, Series A,
Revenue Bond, ACA Insured,
5.625%, 08/01/2034 | | | 577,278 | |
| 1,000,000 | | California, GO,
6.500%, 04/01/2033 | | | 1,096,130 | |
| 5,000,000 | | Chabot-Las Positas CA Community
College, Series C, GO, AMBAC
Insured,
0.000%, 08/01/2036 (a) | | | 886,950 | |
| 1,000,000 | | Gilroy Unified School District, GO,
Assured Guaranty Insured,
6.000%, 08/01/2025 | | | 1,134,260 | |
| 700,000 | | Golden State Tobacco Securitization,
Series A, Revenue Bond,
5.000%, 06/01/2017 | | | 700,210 | |
| 2,970,000 | | Golden West Schools Funding
Authority, Refunding, GO,
AMBAC Insured,
5.500%, 08/01/2019 | | | 3,367,950 | |
| 1,000,000 | | Los Angeles Department of Airports,
Series A, Refunding, Revenue Bond,
5.250%, 05/15/2029 | | | 1,053,960 | |
| 145,000 | | Los Angeles Unified School District,
Series A, Refunding, GO,
FGIC Insured,
4.250%, 01/01/2028 | | | 131,598 | |
| 580,000 | | Los Angeles Unified School District,
Series F, GO, FGIC Insured,
5.000%, 07/01/2021 | | | 612,921 | |
| 905,000 | | Manteca Financing Authority,
Revenue Bond,
5.250%, 12/01/2028 | | | 946,784 | |
See notes to financial statements.
51
|
AssetMark Tax-Exempt Fixed Income Fund |
SCHEDULE OF INVESTMENTS (Continued) |
March 31, 2010 |
| |
| | | | | | | |
Principal
Amount | | | | Value | |
| | | | | | |
| | | MUNICIPAL BONDS (Continued) | | | | |
| | | California (Continued) | | | | |
| | | M-S-R Energy Authority, Series A, | | | | |
| | | Revenue Bond, | | | | |
$ | 295,000 | | 6.125%, 11/01/2029 | | $ | 305,764 | |
| 605,000 | | 6.500%, 11/01/2039 | | | 645,729 | |
| 1,250,000 | | Palo Alto Unified School | | | | |
| | | District, GO, | | | | |
| | | 0.000%, 08/01/2026 (a) | | | 556,562 | |
| 500,000 | | Roseville Westpark Community | | | | |
| | | Facilities, Special Tax, | | | | |
| | | 5.250%, 09/01/2037 | | | 384,525 | |
| 1,175,000 | | San Francisco Steinhart Aquarium, | | | | |
| | | Series F, GO, | | | | |
| | | 5.000%, 06/15/2023 | | | 1,241,293 | |
| 500,000 | | San Mateo Joint Powers Financing | | | | |
| | | Authority, Series A, Refunding, | | | | |
| | | Revenue Bond, | | | | |
| | | 5.250%, 07/15/2025 | | | 533,845 | |
| 500,000 | | San Mateo Union High School | | | | |
| | | District, Series A, Refunding, | | | | |
| | | Certificate Participation, | | | | |
| | | AMBAC Insured, | | | | |
| | | 5.000%, 12/15/2030 | | | 450,685 | |
| | | | | | | |
| | | | | | 16,748,054 | |
| | | | | | | |
| | | Connecticut - 1.67% | | | | |
| 1,000,000 | | Connecticut Health & Educational | | | | |
| | | Facilities Authority, Revenue Bond, | | | | |
| | | 4.700%, 07/01/2029 | | | 1,045,470 | |
| 2,000,000 | | Connecticut Health & Educational | | | | |
| | | Facilities Authority, Series A, | | | | |
| | | Refunding, Revenue Bond, | | | | |
| | | 5.000%, 07/01/2025 | | | 2,211,440 | |
| | | | | | | |
| | | | | | 3,256,910 | |
| | | | | | | |
| | | Delaware - 0.42% | | | | |
| 1,000,000 | | New Castle County, Revenue Bond, | | | | |
| | | 5.000%, 09/01/2036 | | | 822,640 | |
| | | | | | | |
| | | Florida - 2.71% | | | | |
| 315,000 | | Beacon Lakes Community | | | | |
| | | Development, Series A, | | | | |
| | | Special Assessment, | | | | |
| | | 6.000%, 05/01/2038 | | | 264,427 | |
| | | | | | | |
Principal
Amount | | | | Value | |
| | | | | | |
| | | Florida (Continued) | | | | |
$ | 245,000 | | Boynton Village Community | | | | |
| | | Development District, Series A, | | | | |
| | | Special Assessment, | | | | |
| | | 5.750%, 05/01/2037 | | $ | 170,763 | |
| 300,000 | | Brevard County Health Facilities | | | | |
| | | Authority, Revenue Bond, | | | | |
| | | 7.000%, 04/01/2039 | | | 328,674 | |
| 2,000,000 | | Broward County Professional Sports | | | | |
| | | Facilities, Series A, Refunding, | | | | |
| | | Revenue Bond, | | | | |
| | | 5.000%, 09/01/2019 | | | 2,037,180 | |
| 500,000 | | Gulf Breeze, Series J, Refunding, | | | | |
| | | Revenue Bond, | | | | |
| | | 2.600%, 12/01/2020 | | | 500,500 | |
| 1,250,000 | | Miami-Dade County Educational | | | | |
| | | Facilities, Series A, Revenue Bond, | | | | |
| | | 5.000%, 04/01/2034 | | | 1,416,587 | |
| 625,000 | | Tolomato Community Development | | | | |
| | | District, Special Assessment, | | | | |
| | | 6.375%, 05/01/2017 | | | 575,656 | |
| | | | | | | |
| | | | | | 5,293,787 | |
| | | | | | | |
| | | Georgia - 2.70% | | | | |
| 1,000,000 | | Atlanta Water & Wastewater, | | | | |
| | | Revenue Bond, | | | | |
| | | 6.250%, 11/01/2039 | | | 1,052,900 | |
| 440,000 | | Atlanta Water & Wastewater, | | | | |
| | | Series A, Refunding, Revenue Bond, | | | | |
| | | 6.000%, 11/01/2024 | | | 478,707 | |
| 350,000 | | Chatham County Hospital Authority, | | | | |
| | | Revenue Bond, | | | | |
| | | 6.125%, 01/01/2024 | | | 348,834 | |
| 545,000 | | Clayton County Development | | | | |
| | | Authority, Series A, Revenue Bond, | | | | |
| | | 8.750%, 06/01/2029 | | | 574,501 | |
| 1,000,000 | | Fulton County School District, | | | | |
| | | Refunding, GO, | | | | |
| | | 5.250%, 01/01/2014 | | | 1,127,180 | |
| 1,400,000 | | Gainesville Educational Facilities | | | | |
| | | Redevelopment Authority, | | | | |
| | | Refunding, Revenue Bond, | | | | |
| | | 5.125%, 03/01/2037 | | | 881,790 | |
See notes to financial statements.
52
|
AssetMark Tax-Exempt Fixed Income Fund |
SCHEDULE OF INVESTMENTS (Continued) |
March 31, 2010 |
| |
| | | | | | | |
Principal
Amount | | | | Value | |
| | | | | | | |
| | | MUNICIPAL BONDS (Continued) | | | | |
| | | Georgia (Continued) | | | | |
$ | 870,000 | | Marietta Development Authority, | | | | |
| | | Revenue Bond, | | | | |
| | | 7.000%, 06/15/2039 | | | 814,738 | |
| | | | | | | |
| | | | | | 5,278,650 | |
| | | | | | | |
| | | Hawaii - 0.46% | | | | |
| 825,000 | | Hawaii State Department of | | | | |
| | | Budget & Finance, Revenue Bond, | | | | |
| | | 6.500%, 07/01/2039 | | | 890,851 | |
| | | | | | | |
| | | Idaho - 0.58% | | | | |
| 1,000,000 | | Boise-Kuna District, Revenue Bond, | | | | |
| | | 7.375%, 06/01/2034 | | | 1,125,960 | |
| | | | | | | |
| | | Illinois - 9.29% | | | | |
| 1,250,000 | | Chicago Board of Education, | | | | |
| | | Series B, Refunding, GO, | | | | |
| | | 5.000%, 12/01/2023 | | | 1,314,800 | |
| 100,000 | | Chicago Wastewater Transmission, | | | | |
| | | Refunding, Revenue Bond, | | | | |
| | | FGIC Insured, | | | | |
| | | 5.375%, 01/01/2013 | | | 105,273 | |
| 500,000 | | Chicago Water, Refunding, | | | | |
| | | Revenue Bond, | | | | |
| | | 5.000%, 11/01/2022 | | | 540,105 | |
| | | Chicago, GO, | | | | |
| 2,500,000 | | 5.000%, 12/01/2024 | | | 2,668,725 | |
| 1,000,000 | | 5.000%, 01/01/2026 | | | 1,045,330 | |
| 850,000 | | Illinois Financial Authority, | | | | |
| | | Revenue Bond, | | | | |
| | | 7.000%, 08/15/2044 | | | 884,008 | |
| 1,000,000 | | Illinois State Sales Tax, | | | | |
| | | Revenue Bond, | | | | |
| | | 5.250%, 06/15/2024 | | | 1,051,740 | |
| 2,500,000 | | Illinois State Toll Highway Authority, | | | | |
| | | Series A, Revenue Bond, | | | | |
| | | FSA Insured, | | | | |
| | | 5.000%, 01/01/2026 | | | 2,891,550 | |
| 600,000 | | Markham, Series C, GO, | | | | |
| | | 4.750%, 02/01/2017 | | | 601,602 | |
| 1,000,000 | | Metropolitan Pier & Exposition | | | | |
| | | Authority, Refunding, Revenue | | | | |
| | | Bond, FGIC Insured, | | | | |
| | | 5.500%, 12/15/2024 | | | 1,013,300 | |
| | | | | | | |
Principal
Amount | | | | Value | |
| | | | | | |
| | | Illinois (Continued) | | | | |
$ | 500,000 | | Northlake, GO, FGIC Insured, | | | | |
| | | 5.000%, 12/01/2029 | | | 513,340 | |
| 2,000,000 | | Southwestern Illinois Development | | | | |
| | | Authority, Revenue Bond, | | | | |
| | | 5.750%, 02/01/2029 | | | 2,201,600 | |
| 3,030,000 | | St. Clair County High School | | | | |
| | | District No. 203, Series A, GO, | | | | |
| | | AMBAC Insured, | | | | |
| | | 5.750%, 12/01/2026 | | | 3,324,092 | |
| | | | | | | |
| | | | | | 18,155,465 | |
| | | | | | | |
| | | Indiana - 5.94% | | | | |
| 1,500,000 | | Fishers, Revenue Bond, | | | | |
| | | 5.250%, 07/15/2034 | | | 1,512,435 | |
| 2,000,000 | | Indiana State Finance Authority, | | | | |
| | | Series A, Refunding, | | | | |
| | | Revenue Bond, | | | | |
| | | 5.000%, 02/01/2021 | | | 2,270,520 | |
| 1,500,000 | | Indianapolis Local Public | | | | |
| | | Improvement Bond Bank, Series B, | | | | |
| | | Revenue Bond, | | | | |
| | | 5.000%, 01/15/2017 | | | 1,683,600 | |
| 305,000 | | Noblesville Redevelopment | | | | |
| | | Authority, Revenue Bond, | | | | |
| | | 4.500%, 08/01/2012 | | | 321,619 | |
| 820,000 | | Portage Economic Development, | | | | |
| | | Revenue Bond, | | | | |
| | | 5.000%, 07/15/2023 | | | 758,344 | |
| 1,155,000 | | Sheridan Community School’s | | | | |
| | | Building Corporation, Revenue | | | | |
| | | Bond, FSA Insured, | | | | |
| | | 5.500%, 07/15/2020 | | | 1,337,629 | |
| 1,285,000 | | Tri-Creek Middle School Building | | | | |
| | | Corporation, Revenue Bond, | | | | |
| | | FSA Insured, | | | | |
| | | 5.250%, 07/15/2021 | | | 1,430,629 | |
| 1,000,000 | | Vincennes University Indiana, | | | | |
| | | Series J, Refunding, Revenue Bond, | | | | |
| | | 3.000%, 06/01/2013 | | | 1,036,920 | |
| 1,135,000 | | Wayne Township Marion County | | | | |
| | | School Building Corporation, | | | | |
| | | Revenue Bond, MBIA Insured, | | | | |
| | | 5.500%, 07/15/2023 | | | 1,256,377 | |
| | | | | | | |
| | | | | | 11,608,073 | |
| | | | | | | |
See notes to financial statements.
53
|
AssetMark Tax-Exempt Fixed Income Fund |
SCHEDULE OF INVESTMENTS (Continued) |
March 31, 2010 |
| |
| | | | | | | |
Principal
Amount | | | | Value | |
| | | | | | |
| | | MUNICIPAL BONDS (Continued) | | | | |
| | | Iowa - 0.92% | | | | |
$ | 600,000 | | Iowa Finance Authority Pollution | | | | |
| | | Control, Revenue Bond, | | | | |
| | | FGIC Insured, | | | | |
| | | 5.000%, 07/01/2014 | | $ | 659,154 | |
| 1,000,000 | | Iowa Finance Authority, | | | | |
| | | Revenue Bond, | | | | |
| | | 5.000%, 08/01/2018 | | | 1,134,430 | |
| | | | | | | |
| | | | | | 1,793,584 | |
| | | | | | | |
| | | Kansas - 0.26% | | | | |
| 715,000 | | Wyandotte County, Revenue Bond, | | | | |
| | | 4.875%, 10/01/2028 | | | 509,295 | |
| | | | | | | |
| | | Kentucky - 0.28% | | | | |
| 500,000 | | Kentucky Economic Development | | | | |
| | | Finance Authority, Revenue Bond, | | | | |
| | | 5.750%, 12/01/2028 | | | 544,005 | |
| | | | | | | |
| | | Louisiana - 1.36% | | | | |
| 800,000 | | Louisiana Citizens Property, | | | | |
| | | Revenue Bond, | | | | |
| | | 6.750%, 06/01/2026 | | | 908,784 | |
| 1,500,000 | | Louisiana Public Facilities Authority, | | | | |
| | | Revenue Bond, | | | | |
| | | 5.500%, 05/15/2032 | | | 1,743,810 | |
| | | | | | | |
| | | | | | 2,652,594 | |
| | | | | | | |
| | | Maine - 0.21% | | | | |
| 410,000 | | South Berwick Education, | | | | |
| | | Revenue Bond, | | | | |
| | | 5.250%, 08/01/2013 | | | 413,067 | |
| | | | | | | |
| | | Maryland - 3.61% | | | | |
| 1,160,000 | | Maryland Department of | | | | |
| | | Transportation County T | | | | |
| | | Construction, Revenue Bond, | | | | |
| | | 5.500%, 02/01/2017 | | | 1,363,383 | |
| 720,000 | | Maryland Economic Development | | | | |
| | | Corporation, Series A, | | | | |
| | | Revenue Bond, | | | | |
| | | 5.750%, 06/01/2035 | | | 732,679 | |
| 820,000 | | Maryland Health & Higher | | | | |
| | | Education Facilities Authority, | | | | |
| | | Refunding, Revenue Bond, | | | | |
| | | 5.000%, 07/01/2013 | | | 820,139 | |
| | | | | | | |
Principal
Amount | | | | Value | |
| | | | | | |
| | | Maryland (Continued) | | | | |
| | | Maryland Health & Higher | | | | |
| | | Education Facilities Authority, | | | | |
| | | Revenue Bond, | | | | |
$ | 750,000 | | 5.200%, 01/01/2024 | | $ | 702,998 | |
| 245,000 | | 5.000%, 05/15/2048 | | | 269,135 | |
| 2,000,000 | | Maryland, Refunding, GO, | | | | |
| | | 5.000%, 03/01/2021 | | | 2,303,420 | |
| 860,000 | | Maryland Student Housing | | | | |
| | | Economic Development, | | | | |
| | | Revenue Bond, | | | | |
| | | 5.750%, 06/01/2033 | | | 867,164 | |
| | | | | | | |
| | | | | | 7,058,918 | |
| | | | | | | |
| | | Massachusetts - 2.47% | | | | |
| 95,000 | | Massachusetts Bay Transportation | | | | |
| | | Authority, Series C, Revenue Bond, | | | | |
| | | 5.500%, 03/01/2012 | | | 103,263 | |
| 430,000 | | Massachusetts Development Finance | | | | |
| | | Agency, Series A, Revenue Bond, | | | | |
| | | 5.450%, 04/15/2014 | | | 438,540 | |
| 785,000 | | Massachusetts Health & Educational | | | | |
| | | Facilities Authority, Series A, | | | | |
| | | Refunding, Revenue Bond, | | | | |
| | | 5.500%, 11/15/2036 | | | 872,425 | |
| 1,000,000 | | Massachusetts Health & Educational | | | | |
| | | Facilities Authority, Series A, | | | | |
| | | Revenue Bond, | | | | |
| | | 5.000%, 07/15/2036 | | | 1,040,320 | |
| 1,000,000 | | Massachusetts Health & Educational | | | | |
| | | Facilities Authority, Series B, | | | | |
| | | Revenue Bond, | | | | |
| | | 5.000%, 10/01/2038 | | | 1,052,900 | |
| 800,000 | | Massachusetts Health & Educational | | | | |
| | | Facilities Authority, Series C, | | | | |
| | | Revenue Bond, | | | | |
| | | 6.125%, 10/01/2029 | | | 756,984 | |
| 120,000 | | Massachusetts State Water Resources | | | | |
| | | Authority, Series B, Revenue Bond, | | | | |
| | | 6.250%, 12/01/2011 | | | 131,050 | |
| 370,000 | | Massachusetts State, Series C, | | | | |
| | | Refunding, GO, | | | | |
| | | 5.500%, 11/01/2015 | | | 433,877 | |
| | | | | | | |
| | | | | | 4,829,359 | |
| | | | | | | |
See notes to financial statements.
54
|
AssetMark Tax-Exempt Fixed Income Fund |
SCHEDULE OF INVESTMENTS (Continued) |
March 31, 2010 |
| |
| | | | | | | |
Principal
Amount | | | | Value | |
| | | | | | |
| | | MUNICIPAL BONDS (Continued) | | | | |
| | | Michigan - 0.89% | | | | |
$ | 150,000 | | Dundee Community School District, | | | | |
| | | GO, Q-SBLF Insured, | | | | |
| | | 5.375%, 05/01/2010 | | $ | 150,243 | |
| 800,000 | | Lansing School District, Refunding, | | | | |
| | | GO, Q-SBLF Insured, | | | | |
| | | 5.000%, 05/01/2017 | | | 853,256 | |
| 730,000 | | Michigan Building Authority, | | | | |
| | | Series I, Refunding, Revenue Bond, | | | | |
| | | 4.750%, 10/15/2025 | | | 729,197 | |
| | | | | | | |
| | | | | | 1,732,696 | |
| | | | | | | |
| | | Minnesota - 1.49% | | | | |
| 1,280,000 | | Minneapolis & St Paul Housing | | | | |
| | | and Redevelopment Authority | | | | |
| | | Health Care, Revenue Bond, | | | | |
| | | 4.000%, 08/15/2015 | | | 1,350,029 | |
| 1,500,000 | | Osseo Independent School | | | | |
| | | District 279, GO, | | | | |
| | | 4.000%, 02/01/2022 | | | 1,558,740 | |
| | | | | | | |
| | | | | | 2,908,769 | |
| | | | | | | |
| | | Missouri - 3.12% | | | | |
| 465,000 | | Manchester Tax Increment & | | | | |
| | | Transportation, Refunding, | | | | |
| | | Tax Allocation, | | | | |
| | | 6.875%, 11/01/2039 | | | 457,750 | |
| 900,000 | | Missouri Development Finance | | | | |
| | | Board, Revenue Bond, | | | | |
| | | 5.750%, 06/01/2034 | | | 934,866 | |
| 1,000,000 | | Missouri Health & Educational | | | | |
| | | Facilities Authority, Series A, | | | | |
| | | Revenue Bond, | | | | |
| | | 5.375%, 03/15/2039 | | | 1,087,770 | |
| 1,000,000 | | Missouri Highway & Transportation | | | | |
| | | Commission, Series B, | | | | |
| | | Revenue Bond, | | | | |
| | | 5.000%, 05/01/2024 | | | 1,097,400 | |
| 1,090,000 | | St Louis Airport, Revenue Bond, | | | | |
| | | 6.625%, 07/01/2034 | | | 1,163,924 | |
| 1,330,000 | | St. Joseph Industrial Development | | | | |
| | | Authority, Revenue Bond, | | | | |
| | | 5.000%, 04/01/2027 | | | 1,359,872 | |
| | | | | | | |
| | | | | | 6,101,582 | |
| | | | | | | |
| | | | | | | |
Principal
Amount | | | | Value | |
| | | | | | |
| | | Nebraska - 1.40% | | | | |
$ | 1,500,000 | | Lincoln Electric Systems, | | | | |
| | | Revenue Bond, | | | | |
| | | 5.000%, 09/01/2031 | | $ | 1,558,140 | |
| 1,000,000 | | Omaha, Refunding, GO, | | | | |
| | | 5.250%, 04/01/2026 | | | 1,185,780 | |
| | | | | | | |
| | | | | | 2,743,920 | |
| | | | | | | |
| | | Nevada - 0.54% | | | | |
| 1,000,000 | | Clark County High Way | | | | |
| | | Improvement, Refunding, | | | | |
| | | Revenue Bond, AMBAC Insured, | | | | |
| | | 5.000%, 07/01/2020 | | | 1,057,080 | |
| | | | | | | |
| | | New Hampshire - 0.77% | | | | |
| 1,750,000 | | New Hampshire Health & Education | | | | |
| | | Facilities, Revenue Bond, | | | | |
| | | 5.250%, 06/01/2036 | | | 1,511,772 | |
| | | | | | | |
| | | New Jersey - 0.57% | | | | |
| 1,000,000 | | New Jersey Transportation Trust | | | | |
| | | Fund Authority, Series A, | | | | |
| | | Revenue Bond, | | | | |
| | | 5.875%, 12/15/2038 | | | 1,107,790 | |
| | | | | | | |
| | | New York - 7.98% | | | | |
| 850,000 | | Brooklyn Arena Local Development | | | | |
| | | Corporation, Revenue Bond, | | | | |
| | | 6.500%, 07/15/2030 | | | 905,301 | |
| 1,000,000 | | East Rochester Housing Authority | | | | |
| | | Senior Living, Revenue Bond, | | | | |
| | | 5.500%, 08/01/2033 | | | 829,670 | |
| 1,765,000 | | Metropolitan Transportation | | | | |
| | | Authority, Series F, Revenue Bond, | | | | |
| | | 5.000%, 11/15/2014 | | | 1,947,801 | |
| 500,000 | | New York City Transit Authority, | | | | |
| | | Series A, CP, AMBAC Insured, | | | | |
| | | 5.625%, 01/01/2012 | | | 505,995 | |
| 1,100,000 | | New York City Transitional Finance | | | | |
| | | Authority, Series C, Revenue Bond, | | | | |
| | | 5.000%, 02/01/2022 | | | 1,166,132 | |
| 1,250,000 | | New York City, Series A, GO, | | | | |
| | | 5.000%, 08/01/2020 | | | 1,354,138 | |
| | | New York Dormitory Authority, | | | | |
| | | Revenue Bond, | | | | |
| 1,000,000 | | 5.500%, 05/15/2025 | | | 1,127,510 | |
| 500,000 | | 6.125%, 12/01/2029 | | | 490,715 | |
See notes to financial statements.
55
|
AssetMark Tax-Exempt Fixed Income Fund |
SCHEDULE OF INVESTMENTS (Continued) |
March 31, 2010 |
| |
| | | | | | | |
Principal
Amount | | | | Value | |
| | | | | | |
| | | MUNICIPAL BONDS (Continued) | | | | |
| | | New York (Continued) | | | | |
$ | 500,000 | | New York Dormitory Authority, | | | | |
| | | Revenue Bond, JP Morgan Chase | | | | |
| | | Bank Insured, | | | | |
| | | 0.140%, 07/01/2031 | | $ | 500,000 | |
| 1,000,000 | | New York Dormitory Authority, | | | | |
| | | Series B, Revenue Bond, | | | | |
| | | 5.250%, 11/15/2023 | | | 1,076,220 | |
| 500,000 | | New York Environmental Facilities, | | | | |
| | | Revenue Bond, | | | | |
| | | 5.500%, 10/15/2027 | | | 601,590 | |
| 1,000,000 | | New York, GO, | | | | |
| | | 5.375%, 04/01/2036 | | | 1,071,720 | |
| | | Sales Tax Asset Receivable Corp., | | | | |
| | | Series A, Revenue Bond, | | | | |
| 500,000 | | 5.000%, 10/15/2017 | | | 559,525 | |
| 1,500,000 | | 5.250%, 10/15/2019 | | | 1,682,955 | |
| | | Tobacco Settlement Financing, | | | | |
| | | Revenue Bond, | | | | |
| 650,000 | | 5.000%, 06/01/2012 | | | 703,339 | |
| 1,000,000 | | 5.250%, 06/01/2021 | | | 1,064,680 | |
| | | | | | | |
| | | | | | 15,587,291 | |
| | | | | | | |
| | | North Carolina - 4.48% | | | | |
| 2,500,000 | | Eastern Municipal Power Agency, | | | | |
| | | Series B, Refunding, Revenue | | | | |
| | | Bond, FGIC Insured, | | | | |
| | | 6.000%, 01/01/2022 | | | 2,905,850 | |
| 1,480,000 | | North Carolina Capital Facilities | | | | |
| | | Finance Agency, Series B, | | | | |
| | | Refunding, Revenue Bond, | | | | |
| | | 5.000%, 10/01/2038 | | | 1,541,968 | |
| 1,000,000 | | North Carolina Grant, Revenue | | | | |
| | | Bond, MBIA Insured, | | | | |
| | | 5.000%, 03/01/2015 | | | 1,129,440 | |
| 700,000 | | North Carolina Medical Care | | | | |
| | | Community, Revenue Bond, | | | | |
| | | 5.500%, 10/01/2017 | | | 699,146 | |
| 1,500,000 | | North Carolina Municipal Power | | | | |
| | | Agency, Series C, Revenue Bond, | | | | |
| | | 5.250%, 01/01/2019 | | | 1,682,955 | |
| 750,000 | | Raleigh North Carolina Comb | | | | |
| | | Enterprise, Series A, Revenue Bond, | | | | |
| | | 5.000%, 03/01/2031 | | | 789,862 | |
| | | | | | | |
| | | | | | 8,749,221 | |
| | | | | | | |
| | | | | | | |
Principal
Amount | | | | Value | |
| | | | | | |
| | | North Dakota - 0.33% | | | | |
$ | 685,000 | | Williams County Sales Tax, | | | | |
| | | Revenue Bond, | | | | |
| | | 5.000%, 11/01/2026 | | $ | 644,496 | |
| | | | | | | |
| | | Ohio - 2.05% | | | | |
| 1,490,000 | | Buckeye Ohio Tobacco Settlement | | | | |
| | | Financial Authority, Series A, | | | | |
| | | Revenue Bond, | | | | |
| | | 5.875%, 06/01/2047 | | | 1,085,152 | |
| 750,000 | | Lorain, Refunding, GO, | | | | |
| | | 6.750%, 12/01/2023 | | | 817,020 | |
| 690,000 | | Ohio Air Quality Development | | | | |
| | | Authority, Series A, Revenue Bond, | | | | |
| | | 5.700%, 08/01/2020 | | | 744,689 | |
| 1,000,000 | | Ohio, Series A, GO, | | | | |
| | | 5.000%, 09/01/2015 | | | 1,145,720 | |
| 250,000 | | Toledo-Lucas County Port Authority, | | | | |
| | | Special Assessment, | | | | |
| | | 5.375%, 12/01/2035 | | | 207,535 | |
| | | | | | | |
| | | | | | 4,000,116 | |
| | | | | | | |
| | | Oklahoma - 0.94% | | | | |
| 650,000 | | Tulsa Industrial Authority, Series A, | | | | |
| | | Refunding, Revenue Bond, | | | | |
| | | NATL-RE Insured, | | | | |
| | | 5.000%, 10/01/2022 | | | 651,885 | |
| 1,000,000 | | Tulsa Airports Improvement Trust, | | | | |
| | | Refunding, Revenue Bond, | | | | |
| | | 7.050%, 06/01/2017 | | | 1,176,280 | |
| | | | | | | |
| | | | | | 1,828,165 | |
| | | | | | | |
| | | Oregon - 0.52% | | | | |
| 1,000,000 | | Clackamas County School | | | | |
| | | District, GO, | | | | |
| | | 5.000%, 06/15/2021 | | | 1,014,590 | |
| | | | | | | |
| | | Pennsylvania - 6.71% | | | | |
| 1,250,000 | | Allegheny County Hospital | | | | |
| | | Development Authority, Series A, | | | | |
| | | Revenue Bond, | | | | |
| | | 5.000%, 09/01/2014 | | | 1,399,988 | |
| 370,000 | | Allegheny County Industrial | | | | |
| | | Development Authority, Refunding, | | | | |
| | | Revenue Bond, | | | | |
| | | 6.500%, 05/01/2017 | | | 393,861 | |
See notes to financial statements.
56
|
AssetMark Tax-Exempt Fixed Income Fund |
SCHEDULE OF INVESTMENTS (Continued) |
March 31, 2010 |
| |
| | | | | | | |
Principal
Amount | | | | Value | |
| | | | | | |
| | | MUNICIPAL BONDS (Continued) | | | | |
| | | Pennsylvania (Continued) | | | | |
$ | 900,000 | | Butler County Hospital Authority, | | | | |
| | | Revenue Bond, | | | | |
| | | 7.125%, 07/01/2029 | | | 1,014,435 | |
| 2,000,000 | | Lackawanna County, Series B, | | | | |
| | | Refunding, GO, | | | | |
| | | 6.000%, 09/15/2032 | | | 2,065,360 | |
| 500,000 | | Lancaster County Hospital Authority, | | | | |
| | | Series A, Refunding, | | | | |
| | | Revenue Bond, | | | | |
| | | 5.200%, 07/01/2012 | | | 503,520 | |
| 1,000,000 | | Pennsylvania Economic | | | | |
| | | Development Authority Allegheny | | | | |
| | | Energy Supply, Revenue Bond, | | | | |
| | | 7.000%, 07/15/2039 | | | 1,104,670 | |
| 1,250,000 | | Pennsylvania Economic | | | | |
| | | Development Authority Financing | | | | |
| | | Authority Health System, Series A, | | | | |
| | | Refunding, Revenue Bond, | | | | |
| | | 6.250%, 10/15/2023 | | | 1,335,000 | |
| 1,000,000 | | Pennsylvania, Refunding, GO, | | | | |
| | | 5.250%, 02/01/2014 | | | 1,135,490 | |
| 1,000,000 | | Pennsylvania, Series A, GO, | | | | |
| | | 5.000%, 08/01/2023 | | | 1,093,370 | |
| 1,000,000 | | Philadelphia Gas Works, Refunding, | | | | |
| | | Revenue Bond, | | | | |
| | | 5.250%, 08/01/2017 | | | 1,041,830 | |
| 500,000 | | St Mary Hospital Authority, | | | | |
| | | Series A, Refunding, Revenue Bond, | | | | |
| | | 5.000%, 11/15/2040 | | | 482,390 | |
| 1,500,000 | | Warwick School District, GO, | | | | |
| | | 4.375%, 02/01/2025 | | | 1,527,285 | |
| | | | | | | |
| | | | | | 13,097,199 | |
| | | | | | | |
| | | Puerto Rico - 4.19% | | | | |
| 1,250,000 | | Puerto Rico Commonwealth, | | | | |
| | | Series A, GO, | | | | |
| | | 5.250%, 07/01/2022 | | | 1,270,487 | |
| 1,000,000 | | Puerto Rico Commonwealth, | | | | |
| | | Series A, Refunding, GO, | | | | |
| | | 5.500%, 07/01/2017 | | | 1,061,740 | |
| | | | | | | |
Principal
Amount | | | | Value | |
| | | | | | |
| | | Puerto Rico (Continued) | | | | |
$ | 625,000 | | Puerto Rico Commonwealth, | | | | |
| | | Series A, Rerefunding, Revenue | | | | |
| | | Bond, Assured Guaranty Insured, | | | | |
| | | 5.000%, 07/01/2016 | | $ | 683,675 | |
| 620,000 | | Puerto Rico Commonwealth, | | | | |
| | | Series B, Prerefunded, | | | | |
| | | Refunding, GO, | | | | |
| | | 5.250%, 07/01/2032 | | | 726,851 | |
| 380,000 | | Puerto Rico Commonwealth, | | | | |
| | | Series B, Unrefunded, | | | | |
| | | Refunding, GO, | | | | |
| | | 5.250%, 07/01/2032 | | | 369,288 | |
| 570,000 | | Puerto Rico Commonwealth, | | | | |
| | | Series C, Refunding, GO, | | | | |
| | | 6.000%, 07/01/2039 | | | 597,092 | |
| 1,000,000 | | Puerto Rico Electric Power | | | | |
| | | Authority, Revenue Bond, | | | | |
| | | 5.750%, 07/01/2036 | | | 1,065,210 | |
| | | Puerto Rico Sales Tax Financing, | | | | |
| | | Series A, Revenue Bond, | | | | |
| 790,000 | | 5.750%, 08/01/2037 | | | 839,699 | |
| 1,500,000 | | 5.000%, 08/01/2039 | | | 1,568,910 | |
| | | | | | | |
| | | | | | 8,182,952 | |
| | | | | | | |
| | | South Carolina - 0.28% | | | | |
| 500,000 | | South Carolina Educational | | | | |
| | | Facilities Authority for Private | | | | |
| | | Nonprofit Institutions, | | | | |
| | | Refunding, Revenue Bond, | | | | |
| | | 5.000%, 10/01/2012 | | | 541,145 | |
| | | | | | | |
| | | Tennessee - 0.55% | | | | |
| 1,000,000 | | Memphis-Shelby County Airport | | | | |
| | | Authority Special Facilities, | | | | |
| | | Refunding, Revenue Bond, | | | | |
| | | 5.050%, 09/01/2012 | | | 1,068,750 | |
| | | | | | | |
| | | Texas - 6.96% | | | | |
| 45,000 | | Dallas, GO, | | | | |
| | | 5.000%, 02/15/2018 | | | 45,009 | |
| 635,000 | | Forney Independent School District, | | | | |
| | | GO, PSF-GTD Insured, | | | | |
| | | 0.000%, 08/15/2025 (a) | | | 294,037 | |
| 425,000 | | Harris County Industrial | | | | |
| | | Development, Revenue Bond, | | | | |
| | | 5.000%, 02/01/2023 | | | 424,571 | |
See notes to financial statements.
57
|
AssetMark Tax-Exempt Fixed Income Fund |
SCHEDULE OF INVESTMENTS (Continued) |
March 31, 2010 |
| |
| | | | | | | |
Principal
Amount | | | | Value | |
| | | | | | |
| | | MUNICIPAL BONDS (Continued) | | | | |
| | | Texas (Continued) | | | | |
$ | 1,280,000 | | La Porte Independent School | | | | |
| | | District, GO, | | | | |
| | | 5.250%, 02/15/2024 | | $ | 1,407,283 | |
| 200,000 | | Lower Colorado River Authority | | | | |
| | | Texas, Series B, Refunding, | | | | |
| | | Revenue Bond, FSA Insured, | | | | |
| | | 6.000%, 05/15/2013 | | | 201,044 | |
| 2,000,000 | | North East Independent School | | | | |
| | | District, GO, | | | | |
| | | 5.250%, 02/01/2027 | | | 2,338,780 | |
| 700,000 | | North Texas Tollway Authority, | | | | |
| | | Series A, Refunded, | | | | |
| | | Revenue Bond, | | | | |
| | | 6.000%, 01/01/2019 | | | 787,360 | |
| 770,000 | | North Texas Tollway Authority, | | | | |
| | | Series E, Refunding, Revenue Bond, | | | | |
| | | 5.750%, 01/01/2038 | | | 853,376 | |
| 2,000,000 | | San Antonio Electric & Gas, | | | | |
| | | Refunding, Revenue Bond, | | | | |
| | | 5.375%, 02/01/2015 | | | 2,313,580 | |
| 15,000 | | Socorro Independent School District, | | | | |
| | | Unrefunded, GO, | | | | |
| | | PSF-GTD Insured, | | | | |
| | | 5.375%, 08/15/2013 | | | 15,837 | |
| 850,000 | | Texas Private Activity Surface | | | | |
| | | Transportation Corp., | | | | |
| | | Revenue Bond, | | | | |
| | | 7.500%, 12/31/2031 | | | 929,101 | |
| 500,000 | | Texas Transportation Commission, | | | | |
| | | Revenue Bond, | | | | |
| | | 5.000%, 04/01/2018 | | | 566,645 | |
| 750,000 | | Texas Turnpike Authority, Series A, | | | | |
| | | Revenue Bond, AMBAC Insured, | | | | |
| | | 5.500%, 08/15/2039 | | | 752,572 | |
| 1,000,000 | | Texas Water Development Board, | | | | |
| | | Series B, Revenue Bond, | | | | |
| | | 5.250%, 07/15/2027 | | | 1,088,700 | |
| 1,000,000 | | Texas, GO, | | | | |
| | | 5.000%, 04/01/2016 | | | 1,144,170 | |
| 400,000 | | Texas, Series A, GO, | | | | |
| | | 5.000%, 04/01/2022 | | | 438,196 | |
| | | | | | | |
| | | | | | 13,600,261 | |
| | | | | | | |
| | | | | | | |
Principal
Amount | | | | Value | |
| | | | | | |
| | | Utah - 0.37% | | | | |
$ | 630,000 | | Sandy City Utah Sales Tax Revenue, | | | | |
| | | Refunding, Revenue Bond, | | | | |
| | | 5.000%, 09/15/2016 | | $ | 719,139 | |
| | | | | | | |
| | | Virgin Islands - 0.26% | | | | |
| 500,000 | | Virgin Islands Public Finance | | | | |
| | | Authority, Series C, Refunding, | | | | |
| | | Revenue Bond, | | | | |
| | | 5.000%, 10/01/2022 | | | 507,925 | |
| | | | | | | |
| | | Virginia - 2.07% | | | | |
| 1,000,000 | | Arlington County Industrial | | | | |
| | | Development Authority Hospital | | | | |
| | | Facility Revenue, Refunding, | | | | |
| | | Revenue Bond, | | | | |
| | | 4.000%, 07/01/2014 | | | 1,068,220 | |
| 1,000,000 | | Henry County Public Service | | | | |
| | | Authority Water & Sewer, | | | | |
| | | Refunding, Revenue Bond, | | | | |
| | | FSA Insured, | | | | |
| | | 5.500%, 11/15/2019 | | | 1,142,660 | |
| 870,000 | | Tobacco Settlement Financing, | | | | |
| | | Series B, Revenue Bond, | | | | |
| | | 5.000%, 06/01/2047 | | | 586,302 | |
| 1,000,000 | | Virginia College Building Authority | | | | |
| | | Educational Facilities, | | | | |
| | | Revenue Bond, | | | | |
| | | 5.750%, 01/01/2034 | | | 1,236,560 | |
| | | | | | | |
| | | | | | 4,033,742 | |
| | | | | | | |
| | | Washington - 2.08% | | | | |
| 1,000,000 | | Clark County School District, | | | | |
| | | Refunding, GO, FGIC Insured, | | | | |
| | | 5.500%, 12/01/2017 | | | 1,056,920 | |
| 1,000,000 | | Energy Northwest, Series A, | | | | |
| | | Revenue Bond, FSA Insured, | | | | |
| | | 5.500%, 07/01/2017 | | | 1,059,110 | |
| 500,000 | | King County Hospital, Refunding, | | | | |
| | | GO, MBIA Insured, | | | | |
| | | 5.000%, 12/01/2021 | | | 524,165 | |
| 1,250,000 | | Washington, Series A, GO, | | | | |
| | | 5.000%, 07/01/2016 | | | 1,431,700 | |
| | | | | | | |
| | | | | | 4,071,895 | |
| | | | | | | |
See notes to financial statements.
58
|
AssetMark Tax-Exempt Fixed Income Fund |
SCHEDULE OF INVESTMENTS (Continued) |
March 31, 2010 |
| |
| | | | | | | |
Principal
Amount | | | | Value | |
| | | | | | |
| | | MUNICIPAL BONDS (Continued) | | | | |
| | | Wisconsin - 3.19% | | | | |
$ | 315,000 | | Badger Tobacco Asset Securitization, | | | | |
| | | Revenue Bond, | | | | |
| | | 6.125%, 06/01/2027 | | $ | 339,003 | |
| 1,500,000 | | Southeast Wisconsin Professional | | | | |
| | | Baseball Park Sales Tax, Series A, | | | | |
| | | Revenue Bond, MBIA Insured, | | | | |
| | | 5.500%, 12/15/2026 | | | 1,660,530 | |
| 660,000 | | Wisconsin Health & Educational | | | | |
| | | Facilities Authority, Refunding, | | | | |
| | | Revenue Bond, | | | | |
| | | 5.125%, 02/15/2026 | | | 624,037 | |
| 400,000 | | Wisconsin Health & Educational | | | | |
| | | Facilities, Series A, Revenue Bond, | | | | |
| | | 5.000%, 02/15/2018 | | | 398,692 | |
| 1,000,000 | | Wisconsin Transportation, Series A, | | | | |
| | | Revenue Bond, FGIC Insured, | | | | |
| | | 5.500%, 07/01/2016 | | | 1,012,360 | |
| 2,000,000 | | Wisconsin, Series A, Refunding, | | | | |
| | | Revenue Bond, | | | | |
| | | 6.000%, 05/01/2033 | | | 2,193,220 | |
| | | | | | | |
| | | | | | 6,227,842 | |
| | | | | | | |
| | | Total Municipal Bonds | | | | |
| | | (Cost $185,515,708) | | | 190,508,775 | |
| | | | | | | |
Number of
Shares | | | | | | |
| | | | | | | |
| | | SHORT TERM INVESTMENTS - 3.01% | | | | |
| | | Money Market Funds - 3.01% | | | | |
| 5,882,000 | | Fidelity Tax Exempt Portfolio | | | | |
| | | Effective Yield, 0.08% | | | 5,882,000 | |
| | | | | | | |
| | | Total Short Term Investments | | | | |
| | | (Cost $5,882,000) | | | 5,882,000 | |
| | | | | | | |
| | | Total Investments | | | | |
| | | (Cost $191,397,708) - 100.54% | | | 196,390,775 | |
| | | Liabilities in Excess of Other | | | | |
| | | Assets - (0.54)% | | | (1,061,824) | |
| | | | | | | |
| | | TOTAL NET ASSETS - 100.00% | | $ | 195,328,951 | |
| | | | | | | |
| |
Percentages are stated as a percent of net assets. |
(a) Zero coupon bond |
| |
Glossary of Terms |
AMBAC | - American Municipal Bond Assurance Corp. |
ACA | - American Capital Access |
CP | - Certificate of Participation |
FGIC | - Financial Guaranty Insurance Corp. |
FSA | - Financial Security Assurance, Inc. |
GO | - General Obligation |
MBIA | - Municipal Bond Investors Assurance Corp. |
NATL-RE | - National Public Finance Guarantee Corporation |
PSF-GTD | - Permanent School Fund Guaranteed |
Q-SBLF | - Qualified School Board Loan Fund |
See notes to financial statements.
59
|
AssetMark Core Plus Fixed Income Fund |
SCHEDULE OF INVESTMENTS |
March 31, 2010 |
| |
| | | | | | | |
Number of
Shares | | | | Value | |
| | | | | | |
| | | COMMON STOCKS - 0.00% | | | | |
| | | Oil & Gas - 0.00% | | | | |
| 259 | | Semgroup Corporation (a) | | $ | 2,368 | |
| | | | | | | |
| | | Total Common Stocks | | | | |
| | | (Cost $98,745) | | | 2,368 | |
| | | | | | | |
| | | CONVERTIBLE PREFERRED | | | | |
| | | STOCKS - 0.02% | | | | |
| | | Automobiles - 0.02% | | | | |
| 12,000 | | General Motors Corporation (b) | | | 103,710 | |
| 1,800 | | General Motors Corporation | | | 15,467 | |
| | | | | | | |
| | | | | | 119,177 | |
| | | | | | | |
| | | Total Convertible Preferred Stocks | | | | |
| | | (Cost $304,161) | | | 119,177 | |
| | | | | | | |
| | | PREFERRED STOCKS - 0.28% | | | | |
| | | Banks - 0.13% | | | | |
| 800,000 | | HSBC Capital Funding LP | | | | |
| | | 4.610%, 12/31/2049 (c)(e) | | | 738,212 | |
| | | | | | | |
| | | Diversified Financial Services - 0.15% | | | | |
| 14,200 | | Citigroup Capital XII (a) | | | 364,514 | |
| 12,000 | | Corts Trust for Ford | | | | |
| | | Motor Company | | | 284,160 | |
| 44,650 | | FHLMC (a) | | | 56,705 | |
| 1,300 | | FNMA (a) | | | 2,178 | |
| 32,350 | | FNMA (a) | | | 41,085 | |
| 74 | | GMAC - Preferred | | | | |
| | | Blocker, Inc. (c) | | | 56,411 | |
| | | | | | | |
| | | | | | 805,053 | |
| | | | | | | |
| | | Total Preferred Stocks | | | | |
| | | (Cost $3,303,979) | | | 1,543,265 | |
| | | | | | | |
Principal
Amount | | | | | | |
| | | | | | | |
| | | ASSET BACKED SECURITIES - 3.72% | | | | |
$ | 350,000 | | AESOP Funding II LLC | | | | |
| | | Series 2010-3A, | | | | |
| | | 4.640%, 05/20/2016 (c) | | | 341,974 | |
| 80,716 | | Conseco Finance | | | | |
| | | Securitizations Corp. | | | | |
| | | Series 2000-4, | | | | |
| | | 8.310%, 05/01/2032 (e) | | | 60,944 | |
| | | | | | | |
Principal
Amount | | | | Value | |
| | | | | | |
| | | ASSET BACKED SECURITIES (Continued) | | | | |
$ | 191,664 | | Countrywide Asset-Backed | | | | |
| | | Certificiates | | | | |
| | | Series 2005-4, | | | | |
| | | 4.456%, 10/25/2035 (e) | | $ | 182,264 | |
| | | Countrywide Home Equity | | | | |
| | | Loan Trust | | | | |
| 245,288 | | Series 2004-R, | | | | |
| | | 0.480%, 03/15/2030 | | | | |
| | | (Acquired 12/03/2004, | | | | |
| | | Cost $245,288) (d)(e) | | | 79,612 | |
| 319,039 | | Series 2004-N, | | | | |
| | | 0.510%, 02/15/2034 (e) | | | 140,302 | |
| 348,122 | | Series 2004-O, | | | | |
| | | 0.510%, 02/15/2034 (e) | | | 153,122 | |
| 327,735 | | Series 2005-F, | | | | |
| | | 0.472%, 12/15/2035 (e) | | | 113,872 | |
| 337,079 | | Delta Air Lines, Inc. | | | | |
| | | Pool #081022, | | | | |
| | | 6.821%, 08/10/2022 | | | 337,079 | |
| 450,000 | | Hertz Vehicle Financing LLC | | | | |
| | | Series 2009-2A, | | | | |
| | | 5.290%, 03/25/2016 (c) | | | 470,192 | |
| 1,483,238 | | Household Home Equity Loan Trust | | | | |
| | | Series 2007-3, | | | | |
| | | 1.440%, 11/20/2036 (e) | | | 1,345,709 | |
| | | JetBlue Airways Corporation | | | | |
| 620,787 | | Series 2004-2, G-1, | | | | |
| | | 0.625%, 02/15/2018 (e) | | | 479,376 | |
| 900,000 | | Series 2004-2, G-2, | | | | |
| | | 0.723%, 05/15/2018 (e) | | | 639,000 | |
| 822,163 | | Morgan Stanley | | | | |
| | | Series M-1, | | | | |
| | | 1.249%, 10/25/2033 (e) | | | 639,457 | |
| 830,000 | | Nelnet, Inc. | | | | |
| | | Series 2008-4, | | | | |
| | | 1.729%, 04/25/2024 (e) | | | 874,279 | |
| | | New Valley Generation | | | | |
| 2,807,151 | | Series 2000-1, | | | | |
| | | 7.299%, 03/15/2019 | | | 3,249,277 | |
| 7,259,432 | | Series 2001-1, | | | | |
| | | 5.572%, 05/01/2020 | | | 7,741,216 | |
See notes to financial statements.
60
|
AssetMark Core Plus Fixed Income Fund
SCHEDULE OF INVESTMENTS (Continued)
March 31, 2010 |
| | | | | | | |
Principal
Amount | | | | Value | |
| | | ASSET BACKED SECURITIES (Continued) | | | | |
$ | 161,577 | | Residential Asset Mortgage | | | | |
| | | Products, Inc. | | | | |
| | | Series FLT, | | | | |
| | | 0.709%, 03/25/2034 (e) | | $ | 100,019 | |
| 550,000 | | SLC Student Loan Trust | | | | |
| | | Series 2008-1, | | | | |
| | | 1.854%, 12/15/2032 (e) | | | 579,759 | |
| 400,000 | | SLM Private Loan Trust | | | | |
| | | Series 2003-7, | | | | |
| | | 1.454%, 12/15/2033 (c)(e) | | | 405,258 | |
| 1,500,000 | | SLM Student Loan Trust | | | | |
| | | Series 2006-7, | | | | |
| | | 0.319%, 04/25/2022 (e) | | | 1,488,304 | |
| 1,000,000 | | South Carolina Student Loan Corporation | | | | |
| | | Series 2005-A, | | | | |
| | | 0.352%, 12/01/2018 (e) | | | 983,541 | |
| | | Total Asset Backed Securities | | | | |
| | | (Cost $20,956,710) | | | 20,404,556 | |
| | | COLLATERALIZED MORTGAGE
OBLIGATIONS - 12.76% | | | | |
| 423,253 | | Accredited Mortgage Loan Trust | | | | |
| | | Series 2005-3, | | | | |
| | | 0.469%, 09/25/2035 (e) | | | 375,401 | |
| 30,368 | | Adjustable Rate Mortgage Trust | | | | |
| | | Series 2004-5, | | | | |
| | | 3.175%, 04/25/2035 (e) | | | 25,296 | |
| | | Bank of America Corporation | | | | |
| 589,556 | | Series 2005-B, | | | | |
| | | 4.010%, 04/20/2035 (e) | | | 407,467 | |
| 2,500,000 | | Series 2005-6, | | | | |
| | | 5.179%, 09/10/2047 (e) | | | 2,605,516 | |
| 110,000 | | Series 2007-5, | | | | |
| | | 5.620%, 02/10/2051 | | | 113,979 | |
| 149,314 | | BCAP LLC Trust | | | | |
| | | Series 2006-RR1, | | | | |
| | | 0.886%, 11/25/2036 (e) | | | 132,441 | |
| | | Bear Stearns Trust | | | | |
| 52,667 | | Series 2004-1, | | | | |
| | | 3.059%, 04/25/2034 (e) | | | 47,337 | |
| 432,889 | | Series 2004-9, | | | | |
| | | 2.623%, 09/25/2034 (e) | | | 344,245 | |
| | | | | | | |
Principal
Amount | | | | Value | |
| | | COLLATERALIZED MORTGAGE
OBLIGATIONS (Continued) | | | | |
$ | 771,393 | | Series 2005-2, | | | | |
| | | 3.074%, 04/25/2035 (e) | | $ | 577,390 | |
| 1,736,431 | | Series 2006-4, | | | | |
| | | 3.428%, 10/25/2036 (e) | | | 1,024,554 | |
| 3,014,057 | | Series FLT, | | | | |
| | | 5.905%, 09/25/2047 (e) | | | 1,738,369 | |
| | | Chase Mortgage Financial Trust | | | | |
| 311,926 | | Series 2007-A1, | | | | |
| | | 3.545%, 02/25/2037 (e) | | | 289,846 | |
| 1,158,413 | | Series 2007-A1, | | | | |
| | | 3.642%, 02/25/2037 (e) | | | 1,089,316 | |
| 1,530,226 | | Series 2007-A1, | | | | |
| | | 3.824%, 02/25/2037 (e) | | | 1,391,013 | |
| 1,463,216 | | Series 2007-A1, | | | | |
| | | 4.125%, 02/25/2037 (e) | | | 1,391,058 | |
| 965,336 | | Series 2007-A1, | | | | |
| | | 4.562%, 02/25/2037 (e) | | | 966,541 | |
| | | CIT Mortgage Loan Trust | | | | |
| 745,111 | | Pool #2007A1, | | | | |
| | | 1.246%, 10/25/2037 | | | | |
| | | (Acquired 10/05/2007, | | | | |
| | | Cost $745,111) (d)(e) | | | 503,752 | |
| 550,000 | | Pool #2007A2, | | | | |
| | | 1.479%, 10/25/2037 | | | | |
| | | (Acquired 10/05/2007, | | | | |
| | | Cost $550,000) (d)(e) | | | 140,240 | |
| 1,000,000 | | Pool #2007A3, | | | | |
| | | 1.679%, 10/25/2037 | | | | |
| | | (Acquired 10/05/2007, | | | | |
| | | Cost $1,000,000) (d)(e) | | | 268,201 | |
| 2,000,000 | | Commercial Mortgage Pass Through | | | | |
| | | 2005-LP5, 4.982%, 05/10/2043 (e) | | | 2,071,739 | |
| | | Countrywide Alternative Loan Trust | | | | |
| 1,267,433 | | Series 2005-27, | | | | |
| | | 2.031%, 08/25/2035 (e) | | | 699,654 | |
| 618,520 | | Series 2005-36, | | | | |
| | | 4.794%, 08/25/2035 (e) | | | 390,726 | |
| 301,803 | | Series 2005-38, | | | | |
| | | 1.963%, 09/25/2035 (e) | | | 176,432 | |
| 591,876 | | Series 2005-51, | | | | |
| | | 0.024%, 11/20/2035 (e) | | | 343,460 | |
See notes to financial statements.
61
|
AssetMark Core Plus Fixed Income Fund
SCHEDULE OF INVESTMENTS (Continued)
March 31, 2010 |
| | | | | | | |
Principal
Amount | | | | Value | |
| | | COLLATERALIZED MORTGAGE
OBLIGATIONS (Continued) | | | | |
$ | 1,791,052 | | Series 2005-62, | | | | |
| | | 0.546%, 12/25/2035 (e) | | $ | 954,406 | |
| 1,183,213 | | Series 2005-63, | | | | |
| | | 5.257%, 12/25/2035 (e) | | | 790,785 | |
| 2,298,473 | | Series 2007-16CB, | | | | |
| | | 6.000%, 08/25/2037 | | | 1,581,194 | |
| 1,397,535 | | Series 2006-OA10, | | | | |
| | | 0.436%, 08/25/2046 (e) | | | 683,023 | |
| | | Countrywide Home Loans, Inc. | | | | |
| 131,532 | | Series 2003-52, | | | | |
| | | 3.421%, 02/19/2034 (e) | | | 115,330 | |
| 47,435 | | Series 2004-HYB6, | | | | |
| | | 3.527%, 11/20/2034 (e) | | | 38,918 | |
| 321,728 | | Series 2005-11, | | | | |
| | | 0.546%, 03/25/2035 (e) | | | 181,554 | |
| 750,239 | | Series 2005-R1, | | | | |
| | | 0.606%, 03/25/2035 (c)(e) | | | 600,258 | |
| 472,175 | | Series 2005-11, | | | | |
| | | 3.791%, 04/25/2035 (e) | | | 232,810 | |
| 27,898 | | First Horizon Mortgage Trust | | | | |
| | | Series FLT, | | | | |
| | | 3.007%, 12/25/2034 (e) | | | 26,830 | |
| 1,726,014 | | First Union National Bank | | | | |
| | | Commercial Mortgage | | | | |
| | | Series 2000-C2, | | | | |
| | | 7.202%, 10/15/2032 | | | 1,745,378 | |
| | | GMAC Mortgage, LLC | | | | |
| 1,947,761 | | Series FLT, | | | | |
| | | 0.979%, 02/25/2031 (c)(e) | | | 1,406,571 | |
| 1,290,000 | | Series 1998-C2, | | | | |
| | | 6.500%, 05/15/2035 | | | 1,348,448 | |
| 605,401 | | Series 2007-HE3, | | | | |
| | | 7.000%, 09/25/2037 | | | 316,053 | |
| 2,500,000 | | Series 2002-C1, | | | | |
| | | 6.278%, 11/15/2039 | | | 2,633,982 | |
| 646,442 | | Granite Master Issuer Plc | | | | |
| | | Series 2007-2, | | | | |
| | | 0.320%, 12/17/2054 (e) | | | 596,878 | |
| 773,813 | | GS Mortgage Securities Corporation | | | | |
| | | Series 2005-GG4, | | | | |
| | | 4.680%, 07/10/2039 | | | 801,166 | |
| | | | | | | |
Principal
Amount | | | | Value | |
| | | COLLATERALIZED MORTGAGE
OBLIGATIONS (Continued) | | | | |
$ | 895,675 | | GSMPS Mortgage Loan Trust | | | | |
| | | Series 2005-RP1, | | | | |
| | | 0.596%, 01/25/2035 (c)(e) | | $ | 742,783 | |
| | | Harborview Mortgage Loan Trust | | | | |
| 1,168,091 | | Series 2005-10, | | | | |
| | | 0.547%, 11/19/2035 (e) | | | 706,637 | |
| 222,836 | | Series 2005-16, | | | | |
| | | 0.477%, 01/19/2036 (e) | | | 122,173 | |
| | | IMPAC Secured Assets Corp. | | | | |
| 846,106 | | Series 2005-6, | | | | |
| | | 0.496%, 10/25/2035 (e) | | | 492,066 | |
| 985,262 | | Series 2005-2, | | | | |
| | | 0.549%, 03/25/2036 (e) | | | 483,184 | |
| | | IndyMac Mortgage Loan Trust | | | | |
| 371,072 | | Series 2005-AR15, | | | | |
| | | 5.099%, 09/25/2035 (e) | | | 279,799 | |
| 1,724,574 | | Series 2007-AR15, | | | | |
| | | 5.552%, 08/25/2037 (e) | | | 843,889 | |
| 1,128,274 | | Series 2007-AR7, | | | | |
| | | 6.143%, 11/25/2037 (e) | | | 829,325 | |
| 565,624 | | Series 2005-AR16IP, | | | | |
| | | 0.566%, 07/25/2045 (e) | | | 317,264 | |
| 1,500,000 | | JPMorgan Commercial Mortgage | | | | |
| | | Series 2005-LDP2, | | | | |
| | | 4.738%, 07/15/2042 | | | 1,518,338 | |
| | | JPMorgan Mortgage Trust | | | | |
| 523,465 | | Series 2007-A1, | | | | |
| | | 3.441%, 07/25/2035 (e) | | | 490,186 | |
| 535,602 | | Series 2007-A1, | | | | |
| | | 4.011%, 07/25/2035 (e) | | | 488,122 | |
| 485,961 | | Series 2007-A1, | | | | |
| | | 4.071%, 07/25/2035 (e) | | | 454,662 | |
| | | Lehman Brothers Trust | | | | |
| 1,602,624 | | Series 2005-5N, | | | | |
| | | 0.546%, 11/25/2035 (e) | | | 1,016,157 | |
| 193,667 | | Series 2005-7N, | | | | |
| | | 0.516%, 12/25/2035 (e) | | | 124,813 | |
| 2,557,867 | | Series 2007-16N, | | | | |
| | | 1.096%, 09/25/2047 (e) | | | 1,389,354 | |
See notes to financial statements.
62
|
AssetMark Core Plus Fixed Income Fund |
SCHEDULE OF INVESTMENTS (Continued) |
March 31, 2010 |
| |
| | | | | | | |
Principal
Amount | | | | Value | |
| | | | | | |
| | | COLLATERALIZED MORTGAGE | | | | |
| | | OBLIGATIONS (Continued) | | | | |
$ | 600,000 | | Lehman Brothers-UBS Commercial | | | | |
| | | Mortgage Trust | | | | |
| | | Series 2005-C3, | | | | |
| | | 4.664%, 07/15/2030 | | $ | 621,212 | |
| 3,100,000 | | Master Adjustable Rate Mortgages | | | | |
| | | Series 2004-13, | | | | |
| | | 3.096%, 11/21/2034 (e) | | | 2,736,085 | |
| 419,625 | | Master Reperforming Loan Trust | | | | |
| | | Series 2005-1, | | | | |
| | | 7.000%, 08/25/2034 (c) | | | 398,788 | |
| 1,000,000 | | Merrill Lynch Mortgage Trust | | | | |
| | | Series 2006-C1, | | | | |
| | | 5.656%, 05/12/2039 (e) | | | 1,041,056 | |
| | | MLCC Mortgage Investors, Inc. | | | | |
| 605,688 | | Series 2004-A3, | | | | |
| | | 5.050%, 05/25/2034 (e) | | | 593,924 | |
| 716,459 | | Series 2005-1, | | | | |
| | | 2.479%, 04/25/2035 (e) | | | 637,993 | |
| 1,000,000 | | Series 2007-7, | | | | |
| | | 5.747%, 06/12/2050 (e) | | | 918,728 | |
| 2,000,000 | | Morgan Stanley | | | | |
| | | Series 2005-HQ7, | | | | |
| | | 5.208%, 11/14/2042 (e) | | | 2,055,229 | |
| | | Prime Mortgage Trust | | | | |
| 1,027,793 | | Series 2006-DR1, | | | | |
| | | 5.500%, 05/25/2035 (c) | | | 997,654 | |
| 2,033,589 | | Series 2006-DR1, | | | | |
| | | 5.500%, 05/25/2035 (c) | | | 1,882,305 | |
| 426,274 | | Series 2006-DR1, | | | | |
| | | 6.000%, 05/25/2035 (c) | | | 417,174 | |
| 2,063,988 | | Series 2006-DR1, | | | | |
| | | 6.000%, 05/25/2035 (c) | | | 1,741,884 | |
| | | Residential Accredit Loans, Inc. | | | | |
| 3,588,426 | | Series 2007-QH9, | | | | |
| | | 6.454%, 11/25/2037 (e) | | | 1,673,401 | |
| 1,127,524 | | Series 2005-QO4, | | | | |
| | | 0.526%, 12/25/2045 (e) | | | 615,043 | |
| 1,407,663 | | Series 2005-QO5, | | | | |
| | | 1.463%, 01/25/2046 (e) | | | 789,265 | |
| | | | | | | |
Principal
Amount | | | | Value | |
| | | | | | |
| | | COLLATERALIZED MORTGAGE | | | | |
| | | OBLIGATIONS (Continued) | | | | |
$ | 437,607 | | Residential Asset Mortgage | | | | |
| | | Products, Inc. | | | | |
| | | Series 2004-SL4, | | | | |
| | | 7.500%, 07/25/2032 | | $ | 425,262 | |
| 1,144,996 | | Residential Funding Mortgage | | | | |
| | | Series FLT, | | | | |
| | | 5.200%, 09/25/2035 (e) | | | 966,835 | |
| | | Structured Adjustable Rate | | | | |
| | | Mortgage Loan | | | | |
| 85,211 | | Series FLT, | | | | |
| | | 2.915%, 05/25/2034 (e) | | | 76,978 | |
| 25,436 | | Series FLT, | | | | |
| | | 2.582%, 09/25/2034 (e) | | | 21,790 | |
| | | Washington Mutual | | | | |
| 106,117 | | Series 2004-AR3, | | | | |
| | | 3.080%, 06/25/2034 (e) | | | 99,061 | |
| 1,700,000 | | Series 2005-AR4, | | | | |
| | | 4.160%, 04/25/2035 (e) | | | 1,239,218 | |
| 1,025,096 | | Series 2007-HY4, | | | | |
| | | 5.508%, 09/25/2036 (e) | | | 831,443 | |
| 1,816,539 | | Series 2007-HY2, | | | | |
| | | 5.558%, 12/25/2036 (e) | | | 1,272,322 | |
| 978,349 | | Series 2005-AR8, | | | | |
| | | 0.536%, 07/25/2045 (e) | | | 756,925 | |
| 1,046,101 | | Series 2005-AR13, | | | | |
| | | 0.536%, 10/25/2045 (e) | | | 808,061 | |
| 1,103,388 | | Series 2005-AR15, | | | | |
| | | 0.509%, 11/25/2045 (e) | | | 741,090 | |
| 1,093,701 | | Series 2005-AR17, | | | | |
| | | 0.516%, 12/25/2045 (e) | | | 836,357 | |
| 856,068 | | Series 2005-AR19, | | | | |
| | | 0.516%, 12/25/2045 (e) | | | 654,037 | |
| | | Wells Fargo Company | | | | |
| 662,225 | | Series 2005-AR16, | | | | |
| | | 3.305%, 10/25/2035 (e) | | | 638,587 | |
| 2,826,081 | | Series 2007-PA6, | | | | |
| | | 6.462%, 12/28/2037 (e) | | | 1,982,417 | |
| | | | | | | |
| | | Total Collateralized Mortgage | | | | |
| | | Obligations (Cost $89,496,864) | | | 69.936,433 | |
| | | | | | | |
See notes to financial statements.
63
|
AssetMark Core Plus Fixed Income Fund |
SCHEDULE OF INVESTMENTS (Continued) |
March 31, 2010 |
| |
| | | | | | | |
Principal
Amount | | | | Value | |
| | | | | | |
| | | CONVERTIBLE BONDS - 0.29% | | | | |
| | | Metals & Mining - 0.29% | | | | |
$ | 1,625,000 | | Transocean, Inc. | | | | |
| | | 1.500%, 12/15/2037 | | $ | 1,594,531 | |
| | | | | | | |
| | | Total Convertible Bonds | | | | |
| | | (Cost $1,582,214) | | | 1,594,531 | |
| | | | | | | |
| | | CORPORATE BONDS - 30.92% | | | | |
| | | Aerospace & Defense - 0.07% | | | | |
| | | Boeing Co. | | | | |
| 240,000 | | 6.000%, 03/15/2019 | | | 265,231 | |
| 110,000 | | 4.875%, 02/15/2020 | | | 112,765 | |
| | | | | | | |
| | | | | | 377,996 | |
| | | | | | | |
| | | Airlines - 0.04% | | | | |
| 180,000 | | United Airlines, Inc. | | | | |
| | | 9.750%, 01/15/2017 | | | 189,450 | |
| | | | | | | |
| | | Auto Components - 0.05% | | | | |
| 250,000 | | The Goodyear Tire & | | | | |
| | | Rubber Company | | | | |
| | | 9.000%, 07/01/2015 (b) | | | 259,375 | |
| | | | | | | |
| | | Automobiles - 0.11% | | | | |
| 260,000 | | DaimlerChrysler N.A. | | | | |
| | | 5.875%, 03/15/2011 | | | 270,563 | |
| | | General Motors Corporation | | | | |
| 2,420,000 | | 8.250%, 07/15/2023 (f) | | | 299,371 | |
| 250,000 | | 8.375%, 07/05/2033 (f) | | | 40,766 | |
| 30,000 | | 8.375%, 07/15/2033 (f) | | | 3,241 | |
| | | | | | | |
| | | | | | 613,941 | |
| | | | | | | |
| | | Banks - 6.63% | | | | |
| 2,400,000 | | Achmea Hypotheekbank NV | | | | |
| | | 3.200%, 11/03/2014 (c) | | | 2,433,180 | |
| 270,000 | | AIFUL Corporation | | | | |
| | | 5.000%, 08/10/2010 (c) | | | 259,200 | |
| 750,000 | | ANZ Capital Trust | | | | |
| | | 5.360%, 12/15/2053 (c) | | | 743,799 | |
| 2,800,000 | | ANZ National Bank Ltd. | | | | |
| | | 3.250%, 04/02/2012 (c) | | | 2,900,251 | |
| 30,000 | | BAC Capital Trust | | | | |
| | | 5.630%, 12/31/2099 (e) | | | 22,800 | |
| 270,000 | | Bank of Tokyo-Mitsubishi UFJ | | | | |
| | | 3.850%, 01/22/2015 (c) | | | 273,115 | |
| | | | | | | |
Principal
Amount | | | | Value | |
| | | | | | |
| | | Banks (Continued) | | | | |
| | | Barclays Bank Plc | | | | |
$ | 340,000 | | 5.200%, 07/10/2014 | | $ | 363,412 | |
| 160,000 | | 6.050%, 12/04/2017 (c) | | | 165,255 | |
| 980,000 | | Credit Agricole SA | | | | |
| | | 8.375%, 12/31/2049 (c)(e) | | | 1,065,750 | |
| 1,200,000 | | Dexia Credit Local | | | | |
| | | 2.750%, 01/10/2014 (c) | | | 1,211,695 | |
| 500,000 | | Fifth Third Bancorp | | | | |
| | | 0.360%, 05/17/2013 (e) | | | 467,324 | |
| | | Glitnir Bank | | | | |
| 370,000 | | 6.330%, 07/28/2011 | | | | |
| | | (Acquired 07/21/2006, | | | | |
| | | Cost $370,000) (d)(f) | | | 26,477 | |
| 760,000 | | 6.693%, 06/15/2016 | | | | |
| | | (Acquired 06/14/2006 and | | | | |
| | | 06/21/2006, Cost $758,848) (d)(f) | | | 685 | |
| | | ICICI Bank Ltd. | | | | |
| 254,000 | | 6.375%, 04/30/2022 (c)(e) | | | 239,814 | |
| 140,000 | | 6.375%, 04/30/2022 (e) | | | 131,998 | |
| | | Kaupthing Bank Hf | | | | |
| 130,000 | | 5.750%, 10/04/2011 | | | | |
| | | (Acquired 09/28/2006, | | | | |
| | | Cost $129,288) (d)(f) | | | 8,820 | |
| 1,990,000 | | 7.625%, 02/28/2015 | | | | |
| | | (Acquired 02/25/2008, | | | | |
| | | Cost $1,708,395) (d)(f) | | | 156,436 | |
| 250,000 | | 7.125%, 05/19/2016 | | | | |
| | | (Acquired 05/12/2006, | | | | |
| | | Cost $248,680) (d)(f) | | | 461 | |
| 2,200,000 | | Kreditanstalt Fur Wiederaufbau | | | | |
| | | 1.875%, 01/14/2013 | | | 2,209,528 | |
| 1,080,000 | | Landsbanki Islands Hf | | | | |
| | | 6.100%, 08/25/2011 | | | | |
| | | (Acquired 08/22/2006, | | | | |
| | | Cost $1,079,719) (d)(f) | | | 6,451 | |
| | | Lloyds TSB Bank Plc | | | | |
| 1,055,000 | | 4.375%, 01/12/2015 (c) | | | 1,041,107 | |
| 430,000 | | 5.800%, 01/13/2020 (c) | | | 420,316 | |
| 1,500,000 | | Macquarie Bank Ltd. | | | | |
| | | 3.300%, 07/17/2014 (c) | | | 1,521,830 | |
| | | Nordea Bank AB | | | | |
| 430,000 | | 3.700%, 11/13/2014 (c) | | | 433,707 | |
| 250,000 | | 4.875%, 01/27/2020 (c) | | | 248,386 | |
See notes to financial statements.
64
|
AssetMark Core Plus Fixed Income Fund |
SCHEDULE OF INVESTMENTS (Continued) |
March 31, 2010 |
| |
| | | | | | | |
Principal
Amount | | | | Value | |
| | | | | | |
| | | CORPORATE BONDS (Continued) | | | | |
| | | Banks (Continued) | | | | |
$ | 1,100,000 | | North American Development Bank | | | | |
| | | 4.375%, 02/11/2020 | | $ | 1,075,554 | |
| 650,000 | | PNC Bank N.A. | | | | |
| | | 6.875%, 04/01/2018 | | | 721,980 | |
| 470,000 | | Rabobank Nederland | | | | |
| | | 11.000%, 12/31/2049 (c)(e) | | | 606,597 | |
| | | Resona Bank | | | | |
| 525,000 | | 5.850%, 09/29/2049 | | | | |
| | | (Acquired 09/08/2005, | | | | |
| | | Cost $524,633) (d)(e) | | | 496,175 | |
| 450,000 | | 4.125%, 12/31/2049 | | | | |
| | | (Acquired 10/05/2005, | | | | |
| | | Cost $536,375) (d)(e) | | | 589,562 | |
| 410,000 | | Resona Preferred Global Securities | | | | |
| | | 7.191%, 12/31/2049 (c)(e) | | | 384,719 | |
| | | Royal Bank of Scotland Group PLC | | | | |
| 3,000,000 | | 1.500%, 03/30/2012 (c) | | | 2,998,887 | |
| 1,100,000 | | 2.625%, 05/11/2012 (c) | | | 1,123,635 | |
| 140,000 | | 5.000%, 11/12/2013 | | | 136,117 | |
| 625,000 | | 4.875%, 08/25/2014 (c) | | | 629,628 | |
| 50,000 | | 5.000%, 10/01/2014 | | | 47,897 | |
| 220,000 | | 4.875%, 03/16/2015 | | | 220,185 | |
| 530,000 | | 6.400%, 10/21/2019 (b) | | | 530,803 | |
| 200,000 | | 7.640%, 03/31/2049 (e) | | | 127,000 | |
| 990,000 | | 9.118%, 03/31/2049 | | | 908,325 | |
| 140,000 | | Russian Agriculture Bank | | | | |
| | | 6.299%, 05/15/2017 (c) | | | 145,936 | |
| 560,000 | | Santander Issuances SA | | | | |
| | | 5.805%, 06/20/2016 (c)(e) | | | 558,915 | |
| 600,000 | | Shinsei Finance Cayman Ltd. | | | | |
| | | 6.418%, 07/20/2048 (c)(e) | | | 416,567 | |
| 300,000 | | Sovereign Bank | | | | |
| | | 1.959%, 08/01/2013 (e) | | | 296,409 | |
| 280,000 | | Suntrust Capital | | | | |
| | | 6.100%, 12/01/2066 (e) | | | 231,123 | |
| 300,000 | | U.S. Bank, N.A. | | | | |
| | | 4.375%, 02/28/2017 (e) | | | 410,874 | |
| | | U.S. Central Federal Credit | | | | |
| 1,200,000 | | 1.250%, 10/19/2011 | | | 1,207,645 | |
| 800,000 | | 1.900%, 10/19/2012 | | | 807,870 | |
| 360,000 | | UBS AG, Stamford Branch | | | | |
| | | 3.875%, 01/15/2015 | | | 355,535 | |
| | | | | | | |
Principal
Amount | | | | Value | |
| | | | | | |
| | | Banks (Continued) | | | | |
| | | Wells Fargo Company | | | | |
$ | 840,000 | | 9.750%, 09/26/2013 (e) | | $ | 945,000 | |
| 400,000 | | 7.700%, 12/29/2049 (e) | | | 415,000 | |
| 440,000 | | 5.950%, 12/01/2086 | | | 405,608 | |
| 1,900,000 | | Westpac Banking Corp. | | | | |
| | | 1.900%, 12/14/2012 (c) | | | 1,925,019 | |
| | | Zurich Financial Services | | | | |
| 675,000 | | 6.150%, 12/15/2065 (c)(e) | | | 664,875 | |
| 575,000 | | 6.450%, 12/15/2065 (c)(e) | | | 554,875 | |
| | | | | | | |
| | | | | | 36,290,112 | |
| | | | | | | |
| | | Beverages - 0.73% | | | | |
| | | Anheuser-Busch InBev NV | | | | |
| 675,000 | | 7.200%, 01/15/2014 (c) | | | 773,947 | |
| 875,000 | | 4.125%, 01/15/2015 | | | 901,260 | |
| 450,000 | | 5.375%, 01/15/2020 | | | 465,093 | |
| 140,000 | | 5.000%, 04/15/2020 (c) | | | 140,706 | |
| 960,000 | | Diageo Plc | | | | |
| | | 7.375%, 01/15/2014 | | | 1,117,350 | |
| 470,000 | | PepsiCo, Inc. | | | | |
| | | 7.900%, 11/01/2018 | | | 583,065 | |
| | | | | | | |
| | | | | | 3,981,421 | |
| | | | | | | |
| | | Business Services - 0.01% | | | | |
| 46,000 | | Dyncorp International LLC | | | | |
| | | 9.500%, 02/15/2013 | | | 46,805 | |
| 10,000 | | Lamar Media Corp. | | | | |
| | | 6.625%, 08/15/2015 | | | 9,662 | |
| | | | | | | |
| | | | | | 56,467 | |
| | | | | | | |
| | | Capital Markets - 2.01% | | | | |
| 500,000 | | Ameriprise Financial, Inc. | | | | |
| | | 5.300%, 03/15/2020 | | | 506,792 | |
| | | Bear Stearns Companies, Inc. | | | | |
| 620,000 | | 6.400%, 10/02/2017 | | | 685,953 | |
| 2,705,000 | | 7.250%, 02/01/2018 | | | 3,130,910 | |
| | | Goldman Sachs Group, Inc. | | | | |
| 200,000 | | 4.500%, 06/15/2010 | | | 201,502 | |
| 80,000 | | 5.450%, 11/01/2012 | | | 86,532 | |
| 1,240,000 | | 5.375%, 03/15/2020 | | | 1,230,871 | |
| 50,000 | | 5.793%, 12/31/2099 (e) | | | 42,625 | |
See notes to financial statements.
65
|
AssetMark Core Plus Fixed Income Fund |
SCHEDULE OF INVESTMENTS (Continued) |
March 31, 2010 |
| |
| | | | | | | |
Principal
Amount | | | | Value | |
| | | | | | |
| | | CORPORATE BONDS (Continued) | | | | |
| | | Capital Markets (Continued) | | | | |
| | | Lehman Brothers Holdings, Inc. | | | | |
$ | 120,000 | | 5.250%, 02/06/2012 (f) | | $ | 20,086 | |
| 1,820,000 | | 6.750%, 12/28/2017 (f) | | | 9 | |
| 370,000 | | 3.019%, 08/19/2065 (f) | | | 2 | |
| 270,000 | | 5.857%, 12/29/2099 (f) | | | 2 | |
| | | Merrill Lynch Co. | | | | |
| 550,000 | | 6.400%, 08/28/2017 | | | 580,513 | |
| 1,075,000 | | 6.875%, 04/25/2018 | | | 1,160,295 | |
| | | Morgan Stanley | | | | |
| 340,000 | | 5.625%, 01/09/2012 | | | 360,268 | |
| 500,000 | | 5.750%, 08/31/2012 | | | 536,744 | |
| 230,000 | | 0.701%, 10/18/2016 (e) | | | 210,626 | |
| 600,000 | | 5.950%, 12/28/2017 | | | 617,373 | |
| 1,250,000 | | 6.625%, 04/01/2018 | | | 1,335,298 | |
| 380,000 | | Wachovia Capital Trust | | | | |
| | | 5.800%, 03/15/2042 (e) | | | 325,850 | |
| | | | | | | |
| | | | | | 11,032,251 | |
| | | | | | | |
| | | Chemicals - 0.23% | | | | |
| | | Dow Chemical Co. | | | | |
| 800,000 | | 7.600%, 05/15/2014 | | | 914,090 | |
| 300,000 | | 5.900%, 02/15/2015 | | | 325,132 | |
| 40,000 | | Westlake Chemical Corp. | | | | |
| | | 6.625%, 01/15/2016 | | | 39,200 | |
| | | | | | | |
| | | | | | 1,278,422 | |
| | | | | | | |
| | | Commercial Services & Supplies - 0.14% | | | | |
| 375,000 | | Allied Waste North America, Inc. | | | | |
| | | 7.125%, 05/15/2016 | | | 407,851 | |
| 325,000 | | Waste Management, Inc. | | | | |
| | | 6.375%, 11/15/2012 | | | 360,322 | |
| | | | | | | |
| | | | | | 768,173 | |
| | | | | | | |
| | | Communications - 0.10% | | | | |
| 295,000 | | British Telecommunications Plc | | | | |
| | | 9.125%, 12/15/2010 | | | 311,581 | |
| 40,000 | | News America Marketing, Inc. | | | | |
| | | 6.650%, 11/15/2037 | | | 42,204 | |
| 110,000 | | Rogers Cable, Inc. | | | | |
| | | 6.750%, 03/15/2015 | | | 125,368 | |
| 50,000 | | Verizon Global Funding Corp. | | | | |
| | | 7.375%, 09/01/2012 | | | 56,653 | |
| | | | | | | |
| | | | | | 535,806 | |
| | | | | | | |
| | | | | | | |
Principal
Amount | | | | Value | |
| | | | | | |
| | | Containers & Packaging - 0.04% | | | | |
$ | 220,000 | | Ball Corp. | | | | |
| | | 6.750%, 09/15/2020 | | $ | 224,950 | |
| | | | | | | |
| | | Diversified Consumer Services - 0.36% | | | | |
| 1,800,000 | | Leaseplan Corp. NV | | | | |
| | | 3.000%, 05/07/2012 (c) | | | 1,860,912 | |
| 130,000 | | Service Corporation International | | | | |
| | | 7.500%, 04/01/2027 | | | 119,600 | |
| | | | | | | |
| | | | | | 1,980,512 | |
| | | | | | | |
| | | Diversified Financial Services - 5.49% | | | | |
| | | American Express Co. | | | | |
| 60,000 | | 8.125%, 05/20/2019 (b) | | | 72,794 | |
| 440,000 | | 6.800%, 09/01/2066 (e) | | | 432,300 | |
| | | American Express Credit Corp. | | | | |
| 60,000 | | 5.875%, 05/02/2013 | | | 65,040 | |
| 10,000 | | 5.125%, 08/25/2014 | | | 10,628 | |
| 210,000 | | American General Finance | | | | |
| | | 6.900%, 12/15/2017 | | | 184,204 | |
| | | Bank of America Corporation | | | | |
| 360,000 | | 7.400%, 01/15/2011 | | | 376,775 | |
| 1,100,000 | | 4.500%, 04/01/2015 | | | 1,110,404 | |
| 330,000 | | 5.420%, 03/15/2017 | | | 326,587 | |
| 550,000 | | 8.000%, 01/30/2018 (e) | | | 561,991 | |
| 110,000 | | 7.625%, 06/01/2019 (b) | | | 126,037 | |
| 14,000 | | 8.125%, 12/29/2049 (e) | | | 14,302 | |
| 160,000 | | Boeing Capital Corp. | | | | |
| | | 4.700%, 10/27/2019 | | | 161,176 | |
| 690,000 | | Caterpillar Financial Services Corp. | | | | |
| | | 6.200%, 09/30/2013 | | | 779,886 | |
| | | Citigroup Funding, Inc. | | | | |
| 3,100,000 | | 1.875%, 10/22/2012 | | | 3,126,669 | |
| 400,000 | | 1.875%, 11/15/2012 | | | 403,155 | |
| | | Citigroup, Inc. | | | | |
| 575,000 | | 5.850%, 07/02/2013 | | | 604,702 | |
| 1,030,000 | | 6.500%, 08/19/2013 | | | 1,111,195 | |
| 1,920,000 | | 5.000%, 09/15/2014 | | | 1,919,184 | |
| 950,000 | | 6.875%, 03/05/2038 | | | 962,958 | |
| 350,000 | | Deutsche Telekom International Finance B.V. | | | | |
| | | 5.750%, 03/23/2016 | | | 376,727 | |
| 550,000 | | Discover Bank | | | | |
| | | 8.700%, 11/18/2019 | | | 603,396 | |
See notes to financial statements.
66
|
AssetMark Core Plus Fixed Income Fund |
SCHEDULE OF INVESTMENTS (Continued) |
March 31, 2010 |
| |
| | | | | | | |
Principal
Amount | | | | Value | |
| | | | | | |
| | | CORPORATE BONDS (Continued) | | | | |
| | | Diversified Financial Services (Continued) | | | | |
$ | 350,000 | | First Niagara Financial Group, Inc. | | | | |
| | | 6.750%, 03/19/2020 | | $ | 354,330 | |
| | | Ford Motor Credit Company LLC | | | | |
| 190,000 | | 7.500%, 08/01/2012 | | | 196,845 | |
| 540,000 | | 12.000%, 05/15/2015 | | | 645,770 | |
| | | GE Capital Corp. | | | | |
| 650,000 | | 0.514%, 09/15/2014 (e) | | | 618,479 | |
| 1,160,000 | | 6.375%, 11/15/2067 (e) | | | 1,096,200 | |
| 1,700,000 | | General Motors Acceptance Corporation | | | | |
| | | 6.875%, 09/15/2011 | | | 1,724,225 | |
| 956,000 | | GMAC LLC | | | | |
| | | 6.625%, 05/15/2012 | | | 975,120 | |
| 4,270,000 | | GMAC Mortgage, LLC | | | | |
| | | 1.750%, 10/30/2012 | | | 4,297,392 | |
| | | JPMorgan Chase & Co. | | | | |
| 500,000 | | 6.125%, 06/27/2017 | | | 539,022 | |
| 575,000 | | 6.000%, 01/15/2018 | | | 625,256 | |
| 500,000 | | JPMorgan Chase Cap XXV | | | | |
| | | 6.800%, 10/01/2037 | | | 499,251 | |
| 925,000 | | Prudential Financial, Inc. | | | | |
| | | 3.875%, 01/14/2015 | | | 924,259 | |
| | | SLM Corp. | | | | |
| 1,750,000 | | 5.000%, 10/01/2013 | | | 1,673,189 | |
| 260,000 | | 4.246%, 04/01/2014 (e) | | | 225,358 | |
| 1,140,000 | | 5.375%, 05/15/2014 | | | 1,080,770 | |
| 120,000 | | 5.050%, 11/14/2014 | | | 111,158 | |
| 20,000 | | 5.000%, 04/15/2015 | | | 18,230 | |
| 100,000 | | 5.625%, 08/01/2033 | | | 77,383 | |
| 1,214,000 | | UBS AG | | | | |
| | | 0.000%, 12/31/2017 (credit linked | | | | |
| | | to a Republic of Brazil Treasury | | | | |
| | | Security and IPCA Index Units) | | | | |
| | | (Acquired 12/01/2007, | | | | |
| | | Cost $327,072) (d)(j) | | | 393,273 | |
| 675,000 | | Westfield Capital Corp. | | | | |
| | | 4.375%, 11/15/2010 (c) | | | 685,606 | |
| | | | | | | |
| | | | | | 30,091,226 | |
| | | | | | | |
| | | | | | | |
Principal
Amount | | | | Value | |
| | | | | | |
| | | Diversified Telecommunication Services - 1.55% | | | | |
| | | America Movil S.A.B. de C.V. | | | | |
$ | 200,000 | | 5.625%, 11/15/2017 | $ | | 212,276 | |
| 100,000 | | 5.000%, 03/30/2020 (c) | | | 99,087 | |
| | | AT&T, Inc. | | | | |
| 310,000 | | 5.500%, 02/01/2018 | | | 329,635 | |
| 40,000 | | 5.800%, 02/15/2019 (b) | | | 42,832 | |
| 320,000 | | 6.550%, 02/15/2039 | | | 337,516 | |
| 30,000 | | BellSouth Corp. | | | | |
| | | 4.750%, 11/15/2012 | | | 32,008 | |
| 195,000 | | Cricket Communications, Inc. | | | | |
| | | 7.750%, 05/15/2016 | | | 203,287 | |
| 100,000 | | Intelsat Corp. | | | | |
| | | 9.250%, 08/15/2014 | | | 103,000 | |
| | | Intelsat Ltd. | | | | |
| 30,000 | | 9.500%, 06/15/2016 | | | 32,100 | |
| 75,000 | | 8.500%, 11/01/2019 (c) | | | 79,125 | |
| 520,000 | | KPN Mobile NV | | | | |
| | | 8.375%, 10/01/2030 | | | 647,240 | |
| 425,000 | | Qwest Corp. | | | | |
| | | 8.375%, 05/01/2016 | | | 480,250 | |
| 70,000 | | Rogers Communications, Inc. | | | | |
| | | 6.800%, 08/15/2018 | | | 79,758 | |
| 240,000 | | Rogers Wireless Communications, Inc. | | | | |
| | | 6.375%, 03/01/2014 | | | 266,576 | |
| 410,000 | | SBC Communications, Inc. | | | | |
| | | 5.100%, 09/15/2014 | | | 444,039 | |
| | | Sprint Capital Corp. | | | | |
| 830,000 | | 8.375%, 03/15/2012 | | | 867,350 | |
| 40,000 | | 8.750%, 03/15/2032 | | | 37,300 | |
| | | Telecom Italia Capital | | | | |
| 450,000 | | 6.200%, 07/18/2011 | | | 472,641 | |
| 200,000 | | 4.950%, 09/30/2014 | | | 205,371 | |
| 190,000 | | 5.250%, 10/01/2015 | | | 194,770 | |
| 430,000 | | 6.999%, 06/04/2018 (b) | | | 465,771 | |
| 875,000 | | Telefonica Emisiones SAU | | | | |
| | | 6.421%, 06/20/2016 | | | 973,312 | |
| | | Verizon Communications, Inc. | | | | |
| 80,000 | | 5.500%, 02/15/2018 | | | 84,926 | |
| 140,000 | | 8.950%, 03/01/2039 | | | 190,444 | |
| 740,000 | | Verizon New York, Inc. | | | | |
| | | 6.875%, 04/01/2012 | | | 806,126 | |
| 40,000 | | Verizon Wireless Cap LLC | | | | |
| | | 8.500%, 11/15/2018 | | | 49,986 | |
See notes to financial statements.
67
|
AssetMark Core Plus Fixed Income Fund |
SCHEDULE OF INVESTMENTS (Continued) |
March 31, 2010 |
| |
| | | | | | | |
Principal
Amount | | | | Value | |
| | | | | | |
| | | CORPORATE BONDS (Continued) | | | | |
| | | Diversified Telecommunication | | | | |
| | | Services (Continued) | | | | |
$ | 200,000 | | VIP Finance Vipelcom | | | | |
| | | 9.125%, 04/30/2018 | | $ | 227,800 | |
| 515,000 | | Windstream Corp. | | | | |
| | | 8.625%, 08/01/2016 | | | 529,163 | |
| | | | | | | |
| | | | | | 8,493,689 | |
| | | | | | | |
| | | Electric Utilities - 1.61% | | | | |
| | | AES Corp. | | | | |
| 47,000 | | 7.750%, 03/01/2014 | | | 48,293 | |
| 190,000 | | 7.750%, 10/15/2015 | | | 194,275 | |
| 860,000 | | 8.000%, 06/01/2020 (b) | | | 861,075 | |
| 675,000 | | Arizona Pubic Service Co. | | | | |
| | | 8.750%, 03/01/2019 | | | 819,343 | |
| | | Commonwealth Edison Co. | | | | |
| 425,000 | | 5.400%, 12/15/2011 | | | 452,213 | |
| 250,000 | | 6.950%, 07/15/2018 | | | 276,295 | |
| | | Energy Future Holdings Corp. | | | | |
| 10,000 | | 10.875%, 11/01/2017 | | | 7,475 | |
| 3,865,184 | | 11.250%, 11/01/2017 | | | 2,647,651 | |
| 270,000 | | 6.500%, 11/15/2024 | | | 141,750 | |
| 575,000 | | 6.550%, 11/15/2034 | | | 299,000 | |
| 75,000 | | Exelon Corp. | | | | |
| | | 5.625%, 06/15/2035 | | | 69,873 | |
| | | FirstEnergy Corp. | | | | |
| 9,000 | | 6.450%, 11/15/2011 | | | 9,550 | |
| 1,265,000 | | 7.375%, 11/15/2031 | | | 1,312,707 | |
| 375,000 | | Nevada Power Co. | | | | |
| | | 5.875%, 01/15/2015 | | | 408,920 | |
| | | Pacific Gas & Electric Co. | | | | |
| 470,000 | | 5.625%, 11/30/2017 | | | 506,773 | |
| 290,000 | | 5.800%, 03/01/2037 | | | 288,729 | |
| 400,000 | | Progress Energy, Inc. | | | | |
| | | 7.750%, 03/01/2031 | | | 473,002 | |
| | | | | | | |
| | | | | | 8,816,924 | |
| | | | | | | |
| | | Electrical Equipment - 0.16% | | | | |
| 100,000 | | L-3 Communications Holdings, Inc. | | | | |
| | | 6.375%, 10/15/2015 (b) | | | 103,125 | |
| | | Tyco International Group | | | | |
| 130,000 | | 6.750%, 02/15/2011 | | | 136,334 | |
| 455,000 | | 6.375%, 10/15/2011 | | | 490,408 | |
| | | | | | | |
Principal
Amount | | | | Value | |
| | | | | | |
| | | Electrical Equipment (Continued) | | | | |
$ | 105,000 | | Tyco International Ltd. | | | | |
| | | 6.875%, 01/15/2021 | | $ | 120,218 | |
| | | | | | | |
| | | | | | 850,085 | |
| | | | | | | |
| | | Electronic Equipment & Instruments - 0.17% | | | | |
| 850,000 | | Agilent Technologies, Inc. | | | | |
| | | 5.500%, 09/14/2015 | | | 912,239 | |
| 10,000 | | Freescale Semiconductor, Inc. | | | | |
| | | 8.875%, 12/15/2014 | | | 9,600 | |
| | | | | | | |
| | | | | | 921,839 | |
| | | | | | | |
| | | Energy Equipment & Services - 0.20% | | | | |
| 500,000 | | Baker Hughes, Inc. | | | | |
| | | 7.500%, 11/15/2018 (b) | | | 598,735 | |
| 190,000 | | Complete Production Services | | | | |
| | | 8.000%, 12/15/2016 | | | 189,050 | |
| | | Geophysique | | | | |
| 155,000 | | 7.500%, 05/15/2015 | | | 156,163 | |
| 90,000 | | 7.750%, 05/15/2017 | | | 90,450 | |
| 50,000 | | Pride International, Inc. | | | | |
| | | 7.375%, 07/15/2014 | | | 51,750 | |
| | | | | | | |
| | | | | | 1,086,148 | |
| | | | | | | |
| | | Food & Staples Retailing - 0.25% | | | | |
| | | CVS Caremark Corporation | | | | |
| 500,000 | | 6.600%, 03/15/2019 | | | 559,967 | |
| 764,172 | | 6.943%, 01/10/2030 | | | 812,508 | |
| | | | | | | |
| | | | | | 1,372,475 | |
| | | | | | | |
| | | Food Products - 0.42% | | | | |
| 375,000 | | Dean Foods Co. | | | | |
| | | 7.000%, 06/01/2016 | | | 369,375 | |
| | | Kraft Foods, Inc. | | | | |
| 400,000 | | 6.125%, 08/23/2018 | | | 436,624 | |
| 1,100,000 | | 5.375%, 02/10/2020 | | | 1,120,116 | |
| 375,000 | | 6.500%, 02/09/2040 | | | 389,908 | |
| | | | | | | |
| | | | | | 2,316,023 | |
| | | | | | | |
| | | Health Care Equipment & Supplies - 0.15% | | | | |
| | | Boston Scientific Corp. | | | | |
| 375,000 | | 4.500%, 01/15/2015 | | | 359,768 | |
| 150,000 | | 6.000%, 01/15/2020 | | | 141,960 | |
| 125,000 | | 7.000%, 11/15/2035 | | | 112,766 | |
| 200,000 | | Medtronic, Inc. | | | | |
| | | 4.450%, 03/15/2020 | | | 199,439 | |
| | | | | | | |
| | | | | | 813,933 | |
| | | | | | | |
See notes to financial statements.
68
|
AssetMark Core Plus Fixed Income Fund |
SCHEDULE OF INVESTMENTS (Continued) |
March 31, 2010 |
| |
| | | | | | | |
Principal
Amount | | | | Value | |
| | | | | | |
| | | CORPORATE BONDS (Continued) | | | | |
| | | Health Care Providers & Services - 0.58% | | | | |
$ | 180,000 | | Community Health Systems, Inc. | | | | |
| | | 8.875%, 07/15/2015 | | $ | 186,750 | |
| 205,000 | | Davita, Inc. | | | | |
| | | 6.625%, 03/15/2013 | | | 207,306 | |
| 250,000 | | FMC Finance III SA | | | | |
| | | 6.875%, 07/15/2017 | | | 261,250 | |
| | | HCA, Inc. | | | | |
| 13,000 | | 6.300%, 10/01/2012 | | | 13,049 | |
| 234,000 | | 6.250%, 02/15/2013 | | | 233,415 | |
| 460,000 | | 6.750%, 07/15/2013 | | | 462,300 | |
| 40,000 | | 9.125%, 11/15/2014 | | | 42,350 | |
| 340,000 | | 9.250%, 11/15/2016 | | | 362,312 | |
| 72,579 | | 9.625%, 11/15/2016 | | | 77,932 | |
| 500,000 | | 7.875%, 02/15/2020 (c) | | | 524,687 | |
| 542,000 | | Tenet Healthcare Corp. | | | | |
| | | 9.250%, 02/01/2015 | | | 571,133 | |
| 160,000 | | UnitedHealth Group, Inc. | | | | |
| | | 6.000%, 02/15/2018 | | | 171,100 | |
| 50,000 | | WellPoint, Inc. | | | | |
| | | 5.875%, 06/15/2017 | | | 53,763 | |
| | | | | | | |
| | | | | | 3,167,347 | |
| | | | | | | |
| | | Hotels, Restaurants & Leisure - 0.07% | | | | |
| | | Boyd Gaming Corp. | | | | |
| 65,000 | | 6.750%, 04/15/2014 (b) | | | 57,037 | |
| 160,000 | | 7.125%, 02/01/2016 (b) | | | 134,400 | |
| 60,000 | | Inn of the Mountain Gods | | | | |
| | | Resort & Casino | | | | |
| | | 12.000%, 11/15/2010 | | | | |
| | | (Acquired 03/01/2005 and | | | | |
| | | 05/18/2005, Cost $61,343) (f)(n) | | | 17,940 | |
| | | MGM Mirage, Inc. | | | | |
| 20,000 | | 8.500%, 09/15/2010 | | | 20,225 | |
| 20,000 | | 10.375%, 05/15/2014 (c) | | | 22,150 | |
| 20,000 | | 6.625%, 07/15/2015 | | | 16,650 | |
| 30,000 | | 7.625%, 01/15/2017 (b) | | | 25,125 | |
| 50,000 | | 11.125%, 11/15/2017 (c) | | | 56,500 | |
| | | Station Casinos, Inc. | | | | |
| 25,000 | | 6.875%, 03/01/2016 | | | | |
| | | (Acquired 12/13/2006, | | | | |
| | | Cost $25,577) (f)(n) | | | 486 | |
| | | | | | | |
Principal
Amount | | | | Value | |
| | | | | | |
| | | Hotels, Restaurants & Leisure (Continued) | | | | |
$ | 190,000 | | 7.750%, 08/15/2016 | | | | |
| | | (Acquired 05/02/2007, | | | | |
| | | Cost $193,093) (f)(n) | | $ | 42,574 | |
| | | | | | | |
| | | | | | 393,087 | |
| | | | | | | |
| | | Household Durables - 0.09% | | | | |
| | | Whirlpool Corp. | | | | |
| 200,000 | | 8.000%, 05/01/2012 | | | 219,918 | |
| 250,000 | | 8.600%, 05/01/2014 | | | 290,387 | |
| | | | | | | |
| | | | | | 510,305 | |
| | | | | | | |
| | | Industrials - 0.14% | | | | |
| 340,000 | | Reed Elsevier Capital | | | | |
| | | 8.625%, 01/15/2019 | | | 424,854 | |
| 310,000 | | Roche Holding, Inc. | | | | |
| | | 6.000%, 03/01/2019 (c) | | | 343,187 | |
| | | | | | | |
| | | | | | 768,041 | |
| | | | | | | |
| | | Insurance - 1.24% | | | | |
| | | American International Group, Inc. | | | | |
| 130,000 | | 5.850%, 01/16/2018 | | | 120,976 | |
| 390,000 | | 8.250%, 08/15/2018 | | | 409,837 | |
| 150,000 | | 6.250%, 03/15/2087 | | | 111,750 | |
| 400,000 | | Arch Capital Group Ltd. | | | | |
| | | 7.350%, 05/01/2034 | | | 402,130 | |
| 80,000 | �� | ASIF Global Financing XIX | | | | |
| | | 4.900%, 01/17/2013 (c) | | | 80,944 | |
| 200,000 | | AXA Group | | | | |
| | | 6.463%, 12/31/2049 (b)(c)(e) | | | 176,000 | |
| 490,000 | | Berkshire Hathaway Inc. | | | | |
| | | 3.200%, 02/11/2015 | | | 494,734 | |
| 250,000 | | Endurance Specialty Holdings Ltd. | | | | |
| | | 6.150%, 10/15/2015 | | | 267,222 | |
| 300,000 | | Hartford Financial Services | | | | |
| | | Group, Inc. | | | | |
| | | 6.625%, 03/30/2040 | | | 296,135 | |
| 1,200,000 | | Metlife, Inc. | | | | |
| | | 6.400%, 12/15/2066 | | | 1,092,000 | |
| 1,025,000 | | Northwestern Mutual Life | | | | |
| | | Insurance Co. | | | | |
| | | 6.063%, 03/30/2040 | | | | |
| | | (Acquired 03/23/2010, | | | | |
| | | Cost $1,025,000) (d) | | | 1,032,208 | |
See notes to financial statements.
69
|
AssetMark Core Plus Fixed Income Fund |
SCHEDULE OF INVESTMENTS (Continued) |
March 31, 2010 |
| |
| | | | | | | |
Principal
Amount | | | | Value | |
| | | | | | |
| | | CORPORATE BONDS (Continued) | | | | |
| | | Insurance (Continued) | | | | |
$ | 450,000 | | QBE Insurance Group Ltd. | | | | |
| | | 5.647%, 07/01/2023 | | | | |
| | | (Acquired 08/23/2004, | | | | |
| | | Cost $441,198) (d)(e) | | $ | 419,564 | |
| 300,000 | | Reinsurance Group of America, Inc. | | | | |
| | | 6.750%, 12/15/2065 (e) | | | 275,956 | |
| 360,000 | | Teachers Insurance & | | | | |
| | | Annuity Association | | | | |
| | | 6.850%, 12/16/2039 (c) | | | 391,800 | |
| 375,000 | | Transatlantic Holdings, Inc. | | | | |
| | | 8.000%, 11/30/2039 | | | 384,352 | |
| 840,000 | | Travelers Companies, Inc. | | | | |
| | | 6.250%, 03/15/2067 (e) | | | 828,006 | |
| | | | | | | |
| | | | | | 6,783,614 | |
| | | | | | | |
| | | IT Services - 0.11% | | | | |
| 575,000 | | Fiserv, Inc. | | | | |
| | | 6.125%, 11/20/2012 | | | 626,186 | |
| | | | | | | |
| | | Machinery - 0.00% | | | | |
| 20,000 | | American Achievement Corp. | | | | |
| | | 8.250%, 04/01/2012 (c) | | | 19,900 | |
| | | | | | | |
| | | Media - 1.29% | | | | |
| | | Comcast Cable Communications | | | | |
| | | Holdings, Inc. | | | | |
| 320,000 | | 8.875%, 05/01/2017 | | | 387,586 | |
| 500,000 | | 9.455%, 11/15/2022 | | | 669,439 | |
| | | Comcast Corp. | | | | |
| 220,000 | | 6.500%, 01/15/2015 | | | 247,900 | |
| 50,000 | | 6.500%, 01/15/2017 | | | 55,662 | |
| 20,000 | | 5.875%, 02/15/2018 | | | 21,409 | |
| 650,000 | | Comcast Holdings Corp. | | | | |
| | | 10.625%, 07/15/2012 | | | 763,043 | |
| | | CSC Holdings, Inc. | | | | |
| 125,000 | | 7.625%, 04/01/2011 (b) | | | 131,094 | |
| 30,000 | | 8.625%, 02/15/2019 (c) | | | 33,000 | |
| 525,000 | | DIRECTV Holdings LLC | | | | |
| | | 6.350%, 03/15/2040 (c) | | | 522,881 | |
| 95,000 | | Dish DBS Corp. | | | | |
| | | 7.875%, 09/01/2019 | | | 99,275 | |
| | | EchoStar DBS Corporation | | | | |
| 40,000 | | 6.625%, 10/01/2014 | | | 40,400 | |
| 125,000 | | 7.750%, 05/31/2015 | | | 131,250 | |
| 500,000 | | 7.125%, 02/01/2016 | | | 511,875 | |
| | | | | | | |
Principal
Amount | | | | Value | |
| | | | | | |
| | | Media (Continued) | | | | |
$ | 285,000 | | The Reynolds Group, Inc. | | | | |
| | | 7.750%, 10/15/2016 (c) | | $ | 294,262 | |
| 70,000 | | Sun Media Corp. | | | | |
| | | 7.625%, 02/15/2013 | | | 69,037 | |
| | | Time Warner Cable, Inc. | | | | |
| 310,000 | | 6.875%, 05/01/2012 | | | 341,153 | |
| 540,000 | | 5.850%, 05/01/2017 | | | 579,045 | |
| 150,000 | | 8.750%, 02/14/2019 (b) | | | 186,328 | |
| 530,000 | | 8.250%, 04/01/2019 | | | 642,406 | |
| 210,000 | | 6.750%, 06/15/2039 | | | 221,011 | |
| 750,000 | | Time Warner, Inc. | | | | |
| | | 4.875%, 03/15/2020 | | | 734,199 | |
| 90,000 | | TL Acquisitions, Inc. | | | | |
| | | 10.500%, 01/15/2015 (c) | | | 86,850 | |
| 251,000 | | WPP Finance UK | | | | |
| | | 8.000%, 09/15/2014 | | | 288,670 | |
| | | | | | | |
| | | | | | 7,057,775 | |
| | | | | | | |
| | | Metals & Mining - 1.04% | | | | |
| 260,000 | | Alcoa, Inc. | | | | |
| | | 6.000%, 07/15/2013 (b) | | | 277,540 | |
| | | Anglo American Capital Plc | | | | |
| 144,000 | | 9.375%, 04/08/2014 (c) | | | 173,124 | |
| 350,000 | | 9.375%, 04/08/2019 (c) | | | 446,517 | |
| 650,000 | | ArcelorMittal SA | | | | |
| | | 6.125%, 06/01/2018 | | | 683,405 | |
| 200,000 | | Barrick Gold Corp. | | | | |
| | | 6.950%, 04/01/2019 (b) | | | 229,231 | |
| 640,000 | | BHP Billiton Ltd. | | | | |
| | | 6.500%, 04/01/2019 | | | 732,980 | |
| 100,000 | | Codelco | | | | |
| | | 4.750%, 10/15/2014 (c) | | | 105,188 | |
| | | Freeport-McMoRan Copper & | | | | |
| | | Gold, Inc. | | | | |
| 10,000 | | 8.250%, 04/01/2015 | | | 10,899 | |
| 895,000 | | 8.375%, 04/01/2017 | | | 997,022 | |
| 670,000 | | Rio Tinto Ltd. | | | | |
| | | 6.500%, 07/15/2018 | | | 755,357 | |
| | | Steel Dynamics, Inc. | | | | |
| 5,000 | | 7.375%, 11/01/2012 | | | 5,225 | |
| 150,000 | | 6.750%, 04/01/2015 (b) | | | 151,875 | |
| 60,000 | | 7.625%, 03/15/2020 (c) | | | 61,800 | |
See notes to financial statements.
70
|
AssetMark Core Plus Fixed Income Fund |
SCHEDULE OF INVESTMENTS (Continued) |
March 31, 2010 |
| |
| | | | | | | |
Principal
Amount | | | | Value | |
| | | | | | |
| | | CORPORATE BONDS (Continued) | | | | |
| | | Metals & Mining (Continued) | | | | |
| | | Teck Resources Ltd | | | | |
$ | 25,000 | | 9.750%, 05/15/2014 | | $ | 29,750 | |
| 20,000 | | 10.250%, 05/15/2016 | | | 23,900 | |
| 540,000 | | 10.750%, 05/15/2019 | | | 664,200 | |
| 300,000 | | Vedanta Resources Plc | | | | |
| | | 8.750%, 01/15/2014 (c) | | | 330,750 | |
| | | | | | | |
| | | | | | 5,678,763 | |
| | | | | | | |
| | | Multi-Utilities - 0.40% | | | | |
| 225,000 | | Calpine Construction Finance | | | | |
| | | Co. LP | | | | |
| | | 8.000%, 06/01/2016 (c) | | | 231,187 | |
| | | CenterPoint Energy, Inc. | | | | |
| 50,000 | | 7.250%, 09/01/2010 | | | 51,108 | |
| 475,000 | | 7.875%, 04/01/2013 | | | 544,270 | |
| | | Dominion Resources, Inc. | | | | |
| 80,000 | | 4.750%, 12/15/2010 | | | 82,202 | |
| 300,000 | | 5.700%, 09/17/2012 | | | 325,260 | |
| 260,000 | | 8.875%, 01/15/2019 (b) | | | 328,538 | |
| 25,000 | | Duke Energy Corp. | | | | |
| | | 5.625%, 11/30/2012 | | | 27,396 | |
| | | Edison Mission Energy | | | | |
| 90,000 | | 7.750%, 06/15/2016 | | | 66,150 | |
| 70,000 | | 7.000%, 05/15/2017 | | | 49,175 | |
| 220,000 | | 7.200%, 05/15/2019 | | | 152,900 | |
| 80,000 | | 7.625%, 05/15/2027 | | | 51,600 | |
| | | NRG Energy, Inc. | | | | |
| 225,000 | | 7.250%, 02/01/2014 | | | 227,250 | |
| 30,000 | | 7.375%, 02/01/2016 | | | 29,850 | |
| 20,000 | | 7.375%, 01/15/2017 | | | 19,850 | |
| | | | | | | |
| | | | | | 2,186,736 | |
| | | | | | | |
| | | Oil & Gas - 3.85% | | | | |
| | | Amerada Hess Corp. | | | | |
| 160,000 | | 7.875%, 10/01/2029 | | | 192,221 | |
| 350,000 | | 7.300%, 08/15/2031 | | | 399,963 | |
| 130,000 | | Anadarko Petroleum Corp. | | | | |
| | | 6.450%, 09/15/2036 | | | 132,911 | |
| 480,000 | | Apache Corp. | | | | |
| | | 6.000%, 09/15/2013 | | | 538,217 | |
| 700,000 | | Boardwalk Pipelines LP | | | | |
| | | 5.875%, 11/15/2016 | | | 751,464 | |
| | | | | | | |
Principal
Amount | | | | Value | |
| | | | | | |
| | | Oil & Gas (Continued) | | | | |
| | | BP Capital PLC | | | | |
$ | 680,000 | | 5.250%, 11/07/2013 | | $ | 748,905 | |
| 210,000 | | 3.875%, 03/10/2015 | | | 218,345 | |
| 25,000 | | Canadian Natural Resources Ltd. | | | | |
| | | 5.150%, 02/01/2013 | | | 26,860 | |
| | | Chesapeake Energy Corp. | | | | |
| 60,000 | | 6.375%, 06/15/2015 | | | 59,250 | |
| 80,000 | | 6.250%, 01/15/2018 | | | 76,600 | |
| 155,000 | | 7.250%, 12/15/2018 | | | 155,775 | |
| 70,000 | | Conoco Funding Co. | | | | |
| | | 6.350%, 10/15/2011 | | | 75,538 | |
| | | ConocoPhillips | | | | |
| 350,000 | | 6.000%, 01/15/2020 | | | 389,513 | |
| 490,000 | | 6.500%, 02/01/2039 | | | 549,246 | |
| 180,000 | | Consol Energy, Inc. | | | | |
| | | 8.250%, 04/01/2020 (c) | | | 185,850 | |
| 386,100 | | Dolphin Energy Ltd. | | | | |
| | | 5.888%, 06/15/2019 (c) | | | 397,419 | |
| 55,000 | | Dynegy, Inc. | | | | |
| | | 7.750%, 06/01/2019 | | | 41,800 | |
| | | El Paso Corp. | | | | |
| 275,000 | | 7.000%, 06/15/2017 | | | 282,037 | |
| 217,000 | | 7.800%, 08/01/2031 | | | 214,358 | |
| 355,000 | | 7.750%, 01/15/2032 | | | 350,602 | |
| | | El Paso Natural Gas Co. | | | | |
| 400,000 | | 7.500%, 11/15/2026 | | | 437,231 | |
| 59,000 | | 8.375%, 06/15/2032 | | | 69,346 | |
| 1,070,000 | | El Paso Performance Linked Trust | | | | |
| | | 7.750%, 07/15/2011 (c) | | | 1,113,094 | |
| 1,150,000 | | Energy Transfer Partners LP | | | | |
| | | 5.950%, 02/01/2015 | | | 1,250,753 | |
| | | Enterprise Products Operating LP | | | | |
| 375,000 | | 8.375%, 08/01/2066 (e) | | | 381,088 | |
| 450,000 | | 7.034%, 01/15/2068 (e) | | | 428,689 | |
| 400,000 | | Hess Corp. | | | | |
| | | 8.125%, 02/15/2019 | | | 488,382 | |
| 1,085,000 | | Kerr Mcgee Corp. | | | | |
| | | 7.875%, 09/15/2031 | | | 1,263,887 | |
| | | Kinder Morgan Energy Partners | | | | |
| 360,000 | | 6.750%, 03/15/2011 | | | 378,326 | |
| 110,000 | | 5.850%, 09/15/2012 | | | 119,578 | |
| 60,000 | | 6.000%, 02/01/2017 | | | 64,527 | |
| 410,000 | | Noble Energy, Inc. | | | | |
| | | 8.250%, 03/01/2019 | | | 497,367 | |
See notes to financial statements.
71
|
AssetMark Core Plus Fixed Income Fund |
SCHEDULE OF INVESTMENTS (Continued) |
March 31, 2010 |
| |
| | | | | | | |
Principal
Amount | | | | Value | |
| | | | | | |
| | | CORPORATE BONDS (Continued) | | | | |
| | | Oil & Gas (Continued) | | | | |
$ | 790,000 | | Occidental Petroleum Corp. | | | | |
| | | 7.000%, 11/01/2013 | | $ | 915,828 | |
| 425,000 | | Oneok Partners LP | | | | |
| | | 6.650%, 10/01/2036 | | | 444,489 | |
| | | OPTI Canada, Inc. | | | | |
| 40,000 | | 7.875%, 12/15/2014 | | | 37,600 | |
| 20,000 | | 8.250%, 12/15/2014 | | | 18,900 | |
| 50,000 | | Peabody Energy Corp. | | | | |
| | | 5.875%, 04/15/2016 | | | 50,000 | |
| 781,000 | | Pemex Project Funding Master Trust | | | | |
| | | 6.625%, 06/15/2035 (b) | | | 770,406 | |
| | | Petrobras International Finance Co. | | | | |
| 180,000 | | 6.125%, 10/06/2016 | | | 194,801 | |
| 162,000 | | 5.750%, 01/20/2020 | | | 166,777 | |
| 980,000 | | Petroleos Mexicanos | | | | |
| | | 8.000%, 05/03/2019 | | | 1,153,950 | |
| | | Sandridge Energy, Inc. | | | | |
| 200,000 | | 9.875%, 05/15/2016 (c) | | | 206,500 | |
| 5,000 | | 8.750%, 01/15/2020 (c) | | | 4,900 | |
| 550,000 | | Shell International Finance BV | | | | |
| | | 4.375%, 03/25/2020 | | | 546,350 | |
| 45,000 | | Southern Natural Gas Co. | | | | |
| | | 8.000%, 03/01/2032 | | | 50,953 | |
| 425,000 | | Suncor Energy, Inc. | | | | |
| | | 6.100%, 06/01/2018 | | | 458,671 | |
| | | Tennessee Gas Pipeline Co. | | | | |
| 250,000 | | 7.500%, 04/01/2017 | | | 283,277 | |
| 140,000 | | 7.625%, 04/01/2037 | | | 155,502 | |
| | | Williams Companies, Inc. | | | | |
| 267,000 | | 7.875%, 09/01/2021 | | | 314,987 | |
| 570,000 | | 7.500%, 01/15/2031 | | | 628,021 | |
| 437,000 | | 7.750%, 06/15/2031 | | | 491,580 | |
| 450,000 | | 8.750%, 03/15/2032 | | | 549,732 | |
| | | Oil & Gas (Continued) | | | | |
| 425,000 | | Williams Partners LP | | | | |
| | | 5.250%, 03/15/2020 (c) | | | 426,684 | |
| | | XTO Energy, Inc. | | | | |
| 800,000 | | 7.500%, 04/15/2012 | | | 896,702 | |
| 30,000 | | 5.650%, 04/01/2016 | | | 33,257 | |
| | | | | | | |
| | | | | | 21,079,009 | |
| | | | | | | |
| | | | | | | |
Principal
Amount | | | | Value | |
| | | | | | |
| | | Paper & Forest Products - 0.04% | | | | |
$ | 175,000 | | International Paper Co. | | | | |
| | | 7.950%, 06/15/2018 | | $ | 204,776 | |
| | | | | | | |
| | | Pharmaceuticals - 0.35% | | | | |
| 820,000 | | Abbott Laboratories | | | | |
| | | 5.125%, 04/01/2019 | | | 865,286 | |
| 550,000 | | Pfizer, Inc. | | | | |
| | | 6.200%, 03/15/2019 | | | 622,299 | |
| 420,000 | | Wyeth | | | | |
| | | 5.950%, 04/01/2037 | | | 441,236 | |
| | | | | | | |
| | | | | | 1,928,821 | |
| | | | | | | |
| | | Pipelines - 0.20% | | | | |
| 225,000 | | DCP Midstream LLC | | | | |
| | | 9.750%, 03/15/2019 (c) | | | 288,903 | |
| 275,000 | | El Paso Pipeline Partners, L.P. | | | | |
| | | 6.500%, 04/01/2020 | | | 279,733 | |
| 550,000 | | TransCanada PipeLines Ltd. | | | | |
| | | 6.350%, 05/15/2067 (e) | | | 524,054 | |
| | | | | | | |
| | | | | | 1,092,690 | |
| | | | | | | |
| | | Real Estate - 0.42% | | | | |
| 450,000 | | Developers Diversified Realty Corp. | | | | |
| | | 7.500%, 04/01/2017 | | | 455,866 | |
| 29,000 | | Forest City Enterprises, Inc. | | | | |
| | | 6.500%, 02/01/2017 | | | 23,490 | |
| 450,000 | | ProLogis | | | | |
| | | 1.875%, 11/15/2037 | | | 426,375 | |
| 550,000 | | Realogy Corp. | | | | |
| | | 10.500%, 04/15/2014 (b) | | | 477,125 | |
| 600,000 | | Simon Property Group LP | | | | |
| | | 10.350%, 04/01/2019 | | | 755,590 | |
| | | Ventas Realty LP | | | | |
| 90,000 | | 9.000%, 05/01/2012 | | | 96,092 | |
| 70,000 | | 6.750%, 04/01/2017 | | | 71,968 | |
| | | | | | | |
| | | | | | 2,306,506 | |
| | | | | | | |
| | | Retail - 0.01% | | | | |
| 40,000 | | J.C. Penney Co., Inc. | | | | |
| | | 7.400%, 04/01/2037 | | | 40,200 | |
| | | | | | | |
See notes to financial statements.
72
|
AssetMark Core Plus Fixed Income Fund |
SCHEDULE OF INVESTMENTS (Continued) |
March 31, 2010 |
| |
| | | | | | | |
Principal
Amount | | | | Value | |
| | | | | | |
| | | CORPORATE BONDS (Continued) | | | | |
| | | Road & Rail - 0.13% | | | | |
$ | 165,000 | | Kansas City Southern de Mexico, | | | | |
| | | S.A. de C.V. | | | | |
| | | 12.500%, 04/01/2016 | | $ | 195,937 | |
| 270,000 | | Railamerica, Inc. | | | | |
| | | 9.250%, 07/01/2017 | | | 289,238 | |
| 3,000 | | TFM S.A. de C.V. | | | | |
| | | 9.375%, 05/01/2012 | | | 3,090 | |
| 230,000 | | Union Pacific Corp. | | | | |
| | | 5.375%, 05/01/2014 | | | 248,098 | |
| | | | | | | |
| | | | | | 736,363 | |
| | | | | | | |
| | | Semiconductor & Semiconductor | | | | |
| | | Equipment - 0.01% | | | | |
| 60,000 | | National Semiconductor Corp. | | | | |
| | | 6.600%, 06/15/2017 | | | 65,238 | |
| | | | | | | |
| | | Special Purpose Entity - 0.24% | | | | |
| 375,000 | | Hellas Telecom V | | | | |
| | | 4.684%, 10/15/2012 (e) | | | 364,677 | |
| 280,000 | | ILFC E-Capital Trust II | | | | |
| | | 6.250%, 12/21/2065 (c)(e) | | | 218,400 | |
| 330,000 | | MUFG Capital Finance 1 Ltd. | | | | |
| | | 6.346%, 07/29/2049 (e) | | | 327,630 | |
| 390,000 | | TNK-BP | | | | |
| | | 7.500%, 07/18/2016 (c) | | | 426,575 | |
| | | | | | | |
| | | | | | 1,337,282 | |
| | | | | | | |
| | | Tobacco - 0.11% | | | | |
| 240,000 | | Altria Group, Inc. | | | | |
| | | 9.250%, 08/06/2019 | | | 292,109 | |
| | | Reynolds American, Inc. | | | | |
| 70,000 | | 7.250%, 06/01/2012 | | | 76,511 | |
| 230,000 | | 6.750%, 06/15/2017 | | | 246,702 | |
| | | | | | | |
| | | | | | 615,322 | |
| | | | | | | |
| | | Transportation - 0.08% | | | | |
| 446,000 | | Vale Overseas Ltd. | | | | |
| | | 6.875%, 11/21/2036 | | | 462,524 | |
| | | | | | | |
| | | Total Corporate Bonds | | | | |
| | | (Cost $173,158,966) | | | 169,411,703 | |
| | | | | | | |
| | | | | | | |
Principal
Amount | | | | Value | |
| | | | | | |
| | | FOREIGN GOVERNMENT | | | | |
| | | NOTE/BONDS - 3.66% | | | | |
$ | 550,000 | | Hellenic Republic | | | | |
| | | 6.100%, 08/20/2015 | | $ | 744,073 | |
| | | United Mexican States | | | | |
| 14,000 | | 5.625%, 01/15/2017 | | | 15,050 | |
| 156,000 | | 6.750%, 09/27/2034 | | | 172,380 | |
| | | Province of Ontario | | | | |
| 500,000 | | 4.100%, 06/16/2014 | | | 534,660 | |
| 1,660,000 | | 2.950%, 02/05/2015 | | | 1,666,285 | |
| 4,240,000 | | Republic Of Argentina | | | | |
| | | 3.169%, 12/15/2035 (e) | | | 339,200 | |
| | | Societe de Financement de | | | | |
| | | l’Economie Francaise’s | | | | |
| 2,400,000 | | 3.375%, 05/05/2014 (b)(c) | | | 2,492,443 | |
| 2,500,000 | | 2.875%, 09/22/2014 (b)(c) | | | 2,517,730 | |
| 570,000 | | Republic of Peru | | | | |
| | | 7.125%, 03/30/2019 | | | 663,195 | |
| 710,000 | | Republic of Indonesia | | | | |
| | | 5.875%, 03/13/2020 (c) | | | 740,175 | |
| 3,500,000 | | Bundesrepublik Deutschland | | | | |
| | | 4.250%, 07/04/2039 | | | 5,087,702 | |
| 1,120,000 | | Japan Finance Corporation | | | | |
| | | 2.875%, 02/02/2015 | | | 1,122,985 | |
| 17,960,000 | | Mexican Bonos | | | | |
| | | 9.000%, 12/20/2012 | | | 1,565,213 | |
| 73,600 | | Russia Foreign Bond | | | | |
| | | 7.500%, 03/31/2030 | | | 85,015 | |
| | | State of Qatar | | | | |
| 1,600,000 | | 5.250%, 01/20/2020 (c) | | | 1,668,800 | |
| 140,000 | | 5.150%, 04/09/2014 | | | 150,514 | |
| 500,000 | | Swedish Housing Finance Corp. | | | | |
| | | 3.125%, 03/23/2012 (c) | | | 515,551 | |
| | | | | | | |
| | | Total Foreign Government | | | | |
| | | Note/Bonds (Cost $19,952,457) | | | 20,080,971 | |
| | | | | | | |
| | | MORTGAGE BACKED SECURITIES - U.S. | | | | |
| | | GOVERNMENT AGENCY - 29.97% | | | | |
| | | Federal Home Loan Mortgage Corp. | | | | |
| 1,000,000 | | Series 2590, | | | | |
| | | 5.000%, 03/15/2018 | | | 1,078,383 | |
| 1,080,688 | | Series 2329, | | | | |
| | | 6.500%, 06/15/2031 | | | 1,181,986 | |
See notes to financial statements.
73
|
AssetMark Core Plus Fixed Income Fund |
SCHEDULE OF INVESTMENTS (Continued) |
March 31, 2010 |
| |
| | | | | | | |
Principal
Amount | | | | Value | |
| | | | | | |
| | | MORTGAGE BACKED SECURITIES - U.S. | | | | |
| | | GOVERNMENT AGENCY (Continued) | | | | |
| | | Federal Home Loan Mortgage Corp. | | | | |
$ | 604,532 | | Series 2338, | | | | |
| | | 6.500%, 07/15/2031 | | $ | 660,594 | |
| 2,722,788 | | Pool #1G-0058, | | | | |
| | | 3.829%, 01/01/2035 (e) | | | 2,836,966 | |
| 1,216,756 | | Pool #1H-2524, | | | | |
| | | 3.390%, 08/01/2035 (e) | | | 1,268,154 | |
| 29,266 | | Series 3013, 0.000%, 08/15/2035 | | | | |
| | | (Acquired 05/01/2007, | | | | |
| | | Cost $29,790) (d)(e) | | | 28,489 | |
| 1,798,222 | | Pool #1Q-0160, | | | | |
| | | 5.056%, 09/01/2035 (e) | | | 1,881,794 | |
| 1,188 | | Pool #A4-3129, | | | | |
| | | 5.500%, 02/01/2036 | | | 1,257 | |
| 8,353 | | Series 3167, | | | | |
| | | 0.000%, 06/15/2036 | | | | |
| | | (Acquired 04/13/2007, | | | | |
| | | Cost $7,780) (d)(e) | | | 8,324 | |
| 454,875 | | Pool #1N-1582, | | | | |
| | | 5.907%, 05/01/2037 (e) | | | 482,682 | |
| 1,693,296 | | Pool #1G-2201, | | | | |
| | | 6.079%, 09/01/2037 (e) | | | 1,808,001 | |
| 86,915 | | Pool #GO-5335, | | | | |
| | | 5.000%, 03/01/2039 | | | 89,869 | |
| 34,455 | | Pool #A8-6141, | | | | |
| | | 5.000%, 05/01/2039 | | | 35,626 | |
| 563,525 | | Pool #A8-6245, | | | | |
| | | 5.000%, 05/01/2039 | | | 582,677 | |
| 939,041 | | Pool #A8-6862, | | | | |
| | | 5.000%, 06/01/2039 | | | 970,957 | |
| 666,748 | | Pool #A8-7059, | | | | |
| | | 5.000%, 06/01/2039 | | | 689,408 | |
| 1,244,335 | | Pool #A8-7062, | | | | |
| | | 5.000%, 06/01/2039 | | | 1,286,626 | |
| 289,381 | | Pool #A8-7438, | | | | |
| | | 5.000%, 07/01/2039 | | | 299,216 | |
| 291,836 | | Pool #A8-7443, | | | | |
| | | 5.000%, 07/01/2039 | | | 301,754 | |
| 222,089 | | Pool #G0-5529, | | | | |
| | | 5.000%, 07/01/2039 | | | 229,659 | |
| | | | | | | |
Principal
Amount | | | | Value | |
| | | | | | |
| | | MORTGAGE BACKED SECURITIES - U.S. | | | | |
| | | GOVERNMENT AGENCY (Continued) | | | | |
$ | 33,850 | | Pool #A8-7625, | | | | |
| | | 5.000%, 08/01/2039 | | $ | 35,000 | |
| 28,939 | | Pool #A8-7706, | | | | |
| | | 5.000%, 08/01/2039 | | | 29,922 | |
| 29,212 | | Pool #A8-8050, | | | | |
| | | 5.000%, 08/01/2039 | | | 30,205 | |
| 32,808 | | Pool #A8-8118, | | | | |
| | | 5.000%, 08/01/2039 | | | 33,923 | |
| 49,626 | | Pool #A8-8153, | | | | |
| | | 5.000%, 08/01/2039 | | | 51,313 | |
| 978,062 | | Pool #C0-3404, | | | | |
| | | 4.500%, 09/01/2039 | | | 981,700 | |
| 418,634 | | Pool #A8-8640, | | | | |
| | | 5.000%, 09/01/2039 | | | 432,862 | |
| 230,876 | | Pool #A8-8642, | | | | |
| | | 5.000%, 09/01/2039 | | | 238,723 | |
| 43,792 | | Pool #A8-9012, | | | | |
| | | 5.000%, 09/01/2039 | | | 45,281 | |
| 48,776 | | Pool #A8-9014, | | | | |
| | | 5.000%, 09/01/2039 | | | 50,434 | |
| 80,634 | | Pool #A8-9211, | | | | |
| | | 5.000%, 10/01/2039 | | | 83,374 | |
| 1,558,483 | | Pool #C03425, | | | | |
| | | 5.000%, 10/01/2039 | | | 1,611,607 | |
| 571,465 | | Pool #A8-9843, | | | | |
| | | 5.000%, 11/01/2039 | | | 590,887 | |
| 195,163 | | Pool #A9-0206, | | | | |
| | | 5.000%, 12/01/2039 | | | 201,796 | |
| 1,878,485 | | Pool #A9-0317, | | | | |
| | | 5.000%, 12/01/2039 | | | 1,942,329 | |
| 264,555 | | Pool #A9-0690, | | | | |
| | | 5.000%, 01/01/2040 | | | 273,547 | |
| 58,062 | | Pool #A9-0815, | | | | |
| | | 5.000%, 01/01/2040 | | | 60,035 | |
| 37,704 | | Pool #A9-0844, | | | | |
| | | 5.000%, 01/01/2040 | | | 38,985 | |
| | | Federal Home Loan Mortgage | | | | |
| | | Corp. - Gold | | | | |
| 15,926 | | Pool #B1-2301, | | | | |
| | | 4.000%, 02/01/2014 | | | 16,368 | |
See notes to financial statements.
74
|
AssetMark Core Plus Fixed Income Fund |
SCHEDULE OF INVESTMENTS (Continued) |
March 31, 2010 |
| |
| | | | | | | |
Principal
Amount | | | | Value | |
| | | | | | |
| | | MORTGAGE BACKED SECURITIES - U.S. | | | | |
| | | GOVERNMENT AGENCY (Continued) | | | | |
$ | 29,700 | | Pool #B1-2730, | | | | |
| | | 4.000%, 03/01/2014 | | $ | 30,525 | |
| 32,566 | | Pool #B1-2772, | | | | |
| | | 4.000%, 03/01/2014 | | | 33,479 | |
| 23,871 | | Pool #B1-2818, | | | | |
| | | 4.000%, 03/01/2014 | | | 24,534 | |
| 28,578 | | Pool #B1-2819, | | | | |
| | | 4.000%, 03/01/2014 | | | 29,365 | |
| 25,660 | | Pool #B1-2883, | | | | |
| | | 4.000%, 03/01/2014 | | | 26,367 | |
| 19,899 | | Pool #B1-2910, | | | | |
| | | 4.000%, 03/01/2014 | | | 20,447 | |
| 21,666 | | Pool #B1-2911, | | | | |
| | | 4.000%, 03/01/2014 | | | 22,268 | |
| 99,709 | | Pool #B1-3066, | | | | |
| | | 4.000%, 03/01/2014 | | | 102,482 | |
| 13,383 | | Pool #B1-3343, | | | | |
| | | 4.000%, 04/01/2014 | | | 13,765 | |
| 18,048 | | Pool #B1-3344, | | | | |
| | | 4.000%, 04/01/2014 | | | 18,554 | |
| 21,740 | | Pool #B1-3360, | | | | |
| | | 4.000%, 04/01/2014 | | | 22,350 | |
| 45,450 | | Pool #E9-6247, | | | | |
| | | 4.500%, 05/01/2018 | | | 47,872 | |
| 48,306 | | Pool #E9-6248, | | | | |
| | | 4.500%, 05/01/2018 | | | 50,881 | |
| 56,441 | | Pool #E9-7034, | | | | |
| | | 4.500%, 06/01/2018 | | | 59,431 | |
| 21,192 | | Pool #E9-9763, | | | | |
| | | 4.500%, 09/01/2018 | | | 22,315 | |
| 21,282 | | Pool #E9-9764, | | | | |
| | | 4.500%, 09/01/2018 | | | 22,410 | |
| 15,508 | | Pool #E9-9765, | | | | |
| | | 4.500%, 09/01/2018 | | | 16,330 | |
| 44,657 | | Pool #E9-9769, | | | | |
| | | 4.500%, 09/01/2018 | | | 47,023 | |
| 30,864 | | Pool #E9-9770, | | | | |
| | | 4.500%, 09/01/2018 | | | 32,500 | |
| 48,439 | | Pool #B1-0170, | | | | |
| | | 4.500%, 10/01/2018 | | | 51,005 | |
| | | | | | | |
Principal
Amount | | | | Value | |
| | | | | | |
| | | MORTGAGE BACKED SECURITIES - U.S. | | | | |
| | | GOVERNMENT AGENCY (Continued) | | | | |
$ | 63,660 | | Pool #B1-0207, | | | | |
| | | 4.500%, 10/01/2018 | | $ | 67,032 | |
| 59,536 | | Pool #E0-1481, | | | | |
| | | 4.500%, 10/01/2018 | | | 62,455 | |
| 292,565 | | Pool #B1-0178, | | | | |
| | | 5.000%, 10/01/2018 | | | 312,534 | |
| 490,517 | | Pool #E0-1538, | | | | |
| | | 5.000%, 12/01/2018 | | | 521,419 | |
| 68,427 | | Pool #B1-1801, | | | | |
| | | 4.500%, 01/01/2019 | | | 72,052 | |
| 61,935 | | Pool #G1-1526, | | | | |
| | | 4.500%, 03/01/2019 | | | 65,216 | |
| 798,826 | | Pool #G1-1719, | | | | |
| | | 5.000%, 06/01/2020 | | | 851,851 | |
| 780,094 | | Pool #G1-1733, | | | | |
| | | 5.000%, 07/01/2020 | | | 830,901 | |
| 551,672 | | Pool #D9-6291, | | | | |
| | | 4.500%, 09/01/2023 | | | 573,705 | |
| 806,436 | | Pool #78-0447, | | | | |
| | | 2.844%, 04/01/2033 (e) | | | 824,765 | |
| 2,546,843 | | Pool #G0-8085, | | | | |
| | | 5.000%, 10/01/2035 | | | 2,637,381 | |
| 186,839 | | Pool #1N-1447, | | | | |
| | | 5.679%, 02/01/2037 (e) | | | 198,079 | |
| 486,565 | | Pool #1N-1463, | | | | |
| | | 5.879%, 05/01/2037 (e) | | | 515,197 | |
| | | Federal National Mortgage Association | | | | |
| 4,000,000 | | Pool #TBA, | | | | |
| | | 4.500%, 09/11/2016 (g) | | | 4,009,414 | |
| 51,717 | | Pool #357273, | | | | |
| | | 5.000%, 09/01/2017 | | | 55,231 | |
| 6,184 | | Pool #254684, | | | | |
| | | 5.000%, 03/01/2018 | | | 6,600 | |
| 7,380 | | Pool #555361, | | | | |
| | | 4.500%, 04/01/2018 | | | 7,772 | |
| 5,872 | | Pool #656564, | | | | |
| | | 5.000%, 04/01/2018 | | | 6,267 | |
| 79,505 | | Pool #695826, | | | | |
| | | 5.000%, 04/01/2018 | | | 84,857 | |
| 9,283 | | Pool #357378, | | | | |
�� | | | 4.500%, 05/01/2018 | | | 9,777 | |
See notes to financial statements.
75
|
AssetMark Core Plus Fixed Income Fund |
SCHEDULE OF INVESTMENTS (Continued) |
March 31, 2010 |
| |
| | | | | | | |
Principal
Amount | | | | Value | |
| | | | | | |
| | | MORTGAGE BACKED SECURITIES - U.S. | | | | |
| | | GOVERNMENT AGENCY (Continued) | | | | |
$ | 6,808 | | Pool #685505, | | | | |
| | | 5.000%, 05/01/2018 | | $ | 7,267 | |
| 5,547 | | Pool #685506, | | | | |
| | | 5.000%, 05/01/2018 | | | 5,921 | |
| 8,251 | | Pool #705709, | | | | |
| | | 5.000%, 05/01/2018 | | | 8,806 | |
| 9,285 | | Pool #555549, | | | | |
| | | 5.000%, 06/01/2018 | | | 9,910 | |
| 18,000 | | Pool #357413, | | | | |
| | | 5.000%, 07/01/2018 | | | 19,211 | |
| 2,638,533 | | Pool #734788, | | | | |
| | | 4.000%, 09/01/2018 | | | 2,737,963 | |
| 39,637 | | Pool #713830, | | | | |
| | | 4.500%, 10/01/2018 | | | 41,743 | |
| 91,708 | | Pool #734743, | | | | |
| | | 4.500%, 10/01/2018 | | | 96,580 | |
| 43,977 | | Pool #740468, | | | | |
| | | 4.500%, 10/01/2018 | | | 46,313 | |
| 29,415 | | Pool #743133, | | | | |
| | | 5.000%, 10/01/2018 | | | 31,395 | |
| 36,701 | | Pool #769278, | | | | |
| | | 4.500%, 11/01/2018 | | | 38,651 | |
| 65,969 | | Pool #752853, | | | | |
| | | 4.500%, 12/01/2018 | | | 69,474 | |
| 41,318 | | Pool #254987, | | | | |
| | | 5.000%, 12/01/2018 | | | 44,099 | |
| 9,208 | | Pool #357478, | | | | |
| | | 5.000%, 12/01/2018 | | | 9,827 | |
| 504,944 | | Pool #745387, | | | | |
| | | 5.000%, 04/01/2019 | | | 538,935 | |
| 17,789 | | Pool #776276, | | | | |
| | | 5.000%, 04/01/2019 | | | 18,987 | |
| 15,216 | | Pool #775653, | | | | |
| | | 4.500%, 05/01/2019 | | | 16,001 | |
| 86,087 | | Pool #775688, | | | | |
| | | 4.500%, 05/01/2019 | | | 90,526 | |
| 45,966 | | Pool #777358, | | | | |
| | | 4.500%, 05/01/2019 | | | 48,336 | |
| 73,688 | | Pool #735985, | | | | |
| | | 5.000%, 06/01/2019 | | | 78,649 | |
| | | | | | | |
Principal
Amount | | | | Value | |
| | | | | | |
| | | MORTGAGE BACKED SECURITIES - U.S. | | | | |
| | | GOVERNMENT AGENCY (Continued) | | | | |
$ | 45,891 | | Pool #788275, | | | | |
| | | 5.000%, 07/01/2019 | | $ | 48,894 | |
| 23,742 | | Pool #790397, | | | | |
| | | 5.000%, 08/01/2019 | | | 25,296 | |
| 10,806 | | Pool #761496, | | | | |
| | | 5.000%, 09/01/2019 | | | 11,513 | |
| 834,679 | | Pool #735439, | | | | |
| | | 6.000%, 09/01/2019 | | | 903,908 | |
| 19,831 | | Pool #930637, | | | | |
| | | 4.500%, 10/01/2019 | | | 20,885 | |
| 156,162 | | Pool #811034, | | | | |
| | | 5.000%, 10/01/2019 | | | 166,674 | |
| 1,036,465 | | Pool #745238, | | | | |
| | | 6.000%, 12/01/2020 | | | 1,122,430 | |
| 384,000 | | Pool #888104, | | | | |
| | | 5.000%, 05/01/2021 | | | 409,130 | |
| 2,623,122 | | Pool #981272, | | | | |
| | | 4.500%, 04/01/2023 | | | 2,728,459 | |
| 1,363,756 | | Pool #889428, | | | | |
| | | 5.000%, 05/01/2023 | | | 1,444,905 | |
| 1,096,495 | | Pool #981644, | | | | |
| | | 4.500%, 06/01/2023 | | | 1,139,851 | |
| 525,304 | | Pool #966689, | | | | |
| | | 5.000%, 06/01/2023 | | | 554,808 | |
| 5,000,000 | | Pool #TBA, | | | | |
| | | 6.500%, 05/01/2029 (g) | | | 5,403,910 | |
| 673,437 | | Pool #544859, | | | | |
| | | 3.581%, 08/01/2029 (e) | | | 697,598 | |
| 769,153 | | Pool #786848, | | | | |
| | | 7.000%, 10/01/2031 | | | 863,468 | |
| 58,261 | | Pool #727181, | | | | |
| | | 5.000%, 08/01/2033 | | | 60,460 | |
| 15,431 | | Pool #730727, | | | | |
| | | 5.000%, 08/01/2033 | | | 16,014 | |
| 3,896 | | Pool #741862, | | | | |
| | | 5.500%, 09/01/2033 | | | 4,135 | |
| 25,126 | | Pool #745944, | | | | |
| | | 5.000%, 12/01/2033 | | | 26,054 | |
| 4,997 | | Pool #766197, | | | | |
| | | 5.500%, 02/01/2034 | | | 5,293 | |
See notes to financial statements.
76
|
AssetMark Core Plus Fixed Income Fund |
SCHEDULE OF INVESTMENTS (Continued) |
March 31, 2010 |
| |
| | | | | | | |
Principal
Amount | | | | Value | |
| | | | | | |
| | | MORTGAGE BACKED SECURITIES - U.S. | | | | |
| | | GOVERNMENT AGENCY (Continued) | | | | |
$ | 453,664 | | Pool #888504, | | | | |
| | | 2.594%, 04/01/2034 (e) | | $ | 466,815 | |
| 803 | | Pool #776974, | | | | |
| | | 5.500%, 04/01/2034 | | | 850 | |
| 440,364 | | Series 2004-71, | | | | |
| | | 0.000%, 04/25/2034 | | | | |
| | | (Acquired 04/07/2006, | | | | |
| | | Cost $39,505) (d)(e)(i) | | | 1,117 | |
| 32,545 | | Pool #775776, | | | | |
| | | 5.500%, 05/01/2034 | | | 34,473 | |
| 879,088 | | Pool #725705, | | | | |
| | | 5.000%, 08/01/2034 | | | 910,726 | |
| 1,301,777 | | Pool #782284, | | | | |
| | | 6.000%, 09/01/2034 | | | 1,412,854 | |
| 956,735 | | Pool #791563, | | | | |
| | | 6.000%, 09/01/2034 | | | 1,032,392 | |
| 34,039 | | Pool #794371, | | | | |
| | | 6.000%, 09/01/2034 | | | 36,731 | |
| 484,606 | | Pool #802783, | | | | |
| | | 3.041%, 10/01/2034 (e) | | | 500,117 | |
| 1,002,124 | | Pool #802493, | | | | |
| | | 6.000%, 11/01/2034 | | | 1,081,370 | |
| 52,657 | | Pool #781629, | | | | |
| | | 5.500%, 12/01/2034 | | | 55,776 | |
| 2,474 | | Pool #806098, | | | | |
| | | 6.000%, 12/01/2034 | | | 2,670 | |
| 5,869,526 | | Pool #735224, | | | | |
| | | 5.500%, 02/01/2035 | | | 6,230,040 | |
| 2,460,019 | | Pool #808057, | | | | |
| | | 6.000%, 02/01/2035 | | | 2,633,026 | |
| 54,765 | | Pool #822815, | | | | |
| | | 5.500%, 04/01/2035 | | | 57,906 | |
| 714,463 | | Pool #735504, | | | | |
| | | 6.000%, 04/01/2035 | | | 776,319 | |
| 592,316 | | Pool #773306, | | | | |
| | | 6.000%, 05/01/2035 | | | 633,972 | |
| 42,725 | | Series 2007-27, | | | | |
| | | 0.000%, 05/25/2035 | | | | |
| | | (Acquired 05/29/2007, | | | | |
| | | Cost $40,429) (d)(e) | | | 41,304 | |
| | | | | | | |
Principal
Amount | | | | Value | |
| | | | | | |
| | | MORTGAGE BACKED SECURITIES - U.S. | | | | |
| | | GOVERNMENT AGENCY (Continued) | | | | |
$ | 59,082 | | Pool #820242, | | | | |
| | | 5.000%, 07/01/2035 | | $ | 61,127 | |
| 15,173 | | Pool #833958, | | | | |
| | | 5.000%, 07/01/2035 | | | 15,699 | |
| 16,159 | | Pool #835738, | | | | |
| | | 5.000%, 07/01/2035 | | | 16,718 | |
| 43,862 | | Pool #357850, | | | | |
| | | 5.500%, 07/01/2035 | | | 46,378 | |
| 17,614 | | Pool #834513, | | | | |
| | | 5.000%, 08/01/2035 | | | 18,224 | |
| 859,869 | | Pool #829334, | | | | |
| | | 3.454%, 09/01/2035 (e) | | | 892,302 | |
| 4,073,794 | | Pool #820345, | | | | |
| | | 5.000%, 09/01/2035 | | | 4,214,796 | |
| 16,660 | | Pool #840696, | | | | |
| | | 5.000%, 09/01/2035 | | | 17,236 | |
| 6,576 | | Pool #838452, | | | | |
| | | 5.500%, 09/01/2035 | | | 6,953 | |
| 894,856 | | Pool #836852, | | | | |
| | | 2.410%, 10/01/2035 (e) | | | 912,833 | |
| 1,282,283 | | Pool #836464, | | | | |
| | | 2.447%, 10/01/2035 (e) | | | 1,312,113 | |
| 105,250 | | Pool #745000, | | | | |
| | | 6.000%, 10/01/2035 | | | 112,968 | |
| 98,506 | | Pool #844052, | | | | |
| | | 2.414%, 11/01/2035 (e) | | | 100,501 | |
| 94,718 | | Pool #844237, | | | | |
| | | 2.418%, 11/01/2035 (e) | | | 96,666 | |
| 564,553 | | Pool #843823, | | | | |
| | | 2.429%, 11/01/2035 (e) | | | 576,441 | |
| 100,714 | | Pool #844789, | | | | |
| | | 2.432%, 11/01/2035 (e) | | | 102,885 | |
| 99,075 | | Pool #843997, | | | | |
| | | 2.444%, 11/01/2035 (e) | | | 101,193 | |
| 89,422 | | Pool #844148, | | | | |
| | | 2.436%, 11/01/2035 (e) | | | 91,385 | |
| 2,644,486 | | Pool #844158, | | | | |
| | | 5.000%, 11/01/2035 | | | 2,736,017 | |
| 1,143,045 | | Pool #745755, | | | | |
| | | 5.000%, 12/01/2035 | | | 1,184,394 | |
See notes to financial statements.
77
|
AssetMark Core Plus Fixed Income Fund |
SCHEDULE OF INVESTMENTS (Continued) |
March 31, 2010 |
| |
| | | | | | | |
Principal
Amount | | | | Value | |
| | | | | | |
| | | MORTGAGE BACKED SECURITIES - U.S. | | | | |
| | | GOVERNMENT AGENCY (Continued) | | | | |
$ | 171,174 | | Pool #848939, | | | | |
| | | 6.500%, 01/01/2036 | | $ | 186,529 | |
| 40,266 | | Pool #851639, | | | | |
| | | 6.500%, 01/01/2036 | | | 43,765 | |
| 480,652 | | Pool #888022, | | | | |
| | | 5.000%, 02/01/2036 | | | 497,288 | |
| 227,789 | | Pool #852263, | | | | |
| | | 5.000%, 03/01/2036 | | | 235,389 | |
| 55,650 | | Pool #865854, | | | | |
| | | 6.000%, 03/01/2036 | | | 59,407 | |
| 2,368,423 | | Pool #256219, | | | | |
| | | 5.500%, 04/01/2036 | | | 2,484,660 | |
| 68,336 | | Pool #891474, | | | | |
| | | 6.000%, 04/01/2036 | | | 72,949 | |
| 2,720,749 | | Pool #872236, | | | | |
| | | 2.786%, 05/01/2036 (e) | | | 2,841,559 | |
| 2,424,609 | | Pool #868993, | | | | |
| | | 2.925%, 05/01/2036 (e) | | | 2,532,715 | |
| 2,899,424 | | Pool #885961, | | | | |
| | | 2.835%, 07/01/2036 (e) | | | 3,030,577 | |
| 3,011,783 | | Pool #886376, | | | | |
| | | 2.929%, 08/01/2036 (e) | | | 3,148,344 | |
| 2,994,712 | | Pool #886891, | | | | |
| | | 2.791%, 09/01/2036 (e) | | | 3,142,774 | |
| 983,872 | | Pool #831808, | | | | |
| | | 6.000%, 09/01/2036 | | | 1,050,299 | |
| 406,632 | | Pool #897776, | | | | |
| | | 6.500%, 09/01/2036 | | | 441,965 | |
| 34,738 | | Series 2006-81, | | | | |
| | | 0.000%, 09/25/2036 | | | | |
| | | (Acquired 05/29/2007, | | | | |
| | | Cost $34,456) (d)(e) | | | 33,974 | |
| 801,335 | | Pool #893681, | | | | |
| | | 6.000%, 10/01/2036 | | | 855,437 | |
| 1,782,700 | | Pool #893923, | | | | |
| | | 6.000%, 10/01/2036 | | | 1,903,059 | |
| 2,218,777 | | Pool #894005, | | | | |
| | | 6.000%, 10/01/2036 | | | 2,368,578 | |
| 270,150 | | Pool #905857, | | | | |
| | | 3.712%, 12/01/2036 (e) | | | 281,277 | |
| | | | | | | |
Principal
Amount | | | | Value | |
| | | | | | |
| | | MORTGAGE BACKED SECURITIES - U.S. | | | | |
| | | GOVERNMENT AGENCY (Continued) | | | | |
$ | 212,481 | | Pool #905110, | | | | |
| | | 6.000%, 12/01/2036 | | $ | 226,826 | |
| 187,795 | | Pool #905111, | | | | |
| | | 6.000%, 12/01/2036 | | | 200,474 | |
| 406,439 | | Pool #897505, | | | | |
| | | 6.500%, 12/01/2036 | | | 441,754 | |
| 190,061 | | Pool #906055, | | | | |
| | | 6.000%, 01/01/2037 | | | 202,893 | |
| 852 | | Pool #928062, | | | | |
| | | 5.500%, 02/01/2037 | | | 900 | |
| 1,533 | | Pool #899119, | | | | |
| | | 5.500%, 04/01/2037 | | | 1,617 | |
| 1,578 | | Pool #938488, | | | | |
| | | 5.500%, 05/01/2037 | | | 1,665 | |
| 7,000,000 | | Pool #TBA, | | | | |
| | | 6.000%, 05/15/2037 (g) | | | 7,469,224 | |
| 5,000,000 | | Pool #TBA, | | | | |
| | | 5.500%, 06/01/2037 (g) | | | 5,246,875 | |
| 51,898 | | Series 2007-56, | | | | |
| | | 0.000%, 06/25/2037 | | | | |
| | | (Acquired 06/11/2007, | | | | |
| | | Cost $55,950) (d)(e) | | | 51,559 | |
| 469,443 | | Pool #945069, | | | | |
| | | 6.500%, 08/01/2037 | | | 509,500 | |
| 13,184 | | Pool #933376, | | | | |
| | | 5.000%, 02/01/2038 | | | 13,621 | |
| 1,855 | | Pool #970131, | | | | |
| | | 5.500%, 03/01/2038 | | | 1,958 | |
| 721,360 | | Pool #982817, | | | | |
| | | 5.000%, 05/01/2038 | | | 745,273 | |
| 1,270 | | Pool #981313, | | | | |
| | | 5.500%, 06/01/2038 | | | 1,340 | |
| 41,892 | | Pool #986758, | | | | |
| | | 5.000%, 07/01/2038 | | | 43,280 | |
| 1,807 | | Pool #985108, | | | | |
| | | 5.500%, 07/01/2038 | | | 1,907 | |
| 137,868 | | Pool #889697, | | | | |
| | | 6.000%, 07/01/2038 | | | 146,638 | |
| 982 | | Pool #964930, | | | | |
| | | 5.500%, 08/01/2038 | | | 1,036 | |
See notes to financial statements.
78
|
AssetMark Core Plus Fixed Income Fund |
SCHEDULE OF INVESTMENTS (Continued) |
March 31, 2010 |
| |
| | | | | | | |
Principal
Amount | | | | Value | |
| | | | | | |
| | | MORTGAGE BACKED SECURITIES - U.S. | | | | |
| | | GOVERNMENT AGENCY (Continued) | | | | |
$ | 1,563 | | Pool #987032, | | | | |
| | | 5.500%, 08/01/2038 | | $ | 1,650 | |
| 1,261 | | Pool #968371, | | | | |
| | | 5.500%, 09/01/2038 | | | 1,331 | |
| 796 | | Pool #993050, | | | | |
| | | 5.500%, 12/01/2038 | | | 840 | |
| 285 | | Pool #MC0018, | | | | |
| | | 5.500%, 12/01/2038 | | | 301 | |
| 262,454 | | Pool #930559, | | | | |
| | | 5.000%, 02/01/2039 | | | 271,155 | |
| 109,567 | | Pool #930671, | | | | |
| | | 4.500%, 03/01/2039 | | | 109,993 | |
| 90,303 | | Pool #AA3920, | | | | |
| | | 4.500%, 03/01/2039 | | | 90,639 | |
| 51,297 | | Pool #AA4983, | | | | |
| | | 4.500%, 03/01/2039 | | | 51,488 | |
| 364,078 | | Pool #930677, | | | | |
| | | 5.000%, 03/01/2039 | | | 376,147 | |
| 106,230 | | Pool #AA4221, | | | | |
| | | 4.500%, 04/01/2039 | | | 106,626 | |
| 2,000,000 | | Pool #TBA, | | | | |
| | | 5.000%, 04/01/2039 (g) | | | 2,063,438 | |
| 5,000,000 | | Pool #TBA, | | | | |
| | | 5.500%, 04/01/2039 (g) | | | 5,348,440 | |
| 1,900,000 | | Pool #TBA, | | | | |
| | | 6.500%, 04/01/2039 (g) | | | 2,059,421 | |
| 129,997 | | Pool #993588, | | | | |
| | | 4.500%, 05/01/2039 | | | 130,481 | |
| 81,661 | | Pool #931147, | | | | |
| | | 5.000%, 05/01/2039 | | | 84,368 | |
| 44,188 | | Pool #931154, | | | | |
| | | 5.000%, 05/01/2039 | | | 45,653 | |
| 96,670 | | Pool #935221, | | | | |
| | | 5.000%, 05/01/2039 | | | 99,865 | |
| 60,204 | | Pool #AA5414, | | | | |
| | | 5.000%, 05/01/2039 | | | 62,193 | |
| 52,589 | | Pool #AA5804, | | | | |
| | | 5.000%, 05/01/2039 | | | 54,327 | |
| 94,910 | | Pool #AA6024, | | | | |
| | | 5.000%, 05/01/2039 | | | 98,056 | |
| | | | | | | |
Principal
Amount | | | | Value | |
| | | | | | |
| | | MORTGAGE BACKED SECURITIES - U.S. | | | | |
| | | GOVERNMENT AGENCY (Continued) | | | | |
$ | 96,540 | | Pool #AA6061, | | | | |
| | | 5.000%, 05/01/2039 | | $ | 99,741 | |
| 25,789 | | Pool #AA6579, | | | | |
| | | 5.000%, 05/01/2039 | | | 26,641 | |
| 44,540 | | Pool #AA6580, | | | | |
| | | 5.000%, 05/01/2039 | | | 46,012 | |
| 75,365 | | Pool #AA6852, | | | | |
| | | 5.000%, 05/01/2039 | | | 77,856 | |
| 36,567 | | Pool #931378, | | | | |
| | | 4.500%, 06/01/2039 | | | 36,703 | |
| 36,004 | | Pool #AA8422, | | | | |
| | | 4.500%, 06/01/2039 | | | 36,137 | |
| 106,002 | | Pool #AA7412, | | | | |
| | | 5.000%, 06/01/2039 | | | 109,506 | |
| 29,116 | | Pool #AA9296, | | | | |
| | | 5.000%, 06/01/2039 | | | 30,081 | |
| 32,616 | | Pool #AA8222, | | | | |
| | | 4.500%, 07/01/2039 | | | 32,738 | |
| 30,741 | | Pool #AA8965, | | | | |
| | | 4.500%, 07/01/2039 | | | 30,856 | |
| 27,337 | | Pool #AA9006, | | | | |
| | | 4.500%, 07/01/2039 | | | 27,439 | |
| 25,646 | | Pool #AA4106, | | | | |
| | | 5.000%, 07/01/2039 | | | 26,494 | |
| 26,323 | | Pool #AA8232, | | | | |
| | | 5.000%, 07/01/2039 | | | 27,193 | |
| 53,271 | | Pool #AA8979, | | | | |
| | | 5.000%, 07/01/2039 | | | 55,032 | |
| 24,598 | | Pool #AA9010, | | | | |
| | | 5.000%, 07/01/2039 | | | 25,411 | |
| 98,376 | | Pool #AA9386, | | | | |
| | | 5.000%, 07/01/2039 | | | 101,628 | |
| 95,937 | | Pool #AA9391, | | | | |
| | | 5.000%, 07/01/2039 | | | 99,108 | |
| 82,632 | | Pool #AA9794, | | | | |
| | | 5.000%, 07/01/2039 | | | 85,363 | |
| 46,997 | | Pool #AC2141, | | | | |
| | | 5.000%, 07/01/2039 | | | 48,555 | |
| 33,310 | | Pool #AC2142, | | | | |
| | | 5.000%, 07/01/2039 | | | 34,414 | |
See notes to financial statements.
79
|
AssetMark Core Plus Fixed Income Fund |
SCHEDULE OF INVESTMENTS (Continued) |
March 31, 2010 |
| |
| | | | | | | |
Principal
Amount | | | | Value | |
| | | | | | |
| | | MORTGAGE BACKED SECURITIES - U.S. | | | | |
| | | GOVERNMENT AGENCY (Continued) | | | | |
$ | 31,913 | | Pool #AA9132, | | | | |
| | | 4.500%, 08/01/2039 | | $ | 32,032 | |
| 25,613 | | Pool #AA9133, | | | | |
| | | 4.500%, 08/01/2039 | | | 25,708 | |
| 23,980 | | Pool #AA9154, | | | | |
| | | 4.500%, 08/01/2039 | | | 24,069 | |
| 48,534 | | Pool #AC2861, | | | | |
| | | 4.500%, 08/01/2039 | | | 48,715 | |
| 27,386 | | Pool #935541, | | | | |
| | | 5.000%, 08/01/2039 | | | 28,291 | |
| 24,911 | | Pool #AA9142, | | | | |
| | | 5.000%, 08/01/2039 | | | 25,734 | |
| 91,642 | | Pool #AC0166, | | | | |
| | | 5.000%, 08/01/2039 | | | 94,670 | |
| 70,673 | | Pool #AC0169, | | | | |
| | | 5.000%, 08/01/2039 | | | 73,009 | |
| 431,242 | | Pool #AC1259, | | | | |
| | | 5.000%, 08/01/2039 | | | 445,494 | |
| 25,241 | | Pool #AC3503, | | | | |
| | | 5.000%, 08/01/2039 | | | 26,075 | |
| 195,808 | | Pool #AC3246, | | | | |
| | | 4.500%, 09/01/2039 | | | 196,536 | |
| 368,505 | | Pool #AC1441, | | | | |
| | | 5.000%, 09/01/2039 | | | 380,684 | |
| 370,642 | | Pool #AC3234, | | | | |
| | | 5.000%, 09/01/2039 | | | 382,891 | |
| 923,232 | | Pool #AC3235, | | | | |
| | | 5.000%, 09/01/2039 | | | 953,744 | |
| 394,743 | | Pool #AC3247, | | | | |
| | | 4.500%, 10/01/2039 | | | 396,211 | |
| 196,200 | | Pool #AC3310, | | | | |
| | | 4.500%, 10/01/2039 | | | 196,930 | |
| 395,979 | | Pool #AC3311, | | | | |
| | | 4.500%, 10/01/2039 | | | 397,452 | |
| 393,825 | | Pool #AC3304, | | | | |
| | | 5.000%, 10/01/2039 | | | 406,840 | |
| 492,354 | | Pool #AC3316, | | | | |
| | | 5.000%, 10/01/2039 | | | 508,626 | |
| 434,316 | | Pool #AC3661, | | | | |
| | | 5.000%, 10/01/2039 | | | 448,670 | |
| | | | | | | |
Principal
Amount | | | | Value | |
| | | | | | |
| | | MORTGAGE BACKED SECURITIES - U.S. | | | | |
| | | GOVERNMENT AGENCY (Continued) | | | | |
$ | 97,227 | | Pool #AC6121, | | | | |
| | | 4.500%, 11/01/2039 | | $ | 97,589 | |
| 49,892 | | Pool #AC5504, | | | | |
| | | 5.000%, 11/01/2039 | | | 51,541 | |
| 62,084 | | Pool #AC5505, | | | | |
| | | 5.000%, 11/01/2039 | | | 64,136 | |
| 33,643 | | Pool #AC8372, | | | | |
| | | 4.500%, 12/01/2039 | | | 33,769 | |
| 894,995 | | Pool #AD0586, | | | | |
| | | 4.500%, 12/01/2039 | | | 898,414 | |
| 126,046 | | Pool #AC3891, | | | | |
| | | 5.000%, 12/01/2039 | | | 130,211 | |
| 195,534 | | Pool #AC3892, | | | | |
| | | 5.000%, 12/01/2039 | | | 201,997 | |
| 27,827 | | Pool #AC5515, | | | | |
| | | 5.000%, 12/01/2039 | | | 28,747 | |
| 297,439 | | Pool #AC8630, | | | | |
| | | 4.500%, 01/01/2040 | | | 298,545 | |
| 65,738 | | Pool #AC8794, | | | | |
| | | 4.500%, 01/01/2040 | | | 65,982 | |
| 298,915 | | Pool #AC9528, | | | | |
| | | 4.500%, 01/01/2040 | | | 300,027 | |
| 199,063 | | Pool #AC9548, | | | | |
| | | 4.500%, 01/01/2040 | | | 199,804 | |
| 199,130 | | Pool #AC9550, | | | | |
| | | 4.500%, 01/01/2040 | | | 199,871 | |
| 54,204 | | Pool #AD1356, | | | | |
| | | 4.500%, 01/01/2040 | | | 54,406 | |
| 1,692,320 | | Pool #AC8570, | | | | |
| | | 5.000%, 01/01/2040 | | | 1,748,250 | |
| 2,384,860 | | Pool #AC8571, | | | | |
| | | 5.000%, 01/01/2040 | | | 2,463,679 | |
| 44,386 | | Pool #AD1274, | | | | |
| | | 5.000%, 01/01/2040 | | | 45,853 | |
| 79,403 | | Pool #AD1276, | | | | |
| | | 5.000%, 01/01/2040 | | | 82,027 | |
| 28,893 | | Pool #AD1187, | | | | |
| | | 4.500%, 02/01/2040 | | | 29,001 | |
| 25,770 | | Pool #AD1188, | | | | |
| | | 4.500%, 02/01/2040 | | | 25,866 | |
See notes to financial statements.
80
|
AssetMark Core Plus Fixed Income Fund |
SCHEDULE OF INVESTMENTS (Continued) |
March 31, 2010 |
| |
| | | | | | | |
Principal
Amount | | | | Value | |
| | | | | | |
| | | MORTGAGE BACKED SECURITIES - U.S. | | | | |
| | | GOVERNMENT AGENCY (Continued) | | | | |
$ | 50,754 | | Pool #AD2204, | | | | |
| | | 5.000%, 02/01/2040 | | $ | 52,432 | |
| 28,275 | | Pool #AD2206, | | | | |
| | | 5.000%, 02/01/2040 | | | 29,209 | |
| 1,000,000 | | Pool #TBA, | | | | |
| | | 5.500%, 04/15/2040 (g) | | | 1,054,063 | |
| 2,082,400 | | Pool #200822, | | | | |
| | | 1.086%, 04/25/2048 (e) | | | 2,088,506 | |
| | | Government National | | | | |
| | | Mortgage Association | | | | |
| 61,447 | | Pool #614436X, | | | | |
| | | 5.000%, 08/15/2033 | | | 64,385 | |
| 996,645 | | Pool #618907X, | | | | |
| | | 5.000%, 09/15/2033 | | | 1,044,313 | |
| 163,230 | | Pool #605098X, | | | | |
| | | 5.000%, 03/15/2034 | | | 170,884 | |
| 179,943 | | Pool #081116M, | | | | |
| | | 2.750%, 10/20/2034 (e) | | | 182,594 | |
| 124,143 | | Pool #520279X, | | | | |
| | | 5.000%, 11/15/2034 | | | 129,964 | |
| 622,610 | | Pool #081153M, | | | | |
| | | 2.750%, 11/20/2034 (e) | | | 631,793 | |
| 267,217 | | Pool #081150M, | | | | |
| | | 2.750%, 11/20/2034 (e) | | | 271,272 | |
| 2,142,908 | | Pool #644812X, | | | | |
| | | 6.000%, 05/15/2035 | | | 2,303,442 | |
| 27,212 | | Pool #716855X, | | | | |
| | | 5.000%, 04/15/2039 | | | 28,352 | |
| 24,362 | | Pool #716807X, | | | | |
| | | 5.000%, 04/15/2039 | | | 25,382 | |
| 126,409 | | Pool#717087X, | | | | |
| | | 5.000%, 05/15/2039 | | | 131,704 | |
| 586,212 | | Pool #720103X, | | | | |
| | | 4.500%, 06/15/2039 | | | 594,541 | |
| 235,759 | | Pool #698214X, | | | | |
| | | 5.000%, 06/15/2039 | | | 245,635 | |
| 146,216 | | Pool #698210X, | | | | |
| | | 5.000%, 06/15/2039 | | | 152,341 | |
| 86,874 | | Pool #698197X, | | | | |
| | | 5.000%, 06/15/2039 | | | 90,513 | |
| | | | | | | |
Principal
Amount | | | | Value | |
| | | | | | |
| | | MORTGAGE BACKED SECURITIES - U.S. | | | | |
| | | GOVERNMENT AGENCY (Continued) | | | | |
$ | 61,131 | | Pool #720063X, | | | | |
| | | 5.000%, 06/15/2039 | | $ | 63,692 | |
| 58,398 | | Pool #698194X, | | | | |
| | | 5.000%, 06/15/2039 | | | 60,844 | |
| 794,147 | | Pool #710923, | | | | |
| | | 5.000%, 10/15/2039 | | | 827,414 | |
| 784,983 | | Pool #723248, | | | | |
| | | 5.000%, 10/15/2039 | | | 817,866 | |
| 297,463 | | Pool #723244, | | | | |
| | | 5.000%, 10/15/2039 | | | 309,923 | |
| 296,630 | | Pool #710922, | | | | |
| | | 5.000%, 10/15/2039 | | | 309,056 | |
| 296,304 | | Pool #726382, | | | | |
| | | 5.000%, 10/15/2039 | | | 308,716 | |
| 197,644 | | Pool #726381, | | | | |
| | | 5.000%, 10/15/2039 | | | 205,924 | |
| 2,800,000 | | Pool #TBA, | | | | |
| | | 6.50%, 04/01/2029 (g) | | | 3,015,468 | |
| 1,150,000 | | Pool #TBA, | | | | |
| | | 6.00%, 04/01/2039 (g) | | | 1,228,524 | |
| | | | | | | |
| | | Total Mortgage Backed Securities - | | | | |
| | | U.S. Government Agency | | | | |
| | | (Cost $159,252,795) | | | 164,197,740 | |
| | | | | | | |
| | | MUNICIPAL BONDS - 1.19% | | | | |
| | | California, GO, | | | | |
| 725,000 | | 7.500%, 04/01/2034 (b) | | | 748,816 | |
| 175,000 | | 7.950%, 03/01/2036 | | | 179,433 | |
| 600,000 | | 7.550%, 04/01/2039 | | | 620,922 | |
| 260,000 | | 7.300%, 10/01/2039 | | | 261,180 | |
| 925,000 | | 7.625%, 03/01/2040 | | | 964,007 | |
| 1,000,000 | | Missouri Higher Education Loan | | | | |
| | | Authority, Series A-1, Revenue Bond, | | | | |
| | | 1.224%, 11/26/2032 (e) | | | 999,530 | |
| | | Municipal Electric Authority of | | | | |
| | | Georgia, Refunding, Revenue Bond, | | | | |
| 160,000 | | 6.637%, 04/01/2057 | | | 158,859 | |
| 80,000 | | 6.655%, 04/01/2057 | | | 79,616 | |
| 1,000,000 | | South Carolina Student Loan Corp., | | | | |
| | | Series A-1, Revenue Bond, | | | | |
| | | 0.342%, 12/02/2019 (e) | | | 960,500 | |
See notes to financial statements.
81
|
AssetMark Core Plus Fixed Income Fund |
SCHEDULE OF INVESTMENTS (Continued) |
March 31, 2010 |
| |
| | | | | | | |
Principal
Amount | | | | Value | |
| | | | | | |
| | | MUNICIPAL BONDS - (Continued) | | | | |
$ | 1,546,644 | | Virginia Housing Development | | | | |
| | | Authority, Series C, Revenue Bond, | | | | |
| | | 6.000%, 06/25/2034 | | $ | 1,550,635 | |
| | | | | | | |
| | | Total Municipal Bonds | | | | |
| | | (Cost $6,398,630) | | | 6,523,498 | |
| | | | | | | |
| | | SUPRANATIONAL OBLIGATIONS - 1.27% | | | | |
| 2,500,000 | | African Development Bank | | | | |
| | | 0.500%, 02/27/2014 | | | 2,337,228 | |
| | | Commonwealth Bank of Australia | | | | |
| 300,000 | | 3.750%, 10/15/2014 (c) | | | 304,430 | |
| 130,000 | | 5.000%, 10/15/2019 (c) | | | 130,899 | |
| 500,000 | | Swedish Export Credit | | | | |
| | | 3.250%, 09/16/2014 | | | 511,334 | |
| 4,000,000 | | Inter-American Development Bank | | | | |
| | | 0.500%, 05/29/2014 | | | 3,655,548 | |
| | | | | | | |
| | | Total Supranational Obligations | | | | |
| | | (Cost $6,345,426) | | | 6,939,439 | |
| | �� | | | | | |
| | | U.S. GOVERNMENT AGENCY ISSUES - 1.88% | | | | |
| 1,400,000 | | Federal Farm Credit Banks | | | | |
| | | 5.125%, 04/19/2017 (c) | | | 1,466,535 | |
| 290,000 | | Federal Home Loan Bank | | | | |
| | | 1.500%, 01/16/2013 (b) | | | 289,682 | |
| | | Federal Home Loan Mortgage Corp. | | | | |
| 1,550,000 | | 2.875%, 02/09/2015 (b) | | | 1,561,276 | |
| 880,000 | | 5.625%, 11/23/2035 | | | 892,427 | |
| | | Federal National Mortgage Association | | | | |
| 600,000 | | 1.750%, 03/23/2011 (b) | | | 606,982 | |
| 1,000,000 | | 0.000%, 10/09/2019 (l) | | | 586,446 | |
| 570,000 | | 6.250%, 05/15/2029 | | | 645,870 | |
| 560,000 | | 7.125%, 01/15/2030 (b) | | | 705,779 | |
| | | Tennessee Valley Authority | | | | |
| 1,200,000 | | 4.375%, 06/15/2015 | | | 1,277,843 | |
| 830,000 | | 5.980%, 04/01/2036 | | | 904,175 | |
| 250,000 | | 5.250%, 09/15/2039 | | | 248,138 | |
| 1,100,000 | | 5.375%, 04/01/2056 | | | 1,104,676 | |
| | | | | | | |
| | | Total U.S. Government Agency Issues | | | | |
| | | (Cost $10,168,727) | | | 10,289,829 | |
| | | | | | | |
| | | | | | | |
Principal
Amount | | | | Value | |
| | | | | | |
| | | U.S. TREASURY | | | | |
| | | OBLIGATIONS - 12.05% | | | | |
| | | U.S. Treasury Bond - 4.64% | | | | |
$ | 1,230,019 | | 2.375%, 01/15/2025 (h) | | $ | 1,289,886 | |
| 360,278 | | 2.000%, 01/15/2026 (b)(h) | | | 359,124 | |
| 999,276 | | 2.375%, 01/15/2027 (h) | | | 1,043,306 | |
| 1,551,480 | | 1.750%, 01/15/2028 (h)(m) | | | 1,471,846 | |
| 1,130,371 | | 2.500%, 01/15/2029 (h) | | | 1,197,487 | |
| 5,290,000 | | 3.500%, 02/15/2039 (b) | | | 4,282,424 | |
| 4,000,000 | | 4.250%, 05/15/2039 (b) | | | 3,707,504 | |
| 5,670,000 | | 4.500%, 08/15/2039 (b) | | | 5,476,868 | |
| 4,040,000 | | 4.375%, 11/15/2039 (b) | | | 3,821,590 | |
| 802,024 | | 2.125%, 02/15/2040 (h) | | | 797,325 | |
| 2,000,000 | | 4.625%, 02/15/2040 (b) | | | 1,971,876 | |
| | | | | | | |
| | | | | | 25,419,235 | |
| | | | | | | |
| | | U.S. Treasury Note - 6.91% | | | | |
| 6,062,140 | | 0.875%, 04/15/2010 (b)(h) | | | 6,066,836 | |
| 40,000 | | 1.375%, 02/15/2013 (b) | | | 39,825 | |
| 320,000 | | 1.375%, 03/15/2013 (b) | | | 318,225 | |
| 50,000 | | 2.375%, 09/30/2014 | | | 50,031 | |
| 8,100,000 | | 2.500%, 03/31/2015 | | | 8,078,484 | |
| 1,091,750 | | 2.000%, 01/15/2016 (b)(h) | | | 1,159,472 | |
| 230,000 | | 3.250%, 05/31/2016 (b) | | | 232,965 | |
| 965,664 | | 2.500%, 07/15/2016 (h) | | | 1,056,195 | |
| 6,870,000 | | 2.750%, 11/30/2016 (b) | | | 6,682,690 | |
| 2,230,000 | | 3.125%, 01/31/2017 (b) | | | 2,214,845 | |
| 1,290,000 | | 3.250%, 03/31/2017 | | | 1,288,791 | |
| 4,750,000 | | 3.375%, 11/15/2019 (b) | | | 4,584,866 | |
| 6,180,000 | | 3.625%, 02/15/2020 | | | 6,076,683 | |
| | | | | | | |
| | | | | | 37,849,908 | |
| | | | | | | |
| | | U.S. Treasury Strip - 0.50% | | | | |
| 4,600,000 | | 0.000%, 11/15/2021 (b)(l) | | | 2,758,712 | |
| | | | | | | |
| | | Total U.S. Treasury Obligations | | | | |
| | | (Cost $66,510,212) | | | 66,027,856 | |
| | | | | | | |
| | | | | | | |
Number of
Shares | | | | | | |
| | | | | | | |
| | | WARRANTS - 0.00% | | | | |
| | | Warrant - 0.00% | | | | |
| 272 | | Semgroup | | | | |
| | | Expiration: November, 2014, | | | | |
| | | Exercise Price: $1.00 | | | | |
| | | (Acquired 12/07/2009, | | | | |
| | | Cost $0) (a)(n) | | | 0 | |
| | | | | | | |
| | | Total Warrants (Cost $0) | | | 0 | |
| | | | | | | |
See notes to financial statements.
82
|
AssetMark Core Plus Fixed Income Fund |
SCHEDULE OF INVESTMENTS (Continued) |
March 31, 2010 |
| |
| | | | | | | |
Number of
Shares | | | | Value | |
| | | | | | |
| | | SHORT TERM INVESTMENTS - 7.28% | | | | |
| | | Money Market Funds - 0.13% | | | | |
| 692,165 | | Federated Prime Obligations Fund | | | | |
| | | Effective Yield, 0.11% | | $ | 692,165 | |
| | | | | | | |
| | | | | | | |
Principal
Amount | | | | | | |
| | | | | | | |
| | | Repurchase Agreement - 7.15% | | | | |
$ | 14,000,000 | | Morgan Stanley Repurchase | | | | |
| | | Agreement 04/01/2010 at 0.010% | | | | |
| | | (Collateralized by a U.S. | | | | |
| | | Government Agency Issue, | | | | |
| | | value $14,277,396, | | | | |
| | | 2.100%, 10/05/2012) | | | 14,000,000 | |
| 25,200,000 | | UBS Warburg Repurchase | | | | |
| | | Agreement 04/01/2010 at 0.020% | | | | |
| | | (Collateralized by various U.S. | | | | |
| | | Government Agency Issues, | | | | |
| | | value $25,704,178, 0.000%) | | | 25,200,000 | |
| | | | | | | |
| | | | | | 39,200,000 | |
| | | | | | | |
| | | Total Short Term Investments | | | | |
| | | (Cost $39,892,165) | | | 39,892,165 | |
| | | | | | | |
| | | INVESTMENTS PURCHASED | | | | |
| | | AS SECURITIES LENDING | | | | |
| | | COLLATERAL - 8.40% | | | | |
| | | Corporate Paydown Securities - 1.28% | | | | |
| 5,882,373 | | KKR Atlantic East Holding Group | | | | |
| | | Trust, 3.059%, 03/25/11 (k) | | | 3,635,977 | |
| 6,736,019 | | KKR Pacific West Holding Group | | | | |
| | | Trust, 3.059%, 03/25/11 (k) | | | 3,382,445 | |
| | | | | | | |
| | | Total Corporate Paydown Securities | | | | |
| | | (Cost $12,618,392) | | | 7,018,422 | |
| | | | | | | |
| | | | | | | |
Number of
Shares | | | | | | |
| | | | | | | |
| | | Money Market Funds - 7.12% | | | | |
| 38,985,033 | | Mount Vernon Prime Portfolio | | | | |
| | | Effective Yield, 0.24% | | | 38,985,033 | |
| 27,413 | | Reserve Primary Fund (k) | | | — | |
| | | | | | | |
| | | Total Money Market Funds | | | | |
| | | (Cost $39,012,446) | | | 38,985,033 | |
| | | | | | | |
| | | | | | | |
Principal
Amount | | | | Value | |
| | | | | | |
| | | Cash - 0.00% | | | | |
$ | 11,360 | | Cash | | $ | 11,360 | |
| | | | | | | |
| | | Total Cash | | | | |
| | | (Cost $11,360) | | | 11,360 | |
| | | | | | | |
| | | Total Investments Purchased as | | | | |
| | | Securities Lending Collateral | | | | |
| | | (Cost $51,642,198) | | | 46,014,815 | |
| | | | | | | |
| | | Total Investments | | | | |
| | | (Cost $649,064,249) - 113.69% | | | 622,978,346 | |
| | | | | | | |
| | | Liabilities in Excess of | | | | |
| | | Other Assets - (13.69)% | | | (75,014,595 | ) |
| | | | | | | |
| | | TOTAL NET | | | | |
| | | ASSETS - 100.00% | | $ | 547,963,751 | |
| | | | | | | |
| |
| Percentages are stated as a percent of net assets. |
(a) | Non-income producing. |
(b) | All or a portion of this security is on loan. |
(c) | Restricted securities as defined in Rule 144(a) under the Securities Act of 1933. Such securities are treated as liquid securities according to the Fund’s liquidity guidelines. The value of these securities total $53,811,520, which represents 9.82% of total net assets. |
(d) | Restricted securities as defined in Rule 144(a) under the Securities Act of 1933. Such securities are treated as illiquid securities according to the Fund’s liquidity guidelines. The value of these securities total $4,286,684, which represents 0.78% of total net assets. |
(e) | Variable Rate Security. The rate shown is the rate in effect on March 31, 2010. |
(f) | Non-income producing. Item identified as in default as to payment of interest. |
(g) | Security purchased on a when-issued basis. On March 31, 2010, the total value of the investments purchased on a when-issued basis was $36,898,777 or 6.73% of total net assets. |
(h) | Represents a U.S. Treasury Inflation Protected Security. |
(i) | Represents an interest only security that entitles holders to receive only interest payments on the underlying mortgages. The yield to maturity of an interest only security is extremely sensitive to the rate of principal payments on the underlying mortgage assets. A rapid (slow) rate of principal repayments may have an adverse (positive) effect on yield to maturity. The principal amount shown is the notional amount of the underlying mortgage. Interest rate disclosed represents yield upon the estimated timing and amount of future cash flows at March 31, 2010. The security is illiquid and represents less than 0.01% of net assets. |
See notes to financial statements.
83
|
AssetMark Core Plus Fixed Income Fund |
SCHEDULE OF INVESTMENTS (Continued) |
March 31, 2010 |
| |
| |
(j) | Credit linked note. Investment performance is wholly or partially derived from an underlying source. |
(k) | As of March 31, 2010, the Advisor has fair valued this security and deemed it illiquid. The value of these securities were $7,018,422 which represent 1.28% of total net assets. |
(l) | Zero coupon bond. |
(m) | Partially assigned as collateral for certain futures and options contracts. |
(n) | Investments are treated illiquid according to the Fund’s liquidity guidelines. The value of these securities total $61,000, which represents 0.01% of total net assets. |
See notes to financial statements.
84
|
AssetMark Core Plus Fixed Income Fund
SCHEDULE OF FORWARD SALE COMMITMENTS
March 31, 2010 |
| | | | | | | | | |
Description | | | Principal
Amount | | Settlement
Date | | Proceeds
Received | | Value |
Government National Mortgage Association,
Pool #TBA, 6.00%, 04/01/2039 | | $800,000 | | 4/20/10 | | $856,453 | | $854,626 |
|
AssetMark Core Plus Fixed Income Fund
SCHEDULE OF OPTIONS WRITTEN
March 31, 2010 |
| | | | | | | |
Number of
Contracts | | | | Value | |
| | | CALL OPTIONS | | | | |
| 11 | | Eurodollar 90 Day Future | | | | |
| | | Expiration: September, 2010, | | | | |
| | | Exercise Price: $99.25 | | $ | 7,769 | |
| 9 | | Eurodollar 90 Day Future | | | | |
| | | Expiration: June, 2010, | | | | |
| | | Exercise Price: $99.38 | | | 5,962 | |
| | | | | $ | 13,731 | |
| | | Total Options Written | | | | |
| | | (Premiums received $11,060) | | $ | 13,731 | |
See notes to financial statements.
85
|
AssetMark Core Plus Fixed Income Fund
SCHEDULE OF OPEN FORWARD CURRENCY CONTRACTS
March 31, 2010 |
| | | | | | | | | | | | | | |
Forward
expiration date | | Currency to
be received | | Amount of
Currency to be
received | | Currency to
be delivered | | Amount of
Currency to
be delivered | | Unrealized
Appreciation |
4/12/10 | | U.S. Dollars | | 211,252 | | | Brazil Real | | 374,000 | | | $ | 1,463 | |
4/30/10 | | U.S. Dollars | | 6,673,649 | | | European Monetary Unit | | 4,933,492 | | | | 10,009 | |
5/18/10 | | U.S. Dollars | | 756,777 | | | European Monetary Unit | | 546,365 | | | | 18,800 | |
| | | | | | | | | | | | $ | 30,272 | |
|
AssetMark Core Plus Fixed Income Fund
SCHEDULE OF OPEN FUTURES CONTRACTS
March 31, 2010 |
| | | | | | | | | | | | | | | | |
Description | | | Number of
Contracts
Purchased (Sold) | | Notional
Value | | Settlement
Month | | Unrealized
Appreciation
(Depreciation) | |
Euro-Bobl Future | | 29 | | | $ | 4,585,915 | | Jun-10 | | | | $ | 8,147 | | |
Euro-Bund Future | | 46 | | | | 7,663,766 | | Jun-10 | | | | | 28,618 | | |
Euro-Bund Future | | (19 | ) | | | (3,165,468 | ) | Jun-10 | | | | | (16,845 | ) | |
Eurodollar 90 Day Futures | | 5 | | | | 1,245,375 | | Jun-10 | | | | | 14,408 | | |
Eurodollar 90 Day Futures | | 3 | | | | 745,988 | | Sep-10 | | | | | 10,803 | | |
Eurodollar 90 Day Futures | | 4 | | | | 991,700 | | Dec-10 | | | | | 1,879 | | |
Eurodollar 90 Day Futures | | 5 | | | | 1,235,250 | | Mar-11 | | | | | 19,931 | | |
Eurodollar 90 Day Futures | | 5 | | | | 1,230,563 | | Jun-11 | | | | | 19,306 | | |
Eurodollar 90 Day Futures | | 5 | | | | 1,226,000 | | Sep-11 | | | | | 18,295 | | |
Eurodollar 90 Day Futures | | 5 | | | | 1,221,563 | | Dec-11 | | | | | 17,267 | | |
Long Gilt Future | | 53 | | | | 9,229,038 | | Jun-10 | | | | | 51,742 | | |
U.S. Treasury 2 Year Note Futures | | 117 | | | | 25,383,524 | | Jun-10 | | | | | 3,302 | | |
U.S. Treasury 5 Year Note Futures | | 210 | | | | 24,117,198 | | Jun-10 | | | | | (74,699 | ) | |
U.S. Treasury 5 Year Note Futures | | (178 | ) | | | (20,442,196 | ) | Jun-10 | | | | | 68,070 | | |
U.S. Treasury 10 Year Note Futures | | 341 | | | | 39,641,250 | | Jun-10 | | | | | 9,577 | | |
U.S. Treasury Long Bond Futures | | 127 | | | | 14,747,875 | | Jun-10 | | | | | (58,434 | ) | |
U.S. Treasury Long Bond Futures | | (91 | ) | | | (10,567,375 | ) | Jun-10 | | | | | (89,850 | ) | |
U.S. Treasury Ultra Bond Futures | | 8 | | | | 959,750 | | Jun-10 | | | | | (3,026 | ) | |
| | | | | | | | | | | | $ | 28,491 | | |
See notes to financial statements.
86
|
AssetMark Enhanced Fundamental Index® Large Company Growth Fund
SCHEDULE OF INVESTMENTS
March 31, 2010 |
| | | | | | | |
Number of
Shares | | | | Value | |
| | | COMMON STOCKS - 90.75% | | | | |
| | | Aerospace & Defense - 2.66% | | | | |
| 116 | | BE Aerospace, Inc. (a) | | $ | 3,532 | |
| 3,019 | | General Dynamics Corp. | | | 233,067 | |
| 1,453 | | Goodrich Corp. | | | 102,465 | |
| 2,000 | | ITT Corp. | | | 107,220 | |
| 1,266 | | L-3 Communications Holdings, Inc. | | | 116,004 | |
| 3,234 | | Lockheed Martin Corp. | | | 269,133 | |
| 545 | | Precision Castparts Corp. (b) | | | 69,057 | |
| 5,198 | | Raytheon Co. | | | 296,910 | |
| 1,178 | | Rockwell Collins, Inc. | | | 73,731 | |
| 8,270 | | United Technologies Corp. | | | 608,755 | |
| | | | | | 1,879,874 | |
| | | Air Freight & Logistics - 1.48% | | | | |
| 1,105 | | C.H. Robinson Worldwide, Inc. | | | 61,714 | |
| 1,318 | | Expeditors International of | | | | |
| | | Washington | | | 48,661 | |
| 2,758 | | FedEx Corp. (b) | | | 257,597 | |
| 9,714 | | United Parcel Service, Inc. | | | 625,679 | |
| 3,372 | | UTI Worldwide, Inc. | | | 51,659 | |
| | | | | | 1,045,310 | |
| | | Airlines - 0.21% | | | | |
| 11,219 | | Southwest Airlines Co. (b) | | | 148,315 | |
| | | Auto Components - 0.01% | | | | |
| 225 | | Gentex Corp. | | | 4,369 | |
| | | Automobiles - 0.03% | | | | |
| 678 | | Thor Industries, Inc. | | | 20,482 | |
| | | Beverages - 3.00% | | | | |
| 679 | | Brown-Forman Corp. (b) | | | 40,367 | |
| 19,708 | | The Coca-Cola Company | | | 1,083,940 | |
| 2,298 | | Molson Coors Brewing Co. | | | 96,654 | |
| 13,651 | | Pepsico, Inc. | | | 903,150 | |
| | | | | | 2,124,111 | |
| | | Biotechnology - 1.19% | | | | |
| 6,603 | | Amgen, Inc. (a) | | | 394,595 | |
| 1,739 | | Biogen Idec, Inc. (a) | | | 99,749 | |
| 729 | | Celgene Corp. (a) | | | 45,169 | |
| 91 | | Cephalon, Inc. (a)(b) | | | 6,168 | |
| 3,382 | | Gilead Sciences, Inc. (a) | | | 153,813 | |
| 23,436 | | PDL BioPharma, Inc. (b) | | | 145,538 | |
| | | | | | 845,032 | |
| | | | | | | |
Number of
Shares | | | | Value | |
| | | Capital Markets - 3.95% | | | | |
| 355 | | Affiliated Managers Group (a)(b) | | $ | 28,045 | |
| 1,793 | | Ameriprise Financial, Inc. | | | 81,330 | |
| 10,042 | | The Bank of New York Mellon Corp. | | | 310,097 | |
| 930 | | Blackrock, Inc. | | | 202,517 | |
| 9,498 | | The Charles Schwab Corp. (b) | | | 177,518 | |
| 370 | | Eaton Vance Corp. (b) | | | 12,410 | |
| 258 | | Federated Investors, Inc. (b) | | | 6,806 | |
| 1,693 | | Franklin Resources, Inc. | | | 187,754 | |
| 5,164 | | Goldman Sachs Group, Inc. | | | 881,133 | |
| 5,852 | | Invesco Ltd. | | | 128,217 | |
| 849 | | Janus Capital Group, Inc. (b) | | | 12,132 | |
| 1,212 | | Jefferies Group, Inc. (b) | | | 28,688 | |
| 1,416 | | Northern Trust Corp. (b) | | | 78,248 | |
| 2,516 | | Raymond James Financial, Inc. (b) | | | 67,278 | |
| 1,169 | | SEI Investments Co. | | | 25,683 | |
| 5,500 | | State Street Corp. | | | 248,270 | |
| 1,136 | | T. Rowe Price Group, Inc. | | | 62,401 | |
| 13,415 | | TD Ameritrade Holding Corp. (a) | | | 255,690 | |
| | | | | | 2,794,217 | |
| | | Chemicals - 1.44% | | | | |
| 1,646 | | Air Products & Chemicals, Inc. | | | 121,722 | |
| 144 | | Airgas, Inc. | | | 9,161 | |
| 686 | | Albemarle Corp. | | | 29,244 | |
| 1,765 | | Celanese Corp. | | | 56,215 | |
| 319 | | CF Industries Holdings, Inc. (b) | | | 29,086 | |
| 1,569 | | Ecolab, Inc. | | | 68,958 | |
| 505 | | FMC Corp. | | | 30,573 | |
| 841 | | International Flavors & | | | | |
| | | Fragrances, Inc. (b) | | | 40,090 | |
| 382 | | Lubrizol Corp. | | | 35,037 | |
| 2,614 | | Monsanto Co. | | | 186,692 | |
| 1,565 | | Mosaic Co. | | | 95,105 | |
| 1,794 | | Praxair, Inc. | | | 148,902 | |
| 1,130 | | The Scotts Miracle-Gro Co. | | | 52,376 | |
| 230 | | Sigma Aldrich Corp. | | | 12,342 | |
| 1,096 | | Terra Industries, Inc. | | | 50,153 | |
| 1,505 | | Valspar Corp. | | | 44,367 | |
| 262 | | Westlake Chemical Corp. | | | 6,757 | |
| | | | | | 1,016,780 | |
| | | Commercial Banks - 3.94% | | | | |
| 1,584 | | BancorpSouth, Inc. (b) | | | 33,201 | |
| 982 | | Bank Hawaii Corp. | | | 44,141 | |
| 12,003 | | BB&T Corp. (b) | | | 388,777 | |
See notes to financial statements.
87
|
AssetMark Enhanced Fundamental Index® Large Company Growth Fund
SCHEDULE OF INVESTMENTS (Continued)
March 31, 2010 |
| | | | | | | |
Number of
Shares | | | | Value | |
| | | COMMON STOCKS (Continued) | | | | |
| | | Commercial Banks (Continued) | | | | |
| 984 | | BOK Financial Corp. | | $ | 51,601 | |
| 1,203 | | City National Corp. | | | 64,926 | |
| 989 | | Commerce Bancshares, Inc. | | | 40,687 | |
| 993 | | Cullen Frost Bankers, Inc. | | | 55,409 | |
| 3,780 | | F.N.B. Corp. (b) | | | 30,656 | |
| 460 | | First Citizens BancShares, Inc. (b) | | | 91,430 | |
| 1,183 | | FirstMerit Corp. | | | 25,517 | |
| 1,432 | | M & T Bank Corp. (b) | | | 113,672 | |
| 3,468 | | PNC Financial Services Group, Inc. | | | 207,040 | |
| 19,572 | | U.S. Bancorp | | | 506,523 | |
| 3,584 | | Valley National Bancorp (b) | | | 55,086 | |
| 34,773 | | Wells Fargo & Co. | | | 1,082,136 | |
| | | | | | 2,790,802 | |
| | | Commercial Services &
Supplies - 0.28% | | | | |
| 1,974 | | ABM Industries, Inc. (b) | | | 41,849 | |
| 3,411 | | Cintas Corp. | | | 95,815 | |
| 107 | | Corrections Corporation of | | | | |
| | | America (a) | | | 2,125 | |
| 614 | | Covanta Holding Corp. (a) | | | 10,229 | |
| 1,552 | | Iron Mountain, Inc. (a) | | | 42,525 | |
| 86 | | Republic Services, Inc. (b) | | | 2,496 | |
| | | | | | 195,039 | |
| | | Communications Equipment - 2.48% | | | | |
| 43,143 | | Cisco Systems, Inc. (a) | | | 1,123,012 | |
| 1,043 | | Commscope, Inc. (a) | | | 29,225 | |
| 318 | | Echostar Corp. (a) | | | 6,449 | |
| 438 | | Harris Corp. | | | 20,801 | |
| 4,059 | | Juniper Networks, Inc. (a)(b) | | | 124,530 | |
| 8,890 | | Qualcomm, Inc. | | | 373,291 | |
| 9,946 | | Tellabs, Inc. | | | 75,291 | |
| | | | | | 1,752,599 | |
| | | Computers & Peripherals - 6.10% | | | | |
| 5,622 | | Apple, Inc. (a) | | | 1,320,776 | |
| 1,889 | | Diebold, Inc. (b) | | | 59,995 | |
| 17,199 | | EMC Corp. (a) | | | 310,270 | |
| 20,678 | | Hewlett Packard Co. | | | 1,099,036 | |
| 10,764 | | International Business Machines | | | | |
| | | Corp. (b) | | | 1,380,483 | |
| 1,199 | | NetApp, Inc. (a) | | | 39,039 | |
| 228 | | Sandisk Corp. (a) | | | 7,896 | |
| | | | | | | |
Number of
Shares | | | | Value | |
| | | Computers & Peripherals (Continued) | | | | |
| 698 | | Teradata Corp. (a) | | $ | 20,165 | |
| 2,048 | | Western Digital Corp. (a) | | | 79,852 | |
| | | | | | 4,317,512 | |
| | | Construction & Engineering - 0.90% | | | | |
| 1,589 | | AECOM Technology Corp. (a) | | | 45,080 | |
| 4,131 | | Fluor Corp. | | | 192,133 | |
| 2,319 | | Jacobs Engineering Group, | | | | |
| | | Inc. (a)(b) | | | 104,796 | |
| 4,469 | | KBR, Inc. | | | 99,033 | |
| 1,649 | | Quanta Services, Inc. (a)(b) | | | 31,595 | |
| 2,301 | | Shaw Group, Inc. (a) | | | 79,200 | |
| 1,759 | | URS Corp. (a) | | | 87,264 | |
| | | | | | 639,101 | |
| | | Construction Materials - 0.05% | | | | |
| 13 | | Martin Marietta Materials, Inc. (b) | | | 1,086 | |
| 774 | | Vulcan Materials Co. (b) | | | 36,564 | |
| | | | | | 37,650 | |
| | | Consumer Finance - 0.14% | | | | |
| 6,514 | | Discover Financial Services | | | 97,059 | |
| | | Containers & Packaging - 0.16% | | | | |
| 448 | | AptarGroup, Inc. | | | 17,629 | |
| 1,484 | | Ball Corp. | | | 79,216 | |
| 131 | | Greif, Inc. | | | 7,195 | |
| 183 | | Rock-Tenn Co. (b) | | | 8,339 | |
| | | | | | 112,379 | |
| | | Diversified Consumer Services - 0.14% | | | | |
| 468 | | Apollo Group, Inc. (a) | | | 28,684 | |
| 3,974 | | H&R Block, Inc. | | | 70,737 | |
| | | | | | 99,421 | |
| | | Diversified Financial Services - 1.96% | | | | |
| 118 | | CME Group, Inc. | | | 37,301 | |
| 2,280 | | Interactive Brokers Group, Inc. (a) | | | 36,822 | |
| 11 | | IntercontinentalExchange, Inc. (a) | | | 1,234 | |
| 23,884 | | JPMorgan Chase & Co. | | | 1,068,809 | |
| 505 | | Leucadia National Corp. (a)(b) | | | 12,529 | |
| 753 | | Moodys Corp. (b) | | | 22,402 | |
| 2,583 | | MSCI, Inc. (a) | | | 93,246 | |
| 3,910 | | NYSE Euronext | | | 115,775 | |
| | | | | | 1,388,118 | |
See notes to financial statements.
88
|
AssetMark Enhanced Fundamental Index® Large Company Growth Fund |
SCHEDULE OF INVESTMENTS (Continued) |
March 31, 2010 |
| |
| | | | | | | |
Number of
Shares | | | | Value | |
| | | | | | |
| | | COMMON STOCKS (Continued) | | | | |
| | | Diversified Telecommunication Services - 2.94% | | | | |
| 75,700 | | AT&T, Inc. (b) | | $ | 1,956,088 | |
| 1,112 | | Centurytel, Inc. | | | 39,431 | |
| 8,138 | | Windstream Corp. (b) | | | 88,623 | |
| | | | | | | |
| | | | | | 2,084,142 | |
| | | | | | | |
| | | Electric Utilities - 1.47% | | | | |
| 222 | | Allete, Inc. | | | 7,433 | |
| 528 | | Cleco Corp. (b) | | | 14,018 | |
| 1,450 | | DPL, Inc. | | | 39,426 | |
| 8,067 | | Exelon Corp. | | | 353,415 | |
| 5,375 | | FPL Group, Inc. | | | 259,774 | |
| 11,001 | | Southern Co. | | | 364,793 | |
| | | | | | | |
| | | | | | 1,038,859 | |
| | | | | | | |
| | | Electrical Equipment - 0.69% | | | | |
| 97 | | AMETEK, Inc. | | | 4,021 | |
| 947 | | Brady Corp. | | | 29,471 | |
| 6,397 | | Emerson Electric Co. (b) | | | 322,025 | |
| 290 | | Regal Beloit Corp. | | | 17,229 | |
| 2,017 | | Rockwell Automation, Inc. | | | 113,678 | |
| 33 | | Roper Industries, Inc. (b) | | | 1,909 | |
| | | | | | | |
| | | | | | 488,333 | |
| | | | | | | |
| | | Electronic Equipment & Instruments - 0.47% | | | | |
| 2,721 | | Agilent Technologies, Inc. (a) | | | 93,575 | |
| 190 | | Amphenol Corp. | | | 8,016 | |
| 3,682 | | AVX Corp. | | | 52,284 | |
| 6,040 | | Corning, Inc. | | | 122,069 | |
| 2,830 | | Molex, Inc. | | | 59,034 | |
| | | | | | | |
| | | | | | 334,978 | |
| | | | | | | |
| | | Energy Equipment & Services - 1.83% | | | | |
| 2,963 | | Baker Hughes, Inc. | | | 138,787 | |
| 1,622 | | BJ Services Co. | | | 34,711 | |
| 1,675 | | Cameron International Corp. (a) | | | 71,790 | |
| 464 | | Diamond Offshore Drilling, Inc. (b) | | | 41,208 | |
| 670 | | Ensco International Ltd. - ADR | | | 30,003 | |
| 489 | | FMC Technologies, Inc. (a) | | | 31,604 | |
| 7,096 | | Halliburton Co. | | | 213,802 | |
| 70 | | Helmerich & Payne, Inc. | | | 2,666 | |
| 2,061 | | National-Oilwell Varco, Inc. | | | 83,635 | |
| 2,132 | | Pride International, Inc. (a) | | | 64,194 | |
| 1,581 | | Rowan Companies, Inc. (a) | | | 46,023 | |
| | | | | | | |
Number of
Shares | | | | Value | |
| | | | | | |
| | | Energy Equipment & Services (Continued) | | | | |
| 8,345 | | Schlumberger Ltd. | | $ | 529,574 | |
| 218 | | Tidewater, Inc. (b) | | | 10,305 | |
| | | | | | | |
| | | | | | 1,298,302 | |
| | | | | | | |
| | | Food & Staples Retailing - 1.84% | | | | |
| 2,582 | | Casey’s General Stores, Inc. (b) | | | 81,075 | |
| 5,530 | | Costco Wholesale Corp. | | | 330,196 | |
| 11,693 | | CVS Caremark Corporation | | | 427,496 | |
| 10,773 | | Walgreen Co. | | | 399,571 | |
| 1,688 | | Whole Foods Market, Inc. (a)(b) | | | 61,021 | |
| | | | | | | |
| | | | | | 1,299,359 | |
| | | | | | | |
| | | Food Products - 1.12% | | | | |
| 3,158 | | Campbell Soup Co. | | | 111,635 | |
| 403 | | Flowers Foods, Inc. (b) | | | 9,970 | |
| 1,971 | | General Mills, Inc. | | | 139,527 | |
| 3,501 | | H.J. Heinz Co. | | | 159,681 | |
| 2,593 | | Hershey Co. | | | 111,006 | |
| 1,626 | | Hormel Foods Corp. | | | 68,308 | |
| 233 | | The J.M. Smucker Co. | | | 14,041 | |
| 2,911 | | Kellogg Co. | | | 155,535 | |
| 101 | | McCormick & Co, Inc. (b) | | | 3,875 | |
| 267 | | Ralcorp Holdings, Inc. (a) | | | 18,097 | |
| | | | | | | |
| | | | | | 791,675 | |
| | | | | | | |
| | | Gas Utilities - 0.13% | | | | |
| 726 | | Energen Corp. | | | 33,781 | |
| 83 | | EQT Corp. | | | 3,403 | |
| 955 | | National Fuel Gas Co. | | | 48,275 | |
| 187 | | Questar Corp. | | | 8,078 | |
| | | | | | | |
| | | | | | 93,537 | |
| | | | | | | |
| | | Health Care Equipment & Supplies - 1.44% | | | | |
| 4,494 | | Baxter International, Inc. | | | 261,551 | |
| 476 | | Beckman Coulter, Inc. | | | 29,893 | |
| 1,227 | | Becton Dickinson & Co. | | | 96,602 | |
| 15,280 | | Boston Scientific Corp. (a) | | | 110,322 | |
| 382 | | C.R. Bard, Inc. | | | 33,089 | |
| 295 | | Dentsply International, Inc. | | | 10,281 | |
| 1,285 | | Hologic, Inc. (a) | | | 23,824 | |
| 747 | | Hospira, Inc. (a) | | | 42,318 | |
| 40 | | Inverness Medical Innovations, | | | | |
| | | Inc. (a) | | | 1,558 | |
| 189 | | Kinetic Concepts, Inc. (a) | | | 9,036 | |
See notes to financial statements.
89
AssetMark Enhanced Fundamental Index® Large Company Growth Fund
SCHEDULE OF INVESTMENTS (Continued) |
March 31, 2010 |
| |
| | | | | | | |
Number of
Shares | | | | Value | |
| | | | | | |
| | | COMMON STOCKS (Continued) | | | | |
| | | Health Care Equipment & Supplies (Continued) | | | | |
| 4,346 | | Medtronic, Inc. | | $ | 195,700 | |
| 570 | | St. Jude Medical, Inc. (a) | | | 23,398 | |
| 1,906 | | Stryker Corp. | | | 109,061 | |
| 434 | | Varian Medical Systems, Inc. (a) | | | 24,013 | |
| 801 | | Zimmer Holdings, Inc. (a) | | | 47,419 | |
| | | | | | | |
| | | | | | 1,018,065 | |
| | | | | | | |
| | | Health Care Providers & Services - 3.32% | | | | |
| 6,753 | | Aetna, Inc. | | | 237,098 | |
| 10,547 | | Amerisourcebergen Corp. | | | 305,019 | |
| 113 | | Brookdale Senior Living, Inc. (a) | | | 2,354 | |
| 116 | | Cerner Corp. (a)(b) | | | 9,867 | |
| 4,558 | | CIGNA Corp. | | | 166,732 | |
| 1,589 | | Express Scripts, Inc. (a) | | | 161,697 | |
| 981 | | Henry Schein, Inc. (a) | | | 57,781 | |
| 624 | | Laboratory Corporation of America | | | | |
| | | Holdings (a) | | | 47,243 | |
| 4,325 | | McKesson Corp. | | | 284,239 | |
| 4,650 | | Medco Health Solutions, Inc. (a) | | | 300,204 | |
| 2,745 | | Omnicare, Inc. | | | 77,656 | |
| 664 | | Owens & Minor, Inc. | | | 20,551 | |
| 991 | | Patterson Companies, Inc. (a)(b) | | | 30,770 | |
| 1,454 | | PerkinElmer, Inc. | | | 34,751 | |
| 1,194 | | Quest Diagnostics, Inc. | | | 69,598 | |
| 15,364 | | UnitedHealth Group, Inc. | | | 501,942 | |
| 1,273 | | Universal Health Services, Inc. | | | 44,669 | |
| | | | | | | |
| | | | | | 2,352,171 | |
| | | | | | | |
| | | Hotels, Restaurants & Leisure - 1.44% | | | | |
| 7,004 | | Carnival Corp. | | | 272,316 | |
| 2,875 | | International Game Technology | | | 53,044 | |
| 243 | | Las Vegas Sands Corp. (a)(b) | | | 5,139 | |
| 2,140 | | Marriott International, Inc. | | | 67,453 | |
| 8,488 | | McDonald’s Corp. | | | 566,319 | |
| 1,990 | | Starbucks Corp. (a) | | | 48,297 | |
| 259 | | Wendy’s Arby’s Group, Inc. | | | 1,295 | |
| 108 | | Wynn Resorts, Limited (b) | | | 8,190 | |
| | | | | | | |
| | | | | | 1,022,053 | |
| | | | | | | |
| | | | | | | |
Number of
Shares | | | | Value | |
| | | | | | |
| | | Household Durables - 0.18% | | | | |
| 1,899 | | Garmin Ltd. (b) | | $ | 73,074 | |
| 457 | | Harman International Industries, | | | | |
| | | Inc. (a) | | | 21,378 | |
| 661 | | Tupperware Brands Corp. | | | 31,873 | |
| | | | | | | |
| | | | | | 126,325 | |
| | | | | | | |
| | | Household Products - 2.85% | | | | |
| 11 | | Church & Dwight, Inc. | | | 737 | |
| 3,655 | | Colgate Palmolive Co. | | | 311,625 | |
| 24 | | Energizer Holdings, Inc. (a) | | | 1,506 | |
| 4,180 | | Kimberly Clark Corp. | | | 262,838 | |
| 22,739 | | Procter & Gamble Co. | | | 1,438,697 | |
| | | | | | | |
| | | | | | 2,015,403 | |
| | | | | | | |
| | | Industrial Conglomerates - 0.87% | | | | |
| 6,157 | | 3M Co. | | | 514,540 | |
| 779 | | Carlisle Companies, Inc. | | | 29,680 | |
| 2,250 | | Mcdermott International, Inc. (a) | | | 60,570 | |
| 11 | | Seaboard Corp. | | | 14,290 | |
| | | | | | | |
| | | | | | 619,080 | |
| | | | | | | |
| | | Insurance - 2.38% | | | | |
| 4,113 | | Aflac, Inc. | | | 223,295 | |
| 159 | | Alleghany Corp. (a) | | | 46,272 | |
| 1,092 | | Allied World Assurance | | | | |
| | | Holdings, Ltd. | | | 48,976 | |
| 2,174 | | Aon Corp. | | | 92,851 | |
| 2,450 | | Arthur J. Gallagher & Co. | | | 60,147 | |
| 2,796 | | Aspen Insurance Holdings Ltd. | | | 80,637 | |
| 3,684 | | Axis Capital Holdings Ltd. | | | 115,162 | |
| 704 | | Brown & Brown, Inc. | | | 12,616 | |
| 2,019 | | CNA Financial Corp. (a)(b) | | | 53,948 | |
| 1,260 | | Erie Indemnity Co. (b) | | | 54,344 | |
| 455 | | Everest Re Group, Ltd. (b) | | | 36,823 | |
| 1,384 | | The Hanover Insurance Group, Inc. | | | 60,356 | |
| 1,116 | | HCC Insurance Holdings, Inc. | | | 30,802 | |
| 62 | | Markel Corp. (a) | | | 23,229 | |
| 9,014 | | Marsh & McLennan Cos., Inc. | | | 220,122 | |
| 471 | | Mercury General Corp. | | | 20,592 | |
| 3,424 | | Montpelier Re Holdings Ltd. | | | 57,557 | |
| 909 | | PartnerRe Ltd. (b) | | | 72,465 | |
| 1,368 | | Platinum Underwriters Holdings Ltd. | | | 50,725 | |
| 1,641 | | Reinsurance Group of America | | | 86,185 | |
| 1,118 | | Renaissancere Holdings Ltd. (b) | | | 63,458 | |
| 2,062 | | Transatlantic Holdings, Inc. | | | 108,874 | |
See notes to financial statements.
90
|
AssetMark Enhanced Fundamental Index® Large Company Growth Fund |
SCHEDULE OF INVESTMENTS (Continued) |
March 31, 2010 |
| |
| | | | | | | |
Number of
Shares | | | | Value | |
| | | | | | |
| | | COMMON STOCKS (Continued) | | | | |
| | | Insurance (Continued) | | | | |
| 1,569 | | Validus Holdings Ltd. | | $ | 43,195 | |
| 58 | | Wesco Financial Corp. | | | 22,359 | |
| 3 | | White Mountains Insurance | | | | |
| | | Group Ltd. | | | 1,065 | |
| | | | | | | |
| | | | | | 1,686,055 | |
| | | | | | | |
| | | Internet & Catalog Retail - 0.43% | | | | |
| 1,684 | | Amazon.com, Inc. (a)(b) | | | 228,569 | |
| 2,979 | | Expedia, Inc. (a) | | | 74,356 | |
| | | | | | | |
| | | | | | 302,925 | |
| | | | | | | |
| | | Internet Software & Services - 2.51% | | | | |
| 9,749 | | Ebay, Inc. (a) | | | 262,736 | |
| 2,503 | | Google, Inc. (a)(b) | | | 1,419,226 | |
| 5,800 | | Yahoo, Inc. (a) | | | 95,874 | |
| | | | | | | |
| | | | | | 1,777,836 | |
| | | | | | | |
| | | IT Services - 1.67% | | | | |
| 82 | | Alliance Data Systems Corp. (a)(b) | | | 5,247 | |
| 2,102 | | Amdocs Ltd. (a) | | | 63,291 | |
| 4,576 | | Automatic Data Processing, Inc. | | | 203,495 | |
| 1,855 | | Broadridge Financial | | | | |
| | | Solutions, Inc. | | | 39,660 | |
| 316 | | Cognizant Technology | | | | |
| | | Solutions Corp. (a) | | | 16,110 | |
| 1,688 | | Fidelity National | | | | |
| | | Information Services (b) | | | 39,567 | |
| 983 | | Fiserv, Inc. (a) | | | 49,897 | |
| 100 | | Global Payments, Inc. (b) | | | 4,555 | |
| 1,092 | | Hewitt Associates, Inc. (a) | | | 43,440 | |
| 14 | | Lender Processing Services, Inc. | | | 528 | |
| 325 | | Mastercard, Inc. (b) | | | 82,550 | |
| 3,023 | | Paychex, Inc. | | | 92,806 | |
| 5,492 | | SAIC, Inc. (a) | | | 97,208 | |
| 3,192 | | Total System Services, Inc. (b) | | | 49,987 | |
| 3,159 | | Visa, Inc. | | | 287,564 | |
| 3,638 | | Wright Express Corp. (a)(b) | | | 109,576 | |
| | | | | | | |
| | | | | | 1,185,481 | |
| | | | | | | |
| | | Leisure Equipment & Products - 0.29% | | | | |
| 1,808 | | Hasbro, Inc. | | | 69,210 | |
| 6,013 | | Mattel, Inc. | | | 136,736 | |
| | | | | | | |
| | | | | | 205,946 | |
| | | | | | | |
| | | | | | | |
Number of
Shares | | | | Value | |
| | | | | | |
| | | Life Sciences Tools & Services - 0.44% | | | | |
| 1,187 | | Charles River Laboratories (a)(b) | | $ | 46,661 | |
| 337 | | Covance, Inc. (a) | | | 20,688 | |
| 259 | | Life Technologies Corp. (a) | | | 13,538 | |
| 99 | | Millipore Corp. (a) | | | 10,454 | |
| 1,189 | | Pharmaceutical Product | | | | |
| | | Development, Inc. | | | 28,239 | |
| 3,668 | | Thermo Fisher Scientific, Inc. (a) | | | 188,682 | |
| | | | | | | |
| | | | | | 308,262 | |
| | | | | | | |
| | | Machinery - 1.35% | | | | |
| 2,387 | | Cummins, Inc. | | | 147,875 | |
| 2,029 | | Danaher Corp. | | | 162,137 | |
| 625 | | Donaldson Company, Inc. | | | 28,200 | |
| 2,094 | | Dover Corp. | | | 97,895 | |
| 867 | | Flowserve Corp. | | | 95,604 | |
| 28 | | IDEX Corp. | | | 927 | |
| 4,618 | | Illinois Tool Works, Inc. | | | 218,708 | |
| 372 | | Joy Global, Inc. | | | 21,055 | |
| 810 | | Lincoln Electric Holdings, Inc. | | | 44,007 | |
| 1,136 | | Oshkosh Corp. (a) | | | 45,826 | |
| 1,183 | | Pall Corp. | | | 47,900 | |
| 1,255 | | Pentair, Inc. | | | 44,703 | |
| | | | | | | |
| | | | | | 954,837 | |
| | | | | | | |
| | | Marine - 0.01% | | | | |
| 370 | | Genco Shipping & | | | | |
| | | Trading Ltd. (a)(b) | | | 7,811 | |
| | | | | | | |
| | | Media - 2.93% | | | | |
�� | 35,997 | | Comcast Corp. (b) | | | 677,464 | |
| 6,793 | | DIRECTV (a) | | | 229,671 | |
| 312 | | Discovery Communications (a) | | | 9,176 | |
| 895 | | Interactive Data Corp. | | | 28,640 | |
| 654 | | Lamar Advertising Co. (a) | | | 22,465 | |
| 34,035 | | News Corporation | | | 490,445 | |
| 318 | | Scripps Networks Interactive, Inc. | | | 14,103 | |
| 17,341 | | The Walt Disney Co. (b) | | | 605,374 | |
| | | | | | | |
| | | | | | 2,077,338 | |
| | | | | | | |
| | | Metals & Mining - 1.02% | | | | |
| 48 | | Cliffs Natural Resources, Inc. (b) | | | 3,406 | |
| 3,182 | | Freeport-McMoran Copper & | | | | |
| | | Gold, Inc. | | | 265,824 | |
| 2,704 | | Newmont Mining Corp. | | | 137,715 | |
| 265 | | Reliance Steel & Aluminum Co. | | | 13,046 | |
| 74 | | Schnitzer Steel Industries, Inc. | | | 3,887 | |
See notes to financial statements.
91
|
AssetMark Enhanced Fundamental Index® Large Company Growth Fund |
SCHEDULE OF INVESTMENTS (Continued) |
March 31, 2010 |
| |
| | | | | | | |
Number of
Shares | | | | Value | |
| | | | | | |
| | | COMMON STOCKS (Continued) | | | | |
| | | Metals & Mining (Continued) | | | | |
| 8,668 | | Southern Copper Corp. | | $ | 274,516 | |
| 1,299 | | Titanium Metals Corp. (a)(b) | | | 21,550 | |
| | | | | | | |
| | | | | | 719,944 | |
| | | | | | | |
| | | Multiline Retail - 0.29% | | | | |
| 1,831 | | Dollar Tree, Inc. (a) | | | 108,432 | |
| 1,812 | | Kohls Corp. (a) | | | 99,261 | |
| | | | | | | |
| | | | | | 207,693 | |
| | | | | | | |
| | | Oil & Gas - 3.69% | | | | |
| 5,227 | | Anadarko Petroleum Corp. | | | 380,682 | |
| 2,190 | | Apache Corp. | | | 222,285 | |
| 185 | | Arch Coal, Inc. | | | 4,227 | |
| 283 | | Cabot Oil & Gas Corp. | | | 10,414 | |
| 2,062 | | Chesapeake Energy Corp. | | | 48,746 | |
| 1,223 | | Cimarex Energy Co. | | | 72,622 | |
| 866 | | Consol Energy, Inc. (b) | | | 36,944 | |
| 281 | | Continental Resources, Inc. (a) | | | 11,957 | |
| 53 | | Denbury Resources, Inc. (a)(b) | | | 894 | |
| 5,211 | | Devon Energy Corp. | | | 335,745 | |
| 938 | | EOG Resources, Inc. | | | 87,178 | |
| 465 | | EXCO Resources, Inc. | | | 8,547 | |
| 507 | | Massey Energy Corp. (b) | | | 26,511 | |
| 1,478 | | Newfield Exploration Co. (a) | | | 76,930 | |
| 593 | | Noble Energy, Inc. (b) | | | 43,289 | |
| 110 | | Nordic American Tanker | | | | |
| | | Shipping Ltd. (b) | | | 3,330 | |
| 7,246 | | Occidental Petroleum Corp. | | | 612,577 | |
| 1,092 | | Peabody Energy Corp. | | | 49,904 | |
| 37 | | Petrohawk Energy Corp. (a) | | | 750 | |
| 1,029 | | Pioneer Natural Resources Co. | | | 57,953 | |
| 2,667 | | Plains Exploration & | | | | |
| | | Production Co. (a) | | | 79,983 | |
| 267 | | Range Resources Corp. (b) | | | 12,514 | |
| 13 | | Southwestern Energy Co. (a) | | | 529 | |
| 8,219 | | Spectra Energy Corp. (b) | | | 185,174 | |
| 665 | | St Mary Land & Exploration Co. (b) | | | 23,149 | |
| 42 | | Whiting Petroleum Corp. (a) | | | 3,395 | |
| 3,521 | | World Fuel Services Corp. (b) | | | 93,799 | |
| 2,647 | | XTO Energy, Inc. | | | 124,886 | |
| | | | | | | |
| | | | | | 2,614,914 | |
| | | | | | | |
| | | | | | | |
Number of
Shares | | | | Value | |
| | | | | | |
| | | Personal Products - 0.45% | | | | |
| 815 | | Alberto-Culver Co. | | $ | 21,312 | |
| 4,108 | | Avon Products, Inc. | | | 139,138 | |
| 1,863 | | The Estee Lauder Cos., Inc. | | | 120,853 | |
| 797 | | Herbalife Ltd. | | | 36,758 | |
| 27 | | NBTY, Inc. (a) | | | 1,295 | |
| | | | | | | |
| | | | | | 319,356 | |
| | | | | | | |
| | | Pharmaceuticals - 7.73% | | | | |
| 10,905 | | Abbott Laboratories | | | 574,475 | |
| 877 | | Allergan, Inc. | | | 57,286 | |
| 16,498 | | Bristol Myers Squibb Co. (b) | | | 440,497 | |
| 1,618 | | Endo Pharmaceuticals | | | | |
| | | Holdings, Inc. (a) | | | 38,330 | |
| 2,927 | | Forest Labs, Inc. (a) | | | 91,791 | |
| 999 | | Genzyme Corp. (a) | | | 51,778 | |
| 25,506 | | Johnson & Johnson | | | 1,662,991 | |
| 9,974 | | Eli Lilly & Co. | | | 361,258 | |
| 23,510 | | Merck & Co., Inc. | | | 878,099 | |
| 351 | | Mylan Laboratories, Inc. (a)(b) | | | 7,971 | |
| 105 | | Perrigo Co. (b) | | | 6,166 | |
| 73,454 | | Pfizer, Inc. | | | 1,259,736 | |
| 962 | | Watson Pharmaceuticals, Inc. (a) | | | 40,183 | |
| | | | | | | |
| | | | | | 5,470,561 | |
| | | | | | | |
| | | Professional Services - 0.12% | | | | |
| 119 | | The Dun & Bradstreet Corporation | | | 8,856 | |
| 666 | | Equifax, Inc. | | | 23,843 | |
| 1,674 | | Robert Half International, Inc. (b) | | | 50,940 | |
| | | | | | | |
| | | | | | 83,639 | |
| | | | | | | |
| | | Real Estate - 0.04% | | | | |
| 409 | | Forest City Enterprises, Inc. (a)(b) | | | 5,893 | |
| 329 | | Jones Lang Lasalle, Inc. | | | 23,981 | |
| | | | | | | |
| | | | | | 29,874 | |
| | | | | | | |
| | | Road & Rail - 1.06% | | | | |
| 3,327 | | CSX Corp. (b) | | | 169,344 | |
| 877 | | J.B. Hunt Transport Services, Inc. | | | 31,467 | |
| 114 | | Kansas City Southern (a)(b) | | | 4,124 | |
| 4,052 | | Norfolk Southern Corp. | | | 226,466 | |
| 4,381 | | Union Pacific Corp. | | | 321,127 | |
| | | | | | | |
| | | | | | 752,528 | |
| | | | | | | |
See notes to financial statements.
92
|
AssetMark Enhanced Fundamental Index® Large Company Growth Fund |
SCHEDULE OF INVESTMENTS (Continued) |
March 31, 2010 |
| |
| | | | | | | |
Number of
Shares | | | | Value | |
| | | | | | |
| | | COMMON STOCKS (Continued) | | | | |
| | | Semiconductor & Semiconductor | | | | |
| | | Equipment - 2.87% | | | | |
| 690 | | Altera Corp. (b) | | $ | 16,774 | |
| 2,162 | | Analog Devices, Inc. | | | 62,309 | |
| 7,727 | | Applied Materials, Inc. | | | 104,160 | |
| 2,460 | | Broadcom Corp. | | | 81,623 | |
| 49,705 | | Intel Corp. | | | 1,106,433 | |
| 1,672 | | Intersil Corp. | | | 24,679 | |
| 293 | | KLA-Tencor Corp. | | | 9,059 | |
| 519 | | Lam Research Corp. (a)(b) | | | 19,369 | |
| 649 | | Linear Technology Corp. (b) | | | 18,354 | |
| 697 | | LSI Corp. (a) | | | 4,266 | |
| 1,799 | | Marvell Technology Group Ltd. (a) | | | 36,663 | |
| 4,678 | | Maxim Integrated Products, Inc. | | | 90,706 | |
| 5,090 | | MEMC Electronic | | | | |
| | | Materials, Inc. (a)(b) | | | 78,030 | |
| 1,329 | | Microchip Technology, Inc. (b) | | | 37,425 | |
| 2,626 | | National Semiconductor Corp. (b) | | | 37,946 | |
| 681 | | NVIDIA Corp. (a) | | | 11,836 | |
| 9,465 | | Texas Instruments, Inc. | | | 231,608 | |
| 2,261 | | Xilinx, Inc. | | | 57,655 | |
| | | | | | | |
| | | | | | 2,028,895 | |
| | | | | | | |
| | | Software - 5.48% | | | | |
| 1,922 | | Activision Blizzard, Inc. | | | 23,179 | |
| 1,288 | | Adobe Systems, Inc. (a) | | | 45,557 | |
| 913 | | Autodesk, Inc. (a) | | | 26,861 | |
| 685 | | BMC Software, Inc. (a) | | | 26,030 | |
| 2,144 | | CA, Inc. | | | 50,320 | |
| 414 | | Citrix Systems, Inc. (a)(b) | | | 19,653 | |
| 3,617 | | Electronic Arts, Inc. (a) | | | 67,493 | |
| 1,903 | | Intuit, Inc. (a) | | | 65,349 | |
| 557 | | McAfee, Inc. (a) | | | 22,352 | |
| 83,236 | | Microsoft Corp. | | | 2,436,318 | |
| 35,574 | | Oracle Corp. | | | 913,896 | |
| 6,982 | | Symantec Corp. (a) | | | 118,135 | |
| 1,402 | | Synopsys, Inc. (a) | | | 31,363 | |
| 571 | | VMware, Inc. (a) | | | 30,434 | |
| | | | | | | |
| | | | | | 3,876,940 | |
| | | | | | | |
| | | Specialty Retail - 1.66% | | | | |
| 666 | | Aarons, Inc. (b) | | | 22,204 | |
| 1,495 | | Advance Auto Parts, Inc. (b) | | | 62,670 | |
| 6,676 | | American Eagle Outfitters | | | 123,640 | |
| 2,226 | | Bed Bath & Beyond, Inc. (a)(b) | | | 97,410 | |
| | | | | | | |
Number of
Shares | | | | Value | |
| | | | | | |
| | | Specialty Retail (Continued) | | | | |
| 1,311 | | CarMax, Inc. (a) | | $ | 32,932 | |
| 2,238 | | Dicks Sporting Goods, Inc. (a) | | | 58,434 | |
| 1,818 | | GameStop Corp. (a)(b) | | | 39,832 | |
| 9,604 | | The Gap, Inc. | | | 221,949 | |
| 475 | | Guess?, Inc. | | | 22,316 | |
| 74 | | O’Reilly Automotive, Inc. (a)(b) | | | 3,087 | |
| 1,348 | | Petsmart, Inc. | | | 43,082 | |
| 1,194 | | Ross Stores, Inc. | | | 63,843 | |
| 1,712 | | Sherwin Williams Co. | | | 115,868 | |
| 3,585 | | Staples, Inc. | | | 83,853 | |
| 576 | | Tiffany & Co. | | | 27,354 | |
| 3,750 | | The TJX Companies, Inc. | | | 159,450 | |
| | | | | | | |
| | | | | | 1,177,924 | |
| | | | | | | |
| | | Textiles, Apparel & Luxury | | | | |
| | | Goods - 0.73% | | | | |
| 318 | | Coach, Inc. | | | 12,567 | |
| 4,067 | | Nike, Inc. | | | 298,925 | |
| 817 | | Phillips-Van Heusen Corp. (b) | | | 46,863 | |
| 605 | | Polo Ralph Lauren Corp. (b) | | | 51,449 | |
| 1,362 | | VF Corp. | | | 109,164 | |
| | | | | | | |
| | | | | | 518,968 | |
| | | | | | | |
| | | Thrifts & Mortgage Finance - 0.41% | | | | |
| 933 | | First Niagara Financial Group, Inc. | | | 13,267 | |
| 4,013 | | Hudson City Bancorp | | | 56,824 | |
| 5,908 | | New York Community | | | | |
| | | Bancorp, Inc. (b) | | | 97,718 | |
| 4,054 | | People’s United Financial, Inc. | | | 63,405 | |
| 948 | | TFS Financial Corp. | | | 12,656 | |
| 2,385 | | Washington Federal, Inc. | | | 48,463 | |
| | | | | | | |
| | | | | | 292,333 | |
| | | | | | | |
| | | Tobacco - 2.16% | | | | |
| 2,525 | | Lorillard, Inc. | | | 189,981 | |
| 20,820 | | Philip Morris International, Inc. | | | 1,085,971 | |
| 4,716 | | Reynolds American, Inc. | | | 254,570 | |
| | | | | | | |
| | | | | | 1,530,522 | |
| | | | | | | |
| | | Trading Companies & | | | | |
| | | Distributors - 0.17% | | | | |
| 4,839 | | Aircastle Ltd. | | | 45,825 | |
| 378 | | Fastenal Co. (b) | | | 18,140 | |
| 1 | | MSC Industrial Direct Co., Inc. | | | 51 | |
| 508 | | W.W. Grainger, Inc. (b) | | | 54,925 | |
| | | | | | | |
| | | | | | 118,941 | |
| | | | | | | |
See notes to financial statements.
93
|
AssetMark Enhanced Fundamental Index® Large Company Growth Fund |
SCHEDULE OF INVESTMENTS (Continued) |
March 31, 2010 |
| |
| | | | | | | |
Number of
Shares | | | | Value | |
| | | | | | |
| | | COMMON STOCKS (Continued) | | | | |
| | | Water Utilities - 0.02% | | | | |
| 634 | | Aqua America, Inc. (b) | | $ | 11,139 | |
| | | | | | | |
| | | Wireless Telecommunication Services - 0.13% | | | | |
| 173 | | American Tower Corp. (a)(b) | | | 7,372 | |
| 218 | | Crown Castle | | | | |
| | | International Corp. (a) | | | 8,334 | |
| 1,828 | | NII Holdings, Inc. (a) | | | 76,154 | |
| | | | | | | |
| | | | | | 91,860 | |
| | | | | | | |
| | | Total Common Stocks | | | | |
| | | (Cost $54,359,653) | | | 64,242,974 | |
| | | | | | | |
| | | MANAGEMENT INVESTMENT | | | | |
| | | COMPANIES - 0.09% | | | | |
| | | Capital Markets - 0.09% | | | | |
| 56 | | ARES Capital Corp. (b) | | $ | 831 | |
| 4,818 | | Apollo Investment Corp. | | | 61,333 | |
| | | | | | | |
| | | Total Management Investment | | | | |
| | | Companies (Cost $48,483) | | | 62,164 | |
| | | | | | | |
| | | REAL ESTATE INVESTMENT TRUSTS - 1.17% | | | | |
| | | Real Estate Investment Trusts - 1.17% | | | | |
| 181 | | Alexandria Real Estate | | | | |
| | | Equities, Inc. (b) | | | 12,236 | |
| 8 | | AMB Property Corp. | | | 218 | |
| 1,457 | | Annaly Capital | | | | |
| | | Management, Inc. (b) | | | 25,031 | |
| 103 | | AvalonBay Communities, Inc. (b) | | | 8,894 | |
| 82 | | Biomed Realty Trust, Inc. | | | 1,356 | |
| 934 | | Boston Properties, Inc. | | | 70,461 | |
| 33 | | Brandywine Realty Trust | | | 403 | |
| 317 | | BRE Properties, Inc. | | | 11,333 | |
| 8 | | Camden Property Trust (b) | | | 333 | |
| 197 | | Cousins Properties, Inc. (b) | | | 1,637 | |
| 338 | | DCT Industrial Trust, Inc. | | | 1,768 | |
| 166 | | Diamondrock Hospitality Co. | | | 1,678 | |
| 399 | | Douglas Emmett, Inc. (b) | | | 6,133 | |
| 1,209 | | Duke Realty Corp. | | | 14,992 | |
| 624 | | Entertainment Properties Trust (b) | | | 25,665 | |
| 8 | | Equity One | | | 151 | |
| 274 | | Equity Residential | | | 10,727 | |
| 90 | | Essex Property Trust, Inc. | | | 8,096 | |
| 223 | | Federal Realty Investment Trust | | | 16,237 | |
| | | | | | | |
Number of
Shares | | | | Value | |
| | | | | | |
| | | Real Estate Investment Trusts (Continued) | | | | |
| 3,593 | | First Industrial Realty Trust (a) | | $ | 27,882 | |
| 2,038 | | Hatteras Financial Corp. (b) | | | 52,519 | |
| 482 | | HCP, Inc. (b) | | | 15,906 | |
| 6 | | Health Care REIT, Inc. (b) | | | 140 | |
| 52 | | Health Care REIT, Inc. | | | 2,352 | |
| 190 | | Highwoods Properties, Inc. | | | 6,029 | |
| 16 | | Home Properties, Inc. | | | 749 | |
| 821 | | Hospitality Property Trust | | | 19,663 | |
| 3,376 | | Host Hotels & Resorts, Inc. (b) | | | 49,458 | |
| 50 | | HRTP Properties Trust | | | 389 | |
| 1,094 | | Kimco Realty Corp. | | | 17,110 | |
| 4,840 | | Lexington Realty Trust (b) | | | 31,508 | |
| 266 | | Liberty Property Trust | | | 9,028 | |
| 256 | | Macerich Co. (b) | | | 9,807 | |
| 858 | | Mack Cali Realty Corp. | | | 30,245 | |
| 479 | | MFA Financial, Inc. | | | 3,525 | |
| 66 | | National Retail Properties, Inc. (b) | | | 1,507 | |
| 367 | | Nationwide Health Properties, Inc. | | | 12,900 | |
| 48 | | Plum Creek Timber Co., Inc. (b) | | | 1,868 | |
| 68 | | Post Properties, Inc. (b) | | | 1,497 | |
| 558 | | Public Storage | | | 51,330 | |
| 536 | | Rayonier, Inc. | | | 24,351 | |
| 755 | | Realty Income Corp. (b) | | | 23,171 | |
| 4,883 | | Redwood Trust, Inc. (b) | | | 75,296 | |
| 301 | | Regency Centers Corp. (b) | | | 11,278 | |
| 47 | | Senior Housing Properties Trust | | | 1,041 | |
| 590 | | Simon Property Group, Inc. (b) | | | 49,501 | |
| 139 | | SL Green Realty Corp. | | | 7,961 | |
| 110 | | UDR, Inc. | | | 1,940 | |
| 263 | | Ventas, Inc. | | | 12,487 | |
| 530 | | Vornado Realty Trust (b) | | | 40,121 | |
| 883 | | Weingarten Realty Investors (b) | | | 19,037 | |
| | | | | | | |
| | | | | | 828,945 | |
| | | | | | | |
| | | Total Real Estate Investment Trusts | | | | |
| | | (Cost $698,163) | | | 828,945 | |
| | | | | | | |
See notes to financial statements.
94
|
AssetMark Enhanced Fundamental Index® Large Company Growth Fund |
SCHEDULE OF INVESTMENTS (Continued) |
March 31, 2010 |
| |
| | | | | | | |
Number of
Shares | | | | Value | |
| | | | | | |
| | | SHORT TERM INVESTMENTS - 7.22% | | | | |
| | | Money Market Funds - 7.22% | | | | |
| 5,112,400 | | Federated Prime Obligations Fund | | | | |
| | | Effective Yield, 0.11% | | $ | 5,112,400 | |
| | | | | | | |
| | | Total Short Term Investments | | | | |
| | | (Cost $5,112,400) | | | 5,112,400 | |
| | | | | | | |
| | | INVESTMENTS PURCHASED | | | | |
| | | AS SECURITIES LENDING | | | | |
| | | COLLATERAL - 17.07% | | | | |
| | | Money Market Funds - 17.07% | | | | |
| 12,083,657 | | Mount Vernon Prime Portfolio | | | | |
| | | Effective Yield, 0.24% | | | 12,083,657 | |
| | | | | | | |
| | | Total Mutual Funds | | | | |
| | | (Cost $12,083,657) | | | 12,083,657 | |
| | | | | | | |
| | | Total Investments Purchased as | | | | |
| | | Securities Lending Collateral | | | | |
| | | (Cost $12,083,657) | | | 12,083,657 | |
| | | | | | | |
| | | Total Investments | | | | |
| | | (Cost $72,302,356) - 116.30% | | | 82,330,140 | |
| | | | | | | |
| | | Liabilities in Excess of | | | | |
| | | Other Assets - (16.30)% | | | (11,538,494 | ) |
| | | | | | | |
| | | TOTAL NET | | | | |
| | | ASSETS - 100.00% | | $ | 70,791,646 | |
| | | | | | | |
Percentages are stated as a percent of net assets.
ADR - American Depositary Receipt
(a) Non-income producing.
(b) All or a portion of this security is on loan.
See notes to financial statements.
95
|
AssetMark Enhanced Fundamental Index® Large Company Growth Fund |
SCHEDULE OF OPEN FUTURES CONTRACTS |
March 31, 2010 |
| |
| | | | | | | | | |
Description | | | Number of
Contracts
Purchased | | Notional
Value | | Settlement
Month | | Unrealized
Appreciation |
| | | | | | | | | | |
S&P 500 Index Mini Futures | | 94 | | $5,476,440 | | Jun-10 | | $110,732 |
See notes to financial statements.
96
|
AssetMark Enhanced Fundamental Index® Large Company Value Fund |
SCHEDULE OF INVESTMENTS |
March 31, 2010 |
| |
| | | | | | | |
Number of
Shares | | | | Value | |
| | | | | | |
| | | COMMON STOCKS - 91.03% | | | | |
| | | Aerospace & Defense - 2.05% | | | | |
| 417 | | Alliant Techsystems, Inc. (a) | | $ | 33,902 | |
| 6,396 | | Boeing Co. | | | 464,414 | |
| 7,178 | | Honeywell International, Inc. | | | 324,948 | |
| 4,191 | | Northrop Grumman Corp. (b) | | | 274,804 | |
| 2,363 | | Spirit AeroSystems | | | | |
| | | Holdings, Inc. (a)(b) | | | 55,247 | |
| | | | | | | |
| | | | | | 1,153,315 | |
| | | | | | | |
| | | Airlines - 0.49% | | | | |
| 167 | | Alaska Air Group, Inc. (a) | | | 6,885 | |
| 5,251 | | AMR Corp. (a) | | | 47,837 | |
| 1,110 | | Continental Airlines, Inc. (a)(b) | | | 24,387 | |
| 3,078 | | Delta Air Lines, Inc. (a)(b) | | | 44,908 | |
| 1,046 | | JetBlue Airways Corp. (a) | | | 5,837 | |
| 1,843 | | Skywest, Inc. | | | 26,318 | |
| 3,664 | | UAL Corp. (a) | | | 71,631 | |
| 6,311 | | US Airways Group, Inc. (a)(b) | | | 46,386 | |
| | | | | | | |
| | | | | | 274,189 | |
| | | | | | | |
| | | Auto Components - 1.43% | | | | |
| 4,448 | | ArvinMeritor, Inc. (a)(b) | | | 59,381 | |
| 1,401 | | Autoliv, Inc. (a) | | | 72,194 | |
| 648 | | Borgwarner, Inc. (a)(b) | | | 24,741 | |
| 262 | | Cooper Tire & Rubber Co. (b) | | | 4,983 | |
| 3,774 | | Dana Holding Corp. (a)(b) | | | 44,835 | |
| 3,098 | | Federal Mogul Corp. (a) | | | 56,879 | |
| 6,963 | | Goodyear Tire & Rubber Co. (a) | | | 88,012 | |
| 7,556 | | Johnson Controls, Inc. | | | 249,272 | |
| 2,372 | | Tenneco, Inc. (a) | | | 56,098 | |
| 4,393 | | TRW Automotive | | | | |
| | | Holdings Corp. (a) | | | 125,552 | |
| 722 | | WABCO Holdings, Inc. | | | 21,602 | |
| | | | | | | |
| | | | | | 803,549 | |
| | | | | | | |
| | | Automobiles - 0.46% | | | | |
| 20,257 | | Ford Motor Co. (a)(b) | | | 254,631 | |
| 228 | | Harley Davidson, Inc. (b) | | | 6,400 | |
| | | | | | | |
| | | | | | 261,031 | |
| | | | | | | |
| | | Beverages - 0.44% | | | | |
| 3,700 | | Coca Cola Enterprises, Inc. | | | 102,342 | |
| 3,459 | | Constellation Brands, Inc. (a) | | | 56,866 | |
| 2,584 | | Dr Pepper Snapple Group, Inc. | | | 90,879 | |
| | | | | | | |
| | | | | | 250,087 | |
| | | | | | | |
| | | | | | | |
Number of
Shares | | | | Value | |
| | | | | | |
| | | Building Products - 0.65% | | | | |
| 2,306 | | Armstrong World Industries, Inc. (a) | | $ | 83,731 | |
| 598 | | Lennox International, Inc. (b) | | | 26,503 | |
| 9,421 | | Masco Corp. | | | 146,214 | |
| 2,867 | | Owens Corning (a) | | | 72,936 | |
| 2,028 | | USG Corp. (a)(b) | | | 34,801 | |
| | | | | | | |
| | | | | | 364,185 | |
| | | | | | | |
| | | Capital Markets - 0.79% | | | | |
| 8,645 | | American Capital Ltd. | | | 43,916 | |
| 14,544 | | E Trade Financial Corp. (a) | | | 23,998 | |
| 2,423 | | Legg Mason, Inc. | | | 69,467 | |
| 5,828 | | MF Global Holdings Ltd. (a)(b) | | | 47,032 | |
| 8,865 | | Morgan Stanley | | | 259,656 | |
| | | | | | | |
| | | | | | 444,069 | |
| | | | | | | |
| | | Chemicals - 2.04% | | | | |
| 939 | | Ashland, Inc. | | | 49,551 | |
| 893 | | Cabot Corp. | | | 27,147 | |
| 964 | | Cytec Industries, Inc. (b) | | | 45,057 | |
| 11,845 | | The Dow Chemical Co. (b) | | | 350,257 | |
| 7,411 | | E.I. du Pont de Nemours & Co. | | | 275,986 | |
| 1,135 | | Eastman Chemical Co. | | | 72,277 | |
| 4,590 | | Huntsman Corp. | | | 55,309 | |
| 867 | | Nalco Holding Company | | | 21,094 | |
| 1,747 | | Olin Corp. | | | 34,276 | |
| 1,935 | | PPG Industries, Inc. | | | 126,549 | |
| 1,574 | | Rockwood Holdings, Inc. (a) | | | 41,900 | |
| 2,275 | | RPM International, Inc. | | | 48,549 | |
| | | | | | | |
| | | | | | 1,147,952 | |
| | | | | | | |
| | | Commercial Banks - 3.15% | | | | |
| 2,693 | | Associated Banc Corp. (b) | | | 37,163 | |
| 9,411 | | CapitalSource, Inc. | | | 52,608 | |
| 69,683 | | Citizens Republic Bancorp, Inc. (a) | | | 82,226 | |
| 754 | | Comerica, Inc. (b) | | | 28,682 | |
| 476 | | East West Bancorp, Inc. (b) | | | 8,292 | |
| 14,988 | | Fifth Third Bancorp (b) | | | 203,687 | |
| 23,706 | | First Bancorp (b) | | | 57,131 | |
| 3,156 | | First Horizon National Corp. (a) | | | 44,346 | |
| 0 | | FirstMerit Corp. | | | 0 | |
| 3,674 | | Fulton Financial Corp. (b) | | | 37,438 | |
| 8,137 | | Huntington Bancshares, Inc. | | | 43,696 | |
| 285 | | International Bancshares Corp. (b) | | | 6,552 | |
| 21,734 | | KeyCorp (b) | | | 168,439 | |
| 14,260 | | Marshall & Ilsley Corp. | | | 114,793 | |
See notes to financial statements.
97
|
AssetMark Enhanced Fundamental Index® Large Company Value Fund |
SCHEDULE OF INVESTMENTS (Continued) |
March 31, 2010 |
| |
| | | | | | | |
Number of
Shares | | | | Value | |
| | | | | | |
| | | COMMON STOCKS (Continued) | | | | |
| | | Commercial Banks (Continued) | | | | |
| 39,999 | | Popular, Inc. | | $ | 116,397 | |
| 11,091 | | Regions Financial Corporation (b) | | | 87,064 | |
| 53,895 | | The South Financial Group (b) | | | 37,258 | |
| 9,489 | | SunTrust Banks, Inc. (b) | | | 254,210 | |
| 5,816 | | Susquehanna Bancshares, Inc. (b) | | | 57,055 | |
| 32,246 | | Synovus Financial Corp. | | | 106,089 | |
| 3,565 | | TCF Financial Corp. (b) | | | 56,826 | |
| 336 | | Trustmark Corp. (b) | | | 8,209 | |
| 624 | | Webster Financial Corp. (b) | | | 10,914 | |
| 3,868 | | Whitney Holding Corp. | | | 53,340 | |
| 1,702 | | Wilmington Trust Corp. (b) | | | 28,202 | |
| 3,266 | | Zions Bancorporation (b) | | | 71,264 | |
| | | | | | | |
| | | | | | 1,771,881 | |
| | | | | | | |
| | | Commercial Services & Supplies - 1.04% | | | | |
| 1,764 | | Avery Dennison Corp. | | | 64,227 | |
| 357 | | Brinks Co. | | | 10,078 | |
| 1,079 | | Deluxe Corp. | | | 20,954 | |
| 951 | | HNI Corp. | | | 25,325 | |
| 3,939 | | Pitney Bowes, Inc. (b) | | | 96,309 | |
| 4,247 | | R.R. Donnelley & Sons Co. | | | 90,673 | |
| 9,521 | | Steelcase, Inc. | | | 61,601 | |
| 556 | | United Stationers, Inc. (a) | | | 32,721 | |
| 5,406 | | Waste Management, Inc. | | | 186,129 | |
| | | | | | | |
| | | | | | 588,017 | |
| | | | | | | |
| | | Communications Equipment - 0.22% | | | | |
| 17,713 | | Motorola, Inc. (a)(b) | | | 124,345 | |
| | | | | | | |
| | | Computers & Peripherals - 0.79% | | | | |
| 18,457 | | Dell, Inc. (a) | | | 277,039 | |
| 2,045 | | Lexmark International, Inc. (a) | | | 73,784 | |
| 4,207 | | NCR Corp. (a) | | | 58,057 | |
| 1,975 | | Seagate Technology (a) | | | 36,063 | |
| | | | | | | |
| | | | | | 444,943 | |
| | | | | | | |
| | | Construction & Engineering - 0.21% | | | | |
| 2,286 | | EMCOR Group, Inc. (a) | | | 56,304 | |
| 946 | | Granite Construction, Inc. (b) | | | 28,588 | |
| 1,569 | | Tutor Perini Corp. (a)(b) | | | 34,126 | |
| | | | | | | |
| | | | | | 119,018 | |
| | | | | | | |
| | | Consumer Finance - 0.98% | | | | |
| 7,012 | | American Express Co. | | | 289,315 | |
| 2,027 | | AmeriCredit Corp. (a)(b) | | | 48,162 | |
| | | | | | | |
Number of
Shares | | | | Value | |
| | | | | | |
| | | Consumer Finance (Continued) | | | | |
| 3,563 | | Capital One Financial Corp. (b) | | $ | 147,544 | |
| 10,888 | | CompuCredit Holdings Corp. (b) | | | 56,182 | |
| 105 | | Nelnet, Inc. | | | 1,949 | |
| 352 | | SLM Corp. (a) | | | 4,407 | |
| 78 | | Student Loan Corp. | | | 2,771 | |
| | | | | | | |
| | | | | | 550,330 | |
| | | | | | | |
| | | Containers & Packaging - 0.87% | | | | |
| 2,572 | | Bemis, Inc. | | | 73,868 | |
| 2,133 | | Crown Holdings, Inc. (a) | | | 57,506 | |
| 1,736 | | Graphic Packaging Holding Co. (a) | | | 6,267 | |
| 2,249 | | Owens-Illinois, Inc. (a) | | | 79,929 | |
| 1,341 | | Packaging Corp. of America | | | 33,002 | |
| 1,502 | | Pactiv Corp. (a) | | | 37,820 | |
| 2,331 | | Sealed Air Corp. | | | 49,138 | |
| 296 | | Silgan Holdings, Inc. | | | 17,828 | |
| 1,781 | | Sonoco Products Co. | | | 54,837 | |
| 3,880 | | Temple Inland, Inc. | | | 79,268 | |
| | | | | | | |
| | | | | | 489,463 | |
| | | | | | | |
| | | Distributors - 0.40% | | | | |
| 2,288 | | Core-Mark Holding Co., Inc. (a) | | | 70,036 | |
| 3,641 | | Genuine Parts Co. | | | 153,796 | |
| | | | | | | |
| | | | | | 223,832 | |
| | | | | | | |
| | | Diversified Consumer Services - 0.15% | | | | |
| 458 | | Career Education Corp. (a) | | | 14,491 | |
| 1,510 | | Regis Corp. (b) | | | 28,207 | |
| 4,794 | | Service Corp International (b) | | | 44,009 | |
| | | | | | | |
| | | | | | 86,707 | |
| | | | | | | |
| | | Diversified Financial Services - 3.20% | | | | |
| 60,538 | | Bank of America Corporation | | | 1,080,604 | |
| 169,360 | | Citigroup, Inc. (a)(b) | | | 685,908 | |
| 1,567 | | PHH Corp. (a)(b) | | | 36,934 | |
| | | | | | | |
| | | | | | 1,803,446 | |
| | | | | | | |
| | | Diversified Telecommunication Services - 2.27% | | | | |
| 12,550 | | Frontier Communications Corp. (b) | | | 93,372 | |
| 7,070 | | Level 3 Communications, Inc. (a) | | | 11,453 | |
| 36,711 | | Qwest Communications International, | | | | |
| | | Inc. (b) | | | 191,632 | |
| 31,743 | | Verizon Communications, Inc. | | | 984,668 | |
| | | | | | | |
| | | | | | 1,281,125 | |
| | | | | | | |
See notes to financial statements.
98
|
AssetMark Enhanced Fundamental Index® Large Company Value Fund |
SCHEDULE OF INVESTMENTS (Continued) |
March 31, 2010 |
| |
| | | | | | | |
Number of
Shares | | | | Value | |
| | | | | | |
| | | COMMON STOCKS (Continued) | | | | |
| | | Electric Utilities - 3.48% | | | | |
| 11,616 | | AES Corp. (a) | | $ | 127,776 | |
| 1,752 | | Allegheny Energy, Inc. | | | 40,296 | |
| 6,294 | | American Electric Power | | | | |
| | | Company, Inc. | | | 215,129 | |
| 18,583 | | Duke Energy Corp. | | | 303,275 | |
| 5,851 | | Edison International | | | 199,929 | |
| 2,377 | | Entergy Corp. | | | 193,369 | |
| 3,670 | | FirstEnergy Corp. (b) | | | 143,460 | |
| 623 | | Great Plains Energy, Inc. | | | 11,569 | |
| 4,443 | | Hawaiian Electric Industries, Inc. (b) | | | 99,745 | |
| 1,297 | | IDACORP, Inc. (b) | | | 44,902 | |
| 2,220 | | Northeast Utilities | | | 61,361 | |
| 1,392 | | NV Energy, Inc. | | | 17,163 | |
| 5,078 | | Pepco Holdings, Inc. | | | 87,088 | |
| 1,770 | | Pinnacle West Capital Corp. | | | 66,782 | |
| 1,190 | | PNM Resources, Inc. | | | 14,911 | |
| 1,333 | | Portland General Electric Co. | | | 25,740 | |
| 3,763 | | PPL Corp. | | | 104,273 | |
| 4,006 | | Progress Energy, Inc. | | | 157,676 | |
| 316 | | UniSource Energy Corp. | | | 9,935 | |
| 1,610 | | Westar Energy, Inc. | | | 35,903 | |
| | | | | | | |
| | | | | | 1,960,282 | |
| | | | | | | |
| | | Electrical Equipment - 0.23% | | | | |
| 534 | | A.O. Smith Corp. | | | 28,072 | |
| 374 | | Acuity Brands, Inc. | | | 15,787 | |
| 1,499 | | General Cable Corp. (a)(b) | | | 40,473 | |
| 291 | | Hubbell, Inc. | | | 14,675 | |
| 747 | | Thomas & Betts Corp. (a) | | | 29,312 | |
| | | | | | | |
| | | | | | 128,319 | |
| | | | | | | |
| | | Electronic Equipment & Instruments - 1.39% | | | | |
| 842 | | Anixter International, Inc. (a)(b) | | | 39,448 | |
| 3,911 | | Arrow Electronics, Inc. (a) | | | 117,839 | |
| 4,061 | | Avnet, Inc. (a) | | | 121,830 | |
| 1,973 | | Benchmark Electronics, Inc. (a) | | | 40,920 | |
| 6,609 | | Ingram Micro, Inc. (a) | | | 115,988 | |
| 4,222 | | Insight Enterprises, Inc. (a) | | | 60,628 | |
| 3,049 | | Jabil Circuit, Inc. | | | 49,363 | |
| 1,555 | | Synnex Corp. (a)(b) | | | 45,966 | |
| 3,228 | | Tech Data Corp. (a) | | | 135,253 | |
| 5,275 | | Vishay Intertechnology, Inc. (a) | | | 53,963 | |
| | | | | | | |
| | | | | | 781,198 | |
| | | | | | | |
| | | | | | | |
Number of
Shares | | | | Value | |
| | | | | | |
| | | Energy Equipment & Services - 0.43% | | | | |
| 2,326 | | Exterran Holdings, Inc. (a)(b) | | $ | 56,219 | |
| 2,831 | | Helix Energy Solutions | | | | |
| | | Group, Inc. (a) | | | 36,888 | |
| 3,093 | | Key Energy Services, Inc. (a) | | | 29,538 | |
| 1,818 | | Nabors Industries Ltd. (a) | | | 35,687 | |
| 166 | | Oil States International, Inc. (a)(b) | | | 7,527 | |
| 740 | | Patterson-UTI Energy, Inc. | | | 10,338 | |
| 414 | | Seacor Holdings, Inc. (a)(b) | | | 33,393 | |
| 402 | | Smith International, Inc. | | | 17,214 | |
| 145 | | Superior Energy Services, Inc. (a) | | | 3,048 | |
| 233 | | Unit Corp. (a)(b) | | | 9,851 | |
| | | | | | | |
| | | | | | 239,703 | |
| | | | | | | |
| | | Food & Staples Retailing - 6.20% | | | | |
| 1,965 | | BJ’s Wholesale Club, Inc. (a) | | | 72,685 | |
| 7,875 | | The Great Atlantic & Pacific | | | | |
| | | Tea Co. (a)(b) | | | 60,401 | |
| 12,386 | | Kroger Co. | | | 268,281 | |
| 1,122 | | Nash Finch Co. (b) | | | 37,755 | |
| 43,539 | | Rite Aid Corp. (a) | | | 65,308 | |
| 747 | | Ruddick Corp. (b) | | | 23,635 | |
| 11,930 | | Safeway, Inc. (b) | | | 296,580 | |
| 11,397 | | Supervalu, Inc. | | | 190,102 | |
| 8,014 | | SYSCO Corp. | | | 236,413 | |
| 38,206 | | Wal-Mart Stores, Inc. | | | 2,124,254 | |
| 561 | | Weis Markets, Inc. (b) | | | 20,398 | |
| 7,826 | | Winn Dixie Stores, Inc. (a)(b) | | | 97,747 | |
| | | | | | | |
| | | | | | 3,493,559 | |
| | | | | | | |
| | | Food Products - 2.90% | | | | |
| 9,990 | | Archer Daniels Midland Co. | | | 288,711 | |
| 2,781 | | Bunge Limited | | | 171,393 | |
| 2,598 | | Chiquita Brands | | | | |
| | | International, Inc. (a)(b) | | | 40,867 | |
| 5,302 | | Conagra Foods, Inc. | | | 132,921 | |
| 646 | | Corn Products | | | | |
| | | International, Inc. (b) | | | 22,390 | |
| 12,151 | | Dean Foods Co. (a) | | | 190,649 | |
| 1,537 | | Del Monte Foods Co. | | | 22,440 | |
| 284 | | Fresh Del Monte Produce, Inc. (a) | | | 5,751 | |
| 16,893 | | Kraft Foods, Inc. | | | 510,844 | |
| 6,410 | | Sara Lee Corp. | | | 89,291 | |
| 2,279 | | Smithfield Foods, Inc. (a)(b) | | | 47,267 | |
| 5,891 | | Tyson Foods, Inc. | | | 112,813 | |
| | | | | | | |
| | | | | | 1,635,337 | |
| | | | | | | |
See notes to financial statements.
99
|
AssetMark Enhanced Fundamental Index® Large Company Value Fund
SCHEDULE OF INVESTMENTS (Continued)
March 31, 2010 |
| |
| | | | | | | |
Number of
Shares | | | | Value | |
| | | | | | |
| | | COMMON STOCKS (Continued) | | | | |
| | | Gas Utilities - 0.64% | | | | |
| 934 | | AGL Resources, Inc. | | $ | 36,099 | |
| 1,510 | | Atmos Energy Corp. | | | 43,141 | |
| 719 | | New Jersey Resources Corp. | | | 27,006 | |
| 2,061 | | Nicor, Inc. | | | 86,397 | |
| 725 | | Oneok, Inc. | | | 33,096 | |
| 777 | | Piedmont Natural Gas, Inc. (b) | | | 21,430 | |
| 1,024 | | Southwest Gas Corp. | | | 30,638 | |
| 1,932 | | UGI Corp. (b) | | | 51,275 | |
| 994 | | WGL Holdings, Inc. | | | 34,442 | |
| | | | | | | |
| | | | | | 363,524 | |
| | | | | | | |
| | | Health Care Equipment & Supplies - 0.21% | | | | |
| 3,075 | | CareFusion Corp. (a) | | | 81,272 | |
| 1,251 | | Hill-Rom Holdings, Inc. (b) | | | 34,040 | |
| 76 | | Teleflex, Inc. | | | 4,869 | |
| | | | | | | |
| | | | | | 120,181 | |
| | | �� | | | | |
| | | Health Care Providers & Services - 2.29% | | | | |
| 1,375 | | Amerigroup Corp. (a) | | | 45,705 | |
| 6,376 | | Cardinal Health, Inc. | | | 229,727 | |
| 1,329 | | Community Health | | | | |
| | | Systems, Inc. (a) | | | 49,080 | |
| 3,947 | | Coventry Health Care, Inc. (a) | | | 97,570 | |
| 649 | | Davita, Inc. (a)(b) | | | 41,147 | |
| 3,157 | | Health Management | | | | |
| | | Associates, Inc. (a) | | | 27,150 | |
| 2,969 | | Health Net, Inc. (a)(b) | | | 73,839 | |
| 3,129 | | Humana, Inc. (a) | | | 146,343 | |
| 4,029 | | Kindred Healthcare, Inc. (a) | | | 72,723 | |
| 441 | | Lifepoint Hospitals, Inc. (a)(b) | | | 16,220 | |
| 499 | | Lincare Holdings, Inc. (a)(b) | | | 22,395 | |
| 4,430 | | Tenet Healthcare Corp. (a) | | | 25,340 | |
| 3,143 | | Universal American Corp. (a) | | | 48,402 | |
| 582 | | Wellcare Health Plans, Inc. (a) | | | 17,344 | |
| 5,850 | | Wellpoint, Inc. (a) | | | 376,623 | |
| | | | | | | |
| | | | | | 1,289,608 | |
| | | | | | | |
| | | Hotels, Restaurants & Leisure - 1.21% | | | | |
| 11,605 | | AFC Enterprises, Inc. (a) | | | 124,522 | |
| 2,488 | | Boyd Gaming Corp. (a)(b) | | | 24,581 | |
| 1,672 | | Brinker International, Inc. (b) | | | 32,236 | |
| 449 | | Burger King Holdings, Inc. (b) | | | 9,546 | |
| 732 | | Darden Restaurants, Inc. (b) | | | 32,603 | |
| | | | | | | |
Number of
Shares | | | | Value | |
| | | | | | |
| | | Hotels, Restaurants & Leisure (Continued) | | | | |
| 4,998 | | Domino’s Pizza, Inc. (a)(b) | | $ | 68,173 | |
| 6,114 | | MGM MIRAGE (a)(b) | | | 73,368 | |
| 470 | | Penn National Gaming, Inc. (a) | | | 13,066 | |
| 1,425 | | Royal Caribbean Cruises Ltd. (a)(b) | | | 47,011 | |
| 1,948 | | Starwood Hotels & Resorts | | | | |
| | | Worldwide, Inc. (b) | | | 90,855 | |
| 1,573 | | Wyndham Worldwide Corp. | | | 40,473 | |
| 3,253 | | Yum Brands, Inc. (b) | | | 124,687 | |
| | | | | | | |
| | | | | | 681,121 | |
| | | | | | | |
| | | Household Durables - 1.73% | | | | |
| 13,168 | | Beazer Homes USA, Inc. (a)(b) | | | 59,783 | |
| 3,371 | | D.R. Horton, Inc. (b) | | | 42,475 | |
| 2,024 | | Fortune Brands, Inc. | | | 98,184 | |
| 16,013 | | Hovnanian Enterprises, Inc. (a)(b) | | | 69,657 | |
| 1,121 | | Jarden Corp. | | | 37,318 | |
| 3,754 | | KB Home | | | 62,879 | |
| 2,577 | | Leggett & Platt, Inc. (b) | | | 55,766 | |
| 2,477 | | Lennar Corp. | | | 42,629 | |
| 255 | | M.D.C Holdings, Inc. | | | 8,826 | |
| 1,555 | | Mohawk Industries, Inc. (a) | | | 84,561 | |
| 3,551 | | Newell Rubbermaid, Inc. | | | 53,975 | |
| 83 | | NVR, Inc. (a)(b) | | | 60,299 | |
| 765 | | Pulte Homes, Inc. (a) | | | 8,606 | |
| 1,883 | | Ryland Group, Inc. (b) | | | 42,255 | |
| 1,753 | | Stanley Black & Decker, Inc. | | | 100,640 | |
| 1,115 | | Toll Brothers, Inc. (a)(b) | | | 23,192 | |
| 1,446 | | Whirlpool Corp. (b) | | | 126,163 | |
| | | | | | | |
| | | | | | 977,208 | |
| | | | | | | |
| | | Household Products - 0.10% | | | | |
| 845 | | Clorox Co. | | | 54,198 | |
| | | | | | | |
| | | Independent Power Producers & | | | | |
| | | Energy Traders - 0.43% | | | | |
| 6,044 | | Calpine Corp. (a) | | | 71,863 | |
| 1,159 | | Constellation Energy Group, Inc. | | | 40,693 | |
| 37,950 | | Dynegy, Inc. (a)(b) | | | 47,817 | |
| 5,897 | | Mirant Corp. (a) | | | 64,041 | |
| 5,462 | | RRI Energy, Inc. (a) | | | 20,155 | |
| | | | | | | |
| | | | | | 244,569 | |
| | | | | | | |
| | | Industrial Conglomerates - 2.95% | | | | |
| 85,865 | | General Electric Co. | | | 1,562,743 | |
| 4,677 | | Textron, Inc. (b) | | | 99,293 | |
| | | | | | | |
| | | | | | 1,662,036 | |
| | | | | | | |
See notes to financial statements.
100
|
AssetMark Enhanced Fundamental Index® Large Company Value Fund
SCHEDULE OF INVESTMENTS (Continued)
March 31, 2010 |
| |
| | | | | | | |
Number of
Shares | | | | Value | |
| | | | | | |
| | | COMMON STOCKS (Continued) | | | | |
| | | Insurance - 6.66% | | | | |
| 4,266 | | Allstate Corp. | | $ | 137,834 | |
| 2,367 | | American Financial Group, Inc. | | | 67,341 | |
| 3,859 | | American International | | | | |
| | | Group, Inc. (a)(b) | | | 131,746 | |
| 959 | | American National Insurance | | | | |
| | | Company | | | 108,885 | |
| 1,514 | | Arch Capital Group Ltd. (a) | | | 115,443 | |
| 2,713 | | Assurant, Inc. | | | 93,273 | |
| 6,287 | | Chubb Corp. | | | 325,981 | |
| 3,488 | | Cincinnati Financial Corp. (b) | | | 100,803 | |
| 10,893 | | Conseco, Inc. (a) | | | 67,754 | |
| 1,197 | | Endurance Specialty Holdings Ltd. | | | 44,469 | |
| 3,769 | | Fidelity National Financial, Inc. | | | 55,857 | |
| 2,556 | | First American Corp. (b) | | | 86,495 | |
| 2,363 | | Hartford Financial Services | | | | |
| | | Group, Inc. | | | 67,156 | |
| 4,092 | | Lincoln National Corp. | | | 125,624 | |
| 5,613 | | Loews Corp. | | | 209,253 | |
| 9,800 | | Metlife, Inc. | | | 424,732 | |
| 2,300 | | Old Republic International Corp. | | | 29,164 | |
| 672 | | OneBeacon Insurance Group, Ltd. | | | 11,592 | |
| 6,406 | | The Phoenix Companies, Inc. (a)(b) | | | 15,503 | |
| 3,108 | | Principal Financial Group, Inc. | | | 90,785 | |
| 4,081 | | Progressive Corp. | | | 77,906 | |
| 2,324 | | Protective Life Corp. | | | 51,105 | |
| 4,171 | | Prudential Financial, Inc. | | | 252,345 | |
| 2,490 | | Selective Insurance Group, Inc. | | | 41,334 | |
| 846 | | StanCorp Financial Group, Inc. | | | 40,295 | |
| 1,265 | | Torchmark Corp. | | | 67,690 | |
| 7,602 | | Travelers Companies, Inc. (b) | | | 410,052 | |
| 1,458 | | Unitrin, Inc. | | | 40,897 | |
| 8,108 | | Unum Group | | | 200,835 | |
| 2,601 | | W.R. Berkley Corp. | | | 67,860 | |
| 6,571 | | XL Capital Ltd. (b) | | | 124,192 | |
| 1,836 | | Zenith National Insurance Corp. | | | 70,356 | |
| | | | | | | |
| | | | | | 3,754,557 | |
| | | | | | | |
| | | Internet Software & Services - 0.04% | | | | |
| 884 | | IAC/InterActiveCorp (a) | | | 20,102 | |
| | | | | | | |
| | | IT Services - 0.46% | | | | |
| 449 | | CACI International, Inc. (a) | | | 21,934 | |
| 3,107 | | Computer Sciences Corp. (a) | | | 169,300 | |
| 2,431 | | Convergys Corp. (a) | | | 29,804 | |
| 603 | | DST Systems, Inc. (a) | | | 24,994 | |
| | | | | | | |
Number of
Shares | | | | Value | |
| | | | | | |
| | | IT Services (Continued) | | | | |
| 753 | | The Western Union Co. | | $ | 12,771 | |
| | | | | | | |
| | | | | | 258,803 | |
| | | | | | | |
| | | Leisure Equipment & Products - 0.22% | | | | |
| 4,406 | | Brunswick Corp. (b) | | | 70,364 | |
| 5,774 | | Eastman Kodak Co. (a)(b) | | | 33,431 | |
| 435 | | Polaris Industries, Inc. (b) | | | 22,255 | |
| | | | | | | |
| | | | | | 126,050 | |
| | | | | | | |
| | | Machinery - 2.62% | | | | |
| 2,079 | | AGCO Corp. (a) | | | 74,574 | |
| 2,260 | | Briggs & Stratton Corp. (b) | | | 44,070 | |
| 5,059 | | Caterpillar, Inc. | | | 317,958 | |
| 955 | | Crane Co. | | | 33,902 | |
| 2,822 | | Deere & Co. (b) | | | 167,796 | |
| 1,508 | | Eaton Corp. | | | 114,261 | |
| 157 | | Gardner Denver, Inc. | | | 6,914 | |
| 1,140 | | Harsco Corp. | | | 36,412 | |
| 856 | | Kennametal, Inc. | | | 24,071 | |
| 193 | | Manitowoc, Inc. | | | 2,509 | |
| 1,883 | | Mueller Industries, Inc. | | | 50,446 | |
| 3,707 | | Mueller Water Products, Inc. - | | | | |
| | | Class A | | | 17,719 | |
| 409 | | NACCO Industries, Inc. (b) | | | 30,327 | |
| 1,244 | | Navistar International Corp. (a) | | | 55,644 | |
| 4,384 | | Paccar, Inc. (b) | | | 190,003 | |
| 1,314 | | Parker Hannifin Corp. | | | 85,068 | |
| 550 | | Snap On, Inc. | | | 23,837 | |
| 972 | | SPX Corp. (b) | | | 64,463 | |
| 2,446 | | Terex Corp. (a)(b) | | | 55,549 | |
| 2,254 | | Timken Co. | | | 67,643 | |
| 628 | | Trinity Industries, Inc. (b) | | | 12,535 | |
| | | | | | | |
| | | | | | 1,475,701 | |
| | | | | | | |
| | | Marine - 0.04% | | | | |
| 605 | | Alexander & Baldwin, Inc. | | | 19,995 | |
| | | | | | | |
| | | Media - 4.26% | | | | |
| 5,014 | | Belo Corp. (b) | | | 34,195 | |
| 583 | | Cablevision Systems Corp. | | | 14,074 | |
| 14,578 | | CBS Corp. (b) | | | 203,217 | |
| 925 | | Cinemark Holdings, Inc. (b) | | | 16,965 | |
| 1,505 | | Clear Channel Outdoor | | | | |
| | | Holdings, Inc. (a) | | | 15,968 | |
| 3,691 | | Dish Network Corp. | | | 76,847 | |
| 7,765 | | The E.W. Scripps Co. (a) | | | 65,614 | |
| 7,810 | | Gannett Co., Inc. (b) | | | 129,021 | |
See notes to financial statements.
101
|
AssetMark Enhanced Fundamental Index® Large Company Value Fund
SCHEDULE OF INVESTMENTS (Continued)
March 31, 2010 |
| |
| | | | | | | |
Number of
Shares | | | | Value | |
| | | | | | |
| | | COMMON STOCKS (Continued) | | | | |
| | | Media (Continued) | | | | |
| 7,182 | | Interpublic Group Cos., Inc. (a)(b) | | $ | 59,754 | |
| 2,656 | | Liberty Global, Inc. (a)(b) | | | 77,449 | |
| 7,965 | | Liberty Media Corporation - | | | | |
| | | Interactive (a) | | | 121,944 | |
| 2,057 | | Live Nation, Inc. (a) | | | 29,827 | |
| 145 | | Madison Square Garden, Inc. (a) | | | 3,151 | |
| 3,125 | | McGraw-Hill Companies, Inc. | | | 111,406 | |
| 879 | | Meredith Corp. (b) | | | 30,246 | |
| 2,215 | | New York Times Co. (a) | | | 24,653 | |
| 3,321 | | Omnicom Group, Inc. | | | 128,888 | |
| 3,908 | | RCN Corp. (a) | | | 58,933 | |
| 4,494 | | Regal Entertainment Group (b) | | | 78,960 | |
| 773 | | Scholastic Corp. | | | 21,644 | |
| 4,936 | | Time Warner Cable, Inc. | | | 263,138 | |
| 17,390 | | Time Warner, Inc. | | | 543,785 | |
| 5,124 | | Viacom, Inc. (a) | | | 176,163 | |
| 246 | | Virgin Media, Inc. | | | 4,246 | |
| 8,041 | | Warner Music Group Corp. (a) | | | 55,563 | |
| 125 | | The Washington Post Company | | | 55,523 | |
| | | | | | | |
| | | | | | 2,401,174 | |
| | | | | | | |
| | | Metals & Mining - 1.18% | | | | |
| 2,069 | | AK Steel Holding Corp. | | | 47,297 | |
| 17,695 | | Alcoa, Inc. (b) | | | 251,977 | |
| 936 | | Allegheny Technologies, Inc. | | | 50,535 | |
| 2,455 | | Century Aluminum Co. (a)(b) | | | 33,781 | |
| 2,310 | | Commercial Metals Co. | | | 34,789 | |
| 1,880 | | Nucor Corp. | | | 85,314 | |
| 175 | | Steel Dynamics, Inc. | | | 3,057 | |
| 2,184 | | United States Steel Corp. (b) | | | 138,728 | |
| 1,081 | | Worthington Industries, Inc. | | | 18,690 | |
| | | | | | | |
| | | | | | 664,168 | |
| | | | | | | |
| | | Multiline Retail - 2.10% | | | | |
| 1,235 | | Big Lots, Inc. (a) | | | 44,979 | |
| 1,457 | | Dillard’s, Inc. | | | 34,385 | |
| 1,486 | | Family Dollar Stores, Inc. | | | 54,402 | |
| 4,822 | | J.C. Penney Co., Inc. | | | 155,124 | |
| 7,736 | | Macy’s, Inc. (b) | | | 168,413 | |
| 1,448 | | Nordstrom, Inc. (b) | | | 59,151 | |
| 4,113 | | Saks, Inc. (a) | | | 35,372 | |
| 2,070 | | Sears Holdings Corp. (a)(b) | | | 224,450 | |
| 7,734 | | Target Corp. | | | 406,808 | |
| | | | | | | |
| | | | | | 1,183,084 | |
| | | | | | | |
| | | | | | | |
Number of
Shares | | | | Value | |
| | | | | | |
| | | Multi-Utilities - 4.09% | | | | |
| 1,721 | | Alliant Energy Corp. | | $ | 57,240 | |
| 8,021 | | Ameren Corp. | | | 209,188 | |
| 1,030 | | Avista Corp. | | | 21,331 | |
| 176 | | Black Hills Corp. (b) | | | 5,342 | |
| 6,338 | | CenterPoint Energy, Inc. | | | 91,014 | |
| 5,488 | | CMS Energy Corp. (b) | | | 84,844 | |
| 6,437 | | Consolidated Edison, Inc. | | | 286,704 | |
| 4,368 | | Dominion Resources, Inc. | | | 179,568 | |
| 2,984 | | DTE Energy Co. | | | 133,086 | |
| 1,190 | | Integrys Energy Group, Inc. (b) | | | 56,382 | |
| 1,725 | | MDU Resources Group, Inc. | | | 37,226 | |
| 6,046 | | NiSource, Inc. | | | 95,527 | |
| 601 | | Northwestern Corp. (b) | | | 16,113 | |
| 2,053 | | NRG Energy, Inc. (a) | | | 42,908 | |
| 1,570 | | NSTAR | | | 55,609 | |
| 1,034 | | OGE Energy Corp. | | | 40,264 | |
| 4,905 | | PG&E Corp. | | | 208,070 | |
| 6,469 | | Public Services Enterprise | | | | |
| | | Group, Inc. | | | 190,965 | |
| 1,502 | | SCANA Corp. | | | 56,460 | |
| 3,283 | | Sempra Energy | | | 163,822 | |
| 2,865 | | Teco Energy, Inc. | | | 45,525 | |
| 1,314 | | Vectren Corp. (b) | | | 32,482 | |
| 1,143 | | Wisconsin Energy Corp. (b) | | | 56,476 | |
| 6,392 | | Xcel Energy, Inc. (b) | | | 135,510 | |
| | | | | | | |
| | | | | | 2,301,656 | |
| | | | | | | |
| | | Office Electronics - 0.15% | | | | |
| 8,548 | | Xerox Corp. | | | 83,343 | |
| | | | | | | |
| | | Oil & Gas - 14.75% | | | | |
| 727 | | Alon USA Energy, Inc. (b) | | | 5,271 | |
| 20,850 | | Chevron Corp. | | | 1,581,055 | |
| 17,672 | | ConocoPhillips | | | 904,276 | |
| 3,518 | | Crosstex Energy, Inc. (a)(b) | | | 30,571 | |
| 4,337 | | CVR Energy, Inc. (a)(b) | | | 37,949 | |
| 4,649 | | Delek US Holdings, Inc. | | | 33,845 | |
| 1,816 | | El Paso Corp. | | | 19,685 | |
| 54,299 | | Exxon Mobil Corp. | | | 3,636,947 | |
| 1,023 | | Forest Oil Corp. (a) | | | 26,414 | |
| 1,413 | | Frontier Oil Corp. | | | 19,076 | |
| 551 | | Frontline Ltd. (b) | | | 16,877 | |
| 3,656 | | General Maritime Corp. | | | 26,287 | |
| 5,992 | | Hess Corp. | | | 374,800 | |
| 592 | | Holly Corp. | | | 16,523 | |
| 11,972 | | Marathon Oil Corp. | | | 378,794 | |
See notes to financial statements.
102
|
AssetMark Enhanced Fundamental Index® Large Company Value Fund
SCHEDULE OF INVESTMENTS (Continued)
March 31, 2010 |
| |
| | | | | | | |
Number of
Shares | | | | Value | |
| | | | | | |
| | | COMMON STOCKS (Continued) | | | | |
| | | Oil & Gas (Continued) | | | | |
| 856 | | Mariner Energy, Inc. (a) | | $ | 12,814 | |
| 2,443 | | Murphy Oil Corp. | | | 137,272 | |
| 821 | | Overseas Shipholding | | | | |
| | | Group, Inc. (b) | | | 32,208 | |
| 46 | | Ship Finance International Ltd. (b) | | | 817 | |
| 212 | | Southern Union Co. | | | 5,378 | |
| 6,052 | | Sunoco, Inc. | | | 179,805 | |
| 1,355 | | Teekay Corporation (b) | | | 30,813 | |
| 9,348 | | Tesoro Corp. (b) | | | 129,937 | |
| 7,624 | | USEC, Inc. (a)(b) | | | 43,990 | |
| 19,835 | | Valero Energy Corp. | | | 390,750 | |
| 3,529 | | W & T Offshore, Inc. (b) | | | 29,644 | |
| 13,032 | | Western Refining, Inc. (a)(b) | | | 71,676 | |
| 5,972 | | Williams Companies, Inc. | | | 137,953 | |
| | | | | | | |
| | | | | | 8,311,427 | |
| | | | | | | |
| | | Paper & Forest Products - 0.67% | | | | |
| 1,571 | | Domtar Corp. (a) | | | 101,188 | |
| 5,447 | | International Paper Co. | | | 134,051 | |
| 2,478 | | Louisiana-Pacific Corp. (a) | | | 22,426 | |
| 1,351 | | MeadWestvaco Corp. (b) | | | 34,518 | |
| 1,903 | | Weyerhaeuser Co. | | | 86,149 | |
| | | | | | | |
| | | | | | 378,332 | |
| | | | | | | |
| | | Pharmaceuticals - 0.01% | | | | |
| 513 | | King Pharmaceuticals, Inc. (a) | | | 6,033 | |
| | | | | | | |
| | | Professional Services - 0.43% | | | | |
| 3,968 | | Kelly Services, Inc. (a)(b) | | | 66,107 | |
| 3,127 | | Manpower, Inc. | | | 178,614 | |
| | | | | | | |
| | | | | | 244,721 | |
| | | | | | | |
| | | Real Estate - 0.04% | | | | |
| 1,497 | | CB Richard Ellis Group, Inc. (a) | | | 23,727 | |
| | | | | | | |
| | | Road & Rail - 0.92% | | | | |
| 1,519 | | AMERCO (a)(b) | | | 82,466 | |
| 8,428 | | Avis Budget Group (a) | | | 96,922 | |
| 1,146 | | Con-Way, Inc. | | | 40,248 | |
| 1,325 | | Dollar Thrifty Automotive | | | | |
| | | Group, Inc. (a)(b) | | | 42,572 | |
| 6,934 | | Hertz Global Holdings, Inc. (a)(b) | | | 69,271 | |
| 1,841 | | Ryder Systems, Inc. (b) | | | 71,357 | |
| 2,776 | | Werner Enterprises, Inc. (b) | | | 64,320 | |
| 94,919 | | YRC Worldwide, Inc. (a) | | | 51,617 | |
| | | | | | | |
| | | | | | 518,773 | |
| | | | | | | |
| | | | | | | |
Number of
Shares | | | | Value | |
| | | | | | |
| | | Semiconductor & Semiconductor | | | | |
| | | Equipment - 0.25% | | | | |
| 1,970 | | Advanced Micro Devices, Inc. (a) | | $ | 18,262 | |
| 6,862 | | Amkor Technology, Inc. (a)(b) | | | 48,514 | |
| 2,950 | | Fairchild Semiconductor | | | | |
| | | International (a) | | | 31,418 | |
| 1,452 | | Micron Technology, Inc. (a) | | | 15,086 | |
| 1,052 | | Novellus Systems, Inc. (a) | | | 26,300 | |
| | | | | | | |
| | | | | | 139,580 | |
| | | | | | | |
| | | Specialty Retail - 3.88% | | | | |
| 364 | | Abercrombie & Fitch Co. (b) | | | 16,613 | |
| 2,172 | | Asbury Automotive Group, Inc. (a) | | | 28,888 | |
| 5,640 | | AutoNation, Inc. (a)(b) | | | 101,971 | |
| 337 | | AutoZone, Inc. (a) | | | 58,331 | |
| 3,097 | | Barnes & Noble, Inc. (b) | | | 66,957 | |
| 3,817 | | Best Buy Co., Inc. | | | 162,375 | |
| 37,005 | | Borders Group, Inc. (a)(b) | | | 63,649 | |
| 1,547 | | Collective Brands, Inc. (a) | | | 35,179 | |
| 5,149 | | Foot Locker, Inc. (b) | | | 77,441 | |
| 1,296 | | Group 1 Automotive, Inc. (a)(b) | | | 41,291 | |
| 17,053 | | Home Depot, Inc. | | | 551,664 | |
| 4,974 | | Limited Brands, Inc. | | | 122,460 | |
| 14,564 | | Lowe’s Companies, Inc. | | | 353,031 | |
| 773 | | Mens Wearhouse, Inc. | | | 18,506 | |
| 7,510 | | Office Depot, Inc. (a) | | | 59,930 | |
| 4,324 | | OfficeMax, Inc. (a)(b) | | | 71,000 | |
| 4,618 | | The Pantry, Inc. (a) | | | 57,679 | |
| 3,500 | | Penske Automotive Group, Inc. (a) | | | 50,470 | |
| 2,234 | | Radioshack Corp. | | | 50,555 | |
| 2,041 | | Rent-A-Center, Inc. (a)(b) | | | 48,270 | |
| 1,836 | | Signet Jewelers Limited (a) | | | 59,376 | |
| 3,961 | | Sonic Automotive, Inc. (a) | | | 43,571 | |
| 1,826 | | Williams Sonoma, Inc. (b) | | | 48,005 | |
| | | | | | | |
| | | | | | 2,187,212 | |
| | | | | | | |
| | | Textiles, Apparel & Luxury Goods - 0.19% | | | | |
| 993 | | Hanesbrands, Inc. (a) | | | 27,625 | |
| 2,024 | | Jones Apparel Group, Inc. | | | 38,497 | |
| 5,407 | | Liz Claiborne, Inc. (a)(b) | | | 40,174 | |
| | | | | | | |
| | | | | | 106,296 | |
| | | | | | | |
| | | Thrifts & Mortgage Finance - 0.08% | | | | |
| 1,458 | | Astoria Financial Corp. | | | 21,141 | |
| 1,976 | | MGIC Investment Corp. (a)(b) | | | 21,677 | |
| | | | | | | |
| | | | | | 42,818 | |
| | | | | | | |
See notes to financial statements.
103
|
AssetMark Enhanced Fundamental Index® Large Company Value Fund |
SCHEDULE OF INVESTMENTS (Continued) |
March 31, 2010 |
| |
| | | | | | | |
Number of
Shares | | | | Value | |
| | | | | | |
| | | COMMON STOCKS (Continued) | | | | |
| | | Tobacco - 1.02% | | | | |
| 26,729 | | Altria Group, Inc. | | $ | 548,479 | |
| 499 | | Universal Corp. (b) | | | 26,292 | |
| | | | | | | |
| | | | | | 574,771 | |
| | | | | | | |
| | | Trading Companies & Distributors - 0.48% | | | | |
| 17,391 | | BlueLinx Holdings, Inc. (a)(b) | | | 66,260 | |
| 605 | | GATX Corp. | | | 17,333 | |
| 4,792 | | RSC Holdings, Inc. (a)(b) | | | 38,144 | |
| 10,041 | | United Rentals, Inc. (a) | | | 94,185 | |
| 1,585 | | Wesco International, Inc. (a)(b) | | | 55,015 | |
| | | | | | | |
| | | | | | 270,937 | |
| | | | | | | |
| | | Water Utilities - 0.09% | | | | |
| 2,228 | | American Water Works Co., Inc. | | | 48,481 | |
| | | | | | | |
| | | Wireless Telecommunication Services - 0.58% | | | | |
| 7 | | Leap Wireless | | | | |
| | | International, Inc. (a) | | | 115 | |
| 4,784 | | MetroPCS | | | | |
| | | Communications, Inc. (a)(b) | | | 33,871 | |
| 39,014 | | Sprint Nextel Corp. (a) | | | 148,253 | |
| 2,539 | | Telephone & Data Systems, Inc. | | | 85,945 | |
| 1,467 | | United States Cellular Corp. (a) | | | 60,704 | |
| | | | | | | |
| | | | | | 328,888 | |
| | | | | | | |
| | | Total Common Stocks | | | | |
| | | (Cost $41,210,777) | | | 51,282,956 | |
| | | | | | | |
| | | MANAGEMENT INVESTMENT | | | | |
| | | COMPANIES - 0.11% | | | | |
| | | Capital Markets - 0.11% | | | | |
| 12,182 | | Allied Capital Corp. | | | 60,544 | |
| | | | | | | |
| | | Total Management | | | | |
| | | Investment Companies | | | | |
| | | (Cost $29,318) | | | 60,544 | |
| | | | | | | |
| | | REAL ESTATE INVESTMENT TRUSTS - 0.40% | | | | |
| | | Real Estate Investment Trusts - 0.40% | | | | |
| 432 | | Apartment Investment & | | | | |
| | | Management Co. (b) | | | 7,953 | |
| 865 | | Ashford Hospitality Trust, Inc. (a)(b) | | | 6,202 | |
| 48 | | CBL & Associates Properties, Inc. | | | 658 | |
| 176 | | Colonial Properties Trust | | | 2,267 | |
| 1,347 | | Developers Diversified Realty Corp. | | | 16,393 | |
| | | | | | | |
Number of
Shares | | | | Value | |
| | | | | | |
| | | Real Estate Investment Trusts (Continued) | | | | |
| 5,933 | | Felcor Lodging Trust, Inc. (a) | | $ | 33,818 | |
| 8,820 | | iStar Financial, Inc. (a)(b) | | | 40,484 | |
| 7,336 | | NorthStar Realty Finance Corp. (b) | | | 30,884 | |
| 312 | | Pennsylvania Real Estate | | | | |
| | | Investment Trust (b) | | | 3,891 | |
| 1,594 | | ProLogis (b) | | | 21,041 | |
| 26,176 | | RAIT Financial Trust (a)(b) | | | 51,828 | |
| 861 | | Sunstone Hotel | | | | |
| | | Investors, Inc. (a)(b) | | | 9,617 | |
| | | | | | | |
| | | | | | 225,036 | |
| | | | | | | |
| | | Total Real Estate Investment Trusts | | | | |
| | | (Cost $158,996) | | | 225,036 | |
| | | | | | | |
| | | SHORT TERM INVESTMENTS - 7.63% | | | | |
| | | Money Market Funds - 7.63% | | | | |
| 4,298,080 | | Federated Prime Obligations Fund | | | | |
| | | Effective Yield, 0.11% | | | 4,298,080 | |
| | | | | | | |
| | | Total Short Term Investments | | | | |
| | | (Cost $4,298,080) | | | 4,298,080 | |
| | | | | | | |
| | | INVESTMENTS PURCHASED | | | | |
| | | AS SECURITIES LENDING | | | | |
| | | COLLATERAL - 19.56% | | | | |
| | | Money Market Funds - 19.56% | | | | |
| 11,019,836 | | Mount Vernon Prime Portfolio | | | | |
| | | Effective Yield, 0.24% | | | 11,019,836 | |
| | | | | | | |
| | | Total Mutual Funds | | | | |
| | | (Cost $11,019,836) | | | 11,019,836 | |
| | | | | | | |
| | | Total Investments Purchased as | | | | |
| | | Securities Lending Collateral | | | | |
| | | (Cost $11,019,836) | | | 11,019,836 | |
| | | | | | | |
| | | Total Investments | | | | |
| | | (Cost $56,717,007) - 118.73% | | | 66,886,452 | |
| | | | | | | |
| | | Liabilities in Excess of | | | | |
| | | Other Assets - (18.73)% | | | (10,552,510) | |
| | | | | | | |
| | | TOTAL NET | | | | |
| | | ASSETS - 100.00% | | $ | 56,333,942 | |
| | | | | | | |
|
Percentages are stated as a percent of net assets.
(a) Non-income producing.
(b) All or a portion of this security is on loan.
See notes to financial statements.
104
|
AssetMark Enhanced Fundamental Index® Large Company Value Fund |
SCHEDULE OF OPEN FUTURES CONTRACTS |
March 31, 2010 |
| |
| | | | | | | | | |
Description | | Number of
Contracts
Purchased | | Notional
Value | | Settlement
Month | | Unrealized
Appreciation | |
| | | | | | | | | |
S&P 500 Index Mini Futures | | 80 | | $4,369,500 | | Jun-10 | | $90,163 | |
See notes to financial statements.
105
|
AssetMark Enhanced Fundamental Index® Small Company Growth Fund |
SCHEDULE OF INVESTMENTS |
March 31, 2010 |
| |
| | | | | | | |
Number of
Shares | | | | Value | |
| | | | | | |
| | | COMMON STOCKS - 91.90% | | | | |
| | | Aerospace & Defense - 0.72% | | | | |
| 617 | | AeroVironment, Inc. (a) | | $ | 16,110 | |
| 147 | | American Science & | | | | |
| | | Engineering, Inc. | | | 11,013 | |
| 564 | | Cubic Corp. | | | 20,304 | |
| 1,013 | | Curtiss Wright Corp. | | | 35,252 | |
| 393 | | Ducommun, Inc. | | | 8,257 | |
| 164 | | TransDigm Group, Inc. | | | 8,699 | |
| 128 | | Triumph Group, Inc. | | | 8,972 | |
| | | | | | | |
| | | | | | 108,607 | |
| | | | | | | |
| | | Airlines - 0.46% | | | | |
| 211 | | Allegiant Travel Co. (a)(b) | | | 12,208 | |
| 661 | | Copa Holdings, SA (b) | | | 40,189 | |
| 2,213 | | Hawaiian Holdings, Inc. (a)(b) | | | 16,310 | |
| | | | | | | |
| | | | | | 68,707 | |
| | | | | | | |
| | | Beverages - 0.31% | | | | |
| 282 | | Central European District Corp. (a) | | | 9,873 | |
| 859 | | Hansen Natural Corp. (a) | | | 37,263 | |
| | | | | | | |
| | | | | | 47,136 | |
| | | | | | | |
| | | Biotechnology - 0.11% | | | | |
| 646 | | Alkermes, Inc. (a) | | | 8,378 | |
| 370 | | Cubist Pharmaceuticals, Inc. (a) | | | 8,340 | |
| | | | | | | |
| | | | | | 16,718 | |
| | | | | | | |
| | | Building Products - 0.52% | | | | |
| 399 | | Ameron International, Inc. | | | 25,093 | |
| 983 | | Simpson Manufacturing Co, Inc. (b) | | | 27,288 | |
| 668 | | Universal Forest Products, Inc. (b) | | | 25,732 | |
| | | | | | | |
| | | | | | 78,113 | |
| | | | | | | |
| | | Capital Markets - 3.73% | | | | |
| 3,397 | | BGC Partners, Inc. (b) | | | 20,756 | |
| 3,458 | | Calamos Asset Management, Inc. | | | 49,588 | |
| 1,248 | | Cohen & Steers, Inc. (b) | | | 31,150 | |
| 815 | | Epoch Holding Corp. (b) | | | 9,201 | |
| 25 | | Fifth Street Finance Corp. (b) | | | 290 | |
| 786 | | Gamco Investors, Inc. | | | 35,763 | |
| 501 | | Greenhill & Co, Inc. | | | 41,127 | |
| 523 | | Hercules Technology Growth | | | | |
| | | Capital, Inc. | | | 5,539 | |
| 2,172 | | Investment Technology Group (a) | | | 36,251 | |
| 550 | | KBW, Inc. (a) | | | 14,795 | |
| 1,947 | | Knight Capital Group, Inc. (a) | | | 29,692 | |
| 2,697 | | Kohlberg Capital Corp. (b) | | | 15,265 | |
| | | | | | | |
Number of
Shares | | | | Value | |
| | | | | | |
| | | Capital Markets (Continued) | | | | |
| 1,483 | | Lazard Ltd. | | $ | 52,943 | |
| 1,448 | | Main Street Capital Corp. (b) | | | 22,603 | |
| 1,532 | | optionsXpress Holdings, Inc. | | | 24,956 | |
| 465 | | Piper Jaffray Cos. (a) | | | 18,740 | |
| 512 | | RiskMetrics Group, Inc. (a) | | | 11,576 | |
| 467 | | Stifel Financial Corp. (a) | | | 25,101 | |
| 3,261 | | Thomas Weisel Partners | | | | |
| | | Group, Inc. (a)(b) | | | 12,783 | |
| 1,512 | | Tradestation Group, Inc. (a)(b) | | | 10,599 | |
| 458 | | Triangle Capital Corp. (b) | | | 6,430 | |
| 1,217 | | U.S. Global Investors, Inc. (b) | | | 12,036 | |
| 2,040 | | Waddell & Reed Financial, Inc. | | | 73,522 | |
| | | | | | | |
| | | | | | 560,706 | |
| | | | | | | |
| | | Chemicals - 1.17% | | | | |
| 676 | | Calgon Carbon Corp. (a)(b) | | | 11,573 | |
| 326 | | Hawkins, Inc. (b) | | | 7,889 | |
| 2,441 | | Innospec, Inc. (a) | | | 27,730 | |
| 1,196 | | Koppers Holdings, Inc. | | | 33,871 | |
| 909 | | Minerals Technologies, Inc. | | | 47,123 | |
| 212 | | Newmarket Corp. (b) | | | 21,834 | |
| 1,790 | | Omnova Solutions, Inc. (a)(b) | | | 14,051 | |
| 565 | | Zep, Inc. (b) | | | 12,362 | |
| | | | | | | |
| | | | | | 176,433 | |
| | | | | | | |
| | | Commercial Banks - 10.39% | | | | |
| 1,253 | | American National | | | | |
| | | Bankshares, Inc. (b) | | | 25,248 | |
| 903 | | Ames National Corp. (b) | | | 18,105 | |
| 616 | | Arrow Financial Corp. (b) | | | 16,564 | |
| 1,123 | | BancFirst Corp. (b) | | | 47,065 | |
| 2,662 | | Banco Latinoamericano de | | | | |
| | | Exportaciones, SA | | | 38,226 | |
| 1,314 | | Bancorp, Inc. (a)(b) | | | 11,695 | |
| 255 | | Bank of the Ozarks, Inc. (b) | | | 8,973 | |
| 884 | | Bridge Bancorp, Inc. (b) | | | 20,686 | |
| 664 | | Bryn Mawr Bank Corp. (b) | | | 12,052 | |
| 503 | | Camden National Corp. (b) | | | 16,151 | |
| 2,439 | | Center Bancorp, Inc. (b) | | | 20,268 | |
| 905 | | Chicopee Bancorp, Inc. (a)(b) | | | 11,493 | |
| 412 | | Citizens Holding Co. (b) | | | 10,168 | |
| 991 | | City Holding Co. (b) | | | 33,981 | |
| 667 | | CNB Financial Corp. | | | 10,298 | |
| 1,034 | | Columbia Banking System, Inc. | | | 21,001 | |
| 1,167 | | Community Trust Bancorp, Inc. (b) | | | 31,614 | |
See notes to financial statements.
106
|
AssetMark Enhanced Fundamental Index® Small Company Growth Fund |
SCHEDULE OF INVESTMENTS (Continued) |
March 31, 2010 |
| |
| | | | | | | |
Number of
Shares | | | | Value | |
| | | | | | |
| | | COMMON STOCKS (Continued) | | | | |
| | | Commercial Banks (Continued) | | | | |
| 4,541 | | CVB Financial Corp. (b) | | $ | 45,092 | |
| 881 | | First Bancorp, Inc. (b) | | | 14,043 | |
| 1,465 | | First Bancorp (b) | | | 19,807 | |
| 1,658 | | First Financial Bancorp (b) | | | 29,496 | |
| 360 | | First Financial Bankshares (b) | | | 18,558 | |
| 1,340 | | First Financial Corp. (b) | | | 38,806 | |
| 778 | | First Long Island Corp. (b) | | | 18,750 | |
| 2,745 | | Glacier Bancorp, Inc. (b) | | | 41,806 | |
| 733 | | Great Southern Bancorp, Inc. (b) | | | 16,449 | |
| 1,095 | | Hancock Holding Co. | | | 45,782 | |
| 768 | | Heritage Financial Corp. (a) | | | 11,589 | |
| 271 | | Home Bancshares, Inc. | | | 7,165 | |
| 432 | | Iberiabank Corp. (b) | | | 25,924 | |
| 889 | | Independent Bank Corp. | | | 21,923 | |
| 1,652 | | Investors Bancorp, Inc. (a) | | | 21,806 | |
| 712 | | Lakeland Financial Corp. | | | 13,564 | |
| 1,936 | | MB Financial, Inc. | | | 43,618 | |
| 440 | | National Bankshares, Inc. (b) | | | 11,990 | |
| 1,823 | | NBT Bancorp, Inc. | | | 41,656 | |
| 612 | | Norwood Financial Corp. | | | 16,524 | |
| 935 | | Pacific Continental Corp. (b) | | | 9,818 | |
| 1,961 | | PacWest Bancorp (b) | | | 44,750 | |
| 476 | | Penns Woods Bancorp, Inc. (b) | | | 15,970 | |
| 544 | | Peoples Financial Corp. (b) | | | 8,144 | |
| 1,322 | | Pinnacle Financial Partners, Inc. (a) | | | 19,975 | |
| 1,514 | | PrivateBancorp, Inc. | | | 20,742 | |
| 949 | | Prosperity Bancshares, Inc. | | | 38,909 | |
| 958 | | Republic Bancorp, Inc. (b) | | | 18,049 | |
| 631 | | S.Y. Bancorp, Inc. (b) | | | 14,355 | |
| 837 | | SCBT Financial Corp. (b) | | | 31,002 | |
| 2,041 | | Shore Bancshares, Inc. (b) | | | 29,084 | |
| 597 | | Signature Bank (a) | | | 22,119 | |
| 862 | | Simmons 1st National Corp. (b) | | | 23,765 | |
| 668 | | Southside Bancshares, Inc. (b) | | | 14,409 | |
| 1,422 | | StellarOne Corp. (b) | | | 19,012 | |
| 6,437 | | Sterling Bancshares, Inc. (b) | | | 35,918 | |
| 970 | | Suffolk Bancorp (b) | | | 29,789 | |
| 863 | | SVB Financial Group (a)(b) | | | 40,268 | |
| 1,089 | | Texas Capital Bancshares, Inc. (a) | | | 20,680 | |
| 590 | | Tompkins Financial Corp. | | | 21,523 | |
| 1,404 | | TowneBank (b) | | | 19,600 | |
| 745 | | UMB Financial Corp. | | | 30,247 | |
| 3,983 | | Umpqua Holdings Corp. (b) | | | 52,815 | |
| | | | | | | |
Number of
Shares | | | | Value | |
| | | | | | |
| | | Commercial Banks (Continued) | | | | |
| 1,081 | | United Security | | | | |
| | | Bancshares, Inc. (b) | | $ | 16,183 | |
| 1,014 | | Univest Corp. of PA | | | 18,952 | |
| 560 | | WestAmerica Bancorporation (b) | | | 32,284 | |
| 3,952 | | Western Alliance Bancorp (a)(b) | | | 22,487 | |
| 959 | | Wintrust Financial Corp. (b) | | | 35,684 | |
| | | | | | | |
| | | | | | 1,564,469 | |
| | | | | | | |
| | | Commercial Services & | | | | |
| | | Supplies - 2.56% | | | | |
| 1,833 | | APAC Customer | | | | |
| | | Services, Inc. (a)(b) | | | 10,540 | |
| 869 | | Clean Harbors, Inc. (a)(b) | | | 48,282 | |
| 892 | | Copart, Inc. (a) | | | 31,755 | |
| 842 | | G & K Services, Inc. | | | 21,791 | |
| 423 | | The Geo Group, Inc. (a) | | | 8,384 | |
| 649 | | Healthcare Services Group, Inc. | | | 14,531 | |
| 4,217 | | Knoll, Inc. | | | 47,441 | |
| 366 | | McGrath RentCorp | | | 8,868 | |
| 2,614 | | Miller Herman, Inc. | | | 47,209 | |
| 1,209 | | Rollins, Inc. | | | 26,211 | |
| 770 | | Standard Parking Corp. (a) | | | 12,643 | |
| 419 | | Stericycle, Inc. (a)(b) | | | 22,835 | |
| 976 | | Sykes Enterprises, Inc. (a) | | | 22,292 | |
| 1,200 | | Tetra Tech, Inc. (a) | | | 27,648 | |
| 1,155 | | US Ecology, Inc. (b) | | | 18,596 | |
| 471 | | Waste Connections, Inc. (a) | | | 15,995 | |
| | | | | | | |
| | | | | | 385,021 | |
| | | | | | | |
| | | Communications Equipment - 2.85% | | | | |
| 817 | | ADTRAN, Inc. (b) | | | 21,528 | |
| 1,605 | | Airvana, Inc. (a) | | | 12,294 | |
| 3,183 | | Arris Group, Inc. (a) | | | 38,228 | |
| 1,164 | | Bel Fuse, Inc. | | | 23,455 | |
| 4,338 | | Brocade Communications | | | | |
| | | Systems, Inc. (a)(b) | | | 24,770 | |
| 1,290 | | Ciena Corp. (a)(b) | | | 19,660 | |
| 738 | | Comtech Telecommunications | | | | |
| | | Corp. (a) | | | 23,609 | |
| 2,241 | | Emulex Corp. (a) | | | 29,760 | |
| 383 | | F5 Networks, Inc. (a)(b) | | | 23,558 | |
| 513 | | InterDigital, Inc. (a)(b) | | | 14,292 | |
| 1,249 | | Ixia (a) | | | 11,578 | |
| 1,520 | | JDS Uniphase Corp. (a) | | | 19,046 | |
See notes to financial statements.
107
|
AssetMark Enhanced Fundamental Index® Small Company Growth Fund |
SCHEDULE OF INVESTMENTS (Continued) |
March 31, 2010 |
| |
| | | | | | | |
Number of
Shares | | | | Value | |
| | | | | | |
| | | COMMON STOCKS (Continued) | | | | |
| | | Communications Equipment (Continued) | | | | |
| 288 | | Loral Space & | | | | |
| | | Communications Ltd. (a) | | $ | 10,114 | |
| 1,738 | | Plantronics, Inc. | | | 54,365 | |
| 1,164 | | Polycom, Inc. (a) | | | 35,595 | |
| 1,153 | | Seachange International, Inc. (a)(b) | | | 8,278 | |
| 4,329 | | Sonus Networks, Inc. (a)(b) | | | 11,299 | |
| 679 | | Sycamore Networks, Inc. | | | 13,655 | |
| 1,169 | | Tekelec (a) | | | 21,229 | |
| 374 | | ViaSat, Inc. (a) | | | 12,944 | |
| | | | | | | |
| | | | | | 429,257 | |
| | | | | | | |
| | | Computers & Peripherals - 0.42% | | | | |
| 631 | | Netezza Corp. (a)(b) | | | 8,071 | |
| 2,150 | | QLogic Corp. (a) | | | 43,645 | |
| 423 | | Synaptics, Inc. (a)(b) | | | 11,679 | |
| | | | | | | |
| | | | | | 63,395 | |
| | | | | | | |
| | | Construction & Engineering - 0.28% | | | | |
| 1,462 | | Great Lakes Dredge & Dock Corp. | | | 7,675 | |
| 393 | | Insituform Technologies, Inc. (a) | | | 10,458 | |
| 1,854 | | Primoris Services Corp. (b) | | | 14,350 | |
| 284 | | Texas Industries, Inc. | | | 9,704 | |
| | | | | | | |
| | | | | | 42,187 | |
| | | | | | | |
| | | Construction Materials - - 0.22% | | | | |
| 1,253 | | Eagle Materials, Inc. | | | 33,255 | |
| | | | | | | |
| | | Consumer Finance - 0.07% | | | | |
| 127 | | Cash America International, Inc. (b) | | | 5,014 | |
| 139 | | Credit Acceptance Corp. (a)(b) | | | 5,732 | |
| | | | | | | |
| | | | | | 10,746 | |
| | | | | | | |
| | | Containers & Packaging - 0.02% | | | | |
| 106 | | AEP Industries, Inc. (a) | | | 2,758 | |
| | | | | | | |
| | | Distributors - 0.09% | | | | |
| 645 | | LKQ Corp. (a) | | | 13,094 | |
| | | | | | | |
| | | Diversified Consumer Services - 2.30% | | | | |
| 744 | | Brink’s Home Security | | | | |
| | | Holdings, Inc. (a) | | | 31,657 | |
| 196 | | Coinstar, Inc. (a) | | | 6,370 | |
| 2,128 | | Corinthian Colleges, Inc. (a)(b) | | | 37,432 | |
| 1,642 | | CPI Corp. (b) | | | 22,758 | |
| 233 | | DeVry, Inc. (b) | | | 15,192 | |
| 1,594 | | Hillenbrand, Inc. | | | 35,052 | |
| 404 | | ITT Educational Services, Inc. (a) | | | 45,442 | |
| | | | | | | |
Number of
Shares | | | | Value | |
| | | | | | |
| | | Diversified Consumer Services (Continued) | | | | |
| 228 | | Lincoln Educational | | | | |
| | | Services Corp. (a)(b) | | $ | 5,768 | |
| 415 | | Matthews International Corp. | | | 14,732 | |
| 401 | | Pre-Paid Legal Services, Inc. (a)(b) | | | 15,178 | |
| 1,592 | | Sotheby’s (b) | | | 49,495 | |
| 421 | | Steiner Leisure Ltd. (a)(b) | | | 18,659 | |
| 149 | | Strayer Education, Inc. (b) | | | 36,284 | |
| 513 | | Universal Technical | | | | |
| | | Institute, Inc. (a) | | | 11,707 | |
| | | | | | | |
| | | | | | 345,726 | |
| | | | | | | |
| | | Diversified Telecommunication Services - 0.83% | | | | |
| 232 | | AboveNet, Inc. (a) | | | 11,769 | |
| 2,008 | | Alaska Communications Systems | | | | |
| | | Group, Inc. (b) | | | 16,305 | |
| 150 | | Atlantic Tele-Network, Inc. | | | 6,740 | |
| 1,456 | | Cbeyond, Inc. (a)(b) | | | 19,918 | |
| 1,876 | | Consolidated Communications | | | | |
| | | Holdings, Inc. (b) | | | 35,569 | |
| 1,909 | | TW Telecom, Inc. (a) | | | 34,648 | |
| | | | | | | |
| | | | | | 124,949 | |
| | | | | | | |
| | | Electric Utilities - 0.11% | | | | |
| 293 | | ITC Holdings Corp. (b) | | | 16,115 | |
| | | | | | | |
| | | Electrical Equipment - 2.55% | | | | |
| 1,849 | | Belden, Inc. | | | 50,774 | |
| 1,357 | | Encore Wire Corp. | | | 28,226 | |
| 1,185 | | First Solar, Inc. (a)(b) | | | 145,340 | |
| 545 | | Franklin Electric Co., Inc. | | | 16,345 | |
| 2,020 | | Graftech International Ltd. (a) | | | 27,613 | |
| 14,086 | | GT Solar International, Inc. (a)(b) | | | 73,670 | |
| 297 | | II-VI, Inc. (a) | | | 10,050 | |
| 808 | | SunPower Corp. (a)(b) | | | 15,271 | |
| 872 | | Vicor Corp. (a)(b) | | | 12,042 | |
| 156 | | Woodward Governor Co. | | | 4,989 | |
| | | | | | | |
| | | | | | 384,320 | |
| | | | | | | |
| | | Electronic Equipment & Instruments - 2.52% | | | | |
| 1,483 | | Cognex Corp. | | | 27,421 | |
| 1,402 | | Daktronics, Inc. (b) | | | 10,683 | |
| 704 | | Dolby Laboratories, Inc. (a) | | | 41,304 | |
| 2,042 | | Electro Rent Corp. | | | 26,811 | |
| 1,055 | | Electro Scientific Industries (a) | | | 13,515 | |
See notes to financial statements.
108
|
AssetMark Enhanced Fundamental Index® Small Company Growth Fund |
SCHEDULE OF INVESTMENTS (Continued) |
March 31, 2010 |
| |
| | | | | | | |
Number of
Shares | | | | Value | |
| | | | | | |
| | | COMMON STOCKS (Continued) | | | | |
| | | Electronic Equipment & Instruments (Continued) | | | | |
| 1,340 | | FLIR Systems, Inc. (a) | | $ | 37,788 | |
| 464 | | Itron, Inc. (a) | | | 33,672 | |
| 987 | | L-1 Identity Solutions, Inc. (a) | | | 8,814 | |
| 345 | | MTS Systems Corp. | | | 10,015 | |
| 655 | | Multi Fineline Electronix, Inc. (a) | | | 16,873 | |
| 1,433 | | National Instruments Corp. | | | 47,791 | |
| 617 | | Park Electrochemical Corp. (b) | | | 17,733 | |
| 802 | | Rofin Sinar Technologies, Inc. (a) | | | 18,141 | |
| 1,364 | | Trimble Navigation Ltd. (a)(b) | | | 39,174 | |
| 1,007 | | Zebra Technologies Corp. (a) | | | 29,807 | |
| | | | | | | |
| | | | | | 379,542 | |
| | | | | | | |
| | | Energy Equipment & Services - 1.65% | | | | |
| 445 | | Atwood Oceanics, Inc. (a) | | | 15,410 | |
| 2,615 | | Cal Dive International, Inc. (a) | | | 19,168 | |
| 260 | | Carbo Ceramics, Inc. | | | 16,208 | |
| 1,686 | | Dresser-Rand Group, Inc. (a) | | | 52,974 | |
| 565 | | Dril-Quip, Inc. (a) | | | 34,375 | |
| 255 | | Gulfmark Offshore, Inc. (a)(b) | | | 6,770 | |
| 304 | | Hornbeck Offshore | | | | |
| | | Services, Inc. (a) | | | 5,645 | |
| 278 | | Lufkin Industries, Inc. | | | 22,004 | |
| 956 | | Oceaneering International, | | | | |
| | | Inc. (a)(b) | | | 60,697 | |
| 1,337 | | RPC, Inc. (b) | | | 14,881 | |
| | | | | | | |
| | | | | | 248,132 | |
| | | | | | | |
| | | Food & Staples Retailing - 0.46% | | | | |
| 1,163 | | Andersons, Inc. | | | 38,937 | |
| 281 | | Arden Group, Inc. | | | 29,865 | |
| | | | | | | |
| | | | | | 68,802 | |
| | | | | | | |
| | | Food Products - 1.21% | | | | |
| 314 | | Alico, Inc. (b) | | | 7,928 | |
| 202 | | American Italian Pasta Co. (a)(b) | | | 7,852 | |
| 3,746 | | B&G Foods, Inc. | | | 39,258 | |
| 1,585 | | Darling International, Inc. (a) | | | 14,202 | |
| 20 | | Diamond Foods, Inc. (b) | | | 841 | |
| 349 | | Farmer Brothers Co. | | | 6,540 | |
| 251 | | J & J Snack Foods Corp. | | | 10,911 | |
| 656 | | Lancaster Colony Corp. | | | 38,678 | |
| 820 | | Lance, Inc. | | | 18,966 | |
| 1,356 | | Tootsie Roll Industries, Inc. (b) | | | 36,650 | |
| | | | | | | |
| | | | | | 181,826 | |
| | | | | | | |
| | | | | | | |
Number of
Shares | | | | Value | |
| | | | | | |
| | | Health Care Equipment & Supplies - 3.48% | | | | |
| 592 | | Align Technology, Inc. (a)(b) | | | 11,449 | |
| 394 | | Analogic Corp. | | | 16,836 | |
| 286 | | The Cooper Companies, Inc. | | | 11,120 | |
| 553 | | Edwards Lifesciences Corp. (a)(b) | | | 54,681 | |
| 328 | | Haemonetics Corporation (a) | | | 18,745 | |
| 458 | | IDEXX Laboratories, Inc. (a)(b) | | | 26,358 | |
| 576 | | Immucor, Inc. (a) | | | 12,897 | |
| 351 | | Intuitive Surgical, Inc. (a) | | | 122,194 | |
| 927 | | Invacare Corp. | | | 24,602 | |
| 848 | | Masimo Corp. (a) | | | 22,514 | |
| 403 | | Meridian Bioscience, Inc. | | | 8,209 | |
| 459 | | Orthofix International NV (a) | | | 16,698 | |
| 1,141 | | ResMed, Inc. (a)(b) | | | 72,625 | |
| 440 | | Sirona Dental Systems, Inc. (a) | | | 16,733 | |
| 251 | | Sonosite, Inc. (a) | | | 8,060 | |
| 1,065 | | Steris Corp. | | | 35,848 | |
| 674 | | West Pharmaceutical Services, Inc. | | | 28,274 | |
| 508 | | Wright Medical Group, Inc. (a)(b) | | | 9,027 | |
| 252 | | Zoll Medical Corp. (a) | | | 6,643 | |
| | | | | | | |
| | | | | | 523,513 | |
| | | | | | | |
| | | Health Care Providers & Services - 1.80% | | | | |
| 239 | | Air Methods Corp. (a) | | | 8,126 | |
| 3,715 | | Alliance Healthcare | | | | |
| | | Services, Inc. (a) | | | 20,878 | |
| 371 | | AmSurg Corp. (a) | | | 8,010 | |
| 142 | | Bio-Reference Labs, Inc. (a)(b) | | | 6,244 | |
| 606 | | Catalyst Health Solutions, Inc. (a) | | | 25,076 | |
| 585 | | Chemed Corp. | | | 31,812 | |
| 207 | | Corvel Corp. (a) | | | 7,400 | |
| 618 | | Emdeon, Inc. (a) | | | 10,210 | |
| 758 | | Emergency Medical | | | | |
| | | Services Corp. (a)(b) | | | 42,865 | |
| 588 | | The Ensign Group, Inc. | | | 10,190 | |
| 335 | | Landauer, Inc. | | | 21,849 | |
| 337 | | Mednax, Inc. (a) | | | 19,610 | |
| 1,234 | | PSS World Medical, Inc. (a)(b) | | | 29,011 | |
| 485 | | Psychiatric Solutions, Inc. (a) | | | 14,453 | |
| 519 | | VCA Antech, Inc. (a)(b) | | | 14,548 | |
| | | | | | | |
| | | | | | 270,282 | |
| | | | | | | |
See notes to financial statements.
109
|
AssetMark Enhanced Fundamental Index® Small Company Growth Fund |
SCHEDULE OF INVESTMENTS (Continued) |
March 31, 2010 |
| |
| | | | | | | |
Number of
Shares | | | | Value | |
| | | | | | |
| | | COMMON STOCKS (Continued) | | | | |
| | | Health Care Technology - - 0.38% | | | | |
| 210 | | Computer Programs & | | | | |
| | | Systems, Inc. (b) | | $ | 8,207 | |
| 689 | | Omnicell, Inc. (a) | | | 9,666 | |
| 425 | | Quality Systems, Inc. (b) | | | 26,112 | |
| 851 | | Vital Images, Inc. (a)(b) | | | 13,761 | |
| | | | | | | |
| | | | | | 57,746 | |
| | | | | | | |
| | | Hotels, Restaurants & Leisure - 1.76% | | | | |
| 636 | | Bally Technologies, Inc. (a) | | | 25,783 | |
| 228 | | BJ’s Restaurants, Inc. (a)(b) | | | 5,312 | |
| 579 | | CEC Entertainment, Inc. (a)(b) | | | 22,054 | |
| 215 | | Chipotle Mexican Grill, Inc. (a)(b) | | | 24,224 | |
| 341 | | Churchill Downs, Inc. (b) | | | 12,788 | |
| 780 | | DineEquity, Inc. (a)(b) | | | 30,833 | |
| 1,455 | | International Speedway Corp. | | | 37,495 | |
| 1,646 | | Interval Leisure Group, Inc. (a)(b) | | | 23,966 | |
| 243 | | Life Time Fitness, Inc. (a)(b) | | | 6,828 | |
| 449 | | Orient-Express Hotels Ltd. (a)(b) | | | 6,367 | |
| 352 | | Panera Bread Co. (a)(b) | | | 26,925 | |
| 414 | | Papa Johns International, Inc. (a)(b) | | | 10,644 | |
| 683 | | Scientific Games Corp. (a) | | | 9,617 | |
| 531 | | WMS Industries, Inc. (a) | | | 22,270 | |
| | | | | | | |
| | | | | | 265,106 | |
| | | | | | | |
| | | Household Durables - 0.50% | | | | |
| 1,964 | | M/I Homes, Inc. (a) | | | 28,773 | |
| 112 | | National Presto Industries, Inc. | | | 13,318 | |
| 1,100 | | Tempur Pedic | | | | |
| | | International, Inc. (a)(b) | | | 33,176 | |
| | | | | | | |
| | | | | | 75,267 | |
| | | | | | | |
| | | Household Products - 0.22% | | | | |
| 990 | | WD-40 Co. | | | 32,502 | |
| | | | | | | |
| | | Industrial Conglomerates - 0.08% | | | | |
| 421 | | Raven Industries, Inc. (b) | | | 12,415 | |
| | | | | | | |
| | | Insurance - 5.16% | | | | |
| 4,062 | | American Equity Investment | | | | |
| | | Life Holding (b) | | | 43,260 | |
| 554 | | American Physicians Capital | | | 17,700 | |
| 1,434 | | Amtrust Financial Services, Inc. (b) | | | 20,004 | |
| 969 | | Argo Group International | | | | |
| | | Holdings, Ltd. (b) | | | 31,580 | |
| 1,894 | | Assured Guaranty Ltd. | | | 41,611 | |
| 2,130 | | CNA Surety Corp. (a)(b) | | | 37,893 | |
| | | | | | | |
Number of
Shares | | | | Value | |
| | | | | | |
| | | Insurance (Continued) | | | | |
| 3,943 | | Delphi Financial Group, Inc. | | $ | 99,206 | |
| 2,469 | | Employers Holdings, Inc. | | | 36,665 | |
| 639 | | Enstar Group Ltd. (a) | | | 44,193 | |
| 1,092 | | First Mercury Financial Corp. | | | 14,229 | |
| 1,444 | | Flagstone Reinsurance | | | | |
| | | Holdings Ltd. (b) | | | 16,548 | |
| 774 | | Greenlight Capital Re, Ltd. (a) | | | 20,650 | |
| 3,041 | | Maiden Holdings Ltd. (b) | | | 22,473 | |
| 1,678 | | Max Capital Group Ltd. | | | 38,577 | |
| 2,799 | | Meadowbrook Insurance | | | | |
| | | Group, Inc. | | | 22,112 | |
| 1,075 | | Mercer Insurance Group, Inc. (b) | | | 19,350 | |
| 1,586 | | National Interstate Corp. | | | 32,846 | |
| 182 | | National Western Life Insurance Co. | | | 33,552 | |
| 1,242 | | Navigators Group, Inc. (a)(b) | | | 48,848 | |
| 1,015 | | ProAssurance Corp. (a) | | | 59,418 | |
| 818 | | RLI Corp. | | | 46,643 | |
| 542 | | Tower Group, Inc. (b) | | | 12,016 | |
| 3,498 | | Universal Insurance | | | | |
| | | Holdings, Inc. (b) | | | 17,700 | |
| | | | | | | |
| | | | | | 777,074 | |
| | | | | | | |
| | | Internet & Catalog Retail - 0.96% | | | | |
| 642 | | Netflix, Inc. (a) | | | 47,341 | |
| 340 | | Priceline.com, Inc. (a) | | | 86,700 | |
| 1,043 | | Stamps.com, Inc. (a) | | | 10,534 | |
| | | | | | | |
| | | | | | 144,575 | |
| | | | | | | |
| | | Internet Software & Services - 1.62% | | | | |
| 731 | | Akamai Technologies, Inc. (a)(b) | | | 22,961 | |
| 710 | | DealerTrack Holdings, Inc. (a)(b) | | | 12,127 | |
| 1,102 | | Dice Holdings, Inc. (a)(b) | | | 8,375 | |
| 866 | | Digital River, Inc. (a) | | | 26,240 | |
| 132 | | Equinix, Inc. (a)(b) | | | 12,849 | |
| 471 | | GSI Commerce, Inc. (a)(b) | | | 13,033 | |
| 646 | | J2 Global Communications, Inc. (a) | | | 15,116 | |
| 2,119 | | NIC, Inc. (b) | | | 16,676 | |
| 697 | | SAVVIS, Inc. (a) | | | 11,500 | |
| 321 | | Sohu.com, Inc. (a)(b) | | | 17,527 | |
| 2,394 | | Valueclick, Inc. (a) | | | 24,275 | |
| 2,434 | | Verisign, Inc. (a) | | | 63,308 | |
| | | | | | | |
| | | | | | 243,987 | |
| | | | | | | |
| | | IT Services - 2.15% | | | | |
| 280 | | Cass Information Systems, Inc. (b) | | | 8,722 | |
| 765 | | CSG Systems International, Inc. (a) | | | 16,034 | |
See notes to financial statements.
110
|
AssetMark Enhanced Fundamental Index® Small Company Growth Fund |
SCHEDULE OF INVESTMENTS (Continued) |
March 31, 2010 |
| |
| | | | | | | |
Number of
Shares | | | | Value | |
| | | | | | |
| | | COMMON STOCKS (Continued) | | | | |
| | | IT Services (Continued) | | | | |
| 1,292 | | Euronet Worldwide, Inc. (a)(b) | | $ | 23,812 | |
| 825 | | ExlService Holdings, Inc. (a)(b) | | | 13,761 | |
| 3,128 | | Genpact Limited (a) | | | 52,457 | |
| 1,853 | | Global Cash Access | | | | |
| | | Holdings, Inc. (a) | | | 15,139 | |
| 391 | | ManTech International Corp. (a) | | | 19,092 | |
| 408 | | Maximus, Inc. | | | 24,859 | |
| 1,141 | | Neustar, Inc. (a) | | | 28,753 | |
| 1,640 | | Sapient Corp. (a) | | | 14,990 | |
| 838 | | Syntel, Inc. | | | 32,238 | |
| 2,286 | | TNS, Inc. (a) | | | 50,978 | |
| 676 | | Verifone Holdings, Inc. (a)(b) | | | 13,662 | |
| 886 | | Virtusa Corp. (a) | | | 9,135 | |
| | | | | | | |
| | | | | | 323,632 | |
| | | | | | | |
| | | Leisure Equipment & Products - 0.29% | | | | |
| 1,480 | | Pool Corporation | | | 33,507 | |
| 826 | | Sturm, Ruger & Company, Inc. (b) | | | 9,904 | |
| | | | | | | |
| | | | | | 43,411 | |
| | | | | | | |
| | | Life Sciences Tools & Services - 2.48% | | | | |
| 2,403 | | Affymetrix, Inc. (a) | | | 17,638 | |
| 425 | | Bio-Rad Laboratories, Inc. (a) | | | 43,996 | |
| 1,697 | | Bruker Corp. (a)(b) | | | 24,861 | |
| 224 | | Dionex Corp. (a)(b) | | | 16,751 | |
| 1,310 | | eResearchTechnology, Inc. (a) | | | 9,052 | |
| 314 | | Illumina, Inc. (a)(b) | | | 12,215 | |
| 909 | | Mettler-Toledo | | | | |
| | | International, Inc. (a) | | | 99,263 | |
| 532 | | Techne Corp. | | | 33,883 | |
| 619 | | Varian, Inc. (a) | | | 32,052 | |
| 1,245 | | Waters Corp. (a) | | | 84,087 | |
| | | | | | | |
| | | | | | 373,798 | |
| | | | | | | |
| | | Machinery - 3.02% | | | | |
| 1,293 | | Actuant Corp. | | | 25,278 | |
| 574 | | Bucyrus International, Inc. | | | 37,878 | |
| 1,212 | | Circor International, Inc. | | | 40,251 | |
| 202 | | Clarcor, Inc. (b) | | | 6,967 | |
| 1,122 | | Freightcar America, Inc. | | | 27,108 | |
| 687 | | Gorman Rupp Co. | | | 17,477 | |
| 1,414 | | Graco, Inc. | | | 45,248 | |
| 884 | | Kaydon Corp. | | | 33,238 | |
| 92 | | K-Tron International, Inc. (a) | | | 13,797 | |
| | | | | | | |
Number of
Shares | | | | Value | |
| | | | | | |
| | | Machinery (Continued) | | | | |
| 633 | | Met-Pro Corp. | | $ | 6,203 | |
| 671 | | Nordson Corp. | | | 45,574 | |
| 958 | | Robbins & Myers, Inc. | | | 22,820 | |
| 451 | | Sun Hydraulics Corp. | | | 11,717 | |
| 1,496 | | Titan International Inc. (b) | | | 13,060 | |
| 1,157 | | Toro Co. (b) | | | 56,890 | |
| 110 | | Valmont Industries, Inc. (b) | | | 9,111 | |
| 231 | | Wabtec Corp. | | | 9,730 | |
| 1,026 | | Watts Water Technologies, Inc. | | | 31,868 | |
| | | | | | | |
| | | | | | 454,215 | |
| | | | | | | |
| | | Marine - 0.37% | | | | |
| 4,399 | | Eagle Bulk Shipping, Inc. (a)(b) | | | 23,359 | |
| 847 | | Kirby Corp. (a)(b) | | | 32,313 | |
| | | | | | | |
| | | | | | 55,672 | |
| | | | | | | |
| | | Media - 2.26% | | | | |
| 661 | | Central European Media | | | | |
| | | Enterprises Ltd. (a) | | | 19,374 | |
| 2,182 | | CKX, Inc. (a)(b) | | | 13,376 | |
| 900 | | CTC Media, Inc. (a) | | | 15,498 | |
| 951 | | DreamWorks Animation | | | | |
| | | SKG, Inc. (a) | | | 37,460 | |
| 1,383 | | Global Sources Ltd. (a)(b) | | | 9,003 | |
| 410 | | Liberty Media | | | | |
| | | Corporation - Capital (a) | | | 14,912 | |
| 563 | | Morningstar, Inc. (a) | | | 27,075 | |
| 1,187 | | National CineMedia, Inc. | | | 20,488 | |
| 4,787 | | Playboy Enterprises, Inc. (a)(b) | | | 17,520 | |
| 1,182 | | Valassis Communications, Inc. (a) | | | 32,895 | |
| 741 | | Value Line, Inc. (b) | | | 17,110 | |
| 1,420 | | Wiley John & Sons, Inc. | | | 61,457 | |
| 3,105 | | World Wrestling Entertainment, Inc. | | | 53,716 | |
| | | | | | | |
| | | | | | 339,884 | |
| | | | | | | |
| | | Metals & Mining - 0.93% | | | | |
| 1,522 | | Carpenter Technology Corp. | | | 55,705 | |
| 567 | | Coeur D’Alene Mines Corp. (a)(b) | | | 8,494 | |
| 441 | | Compass Minerals International, Inc. | | | 35,381 | |
| 639 | | RTI International Metals, Inc. (a)(b) | | | 19,381 | |
| 229 | | Walter Energy, Inc. | | | 21,130 | |
| | | | | | | |
| | | | | | 140,091 | |
| | | | | | | |
| | | Multiline Retail - 0.28% | | | | |
| 3,561 | | Freds, Inc. (b) | | | 42,661 | |
| | | | | | | |
See notes to financial statements.
111
|
AssetMark Enhanced Fundamental Index® Small Company Growth Fund |
SCHEDULE OF INVESTMENTS (Continued) |
March 31, 2010 |
| |
| | | | | | | |
Number of
Shares | | | | Value | |
| | | | | | |
| | | COMMON STOCKS (Continued) | | | | |
| | | Oil & Gas - 3.18% | | | | |
| 1,442 | | Alpha Natural Resources, Inc. (a) | | $ | 71,941 | |
| 848 | | ATP Oil & Gas Corp. (a) | | | 15,951 | |
| 338 | | Barrett Bill Corp. (a) | | | 10,380 | |
| 357 | | Berry Petroleum Co. | | | 10,053 | |
| 1,001 | | CNX Gas Corp. (a) | | | 38,088 | |
| 1,386 | | Comstock Resources, Inc. (a) | | | 44,075 | |
| 188 | | Concho Resources, Inc. (a)(b) | | | 9,468 | |
| 210 | | Contango Oil & Gas Company (a) | | | 10,741 | |
| 1,195 | | Golar LNG Ltd. (b) | | | 13,982 | |
| 1,598 | | Gulfport Energy Corp. (a) | | | 17,962 | |
| 3,167 | | Harvest Natural | | | | |
| | | Resources, Inc. (a)(b) | | | 23,848 | |
| 359 | | James River Coal Co. (a)(b) | | | 5,708 | |
| 2,513 | | McMoRan Exploration Co. (a)(b) | | | 36,765 | |
| 951 | | Penn Virginia Corp. | | | 23,299 | |
| 2,169 | | PetroQuest Energy, Inc. (a)(b) | | | 10,910 | |
| 947 | | Quicksilver Resources, Inc. (a) | | | 13,324 | |
| 1,141 | | Rosetta Resources, Inc. (a) | | | 26,871 | |
| 1,881 | | Sandridge Energy, Inc. (a)(b) | | | 14,484 | |
| 1,388 | | Swift Energy Co. (a) | | | 42,667 | |
| 3,943 | | Vaalco Energy, Inc. | | | 19,478 | |
| 7,123 | | Warren Resources, Inc. (a)(b) | | | 17,950 | |
| | | | | | | |
| | | | | | 477,945 | |
| | | | | | | |
| | | Paper & Forest Products - 0.06% | | | | |
| 192 | | Schweitzer-Mauduit | | | | |
| | | International, Inc. (b) | | | 9,132 | |
| | | | | | | |
| | | Personal Products - 1.47% | | | | |
| 833 | | Inter Parfums, Inc. | | | 12,345 | |
| 2,641 | | Mead Johnson Nutrition Co. | | | 137,411 | |
| 2,065 | | Nu Skin Enterprises, Inc. (b) | | | 60,092 | |
| 342 | | Usana Health Sciences, Inc. (a)(b) | | | 10,742 | |
| | | | | | | |
| | | | | | 220,590 | |
| | | | | | | |
| | | Pharmaceuticals - 0.22% | | | | |
| 343 | | Medicis Pharmaceutical Corp. | | | 8,630 | |
| 585 | | Valeant Pharmaceuticals | | | | |
| | | International (a)(b) | | | 25,102 | |
| | | | | | | |
| | | | | | 33,732 | |
| | | | | | | |
| | | Professional Services - 1.54% | | | | |
| 274 | | The Advisory Board Co. (a) | | | 8,631 | |
| 1,794 | | Corporate Executive Board Co. | | | 47,703 | |
| 238 | | Costar Group, Inc. (a) | | | 9,882 | |
| | | | | | | |
Number of
Shares | | | | Value | |
| | | | | | |
| | | Professional Services (Continued) | | | | |
| 296 | | Exponent, Inc. (a) | | $ | 8,442 | |
| 420 | | FTI Consulting, Inc. (a) | | | 16,514 | |
| 364 | | IHS, Inc. (a) | | | 19,463 | |
| 3,269 | | Monster Worldwide, Inc. (a)(b) | | | 54,298 | |
| 1,184 | | Towers Watson & Co. (a)(b) | | | 56,240 | |
| 271 | | VSE Corp. | | | 11,154 | |
| | | | | | | |
| | | | | | 232,327 | |
| | | | | | | |
| | | Real Estate - 0.14% | | | | |
| 1,779 | | Hilltop Holdings, Inc. (a) | | | 20,903 | |
| | | | | | | |
| | | Real Estate Management & Development - 0.30% | | | | |
| 1,392 | | The St. Joe Co. (a) | | | 45,031 | |
| | | | | | | |
| | | Road & Rail - 0.72% | | | | |
| 2,688 | | Heartland Express, Inc. (b) | | | 44,352 | |
| 907 | | Knight Transportation, Inc. (b) | | | 19,129 | |
| 1,085 | | Landstar Systems, Inc. | | | 45,548 | |
| | | | | | | |
| | | | | | 109,029 | |
| | | | | | | |
| | | Semiconductor & Semiconductor | | | | |
| | | Equipment - 4.50% | | | | |
| 529 | | Actel Corp. (a)(b) | | | 7,327 | |
| 883 | | Advanced Energy | | | | |
| | | Industries, Inc. (a) | | | 14,622 | |
| 479 | | Atheros Communications, | | | | |
| | | Inc. (a)(b) | | | 18,542 | |
| 10,873 | | Atmel Corp. (a) | | | 54,691 | |
| 673 | | ATMI, Inc. (a)(b) | | | 12,996 | |
| 443 | | Cabot Microelectronics Corp. (a) | | | 16,759 | |
| 628 | | Cree, Inc. (a) | | | 44,098 | |
| 703 | | Cymer, Inc. (a) | | | 26,222 | |
| 2,296 | | Cypress Semiconductor Corp. (a) | | | 26,404 | |
| 515 | | FEI Co. (a) | | | 11,799 | |
| 1,107 | | FormFactor, Inc. (a) | | | 19,660 | |
| 1,450 | | Hittite Microwave Corp. (a) | | | 63,756 | |
| 4,711 | | Integrated Device | | | | |
| | | Technology, Inc. (a) | | | 28,878 | |
| 1,510 | | IXYS Corp. (a) | | | 12,895 | |
| 2,773 | | Lattice Semiconductor Corp. (a) | | | 10,177 | |
| 2,022 | | Micrel, Inc. | | | 21,555 | |
| 675 | | Microsemi Corp. (a)(b) | | | 11,705 | |
| 1,216 | | MKS Instrument, Inc. (a) | | | 23,821 | |
| 1,322 | | Omnivision Technologies, Inc. (a) | | | 22,712 | |
| 3,158 | | ON Semiconductor Corp. (a)(b) | | | 25,264 | |
See notes to financial statements.
112
|
AssetMark Enhanced Fundamental Index® Small Company Growth Fund |
SCHEDULE OF INVESTMENTS (Continued) |
March 31, 2010 |
| |
| | | | | | | |
Number of
Shares | | | | Value | |
| | | | | | |
| | | COMMON STOCKS (Continued) | | | | |
| | | Semiconductor & Semiconductor | | | | |
| | | Equipment (Continued) | | | | |
| 1,739 | | PMC-Sierra, Inc. (a) | | $ | 15,512 | |
| 311 | | Power Integrations, Inc. (b) | | | 12,813 | |
| 1,618 | | RF Micro Devices, Inc. (a) | | | 8,058 | |
| 647 | | Semtech Corp. (a) | | | 11,277 | |
| 676 | | Sigma Designs, Inc. (a)(b) | | | 7,929 | |
| 503 | | Silicon Laboratories, Inc. (a) | | | 23,978 | |
| 1,381 | | Skyworks Solutions, Inc. (a) | | | 21,544 | |
| 560 | | Standard Microsystems Corp. (a) | | | 13,037 | |
| 3,694 | | Teradyne, Inc. (a)(b) | | | 41,262 | |
| 992 | | Varian Semiconductor | | | | |
| | | Equipment (a) | | | 32,855 | |
| 356 | | Veeco Instruments, Inc. (a)(b) | | | 15,486 | |
| | | | | | | |
| | | | | | 677,634 | |
| | | | | | | |
| | | Software - 5.75% | | | | |
| 815 | | ACI Worldwide, Inc. (a)(b) | | | 16,797 | |
| 4,661 | | American Software, Inc. | | | 27,080 | |
| 334 | | ANSYS, Inc. (a) | | | 14,409 | |
| 667 | | Ariba, Inc. (a) | | | 8,571 | |
| 401 | | Blackbaud, Inc. | | | 10,101 | |
| 3,918 | | Cadence Design System, Inc. (a)(b) | | | 26,094 | |
| 365 | | CommVault Systems, Inc. (a) | | | 7,793 | |
| 6,335 | | Compuware Corp. (a) | | | 53,214 | |
| 723 | | Factset Research Systems, Inc. (b) | | | 53,046 | |
| 388 | | Fair Isaac Corp. | | | 9,832 | |
| 648 | | Informatica Corp. (a) | | | 17,405 | |
| 1,438 | | Jack Henry & Associates, Inc. | | | 34,598 | |
| 391 | | JDA Software Group, Inc. (a) | | | 10,878 | |
| 649 | | Kenexa Corp. (a) | | | 8,924 | |
| 4,441 | | Lawson Software, Inc. (a)(b) | | | 29,355 | |
| 526 | | Manhattan Associates, Inc. (a) | | | 13,402 | |
| 1,311 | | MICROS Systems, Inc. (a) | | | 43,106 | |
| 168 | | MicroStrategy, Inc. (a) | | | 14,292 | |
| 554 | | Net 1 UEPs Technologies, Inc. (a) | | | 10,188 | |
| 6,694 | | Novell, Inc. (a) | | | 40,097 | |
| 1,302 | | Nuance Communications, | | | | |
| | | Inc. (a)(b) | | | 21,665 | |
| 2,271 | | Parametric Technology Corp. (a) | | | 40,992 | |
| 700 | | Progress Software Corp. (a) | | | 22,001 | |
| 1,833 | | Quest Software, Inc. (a) | | | 32,609 | |
| 2,020 | | Red Hat, Inc. (a) | | | 59,125 | |
| 1,837 | | S1 Corporation (a) | | | 10,838 | |
| | | | | | | |
Number of
Shares | | | | Value | |
| | | | | | |
| | | Software (Continued) | | | | |
| 1,302 | | Salesforce.com, Inc. (a)(b) | | $ | 96,934 | |
| 545 | | Solera Holdings, Inc. | | | 21,064 | |
| 969 | | Sonicwall, Inc. (a) | | | 8,421 | |
| 1,274 | | Sybase, Inc. (a)(b) | | | 59,394 | |
| 1,883 | | Symyx Technologies (a) | | | 8,455 | |
| 3,254 | | Tibco Software, Inc. (a)(b) | | | 35,111 | |
| | | | | | | |
| | | | | | 865,791 | |
| | | | | | | |
| | | Specialty Retail - 3.31% | | | | |
| 1,881 | | Aeropostale (a)(b) | | | 54,229 | |
| 1,713 | | The Buckle, Inc. (b) | | | 62,970 | |
| 2,223 | | Chico’s FAS, Inc. | | | 32,056 | |
| 294 | | Citi Trends, Inc. (a)(b) | | | 9,537 | |
| 2,676 | | The Finish Line, Inc. (b) | | | 43,672 | |
| 674 | | Gymboree Corp. (a) | | | 34,799 | |
| 762 | | hhgregg, Inc. (a) | | | 19,233 | |
| 1,288 | | Hibbett Sports, Inc. (a)(b) | | | 32,947 | |
| 823 | | J.Crew Group, Inc. (a)(b) | | | 37,776 | |
| 363 | | Jos. A. Bank Clothiers, Inc. (a)(b) | | | 19,838 | |
| 509 | | Kirklands, Inc. (a)(b) | | | 10,689 | |
| 462 | | Lumber Liquidators | | | | |
| | | Holdings, Inc. (a)(b) | | | 12,321 | |
| 1,236 | | Midas Group, Inc. (a) | | | 13,942 | |
| 168 | | Monro Muffler Brake, Inc. (b) | | | 6,008 | |
| 1,120 | | Ulta Salon, Cosmetics & | | | | |
| | | Fragrance, Inc. (a) | | | 25,334 | |
| 1,736 | | Urban Outfitters, Inc. (a) | | | 66,020 | |
| 810 | | Zumiez, Inc. (a)(b) | | | 16,597 | |
| | | | | | | |
| | | | | | 497,968 | |
| | | | | | | |
| | | Textiles, Apparel & Luxury Goods - 2.37% | | | | |
| 887 | | Carter, Inc. (a)(b) | | | 26,743 | |
| 1,897 | | Cherokee, Inc. (b) | | | 34,146 | |
| 1,406 | | Columbia Sportswear Co. | | | 73,857 | |
| 2,188 | | Crocs, Inc. (a) | | | 19,189 | |
| 57 | | Deckers Outdoor Corp. (a)(b) | | | 7,866 | |
| 1,001 | | Fossil, Inc. (a) | | | 37,778 | |
| 435 | | Steven Madden Ltd. (a) | | | 21,228 | |
| 726 | | Under Armour, Inc. (a)(b) | | | 21,352 | |
| 503 | | UniFirst Corp. | | | 25,904 | |
| 503 | | Volcom, Inc. (a)(b) | | | 9,818 | |
| 1,164 | | Warnaco Group, Inc. (a) | | | 55,534 | |
| 265 | | Weyco Group, Inc. (b) | | | 6,233 | |
| 566 | | Wolverine World Wide, Inc. | | | 16,505 | |
| | | | | | | |
| | | | | | 356,153 | |
| | | | | | | |
See notes to financial statements.
113
|
AssetMark Enhanced Fundamental Index® Small Company Growth Fund |
SCHEDULE OF INVESTMENTS (Continued) |
March 31, 2010 |
| |
| | | | | | | |
Number of
Shares | | | | Value | |
| | | | | | |
| | | COMMON STOCKS (Continued) | | | | |
| | | Thrifts & Mortgage Finance - 3.35% | | | | |
| 1,461 | | Abington Bancorp, Inc. (b) | | $ | 11,542 | |
| 4,661 | | Bank Mutual Corp. | | | 30,297 | |
| 1,570 | | BankFinancial Corp. | | | 14,397 | |
| 1,323 | | Beneficial Mutual Bancorp, Inc. (a) | | | 12,542 | |
| 886 | | Berkshire Hills Bancorp, Inc. (b) | | | 16,240 | |
| 4,432 | | Brookline Bancorp, Inc. | | | 47,157 | |
| 1,560 | | Capitol Federal Financial (b) | | | 58,438 | |
| 1,703 | | Flushing Financial Corp. (b) | | | 21,560 | |
| 566 | | Home Federal Bancorp, Inc. | | | 8,213 | |
| 919 | | Kearny Financial Corp. (b) | | | 9,585 | |
| 3,582 | | NewAlliance Bancshares, Inc. | | | 45,205 | |
| 2,757 | | Northwest Bancshares, Inc. | | | 32,367 | |
| 1,329 | | Ocwen Financial Corp. (a) | | | 14,739 | |
| 1,950 | | Provident New York Bancorp (b) | | | 18,486 | |
| 2,766 | | Radian Group, Inc. (b) | | | 43,260 | |
| 1,281 | | Rockville Financial, Inc. (b) | | | 15,615 | |
| 13,138 | | TrustCo Bank Corp. (b) | | | 81,061 | |
| 532 | | United Financial Bancorp, Inc. | | | 7,437 | |
| 1,695 | | Westfield Financial, Inc. | | | 15,577 | |
| | | | | | | |
| | | | | | 503,718 | |
| | | | | | | |
| | | Tobacco - 0.48% | | | | |
| 4,723 | | Vector Group Ltd. (b) | | | 72,876 | |
| | | | | | | |
| | | Trading Companies & Distributors - 0.31% | | | | |
| 595 | | Textainer Group Holdings Ltd. (b) | | | 12,822 | |
| 585 | | Watsco, Inc. (b) | | | 33,275 | |
| | | | | | | |
| | | | | | 46,097 | |
| | | | | | | |
| | | Water Utilities - 0.55% | | | | |
| 575 | | American States Water Co. (b) | | | 19,952 | |
| 765 | | California Water Service Group | | | 28,772 | |
| 430 | | Connecticut Water Service, Inc. (b) | | | 10,006 | |
| 458 | | Middlesex Water Co. (b) | | | 7,809 | |
| 659 | | SJW Corp. | | | 16,752 | |
| | | | | | | |
| | | | | | 83,291 | |
| | | | | | | |
| | | Wireless Telecommunication Services - 0.36% | | | | |
| 1,421 | | NTELOS Holdings Corp. | | | 25,280 | |
| 278 | | SBA Communications Corp. (a)(b) | | | 10,027 | |
| 941 | | Syniverse Holdings, Inc. (a) | | | 18,321 | |
| | | | | | | |
| | | | | | 53,628 | |
| | | | | | | |
| | | Total Common Stocks | | | | |
| | | (Cost $11,046,767) | | | 13,831,690 | |
| | | | | | | |
| | | | | | | |
Number of
Shares | | | | Value | |
| | | | | | |
| | | MANAGEMENT INVESTMENT | | | | |
| | | COMPANIES - 0.69% | | | | |
| | | Capital Markets - 0.69% | | | | |
| 1,715 | | Gladstone Capital Corp. | | $ | 20,237 | |
| 5,161 | | MCG Capital Corp. (b) | | | 26,889 | |
| 345 | | MVC Capital, Inc. | | | 4,682 | |
| 3,608 | | NGP Capital Resources Co. (b) | | | 30,740 | |
| 3,151 | | TICC Capital Corp. (b) | | | 20,765 | |
| | | | | | | |
| | | | | | 103,313 | |
| | | | | | | |
| | | Total Management Investment | | | | |
| | | Companies (Cost $83,804) | | | 103,313 | |
| | | | | | | |
| | | REAL ESTATE INVESTMENT TRUSTS - 3.62% | | | | |
| | | Real Estate Investment Trusts - 3.62% | | | | |
| 210 | | Acadia Realty Trust | | | 3,750 | |
| 208 | | Agree Realty Corp. | | | 4,755 | |
| 156 | | American Campus Communities, Inc. | | | 4,315 | |
| 1,100 | | Anworth Mortgage Asset Corp. | | | 7,414 | |
| 1,091 | | Cedar Shopping Centers, Inc. | | | 8,630 | |
| 414 | | Corporate Office Properties Trust | | | 16,614 | |
| 426 | | Digital Realty Trust, Inc. (b) | | | 23,089 | |
| 294 | | EastGroup Properties, Inc. | | | 11,095 | |
| 2,243 | | Education Realty Trust, Inc. | | | 12,875 | |
| 801 | | Extra Space Storage, Inc. | | | 10,157 | |
| 285 | | First Potomac Realty Trust | | | 4,283 | |
| 1,487 | | Franklin Street Properties Corp. (b) | | | 21,457 | |
| 643 | | Getty Realty Corp. | | | 15,046 | |
| 1,805 | | Inland Real Estate Corp. (b) | | | 16,516 | |
| 1,604 | | Investors Real Estate Trust | | | 14,468 | |
| 1,032 | | Kilroy Realty Corp. | | | 31,827 | |
| 743 | | Lasalle Hotel Properties | | | 17,312 | |
| 323 | | LTC Properties, Inc. | | | 8,740 | |
| 1,002 | | Medical Properties Trust, Inc. (b) | | | 10,501 | |
| 484 | | Mid-American Apartment | | | | |
| | | Communities, Inc. | | | 25,066 | |
| 1,089 | | National Health Investors, Inc. (b) | | | 42,210 | |
| 840 | | Omega Healthcare Investors, Inc. | | | 16,372 | |
| 2,117 | | Potlatch Corp. | | | 74,180 | |
| 391 | | PS Business Parks, Inc. | | | 20,879 | |
| 324 | | Saul Centers, Inc. | | | 13,414 | |
| 151 | | Sovran Self Storage, Inc. | | | 5,264 | |
| 210 | | Tanger Factory Outlet Centers, Inc. | | | 9,064 | |
| 855 | | UMH Properties, Inc. | | | 6,985 | |
See notes to financial statements.
114
|
AssetMark Enhanced Fundamental Index® Small Company Growth Fund |
SCHEDULE OF INVESTMENTS (Continued) |
March 31, 2010 |
| |
| | | | | | | |
Number of
Shares | | | | Value | |
| | | | | | |
| | | Real Estate Investment Trusts (Continued) | | | | |
| 159 | | Universal Health Realty | | | | |
| | | Income Trust | | $ | 5,619 | |
| 2,105 | | Urstadt Biddle Properties, Inc. | | | 33,280 | |
| 3,305 | | U-Store-It Trust | | | 23,796 | |
| 563 | | Washington Real Estate Investment | | | | |
| | | Trust (b) | | | 17,200 | |
| 740 | | Winthrop Realty Trust | | | 8,910 | |
| | | | | | | |
| | | | | | 545,083 | |
| | | | | | | |
| | | Total Real Estate Investment Trusts | | | | |
| | | (Cost $444,590) | | | 545,083 | |
| | | | | | | |
| | | SHORT TERM INVESTMENTS - 3.12% | | | | |
| | | Money Market Funds - 3.12% | | | | |
| 469,237 | | Federated Prime Obligations Fund | | | | |
| | | Effective Yield, 0.11% | | | 469,237 | |
| | | | | | | |
| | | Total Short Term Investments | | | | |
| | | (Cost $469,237) | | | 469,237 | |
| | | | | | | |
| | | | | | | |
Number of
Shares | | | | Value | |
| | | | | | |
| | | INVESTMENTS PURCHASED | | | | |
| | | AS SECURITIES LENDING | | | | |
| | | COLLATERAL - 34.04% | | | | |
| | | Money Market Funds - 34.04% | | | | |
| 5,124,065 | | Mount Vernon Prime Portfolio | | | | |
| | | Effective Yield, 0.24% | | $ | 5,124,065 | |
| | | | | | | |
| | | Total Mutual Funds | | | | |
| | | (Cost $5,124,065) | | | 5,124,065 | |
| | | | | | | |
| | | Total Investments Purchased as | | | | |
| | | Securities Lending Collateral | | | | |
| | | (Cost $5,124,065) | | | 5,124,065 | |
| | | | | | | |
| | | Total Investments | | | | |
| | | (Cost $17,168,463) - 133.37% | | | 20,073,388 | |
| | | Liabilities in Excess of | | | | |
| | | Other Assets - (33.37)% | | | (5,022,132 | ) |
| | | | | | | |
| | | TOTAL NET | | | | |
| | | ASSETS - 100.00% | | $ | 15,051,256 | |
| | | | | | | |
| |
Percentages are stated as a percent of net assets. |
(a) | Non-income producing. |
(b) | All or a portion of this security is on loan. |
See notes to financial statements.
115
|
AssetMark Enhanced Fundamental Index® Small Company Growth Fund |
SCHEDULE OF OPEN FUTURES CONTRACTS |
March 31, 2009 |
| |
| | | | | | | | | | |
Description | | | Number of
Contracts
Purchased | | Notional
Value | | Settlement
Month | | Unrealized
Appreciation | |
| | | | | | | | | | | |
Russell 2000 Index Mini Futures | | 8 | | $541,680 | | Jun-10 | | $3,607 | |
See notes to financial statements.
116
|
AssetMark Enhanced Fundamental Index® Small Company Value Fund |
SCHEDULE OF INVESTMENTS |
March 31, 2010 |
| |
| | | | | | | |
Number of
Shares | | | | Value | |
| | | | | | |
| | | COMMON STOCKS - 92.39% | | | | |
| | | Aerospace & Defense - 1.47% | | | | |
| 512 | | AAR Corp. (a) | | $ | 12,708 | |
| 503 | | Ceradyne, Inc. (a) | | | 11,413 | |
| 1,460 | | DynCorp International, Inc. (a) | | | 16,775 | |
| 197 | | Esterline Technologies Corp. (a)(b) | | | 9,738 | |
| 692 | | Gencorp, Inc. (a) | | | 3,986 | |
| 572 | | Hexcel Corp. (a) | | | 8,260 | |
| 286 | | Moog, Inc. (a) | | | 10,130 | |
| 1,383 | | Orbital Sciences Corp. (a) | | | 26,291 | |
| 391 | | Teledyne Technologies, Inc. (a)(b) | | | 16,136 | |
| | | | | | | |
| | | | | | 115,437 | |
| | | | | | | |
| | | Air Freight & Logistics - 1.00% | | | | |
| 5,933 | | Air Transport Services | | | | |
| | | Group, Inc. (a)(b) | | | 19,994 | |
| 284 | | Atlas Air Worldwide | | | | |
| | | Holdings, Inc. (a) | | | 15,066 | |
| 264 | | Dynamex, Inc. (a) | | | 4,541 | |
| 712 | | Hub Group, Inc. (a) | | | 19,922 | |
| 3,210 | | Pacer International, Inc. (a) | | | 19,324 | |
| | | | | | | |
| | | | | | 78,847 | |
| | | | | | | |
| | | Airlines - 0.28% | | | | |
| 3,080 | | AirTran Holdings, Inc. (a)(b) | | | 15,646 | |
| 1,037 | | Republic Airways Holdings, Inc. (a) | | | 6,139 | |
| | | | | | | |
| | | | | | 21,785 | |
| | | | | | | |
| | | Auto Components - 1.52% | | | | |
| 1,386 | | American Axle & Manufacturing | | | | |
| | | Holdings, Inc. (a) | | | 13,832 | |
| 250 | | Drew Industries, Inc. (a)(b) | | | 5,505 | |
| 4,447 | | Exide Technologies (a) | | | 25,570 | |
| 315 | | Hawk Corp. (a) | | | 6,143 | |
| 1,926 | | Modine Manufacturing Co. (a)(b) | | | 21,648 | |
| 1,066 | | Spartan Motors, Inc. (b) | | | 5,970 | |
| 1,020 | | Standard Motor Products, Inc. | | | 10,118 | |
| 1,387 | | Stoneridge, Inc. (a)(b) | | | 13,718 | |
| 1,061 | | Superior Industries | | | | |
| | | International, Inc. | | | 17,061 | |
| | | | | | | |
| | | | | | 119,565 | |
| | | | | | | |
| | | Automobiles - 0.17% | | | | |
| 911 | | Winnebago Industries, Inc. (a)(b) | | | 13,310 | |
| | | | | | | |
| | | Beverages - 0.53% | | | | |
| 200 | | Coca-Cola Bottling Co. | | | 11,732 | |
| 1,313 | | Heckmann Corp. (a)(b) | | | 7,615 | |
| | | | | | | |
Number of
Shares | | | | Value | |
| | | | | | |
| | | Beverages (Continued) | | | | |
| 1,999 | | National Beverage Corp. (b) | | $ | 22,229 | |
| | | | | | | |
| | | | | | 41,576 | |
| | | | | | | |
| | | Biotechnology - 0.19% | | | | |
| 292 | | Abraxis BioScience, Inc. (a) | | | 15,111 | |
| | | | | | | |
| | | Building Products - 1.42% | | | | |
| 564 | | American Woodmark Corp. (b) | | | 10,936 | |
| 786 | | Apogee Enterprises, Inc. | | | 12,427 | |
| 6,301 | | Builders FirstSource, Inc. (a) | | | 19,848 | |
| 1,486 | | Griffon Corp. (a)(b) | | | 18,516 | |
| 2,734 | | NCI Building Systems, Inc. (a) | | | 30,183 | |
| 1,206 | | Quanex Building Products Corp. (b) | | | 19,935 | |
| | | | | | | |
| | | | | | 111,845 | |
| | | | | | | |
| | | Capital Markets - 0.96% | | | | |
| 3,617 | | GFI Group, Inc. | | | 20,906 | |
| 934 | | LaBranche & Co., Inc. (a) | | | 4,913 | |
| 468 | | Oppenheimer Holdings, Inc. (b) | | | 11,939 | |
| 179 | | PennantPark Investment Corp. | | | 1,855 | |
| 834 | | Penson Worldwide, Inc. (a)(b) | | | 8,398 | |
| 579 | | Sanders Morris Harris Group (b) | | | 3,584 | |
| 2,047 | | SWS Group, Inc. | | | 23,602 | |
| | | | | | | |
| | | | | | 75,197 | |
| | | | | | | |
| | | Chemicals - 3.37% | | | | |
| 864 | | A. Schulman, Inc. | | | 21,142 | |
| 654 | | Arch Chemicals, Inc. | | | 22,491 | |
| 2,472 | | Ferro Corp. (a) | | | 21,729 | |
| 1,033 | | H.B. Fuller Co. | | | 23,976 | |
| 697 | | ICO, Inc. | | | 5,632 | |
| 313 | | Innophos Holdings, Inc. | | | 8,733 | |
| 648 | | Landec Corp. (a) | | | 4,296 | |
| 343 | | LSB Industries, Inc. (a) | | | 5,227 | |
| 557 | | OM Group, Inc. (a) | | | 18,871 | |
| 2,229 | | PolyOne Corp. (a) | | | 22,825 | |
| 670 | | Quaker Chemical Corp. | | | 18,164 | |
| 409 | | Sensient Technologies Corp. | | | 11,885 | |
| 869 | | Solutia, Inc. (a) | | | 14,000 | |
| 1,890 | | Spartech Corp. (a) | | | 22,113 | |
| 195 | | Stepan Co. (b) | | | 10,899 | |
| 1,174 | | W.R. Grace & Co. (a) | | | 32,590 | |
| | | | | | | |
| | | | | | 264,573 | |
| | | | | | | |
| | | Commercial Banks - 9.99% | | | | |
| 848 | | 1st Source Corp. (b) | | | 14,882 | |
| 163 | | Alliance Financial Corp. | | | 4,805 | |
See notes to financial statements.
117
|
AssetMark Enhanced Fundamental Index® Small Company Value Fund |
SCHEDULE OF INVESTMENTS (Continued) |
March 31, 2010 |
| |
| | | | | | | |
Number of
Shares | | | | Value | |
| | | | | | |
| | | COMMON STOCKS (Continued) | | | | |
| | | Commercial Banks (Continued) | | | | |
| 1,050 | | Ameris Bancorp (b) | | $ | 9,482 | |
| 309 | | Bancorp Rhode Island, Inc. (b) | | | 8,451 | |
| 4,396 | | Banner Corp. (b) | | | 16,881 | |
| 1,661 | | Boston Private Financial | | | | |
| | | Holdings, Inc. (b) | | | 12,242 | |
| 967 | | Capital City Bank Group, Inc. (b) | | | 13,780 | |
| 2,325 | | Cathay General Bancorp (b) | | | 27,086 | |
| 15,714 | | Central Pacific | | | | |
| | | Financial Corp. (a)(b) | | | 26,399 | |
| 1,398 | | Chemical Financial Corp. (b) | | | 33,021 | |
| 606 | | Citizens & Northern Corp. (b) | | | 7,605 | |
| 1,055 | | CoBiz Financial, Inc. (b) | | | 6,573 | |
| 729 | | Community Bank Systems, Inc. | | | 16,607 | |
| 596 | | Enterprise Financial | | | | |
| | | Services Corp. (b) | | | 6,592 | |
| 564 | | Financial Institutions, Inc. (b) | | | 8,246 | |
| 3,084 | | First Busey Corp. | | | 13,631 | |
| 3,988 | | First Commonwealth Financial Corp. | | | 26,759 | |
| 868 | | First Community | | | | |
| | | Bancshares, Inc. (b) | | | 10,737 | |
| 2,408 | | First Merchants Corp. (b) | | | 16,760 | |
| 2,337 | | First Midwest Bancorp, Inc. | | | 31,666 | |
| 2,380 | | Harleysville National Corp. (b) | | | 15,946 | |
| 583 | | Heartland Financial U.S.A., Inc. (b) | | | 9,310 | |
| 1,186 | | Lakeland Bancorp, Inc. (b) | | | 10,496 | |
| 1,567 | | Mainsource Financial Group, Inc. | | | 10,546 | |
| 261 | | Merchants Bancshares (b) | | | 5,666 | |
| 1,303 | | Nara Bancorp, Inc. (a) | | | 11,414 | |
| 3,447 | | National Penn Bancshares, Inc. (b) | | | 23,784 | |
| 325 | | Northrim Bancorp, Inc. (b) | | | 5,551 | |
| 2,490 | | Old National Bancorp | | | 29,755 | |
| 323 | | Old Point Financial Corp. | | | 4,767 | |
| 617 | | Oriental Financial Group, Inc. (b) | | | 8,329 | |
| 18,018 | | Pacific Capital Bancorp (a)(b) | | | 32,613 | |
| 474 | | Park National Corp. (b) | | | 29,535 | |
| 356 | | Peapack-Gladstone Financial Corp. (b) | | | 5,593 | |
| 349 | | Peoples Bancorp, Inc. (b) | | | 5,752 | |
| 693 | | Renasant Corp. (b) | | | 11,213 | |
| 1,015 | | Republic First Bancorp, Inc. (a)(b) | | | 3,928 | |
| 1,042 | | S & T Bancorp, Inc. (b) | | | 21,778 | |
| 975 | | Sandy Spring Bancorp, Inc. | | | 14,625 | |
| 1,735 | | Santander Bancorp (a)(b) | | | 21,288 | |
| 648 | | Sierra Bancorp (b) | | | 8,353 | |
| | | | | | | |
Number of
Shares | | | | Value | |
| | | | | | |
| | | Commercial Banks (Continued) | | | | |
| 1,134 | | Southwest Bancorp, Inc. (b) | | $ | 9,378 | |
| 986 | | State Bancorp, Inc. (b) | | | 7,760 | |
| 1,155 | | Sterling Bancorp (b) | | | 11,608 | |
| 31,675 | | Sterling Financial Corp. (a)(b) | | | 18,055 | |
| 2,959 | | Sun Bancorp, Inc. (a) | | | 11,658 | |
| 432 | | TriCo Bancshares | | | 8,597 | |
| 1,227 | | Union First Market | | | | |
| | | Bankshares Corporation | | | 18,528 | |
| 1,157 | | United Bankshares, Inc. (b) | | | 30,337 | |
| 3,739 | | United Community Banks, Inc. (a) | | | 16,489 | |
| 508 | | Washington Banking Co. (b) | | | 6,396 | |
| 480 | | Washington Trust Bancorp | | | 8,947 | |
| 1,118 | | Wesbanco, Inc. (b) | | | 18,179 | |
| 1,447 | | Wilshire Bancorp, Inc. (b) | | | 15,960 | |
| | | | | | | |
| | | | | | 784,339 | |
| | | | | | | |
| | | Commercial Services & | | | | |
| | | Supplies - 3.30% | | | | |
| 2,220 | | ACCO Brands Corp. (a)(b) | | | 17,005 | |
| 537 | | American Reprographics Co. (a) | | | 4,817 | |
| 362 | | ATC Technology Corp. (a) | | | 6,212 | |
| 491 | | Barrett Business Services, Inc. | | | 6,658 | |
| 839 | | Bowne & Co, Inc. | | | 9,363 | |
| 2,053 | | Cenveo, Inc. (a) | | | 17,779 | |
| 1,098 | | Comfort Systems U.S.A., Inc. | | | 13,714 | |
| 262 | | Consolidated Graphics, Inc. (a) | | | 10,850 | |
| 329 | | Courier Corp. | | | 5,432 | |
| 2,138 | | EnergySolutions, Inc. | | | 13,747 | |
| 538 | | Ennis, Inc. | | | 8,753 | |
| 1,411 | | Interface, Inc. | | | 16,339 | |
| 3,043 | | Kimball International, Inc. | | | 21,149 | |
| 419 | | M & F Worldwide Corp. (a) | | | 12,821 | |
| 1,386 | | Mine Safety Appliances Co. | | | 38,753 | |
| 388 | | Schawk, Inc. | | | 7,035 | |
| 3,289 | | Standard Register Co. | | | 17,596 | |
| 1,197 | | Viad Corp. | | | 24,598 | |
| 627 | | Waste Services, Inc. (a)(b) | | | 6,201 | |
| | | | | | | |
| | | | | | 258,822 | |
| | | | | | | |
| | | Communications Equipment - 1.61% | | | | |
| 3,283 | | 3Com Corp. (a) | | | 25,246 | |
| 3,171 | | ADC Telecommunications (a)(b) | | | 23,180 | |
| 716 | | Aviat Networks, Inc. (a) | | | 4,747 | |
| 139 | | Black Box Corp. | | | 4,276 | |
| 539 | | Cogo Group, Inc. (a) | | | 3,768 | |
See notes to financial statements.
118
|
AssetMark Enhanced Fundamental Index® Small Company Value Fund |
SCHEDULE OF INVESTMENTS (Continued) |
March 31, 2010 |
| |
| | | | | | | |
Number of
Shares | | | | Value | |
| | | | | | |
| | | COMMON STOCKS (Continued) | | | | |
| | | Communications Equipment (Continued) | | | | |
| 229 | | Communications Systems, Inc. (b) | | $ | 2,961 | |
| 3,084 | | Extreme Networks, Inc. (a)(b) | | | 9,468 | |
| 312 | | Hughes Communications, Inc. (a) | | | 8,689 | |
| 397 | | Netgear, Inc. (a) | | | 10,362 | |
| 1,735 | | Opnext, Inc. (a) | | | 4,095 | |
| 790 | | PC-TEL, Inc. (a) | | | 4,882 | |
| 4,965 | | Powerwave Technologies, | | | | |
| | | Inc. (a)(b) | | | 6,206 | |
| 795 | | Symmetricom, Inc. (a) | | | 4,635 | |
| 5,098 | | UTStarcom, Inc. (a) | | | 14,223 | |
| | | | | | | |
| | | | | | 126,738 | |
| | | | | | | |
| | | Computers & Peripherals - 1.03% | | | | |
| 862 | | Avid Technology, Inc. (a) | | | 11,878 | |
| 964 | | Electronics For Imaging, Inc. (a) | | | 11,211 | |
| 2,574 | | Imation Corp. (a) | | | 28,340 | |
| 958 | | Intermec, Inc. (a) | | | 13,585 | |
| 3,246 | | Quantum Corp. (a) | | | 8,537 | |
| 410 | | Super Micro Computer, Inc. (a) | | | 7,085 | |
| | | | | | | |
| | | | | | 80,636 | |
| | | | | | | |
| | | Construction & Engineering - 0.85% | | | | |
| 257 | | Baker Michael Corp. (a) | | | 8,861 | |
| 2,168 | | Dycom Industries, Inc. (a) | | | 19,013 | |
| 1,584 | | Furmanite Corporation (a) | | | 8,221 | |
| 314 | | Layne Christensen Co. (a) | | | 8,387 | |
| 222 | | Mastec, Inc. (a) | | | 2,800 | |
| 554 | | MYR Group, Inc. (a) | | | 9,036 | |
| 860 | | Pike Electric Corp. (a) | | | 8,015 | |
| 167 | | Sterling Construction Co., Inc. (a) | | | 2,625 | |
| | | | | | | |
| | | | | | 66,958 | |
| | | | | | | |
| | | Construction Materials - 0.24% | | | | |
| 2,918 | | Headwaters, Inc. (a)(b) | | | 13,394 | |
| 13,458 | | U.S. Concrete, Inc. (a)(b) | | | 5,114 | |
| | | | | | | |
| | | | | | 18,508 | |
| | | | | | | |
| | | Consumer Finance - 0.44% | | | | |
| 2,311 | | Advance America, Cash Advance | | | | |
| | | Centers, Inc. | | | 13,450 | |
| 347 | | Cardtronics, Inc. (a) | | | 4,362 | |
| 298 | | Dollar Financial Corp. (a)(b) | | | 7,170 | |
| 738 | | QC Holdings, Inc. (b) | | | 3,815 | |
| 409 | | Rewards Network, Inc. (b) | | | 5,481 | |
| | | | | | | |
| | | | | | 34,278 | |
| | | | | | | |
| | | | | | | |
Number of
Shares | | | | Value | |
| | | | | | |
| | | Containers & Packaging - 0.39% | | | | |
| 1,753 | | Boise, Inc. (a) | | $ | 10,746 | |
| 691 | | Bway Holding Company (a) | | | 13,889 | |
| 578 | | Myers Industries, Inc. | | | 6,057 | |
| | | | | | | |
| | | | | | 30,692 | |
| | | | | | | |
| | | Distributors - 0.11% | | | | |
| 1,078 | | Audiovox Corp. (a) | | | 8,387 | |
| | | | | | | |
| | | Diversified Consumer Services - 0.74% | | | | |
| 2,617 | | Jackson Hewitt Tax | | | | |
| | | Services, Inc. (a)(b) | | | 5,234 | |
| 2,873 | | Stewart Enterprises, Inc. (b) | | | 17,956 | |
| 1,355 | | Weight Watchers International, Inc. | | | 34,593 | |
| | | | | | | |
| | | | | | 57,783 | |
| | | | | | | |
| | | Diversified Financial Services - 0.58% | | | | |
| 964 | | Compass Diversified Holdings (b) | | | 14,711 | |
| 7,745 | | First Marblehead Corp. (a)(b) | | | 21,996 | |
| 1,452 | | Resource America, Inc. (b) | | | 6,969 | |
| 55 | | World Acceptance Corp. (a)(b) | | | 1,984 | |
| | | | | | | |
| | | | | | 45,660 | |
| | | | | | | |
| | | Diversified Telecommunication Services - 0.90% | | | | |
| 5,765 | | Cincinnati Bell, Inc. (a) | | | 19,659 | |
| 267,701 | | Fairpoint Communications, | | | | |
| | | Inc. (a)(b) | | | 7,763 | |
| 1,004 | | General Communication, Inc. (a) | | | 5,793 | |
| 775 | | Global Crossing Ltd. (a)(b) | | | 11,741 | |
| 478 | | Hickory Tech Corp. | | | 4,221 | |
| 609 | | Iowa Telecommunications | | | | |
| | | Services, Inc. | | | 10,170 | |
| 688 | | PAETEC Holding Corp. (a) | | | 3,220 | |
| 667 | | Premiere Global Services, Inc. (a) | | | 5,510 | |
| 299 | | SureWest Communications (a)(b) | | | 2,568 | |
| | | | | | | |
| | | | | | 70,645 | |
| | | | | | | |
| | | Electric Utilities - 0.99% | | | | |
| 473 | | Central Vermont Public | | | | |
| | | Service Corp. | | | 9,541 | |
| 1,057 | | El Paso Electric Co. (a) | | | 21,774 | |
| 486 | | Empire District Electric Co. | | | 8,758 | |
| 559 | | MGE Energy, Inc. | | | 19,766 | |
| 660 | | UIL Holdings Corp. | | | 18,150 | |
| | | | | | | |
| | | | | | 77,989 | |
| | | | | | | |
See notes to financial statements.
119
|
AssetMark Enhanced Fundamental Index® Small Company Value Fund |
SCHEDULE OF INVESTMENTS (Continued) |
March 31, 2010 |
| |
| | | | | | | |
Number of
Shares | | | | Value | |
| | | | | | |
| | | COMMON STOCKS (Continued) | | | | |
| | | Electrical Equipment - 0.95% | | | | |
| 499 | | Baldor Electric Co. (b) | | $ | 18,663 | |
| 1,038 | | EnerSys (a)(b) | | | 25,597 | |
| 920 | | LSI Industries, Inc. (b) | | | 6,274 | |
| 457 | | Polypore International, Inc. (a) | | | 7,979 | |
| 176 | | Powell Industries, Inc. (a) | | | 5,725 | |
| 1,486 | | Power-One, Inc. (a)(b) | | | 6,271 | |
| 110 | | Preformed Line Products Co. (b) | | | 4,197 | |
| | | | | | | |
| | | | | | 74,706 | |
| | | | | | | |
| | | Electronic Equipment & Instruments - 2.43% | | | | |
| 751 | | Agilysys, Inc. | | | 8,389 | |
| 3,364 | | Brightpoint, Inc. (a) | | | 25,331 | |
| 702 | | Checkpoint Systems, Inc. (a) | | | 15,528 | |
| 381 | | Coherent, Inc. (a)(b) | | | 12,177 | |
| 369 | | CPI International, Inc. (a) | | | 4,893 | |
| 870 | | CTS Corp. | | | 8,195 | |
| 232 | | Mercury Computer Systems (a) | | | 3,183 | |
| 1,123 | | Methode Electronics, Inc. | | | 11,118 | |
| 767 | | Newport Corp. (a) | | | 9,587 | |
| 192 | | OSI Systems, Inc. (a) | | | 5,386 | |
| 491 | | Plexus Corp. (a) | | | 17,691 | |
| 967 | | Radisys Corp. (a) | | | 8,664 | |
| 195 | | Rogers Corp. (a) | | | 5,657 | |
| 754 | | ScanSource, Inc. (a)(b) | | | 21,700 | |
| 2,028 | | Smart Modular | | | | |
| | | Technologies Inc. (a) | | | 15,636 | |
| 1,513 | | Technitrol, Inc. (b) | | | 7,989 | |
| 700 | | TTM Technologies, Inc. (a) | | | 6,216 | |
| 388 | | Zygo Corp. (a) | | | 3,581 | |
| | | | | | | |
| | | | | | 190,921 | |
| | | | | | | |
| | | Energy Equipment & Services - 1.70% | | | | |
| 488 | | Allis Chalmers Energy, Inc. (a) | | | 1,728 | |
| 730 | | Basic Energy Services, Inc. (a) | | | 5,628 | |
| 230 | | Bristow Group, Inc. (a) | | | 8,678 | |
| 686 | | Bronco Drilling Co, Inc. (a)(b) | | | 3,224 | |
| 811 | | Complete Production Services (a) | | | 9,367 | |
| 232 | | Dawson Geophysical Co. (a) | | | 6,784 | |
| 2,451 | | Global Industries Ltd. (a) | | | 15,735 | |
| 211 | | Gulf Island Fabrication, Inc. | | | 4,589 | |
| 5,463 | | Hercules Offshore, Inc. (a) | | | 23,546 | |
| 563 | | ION Geophysical Corp. (a) | | | 2,770 | |
| 761 | | Matrix Service Co. (a) | | | 8,188 | |
| | | | | | | |
Number of
Shares | | | | Value | |
| | | | | | |
| | | Energy Equipment & Services (Continued) | | | | |
| 604 | | Newpark Resources, Inc. (a) | | $ | 3,171 | |
| 2,050 | | Parker Drilling Co. (a) | | | 10,107 | |
| 97 | | PHI, Inc. (a)(b) | | | 2,054 | |
| 230 | | Pioneer Drilling Co. (a)(b) | | | 1,619 | |
| 97 | | Superior Well Services, Inc. (a)(b) | | | 1,298 | |
| 871 | | Tetra Technologies, Inc. (a) | | | 10,644 | |
| 473 | | Union Drilling, Inc. (a) | | | 2,914 | |
| 931 | | Willbros Group, Inc. (a) | | | 11,181 | |
| | | | | | | |
| | | | | | 133,225 | |
| | | | | | | |
| | | Environmental Services - 0.03% | | | | |
| 143 | | Team, Inc. (a) | | | 2,372 | |
| | | | | | | |
| | | Food & Staples Retailing - 1.31% | | | | |
| 1,173 | | Ingles Markets, Inc. | | | 17,630 | |
| 276 | | PriceSmart, Inc. | | | 6,417 | |
| 867 | | Spartan Stores, Inc. | | | 12,502 | |
| 1,859 | | Susser Holdings Corp. (a) | | | 15,709 | |
| 1,035 | | United Natural Foods, Inc. (a) | | | 29,114 | |
| 753 | | Village Super Market, Inc. | | | 21,107 | |
| | | | | | | |
| | | | | | 102,479 | |
| | | | | | | |
| | | Food Products - 0.77% | | | | |
| 250 | | Cal Maine Foods, Inc. (b) | | | 8,472 | |
| 627 | | The Hain Celestial Group, Inc. (a) | | | 10,878 | |
| 903 | | Imperial Sugar Co. (b) | | | 14,006 | |
| 155 | | Sanderson Farms, Inc. | | | 8,310 | |
| 252 | | Seneca Foods Corp. (a) | | | 7,338 | |
| 269 | | TreeHouse Foods, Inc. (a) | | | 11,801 | |
| | | | | | | |
| | | | | | 60,805 | |
| | | | | | | |
| | | Gas Utilities - 0.82% | | | | |
| 863 | | The Laclede Group, Inc. | | | 29,101 | |
| 387 | | Northwest Natural Gas Co. | | | 18,034 | |
| 402 | | South Jersey Industries, Inc. | | | 16,880 | |
| | | | | | | |
| | | | | | 64,015 | |
| | | | | | | |
| | | Health Care Equipment & Supplies - 0.13% | | | | |
| 2,795 | | Cardiac Science Corp. (a) | | | 5,227 | |
| 200 | | CONMED Corp. (a)(b) | | | 4,762 | |
| | | | | | | |
| | | | | | 9,989 | |
| | | | | | | |
| | | Health Care Providers & Services - 4.11% | | | | |
| 1,832 | | Allied Healthcare | | | | |
| | | International, Inc. (a) | | | 4,983 | |
See notes to financial statements.
120
|
AssetMark Enhanced Fundamental Index® Small Company Value Fund |
SCHEDULE OF INVESTMENTS (Continued) |
March 31, 2010 |
| |
| | | | | | | |
Number of
Shares | | | | Value | |
| | | | | | |
| | | COMMON STOCKS (Continued) | | | | |
| | | Health Care Providers & Services (Continued) | | | | |
| 374 | | America Service Group, Inc. | | $ | 6,018 | |
| 241 | | American Dental Partners (a) | | | 3,145 | |
| 1,214 | | AMN Healthcare Services, Inc. (a) | | | 10,683 | |
| 1,375 | | BioScrip, Inc. (a) | | | 10,973 | |
| 403 | | Capital Senior Living Corp. (a) | | | 2,120 | |
| 1,274 | | Centene Corp. (a) | | | 30,627 | |
| 729 | | Cross Country Healthcare, Inc. (a) | | | 7,370 | |
| 311 | | Gentiva Health Services, Inc. (a)(b) | | | 8,795 | |
| 151 | | Hanger Orthopedic Group, Inc. (a) | | | 2,745 | |
| 897 | | HealthSouth Corp. (a) | | | 16,774 | |
| 1,279 | | HealthSpring, Inc. (a) | | | 22,510 | |
| 662 | | inVentiv Health, Inc. (a) | | | 14,869 | |
| 1,089 | | LCA-Vision, Inc. (a) | | | 9,060 | |
| 764 | | Magellan Health Services, Inc. (a) | | | 33,219 | |
| 1,198 | | MedCath Corp. (a) | | | 12,543 | |
| 1,049 | | Molina Healthcare, Inc. (a) | | | 26,403 | |
| 116 | | MWI Veterinary Supply, Inc. (a)(b) | | | 4,686 | |
| 358 | | National Healthcare Corp. (b) | | | 12,666 | |
| 1,155 | | Nighthawk Radiology | | | | |
| | | Holdings, Inc. (a)(b) | | | 3,673 | |
| 906 | | Pharmerica Corp. (a)(b) | | | 16,507 | |
| 273 | | Providence Service Corp. (a) | | | 4,147 | |
| 197 | | RehabCare Group, Inc. (a)(b) | | | 5,372 | |
| 520 | | Res-Care, Inc. (a) | | | 6,235 | |
| 541 | | Skilled Healthcare Group, Inc. (a) | | | 3,338 | |
| 1,041 | | Sun Healthcare Group, Inc. (a) | | | 9,931 | |
| 2,800 | | Sunrise Senior Living, Inc. (a)(b) | | | 14,336 | |
| 1,045 | | Triple-S Management Corp. (a) | | | 18,549 | |
| | | | | | | |
| | | | | | 322,277 | |
| | | | | | | |
| | | Health Care Technology - 0.05% | | | | |
| 482 | | Medquist, Inc. (b) | | | 3,764 | |
| | | | | | | |
| | | Hotels, Restaurants & Leisure - 4.51% | | | | |
| 823 | | Ameristar Casinos, Inc. (b) | | | 14,995 | |
| 479 | | Benihana, Inc. (a)(b) | | | 3,113 | |
| 1,230 | | Bluegreen Corp. (a) | | | 4,022 | |
| 524 | | Bob Evans Farms, Inc. | | | 16,197 | |
| 356 | | California Pizza Kitchen, Inc. (a) | | | 5,977 | |
| 1,225 | | Callaway Golf Co. (b) | | | 10,804 | |
| 1,182 | | Carrols Restaurant Group, Inc. (a) | | | 8,038 | |
| 695 | | Cheesecake Factory, Inc. (a)(b) | | | 18,807 | |
| 755 | | Choice Hotels International, Inc. (b) | | | 26,282 | |
| | | | | | | |
Number of
Shares | | | | Value | |
| | | | | | |
| | | Hotels, Restaurants & Leisure (Continued) | | | | |
| 1,229 | | CKE Restaurants, Inc. | | $ | 13,605 | |
| 456 | | Cracker Barrel Old Country | | | | |
| | | Store, Inc. (b) | | | 21,149 | |
| 6,880 | | Denny’s Corp. (a) | | | 26,419 | |
| 1,220 | | Dover Downs Gaming & | | | | |
| | | Entertainment, Inc. | | | 4,831 | |
| 201 | | Gaylord Entertainment Co. (a) | | | 5,887 | |
| 1,418 | | Isle of Capri Casinos, Inc. (a)(b) | | | 11,032 | |
| 1,070 | | Jack in the Box, Inc. (a) | | | 25,199 | |
| 498 | | Landry’s Restaurants, Inc. (a)(b) | | | 8,924 | |
| 2,290 | | Lubys, Inc. (a) | | | 9,023 | |
| 413 | | Marcus Corp. | | | 5,365 | |
| 1,433 | | McCormick & Schmick’s | | | | |
| | | Seafood Restaurants (a) | | | 14,430 | |
| 732 | | Morgans Hotel Group Co. (a)(b) | | | 4,692 | |
| 977 | | O’Charleys, Inc. (a) | | | 8,734 | |
| 191 | | P.F. Chang’s China | | | | |
| | | Bistro, Inc. (a)(b) | | | 8,429 | |
| 1,135 | | Pinnacle Entertainment, Inc. (a) | | | 11,055 | |
| 622 | | RC2 Corp. (a) | | | 9,311 | |
| 95 | | Red Robin Gourmet | | | | |
| | | Burgers, Inc. (a)(b) | | | 2,322 | |
| 1,184 | | Ruby Tuesday, Inc. (a) | | | 12,515 | |
| 772 | | Sonic Corp. (a)(b) | | | 8,531 | |
| 434 | | Speedway Motorsports, Inc. | | | 6,775 | |
| 16 | | Steak N Shake Co. (a)(b) | | | 6,100 | |
| 166 | | Texas Roadhouse, Inc. (a) | | | 2,306 | |
| 469 | | Vail Resorts, Inc. (a)(b) | | | 18,802 | |
| | | | | | | |
| | | | | | 353,671 | |
| | | | | | | |
| | | Household Durables - 2.43% | | | | |
| 1,112 | | American Greetings Corp. (b) | | | 23,174 | |
| 668 | | Blyth, Inc. | | | 20,875 | |
| 282 | | CSS Industries, Inc. | | | 5,668 | |
| 606 | | Ethan Allen Interiors, Inc. (b) | | | 12,502 | |
| 3,622 | | Furniture Brands | | | | |
| | | International, Inc. (a)(b) | | | 23,290 | |
| 324 | | Helen of Troy Ltd. (a) | | | 8,443 | |
| 279 | | Hooker Furniture Corp. | | | 4,486 | |
| 1,956 | | La-Z-Boy, Inc. (a) | | | 24,528 | |
| 963 | | Meritage Homes Corp. (a)(b) | | | 20,223 | |
| 4,686 | | Sealy Corp. (a)(b) | | | 16,401 | |
| 202 | | Skyline Corp. | | | 3,757 | |
See notes to financial statements.
121
|
AssetMark Enhanced Fundamental Index® Small Company Value Fund |
SCHEDULE OF INVESTMENTS (Continued) |
March 31, 2010 |
| |
| | | | | | | |
Number of
Shares | | | | Value | |
| | | | | | |
| | | COMMON STOCKS (Continued) | | | | |
| | | Household Durables (Continued) | | | | |
| 3,869 | | Standard Pacific Corp. (a) | | $ | 17,488 | |
| 585 | | Stanley Furniture, Inc. (a)(b) | | | 5,944 | |
| 167 | | Universal Electronics, Inc. (a) | | | 3,731 | |
| | | | | | | |
| | | | | | 190,510 | |
| | | | | | | |
| | | Household Products - 0.25% | | | | |
| 1,328 | | Central Garden & Pet Co. (a) | | | 12,165 | |
| 368 | | Oil-Dri Corporation of America (b) | | | 7,113 | |
| | | | | | | |
| | | | | | 19,278 | |
| | | | | | | |
| | | Industrial Conglomerates - 0.56% | | | | |
| 732 | | Otter Tail Corp. (b) | | | 16,075 | |
| 481 | | Standex International Corp. | | | 12,395 | |
| 891 | | Tredegar Corp. | | | 15,218 | |
| | | | | | | |
| | | | | | 43,688 | |
| | | | | | | |
| | | Insurance - 4.47% | | | | |
| 719 | | American Safety Insurance | | | | |
| | | Holdings Ltd. (a)(b) | | | 11,928 | |
| 431 | | Amerisafe, Inc. (a) | | | 7,055 | |
| 696 | | Baldwin & Lyons, Inc. (b) | | | 16,767 | |
| 388 | | Eastern Insurance Holdings, Inc. | | | 3,934 | |
| 756 | | EMC Insurance Group, Inc. (b) | | | 17,025 | |
| 781 | | FBL Financial Group, Inc. (b) | | | 19,119 | |
| 657 | | FPIC Insurance Group, Inc. (a) | | | 17,811 | |
| 799 | | Hallmark Financial | | | | |
| | | Services, Inc. (a)(b) | | | 7,191 | |
| 1,074 | | Harleysville Group, Inc. | | | 36,258 | |
| 1,428 | | Horace Mann Educators Corp. | | | 21,506 | |
| 402 | | Infinity Property & Casuality Corp. | | | 18,267 | |
| 1,197 | | National Financial | | | | |
| | | Partners Corp. (a)(b) | | | 16,878 | |
| 1,848 | | PMA Capital Corp. (a) | | | 11,347 | |
| 1,461 | | Presidential Life Corp. | | | 14,566 | |
| 843 | | Safety Insurance Group, Inc. | | | 31,756 | |
| 1,692 | | Seabright Insurance Holdings, Inc. | | | 18,629 | |
| 1,056 | | State Auto Financial Corp. | | | 18,955 | |
| 1,517 | | Stewart Information Services Corp. | | | 20,935 | |
| 1,381 | | United America Indemnity, Ltd. (a) | | | 13,216 | |
| 1,519 | | United Fire & Casualty Co. | | | 27,327 | |
| | | | | | | |
| | | | | | 350,470 | |
| | | | | | | |
| | | Internet & Catalog Retail - 0.90% | | | | |
| 4,082 | | 1-800-Flowers.Com, Inc. (a) | | | 10,246 | |
| 1,166 | | HSN, Inc. (a) | | | 34,327 | |
| | | | | | | |
Number of
Shares | | | | Value | |
| | | | | | |
| | | Internet & Catalog Retail (Continued) | | | | |
| 670 | | NutriSystem, Inc. (b) | | $ | 11,933 | |
| 1,976 | | Orbitz Worldwide, Inc. (a) | | | 14,049 | |
| | | | | | | |
| | | | | | 70,555 | |
| | | | | | | |
| | | Internet Software & Services - 0.68% | | | | |
| 2,497 | | EarthLink, Inc. | | | 21,324 | |
| 549 | | iMERGENT, Inc. | | | 3,695 | |
| 495 | | InfoSpace, Inc. (a) | | | 5,470 | |
| 900 | | InterNAP Network | | | | |
| | | Services Corp. (a)(b) | | | 5,040 | |
| 5,077 | | iPass, Inc. | | | 5,839 | |
| 1,692 | | RealNetworks, Inc. (a) | | | 8,172 | |
| 516 | | United Online, Inc. | | | 3,860 | |
| | | | | | | |
| | | | | | 53,400 | |
| | | | | | | |
| | | IT Services - 2.23% | | | | |
| 1,206 | | Acxiom Corp. (a) | | | 21,636 | |
| 2,871 | | CIBER, Inc. (a) | | | 10,737 | |
| 545 | | Computer Task Group, Inc. (a) | | | 3,951 | |
| 774 | | Gartner, Inc. (a)(b) | | | 17,214 | |
| 482 | | Heartland Payment | | | | |
| | | Systems, Inc. (b) | | | 8,965 | |
| 1,203 | | infoGROUP, Inc. (a) | | | 9,383 | |
| 1,516 | | Lionbridge Technologies, Inc. (a) | | | 5,503 | |
| 1,537 | | ModusLink Global | | | | |
| | | Solutions, Inc. (a) | | | 12,957 | |
| 1,131 | | Ness Technologies, Inc. (a) | | | 7,137 | |
| 781 | | SRA International, Inc. (a) | | | 16,237 | |
| 1,502 | | StarTek, Inc. (a) | | | 10,439 | |
| 1,174 | | Teletech Holdings, Inc. (a) | | | 20,052 | |
| 889 | | Unisys Corp. (a)(b) | | | 31,017 | |
| | | | | | | |
| | | | | | 175,228 | |
| | | | | | | |
| | | Leisure Equipment & Products - 0.14% | | | | |
| 833 | | JAKKS Pacific, Inc. (a) | | | 10,871 | |
| | | | | | | |
| | | Life Sciences Tools & Services - 0.58% | | | | |
| 450 | | Albany Molecular Research, Inc. (a) | | | 3,758 | |
| 7,617 | | Cambrex Corp. (a) | | | 30,849 | |
| 244 | | Kendle International, Inc. (a) | | | 4,265 | |
| 288 | | Parexel International Corp. (a) | | | 6,713 | |
| | | | | | | |
| | | | | | 45,585 | |
| | | | | | | |
| | | Machinery - 3.39% | | | | |
| 220 | | Alamo Group, Inc. | | | 4,398 | |
| 633 | | Albany International Corp. (b) | | | 13,628 | |
| 507 | | Altra Holdings, Inc. (a) | | | 6,961 | |
See notes to financial statements.
122
|
AssetMark Enhanced Fundamental Index® Small Company Value Fund |
SCHEDULE OF INVESTMENTS (Continued) |
March 31, 2010 |
| |
| | | | | | | |
Number of
Shares | | | | Value | |
| | | | | | |
| | | COMMON STOCKS (Continued) | | | | |
| | | Machinery (Continued) | | | | |
| 1,143 | | American Railcar | | | | |
| | | Industries, Inc. (b) | | $ | 13,899 | |
| 290 | | Ampco-Pittsburgh Corp. | | | 7,198 | |
| 246 | | Astec Industries, Inc. (a)(b) | | | 7,124 | |
| 825 | | Barnes Group, Inc. | | | 16,046 | |
| 1,580 | | Blount International, Inc. (a) | | | 16,369 | |
| 202 | | Cascade Corp. | | | 6,506 | |
| 423 | | Chart Industries, Inc. (a) | | | 8,460 | |
| 994 | | Colfax Corp. (a)(b) | | | 11,699 | |
| 729 | | Columbus McKinnon | | | | |
| | | Corporation (a) | | | 11,569 | |
| 628 | | Enpro Industries, Inc. (a) | | | 18,262 | |
| 1,772 | | Federal Signal Corp. | | | 15,966 | |
| 1,201 | | Force Protection, Inc. (a) | | | 7,230 | |
| 1,159 | | The Greenbrier Companies, Inc. (a) | | | 12,761 | |
| 263 | | Hurco Companies, Inc. (a) | | | 4,426 | |
| 569 | | John Bean Technologies Corp. | | | 9,980 | |
| 595 | | Kadant, Inc. (a) | | | 8,574 | |
| 231 | | L.B. Foster Co. (a) | | | 6,674 | |
| 772 | | Miller Industries, Inc. (a) | | | 9,596 | |
| 1,585 | | Sauer-Danfoss, Inc. (a) | | | 21,049 | |
| 1,198 | | Tecumseh Products Co. (a) | | | 14,699 | |
| 217 | | Tennant Co. | | | 5,944 | |
| 566 | | Twin Disc, Inc. | | | 6,917 | |
| | | | | | | |
| | | | | | 265,935 | |
| | | | | | | |
| | | Marine - 0.47% | | | | |
| 403 | | American Commercial Lines (a) | | | 10,115 | |
| 2,531 | | Horizon Lines, Inc. | | | 13,769 | |
| 118 | | International Shipholding Corp. | | | 3,468 | |
| 603 | | TBS International Plc (a) | | | 4,402 | |
| 895 | | Ultrapetrol Bahamas Ltd. (a) | | | 4,913 | |
| | | | | | | |
| | | | | | 36,667 | |
| | | | | | | |
| | | Media - 1.63% | | | | |
| 393 | | Arbitron, Inc. | | | 10,477 | |
| 152 | | Ascent Media Corp. (a)(b) | | | 4,142 | |
| 601 | | Carmike Cinemas, Inc. (a) | | | 8,336 | |
| 1,500 | | Fisher Communications, Inc. (a) | | | 21,150 | |
| 1,191 | | Harte-Hanks, Inc. | | | 15,316 | |
| 4,412 | | Journal Communications, Inc. (a) | | | 18,531 | |
| 1,634 | | LIN TV Corp. (a) | | | 9,396 | |
| 744 | | Lodgenet Interactive Corp. (a)(b) | | | 5,186 | |
| | | | | | | |
Number of
Shares | | | | Value | |
| | | | | | |
| | | Media (Continued) | | | | |
| 2,652 | | Mediacom Communications | | | | |
| | | Corp. (a)(b) | | $ | 15,779 | |
| 3,851 | | Sinclair Broadcast | | | | |
| | | Group, Inc. (a)(b) | | | 19,563 | |
| | | | | | | |
| | | | | | 127,876 | |
| | | | | | | |
| | | Metals & Mining - 1.01% | | | | |
| 843 | | A.M. Castle & Co. (a) | | | 11,026 | |
| 180 | | AMCOL International Corp. (b) | | | 4,896 | |
| 378 | | Brush Engineered Materials, Inc. (a) | | | 8,532 | |
| 745 | | Gibraltar Industries, Inc. (a) | | | 9,394 | |
| 313 | | Haynes International, Inc. (b) | | | 11,121 | |
| 1,117 | | Horsehead Holding Corp. (a) | | | 13,225 | |
| 319 | | Kaiser Aluminum Corp. | | | 12,304 | |
| 519 | | Stillwater Mining Co. (a) | | | 6,737 | |
| 684 | | Sutor Tech Group Ltd. (a) | | | 1,984 | |
| | | | | | | |
| | | | | | 79,219 | |
| | | | | | | |
| | | Multiline Retail - 0.59% | | | | |
| 500 | | 99 Cents Only Stores (a) | | | 8,150 | |
| 2,341 | | Retail Ventures, Inc. (a)(b) | | | 22,263 | |
| 2,465 | | Tuesday Morning Corp. (a)(b) | | | 16,244 | |
| | | | | | | |
| | | | | | 46,657 | |
| | | | | | | |
| | | Multi-Utilities - 0.23% | | | | |
| 441 | | CH Energy Group, Inc. | | | 18,010 | |
| | | | | | | |
| | | Oil & Gas - 1.90% | | | | |
| 769 | | Atlas Energy, Inc. (a) | | | 23,931 | |
| 159 | | Chesapeake Utilities Corp. | | | 4,738 | |
| 1,808 | | DHT Maritime, Inc. (b) | | | 7,087 | |
| 3,637 | | Endeavour International Corp. (a) | | | 4,619 | |
| 2,059 | | International Coal Group, Inc. (a) | | | 9,410 | |
| 1,168 | | Knightsbridge Tankers Ltd. | | | 19,786 | |
| 455 | | Patriot Coal Corp. (a) | | | 9,309 | |
| 179 | | Petroleum Development Corp. (a) | | | 4,148 | |
| 396 | | PrimeEnergy Corp. (a)(b) | | | 10,664 | |
| 741 | | Stone Energy Corp. (a) | | | 13,153 | |
| 2,310 | | Teekay Tankers Ltd. (b) | | | 29,037 | |
| 418 | | Venoco, Inc. (a) | | | 5,363 | |
| 216 | | Williams Clayton Energy, Inc. (a) | | | 7,556 | |
| | | | | | | |
| | | | | | 148,801 | |
| | | | | | | |
| | | Paper & Forest Products - 1.07% | | | | |
| 914 | | Buckeye Technologies, Inc. (a) | | | 11,955 | |
| 333 | | Clearwater Paper Corp. (a) | | | 16,400 | |
| 1,988 | | P.H. Glatfelter Co. | | | 28,806 | |
See notes to financial statements.
123
|
AssetMark Enhanced Fundamental Index® Small Company Value Fund |
SCHEDULE OF INVESTMENTS (Continued) |
March 31, 2010 |
| |
| | | | | | | |
Number of
Shares | | | | Value | |
| | | | | | |
| | | COMMON STOCKS (Continued) | | | | |
| | | Paper & Forest Products (Continued) | | | | |
| 727 | | Neenah Paper, Inc. | | $ | 11,516 | |
| 1,801 | | Wausau Paper Corp. (a) | | | 15,381 | |
| | | | | | | |
| | | | | | 84,058 | |
| | | | | | | |
| | | Personal Products - 0.41% | | | | |
| 545 | | Elizabeth Arden, Inc. (a) | | | 9,810 | |
| 2,070 | | Mannatech, Inc. | | | 6,914 | |
| 996 | | Prestige Brands Holdings, Inc. (a) | | | 8,964 | |
| 437 | | Revlon, Inc. (a)(b) | | | 6,489 | |
| | | | | | | |
| | | | | | 32,177 | |
| | | | | | | |
| | | Pharmaceuticals - 0.16% | | | | |
| 1,125 | | K-V Pharmaceutical Co. (a) | | | 1,980 | |
| 422 | | Par Pharmaceutical Cos., Inc. (a) | | | 10,466 | |
| | | | | | | |
| | | | | | 12,446 | |
| | | | | | | |
| | | Professional Services - 3.16% | | | | |
| 1,299 | | Administaff, Inc. | | | 27,721 | |
| 624 | | CBIZ, Inc. (a) | | | 4,100 | |
| 1,918 | | CDI Corp. (b) | | | 28,118 | |
| 316 | | CRA International, Inc. (a) | | | 7,243 | |
| 1,536 | | Diamond Management. & | | | | |
| | | Technology Consultants, Inc. | | | 12,057 | |
| 439 | | Franklin Covey Co. (a)(b) | | | 3,486 | |
| 300 | | GP Strategies Corp. (a) | | | 2,508 | |
| 335 | | Heidrick & Struggles | | | | |
| | | International, Inc. (b) | | | 9,390 | |
| 121 | | ICF International, Inc. (a) | | | 3,006 | |
| 716 | | Kforce, Inc. (a) | | | 10,890 | |
| 715 | | Korn Ferry International (a) | | | 12,620 | |
| 739 | | Navigant Consulting, Inc. (a) | | | 8,964 | |
| 461 | | On Assignment, Inc. (a) | | | 3,287 | |
| 2,172 | | Resources Connection, Inc. (a) | | | 41,637 | |
| 253 | | School Specialty, Inc. (a)(b) | | | 5,745 | |
| 2,361 | | SFN Group, Inc. (a) | | | 18,911 | |
| 1,852 | | TrueBlue, Inc. (a) | | | 28,706 | |
| 1,951 | | Volt Information | | | | |
| | | Sciences, Inc. (a)(b) | | | 19,920 | |
| | | | | | | |
| | | | | | 248,309 | |
| | | | | | | |
| | | Real Estate Management & | | | | |
| | | Development - 0.20% | | | | |
| 727 | | Avatar Holdings, Inc. (a)(b) | | | 15,805 | |
| | | | | | | |
| | | | | | | |
Number of
Shares | | | | Value | |
| | | | | | |
| | | Road & Rail - 1.26% | | | | |
| 1,379 | | Arkansas Best Corp. (b) | | $ | 41,205 | |
| 449 | | Celadon Group, Inc. (a)(b) | | | 6,259 | |
| 349 | | Marten Transport, Ltd. (a) | | | 6,879 | |
| 247 | | Old Dominion Freight | | | | |
| | | Lines, Inc. (a) | | | 8,247 | |
| 1,038 | | Saia, Inc. (a) | | | 14,407 | |
| 737 | | U.S.A. Truck, Inc. (a) | | | 11,910 | |
| 550 | | Universal Truckload | | | | |
| | | Services, Inc. (a) | | | 9,669 | |
| | | | | | | |
| | | | | | 98,576 | |
| | | | | | | |
| | | Semiconductor & Semiconductor | | | | |
| | | Equipment - 1.07% | | | | |
| 1,133 | | Brooks Automation, Inc. (a) | | | 9,993 | |
| 778 | | DSP Group, Inc. (a) | | | 6,481 | |
| 1,685 | | Entegris, Inc. (a) | | | 8,492 | |
| 684 | | International Rectifier Corp. (a) | | | 15,664 | |
| 1,713 | | Microtune, Inc. (a) | | | 4,676 | |
| 1,754 | | Photronics, Inc. (a)(b) | | | 8,928 | |
| 3,128 | | Silicon Image, Inc. (a) | | | 9,446 | |
| 1,972 | | Silicon Storage Technology Inc. (a) | | | 5,995 | |
| 2,517 | | Trident Microsystems, Inc. (a) | | | 4,380 | |
| 962 | | Zoran Corp. (a) | | | 10,351 | |
| | | | | | | |
| | | | | | 84,406 | |
| | | | | | | |
| | | Software - 0.67% | | | | |
| 1,279 | | Mentor Graphics Corp. (a) | | | 10,258 | |
| 719 | | QAD, Inc. | | | 3,775 | |
| 1,730 | | Take-Two Interactive | | | | |
| | | Software, Inc. (a) | | | 17,040 | |
| 3,094 | | THQ, Inc. (a) | | | 21,689 | |
| | | | | | | |
| | | | | | 52,762 | |
| | | | | | | |
| | | Specialty Retail - 8.01% | | | | |
| 1,553 | | AnnTaylor Stores Corp. (a) | | | 32,147 | |
| 1,455 | | Bebe Stores, Inc. | | | 12,950 | |
| 1,269 | | Big 5 Sporting Goods Corp. (b) | | | 19,314 | |
| 2,026 | | Books-A-Million, Inc. (b) | | | 14,668 | |
| 1,675 | | Brown Shoe Co., Inc. | | | 25,929 | |
| 1,824 | | Build-A-Bear Workshop, Inc. (a) | | | 12,987 | |
| 1,803 | | Cabelas, Inc. (a)(b) | | | 31,534 | |
| 717 | | Cato Corp. | | | 15,373 | |
| 4,091 | | Charming Shoppes, Inc. (a) | | | 22,337 | |
| 603 | | Children’s Place Retail | | | | |
| | | Stores, Inc. (a) | | | 26,864 | |
See notes to financial statements.
124
|
AssetMark Enhanced Fundamental Index® Small Company Value Fund |
SCHEDULE OF INVESTMENTS (Continued) |
March 31, 2010 |
| |
| | | | | | | |
Number of
Shares | | | | Value | |
| | | | | | |
| | | COMMON STOCKS (Continued) | | | | |
| | | Specialty Retail (Continued) | | | | |
| 1,383 | | Christopher & Banks Corp. | | $ | 11,064 | |
| 2,680 | | Coldwater Creek, Inc. (a)(b) | | | 18,599 | |
| 494 | | Conns, Inc. (a)(b) | | | 3,868 | |
| 429 | | Destination Maternity Corp. (a) | | | 11,008 | |
| 1,000 | | Dress Barn, Inc. (a) | | | 26,160 | |
| 491 | | DSW, Inc. (a)(b) | | | 12,535 | |
| 508 | | Genesco, Inc. (a) | | | 15,753 | |
| 769 | | Haverty Furniture, Inc. | | | 12,550 | |
| 3,243 | | Hot Topic, Inc. (a) | | | 21,080 | |
| 408 | | Jo-Ann Stores, Inc. (a)(b) | | | 17,128 | |
| 1,449 | | Lithia Motors, Inc. (a) | | | 9,274 | |
| 3,472 | | New York & Co, Inc. (a) | | | 16,631 | |
| 2,567 | | Pacific Sunwear Of | | | | |
| | | California, Inc. (a)(b) | | | 13,631 | |
| 1,825 | | PEP Boys | | | 18,341 | |
| 1,987 | | Pier 1 Imports, Inc. (a) | | | 12,657 | |
| 187 | | Rex Stores Corp. (a)(b) | | | 3,029 | |
| 2,124 | | Sally Beauty Holdings, Inc. (a) | | | 18,946 | |
| 657 | | Shoe Carnival, Inc. (a) | | | 15,019 | |
| 1,303 | | Stage Stores, Inc. | | | 20,053 | |
| 1,935 | | Stein Mart, Inc. (a) | | | 17,473 | |
| 1,443 | | Systemax, Inc. | | | 31,371 | |
| 1,172 | | Talbots, Inc. (a)(b) | | | 15,189 | |
| 583 | | Tractor Supply Co. | | | 33,843 | |
| 529 | | West Marine, Inc. (a)(b) | | | 5,740 | |
| 1,775 | | The Wet Seal, Inc. (a) | | | 8,449 | |
| 9,253 | | Zale Corp. (a)(b) | | | 25,353 | |
| | | | | | | |
| | | | | | 628,847 | |
| | | | | | | |
| | | Textiles, Apparel & Luxury Goods - 1.95% | | | | |
| 101 | | G-III Apparel Group, Ltd. (a)(b) | | | 2,784 | |
| 1,097 | | Kenneth Cole Productions, Inc. (a) | | | 14,053 | |
| 1,027 | | K-Swiss, Inc. (a) | | | 10,742 | |
| 215 | | Maidenform Brands, Inc. (a) | | | 4,698 | |
| 518 | | Movado Group, Inc. (a) | | | 5,843 | |
| 775 | | Oxford Industries, Inc. | | | 15,756 | |
| 173 | | Perry Ellis International, Inc. (a) | | | 3,918 | |
| 9,967 | | Quiksilver, Inc. (a) | | | 47,144 | |
| 441 | | Skechers U.S.A., Inc. (a) | | | 16,017 | |
| 1,260 | | Timberland Co. (a) | | | 26,888 | |
| 1,377 | | Unifi, Inc. (a) | | | 5,012 | |
| | | | | | | |
| | | | | | 152,855 | |
| | | | | | | |
| | | | | | | |
Number of
Shares | | | | Value | |
| | | | | | |
| | | Thrifts & Mortgage Finance - 1.98% | | | | |
| 1,095 | | Dime Community Bancshares | | $ | 13,830 | |
| 1,561 | | Doral Financial Corp. (a) | | | 6,728 | |
| 220 | | ESB Financial Corp. | | | 2,836 | |
| 915 | | First Defiance Financial Corp. (b) | | | 9,260 | |
| 784 | | First Financial Holdings, Inc. (b) | | | 11,807 | |
| 1,018 | | First Financial Northwest, Inc. (b) | | | 6,953 | |
| 20,646 | | Flagstar Bancorp, Inc. (a)(b) | | | 12,388 | |
| 705 | | NASB Financial, Inc. (b) | | | 16,299 | |
| 695 | | OceanFirst Financial Corp. | | | 7,895 | |
| 6,374 | | The PMI Group, Inc. (a)(b) | | | 34,547 | |
| 1,640 | | Provident Financial | | | | |
| | | Services, Inc. (b) | | | 19,516 | |
| 717 | | Tree.com, Inc. (a) | | | 6,560 | |
| 183 | | WSFS Financial Corp. | | | 7,137 | |
| | | | | | | |
| | | | | | 155,756 | |
| | | | | | | |
| | | Tobacco - 0.16% | | | | |
| 2,473 | | Alliance One International, Inc. (a) | | | 12,588 | |
| | | | | | | |
| | | Trading Companies & Distributors - 1.46% | | | | |
| 1,203 | | Aceto Corp. | | | 7,266 | |
| 696 | | Applied Industrial | | | | |
| | | Technologies, Inc. | | | 17,296 | |
| 624 | | Beacon Roofing Supply, Inc. (a)(b) | | | 11,937 | |
| 2,125 | | H&E Equipment Services, Inc. (a) | | | 22,907 | |
| 278 | | Interline Brands, Inc. (a) | | | 5,321 | |
| 457 | | Kaman Corp. | | | 11,430 | |
| 708 | | Lawson Products, Inc. | | | 10,953 | |
| 967 | | Rush Enterprises, Inc. (a)(b) | | | 12,774 | |
| 741 | | TAL International Group, Inc. (b) | | | 14,805 | |
| | | | | | | |
| | | | | | 114,689 | |
| | | | | | | |
| | | Wireless Telecommunication Services - 0.48% | | | | |
| 2,951 | | USA Mobility, Inc. | | | 37,389 | |
| | | | | | | |
| | | Total Common Stocks | | | | |
| | | (Cost $5,770,724) | | | 7,250,318 | |
| | | | | | | |
| | | MANAGEMENT INVESTMENT | | | | |
| | | COMPANIES - 0.08% | | | | |
| | | Capital Markets - 0.08% | | | | |
| 393 | | Kayne Anderson Energy | | | | |
| | | Development Co. | | | 6,351 | |
| | | | | | | |
| | | Total Management Investment | | | | |
| | | Companies (Cost $5,473) | | | 6,351 | |
| | | | | | | |
See notes to financial statements.
125
|
AssetMark Enhanced Fundamental Index® Small Company Value Fund |
SCHEDULE OF INVESTMENTS (Continued) |
March 31, 2010 |
| |
| | | | | | | |
Number of
Shares | | | | Value | |
| | | | | | |
| | | REAL ESTATE INVESTMENT TRUSTS - 1.16% | | | | |
| | | Real Estate Investment Trusts - 1.16% | | | | |
| 207,469 | | Anthracite Capital, Inc. (a)(b) | | $ | 3,216 | |
| 247 | | CapLease, Inc. (b) | | | 1,371 | |
| 1,530 | | Glimcher Realty Trust (b) | | | 7,757 | |
| 2,742 | | Gramercy Capital Corp. (a) | | | 7,650 | |
| 1,598 | | Hersha Hospitality Trust | | | 8,278 | |
| 1,085 | | Kite Realty Group Trust | | | 5,132 | |
| 440 | | Mission West Properties, Inc. | | | 3,027 | |
| 236 | | Parkway Properties, Inc. | | | 4,432 | |
| 341 | | Ramco-Gershenson Properties Trust | | | 3,840 | |
| 1,227 | | Resource Capital Corp. | | | 8,294 | |
| 4,643 | | Strategic Hotels & | | | | |
| | | Resorts, Inc. (a)(b) | | | 19,733 | |
| 166 | | Sun Communities, Inc. | | | 4,183 | |
| 349 | | Taubman Centers, Inc. (b) | | | 13,932 | |
| | | | | | | |
| | | | | | 90,845 | |
| | | | | | | |
| | | Total Real Estate Investment Trusts | | | | |
| | | (Cost $104,456) | | | 90,845 | |
| | | | | | | |
| | | SHORT TERM INVESTMENTS - 5.66% | | | | |
| | | Money Market Funds - 5.66% | | | | |
| 444,022 | | Federated Prime Obligations Fund | | | | |
| | | Effective Yield, 0.11% | | | 444,022 | |
| | | | | | | |
| | | Total Short Term Investments | | | | |
| | | (Cost $444,022) | | | 444,022 | |
| | | | | | | |
| | | | | | | |
Number of
Shares | | | | Value | |
| | | | | | |
| | | INVESTMENTS PURCHASED | | | | |
| | | AS SECURITIES LENDING | | | | |
| | | COLLATERAL - 28.79% | | | | |
| | | Money Market Funds - 28.79% | | | | |
| 2,259,561 | | Mount Vernon Prime Portfolio | | | | |
| | | Effective Yield, 0.24% | | $ | 2,259,561 | |
| | | | | | | |
| | | Total Mutual Funds | | | | |
| | | (Cost $2,259,561) | | | 2,259,561 | |
| | | | | | | |
| | | Total Investments Purchased as | | | | |
| | | Securities Lending Collateral | | | | |
| | | (Cost $2,259,561) | | | 2,259,561 | |
| | | | | | | |
| | | Total Investments | | | | |
| | | (Cost $8,584,236) - 128.08% | | | 10,051,097 | |
| | | Liabilities in Excess of | | | | |
| | | Other Assets - (28.08)% | | | (2,203,492 | ) |
| | | | | | | |
| | | TOTAL NET | | | | |
| | | ASSETS - 100.00% | | $ | 7,847,605 | |
| | | | | | | |
|
Percentages are stated as a percent of net assets. |
(a) Non-income producing. |
(b) All or a portion of this security is on loan. |
See notes to financial statements.
126
|
AssetMark Enhanced Fundamental Index® Small Company Value Fund |
SCHEDULE OF OPEN FUTURES CONTRACTS |
March 31, 2010 |
| |
| | | | | | | | | | |
Description | | | Number of
Contracts
Purchased | | Notional
Value | | Settlement
Month | | Unrealized
Appreciation | |
| | | | | | | | | | | |
Russell 2000 Index Mini Futures | | 7 | | $473,970 | | Jun-10 | | $3,130 | |
See notes to financial statements.
127
|
AssetMark Funds |
STATEMENTS OF ASSETS & LIABILITIES |
March 31, 2010 |
| |
| | | | | | | | | | | | | |
| | Large Cap
Growth Fund | | Large Cap
Value Fund | | Small/Mid Cap
Growth Fund | | Small/Mid Cap
Value Fund | |
| | | | | | | | | |
ASSETS: | | | | | | | | | | | | | |
Investments, at value (cost $201,988,908,
$197,455,337, $46,790,974, and
$49,028,699, respectively)1 | | $ | 241,078,111 | | $ | 233,788,931 | | $ | 52,928,402 | | $ | 56,545,319 | |
Cash | | | — | | | — | | | 550 | | | 9,358 | |
Income receivable | | | 243,267 | | | 413,254 | | | 23,193 | | | 29,912 | |
Receivable for investment securities sold | | | 879,984 | | | 271,801 | | | 103,982 | | | 315,985 | |
Receivable for fund shares sold | | | 412,498 | | | 432,300 | | | 66,989 | | | 71,887 | |
Receivable from securities lending agent (See Note 6) | | | — | | | — | | | 812,528 | | | 2,885,357 | |
Other assets | | | 13,131 | | | 10,715 | | | 31,304 | | | 13,405 | |
| | | | | | | | | | | | | |
Total Assets | | | 242,626,991 | | | 234,917,001 | | | 53,966,948 | | | 59,871,223 | |
| | | | | | | | | | | | | |
LIABILITIES: | | | | | | | | | | | | | |
Payable for collateral on securities loaned (See Note 6) | | | 29,108,406 | | | 30,745,404 | | | 13,546,811 | | | 16,483,103 | |
Payable to securities lending agent (See Note 6) | | | 4,097,950 | | | 2,634,387 | | | — | | | — | |
Payable for investment securities purchased | | | 841,905 | | | 251,506 | | | — | | | 569,512 | |
Payable for fund shares redeemed | | | 324,786 | | | 320,223 | | | 68,645 | | | 65,662 | |
Payable to Investment Advisor | | | 157,969 | | | 166,948 | | | 34,926 | | | 38,507 | |
Payable to Custodian | | | 8,222 | | | 5,062 | | | 6,810 | | | 4,556 | |
Payable for dividend withholding tax | | | — | | | 413 | | | — | | | — | |
Other accrued expenses | | | 159,530 | | | 165,119 | | | 59,570 | | | 60,395 | |
| | | | | | | | | | | | | |
Total Liabilities | | | 34,698,768 | | | 34,289,062 | | | 13,716,762 | | | 17,221,735 | |
| | | | | | | | | | | | | |
NET ASSETS | | $ | 207,928,223 | | $ | 200,627,939 | | $ | 40,250,186 | | $ | 42,649,488 | |
| | | | | | | | | | | | | |
NET ASSETS CONSIST OF: | | | | | | | | | | | | | |
Capital stock | | | 283,383,317 | | | 375,024,616 | | | 57,675,028 | | | 72,061,077 | |
Unrealized appreciation on investments | | | 39,089,203 | | | 36,333,618 | | | 6,137,428 | | | 7,516,620 | |
Accumulated undistributed net investment
income | | | 3,154 | | | 592,543 | | | — | | | 124,604 | |
Accumulated undistributed net realized loss | | | (114,547,451 | ) | | (211,322,838 | ) | | (23,562,270 | ) | | (37,052,813 | ) |
| | | | | | | | | | | | | |
Total Net Assets | | $ | 207,928,223 | | $ | 200,627,939 | | $ | 40,250,186 | | $ | 42,649,488 | |
| | | | | | | | | | | | | |
Shares outstanding (unlimited shares of no par
value authorized) | | | 24,714,998 | | | 26,956,863 | | | 5,250,602 | | | 4,507,206 | |
Net asset value, offering and redemption price
per share | | $ | 8.41 | | $ | 7.44 | | $ | 7.67 | | $ | 9.46 | |
| | | | | | | | | | | | | |
| | | | | | | | | | | | | |
1 Includes loaned securities with a value of: | | $ | 28,188,619 | | $ | 29,707,432 | | $ | 13,035,057 | | $ | 15,709,513 | |
| | | | | | | | | | | | | |
See notes to financial statements.
128
|
AssetMark Funds |
STATEMENTS OF ASSETS & LIABILITIES (Continued) |
March 31, 2010 |
| |
| | | | | | | | | | | | | |
| | International
Equity
Fund | | Real Estate
Securities
Fund | | Tax-Exempt
Fixed Income
Fund | | Core Plus
Fixed Income
Fund | |
| | | | | | | | | |
ASSETS: | | | | | | | | | | | | | |
Investments, at value (cost $243,563,858, $46,535,890, | | | | | | | | | | | | | |
$191,397,708 and $609,864,249, respectively)1 | | $ | 270,490,033 | | $ | 62,107,775 | | $ | 196,390,775 | | $ | 583,778,346 | |
Repurchase Agreements (cost $0, $0, | | | | | | | | | | | | | |
$0 and $39,200,000, respectively) | | | — | | | — | | | — | | | 39,200,000 | |
Appreciation of forward foreign currency contracts | | | — | | | — | | | — | | | 30,272 | |
Variation margin on futures contracts | | | — | | | — | | | — | | | 198,976 | |
Foreign currencies (cost $2,189,703, $0, $0 and | | | | | | | | | | | | | |
$0, respectively) | | | 2,213,014 | | | — | | | — | | | — | |
Foreign currencies due from brokers for futures | | | | | | | | | | | | | |
(cost $0, $0, $0 and $534,326, respectively) | | | — | | | — | | | — | | | 521,155 | |
Cash | | | 64,696 | | | — | | | — | | | — | |
Income receivable | | | 955,027 | | | 141,484 | | | 2,469,266 | | | 4,759,778 | |
Receivable for dividend reclaims | | | 818,801 | | | — | | | — | | | — | |
Receivable for investment securities and foreign | | | | | | | | | | | | | |
currencies sold | | | 330,996 | | | 269,784 | | | 148,666 | | | 79,914,192 | |
Receivable for fund shares sold | | | 599,136 | | | 62,567 | | | 519,340 | | | 1,495,644 | |
Deposits with brokers for futures and options | | | — | | | — | | | — | | | 383,843 | |
Receivable from securities lending agent (See Note 6) | | | — | | | 2,078,522 | | | — | | | 2,754,902 | |
Other assets | | | 13,163 | | | 17,095 | | | 18,519 | | | 78,732 | |
| | | | | | | | | | | | | |
Total Assets | | | 275,484,866 | | | 64,677,227 | | | 199,546,566 | | | 713,115,840 | |
| | | | | | | | | | | | | |
LIABILITIES: | | | | | | | | | | | | | |
Options written, at value (Premium received $0, | | | | | | | | | | | | | |
$0, $0 and $11,060, respectively) | | | — | | | — | | | — | | | 13,731 | |
Forward sale commitments (Proceeds received $0, $0, | | | | | | | | | | | | | |
$0 and $856,453, respectively) | | | — | | | — | | | — | | | 854,626 | |
Payable for collateral on securities loaned (See Note 6) | | | — | | | 13,219,202 | | | — | | | 54,397,100 | |
Payable to securities lending agent (See Note 6) | | | 1,798,972 | | | — | | | — | | | — | |
Payable for investment securities purchased | | | 3,186,269 | | | 287,850 | | | 3,443,408 | | | 107,868,276 | |
Payable for fund shares redeemed | | | 390,714 | | | 91,976 | | | 470,797 | | | 1,162,607 | |
Payable to Investment Advisor | | | 211,586 | | | 37,289 | | | 135,236 | | | 350,397 | |
Payable to Custodian | | | 43,270 | | | 2,870 | | | 4,726 | | | 27,948 | |
Payable for dividend withholding tax | | | 45,182 | | | — | | | — | | | — | |
Other accrued expenses | | | 187,304 | | | 59,883 | | | 163,448 | | | 477,404 | |
| | | | | | | | | | | | | |
Total Liabilities | | | 5,863,297 | | | 13,699,070 | | | 4,217,615 | | | 165,152,089 | |
| | | | | | | | | | | | | |
NET ASSETS | | $ | 269,621,569 | | $ | 50,978,157 | | $ | 195,328,951 | | $ | 547,963,751 | |
| | | | | | | | | | | | | |
NET ASSETS CONSIST OF: | | | | | | | | | | | | | |
Capital stock | | | 467,081,160 | | | 47,289,660 | | | 197,716,120 | | | 575,574,134 | |
Unrealized appreciation (depreciation) on: | | | | | | | | | | | | | |
Investments | | | 26,926,175 | | | 15,571,885 | | | 4,993,067 | | | (26,085,903 | ) |
Written options | | | — | | | — | | | — | | | (2,671 | ) |
Foreign currencies | | | 23,811 | | | — | | | — | | | (13,171 | ) |
Forward currency exchange contracts | | | — | | | — | | | — | | | 30,272 | |
Forward sale commitments | | | — | | | — | | | — | | | 1,827 | |
Futures contracts | | | — | | | — | | | — | | | 28,491 | |
Accumulated undistributed net investment income | | | 4,075,917 | | | 35,538 | | | 218,410 | | | 2,289,729 | |
Accumulated undistributed net realized loss | | | (228,485,494 | ) | | (11,918,926 | ) | | (7,598,646 | ) | | (3,858,957 | ) |
| | | | | | | | | | | | | |
Total Net Assets | | $ | 269,621,569 | | $ | 50,978,157 | | $ | 195,328,951 | | $ | 547,963,751 | |
| | | | | | | | | | | | | |
Shares outstanding (unlimited shares of no | | | | | | | | | | | | | |
par value authorized) | | | 33,648,236 | | | 5,043,096 | | | 17,851,657 | | | 60,203,361 | |
Net asset value, offering and redemption price per share | | $ | 8.01 | | $ | 10.11 | | $ | 10.94 | | $ | 9.10 | |
| | | | | | | | | | | | | |
1Includes loaned securities with a value of: | | $ | — | | $ | 12,623,115 | | $ | — | | $ | 53,203,166 | |
| | | | | | | | | | | | | |
See notes to financial statements.
129
|
AssetMark Funds |
STATEMENTS OF ASSETS & LIABILITIES (Continued) |
March 31, 2010 |
| |
| | | | | | | | | | | | | |
| | Enhanced
Fundamental
Index®
Large Company
Growth Fund | | Enhanced
Fundamental
Index®
Large Company
Value Fund | | Enhanced
Fundamental
Index®
Small Company
Growth Fund | | Enhanced
Fundamental
Index®
Small Company
Value Fund | |
| | | | | | | | | |
ASSETS: | | | | | | | | | | | | | |
Investments, at value (cost $72,302,356, | | | | | | | | | | | | | |
$56,717,007, $17,168,463 and | | | | | | | | | | | | | |
$8,584,236, respectively)1 | | $ | 82,330,140 | | $ | 66,886,452 | | $ | 20,073,388 | | $ | 10,051,097 | |
Cash | | | 741 | | | 1,097 | | | — | | | — | |
Income receivable | | | 98,896 | | | 79,202 | | | 15,191 | | | 6,219 | |
Receivable for investment securities sold | | | 19 | | | 32,724 | | | — | | | 5,255 | |
Receivable for fund shares sold | | | 231,303 | | | 160,731 | | | 52,234 | | | 22,900 | |
Receivable from Investment Advisor | | | — | | | — | | | 1,198 | | | — | |
Deposits with brokers for futures contracts | | | 445,000 | | | 365,000 | | | 80,000 | | | 55,000 | |
Other assets | | | 13,305 | | | 17,591 | | | 10,622 | | | 9,431 | |
| | | | | | | | | | | | | |
Total Assets | | | 83,119,404 | | | 67,542,797 | | | 20,232,633 | | | 10,149,902 | |
| | | | | | | | | | | | | |
LIABILITIES: | | | | | | | | | | | | | |
Variation margin on futures contracts | | | 19,740 | | | 16,800 | | | 4,160 | | | 3,640 | |
Payable for collateral on securities loaned | | | | | | | | | | | | | |
(See Note 6) | | | 12,083,657 | | | 11,019,836 | | | 5,124,065 | | | 2,259,561 | |
Payable for fund shares redeemed | | | 99,623 | | | 64,356 | | | 14,941 | | | 11 | |
Payable to Investment Advisor | | | 36,652 | | | 34,339 | | | — | | | 7,255 | |
Payable to Custodian | | | 1,984 | | | 1,730 | | | 2,399 | | | 352 | |
Other accrued expenses | | | 86,102 | | | 71,794 | | | 35,812 | | | 31,478 | |
| | | | | | | | | | | | | |
Total Liabilities | | | 12,327,758 | | | 11,208,855 | | | 5,181,377 | | | 2,302,297 | |
| | | | | | | | | | | | | |
NET ASSETS | | $ | 70,791,646 | | $ | 56,333,942 | | $ | 15,051,256 | | $ | 7,847,605 | |
| | | | | | | | | | | | | |
NET ASSETS CONSIST OF: | | | | | | | | | | | | | |
Capital stock | | | 82,790,614 | | | 72,521,833 | | | 13,896,657 | | | 8,098,357 | |
Unrealized appreciation on: | | | | | | | | | | | | | |
Investments | | | 10,027,784 | | | 10,169,445 | | | 2,904,925 | | | 1,466,861 | |
Futures contracts | | | 110,732 | | | 90,163 | | | 3,607 | | | 3,130 | |
Accumulated undistributed net investment | | | | | | | | | | | | | |
income | | | 127,297 | | | 126,000 | | | 203 | | | 2,321 | |
Accumulated undistributed net realized loss | | | (22,264,781 | ) | | (26,573,499 | ) | | (1,754,136 | ) | | (1,723,064 | ) |
| | | | | | | | | | | | | |
Total Net Assets | | $ | 70,791,646 | | $ | 56,333,942 | | $ | 15,051,256 | | $ | 7,847,605 | |
| | | | | | | | | | | | | |
Shares outstanding (unlimited shares of no | | | | | | | | | | | | | |
par value authorized) | | | 7,635,925 | | | 7,295,332 | | | 1,472,537 | | | 948,551 | |
Net asset value, offering and redemption | | | | | | | | | | | | | |
price per share | | $ | 9.27 | | $ | 7.72 | | $ | 10.22 | | $ | 8.27 | |
| | | | | | | | | | | | | |
| | | | | | | | | | | | | |
1 Includes loaned securities with a value of: | | $ | 11,619,048 | | $ | 10,397,156 | | $ | 4,838,150 | | $ | 1,843,901 | |
| | | | | | | | | | | | | |
See notes to financial statements.
130
|
AssetMark Funds |
STATEMENTS OF OPERATIONS |
For the Year Ended March 31, 2010 |
| |
| | | | | | | | | | | | | |
| | Large Cap
Growth Fund | | Large Cap
Value Fund | | Small/Mid Cap
Growth Fund | | Small/Mid Cap
Value Fund | |
| | | | | | | | | |
INVESTMENT INCOME: | | | | | | | | | | | | | |
Dividend income (net of withholding tax of | | | | | | | | | | | | | |
$14,330, $2,045, $0 and $0, respectively) | | $ | 3,491,362 | | $ | 5,742,062 | | $ | 515,952 | | $ | 841,407 | |
Interest income | | | 4,032 | | | 24,745 | | | 2,502 | | | 4,560 | |
| | | | | | | | | | | | | |
Total investment income | | | 3,495,394 | | | 5,766,807 | | | 518,454 | | | 845,967 | |
| | | | | | | | | | | | | |
EXPENSES: | | | | | | | | | | | | | |
Investment advisory fees | | | 2,130,675 | | | 1,999,561 | | | 476,987 | | | 521,755 | |
Distribution (12b-1) fees | | | 563,968 | | | 531,804 | | | 125,722 | | | 131,588 | |
Shareholder servicing fees | | | 135,353 | | | 127,633 | | | 30,174 | | | 31,581 | |
Administration fees | | | 86,970 | | | 81,518 | | | 19,379 | | | 20,334 | |
Legal fees | | | 84,450 | | | 76,727 | | | 23,094 | | | 32,677 | |
Custody fees | | | 52,674 | | | 26,882 | | | 43,321 | | | 30,515 | |
Directors’ fees and expenses | | | 50,493 | | | 47,684 | | | 9,745 | | | 10,398 | |
Reports to shareholders | | | 48,116 | | | 37,317 | | | 18,862 | | | 14,657 | |
Fund accounting fees | | | 42,696 | | | 38,157 | | | 17,134 | | | 16,905 | |
Audit and tax fees | | | 33,033 | | | 33,029 | | | 28,609 | | | 29,733 | |
Federal and state registration fees | | | 26,510 | | | 29,963 | | | 21,048 | | | 21,345 | |
Transfer agent fees and expenses | | | 15,842 | | | 15,804 | | | 12,845 | | | 13,099 | |
Insurance fees | | | 13,963 | | | 13,328 | | | 2,346 | | | 3,039 | |
Compliance fees | | | 7,665 | | | 6,570 | | | 1,825 | | | 1,825 | |
| | | | | | | | | | | | | |
Total expenses | | | 3,292,408 | | | 3,065,977 | | | 831,091 | | | 879,451 | |
| | | | | | | | | | | | | |
Less securities lending credit (See Note 6) | | | (109,362 | ) | | (78,347 | ) | | (77,307 | ) | | (43,828 | ) |
| | | | | | | | | | | | | |
Net expenses | | | 3,183,046 | | | 2,987,630 | | | 753,784 | | | 835,623 | |
| | | | | | | | | | | | | |
Net investment income (loss) | | | 312,348 | | | 2,779,177 | | | (235,330 | ) | | 10,344 | |
| | | | | | | | | | | | | |
NET REALIZED AND UNREALIZED GAIN (LOSS) | | | | | | | | | | | | | |
ON INVESTMENTS: | | | | | | | | | | | | | |
Net realized gain (loss) on investments | | | 4,409,401 | | | (2,108,925 | ) | | 12,129,280 | | | (3,476,667 | ) |
Net change in unrealized appreciation on investments | | | 83,338,456 | | | 91,198,734 | | | 10,338,185 | | | 29,747,497 | |
| | | | | | | | | | | | | |
Net realized and unrealized gain | | | 87,747,857 | | | 89,089,809 | | | 22,467,465 | | | 26,270,830 | |
| | | | | | | | | | | | | |
NET INCREASE IN NET ASSETS | | | | | | | | | | | | | |
RESULTING FROM OPERATIONS | | $ | 88,060,205 | | $ | 91,868,986 | | $ | 22,232,135 | | $ | 26,281,174 | |
| | | | | | | | | | | | | |
See notes to financial statements.
131
|
AssetMark Funds |
STATEMENTS OF OPERATIONS (Continued) |
For the Year Ended March 31, 2010 |
| |
| | | | | | | | | | | | | |
| | International
Equity
Fund | | Real Estate
Securities
Fund | | Tax-Exempt
Fixed Income
Fund | | Core Plus
Fixed Income
Fund | |
| | | | | | | | | |
INVESTMENT INCOME: | | | | | | | | | | | | | |
Dividend income (net of withholding tax of | | | | | | | | | | | | | |
$943,609, $0, $0 and $2,723, respectively) | | $ | 9,167,322 | | $ | 1,284,550 | | $ | — | | $ | 44,182 | |
Interest income | | | 7,434 | | | 1,903 | | | 8,734,075 | | | 26,852,931 | |
| | | | | | | | | | | | | |
Total investment income | | | 9,174,756 | | | 1,286,453 | | | 8,734,075 | | | 26,897,113 | |
| | | | | | | | | | | | | |
EXPENSES: | | | | | | | | | | | | | |
Investment advisory fees | | | 2,459,938 | | | 341,535 | | | 1,518,425 | | | 4,043,222 | |
Distribution (12b-1) fees | | | 647,352 | | | 89,878 | | | 474,508 | | | 1,347,758 | |
Shareholder servicing fees | | | 155,365 | | | 21,570 | | | 113,882 | | | 323,462 | |
Administration fees | | | 96,434 | | | 13,304 | | | 72,625 | | | 208,789 | |
Legal fees | | | 87,015 | | | 5,334 | | | 67,858 | | | 169,491 | |
Custody fees | | | 223,648 | | | 17,782 | | | 28,209 | | | 129,595 | |
Directors’ fees and expenses | | | 55,551 | | | 3,295 | | | 32,466 | | | 104,871 | |
Reports to shareholders | | | 44,524 | | | 7,938 | | | 24,541 | | | 87,320 | |
Fund accounting fees | | | 95,603 | | | 8,601 | | | 48,213 | | | 338,266 | |
Audit and tax fees | | | 31,876 | | | 27,519 | | | 27,508 | | | 37,412 | |
Federal and state registration fees | | | 28,145 | | | 23,499 | | | 33,278 | | | 38,529 | |
Transfer agent fees and expenses | | | 15,740 | | | 12,630 | | | 15,913 | | | 21,499 | |
Insurance fees | | | 15,039 | | | 2,072 | | | 10,595 | | | 29,444 | |
Compliance fees | | | 8,030 | | | 1,825 | | | 6,360 | | | 16,790 | |
| | | | | | | | | | | | | |
Total expenses | | | 3,964,260 | | | 576,782 | | | 2,474,381 | | | 6,896,448 | |
| | | | | | | | | | | | | |
Expense reimbursement by Advisor (See Note 3) | | | — | | | — | | | (25,920 | ) | | — | |
Less securities lending credit (See Note 6) | | | — | | | (42,240 | ) | | — | | | (181,943 | ) |
| | | | | | | | | | | | | |
Net expenses | | | 3,964,260 | | | 534,542 | | | 2,448,461 | | | 6,714,505 | |
| | | | | | | | | | | | | |
Net investment income | | | 5,210,496 | | | 751,911 | | | 6,285,614 | | | 20,182,608 | |
| | | | | | | | | | | | | |
NET REALIZED AND UNREALIZED GAIN (LOSS) | | | | | | | | | | | | | |
ON INVESTMENTS: | | | | | | | | | | | | | |
Net realized gain (loss) on: | | | | | | | | | | | | | |
Investments | | | 9,560,850 | | | (675,534 | ) | | 277,209 | | | (4,432,262 | ) |
Written options | | | — | | | — | | | — | | | 445,294 | |
Foreign currencies | | | (888,988 | ) | | — | | | — | | | (163,322 | ) |
Forward currency contracts | | | — | | | — | | | — | | | 466,570 | |
Futures contracts | | | — | | | — | | | — | | | 1,896,226 | |
| | | | | | | | | | | | | |
Total | | | 8,671,862 | | | (675,534 | ) | | 277,209 | | | (1,787,494 | ) |
| | | | | | | | | | | | | |
Net change in unrealized appreciation (depreciation) on: | | | | | | | | | | | | | |
Investments | | | 74,626,047 | | | 27,080,180 | | | 11,510,912 | | | 76,556,628 | |
Written options | | | — | | | — | | | — | | | (95,887 | ) |
Foreign currencies | | | 61,071 | | | — | | | — | | | 169,281 | |
Forward currency contracts | | | — | | | — | | | — | | | 91,248 | |
Forward sale commitments | | | — | | | — | | | — | | | 153,776 | |
Futures contracts | | | — | | | — | | | — | | | (1,197,405 | ) |
| | | | | | | | | | | | | |
Total | | | 74,687,118 | | | 27,080,180 | | | 11,510,912 | | | 75,677,641 | |
| | | | | | | | | | | | | |
Net realized and unrealized gain | | | 83,358,980 | | | 26,404,646 | | | 11,788,121 | | | 73,890,147 | |
| | | | | | | | | | | | | |
NET INCREASE IN NET ASSETS | | | | | | | | | | | | | |
RESULTING FROM OPERATIONS | | $ | 88,569,476 | | $ | 27,156,557 | | $ | 18,073,735 | | $ | 94,072,755 | |
| | | | | | | | | | | | | |
See notes to financial statements.
132
| | | | | | | | | | | | | |
AssetMark Funds |
STATEMENTS OF OPERATIONS (Continued) |
For the Year Ended March 31, 2010 |
| |
| | Enhanced
Fundamental
Index®
Large Company
Growth Fund | | Enhanced
Fundamental
Index®
Large Company
Value Fund | | Enhanced
Fundamental
Index®
Small Company
Growth Fund | | Enhanced
Fundamental
Index®
Small Company
Value Fund | |
| | | | | | | | | |
INVESTMENT INCOME: | | | | | | | | | | | | | |
Dividend income (net of withholding tax of
$0, $45, $0 and $11, respectively) | | $ | 1,298,873 | | $ | 1,097,627 | | $ | 170,445 | | $ | 100,221 | |
Interest income | | | 7,994 | | | 23,083 | | | 1,585 | | | 834 | |
| | | | | | | | | | | | | |
Total investment income | | | 1,306,867 | | | 1,120,710 | | | 172,030 | | | 101,055 | |
| | | | | | | | | | | | | |
EXPENSES: | | | | | | | | | | | | | |
Investment advisory fees | | | 445,790 | | | 369,541 | | | 107,277 | | | 61,933 | |
Distribution (12b-1) fees | | | 148,597 | | | 123,180 | | | 35,759 | | | 20,644 | |
Shareholder servicing fees | | | 35,663 | | | 29,564 | | | 8,582 | | | 4,955 | |
Administration fees | | | 79,654 | | | 66,047 | | | 19,347 | | | 11,170 | |
Legal fees | | | 20,205 | | | 17,098 | | | 7,593 | | | 2,596 | |
Custody fees | | | 10,458 | | | 9,533 | | | 2,640 | | | 1,928 | |
Directors’ fees and expenses | | | 12,961 | | | 10,847 | | | 2,979 | | | 1,764 | |
Reports to shareholders | | | 11,230 | | | 9,918 | | | 10,772 | | | 2,006 | |
Fund accounting fees | | | 63,396 | | | 52,479 | | | 15,371 | | | 8,878 | |
Audit and tax fees | | | 21,998 | | | 21,986 | | | 22,097 | | | 21,991 | |
Federal and state registration fees | | | 23,033 | | | 22,551 | | | 18,661 | | | 17,650 | |
Transfer agent fees and expenses | | | 13,017 | | | 12,809 | | | 12,518 | | | 12,490 | |
Insurance fees | | | 3,011 | | | 2,527 | | | 730 | | | 365 | |
Compliance fees | | | 2,662 | | | 1,460 | | | 365 | | | 365 | |
| | | | | | | | | | | | | |
Total expenses | | | 891,675 | | | 749,540 | | | 264,691 | | | 168,735 | |
| | | | | | | | | | | | | |
Expense (reimbursement)/recapture by Advisor
(See Note 3) | | | (150,369 | ) | | 14,292 | | | (76,154 | ) | | (44,443 | ) |
Less securities lending credit (See Note 6) | | | (16,154 | ) | | (162,712 | ) | | (14,033 | ) | | (23,547 | ) |
| | | | | | | | | | | | | |
Net expenses | | | 725,152 | | | 601,120 | | | 174,504 | | | 100,745 | |
| | | | | | | | | | | | | |
Net investment income (loss) | | | 581,715 | | | 519,590 | | | (2,474 | ) | | 310 | |
| | | | | | | | | | | | | |
NET REALIZED AND UNREALIZED GAIN (LOSS)
ON INVESTMENTS: | | | | | | | | | | | | | |
Net realized gain (loss) on: | | | | | | | | | | | | | |
Investments | | | (5,275,738 | ) | | (3,098,806 | ) | | 1,287,511 | | | 836,350 | |
Futures contracts | | | 1,301,353 | | | 991,383 | | | 364,731 | | | 166,111 | |
| | | | | | | | | | | | | |
Total | | | (3,974,385 | ) | | (2,107,423 | ) | | 1,652,242 | | | 1,002,461 | |
| | | | | | | | | | | | | |
Net change in unrealized appreciation (depreciation) on: | | | | | | | | | | | | | |
Investments | | | 24,932,679 | | | 28,158,386 | | | 5,994,891 | | | 4,374,858 | |
Futures contracts | | | (23,696 | ) | | (10,239 | ) | | (45,402 | ) | | (6,583 | ) |
| | | | | | | | | | | | | |
Total | | | 24,908,983 | | | 28,148,147 | | | 5,949,489 | | | 4,368,275 | |
| | | | | | | | | | | | | |
Net realized and unrealized gain | | | 20,934,598 | | | 26,040,724 | | | 7,601,731 | | | 5,370,736 | |
| | | | | | | | | | | | | |
NET INCREASE IN NET ASSETS
RESULTING FROM OPERATIONS | | $ | 21,516,313 | | $ | 26,560,314 | | $ | 7,599,257 | | $ | 5,371,046 | |
| | | | | | | | | | | | | |
See notes to financial statements.
133
| | | | | | | | | | | | | |
AssetMark Funds |
STATEMENTS OF CHANGES IN NET ASSETS |
|
| |
| | Large Cap Growth Fund | | Large Cap Value Fund | |
| | | | | |
| | Year
Ended
March 31,
2010 | | Year
Ended
March 31,
2009 | | Year
Ended
March 31,
2010 | | Year
Ended
March 31,
2009 | |
| | | | | | | | | |
OPERATIONS: | | | | | | | | | | | | | |
Net investment income (loss) | | $ | 312,348 | | $ | (101,958 | ) | $ | 2,779,177 | | $ | 6,847,863 | |
Net realized gain (loss) on investment transactions | | | 4,409,401 | | | (101,077,784 | ) | | (2,108,925 | ) | | (196,277,402 | ) |
Change in unrealized appreciation (depreciation)
on investments | | | 83,338,456 | | | (80,048,610 | ) | | 91,198,734 | | | (42,850,671 | ) |
| | | | | | | | | | | | | |
Net increase (decrease) in net assets resulting
from operations | | | 88,060,205 | | | (181,228,352 | ) | | 91,868,986 | | | (232,280,210 | ) |
| | | | | | | | | | | | | |
CAPITAL SHARE TRANSACTIONS: | | | | | | | | | | | | | |
Shares sold | | | 44,507,131 | | | 115,002,964 | | | 47,486,766 | | | 132,367,268 | |
Shares issued to holders in reinvestment of dividends | | | 436,737 | | | 21,374 | | | 3,205,994 | | | 4,035,189 | |
Shares redeemed | | | (128,118,332 | ) | | (379,582,696 | ) | | (118,909,177 | ) | | (290,318,553 | ) |
| | | | | | | | | | | | | |
Net decrease | | | (83,174,464 | ) | | (264,558,358 | ) | | (68,216,417 | ) | | (153,916,096 | ) |
| | | | | | | | | | | | | |
DIVIDENDS AND DISTRIBUTIONS
TO SHAREHOLDERS: | | | | | | | | | | | | | |
Net investment income | | | (312,348 | ) | | — | | | (3,205,994 | ) | | (8,006,947 | ) |
From net realized gains | | | — | | | (41,523 | ) | | — | | | (3,972 | ) |
Return of capital | | | (124,389 | ) | | — | | | — | | | — | |
| | | | | | | | | | | | | |
Total dividends and distributions | | | (436,737 | ) | | (41,523 | ) | | (3,205,994 | ) | | (8,010,919 | ) |
| | | | | | | | | | | | | |
| | | | | | | | | | | | | |
INCREASE (DECREASE) IN NET ASSETS | | | 4,449,004 | | | (445,828,233 | ) | | 20,446,575 | | | (394,207,225 | ) |
| | | | | | | | | | | | | |
NET ASSETS: | | | | | | | | | | | | | |
Beginning of year | | $ | 203,479,219 | | $ | 649,307,452 | | $ | 180,181,364 | | $ | 574,388,589 | |
| | | | | | | | | | | | | |
End of year (including undistributed net investment
income (loss) of (($119,204), $5,185, $592,601
and $1,019,418, respectively) | | $ | 207,928,223 | | $ | 203,479,219 | | $ | 200,627,939 | | $ | 180,181,364 | |
| | | | | | | | | | | | | |
| | | | | | | | | | | | | |
CHANGES IN SHARES OUTSTANDING | | | | | | | | | | | | | |
Shares sold | | | 6,098,350 | | | 15,129,303 | | | 7,400,493 | | | 17,638,533 | |
Shares issued to holders in reinvestment of dividends | | | 54,456 | | | 3,783 | | | 449,019 | | | 732,339 | |
Shares redeemed | | | (17,316,881 | ) | | (52,990,271 | ) | | (18,007,928 | ) | | (39,585,341 | ) |
| | | | | | | | | | | | | |
Net decrease | | | (11,164,075 | ) | | (37,857,185 | ) | | (10,158,416 | ) | | (21,214,469 | ) |
| | | | | | | | | | | | | |
See notes to financial statements.
134
| | | | | | | | | | | | | |
AssetMark Funds |
STATEMENTS OF CHANGES IN NET ASSETS (Continued) |
|
| |
| | Small/Mid Cap Growth Fund | | Small/Mid Cap Value Fund | |
| | | | | |
| | Year
Ended
March 31,
2010 | | Year
Ended
March 31,
2009 | | Year
Ended
March 31,
2010 | | Year
Ended
March 31,
2009 | |
| | | | | | | | | |
OPERATIONS: | | | | | | | | | | | | | |
Net investment income (loss) | | $ | (235,330 | ) | $ | (602,469 | ) | $ | 10,344 | | $ | 692,982 | |
Net realized gain (loss) on investment transactions | | | 12,129,280 | | | (25,626,820 | ) | | (3,476,667 | ) | | (17,333,806 | ) |
Change in unrealized appreciation (depreciation)
on investments | | | 10,338,185 | | | (8,542,911 | ) | | 29,747,497 | | | (16,861,051 | ) |
| | | | | | | | | | | | | |
Net increase (decrease) in net assets resulting
from operations | | | 22,232,135 | | | (34,772,200 | ) | | 26,281,174 | | | (33,501,875 | ) |
| | | | | | | | | | | | | |
CAPITAL SHARE TRANSACTIONS: | | | | | | | | | | | | | |
Shares sold | | | 8,347,866 | | | 35,335,158 | | | 10,261,480 | | | 40,458,584 | |
Shares issued to holders in reinvestment of dividends | | | — | | | 68,972 | | | 132,181 | | | 340,873 | |
Shares redeemed | | | (36,927,371 | ) | | (80,436,506 | ) | | (39,072,820 | ) | | (61,005,517 | ) |
| | | | | | | | | | | | | |
Net decrease | | | (28,579,505 | ) | | (45,032,376 | ) | | (28,679,159 | ) | | (20,206,060 | ) |
| | | | | | | | | | | | | |
DIVIDENDS AND DISTRIBUTIONS
TO SHAREHOLDERS: | | | | | | | | | | | | | |
Net investment income | | | — | | | — | | | (10,573 | ) | | (629,649 | ) |
From net realized gains | | | — | | | (132,673 | ) | | — | | | — | |
Return of capital | | | — | | | — | | | (121,608 | ) | | (31,146 | ) |
| | | | | | | | | | | | | |
Total dividends and distributions | | | — | | | (132,673 | ) | | (132,181 | ) | | (660,795 | ) |
| | | | | | | | | | | | | |
| | | | | | | | | | | | | |
DECREASE IN NET ASSETS | | | (6,347,370 | ) | | (79,937,249 | ) | | (2,530,166 | ) | | (54,368,730 | ) |
| | | | | | | | | | | | | |
NET ASSETS: | | | | | | | | | | | | | |
Beginning of year | | $ | 46,597,556 | | $ | 126,534,805 | | $ | 45,179,654 | | $ | 99,548,384 | |
| | | | | | | | | | | | | |
End of year (including undistributed net investment
income (loss) of (($188,935), $88,037, $2,996 and
$64,600, respectively) | | $ | 40,250,186 | | $ | 46,597,556 | | $ | 42,649,488 | | $ | 45,179,654 | |
| | | | | | | | | | | | | |
| | | | | | | | | | | | | |
CHANGES IN SHARES OUTSTANDING | | | | | | | | | | | | | |
Shares sold | | | 1,323,101 | | | 5,246,578 | | | 1,379,226 | | | 5,003,895 | |
Shares issued to holders in reinvestment of dividends | | | — | | | 13,658 | | | 15,388 | | | 53,681 | |
Shares redeemed | | | (5,581,633 | ) | | (11,469,038 | ) | | (4,821,360 | ) | | (7,900,445 | ) |
| | | | | | | | | | | | | |
Net decrease | | | (4,258,532 | ) | | (6,208,802 | ) | | (3,426,746 | ) | | (2,842,869 | ) |
| | | | | | | | | | | | | |
See notes to financial statements.
135
| | | | | | | | | | | | | |
AssetMark Funds |
STATEMENTS OF CHANGES IN NET ASSETS (Continued) |
|
| |
| | International Equity Fund | | Real Estate Securities Fund | |
| | | | | |
| | Year
Ended
March 31,
2010 | | Year
Ended
March 31,
2009 | | Year
Ended
March 31,
2010 | | Year
Ended
March 31,
2009 | |
| | | | | | | | | |
OPERATIONS: | | | | | | | | | | | | | |
Net investment income | | $ | 5,210,496 | | $ | 8,932,734 | | $ | 751,911 | | $ | 1,351,488 | |
Net realized gain (loss) on investment transactions | | | 8,671,862 | | | (234,065,611 | ) | | (675,534 | ) | | (7,077,632 | ) |
Change in unrealized appreciation (depreciation)
on investments | | | 74,687,118 | | | (78,554,201 | ) | | 27,080,180 | | | (29,505,120 | ) |
| | | | | | | | | | | | | |
Net increase (decrease) in net assets resulting
from operations | | | 88,569,476 | | | (303,687,078 | ) | | 27,156,557 | | | (35,231,274 | ) |
| | | | | | | | | | | | | |
CAPITAL SHARE TRANSACTIONS: | | | | | | | | | | | | | |
Shares sold | | | 80,322,291 | | | 194,365,038 | | | 19,760,246 | | | 76,749,848 | |
Shares issued to holders in reinvestment of dividends | | | 6,512,687 | | | 3,227,760 | | | 744,733 | | | 285,858 | |
Shares redeemed | | | (122,609,399 | ) | | (345,996,813 | ) | | (42,120,324 | ) | | (77,204,383 | ) |
| | | | | | | | | | | | | |
Net decrease | | | (35,774,421 | ) | | (148,404,015 | ) | | (21,615,345 | ) | | (168,677 | ) |
| | | | | | | | | | | | | |
DIVIDENDS AND DISTRIBUTIONS
TO SHAREHOLDERS: | | | | | | | | | | | | | |
Net investment income | | | (6,512,687 | ) | | (2,826,522 | ) | | (744,733 | ) | | (543,149 | ) |
From net realized gains | | | — | | | (3,365,214 | ) | | — | | | — | |
| | | | | | | | | | | | | |
Total dividends and distributions | | | (6,512,687 | ) | | (6,191,736 | ) | | (744,733 | ) | | (543,149 | ) |
| | | | | | | | | | | | | |
| | | | | | | | | | | | | |
INCREASE (DECREASE) IN NET ASSETS | | | 46,282,368 | | | (458,282,829 | ) | | 4,796,479 | | | (35,943,100 | ) |
| | | | | | | | | | | | | |
NET ASSETS: | | | | | | | | | | | | | |
Beginning of year | | $ | 223,339,201 | | $ | 681,622,030 | | $ | 46,181,678 | | $ | 82,124,778 | |
| | | | | | | | | | | | | |
End of year (including undistributed net investment
income of $5,210,496, $6,512,687, $7,178 and
$0, respectively) | | $ | 269,621,569 | | $ | 223,339,201 | | $ | 50,978,157 | | $ | 46,181,678 | |
| | | | | | | | | | | | | |
| | | | | | | | | | | | | |
CHANGES IN SHARES OUTSTANDING | | | | | | | | | | | | | |
Shares sold | | | 10,502,217 | | | 22,784,286 | | | 2,206,056 | | | 10,505,784 | |
Shares issued to holders in reinvestment of dividends | | | 806,026 | | | 489,054 | | | 79,993 | | | 39,703 | |
Shares redeemed | | | (16,141,843 | ) | | (41,762,653 | ) | | (6,204,761 | ) | | (7,519,879 | ) |
| | | | | | | | | | | | | |
Net increase (decrease) | | | (4,833,600 | ) | | (18,489,313 | ) | | (3,918,712 | ) | | 3,025,608 | |
| | | | | | | | | | | | | |
See notes to financial statements.
136
|
AssetMark Funds |
STATEMENTS OF CHANGES IN NET ASSETS (Continued) |
| | | | | | | | | | | | | |
| | | | | | |
| | Tax-Exempt Fixed Income Fund | | Core Plus Fixed Income Fund | |
| | | | | |
| | Year
Ended
March 31,
2010 | | Year
Ended
March 31,
2009 | | Year
Ended
March 31,
2010 | | Year
Ended
March 31,
2009 | |
| | | | | | | | | |
OPERATIONS: | | | | | | | | | | | | | |
Net investment income | | $ | 6,285,614 | | $ | 7,027,668 | | $ | 20,182,608 | | $ | 28,686,142 | |
Net realized gain (loss) on investment transactions | | | 277,209 | | | (4,975,869 | ) | | (1,787,494 | ) | | 2,761,832 | |
Change in unrealized appreciation (depreciation)
on investments | | | 11,510,912 | | | (2,952,074 | ) | | 75,677,641 | | | (84,215,994 | ) |
| | | | | | | | | | | | | |
Net increase (decrease) in net assets resulting
from operations | | | 18,073,735 | | | (900,275 | ) | | 94,072,755 | | | (52,768,020 | ) |
| | | | | | | | | | | | | |
CAPITAL SHARE TRANSACTIONS: | | | | | | | | | | | | | |
Shares sold | | | 85,249,245 | | | 151,089,362 | | | 229,127,655 | | | 367,493,809 | |
Shares issued to holders in reinvestment of dividends | | | 6,165,984 | | | 3,578,566 | | | 19,827,926 | | | 20,027,049 | |
Shares redeemed | | | (101,573,939 | ) | | (210,502,796 | ) | | (279,687,960 | ) | | (594,635,630 | ) |
| | | | | | | | | | | | | |
Net decrease | | | (10,158,710 | ) | | (55,834,868 | ) | | (30,732,379 | ) | | (207,114,772 | ) |
| | | | | | | | | | | | | |
DIVIDENDS AND DISTRIBUTIONS
TO SHAREHOLDERS: | | | | | | | | | | | | | |
Net investment income | | | (6,165,984 | ) | | (7,125,080 | ) | | (19,828,054 | ) | | (28,304,294 | ) |
From net realized gains | | | — | | | — | | | — | | | (11,447,403 | ) |
| | | | | | | | | | | | | |
Total dividends and distributions | | | (6,165,984 | ) | | (7,125,080 | ) | | (19,828,054 | ) | | (39,751,697 | ) |
| | | | | | | | | | | | | |
| | | | | | | | | | | | | |
INCREASE (DECREASE) IN NET ASSETS | | | 1,749,041 | | | (63,860,223 | ) | | 43,512,322 | | | (299,634,489 | ) |
| | | | | | | | | | | | | |
NET ASSETS: | | | | | | | | | | | | | |
Beginning of year | | $ | 193,579,910 | | $ | 257,440,133 | | $ | 504,451,429 | | $ | 804,085,918 | |
| | | | | | | | | | | | | |
End of year (including undistributed net investment
income of $218,410, $98,780, $2,289,729 and
$947,533, respectively) | | $ | 195,328,951 | | $ | 193,579,910 | | $ | 547,963,751 | | $ | 504,451,429 | |
| | | | | | | | | | | | | |
| | | | | | | | | | | | | |
CHANGES IN SHARES OUTSTANDING | | | | | | | | | | | | | |
Shares sold | | | 7,880,178 | | | 14,687,220 | | | 26,228,305 | | | 43,769,031 | |
Shares issued to holders in reinvestment of dividends | | | 569,272 | | | 349,712 | | | 2,270,155 | | | 2,431,720 | |
Shares redeemed | | | (9,440,467 | ) | | (20,388,213 | ) | | (31,956,596 | ) | | (69,936,071 | ) |
| | | | | | | | | | | | | |
Net decrease | | | (991,017 | ) | | (5,351,281 | ) | | (3,458,136 | ) | | (23,735,320 | ) |
| | | | | | | | | | | | | |
See notes to financial statements.
137
|
AssetMark Funds |
STATEMENTS OF CHANGES IN NET ASSETS (Continued) |
| | | | | | | | | | | | | |
| | | | | | | | | | | | | | |
| | Enhanced
Fundamental Index® Large
Company Growth Fund | | Enhanced
Fundamental Index® Large
Company Value Fund | |
| | | | | |
| | Year
Ended
March 31,
2010 | | Year
Ended
March 31,
2009 | | Year
Ended
March 31,
2010 | | Year
Ended
March 31,
2009 | |
| | | | | | | | | |
OPERATIONS: | | | | | | | | | | | | | |
Net investment income | | $ | 581,715 | | $ | 686,466 | | $ | 519,590 | | $ | 1,290,388 | |
Net realized loss on investment transactions | | | (3,974,385 | ) | | (17,524,240 | ) | | (2,107,423 | ) | | (23,944,567 | ) |
Change in unrealized appreciation (depreciation)
on investments | | | 24,908,983 | | | (11,795,162 | ) | | 28,148,147 | | | (12,030,246 | ) |
| | | | | | | | | | | | | |
Net increase (decrease) in net assets resulting
from operations | | | 21,516,313 | | | (28,632,936 | ) | | 26,560,314 | | | (34,684,425 | ) |
| | | | | | | | | | | | | |
CAPITAL SHARE TRANSACTIONS: | | | | | | | | | | | | | |
Shares sold | | | 31,166,944 | | | 69,899,546 | | | 22,705,815 | | | 67,799,021 | |
Shares issued to holders in reinvestment of dividends | | | 630,394 | | | 354,616 | | | 671,533 | | | 694,237 | |
Shares redeemed | | | (27,721,788 | ) | | (62,727,279 | ) | | (29,880,501 | ) | | (50,345,840 | ) |
| | | | | | | | | | | | | |
Net increase (decrease) | | | 4,075,550 | | | 7,526,883 | | | (6,503,153 | ) | | 18,147,418 | |
| | | | | | | | | | | | | |
DIVIDENDS AND DISTRIBUTIONS
TO SHAREHOLDERS: | | | | | | | | | | | | | |
Net investment income | | | (630,394 | ) | | (610,709 | ) | | (671,533 | ) | | (1,211,759 | ) |
| | | | | | | | | | | | | |
Total dividends and distributions | | | (630,394 | ) | | (610,709 | ) | | (671,533 | ) | | (1,211,759 | ) |
| | | | | | | | | | | | | |
| | | | | | | | | | | | | |
INCREASE (DECREASE) IN NET ASSETS | | | 24,961,469 | | | (21,716,762 | ) | | 19,385,628 | | | (17,748,766 | ) |
| | | | | | | | | | | | | |
NET ASSETS: | | | | | | | | | | | | | |
Beginning of year | | $ | 45,830,177 | | $ | 67,546,939 | | $ | 36,948,314 | | $ | 54,697,080 | |
| | | | | | | | | | | | | |
End of year (including undistributed net investment
income of $127,195, $175,874, $126,000 and
$277,943, respectively) | | $ | 70,791,646 | | $ | 45,830,177 | | $ | 56,333,942 | | $ | 36,948,314 | |
| | | | | | | | | | | | | |
| | | | | | | | | | | | | |
| | | | | | | | | | | | | |
CHANGES IN SHARES OUTSTANDING | | | | | | | | | | | | | |
Shares sold | | | 3,781,334 | | | 8,530,402 | | | 3,437,719 | | | 10,406,162 | |
Shares issued to holders in reinvestment of dividends | | | 70,751 | | | 52,849 | | | 94,316 | | | 139,686 | |
Shares redeemed | | | (3,400,284 | ) | | (8,410,471 | ) | | (4,659,346 | ) | | (8,564,241 | ) |
| | | | | | | | | | | | | |
Net increase (decrease) | | | 451,801 | | | 172,780 | | | (1,127,311 | ) | | 1,981,607 | |
| | | | | | | | | | | | | |
See notes to financial statements.
138
|
AssetMark Funds |
STATEMENTS OF CHANGES IN NET ASSETS (Continued) |
| | | | | | | | | | | | | |
| | | | | | | | | | | | | | |
| | Enhanced
Fundamental Index® Small
Company Growth Fund | | Enhanced
Fundamental Index® Small
Company Value Fund | |
| | | | | |
| | Year
Ended
March 31,
2010 | | Year
Ended
March 31,
2009 | | Year
Ended
March 31,
2010 | | Year
Ended
March 31,
2009 | |
| | | | | | | | | |
OPERATIONS: | | | | | | | | | | | | | |
Net investment income (loss) | | $ | (2,474 | ) | $ | (19,208 | ) | $ | 310 | | $ | 68,294 | |
Net realized gain (loss) on investment transactions | | | 1,652,242 | | | (3,308,536 | ) | | 1,002,461 | | | (2,593,564 | ) |
Change in unrealized appreciation (depreciation)
on investments | | | 5,949,489 | | | (2,340,903 | ) | | 4,368,275 | | | (2,497,329 | ) |
| | | | | | | | | | | | | |
Net increase (decrease) in net assets resulting
from operations | | | 7,599,257 | | | (5,668,647 | ) | | 5,371,046 | | | (5,022,599 | ) |
| | | | | | | | | | | | | |
CAPITAL SHARE TRANSACTIONS: | | | | | | | | | | | | | |
Shares sold | | | 6,273,047 | | | 15,292,704 | | | 3,034,857 | | | 11,270,413 | |
Shares issued to holders in reinvestment of dividends | �� | | — | | | — | | | — | | | 56,966 | |
Shares redeemed | | | (9,421,747 | ) | | (11,634,256 | ) | | (6,402,256 | ) | | (6,403,312 | ) |
| | | | | | | | | | | | | |
Net increase (decrease) | | | (3,148,700 | ) | | 3,658,448 | | | (3,367,399 | ) | | 4,924,067 | |
| | | | | | | | | | | | | |
DIVIDENDS AND DISTRIBUTIONS
TO SHAREHOLDERS: | | | | | | | | | | | | | |
Net investment income | | | — | | | — | | | — | | | (86,041 | ) |
Return of capital | | | — | | | — | | | — | | | (16,930 | ) |
| | | | | | | | | | | | | |
Total dividends and distributions | | | — | | | — | | | — | | | (102,971 | ) |
| | | | | | | | | | | | | |
| | | | | | | | | | | | | |
INCREASE (DECREASE) IN NET ASSETS | | | 4,450,557 | | | (2,010,199 | ) | | 2,003,647 | | | (201,503 | ) |
| | | | | | | | | | | | | |
NET ASSETS: | | | | | | | | | | | | | |
Beginning of year | | $ | 10,600,699 | | $ | 12,610,898 | | $ | 5,843,958 | | $ | 6,045,461 | |
| | | | | | | | | | | | | |
End of year (including undistributed net investment
income (loss) of ($2,091), $383, $889 and
$579, respectively) | | $ | 15,051,256 | | $ | 10,600,699 | | $ | 7,847,605 | | $ | 5,843,958 | |
| | | | | | | | | | | | | |
| | | | | | | | | | | | | |
| | | | | | | | | | | | | |
CHANGES IN SHARES OUTSTANDING | | | | | | | | | | | | | |
Shares sold | | | 735,301 | | | 2,072,271 | | | 449,545 | | | 1,875,381 | |
Shares issued to holders in reinvestment of dividends | | | — | | | — | | | — | | | 12,043 | |
Shares redeemed | | | (1,083,105 | ) | | (1,637,721 | ) | | (915,553 | ) | | (1,198,319 | ) |
| | | | | | | | | | | | | |
Net increase (decrease) | | | (347,804 | ) | | 434,550 | | | (466,008 | ) | | 689,105 | |
| | | | | | | | | | | | | |
See notes to financial statements.
139
|
AssetMark Funds |
FINANCIAL HIGHLIGHTS |
|
| |
| | | | | | | | | | | | | | | | |
| | Large Cap Growth Fund | |
| | | |
| | Year Ended
March 31, 2010 | | Year Ended
March 31, 2009 | | Year Ended
March 31, 2008 | | Year Ended
March 31, 2007 | | Period Ended
March 31, 2006 | |
| | | | | | | | | | | |
Per share data for a share of capital
stock outstanding for the entire period
and selected information for the period
are as follows: | | | | | | | | | | | | | | | | |
Net asset value, beginning of period | | | $ 5.67 | | | $ 8.81 | | | $ 9.62 | | | $ 9.95 | | | $ 9.20 | |
|
Income from investment operations: | | | | | | | | | | | | | | | | |
Net investment income (loss) | | | 0.01 | | | 0.00 | | | (0.01 | ) | | (0.02 | ) | | (0.03 | ) |
Net realized and unrealized gains
(losses) on investments | | | 2.75 | | | (3.14 | ) | | (0.30 | ) | | (0.06 | ) | | 0.78 | |
| | | | | | | | | | | | | | | | |
Total from investment operations | | | 2.76 | | | (3.14 | ) | | (0.31 | ) | | (0.08 | ) | | 0.75 | |
| | | | | | | | | | | | | | | | |
|
Less distributions: | | | | | | | | | | | | | | | | |
Dividends from net investment
income | | | (0.01 | ) | | — | | | — | | | — | | | — | |
Dividends from net realized gains | | | — | | | — | * | | (0.50 | ) | | (0.25 | ) | | — | |
Return of capital | | | (0.01 | ) | | — | | | — | | | — | | | — | |
| | | | | | | | | | | | | | | | |
Total distributions | | | (0.02 | ) | | — | | | (0.50 | ) | | (0.25 | ) | | — | |
| | | | | | | | | | | | | | | | |
Net asset value, end of period | | | $ 8.41 | | | $ 5.67 | | | $ 8.81 | | | $ 9.62 | | | $ 9.95 | |
| | | | | | | | | | | | | | | | |
| | | | | | | | | | | | | | | | |
Total return | | | 48.60 | % | | –35.63 | % | | –3.88 | % | | –0.80 | % | | 8.15 | % (1) |
|
Supplemental data and ratios: | | | | | | | | | | | | | | | | |
Net assets, end of period | | | $207,928,223 | | | $203,479,219 | | | $649,307,452 | | | $753,638,303 | | | $653,921,538 | |
|
Ratio of expenses to average net assets | | | | | | | | | | | | | | | | |
Before expense reimbursement,
including (recapture) and
securities lending credit | | | 1.46 | % | | 1.40 | % | | 1.33 | % | | 1.33 | % | | 1.35 | %(2) |
After expense reimbursement
(recapture) and securities
lending credit | | | 1.41 | % | | 1.27 | % | | 1.28 | % | | 1.31 | % | | 1.32 | %(2) |
|
Ratio of net investment income
(loss) to average net assets | | | | | | | | | | | | | | | | |
Before expense reimbursement,
including (recapture) | | | 0.09 | % | | –0.15 | % | | –0.15 | % | | –0.27 | % | | –0.38 | %(2) |
After expense reimbursement
(recapture) | | | 0.14 | % | | –0.02 | % | | –0.10 | % | | –0.25 | % | | –0.35 | %(2) |
|
Portfolio turnover rate | | | 69.83 | % | | 98.67 | % | | 62.86 | % | | 142.66 | % | | 72.34 | % |
| |
(1) | Not Annualized. |
(2) | Annualized. |
* | Amount represents less than $0.01 per share. |
See notes to financial statements.
140
|
AssetMark Funds |
FINANCIAL HIGHLIGHTS |
|
| |
| | | | | | | | | | | | | | | | |
| | Large Cap Value Fund | |
| | | |
| | Year Ended
March 31, 2010 | | Year Ended
March 31, 2009 | | Year Ended
March 31, 2008 | | Year Ended
March 31, 2007 | | Period Ended
March 31, 2006 | |
| | | | | | | | | | | |
Per share data for a share of capital
stock outstanding for the entire period
and selected information for the period
are as follows: | | | | | | | | | | | | | | | | |
Net asset value, beginning of period | | | $ 4.85 | | | $ 9.85 | | | $12.34 | | | $11.77 | | | $ 11.24 | |
| | | | | | | | | | | | | | | | |
Income from investment operations: | | | | | | | | | | | | | | | | |
Net investment income | | | 0.10 | | | 0.19 | | | 0.15 | | | 0.14 | | | 0.07 | |
Net realized and unrealized gains
(losses) on investments | | | 2.60 | | | (4.99 | ) | | (1.55 | ) | | 1.67 | | | 0.79 | |
| | | | | | | | | | | | | | | | |
Total from investment operations | | | 2.70 | | | (4.80 | ) | | (1.40 | ) | | 1.81 | | | 0.86 | |
| | | | | | | | | | | | | | | | |
| | | | | | | | | | | | | | | | |
Less distributions: | | | | | | | | | | | | | | | | |
Dividends from net investment income | | | (0.11 | ) | | (0.20 | ) | | (0.14 | ) | | (0.14 | ) | | (0.07 | ) |
Dividends from net realized gains | | | — | | | — | * | | (0.95 | ) | | (1.10 | ) | | (0.26 | ) |
| | | | | | | | | | | | | | | | |
Total distributions | | | (0.11 | ) | | (0.20 | ) | | (1.09 | ) | | (1.24 | ) | | (0.33 | ) |
| | | | | | | | | | | | | | | | |
Net asset value, end of period | | | $ 7.44 | | | $ 4.85 | | | $ 9.85 | | | $12.34 | | | $11.77 | |
| | | | | | | | | | | | | | | | |
| | | | | | | | | | | | | | | | |
Total return | | | 55.37 | % | | –48.85 | % | | –12.23 | % | | 15.32 | % | | 7.85 | %(1) |
| | | | | | | | | | | | | | | | |
Supplemental data and ratios: | | | | | | | | | | | | | | | | |
Net assets, end of period | | | $200,627,939 | | | $180,181,364 | | | $574,388,589 | | | $682,408,978 | | | $660,129,983 | |
| | | | | | | | | | | | | | | | |
Ratio of expenses to average net assets | | | | | | | | | | | | | | | | |
Before expense reimbursement,
including (recapture) and
securities lending credit | | | 1.44 | % | | 1.38 | % | | 1.33 | % | | 1.32 | % | | 1.36 | %(2) |
After expense reimbursement
(recapture) and securities
lending credit | | | 1.40 | % | | 1.22 | % | | 1.28 | % | | 1.28 | % | | 1.30 | %(2) |
| | | | | | | | | | | | | | | | |
Ratio of net investment income
to average net assets | | | | | | | | | | | | | | | | |
Before expense reimbursement,
including (recapture) | | | 1.27 | % | | 1.60 | % | | 1.16 | % | | 1.00 | % | | 0.86 | %(2) |
After expense reimbursement
(recapture) | | | 1.31 | % | | 1.76 | % | | 1.21 | % | | 1.04 | % | | 0.92 | %(2) |
|
Portfolio turnover rate | | | 26.85 | % | | 58.45 | % | | 40.54 | % | | 30.25 | % | | 64.61 | % |
| |
(1) | Not Annualized. |
(2) | Annualized. |
* | Amount represents less than $0.01 per share. |
See notes to financial statements.
141
|
AssetMark Funds |
FINANCIAL HIGHLIGHTS |
|
| |
| | | | | | | | | | | | | | | | |
| | Small/Mid Cap Growth Fund | |
| | | |
| | Year Ended
March 31, 2010 | | Year Ended
March 31, 2009 | | Year Ended
March 31, 2008 | | Year Ended
March 31, 2007 | | Period Ended
March 31, 2006 | |
| | | | | | | | | | | |
Per share data for a share of capital
stock outstanding for the entire period
and selected information for the period
are as follows: | | | | | | | | | | | | | | | | |
Net asset value, beginning of period | | | $ 4.90 | | | $ 8.05 | | | $10.65 | | | $10.60 | | | $ 9.56 | |
| | | | | | | | | | | | | | | | |
Income from investment operations: | | | | | | | | | | | | | | | | |
Net investment loss | | | (0.04 | ) | | (0.06 | ) | | (0.09 | ) | | (0.07 | ) | | (0.06 | ) |
Net realized and unrealized gains
(losses) on investments | | | 2.81 | | | (3.08 | ) | | (0.69 | ) | | 0.56 | | | 1.95 | |
| | | | | | | | | | | | | | | | |
Total from investment operations | | | 2.77 | | | (3.14 | ) | | (0.78 | ) | | 0.49 | | | 1.89 | |
| | | | | | | | | | | | | | | | |
| | | | | | | | | | | | | | | | |
Less distributions: | | | | | | | | | | | | | | | | |
Dividends from net realized gains | | | — | | | (0.01 | ) | | (1.82 | ) | | (0.44 | ) | | (0.85 | ) |
| | | | | | | | | | | | | | | | |
Total distributions | | | — | | | (0.01 | ) | | (1.82 | ) | | (0.44 | ) | | (0.85 | ) |
| | | | | | | | | | | | | | | | |
Net asset value, end of period | | | $ 7.67 | | | $ 4.90 | | | $ 8.05 | | | $10.65 | | | $ 10.60 | |
| | | | | | | | | | | | | | | | |
| | | | | | | | | | | | | | | | |
Total return | | | 56.53 | % | | –38.98 | % | | –10.31 | % | | 4.84 | % | | 20.82 | %(1) |
| | | | | | | | | | | | | | | | |
Supplemental data and ratios: | | | | | | | | | | | | | | | | |
Net assets, end of period | | | $40,250,186 | | | $46,597,556 | | | $126,534,805 | | | $171,403,932 | | | $215,514,988 | |
| | | | | | | | | | | | | | | | |
Ratio of expenses to average net assets | | | | | | | | | | | | | | | | |
Before expense reimbursement,
including (recapture) and
securities lending credit | | | 1.65 | % | | 1.54 | % | | 1.44 | % | | 1.43 | % | | 1.43 | %(2) |
After expense reimbursement
(recapture) and securities
lending credit | | | 1.50 | % | | 1.26 | % | | 1.29 | % | | 1.37 | % | | 1.38 | %(2) |
| | | | | | | | | | | | | | | | |
Ratio of net investment (loss) to
average net assets | | | | | | | | | | | | | | | | |
Before expense reimbursement,
including (recapture) | | | –0.62 | % | | –1.01 | % | | –0.99 | % | | –0.75 | % | | –0.92 | %(2) |
After expense reimbursement
(recapture) | | | –0.47 | % | | –0.73 | % | | –0.84 | % | | –0.69 | % | | –0.87 | %(2) |
|
Portfolio turnover rate | | | 209.03 | % | | 219.24 | % | | 209.64 | % | | 213.08 | % | | 180.64 | % |
| |
(1) | Not Annualized. |
(2) | Annualized. |
See notes to financial statements.
142
|
AssetMark Funds |
FINANCIAL HIGHLIGHTS |
|
| |
| | | | | | | | | | | | | | | | |
| | Small/Mid Cap Value Fund | |
| | | |
| | Year Ended
March 31, 2010 | | Year Ended
March 31, 2009 | | Year Ended
March 31, 2008 | | Year Ended
March 31, 2007 | | Period Ended
March 31, 2006 | |
| | | | | | | | | | | |
Per share data for a share of capital
stock outstanding for the entire period
and selected information for the period
are as follows: | | | | | | | | | | | | | | | | |
Net asset value, beginning of period | | | $ 5.69 | | | $ 9.24 | | | $11.95 | | | $14.41 | | | $13.89 | |
| | | | | | | | | | | | | | | | |
Income from investment operations: | | | | | | | | | | | | | | | | |
Net investment income (loss) | | | 0.01 | | | 0.08 | | | 0.08 | | | 0.31 | | | (0.04 | ) |
Net realized and unrealized gains
(losses) on investments | | | 3.78 | | | (3.56 | ) | | (2.36 | ) | | 0.81 | | | 1.52 | |
| | | | | | | | | | | | | | | | |
Total from investment operations | | | 3.79 | | | (3.48 | ) | | (2.28 | ) | | 1.12 | | | 1.48 | |
| | | | | | | | | | | | | | | | |
| | | | | | | | | | | | | | | | |
Less distributions: | | | | | | | | | | | | | | | | |
Dividends from net investment income | | | — | * | | (0.07 | ) | | (0.08 | ) | | (0.31 | ) | | — | |
Dividends from net realized gains | | | — | | | — | | | (0.35 | ) | | (3.27 | ) | | (0.96 | ) |
Return of capital | | | (0.02 | ) | | — | * | | — | * | | — | | | — | |
| | | | | | | | | | | | | | | | |
Total distributions | | | (0.02 | ) | | (0.07 | ) | | (0.43 | ) | | (3.58 | ) | | (0.96 | ) |
| | | | | | | | | | | | | | | | |
Net asset value, end of period | | | $ 9.46 | | | $ 5.69 | | | $ 9.24 | | | $11.95 | | | $14.41 | |
| | | | | | | | | | | | | | | | |
| | | | | | | | | | | | | | | | |
Total return | | | 66.39 | % | | –37.59 | % | | –19.47 | % | | 7.63 | % | | 11.18 | %(1) |
| | | | | | | | | | | | | | | | |
Supplemental data and ratios: | | | | | | | | | | | | | | | | |
Net assets, end of period | | | $42,649,488 | | | $45,179,654 | | | $99,548,384 | | | $110,079,540 | | | $185,589,680 | |
| | | | | | | | | | | | | | | | |
Ratio of expenses to average net assets | | | | | | | | | | | | | | | | |
Before expense reimbursement,
including (recapture) and
securities lending credit | | | 1.67 | % | | 1.59 | % | | 1.48 | % | | 1.47 | % | | 1.55 | %(2) |
After expense reimbursement
(recapture) and securities
lending credit | | | 1.59 | % | | 1.28 | % | | 1.40 | % | | 1.41 | % | | 1.53 | %(2) |
| | | | | | | | | | | | | | | | |
Ratio of net investment income (loss)
to average net assets | | | | | | | | | | | | | | | | |
Before expense reimbursement,
including (recapture) | | | –0.06 | % | | 0.58 | % | | 0.61 | % | | 1.68 | % | | –0.45 | %(2) |
After expense reimbursement
(recapture) | | | 0.02 | % | | 0.89 | % | | 0.69 | % | | 1.75 | % | | –0.43 | %(2) |
|
Portfolio turnover rate | | | 52.31 | % | | 65.97 | % | | 127.62 | % | | 174.94 | % | | 72.42 | % |
| |
(1) | Not Annualized. |
(2) | Annualized. |
* | Amount represents less than $0.01 per share. |
See notes to financial statements.
143
|
AssetMark Funds |
FINANCIAL HIGHLIGHTS |
|
| |
| | | | | | | | | | | | | | | | |
| | International Equity Fund | |
| | | |
| | Year Ended
March 31, 2010 | | Year Ended
March 31, 2009 | | Year Ended
March 31, 2008 | | Year Ended
March 31, 2007 | | Period Ended
March 31, 2006 | |
| | | | | | | | | | | |
Per share data for a share of capital | | | | | | | | | | | | | | | | |
stock outstanding for the entire period | | | | | | | | | | | | | | | | |
and selected information for the period | | | | | | | | | | | | | | | | |
are as follows: | | | | | | | | | | | | | | | | |
Net asset value, beginning of period | | | $ 5.80 | | | $11.96 | | | $14.73 | | | $14.06 | | | $11.79 | |
| | | | | | | | | | | | | | | | |
Income from investment operations: | | | | | | | | | | | | | | | | |
Net investment income (loss) | | | 0.20 | | | 0.25 | | | 0.13 | | | 0.16 | | | (0.01 | ) |
Net realized and unrealized gains | | | | | | | | | | | | | | | | |
(losses) on investments | | | 2.22 | | | (6.26 | ) | | (0.44 | ) | | 2.24 | | | 3.40 | |
| | | | | | | | | | | | | | | | |
Total from investment operations | | | 2.42 | | | (6.01 | ) | | (0.31 | ) | | 2.40 | | | 3.39 | |
| | | | | | | | | | | | | | | | |
| | | | | | | | | | | | | | | | |
Less distributions: | | | | | | | | | | | | | | | | |
Dividends from net investment | | | | | | | | | | | | | | | | |
income | | | (0.21 | ) | | (0.07 | ) | | (0.14 | ) | | (0.18 | ) | | (0.15 | ) |
Dividends from net realized gains | | | — | | | (0.08 | ) | | (2.32 | ) | | (1.55 | ) | | (0.97 | ) |
| | | | | | | | | | | | | | | | |
Total distributions | | | (0.21 | ) | | (0.15 | ) | | (2.46 | ) | | (1.73 | ) | | (1.12 | ) |
| | | | | | | | | | | | | | | | |
Net asset value, end of period | | | $ 8.01 | | | $ 5.80 | | | $11.96 | | | $14.73 | | | $14.06 | |
| | | | | | | | | | | | | | | | |
| | | | | | | | | | | | | | | | |
Total return | | | 41.68 | % | | –50.42 | % | | –3.85 | % | | 17.65 | % | | 29.75 | %(1) |
|
Supplemental data and ratios: | | | | | | | | | | | | | | | | |
Net assets, end of period | | | $269,621,569 | | | $223,339,201 | | | $681,622,030 | | | $779,422,324 | | | $612,288,218 | |
| | | | | | | | | | | | | | | | |
Ratio of expenses to average net assets | | | | | | | | | | | | | | | | |
Before expense reimbursement,
including (recapture) and
securities lending credit | | | 1.53 | % | | 1.53 | % | | 1.43 | % | | 1.39 | % | | 1.38 | %(2) |
After expense reimbursement
(recapture) and securities
lending credit | | | 1.53 | % | | 1.52 | % | | 1.42 | % | | 1.37 | % | | 1.34 | %(2) |
|
Ratio of net investment income | | | | | | | | | | | | | | | | |
(loss) to average net assets | | | | | | | | | | | | | | | | |
Before expense reimbursement,
including (recapture) | | | 2.01 | % | | 1.94 | % | | 0.87 | % | | 0.95 | % | | –0.16 | %(2) |
After expense reimbursement
(recapture) | | | 2.01 | % | | 1.95 | % | | 0.88 | % | | 0.97 | % | | –0.12 | %(2) |
|
Portfolio turnover rate | | | 65.33 | % | | 144.98 | % | | 119.13 | % | | 89.16 | % | | 66.98 | % |
| |
(1) | Not Annualized. |
(2) | Annualized. |
See notes to financial statements.
144
|
AssetMark Funds |
FINANCIAL HIGHLIGHTS |
|
| |
| | | | | | | | | | | | | | | | |
| | Real Estate Securities Fund | |
| | | |
| | Year Ended
March 31, 2010 | | Year Ended
March 31, 2009 | | Year Ended
March 31, 2008 | | Year Ended
March 31, 2007 | | Period Ended
March 31, 2006 | |
| | | | | | | | | | | |
Per share data for a share of capital | | | | | | | | | | | | | | | | |
stock outstanding for the entire period | | | | | | | | | | | | | | | | |
and selected information for the period | | | | | | | | | | | | | | | | |
are as follows: | | | | | | | | | | | | | | | | |
Net asset value, beginning of period | | | $ 5.15 | | | $13.83 | | | $20.91 | | | $18.46 | | | $17.31 | |
| | | | | | | | | | | | | | | | |
Income from investment operations: | | | | | | | | | | | | | | | | |
Net investment income | | | 0.19 | | | 0.15 | | | 0.43 | | | 0.16 | | | 0.33 | |
Net realized and unrealized gains | | | | | | | | | | | | | | | | |
(losses) on investments | | | 4.96 | | | (8.77 | ) | | (4.58 | ) | | 3.84 | | | 3.27 | |
| | | | | | | | | | | | | | | | |
Total from investment operations | | | 5.15 | | | (8.62 | ) | | (4.15 | ) | | 4.00 | | | 3.60 | |
| | | | | | | | | | | | | | | | |
| | | | | | | | | | | | | | | | |
Less distributions: | | | | | | | | | | | | | | | | |
Dividends from net investment | | | | | | | | | | | | | | | | |
income | | | (0.19 | ) | | (0.06 | ) | | (0.21 | ) | | (0.25 | ) | | (0.32 | ) |
Dividends from net realized gains | | | — | | | — | | | (2.68 | ) | | (1.30 | ) | | (2.13 | ) |
Return of capital | | | — | | | — | | | (0.04 | ) | | — | | | — | |
| | | | | | | | | | | | | | | | |
Total distributions | | | (0.19 | ) | | (0.06 | ) | | (2.93 | ) | | (1.55 | ) | | (2.45 | ) |
| | | | | | | | | | | | | | | | |
Net asset value, end of period | | | $10.11 | | | $ 5.15 | | | $13.83 | | | $20.91 | | | $18.46 | |
| | | | | | | | | | | | | | | | |
| | | | | | | | | | | | | | | | |
Total return | | | 100.30 | % | | –62.46 | % | | –19.74 | % | | 21.96 | % | | 22.94 | %(1) |
| | | | | | | | | | | | | | | | |
Supplemental data and ratios: | | | | | | | | | | | | | | | | |
Net assets, end of period | | | $50,978,157 | | | $46,181,678 | | | $82,124,778 | | | $117,462,121 | | | $89,616,046 | |
| | | | | | | | | | | | | | | | |
Ratio of expenses to average net assets | | | | | | | | | | | | | | | | |
Before expense reimbursement,
including (recapture) and
securities lending credit | | | 1.61 | % | | 1.69 | % | | 1.52 | % | | 1.49 | % | | 1.51 | %(2) |
After expense reimbursement
(recapture) and securities
lending credit | | | 1.49 | % | | 1.49 | % | | 1.46 | % | | 1.46 | % | | 1.49 | %(2) |
|
Ratio of net investment income to | | | | | | | | | | | | | | | | |
average net assets | | | | | | | | | | | | | | | | |
Before expense reimbursement,
including (recapture) | | | 1.97 | % | | 2.52 | % | | 0.99 | % | | 0.67 | % | | 2.46 | %(2) |
After expense reimbursement
(recapture) | | | 2.09 | % | | 2.72 | % | | 1.05 | % | | 0.70 | % | | 2.48 | %(2) |
|
Portfolio turnover rate | | | 78.39 | % | | 126.60 | % | | 81.59 | % | | 43.86 | % | | 41.09 | % |
| |
(1) | Not Annualized. |
(2) | Annualized. |
See notes to financial statements.
145
|
AssetMark Funds |
FINANCIAL HIGHLIGHTS |
|
| |
| | | | | | | | | | | | | | | | |
| | Tax-Exempt Fixed Income Fund | |
| | | |
| | Year Ended
March 31, 2010 | | Year Ended
March 31, 2009 | | Year Ended
March 31, 2008 | | Year Ended
March 31, 2007 | | Period Ended
March 31, 2006 | |
| | | | | | | | | | | |
Per share data for a share of capital | | | | | | | | | | | | | | | | |
stock outstanding for the entire period | | | | | | | | | | | | | | | | |
and selected information for the period | | | | | | | | | | | | | | | | |
are as follows: | | | | | | | | | | | | | | | | |
Net asset value, beginning of period | | | $10.27 | | | $10.64 | | | $10.92 | | | $10.77 | | | $11.01 | |
| | | | | | | | | | | | | | | | |
Income from investment operations: | | | | | | | | | | | | | | | | |
Net investment income | | | 0.36 | | | 0.34 | | | 0.31 | | | 0.27 | | | 0.17 | |
Net realized and unrealized gains | | | | | | | | | | | | | | | | |
(losses) on investments | | | 0.66 | | | (0.37 | ) | | (0.28 | ) | | 0.15 | | | (0.24 | ) |
| | | | | | | | | | | | | | | | |
Total from investment operations | | | 1.02 | | | (0.03 | ) | | 0.03 | | | 0.42 | | | (0.07 | ) |
| | | | | | | | | | | | | | | | |
| | | | | | | | | | | | | | | | |
Less distributions: | | | | | | | | | | | | | | | | |
Dividends from net investment | | | | | | | | | | | | | | | | |
income | | | (0.35 | ) | | (0.34 | ) | | (0.31 | ) | | (0.27 | ) | | (0.17 | ) |
Dividends from net realized gains | | | — | | | — | | | — | | | — | | | — | |
| | | | | | | | | | | | | | | | |
Total distributions | | | (0.35 | ) | | (0.34 | ) | | (0.31 | ) | | (0.27 | ) | | (0.17 | ) |
| | | | | | | | | | | | | | | | |
Net asset value, end of period | | | $10.94 | | | $10.27 | | | $10.64 | | | $10.92 | | | $10.77 | |
| | | | | | | | | | | | | | | | |
| | | | | | | | | | | | | | | | |
Total return | | | 10.06 | % | | –0.25 | % | | 0.28 | % | | 3.92 | % | | –0.64 | %(1) |
| | | | | | | | | | | | | | | | |
Supplemental data and ratios: | | | | | | | | | | | | | | | | |
Net assets, end of period | | | $195,328,951 | | | $193,579,910 | | | $257,440,133 | | | $247,841,846 | | | $213,170,198 | |
| | | | | | | | | | | | | | | | |
Ratio of expenses to average net assets | | | | | | | | | | | | | | | | |
Before expense reimbursement,
including (recapture) | | | 1.30 | % | | 1.30 | % | | 1.23 | % | | 1.28 | % | | 1.29 | %(2) |
After expense reimbursement
(recapture) | | | 1.29 | % | | 1.29 | % | | 1.23 | % | | 1.28 | % | | 1.29 | %(2) |
| | | | | | | | | | | | | | | | |
Ratio of net investment income to | | | | | | | | | | | | | | | | |
average net assets | | | | | | | | | | | | | | | | |
Before expense reimbursement,
including (recapture) | | | 3.30 | % | | 3.09 | % | | 2.93 | % | | 2.53 | % | | 2.15 | %(2) |
After expense reimbursement
(recapture) | | | 3.31 | % | | 3.10 | % | | 2.93 | % | | 2.53 | % | | 2.15 | %(2) |
|
Portfolio turnover rate | | | 57.44 | % | | 44.37 | % | | 66.26 | % | | 50.36 | % | | 14.61 | % |
| |
(1) | Not Annualized. |
(2) | Annualized. |
See notes to financial statements.
146
|
AssetMark Funds |
FINANCIAL HIGHLIGHTS |
|
| |
| | | | | | | | | | | | | | | | |
| | Core Plus Fixed Income Fund | |
| | | |
| | Year Ended
March 31, 2010 | | Year Ended
March 31, 2009 | | Year Ended
March 31, 2008 | | Year Ended
March 31, 2007 | | Period Ended
March 31, 2006 | |
| | | | | | | | | | | |
Per share data for a share of capital | | | | | | | | | | | | | | | | |
stock outstanding for the entire period | | | | | | | | | | | | | | | | |
and selected information for the period | | | | | | | | | | | | | | | | |
are as follows: | | | | | | | | | | | | | | | | |
Net asset value, beginning of period | | | $ 7.92 | | | $ 9.20 | | | $ 9.27 | | | $ 9.11 | | | $10.73 | |
| | | | | | | | | | | | | | | | |
Income from investment operations: | | | | | | | | | | | | | | | | |
Net investment income | | | 0.33 | | | 0.41 | | | 0.41 | | | 0.38 | | | 0.34 | |
Net realized and unrealized gains | | | | | | | | | | | | | | | | |
(losses) on investments | | | 1.17 | | | (1.11 | ) | | (0.06 | ) | | 0.15 | | | (0.39 | ) |
| | | | | | | | | | | | | | | | |
Total from investment operations | | | 1.50 | | | (0.70 | ) | | 0.35 | | | 0.53 | | | (0.05 | ) |
| | | | | | | | | | | | | | | | |
| | | | | | | | | | | | | | | | |
Less distributions: | | | | | | | | | | | | | | | | |
Dividends from net investment | | | | | | | | | | | | | | | | |
income | | | (0.32 | ) | | (0.40 | ) | | (0.41 | ) | | (0.37 | ) | | (0.26 | ) |
Dividends from net realized gains | | | — | | | (0.18 | ) | | (0.01 | ) | | — | | | (0.08 | ) |
Return of Capital | | | — | | | — | | | — | | | — | | | (1.23 | ) |
| | | | | | | | | | | | | | | | |
Total distributions | | | (0.32 | ) | | (0.58 | ) | | (0.42 | ) | | (0.37 | ) | | (1.57 | ) |
| | | | | | | | | | | | | | | | |
Net asset value, end of period | | | $ 9.10 | | | $ 7.92 | | | $ 9.20 | | | $ 9.27 | | | $ 9.11 | |
| | | | | | | | | | | | | | | | |
| | | | | | | | | | | | | | | | |
Total return | | | 19.21 | % | | –7.57 | % | | 3.87 | % | | 5.96 | % | | –0.48 | %(1) |
| | | | | | | | | | | | | | | | |
Supplemental data and ratios: | | | | | | | | | | | | | | | | |
Net assets, end of period | | | $547,963,751 | | | $504,451,429 | | | $804,085,918 | | | $716,017,829 | | | $612,841,433 | |
| | | | | | | | | | | | | | | | |
Ratio of expenses to average net assets | | | | | | | | | | | | | | | | |
Before expense reimbursement,
including (recapture) and
securities lending credit | | | 1.28 | % | | 1.26 | % | | 1.18 | % | | 1.16 | % | | 1.19 | %(2) |
After expense reimbursement
(recapture) and securities
lending credit | | | 1.25 | % | | 1.18 | % | | 1.13 | % | | 1.14 | % | | 1.16 | %(2) |
| | | | | | | | | | | | | | | | |
Ratio of net investment income to | | | | | | | | | | | | | | | | |
average net assets | | | | | | | | | | | | | | | | |
Before expense reimbursement,
including (recapture) | | | 3.71 | % | | 4.54 | % | | 4.37 | % | | 4.14 | % | | 3.43 | %(2) |
After expense reimbursement
(recapture) | | | 3.74 | % | | 4.62 | % | | 4.42 | % | | 4.16 | % | | 3.47 | %(2) |
|
Portfolio turnover rate | | | 224.89 | % | | 261.77 | % | | 307.52 | % | | 280.55 | % | | 261.52 | % |
| |
(1) | Not Annualized. |
(2) | Annualized. |
See notes to financial statements.
147
|
AssetMark Funds |
FINANCIAL HIGHLIGHTS |
|
| |
| | | | | | | | | | | | | | | | | | | |
| | Enhanced Fundamental Index®
Large Company Growth Fund | | Enhanced Fundamental Index®
Large Company Value Fund | |
| | | | | |
| | Year
Ended
March 31,
2010 | | Year
Ended
March 31,
2009 | | August 9, 2007(1)
through
March 31,
2008 | | Year
Ended
March 31,
2010 | | Year
Ended
March 31,
2009 | | August 9, 2007(1)
through
March 31,
2008 | |
| | | | | | | | | | | | | |
Per share data for a share of capital | | | | | | | | | | | | | | | | | | | |
stock outstanding for the entire period | | | | | | | | | | | | | | | | | | | |
and selected information for the period | | | | | | | | | | | | | | | | | | | |
are as follows: | | | | | | | | | | | | | | | | | | | |
Net asset value, beginning of period | | | $ 6.38 | | | $ 9.63 | | | $10.00 | | | $ 4.39 | | | $ 8.49 | | | $10.00 | |
| | | | | | | | | | | | | | | | | | | |
Income from investment operations: | | | | | | | | | | | | | | | | | | | |
Net investment income | | | 0.08 | | | 0.09 | | | 0.04 | | | 0.07 | | | 0.14 | | | 0.07 | |
Net realized and unrealized gains | | | | | | | | | | | | | | | | | | | |
(losses) on investments | | | 2.90 | | | (3.26 | ) | | (0.38 | ) | | 3.35 | | | (4.10 | ) | | (1.53 | ) |
| | | | | | | | | | | | | | | | | | | |
Total from investment operations | | | 2.98 | | | (3.17 | ) | | (0.34 | ) | | 3.42 | | | (3.96 | ) | | (1.46 | ) |
| | | | | | | | | | | | | | | | | | | |
| | | | | | | | | | | | | | | | | | | |
Less distributions: | | | | | | | | | | | | | | | | | | | |
Dividends from net investment income | | | (0.09 | ) | | (0.08 | ) | | (0.02 | ) | | (0.09 | ) | | (0.14 | ) | | (0.04 | ) |
Dividends from net realized gains | | | — | | | — | | | (0.01 | ) | | — | | | — | | | (0.01 | ) |
| | | | | | | | | | | | | | | | | | | |
Total distributions | | | (0.09 | ) | | (0.08 | ) | | (0.03 | ) | | (0.09 | ) | | (0.14 | ) | | (0.05 | ) |
| | | | | | | | | | | | | | | | | | | |
Net asset value, end of period | | | $ 9.27 | | | $ 6.38 | | | $ 9.63 | | | $ 7.72 | | | $ 4.39 | | | $ 8.49 | |
| | | | | | | | | | | | | | | | | | | |
| | | | | | | | | | | | | | | | | | | |
Total return | | | 46.70 | % | | –32.99 | % | | –3.40 | %(2) | | 78.09 | % | | –46.83 | % | | –14.73 | %(2) |
| | | | | | | | | | | | | | | | | | | |
Supplemental data and ratios: | | | | | | | | | | | | | | | | | | | |
Net assets, end of period | | $ | 70,791,646 | | $ | 45,830,177 | | | $67,546,939 | | $ | 56,333,942 | | $ | 36,948,314 | | | $54,697,080 | |
| | | | | | | | | | | | | | | | | | | |
Ratio of expenses to average net assets | | | | | | | | | | | | | | | | | | | |
Before expense reimbursement,
including (recapture) and
securities lending credit | | | 1.50 | % | | 1.50 | % | | 1.82 | %(3) | | 1.52 | % | | 1.51 | % | | 1.92 | %(3) |
After expense reimbursement
(recapture) and before securities
lending credit | | | 1.25 | % | | 1.26 | % | | 1.22 | %(3) | | 1.55 | % | | 1.40 | % | | 1.22 | %(3) |
After expense reimbursement
(recapture) and securities lending
credit | | | 1.22 | % | | 1.22 | % | | 1.22 | %(3) | | 1.22 | % | | 1.22 | % | | 1.22 | %(3) |
| | | | | | | | | | | | | | | | | | | |
Ratio of net investment income to | | | | | | | | | | | | | | | | | | | |
average net assets | | | | | | | | | | | | | | | | | | | |
Before expense reimbursement
(recapture) | | | 0.70 | % | | 0.73 | % | | 0.28 | %(3) | | 0.75 | % | | 2.03 | % | | 1.21 | %(3) |
After expense reimbursement
(recapture) | | | 0.98 | % | | 1.01 | % | | 0.88 | %(3) | | 1.05 | % | | 2.32 | % | | 1.91 | %(3) |
| | | | | | | | | | | | | | | | | | | |
Portfolio turnover rate | | | 78.10 | % | | 98.22 | % | | 22.70 | % | | 83.43 | % | | 104.24 | % | | 7.67 | % |
| |
(1) | Commencement of operations. |
(2) | Not Annualized. |
(3) | Annualized. |
See notes to financial statements.
148
|
AssetMark Funds |
FINANCIAL HIGHLIGHTS |
|
| |
| | | | | | | | | | | | | | | | | | | |
| | Enhanced Fundamental Index®
Small Company Growth Fund | | Enhanced Fundamental Index®
Small Company Value Fund | |
| | | | | |
| | Year
Ended
March 31,
2010 | | Year
Ended
March 31,
2009 | | August 9, 2007(1)
through
March 31,
2008 | | Year
Ended
March 31,
2010 | | Year
Ended
March 31,
2009 | | August 9, 2007(1)
through
March 31,
2008 | |
| | | | | | | | | | | | | |
Per share data for a share of capital | | | | | | | | | | | | | | | | | | | |
stock outstanding for the entire period | | | | | | | | | | | | | | | | | | | |
and selected information for the period | | | | | | | | | | | | | | | | | | | |
are as follows: | | | | | | | | | | | | | | | | | | | |
Net asset value, beginning of period | | | $ 5.82 | | | $ 9.10 | | | $10.00 | | | $ 4.13 | | | $ 8.33 | | | $10.00 | |
| | | | | | | | | | | | | | | | | | | |
Income from investment operations: | | | | | | | | | | | | | | | | | | | |
Net investment income (loss) | | | — | | | (0.01 | ) | | (0.01 | ) | | — | | | 0.05 | | | 0.05 | |
Net realized and unrealized gains | | | | | | | | | | | | | | | | | | | |
(losses) on investments | | | 4.40 | | | (3.27 | ) | | (0.87 | ) | | 4.14 | | | (4.17 | ) | | (1.67 | ) |
| | | | | | | | | | | | | | | | | | | |
Total from investment operations | | | 4.40 | | | (3.28 | ) | | (0.88 | ) | | 4.14 | | | (4.12 | ) | | (1.62 | ) |
| | | | | | | | | | | | | | | | | | | |
| | | | | | | | | | | | | | | | | | | |
Less distributions: | | | | | | | | | | | | | | | | | | | |
Dividends from net investment income | | | — | | | — | | | — | | | — | | | (0.07 | ) | | (0.03 | ) |
Dividends from net realized gains | | | — | | | — | | | (0.02 | ) | | — | | | — | | | (0.02 | ) |
Return of Capital | | | — | | | — | | | — | * | | — | | | (0.01 | ) | | — | |
| | | | | | | | | | | | | | | | | | | |
Total distributions | | | — | | | — | | | (0.02 | ) | | — | | | (0.08 | ) | | (0.05 | ) |
| | | | | | | | | | | | | | | | | | | |
Net asset value, end of period | | | $10.22 | | | $ 5.82 | | | $ 9.10 | | | $ 8.27 | | | $ 4.13 | | | $ 8.33 | |
| | | | | | | | | | | | | | | | | | | |
| | | | | | | | | | | | | | | | | | | |
Total return | | | 75.60 | % | | –36.04 | % | | –8.80 | %(2) | | 100.24 | % | | –49.62 | % | | –16.27 | %(2) |
| | | | | | | | | | | | | | | | | | | |
Supplemental data and ratios: | | | | | | | | | | | | | | | | | | | |
Net assets, end of period | | $ | 15,051,256 | | $ | 10,600,699 | | | $12,610,898 | | | $7,847,605 | | $ | 5,843,958 | | | $6,045,461 | |
| | | | | | | | | | | | | | | | | | | |
Ratio of expenses to average net assets | | | | | | | | | | | | | | | | | | | |
Before expense reimbursement and
securities lending credit | | | 1.85 | % | | 1.85 | % | | 3.55 | %(3) | | 2.04 | % | | 2.15 | % | | 6.30 | %(3) |
After expense reimbursement and
before securities lending credit | | | 1.32 | % | | 1.36 | % | | 1.22 | %(3) | | 1.51 | % | | 1.42 | % | | 1.22 | %(3) |
After expense reimbursement and
securities lending credit | | | 1.22 | % | | 1.22 | % | | 1.22 | %(3) | | 1.22 | % | | 1.22 | % | | 1.22 | %(3) |
Ratio of net investment income (loss)
to average net assets | | | | | | | | | | | | | | | | | | | |
Before expense reimbursement | | | –0.65 | % | | –0.79 | % | | –2.62 | % | | –0.82 | %(3) | | 0.06 | % | | –3.72 | %(3) |
After expense reimbursement | | | –0.02 | % | | –0.16 | % | | –0.29 | %(3) | | 0.00 | % | | 0.99 | % | | 1.36 | %(3) |
| | | | | | | | | | | | | | | | | | | |
Portfolio turnover rate | | | 90.34 | % | | 122.95 | % | | 11.86 | % | | 110.46 | % | | 112.49 | % | | 16.18 | % |
| |
(1) | Commencement of operations. |
(2) | Not Annualized. |
(3) | Annualized. |
* | Amount represents less than $0.01 per share. |
See notes to financial statements.
149
|
AssetMark Funds |
NOTES TO FINANCIAL STATEMENTS |
March 31, 2010 |
| |
| | |
1. | Organization |
| | |
| AssetMark Funds (the “Trust”) is organized as a Delaware statutory trust under a Declaration of Trust dated January 2, 2001. The Trust is registered under the Investment Company Act of 1940, as amended (the “1940 Act”), as an open-end management investment company with thirteen funds (the “Funds”). The following funds are diversified: AssetMark Large Cap Growth Fund, AssetMark Large Cap Value Fund, AssetMark Small/Mid Cap Growth Fund, AssetMark Small/Mid Cap Value Fund, AssetMark International Equity Fund, AssetMark Tax-Exempt Fixed Income Fund, AssetMark Core Plus Fixed Income Fund, AssetMark Enhanced Fundamental Index® Large Company Growth Fund, AssetMark Enhanced Fundamental Index® Large Company Value Fund, AssetMark Enhanced Fundamental Index® Small Company Growth Fund, AssetMark Enhanced Fundamental Index® Small Company Value Fund, and AssetMark Enhanced Fundamental Index® International Equity Fund, which has not commenced operations as of the date of this Annual Report. The AssetMark Real Estate Securities Fund is non-diversified. Each fund represents a distinct portfolio with its own investment objectives and policies. The assets of each Fund are segregated, and a shareholder’s interest is limited to the Fund in which shares are held. The Enhanced Fundamental Index® Funds commenced operations on August 9, 2007. The other eight Funds commenced operations on June 29, 2001. |
| | |
2. | Significant Accounting Policies |
| | |
| The following is a summary of significant accounting policies consistently followed by the Funds in the preparation of the financial statements. These policies are in conformity with U.S. generally accepted accounting principals (“GAAP”). |
| | |
| (a) | Investment Valuation |
| | |
| | Portfolio securities listed on a national or foreign securities exchange, except those listed on NASDAQ, for which market quotations are available are valued at the last quoted sale price on each business day. Portfolio securities traded on |
| | |
| | NASDAQ are valued at the NASDAQ Official Closing Price (“NOCP”) on each business day. If there is no reported sale on an exchange or NASDAQ, the portfolio security will be valued at the mean between the most recent quoted bid and asked price. Price information on listed securities is taken from the exchange where the security is primarily traded. |
| | |
| | All equity securities that are not traded on a listed exchange are valued at the last sale price in the over-the-counter market. If a non-exchange traded security does not trade on a particular day, then the mean between the last quoted closing bid and asked price will be used. Non-exchange traded ADRs are priced with an evaluated price as determined by the current evaluated pricing procedures of, and provided by, the pricing vendor. |
| | |
| | Fixed-income securities that have a maturity of greater than 60 days are generally valued on the basis of evaluations obtained from third party pricing services, which take into account appropriate factors such as institutional sized trading in similar groups of securities, yield, quality, coupon rate, maturity, type of issue, trading characteristics and other market data. Short-term investments having a maturity of less than 60 days are valued at amortized cost. |
| | |
| | Investments in mutual funds are valued at the closing net asset value per share of each mutual fund on the day of valuation. |
| | |
| | Securities for which no market quotations are readily available or when a significant event has occurred between the time of the security’s last close and the time that a Fund next calculates its net asset value will be valued at their fair value as determined by the Valuation Committee. Securities for which no market prices are readily available will be valued at their fair value as determined by the Valuation Committee under procedures adopted by the Board of Trustees. |
150
|
AssetMark Funds |
NOTES TO FINANCIAL STATEMENTS (Continued) |
March 31, 2010 |
| |
Valuation Measurements
The Trust has adopted authoritative fair valuation accounting standards which establish an authoritative definition of fair value and set out a hierarchy for measuring fair value. These standards require additional disclosures about the various inputs and valuation techniques used to develop the measurements of fair value and a discussion of changes in valuation techniques and related inputs, if any, during the period. In addition, these standards require expanded disclosure for each major category of assets. These inputs are summarized in the three broad levels listed below:
Level 1 – Quoted prices in active markets for identical securities.
Level 2 – Other significant observable inputs (including quoted prices for similar securities, interest rates, prepayment speeds, credit risk, etc.).
Level 3 – Significant unobservable inputs (including the Fund’s own assumptions in determining the fair value of investments).
The inputs or methodology used for valuing securities are not an indication of the risk associated with investing in those securities. For example, money market securities are valued using amortized cost, in accordance with the 1940 Act. Generally, amortized cost reflects the current fair value of a security, but since the value is not obtained from a quoted price in an active market, such securities are reflected as Level 2. Fair value determinations are required for securities whose value is affected by a significant event that will materially affect the value of a domestic or foreign security and which occurs subsequent to the time of the close of the principal market on which such domestic or foreign security trades but prior to the calculation of the Fund’s NAV.
The following is a summary of the inputs used to value the Fund’s net assets as of March 31, 2010:
151
|
AssetMark Funds |
NOTES TO FINANCIAL STATEMENTS (Continued) |
March 31, 2010 |
| |
AssetMark Large Cap Growth Fund
| | | | | | | | | | | | | |
| | Level 1 | | Level 2 | | Level 3 | | Total | |
| | | | | | | | | |
Equity | | | | | | | | | | | | | |
Consumer Discretionary | | $ | 24,737,200 | | | $— | | $ | — | | $ | 24,737,200 | |
Consumer Staples | | | 24,790,604 | | | — | | | — | | | 24,790,604 | |
Energy | | | 10,656,134 | | | — | | | — | | | 10,656,134 | |
Financials | | | 15,115,521 | | | — | | | — | | | 15,115,521 | |
Health Care | | | 33,452,390 | | | — | | | — | | | 33,452,390 | |
Industrials | | | 25,588,235 | | | — | | | — | | | 25,588,235 | |
Information Technology | | | 67,729,843 | | | — | | | — | | | 67,729,843 | |
Materials | | | 5,770,118 | | | — | | | — | | | 5,770,118 | |
Telecommunication Services | | | 893,532 | | | — | | | — | | | 893,532 | |
Utilities | | | 1,546,140 | | | | | | | | | 1,546,140 | |
| | | | | | | | | | | | | |
Total Equity | | | 210,279,717 | | | — | | | — | | | 210,279,717 | |
Short Term Investments | | | 3,131,418 | | | — | | | — | | | 3,131,418 | |
Investments Purchased as Securities Lending Collateral | | | 20,867,342 | | | — | | | 6,799,634 | | | 27,666,976 | |
| | | | | | | | | | | | | |
Total Investments in Securities | | $ | 234,278,477 | | | $— | | $ | 6,799,634 | | $ | 241,078,111 | |
| | | | | | | | | | | | | |
Level 3 Reconciliation Disclosure
Following is a reconciliation of Level 3 assets for which significant unobservable inputs were used to determine fair value.
| | | | | | | | | | | | | | |
Description | | | Investments
in Securities | | | | | | | | | | |
| | | | | | | | | | | | | | |
Balance as of March 31, 2009 | | $ | 8,138,893 | | | | | | | | | | |
Accrued discounts/(amortization of premiums), net | | | — | | | | | | | | | | |
Realized gain (loss) | | | — | | | | | | | | | | |
Change in unrealized appreciation | | | 2,161,612 | | | | | | | | | | |
Net sales | | | (3,500,871 | ) | | | | | | | | | |
Transfers in and/or (out) of Level 3 | | | — | | | | | | | | | | |
| | | | | | | | | | | | | |
Balance as of March 31, 2010 | | $ | 6,799,634 | | | | | | | | | | |
| | | | | | | | | | | | | |
Change in unrealized appreciation during the period | | | | | | | | | | | | | |
for Level 3 investments held at March 31, 2010. | | $ | 2,161,612 | | | | | | | | | | |
| | | | | | | | | | | | | |
152
|
AssetMark Funds
NOTES TO FINANCIAL STATEMENTS (Continued)
March 31, 2010 |
| |
| | | | | | | | | | | | | |
AssetMark Large Cap Value Fund | | | | | | | | | | | | | |
|
| | Level 1 | | Level 2 | | Level 3 | | Total | |
| | | | | | | | | |
Equity | | | | | | | | | | | | | |
Consumer Discretionary | | $ | 13,322,249 | | | $— | | $ | — | | $ | 13,322,249 | |
Consumer Staples | | | 26,861,411 | | | — | | | — | | | 26,861,411 | |
Energy | | | 38,266,294 | | | — | | | — | | | 38,266,294 | |
Financials | | | 42,931,585 | | | — | | | — | | | 42,931,585 | |
Health Care | | | 28,090,551 | | | — | | | — | | | 28,090,551 | |
Industrials | | | 15,836,422 | | | — | | | — | | | 15,836,422 | |
Information Technology | | | 15,665,630 | | | — | | | — | | | 15,665,630 | |
Materials | | | 4,845,382 | | | — | | | — | | | 4,845,382 | |
Telecommunication Services | | | 6,858,922 | | | — | | | — | | | 6,858,922 | |
Utilities | | | 5,396,094 | | | — | | | — | | | 5,396,094 | |
| | | | | | | | | | | | | |
Total Equity | | | 198,074,540 | | | — | | | — | | | 198,074,540 | |
Short Term Investments | | | 7,439,284 | | | — | | | — | | | 7,439,284 | |
Investments Purchased as Securities Lending Collateral | | | 22,040,879 | | | — | | | 6,234,228 | | | 28,275,107 | |
| | | | | | | | | | | | | |
Total Investments in Securities | | $ | 227,554,703 | | | $— | | $ | 6,234,228 | | $ | 233,788,931 | |
| | | | | | | | | | | | | |
Level 3 Reconciliation Disclosure
Following is a reconciliation of Level 3 assets for which significant unobservable inputs were used to determine fair value.
| | | | | |
Description | | | Investments
in Securities | |
| | | | | |
Balance as of March 31, 2009 | | $ | 7,716,178 | |
Accrued discounts/(amortization of premiums), net | | | — | |
Realized gain (loss) | | | — | |
Change in unrealized appreciation | | | 1,996,796 | |
Net sales | | | (3,478,746 | ) |
Transfers in and/or (out) of Level 3 | | | — | |
| | | | |
Balance as of March 31, 2010 | | $ | 6,234,228 | |
| | | | |
Change in unrealized appreciation during the period
for Level 3 investments held at March 31, 2010. | | $ | 1,996,796 | |
| | | | |
153
|
AssetMark Funds
NOTES TO FINANCIAL STATEMENTS (Continued)
March 31, 2010 |
| |
| | | | | | | | | | | | | |
AssetMark Small/Mid Cap Growth Fund | | | | | | | | | | | | | |
|
| | Level 1 | | Level 2 | | Level 3 | | Total | |
| | | | | | | | | |
Equity | | | | | | | | | | | | | |
Consumer Discretionary | | $ | 8,496,694 | | | $— | | $ | — | | $ | 8,496,694 | |
Consumer Staples | | | 1,196,596 | | | — | | | — | | | 1,196,596 | |
Energy | | | 1,649,438 | | | — | | | — | | | 1,649,438 | |
Financials | | | 3,382,980 | | | — | | | — | | | 3,382,980 | |
Health Care | | | 8,248,143 | | | — | | | — | | | 8,248,143 | |
Industrials | | | 5,804,235 | | | — | | | — | | | 5,804,235 | |
Information Technology | | | 9,522,688 | | | — | | | — | | | 9,522,688 | |
Materials | | | 2,706,899 | | | — | | | — | | | 2,706,899 | |
Telecommunication Services | | | 368,130 | | | — | | | — | | | 368,130 | |
| | | | | | | | | | | | | |
Total Equity | | | 41,375,803 | | | — | | | — | | | 41,375,803 | |
Short Term Investments | | | 179,307 | | | — | | | — | | | 179,307 | |
Investments Purchased as Securities Lending Collateral | | | 9,711,488 | | | — | | | 1,661,804 | | | 11,373,292 | |
| | | | | | | | | | | | | |
Total Investments in Securities | | $ | 51,266,598 | | | $— | | $ | 1,661,804 | | $ | 52,928,402 | |
| | | | | | | | | | | | | |
Level 3 Reconciliation Disclosure
Following is a reconciliation of Level 3 assets for which significant unobservable inputs were used to determine fair value.
| | | | | |
Description | | | Investments
in Securities | |
| | | | | |
Balance as of March 31, 2009 | | $ | 2,059,566 | |
Accrued discounts/(amortization of premiums), net | | | — | |
Realized gain (loss) | | | — | |
Change in unrealized appreciation | | | 532,429 | |
Net sales | | | (930,191 | ) |
Transfers in and/or (out) of Level 3 | | | — | |
| | | | |
Balance as of March 31, 2010 | | $ | 1,661,804 | |
| | | | |
Change in unrealized appreciation during the period
for Level 3 investments held at March 31, 2010. | | $ | 532,429 | |
| | | | |
154
|
AssetMark Funds
NOTES TO FINANCIAL STATEMENTS (Continued)
March 31, 2010 |
| |
| | | | | | | | | | | | | |
AssetMark Small/Mid Cap Value Fund | | | | | | | | | | | | | |
|
| | Level 1 | | Level 2 | | Level 3 | | Total | |
| | | | | | | | | |
Equity | | | | | | | | | | | | | |
Consumer Discretionary | | $ | 5,216,135 | | | $— | | $ | — | | $ | 5,216,135 | |
Consumer Staples | | | 1,181,500 | | | — | | | — | | | 1,181,500 | |
Energy | | | 4,139,813 | | | — | | | — | | | 4,139,813 | |
Financials | | | 14,378,895 | | | — | | | — | | | 14,378,895 | |
Health Care | | | 1,892,288 | | | — | | | — | | | 1,892,288 | |
Industrials | | | 4,477,851 | | | — | | | — | | | 4,477,851 | |
Information Technology | | | 4,555,335 | | | — | | | — | | | 4,555,335 | |
Materials | | | 4,077,746 | | | — | | | — | | | 4,077,746 | |
Telecommunication Services | | | 759,974 | | | — | | | — | | | 759,974 | |
Utilities | | | 2,432,683 | | | — | | | — | | | 2,432,683 | |
| | | | | | | | | | | | | |
Total Equity | | | 43,112,220 | | | — | | | — | | | 43,112,220 | |
Short Term Investments | | | 645,606 | | | — | | | — | | | 645,606 | |
Investments Purchased as Securities Lending Collateral | | | 11,816,467 | | | — | | | 971,026 | | | 12,787,493 | |
| | | | | | | | | | | | | |
Total Investments in Securities | | $ | 55,574,293 | | | $— | | $ | 971,026 | | $ | 56,545,319 | |
| | | | | | | | | | | | | |
Level 3 Reconciliation Disclosure
Following is a reconciliation of Level 3 assets for which significant unobservable inputs were used to determine fair value.
| | | | | |
Description | | | Investments
in Securities | |
| | | | | |
Balance as of March 31, 2009 | | $ | 1,350,476 | |
Accrued discounts/(amortization of premiums), net | | | — | |
Realized gain (loss) | | | — | |
Change in unrealized appreciation | | | 319,747 | |
Net sales | | | (699,197 | ) |
Transfers in and/or (out) of Level 3 | | | — | |
| | | | |
Balance as of March 31, 2010 | | $ | 971,026 | |
| | | | |
Change in unrealized appreciation during the period
for Level 3 investments held at March 31, 2010. | | $ | 319,747 | |
| | | | |
155
|
AssetMark Funds
NOTES TO FINANCIAL STATEMENTS (Continued)
March 31, 2010 |
| |
| | | | | | | | | | | | | |
AssetMark International Equity Fund | | | | | | | | | | | | | |
| | Level 1 | | Level 2 | | Level 3 | | Total | |
| | | | | | | | | |
Equity | | | | | | | | | | | | | |
Asia | | $ | 8,252,692 | | $ | 77,271,591 | | $ | — | | $ | 85,524,283 | |
Australia | | | — | | | 15,323,492 | | | — | | | 15,323,492 | |
Europe | | | — | | | 158,692,446 | | | — | | | 158,692,446 | |
North America | | | 3,807,551 | | | — | | | — | | | 3,807,551 | |
South America | | | 2,448,432 | | | — | | | — | | | 2,448,432 | |
| | | | | | | | | | | | | |
Total Equity | | | 14,508,675 | | | 251,287,529 | | | — | | | 265,796,204 | |
Short Term Investments | | | 3,710,512 | | | — | | | — | | | 3,710,512 | |
Investments Purchased as Securities Lending Collateral | | | — | | | — | | | 983,317 | | | 983,317 | |
| | | | | | | | | | | | | |
Total Investments in Securities | | $ | 18,219,187 | | $ | 251,287,529 | | $ | 983,317 | | $ | 270,490,033 | |
| | | | | | | | | | | | | |
Level 3 Reconciliation Disclosure
Following is a reconciliation of Level 3 assets for which significant unobservable inputs were used to determine fair value.
| | | | | |
Description | | | Investments
in Securities | |
| | | | | |
Balance as of March 31, 2009 | | $ | 1,319,989 | |
Accrued discounts/(amortization of premiums), net | | | — | |
Realized gain (loss) | | | — | |
Change in unrealized appreciation | | | 320,999 | |
Net sales | | | (657,671 | ) |
Transfers in and/or (out) of Level 3 | | | — | |
| | | | |
Balance as of March 31, 2010 | | $ | 983,317 | |
| | | | |
Change in unrealized appreciation during the period
for Level 3 investments held at March 31, 2010. | | $ | 320,999 | |
| | | | |
156
|
AssetMark Funds |
NOTES TO FINANCIAL STATEMENTS (Continued) |
March 31, 2010 |
| |
| | | | | | | | | | | | | | |
AssetMark Real Estate Securities Fund | | | | | | | | | | | | | |
| | Level 1 | | Level 2 | | Level 3 | | Total | |
| | | | | | | | | |
Equity | | | | | | | | | | | | | |
Real Estate Investment Trusts | | $ | 50,319,229 | | $ | — | | $ | — | | $ | 50,319,229 | |
| | | | | | | | | | | | | |
Total Equity | | | 50,319,229 | | | — | | | — | | | 50,319,229 | |
Short Term Investments | | | 1,397,431 | | | — | | | — | | | 1,397,431 | |
Investments Purchased as Securities Lending Collateral | | | 9,476,631 | | | — | | | 914,484 | | | 10,391,115 | |
| | | | | | | | | | | | | |
Total Investments in Securities | | $ | 61,193,291 | | $ | — | | $ | 914,484 | | $ | 62,107,775 | |
| | | | | | | | | | | | | |
| | | | | | | | | | | | | |
Level 3 Reconciliation Disclosure | | | | | | | | | | | | | |
|
Following is a reconciliation of Level 3 assets for which significant unobservable inputs were used to determine fair value. | |
| | | | | | | | | | | | | |
Description | | | Investments
in Securities | | | | | | | | | | |
| | | | | | | | | | | | | | |
Balance as of March 31, 2009 | | $ | 1,139,419 | | | | | | | | | | |
Accrued discounts/(amortization of premiums), net | | | — | | | | | | | | | | |
Realized gain (loss) | | | — | | | | | | | | | | |
Change in unrealized appreciation | | | 293,348 | | | | | | | | | | |
Net sales | | | (518,283 | ) | | | | | | | | | |
Transfers in and/or (out) of Level 3 | | | — | | | | | | | | | | |
| | | | | | | | | | | | | |
Balance as of March 31, 2010 | | $ | 914,484 | | | | | | | | | | |
| | | | | | | | | | | | | |
| | | | | | | | | | | | | |
Change in unrealized appreciation during the period for Level 3 investments held at March 31, 2010. | | $ | 293,348 | | | | | | | | | | |
| | | | | | | | | | | | | |
|
AssetMark Tax-Exempt Fixed Income Fund | | | | | | | | | | | | | |
| | Level 1 | | Level 2 | | Level 3 | | Total | |
| | | | | | | | | |
Fixed Income | | | | | | | | | | | | | |
Municipal Bonds | | $ | — | | $ 190,508,775 | | | $ — | | $ | 190,508,775 | |
| | | | | | | | | | | | | |
Total Fixed Income | | | — | | 190,508,775 | | | — | | | 190,508,775 | |
Short Term Investments | | | 5,882,000 | | | — | | | — | | | 5,882,000 | |
| | | | | | | | | | | | | |
Total Investments in Securities | | $ | 5,882,000 | | $ 190,508,775 | | | $ — | | $ | 196,390,775 | |
| | | | | | | | | | | | | |
157
|
AssetMark Funds |
NOTES TO FINANCIAL STATEMENTS (Continued) |
March 31, 2010 |
| |
| | | | | | | | | | | | | |
AssetMark Core Plus Fixed Income Fund | | Level 1 | | Level 2 | | Level 3 | | Total | |
| | | | | | | | | |
| | | | | | | | | | | | | |
Equity | | | | | | | | | | | | | |
Convertible Preferred Stock | | | 119,177 | | | — | | | — | | | 119,177 | |
Preferred Stock | | | 746,464 | | | 796,801 | | | — | | | 1,543,265 | |
Common Stock | | | 2,368 | | | | | | | | | 2,368 | |
| | | | | | | | | | | | | |
Total Equity | | | 868,009 | | | 796,801 | | | — | | | 1,664,810 | |
Fixed Income | | | | | | | | | | | | | |
Asset Backed Securities | | $ | — | | $ | 19,925,180 | | $ | 479,376 | | $ | 20,404,556 | |
Collateralized Mortgage Obligations | | | — | | | 69,024,240 | | | 912,193 | | | 69,936,433 | |
Corporate Bonds | | | — | | | 169,385,153 | | | 26,550 | | | 169,411,703 | |
Mortgage Backed Securities - U.S. Government Agency | | | — | | | 164,197,740 | | | — | | | 164,197,740 | |
Municipal Bonds | | | — | | | 6,523,498 | | | — | | | 6,523,498 | |
Foreign Government Note/Bond | | | — | | | 20,080,971 | | | — | | | 20,080,971 | |
Supranational Obligation | | | — | | | 6,939,439 | | | — | | | 6,939,439 | |
U.S. Government Agency Issues | | | — | | | 10,289,829 | | | — | | | 10,289,829 | |
U.S. Treasury Obligations | | | — | | | 66,027,856 | | | — | | | 66,027,856 | |
Convertible Bond | | | — | | | 1,594,531 | | | — | | | 1,594,531 | |
| | | | | | | | | | | | | |
Total Fixed Income | | | — | | | 533,988,437 | | | 1,418,119 | | | 535,406,556 | |
Short Term Investments | | | 692,165 | | | 39,200,000 | | | — | | | 39,892,165 | |
Investments Purchased as Securities Lending Collateral | | | 38,996,393 | | | — | | | 7,018,422 | | | 46,014,815 | |
| | | | | | | | | | | | | |
Total Investments in Securities | | $ | 40,556,567 | | $ | 573,985,238 | | $ | 8,436,541 | | $ | 622,978,346 | |
| | | | | | | | | | | | | |
| | | | | | | | | | | | | |
Other Financial Instruments* | | | | | | | | | | | | | |
Forward Currency Contracts | | $ | — | | $ | 30,272 | | $ | — | | $ | 30,272 | |
Forward Sale Commitments and Securities Sold Short | | | — | | | (854,626 | ) | | — | | | (854,626 | ) |
Futures, net | | | 28,491 | | | — | | | — | | | 28,491 | |
Options Written | | | (13,731 | ) | | — | | | — | | | (13,731 | ) |
| | | | | | | | | | | | | |
Total | | $ | 14,760 | | $ | (824,354 | ) | $ | — | | $ | (809,594 | ) |
| | | | | | | | | | | | | |
| |
* | Other financial instruments are derivative instruments not reflected in the Schedule of Investments, such as forward sale commitments, securities sold short, written options, forward currency contracts, and futures, which are reflected at the unrealized appreciation (depreciation) on the instrument. All derivatives, except for forward sale commitments, securities sold short and written options are reflected at the unrealized appreciation on the instrument. Forward sale commitments, securities sold short and written options are reflected at market value. |
158
|
AssetMark Funds |
NOTES TO FINANCIAL STATEMENTS (Continued) |
March 31, 2010 |
| |
| | | | | | | | | | | | | |
Level 3 Reconciliation Disclosure | | | | | | | | | | | | | |
|
Following is a reconciliation of Level 3 assets for which significant unobservable inputs were used to determine fair value. |
|
Description | | Investments
in Securities | | | | | | | | | | |
| | | | | | | | | | | | |
Balance as of March 31, 2009 | | $ | 17,566,887 | | | | | | | | | | |
Accreted discounts, net | | | 42,630 | | | | | | | | | | |
Realized loss | | | (1,356,663 | ) | | | | | | | | | |
Change in unrealized appreciation | | | 9,015,604 | | | | | | | | | | |
Net sales | | | (7,787,722 | ) | | | | | | | | | |
Transfers in and/or (out) of Level 3 | | | (9,044,196 | ) | | | | | | | | | |
| | | | | | | | | | | | | |
Balance as of March 31, 2010 | | $ | 8,436,540 | | | | | | | | | | |
| | | | | | | | | | | | | |
| | | | | | | | | | | | | |
Change in unrealized appreciation during the period for Level 3 investments held at March 31, 2010. | | $ | 2,340,285 | | | | | | | | | | |
| | | | | | | | | | | | | |
| | | | | | | | | | | | | |
| | | | | | | | | | | | | |
AssetMark Enhanced Fundamental Index® Large Company Growth Fund | |
| | | | | | | | | |
| | Level 1 | | Level 2 | | Level 3 | | Total | |
| | | | | | | | | |
| | | | | | | | | | | | | |
Equity | | | | | | | | | | | | | |
Consumer Discretionary | | $ | 5,762,151 | | $ | — | | $ | — | | $ | 5,762,151 | |
Consumer Staples | | | 8,081,720 | | | — | | | — | | | 8,081,720 | |
Energy | | | 3,913,216 | | | — | | | — | | | 3,913,216 | |
Financials | | | 9,969,567 | | | — | | | — | | | 9,969,567 | |
Health Care | | | 9,994,090 | | | — | | | — | | | 9,994,090 | |
Industrials | | | 6,932,808 | | | — | | | — | | | 6,932,808 | |
Information Technology | | | 15,274,241 | | | — | | | — | | | 15,274,241 | |
Materials | | | 1,886,752 | | | — | | | — | | | 1,886,752 | |
Telecommunication Services | | | 2,176,003 | | | — | | | — | | | 2,176,003 | |
Utilities | | | 1,143,535 | | | — | | | — | | | 1,143,535 | |
| | | | | | | | | | | | | |
Total Equity | | | 65,134,083 | | | — | | | — | | | 65,134,083 | |
Short Term Investments | | | 5,112,400 | | | — | | | — | | | 5,112,400 | |
Investments Purchased as Securities Lending Collateral | | | 12,083,657 | | | — | | | — | | | 12,083,657 | |
| | | | | | | | | | | | | |
Total Investments in Securities | | $ | 82,330,140 | | $ | — | | $ | — | | $ | 82,330,140 | |
| | | | | | | | | | | | | |
| | | | | | | | | | | | | |
Other Financial Instruments* | | | | | | | | | | | | | |
Futures | | $ | 110,732 | | $ | — | | $ | — | | $ | 110,732 | |
| | | | | | | | | | | | | |
| |
* | Other financial instruments are derivative instruments not reflected in the Schedule of Investments, such as futures contracts, which are reflected at the unrealized appreciation on the instrument. |
159
|
AssetMark Funds |
NOTES TO FINANCIAL STATEMENTS (Continued) |
March 31, 2010 |
| |
|
AssetMark Enhanced Fundamental Index® Large Company Value Fund |
| | | | | | | | | | | | | |
| | Level 1 | | Level 2 | | Level 3 | | Total | |
| | | | | | | | | |
Equity | | | | | | | | | | | | | |
Consumer Discretionary | | $ | 9,037,263 | | $ | — | | $ | — | | $ | 9,037,263 | |
Consumer Staples | | | 6,007,953 | | | — | | | — | | | 6,007,953 | |
Energy | | | 8,551,130 | | | — | | | — | | | 8,551,130 | |
Financials | | | 8,676,408 | | | — | | | — | | | 8,676,408 | |
Health Care | | | 1,415,822 | | | — | | | — | | | 1,415,822 | |
Industrials | | | 6,819,205 | | | — | | | — | | | 6,819,205 | |
Information Technology | | | 1,852,315 | | | — | | | — | | | 1,852,315 | |
Materials | | | 2,679,915 | | | — | | | — | | | 2,679,915 | |
Telecommunication Services | | | 1,610,013 | | | — | | | — | | | 1,610,013 | |
Utilities | | | 4,918,512 | | | — | | | — | | | 4,918,512 | |
| | | | | | | | | | | | | |
Total Equity | | | 51,568,536 | | | — | | | — | | | 51,568,536 | |
Short Term Investments | | | 4,298,080 | | | — | | | — | | | 4,298,080 | |
Investments Purchased as Securities Lending Collateral | | | 11,019,836 | | | — | | | — | | | 11,019,836 | |
| | | | | | | | | | | | | |
Total Investments in Securities | | $ | 66,886,452 | | $ | — | | $ | — | | $ | 66,886,452 | |
| | | | | | | | | | | | | |
| | | | | | | | | | | | | |
Other Financial Instruments* | | | | | | | | | | | | | |
Futures | | $ | 90,163 | | $ | — | | $ | — | | $ | 90,163 | |
| | | | | | | | | | | | | |
| |
* | Other financial instruments are derivative instruments not reflected in the Schedule of Investments, such as futures contracts, which are reflected at the unrealized appreciation on the instrument. |
| |
AssetMark Enhanced Fundamental Index® Small Company Growth Fund |
| | | | | | | | | | | | | |
| | Level 1 | | Level 2 | | Level 3 | | Total | |
| | | | | | | | | |
Equity | | | | | | | | | | | | | |
Consumer Discretionary | | $ | 2,123,845 | | $ | — | | $ | — | | $ | 2,123,845 | |
Consumer Staples | | | 623,732 | | | — | | | — | | | 623,732 | |
Energy | | | 726,077 | | | — | | | — | | | 726,077 | |
Financials | | | 4,131,044 | | | — | | | — | | | 4,131,044 | |
Health Care | | | 1,275,789 | | | — | | | — | | | 1,275,789 | |
Industrials | | | 1,967,006 | | | — | | | — | | | 1,967,006 | |
Information Technology | | | 2,983,238 | | | — | | | — | | | 2,983,238 | |
Materials | | | 371,372 | | | — | | | — | | | 371,372 | |
Telecommunication Services | | | 178,577 | | | — | | | — | | | 178,577 | |
Utilities | | | 99,406 | | | — | | | — | | | 99,406 | |
| | | | | | | | | | | | | |
Total Equity | | | 14,480,086 | | | — | | | — | | | 14,480,086 | |
Short Term Investments | | | 469,237 | | | — | | | — | | | 469,237 | |
Investments Purchased as Securities Lending Collateral | | | 5,124,065 | | | — | | | — | | | 5,124,065 | |
| | | | | | | | | | | | | |
Total Investments in Securities | | $ | 20,073,388 | | $ | — | | $ | — | | $ | 20,073,388 | |
| | | | | | | | | | | | | |
| | | | | | | | | | | | | |
Other Financial Instruments* | | | | | | | | | | | | | |
Futures | | $ | 3,607 | | $ | — | | $ | — | | $ | 3,607 | |
| | | | | | | | | | | | | |
| |
* | Other financial instruments are derivative instruments not reflected in the Schedule of Investments, such as futures contracts, which are reflected at the unrealized appreciation on the instrument. |
160
|
AssetMark Funds |
NOTES TO FINANCIAL STATEMENTS (Continued) |
March 31, 2010 |
| |
|
AssetMark Enhanced Fundamental Index® Small Company Value Fund |
| | | | | | | | | | | | | |
| | Level 1 | | Level 2 | | Level 3 | | Total | |
| | | | | | | | | |
Equity | | | | | | | | | | | | | |
Consumer Discretionary | | $ | 1,780,887 | | $ | — | | $ | — | | $ | 1,780,887 | |
Consumer Staples | | | 268,903 | | | — | | | — | | | 268,903 | |
Energy | | | 277,287 | | | — | | | — | | | 277,287 | |
Financials | | | 1,558,701 | | | — | | | — | | | 1,558,701 | |
Health Care | | | 409,172 | | | — | | | — | | | 409,172 | |
Industrials | | | 1,548,033 | | | — | | | — | | | 1,548,033 | |
Information Technology | | | 764,090 | | | — | | | — | | | 764,090 | |
Materials | | | 467,655 | | | — | | | — | | | 467,655 | |
Telecommunication Services | | | 108,034 | | | — | | | — | | | 108,034 | |
Utilities | | | 164,752 | | | — | | | — | | | 164,752 | |
| | | | | | | | | | | | | |
Total Equity | | | 7,347,514 | | | — | | | — | | | 7,347,514 | |
Short Term Investments | | | 444,022 | | | — | | | — | | | 444,022 | |
Investments Purchased as Securities Lending Collateral | | | 2,259,561 | | | — | | | — | | | 2,259,561 | |
| | | | | | | | | | | | | |
Total Investments in Securities | | $ | 10,051,097 | | $ | — | | $ | — | | $ | 10,051,097 | |
| | | | | | | | | | | | | |
| | | | | | | | | | | | | |
Other Financial Instruments* | | | | | | | | | | | | | |
Futures | | $ | 3,130 | | $ | — | | $ | — | | $ | 3,130 | |
| | | | | | | | | | | | | |
| |
* | Other financial instruments are derivative instruments not reflected in the Schedule of Investments, such as futures contracts, which are reflected at the unrealized appreciation on the instrument. |
Derivative Instruments and Hedging Activities
The Trust has adopted derivative instruments disclosure standards, in order to enable the investor to understand how and why an entity used derivatives, how derivatives are accounted for, and how derivative instruments affect an entity’s results of operations and financial position.
AssetMark Core Plus Fixed Income Fund
The Fund uses money market and fixed income derivatives contracts including futures, forwards, and options for a variety of hedging and investment purposes such as duration management and the pursuit of relative value opportunities. In general, the use of fixed income derivatives may increase the risk within the Fund. The use of over-the-counter derivatives involves the risk that the counterparty to the contract will fail to make required payments or otherwise comply with the terms of the contract. The investment results achieved by the use of fixed income derivatives by the Fund may not match or fully offset changes in the value of the underlying financial asset they were attempting to hedge or the investment opportunity the Fund was attempting to pursue, thereby failing to achieve, to an extent, the original purpose for using the derivatives. Certain types of derivatives may create leverage insofar as a Fund may receive returns (or suffer losses) that exceed the initial amounts that the Fund invested in connection with the derivatives. The use of derivatives can result in losses or gains to a Fund that exceed the amount the Fund would have experienced in the absence of using derivatives. A relatively small price movement in a derivative may result in an immediate and substantial loss, or gain, to the Fund.
The Fund uses currency futures, currency forwards and currency option contracts for the purpose of hedging exposures within the Funds to non-dollar-denominated assets. In general, the use of currency derivative contracts for hedging may reduce the overall risk level of the Fund, albeit at a cost that may lower overall performance. In addition, the use of currency derivatives
161
|
AssetMark Funds |
NOTES TO FINANCIAL STATEMENTS (Continued) |
March 31, 2010 |
| |
may not match or fully offset changes in the value of the underlying non-dollar-denominated assets, thereby failing to achieve, to an extent, the original purpose for using the currency derivatives. The use of over-the-counter currency derivatives involves the risk that the counterparty to the currency derivative will fail to make required payments or otherwise comply with the terms of the contract. In general the use of currency derivatives for hedging purposes will not lead to leverage within the Fund.
Balance Sheet — Values of Derivative Instruments as of March 31, 2010
| | | | | | | | | | | | | | | | | | | | | | |
| | Asset Derivatives | | Liability Derivatives | |
| | | | | |
Derivatives not accounted for as
hedging instruments | | Balance Sheet Location | | Value | | | Balance Sheet Location | | Value | | |
| | | | | | | | | | |
| | | | | | | | | | | | | | | | | | |
Foreign Exchange Contracts—Forward
Currency Contracts | | Appreciation of forward
foreign currency contracts | | | | $30,272 | | | | | | | | | | — | | |
| | | | | | | | | | | | | | | | | | | |
Interest Rate Contracts—Futures* | | Variation margin on
futures contracts | | | | 271,345 | | | Variation margin on
futures contracts | | | | $242,854 | | |
| | | | | | | | | | | | | | | | |
Interest Rate Contracts—Options | | | | | | | | | — | | | Options Written, at value | | | | 13,731 | | |
| | | | | | | | | | | | | | | | | | | |
Total | | | | | | | | | $301,617 | | | | | | | | | | $256,585 | | |
| | | | | | | | | | | | | | | | | | | | | | |
| | | | | | | | | | | | | | | | | | | | | |
*Includes cumulative appreciation/depreciation as reported in Schedule of Investments/footnotes. Only the current day’s variation margin is reported within the Statement of Assets & Liabilities. |
| | | | | | | | | | | | | | | | | | | | | |
The Effect of Derivative Instruments on the Statement of Operations for the Year Ended March 31, 2010 |
| | | | | | | | | | | | | | | | | | | | | |
Amount of Realized Gain on Derivatives Recognized in Income |
| |
| | Written Options | | Futures | | Forward Currency
Contracts | | Total | |
| | | | | | | | | | |
Interest Rate Contracts | | | | $445,294 | | | | | $1,896,226 | | | | | — | | | | | $2,341,520 | | |
Foreign Exchange Contracts | | | | — | | | | | — | | | | | $466,570 | | | | | $ 466,570 | | |
| | | | | | | | | | | | | | | | | | | | | | |
Total | | | | $445,294 | | | | | $1,896,226 | | | | | $466,570 | | | | | $2,808,090 | | |
| | | | | | | | | | | | | | | | | | | | | | |
| | | | | | | | | | | | | | | | | | | | | |
Change in Unrealized Appreciation or (Depreciation) on Derivatives Recognized in Income |
| |
| | Written Options | | Futures | | Forward Currency
Contracts | | Total | |
| | | | | | | | | | |
Interest Rate Contracts | | | | $(95,887 | ) | | | | $(1,197,405 | ) | | | | — | | | | | $(1,293,292 | ) | |
Foreign Exchange Contracts | | | | — | | | | | — | | | | | $91,248 | | | | | $91,248 | | |
| | | | | | | | | | | | | | | | | | | | | | |
Total | | | | $(95,887 | ) | | | | $(1,197,405 | ) | | | | $91,248 | | | | | $(1,202,044 | ) | |
| | | | | | | | | | | | | | | | | | | | | | |
AssetMark Enhanced Fundamental Index® Large Company Growth Fund
The Fund uses exchange-traded stock index futures for the purposes of equitizing the ongoing cash holdings so as to fully maintain the Fund’s exposure to its benchmark. In general, the use of stock index futures for this purpose does not significantly increase the Fund’s risk and does not lead to leverage within the Fund.
162
|
AssetMark Funds |
NOTES TO FINANCIAL STATEMENTS (Continued) |
March 31, 2010 |
| |
|
Balance Sheet — Values of Derivative Instruments as of March 31, 2010 |
| | | | |
| | Asset Derivatives |
| | |
Derivatives not accounted for as
hedging instruments | | Balance Sheet Location | | Value |
| | | | | |
Equity Contracts—Futures* | | Variation margin on | | |
| | futures contracts | | $110,732 |
| | | | | |
Total | | | | $110,732 |
| | | | | |
*Includes cumulative appreciation/depreciation as reported in Schedule of Investments/footnotes. Only the current day’s variation margin is reported within the Statement of Assets & Liabilities.
| | | | | | | | | | | | | | | |
The Effect of Derivative Instruments on the Statement of Operations for the Year Ended March 31, 2010 |
| | | | | | | | | | | | | | | |
Amount of Realized Gain on Derivatives
Recognized in Income | | Change in Unrealized Depreciation
on Derivatives Recognized in Income | |
| | | | |
| | Futures | | Total | | | | Futures | | Total | |
| | | | | | | | | | | | |
Equity Contracts | | $ | 1,301,353 | | $ | 1,301,353 | | Equity Contracts | | $ | (23,696 | ) | $ | (23,696 | ) |
| | | | | | | | | | | | | | | | |
Total | | $ | 1,301,353 | | $ | 1,301,353 | | Total | | $ | (23,696 | ) | $ | (23,696 | ) |
| | | | | | | | | | | | | | | | |
AssetMark Enhanced Fundamental Index® Large Company Value Fund
The Fund uses exchange-traded stock index futures for the purposes of equitizing the ongoing cash holdings so as to fully maintain the Fund’s exposure to its benchmark. In general, the use of stock index futures for this purpose does not significantly increase the Fund’s risk and does not lead to leverage within the Fund.
Balance Sheet — Values of Derivative Instruments as of March 31, 2010
| | | | |
| | Asset Derivatives |
| | |
Derivatives not accounted for as
hedging instruments | | Balance Sheet Location | | Value |
| | | | | |
Equity Contracts—Futures* | | Variation margin on | | |
| | futures contracts | | $90,163 |
| | | | | |
Total | | | | $90,163 |
| | | | | |
*Includes cumulative appreciation/depreciation as reported in Schedule of Investments/footnotes. Only the current day’s variation margin is reported within the Statement of Assets & Liabilities.
| | | | | | | | | | | | | | | |
The Effect of Derivative Instruments on the Statement of Operations for the Year Ended March 31, 2010 |
| | | | | | | | | | | | | | | |
Amount of Realized Gain on Derivatives
Recognized in Income | | Change in Unrealized Depreciation
on Derivatives Recognized in Income | |
| | | | |
| | Futures | | Total | | | | Futures | | Total | |
| | | | | | | | | | | | |
Equity Contracts | | $ | 991,383 | | $ | 991,383 | | Equity Contracts | | $ | (10,239 | ) | $ | (10,239 | ) |
| | | | | | | | | | | | | | |
Total | | $ | 991,383 | | $ | 991,383 | | Total | | $ | (10,239 | ) | $ | (10,239 | ) |
| | | | | | | | | | | | |
163
|
AssetMark Funds
NOTES TO FINANCIAL STATEMENTS (Continued)
March 31, 2010 |
AssetMark Enhanced Fundamental Index® Small Company Growth Fund
The Fund uses exchange-traded stock index futures for the purposes of equitizing the ongoing cash holdings so as to fully maintain the Fund’s exposure to its benchmark. In general, the use of stock index futures for this purpose does not significantly increase the Fund’s risk and does not lead to leverage within the Fund.
Balance Sheet—Values of Derivative Instruments as of March 31, 2010
| | | | |
Derivatives not accounted for as
hedging instruments | | Asset Derivatives |
| | | |
| Balance Sheet Location | | Value |
Equity Contracts—Futures* | | Variation margin on | | |
| | futures contracts | | $3,607 |
|
Total | | | | $3,607 |
*Includes cumulative appreciation/depreciation as reported in Schedule of Investments/footnotes. Only the current day’s variation margin is reported within the Statement of Assets & Liabilities.
The Effect of Derivative Instruments on the Statement of Operations for the Year Ended March 31, 2010
| | | | | | | | | | | | | |
Amount of Realized Gain on Derivatives
Recognized in Income | | Change in Unrealized Depreciation
on Derivatives Recognized in Income | |
| | Futures | | Total | | | | Futures | | Total | |
Equity Contracts | | $364,731 | | $364,731 | | Equity Contracts | | | $ (45,402 | ) | | $ (45,402 | ) |
Total | | $364,731 | | $364,731 | | Total | | | $ (45,402 | ) | | $ (45,402 | ) |
AssetMark Enhanced Fundamental Index® Small Company Value Fund
The Fund uses exchange-traded stock index futures for the purposes of equitizing the ongoing cash holdings so as to fully maintain the Fund’s exposure to its benchmark. In general, the use of stock index futures for this purpose does not significantly increase the Fund’s risk and does not lead to leverage within the Fund.
Balance Sheet — Values of Derivative Instruments as of March 31, 2010
| | | | |
Derivatives not accounted for as
hedging instruments | | Asset Derivatives |
| | | |
| Balance Sheet Location | | Value |
Equity Contracts—Futures* | | Variation margin on | | |
| | futures contracts | | $3,130 |
Total | | | | $3,130 |
*Includes cumulative appreciation/depreciation as reported in Schedule of Investments/footnotes. Only the current day’s variation margin is reported within the Statement of Assets & Liabilities.
164
|
AssetMark Funds
NOTES TO FINANCIAL STATEMENTS (Continued)
March 31, 2010 |
The Effect of Derivative Instruments on the Statement of Operations for the Year Ended March 31, 2010
| | | | | | | | | | | | | |
Amount of Realized Gain on Derivatives
Recognized in Income | | Change in Unrealized Depreciation
on Derivatives Recognized in Income | |
| | Futures | | Total | | | | Futures | | Total | |
Equity Contracts | | $166,111 | | $166,111 | | Equity Contracts | | | $(6,583 | ) | | $(6,583 | ) |
Total | | $166,111 | | $166,111 | | Total | | | $(6,583 | ) | | $(6,583 | ) |
Average Balance Information
The average monthly market value of purchased and written options during the year ended March 31, 2010 for the Core Plus Fixed Income Fund were $6,128 and ($113,935) respectively.
The average monthly notional amount of futures and forwards during the year ended March 31, 2010 for were as follows:
| | | | | | | | | | | | | | | | | | | | | | | | | | |
Long Positions | | AssetMark
Core Plus
Fixed Income
Fund | | AssetMark
Fundamental Index™
Large Company
Growth Fund | | AssetMark
Fundamental Index™
Large Company
Value Fund | | AssetMark
Fundamental Index™
Small Company
Growth Fund | | AssetMark
Fundamental Index™
Small Company
Value Fund | |
|
Futures | | | $ | 149,823,115 | | | | $ | 3,444,952 | | | | $ | 2,523,793 | | | | $ | 673,843 | | | | $ | 345,797 | | |
Forwards | | | $ | 4,752,526 | | | | $ | — | | | | $ | — | | | | $ | — | | | | $ | — | | |
| | | | | | | | | | | | | | | | | | | | | | | | | | |
Short Positions | | AssetMark
Core Plus
Fixed Income
Fund | | AssetMark
Fundamental Index™
Large Company
Growth Fund | | AssetMark
Fundamental Index™
Large Company
Value Fund | | AssetMark
Fundamental Index™
Small Company
Growth Fund | | AssetMark
Fundamental Index™
Small Company
Value Fund | |
|
Futures | | | $ | (40,607,921 | ) | | | $ | — | | | | $ | — | | | | $ | — | | | | $ | — | | |
Forwards | | | $ | (628,719 | ) | | | $ | — | | | | $ | — | | | | $ | — | | | | $ | — | | |
Derivative Risks
The risks of using the various types of derivatives in which the Funds may engage include the risk that movements in the value of the derivative may not fully offset or complement instruments currently held in the Fund in the manner intended by the Advisor; the risk that the counterparty to a derivative contract may fail to comply with their obligations to the Fund; the risk that the derivative may not possess a liquid secondary market at a time when the Fund would look to disengage the position; the risk that additional capital from the Fund may be called upon to fulfill the conditions of the derivative contract; the risk that the use of derivatives in the Fund may induce leverage in the Fund, and the risk that the cost of the derivative contracts may reduce the overall returns experienced by the Fund.
165
|
AssetMark Funds
NOTES TO FINANCIAL STATEMENTS (Continued)
March 31, 2010 |
| | |
| (b) | Subsequent Events Evaluation |
| | In preparing these financial statements, the Trust has evaluated events and transactions for potential recognition or disclosure resulting from subsequent events. This evaluation did not result in any subsequent events that necessitated financial statement disclosures and/or adjustments. The corporate paydown securities denoted as illiquid in the AssetMark Large Cap Growth Fund, AssetMark Large Cap Value Fund, AssetMark Small/Mid Cap Growth Fund, AssetMark Small/Mid Cap Value Fund, AssetMark International Equity Fund, AssetMark Real Estate Securities Fund, and AssetMark Core Plus Fixed Income Fund were liquidated on April 29, 2010 and are no longer held in each of the Funds’ portfolios. |
| | |
| (c) | Repurchase Agreements |
| | Each Fund may enter into repurchase agreements with banks and securities dealers. These transactions involve the purchase of securities with a simultaneous commitment to sell the securities to the bank or the dealer at an agreed-upon date and price. A repurchase agreement is accounted for as an investment by the Fund, collateralized by securities, which are delivered to the Fund’s Custodian or to an agent bank under a tri-party agreement. The securities are marked-to-market daily and additional securities are acquired as needed, to ensure that their value equals or exceeds the repurchase price plus accrued interest. The Core Plus Fixed Income Fund entered into repurchase agreements at March 31, 2010. |
| | |
| (d) | Federal Income Taxes |
| | The Funds intend to continue to comply with the requirements of sub chapter M of the Internal Revenue Code necessary to qualify as regulated investment companies and to make the requisite distributions of income and capital gains to their shareholders sufficient to relieve the Funds from all or substantially all Federal income taxes. Therefore, no Federal income tax provision is required. |
| | |
| | The Trust has adopted financial reporting rules regarding recognition and measurement of tax |
| | |
| | positions taken or expected to be taken on a tax return. The Trust has reviewed all open tax years and major jurisdictions and concluded that no provision for income tax would be required in the Funds’ financial statements. The Funds’ Federal and state income and Federal excise tax returns for tax years for which the applicable statutes of limitations have not expired are subject to examination by the Internal Revenue Service and state departments of revenue. |
| | |
| (e) | Use of Estimates |
| | The preparation of financial statements in conformity with GAAP requires management to make estimates and assumptions that affect the reported amounts of assets and liabilities and disclosure of contingent assets and liabilities at the date of the financial statements and the reported amounts of revenues and expenses during the reported period. Actual results could differ from those estimates. |
| | |
| (f) | Indemnifications |
| | Under the Trust’s organizational documents, its officers and trustees are indemnified against certain liability arising out of their performance of their duties to the Trust. In addition, in the normal course of business, the Trust enters into contracts that contain a variety of representations and warranties which provide general indemnifications. The Trust’s maximum exposure under these arrangements are unknown as this would involve future claims that may be made against the Trust that have not yet occurred. However, the Trust expects the risk of loss to be remote. |
| | |
| (g) | Expenses |
| | Many expenses of the Trust can be directly attributed to a specific Fund. Expenses that cannot be directly attributed to a specific Fund are apportioned among all the Funds in the Trust based on relative net assets. |
| | |
| (h) | Security Transactions and Income Recognition Security transactions are accounted for on trade date. Dividend income is recognized on the ex-dividend date, and the interest income recorded using the effective yield method is accrued daily. |
166
|
AssetMark Funds
NOTES TO FINANCIAL STATEMENTS (Continued)
March 31, 2010 |
| | |
| | Realized gains and losses on investment transactions are determined using the high cost method. Return of capital distributions received from REIT securities are recorded as an adjustment to the cost of the security and thus may impact unrealized or realized gains or losses on the security. Gains and losses from paydowns on mortgage and asset backed securities are recorded as adjustments to interest income. |
| | |
| (i) | Distributions to shareholders |
| | The Funds, with the exception of the Tax-Exempt Income Fund and Core Plus Fixed Income Fund, will distribute any net investment income at least annually. The Tax-Exempt Fixed Income Fund and Core Plus Fixed Income Fund will distribute any net investment income quarterly. All of the Funds will distribute any net realized long or short-term capital gains at least annually. Distributions to shareholders are recorded on the ex-dividend date. The Funds may also pay a special distribution at the end of the calendar year to comply with Federal tax requirements. |
| | |
| (j) | Derivatives |
| | Each Fund may invest in derivative securities including call and put options, futures, forward currency contracts and swaps. These instruments may be used by a Fund for hedging purposes as well as direct investment. |
| | |
| | Forward Currency Contracts |
| | The Funds may enter into forward currency contracts, obligating the Funds to deliver and receive currency at a specified future date. Transactions involving forward currency contracts may serve as long hedges (for example, if a Fund seeks to buy a security denominated in a foreign security, it may purchase a forward currency contract to lock in the U.S. dollar price of the security) or as short hedges (if a Fund anticipates selling a security denominated in a foreign currency, it may sell a forward currency contract to lock in the U.S. dollar equivalent of the anticipated sales proceeds). Forward contracts are valued daily and unrealized appreciation or depreciation is |
| | recorded daily as the difference between the contract exchange rate and the closing forward rate applied to the face amount of the contract. |
| | |
| | Options |
| | Exchange-traded options are valued at the last reported sale price on the exchange on which the security underlying the option is principally traded. If no sales are reported on a particular day for exchange traded options, or the options are not exchange traded, the options are valued at the mean between the most recent quoted bid and asked quotations at the close of the exchange. |
| | |
| | The premium that a Fund pays when purchasing a call option or receives when writing a call option will reflect, among other things, the market price of the security, the relationship of the exercise price to the market price of the security, the relationship of the exercise price to the volatility of the security, the length of the option period and supply and demand factors. The premium is the value of an option at the date of purchase. A purchaser (holder) of a put option pays a non-refundable premium to the seller (writer) of a put option to obtain the right to sell a specified amount of a security at a fixed price (the exercise price) during a specified period (exercise period). Conversely, the seller (writer) of a put option, upon payment by the holder of the premium, has the obligation to buy the security from the holder of the put option at the exercise price during the exercise period. |
| | |
| | As of March 31, 2010, the Core Plus Fixed Income Fund has entered into written call options, for which sufficient collateral was set aside, as disclosed in the Schedule of Investments. |
| | |
| | Futures |
| | Each actively managed Fund has the ability to buy and sell stock index futures contracts traded on domestic stock exchanges to hedge the value of its portfolio against changes in market conditions. Each Enhanced Fundamental Index® Fund will typically invest net cash inflows in stock index futures over the short term until the Fund can invest |
167
|
AssetMark Funds |
NOTES TO FINANCIAL STATEMENTS (Continued) |
March 31, 2010 |
| |
| | |
| | its assets in common stock in a cost effective manner in accordance with its principal investment strategies. A stock index futures contract is an agreement between two parties to take or make delivery of an amount of cash equal to a specified dollar amount, times the difference between stock index value at the close of the last trading day of the contract and the price at which the futures contract is originally struck. A stock index futures contract does not involve the physical delivery of the underlying stocks in the index. Although stock index futures contracts call for the actual taking of delivery of cash, in most cases a Fund expects to liquidate its stock index futures positions through offsetting transactions, which may result in a gain or loss, before cash settlement is required. |
| | |
| | The Core Plus Fixed Income Fund may purchase or sell other types of futures contracts, including those based on particular interest rates, securities, foreign currencies, securities indices and other financial instruments and indices. The Core Plus Fixed Income Fund may also purchase and write call and put options on such future contracts, in order to seek to increase total return or to hedge against changes in interest rates, securities prices, or currency exchange rates, or, to the extent permitted by its investment policies, to otherwise manage its portfolio of investments. |
| | |
| | Futures contracts are valued at the daily quoted settlement prices. |
| | |
| | Swaps |
| | The Core Plus Fixed Income Fund may enter into interest rate, mortgage, credit, currency and total return swaps, interest rate caps, floors and collars. The Core Plus Fixed Income Fund may also purchase and write (sell) options contracts on swaps, referred to as “swaptions”. The Fund may enter into swap transactions for hedging purposes or to seek to increase total return. Since interest rate, mortgage, credit and currency swaps and interest rate caps, floors and collars are individually negotiated, the Fund expects to achieve an acceptable degree of correlation between its |
| | |
| | portfolio investments and its swap, cap, floor and collar positions. |
| | |
| | Swap agreements are valued daily and unrealized appreciation or depreciation is recorded daily as the difference between the prior day and current day closing price. |
| | |
| | During the period ended March 31, 2010, the Funds had no open or outstanding swap contracts. |
| | |
| (k) | Securities Purchased or Sold on a Forward-Commitment Basis |
| | The Funds may enter into when-issued or other purchase or sale transactions that specify forward delivery of a financial security. In connection with this ability, the Funds may enter into mortgage “dollar rolls” in which a Fund sells securities in the current month for delivery and simultaneously contracts with the same counterparty to repurchase similar (same type, coupon and maturity) but not identical securities on a specified future date. The party that is obligated to buy a security in the future will retain the use of their funds, and will benefit from any interest that is earned on those funds from the day that they enter into the forward contract until the day that they take delivery and pay for the security. |
| | |
| (l) | Foreign Currency Translation |
| | The accounting records of the Funds are maintained in U.S. dollars. Investment securities and all other assets and liabilities of the Funds denominated in a foreign currency are translated into U.S. dollars at current exchange rates. Purchases and sales of securities, income receipts, and expense payments are translated into U.S. dollars at the exchange rate in effect on the dates of the respected transactions. The Funds do not isolate the portion of the fluctuations on investments resulting from changes in foreign currency exchange rates from the fluctuations in market prices of investments held. Such fluctuations are included with the net realized and unrealized gain or loss from investments. |
| | |
| (m) | Restricted and Illiquid Securities |
| | Each Fund may invest up to 15% of its net assets in securities that are illiquid at the time of purchase, |
168
|
AssetMark Funds |
NOTES TO FINANCIAL STATEMENTS (Continued) |
March 31, 2010 |
| |
| | |
| | which includes securities with legal or contractual restrictions on their disposition, and securities for which there are no readily available market quotations. The Board of Trustees, with the assistance of the Advisor, sub-advisors and/or pricing services, will determine the value of such securities in good faith in accordance with the provisions of the 1940 Act. Illiquid securities present the risks that a Fund may have difficulty valuing these holdings and/or may be unable to sell these holdings at the time or price desired. There are no restrictions on each Fund’s ability to invest in restricted securities (that is, securities that are not registered pursuant to the Securities Act of 1933), except to the extent such securities may be considered illiquid. Securities issued pursuant to Rule 144A of the Securities Act of 1933 will be considered liquid if determined to be so under procedures adopted by the Board of Trustees. |
| | |
| (n) | Auction Rate Securities |
| | The Tax-Exempt Fixed Income Fund and the Core Plus Fixed Income Fund each may invest in auction rate municipal securities. Auction rate securities usually permit the holder to sell the securities in an auction at par value at specified intervals. The dividend is reset by “Dutch” auction in which bids are made by broker-dealers and other institutions for a certain amount of securities at a specified minimum yield. The dividend rate set by the auction is the lowest interest or dividend rate that covers all securities offered for sale. While this progress is designed to permit auction rate securities to be traded at par value, there is a risk that an auction will fail due to insufficient demand for the securities. Neither Fund was invested in any auction rate securities at March 31, 2010. |
| | |
| (o) | Short Sales |
| | Although not currently part of any of the Funds’ investment strategies, each Fund has the ability to make short sales. Short sales are transactions where a Fund sells securities it does not own in anticipation of a decline in the value of the securities. |
| | |
| (p) | Trustee and Other Compensation |
| | For their services as Trustees of the Trust, the Independent Trustees receive a retainer fee of $45,000 per year and $4,500 per in person meeting attended, as well as reimbursement for expenses incurred in connection with attendance at such meetings. The Lead Independent Trustee receives an additional retainer fee of $10,000 per year. The Audit Committee Chair receives an additional retainer fee of $5,000 per year. Telephonic meeting fees are determined according to the length of the meeting as follows: $2,000 for one to two hours, $3,000 for two to three hours and $4,000 for three hours or longer. The “interested persons” who serve as Trustees of the Trust receive no compensation from the Trust for their services as Trustees. The Funds reimburse the Advisor an allocated amount for the compensation and related expenses of certain officers of the Trust who provide compliance services to the Funds. The aggregate amount of all such reimbursements is determined by the Trustees. No other compensation or retirement benefits are received by any Trustee or officer from the Funds. |
| | |
3. | Investment Advisor |
| | |
| The Trust has an Investment Advisory Agreement (the “Agreement”) with Genworth Financial Wealth Management, Inc. (the “Advisor”), with whom certain officers and trustees of the Trust are affiliated, to furnish investment advisory services to the Funds. Under the terms of the Agreement, the Trust, on behalf of the Funds, compensates the Advisor for its management services at the following contractual rates, based on each Fund’s average daily net assets: |
| | | | | |
| Large Cap Growth Fund | | | 0.95 | % |
| Large Cap Value Fund | | | 0.95 | % |
| Small/Mid Cap Growth Fund | | | 0.95 | % |
| Small/Mid Cap Value Fund | | | 1.00 | % |
| International Equity Fund | | | 0.95 | % |
| Real Estate Securities Fund | | | 0.95 | % |
| Tax-Exempt Fixed Income Fund | | | 0.80 | % |
| Core Plus Fixed Income Fund | | | 0.75 | % |
169
|
AssetMark Funds |
NOTES TO FINANCIAL STATEMENTS (Continued) |
March 31, 2010 |
| |
| | | | | |
| Enhanced Fundamental Index®
Large Company Growth Fund | | | 0.75 | % |
| Enhanced Fundamental Index®
Large Company Value Fund | | | 0.75 | % |
| Enhanced Fundamental Index®
Small Company Growth Fund | | | 0.75 | % |
| Enhanced Fundamental Index®
Small Company Value Fund | | | 0.75 | % |
| |
| In addition, the Trust and the Advisor have also entered into a Fee Waiver Agreement designed to provide Fund shareholders with the economic benefits of economies of scale that may be realized as Fund assets increase. Under the Fee Waiver Agreement, the Advisor has contractually agreed to: (1) waive 0.025% of each Fund’s annual advisory fee on Trust assets in excess of $6 billion, and an additional 0.025% of each Fund’s annual advisory fee on Trust assets in excess of $12 billion, and (2) waive portions of its advisory fee monthly on aggregate average assets of the Large Cap Growth Fund, Large Cap Value Fund, Small/Mid Cap Growth Fund, Small/Mid Cap Value Fund, International Equity Fund, Real Estate Securities Fund, Tax-Exempt Fixed Income Fund and Core Plus Fixed Income Fund in excess of $2.5 billion to pass on certain savings in the underlying sub-advisory fee arrangements. |
| |
| The Trust and Advisor have also entered into an Expense Waiver and Reimbursement Agreement under which the Advisor has agreed to waive, through July 31, 2010, its management fee and/or reimburse each Fund’s other expenses to the extent necessary to ensure that the Fund’s operating expenses (net of securities lending credit) do not exceed the following rates, based on each Fund’s average daily net assets: |
| | | | | |
| Large Cap Growth Fund | | | 1.49 | % |
| Large Cap Value Fund | | | 1.49 | % |
| Small/Mid Cap Growth Fund | | | 1.59 | % |
| Small/Mid Cap Value Fund | | | 1.59 | % |
| International Equity Fund | | | 1.59 | % |
| Real Estate Securities Fund | | | 1.49 | % |
| Tax-Exempt Fixed Income Fund | | | 1.29 | % |
| Core Plus Fixed Income Fund | | | 1.29 | % |
| Enhanced Fundamental Index®
Large Company Growth Fund | | | 1.22 | % |
| | | | | |
| Enhanced Fundamental Index®
Large Company Value Fund | | | 1.22 | % |
| Enhanced Fundamental Index®
Small Company Growth Fund | | | 1.22 | % |
| Enhanced Fundamental Index®
Small Company Value Fund | | | 1.22 | % |
| | | | | |
| Any such waiver or reimbursement is subject to later adjustment to allow the Advisor to recoup amounts waived or reimbursed to the extent actual fees and expenses for a fiscal period are less than each Fund’s expense limitation cap, provided, however, that the Advisor shall only be entitled to recoup such amounts for a period of three years from the date such amount was waived or reimbursed. As of March 31, 2010, the Large Cap Growth Fund, Large Cap Value Fund, Small/Mid Cap Growth Fund, Small/Mid Cap Value Fund, International Equity Fund, Real Estate Securities Fund, and Core Plus Fixed Income Fund have recouped all potential recoverable waivers or reimbursed expenses. |
| |
| The Advisor is currently waiving expenses in the Tax-Exempt Fixed Income Fund, Enhanced Fundamental Index® Large Company Growth Fund, Enhanced Fundamental Index® Large Company Value Fund, Enhanced Fundamental Index® Small Company Growth Fund and Enhanced Fundamental Index® Small Company Value Fund to keep these Funds at their expense cap. Waived expenses subject to potential recovery are as follows: |
| | | | | | | | | | | |
| | | Year of
Expiration
03/31/2011 | | Year of
Expiration
03/31/2012 | | Year of
Expiration
03/31/2013 | |
| | | | | | | | |
| Tax-Exempt Fixed
Income Fund | | $ | — | | $ | 26,066 | | $ | 32,625 | |
| Enhanced
Fundamental
Index® Large
Company
Growth Fund | | | 132,884 | | | 162,651 | | | 150,369 | |
| Enhanced
Fundamental
Index® Large
Company
Value Fund | | | 20,406 | | | 77,621 | | | 66,824 | |
170
|
AssetMark Funds |
NOTES TO FINANCIAL STATEMENTS (Continued) |
March 31, 2010 |
| |
| | | | | | | | | | | |
| | | Year of
Expiration
03/31/2011 | | Year of
Expiration
03/31/2012 | | Year of
Expiration
03/31/2013 | |
| | | | | | | | |
| Enhanced
Fundamental
Index® Small
Company
Growth Fund | | | 85,646 | | | 59,941 | | | 76,154 | |
| Enhanced
Fundamental
Index® Small
Company
Value Fund | | | 79,554 | | | 50,363 | | | 46,323 | |
| | | | | | | | | | | |
| Sub-advisory services are provided to the Funds, pursuant to agreements between the Advisor and various sub-advisors. Under the terms of these sub-advisory agreements, the Advisor, not the Fund, compensates each sub-advisor based on the portion of each Fund’s average daily net assets that is allocated to the sub-advisor. |
| |
4. | Distribution Plan |
| |
| The Trust, on behalf of the Funds, has adopted a distribution plan pursuant to Rule 12b-1 under the 1940 Act (the “12b-1 Plan”), which provides for each Fund to pay distribution fees at an annual rate of 0.25% of the average daily net assets of the Funds. Payments under the 12b-1 Plan shall be used to compensate persons (including affiliates of the Trust) who provide support services in connection with the distribution of the Fund’s shares and servicing of the Fund’s shareholders. For example, these amounts are paid to financial intermediaries that perform back office shareholder servicing and recordkeeping services that facilitate the operation of the Genworth Financial Wealth Management Program through which the Funds are primarily distributed. The Advisor (and its affiliates) similarly receive portions of such payments for their services provided that facilitate the operation of the program. These financial intermediaries and affiliates of the Trust also receive payments from the Trust outside of the 12b-1 Plan for shareholder services that are unrelated to distribution services. Capital Brokerage Corp., an affiliate of the Advisor, serves as principal underwriter and distributor for the Funds. |
| |
| Quasar Distributors, LLC serves as sub-distributor for the Funds. Quasar Distributors, LLC is an affiliated company of U.S. Bank, N.A. |
| |
5. | Service and Custody Agreements |
| |
| The Trust has entered into Service Agreements with U.S. Bancorp Fund Services, LLC (“USBFS”) and a Custody Agreement with U.S. Bank, N.A., an affiliate of USBFS. Under these agreements, USBFS and U.S. Bank, N.A. provide certain transfer agency, administrative, accounting and custody services. |
| |
6. | Securities Lending |
| |
| Effective July 1, 2003 the actively managed Funds entered into a collective securities lending arrangement with U.S. Bank, N.A. (the “Custodian”). Effective September 17, 2008, the Enhanced Fundamental Index® Funds entered into a collective securities lending arrangement with the custodian. Under the term of the agreement, the Custodian is authorized to loan securities on behalf of the Funds to approved brokers. In exchange, under normal market conditions, the Funds receive cash collateral in the amount of at least 102% of the value of securities loaned. The cash collateral is invested in short term instruments as noted in the Schedule of Investments. Although risk is mitigated by the collateral, the Funds could experience a delay in recovering their securities and possible loss of income or value if the borrower fails to return the borrowed securities. In addition, the Funds bear the risk of loss associated with the investment of cash collateral received. After predetermined rebates to brokers, a percentage of the net securities lending revenue is credited to the Funds to be used as an offset against custody costs and other charges incurred by the Funds. The Custodian is paid a fee for administering a securities lending program for the Funds, equal to the remaining percentage of the net securities lending revenues generated under the agreement. A portion of the fee to be paid to the Custodian in the fiscal year ended March 31, 2010 was waived. |
| |
| As of March 31, 2010, the Funds (excluding the International Equity Fund and Tax-Exempt Fixed Income Fund) had loaned securities which were |
171
|
AssetMark Funds |
NOTES TO FINANCIAL STATEMENTS (Continued) |
March 31, 2010 |
| |
collateralized by cash. The cash collateral received was invested in securities as listed in each Fund’s Schedule of Investments. Income earned from these investments is allocated to each Fund based on each Fund’s portion
of total cash collateral received. Securities lending income is disclosed in each Fund’s Statement of Operations as a securities lending offset.
As of March 31, 2010, the values of securities loaned and collateral received were as follows:
| | | | | | | | | | | | | | | | | | | |
| | Value of
Securities
Loaned | | Payable for
Collateral
on Securities
Loaned | | Collateral
Excess
(Deficit) due
to (from)
Securities
Lending
Agent | | Cost of
Securities
Purchased
as Securities
Lending
Collateral | | Unrealized
Depreciation | | Value
of Securities
Purchased
as Securities
Lending
Collateral | |
| | | | | | | | | | | | | |
| | | | | | | | | | | | | |
Large Cap | | | | | | | | | | | | | | | | | | | |
Growth Fund | | $ | 28,188,619 | | $ | 29,108,406 | | $ | 4,097,950 | | $ | 33,206,356 | | $ | (5,539,380 | ) | $ | 27,666,976 | |
Large Cap | | | | | | | | | | | | | | | | | | | |
Value Fund | | | 29,707,432 | | | 30,745,404 | | | 2,634,387 | | | 33,379,791 | | | (5,104,684 | ) | | 28,275,107 | |
Small/Mid Cap | | | | | | | | | | | | | | | | | | | |
Growth Fund | | | 13,035,057 | | | 13,546,811 | | | (812,528 | ) | | 12,734,283 | | | (1,360,991 | ) | | 11,373,292 | |
Small/Mid Cap | | | | | | | | | | | | | | | | | | | |
Value Fund | | | 15,709,513 | | | 16,483,103 | | | (2,885,357 | ) | | 13,597,746 | | | (810,253 | ) | | 12,787,493 | |
International | | | | | | | | | | | | | | | | | | | |
Equity Fund | | | — | | | — | | | 1,798,972 | | | 1,798,972 | | | (815,655 | ) | | 983,317 | |
Real Estate | | | | | | | | | | | | | | | | | | | |
Securities Fund | | | 12,623,115 | | | 13,219,202 | | | (2,078,522 | ) | | 11,140,680 | | | (749,565 | ) | | 10,391,115 | |
Core Plus Fixed | | | | | | | | | | | | | | | | | | | |
Income Fund | | | 53,203,166 | | | 54,397,100 | | | (2,754,902 | ) | | 51,642,198 | | | (5,627,383 | ) | | 46,014,815 | |
Enhanced Fundamental | | | | | | | | | | | | | | | | | | | |
Index® Large | | | | | | | | | | | | | | | | | | | |
Company Growth Fund | | | 11,619,048 | | | 12,083,657 | | | — | | | 12,083,657 | | | — | | | 12,083,657 | |
Enhanced Fundamental | | | | | | | | | | | | | | | | | | | |
Index® Large | | | | | | | | | | | | | | | | | | | |
Company Value Fund | | | 10,397,156 | | | 11,019,836 | | | — | | | 11,019,836 | | | — | | | 11,019,836 | |
Enhanced Fundamental | | | | | | | | | | | | | | | | | | | |
Index® Small | | | | | | | | | | | | | | | | | | | |
Company Growth Fund | | | 4,838,150 | | | 5,124,065 | | | — | | | 5,124,065 | | | — | | | 5,124,065 | |
Enhanced Fundamental | | | | | | | | | | | | | | | | | | | |
Index® Small | | | | | | | | | | | | | | | | | | | |
Company Value Fund | | | 1,843,901 | | | 2,259,561 | | | — | | | 2,259,561 | | | — | | | 2,259,561 | |
| | | | | | | | | | | | | | | | | | | |
| | $ | 181,165,157 | | $ | 187,987,145 | | $ | — | | $ | 187,987,145 | | $ | (20,007,911 | ) | $ | 167,979,234 | |
| | | | | | | | | | | | | | | | | | | |
172
|
AssetMark Funds |
NOTES TO FINANCIAL STATEMENTS (Continued) |
March 31, 2010 |
| |
| |
7. | Investment Transactions |
| |
| The aggregate purchases and sales of securities, excluding short-term investments, for the year ended March 31, 2010 are summarized below. |
| | | | | | | |
| | Purchases | | Sales | |
| | | | | |
Large Cap Growth Fund | | $ | 159,020,042 | | $ | 243,886,731 | |
Large Cap Value Fund | | | 56,311,267 | | | 125,965,534 | |
Small/Mid Cap | | | | | | | |
Growth Fund | | | 105,255,214 | | | 133,225,187 | |
Small/Mid Cap Value Fund | | | 26,962,239 | | | 55,380,709 | |
International Equity Fund | | | 165,281,519 | | | 204,316,535 | |
Real Estate Securities Fund | | | 28,673,818 | | | 50,299,320 | |
Tax-Exempt Fixed | | | | | | | |
Income Fund | | | 106,166,458 | | | 116,106,527 | |
Core Plus Fixed | | | | | | | |
Income Fund* | | | 1,165,315,870 | | | 1,227,680,903 | |
Enhanced Fundamental | | | | | | | |
Index® Large Company | | | | | | | |
Growth Fund | | | 45,986,631 | | | 43,308,102 | |
Enhanced Fundamental | | | | | | | |
Index® Large Company | | | | | | | |
Value Fund | | | 38,434,020 | | | 46,380,191 | |
Enhanced Fundamental | | | | | | | |
Index® Small Company | | | | | | | |
Growth Fund | | | 12,090,533 | | | 14,890,017 | |
Enhanced Fundamental | | | | | | | |
Index® Small Company | | | | | | | |
Value Fund | | | 8,453,285 | | | 11,691,694 | |
| |
* | Included in these amounts were $199,012,777 of purchases and $146,822,134 of sales of U.S. Government Securities. |
| |
8. Option Contracts Written |
| |
| The premium amount and number of option contracts written during the year ended March 31, 2010 in the Core Plus Fixed Income Fund, were as follows: |
| | | | | | | | |
| | Amount of
Premiums | | Number of
Contracts | |
| | | | | |
Outstanding at 3/31/09 | | $ | (182,450 | ) | | (85 | ) | |
Options written | | | (741,227 | ) | | (1,299 | ) | |
Options expired | | | 87,682 | | | 242 | | |
Options exercised | | | — | | | — | | |
Options closed | | | 824,935 | | | 1,122 | | |
| | | | | | | | |
Outstanding at 3/31/10 | | $ | (11,060 | ) | | (20 | ) | |
| | | | | | | | |
| |
9. Other Tax Information |
| |
| Net Investment Income and realized gains and losses for Federal income tax purposes may differ from that reported on the financial statements because of permanent book-to-tax differences. GAAP requires that permanent differences between financial reporting and tax reporting be reclassified between various components of net assets. |
| |
| These differences are primarily due to net operating losses, foreign currency, sales of partnerships, paydowns and return of capital. On the Statement of Assets & Liabilities, the following adjustments were made: |
| | | | | | | | | | |
| | Accumulated
Net
Investment
Income
or (Loss) | | Accumulated
Realized
Gain or
(Loss) | | Capital
Stock | |
| | | | | | | |
Large Cap | | | | | | | | | | |
Growth | | | | | | | | | | |
Fund | | $ | (2,031 | ) | $ | 2,031 | | $ | — | |
Large Cap | | | | | | | | | | |
Value Fund | | | (58 | ) | | 58 | | | — | |
Small/Mid | | | | | | | | | | |
Cap Growth | | | | | | | | | | |
Fund | | | 188,935 | | | 175,841 | | | (364,776 | ) |
Small/Mid | | | | | | | | | | |
Cap Value | | | | | | | | | | |
Fund | | | — | | | — | | | — | |
International | | | | | | | | | | |
Equity | | | | | | | | | | |
Fund | | | (1,134,579 | ) | | 1,134,579 | | | — | |
Real Estate | | | | | | | | | | |
Securities | | | | | | | | | | |
Fund | | | 28,360 | | | (28,360 | ) | | — | |
Tax-Exempt | | | | | | | | | | |
Fixed | | | | | | | | | | |
Income | | | | | | | | | | |
Fund | | | — | | | — | | | — | |
Core Plus | | | | | | | | | | |
Fixed | | | | | | | | | | |
Income | | | | | | | | | | |
Fund | | | 987,642 | | | (987,641 | ) | | (1 | ) |
173
|
AssetMark Funds |
NOTES TO FINANCIAL STATEMENTS (Continued) |
March 31, 2010 |
| |
| | | | | | | | | | |
| | Accumulated
Net
Investment
Income
or (Loss) | | Accumulated
Realized
Gain or
(Loss) | | Capital
Stock | |
| | | | | | | |
Enhanced | | | | | | | | | | |
Fundamental | | | | | | | | | | |
Index® | | | | | | | | | | |
Large | | | | | | | | | | |
Company | | | | | | | | | | |
Growth | | | | | | | | | | |
Fund | | | 102 | | | (102 | ) | | — | |
Enhanced | | | | | | | | | | |
Fundamental | | | | | | | | | | |
Index® | | | | | | | | | | |
Large | | | | | | | | | | |
Company | | | | | | | | | | |
Value | | | | | | | | | | |
Fund | | | — | | | — | | | — | |
Enhanced | | | | | | | | | | |
Fundamental | | | | | | | | | | |
Index® | | | | | | | | | | |
Small | | | | | | | | | | |
Company | | | | | | | | | | |
Growth | | | | | | | | | | |
Fund | | | 2,294 | | | — | | | (2,294 | ) |
Enhanced | | | | | | | | | | |
Fundamental | | | | | | | | | | |
Index® | | | | | | | | | | |
Small | | | | | | | | | | |
Company | | | | | | | | | | |
Value | | | | | | | | | | |
Fund | | | 1,432 | | | 212 | | | (1,644 | ) |
The Funds intend to utilize provisions of the Federal income tax laws which allow the Funds to carry realized capital losses forward for eight years following the year of loss and offset such losses against any future realized capital gains. Capital loss carryforwards available for Federal income tax purposes are as follows:
174
|
AssetMark Funds |
NOTES TO FINANCIAL STATEMENTS (Continued) |
March 31, 2010 |
| |
| | | | | | | | | | | | | | | | | | | | | | |
| | Capital losses expiring: | |
| | | |
| | 3/31/12 | | 3/31/13 | | 3/31/14 | | 3/31/15 | | 3/31/16 | | 3/31/17 | | 3/31/18 | |
| | | | | | | | | | | | | | | |
Large Cap Growth | | | | | | | | | | | | | | | | | | | | | | |
Fund | | | — | | | — | | | — | | | — | | | — | | $ | (46,208,208 | ) | $ | (59,171,144 | ) |
Large Cap Value | | | | | | | | | | | | | | | | | | | | | | |
Fund | | | — | | | — | | | — | | | — | | | — | | | (55,440,627 | ) | | (146,948,668 | ) |
Small/Mid Cap | | | | | | | | | | | | | | | | | | | | | | |
Growth Fund | | | — | | | — | | | — | | | — | | | — | | | (12,388,825 | ) | | (10,611,067 | ) |
Small/Mid Cap | | | | | | | | | | | | | | | | | | | | | | |
Value Fund | | | — | | | — | | | — | | | — | | | — | | | (23,189,121 | ) | | (12,877,160 | ) |
International Equity | | | | | | | | | | | | | | | | | | | | | | |
Fund | | | — | | | — | | | — | | | — | | | — | | | (85,366,736 | ) | | (139,582,037 | ) |
Real Estate Securities | | | | | | | | | | | | | | | | | | | | | | |
Fund | | | — | | | — | | | — | | | — | | | — | | | — | | | (7,762,765 | ) |
Tax-Exempt Fixed | | | | | | | | | | | | | | | | | | | | | | |
Income Fund | | $ | (16,163 | ) | $ | (128,240 | ) | $ | (10,395 | ) | $ | (573,575 | ) | $ | (1,190,258 | ) | | (3,325,230 | ) | | (2,354,785 | ) |
Core Plus Fixed | | | | | | | | | | | | | | | | | | | | | | |
Income Fund | | | — | | | — | | | — | | | — | | | — | | | — | | | (3,523,058 | ) |
Enhanced Fundamental | | | | | | | | | | | | | | | | | | | | | | |
Index® Large Company | | | | | | | | | | | | | | | | | | | | | | |
Growth Fund | | | — | | | — | | | — | | | — | | | — | | | (9,014,711 | ) | | (10,963,181 | ) |
Enhanced Fundamental | | | | | | | | | | | | | | | | | | | | | | |
Index® Large Company | | | | | | | | | | | | | | | | | | | | | | |
Value Fund | | | — | | | — | | | — | | | — | | | — | | | (11,944,558 | ) | | (12,646,580 | ) |
Enhanced Fundamental | | | | | | | | | | | | | | | | | | | | | | |
Index® Small Company | | | | | | | | | | | | | | | | | | | | | | |
Growth Fund | | | — | | | — | | | — | | | — | | | — | | | (1,103,169 | ) | | (106,012 | ) |
Enhanced Fundamental | | | | | | | | | | | | | | | | | | | | | | |
Index® Small Company | | | | | | | | | | | | | | | | | | | | | | |
Value Fund | | | — | | | — | | | — | | | — | | | — | | | (879,255 | ) | | (547,558 | ) |
175
|
AssetMark Funds |
NOTES TO FINANCIAL STATEMENTS (Continued) |
March 31, 2010 |
| |
Additionally, at March 31, 2010, the Funds deferred on a tax basis post-October 2009 losses as follows:
| | | | |
| Large Cap Growth Fund | | — | |
| Large Cap Value Fund | | — | |
| Small/Mid Cap Growth Fund | | — | |
| Small/Mid Cap Value Fund | | $385,542 | |
| International Equity Fund | | — | |
| Real Estate Securities Fund | | — | |
| Tax-Exempt Fixed Income Fund | | — | |
| Core Plus Fixed Income Fund | | 174,771 | |
| Enhanced Fundamental Index® Large | | | |
| Company Growth Fund | | — | |
| Enhanced Fundamental Index® Large | | | |
| Company Value Fund | | — | |
| Enhanced Fundamental Index® Small | | | |
| Company Growth Fund | | — | |
| Enhanced Fundamental Index® Small | | | |
| Company Value Fund | | 212 | |
The tax components of distributions paid during the fiscal years ended March 31, 2010 and March 31, 2009 are as follows:
| | | | | | | | | | | |
| | | Year Ended March 31, 2010 | |
| | | | |
| | | Ordinary
Income
Distributions | | Long-Term
Capital Gain
Distributions | | Return of
Capital | |
| | | | | | | | |
| Large Cap | | | | | | | | | | |
| Growth Fund | | $ | 312,348 | | | — | | $124,389 | |
| Large Cap | | | | | | | | | | |
| Value Fund | | | 3,205,994 | | | — | | | — | |
| Small/Mid Cap | | | | | | | | | | |
| Growth Fund | | | — | | | — | | | — | |
| Small/Mid Cap | | | | | | | | | | |
| Value Fund | | | 10,573 | | | — | | $121,608 | |
| International | | | | | | | | | | |
| Equity Fund | | | 6,512,687 | | | — | | | — | |
| Real Estate | | | | | | | | | | |
| Securities Fund | | | 744,733 | | | — | | | — | |
| Tax-Exempt Fixed | | | | | | | | | | |
| Income Fund* | | | 6,165,984 | | | — | | | — | |
| Core Plus Fixed | | | | | | | | | | |
| Income Fund | | | 19,828,054 | | | — | | | — | |
| | | | | | | | | | | |
| | | | | | | | | | | |
| | | Year Ended March 31, 2010 | |
| | | | |
| | | Ordinary
Income
Distributions | | Long-Term
Capital Gain
Distributions | | Return of
Capital | |
| | | | | | | | |
| | | | | | | | | | | |
| Enhanced | | | | | | | | | | |
| Fundamental | | | | | | | | | | |
| Index® Large | | | | | | | | | | |
| Company | | | | | | | | | | |
| Growth Fund | | $ | 630,394 | | | — | | | — | |
| Enhanced | | | | | | | | | | |
| Fundamental | | | | | | | | | | |
| Index® Large | | | | | | | | | | |
| Company | | | | | | | | | | |
| Value Fund | | | 671,533 | | | — | | | — | |
| Enhanced | | | | | | | | | | |
| Fundamental | | | | | | | | | | |
| Index® Small | | | | | | | | | | |
| Company | | | | | | | | | | |
| Growth Fund | | | — | | | — | | | — | |
| Enhanced | | | | | | | | | | |
| Fundamental | | | | | | | | | | |
| Index® Small | | | | | | | | | | |
| Company | | | | | | | | | | |
| Value Fund | | | — | | | — | | | — | |
| | |
| * | Contains $6,036,958 of tax-exempt income for year ended 3/31/2010. |
| | | | | | | | | | | |
| | | Year Ended March 31, 2009 | |
| | | | |
| | | Ordinary
Income
Distributions | | Long-Term
Capital Gain
Distributions | | Return of
Capital | |
| | | | | | | | |
| Large Cap | | | | | | | | | | |
| Growth Fund | | $ | 41,523 | | | — | | | — | |
| Large Cap | | | | | | | | | | |
| Value Fund | | | 8,006,993 | | | $ 3,926 | | | — | |
| Small/Mid Cap | | | | | | | | | | |
| Growth Fund | | | — | | | 132,673 | | | — | |
| Small/Mid Cap | | | | | | | | | | |
| Value Fund | | | 629,649 | | | — | | $ | 31,146 | |
176
|
AssetMark Funds |
NOTES TO FINANCIAL STATEMENTS (Continued) |
March 31, 2010 |
| |
| | | | | | | | | | | |
| | | Year Ended March 31, 2009 | |
| | | | |
| | | Ordinary
Income
Distributions | | Long-Term
Capital Gain
Distributions | | Return of
Capital | |
| | | | | | | | |
| International | | | | | | | | | | |
| Equity Fund | | $ | 2,924,385 | | $ | 3,267,351 | | | — | |
| Real Estate | | | | | | | | | | |
| Securities Fund | | | 543,149 | | | — | | | — | |
| Tax-Exempt Fixed | | | | | | | | | | |
| Income Fund* | | | 7,125,080 | | | — | | | — | |
| Core Plus Fixed | | | | | | | | | | |
| Income Fund | | | 31,691,278 | | | 8,060,419 | | | — | |
| Enhanced | | | | | | | | | | |
| Fundamental | | | | | | | | | | |
| Index® Large | | | | | | | | | | |
| Company | | | | | | | | | | |
| Growth Fund | | | 610,544 | | | 165 | | | — | |
| Enhanced | | | | | | | | | | |
| Fundamental | | | | | | | | | | |
| Index® Large | | | | | | | | | | |
| Company | | | | | | | | | | |
| Value Fund | | | 1,211,740 | | | 19 | | | — | |
| Enhanced | | | | | | | | | | |
| Fundamental | | | | | | | | | | |
| Index® Small | | | | | | | | | | |
| Company | | | | | | | | | | |
| Growth Fund | | | — | | | — | | | — | |
| Enhanced | | | | | | | | | | |
| Fundamental | | | | | | | | | | |
| Index® Small | | | | | | | | | | |
| Company | | | | | | | | | | |
| Value Fund | | | 86,041 | | | — | | | 16,930 | |
| | |
| * | Contains $7,125,080 of tax-exempt income for year ended 3/31/2009. |
The Core Plus Fixed Income Fund and Real Estate Securities Fund had additional earnings and profits of $388,073 and $1,276,355, respectively, distributed to shareholders on redemptions. The Funds designated as long-term capital gain and ordinary income dividends, pursuant to Internal Revenue Code Section 852(b)(3), the amount necessary to reduce the earnings and profits of the Funds related to net capital gain and ordinary income to zero for the tax year ended 3/31/2009.
177
|
AssetMark Funds |
NOTES TO FINANCIAL STATEMENTS (Continued) |
March 31, 2010 |
| |
At March 31, 2010 the components of accumulated earnings (losses) on a tax basis were as follows:
| | | | | | | | | | | | | | | | | | | |
| | Large Cap
Growth
Fund | | Large Cap
Value
Fund | | Small/Mid
Cap Growth
Fund | | Small/Mid
Cap Value
Fund | | International
Equity
Fund | | Real Estate
Securities
Fund | |
| | | | | | | | | | | | | |
Cost of | | | | | | | | | | | | | | | | | | | |
Investments | | | 211,153,853 | | | 206,388,880 | | | 47,353,352 | | | 49,434,223 | | | 247,100,579 | | | 50,692,051 | |
Gross Unrealized | | | | | | | | | | | | | | | | | | | |
Appreciation | | | 41,955,093 | | | 39,940,538 | | | 6,494,321 | | | 9,128,890 | | | 39,615,222 | | | 15,571,885 | |
Gross Unrealized | | | | | | | | | | | | | | | | | | | |
Depreciation | | | (12,030,835 | ) | | (12,540,463 | ) | | (919,271 | ) | | (2,017,794 | ) | | (16,225,768 | ) | | (4,156,161 | ) |
| | | | | | | | | | | | | | | | | | | |
Net Unrealized | | | | | | | | | | | | | | | | | | | |
Appreciation | | | | | | | | | | | | | | | | | | | |
(Depreciation) | | | 29,924,258 | | | 27,400,075 | | | 5,575,050 | | | 7,111,096 | | | 23,389,454 | | | 11,415,724 | |
| | | | | | | | | | | | | | | | | | | |
| | | | | | | | | | | | | | | | | | | |
Undistributed | | | | | | | | | | | | | | | | | | | |
Tax-Exempt | | | | | | | | | | | | | | | | | | | |
Ordinary Income | | | — | | | — | | | — | | | — | | | — | | | — | |
Undistributed | | | | | | | | | | | | | | | | | | | |
Ordinary Income | | | — | | | 592,543 | | | — | | | — | | | 4,263,692 | | | 35,538 | |
Undistributed | | | | | | | | | | | | | | | | | | | |
Long-Term | | | | | | | | | | | | | | | | | | | |
Cap Gains | | | — | | | — | | | — | | | — | | | — | | | — | |
| | | | | | | | | | | | | | | | | | | |
Total Distributable | | | | | | | | | | | | | | | | | | | |
Earnings | | | — | | | 592,543 | | | — | | | — | | | 4,263,692 | | | 35,538 | |
| | | | | | | | | | | | | | | | | | | |
| | | | | | | | | | | | | | | | | | | |
Other Accumulated | | | | | | | | | | | | | | | | | | | |
Losses | | | (105,379,352 | ) | | (202,389,295 | ) | | (22,999,892 | ) | | (36,522,685 | ) | | (225,112,737 | ) | | (7,762,765 | ) |
| | | | | | | | | | | | | | | | | | | |
Total Accumulated | | | | | | | | | | | | | | | | | | | |
Earnings (Losses) | | | (75,455,094 | ) | | (174,396,677 | ) | | (17,424,842 | ) | | (29,411,589 | ) | | (197,459,591 | ) | | 3,688,497 | |
| | | | | | | | | | | | | | | | | | | |
178
| | | | | | | | | | | | | | | | |
Tax-Exempt
Fixed Income
Fund | | Core Plus
Fixed Income
Fund | | Enhanced
Fundamental
Index® Large
Company
Growth Fund | | Enhanced
Fundamental
Index® Large
Company
Value Fund | | Enhanced
Fundamental
Index® Small
Company
Growth Fund | | Enhanced
Fundamental
Index® Small
Company
Value Fund | |
| | | | | | | | | | | | | | | | | |
|
191,397,708 | | | 610,071,219 | | | 74,478,513 | | | 58,609,205 | | | 17,709,608 | | | 8,874,824 | |
| | | | | | | | | | | | | | | | |
7,325,337 | | | 17,763,937 | | | 10,900,518 | | | 10,998,694 | | | 3,208,516 | | | 1,766,610 | |
| | | | | | | | | | | | | | | | |
(2,332,270 | ) | | (44,056,810 | ) | | (3,048,891 | ) | | (2,721,447 | ) | | (844,736 | ) | | (590,337 | ) |
| | | | | | | | | | | | | | | | | |
| | | | | | | | | | | | | | | | |
4,993,067 | | | (26,292,873 | ) | | 7,851,627 | | | 8,277,247 | | | 2,363,780 | | | 1,176,273 | |
| | | | | | | | | | | | | | | | | |
| | | | | | | | | | | | | | | | |
192,537 | | | — | | | — | | | — | | | — | | | — | |
| | | | | | | | | | | | | | | | |
25,873 | | | 2,320,001 | | | 127,297 | | | 126,000 | | | — | | | — | |
| | | | | | | | | | | | | | | | |
| | | | | | | | | | | | | | | | |
— | | | — | | | — | | | — | | | — | | | — | |
| | | | | | | | | | | | | | | | | |
| | | | | | | | | | | | | | | | |
218,410 | | | 2,320,001 | | | 127,297 | | | 126,000 | | | — | | | — | |
| | | | | | | | | | | | | | | | | |
| | | | | | | | | | | | | | | | |
(7,598,646 | ) | | (3,637,511 | ) | | (19,977,892 | ) | | (24,591,138 | ) | | (1,209,181 | ) | | (1,427,025 | ) |
| | | | | | | | | | | | | | | | | |
| | | | | | | | | | | | | | | | |
(2,387,169 | ) | | (27,610,383 | ) | | (11,998,968 | ) | | (16,187,891 | ) | | 1,154,599 | | | (250,752 | ) |
| | | | | | | | | | | | | | | | | |
179
|
AssetMark Funds |
REPORT OF INDEPENDENT REGISTERED PUBLIC ACCOUNTING FIRM |
|
| |
The Shareholders and Board of Trustees of the AssetMark Funds:
We have audited the accompanying statements of assets and liabilities, including the schedules of investments, of AssetMark Large Cap Growth Fund, AssetMark Large Cap Value Fund, AssetMark Small Mid/Cap Growth Fund, AssetMark Small Mid/Cap Value Fund, AssetMark International Equity Fund, AssetMark Real Estate Securities Fund, AssetMark Tax-Exempt Fixed Income Fund, AssetMark Core Plus Fixed Income Fund, AssetMark Enhanced Fundamental Index Large Company Growth Fund, AssetMark Enhanced Fundamental Index Large Company Value Fund, AssetMark Enhanced Fundamental Index Small Company Growth Fund, and AssetMark Enhanced Fundamental Index Small Company Value Fund as of March 31, 2010, and the related statements of operations for the year then ended, statements of changes in net assets for the two years then ended, and the financial highlights for each of the periods presented in the four year period then ended. These financial statements and financial highlights are the responsibility of fund management. Our responsibility is to express an opinion on these financial statements and financial highlights based on our audits. The financial highlights for the periods presented through March 31, 2006, were audited by other auditors whose report dated May 26, 2006, expressed an unqualified opinion on those financial highlights.
We conducted our audits in accordance with the standards of the Public Company Accounting Oversight Board (United States). Those standards require that we plan and perform the audit to obtain reasonable assurance about whether the financial statements and financial highlights are free of material misstatement. An audit includes examining, on a test basis, evidence supporting the amounts and disclosures in the financial statements. Our procedures included confirmation of investments owned as of March 31, 2010, by correspondence with the custodian and brokers or by other appropriate auditing procedures. An audit also includes assessing the accounting principles used and significant estimates made by management, as well as evaluating the overall financial statement presentation. We believe that our audits provide a reasonable basis for our opinion.
In our opinion, the financial statements and financial highlights referred to above present fairly, in all material respects, the financial position of AssetMark Large Cap Growth Fund, AssetMark Large Cap Value Fund, AssetMark Small Mid/Cap Growth Fund, AssetMark Small Mid/Cap Value Fund, AssetMark International Equity Fund, AssetMark Real Estate Securities Fund, AssetMark Tax-Exempt Fixed Income Fund, AssetMark Core Plus Fixed Income Fund, AssetMark Enhanced Fundamental Index Large Company Growth Fund, AssetMark Enhanced Fundamental Index Large Company Value Fund, AssetMark Enhanced Fundamental Index Small Company Growth Fund, and AssetMark Enhanced Fundamental Index Small Company Value Fund as of March 31, 2010, and the results of their operations, the changes in their net assets and the financial highlights for each of the periods described in the first paragraph above, in conformity with U.S. generally accepted accounting principles.
[Signed] KPMG LLP
Milwaukee, WI
May 28, 2010
180
|
AssetMark Funds |
ADDITIONAL INFORMATION |
March 31, 2010 |
| |
| |
1. | Shareholder Notification of Federal Tax Status (Unaudited) |
| The Large Cap Growth Fund, Large Cap Value Fund, Small/Mid Cap Value Fund, International Equity Fund, Real Estate Securities Fund, Core Fixed Income Fund, Enhanced Fundamental Index® Large Company Growth Fund and Enhanced Fundamental Index® Large Company Value Fund designated 100%, 100%, 100%, 0%, 0%, 0%, 100% and 100%, respectively, of dividends during the fiscal year ended March 31, 2010, as dividends qualifying for the dividends received deduction available to corporate shareholders. |
| |
| The Large Cap Growth Fund, Large Cap Value Fund, Small/Mid Cap Value Fund, International Equity Fund, Real Estate Securities Fund, Core Plus Fixed Income Fund, Enhanced Fundamental Index® Large Company Growth Fund and Enhanced Fundamental Index® Large Company Value Fund designated 100%, 100%, 100%, 100%, 1%, 0%, 100% and 100%, respectively, of dividends declared from net investment income during the fiscal year ended March 31, 2010, as qualified income under the Jobs and Growth Tax Relief Reconciliation Act of 2003. |
| |
2. | Foreign Tax Credit Pass Through (Unaudited) |
| For the year ended March 31, 2010, the International Equity Fund earned foreign source income and paid foreign taxes, which it intends to pass through to its shareholders pursuant to section 853 of the Internal Revenue Code as follows: |
| | | | | | | | | |
| | | Foreign Sourced Income Earned | | Taxes Paid |
| | | | | |
| Australia | | $ | 816,312 | | | | — | |
| Brazil | | | 56,427 | | | | — | |
| Canada | | | 5,818 | | | $ | 872 | |
| China | | | 102,638 | | | | 10,264 | |
| Czech | | | 130,591 | | | | 19,589 | |
| Denmark | | | 19,897 | | | | 2,985 | |
| Finland | | | 61,927 | | | | 9,289 | |
| France | | | 1,649,199 | | | | 247,380 | |
| Germany | | | 999,870 | | | | 134,029 | |
| Hong Kong | | | 164,918 | | | | — | |
| Indonesia | | | 5,861 | | | | 879 | |
| Israel | | | 12,381 | | | | 1,977 | |
| Italy | | | 149,979 | | | | 22,497 | |
| Japan | | | 858,859 | | | | 60,120 | |
| Korea | | | 16,928 | | | | 2,793 | |
| Luxembourg | | | 54,441 | | | | 8,166 | |
| Netherlands | | | 598,136 | | | | 89,721 | |
| Singapore | | | 384,190 | | | | — | |
| Spain | | | 828,411 | | | | 124,262 | |
| Sweden | | | 152,969 | | | | 22,945 | |
| Switzerland | | | 790,724 | | | | 118,609 | |
| Taiwan | | | 250,141 | | | | 50,132 | |
| United Kingdom | | | 2,169,694 | | | | — | |
181
|
AssetMark Funds |
ADDITIONAL INFORMATION (Continued) |
March 31, 2010 |
| |
| |
3. | Disclosure Regarding Fund Trustees and Officers (Unaudited) |
| | | | | | | | | | |
Name, Age
and Address | | Position(s)
Held with
the Trust | | Term of Office
and Length of
Time Served | | Principal
Occupation During Past Five Years | | # of
Portfolios
in Fund
Complex
Overseen
by Trustee | | Other
Director/
Trustee
Positions |
| | | | | | | | | | | |
| | | | | | | | | | |
Independent Trustees | | | | | | | | | | |
|
R. Thomas DeBerry | | Trustee | | Indefinite Term | | Retired, President, DeBerry Consulting | | 13 | | None |
c/o Genworth Financial | | | | since January | | (a securities consulting firm) | | | | |
Wealth Management, Inc. | | | | 2001. | | (1998-present). | | | | |
2300 Contra Costa | | | | | | | | | | |
Boulevard Ste 600 | | | | | | | | | | |
Pleasant Hill, CA 94523 | | | | | | | | | | |
Year of Birth: 1941 | | | | | | | | | | |
|
William J. Klipp | | Trustee | | Indefinite Term | | Retired; President and Chief Operating | | 13 | | Trustee of |
c/o Genworth Financial | | | | since January | | Officer, Charles Schwab Investment | | | | Adelante |
Wealth Management, Inc. | | | | 2001, Lead | | Management, Inc. and Executive Vice | | | | Funds |
2300 Contra Costa | | | | Independent | | President, Schwab Funds (1993-1999). | | | | (2000-present). |
Boulevard Ste 600 | | | | Trustee since | | | | | | |
Pleasant Hill, CA 94523 | | | | May 2007. | | | | | | |
Year of Birth: 1955 | | | | | | | | | | |
|
Leonard H. Rossen | | Trustee | | Indefinite Term | | President, Len Rossen Consulting (a legal | | 13 | | None |
c/o Genworth Financial | | | | since January | | consulting firm) (1999-present). | | | | |
Wealth Management, Inc. | | | | 2001. | | | | | | |
2300 Contra Costa | | | | | | | | | | |
Boulevard Ste 600 | | | | | | | | | | |
Pleasant Hill, CA 94523 | | | | | | | | | | |
Year of Birth: 1932 | | | | | | | | | | |
|
Dennis G. Schmal | | Trustee | | Indefinite Term | | Self-employed consultant | | 13 | | Trustee, Grail |
c/o Genworth Financial | | | | since July 2007. | | (2003-present). | | | | Advisors ETF Trust |
Wealth Management, Inc. | | | | | | | | | | (2009-present); |
2300 Contra Costa | | | | | | | | | | Trustee, Wells Fargo |
Boulevard Ste 600 | | | | | | | | | | Multi-Strategy 100 |
Pleasant Hill, CA 94523 | | | | | | | | | | Fund (closed-end |
Year of Birth: 1947 | | | | | | | | | | hedge fund) (2008- |
| | | | | | | | | | present); Director/ |
| | | | | | | | | | Chairman, Pacific |
| | | | | | | | | | Metrics Corp. |
| | | | | | | | | | (Educational |
| | | | | | | | | | Services) (2005- |
| | | | | | | | | | present); Director, |
| | | | | | | | | | Varian Semiconductor |
| | | | | | | | | | Equipment Associates, |
| | | | | | | | | | Inc. (2004-present); |
| | | | | | | | | | Director, Merriman |
| | | | | | | | | | Curhan Ford Group, |
| | | | | | | | | | Inc. (Financial |
| | | | | | | | | | Services) (2003- |
| | | | | | | | | | present). |
182
|
AssetMark Funds |
ADDITIONAL INFORMATION (Continued) |
March 31, 2010 |
| |
| | | | | | | | | | |
Name, Age
and Address | | Position(s)
Held with
the Trust | | Term of Office
and Length of
Time Served | | Principal
Occupation During Past Five Years | | # of
Portfolios
in Fund
Complex
Overseen
by Trustee | | Other
Director/
Trustee
Positions |
| | | | | | | | | | | |
| | | | | | | | | | |
Interested Trustees | | | | | | | | | | |
Ronald Cordes* | | Chairperson, | | Indefinite Term | | Principal, Genworth Financial Wealth | | 13 | | ThinkImpact (non-profit |
Genworth Financial | | Trustee | | since January | | Management (“GFWM”) (1994-present); | | | | organization) (2010- |
Wealth Management, Inc. | | | | 2001. | | President, AssetMark Funds (2001-2008). | | | | present); Transfair, USA |
2300 Contra Costa | | | | | | | | | | (non-profit organization) |
Boulevard Ste 600 | | | | | | | | | | (2010-present); Sarona |
Pleasant Hill, CA 94523 | | | | | | | | | | Frontier General Partner, |
Year of Birth: 1959 | | | | | | | | | | Inc. (investment fund) |
| | | | | | | | | | (2010-present); Microvest |
| | | | | | | | | | Fund I, Investment |
| | | | | | | | | | Committee (investment |
| | | | | | | | | | fund) (2009-present); |
| | | | | | | | | | University of the Pacific |
| | | | | | | | | | (2009-present); East Bay |
| | | | | | | | | | Community Foundation |
| | | | | | | | | | (2007-present); Katalysis |
| | | | | | | | | | Bootstrap Fund (non- |
| | | | | | | | | | profit organization) |
| | | | | | | | | | (2005-present); Boys and |
| | | | | | | | | | Girls Clubs of Oakland |
| | | | | | | | | | (2002-present). |
| | | | | | | | | | |
Officers | | | | | | | | | | |
Carrie E. Hansen | | President | | Renewed | | President, Genworth Financial Asset | | N/A | | N/A |
Genworth Financial | | | | 1-Year Term | | Management (“GFAM”) Funds (2008- | | | | |
Wealth Management, Inc. | | | | since 2007 | | present) and Genworth Variable Insurance | | | | |
2300 Contra Costa | | | | | | Trust (“GVIT”) (2008-present); Senior Vice | | | | |
Boulevard Ste 600 | | | | | | President and Chief Operations Officer, | | | | |
Pleasant Hill, CA 94523 | | | | | | GFWM (2008-present); Chairman, Genworth | | | | |
Year of Birth: 1970 | | | | | | Financial Trust Company (2008-present); | | | | |
| | | | | | Senior Vice President and Managing | | | | |
| | | | | | Director, AssetMark Funds (2007-2008); | | | | |
| | | | | | Treasurer and Chief Compliance Officer, | | | | |
| | | | | | GFAM Funds (2007-2008); Chief Compliance | | | | |
| | | | | | Officer, AssetMark Funds (2005-2008); | | | | |
| | | | | | Treasurer, AssetMark Funds (2001-2008); | | | | |
| | | | | | Senior Vice President, Chief Financial Officer | | | | |
| | | | | | and Chief Compliance Officer, GFWM, | | | | |
| | | | | | formerly, AssetMark Investment Services, | | | | |
| | | | | | Inc. (2004-2007). | | | | |
Deborah Djeu | | Vice President, | | Renewed | | Vice President, Chief Compliance Officer | | N/A | | N/A |
Genworth Financial | | Chief | | 1-Year Term | | and AML Compliance Officer, GFAM Funds | | | | |
Wealth Management, Inc. | | Compliance | | since May | | (2008-present) and GVIT (2008-present); | | | | |
2300 Contra Costa | | Officer and | | 2008 | | Deputy Chief Compliance Officer, AssetMark | | | | |
Boulevard Ste 600 | | AML | | | | Funds (2007-2008); Compliance Manager, | | | | |
Pleasant Hill, CA 94523 | | Compliance | | | | GE Money (2006-2007); Vice President, | | | | |
Year of Birth: 1962 | | Officer | | | | Wells Fargo Investments LLC (2004-2006). | | | | |
183
|
AssetMark Funds |
ADDITIONAL INFORMATION (Continued) |
March 31, 2010 |
| |
| | | | | | | | | | |
Name, Age
and Address | | Position(s)
Held with
the Trust | | Term of Office
and Length of
Time Served | | Principal
Occupation During Past Five Years | | # of
Portfolios
in Fund
Complex
Overseen
by Trustee | | Other
Director/
Trustee
Positions |
| | | | | | | | | | | |
| | | | | | | | | | |
Starr E. Frohlich | | Vice | | Since | | Vice President and Treasurer, GFAM | | N/A | | N/A |
Genworth Financial | | President, | | 2010 | | Funds and GVIT (2010-present); | | | | |
Wealth Management, Inc. | | Treasurer | | | | Director of Fund Administration, GFWM | | | | |
2300 Contra Costa | | | | | | (2010-present); Vice President, U.S. | | | | |
Boulevard Ste 600 | | | | | | Bancorp Fund Services, LLC (1997-2010). | | | | |
Pleasant Hill, CA 94523 | | | | | | | | | | |
Year of Birth: 1972 | | | | | | | | | | |
|
Chris Villas-Chernak | | Deputy Chief | | Renewed | | Secretary, GFAM Funds (2009-present); | | N/A | | N/A |
Genworth Financial | | Compliance | | 1-Year Term | | Deputy Chief Compliance Officer, Secretary, | | | | |
Wealth Management, Inc. | | Officer, | | since September | | GVIT (2008-present); Senior Compliance | | | | |
2300 Contra Costa | | Secretary | | 2006 | | Officer, Genworth Financial Wealth | | | | |
Boulevard Ste 600 | | | | | | Management, Inc., (2005-2009); Fund | | | | |
Pleasant Hill, CA 94523 | | | | | | Administration & Compliance Manager, | | | | |
Year of Birth: 1968 | | | | | | GFWM, formerly, AssetMark Investment | | | | |
| | | | | | Services, Inc. (2004-2005); Fund | | | | |
| | | | | | Administration & Compliance Specialist, | | | | |
| | | | | | GFWM, formerly, AssetMark Investment | | | | |
| | | | | | Services, Inc. (2002-2004). | | | | |
| |
* | Ronald Cordes is an “interested person” of the Funds as defined in the 1940 Act due to his relationship with the Advisor. |
| |
The Statement of Additional Information includes additional information about the Funds’ Trustees and is available free of charge upon request by calling the Funds toll free at (888) 278-5809. |
| |
4. | Proxy Voting Policies and Procedures and Proxy Voting Record (Unaudited) |
| A description of the policies and procedures that the Funds use to determine how to vote proxies related to the Funds’ portfolio securities as well as information regarding how the Funds voted proxies relating to portfolio securities during the most recent 12-month period ended June 30 is available without charge, upon request, by calling (888) 278-5809. Furthermore, you can obtain the Fund’s proxy voting records on the SEC’s website at http://www.sec.gov. |
| |
5. | Availability of Quarterly Portfolio Holdings Schedules (Unaudited) |
| The Funds file their complete schedules of portfolio holdings with the SEC for their first and third fiscal quarters on Form N-Q. Once filed, the Funds’ Form N-Q is available without charge, upon request on the SEC’s website (http://www.sec.gov) and is available by calling (888) 278-5809. You can also obtain copies of Form N-Q by (i) visiting the SEC’s Public Reference Room in Washington, D.C. (information on the operation of the Public Reference Room may be obtained by calling 1-800-SEC-0330); (ii) sending your request and a duplicating fee to the SEC’s Public Reference Room, Washington, D.C. 20549-0102; or (iii) sending your request electronically to publicinfosec.gov. |
| |
6. | Statement Regarding the Basis for Approval of Sub-Advisory Agreement (Unaudited) |
| |
| During the six-month period ended March 31, 2010, the Board of Trustees (the “Board” or the “Trustees”) of AssetMark Funds (the “Trust”) approved a new sub-advisory agreement between the Trust’s investment advisor, Genworth Financial Wealth Management, Inc. (the “Advisor”), on behalf of one of the Trust’s series, the AssetMark Small/Mid Cap Value Fund (the “Small/Mid Cap Value Fund”). |
184
|
AssetMark Funds |
ADDITIONAL INFORMATION (Continued) |
March 31, 2010 |
| |
| |
| At a meeting held on January 29, 2010, the Board considered and approved a new sub-advisory agreement between Advisory Research, Inc. (“ARI”) and the Advisor, on behalf of the Small/Mid Cap Value Fund, in the expectation that ARI, a current sub-advisor of the Small/Mid Cap Value Fund, would undergo a change in ownership during the first calendar quarter of 2010. Specifically, it was anticipated that ARI would be acquired by the Piper Jaffray Companies, a Minneapolis-based investment bank and investment securities firm (the “Transaction”), which would constitute an assignment of, and result in the termination of, the existing sub-advisory agreement under its terms. The terms of the proposed new sub-advisory agreement with ARI, other than the date, were identical in all respects to the sub-advisory agreement that had been considered and approved by the Board at the meeting held on May 20, 2009 (the “Existing Sub-Advisory Agreement”), and that was currently in effect. In order to permit ARI to continue to provide investment advisory services to the Small/Mid Cap Value Fund following the Transaction, the Board considered and approved a new sub-advisory agreement for the Small/Mid Cap Value Fund at the meeting held on January 29, 2010 (the “New ARI Sub-Advisory Agreement”), to become effective following the Transaction. The New ARI Sub-Advisory Agreement was not submitted to a vote of shareholders, in accordance with the terms of an exemptive order that the Advisor and the Funds have received from the U.S. Securities and Exchange Commission. |
| |
| The Funds are managed using a “manager-of-managers” structure that generally involves the use of one or more sub-advisors to manage allocated portions of the Funds’ portfolios. Under this structure, the Advisor is responsible for evaluating and selecting sub-advisors on an ongoing basis and making any decisions to recommend hiring, retaining or replacing sub-advisors. The Board is engaged in monitoring this process in connection with meetings held throughout the year and, under the manager-of-managers structure, all parties understand that sub-advisors are being monitored and evaluated, and are subject to replacement, at all times. |
| |
| The material factors considered and the conclusions that formed the basis of the Board’s approval of the New ARI Sub-Advisory Agreement are described below. This summary describes the most significant, but not all, of the factors evaluated by the Board. In deciding to approve the New ARI Sub-Advisory Agreement, the Trustees did not identify any particular information or any single factor or conclusion that was controlling. |
| |
| Materials Reviewed and the Review Process |
| |
| In considering the approval of the New ARI Sub-Advisory Agreement for the Small/Mid Cap Value Fund, the Board was able to draw on its knowledge of the Trust, the Fund and the Advisor, as well as ARI. At the meeting held on May 20, 2009, the Board had considered the approval of the Existing Sub-Advisory Agreement with ARI, and had considered the nature, extent and quality of services provided by ARI, ARI’s investment performance with regard to the management of its portion of the Small/Mid Cap Value Fund, and the relevant sub-advisory fees. |
| |
| The Board reviewed a copy of the New ARI Sub-Advisory Agreement. The Board considered that the New ARI Sub-Advisory Agreement provided for the same services and fees as the Existing Sub-Advisory Agreement, and, most importantly, that the New ARI Sub-Advisory Agreement was in all respects identical to the Existing Sub-Advisory Agreement, except for the effective date. Given that the services and fees provided under the New ARI Sub-Advisory Agreement were identical to the services and fees under the Existing Sub-Advisory Agreement, the Board’s deliberations at the meeting held on May 20, 2009, when the Existing Sub-Advisory Agreement was approved, remained relevant. |
| |
| At a meeting held on January 29, 2010, the Trustees considered and reached conclusions on a number of factors in making the decision to approve the New ARI Sub-Advisory Agreement. The Trustees reviewed the nature, extent and quality of the services to be provided to the Small/Mid Cap Value Fund by ARI. The Trustees considered ARI’s investment management process, including (i) the experience and capability of ARI’s management and other personnel; (ii) the financial position of ARI; (iii) the quality and commitment of the ARI’s regulatory and legal compliance policies, |
185
|
AssetMark Funds |
ADDITIONAL INFORMATION (Continued) |
March 31, 2010 |
| |
| |
| procedures and systems; and (iv) ARI’s brokerage practices. The Trustees also considered the Advisor’s favorable assessment as to the nature, extent and quality of the sub-advisory services expected to be provided by ARI. Based on their review and consideration of the foregoing information, the Trustees concluded that the nature, extent and quality of the services to be provided by ARI would likely benefit the Small/Mid Cap Value Fund and its shareholders. The Trustees also considered ARI’s performance record in managing the Small/Mid Cap Value Fund, and concluded that ARI’s continued management would benefit the Fund and its shareholders. The Trustees also considered the proposed fee schedule for ARI, and concluded that the sub-advisory fees to be paid to ARI are reasonable and that the Fund and its shareholders receive reasonable value in return for those fees. Based on their evaluation of the relevant factors, the Board, including the independent Trustees, concluded that each of the factors discussed above favored approval of the New ARI Sub-Advisory Agreement. |
| |
| The Advisor recommended the approval of the New ARI Sub-Advisory Agreement, pursuant to which ARI would continue to serve as a sub-advisor of the Small/Mid Cap Value Fund following the Transaction. The approval of the New ARI Sub-Advisory Agreement was recommended by the Advisor because, among other factors, (i) the Transaction was not expected to have a material effect on the nature, extent or quality of the services provided by ARI to the Small/Mid Cap Value Fund; (ii) the ARI personnel who have been responsible for managing ARI’s allocated portion of the Small/Mid Cap Value Fund would continue to serve in their respective capacities following the Transaction; and (iii) the terms of the New ARI Sub-Advisory Agreement were identical, in all respects other than the effective date, to the Existing Sub-Advisory Agreement that was approved by the Board at the meeting held on May 20, 2009, as described above. |
| |
| The Board considered that the Transaction was expected to result in a change of control of ARI, and hence, the assignment and termination of the Existing Sub-Advisory Agreement between ARI and the Advisor, on behalf of the Small/Mid Cap Value Fund. Because of the anticipated assignment and resulting termination of the Existing Sub-Advisory Agreement with ARI, the Trustees, and by a separate vote, the independent Trustees, approved the New ARI Sub-Advisory Agreement between the Advisor and ARI, to become effective following the Transaction. |
| |
| After full consideration of the factors discussed above, with no single factor identified as being of paramount importance, the Board, including all of the independent Trustees, with the assistance of independent counsel, concluded that the approval of the New ARI Sub-Advisory Agreement was in the best interests of the Small/Mid Cap Value Fund and its shareholders, and approved the New ARI Sub-Advisory Agreement with respect to the Small/Mid Cap Value Fund. |
186

| |
ASSETMARK FUNDS |
| |
AssetMark Large Cap Growth Fund | |
AssetMark Large Cap Value Fund | |
AssetMark Small/Mid Cap Growth Fund | |
AssetMark Small/Mid Cap Value Fund | |
AssetMark International Equity Fund | |
AssetMark Real Estate Securities Fund | |
AssetMark Tax-Exempt Fixed Income Fund | |
AssetMark Core Plus Fixed Income Fund | |
AssetMark Enhanced Fundamental Index® Large Company Growth Fund | |
AssetMark Enhanced Fundamental Index® Large Company Value Fund | |
AssetMark Enhanced Fundamental Index® Small Company Growth Fund | |
AssetMark Enhanced Fundamental Index® Small Company Value Fund | |
| |
Investment Advisor | |
Genworth Financial Wealth Management, Inc. | |
2300 Contra Costa Blvd., Suite 600 | |
Pleasant Hill, CA 94523 | |
| |
Legal Counsel | |
Stradley Ronon Stevens & Young, LLP | |
2600 One Commerce Square | |
Philadelphia, PA 19103 | |
| |
Independent Registered Public Accounting Firm | |
KPMG LLP | |
777 East Wisconsin Avenue | |
Milwaukee, WI 53202 | |
| |
Transfer Agent, Fund Accountant | |
and Fund Administrator | |
U.S. Bancorp Fund Services, LLC | |
615 East Michigan Street | |
Milwaukee, WI 53202 | |
| |
Custodian | |
U.S. Bank, N.A. | |
1555 North RiverCenter Drive, Suite 302 | |
Milwaukee, WI 53212 | |
| |
Distributor
Capital Brokerage Corporation | Annual Report |
(dba Genworth Financial Brokerage Corporation in Indiana) | March 31, 2010 |
6620 West Broad Street Building 2 | |
Richmond, VA 23230 | |
Member FINRA | |
Item 2. Code of Ethics.
As of the end of the period covered by this report, the registrant has adopted a code of ethics that applies to the registrant’s principal executive officer and principal financial officer. The registrant has not made any amendments to its code of ethics during the period covered by this report that apply to the registrant’s principal executive officer or principal financial officer. The registrant has not granted any waivers from any provisions of the code of ethics during the period covered by this report to the registrant’s principal executive officer or principal financial officer.
Item 3. Audit Committee Financial Expert.
The registrant’s board of trustees has determined that there is at least one audit committee financial expert serving on its audit committee. Dennis Schmal is the “audit committee financial expert” and is considered to be “independent” as each term is defined in Item 3 of Form N-CSR.
Item 4. Principal Accountant Fees and Services.
(a) Audit Fees
For the fiscal year ended March 31, 2010, the registrant’s principal accountant billed the registrant $285,029 for professional services rendered for the audit of the registrant’s annual financial statements or services that are normally provided by the principal accountant in connection with statutory and regulatory filings or engagements.
For the fiscal year ended March 31, 2009, the registrant’s principal accountant billed the registrant $289,380 for professional services rendered for the audit of the registrant’s annual financial statements or services that are normally provided by the principal accountant in connection with statutory and regulatory filings or engagements.
(b) Audit-Related Fees
None.
(c) Tax Fees
For the fiscal year ended March 31, 2010, the registrant’s principal accountant billed the registrant $51,000 for professional services rendered for tax compliance, tax advice and tax planning.
For the fiscal year ended March 31, 2009, the registrant’s principal accountant billed the registrant $57,720 for professional services rendered for tax compliance, tax advice and tax planning.
1
(d) All Other Fees
None.
| |
(e)(1) | The registrant’s audit committee charter provides that the audit committee is responsible for the approval, prior to appointment, of the engagement of auditors annually to audit and to provide their opinion on the registrant’s financial statements. The audit committee charter also provides that the audit committee is responsible for the approval, prior to appointment, of the engagement of the auditor to provide other audit services to the registrant or to provide non-audit services to the registrant, its investment adviser or any entity controlling, controlled by, or under common control with the investment adviser that provides ongoing services to the Trust, if the engagement relates directly to the operations and financial reporting of the Trust. |
| |
(e)(2) | There were no services in paragraphs (b) through (d) above (including services required to be approved by the audit committee pursuant to paragraph (c)(7)(ii) of Rule 2-01 of Regulation S-X) that were approved pursuant to the waiver provision of paragraph (c)(7)(i)(C) of Rule 2-01 of Regulation S-X. |
| |
(f) | None of the hours expended on the principal accountant’s engagement to audit the Funds’ financial statements for the fiscal year ended March 31, 2010 were attributable to work performed by persons other than the principal accountant’s full-time, permanent employees. |
| |
(g) | The aggregate non-audit fees billed by the registrant’s principal accountant for services rendered to the registrant’s investment adviser and any entity controlling, controlled by, or under common control with the investment adviser that provides ongoing services to the registrant for the fiscal years ended March 31, 2010 and March 31, 2009, was $0 and $0, respectively. |
| |
(h) | The registrant’s audit committee has considered whether the provision of non-audit services that were rendered to the registrant’s investment adviser, and any entity controlling, controlled by, or under common control with the investment adviser that provides ongoing services to the registrant, that were not pre-approved pursuant to paragraph (c)(7)(ii) of Rule 2-01 of Regulation S-X is compatible with maintaining the principal accountant’s independence. |
Item 5. Audit Committee of Listed Registrants.
Not applicable to registrants who are not listed issuers (as defined in Rule 10A-3 under the Securities Exchange Act of 1934).
Item 6. Investments.
Schedule of Investments is included as part of the report to shareholders filed under Item 1 of this Form.
2
Item 7. Disclosure of Proxy Voting Policies and Procedures for Closed-End Management Investment Companies.
Not applicable to open-end investment companies.
Item 8. Portfolio Managers of Closed-End Management Investment Companies.
Not applicable to open-end investment companies.
Item 9. Purchases of Equity Securities by Closed-End Management Investment Company and Affiliated Purchasers.
Not applicable to open-end investment companies.
Item 10. Submission of Matters to a Vote of Security Holders.
None.
Item 11. Controls and Procedures.
| |
(a) | Based on their evaluation of the registrant’s disclosure controls and procedures as of a date within 90 days of the filing date of this Form N-CSR (the “Report”), the registrant’s President/Chief Executive Officer and Treasurer/Chief Financial Officer believe that the disclosure controls and procedures (as defined in Rule 30a-3(c) under the Investment Company Act of 1940, as amended (the “1940 Act”)) are effectively designed to ensure that information required to be disclosed by the registrant in the Report is recorded, processed, summarized and reported by the filing date, including ensuring that information required to be disclosed in the Report is accumulated and communicated to the registrant’s officers who are making certifications in the Report, as appropriate, to allow timely decisions regarding required disclosure. |
| |
(b) | There were no changes in the registrant’s internal control over financial reporting (as defined in Rule 30a-3(d) under the 1940 Act) that occurred during the registrant’s second fiscal quarter of the period covered by this report that have materially affected, or are reasonably likely to materially affect, the registrant’s internal control over financial reporting. |
Item 12. Exhibits.
| |
(a) | (1) Any code of ethics or amendment thereto, that is the subject of the disclosure required by Item 2, to the extent that the registrant intends to satisfy Item 2 requirements through filing an exhibit. Filed herewith. |
| |
| (2) A separate certification for each principal executive and principal financial officer pursuant to Section 302 of the Sarbanes-Oxley Act of 2002. Filed herewith. |
| |
(b) | Certifications pursuant to Section 906 of the Sarbanes-Oxley Act of 2002. Furnished herewith. |
3
SIGNATURES
Pursuant to the requirements of the Securities Exchange Act of 1934 and the Investment Company Act of 1940, the registrant has duly caused this report to be signed on its behalf by the undersigned, thereunto duly authorized.
| | | | | | |
| (Registrant) | AssetMark Funds | |
| | | |
| | | | | |
| By | | | /s/ Carrie E. Hansen | |
| | | |
| | | | Carrie E. Hansen, Principal Executive Officer/President | |
| | | | | |
| Date | | 5/27/2010 | |
| | | |
Pursuant to the requirements of the Securities Exchange Act of 1934 and the Investment Company Act of 1940, this report has been signed below by the following persons on behalf of the registrant and in the capacities and on the dates indicated.
| | | | | | |
| By | | | /s/ Carrie E. Hansen | |
| | | |
| | | | Carrie E. Hansen, Principal Executive Officer/President | |
| | | | | |
| Date | | 5/27/2010 | |
| | | |
| | | |
|
| By | | | /s/ Starr E. Frohlich | |
| | | |
| | | | Starr E. Frohlich, Principal Financial Officer/Treasurer | |
| | | | | |
| Date | | 5/27/2010 | |
| | | |
4