As filed with the Securities and Exchange Commission on June 7, 2007
UNITED STATES
SECURITIES AND EXCHANGE COMMISSION
Washington, D.C. 20549
FORM N-CSR
CERTIFIED SHAREHOLDER REPORT OF REGISTERED
MANAGEMENT INVESTMENT COMPANIES
811-10267
Investment Company Act file number
ASSETMARK FUNDS
(Exact name of registrant as specified in charter)
2300 CONTRA COSTA BOULEVARD, SUITE 600,
PLEASANT HILL, CA 94523-3967
(Address of principal executive offices) (Zip code)
CARRIE HANSEN
ASSETMARK INVESTMENT SERVICES, INC.
2300 CONTRA COSTA BOULEVARD, SUITE 600
PLEASANT HILL, CA 94523-3967
(Name and address of agent for service)
800-664-5345
Registrant's telephone number, including area code
Date of fiscal year end: MARCH 31, 2007
Date of reporting period: APRIL 1, 2006 to MARCH 31, 2007
Item 1. Report to Stockholders.
Dear Shareholder,
You will find enclosed our Annual Report for the AssetMark Funds. This Annual Report covers the twelve-month period from April 1, 2006 through March 31, 2007.
Economic & Market Overview:
Over the last twelve months, markets, domestic and international, equity and fixed income, have provided positive returns, and in some cases have provided returns above 10%. The world has continued to experience positive economic growth, in addition to increased merger and acquisition activity, which helped to drive the strong market performance.
International developed equity markets, as measured by the MSCI EAFE, outperformed the U.S. markets, as returns were boosted by the depreciating U.S. dollar. Domestically, the tide started to turn in the equity markets as U.S. large capitalization companies outperformed their smaller capitalization counterparts. However, real estate remained the clear winner, significantly outperforming the broader market. Within the fixed income markets, high yield and emerging markets provided the strongest returns while domestically the long-end of the yield curve outperformed the shorter-end.
AssetMark Funds Overview:
In consultation with Wilshire Associates, an institutional investment consulting and research firm, AssetMark Investment Services, Inc. seeks to consistently identify and engage highly skilled investment managers as Sub-Advisors for each Fund, as well as effectively combine managers with complementary skills to reduce volatility and achieve more consistent investment results.
During this period, we replaced both Sub-Advisors in the Small/Mid Cap Value Fund, replaced a Sub-Advisor in the Large Cap Growth Fund and replaced the sole Sub-Advisor in the Tax-Exempt Fund with two new Sub-Advisors.
| • | On April 17, 2006, First Quadrant L.P. (“First Quadrant”) and Advisory Research Inc. (“Advisory Research”) were engaged to replace Cramer Rosenthal and McGlynn LLC., (CRM) and Ariel Capital Management (Ariel). |
| • | On December 5, 2006, Wellington Asset Management (“Wellington”) was engaged to replace Loomis, Sayles & Company, L.P. (“Loomis”). |
| • | On May 2, 2006, Nuveen Asset Management (“Nuveen”) and Delaware Investments (“Delaware”) were engaged to replace Weiss, Peck & Greer LLC (“WPG”). |
The following is a discussion of the performance of each of the eight AssetMark Funds during the period:
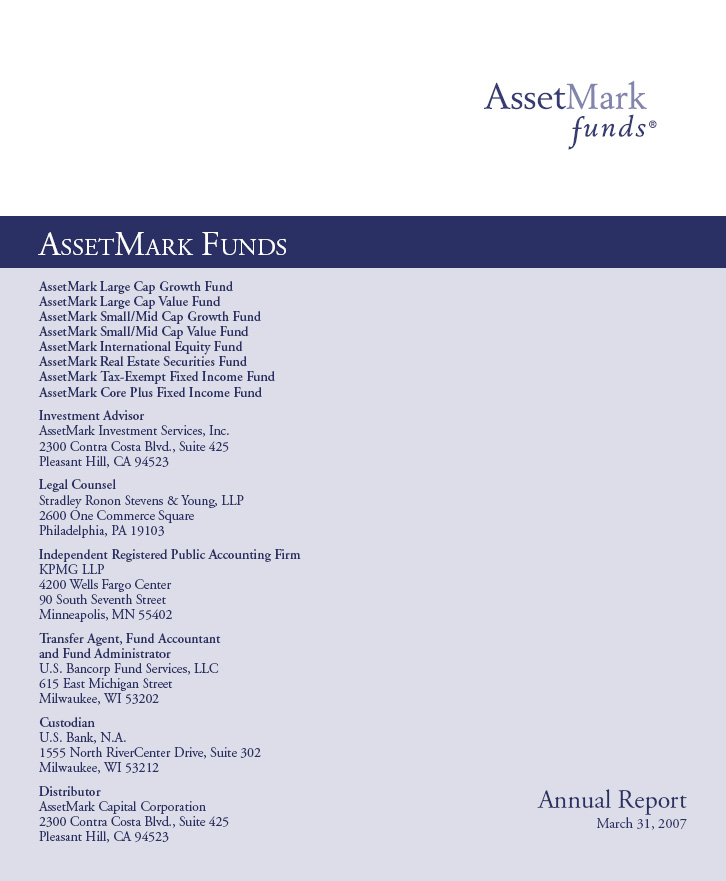
The AssetMark Large Cap Growth Fund returned -0.80% on a net basis for the twelve months ended March 31, 2007, underperforming the Russell 1000 Growth Index1 a widely accepted unmanaged benchmark for large cap growth portfolios, which returned 7.06%. This underperformance was largely due to the significant lagging performance of the core manager, Loomis, which was replaced in December 2006, in addition to the underperformance of TCW Investment Management Company (“TCW”). TCW’s underperformance primarily resulted from five core holdings that were adversely affected by negative market sentiment. Additionally TCW’s concentration on quality growth companies caused a drag on performance as lower quality companies continued to drive the benchmark returns. Atlanta Capital Management Company, LLC (“Atlanta”) also trailed the benchmark and while benefiting from broad diversification, Atlanta’s focus on high quality growth companies led to lagging performance. As noted above, during the period Loomis was replaced as a Sub-Advisor by Wellington, and since being added to the fund, Wellington has outperformed the benchmark through its strong stock selection methodology.
1Source: All benchmark return data provided by U.S. Bancorp Fund Services, LLC. One can not invest directly in an index, nor is an index representative of any Fund’s portfolio. The indexes provided are widely accepted benchmarks for the associated portfolios. The performance data quoted represents past performance. The investment return and principal value of an investment will fluctuate so that an investor’s shares, when redeemed, may be worth more or less than their original cost.
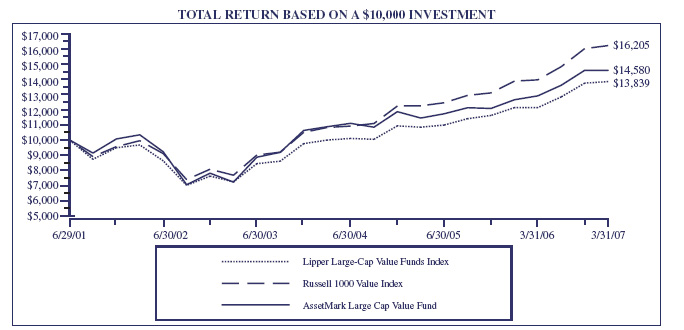
The AssetMark Large Cap Value Fund returned 15.32% on a net basis for the twelve months ended March 31, 2007, underperforming the Russell 1000 Value Index, a widely accepted unmanaged benchmark for large cap value portfolios, which returned 16.83%. The core manager, NFJ Investment Group, L.P. (“NFJ”) provided the strongest performance of the three sub-advisors during the period. In addition to an overweight position in materials, stock selection benefited performance, especially in the energy, industrials and utilities sectors. Brandes Investment Partners, L.P. (“Brandes”) returns were in line with the index with stock selection being the driver of performance as some of the large overweight allocations were to poorly performing sectors. Davis Selected Advisors, L.P. (“Davis”) experienced trailing performance, which mainly resulted from a lack of exposure to the strongest performing sectors – utilities and telecommunication services – and Davis’ large overweight exposure to financials.
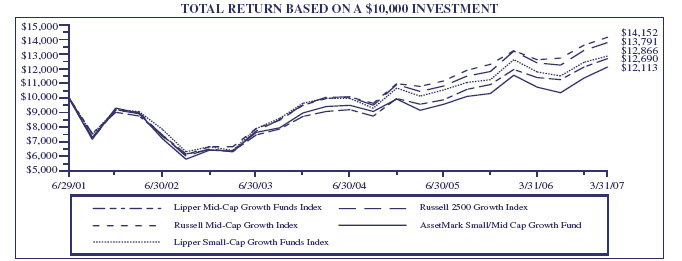
The AssetMark Small/Mid Cap Growth Fund returned 4.84% on a net basis for the twelve months ended March 31, 2007, outperforming the Russell 2500 Growth Index, a widely accepted unmanaged benchmark for Small/Mid Cap Growth portfolios, which rose 4.44%. Nicholas-Applegate Capital Management (“NACM”) significantly outperformed the benchmark due to stock selection across a broad variety of industries. Copper Rock Capital Partners, LLC (“Copper Rock”), trailed the benchmark due to their large exposures in technology and consumer discretionary, which suffered due to the market volatility in these sectors.
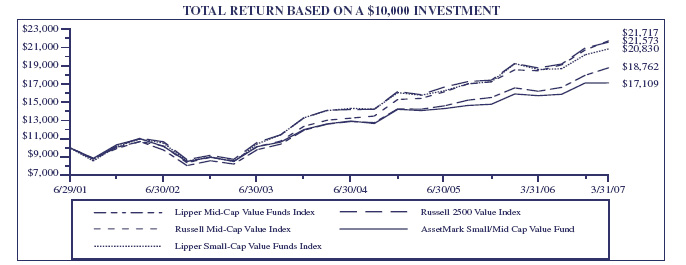
The AssetMark Small/Mid Cap Value Fund returned 7.63% on a net basis for the twelve months ended March 31, 2007, underperforming the Russell 2500 Value Index, a widely accepted unmanaged benchmark for Small/Mid Cap Value portfolios, which rose 12.15%. As noted above, during the period, CRM and Ariel were replaced as Sub-Advisors by Advisory Research and First Quadrant. Since being added to the fund, Advisory Research performed slightly above the benchmark, aided by their stock selection. First Quadrant’s performance has suffered since being added to the Fund. Most of the lagging performance came in the first quarter of 2007 as First Quadrant had sub-prime mortgage exposure that was removed from the portfolio by the end of the quarter.
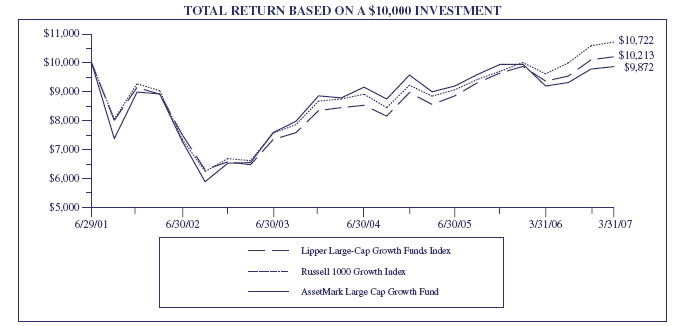
The AssetMark International Equity Fund returned 17.65% on a net basis for the twelve months ended March 31, 2007, trailing the MSCI EAFE Index of developed country non-U.S. stocks, which returned 20.69%. This unmanaged index is a widely accepted benchmark for developed market, international equity portfolios. Clay Finlay, Inc. (“Clay Finlay”) lagged the benchmark for the period suffering with an overweight exposure to Japan in addition to an underweight exposure to Europe. Oppenheimer Capital LLC (“Oppenheimer”) also trailed the benchmark. While benefiting from an overweight exposure to Europe, Oppenheimer’s underweight exposure to Asia ex-Japan and UK caused a drag on performance.
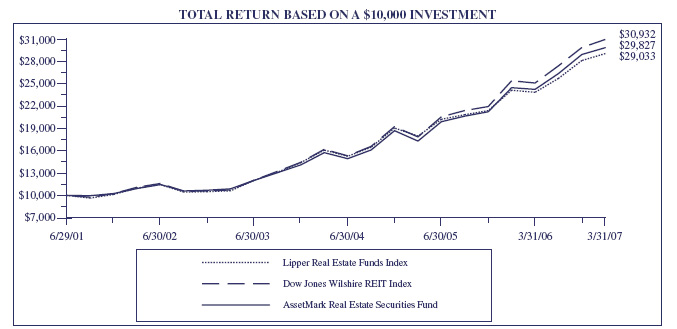
The AssetMark Real Estate Securities Fund returned 21.96% on a net basis for the twelve months ended March 31, 2007, outperforming the Dow Jones Wilshire REIT Index, which gained 21.85% for the period. Both sub-advisors, Adelante Capital Management, LLC (“Adelante”) and AEW Management and Advisors, L.P. (“AEW”), outperformed the benchmark primarily being driven by a strong fourth quarter in 2006. Adelante’s overweight to apartments has been a drag on performance, however solid security selection in hotels and regional malls contributed positively to performance. Security selection was also the main driver of performance returns for AEW, especially in the hotels and shopping center sectors.
The AssetMark Tax-Exempt Fixed Income Fund returned 3.92% on a net basis for the twelve-month period ended March 31, 2007, underperforming the Lehman Municipal Bond Index, which returned 5.43%. This managed index is a widely accepted benchmark for broad tax-exempt portfolios. The AssetMark Fund is positioned towards the short and intermediate end of the municipal curve, whereas the benchmark has broad exposure across the full maturity spectrum and includes a larger allocation to longer-term maturities. With longer-term maturities providing the strongest performance over the twelve month period, the limited exposure in this space led to the lagging performance of the Fund. As noted above, during the period WPG was replaced as a Sub-Advisor by Nuveen and Delaware. Since being added to the Fund, Nuveen performed in line with the benchmark as the portfolio expanded its maturity exposure along the curve benefiting from some longer-term securities with higher yields. Delaware marginally trailed the benchmark since being added to the fund due to their slightly shorter duration and higher exposure to more intermediate-term securities.
The AssetMark Core Plus Fixed Income Fund returned 5.96% on a net basis for the twelve months ended March 31, 2007, trailing the Lehman Brothers Aggregate Bond Index, which returned 6.59%. The Lehman Brothers Aggregate Bond Index is a widely accepted unmanaged benchmark for core U.S. fixed income portfolios. Goldman Sachs Asset Management, L.P. (“GSAM”) marginally outperformed the benchmark. While being short in duration hurt performance, solid security selection within corporate bonds benefited performance along with the overweight mortgage exposure. Western Asset Management Company (“WAMCO”) outperformed the benchmark, benefiting from its small exposure to non-benchmark sectors, including exposure to emerging markets and high yield.
We greatly appreciate your decision, in working closely with your investment advisor, to include the AssetMark Funds as a component of your overall investment portfolio, and we remain confident that each Fund is well positioned to deliver strong long-term value to our shareholders.
Sincerely,
Ronald D. Cordes
President
AssetMark Funds
AssetMark Funds
EXPENSE EXAMPLE (Unaudited)
March 31, 2007
As a shareholder of the AssetMark Funds (the “Funds”), you incur ongoing costs, including management fees; distribution and/or service fees; and other Fund expenses. This example is intended to help you understand your ongoing costs (in dollars) of investing in the Funds and to compare costs with the ongoing costs of investing in other mutual funds.
The Example is based on an investment of $1,000 invested at the beginning of the period and held the entire period (October 1, 2006 – March 31, 2007).
Actual Expenses
The first line of the table below provides information about actual account values and actual expenses. Although the Funds charge no sales load or transactions fees, you will be assessed fees for outgoing wire transfers, returned checks or stop payment orders at prevailing rates charged by U.S. Bancorp Fund Services, LLC, the Funds’ transfer agent. To the extent that a Fund invests in shares of other investment companies as part of its investment strategy, you will indirectly bear your proportionate share of any fees and expenses charged by the underlying funds in which a Fund invests in addition to the expenses of the Fund. Actual expenses of the underlying funds are expected to vary among the various underlying funds. These expenses are not included in the example below. The example includes, but is not limited to, management fees, shareholder servicing fees, distribution fees, fund accounting, custody and transfer agent fees. However, the example below does not include portfolio trading commissions and related expenses, interest expense or dividends on short positions taken by the Funds and other extraordinary expenses as determined under generally accepted accounting principles. You may use the information in this line, together with the amount you invested, to estimate the expenses that you paid over the period. Simply divide your account value by $1,000 (for example, an $8,600 account value divided by $1,000 = 8.6), then multiply the result by the number in the first line under the heading entitled “Expenses Paid During Period” to estimate the expenses you paid on your account during this period.
Hypothetical Example for Comparison Purposes
The second line of the table below provides information about hypothetical account values and hypothetical expenses based on the Funds’ actual expense ratios and an assumed rate of return of 5% per year before expenses, which is not the Funds’ actual return. The hypothetical account values and expenses may not be used to estimate the actual ending account balance or expenses you paid for the period. You may use this information to compare the ongoing costs of investing in the Funds and other funds. To do so, compare this 5% hypothetical example with the 5% hypothetical examples that appear in the shareholder reports of the other funds.
Please note that the expenses shown in the table are meant to highlight your ongoing costs only and do not reflect any transactional costs, such as sales charges (loads), redemption fees, or exchange fees. Therefore, the second line of the table is useful in comparing ongoing costs only, and will not help you determine the relative costs of owning different funds. In addition, if these transactional costs were included, your costs would have been higher.
AssetMark Large Cap Growth Fund
| | Beginning | Ending | Expenses Paid |
| | Account Value | Account Value | During Period* |
| | October 1, 2006 | March 31, 2007 | October 1, 2006 - March 31, 2007 |
| | | | |
| Actual | $1,000.00 | $1,059.10 | $6.78 |
| | | | |
| Hypothetical (5% return | | | |
| before expenses) | 1,000.00 | 1,018.35 | 6.64 |
| | |
| * Expenses are equal to the Fund’s annualized expense ratio of 1.32%, mutiplied by the average account value over the period, muliplied by |
| 182/365 to reflect the one-half year period. | | | |
AssetMark Funds
EXPENSE EXAMPLE (Continued) (Unaudited)
March 31, 2007
AssetMark Large Cap Value Fund | | | |
| | | | |
| | Beginning | Ending | Expenses Paid |
| | Account Value | Account Value | During Period* |
| | October 1, 2006 | March 31, 2007 | October 1, 2006 - March 31, 2007 |
| | | | |
| Actual | $1,000.00 | $1,072.20 | $6.77 |
| | | | |
| Hypothetical (5% return | | | |
| before expenses) | 1,000.00 | 1,018.40 | 6.59 |
| | |
| * Expenses are equal to the Fund’s annualized expense ratio of 1.31%, mutiplied by the average account value over the period, muliplied by |
| 182/365 to reflect the one-half year period. | | | |
| | | | |
AssetMark Small/Mid Cap Growth Fund | | | |
| | | | |
| | Beginning | Ending | Expenses Paid |
| | Account Value | Account Value | During Period* |
| | October 1, 2006 | March 31, 2007 | October 1, 2006 - March 31, 2007 |
| | | | |
| Actual | $1,000.00 | $1,169.80 | $7.68 |
| | | | |
| Hypothetical (5% return | | | |
| before expenses) | 1,000.00 | 1,017.85 | 7.14 |
| | |
| * Expenses are equal to the Fund’s annualized expense ratio of 1.42%, mutiplied by the average account value over the period, muliplied by |
| 182/365 to reflect the one-half year period. | | | |
| | | | |
AssetMark Small/Mid Cap Value Fund | | | |
| | | | |
| | Beginning | Ending | Expenses Paid |
| | Account Value | Account Value | During Period* |
| | October 1, 2006 | March 31, 2007 | October 1, 2006 - March 31, 2007 |
| | | | |
| Actual | $1,000.00 | $1,078.60 | $7.93 |
| | | | |
| Hypothetical (5% return | | | |
| before expenses) | 1,000.00 | 1,017.30 | 7.70 |
| | |
| * Expenses are equal to the Fund’s annualized expense ratio of 1.53%, mutiplied by the average account value over the period, muliplied by |
| 182/365 to reflect the one-half year period. | | | |
| | | | |
AssetMark International Equity Fund | | | |
| | | | |
| | Beginning | Ending | Expenses Paid |
| | Account Value | Account Value | During Period* |
| | October 1, 2006 | March 31, 2007 | October 1, 2006 - March 31, 2007 |
| | | | |
| Actual | $1,000.00 | $1,158.40 | $7.43 |
| | | | |
| Hypothetical (5% return | | | |
| before expenses) | 1,000.00 | 1,018.05 | 6.94 |
| |
| * Expenses are equal to the Fund’s annualized expense ratio of 1.38%, mutiplied by the average account value over the period, muliplied by |
| 182/365 to reflect the one-half year period. | | | |
AssetMark Funds
EXPENSE EXAMPLE (Continued) (Unaudited)
March 31, 2007
AssetMark Real Estate Securities Fund | | | |
| | | | |
| | Beginning | Ending | Expenses Paid |
| | Account Value | Account Value | During Period* |
| | October 1, 2006 | March 31, 2007 | October 1, 2006 - March 31, 2007 |
| | | | |
| Actual | $1,000.00 | $1,131.90 | $7.76 |
| | | | |
| Hypothetical (5% return | | | |
| before expenses) | 1,000.00 | 1,017.65 | 7.34 |
| |
| * Expenses are equal to the Fund’s annualized expense ratio of 1.46%, mutiplied by the average account value over the period, muliplied by |
| 182/365 to reflect the one-half year period. | | | |
| | | |
AssetMark Tax-Exempt Fixed Income Fund | | |
| | | | |
| | Beginning | Ending | Expenses Paid |
| | Account Value | Account Value | During Period* |
| | October 1, 2006 | March 31, 2007 | October 1, 2006 - March 31, 2007 |
| | | | |
| Actual | $1,000.00 | $1,011.90 | $6.37 |
| | | | |
| Hypothetical (5% return | | | |
| before expenses) | 1,000.00 | 1,018.60 | 6.39 |
| |
| * Expenses are equal to the Fund’s annualized expense ratio of 1.27%, mutiplied by the average account value over the period, muliplied by |
| 182/365 to reflect the one-half year period. | | | |
| | | | |
AssetMark Core Plus Fixed Income Fund | | | |
| | | | |
| | Beginning | Ending | Expenses Paid |
| | Account Value | Account Value | During Period* |
| | October 1, 2006 | March 31, 2007 | October 1, 2006 - March 31, 2007 |
| | | | |
| Actual | $1,000.00 | $1,025.50 | $5.81 |
| | | | |
| Hypothetical (5% return | | | |
| before expenses) | 1,000.00 | 1,019.20 | 5.79 |
| | |
| * Expenses are equal to the Fund’s annualized expense ratio of 1.15%, mutiplied by the average account value over the period, muliplied by |
| 182/365 to reflect the one-half year period. | | | |
AssetMark Funds
ALLOCATION OF PORTFOLIO HOLDINGS
March 31, 2007
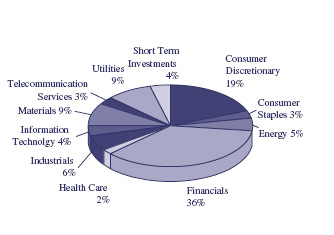
AssetMark Large Cap Growth Fund | | |
| | | | |
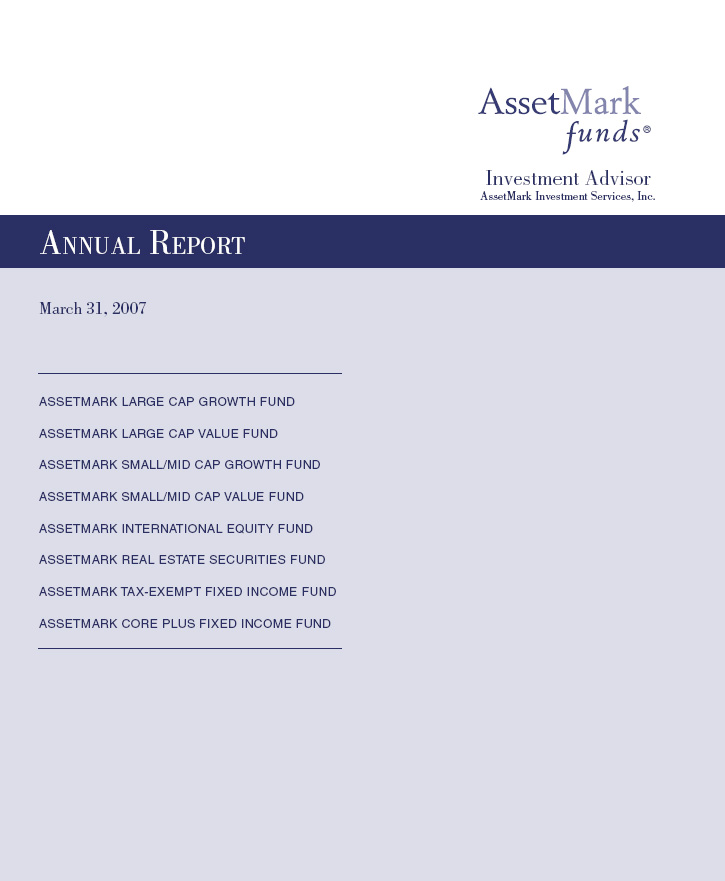
Components of Portfolio Holdings | |
| Consumer Discretionary | | $100,876,008 | |
| Consumer Staples | | 50,807,391 | |
| Energy | | 38,766,685 | |
| Financials | | 107,795,111 | |
| Health Care | | 135,043,479 | |
| Industrials | | 85,089,482 | |
| Information Technology | | 201,747,588 | |
| Materials | | 13,717,924 | |
| Utilities | | 8,751,054 | |
| Short Term Investments | | 14,110,418 | |
| | Total | $756,705,140 | (1) |
| | | | |
(1) Total excludes $236,995,445 of Securities Lending Collateral
Pie chart represents percentages of total portfolio.
AssetMark Large Cap Value Fund | | |
| | | | |
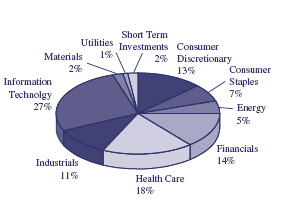
Components of Portfolio Holdings | |
| Consumer Discretionary | | $99,371,696 | |
| Consumer Staples | | 71,354,329 | |
| Energy | | 73,695,868 | |
| Financials | | 176,499,882 | |
| Health Care | | 62,309,759 | |
| Industrials | | 37,522,630 | |
| Information Technology | | 54,733,393 | |
| Materials | | 32,694,542 | |
| Telecommunication Services | | 33,258,354 | |
| Utilities | | 13,107,530 | |
| Short Term Investments | | 27,337,235 | |
| | Total | $681,885,218 | (1) |
| | | | |
(1) Total excludes $202,616,856 of Securities Lending Collateral
Pie chart represents percentages of total portfolio.
AssetMark Funds
ALLOCATION OF PORTFOLIO HOLDINGS (Continued)
March 31, 2007
AssetMark Small/Mid Cap Growth Fund | | |
| | | | |
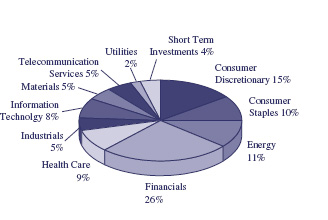
Components of Portfolio Holdings | |
| Consumer Discretionary | | $28,469,624 | |
| Consumer Staples | | 6,058,209 | |
| Energy | | 11,579,814 | |
| Financials | | 17,990,322 | |
| Health Care | | 20,647,543 | |
| Industrials | | 34,792,444 | |
| Information Technology | | 36,108,576 | |
| Materials | | 5,954,562 | |
| Telecommunication Services | | 7,104,913 | |
| Utilities | | 977,461 | |
| Short Term Investments | | 3,289,135 | |
| | Total | $172,972,603 | (1) |
| | | | |
(1) Total excludes $57,934,484 of Securities Lending Collateral
Pie chart represents percentages of total portfolio.
AssetMark Small/Mid Cap Value Fund | | |
| | | | |
Components of Portfolio Holdings | |
| Consumer Discretionary | | $ 21,487,274 | |
| Consumer Staples | | 3,588,284 | |
| Energy | | 5,712,308 | |
| Financials | | 40,051,224 | |
| Health Care | | 2,326,092 | |
| Industrials | | 6,930,853 | |
| Information Technology | | 4,702,041 | |
| Materials | | 9,441,722 | |
| Telecommunication Services | | 2,912,956 | |
| Utilities | | 9,564,676 | |
| Short Term Investments | | 4,206,766 | |
| | Total | $110,924,196 | (1) |
| | | | |
(1) Total excludes $41,311,210 of Securities Lending Collateral
Pie chart represents percentages of total portfolio.
AssetMark Funds
ALLOCATION OF PORTFOLIO HOLDINGS (Continued)
March 31, 2007
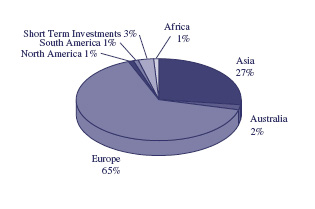
AssetMark International Equity Fund | | |
| | | | |
Components of Portfolio Holdings | |
| Africa | | $4,589,277 | |
| Asia | | 213,480,660 | |
| Australia | | 12,151,001 | |
| Europe | | 511,449,716 | |
| North America | | 5,021,300 | |
| South America | | 12,064,530 | |
| Short Term Investments | | 23,752,439 | |
| | Total | $782,508,923 | (1) |
| | | | |
(1) Total excludes $67,961,428 of Securities Lending Collateral
Pie chart represents percentages of total portfolio.
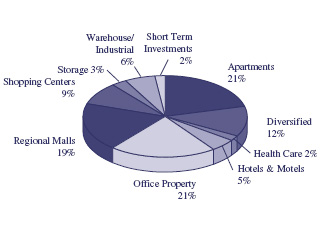
AssetMark Real Estate Securities Fund | | |
| | | | |
Components of Portfolio Holdings | |
| Apartments | | $23,869,364 | |
| Diversified | | 14,412,603 | |
| Health Care | | 1,856,808 | |
| Hotels & Motels | | 5,564,107 | |
| Office Property | | 23,960,533 | |
| Regional Malls | | 22,376,662 | |
| Shopping Centers | | 11,111,053 | |
| Storage | | 3,633,710 | |
| Warehouse/Industrial | | 7,590,684 | |
| Short Term Investments | | 2,918,441 | |
| | Total | $117,293,965 | (1) |
| | | | |
(1) Total excludes $45,923,235 of Securities Lending Collateral
Pie chart represents percentages of total portfolio.
AssetMark Funds
ALLOCATION OF PORTFOLIO HOLDINGS (Continued)
March 31, 2007
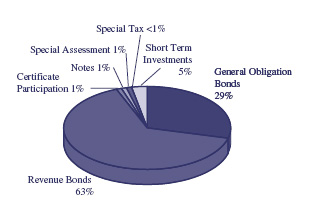
AssetMark Tax-Exempt Fixed Income Fund | |
| | | | |
Components of Portfolio Holdings | |
| General Obligation Bonds | | $72,074,160 | |
| Revenue Bonds | | 157,849,281 | |
| Certificate Participation | | 2,534,816 | |
| Notes | | 2,254,605 | |
| Special Assessment | | 1,067,192 | |
| Special Tax | | 510,775 | |
| Short Term Investments | | 11,801,785 | |
| | Total | $248,092,614 | |
| | | | |
Pie chart represents percentages of total portfolio.
AssetMark Core Plus Fixed Income Fund
Components of Portfolio Holdings |
| Asset Backed Securities | $33,248,200 | |
| Collateralized Mortgage Obligations | 23,878,244 | |
| Convertible Preferred Stocks | 309,750 | |
| Corporate Bonds | 131,166,656 | |
| Foreign Government Note/Bonds | 6,450,727 | |
| Mortgage Backed Securities | 267,929,298 | |
| Purchased Options | 12,148 | |
| Preferred Stocks | 1,045,936 | |
| Supranational Obligations | 3,669,596 | |
| U.S. Government Agency Issues | 183,875,689 | |
| U.S. Treasury Obligations | 67,515,669 | |
| Municipal Bonds | 2,863,569 | |
| Short Term Investments | 69,304,744 | |
| Total | $791,270,226 | (1) |
| | | |
(1) Total excludes $212,879,454 of Securities Lending Collateral
Pie chart represents percentages of total portfolio.
AssetMark Large Cap Growth Fund
PERFORMANCE DATA
This chart assumes an initial gross investment of $10,000 made on June 29, 2001 (commencement of operations). Returns shown include the reinvestment of all dividends. Returns shown do not reflect the deduction of taxes that a shareholder would pay on fund distributions or the redemption of fund shares. In the absence of fee waivers and reimbursements, total return would be reduced. Past performance is not predictive of future performance. Investment return and principal value will fluctuate, so that your shares, when redeemed, may be worth more or less than the original cost.
RUSSELL 1000 GROWTH INDEX – An unmanaged index which measures the performance of those Russell 1000 companies with higher price-to-book ratios and higher forecasted growth values. The Russell 1000 Index is an unmanaged index which measures the performance of the 1,000 largest companies in the Russell 3000 Index. The Russell 3000 Index is an unmanaged index which measures the performance of the 3,000 largest U.S. Companies, based on total market capitalization, which represents approximately 98% of the investable U.S. equity market.
LIPPER LARGE-CAP GROWTH FUNDS INDEX – The Lipper Large-Cap Growth Funds Index is the average of the 30 largest funds in the Lipper Large-Cap Growth Funds Category. These funds, by portfolio practice, invest at least 75% of equity assets in companies with market capitalizations (on three-year weighted basis) greater than 300% of the dollar-weighted median market capitalization of the middle 1,000 securities of the Standard & Poor’s (“S&P”) Super Composite 1500® Index. These funds typically have an above average price-to-earnings ratio, price-to-book ratio and three-year sales-per-share growth value, compared to the Standard & Poor’s 500 Composite Index (“S&P 500® Index”).
AVERAGE ANNUAL TOTAL RETURN (for the periods ended March 31) | | |
| | One Year | Five Year | Since Inception (6/29/01) |
| AssetMark Large Cap Growth Fund | -0.80% | 2.02% | -0.23% |
| Russell 1000 Growth Index | 7.06% | 3.48% | 1.22% |
| Lipper Large-Cap Growth Funds Index | 3.39% | 2.75% | 0.37% |
AssetMark Large Cap Growth Fund
SCHEDULE OF INVESTMENTS
March 31, 2007
Number of | | | | Market | |
Shares | | | | Value | |
| | | COMMON STOCKS - 98.17% | | | |
| | | Aerospace & Defense - 1.94% | | | |
| | 95,100 | | Lockheed Martin Corp. (b) | | $ | 9,226,602 | |
| | 13,000 | | Precision Castparts Corp. (b) | | | 1,352,650 | |
| | 62,500 | | United Technologies Corp. (b) | | | 4,062,500 | |
| | | | | | | 14,641,752 | |
| | | | Air Freight & Logistics - 1.29% | | | | |
| | 104,120 | | C.H. Robinson Worldwide, Inc. (b) | | | 4,971,730 | |
| | 114,100 | | Expeditors International | | | | |
| | | | Washington, Inc. (b) | | | 4,714,612 | |
| | | | | | | 9,686,342 | |
| | | | Auto Components - 0.29% | | | | |
| | 70,200 | | The Goodyear Tire & | | | | |
| | | | Rubber Co. (a)(b) | | | 2,189,538 | |
| | | | Beverages - 1.03% | | | | |
| | 77,000 | | The Coca-Cola Co | | | 3,696,000 | |
| | 63,450 | | PepsiCo, Inc | | | 4,032,882 | |
| | | | | | | 7,728,882 | |
| | | | Biotechnology - 3.34% | | | | |
| | 161,419 | | Amgen, Inc. (a)(b) | | | 9,020,094 | |
| | 130,160 | | Genentech, Inc. (a) | | | 10,688,739 | |
| | 344,100 | | Millennium Pharmaceuticals, | | | | |
| | | | Inc. (a)(b) | | | 3,908,976 | |
| | 56,600 | | Vertex Pharmaceuticals, Inc. (a) | | | 1,587,064 | |
| | | | | | | 25,204,873 | |
| | | | Capital Markets - 2.56% | | | | |
| | 99,400 | | The Bank of New York Co., Inc. | | | 4,030,670 | |
| | 42,400 | | The Goldman Sachs Group, Inc. | | | 8,761,112 | |
| | 58,190 | | Merrill Lynch & Co., Inc. (b) | | | 4,752,377 | |
| | 28,500 | | SEI Investments Co | | | 1,716,555 | |
| | | | | | | 19,260,714 | |
| | | | Chemicals - 0.84% | | | | |
| | 52,800 | | Air Products & Chemicals, Inc | | | 3,905,088 | |
| | 81,000 | | Lyondell Chemical Co. (b) | | | 2,427,570 | |
| | | | | | | 6,332,658 | |
| | | | Commercial Banks - 2.26% | | | | |
| | 123,660 | | Bank of America Corp | | | 6,309,133 | |
| | 235,957 | | Commerce Bancorp, Inc. (b) | | | 7,876,245 | |
| | 52,100 | | Wachovia Corp. (b) | | | 2,868,105 | |
| | | | | | | 17,053,483 | |
| | | | Commercial Services & Supplies - 1.74% | | | | |
| | 68,800 | | ITT Educational Services, Inc. (a)(b) | | | 5,606,512 | |
| | 66,700 | | Manpower, Inc. (b) | | | 4,920,459 | |
| | 130,200 | | Steelcase, Inc. (b) | | | 2,589,678 | |
| | | | | | | 13,116,649 | |
| | | | Communications Equipment - 5.39% | | | | |
| | 616,180 | | Cisco Systems, Inc. (a) | | | 15,731,075 | |
| | 201,950 | | Motorola, Inc | | | 3,568,457 | |
| | 455,201 | | QUALCOMM, Inc. (b) | | | 19,418,875 | |
| | 13,900 | | Research In Motion Ltd. (a)(b) | | | 1,897,211 | |
| | | | | | | 40,615,618 | |
| | | | | | | | |
| | | | Computers & Peripherals - 6.71% | | | | |
| | 160,400 | | Apple, Inc. (a)(b) | | | 14,902,764 | |
| | 133,225 | | Dell, Inc. (a) | | | 3,092,152 | |
| | 268,990 | | Hewlett-Packard Co. | | | 10,797,259 | |
| | 92,990 | | International Business achines Corp. | | | 8,765,237 | |
| | 355,475 | | Network Appliance, Inc. (a) | | | 12,981,947 | |
| | | | | | | 50,539,359 | |
| | | | | | | | |
| | | | Consumer Finance - 1.68% | | | | |
| | 53,750 | | American Express Co | | | 3,031,500 | |
| | 36,900 | | Capital One Financial Corp. (b) | | | 2,784,474 | |
| | 168,080 | | SLM Corp. (b) | | | 6,874,472 | |
| | | | | | | 12,690,446 | |
| | | | | | | | |
| | | | Diversified Financial Services - 1.42% | | | | |
| | 177,750 | | Citigroup, Inc. | | | 9,125,685 | |
| | 35,600 | | The First Marblehead Corp | | | 1,598,084 | |
| | | | | | | 10,723,769 | |
| | | | | | | | |
| | | | Electric Utilities - 0.40% | | | | |
| | 46,500 | | TXU Corp | | | 2,980,650 | |
| | | | | | | | |
| | | | Electrical Equipment - 0.86% | | | | |
| | 51,400 | | Cooper Industries Ltd. | | | 2,312,486 | |
| | 97,000 | | Emerson Electric Co | | | 4,179,730 | |
| | | | | | | 6,492,216 | |
| | | | | | | | |
| | | | Electronic Equipment & Instruments - 0.99% | | | | |
| | 66,800 | | Avnet, Inc. (a)(b) | | | 2,414,152 | |
| | 48,800 | | CDW Corp. (b) | | | 2,997,784 | |
| | 71,650 | | Molex, Inc. (b) | | | 2,020,530 | |
| | | | | | | 7,432,466 | |
See notes to financial statements.
AssetMark Large Cap Growth Fund
SCHEDULE OF INVESTMENTS (Continued)
March 31, 2007
Number of | | | | Market | |
Shares | | | | Value | |
| | | COMMON STOCKS (Continued) | | | |
| | | Energy Equipment & Services - 3.57% | | | |
| | 76,150 | | Baker Hughes, Inc. (b) | | $ | 5,035,799 | |
| | 52,350 | | National-Oilwell, Inc. (a)(b) | | | 4,072,307 | |
| | 257,240 | | Schlumberger Ltd. (b) | | | 17,775,284 | |
| | | | | | | 26,883,390 | |
| | | | Food & Staples Retailing - 1.87% | | | | |
| | 69,900 | | Costco Wholesale Corp. (b) | | | 3,763,416 | |
| | 87,600 | | CVS Corp. (b) | | | 2,990,664 | |
| | 77,829 | | Walgreen Co. (b) | | | 3,571,573 | |
| | 79,870 | | Wal-Mart Stores, Inc | | | 3,749,896 | |
| | | | | | | 14,075,549 | |
| | | | Food Products - 0.51% | | | | |
| | 65,640 | | General Mills, Inc | | | 3,821,561 | |
| | | | | |
| | | | Health Care Equipment & Supplies - 2.83% | |
| | 67,100 | | Dentsply International, Inc. (b) | | | 2,197,525 | |
| | 50,600 | | Kinetic Concepts, Inc. (a) | | | 2,562,384 | |
| | 88,100 | | Medtronic, Inc. (b) | | | 4,322,186 | |
| | 52,300 | | St Jude Medical, Inc. (a) | | | 1,967,003 | |
| | 184,617 | | Varian Medical Systems, Inc. (a)(b) | | | 8,804,385 | |
| | 17,145 | | Zimmer Holdings, Inc. (a) | | | 1,464,354 | |
| | | | | | | 21,317,837 | |
| | | | | | | | |
| | | | Health Care Providers & Services - 4.67% | | | | |
| | 83,900 | | Cerner Corp. (a)(b) | | | 4,568,355 | |
| | 79,600 | | Coventry Health Care, Inc. (a) | | | 4,461,580 | |
| | 140,900 | | McKesson Corp | | | 8,248,286 | |
| | 66,040 | | Medco Health Solutions, Inc. (a) | | | 4,789,881 | |
| | 151,100 | | UnitedHealth Group, Inc | | | 8,003,767 | |
| | 62,900 | | Wellpoint, Inc. (a) | | | 5,101,190 | |
| | | | | | | 35,173,059 | |
| | | | Hotels, Restaurants & Leisure - 0.81% | | | | |
| | 57,600 | | International Game Technology (b) | | | 2,325,888 | |
| | 66,000 | | Yum! Brands, Inc. (b) | | | 3,812,160 | |
| | | | | | | 6,138,048 | |
| | | | Household Durables - 0.63% | | | | |
| | 180,175 | | Pulte Homes, Inc. (b) | | | 4,767,431 | |
| | | | | | | | |
| | | | Household Products - 2.00% | | | | |
| | 28,150 | | Colgate-Palmolive Co | | | 1,880,138 | |
| | 111,500 | | Kimberly-Clark Corp | | | 7,636,635 | |
| | 88,550 | | Procter & Gamble Co. (b) | | | 5,592,818 | |
| | | | | | | 15,109,591 | |
| | | | | | | | |
| | | | Industrial Conglomerates - 2.53% | | | | |
| | 539,475 | | General Electric Co | | | 19,075,836 | |
| | | | | | | | |
| | | | Insurance - 4.93% | | | | |
| | 70,600 | | ACE Ltd | | | 4,028,436 | |
| | 80,250 | | Aflac, Inc | | | 3,776,565 | |
| | 107,650 | | American International Group, Inc. (b) | | | 7,236,233 | |
| | 46,600 | | Everest Re Group Ltd | | | 4,481,522 | |
| | 33,700 | | Hartford Financial Services Group, Inc. (b) | | | 3,221,046 | |
| | 40,700 | | MBIA, Inc | | | 2,665,443 | |
| | 538,092 | | The Progressive Corp. (b) | | | 11,741,167 | |
| | | | | | | 37,150,412 | |
| | | | | | | | |
| | | | Internet & Catalog Retail - 3.20% | | | | |
| | 316,965 | | Amazon.Com, Inc. (a)(b) | | | 12,612,038 | |
| | 348,055 | | eBay, Inc. (a)(b) | | | 11,538,023 | |
| | | | | | | 24,150,061 | |
| | | | | | | | |
| | | | Internet Software & Services - 2.15% | | | | |
| | 29,902 | | Google, Inc. (a) | | | 13,699,900 | |
| | 18,030 | | VeriSign, Inc. (a)(b) | | | 452,914 | |
| | 66,185 | | Yahoo!, Inc. (a)(b) | | | 2,070,929 | |
| | | | | | | 16,223,743 | |
| | | | | | | | |
| | | | IT Services - 2.49% | | | | |
| | 207,900 | | Accenture Ltd | | | 8,012,466 | |
| | 53,700 | | Automatic Data Processing, Inc | | | 2,599,080 | |
| | 17,800 | | Cognizant Technology Solutions Corp. (a)(b) | | | 1,571,206 | |
| | 28,400 | | DST Systems, Inc. (a)(b) | | | 2,135,680 | |
| | 202,900 | | Western Union Co | | | 4,453,655 | |
| | | | | | | 18,772,087 | |
| | | | | | | | |
| | | | Machinery - 2.93% | | | | |
| | 86,470 | | AGCO Corp. (a)(b) | | | 3,196,796 | |
| | 207,400 | | Dover Corp | | | 10,123,194 | |
| | 54,440 | | Gardner Denver, Inc. (a) | | | 1,897,234 | |
| | 50,930 | | Manitowoc Co | | | 3,235,583 | |
| | 50,500 | | Terex Corp. (a) | | | 3,623,880 | |
| | | | | | | 22,076,687 | |
| | | | | | | | |
| | | | Media - 1.94% | | | | |
| | 82,250 | | The McGraw-Hill Companies, Inc. (b) | | | 5,171,880 | |
| | 57,800 | | Omnicom Group, Inc | | | 5,917,564 | |
| | 101,600 | | The Walt Disney Co. (b) | | | 3,498,088 | |
| | | | | | | 14,587,532 | |
See notes to financial statements.
AssetMark Large Cap Growth Fund
SCHEDULE OF INVESTMENTS (Continued)
March 31, 2007
Number of | | | | Market | |
Shares | | | | Value | |
| | | COMMON STOCKS (Continued) | | | |
| | | Metals & Mining - 0.98% | | | |
| | 49,200 | | Alcoa, Inc | | $ | 1,667,880 | |
| | 52,600 | | Freeport-McMoRan Copper & | | | | |
| | | | Gold, Inc. (b) | | | 3,481,594 | |
| | 31,200 | | Southern Copper Corp. (b) | | | 2,235,792 | |
| | | | | | | 7,385,266 | |
| | | | Multiline Retail - 2.47% | | | | |
| | 62,170 | | Dollar Tree Stores, Inc. (a) | | | 2,377,381 | |
| | 164,100 | | Kohl’s Corp. (a)(b) | | | 12,571,701 | |
| | 62,200 | | Target Corp. (b) | | | 3,685,972 | |
| | | | | | | 18,635,054 | |
| | | | Multi-Utilities - 0.77% | | | | |
| | 80,100 | | NRG Energy, Inc. (a)(b) | | | 5,770,404 | |
| | | | Office Electronics - 0.26% | | | | |
| | 51,600 | | Zebra Technologies Corp. (a)(b) | | | 1,992,276 | |
| | | | Oil & Gas - 1.58% | | | | |
| | 59,900 | | Apache Corp | | | 4,234,930 | |
| | 111,900 | | ConocoPhillips | | | 7,648,365 | |
| | | | | | | 11,883,295 | |
| | | | Pharmaceuticals - 7.08% | | | | |
| | 150,500 | | Abbott Laboratories | | | 8,397,900 | |
| | 98,900 | | Amylin Pharmaceuticals, Inc. (a)(b) | | | 3,694,904 | |
| | 311,700 | | Bristol-Myers Squibb Co | | | 8,652,792 | |
| | 20,500 | | Eli Lilly & Co. (b) | | | 1,101,055 | |
| | 143,100 | | Forest Laboratories, Inc. (a)(b) | | | 7,361,064 | |
| | 95,600 | | Genzyme Corp. (a)(b) | | | 5,737,912 | |
| | 44,970 | | Johnson & Johnson (b) | | | 2,709,892 | |
| | 67,300 | | Merck & Co., Inc | | | 2,972,641 | |
| | 382,900 | | Schering Plough Corp | | | 9,767,779 | |
| | 59,000 | | Wyeth | | | 2,951,770 | |
| | | | | | | 53,347,709 | |
| | | | Semiconductor & | | | | |
| | | | Semiconductor Equipment - 2.80% | | | | |
| | 141,600 | | Lam Research Corp. (a)(b) | | | 6,703,344 | |
| | 104,300 | | Linear Technology Corp. (b) | | | 3,294,837 | |
| | 72,940 | | MEMC Electronic Materials, Inc. (a) | | | 4,418,705 | |
| | 112,410 | | Nvidia Corp. (a) | | | 3,235,160 | |
| | 114,500 | | Texas Instruments, Inc. (b) | | | 3,446,450 | |
| | | | | | | 21,098,496 | |
| | | | Software - 5.98% | | | | |
| | 204,555 | | Autodesk, Inc. (a) | | | 7,691,268 | |
| | 92,510 | | BMC Software, Inc. (a)(b) | | | 2,848,383 | |
| | 508,900 | | Microsoft Corp | | | 14,183,043 | |
| | 518,800 | | Oracle Corp. (a) | | | 9,405,844 | |
| | 183,488 | | Salesforce.com, Inc. (a)(b) | | | 7,856,956 | |
| | 178,500 | | Symantec Corp. (a)(b) | | | 3,088,050 | |
| | | | | | | 45,073,544 | |
| | | | Specialty Retail - 2.66% | | | | |
| | 83,200 | | AnnTaylor Stores Corp. (a) | | | 3,226,496 | |
| | 96,400 | | The Gap Inc | | | 1,659,044 | |
| | 75,600 | | Lowe’s Cos, Inc. (b) | | | 2,380,644 | |
| | 125,210 | | Rent-A-Center, Inc. (a) | | | 3,503,376 | |
| | 159,990 | | Ross Stores, Inc | | | 5,503,656 | |
| | 146,275 | | Staples, Inc | | | 3,779,746 | |
| | | | | | | 20,052,962 | |
| | | | Textiles, Apparel & Luxury Goods - 1.37% | | | | |
| | 137,370 | | Coach, Inc. (a)(b) | | | 6,875,368 | |
| | 32,750 | | Nike, Inc | | | 3,480,015 | |
| | | | | | | 10,355,383 | |
| | | | Thrifts & Mortgage Finance - 1.08% | | | | |
| | 242,120 | | Countrywide Financial Corp. (b) | | | 8,144,917 | |
| | | | Tobacco - 1.34% | | | | |
| | 114,700 | | Altria Group, Inc | | | 10,071,807 | |
| | | | | | | | |
| | | | Total Common Stocks | | | | |
| | | | (Cost $673,571,837) | | | 739,823,352 | |
| | | | INVESTMENT COMPANIES - 0.37% | | | | |
| | | | Investment Company - 0.37% | | | | |
| | 49,800 | | iShares Russell 1000 Growth | | | | |
| | | | Index Fund | | | 2,771,370 | |
| | | | Total Investment Companies | | | | |
| | | | (Cost $2,769,518) | | | 2,771,370 | |
| | | | SHORT TERM INVESTMENTS - 1.87% | | | | |
| | | | Money Market Funds - 1.87% | | | | |
| | 14,110,418 | | Federated Prime Obligations Fund | | | | |
| | | | 5.18%, 01/01/2050 (d) | | | 14,110,418 | |
| | | | Total Short Term Investments | | | | |
| | | | (Cost $14,110,418) | | | 14,110,418 | |
See notes to financial statements.
AssetMark Large Cap Growth Fund
SCHEDULE OF INVESTMENTS (Continued)
March 31, 2007
Principal | | | | Market | |
Amount | | | | Value | |
| | | INVESTMENTS PURCHASED | | | |
| | | AS SECURITIES LENDING | | | |
| | | COLLATERAL - 31.44% | | | |
| | | COMMERCIAL PAPER - 13.31% | | | |
| $ | 10,951,451 | | Antalis Funding, | | | |
| | | | 5.37%, 04/10/07 (c) | | $ | 10,933,514 | |
| | 821,359 | | Chesham Finance LLC, | | | | |
| | | | 5.46%, 04/02/07 (c) | | | 820,985 | |
| | 9,582,519 | | Concord Minutemen Capital Co., | | | | |
| | | | 5.30%, 04/04/07 (c) (d) | | | 9,582,519 | |
| | 2,464,076 | | Duke Funding, | | | | |
| | | | 5.32%, 04/20/07 (c) | | | 2,453,193 | |
| | 9,034,947 | | Duke Funding, | | | | |
| | | | 5.32%, 04/13/07 (c) | | | 8,995,080 | |
| | 9,582,519 | | Fenway Funding LLC, | | | | |
| | | | 5.48%, 04/02/07 (c) | | | 9,578,143 | |
| | 10,951,451 | | KKR Atlantic Funding Trust, | | | | |
| | | | 5.33%, 04/23/07 (c) | | | 10,901,375 | |
| | 8,213,588 | | Laguna Corp., | | | | |
| | | | 5.34%, 05/31/07 (c) | | | 8,102,969 | |
| | 9,856,306 | | Mortgage Interest Networking Trust, | | | | |
| | | | 5.52%, 04/02/07 (c) | | | 9,851,772 | |
| | 4,654,367 | | Ocala Funding, | | | | |
| | | | 5.33%, 04/20/07 (c) | | | 4,633,084 | |
| | 4,928,153 | | Rams Funding LLC, | | | | |
| | | | 5.33%, 04/24/07 (c) | | | 4,907,073 | |
| | 8,213,588 | | Thornburg Mortgage Capital LLC, | | | | |
| | | | 5.33%, 04/13/07 (c) | | | 8,177,311 | |
| | 8,213,588 | | Valcour Bay Capital LLC, | | | | |
| | | | 5.36%, 04/02/07 (c) | | | 8,106,170 | |
| | 3,285,435 | | Valcour Bay Capital LLC, | | | | |
| | | | 5.34%, 04/02/07 (c) | | | 3,272,326 | |
| | | | Total Commercial Paper | | | | |
| | | | (Cost $100,315,514) | | | 100,315,514 | |
| | | | CORPORATE BONDS AND NOTES - 0.80% | | | | |
| | 2,737,863 | | Bayerische Landesbank, | | | | |
| | | | 5.37%, 12/24/15 | | | 2,737,863 | |
| | 3,285,435 | | Metlife Global, 5.42%, 04/28/08 | | | 3,285,435 | |
| | | | Total Corporate Bonds and Notes | | | | |
| | | | (Cost $6,023,298) | | | 6,023,298 | |
Principal | | | | Market | |
Amount | | | | Value | |
| | | CORPORATE PAYDOWN | | | |
| | | SECURITIES - 1.34% | | | |
| $ | 2,737,863 | | Duke Funding, 5.43%, 04/08/07 (c) | | $ | 2,737,863 | |
| | 7,343,649 | | Leafs LLC, 5.32%, 04/20/07 (c). . . | | | 7,343,649 | |
| | | | Total Corporate Paydown Securities | | | | |
| | | | (Cost $10,081,512) | | | 10,081,512 | |
Number of | | | | | |
Shares | | | | | |
| | | MUTUAL FUNDS - 0.19% | | | |
| | 1,478,093 | | AIM STIT-Liquid Assets Portfolio | | | 1,478,093 | |
| | | | Total Mutual Funds | | | | |
| | | | (Cost $1,478,093) | | | 1,478,093 | |
Principal | | | | | |
Amount | | | | | |
| | | | | | |
| | | REPURCHASE AGREEMENTS - 15.80% | | | |
| $ | 5,475,725 | | Bear Stearns Repurchase Agreement, | | | |
| | | | 5.56%, 04/02/07 (Collateralized | | | |
| | | | by non-U.S. Government debt | | | |
| | | | securities, value $5,724,117, 5.82% | | | |
| | | | to 6.37%, 01/01/12 to 03/01/17) | | | 5,475,725 | |
| | 13,689,314 | | Cantor Fitzgerald Repurchase | | | | |
| | | | Agreement, 5.38%, 04/02/07 | | | | |
| | | | (Collateralized by U.S. | | | | |
| | | | Government Agency Issues, | | | | |
| | | | value $14,450,393, 4.00% to | | | | |
| | | | 7.50%, 06/01/08 to 03/01/37) | | | 13,689,314 | |
| | 13,689,314 | | Cantor Fitzgerald Repurchase | | | | |
| | | | Agreement, 5.38%, 04/02/07 | | | | |
| | | | (Collateralized by U.S. Government | | | | |
| | | | Agency Issues, value $13,900,328, | | | | |
| | | | 4.50% to 9.00%, 01/01/08 to | | | | |
| | | | 03/01/37) | | | 13,689,314 | |
| | 27,378,627 | | CS First Boston Repurchase | | | | |
| | | | Agreement, 5.38%, 04/02/07 | | | | |
| | | | (Collateralized by non-U.S. | | | | |
| | | | Government debt securities, | | | | |
| | | | value $27,775,848, 0.00% to | | | | |
| | | | 9.16%, 10/15/22 to 02/25/37) | | | 27,378,627 | |
| | 2,737,863 | | CS First Boston Repurchase | | | | |
| | | | Agreement, 5.38%, 04/02/07 | | | | |
| | | | (Collateralized by non-U.S. Government | | | | |
| | | | debt securities, value $2,874,520, | | | | |
| | | | | | | 2,737,863 | |
See notes to financial statements.
AssetMark Large Cap Growth Fund
SCHEDULE OF INVESTMENTS (Continued)
March 31, 2007
Principal | | | | Market | |
Amount | | | | Value | |
| | | REPURCHASE AGREEMENTS (Continued) | | | |
| $ | 2,737,863 | | CS First Boston Repurchase | | | |
| | | | Agreement, 5.38%, 04/02/07 | | | |
| | | | (Collateralized by non-U.S. | | | |
| | | | Government debt securities, | | | |
| | | | value $2,860,830, 6.25%, | | | |
| | | | 02/25/37) | | $ | 2,737,863 | |
| | 2,737,863 | | CS First Boston Repurchase | | | | |
| | | | Agreement, 5.38%, 04/02/07 | | | | |
| | | | (Collateralized by U.S. Government | | | | |
| | | | Agency Issues, value $2,787,410, | | | | |
| | | | 0.00%, 04/25/37) | | | 2,737,863 | |
| | 1,368,931 | | Merrill Lynch Repurchase | | | | |
| | | | Agreement, 5.37%, 04/02/07 | | | | |
| | | | (Collateralized by U.S. | | | | |
| | | | Government Agency Issues, | | | | |
| | | | value $1,390,683, 5.50%, | | | | |
| | | | 03/01/37) | | | 1,368,931 | |
| | 49,281,528 | | Morgan Stanley Repurchase | | | | |
| | | | Agreement, 5.51%, 04/02/07 | | | | |
| | | | (Collateralized by non-U.S. | | | | |
| | | | Government debt securities, | | | | |
| | | | value $52,995,041, 0.00% to 6.99%, | | | | |
| | | | 11/20/08 to 09/20/43) | | | 49,281,528 | |
| | | | Total Repurchase Agreements | | | | |
| | | | (Cost $119,097,028) | | | 119,097,028 | |
| | | | Total Investments Purchased as | | | | |
| | | | Securities Lending Collateral | | | | |
| | | | (Cost $236,995,445) | | | 236,995,445 | |
| | | | Total Investments | | | | |
| | | | (Cost $927,447,218) - 131.85% | | | 993,700,585 | |
| | | | Liabilities in Excess of | | | | |
| | | | Other Assets - (31.85)% | | | (240,062,282 | ) |
| | | | TOTAL NET | | | | |
| | | | ASSETS - 100.00% | | $ | 753,638,303 | |
| | | | | | | | |
Percentages are stated as a percent of net assets.
| (b) | All or a portion of this security is on loan. |
| (c) | Restricted securities as defined in Rule 144(a) under the Securities Act of 1933. Such securities are treated as liquid securities according to the Fund’s liquidity guidelines. The market value of these securities total $110,397,026, which represents 14.65% of total net assets. |
| (d) | Variable Rate Security. The rate shown is the rate in effect on March 31, 2007. |
See notes to financial statements.
AssetMark Large Cap Value Fund
PERFORMANCE DATA
This chart assumes an initial gross investment of $10,000 made on June 29, 2001 (commencement of operations). Returns shown include the reinvestment of all dividends. Returns shown do not reflect the deduction of taxes that a shareholder would pay on fund distributions or the redemption of fund shares. In the absence of fee waivers and reimbursements, total return would be reduced. Past performance is not predictive of future performance. Investment return and principal value will fluctuate, so that your shares, when redeemed, may be worth more or less than the original cost.
RUSSELL 1000 VALUE INDEX – An unmanaged index which measures the performance of those Russell 1000 companies with lower price-to-book ratios and lower forecasted growth values. The Russell 1000 Index is an unmanaged index which measures the performance of the 1,000 largest companies in the Russell 3000 Index. The Russell 3000 Index is an unmanaged index which measures the performance of the 3,000 largest U.S. Companies, based on total market capitalization, which represents approximately 98% of the investable U.S. equity market.
LIPPER LARGE-CAP VALUE FUNDS INDEX – The Lipper Large-Cap Value Funds Index is the average of the 30 largest funds in the Lipper Large-Cap Value Funds Category. These funds, by portfolio practice, invest at least 75% of equity assets in companies with market capitalizations (on three-year weighted basis) greater than 300% of the dollar-weighted median market capitalization of the middle 1,000 securities of the S&P Super Composite 1500® Index. Large-cap value funds typically have a below-average price-to-earnings ratio, price-to-book ratio and three-year sales-per-share growth value, compared to the S&P 500® Index.
AVERAGE ANNUAL TOTAL RETURN (for the periods ended March 31) | | |
| | One Year | Five Year | Since Inception (6/29/01) |
| AssetMark Large Cap Value Fund | 15.32% | 7.12% | 6.77% |
| Russell 1000 Value Index | 16.83% | 10.25% | 8.76% |
| Lipper Large-Cap Value Funds Index | 14.14% | 7.42% | 5.81% |
Number of | | | | Market | |
Shares | | | | Value | |
| | | COMMON STOCKS - 95.92% | | | |
| | | Aerospace & Defense - 0.96% | | | |
| | 88,200 | | Northrop Grumman Corp. | | $ | 6,546,204 | |
| | | | Auto Components - 0.95% | | | | |
| | 1,038,246 | | Delphi Corp. (a)(b) | | | 3,010,913 | |
| | 36,500 | | Johnson Controls, Inc. (b) | | | 3,453,630 | |
| | | | | | | 6,464,543 | |
| | | | Automobiles - 3.94% | | | | |
| | 888,836 | | Ford Motor Co. (b) | | | 7,012,916 | |
| | 453,125 | | General Motors Corp. (b) | | | 13,883,750 | |
| | 101,650 | | Harley-Davidson, Inc. (b) | | | 5,971,938 | |
| | | | | | | 26,868,604 | |
| | | | Beverages - 1.29% | | | | |
| | 64,300 | | Anheuser-Busch Companies, Inc. (b) | | | 3,244,578 | |
| | 156,800 | | Coca-Cola Enterprises, Inc. | | | 3,175,200 | |
| | 29,350 | | Diageo PLC - ADR | | | 2,375,882 | |
| | | | | | | 8,795,660 | |
| | | | Building Products - 0.41% | | | | |
| | 103,100 | | Masco Corp. (b) | | | 2,824,940 | |
| | | | Capital Markets - 1.91% | | | | |
| | 37,770 | | Ameriprise Financial, Inc. | | | 2,158,178 | |
| | 132,600 | | Lehman Brothers Holdings, Inc. (b) | | | 9,291,282 | |
| | 37,200 | | Mellon Financial Corp. (b) | | | 1,604,808 | |
| | | | | | | 13,054,268 | |
| | | Chemicals - 2.46% | | | |
| | 294,270 | | The Dow Chemical Co. | | | 13,495,222 | |
| | 46,400 | | PPG Industries, Inc. (b) | | | 3,262,384 | |
| | | | | | | 16,757,606 | |
| | | | Commercial Banks - 5.95% | | | | |
| | 189,800 | | Bank of America Corp | | | 9,683,596 | |
| | 141,130 | | Fifth Third Bancorp (b) | | | 5,460,320 | |
| | 57,709 | | HSBC Holdings PLC - ADR (b) | | | 5,067,427 | |
| | 186,910 | | Popular, Inc. (b) | | | 3,095,229 | |
| | 237,134 | | Wachovia Corp. | | | 13,054,227 | |
| | 123,600 | | Wells Fargo & Co. | | | 4,255,548 | |
| | | | | | | 40,616,347 | |
| | | | Commercial Services & Supplies - 1.05% | |
| | 14,150 | | Dun & Bradstreet Corp. | | | 1,290,480 | |
| | 279,480 | | H&R Block, Inc. (b) | | | 5,880,259 | |
| | | | | | | 7,170,739 | |
| | | Communications Equipment - 0.87% | | | |
| | 501,689 | | Alcatel SA - ADR (b) | | $ | 5,929,964 | |
| | | | Computers & Peripherals - 2.16% | | | | |
| | 287,730 | | Dell, Inc. (a) | | | 6,678,213 | |
| | 79,500 | | Hewlett-Packard Co. | | | 3,191,130 | |
| | 51,690 | | International Business | | | | |
| | | | Machines Corp. | | | 4,872,300 | |
| | | | | | | 14,741,643 | |
| | | | Construction Materials - 0.23% | | | | |
| | 13,550 | | Vulcan Materials Co. (b) | | | 1,578,304 | |
| | | | Consumer Finance - 1.69% | | | | |
| | 148,300 | | American Express Co. | | | 8,364,120 | |
| | 76,700 | | SLM Corp. | | | 3,137,030 | |
| | | | | | | 11,501,150 | |
| | | | Containers & Packaging - 0.62% | | | | |
| | 133,200 | | Sealed Air Corp. | | | 4,209,120 | |
| | | | Diversified Financial Services - 3.40% | | | | |
| | 266,770 | | Citigroup, Inc. | | | 13,695,972 | |
| | 152,738 | | J.P. Morgan Chase & Co. | | | 7,389,464 | |
| | 34,350 | | Moody’s Corp. (b) | | | 2,131,761 | |
| | | | | | | 23,217,197 | |
| | | | Diversified Telecommunication | | | | |
| | | | Services - 4.87% | | | | |
| | 336,742 | | AT&T Inc. (b) | | | 13,277,737 | |
| | 108,100 | | Sprint Corp. (b) | | | 2,049,576 | |
| | 472,865 | | Verizon Communications, Inc. (b) | | | 17,931,041 | |
| | | | | | | 33,258,354 | |
| | | Electric Utilities - 1.92% | | | |
| | 69,000 | | Edison International | | | 3,389,970 | |
| | 151,600 | | TXU Corp. | | | 9,717,560 | |
| | | | | | | 13,107,530 | |
| | | | Energy Equipment & Services - 1.71% | | | | |
| | 109,600 | | GlobalSantaFe Corp. (b) | | | 6,760,128 | |
| | 107,500 | | Halliburton Co. | | | 3,412,050 | |
| | 18,600 | | Transocean, Inc. (a) | | | 1,519,620 | |
| | | | | | | 11,691,798 | |
| | | | Food & Staples Retailing - 4.06% | | | | |
| | 121,100 | | Costco Wholesale Corp. (b) | | | 6,520,024 | |
| | 67,217 | | CVS Corp. | | | 2,294,788 | |
| | 165,596 | | The Kroger Co. (b) | | | 4,678,087 | |
| | 140,285 | | Safeway, Inc. (b) | | | 5,140,042 | |
See notes to financial statements.
AssetMark Large Cap Value Fund
SCHEDULE OF INVESTMENTS (Continued)
March 31, 2007
Number of | | | | Market | |
Shares | | | | Value | |
| | | COMMON STOCKS (Continued) | | | |
| | | Food & Staples Retailing (Continued) | | | |
| | 151,410 | | Supervalu, Inc. (b) | | $ | 5,915,589 | |
| | 67,250 | | Wal-Mart Stores, Inc | | | 3,157,388 | |
| | | | | | | 27,705,918 | |
| | | | Food Products - 1.33% | | | | |
| | 91,600 | | Archer-Daniels-Midland Co. (b) | | | 3,361,720 | |
| | 338,860 | | Sara Lee Corp. | | | 5,733,511 | |
| | | | | | | 9,095,231 | |
| | | | Health Care Equipment & Supplies - 0.79% | | | | |
| | 369,220 | | Boston Scientific Corp. (a) | | | 5,368,459 | |
| | | | Health Care Providers & Services - 1.89% | | | | |
| | 23,650 | | Cardinal Health, Inc. | | | 1,725,268 | |
| | 44,800 | | Cigna Corp. | | | 6,391,168 | |
| | 427,500 | | Tenet Healthcare Corp. (a)(b) | | | 2,748,825 | |
| | 38,900 | | UnitedHealth Group, Inc. | | | 2,060,533 | |
| | | | | | | 12,925,794 | |
| | | | Hotels, Restaurants & Leisure - 0.96% | | | | |
| | 69,000 | | Carnival Corp. (b) | | | 3,233,340 | |
| | 73,000 | | McDonald’s Corp. | | | 3,288,650 | |
| | | | | | | 6,521,990 | |
| | | | Household Durables - 1.10% | | | | |
| | 40,500 | | Fortune Brands, Inc. | | | 3,192,210 | |
| | 50,860 | | Whirlpool Corp. (b) | | | 4,318,523 | |
| | | | | | | 7,510,733 | |
| | | | Household Products - 1.19% | | | | |
| | 94,800 | | Kimberly-Clark Corp | | | 6,492,852 | |
| | 25,900 | | Procter & Gamble Co. (b) | | | 1,635,844 | |
| | | | | | | 8,128,696 | |
| | | | Industrial Conglomerates - 2.03% | | | | |
| | 42,000 | | 3M Co. (b) | | | 3,210,060 | |
| | 91,400 | | General Electric Co. | | | 3,231,904 | |
| | 234,050 | | Tyco International Ltd. | | | 7,384,278 | |
| | | | | | | 13,826,242 | |
| | | | Insurance - 9.27% | | | | |
| | 212,600 | | The Allstate Corp. | | | 12,768,756 | |
| | 110,100 | | American International Group, Inc. | | | 7,400,922 | |
| | 32,350 | | AON Corp. | | | 1,228,006 | |
| | 1,703 | | Berkshire Hathaway, Inc. (a)(b) | | | 6,198,920 | |
| | 138,880 | | Conseco, Inc. (a)(b) | | | 2,402,624 | |
| | 88,200 | | Loews Corp. | | | 4,006,926 | |
| | | Insurance (Continued) | | | |
| | 131,860 | | Marsh & McLennan | | | |
| | | | Companies, Inc. (b) | | $ | 3,862,179 | |
| | 159,800 | | Metlife, Inc. | | | 10,091,370 | |
| | 154,900 | | The Progressive Corp. (b) | | | 3,379,918 | |
| | 31,866 | | Transatlantic Holdings, Inc. (b) | | | 2,075,114 | |
| | 189,700 | | Travelers Companies, Inc. | | | 9,820,769 | |
| | | | | | | 63,235,504 | |
| | | | IT Services - 1.20% | | | | |
| | 59,637 | | Electronic Data Systems Corp. | | | 1,650,752 | |
| | 83,325 | | Iron Mountain, Inc. (a) | | | 2,177,283 | |
| | 515,175 | | Unisys Corp. (a)(b) | | | 4,342,925 | |
| | | | | | | 8,170,960 | |
| | | | Leisure Equipment & Products - 0.81% | | | | |
| | 245,286 | | Eastman Kodak Co. (b) | | | 5,533,652 | |
| | | | Machinery - 1.44% | | | | |
| | 57,600 | | Deere & Co. (b) | | | 6,257,664 | |
| | 48,500 | | Paccar, Inc. (b) | | | 3,559,900 | |
| | | | | | | 9,817,564 | |
| | | Media - 4.93% | | | |
| | 211,800 | | CBS Corp. (b) | | | 6,478,962 | |
| | 216,525 | | Comcast Corp. (a) | | | 5,514,892 | |
| | 221,725 | | Gannett Co., Inc. | | | 12,480,900 | |
| | 10,493 | | Idearc, Inc. | | | 368,304 | |
| | 17,890 | | McClatchy Co. | | | 565,503 | |
| | 135,700 | | News Corp. | | | 3,137,384 | |
| | 158,380 | | Tribune Co. (b) | | | 5,085,582 | |
| | | | | | | 33,631,527 | |
| | | | Metals & Mining - 1.49% | | | | |
| | 197,670 | | Alcoa, Inc. | | | 6,701,013 | |
| | 52,100 | | Freeport-McMoRan Copper & | | | | |
| | | | Gold, Inc. | | | 3,448,499 | |
| | | | | | | 10,149,512 | |
| | | | Multiline Retail - 0.55% | | | | |
| | 82,600 | | Federated Department Stores (b) | | | 3,721,130 | |
| | | | Office Electronics - 0.66% | | | | |
| | 265,230 | | Xerox Corp. (a) | | | 4,479,735 | |
| | | | Oil & Gas - 9.09% | | | | |
| | 146,300 | | Apache Corp. | | | 10,343,410 | |
| | 306,152 | | ConocoPhillips (b) | | | 20,925,489 | |
| | 58,100 | | Devon Energy Corp. (b) | | | 4,021,682 | |
| | 103,795 | | El Paso Corp. | | | 1,501,914 | |
See notes to financial statements.
AssetMark Large Cap Value Fund
SCHEDULE OF INVESTMENTS (Continued)
March 31, 2007
Number of | | | | Market | |
Shares | | | | Value | |
| | | COMMON STOCKS (Continued) | | | |
| | | Oil & Gas (Continued) | | | |
| | 50,750 | | EOG Resources, Inc. (b) | | $ | 3,620,505 | |
| | 288,900 | | Occidental Petroleum Corp. (b) | | | 14,245,659 | |
| | 113,900 | | Valero Energy Corp. | | | 7,345,411 | |
| | | | | | | 62,004,070 | |
| | | | Pharmaceuticals - 6.45% | | | | |
| | 232,324 | | Bristol-Myers Squibb Co. | | | 6,449,314 | |
| | 104,900 | | Johnson & Johnson | | | 6,321,274 | |
| | 271,530 | | Merck & Co., Inc. (b) | | | 11,993,480 | |
| | 470,616 | | Pfizer, Inc. | | | 11,887,760 | |
| | 237,795 | | Schering Plough Corp. | | | 6,066,151 | |
| | 25,935 | | Wyeth | | | 1,297,528 | |
| | | | | | | 44,015,507 | |
| | | | Road & Rail - 0.47% | | | | |
| | 40,000 | | Burlington Northern Santa Fe | | | | |
| | | | Corp. (b) | | | 3,217,200 | |
| | | | Semiconductor & | | | | |
| | | | Semiconductor Equipment - 1.83% | | | | |
| | 356,200 | | Intel Corp. | | | 6,814,106 | |
| | 471,166 | | Micron Technology, Inc. (a) | | | 5,691,685 | |
| | | | | | | 12,505,791 | |
| | | Software - 1.30% | | | |
| | 319,530 | | Microsoft Corp. | | | 8,905,301 | |
| | | | Specialty Retail - 0.47% | | | | |
| | 124,300 | | Limited Brands, Inc. | | | 3,239,258 | |
| | | | Thrifts & Mortgage Finance - 3.64% | | | | |
| | 176,700 | | Countrywide Financial Corp. (b) | | | 5,944,188 | |
| | 157,900 | | Federal Home Loan Mortgage | | | | |
| | | | Corp. (b) | | | 9,393,471 | |
| | 236,200 | | Washington Mutual, Inc. (b) | | | 9,537,756 | |
| | | | | | | 24,875,415 | |
| | | | Tobacco - 2.58% | | | | |
| | 200,761 | | Altria Group, Inc. | | | 17,628,823 | |
| | | | Total Common Stocks | | | | |
| | | | (Cost $554,199,127) | | | 654,547,983 | |
| | | | SHORT TERM INVESTMENTS - 4.00% | | | | |
| | | | Money Market Funds - 4.00% | | | | |
| | 27,337,235 | | Federated Prime Obligations Fund | | | | |
| | | | 5.18%, 01/01/2050 (d) | | | 27,337,235 | |
| | | | Total Short Term Investments | | | | |
| | | | (Cost $27,337,235) | | | 27,337,235 | |
Principal | | | | Market | |
Amount | | | | Value | |
| | | INVESTMENTS PURCHASED | | | |
| | | AS SECURITIES LENDING | | | |
| | | COLLATERAL - 29.69% | | | |
| | | COMMERCIAL PAPER - 12.57% | | | |
| $ | 9,362,832 | | Antalis Funding, | | | |
| | | | 5.37%, 04/10/07 (c) | | $ | 9,347,498 | |
| | 702,212 | | Chesham Finance LLC, | | | | |
| | | | 5.46%, 04/02/07 (c) | | | 701,893 | |
| | 8,192,478 | | Concord Minutemen Capital Co., | | | | |
| | | | 5.30%, 04/04/07 (c)(d) | | | 8,192,478 | |
| | 2,106,637 | | Duke Funding, | | | | |
| | | | 5.32%, 04/20/07 (c) | | | 2,097,333 | |
| | 7,724,335 | | Duke Funding, | | | | |
| | | | 5.32%, 04/13/07 (c) | | | 7,690,252 | |
| | 8,192,478 | | Fenway Funding LLC, | | | | |
| | | | 5.48%, 04/02/07 (c) | | | 8,188,737 | |
| | 9,362,832 | | KKR Atlantic Funding Trust, | | | | |
| | | | 5.33%, 04/23/07 (c) | | | 9,320,020 | |
| | 7,022,124 | | Laguna Corp., | | | | |
| | | | 5.34%, 05/31/07 (c) | | | 6,927,552 | |
| | 8,426,548 | | Mortgage Interest Networking Trust, | | | | |
| | | | 5.52%, 04/02/07 (c) | | | 8,422,671 | |
| | 3,979,204 | | Ocala Funding, | | | | |
| | | | 5.33%, 04/20/07 (c) | | | 3,961,008 | |
| | 4,213,274 | | Rams Funding LLC, | | | | |
| | | | 5.33%, 04/24/07 (c) | | | 4,195,252 | |
| | 7,022,124 | | Thornburg Mortgage Capital LLC, | | | | |
| | | | 5.33%, 04/13/07 (c) | | | 6,991,109 | |
| | 7,022,124 | | Valcour Bay Capital LLC, | | | | |
| | | | 5.36%, 04/02/07 (c) | | | 6,930,288 | |
| | 2,808,850 | | Valcour Bay Capital LLC, | | | | |
| | | | 5.34%, 04/02/07 (c) | | | 2,797,642 | |
| | | | Total Commercial Paper | | | | |
| | | | (Cost $85,763,733) | | | 85,763,733 | |
| | | | CORPORATE BONDS AND NOTES - 0.75% | | | | |
| | 2,340,708 | | Bayerische Landesbank, | | | |
| | | | 5.37%, 12/24/15 | | | 2,340,708 | |
| | 2,808,850 | | Metlife Global, 5.42%, 04/28/08 | | | 2,808,850 | |
| | | | Total Corporate Bonds and Notes | | | | |
| | | | (Cost $5,149,558) | | | 5,149,558 | |
| | | | CORPORATE PAYDOWN | | | | |
| | | | SECURITIES - 1.26% | | | | |
| | 2,340,708 | | Duke Funding, 5.43%, 04/08/07 (c) | | | 2,340,708 | |
| | 6,278,379 | | Leafs LLC, 5.32%, 04/20/07 (c) | | | 6,278,379 | |
| | | | Total Corporate Paydown Securities | | | | |
| | | | (Cost $8,619,087) | | | 8,619,087 | |
See notes to financial statements.
AssetMark Large Cap Value Fund
SCHEDULE OF INVESTMENTS (Continued)
March 31, 2007
Number of | | | | | | | Market | |
Shares | | | | | | | Value | |
| | | MUTUAL FUNDS - 0.19% | | | | | | |
| | 1,263,681 | | AIM STIT-Liquid Assets Portfolio | | | | | $ | 1,263,681 | |
| | | | Total Mutual Funds | | | | | | | |
| | | | (Cost $1,263,681) | | | | 1,263,681 | |
| | | | | | | | | | |
Principal | | | | | | | | | |
Amount | | | | | | | | | |
| | | | REPURCHASE AGREEMENTS - 14.92% | |
| $ | 4,681,416 | | Bear Stearns Repurchase Agreement, | | | | | |
| | | | 5.56%, 04/02/07 (Collateralized | | | | | | | |
| | | | by non-U.S. Government debt | | | | | | | |
| | | | securities, value $4,893,775, 5.82% | | | | | |
| | | | to 6.37%, 01/01/12 to 03/01/17) | | | | | | | 4,681,416 | |
| | 11,703,540 | | Cantor Fitzgerald Repurchase | | | | | | | | |
| | | | Agreement, 5.38%, 04/02/07 | | | | | | | | |
| | | | (Collateralized by U.S. | | | | | | | | |
| | | | Government Agency Issues, | | | | | | | | |
| | | | value $12,354,217, 4.00% to | | | | | | | | |
| | | | 7.50%, 06/01/08 to 03/01/37) | | | . | | | | 11,703,540 | |
| | 11,703,540 | | Cantor Fitzgerald Repurchase | | | | | | | | |
| | | | Agreement, 5.38%, 04/02/07 | | | | | | | | |
| | | | (Collateralized by U.S. | | | | | | | | |
| | | | Government Agency Issues, | | | | | | | | |
| | | | value $11,883,945, 4.50% to | | | | | | | | |
| | | | 9.00%, 01/01/08 to 03/01/37) | | | | | | | 11,703,540 | |
| | 23,407,080 | | CS First Boston Repurchase | | | | | | | | |
| | | | Agreement, 5.38%, 04/02/07 | | | | | | | | |
| | | | (Collateralized by non-U.S. | | | | | | | | |
| | | | Government debt securities, | | | | | | | | |
| | | | value $23,746,680, 0.00% to | | | | | | | | |
| | | | 9.16%, 10/15/22 to 02/25/37) | | | | | | | 23,407,080 | |
| | 2,340,708 | | CS First Boston Repurchase | | | |
| | | | Agreement, 5.38%, 04/02/07 | | | |
| | | | (Collateralized by non-U.S. | | | |
| | | | Government debt securities, | | | |
| | | | value $2,457,541, 6.25%, | | | |
| | | | 02/25/37) | | | 2,340,708 | |
| | 2,340,708 | | CS First Boston Repurchase | | | | |
| | | | Agreement, 5.38%, 04/02/07 | | | | |
| | | | (Collateralized by non-U.S. | | | | |
| | | | Government debt securities, | | | | |
| | | | value $2,445,838, 6.25%, | | | | |
| | | | 02/25/37) | | | 2,340,708 | |
Principal | | | | Market | |
Amount | | | | Value | |
| $ | 2,340,708 | | CS First Boston Repurchase | | | |
| | | | Agreement, 5.38%, 04/02/07 | | | |
| | | | (Collateralized by U.S. | | | |
| | | | Government Agency Issues, | | | |
| | | | value $2,383,068, 0.00%, | | | |
| | | | 04/25/37) | | $ | 2,340,708 | |
| | 1,170,354 | | Merrill Lynch Repurchase | | | | |
| | | | Agreement, 5.37%, 04/02/07 | | | | |
| | | | (Collateralized by U.S. | | | | |
| | | | Government Agency Issues, | | | | |
| | | | value $1,188,950, 5.50%, | | | | |
| | | | 03/01/37) | | | 1,170,354 | |
| | 42,132,743 | | Morgan Stanley Repurchase | | | | |
| | | | Agreement, 5.51%, 04/02/07 | | | | |
| | | | (Collateralized by non-U.S. | | | | |
| | | | Government debt securities, | | | | |
| | | | value $45,307,574, 0.00% to | | | | |
| | | | 6.99%, 11/20/28 to 09/20/43) | | | 42,132,743 | |
| | | | Total Repurchase Agreements | | | | |
| | | | (Cost $101,820,797) | | | 101,820,797 | |
| | | | Total Investments Purchased as | | | | |
| | | | Securities Lending Collateral | | | | |
| | | | (Cost $202,616,856) | | | 202,616,856 | |
| | | | Total Investments | | | | |
| | | | (Cost $784,153,218) - 129.61% | | | 884,502,074 | |
| | | | Liabilities in Excess of | | | | |
| | | | Other Assets - (29.61)% | | | (202,093,096 | ) |
TOTAL NET | | | |
ASSETS - 100.00% | | $ | 682,408,978 | |
| | | | | |
| Percentages are stated as a percent of net assets. |
| ADR - | American Depository Receipt |
| (a) | Non Income Producing. |
| (b) | All or a portion of this security is on loan. |
| (c) | Restricted securities as defined in Rule 144(a) under the |
| | Securities Act of 1933. Such securities are treated as liquid |
| | securities according to the Fund’s liquidity guidelines. The |
| | market value of these securities total $94,382,820, which |
| | represents 13.83% of total net assets. |
| (d) | Variable Rate Security. The rate shown is the rate in effect on |
| | March 31, 2007. |
See notes to financial statements.
This chart assumes an initial gross investment of $10,000 made on June 29, 2001 (commencement of operations). Returns shown include the reinvestment of all dividends. Returns shown do not reflect the deduction of taxes that a shareholder would pay on fund distributions or the redemption of fund shares. In the absence of fee waivers and reimbursements, total return would be reduced. Past performance is not predictive of future performance. Investment return and principal value will fluctuate, so that your shares, when redeemed, may be worth more or less than the original cost.
RUSSELL 2500 GROWTH INDEX - An unmanaged index which measures the performance of those Russell 2500 Index companies with higher price-to-book ratios and higher forecasted growth values. The Russell 2500 Index measures the performance of the 2,500 smallest companies in the Russell 3000 Index. The Russell 3000 Index is an unmanaged index which measures the performance of the 3,000 largest U.S. companies based on total market capitalization, which represents approximately 98% of the investable U.S. equity market.
RUSSELL MID-CAP GROWTH INDEX - Measures the performance of those Russell Midcap companies with higher price-to-book ratios and higher forecasted growth values. The stocks are also members of the Russell 1000 Growth Index. The Russell 1000 Growth Index contains those securities in the Russell 1000 Index with a greater-than-average growth orientation.
LIPPER SMALL-CAP GROWTH FUNDS INDEX - The Lipper Small-Cap Growth Funds Index is the average of the 30 largest funds in the Lipper Small-Cap Growth Funds Category. These funds, by portfolio practice, invest 75% of equity assets in companies with market capitalizations (on a three-year weighted basis) less than 250% of the dollar-weighted median market capitalization of the smallest 500 of the middle 1,000 securities of the S&P Super Composite 1500® Index. These funds typically have an above average price-to-earnings ratio, price-to-book ratio and three-year sales-per-share growth value, compared to the S&P SmallCap 600 IndexTM.
LIPPER MID-CAP GROWTH FUNDS INDEX - Funds that, by portfolio practice, invest at least 75% of their equity assets in companies with market capitalizations (on a three-year weighted basis) of less than 300% of the dollar-weighted median market capitalization of the S&P Mid-Cap 400 Index. Mid-Cap Growth funds normally invest in companies with long-term earnings expected to grow significantly faster than the earnings of the stocks represented in a major unmanaged stock index. These funds will normally have an above-average price-to-earnings ratio, price-to-book ratio and three-year earnings growth figure, compared to the U.S. diversified mid-cap funds universe average.
AVERAGE ANNUAL TOTAL RETURN (for the periods ended March 31) | | |
| | One Year | Five Year | Since Inception (6/29/01) |
| AssetMark Small/Mid Cap Growth Fund | 4.84% | 6.21% | 3.38% |
| Russell 2500 Growth Index | 4.44% | 9.13% | 5.74% |
| Russell Mid-Cap Growth Index | 6.90% | 9.45% | 6.22% |
| Lipper Small-Cap Growth Funds Index | 1.96% | 7.26% | 4.48% |
| Lipper Mid-Cap Growth Funds Index | 6.22% | 7.70% | 4.23% |
| | | | |
AssetMark Small/Mid Cap Growth Fund
SCHEDULE OF INVESTMENTS
March 31, 2007
Number of | | | | Market | |
Shares | | | | Value | |
| | | COMMON STOCKS - 98.99% | | | |
| | | Aerospace & Defense - 5.92% | | | |
| | 19,600 | | Armor Holdings, Inc. (a)(b) | | $ | 1,319,668 | |
| | 81,643 | | BE Aerospace, Inc. (a)(b) | | | 2,588,083 | |
| | 25,700 | | Ceradyne, Inc. (a)(b) | | | 1,406,818 | |
| | 30,325 | | Precision Castparts Corp. (b) | | | 3,155,316 | |
| | 52,800 | | Spirit Aerosystems Holdings, Inc. (a) | | | 1,681,680 | |
| | | | | | | 10,151,565 | |
| | | | Airlines - 1.43% | | | | |
| | 13,200 | | AMR Corp. (a)(b) | | | 401,940 | |
| | 31,800 | | Continental Airlines, Inc. (a)(b) | | | 1,157,202 | |
| | 19,600 | | US Airways Group, Inc. (a) | | | 891,408 | |
| | | | | | | 2,450,550 | |
| | | | Auto Components - 0.23% | | | | |
| | 22,800 | | Standard Motor Products, Inc. (b) | | | 389,196 | |
| | | | Banks - 0.87% | | | | |
| | 45,855 | | Signature Bank (a) | | | 1,492,122 | |
| | | | Beverages - 0.64% | | | | |
| | 11,500 | | Molson Coors Brewing Co. (b) | | | 1,088,130 | |
| | | | Biotechnology - 1.42% | | | | |
| | 11,500 | | Kendle International, Inc. (a) | | | 408,480 | |
| | 85,575 | | Keryx Biopharmaceuticals, | | | | |
| | | | Inc. (a)(b) | | | 900,249 | |
| | 45,275 | | Lifecell Corp. (a)(b) | | | 1,130,517 | |
| | | | | | | 2,439,246 | |
| | | Capital Markets - 2.37% | | | |
| | 21,330 | | Affiliated Managers Group, Inc. (a)(b) | | | 2,311,105 | |
| | 4,368 | | Evercore Partners, Inc. | | | 136,238 | |
| | 23,869 | | GFI Group Inc. (a)(b) | | | 1,622,376 | |
| | | | | | | 4,069,719 | |
| | | | Chemicals - 1.98% | | | | |
| | 33,200 | | CF Industries Holdings, Inc. | | | 1,279,860 | |
| | 24,700 | | Headwaters, Inc. (a)(b) | | | 539,695 | |
| | 8,500 | | Lubrizol Corp. | | | 438,005 | |
| | 25,300 | | OM Group, Inc. (a) | | | 1,130,404 | |
| | | | | | | 3,387,964 | |
| | | | Commercial Services & Supplies - 7.89% | | | | |
| | 30,805 | | American Reprographics Co. (a) | | | 948,486 | |
| | 8,895 | | The Corporate Executive Board Co. | | | 675,664 | |
| | 12,400 | | Dun & Bradstreet Corp. | | | 1,130,880 | |
| | 11,300 | | First Advantage Corp. (a) | | | 270,861 | |
| | 95,259 | | InnerWorkings, Inc. (a)(b) | | | 1,124,056 | |
| | | Commercial Services & Supplies (Continued) | | | |
| | 16,500 | | ITT Educational Services, Inc. (a)(b) | | $ | 1,344,585 | |
| | 37,184 | | Kenexa Corp. (a)(b) | | | 1,157,538 | |
| | 15,770 | | Sotheby’s Holdings | | | 701,450 | |
| | 12,200 | | Strayer Education, Inc. | | | 1,525,000 | |
| | 88,228 | | TeleTech Holdings, Inc. (a)(b) | | | 3,237,085 | |
| | 35,900 | | United Rentals, Inc. (a) | | | 987,250 | |
| | 6,600 | | Volt Information Sciences, Inc. (a)(b) | | | 172,854 | |
| | 5,200 | | Watson Wyatt Worldwide, Inc. (b) | | | 252,980 | |
| | | | | | | 13,528,689 | |
| | | | Communications Equipment - 3.10% | | | | |
| | 9,400 | | Avocent Corp. (a) | | | 253,518 | |
| | 25,400 | | Belden CDT, Inc. (b) | | | 1,361,186 | |
| | 20,040 | | Ciena Corp. (a) | | | 560,118 | |
| | 38,621 | | CommScope, Inc. (a)(b) | | | 1,656,841 | |
| | 12,000 | | NICE Systems Ltd. - ADR (a) | | | 408,240 | |
| | 38,805 | | Riverbed Technology, Inc. (a)(b) | | | 1,072,570 | |
| | | | | | | 5,312,473 | |
| | | Computers & Peripherals - 0.67% | | | |
| | 83,800 | | Brocade Communications Systems, | | | |
| | | | Inc. (a)(b) | | | 797,776 | |
| | 7,500 | | Diebold, Inc. | | | 357,825 | |
| | | | | | | 1,155,601 | |
| | | | Construction & Engineering - 1.41% | | | | |
| | 15,900 | | EMCOR Group, Inc. (a) | | | 937,782 | |
| | 31,600 | | Jacobs Engineering Group, Inc. (a) | | | 1,474,140 | |
| | | | | | | 2,411,922 | |
| | | | Containers & Packaging - 0.33% | | | | |
| | 8,400 | | Aptargroup, Inc. | | | 562,212 | |
| | | | Distributors - 0.15% | | | | |
| | 14,000 | | Building Material Holding Corp. (b) | | | 253,540 | |
| | | | Diversified Financial Services - 3.39% | | | | |
| | 31,600 | | The First Marblehead Corp. | | | 1,418,524 | |
| | 9,490 | | Huron Consulting Group, Inc. (a) | | | 577,372 | |
| | 31,011 | | International Securities Exchange | | | | |
| | | | Holdings, Inc. (b) | | | 1,513,337 | |
| | 25,000 | | NewStar Financial, Inc. (a)(b) | | | 419,000 | |
| | 13,848 | | Nymex Holdings, Inc. (a)(b) | | | 1,880,004 | |
| | | | | | | 5,808,237 | |
| | | | Diversified Telecommunication Services - 3.35% | | | | |
| | 62,635 | | Cbeyond Communications, Inc. (a)(b) | | | 1,837,085 | |
| | 57,416 | | Cogent Comm Group, Inc. (a) | | | 1,356,740 | |
See notes to financial statements.
AssetMark Small/Mid Cap Growth Fund
SCHEDULE OF INVESTMENTS (Continued)
March 31, 2007
Number of | | | | Market | |
Shares | | | | Value | |
| | | COMMON STOCKS (Continued) | | | |
| | | Diversified Telecommunication | | | |
| | | Services (Continued) | | | |
| | 11,500 | | Consolidated Communications | | | |
| | | | Holdings, Inc. | | $ | 228,735 | |
| | 154,700 | | Level 3 Communications, Inc. (a)(b) | | | 943,670 | |
| | 66,270 | | Time Warner Telecom, Inc. (a)(b) | | | 1,376,428 | |
| | | | | | | 5,742,658 | |
| | | | Electrical Equipment - 1.00% | | | | |
| | 26,000 | | Thomas & Betts Corp. (a) | | | 1,269,320 | |
| | 10,900 | | Woodward Governor Co. (b) | | | 448,753 | |
| | | | | | | 1,718,073 | |
| | | | Electronic Equipment & Instruments - 1.28% | | | | |
| | 10,900 | | Anixter International, Inc. (a)(b) | | | 718,746 | |
| | 22,580 | | Itron, Inc. (a) | | | 1,468,603 | |
| | | | | | | 2,187,349 | |
| | | | Energy Equipment & Services - 4.62% | | | | |
| | 90,700 | | Dresser-Rand Group, Inc. (a) | | | 2,762,722 | |
| | 22,000 | | Helix Energy Solutions Group, | | | | |
| | | | Inc. (a)(b) | | | 820,380 | |
| | 42,800 | | Input/Output, Inc. (a)(b) | | | 589,784 | |
| | 40,700 | | Pride International, Inc. (a)(b) | | | 1,225,070 | |
| | 10,400 | | Superior Energy Services, Inc. (a) | | | 358,488 | |
| | 23,700 | | Tidewater, Inc. (b) | | | 1,388,346 | |
| | 16,375 | | W-H Energy Services, Inc. (a) | | | 765,368 | |
| | | | | | | 7,910,158 | |
| | | Food Products - 0.95% | | | |
| | 12,800 | | Ralcorp Holdings, Inc. (a)(b) | | | 823,040 | |
| | 67,005 | | SunOpta, Inc. (a) | | | 797,360 | |
| | | | | | | 1,620,400 | |
| | | | Gas Utilities - 0.57% | | | | |
| | 8,300 | | Northwest Natural Gas Co. (b) | | | 379,061 | |
| | 13,600 | | Suburban Propane Partners LP | | | 598,400 | |
| | | | | | | 977,461 | |
| | | | Health Care Equipment & Supplies - 2.88% | | | | |
| | 62,190 | | Conceptus, Inc. (a)(b) | | | 1,243,800 | |
| | 6,900 | | Cutera, Inc. (a) | | | 249,711 | |
| | 28,465 | | Hologic, Inc. (a) | | | 1,640,722 | |
| | 6,345 | | Intuitive Surgical, Inc. (a)(b) | | | 771,362 | |
| | 6,200 | | Mentor Corp. (b) | | | 285,200 | |
| | 28,100 | | Zoll Medical Corp. (a) | | | 748,865 | |
| | | | | | | 4,939,660 | |
| | | Health Care Providers & Services - 5.22% | |
| | 25,985 | | The Advisory Board Co. (a)(b) | | $ | 1,315,361 | |
| | 49,378 | | Allscripts Healthcare Solutions, | | | | |
| | | | Inc. (a)(b) | | | 1,323,824 | |
| | 42,100 | | Apria Healthcare Group, Inc. (a) | | | 1,357,725 | |
| | 9,000 | | Coventry Health Care, Inc. (a) | | | 504,450 | |
| | 64,605 | | Psychiatric Solutions, Inc. (a)(b) | | | 2,604,228 | |
| | 60,135 | | Radiation Therapy Services, | | | | |
| | | | Inc. (a)(b) | | | 1,842,536 | |
| | | | | | | 8,948,124 | |
| | | | Health Care Technology - 0.01% | | | | |
| | 547 | | Vital Images, Inc. (a) | | | 18,193 | |
| | | | Hotels, Restaurants & Leisure - 3.00% | | | | |
| | 4,700 | | CEC Entertainment, Inc. (a) | | | 195,238 | |
| | 12,815 | | Chipotle Mexican Grill, Inc. (a)(b) | | | 795,812 | |
| | 18,400 | | Dominos Pizza, Inc. | | | 597,448 | |
| | 11,500 | | Gaylord Entertainment Co. (a)(b) | | | 608,005 | |
| | 15,700 | | Jack in the Box, Inc. (a) | | | 1,085,341 | |
| | 63,733 | | Pinnacle Entertainment, Inc. (a)(b) | | | 1,852,718 | |
| | | | | | | 5,134,562 | |
| | | Household Durables - 0.59% | | | |
| | 8,100 | | Snap-On, Inc. | | | 389,610 | |
| | 24,100 | | Tempur-Pedic International, Inc. | | | 626,359 | |
| | | | | | | 1,015,969 | |
| | | | Industrial Conglomerates - 0.59% | | | | |
| | 14,900 | | Teleflex, Inc. (b) | | | 1,014,243 | |
| | | | Insurance - 0.86% | | | | |
| | 10,500 | | Hilb Rogal & Hobbs Co. (b) | | | 515,025 | |
| | 4,500 | | Reinsurance Group Of America | | | 259,740 | |
| | 21,000 | | WR Berkley Corp. | | | 695,520 | |
| | | | | | | 1,470,285 | |
| | | | Internet & Catalog Retail - 0.93% | | | | |
| | 30,500 | | Nutri Systems, Inc. (a)(b) | | | 1,598,505 | |
| | | | Internet Software & Services - 2.78% | | | | |
| | 64,700 | | DealerTrack Holdings, Inc. (a) | | | 1,987,584 | |
| | 12,825 | | Equinix, Inc. (a) | | | 1,098,205 | |
| | 36,200 | | Interwoven, Inc. (a)(b) | | | 611,780 | |
| | 59,356 | | Switch & Data Facilities Co. (a) | | | 1,075,530 | |
| | | | | | | 4,773,099 | |
| | | | IT Services - 1.45% | | | | |
| | 11,900 | | Convergys Corp. (a) | | | 302,379 | |
| | 13,700 | | SYKES Enterprises, Inc. (a) | | | 249,888 | |
See notes to financial statements.
AssetMark Small/Mid Cap Growth Fund
SCHEDULE OF INVESTMENTS (Continued)
March 31, 2007
Number of | | | | Market | |
Shares | | | | Value | |
| | | COMMON STOCKS (Continued) | | | |
| | | IT Services (Continued) | | | |
| | 22,414 | | Syntel, Inc. | | $ | 776,645 | |
| | 31,575 | | Verifone Holdings, Inc. (a) | | | 1,159,750 | |
| | | | | | | 2,488,662 | |
| | | | Leisure Equipment & Products - 1.75% | | | | |
| | 44,000 | | Marvel Entertainment, Inc. (a)(b) | | | 1,221,000 | |
| | 59,200 | | Mattel, Inc. | | | 1,632,144 | |
| | 3,800 | | RC2 Corp. (a)(b) | | | 153,482 | |
| | | | | | | 3,006,626 | |
| | | | Machinery - 0.78% | | | | |
| | 52,097 | | Force Protection, Inc. (a)(b) | | | 977,340 | |
| | 5,100 | | Gardner Denver, Inc. (a) | | | 177,735 | |
| | 5,000 | | Robbins & Myers, Inc. | | | 186,450 | |
| | | | | | | 1,341,525 | |
| | | | Media - 3.01% | | | | |
| | 14,300 | | Dreamworks Animation | | | | |
| | | | Skg, Inc. (a)(b) | | | 437,294 | |
| | 9,320 | | Focus Media Holding Ltd - ADR (a) | | | 731,247 | |
| | 15,900 | | Lee Enterprises, Inc. (b) | | | 477,795 | |
| | 23,100 | | Meredith Corp. (b) | | | 1,325,709 | |
| | 35,800 | | Scholastic Corp. (a)(b) | | | 1,113,380 | |
| | 69,600 | | Sinclair Broadcast Group, Inc. (b) | | | 1,075,320 | |
| | | | | | | 5,160,745 | |
| | | Metals & Mining - 1.17% | | | |
| | 6,700 | | Alliance Resource Partners L.P. | | | 254,064 | |
| | 5,100 | | Brush Engineered Materials, | | | | |
| | | | Inc. (a)(b) | | | 247,197 | |
| | 92,500 | | USEC, Inc. (a) | | | 1,503,125 | |
| | | | | | | 2,004,386 | |
| | | | Multiline Retail - 0.69% | | | | |
| | 12,000 | | Dollar Tree Stores, Inc. (a)(b) | | | 458,880 | |
| | 24,700 | | Family Dollar Stores, Inc. (b) | | | 731,614 | |
| | | | | | | 1,190,494 | |
| | | | Oil & Gas - 2.14% | | | | |
| | 33,050 | | ATP Oil & Gas Corp. (a)(b) | | | 1,242,680 | |
| | 2,800 | | Oneok Partners L.P. | | | 189,000 | |
| | 61,375 | | Parallel Petroleum Corp. (a)(b) | | | 1,408,556 | |
| | 11,300 | | Penn Virginia Corp. | | | 829,420 | |
| | | | | | | 3,669,656 | |
| | | Personal Products - 1.95% | | | |
| | 40,939 | | Bare Escentuals, Inc. (a) | | $ | 1,468,482 | |
| | 6,900 | | Chattem, Inc. (a)(b) | | | 406,686 | |
| | 27,800 | | NBTY, Inc. (a)(b) | | | 1,474,512 | |
| | | | | | | 3,349,680 | |
| | | | Pharmaceuticals - 2.51% | | | | |
| | 27,100 | | Bradley Pharmaceuticals, Inc. (a) | | | 520,049 | |
| | 21,830 | | Medicis Pharmaceutical (b) | | | 672,801 | |
| | 18,700 | | Mylan Laboratories, Inc. (b) | | | 395,318 | |
| | 24,975 | | Shire PLC - ADR | | | 1,545,952 | |
| | 39,600 | | Theravance, Inc. (a)(b) | | | 1,168,200 | |
| | | | | | | 4,302,320 | |
| | | | Real Estate - 3.24% | | | | |
| | 6,500 | | Capital Trust, Inc. (b) | | | 296,205 | |
| | 42,740 | | CB Richard Ellis Group, Inc. (a) | | | 1,460,853 | |
| | 15,700 | | Cedar Shopping Centers, Inc. | | | 254,340 | |
| | 5,000 | | Hospitality Properties Trust | | | 234,000 | |
| | 5,700 | | Jones Lang LaSalle, Inc. | | | 594,396 | |
| | 24,900 | | KKR Financial Corp. (b) | | | 683,007 | |
| | 38,900 | | Luminent Mortgage Capital, Inc. | | | 347,766 | |
| | 8,000 | | Newcastle Investment Corp. (b) | | | 221,840 | |
| | 23,200 | | NorthStar Realty Finance Corp. | | | 352,872 | |
| | 8,400 | | RAIT Investment Trust | | | 234,696 | |
| | 16,700 | | Redwood Trust, Inc. (b) | | | 871,406 | |
| | | | | | | 5,551,381 | |
| | | Semiconductor & | | | |
| | | Semiconductor Equipment - 5.69% | | | |
| | 75,800 | | Amkor Technology, Inc. (a) | | | 945,984 | |
| | 293,685 | | Applied Micro Circuits Corp. (a) | | | 1,071,950 | |
| | 31,600 | | Atmel Corp. (a) | | | 158,948 | |
| | 16,500 | | Cymer, Inc. (a)(b) | | | 685,575 | |
| | 76,400 | | Genesis Microchip, Inc. (a)(b) | | | 709,756 | |
| | 36,200 | | Lattice Semiconductor Corp. (a) | | | 211,770 | |
| | 34,940 | | Netlogic Microsystems, Inc. (a)(b) | | | 930,103 | |
| | 11,750 | | Novellus Systems, Inc. (a)(b) | | | 376,235 | |
| | 16,600 | | Sigma Designs, Inc. (a)(b) | | | 435,916 | |
| | 59,755 | | Tessera Technologies, Inc. (a)(b) | | | 2,374,664 | |
| | 34,565 | | Varian Semiconductor Equipment | | | | |
| | | | Associates, Inc. (a)(b) | | | 1,845,079 | |
| | | | | | | 9,745,980 | |
See notes to financial statements.
AssetMark Small/Mid Cap Growth Fund
SCHEDULE OF INVESTMENTS (Continued)
March 31, 2007
Number of | | | | Market | |
Shares | | | | Value | |
| | | COMMON STOCKS (Continued) | | | |
| | | Software - 6.09% | | | |
| | 62,145 | | Activision, Inc. (a)(b) | | $ | 1,177,026 | |
| | 64,450 | | Blackboard, Inc. (a)(b) | | | 2,167,454 | |
| | 49,490 | | Commvault Systems, Inc. (a)(b) | | | 801,738 | |
| | 12,800 | | MicroStrategy, Inc. (a)(b) | | | 1,617,792 | |
| | 41,985 | | Nuance Communications, Inc. (a)(b) | | | 642,790 | |
| | 78,548 | | Opsware, Inc. (a)(b) | | | 569,473 | |
| | 21,100 | | Progress Software Corp. (a) | | | 658,320 | |
| | 43,025 | | THQ, Inc. (a) | | | 1,471,025 | |
| | 29,100 | | TIBCO Software, Inc. (a)(b) | | | 247,932 | |
| | 41,690 | | Ultimate Software Group, Inc. (a) | | | 1,091,861 | |
| | | | | | | 10,445,411 | |
| | | | Specialty Retail - 5.71% | | | | |
| | 33,100 | | Aeropostale, Inc. (a) | | | 1,331,613 | |
| | 94,587 | | GameStop Corp. - Class A (a) | | | 3,080,698 | |
| | 37,534 | | Hibbett Sports, Inc. (a) | | | 1,073,097 | |
| | 22,900 | | Jo-Ann Stores, Inc. (a) | | | 624,025 | |
| | 21,000 | | Maidenform Brands, Inc. (a) | | | 484,470 | |
| | 23,300 | | Payless Shoesource, Inc. (a)(b) | | | 773,560 | |
| | 46,745 | | Urban Outfitters, Inc. (a)(b) | | | 1,239,210 | |
| | 29,355 | | Zumiez, Inc. (a)(b) | | | 1,177,723 | |
| | | | | | | 9,784,396 | |
| | | Textiles, Apparel & Luxury Goods - 1.48% | |
| | 3,000 | | Columbia Sportswear Co. | | | 186,930 | |
| | 18,500 | | Deckers Outdoor Corp. (a)(b) | | | 1,313,870 | |
| | 20,900 | | Oxford Industries, Inc. (b) | | | 1,033,296 | |
| | | | | | | 2,534,096 | |
| | | | Thrifts & Mortgage Finance - 0.10% | | | | |
| | 7,500 | | Washington Federal, Inc. | | | 175,950 | |
| | | | Wireless Telecommunication Services - 0.80% | | | | |
| | 46,100 | | SBA Communications | | | | |
| | | | Corp. - Class A (a)(b) | | | 1,362,255 | |
| | | | Total Common Stocks | | | | |
| | | | (Cost $147,885,713) | | | 169,683,468 | |
| | | | SHORT TERM INVESTMENTS - 2.42% | | | | |
| | | | Money Market Funds - 2.42% | | | | |
| | 3,289.135 | | Federated Prime Obligations Fund | | | | |
| | | | 5.18%, 01/01/2050 (d) | | | 3,289,135 | |
| | | | Total Short Term Investments | | | | |
| | | | (Cost $3,289,135) | | | 3,289,135 | |
Principal | | | | Market | |
Amount | | | | Value | |
| | | INVESTMENTS PURCHASED | | | |
| | | AS SECURITIES LENDING | | | |
| | | COLLATERAL - 33.80% | | | |
| | | COMMERCIAL PAPER - 14.31% | | | |
| $ | 2,677,125 | | Antalis Funding, | | | |
| | | | 5.37%, 04/10/07 (c) | | $ | 2,672,741 | |
| | 200,784 | | Chesham Finance LLC, | | | | |
| | | | 5.46%, 04/02/07 (c) | | | 200,693 | |
| | 2,342,485 | | Concord Minutemen Capital Co., | | | | |
| | | | 5.30%, 04/04/07 (c)(d) | | | 2,342,485 | |
| | 602,353 | | Duke Funding, | | | | |
| | | | 5.32%, 04/20/07 (c) | | | 599,693 | |
| | 2,208,629 | | Duke Funding, | | | | |
| | | | 5.32%, 04/13/07 (c) | | | 2,198,883 | |
| | 2,342,485 | | Fenway Funding LLC, | | | | |
| | | | 5.48%, 04/02/07 (c) | | | 2,341,415 | |
| | 2,677,125 | | KKR Atlantic Funding Trust, | | | | |
| | | | 5.33%, 04/23/07 (c) | | | 2,664,885 | |
| | 2,007,844 | | Laguna Corp., | | | | |
| | | | 5.34%, 05/31/07 (c) | | | 1,980,803 | |
| | 2,409,413 | | Mortgage Interest Networking Trust, | | | | |
| | | | 5.52%, 04/02/07 (c) | | | 2,408,305 | |
| | 1,137,778 | | Ocala Funding, | | | | |
| | | | 5.33%, 04/20/07 (c) | | | 1,132,576 | |
| | 1,204,707 | | Rams Funding LLC, | | | | |
| | | | 5.33%, 04/24/07 (c) | | | 1,199,554 | |
| | 2,007,844 | | Thornburg Mortgage Capital LLC, | | | | |
| | | | 5.33%, 04/13/07 (c) | | | 1,998,976 | |
| | 2,007,844 | | Valcour Bay Capital LLC, | | | | |
| | | | 5.36%, 04/02/07 (c) | | | 1,981,586 | |
| | 803,138 | | Valcour Bay Capital LLC, | | | | |
| | | | 5.34%, 04/02/07 (c) | | | 799,933 | |
| | | | Total Commercial Paper | | | | |
| | | | (Cost $24,522,528) | | | 24,522,528 | |
| | | | CORPORATE BONDS AND NOTES - 0.86% | |
| | 669,281 | | Bayerische Landesbank, | | | |
| | | | 5.37%, 12/24/15 | | | 669,281 | |
| | 803,138 | | Metlife Global, 5.42%, 04/28/08 | | | 803,138 | |
| | | | Total Corporate Bonds and Notes | | | | |
| | | | (Cost $1,472,419) | | | 1,472,419 | |
| | | | CORPORATE PAYDOWN | | | | |
| | | | SECURITIES - 1.44% | | | | |
| | 669,281 | | Duke Funding, 5.43%, 04/08/07 (c) | | | 669,281 | |
| | 1,795,184 | | Leafs LLC, 5.32%, 04/20/07 (c) | | | 1,795,184 | |
| | | | Total Corporate Paydown Securities | | | | |
| | | | (Cost $2,464,465) | | | 2,464,465 | |
See notes to financial statements.
AssetMark Small/Mid Cap Growth Fund
SCHEDULE OF INVESTMENTS
March 31, 2007
Number of | | | | Market | |
Shares | | | | Value | |
| | | MUTUAL FUNDS - 0.21% | | | |
| | 361,326 | | AIM STIT-Liquid Assets Portfolio | | $ | 361,326 | |
| | | | Total Mutual Funds | | | | |
| | | | (Cost $361,326) | | | 361,326 | |
Principal | | | | | |
Amount | | | | | |
| | | REPURCHASE AGREEMENTS - 16.98% | |
| $ | 1,338,563 | | Bear Stearns Repurchase Agreement, | | | |
| | | | 5.56%, 04/02/07 (Collateralized | | | |
| | | | by non-U.S. Government debt | | | |
| | | | securities, value $1,399,283, 5.82% | | | |
| | | | to 6.37%, 01/01/12 to 03/01/17). | | | 1,338,563 | |
| | 3,346,407 | | Cantor Fitzgerald Repurchase | | | | |
| | | | Agreement, 5.38%, 04/02/07 | | | | |
| | | | (Collateralized by U.S. | | | | |
| | | | Government Agency Issues, | | | | |
| | | | value $3,532,456, 4.00% to | | | | |
| | | | 7.50%, 06/01/08 to 03/01/37) | | | 3,346,407 | |
| | 3,346,407 | | Cantor Fitzgerald Repurchase | | | | |
| | | | Agreement, 5.38%, 04/02/07 | | | | |
| | | | (Collateralized by U.S. | | | | |
| | | | Government Agency Issues, | | | | |
| | | | value $3,397,991, 4.50% to | | | | |
| | | | 9.00%, 01/01/08 to 03/01/37) | | | 3,346,407 | |
| | 6,692,816 | | CS First Boston Repurchase | | | | |
| | | | Agreement, 5.38%, 04/02/07 | | | | |
| | | | (Collateralized by non-U.S. | | | | |
| | | | Government debt securities, | | | | |
| | | | value $6,789,917, 0.00% to | | | | |
| | | | 9.16%, 10/15/22 to 02/25/37) | | | 6,692,816 | |
| | 669,282 | | CS First Boston Repurchase | | | |
| | | | Agreement, 5.38%, 04/02/07 | | | |
| | | | (Collateralized by non-U.S. | | | |
| | | | Government debt securities, | | | |
| | | | value $702,688, 6.25%, 02/25/37) | | | 669,282 | |
| | 669,282 | | CS First Boston Repurchase | | | | |
| | | | Agreement, 5.38%, 04/02/07 | | | | |
| | | | (Collateralized by non-U.S. | | | | |
| | | | Government debt securities, | | | | |
| | | | value $699,341, 6.25%, 02/25/37) | | | 669,282 | |
Principal | | | | Market | |
Amount | | | | Value | |
| $ | 669,282 | | CS First Boston Repurchase | | | |
| | | | Agreement, 5.38%, 04/02/07 | | | |
| | | | (Collateralized by U.S. | | | |
| | | | Government Agency Issues, | | | |
| | | | value $681,394, 0.00%, 04/25/37) | | $ | | |
| | 334,641 | | Merrill Lynch Repurchase | | | | |
| | | | Agreement, 5.37%, 04/02/07 | | | | |
| | | | (Collateralized by U.S. | | | | |
| | | | Government Agency Issues, | | | | |
| | | | value $339,958, 5.50%, 3/01/37) . | | | 334,641 | |
| | 12,047,066 | | Morgan Stanley Repurchase | | | | |
| | | | Agreement, 5.51%, 04/02/07 | | | | |
| | | | (Collateralized by non-U.S. | | | | |
| | | | Government debt securities, | | | | |
| | | | value $12,954,850, 0.00% to | | | | |
| | | | 6.99%, 11/20/08 to 09/20/43) | | | 12,047,066 | |
| | | | Total Repurchase Agreements | | | | |
| | | | (Cost $29,113,746) | | | 29,113,746 | |
| | | | Total Investments Purchased as | | | | |
| | | | Securities Lending Collateral | | | | |
| | | | (Cost $57,934,484) | | | 57,934,484 | |
| | | | Total Investments | | | | |
| | | | (Cost $209,109,332) - 135.21% | | | 230,907,087 | |
| | | | Liabilities in Excess of | | | | |
| | | | Other Assets - (35.21)% | | | (59,503,155 | ) |
| | | | TOTAL NET | | | | |
| | | | ASSETS - 100.00% | | $ | 171,403,932 | |
| Percentages are stated as a percent of net assets. |
| ADR - | American Depository Receipt |
| (a) | Non Income Producing. |
| (b) | All or a portion of this security is on loan. |
| (c) | Restricted securities as defined in Rule 144(a) under the |
| | Securities Act of 1933. Such securities are treated as liquid |
| | securities according to the Fund’s liquidity guidelines. The |
| | market value of these securities total $26,986,993, which |
| | represents 15.74% of total net assets. |
| (d) | Variable Rate Security. The rate shown is the rate in effect on |
| | March 31, 2007. |
See notes to financial statements.
AssetMark Small/Mid Cap Value Fund
PERFORMANCE DATA
This chart assumes an initial gross investment of $10,000 made on June 29, 2001 (commencement of operations). Returns shown include the reinvestment of all dividends. Returns shown do not reflect the deduction of taxes that a shareholder would pay on fund distributions or the redemption of fund shares. In the absence of fee waivers and reimbursements, total return would be reduced. Past performance is not predictive of future performance. Investment return and principal value will fluctuate, so that your shares, when redeemed, may be worth more or less than the original cost.
RUSSELL 2500 VALUE INDEX - An unmanaged index which measures the performance of those Russell 2500 Index companies with lower price-to-book ratios and lower forecasted growth values. The Russell 2500 Index is an unmanaged index which measures the performance of the 2,500 smallest companies in the Russell 3000 Index. The Russell 3000 Index is an unmanaged index which measures the performance of the 3,000 largest U.S. companies based on total market capitalization, which represents approximately 98% of the investable U.S. equity market.
RUSSELL MID-CAP VALUE INDEX - Measures the performance of those Russell Midcap companies with lower price-to-book ratios and lower forecasted growth values. The stocks are also members of the Russell 1000 Value Index. The Russell 1000 Value Index contains those securities in the Russell 1000 Index with a less-than-average growth orientation.
LIPPER SMALL-CAP VALUE FUNDS INDEX - The Lipper Small-Cap Value Funds Index is the average of the 30 largest funds in the Lipper Small-Cap Value Funds Category. These funds, by portfolio practice, invest 75% of equity assets in companies with market capitalizations (on a three-year weighted basis) less than 250% of the dollar-weighted median market capitalization of the smallest 500 of the middle 1,000 securities of the S&P Super Composite 1500® Index. These funds typically have a below average price-to-earnings ratio, price-to-book ratio and three-year sales-per-share growth value, compared to the S&P SmallCap 600 IndexTM.
LIPPER MID-CAP VALUE FUNDS INDEX - Funds that, by portfolio practice, invest at least 75% of their equity assets in companies with market capitalizations (on a three-year weighted basis) of less than 300% of the dollar-weighted median market capitalization of the S&P Mid-Cap 400 Index. Mid-Cap Value funds seek long-term growth of capital by investing in companies that are considered to be undervalued relative to a major unmanaged stock index based on price-to-current earnings, book value, asset value, or other factors. These funds will normally have a below-average price-to-earnings ratio, price-to-book ratio and three-year earnings growth figure, compared to the U.S. diversified mid-cap funds universe average.
AVERAGE ANNUAL TOTAL RETURN (for the periods ended March 31) | | |
| | One Year | Five Year | Since Inception (6/29/01) |
| AssetMark Small/Mid Cap Value Fund | 7.63% | 9.25% | 9.78% |
| Russell 2500 Value Index | 12.15% | 14.33% | 14.30% |
| Russell Mid-Cap Value Index | 17.13% | 15.22% | 14.43% |
| Lipper Small-Cap Value Funds Index | 8.33% | 13.71% | 13.61% |
| Lipper Mid-Cap Value Funds Index | 13.29% | 11.93% | 11.57% |
AssetMark Small/Mid Cap Value Fund
SCHEDULE OF INVESTMENTS
March 31, 2007
Number of | | | | Market | |
Shares | | | | Value | |
| | | COMMON STOCKS - 96.95% | | | |
| | | Airlines - 2.05% | | | |
| | 59,200 | | Alaska Air Group, Inc. (a)(b) | | $ | 2,255,520 | |
| | | | Auto Components - 1.98% | | | | |
| | 34,600 | | Autoliv, Inc. | | | 1,976,006 | |
| | 12,500 | | Gentex Corp. (b) | | | 203,125 | |
| | | | | | | 2,179,131 | |
| | | | Capital Markets - 5.09% | | | | |
| | 16,450 | | AG Edwards, Inc. (b) | | | 1,138,011 | |
| | 37,150 | | Ameriprise Financial, Inc. | | | 2,122,751 | |
| | 109,300 | | Apollo Investment Corp. (b) | | | 2,339,020 | |
| | | | | | | 5,599,782 | |
| | | | Chemicals - 4.38% | | | | |
| | 66,150 | | Ashland, Inc. | | | 4,339,440 | |
| | 12,460 | | CF Industries Holdings, Inc. | | | 480,333 | |
| | | | | | | 4,819,773 | |
| | | | Commercial Banks - 9.07% | | | | |
| | 12,000 | | BancFirst Corp. (b) | | | 556,200 | |
| | 18,300 | | BOK Financial Corp. (b) | | | 906,399 | |
| | 47,200 | | Boston Private Financial | | | | |
| | | | Holdings, Inc. (b) | | | 1,317,824 | |
| | 24,000 | | Central Pacific Financial Corp. (b) | | | 877,680 | |
| | 71,600 | | The Colonial BancGroup, Inc. (b) | | | 1,772,100 | |
| | 86,960 | | Investors Bancorp, Inc. (a)(b) | | | 1,255,702 | |
| | 74,200 | | Irwin Financial Corp. | | | 1,383,088 | |
| | 11,400 | | Provident Bankshares Corp. (b) | | | 374,604 | |
| | 40,760 | | UMB Financial Corp. (b) | | | 1,539,098 | |
| | | | | | | 9,982,695 | |
| | | Commercial Services & Supplies - 4.25% | | | |
| | 164,500 | | Allied Waste Industries, Inc. (a)(b) | | | 2,071,055 | |
| | 20,200 | | Equifax, Inc. (b) | | | 736,290 | |
| | 38,200 | | PHH Corp. (a)(b) | | | 1,167,392 | |
| | 23,400 | | Waste Connections, Inc. (a) | | | 700,596 | |
| | | | | | | 4,675,333 | |
| | | | Diversified Financial Services - 3.30% | | | | |
| | 34,790 | | CIT Group, Inc. (b) | | | 1,841,087 | |
| | 61,040 | | Leucadia National Corp. (b) | | | 1,795,797 | |
| | | | | | | 3,636,884 | |
| | | Diversified Telecommunication | | | |
| | | Services - 2.65% | | | |
| | 32,970 | | Embarq Corp. | | $ | 1,857,860 | |
| | 92,960 | | IDT Corp. (a)(b) | | | 1,055,096 | |
| | | | | | | 2,912,956 | |
| | | | Electric Utilities - 3.65% | | | | |
| | 87,320 | | Centerpoint Energy, Inc. | | | 1,566,521 | |
| | 75,100 | | El Paso Electric Co. (a) | | | 1,978,885 | |
| | 16,100 | | Portland General Electric Co. (b) | | | 470,120 | |
| | | | | | | 4,015,526 | |
| | | | Electronic Equipment & Instruments - 3.28% | | | | |
| | 35,620 | | Tech Data Corp. (a) | | | 1,275,552 | |
| | 166,900 | | Vishay Intertechnology, Inc. (a)(b) | | | 2,333,262 | |
| | | | | | | 3,608,814 | |
| | | | Food & Staples Retailing - 3.26% | | | | |
| | 30,100 | | Longs Drug Stores Corp. | | | 1,554,364 | |
| | 158,900 | | Pathmark Stores, Inc. (a) | | | 2,033,920 | |
| | | | | | | 3,588,284 | |
| | | | Health Care Equipment & Supplies - 0.71% | | | | |
| | 13,200 | | Hillenbrand Industries, Inc. (b) | | | 783,684 | |
| | | Health Care Providers & Services - 1.40% | |
| | 24,440 | | Genesis HealthCare Corp. (a)(b) | | | 1,542,408 | |
| | | | Hotels, Restaurants & Leisure - 7.67% | | | | |
| | 35,830 | | Gaylord Entertainment Co. (a)(b) | | | 1,894,332 | |
| | 5,100 | | Great Wolf Resorts, Inc. (a) | | | 67,473 | |
| | 44,900 | | International Speedway | | | | |
| | | | Corp. - Class A | | | 2,321,330 | |
| | 77,800 | | Pinnacle Entertainment, Inc. (a)(b) | | | 2,261,646 | |
| | 88,080 | | Triarc Companies, Inc. (b) | | | 1,514,095 | |
| | 7,100 | | Vail Resorts, Inc. (a) | | | 385,743 | |
| | | | | | | 8,444,619 | |
| | | | Household Durables - 1.39% | | | | |
| | 31,820 | | MDC Holdings, Inc. (b) | | | 1,529,587 | |
| | | | Insurance - 4.61% | | | | |
| | 21,300 | | LandAmerica Financial | | | | |
| | | | Group, Inc. (b) | | | 1,574,283 | |
| | 81,390 | | Old Republic International Corp. | | | 1,800,347 | |
| | 3,000 | | White Mountains Insurance | | | | |
| | | | Group Ltd. | | | 1,699,500 | |
| | | | | | | 5,074,130 | |
See notes to financial statements.
AssetMark Small/Mid Cap Value Fund
SCHEDULE OF INVESTMENTS (Continued)
March 31, 2007
Number of | | | | Market | |
Shares | | | | Value | |
| | | COMMON STOCKS (Continued) | | | |
| | | IT Services - 0.56% | | | |
| | 24,300 | | Convergys Corp. (a) | | $ | 617,463 | |
| | | | Media - 1.82% | | | | |
| | 104,460 | | Discovery Holding Co. (a)(b) | | | 1,998,320 | |
| | | | Metals & Mining - 0.23% | | | | |
| | 3,900 | | Cleveland-Cliffs, Inc. (b) | | | 249,639 | |
| | | | Multiline Retail - 5.49% | | | | |
| | 62,100 | | Big Lots, Inc. (a)(b) | | | 1,942,488 | |
| | 36,500 | | Dillard’s, Inc. (b) | | | 1,194,645 | |
| | 36,200 | | Family Dollar Stores, Inc. (b) | | | 1,072,244 | |
| | 12,620 | | J.C. Penney Co., Inc. (b) | | | 1,036,859 | |
| | 38,200 | | Saks, Inc. | | | 796,088 | |
| | | | | | | 6,042,324 | |
| | | | Multi-Utilities - 2.27% | | | | |
| | 140,500 | | CMS Energy Corp. (b) | | | 2,500,900 | |
| | | | Multi-Utilities & Unregulated Power - 2.77% | | | | |
| | 328,880 | | Aquila, Inc. (a) | | | 1,374,719 | |
| | 68,700 | | Energy East Corp. (b) | | | 1,673,532 | |
| | | | | | | 3,048,251 | |
| | | Oil & Gas - 5.19% | | | |
| | 50,250 | | CNX Gas Corp. (a)(b) | | | 1,423,583 | |
| | 37,320 | | Denbury Resources, Inc. (a)(b) | | | 1,111,763 | |
| | 18,110 | | Plains All American Pipeline, L.P. | | | 1,043,317 | |
| | 23,400 | | Plains Exploration & | | | | |
| | | | Production Co. (a) | | | 1,056,276 | |
| | 27,090 | | Quicksilver Resources, Inc. (a)(b) | | | 1,077,369 | |
| | | | | | | 5,712,308 | |
| | | | Paper & Forest Products - 3.97% | | | | |
| | 190,900 | | Buckeye Technologies, Inc. (a) | | | 2,477,882 | |
| | 78,400 | | Louisiana-Pacific Corp. (b) | | | 1,572,704 | |
| | 26,900 | | Mercer International, Inc. (a)(b) | | | 321,724 | |
| | | | | | | 4,372,310 | |
| | | | Real Estate - 8.04% | | | | |
| | 23,500 | | American Home Mortgage | | | | |
| | | | Investment Corp. (b) | | | 634,265 | |
| | 43,700 | | Apartment Investment & | | | | |
| | | | Management Co. (b) | | | 2,521,053 | |
| | 69,000 | | Brandywine Realty Trust (b) | | | 2,305,290 | |
| | 35,300 | | Duke Realty Corp. (b) | | | 1,534,491 | |
| | 47,160 | | Plum Creek Timber Co., Inc. (b) | | | 1,859,047 | |
| | | | | | | 8,854,146 | |
Number of | | | | Market | |
Shares | | | | Value | |
| | | Software - 0.43% | | | |
| | 12,300 | | Fair Isaac Corp. (b) | | $ | 475,764 | |
| | | | Specialty Retail - 1.17% | | | | |
| | 28,600 | | The Pantry Inc. (a) | | | 1,293,292 | |
| | | | Thrifts & Mortgage Finance - 6.27% | | | | |
| | 62,890 | | Brookline Bancorp, Inc. (b) | | | 796,816 | |
| | 41,130 | | Capitol Federal Financial (b) | | | 1,555,125 | |
| | 115,460 | | Hudson City Bancorp, Inc. (b) | | | 1,579,493 | |
| | 2,000 | | ITLA Capital Corp. (b) | | | 104,040 | |
| | 37,420 | | MAF Bancorp, Inc. (b) | | | 1,546,943 | |
| | 1,400 | | The PMI Group, Inc. (b) | | | 63,308 | |
| | 26,200 | | Webster Financial Corp. (b) | | | 1,257,862 | |
| | | | | | | 6,903,587 | |
| | | | Total Common Stocks | | | | |
| | | | (Cost $100,899,506) | | | 106,717,430 | |
| | | SHORT TERM INVESTMENTS - 3.82% | |
| | | Money Market Funds - 3.82% | | | |
| | 4,206,766 | | Federated Prime Obligations Fund | | | |
| | | | 5.18%, 01/01/2050 (d) | | | 4,206,766 | |
| | | | Total Short Term Investments | | | | |
| | | | (Cost $4,206,766) | | | 4,206,766 | |
Principal | | | | | | |
Amount | | | | | | |
| | | | INVESTMENTS PURCHASED | | | | |
| | | | AS SECURITIES LENDING | | | | |
| | | | COLLATERAL - 37.53% | | | | |
| | | | COMMERCIAL PAPER - 15.89% | | | | |
| $ | 1,908,972 | | Antalis Funding, | | | |
| | | | 5.37%, 04/10/07 (c) | | | 1,905,846 | |
| | 143,173 | | Chesham Finance LLC, | | | | |
| | | | 5.46%, 04/02/07 (c) | | | 143,108 | |
| | 1,670,351 | | Concord Minutemen Capital Co., | | | | |
| | | | 5.30%, 04/04/07 (c)(d) | | | 1,670,351 | |
| | 429,519 | | Duke Funding, | | | | |
| | | | 5.32%, 04/20/07 (c) | | | 427,622 | |
| | 1,574,902 | | Duke Funding, | | | | |
| | | | 5.32%, 04/13/07 (c) | | | 1,567,953 | |
| | 1,670,351 | | Fenway Funding LLC, | | | | |
| | | | 5.48%, 04/02/07 (c) | | | 1,669,588 | |
| | 1,908,972 | | KKR Atlantic Funding Trust, | | | | |
| | | | 5.33%, 04/23/07 (c) | | | 1,900,243 | |
| | 1,431,729 | | Laguna Corp., | | | | |
| | | | 5.34%, 05/31/07 (c) | | | 1,412,447 | |
See notes to financial statements.
AssetMark Small/Mid Cap Value Fund
SCHEDULE OF INVESTMENTS (Continued)
March 31, 2007
Principal | | | | Market | |
Amount | | | | Value | |
| | | COMMERCIAL PAPER (Continued) | | | |
| $ | 1,718,075 | | Mortgage Interest Networking Trust, | | | |
| | | | 5.52%, 04/02/07 (c) | | $ | 1,717,285 | |
| | 811,313 | | Ocala Funding, | | | | |
| | | | 5.33%, 04/20/07 (c) | | | 807,603 | |
| | 859,037 | | Rams Funding LLC, | | | | |
| | | | 5.33%, 04/24/07 (c) | | | 855,362 | |
| | 1,431,729 | | Thornburg Mortgage Capital LLC, | | | | |
| | | | 5.33%, 04/13/07 (c) | | | 1,425,406 | |
| | 1,431,729 | | Valcour Bay Capital LLC, | | | | |
| | | | 5.36%, 04/02/07 (c) | | | 1,413,005 | |
| | 572,691 | | Valcour Bay Capital LLC, | | | | |
| | | | 5.34%, 04/02/07 (c) | | | 570,407 | |
| | | | Total Commercial Paper | | | | |
| | | | (Cost $17,486,226) | | | 17,486,226 | |
| | | CORPORATE BONDS AND NOTES - 0.95% | |
| | 477,243 | | Bayerische Landesbank, | | | |
| | | | 5.37%, 12/24/15 | | | 477,243 | |
| | 572,691 | | Metlife Global, 5.42%, 04/28/08 | | | 572,691 | |
| | | | Total Corporate Bonds and Notes | | | | |
| | | | (Cost $1,049,934) | | | 1,049,934 | |
| | | | CORPORATE PAYDOWN | | | | |
| | | | SECURITIES - 1.60% | | | | |
| | 477,243 | | Duke Funding, 5.43%, 04/08/07 (c) | | | 477,243 | |
| | 1,280,088 | | Leafs LLC, 5.32%, 04/20/07 (c) | | | 1,280,088 | |
| | | | Total Corporate Paydown Securities | | | | |
| | | | (Cost $1,757,331) | | | 1,757,331 | |
Number of | | | | | | |
Shares | | | | | | |
| | | | MUTUAL FUNDS - 0.23% | | | | |
| | 257,650 | | AIM STIT-Liquid Assets Portfolio | | | 257,650 | |
| | | | Total Mutual Funds | | | | |
| | | | (Cost $257,650) | | | 257,650 | |
Principal | | | | Market | |
Amount | | | | Value | |
| | | REPURCHASE AGREEMENTS - 18.86% | | | |
| $ | 954,486 | | Bear Stearns Repurchase | | | |
| | | | Agreement, 5.56%, 04/02/07 | | | |
| | | | (Collateralized by non-U.S. | | | |
| | | | Government debt securities, | | | |
| | | | value $997,784, 5.82% to 6.37%, | | | |
| | | | 01/01/12 to 03/01/17) | | $ | 954,486 | |
| | 2,386,215 | | Cantor Fitzgerald Repurchase | | | | |
| | | | Agreement, 5.38%, 04/02/07 | | | | |
| | | | (Collateralized by U.S. | | | | |
| | | | Government Agency Issues, | | | | |
| | | | value $2,518,880, 4.00% to 7.50%, | | | | |
| | | | 06/01/08 to 03/01/37) | | | 2,386,215 | |
| | 2,386,215 | | Cantor Fitzgerald Repurchase | | | | |
| | | | Agreement, 5.38%, 04/02/07 | | | | |
| | | | (Collateralized by U.S. | | | | |
| | | | Government Agency Issues, | | | | |
| | | | value $2,422,998, 4.50% to 9.00%, | | | | |
| | | | 01/01/08 to 03/01/37) | | | 2,386,215 | |
| | 4,772,428 | | CS First Boston Repurchase | | | |
| | | | Agreement, 5.38%, 04/02/07 | | | |
| | | | (Collateralized by non-U.S. | | | |
| | | | Government debt securities, | | | |
| | | | value $4,841,671, 0.00% to 9.16%, | | | |
| | | | 10/15/22 to 02/25/37) | | | 4,772,428 | |
| | 477,243 | | CS First Boston Repurchase | | | | |
| | | | Agreement, 5.38%, 04/02/07 | | | | |
| | | | (Collateralized by non-U.S. | | | | |
| | | | Government debt securities, | | | | |
| | | | value $501,064, 6.25%, 02/25/37) | | | 477,243 | |
| | 477,243 | | CS First Boston Repurchase | | | | |
| | | | Agreement, 5.38%, 04/02/07 | | | | |
| | | | (Collateralized by non-U.S. | | | | |
| | | | Government debt securities, | | | | |
| | | | value $498,678, 6.25%, 02/25/37) | | | 477,243 | |
| | 477,243 | | CS First Boston Repurchase | | | | |
| | | | Agreement, 5.38%, 04/02/07 | | | | |
| | | | (Collateralized by U.S. | | | | |
| | | | Government Agency Issues, | | | | |
| | | | value $485,880, 0.00%, 04/25/37) | | | 477,243 | |
See notes to financial statements.
AssetMark Small/Mid Cap Value Fund
SCHEDULE OF INVESTMENTS (Continued)
March 31, 2007
Principal | | | | Market | |
Amount | | | | Value | |
| | | REPURCHASE AGREEMENTS (Continued) | |
| $ | 238,622 | | Merrill Lynch Repurchase | | | |
| | | | Agreement, 5.37%, 04/02/07 | | | |
| | | | (Collateralized by U.S. | | | |
| | | | Government Agency Issues, | | | |
| | | | value $242,414, 5.50%, 03/01/37) | | $ | 238,622 | |
| | 8,590,374 | | Morgan Stanley Repurchase | | | | |
| | | | Agreement, 5.51%, 04/02/07 | | | | |
| | | | (Collateralized by non-U.S. | | | | |
| | | | Government debt securities, | | | | |
| | | | value $9,237,685, 0.00% to 6.99%, | | | | |
| | | | 11/20/08 to 09/20/43) | | | 8,590,374 | |
| | | | Total Repurchase Agreements | | | | |
| | | | (Cost $20,760,069) | | | 20,760,069 | |
| | | | Total Investments Purchased as | | | | |
| | | | Securities Lending Collateral | | | | |
| | | | (Cost $41,311,210) | | | 41,311,210 | |
| | | | Total Investments | | | | |
| | | | (Cost $146,417,482) - 138.30% | | | 152,235,406 | |
| | | | Liabilities in Excess of | | | | |
| | | | Other Assets - (38.30)% | | | (42,155,866 | ) |
| | | | TOTAL NET | | | | |
| | | | ASSETS - 100.00% | | $ | 110,079,540 | |
| | | | | | | | |
Percentages are stated as a percent of net assets. | |
| (b) | All or a portion of this security is on loan. |
| (c) | Restricted securities as defined in Rule 144(a) under the Securities Act of 1933. Such securities are treated as liquid securities according to the Fund’s liquidity guidelines. The market value of these securities total $19,243,557, which represents 17.48% of total net assets. |
| (d) | Variable Rate Security. The rate shown is the rate in effect on March 31, 2007. |
See notes to financial statements.
AssetMark International Equity Fund
PERFORMANCE DATA
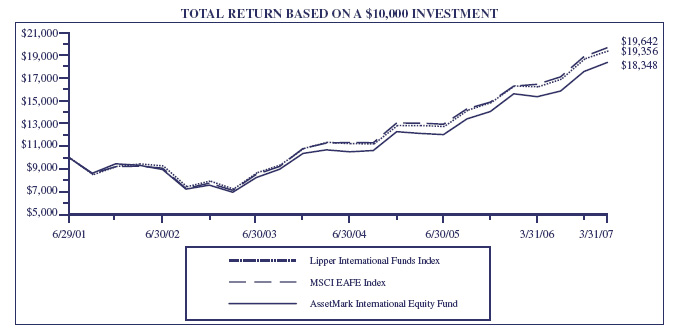
This chart assumes an initial gross investment of $10,000 made on June 29, 2001 (commencement of operations). Returns shown include the reinvestment of all dividends. Returns shown do not reflect the deduction of taxes that a shareholder would pay on fund distributions or the redemption of fund shares. In the absence of fee waivers and reimbursements, total return would be reduced. Past performance is not predictive of future performance. Investment return and principal value will fluctuate, so that your shares, when redeemed, may be worth more or less than the original cost.
MORGAN STANLEY CAPITAL INTERNATIONAL EAFE INDEX - The MSCI EAFE® Index (Europe, Australasia, Far East) is a free float-adjusted market capitalization index that is designed to measure developed market equity performance, excluding the US & Canada. As of April 2002, the MSCI EAFE® Index consisted of the following 21 developed market country indices: Australia, Austria, Belgium, Denmark, Finland, France, Germany, Greece, Hong Kong, Ireland, Italy, Japan, the Netherlands, New Zealand, Norway, Portugal, Singapore, Spain, Sweden, Switzerland and the United Kingdom. The Index is unmanaged and cannot be invested in directly. The Index does not reflect any deduction for fees, expenses or taxes.
LIPPER INTERNATIONAL FUNDS INDEX - An unmanaged index which measures the composite performance of the 30 largest “international” mutual funds, as categorized by Lipper Inc. These funds invest assets in securities with primary trading markets outside of the United States.
AVERAGE ANNUAL TOTAL RETURN (for the periods ended March 31) | | |
| | One Year | Five Year | Since Inception (6/29/01) |
| AssetMark International Equity Fund | 17.65% | 14.49% | 11.13% |
| Morgan Stanley Capital International EAFE Index | 20.69% | 16.13% | 12.45% |
| Lipper International Funds Index | 18.83% | 15.42% | 12.17% |
Number of | | | | Market | |
Shares | | | | Value | |
| | | COMMON STOCKS - 95.81% | | | |
| | | Australia - 0.49% | | | |
| | 660,000 | | Axa Asia Pacific Holdings | | $ | 3,848,682 | |
| | | | Austria - 2.81% | | | | |
| | 210,000 | | Boehler-Uddeholm AG - ADR (b) | | | 5,031,747 | |
| | 58,200 | | Boehler-Uddeholm AG | | | 5,608,193 | |
| | 99,400 | | Erste Bank der Oesterreichischen | | | | |
| | | | Sparkassen AG - ADR | | | 3,857,018 | |
| | 104,300 | | Wiener Staedtische Allgemeine | | | | |
| | | | Versicher AG (a) | | | 7,400,251 | |
| | | | | | | 21,897,209 | |
| | | | Belgium - 0.89% | | | | |
| | 151,800 | | Fortis - ADR (b) | | | 6,908,722 | |
| | | | Brazil - 1.55% | | | | |
| | 110,200 | | Gafisa SA (a)(b) | | | 2,810,100 | |
| | 93,000 | | Petroleo Brasileiro SA - ADR (b) | | | 9,254,430 | |
| | | | | | | 12,064,530 | |
| | | | Denmark - 0.83% | | | | |
| | 71,100 | | Novo-Nordisk A/S - Class B | | | 6,482,755 | |
| | | France - 9.51% | | | |
| | 107,800 | | Accor SA | | | 10,314,773 | |
| | 92,600 | | AXA | | | 3,938,063 | |
| | 339,600 | | AXA - ADR (b) | | | 14,466,960 | |
| | 5,500 | | BNP Paribas SA | | | 575,272 | |
| | 167,500 | | BNP Paribas - ADR (b) | | | 8,716,918 | |
| | 72,000 | | Cie de Saint-Gobain | | | 7,069,077 | |
| | 33,185 | | CNP Assurances | | | 3,883,416 | |
| | 68,700 | | Lafarge SA | | | 10,794,100 | |
| | 45,300 | | PPR SA | | | 7,272,661 | |
| | 98,000 | | Zodiac SA | | | 7,059,080 | |
| | | | | | | 74,090,320 | |
| | | | Germany - 11.63% | | | | |
| | 137,000 | | Adidas-Salomon AG | | | 7,463,089 | |
| | 30,500 | | Bayer AG | | | 1,950,772 | |
| | 203,800 | | Commerzbank AG | | | 9,010,996 | |
| | 23,300 | | Deutsche Bank AG (b) | | | 3,134,782 | |
| | 19,500 | | Deutsche Bank AG | | | 2,623,649 | |
| | 142,600 | | Hypo Real Estate Holding AG | | | 9,109,280 | |
| | 110,500 | | Linde AG | | | 11,895,134 | |
| | 73,300 | | Merck KGaA | | | 9,465,661 | |
| | 231,100 | | Patrizia Immobilien AG (a) | | | 5,131,992 | |
| | 72,900 | | RWE AG | | | 7,707,609 | |
| | 23,600 | | RWE AG - ADR (b) | | | 2,488,080 | |
| | | Germany (Continued) | | | |
| | 130,600 | | SAP AG | | $ | 5,828,007 | |
| | 89,900 | | Siemens AG | | | 9,627,048 | |
| | 13,700 | | Siemens AG - ADR | | | 1,468,640 | |
| | 144,100 | | Symrise AG (a)(c) | | | 3,732,482 | |
| | | | | | | 90,637,221 | |
| | | | Greece - 2.74% | | | | |
| | 136,300 | | Hellenic Exchanges SA | | | 3,109,439 | |
| | 241,080 | | National Bank of Greece SA | | | 12,753,318 | |
| | 143,800 | | OPAP SA | | | 5,465,712 | |
| | | | | | | 21,328,469 | |
| | | | Hong Kong - 1.99% | | | | |
| | 3,131,000 | | Hang Lung Properties Ltd. | | | 8,692,402 | |
| | 5,172,000 | | Shun Tak Holdings Ltd. | | | 6,855,207 | |
| | | | | | | 15,547,609 | |
| | | | Indonesia - 0.48% | | | | |
| | 6,836,000 | | Bank Rakyat Indonesia | | | 3,760,851 | |
| | | | Ireland (Republic of) - 1.01% | | | | |
| | 183,700 | | CRH PLC | | | 7,874,394 | |
| | | | Italy - 3.61% | | | | |
| | 729,800 | | Banca Intesa SpA | | | 5,546,775 | |
| | 48,500 | | ENI SpA | | | 1,578,278 | |
| | 76,800 | | ENI SpA - ADR (b) | | | 4,978,944 | |
| | 1,685,400 | | Unicredito Italiano SpA | | | 16,048,759 | |
| | | | | | | 28,152,756 | |
| | | Japan - 22.49% | | | |
| | 119,400 | | Canon, Inc. | | | 6,411,094 | |
| | 1,423 | | East Japan Railway | | | 11,067,957 | |
| | 53,700 | | Fanuc Ltd. | | | 4,975,604 | |
| | 1,332,200 | | The Fuji Fire & Marine Insurance | | | | |
| | | | Company Ltd. | | | 5,475,068 | |
| | 394,100 | | Higo Bank | | | 2,670,193 | |
| | 68,200 | | Hogy Medical Co. | | | 3,181,203 | |
| | 128,000 | | Honda Motor Co. Ltd. | | | 4,460,245 | |
| | 1,526,000 | | Isuzu Motors | | | 7,647,079 | |
| | 315 | | Mitsubishi Tokyo Financial | | | | |
| | | | Group, Inc. | | | 3,549,016 | |
| | 1,067,600 | | Mitsubishi Tokyo Financial Group, | | | | |
| | | | Inc. - ADR (b) | | | 12,021,176 | |
| | 35,900 | | Nintendo Co. Ltd. | | | 10,416,808 | |
| | 700,500 | | Nippon Elec Glass | | | 12,228,703 | |
| | 922,800 | | Nissan Motor Co., Ltd. | | | 9,858,637 | |
| | 500,000 | | Nomura Holdings, Inc. | | | 10,366,242 | |
See notes to financial statements.
AssetMark International Equity Fund
SCHEDULE OF INVESTMENTS (Continued)
March 31, 2007
Number of | | | | Market | |
Shares | | | | Value | |
| | | COMMON STOCKS (Continued) | | | |
| | | Japan (Continued) | | | |
| | 761,600 | | Nsk Ltd. | | $ | 7,240,938 | |
| | 373 | | Osaka Securities Exchange Co., Ltd. | | | 2,140,222 | |
| | 3,080 | | Pacific Golf Group International (a) | | | 3,229,334 | |
| | 183,400 | | Sega Sammy Holdings, Inc. (a) | | | 4,274,760 | |
| | 406,500 | | THE SHIZUOKA BANK, LTD. | | | 4,314,897 | |
| | 37,400 | | THE SHIZUOKA BANK, | | | | |
| | | | LTD. - ADR (b) | | | 3,975,186 | |
| | 27,500 | | SMC Corp. | | | 3,677,253 | |
| | 107,000 | | Sony Corp. | | | 5,407,721 | |
| | 473,100 | | TAIYO NIPPON SANSO | | | | |
| | | | CORPORATION | | | 4,263,204 | |
| | 1,262,000 | | Toray Industries, Inc. | | | 9,083,458 | |
| | 59,200 | | Toyota Motor Corp. - ADR (a) | | | 7,587,072 | |
| | 59,800 | | XEBIO CO., LTD. | | | 1,664,100 | |
| | 152,300 | | Yamada Denki Co. Ltd. | | | 14,127,697 | |
| | | | | | | 175,314,867 | |
| | | Luxembourg - 0.52% | | | |
| | 26,600 | | Millicom International | | | |
| | | | Cellular SA (a)(b) | | | 2,084,376 | |
| | 92,800 | | Stolt Offshore (a) | | | 1,964,033 | |
| | | | | | | 4,048,409 | |
| | | | Mexico - 0.64% | | | | |
| | 168,500 | | Grupo Televisa SA - ADR (b) | | | 5,021,300 | |
| | | | Netherlands - 1.67% | | | | |
| | 91,400 | | ABN AMRO Holding NV | | | 3,938,259 | |
| | 76,000 | | Endemol NV (a) | | | 2,383,798 | |
| | 426,000 | | Royal KPN NV | | | 6,637,771 | |
| | | | | | | 12,959,828 | |
| | | | New Zealand - 1.07% | | | | |
| | 1,058,000 | | Fletcher Building Limited | | | 8,302,320 | |
| | | | Norway - 3.41% | | | | |
| | 473,100 | | Prosafe Asa (a) | | | 7,122,662 | |
| | 300,500 | | Statoil ASA | | | 8,113,704 | |
| | 712,600 | | Storebrand ASA | | | 11,348,500 | |
| | | | | | | 26,584,866 | |
| | | | Philippines - 0.54% | | | | |
| | 364,000 | | Ayala Corp. (a) | | | 4,211,769 | |
| | | | South Africa - 0.59% | | | | |
| | 944,000 | | Truworths International . | | | 4,589,277 | |
| | | | | | |
| | | South Korea - 1.40% | | | |
| | 79,800 | | Kookmin Bank - ADR (a)(b) | | $ | 7,193,970 | |
| | 10,580 | | Lotte Shopping Co. (a) | | | 3,715,425 | |
| | | | | | | 10,909,395 | |
| | | | Sweden - 5.04% | | | | |
| | 137,000 | | AB SKF (a) | | | 2,856,729 | |
| | 169,400 | | ForeningsSparbank AB | | | 5,937,684 | |
| | 443,500 | | Sandvik AB - ADR | | | 7,838,242 | |
| | 44,000 | | Sandvik AB (a) | | | 783,610 | |
| | 486,900 | | SKF AB - ADR (b) | | | 10,079,999 | |
| | 3,184,000 | | Telefonaktiebolaget LM Ericsson | | | 11,803,987 | |
| | | | | | | 39,300,251 | |
| | | | Switzerland - 8.43% | | | | |
| | 140,600 | | Credit Suisse Group | | | 10,121,610 | |
| | 43,425 | | Julius Baer Holding Ltd. (a) | | | 5,951,435 | |
| | 37,450 | | Nestle SA | | | 14,593,465 | |
| | 19,200 | | Nobel Biocare Holding AG | | | 7,003,284 | |
| | 9,000 | | Novartis AG | | | 502,795 | |
| | 75,900 | | Novartis AG - ADR | | | 4,146,417 | |
| | 37,300 | | Roche Holding AG | | | 6,625,833 | |
| | 59,600 | | Roche Holding Ltd. - ADR | | | 5,248,197 | |
| | 9,600 | | SGS SA | | | 11,492,183 | |
| | | | | | | 65,685,219 | |
| | | Taiwan - 0.48% | | | |
| | 1,174,896 | | United Microelectronics | | | |
| | | | Corp. - ADR (b) | | | 3,736,169 | |
| | | | United Kingdom - 11.99% | | | | |
| | 412,923 | | 3i Group PLC (a) | | | 9,256,160 | |
| | 571,400 | | Alliance Boots Group PLC (a) | | | 11,551,358 | |
| | 203,200 | | HSBC Holdings PLC | | | 3,558,282 | |
| | 651,600 | | Michael Page International | | | 6,876,018 | |
| | 701,800 | | Renovo Group PLC (a) | | | 2,410,182 | |
| | 156,000 | | Royal Bank of Scotland Group PLC | | | 6,107,152 | |
| | 4,425,000 | | Sage Group PLC | | | 22,523,500 | |
| | 257,300 | | Standard Chartered PLC | | | 7,432,906 | |
| | 1,086,200 | | Tesco PLC | | | 9,506,014 | |
| | 200,000 | | Tesco PLC - ADR | | | 5,228,000 | |
| | 62,900 | | Unilever PLC (a) | | | 1,899,582 | |
| | 2,670,000 | | Vodafone Group PLC (a) | | | 7,139,199 | |
| | | | | | | 93,488,353 | |
| | | | Total Common Stocks | | | | |
| | | | (Cost $617,904,450) | | | 746,745,541 | |
See notes to financial statements.
AssetMark International Equity Fund
SCHEDULE OF INVESTMENTS (Continued)
March 31, 2007
Number of | | | | Market | |
Shares | | | | Value | |
| | | PREFERRED STOCKS - 1.54% | | | |
| | | Germany - 1.54% | | | |
| | 151,350 | | Fresenius AG | | | 12,010,943 | |
| | | | Total Preferred Stocks | | | | |
| | | | (Cost $8,463,459) | | | 12,010,943 | |
| | | | SHORT TERM INVESTMENTS - 3.05% | |
| | | | Money Market Funds - 3.05% | | | | |
| | 23,752,439 | | Federated Prime Obligations Fund | | | | |
| | | | 5.18%, 01/01/2050 | | | 23,752,439 | |
| | | | Total Short Term Investments | | | | |
| | | | (Cost $23,752,439) | | | 23,752,439 | |
Principal | | | | | | |
Amount | | | | | | |
| | | | INVESTMENTS PURCHASED | | | | |
| | | | AS SECURITIES LENDING | | | | |
| | | | COLLATERAL - 8.72% | | | | |
| | | | COMMERCIAL PAPER - 3.69% | | | | |
| $ | 3,140,466 | | Antalis Funding, | | | | |
| | | | 5.37%, 04/10/07 (c) | | | 3,135,323 | |
| | 235,535 | | Chesham Finance LLC, | | | | |
| | | | 5.46%, 04/02/07 (c) | | | 235,428 | |
| | 2,747,908 | | Concord Minutemen Capital Co., | | | | |
| | | | 5.30%, 04/04/07 (c)(d) | | | 2,747,908 | |
| | 706,605 | | Duke Funding, | | | | |
| | | | 5.32%, 04/20/07 (c) | | | 703,484 | |
| | 2,590,885 | | Duke Funding, | | | |
| | | | 5.32%, 04/13/07 (c) | | | 2,579,453 | |
| | 2,747,908 | | Fenway Funding LLC, | | | | |
| | | | 5.48%, 04/02/07 (c) | | | 2,746,653 | |
| | 3,140,466 | | KKR Atlantic Funding Trust, | | | | |
| | | | 5.33%, 04/23/07 (c) | | | 3,126,107 | |
| | 2,355,350 | | Laguna Corp., | | | | |
| | | | 5.34%, 05/31/07 (c) | | | 2,323,628 | |
| | 2,826,420 | | Mortgage Interest Networking Trust, | | | | |
| | | | 5.52%, 04/02/07 (c) | | | 2,825,120 | |
| | 1,334,698 | | Ocala Funding, | | | | |
| | | | 5.33%, 04/20/07 (c) | | | 1,328,595 | |
| | 1,413,210 | | Rams Funding LLC, | | | | |
| | | | 5.33%, 04/24/07 (c) | | | 1,407,165 | |
| | 2,355,350 | | Thornburg Mortgage Capital LLC, | | | | |
| | | | 5.33%, 04/13/07 (c) | | | 2,344,947 | |
| | 2,355,350 | | Valcour Bay Capital LLC, | | | | |
| | | | 5.36%, 04/02/07 (c) | | | 2,324,546 | |
Principal | | | | Market | |
Amount | | | | Value | |
| | | COMMERCIAL PAPER (Continued) | | | |
| $ | 942,140 | | Valcour Bay Capital LLC, | | | |
| | | | 5.34%, 04/02/07 (c) | | $ | 938,381 | |
| | | | Total Commercial Paper | | | | |
| | | | (Cost $28,766,738) | | | 28,766,738 | |
| | | | CORPORATE BONDS AND NOTES - 0.22% | |
| | 785,117 | | Bayerische Landesbank, | | | | |
| | | | 5.37%, 12/24/15 | | | 785,117 | |
| | 942,140 | | Metlife Global, 5.42%, 04/28/08 | | | 942,140 | |
| | | | Total Corporate Bonds and Notes | | | | |
| | | | (Cost $1,727,257) | | | 1,727,257 | |
| | | | CORPORATE PAYDOWN | | | | |
| | | | SECURITIES - 0.37% | | | | |
| | 785,117 | | Duke Funding, 5.43%, 04/08/07 (c) | | | 785,117 | |
| | 2,105,884 | | Leafs LLC, 5.32%, 04/20/07 (c) | | | 2,105,884 | |
| | | | Total Corporate Paydown Securities | | | | |
| | | | (Cost $2,891,001) | | | 2,891,001 | |
Number of | | | | | |
Shares | | | | | |
| | | MUTUAL FUNDS - 0.06% | | | |
| | 423,862 | | AIM STIT-Liquid Assets Portfolio | | | 423,862 | |
| | | | Total Mutual Funds | | | | |
| | | | (Cost $423,862) | | | 423,862 | |
Principal | | | | | | |
Amount | | | | | | |
| | | | REPURCHASE AGREEMENTS - 4.38% | |
| $ | 1,570,233 | | Bear Stearns Repurchase | | |
| | | | Agreement, 5.56%, 04/02/07 | | |
| | | | (Collateralized by non-U.S. | | |
| | | | Government debt securities, | | |
| | | | value $1,641,463, 5.82% to 6.37%, | | |
| | | | 01/01/12 to 03/01/17) | | | 1,570,233 | |
| | 3,925,583 | | Cantor Fitzgerald Repurchase | | |
| | | | Agreement, 5.38%, 04/02/07 | | |
| | | | (Collateralized by U.S. | | |
| | | | Government Agency Issues, | | �� |
| | | | value $4,143,832, 4.00% to 7.50%, | | |
| | | | 06/01/18 to 03/01/37) | | | 3,925,583 | |
| | 3,925,583 | | Cantor Fitzgerald Repurchase | | |
| | | | Agreement, 5.38%, 04/02/07 | | |
| | | | (Collateralized by U.S. | | |
| | | | Government Agency Issues, | | |
| | | | value $3,986,094, 4.50% to 9.00%, | | |
| | | | 01/01/08 to 03/01/37) | | | 3,925,583 | |
See notes to financial statements.
AssetMark International Equity Fund
SCHEDULE OF INVESTMENTS (Continued)
March 31, 2007
Principal | | | | Market | |
Amount | | | | Value | |
| | | REPURCHASE AGREEMENTS (Continued) | |
| $ | 7,851,166 | | CS First Boston Repurchase | | | |
| | | | Agreement, 5.38%, 04/02/07 | | | |
| | | | (Collateralized by non-U.S. | | | |
| | | | Government debt securities, | | | |
| | | | value $7,965,074, 0.00% to | | | |
| | | | 9.16%, 10/15/22 to 02/25/37) | | $ | 7,851,166 | |
| | 785,116 | | CS First Boston Repurchase | | | | |
| | | | Agreement, 5.38%, 04/02/07 | | | | |
| | | | (Collateralized by non-U.S. | | | | |
| | | | Government debt securities, | | | | |
| | | | value $824,305, 6.25%, 02/25/37) | | | 785,116 | |
| | 785,116 | | CS First Boston Repurchase | | | | |
| | | | Agreement, 5.38%, 04/02/07 | | | | |
| | | | (Collateralized by non-U.S. | | | | |
| | | | Government debt securities, | | | | |
| | | | value $820,379, 6.25%, 02/25/37) | | | 785,116 | |
| | 785,116 | | CS First Boston Repurchase | | | | |
| | | | Agreement, 5.38%, 04/02/07 | | | | |
| | | | (Collateralized by U.S. | | | | |
| | | | Government Agency Issues, | | | | |
| | | | value $799,325, 0.00%, 04/25/37) | | | 785,116 | |
| | 392,558 | | Merrill Lynch Repurchase | | | | |
| | | | Agreement, 5.37%, 04/02/07 | | | | |
| | | | (Collateralized by U.S. | | | | |
| | | | Government Agency Issues, | | | | |
| | | | value $398,796, 5.50%, 03/01/37) | | | 392,558 | |
| | 14,132,099 | | Morgan Stanley Repurchase | | | |
| | | | Agreement, 5.51%, 04/02/07 | | | |
| | | | (Collateralized by non-U.S. | | | |
| | | | Government debt securities, | | | |
| | | | value $15,196,995, 0.00% to 6.99%, | | | |
| | | | 11/20/08 to 09/20/43) | | | 14,132,099 | |
| | | | Total Repurchase Agreements | | | | |
| | | | (Cost $34,152,570) | | | 34,152,570 | |
| | | | Total Investments Purchased as | | | | |
| | | | Securities Lending Collateral | | | | |
| | | | (Cost $67,961,428) | | | 67,961,428 | |
| | | | |
| | | Market | |
| | | Value | |
Total Investments | | | |
(Cost $718,081,776) – 109.12% | | $ | 850,470,351 | |
Liabilities in Excess of | | | | |
Other Assets – (9.12)% | | | (71,048,027 | ) |
TOTAL NET | | | | |
ASSETS – 100.00% | | $ | 779,422,324 | |
| | |
| Percentages are stated as a percent of net assets. |
| ADR - | American Depository Receipt |
| (a) | Non Income Producing. |
| (b) | All or a portion of this security is on loan. |
| (c) | Restricted securities as defined in Rule 144(a) under the |
| | Securities Act of 1933. Such securities are treated as liquid |
| | securities according to the Fund’s liquidity guidelines. The |
| | market value of these securities total $35,390,221, which |
| | represents 4.5% of total net assets. |
| (d) | Variable Rate Security. The rate shown is the rate in effect on |
| | March 31, 2007. |
See notes to financial statements.
AssetMark Real Estate Securities Fund
PERFORMANCE DATA
This chart assumes an initial gross investment of $10,000 made on June 29, 2001 (commencement of operations). Returns shown include the reinvestment of all dividends. Returns shown do not reflect the deduction of taxes that a shareholder would pay on fund distributions or the redemption of fund shares. In the absence of fee waivers and reimbursements, total return would be reduced. Past performance is not predictive of future performance. Investment return and principal value will fluctuate, so that your shares, when redeemed, may be worth more or less than the original cost.
DOW JONES WILSHIRE REIT INDEX - The Dow Jones Wilshire REIT Index measures U.S. publicly traded Real Estate Investment Trusts. The Index is comprised of companies whose charters are the equity ownership and operation of commercial real estate and that derive a minimum of 75% of revenue from stated operations. The Index is composed of 93 common stocks, selected for their market capitalization, source of revenue, and liquidity. The Index is unmanaged and cannot be invested in directly. The Index does not reflect any deduction for fees, expenses or taxes.
LIPPER REAL ESTATE FUNDS INDEX - An unmanaged index which measures the composite performance of the 30 largest “real estate” mutual funds, as categorized by Lipper Inc. The index is adjusted for the reinvestment of capital gains and income dividends.
AVERAGE ANNUAL TOTAL RETURN (for the periods ended March 31) | | |
| | One Year | Five Year | Since Inception (6/29/01) |
| AssetMark Real Estate Securities Fund | 21.96% | 22.24% | 20.92% |
| Dow Jones Wilshire REIT Index | 21.85% | 22.76% | 21.68% |
| Lipper Real Estate Funds Index | 20.34% | 21.47% | 20.36% |
AssetMark Real Estate Securities Fund
SCHEDULE OF INVESTMENTS
March 31, 2007
Number of | | | | Market | |
Shares | | | | Value | |
| | | COMMON STOCKS - 12.47% | | | |
| | | Apartments - 0.57% | | | |
| | 6,600 | | Home Properties, Inc. (a) | | $ | 348,546 | |
| | 7,100 | | Post Properties, Inc.(a) | | | 324,683 | |
| | | | | | | 673,229 | |
| | | | Diversified - 2.31% | | | | |
| | 4,400 | | Alexander’s, Inc. (a) | | | 1,811,480 | |
| | 9,500 | | Digital Realty Trust,Inc. | | | 379,050 | |
| | 7,900 | | Forest City Enterprises,Inc. (a) | | | 522,822 | |
| | | | | | | 2,713,352 | |
| | | | Health Care - 1.39% | | | | |
| | 11,400 | | Health Care Property | | | | |
| | | | Investors, Inc. (a) | | | 410,742 | |
| | 39,100 | | Nationwide Health | | | | |
| | | | | | | 1,222,266 | |
| | | | | | | 1,633,008 | |
| | | Hotels & Motels - 2.32% | | | |
| | 24,000 | | Ashford Hospitality Trust,Inc. | | | 286,560 | |
| | 38,000 | | Hilton Hotels Corp. (a) | | | 1,366,480 | |
| | 16,500 | | Starwood Hotels & Resorts | | | | |
| | | | Worldwide, Inc. | | | 1,070,025 | |
| | | | | | | 2,723,065 | |
| | | | Office Property - 4.10% | | | | |
| | 71,600 | | Brookfield Properties Co. (a) | | | 2,885,480 | |
| | 75,600 | | Douglas Emmett, Inc. | | | 1,930,068 | |
| | | | | | | 4,815,548 | |
| | | | Shopping Centers - 0.29% | | | | |
| | 20,900 | | Cedar Shopping Centers, Inc. (a) | | | 338,580 | |
| | | | Storage - 0.74% | | | | |
| | 45,900 | | Extra Space Storage, Inc. | | | 869,346 | |
| | | | Warehouse/Industrial - 0.75% | | | | |
| | 74,500 | | DCT Industrial Trust, Inc. | | | 881,335 | |
| | | | Total Common Stocks | | | | |
| | | | (Cost $12,408,433) | | | 14,647,463 | |
| | | REAL ESTATE INVESTMENT TRUSTS, | |
| | | COMMON STOCKS - 83.27% | | | |
| | | Apartments - 19.75% | | | |
| | 13,200 | | Apartment Investment & | | | |
| | | | Management Co. (a) | | | 761,508 | |
| | 73,007 | | Archstone-Smith Trust (a) | | | 3,962,820 | |
| | 39,680 | | AvalonBay Communities, Inc. (a) | | | 5,158,400 | |
| | 26,687 | | BRE Properties, Inc. (a) | | | 1,685,284 | |
| | 35,604 | | Camden Property Trust | | | 2,503,317 | |
Number of | | | | Market | |
Shares | | | | Value | |
| | | Apartments (Continued) | | | |
| | 134,622 | | Equity Residential (a) | | $ | 6,492,819 | |
| | 10,894 | | Essex Property Trust, Inc. (a) | | | 1,410,555 | |
| | 39,890 | | UDR, Inc. (a) | | | 1,221,432 | |
| | | | | | | 23,196,135 | |
| | | | Diversified - 9.06% | | | | |
| | 2,713 | | Colonial Properties Trust (a) | | | 123,903 | |
| | 3,558 | | Duke Realty Corp. (a) | | | 154,666 | |
| | 15,400 | | iStar Financial, Inc. (a) | | | 721,182 | |
| | 44,685 | | Liberty Property Trust (a) | | | 2,177,053 | |
| | 10,400 | | PS Business Parks, Inc. | | | 733,408 | |
| | 23,500 | | Spirit Finance Corp. | | | 350,150 | |
| | 53,434 | | Vornado Realty Trust (a) | | | 6,376,814 | |
| | | | | | | 10,637,176 | |
| | | | Health Care - 0.19% | | | | |
| | 6,000 | | Healthcare Realty Trust, Inc. | | | 223,800 | |
| | | | Hotels & Motels - 2.42% | | | | |
| | 5,500 | | Hospitality Properties Trust (a) | | | 257,400 | |
| | 98,200 | | Host Marriott Corp. (a) | | | 2,583,642 | |
| | | | | | | 2,841,042 | |
| | | Office Property - 15.57% | | | |
| | 7,666 | | Alexandria Real Estate | | | |
| | | | Equities, Inc. (a) | | | 769,437 | |
| | 28,600 | | BioMed Realty Trust, Inc. | | | 752,180 | |
| | 56,778 | | Boston Properties, Inc. (a) | | | 6,665,737 | |
| | 38,000 | | Brandywine Realty Trust (a) | | | 1,269,580 | |
| | 35,500 | | Corporate Office Properties Trust (a) | | | 1,621,640 | |
| | 29,800 | | Highwoods Properties, Inc. | | | 1,176,802 | |
| | 65,100 | | HRPT Properties Trust (a) | | | 800,730 | |
| | 29,727 | | Kilroy Realty Corp. | | | 2,192,366 | |
| | 4,356 | | Mack-Cali Realty Corp. (a) | | | 207,476 | |
| | 28,300 | | Maguire Properties, Inc. (a) | | | 1,006,348 | |
| | 13,351 | | SL Green Realty Corp. (a) | | | 1,831,490 | |
| | | | | | | 18,293,786 | |
| | | | Regional Malls - 19.05% | | | | |
| | 3,900 | | CBL & Associates | | | | |
| | | | Properties, Inc. (a) | | | 174,876 | |
| | 88,708 | | General Growth Properties, Inc. (a) | | | 5,727,875 | |
| | 43,324 | | The Macerich Co. (a) | | | 4,001,405 | |
| | 86,675 | | Simon Property Group, Inc. (a) | | | 9,642,594 | |
| | 48,800 | | Taubman Centers, Inc. | | | 2,829,912 | |
| | | | | | | 22,376,662 | |
See notes to financial statements.
AssetMark Real Estate Securities Fund
SCHEDULE OF INVESTMENTS (Continued)
March 31, 2007
Number of | | | | Market | |
Shares | | | | Value | |
| | | Real Estate Investment Trusts, | | | |
| | | Common Stocks (Continued) | | | |
| | | Shopping Centers - 9.17% | | | |
| | 29,975 | | Acadia Realty Trust (a) | | $ | 781,448 | |
| | 35,300 | | Developers Diversified Realty Corp. | | | 2,220,370 | |
| | 34,664 | | Federal Realty Investment Trust (a) | | | 3,141,252 | |
| | 28,242 | | Kimco Realty Corp. (a) | | | 1,376,515 | |
| | 12,100 | | Kite Realty Group Trust | | | 241,395 | |
| | 33,309 | | Regency Centers Corp. (a) | | | 2,782,967 | |
| | 4,805 | | Weingarten Realty Investors (a) | | | 228,526 | |
| | | | | | | 10,772,473 | |
| | | | Storage - 2.35% | | | | |
| | 29,200 | | Public Storage, Inc. (a) | | | 2,764,364 | |
| | | | Warehouse/Industrial - 5.71% | | | | |
| | 37,194 | | AMB Property Corp. | | | 2,186,635 | |
| | 18,100 | | First Potomac Realty Trust (a) | | | 517,117 | |
| | 61,691 | | Prologis (a) | | | 4,005,597 | |
| | | | | | | 6,709,349 | |
| | | Total Real Estate Investment Trusts, | | | |
| | | Common Stocks | | | |
| | | (Cost $59,467,938) | | | 97,814,787 | |
| | | REAL ESTATE INVESTMENT TRUSTS, | | | | |
| | | PREFERRED STOCKS - 1.63% | | | | |
| | | Diversified - 0.90% | | | | |
| | 42,500 | | Vornado Realty Trust (a) | | | 1,062,075 | |
| | | | Office Property - 0.73% | | | | |
| | 6,950 | | Alexandria Real Estate Equities, Inc. | | | 188,415 | |
| | 25,600 | | SL Green Realty Corp. | | | 662,784 | |
| | | | | | | 851,199 | |
| | | | Total Real Estate Investment Trusts, | | | | |
| | | | Preferred Stocks | | | | |
| | | | (Cost $1,836,421) | | | 1,913,274 | |
| | | | SHORT TERM INVESTMENTS - 2.49% | | | | |
| | | | Money Market Funds - 2.49% | | | | |
| | 2,918,441 | | Federated Prime Obligations Fund | | | | |
| | | | 5.18%, 01/01/2050 (c) | | | 2,918,441 | |
| | | | Total Short Term Investments | | | | |
| | | | (Cost $2,918,441) | | | 2,918,441 | |
Principal | | | | Market | |
Amount | | | | Value | |
| | | INVESTMENTS PURCHASED | | | |
| | | AS SECURITIES LENDING | | | |
| | | COLLATERAL - 39.09% | | | |
| | | COMMERCIAL PAPER - 16.55% | | | |
| $ | 2,122,092 | | Antalis Funding, | | | |
| | | | 5.37%, 04/10/07 (b) | | $ | 2,118,616 | |
| | 159,157 | | Chesham Finance LLC, | | | | |
| | | | 5.46%, 04/02/07 (b) | | | 159,084 | |
| | 1,856,830 | | Concord Minutemen Capital Co., | | | | |
| | | | 5.30%, 04/04/07 (b) (c) | | | 1,856,830 | |
| | 477,471 | | Duke Funding, | | | | |
| | | | 5.32%, 04/20/07 (b) | | | 475,362 | |
| | 1,750,726 | | Duke Funding, | | | | |
| | | | 5.32%, 04/13/07 (b) | | | 1,743,001 | |
| | 1,856,830 | | Fenway Funding LLC, | | | | |
| | | | 5.48%, 04/02/07 (b) | | | 1,855,983 | |
| | 2,122,092 | | KKR Atlantic Funding Trust, | | | | |
| | | | 5.33%, 04/23/07 (b) | | | 2,112,388 | |
| | 1,591,569 | | Laguna Corp., | | | | |
| | | | 5.34%, 05/31/07 (b) | | | 1,570,134 | |
| | 1,909,882 | | Mortgage Interest Networking Trust, | | | | |
| | | | 5.52%, 04/02/07 (b) | | | 1,909,004 | |
| | 901,889 | | Ocala Funding, | | | | |
| | | | 5.33%, 04/20/07 (b) | | | 897,765 | |
| | 954,941 | | Rams Funding LLC, | | | |
| | | | 5.33%, 04/24/07 (b) | | | 950,856 | |
| | 1,591,569 | | Thornburg Mortgage Capital LLC, | | | | |
| | | | 5.33%, 04/13/07 (b) | | | 1,584,540 | |
| | 1,591,569 | | Valcour Bay Capital LLC, | | | | |
| | | | 5.36%, 04/02/07 (b) | | | 1,570,754 | |
| | 636,627 | | Valcour Bay Capital LLC, | | | | |
| | | | 5.34%, 04/02/07 (b) | | | 634,087 | |
| | | | Total Commercial Paper | | | | |
| | | | (Cost $19,438,404) | | | 19,438,404 | |
| | | | CORPORATE BONDS AND NOTES - 0.99% | |
| | 530,523 | | Bayerische Landesbank, | | | | |
| | | | 5.37%, 12/24/15 | | | 530,523 | |
| | 636,627 | | Metlife Global, 5.42%, 04/28/08 | | | 636,627 | |
| | | | Total Corporate Bonds and Notes | | | | |
| | | | (Cost $1,167,150) | | | 1,167,150 | |
| | | | CORPORATE PAYDOWN | | | | |
| | | | SECURITIES - 1.66% | | | | |
| | 530,523 | | Duke Funding, 5.43%, 04/08/07 (b) | | | 530,523 | |
| | 1,422,999 | | Leafs LLC, 5.32%, 04/20/07 (b) | | | 1,422,999 | |
| | | | Total Corporate Paydown Securities | | | | |
| | | | (Cost $1,953,522) | | | 1,953,522 | |
See notes to financial statements.
AssetMark Real Estate Securities Fund
SCHEDULE OF INVESTMENTS (Continued)
March 31, 2007
Number of | | | | Market | |
Shares | | | | Value | |
| | | MUTUAL FUNDS - 0.24% | | | |
| | 286,414 | | AIM STIT-Liquid Assets Portfolio | | $ | 286,414 | |
| | | | Total Mutual Funds | | | | |
| | | | (Cost $286,414) | | | 286,414 | |
Principal | | | | | | |
Amount | | | | | | |
| | | REPURCHASE AGREEMENTS - 19.65% |
| $ | 1,061,046 | | Bear Stearns Repurchase | | |
| | | | Agreement, 5.56%, 04/02/07 | | |
| | | | (Collateralized by non-U.S. | | |
| | | | Government debt securities, | | |
| | | | value $1,109,177, 5.82% to 6.37%, | | |
| | | | 01/01/12 to 03/01/17) | | | 1,061,046 | |
| | 2,652,614 | | Cantor Fitzgerald Repurchase | | |
| | | | Agreement, 5.38%, 04/02/07 | | |
| | | | (Collateralized by U.S. | | |
| | | | Government Agency Issues, | | |
| | | | value $2,800,091, 4.00% to 7.50%, | | |
| | | | 06/01/08 to 03/01/37) | | | 2,652,614 | |
| | 2,652,614 | | Cantor Fitzgerald Repurchase | | |
| | | | Agreement, 5.38%, 04/02/07 | | |
| | | | (Collateralized by U.S. | | |
| | | | Government Agency Issues, | | |
| | | | value $2,693,503, 4.50% to 9.00%, | | |
| | | | 01/01/08 to 03/01/37) | | | 2,652,614 | |
| | 5,305,229 | | CS First Boston Repurchase | | |
| | | | Agreement, 5.38%, 04/02/07 | | |
| | | | (Collateralized by non-U.S. | | |
| | | | Government debt securities, | | |
| | | | value $5,382,200, 0.00% to 9.16%, | | |
| | | | 10/15/22 to 02/25/37) | | | 5,305,229 | |
| | 530,523 | | CS First Boston Repurchase | | |
| | | | Agreement, 5.38%, 04/02/07 | | |
| | | | (Collateralized by non-U.S. | | |
| | | | Government debt securities, | | |
| | | | value $557,003,6.25%, 02/25/37) | | | 530,523 | |
| | 530,523 | | CS First Boston Repurchase | | |
| | | | Agreement, 5.38%, 04/02/07 | | |
| | | | (Collateralized by non-U.S. | | |
| | | | Government debt securities, | | |
| | | | value $554,351, 6.25%, 02/25/37) | | | 530,523 | |
Principal | | | | Market | |
Amount | | | | Value | |
| | | REPURCHASE AGREEMENTS (Continued) | |
| $ | 530,523 | | CS First Boston Repurchase | | | |
| | | | Agreement, 5.38%, 04/02/07 | | | |
| | | | (Collateralized by U.S. | | | |
| | | | Government Agency Issues, | | | |
| | | | value $540,124, 0.00%, 04/25/37) | | $ | 530,523 | |
| | 265,261 | | Merrill Lynch Repurchase | | | | |
| | | | Agreement, 5.37%, 04/02/07 | | | | |
| | | | (Collateralized by U.S. | | | | |
| | | | Government Agency Issues, | | | | |
| | | | value $269,476, 5.50%, 03/01/37) | | | 265,261 | |
| | 9,549,412 | | Morgan Stanley Repurchase | | | |
| | | | Agreement, 5.51%, 04/02/07 | | | |
| | | | (Collateralized by non-U.S. | | | |
| | | | Government debt securities, | | | |
| | | | value $10,268,989, 0.00% to 6.99%, | | | |
| | | | 11/20/28 to 09/20/43) | | | 9,549,412 | |
| | | | Total Repurchase Agreements | | | | |
| | | | (Cost $23,077,745) | | | 23,077,745 | |
| | | | Total Investments Purchased as | | | | |
| | | | Securities Lending Collateral | | | | |
| | | | (Cost $45,923,235) | | | 45,923,235 | |
| | | | Total Investments | | | | |
| | | | (Cost $122,554,468) - 138.95% | | | 163,217,200 | |
| | | | Liabilities in Excess of | | | | |
| | | | Other Assets - (38.95)% | | | (45,755,079 | ) |
| | | | TOTAL NET | | | | |
| | | | ASSETS - 100.00% | | $ | 117,462,121 | |
| | | | | | | | |
Percentages re stated as a percent of net assets. | |
| (a) | All or a portion of this security is on loan. |
| (b) | Restricted securities as defined in Rule 144(a) under the Securities Act of 1933. Such securities are treated as liquid securities according to the Fund’s liquidity guidelines. The market value of these securities total $21,391,926, which represents 18.21% of total net assets. |
| (c) | Variable Rate Security. The rate shown is the rate in effect on March 31, 2007. |
See notes to financial statements.
AssetMark Tax-Exempt Fixed Income Fund
PERFORMANCE DATA
This chart assumes an initial gross investment of $10,000 made on June 29, 2001 (commencement of operations). Returns shown include the reinvestment of all dividends. Returns shown do not reflect the deduction of taxes that a shareholder would pay on fund distributions or the redemption of fund shares. In the absence of fee waivers and reimbursements, total return would be reduced. Past performance is not predictive of future performance. Investment return and principal value will fluctuate, so that your shares, when redeemed, may be worth more or less than the original cost.
LEHMAN BROTHERS MUNICIPAL BOND INDEX - An unmanaged index which measures the performance of investment-grade, tax-exempt and fixed-rate bonds with long-term maturities (greater than two years) selected from issues larger than $50 million. The Index does not reflect any deduction for fees, expenses or taxes.
LEHMAN BROTHERS MUNICIPAL 3-10 YEAR BLENDED INDEX - The Lehman Brothers Municipal 3-10 Year Blended Index is a broad based index which contains all securities in the Lehman Brothers Municipal Bond Index with maturities from 3-10 years. The Index does not reflect any deduction for fees, expenses or taxes. Going forward the data for this Index is no longer going to be available. Therefore, the Fund intends to discontinue using the Lehman Brothers Municipal 3-10 Year Blended Index in future years.
LIPPER INTERMEDIATE MUNICIPAL BOND FUNDS INDEX - The Lipper Intermediate Municipal Bond Fund Index is an index of portfolios that invest in municipal debt issues with dollar-weighted average maturities of five to ten years. As of October 2005, the Lipper Intermediate Municipal Bond Fund Index has been added as an additional measure of market performance for the Tax-Exempt Fixed Income Fund.
AVERAGE ANNUAL TOTAL RETURN (for the periods ended March 31,) | | |
| | One Year | Five Year | Since Inception (6/29/01) |
| AssetMark Tax-Exempt Fixed Income Fund | 3.92% | 3.69% | 3.56% |
| Lehman Brothers Municipal Bond Index | 5.43% | 5.50% | 5.33% |
| Lehman Brothers Municipal 3-10 Year Blended Index | 4.80% | 2.68% | 4.45% |
| Lipper Intermediate Municipal Bond Funds Index | 4.55% | 4.27% | 4.14% |
AssetMark Tax-Exempt Fixed Income Fund
SCHEDULE OF INVESTMENTS
March 31, 2007
Principal | | | | Market | |
Amount | | | | Value | |
| | | MUNICIPAL BONDS - 95.34% | | | |
| | | Alabama - 1.12% | | | |
| $ | 500,000 | | Alabama 21st Century Authority, | | | |
| | | | Revenue Bond, | | | |
| | | | 5.000%, 12/01/2007 | | $ | 503,775 | |
| | 1,200,000 | | Jefferson County Sewer, Refunded, | | | | |
| | | | Revenue Bond, | | | | |
| | | | 5.000%, 02/01/2033 | | | 1,239,960 | |
| | 1,000,000 | | Montgomery Medical Clinic Board, | | | | |
| | | | Revenue Bond, | | | | |
| | | | 5.250%, 03/01/2036 | | | 1,040,350 | |
| | | | | | | 2,784,085 | |
| | | Arizona - 4.35% | | | |
| | 2,710,000 | | Arizona School Facilities Board, | | | |
| | | | Refunding, Revenue Bond, | | | |
| | | | 5.000%, 07/01/2013 | | | 2,909,293 | |
| | 320,000 | | Marana Tangerine Farms, | | | | |
| | | | Special Assessment, | | | | |
| | | | 4.600%, 01/01/2026 | | | 316,019 | |
| | 135,000 | | Maricopa County Elementary | | | | |
| | | | School District, Refunding, GO, | | | | |
| | | | FSA Insured, 5.000%, 07/01/2012 | | | 143,616 | |
| | 985,000 | | Maricopa County Individual | | | | |
| | | | Development Authority Senior | | | | |
| | | | Living Facilities, Refunding, | | | | |
| | | | Revenue Bond, | | | | |
| | | | 3.650%, 09/15/2035 | | | 981,257 | |
| | 3,000,000 | | Mesa Industrial Development | | | | |
| | | | Authority, Revenue Bond, | | | | |
| | | | 5.750%, 01/01/2025 | | | 3,190,740 | |
| | 300,000 | | Navajo County Unified School | | | | |
| | | | District No 32 Blue Ridge, | | | | |
| | | | Refunding, GO, FSA Insured, | | | | |
| | | | 5.000%, 07/01/2014 | | | 324,165 | |
| | | | Pinal County Individual Development | | | | |
| | | | Authority Correctional Facilities, | | | | |
| | | | Revenue Bond, ACA Insured, | | | | |
| | 750,000 | | 5.250%, 10/01/2014 | | | 800,663 | |
| | 1,000,000 | | 5.250%, 10/01/2015 | | | 1,071,390 | |
| | 1,000,000 | | Pinal County, CP, | | | | |
| | | | 5.000%, 12/01/2029 | | | 1,033,340 | |
| | | | | | | 10,770,483 | |
| | | | | | |
Principal | | | | Market | |
Amount | | | | Value | |
| | | California - 7.04% | | | |
| $ | 500,000 | | California Department of Veteran | | | |
| | | | Affairs, Series A, Revenue Bond, | | | |
| | | | 4.600%, 12/01/2028 | | $ | 503,190 | |
| | 875,000 | | California Municipal Finance | | | | |
| | | | Authority, Revenue Bond, | | | | |
| | | | 5.000%, 06/01/2036 | | | 909,492 | |
| | 500,000 | | California Statewide Communities | | | | |
| | | | Development Authority, Refunding, | | | | |
| | | | Revenue Bond, | | | | |
| | | | 4.900%, 05/15/2025 | | | 505,540 | |
| | 450,000 | | California Statewide Communities | | | | |
| | | | Development Authority, Series A, | | | | |
| | | | Revenue Bond, | | | | |
| | | | 4.750%, 04/01/2033 | | | 448,664 | |
| | 5,100,000 | | California Statewide Communities | | | | |
| | | | Development Authority, Series C, | | | | |
| | | | Revenue Bond, | | | | |
| | | | 3.850%, 11/01/2029 | | | 5,092,707 | |
| | | California, GO, | | | |
| | 400,000 | | 5.000%, 08/01/2014 | | | 430,156 | |
| | 1,500,000 | | 5.000%, 02/01/2020 | | | 1,563,135 | |
| | 1,000,000 | | 5.000%, 06/01/2031 | | | 1,046,980 | |
| | 1,000,000 | | 5.000%, 06/01/2034 | | | 1,044,540 | |
| | 500,000 | | Golden State Tobacco Securitization, | | | | |
| | | | Series A, Revenue Bond, | | | | |
| | | | Effective yield 5.18%, | | | | |
| | | | 06/01/2037 | | | 382,620 | |
| | 2,970,000 | | Golden West Schools Funding | | | | |
| | | | Authority, Refunding, GO, | | | | |
| | | | AMBAC Insured, | | | | |
| | | | 5.500%, 08/01/2019 | | | 3,434,478 | |
| | 350,000 | | Los Angeles County Metropolitan | | | | |
| | | | Transportation Authority, Series A, | | | | |
| | | | Refunding, Revenue Bond, | | | | |
| | | | 5.000%, 07/01/2014 | | | 377,153 | |
| | 145,000 | | Los Angeles Unified School District, | | | | |
| | | | Series A, Refunding, GO, FGIC Insured, | | | | |
| | | | 4.250%, 01/01/2028 | | | 141,091 | |
| | 500,000 | | Roseville Westpark Community | | | | |
| | | | Facilities, Special Tax, | | | | |
| | | | 5.250%, 09/01/2037 | | | 510,775 | |
See notes to financial statements.
AssetMark Tax-Exempt Fixed Income Fund
SCHEDULE OF INVESTMENTS (Continued)
March 31, 2007
Principal | | | | Market | |
Amount | | | | Value | |
| | | MUNICIPAL BONDS (Continued) | | | |
| | | California (Continued) | | | |
| $ | 1,000,000 | | Sacramento County Sanitation | | | |
| | | | District, Revenue Bond, | | | |
| | | | 5.000%, 12/01/2036 | | $ | 1,062,590 | |
| | | | | | | 17,453,111 | |
| | | | Colorado - 1.22% | | | | |
| | 1,065,000 | | Colorado Deptartment of | | | | |
| | | | Transportation, Revenue Bond, | | | | |
| | | | 5.380%, 06/15/2013 | | | 1,160,019 | |
| | | | Colorado Health Facilities Authority, | | | | |
| | | | Revenue Bond, | | | | |
| | 1,000,000 | | 5.250%, 06/01/2020 | | | 1,068,890 | |
| | 750,000 | | 5.000%, 12/01/2020 | | | 793,530 | |
| | | | | | | 3,022,439 | |
| | | Delaware - 0.62% | | | |
| | 500,000 | | Delaware Health Facilities Authority, | | | |
| | | | Revenue Bond, | | | |
| | | | 5.250%, 06/01/2012 | | | 524,095 | |
| | 1,000,000 | | New Castle County, Revenue Bond, | | | | |
| | | | 5.000%, 09/01/2036 | | | 1,018,750 | |
| | | | | | | 1,542,845 | |
| | | | District of Columbia - 0.85% | | | | |
| | 200,000 | | District of Columbia, Series B, | | | | |
| | | | Unrefunded, GO, | | | | |
| | | | 5.500%, 06/01/2009 | | | 207,602 | |
| | 100,000 | | District of Columbia, Series B-1, | | | | |
| | | | Refunding, GO, | | | | |
| | | | 5.500%, 06/01/2007 | | | 100,290 | |
| | 200,000 | | District of Columbia, Series B-2, | | | | |
| | | | Refunding, GO, | | | | |
| | | | 5.500%, 06/01/2008 | | | 204,218 | |
| | 1,500,000 | | Washington D.C. Airport Authority, | | | | |
| | | | Refunding, Revenue Bond, | | | | |
| | | | 5.000%, 10/01/2021 | | | 1,587,315 | |
| | | | | | | 2,099,425 | |
| | | | Florida - 3.32% | | | | |
| | 100,000 | | Dade County Water & Sewer System, | | | | |
| | | | Revenue Bond, | | | | |
| | | | 6.250%, 10/01/2007 | | | 101,274 | |
| | 2,375,000 | | Highlands County Health Facilities | | | | |
| | | | Authority, Revenue Bond, | | | | |
| | | | 5.000%, 11/15/2029 | | | 2,441,666 | |
| | | Florida (Continued) | | | |
| $ | 1,000,000 | | Highlands County Health Facilities | | | |
| | | | Hospital, Revenue Bond, | | | |
| | | | 5.000%, 11/15/2035 | | $ | 1,032,440 | |
| | 1,000,000 | | Lakeland Hospital System, | | | | |
| | | | Revenue Bond, | | | | |
| | | | 5.000%, 11/15/2032 | | | 1,029,960 | |
| | 1,000,000 | | Lee Memorial Health Systems, | | | | |
| | | | Series A, Revenue Bond, | | | | |
| | | | 5.000%, 04/01/2037 | | | 1,026,910 | |
| | 750,000 | | Miami Homeland Defense, GO, | | | | |
| | | | 5.500%, 01/01/2021 | | | 804,465 | |
| | 755,000 | | Palm Glades Community Development, | | | | |
| | | | Series B, Special Assessment, | | | | |
| | | | 4.850%, 08/01/2011 | | | 751,172 | |
| | 1,000,000 | | Tampa Water & Sewer, Series B, | | | | |
| | | | Revenue Bond, | | | | |
| | | | 5.000%, 07/01/2010 | | | 1,041,180 | |
| | | | | | | 8,229,067 | |
| | | Georgia - 1.78% | | | |
| | 1,000,000 | | Appling County Development | | | |
| | | | Authority Pollution Control, | | | |
| | | | Revenue Bond, | | | |
| | | | 4.400%, 07/01/2016 | | | 1,016,190 | |
| | 1,000,000 | | Coffee County Hospital Authority, | | | | |
| | | | Revenue Bond, | | | | |
| | | | 5.000%, 12/01/2019 | | | 1,030,070 | |
| | 1,000,000 | | Fulton County School District, | | | | |
| | | | Refunding, GO, | | | | |
| | | | 5.250%, 01/01/2014 | | | 1,090,430 | |
| | 500,000 | | Gainesville Educational Facilities | | | | |
| | | | Redevelopment Authority, | | | | |
| | | | Refunding, Revenue Bond, | | | | |
| | | | 5.130%, 03/01/2037 | | | 515,460 | |
| | 700,000 | | Main Street Natural Gas Inc., | | | | |
| | | | Series A, Revenue Bond, | | | | |
| | | | 5.000%, 03/15/2018 | | | 755,104 | |
| | | | | | | 4,407,254 | |
| | | | Hawaii - 0.04% | | | | |
| | 100,000 | | Honolulu City & County, Series A, | | | | |
| | | | Prerefunded, GO, | | | | |
| | | | 6.000%, 01/01/2009 | | | 104,010 | |
See notes to financial statements.
AssetMark Tax-Exempt Fixed Income Fund
SCHEDULE OF INVESTMENTS (Continued)
March 31, 2007
Principal | | | | Market | |
Amount | | | | Value | |
| | | MUNICIPAL BONDS (Continued) | | | |
| | | Illinois - 6.01% | | | |
| $ | 100,000 | | Chicago Metropolitan Water | | | |
| | | | Reclamation District Greater | | | |
| | | | Chicago, GO, | | | |
| | | | 5.500%, 12/01/2012 | | $ | 107,644 | |
| | 100,000 | | Chicago Metropolitan Water | | | | |
| | | | Reclamation District Greater | | | | |
| | | | Chicago, Refunding, GO, | | | | |
| | | | 6.050%, 12/01/2009 | | | 106,022 | |
| | 75,000 | | Chicago Park District, Revenue Bond, | | | | |
| | | | ACA Insured, | | | | |
| | | | 6.250%, 01/01/2016 | | | 79,897 | |
| | | | Chicago Wastewater Transmission, | | | | |
| | | | Refunding, Revenue Bond, | | | | |
| | | | FGIC Insured, | | | | |
| | 625,000 | | 5.500%, 01/01/2010 | | | 655,037 | |
| | 100,000 | | 5.380%, 01/01/2013 | | | 106,517 | |
| | 1,000,000 | | Cook County, Series C, GO, | | | |
| | | | AMBAC Insured, | | | |
| | | | 5.000%, 11/15/2025 | | | 1,047,230 | |
| | 300,000 | | Cook County School District, | | | | |
| | | | CP, 0.000%, 12/01/2016 | | | 300,633 | |
| | 100,000 | | Du Page & Cook Counties | | | | |
| | | | Community School District, | | | | |
| | | | GO, FGIC Insured, | | | | |
| | | | 4.380%, 01/01/2009 | | | 101,242 | |
| | 1,000,000 | | East Peorial Central College, | | | | |
| | | | Refunding, Revenue Bond, | | | | |
| | | | 5.130%, 06/01/2036 | | | 1,042,160 | |
| | 270,000 | | Illinois Finance Authority Chicago | | | | |
| | | | Schools Project, Refunding, | | | | |
| | | | Revenue Bond, | | | | |
| | | | 4.500%, 12/01/2008 | | | 271,528 | |
| | 1,200,000 | | Illinois Finance Authority Hospital | | | | |
| | | | Sisters Services, Series A, | | | | |
| | | | Revenue Bond, | | | | |
| | | | 5.000%, 03/15/2025 | | | 1,261,416 | |
| | 450,000 | | Illinois Finance Authority Resurrection | | | | |
| | | | Health Care, Revenue Bond, | | | | |
| | | | 3.750%, 05/15/2020 | | | 448,735 | |
| | 750,000 | | Illinois Finance Authority Student | | | | |
| | | | Housing, Revenue Bond, | | | | |
| | | | 5.000%, 05/01/2030 | | | 764,265 | |
| | | Illinois (Continued) | | | |
| $ | 2,000,000 | | Illinois Finance Authority, | | | |
| | | | Revenue Bond, | | | |
| | | | 5.000%, 07/01/2022 | | $ | 2,114,860 | |
| | 1,370,000 | | Illinois Finance Authority, Series A, | | | | |
| | | | Revenue Bond, | | | | |
| | | | 5.250%, 10/01/2010 | | | 1,428,006 | |
| | | | Illinois Sales Tax, Revenue Bond, | | | | |
| | 100,000 | | 5.380%, 06/15/2007 | | | 100,324 | |
| | 1,000,000 | | 5.000%, 06/15/2011 | | | 1,050,060 | |
| | 1,155,000 | | 5.500%, 06/15/2011 | | | 1,235,065 | |
| | 220,000 | | Illinois Sales Tax, Series 1, | | | | |
| | | | Revenue Bond, | | | | |
| | | | 5.500%, 06/15/2009 | | | 228,411 | |
| | | | Illinois, Series 1, GO, | | | | |
| | 775,000 | | 5.500%, 08/01/2010 | | | 818,470 | |
| | 1,000,000 | | 5.380%, 07/01/2013 | | | 1,080,080 | |
| | 500,000 | | Regional Transportation Authority, | | | | |
| | | | Series B, Revenue Bond, | | | | |
| | | | FGIC Insured, | | | | |
| | | | 5.380%, 06/01/2014 | | | 543,115 | |
| | | | | | | 14,890,717 | |
| | | Indiana - 1.23% | | | |
| | 760,000 | | Allen County War Memorial, | | | |
| | | | Revenue Bond, | | | |
| | | | 4.500%, 05/01/2019 | | | 768,915 | |
| | 400,000 | | Anderson Industrial Economic | | | | |
| | | | Development, Refunding, | | | | |
| | | | Revenue Bond, | | | | |
| | | | 4.500%, 10/01/2008 | | | 403,212 | |
| | 525,000 | | Indiana Health Facilities Funding | | | | |
| | | | Authority, Revenue Bond, | | | | |
| | | | 5.000%, 05/01/2007 | | | 525,499 | |
| | | | Noblesville Redevelopment Authority, | | | | |
| | | | Revenue Bond, | | | | |
| | 200,000 | | 4.500%, 02/01/2011 | | | 203,576 | |
| | 305,000 | | 4.500%, 08/01/2012 | | | 312,088 | |
| | 320,000 | | 4.500%, 08/01/2013 | | | 328,128 | |
| | 500,000 | | Purdue University, Revenue Bond, | | | | |
| | | | 5.250%, 07/01/2008 | | | 509,780 | |
| | | | | | | 3,051,198 | |
See notes to financial statements.
AssetMark Tax-Exempt Fixed Income Fund
SCHEDULE OF INVESTMENTS (Continued)
March 31, 2007
Principal | | | | Market | |
Amount | | | | Value | |
| | | MUNICIPAL BONDS (Continued) | | | |
| | | Iowa - 1.17% | | | |
| $ | 1,250,000 | | Coralville, Series L-1, Notes, | | | |
| | | | 4.130%, 06/01/2007 | | $ | 1,250,575 | |
| | | | Iowa Finance Authority Health | | | | |
| | | | Facilities, Revenue Bond, | | | | |
| | 600,000 | | 5.250%, 07/01/2010 | | | 617,586 | |
| | 1,000,000 | | 5.000%, 12/01/2039 | | | 1,033,210 | |
| | | | | | | 2,901,371 | |
| | | Kansas - 0.30% | | | |
| | 750,000 | | Wyandotte County, Revenue Bond, | | | |
| | | | 4.880%, 10/01/2028 | | | 750,788 | |
| | | | Kentucky - 1.00% | | | | |
| | 1,250,000 | | Louisville & Jefferson County | | | | |
| | | | Health Systems, Revenue Bond, | | | | |
| | | | 5.250%, 10/01/2036 | | | 1,309,962 | |
| | | | Murray Hospital Facilities, | | | | |
| | | | Refunding, Revenue Bond, | | | | |
| | 535,000 | | 4.200%, 08/01/2010 | | | 536,787 | |
| | 630,000 | | 4.380%, 08/01/2014 | | | 638,045 | |
| | | | | | | 2,484,794 | |
| | | Louisiana - 2.45% | | | |
| | | Louisiana Gas & Fuels Tax, Series A, | | | |
| | | Revenue Bond, FGIC Insured, | | | |
| | 1,120,000 | | 5.000%, 05/01/2015 | | | 1,210,250 | |
| | 1,000,000 | | 5.000%, 05/01/2021 | | | 1,064,850 | |
| | 785,000 | | Louisiana Military Department | | | | |
| | | | Custody Receipts, Revenue Bond, | | | | |
| | | | 5.000%, 08/01/2012 | | | 816,164 | |
| | 1,305,000 | | Louisiana Public Facilities Authority, | | | | |
| | | | Revenue Bond, | | | | |
| | | | 5.500%, 05/15/2032 | | | 1,373,291 | |
| | 1,500,000 | | Louisiana, Series A, GO, | | | | |
| | | | 5.000%, 10/15/2018 | | | 1,601,715 | |
| | | | | | | 6,066,270 | |
| | | | Maryland - 1.05% | | | | |
| | 1,160,000 | | Maryland Department of | | | | |
| | | | Transportation County T Construction, | | | | |
| | | | Revenue Bond, | | | | |
| | | | 5.500%, 02/01/2017 | | | 1,315,278 | |
| | | | Maryland Health & Higher Education, | | | | |
| | | | Revenue Bond, | | | | |
| | 750,000 | | 5.200%, 01/01/2024 | | | 776,085 | |
| | | | | | |
| | | Maryland (Continued) | | | |
| $ | 500,000 | | 5.000%, 07/01/2036 | | $ | 515,265 | |
| | | | | | | 2,606,628 | |
| | | | Massachusetts - 2.15% | | | | |
| | 500,000 | | Massachusetts Bay Transportation | | | | |
| | | | Authority, Refunding, Revenue | | | | |
| | | | Bond, FGIC Insured, | | | | |
| | | | 5.500%, 03/01/2009 | | | 517,445 | |
| | 900,000 | | Massachusetts Bay Transportation | | | | |
| | | | Authority, Series A, Revenue Bond, | | | | |
| | | | 5.250%, 07/01/2015 | | | 987,255 | |
| | 95,000 | | Massachusetts Bay Transportation | | | | |
| | | | Authority, Series C, Revenue Bond, | | | | |
| | | | 5.500%, 03/01/2012 | | | 102,829 | |
| | 120,000 | | Massachusetts State Water Resources | | | | |
| | | | Authority, Series B, Revenue Bond, | | | | |
| | | | 6.250%, 12/01/2011 | | | 133,356 | |
| | 1,500,000 | | Massachusetts, GO, | | | | |
| | | | 5.500%, 11/01/2016 | | | 1,697,880 | |
| | 500,000 | | Massachusetts, Series B, GO, | | | | |
| | | | 5.250%, 09/01/2022 | | | 567,640 | |
| | 1,255,000 | | Route 3 North Transportation Import | | | | |
| | | | Association, Revenue Bond, | | | | |
| | | | MBIA Insured, | | | | |
| | | | 5.380%, 06/15/2029 | | | 1,320,862 | |
| | | | | | | 5,327,267 | |
| | | Michigan - 1.89% | | | |
| | 230,000 | | Detroit Sewer Disposal, Revenue Bond, | | | |
| | | | 7.100%, 12/15/2009 | | | 241,585 | |
| | 150,000 | | Dundee Community School District, | | | | |
| | | | GO, Q-SBLF Insured, | | | | |
| | | | 5.380%, 05/01/2010 | | | 157,279 | |
| | 800,000 | | Lansing School District, Refunding, | | | | |
| | | | GO, Q-SBLF Insured, | | | | |
| | | | 5.000%, 05/01/2017 | | | 853,416 | |
| | 1,000,000 | | Michigan Environmental Protection | | | | |
| | | | Program, GO, | | | | |
| | | | 5.000%, 11/01/2013 | | | 1,044,840 | |
| | | | Michigan Hospital Finance Authority, | | | | |
| | | | Revenue Bond, | | | | |
| | 1,280,000 | | 7.130%, 05/01/2009 | | | 1,323,994 | |
| | 1,000,000 | | 5.250%, 11/15/2046 | | | 1,057,160 | |
| | | | | | | 4,678,274 | |
See notes to financial statements.
AssetMark Tax-Exempt Fixed Income Fund
SCHEDULE OF INVESTMENTS (Continued)
March 31, 2007
Principal | | | | Market | |
Amount | | | | Value | |
| | | MUNICIPAL BONDS (Continued) | | | |
| | | Minnesota - 0.91% | | | |
| $ | 1,000,000 | | Maple Grove Health Care Facilities, | | | |
| | | | Revenue Bond, | | | |
| | | | 5.000%, 09/01/2029 | | $ | 1,039,610 | |
| | 375,000 | | Northfield Hospital, Revenue Bond, | | | | |
| | | | 5.000%, 11/01/2011 | | | 388,462 | |
| | 295,000 | | Prior Lake Independent School District, | | | | |
| | | | Series A, GO, FGIC Insured, | | | | |
| | | | 4.750%, 02/01/2010 | | | 304,101 | |
| | 500,000 | | St Paul Housing and Redevelopment | | | | |
| | | | Authority, Revenue Bond, | | | | |
| | | | 5.250%, 05/15/2036 | | | 524,205 | |
| | | | | | | 2,256,378 | |
| | | Missouri - 0.68% | | | |
| | | Cape Girardeau County Industrial | | | |
| | | Development, Revenue Bond, | | | |
| | 100,000 | | 4.000%, 06/01/2007 | | | 103,631 | |
| | 245,000 | | 4.250%, 06/01/2008 | | | 245,737 | |
| | 350,000 | | 4.250%, 06/01/2009 | | | 351,859 | |
| | 300,000 | | Kansas City Municipal Assistance | | | | |
| | | | Corp., Series A, Revenue Bond, | | | | |
| | | | AMBAC Insured, | | | | |
| | | | 5.000%, 03/01/2012 | | | 317,109 | |
| | 615,000 | | Springfield Public Utilities, | | | | |
| | | | Series A, CP, 5.000%, 12/01/2016 | | | 669,458 | |
| | | | | | | 1,687,794 | |
| | | | Nebraska - 0.81% | | | | |
| | 1,000,000 | | Central Plains Energy Project, | | | | |
| | | | Revenue Bond, | | | | |
| | | | 4.250%, 12/01/2026 | | | 1,001,000 | |
| | 1,000,000 | | Southern Nebraska Public Power, Notes, | | | | |
| | | | 4.000%, 12/15/2008 | | | 1,004,030 | |
| | | | | | | 2,005,030 | |
| | | New Hampshire - 0.74% | | | |
| | 1,750,000 | | New Hampshire Health & Education | | | |
| | | | Facilities, Revenue Bond, | | | |
| | | | 5.250%, 06/01/2036 | | | 1,820,858 | |
| | | | New Jersey - 4.84% | | | | |
| | 500,000 | | Hudson County Import Authority, | | | | |
| | | | Revenue Bond, FSA Insured, | | | | |
| | | | 4.130%, 07/01/2016 | | | 505,700 | |
| | | New Jersey (Continued) | | | |
| $ | 1,105,000 | | New Jersey Educational Facilities, | | | |
| | | | Revenue Bond, | | | |
| | | | 5.000%, 07/01/2007 | | $ | 1,107,110 | |
| | 440,000 | | New Jersey Health Care Facilities, | | | | |
| | | | Revenue Bond, | | | | |
| | | | 5.000%, 07/01/2029 | | | 452,619 | |
| | 1,000,000 | | New Jersey Transportation Trust | | | | |
| | | | Fund Authority, Revenue Bond, | | | | |
| | | | 5.250%, 12/15/2020 | | | 1,117,320 | |
| | 310,000 | | New Jersey Turnpike Authority, | | | | |
| | | | Revenue Bond, MBIA Insured, | | | | |
| | | | 6.750%, 01/01/2009 | | | 317,862 | |
| | 3,255,000 | | New Jersey, Refunding, Series N, GO, | | | | |
| | | | 5.500%, 07/15/2013 | | | 3,582,388 | |
| | 3,270,000 | | New Jersey, Series L, Refunding, GO, | | | | |
| | | | 5.250%, 07/15/2019 | | | 3,666,749 | |
| | 1,255,000 | | Tobacco Settlement Financing, | | | | |
| | | | Series 1A, Revenue Bond, | | | | |
| | | | 4.130%, 06/01/2010 | | | 1,254,762 | |
| | | | | | | 12,004,510 | |
| | | New Mexico - 1.04% | | | |
| | 1,450,000 | | New Mexico State Severance Tax, | | | |
| | | | Revenue Bond, | | | |
| | | | 5.000%, 07/01/2009 | | | 1,454,814 | |
| | 1,035,000 | | University of New Mexico, | | | | |
| | | | Refunding, Revenue Bond, | | | | |
| | | | 5.250%, 06/01/2014 | | | 1,119,611 | |
| | | | | | | 2,574,425 | |
| | | New York - 10.01% | | | |
| | 1,000,000 | | East Rochester Housing Authority | | | |
| | | | Senior Living, Revenue Bond, | | | |
| | | | 5.500%, 08/01/2033 | | | 1,021,060 | |
| | 1,500,000 | | Erie County, Series A, GO, | | | | |
| | | | FGIC Insured, | | | | |
| | | | 5.250%, 03/15/2018 | | | 1,601,610 | |
| | 1,000,000 | | Hudson Yards Infrastructure | | | | |
| | | | Corporation, Series A, Revenue Bond, | | | | |
| | | | 5.000%, 02/15/2047 | | | 1,047,540 | |
| | 500,000 | | Liberty Development Corp., | | | | |
| | | | Revenue Bond, | | | | |
| | | | 5.250%, 10/01/2035 | | | 572,195 | |
See notes to financial statements.
AssetMark Tax-Exempt Fixed Income Fund
SCHEDULE OF INVESTMENTS (Continued)
March 31, 2007
Principal | | | | Market | |
Amount | | | | Value | |
| | | MUNICIPAL BONDS (Continued) | | | |
| | | New York (Continued) | | | |
| $ | 750,000 | | Long Island Power Authority, | | | |
| | | | Series E, Revenue Bond, | | | |
| | | | 5.000%, 12/01/2022 | | $ | 802,732 | |
| | 100,000 | | Metropolitan Transportation Authority, | | | | |
| | | | Series A, Revenue Bond, | | | | |
| | | | 5.250%, 04/01/2009 | | | 101,848 | |
| | 1,765,000 | | Metropolitan Transportation Authority, | | | | |
| | | | Series F, Revenue Bond, | | | | |
| | | | 5.000%, 11/15/2014 | | | 1,901,399 | |
| | 2,000,000 | | New York City Industrial Development | | | | |
| | | | Agency Queens Baseball Stadium, | | | | |
| | | | Revenue Bond, | | | | |
| | | | 4.750%, 01/01/2042 | | | 2,042,120 | |
| | 500,000 | | New York City Transit Authority, | | | | |
| | | | Series A, CP, AMBAC Insured, | | | | |
| | | | 5.630%, 01/01/2012 | | | 531,385 | |
| | 1,000,000 | | New York City, GO, | | | | |
| | | | 5.000%, 11/01/2034 | | | 1,044,160 | |
| | 1,000,000 | | New York City, Series J, GO, | | | | |
| | | | 5.000%, 03/01/2035 | | | 1,045,790 | |
| | 4,850,000 | | New York Dormitory Authority, | | | | |
| | | | Series B, Revenue Bond, | | | | |
| | | | 5.250%, 11/15/2023 | | | 5,176,163 | |
| | 2,830,000 | | New York Environmental Facilities, | | | | |
| | | | Series A, Revenue Bond, | | | | |
| | | | 5.000%, 12/15/2014 | | | 3,072,361 | |
| | 1,000,000 | | New York Thruway Authority Second | | | | |
| | | | Generation, Revenue Bond, | | | | |
| | | | AMBAC Insured, | | | | |
| | | | 5.000%, 04/01/2018 | | | 1,066,750 | |
| | 40,000 | | New York Thruway Authority, Series E, | | | |
| | | | Prerefunded, Revenue Bond, GO Insured, | | | |
| | | | 5.250%, 01/01/2010 | | | 40,890 | |
| | 500,000 | | Port Authority, Series 116, | | | | |
| | | | Revenue Bond, | | | | |
| | | | 5.000%, 10/01/2010 | | | 502,635 | |
| | | | Sales Tax Asset Receivable Corp., | | | | |
| | | | Series A, Revenue Bond, | | | | |
| | 500,000 | | 5.000%, 10/15/2017 | | | 538,970 | |
| | 1,500,000 | | 5.250%, 10/15/2019 | | | 1,636,140 | |
| | 1,000,000 | | Tobacco Settlement Financing, | | | | |
| | | | Revenue Bond, | | | | |
| | | | 5.250%, 06/01/2021 | | | 1,066,460 | |
| | | | | | | 24,812,208 | |
| | | North Carolina - 0.34% | | | |
| $ | 180,000 | | North Carolina CAP Facilities, | | | |
| | | | Revenue Bond, | | | |
| | | | 4.250%, 07/01/2042 | | $ | 169,051 | |
| | 650,000 | | North Carolina Medical Care | | | | |
| | | | Community, Revenue Bond, | | | | |
| | | | 5.600%, 10/01/2036 | | | 679,185 | |
| | | | | | | 848,236 | |
| | | | North Dakota - 0.49% | | | | |
| | 500,000 | | Ward County Health Care Facilities, | | | | |
| | | | Revenue Bond, | | | | |
| | | | 5.000%, 07/01/2008 | | | 506,330 | |
| | 685,000 | | Williams County Sales Tax, | | | | |
| | | | Revenue Bond, | | | | |
| | | | 5.000%, 11/01/2026 | | | 701,454 | |
| | | | | | | 1,207,784 | |
| | | Ohio - 1.21% | | | |
| | 305,000 | | Cleveland Waterworks, | | | |
| | | | Refunding, Revenue Bond, Series J, | | | |
| | | | FSA Insured, | | | |
| | | | 5.000%, 01/01/2008 | | | 308,059 | |
| | 500,000 | | Lucas County Health Facilities, | | | | |
| | | | Refunding, Revenue Bond, | | | | |
| | | | 6.630%, 07/01/2014 | | | 512,330 | |
| | | | Ohio Higher Educational Facility | | | | |
| | | | Commission, Revenue Bond, | | | | |
| | 625,000 | | 5.250%, 10/01/2014 | | | 685,306 | |
| | 700,000 | | 5.250%, 10/01/2026 | | | 750,813 | |
| | 700,000 | | 5.000%, 10/01/2031 | | | 731,745 | |
| | | | | | | 2,988,253 | |
| | | Oklahoma - 0.42% | | | |
| | 1,000,000 | | University of Tulsa Student Housing, | | | |
| | | | Revenue Bond, | | | |
| | | | 5.000%, 10/01/2037 | | | 1,032,030 | |
| | | | Oregon - 0.87% | | | | |
| | 1,000,000 | | Clackamas County School District, GO, | | | | |
| | | | 0.000%, 06/15/2021 | | | 867,950 | |
| | 1,000,000 | | Tri-County Metropolitan | | | | |
| | | | Transportation, Revenue Bond, | | | | |
| | | | 4.000%, 05/01/2014 | | | 1,004,330 | |
| | 250,000 | | Washington County School District, | | | | |
| | | | Refunding, GO, FSA Insured, | | | | |
| | | | 5.500%, 06/15/2019 | | | 286,422 | |
| | | | | | | 2,158,702 | |
See notes to financial statements.
AssetMark Tax-Exempt Fixed Income Fund
SCHEDULE OF INVESTMENTS (Continued)
March 31, 2007
Principal | | | | | Market | |
Amount | | | | | Value | |
| | | MUNICIPAL BONDS (Continued) | | | |
| | | Pennsylvania - 0.18% | | | | |
| $ | 430,000 | | Cumberland County Authority, | | | |
| | | | Revenue Bond, | | | | |
| | | | 5.000%, 01/01/2036 | | | $ | 443,012 | |
| | | | Puerto Rico - 1.12% | | | | | |
| | 1,595,000 | | Puerto Rico Electric Power Authority, | | | | |
| | | | Series JJ, Refunding, Revenue Bond, | | | | | |
| | | | XLCA Insured, | | | | | |
| | | | 5.250%, 07/01/2012 | | | | 1,713,301 | |
| | 1,000,000 | | Puerto Rico, Series B, GO, | | | | | |
| | | | 5.250%, 07/01/2032 | | | | 1,070,970 | |
| | | | | | | | 2,784,271 | |
| | | | South Carolina - 1.10% | | | | |
| | 500,000 | | Charleston County Hospital Facilities, | | | | |
| | | | Revenue Bond, | | | | | |
| | | | 5.500%, 08/15/2013 | | | | 536,810 | |
| | 2,055,000 | | Greenville Waterworks, Refunding, | | | | |
| | | | Revenue Bond, | | | | | |
| | | | 5.000%, 02/01/2013 | | | | 2,198,172 | |
| | | | | | | | 2,734,982 | |
| | | Tennessee - 2.92% | | | |
| | 500,000 | | Johnson City Health & Educational | | | |
| | | | Facilities Board, Revenue Bond, | | | |
| | | | 6.000%, 07/01/2021 | | | 536,695 | |
| | 250,000 | | Knoxville Water, Series P, | | | | |
| | | | Revenue Bond, | | | | |
| | | | 5.000%, 03/01/2009 | | | 256,020 | |
| | 300,000 | | Memphis, GO, | | | | |
| | | | 5.500%, 11/01/2010 | | | 317,814 | |
| | 1,500,000 | | Memphis-Shelby County Airport | | | | |
| | | | Authority Special Facilities, | | | | |
| | | | Refunding, Revenue Bond, | | | | |
| | | | 5.050%, 09/01/2012 | | | 1,575,120 | |
| | 740,000 | | Sullivan County Health, Educational | | | | |
| | | | and Housing Facilities Board, | | | | |
| | | | Refunding, Revenue Bond, | | | | |
| | | | 5.000%, 09/01/2007 | | | 743,041 | |
| | | | Sullivan County Health, Educational | | | | |
| | | | and Housing Facilities Board, | | | | |
| | | | Series C, Revenue Bond, | | | | |
| | 1,000,000 | | 5.000%, 09/01/2022 | | | 1,037,190 | |
| | 400,000 | | 5.250%, 09/01/2036 | | | 419,036 | |
| | | Tennessee (Continued) | | | |
| $ | 1,000,000 | | Tennessee Energy Acquisition | | | |
| | | | Corporation, Series C, Revenue Bond, | | | |
| | | | 5.000%, 02/01/2023 | | $ | 1,072,550 | |
| | 1,205,000 | | Williamson County, GO, | | | | |
| | | | 6.000%, 03/01/2010 | | | 1,283,446 | |
| | | | | | | 7,240,912 | |
| | | | Texas - 12.93% | | | | |
| | 1,560,000 | | Dallas Civic Center, Refunding, | | | | |
| | | | Revenue Bond, MBIA Insured, | | | | |
| | | | 4.880%, 08/15/2023 | | | 1,587,862 | |
| | 600,000 | | Denton Independent School District, GO, | | | | |
| | | | 3.000%, 08/01/2030 | | | 593,868 | |
| | 515,000 | | Denton Utilities System, Series A, | | | | |
| | | | Revenue Bond, FSA Insured, | | | | |
| | | | 5.250%, 12/01/2013 | | | 554,572 | |
| | 2,740,000 | | El Paso, GO, MBIA Insured, | | | | |
| | | | 5.000%, 08/15/2024 | | | 2,901,057 | |
| | 145,000 | | Frisco, GO, FGIC Insured, | | | | |
| | | | 5.880%, 02/15/2010 | | | 153,610 | |
| | 630,000 | | Gregg County Health Facilities, | | | | |
| | | | Revenue Bond, | | | | |
| | | | 4.250%, 10/01/2009 | | | 632,810 | |
| | 750,000 | | Harris County, Refunding, GO, | | | | |
| | | | 5.250%, 10/01/2013 | | | 806,520 | |
| | 225,000 | | Houston, Series A, GO, | | | | |
| | | | 5.000%, 03/01/2021 | | | 233,719 | |
| | 2,445,000 | | Irving, Series A, Refunding, GO, | | | |
| | | | 5.000%, 11/15/2013 | | | 2,622,458 | |
| | 935,000 | | Lower Colorado River Authority, | | | | |
| | | | Refunding, Revenue Bond, | | | | |
| | | | 6.000%, 05/15/2013 | | | 987,538 | |
| | 370,000 | | Marble Falls Independent School | | | | |
| | | | District, Series A, Refunding, | | | | |
| | | | GO, PSF-GTD Insured, | | | | |
| | | | 5.000%, 08/15/2015 | | | 400,440 | |
| | 2,300,000 | | North Texas & Dallas Thruway System, | | | | |
| | | | Series A, Refunded, Revenue Bond, | | | | |
| | | | 5.380%, 01/01/2016 | | | 2,328,635 | |
| | 1,000,000 | | Plano Independent School District, | | | | |
| | | | GO, PSF-GTD Insured, | | | | |
| | | | 4.700%, 02/15/2013 | | | 1,009,230 | |
| | 3,600,000 | | Round Rock Independent School | | | | |
| | | | District, GO, PSF-GTD Insured, | | | | |
| | | | 5.000%, 08/01/2018 | | | 3,750,696 | |
See notes to financial statements.
AssetMark Tax-Exempt Fixed Income Fund
SCHEDULE OF INVESTMENTS (Continued)
March 31, 2007
Principal | | | | Market | |
Amount | | | | Value | |
| | | MUNICIPAL BONDS (Continued) | | | |
| | | Texas (Continued) | | | |
| | 2,000,000 | | San Antonio Electric & Gas, | | | |
| | | | Refunding, Revenue Bond, | | | |
| | | | 5.380%, 02/01/2015 | | $ | 2,208,540 | |
| | | | San Antonio Electric & Gas, | | | | |
| | | | Series A, Refunding, Revenue Bond, | | | | |
| | 1,000,000 | | 5.000%, 02/01/2008 | | | 1,010,900 | |
| | 2,200,000 | | 5.000%, 02/01/2017 | | | 2,268,904 | |
| | 70,000 | | San Antonio Electric & Gas, | | | | |
| | | | Unrefunded, Revenue Bond, | | | | |
| | | | 5.500%, 02/01/2013 | | | 72,288 | |
| | 185,000 | | Socorro Independent School District, | | | | |
| | | | Prerefunded, GO, PSF-GTD Insured, | | | | |
| | | | 5.380%, 08/15/2013 | | | 197,680 | |
| | 15,000 | | Socorro Independent School District, | | | | |
| | | | Unrefunded, GO, PSF-GTD Insured, | | | | |
| | | | 5.380%, 08/15/2013 | | | 16,009 | |
| | 1,035,000 | | Texas A&M University, Series B, | | | | |
| | | | Revenue Bond, | | | | |
| | | | 5.380%, 05/15/2011 | | | 1,100,960 | |
| | 1,875,000 | | Texas Municipal Gas Acquisition and | | | | |
| | | | Supply Corporation, Series B, | | | | |
| | | | Revenue Bond, | | | | |
| | | | 3.930%, 12/15/2009. | | | 1,879,669 | |
| | 400,000 | | Texas Public Finance Authority, | | | |
| | | | Refunding, GO, | | | |
| | | | 5.500%, 10/01/2009 | | | 417,376 | |
| | 100,000 | | Texas State University System, | | | | |
| | | | Revenue Bond, FSA Insured, | | | | |
| | | | 5.250%, 03/15/2010 | | | 104,373 | |
| | 300,000 | | Texas Water Financial Assistance, | | | | |
| | | | Series B, Refunding, GO, | | | | |
| | | | 5.000%, 08/01/2014 | | | 323,013 | |
| | 400,000 | | Texas, Series A, GO, | | | | |
| | | | 5.000%, 04/01/2022 | | | 427,576 | |
| | 390,000 | | Tomball Hospital Authority, | | | | |
| | | | Revenue Bond, | | | | |
| | | | 5.000%, 07/01/2012 | | | 401,556 | |
| | | Texas (Continued) | | | |
| $ | 100,000 | | University of Texas, Revenue Bond, | | | |
| | | | 5.250%, 08/15/2008 | | $ | 102,172 | |
| | 1,855,000 | | University of Texas, Series B, | | | | |
| | | | Revenue Bond, | | | | |
| | | | 5.250%, 07/01/2008 | | | 1,891,729 | |
| | 1,000,000 | | University of Texas, Series F, | | | | |
| | | | Revenue Bond, | | | | |
| | | | 5.000%, 08/15/2024 | | | 1,069,020 | |
| | | | | | | 32,054,780 | |
| | | | Utah - 1.98% | | | | |
| | 100,000 | | Jordan School District, GO, | | | | |
| | | | 5.130%, 06/15/2008 | | | 101,790 | |
| | 2,630,000 | | Utah, Refunding, Series A, GO, | | | | |
| | | | 5.000%, 07/01/2012 | | | 2,675,131 | |
| | 2,000,000 | | Wasatch County School District, GO, | | | | |
| | | | 5.000%, 06/01/2024 | | | 2,123,620 | |
| | | | | | | 4,900,541 | |
| | | Virginia - 4.23% | | | |
| | 3,000,000 | | Fairfax County, Refunding, | | | |
| | | | GO, STAID Insured, | | | |
| | | | 5.000%, 10/01/2009 | | | 3,102,840 | |
| | 450,000 | | Fairfax County, Series A, Refunding, | | | | |
| | | | GO, STAID Insured, | | | | |
| | | | 5.000%, 06/01/2007 | | | 450,954 | |
| | 1,000,000 | | Henry County Public Service Authority | | | | |
| | | | Water & Sewer, Refunding, | | | | |
| | | | Revenue Bond, FSA Insured, | | | | |
| | | | 5.500%, 11/15/2019 | | | 1,154,930 | |
| | 325,000 | | Newport News, Series B, GO, | | | | |
| | | | STAID Insured, | | | | |
| | | | 5.000%, 11/01/2014 | | | 348,666 | |
| | 100,000 | | Norfolk, Refunding, GO, | | | | |
| | | | 5.000%, 01/01/2009 | | | 102,321 | |
| | 625,000 | | Suffolk Individual Development | | | | |
| | | | Authority Retirement Facilities, | | | | |
| | | | Revenue Bond, | | | | |
| | | | 5.300%, 09/01/2031 | | | 638,294 | |
| | 2,000,000 | | Virginia Commonwealth Transportation | | | | |
| | | | Board, Revenue Bond, | | | | |
| | | | 5.000%, 10/01/2011 | | | 2,111,760 | |
| | 2,495,000 | | Virginia, Series A, GO, | | | | |
| | | | 5.000%, 06/01/2009 | | | 2,567,330 | |
| | | | | | | 10,477,095 | |
See notes to financial statements.
AssetMark Tax-Exempt Fixed Income Fund
SCHEDULE OF INVESTMENTS (Continued)
March 31, 2007
Principal | | | | Market | |
Amount | | | | Value | |
| | | MUNICIPAL BONDS (Continued) | | | |
| | | Washington - 5.70% | | | |
| $ | 2,000,000 | | Clark County School District, | | | |
| | | | Refunding, GO, FGIC Insured, | | | |
| | | | 5.500%, 12/01/2017 | | $ | 2,139,060 | |
| | 2,465,000 | | Energy Northwest, Series A, | | | | |
| | | | Refunding, Revenue Bond, | | | | |
| | | | FSA Insured, | | | | |
| | | | 5.500%, 07/01/2017 | | | 2,650,590 | |
| | 500,000 | | King County Hospital, Refunding, | | | | |
| | | | GO, MBIA Insured, | | | | |
| | | | 5.000%, 12/01/2021 | | | 531,870 | |
| | 3,150,000 | | King County Sewer, Refunding, | | | | |
| | | | Revenue Bond, FSA Insured, | | | | |
| | | | 5.250%, 01/01/2011 | | | 3,320,100 | |
| | 45,000 | | King County, Prerefunded, GO, | | | | |
| | | | 5.500%, 12/01/2010 | | | 47,825 | |
| | 55,000 | | King County, Unrefunded, GO, | | | | |
| | | | 5.500%, 12/01/2010 | | | 58,472 | |
| | 2,000,000 | | Klickitat County Public Utilities, | | | | |
| | | | Series B, Refunding, Revenue Bond, | | | | |
| | | | FGIC Insured, | | | | |
| | | | 5.250%, 12/01/2020 | | | 2,180,140 | |
| | 1,000,000 | | Port Seattle, Series A, Revenue Bond, | | | | |
| | | | 5.000%, 04/01/2031 | | | 1,034,920 | |
| | 30,000 | | Seattle, Prerefunded, GO, | | | | |
| | | | 5.000%, 07/01/2013 | | | 31,870 | |
| | 2,125,000 | | Washington, Refunding, GO, | | | | |
| | | | 4.000%, 01/01/2008 | | | 2,130,610 | |
| | | | | | | 14,125,457 | |
| | | Wisconsin – 5.23% | | | |
| | 470,000 | | Badger Asset Securitizatoin, | | | |
| | | | Revenue Bond, | | | |
| | | | 6.130%, 06/01/2027 | | | 502,994 | |
| | 1,445,000 | | Middleton Cross Plains Area | | | | |
| | | | School District, Refunding, | | | | |
| | | | GO, FSA Insured, | | | | |
| | | | 5.000%, 04/01/2020 | | | 1,555,644 | |
| | 1,000,000 | | Oak Creek-Franklin Joint School | | | | |
| | | | District, Revenue Note, | | | | |
| | | | 4.250%, 02/01/2008 | | | 1,001,340 | |
| | 2,000,000 | | Southeast Wisconsin Professional | | | | |
| | | | Baseball Park Sales Tax, Series A, | | | | |
| | | | Revenue Bond, MBIA Insured, | | | | |
| | | | 5.500%, 12/15/2026 | | | 2,309,300 | |
| | | Wisconsin (continued) | | | |
| $ | 250,000 | | Wisconsin Health & Educational | | | |
| | | | Facilities, Revenue Bond, | | | |
| | | | 5.000%, 02/15/2012 | | $ | 258,260 | |
| | 500,000 | | Wisconsin Health & Educational | | | | |
| | | | Facilities, Series A, Revenue Bond, | | | | |
| | | | 5.000%, 02/15/2018 | | | 519,190 | |
| | 1,400,000 | | Wisconsin Health & Educational | | | | |
| | | | Facilities, Series B, Revenue Bond, | | | | |
| | | | 5.000%, 08/15/2013 | | | 1,457,946 | |
| | 5,000,000 | | Wisconsin, Series A, GO, | | | | |
| | | | 5.000%, 05/01/2011 | | | 5,255,250 | |
| | 100,000 | | Wisconsin, Series C, GO, | | | | |
| | | | 5.500%, 05/01/2009 | | | 103,621 | |
| | | | | | | 12,963,545 | |
| | | | Total Municipal Bonds | | | | |
| | | | (Cost $234,872,796) | | | 236,290,829 | |
| | | | SHORT TERM INVESTMENTS - 4.76% | |
| | | | General Obligation Bonds - 0.08% | | | | |
| | 200,000 | | Massachusetts, Series B, GO, | | | | |
| | | | 3.780%, 03/01/2026 | | | 200,000 | |
| | | Revenue Bonds - 1.85% | | | |
| | 300,000 | | Huntsville Health Care Authority, | | | |
| | | | Refunding, Revenue Bond, | | | |
| | | | 4.450%, 06/01/2032 | | | 300,000 | |
| | 100,000 | | Minnesota Higher Education | | | | |
| | | | Facilities Authority, Series 5-H, | | | | |
| | | | Revenue Bond, HTSB Insured, | | | | |
| | | | 3.790%, 10/01/2030 | | | 100,000 | |
| | 700,000 | | Missouri Development Financial | | | | |
| | | | Board of Cultural Facilities, Series A, | | | | |
| | | | Revenue Bond, JPM Insured, | | | | |
| | | | 3.770%, 12/01/2033 | | | 700,000 | |
| | 500,000 | | Nebraska Educational Finance | | | | |
| | | | Authority, Revenue Bond, | | | | |
| | | | 3.790%, 03/01/2033 | | | 500,000 | |
| | 1,500,000 | | Penn State University, Series A, | | | | |
| | | | Revenue Bond, | | | | |
| | | | 3.640%, 04/01/2031 | | | 1,500,000 | |
| | 1,000,000 | | Sacramento County Sanitation | | | | |
| | | | District, Refunding, Revenue Bond, | | | | |
| | | | 0.000%, 12/01/2035 | | | 1,000,000 | |
See notes to financial statements.
AssetMark Tax-Exempt Fixed Income Fund
SCHEDULE OF INVESTMENTS (Continued)
March 31, 2007
Principal | | | | Market | |
Amount | | | | Value | |
| | | Revenue Bonds (continued) | | | |
| $ | 500,000 | | Sayre Health Care Facilities Authority, | | | |
| | | | Revenue Bond, | | | |
| | | | Effective Yield, 4.42%, 12/01/2031 | | $ | 500,000 | |
| | | | | | | 4,600,000 | |
Number of | | | | | |
Shares | | | | | |
| | | Money Market Funds - 2.83% | | | |
| | 7,001,785 | | First American Tax Free Obligations | | | |
| | | | Fund 3.220% | | | 7,001,785 | |
| | | | Total Short Term Investments | | | | |
| | | | (Cost $11,801,785) | | | 11,801,785 | |
| | | | Total Investments | | | | |
| | | | (Cost $246,674,581) - 100.10% | | | 248,092,614 | |
| | | | Liabilities in Excess of | | | | |
| | | | Other Assets - (0.10)% | | | (250,768 | ) |
| | | | TOTAL NET | | | | |
| | | | ASSETS - 100.00% | | $ | 247,841,846 | |
| | | | | | | | |
| Percentages are stated as a percent of net assets. | | | | |
| Glossary of Terms |
| AMBAC | - American Municipal Bond Assurance Corp. |
| ACA | - American Capital Access |
| CP | - Certificate of Participation |
| FGIC | - Financial Guaranty Insurance Corp. |
| FSA | - Federal Housing Authority/Agency |
| GO | - General Obligation |
| HTSB | - Harris Trust & Savings Bank |
| JPM | - JP Morgan Chase Bank |
| MBIA | - Municipal Bond Investors Assurance Corp. |
| PSF-GTD | - Permanent School Fund Guaranteed |
| Q-SBLF | - Qualified School Board Loan |
| STAID | - State Aid Withholding |
| XLCA | - XL Capital Assurance |
See notes to financial statements.
AssetMark Core Plus Fixed Income Fund
PERFORMANCE DATA
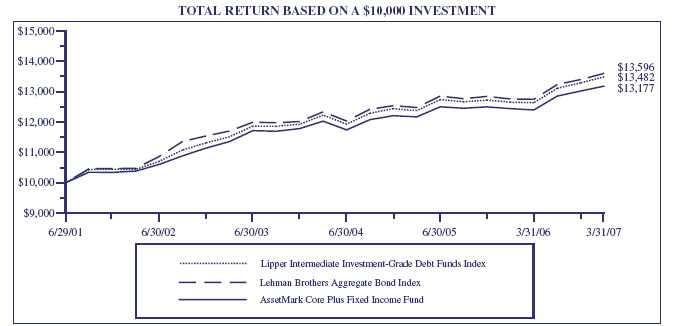
This chart assumes an initial gross investment of $10,000 made on June 29, 2001 (commencement of operations). Returns shown include the reinvestment of all dividends. Returns shown do not reflect the deduction of taxes that a shareholder would pay on fund distributions or the redemption of fund shares. In the absence of fee waivers and reimbursements, total return would be reduced. Past performance is not predictive of future performance. Investment return and principal value will fluctuate, so that your shares, when redeemed, may be worth more or less than the original cost.
LEHMAN BROTHERS AGGREGATE BOND INDEX - An unmanaged index which measures the performance of securities from the Lehman Brothers Government/Corporate Bond Index, Mortgage-Backed Securities Index and the Asset-Backed Securities Index. The Lehman Brothers Aggregate Bond Index is a broad representation of the investment-grade fixed-income market in the U.S. and includes U.S. Government and corporate debt securities, mortgage- and asset-backed securities and international U.S. dollar-denominated bonds. All securities contained in the Lehman Brothers Aggregate Bond Index have a minimum term to maturity of one year. The index does not reflect any deduction for fees, expenses or taxes.
LIPPER INTERMEDIATE INVESTMENT-GRADE DEBT FUNDS INDEX - The Lipper Intermediate Investment-Grade Debt Funds Index is an index of portfolios that invests at least 65% of its assets in investment-grade debt issues (rated in the top four grades) with dollar-weighted average maturities of five to ten years.
AVERAGE ANNUAL TOTAL RETURN (for the periods ended March 31,) | | |
| | One Year | Five Year | Since Inception (6/29/01) |
| AssetMark Core Plus Fixed Income Fund | 5.96% | 4.88% | 4.91% |
| Lehman Brothers Aggregate Bond Index | 6.59% | 5.35% | 5.48% |
| Lipper Intermediate Investment-Grade Debt Funds Index | 6.60% | 5.25% | 5.34% |
AssetMark Core Plus Fixed Income Fund
SCHEDULE OF INVESTMENTS
March 31, 2007
Number of | | | | Market | |
Shares | | | | Value | |
| | | CONVERTIBLE PREFERRED | | | |
| | | STOCKS - 0.04% | | | |
| | | Automobiles - 0.04% | | | |
| | 12,000 | | General Motors Corporation | | $ | 272,400 | |
| | 1,800 | | General Motors Corporation (b) | | | 37,350 | |
| | | | | | | 309,750 | |
| | | | Total Convertible Preferred Stocks | | | | |
| | | | (Cost $304,162) | | | 309,750 | |
| | | | PREFERRED STOCKS - 0.15% | | | | |
| | | | Banks - 0.11% | | | | |
| | 800,000 | | HSBC Capital Funding LP | | | | |
| | | | (Callable at $100.00 on | | | | |
| | | | 06/27/2013) (a)(c)(e) | | | 765,211 | |
| | | | Consumer Finance - 0.03% | | | | |
| | 12,000 | | Corts Trust for Ford Motor Company | | | 228,960 | |
| | | | Medical Supplies - 0.01% | | | | |
| | 51 | | Fresenius Medical Care | | | | |
| | | | Capital Trust II (a) | | | 51,765 | |
| | | | Total Preferred Stocks | | | | |
| | | | (Cost $1,009,797) | | | 1,045,936 | |
Principal | | | | | |
Amount | | | | | |
| | | ASSET BACKED SECURITIES - 4.64% | |
| $ | 1,655,585 | | Accredited Mortgage Loan Trust | | | |
| | | | Series 2005-3, 5.57%, 09/25/2035 | | | 1,656,322 | |
| | 6,750,000 | | Citibank Credit Card Insurance Trust | | | | |
| | | | Series 2006-A4, 5.45%, 05/10/2013 | | | 6,873,293 | |
| | 100,000 | | Conseco Finance Securitizations Corp. | | | | |
| | | | Series 2000-4, 8.31%, 04/01/2031 | | | 83,148 | |
| | 640,000 | | Countrywide Asset-Backed Certificates | | | | |
| | | | Series 2005-4, 4.46%, 09/25/2032 | | | 634,461 | |
| | | | Countrywide Home Equity Loan Trust | | | | |
| | 743,756 | | Series 2003-A, 5.67%, | | | | |
| | | | 03/15/2029 | | | 745,422 | |
| | 618,040 | | Series 2004-S, 5.56%, | | | | |
| | | | 02/15/2030 | | | 618,933 | |
| | 454,722 | | Series 2004-R, 5.57%, | | | | |
| | | | 03/15/2030 | | | 456,100 | |
| | 642,239 | | Series 2004-N, 5.60%, | | | | |
| | | | 02/15/2034 | | | 643,385 | |
| | 719,851 | | Series 2004-O, 5.60%, | | | | |
| | | | 02/15/2034 | | | 721,347 | |
| | | ASSET BACKED SECURITIES (Continued) | |
| $ | 1,320,991 | | Series 2005-F, 5.56%, | | | |
| | | | 12/15/2035 | | $ | 1,322,821 | |
| | 1,375,754 | | Series 2005-I, 5.58%, | | | | |
| | | | 02/15/2036 | | | 1,375,846 | |
| | 1,129,049 | | Home Equity Loan Trust | | | | |
| | | | Series 2005-HS1, | | | | |
| | | | 5.44%, 07/25/2020 | | | 1,126,767 | |
| | 1,916,821 | | IMPAC Secured Assets Corp. | | | | |
| | | | Series 2005-6, 5.60%, | | | | |
| | | | 10/25/2035 | | | 1,919,462 | |
| | 1,168,006 | | Indymac Mortgage Loan Trust | | | | |
| | | | Series 2005-AR16IP, 5.64%, | | | | |
| | | | 07/25/2045 | | | 1,170,631 | |
| | | | JetBlue Airways Corporation | | | | |
| | 833,705 | | Series 2004-2, G-1, 5.74%, | | | | |
| | | | 02/15/2018 (e) | | | 836,311 | |
| | 900,000 | | Series 2004-2, G-2, 5.82%, | | | | |
| | | | 05/15/2018 (e) | | | 905,625 | |
| | 8,199,268 | | New Valley Generation II | | | | |
| | | | Series 2001-1, 5.57%, | | | | |
| | | | 05/01/2020 | | | 8,272,857 | |
| | 208,590 | | Residential Asset Mortgage | | | | |
| | | | Products, Inc. | | | | |
| | | | Series 2004-RZ1, 5.57%, | | | | |
| | | | 03/25/2034 | | | 208,966 | |
| | | Washington Mutual | | | |
| | 1,700,000 | | Series 2005-AR4, 4.67%, | | | |
| | | | 04/25/2035 | | | 1,717,387 | |
| | 1,955,122 | | Series 2005-AR8, 5.61%, | | | | |
| | | | 07/25/2045 (e) | | | 1,959,116 | |
| | | | Total Asset Backed Securities | | | | |
| | | | (Cost $33,319,198) | | | 33,248,200 | |
| | | | COLLATERALIZED MORTGAGE | | | | |
| | | | OBLIGATIONS - 3.34% | | | | |
| | 876,019 | | Bank of America Corporation | | | | |
| | | | Series 2005-B, 5.10%, | | | | |
| | | | 04/25/2035 | | | 872,785 | |
| | 1,186,635 | | Bear Stearns Trust | | | | |
| | | | Series 2005-2, 4.74%, | | | | |
| | | | 04/25/2035 | | | 1,175,603 | |
See notes to financial statements.
AssetMark Core Plus Fixed Income Fund
SCHEDULE OF INVESTMENTS (Continued)
March 31, 2007
Principal | | | | | | | Market | |
Amount | | | | | | | Value | |
| | | COLLATERALIZED MORTGAGE | | | | |
| | | OBLIGATIONS (Continued) | | | | | | |
| | | Countrywide Home Loans | | | | | | |
| $ | 692,423 | | Series 2005-11, 5.63%, | | | | | | |
| | | | 03/25/2035 | | | $ | 694,386 | |
| | 827,028 | | Series 2005-11, 6.18%, | | | | | | | |
| | | | 04/25/2035 | | | | 787,708 | |
| | 437,566 | | CS First Boston Mortgage | | | | | | | |
| | | | Securities Corp. | | | | | | | |
| | | | Series 1997-C2, 6.55%, | | | | | | | |
| | | | 01/17/2035 | | | | 439,834 | |
| | | | FHLMC | | | | | | | |
| | 366,945 | | Series 1647, 6.50%, 12/15/2008 | | | . . | | | | 366,831 | |
| | 2,058,127 | | Series 2329, 6.50%, 06/15/2031 | | | . . | | | | 2,120,499 | |
| | 1,159,678 | | Series 2338, 6.50%, 07/15/2031 | | | . . | | | | 1,192,405 | |
| | 1,373,745 | | GSMPS Mortgage Loan Trust | | | | | | | | |
| | | | Series 2005-RP1, 5.67%, | | | | | | | | |
| | | | 01/25/2035 (c) | | | | 1,379,631 | |
| | 2,700,000 | | Master Adjustable Rate | | | | | | | | |
| | | | Mortgages Trust | | | | | | | | |
| | | | Series 2004-13, 3.79%, | | | | | | | | |
| | | | 11/21/2034 | | | | 2,655,482 | |
| | 638,643 | | Master Reperforming Loan Trust | | | | | | | | |
| | | | Series 2005-1, 7.00%, | | | | | | | | |
| | | | 08/25/2034 (c) | | | | 661,940 | |
| | 1,455,062 | | MLCC Mortgage Investors, Inc. | | | | | | |
| | | | Series 2005-1, 4.96%, 04/25/2035 | | | . . | | | | 1,447,328 | |
| | | | Prime Mortgage Trust | | | | | | | | |
| | 4,474,737 | | 5.50%, 05/25/2035 (c) | | | | 4,457,392 | |
| | 3,616,941 | | 6.00%, 05/25/2035 (c) | | | | 3,623,800 | |
| | 693,482 | | Residential Asset Mortgage | | | | | | | | |
| | | | Products, Inc. | | | | | | | | |
| | | | Series 2004-SL4, 7.50%, | | | | | | | | |
| | | | 07/25/2032 | | | | 709,302 | |
| | 1,273,890 | | Structured Adjustable Rate | | | | | | | | |
| | | | Mortgage Loan | | | | | | | | |
| | | | Series 2004-18, 5.00%, | | | | | | | | |
| | | | 12/25/2034 | | | | 1,293,318 | |
| | | | Total Collateralized Mortgage | | | | | | | | |
| | | | Obligations | | | | | | | | |
| | | | (Cost $23,992,626) | | | | 23,878,244 | |
Principal | | | | | | | Market | |
Amount | | | | | | | Value | |
| | | CORPORATE BONDS - 18.32% | | | | |
| | | Aerospace & Defense - 0.01% | | | | | | |
| $ | 55,000 | | DRS Technologies, Inc. | | | | | | |
| | | | 6.63%, 02/01/2016 | | | $ | 55,825 | |
| | | | Auto Components - 0.01% | | | | | | | |
| | 100,000 | | Visteon Corp. | | | | | | | |
| | | | 8.25%, 08/01/2010 | | | | 102,500 | |
| | | | Automobiles - 0.64% | | | | | | | |
| | 375,000 | | Bombardier, Inc. | | | | | | | |
| | | | 7.25%, 11/15/2016 (Acquired | | | | | | | |
| | | | 11/20/2006, Cost $481,745) (d) | | | | | | | 524,736 | |
| | | | DaimlerChrysler N.A. | | | | | | | | |
| | 750,000 | | 5.83%, 09/10/2007 (e) | | | | 751,244 | |
| | 5,000 | | 4.05%, 06/04/2008 | | | | 4,926 | |
| | 150,000 | | 7.20%, 09/01/2009 | | | | 156,661 | |
| | 260,000 | | 5.88%, 03/15/2011 | | | | 265,214 | |
| | | | Ford Motor Company | | | | | | | | |
| | 670,000 | | 7.45%, 07/16/2031 (b) | | | | 521,763 | |
| | 150,000 | | 4.25%, 12/15/2036 | | | | 166,125 | |
| | | | General Motors Corporation | | | | | | | | |
| | 2,420,000 | | 8.25%, 07/15/2023 (b) | | | | 2,190,100 | |
| | 30,000 | | 8.38%, 07/15/2033 (b) | | | | 27,075 | |
| | | | | | | | | | | 4,607,844 | |
| | | Banks - 4.21% | | | |
| | 300,000 | | Aiful Corporation | | | |
| | | | 5.00%, 08/10/2010 (b)(c) | | | 295,770 | |
| | 750,000 | | ANZ Capital Trust II | | | | |
| | | | 5.36%, 12/15/2049 (Callable at | | | | |
| | | | $100.00 on 12/15/2013) (c) | | | 736,512 | |
| | 410,000 | | Bank of America Corporation | | | | |
| | | | 5.38%, 08/15/2011 | | | 415,082 | |
| | 995,000 | | Bank One Corp. | | | | |
| | | | 2.63%, 06/30/2008 | | | 965,157 | |
| | 320,000 | | Banque Paribas | | | | |
| | | | 6.88%, 03/01/2009 | | | 330,867 | |
| | | | Barclay’s Bank PLC | | | | |
| | 1,000,000 | | Effective yield, 7.20%, 05/19/2015 | | | | |
| | | | (Credit linked to Republic of Brazil | | | | |
| | | | Treasury Security) (Acquired | | | | |
| | | | 03/27/2007, Cost $749,580) (d)(l) | | | 751,474 | |
| | 3,300,000 | | Effective yield, 7.32%, 05/17/2045 | | | | |
| | | | (Credit linked to Republic of Brazil | | | | |
| | | | Treasury Security) (Acquired | | | | |
| | | | 10/30/2006, Cost $1,988,440) | | | | |
| | | | (d)(l) | | | 2,336,095 | |
See notes to financial statements.
AssetMark Core Plus Fixed Income Fund
SCHEDULE OF INVESTMENTS (Continued)
March 31, 2007
Principal | | | | Market | |
Amount | | | | Value | |
| | | CORPORATE BONDS (Continued) | | | |
| | | Banks (Continued) | | | |
| | | Countrywide Financial Corp. | | | |
| $ | 550,000 | | 5.52%, 02/27/2008 (e) | | $ | 549,771 | |
| | 280,000 | | 5.47%, 06/18/2008 (e) | | | 279,792 | |
| | 220,000 | | 5.50%, 01/05/2009 (e) | | | 219,723 | |
| | 700,000 | | First Chicago Corporation | | | | |
| | | | 6.38%, 01/30/2009 | | | 713,831 | |
| | 250,000 | | First Union National Bank | | | | |
| | | | 5.80%, 12/01/2008 | | | 253,069 | |
| | 280,000 | | General Electric Capital Corporation | | | | |
| | | | 4.13%, 09/01/2009 | | | 274,877 | |
| | | | Glitnir Bank Hf | | | | |
| | 370,000 | | 6.33%, 07/28/2011 (c) | | | 384,296 | |
| | 760,000 | | 6.69%, 06/15/2016 (c) | | | 797,433 | |
| | 375,000 | | Greenpoint Bank | | | | |
| | | | 9.25%, 10/01/2010 | | | 423,223 | |
| | 700,000 | | HBOS Capital Funding L.P. | | | | |
| | | | 6.07%, 06/01/2049 (c)(e) | | | 714,117 | |
| | 685,000 | | HSBC Finance Corp. | | | | |
| | | | 4.13%, 11/16/2009 | | | 669,151 | |
| | 354,000 | | Icici Bank Ltd. | | | | |
| | | | 6.38%, 04/30/2022 (c) | | | 351,517 | |
| | 4,000,000 | | Inter-American Development Bank | | | | |
| | | | 0.50%, 05/29/2014 | | | 2,927,332 | |
| | | | JP Morgan Chase Bank | | | | |
| | 1,359,025 | | 10.40%, 05/15/2009 (Acquired | | | | |
| | | | 01/04/2006 and 01/06/2006, | | | | |
| | | | Cost $1,219,666) (Credit linked | | | | |
| | | | to the Republic of Brazil Treasury | | | | |
| | | | Security) (d)(l) | | | 1,535,386 | |
| | 2,475,368 | | 6.00%, 05/15/2011 (Acquired | | | |
| | | | 03/07/2006, Cost $2,171,772) | | | |
| | | | (Credit linked to the Republic of | | | |
| | | | Brazil Treasury Security and IPCA | | | |
| | | | Index Units) (d)(l) | | | 2,472,348 | |
| | | | Kaupthing Bank Hf | | | | |
| | 1,140,000 | | 6.05%, 04/12/2011 (c)(e) | | | 1,150,731 | |
| | 130,000 | | 5.75%, 10/04/2011 (c) | | | 131,208 | |
| | 250,000 | | 7.13%, 05/19/2016 (c) | | | 270,889 | |
| | 1,080,000 | | Landsbanki Hf | | | | |
| | | | 6.10%, 08/25/2011 (c) | | | 1,109,390 | |
| | | | Popular North America, Inc. | | | | |
| | 600,000 | | 5.20%, 12/12/2007 | | | 599,233 | |
| | 700,000 | | 4.70%, 06/30/2009 | | | 691,405 | |
| | | Banks (Continued) | | | |
| $ | 350,000 | | Residential Cap Corp. | | | |
| | | | 6.00%, 02/22/2011 | | $ | 345,541 | |
| | | | Resona Bank | | | | |
| | 525,000 | | 5.85%, 09/29/2049 (Acquired | | | | |
| | | | 09/08/2005, Cost $524,633) (d) | | | 523,340 | |
| | 450,000 | | 4.13%, 12/31/2049 (Acquired | | | | |
| | | | 10/05/2005, Cost $536,375) (d) | | | 583,649 | |
| | 410,000 | | Resona Preferred Global Securities | | | | |
| | | | 7.19%, 12/29/2049 (c) | | | 433,742 | |
| | 990,000 | | Royal Bank of Scotland Group PLC | | | | |
| | | | 9.12%, 03/31/2049 | | | 1,094,823 | |
| | 560,000 | | Santander Issuances SA | | | | |
| | | | 5.81%, 06/20/2016 (c) | | | 569,147 | |
| | 600,000 | | Shinsei Finance Cayman Ltd. | | | | |
| | | | 6.42%, 07/20/2048 (c) | | | 607,094 | |
| | 550,000 | | Sovereign Bank | | | | |
| | | | 4.38%, 08/01/2013 (e) | | | 543,754 | |
| | 280,000 | | Suntrust Capital | | | | |
| | | | 6.10%, 12/01/2066 | | | 263,278 | |
| | 850,000 | | Turanalem Finance BV | | | | |
| | | | 8.25%, 01/22/2037 (b)(c) | | | 856,375 | |
| | 1,120,000 | | VTB Capital SA | | | | |
| | | | 5.96%, 08/01/2008 (c)(e) | | | 1,121,960 | |
| | 200,000 | | Wells Fargo Company | | | | |
| | | | 5.95%, 12/01/2086 | | | 193,338 | |
| | 575,000 | | ZFS Finance USA Trust II | | | | |
| | | | 6.45%, 12/15/2065(c) | | | 575,917 | |
| | | | | | | 30,061,637 | |
| | | Business Services - 0.04% | | | |
| | 46,000 | | Dyncorp International LLC | | | |
| | | | 9.50%, 02/15/2013 | | | 49,220 | |
| | 40,000 | | Electronic Data Systems Corp. | | | | |
| | | | 7.13%, 10/15/2009 (b) | | | 41,735 | |
| | | | Lamar Media Corp. | | | | |
| | 80,000 | | 7.25%, 01/01/2013 | | | 81,400 | |
| | 50,000 | | 6.63%, 08/15/2015 | | | 49,000 | |
| | 30,000 | | UGS Corp. | | | | |
| | | | 10.00%, 06/01/2012 | | | 32,963 | |
| | | | | | | 254,318 | |
| | | | Capital Markets - 0.68% | | | | |
| | 500,000 | | Bear Stearns Cos, Inc. | | | | |
| | | | 5.55%, 01/22/2017 | | | 491,323 | |
| | 30,000 | | E*Trade Financial Corp. | | | | |
| | | | 7.38%, 09/15/2013 | | | 31,500 | |
See notes to financial statements.
AssetMark Core Plus Fixed Income Fund
SCHEDULE OF INVESTMENTS (Continued)
March 31, 2007
Principal | | | | Market | |
Amount | | | | Value | |
| | | CORPORATE BONDS (Continued) | | | |
| | | Business Services (Continued) | | | |
| | | Goldman Sachs Group, Inc. | | | |
| $ | 200,000 | | 4.50%, 06/15/2010 | | $ | 196,761 | |
| | 140,000 | | 5.00%, 01/15/2011 | | | 139,129 | |
| | | | Lehman Brothers Holdings, Inc. | | | | |
| | 1,350,000 | | 4.50%, 07/26/2010 | | | 1,323,730 | |
| | 350,000 | | 5.25%, 02/06/2012 | | | 350,049 | |
| | 250,000 | | Mizuho JGB Investment | | | | |
| | | | 9.87%, 06/30/2049 (Acquired | | | | |
| | | | 08/22/2005 and 08/23/2005, | | | | |
| | | | Cost $281,023) (d)(e) | | | 263,200 | |
| | | | Morgan Stanley | | | | |
| | 90,000 | | 3.63%, 04/01/2008 | | | 88,587 | |
| | 340,000 | | 5.63%, 01/09/2012 | | | 344,824 | |
| | 230,000 | | 5.82%, 10/18/2016 (e) | | | 230,876 | |
| | 975,000 | | Residential Cap Corp. | | | | |
| | | | 6.38%, 06/30/2010 | | | 975,442 | |
| | 430,000 | | Wachovia Capital Trust II | | | | |
| | | | 5.80%, 03/15/2042 | | | 435,508 | |
| | | | | | | 4,870,929 | |
| | | | Chemicals - 0.03% | | | | |
| | 40,000 | | Georgia Gulf Corp. | | | | |
| | | | 9.50%, 10/15/2014 (c) | | | 38,600 | |
| | | | Lyondell Chemical Co. | | | | |
| | 40,000 | | 8.00%, 09/15/2014 | | | 42,100 | |
| | 25,000 | | 8.25%, 09/15/2016 | | | 26,875 | |
| | 20,000 | | MacDermid, Inc. | | | | |
| | | | 9.13%, 07/15/2011 | | | 20,963 | |
| | 63,000 | | Westlake Chemical Corp. | | | | |
| | | | 6.63%, 01/15/2016 | | | 61,740 | |
| | | | | | | 190,278 | |
| | | Commercial Services & Supplies - 0.28% | | | |
| | 375,000 | | Allied Waste North America, Inc. | | | |
| | | | 7.13%, 05/15/2016 | | | 383,437 | |
| | 1,275,000 | | PHH Corp. | | | | |
| | | | 6.00%, 03/01/2008 | | | 1,278,115 | |
| | 325,000 | | Waste Management, Inc. | | | | |
| | | | 6.38%, 11/15/2012 | | | 341,510 | |
| | | | | | | 2,003,062 | |
| | | | Communications - 0.71% | | | | |
| | 150,000 | | AMFM Inc. | | | | |
| | | | 8.00%, 11/01/2008 | | | 155,475 | |
| | 295,000 | | British Telecommunications PLC | | | | |
| | | | 8.38%, 12/15/2010 | | | 329,559 | |
| | | Communications (Continued) | | | |
| | | Deutsche Telekom International | | | |
| | | Finance B.V. | | | |
| $ | 350,000 | | 5.75%, 03/23/2016 | | $ | 350,599 | |
| | 675,000 | | 8.25%, 06/15/2030 | | | 838,505 | |
| | 135,000 | | Level 3 Financing, Inc. | | | | |
| | | | 8.75%, 02/15/2017 (c) | | | 136,687 | |
| | | | Rogers Cable, Inc. | | | | |
| | 200,000 | | 5.50%, 03/15/2014 | | | 195,750 | |
| | 110,000 | | 6.75%, 03/15/2015 | | | 114,400 | |
| | | | Sprint Capital Corp. | | | | |
| | 100,000 | | 7.63%, 01/30/2011 | | | 107,602 | |
| | 580,000 | | 8.38%, 03/15/2012 | | | 647,784 | |
| | 600,000 | | 6.88%, 11/15/2028 | | | 599,202 | |
| | 300,000 | | 8.75%, 03/15/2032 | | | 354,842 | |
| | | | Telecom Italia Capital | | | | |
| | 125,000 | | 4.00%, 01/15/2010 | | | 120,845 | |
| | 425,000 | | 4.88%, 10/01/2010 | | | 418,659 | |
| | 500,000 | | 4.95%, 09/30/2014 | | | 471,719 | |
| | 190,000 | | 5.25%, 10/01/2015 | | | 180,564 | |
| | 50,000 | | Verizon Global Funding Corp. | | | | |
| | | | 7.38%, 09/01/2012 | | | 55,007 | |
| | | | | | | 5,077,199 | |
| | | Consumer Finance - 1.62% | | | |
| | | Ford Motor Credit Company | | | |
| | 670,000 | | 6.63%, 06/16/2008 | | | 668,076 | |
| | 5,345,000 | | 5.80%, 01/12/2009 | | | 5,245,326 | |
| | 460,000 | | 7.38%, 10/28/2009 | | | 459,419 | |
| | 510,000 | | General Motors Acceptance | | | | |
| | | | Corporation | | | | |
| | | | 6.13%, 01/22/2008 | | | 509,489 | |
| | | | General Motors Acceptance | | | | |
| | | | Corporation | | | | |
| | 130,000 | | 6.13%, 08/28/2007 | | | 129,935 | |
| | 70,000 | | 6.31%, 11/30/2007 | | | 69,699 | |
| | 140,000 | | 4.38%, 12/10/2007 | | | 138,257 | |
| | 100,000 | | 5.13%, 05/09/2008 | | | 98,859 | |
| | 330,000 | | 6.50%, 09/23/2008 (e) | | | 329,636 | |
| | 2,490,000 | | 5.85%, 01/14/2009 | | | 2,458,977 | |
| | 270,000 | | 7.75%, 01/19/2010 | | | 277,306 | |
| | 625,000 | | 6.88%, 09/15/2011 | | | 626,197 | |
| | 550,000 | | Nelnet, Inc. | | | | |
| | | | 7.40%, 09/15/2061 | | | 565,463 | |
| | | | | | | 11,576,639 | |
See notes to financial statements.
AssetMark Core Plus Fixed Income Fund
SCHEDULE OF INVESTMENTS (Continued)
March 31, 2007
Principal | | | | Market | |
Amount | | | | Value | |
| | | CORPORATE BONDS (Continued) | | | |
| | | Consumer Products - 0.00% | | | |
| $ | 20,000 | | American Achievement Corp. | | | |
| | | | 8.25%, 04/01/2012 | | $ | 20,500 | |
| | | | Diversified Financial Services - 0.85% | | | | |
| | | | Citigroup Funding, Inc. | | | | |
| | 2,500,000 | | 0.00%, 11/15/2007 (Credit linked | | | | |
| | | | to an Egyptian Treasury Bill) (l) | | | 2,608,900 | |
| | 1,000,000 | | 6.00%, 05/18/2015 | | | | |
| | | | (Acquired 12/07/2006, | | | | |
| | | | Cost $653,385) (Credit linked to | | | | |
| | | | the Republic of Brazil Treasury | | | | |
| | | | Security and IPCA Index Units) | | | | |
| | | | (d)(l) | | | 750,070 | |
| | | | General Electric Capital Corporation | | | | |
| | 200,000 | | 4.25%, 01/15/2008 | | | 198,639 | |
| | 650,000 | | 5.65%, 09/15/2014 (e) | | | 654,607 | |
| | 30,000 | | Rabobank Capital Funding Trust II | | | | |
| | | | 5.26%, 12/29/2049 (c)(e) | | | 29,229 | |
| | 180,000 | | Rabobank Capital Funding Trust III | | | | |
| | | | 5.25%, 10/31/2049 (c)(e) | | | 173,823 | |
| | 1,397,825 | | Steers Holdings Ltd. | | | | |
| | | | 6.00%, 05/15/2045 (Acquired | | | | |
| | | | 02/14/2006, Cost $1,534,491) | | | | |
| | | | (Credit linked to the Republic of | | | | |
| | | | Brazil Treasury Security IPCA | | | | |
| | | | Index Units) (d)(l) | | | 1,732,954 | |
| | | | | | | 6,148,222 | |
| | | Diversified Telecommunication Services - 0.52% | |
| | 700,000 | | Ameritech Capital Funding Corp. | | | |
| | | | 6.25%, 05/18/2009 | | | 710,396 | |
| | 30,000 | | Bellsouth Corp. | | | | |
| | | | 4.75%, 11/15/2012 | | | 29,271 | |
| | 95,000 | | Cincinnati Bell, Inc. | | | | |
| | | | 7.00%, 02/15/2015 | | | 94,763 | |
| | | | Citizens Communications Co. | | | | |
| | 30,000 | | 9.25%, 05/15/2011 | | | 33,600 | |
| | 35,000 | | 7.13%, 03/15/2019 (c) | | | 34,825 | |
| | 215,000 | | Embarq Corp. | | | | |
| | | | 8.00%, 06/01/2036 | | | 222,650 | |
| | 70,000 | | Intelsat Bermuda Ltd. | | | | |
| | | | 8.87%, 01/15/2015 (c)(e) | | | 71,750 | |
| | | | Qwest Communications International, Inc. | | | | |
| | 850,000 | | 8.91%, 02/15/2009 (b)(e) | | | 862,750 | |
| | 127,000 | | 7.25%, 02/15/2011 | | | 130,651 | |
| | 520,000 | | Royal KPN NV | | | | |
| | | | 8.38%, 10/01/2030 | | | 590,295 | |
| | | Diversified Telecommunication Services | |
| | | (Continued) | | | |
| $ | 410,000 | | SBC Communications, Inc. | | | |
| | | | 5.10%, 09/15/2014 | | $ | 401,176 | |
| | 10,000 | | Sprint Nextel Corp. | | | | |
| | | | 6.00%, 12/01/2016 | | | 9,859 | |
| | 80,000 | | Verizon New York, Inc. - Series A | | | | |
| | | | 6.88%, 04/01/2012 (b) | | | 84,516 | |
| | 380,000 | | Windstream Corp. | | | | |
| | | | 8.63%, 08/01/2016 | | | 417,525 | |
| | | | | | | 3,694,027 | |
| | | | Electric Services - 0.23% | | | | |
| | 475,000 | | CenterPoint Energy Resources Corp. | | | | |
| | | | 7.88%, 04/01/2013 | | | 530,001 | |
| | 700,000 | | MidAmerican Energy Holdings | | | | |
| | | | 7.52%, 09/15/2008 | | | 721,119 | |
| | 375,000 | | Midwest Generation LLC | | | | |
| | | | 8.75%, 05/01/2034 | | | 408,750 | |
| | | | | | | 1,659,870 | |
| | | Electric Utilities - 0.69% | | | |
| | | Commonwealth Edison Co. | | | |
| | 425,000 | | 5.40%, 12/15/2011 | | | 415,264 | |
| | 250,000 | | 6.95%, 07/15/2018 | | | 248,519 | |
| | | | Dominion Resources, Inc. | | | | |
| | 80,000 | | 4.75%, 12/15/2010 | | | 78,932 | |
| | 300,000 | | 5.70%, 09/17/2012 | | | 306,834 | |
| | | | Duke Energy Corp. | | | | |
| | 120,000 | | 6.25%, 01/15/2012 | | | 125,705 | |
| | 35,000 | | 5.63%, 11/30/2012 | | | 35,866 | |
| | 340,000 | | Exelon Corp. | | | | |
| | | | 5.63%, 06/15/2035 | | | 312,128 | |
| | | | FirstEnergy Corp. | | | | |
| | 200,000 | | 6.45%, 11/15/2011 | | | 209,841 | |
| | 1,535,000 | | 7.38%, 11/15/2031 | | | 1,749,134 | |
| | 375,000 | | Nevada Power Co. | | | | |
| | | | 5.88%, 01/15/2015 | | | 379,978 | |
| | 290,000 | | Pacific Gas & Elec Co. | | | | |
| | | | 5.80%, 03/01/2037 | | | 280,558 | |
| | 170,000 | | Pacific Gas & Electric Co. | | | | |
| | | | 6.05%, 03/01/2034 | | | 170,981 | |
| | | | Progress Energy, Inc. | | | | |
| | 150,000 | | 5.63%, 01/15/2016 | | | 151,538 | |
| | 400,000 | | 7.75%, 03/01/2031 | | | 479,804 | |
| | | | | | | 4,945,082 | |
See notes to financial statements.
AssetMark Core Plus Fixed Income Fund
SCHEDULE OF INVESTMENTS (Continued)
March 31, 2007
Principal | | | | | Market | |
Amount | | | | | Value | |
| | | CORPORATE BONDS (Continued) | | | |
| | | Electrical Equipment - 0.36% | | | | |
| $ | 100,000 | | L-3 Communications Corp. | | | | |
| | | | 6.38%, 10/15/2015 | | | $ | 99,625 | |
| | | | NXP BV / NXP Funding LLC | | | | | |
| | 20,000 | | 7.88%, 10/15/2014 (c) | | | | 20,750 | |
| | 70,000 | | 9.50%, 10/15/2015 (c) | | | | 72,625 | |
| | | | Tyco International Group SA | | | | | |
| | 500,000 | | 4.44%, 06/15/2007 (Acquired | | | | | |
| | | | 08/23/2004, Cost $500,795) (d) | | | | 498,910 | |
| | 325,000 | | 6.38%, 10/15/2011 | | | | 343,787 | |
| | 1,285,000 | | 6.88%, 01/15/2029 | | | | 1,521,270 | |
| | | | | | | | 2,556,967 | |
| | | | Energy Equipment & Services - 0.06% | | | | |
| | 155,000 | | Complete Production Services | | | | | |
| | | | 8.00%, 12/15/2016 (c) | | | 159,650 | |
| | | | Geophysique | | | | | |
| | 155,000 | | 7.50%, 05/15/2015 | | | | 160,425 | |
| | 50,000 | | 7.75%, 05/15/2017 | | | | 52,375 | |
| | 50,000 | | Pride International, Inc. | | | | | |
| | | | 7.38%, 07/15/2014 | | | | 51,500 | |
| | 40,000 | | SemGroup LP | | | | | |
| | | | 8.75%, 11/15/2015 (b)(c) | | | | 40,800 | |
| | | | | | | | 464,750 | |
| | | | Food Products - 0.07% | | | | | |
| | 375,000 | | Dean Foods Co. | | | | | |
| | | | 7.00%, 06/01/2016 | | | | 378,281 | |
| | 5,000 | | Kraft Foods, Inc. | | | | | |
| | | | 5.63%, 11/01/2011 | | | | 5,066 | |
| | 125,000 | | Land O’ Lakes, Inc. | | | | | |
| | | | 9.00%, 12/15/2010 | | | | 133,125 | |
| | | | | | | | 516,472 | |
| | | Gas Utilities - 0.01% | | | |
| | 60,000 | | Southern Natural Gas Co. | | | |
| | | | 5.90%, 04/01/2017 (c) | | | 60,300 | |
| | | | Health Care Providers & Services - 0.38% | | | | |
| | 100,000 | | AmerisourceBergen Corp. | | | | |
| | | | 5.88%, 09/15/2015 | | | 99,873 | |
| | 185,000 | | Davita, Inc. | | | | |
| | | | 6.63%, 03/15/2013 (c) | | | 185,925 | |
| | | Health Care Providers & Services | | | |
| | | (Continued) | | | |
| | | HCA, Inc. | | | |
| $ | 23,000 | | 6.30%, 10/01/2012 | | $ | 21,562 | |
| | 211,000 | | 6.25%, 02/15/2013 | | | 192,274 | |
| | 460,000 | | 6.75%, 07/15/2013 | | | 425,500 | |
| | 415,000 | | 9.13%, 11/15/2014 (c) | | | 444,569 | |
| | 13,000 | | 6.50%, 02/15/2016 (b) | | | 11,131 | |
| | 340,000 | | 9.25%, 11/15/2016 (c) | | | 367,625 | |
| | 69,000 | | 9.63%, 11/15/2016 (c) | | | 74,693 | |
| | | | Service Corporation International | | | | |
| | 60,000 | | 7.00%, 06/15/2017 | | | 60,750 | |
| | 10,000 | | 7.63%, 10/01/2018 | | | 10,625 | |
| | 130,000 | | 7.50%, 04/01/2027 (c) | | | 130,650 | |
| | | | Tenet Healthcare Corp. | | | | |
| | 2,000 | | 9.88%, 07/01/2014 | | | 2,030 | |
| | 721,000 | | 9.25%, 02/01/2015 | | | 717,395 | |
| | | | | | | 2,744,602 | |
| | | | Hotels, Restaurants & Leisure - 0.20% | |
| | | | Boyd Gaming Corp. | | | | |
| | 65,000 | | 6.75%, 04/15/2014 | | | 65,162 | |
| | 160,000 | | 7.13%, 02/01/2016 | | | 157,600 | |
| | 550,000 | | Harrahs Operating Company, Inc. | | | | |
| | | | 5.50%, 07/01/2010 | | | 541,879 | |
| | 85,000 | | Host Marriott LP | | | | |
| | | | 6.75%, 06/01/2016 | | | 86,062 | |
| | 60,000 | | Inn of the Mountain Gods Resort | | | | |
| | | | & Casino | | | | |
| | | | 12.00%, 11/15/2010 | | | 65,550 | |
| | | MGM Mirage, Inc. | | | |
| | 10,000 | | 9.50%, 08/01/2008 | | | 10,488 | |
| | 180,000 | | 8.50%, 09/15/2010 | | | 193,275 | |
| | 20,000 | | 6.63%, 07/15/2015 | | | 19,300 | |
| | 70,000 | | 7.63%, 01/15/2017 | | | 71,225 | |
| | 30,000 | | Premier Entertainment Biloxi LLC | | | | |
| | | | 10.75%, 02/01/2012 | | | 31,200 | |
| | 20,000 | | River Rock Entertainment | | | | |
| | | | 9.75%, 11/01/2011 | | | 21,400 | |
| | | | Station Casinos, Inc. | | | | |
| | 25,000 | | 6.88%, 03/01/2016 | | | 23,031 | |
| | 130,000 | | 7.75%, 08/15/2016 | | | 134,063 | |
| | | | | | | 1,420,235 | |
See notes to financial statements.
AssetMark Core Plus Fixed Income Fund
SCHEDULE OF INVESTMENTS (Continued)
March 31, 2007
Principal | | | | Market | |
Amount | | | | Value | |
| | | CORPORATE BONDS (Continued) | | | |
| | | Insurance - 1.15% | | | |
| $ | 150,000 | | ACE Limited | | | |
| | | | 6.00%, 04/01/2007 | | $ | 150,000 | |
| | 425,000 | | American Intl Group, Inc. | | | | |
| | | | 6.25%, 03/15/2087 | | | 415,036 | |
| | 400,000 | | Arch Capital Group Ltd. | | | | |
| | | | 7.35%, 05/01/2034 | | | 435,124 | |
| | 80,000 | | ASIF Global Financing XIX | | | | |
| | | | 4.90%, 01/17/2013 (c) | | | 78,883 | |
| | 200,000 | | Aspen Insurance Holdings, Ltd. | | | | |
| | | | 6.00%, 08/15/2014 | | | 199,403 | |
| | | | AXA SA | | | | |
| | 300,000 | | 6.38%, 12/31/2049 (c) | | | 288,889 | |
| | 300,000 | | 6.46%, 12/31/2049 (c) | | | 294,145 | |
| | 375,000 | | Catlin Insurance Co. Ltd. | | | | |
| | | | 7.25%, 12/31/2049 (Acquired | | | | |
| | | | 01/11/2007, Cost $375,000) (d) | | | 372,984 | |
| | 725,000 | | Chubb Corp. | | | | |
| | | | 6.38%, 03/29/2067 | | | 724,475 | |
| | 890,000 | | CNA Financial Corp. | | | | |
| | | | 7.25%, 11/15/2023 | | | 945,299 | |
| | 425,000 | | Endurance Specialty Holdings | | | | |
| | | | 6.15%, 10/15/2015 | | | 425,053 | |
| | 575,000 | | Lincoln National Corp. | | | | |
| | | | 7.00%, 05/17/2066 | | | 603,560 | |
| | 560,000 | | Metlife, Inc. | | | | |
| | | | 6.40%, 12/15/2066 | | | 548,568 | |
| | 125,000 | | PartnerRe Finance, Inc. | | | | |
| | | | 6.44%, 12/01/2066 | | | 123,793 | |
| | 500,000 | | Phoenix Life Insurance Co. | | | |
| | | | 7.15%, 12/15/2034 (c) | | | 531,714 | |
| | 450,000 | | QBE Insurance Group Ltd. | | | | |
| | | | 5.65%, 07/01/2023 (Callable at | | | | |
| | | | $100.00 on 07/01/2013) (c)(e) | | | 442,357 | |
| | 300,000 | | Reinsurance Group of America, Inc. | | | | |
| | | | 6.75%, 12/15/2065 | | | 298,502 | |
| | 875,000 | | Swiss Re Capital I LP | | | | |
| | | | 6.85%, 05/29/2049 (c) | | | 905,461 | |
| | 440,000 | | Travelers Companies, Inc. | | | | |
| | | | 6.25%, 03/15/2067 | | | 435,337 | |
| | | | | | | 8,218,583 | |
| | | CORPORATE BONDS (Continued) | | | |
| | | IT Services - 0.01% | | | |
| $ | 90,000 | | SunGard Data Systems, Inc. | | | |
| | | | 9.13%, 08/15/2013 | | $ | | |
| | | | Media - 1.07% | | | | |
| | 30,000 | | AMC Entertainment, Inc. | | | | |
| | | | 11.00%, 02/01/2016 | | | 34,312 | |
| | | | Clear Channel Communications, Inc. | | | | |
| | 50,000 | | 6.25%, 03/15/2011 | | | 49,802 | |
| | 330,000 | | 5.50%, 09/15/2014 | | | 292,582 | |
| | 270,000 | | 4.90%, 05/15/2015 | | | 227,370 | |
| | 30,000 | | Clear Channel Communications, Inc. | | | | |
| | | | 4.63%, 01/15/2008 | | | 29,801 | |
| | 320,000 | | Comcast Cable Communications | | | | |
| | | | Holdings, Inc. | | | | |
| | | | 8.88%, 05/01/2017 | | | 391,923 | |
| | 500,000 | | Comcast Cable Communications | | | | |
| | | | Holdings, Inc. | | | | |
| | | | 9.46%, 11/15/2022 | | | 650,767 | |
| | | | Comcast Corp. | | | | |
| | 220,000 | | 6.50%, 01/15/2015 | | | 232,397 | |
| | 20,000 | | 5.88%, 02/15/2018 | | | 20,094 | |
| | | | COX Communications, Inc. | | | | |
| | 220,000 | | 3.88%, 10/01/2008 | | | 215,829 | |
| | 1,000,000 | | 4.63%, 01/15/2010 | | | 987,113 | |
| | 520,000 | | COX Enterprises, Inc. | | | | |
| | | | 4.38%, 05/01/2008 (c) | | | 512,014 | |
| | | | CSC Holdings, Inc. | | | | |
| | 45,000 | | 7.63%, 04/01/2011 (b) | | | 46,350 | |
| | 100,000 | | 7.63%, 07/15/2018 | | | 101,500 | |
| | 110,000 | | DirecTV Holdings LLC | | | | |
| | | | 8.38%, 03/15/2013 | | | 116,463 | |
| | | | EchoStar DBS Corporation | | | | |
| | 40,000 | | 6.63%, 10/01/2014 (b) | | | 40,350 | |
| | 160,000 | | 7.13%, 02/01/2016 | | | 166,000 | |
| | 445,000 | | Idearc, Inc. | | | | |
| | | | 8.00%, 11/15/2016 (c) | | | 460,019 | |
| | | | Liberty Media Corp. | | | | |
| | 460,000 | | 7.88%, 07/15/2009 | | | 484,886 | |
| | 20,000 | | 5.70%, 05/15/2013 | | | 19,275 | |
| | 40,000 | | Panamsat Corp. | | | | |
| | | | 9.00%, 06/15/2016 (c) | | | 44,250 | |
| | 70,000 | | Quebecor Media, Inc. | | | | |
| | | | 7.75%, 03/15/2016 | | | 72,275 | |
See notes to financial statements.
AssetMark Core Plus Fixed Income Fund
SCHEDULE OF INVESTMENTS (Continued)
March 31, 2007
Principal | | | | Market | |
Amount | | | | Value | |
| | | CORPORATE BONDS (Continued) | | | |
| | | Media (Continued) | | | |
| $ | 20,000 | | Sinclair Broadcast Group, Inc. | | | |
| | | | 8.00%, 03/15/2012 | | $ | 20,800 | |
| | | | Time Warner, Inc. | | | | |
| | 450,000 | | 6.88%, 05/01/2012 | | | 480,042 | |
| | 325,000 | | 5.88%, 11/15/2016 | | | 328,303 | |
| | 830,000 | | 7.70%, 05/01/2032 (b) | | | 943,793 | |
| | 275,000 | | 6.50%, 11/15/2036 | | | 275,119 | |
| $ | 400,000 | | Viacom, Inc. | | | | |
| | | | 5.75%, 04/30/2011 | | | 405,854 | |
| | | | | | | 7,649,283 | |
| | | | Metals & Mining - 0.07% | | | | |
| | 100,000 | | Codelco, Inc. | | | | |
| | | | 4.75%, 10/15/2014 (c) | | | 96,139 | |
| | | | Freeport-McMoran Copper & Gold | | | | |
| | 10,000 | | 8.25%, 04/01/2015 | | | 10,787 | |
| | 270,000 | | 8.38%, 04/01/2017 | | | 292,613 | |
| | 135,000 | | Steel Dynamics, Inc. | | | | |
| | | | 6.75%, 04/01/2015 (c) | | | 135,844 | |
| | | | | | | 535,383 | |
| | | Multi Utilities - 0.37% | | | |
| | 47,000 | | AES Corp. | | | |
| | | | 7.75%, 03/01/2014 | | | 49,585 | |
| | 50,000 | | CenterPoint Energy, Inc. | | | | |
| | | | 7.25%, 09/01/2010 | | | 52,819 | |
| | 850,000 | | MidAmerican Energy Holdings | | | | |
| | | | 6.13%, 04/01/2036 | | | 851,026 | |
| | 170,000 | | NRG Energy, Inc. | | | | |
| | | | 7.25%, 02/01/2014 | | | 174,675 | |
| | | | TXU Corp. | | | | |
| | 500,000 | | 4.80%, 11/15/2009 | | | 493,652 | |
| | 110,000 | | 5.55%, 11/15/2014 | | | 97,975 | |
| | 100,000 | | 6.50%, 11/15/2024 | | | 84,782 | |
| | 975,000 | | 6.55%, 11/15/2034 | | | 821,338 | |
| | | | | | | 2,625,852 | |
| | | | Multiline Retail - 0.23% | | | | |
| | 40,000 | | J.C. Penney Co., Inc. | | | | |
| | | | 7.40%, 04/01/2037 | | | 43,353 | |
| | 470,000 | | Target Corp. | | | | |
| | | | 5.40%, 10/01/2008 | | | 472,653 | |
| | 1,150,000 | | Wal-Mart Stores, Inc. | | | | |
| | | | 3.38%, 10/01/2008 | | | 1,124,695 | |
| | | | | | | 1,640,701 | |
| | | Office Electronics - 0.01% | | | |
| $ | 40,000 | | Xerox Corp. | | | |
| | | | 6.75%, 02/01/2017 | | $ | 42,057 | |
| | | | Oil & Gas - 2.16% | | | | |
| | | | Amerada Hess Corp. | | | | |
| | 90,000 | | 7.88%, 10/01/2029 | | | 104,109 | |
| | 740,000 | | 7.30%, 08/15/2031 | | | 818,128 | |
| | | | Amerigas Partners LP | | | | |
| | 50,000 | | 7.25%, 05/20/2015 | | | 50,750 | |
| | 25,000 | | 7.13%, 05/20/2016 | | | 25,187 | |
| | 80,000 | | Anadarko Finance Co. | | | | |
| | | | 7.50%, 05/01/2031 | | | 88,566 | |
| | 1,260,000 | | Anadarko Petroleum Corp. | | | | |
| | | | 6.45%, 09/15/2036 | | | 1,250,903 | |
| | 700,000 | | Boardwalk Pipelines LP | | | | |
| | | | 5.88%, 11/15/2016 | | | 702,501 | |
| | | | Canadian Natural Resources Ltd. | | | | |
| | 300,000 | | 5.70%, 05/15/2017 | | | 299,181 | |
| | 75,000 | | 5.85%, 02/01/2035 | | | 69,976 | |
| | 475,000 | | 6.50%, 02/15/2037 | | | 483,412 | |
| | 150,000 | | 6.25%, 03/15/2038 | | | 147,255 | |
| | | | Chesapeake Energy Corp. | | | | |
| | 60,000 | | 6.38%, 06/15/2015 | | | 60,000 | |
| | 80,000 | | 6.25%, 01/15/2018 | | | 79,400 | |
| | 420,000 | | ChevronTexaco Capital Co. | | | | |
| | | | 3.50%, 09/17/2007 | | | 416,927 | |
| | 70,000 | | Conoco Funding Co. | | | |
| | | | 6.35%, 10/15/2011 | | | 73,599 | |
| | 145,000 | | Conoco, Inc. | | | | |
| | | | 6.95%, 04/15/2029 | | | 164,900 | |
| | 285,000 | | ConocoPhillips, Inc. | | | | |
| | | | 4.75%, 10/15/2012 | | | 281,657 | |
| | 309,000 | | El Paso Natural Gas Co. | | | | |
| | | | 8.38%, 06/15/2032 | | | 382,247 | |
| | | | El Paso Corp. | | | | |
| | 217,000 | | 7.80%, 08/01/2031 | | | 240,870 | |
| | 355,000 | | 7.75%, 01/15/2032 | | | 394,050 | |
| | | | Energy Transfer Partners LP | | | | |
| | 350,000 | | 5.65%, 08/01/2012 | | | 354,699 | |
| | 500,000 | | 5.95%, 02/01/2015 (b) | | | 507,844 | |
| | | | Enterprise Products Operating LP | | | | |
| | 750,000 | | 4.95%, 06/01/2010 | | | 744,072 | |
| | 375,000 | | 8.38%, 08/01/2066 | | | 411,031 | |
See notes to financial statements.
AssetMark Core Plus Fixed Income Fund
SCHEDULE OF INVESTMENTS (Continued)
March 31, 2007
Principal | | | | Market | |
Amount | | | | Value | |
| | | CORPORATE BONDS (Continued) | | | |
| | | Oil & Gas (Continued) | | | |
| | | Kerr-McGee Corp. | | | |
| $ | 625,000 | | 6.95%, 07/01/2024 | | $ | 660,162 | |
| | 1,335,000 | | 7.88%, 09/15/2031 (b) | | | 1,557,294 | |
| | | | Kinder Morgan Energy Partners | | | | |
| | 110,000 | | 6.30%, 02/01/2009 | | | 111,986 | |
| | 470,000 | | 6.75%, 03/15/2011 | | | 494,239 | |
| | 80,000 | | 6.00%, 02/01/2017 (b) | | | 81,028 | |
| | 425,000 | | Oneok Partners LP | | | | |
| | | | 6.65%, 10/01/2036 | | | 438,090 | |
| | 80,000 | | OPTI Canada, Inc. | | | | |
| | | | 8.25%, 12/15/2014 (c) | | | 83,600 | |
| | | | Peabody Energy Corp. | | | | |
| | 10,000 | | 6.88%, 03/15/2013 | | | 10,225 | |
| | 50,000 | | 5.88%, 04/15/2016 | | | 48,250 | |
| | | | Pemex Project Funding Master Trust | | | | |
| | 560,000 | | 7.38%, 12/15/2014 | | | 619,920 | |
| | 230,000 | | 6.63%, 06/15/2035 | | | 237,188 | |
| | 620,000 | | Petrobras International Finance Co. | | | | |
| | | | 6.13%, 10/06/2016 | | | 635,500 | |
| | 100,000 | | Pogo Producing Co. | | | | |
| | | | 6.88%, 10/01/2017 | | | 98,000 | |
| | 45,000 | | Southern Natural Gas Co. | | | | |
| | | | 8.00%, 03/01/2032 | | | 53,677 | |
| | 140,000 | | Suburban Propane Partners LP | | | | |
| | | | 6.88%, 12/15/2013 | | | 138,600 | |
| | 140,000 | | Tennessee Gas Pipeline Co. | | | | |
| | | | 7.63%, 04/01/2037 | | | 161,556 | |
| | 150,000 | | Western Oil Sands, Inc. | | | | |
| | | | 8.38%, 05/01/2012 | | | 168,375 | |
| | | | Williams Companies, Inc. | | | | |
| | 560,000 | | 7.50%, 01/15/2031 | | | 596,400 | |
| | 230,000 | | 7.75%, 06/15/2031 | | | 247,250 | |
| | 800,000 | | XTO Energy, Inc. | | | | |
| | | | 7.50%, 04/15/2012 | | | 876,626 | |
| | | | | | | 15,469,230 | |
| | | Pharmaceuticals - 0.07% | | | |
| | 520,000 | | Wyeth | | | |
| | | | 5.95%, 04/01/2037 | | | 513,894 | |
| | | | Real Estate - 0.31% | | | | |
| | 250,000 | | Arden Realty LP | | | | |
| | | | 9.15%, 03/01/2010 | | | 277,475 | |
| | | Real Estate (Continued) | | | |
| | | Forest City Enterprises, Inc. | | | |
| $ | 10,000 | | 7.63%, 06/01/2015 | | $ | 10,225 | |
| | 29,000 | | 6.50%, 02/01/2017 | | | 28,348 | |
| | | | iStar Financial, Inc. | | | | |
| | 225,000 | | 5.13%, 04/01/2011 | | | 223,080 | |
| | 325,000 | | 5.65%, 09/15/2011 | | | 327,667 | |
| | 225,000 | | 5.95%, 10/15/2013 | | | 228,052 | |
| | 100,000 | | 5.70%, 03/01/2014 | | | 99,598 | |
| | 350,000 | | Simon Property Group LP | | | | |
| | | | 7.13%, 09/20/2007 | | | 352,801 | |
| | 515,000 | | Summit Properties Partnership | | | | |
| | | | 7.20%, 08/15/2007 | | | 518,112 | |
| | | | Ventas Realty LP | | | | |
| | 50,000 | | 6.75%, 06/01/2010 | | | 51,625 | |
| | 40,000 | | 9.00%, 05/01/2012 | | | 45,200 | |
| | 40,000 | | 7.13%, 06/01/2015 | | | 42,100 | |
| | 30,000 | | 6.75%, 04/01/2017 | | | 31,200 | |
| | | | | | | 2,235,483 | |
| | | | Road & Rail - 0.05% | | | | |
| | 80,000 | | Hertz Corp. | | | | |
| | | | 8.88%, 01/01/2014 | | | 86,600 | |
| | 14,000 | | Kansas City Southern Railway Co. | | | | |
| | | | 9.50%, 10/01/2008 | | | 14,735 | |
| | 230,000 | | Union Pacific Corp. | | | | |
| | | | 5.38%, 05/01/2014 | | | 228,729 | |
| | | | | | | 330,064 | |
| | | Special Purpose Entity - 0.58% | | | |
| | 280,000 | | Agfc Cap Tr I | | | |
| | | | 6.00%, 01/15/2067 (c) | | | 280,894 | |
| | 1,070,000 | | El Paso Performance Linked Trust | | | | |
| | | | 7.75%, 07/15/2011 (c) | | | 1,143,562 | |
| | 280,000 | | ILFC E-Capital Trust II | | | | |
| | | | 6.25%, 12/21/2065 (c)(e) | | | 287,051 | |
| | 655,000 | | MUFG Capital Finance 1 Ltd. | | | | |
| | | | 6.35%, 07/29/2049 | | | 670,227 | |
| | 1,090,000 | | Sigma Finance, Inc. | | | | |
| | | | 8.50%, 08/11/2016 (c)(e) | | | 1,090,000 | |
| | | | TNK-BP Finance SA | | | | |
| | 490,000 | | 7.50%, 07/18/2016 (c) | | | 518,175 | |
| | 200,000 | | 6.63%, 03/20/2017 (b)(c) | | | 199,000 | |
| | | | | | | 4,188,909 | |
See notes to financial statements.
AssetMark Core Plus Fixed Income Fund
SCHEDULE OF INVESTMENTS (Continued)
March 31, 2007
Principal | | | | Market | |
Amount | | | | Value | |
| | | CORPORATE BONDS (Continued) | | | |
| | | Supranational Obligation - 0.06% | | | |
| $ | 440,000 | | GazInvest | | | |
| | | | 6.51%, 03/07/2022 (b)(c) | | $ | 447,700 | |
| | | | Textiles, Apparel & Luxury Goods - 0.03% | |
| | 125,000 | | INVISTA | | | | |
| | | | 9.25%, 05/01/2012 (c) | | | 133,750 | |
| | 50,000 | | Oxford Industries, Inc. | | | | |
| | | | 8.88%, 06/01/2011 | | | 52,000 | |
| | | | | | | 185,750 | |
| | | | Tobacco - 0.14% | | | | |
| | 770,000 | | Altria Group, Inc. | | | | |
| | | | 7.00%, 11/04/2013 | | | 837,314 | |
| | 125,000 | | Philip Morris Companies, Inc. | | | | |
| | | | 7.75%, 01/15/2027 | | | 149,809 | |
| | | | | | | 987,123 | |
| | | | Transportation - 0.14% | | | | |
| | 41,000 | | Horizon Lines LLC | | | | |
| | | | 9.00%, 11/01/2012 | | | 43,255 | |
| | 60,000 | | OMI Corp. | | | | |
| | | | 7.63%, 12/01/2013 | | | 61,200 | |
| | 86,000 | | Teekay Shipping Corp. | | | | |
| | | | 8.88%, 07/15/2011 | | | 93,095 | |
| | 786,000 | | Vale Overseas Ltd. | | | | |
| | | | 6.88%, 11/21/2036 | | | 815,622 | |
| | | | | | | 1,013,172 | |
| | | Wireless Telecommunication Services - 0.27% | |
| | 750,000 | | AT&T Wireless Services, Inc. | | | |
| | | | 7.88%, 03/01/2011 | | | 821,356 | |
| | | | Nextel Communications, Inc. | | | | |
| | 930,000 | | 6.88%, 10/31/2013 | | | 953,675 | |
| | 15,000 | | 5.95%, 03/15/2014 | | | 14,778 | |
| | 120,000 | | 7.38%, 08/01/2015 | | | 124,230 | |
| | 40,000 | | Rogers Wireless Communications, Inc. | | | | |
| | | | 6.38%, 03/01/2014 | | | 41,200 | |
| | | | | | | 1,955,239 | |
| | | | Total Corporate Bonds | | | | |
| | | | (Cost $127,960,388) | | | 131,166,656 | |
| | | FOREIGN GOVERNMENT | | | |
| | | NOTE/BONDS - 0.90% | | | |
| | | Brazil Federative Republic | | | |
| $ | 145,000 | | 10.13%, 05/15/2027 | | $ | 210,975 | |
| | 802,000 | | 11.00%, 08/17/2040 (b) | | | 1,082,900 | |
| | 191,704 | | Canadian Government Inflationary | | | | |
| | | | Index Note | | | | |
| | | | 4.00%, 12/01/2031 (k) | | | 240,108 | |
| | 388,000 | | Republic of Colombia | | | | |
| | | | 7.38%, 09/18/2037 | | | 423,308 | |
| | 1,130,000 | | Republic of Deutschland | | | | |
| | | | 3.75%, 01/04/2015 | | | 1,480,309 | |
| | 401,000 | | Republic of Panama | | | | |
| | | | 7.13%, 01/29/2026 | | | 435,085 | |
| | 980,000 | | Russia Federation | | | | |
| | | | 5.00%, 03/31/2030 | | | 1,114,577 | |
| | | | United Mexican States | | | | |
| | 14,000 | | 5.63%, 01/15/2017 (b) | | | 14,147 | |
| | 1,326,000 | | 6.75%, 09/27/2034 (b) | | | 1,449,318 | |
| | | | Total Foreign Government | | | | |
| | | | Note/Bonds (Cost $5,702,528) | | | 6,450,727 | |
| | | | MORTGAGE BACKED SECURITIES - 37.42% | |
| | | Bank of America Corporation | | | |
| | 1,500,000 | | Series 2006-5, 5.41%, 09/10/2016 | | | 1,506,048 | |
| | 770,000 | | Series 2005-5, 5.12%, 10/10/2045 | | | 758,901 | |
| | 1,500,000 | | Series 2006-4, 5.63%, 07/10/2046 | | | 1,528,467 | |
| | 3,500,000 | | Series 2005-6, 5.19%, 09/10/2047 | | | 3,486,390 | |
| | | | Bear Stearns Trust | | | | |
| | 696,226 | | Series 2004-9, 5.25%, 09/25/2034 | | | 698,152 | |
| | 3,000,000 | | Series 2005-PWR10, 5.41%, | | | | |
| | | | 12/11/2040 (b) | | | 3,016,596 | |
| | 1,500,000 | | Series 2006-TOP24, 5.54%, | | | | |
| | | | 10/12/2041 | | | 1,520,261 | |
| | | | Chase Mortgage Financial Trust | | | | |
| | 2,968,818 | | Series 2007-A1, 4.14%, | | | | |
| | | | 01/01/2049 | | | 2,915,443 | |
| | 2,959,150 | | Series 2007-A1, 4.37%, | | | | |
| | | | 01/01/2049 | | | 2,932,666 | |
| | 985,278 | | Series 2007-A1, 4.50%, | | | | |
| | | | 01/01/2049 | | | 977,889 | |
See notes to financial statements.
AssetMark Core Plus Fixed Income Fund
SCHEDULE OF INVESTMENTS (Continued)
March 31, 2007
Principal | | | | Market | |
Amount | | | | Value | |
| | | MORTGAGE BACKED SECURITIES | |
| | | (Continued) | | | |
| | | Citigroup Commercial Mortgage Trust | | | |
| $ | 2,000,000 | | Series 2006-C4, 5.72%, | | | |
| | | | 03/15/2049 | | $ | 2,061,389 | |
| | 4,000,000 | | Series 2006-C5, 5.43%, | | | | |
| | | | 10/15/2049 | | | 4,012,473 | |
| | 2,500,000 | | Citigroup/Deutsche Bank | | | | |
| | | | Commerical Mortgage | | | | |
| | | | Series TR, 5.36%, 01/15/2046 (b) | | | 2,512,383 | |
| | 2,272,062 | | Countrywide Alternative Loan Trust | | | | |
| | | | Series 2006-OA10, 5.52%, | | | | |
| | | | 08/25/2046 | | | 2,272,196 | |
| | | | Countrywide Asset-Backed | | | | |
| | | | Certificates | | | | |
| | 974,239 | | Series 2005-36, 4.96%, | | | | |
| | | | 08/25/2035 | | | 970,423 | |
| | 1,723,219 | | Series 2005-27, 6.49%, | | | | |
| | | | 08/25/2035 | | | 1,641,291 | |
| | 1,430,601 | | Series 2005-59, 5.65%, | | | | |
| | | | 11/20/2035 | | | 1,436,555 | |
| | 944,087 | | Series 2005-51, 5.67%, | | | | |
| | | | 11/20/2035 | | | 948,340 | |
| | 2,356,653 | | Series 2005-62, 5.43%, | | | | |
| | | | 12/25/2035 | | | 2,369,255 | |
| | 1,208,411 | | Countrywide Home Loans | | | | |
| | | | Series 2005-R1, 5.68%, | | | | |
| | | | 03/25/2035 | | | 1,212,527 | |
| | | FHLMC | | | | | | |
| | 1,000,000 | | Series 2590, 5.00%, 03/15/2018 | | | | | | | 989,326 | |
| | 4,553,295 | | Pool #1G-0058, 4.61%, | | | | | | | | |
| | | | 01/01/2035 | | | | 4,528,200 | |
| | 2,330,340 | | Pool #1H-2524, 4.58%, | | | | | | | | |
| | | | 08/01/2035 | | | | 2,301,386 | |
| | 2,999,716 | | Pool #1Q-0160, 5.06%, | | | | | | | | |
| | | | 09/01/2035 | | | | 2,991,879 | |
| | | | FHLMC Gold | | | | | | | | |
| | 46,269 | | Pool #B1-2301, 4.00%, | | | | | | | | |
| | | | 02/01/2014 | | | | 44,964 | |
| | 76,527 | | Pool #B1-2730, 4.00%, | | | | | | | | |
| | | | 03/01/2014 | | | | 74,351 | |
| | 69,625 | | Pool #B1-2772, 4.00%, | | | | | | | | |
| | | | 03/01/2014 | | | | 67,631 | |
| | 63,059 | | Pool #B1-2818, 4.00%, | | | | | | | | |
| | | | 03/01/2014 | | | | 61,282 | |
| | | MORTGAGE BACKED SECURITIES | |
| | | (Continued) | | | |
| | | FHLMC Gold (Continued) | | | |
| $ | 72,437 | | Pool #B1-2819, 4.00%, | | | |
| | | | 03/01/2014 | | $ | 70,378 | |
| | 68,458 | | Pool #B1-2883, 4.00%, | | | | |
| | | | 03/01/2014 | | | 66,520 | |
| | 54,917 | | Pool #B1-2910, 4.00%, | | | | |
| | | | 03/01/2014 | | | 53,378 | |
| | 64,278 | | Pool #B1-2911, 4.00%, | | | | |
| | | | 03/01/2014 | | | 62,467 | |
| | 257,298 | | Pool #B1-3066, 4.00%, | | | | |
| | | | 03/01/2014 | | | 249,978 | |
| | 33,339 | | Pool #B1-3343, 4.00%, | | | | |
| | | | 04/01/2014 | | | 32,376 | |
| | 47,223 | | Pool #B1-3344, 4.00%, | | | | |
| | | | 04/01/2014 | | | 45,880 | |
| | 60,982 | | Pool #B1-3360, 4.00%, | | | | |
| | | | 04/01/2014 | | | 59,234 | |
| | 257,106 | | Pool #E9-6057, 4.50%, | | | | |
| | | | 05/01/2018 | | | 249,676 | |
| | 87,054 | | Pool #E9-6247, 4.50%, | | | | |
| | | | 05/01/2018 | | | 84,563 | |
| | 87,088 | | Pool #E9-6248, 4.50%, | | | | |
| | | | 05/01/2018 | | | 84,595 | |
| | 101,024 | | Pool #E9-7034, 4.50%, | | | | |
| | | | 06/01/2018 | | | 98,105 | |
| | 38,711 | | Pool #E9-9763, 4.50%, | | | | |
| | | | 09/01/2018 | | | 37,592 | |
| | 36,907 | | Pool #E9-9764, 4.50%, | | | | |
| | | | 09/01/2018 | | | 35,840 | |
| | 28,642 | | Pool #E9-9765, 4.50%, | | | |
| | | | 09/01/2018 | | | 27,815 | |
| | 168,336 | | Pool #E9-9768, 4.50%, | | | | |
| | | | 09/01/2018 | | | 163,472 | |
| | 83,326 | | Pool #E9-9769, 4.50%, | | | | |
| | | | 09/01/2018 | | | 80,918 | |
| | 53,093 | | Pool #E9-9770, 4.50%, | | | | |
| | | | 09/01/2018 | | | 51,559 | |
| | 92,950 | | Pool #B1-0170, 4.50%, | | | | |
| | | | 10/01/2018 | | | 90,264 | |
| | 102,877 | | Pool #B1-0207, 4.50%, | | | | |
| | | | 10/01/2018 | | | 99,904 | |
| | 102,192 | | Pool #E0-1481, 4.50%, | | | | |
| | | | 10/01/2018 | | | 99,245 | |
See notes to financial statements.
AssetMark Core Plus Fixed Income Fund
SCHEDULE OF INVESTMENTS (Continued)
March 31, 2007
Principal | | | | Market | |
Amount | | | | Value | |
| | | MORTGAGE BACKED SECURITIES | |
| | | (Continued) | | | |
| | | FHLMC Gold (Continued) | | | |
| $ | 102,667 | | Pool #B1-0931, 4.50%, | | | |
| | | | 11/01/2018 | | $ | 99,701 | |
| | 204,552 | | Pool #E0-1489, 4.50%, | | | | |
| | | | 11/01/2018 | | | 198,649 | |
| | 898,893 | | Pool #E0-1538, 5.00%, | | | | |
| | | | 12/01/2018 | | | 889,051 | |
| | 112,109 | | Pool #B1-1801, 4.50%, | | | | |
| | | | 01/01/2019 | | | 108,869 | |
| | 110,383 | | Pool #E0-1602, 4.50%, | | | | |
| | | | 03/01/2019 | | | 107,168 | |
| | 112,369 | | Pool #G1-1526, 4.50%, | | | | |
| | | | 03/01/2019 | | | 109,122 | |
| | 5,450,751 | | Pool #G1-2251, 4.00%, | | | | |
| | | | 06/01/2019 (b) | | | 5,152,796 | |
| | 1,515,570 | | Pool #G1-1719, 5.00%, | | | | |
| | | | 06/01/2020 | | | 1,497,426 | |
| | 1,535,408 | | Pool #G1-1733, 5.00%, | | | | |
| | | | 07/01/2020 | | | 1,515,346 | |
| | 867,065 | | Pool #D9-6291, 4.50%, | | | | |
| | | | 09/01/2023 | | | 826,448 | |
| | 634,328 | | Pool #C0-1385, 6.50%, | | | | |
| | | | 08/01/2032 | | | 652,192 | |
| | 225,362 | | Pool #C7-0562, 6.50%, | | | | |
| | | | 09/01/2032 | | | 231,708 | |
| | 282,235 | | Pool #C7-0760, 6.50%, | | | | |
| | | | 09/01/2032 | | | 290,183 | |
| | 2,532,587 | | Pool #78-0447, 4.26%, | | | |
| | | | 04/01/2033 | | | 2,525,912 | |
| | 3,689,110 | | Pool #G0-8085, 5.00%, | | | | |
| | | | 10/01/2035 | | | 3,570,091 | |
| | 3,000,000 | | First Union National Bank | | | | |
| | | | Commercial Mortgage | | | | |
| | | | Series 2000-C2, 7.20%, | | | | |
| | | | 10/15/2032 | | | 3,173,921 | |
| | | | FNMA | | | | |
| | 3,039,445 | | Pool #668357, 5.00%, | | | | |
| | | | 12/01/2017 | | | 3,007,741 | |
| | 174,520 | | Pool #694900, 4.50%, | | | | |
| | | | 04/01/2018 | | | 169,474 | |
| | 166,144 | | Pool #695826, 5.00%, | | | | |
| | | | 04/01/2018 | | | 164,339 | |
| | 264,934 | | Pool #254720, 4.50%, | | | | |
| | | | 05/01/2018 | | | 257,273 | |
| | | MORTGAGE BACKED SECURITIES | |
| | | (Continued) | | | |
| | | FNMA (Continued) | | | |
| $ | 101,761 | | Pool #695854, 4.50%, | | | |
| | | | 05/01/2018 | | $ | 98,818 | |
| | 204,961 | | Pool #695863, 4.50%, | | | | |
| | | | 05/01/2018 | | | 199,034 | |
| | 97,790 | | Pool #695893, 4.50%, | | | | |
| | | | 05/01/2018 | | | 94,962 | |
| | 417,967 | | Pool #697602, 4.50%, | | | | |
| | | | 05/01/2018 | | | 405,880 | |
| | 95,469 | | Pool #701379, 4.50%, | | | | |
| | | | 05/01/2018 | | | 92,708 | |
| | 85,076 | | Pool #702326, 4.50%, | | | | |
| | | | 05/01/2018 | | | 82,616 | |
| | 211,249 | | Pool #709817, 4.50%, | | | | |
| | | | 05/01/2018 | | | 205,140 | |
| | 87,065 | | Pool #687485, 4.50%, | | | | |
| | | | 06/01/2018 | | | 84,547 | |
| | 207,434 | | Pool #689085, 4.50%, | | | | |
| | | | 06/01/2018 | | | 201,435 | |
| | 1,526,120 | | Pool #707774, 4.50%, | | | | |
| | | | 06/01/2018 | | | 1,481,988 | |
| | 200,536 | | Pool #720307, 4.50%, | | | | |
| | | | 06/01/2018 | | | 194,737 | |
| | 112,070 | | Pool #720309, 4.50%, | | | | |
| | | | 06/01/2018 | | | 108,829 | |
| | 45,295 | | Pool #720311, 4.50%, | | | | |
| | | | 06/01/2018 | | | 43,994 | |
| | 46,529 | | Pool #720312, 4.50%, | | | |
| | | | 06/01/2018 | | | 45,184 | |
| | 549,333 | | Pool #720364, 4.50%, | | | | |
| | | | 06/01/2018 | | | 533,447 | |
| | 104,043 | | Pool #720370, 4.50%, | | | | |
| | | | 06/01/2018 | | | 101,034 | |
| | 109,108 | | Pool #720373, 4.50%, | | | | |
| | | | 06/01/2018 | | | 105,953 | |
| | 238,706 | | Pool #720718, 4.50%, | | | | |
| | | | 06/01/2018 | | | 231,804 | |
| | 287,552 | | Pool #721345, 4.50%, | | | | |
| | | | 06/01/2018 | | | 279,236 | |
| | 96,112 | | Pool #721346, 4.50%, | | | | |
| | | | 06/01/2018 | | | 93,333 | |
| | 4,176,729 | | Pool #555549, 5.00%, | | | | |
| | | | 06/01/2018 | | | 4,131,347 | |
See notes to financial statements.
AssetMark Core Plus Fixed Income Fund
SCHEDULE OF INVESTMENTS (Continued)
March 31, 2007
Principal | | | | Market | |
Amount | | | | Value | |
| | | MORTGAGE BACKED SECURITIES | |
| | | (Continued) | | | |
| | | FNMA (Continued) | | | |
| $ | 60,260 | | Pool #254802, 4.50%, | | | |
| | | | 07/01/2018 | | $ | 58,517 | |
| | 106,119 | | Pool #720321, 4.50%, | | | | |
| | | | 07/01/2018 | | | 103,050 | |
| | 177,936 | | Pool #728746, 4.50%, | | | | |
| | | | 07/01/2018 | | | 172,790 | |
| | 4,528,389 | | Pool #734788, 4.00%, | | | | |
| | | | 09/01/2018 (b) | | | 4,288,127 | |
| | 2,860,230 | | Pool #254865, 4.50%, | | | | |
| | | | 09/01/2018 | | | 2,777,519 | |
| | 142,263 | | Pool #739798, 4.50%, | | | | |
| | | | 09/01/2018 | | | 138,149 | |
| | 104,855 | | Pool #747784, 4.50%, | | | | |
| | | | 10/01/2018 | | | 101,823 | |
| | 136,585 | | Pool #747967, 4.50%, | | | | |
| | | | 11/01/2018 | | | 132,635 | |
| | 132,144 | | Pool #752085, 4.50%, | | | | |
| | | | 11/01/2018 | | | 128,323 | |
| | 139,586 | | Pool #755501, 4.50%, | | | | |
| | | | 11/01/2018 | | | 135,549 | |
| | 563,098 | | Pool #745388, 5.00%, | | | | |
| | | | 11/01/2018 | | | 556,980 | |
| | 133,949 | | Pool #753656, 4.50%, | | | | |
| | | | 12/01/2018 | | | 130,076 | |
| | 95,737 | | Pool #757588, 4.50%, | | | | |
| | | | 12/01/2018 | | | 92,968 | |
| | 81,751 | | Pool #757593, 4.50%, | | | | |
| | | | 12/01/2018 | | | 79,386 | |
| | 97,119 | | Pool #757596, 4.50%, | | | |
| | | | 12/01/2018 | | | 94,311 | |
| | 104,093 | | Pool #762751, 4.50%, | | | | |
| | | | 12/01/2018 | | | 101,083 | |
| | 106,283 | | Pool #725050, 4.50%, | | | | |
| | | | 01/01/2019 | | | 103,210 | |
| | 148,726 | | Pool #725277, 4.50%, | | | | |
| | | | 03/01/2019 | | | 144,425 | |
| | 931,143 | | Pool #745387, 5.00%, | | | | |
| | | | 04/01/2019 | | | 921,026 | |
| | 139,331 | | Pool #735985, 5.00%, | | | | |
| | | | 06/01/2019 | | | 137,817 | |
| | 68,801 | | Pool #725608, 4.50%, | | | | |
| | | | 07/01/2019 | | | 66,719 | |
| | | MORTGAGE BACKED SECURITIES | |
| | | (Continued) | | | |
| | | FNMA (Continued) | | | |
| $ | 62,256 | | Pool #725792, 4.50%, | | | |
| | | | 08/01/2019 | | $ | 60,372 | |
| | 1,242,159 | | Pool #745268, 4.50%, | | | | |
| | | | 09/01/2019 | | | 1,206,239 | |
| | 355,104 | | Pool #735494, 4.50%, | | | | |
| | | | 03/01/2020 | | | 344,835 | |
| | 925,795 | | Pool #745395, 4.50%, | | | | |
| | | | 04/01/2020 | | | 899,023 | |
| | 1,750,857 | | Pool #254915, 4.50%, | | | | |
| | | | 09/01/2023 | | | 1,672,219 | |
| | 106,377 | | Pool #251925, 6.50%, | | | | |
| | | | 07/01/2028 | | | 109,790 | |
| | 55,500 | | Pool #435151, 6.50%, | | | | |
| | | | 07/01/2028 | | | 57,280 | |
| | 394,517 | | Pool #433575, 6.50%, | | | | |
| | | | 09/01/2028 | | | 407,174 | |
| | 383,426 | | Pool #251985, 6.50%, | | | | |
| | | | 10/01/2028 | | | 395,728 | |
| | 590,904 | | Pool #446107, 6.50%, | | | | |
| | | | 11/01/2028 | | | 609,862 | |
| | 683,844 | | Pool #452955, 6.50%, | | | | |
| | | | 11/01/2028 | | | 705,783 | |
| | 378,832 | | Pool #457553, 6.50%, | | | | |
| | | | 01/01/2029 | | | 390,986 | |
| | 244,803 | | Pool #252255, 6.50%, | | | | |
| | | | 02/01/2029 | | | 252,657 | |
| | 152,686 | | Pool #252342, 6.50%, | | | | |
| | | | 04/01/2029 | | | 157,494 | |
| | 567,588 | | Pool #323632, 6.50%, | | | |
| | | | 04/01/2029 | | | 585,811 | |
| | 665,835 | | Pool #494339, 6.50%, | | | | |
| | | | 04/01/2029 | | | 686,799 | |
| | 137,615 | | Pool #252497, 6.50%, | | | | |
| | | | 06/01/2029 | | | 141,948 | |
| | 69,913 | | Pool #498092, 6.50%, | | | | |
| | | | 06/01/2029 | | | 72,114 | |
| | 492,822 | | Pool #500441, 6.50%, | | | | |
| | | | 06/01/2029 | | | 508,340 | |
| | 773,200 | | Pool #501198, 6.50%, | | | | |
| | | | 06/01/2029 | | | 797,545 | |
| | 297,210 | | Pool #503223, 6.50%, | | | | |
| | | | 07/01/2029 | | | 306,568 | |
See notes to financial statements.
AssetMark Core Plus Fixed Income Fund
SCHEDULE OF INVESTMENTS (Continued)
March 31, 2007
Principal | | | | Market | |
Amount | | | | Value | |
| | | MORTGAGE BACKED SECURITIES | |
| | | (Continued) | | | |
| | | FNMA (Continued) | | | |
| $ | 97,925 | | Pool #504708, 6.50%, | | | |
| | | | 07/01/2029 | | $ | 101,009 | |
| | 90,251 | | Pool #535476, 6.50%, | | | | |
| | | | 07/01/2029 | | | 93,146 | |
| | 1,160,708 | | Pool #544859, 6.11%, | | | | |
| | | | 08/01/2029 | | | 1,174,739 | |
| | 6,784 | | Pool #479552, 7.50%, | | | | |
| | | | 09/01/2029 | | | 7,113 | |
| | 72,967 | | Pool #535506, 6.50%, | | | | |
| | | | 08/01/2030 | | | 75,265 | |
| | 6,380 | | Pool #535996, 7.50%, | | | | |
| | | | 06/01/2031 | | | 6,679 | |
| | 1,509,531 | | Pool #786848, 7.00%, | | | | |
| | | | 10/01/2031 | | | 1,573,769 | |
| | 1,005,689 | | Pool #607398, 6.50%, | | | | |
| | | | 11/01/2031 | | | 1,036,204 | |
| | 1,583,870 | | Pool #879906, 3.85%, | | | | |
| | | | 10/01/2033 | | | 1,583,068 | |
| | 1,502,474 | | Pool #733132, 3.85%, | | | | |
| | | | 04/01/2034 | | | 1,523,117 | |
| | 752,475 | | Series 2004-71, 4.00%, | | | | |
| | | | 04/25/2034 (Acquired | | | | |
| | | | 04/07/2006, Cost $39,505) (e)(j) | | | 30,446 | |
| | 1,384,529 | | Pool #782284, 6.00%, | | | | |
| | | | 09/01/2034 | | | 1,401,495 | |
| | 1,323,819 | | Pool #791563, 6.00%, | | | | |
| | | | 09/01/2034 | | | 1,337,576 | |
| | 56,284 | | Pool #794371, 6.00%, | | | | |
| | | | 09/01/2034 | | | 56,869 | |
| | 1,680,606 | | Pool #802783, 4.22%, | | | |
| | | | 10/01/2034 | | | 1,687,026 | |
| | 301,679 | | Pool #798711, 6.00%, | | | | |
| | | | 10/01/2034 | | | 304,814 | |
| | 1,066,909 | | Pool #802493, 6.00%, | | | | |
| | | | 11/01/2034 | | | 1,077,996 | |
| | 9,589,986 | | Pool #735224, 5.50%, | | | | |
| | | | 02/01/2035 (b) | | | 9,514,400 | |
| | 3,065,689 | | Pool #808057, 6.00%, | | | | |
| | | | 02/01/2035 | | | 3,091,512 | |
| | 1,503,827 | | Pool #773306, 6.00%, | | | | |
| | | | 05/01/2035 | | | 1,516,494 | |
| | | MORTGAGE BACKED SECURITIES | |
| | | (Continued) | | | |
| | | FNMA (Continued) | | | |
| $ | 6,045,287 | | Pool #827741, 5.50%, | | | |
| | | | 06/01/2035 | | $ | 5,990,116 | |
| | 929,304 | | Pool #821657, 7.50%, | | | | |
| | | | 06/01/2035 | | | 963,759 | |
| | 408,211 | | Pool #830490, 7.50%, | | | | |
| | | | 06/01/2035 | | | 423,346 | |
| | 2,053,040 | | Pool #829334, 4.60%, | | | | |
| | | | 09/01/2035 | | | 2,059,204 | |
| | 5,865,021 | | Pool #820345, 5.00%, | | | | |
| | | | 09/01/2035 | | | 5,674,053 | |
| | 13,529,339 | | Pool #832738, 5.50%, | | | | |
| | | | 09/01/2035 (b) | | | 13,405,867 | |
| | 508,429 | | Pool #836273, 5.50%, | | | | |
| | | | 10/01/2035 | | | 503,789 | |
| | 163,774 | | Pool #745000, 6.00%, | | | | |
| | | | 10/01/2035 | | | 165,153 | |
| | 1,338,951 | | Pool #836852, 6.89%, | | | | |
| | | | 10/01/2035 | | | 1,387,724 | |
| | 2,078,228 | | Pool #836464, 6.91%, | | | | |
| | | | 10/01/2035 | | | 2,154,032 | |
| | 3,702,432 | | Pool #844158, 5.00%, | | | | |
| | | | 11/01/2035 | | | 3,581,879 | |
| | 890,009 | | Pool #843823, 6.90%, | | | | |
| | | | 11/01/2035 | | | 922,429 | |
| | 162,670 | | Pool #843997, 6.91%, | | | | |
| | | | 11/01/2035 | | | 168,599 | |
| | 156,718 | | Pool #844052, 6.91%, | | | |
| | | | 11/01/2035 | | | 162,430 | |
| | 157,406 | | Pool #844148, 6.91%, | | | | |
| | | | 11/01/2035 | | | 163,143 | |
| | 163,056 | | Pool #844237, 6.92%, | | | | |
| | | | 11/01/2035 | | | 168,999 | |
| | 154,847 | | Pool #844789, 6.92%, | | | | |
| | | | 11/01/2035 | | | 160,492 | |
| | 201,008 | | Pool #833642, 7.50%, | | | | |
| | | | 05/01/2036 | | | 208,407 | |
| | 969,505 | | Pool #256331, 7.50%, | | | | |
| | | | 06/01/2036 | | | 1,005,191 | |
| | 182,732 | | Pool #887729, 7.50%, | | | | |
| | | | 07/01/2036 | | | 189,459 | |
| | 190,050 | | Pool #893287, 7.50%, | | | | |
| | | | 07/01/2036 | | | 197,045 | |
See notes to financial statements.
AssetMark Core Plus Fixed Income Fund
SCHEDULE OF INVESTMENTS (Continued)
March 31, 2007
Principal | | | | Market | |
Amount | | | | Value | |
| | | MORTGAGE BACKED SECURITIES | |
| | | (Continued) | | | |
| | | FNMA (Continued) | | | |
| $ | 232,077 | | Pool #895099, 7.50%, | | | |
| | | | 08/01/2036 | | $ | 240,619 | |
| | 1,559,416 | | Pool #893681, 6.00%, | | | | |
| | | | 10/01/2036 | | | 1,571,495 | |
| | 3,237,555 | | Pool #893923, 6.00%, | | | | |
| | | | 10/01/2036 | | | 3,262,632 | |
| | 3,996,272 | | Pool #894005, 6.00%, | | | | |
| | | | 10/01/2036 | | | 4,027,226 | |
| | 32,688 | | Pool #831774, 7.50%, | | | | |
| | | | 10/01/2036 | | | 33,891 | |
| | 3,000,000 | | GE Capital Commercial Mortgage | | | | |
| | | | Corporation | | | | |
| | | | Series 2005-C4, 5.33%, | | | | |
| | | | 11/10/2045 | | | 3,013,745 | |
| | 2,500,000 | | General Motors Acceptance | | | | |
| | | | Corporation | | | | |
| | | | Series 2002-C1, 6.28%, | | | | |
| | | | 11/15/2039 | | | 2,611,027 | |
| | | GNMA | | | |
| | 170,665 | | Pool #614436X, 5.00%, | | | |
| | | | 08/15/2033 | | | 166,392 | |
| | 1,596,258 | | Pool #618907X, 5.00%, | | | | |
| | | | 09/15/2033 | | | 1,556,296 | |
| | 269,024 | | Pool #605098X, 5.00%, | | | | |
| | | | 03/15/2034 | | | 262,140 | |
| | 500,558 | | Pool #081116M, 4.75%, | | | | |
| | | | 10/20/2034 | | | 499,747 | |
| | 170,580 | | Pool #520279X, 5.00%, | | | | |
| | | | 11/15/2034 | | | 166,215 | |
| | 580,776 | | Pool #081150M, 4.50%, | | | | |
| | | | 11/20/2034 | | | 577,906 | |
| | 1,563,717 | | Pool #081153M, 4.75%, | | | | |
| | | | 11/20/2034 | | | 1,561,176 | |
| | 4,242,820 | | Pool #644812X, 6.00%, | | | | |
| | | | 05/15/2035 | | | 4,300,915 | |
| | 800,000 | | GS Mortgage Securities | | | | |
| | | | Corporation II | | | | |
| | | | Series 2005-GG4, 4.68%, | | | | |
| | | | 07/10/2039 | | | 781,211 | |
| | | | Harborview Mortgage Loan Trust | | | | |
| | 1,832,206 | | Series 2005-10, 5.63%, | | | | |
| | | | 11/19/2035 | | | 1,838,429 | |
| | | MORTGAGE BACKED SECURITIES | |
| | | (Continued) | | | |
| | | Harborview Mortgage Loan Trust (Continued) | |
| $ | 466,803 | | Series 2005-16, 5.56%, | | | |
| | | | 01/19/2036 | | $ | 468,021 | |
| | 2,245,428 | | Series 2005-16, 5.57%, | | | | |
| | | | 01/19/2036 | | | 2,250,947 | |
| | 1,997,164 | | IMPAC Secured Assets Corp. | | | | |
| | | | Series 2005-2, 5.64%, | | | | |
| | | | 03/25/2036 | | | 2,004,902 | |
| | 499,872 | | Indymac Mortgage Loan Trust | | | | |
| | | | Series 2005-AR15, 5.10%, | | | | |
| | | | 09/25/2035 | | | 487,222 | |
| | | | JP Morgan Commercial Mortgage | | | | |
| | 1,880,000 | | Series 2005-CIBC12, 4.90%, | | | | |
| | | | 09/12/2037 | | | 1,826,723 | |
| | 1,500,000 | | Series 2005-LDP2, 4.74%, | | | | |
| | | | 07/15/2042 | | | 1,442,351 | |
| | 2,500,000 | | Series 2006-CIBC15, 5.81%, | | | | |
| | | | 06/12/2043 | | | 2,580,792 | |
| | 2,000,000 | | Series 2006-CIBC17, 5.43%, | | | | |
| | | | 12/12/2043 | | | 2,006,331 | |
| | 3,500,000 | | Series 2006-LDP8, 5.40%, | | | | |
| | | | 05/15/2045 | | | 3,504,888 | |
| | | JP Morgan Mortgage Trust | | | |
| | 993,553 | | Series 2007-A1, 4.07%, | | | |
| | | | 07/25/2035 | | | 976,102 | |
| | 989,814 | | Series 2007-A1, 4.20%, | | | | |
| | | | 07/25/2035 | | | 973,860 | |
| | 981,125 | | Series 2007-A1, 4.77%, | | | | |
| | | | 07/25/2035 | | | 973,695 | |
| | | | Lehman Brothers Trust | | | | |
| | 1,584,319 | | Series 2005-5N, 5.62%, | | | | |
| | | | 11/25/2035 | | | 1,586,242 | |
| | 1,473,347 | | Series 2005-5N, 5.63%, | | | | |
| | | | 11/25/2035 | | | 1,478,040 | |
| | | | Lehman Brothers-UBS Commercial | | | | |
| | | | Mortgage Trust | | | | |
| | 600,000 | | Series 2005-C3, 4.66%, | | | | |
| | | | 07/15/2030 | | | 585,737 | |
| | 520,000 | | Series 2005-C3, 4.74%, | | | | |
| | | | 07/15/2030 (b) | | | 500,784 | |
| | 2,000,000 | | Series 2006-C1, 5.16%, | | | | |
| | | | 02/15/2031 | | | 1,974,580 | |
See notes to financial statements.
AssetMark Core Plus Fixed Income Fund
SCHEDULE OF INVESTMENTS (Continued)
March 31, 2007
Principal | | | | Market | |
Amount | | | | Value | |
| | | MORTGAGE BACKED SECURITIES | |
| | | (Continued) | | | |
| $ | 1,030,000 | | Merrill Lynch Mortgage Trust | | | |
| | | | Series 2006-C1, 5.66%, | | | |
| | | | 05/12/2039 | | $ | 1,058,328 | |
| | | | Morgan Stanley | | | | |
| | 770,000 | | Series 2005-HQ6, 4.99%, | | | | |
| | | | 08/13/2042 | | | 753,247 | |
| | 2,300,000 | | Series 2007-TOP25, 5.51%, | | | | |
| | | | 11/12/2049 | | | 2,324,533 | |
| | 1,745,895 | | Residential Accredit Loans, Inc. | | | | |
| | | | Series 2005-QO4, 5.60%, | | | | |
| | | | 12/25/2045 | | | 1,754,158 | |
| | | | Thornburg Mortgage Trust | | | | |
| | 4,444,047 | | Series 2006-1, 5.50%, | | | | |
| | | | 01/25/2036 | | | 4,441,409 | |
| | 2,885,677 | | Series 2006-3, 5.43%, | | | | |
| | | | 06/25/2036 | | | 2,883,050 | |
| | 2,845,204 | | Series 2006-3, 5.44%, | | | | |
| | | | 06/25/2036 | | | 2,841,975 | |
| | | | Washington Mutual | | | | |
| | 1,500,000 | | Series 2007-HY4, 5.53%, | | | | |
| | | | 09/25/2036 | | | 1,500,469 | |
| | 2,461,593 | | Series 2007-HY2, 5.65%, | | | | |
| | | | 12/25/2036 | | | 2,469,754 | |
| | 1,947,422 | | Series 2005-AR13, 5.61%, | | | | |
| | | | 10/25/2045 | | | 1,951,424 | |
| | 2,240,547 | | Series 2005-AR15, 5.58%, | | | | |
| | | | 11/25/2045 | | | 2,248,792 | |
| | 1,856,453 | | Series 2005-AR15, 5.61%, | | | |
| | | | 11/25/2045 | | | 1,863,814 | |
| | 1,893,864 | | Series 2005-AR17, 5.59%, | | | | |
| | | | 12/25/2045 | | | 1,900,452 | |
| | 1,615,726 | | Series 2005-AR19, 5.59%, | | | | |
| | | | 12/25/2045 | | | 1,621,491 | |
| | 944,882 | | Series 2006-AR11, 5.85%, | | | | |
| | 1,672,283 | | Series 2006-AR7, 5.85%, | | | | |
| | | | 09/25/2046 | | | 1,673,459 | |
| | 1,808,567 | | Series 2006-AR13, 5.81%, | | | | |
| | | | 10/25/2046 | | | 1,808,990 | |
| | 961,052 | | Series 2007-OA2, 5.63%, | | | | |
| | | | 03/25/2047 | | | 960,151 | |
| | | MORTGAGE BACKED SECURITIES | |
| | | (Continued) | | | |
| | | Wells Fargo Company | | | |
| $ | 2,014,634 | | Series 2005-AR16, 4.98%, | | | |
| | | | 10/25/2035 | | $ | 2,018,630 | |
| | | | 09/25/2046 | | | 945,583 | |
| | 4,412,096 | | Series 2006-AR2, 5.09%, | | | | |
| | | | 03/25/2036 | | | 4,407,660 | |
| | 1,686,328 | | Series 2006-AR10, 5.61%, | | | | |
| | | | 07/25/2036 | | | 1,684,888 | |
| | | | Total Mortgage Backed Securities | | | | |
| | | | (Cost $268,551,287) | | | 267,929,298 | |
| | | | MUNICIPAL BONDS - 0.40% | | | | |
| | 2,863,541 | | Virginia Housing Development Authority | |
| | | | 6.00%, 06/25/2034 | | | 2,863,569 | |
| | | | Total Municipal Bonds | | | | |
| | | | (Cost $2,816,113) | | | 2,863,569 | |
| | | | SUPRANATIONAL OBLIGATIONS - 0.51% | |
| | 1,150,000 | | Argentina | | | | |
| | | | 11.38%, 03/15/2010 (Acquired | | | | |
| | | | 07/06/2005, Cost $477,402) (d)(g) | | | 414,000 | |
| | 380,000 | | European Investment Bank | | | | |
| | | | 4.63%, 03/21/2012 | | | 376,690 | |
| | | | GazInvest | | | | |
| | 820,000 | | 7.25%, 10/30/2008 | | | 841,566 | |
| | 1,250,000 | | 6.21%, 11/22/2016 (c) | | | 1,253,750 | |
| | 250,000 | | General Motors Corporation | | | | |
| | | | 8.38%, 07/05/2033 | | | 316,358 | |
| | 480,000 | | Ministry of Finance of Russia | | | | |
| | | | 3.00%, 05/14/2008 | | | 467,232 | |
| | | | Total Supranational Obligations | | | | |
| | | | (Cost $3,728,299) | | | 3,669,596 | |
| | | U.S. GOVERNMENT AGENCY ISSUES - 25.68% | |
| | | FAMC - 0.06% | | | |
| | 420,000 | | 4.25%, 07/29/2008 | | | 416,170 | |
| | | | FFCB - 5.92% | | | | |
| | 4,900,000 | | 5.50%, 07/15/2011 (c) | | | 5,010,520 | |
| | 4,000,000 | | 4.55%, 08/10/2012 (b) | | | 3,944,516 | |
| | 9,000,000 | | 4.95%, 04/07/2014 (b) | | | 9,023,481 | |
| | 3,000,000 | | 4.50%, 01/22/2015 (b) | | | 2,917,152 | |
| | 7,400,000 | | 5.09%, 01/30/2015 (b) | | | 7,475,539 | |
| | 1,500,000 | | 4.80%, 10/19/2015 (b) | | | 1,484,264 | |
See notes to financial statements.
AssetMark Core Plus Fixed Income Fund
SCHEDULE OF INVESTMENTS (Continued)
March 31, 2007
Principal | | | | Market | |
Amount | | | | Value | |
| | | U.S. GOVERNMENT AGENCY ISSUES | |
| | | (Continued) | | | |
| | | FFCB (Continued) | | | |
| $ | 3,000,000 | | 5.20%, 11/28/2016 (b) | | $ | 3,047,214 | |
| | 9,300,000 | | 5.30%, 02/06/2017 (b) | | | 9,514,653 | |
| | | | FHLB - 5.39% | | | | |
| | 760,000 | | 5.13%, 06/13/2008 (b) | | | 761,271 | |
| | 400,000 | | 5.10%, 09/19/2008 (b) | | | 401,152 | |
| | 690,000 | | 5.40%, 01/02/2009 | | | 690,092 | |
| | 4,000,000 | | 7.38%, 02/12/2010 (b) | | | 4,270,352 | |
| | 1,200,000 | | 4.08%, 04/26/2010 (b) | | | 1,176,335 | |
| | 5,500,000 | | 5.25%, 06/11/2010 (b) | | | 5,574,789 | |
| | 6,000,000 | | 4.88%, 12/14/2012 (b) | | | 6,005,952 | |
| | 3,000,000 | | 5.31%, 12/28/2012 (b) | | | 3,067,425 | |
| | 5,000,000 | | 5.00%, 03/08/2013 (b) | | | 5,034,860 | |
| | 7,500,000 | | 5.38%, 06/14/2013 (b) | | | 7,699,500 | |
| | 460,000 | | 5.00%, 12/21/2015 | | | 460,476 | |
| | 180,000 | | 4.75%, 12/16/2016 | | | 176,646 | |
| | 3,170,000 | | 5.50%, 07/15/2036 (b) | | | 3,288,577 | |
| | | | FHLMC - 0.83% | | | | |
| | 1,990,000 | | 4.38%, 11/16/2007 (b) | | | 1,980,193 | |
| | 3,070,000 | | 4.75%, 01/18/2011 (b) | | | 3,064,173 | |
| | 880,000 | | 5.63%, 11/23/2035 (b) | | | 866,381 | |
| | | | FHLMC Gold - 0.20% | | | | |
| | 542,415 | | 5.00%, 10/01/2018 | | | 536,469 | |
| | 900,000 | | 5.00%, 04/15/2036 (h) | | | 869,906 | |
| | | | FNCL - 1.80% | | | | |
| | 6,800,000 | | 5.50%, 04/15/2021 (h) | | | 6,817,000 | |
| | 6,300,000 | | 5.00%, 05/01/2034 (h) | | | 6,087,375 | |
| | | FNMA - 8.25% | | | |
| | 400,000 | | 6.00%, 04/01/2019 (h) | | | 406,625 | |
| | 11,600,000 | | 6.50%, 04/01/2034 (h) | | | 11,835,619 | |
| | 29,850,000 | | 5.00%, 04/01/2036 (h) | | | 28,842,563 | |
| | 5,100,000 | | 5.50%, 04/15/2036 (h) | | | 5,047,409 | |
| | 160,000 | | 5.40%, 04/13/2009 | | | 160,003 | |
| | 490,000 | | 6.63%, 09/15/2009 (b) | | | 510,124 | |
| | 220,000 | | 7.25%, 01/15/2010 (b) | | | 233,941 | |
| | 8,600,000 | | 3.32%, 07/14/2010 (b) | | | 8,223,045 | |
| | 2,210,000 | | 4.63%, 10/15/2013 (b) | | | 2,177,911 | |
| | 1,630,000 | | 5.55%, 02/16/2017 | | | 1,637,265 | |
| | | | GNMA - 2.83% | | | | |
| | 3,000,000 | | 6.50%, 04/01/2029 (h) | | | 3,077,814 | |
| | 10,750,000 | | 6.00%, 04/01/2034 (h) | | | 10,891,094 | |
| | 6,300,000 | | 5.50%, 04/15/2036 (h) | | | 6,266,534 | |
| | | U.S. GOVERNMENT AGENCY ISSUES | |
| | | (Continued) | | | |
| | | Tennessee Valley Authority - 0.40% | | | |
| $ | 830,000 | | 5.98%, 04/01/2036 | | $ | 907,103 | |
| | 2,000,000 | | 5.38%, 04/01/2056 | | | 1,996,206 | |
| | | | Total U.S. Government Agency | | | | |
| | | | Issues (Cost $183,514,812) | | | 183,875,689 | |
| | | | U.S. TREASURY OBLIGATIONS - 9.43% | |
| | | | U.S. Treasury Bond - 1.49% | | | | |
| | 10,000 | | 4.25%, 11/15/2014 (b) | | | 9,766 | |
| | 401,452 | | 2.38%, 01/15/2017 (b)(i) | | | 407,521 | |
| | 80,000 | | 8.88%, 08/15/2017 | | | 107,000 | |
| | 880,467 | | 2.38%, 01/15/2025 (b)(i) | | | 886,451 | |
| | 387,501 | | 2.00%, 01/15/2026 (i) | | | 368,399 | |
| | 4,203,228 | | 2.38%, 01/15/2027 (b)(i) | | | 4,239,186 | |
| | 4,685,000 | | 4.50%, 02/15/2036 (b) | | | 4,418,545 | |
| | 210,000 | | 4.75%, 02/15/2037 (b) | | | 206,785 | |
| | | | | | | 10,643,653 | |
| | | U.S. Treasury Note - 7.34% | | | |
| | 290,000 | | 3.00%, 02/15/2008 (b) | | | 285,299 | |
| | 700,000 | | 3.38%, 02/15/2008 (b) | | | 690,895 | |
| | 4,470,000 | | 3.75%, 05/15/2008 (b) | | | 4,418,144 | |
| | 11,240,000 | | 3.38%, 10/15/2009 (b) | | | 10,926,516 | |
| | 683,750 | | 0.88%, 04/15/2010 (b)(i) | | | 661,342 | |
| | 1,060,000 | | 4.50%, 02/28/2011 (b) | | | 1,058,883 | |
| | 300,000 | | 4.75%, 03/31/2011 (b) | | | 302,367 | |
| | 5,106,917 | | 2.38%, 04/15/2011 (b)(i) | | | 5,174,946 | |
| | 7,540,000 | | 5.13%, 06/30/2011 (b) | | | 7,709,062 | |
| | 90,000 | | 4.63%, 10/31/2011 (b) | | | 90,323 | |
| | 220,000 | | 4.75%, 01/31/2012 (b) | | | 221,985 | |
| | 881,592 | | 1.88%, 07/15/2013 (b)(i) | | | 870,366 | |
| | 1,862,129 | | 2.00%, 01/15/2014 (b)(i) | | | 1,844,526 | |
| | 6,730,000 | | 4.00%, 02/15/2014 (b) | | | 6,494,457 | |
| | 1,417,337 | | 2.00%, 07/15/2014 (b)(i) | | | 1,404,051 | |
| | 31,799 | | 1.63%, 01/15/2015 (b)(i) | | | 30,537 | |
| | 2,267,923 | | 1.88%, 07/15/2015 (b)(i) | | | 2,217,693 | |
| | 2,000,000 | | 4.50%, 11/15/2015 (b) | | | 1,980,236 | |
| | 866,779 | | 2.00%, 01/15/2016 (b)(i) | | | 853,676 | |
| | 380,000 | | 5.13%, 05/15/2016 (b) | | | 393,018 | |
| | 4,830,531 | | 2.50%, 01/15/2016 (b)(i) | | | 4,958,279 | |
| | 10,000 | | 4.63%, 02/15/2017 (b) | | | 9,983 | |
| | | | | | | 52,596,584 | |
See notes to financial statements.
AssetMark Core Plus Fixed Income Fund
SCHEDULE OF INVESTMENTS (Continued)
March 31, 2007
Principal | | | | Market | |
Amount | | | | Value | |
| | | U.S. TREASURY OBLIGATIONS (Continued) | |
| | | U.S. Treasury Strip - 0.60% | | | |
| $ | 3,800,000 | | Effective yield, 5.07%, | | | |
| | | | 11/15/2021 (b) | | $ | 1,843,361 | |
| | 3,640,000 | | Effective yield, 5.08%, | | | | |
| | | | 11/15/2024 (b) | | | 1,519,536 | |
| | 2,400,000 | | Effective yield, 5.05%, | | | | |
| | | | 11/15/2026 | | | 912,535 | |
| | | | | | | 4,275,432 | |
| | | | Total U.S. Treasury Obligations | | | | |
| | | | (Cost $67,354,516) | | | 67,515,669 | |
Contracts | | | | | | |
| | | | PURCHASED OPTIONS - 0.00% | | | | |
| | | | Options - 0.00% | | | | |
| | 97 | | Eurodollar 90 Day Future | | | | |
| | | | Expiration: September, 2007, | | | | |
| | | | Exercise Price: $95.880 | | | 12,148 | |
| | | | Total Purchased Options | | | | |
| | | | (Cost $35,144) | | | 12,148 | |
Shares | | | | | |
| | | SHORT TERM INVESTMENTS - 9.68% | |
| | | Money Market Funds - 5.25% | | | |
| | 37,568,668 | | Federated Prime Obligations Fund | | | |
| | | | 5.18%, 01/01/2050 | | | 37,568,668 | |
| | | | | | | |
Principal | | | | | | |
Amount | | | | | | |
| | | | Repurchase Agreements - 4.33% | | | | |
| | | | Lehman Brothers Repurchase | | | | |
| | | | Agreement | | | | |
| $ | 31,000,000 | | 5.25%, 10/02/06 (Collateralized | | | | |
| | | | by non-U.S. Government debt | | | | |
| | | | securities, value $31,454,247, | | | | |
| | | | 0.00% to 6.25%, 11/15/24 | | | | |
| | | | to 08/01/36) | | | 31,000,000 | |
| | | | U.S. Government Agency Issues - 0.10% | |
| | | | FNMA | | | | |
| | 545,000 | | Effective yield, 5.20%, | | | | |
| | | | 06/25/07 (f) | | | 538,534 | |
| | 200,000 | | Effective yield, 5.20%, | | | | |
| | | | 06/28/07 (f) | | | 197,542 | |
| | | | | | | 736,076 | |
| | | | Total Short Term Investments | | | | |
| | | | (Cost $69,304,749) | | | 69,304,744 | |
Principal | | | | Market | |
Amount | | | | Value | |
| | | INVESTMENTS PURCHASED | | | |
| | | AS SECURITIES LENDING | | | |
| | | COLLATERAL - 29.73% | | | |
| | | COMMERCIAL PAPER - 12.58% | | | |
| $ | 9,837,062 | | Antalis Funding, 5.37%, | | | |
| | | | 04/10/07 (c) | | $ | 9,820,951 | |
| | 737,780 | | Chesham Finance LLC, 5.46%, | | | | |
| | | | 04/02/07 (c) | | | 737,444 | |
| | 8,607,429 | | Concord Minutemen Capital Co., | | | | |
| | | | 5.30%, 04/04/07 (c)(e) | | | 8,607,429 | |
| | 2,213,339 | | Duke Funding, 5.32%, | | | | |
| | | | 04/20/07 (c) | | | 2,203,563 | |
| | 8,115,576 | | Duke Funding, 5.32%, | | | | |
| | | | 04/13/07 (c) | | | 8,079,766 | |
| | 8,607,429 | | Fenway Funding LLC, 5.48%, | | | | |
| | | | 04/02/07 (c) | | | 8,603,498 | |
| | 9,837,062 | | KKR Atlantic Funding Trust, 5.33%, | | | | |
| | | | 04/23/07 (c) | | | 9,792,082 | |
| | 7,377,796 | | Laguna Corp., 5.34%, | | | | |
| | | | 05/31/07 (c) | | | 7,278,434 | |
| | 8,853,356 | | Mortgage Interest Networking Trust, | | | | |
| | | | 5.52%, 04/02/07 (c) | | | 8,849,283 | |
| | 4,180,751 | | Ocala Funding, 5.33%, | | | | |
| | | | 04/20/07 (c) | | | 4,161,636 | |
| | 4,426,678 | | Rams Funding LLC, 5.33%, | | | | |
| | | | 04/24/07 (c) | | | 4,407,743 | |
| | 7,377,796 | | Thornburg Mortgage Capital LLC, | | | | |
| | | | 5.33%, 04/13/07 (c) | | | 7,345,211 | |
| | 7,377,796 | | Valcour Bay Capital LLC, 5.36%, | | | | |
| | | | 04/02/07 (c) | | | 7,281,309 | |
| | 2,951,119 | | Valcour Bay Capital LLC, 5.34%, | | | | |
| | | | 04/02/07 (c) | | | 2,939,344 | |
| | | | Total Commercial Paper | | | | |
| | | | (Cost $90,107,693) | | | 90,107,693 | |
| | | CORPORATE BONDS AND NOTES - 0.76% | |
| | 2,459,265 | | Bayerische Landesbank, 5.37%, | | | |
| | | | 12/24/15 | | | 2,459,265 | |
| | 2,951,119 | | Metlife Global, 5.42%, 04/28/08 | | | 2,951,119 | |
| | | | Total Corporate Bonds and Notes | | | | |
| | | | (Cost $5,410,384) | | | 5,410,384 | |
See notes to financial statements.
AssetMark Core Plus Fixed Income Fund
SCHEDULE OF INVESTMENTS (Continued)
March 31, 2007
Principal | | | | | | | Market | |
Amount | | | | | | | Value | |
| | | CORPORATE PAYDOWN SECURITIES - 1.26% | |
| $ | 2,459,265 | | Duke Funding, 5.43%, | | | | | | |
| | | | 04/08/07 (c) | | | $ | 2,459,265 | |
| | 6,596,380 | | Leafs LLC, 5.32%, 04/20/07 (c) | | | | | | | 6,596,380 | |
| | | | Total Corporate Paydown | | | | | | | | |
Securities (Cost $9,055,645) | | | | 9,055,645 | |
Shares | | | | | | | | | | |
| | | | MUTUAL FUNDS - 0.19% | | | | | | | | |
| | 1,327,687 | | AIM STIT-Liquid Assets Portfolio | | | | 1,327,687 | |
| | | | Total Mutual Funds | | | | | | | | |
| | | | (Cost $1,327,687) | | | | 1,327,687 | |
Principal | | | | | | |
Amount | | | | | | |
| | | REPURCHASE AGREEMENTS - 14.94% | |
| | 4,918,531 | | Bear Stearns Repurchase | | | | |
| | | | Agreement, 5.56%, 04/02/07 | | | | |
| | | | (Collateralized by U.S. | | | | |
| | | | Government debt securities, value | | | | |
| | | | $5,141,647,5.82% to 6.37%, | | | | |
| | | | 01/01/12 to 03/01/17) | | | | 4,918,531 | |
| | 12,296,327 | | Cantor Fitzgerald Repurchase | | | | | |
| | | | Agreement, 5.38%, 04/02/07 | | | | | |
| | | | (Collateralized by U.S. | | | | | |
| | | | Government Agency Issues, value | | | | | |
| | | | $12,979,961, 4.00to 7.50)%, | | | | | |
| | | | 06/01/08 to 03/01/37 | | | | 12,296,327 | |
| | 12,296,327 | | Cantor Fitzgerald Repurchase | | | | | |
| | | | Agreement, 5.38%, 04/02/07 | | | | | |
| | | | (Collateralized by U.S. Government | | | | | |
| | | | Agency Issues, value $12,485,870, | | | | | |
| | | | 4.50% to 9.00%, 01/01/08 to | | | | | |
| | | | 03/01/37) | | | | 12,296,327 | |
| | 24,592,654 | | CS First Boston Repurchase | | | | | |
| | | | Agreement, 5.38%, 04/02/07 | | | | | |
| | | | (Collateralized by non-U.S. | | | | | |
| | | | Government debt securities, value | | | | | |
| | | | $24,949,455, 0.00%to 9.16%, | | | | | |
| | | | 10/15/22 to 02/25/37) | | | | 24,592,654 | |
| | 2,459,265 | | CS First Boston Repurchase | | | | | |
| | | | Agreement, 5.38%, 04/02/07 | | | | | |
| | | | (Collateralized by non-U.S. Government | | | | | |
| | | | debt securities, value $2,582,016, 6.25%, | | | | | |
| | | | 02/25/37) | | | | 2,459,265 | |
Principal | | | | | | | | Market | |
Amount | | | | | | | | Value | |
| | | REPURCHASE AGREEMENTS (Continued) | | | |
| $ | 2,459,265 | | CS First Boston Repurchase | | | | | | | |
| | | | Agreement, 5.38%, 04/02/07 | | | | | | | |
| | | | (Collateralized by non-U.S. Government | | | | | |
| | | | debt securities, value $2,569,720, | | | | | | | |
| | | | 6.25%, 02/25/37) | | | | | | $ | | 2,459,265 | |
| | 2,459,265 | | CS First Boston Repurchase | | | | | | | | | |
| | | | Agreement, 5.38%, 04/02/07 | | | | | | | | | |
| | | | (Collateralized by U.S. Government | | | | | | | | | |
| | | | Agency Issues, value $2,503,770, | | | | | | | | | |
| | | | 0.00%, 04/25/37) | | | | | | | | 2,459,265 | |
| | 1,229,633 | | Merrill Lynch Repurchase | | | | | | | | | |
| | | | Agreement, 5.37%, 04/02/07 | | | | | | | | | |
| | | | (Collateralized by U.S. | | | | | | | | | |
| | | | Government Agency Issues, value | | | | | | | | | |
| | | | $1,249,171, 5.50%, 03/01/37) | | | | | | | | 1,229,633 | |
| | 44,266,778 | | Morgan Stanley Repurchase | | | | | | | | | |
| | | | Agreement, 5.51%, 04/02/07 | | | | | | | | | |
| | | | (Collateralized by non-U.S. Government | | | | | | |
| | | | debt securities, value $47,602,415, | �� | | | | | | | | |
| | | | 0.00% to 6.99%, 11/20/08 to | | | | | | | | | |
| | | | 09/20/43) | | | | | | | | 44,266,778 | |
| | | | Total Repurchase Agreements | | | | | | | | | |
| | | | (Cost $106,978,045) | | | | | 106,978,045 | |
| | | | Total Investments Purchased as | | | | | | | | | |
| | | | Securities Lending Collateral | | | | | | | | | |
| | | | (Cost $212,879,454) | | | | | 212,879,454 | |
| | | | Total Investments | | | | | | | | | |
| | | | (Cost $1,000,473,073) - 140.24% | | | | | 1,004,149,680 | |
| | | | Liabilities in Excess of | | | | | | | | | |
| | | | Other Assets - (40.24)% | | | | | (288,131,851 | ) |
| | | | TOTAL NET | | | | | | | | | |
| | | | ASSETS - 100.00% | | | | $ | 716,017,829 | |
| | | | | | | | | | | | | |
| (a) | Non Income Producing. |
| (b) | All or a portion of this security is on loan. |
| (c) | Restricted securities as defined in Rule 144(a) under the Securities |
| | Act of 1933. Such securities are treated as liquid securities |
| | according to the Fund’s liquidity guidelines. The market value of |
| | these securities total $136,437,628, which represents 19.0% of |
| | total net assets. |
| (d) | Restricted securities as defined in Rule 144(a) under the Securities |
| | Act of 1933. Such securities are treated as illiquid securities |
| | according to the Fund’s liquidity guidelines. The market value of |
| | these securities total $12,759,146, which represents 1.8% of total |
| | net assets. |
See notes to financial statements.
AssetMark Core Plus Fixed Income Fund
SCHEDULE OF INVESTMENTS (Continued)
March 31, 2007
| (e) | Variable Rate Security. The rate shown is the rate in effect on |
| | March 31, 2007. |
| (f) | Assigned as collateral for certain futures and options contracts. |
| (g) | Non-income producing. Item identified as in default as to |
| | payment of interest. |
| (h) | Security purchased on a when-issued basis. On March 31, 2007 |
| | the total value of the investments purchased on a when-issued |
| | basis was $80,141,939 or 11.2% of total net assets. |
| (i) | Represents a U.S. Treasury Inflation Protected Security. |
| (j) | Represents an interest only security that entitles holders to receive |
| | only interest payments on the underlying mortgages. The yield to |
| | maturity of an interest only security is extremely sensitive to the |
| | rate of principal payments on the underlying mortgage assets. A |
| | rapid (slow) rate of principal repayments may have an adverse |
| | (positive) effect on yield to maturity. The principal amount shown |
| | is the national amount of the underlying mortgages. Interest rate |
| | disclosed represents yield upon the estimated timing and amount |
| | of future cash flows at March 31, 2007. The security is illiquid |
| | and represents less than 0.1% of net assets. |
| (k) | Inflation-indexed bond. Principal amount is adjusted for |
| | inflation and interest payments equal a percentage of the |
| | inflation-adjusted principal amount. |
| (l) | Credit linked note. Investment performance is wholly or |
| | partially derived from an underlying source. |
See notes to financial statements.
AssetMark Core Plus Fixed Income
SCHEDULE OF OPTIONS WRITTEN
March 31, 2007
| | | | | | Market | |
Contracts | | | | | Value | |
| | | CALL OPTIONS | | | | |
| | 116 | | U.S. Treasury 10 Year Note Future | | | |
| | | | Expiration: June, 2007, | | | | |
| | | | Exercise Price: $116.00 | | $ | 10,875 | |
| | | | PUT OPTIONS | | | | | |
| | 116 | | U.S. Treasury 10 Year Note Future | | | | |
| | | | Expiration: June, 2007, | | | | | |
| | | | Exercise Price: $108.00 | | | 21,750 | |
| | | | Total Options Written | | | | | |
| | | | (Premiums received $46,308) | . . . | | $ | 32,625 | |
| | | | | | | | | |
See notes to financial statements.
| AssetMark Core Plus Fixed Income | | | | | | | |
| SCHEDULE OF OPEN FORWARD CURRENCY CONTRACTS | | | | |
| March 31, 2007 | | | | | | | | |
| | | | | | | | | |
| | | Amount of | | Amount of | | Unrealized |
Forward | Currency to | Currency to be | Currency to | Currency to | | Appreciation |
expiration date | be received | received/(sold) | be delivered | be delivered | | (Depreciation) |
| 04/30/07 | U.S. Dollars | 800,000 | | Brazil Real | 1,733,320 | | | |
| 05/07/07 | U.S. Dollars | 2,213,380 | | Brazil Real | 4,744,380 | | (71,789) | |
| 06/05/07 | U.S. Dollars | 1,309,316 | | Brazil Real | 2,766,847 | | (28,104) | |
| 06/06/07 | U.S. Dollars | 1,286,466 | | Brazil Real | 2,777,223 | | (51,035) | |
| 06/12/07 | U.S. Dollars | 2,692,973 | | Brazil Real | 5,768,348 | | (82,906) | |
| 06/29/07 | U.S. Dollars | 736,490 | | Brazil Real | 1,540,000 | | (2,960) | |
| 05/09/07 | U.S. Dollars | 927,882 | | Canadian Dollars | 1,093,926 | | (21,054) | |
| 04/26/07 | U.S. Dollars | 1,479,723 | | European Monetary Unit | 1,107,994 | | (1,817) | |
| 05/09/07 | U.S. Dollars | 1,427,005 | | European Monetary Unit | 1,097,722 | | (41,585) | |
| 04/12/07 | U.S. Dollars | 2,662,720 | | Mexican Pesos | 29,552,913 | | (10,569) | |
| 04/12/07 | Mexican Pesos | 29,358,011 | | U.S. Dollars | 2,647,799 | | 10,628 | |
| | | | | | | | $(339,857) | |
| AssetMark Core Plus Fixed Income | | | | | | | | | |
| SCHEDULE OF OPEN FUTURES CONTRACTS | | | | | | | | |
| March 31, 2007 | | | | | | | | | |
| | | | | | | | | | |
| | | | | | | | | | |
| | Number of | | | | | | | |
| | Contracts | | | | Unrealized |
| | Purchased | Notional | | Settlement | Appreciation |
Description | (Sold) | Value | | Month | (Depreciation) |
| Australian 3 Year Bond Future | 335 | | 25,440,636 | | Jun-07 | | $ | (95,160) | |
| Australian 10 Year Bond Future | 30 | | 2,284,698 | | Jun-07 | | | (5,716) | |
| Euro Bond Future | 124 | | 19,035,894 | | Jun-07 | | | (196,289) | |
| Eurodollar 90 Day Futures | 33 | | 7,860,188 | | Mar-08 | | | 12,013 | |
| Eurodollar 90 Day Futures | 136 | | 32,209,900 | | Jun-07 | | | (15,428) | |
| Eurodollar 90 Day Futures | 21 | | 5,055,613 | | Jun-08 | | | 9,941 | |
| Eurodollar 90 Day Futures | 115 | | 27,290,938 | | Sep-07 | | | (14,059) | |
| Eurodollar 90 Day Futures | (357) | | (84,899,063) | | Dec-07 | | | 29,103 | |
| Libor 90 Day Futures | 267 | | 61,861,016 | | Sep-07 | | | (159,185) | |
| U.S. Treasury 2 Year Note Futures | 220 | | 45,075,936 | | Jun-07 | | | 91,765 | |
| U.S. Treasury 5 Year Note Futures | 618 | | 65,382,471 | | Jun-07 | | | (134,110) | |
| U.S. Treasury 10 Year Note Futures | (532) | | (57,522,500) | | Jun-07 | | | (186,308) | |
| U.S. Treasury Long Bond Futures | (77) | | (8,566,250) | | Jun-07 | | | 87,837 | |
| | | | | | | | | $(575,596) | |
AssetMark Funds
STATEMENTS OF ASSETS & LIABILITIES
March 31, 2007
| | | | Large Cap | | | Large Cap | | | Small/Mid Cap | | | Small/Mid Cap | |
| | | | Growth Fund | | | Value Fund | | | Growth Fund | | | Value Fund | |
| ASSETS: | | | | | | | | | | | | |
| | Investments, at value (cost $808,350,190, | | | | | | | | | | | | |
| | $682,332,421, $179,995,586 and | | | | | | | | | | | | |
| | $125,657,413, respectively)1 | | $ | 874,603,557 | | | $ | 782,681,277 | | | $ | 201,793,341 | | | $ | 131,475,337 | |
| | Repurchase Agreements (cost $119,097,028, | | | | | | | | | | | | | | | | |
| | $101,820,797, $29,113,746 and | | | | | | | | | | | | | | | | |
| | $20,760,069, respectively) | | | 119,097,028 | | | | 101,820,797 | | | | 29,113,746 | | | | 20,760,069 | |
| | Cash | | | — | | | | 297 | | | | 964,523 | | | | — | |
| | Receivable for investment securities sold | | | 625,052 | | | | — | | | | 3,964,056 | | | | — | |
| | Income receivable | | | 763,357 | | | | 1,321,061 | | | | 85,171 | | | | 80,299 | |
| | Receivable for fund shares sold | | | 884,243 | | | | 784,677 | | | | 211,345 | | | | 132,505 | |
| | Other assets | | | 41,524 | | | | 43,187 | | | | 14,768 | | | | 17,478 | |
| | Total Assets | | | 996,014,761 | | | | 886,651,296 | | | | 236,146,950 | | | | 152,465,688 | |
| LIABILITIES: | | | | | | | | | | | | | | | | |
| | Collateral on securities loaned | | | 236,995,445 | | | | 202,616,856 | | | | 57,934,484 | | | | 41,311,210 | |
| | Payable to Investment Advisor | | | 556,864 | | | | 521,723 | | | | 135,174 | | | | 98,807 | |
| | Payable to Custodian | | | 17,475 | | | | 19,543 | | | | 5,559 | | | | 3,119 | |
| | Payable for investment securities purchased | | | 3,595,268 | | | | — | | | | 6,432,556 | | | | 778,008 | |
| | Payable for fund shares redeemed | | | 867,625 | | | | 762,501 | | | | 130,939 | | | | 112,007 | |
| | Other accrued expenses | | | 343,781 | | | | 321,695 | | | | 104,306 | | | | 82,997 | |
| | Total Liabilities | | | 242,376,458 | | | | 204,242,318 | | | | 64,743,018 | | | | 42,386,148 | |
| NET ASSETS | | $ | 753,638,303 | | | $ | 682,408,978 | | | $ | 171,403,932 | | | $ | 110,079,540 | |
| | | | | | | | | | | | | | | | | | |
| NET ASSETS CONSIST OF: | | | | | | | | | | | | | | | | |
| | Capital stock | | | 674,349,322 | | | | 562,262,667 | | | | 140,382,258 | | | | 102,318,896 | |
| | Unrealized appreciation on investments | | | 66,253,367 | | | | 100,348,856 | | | | 21,797,755 | | | | 5,817,924 | |
| | Accumulated undistributed net investment | | | | | | | | | | | | | | | | |
| | income | | | 14,780 | | | | 1,823,474 | | | | — | | | | 38,800 | |
| | Accumulated undistributed net realized gain | | | 13,020,834 | | | | 17,973,981 | | | | 9,223,919 | | | | 1,903,920 | |
| | Total Net Assets | | $ | 753,638,303 | | | $ | 682,408,978 | | | $ | 171,403,932 | | | $ | 110,079,540 | |
| | | | | | | | | | | | | | | | | | |
| | Shares outstanding (unlimited shares | | | | | | | | | | | | | | | | |
| | of no par value authorized) | | | 78,309,235 | | | | 55,280,520 | | | | 16,089,896 | | | | 9,211,943 | |
| | Net asset value, offering and | | | | | | | | | | | | | | | | |
| | redemption price per share | | $ | 9.62 | | | $ | 12.34 | | | $ | 10.65 | | | $ | 11.95 | |
| | | | | | | | | | | | | | | | | | |
| | | | | | | | | | | | | | | | | | |
1 | Includes loaned securities with a market value of: | | $ | 229,095,906 | | | $ | 194,757,323 | | | $ | 55,961,029 | | | $ | 39,788,984 | |
| | | | | | | | | | | | | | | | | | |
See notes to financial statements.
AssetMark Funds
STATEMENTS OF ASSETS & LIABILITIES (Continued)
March 31, 2007
| | | | International | | | Real Estate | | | Tax-Exempt | | | Core Plus | |
| | | | Equity | | | Securities | | | Fixed Income | | | Fixed Income | |
| | | | Fund | | | Fund | | | Fund | | | Fund | |
| ASSETS: | | | | | | | | | | | | |
| | Investments, at value (cost $683,929,206, | | | | | | | | | | | | |
| | $99,476,723, $246,674,581 and | | | | | | | | | | | | |
| | $862,495,028, respectively)1 | | $ | 816,317,781 | | | $ | 140,139,455 | | | $ | 248,092,614 | | | $ | 866,171,635 | |
| | Foreign currencies (cost $17,633,465, $0, $0 and | | | | | | | | | | | | | | | | |
| | $1,639,684 respectively) | | | 17,633,314 | | | | — | | | | — | | | | 1,639,769 | |
| | Repurchase Agreements (cost $34,152,570, | | | | | | | | | | | | | | | | |
| | $23,077,745, $0 and $137,978,045, respectively) | | | 34,152,570 | | | | 23,077,745 | | | | — | | | | 137,978,045 | |
| | Variation margin on futures contracts | | | — | | | | — | | | | — | | | | 17,257 | |
| | Cash | | | — | | | | 12,351 | | | | — | | | | 387,967 | |
| | Receivable for investment securities sold | | | 6,658,796 | | | | 110,716 | | | | 3,147,565 | | | | 8,435,721 | |
| | Income receivable | | | 2,082,835 | | | | 423,815 | | | | 3,226,028 | | | | 5,559,902 | |
| | Receivable for fund shares sold | | | 921,688 | | | | 213,133 | | | | 922,187 | | | | 983,212 | |
| | Other assets | | | 25,370 | | | | 6,076 | | | | 6,883 | | | | 38,433 | |
| | Total Assets | | | 877,792,354 | | | | 163,983,291 | | | | 255,395,277 | | | | 1,021,211,941 | |
| LIABILITIES: | | | | | | | | | | | | | | | | |
| | Options written at value (Premium received $0, $0, | | | | | | | | | | | | | | | | |
| | $0 and $46,308, respectively | | | — | | | | — | | | | — | | | | 32,625 | |
| | Collateral on securities loaned | | | 67,961,428 | | | | 45,923,235 | | | | — | | | | 212,879,454 | �� |
| | Depreciation of forward foreign currency contracts | | | — | | | | — | | | | — | | | | 339,857 | |
| | Payable to Investment Advisor | | | 595,899 | | | | 87,797 | | | | 165,688 | | | | 444,440 | |
| | Payable to Custodian | | | 78,840 | | | | 2,473 | | | | 3,902 | | | | 16,255 | |
| | Payable for investment securities purchased | | | 28,682,301 | | | | 306,373 | | | | 7,160,654 | | | | 89,827,510 | |
| | Payable for fund shares redeemed | | | 679,796 | | | | 119,210 | | | | 87,858 | | | | 1,318,255 | |
| | Other accrued expenses | | | 371,766 | | | | 82,082 | | | | 135,329 | | | | 335,716 | |
| | Total Liabilities | | | 98,370,030 | | | | 46,521,170 | | | | 7,553,431 | | | | 305,194,112 | |
| NET ASSETS | | $ | 779,422,324 | | | $ | 117,462,121 | | | $ | 247,841,846 | | | $ | 716,017,829 | |
| | | | | | | | | | | | | | | | | | |
| NET ASSETS CONSIST OF: | | | | | | | | | | | | | | | | |
| | Capital stock | | | 596,569,093 | | | | 72,044,386 | | | | 247,142,148 | | | | 718,446,364 | |
| | Unrealized appreciation/(depreciation) on: | | | | | | | | | | | | | | | | |
| | | | | 132,388,575 | | | | 40,662,732 | | | | 1,418,033 | | | | 3,676,607 | |
| | Written options | | | — | | | | — | | | | — | | | | 13,683 | |
| | Foreign currencies | | | (16,305 | ) | | | — | | | | — | | | | 18,496 | |
| | Futures contracts | | | — | | | | — | | | | — | | | | (575,596 | ) |
| | Forward currency exchange contracts | | | — | | | | — | | | | — | | | | (339,857 | ) |
| | Accumulated undistributed net investment | | | | | | | | | | | | | | | | |
| | income/(loss) | | | 1,340,053 | | | | — | | | | 73,322 | | | | (484,341 | ) |
| | Accumulated undistributed net realized gain/(loss) | | | 49,140,908 | | | | 4,755,003 | | | | (791,657 | ) | | | (4,737,527 | ) |
| | Total Net Assets | | $ | 779,422,324 | | | $ | 117,462,121 | | | $ | 247,841,846 | | | $ | 716,017,829 | |
| | | | | | | | | | | | | | | | | | |
| | Shares outstanding (unlimited shares | | | | | | | | | | | | | | | | |
| | of no par value authorized) | | | 52,920,039 | | | | 5,616,389 | | | | 22,688,450 | | | | 77,199,836 | |
| | Net asset value, offering and | | | | | | | | | | | | | | | | |
| | redemption price per share | | $ | 14.73 | | | $ | 20.91 | | | $ | 10.92 | | | $ | 9.27 | |
| | | | | | | | | | | | | | | | | | |
| | | | | | | | | | | | | | | | | | |
1 | Includes loaned securities with a market value of: | | $ | 64,917,252 | | | $ | 45,295,735 | | | $ | — | | | $ | 207,964,344 | |
| | | | | | | | | | | | | | | | | | |
See notes to financial statements.
AssetMark Funds
STATEMENTS OF OPERATIONS
For the Year Ended March 31, 2007
| | | Large Cap | | | Large Cap | | | Small/Mid Cap | | | Small/Mid Cap | |
| | | Growth Fund | | | Value Fund | | | Growth Fund | | | Value Fund | |
| INVESTMENT INCOME: | | | | | | | | | | | | |
| Dividend income (net of withholding tax of $0, | | | | | | | | | | | | |
| $5,145, $0 and $3,083, respectively) | | $ | 6,394,530 | | | $ | 14,298,534 | | | $ | 983,647 | | | $ | 4,731,045 | |
| Interest income | | | 787,754 | | | | 898,669 | | | | 172,508 | | | | 160,003 | |
| Total investment income | | | 7,182,284 | | | | 15,197,203 | | | | 1,156,155 | | | | 4,891,048 | |
| EXPENSES: | | | | | | | | | | | | | | | | |
| Investment advisory fees | | | 6,239,996 | | | | 6,007,991 | | | | 1,617,552 | | | | 1,512,074 | |
| Distribution (12b-1) fees | | | 1,700,659 | | | | 1,633,806 | | | | 425,672 | | | | 387,238 | |
| Shareholder servicing fees | | | 345,832 | | | | 324,761 | | | | 85,416 | | | | 85,448 | |
| Administration fees | | | 229,618 | | | | 222,725 | | | | 58,341 | | | | 53,668 | |
| Legal fees | | | 108,176 | | | | 100,375 | | | | 25,963 | | | | 21,749 | |
| Custody fees | | | 84,411 | | | | 72,040 | | | | 40,225 | | | | 65,264 | |
| Federal and state registration fees | | | 76,850 | | | | 58,897 | | | | 48,695 | | | | 42,390 | |
| Reports to shareholders | | | 70,539 | | | | 54,058 | | | | 53,276 | | | | 40,319 | |
| Fund accounting fees | | | 56,253 | | | | 55,596 | | | | 18,854 | | | | 15,550 | |
| Audit fees | | | 35,626 | | | | 35,851 | | | | 31,328 | | | | 32,186 | |
| Directors' fees and expenses | | | 34,918 | | | | 32,583 | | | | 8,126 | | | | 7,287 | |
| Transfer agent fees and expenses | | | 19,073 | | | | 18,879 | | | | 13,801 | | | | 13,652 | |
| Insurance fees | | | 18,811 | | | | 20,872 | | | | 5,722 | | | | 5,428 | |
| Payroll expense | | | 11,315 | | | | 10,585 | | | | 2,920 | | | | 2,920 | |
| Compliance fees | | | 1,076 | | | | 1,076 | | | | 335 | | | | 335 | |
| Total expenses before securities lending credit | | | 9,033,153 | | | | 8,650,095 | | | | 2,436,226 | | | | 2,285,508 | |
| Less securities lending credit (See Note 6) | | | (141,009 | ) | | | (267,817 | ) | | | (100,698 | ) | | | (98,440 | ) |
| Net expenses | | | 8,892,144 | | | | 8,382,278 | | | | 2,335,528 | | | | 2,187,068 | |
| Net investment income/(loss) | | | (1,709,860 | ) | | | 6,814,925 | | | | (1,179,373 | ) | | | 2,703,980 | |
| NET REALIZED AND UNREALIZED | | | | | | | | | | | | | | | | |
| GAIN/(LOSS) ON INVESTMENTS: | | | | | | | | | | | | | | | | |
| Net realized gain on investments | | | 15,119,963 | | | | 37,154,587 | | | | 11,591,748 | | | | 25,993,393 | |
| Net change in unrealized appreciation/(depreciation) | | | | | | | | | | | | | | | | |
| on investments | | | (11,405,943 | ) | | | 49,683,330 | | | | (8,817,990 | ) | | | (20,194,858 | ) |
| Net realized and unrealized gains | | | 3,714,020 | | | | 86,837,917 | | | | 2,773,758 | | | | 5,798,535 | |
| NET INCREASE IN NET ASSETS | | | | | | | | | | | | | | | | |
| RESULTING FROM OPERATIONS | | $ | 2,004,160 | | | $ | 93,652,842 | | | $ | 1,594,385 | | | $ | 8,502,515 | |
| | | | | | | | | | | | | | | | | |
See notes to financial statements.
AssetMark Funds
STATEMENTS OF OPERATIONS (Continued)
For the Year Ended March 31, 2007
| | | International | | | Real Estate | | | Tax-Exempt | | | Core Plus | |
| | | Equity | | | Securities | | | Fixed Income | | | Fixed Income | |
| | | Fund | | | Fund | | | Fund | | | Fund | |
| INVESTMENT INCOME: | | | | | | | | | | | | |
| Dividend income (net of withholding tax of | | | | | | | | | | | | |
| $1,728,215, $4,301, $0 and $0, respectively) | | $ | 15,887,883 | | | $ | 1,935,964 | | | $ | — | | | $ | 87,866 | |
| Interest income | | | 612,137 | | | | 103,543 | | | | 8,486,386 | | | | 34,614,492 | |
| Total investment income | | | 16,500,020 | | | | 2,039,507 | | | | 8,486,386 | | | | 34,702,358 | |
| EXPENSES: | | | | | | | | | | | | | | | | |
| Investment advisory fees | | | 6,575,116 | | | | 897,492 | | | | 1,781,238 | | | | 4,898,185 | |
| Distribution (12b-1) fees | | | 1,760,392 | | | | 236,182 | | | | 556,637 | | | | 1,644,028 | |
| Shareholder servicing fees | | | 347,078 | | | | 47,236 | | | | 115,327 | | | | 339,806 | |
| Administration fees | | | 243,437 | | | | 32,425 | | | | 76,033 | | | | 225,199 | |
| Legal fees | | | 115,732 | | | | 17,422 | | | | 33,382 | | | | 103,032 | |
| Custody fees | | | 384,805 | | | | 14,576 | | | | 21,982 | | | | 118,270 | |
| Federal and state registration fees | | | 89,684 | | | | 32,998 | | | | 34,551 | | | | 69,548 | |
| Reports to shareholders | | | 53,988 | | | | 19,603 | | | | 13,632 | | | | 40,247 | |
| Fund accounting fees | | | 72,151 | | | | 9,411 | | | | 27,402 | | | | 82,731 | |
| Audit fees | | | 33,928 | | | | 30,405 | | | | 30,830 | | | | 36,737 | |
| Directors' fees and expenses | | | 37,493 | | | | 5,678 | | | | 11,201 | | | | 33,366 | |
| Transfer agent fees and expenses | | | 20,175 | | | | 13,098 | | | | 13,859 | | | | 18,010 | |
| Insurance fees | | | 17,753 | | | | 2,121 | | | | 6,187 | | | | 18,962 | |
| Payroll expense | | | 11,460 | | | | 1,320 | | | | 3,620 | | | | 11,599 | |
| Compliance fees | | | 1,000 | | | | 190 | | | | 380 | | | | 1,400 | |
| Total expenses | | | 9,764,192 | | | | 1,360,157 | | | | 2,726,261 | | | | 7,641,120 | |
| Less securities lending credit (See Note 6) | | | (106,683 | ) | | | (24,183 | ) | | | — | | | | (157,835 | ) |
| Expenses recouped by the Adviser (See Note 3) | | | — | | | | 42,952 | | | | 125,231 | | | | — | |
| Net expenses | | | 9,657,509 | | | | 1,378,926 | | | | 2,851,492 | | | | 7,483,285 | |
| Net investment income | | | 6,842,511 | | | | 660,581 | | | | 5,634,894 | | | | 27,219,073 | |
| NET REALIZED AND UNREALIZED | | | | | | | | | | | | | | | | |
| GAIN/(LOSS) ON INVESTMENTS: | | | | | | | | | | | | | | | | |
| Net realized gain/(loss) on: | | | | | | | | | | | | | | | | |
| Investments | | | 99,185,929 | | | | 10,301,737 | | | | (501,893 | ) | | | 811,013 | |
| Written options | | | — | | | | — | | | | — | | | | 175,410 | |
| Foreign currencies | | | (1,176,210 | ) | | | — | | | | — | | | | 283 | |
| Futures contracts | | | — | | | | — | | | | — | | | | 154,940 | |
| Forward currency contracts | | | — | | | | — | | | | — | | | | (704,071 | ) |
| Total | | | 98,009,719 | | | | 10,301,737 | | | | (501,893 | ) | | | 437,575 | |
| Net change in unrealized appreciation/ | | | | | | | | | | | | | | | | |
| (depreciation) on: | | | | | | | | | | | | | | | | |
| Investments | | | 13,848,672 | | | | 7,585,486 | | | | 3,528,011 | | | | 12,155,631 | |
| Written options | | | — | | | | — | | | | — | | | | (17,288 | ) |
| Foreign currencies | | | 394 | | | | — | | | | — | | | | 8,844 | |
| Futures contracts | | | — | | | | — | | | | — | | | | (139,505 | ) |
| Forward currency contracts | | | — | | | | — | | | | — | | | | (481,763 | ) |
| Total | | | 13,849,066 | | | | 7,585,486 | | | | 3,528,011 | | | | 11,525,919 | |
| Net realized and unrealized gain | | | 111,858,785 | | | | 17,887,223 | | | | 3,026,118 | | | | 11,963,494 | |
| NET INCREASE IN NET ASSETS | | | | | | | | | | | | | | | | |
| RESULTING FROM OPERATIONS | | $ | 118,701,296 | | | $ | 18,547,804 | | | $ | 8,661,012 | | | $ | 39,182,567 | |
| | | | | | | | | | | | | | | | | |
AssetMark Funds
STATEMENTS OF CHANGES IN NET ASSETS
| | | | | | | | | | |
| | | Large Cap Growth Fund | | | Large Cap Value Fund | |
| | | Year | | | Period | | | Year | | | Period | |
| | | Ended | | | Ended | | | Ended | | | Ended | |
| | | March 31, | | | March 31, | | | March 31, | | | March 31, | |
| | | 2007 | | | 2006 | | | 2007 | | | 2006 | |
| OPERATIONS: | | | | | | | | | | | | |
| Net investment income/(loss) | | $ | (1,709,860 | ) | | $ | (1,681,971 | ) | | $ | 6,814,925 | | | $ | 4,342,091 | |
| Net realized gain on investment transactions | | | 15,036,136 | | | | 29,183,549 | | | | 37,154,587 | | | | 43,143,883 | |
| Change in unrealized appreciation/(depreciation) | | | | | | | | | | | | | | | | |
| on investments | | | (11,322,116 | ) | | | 20,178,486 | | | | 49,683,330 | | | | 96,089 | |
| Net increase in net assets | | | | | | | | | | | | | | | | |
| resulting from operations | | | 2,004,160 | | | | 47,680,064 | | | | 93,652,842 | | | | 47,582,063 | |
| CAPITAL SHARE TRANSACTIONS: | | | | | | | | | | | | | | | | |
| Shares sold | | | 347,544,018 | | | | 201,714,521 | | | | 241,132,362 | | | | 204,871,407 | |
| Shares issued to holders in reinvestment of dividends | | | 10,257,279 | | | | — | | | | 33,955,890 | | | | 10,739,626 | |
| Shares redeemed | | | (241,421,753 | ) | | | (165,944,592 | ) | | | (283,517,492 | ) | | | (154,900,921 | ) |
| Net increase | | | 116,379,544 | | | | 35,769,929 | | | | (8,429,240 | ) | | | 60,710,112 | |
| DIVIDENDS AND DISTRIBUTIONS | | | | | | | | | | | | | | | | |
| TO SHAREHOLDERS: | | | | | | | | | | | | | | | | |
| Net investment income | | | — | | | | — | | | | (7,114,128 | ) | | | (4,087,194 | ) |
| From net realized gains | | | (18,666,939 | ) | | | — | | | | (55,830,479 | ) | | | (14,924,573 | ) |
| Total dividends and distributions | | | (18,666,939 | ) | | | — | | | | (62,944,607 | ) | | | (19,011,767 | ) |
| | | | | | | | | | | | | | | | | |
| INCREASE IN NET ASSETS | | | 99,716,765 | | | | 83,449,993 | | | | 22,278,995 | | | | 89,280,408 | |
| | | | | | | | | | | | | | | | | |
| NET ASSETS: | | | | | | | | | | | | | | | | |
| Beginning of year | | $ | 653,921,538 | | | $ | 570,471,545 | | | $ | 660,129,983 | | | $ | 570,849,575 | |
| End of year (including undistributed net investment | | | | | | | | | | | | | | | | |
| income of ($14,784, $31,439, $1,823,473 and | | | | | | | | | | | | | | | | |
| $2,122,677, respectively) | | $ | 753,638,303 | | | $ | 653,921,538 | | | $ | 682,408,978 | | | $ | 660,129,983 | |
| | | | | | | | | | | | | | | | | |
| | | | | | | | | | | | | | | | | |
| CHANGES IN SHARES OUTSTANDING | | | | | | | | | | | | | | | | |
| Shares sold | | | 37,074,341 | | | | 20,603,043 | | | | 19,578,975 | | | | 17,813,559 | |
| Shares issued to holders in reinvestment of dividends | | | 1,070,697 | | | | — | | | | 2,738,378 | | | | 950,409 | |
| Shares redeemed | | | (25,567,414 | ) | | | (16,889,797 | ) | | | (23,146,431 | ) | | | (13,439,287 | ) |
| Net increase | | | 12,577,624 | | | | 3,713,246 | | | | (829,078 | ) | | | 5,324,681 | |
| | | | | | | | | | | | | | | | | |
See notes to financial statements.
AssetMark Funds
STATEMENTS OF CHANGES IN NET ASSETS (Continued)
| | | Small/Mid Cap Growth Fund | | Small/Mid Cap Value Fund | |
| | | Year | | | Period | | | Year | | | Period | |
| | | Ended | | | Ended | | | Ended | | | Ended | |
| | | March 31, | | | March 31, | | | March 31, | | | March 31, | |
| | | 2007 | | | 2006 | | | 2007 | | | 2006 | |
| OPERATIONS: | | | | | | | | | | | | |
| Net investment income/(loss) | | $ | (1,179,373 | ) | | $ | (1,179,169 | ) | | $ | 2,703,980 | | | $ | (519,346 | ) |
| Net realized gain on investment transactions | | | 11,591,748 | | | | 19,762,867 | | | | 25,993,393 | | | | 9,303,736 | |
| Change in unrealized appreciation/(depreciation) | | | | | | | | | | | | | | | | |
| on investments | | | (8,817,990 | ) | | | 17,742,682 | | | | (20,194,858 | ) | | | 9,808,704 | |
| Net increase in net assets | | | | | | | | | | | | | | | | |
| resulting from operations | | | 1,594,385 | | | | 36,326,380 | | | | 8,502,515 | | | | 18,593,094 | |
| CAPITAL SHARE TRANSACTIONS: | | | | | | | | | | | | | | | | |
| Shares sold | | | 89,530,789 | | | | 87,369,505 | | | | 66,656,437 | | | | 76,154,464 | |
| Shares issued to holders in reinvestment of dividends | | | 3,600,261 | | | | 8,284,613 | | | | 14,357,797 | | | | 5,793,390 | |
| Shares redeemed | | | (132,302,419 | ) | | | (49,433,823 | ) | | | (134,065,122 | ) | | | (34,523,553 | ) |
| Net increase | | | (39,171,369 | ) | | | 46,220,295 | | | | (53,050,888 | ) | | | 47,424,301 | |
| DIVIDENDS AND DISTRIBUTIONS | | | | | | | | | | | | | | | | |
| TO SHAREHOLDERS: | | | | | | | | | | | | | | | | |
| Net investment income | | | — | | | | — | | | | (2,693,593 | ) | | | — | |
| From net realized gains | | | (6,534,072 | ) | | | (15,602,948 | ) | | | (28,268,174 | ) | | | (11,531,340 | ) |
| Total dividends and distributions | | | (6,534,072 | ) | | | (15,602,948 | ) | | | (30,961,767 | ) | | | (11,531,340 | ) |
| | | | | | | | | | | | | | | | | |
| INCREASE/(DECREASE) IN NET ASSETS | | | (44,111,056 | ) | | | 66,943,727 | | | | (75,510,140 | ) | | | 54,486,055 | |
| | | | | | | | | | | | | | | | | |
| NET ASSETS: | | | | | | | | | | | | | | | | |
| Beginning of year | | $ | 215,514,988 | | | | 148,571,261 | | | $ | 185,589,680 | | | | 131,103,625 | |
| End of year (including undistributed net investment | | | | | | | | | | | | | | | | |
| income of ($0, $0, $38,800 and $0, respectively) | | $ | 171,403,932 | | | $ | 215,514,988 | | | $ | 110,079,540 | | | $ | 185,589,680 | |
| | | | | | | | | | | | | | | | | |
| | | | | | | | | | | | | | | | | |
| CHANGES IN SHARES OUTSTANDING | | | | | | | | | | | | | | | | |
| Shares sold | | | 8,874,843 | | | | 8,833,116 | | | | 4,991,302 | | | | 5,462,863 | |
| Shares issued to holders in reinvestment of dividends | | | 357,169 | | | | 871,148 | | | | 1,193,499 | | | | 430,415 | |
| Shares redeemed | | | (13,478,510 | ) | | | (4,914,137 | ) | | | (9,849,525 | ) | | | (2,456,339 | ) |
| Net increase/(decrease) | | | (4,246,498 | ) | | | 4,790,127 | | | | (3,664,724 | ) | | | 3,436,939 | |
| | | | | | | | | | | | | | | | | |
See notes to financial statements.
AssetMark Funds
STATEMENTS OF CHANGES IN NET ASSETS (Continued)
| | | International Equity Fund | | | Real Estate Securities Fund | |
| | | Year | | | Period | | | Year | | | Period | |
| | | Ended | | | Ended | | | Ended | | | Ended | |
| | | March 31, | | | March 31, | | | March 31, | | | March 31, | |
| | | 2007 | | | 2006 | | | 2007 | | | 2006 | |
| OPERATIONS: | | | | | | | | | | | | |
| Net investment income/(loss) | | $ | 6,842,511 | | | $ | (440,315 | ) | | $ | 660,581 | | | $ | 1,447,841 | |
| Net realized gain on investment transactions | | | 98,009,719 | | | | 48,785,883 | | | | 10,301,737 | | | | 2,991,291 | |
| Change in unrealized appreciation on investments | | | 13,849,066 | | | | 82,799,085 | | | | 7,585,486 | | | | 11,445,981 | |
| Net increase in net assets | | | | | | | | | | | | | | | | |
| resulting from operations | | | 118,701,296 | | | | 131,144,653 | | | | 18,547,804 | | | | 15,885,113 | |
| CAPITAL SHARE TRANSACTIONS: | | | | | | | | | | | | | | | | |
| Shares sold | | | 357,626,736 | | | | 216,783,941 | | | | 61,137,806 | | | | 43,135,447 | |
| Shares issued to holders in reinvestment of dividends | | | 46,838,067 | | | | 23,536,325 | | | | 3,888,581 | | | | 5,420,394 | |
| Shares redeemed | | | (272,240,775 | ) | | | (130,180,681 | ) | | | (48,653,364 | ) | | | (40,092,104 | ) |
| Net increase | | | 132,224,028 | | | | 110,139,585 | | | | 16,373,023 | | | | 8,463,737 | |
| DIVIDENDS AND DISTRIBUTIONS | | | | | | | | | | | | | | | | |
| TO SHAREHOLDERS: | | | | | | | | | | | | | | | | |
| Net investment income | | | (8,971,421 | ) | | | (5,758,870 | ) | | | (1,121,696 | ) | | | (1,276,459 | ) |
| From net realized gains | | | (74,819,797 | ) | | | (36,222,721 | ) | | | (5,953,056 | ) | | | (8,500,223 | ) |
| Total dividends and distributions | | | (83,791,218 | ) | | | (41,981,591 | ) | | | (7,074,752 | ) | | | (9,776,682 | ) |
| | | | | | | | | | | | | | | | | |
| INCREASE IN NET ASSETS | | | 167,134,106 | | | | 199,302,647 | | | | 27,846,075 | | | | 14,572,168 | |
| | | | | | | | | | | | | | | | | |
| NET ASSETS: | | | | | | | | | | | | | | | | |
| Beginning of year | | $ | 612,288,218 | | | $ | 412,985,571 | | | $ | 89,616,046 | | | $ | 75,043,878 | |
| End of year (including undistributed net investment | | | | | | | | | | | | | | | | |
| income/(loss) of $1,340,053, $(3,461,577), | | | | | | | | | | | | | | | | |
| $0 and $0, respectively) | | $ | 779,422,324 | | | $ | 612,288,218 | | | $ | 117,462,121 | | | $ | 89,616,046 | |
| | | | | | | | | | | | | | | | | |
| | | | | | | | | | | | | | | | | |
| CHANGES IN SHARES OUTSTANDING | | | | | | | | | | | | | | | | |
| Shares sold | | | 25,260,683 | | | | 16,753,013 | | | | 3,085,833 | | | | 2,485,087 | |
| Shares issued to holders in reinvestment of dividends | | | 3,326,567 | | | | 1,847,435 | | | | 192,599 | | | | 337,719 | |
| Shares redeemed | | | (19,203,610 | ) | | | (10,092,590 | ) | | | (2,515,969 | ) | | | (2,304,689 | ) |
| Net increase | | | 9,383,640 | | | | 8,507,858 | | | | 762,463 | | | | 518,117 | |
| | | | | | | | | | | | | | | | | |
See notes to financial statements.
AssetMark Funds
STATEMENTS OF CHANGES IN NET ASSETS (Continued)
| | | Tax-Exempt Fixed Income Fund | | | Core Plus Fixed Income Fund | |
| | | Year | | | Period | | | Year | | | Period | |
| | | Ended | | | Ended | | | Ended | | | Ended | |
| | | March 31, | | | March 31, | | | March 31, | | | March 31, | |
| | | 2007 | | | 2006 | | | 2007 | | | 2006 | |
| OPERATIONS: | | | | | | | | | | | | |
| Net investment income | | $ | 5,634,894 | | | $ | 3,045,600 | | | $ | 27,219,073 | | | $ | 15,278,611 | |
| Net realized gain/(loss) on investment transactions | | | (501,893 | ) | | | (67,861 | ) | | | 437,575 | | | | (5,465,080 | ) |
| Change in unrealized appreciation/(depreciation) | | | | | | | | | | | | | | | | |
| on investments | | | 3,528,011 | | | | (4,156,643 | ) | | | 11,525,919 | | | | (12,502,266 | ) |
| Net increase/(decrease) in net assets | | | | | | | | | | | | | | | | |
| resulting from operations | | | 8,661,012 | | | | (1,178,904 | ) | | | 39,182,567 | | | | (2,688,735 | ) |
| CAPITAL SHARE TRANSACTIONS: | | | | | | | | | | | | | | | | |
| Shares sold | | | 112,068,712 | | | | 99,145,899 | | | | 345,088,680 | | | | 305,567,156 | |
| Shares issued to holders in reinvestment of dividends | | | 2,703,893 | | | | 1,639,001 | | | | 14,064,652 | | | | 48,529,614 | |
| Shares redeemed | | | (83,186,911 | ) | | | (40,924,483 | ) | | | (268,111,990 | ) | | | (157,120,055 | ) |
| Net increase | | | 31,585,694 | | | | 59,860,417 | | | | 91,041,342 | | | | 196,976,715 | |
| DIVIDENDS AND DISTRIBUTIONS | | | | | | | | | | | | | | | | |
| TO SHAREHOLDERS: | | | | | | | | | | | | | | | | |
| Net investment income | | | (5,575,058 | ) | | | (3,056,168 | ) | | | (27,047,513 | ) | | | (10,056,865 | ) |
| From net realized gains | | | — | | | | — | | | | — | | | | (10,241,890 | ) |
| Return of Capital | | | — | | | | — | | | | — | | | | (69,195,594 | ) |
| Total dividends and distributions | | | (5,575,058 | ) | | | (3,056,168 | ) | | | (27,047,513 | ) | | | (89,494,349 | ) |
| | | | | | | | | | | | | | | | | |
| INCREASE IN NET ASSETS | | | 34,671,648 | | | | 55,625,345 | | | | 103,176,396 | | | | 104,793,631 | |
| | | | | | | | | | | | | | | | | |
| NET ASSETS: | | | | | | | | | | | | | | | | |
| Beginning of year | | $ | 213,170,198 | | | | 157,544,853 | | | $ | 612,841,433 | | | | 508,047,802 | |
| End of year (including undistributed net investment | | | | | | | | | | | | | | | | |
| income/(loss) of $73,322, $13,486, $(484,341) and | | | | | | | | | | | | | | | | |
| $(244,315), respectively) | | | | | | | | | | | | | | | | |
| | | $ | 247,841,846 | | | $ | 213,170,198 | | | $ | 716,017,829 | | | $ | 612,841,433 | |
| | | | | | | | | | | | | | | | | |
| | | | | | | | | | | | | | | | | |
| CHANGES IN SHARES OUTSTANDING | | | | | | | | | | | | | | | | |
| Shares sold | | | 10,295,601 | | | | 9,097,399 | | | | 37,525,129 | | | | 30,579,856 | |
| Shares issued to holders in reinvestment of dividends | | | 248,714 | | | | 151,237 | | | | 1,531,705 | | | | 5,224,186 | |
| Shares redeemed | | | (7,656,887 | ) | | | (3,759,123 | ) | | | (29,138,674 | ) | | | (15,879,856 | ) |
| Net increase | | | 2,887,428 | | | | 5,489,513 | | | | 9,918,160 | | | | 19,924,186 | |
| | | | | | | | | | | | | | | | | |
See notes to financial statements.
AssetMark Funds
FINANCIAL HIGHLIGHTS
| | | Large Cap Growth Fund |
| | | Year ended | | | Period Ended | | | Year Ended | | | Year Ended | | | Year Ended | |
| | | March 31, 2007 | | | March 31, 2006 | | | June 30, 2005 | | | June 30, 2004 | | | June 30, 2003 | |
| Per share data for a share of capital | | | | | | | | | | | | | | | |
| stock outstanding for the entire period | | | | | | | | | | | | | | | |
| and selected information for the period | | | | | | | | | | | | | | | |
| are as follows: | | | | | | | | | | | | | | | |
| Net asset value, beginning of period | | $ | 9.95 | | | $ | 9.20 | | | $ | 9.16 | | | $ | 7.59 | | | $ | 7.28 | |
| | | | | | | | | | | | | | | | | | | | | |
| Income from investment operations: | | | | | | | | | | | | | | | | | | | | |
| Net investment loss | | | (0.02 | ) | | | (0.03 | ) | | | (0.03 | ) | | | (0.04 | ) | | | — | |
| Net realized and unrealized | | | | | | | | | | | | | | | | | | | | |
| gains/(losses) on investments | | | (0.06 | ) | | | 0.78 | | | | 0.07 | | | | 1.61 | | | | 0.31 | |
| Total from investment operations | | | (0.08 | ) | | | 0.75 | | | | 0.04 | | | | 1.57 | | | | 0.31 | |
| | | | | | | | | | | | | | | | | | | | | |
| Less distributions: | | | | | | | | | | | | | | | | | | | | |
| Dividends from | | | | | | | | | | | | | | | | | | | | |
| net investment income | | | — | | | | — | | | | — | | | | — | | | | — | |
| Dividends from net realized gains | | | (0.25 | ) | | | — | | | | — | | | | — | | | | — | |
| Total distributions | | | (0.25 | ) | | | — | | | | — | | | | — | | | | — | |
| | | | | | | | | | | | | | | | | | | | | |
| Net asset value, end of period | | $ | 9.62 | | | $ | 9.95 | | | $ | 9.20 | | | $ | 9.16 | | | $ | 7.59 | |
| | | | | | | | | | | | | | | | | | | | | |
| | | | | | | | | | | | | | | | | | | | | |
| Total return | | | -0.80 | % | | | 8.15 | %(1) | | | 0.44 | % | | | 20.69 | % | | | 4.26 | % |
| | | | | | | | | | | | | | | | | | | | | |
| Supplemental data and ratios: | | | | | | | | | | | | | | | | | | | | |
| Net assets, end of period | | $ | 753,638,303 | | | $ | 653,921,538 | | | $ | 570,471,545 | | | $ | 344,452,770 | | | $ | 118,363,326 | |
| | | | | | | | | | | | | | | | | | | | | |
| Ratio of expenses to average net assets | | | | | | | | | | | | | | | | | | | | |
| Before Expense Reimbursement, | | | | | | | | | | | | | | | | | | | | |
| including (Recapture) | | | 1.33 | % | | | 1.35 | %(2) | | | 1.39 | % | | | 1.51 | % | | | 1.63 | % |
| After Expense | | | | | | | | | | | | | | | | | | | | |
| Reimbursement/(Recapture ) | | | | | | | | | | | | | | | | | | | | |
| and Securities Lending Credit | | | 1.31 | % | | | 1.32 | %(2) | | | 1.37 | % | | | 1.49 | % | | | 1.49 | % |
| | | | | | | | | | | | | | | | | | | | | |
| Ratio of net investment loss | | | | | | | | | | | | | | | | | | | | |
| to average net assets | | | | | | | | | | | | | | | | | | | | |
| Before Expense Reimbursement, | | | | | | | | | | | | | | | | | | | | |
| including (Recapture) | | | -0.27 | % | | | -0.38 | %(2) | | | -0.41 | % | | | -0.83 | % | | | -0.84 | % |
| After Expense | | | | | | | | | | | | | | | | | | | | |
| Reimbursement/(Recapture) | | | -0.25 | % | | | -0.35 | %(2) | | | -0.39 | % | | | -0.81 | % | | | -0.70 | % |
| | | | | | | | | | | | | | | | | | | | | |
| Portfolio turnover rate | | | 142.66 | % | | | 72.34 | % | | | 21.63 | % | | | 24.66 | % | | | 30.47 | % |
| | | | | | | | | | | | | | | | | | | | | |
| (1) Not Annualized. | | | | | | | | | | | | | | | | | | | | |
| (2) Annualized. | | | | | | | | | | | | | | | | | | | | |
See notes to financial statements.
AssetMark Funds
FINANCIAL HIGHLIGHTS
| | | Large Cap Value Fund |
| | | Year ended | | | Period Ended | | | Year Ended | | | Year Ended | | | Year Ended | |
| | | March 31, 2007 | | | March 31, 2006 | | | June 30, 2005 | | | June 30, 2004 | | | June 30, 2003 | |
| Per share data for a share of capital | | | | | | | | | | | | | | | |
| stock outstanding for the entire period | | | | | | | | | | | | | | | |
| and selected information for the period | | | | | | | | | | | | | | | |
| are as follows: | | | | | | | | | | | | | | | |
| Net asset value, beginning of period | | $ | 11.77 | | | $ | 11.24 | | | $ | 10.96 | | | $ | 8.78 | | | $ | 9.20 | |
| Income from investment operations: | | | | | | | | | | | | | | | | | | | | |
| Net investment income | | | 0.14 | | | | 0.07 | | | | 0.07 | | | | 0.03 | | | | 0.04 | |
| Net realized and unrealized | | | | | | | | | | | | | | | | | | | | |
| gains/(losses) on investments | | | 1.67 | | | | 0.79 | | | | 0.56 | | | | 2.17 | | | | (0.41 | ) |
| Total from investment operations | | | 1.81 | | | | 0.86 | | | | 0.63 | | | | 2.20 | | | | (0.37 | ) |
| | | | | | | | | | | | | | | | | | | | | |
| Less distributions: | | | | | | | | | | | | | | | | | | | | |
| Dividends from | | | | | | | | | | | | | | | | | | | | |
| net investment income | | | (0.14 | ) | | | (0.07 | ) | | | (0.05 | ) | | | (0.02 | ) | | | (0.04 | ) |
| Dividends from net realized gains | | | (1.10 | ) | | | (0.26 | ) | | | (0.30 | ) | | | — | | | | (0.01 | ) |
| Total distributions | | | (1.24 | ) | | | (0.33 | ) | | | (0.35 | ) | | | (0.02 | ) | | | (0.05 | ) |
| Net asset value, end of period | | $ | 12.34 | | | $ | 11.77 | | | $ | 11.24 | | | $ | 10.96 | | | $ | 8.78 | |
| �� | | | | | | | | | | | | | | | | | | | | |
| | | | | | | | | | | | | | | | | | | | | |
| Total return | | | 15.32 | % | | | 7.85 | %(1) | | | 5.69 | % | | | 25.12 | % | | | -3.89 | % |
| | | | | | | | | | | | | | | | | | | | | |
| Supplemental data and ratios: | | | | | | | | | | | | | | | | | | | | |
| Net assets, end of period | | $ | 682,408,978 | | | $ | 660,129,983 | | | $ | 570,849,575 | | | $ | 340,186,439 | | | $ | 117,847,247 | |
| | | | | | | | | | | | | | | | | | | | | |
| Ratio of expenses to average net assets | | | | | | | | | | | | | | | | | | | | |
| Before Expense Reimbursement, | | | | | | | | | | | | | | | | | | | | |
| including (Recapture) | | | 1.32 | % | | | 1.36 | %(2) | | | 1.38 | % | | | 1.51 | % | | | 1.61 | % |
| After Expense | | | | | | | | | | | | | | | | | | | | |
| Reimbursement/(Recapture) and | | | | | | | | | | | | | | | | | | | | |
| Securities Lending Credit | | | 1.28 | % | | | 1.30 | %(2) | | | 1.33 | % | | | 1.49 | % | | | 1.49 | % |
| Ratio of net investment income/(loss) | | | | | | | | | | | | | | | | | | | | |
| to average net assets | | | | | | | | | | | | | | | | | | | | |
| Before Expense Reimbursement, | | | | | | | | | | | | | | | | | | | | |
| including (Recapture) | | | 1.00 | % | | | 0.86 | %(2) | | | 0.67 | % | | | 0.47 | % | | | 0.56 | % |
| After Expense | | | | | | | | | | | | | | | | | | | | |
| Reimbursement/(Recapture) | | | 1.04 | % | | | 0.92 | %(2) | | | 0.72 | % | | | 0.49 | % | | | 0.68 | % |
| | | | | | | | | | | | | | | | | | | | | |
| Portfolio turnover rate | | | 30.25 | % | | | 64.61 | % | | | 20.06 | % | | | 26.27 | % | | | 49.79 | % |
| | | | | | | | | | | | | | | | | | | | | |
| (1) Not Annualized. | | | | | | | | | | | | | | | | | | | | |
| (2) Annualized. | | | | | | | | | | | | | | | | | | | | |
See notes to financial statements.
AssetMark Funds
FINANCIAL HIGHLIGHTS
| | | Small/Mid Cap Growth Fund |
| | | Year ended | | | Period Ended | | | Year Ended | | | Year Ended | | | Year Ended | |
| | | March 31, 2007 | | | March 31, 2006 | | | June 30, 2005 | | | June 30, 2004 | | | June 30, 2003 | |
| Per share data for a share of capital | | | | | | | | | | | | | | | |
| stock outstanding for the entire period | | | | | | | | | | | | | | | |
| and selected information for the period | | | | | | | | | | | | | | | |
| are as follows: | | | | | | | | | | | | | | | |
| Net asset value, beginning of period | | $ | 10.60 | | | $ | 9.56 | | | $ | 9.49 | | | $ | 7.64 | | | $ | 7.20 | |
| Income from investment operations: | | | | | | | | | | | | | | | | | | | | |
| Net investment income (loss) | | | (0.07 | ) | | | (0.06 | ) | | | (0.06 | ) | | | (0.06 | ) | | | — | |
| Net realized and unrealized | | | | | | | | | | | | | | | | | | | | |
| gains on investments | | | 0.56 | | | | 1.95 | | | | 0.13 | | | | 1.91 | | | | 0.44 | |
| Total from investment operations | | | 0.49 | | | | 1.89 | | | | 0.07 | | | | 1.85 | | | | 0.44 | |
| Less distributions: | | | | | | | | | | | | | | | | | | | | |
| Dividends from | | | | | | | | | | | | | | | | | | | | |
| net investment income | | | — | | | | — | | | | — | | | | — | | | | — | |
| Dividends from net realized gains | | | (0.44 | ) | | | (0.85 | ) | | | — | | | | — | | | | — | |
| Total distributions | | | (0.44 | ) | | | (0.85 | ) | | | — | | | | — | | | | — | |
| Net asset value, end of period | | $ | 10.65 | | | $ | 10.60 | | | $ | 9.56 | | | $ | 9.49 | | | $ | 7.64 | |
| | | | | | | | | | | | | | | | | | | | | |
| | | | | | | | | | | | | | | | | | | | | |
| Total return | | | 4.84 | % | | | 20.82 | %(1) | | | 0.74 | % | | | 24.21 | % | | | 6.11 | % |
| | | | | | | | | | | | | | | | | | | | | |
| Supplemental data and ratios: | | | | | | | | | | | | | | | | | | | | |
| Net assets, end of period | | $ | 171,403,932 | | | $ | 215,514,988 | | | $ | 148,571,261 | | | $ | 87,189,588 | | | $ | 31,520,846 | |
| | | | | | | | | | | | | | | | | | | | | |
| Ratio of expenses to average net assets | | | | | | | | | | | | | | | | | | | | |
| Before Expense Reimbursement, | | | | | | | | | | | | | | | | | | | | |
| including (Recapture) | | | 1.43 | % | | | 1.43 | %(2) | | | 1.54 | % | | | 1.61 | % | | | 2.01 | % |
| After Expense | | | | | | | | | | | | | | | | | | | | |
| Reimbursement/(Recapture) and | | | | | | | | | | | | | | | | | | | | |
| Securities Lending Credit | | | 1.37 | % | | | 1.38 | %(2) | | | 1.50 | % | | | 1.57 | % | | | 1.59 | % |
| Ratio of net investment loss | | | | | | | | | | | | | | | | | | | | |
| to average net assets | | | | | | | | | | | | | | | | | | | | |
| Before Expense Reimbursement, | | | | | | | | | | | | | | | | | | | | |
| | | | | | | | | | | | | | | | | | | | | |
| including (Recapture) | | | -0.75 | % | | | -0.92 | %(2) | | | -0.85 | % | | | -0.97 | % | | | -1.78 | % |
| After Expense | | | | | | | | | | | | | | | | | | | | |
| Reimbursement/(Recapture) | | | -0.69 | % | | | -0.87 | %(2) | | | -0.81 | % | | | -0.93 | % | | | -1.36 | % |
| | | | | | | | | | | | | | | | | | | | | |
| Portfolio turnover rate | | | 213.08 | % | | | 180.64 | % | | | 99.09 | % | | | 56.19 | % | | | 19.02 | % |
| | | | | | | | | | | | | | | | | | | | | |
| (1) Not Annualized. | | | | | | | | | | | | | | | | | | | | |
| (2) Annualized. | | | | | | | | | | | | | | | | | | | | |
See notes to financial statements.
AssetMark Funds
FINANCIAL HIGHLIGHTS
| | | Small/Mid Cap Value Fund |
| | | Year ended | | | Period Ended | | | Year Ended | | | Year Ended | | | Year Ended | |
| | | March 31, 2007 | | | March 31, 2006 | | | June 30, 2005 | | | June 30, 2004 | | | June 30, 2003 | |
| Per share data for a share of capital | | | | | | | | | | | | | | | |
| stock outstanding for the entire period | | | | | | | | | | | | | | | |
| and selected information for the period | | | | | | | | | | | | | | | |
| are as follows: | | | | | | | | | | | | | | | |
| Net asset value, beginning of period | | $ | 14.41 | | | $ | 13.89 | | | $ | 12.93 | | | $ | 10.13 | | | $ | 10.15 | |
| Income from investment operations: | | | | | | | | | | | | | | | | | | | | |
| Net investment income (loss) | | | 0.31 | | | | (0.04 | ) | | | (0.04 | ) | | | (0.04 | ) | | | — | |
| Net realized and unrealized | | | | | | | | | | | | | | | | | | | | |
| gains/(losses) on investments | | | 0.81 | | | | 1.52 | | | | 1.40 | | | | 2.84 | | | | (0.02 | ) |
| Total from investment operations | | | 1.12 | | | | 1.48 | | | | 1.36 | | | | 2.80 | | | | (0.02 | ) |
| | | | | | | | | | | | | | | | | | | | | |
| Less distributions: | | | | | | | | | | | | | | | | | | | | |
| Dividends from | | | | | | | | | | | | | | | | | | | | |
| net investment income | | | (0.31 | ) | | | — | | | | — | | | | — | | | | — | |
| Dividends from net realized gains | | | (3.27 | ) | | | (0.96 | ) | | | (0.40 | ) | | | — | | | | — | |
| Total distributions | | | (3.58 | ) | | | (0.96 | ) | | | (0.40 | ) | | | — | | | | — | |
| Net asset value, end of period | | $ | 11.95 | | | $ | 14.41 | | | $ | 13.89 | | | $ | 12.93 | | | $ | 10.13 | |
| | | | | | | | | | | | | | | | | | | | | |
| | | | | | | | | | | | | | | | | | | | | |
| Total return | | | 7.63 | % | | | 11.18 | %(1) | | | 10.56 | % | | | 27.64 | % | | | -0.20 | % |
| | | | | | | | | | | | | | | | | | | | | |
| Supplemental data and ratios: | | | | | | | | | | | | | | | | | | | | |
| Net assets, end of period | | $ | 110,079,540 | | | $ | 185,589,680 | | | $ | 131,103,625 | | | $ | 98,948,678 | | | $ | 29,703,370 | |
| Ratio of expenses to average net assets | | | | | | | | | | | | | | | | | | | | |
| Before Expense Reimbursement, | | | | | | | | | | | | | | | | | | | | |
| including (Recapture) | | | 1.47 | % | | | 1.55 | %(2) | | | 1.61 | % | | | 1.66 | % | | | 2.20 | % |
| After Expense | | | | | | | | | | | | | | | | | | | | |
| Reimbursement/(Recapture) and | | | | | | | | | | | | | | | | | | | | |
| Securities Lending Credit | | | 1.41 | % | | | 1.53 | %(2) | | | 1.59 | % | | | 1.56 | % | | | 1.59 | % |
| Ratio of net investment income/(loss) | | | | | | | | | | | | | | | | | | | | |
| to average net assets | | | | | | | | | | | | | | | | | | | | |
| Before Expense Reimbursement, | | | | | | | | | | | | | | | | | | | | |
| including (Recapture) | | | 1.68 | % | | | -0.45 | %(2) | | | -0.32 | % | | | -0.53 | % | | | -0.97 | % |
| After Expense | | | | | | | | | | | | | | | | | | | | |
| Reimbursement/(Recapture) | | | 1.75 | % | | | -0.43 | %(2) | | | -0.30 | % | | | -0.43 | % | | | -0.36 | % |
| | | | | | | | | | | | | | | | | | | | | |
| Portfolio turnover rate | | | 174.94 | % | | | 72.42 | % | | | 92.42 | % | | | 82.83 | % | | | 64.32 | % |
| | | | | | | | | | | | | | | | | | | | | |
| (1) Not Annualized. | | | | | | | | | | | | | | | | | | | | |
| (2) Annualized. | | | | | | | | | | | | | | | | | | | | |
See notes to financial statements.
AssetMark Funds
FINANCIAL HIGHLIGHTS
| | | International Equity Fund |
| | | Year ended | | | Period Ended | | | Year Ended | | | Year Ended | | | Year Ended | |
| | | March 31, 2007 | | | March 31, 2006 | | | June 30, 2005 | | | June 30, 2004 | | | June 30, 2003 | |
| Per share data for a share of capital | | | | | | | | | | | | | | | |
| stock outstanding for the entire period | | | | | | | | | | | | | | | |
| and selected information for the period | | | | | | | | | | | | | | | |
| are as follows: | | | | | | | | | | | | | | | |
| Net asset value, beginning of period | | $ | 14.06 | | | $ | 11.79 | | | $ | 10.43 | | | $ | 8.22 | | | $ | 8.96 | |
| Income from investment operations: | | | | | | | | | | | | | | | | | | | | |
| Net investment income | | | 0.16 | | | | (0.01 | ) | | | 0.10 | | | | 0.02 | | | | 0.06 | |
| Net realized and unrealized | | | | | | | | | | | | | | | | | | | | |
| gains/(losses) on investments | | | 2.24 | | | | 3.40 | | | | 1.40 | | | | 2.23 | | | | (0.77 | ) |
| Total from investment operations | | | 2.40 | | | | 3.39 | | | | 1.50 | | | | 2.25 | | | | (0.71 | ) |
| Less distributions: | | | | | | | | | | | | | | | | | | | | |
| Dividends from | | | | | | | | | | | | | | | | | | | | |
| net investment income | | | (0.18 | ) | | | (0.15 | ) | | | (0.06 | ) | | | (0.04 | ) | | | (0.03 | ) |
| Dividends from net realized gains | | | (1.55 | ) | | | (0.97 | ) | | | (0.08 | ) | | | — | | | | — | |
| Total distributions | | | (1.73 | ) | | | (1.12 | ) | | | (0.14 | ) | | | (0.04 | ) | | | (0.03 | ) |
| Net asset value, end of period | | $ | 14.73 | | | $ | 14.06 | | | $ | 11.79 | | | $ | 10.43 | | | $ | 8.22 | |
| | | | | | | | | | | | | | | | | | | | | |
| | | | | | | | | | | | | | | | | | | | | |
| Total return | | | 17.65 | % | | | 29.75 | %(1) | | | 14.37 | % | | | 27.40 | % | | | -7.92 | % |
| | | | | | | | | | | | | | | | | | | | | |
| Supplemental data and ratios: | | | | | | | | | | | | | | | | | | | | |
| Net assets, end of period | | $ | 779,422,324 | | | $ | 612,288,218 | | | $ | 412,985,571 | | | $ | 261,777,374 | | | $ | 76,915,396 | |
| Ratio of expenses to average net assets | | | | | | | | | | | | | | | | | | | | |
| Before Expense Reimbursement, | | | | | | | | | | | | | | | | | | | | |
| including (Recapture) | | | 1.39 | % | | | 1.38 | %(2) | | | 1.38 | % | | | 1.53 | % | | | 1.60 | % |
| After Expense | | | | | | | | | | | | | | | | | | | | |
| Reimbursement/(Recapture) and | | | | | | | | | | | | | | | | | | | | |
| Securities Lending Credit | | | 1.37 | % | | | 1.34 | %(2) | | | 1.33 | % | | | 1.47 | % | | | 1.59 | % |
| Ratio of net investment income/(loss) | | | | | | | | | | | | | | | | | | | | |
| to average net assets | | | | | | | | | | | | | | | | | | | | |
| Before Expense Reimbursement, | | | | | | | | | | | | | | | | | | | | |
| including (Recapture) | | | 0.95 | % | | | -0.16 | %(2) | | | 1.01 | % | | | 0.56 | % | | | 0.97 | % |
| After Expense | | | | | | | | | | | | | | | | | | | | |
| Reimbursement/(Recapture) | | | 0.97 | % | | | -0.12 | %(2) | | | 1.06 | % | | | 0.62 | % | | | 0.99 | % |
| | | | | | | | | | | | | | | | | | | | | |
| Portfolio turnover rate | | | 89.16 | % | | | 66.98 | % | | | 80.32 | % | | | 60.74 | % | | | 148.87 | % |
| | | | | | | | | | | | | | | | | | | | | |
| (1) Not Annualized. | | | | | | | | | | | | | | | | | | | | |
| (2) Annualized. | | | | | | | | | | | | | | | | | | | | |
See notes to financial statements.
AssetMark Funds
FINANCIAL HIGHLIGHTS
| | | Real Estate Securities Fund |
| | | Year ended | | | Period Ended | | | Year Ended | | | Year Ended | | | Year Ended | |
| | | March 31, 2007 | | | March 31, 2006 | | | June 30, 2005 | | | June 30, 2004 | | | June 30, 2003 | |
| Per share data for a share of capital | | | | | | | | | | | | | | | |
| stock outstanding for the entire period | | | | | | | | | | | | | | | |
| and selected information for the period | | | | | | | | | | | | | | | |
| are as follows: | | | | | | | | | | | | | | | |
| Net asset value, beginning of period | | $ | 18.46 | | | $ | 17.31 | | | $ | 13.66 | | | $ | 11.27 | | | $ | 11.18 | |
| Income from investment operations: | | | | | | | | | | | | | | | | | | | | |
| Net investment income | | | 0.16 | | | | 0.33 | | | | 0.44 | | | | 0.44 | | | | 0.45 | |
| Net realized and unrealized | | | | | | | | | | | | | | | | | | | | |
| gains on investments | | | 3.84 | | | | 3.27 | | | | 4.04 | | | | 2.27 | | | | 0.05 | |
| Total from investment operations | | | 4.00 | | | | 3.60 | | | | 4.48 | | | | 2.71 | | | | 0.50 | |
| | | | | | | | | | | | | | | | | | | | | |
| Less distributions: | | | | | | | | | | | | | | | | | | | | |
| Dividends from | | | | | | | | | | | | | | | | | | | | |
| net investment income | | | (0.25 | ) | | | (0.32 | ) | | | (0.43 | ) | | | (0.32 | ) | | | (0.33 | ) |
| Dividends from net realized gains | | | (1.30 | ) | | | (2.13 | ) | | | (0.40 | ) | | | — | | | | (0.08 | ) |
| Total distributions | | | (1.55 | ) | | | (2.45 | ) | | | (0.83 | ) | | | (0.32 | ) | | | (0.41 | ) |
| Net asset value, end of period | | $ | 20.91 | | | $ | 18.46 | | | $ | 17.31 | | | $ | 13.66 | | | $ | 11.27 | |
| | | | | | | | | | | | | | | | | | | | | |
| | | | | | | | | | | | | | | | | | | | | |
| Total return | | | 21.96 | % | | | 22.94 | %(1) | | | 33.22 | % | | | 24.24 | % | | | 4.87 | % |
| | | | | | | | | | | | | | | | | | | | | |
| Supplemental data and ratios: | | | | | | | | | | | | | | | | | | | | |
| Net assets, end of period | | $ | 117,462,121 | | | $ | 89,616,046 | | | $ | 75,043,878 | | | $ | 79,795,852 | | | $ | 26,188,608 | |
| Ratio of expenses to average net assets | | | | | | | | | | | | | | | | | | | | |
| Before Expense Reimbursement, | | | | | | | | | | | | | | | | | | | | |
| including (Recapture) | | | 1.49 | % | | | 1.51 | %(2) | | | 1.51 | % | | | 1.56 | % | | | 2.02 | % |
| After Expense | | | | | | | | | | | | | | | | | | | | |
| Reimbursement/(Recapture) and | | | | | | | | | | | | | | | | | | | | |
| Securities Lending Credit | | | 1.46 | % | | | 1.49 | %(2) | | | 1.49 | % | | | 1.49 | % | | | 1.49 | % |
| Ratio of net investment income to | | | | | | | | | | | | | | | | | | | | |
| average net assets | | | | | | | | | | | | | | | | | | | | |
| Before Expense Reimbursement, | | | | | | | | | | | | | | | | | | | | |
| including (Recapture) | | | 0.67 | % | | | 2.46 | %(2) | | | 2.83 | % | | | 3.35 | % | | | 3.80 | % |
| After Expense | | | | | | | | | | | | | | | | | | | | |
| Reimbursement/(Recapture) | | | 0.70 | % | | | 2.48 | %(2) | | | 2.85 | % | | | 3.41 | % | | | 4.33 | % |
| | | | | | | | | | | | | | | | | | | | | |
| Portfolio turnover rate | | | 43.86 | % | | | 41.09 | % | | | 77.64 | % | | | 24.30 | % | | | 28.71 | % |
| | | | | | | | | | | | | | | | | | | | | |
| (1) Not Annualized. | | | | | | | | | | | | | | | | | | | | |
| (2) Annualized. | | | | | | | | | | | | | | | | | | | | |
See notes to financial statements.
AssetMark Funds
FINANCIAL HIGHLIGHTS
| | | Tax-Exempt Fixed Income Fund |
| | | Year ended | | | Period Ended | | | Year Ended | | | Year Ended | | | Year Ended | |
| | | March 31, 2007 | | | March 31, 2006 | | | June 30, 2005 | | | June 30, 2004 | | | June 30, 2003 | |
| Per share data for a share of capital | | | | | | | | | | | | | | | |
| stock outstanding for the entire period | | | | | | | | | | | | | | | |
| and selected information for the period | | | | | | | | | | | | | | | |
| are as follows: | | | | | | | | | | | | | | | |
| Net asset value, beginning of period | | $ | 10.77 | | | $ | 11.01 | | | $ | 10.75 | | | $ | 11.05 | | | $ | 10.46 | |
| Income from investment operations: | | | | | | | | | | | | | | | | | | | | |
| Net investment income | | | 0.27 | | | | 0.17 | | | | 0.20 | | | | 0.17 | | | | 0.22 | |
| Net realized and unrealized | | | | | | | | | | | | | | | | | | | | |
| gains/(losses) on investments | | | 0.15 | | | | (0.24 | ) | | | 0.26 | | | | (0.28 | ) | | | 0.59 | |
| Total from investment operations | | | 0.42 | | | | (0.07 | ) | | | 0.46 | | | | (0.11 | ) | | | 0.81 | |
| | | | | | | | | | | | | | | | | | | | | |
| Less distributions: | | | | | | | | | | | | | | | | | | | | |
| Dividends from | | | | | | | | | | | | | | | | | | | | |
| net investment income | | | (0.27 | ) | | | (0.17 | ) | | | (0.20 | ) | | | (0.17 | ) | | | (0.22 | ) |
| Dividends from net realized gains | | | — | | | | — | | | | — | | | | (0.02 | ) | | | — | |
| Total distributions | | | (0.27 | ) | | | (0.17 | ) | | | (0.20 | ) | | | (0.19 | ) | | | (0.22 | ) |
| Net asset value, end of period | | $ | 10.92 | | | $ | 10.77 | | | $ | 11.01 | | | $ | 10.75 | | | $ | 11.05 | |
| | | | | | | | | | | | | | | | | | | | | |
| | | | | | | | | | | | | | | | | | | | | |
| Total return | | | 3.92 | % | | | -0.64 | %(1) | | | 4.29 | % | | | -1.01 | % | | | 7.78 | % |
| | | | | | | | | | | | | | | | | | | | | |
| Supplemental data and ratios: | | | | | | | | | | | | | | | | | | | | |
| Net assets, end of period | | $ | 247,841,846 | | | $ | 213,170,198 | | | $ | 157,544,853 | | | $ | 80,301,556 | | | $ | 26,100,100 | |
| Ratio of expenses to average net assets | | | | | | | | | | | | | | | | | | | | |
| Before Expense Reimbursement, | | | | | | | | | | | | | | | | | | | | |
| including (Recapture) | | | 1.28 | % | | | 1.29 | %(2) | | | 1.33 | % | | | 1.41 | % | | | 1.82 | % |
| After Expense | | | | | | | | | | | | | | | | | | | | |
| Reimbursement/(Recapture) and | | | | | | | | | | | | | | | | | | | | |
| Securities Lending Credit | | | 1.28 | % | | | 1.29 | %(2) | | | 1.29 | % | | | 1.29 | % | | | 1.29 | % |
| Ratio of net investment income | | | | | | | | | | | | | | | | | | | | |
| to average net assets | | | | | | | | | | | | | | | | | | | | |
| Before Expense Reimbursement, | | | | | | | | | | | | | | | | | | | | |
| including (Recapture) | | | 2.53 | % | | | 2.15 | %(2) | | | 1.90 | % | | | 1.65 | % | | | 1.66 | % |
| After Expense | | | | | | | | | | | | | | | | | | | | |
| Reimbursement/(Recapture) | | | 2.53 | % | | | 2.15 | %(2) | | | 1.94 | % | | | 1.77 | % | | | 2.19 | % |
| Portfolio turnover rate | | | 50.36 | % | | | 14.61 | % | | | 30.05 | % | | | 18.90 | % | | | 19.18 | % |
| | | | | | | | | | | | | | | | | | | | | |
| (1) Not Annualized. | | | | | | | | | | | | | | | | | | | | |
| (2) Annualized. | | | | | | | | | | | | | | | | | | | | |
See notes to financial statements.
AssetMark Funds
FINANCIAL HIGHLIGHTS
| | | Core Plus Fixed Income Fund |
| | | Year ended | | | Period Ended | | | Year Ended | | | Year Ended | | | Year Ended | |
| | | March 31, 2007 | | | March 31, 2006 | | | June 30, 2005 | | | June 30, 2004 | | | June 30, 2003 | |
| Per share data for a share of capital | | | | | | | | | | | | | | | |
| stock outstanding for the entire period | | | | | | | | | | | | | | | |
| and selected information for the period | | | | | | | | | | | | | | | |
| are as follows: | | | | | | | | | | | | | | | |
| Net asset value, beginning of period | | $ | 9.11 | | | $ | 10.73 | | | $ | 10.38 | | | $ | 10.71 | | | $ | 10.15 | |
| Income from investment operations: | | | | | | | | | | | | | | | | | | | | |
| Net investment income | | | 0.38 | | | | 0.34 | | | | 0.25 | | | | 0.36 | | | | 0.48 | |
| Net realized and unrealized | | | | | | | | | | | | | | | | | | | | |
| gains/(losses) on investments | | | 0.15 | | | | (0.39 | ) | | | 0.41 | | | | (0.34 | ) | | | 0.56 | |
| Total from investment operations | | | 0.53 | | | | (0.05 | ) | | | 0.66 | | | | 0.02 | | | | 1.04 | |
| | | | | | | | | | | | | | | | | | | | | |
| Less distributions: | | | | | | | | | | | | | | | | | | | | |
| Dividends from | | | | | | | | | | | | | | | | | | | | |
| net investment income | | | (0.37 | ) | | | (0.26 | ) | | | (0.27 | ) | | | (0.35 | ) | | | (0.48 | ) |
| Dividends from net realized gains | | | — | | | | (0.08 | ) | | | (0.04 | ) | | | — | | | | — | |
| Return of Capital | | | — | | | | (1.23 | ) | | | — | | | | — | | | | — | |
| Total distributions | | | (0.37 | ) | | | (1.57 | ) | | | (0.31 | ) | | | (0.35 | ) | | | (0.48 | ) |
| Net asset value, end of period | | $ | 9.27 | | | $ | 9.11 | | | $ | 10.73 | | | $ | 10.38 | | | $ | 10.71 | |
| | | | | | | | | | | | | | | | | | | | | |
| | | | | | | | | | | | | | | | | | | | | |
| Total return | | | 5.96 | % | | | -0.48 | %(1) | | | 6.47 | % | | | 0.21 | % | | | 10.47 | % |
| | | | | | | | | | | | | | | | | | | | | |
| Supplemental data and ratios: | | | | | | | | | | | | | | | | | | | | |
| Net assets, end of period | | $ | 716,017,829 | | | $ | 612,841,433 | | | $ | 508,047,802 | | | $ | 284,788,044 | | | $ | 110,280,032 | |
| Ratio of expenses to average net assets | | | | | | | | | | | | | | | | | | | | |
| Before Expense Reimbursement, | | | | | | | | | | | | | | | | | | | | |
| including (Recapture) | | | 1.16 | % | | | 1.19 | %(2) | | | 1.24 | % | | | 1.29 | % | | | 1.41 | % |
| After Expense | | | | | | | | | | | | | | | | | | | | |
| Reimbursement/(Recapture) and | | | | | | | | | | | | | | | | | | | | |
| Securities Lending Credit | | | 1.14 | % | | | 1.16 | %(2) | | | 1.20 | % | | | 1.29 | % | | | 1.29 | % |
| Ratio of net investment income | | | | | | | | | | | | | | | | | | | | |
| to average net assets | | | | | | | | | | | | | | | | | | | | |
| Before Expense Reimbursement, | | | | | | | | | | | | | | | | | | | | |
| including (Recapture) | | | 4.14 | % | | | 3.43 | %(2) | | | 2.51 | % | | | 3.71 | % | | | 4.69 | % |
| After Expense | | | | | | | | | | | | | | | | | | | | |
| Reimbursement/(Recapture) | | | 4.16 | % | | | 3.47 | %(2) | | | 2.55 | % | | | 3.71 | % | | | 4.81 | % |
| | | | | | | | | | | | | | | | | | | | | |
| Portfolio turnover rate | | | 280.55 | % | | | 261.52 | % | | | 471.24 | % | | | 11.82 | % | | | 52.99 | % |
| | | | | | | | | | | | | | | | | | | | | |
| (1) Not Annualized. | | | | | | | | | | | | | | | | | | | | |
| (2) Annualized. | | | | | | | | | | | | | | | | | | | | |
See notes to financial statements.
AssetMark Funds
NOTES TO FINANCIAL STATEMENTS
March 31, 2007
AssetMark Funds (the “Trust”) is organized as a Delaware statutory trust under a Declaration of Trust dated January 2, 2001. The Trust is registered under the Investment Company Act of 1940, as amended (the“1940 Act”), as an open-end management investment company with eight non-diversified funds (the “Funds”): AssetMark Large Cap Growth Fund, AssetMark Large Cap Value Fund, AssetMark Small/Mid Cap Growth Fund, AssetMark Small/Mid Cap Value Fund, AssetMark International Equity Fund, AssetMark Real Estate Securities Fund, AssetMark Tax-Exempt Fixed Income Fund and AssetMark Core Plus Fixed Income Fund. Each Fund represents a distinct portfolio with its own investment objectives and policies. The assets of each Fund are segregated, and a shareholder’s interest is limited to the Fund in which shares are held. The Funds commenced operations on June 29, 2001.
2. | Significant Accounting Policies |
The following is a summary of significant accounting policies consistently followed by the Funds in the preparation of the financial statements. These policies are in conformity with U.S. generally accepted accounting principles (“GAAP”).
Portfolio securities listed on a national or foreign securities exchange, except those listed on NASDAQ, for which market quotations are available are valued at the last quoted sale price on each business day. Portfolio securities traded on NASDAQ are valued at the NASDAQ Official Closing Price (“NOCP”) on each business day. If there is no reported sale on an exchange or NASDAQ, the portfolio security will be valued at the mean between the most recent quoted bid and asked price. Price information on listed securities is taken from the exchange where the security is primarily traded.
All equity securities that are not traded on a listed exchange are valued at the last sale price in the over-the-counter market. If a non-exchange traded security does not trade on a particular day, then the mean between the last quoted closing bid and asked price will be used. Non-exchange traded ADR’s are priced with an evaluated price as determined by the current evaluated pricing procedures of, and provided by, the pricing vendor.
Investments in mutual funds are valued at the closing net asset value per share of each mutual fund on the day of valuation.
Securities for which no market quotations are readily available or when a significant event has occurred between the time of the security’s last close and the time that a fund calculates net asset value will be valued at their fair market value as determined by the Valuation Committee.
Each Fund may enter into repurchase agreements with banks and securities dealers. These transactions involve the purchase of securities with a simultaneous commitment to sell the securities to the bank or the dealer at an agreed-upon date and price. A repurchase agreement is accounted for as an investment by the Fund, collateralized by securities, which are delivered to the Fund’s Custodian or to an agent bank under a tri-party agreement. The securities are marked-to-market daily and additional securities are acquired as needed, to ensure that their value equals or exceeds the repurchase price plus accrued interest. The Core Plus Fixed Income Fund entered into repurchase agreements during the period ended March 31, 2007. For all funds engaged in securities lending, portions of cash collateral for securities on loan were invested in repurchase agreements at March 31, 2007.
The Funds intend to continue to comply with the requirements of sub chapter M of the Internal Revenue Code necessary to qualify as regulated investment companies and to make the requisite distributions of income and capital gains to their shareholders sufficient to relieve them from all or substantially all Federal income taxes. Therefore, no Federal income tax provision is required.
AssetMark Funds
NOTES TO FINANCIAL STATEMENTS (Continued)
March 31, 2007
The preparation of financial statements in conformity with GAAP requires management to make estimates and assumptions that affect the reported amounts of assets and liabilities and disclosure of contingent assets and liabilities at the date of the financial statements and the reported amounts of revenues and expenses during the reporting period. Actual results could differ from those estimates.
Under the Trust’s organizational documents, its officers and trustees are indemnified against certain liability arising out of the performance of their duties to the Trust. In addition, in the normal course of business, the Trust enters into contracts that contain a variety of representations and warranties which provide general indemnifications. The Trust’s maximum exposure under these arrangements are unknown as this would involve future claims that may be made against the Trust that have not yet occurred. However, the Trust expects the risk of loss to be remote.
Most expenses of the Trust can be directly attributed to a specific Fund. Expenses that cannot be directly attributed to a specific Fund are apportioned among all the Funds in the Trust based on relative net assets.
| (g) | Security Transactions and Income Recognition |
Security transactions are accounted for on trade date. Dividend income is recognized on the ex-dividend date, and interest income recorded using the effective yield method is accrued daily. Realized gains and losses on investment transactions are determined using the specific identification method. Return of capital distributions received from REIT securities are recorded as an adjustment to the cost of the security and thus may impact unrealized or realized gains or losses on the security. Gains and losses from paydowns on mortgage and asset backed securities are recorded as adjustments to interest income.
| (h) | Distributions to Shareholders |
The Funds, with the exception of the Tax-Exempt Fixed Income Fund and Core Plus Fixed Income Fund, will distribute any net investment income at least annually. The Tax-Exempt Fixed Income Fund and Core Plus Fixed Income Fund will distribute any net investment income quarterly. All of the Funds will distribute any net realized long or short-term capital gains at least annually. Distributions to shareholders are recorded on the ex-dividend date. The Funds may also pay a special distribution at the end of the calendar year to comply with Federal tax requirements.
Each Fund may invest in derivative securities including call and put options, futures, forward currency contracts and swaps and may be used by a Fund for hedging purposes as well as direct investment.
Forward Currency Contracts
The Funds may enter into forward currency contracts, obligating the Funds to deliver and receive currency at a specified future date. Transactions involving forward currency contracts may serve as long hedges (for example, if a Fund seeks to buy a security denominated in a foreign currency, it may purchase a forward currency contract to lock in the U.S. dollar price of the security) or as short hedges (if a Fund anticipates selling a security denominated in a foreign currency it may sell a forward currency contract to lock in the U.S. dollar equivalent of the anticipated sales proceeds). Forward contracts are valued daily and unrealized appreciation or depreciation is recorded daily as the difference between the contract exchange rate and the closing forward rate applied to the face amount of the contract.
Options
The Funds may purchase and write call or put options on securities and indices and enter into related closing transactions, but will only engage in option strategies for non-speculative purposes. As a holder of a call option, a Fund has the right, but not the obligation, to purchase a security at the exercise price during the exercise period. As the writer of a call option, a Fund has the obligation to sell the security at the exercise price during the exercise period. As a holder of a put option, a Fund has the right, but not the obligation, to sell a security at the exercise price during the exercise period. As the writer of a put option, a Fund has the obligation to buy the underlying security at the exercise price during the exercise period.
AssetMark Funds
NOTES TO FINANCIAL STATEMENTS (Continued)
March 31, 2007
The premium that a Fund pays when purchasing a call option or receives when writing a call option will reflect, among other things, the market price of the security, the relationship of the exercise price to the market price of the security, the relationship of the exercise price to the volatility of the security, the length of the option period and supply and demand factors. The premium is the market value of an option at the date of purchase.
A purchaser (holder) of a put option pays a non-refundable premium to the seller (writer) of a put option to obtain the right to sell a specified amount of a security at a fixed price (the exercise price) during a specified period (exercise period). Conversely, the seller (writer) of a put option, upon payment by the holder of the premium, has the obligation to buy the security from the holder of the put option at the exercise price during the exercise period.
Options are valued daily at the last reported sale price at the close of the exchange on which the security is primarily traded. If no sales are reported for exchange-traded options, or the options are not exchange-traded, then they are valued at the mean of the most recent quoted bid and asked price.
As of March 31, 2007, the Core Plus Fixed Income Fund has entered into written call options, for which sufficient collateral was set aside, as disclosed in the Schedule of Investments.
Futures
Each Fund has the ability to buy and sell stock index futures contracts traded on domestic stock exchanges to hedge the value of its portfolio against changes in market conditions. A stock index futures contract is an agreement between two parties to take or make delivery of an amount of cash equal to a specified dollar amount, times the difference between the stock index value at the close of the last trading day of the contract and the price at which the futures contract is originally struck. A stock index futures contract does not involve the physical delivery of the underlying stocks in the index. Although stock index futures contracts call for the actual taking or delivery of cash, in most cases a Fund expects to liquidate its stock index futures positions through offsetting transactions, which may result in a gain or a loss, before cash settlement is required.
The Core Plus Fixed Income Fund may also purchase or sell other types of futures contracts, including those based on particular interest rates, securities, foreign currencies, securities indices and other financial instruments and indices. The Core Plus Fixed Income Fund may also purchase and write call and put options on such futures contracts, in order to seek to increase total return or to hedge against changes in interest rates, securities prices, or currency exchange rates, or, to the extent permitted by its investment policies, to otherwise manage its portfolio of investments.
Futures contracts are valued at the daily quoted settlement prices.
Swaps
The Core Plus Fixed Income Fund may enter into credit default swaps. Credit default swaps involve the receipt of floating or fixed rate payments in exchange for assuming potential credit losses of an underlying security or basket of securities. Credit default swaps give one party to a transaction the right to dispose of or acquire an asset (or group of assets), or the right to receive or make a payment from the other party, upon the occurrence of specified credit events. Credit default swaps involve transferring the credit exposure of fixed income products between parties. The buyer of a credit default swap receives credit protection, whereas the seller of the swap guarantees the credit worthiness of the product. By doing this, the risk of default is transferred from the holder of the fixed income security to the seller of the swap.
AssetMark Funds
NOTES TO FINANCIAL STATEMENTS (Continued)
March 31, 2007
Swap agreements are valued daily and unrealized appreciation or depreciation is recorded daily as the difference between the prior day and current day closing price.
During the year ended March 31, 2007, the Funds had no open or outstanding swap contracts.
| (j) | Securities Purchased on a Forward-Commitment Basis |
The Funds may enter into when-issued or other transactions that specify forward delivery of a financial security. In connection with this ability, the Funds may enter into mortgage ‘‘dollar rolls’’ in which the Funds sell securities in the current month for delivery and simultaneously contract with the same counterparty to repurchase similar (same type, coupon and maturity) but not identical securities on a specified future date. The party that is obligated to buy a security in the future will retain the use of their funds, and will benefit from any interest that is earned on those funds from the day that they enter into the forward contract until the day that they take delivery and pay for the security.
| (k) | Foreign Currency Translation |
The accounting records of the Funds are maintained in U.S. dollars. Investment securities and all other assets and liabilities of the Funds denominated in a foreign currency are translated into U.S. dollars at current exchange rates. Purchases and sales of securities, income receipts, and expense payments are translated into U.S. dollars at the exchange rate in effect on the dates of the respective transactions. The Funds do not isolate the portion of the fluctuations on investments resulting from changes in foreign currency exchange rates from the fluctuations in market prices of investments held. Such fluctuations are included with the net realized and unrealized gain or loss from investments.
| (l) | Restricted and Illiquid Securities |
Each Fund may invest up to 15% of its net assets in securities that are illiquid at the time of purchase, which includes securities with legal or contractual restrictions on their disposition, and securities for which there are no readily available market quotations. The Board of Trustees, with the assistance of the Advisor, sub-advisors and/or pricing services, will determine the value of such securities in good faith in accordance with the provisions of the 1940 Act. Illiquid securities present the risks that a Fund may have difficulty valuing these holdings and/or may be unable to sell these holdings at the time or price desired. There are no restrictions on each Fund’s ability to invest in restricted securities (that is, securities that are not registered pursuant to the Securities Act of 1933), except to the extent such securities may be considered illiquid. Securities issued pursuant to Rule 144A of the Securities Act of 1933 will be considered liquid if determined to be so under procedures adopted by the Board of Trustees.
Although not currently part of any of the Fund’s investment strategies, each Fund has the ability to make short sales. Short sales are transactions where a Fund sells securities it does not own in anticipation of a decline in the market value of the securities.
For their service as Trustees of the Trust, the Independent Trustees receive a retainer fee of $32,000 per year and $3,500 per in-person meeting attended, as well as reimbursement for expenses incurred in connection with attendance at such meetings. Telephonic meeting fees are determined according to length of the meeting as follows: $1,500 for one to two hours, $2,000 for two to three hours and $3,500 for three hours or longer. The interested persons who serve as Trustees of the Trust receive no compensation for their service as Trustees.
AssetMark Funds
NOTES TO FINANCIAL STATEMENTS (Continued)
March 31, 2007
On October 21, 2006, AssetMark and Genworth Financial, Inc. (“Genworth”) completed a transaction whereby Genworth acquired 100% ownership of AssetMark and AssetMark Capital (the “Transaction”). The Transaction resulted in the automatic termination of the existing investment advisory agreement with AssetMark for each Fund. The Board of Trustees of the Trust approved a new investment advisory agreement with AssetMark for each Fund, which was later approved by shareholders of each Fund at a meeting held on October 16, 2006 and became effective upon the completion of the Transaction.
The Trust has an Investment Advisory Agreement (the “Agreement”) with AssetMark Investment Services, Inc. (the “Advisor”), with whom certain officers and trustees of the Trust are affiliated, to furnish investment advisory services to the Funds. Under the terms of the Agreement, the Trust, on behalf of the Funds, compensates the Advisor for its management services at the following contractual rates, based on each Fund’s average daily net assets:
| Large Cap Growth Fund | | 0.95% |
Large Cap Value Fund | | 0.95% |
| Small/Mid Cap Growth Fund | | 0.95% |
| Small/Mid Cap Value Fund | | 1.00% |
| International Equity Fund | | 0.95% |
| Real Estate Securities Fund | | 0.95% |
| Tax-Exempt Fixed Income Fund | | 0.80% |
| Core Plus Fixed Income Fund | | 0.75% |
In addition, the Trust and Advisor have also entered into a Fee Waiver Agreement designed to provide Fund shareholders with the economic benefits of economies of scale that may be realized as Fund assets increase. Under the Fee Waiver Agreement, the Advisor has contractually agreed to: (1) waive 0.025% of each Fund’s annual advisory fee on Trust assets in excess of $6 billion, and an additional 0.025% of each Fund’s annual advisory fee on Trust assets in excess of $12 billion; and (2) waive portions of its advisory fee to the extent necessary to pass on certain breakpoints in the underlying sub-advisory fee arrangements that are reached as Fund assets grow.
The Advisor has agreed to waive, through October 31, 2007, its management fee and/or reimburse each Fund’s other expenses to the extent necessary to ensure that the Funds’ operating expenses do exceed the following rates, based on each Fund’s average daily net assets:
| Large Cap Growth Fund | | 1.49% |
| Large Cap Value Fund | | 1.49% |
| Small/Mid Cap Growth Fund | | 1.59% |
| Small/Mid Cap Value Fund | | 1.59% |
| International Equity Fund | | 1.59% |
| Real Estate Securities Fund | | 1.49% |
| Tax-Exempt Fixed Income Fund | | 1.29% |
| Core Plus Fixed Income Fund | | 1.29% |
Any such waiver or reimbursement is subject to later adjustment to allow the Advisor to recoup amounts waived or reimbursed to the extent actual fees and expenses for a fiscal period are less than each Fund’s expense limitation cap, provided, however, that the Advisor shall only be entitled to recoup such amounts for a period of three years from the date such amount was waived or reimbursed. As of March 31, 2007, each Fund has recouped all potential recoverable waivers or reimbursed expenses.
Sub-advisory services are provided to the Funds, pursuant to agreements between the Advisor and various sub-advisors. Under the terms of these sub-advisory agreements, the Advisor compensates the sub-advisors based on each Fund’s average daily net assets.
The Trust, on behalf of the Funds, has adopted a distribution plan pursuant to Rule 12b-1 under the 1940 Act (the “12b-1 Plan”), which provides for each Fund to pay distribution fees at an annual rate of 0.25% of the average daily net assets of the Funds. Payments under the 12b-1 Plan shall be used to compensate persons who provide support services in connection with the distribution of the Funds’ shares and servicing of the Funds’ shareholders. AssetMark Capital Corporation, an affiliate of the Advisor, serves as principal underwriter and distributor for the Funds. Quasar Distributors, LLC serves as sub-distributor for the Funds. Quasar Distributors, LLC is an affiliated company of U.S. Bank, N.A.
AssetMark Funds
NOTES TO FINANCIAL STATEMENTS (Continued)
March 31, 2007
| 5. | Service and Custody Agreements |
The Trust has entered into Service Agreements with U.S. Bancorp Fund Services, LLC (“USBFS”) and a Custody Agreement with U.S. Bank, N.A., an affiliate of USBFS. Under these agreements, USBFS and U.S. Bank, N.A. provide certain transfer agency, administrative, accounting and custody services.
Effective July 1, 2003 the Funds entered into a securities lending arrangement with U.S. Bank, N.A. (the “Custodian”). Under the terms of the agreement, the Custodian is authorized to loan securities on behalf of the Funds to approved brokers. In exchange, the Funds receive cash collateral in the amount of at least 102% of the value of the securities loaned. The cash collateral is invested in short term instruments as noted in the Schedule of Investments. Although risk is mitigated by the collateral, the Funds could experience a delay in recovering their securities and possible loss of income or value if the borrower fails to return them. The agreement provides that after predetermined rebates to brokers, a percentage of the net securities lending revenue shall be solely paid as credits to the Funds to be used as an offset against custody costs and other charges incurred by the Funds from the custodian, administration, fund accounting and transfer agent fees and shall not, in any event, be paid as cash to the Funds. The Custodian shall be paid a fee for administering a securities lending program for the Funds, equal to the remaining percentage of the net securities lending revenues generated under the agreement.
As of March 31, 2007, the Funds had loaned securities which were collateralized by cash. The cash collateral received was invested in securities as listed in each Fund’s Schedule of Investments. Income earned from these investments is allocated to each Fund based on each Fund’s portion of the total cash collateral received. Securities lending income is disclosed in each Fund’s Statement of Operations.
As of March 31, 2007, the values of securities loaned and collateral held were as follows:
| | | Market Value of Securities Loaned | Collateral | |
| Large Cap Growth Fund | | $229,095,906 | | | |
| Large Cap Value Fund | | 194,757,323 | | 202,616,856 | |
| Small/Mid Cap Growth Fund | | 55,961,029 | | 57,934,484 | |
| Small/Mid Cap Value Fund | | 39,788,984 | | 41,311,210 | |
| International Equity Fund | | 64,917,252 | | 67,961,428 | |
| Real Estate Securities Fund | | 45,295,735 | | 45,923,235 | |
| Core Plus Fixed Income Fund | | 207,964,344 | | 212,879,454 | |
| 7. | Investment Transactions |
The aggregate purchases and sales of securities, excluding short-term investments, for the year ended March 31, 2007 are summarized below.
| | | Purchases | | Sales | |
| Large Cap Growth Fund | | 1,050,265,577 | | 954,457,930 | |
| Large Cap Value Fund | | 192,927,823 | | 262,550,972 | |
| Small/Mid Cap Growth Fund | | 360,021,370 | | 405,468,372 | |
| Small/Mid Cap Value Fund | | 262,413,131 | | 336,035,741 | |
| International Equity Fund | | 666,837,832 | | 617,999,582 | |
| Real Estate Securities Fund | | 51,356,188 | | 41,019,464 | |
| Tax-Exempt Fixed Income Fund | | 138,288,798 | | 106,985,490 | |
| Core Plus Fixed Income Fund* | | 1,749,330,475 | | 1,691,842,975 | |
| |
| * Included in these amounts were $294,155,993 of purchases and $337,642,872 of sales of U.S. Government Securities. |
AssetMark Funds
NOTES TO FINANCIAL STATEMENTS (Continued)
March 31, 2007
| 8. | Option Contracts Written |
The premium amount and number of option contracts written during the year ended March 31, 2007 in the AssetMark Core Plus Fixed Income Fund, were as follows:
| | | | | | |
| | | | Amount of Premiums | | Number of Contracts | |
| Outstanding at 3/31/06 | | | $(100,174) | | (2,399) | |
| Options written | | | (418,342) | | (1,688) | |
| Options expired | | | 981 | | 5 | |
| Options exercised | | | — | | — | |
| Options closed | | | 471,227 | | 3,850 | |
| Outstanding at 3/31/07 | | | $(46,308) | | (232) | |
Net investment income and realized gains and losses for federal income tax purposes may differ from that reported on the financial statements because of permanent book-to-tax differences. GAAP requires that permanent differences between financial reporting and tax reporting be reclassified between various components of net assets.
These differences are primarily due to net operating losses and foreign currency. On the Statements of Assets and Liabilities, the following adjustments were made:
| | Accumulated | | | |
| | Net | Accumulated | | |
| | Investment | Realized | | |
| | Income | Gain or | Capital | |
| | or (Loss) | (Loss) | Stock | |
| | | | | |
Large Cap Growth Fund | $1,693,201 | $ 12,989 | $(1,706,190) | |
| | | | | |
Large Cap Value Fund | — | (2) | 2 | |
| | | | | |
Small/Mid Cap Growth Fund | 1,179,373 | (1,179,373) | — | |
| | | | | |
Small/Mid Cap Value Fund | 28,413 | (11,913) | (16,500) | |
| | | | | |
International Equity Fund | 6,930,540 | (6,930,540) | — | |
| | | | | |
Real Estate Securities Fund | 461,115 | (461,115) | — | |
| | | | | |
Tax-Exempt Fixed Income Fund | — | — | — | |
| | | | | |
Core Plus Fixed Income Fund | (411,586) | 432,999 | (21,413) | |
The Funds intend to utilize provisions of the Federal income tax laws which allow the Funds to carry realized capital losses forward for eight years following the year of loss and offset such losses against any future realized capital gains. Capital loss carryforwards available for Federal income tax purposes are as follows
AssetMark Funds
NOTES TO FINANCIAL STATEMENTS (Continued)
March 31, 2007
| | Capital losses expiring: | |
| | 3/31/12 | 3/31/13 | |
| Large Cap Growth Fund | — | — | |
| Large Cap Value Fund | — | — | |
| Small/Mid Cap Growth Fund | — | — | |
| Small/Mid Cap Value Fund | — | — | |
| International Equity Fund | — | — | |
| Real Estate Securities Fund | — | — | |
Tax-Exempt Fixed Income Fund | (16,163) | (128,240) | |
Core Plus Fixed Income Fund | — | — | |
| | | | |
| | 3/31/14 | 3/31/15 | |
| Large Cap Growth Fund | — | — | |
| Large Cap Value Fund | — | — | |
| Small/Mid Cap Growth Fund | — | — | |
| Small/Mid Cap Value Fund | — | — | |
| International Equity Fund | — | — | |
| Real Estate Securities Fund | — | — | |
Tax-Exempt Fixed Income Fund | (10,395) | (573,575) | |
Core Plus Fixed Income Fund | (2,286,685) | (2,411,835) | |
| | | | |
| | | | |
Additionally, at March 31,2007, the Funds deferred on a tax basis post-October losses of $63,284 for the Tax-Exempt Fixed Income Fund and $826,744 for the Core Plus Fixed Income Fund. |
The tax components of distributions paid during the fiscal years ended March 31, 2007 and March 31, 2006 are as follows: |
| | | Year Ended | |
| | | March 31, 2007 | |
| | | Ordinary | Long-Term | |
| | | Income | Capital Gains | |
| | | Distributions | Distributions | |
| | | | |
| Large Cap Growth Fund | — | $18,666,939 | |
| | | | |
| Large Cap Value Fund | $21,479,966 | 41,464,641 | |
| | | | |
| Small/Mid Cap Growth Fund | 5,361,435 | 1,172,637 | |
| | | | |
| Small/Mid CapValue Fund | 10,109,223 | 20,852,544 | |
| | | | |
| International Equity Fund | 45,260,017 | 38,531,201 | |
| | | | |
| Real Estate Securities Fund | 1,993,621 | 5,081,132 | |
| | | | |
| Tax-Exempt Fixed Income Fund | 5,575,058* | — | |
| | | | |
| Core Plus Fixed Income Fund | 27,047,513 | | |
| | | |
| * Contains $5,575,058 of tax-exempt income. | | |
AssetMark Funds
NOTES TO FINANCIAL STATEMENTS (Continued)
March 31, 2007
| | | Period Ended March 31, 2006 | |
| | | Ordinary | Long-Term | | Return | |
| | | Income | Capital Gains | | of Capital | |
| | | | | | | |
| Large Cap Growth Fund | — | | — | | — | |
| | | | | | | |
| Large Cap Value Fund | $ 11,863,655 | | | | | |
| | | | | | | |
Small/Mid Cap Growth Fund | 4,714,801 | | 10,888,147 | | — | |
| | | | | | | |
Small/Mid Cap Value Fund | 3,728,475 | | 7,802,865 | | — | |
| | | | | | | | |
International Equity Fund | 22,611,018 | | 19,370,573 | | — | |
| | | | | | | |
Real Estate Securities Fund | 2,486,920 | | 7,289,762 | | — | |
| | | | | | | | |
Tax-Exempt Fixed Income Fund | 3,056,168* | | — | | — | |
| | | | | | | |
| Core Plus Fixed Income Fund | 19,005,741 | | 1,293,014 | | 69,195,594 | |
| | | | |
| * Contains $3,056,168 of tax-exempt income. | | | |
AssetMark Funds
NOTES TO FINANCIAL STATEMENTS (Continued)
March 31, 2007
At March 31, 2007 the components of accumulated earnings/losses on a tax basis were as follows: | | | | | | | |
| | | Large Cap | | | Large Cap | | | Small/Mid | | | Small/Mid | | | International | | | Real Estate | | | Tax-Exempt | | | Core Plus | |
| | | Growth | | | Value | | | Cap Growth | | | Cap Value | | | Equity | | | Securities | | | Fixed Income | | | Fixed Income | |
| | | Fund | | | Fund | | | Fund | | | Fund | | | Fund | | | Fund | | | Fund | | | Fund | |
| Cost of | | | | | | | | | | | | | | | | | | | | | | | | |
| investments | | | 812,174,267 | | | | 682,998,447 | | | | 180,872,429 | | | | 125,714,768 | | | | 686,549,391 | | | | 100,351,849 | | | | 246,674,581 | | | | 862,577,482 | |
| Gross | | | | | | | | | | | | | | | | | | | | | | | | | | | | | | | | |
| unrealized | | | | | | | | | | | | | | | | | | | | | | | | | | | | | | | | |
| appreciation | | | 81,277,504 | | | | 116,061,365 | | | | 24,750,787 | | | | 8,368,100 | | | | 143,526,249 | | | | 41,420,847 | | | | 2,013,105 | | | | 9,620,151 | |
| Gross | | | | | | | | | | | | | | | | | | | | | | | | | | | | | | | | |
| unrealized | | | | | | | | | | | | | | | | | | | | | | | | | | | | | | | | |
| depreciation | | | (18,848,214 | ) | | | (16,378,535 | ) | | | (3,829,875 | ) | | | (2,607,531 | ) | | | (13,757,859 | ) | | | (1,633,241 | ) | | | (595,072 | ) | | | (6,025,998 | ) |
| Net unrealized | | | | | | | | | | | | | | | | | | | | | | | | | | | | | | | | |
| apprec/deprec | | | 62,429,290 | | | | 99,682,830 | | | | 20,920,912 | | | | 5,760,569 | | | | 129,768,390 | | | | 39,787,606 | | | | 1,418,033 | | | | 3,594,153 | |
| | | | | | | | | | | | | | | | | | | | | | | | | | | | | | | | | |
| Undistributed | | | | | | | | | | | | | | | | | | | | | | | | | | | | | | | | |
| tax-exempt | | | | | | | | | | | | | | | | | | | | | | | | | | | | | | | | |
| ordinary | | | | | | | | | | | | | | | | | | | | | | | | | | | | | | | | |
| income | | | — | | | | — | | | | — | | | | — | | | | — | | | | — | | | | 71,095 | | | | — | |
| Undistributed | | | | | | | | | | | | | | | | | | | | | | | | | | | | | | | | |
| ordinary | | | | | | | | | | | | | | | | | | | | | | | | | | | | | | | | |
| income | | | — | | | | 8,595,902 | | | | 4,966,236 | | | | 1,900,626 | | | | 19,584,694 | | | | 744,804 | | | | 2,227 | | | | — | |
| Undistributed | | | | | | | | | | | | | | | | | | | | | | | | | | | | | | | | |
| long-term | | | | | | | | | | | | | | | | | | | | | | | | | | | | | | | | |
| capital gain | | | 16,859,691 | | | | 11,867,579 | | | | 5,134,236 | | | | 100,380 | | | | 34,158,185 | | | | 4,886,562 | | | | — | | | | — | |
| Total | | | | | | | | | | | | | | | | | | | | | | | | | | | | | | | | |
| distributable | | | | | | | | | | | | | | | | | | | | | | | | | | | | | | | | |
| earnings | | | 16,859,691 | | | | 20,463,481 | | | | 10,100,472 | | | | 2,001,006 | | | | 53,742,879 | | | | 5,631,366 | | | | 73,322 | | | | — | |
| | | | | | | | | | | | | | | | | | | | | | | | | | | | | | | | | |
| Other | | | | | | | | | | | | | | | | | | | | | | | | | | | | | | | | |
| accumulated | | | | | | | | | | | | | | | | | | | | | | | | | | | | | | | | |
| losses | | | — | | | | — | | | | — | | | | — | | | | (658,038 | ) | | | (1,237 | ) | | | (791,657 | ) | | | (6,021,875 | ) |
| Total | | | | | | | | | | | | | | | | | | | | | | | | | | | | | | | | |
| accumulated | | | | | | | | | | | | | | | | | | | | | | | | | | | | | | | | |
| earnings/ | | | | | | | | | | | | | | | | | | | | | | | | | | | | | | | | |
| (losses) | | | 79,288,981 | | | | 120,146,311 | | | | 31,021,384 | | | | 7,761,575 | | | | 182,853,231 | | | | 45,417,735 | | | | 699,698 | | | | (2,427,722 | ) |
| | | | | | | | | | | | | | | | | | | | | | | | | | | | | | | | | |
11. | New Accounting Pronouncements |
In June 2006, the Financial Accounting Standards Board (FASB) issued FASB Interpretation No. 48 - Accounting for Uncertainty in Income Taxes, that requires the tax effects of certain tax positions to be recognized. These tax positions must meet a “more likely than not” standard that based on their technical merits, have a more than 50 percent likelihood of being sustained upon examination. FASB Interpretation No. 48 is effective for fiscal periods beginning after December 15, 2006. At adoption, the financial statements must be adjusted to reflect only those tax positions that are more likely than not of being sustained. Management of the Funds is in the process of evaluating the impact that FASB Interpretation No. 48 will have on the Funds’ financial statements and believes that there will not be a material impact.
In September 2006, the Financial Accounting Standards Board (FASB) issued Statement on Financial Accounting Standards No. 157, “Fair Value Measurements” (FAS 157). This standard clarifies the definition of fair value for financial reporting, establishes a framework for measuring fair value and requires additional disclosures about the use of fair value measurements. FAS 157 is effective for financial statements issued for fiscal years beginning after November 15, 2007 and interim periods within those fiscal years. At March 31, 2007, the Funds do not believe the adoption of FAS 157 will impact the amounts reported in the financial statements, however, additional disclosures will be required about the inputs used to develop the measurements of fair value and the effect of certain measurements reported in the statement of operations for a fiscal period.
AssetMark Funds
REPORT OF INDEPENDENT REGISTERED PUBLIC ACCOUNTING FIRM
To the Board of Trustees and Shareholders of AssetMark Funds
We have audited the accompanying statements of assets and liabilities, including the schedules of investments, of AssetMark Large Cap Growth Fund, AssetMark Large Cap Value Fund, AssetMark Small/Mid Cap Growth Fund, AssetMark Small/Mid Cap Value Fund, AssetMark International Equity Fund, AssetMark Real Estate Securities Fund, AssetMark Tax-Exempt Fixed Income Fund and AssetMark Core Plus Fixed Income Fund as of March 31, 2007, and the related statements of operations, statements of changes in net assets, and the financial highlights for the year then ended. These financial statements and financial highlights are the responsibility of fund management. Our responsibility is to express an opinion on these financial statements and financial highlights based on our audits. The statements of changes in net assets and financial highlights for the periods presented through March 31, 2006, were audited by other auditors whose report dated May 26, 2006, expressed an unqualified opinion on those financial statements and financial highlights.
We conducted our audits in accordance with the standards of the Public Company Accounting Oversight Board (United States). Those standards require that we plan and perform the audit to obtain reasonable assurance about whether the financial statements and financial highlights are free of material misstatement. An audit includes examining, on a test basis, evidence supporting the amounts and disclosures in the financial statements. Our procedures included confirmation of securities owned as of March 31, 2007, by correspondence with the custodian and brokers or by other appropriate auditing procedures. An audit also includes assessing the accounting principles used and significant estimates made by management, as well as evaluating the overall financial statement presentation. We believe that our audits provide a reasonable basis for our opinion.
In our opinion, the financial statements and financial highlights referred to above present fairly, in all material respects, the financial position of as of AssetMark Large Cap Growth Fund, AssetMark Large Cap Value Fund, AssetMark Small/Mid Cap Growth Fund, AssetMark Small/Mid Cap Value Fund, AssetMark International Equity Fund, AssetMark Real Estate Securities Fund, AssetMark Tax-Exempt Fixed Income Fund and AssetMark Core Plus Fixed Income Fund as of March 31, 2007, and the results of their operations, the changes in their net assets, and the financial highlights for the year then ended, in conformity with U.S. generally accepted accounting principles.
KPMG LLP
Milwaukee, Wisconsin
May 30, 2007
AssetMark Funds
ADDITIONAL INFORMATION
March 31, 2007
1. | Statement Regarding the Basis for Approval of Sub-Advisory Agreement (Unaudited) |
At a meeting held on November 29, 2006, the Board of Trustees of AssetMark Funds (the “Trust”) considered and approved a new sub-advisory agreement for the AssetMark Large Cap Growth Fund (the “Fund”), a series of the Trust. At the meeting, the Board of Trustees appointed Wellington Management Company, LLP (“Wellington”) to replace Loomis, Sayles & Company, L.P. as one of the sub-advisors to the Fund.
The Fund is managed using a “manager of managers” structure that generally involves the use of one or more sub-advisors to manage allocated portions of the Fund’s portfolio. Under this structure, the Fund’s investment advisor, AssetMark Investment Services, Inc. (the “Advisor”), is responsible for evaluating and selecting sub-advisors on an ongoing basis and making any decisions to recommend hiring, retaining or replacing sub-advisors. The Board of Trustees is engaged in monitoring this process in connection with quarterly meetings held throughout the year and, under the manager of managers structure, all parties understand that sub-advisors are being monitored and evaluated, and are subject to replacement, at all times.
The information, the material factors considered, and the conclusions that formed the basis of the Board’s approval of the sub-advisory agreement are described below. This summary describes the most important, but not all, of the factors evaluated by the Board. In deciding to approve the sub-advisory agreement, the Trustees did not identify any particular information or any single factor or conclusion that was controlling.
Materials Reviewed and the Review Process
Assisted by independent legal counsel, the Trustees specifically requested and were furnished with materials for purposes of their review. The materials provided to the Board of Trustees related to, among other things: (a) the terms and conditions of the proposed sub-advisory agreement; (b) the nature, quality and scope of the services to be provided by Wellington, as well as the fees to be charged for such services; (c) Wellington’s investment performance compared to industry peer groups as well as other sub-advisor client accounts; (d) comparative sub-advisory fee information; (e) information regarding Wellington’s personnel, operations, financial position and business operations; (f) information regarding Wellington’s brokerage and compliance practices; and (g) information regarding Wellington’s interactions with the Advisor regarding the management of the Fund.
The Trustees received assistance and advice regarding legal and industry standards from both independent counsel and from counsel to the Trust, and had previously received detailed memoranda prepared by each that described the Trustees’ legal duties and obligations in considering the approval of the sub-advisory agreement. In addition, at the Advisor’s request, counsel to the Trust performed extensive due diligence regarding Wellington’s compliance capabilities, which included an in-person visit to Wellington’s offices in Boston. The Independent Trustees discussed in detail, in an executive session with independent counsel at which no representatives of the Advisor or Wellington were present, the materials provided by Wellington.
Factors Considered
The Trustees considered, and reached conclusions on a number of factors in making the decision to approve the sub-advisory agreement. In so doing, the Trustees considered the Advisor’s active role as a “manager of managers,” which includes, among other functions, monitoring and evaluating the performance of the sub-advisors, recommending that sub-advisors not performing as expected be replaced, and negotiating advantageous fee arrangements that could permit the AssetMark Funds to realize economies of scale without compromising the quality of services. These factors and the Board’s conclusions are set forth below.
AssetMark Funds
ADDITIONAL INFORMATION (Continued)
March 31, 2007
Nature, Extent and Quality of Services
The Trustees considered Wellington’s investment management process, including (a) the experience and capability of Wellington’s management and other personnel; (b) the financial position of Wellington; (c) the quality and commitment of Wellington’s regulatory and legal compliance policies, procedures and systems; and (d) Wellington’s brokerage practices. The Trustees concluded that the nature, extent, and quality of the services provided by Wellington will likely benefit the Fund and its shareholders.
Investment Performance
At the time of the Board’s consideration of the sub-advisory agreement, Wellington had not commenced managing the Fund. While there was therefore no record of Wellington’s specific performance with respect to the Fund, the Board was provided with, and considered, performance information for other accounts managed by Wellington that have similar investment objectives and policies. The Trustees also considered Wellington’s investment performance record relative to benchmark indices. The Trustees concluded that Wellington’s performance record supported the approval of the sub-advisory agreement.
Sub-Advisory Fees and Economies of Scale
The Trustees considered the proposed fee schedule for Wellington. The Trustees also considered individual reports prepared for Wellington containing comparative information regarding fees. In order to consider comparative advisory fees, the Trustees generally compare the fees in sub-advisory agreements to a peer group that contains funds with similar investment objectives and policies. The funds in the relevant peer group are selected by an independent, nationally recognized, third-party data service in order to ensure that the Trustees are provided with objective data with which to conduct their analyses. The Trustees considered that breakpoints in the sub-advisory agreement fee schedule represented potential economies of scale that could be shared with Fund shareholders.
Ancillary Benefits
The Trustees considered other benefits that Wellington might receive as a result of its relationship with the Fund, including the receipt of research from brokers.
Conclusions
Based on their full evaluation of the relevant factors, the Board and the Independent Trustees concluded that each of the factors above favored approval of the sub-advisory agreement. The Board and the Independent Trustees also concluded that the sub-advisory fee is reasonable; and that the approval of the sub-advisory agreement is in the best interests of the Fund and its shareholders.
2. | Shareholder Notification of Federal Tax Status (Unaudited) |
The Large Cap Value Fund, Small/Mid Cap Growth Fund, Small/Mid Cap Value Fund, International Equity Fund, Real Estate Securities Fund and Core Plus Fixed Income Fund designates 68.3 percent, 4.4 percent, 46.7 percent, 0.1 percent, 24.3 percent and 0.1 percent, respectively, of dividends declared during the fiscal year ended March 31, 2007 as dividends qualifying for the dividends received deduction available to corporate shareholders.
The Large Cap Value Fund, Small/Mid Cap Growth Fund, Small/Mid Cap Value Fund, International Equity Fund, Real Estate Securities Fund and Core Plus Fixed Income Fund designates 69.5 percent, 5.1 percent, 43.6 percent, 29.2 percent, 26.5 percent and 0.1 percent, respectively, of dividends declared from net investment income during the fiscal year ended March 31, 2007 as qualified income under the Jobs and Growth Tax Relief Reconciliation Act of 2003.
AssetMark Funds
ADDITIONAL INFORMATION (Continued)
March 31, 2007
| 3. | Foreign Tax Credit (Unaudited) |
For the year ended March 31, 2007, the International Equity Fund earned foreign source income and paid foreign taxes, which they intend to pass through to their shareholders pursuant to Section 853 of the Internal Revenue Code as follows:
| | Foreign Source Income Earned | Foreign Taxes Paid |
| Austria | | $ 656,776.11 | | | $ 150,834.62 |
| Australia | | 89.92 | | | (13.49) |
| Belgium | | 349,367.78 | | | 56,611.48 |
| Brazil | | 357,893.78 | | | 46,282.59 |
| Canada | | 15,236.90 | | | 2,285.53 |
| Denmark | | 27,501.75 | | | 4,125.26 |
| France | | 2,415,850.23 | | | 343,479.54 |
| Germany | | 990,179.35 | | | 163,653.87 |
| Greece | | 506,355.31 | | | — |
| Hong Kong | | 527,605.93 | | | 5,874.00 |
| Ireland | | 93,296.70 | | | — |
| Israel | | 4,506.52 | | | 721.04 |
| Italy | | 1,099,392.28 | | | 180,729.08 |
| Japan | | 2,114,717.05 | | | 152,687.80 |
| Luxemburg | | 322,529.34 | | | 48,379.40 |
| Mexico | | 168,674.00 | | | — |
| Netherlands | | 188,150.42 | | | 28,222.56 |
| Philippines | | 14,842.00 | | | 3,710.50 |
| Norway | | 240,260.31 | | | 36,039.05 |
| Russia | | 72,187.04 | | | 10,828.06 |
| Singapore | | 130,578.87 | | | — |
| South Africa | | 76,527.61 | | | — |
| South Korea | | 165,991.58 | | | 27,388.61 |
| Spain | | 301,394.45 | | | 47,317.92 |
| Sweden | | 632,511.77 | | | 104,726.97 |
| Switzerland | | 630,542.19 | | | 96,267.81 |
| Taiwan | | 269,970.27 | | | 57,531.63 |
| Total | | $ 12,372,929.46 | | | $ 1,567,683.83 |
AssetMark Funds
ADDITIONAL INFORMATION (Continued)
March 31, 2007
4. | Disclosure Regarding Fund Trustees and Officers (Unaudited) |
| | | | | # of | |
| | | | | Portfolios | |
| | | | | in Fund | Other |
| | Position(s) | Term of Office | | Complex | Director/ |
Name, Age | Held with | and Length of | Principal | Overseen | Trustee |
and Address | the Trust | Time Served | Occupation During Past Five Years | byTrustee | Positions |
| | | | | | | |
Independent Trustees | | | | | | |
| | | | | | | |
| R. Thomas DeBerry, 65 | Trustee | Indefinite Term | President, DeBerry Consulting (a | 8 | None |
| c/o AssetMark | | since January | securities consulting firm) (1988-present); | | | |
| Investment Services, Inc. | | 2001. | Director, Investment Manager Services | | | |
| 2300 Contra Costa | | | Division of Resources Trust Company | | | |
| Boulevard, Suite 600 | | | (1998-2000). | | | |
| Pleasant Hill, CA 94523 | | | | | | |
| | | | | | | |
| William J. Klipp, 51 | Trustee | Indefinite Term | Retired; President and Chief Operating | 8 | Trustee of |
| c/o AssetMark | | since January | Officer, Charles Schwab Investment | | | Adelante |
| Investment Services, Inc. | | 2001. | Management, Inc. and Executive Vice | | | Funds |
| 2300 Contra Costa | | | President, Schwab Funds (1993-1999). | | | (2000-present). |
| Boulevard, Suite 600 | | | | | | |
| Pleasant Hill, CA 94523 | | | | | | |
| | | | | | | |
| Leonard H. Rossen, 74 | Trustee | Indefinite Term | President, Len Rossen Consulting (a legal | 8 | None |
| c/o AssetMark | | since January | consulting firm) (1999-present). | | | |
| Investment Services, Inc. | | 2001. | | | | |
| 2300 Contra Costa | | | | | | |
| Boulevard, Suite 600 | | | | | | |
| Pleasant Hill, CA 94523 | | | | | | |
| | | | | | | |
Interested Trustees | | | | | | |
| Ronald Cordes*, 47 | President, | Indefinite Term | Principal, AssetMark Investment Services, Inc. | 8 | None |
| AssetMark Investment | Chairperson, | since January | (1994-present). | | | |
| 2300 Contra Costa | AML | 2001. | | | | |
| Boulevard, Suite 600 | Compliance | | | | | |
| Pleasant Hill, CA 94523 | Officer, Trustee | | | | | |
| | | | | | | |
Officers | | | | | | |
| John Whittaker, 37 | Vice President | 1-Year Term | Senior Vice President and Chief Operating | N/A | N/A |
| AssetMark | | since January | Officer, AssetMark Investment | | | |
| Investment Services, Inc. | | 2001 | Services, 2000 to present. | | | |
| 2300 Contra Costa | | | | | | |
| Boulevard, Suite 600 | | | | | | |
| Pleasant Hill, CA 94523 | | | | | | |
AssetMark Funds
ADDITIONAL INFORMATION (Continued)
March 31, 2007
| | | | | # of | |
| | | | | Portfolios | |
| | | | | in Fund | Other |
| | Position(s) | Term of Office | | Complex | Director/ |
Name, Age | Held with | and Length of | Principal | Overseen | Trustee |
and Address | the Trust | Time Served | Occupation During Past Five Years | by Trustee | Positions |
| | | | | | | |
Officers | | | | | | |
| Carrie E. Hansen, 36 | Treasurer, | 1-Year Term | Senior Vice President, CFO/Chief Compliance | N/A | N/A |
| AssetMark | Chief | since January | Officer, AssetMark Investment Services, | | | |
| Investment Services, Inc. | Compliance | 2001 | Inc., October 2004 to present; CFO/Director | | | |
| 2300 Contra Costa | Officer | | of Operations, AssetMark Investment Services, | | | |
| Boulevard, Suite 600 | and AML | | Inc., February 2004 to October 2004. Director | | | |
| Pleasant Hill, CA 94523 | Compliance | | of Operations, AssetMark Investment Services, | | | |
| | Officer | | Inc., 2000 to February 2004. | | | |
| | | | | | | |
| Chris Villas-Chernak, 38 | Secretary | 1-Year Term | Senior Compliance Officer, AssetMark | N/A | N/A |
| AssetMark | | since September | Investment Services, Inc., 2005 to present; Fund | | |
| Investment Services, Inc. | | 2006 | Administration and Compliance Manager, | | | |
| 2300 Contra Costa | | | AssetMark Investment Services, Inc., 2004 to | | | |
| Boulevard, Suite 600 | | | 2005; Fund Administration and Compliance | | | |
| Pleasant Hill, CA 94523 | | | Specialist, AssetMark Investment Services, Inc., | | |
| | | | 2002 to 2004; Project Manager, AssetMark | | | |
| | | | Investment Services, Inc., 2001 to 2002. | | | |
The Statement of Additional Information includes additional information about the Funds’ Trustees and is available free of charge upon request by calling the Funds toll free at
(888) 278-5809.
| * | Ronald Cordes is an “interested person” of the Funds as defined in the 1940 Act due to his relationship with the Advisor. |
5. | Proxy Voting Policies and Procedures and Proxy Voting Record (Unaudited) |
A description of the policies and procedures that the Funds use to determine how to vote proxies related to the Funds’ portfolio securities as well as information regarding how the Funds voted proxies relating to portfolio securities during the most recent 12-month period ended June 30 is available without charge, upon request, by calling (888) 278-5809. Furthermore, you can obtain the Funds’ proxy voting records on the SEC’s website at http://www.sec.gov.
6. | Availability of Quarterly Portfolio Holdings Schedules (Unaudited) |
The Funds are required to file their complete schedules of portfolio holdings with the SEC for their first and third fiscal quarters on Form N-Q. Once filed, the Funds’ Form N-Q is available without charge, upon request on the SEC’s website (http://www.sec.gov) and may be available by calling (888) 278-5809. You can also obtain copies of Form N-Q by (i) visiting the SEC’s Public Reference Room in Washington, DC (information on the operation of the Public Reference Room may be obtained by calling 1-800-SEC-0330); (ii) sending your request and a duplicating fee to the SEC’s Public Reference Room, Washington, DC 20549-0102; or (iii) sending your request electronically to publicinfosec.gov.
7. | Change in Independent Registered Public Accounting Firm (Unaudited) |
Effective March 1, 2007, PricewaterhouseCoopers (“PwC”) resigned as the Funds’ independent registered public accounting firm. The Board of Trustees of the funds has engaged KPMG, LLP as the Funds’ independent registered public accounting firm. The resignation of PwC was a result of an independence issue with PwC due to the acquisition of AssetMark Investment Services, Inc. by Genworth. PwC’s report on the Trust’s financial statements for each of the past five years did not include any adverse opinion or disclaimer of opinion and was not qualified or modified as to uncertainty, audit scope or accounting principles. During the Registrant’s two most recent fiscal years and any subsequent period through March 31, 2007, there were no disagreements or events of the type required to be reported in PwC’s opinions pursuant to paragraph (iv) or (v) of Item 304(a)(1) of Regulation S-K.
AssetMark Funds
ADDITIONAL INFORMATION (Continued)
March 31, 2007
| 8. | Results of the Meeting of the Shareholders of the AssetMark Funds (Unaudited) |
A meeting of the AssetMark Fund shareholders was held on October 16, 2006. The matter voted on by the shareholders and the results of the vote at the shareholder meeting were as follows:
To approve a new investment advisory agreement between AssetMark Investment Services, Inc. and the Trust, on behalf of each Fund.
| AssetMark Large Cap Growth Fund | | |
| Affirmative | 32,721,608 | |
| Against | 501,749 | |
| Abstain | 845,800 | |
| Total | 34,069,157 | |
| | | |
| AssetMark Large Cap Value Fund | | |
| Affirmative | 26,001,618 | |
| Against | 413,106 | |
| Abstain | 680,787 | |
| Total | 27,095,511 | |
| | | |
| AssetMark Small/Mid Cap Growth Fund | | |
| Affirmative | 8,714,768 | |
| Against | 148,127 | |
| Abstain | 198,824 | |
| Total | 9,061,719 | |
| | | |
| AssetMark Small/Mid Cap Value Fund | | |
| Affirmative | 6,617,103 | |
| Against | 106,770 | |
| Abstain | 152,573 | |
| Total | 6,876,446 | |
| AssetMark International Equity Fund | | |
| Affirmative | 24,377,107 | |
| Against | 358,940 | |
| Abstain | 621,859 | |
| Total | 25,357,906 | |
| | | |
| AssetMark Real Estate Securities Fund | | |
| Affirmative | 2,311,793 | |
| Against | 30,028 | |
| Abstain | 64,595 | |
| Total | 2,406,416 | |
| | | |
| AssetMark Tax-Exempt Fixed Income Fund | | |
| Affirmative | 9,938,598 | |
| Against | 130,995 | |
| Abstain | 206,149 | |
| Total | 10,275,742 | |
| | | |
| AssetMark Core Plus Fixed Income Fund | | |
| Affirmative | 35,265,739 | |
| Against | 447,388 | |
| Abstain | 1,268,343 | |
| Total | 36,981,470 | |
Item 2. Code of Ethics.
As of the end of the period covered by this report, the Registrant has adopted a code of ethics that applies to the Registrant’s principal executive officer and principal financial officer. During the period covered by this report, there were no; (i) amendments to the code, or (ii) waivers (including implicit waivers) granted from the provisions of the code.
Item 3. Audit Committee Financial Expert.
The Registrant’s Board of Trustees has determined that the Registrant does not currently have a member serving on its audit committee that meets the definition of an “audit committee financial expert” as defined in instruction 2(b) of Item 3 of Form N-CSR. The Trustees reviewed the attributes, education and experience of each member of the Registrant’s audit committee, the nature of the accounting principles applicable to the Registrant, and the Registrant’s underlying internal controls and reporting mechanisms and determined that the members of the Registrant’s audit committee, as a group, have the experience and education necessary to perform the audit committee’s responsibilities, including those regarding the financial statements of the Registrant. In addition, the members of the audit committee determined that the committee has the resources and authority necessary to discharge its responsibilities, including the authority to retain at any time independent counsel and other advisers and experts, and they will seek such additional expert assistance as they determine it necessary. The Trustees also determined that each member of the Registrant’s audit committee is “independent” as defined in the instructions to Form N-CSR.
Item 4. Principal Accountant Fees and Services.
| (a) | – (d) The Registrant has engaged its principal accountant to perform audit services and tax services during the past two fiscal years. “Audit services” refer to performing an audit of the Registrant's annual financial statements or services that are normally provided by the accountant in connection with statutory and regulatory filings or engagements for those fiscal years. “Tax services” refer to professional services rendered by the principal accountant for tax compliance, tax advice, and tax planning. The following table details the aggregate fees billed for each of the last two fiscal years for audit services and tax services by the principal accountant. The fees for FYE 03/31/2006 were billed by PricewaterhouseCoopers LLC. The fees for FYE 03/31/2007 were billed by KPMG LLP. |
| | | |
| | FYE 03/31/07 | FYE 03/31/2006 (1) |
| Audit Fees | $173,000 | $158,000 |
| Audit-Related Fees | $0 | $0 |
| Tax Fees | $37,000 | $26,000 |
| All Other Fees | $0 | $0 |
(1) The Registrant changed its fiscal year end from June 30 to March 31. The data pertaining to 03/31/2006 covers the nine months ended March 31, 2006.
(e) (1) The audit committee has adopted an Audit Committee Charter that provides that the audit committee shall approve, prior to appointment, the engagement of the auditor to provide audit services to the Registrant and non-audit services to the Registrant, its investment adviser or any entity controlling, controlled by or under common control with the investment adviser that provides on-going services to the Registrant if the engagement relates directly to the operations and financial reporting of the Registrant.
(e) (2)None of the services described above were approved by the Registrant's audit committee pursuant to paragraph (c)(7)(i)(C) of Rule 2-01 of Regulation S-X.
(f) All of the principal accountant’s hours spent on auditing the Registrant’s financial statements were attributed to work performed by full-time permanent employees of the principal accountant.
(g) The following table indicates the non-audit fees billed by the Registrant’s accountant for services to the Registrant and to the Registrant’s investment adviser (not sub-advisor) and any entity controlling, controlled by or under common control with the investment adviser for the last two years.
| | | |
| Non-Audit Related Fees | FYE 03/31/2007 | FYE 03/31/2006 (1) |
| Registrant | $37,000 | $26,000 |
| Registrant’s Investment Adviser | $0 | $0 |
(1) The Registrant changed its fiscal year end from June 30 to March 31. The data pertaining to 03/31/2006 covers the nine months ended March 31, 2006.
(h) The audit committee of the Board of Trustees has considered whether the provision of non-audit services that were rendered to the Registrant's investment adviser is compatible with maintaining the principal accountant's independence and has concluded that the provision of such non-audit services by the accountant has not compromised the accountant’s independence.
Item 5. Audit Committee of Listed Registrants.
Not applicable.
Item 6. Schedule of Investments.
Schedule of Investments is included as part of the report to shareholders filed under Item 1 of this Form.
Item 7. Disclosure of Proxy Voting Policies and Procedures for Closed-End Management Investment Companies.
Not applicable to open-end investment companies.
Item 8. Portfolio Managers of Closed-End Management Investment Companies.
Not applicable to open-end investment companies.
Item 9. Purchases of Equity Securities by Closed-End Management Investment Company and Affiliated Purchasers.
Not applicable to open-end investment companies.
Item 10. Submission of Matters to a Vote of Security Holders.
None.
Item 11. Controls and Procedures.
| (a) | Based on their evaluation of the Registrant’s disclosure controls and procedures as of a date within 90 days of the filing date of this Form N-CSR (the “Report”), the Registrant’s President/Chief Executive Officer and Treasurer/Chief Financial Officer believe that the disclosure controls and procedures (as defined in Rule 30a-3(c) under the Investment Company Act of 1940, as amended (the “1940 Act”)) are effectively designed to ensure that information required to be disclosed by the Registrant in the Report is recorded, processed, summarized and reported by the filing date, including ensuring that information required to be disclosed in the Report is accumulated and communicated to the Registrant’s officers who are making certifications in the Report, as appropriate, to allow timely decisions regarding required disclosure. |
| (b) | There were no changes in the Registrant’s internal control over financial reporting (as defined in Rule 30a-3(d) under the 1940 Act) that occurred during the Registrant’s second Fiscal quarter of the period covered by this report that have materially affected, or are reasonably likely to materially affect, the Registrant’s internal control over financial reporting. |
Item 12. Exhibits.
| (a) | (1) Any code of ethics, or amendment thereto, that is the subject of the disclosure required by Item 2, to the extent that the Registrant intends to satisfy the Item 2 requirements through filing an exhibit. Form filed herewith. |
(2) Certifications pursuant to Section 302 of the Sarbanes-Oxley Act of 2002. Filed herewith.
(b) | Certification pursuant to Section 906 of the Sarbanes-Oxley Act of 2002. Furnished herewith. |
SIGNATURES
Pursuant to the requirements of the Securities Exchange Act of 1934 and the Investment Company Act of 1940, the registrant has duly caused this report to be signed on its behalf by the undersigned, thereunto duly authorized.
(Registrant) AssetMark Funds
By (Signature and Title)* /s/ Ronald D. Cordes
Ronald D. Cordes, President
Date May 30, 2007
Pursuant to the requirements of the Securities Exchange Act of 1934 and the Investment Company Act of 1940, this report has been signed below by the following persons on behalf of the registrant and in the capacities and on the dates indicated.
By (Signature and Title)* /s/ Ronald D. Cordes
Ronald D. Cordes, President
Date May 30, 2007
By (Signature and Title)* /s/ Carrie E. Hansen
Carrie E. Hansen, Treasurer
Date May 30, 2007
* Print the name and title of each signing officer under his or her signature.