As filed with the Securities and Exchange Commission on June 9, 2006
UNITED STATES
SECURITIES AND EXCHANGE COMMISSION
Washington, D.C. 20549
FORM N-CSR
CERTIFIED SHAREHOLDER REPORT OF REGISTERED MANAGEMENT INVESTMENT COMPANIES
811-10267
Investment Company Act file number
ASSETMARK FUNDS
(Exact name of registrant as specified in charter)
2300 CONTRA COSTA BOULEVARD, SUITE 425, PLEASANT HILL, CA 94523-3967
(Address of principal executive offices) (Zip code)
800-664-5345
(Name and address of agent for service)
CARRIE HANSEN
ASSETMARK INVESTMENT SERVICES, INC.
2300 CONTRA COSTA BOULEVARD, SUITE 425
PLEASANT HILL, CA 94523-3967
Registrant's telephone number, including area code
Date of fiscal year end: March 31
Date of reporting period: March 31, 2006
Item 1. Report to Stockholders.
March 31, 2006
ASSETMARK LARGE CAP GROWTH FUND
ASSETMARK LARGE CAP VALUE FUND
ASSETMARK SMALL/MID CAP GROWTH FUND
ASSETMARK SMALL/MID CAP VALUE FUND
ASSETMARK INTERNATIONAL EQUITY FUND
ASSETMARK REAL ESTATE SECURITIES FUND
ASSETMARK TAX-EXEMPT FIXED INCOME FUND
ASSETMARK CORE PLUS FIXED INCOME FUND
Dear Shareholder,
You will find enclosed our Annual Report for the AssetMark Funds. In reviewing the data contained in the Report, you should note that, for a number of reasons related to the internal administration of the Funds, the Board of Trustees of the Funds elected to change the fiscal year-end of the Funds from June 30th to March 31st. Therefore, this Annual Report covers the nine-month period from July 1, 2005 through March 31, 2006.
Economic & Market Overview:
Over the past nine months, both the U.S. and global equity markets have generally performed very well, with several of the major market indices, as noted below, posting returns of greater than 10%. This strong market performance is reflective of generally positive economic growth throughout the world, particularly in the U.S., Japan, and several developing countries, as well as strong year-over-year increases in corporate profits. During this period, international equity markets, as measured by the MSCI EAFE Index, outperformed U.S. markets, while in the U.S., smaller companies outperformed their larger counterparts and real estate stocks continued to strongly outperform the broader market indices.
AssetMark Funds Overview:
In consultation with Wilshire Associates, an institutional investment consulting and research firm, AssetMark Investment Services, Inc. seeks to consistently identify and engage highly skilled investment managers as Sub-Advisors for each Fund, as well as effectively combine managers with complementary skills to reduce volatility and achieve more consistent investment results.
During this period, we replaced a Sub-Advisor in the Small/Mid Cap Growth Fund and added a new Sub-Advisor to both the Large Cap Growth and Large Cap Value Funds. On September 19, 2005, Nicholas-Applegate Capital Management (“Nicholas-Applegate”) was engaged to replace TCW Investment Management Company (“TCW”) in the Small/Mid Cap Growth Fund. On January 25, 2006, Loomis, Sayles & Company, L.P. (“Loomis”) and NFJ Investment Group, L.P. (“NFJ”) were added as Sub-Advisors to the Large Cap Growth and Large Cap Value Funds, respectively, as part of our continuing effort to reduce the volatility and enhance the risk-adjusted return of each Fund.
The AssetMark Funds generally performed in accordance with their sectors and style orientation during this period, as described below:
The AssetMark Large Cap Growth Fund returned 8.15% for the nine months ended March 31, 2006, underperforming the Russell 1000 Growth Index1, a widely accepted unmanaged benchmark for large cap growth portfolios, which returned 10.42%. This underperformance was due in part to underperformance in TCW’s portion of the portfolio, which returned 8.72% for period, underperforming the benchmark by 1.70%. The primary contributor to TCW’s underperformance was specific stock selection in the technology sector. Atlanta Capital Management Company, LLC (“Atlanta”) returned 9.77% for the period in its portion of the portfolio, underperforming the benchmark by 0.65%. Atlanta’s philosophy of owning high quality growth companies was a drag on performance, as lower quality companies drove the benchmark’s return for the period. Shareholders should note that no specific performance information is provided with respect to Loomis, as it was not a Sub-Advisor for the entire period.
___________
| 1 | Source: All benchmark return data provided by U.S. Bancorp Fund Services, LLC. One cannot invest directly in an index, nor is an index representative of any Fund’s portfolio. The indexes provided are widely accepted benchmarks for the associated portfolios. The performance data quoted represents past performance. The investment return and principal value of an investment will fluctuate so that an investor’s shares, when redeemed, may be worth more or less than their original cost. |
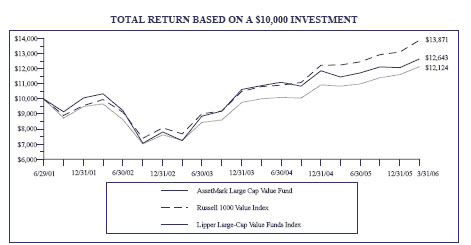
The AssetMark Large Cap Value Fund returned 7.85% for the nine months ended March 31, 2006, underperforming the Russell 1000 Value Index, a widely accepted unmanaged benchmark for large cap value portfolios, which returned 11.44%. Davis Selected Advisors, L.P. (“Davis”) had the best performance of the two Sub-Advisors in the Fund, returning 9.61% for the nine-month period, but underperformed the benchmark by 1.81%. Davis’ underperformance was due to specific stock selection in the first quarter of 2006 in industrials and health care. Brandes Investment Partners, L.P. (“Brandes”) returned 7.84% for the period, underperforming the benchmark by 3.60%. Brandes’ performance was affected by its overweight allocations to the auto, auto components and pharmaceuticals sectors. Both firms are long-term investors seeking to outperform the market over a 10-year period, thus their performance over a shorter time period may lag the benchmark. Shareholders should note that no specific performance information is provided with respect to NFJ, as it was not a Sub-Advisor for the entire period.
The AssetMark Small/Mid Cap Growth Fund returned 20.82% for the nine months ended March 31, 2006, underperforming the Russell 2500 Growth Index, a widely accepted unmanaged benchmark for Small/Mid Cap Growth portfolios, which rose 22.09%. As noted above, during the period TCW was replaced as a Sub-Advisor by Nicholas-Applegate. The combination of TCW and Nicholas-Applegate returned 18.77% for the period, underperforming the benchmark by 3.32%, which was largely attributable to specific stock selection by TCW. This underperformance was offset by the 22.09% return by Copper Rock Capital Partners, LLC (“Copper Rock”), which equaled the benchmark. Copper Rock’s performance resulted from strong stock selection in nearly every sector and favorable sector allocation.
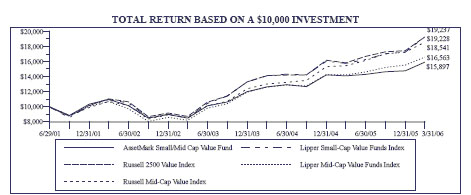
The AssetMark Small/Mid Cap Value Fund returned 11.18% for the nine months ended March 31, 2006, underperforming the Russell 2500 Value Index, a widely accepted unmanaged benchmark for Small/Mid Cap Value portfolios, which rose 15.45%. Ariel Capital Management, LLC (“Ariel”) returned 5.60% for the nine-month period, dramatically underperforming the benchmark by 9.85%. Ariel’s underperformance was caused by its stock selection in the financials and consumer discretionary sectors and an underweight position in the energy sector. Cramer Rosenthal McGlynn, LLC (“Cramer”) returned 16.65% for the period, outperforming the benchmark by 1.20%. Cramer benefited from a moderate overweight to energy, which performed well during the period. One of the difficulties with benchmarking this asset class is the fact that the Russell 2500 Value Index includes an exposure of 12% to real estate investment trust (“REIT”) stocks, which are not generally considered by either of our Sub-Advisors as appropriate small/mid cap value companies for their portfolios. This is exacerbated in times when REIT’s deliver very strong returns as they have over the past nine months. During these periods, shareholders in diversified portfolios utilizing the AssetMark Funds may benefit from REIT exposure through the specialized management of our two Sub-Advisors in the AssetMark Real Estate Securities Fund.
The AssetMark International Equity Fund returned 29.75% for the nine months ended March 31, 2006, outperforming the MSCI EAFE Index of developed country non-U.S. stocks, which returned 25.88%. This unmanaged index is a widely accepted benchmark for international equity portfolios. Clay Finlay, Inc. (“Clay Finlay”) returned 31.45% for the nine-month period, strongly outperforming the benchmark by 5.57%. Clay Finlay benefited both from individual stock selection and from exposure to emerging markets and Japan. Oppenheimer Capital LLC returned 28.25% for the period, outperforming its benchmark by 2.37%, which was driven largely by strong stock selection in Europe.
The AssetMark Real Estate Securities Fund, sub-advised by Adelante Capital Management, LLC (“Adelante”) and AEW Management and Advisors, L.P. (“AEW”), returned 22.94% for the nine-month period ended March 31, 2006, performing nearly in line with the Dow Jones Wilshire REIT Index, which gained 23.53% for the period. Adelante returned 22.33% for the period, underperforming the benchmark by 1.20%. Adelante’s underweight to the public storage and hotel sectors contributed to its underperformance. AEW returned 23.65%, outperforming the benchmark by 0.12%. This outperformance was mainly due to an overweight position in the apartment sector.
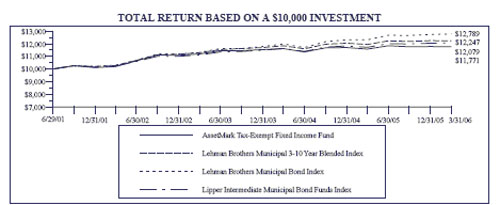
The AssetMark Tax-Exempt Fund, sub-advised by Weiss, Peck & Greer LLC (“Weiss Peck”), returned -0.64% for the nine-month period ended March 31, 2006, slightly underperforming the Lehman Brothers Municipal 3-10 Year Blended Index, which returned 0.11%. This unmanaged index is a widely accepted benchmark for intermediate duration tax-exempt portfolios. Weiss Peck underperformed due primarily to an underweight position in high yield bonds and other more volatile sectors relative to the benchmark, as these were among the best performing tax-exempt fixed income sectors during the period.
The AssetMark Core Plus Fixed Income Fund returned -0.48% for the nine months ended March 31, 2006, outperforming the Lehman Brothers Aggregate Bond Index, which returned -0.73%. The Lehman Brothers Aggregate Bond Index is a widely accepted unmanaged benchmark for core U.S. fixed income portfolios. Goldman Sachs Asset Management, L.P. returned -0.39% for the period, outperforming the benchmark by 0.34%, while Western Asset Management Company returned -0.59% for the period, outperforming the benchmark by 0.14%. In the case of both managers, the international and high yield components of their portfolios had a positive contribution to the Fund’s returns during the period We greatly appreciate your decision, in working closely with your investment advisor, to include the AssetMark Funds as a component of your overall investment portfolio, and we remain confident that each Fund is well positioned to deliver strong long-term value to our shareholders.
Sincerely,
Ronald D. Cordes,
President
AssetMark Funds
AssetMark Funds
EXPENSE EXAMPLE (Unaudited)
As a shareholder of the AssetMark Funds (the “Funds”), you incur ongoing costs, including management fees; distribution and/or service fees; and other Fund expenses. This example is intended to help you understand your ongoing costs (in dollars) of investing in the Funds and to compare costs with the ongoing costs of investing in other mutual funds.
The Example is based on an investment of $1,000 invested at the beginning of the period and held the entire period (October 1, 2005 - March 31, 2006).
Actual Expenses
The first line of the table below provides information about actual account values and actual expenses. You may use the information in this line, together with the amount you invested, to estimate the expenses that you paid over the period. Simply divide your account value by $1,000 (for example, an $8,600 account value divided by $1,000 = 8.6), then multiply the result by the number in the first line under the heading entitled “Expenses Paid During Period” to estimate the expenses you paid on your account during this period. The expenses reflected in the expense example include, but are not limited to, management fees, shareholder servicing fees, distribution fees, fund accounting, custody and transfer agent fees. However, the expense example below does not include portfolio trading commissions and related expenses, interest expense or dividends on short positions taken by the Funds and other extraordinary expenses as determined under generally accepted accounting principles. To the extent that a Fund invests in shares of other investment companies as part of its investment strategy, you will indirectly bear your proportionate share of any fees and expenses charged by the underlying funds in which a Fund invests in addition to the expenses of the Fund. Actual expenses of the underlying funds are expected to vary among the various underlying funds. These expenses are not included in the example below.
Hypothetical Example for Comparison Purposes
The second line of the table below provides information about hypothetical account values and hypothetical expenses based on the Funds’ actual expense ratios and an assumed rate of return of 5% per year before expenses, which is not the Funds’ actual return. The hypothetical account values and expenses may not be used to estimate the actual ending account balance or expenses you paid for the period. You may use this information to compare the ongoing costs of investing in the Funds and other funds. To do so, compare this 5% hypothetical example with the 5% hypothetical examples that appear in the shareholder reports of the other funds.
Please note that the expenses shown in the table are meant to highlight your ongoing costs only and do not reflect any transactional costs, such as sales charges (loads), redemption fees, or exchange fees. Therefore, the second line of the table is useful in comparing ongoing costs only, and will not help you determine the relative costs of owning different funds. In addition, if these transactional costs were included, your costs would have been higher.
| | AssetMark Large Cap Growth Fund | | | |
| | | | | |
| | | Beginning | Ending | Expenses Paid |
| | | Account Value | Account Value | During Period* |
| | | October 1, 2005 | March 31, 2006 | October 1, 2005 - March 31, 2006 |
| | Actual | $1,000.00 | $1,036.50 | $6.70 |
| | | | | |
| | Hypothetical (5% return | | | |
| | before expenses) | 1,000.00 | 1,018.35 | 6.64 |
| | | | | |
| * | Expenses are equal to the Fund’s annualized expense ratio of 1.32%, multiplied by the average account value over the period, multiplied by 182/365 to reflect the one-half year period. | |
AssetMark Funds
EXPENSE EXAMPLE (Continued) (Unaudited)
| | AssetMark Large Cap Value Fund | | | |
| | | | | |
| | | Beginning | Ending | Expenses Paid |
| | | Account Value | Account Value | During Period* |
| | | October 1, 2005 | March 31, 2006 | October 1, 2005 - March 31, 2006 |
| | Actual | $1,000.00 | $1,043.20 | $6.67 |
| | | | | |
| | Hypothetical (5% return | | | |
| | before expenses) | 1,000.00 | 1,018.40 | 6.59 |
| | | | | |
| * | Expenses are equal to the Fund’s annualized expense ratio of 1.31%, multiplied by the average account value over the period, multiplied by 182/365 to reflect the one-half year period. | |
| | AssetMark Small/Mid Cap Growth Fund | | | |
| | | | | |
| | | Beginning | Ending | Expenses Paid |
| | | Account Value | Account Value | During Period* |
| | | October 1, 2005 | March 31, 2006 | October 1, 2005 - March 31, 2006 |
| | Actual | $1,000.00 | $1,143.60 | $7.38 |
| | | | | |
| | Hypothetical (5% return | | | |
| | before expenses) | 1,000.00 | 1,018.05 | 6.94 |
| | | | | |
| * | Expenses are equal to the Fund’s annualized expense ratio of 1.38%, multiplied by the average account value over the period, multiplied by 182/365 to reflect the one-half year period. | |
| | AssetMark Small/Mid Cap Value Fund | | | |
| | | | | |
| | | Beginning | Ending | Expenses Paid |
| | | Account Value | Account Value | During Period* |
| | | October 1, 2005 | March 31, 2006 | October 1, 2005 - March 31, 2006 |
| | Actual | $1,000.00 | $1,086.00 | $7.80 |
| | | | | |
| | Hypothetical (5% return | | | |
| | before expenses) | 1,000.00 | 1,017.45 | 7.54 |
| | | | | |
| * | Expenses are equal to the Fund’s annualized expense ratio of 1.50%, multiplied by the average account value over the period, multiplied by 182/365 to reflect the one-half year period. | |
| | AssetMark International Equity Fund | | | |
| | | | | |
| | | Beginning | Ending | Expenses Paid |
| | | Account Value | Account Value | During Period* |
| | | October 1, 2005 | March 31, 2006 | October 1, 2005 - March 31, 2006 |
| | Actual | $1,000.00 | $1,164.20 | $7.34 |
| | | | | |
| | Hypothetical (5% return | | | |
| | before expenses) | 1,000.00 | 1,018.15 | 6.84 |
| | | | | |
| * | Expenses are equal to the Fund’s annualized expense ratio of 1.36%, multiplied by the average account value over the period, multiplied by 182/365 to reflect the one-half year period. | |
AssetMark Funds
EXPENSE EXAMPLE (Continued) (Unaudited)
| | AssetMark Real Estate Securities Fund | | | |
| | | | | |
| | | Beginning | Ending | Expenses Paid |
| | | Account Value | Account Value | During Period* |
| | | October 1, 2005 | March 31, 2006 | October 1, 2005 - March 31, 2006 |
| | Actual | $1,000.00 | $1,184.90 | $8.12 |
| | | | | |
| | Hypothetical (5% return | | | |
| | before expenses) | 1,000.00 | 1,017.50 | 7.49 |
| | | | | |
| * | Expenses are equal to the Fund’s annualized expense ratio of 1.49%, multiplied by the average account value over the period, multiplied by 182/365 to reflect the one-half year period. | |
| | AssetMark Tax-Exempt Fixed Income Fund | | | |
| | | | | |
| | | | Ending | Expenses Paid |
| | Account Value | Beginning | Account Value | During Period* |
| | | October 1, 2005 | March 31, 2006 | October 1, 2005 - March 31, 2006 |
| | Actual | $1,000.00 | $999.70 | $6.43 |
| | | | | |
| | Hypothetical (5% return | | | |
| | before expenses) | 1,000.00 | 1,018.50 | 6.49 |
| | | | | |
| * | Expenses are equal to the Fund’s annualized expense ratio of 1.29%, multiplied by the average account value over the period, multiplied by 182/365 to reflect the one-half year period. | |
| | AssetMark Core Plus Fixed Income Fund | | | |
| | | | | |
| | | Beginning | Ending | Expenses Paid |
| | | Account Value | Account Value | During Period* |
| | | October 1, 2005 | March 31, 2006 | October 1, 2005 - March 31, 2006 |
| | Actual | $1,000.00 | $999.00 | $5.78 |
| | | | | |
| | Hypothetical (5% return | | | |
| | before expenses) | 1,000.00 | 1,019.15 | 5.84 |
| | | | | |
| * | Expenses are equal to the Fund’s annualized expense ratio of 1.16%, multiplied by the average account value over the period, multiplied by 182/365 to reflect the one-half year period. | |
AssetMark Funds
ALLOCATION OF PORTFOLIO HOLDINGS
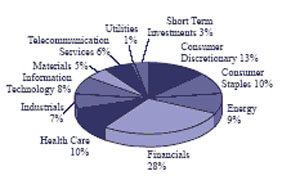
AssetMark Large Cap Growth Fund | | | |
| | | |
Components of Portfolio Holdings | |
| Consumer Discretionary | | $ | 99,871,522 |
| Consumer Staples | | | 34,068,711 |
| Energy | | | 27,044,573 |
| Financials | | | 129,299,850 |
| Health Care | | | 115,021,693 |
| Industrials | | | 57,621,067 |
| Information Technology | | | 175,505,014 |
| Materials | | | 4,468,135 |
| Short Term Investments | | | 13,870,283 |
| | Total | $ | 656,770,848(1) |
| | | | |
| (1) Total excludes $223,947,221 of Securities Lending Collateral | | |
AssetMark Large Cap Value Fund | | | |
| | | | |
Components of Portfolio Holdings | |
| Consumer Discretionary | | $ | 83,810,852 |
| Consumer Staples | | | 67,873,892 |
| Energy | | | 61,603,346 |
| Financials | | | 189,347,483 |
| Health Care | | | 63,588,238 |
| Industrials | | | 45,957,706 |
| Information Technology | | | 52,031,165 |
| Materials | | | 31,325,292 |
| Telecommunication Services | | | 38,628,839 |
| Utilities | | | 7,904,616 |
| Short Term Investments | | | 18,755,998 |
| | Total | $ | 660,827,427(1) |
| | | | |
| (1) Total excludes $260,587,989 of Securities Lending Collateral | | |
AssetMark Funds
ALLOCATION OF PORTFOLIO HOLDINGS (Continued)
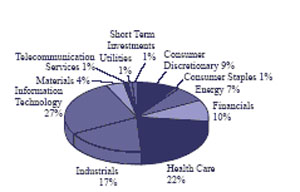
AssetMark Small/Mid Cap Growth Fund | | | |
| | | | |
Components of Portfolio Holdings | |
| Consumer Discretionary | | $ | 19,192,691 |
| Consumer Staples | | | 2,401,848 |
| Energy | | | 14,421,042 |
| Financials | | | 21,356,364 |
| Health Care | | | 48,358,585 |
| Industrials | | | 37,515,194 |
| Information Technology | | | 58,785,264 |
| Materials | | | 7,811,186 |
| Telecommunication Services | | | 1,168,020 |
| Utilities | | | 1,397,286 |
| Short Term Investments | | | 2,622,103 |
| | Total | $ | 215,029,583(1) |
| | | | |
| (1) Total excludes $77,426,550 of Securities Lending Collateral | | |
AssetMark Small/Mid Cap Value Fund | | |
| | | | |
Components of Portfolio Holdings | |
| Consumer Discretionary | | $ | 25,390,817 |
| Consumer Staples | | | 9,490,598 |
| Energy | | | 2,320,192 |
| Financials | | | 36,420,700 |
| Health Care | | | 18,653,379 |
| Industrials | | | 39,691,159 |
| Information Technology | | | 24,631,004 |
| Materials | | | 8,527,089 |
| Utilities | | | 9,732,465 |
| Short Term Investments | | | 7,109,671 |
| | Total | $ | 181,967,074(1) |
| | | | |
| (1) Total excludes $65,488,429 of Securities Lending Collateral | | |
AssetMark Funds
ALLOCATION OF PORTFOLIO HOLDINGS (Continued)
AssetMark International Equity Fund | | |
| | | | |
Components of Portfolio Holdings | |
| Asia | | $ | 213,465,873 |
| Australia | | | 14,260,435 |
| Europe | | | 331,908,219 |
| North America | | | 30,137,682 |
| South America | | | 10,238,900 |
| Short Term Investments | | | 13,135,502 |
| | Total | $ | 613,146,611(1) |
| | | | |
| (1) Total excludes $114,781,055 of Securities Lending Collateral | | |
AssetMark International Equity Fund | | |
| | | | |
Components of Portfolio Holdings | |
| Apartments | | $ | 19,004,973 |
| Diversified | | | 10,931,853 |
| Health Care | | | 485,090 |
| Hotels & Motels | | | 3,575,210 |
| Office Property | | | 19,121,488 |
| Regional Malls | | | 14,209,901 |
| Shopping Centers | | | 10,871,549 |
| Storage | | | 2,183,810 |
| Warehouse/Industrial | | | 7,580,260 |
| Short Term Investments | | | 1,879,814 |
| | Total | $ | 89,843,948(1) |
| | | | |
| | | | |
| (1) Total excludes $114,781,055 of Securities Lending Collateral | | | |
AssetMark Funds
ALLOCATION OF PORTFOLIO HOLDINGS (Continued)
AssetMark Tax-Exempt Fixed Income Fund | |
| | | | |
Components of Portfolio Holdings | |
| General Obligation Bonds | | $ | 81,982,007 |
| Revenue Bonds | | | 118,773,265 |
| Certificate Participation | | | 1,199,578 |
| Notes | | | 1,255,862 |
| Warrants | | | 700,882 |
| Short Term Investments | | | 7,369,000 |
| | Total | $ | 211,280,594 |
| | | | |
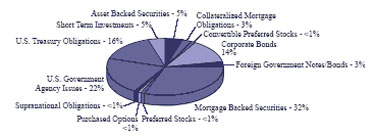
AssetMark Core Plus Fixed Income Fund
| | Components of Portfolio Holdings |
| | Asset Backed Securities | $ | 34,148,505 |
| | Collateralized Mortgage Obligations | | 21,759,629 |
| | Convertible Preferred Stocks | | 1,260,637 |
| | Corporate Bonds | | 97,071,955 |
| | Foreign Government Note/Bonds | | 22,702,600 |
| | Mortgage Backed Securities | | 215,581,566 |
| | Preferred Stocks | | 994,808 |
| | Purchased Options | | 73,775 |
| | Supranational Obligations | | 1,410,483 |
| | U.S. Government Agency Issues | | 148,158,814 |
| | U.S. Treasury Obligations | | 107,254,832 |
| | Short Term Investments | | 36,300,088 |
| | Total | $ | 686,717,692(1) |
| | | | |
| | | | |
| (1) | Total excludes $195,022,695 of Securities Lending Collateral | |
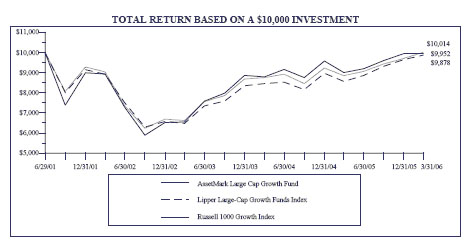
AssetMark Large Cap Growth Fund
This chart assumes an initial gross investment of $10,000 made on June 29, 2001 (commencement of operations). Returns shown include the reinvestment of all dividends. Returns shown do not reflect the deduction of taxes that a shareholder would pay on fund distributions or the redemption of fund shares. In the absence of fee waivers and reimbursements, total return would be reduced. Past performance is not predictive of future performance. Investment return and principal value will fluctuate, so that your shares, when redeemed, may be worth more or less than the original cost.
RUSSELL 1000 GROWTH INDEX - An unmanaged index which measures the performance of those Russell 1000 companies with higher price-to-book ratios and higher forecasted growth values. The Russell 1000 Index is an unmanaged index which measures the performance of the 1,000 largest companies in the Russell 3000 Index. The Russell 3000 Index is an unmanaged index which measures the performance of the 3,000 largest U.S. Companies, based on total market capitalization, which represents approximately 98% of the investable U.S. equity market.
LIPPER LARGE-CAP GROWTH FUNDS INDEX - The Lipper Large-Cap Growth Funds Index is the average of the 30 largest funds in the Lipper Large-Cap Growth Funds Category. These funds, by portfolio practice, invest at least 75% of equity assets in companies with market capitalizations (on three-year weighted basis) greater than 300% of the dollar-weighted median market capitalization of the middle 1,000 securities of the Standard & Poor’s (“S&P”) Super Composite 1500® Index. These funds typically have an above average price-to-earnings ration, price-to-book ratio, and three-year sales-per-share growth value, compared to the Standard & Poor’s 500 Composite Index (“S&P 500® Index”).
AVERAGE ANNUAL TOTAL RETURN (for the periods ended March 31, 2006) | | | |
| | One Year | Three Year | Since Inception (6/29/01) |
| AssetMark Large Cap Growth Fund | 10.56% | 14.95% | -0.11% |
| Russell 1000 Growth Index | 13.14% | 14.80% | 0.03% |
| Lipper Large-Cap Growth Funds Index | 15.36% | 15.11% | -0.25% |
AssetMark Large Cap Growth Fund
SCHEDULE OF INVESTMENTS
| | Number of | | | | Market | |
| | Shares | | | | Value | |
| | | | COMMON STOCKS - 98.32% | | | |
| | | | Air Freight & Logistics - 0.64% | | | |
| | 48,600 | | Expeditors International | | | |
| | | | Washington, Inc. | $ | 4,198,554 | |
| | | | Beverages - 1.53% | | | |
| | 172,775 | | PepsiCo, Inc. | | 9,984,667 | |
| | | | Biotechnology - 5.31% | | | |
| | 203,426 | | Amgen, Inc. (a)(b) | | 14,799,241 | |
| | 181,090 | | Genentech, Inc. (a)(b) | | 15,303,916 | |
| | 74,300 | | Gilead Sciences, Inc. (a) | | 4,622,946 | |
| | | | | | 34,726,103 | |
| | | | Capital Markets - 8.23% | | | |
| | 29,450 | | AG Edwards, Inc. | | 1,468,377 | |
| | 80,000 | | The Bank of New York Co., Inc. | | 2,883,200 | |
| | 71,000 | | Franklin Resources, Inc. | | 6,691,040 | |
| | 67,900 | | The Goldman Sachs Group, Inc. (b) | | 10,657,584 | |
| | 81,825 | | Legg Mason, Inc. | | 10,255,127 | |
| | 69,155 | | Lehman Brothers Holdings, Inc. (b) | | 9,994,972 | |
| | 52,950 | | Merrill Lynch & Co, Inc. (b) | | 4,170,342 | |
| | 47,300 | | SEI Investments Co. | | 1,917,069 | |
| | 275,925 | | TD Ameritrade | | | |
| | | | Holding Corporation | | 5,758,555 | |
| | | | | | 53,796,266 | |
| | | | Chemicals - 0.68% | | | |
| | 66,500 | | Air Products & Chemicals, Inc. | | 4,468,135 | |
| | | | Commercial Banks - 1.15% | | | |
| | 153,667 | | Commerce Bancorp Inc. (b) | | 5,631,896 | |
| | 33,400 | | Wachovia Corp. (b) | | 1,872,070 | |
| | | | | | 7,503,966 | |
| | | | Commercial Services & Supplies - 1.13% | | | |
| | 11,576 | | Apollo Group, Inc. (a)(b) | | 607,856 | |
| | 135,500 | | Monster Worldwide, Inc. (a)(b) | | 6,756,030 | |
| | | | | | 7,363,886 | |
| | | | Communications Equipment - 8.58% | | | |
| | 869,150 | | Cisco Systems, Inc. (a) | | 18,834,480 | |
| | 320,625 | | Corning, Inc. (a) | | 8,628,019 | |
| | 356,575 | | Motorola, Inc. | | 8,169,133 | |
| | 404,201 | | QUALCOMM, Inc. (b) | | 20,456,613 | |
| | | | | | 56,088,245 | |
| | | | Computers & Peripherals - 5.75% | | | |
| | 172,250 | | Apple Computer, Inc. (a) | | 10,803,520 | |
| | 233,175 | | Dell, Inc. (a)(b) | | 6,939,288 | |
| | 164,650 | | Hewlett-Packard Co. | | 5,416,985 | |
| | Number of | | | | Market | |
| | Shares | | | | Value | |
| | | | Computers & Peripherals (Continued) | | | |
| | 401,425 | | Network Appliance, Inc. (a)(b) | $ | 14,463,343 | |
| | | | | | 37,623,136 | |
| | | | Consumer Finance - 1.49% | | | |
| | 68,550 | | American Express Co. | | 3,602,302 | |
| | 22,000 | | Capital One Financial Corp. (b) | | 1,771,440 | |
| | 84,600 | | SLM Corp. | | 4,394,124 | |
| | | | | | 9,767,866 | |
| | | | Diversified Financial Services - 2.73% | | | |
| | 11,700 | | Chicago Mercantile Exchange | | | |
| | | | Holdings, Inc. (b) | | 5,235,750 | |
| | 66,950 | | Citigroup, Inc. | | 3,162,048 | |
| | 132,000 | | Moody’s Corp. (b) | | 9,432,720 | |
| | | | | | 17,830,518 | |
| | | | Electrical Equipment - 1.68% | | | |
| | 131,350 | | Emerson Electric Co. | | 10,984,801 | |
| | | | Electronic Equipment & Instruments - 0.77% | | | |
| | 40,600 | | CDW Corp. (b) | | 2,389,310 | |
| | 80,050 | | Molex, Inc. (b) | | 2,657,660 | |
| | | | | | 5,046,970 | |
| | | | Energy Equipment & Services - 2.71% | | | |
| | 64,150 | | Baker Hughes, Inc. (b) | | 4,387,860 | |
| | 89,350 | | National-Oilwell, Inc. (a)(b) | | 5,729,122 | |
| | 59,950 | | Schlumberger Ltd. (b) | | 7,587,871 | |
| | | | | | 17,704,853 | |
| | | | Food & Staples Retailing - 2.29% | | | |
| | 55,100 | | Costco Wholesale Corp. (b) | | 2,984,216 | |
| | 138,954 | | Walgreen Co. | | 5,993,086 | |
| | 90,250 | | Whole Foods Market, Inc. (b) | | 5,996,210 | |
| | | | | | 14,973,512 | |
| | | | Food Products - 0.37% | | | |
| | 47,350 | | General Mills, Inc. | | 2,399,698 | |
| | | | Health Care Equipment & Supplies - 4.24% | | | |
| | 81,100 | | Biomet, Inc. (b) | | 2,880,672 | |
| | 24,675 | | Intuitive Surgical, Inc. (a)(b) | | 2,911,650 | |
| | 85,200 | | Medtronic, Inc. | | 4,323,900 | |
| | 135,500 | | St Jude Medical, Inc. (a) | | 5,555,500 | |
| | 124,117 | | Varian Medical Systems, Inc. (a)(b) | | 6,970,411 | |
| | 75,500 | | Zimmer Holdings, Inc. (a)(b) | | 5,103,800 | |
| | | | | | 27,745,933 | |
| | | | Health Care Providers & Services - 6.79% | | | |
| | 162,475 | | Aetna, Inc. (b) | | 7,984,021 | |
| | 157,925 | | Caremark Rx, Inc. (a)(b) | | 7,766,751 | |
See notes to financial statements.
AssetMark Large Cap Growth Fund
SCHEDULE OF INVESTMENTS (Continued)
| | Number of | | | | Market | |
| | Shares | | | | Value | |
| | | | COMMON STOCKS (Continued) | | | |
| | | | Health Care Providers & Services (Continued) | | | |
| | 73,050 | | DaVita, Inc. (a) | $ | 4,398,341 | |
| | 60,525 | | Express Scripts, Inc. (a)(b) | | 5,320,148 | |
| | 89,225 | | Humana, Inc. (a)(b) | | 4,697,696 | |
| | 255,175 | | UnitedHealth Group, Inc. | | 14,254,076 | |
| | | | | | 44,421,033 | |
| | | | Hotels Restaurants & Leisure - 2.34% | | | |
| | 39,600 | | Carnival Corp. (b) | | 1,875,852 | |
| | 357,550 | | Starbucks Corp. (a)(b) | | 13,458,182 | |
| | | | | | 15,334,034 | |
| | | | Household Products - 1.03% | | | |
| | 59,050 | | Colgate-Palmolive Co. | | 3,371,755 | |
| | 57,950 | | Procter & Gamble Co. | | 3,339,079 | |
| | | | | | 6,710,834 | |
| | | | Industrial Conglomerates - 1.85% | | | |
| | 37,050 | | 3M Co. | | 2,804,315 | |
| | 267,475 | | General Electric Co. | | 9,302,780 | |
| | | | | | 12,107,095 | |
| | | | Insurance - 4.27% | | | |
| | 90,101 | | Aflac, Inc. | | 4,066,258 | |
| | 64,050 | | American International Group, Inc. | | 4,233,065 | |
| | 122,898 | | The Progressive Corp. (b) | | 12,813,345 | |
| | 89,575 | | Prudential Financial, Inc. | | 6,790,681 | |
| | | | | | 27,903,349 | |
| | | | Internet & Catalog Retail - 4.14% | | | |
| | 195,200 | | Amazon.Com, Inc. (a)(b) | | 7,126,752 | |
| | 510,955 | | eBay, Inc. (a)(b) | | 19,957,902 | |
| | | | | | 27,084,654 | |
| | | | Internet Software & Services - 3.17% | | | |
| | 34,577 | | Google, Inc. (a) | | 13,485,030 | |
| | 223,950 | | Yahoo!, Inc. (a)(b) | | 7,224,627 | |
| | | | | | 20,709,657 | |
| | | | IT Services - 1.61% | | | |
| | 97,400 | | Cognizant Technology | | | |
| | | | Solutions Corp. (a) | | 5,794,326 | |
| | 56,319 | | First Data Corp. (b) | | 2,636,856 | |
| | 49,650 | | Fiserv, Inc. (a) | | 2,112,607 | |
| | | | | | 10,543,789 | |
| | | | Machinery - 3.60% | | | |
| | 127,600 | | Caterpillar, Inc. | | 9,162,956 | |
| | 64,400 | | Dover Corp. | | 3,127,264 | |
| | 43,750 | | Illinois Tool Works, Inc. | | 4,213,563 | |
| | Number of | | | | Market | |
| | Shares | | | | Value | |
| | | | Machinery (Continued) | | | |
| | 81,825 | | Joy Global, Inc. | $ | 4,890,680 | |
| | 53,500 | | Pentair, Inc. (b) | | 2,180,125 | |
| | | | | | 23,574,588 | |
| | | | Media - 1.97% | | | |
| | 80,175 | | Getty Images, Inc. (a)(b) | | 6,003,504 | |
| | 17,300 | | Omnicom Group (b) | | 1,440,225 | |
| | 54,900 | | Pixar (a) | | 3,521,286 | |
| | 86,297 | | XM Satellite Radio | | | |
| | | | Holdings, Inc. - Class A (a)(b) | | 1,921,834 | |
| | | | | | 12,886,849 | |
| | | | Multiline Retail - 1.18% | | | |
| | 58,900 | | Kohl’s Corp. (a)(b) | | 3,122,289 | |
| | 116,875 | | Nordstrom, Inc. (b) | | 4,579,163 | |
| | | | | | 7,701,452 | |
| | | | Oil & Gas - 1.43% | | | |
| | 40,925 | | EOG Resources, Inc. (b) | | 2,946,600 | |
| | 53,000 | | Exxon Mobil Corp. (b) | | 3,225,580 | |
| | 72,700 | | XTO Energy, Inc. (b) | | 3,167,539 | |
| | | | | | 9,339,719 | |
| | | | Pharmaceuticals - 1.24% | | | |
| | 81,000 | | Johnson & Johnson | | 4,796,820 | |
| | 133,700 | | Pfizer, Inc. | | 3,331,804 | |
| | | | | | 8,128,624 | |
| | | | Real Estate Agents And Managers - 1.11% | | | |
| | 90,100 | | Cb Richard Ellis Group, Inc. (a)(b) | | 7,271,070 | |
| | | | Semiconductor & | | | |
| | | | Semiconductor Equipment - 3.46% | | | |
| | 177,312 | | Broadcom Corp. (a) | | 7,652,786 | |
| | 118,850 | | Intel Corp. | | 2,299,747 | |
| | 142,050 | | Maxim Integrated Products, Inc. (b) | | 5,277,158 | |
| | 177,825 | | Texas Instruments, Inc. | | 5,773,978 | |
| | 62,600 | | Xilinx, Inc. | | 1,593,796 | |
| | | | | | 22,597,465 | |
| | | | Software - 3.50% | | | |
| | 260,553 | | Adobe Systems, Inc. (b) | | 9,098,511 | |
| | 93,513 | | Electronic Arts, Inc. (a)(b) | | 5,117,031 | |
| | 170,700 | | Microsoft Corp. | | 4,644,747 | |
| | 111,078 | | Salesforce.com, Inc. (a)(b) | | 4,035,464 | |
| | | | | | 22,895,753 | |
| | | | Specialty Retail - 3.92% | | | |
| | 61,100 | | Bed Bath & Beyond, Inc. (a)(b) | | 2,346,240 | |
| | 170,075 | | Chico’s FAS, Inc. (a)(b) | | 6,911,848 | |
See notes to financial statements.
AssetMark Large Cap Growth Fund
SCHEDULE OF INVESTMENTS (Continued)
| | Number of | | | | Market | |
| | Shares | | | | Value | |
| | | | COMMON STOCKS (Continued) | | | |
| | | | Specialty Retail (Continued) | | | |
| | 149,725 | | Home Depot, Inc. (b) | $ | 6,333,367 | |
| | 113,600 | | Lowe’s Cos, Inc. (b) | | 7,320,384 | |
| | 106,375 | | Staples, Inc. (b) | | 2,714,690 | |
| | | | | | 25,626,529 | |
| | | | Textiles, Apparel & Luxury Goods - 1.63% | | | |
| | 224,350 | | Coach, Inc. (a) | | 7,758,023 | |
| | 33,750 | | Nike, Inc. (b) | | 2,872,125 | |
| | | | | | 10,630,148 | |
| | | | Thrifts & Mortgage Finance - 0.80% | | | |
| | 142,420 | | Countrywide Financial Corp. (b) | | 5,226,814 | |
| | | | Total Common Stocks | | | |
| | | | (Cost $565,241,256) | | 642,900,565 | |
| | | | SHORT TERM INVESTMENTS - 2.12% | | | |
| | | | Money Market Funds - 2.12% | | | |
| | 138,70,283 | | Federated Prime Obligations Fund | | | |
| | | | 4.600%, 01/01/2050 | | 13,870,283 | |
| | | | Total Short Term Investments | | | |
| | | | (Cost $13,870,282) | | 13,870,283 | |
| | Principal | | | | | |
| | Amount | | | | | |
| | | | INVESTMENTS PURCHASED | | | |
| | | | AS SECURITIES LENDING | | | |
| | | | COLLATERAL - 34.24% | | | |
| | | | COMMERCIAL PAPER - 9.92% | | | |
| | $ 2,272,388 | | CCN Bluegrass, | | | |
| | | | 4.85%, 11/20/06 (c) | | 2,272,388 | |
| | 4,544,777 | | CCN Independence IV LLC, | | | |
| | | | 4.82%,10/16/06 (c) | | 4,544,777 | |
| | 4,999,255 | | CCN Orchard Park, | | | |
| | | | 4.76%, 10/06/06 (c) | | 4,999,255 | |
| | 3,408,583 | | Concord Minutemen Capital Co., | | | |
| | | | 4.65%, 04/04/06 (c) | | 3,408,583 | |
| | 6,817,166 | | Concord Minutemen Capital Co., | | | |
| | | | 4.75%, 04/18/06 (c) | | 6,817,166 | |
| | 3,635,821 | | Duke Funding, | | | |
| | | | 4.82%, 04/26/06 (c) (d) | | 3,621,090 | |
| | 4,544,777 | | Duke Funding, 4.64%, 06/06/06 (c) | | 4,544,777 | |
| | 9,089,554 | | Fenway Funding LLC, | | | |
| | | | 4.82%, 04/07/06 (c) (d) | | 9,077,227 | |
| | 9,089,554 | | Laguna Corp., 4.83%, 04/18/06 (c) (d) | | 9,058,800 | |
| | 5,226,494 | | Lakeside Funding LLC, | | | |
| | | | 4.70%, 04/10/06 (c) | | 5,226,494 | |
| | 2,272,388 | | Morgan Stanley, 4.96%, 04/11/06 . | | 2,272,388 | |
| | Principal | | | | Market | |
| | Amount | | | | Value | |
| | | | COMMERCIAL PAPER (Continued) | | | |
| | $ 9,089,554 | | Thornburg Mortgage Capital LLC, | | | |
| | | | 4.71%, 04/10/06 (c) (d) | $ | 9,052,370 | |
| | | | Total Commercial Paper | | | |
| | | | (Cost $64,895,315) | | 64,895,315 | |
| | | | CORPORATE BONDS AND NOTES - 1.77% | | | |
| | 2,272,388 | | Bayerische Landesbank, | | | |
| | | | 4.83%, 12/24/15 | | 2,272,388 | |
| | 4,544,777 | | Liquid Funding Ltd., | | | |
| | | | 4.73%, 05/15/06 (c) (d) | | 4,544,317 | |
| | 2,726,866 | | Metlife Global, 4.89%, 04/28/08 | | 2,726,866 | |
| | 2,045,150 | | Northlake, 4.91%, 03/06/33 (c) | | 2,045,150 | |
| | | | Total Corporate Bonds and Notes | | | |
| | | | (Cost $11,588,721) | | 11,588,721 | |
| | | | CORPORATE PAYDOWN | | | |
| | | | SECURITIES - 1.28% | | | |
| | 2,272,388 | | Duke Funding, | | | |
| | | | 4.62%, 04/08/06 (c) | | 2,272,388 | |
| | 6,120,563 | | Leafs LLC, 4.78%, 04/20/06 (c) | | 6,120,563 | |
| | | | Total Corporate Paydown | | | |
| | | | Securities (Cost $8,392,951) | | 8,392,951 | |
| | Number of | | | | | |
| | Shares | | | | | |
| | | | MUTUAL FUND - 0.00% | | | |
| | 58 | | AIM Short Term | | | |
| | | | Liquid Asset Fund | | 58 | |
| | | | Total Mutual Fund | | | |
| | | | (Cost $58) | | 58 | |
| | Principal | | | | | |
| | Amount | | | | | |
| | | | REPURCHASE AGREEMENTS - 21.27% | | | |
| | $34,085,827 | | Goldman Sachs Repurchase Agreement, | | | |
| | | | 4.94%, 04/03/06, repurchase price | | | |
| | | | $34,099,859, maturing 04/03/06 | | | |
| | | | (Collateralized by non-U.S. | | | |
| | | | Government Debt Securities, value | | | |
| | | | $36,892,332, 0.00% to 11.13%, | | | |
| | | | 04/01/08 to 07/15/32) | | 34,085,827 | |
| | 20,451,497 | | Merrill Lynch Repurchase Agreement, | | | |
| | | | 4.93%, 04/03/06, repurchase price | | | |
| | | | $20,459,899, maturing 04/03/06 | | | |
| | | | (Collateralized by non-U.S. | | | |
| | | | Government Debt Securities, value | | | |
| | | | $21,536,597, 0.00% to 12.00%, | | | |
| | | | 07/15/06 to 10/01/45) | | 20,451,497 | |
See notes to financial statements.
AssetMark Large Cap Growth Fund
SCHEDULE OF INVESTMENTS (Continued)
| | Principal | | | | Market | |
| | Amount | | | | Value | |
| | | | REPURCHASE AGREEMENTS (Continued) | | | |
| | $19,542,541 | | Morgan Stanley Repurchase | | | |
| | | | Agreement, 4.91%, 04/03/06, | | | |
| | | | repurchase price $19,550,551, | | | |
| | | | maturing 04/03/06 (Collateralized | | | |
| | | | by Fannie Mae Mortgage | | | |
| | | | Obligations, value $20,134,838, | | | |
| | | | 0.00% to 6.75%, 9/25/07 to | | | |
| | | | 10/25/35) | $ | 19,542,541 | |
| | 64,990,311 | | Morgan Stanley Repurchase | | | |
| | | | Agreement, 4.91%, 04/03/06, | | | |
| | | | repurchase price $65,016,903, | | | |
| | | | maturing 04/03/06 (Collateralized | | | |
| | | | by Ginnie Mae Mortgage | | | |
| | | | Obligations, value $66,849,817, | | | |
| | | | 0.97% to 6.50%, 5/20/14 to | | | |
| | | | 1/20/35) | | 64,990,311 | |
| | | | Total Repurchase Agreements | | | |
| | | | (Cost $139,070,176) | | 139,070,176 | |
| | | | Total Investments Purchased as | | | |
| | | | Securities Lending Collateral | | | |
| | | | (Cost $223,947,221) | | 223,947,221 | |
| | | | Total Investments - 134.68% | | | |
| | | | (Cost $803,058,759) | | 880,718,069 | |
| | | | Liabilities in Excess of | | | |
| | | | Other Assets - (34.68)% | | (226,796,531) | |
| | | | TOTAL NET | | | |
| | | | ASSETS - 100.00% | $ | 653,921,538 | |
| | | | | | | |
| | | | | |
| | Percentages are stated as a percent of net assets. | | | |
| | (a) | | Non Income Producing. | | | |
| | (b) | | All or a portion of this security is on loan. | | | |
| | (c) | | Restricted securities as defined in Rule 144(a) under the Securities Act of 1933. Such securities are treated as liquid securities according the the Fund’s liquidity guidelines. The market value of these securities total $77,605,345, 11.9% of total net assets. | | | |
| | (d) | | Variable Rate Security. The rate shown is the rate in effect on March 31, 2006. | | | |
See notes to financial statements.
AssetMark Large Cap Value Fund
PERFORMANCE DATA
This chart assumes an initial gross investment of $10,000 made on June 29, 2001 (commencement of operations). Returns shown include the reinvestment of all dividends. Returns shown do not reflect the deduction of taxes that a shareholder would pay on fund distributions or the redemption of fund shares. In the absence of fee waivers and reimbursements, total return would be reduced. Past performance is not predictive of future performance. Investment return and principal value will fluctuate, so that your shares, when redeemed, may be worth more or less than the original cost.
RUSSELL 1000 VALUE INDEX - An unmanaged index which measures the performance of those Russell 1000 companies with lower price-to-book ratios and lower forecasted growth values. The Russell 1000 Index is an unmanaged index which measures the performance of the 1,000 largest companies in the Russell 3000 Index. The Russell 3000 Index is an unmanaged index which measures the performance of the 3,000 largest U.S. Companies, based on total market capitalization, which represents approximately 98% of the investable U.S. equity market.
LIPPER LARGE-CAP VALUE FUNDS INDEX - The Lipper Large-Cap Value Funds Index is the average of the 30 largest funds in the Lipper Large-Cap Value Funds Category. These funds, by portfolio practice, invest as least 75% of equity assets in companies with market capitalizations (on three-year weighted basis) greater than 300% of the dollar-weighted median market capitalization of the middle 1,000 securities of the S&P Super Composite 1500® Index. Large-cap value funds typically have a below-average price-to-earnings ratio, price-to-book ratio, and three-year sales-per-share growth value, compared to the S&P 500® Index.
AVERAGE ANNUAL TOTAL RETURN (for the periods ended March 31, 2006) | |
| | One Year | Three Year | Since Inception (6/29/01) |
| AssetMark Large Cap Value Fund. | 10.50% | 20.48% | 5.06% |
| Russell 1000 Value Index | 13.31% | 21.77% | 7.13% |
| Lipper Large-Cap Value Funds Index | 11.87% | 18.69% | 4.13% |
AssetMark Large Cap Value Fund
SCHEDULE OF INVESTMENTS
| | Number of | | | | Market | |
| | Shares | | | | Value | |
| | | | COMMON STOCKS - 97.27% | | | |
| | | | Aerospace & Defense - 1.05% | | | |
| | 101,200 | | Northrop Grumman Corp. | $ | 6,910,948 | |
| | | | Airlines - 0.01% | | | |
| | 121,040 | | Delta Air Lines, Inc. (a)(b) | | 68,993 | |
| | | | Auto Components - 1.86% | | | |
| | 1,038,246 | | Delphi Corp. | | 659,286 | |
| | 96,915 | | The Goodyear Tire & | | | |
| | | | Rubber Co. (a)(b) | | 1,403,329 | |
| | 134,700 | | Johnson Controls, Inc. (b) | | 10,227,771 | |
| | | | | | 12,290,386 | |
| | | | Automobiles - 2.58% | | | |
| | 874,176 | | Ford Motor Co. (b) | | 6,958,441 | |
| | 331,675 | | General Motors Corp. (b) | | 7,054,727 | |
| | 58,250 | | Harley-Davidson, Inc. (b) | | 3,022,010 | |
| | | | | | 17,035,178 | |
| | | | Beverages - 1.30% | | | |
| | 74,300 | | Anheuser-Busch | | | |
| | | | Companies, Inc. (b) | | 3,177,811 | |
| | 156,800 | | Coca-Cola Enterprises, Inc. | | 3,189,312 | |
| | 34,650 | | Diageo PLC - ADR (b) | | 2,197,850 | |
| | | | | | 8,564,973 | |
| | | | Building Products - 1.54% | | | |
| | 312,500 | | Masco Corp. (b) | | 10,153,125 | |
| | | | Capital Markets - 1.78% | | | |
| | 45,470 | | Ameriprise Financial, Inc. | | 2,048,878 | |
| | 67,300 | | Lehman Brothers Holdings, Inc. (b) | | 9,726,869 | |
| | | | | | 11,775,747 | |
| | | | Chemicals - 2.35% | | | |
| | 217,300 | | The Dow Chemical Co. (b) | | 8,822,380 | |
| | 105,500 | | PPG Industries, Inc. (b) | | 6,683,425 | |
| | | | | | 15,505,805 | |
| | | | Commercial Banks - 5.45% | | | |
| | 204,800 | | Bank of America Corp. | | 9,326,592 | |
| | 145,330 | | Fifth Third Bancorp (b) | | 5,720,189 | |
| | 63,467 | | HSBC Holdings PLC - ADR (b) | | 5,317,265 | |
| | 264,300 | | KeyCorp (b) | | 9,726,240 | |
| | 35,000 | | Lloyds TSB Group Plc - ADR (b) | | 1,347,150 | |
| | 70,650 | | Wells Fargo & Co. | | 4,512,416 | |
| | | | | | 35,949,852 | |
| | | | Commercial Services & Supplies - 0.49% | | | |
| | 14,150 | | Dun & Bradstreet Corp. (a)(b) | | 1,085,022 | |
| | Number of | | | | Market | |
| | Shares | | | | Value | |
| | | | Commercial Services & Supplies (Continued) | | | |
| | 99,900 | | H&R Block, Inc. (b) | $ | 2,162,835 | |
| | | | | | 3,247,857 | |
| | | | Communications Equipment - 1.28% | | | |
| | 158,750 | | Avaya, Inc. (a)(b) | | 1,793,875 | |
| | 2,182,845 | | Lucent Technologies, Inc. (a)(b) | | 6,657,677 | |
| | | | | | 8,451,552 | |
| | | | Computers & Peripherals - 2.25% | | | |
| | 53,500 | | Dell, Inc. (a) | | 1,592,160 | |
| | 100,500 | | Hewlett-Packard Co. | | 3,306,450 | |
| | 35,750 | | International Business | | | |
| | | | Machines Corp. | | 2,948,302 | |
| | 106,905 | | Lexmark International, Inc. (a)(b) | | 4,851,349 | |
| | 422,451 | | Sun Microsystems, Inc. (a)(b) | | 2,167,174 | |
| | | | | | 14,865,435 | |
| | | | Construction Materials - 0.21% | | | |
| | 16,250 | | Vulcan Materials Co. (b) | | 1,408,063 | |
| | | | Consumer Finance - 1.33% | | | |
| | 166,500 | | American Express Co. | | 8,749,575 | |
| | | | Containers & Packaging - 0.67% | | | |
| | 76,300 | | Sealed Air Corp. | | 4,415,481 | |
| | | | Diversified Financial Services - 4.44% | | | |
| | 291,870 | | Citigroup, Inc. | | 13,785,020 | |
| | 300,443 | | J.P. Morgan Chase & Co. | | 12,510,447 | |
| | 42,050 | | Moody’s Corp. (b) | | 3,004,893 | |
| | | | | | 29,300,360 | |
| | | | Diversified Telecommunication Services - 5.85% | | | |
| | 519,445 | | At&t, Inc. (b) | | 14,045,793 | |
| | 256,105 | | BellSouth Corp. (b) | | 8,874,038 | |
| | 60,700 | | Sprint Corp. | | 1,568,488 | |
| | 415,165 | | Verizon Communications, Inc. (b) | | 14,140,520 | |
| | | | | | 38,628,839 | |
| | | | Electric Utilities - 1.20% | | | |
| | 176,600 | | TXU Corp. | | 7,904,616 | |
| | | | Energy Equipment & Services - 0.53% | | | |
| | 57,500 | | GlobalSantaFe Corp. (b) | | 3,493,125 | |
| | | | Food & Staples Retailing - 4.24% | | | |
| | 197,697 | | Albertson’s, Inc. (b) | | 5,074,882 | |
| | 125,800 | | Costco Wholesale Corp. (b) | | 6,813,328 | |
| | 256,756 | | The Kroger Co. (a)(b) | | 5,227,552 | |
| | 295,695 | | Safeway, Inc. (b) | | 7,427,859 | |
| | 73,550 | | Wal-Mart Stores, Inc. (b) | | 3,474,502 | |
| | | | | | 28,018,123 | |
See notes to financial statements.
AssetMark Large Cap Value Fund
SCHEDULE OF INVESTMENTS (Continued)
| | Number of | | | | Market | |
| | Shares | | | | Value | |
| | | | COMMON STOCKS (Continued) | | | |
| | | | Food Products - 1.14% | | | |
| | 294,800 | | ConAgra Foods, Inc. (b) | $ | 6,326,408 | |
| | 23,500 | | Hershey Foods Corp. | | 1,227,405 | |
| | | | | | 7,553,813 | |
| | | | Health Care Providers & Services - 2.62% | | | |
| | 29,750 | | Cardinal Health, Inc. | | 2,216,970 | |
| | 38,950 | | Caremark Rx, Inc. (a)(b) | | 1,915,561 | |
| | 25,000 | | Cigna Corp. | | 3,265,500 | |
| | 131,650 | | HCA, Inc. (b) | | 6,028,253 | |
| | 528,110 | | Tenet Healthcare Corp. (a)(b) | | 3,897,452 | |
| | | | | | 17,323,736 | |
| | | | Hotels Restaurants & Leisure - 0.45% | | | |
| | 86,000 | | McDonald’s Corp. | | 2,954,960 | |
| | | | Household Durables - 0.58% | | | |
| | 28,920 | | American Greetings (b) | | 625,250 | |
| | 39,500 | | Fortune Brands, Inc. | | 3,184,885 | |
| | | | | | 3,810,135 | |
| | | | Household Products - 0.90% | | | |
| | 102,800 | | Kimberly-Clark Corp. | | 5,941,840 | |
| | | | Industrial Conglomerates - 1.66% | | | |
| | 42,000 | | 3M Co. | | 3,178,980 | |
| | 289,050 | | Tyco International Ltd. | | 7,769,664 | |
| | | | | | 10,948,644 | |
| | | | Insurance - 9.53% | | | |
| | 234,600 | | The Allstate Corp. (b) | | 12,225,006 | |
| | 113,700 | | American International Group, Inc. | | 7,514,433 | |
| | 38,150 | | AON Corp. (b) | | 1,583,606 | |
| | 2,103 | | Berkshire Hathaway, Inc. (a) | | 6,334,236 | |
| | 48,190 | | Loews Corp. | | 4,876,828 | |
| | 188,060 | | Marsh & McLennan | | | |
| | | | Companies, Inc. (b) | | 5,521,442 | |
| | 189,800 | | Metlife, Inc. | | 9,180,626 | |
| | 50,950 | | The Progressive Corp. (b) | | 5,312,047 | |
| | 202,600 | | The St. Paul Travelers | | | |
| | | | Companies Inc. | | 8,466,654 | |
| | 31,866 | | Transatlantic Holdings, Inc. | | 1,862,568 | |
| | | | | | 62,877,446 | |
| | | | IT Services - 1.41% | | | |
| | 128,417 | | Electronic Data Systems Corp. (b) . | | 3,445,428 | |
| | 68,650 | | Iron Mountain, Inc. (a)(b) | | 2,796,801 | |
| | 443,415 | | Unisys Corp. (a) | | 3,055,129 | |
| | | | | | 9,297,358 | |
| | | | | | | |
| | Number of | | | | Market | |
| | Shares | | | | Value | |
| | | | Leisure Equipment & Products - 1.98% | | | |
| | 245,286 | | Eastman Kodak Co. (b) | $ | 6,975,934 | |
| | 334,105 | | Mattel, Inc. | | 6,057,324 | |
| | | | | | 13,033,258 | |
| | | | Machinery - 2.00% | | | |
| | 88,800 | | Deere & Co. (b) | | 7,019,640 | |
| | 87,800 | | Paccar, Inc. | | 6,188,144 | |
| | | | | | 13,207,784 | |
| | | | Media - 3.91% | | | |
| | 234,800 | | CBS Corporation | | 5,630,504 | |
| | 174,050 | | Comcast Corp. (a)(b) | | 4,546,186 | |
| | 188,275 | | Gannett Co, Inc. (b) | | 11,281,438 | |
| | 158,380 | | Tribune Co. | | 4,344,363 | |
| | | | | | 25,802,491 | |
| | | | Metals & Mining - 1.51% | | | |
| | 100,470 | | Alcoa, Inc. | | 3,070,363 | |
| | 86,000 | | Phelps Dodge Corp. (b) | | 6,925,580 | |
| | | | | | 9,995,943 | |
| | | | Office Electronics - 0.80% | | | |
| | 346,420 | | Xerox Corp. (a)(b) | | 5,265,584 | |
| | | | Oil & Gas - 8.80% | | | |
| | 123,600 | | Apache Corp. | | 8,097,036 | |
| | 244,152 | | ConocoPhillips (b) | | 15,418,199 | |
| | 70,600 | | Devon Energy Corp. | | 4,318,602 | |
| | 126,555 | | El Paso Corp. (b) | | 1,524,988 | |
| | 58,650 | | EOG Resources, Inc. (b) | | 4,222,800 | |
| | 153,250 | | Occidental Petroleum Corp. (b) | | 14,198,612 | |
| | 172,800 | | Valero Energy Corp. (b) | | 10,329,984 | |
| | | | | | 58,110,221 | |
| | | | Personal Products - 0.24% | | | |
| | 50,400 | | Avon Products, Inc. (b) | | 1,570,968 | |
| | | | Pharmaceuticals - 7.01% | | | |
| | 291,751 | | Bristol-Myers Squibb Co. | | 7,179,992 | |
| | 52,000 | | Johnson & Johnson | | 3,079,440 | |
| | 410,470 | | Merck & Co., Inc. (b) | | 14,460,858 | |
| | 540,806 | | Pfizer, Inc. | | 13,476,886 | |
| | 358,555 | | Schering-Plough Corp. | | 6,808,959 | |
| | 25,935 | | Wyeth (b) | | 1,258,366 | |
| | | | | | 46,264,501 | |
| | | | Real Estate - 1.96% | | | |
| | 196,800 | | Equity Office Properties Trust (b) . | | 6,608,544 | |
| | 75,400 | | Simon Property Group, Inc. (b) | | 6,344,156 | |
| | | | | | 12,952,700 | |
See notes to financial statements.
AssetMark Large Cap Value Fund
SCHEDULE OF INVESTMENTS (Continued)
| | Number of | | | | Market | |
| | Shares | | | | Value | |
| | | | COMMON STOCKS (Continued) | | | |
| | | | Road & Rail - 0.54% | | | |
| | 43,000 | | Burlington Northern Santa Fe Corp. | $ | 3,583,190 | |
| | | | Semiconductor & Semiconductor | | | |
| | | | Equipment - 1.60% | | | |
| | 356,200 | | Intel Corp. | | 6,892,470 | |
| | 250,876 | | Micron Technology, Inc. (a)(b) | | 3,692,895 | |
| | | | | | 10,585,365 | |
| | | | Software - 0.54% | | | |
| | 131,050 | | Microsoft Corp. | | 3,565,871 | |
| | | | Specialty Retail - 1.02% | | | |
| | 274,800 | | Limited Brands | | 6,721,608 | |
| | | | Thrifts & Mortgage Finance - 4.20% | | | |
| | 177,700 | | Countrywide Financial Corp. (b) | | 6,521,590 | |
| | 115,800 | | Fannie Mae | | 5,952,120 | |
| | 87,900 | | Golden West Financial Corp. (b) | | 5,968,410 | |
| | 218,200 | | Washington Mutual, Inc. | | 9,299,684 | |
| | | | | | 27,741,804 | |
| | | | Tobacco - 2.46% | | | |
| | 228,961 | | Altria Group, Inc. | | 16,224,176 | |
| | | | Total Common Stocks | | | |
| | | | (Cost $591,405,903) | | 642,071,429 | |
| | | | SHORT TERM INVESTMENTS - 2.84% | | | |
| | | | Money Market Funds - 2.84% | | | |
| | 18,756,011 | | Federated Prime Obligations Fund | | | |
| | | | 4.600%, 01/01/2050 | | 18,755,998 | |
| | | | Total Short Term Investments | | | |
| | | | (Cost $18,755,999) | | 18,755,998 | |
| | Principal | | | | | |
| | Amount | | | | | |
| | | | INVESTMENTS PURCHASED | | | |
| | | | AS SECURITIES LENDING | | | |
| | | | COLLATERAL - 39.47% | | | |
| | | | COMMERCIAL PAPER - 11.44% | | | |
| | $ 2,644,182 | | CCN Bluegrass, | | | |
| | | | 4.85%, 11/20/06 (c) | | 2,644,182 | |
| | 5,288,364 | | CCN Independence IV LLC, | | | |
| | | | 4.82%,10/16/06 (c) | | 5,288,364 | |
| | 5,817,200 | | CCN Orchard Park, | | | |
| | | | 4.76%, 10/06/06 (c) | | 5,817,200 | |
| | 3,966,273 | | Concord Minutemen Capital Co., | | | |
| | | | 4.65%, 04/04/06 (c) | | 3,966,273 | |
| | Principal | | | | Market | |
| | Amount | | | | Value | |
| | | | COMMERCIAL PAPER (Continued) | | | |
| | $ 7,932,545 | | Concord Minutemen Capital Co., | | | |
| | | | 4.75%, 04/18/06 (c) | $ | 7,932,545 | |
| | 4,230,691 | | Duke Funding, | | | |
| | | | 4.82%, 04/26/06 (c) (d) | | 4,213,549 | |
| | 5,288,364 | | Duke Funding, | | | |
| | | | 4.64%, 06/06/06 (c) | | 5,288,364 | |
| | 10,576,727 | | Fenway Funding LLC, | | | |
| | | | 4.82%, 04/07/06 (c) (d) | | 10,562,383 | |
| | 10,576,727 | | Laguna Corp., | | | |
| | | | 4.83%, 04/18/06 (c) (d) | | 10,540,941 | |
| | 6,081,618 | | Lakeside Funding LLC, | | | |
| | | | 4.70%, 04/10/06 (c) | | 6,081,618 | |
| | 2,644,182 | | Morgan Stanley, | | | |
| | | | 4.96%, 04/11/06 | | 2,644,182 | |
| | 10,576,727 | | Thornburg Mortgage Capital LLC, | | | |
| | | | 4.71%, 04/10/06 (c) (d) | | 10,533,459 | |
| | | | Total Commercial Paper | | | |
| | | | (Cost $75,513,060) | | 75,513,060 | |
| | | | CORPORATE BONDS AND NOTES - 2.04% | | | |
| | 2,644,182 | | Bayerische Landesbank, | | | |
| | | | 4.83%, 12/24/15 | | 2,644,182 | |
| | 5,288,364 | | Liquid Funding Ltd., | | | |
| | | | 4.73%, 05/15/06 (c) (d) | | 5,287,828 | |
| | 3,173,018 | | Metlife Global, 4.89%, 04/28/08 | | 3,173,018 | |
| | 2,379,763 | | Northlake, 4.91%, 03/06/33 (c) | | 2,379,763 | |
| | | | Total Corporate Bonds and Notes | | | |
| | | | (Cost $13,484,791) | | 13,484,791 | |
| | | | CORPORATE PAYDOWN | | | |
| | | | SECURITIES - 1.48% | | | |
| | 2,644,182 | | Duke Funding, 4.62%, 04/08/06 (c) | | 2,644,182 | |
| | 7,121,969 | | Leafs LLC, 4.78%, 04/20/06 (c) | | 7,121,969 | |
| | | | Total Corporate Paydown | | | |
| | | | Securities (Cost $9,766,151) | | 9,766,151 | |
| | Number of | | | | | |
| | Shares | | | | | |
| | | | MUTUAL FUND - 0.00% | | | |
| | 67 | | AIM Short Term | | | |
| | | | Liquid Asset Fund | | 67 | |
| | | | Total Mutual Fund | | | |
| | | | (Cost $67) | | 67 | |
| | | | | | | |
See notes to financial statements.
AssetMark Large Cap Value Fund
SCHEDULE OF INVESTMENTS (Continued)
| | Principal | | | | Market | |
| | Amount | | | | Value | |
| | | | REPURCHASE AGREEMENTS - 24.51% | | | |
| | $39,662,726 | | Goldman Sachs Repurchase | | | |
| | | | Agreement, 4.94%, 04/03/06, | | | |
| | | | repurchase price $39,668,169, | | | |
| | | | maturing 04/03/06 (Collateralized | | | |
| | | | by non-U.S. Government Debt | | | |
| | | | Securities, value $42,928,412, | | | |
| | | | 0.00% to 11.13%, 04/01/08 to | | | |
| | | | 07/15/32) | $ | 39,662,726 | |
| | 23,797,635 | | Merrill Lynch Repurchase | | | |
| | | | Agreement, 4.93%, 04/03/06, | | | |
| | | | repurchase price $23,807,412, | | | |
| | | | maturing 04/03/06, (Collateralized | | | |
| | | | by non-U.S. Government Debt | | | |
| | | | Securities, value $25,060,272, | | | |
| | | | 0.00% to 12.00%, 07/15/06 to | | | |
| | | | 10/01/45) | | 23,797,635 | |
| | 22,739,963 | | Morgan Stanley Repurchase | | | |
| | | | Agreement, 4.91%, 04/03/06, | | | |
| | | | repurchase price $22,749,267, | | | |
| | | | maturing 04/03/06 (Collateralized | | | |
| | | | by Fannie Mae Mortgage | | | |
| | | | Obligations, value $23,429,167, | | | |
| | | | 0.00% to 6.75%, 9/25/07 to | | | |
| | | | 10/25/35) | | 22,739,963 | |
| | Principal | | | | Market | |
| | Amount | | | | Value | |
| | | | REPURCHASE AGREEMENTS (Continued) | | | |
| | $75,623,596 | | Morgan Stanley Repurchase | | | |
| | | | Agreement, 4.91%, 04/03/06, | | | |
| | | | repurchase price $75,654,539, | | | |
| | | | maturing 04/03/06 (Collateralized | | | |
| | | | by Ginnie Mae Mortgage | | | |
| | | | Obligations, value $77,787,343, | | | |
| | | | 0.97% to 6.50%, 5/20/14 to | | | |
| | | | 1/20/35) | $ | 75,623,596 | |
| | | | Total Repurchase Agreements | | | |
| | | | (Cost $161,823,920) | | 161,823,920 | |
| | | | Total Investments Purchased as | | | |
| | | | Securities Lending Collateral | | | |
| | | | (Cost $260,587,989) | | 260,587,989 | |
| | | | Total Investments - 139.58% | | | |
| | | | (Cost $870,749,890) | | 921,415,416 | |
| | | | Liabilities in Excess of | | | |
| | | | Other Assets - (39.58)% | | (261,285,433) | |
| | | | TOTAL NET | | | |
| | | | ASSETS - 100.00% | | $660,129,983 | |
| | | | | | | |
| | Percentages are stated as a percent of net assets. | | | |
| | ADR - American Depository Receipt | | | |
| | (a) | | Non Income Producing. | | | |
| | (b) | | All or a portion of this security is on loan. | | | |
| | (c) | | Restricted securities as defined in Rule 144(a) under the Securities Act of 1933. Such securities are treated as liquid securities according to the Fund’s liquidity guidelines. The market value of these securities total $90,302,620, 13.7% of total net assets. | | | |
| | (d) | | Variable Rate Security. The rate shown is the rate in effect on March 31, 2006. | | | |
See notes to financial statements.
AssetMark Small/Mid Cap Growth Fund
This chart assumes an initial gross investment of $10,000 made on June 29, 2001 (commencement of operations). Returns shown include the reinvestment of all dividends. Returns shown do not reflect the deduction of taxes that a shareholder would pay on fund distributions or the redemption of fund shares. In the absence of fee waivers and reimbursements, total return would be reduced. Past performance is not predictive of future performance. Investment return and principal value will fluctuate, so that your shares, when redeemed, may be worth more or less than the original cost.
RUSSELL 2500 GROWTH INDEX - An unmanaged index which measures the performance of those Russell 2500 Index companies with higher price-to-book ratios and higher forecasted growth values. The Russell 2500 Index measures the performance of the 2,500 smallest companies in the Russell 3000 Index. The Russell 3000 Index is an unmanaged index which measures the performance of the 3,000 largest U.S. companies based on total market capitalization, which represents approximately 98% of the investable U.S. equity market.
RUSSELL MID-CAP GROWTH INDEX - Measures the performance of those Russell Midcap companies with higher price-to-book ratios and higher forecasted growth values. The stocks are also members of the Russell 1000 Growth index. The Russell 1000 Growth Index contains those securities in the Russell 1000 Index with a greater-than-average growth orientation.
LIPPER SMALL-CAP GROWTH FUNDS INDEX - The Lipper Small-Cap Growth Funds Index is the average of the 30 largest funds in the Lipper Small-Cap Growth Funds Category. These funds, by portfolio practice, invest 75% of equity assets in companies with market capitalizations (on a three-year weighted basis) less than 250% of the dollar-weighted median market capitalization of the smallest 500 of the middle 1,000 securities of the S&P Super Composite 1500® Index. These funds typically have an above average price-to-earnings ratio, price-to-book ratio, and three-year sales-per-share growth value, compared to the S&P SmallCap 600 Index™.
LIPPER MID-CAP GROWTH FUNDS INDEX - Funds that, by portfolio practice, invest at least 75% of their equity assets in companies with market capitalizations (on a three-year weighted basis) of less than 300% of the dollar-weighted median market capitalization of the S&P Mid-Cap 400 Index. Mid-Cap Growth funds normally invest in companies with long-term earnings expected to grow significantly faster than the earnings of the stocks represented in a major unmanaged stock index. These funds will normally have an above-average price-to-earnings ratio, price-to-book ratio, and three-year earnings growth figure, compared to the U.S. diversified mid-cap funds universe average.
AVERAGE ANNUAL TOTAL RETURN (for the periods ended March 31, 2006) | |
| | One Year | Three Year | Since Inception (6/29/01) |
| AssetMark Small/Mid Cap Growth Fund | 26.24% | 22.01% | 3.08% |
| Russell 2500 Growth Index | 26.44% | 27.96% | 6.02% |
| Russell Mid-Cap Growth Index | 22.68% | 25.75% | 6.08% |
| Lipper Small-Cap Growth Funds Index | 24.66% | 25.35% | 5.01% |
| Lipper Mid-Cap Growth Funds Index | 24.88% | 23.48% | 3.81% |
AssetMark Small/Mid Cap Growth Fund
SCHEDULE OF INVESTMENTS
| | Number of | | | | Market | |
| | Shares | | | | Value | |
| | | | COMMON STOCKS - 98.55% | | | |
| | | | Aerospace & Defense - 1.74% | | | |
| | 104,550 | | BE Aerospace, Inc. (a)(b) | $ | 2,626,296 | |
| | 18,900 | | Precision Castparts Corp. | | 1,122,660 | |
| | | | | | 3,748,956 | |
| | | | Air Freight & Logistics - 0.90% | | | |
| | 43,100 | | EGL, Inc. (a)(b) | | 1,939,500 | |
| | | | Airlines - 1.01% | | | |
| | 20,600 | | AMR Corp. (a)(b) | | 557,230 | |
| | 64,300 | | Mesa Air Group, Inc. (a)(b) | | 735,592 | |
| | 22,300 | | US Airways Group, Inc. (a)(b) | | 892,000 | |
| | | | | | 2,184,822 | |
| | | | Auto Components - 0.18% | | | |
| | 16,900 | | TRW Automotive | | | |
| | | | Holdings Corp. (a) | | 393,770 | |
| | | | Biotechnology - 3.50% | | | |
| | 87,779 | | Alkermes, Inc. (a)(b) | | 1,935,527 | |
| | 28,200 | | Applera Corp. - Applied | | | |
| | | | Biosystems Group (b) | | 765,348 | |
| | 40,900 | | Kendle International, Inc. (a) | | 1,382,420 | |
| | 85,750 | | PDL BioPharma Inc. (a)(b) | | 2,812,600 | |
| | 18,300 | | Regeneron | | | |
| | | | Pharmaceuticals, Inc. (a) | | 304,329 | |
| | 26,400 | | Viropharma, Inc. (a)(b) | | 335,280 | |
| | | | | | 7,535,504 | |
| | | | Capital Markets - 4.06% | | | |
| | 37,850 | | Affiliated Managers | | | |
| | | | Group, Inc. (a)(b) | | 4,035,188 | |
| | 21,504 | | GFI Group Inc. (a)(b) | | 1,116,273 | |
| | 40,600 | | Investment Technology | | | |
| | | | Group, Inc. (a) | | 2,021,880 | |
| | 27,900 | | National Financial | | | |
| | | | Partners Corp. (b) | | 1,576,908 | |
| | | | | | 8,750,249 | |
| | | | Chemicals - 0.96% | | | |
| | 27,900 | | Airgas, Inc. | | 1,090,611 | |
| | 19,200 | | Eastman Chemical Co. | | 982,656 | |
| | | | | | 2,073,267 | |
| | | | Commercial Banks - 1.37% | | | |
| | 90,650 | | Signature Bank (a) | | 2,954,284 | |
| | | | Commercial Services & Supplies - 7.47% | | | |
| | 36,550 | | The Corporate Executive Board Co. | | 3,687,895 | |
| | 19,400 | | Dun & Bradstreet Corp. (a)(b) | | 1,487,592 | |
| | 17,800 | | First Advantage Corp. (a)(b) | | 430,404 | |
| | Number of | | | | Market | |
| | Shares | | | | Value | |
| | | | Commercial Services & Supplies (Continued) | | | |
| | 36,200 | | ITT Educational Services, Inc. (a) | $ | 2,318,610 | |
| | 69,650 | | Labor Ready, Inc. (a)(b) | | 1,668,118 | |
| | 99,111 | | Mobile Mini, Inc. (a)(b) | | 3,064,512 | |
| | 50,150 | | Monster Worldwide, Inc. (a)(b) | | 2,500,479 | |
| | 49,200 | | Tetra Tech, Inc. (a) | | 939,228 | |
| | | | | | 16,096,838 | |
| | | | Communications Equipment - 1.24% | | | |
| | 23,100 | | Avocent Corp. (a) | | 733,194 | |
| | 22,500 | | Harris Corp. (b) | | 1,064,025 | |
| | 17,100 | | Nice Sys Ltd. - ADR (a) | | 871,416 | |
| | | | | | 2,668,635 | |
| | | | Computers & Peripherals - 3.71% | | | |
| | 34,700 | | Electronics for Imaging (a)(b) | | 970,559 | |
| | 35,200 | | Intergraph Corp. (a)(b) | | 1,466,432 | |
| | 16,100 | | Intermec, Inc. (a)(b) | | 491,211 | |
| | 84,300 | | Neoware Systems, Inc. (a)(b) | | 2,496,966 | |
| | 48,550 | | Rackable Systems, Inc. (a)(b) | | 2,565,868 | |
| | | | | | 7,991,036 | |
| | | | Construction & Engineering - 0.50% | | | |
| | 21,800 | | EMCOR Group, Inc. (a) | | 1,082,588 | |
| | | | Containers & Packaging - 1.04% | | | |
| | 51,800 | | Crown Holdings, Inc. (a) | | 918,932 | |
| | 59,100 | | Packaging Corp of America | | 1,326,204 | |
| | | | | | 2,245,136 | |
| | | | Diversified Financial Services - 1.81% | | | |
| | 27,200 | | GATX Corp. (b) | | 1,123,088 | |
| | 19,525 | | Intercontinentalexchange, Inc. (a) | | 1,348,201 | |
| | 35,900 | | Nasdaq Stock Market, Inc. (a)(b) | | 1,437,436 | |
| | | | | | 3,908,725 | |
| | | | Electric Utilities - 0.28% | | | |
| | 24,500 | | PNM Resources, Inc. | | 597,800 | |
| | | | Electrical Equipment - 1.14% | | | |
| | 24,000 | | The Lamson & Sessions Co. (a)(b) | | 667,920 | |
| | 23,800 | | Thomas & Betts Corp. (a)(b) | | 1,222,844 | |
| | 17,100 | | Woodward Governor Co. | | 568,575 | |
| | | | | | 2,459,339 | |
| | | | Electronic Equipment & Instruments - 1.83% | | | |
| | 21,100 | | Electro Scientific | | | |
| | | | Industries, Inc. (a) | | 466,943 | |
| | 27,350 | | Itron, Inc. (a) | | 1,636,898 | |
| | 13,600 | | Multi-Fineline | | | |
| | | | Electronix, Inc. (a)(b) | | 795,464 | |
See notes to financial statements.
AssetMark Small/Mid Cap Growth Fund
SCHEDULE OF INVESTMENTS (Continued)
| | Number of | | | | Market | |
| | Shares | | | | Value | |
| | | | COMMON STOCKS (Continued) | | | |
| | | | Electronic Equipment & Instruments (Continued) | | | |
| | 85,500 | | Sanmina-SCI Corporation (a) | $ | 350,550 | |
| | 18,600 | | Tech Data Corp. (a) | | 686,526 | |
| | | | | | 3,936,381 | |
| | | | Energy Equipment & Services - 4.20% | | | |
| | 25,800 | | Grant Prideco, Inc. (a) | | 1,105,272 | |
| | 26,900 | | Helmerich & Payne, Inc. | | 1,878,158 | |
| | 39,300 | | Patterson-UTI Energy, Inc. | | 1,256,028 | |
| | 64,000 | | Pride International, Inc. (a)(b) | | 1,995,520 | |
| | 24,693 | | Tidewater, Inc. (b) | | 1,363,794 | |
| | 26,200 | | Unit Corp. (a) | | 1,460,650 | |
| | | | | | 9,059,422 | |
| | | | Food Products - 0.30% | | | |
| | 400 | | Seaboard Corp. (b) | | 637,600 | |
| | | | Gas Utilities - 0.37% | | | |
| | 8,600 | | Amerigas Partners L P | | 257,312 | |
| | 22,600 | | Piedmont Natural Gas Co. (b) | | 542,174 | |
| | | | | | 799,486 | |
| | | | Health Care Equipment & Supplies - 4.08% | | | |
| | 62,350 | | American Medical Systems | | | |
| | | | Holdings, Inc. (a) | | 1,402,875 | |
| | 34,000 | | Candela Corp. (a) | | 734,400 | |
| | 19,000 | | Cutera, Inc. (a) | | 515,280 | |
| | 10,200 | | Datascope Corp. | | 403,512 | |
| | 26,000 | | Greatbatch, Inc. (a) | | 569,660 | |
| | 26,900 | | Haemonetics Corp. (a) | | 1,365,713 | |
| | 54,300 | | Natus Medical, Inc. (a) | | 1,113,150 | |
| | 41,700 | | PerkinElmer, Inc. | | 978,699 | |
| | 43,700 | | Thoratec Corp. (a)(b) | | 842,099 | |
| | 33,200 | | Zoll Medical Corp. (a)(b) | | 874,488 | |
| | | | | | 8,799,876 | |
| | | | Health Care Providers & Services - 10.90% | | | |
| | 34,550 | | The Advisory Board Co. (a)(b) | | 1,926,853 | |
| | 31,300 | | American Retirement Corp. (a)(b) | | 801,906 | |
| | 20,900 | | Community Health | | | |
| | | | Systems, Inc. (a) | | 755,535 | |
| | 51,550 | | Covance, Inc. (a)(b) | | 3,028,563 | |
| | 14,300 | | Coventry Health Care, Inc. (a)(b) | | 771,914 | |
| | 33,200 | | Health Net, Inc. (a) | | 1,687,224 | |
| | 47,550 | | Healthways, Inc. (a)(b) | | 2,422,197 | |
| | 75,500 | | LCA-Vision, Inc. | | 3,783,305 | |
| | 13,100 | | Lincare Holdings, Inc. (a)(b) | | 510,376 | |
| | 27,000 | | Odyssey HealthCare, Inc. (a) | | 464,670 | |
| | Number of | | | | Market | |
| | Shares | | | | Value | |
| | | | Health Care Providers & Services (Continued) | | | |
| | 5,300 | | Pediatrix Medical Group, Inc. (a) | $ | 543,992 | |
| | 36,200 | | Pharmaceutical Product | | | |
| | | | Development, Inc. | | 1,252,882 | |
| | 92,200 | | Psychiatric Solutions, Inc. (a)(b) | | 3,054,586 | |
| | 61,050 | | Sierra Health Services (a)(b) | | 2,484,735 | |
| | | | | | 23,488,738 | |
| | | | Hotels Restaurants & Leisure - 3.00% | | | |
| | 29,350 | | The Cheesecake Factory (a)(b) | | 1,099,157 | |
| | 48,500 | | Pinnacle Entertainment, Inc. (a) | | 1,366,245 | |
| | 29,700 | | Station Casinos, Inc. (b) | | 2,357,289 | |
| | 96,050 | | Texas Roadhouse, Inc. (a)(b) | | 1,641,495 | |
| | | | | | 6,464,186 | |
| | | | Household Durables - 1.63% | | | |
| | 22,600 | | Blount International, Inc. (a) | | 364,086 | |
| | 9,350 | | Harman International | | | |
| | | | Industries, Inc. (b) | | 1,039,065 | |
| | 16,000 | | KB Home (b) | | 1,039,680 | |
| | 11,700 | | Whirlpool Corp. | | 1,070,199 | |
| | | | | | 3,513,030 | |
| | | | Household Products - 0.82% | | | |
| | 33,200 | | Central Garden and Pet Co. (a) | | 1,764,248 | |
| | | | Industrial Conglomerates - 0.59% | | | |
| | 17,800 | | Teleflex, Inc. | | 1,275,014 | |
| | | | Insurance - 0.89% | | | |
| | 39,600 | | The Phoenix Cos Inc. (b) | | 645,480 | |
| | 22,000 | | WR Berkley Corp. | | 1,277,320 | |
| | | | | | 1,922,800 | |
| | | | Internet Software & Services - 3.78% | | | |
| | 67,450 | | Akamai Technologies, Inc. (a)(b) | | 2,218,430 | |
| | 39,500 | | Digital Insight Corp. (a) | | 1,437,800 | |
| | 48,000 | | Entrust, Inc. (a)(b) | | 216,000 | |
| | 16,000 | | Equinix, Inc. (a) | | 1,428,831 | |
| | 56,700 | | Interwoven, Inc. (a)(b) | | 509,733 | |
| | 34,000 | | Stellent, Inc. | | 403,240 | |
| | 66,300 | | Valueclick, Inc. (a)(b) | | 1,121,796 | |
| | 30,200 | | Websense, Inc. (a) | | 832,916 | |
| | | | | | 8,168,746 | |
| | | | IT Services - 3.18% | | | |
| | 54,400 | | Acxiom Corp. (b) | | 1,405,696 | |
| | 47,050 | | Alliance Data Systems Corp. (a)(b) | | 2,200,528 | |
| | 51,400 | | The BISYS Group, Inc. (a) | | 692,872 | |
| | 40,400 | | Ciber, Inc. (a) | | 257,752 | |
See notes to financial statements.
AssetMark Small/Mid Cap Growth Fund
SCHEDULE OF INVESTMENTS (Continued)
| | Number of | | | | Market | |
| | Shares | | | | Value | |
| | | | COMMON STOCKS (Continued) | | | |
| | | | IT Services (Continued) | | | |
| | 18,050 | | Cognizant Technology | | | |
| | | | Solutions Corp. (a)(b) | $ | 1,073,795 | |
| | 12,600 | | Global Payments, Inc. | | 667,926 | |
| | 39,800 | | SYKES Enterprises, Inc. (a) | | 564,364 | |
| | | | | | 6,862,933 | |
| | | | Machinery - 2.42% | | | |
| | 15,200 | | Columbus Mckinnon Corp. (a) | | 409,336 | |
| | 16,200 | | Crane Co. | | 664,362 | |
| | 81,871 | | ESCO Technologies, Inc. (a) | | 4,146,766 | |
| | | | | | 5,220,464 | |
| | | | Media - 0.32% | | | |
| | 25,600 | | Cablevision Systems Corp. (a)(b) | | 683,520 | |
| | | | Metals & Mining - 1.62% | | | |
| | 10,500 | | Alliance Resource Partners LP | | 379,050 | |
| | 33,300 | | Steel Dynamics, Inc. (b) | | 1,889,109 | |
| | 74,400 | | Stillwater Mining Co. (a) | | 1,224,624 | |
| | | | | | 3,492,783 | |
| | | | Multiline Retail - 0.25% | | | |
| | 19,100 | | Dollar Tree Stores, Inc. (a)(b) | | 528,497 | |
| | | | Offices And Clinics Of | | | |
| | | | Doctors Of Medicine - 0.58% | | | |
| | 48,650 | | Radiation Therapy | | | |
| | | | Services, Inc. (a)(b) | | 1,241,062 | |
| | | | Oil & Gas - 2.49% | | | |
| | 22,474 | | Cabot Oil & Gas Corp. (b) | | 1,077,179 | |
| | 19,000 | | Callon Petroleum Co. (a) | | 399,380 | |
| | 49,411 | | Encore Acquisition Co. (a)(b) | | 1,531,741 | |
| | 35,000 | | General Maritime Corp. | | 1,166,900 | |
| | 15,100 | | Swift Energy Co. (a)(b) | | 565,646 | |
| | 15,400 | | W & T Offshore, Inc. (b) | | 620,774 | |
| | | | | | 5,361,620 | |
| | | | Pharmaceutical Preparations - 0.54% | | | |
| | 41,350 | | Theravance, Inc. (a)(b) | | 1,159,454 | |
| | | | Pharmaceuticals - 2.85% | | | |
| | 73,884 | | Adams Respiratory Therapeutics (a) | | 2,938,367 | |
| | 50,700 | | Mylan Laboratories (b) | | 1,186,380 | |
| | 60,500 | | New River | | | |
| | | | Pharmaceuticals, Inc. (a) | | 2,009,205 | |
| | | | | | 6,133,952 | |
| | | | Prepackaged Software - 0.29% | | | |
| | 29,700 | | Blackbaud, Inc. (b) | | 629,343 | |
| | Number of | | | | Market | |
| | Shares | | | | Value | |
| | | | Real Estate - 0.88% | | | |
| | 29,500 | | Healthcare Realty Trust, Inc. | $ | 1,102,710 | |
| | 10,400 | | Jones Lang LaSalle, Inc. | | 796,016 | |
| | | | | | 1,898,726 | |
| | | | Real Estate Agents And Managers - 0.67% | | | |
| | 17,900 | | CB Richard Ellis Group, Inc. (a) | | 1,444,530 | |
| | | | Road & Rail - 1.09% | | | |
| | 18,400 | | Arkansas Best Corp. | | 719,808 | |
| | 53,100 | | Knight Transportation, Inc. | | 1,048,725 | |
| | 21,100 | | Laidlaw International, Inc. | | 573,920 | |
| | | | | | 2,342,453 | |
| | | | Semiconductor & Semiconductor | | | |
| | | | Equipment - 8.05% | | | |
| | 135,500 | | Axcelis Technologies, Inc. (a)(b) | | 794,030 | |
| | 38,300 | | Cymer, Inc. (a)(b) | | 1,740,352 | |
| | 48,012 | | Diodes, Inc. (a) | | 1,992,498 | |
| | 44,900 | | Integrated Device | | | |
| | | | Technology, Inc. (a)(b) | | 667,214 | |
| | 22,000 | | Intersil Corp. (b) | | 636,240 | |
| | 109,900 | | Kopin Corp. (a) | | 550,599 | |
| | 11,900 | | Lam Research Corp. (a)(b) | | 511,700 | |
| | 103,500 | | LSI Logic Corp. (a)(b) | | 1,196,460 | |
| | 116,700 | | Mattson Technology, Inc. (a) | | 1,400,400 | |
| | 68,650 | | MEMC Electronic | | | |
| | | | Materials, Inc. (a)(b) | | 2,534,558 | |
| | 63,350 | | Microsemi Corp. (a) | | 1,844,118 | |
| | 70,100 | | Pixelworks, Inc. (a)(b) | | 348,397 | |
| | 110,300 | | Triquint Semiconductor, Inc. (a) | | 542,676 | |
| | 52,062 | | Varian Semiconductor Equipment | | | |
| | | | Associates, Inc. (a)(b) | | 1,461,901 | |
| | 51,200 | | Zoran Corp. (a)(b) | | 1,120,256 | |
| | | | | | 17,341,399 | |
| | | | Software - 5.19% | | | |
| | 17,100 | | Advent Software, Inc. (a) | | 485,982 | |
| | 23,000 | | Cognos, Inc. (a) | | 894,700 | |
| | 111,500 | | Compuware Corp. (a) | | 873,045 | |
| | 13,400 | | Fair Isaac Corp. (b) | | 530,908 | |
| | 35,500 | | Informatica Corp. (a) | | 552,025 | |
| | 32,500 | | Kronos, Inc. (a) | | 1,215,175 | |
| | 30,600 | | NAVTEQ Corp. (a)(b) | | 1,549,890 | |
| | 178,700 | | Nuance | | | |
| | | | Communications, Inc. (a) | | 2,110,447 | |
| | 46,800 | | Red Hat, Inc. (a)(b) | | 1,309,464 | |
| | 19,600 | | The Reynolds & Reynolds Co. | | 556,640 | |
| | 18,000 | | SPSS, Inc. (a)(b) | | 569,880 | |
See notes to financial statements.
AssetMark Small/Mid Cap Growth Fund
SCHEDULE OF INVESTMENTS (Continued)
| | Number of | | | | Market | |
| | Shares | | | | Value | |
| | | | COMMON STOCKS (Continued) | | | |
| | | | Software (Continued) | | | |
| | 24,100 | | Synopsys, Inc. (a) | $ | 538,635 | |
| | | | | | 11,186,791 | |
| | | | Specialty Retail - 3.53% | | | |
| | 47,200 | | Aaron Rents, Inc. | | 1,282,424 | |
| | 35,650 | | Aeropostale, Inc. (a)(b) | | 1,075,204 | |
| | 21,050 | | Chico’s FAS, Inc. (a)(b) | | 855,472 | |
| | 65,300 | | CSK Auto Corp. (a) | | 905,711 | |
| | 82,079 | | Hibbett Sporting Goods, Inc. (a)(b) | | 2,707,786 | |
| | 19,800 | | Select Comfort Corp. (a)(b) | | 783,090 | |
| | | | | | 7,609,687 | |
| | | | Thrifts & Mortgage Finance - 0.22% | | | |
| | 23,500 | | CharterMac (b) | | 477,050 | |
| | | | Trading Companies & Distributors - 0.54% | | | |
| | 16,400 | | Watsco, Inc. | | 1,165,220 | |
| | | | Wireless Telecommunication Services - 0.54% | | | |
| | 41,200 | | Crown Castle | | | |
| | | | International Corp. (a) | | 1,168,020 | |
| | | | Total Common Stocks | | | |
| | | | (Cost $181,785,399) | | 212,407,480 | |
| | | | SHORT TERM INVESTMENTS - 1.22% | | | |
| | | | Money Market Funds - 1.22% | | | |
| | 2,622,103 | | Federated Prime Obligations Fund | | | |
| | | | 4.600%, 01/01/2050 | | 2,622,103 | |
| | | | Total Short Term Investments | | | |
| | | | (Cost $2,622,103) | | 2,622,103 | |
| | Principal | | | | | |
| | Amount | | | | | |
| | | | INVESTMENTS PURCHASED | | | |
| | | | AS SECURITIES LENDING | | | |
| | | | COLLATERAL - 35.93% | | | |
| | | | COMMERCIAL PAPER - 10.41% | | | |
| | $ 785,646 | | CCN Bluegrass, | | | |
| | | | 4.85%, 11/20/06 (c) | | 785,646 | |
| | 1,571,292 | | CCN Independence IV LLC, | | | |
| | | | 4.82%,10/16/06 (c) | | 1,571,292 | |
| | 1,728,420 | | CCN Orchard Park, | | | |
| | | | 4.76%, 10/06/06 (c) | | 1,728,420 | |
| | 1,178,468 | | Concord Minutemen Capital Co., | | | |
| | | | 4.65%, 04/04/06 (c) | | 1,178,468 | |
| | 2,356,938 | | Concord Minutemen Capital Co., | | | |
| | | | 4.75%, 04/18/06 (c) | | 2,356,938 | |
| | Principal | | | | Market | |
| | Amount | | | | Value | |
| | | | COMMERCIAL PAPER (Continued) | | | |
| | $ 1,257,033 | | Duke Funding, | | | |
| | | | 4.82%, 04/26/06 (c) (d) | $ | 1,251,940 | |
| | 1,571,292 | | Duke Funding, | | | |
| | | | 4.64%, 06/06/06 (c) | | 1,571,292 | |
| | 3,142,583 | | Fenway Funding LLC, | | | |
| | | | 4.82%, 04/07/06 (c) (d) | | 3,138,320 | |
| | 3,142,583 | | Laguna Corp., | | | |
| | | | 4.83%, 04/18/06 (c) (d) | | 3,131,950 | |
| | 1,806,985 | | Lakeside Funding LLC, | | | |
| | | | 4.70%, 04/10/06 (c) | | 1,806,985 | |
| | 785,646 | | Morgan Stanley, | | | |
| | | | 4.96%, 04/11/06 | | 785,646 | |
| | 3,142,583 | | Thornburg Mortgage Capital LLC, | | | |
| | | | 4.71%, 04/10/06 (c) (d) | | 3,129,729 | |
| | | | Total Commercial Paper | | | |
| | | | (Cost $22,436,626) | | 22,436,626 | |
| | | | CORPORATE BONDS AND NOTES - 1.86% | | | |
| | 785,646 | | Bayerische Landesbank, | | | |
| | | | 4.83%, 12/24/15 | | 785,646 | |
| | 1,571,292 | | Liquid Funding Ltd., | | | |
| | | | 4.73%, 05/15/06 (c) (d) | | 1,571,133 | |
| | 942,775 | | Metlife Global, | | | |
| | | | 4.89%, 04/28/08 | | 942,775 | |
| | 707,081 | | Northlake, 4.91%, 03/06/33 (c) | | 707,081 | |
| | | | Total Corporate Bonds and Notes | | | |
| | | | (Cost $4,006,635) | | 4,006,635 | |
| | | | CORPORATE PAYDOWN | | | |
| | | | SECURITIES - 1.35% | | | |
| | 785,646 | | Duke Funding, | | | |
| | | | 4.62%, 04/08/06 (c) | | 785,646 | |
| | 2,116,097 | | Leafs LLC, 4.78%, 04/20/06 (c) | | 2,116,097 | |
| | | | Total Corporate Paydown | | | |
| | | | Securities (Cost $2,901,743) | | 2,901,743 | |
| | Number of | | | | | |
| | Shares | | | | | |
| | | | MUTUAL FUND - 0.00% | | | |
| | 20 | | AIM Short Term | | | |
| | | | Liquid Asset Fund | | 20 | |
| | | | Total Mutual Fund | | | |
| | | | (Cost $20) | | 20 | |
See notes to financial statements.
AssetMark Small/Mid Cap Growth Fund
SCHEDULE OF INVESTMENTS (Continued)
| | Principal | | | | Market | |
| | Amount | | | | Value | |
| | | | REPURCHASE AGREEMENTS - 22.31% | | | |
| | $11,784,688 | | Goldman Sachs Repurchase | | | |
| | | | Agreement, 4.94%, 04/03/06, | | | |
| | | | repurchase price $11,789,539, | | | |
| | | | maturing 04/03/06 (Collateralized | | | |
| | | | by non-U.S. Government Debt | | | |
| | | | Securities, value $12,754,996, | | | |
| | | | 0.00% to 11.13%, 04/01/08 to | | | |
| | | | 07/15/32) | $ | 11,784,688 | |
| | 7,070,813 | | Merrill Lynch Repurchase | | | |
| | | | Agreement, 4.93%, 04/03/06, | | | |
| | | | repurchase price $7,073,718, | | | |
| | | | maturing 04/03/06 (Collateralized | | | |
| | | | by non-U.S. Government Debt | | | |
| | | | Securities, value $7,445,970, | | | |
| | | | 0.00% to 12.00%, 07/15/06 to | | | |
| | | | 10/01/45) | | 7,070,813 | |
| | 6,756,554 | | Morgan Stanley Repurchase | | | |
| | | | Agreement, 4.91%, 04/03/06, | | | |
| | | | repurchase price $6,759,319, | | | |
| | | | maturing 04/03/06 (Collateralized | | | |
| | | | by Fannie Mae Mortgage | | | |
| | | | Obligations, value $6,961,332, | | | |
| | | | 0.00% to 6.75%, 9/25/07 to | | | |
| | | | 10/25/35) | | 6,756,554 | |
| | Principal | | | | Market | |
| | Amount | | | | Value | |
| | | | REPURCHASE AGREEMENTS (Continued) | | | |
| | $22,469,471 | | Morgan Stanley Repurchase | | | |
| | | | Agreement, 4.91%, 04/03/06, | | | |
| | | | repurchase price $22,478,665, | | | |
| | | | maturing 04/03/06 (Collateralized | | | |
| | | | by Ginnie Mae Mortgage | | | |
| | | | Obligations, value $23,112,368, | | | |
| | | | 0.97% to 6.50%, 5/20/14 to | | | |
| | | | 1/20/35) | $ | 22,469,471 | |
| | | | Total Repurchase Agreements | | | |
| | | | (Cost $48,081,526) | | 48,081,526 | |
| | | | Total Investments Purchased as | | | |
| | | | Securities Lending Collateral | | | |
| | | | (Cost $77,426,550) | | 77,426,550 | |
| | | | Total Investments - 135.70% | | | |
| | | | (Cost $261,834,052) | | 292,456,133 | |
| | | | Liabilities in Excess of | | | |
| | | | Other Assets - (35.70)% | | (76,941,145) | |
| | | | TOTAL NET | | | |
| | | | ASSETS - 100.00% | | $215,514,988 | |
| | | | | | | |
| | Percentages are stated as a percent of net assets. | | | |
| | ADR - American Depository Receipt | | | |
| | (a) | | Non Income Producing. | | | |
| | (b) | | All or a portion of this security is on loan. | | | |
| | (c) | | Restricted securities as defined in Rule 144(a) under the Securities Act of 1933. Such securities are treated as liquid securities according the the Fund’s liquidity guidelines. The market value of these securities total $26,830,937, 12.5% of total net assets. | | | |
| | (d) | | Variable Rate Security. The rate shown is the rate in effect on March 31, 2006. | | | |
See notes to financial statements.
AssetMark Small/Mid Cap Value Fund
This chart assumes an initial gross investment of $10,000 made on June 29, 2001 (commencement of operations). Returns shown include the reinvestment of all dividends. Returns shown do not reflect the deduction of taxes that a shareholder would pay on fund distributions or the redemption of fund shares. In the absence of fee waivers and reimbursements, total return would be reduced. Past performance is not predictive of future performance. Investment return and principal value will fluctuate, so that your shares, when redeemed, may be worth more or less than the original cost.
RUSSELL 2500 VALUE INDEX - An unmanaged index which measures the performance of those Russell 2500 Index companies with lower price-to-book ratios and lower forecasted growth values. The Russell 2500 Index is an unmanaged index which measures the performance of the 2,500 smallest companies in the Russell 3000 Index. The Russell 3000 Index is an unmanaged index which measures the performance of the 3,000 largest U.S. companies based on total market capitalization, which represents approximately 98% of the investable U.S. equity market.
RUSSELL MID-CAP VALUE INDEX - Measures the performance of those Russell Midcap companies with lower price-to-book ratios and lower forecasted growth values. The stocks are also members of the Russell 1000 Value index. The Russell 1000 Value Index contains those securities in the Russell 1000 Index with a less-than-average growth orientation.
LIPPER SMALL-CAP VALUE FUNDS INDEX - The Lipper Small-Cap Value Funds Index is the average of the 30 largest funds in the Lipper Small-Cap Value Funds Category. These funds, by portfolio practice, invest 75% of equity assets in companies with market capitalizations (on a three-year weighted basis) less than 250% of the dollar-weighted median market capitalization of the smallest 500 of the middle 1,000 securities of the S&P Super Composite 1500® Index. These funds typically have a below average price-to-earnings ratio, price-to-book ratio, and three-year sales-per-share growth value, compared to the S&P SmallCap 600 Index™.
LIPPER MID-CAP VALUE FUNDS INDEX - Funds that, by portfolio practice, invest at least 75% of their equity assets in companies with market capitalizations (on a three-year weighted basis) of less than 300% of the dollar-weighted median market capitalization of the S&P Mid-Cap 400 Index. Mid-Cap Value funds seek long-term growth of capital by investing in companies that are considered to be undervalued relative to a major unmanaged stock index based on price-to-current earnings, book value, asset value, or other factors. These funds will normally have a below-average price-to-earnings ratio, price-to-book ratio, and three-year earnings growth figure, compared to the U.S. diversified mid-cap funds universe average.
AVERAGE ANNUAL TOTAL RETURN (for the periods ended March 31, 2006) | |
| | One Year | Three Year | Since Inception (6/29/01) |
| AssetMark Small/Mid Cap Value Fund | 12.89% | 23.15% | 10.24% |
| Russell 2500 Value Index | 21.60% | 30.10% | 14.76% |
| Russell Mid-Cap Value Index | 20.30% | 29.23% | 13.87% |
| Lipper Small-Cap Value Funds Index | 22.00% | 31.31% | 14.74% |
| Lipper Mid-Cap Value Funds Index | 16.38% | 26.33% | 11.20% |
AssetMark Small/Mid Cap Value Fund
SCHEDULE OF INVESTMENTS
| | Number of | | | | Market | |
| | Shares | | | | Value | |
| | | | COMMON STOCKS - 94.22% | | | |
| | | | Aerospace & Defense - 3.58% | | | |
| | 56,400 | | Esterline Technologies Corp. (a) | $ | 2,411,100 | |
| | 74,500 | | Goodrich Corp. | | 3,248,945 | |
| | 27,500 | | Moog, Inc. (a) | | 975,975 | |
| | | | | | 6,636,020 | |
| | | | Building Products - 1.35% | | | |
| | 41,900 | | NCI Building Systems, Inc. (a)(b) | | 2,504,363 | |
| | | | Capital Markets - 4.43% | | | |
| | 7,000 | | Affiliated Managers | | | |
| | | | Group, Inc. (a)(b) | | 746,270 | |
| | 53,900 | | E*Trade Financial Corp. (a)(b) | | 1,454,222 | |
| | 60,300 | | Investors Financial | | | |
| | | | Services Corp. (b) | | 2,826,261 | |
| | 106,000 | | Janus Capital Group, Inc. (b) | | 2,456,020 | |
| | 15,200 | | Nuveen Investments, Inc. | | 731,880 | |
| | | | | | 8,214,653 | |
| | | | Chemicals - 4.60% | | | |
| | 32,800 | | Airgas, Inc. | | 1,282,152 | |
| | 81,200 | | Cambrex Corp. (b) | | 1,586,648 | |
| | 34,900 | | Cytec Industries, Inc. (b) | | 2,094,349 | |
| | 29,200 | | FMC Corp. | | 1,809,816 | |
| | 76,200 | | Rockwood Holdings, Inc. (a) | | 1,754,124 | |
| | | | | | 8,527,089 | |
| | | | Commercial Banks - 3.05% | | | |
| | 42,900 | | Associated Banc-Corp (b) | | 1,457,742 | |
| | 57,624 | | Popular, Inc. | | 1,196,274 | |
| | 55,500 | | Sky Financial Group, Inc. | | 1,470,750 | |
| | 52,497 | | TD Banknorth, Inc. | | 1,540,787 | |
| | | | | | 5,665,553 | |
| | | | Commercial Services & Supplies - 11.66% | | | |
| | 36,600 | | Acco Brands Corp. (a) | | 812,520 | |
| | 88,200 | | Aramark Corp. (b) | | 2,605,428 | |
| | 51,100 | | Brady Corp. (b) | | 1,914,206 | |
| | 90,600 | | Career Education Corp. (a) | | 3,418,338 | |
| | 36,350 | | DeVry, Inc. (a)(b) | | 827,689 | |
| | 12,575 | | Dun & Bradstreet Corp. (a) | | 964,251 | |
| | 46,650 | | Equifax, Inc. | | 1,737,246 | |
| | 60,650 | | Herman Miller, Inc. | | 1,965,667 | |
| | 26,200 | | Manpower, Inc. | | 1,498,116 | |
| | 67,375 | | Pitney Bowes, Inc. (b) | | 2,892,409 | |
| | 114,700 | | The ServiceMaster Co. (b) | | 1,504,864 | |
| | 83,650 | | Steelcase, Inc. (b) | | 1,505,700 | |
| | | | | | 21,646,434 | |
| | Number of | | | | Market | |
| | Shares | | | | Value | |
| | | | Communications Equipment - 1.76% | | | |
| | 128,700 | | Andrew Corp. (a) | $ | 1,580,436 | |
| | 148,800 | | Avaya, Inc. (a)(b) | | 1,681,440 | |
| | | | | | 3,261,876 | |
| | | | Computers & Peripherals - 2.13% | | | |
| | 31,900 | | Avid Technology, Inc. (a) | | 1,386,374 | |
| | 61,600 | | NCR Corp. (a)(b) | | 2,574,264 | |
| | | | | | 3,960,638 | |
| | | | Construction & Engineering - 0.55% | | | |
| | 25,500 | | URS Corp. (a) | | 1,026,375 | |
| | | | Diversified Financial Services - 0.57% | | | |
| | 19,250 | | Brookfield Asset | | | |
| | | | Management, Inc. | | 1,059,905 | |
| | | | Electric Utilities - 0.86% | | | |
| | 81,400 | | Northeast Utilities (b) | | 1,589,742 | |
| | | | Electronic Equipment & Instruments - 1.70% | | | |
| | 28,100 | | Amphenol Corp. | | 1,466,258 | |
| | 35,350 | | Anixter International, Inc. (b) | | 1,689,023 | |
| | | | | | 3,155,281 | |
| | | | Energy Equipment & Services - 0.72% | | | |
| | 42,800 | | Pride International, Inc. (a)(b) | | 1,334,504 | |
| | | | Food Products - 3.09% | | | |
| | 38,400 | | The JM Smucker Co. (b) | | 1,524,480 | |
| | 89,300 | | McCormick & Co, Inc. (b) | | 3,023,698 | |
| | 31,100 | | Ralcorp Holdings, Inc. (a) | | 1,183,355 | |
| | | | | | 5,731,533 | |
| | | | Gas Utilities - 3.52% | | | |
| | 27,000 | | AGL Resources, Inc. | | 973,350 | |
| | 46,400 | | Questar Corp. (b) | | 3,250,320 | |
| | 92,955 | | Southern Union Co. | | 2,308,073 | |
| | | | | | 6,531,743 | |
| | | | Health Care Equipment & Supplies - 7.48% | | | |
| | 59,600 | | C.R. Bard, Inc. | | 4,041,476 | |
| | 33,400 | | Dade Behring Holdings, Inc. | | 1,192,714 | |
| | 10,500 | | Edwards Lifesciences Corp. (a) | | 456,750 | |
| | 32,968 | | Fisher Scientific | | | |
| | | | International (a)(b) | | 2,243,472 | |
| | 34,450 | | Invacare Corp. | | 1,070,017 | |
| | 20,300 | | Millipore Corp. (a)(b) | | 1,483,118 | |
| | 81,300 | | PerkinElmer, Inc. | | 1,908,111 | |
| | 36,000 | | Sybron Dental | | | |
| | | | Specialties, Inc. (a) | | 1,484,640 | �� |
| | | | | | 13,880,298 | |
See notes to financial statements.
AssetMark Small/Mid Cap Value Fund
SCHEDULE OF INVESTMENTS (Continued)
| | Number of | | | | Market | |
| | Shares | | | | Value | |
| | | | COMMON STOCKS (Continued) | | | |
| | | | Health Care Providers & Services - 1.29% | | | |
| | 81,150 | | IMS Health, Inc. (b) | $ | 2,091,235 | |
| | 5,550 | | Omnicare, Inc. (b) | | 305,195 | |
| | | | | | 2,396,430 | |
| | | | Hotels Restaurants & Leisure - 0.89% | | | |
| | 51,700 | | Ruby Tuesday, Inc. (b) | | 1,658,536 | |
| | | | Household Durables - 3.80% | | | |
| | 62,700 | | American Greetings (b) | | 1,355,574 | |
| | 33,425 | | The Black & Decker Corp. (b) | | 2,904,298 | |
| | 34,500 | | Mohawk Industries, Inc. (a)(b) | | 2,784,840 | |
| | | | | | 7,044,712 | |
| | | | Household Products - 1.23% | | | |
| | 43,150 | | Energizer Holdings, Inc. (a) | | 2,286,950 | |
| | | | Industrial Conglomerates - 1.27% | | | |
| | 28,850 | | Carlisle Companies Incorporated | | 2,359,930 | |
| | | | Insurance - 9.43% | | | |
| | 57,800 | | AMBAC Financial Group, Inc. | | 4,600,880 | |
| | 98,075 | | HCC Insurance | | | |
| | | | Holdings, Inc. (b) | | 3,413,010 | |
| | 9,535 | | Markel Corp. (a) | | 3,219,779 | |
| | 73,800 | | MBIA, Inc. (b) | | 4,437,594 | |
| | 36,700 | | Protective Life Corp. | | 1,825,458 | |
| | | | | | 17,496,721 | |
| | | | IT Services - 3.47% | | | |
| | 170,800 | | BearingPoint, Inc. (a)(b) | | 1,450,092 | |
| | 38,900 | | CACI International, | | | |
| | | | Inc. - Class A (a)(b) | | 2,557,675 | |
| | 81,600 | | Hewitt Associates, Inc. (a)(b) | | 2,426,784 | |
| | | | | | 6,434,551 | |
| | | | Leisure Equipment & Products - 2.46% | | | |
| | 73,225 | | Hasbro, Inc. | | 1,545,047 | |
| | 41,300 | | K2, Inc. (a) | | 518,315 | |
| | 138,200 | | Mattel, Inc. (b) | | 2,505,566 | |
| | | | | | 4,568,928 | |
| | | | Machinery - 2.56% | | | |
| | 59,312 | | IDEX Corp. (b) | | 3,094,307 | |
| | 41,000 | | Kaydon Corp. (b) | | 1,654,760 | |
| | | | | | 4,749,067 | |
| | | | Media - 4.13% | | | |
| | 30,200 | | Harte-Hanks, Inc. | | 825,970 | |
| | Number of | | | | Market | |
| | Shares | | | | Value | |
| | | | Media (Continued) | | | |
| | 188,655 | | Interpublic Group of | | | |
| | | | Companies, Inc. (a)(b) | $ | 1,803,542 | |
| | 43,800 | | Lee Enterprises, Inc. | | 1,458,102 | |
| | 25,565 | | McClatchy Co. (b) | | 1,248,850 | |
| | 103,400 | | Radio One, Inc. (a) | | 771,364 | |
| | 53,250 | | Valassis | | | |
| | | | Communications, Inc. (a)(b) | | 1,563,953 | |
| | | | | | 7,671,781 | |
| | | | Multiline Retail - 0.84% | | | |
| | 56,400 | | Dollar Tree Stores, Inc. (a)(b) | | 1,560,588 | |
| | | | Multi-Utilities - 0.87% | | | |
| | 124,400 | | CMS Energy Corp. (a)(b) | | 1,610,980 | |
| | | | Oil, Gas & Consumable Fuels - 0.53% | | | |
| | 101,200 | | International Coal | | | |
| | | | Group, Inc. (a)(b) | | 985,688 | |
| | | | Personal Products - 0.79% | | | |
| | 39,100 | | Chattem, Inc. (a) | | 1,472,115 | |
| | | | Pharmaceutical Preparations - 0.78% | | | |
| | 43,900 | | Endo Pharmaceuticals | | | |
| | | | Holdings Inc. (a) | | 1,440,359 | |
| | | | Pharmaceuticals - 0.50% | | | |
| | 19,600 | | Kos Pharmaceuticals, Inc. (a) | | 936,292 | |
| | | | Real Estate - 0.83% | | | |
| | 24,400 | | The St Joe Co. (b) | | 1,533,296 | |
| | | | Road & Rail - 0.86% | | | |
| | 26,700 | | CSX Corp. | | 1,596,660 | |
| | | | Semiconductor & Semiconductor | | | |
| | | | Equipment - 2.42% | | | |
| | 125,200 | | Brooks Automation, Inc. (a)(b) | | 1,782,848 | |
| | 79,700 | | Integrated Device | | | |
| | | | Technology, Inc. (a) | | 1,184,342 | |
| | 132,400 | | LSI Logic Corp. (a)(b) | | 1,530,544 | |
| | | | | | 4,497,734 | |
| | | | Software - 1.79% | | | |
| | 85,100 | | Activision, Inc. (a)(b) | | 1,173,529 | |
| | 131,500 | | Parametric | | | |
| | | | Technology Corp. (a) | | 2,147,395 | |
| | | | | | 3,320,924 | |
| | | | Specialty Retail - 1.11% | | | |
| | 25,800 | | AnnTaylor Stores Corp. (a) | | 949,182 | |
| | 25,800 | | United Auto Group, Inc. (b) | | 1,109,400 | |
| | | | | | 2,058,582 | |
See notes to financial statements.
AssetMark Small/Mid Cap Value Fund
SCHEDULE OF INVESTMENTS (Continued)
| | Number of | | | | Market | |
| | Shares | | | | Value | |
| | | | COMMON STOCKS (Continued) | | | |
| | | | Thrifts & Mortgage Finance - 1.32% | | | |
| | 29,400 | | People’s Bank | $ | 962,850 | |
| | 30,700 | | Webster Financial Corp. | | 1,487,722 | |
| | | | | | 2,450,572 | |
| | | | Total Common Stocks | | | |
| | | | (Cost $148,844,621) | | 174,857,403 | |
| | | | SHORT TERM INVESTMENTS - 3.83% | | | |
| | | | Money Market Funds - 3.83% | | | |
| | 7,109,671 | | Federated Prime Obligations Fund | | | |
| | | | 4.600%, 01/01/2050 | | 7,109,671 | |
| | | | Total Short Term Investments | | | |
| | | | (Cost $7,109,671) | | 7,109,671 | |
| | Principal | | | | | |
| | Amount | | | | | |
| | | | INVESTMENTS PURCHASED | | | |
| | | | AS SECURITIES LENDING | | | |
| | | | COLLATERAL - 35.28% | | | |
| | | | COMMERCIAL PAPER - 10.22% | | | |
| | $ 664,510 | | CCN Bluegrass, | | | |
| | | | 4.85%, 11/20/06 (c) | | 664,510 | |
| | 1,329,020 | | CCN Independence IV LLC, | | | |
| | | | 4.82%,10/16/06 (c) | | 1,329,020 | |
| | 1,461,922 | | CCN Orchard Park, | | | |
| | | | 4.76%, 10/06/06 (c) | | 1,461,922 | |
| | 996,765 | | Concord Minutemen Capital Co., | | | |
| | | | 4.65%, 04/04/06 (c) | | 996,765 | |
| | 1,993,530 | | Concord Minutemen Capital Co., | | | |
| | | | 4.75%, 04/18/06 (c) | | 1,993,530 | |
| | 1,063,216 | | Duke Funding, | | | |
| | | | 4.82%, 04/26/06 (c) (d) | | 1,058,908 | |
| | 1,329,020 | | Duke Funding, | | | |
| | | | 4.64%, 06/06/06 (c) | | 1,329,020 | |
| | 2,658,040 | | Fenway Funding LLC, | | | |
| | | | 4.82%, 04/07/06 (c) (d) | | 2,654,435 | |
| | 2,658,040 | | Laguna Corp., | | | |
| | | | 4.83%, 04/18/06 (c) (d) | | 2,649,046 | |
| | 1,528,373 | | Lakeside Funding LLC, | | | |
| | | | 4.70%, 04/10/06 (c) | | 1,528,373 | |
| | 664,510 | | Morgan Stanley, 4.96%, 04/11/06 | | 664,510 | |
| | 2,658,040 | | Thornburg Mortgage Capital LLC, | | | |
| | | | 4.71%, 04/10/06 (c) (d) | | 2,647,166 | |
| | | | Total Commercial Paper | | | |
| | | | (Cost $18,977,205) | | 18,977,205 | |
| | Principal | | | | Market | |
| | Amount | | | | Value | |
| | | | CORPORATE BONDS AND NOTES - 1.83% | | | |
| | $ 664,510 | | Bayerische Landesbank, | | | |
| | | | 4.83%, 12/24/15 | $ | 664,510 | |
| | 1,329,020 | | Liquid Funding Ltd., | | | |
| | | | 4.73%, 05/15/06 (c) (d) | | 1,328,885 | |
| | 797,412 | | Metlife Global, | | | |
| | | | 4.89%, 04/28/08 | | 797,412 | |
| | 598,059 | | Northlake, 4.91%, 03/06/33 (c) | | 598,059 | |
| | | | Total Corporate Bonds and Notes | | | |
| | | | (Cost $3,388,866) | | 3,388,866 | |
| | | | CORPORATE PAYDOWN | | | |
| | | | SECURITIES - 1.32% | | | |
| | 664,510 | | Duke Funding, | | | |
| | | | 4.62%, 04/08/06 (c) | | 664,510 | |
| | 1,789,824 | | Leafs LLC, 4.78%, 04/20/06 (c) | | 1,789,824 | |
| | | | Total Corporate Paydown | | | |
| | | | Securities (Cost $2,454,334) | | 2,454,334 | |
| | Number of | | | | | |
| | Shares | | | | | |
| | | | MUTUAL FUND - 0.00% | | | |
| | 17 | | AIM Short Term | | | |
| | | | Liquid Asset Fund | | 17 | |
| | | | Total Mutual Fund | | | |
| | | | (Cost $17) | | 17 | |
| | Principal | | | | | |
| | Amount | | | | | |
| | | | REPURCHASE AGREEMENTS - 21.91% | | | |
| | $ 9,967,649 | | Goldman Sachs Repurchase | | | |
| | | | Agreement, 4.94%, 04/03/06, | | | |
| | | | repurchase price $9,971,752, | | | |
| | | | maturing 04/03/06 (Collateralized | | | |
| | | | by non-U.S. Government Debt | | | |
| | | | Securities, value $10,788,349, | | | |
| | | | 0.00% to 11.13%, 04/01/08 to | | | |
| | | | 07/15/32) | | 9,967,649 | |
| | 5,980,589 | | Merrill Lynch Repurchase | | | |
| | | | Agreement, 4.93%, 04/03/06, | | | |
| | | | repurchase price $5,983,046, | | | |
| | | | maturing 04/03/06 (Collateralized | | | |
| | | | by non-U.S. Government Debt | | | |
| | | | Securities, value $6,297,903, | | | |
| | | | 0.00% to 12.00%, 07/15/06 to | | | |
| | | | 10/01/45) | | 5,980,589 | |
See notes to financial statements.
AssetMark Small/Mid Cap Value Fund
SCHEDULE OF INVESTMENTS (Continued)
| | Principal | | | Market | |
| | Amount | | | Value | |
| | | | REPURCHASE AGREEMENTS (Continued) | | |
| | $ 5,714,785 | | Morgan Stanley Repurchase | | |
| | | | Agreement, 4.91%, 04/03/06, | | |
| | | | repurchase price $5,717,123, | | |
| | | | maturing 04/03/06 (Collateralized | | |
| | | | by Fannie Mae Mortgage | | |
| | | | Obligations, value $5,887,989, | | |
| | | | 0.00% to 6.75%, 9/25/07 to | | |
| | | | 10/25/35) | $ 5,714,785 | |
| | 19,004,984 | | Morgan Stanley Repurchase | | |
| | | | Agreement, 4.91%, 04/03/06, | | |
| | | | repurchase price $19,012,760, | | |
| | | | maturing 04/03/06 (Collateralized | | |
| | | | by Ginnie Mae Mortgage | | |
| | | | Obligations, value $19,548,755, | | |
| | | | 0.97% to 6.50%, 5/20/14 to | | |
| | | | 1/20/35) | 19,004,984 | |
| | | | Total Repurchase Agreements | | |
| | | | (Cost $40,668,007) | 40,668,007 | |
| | | | Total Investments Purchased as | | |
| | | | Securities Lending Collateral | | |
| | | | (Cost $65,488,429) | 65,488,429 | |
| | | | Total Investments - 133.33% | | |
| | | | (Cost $221,442,721) | 247,455,503 | |
| | | | Liabilities in Excess of | | |
| | | | Other Assets - (33.33)% | (61,865,823) | |
| | | | TOTAL NET | | |
| | | | ASSETS - 100.00% | $185,589,680 | |
| | | | | | |
| | Percentages are stated as a percent of net assets. | | |
| | (a) | | Non Income Producing. | | |
| | (b) | | All or a portion of this security is on loan. | | |
| | (c) | | Restricted securities as defined in Rule 144(a) under the Securities Act of 1933. Such securities are treated as liquid securities according the the Fund’s liquidity guidelines. The market value of these securities total $22,693,973, 12.2% of total net assets. | | |
| | (d) | | Variable Rate Security. The rate shown is the rate in effect on March 31, 2006. | | |
| | | | | | |
See notes to financial statements.
AssetMark International Equity Fund
This chart assumes an initial gross investment of $10,000 made on June 29, 2001 (commencement of operations). Returns shown include the reinvestment of all dividends. Returns shown do not reflect the deduction of taxes that a shareholder would pay on fund distributions or the redemption of fund shares. In the absence of fee waivers and reimbursements, total return would be reduced. Past performance is not predictive of future performance. Investment return and principal value will fluctuate, so that your shares, when redeemed, may be worth more or less than the original cost.
MORGAN STANLEY CAPITAL INTERNATIONAL EAFE INDEX - The MSCI EAFE® Index (Europe, Australasia, Far East) is a free float-adjusted market capitalization index that is designed to measure developed market equity performance, excluding the US & Canada. As of April 2002, the MSCI EAFE® Index consisted of the following 21 developed market country indices: Australia, Austria, Belgium, Denmark, Finland, France, Germany, Greece, Hong Kong, Ireland, Italy, Japan, the Netherlands, New Zealand, Norway, Portugal, Singapore, Spain, Sweden, Switzerland and the United Kingdom. The Index is unmanaged and cannot be invested in directly. The Index does not reflect any deduction for fees, expenses or taxes.
LIPPER INTERNATIONAL FUNDS INDEX - An unmanaged index which measures the composite performance of the 30 largest “international” mutual funds, as categorized by Lipper Inc. These funds invest assets in securities with primary trading markets outside of the United States.
AVERAGE ANNUAL TOTAL RETURN (for the periods ended March 31, 2006) | |
| | One Year | Three Year | Since Inception (6/29/01) |
| AssetMark International Equity Fund | 28.66% | 30.83% | 9.80% |
| Morgan Stanley Capital International EAFE Index | 24.94% | 31.66% | 10.79% |
| Lipper International Funds Index | 27.15% | 30.99% | 10.81% |
AssetMark International Equity Fund
SCHEDULE OF INVESTMENTS
March 31, 2006
| | Number of | | | | Market | |
| | Shares | | | | Value | |
| | | | COMMON STOCKS - 97.43% | | | |
| | | | Australia - 1.36% | | | |
| | 212,814 | | CSL Ltd. | $ | 8,347,316 | |
| | | | Austria - 3.33% | | | |
| | 115,634 | | Boehler-Uddeholm | | | |
| | | | AG - ADR (b) | | 7,921,727 | |
| | 205,300 | | Erste Bank der Oesterreichischen | | | |
| | | | Sparkassen AG - ADR | | 6,044,668 | |
| | 104,300 | | Wiener Staedtische | | | |
| | | | Allgemeine Versicher AG (a) | | 6,439,017 | |
| | | | | | 20,405,412 | |
| | | | Belgium - 1.34% | | | |
| | 229,440 | | Fortis - ADR | | 8,185,364 | |
| | | | Brazil - 1.10% | | | |
| | 78,000 | | Petroleo Brasileiro SA - ADR (b) | | 6,760,260 | |
| | | | Canada - 3.40% | | | |
| | 248,500 | | Addax Petroleum Corporation (a) | | 5,957,957 | |
| | 150,800 | | Cameco Corp. (b) | | 5,428,800 | |
| | 71,200 | | Canadian National Railway Co. | | 3,223,936 | |
| | 131,500 | | Petro-Canada Co. | | 6,235,792 | |
| | | | | | 20,846,485 | |
| | | | Cayman Islands - 0.58% | | | |
| | 1,187,000 | | Kingboard Chemical | | 3,579,197 | |
| | | | Denmark - 0.80% | | | |
| | 353,440 | | GN Store Nord | | 4,871,856 | |
| | | | France - 10.33% | | | |
| | 102,000 | | AXA | | 3,567,686 | |
| | 364,400 | | AXA - ADR (b) | | 12,739,424 | |
| | 186,300 | | BNP Paribas - ADR (b) | | 8,640,445 | |
| | 59,700 | | CNP Assurances | | 6,021,986 | |
| | 52,398 | | Dassault Systemes SA - ADR (b) | | 3,000,309 | |
| | 54,700 | | PPR SA | | 6,595,764 | |
| | 193,400 | | Sanofi-Aventis - ADR (b) | | 9,176,830 | |
| | 53,550 | | Total SA - ADR (b) | | 7,054,142 | |
| | 6,700 | | Vallourec SA | | 6,453,451 | |
| | | | | | 63,250,037 | |
| | | | Germany - 9.59% | | | |
| | 22,184 | | Adidas-Salomon AG | | 4,385,906 | |
| | 217,900 | | Commerzbank AG | | 8,656,085 | |
| | 27,400 | | Continental AG | | 3,019,825 | |
| | 37,200 | | Deutsche Bank AG (b) | | 4,249,728 | |
| | 77,000 | | Hypo Real Estate Holding AG | | 5,288,411 | |
| | | | | | | |
| | Number of | | | | Market | |
| | Shares | | | | Value | |
| | | | Germany (Continued) | | | |
| | 151,600 | | IVG Immobilien AG | $ | 4,561,713 | |
| | 155,000 | | Patrizia Immobilien AG (a) | | 4,386,013 | |
| | 35,000 | | RWE AG | | 3,042,197 | |
| | 63,490 | | RWE AG - ADR | | 5,524,278 | |
| | 167,380 | | Siemens AG - ADR (b) | | 15,594,794 | |
| | | | | | 58,708,950 | |
| | | | Greece - 1.68% | | | |
| | 121,000 | | National Bank of Greece SA | | 5,689,785 | |
| | 120,800 | | OPAP SA | | 4,618,377 | |
| | | | | | 10,308,162 | |
| | | | Hong Kong - 1.96% | | | |
| | 5,284,000 | | Shun Tak Holdings Limited | | 7,541,239 | |
| | 496,800 | | Techtronic Industries | | | |
| | | | Company, Ltd. - ADR (b) | | 4,465,536 | |
| | | | | | 12,006,775 | |
| | | | Ireland - 0.66% | | | |
| | 245,400 | | Anglo Irish Bank | | | |
| | | | Corporation Plc (a) | | 4,040,172 | |
| | | | Israel - 0.41% | | | |
| | 60,500 | | Teva Pharmaceutical | | | |
| | | | Industries, Ltd. ADR - ADR | | 2,491,390 | |
| | | | Italy - 3.93% | | | |
| | 1,100,000 | | Banca Intesa SpA | | 6,555,939 | |
| | 85,000 | | ENI SpA - ADR (b) | | 4,843,300 | |
| | 1,752,200 | | Unicredito Italiano SpA | | 12,637,318 | |
| | | | | | 24,036,557 | |
| | | | Japan - 25.77% | | | |
| | 54,500 | | Advantest Corp. | | 6,474,640 | |
| | 63,800 | | THE BANK OF | | | |
| | | | FUKUOKA, LTD. - ADR | | 5,369,389 | |
| | 221,860 | | Canon, Inc. - ADR | | 14,653,853 | |
| | 52,000 | | Fanuc Ltd. | | 4,998,151 | |
| | 364,400 | | Fuji Fire & Marine | | 1,507,276 | |
| | 18,843 | | Hogy Medical Co. | | 1,005,598 | |
| | 335,000 | | Komatsu Ltd. | | 6,389,311 | |
| | 287,000 | | Kyowa Hakko Kogyo Co. Ltd. | | 2,101,467 | |
| | 330 | | Mitsubishi Tokyo | | | |
| | | | Financial Group, Inc. | | 5,018,530 | |
| | 792,310 | | Mitsubishi Tokyo | | | |
| | | | Financial Group, Inc. - ADR | | 12,051,035 | |
| | 260,000 | | Nidec Corp. - ADR (b) | | 5,317,000 | |
See notes to financial statements.
AssetMark International Equity Fund
SCHEDULE OF INVESTMENTS (Continued)
| | Number of | | | | Market | |
| | Shares | | | | Value | |
| | | | COMMON STOCKS (Continued) | | | |
| | | | Japan (Continued) | | | |
| | 51,800 | | Nintendo Co. Ltd. | $ | 7,735,297 | |
| | 776,400 | | Nissan Motor Co., Ltd. | | 9,222,173 | |
| | 196,200 | | Nomura Holdings, Inc. | | 4,346,403 | |
| | 220,800 | | Nomura Holdings, | | | |
| | | | Inc. - ADR (b) | | 4,895,136 | |
| | 362,000 | | Nsk Ltd . | | 3,137,872 | |
| | 437,900 | | NTT DoCoMo, Inc. - ADR (b) | | 6,467,783 | |
| | 64,700 | | ORIX Corp. - ADR | | 10,047,910 | |
| | 360 | | Osaka Securities | | | |
| | | | Exchange Co., Ltd. | | 4,472,882 | |
| | 8,500 | | SBI Holdings, Inc. | | 4,812,007 | |
| | 341,300 | | Shinsei Bank Ltd - ADR | | 4,767,040 | |
| | 225,000 | | THE SHIZUOKA | | | |
| | | | BANK, LTD. (a) | | 2,271,028 | |
| | 44,800 | | Shizuoka Bk Ltd - ADR (b) | | 4,510,755 | |
| | 25,400 | | SMC Corp. | | 3,959,020 | |
| | 440,100 | | Taiyo Nippon Sanso | | 3,252,469 | |
| | 126,678 | | Toyota Motor Corp. - ADR (b) | | 13,795,234 | |
| | 327,400 | | Urban Corporation | | 5,221,320 | |
| | | | | | 157,800,579 | |
| | | | Luxembourg - 0.79% | | | |
| | 122,600 | | Arcelor | | 4,823,525 | |
| | | | Mexico - 0.93% | | | |
| | 87,500 | | Cemex S.A. de C.V. - ADR (b) | | 5,712,000 | |
| | | | Netherlands - 1.41% | | | |
| | 276,800 | | ASML Holding NV (a) | | 5,633,863 | |
| | 76,800 | | ING Groep NV | | 3,024,659 | |
| | | | | | 8,658,522 | |
| | | | New Zealand - 0.97% | | | |
| | 1,079,240 | | Fletcher Building | | 5,913,119 | |
| | | | Republic of Korea (South) - 1.48% | | | |
| | 267,800 | | Daegu Bank | | 4,995,594 | |
| | 13,300 | | Nhn Corp. (a) | | 4,089,165 | |
| | | | | | 9,084,759 | |
| | | | Russia - 0.60% | | | |
| | 48,600 | | Surgutneftegaz - ADR | | 3,657,150 | |
| | | | Russian Federation - 0.64% | | | |
| | 46,900 | | LUKOIL - ADR (b) | | 3,902,080 | |
| | | | Singapore - 1.44% | | | |
| | 1,029,000 | | Keppel Corp. Ltd. | | 8,787,492 | |
| | Number of | | | | Market | |
| | Shares | | | | Value | |
| | | | Spain - 1.41% | | | |
| | 413,600 | | Banco Bilbao Vizcaya | | | |
| | | | Argentaria SA - ADR (b) | $ | 8,623,560 | |
| | | | Sweden - 3.03% | | | |
| | 140,660 | | Foreningssparbank | | 3,961,285 | |
| | 100,800 | | Sandvik AB - ADR (b) | | 5,955,889 | |
| | 528,400 | | SKF AB - ADR (a)(b) | | 8,610,384 | |
| | | | | | 18,527,558 | |
| | | | Switzerland - 7.00% | | | |
| | 450,000 | | ABB Ltd . | | 5,669,971 | |
| | 69,000 | | Credit Suisse Group | | 3,860,119 | |
| | 52,675 | | Julius Baer Holding Ltd. (a) | | 4,757,168 | |
| | 11,500 | | Nestle SA | | 3,405,280 | |
| | 119,200 | | Novartis AG | | 6,613,944 | |
| | 95,300 | | Novartis AG - ADR | | 5,283,432 | |
| | 59,390 | | Roche Holding AG (a) | | 8,826,153 | |
| | 59,600 | | Roche Holding Ltd. - ADR | | 4,426,045 | |
| | | | | | 42,842,112 | |
| | | | Taiwan - 1.72% | | | |
| | 229,200 | | Hon Hai Precision | | | |
| | | | Industries Co., Ltd. - ADR | | 2,839,055 | |
| | 372,820 | | Taiwan Semiconductor | | | |
| | | | Manufacturing Co., | | | |
| | | | Ltd. - ADR (b) | | 3,750,569 | |
| | 1,163,000 | | United Microelectronics | | | |
| | | | Corp. - ADR (b) | | 3,965,830 | |
| | | | | | 10,555,454 | |
| | | | United Kingdom - 9.77% | | | |
| | 351,200 | | 3i Group PLC (a) | | 5,726,996 | |
| | 496,400 | | Collins Stewert Tullett | | 6,251,333 | |
| | 317,900 | | GlaxoSmithKline Plc | | 8,310,911 | |
| | 552,959 | | Hilton Group Plc | | 3,732,709 | |
| | 271,200 | | Next Plc | | 7,750,832 | |
| | 13,610 | | Rio Tinto PLC - ADR | | 2,817,270 | |
| | 1,254,000 | | Sage Group Plc | | 5,982,280 | |
| | 332,387 | | Tesco PLC - ADR | | 5,707,750 | |
| | 247,200 | | Vedanta Resources | | 6,035,985 | |
| | 358,400 | | Vodafone Group PLC - ADR (b) | | 7,490,560 | |
| | | | | | 59,806,626 | |
| | | | Total Common Stocks | | | |
| | | | (Cost $477,781,130) | | 596,532,469 | |
See notes to financial statements.
AssetMark International Equity Fund
SCHEDULE OF INVESTMENTS (Continued)
March 31, 2006
| | Number of | | | | Market | |
| | Shares | | | | Value | |
| | | | PREFERRED STOCKS - 0.57% | | | |
| | | | Brazil - 0.57% | | | |
| | 94,400 | | Empresa Brasileira de | | | |
| | | | Aeronautica SA - ADR (b) | $ | 3,478,640 | |
| | | | Total Preferred Stocks | | | |
| | | | (Cost $3,690,076) | | 3,478,640 | |
| | | | SHORT TERM INVESTMENTS - 2.14% | | | |
| | | | Money Market Funds - 2.14% | | | |
| | 13,135,502 | | Federated Prime Obligations Fund | | | |
| | | | 4.600%, 01/01/2050 | | 13,135,502 | |
| | | | Total Short Term Investments | | | |
| | | | (Cost $13,135,502) | | 13,135,502 | |
| | Principal | | | | | |
| | Amount | | | | | |
| | | | INVESTMENTS PURCHASED | | | |
| | | | AS SECURITIES LENDING | | | |
| | | | COLLATERAL -18.75% | | | |
| | | | COMMERCIAL PAPER - 5.43% | | | |
| | $ 1,164,681 | | CCN Bluegrass, | | | |
| | | | 4.85%, 11/20/06 (c) | | 1,164,681 | |
| | 2,329,363 | | CCN Independence IV LLC, | | | |
| | | | 4.82%,10/16/06 (c) | | 2,329,363 | |
| | 2,562,299 | | CCN Orchard Park, | | | |
| | | | 4.76%, 10/06/06 (c) | | 2,562,299 | |
| | 1,747,022 | | Concord Minutemen Capital Co., | | | |
| | | | 4.65%, 04/04/06 (c) | | 1,747,022 | |
| | 3,494,044 | | Concord Minutemen Capital Co., | | | |
| | | | 4.75%, 04/18/06 (c) | | 3,494,044 | |
| | 1,863,490 | | Duke Funding, | | | |
| | | | 4.82%, 04/26/06 (c) (d) | | 1,855,940 | |
| | 2,329,363 | | Duke Funding, | | | |
| | | | 4.64%, 06/06/06 (c) | | 2,329,363 | |
| | 4,658,725 | | Fenway Funding LLC, | | | |
| | | | 4.82%, 04/07/06 (c) (d) | | 4,652,407 | |
| | 4,658,725 | | Laguna Corp., | | | |
| | | | 4.83%, 04/18/06 (c) (d) | | 4,642,963 | |
| | 2,678,767 | | Lakeside Funding LLC, | | | |
| | | | 4.70%, 04/10/06 (c) | | 2,678,767 | |
| | 1,164,681 | | Morgan Stanley, | | | |
| | | | 4.96%, 04/11/06 | | 1,164,681 | |
| | Principal | | | | Market | |
| | Amount | | | | Value | |
| | | | COMMERCIAL PAPER (Continued) | | | |
| | $ 4,658,725 | | Thornburg Mortgage Capital LLC, | | | |
| | | | 4.71%, 04/10/06 (c) (d) | $ | 4,639,667 | |
| | | | Total Commercial Paper | | | |
| | | | (Cost $33,261,197) | | 33,261,197 | |
| | | | CORPORATE BONDS AND NOTES - 0.97% | | | |
| | 1,164,681 | | Bayerische Landesbank, | | | |
| | | | 4.83%, 12/24/15 | | 1,164,681 | |
| | 2,329,363 | | Liquid Funding Ltd., | | | |
| | | | 4.73%, 05/15/06 (c) (d) | | 2,329,127 | |
| | 1,397,618 | | Metlife Global, 4.89%, 04/28/08 | | 1,397,618 | |
| | 1,048,213 | | Northlake, 4.91%, 03/06/33 (c) | | 1,048,213 | |
| | | | Total Corporate Bonds and Notes | | | |
| | | | (Cost $5,939,639) | | 5,939,639 | |
| | | | CORPORATE PAYDOWN | | | |
| | | | SECURITIES - 0.71% | | | |
| | 1,164,681 | | Duke Funding, | | | |
| | | | 4.62%, 04/08/06 (c) | | 1,164,681 | |
| | 3,137,010 | | Leafs LLC, 4.78%, 04/20/06 (c) | | 3,137,010 | |
| | | | Total Corporate Paydown | | | |
| | | | Securities (Cost $4,301,691) | | 4,301,691 | |
| | Number of | | | | | |
| | Shares | | | | | |
| | | | MUTUAL FUND - 0.00% | | | |
| | 30 | | AIM Short Term | | | |
| | | | Liquid Asset Fund | | 30 | |
| | | | Total Mutual Fund | | | |
| | | | (Cost $30) | | 30 | |
| | Principal | | | | | |
| | Amount | | | | | |
| | | | REPURCHASE AGREEMENTS - 11.64% | | | |
| | $17,470,220 | | Goldman Sachs Repurchase | | | |
| | | | Agreement, 4.94%, 04/03/06, | | | |
| | | | repurchase price $17,477,412, | | | |
| | | | maturing 04/03/06 (Collateralized | | | |
| | | | by non-U.S. Government Debt | | | |
| | | | Securities, value $18,908,655, | | | |
| | | | 0.00% to 11.13%, 04/01/08 to | | | |
| | | | 07/15/32) | | 17,470,220 | |
See notes to financial statements.
AssetMark International Equity Fund
SCHEDULE OF INVESTMENTS (Continued)
March 31, 2006
| | Principal | | | | Market | |
| | Amount | | | | Value | |
| | | | REPURCHASE AGREEMENTS (Continued) | | | |
| | $10,482,132 | | Merrill Lynch Repurchase | | | |
| | | | Agreement, 4.93%, 04/03/06, | | | |
| | | | repurchase price $10,486,438, | | | |
| | | | maturing 04/03/06 (Collateralized | | | |
| | | | by non-U.S. Government Debt | | | |
| | | | Securities, value $11,038,285, | | | |
| | | | 0.00% to 12.00%, 07/15/06 to | | | |
| | | | 10/01/45) | $ | 10,482,132 | |
| | 10,016,260 | | Morgan Stanley Repurchase | | | |
| | | | Agreement, 4.91%, 04/03/06, | | | |
| | | | repurchase price $10,020,358, | | | |
| | | | maturing 04/03/06 (Collateralized | | | |
| | | | by Fannie Mae Mortgage | | | |
| | | | Obligations, value $10,319,833, | | | |
| | | | 0.00% to 6.75%, 9/25/07 to | | | |
| | | | 10/25/35) | | 10,016,260 | |
| | Principal | | | | Market | |
| | Amount | | | | Value | |
| | | | REPURCHASE AGREEMENTS (Continued) | | | |
| | $33,309,886 | | Morgan Stanley Repurchase | | | |
| | | | Agreement, 4.91%, 04/03/06, | | | |
| | | | repurchase price $33,323,515, | | | |
| | | | maturing 04/03/06 (Collateralized | | | |
| | | | by Ginnie Mae Mortgage | | | |
| | | | Obligations, value $34,262,950, | | | |
| | | | 0.97% to 6.50%, 5/20/14 to | | | |
| | | | 1/20/35) | $ | 33,309,886 | |
| | | | Total Repurchase Agreements | | | |
| | | | (Cost $71,278,498) | | 71,278,498 | |
| | | | Total Investments Purchased as | | | |
| | | | Securities Lending Collateral | | | |
| | | | (Cost $114,781,055) | | 114,781,055 | |
| | | | Total Investments - 118.89% | | | |
| | | | (Cost $609,387,763) | | 727,927,666 | |
| | | | Liabilities in Excess of | | | |
| | | | Other Assets - (18.89)% | | (115,639,448) | |
| | | | TOTAL NET | | | |
| | | | ASSETS - 100.00% | | $612,288,218 | |
| | | | | | | |
| | Percentages are stated as a percent of net assets. | | | |
| | ADR - American Depository Receipt | | | |
| | (a) | | Non Income Producing. | | | |
| | (b) | | All or a portion of this security is on loan. | | | |
| | (c) | | Restricted securities as defined in Rule 144(a) under the | | |
| | | | Securities Act of 1933. Such securities are treated as liquid | |
| | | | securities according the the Fund’s liquidity guidelines. | The | |
| | | | market value of these securities total $39,775,547, 6.5% of | |
| | | | total net assets. | | | |
| | (d) | | Variable Rate Security. The rate shown is the rate in effect on | |
| | | | March 31, 2006. | | | |
See notes to financial statements.
AssetMark Real Estate Securities Fund
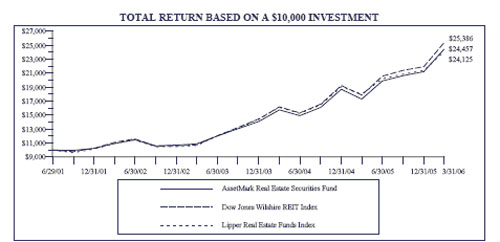
This chart assumes an initial gross investment of $10,000 made on June 29, 2001 (commencement of operations). Returns shown include the reinvestment of all dividends. Returns shown do not reflect the deduction of taxes that a shareholder would pay on fund distributions or the redemption of fund shares. In the absence of fee waivers and reimbursements, total return would be reduced. Past performance is not predictive of future performance. Investment return and principal value will fluctuate, so that your shares, when redeemed, may be worth more or less than the original cost.
DOW JONES WILSHIRE REIT INDEX - The Dow Jones Wilshire REIT Index measures U.S. publicly traded Real Estate Investment Trusts. The Index is comprised of companies whose charters are the equity ownership and operation of commercial real estate and that derive a minimum of 75% of revenue from stated operations. The Index is composed of 93 common stocks, selected for their market capitalization, source of revenue, and liquidity. The Index is unmanaged and cannot be invested in directly. The Index does not reflect any deduction for fees, expenses or taxes.
LIPPER REAL ESTATE FUNDS INDEX - An unmanaged index which measures the composite performance of the 30 largest “real estate” mutual funds, as categorized by Lipper Inc. The index is adjusted for the reinvestment of capital gains and income dividends.
AVERAGE ANNUAL TOTAL RETURN (for the periods ended March 31, 2006) | |
| | One Year | Three Year | Since Inception (6/29/01) |
| AssetMark Real Estate Securities Fund | 41.40% | 30.96% | 20.70% |
| Wilshire REIT Index | 42.24% | 33.23% | 21.64% |
| Lipper Real Estate Funds Index | 34.29% | 31.43% | 20.35% |
AssetMark Real Estate Securities Fund
SCHEDULE OF INVESTMENTS
| | Number of | | | | Market | |
| | Shares | | | | Value | |
| | | | COMMON STOCKS - 5.89% | | | |
| | | | Apartments - 0.78% | | | |
| | 3,200 | | Home Properties, Inc. (a) | $ | 163,520 | |
| | 12,100 | | Post Properties, Inc. (a) | | 538,450 | |
| | | | | | 701,970 | |
| | | | Diversified - 0.70% | | | |
| | 34,700 | | Newkirk Realty Trust, Inc. (a) | | 627,723 | |
| | | | Health Care - 0.31% | | | |
| | 13,000 | | Nationwide Health Properties, Inc. | | 279,500 | |
| | | | Hotels & Motels - 1.89% | | | |
| | 34,500 | | Hilton Hotels Corp. (a) | | 878,370 | |
| | 12,000 | | Starwood Hotels & | | | |
| | | | Resorts Worldwide, Inc. | | 812,760 | |
| | | | | | 1,691,130 | |
| | | | Office Property - 1.48% | | | |
| | 30,000 | | Brookfield Properties Co. | | 1,024,500 | |
| | 14,300 | | Cogdell Spencer, Inc. | | 304,876 | |
| | | | | | 1,329,376 | |
| | | | Shopping Centers - 0.46% | | | |
| | 21,600 | | Cedar Shopping Centers, Inc. | | 342,144 | |
| | 2,500 | | The Mills Corp. | | 70,000 | |
| | | | | | 412,144 | |
| | | | Storage - 0.27% | | | |
| | 14,000 | | Extra Space Storage, Inc. | | 240,660 | |
| | | | Total Common Stocks | | | |
| | | | (Cost $4,386,082) | | 5,282,503 | |
| | | | REAL ESTATE | | | |
| | | | INVESTMENT TRUSTS - 92.26% | | | |
| | | | REAL ESTATE INVESTMENT TRUSTS, | | | |
| | | | COMMON STOCKS - 88.48% | | | |
| | | | Apartments - 20.42% | | | |
| | 9,000 | | Apartment Investment & | | | |
| | | | Management Co. (a) | | 422,100 | |
| | 68,107 | | Archstone-Smith Trust (a) | | 3,321,578 | |
| | 38,680 | | AvalonBay Communities, Inc. (a) | | 4,219,988 | |
| | 16,187 | | BRE Properties (a) | | 906,472 | |
| | 30,504 | | Camden Property Trust | | 2,197,813 | |
| | 93,622 | | Equity Residential (a) | | 4,380,573 | |
| | 9,194 | | Essex Property Trust, Inc. (a) | | 999,664 | |
| | 64,990 | | United Dominion | | | |
| | | | Realty Trust, Inc. (a) | | 1,854,815 | |
| | | | | | 18,303,003 | |
| | Number of | | | | Market | |
| | Shares | | | | Value | |
| | | | Diversified - 9.84% | | | |
| | 7,525 | | American Financial Realty Trust | $ | 87,666 | |
| | 4,313 | | Colonial Properties Trust (a) | | 216,211 | |
| | 10,395 | | Crescent Real Estate Equities Co. | | 219,023 | |
| | 17,058 | | Duke Realty Corp. | | 647,351 | |
| | 11,500 | | iStar Financial, Inc. | | 440,220 | |
| | 42,485 | | Liberty Property Trust (a) | | 2,003,592 | |
| | 8,500 | | PS Business Parks, Inc. | | 475,320 | |
| | 17,000 | | Spirit Finance Corporation | | 207,400 | |
| | 45,534 | | Vornado Realty Trust (a) | | 4,371,264 | |
| | 4,078 | | Washington Real Estate | | | |
| | | | Investment Trust (a) | | 148,113 | |
| | | | | | 8,816,160 | |
| | | | Health Care - 0.23% | | | |
| | 5,500 | | Healthcare Realty Trust, Inc. | | 205,590 | |
| | | | Hotels - 2.10% | | | |
| | 4,000 | | Hospitality Properties Trust (a) | | 174,680 | |
| | 69,000 | | Host Marriott Corp. (a) | | 1,476,600 | |
| | 10,000 | | Strategic Hotels & Resorts, Inc. | | 232,800 | |
| | | | | | 1,884,080 | |
| | | | Office Property - 18.16% | | | |
| | 6,066 | | Alexandria Real | | | |
| | | | Estate Equities, Inc. | | 578,272 | |
| | 11,862 | | Arden Realty, Inc. | | 535,332 | |
| | 21,700 | | BioMed Realty Trust, Inc. | | 643,188 | |
| | 47,878 | | Boston Properties, Inc. | | 4,464,623 | |
| | 39,255 | | Brandywine Realty Trust (a) | | 1,246,739 | |
| | 9,500 | | CarrAmerica Realty Corp. | | 423,795 | |
| | 37,000 | | Corporate Office Properties Trust | | 1,692,380 | |
| | 62,511 | | Equity Office Properties Trust (a) | | 2,099,119 | |
| | 23,000 | | Highwoods Properties, Inc. | | 775,790 | |
| | 19,427 | | Kilroy Realty Corp. (a) | | 1,500,930 | |
| | 10,156 | | Mack-Cali Realty Corp. (a) | | 487,488 | |
| | 9,851 | | SL Green Realty Corp. (a) | | 999,877 | |
| | 32,000 | | Trizec Properties, Inc. (a) | | 823,360 | |
| | | | | | 16,270,893 | |
| | | | Regional Malls - 15.43% | | | |
| | 6,200 | | CBL & Associates Properties, Inc. | | 263,190 | |
| | 42,308 | | General Growth Properties, Inc. (a) | | 2,067,592 | |
| | 29,524 | | The Macerich Co. (a) | | 2,183,300 | |
| | 79,775 | | Simon Property Group, Inc. (a) | | 6,712,268 | |
| | 62,500 | | Taubman Centers, Inc. | | 2,604,375 | |
| | | | | | 13,830,725 | |
See notes to financial statements.
AssetMark Real Estate Securities Fund
SCHEDULE OF INVESTMENTS (Continued)
| | Number of | | | | Market | |
| | Shares | | | | Value | |
| | | | COMMON STOCKS (Continued) | | | |
| | | | Shopping Centers - 11.67% | | | |
| | 29,175 | | Acadia Realty Trust | $ | 687,071 | |
| | 38,056 | | Developers Diversified | | | |
| | | | Realty Corp. (a) | | 2,083,566 | |
| | 22,764 | | Federal Realty Invs Trust | | 1,711,853 | |
| | 32,642 | | Kimco Realty Corp. (a) | | 1,326,571 | |
| | 15,000 | | Kite Realty Group Trust | | 239,250 | |
| | 33,026 | | Pan Pacific Retail | | | |
| | | | Properties, Inc. (a) | | 2,341,543 | |
| | 24,309 | | Regency Centers Corp. (a) | | 1,633,322 | |
| | 10,705 | | Weingarten Realty Investors (a) | | 436,229 | |
| | | | | | 10,459,405 | |
| | | | Storage - 2.17% | | | |
| | 19,000 | | Public Storage, Inc. (a) | | 1,543,370 | |
| | 6,000 | | Shurgard Storage Centers, Inc. | | 399,780 | |
| | | | | | 1,943,150 | |
| | | | Warehouse/Industrial - 8.46% | | | |
| | 42,094 | | AMB Property Corp. | | 2,284,441 | |
| | 7,000 | | First Potomac Realty Trust | | 197,750 | |
| | 95,291 | | Prologis (a) | | 5,098,069 | |
| | | | | | 7,580,260 | |
| | | | Total Real Estate Investment | | | |
| | | | Trusts, Common Stocks | | | |
| | | | (Cost $47,140,233) | | 79,293,266 | |
| | | | REAL ESTATE INVESTMENT TRUSTS, | | | |
| | | | PREFERRED STOCKS - 3.78% | | | |
| | | | Diversified - 0.53% | | | |
| | 18,675 | | Lexington Corporate | | | |
| | | | Properties Trust | | 474,345 | |
| | | | Office Property - 1.70% | | | |
| | 33,750 | | Alexandria Real | | | |
| | | | Estate Equities, Inc. | | 881,888 | |
| | 25,300 | | SL Green Realty Corp. | | 639,331 | |
| | | | | | 1,521,219 | |
| | | | Real Estate - 1.55% | | | |
| | 14,800 | | Taubman Centers, Inc. | | 379,176 | |
| | 42,500 | | Vornado Realty Trust | | 1,013,625 | |
| | | | | | 1,392,801 | |
| | | | Total Real Estate Investment | | | |
| | | | Trusts, Preferred Stocks | | | |
| | | | (Cost $3,360,573) | | 3,388,365 | |
| | | | Total Real Estate Investment | | | |
| | | | Trusts (Cost $51,224,090) | | 82,681,631 | |
| | Number of | | | | Market | |
| | Shares | | | | Value | |
| | | | SHORT TERM INVESTMENTS - 2.10% | | | |
| | | | Money Market Funds - 2.10% | | | |
| | 1,879,814 | | Federated Prime Obligations Fund | | | |
| | | | 4.600%, 01/01/2050 | $ | 1,879,814 | |
| | | | Total Short Term Investments | | | |
| | | | (Cost $1,879,814) | | 1,879,814 | |
| | Principal | | | | | |
| | Amount | | | | | |
| | | | INVESTMENTS PURCHASED | | | |
| | | | AS SECURITIES LENDING | | | |
| | | | COLLATERAL - 39.82% | | | |
| | | | COMMERCIAL PAPER - 11.54% | | | |
| | $ 362,066 | | CCN Bluegrass, | | | |
| | | | 4.85%, 11/20/06 (b) | | 362,066 | |
| | 724,131 | | CCN Independence IV LLC, | | | |
| | | | 4.82%,10/16/06 (b) | | 724,131 | |
| | 796,545 | | CCN Orchard Park, | | | |
| | | | 4.76%, 10/06/06 (b) | | 796,545 | |
| | 543,098 | | Concord Minutemen Capital Co., | | | |
| | | | 4.65%, 04/04/06 (b) | | 543,098 | |
| | 1,086,196 | | Concord Minutemen Capital Co., | | | |
| | | | 4.75%, 04/18/06 (b) | | 1,086,196 | |
| | 579,305 | | Duke Funding, | | | |
| | | | 4.82%, 04/26/06 (b) (c) | | 576,958 | |
| | 724,131 | | Duke Funding, | | | |
| | | | 4.64%, 06/06/06 (b) | | 724,131 | |
| | 1,448,263 | | Fenway Funding LLC, | | | |
| | | | 4.82%, 04/07/06 (b) (c) | | 1,446,299 | |
| | 1,448,263 | | Laguna Corp., | | | |
| | | | 4.83%, 04/18/06 (b) (c) | | 1,443,363 | |
| | 832,751 | | Lakeside Funding LLC, | | | |
| | | | 4.70%, 04/10/06 (b) | | 832,751 | |
| | 362,066 | | Morgan Stanley, 4.96%, 04/11/06 | | 362,066 | |
| | 1,448,263 | | Thornburg Mortgage Capital LLC, | | | |
| | | | 4.71%, 04/10/06 (b) (c) | | 1,442,338 | |
| | | | Total Commercial Paper | | | |
| | | | (Cost $10,339,942) | | 10,339,942 | |
| | | | CORPORATE BONDS AND NOTES - 2.06% | | | |
| | 362,066 | | Bayerische Landesbank, | | | |
| | | | 4.83%, 12/24/15 | | 362,066 | |
| | 724,131 | | Liquid Funding Ltd., | | | |
| | | | 4.73%, 05/15/06 (b) (c) | | 724,058 | |
| | 434,479 | | Metlife Global, 4.89%, 04/28/08 | | 434,479 | |
| | 325,859 | | Northlake, 4.91%, 03/06/33 (b) | | 325,859 | |
| | | | Total Corporate Bonds and Notes | | | |
| | | | (Cost $1,846,462) | | 1,846,462 | |
See notes to financial statements.
AssetMark Real Estate Securities Fund
SCHEDULE OF INVESTMENTS (Continued)
| | Principal | | | | Market | |
| | Amount | | | | Value | |
| | | | CORPORATE PAYDOWN | | | |
| | | | SECURITIES - 1.49% | | | |
| | $ 362,066 | | Duke Funding, | | | |
| | | | 4.62%, 04/08/06 (b) | $ | 362,066 | |
| | 975,206 | | Leafs LLC, 4.78%, 04/20/06 (b) | | 975,206 | |
| | | | Total Corporate Paydown | | | |
| | | | Securities (Cost $1,337,272) | | 1,337,272 | |
| | Number of | | | | | |
| | Shares | | | | | |
| | | | MUTUAL FUND - 0.00% | | | |
| | 9 | | AIM Short Term | | | |
| | | | Liquid Asset Fund | | 9 | |
| | | | Total Mutual Fund | | | |
| | | | (Cost $9) | | 9 | |
| | Principal | | | | | |
| | Amount | | | | | |
| | | | REPURCHASE AGREEMENTS - 24.73% | | | |
| | $ 5,430,985 | | Goldman Sachs Repurchase | | | |
| | | | Agreement, 4.94%, 04/03/06, | | | |
| | | | repurchase price $5,433,221, | | | |
| | | | maturing 04/03/06 (Collateralized | | | |
| | | | by non-U.S. Government Debt | | | |
| | | | Securities, value $5,878,153, | | | |
| | | | 0.00% to 11.13%, 04/01/08 to | | | |
| | | | 07/15/32) | | 5,430,985 | |
| | 3,258,591 | | Merrill Lynch Repurchase | | | |
| | | | Agreement, 4.93%, 04/03/06, | | | |
| | | | repurchase price $3,259,930, | | | |
| | | | maturing 04/03/06 (Collateralized | | | |
| | | | by non-U.S. Government Debt | | | |
| | | | Securities, value $3,431,483, | | | |
| | | | 0.00% to 12.00%, 07/15/06 to | | | |
| | | | 10/01/45) | | 3,258,591 | |
| | 3,113,765 | | Morgan Stanley Repurchase | | | |
| | | | Agreement, 4.91%, 04/03/06, | | | |
| | | | repurchase price $3,115,039, | | | |
| | | | maturing 04/03/06 (Collateralized | | | |
| | | | by Fannie Mae Mortgage | | | |
| | | | Obligations, value $3,208,137, | | | |
| | | | 0.00% to 6.75%, 9/25/07 to | | | |
| | | | 10/25/35) | | 3,113,765 | |
| | Principal | | | | Market | |
| | Amount | | | | Value | |
| | | | REPURCHASE AGREEMENTS (Continued) | | | |
| | $10,355,079 | | Morgan Stanley Repurchase | | | |
| | | | Agreement, 4.91%, 04/03/06, | | | |
| | | | repurchase price $10,359,316, | | | |
| | | | maturing 04/03/06 (Collateralized | | | |
| | | | by Ginnie Mae Mortgage | | | |
| | | | Obligations, value $10,651,359, | | | |
| | | | 0.97% to 6.50%, 5/20/14 to | | | |
| | | | 1/20/35) | $ | 10,355,079 | |
| | | | Total Repurchase Agreements | | | |
| | | | (Cost $22,158,420) | | 22,158,420 | |
| | | | Total Investments Purchased as | | | |
| | | | Securities Lending Collateral | | | |
| | | | (Cost $35,682,105) | | 35,682,105 | |
| | | | Total Investments - 140.07% | | | |
| | | | (Cost $92,448,807) | | 125,526,053 | |
| | | | Liabilities in Excess of | | | |
| | | | Other Assets - (40.07)% | | (35,910,007) | |
| | | | TOTAL NET | | | |
| | | | ASSETS - 100.00% | $ | 89,616,046 | |
| | | | | | | |
| | Percentages are stated as a percent of net assets. | | | |
| | (a) | | All or a portion of this security is on loan. | | | |
| | (b) | | Restricted securities as defined in Rule 144(a) under the | | |
| | | | Securities Act of 1933. Such securities are treated as liquid | |
| | | | securities according the the Fund’s liquidity guidelines. | The | |
| | | | market value of these securities total $12,365,065, 13.8% of | |
| | | | total net assets. | | | |
| | (c) | | Variable Rate Security. The rate shown is the rate in effect on | |
| | | | March 31, 2006. | | | |
See notes to financial statements.
AssetMark Tax-Exempt Fixed Income Fund
This chart assumes an initial gross investment of $10,000 made on June 30, 2001 (commencement of operations). Returns shown include the reinvestment of all dividends. Returns shown do not reflect the deduction of taxes that a shareholder would pay on fund distributions or the redemption of fund shares. In the absence of fee waivers and reimbursements, total return would be reduced. Past performance is not predictive of future performance. Investment return and principal value will fluctuate, so that your shares, when redeemed, may be worth more or less than the original cost.
LEHMAN BROTHERS MUNICIPAL 3-10 YEAR BLENDED INDEX - The Lehman Brothers Municipal 3-10 Year Bond Index is a broad based index which contains all securities in the Lehman Brothers Municipal Bond Index with maturities from 3-10 years. The Index does not reflect any deduction for fees, expenses or taxes. Fund management has determined that the Lehman Brothers Municipal 3-10 Year Bond Index is the most appropriate index to use for evaluating the performance of the Fund, since the duration of the bonds in the index is closest to the anticipated duration of the bonds in the Fund’s portfolio. Therefore, the Fund intends to discontinue using the Lehman Brothers Municipal Bond Index in future years.
LEHMAN BROTHERS MUNICIPAL BOND INDEX - An unmanaged index which measures the performance of investment-grade, tax-exempt and fixed-rate bonds with long-term maturities (greater than two years) selected from issues larger than $50 million.
LIPPER INTERMEDIATE MUNICIPAL BOND FUND INDEX - The Lipper Intermediate Municipal Bond Fund Index is an index of portfolios that invest in municipal debt issues with dollar-weighted average maturities of five to ten years. As of October 2005, the Lipper Intermediate Municipal Bond Fund Index has been added as an additional measure of market performance for the Tax-Exempt Fixed Income Fund.
AVERAGE ANNUAL TOTAL RETURN (for the periods ended March 31, 2006) | |
| | One Year | Three Year | Since Inception (6/29/01) |
| AssetMark Tax-Exempt Fixed Income Fund | 1.56% | 1.67% | 3.49% |
| Lehman Brothers Municipal 3-10 Year Blended Index | 2.45% | 2.72% | 4.71% |
| Lehman Brothers Municipal Bond Index | 3.81% | 4.10% | 5.31% |
| Lipper Intermediate Municipal Bond Funds Index | 2.87% | 2.77% | 4.06% |
AssetMark Tax-Exempt Fixed Income Fund
SCHEDULE OF INVESTMENTS
| | Principal | | | | Market | |
| | Amount | | | | Value | |
| | | | MUNICIPAL BONDS - 95.65% | | | |
| | | | Alabama - 0.74% | | | |
| | $ 125,000 | | Alabama Public School & College | | | |
| | | | Authority, Series A, Revenue | | | |
| | | | Bond, 5.000%, 02/01/2012 | $ | 130,594 | |
| | 195,000 | | Birmingham, Series A, Refunding, | | | |
| | | | GO, 5.000%, 04/01/2008 | | 199,968 | |
| | 1,200,000 | | Jefferson County Sewer, | | | |
| | | | Refunded, Revenue Bond, | | | |
| | | | 5.000%, 02/01/2033 | | 1,254,504 | |
| | | | | | 1,585,066 | |
| | | | Alaska - 0.86% | | | |
| | 1,730,000 | | Alaska Municipal Bond Bank | | | |
| | | | Authority, Series B, Revenue | | | |
| | | | Bond, MBIA Insured, | | | |
| | | | 5.000%, 05/01/2012 | | 1,836,758 | |
| | | | Arizona - 7.16% | | | |
| | 2,710,000 | | Arizona School Facilities Board, | | | |
| | | | Refunding, Revenue Bond, | | | |
| | | | 5.000%, 07/01/2013 | | 2,899,808 | |
| | 900,000 | | Arizona School Facilities Board, | | | |
| | | | Revenue Bond, | | | |
| | | | 5.000%, 07/01/2006 | | 903,168 | |
| | 1,000,000 | | Arizona State Transportation | | | |
| | | | Board, Series A, Revenue Bond, | | | |
| | | | 5.000%, 07/01/2011 | | 1,061,830 | |
| | 1,055,000 | | Arizona State Transportation | | | |
| | | | Board, Series B, Revenue Bond, | | | |
| | | | 5.000%, 07/01/2013 | | 1,128,892 | |
| | 135,000 | | Maricopa County Elementary | | | |
| | | | School District No 3 Tempe | | | |
| | | | Elementary, Refunding, | | | |
| | | | GO, FSA Insured, | | | |
| | | | 5.000%, 07/01/2012 | | 143,762 | |
| | 995,000 | | Maricopa County Individual | | | |
| | | | Development Authority Senior | | | |
| | | | Living Facilities, Refunding, | | | |
| | | | Revenue Bond, | | | |
| | | | 3.650%, 09/15/2035 | | 985,219 | |
| | 3,000,000 | | Mesa Industrial Development | | | |
| | | | Authority, Revenue Bond, | | | |
| | | | 5.750%, 01/01/2025 | | 3,231,240 | |
| | 1,100,000 | | Mesa Street & Highway, | | | |
| | | | Refunding, Revenue Bond, FGIC | | | |
| | | | Insured, 5.000%, 07/01/2018 | | 1,187,846 | |
| | Principal | | | | Market | |
| | Amount | | | | Value | |
| | | | Arizona (Continued) | | | |
| | $ 300,000 | | Navajo County Unified School | | | |
| | | | District No 32 Blue Ridge, | | | |
| | | | Refunding, GO, FSA Insured, | | | |
| | | | 5.000%, 07/01/2014 | $ | 321,081 | |
| | 500,000 | | Phoenix Civic Improvement Corp. | | | |
| | | | Water Systems, Revenue Bond, | | | |
| | | | MBIA Insured, | | | |
| | | | 5.600%, 07/01/2017 | | 502,610 | |
| | | | Pinal County Individual | | | |
| | | | Development Authority | | | |
| | | | Correctional Facilities, Revenue | | | |
| | | | Bond, ACA Insured, | | | |
| | 750,000 | | 5.250%, 10/01/2014 | | 793,658 | |
| | 1,000,000 | | 5.250%, 10/01/2015 | | 1,058,990 | |
| | 1,000,000 | | Scottsdale Water & Sewer, | | | |
| | | | Series E, Revenue Bond, | | | |
| | | | 5.250%, 07/01/2012 | | 1,045,020 | |
| | | | | | 15,263,124 | |
| | | | California - 4.15% | | | |
| | 5,100,000 | | California Statewide Communities | | | |
| | | | Development Authority, Series C, | | | |
| | | | Revenue Bond, | | | |
| | | | 3.850%, 11/01/2029 | | 5,001,111 | |
| | 100,000 | | Fallbrook Union High School | | | |
| | | | District, Refunding, GO, FGIC | | | |
| | | | Insured, 5.375%, 09/01/2014 | | 110,481 | |
| | 2,970,000 | | Golden West Schools Funding | | | |
| | | | Authority, Refunding, GO, | | | |
| | | | AMBAC Insured, | | | |
| | | | 5.500%, 08/01/2019 | | 3,367,208 | |
| | 350,000 | | Los Angeles County Metropolitan | | | |
| | | | Transportation Authority, Series | | | |
| | | | A, Refunding, Revenue Bond, | | | |
| | | | 5.000%, 07/01/2014 | | 375,886 | |
| | | | | | 8,854,686 | |
| | | | Colorado - 1.05% | | | |
| | 2,065,000 | | Colorado Department of | | | |
| | | | Transportation, Revenue Bond, | | | |
| | | | 5.375%, 06/15/2013 | | 2,247,319 | |
| | | | Connecticut - 0.21% | | | |
| | 425,000 | | Connecticut, Series B, GO, | | | |
| | | | 5.250%, 06/15/2009 | | 445,175 | |
See notes to financial statements.
AssetMark Tax-Exempt Fixed Income Fund
SCHEDULE OF INVESTMENTS (Continued)
| | Principal | | | | Market | |
| | Amount | | | | Value | |
| | | | MUNICIPAL BONDS (Continued) | | | |
| | | | District of Columbia - 2.78% | | | |
| | | | District of Columbia Housing | | | |
| | | | Finance Authority, Revenue | | | |
| | | | Bond, FSA Insured, | | | |
| | $ 1,335,000 | | 3.500%, 07/01/2011 | $ | 1,319,834 | |
| | 2,000,000 | | 3.600%, 07/01/2012 | | 1,981,180 | |
| | 1,000,000 | | District of Columbia, Series B, | | | |
| | | | Refunding, GO, | | | |
| | | | 5.000%, 06/01/2010 | | 1,046,460 | |
| | 200,000 | | District of Columbia, Series B, | | | |
| | | | Unrefunded, GO, | | | |
| | | | 5.500%, 06/01/2009 | | 210,496 | |
| | 100,000 | | District of Columbia, Series B-1, | | | |
| | | | Refunding, GO, | | | |
| | | | 5.500%, 06/01/2007 | | 102,138 | |
| | 200,000 | | District of Columbia, Series B-2, | | | |
| | | | Refunding, GO, | | | |
| | | | 5.500%, 06/01/2008 | | 207,466 | |
| | 1,000,000 | | District of Columbia, Series C, | | | |
| | | | Refunding, GO, XLCA Insured, | | | |
| | | | 5.250%, 06/01/2012 | | 1,065,870 | |
| | | | | | 5,933,444 | |
| | | | Florida - 1.76% | | | |
| | 100,000 | | Dade County Water & Sewer | | | |
| | | | System, Revenue Bond, | | | |
| | | | 6.250%, 10/01/2007 | | 103,837 | |
| | 1,375,000 | | Highlands County Health Facilities | | | |
| | | | Authority, Revenue Bond, | | | |
| | | | 5.000%, 11/15/2029 | | 1,419,852 | |
| | 100,000 | | Mary Esther Water & Sewer, | | | |
| | | | Refunding, Revenue Bond, MBIA | | | |
| | | | Insured, 4.950%, 01/01/2007 | | 101,007 | |
| | 1,000,000 | | Pasco County Optional Gas Tax, | | | |
| | | | Refunding, Revenue Bond, FGIC | | | |
| | | | Insured, 5.250%, 08/01/2011 | | 1,068,230 | |
| | 1,000,000 | | Tampa Water & Sewer, Series B, | | | |
| | | | Revenue Bond, | | | |
| | | | 5.000%, 07/01/2010 | | 1,050,910 | |
| | | | | | 3,743,836 | |
| | | | Georgia - 0.75% | | | |
| | 500,000 | | Atlanta Water & Wastewater, | | | |
| | | | Series A, Prerefunded, Revenue | | | |
| | | | Bond, 5.000%, 11/01/2038 | | 524,210 | |
| | Principal | | | | Market | |
| | Amount | | | | Value | |
| | | | Georgia (Continued) | | | |
| | $ 1,000,000 | | Fulton County School District, | | | |
| | | | Refunding, GO, | | | |
| | | | 5.250%, 01/01/2014 | $ | 1,083,120 | |
| | | | | | 1,607,330 | |
| | | | Hawaii - 0.05% | | | |
| | 100,000 | | Honolulu City & County, | | | |
| | | | Series A, Prerefunded, GO, | | | |
| | | | 6.000%, 01/01/2009 | | 106,119 | |
| | | | Illinois - 7.28% | | | |
| | 1,075,000 | | Chicago Board of Education, | | | |
| | | | GO, MBIA Insured, | | | |
| | | | 5.000%, 12/01/2011 | | 1,138,920 | |
| | 100,000 | | Chicago Metropolitan Water | | | |
| | | | Reclamation District Greater | | | |
| | | | Chicago, GO, | | | |
| | | | 5.500%, 12/01/2012 | | 108,401 | |
| | 100,000 | | Chicago Metropolitan Water | | | |
| | | | Reclamation District Greater | | | |
| | | | Chicago, Refunding, GO, | | | |
| | | | 6.050%, 12/01/2009 | | 107,960 | |
| | 75,000 | | Chicago Park District, Revenue | | | |
| | | | Bond, ACA Insured, | | | |
| | | | 6.250%, 01/01/2016 | | 81,561 | |
| | 3,150,000 | | Chicago Sales Tax, Refunding, | | | |
| | | | Revenue Bond, | | | |
| | | | 5.000%, 01/01/2011 | | 3,313,737 | |
| | 500,000 | | Chicago School Finance | | | |
| | | | Authority, Series A, Refunding, | | | |
| | | | GO, FGIC Insured, | | | |
| | | | 5.200%, 06/01/2006 | | 501,260 | |
| | | | Chicago Wastewater Transmission, | | | |
| | | | Refunding, Revenue Bond, FGIC | | | |
| | | | Insured, | | | |
| | 625,000 | | 5.500%, 01/01/2010 | | 662,788 | |
| | 100,000 | | 5.375%, 01/01/2013 | | 108,291 | |
| | 305,000 | | Chicago, Refunding, GO, FSA | | | |
| | | | Insured, 5.500%, 01/01/2015 | | 336,311 | |
| | 100,000 | | Du Page & Cook Counties | | | |
| | | | Community Unit School District | | | |
| | | | No 205, GO, FGIC Insured, | | | |
| | | | 4.375%, 01/01/2009 | | 101,712 | |
| | 3,000,000 | | Du Page County Transportation, | | | |
| | | | Refunding, Revenue Bond, FSA | | | |
| | | | Insured, 5.000%, 01/01/2020 | | 3,149,190 | |
See notes to financial statements.
AssetMark Tax-Exempt Fixed Income Fund
SCHEDULE OF INVESTMENTS (Continued)
| | Principal | | | | Market | |
| | Amount | | | | Value | |
| | | | MUNICIPAL BONDS (Continued) | | | |
| | | | Illinois (Continued) | | | |
| | | | Illinois State Sales Tax, | | | |
| | | | Revenue Bond, | | | |
| | $ 100,000 | | 5.375%, 06/15/2007 | $ | 102,063 | |
| | 1,000,000 | | 5.000%, 06/15/2011 | | 1,056,510 | |
| | 1,155,000 | | 5.500%, 06/15/2011 | | 1,247,261 | |
| | 220,000 | | Illinois State Sales Tax, Series 1, | | | |
| | | | Revenue Bond, | | | |
| | | | 5.500%, 06/15/2009 | | 231,680 | |
| | | | Illinois, Series 1, GO, | | | |
| | 775,000 | | 5.500%, 08/01/2010 | | 827,971 | |
| | 100,000 | | 5.250%, 08/01/2012 | | 107,071 | |
| | 1,000,000 | | 5.375%, 07/01/2013 | | 1,083,800 | |
| | 500,000 | | Regional Transportation Authority, | | | |
| | | | Series B, Revenue Bond, FGIC | | | |
| | | | Insured, 5.375%, 06/01/2014 | | 541,645 | |
| | 700,000 | | Winnebago & Boone Counties | | | |
| | | | School District, Warrants, | | | |
| | | | 4.180%, 10/02/2006 | | 700,882 | |
| | | | | | 15,509,014 | |
| | | | Indiana - 1.59% | | | |
| | 2,225,000 | | Indiana Bond Bank, Series C, | | | |
| | | | Revenue Bond, | | | |
| | | | 5.000%, 02/01/2012 | | 2,354,829 | |
| | 500,000 | | Purdue University, Revenue Bond, | | | |
| | | | 5.250%, 07/01/2008 | | 516,260 | |
| | 200,000 | | Purdue University, Series O, | | | |
| | | | Revenue Bond, | | | |
| | | | 4.250%, 07/01/2008 | | 202,248 | |
| | 300,000 | | Sunman Dearborn Intermediate | | | |
| | | | School Building Corp., | | | |
| | | | Revenue Bond, FGIC Insured, | | | |
| | | | 5.375%, 07/15/2012 | | 322,515 | |
| | | | | | 3,395,852 | |
| | | | Iowa - 0.82% | | | |
| | 1,250,000 | | Coralville, Series L-1, Notes, | | | |
| | | | 4.125%, 06/01/2007 | | 1,255,862 | |
| | 480,000 | | Polk County, Series C, GO, | | | |
| | | | 4.000%, 06/01/2012 | | 482,650 | |
| | | | | | 1,738,512 | |
| | Principal | | | | Market | |
| | Amount | | | | Value | |
| | | | Louisiana - 1.05% | | | |
| | | | Louisiana Gas & Fuels Tax, Series | | | |
| | | | A, Revenue Bond, FGIC Insured, | | | |
| | $ 1,120,000 | | 5.000%, 05/01/2015 | $ | 1,192,195 | |
| | 1,000,000 | | 5.000%, 05/01/2021 | | 1,045,210 | |
| | | | | | 2,237,405 | |
| | | | Maryland - 0.71% | | | |
| | | | Maryland Department of | | | |
| | | | Transportation County T | | | |
| | | | Construction, Revenue Bond, | | | |
| | 1,160,000 | | 5.500%, 02/01/2017 | | 1,311,565 | |
| | | | Maryland, GO, | | | |
| | 175,000 | | 5.500%, 03/01/2013 | | 192,579 | |
| | | | | | 1,504,144 | |
| | | | Massachusetts - 7.54% | | | |
| | 500,000 | | Massachusetts Bay Transportation | | | |
| | | | Authority, Refunding, Revenue | | | |
| | | | Bond, FGIC Insured, | | | |
| | | | 5.500%, 03/01/2009 | | 525,265 | |
| | 3,000,000 | | Massachusetts Bay Transportation | | | |
| | | | Authority, Series A, Prerefunded, | | | |
| | | | Revenue Bond, | | | |
| | | | 5.250%, 07/01/2030 | | 3,179,490 | |
| | 900,000 | | Massachusetts Bay Transportation | | | |
| | | | Authority, Series A, Revenue | | | |
| | | | Bond, 5.250%, 07/01/2015 | | 979,560 | |
| | | | Massachusetts Bay Transportation | | | |
| | | | Authority, Series C, Revenue Bond, | | | |
| | 95,000 | | 5.500%, 03/01/2012 | | 103,363 | |
| | 1,000,000 | | 5.250%, 07/01/2016 | | 1,095,310 | |
| | 1,000,000 | | Massachusetts Bay Transportation | | | |
| | | | Authority, Unrefunded, Revenue | | | |
| | | | Bond, GO Insured, | | | |
| | | | 7.000%, 03/01/2007 | | 1,030,340 | |
| | 4,000,000 | | Massachusetts School Building | | | |
| | | | Authority Dedicated Sales Tax, | | | |
| | | | Series A, Revenue Bond, | | | |
| | | | 5.000%, 08/15/2009 | | 4,170,480 | |
| | 120,000 | | Massachusetts State Water | | | |
| | | | Resources Authority, Series B, | | | |
| | | | Revenue Bond, | | | |
| | | | 6.250%, 12/01/2011 | | 135,024 | |
See notes to financial statements.
AssetMark Tax-Exempt Fixed Income Fund
SCHEDULE OF INVESTMENTS (Continued)
| | Principal | | | | Market | |
| | Amount | | | | Value | |
| | | | MUNICIPAL BONDS (Continued) | | | |
| | | | Massachusetts (Continued) | | | |
| | $ 1,760,000 | | Massachusetts Water Pollution | | | |
| | | | Abatement Trust, Series 4, | | | |
| | | | Prerefunded, Revenue Bond, | | | |
| | | | 5.125%, 08/01/2013 | $ | 1,836,595 | |
| | 1,500,000 | | Massachusetts, GO, | | | |
| | | | 5.500%, 11/01/2016 | | 1,674,555 | |
| | 1,255,000 | | Route 3 North Transportation | | | |
| | | | Import Association, Revenue | | | |
| | | | Bond, MBIA Insured, | | | |
| | | | 5.375%, 06/15/2029 | | 1,335,408 | |
| | | | | | 16,065,390 | |
| | | | Michigan - 2.74% | | | |
| | 295,000 | | Detroit Sewer Disposal, Revenue | | | |
| | | | Bond, 7.100%, 12/15/2009 | | 314,606 | |
| | 150,000 | | Dundee Community School | | | |
| | | | District, GO, Q-SBLF Insured, | | | |
| | | | 5.375%, 05/01/2010 | | 159,063 | |
| | 600,000 | | Kalamazoo Public Library, | | | |
| | | | GO, MBIA Insured, | | | |
| | | | 5.400%, 05/01/2014 | | 660,048 | |
| | 800,000 | | Lansing School District, | | | |
| | | | Refunding, GO, Q-SBLF Insured, | | | |
| | | | 5.000%, 05/01/2017 | | 842,848 | |
| | 1,000,000 | | Michigan State Comprehensive | | | |
| | | | Transportation, Series B, Revenue | | | |
| | | | Bond, 5.250%, 05/15/2013 | | 1,074,990 | |
| | 1,000,000 | | Michigan State Environmental | | | |
| | | | Protection Program, GO, | | | |
| | | | 5.000%, 11/01/2013 | | 1,053,770 | |
| | 1,645,000 | | Michigan State Hospital Finance | | | |
| | | | Authority, Revenue Bond, | | | |
| | | | 7.125%, 05/01/2009 | | 1,727,793 | |
| | | | | | 5,833,118 | |
| | | | Minnesota - 0.34% | | | |
| | 400,000 | | Osseo Independent School District | | | |
| | | | No 279, Series A, GO, FSA | | | |
| | | | Insured, 5.000%, 02/01/2013 | | 423,552 | |
| | 295,000 | | Prior Lake Independent School | | | |
| | | | District No 719, Series A, GO, | | | |
| | | | FGIC Insured, | | | |
| | | | 4.750%, 02/01/2010 | | 306,357 | |
| | | | | | 729,909 | |
| | Principal | | | | Market | |
| | Amount | | | | Value | |
| | | | Mississippi - 0.91% | | | |
| | $ 1,900,000 | | Mississippi, GO, | | | |
| | | | 4.900%, 11/15/2007 | $ | 1,936,765 | |
| | | | Missouri - 0.46% | | | |
| | 300,000 | | Kansas City Municipal Assistance | | | |
| | | | Corp., Series A, Revenue Bond, | | | |
| | | | AMBAC Insured, | | | |
| | | | 5.000%, 03/01/2012 | | 318,180 | |
| | 615,000 | | Springfield Public Utilities, | | | |
| | | | Series A, CP, | | | |
| | | | 5.000%, 12/01/2016 | | 662,293 | |
| | | | | | 980,473 | |
| | | | Nebraska - 0.05% | | | |
| | 100,000 | | Omaha Special Obligations, | | | |
| | | | Riverfront Redevelopment Project, | | | |
| | | | Series A, Revenue Bond, | | | |
| | | | 5.375%, 02/01/2013 | | 108,355 | |
| | | | Nevada - 0.06% | | | |
| | 135,000 | | Clark County School District, GO, | | | |
| | | | 6.000%, 06/15/2007 | | 137,017 | |
| | | | New Jersey - 4.63% | | | |
| | 970,000 | | Lenape Regional High School | | | |
| | | | District, Refunding, GO, FGIC | | | |
| | | | Insured, 5.000%, 04/01/2012 | | 1,032,895 | |
| | 1,050,000 | | New Jersey Health Care Facilities, | | | |
| | | | Revenue Bond, | | | |
| | | | 5.000%, 09/15/2013 | | 1,117,000 | |
| | 515,000 | | New Jersey State Turnpike | | | |
| | | | Authority, Revenue Bond, MBIA | | | |
| | | | Insured, 6.750%, 01/01/2009 | | 524,636 | |
| | 3,255,000 | | New Jersey, Refunding, Series N, | | | |
| | 3,270,000 | | GO, 5.500%, 07/15/2013 | | 3,575,520 | |
| | | | New Jersey, Series L, Refunding, | | | |
| | | | GO, 5.250%, 07/15/2019 | | 3,623,552 | |
| | | | | | 9,873,603 | |
| | | | New Mexico - 2.35% | | | |
| | 1,450,000 | | New Mexico State Severance Tax, | | | |
| | | | Revenue Bond, | | | |
| | | | 5.000%, 07/01/2009 | | 1,474,302 | |
| | 2,350,000 | | New Mexico, Refunding, GO, | | | |
| | | | 5.000%, 09/01/2008 | | 2,424,542 | |
| | 1,035,000 | | University of New Mexico, | | | |
| | | | Refunding, Revenue Bond, | | | |
| | | | 5.250%, 06/01/2014 | | 1,110,100 | |
| | | | | | 5,008,944 | |
See notes to financial statements.
AssetMark Tax-Exempt Fixed Income Fund
SCHEDULE OF INVESTMENTS (Continued)
| | Principal | | | | Market | |
| | Amount | | | | Value | |
| | | | MUNICIPAL BONDS (Continued) | | | |
| | | | New York - 10.44% | | | |
| | $ 100,000 | | Metropolitan Transportation | | | |
| | | | Authority, Series A, Revenue | | | |
| | | | Bond, 5.250%, 04/01/2009 | $ | 102,633 | |
| | 375,000 | | Metropolitan Transportation | | | |
| | | | Authority, Series B, Revenue | | | |
| | | | Bond, 5.250%, 07/01/2007 | | 382,320 | |
| | 1,765,000 | | Metropolitan Transportation | | | |
| | | | Authority, Series F, Revenue | | | |
| | | | Bond, 5.000%, 11/15/2014 | | 1,879,195 | |
| | 900,000 | | Municipal Assistance Corporation | | | |
| | | | For New York City, Series I, | | | |
| | | | Revenue Bond, GO Insured, | | | |
| | | | 6.250%, 07/01/2006 | | 906,066 | |
| | 350,000 | | Nassau County Interim Finance | | | |
| | | | Authority, Series B, Revenue | | | |
| | | | Bond, 5.000%, 11/15/2007 | | 357,865 | |
| | 500,000 | | New York City Transit Authority, | | | |
| | | | Series A, CP, AMBAC Insured, | | | |
| | | | 5.625%, 01/01/2012 | | 537,285 | |
| | 1,000,000 | | New York City Transitional | | | |
| | | | Finance Authority, Series A, | | | |
| | | | Refunding, Revenue Bond, | | | |
| | | | 5.500%, 11/01/2026 | | 1,078,370 | |
| | 2,300,000 | | New York State Dormitory | | | |
| | | | Authority, Series A, Revenue | | | |
| | | | Bond, FGIC Insured, | | | |
| | | | 5.250%, 05/15/2016 | | 2,521,030 | |
| | 4,850,000 | | New York State Dormitory | | | |
| | | | Authority, Series B, Revenue | | | |
| | | | Bond, 5.250%, 11/15/2023 | | 5,167,481 | |
| | 2,130,000 | | New York State Dormitory | | | |
| | | | Authority, Series E, Revenue | | | |
| | | | Bond, FGIC Insured, | | | |
| | | | 4.500%, 02/15/2013 | | 2,212,687 | |
| | 2,830,000 | | New York State Environmental | | | |
| | | | Facilities, Series A, Revenue | | | |
| | | | Bond, 5.000%, 12/15/2014 | | 3,033,788 | |
| | 40,000 | | New York State Thruway | | | |
| | | | Authority, Series E, Prerefunded, | | | |
| | | | Revenue Bond, GO Insured, | | | |
| | | | 5.250%, 01/01/2010 | | 41,497 | |
| | Principal | | | | Market | |
| | Amount | | | | Value | |
| | | | New York (Continued) | | | |
| | $ 260,000 | | New York State Thruway | | | |
| | | | Authority, Series E, Unrefunded, | | | |
| | | | Revenue Bond, GO Insured, | | | |
| | | | 5.250%, 01/01/2010 | $ | 269,329 | |
| | 525,000 | | New York, Series C, Refunding, | | | |
| | | | GO, 4.000%, 04/15/2006 | | 525,359 | |
| | 100,000 | | New York, Series F, GO, FSA | | | |
| | | | Insured, 5.250%, 08/01/2011 | | 106,872 | |
| | 1,300,000 | | Orange County, Series A, | | | |
| | | | Refunding, GO, | | | |
| | | | 5.000%, 07/15/2013 | | 1,390,623 | |
| | 500,000 | | Port Authority, Series 116, | | | |
| | | | Revenue, 5.000%, 10/01/2010 | | 505,390 | |
| | 500,000 | | Sales Tax Asset Receivable Corp., | | | |
| | | | Series A, Revenue Bond, | | | |
| | | | 5.000%, 10/15/2017 | | 534,705 | |
| | 650,000 | | Triborough Bridge & Tunnel | | | |
| | | | Authority, Series B, Refunding, | | | |
| | | | Revenue Bond, GO Insured, | | | |
| | | | 5.250%, 11/15/2015 | | 711,022 | |
| | | | | | 22,263,517 | |
| | | | North Carolina - 0.64% | | | |
| | 500,000 | | North Carolina Municipal Power | | | |
| | | | Agency No 1 Catawba Electric, | | | |
| | | | Revenue Bond, MBIA Insured, | | | |
| | | | 5.250%, 01/01/2009 | | 521,305 | |
| | 100,000 | | North Carolina Public School | | | |
| | | | Building, GO, | | | |
| | | | 4.600%, 04/01/2008 | | 101,980 | |
| | 725,000 | | Raleigh Comb Enterprise System, | | | |
| | | | Revenue Bond, | | | |
| | | | 4.000%, 03/01/2008 | | 730,807 | |
| | | | | | 1,354,092 | |
| | | | Ohio - 0.96% | | | |
| | 100,000 | | Bowling Green State University, | | | |
| | | | Revenue Bond, FGIC Insured, | | | |
| | | | 5.000%, 06/01/2008 | | 102,707 | |
| | 305,000 | | Cleveland Waterworks, Series J, | | | |
| | | | Refunding, Revenue Bond, FSA | | | |
| | | | Insured, 5.000%, 01/01/2008 | | 312,067 | |
See notes to financial statements.
AssetMark Tax-Exempt Fixed Income Fund
SCHEDULE OF INVESTMENTS (Continued)
| | Principal | | | | Market | |
| | Amount | | | | Value | |
| | | | MUNICIPAL BONDS (Continued) | | | |
| | | | Ohio (Continued) | | | |
| | $ 625,000 | | Ohio State Higher Educational | | | |
| | | | Facility Commission, Revenue | | | |
| | | | Bond, 5.250%, 10/01/2014 | $ | 677,487 | |
| | 935,000 | | Ohio State Water Development | | | |
| | | | Authority Water Pollution Control, | | | |
| | | | Refunding, Revenue Bond, | | | |
| | | | 4.000%, 12/01/2010 | | 947,660 | |
| | | | | | 2,039,921 | |
| | | | Oregon - 1.66% | | | |
| | 1,560,000 | | Multnomah County, Refunding, | | | |
| | | | GO, AMBAC Insured, | | | |
| | | | 5.000%, 08/01/2011 | | 1,655,534 | |
| | 1,255,000 | | Oregon State Department of | | | |
| | | | Administrative Services, Revenue | | | |
| | | | Bond, 5.000%, 09/01/2012 | | 1,338,395 | |
| | 245,000 | | Portland Community College | | | |
| | | | District, Series B, GO, | | | |
| | | | 5.125%, 06/01/2013 | | 260,411 | |
| | 250,000 | | Washington County School | | | |
| | | | District No 015, Refunding, | | | |
| | | | GO, FSA Insured, | | | |
| | | | 5.500%, 06/15/2019 | | 282,650 | |
| | | | | | 3,536,990 | |
| | | | Pennsylvania - 0.13% | | | |
| | 245,000 | | Scranton, Series C, GO, | | | |
| | | | 6.700%, 09/01/2018 | | 279,800 | |
| | | | Puerto Rico - 0.81% | | | |
| | 1,595,000 | | Puerto Rico Electric Power | | | |
| | | | Authority, Series JJ, Refunding, | | | |
| | | | Revenue Bond, XLCA Insured, | | | |
| | | | 5.250%, 07/01/2012 | | 1,717,703 | |
| | | | South Carolina - 1.23% | | | |
| | 400,000 | | Grand Strand Water & Sewer | | | |
| | | | Authority, Refunding, Revenue | | | |
| | | | Bond, FSA Insured, | | | |
| | | | 5.375%, 06/01/2014 | | 431,988 | |
| | 2,055,000 | | Greenville Waterworks, | | | |
| | | | Refunding, Revenue Bond, | | | |
| | | | 5.000%, 02/01/2013 | | 2,191,699 | |
| | | | | | 2,623,687 | |
| | Principal | | | | Market | |
| | Amount | | | | Value | |
| | | | Tennessee - 1.69% | | | |
| | $ 250,000 | | Knoxville Water, Series P, | | | |
| | | | Revenue Bond, | | | |
| | | | 5.000%, 03/01/2009 | $ | 258,868 | |
| | | | Memphis, GO, | | | |
| | 300,000 | | 5.500%, 11/01/2010 | | 321,342 | |
| | 1,600,000 | | 5.250%, 11/01/2015 | | 1,712,736 | |
| | 1,205,000 | | Williamson County, GO, | | | |
| | | | 6.000%, 03/01/2010 | | 1,305,786 | |
| | | | | | 3,598,732 | |
| | | | Texas - 16.09% | | | |
| | 1,035,000 | | Arlington, Refunding, Series A, | | | |
| | | | GO, 5.500%, 08/15/2012 | | 1,116,444 | |
| | 100,000 | | Austin, Refunding, GO, | | | |
| | | | 5.250%, 09/01/2007 | | 102,224 | |
| | 820,000 | | Bexar County, Series A, GO, FSA | | | |
| | | | Insured, 5.000%, 06/15/2010 | | 859,393 | |
| | 700,000 | | College Station Independent | | | |
| | | | School District, Refunding, | | | |
| | | | GO, PSF-GTD Insured, | | | |
| | | | 5.000%, 02/15/2013 | | 743,764 | |
| | 995,000 | | Dallas, Prerefunded, GO, | | | |
| | | | 5.000%, 02/15/2012 | | 1,019,457 | |
| | 1,005,000 | | Dallas, Unrefunded, GO, | | | |
| | | | 5.000%, 02/15/2012 | | 1,032,075 | |
| | 600,000 | | Denton Independent | | | |
| | | | School District, GO, | | | |
| | | | 3.000%, 08/01/2030 | | 587,988 | |
| | 515,000 | | Denton Utilities System, Series A, | | | |
| | | | Revenue Bond, FSA Insured, | | | |
| | | | 5.250%, 12/01/2013 | | 554,444 | |
| | 100,000 | | Flower Mound Waterworks & | | | |
| | | | Sewer, Revenue Bond, AMBAC | | | |
| | | | Insured, 5.375%, 09/01/2006 | | 100,735 | |
| | 1,000,000 | | Fort Worth Water & Sewer, | | | |
| | | | Refunding, Revenue Bond, | | | |
| | | | 5.250%, 02/15/2013 | | 1,076,790 | |
| | | | Frisco, GO, FGIC Insured, | | | |
| | 145,000 | | 5.875%, 02/15/2010 | | 156,297 | |
| | 165,000 | | 5.000%, 02/15/2012 | | 173,631 | |
| | 750,000 | | Harris County, Refunding, GO, | | | |
| | | | 5.250%, 10/01/2013 | | 801,345 | |
| | | | Irving, Series A, Refunding, GO, | | | |
| | 2,565,000 | | 5.000%, 11/15/2011 | | 2,716,463 | |
| | 2,445,000 | | 5.000%, 11/15/2013 | | 2,600,673 | |
See notes to financial statements.
AssetMark Tax-Exempt Fixed Income Fund
SCHEDULE OF INVESTMENTS (Continued)
| | Principal | | | | Market | |
| | Amount | | | | Value | |
| | | | MUNICIPAL BONDS (Continued) | | | |
| | | | Texas (Continued) | | | |
| | $ 1,100,000 | | Lake Travis Independent School | | | |
| | | | District, GO, PSF-GTD Insured, | | | |
| | | | 0.000%, 02/15/2012 | $ | 867,130 | |
| | 935,000 | | Lower Colorado River Authority, | | | |
| | | | Series B, Refunding, Revenue | | | |
| | | | Bond, 6.000%, 05/15/2013 | | 1,003,666 | |
| | 150,000 | | Mansfield, GO, FGIC Insured, | | | |
| | | | 5.500%, 02/15/2008 | | 155,023 | |
| | 370,000 | | Marble Falls Independent School | | | |
| | | | District, Series A, Refunding, | | | |
| | | | GO, PSF-GTD Insured, | | | |
| | | | 5.000%, 08/15/2015 | | 396,248 | |
| | 2,300,000 | | North Texas Thruway Authority | | | |
| | | | Dallas North Thruway System, | | | |
| | | | Series A, Refunded, Revenue | | | |
| | | | Bond, 5.375%, 01/01/2016 | | 2,363,779 | |
| | 695,000 | | Pasadena Independent School | | | |
| | | | District, Prerefunded, GO, | | | |
| | | | PSF-GTD Insured, | | | |
| | | | 5.000%, 02/15/2013 | | 727,964 | |
| | 1,000,000 | | Plano Independent School | | | |
| | | | District, GO, PSF-GTD Insured, | | | |
| | | | 4.700%, 02/15/2013 | | 1,020,130 | |
| | | | Round Rock Independent School | | | |
| | | | District, GO, PSF-GTD Insured, | | | |
| | 200,000 | | 4.750%, 08/01/2010 | | 200,874 | |
| | 3,600,000 | | 5.000%, 08/01/2018 | | 3,783,708 | |
| | 80,000 | | San Antonio Electric & Gas, | | | |
| | | | Prerefunded, Revenue Bond, | | | |
| | | | 5.500%, 02/01/2013 | | 81,993 | |
| | 2,000,000 | | San Antonio Electric & Gas, | | | |
| | | | Refunding, Revenue Bond, | | | |
| | | | 5.375%, 02/01/2015 | | 2,188,620 | |
| | 1,000,000 | | San Antonio Electric & Gas, | | | |
| | | | Series A, Refunding, Revenue | | | |
| | | | Bond, 5.000%, 02/01/2008 | | 1,024,070 | |
| | 70,000 | | San Antonio Electric & Gas, | | | |
| | | | Unrefunded, Revenue Bond, | | | |
| | | | 5.500%, 02/01/2013 | | 71,756 | |
| | 200,000 | | Socorro Independent School | | | |
| | | | District, Refunding, GO, | | | |
| | | | PSF-GTD Insured | | | |
| | | | 5.375%, 08/15/2013 | | 214,138 | |
| | Principal | | | | Market | |
| | Amount | | | | Value | |
| | | | Texas (Continued) | | | |
| | $ 125,000 | | Spring Independent School | | | |
| | | | District, GO, PSF-GTD Insured, | | | |
| | | | 5.875%, 08/15/2010 | $ | 135,589 | |
| | 1,035,000 | | Texas A&M University, | | | |
| | | | Series B, Revenue Bond, | | | |
| | | | 5.375%, 05/15/2011 | | 1,111,528 | |
| | 400,000 | | Texas Public Finance Authority, | | | |
| | | | Refunding, GO, | | | |
| | | | 5.500%, 10/01/2009 | | 422,960 | |
| | 500,000 | | Texas State Public Finance | | | |
| | | | Authority Building, Series A, | | | |
| | | | Revenue Bond, | | | |
| | | | 5.250%, 02/01/2016 | | 521,515 | |
| | 100,000 | | Texas State University System, | | | |
| | | | Revenue Bond, FSA Insured, | | | |
| | | | 5.250%, 03/15/2010 | | 105,676 | |
| | 300,000 | | Texas Water Financial Assistance, | | | |
| | | | Series B, Refunding, GO, | | | |
| | | | 5.000%, 08/01/2014 | | 319,512 | |
| | 1,000,000 | | United Independent School | | | |
| | | | District, GO, PSF-GTD Insured, | | | |
| | | | 0.000%, 08/15/2010 | | 835,260 | |
| | 100,000 | | University of Texas, Revenue Bond, | | | |
| | | | 5.250%, 08/15/2008 | | 103,561 | |
| | | | University of Texas, Series B, | | | |
| | | | Revenue Bond, | | | |
| | 1,855,000 | | 5.250%, 07/01/2008 | | 1,918,144 | |
| | 1,000,000 | | 5.250%, 08/15/2013 | | 1,081,620 | |
| | | | | | 34,296,187 | |
| | | | Utah - 1.96% | | | |
| | 100,000 | | Jordan School District, GO, | | | |
| | | | 5.125%, 06/15/2008 | | 103,228 | |
| | 2,630,000 | | Utah, Refunding, Series A, GO, | | | |
| | | | 5.000%, 07/01/2012 | | 2,710,084 | |
| | 1,275,000 | | Utah, Series A, GO, | | | |
| | | | 5.000%, 07/01/2016 | | 1,372,295 | |
| | | | | | 4,185,607 | |
| | | | Virginia - 3.92% | | | |
| | 3,000,000 | | Fairfax County, Refunding, | | | |
| | | | GO, STAID Insured, | | | |
| | | | 5.000%, 10/01/2009 | | 3,137,550 | |
| | 450,000 | | Fairfax County, Series A, | | | |
| | | | Refunding, GO, STAID Insured, | | | |
| | | | 5.000%, 06/01/2007 | | 457,609 | |
See notes to financial statements.
AssetMark Tax-Exempt Fixed Income Fund
SCHEDULE OF INVESTMENTS (Continued)
| | Principal | | | | Market | |
| | Amount | | | | Value | |
| | | | MUNICIPAL BONDS (Continued) | | | |
| | | | Virginia (Continued) | | | |
| | $ 1,000,000 | | Henry County Public Service | | | |
| | | | Authority Water & Sewer, | | | |
| | | | Refunding, Revenue Bond, FSA | | | |
| | | | Insured, 5.500%, 11/15/2019 | $ | 1,139,270 | |
| | 325,000 | | Newport News, Series B, | | | |
| | | | GO, STAID Insured, | | | |
| | | | 5.000%, 11/01/2014 | | 344,952 | |
| | 100,000 | | Norfolk, Refunding, GO, | | | |
| | | | 5.000%, 01/01/2009 | | 103,747 | |
| | 3,000,000 | | Virginia Commonwealth | | | |
| | | | Transportation Board, Revenue | | | |
| | | | Bond, 5.000%, 10/01/2011 | | 3,182,940 | |
| | | | | | 8,366,068 | |
| | | | Washington - 2.58% | | | |
| | 2,000,000 | | Clark County School District, | | | |
| | | | Refunding, GO, FGIC Insured, | | | |
| | | | 5.500%, 12/01/2017 | | 2,165,500 | |
| | 45,000 | | King County, Prerefunded, GO, | | | |
| | | | 5.500%, 12/01/2010 | | 48,413 | |
| | 55,000 | | King County, Unrefunded, GO, | | | |
| | | | 5.500%, 12/01/2010 | | 59,025 | |
| | 100,000 | | Seattle, GO, | | | |
| | | | 5.000%, 08/01/2012 | | 104,990 | |
| | 30,000 | | Seattle, Prerefunded, GO, | | | |
| | | | 5.000%, 07/01/2013 | | 31,895 | |
| | 170,000 | | Seattle, Unrefunded, GO, | | | |
| | | | 5.000%, 07/01/2013 | | 179,007 | |
| | 100,000 | | Snohomish County, GO, | | | |
| | | | 5.000%, 12/01/2006 | | 100,940 | |
| | 800,000 | | Washington State Motor Vehicle | | | |
| | | | Fuel Tax, Series C, GO, FGIC | | | |
| | | | Insured, 0.000%, 06/01/2010 | | 679,152 | |
| | 2,125,000 | | Washington, Refunding, GO, | | | |
| | | | 4.000%, 01/01/2008 | | 2,138,047 | |
| | | | | | 5,506,969 | |
| | | | West Virginia - 0.14% | | | |
| | 300,000 | | West Virginia Economic | | | |
| | | | Development Authority, Revenue | | | |
| | | | Bond, 4.000%, 06/01/2007 | | 301,302 | |
| | | | Wisconsin - 3.36% | | | |
| | 50,000 | | Douglas County, Prerefunded, | | | |
| | | | GO, FGIC Insured, | | | |
| | | | 5.500%, 02/01/2014 | | 54,372 | |
| | Principal | | | | Market | |
| | Amount | | | | Value | |
| | | | Wisconsin (Continued) | | | |
| | $ 25,000 | | Douglas County, Unrefunded, | | | |
| | | | GO, FGIC Insured, | | | |
| | | | 5.500%, 02/01/2014 | $ | 27,064 | |
| | 1,445,000 | | Middleton Cross Plains Area | | | |
| | | | School District, Refunding, | | | |
| | | | GO, FSA Insured, | | | |
| | | | 5.000%, 04/01/2020 | | 1,535,443 | |
| | | | Wisconsin, Series A, GO, | | | |
| | 150,000 | | 5.000%, 05/01/2008 | | 153,942 | |
| | 5,000,000 | | 5.000%, 05/01/2011 | | 5,283,750 | |
| | 100,000 | | Wisconsin, Series C, GO, | | | |
| | | | 5.500%, 05/01/2009 | | 105,090 | |
| | | | | | 7,159,661 | |
| | | | Total Municipal Bonds | | | |
| | | | (Cost $206,021,572) | | 203,911,594 | |
| | | | SHORT TERM INVESTMENTS - 3.46% | | | |
| | | | General Obligation Bonds - 0.85% | | | |
| | 1,000,000 | | New York, GO, | | | |
| | | | 3.180%, 08/01/2021 | | 1,000,000 | |
| | 800,000 | | New York, Series H, | | | |
| | | | GO, MBIA Insured, | | | |
| | | | 3.180%, 08/01/2014 | | 800,000 | |
| | | | | | 1,800,000 | |
| | | | Revenue Bonds - 2.59% | | | |
| | 80,000 | | Alachua County Health Facilities | | | |
| | | | Authority, Revenue Bond, | | | |
| | | | 3.180%, 10/01/2032 | | 80,000 | |
| | 250,000 | | Arden Hills Housing & Health Care | | | |
| | | | Facilities, Refunding, Revenue | | | |
| | | | Bond, 3.230%, 09/01/2029 | | 250,000 | |
| | 100,000 | | Denver City & County Multi-Family | | | |
| | | | Housing, Revenue Bond, | | | |
| | | | 3.180%, 12/01/2029 | | 100,000 | |
| | 200,000 | | Indiana Health Facility Financing | | | |
| | | | Authority, Revenue Bond, | | | |
| | | | 3.230%, 12/01/2029 | | 200,000 | |
| | 100,000 | | Iowa Higher Education Loan | | | |
| | | | Authority, Revenue Bond, | | | |
| | | | 3.180%, 11/01/2030 | | 100,000 | |
| | 190,000 | | Kansas State Development Finance | | | |
| | | | Authority, Revenue Bond, | | | |
| | | | 3.180%, 11/15/2028 | | 190,000 | |
See notes to financial statements.
AssetMark Tax-Exempt Fixed Income Fund
SCHEDULE OF INVESTMENTS (Continued)
| | Principal | | | | Market | |
| | Amount | | | | Value | |
| | | | SHORT TERM INVESTMENTS (Continued) | | | |
| | | | Revenue Bonds (Continued) | | | |
| | $ 100,000 | | Minnesota Higher Education | | | |
| | | | Facilities Authority, Series 5-H, | | | |
| | | | Revenue Bond, HTSB Insured, | | | |
| | | | 3.180%, 10/01/2030 | $ | 100,000 | |
| | 500,000 | | Minnesota Higher Educational | | | |
| | | | Facilities Authority, Revenue | | | |
| | | | Bond, HTSB Insured, | | | |
| | | | 3.180%, 10/01/2032 | | 500,000 | |
| | 700,000 | | Missouri Development Financial | | | |
| | | | Board of Cultural Facilities, | | | |
| | | | Series A, Revenue Bond, JPM | | | |
| | | | Insured, 3.160%, 12/01/2033 | | 700,000 | |
| | 400,000 | | Missouri Health & Educational | | | |
| | | | Facilities Authority, Series A, | | | |
| | | | Revenue Bond, | | | |
| | | | 3.180%, 06/01/2026 | | 400,000 | |
| | 500,000 | | Nebraska Educational Finance | | | |
| | | | Authority, Revenue Bond, | | | |
| | | | 3.180%, 03/01/2033 | | 500,000 | |
| | 100,000 | | New York City Municipal Water | | | |
| | | | Finance Authority, Series C-1, | | | |
| | | | Revenue Bond, | | | |
| | | | 3.180%, 06/15/2018 | | 100,000 | |
| | 400,000 | | New York City Municipal Water | | | |
| | | | Finance Authority Water & Sewer | | | |
| | | | System, Series F-1, Revenue | | | |
| | | | Bond, 3.180%, 06/15/2033 | | 400,000 | |
| | 200,000 | | Pinellas County Health Facility | | | |
| | | | Authority, Refunding, Revenue | | | |
| | | | Bond, 3.180%, 12/01/2015 | | 200,000 | |
| | 400,000 | | University Kansas Hospital | | | |
| | | | Authority, Revenue Bond, | | | |
| | | | 3.180%, 09/01/2034 | | 400,000 | |
| | 1,000,000 | | Valdez Alaska Marine Term, | | | |
| | | | Refunding, Revenue Bond, | | | |
| | | | 3.020%, 12/01/2033 | | 1,000,000 | |
| | 100,000 | | Washington State Housing Finance | | | |
| | | | Commission, Revenue Bond, | | | |
| | | | 3.230%, 06/01/2032 | | 100,000 | |
| | 200,000 | | Wisconsin Health & Educational | | | |
| | | | Facilities Authority, Revenue | | | |
| | | | Bond, 3.180%, 12/01/2015 | | 200,000 | |
| | | | | | 5,520,000 | |
| | Number of | | | | Market | |
| | Shares | | | | Value | |
| | | | Money Market Funds - 0.02% | | | |
| | 49,000 | | First American Tax Free Obligation | | | |
| | | | 2.720% | $ | 49,000 | |
| | | | Total Short Term Investments | | | |
| | | | (Cost $7,369,000) | | 7,369,000 | |
| | | | Total Investments - 99.11% | | | |
| | | | (Cost $213,390,572) | | 211,280,594 | |
| | | | Other Assets in | | | |
| | | | Excess of Liabilities - 0.89% | | 1,889,604 | |
| | | | Total Net Assets - 100.00% | | $213,170,198 | |
| | | | | | | |
| | Percentages are stated as a percent of net assets. | | | |
| | | | | | | |
| | Glossary of Terms | | | | | |
| | AMBAC | | American Municipal Bond Assurance Corp. | | | |
| | ACA | | American Capital Access | | | |
| | CP | | Certificate of Participation | | | |
| | FGIC | | Financial Guaranty Insurance Corp. | | | |
| | FSA | | Federal Housing Authority/Agency | | | |
| | GO | | General Obligation | | | |
| | HTSB | | Harris Trust & Savings Bank | | | |
| | JPM | | JP Morgan Chase Bank | | | |
| | MBIA | | Municipal Bond Investors Assurance Corp. | | | |
| | PSF-GTD | | Permanent School Fund Guaranteed | | | |
| | Q-SBLF | | Qualified School Board Loan | | | |
| | STAID | | State Aid Withholding | | | |
| | XLCA | | XL Capital Assurance | | | |
See notes to financial statements.
AssetMark Core Plus Fixed Income Fund
This chart assumes an initial gross investment of $10,000 made on June 29, 2001 (commencement of operations). Returns shown include the reinvestment of all dividends. Returns shown do not reflect the deduction of taxes that a shareholder would pay on fund distributions or the redemption of fund shares. In the absence of fee waivers and reimbursements, total return would be reduced. Past performance is not predictive of future performance. Investment return and principal value will fluctuate, so that your shares, when redeemed, may be worth more or less than the original cost.
LEHMAN BROTHERS AGGREGATE BOND INDEX - An unmanaged index which measures the performance of securities from the Lehman Brothers Government/Corporate Bond Index, Mortgage-Backed Securities Index and the Asset-Backed Securities Index. The Lehman Brothers Aggregate Bond Index is a broad representation of the investment-grade fixed-income market in the U.S. and includes U.S. Government and corporate debt securities, mortgage- and asset-backed securities and international U.S. dollar-denominated bonds. All securities contained in the Lehman Brothers Aggregate Bond Index have a minimum term to maturity of one year.
LIPPER INTERMEDIATE INVESTMENT GRADE DEBT FUNDS INDEX - A fixed-income fund invests at least 65% of fund assets in investment grade debt issued (rated in top four grades with dollar-weighted average maturities of one to five years).
AVERAGE ANNUAL TOTAL RETURN (for the periods ended March 31, 2006) | |
| | One Year | Three Year | Since Inception (6/29/01) |
| AssetMark Core Plus Fixed Income Fund | 2.23% | 3.08% | 4.69% |
| Lehman Brothers Aggregate Bond Index | 2.26% | 2.92% | 5.25% |
| Lipper Intermediate Investment Grade Debt Funds Index | 2.21% | 3.19% | 5.07% |
AssetMark Core Plus Fixed Income Fund
SCHEDULE OF INVESTMENTS
| | Number of | | | | Market | |
| | Shares | | | | Value | |
| | | | CONVERTIBLE PREFERRED | | | |
| | | | STOCKS - 0.21% | | | |
| | | | Automobiles - 0.21% | | | |
| | 41,300 | | General Motors Corporation (b) | $ | 958,573 | |
| | 18,600 | | General Motors Corporation | | 302,064 | |
| | | | | | 1,260,637 | |
| | | | Total Convertible Preferred Stocks | | | |
| | | | (Cost $1,293,628) | | 1,260,637 | |
| | | | PREFERRED STOCKS - 0.16% | | | |
| | | | Banks - 0.12% | | | |
| | 800,000 | | HSBC Capital Funding L.P. | | | |
| | | | (Callable at $100.00 on | | | |
| | | | 06/27/2013; Acquired 08/23/2004, | | | |
| | | | Cost $756,752) (a)(c)(d) | | 736,606 | |
| | | | Holding And Other Investment Offices - 0.03% | | | |
| | 12,000 | | Corts Trust for Ford Motor Company | | | |
| | | | (Callable at $25.00 on 03/12/2008; | | | |
| | | | Acquired 12/21/2005, Cost $198,010) | | 205,800 | |
| | | | Medical Supplies - 0.01% | | | |
| | 51 | | Fresenius Medical Care | | | |
| | | | Capital Trust II (a) | | 52,402 | |
| | | | Total Preferred Stocks | | | |
| | | | (Cost $1,009,797) | | 994,808 | |
| | Principal | | | | | |
| | Amount | | | | | |
| | | | ASSET BACKED SECURITIES - 5.57% | | | |
| | $ 2,557,379 | | Accredited Mortgage Loan Trust | | | |
| | | | Series 2005-3, | | | |
| | | | 4.821%, 09/25/2035 | | 2,559,931 | |
| | | | Conseco Finance | | | |
| | | | Securitizations Corp. | | | |
| | 255,059 | | Series 2000-C, | | | |
| | | | 6.170%, 03/15/2030 | | 255,760 | |
| | 100,000 | | Series 2000-4, | | | |
| | | | 8.310%, 04/01/2031 | | 82,498 | |
| | | | Countrywide Asset-Backed | | | |
| | | | Certificates | | | |
| | 1,370,121 | | Series 2004-BC5, | | | |
| | | | 5.088%, 07/25/2032 | | 1,372,214 | |
| | 640,000 | | Series 2005-4, | | | |
| | | | 4.456%, 09/25/2032 | | 626,254 | |
| | | | Countrywide Home | | | |
| | | | Equity Loan Trust | | | |
| | 1,199,826 | | Series 2003-A, | | | |
| | | | 4.920%, 03/15/2029 | | 1,203,594 | |
| | Principal | | | | Market | |
| | Amount | | | | Value | |
| | | | ASSET BACKED SECURITIES (Continued) | | | |
| | | | Countrywide Home | | | |
| | | | Equity Loan Trust (Continued) | | | |
| | $ 1,362,214 | | Series 2004-S, | | | |
| | | | 4.989%, 02/15/2030 | $ | 1,364,317 | |
| | 927,805 | | Series 2004-R, | | | |
| | | | 4.999%, 03/15/2030 | | 931,084 | |
| | 1,357,563 | | Series 2004-N, | | | |
| | | | 5.029%, 02/15/2034 | | 1,360,482 | |
| | 1,364,732 | | Series 2004-O, | | | |
| | | | 5.029%, 02/15/2034 | | 1,368,142 | |
| | 2,347,281 | | Series 2005-F, | | | |
| | | | 4.810%, 12/15/2035 | | 2,348,373 | |
| | 2,327,770 | | Series 2005-I, | | | |
| | | | 4.979%, 02/15/2036 | | 2,332,472 | |
| | 2,000,000 | | First Franklin Mortgage | | | |
| | | | Loan Asset-Backed Certificates | | | |
| | | | Series 2004-FF8, | | | |
| | | | 5.088%, 10/25/2034 | | 2,004,410 | |
| | 2,247,988 | | Home Equity Loan Trust | | | |
| | | | Series 2005-HS1, | | | |
| | | | 4.701%, 07/25/2020 | | 2,243,409 | |
| | 2,670,731 | | IMPAC Secured Assets Corp. | | | |
| | | | Series 2005-6, | | | |
| | | | 5.068%, 10/25/2035 | | 2,675,534 | |
| | 2,385,579 | | Indymac Mortgage Loan Trust | | | |
| | | | Series 2005-AR16IP, | | | |
| | | | 5.138%, 07/25/2045 | | 2,394,550 | |
| | | | JetBlue Airways Corporation | | | |
| | 889,029 | | Series 2004-2, G1, | | | |
| | | | 5.124%, 02/15/2018 (d) | | 886,269 | |
| | 900,000 | | Series 2004-2, G-2, | | | |
| | | | 5.199%, 05/15/2018 (d) | | 884,056 | |
| | 490,431 | | Residential Asset | | | |
| | | | Mortgage Products, Inc. | | | |
| | | | Series 2004-RZ1, | | | |
| | | | 4.821%, 03/25/2034 | | 490,732 | |
| | 367,082 | | Residential Asset | | | |
| | | | Securities Corporation | | | |
| | | | Series 2004-KS1, | | | |
| | | | 5.098%, 02/25/2034 | | 367,490 | |
| | 175,972 | | Structured Asset | | | |
| | | | Investment Loan Trust | | | |
| | | | Series 2003-BC5, | | | |
| | | | 4.921%, 06/25/2033 | | 176,099 | |
See notes to financial statements.
AssetMark Core Plus Fixed Income Fund
SCHEDULE OF INVESTMENTS (Continued)
| | Principal | | | | Market | |
| | Amount | | | | Value | |
| | | | ASSET BACKED SECURITIES (Continued) | | | |
| | $ 854,611 | | Structured Asset Securities | | | |
| | | | Series 2005-S3, | | | |
| | | | 4.681%, 06/25/2035 | $ | 855,174 | |
| | | | Washington Mutual | | | |
| | 1,700,000 | | Series 2005-AR4, | | | |
| | | | 4.678%, 04/25/2035 | | 1,681,150 | |
| | 3,677,926 | | Series 2005-AR8, | | | |
| | | | 5.108%, 07/25/2045 | | 3,684,511 | |
| | | | Total Asset Backed Securities | | | |
| | | | (Cost $34,145,396) | | 34,148,505 | |
| | | | COLLATERALIZED MORTGAGE | | | |
| | | | OBLIGATIONS - 3.55% | | | |
| | 1,042,922 | | Bank of America Corporation | | | |
| | | | Series 2005-B, | | | |
| | | | 5.120%, 04/20/2035 | | 1,028,991 | |
| | 1,571,676 | | Bear Stearns Trust | | | |
| | | | Series 2005-2, | | | |
| | | | 4.756%, 04/25/2035 | | 1,546,142 | |
| | 1,113,840 | | Central Bank of Argentina | | | |
| | | | 2.000%, 02/04/2018 ARS | | 545,849 | |
| | | | Countrywide Home Loans | | | |
| | 1,302,910 | | Series 2005-11, | | | |
| | | | 4.881%, 03/25/2035 | | 1,311,560 | |
| | 1,510,167 | | Series 2005-11, | | | |
| | | | 5.045%, 04/25/2035 | | 1,475,386 | |
| | 700,000 | | CS First Boston Mortgage | | | |
| | | | Securities Corp. | | | |
| | | | Series 1997-C2, | | | |
| | | | 6.550%, 01/17/2035 | | 711,203 | |
| | | | FHLMC | | | |
| | 818,686 | | Series 1647, | | | |
| | | | 6.500%, 12/15/2008 | | 824,550 | |
| | 2,497,370 | | Series 2329, | | | |
| | | | 6.500%, 06/15/2031 | | 2,550,960 | |
| | 1,353,258 | | Series 2338, | | | |
| | | | 6.500%, 07/15/2031 | | 1,380,528 | |
| | 579,956 | | FNMA | | | |
| | | | Series 2005-T2, | | | |
| | | | 4.285%, 11/28/2035 | | 580,207 | |
| | 1,769,841 | | GSMPS Mortgage Loan Trust | | | |
| | | | Series 2005-RP1, | | | |
| | | | 5.168%, 01/25/2035 (c) | | 1,777,742 | |
| | | | | | | |
| | Principal | | | | Market | |
| | Amount | | | | Value | |
| | | | COLLATERALIZED MORTGAGE | | | |
| | | | OBLIGATIONS (Continued) | | | |
| | $ 170,419 | | IMPAC Secured Assets Corp. | | | |
| | | | Series 2004-3, | | | |
| | | | 5.018%, 11/25/2034 | $ | 170,550 | |
| | 2,700,000 | | Master Adjustable | | | |
| | | | Rate Mortgages Trust | | | |
| | | | Series 2004-13, | | | |
| | | | 3.787%, 11/21/2034 (c) | | 2,542,235 | |
| | 812,393 | | Master Reperforming Loan Trust | | | |
| | | | Series 2005-1, | | | |
| | | | 7.000%, 08/25/2034 | | 827,885 | |
| | 1,709,392 | | MLCC Mortgage Investors, Inc. | | | |
| | | | Series 2005-1, | | | |
| | | | 4.969%, 04/25/2035 | | 1,681,611 | |
| | 946,681 | | Residential Asset | | | |
| | | | Mortgage Products, Inc. | | | |
| | | | Series 2004-SL4, | | | |
| | | | 7.500%, 07/25/2032 | | 975,082 | |
| | 1,838,565 | | Structured Adjustable | | | |
| | | | Rate Mortgage Loan | | | |
| | | | Series 2004-18, | | | |
| | | | 5.011%, 12/25/2034 | | 1,829,148 | |
| | | | Total Collateralized | | | |
| | | | Mortgage Obligations | | | |
| | | | (Cost $22,216,317) | | 21,759,629 | |
| | | | CORPORATE BONDS - 15.84% | | | |
| | | | Aerospace & Defense - 0.01% | | | |
| | 55,000 | | Drs Technologies, Inc. | | | |
| | | | 6.625%, 02/01/2016 | | 55,000 | |
| | | | Auto Components - 0.02% | | | |
| | 110,000 | | Visteon Corp. | | | |
| | | | 8.250%, 08/01/2010 | | 91,300 | |
| | | | Automobiles - 0.56% | | | |
| | | | DaimlerChrysler N.A. | | | |
| | 750,000 | | 5.360%, 09/10/2007 (d) | | 752,454 | |
| | 5,000 | | 4.050%, 06/04/2008 | | 4,847 | |
| | 150,000 | | 7.200%, 09/01/2009 | | 156,744 | |
| | 260,000 | | 5.875%, 03/15/2011 | | 259,108 | |
| | 670,000 | | Ford Motor Company | | | |
| | | | 7.450%, 07/16/2031 (b) | | 500,825 | |
| | | | General Motors Corporation | | | |
| | 1,940,000 | | 8.250%, 07/15/2023 | | 1,406,500 | |
| | 510,000 | | 8.375%, 07/15/2033 (b) | | 376,125 | |
| | | | | | 3,456,603 | |
See notes to financial statements.
AssetMark Core Plus Fixed Income Fund
SCHEDULE OF INVESTMENTS (Continued)
| | Principal | | | | Market | |
| | Amount | | | | Value | |
| | | | CORPORATE BONDS (Continued) | | | |
| | | | Banks - 2.87% | | | |
| | $ 300,000 | | Aiful Corporation | | | |
| | | | 5.000%, 08/10/2010 | | | |
| | | | (Acquired 08/03/2005 and | | | |
| | | | 11/29/2005, Cost $298,228) (c) | $ | 290,524 | |
| | 750,000 | | ANZ Capital Trust II | | | |
| | | | 5.360%, 12/15/2053 (Callable | | | |
| | | | at $100.00 on 12/15/2013; | | | |
| | | | Acquired 08/23/2004, | | | |
| | | | Cost $741,990) (c) | | 721,272 | |
| | 380,000 | | Bank Of America Corporation | | | |
| | | | 4.500%, 08/01/2010 | | 367,621 | |
| | 995,000 | | Bank One Corp. | | | |
| | | | 2.625%, 06/30/2008 (b) | | 940,222 | |
| | 320,000 | | Banque Paribas | | | |
| | | | 6.875%, 03/01/2009 | | 332,419 | |
| | 550,000 | | Countrywide Financial Corp. | | | |
| | | | 0.000%, 02/27/2008 (d) | | 550,216 | |
| | 700,000 | | First Chicago Corporation | | | |
| | | | 6.375%, 01/30/2009 | | 719,306 | |
| | 250,000 | | First Union National Bank | | | |
| | | | 5.800%, 12/01/2008 | | 253,600 | |
| | 280,000 | | General Electric | | | |
| | | | Capital Corporation | | | |
| | | | 4.125%, 09/01/2009 (b) | | 270,181 | |
| | 375,000 | | Greenpoint Bank | | | |
| | | | 9.250%, 10/01/2010 | | 428,179 | |
| | 700,000 | | HBOS Capital Funding L.P. | | | |
| | | | 6.071%, 06/01/2049 | | | |
| | | | (Acquired 08/23/2004, | | | |
| | | | Cost $722,338) (b)(c)(d) | | 701,000 | |
| | 685,000 | | HSBC Finance Corp. | | | |
| | | | 4.125%, 11/16/2009 | | 656,699 | |
| | 4,000,000 | | Inter-American Development Bank | | | |
| | | | 0.500%, 05/29/2014 | | 2,750,016 | |
| | | | JP Morgan | | | |
| | 5,100,000 | | 6.000%, 05/15/2011 (c)(d) BRL | | 2,094,747 | |
| | 2,800,000 | | 10.400%, 05/15/2009 BRL | | 1,355,439 | |
| | 700,000 | | Popular North America, Inc. | | | |
| | | | 4.700%, 06/30/2009 | | 682,237 | |
| | | | Resona Bank | | | |
| | 525,000 | | 5.850%, 09/29/2049 | | | |
| | | | (Acquired 09/08/2005, | | | |
| | | | Cost $524,633) (c) | | 510,373 | |
| | 450,000 | | 4.125%, 12/31/2049 (c) EUR | | 531,422 | |
| | Principal | | | | Market | |
| | Amount | | | | Value | |
| | | | Banks (Continued) | | | |
| | $ 410,000 | | Resona Preferred Global Securities | | | |
| | | | 7.191%, 12/29/2049 | | | |
| | | | (Acquired 07/20/2005, | | | |
| | | | Cost $413,410) (c) | $ | 428,516 | |
| | 990,000 | | Royal Bank of Scotland Group PLC | | | |
| | | | 9.118%, 03/31/2049 | | 1,110,220 | |
| | 500,000 | | Shinsei Finance Cayman Ltd | | | |
| | | | 6.418%, 07/20/2048 | | | |
| | | | (Acquired 02/16/2006 | | | |
| | | | through 03/14/2006, | | | |
| | 550,000 | | Cost $400,025) (c) | | 493,032 | |
| | | | Sovereign Bank | | | |
| | | | 4.375%, 08/01/2013 (d) | | 535,996 | |
| | 320,000 | | Wells Fargo Company | | | |
| | | | 4.200%, 01/15/2010 | | 307,376 | |
| | 575,000 | | ZFS Finance USA Trust I | | | |
| | | | 6.150%, 12/15/2065 | | | |
| | | | (Acquired 03/30/2006, | | | |
| | | | Cost $560,263) (c) | | 560,548 | |
| | | | | | 17,591,161 | |
| | | | Beverages - 0.08% | | | |
| | 490,000 | | Anheuser-Busch Companies, Inc. | | | |
| | | | 4.950%, 01/15/2014 | | 473,179 | |
| | | | Business Services - 0.03% | | | |
| | 50,000 | | Dyncorp International LLC | | | |
| | | | 9.500%, 02/15/2013 | | 52,250 | |
| | 80,000 | | Lamar Media Corp. | | | |
| | | | 7.250%, 01/01/2013 | | 82,400 | |
| | 30,000 | | UGS Corp. | | | |
| | | | 10.000%, 06/01/2012 | | 33,150 | |
| | | | | | 167,800 | |
| | | | Capital Markets - 1.05% | | | |
| | 30,000 | | E Trade Financial Corp. | | | |
| | | | 7.375%, 09/15/2013 | | 30,750 | |
| | | | Goldman Sachs Group, Inc. | | | |
| | 200,000 | | 4.500%, 06/15/2010 | | 192,922 | |
| | 140,000 | | 5.000%, 01/15/2011 | | 137,159 | |
| | | | Lehman Brothers Holdings, Inc. | | | |
| | 350,000 | | 4.000%, 01/22/2008 | | 342,406 | |
| | 1,350,000 | | 4.500%, 07/26/2010 | | 1,302,332 | |
| | 1,610,000 | | 5.550%, 08/19/2065 | | | |
| | | | (Acquired 10/19/2005, | | | |
| | | | Cost $1,332,587) (c)(d) | | 1,616,231 | |
See notes to financial statements.
AssetMark Core Plus Fixed Income Fund
SCHEDULE OF INVESTMENTS (Continued)
| | Principal | | | | Market | |
| | Amount | | | | Value | |
| | | | CORPORATE BONDS (Continued) | | | |
| | | | Capital Markets (Continued) | | | |
| | $ 4,250,000 | | Merrill Lynch & Co., Inc. | | | |
| | | | 6.000%, 05/15/2045 BRL | $ | 1,561,325 | |
| | 250,000 | | Mizuho Jgb Invest | | | |
| | | | 9.870%, 12/31/2049 (Acquired | | | |
| | | | 08/22/2005 and 08/23/2005, | | | |
| | | | Cost $281,104) (c)(d) | | 271,556 | |
| | 570,000 | | Morgan Stanley | | | |
| | | | 3.625%, 04/01/2008 | | 552,749 | |
| | 430,000 | | Wachovia Capital Trust II | | | |
| | | | 5.800%, 03/15/2042 | | 422,913 | |
| | | | | | 6,430,343 | |
| | | | Chemicals - 0.05% | | | |
| | 70,000 | | IMC Global, Inc. | | | |
| | | | 10.875%, 06/01/2008 | | 76,825 | |
| | 150,000 | | Lubrizol Corp. | | | |
| | | | 7.250%, 06/15/2025 | | 161,272 | |
| | 12,000 | | Lyondell Chemical Co. | | | |
| | | | 9.625%, 05/01/2007 | | 12,450 | |
| | 20,000 | | Macdermid, Inc. | | | |
| | | | 9.125%, 07/15/2011 | | 21,200 | |
| | 63,000 | | Westlake Chem Corp. | | | |
| | | | 6.625%, 01/15/2016 | | 62,606 | |
| | | | | | 334,353 | |
| | | | Commercial Services & Supplies - 0.22% | | | |
| | 1,000,000 | | PHH Corp. | | | |
| | | | 6.000%, 03/01/2008 | | 1,007,431 | |
| | 325,000 | | Waste Management, Inc. | | | |
| | | | 6.375%, 11/15/2012 | | 337,983 | |
| | | | | | 1,345,414 | |
| | | | Communications - 0.92% | | | |
| | 150,000 | | AMFM Inc. | | | |
| | | | 8.000%, 11/01/2008 | | 157,552 | |
| | 295,000 | | British Telecommunications PLC | | | |
| | | | 8.375%, 12/15/2010 | | 329,363 | |
| | 500,000 | | Comcast Cable | | | |
| | | | Communications Holdings, Inc. | | | |
| | | | 9.455%, 11/15/2022 | | 632,207 | |
| | | | Deutsche Telekom | | | |
| | | | International Finance B.V. | | | |
| | 350,000 | | 5.750%, 03/23/2016 | | 342,550 | |
| | 675,000 | | 8.250%, 06/15/2030 | | 809,783 | |
| | 45,000 | | Eircom Funding | | | |
| | | | 8.250%, 08/15/2013 | | 48,656 | |
| | Principal | | | | Market | |
| | Amount | | | | Value | |
| | | | Communications (Continued) | | | |
| | $ 90,000 | | Intelsat Subsidiary Holding Co. | | | |
| | | | 8.625%, 01/15/2015 | $ | 93,375 | |
| | 35,000 | | News American, Inc. | | | |
| | | | 6.200%, 12/15/2034 | | 32,884 | |
| | | | Rogers Cable, Inc. | | | |
| | 220,000 | | 5.500%, 03/15/2014 | | 209,550 | |
| | 110,000 | | 6.750%, 03/15/2015 | | 112,750 | |
| | | | Sprint Capital Corp. | | | |
| | 1,220,000 | | 6.000%, 01/15/2007 | | 1,226,019 | |
| | 100,000 | | 7.625%, 01/30/2011 | | 108,259 | |
| | 675,000 | | 6.875%, 11/15/2028 | | 698,439 | |
| | | | Telecom Italia Capital | | | |
| | 125,000 | | 4.000%, 01/15/2010 | | 117,613 | |
| | 500,000 | | 4.950%, 09/30/2014 | | 460,876 | |
| | 190,000 | | 5.250%, 10/01/2015 | | 177,105 | |
| | 50,000 | | Verizon Global Funding Corp. | | | |
| | | | 7.375%, 09/01/2012 | | 54,224 | |
| | | | | | 5,611,205 | |
| | | | Consumer Finance - 1.14% | | | |
| | 3,845,000 | | Ford Motor Credit Company | | | |
| | | | 5.800%, 01/12/2009 | | 3,513,645 | |
| | 270,000 | | General Motors | | | |
| | | | Acceptance Corporation | | | |
| | | | 7.750%, 01/19/2010 | | 263,465 | |
| | 410,000 | | General Motors | | | |
| | | | Acceptance Corporation | | | |
| | | | 4.500%, 07/15/2006 | | 406,510 | |
| | | | General Motors | | | |
| | | | Acceptance Corporation | | | |
| | 20,000 | | 6.125%, 02/01/2007 | | 19,695 | |
| | 2,340,000 | | 5.850%, 01/14/2009 | | 2,189,779 | |
| | 625,000 | | 6.875%, 09/15/2011 (b) | | 583,192 | |
| | | | | | 6,976,286 | |
| | | | Consumer Products - Manufacturing - 0.00% | | | |
| | 20,000 | | American Achievement Corp. | | | |
| | | | 8.250%, 04/01/2012 | | 20,500 | |
| | | | Consumer Services - 0.00% | | | |
| | 18,000 | | Nationsrent, Inc. | | | |
| | | | 9.500%, 10/15/2010 | | 19,665 | |
| | | | Diversified Financial Services - 1.21% | | | |
| | | | Citigroup, Inc. | | | |
| | 710,000 | | 5.750%, 05/10/2006 | | 711,813 | |
| | 3,800,000 | | 0.000%, 12/21/2006 | | 3,859,356 | |
See notes to financial statements.
AssetMark Core Plus Fixed Income Fund
SCHEDULE OF INVESTMENTS (Continued)
| | Principal | | | | Market | |
| | Amount | | | | Value | |
| | | | CORPORATE BONDS (Continued) | | | |
| | | | Diversified Financial Services (Continued) | | | |
| | $ 670,000 | | Ford Motor Credit Company | | | |
| | | | 6.625%, 06/16/2008 | $ | 634,463 | |
| | | | General Electric | | | |
| | | | Capital Corporation | | | |
| | 200,000 | | 4.250%, 01/15/2008 | | 196,824 | |
| | 650,000 | | 5.170%, 09/15/2014 (d) | | 655,323 | |
| | | | General Motors | | | |
| | | | Acceptance Corporation | | | |
| | 70,000 | | 6.311%, 11/30/2007 | | 65,410 | |
| | 510,000 | | 6.125%, 01/22/2008 | | 485,173 | |
| | 330,000 | | 6.090%, 09/23/2008 (d) | | 311,687 | |
| | 350,000 | | ILFC E-Capital Trust I | | | |
| | | | 5.900%, 12/21/2065 | | | |
| | | | (Acquired 01/18/2006, | | | |
| | | | Cost $352,998) (c)(d) | | 340,025 | |
| | 30,000 | | Rabobank Capital Funding Trust II | | | |
| | | | 5.260%, 12/29/2049 | | | |
| | | | (Acquired 05/23/2005, | | | |
| | | | Cost $30,510) (c)(d) | | 28,881 | |
| | 180,000 | | Rabobank Capital Funding Trust III | | | |
| | | | 5.254%, 10/31/2049 (Acquired | | | |
| | | | 10/14/2004 and 05/20/2005, | | | |
| | | | Cost $180,447) (c)(d) | | 170,458 | |
| | | | | | 7,459,413 | |
| | | | Diversified Telecommunication Services - 0.52% | | | |
| | 300,000 | | ALLTEL Corporation | | | |
| | | | 4.656%, 05/17/2007 | | 298,071 | |
| | 700,000 | | Ameritech Capital Funding Corp. | | | |
| | | | 6.250%, 05/18/2009 | | 710,888 | |
| | 30,000 | | Bellsouth Corp. | | | |
| | | | 4.750%, 11/15/2012 | | 28,451 | |
| | 120,000 | | Cincinnati Bell Inc. | | | |
| | | | 7.000%, 02/15/2015 | | 119,400 | |
| | 30,000 | | Citizens Communications Co. | | | |
| | | | 9.250%, 05/15/2011 | | 33,075 | |
| | 850,000 | | Qwest Communications | | | |
| | | | International, Inc. | | | |
| | | | 8.249%, 02/15/2009 (d) | | 873,375 | |
| | 127,000 | | Qwest Communications | | | |
| | | | International, Inc. | | | |
| | | | 7.250%, 02/15/2011 | | 130,810 | |
| | 520,000 | | Royal Kpn Nv | | | |
| | | | 8.375%, 10/01/2030 | | 573,978 | |
| | Principal | | | | Market | |
| | Amount | | | | Value | |
| | | | Diversified Telecommunication | | | |
| | | | Services (Continued) | | | |
| | $ 410,000 | | Sbc Communications, Inc. | | | |
| | | | 5.100%, 09/15/2014 | $ | 389,801 | |
| | | | | | 3,157,849 | |
| | | | Electric Services - 0.25% | | | |
| | 700,000 | | CenterPoint Energy | | | |
| | | | Resources Corp. | | | |
| | | | 7.875%, 04/01/2013 (b) | | 780,911 | |
| | 700,000 | | Midamerican Energy Holdings | | | |
| | | | 7.520%, 09/15/2008 | | 732,875 | |
| | | | | | 1,513,786 | |
| | | | Electric Utilities - 0.54% | | | |
| | | | Dominion Resources Inc. | | | |
| | 80,000 | | 4.750%, 12/15/2010 | | 76,930 | |
| | 300,000 | | 5.700%, 09/17/2012 | | 297,647 | |
| | 295,000 | | Duke Energy Corp. | | | |
| | | | 5.625%, 11/30/2012 | | 295,754 | |
| | 340,000 | | Exelon Corp. | | | |
| | | | 5.625%, 06/15/2035 | | 309,619 | |
| | | | FirstEnergy Corp. | | | |
| | 200,000 | | 6.450%, 11/15/2011 | | 207,189 | |
| | 1,135,000 | | 7.375%, 11/15/2031 | | 1,264,557 | |
| | 130,000 | | Oncor Electric Delivery Co. | | | |
| | | | 6.375%, 01/15/2015 | | 134,376 | |
| | 170,000 | | Pacific Gas & Electric Co. | | | |
| | | | 6.050%, 03/01/2034 | | 166,911 | |
| | 475,000 | | Progress Energy, Inc. | | | |
| | | | 7.750%, 03/01/2031 | | 553,822 | |
| | | | | | 3,306,805 | |
| | | | Electrical Equipment - 0.35% | | | |
| | | | Tyco International Group S.A. | | | |
| | 500,000 | | 4.436%, 06/15/2007 | | | |
| | | | (Acquired 08/23/2004, | | | |
| | | | Cost $505,194) (c) | | 492,004 | |
| | 325,000 | | 6.375%, 10/15/2011 | | 334,025 | |
| | 1,285,000 | | 6.875%, 01/15/2029 | | 1,345,616 | |
| | | | | | 2,171,645 | |
| | | | Electronic Equipment -0.02% | | | |
| | 100,000 | | L-3 Communications Corp. | | | |
| | | | 6.375%, 10/15/2015 | | 99,000 | |
See notes to financial statements.
AssetMark Core Plus Fixed Income Fund
SCHEDULE OF INVESTMENTS (Continued)
| | Principal | | | | Market | |
| | Amount | | | | Value | |
| | | | CORPORATE BONDS (Continued) | | | |
| | | | Energy Equipment & Services - 0.02% | | | |
| | $ 60,000 | | Geophysique | | | |
| | | | 7.500%, 05/15/2015 | | | |
| | | | (Acquired 01/27/2006, | | | |
| | | | Cost $61,950) (c) | $ | 62,100 | |
| | 50,000 | | Pride International Inc. | | | |
| | | | 7.375%, 07/15/2014 | | 52,750 | |
| | 10,000 | | Semgroup LP | | | |
| | | | 8.750%, 11/15/2015 | | | |
| | | | (Acquired 11/04/2005, | | | |
| | | | Cost $9,838) (c) | | 10,250 | |
| | | | | | 125,100 | |
| | | | Food Products - 0.03% | | | |
| | 195,000 | | Kraft Foods, Inc. | | | |
| | | | 5.625%, 11/01/2011 | | 195,490 | |
| | | | Health Care Providers & Services - 0.33% | | | |
| | 100,000 | | Amerisourcebergen Corp. | | | |
| | | | 5.875%, 09/15/2015 | | | |
| | | | (Acquired 09/08/2005, | | | |
| | | | Cost $99,500) (c) | | 98,856 | |
| | 65,000 | | Davita, Inc. | | | |
| | | | 7.250%, 03/15/2015 | | 65,650 | |
| | | | HCA, Inc. | | | |
| | 500,000 | | 6.750%, 07/15/2013 | | 500,674 | |
| | 150,000 | | 5.750%, 03/15/2014 | | 141,093 | |
| | 190,000 | | 7.690%, 06/15/2025 | | 188,817 | |
| | 80,000 | | Service Corporation International | | | |
| | | | 7.000%, 06/15/2017 | | | |
| | | | (Acquired 06/10/2005, | | | |
| | | | Cost $79,202) (c) | | 81,800 | |
| | | | Tenet Healthcare Corp. | | | |
| | 39,000 | | 9.875%, 07/01/2014 | | 39,682 | |
| | 908,000 | | 9.500%, 02/01/2015 | | | |
| | | | (Acquired 01/25/2005, | | | |
| | | | Cost $893,526) (b)(c) | | 912,540 | |
| | | | | | 2,029,112 | |
| | | | Hotels Restaurants & Leisure - 0.23% | | | |
| | | | Boyd Gaming Corp. | | | |
| | 65,000 | | 6.750%, 04/15/2014 | | 65,162 | |
| | 160,000 | | 7.125%, 02/01/2016 | | 163,000 | |
| | 500,000 | | Harrahs Operating Company, Inc. | | | |
| | | | 5.500%, 07/01/2010 (b) | | 495,400 | |
| | Principal | | | | Market | |
| | Amount | | | | Value | |
| | | | Hotels Restaurants & Leisure (Continued) | | | |
| | $ 100,000 | | Host Marriott L P | | | |
| | | | 6.750%, 06/01/2016 | | | |
| | | | (Acquired 03/29/2006, | | | |
| | | | Cost $100,000) (c) | $ | 100,375 | |
| | 60,000 | | Inn of the Mountain Gods | | | |
| | | | Resort & Casino | | | |
| | | | 12.000%, 11/15/2010 | | 65,100 | |
| | | | MGM Mirage Inc. | | | |
| | 10,000 | | 9.500%, 08/01/2008 | | 10,687 | |
| | 180,000 | | 8.500%, 09/15/2010 | | 193,500 | |
| | 120,000 | | 6.625%, 07/15/2015 | | 118,650 | |
| | 30,000 | | Premier Entertainment Biloxi LLC | | | |
| | | | 10.750%, 02/01/2012 | | 28,800 | |
| | 20,000 | | River Rock Entertainment | | | |
| | | | 9.750%, 11/01/2011 | | 21,700 | |
| | | | Station Casinos, Inc. | | | |
| | 140,000 | | 6.875%, 03/01/2016 | | 141,400 | |
| | 15,000 | | 6.625%, 03/15/2018 | | | |
| | | | (Acquired 02/23/2006, | | | |
| | | | Cost $14,925) (c) | | 14,738 | |
| | | | | | 1,418,512 | |
| | | | Household Durables - 0.08% | | | |
| | 500,000 | | D.R. Horton, Inc. | | | |
| | | | 5.375%, 06/15/2012 | | 477,654 | |
| | | | Independent Power Producers | | | |
| | | | & Energy Traders - 0.30% | | | |
| | 120,000 | | Duke Energy Corp. | | | |
| | | | 6.250%, 01/15/2012 | | 123,811 | |
| | | | Txu Corp. | | | |
| | 500,000 | | 4.800%, 11/15/2009 | | 482,855 | |
| | 325,000 | | 6.500%, 11/15/2024 (b) | | 297,836 | |
| | 1,045,000 | | 6.550%, 11/15/2034 | | 948,281 | |
| | | | | | 1,852,783 | |
| | | | Insurance - 0.83% | | | |
| | 150,000 | | ACE Limited | | | |
| | | | 6.000%, 04/01/2007 | | 150,833 | |
| | 400,000 | | Arch Capital Group Ltd. | | | |
| | | | 7.350%, 05/01/2034 | | 429,639 | |
| | 130,000 | | ASIF Global Financing XIX | | | |
| | | | 4.900%, 01/17/2013 (Acquired | | | |
| | | | 05/18/2005 through 05/20/2005, | | | |
| | | | Cost $129,758) (c) | | 125,601 | |
See notes to financial statements.
AssetMark Core Plus Fixed Income Fund
SCHEDULE OF INVESTMENTS (Continued)
| | Principal | | | | Market | |
| | Amount | | | | Value | |
| | | | CORPORATE BONDS (Continued) | | | |
| | | | Insurance (Continued) | | | |
| | $ 1,250,000 | | ASIF Global Financing XXIII | | | |
| | | | 3.900%, 10/22/2008 | | | |
| | | | (Acquired 04/01/2005, | | | |
| | | | Cost $1,224,657) (c) | $ | 1,208,061 | |
| | 890,000 | | CNA Financial Corp. | | | |
| | | | 7.250%, 11/15/2023 | | 935,701 | |
| | 550,000 | | Endurance Specialty Holdings | | | |
| | | | 6.150%, 10/15/2015 | | 545,970 | |
| | 300,000 | | Liberty Mutual Group, Inc. | | | |
| | | | 7.000%, 03/15/2034 | | | |
| | | | (Acquired 09/09/2004, | | | |
| | | | Cost $304,413) (c) | | 305,740 | |
| | 650,000 | | Prudential Insurance Co. | | | |
| | | | 7.650%, 07/01/2007 | | | |
| | | | (Acquired 08/24/2004, | | | |
| | | | Cost $686,859) (c) | | 668,162 | |
| | 450,000 | | QBE Insurance Group Ltd. | | | |
| | | | 5.647%, 07/01/2023 (Callable | | | |
| | | | at $100.00 on 07/01/2013; | | | |
| | | | Acquired 08/23/2004, | | | |
| | | | Cost $441,198) (c)(d) | | 435,435 | |
| | 150,000 | | Royal & Sun Alliance Insurance | | | |
| | | | 8.500%, 12/08/2049 | | 304,524 | |
| | | | | | 5,109,666 | |
| | | | IT Services - 0.02% | | | |
| | 90,000 | | Sungard Data Systems, Inc. | | | |
| | | | 9.125%, 08/15/2013 | | | |
| | | | (Acquired 07/27/2005, | | | |
| | | | Cost $90,000) (c) | | 95,625 | |
| | | | Leisure Equipment & Products - 0.22% | | | |
| | 1,300,000 | | Eastman Kodak Co. | | | |
| | | | 6.375%, 06/15/2006 | | 1,307,055 | |
| | 50,000 | | Eastman Kodak Co. | | | |
| | | | 7.250%, 11/15/2013 | | 48,821 | |
| | | | | | 1,355,876 | |
| | | | Machinery - 0.02% | | | |
| | 95,000 | | Terex Corp. | | | |
| | | | 7.375%, 01/15/2014 | | 97,850 | |
| | | | Media - 0.91% | | | |
| | 30,000 | | Amc Entertainment, Inc. | | | |
| | | | 11.000%, 02/01/2016 | | | |
| | | | (Acquired 01/26/2006, | | | |
| | | | Cost $30,300) (c) | | 31,125 | |
| | Principal | | | | Market | |
| | Amount | | | | Value | |
| | | | Media (Continued) | | | |
| | | | Clear Channel | | | |
| | | | Communications, Inc. | | | |
| | $ 1,010,000 | | 5.500%, 09/15/2014 (b) | $ | 934,775 | |
| | 270,000 | | 4.900%, 05/15/2015 | | 236,614 | |
| | 150,000 | | 7.250%, 10/15/2027 | | 146,849 | |
| | 30,000 | | Clear Channel | | | |
| | | | Communications, Inc. | | | |
| | | | 4.625%, 01/15/2008 | | 29,469 | |
| | 320,000 | | Comcast Corp. | | | |
| | | | 6.500%, 01/15/2015 | | 328,410 | |
| | | | COX Communications, Inc. | | | |
| | 220,000 | | 3.875%, 10/01/2008 | | 210,828 | |
| | 1,000,000 | | 4.625%, 01/15/2010 | | 959,420 | |
| | 520,000 | | COX Enterprises, Inc. | | | |
| | | | 4.375%, 05/01/2008 | | | |
| | | | (Acquired 03/17/2005, | | | |
| | | | Cost $516,420) (c) | | 505,022 | |
| | | | CSC Holdings, Inc. | | | |
| | 45,000 | | 7.625%, 04/01/2011 | | 45,450 | |
| | 100,000 | | 7.625%, 07/15/2018 | | 99,375 | |
| | 140,000 | �� | DirecTV Holdings LLC | | | |
| | | | 6.375%, 06/15/2015 | | 138,950 | |
| | | | EchoStar DBS Corporation | | | |
| | 40,000 | | 6.625%, 10/01/2014 | | 38,850 | |
| | 160,000 | | 7.125%, 02/01/2016 | | | |
| | | | (Acquired 01/19/2006, | | | |
| | | | Cost $159,379) (c) | | 158,200 | |
| | 170,000 | | Kabel Deutschland GmbH | | | |
| | | | 10.625%, 07/01/2014 (Acquired | | | |
| | | | 01/10/2006 and 02/07/2006, | | | |
| | | | Cost $180,671) (c) | | 182,325 | |
| | | | Liberty Media Corp. | | | |
| | 460,000 | | 7.875%, 07/15/2009 | | 486,343 | |
| | 20,000 | | 5.700%, 05/15/2013 | | 18,698 | |
| | 70,000 | | Quebecor Media, Inc. | | | |
| | | | 7.750%, 03/15/2016 | | | |
| | | | (Acquired 01/11/2006, | | | |
| | | | Cost $70,000) (c) | | 72,275 | |
| | 40,000 | | The Reader’s Digest | | | |
| | | | Association Inc. | | | |
| | | | 6.500%, 03/01/2011 | | 40,100 | |
| | 20,000 | | Sinclair Broadcast Group, Inc. | | | |
| | | | 8.000%, 03/15/2012 | | 20,500 | |
See notes to financial statements.
AssetMark Core Plus Fixed Income Fund
SCHEDULE OF INVESTMENTS (Continued)
| | Principal | | | | Market | |
| | Amount | | | | Value | |
| | | | CORPORATE BONDS (Continued) | | | |
| | | | Media (Continued) | | | |
| | | | Time Warner, Inc. | | | |
| | $ 450,000 | | 6.875%, 05/01/2012 | $ | 472,398 | |
| | 405,000 | | 7.700%, 05/01/2032 | | 446,701 | |
| | | | | | 5,602,677 | |
| | | | Metals & Mining - 0.02% | | | |
| | 100,000 | | Codelco Inc. | | | |
| | | | 4.750%, 10/15/2014 | | | |
| | | | (Acquired 10/21/2004, | | | |
| | | | Cost $98,482) (c) | | 93,768 | |
| | | | Multiline Retail - 0.26% | | | |
| | 40,000 | | JCPenney Co., Inc. | | | |
| | | | 7.400%, 04/01/2037 | | 43,328 | |
| | 470,000 | | Target Corp. | | | |
| | | | 5.400%, 10/01/2008 (b) | | 472,632 | |
| | 1,150,000 | | Wal-Mart Stores, Inc. | | | |
| | | | 3.375%, 10/01/2008 | | 1,102,735 | |
| | | | | | 1,618,695 | |
| | | | Multi-Utilities - 0.09% | | | |
| | 400,000 | | Midamerican Energy Holdings | | | |
| | | | 6.125%, 04/01/2036 | | | |
| | | | (Acquired 03/21/2006, | | | |
| | | | Cost $399,828) (c) | | 392,887 | |
| | 170,000 | | Nrg Energy, Inc. | | | |
| | | | 7.250%, 02/01/2014 | | 173,188 | |
| | | | | | 566,075 | |
| | | | Multi-Utilities & Unregulated Power - 0.02% | | | |
| | 60,000 | | AES Corp/The | | | |
| | | | 7.750%, 03/01/2014 | | 63,300 | |
| | 50,000 | | CenterPoint Energy, Inc. | | | |
| | | | 7.250%, 09/01/2010 | | 52,797 | |
| | | | | | 116,097 | |
| | | | Oil & Gas - 1.54% | | | |
| | 830,000 | | Amerada Hess Corp. | | | |
| | | | 7.300%, 08/15/2031 | | 926,942 | |
| | 50,000 | | Amerigas Partners L P | | | |
| | | | 7.250%, 05/20/2015 | | 50,250 | |
| | 380,000 | | Anadarko Finance Co. | | | |
| | | | 6.750%, 05/01/2011 | | 400,827 | |
| | 445,000 | | Apache Finance Canada Corp. | | | |
| | | | 4.375%, 05/15/2015 | | 410,227 | |
| | Principal | | | | Market | |
| | Amount | | | | Value | |
| | | | Oil & Gas (Continued) | | | |
| | | | Chesapeake Energy Corp. | | | |
| | $ 60,000 | | 6.375%, 06/15/2015 | $ | 59,325 | |
| | 80,000 | | 6.250%, 01/15/2018 | | 78,600 | |
| | 420,000 | | ChevronTexaco Capital Co. | | | |
| | | | 3.500%, 09/17/2007 | | 410,482 | |
| | 70,000 | | Conoco Funding Co. | | | |
| | | | 6.350%, 10/15/2011 (b) | | 73,071 | |
| | 385,000 | | Conoco Inc. | | | |
| | | | 6.950%, 04/15/2029 | | 436,868 | |
| | 285,000 | | ConocoPhillips Inc. | | | |
| | | | 4.750%, 10/15/2012 | | 275,214 | |
| | 415,000 | | Devon Energy Corporation | | | |
| | | | 7.950%, 04/15/2032 | | 509,779 | |
| | 309,000 | | El Paso Natural Gas Co. | | | |
| | | | 8.375%, 06/15/2032 | | 350,936 | |
| | | | El Paso Corp. | | | |
| | 538,000 | | 7.800%, 08/01/2031 (b) | | 543,380 | |
| | 400,000 | | 7.750%, 01/15/2032 (b) | | 405,000 | |
| | | | Energy Transfer Partners L P | | | |
| | 425,000 | | 5.650%, 08/01/2012 (Acquired | | | |
| | | | 08/19/2005 and 09/26/2005, | | | |
| | | | Cost $425,480) (c) | | 418,358 | |
| | 425,000 | | 5.950%, 02/01/2015 | | 421,941 | |
| | 1,255,000 | | Kerr-McGee Corp. | | | |
| | | | 7.875%, 09/15/2031 | | 1,439,801 | |
| | 50,000 | | Peabody Energy Corp. | | | |
| | | | 5.875%, 04/15/2016 | | 47,875 | |
| | | | Pemex Project Funding | | | |
| | | | Master Trust | | | |
| | 560,000 | | 7.375%, 12/15/2014 | | 599,200 | |
| | 230,000 | | 6.625%, 06/15/2035 (Acquired | | | |
| | | | 01/26/2006 and 01/27/2006, | | | |
| | | | Cost $229,343) (c) | | 222,468 | |
| | 100,000 | | Pogo Producing Co. | | | |
| | | | 6.875%, 10/01/2017 | | 99,250 | |
| | 185,000 | | Suburban Propane Partners L.P. | | | |
| | | | 6.875%, 12/15/2013 (b) | | 178,525 | |
| | 70,000 | | Vintage Petroleum, Inc. | | | |
| | | | 7.875%, 05/15/2011 | | 72,808 | |
| | 150,000 | | Western Oil Sands, Inc. | | | |
| | | | 8.375%, 05/01/2012 | | 167,250 | |
| | 800,000 | | Williams Companies, Inc. | | | |
| | | | 7.500%, 01/15/2031 | | 834,000 | |
| | | | | | 9,432,377 | |
See notes to financial statements.
AssetMark Core Plus Fixed Income Fund
SCHEDULE OF INVESTMENTS (Continued)
| | Principal | | | | Market | |
| | Amount | | | | Value | |
| | | | CORPORATE BONDS (Continued) | | | |
| | | | Paper & Forest Products - 0.12% | | | |
| | $ 705,000 | | Weyerhaeuser Co. | | | |
| | | | 6.750%, 03/15/2012 | $ | 734,812 | |
| | | | Real Estate - 0.42% | | | |
| | 250,000 | | Arden Realty LP | | | |
| | | | 9.150%, 03/01/2010 | | 283,281 | |
| | 300,000 | | EOP Operating L.P. | | | |
| | | | 7.750%, 11/15/2007 | | 310,234 | |
| | | | Forest City Enterprises, Inc. | | | |
| | 10,000 | | 7.625%, 06/01/2015 | | 10,600 | |
| | 29,000 | | 6.500%, 02/01/2017 | | 28,782 | |
| | | | iStar Financial, Inc. | | | |
| | 225,000 | | 5.125%, 04/01/2011 | | 217,415 | |
| | 325,000 | | 5.650%, 09/15/2011 (b) | | 320,928 | |
| | 100,000 | | 5.700%, 03/01/2014 | | 97,672 | |
| | 225,000 | | 8.750%, 08/15/2008 | | 240,729 | |
| | 350,000 | | Simon Property Group, L.P. | | | |
| | | | 7.125%, 09/20/2007 | | 358,366 | |
| | 515,000 | | Summit Properties Partnership | | | |
| | | | 7.200%, 08/15/2007 | | 523,797 | |
| | | | Ventas Realty L.P. | | | |
| | 50,000 | | 6.750%, 06/01/2010 | | 50,750 | |
| | 40,000 | | 9.000%, 05/01/2012 | | 45,100 | |
| | 30,000 | | 6.625%, 10/15/2014 | | 30,150 | |
| | 40,000 | | 7.125%, 06/01/2015 | | 41,300 | |
| | | | | | 2,559,104 | |
| | | | Road & Rail - 0.05% | | | |
| | 80,000 | | Hertz Corp. | | | |
| | | | 8.875%, 01/01/2014 (Acquired | | | |
| | | | 12/15/2005 and 01/25/2006, | | | |
| | | | Cost $80,156) (c) | | 83,400 | |
| | 14,000 | | Kansas City Southern Railway Co. | | | |
| | | | 9.500%, 10/01/2008 | | 15,015 | |
| | 230,000 | | Union Pacific Corp. | | | |
| | | | 5.375%, 05/01/2014 | | 226,327 | |
| | | | | | 324,742 | |
| | | | Software - 0.12% | | | |
| | 750,000 | | Computer Associates, Inc. | | | |
| | | | 4.750%, 12/01/2009 (Acquired | | | |
| | | | 05/26/2005 and 08/31/2005, | | | |
| | | | Cost $744,228) (c) | | 730,640 | |
| | | | Special Purpose Entity - 0.06% | | | |
| | 30,000 | | Hexion | | | |
| | | | 9.000%, 07/15/2014 | | 31,050 | |
| | Principal | | | | Market | |
| | Amount | | | | Value | |
| | | | Special Purpose Entity (Continued) | | | |
| | $ 330,000 | | Mufg Capital Finance 1 Ltd. | | | |
| | | | 6.346%, 07/29/2049 | $ | 325,919 | |
| | | | | | 356,969 | |
| | | | Specialty Retail - 0.00% | | | |
| | 25,000 | | Amerigas Partners L P | | | |
| | | | 7.125%, 05/20/2016 | | 25,000 | |
| | | | Textiles, Apparel & Luxury Goods - 0.02% | | | |
| | 50,000 | | Oxford Industries, Inc. | | | |
| | | | 8.875%, 06/01/2011 | | 51,750 | |
| | 51,000 | | Russell Corp. | | | |
| | | | 9.250%, 05/01/2010 | | 53,167 | |
| | | | | | 104,917 | |
| | | | Tobacco - 0.19% | | | |
| | 770,000 | | Altria Group, Inc. | | | |
| | | | 7.000%, 11/04/2013 | | 829,060 | |
| | 300,000 | | Philip Morris Companies, Inc. | | | |
| | | | 7.750%, 01/15/2027 | | 344,218 | |
| | | | | | 1,173,278 | |
| | | | Transportation - 0.03% | | | |
| | 41,000 | | Horizon Lines Llc | | | |
| | | | 9.000%, 11/01/2012 | | 43,562 | |
| | 60,000 | | Omi Corp. | | | |
| | | | 7.625%, 12/01/2013 | | 61,650 | |
| | 86,000 | | Teekay Shipping Corp. | | | |
| | | | 8.875%, 07/15/2011 | | 95,030 | |
| | | | | | 200,242 | |
| | | | Wireless Communication Services - 0.01% | | | |
| | 40,000 | | Rogers Wireless | | | |
| | | | Communications, Inc. | | | |
| | | | 6.375%, 03/01/2014 | | 40,100 | |
| | | | Wireless Telecommunication Services - 0.06% | | | |
| | 225,000 | | America Movil SA de CV | | | |
| | | | 6.375%, 03/01/2035 | | 212,677 | |
| | | | Nextel Communications, Inc. | | | |
| | 15,000 | | 5.950%, 03/15/2014 | | 14,869 | |
| | 120,000 | | 7.375%, 08/01/2015 | | 125,941 | |
| | | | | | 353,487 | |
| | | | Total Corporate Bonds | | | |
| | | | (Cost $98,249,242) | | 97,071,955 | |
See notes to financial statements.
AssetMark Core Plus Fixed Income Fund
SCHEDULE OF INVESTMENTS (Continued)
| | Principal | | | | Market | |
| | Amount | | | | Value | |
| | | | FOREIGN GOVERNMENT | | | |
| | | | NOTE/BONDS - 3.71% | | | |
| | $ 2,900,000 | | Arab Republic of Egypt | | | |
| | | | 4.450%, 09/15/2015 | $ | 2,738,186 | |
| | | | Brazil Federative Republic | | | |
| | 284,000 | | 8.875%, 04/15/2024 | | 329,014 | |
| | 75,000 | | 10.125%, 05/15/2027 | | 97,425 | |
| | 222,000 | | 12.250%, 03/06/2030 | | 338,550 | |
| | 766,000 | | 11.000%, 08/17/2040 (b) | | 983,735 | |
| | 813,380 | | Canadian Government | | | |
| | | | Inflationary Index Note | | | |
| | | | 4.000%, 12/01/2031 CAD | | 1,051,331 | |
| | 780,000 | | Ministry of Finance of Russia | | | |
| | | | 3.000%, 05/14/2008 | | 740,844 | |
| | 1,390,000 | | Queensland Treasury Corp. | | | |
| | | | 6.000%, 06/14/2011 AUD | | 1,017,354 | |
| | | | Republic of Argentina | | | |
| | 810,000 | | 2.000%, 01/03/2016 ARS | | 475,813 | |
| | 5,756,676 | | 0.000%, 12/15/2035 ARS | | 171,883 | |
| | 510,000 | | Republic of Columbia | | | |
| | | | 11.750%, 02/25/2020 | | 729,300 | |
| | 10,000 | | Republic of Guatemala | | | |
| | | | 8.125%, 10/06/2034 (c) | | 11,400 | |
| | 540,000 | | Republic of Panama | | | |
| | | | 7.125%, 01/29/2026 | | 553,500 | |
| | | | Republic of Peru | | 279,147 | |
| | 292,300 | | 5.000%, 03/07/2017 (d) | | | |
| | 150,000 | | 7.350%, 07/21/2025 | | 148,125 | |
| | 179,000 | | 8.750%, 11/21/2033 | | 200,480 | |
| | | | Russia Government | | | |
| | | | International Bond | | | |
| | 270,000 | | 5.000%, 03/31/2030 | | 296,884 | |
| | 3,050,000 | | 5.000%, 03/31/2030 | | 3,353,692 | |
| | 860,000 | | State of Qatar | | | |
| | | | 9.750%, 06/15/2030 | | 1,266,350 | |
| | | | United Mexican States | | | |
| | 48,060,000 | | 8.000%, 12/19/2013 MXN | | 4,278,331 | |
| | 66,000 | | 5.625%, 01/15/2017 | | 64,086 | |
| | 520,000 | | 11.500%, 05/15/2026 (b) | | 808,600 | |
| | 400,000 | | 8.300%, 08/15/2031 | | 484,400 | |
| | 2,044,000 | | 7.500%, 04/08/2033 | | 2,284,170 | |
| | | | Total Foreign Government | | | |
| | | | Note/Bonds (Cost $21,599,922) | | 22,702,600 | |
| | Principal | | | | Market | |
| | Amount | | | | Value | |
| | | | MORTGAGE BACKED SECURITIES - 35.18% | | | |
| | | | Bank of America Corporation | | | |
| | $ 770,000 | | Series 2005-5, | | | |
| | | | 5.115%, 10/10/2045 | $ | 745,203 | |
| | 3,500,000 | | Series 2005-6, | | | |
| | | | 5.182%, 09/10/2047 | | 3,416,357 | |
| | | | Bear Stearns Trust | | | |
| | 919,683 | | Series 2004-9, | | | |
| | | | 5.226%, 09/25/2034 | | 912,024 | |
| | 3,000,000 | | Series 2005-PWR10, | | | |
| | | | 5.405%, 12/11/2040 | | 2,961,176 | |
| | 2,500,000 | | Citigroup/Deutsche Bank | | | |
| | | | Commercial Mortgage | | | |
| | | | Series TR, 5.545%, 01/15/2046 | | 2,467,558 | |
| | | | Countrywide Asset-Backed | | | |
| | | | Certificates | | | |
| | 1,387,601 | | Series 2005-36, | | | |
| | | | 4.995%, 08/25/2035 | | 1,366,497 | |
| | 2,387,406 | | Series 2005-27, | | | |
| | | | 5.178%, 08/25/2035 | | 2,332,421 | |
| | 1,403,117 | | Series 2005-51, | | | |
| | | | 5.096%, 11/20/2035 | | 1,410,281 | |
| | 1,974,337 | | Series 2005-59, | | | |
| | | | 5.106%, 11/20/2035 | | 1,985,694 | |
| | 2,964,724 | | Series 2005-62, | | | |
| | | | 5.118%, 12/25/2035 | | 2,976,651 | |
| | 1,562,599 | | Countrywide Home Loans | | | |
| | | | Series 2005-R1, | | | |
| | | | 4.941%, 03/25/2035 | | 1,567,993 | |
| | | | FHLMC | | | |
| | 1,000,000 | | Series 2590, | | | |
| | | | 5.000%, 03/15/2018 | | 971,635 | |
| | 1,950,057 | | Pool #C9-0732, | | | |
| | | | 5.500%, 11/01/2023 | | 1,923,014 | |
| | 5,384,138 | | Pool #1G-0058, | | | |
| | | | 4.608%, 01/01/2035 | | 5,289,236 | |
| | 2,815,321 | | Pool #1H-2524, | | | |
| | | | 4.583%, 08/01/2035 | | 2,758,347 | |
| | 3,569,015 | | Pool #1J-1216, | | | |
| | | | 4.966%, 08/01/2035 | | 3,531,659 | |
| | | | FHLMC Gold | | | |
| | 975,855 | | Pool #D9-6291, | | | |
| | | | 4.500%, 09/01/2023 | | 917,861 | |
| | 982,919 | | Pool #C9-0932, | | | |
| | | | 5.500%, 11/01/2025 | | 967,664 | |
See notes to financial statements.
AssetMark Core Plus Fixed Income Fund
SCHEDULE OF INVESTMENTS (Continued)
| | Principal | | | | Market | |
| | Amount | | | | Value | |
| | | | MORTGAGE BACKED | | | |
| | | | SECURITIES (Continued) | | | |
| | | | FHLMC Gold (Continued) | | | |
| | $ 766,228 | | Pool #C0-1385, | | | |
| | | | 6.500%, 08/01/2032 | $ | 782,975 | |
| | 276,084 | | Pool #C7-0562, | | | |
| | | | 6.500%, 09/01/2032 | | 282,118 | |
| | 291,151 | | Pool #C7-0760, | | | |
| | | | 6.500%, 09/01/2032 | | 297,514 | |
| | 3,985,067 | | Pool #G0-1767, | | | |
| | | | 6.500%, 12/01/2032 | | 4,074,573 | |
| | 3,239,385 | | Pool #78-0447, | | | |
| | | | 4.255%, 04/01/2033 | | 3,177,197 | |
| | 3,948,420 | | Pool #G0-8085, | | | |
| | | | 5.000%, 10/01/2035 | | 3,758,956 | |
| | 56,343 | | First Franklin Mortgage Loan | | | |
| | | | Asset-Backed Certificates | | | |
| | | | Series 2004-FF2, | | | |
| | | | 4.781%, 03/25/2034 | | 56,369 | |
| | 3,000,000 | | First Union National Bank | | | |
| | | | Commercial Mortgage | | | |
| | | | Series 2000-C2, | | | |
| | | | 7.202%, 10/15/2032 | | 3,205,117 | |
| | | | FNMA | | | |
| | 3,639,644 | | Pool #668357, | | | |
| | | | 5.000%, 12/01/2017 | | 3,559,391 | |
| | 197,489 | | Pool #695826, | | | |
| | | | 5.000%, 04/01/2018 | | 192,990 | |
| | 674,436 | | Pool #745388, | | | |
| | | | 5.000%, 11/01/2018 | | 659,070 | |
| | 1,113,635 | | Pool #745387, | | | |
| | | | 5.000%, 04/01/2019 | | 1,088,264 | |
| | 1,162,786 | | Pool #254832, | | | |
| | | | 5.500%, 08/01/2023 | | 1,146,420 | |
| | 1,964,984 | | Pool #254915, | | | |
| | | | 4.500%, 09/01/2023 | | 1,848,188 | |
| | 134,215 | | Pool #251925, | | | |
| | | | 6.500%, 07/01/2028 | | 137,654 | |
| | 120,069 | | Pool #435151, | | | |
| | | | 6.500%, 07/01/2028 | | 123,145 | |
| | 581,885 | | Pool #433575, | | | |
| | | | 6.500%, 09/01/2028 | | 596,794 | |
| | 460,824 | | Pool #251985, | | | |
| | | | 6.500%, 10/01/2028 | | 472,631 | |
| | 673,991 | | Pool #446107, | | | |
| | | | 6.500%, 11/01/2028 | | 691,260 | |
| | Principal | | | | Market | |
| | Amount | | | | Value | |
| | | | MORTGAGE BACKED | | | |
| | | | SECURITIES (Continued) | | | |
| | | | FNMA (Continued) | | | |
| | $ 758,656 | | Pool #452955, | | | |
| | | | 6.500%, 11/01/2028 | $ | 778,094 | |
| | 392,321 | | Pool #457553, | | | |
| | | | 6.500%, 01/01/2029 | | 402,373 | |
| | 293,471 | | Pool #252255, | | | |
| | | | 6.500%, 02/01/2029 | | 300,991 | |
| | 185,273 | | Pool #252342, | | | |
| | | | 6.500%, 04/01/2029 | | 190,000 | |
| | 688,782 | | Pool #323632, | | | |
| | | | 6.500%, 04/01/2029 | | 706,413 | |
| | 791,706 | | Pool #494339, | | | |
| | | | 6.500%, 04/01/2029 | | 811,906 | |
| | 166,012 | | Pool #252497, | | | |
| | | | 6.500%, 06/01/2029 | | 170,248 | |
| | 87,459 | | Pool #498092, | | | |
| | | | 6.500%, 06/01/2029 | | 89,690 | |
| | 682,731 | | Pool #500441, | | | |
| | | | 6.500%, 06/01/2029 | | 700,150 | |
| | 888,120 | | Pool #501198, | | | |
| | | | 6.500%, 06/01/2029 | | 910,780 | |
| | 386,140 | | Pool #503223, | | | |
| | | | 6.500%, 07/01/2029 | | 395,992 | |
| | 106,226 | | Pool #504708, | | | |
| | | | 6.500%, 07/01/2029 | | 108,937 | |
| | 111,250 | | Pool #535476, | | | |
| | | | 6.500%, 07/01/2029 | | 114,100 | |
| | 1,383,086 | | Pool #544859, | | | |
| | | | 5.098%, 08/01/2029 | | 1,373,544 | |
| | 83,051 | | Pool #535506, | | | |
| | | | 6.500%, 08/01/2030 | | 85,170 | |
| | 1,897,849 | | Pool #786848, | | | |
| | | | 7.000%, 10/01/2031 | | 1,958,677 | |
| | 1,216,998 | | Pool #607398, | | | |
| | | | 6.500%, 11/01/2031 | | 1,245,502 | |
| | 1,980,648 | | Pool #879906, | | | |
| | | | 3.854%, 10/01/2033 | | 1,932,622 | |
| | 1,917,963 | | Pool #733132, | | | |
| | | | 3.535%, 04/01/2034 | | 1,907,613 | |
| | 1,636,113 | | Pool #782284, | | | |
| | | | 6.000%, 09/01/2034 | | 1,637,500 | |
| | 1,414,607 | | Pool #791563, | | | |
| | | | 6.000%, 09/01/2034 | | 1,415,644 | |
See notes to financial statements.
AssetMark Core Plus Fixed Income Fund
SCHEDULE OF INVESTMENTS (Continued)
| | Principal | | | | Market | |
| | Amount | | | | Value | |
| | | | MORTGAGE BACKED | | | |
| | | | SECURITIES (Continued) | | | |
| | | | FNMA (Continued) | | | |
| | $ 63,983 | | Pool #794371, | | | |
| | | | 6.000%, 09/01/2034 | $ | 64,030 | |
| | 2,798,868 | | Pool #802783, | | | |
| | | | 4.200%, 10/01/2034 | | 2,768,896 | |
| | 305,615 | | Pool #798711, | | | |
| | | | 6.000%, 10/01/2034 | | 305,839 | |
| | 1,618,664 | | Pool #802493, | | | |
| | | | 6.000%, 11/01/2034 | | 1,619,851 | |
| | 11,176,282 | | Pool #735224, | | | |
| | | | 5.500%, 02/01/2035 | | 10,934,668 | |
| | 3,609,171 | | Pool #808057, | | | |
| | | | 6.000%, 02/01/2035 | | 3,611,579 | |
| | 1,531,323 | | Pool #773306, | | | |
| | | | 6.000%, 05/01/2035 | | 1,532,345 | |
| | 9,141,628 | | Pool #827741, | | | |
| | | | 5.500%, 06/01/2035 | | 8,928,762 | |
| | 2,573,013 | | Pool #829334, | | | |
| | | | 4.587%, 09/01/2035 | | 2,547,145 | |
| | 6,229,579 | | Pool #820345, | | | |
| | | | 5.000%, 09/01/2035 | | 5,934,056 | |
| | 15,275,685 | | Pool #832738, | | | |
| | | | 5.500%, 09/01/2035 (b) | | 14,919,986 | |
| | 590,812 | | Pool #836273, | | | |
| | | | 5.500%, 10/01/2035 | | 577,055 | |
| | 2,738,307 | | Pool #836464, | | | |
| | | | 5.655%, 10/01/2035 | | 2,803,424 | |
| | 1,674,261 | | Pool #836852, | | | |
| | | | 5.655%, 10/01/2035 | | 1,714,074 | |
| | 195,111 | | Pool #745000, | | | |
| | | | 6.000%, 10/01/2035 | | 195,241 | |
| | 3,961,234 | | Pool #844158, | | | |
| | | | 5.000%, 11/01/2035 | | 3,773,318 | |
| | 1,084,497 | | Pool #843823, | | | |
| | | | 5.645%, 11/01/2035 | | 1,110,260 | |
| | 200,146 | | Pool #843997, | | | |
| | | | 5.651%, 11/01/2035 | | 204,906 | |
| | 196,728 | | Pool #844052, | | | |
| | | | 5.654%, 11/01/2035 | | 201,406 | |
| | 198,795 | | Pool #844148, | | | |
| | | | 5.657%, 11/01/2035 | | 203,522 | |
| | 199,265 | | Pool #844237, | | | |
| | | | 5.656%, 11/01/2035 | | 204,003 | |
| | Principal | | | | Market | |
| | Amount | | | | Value | |
| | | | MORTGAGE BACKED | | | |
| | | | SECURITIES (Continued) | | | |
| | | | FNMA (Continued) | | | |
| | $ 198,291 | | Pool #844789, | | | |
| | | | 5.661%, 11/01/2035 | $ | 203,011 | |
| | 3,000,000 | | GE Capital Commercial | | | |
| | | | Mortgage Corporation | | | |
| | | | Series 2005-C4, | | | |
| | | | 5.331%, 11/10/2045 | | 2,961,116 | |
| | 2,500,000 | | General Motors | | | |
| | | | Acceptance Corporation | | | |
| | | | Series 2002-C1, | | | |
| | | | 6.278%, 11/15/2039 | | 2,595,051 | |
| | | | GNMA | | | |
| | 1,901,871 | | Pool #618907X, | | | |
| | | | 5.000%, 09/15/2033 | | 1,845,541 | |
| | 669,024 | | Pool #081116M, | | | |
| | | | 4.750%, 10/20/2034 | | 661,220 | |
| | 198,924 | | Pool #520279X, | | | |
| | | | 5.000%, 11/15/2034 | | 192,959 | |
| | 760,299 | | Pool #081150M, | | | |
| | | | 4.500%, 11/20/2034 | | 750,930 | |
| | 2,139,382 | | Pool #081153M, | | | |
| | | | 4.750%, 11/20/2034 | | 2,114,366 | |
| | 4,775,127 | | Pool #644812X, | | | |
| | | | 6.000%, 05/15/2035 | | 4,832,985 | |
| | 800,000 | | GS Mortgage Securities | | | |
| | | | Corporation II | | | |
| | | | Series 2005-GG4, | | | |
| | | | 4.680%, 07/10/2039 | | 765,565 | |
| | | | Harborview Mortgage Loan Trust | | | |
| | 2,921,447 | | Series 2005-10, | | | |
| | | | 5.086%, 11/19/2035 | | 2,924,433 | |
| | 884,795 | | Series 2005-16, | | | |
| | | | 5.016%, 01/19/2036 | | 886,912 | |
| | 3,485,104 | | Series 2005-16, | | | |
| | | | 5.026%, 01/19/2036 | | 3,494,336 | |
| | 2,837,968 | | IMPAC Secured Assets Corp. | | | |
| | | | Series 2005-2, | | | |
| | | | 4.901%, 03/25/2036 | | 2,851,619 | |
| | 612,709 | | Indymac Mortgage Loan Trust | | | |
| | | | Series 2005-AR15, | | | |
| | | | 5.099%, 09/25/2035 | | 590,118 | |
| | | | JP Morgan Commercial Mortgage | | | |
| | 1,880,000 | | Series 2005-CIBC12, | | | |
| | | | 4.895%, 09/12/2037 | | 1,788,839 | |
See notes to financial statements.
AssetMark Core Plus Fixed Income Fund
SCHEDULE OF INVESTMENTS (Continued)
| | Principal | | | | Market | |
| | Amount | | | | Value | |
| | | | MORTGAGE BACKED | | | |
| | | | SECURITIES (Continued) | | | |
| | | | JP Morgan Commercial Mortgage (continued) | | | |
| | $ 1,500,000 | | Series 2005-LDP2, | | | |
| | | | 4.738%, 07/15/2042 | $ | 1,409,405 | |
| | | | Lehman Brothers Trust | | | |
| | 2,493,900 | | Series 2005-5N, | | | |
| | | | 4.881%, 11/25/2035 | | 2,489,224 | |
| | 2,343,761 | | Series 2005-5N, | | | |
| | | | 5.118%, 11/25/2035 | | 2,347,061 | |
| | | | Lehman Brothers-UBS | | | |
| | | | Commercial Mortgage Trust | | | |
| | 600,000 | | Series 2005-C3, | | | |
| | | | 4.664%, 07/15/2030 | | 572,567 | |
| | 520,000 | | Series 2005-C3, | | | |
| | | | 4.739%, 07/15/2030 | | 490,209 | |
| | 2,000,000 | | Series 2006-C1, | | | |
| | | | 5.156%, 02/15/2031 | | 1,938,875 | |
| | 770,000 | | Morgan Stanley | | | |
| | | | Series 2005-HQ6, | | | |
| | | | 4.989%, 08/13/2042 (b) | | 738,424 | |
| | 2,429,169 | | Residential Accredit Loans, Inc. | | | |
| | | | Series 2005-QO4, | | | |
| | | | 5.098%, 12/25/2045 | | 2,440,578 | |
| | 4,760,383 | | Thornburg Mortgage Trust | | | |
| | | | Series 2006-1, | | | |
| | | | 4.988%, 01/25/2036 | | 4,753,880 | |
| | | | Washington Mutual | | | |
| | 3,293,555 | | Series 2005-AR13, | | | |
| | | | 5.108%, 10/25/2045 | | 3,311,140 | |
| | 3,396,249 | | Series 2005-AR15, | | | |
| | | | 4.841%, 11/25/2045 | | 3,404,264 | |
| | 2,814,035 | | Series 2005-AR15, | | | |
| | | | 4.861%, 11/25/2045 | | 2,822,096 | |
| | 2,924,530 | | Series 2005-AR17, | | | |
| | | | 5.088%, 12/25/2045 | | 2,932,164 | |
| | 2,932,243 | | Series 2005-AR19, | | | |
| | | | 5.088%, 12/25/2045 | | 2,939,649 | |
| | | | Wells Fargo Company | | | |
| | 2,564,346 | | Series 2005-AR16, | | | |
| | | | 4.979%, 10/25/2035 | | 2,549,242 | |
| | 5,000,000 | | Series 2006-AR2, | | | |
| | | | 5.095%, 03/25/2036 | | 4,941,578 | |
| | | | Total Mortgage Backed Securities | | | |
| | | | (Cost $219,039,234) | | 215,581,566 | |
| | Principal | | | | Market | |
| | Amount | | | | Value | |
| | | | SUPRANATIONAL OBLIGATIONS - 0.23% | | | |
| | $ 1,150,000 | | Argentina | | | |
| | | | 11.375%, 03/15/2010 (Default | | | |
| | | | effective 03/01/2002) (f) | $ | 347,875 | |
| | 820,000 | | Gazinvest | | | |
| | | | 7.250%, 10/30/2008 | | 843,862 | |
| | 250,000 | | General Motors Corporation | | | |
| | | | 8.375%, 07/05/2033 EUR | | 218,746 | |
| | | | Total Supranational Obligations | | | |
| | | | (Cost $1,558,134) | | 1,410,483 | |
| | | | U.S. GOVERNMENT | | | |
| | | | AGENCY ISSUES - 24.18% | | | |
| | | | FAMC - 0.07% | | | |
| | 420,000 | | 4.250%, 07/29/2008 | | 412,741 | |
| | | | FFCB - 2.14% | | | |
| | 2,000,000 | | 3.800%, 09/07/2007 (b) | | 1,964,874 | |
| | 3,000,000 | | 3.625%, 01/04/2008 (b) | | 2,928,288 | |
| | 4,000,000 | | 4.550%, 08/10/2012 (b) | | 3,879,440 | |
| | 3,000,000 | | 4.500%, 01/22/2015 (b) | | 2,855,637 | |
| | 1,500,000 | | 4.800%, 10/19/2015 (b) | | 1,456,914 | |
| | | | FHLB - 3.31% | | | |
| | 1,400,000 | | 4.800%, 02/15/2007 (b) | | 1,396,245 | |
| | 4,000,000 | | 4.320%, 03/20/2008 (b) | | 3,946,176 | |
| | 760,000 | | 4.125%, 04/18/2008 | | 746,898 | |
| | 4,000,000 | | 7.375%, 02/12/2010 (b) | | 4,307,868 | |
| | 1,200,000 | | 4.080%, 04/26/2010 (b) | | 1,154,817 | |
| | 3,000,000 | | 4.000%, 02/15/2011 (b) | | 2,854,068 | |
| | 6,000,000 | | 4.875%, 12/14/2012 (b) | | 5,905,086 | |
| | | | FHLMC - 3.97% | | | |
| | 5,200,000 | | 4.125%, 04/02/2007 (b) | | 5,150,564 | |
| | 6,000,000 | | 3.550%, 11/15/2007 (b) | | 5,857,410 | |
| | 1,990,000 | | 4.375%, 11/16/2007 (b) | | 1,968,398 | |
| | 3,500,000 | | 4.125%, 10/18/2010 (b) | | 3,359,566 | |
| | 3,070,000 | | 4.750%, 01/18/2011 (b) | | 3,020,634 | |
| | 2,010,000 | | 5.000%, 07/15/2014 (b) | | 1,986,216 | |
| | 1,000,000 | | 5.000%, 04/15/2021 (g) | | 974,688 | |
| | 1,170,000 | | 5.625%, 11/23/2035 (b) | | 1,127,190 | |
| | 900,000 | | 5.000%, 04/01/2035 (g) | | 856,406 | |
| | | | FNCL - 5.22% | | | |
| | 33,600,000 | | 5.000%, 05/01/2034 (g) | | 31,972,483 | |
| | | | FNMA - 7.14% | | | |
| | 3,000,000 | | 3.250%, 07/12/2006 (b) | | 2,985,747 | |
| | 3,000,000 | | 3.550%, 01/12/2007 (b) | | 2,964,600 | |
| | 220,000 | | 3.875%, 02/15/2010 | | 210,510 | |
| | 3,400,000 | | 4.750%, 12/15/2010 (b) | | 3,345,525 | |
| | 1,000,000 | | 5.500%, 03/15/2011 (b) | | 1,015,368 | |
See notes to financial statements.
AssetMark Core Plus Fixed Income Fund
SCHEDULE OF INVESTMENTS (Continued)
| | Principal | | | | Market | |
| | Amount | | | | Value | |
| | | | U.S. GOVERNMENT | | | |
| | | | AGENCY ISSUES (Continued) | | | |
| | | | FNMA (Continued) | | | |
| | $ 1,100,000 | | 6.000%, 05/15/2011 (b) | $ | 1,141,643 | |
| | 1,200,000 | | 4.750%, 02/21/2013 (b) | | 1,164,635 | |
| | 1,000,000 | | 5.000%, 04/01/2019 (g) | | 975,000 | |
| | 8,000,000 | | 5.000%, 04/15/2020 (g) | | 7,800,000 | |
| | 3,700,000 | | 5.500%, 05/01/2034 (g) | | 3,608,654 | |
| | 200,000 | | 5.000%, 04/01/2035 (g) | | 190,438 | |
| | 7,200,000 | | 6.000%, 05/15/2035 (g) | | 7,191,000 | |
| | 1,300,000 | | 6.500%, 05/01/2029 (g) | | 1,324,781 | |
| | 4,900,000 | | 5.500%, 04/01/2020 (g) | | 4,870,904 | |
| | 5,100,000 | | 5.500%, 04/01/2036 (g) | | 4,978,875 | |
| | | | GNMA - 1.79% | | | |
| | 5,400,000 | | 5.500%, 04/01/2035 (g) | | 5,347,685 | |
| | 450,000 | | 5.000%, 04/01/2036 (g) | | 435,937 | |
| | 3,400,000 | | 6.000%, 04/01/2035 (g) | | 3,439,311 | |
| | 1,700,000 | | 6.500%, 04/01/2035 (g) | | 1,762,155 | |
| | | | Tennessee Valley Authority - 0.54% | | | |
| | 2,450,000 | | 5.880%, 04/01/2036 | | 2,633,250 | |
| | 700,000 | | 5.375%, 04/01/2056 | | 690,189 | |
| | | | Total U.S. Government Agency | | | |
| | | | Issues (Cost $149,762,125) | | 148,158,814 | |
| | | | U.S. TREASURY OBLIGATIONS - 17.50% | | | |
| | | | U.S. Treasury Bond - 2.23% | | | |
| | 4,785,463 | | 2.375%, 01/15/2025 | | 4,810,701 | |
| | 2,207,481 | | 2.000%, 01/15/2026 (b) | | 2,092,623 | |
| | 277,371 | | 3.875%, 04/15/2029 | | 356,075 | |
| | 4,840,000 | | 6.250%, 05/15/2030 (b) | | 5,657,887 | |
| | 40,000 | | 5.375%, 02/15/2031 | | 42,119 | |
| | 782,000 | | 4.500%, 02/15/2036 (b) | | 733,981 | |
| | | | | | 13,693,386 | |
| | | | U.S. Treasury Note - 13.34% | | | |
| | 5,960,000 | | 2.500%, 09/30/2006 (b) | | 5,894,118 | |
| | 1,400,000 | | 2.875%, 11/30/2006 (b) | | 1,382,391 | |
| | 790,000 | | 3.750%, 03/31/2007 (b) | | 781,669 | |
| | 5,640,000 | | 4.000%, 08/31/2007 (b) | | 5,575,890 | |
| | 290,000 | | 3.000%, 02/15/2008 (b) | | 280,609 | |
| | 700,000 | | 3.375%, 02/15/2008 (b) | | 682,008 | |
| | 4,470,000 | | 3.750%, 05/15/2008 (b) | | 4,375,366 | |
| | 1,378,089 | | 3.875%, 01/15/2009 | | 1,443,226 | |
| | 13,800,000 | | 4.500%, 02/15/2009 (b) | | 13,684,646 | |
| | 6,300,000 | | 3.875%, 05/15/2009 (b) | | 6,130,196 | |
| | 13,340,000 | | 3.375%, 10/15/2009 (b) | | 12,720,424 | |
| | 12,250,000 | | 3.875%, 05/15/2010 (b) | | 11,819,339 | |
| | Principal | | | | Market | |
| | Amount | | | | Value | |
| | | | U.S. TREASURY OBLIGATIONS (Continued) | | | |
| | | | U.S. Treasury Note (Continued) | | | |
| | $ 1,900,000 | | 4.250%, 01/15/2011 (b) | $ | 1,853,465 | |
| | 2,310,000 | | 4.500%, 02/28/2011 (b) | | 2,277,066 | |
| | 1,550,000 | | 3.875%, 02/15/2013 (b) | | 1,461,966 | |
| | 3,390,490 | | 2.000%, 01/15/2014 (b) | | 3,310,102 | |
| | 357,595 | | 2.000%, 07/15/2014 (b) | | 348,865 | |
| | 90,000 | | 4.250%, 11/15/2014 (b) | | 86,048 | |
| | 51,913 | | 1.625%, 01/15/2015 (b) | | 49,007 | |
| | 1,680,000 | | 4.125%, 05/15/2015 (b) | | 1,588,060 | |
| | 5,996,691 | | 1.875%, 07/15/2015 (b) | | 5,769,009 | |
| | 250,000 | | 4.500%, 11/15/2015 (b) | | 242,676 | |
| | | | | | 81,756,146 | |
| | | | U.S. Treasury Strip - 1.93% | | | |
| | 9,300,000 | | 0.000%, 05/15/2020 (b) | | 4,555,512 | |
| | 2,250,000 | | 0.000%, 11/15/2021 (b) | | 1,020,096 | |
| | 8,000,000 | | 0.000%, 11/15/2024 (b) | | 3,121,344 | |
| | 3,200,000 | | 0.000%, 02/15/2025 (b) | | 1,235,126 | |
| | 3,000,000 | | 0.000%, 08/15/2025 (b) | | 1,131,219 | |
| | 2,190,000 | | 0.000%, 11/15/2027 (b) | | 742,003 | |
| | | | | | 11,805,300 | |
| | | | Total U.S. Treasury Obligations | | | |
| | | | (Cost $109,886,810) | | 107,254,832 | |
| | Contracts | | | | | |
| | | | PURCHASED OPTIONS - 0.01% | | | |
| | 227 | | Eurodollar 90 Day Futures | | | |
| | | | Expiration: September, 2006, | | | |
| | | | Exercise Price: $94.750 | | 73,775 | |
| | | | Total Purchased Options | | | |
| | | | (Cost $136,023) | | 73,775 | |
| | Shares | | | | | |
| | | | SHORT TERM INVESTMENTS - 5.92% | | | |
| | | | Money Market Funds - 0.42% | | | |
| | 2,602,734 | | Federated Prime Obligations Fund | | | |
| | | | 4.600%, 01/01/2050 | | 2,602,734 | |
| | Principal | | | | | |
| | Amount | | | | | |
| | | | Repurchase Agreements - 5.42% | | | |
| | $16,600,000 | | Countrywide Capital | | | |
| | | | Repurchase Agreement | | | |
| | | | 4.750%, 04/03/2006, repurchase | | | |
| | | | price $16,606,571 , maturing | | | |
| | | | 04/03/2006 (collateralized by | | | |
| | | | FNMA, 4.25%, 08/23/2007) | | 16,600,000 | |
See notes to financial statements.
AssetMark Core Plus Fixed Income Fund
SCHEDULE OF INVESTMENTS (Continued)
| | Principal | | | | Market | |
| | Amount | | | | Value | |
| | | | SHORT TERM INVESTMENTS (Continued) | | | |
| | | | Repurchase Agreements (Continued) | | | |
| | $16,600,000 | | UBS Warburg | | | |
| | | | Repurchase Agreement | | | |
| | | | 4.760%, 04/03/2006, repurchase | | | |
| | | | price $16,606,585 , maturing | | | |
| | | | 04/03/2006 (collateralized by | | | |
| | | | FNMA, 4.78%, 08/27/2007) | $ | 16,600,000 | |
| | | | | | 33,200,000 | |
| | | | US Government Agency Issues - 0.08% | | | |
| | 500,000 | | FNMA | | | |
| | | | 0.000%, 05/15/2006 (e) | | 497,354 | |
| | | | Total Short Term Investments | | | |
| | | | (Cost $36,300,088) | | 36,300,088 | |
| | | | INVESTMENTS PURCHASED | | | |
| | | | AS SECURITIES LENDING | | | |
| | | | COLLATERAL - 31.82% | | | |
| | | | COMMERCIAL PAPER - 9.22% | | | |
| | 1,978,892 | | CCN Bluegrass, | | | |
| | | | 4.85%, 11/20/06 (c) | | 1,978,892 | |
| | 3,957,783 | | CCN Independence IV LLC, | | | |
| | | | 4.82%,10/16/06 (c) | | 3,957,783 | |
| | 4,353,562 | | CCN Orchard Park, | | | |
| | | | 4.76%, 10/06/06 (c) | | 4,353,562 | |
| | 2,968,338 | | Concord Minutemen Capital Co., | | | |
| | | | 4.65%, 04/04/06 (c) | | 2,968,338 | |
| | 5,936,676 | | Concord Minutemen Capital Co., | | | |
| | | | 4.75%, 04/18/06 (c) | | 5,936,676 | |
| | 3,166,227 | | Duke Funding, | | | |
| | | | 4.82%, 04/26/06 (c) (d) | | 3,153,398 | |
| | 3,957,783 | | Duke Funding, | | | |
| | | | 4.64%, 06/06/06 (c) | | 3,957,783 | |
| | 7,915,567 | | Fenway Funding LLC, | | | |
| | | | 4.82%, 04/07/06 (c) (d) | | 7,904,832 | |
| | 7,915,567 | | Laguna Corp., | | | |
| | | | 4.83%, 04/18/06 (c) (d) | | 7,888,785 | |
| | 4,551,451 | | Lakeside Funding LLC, | | | |
| | | | 4.70%, 04/10/06 (c) | | 4,551,451 | |
| | 1,978,892 | | Morgan Stanley, | | | |
| | | | 4.96%, 04/11/06 | | 1,978,892 | |
| | 7,915,567 | | Thornburg Mortgage Capital LLC, | | | |
| | | | 4.71%, 04/10/06 (c) (d) | | 7,883,186 | |
| | | | Total Commercial Paper | | | |
| | | | (Cost $56,513,578) | | 56,513,578 | |
| | Principal | | | | Market | |
| | Amount | | | | Value | |
| | | | CORPORATE BONDS AND NOTES - 1.65% | | | |
| | $ 1,978,892 | | Bayerische Landesbank, | | | |
| | | | 4.83%, 12/24/15 | $ | 1,978,892 | |
| | 3,957,783 | | Liquid Funding Ltd., | | | |
| | | | 4.73%, 05/15/06 (c) (d) | | 3,957,382 | |
| | 2,374,670 | | Metlife Global, | | | |
| | | | 4.89%, 04/28/08 | | 2,374,670 | |
| | 1,781,003 | | Northlake, | | | |
| | | | 4.91%, 03/06/33 (c) | | 1,781,003 | |
| | | | Total Corporate Bonds and Notes | | | |
| | | | (Cost $10,091,947) | | 10,091,947 | |
| | | | CORPORATE PAYDOWN | | | |
| | | | SECURITIES - 1.19% | | | |
| | 1,978,892 | | Duke Funding, | | | |
| | | | 4.62%, 04/08/06 (c) | | 1,978,892 | |
| | 5,330,045 | | Leafs LLC, | | | |
| | | | 4.78%, 04/20/06 (c) | | 5,330,045 | |
| | | | Total Corporate Paydown | | | |
| | | | Securities (Cost $7,308,937) | | 7,308,937 | |
| | Shares | | | | | |
| | | | MUTUAL FUND - 0.00% | | | |
| | 51 | | AIM Short Term | | | |
| | | | Liquid Asset Fund | | 51 | |
| | | | Total Mutual Fund | | | |
| | | | (Cost $51) | | 51 | |
| | Principal | | | | | |
| | Amount | | | | | |
| | | | REPURCHASE AGREEMENTS - 19.76% | | | |
| | $29,683,378 | | Goldman Sachs Repurchase | | | |
| | | | Agreement, 4.94%, 04/03/06, | | | |
| | | | repurchase price $29,695,598, | | | |
| | | | maturing 04/03/06 (Collateralized | | | |
| | | | by non-U.S. Government Debt | | | |
| | | | Securities, value $32,127,400, | | | |
| | | | 0.00% to 11.13%, 04/01/08 to | | | |
| | | | 07/15/32) | | 29,683,378 | |
| | 17,810,027 | | Merrill Lynch Repurchase | | | |
| | | | Agreement, 4.93%, 04/03/06, | | | |
| | | | repurchase price $17,817,344, | | | |
| | | | maturing 04/03/06 (Collateralized | | | |
| | | | by non-U.S. Government Debt | | | |
| | | | Securities, value $18,754,978, | | | |
| | | | 0.00% to 12.00%, 07/15/06 to | | | |
| | | | 10/01/45) | | 17,810,027 | |
See notes to financial statements.
AssetMark Core Plus Fixed Income Fund
SCHEDULE OF INVESTMENTS (Continued)
| | Principal | | | | Market | |
| | Amount | | | | Value | |
| | | | REPURCHASE AGREEMENTS (Continued) | | | |
| | $17,018,470 | | Morgan Stanley Repurchase | | | |
| | | | Agreement, 4.91%, 04/03/06, | | | |
| | | | repurchase price $17,025,433, | | | |
| | | | maturing 04/03/06 (Collateralized | | | |
| | | | by Fannie Mae Mortgage | | | |
| | | | Obligations, value $17,534,267, | | | |
| | | | 0.00% to 6.75%, 9/25/07 to | | | |
| | | | 10/25/35) | $ | 17,018,470 | |
| | 56,596,307 | | Morgan Stanley Repurchase | | | |
| | | | Agreement, 4.91%, 04/03/06, | | | |
| | | | repurchase price $56,619,464, | | | |
| | | | maturing 04/03/06 (Collateralized | | | |
| | | | by Ginnie Mae Mortgage | | | |
| | | | Obligations, value $58,215,642, | | | |
| | | | 0.97% to 6.50%, 5/20/14 to | | | |
| | | | 1/20/35) | | 56,596,307 | |
| | | | Total Repurchase Agreements | | | |
| | | | (Cost $121,108,182) | | 121,108,182 | |
| | | | Total Investments Purchased as | | | |
| | | | Securities Lending Collateral | | | |
| | | | (Cost $195,022,695) | | 195,022,695 | |
| | | | Total Investments - 143.88% | | | |
| | | | (Cost $890,219,411) | | 881,740,387 | |
| | | | Liabilities in Excess of | | | |
| | | | Other Assets - (43.88)% | | (268,898,954) | |
| | | | TOTAL NET | | | |
| | | | ASSETS - 100.00% | | $612,841,433 | |
| | | | | | | |
| | Percentages are stated as a percent of net assets. | | | |
| | (a) | | Non Income Producing. | | | |
| | (b) | | All or a portion of this security is on loan. | | | |
| | (c) | | Restricted securities as defined in Rule 144(a) under the Securities Act of 1933. Such securities are treated as liquid securities according the the Fund’s liquidity guidelines. The market value of these securities total $88,910,331, 14.5% of total net assets. | | |
| | (d) | | Variable Rate Security. The rate shown is the rate in effect on March 31, 2006. | | | |
| | (e) | | Assigned as collateral for certain futures and options contracts. | | | |
| | (f) | | Defaulted Security | | | |
| | (g) | | Security purchased on a when-issued basis. On March 31, 2006 the total value of the investments purchased on a when- issued basis was $75,728,317 or 12.4% of total net assets. | | | |
| | | | | | | |
See notes to financial statements.
AssetMark Core Plus Fixed Income Fund
SCHEDULE OF OPTIONS WRITTEN
| | | | | | Market | |
| | Contracts | | | | Value | |
| | | | CALL OPTIONS | | | |
| | | | U.S. Treasury Note Future | | | |
| | 2,190 | | Expiration: May 26, 2006, | | | |
| | | | Exercise Price: $109.00 | | 13,687 | |
| | | | PUT OPTIONS | | | |
| | | | U.S. Treasury Note Future | | | |
| | 209 | | Expiration: May 26, 2006, | | | |
| | | | Exercise Price: $105.00 | | 55,516 | |
| | | | Total Options Written | | | |
| | | | (Premiums received $100,174) | | $69,203 | |
| | | | | | | |
See notes to financial statements.
AssetMark Core Plus Fixed Income Fund
SCHEDULE OF OPEN FORWARD CURRENCY CONTRACTS
| | | Amount of | | Amount of | Unrealized |
Forward | Currency to | Currency to be | Currency to | Currency to | Appreciation |
expiration date | be received | received/(sold) | be delivered | be delivered | (Depreciation) |
| 5/10/06 | Australian Dollars | 1,419,024 | U.S. Dollars | 1,064,268 | $ 49,408 |
| 5/15/06 | Brazil Real | 3,392,312 | U.S. Dollars | 1,540,000 | (9,916) |
| 6/9/06 | Brazil Real | 4,744,380 | U.S. Dollars | 2,140,000 | (13,102) |
| 5/10/06 | Canadian Dollars | 1,093,926 | U.S. Dollars | 952,648 | 14,662 |
| 4/27/06 | European Monetary Unit | 1,107,994 | U.S. Dollars | 1,338,187 | (6,552) |
| 4/12/06 | Mexican Pesos | (24,497,242) | U.S. Dollars | (2,286,790) | (37,259) |
| 4/12/06 | Mexican Pesos | 72,075,602 | U.S. Dollars | 6,763,217 | 144,665 |
| | | | | | $141,906 |
| | | | | | |
AssetMark Core Plus Fixed Income Fund
SCHEDULE OF OPEN FUTURES CONTRACTS
| | Number of | | | | |
| | Contracts | | | | Unrealized |
| | Purchased | Contract | Settlement | | Appreciation |
Description | (Sold) | Value | Month | | (Depreciation) |
| Eurodollar 90 Day Futures | 8 | 758 | Mar-07 | $ | (6,640) |
| Eurodollar 90 Day Futures | 93 | 8,816 | Jun-06 | | (61,377) |
| Eurodollar 90 Day Futures | 8 | 759 | Jun-07 | | (5,615) |
| Eurodollar 90 Day Futures | 21 | 1,989 | Sep-06 | | (19,323) |
| Eurodollar 90 Day Futures | 8 | 759 | Sep-07 | | (4,602) |
| Eurodollar 90 Day Futures | 5 | 474 | Dec-06 | | (4,775) |
| U.S. Treasury 5 year Note Futures | 486 | 50,757 | Jun-06 | | (239,401) |
| U.S. Treasury 2 year Note Futures | 152 | 15,493 | Jun-06 | | (31,864) |
| U.S. Treasury 10 year Note Futures | 125 | 13,512 | Jun-06 | | (67,703) |
| U.S. Treasury Long Bond Futures | (2) | (218) | Jun-06 | | 5,209 |
| | | | | $ | (436,091) |
See notes to financial statements.
AssetMark Funds
STATEMENTS OF ASSETS & LIABILITIES
| | | Large Cap | | Large Cap | | Small/Mid Cap | | Small/Mid Cap |
| | | Growth Fund | | Value Fund | | Growth Fund | | Value Fund |
| ASSETS: | | | | | | | | |
| Investments in securities, at value (cost $663,988,583, | | | | | | | | |
| $708,925,970, $213,752,526 and | | | | | | | | |
$180,774,714, respectively)1 | $ | 741,647,893 | $ | 759,591,496 | $ | 244,374,607 | $ | 206,787,496 |
| Repurchase agreements (cost $139,070,176, | | | | | | | | |
| $161,823,920, $48,081,526, and | | | | | | | | |
| $40,668,007, respectively) | | 139,070,176 | | 161,823,920 | | 48,081,526 | | 40,668,007 |
| Cash | | — | | — | | — | | — |
| Receivable for investment securities sold | | 3,062,892 | | 1,547,357 | | 2,311,384 | | 3,489,162 |
| Income receivable | | 252,426 | | 1,282,241 | | 71,185 | | 147,824 |
| Receivable for fund shares sold | | 1,938,879 | | 1,903,311 | | 507,443 | | 405,750 |
| Other assets | | 56,381 | | 59,143 | | 46,375 | | 25,373 |
| Total Assets | | 886,028,647 | | 926,207,468 | | 295,392,520 | | 251,523,612 |
| LIABILITIES: | | | | | | | | |
| Collateral on securities loaned | | 223,947,221 | | 260,587,989 | | 77,426,550 | | 65,488,429 |
| Payable to Investment Advisor | | 497,914 | | 512,714 | | 170,071 | | 155,318 |
| Payable to Custodian | | 10 | | — | | — | | — |
| Payable for investment securities purchased | | 6,602,439 | | 3,890,732 | | 1,933,281 | | — |
| Payable for fund shares redeemed | | 567,260 | | 585,067 | | 172,725 | | 129,063 |
| Payable to Trustees | | 4,287 | | 3,445 | | 1,056 | | 842 |
| Other accrued expenses | | 487,978 | | 497,538 | | 173,849 | | 160,280 |
| Total Liabilities | | 232,107,109 | | 266,077,485 | | 79,877,532 | | 65,933,932 |
| NET ASSETS | $ | 653,921,538 | $ | 660,129,983 | $ | 215,514,988 | $ | 185,589,680 |
| | | | | | | | | |
| NET ASSETS CONSIST OF: | | | | | | | | |
| Capital stock | | 559,675,968 | | 570,691,905 | | 179,547,291 | | 155,386,284 |
| Unrealized appreciation on investments | | 77,659,310 | | 50,665,526 | | 30,622,081 | | 26,012,782 |
| Accumulated undistributed net investment income | | 31,439 | | 2,122,677 | | — | | — |
| Accumulated undistributed net realized gain | | 16,554,821 | | 36,649,875 | | 5,345,616 | | 4,190,614 |
| Total Net Assets | $ | 653,921,538 | $ | 660,129,983 | $ | 215,514,988 | $ | 185,589,680 |
| | | | | | | | | |
| Shares outstanding (unlimited shares | | | | | | | | |
| of no par value authorized) | | 65,731,611 | | 56,109,598 | | 20,336,394 | | 12,876,667 |
| Net asset value, offering and | | | | | | | | |
| redemption price per share | $ | 9.95 | $ | 11.77 | $ | 10.60 | $ | 14.41 |
| | | | | | | | | |
| | | | | | | | | |
1 Includes loaned securities with a market value of | $ | 216,642,536 | $ | 248,646,820 | $ | 74,747,672 | $ | 63,191,725 |
| | | | | | | | | |
See notes to financial statements.
AssetMark Funds
STATEMENTS OF ASSETS & LIABILITIES (Continued)
| | | International | | Real Estate | | Tax-Exempt | | Core Plus |
| | | Equity | | Securities | | Fixed Income | | Fixed Income |
| | | Fund | | Fund | | Fund | | Fund |
| ASSETS: | | | | | | | | |
| Investments in securities, at value (cost $538,109,265, | | | | | | | | |
$70,290,387, $213,390,572 and $735,911,229, respectively)1 . | $ | 656,649,168 | $ | 103,367,633 | $ | 211,280,594 | $ | 727,432,205 |
| Foreign currencies (cost $8,686,664, $0, | | | | | | | | |
| $0 and $59,879, respectively) | | 8,669,733 | | — | | — | | 59,299 |
| Repurchase agreements (cost $71,278,498, $22,158,420, | | | | | | | | |
| $0 and $154,308,182, respectively) | | 71,278,498 | | 22,158,420 | | — | | 154,308,182 |
| Appreciation of forward foreign currency contracts | | — | | — | | — | | 208,735 |
| Variation margin on futures contracts | | — | | — | | — | | 42,995 |
| Cash | | 8,548 | | 4,590 | | 2,242 | | 120,862 |
| Cash held at broker for futures contracts | | — | | — | | — | | 122,527 |
| Receivable for investment securities sold | | 7,428,574 | | 380,648 | | — | | 59,785,482 |
| Income receivable | | 1,413,963 | | 384,730 | | 2,693,490 | | 4,693,867 |
| Receivable for fund shares sold | | 2,025,950 | | 220,628 | | 1,058,272 | | 4,143,756 |
| Other assets | | 57,652 | | 16,215 | | 16,506 | | 62,975 |
| Total Assets | | 747,532,086 | | 126,532,864 | | 215,051,104 | | 950,980,885 |
| LIABILITIES: | | | | | | | | |
| Options written at value (Premium received $0, $0, | | | | | | | | |
| $0 and $100,174, respectively | | — | | — | | — | | 69,203 |
| Collateral on securities loaned | | 114,781,055 | | 35,682,105 | | — | | 195,022,695 |
| Depreciation of forward foreign currency contracts | | — | | — | | — | | 66,829 |
| Payable to Investment Advisor | | 470,675 | | 73,116 | | 154,744 | | 395,872 |
| Payable to Custodian | | — | | — | | — | | — |
| Distributions payable to shareholders | | — | | — | | 576,000 | | 2,657,687 |
| Payable for investment securities purchased | | 18,996,195 | | 997,965 | | 872,872 | | 138,385,845 |
| Payable for fund shares redeemed | | 573,434 | | 80,304 | | 88,984 | | 1,029,638 |
| Payable to Trustees | | 2,407 | | — | | 1,494 | | 3,384 |
| Other accrued expenses | | 420,102 | | 83,328 | | 186,812 | | 508,299 |
| Total Liabilities | | 135,243,868 | | 36,916,818 | | 1,880,906 | | 338,139,452 |
| NET ASSETS | $ | 612,288,218 | $ | 89,616,046 | $ | 213,170,198 | $ | 612,841,433 |
| | | | | | | | | |
| NET ASSETS CONSIST OF: | | | | | | | | |
| Capital stock | | 464,345,065 | | 55,671,363 | | 215,556,454 | | 627,426,435 |
| Unrealized appreciation/(depreciation) on: | | | | | | | | |
| Investments | | 118,539,903 | | 33,077,246 | | (2,109,978) | | (8,479,024) |
| Written options | | — | | — | | — | | 30,971 |
| Foreign currencies | | (16,699) | | — | | — | | 9,652 |
| Futures contracts | | — | | — | | — | | (436,091) |
| Forward currency exchange contracts | | — | | — | | — | | 141,906 |
| Accumulated undistributed net investment income/(loss) | | (3,461,577) | | — | | 13,486 | | (244,315) |
| Accumulated undistributed net realized gain/(loss) | | 32,881,526 | | 867,437 | | (289,764) | | (5,608,101) |
| Total Net Assets | $ | 612,288,218 | $ | 89,616,046 | $ | 213,170,198 | $ | 612,841,433 |
| | | | | | | | | |
| Shares outstanding (unlimited shares | | | | | | | | |
| of no par value authorized) | | 43,536,399 | | 4,853,926 | | 19,801,022 | | 67,281,676 |
| Net asset value, offering and | | | | | | | | |
| redemption price per share | $ | 14.06 | $ | 18.46 | $ | 10.77 | $ | 9.11 |
| | | | | | | | | |
| | | | | | | | | |
1 Includes loaned securities with a market value of | $ | 109,956,115 | $ | 34,795,996 | $ | — | $ | 190,231,522 |
| | | | | | | | | |
See notes to financial statements.
(This Page Intentionally Left Blank.)
AssetMark Funds
STATEMENTS OF OPERATIONS
For the Period Ended March 31, 2006
| | | Large Cap | | Large Cap | | Small/Mid Cap | | Small/Mid Cap |
| | | Growth Fund | | Value Fund | | Growth Fund | | Value Fund |
| INVESTMENT INCOME: | | | | | | | | |
| Dividend income (net of withholding tax of $0, $0, | | | | | | | | |
| $0 and $17,276, respectively) | $ | 4,269,469 | $ | 9,914,553 | $ | 550,846 | $ | 1,092,651 |
| Interest income | | 359,955 | | 574,299 | | 146,450 | | 239,274 |
| Total investment income | | 4,629,424 | | 10,488,852 | | 697,296 | | 1,331,925 |
| EXPENSES: | | | | | | | | |
| Investment advisory fees | | 4,431,801 | | 4,441,027 | | 1,292,495 | | 1,210,974 |
| Distribution (12b-1) fees | | 1,193,069 | | 1,178,767 | | 340,130 | | 302,744 |
| Federal and state registration fees | | 135,564 | | 137,960 | | 67,135 | | 67,841 |
| Custody fees | | 49,772 | | 44,245 | | 28,888 | | 30,830 |
| Audit fees | | 24,105 | | 24,489 | | 20,544 | | 21,009 |
| Shareholder servicing fees | | 242,981 | | 235,042 | | 69,515 | | 65,060 |
| Fund accounting fees | | 53,378 | | 52,787 | | 19,577 | | 15,866 |
| Administration fees | | 162,312 | | 159,817 | | 44,586 | | 40,497 |
| Transfer agent fees and expenses | | 21,829 | | 21,886 | | 12,592 | | 12,203 |
| Reports to shareholders | | 21,759 | | 21,497 | | 18,294 | | 6,919 |
| Directors’ fees and expenses | | 22,048 | | 22,686 | | 6,781 | | 6,743 |
| Legal fees | | 57,822 | | 60,959 | | 18,526 | | 18,431 |
| Insurance fees | | 14,630 | | 14,657 | | 3,980 | | 3,289 |
| Payroll expense | | 6,175 | | 5,915 | | 1,668 | | 1,543 |
| Total expenses before expense reimbursements | | 6,437,245 | | 6,421,734 | | 1,944,711 | | 1,803,949 |
| Less securities lending credit (See Note 6) | | (125,850) | | (274,973) | | (68,246) | | (25,533) |
| Expenses recaptured by the Advisor (See Note 3) | | — | | — | | — | | 72,855 |
| Net expenses | | 6,311,395 | | 6,146,761 | | 1,876,465 | | 1,851,271 |
| Net investment income/(loss) | | (1,681,971) | | 4,342,091 | | (1,179,169) | | (519,346) |
| NET REALIZED AND UNREALIZED | | | | | | | | |
| GAIN ON INVESTMENTS: | | | | | | | | |
| Net realized gain on investments | | 29,183,549 | | 43,143,883 | | 19,762,867 | | 9,303,736 |
| Net change in unrealized appreciation on investments | | 20,178,486 | | 96,089 | | 17,742,682 | | 9,808,704 |
| Net realized and unrealized gains | | 49,362,035 | | 43,239,972 | | 37,505,549 | | 19,112,440 |
| NET INCREASE IN NET ASSETS | | | | | | | | |
| RESULTING FROM OPERATIONS | $ | 47,680,064 | $ | 47,582,063 | $ | 36,326,380 | $ | 18,593,094 |
| | | | | | | | | |
See notes to financial statements.
AssetMark Funds
STATEMENTS OF OPERATIONS (Continued)
For the Period Ended March 31, 2006
| | | International | | Real Estate | | Tax-Exempt | | Core Plus |
| | | Equity | | Securities | | Fixed Income | | Fixed Income |
| | | Fund | | Fund | | Fund | | Fund |
| INVESTMENT INCOME: | | | | | | | | |
| Dividend income (net of withholding tax of | | | | | | | | |
| $544,710, $2,336, $0 and $0, respectively) | $ | 4,200,743 | $ | 2,240,183 | $ | — | $ | 157,593 |
| Interest income | | 356,009 | | 76,183 | | 4,874,736 | | 20,226,179 |
| Total investment income | | 4,556,752 | | 2,316,366 | | 4,874,736 | | 20,383,772 |
| EXPENSES: | | | | | | | | |
| Investment advisory fees | | 3,527,307 | | 553,739 | | 1,134,299 | | 3,303,616 |
| Distribution (12b-1) fees | | 930,595 | | 145,721 | | 354,468 | | 1,101,912 |
| Federal and state registration fees | | 127,151 | | 59,587 | | 64,883 | | 148,748 |
| Custody fees | | 67,388 | | 12,594 | | 13,663 | | 84,806 |
| Audit fees | | 20,548 | | 19,469 | | 20,242 | | 43,874 |
| Shareholder servicing fees | | 187,092 | | 35,599 | | 73,866 | | 231,287 |
| Fund accounting fees | | 45,473 | | 7,411 | | 25,380 | | 71,667 |
| Administration fees | | 123,781 | | 18,986 | | 47,048 | | 146,556 |
| Transfer agent fees and expenses | | 18,773 | | 10,558 | | 12,831 | | 20,848 |
| Reports to shareholders | | 18,274 | | 4,881 | | 6,908 | | 23,174 |
| Directors’ fees and expenses | | 19,377 | | 4,102 | | 6,331 | | 20,224 |
| Legal fees | | 52,189 | | 12,028 | | 16,027 | | 51,787 |
| Insurance fees | | 10,592 | | 1,949 | | 4,005 | | 13,295 |
| Payroll expense | | 4,704 | | 748 | | 1,668 | | 4,509 |
| Total expenses before fee waivers and/or | | | | | | | | |
| expense reimbursements | | 5,153,244 | | 887,372 | | 1,781,619 | | 5,266,303 |
| Less securities lending credit (See Note 6) | | (156,177) | | (12,140) | | — | | (161,142) |
| Expenses (waived)/recaptured | | | | | | | | |
| by the Advisor (See Note 3) | | — | | (6,707) | | 47,517 | | — |
| Net expenses | | 4,997,067 | | 868,525 | | 1,829,136 | | 5,105,161 |
| Net investment income/(loss) | | (440,315) | | 1,447,841 | | 3,045,600 | | 15,278,611 |
See notes to financial statements.
AssetMark Funds
STATEMENTS OF OPERATIONS (Continued)
For the Period Ended March 31, 2006
| | | International | | Real Estate | | Tax-Exempt | | Core Plus |
| | | Equity | | Securities | | Fixed Income | | Fixed Income |
| | | Fund | | Fund | | Fund | | Fund |
| NET REALIZED AND UNREALIZED | | | | | | | | |
| GAIN/(LOSS) ON INVESTMENTS: | | | | | | | | |
| Net realized gain/(loss) on: | | | | | | | | |
| Investments | $ | 49,087,714 | $ | 2,991,291 | $ | (67,861) | $ | (3,546,587) |
| Written options | | — | | — | | — | | 247,280 |
| Foreign currencies | | (301,831) | | — | | — | | 61,523 |
| Futures contracts | | — | | — | | — | | (2,116,077) |
| Swap contracts | | — | | — | | — | | (142,465) |
| Forward currency contracts | | — | | — | | — | | 31,246 |
| Total | | 48,785,883 | | 2,991,291 | | (67,861) | | (5,465,080) |
| Net change in unrealized appreciation/(depreciation) on: | | | | | | | | |
| Investments | | 82,815,784 | | 11,445,981 | (4,156,643) | | (12,224,158) |
| Written options | | — | | — | | — | | 186,376 |
| Foreign currencies | | (16,699) | | — | | — | | 22,797 |
| Futures contracts | | — | | — | | — | | (181,536) |
| Swap contracts | | — | | — | | — | | 38,633 |
| Forward currency contracts | | — | | — | | — | | (344,378) |
| Total | | 82,799,085 | | 11,445,981 | | (4,156,643) | | (12,502,266) |
| Net realized and unrealized gain/(loss) | | 131,584,968 | | 14,437,272 | | (4,224,504) | | (17,967,346) |
| NET INCREASE/(DECREASE) IN NET ASSETS | | | | | | | | |
| RESULTING FROM OPERATIONS | $ | 131,144,653 | $ | 15,885,113 | $ | (1,178,904) | $ | (2,688,735) |
| | | | | | | | | |
See notes to financial statements.
AssetMark Funds
STATEMENTS OF CHANGES IN NET ASSETS
| | | Large Cap Growth Fund | | Large Cap Value Fund |
| | | Period | | Year | | Period | | Year |
| | | Ended | | Ended | | Ended | | Ended |
| | | March 31, | | June 30, | | March 31, | | June 30, |
| | | 2006 | | 2005 | | 2006 | | 2005 |
| OPERATIONS: | | | | | | | | |
| Net investment income/(loss) | $ | (1,681,971) | $ | (1,697,328) | $ | 4,342,091 | $ | 3,251,577 |
| Net realized gain/(loss) on investment transactions | | 29,183,549 | | (3,042,212) | | 43,143,883 | | 11,347,262 |
| Change in unrealized appreciation on investments | | 20,178,486 | | 11,378,549 | | 96,089 | | 15,353,402 |
| Net increase in net assets | | | | | | | | |
| resulting from operations | | 47,680,064 | | 6,639,009 | | 47,582,063 | | 29,952,241 |
| CAPITAL SHARE TRANSACTIONS: | | | | | | | | |
| Shares sold | | 201,714,521 | | 318,816,577 | | 204,871,407 | | 320,385,166 |
| Shares issued to holders in reinvestment of dividends | | — | | — | | 10,739,626 | | 8,172,447 |
| Shares redeemed | | (165,944,592) | | (99,436,811) | | (154,900,921) | | (113,645,485) |
| Net increase | | 35,769,929 | | 219,379,766 | | 60,710,112 | | 214,912,128 |
| DIVIDENDS AND DISTRIBUTIONS | | | | | | | | |
| TO SHAREHOLDERS: | | | | | | | | |
| Net investment income | | — | | — | | (4,087,194) | | (2,137,173) |
| From net realized gains | | — | | — | | (14,924,573) | | (12,064,060) |
| Total dividends and distributions | | — | | — | | (19,011,767) | | (14,201,233) |
| | | | | | | | | |
| INCREASE IN NET ASSETS | | 83,449,993 | | 226,018,775 | | 89,280,408 | | 230,663,136 |
| | | | | | | | | |
| NET ASSETS: | | | | | | | | |
| Beginning of year | | 570,471,545 | | 344,452,770 | | 570,849,575 | | 340,186,439 |
| End of year (including undistributed net | | | | | | | | |
| investment income of ($31,439, $31,439, | | | | | | | | |
| $2,122,677 and $1,867,780, respectively) | $ | 653,921,538 | $ | 570,471,545 | $ | 660,129,983 | $ | 570,849,575 |
| | | | | | | | | |
| | | | | | | | | |
| CHANGES IN SHARES OUTSTANDING | | | | | | | | |
| Shares sold | | 20,603,043 | | 35,501,955 | | 17,813,559 | | 29,366,301 |
| Shares issued to holders in reinvestment of dividends | | — | | — | | 950,409 | | 718,141 |
| Shares redeemed | | (16,889,797) | | (11,104,342) | | (13,439,287) | | (10,341,351) |
| Net increase | | 3,713,246 | | 24,397,613 | | 5,324,681 | | 19,743,091 |
| | | | | | | | | |
See notes to financial statements.
AssetMark Funds
STATEMENTS OF CHANGES IN NET ASSETS (Continued)
| | | Small/Mid Cap Growth Fund | | Small/Mid Cap Value Fund |
| | | Period | | Year | | Period | | Year |
| | | Ended | | Ended | | Ended | | Ended |
| | | March 31, | | June 30, | | March 31, | | June 30, |
| | | 2006 | | 2005 | | 2006 | | 2005 |
| OPERATIONS: | | | | | | | | |
| Net investment loss | $ | (1,179,169) | $ | (918,334) | $ | (519,346) | $ | (363,182) |
| Net realized gain on investment transactions | | 19,762,867 | | 4,068,012 | | 9,303,736 | | 9,054,428 |
| Change in unrealized appreciation on investments | | 17,742,682 | | 115,208 | | 9,808,704 | | 3,701,966 |
| Net increase in net assets | | | | | | | | |
| resulting from operations | | 36,326,380 | | 3,264,886 | | 18,593,094 | | 12,393,212 |
| CAPITAL SHARE TRANSACTIONS: | | | | | | | | |
| Shares sold | | 87,369,505 | | 83,978,187 | | 76,154,464 | | 79,733,516 |
| Shares issued to holders in reinvestment of dividends | | 8,284,613 | | — | | 5,793,390 | | 2,160,322 |
| Shares redeemed | | (49,433,823) | | (25,861,400) | | (34,523,553) | | (58,244,707) |
| Net increase | | 46,220,295 | | 58,116,787 | | 47,424,301 | | 23,649,131 |
| DIVIDENDS AND DISTRIBUTIONS | | | | | | | | |
| TO SHAREHOLDERS: | | | | | | | | |
| Net investment income | | — | | — | | — | | — |
| From net realized gains | | (15,602,948) | | — | | (11,531,340) | | (3,887,396) |
| Total dividends and distributions | | (15,602,948) | | — | | (11,531,340) | | (3,887,396) |
| | | | | | | | | |
| INCREASE IN NET ASSETS | | 66,943,727 | | 61,381,673 | | 54,486,055 | | 32,154,947 |
| | | | | | | | | |
| NET ASSETS: | | | | | | | | |
| Beginning of year | | 148,571,261 | | 87,189,588 | | 131,103,625 | | 98,948,678 |
| End of year (including undistributed net | | | | | | | | |
| investment income of ($0, $0, | | | | | | | | |
| $0 and $0, respectively) | $ | 215,514,988 | $ | 148,571,261 | $ | 185,589,680 | $ | 131,103,625 |
| | | | | | | | | |
| | | | | | | | | |
| CHANGES IN SHARES OUTSTANDING | | | | | | | | |
| Shares sold | | 8,833,116 | | 9,206,311 | | 5,462,863 | | 6,032,856 |
| Shares issued to holders in reinvestment of dividends | | 871,148 | | — | | 430,415 | | 156,319 |
| Shares redeemed | | (4,914,137) | | (2,851,564) | | (2,456,339) | | (4,402,714) |
| Net increase | | 4,790,127 | | 6,354,747 | | 3,436,939 | | 1,786,461 |
| | | | | | | | | |
See notes to financial statements.
AssetMark Funds
STATEMENTS OF CHANGES IN NET ASSETS (Continued)
| | | International Equity Fund | | Real Estate Securities Fund |
| | | Period | | Year | | Period | | Year |
| | | Ended | | Ended | | Ended | | Ended |
| | | March 31, | | June 30, | | March 31, | | June 30, |
| | | 2006 | | 2005 | | 2006 | | 2005 |
| | | | | | | | | (Restated - |
| | | | | | | | | See Note 2) |
| OPERATIONS: | | | | | | | | |
| Net investment income/(loss) | $ | (440,315) | $ | 3,794,499 | $ | 1,447,841 | $ | 2,560,035 |
| Net realized gain on investment transactions | | 48,785,883 | | 24,407,090 | | 2,991,291 | | 8,797,252 |
| Change in unrealized appreciation on investments | | 82,799,085 | | 15,803,738 | | 11,445,981 | | 10,778,805 |
| Net increase in net assets | | | | | | | | |
| resulting from operations | | 131,144,653 | | 44,005,327 | | 15,885,113 | | 22,136,092 |
| CAPITAL SHARE TRANSACTIONS: | | | | | | | | |
| Shares sold | | 216,783,941 | | 239,122,608 | | 43,135,447 | | 59,607,185 |
| Shares issued to holders in reinvestment of dividends | | 23,536,325 | | 2,533,958 | | 5,420,394 | | 2,928,904 |
| Shares redeemed | | (130,180,681) | | (129,960,660) | | (40,092,104) | | (84,251,749) |
| Net increase/(decrease) | | 110,139,585 | | 111,695,906 | | 8,463,737 | | (21,715,660) |
| DIVIDENDS AND DISTRIBUTIONS | | | | | | | | |
| TO SHAREHOLDERS: | | | | | | | | |
| Net investment income | | (5,758,870) | | (1,968,196) | | (1,276,459) | | (2,660,912) |
| From net realized gains | | (36,222,721) | | (2,524,840) | | (8,500,223) | | (2,511,494) |
| Total dividends and distributions | | (41,981,591) | | (4,493,036) | | (9,776,682) | | (5,172,406) |
| | | | | | | | | |
| INCREASE/(DECREASE) IN NET ASSETS | | 199,302,647 | | 151,208,197 | | 14,572,168 | | (4,751,974) |
| | | | | | | | | |
| NET ASSETS: | | | | | | | | |
| Beginning of year | | 412,985,571 | | 261,777,374 | | 75,043,878 | | 79,795,852 |
| End of year (including undistributed net | | | | | | | | |
| investment income/(loss) of $(3,461,577), | | | | | | | | |
| $2,496,575, $0 and $(261,161), respectively) | $ | 612,288,218 | $ | 412,985,571 | $ | 89,616,046 | $ | 75,043,878 |
| | | | | | | | | |
| | | | | | | | | |
| CHANGES IN SHARES OUTSTANDING | | | | | | | | |
| Shares sold | | 16,753,013 | | 21,073,076 | | 2,485,087 | | 3,873,018 |
| Shares issued to holders in reinvestment of dividends | | 1,847,435 | | 210,987 | | 337,719 | | 180,240 |
| Shares redeemed | | (10,092,590) | | (11,359,338) | | (2,304,689) | | (5,560,961) |
| Net increase/(decrease) | | 8,507,858 | | 9,924,725 | | 518,117 | | (1,507,703) |
| | | | | | | | | |
See notes to financial statements.
AssetMark Funds
STATEMENTS OF CHANGES IN NET ASSETS (Continued)
| | | Tax-Exempt Fixed | | Core Plus Fixed |
| | | Income Fund | | Income Fund |
| | | Period | | Year | | Period | | Year |
| | | Ended | | Ended | | Ended | | Ended |
| | | March 31, | | June 30, | | March 31, | | June 30, |
| | | 2006 | | 2005 | | 2006 | | 2005 |
| OPERATIONS: | | | | | | | | |
| Net investment income | $ | 3,045,600 | $ | 2,110,020 | $ | 15,278,611 | $ | 9,635,029 |
| Net realized gain/(loss) on investment transactions | | (67,861) | | (151,193) | | (5,465,080) | | 6,570,977 |
| Change in unrealized appreciation/(depreciation) | | | | | | | | |
| on investments | | (4,156,643) | | 2,247,303 | | (12,502,266) | | 6,699,702 |
| Net increase/(decrease) in net assets | | | | | | | | |
| resulting from operations | | (1,178,904) | | 4,206,130 | | (2,688,735) | | 22,905,708 |
| CAPITAL SHARE TRANSACTIONS: | | | | | | | | |
| Shares sold | | 99,145,899 | | 109,425,741 | | 305,567,156 | | 326,583,212 |
| Shares issued to holders in reinvestment of dividends | | 1,639,001 | | 1,080,128 | | 48,529,614 | | 6,468,013 |
| Shares redeemed | | (40,924,483) | | (35,359,324) | | (157,120,055) | | (120,921,040) |
| Net increase | | 59,860,417 | | 75,146,545 | | 196,976,715 | | 212,130,185 |
| DIVIDENDS AND DISTRIBUTIONS | | | | | | | | |
| TO SHAREHOLDERS: | | | | | | | | |
| Net investment income | | (3,056,168) | | (2,109,378) | | (10,056,865) | | (10,299,353) |
| From net realized gains | | — | | — | | (10,241,890) | | (1,476,782) |
| Return of Capital | | — | | — | | (69,195,594) | | — |
| Total dividends and distributions | | (3,056,168) | | (2,109,378) | | (89,494,349) | | (11,776,135) |
| | | | | | | | | |
| INCREASE IN NET ASSETS | | 55,625,345 | | 77,243,297 | | 104,793,631 | | 223,259,758 |
| | | | | | | | | |
| NET ASSETS: | | | | | | | | |
| Beginning of year | | 157,544,853 | | 80,301,556 | | 508,047,802 | | 284,788,044 |
| End of year (including undistributed net | | | | | | | | |
| investment income of $13,486, $24,054, | | | | | | | | |
| $(244,315) and $30,874, respectively) | $ | 213,170,198 | $ | 157,544,853 | $ | 612,841,433 | $ | 508,047,802 |
| | | | | | | | | |
| | | | | | | | | |
| CHANGES IN SHARES OUTSTANDING | | | | | | | | |
| Shares sold | | 9,097,399 | | 9,973,046 | | 30,579,856 | | 30,715,066 |
| Shares issued to holders in reinvestment of dividends | | 151,237 | | 98,510 | | 5,224,186 | | 609,214 |
| Shares redeemed | | (3,759,123) | | (3,226,517) | | (15,879,856) | | (11,391,944) |
| Net increase | | 5,489,513 | | 6,845,039 | | 19,924,186 | | 19,932,336 |
| | | | | | | | | |
See notes to financial statements.
AssetMark Funds
| | | | | | Large Cap Growth Fund | | |
| | Period Ended | Year Ended | Year Ended | Year Ended | |
| | March 31, 2006 | June 30, 2005 | June 30, 2004 | June 30, 2003 | June 30, 2002 |
| Per share data for a share of capital stock | | | | | | | | | | |
| outstanding for the entire period and selected | | | | | | | | | | |
| information for the period are as follows: | | | | | | | | | | |
| Net asset value, beginning of period | $ | 9.20 | $ | 9.16 | $ | 7.59 | $ | 7.28 | $ | 10.00 |
| | | | | | | | | | | |
| Income from investment operations: | | | | | | | | | | |
| Net investment loss | | (0.03) | | (0.03) | | (0.04) | | — | | (0.04) |
| Net realized and unrealized | | | | | | | | | | |
| gains/(losses) on investments | | 0.78 | | 0.07 | | 1.61 | | 0.31 | | (2.68) |
| Total from investment operations | | 0.75 | | 0.04 | | 1.57 | | 0.31 | | (2.72) |
| Less distributions: | | | | | | | | | | |
| Dividends from | | | | | | | | | | |
| net investment income | | — | | — | | — | | — | | — |
| Dividends from net realized gains | | — | | — | | — | | — | | — |
| Total distributions | | — | | — | | — | | — | | — |
| Net asset value, end of period | $ | 9.95 | $ | 9.20 | $ | 9.16 | $ | 7.59 | $ | 7.28 |
| | | | | | | | | | | |
| | | | | | | | | | | |
| Total return | | 8.15%(1) | | 0.44% | | 20.69% | | 4.26% | | -27.20% |
| | | | | | | | | | | |
| Supplemental data and ratios: | | | | | | | | | | |
| Net assets, end of period | $ | 653,921,538 | $ | 570,471,545 | $ | 344,452,770 | $ | 118,363,326 | $ | 49,664,714 |
| | | | | | | | | | | |
| Ratio of expenses to average net assets | | | | | | | | | | |
| Before Securities Lending Credit, | | | | | | | | | | |
| including Recapture | | 1.35%(2) | | 1.39% | | 1.51% | | 1.63% | | 1.75% |
| After Expense | | | | | | | | | | |
| Reimbursement/Recapture | | | | | | | | | | |
| and Securities Lending Credit | | 1.32%(2) | | 1.37% | | 1.49% | | 1.49% | | 1.49% |
| | | | | | | | | | | |
| Ratio of net investment loss | | | | | | | | | | |
| to average net assets | | | | | | | | | | |
| Before Securities Lending Credit, | | | | | | | | | | |
| including Recapture | | -0.38%(2) | | -0.41% | | -0.83% | | -0.84% | | -1.19% |
| After Expense | | | | | | | | | | |
| Reimbursement/Recapture | | -0.35%(2) | | -0.39% | | -0.81% | | -0.70% | | -0.93% |
| | | | | | | | | | | |
| Portfolio turnover rate | | 72.34% | | 21.63% | | 24.66% | | 30.47% | | 82.84% |
| | | | | | | | | | | |
| (1) Not Annualized. | | | | | | | | | | |
| (2) Annualized. | | | | | | | | | | |
See notes to financial statements.
AssetMark Funds
| | | Large Cap Value Fund | |
| | Period Ended | Year Ended | Year Ended | Year Ended | Year Ended |
| | March 31, 2006 | June 30, 2005 | June 30, 2004 | June 30, 2003 | June 30, 2002 |
| Per share data for a share of capital stock | | | | | |
| outstanding for the entire period and selected | | | | | |
| information for the period are as follows: | | | | | |
| Net asset value, beginning of period | $11.24 | $10.96 | $ 8.78 | | |
| | | | | | |
| Income from investment operations: | | | | | |
| Net investment income | 0.07 | 0.07 | 0.03(3) | 0.04(3) | 0.05 |
| Net realized and unrealized | | | | | |
| gains/(losses) on investments | 0.79 | 0.56 | 2.17(3) | (0.41)(3) | (0.82) |
| Total from investment operations | 0.86 | 0.63 | 2.20 | (0.37) | (0.77) |
| Less distributions: | | | | | |
| Dividends from | | | | | |
| net investment income | (0.07) | (0.05) | (0.02) | (0.04) | (0.03) |
| Dividends from net realized gains | (0.26) | (0.30) | — | (0.01) | — |
| Total distributions | (0.33) | (0.35) | (0.02) | (0.05) | (0.03) |
| Net asset value, end of period | $11.77 | $11.24 | $10.96 | | |
| | | | | | |
| | | | | | |
| Total return | 7.85%(1) | 5.69% | 25.12% | -3.89% | -7.76% |
| | | | | | |
| Supplemental data and ratios: | | | | | |
| Net assets, end of period | $660,129,983 | $570,849,575 | $340,186,439 | | |
| | | | | | |
| Ratio of expenses to average net assets | | | | | |
| Before Securities Lending Credit, | | | | | |
| including Recapture | 1.36%(2) | 1.38% | 1.51% | 1.61% | 1.78% |
| After Expense | | | | | |
| Reimbursement/Recapture | | | | | |
| and Securities Lending Credit | 1.30%(2) | 1.33% | 1.49% | 1.49% | 1.49% |
| | | | | | |
| Ratio of net investment income | | | | | |
| to average net assets | | | | | |
| Before Securities Lending Credit, | | | | | |
| including Recapture | 0.86%(2) | 0.67% | 0.47% | 0.56% | 0.28% |
| After Expense | | | | | |
| Reimbursement/Recapture | 0.92%(2) | 0.72% | 0.49% | 0.68% | 0.57% |
| | | | | | |
| Portfolio turnover rate | 64.61% | 20.06% | 26.27% | 49.79% | 94.61% |
| | | | | | |
(1) Not Annualized. | | | | | |
(2) Annualized. | | | | | |
(3) As restated. See Note 2 to the Financial Statements. | | | | |
See notes to financial statements.
AssetMark Funds
| | | | | Small/Mid Cap Growth Fund | | |
| | | Period Ended | | Year Ended | | Year Ended | | Year Ended | | Year Ended |
| | | March 31, 2006 | | June 30, 2005 | | June 30, 2004 | | June 30, 2003 | | June 30, 2002 |
| Per share data for a share of capital stock | | | | | | | | | | |
| outstanding for the entire period and selected | | | | | | | | | | |
| information for the period are as follows: | | | | | | | | | | |
| Net asset value, beginning of period | $ | 9.56 | $ | 9.49 | $ | 7.64 | $ | 7.20 | $ | 10.00 |
| | | | | | | | | | | |
| Income from investment operations: | | | | | | | | | | |
| Net investment loss | | (0.06) | | (0.06) | | (0.06) | | — | | (0.06) |
| Net realized and unrealized | | | | | | | | | | |
| gains/(losses) on investments | | 1.95 | | 0.13 | | 1.91 | | 0.44 | | (2.74) |
| Total from investment operations | | 1.89 | | 0.07 | | 1.85 | | 0.44 | | (2.80) |
| Less distributions: | | | | | | | | | | |
| Dividends from | | | | | | | | | | |
| net investment income | | — | | — | | — | | — | | — |
| Dividends from net realized gains | | (0.85) | | — | | — | | — | | — |
| Total distributions | | (0.85) | | — | | — | | — | | — |
| Net asset value, end of period | $ | 10.60 | $ | 9.56 | $ | 9.49 | $ | 7.64 | $ | 7.20 |
| | | | | | | | | | | |
| | | | | | | | | | | |
| Total return | | 20.82%(1) | | 0.74% | | 24.21% | | 6.11% | | -28.00% |
| | | | | | | | | | | |
| Supplemental data and ratios: | | | | | | | | | | |
| Net assets, end of period | $ | 215,514,988 | $ | 148,571,261 | $ | 87,189,588 | $ | 31,520,846 | $ | 12,917,171 |
| | | | | | | | | | | |
| Ratio of expenses to average net assets | | | | | | | | | | |
| Before Securities Lending Credit, | | | | | | | | | | |
| including Recapture | | 1.43%(2) | | 1.54% | | 1.61% | | 2.01% | | 2.30% |
| After Expense | | | | | | | | | | |
| Reimbursement/Recapture | | | | | | | | | | |
| and Securities Lending Credit | | 1.38%(2) | | 1.50% | | 1.57% | | 1.59% | | 1.59% |
| | | | | | | | | | | |
| Ratio of net investment loss | | | | | | | | | | |
| to average net assets | | | | | | | | | | |
| Before Securities Lending Credit, | | | | | | | | | | |
| including Recapture | | -0.92%(2) | | -0.85% | | -0.97% | | -1.78% | | -2.01% |
| After Expense | | | | | | | | | | |
| Reimbursement/Recapture | | -0.87%(2) | | -0.81% | | -0.93% | | -1.36% | | -1.30% |
| | | | | | | | | | | |
| Portfolio turnover rate | | 180.64% | | 99.09% | | 56.19% | | 19.02% | | 51.57% |
| | | | | | | | | | | |
| (1) Not Annualized. | | | | | | | | | | |
| (2) Annualized. | | | | | | | | | | |
See notes to financial statements.
AssetMark Funds
| | | Small/Mid Cap Value Fund | |
| | Period Ended | Year Ended | Year Ended | Year Ended | Year Ended |
| | March 31, 2006 | June 30, 2005 | June 30, 2004 | June 30, 2003 | June 30, 2002 |
| Per share data for a share of capital stock | | | | | |
| outstanding for the entire period and selected | | | | | |
| information for the period are as follows: | | | | | |
| Net asset value, beginning of period | $13.89 | $12.93 | $10.13 | $10.15 | $10.00 |
| | | | | | |
| Income from investment operations: | | | | | |
| Net investment loss | (0.04) | (0.04) | (0.04) | — | (0.02) |
| Net realized and unrealized | | | | | |
| gains/(losses) on investments | 1.52 | 1.40 | 2.84 | (0.02) | 0.17 |
| Total from investment operations | 1.48 | 1.36 | 2.80 | (0.02) | 0.15 |
| Less distributions: | | | | | |
| Dividends from | | | | | |
| net investment income | — | — | — | — | — |
| Dividends from net realized gains | (0.96) | (0.40) | — | — | — |
| Total distributions | (0.96) | (0.40) | — | — | — |
| Net asset value, end of period | $14.41 | $13.89 | $12.93 | $10.13 | $10.15 |
| | | | | | |
| | | | | | |
| Total return | 11.18%(1) | 10.56% | 27.64% | -0.20% | 1.50% |
| | | | | | |
| Supplemental data and ratios: | | | | | |
| Net assets, end of period | $185,589,680 | $131,103,625 | $98,948,678 | $29,703,370 | $13,311,184 |
| | | | | | |
| Ratio of expenses to average net assets | | | | | |
| Before Securities Lending Credit, | | | | | |
| including Recapture | 1.55%(2) | 1.61% | 1.66% | 2.20% | 2.40% |
| After Expense | | | | | |
| Reimbursement/Recapture | | | | | |
| and Securities Lending Credit | 1.53%(2) | 1.59% | 1.56% | 1.59% | 1.59% |
| | | | | | |
| Ratio of net investment loss | | | | | |
| to average net assets | | | | | |
| Before Securities Lending Credit, | | | | | |
| including Recapture | -0.45%(2) | -0.32% | -0.53% | -0.97% | -1.14% |
| After Expense | | | | | |
| Reimbursement/Recapture | -0.43%(2) | -0.30% | -0.43% | -0.36% | -0.33% |
| | | | | | |
| Portfolio turnover rate | 72.42% | 92.42% | 82.83% | 64.32% | 84.19% |
| | | | | | |
| (1) Not Annualized. | | | | | |
| (2) Annualized. | | | | | |
See notes to financial statements.
AssetMark Funds
| | | International Equity Fund | |
| | Period Ended | Year Ended | Year Ended | Year Ended | Year Ended |
| | March 31, 2006 | June 30, 2005 | June 30, 2004 | June 30, 2003 | June 30, 2002 |
| Per share data for a share of capital stock | | | | | |
| outstanding for the entire period and selected | | | | | |
| information for the period are as follows: | | | | | |
| Net asset value, beginning of period | $11.79 | $10.43 | $ 8.22 | $ 8.96 | |
| | | | | | |
| Income from investment operations: | | | | | |
| Net investment income | (0.01) | 0.10 | 0.02(3) | 0.06(3) | 0.03 |
| Net realized and unrealized | | | | | |
| gains/(losses) on investments | 3.40 | 1.40 | 2.23(3) | (0.77)(3) | (1.07) |
| Total from investment operations | 3.39 | 1.50 | 2.25 | (0.71) | (1.04) |
| Less distributions: | | | | | |
| Dividends from | | | | | |
| net investment income | (0.15) | (0.06) | (0.04) | (0.03) | — |
| Dividends from net realized gains | (0.97) | (0.08) | — | — | — |
| Total distributions | (1.12) | (0.14) | (0.04) | (0.03) | — |
| Net asset value, end of period | $14.06 | $11.79 | $10.43 | $ 8.22 | |
| | | | | | |
| | | | | | |
| Total return | 29.75%(1) | 14.37% | 27.40% | -7.92% | -10.40% |
| | | | | | |
| Supplemental data and ratios: | | | | | |
| Net assets, end of period | $612,288,218 | $412,985,571 | $261,777,374 | $76,915,396 | $57,301,398 |
| | | | | | |
| Ratio of expenses to average net assets | | | | | |
| Before Securities Lending Credit, | | | | | |
| including Recapture | 1.38%(2) | 1.38% | 1.53% | 1.60% | 1.71% |
| After Expense | | | | | |
| Reimbursement/Recapture | | | | | |
| and Securities Lending Credit | 1.34%(2) | 1.33% | 1.47% | 1.59% | 1.59% |
| | | | | | |
| Ratio of net investment income/(loss) | | | | | |
| to average net assets | | | | | |
| Before Securities Lending Credit, | | | | | |
| including Recapture | -0.16%(2) | 1.01% | 0.56% | 0.97% | 0.36% |
| After Expense | | | | | |
| Reimbursement/Recapture | -0.12%(2) | 1.06% | 0.62% | 0.99% | 0.48% |
| | | | | | |
| Portfolio turnover rate | 66.98% | 80.32% | 60.74% | 148.87% | 76.83% |
| | | | | | |
(1) Not Annualized. | | | | | |
(2) Annualized. | | | | | |
(3) As restated. See Note 2 to the Financial Statements. | | | | | |
See notes to financial statements.
AssetMark Funds
| | | Real Estate Securities Fund | |
| | Period Ended | Year Ended | Year Ended | Year Ended | Year Ended |
| | March 31, 2006 | June 30, 2005 | June 30, 2004 | June 30, 2003 | June 30, 2002 |
| Per share data for a share of capital stock | | | | | |
| outstanding for the entire period and selected | | | | | |
| information for the period are as follows: | | | | | |
| Net asset value, beginning of period | $17.31 | $13.66 | $11.27 | $11.18 | $10.00 |
| | | | | | |
| Income from investment operations: | | | | | |
Net investment income(4) | 0.33 | 0.44(3) | 0.44(3) | 0.45(3) | 0.46(3) |
| Net realized and unrealized | | | | | |
gains on investments(4) | 3.27 | 4.04(3) | 2.27(3) | 0.05(3) | 0.97(3) |
| Total from investment operations | 3.60 | 4.48 | 2.71 | 0.50 | 1.43 |
| Less distributions: | | | | | |
| Dividends from | | | | | |
| net investment income | (0.32) | (0.43) | (0.32) | (0.33) | (0.25) |
| Dividends from net realized gains | (2.13) | (0.40) | — | (0.08) | — |
| Total distributions | (2.45) | (0.83) | (0.32) | (0.41) | (0.25) |
| Net asset value, end of period | $18.46 | $17.31 | $13.66 | $11.27 | $11.18 |
| | | | | | |
| | | | | | |
| Total return | 22.94%(1) | 33.22% | 24.24% | 4.87% | 14.60% |
| | | | | | |
| Supplemental data and ratios: | | | | | |
| Net assets, end of period | $89,616,046 | $75,043,878 | $79,795,852 | $26,188,608 | $14,186,721 |
| | | | | | |
| Ratio of expenses to average net assets | | | | | |
| Before Securities Lending Credit, | | | | | |
| including Recapture | 1.51%(2) | 1.51% | 1.56% | 2.02% | 2.28% |
| After Expense | | | | | |
| Reimbursement/Recapture | | | | | |
| and Securities Lending Credit | 1.49%(2) | 1.49% | 1.49% | 1.49% | 1.49% |
| | | | | | |
| Ratio of net investment income | | | | | |
| to average net assets | | | | | |
| Before Securities Lending Credit, | | | | | |
| including Recapture | 2.46%(2) | 2.83%(3) | 3.35%(3) | 3.80%(3) | 3.72%(3) |
| After Expense | | | | | |
| Reimbursement/Recapture | 2.48%(2) | 2.85%(3) | 3.41%(3) | 4.33%(3) | 4.51%(3) |
| | | | | | |
| Portfolio turnover rate | 41.09% | 77.64% | 24.30% | 28.71% | 68.04% |
| | | | | | |
(1) Not Annualized. | | | | | |
| | | | | |
(3) As restated. See Note 2 of Notes to Financial Statements. | | | | |
(4) Calculated using the average shares outstanding method. | | | | |
See notes to financial statements.
AssetMark Funds
| | | Tax-Exempt Fixed Income Fund | |
| | Period Ended | Year Ended | Year Ended | Year Ended | Year Ended |
| | March 31, 2006 | June 30, 2005 | June 30, 2004 | June 30, 2003 | June 30, 2002 |
| Per share data for a share of capital stock | | | | | |
| outstanding for the entire period and selected | | | | | |
| information for the period are as follows: | | | | | |
| Net asset value, beginning of period | $11.01 | $10.75 | $11.05 | $10.46 | $10.00 |
| | | | | | |
| Income from investment operations: | | | | | |
| Net investment income | 0.17 | 0.20 | 0.17 | 0.22 | 0.18 |
| Net realized and unrealized | | | | | |
| gains (losses) on investments | (0.24) | 0.26 | (0.28) | 0.59 | 0.46 |
| Total from investment operations | (0.07) | 0.46 | (0.11) | 0.81 | 0.64 |
| Less distributions: | | | | | |
| Dividends from | | | | | |
| net investment income | (0.17) | (0.20) | (0.17) | (0.22) | (0.18) |
| Dividends from net realized gains | — | — | (0.02) | — | — |
| Total distributions | (0.17) | (0.20) | (0.19) | (0.22) | (0.18) |
| Net asset value, end of period | $10.77 | $11.01 | $10.75 | $11.05 | $10.46 |
| | | | | | |
| | | | | | |
| Total return | -0.64%(1) | 4.29% | -1.01% | 7.78% | 6.47% |
| | | | | | |
| Supplemental data and ratios: | | | | | |
| Net assets, end of period | $213,170,198 | $157,544,853 | $80,301,556 | $26,100,100 | $14,088,545 |
| | | | | | |
| Ratio of expenses to average net assets | | | | | |
| Before Securities Lending Credit, | | | | | |
| including Recapture | 1.29%(2) | 1.33% | 1.41% | 1.82% | 2.28% |
| After Expense | | | | | |
| Reimbursement/Recapture | | | | | |
| and Securities Lending Credit | 1.29%(2) | 1.29% | 1.29% | 1.29% | 1.29% |
| | | | | | |
| Ratio of net investment income | | | | | |
| to average net assets | | | | | |
| Before Securities Lending Credit, | | | | | |
| including Recapture | 2.15%(2) | 1.90% | 1.65% | 1.66% | 1.42% |
| After Expense | | | | | |
| Reimbursement/Recapture | 2.15%(2) | 1.94% | 1.77% | 2.19% | 2.41% |
| | | | | | |
| Portfolio turnover rate | 14.61% | 30.05% | 18.90% | 19.18% | 11.02% |
| | | | | | |
| (1) Not Annualized. | | | | | |
| (2) Annualized. | | | | | |
See notes to financial statements.
AssetMark Funds
| | | Core Plus Fixed Income Fund | |
| | Period Ended | Year Ended | Year Ended | Year Ended | Year Ended |
| | March 31, 2006 | June 30, 2005 | June 30, 2004 | June 30, 2003 | June 30, 2002 |
| Per share data for a share of capital stock | | | | | |
| outstanding for the entire period and selected | | | | | |
| information for the period are as follows: | | | | | |
| Net asset value, beginning of period | $10.73 | $10.38 | $10.71 | $10.15 | $10.00 |
| | | | | | |
| Income from investment operations: | | | | | |
| Net investment income | 0.34 | 0.25 | 0.36 | 0.48 | 0.45 |
| Net realized and unrealized | | | | | |
| gains/(losses) on investments | (0.39) | 0.41 | (0.34) | 0.56 | 0.15 |
| Total from investment operations | (0.05) | 0.66 | 0.02 | 1.04 | 0.60 |
| Less distributions: | | | | | |
| Dividends from | | | | | |
| net investment income | (0.26) | (0.27) | (0.35) | (0.48) | (0.45) |
| Dividends from net realized gains | (0.08) | (0.04) | — | — | — |
| Return of Capital | (1.23) | — | — | — | — |
| Total distributions | (1.57) | (0.31) | (0.35) | (0.48) | (0.45) |
| Net asset value, end of period | $ 9.11 | $10.73 | $10.38 | $10.71 | $10.15 |
| | | | | | |
| | | | | | |
| Total return | -0.48%(1) | 6.47% | 0.21% | 10.47% | 6.03% |
| | | | | | |
| Supplemental data and ratios: | | | | | |
| Net assets, end of period | $612,841,433 | $508,047,802 | $284,788,044 | $110,280,032 | $52,817,274 |
| | | | | | |
| Ratio of expenses to average net assets | | | | | |
| Before Securities Lending Credit, | | | | | |
| including Recapture | 1.19%(2) | 1.24% | 1.29% | 1.41% | 1.62% |
| After Expense | | | | | |
| Reimbursement/Recapture | | | | | |
| and Securities Lending Credit | 1.16%(2) | 1.20% | 1.29% | 1.29% | 1.29% |
| | | | | | |
| Ratio of net investment income | | | | | |
| to average net assets | | | | | |
| Before Securities Lending Credit, | | | | | |
| including Recapture | 3.43%(2) | 2.51% | 3.71% | 4.69% | 5.04% |
| After Expense | | | | | |
| Reimbursement/Recapture | 3.47%(2) | 2.55% | 3.71% | 4.81% | 5.37% |
| | | | | | |
| Portfolio turnover rate | 261.52% | 471.24% | 11.82% | 52.99% | 39.01% |
| | | | | | |
| (1) Not Annualized. | | | | | |
| (2) Annualized. | | | | | |
See notes to financial statements.
AssetMark Funds
NOTES TO FINANCIAL STATEMENTS
| | AssetMark Funds (the “Trust”) is organized as a Delaware statutory trust under a Declaration of Trust dated January 2, 2001. The Trust is registered under the Investment Company Act of 1940, as amended (the “1940 Act”), as an open-end management investment company with eight non-diversified funds (the “Funds”): AssetMark Large Cap Growth Fund, AssetMark Large Cap Value Fund, AssetMark Small/Mid Cap Growth Fund, AssetMark Small/Mid Cap Value Fund, AssetMark International Equity Fund, AssetMark Real Estate Securities Fund, AssetMark Tax-Exempt Fixed Income Fund and AssetMark Core Plus Fixed Income Fund. Each Fund represents a distinct portfolio with its own investment objectives and policies. The assets of each Fund are segregated, and a shareholder’s interest is limited to the Fund in which shares are held. The Funds commenced operations on June 29, 2001. |
| | In preparing the 2006 financial statements of the AssetMark Real Estate Securities Fund, management determined that it had misclassified returns of capital on distributions received from REIT securities held in the fund portfolio in prior years by recording them as income rather than as an adjustment to the cost of the security. This misclassification had no impact on amounts previously reported for net asset value, distributions paid, amounts of income reported to shareholders, total return, portfolio turnover rate, security valuation, or net change in net assets from operations. These financial statements have been restated to reclassify amounts reported for net investment income, net realized gain and change in unrealized appreciation on investments in the Statement of Changes in Net Assets for the year ended June 30, 2005, and for the net investment income per share, net realized and unrealized gain/(loss) on investments per share, the ratio of net investment income to average net assets, and the ratio of net investment income before securities lending credit, including recapture to average net assets after expense reimbursement recapture for the years ended prior to March 31, 2006 in the Financial Highlights. The amounts before and after the restatement for the AssetMark Real Estate Securities Fund are shown in the table below: |
| | | As originally | | |
| | | reported | | Restated |
| Statement of Changes in Net Assets - | | | | |
| Year Ended June 30, 2005 | | | | |
| Net investment income | $ | 3,134,928 | $ | 2,560,035 |
| Net realized gain | | | | |
| on investments | | 8,401,087 | | 8,797,252 |
| Change in unrealized | | | | |
| appreciation on | | | | |
| Investments | | 10,600,077 | | 10,778,805 |
| Net increase in net assets | | | | |
| from operations | | 22,136,092 | | 22,136,092 |
| Undistributed net | | | | |
| investment income | | — | | (261,161) |
| | | As originally | | |
| | | Reported | | Restated |
| Per Share Financial Highlights - | | | | |
| Net investment income: | 2005 | 0.59 | | 0.44 |
| | 2004 | 0.56 | | 0.44 |
| | 2003 | 0.56 | | 0.45 |
| | 2002 | 0.46 | | 0.46 |
| Net realized and | | | | |
| unrealized gain/(loss) | | | | |
| on investments: | 2005 | 3.89 | | 4.04 |
| | 2004 | 2.15 | | 2.27 |
| | 2003 | (0.06) | | 0.05 |
| | 2002 | 0.97 | | 0.97 |
| Ratio of net investment | | | | |
| income before securities | | | | |
| lending credit, including | | | | |
| recapture to average | | | | |
| net assets: | 2005 | 3.47% | | 2.83% |
| | 2004 | 4.14% | | 3.35% |
| | 2003 | 4.61% | | 3.80% |
| | 2002 | 4.36% | | 3.72% |
| Ratio of net investment | | | | |
| income after expense | | | | |
| reimbursement/recapture | | | | |
| to average net assets: | 2005 | 3.49% | | 2.85% |
| | 2004 | 4.20% | | 3.41% |
| | 2003 | 5.14% | | 4.33% |
| | 2002 | 5.15% | | 4.51% |
AssetMark Funds
NOTES TO FINANCIAL STATEMENTS (Continued)
| | For the AssetMark Large Cap Value Fund and the AssetMark International Equity Fund, certain per share amounts related to net investment income and net realized and unrealized gains/losses on investments for the years ended 2004 and 2003 have been revised to properly correct for a mathematical error. |
| | As originally reported for the AssetMark Large Cap Value Fund, the net investment income amounts per share were $0.05 and $0.06 for 2004 and 2003, respectively, and the net realized and unrealized gains/losses on investments amounts per share were $2.15 and $(0.43) for 2004 and 2003, respectively. As restated, the net investment income amounts per share were $0.03 and $0.04 for 2004 and 2003, respectively, and the net realized and unrealized gains/losses on investments amounts per share were $2.17 and $(0.41) for 2004 and 2003, respectively. |
| | As originally reported for the AssetMark International Equity Fund, the net investment income amounts per share were $0.08 and $0.09 for 2004 and 2003, respectively, and the net realized and unrealized gains/losses on investments amounts per share were $2.17 and $(0.80) for 2004 and 2003, respectively. As restated, the net investment income amounts per share were $0.02 and $0.06 for 2004 and 2003, respectively, and the net realized and unrealized gains/losses on investments amounts per share were $2.23 and $(0.77) for 2004 and 2003, respectively. |
| | This correction has no impact to the Funds’ net assets or total results from operations. |
| 3. | Significant Accounting Policies |
| | The following is a summary of significant accounting policies consistently followed by the Funds in the preparation of the financial statements. These policies are in conformity with accounting principles generally accepted in the United States of America (“GAAP”). |
| | | Portfolio securities listed on a national or foreign securities exchange, except those listed on NASDAQ, for which market quotations are available are valued at the last quoted sale price on each business day. Portfolio securities traded on NASDAQ are valued at the NASDAQ Official Closing Price (“NOCP”) on each business day. If there is no reported sale on an exchange or NASDAQ, the portfolio security will be valued at the mean between the most recent quoted bid and asked price. Price information on listed securities is taken from the exchange where the security is primarily traded. |
| | | All equity securities that are not traded on a listed exchange are valued at the last sale price in the over-the-counter market. If a non-exchange traded security does not trade on a particular day, then the mean between the last quoted closing bid and asked price will be used. Non-exchange traded ADR’s are priced with an evaluated price as determined by the current evaluated pricing procedures of, and provided by, the pricing vendor. |
| | | Investments in open-end investment companies are valued at the closing net asset value per share of each mutual fund on the day of valuation. Securities for which no market quotations are readily available or when a significant event has occurred between the time of the security’s last close and the time that a fund calculates net asset value will be valued at their fair market value as determined by the Valuation Committee. |
| | | Each Fund may enter into repurchase agreements with banks and securities dealers. These transactions involve the purchase of securities with a simultaneous commitment to sell the securities to the bank or the dealer at an agreed-upon date and price. A repurchase agreement is accounted for as an investment by the Fund, collateralized by securities, which are delivered to the Fund’s Custodian or to an agent bank under a tri-party agreement. The securities are marked-to-market daily and additional securities are acquired as needed, to ensure that their value equals or exceeds the repurchase price plus accrued interest. The Core Plus Fixed Income Fund entered into repurchase agreements during the period ended March 31, 2006. For all funds engaged in |
AssetMark Funds
NOTES TO FINANCIAL STATEMENTS (Continued)
| | | securities lending, portions of cash collateral for securities on loan were invested in repurchase agreements at March 31, 2006. |
| | | The Funds intend to continue to comply with the requirements of the Internal Revenue Code necessary to qualify as regulated investment companies and to make the requisite distributions of income and capital gains to their shareholders sufficient to relieve them from all or substantially all Federal income taxes. Therefore, no Federal income tax provision is required. |
| | | The preparation of financial statements in conformity with GAAP requires management to make estimates and assumptions that affect the reported amounts of assets and liabilities and disclosure of contingent assets and liabilities at the date of the financial statements and the reported amounts of revenues and expenses during the reporting period. Actual results could differ from those estimates. |
| | | Under the Trust’s organizational documents, its officers and trustees are indemnified against certain liability arising out of the performance of their duties to the Trust. In addition, in the normal course of business, the Trust enters into contracts that contain a variety of representations and warranties which provide general indemnifications. The Trust’s maximum exposure under these arrangements are unknown as this would involve future claims that may be made against the Trust that have not yet occurred. However, the Trust expects the risk of loss to be remote. |
| | | Most expenses of the Trust can be directly attributed to a specific Fund. Expenses that cannot be directly attributed to a specific Fund are apportioned among all the Funds in the Trust based on relative net assets. |
| | (g) | Security Transactions and Income Recognition Security transactions are accounted for on trade date. Dividend income is recognized on the ex-dividend date, and interest income is accrued daily. Realized gains and losses on investment transactions are determined using the specific identification method. Return of capital distributions received from REIT securities are recorded as an adjustment to the cost of the security and thus may impact unrealized or realized gains or losses on the security. Gains and losses from paydowns on mortgage and asset backed securities are recorded as adjustments to interest income. |
| | (h) | Distributions to Shareholders |
| | | The Funds, with the exception of the Tax-Exempt Fixed Income Fund and Core Plus Fixed Income Fund, will distribute any net investment income at least annually. The Tax-Exempt Fixed Income Fund and Core Plus Fixed Income Fund will distribute any net investment income quarterly. All of the Funds will distribute any net realized long or short-term capital gains at least annually. Distributions to shareholders are recorded on the ex-dividend date. The Funds may also pay a special distribution at the end of the calendar year to comply with Federal tax requirements. |
| | | Each Fund may invest in derivative securities including call and put options, futures, forward currency contracts and swaps and may be used by a Fund for hedging purposes as well as direct investment. |
| | | Forward Currency Contracts |
| | | The Funds may enter into forward currency contracts, obligating the Funds to deliver and receive currency at a specified future date. Transactions involving forward currency contracts may serve as long hedges (for example, if a Fund seeks to buy a security denominated in a foreign currency, it may purchase a forward currency contract to lock in the U.S. dollar price of the security) or as short hedges (if a Fund anticipates selling a security denominated in a foreign currency it may sell a forward currency contract to lock in the U.S. dollar equivalent of the anticipated sales proceeds). Forward contracts are valued daily and unrealized appreciation or |
AssetMark Funds
NOTES TO FINANCIAL STATEMENTS (Continued)
| | | depreciation is recorded daily as the difference between the contract exchange rate and the closing forward rate applied to the face amount of the contract. |
| | | The Funds may purchase and write call or put options on securities and indices and enter into related closing transactions, but will only engage in option strategies for non-speculative purposes. As a holder of a call option, a Fund has the right, but not the obligation, to purchase a security at the exercise price during the exercise period. As the writer of a call option, a Fund has the obligation to sell the security at the exercise price during the exercise period. As a holder of a put option, a Fund has the right, but not the obligation, to sell a security at the exercise price during the exercise period. As the writer of a put option, a Fund has the obligation to buy the underlying security at the exercise price during the exercise period. |
| | | The premium that a Fund pays when purchasing a call option or receives when writing a call option will reflect, among other things, the market price of the security, the relationship of the exercise price to the market price of the security, the relationship of the exercise price to the volatility of the security, the length of the option period and supply and demand factors. The premium is the market value of an option at the date of purchase. |
| | | A purchaser (holder) of a put option pays a non-refundable premium to the seller (writer) of a put option to obtain the right to sell a specified amount of a security at a fixed price (the exercise price) during a specified period (exercise period). Conversely, the seller (writer) of a put option, upon payment by the holder of the premium, has the obligation to buy the security from the holder of the put option at the exercise price during the exercise period. |
| | | Options are valued daily at the last reported sale price at the close of the exchange on which the security is primarily traded. If no sales are reported for exchange-traded options, or the options are not exchange-traded, then they are valued at the mean of the most recent quoted bid and asked price. |
| | | As of March 31, 2006, the Core Plus Fixed Income Fund has entered into written call and put options, for which sufficient collateral was set aside, as disclosed in the schedule of investments. |
| | | Each Fund has the ability to buy and sell stock index futures contracts traded on domestic stock exchanges to hedge the value of its portfolio against changes in market conditions. A stock index futures contract is an agreement between two parties to take or make delivery of an amount of cash equal to a specified dollar amount, times the difference between the stock index value at the close of the last trading day of the contract and the price at which the futures contract is originally struck. A stock index futures contract does not involve the physical delivery of the underlying stocks in the index. Although stock index futures contracts call for the actual taking or delivery of cash, in most cases a Fund expects to liquidate its stock index futures positions through offsetting transactions, which may result in a gain or a loss, before cash settlement is required. |
| | | Futures contracts are valued at the daily quoted settlement prices. |
| | | The Core Plus Fixed Income Fund entered into credit default swaps during the period. Credit default swaps involve the receipt of floating or fixed rate payments in exchange for assuming potential credit losses of an underlying security or basket of securities. Credit default swaps give one party to a transaction the right to dispose of or acquire an asset (or group of assets), or the right to receive or make a payment from the other party, upon the occurrence of specified credit events. Credit default swaps involve transferring the credit exposure of fixed income products between parties. The buyer of a credit default swap receives credit protection, whereas the seller of the swap guarantees the credit worthiness of the product. By doing this, the risk of default is |
AssetMark Funds
NOTES TO FINANCIAL STATEMENTS (Continued)
| | | transferred from the holder of the fixed income security to the seller of the swap. |
| | | Swap agreements are valued daily and unrealized appreciation or depreciation is recorded daily as the difference between the prior day and current day closing price. |
| | | The Funds had no open or outstanding swap contracts as of March 31, 2006. |
| | (j) | Foreign Currency Translation |
| | | The accounting records of the Funds are maintained in U.S. dollars. Investment securities and all other assets and liabilities of the Funds denominated in a foreign currency are translated into U.S. dollars at current exchange rates. Purchases and sales of securities, income receipts, and expense payments are translated into U.S. dollars at the exchange rate in effect on the dates of the respective transactions. The Funds do not isolate the portion of the fluctuations on investments resulting from changes in foreign currency exchange rates from the fluctuations in market prices of investments held. Such fluctuations are included with the net realized and unrealized gain or loss from investments. |
| | | A restricted security generally is subject to restrictions on resale without prior registration under the Securities Act of 1933. If the security is subsequently registered and resold, the issuers would typically bear the expense of all registrations at no cost to the Fund. |
| | | Although not currently part of any of the Fund’s investment strategies, each Fund has the ability to make short sales. Short sales are transactions where a Fund sells securities it does not own in anticipation of a decline in the market value of the securities. |
| | | For their service as Trustees of the Trust, the Independent Trustees receive a retainer fee of $30,000 per year and $2,500 per in-person meeting attended, as well as reimbursement for expenses incurred in connection with attendance at such meetings. Telephonic meeting fees are determined according to length of the meeting as follows: $1,000 for one to two hours, $1,500 for two to three hours and $2,500 for three hours or longer. The interested persons who serve as Trustees of the Trust receive no compensation for their service as Trustees. |
| | The Trust has an Investment Advisory Agreement (the “Agreement”) with AssetMark Investment Services, Inc. (the “Advisor”), with whom certain officers and trustees of the Trust are affiliated, to furnish investment advisory services to the Funds. Under the terms of the Agreement, the Trust, on behalf of the Funds, compensates the Advisor for its management services at the following contractual rates, based on each Fund’s average daily net assets: |
| Large Cap Growth Fund | 0.95% |
| Large Cap Value Fund | 0.95% |
| Small/Mid Cap Growth Fund | 0.95% |
| Small/Mid Cap Value Fund | 1.00% |
| International Equity Fund | 0.95% |
| Real Estate Securities Fund | 0.95% |
| Tax-Exempt Fixed Income Fund | 0.80% |
| Core Plus Fixed Income Fund | 0.75% |
| | In addition, the Trust and Advisor have also entered into a Fee Waiver Agreement designed to provide Fund shareholders with the economic benefits of economies of scale that may be realized as Fund assets increase. Under the Fee Waiver Agreement, the Advisor has contractually agreed to: (1) waive 0.025% of each Fund’s annual advisory fee on Trust assets in excess of $6 billion, and an additional 0.025% of each Fund’s annual advisory fee on Trust assets in excess of $12 billion; and (2) waive portions of its advisory fee to the extent necessary to pass on certain breakpoints in the underlying sub-advisory fee arrangements that are reached as Fund assets grow. |
| | The Advisor has agreed to waive, through October 31, 2006, its management fee and/or reimburse each Fund’s other expenses to the extent necessary to ensure that the Funds’ operating expenses do not |
AssetMark Funds
NOTES TO FINANCIAL STATEMENTS (Continued)
| | exceed the following rates, based on each Fund’s average daily net assets: |
| Large Cap Growth Fund | 1.49% |
| Large Cap Value Fund | 1.49% |
| Small/Mid Cap Growth Fund | 1.59% |
| Small/Mid Cap Value Fund | 1.59% |
| International Equity Fund | 1.59% |
| Real Estate Securities Fund | 1.49% |
| Tax-Exempt Fixed Income Fund | 1.29% |
| Core Plus Fixed Income Fund | 1.29% |
| | Any such waiver or reimbursement is subject to later adjustment to allow the Advisor to recoup amounts waived or reimbursed to the extent actual fees and expenses for a fiscal period are less than each Fund’s expense limitation cap, provided, however, that the Advisor shall only be entitled to recoup such amounts for a period of three years from the date such amount was waived or reimbursed. Waived/reimbursed expenses subject to potential recovery by year of expiration are as follows: |
| | Year of Expiration |
| | 6/30/06 | 6/30/07 | 6/30/08 |
| Large Cap Growth Fund | — | — | — |
| Large Cap Value Fund | — | — | — |
| Small/Mid Cap | | | |
| Growth Fund | — | — | — |
| Small/Mid Cap | | | |
| Value Fund | — | — | — |
| International | | | |
| Equity Fund | — | — | — |
| Real Estate | | | |
| Securities Fund | $87,118 | $29,252 | — |
| Tax-Exempt Fixed | | | |
| Income Fund | 55,295 | 59,111 | $41,084 |
| Core Plus Fixed | | | |
| Income Fund | — | — | — |
| | As of March 31, 2006, the Tax-Exempt Fixed Income Fund is recouping waived or reimbursed expenses. As of March 31, 2006, the Large Cap Growth Fund, Large Cap Value Fund, Small/MidCap Growth Fund, Small/MidCap Value Fund, International Equity Fund and Core Plus Fixed Income Fund have recouped all potential recoverable waived or reimbursed expenses. The Advisor is still waiving expenses periodically in the Real Estate Securities Fund to keep this Fund at the expense cap. |
| | Sub-advisory services are provided to the Funds, pursuant to agreements between the Advisor and various sub-advisors. Under the terms of these sub-advisory agreements, the Advisor compensates the sub-advisors based on each Fund’s average daily net assets. |
| | The Trust, on behalf of the Funds, has adopted a distribution plan pursuant to Rule 12b-1 under the 1940 Act (the “12b-1 Plan”), which provides for each Fund to pay distribution fees at an annual rate of 0.25% of the average daily net assets of the Funds. Payments under the 12b-1 Plan shall be used to compensate persons who provide support services in connection with the distribution of the Funds’ shares and servicing of the Funds’ shareholders. AssetMark Capital Corporation, an affiliate of the Advisor, serves as principal underwriter and distributor for the Funds. Quasar Distributors, LLC serves as sub-distributor for the Funds. Quasar Distributors, LLC is an affiliated company of U.S. Bank, N.A. |
| 6. | Service and Custody Agreements |
| | The Trust has entered into Service Agreements with U.S. Bancorp Fund Services, LLC (“USBFS”) and a Custody Agreement with U.S. Bank, N.A., an affiliate of USBFS. Under these agreements, USBFS and U.S. Bank, N.A. provide certain transfer agency, administrative, accounting and custody services. |
| | Effective July 1, 2003 the Funds entered into a securities lending arrangement with U.S. Bank, N.A. (the “Custodian”). Under the terms of the agreement, the Custodian is authorized to loan securities on behalf of the Funds to approved brokers. In exchange, the Funds receive cash collateral in the amount of at least 102% of the value of the securities loaned. The cash collateral is invested in short term instruments as noted in the Schedule of Investments. Although risk is mitigated by the collateral, the Funds could experience a delay in recovering their securities and possible loss of income or value if the borrower fails to return them. The agreement provides that after predetermined |
AssetMark Funds
NOTES TO FINANCIAL STATEMENTS (Continued)
| | rebates to brokers, 65% of the net securities lending revenue shall be solely paid as credits to the Funds to be used as an offset against custody costs and other charges incurred by the Funds from the custodian, administration, fund accounting and transfer agent fees and shall not, in any event, be paid as cash to the Funds. The Custodian shall be paid a fee for administering a securities lending program for the Funds, equal to the remaining 35% of the net securities lending revenues generated under the agreement. Prior to June 1, 2004, the allocation rate was 60% for the Fund and 40% for the Custodian. |
| | As of March 31, 2006, the Funds had loaned securities which were collateralized by cash. The cash collateral received was invested in securities as listed in each Fund’s Schedule of Investments. Income earned from these investments is allocated to each Fund based on each Fund’s portion of the total cash collateral received. Securities lending income is disclosed in the Fund’s Statement of Operations. |
| | As of March 31, 2006, the values of securities loaned and collateral held were as follows: |
| | Market Value | |
| | of Securities | |
| | Loaned | Collateral |
| | | |
| Large Cap Growth Fund | $216,642,536 | $223,947,221 |
| Large Cap Value Fund | 248,646,820 | 260,587,989 |
| Small/Mid Cap | | |
| Growth Fund | 74,747,672 | 77,426,550 |
| Small/Mid Cap | | |
| Value Fund | 63,191,725 | 65,488,429 |
| International | | |
| Equity Fund | 109,956,115 | 114,781,055 |
| Real Estate | | |
| Securities Fund | 34,795,996 | 35,682,105 |
| Core Plus Fixed | | |
| Income Fund | 190,231,522 | 195,022,695 |
| 8. | Investment Transactions |
| | The aggregate purchases and sales of securities, excluding short-term investments, for the year ended March 31, 2006 are summarized below. |
| | Purchases | Sales |
| Large Cap | | |
| Growth Fund | $484,061,338 | $447,515,868 |
| Large Cap | | |
| Value Fund | 439,911,361 | 391,988,609 |
| Small/Mid Cap | | |
| Growth Fund | 320,188,130 | 289,079,305 |
| Small/Mid Cap | | |
| Value Fund | 111,174,522 | 79,538,509 |
| International | | |
| Equity Fund | 398,079,833 | 325,296,573 |
| Real Estate | | |
| Securities Fund | 32,317,231 | 31,079,308 |
| Tax-Exempt Fixed | | |
| Income Fund | 85,586,471 | 26,107,027 |
| Core Plus Fixed | | |
| Income Fund* | 1,709,650,328 | 1,508,768,057 |
| * Included in these amounts were $320,892,454 of purchases |
| and $306,526,576 of sales of U.S. Government Securities. |
| 9. | Option Contracts Written |
| | The premium amount and number of option contracts written during the year ended March 31, 2006 in the AssetMark Core Plus Fixed Income Fund, were as follows: |
| | | Amount of | Number of |
| | | Premiums | Contracts |
| Outstanding at 6/30/05 | $ | 146,907 | 527 |
| Options written | | 354,328 | 4,802 |
| Options expired | | (126,681) | (2,340) |
| Options exercised | | — | — |
| Options closed | | (274,380) | (590) |
| Outstanding at 3/31/06 | $ | 100,174 | (2,399) |
| | | | |
| | Net investment income and realized gains and losses for federal income tax purposes may differ from that reported on the financial statements because of permanent book-to-tax differences. GAAP requires that permanent differences between financial reporting and tax reporting be reclassified between various components of net assets. These differences are primarily due to net operating losses and capital gain distributions received from real estate investment trusts. On the Statements of Assets and Liabilities, the following adjustments were made: |
AssetMark Funds
NOTES TO FINANCIAL STATEMENTS (Continued)
| | Accumulated | | | |
| | Net | | Accumulated | |
| | Investment | | Realized | |
| | Income | | Gain or | Capital |
| | or (Loss) | | (Loss) | Stock |
| Large Cap | | | | |
| Growth | | | | |
| Fund | $1,681,971 | $ | (1) | $(1,681,970) |
| Large Cap | | | | |
| Value | | | | |
| Fund | — | | — | — |
| Small/Mid | | | | |
| Cap | | | | |
| Growth | | | | |
| Fund | 1,179,169 | | (1,179,169) | — |
| Small/Mid | | | | |
| Cap Value | | | | |
| Fund | 519,346 | | (519,346) | — |
| International | | | | |
| Equity | | | | |
| Fund | 241,033 | | (241,033) | — |
| Real Estate | | | | |
| Securities | | | | |
| Fund | 89,779 | | (89,779) | — |
| Tax-Exempt | | | | |
| Fixed | | | | |
| Income | | | | |
| Fund | — | | — | — |
| Core Plus | | | | |
| Fixed | | | | |
| Income | | | | |
| Fund | (5,496,935) | | 74,725,142 | (69,228,207) |
| | The Funds intend to utilize provisions of the Federal income tax laws which allow the Funds to carry realized capital losses forward for eight years following the year of loss and offset such losses against any future realized capital gains. Capital loss carryforwards available for Federal income tax purposes are as follows: |
| | Capital losses expiring: |
| | 3/31/12 | | 3/31/13 |
| Large Cap | | | |
| Growth Fund | — | | — |
| Large Cap | | | |
| Value Fund | — | | — |
| Small/Mid Cap | | | |
| Growth Fund | — | | — |
| Small/Mid Cap | | | |
| Value Fund | — | | — |
| International | | | |
| Equity Fund | — | | — |
| Real Estate | | | |
| Securities Fund | — | | — |
| Tax-Exempt Fixed | | | |
| Income Fund | $(16,163) | | $(128,240) |
| Core Plus Fixed | | | |
| Income Fund | — | | — |
| | | | |
| | | | 3/31/14 |
| Large Cap Growth Fund | | | — |
| Large Cap Value Fund | | | — |
| Small/Mid Cap Growth Fund | | — |
| Small/Mid Cap Value Fund | | — |
| International Equity Fund | | | — |
| Real Estate Securities Fund | | — |
| Tax-Exempt Fixed Income Fund | $ | (10,395) |
| Core Plus Fixed Income Fund | | (2,286,685) |
| | The Large Cap Growth Fund utilized $11,003,641 of prior year capital loss carryover in the current year. |
| | Additionally, at March 31, 2006, the Funds deferred on a tax basis post-October losses as follows: |
| Large Cap Growth Fund | | — |
| Large Cap Value Fund | | — |
| Small/Mid Cap Growth Fund | | — |
| Small/Mid Cap Value Fund | | — |
| International Equity Fund | $ | 163,218 |
| Real Estate Securities Fund | | — |
| Tax-Exempt Fixed Income Fund | | 134,966 |
| Core Plus Fixed Income Fund | | 3,792,204 |
AssetMark Funds
NOTES TO FINANCIAL STATEMENTS (Continued)
| | The tax components of distributions paid during the fiscal years ended March 31, 2006 and June 30, 2005 are as follows: |
| | | Year Ended March 31, 2006 |
| | | Ordinary | Long-Term | Return |
| | | Income | Capital Gains | of Capital |
| Large Cap | | | | | |
| Growth Fund | $ | — | $ — | $ | — |
| Large Cap | | | | | |
| Value Fund | | 11,863,655 | 7,148,112 | | — |
| Small/Mid | | | | | |
| Cap Growth | | | | | |
| Fund | | 4,714,801 | 10,888,147 | | — |
| Small/Mid | | | | | |
| Cap Value | | | | | |
| Fund | | 3,728,475 | 7,802,865 | | — |
| International | | | | | |
| Equity Fund | | 22,611,018 | 19,370,573 | | — |
| Real Estate | | | | | |
| Securities | | | | | |
| Fund | | 2,486,920 | 7,289,762 | | — |
| Tax-Exempt | | | | | |
| Fixed Income | | | | | |
| Fund | | 3,056,168* | — | | — |
| Core Plus Fixed | | | | | |
| Income Fund | | 19,005,741 | 1,293,014 | | 69,195,594 |
| * Contains $3,056,168 of tax-exempt income. | | |
| | | June 30, 2005 |
| | | Ordinary | Long-Term |
| | | Income | Capital Gains |
| | | Distributions | Distributions |
| Large Cap | | | |
| Growth Fund | | — | — |
| Large Cap | | | |
| Value Fund | $ | 8,777,820 | $5,423,413 |
| Small/Mid Cap | | | |
| Growth Fund | | — | — |
| Small/Mid Cap | | | |
| Value Fund | | 2,534,052 | 1,353,344 |
| International | | | |
| Equity Fund | | 1,968,196 | 2,524,840 |
| Real Estate | | | |
| Securities Fund | | 4,018,059 | 1,154,347 |
| Tax-Exempt Fixed | | | |
| Income Fund | | 2,109,378* | — |
| Core Plus Fixed | | | |
| Income Fund | | 10,299,353 | 1,476,782 |
| * Contains $2,109,378 of tax-exempt income. | |
AssetMark Funds
NOTES TO FINANCIAL STATEMENTS (Continued)
| At March 31, 2006 the components of accumulated earnings/losses on a tax basis were as follows: | | |
| | | | | | | | | | | | | | | | | |
| | | Large Cap | | Large Cap | | Small/Mid | | Small/Mid | | International | | Real Estate | | Tax-Exempt | | Core Plus |
| | | Growth | | Value | | Cap Growth | | Cap Value | | Equity | | Securities | | Fixed Income | | Fixed Income |
| | | Fund | | Fund | | Fund | | Fund | | Fund | | Fund | | Fund | | Fund |
| Cost of | | | | | | | | | | | | | | | | |
| investments | $ | 805,138,949 | $ | 872,084,135 | $ | 262,257,201 | $ | 222,649,237 | $ | 616,457,358 | $ | 93,416,288 | $ | 213,390,572 | $ | 890,318,269 |
| Gross | | | | | | | | | | | | | | | | |
| unrealized | | | | | | | | | | | | | | | | |
| appreciation | | 93,614,073 | | 76,674,055 | | 34,318,055 | | 30,190,823 | | 125,098,040 | | 33,172,317 | | 385,564 | | 3,013,495 |
| Gross | | | | | | | | | | | | | | | | |
| unrealized | | | | | | | | | | | | | | | | |
| depreciation | | (18,034,953) | | (27,342,774) | | (4,119,123) | | (5,384,557) | | (13,627,732) | | (1,062,552) | | (2,495,542) | | (11,591,377) |
| Net unrealized | | | | | | | | | | | | | | | | |
| appreciation/ | | | | | | | | | | | | | | | | |
| depreciation | $ | 75,579,120 | $ | 49,331,281 | $ | 30,198,932 | $ | 24,806,266 | $ | 111,470,308 | $ | 32,109,765 | $ | (2,109,978) | $ | (8,577,882) |
| | | | | | | | | | | | | | | | | |
| Undistributed | | | | | | | | | | | | | | | | |
| tax-exempt | | | | | | | | | | | | | | | | |
| ordinary | | | | | | | | | | | | | | | | |
| income | $ | — | $ | — | $ | — | $ | — | $ | — | $ | — | $ | 589,486 | $ | — |
| Undistributed | | | | | | | | | | | | | | | | |
| ordinary | | | | | | | | | | | | | | | | |
| income | | — | | 5,674,801 | | 5,361,513 | | 2,379,293 | | 18,254,474 | | — | | — | | — |
| Undistributed | | | | | | | | | | | | | | | | |
| long-term | | | | | | | | | | | | | | | | |
| capital gain | | 18,667,606 | | 34,431,996 | | 417,478 | | 3,017,837 | | 18,398,288 | | 1,834,918 | | — | | — |
| Total | | | | | | | | | | | | | | | | |
| distributable | | | | | | | | | | | | | | | | |
| earnings | $ | 18,667,606 | $ | 40,106,797 | $ | 5,778,991 | $ | 5,397,130 | $ | 36,652,762 | $ | 1,834,918 | $ | 589,486 | $ | — |
| | | | | | | | | | | | | | | | | |
| Other | | | | | | | | | | | | | | | | |
| accumulated | | | | | | | | | | | | | | | | |
| losses | $ | (1,156) | $ | — | $ | (10,226) | $ | — | $ | (179,917) | $ | — | $ | (865,764) | $ | (6,007,120) |
| Total | | | | | | | | | | | | | | | | |
| accumulated | | | | | | | | | | | | | | | | |
| earnings/ | | | | | | | | | | | | | | | | |
| (losses) | $ | 94,245,570 | $ | 89,438,078 | $ | 35,967,697 | $ | 30,203,396 | $ | 147,943,153 | $ | 33,944,683 | $ | (2,386,256) | $ | (14,585,002) |
| | | | | | | | | | | | | | | | | |
AssetMark Funds
REPORT OF INDEPENDENT REGISTERED PUBLIC ACCOUNTING FIRM
To the Board of Trustees and Shareholders of AssetMark Funds
In our opinion, the accompanying statements of assets and liabilities, including the schedules of investments, schedule of options written, schedule of open futures contracts, and schedule of open forward currency contracts, and the related statements of operations and of changes in net assets and the financial highlights present fairly, in all material respects, the financial position of AssetMark Large Cap Growth Fund, AssetMark Large Cap Value Fund, AssetMark Small/Mid Cap Growth Fund, AssetMark Small/Mid Cap Value Fund, AssetMark International Equity Fund, AssetMark Real Estate Securities Fund, Assetmark Tax-Exempt Fixed Income Fund and AssetMark Core Plus Fixed Income Fund, (hereafter referred to as the “Funds”), at March 31, 2006, the results of each of their operations for the period then ended, and the changes in each of their net assets and the financial highlights for each of the periods presented, in conformity with accounting principles generally accepted in the United States of America. These financial statements and financial highlights (hereafter referred to as “financial statements”) are the responsibility of the Funds’ management; our responsibility is to express an opinion on these financial statements based on our audits. We conducted our audits of these financial statements in accordance with the standards of the Public Company Accounting Oversight Board (United States). Those standards require that we plan and perform the audits to obtain reasonable assurance about whether the financial statements are free of material misstatement. An audit includes examining, on a test basis, evidence supporting the amounts and disclosures in the financial statements, assessing the accounting principles used and significant estimates made by management, and evaluating the overall financial statement presentation. We believe that our audits, which included confirmation of securities at March 31, 2006 by correspondence with the custodian and brokers, provide a reasonable basis for our opinion.
As discussed in Note 2, the financial statements for the AssetMark Real Estate Securities Fund and certain financial highlights for the AssetMark Large Cap Value Fund and AssetMark International Equity Fund have been restated for the years ended prior to 2006.
PricewaterhouseCoopers LLP
San Francisco, California
May 26, 2006
AssetMark Funds
ADDITIONAL INFORMATION
1. | Investment Advisory Agreement Disclosure (Unaudited) |
| | At an in-person meeting held on March 16, 2006, the Board of Trustees of AssetMark Funds considered and approved two new sub-advisory agreements (“Sub-Advisory Agreements”) for the AssetMark Small/Mid Cap Value Fund (the “Fund”), a series of the Trust. |
| | The Fund is managed using a “manager of managers” structure that generally involves the use of one or more sub-advisors to manage allocated portions of the Fund’s portfolio. Under this structure, the Fund’s investment advisor, AssetMark Investment Services, Inc. (the “Advisor”), is responsible for evaluating and selecting sub-advisors on an ongoing basis and making any decisions to recommend hiring, retaining or replacing sub-advisors. The Board of Trustees is engaged in monitoring this process in connection with quarterly meetings held throughout the year and, under the manager of managers structure, all parties understand that sub-advisors are being monitored and evaluated, and are subject to replacement, at all times. |
| | In preparation for the meeting, the Trustees requested, received and considered information relevant to their consideration of each Sub-Advisory Agreement. The information, the material factors considered, and the conclusions that formed the basis of the Board’s approval of each Sub-Advisory Agreement are set forth below. In deciding to approve each Sub-Advisory Agreement, the Trustees did not identify any particular information or any single factor or conclusion that was controlling. This summary describes, in the case of each Sub-Advisory Agreement, the most important, but not all, of the matters considered. |
| | On March 16, 2006, the Board of Trustees appointed Advisory Research, Inc. (“ARI”) to replace Ariel Capital Management, LLC as one of the sub-advisors to the Fund. ARI is based in Chicago, Illinois and offers an array of investment strategies in both the equity and fixed income asset classes. |
| | On March 16, 2006, the Board of Trustees appointed First Quadrant, L.P. (“First Quadrant”) to replace Cramer Rosenthal McGlynn, LLC as a sub-advisor to the Fund. First Quadrant offers two primary investment strategies, one focused on equities and one with a global focus. |
| | In connection with their consideration of each Sub-Advisory Agreement, the Trustees, with assistance from independent counsel, specifically requested and were furnished with various materials in advance of the meetings for purposes of their review. The materials provided to the Board of Trustees related to, among other things: (a) the terms and conditions of each Sub-Advisory Agreement; (b) the nature, quality and scope of the services to be provided by each Sub-Advisor, as well as the fees charged for such services; (c) investment performance information compared to industry peer groups as well as other Sub-Advisor client accounts; (d) comparative sub-advisory fee information; (e) information regarding the Sub-Advisor’s personnel, operations, financial position and business operations; and (f) information regarding the Sub-Advisor’s brokerage and compliance practices. |
| | The Trustees received assistance and advice regarding legal and industry standards from both independent counsel and from counsel to the Trust, which included detailed descriptions of the Trustees’ legal duties and obligations in considering the approval of each Sub-Advisory Agreement. The Independent Trustees discussed the renewal of each Sub-Advisory Agreement in communications prior to the meeting and, during the course of the meeting, in private sessions with independent counsel, at which no representatives of the Advisor were present. |
| | The Board of Trustees considered and reached conclusions on a number of factors it deemed relevant in making the decisions to renew the Sub- Advisory Agreements. In so doing, the Trustees considered the Advisor’s active role as a “manager of managers,” which includes, among other responsibilities, seeking to identify and engage high-quality sub-advisors to perform services for the Funds through a detailed search and evaluation process conducted with the assistance of experienced consultants, monitoring and evaluating the performance of the Sub-Advisors, recommending |
AssetMark Funds
ADDITIONAL INFORMATION (Continued)
| | that Sub-Advisors not performing as expected be replaced, and negotiating advantageous fee arrangements that may permit the Funds to realize economies of scale without compromising the quality of services. Descriptions of these factors and the conclusions reached by the Board with respect to each are set forth below. |
| | Nature, Extent, and Quality of Services. The Trustees considered each Sub-Advisor’s investment management process, including: (a) the experience, capability and integrity of the Sub-Advisor’s management and other personnel; (b) the financial position of the Sub-Advisor; (c) the quality and commitment of the Sub-Advisor’s regulatory and legal compliance policies, procedures and systems; and (d) the Sub-Advisor’s brokerage practices. The Trustees concluded that the nature, extent, and quality of the services provided by each Sub-Advisor were likely to benefit the Fund and its shareholders. |
| | Investment Performance. At the time of the Board’s consideration of each Sub-Advisory Agreement, the sub-advisors had, of course, not commenced managing the Fund. While there was therefore no record of each sub-advisor’s specific performance with respect to the Fund, the Board was provided with, and considered, performance information for other accounts managed by each sub-advisor that have similar investment objectives and policies. The Trustees also considered the Sub-Advisors’ investment performance record relative to benchmark indices. The Trustees concluded that each Sub-Advisor’s performance record supported the approval of the applicable Sub-Advisory Agreement. |
| | Sub-Advisory Fees and Economies of Scale. The Trustees considered the proposed fee schedule for each Sub-Advisor. The Trustees also considered individual reports prepared for each Sub-Advisor containing comparative information regarding fees. In order to consider comparative advisory fees, the Trustees generally compare the fees in the Sub-Advisory Agreements to a peer group that contains funds with similar investment objectives and policies. The funds in the relevant peer group are selected by an independent, nationally recognized, third-party data service in order to ensure that the Trustees are provided with objective data with which to conduct their analyses. The Trustees considered that breakpoints in certain of the Sub-Advisory Agreement fee schedules represented potential economies of scale that could be shared with Fund shareholders. |
| | Ancillary Benefits. The Trustees considered other benefits received by each Sub-Advisor that might be a result of its relationship with the Fund, including the receipt of research from brokers. |
| | Based on their full evaluation of the relevant factors, the Board and the Independent Trustees concluded that each of the factors above favored approval of each Sub-Advisory Agreement. The Board and the Independent Trustees also concluded that each Sub-Advisory fee is reasonable; and that the approval of each Sub-Advisory Agreement is in the best interests of the Fund and its shareholders. |
2. | Shareholder Notification of Federal Tax Status (Unaudited) |
| | The Large Cap Value Fund, Small/Mid Cap Growth Fund, Small/Mid Cap Value Fund, International Equity Fund, Real Estate Securities Fund and Core Plus Fixed Income Fund designates 76.2 percent, 4.4 percent, 29.9 percent, 0.1 percent, 0.2 percent and 0.7 percent, respectively, of dividends declared during the fiscal year ended March 31, 2006 as dividends qualifying for the dividends received deduction available to corporate shareholders. |
| | The Large Cap Value Fund, Small/Mid Cap Growth Fund, Small/Mid Cap Value Fund, International Equity Fund, Real Estate Securities Fund and Core Plus Fixed Income Fund designates 80.9 percent, 5.1 percent, 38.9 percent, 42.0 percent, 6.7 percent and 0.7 percent, respectively, of dividends declared from net investment income during the fiscal year ended March 31, 2006 as qualified income under the Jobs and Growth Tax Relief Reconciliation Act of 2003. |
AssetMark Funds
ADDITIONAL INFORMATION (Continued)
3. | Foreign Tax Credit (Unaudited) |
| | For the year ended March 31, 2006, the International Equity Fund earned foreign source income and paid foreign taxes, which they intend to pass through to their shareholders pursuant to Section 853 of the Internal Revenue Code as follows: |
| | Foreign Source Income Earned | Foreign Taxes Paid |
| Australia | $ | 130,718 | $ | 15,156 |
| Belgium | | 232,314 | | 47,284 |
| Brazil | | 76,280 | | 11,629 |
| Britain | | 907,589 | | — |
| Canada | | 69,094 | | 10,358 |
| China | | 24,829 | | — |
| Denmark | | 34,347 | | 5,152 |
| Finland | | (47) | | — |
| France | | 240,975 | | 24,272 |
| Germany | | 286,715 | | 54,468 |
| Hong Kong | | 132,170 | | 11,125 |
| India | | 20,014 | | — |
| Indonesia | | 59,712 | | 9,309 |
| Israel | | 16,088 | | 2,815 |
| Italy | | 193,181 | | 37,902 |
| Japan | | 1,098,645 | | 93,626 |
| Liberia | | 7,950 | | — |
| Netherlands | | 121,159 | | 30,290 |
| New Zealand | | 407,916 | | — |
| Russia | | 25,424 | | 3,814 |
| South Korea | | 69,936 | | 11,539 |
| Spain | | 256,908 | | 25,719 |
| Switzerland | | 335,291 | | 51,486 |
| Taiwan | | (1,755) | | 18,342 |
| Total | | $4,745,453 | | $464,286 |
| | | | | |
| 4. | Core Plus Fixed Income Fund-Return of Capital |
| | The AssetMark Core Plus Fixed Income Fund made a distribution of $1.40842 per share on December 29, 2005. It was subsequently determined that this distribution, for book purposes, consisted of $0.10127 of ordinary income, $0.08032 of gains from sale of securities, and $1.22683 of return of principal. Shareholders received a notification to clarify the actual components of the December distribution. |
| | Shareholders who hold shares in taxable accounts received an amended Form 1099-DIV for the 2005 calendar year. The tax treatment of the December distribution may differ from the book treatment used to calculate the source of the Fund’s distributions as shown above. Taxable investors should refer to amended Form 1099-DIV when filing tax returns. Since each shareholder’s tax situation is unique, please consult your tax advisor as to the appropriate treatment of Fund distributions. |
AssetMark Funds
ADDITIONAL INFORMATION (Continued)
5. | Disclosure Regarding Fund Trustees and Officers (Unaudited) |
| | | | | # of | |
| | | | | Portfolios | |
| | | | | in Fund | Other |
| | Position(s) | Term of Office | | Complex | Director/ |
Name, Age | Held with | and Length of | Principal | Overseen | Trustee |
and Address | the Trust | Time Served | Occupation During Past Five Years | by Trustee | Positions |
| | | | | | |
Independent Trustees | | | | | |
| | | | | | |
| R. Thomas DeBerry, 64 | Trustee | Indefinite Term | President, DeBerry Consulting (a | 8 | None |
| c/o AssetMark | | since January | a securities consulting firm) (1988-present); | | |
| Investment Services, Inc. | | 2001. | Director, Investment Manager Services | | |
| 2300 Contra Costa | | | Division of Resources Trust Company | | |
| Boulevard, Suite 425 | | | (1998-2000). | | |
| Pleasant Hill, CA 94523 | | | | | |
| | | | | | |
| William J. Klipp, 50 | Trustee | Indefinite Term | Retired; President and Chief Operating | 8 | Trustee of |
| c/o AssetMark | | since January | Officer, Charles Schwab Investment | | Adelante |
| Investment Services, Inc. | | 2001. | Management, Inc. and Executive Vice | | Funds |
| 2300 Contra Costa | | | President, Schwab Funds (1993-1999). | | (2000-present). |
| Boulevard, Suite 425 | | | | | |
| Pleasant Hill, CA 94523 | | | | | |
| | | | | | |
| Leonard H. Rossen, 74 | Trustee | Indefinite Term | President, Len Rossen Consulting (a legal | 8 | None |
| c/o AssetMark | | since January | consulting firm) (1999-present). | | |
| Investment Services, Inc. | | 2001. | | | |
| 2300 Contra Costa | | | | | |
| Boulevard, Suite 425 | | | | | |
| Pleasant Hill, CA 94523 | | | | | |
| | | | | | |
Interested Trustees | | | | | |
| | | | | | |
| Ronald Cordes*, 46 | President, | Indefinite Term | Principal, AssetMark Investment Services, Inc. | 8 | None |
| AssetMark Investment | Chairperson, | since January | (1994-present). | | |
| 2300 Contra Costa | AML | 2001. | | | |
| Boulevard, Suite 425 | Compliance | | | | |
| Pleasant Hill, CA 94523 | Officer, Trustee | | | | |
| | | | | | |
| Richard Steiny*, 49 | Trustee | Indefinite Term | Principal, AssetMark Investment Services, Inc. | 8 | None |
| AssetMark Investment | | since January | (1994-present). | | |
| 2300 Contra Costa | | 2001. | | | |
| Boulevard, Suite 425 | | | | | |
| Pleasant Hill, CA 94523 | | | | | |
AssetMark Funds
ADDITIONAL INFORMATION (Continued)
| | | | | | # of | |
| | | | | | Portfolios | |
| | | | | | in Fund | Other |
| | Position(s) | Term of Office | | | Complex | Director/ |
Name, Age | Held with | and Length of | Principal | | Overseen | Trustee |
and Address | the Trust | Time Served | Occupation During Past Five Years | | by Trustee | Positions |
| | | | | | | |
Officers | | | | | | |
| | | | | | | |
| John Whittaker, 36 | Vice President | 1-Year Term | Senior Vice President and Chief Operating | N/A | N/A |
| AssetMark | | since January | Officer, AssetMark Investment | | | |
| Investment Services, Inc. | | 2001 | Services, 2000 to present. | | | |
| 2300 Contra Costa | | | | | | |
| Boulevard, Suite 425 | | | | | | |
| Pleasant Hill, CA 94523 | | | | | | |
| | | | | | | |
| Carrie E. Hansen, 35 | Treasurer, | 1-Year Term | Vice President, CFO/Chief Compliance | N/A | N/A |
| AssetMark | Chief | since January | Officer, AssetMark Investment Services, | | |
| Investment Services, Inc. | Compliance | 2001 | Inc., October 2004 to present; CFO/Director | | |
| 2300 Contra Costa | Officer | | of Operations, AssetMark Investment Services, | | |
| Boulevard, Suite 425 | and AML | | Inc., February 2004 to October 2004. Director | | | |
| Pleasant Hill, CA 94523 | Compliance | | of Operations, AssetMark Investment Services, | | |
| | Officer | | Inc., 2000 to February 2004. | | | |
| | | | | | | |
| Teresa Escano, 44 | Secretary | 1-Year Term | Director of Advisor Services Group, | | N/A | N/A |
| AssetMark | | since January | AssetMark Investment Services, Inc., | | | |
| Investment Services, Inc. | | 2001 | 2000 to present; Manager of Advisor | | | |
| 2300 Contra Costa | | | Services Group, 1997 to 2000. | | | |
| Boulevard, Suite 425 | | | | | | |
| Pleasant Hill, CA 94523 | | | | | | |
The Statement of Additional Information includes additional information about the Funds’ Trustees and is available free of charge upon request by calling the Funds toll free at (888) 278-5809.
| | * | Ronald Cordes and Richard Steiny are considered “interested persons” of the Funds as defined in the 1940 Act due to their relationship with the Advisor. |
| 6. | Proxy Voting Policies and Procedures and Proxy Voting Record (Unaudited) |
| | A description of the policies and procedures that the Funds use to determine how to vote proxies related to the Funds’ portfolio securities as well as information regarding how the Funds voted proxies relating to portfolio securities during the most recent 12-month period ended June 30 is available without charge, upon request, by calling (888) 278-5809. Furthermore, you can obtain the Funds’ proxy voting records on the SEC’s website at http://www.sec.gov. |
| 7. | Availability of Quarterly Portfolio Holdings Schedules |
| | The Funds are required to file their complete schedules of portfolio holdings with the SEC for their first and third fiscal quarters on Form N-Q. Once filed, the Funds’ Form N-Q is available without charge, upon request on the SEC’s website (http://www.sec.gov) and may be available by calling (888) 278-5809. You can also obtain copies of Form N-Q by (i) visiting the SEC’s Public Reference Room in Washington, DC (information on the operation of the Public Reference Room may be obtained by calling 1-800-SEC-0330); (ii) sending your request and a duplicating fee to the SEC’s Public Reference Room, Washington, DC 20549-0102; or (iii) sending your request electronically to publicinfosec.gov. |
(This Page Intentionally Left Blank.)
AssetMark Large Cap Growth Fund
AssetMark Large Cap Value Fund
AssetMark Small/Mid Cap Growth Fund
AssetMark Small/Mid Cap Value Fund
AssetMark International Equity Fund
AssetMark Real Estate Securities Fund
AssetMark Tax-Exempt Fixed Income Fund
AssetMark Core Plus Fixed Income Fund
Investment Advisor |
| AssetMark Investment Services, Inc. |
| 2300 Contra Costa Blvd., Suite 425 |
| Pleasant Hill, CA 94523 |
| |
Legal Counsel |
| Stradley Ronon Stevens & Young, LLP |
| 2600 One Commerce Square |
| Philadelphia, PA 19103 |
| |
Independent Registered Public Accounting Firm |
| PricewaterhouseCoopers, LLP |
| Three Embarcadero Center |
| San Francisco, CA 94111 |
| |
Transfer Agent, Fund Accountant |
and Fund Administrator |
| U.S. Bancorp Fund Services, LLC |
| 615 East Michigan Street |
| Milwaukee, WI 53202 |
| |
Custodian |
| U.S. Bank, N.A. |
| 425 Walnut Street |
| Cincinnati, OH 45202 |
| |
Distributor |
| AssetMark Capital Corporation |
| 2300 Contra Costa Blvd., Suite 425 |
| Pleasant Hill, CA 94523 |
Annual Report
March 31, 2006
Item 2. Code of Ethics.
As of the end of the period covered by this report, the Registrant has adopted a code of ethics that applies to the Registrant’s principal executive officer and principal financial officer. During the period covered by this report, there were no; (i) amendments to the code, or (ii) waivers (including implicit waivers) granted from the provisions of the code.
Item 3. Audit Committee Financial Expert.
The Registrant’s Board of Trustees has determined that the Registrant does not currently have a member serving on its audit committee that meets the definition of an “audit committee financial expert” as defined in instruction 2(b) of Item 3 of Form N-CSR. The Trustees reviewed the attributes, education and experience of each member of the Registrant’s audit committee, the nature of the accounting principles applicable to the Registrant, and the Registrant’s underlying internal controls and reporting mechanisms and determined that the members of the Registrant’s audit committee, as a group, have the experience and education necessary to perform the audit committee’s responsibilities, including those regarding the financial statements of the Registrant. In addition, the members of the audit committee determined that the committee has the resources and authority necessary to discharge its responsibilities, including the authority to retain at any time independent counsel and other advisers and experts, and they will seek such additional expert assistance as they determine it necessary. The Trustees also determined that each member of the Registrant’s audit committee is “independent” as defined in the instructions to Form N-CSR.
Item 4. Principal Accountant Fees and Services.
(a) - (d) The Registrant has engaged its principal accountant to perform audit services and tax services during the past two fiscal years. “Audit services” refer to performing an audit of the Registrant's annual financial statements or services that are normally provided by the accountant in connection with statutory and regulatory filings or engagements for those fiscal years. “Tax services” refer to professional services rendered by the principal accountant for tax compliance, tax advice, and tax planning. The following table details the aggregate fees billed for each of the last two fiscal years for audit services and tax services by the principal accountant.
| | | |
| | FYE 03/31/2006 (1) | FYE 06/30/2005 |
| Audit Fees | $158,000 | $160,000 |
| Audit-Related Fees | $ 0 | $ 0 |
| Tax Fees | $26,000 | $35,280 |
| All Other Fees | $ 0 | $ 0 |
(1) The Registrant changed its fiscal year end from June 30 to March 31. The data pertaining to 03/31/2006 covers the nine months ended March 31, 2006.
(e) (1) The audit committee has adopted an Audit Committee Charter that provides that the audit committee shall approve, prior to appointment, the engagement of the auditor to provide audit services to the Registrant and non-audit services to the Registrant, its investment adviser or any entity controlling, controlled by or under common control with the investment adviser that provides on-going services to the Registrant if the engagement relates directly to the operations and financial reporting of the Registrant.
(e) (2) None of the services described above were approved by the Registrant's audit committee pursuant to paragraph (c)(7)(i)(C) of Rule 2-01 of Regulation S-X.
(f) All of the principal accountant’s hours spent on auditing the Registrant’s financial statements were attributed to work performed by full-time permanent employees of the principal accountant.
(g) The following table indicates the non-audit fees billed by the Registrant’s accountant for services to the Registrant and to the Registrant’s investment adviser (not sub-advisor) and any entity controlling, controlled by or under common control with the investment adviser for the last two years.
| | | |
| Non-Audit Related Fees | FYE 03/31/2006 (1) | FYE 06/30/2005 |
| Registrant | $26,000 | $35,280 |
| Registrant’s Investment Adviser | - | - |
(1) The Registrant changed its fiscal year end from June 30 to March 31. The data pertaining to 03/31/2006 covers the nine months ended March 31, 2006.
(h) The audit committee of the Board of Trustees has considered whether the provision of non-audit services that were rendered to the Registrant's investment adviser is compatible with maintaining the principal accountant's independence and has concluded that the provision of such non-audit services by the accountant has not compromised the accountant’s independence.
Item 5. Audit Committee of Listed Registrants.
Not applicable.
Item 6. Schedule of Investments.
Schedule of Investments is included as part of the report to shareholders filed under Item 1 of this Form.
Item 7. Disclosure of Proxy Voting Policies and Procedures for Closed-End Management Investment Companies.
Not applicable to open-end investment companies.
Item 8. Portfolio Managers of Closed-End Management Investment Companies.
Not applicable to open-end investment companies.
Item 9. Purchases of Equity Securities by Closed-End Management Investment Company and Affiliated Purchasers.
Not applicable to open-end investment companies.
Item 10. Submission of Matters to a Vote of Security Holders.
None.
Item 11. Controls and Procedures.
| (a) | Based on their evaluation of the Registrant’s disclosure controls and procedures as of a date within 90 days of the filing date of this Form N-CSR (the “Report”), the Registrant’s President/Chief Executive Officer and Treasurer/Chief Financial Officer believe that the disclosure controls and procedures (as defined in Rule 30a-3(c) under the Investment Company Act of 1940, as amended (the “1940 Act”)) are effectively designed to ensure that information required to be disclosed by the Registrant in the Report is recorded, processed, summarized and reported by the filing date, including ensuring that information required to be disclosed in the Report is accumulated and communicated to the Registrant’s officers who are making certifications in the Report, as appropriate, to allow timely decisions regarding required disclosure. |
| (b) | There were no changes in the Registrant’s internal control over financial reporting (as defined in Rule 30a-3(d) under the 1940 Act) that occurred during the Registrant’s second Fiscal quarter of the period covered by this report that have materially affected, or are reasonably likely to materially affect, the Registrant’s internal control over financial reporting. |
Item 12. Exhibits.
| (a) | (1) Any code of ethics, or amendment thereto, that is the subject of the disclosure required by Item 2, to the extent that the Registrant intends to satisfy the Item 2 requirements through filing an exhibit. Form filed herewith. |
(2) Certifications pursuant to Section 302 of the Sarbanes-Oxley Act of 2002. Filed herewith.
| (b) | Certifications pursuant to Section 906 of the Sarbanes-Oxley Act of 2002. Filed herewith. |
SIGNATURES
Pursuant to the requirements of the Securities Exchange Act of 1934 and the Investment Company Act of 1940, the Registrant has duly caused this report to be signed on its behalf by the undersigned, thereunto duly authorized.
Registrant: AssetMark Funds
By: /s/ Ronald D. Cordes
Ronald D. Cordes, President
Date: June 9, 2006
Pursuant to the requirements of the Securities Exchange Act of 1934 and the Investment Company Act of 1940, this report has been signed below by the following persons on behalf of the Registrant and in the capacities and on the dates indicated.
Registrant: AssetMark Funds
By: /s/ Ronald D. Cordes
Ronald D. Cordes
President (Principal Executive Officer)
AssetMark Funds
Date: June 9, 2006
Registrant: AssetMark Funds
By: /s/ Carrie E. Hansen
Carrie E. Hansen
Treasurer (Principal Financial Officer)
AssetMark Funds
Date: June 9, 2006