Washington, D.C. 20549
ASSETMARK INVESTMENT SERVICES, INC.
ITEM 1. REPORTS TO STOCKHOLDERS.
Annual Report
June 30, 2004
Investment Advisor
AssetMark Investment Services, Inc.
ASSETMARK LARGE CAP GROWTH FUND
ASSETMARK LARGE CAP VALUE FUND
ASSETMARK SMALL/MID CAP GROWTH FUND
ASSETMARK SMALL/MID CAP VALUE FUND
ASSETMARK INTERNATIONAL EQUITY FUND
ASSETMARK REAL ESTATE SECURITIES FUND
ASSETMARK TAX-EXEMPT FIXED INCOME FUND
ASSETMARK CORE PLUS FIXED INCOME FUND
August 2004
Dear Shareholder:
The major stock markets produced positive returns over the past year as a robust economy continued to fuel corporate earnings growth. Driven by low interest rates and strong demand for goods and services, the economy moved ahead at a pace not seen since 1999. As the economy grew, corporate productivity improved as well, providing a catalyst for strong earnings and healthy stock performance.
Although the year was marked with strong returns, countervailing forces in the global economy caused the markets to become more volatile as the year progressed. Continued uncertainty in Iraq, anticipated terrorism, and high oil prices were distracting forces. Additionally, strong economic growth coupled with a modest rise in inflation moved the Federal Open Market Committee to tighten monetary policy at the close of the second quarter of 2004. In anticipation of the Fed’s decision, the bond market began to sell-off in early April, pushing returns lower as we approached the close of our fiscal year.
In consultation with Wilshire Associates, an institutional investment research and consulting firm, AssetMark Investment Services, Inc. strives to identify highly skilled investment managers as Sub-Advisors for each Fund. When appropriate, AssetMark seeks to combine the skills of multiple managers with complementary investment strategies to attempt to reduce volatility and achieve more consistent investment results. As an important element of this ongoing process, AssetMark leverages Wilshire’s experienced investment staff, due diligence, and proprietary research capabilities.
The AssetMark Funds have generally performed in accordance with their sectors and style-orientation over the past year, as presented below:
The AssetMark Large Cap Growth Fund rose 20.69% for the 12 months ended 6/30/04, outperforming the Russell 1000 Growth Index1, a widely accepted unmanaged benchmark for Large Cap Growth portfolios, which rose 17.88%. Both TCW Investment Management and Atlanta Capital Management outperformed the benchmark during the period, returning 21.43% and 19.50%, respectively.
The AssetMark Large Cap Value Fund rose 25.12% for the 12 months ended 6/30/04, outperforming the Russell 1000 Value Index, a widely accepted unmanaged benchmark for Large Cap Value portfolios, which rose 21.13%. Brandes Investment Partners and Davis Selected Advisors both beat the benchmark during the period, returning 26.50% and 23.90%, respectively.
| | 1 | Source: All benchmark return data provided by U.S.Bancorp Fund Services, LLC. One cannot invest directly in an index, nor is an index representative of any Fund’s portfolio. The indexes provided are widely accepted benchmarks for the associated portfolios. The performance data quoted represents past performance. The investment return and principal value of an investment will fluctuate so that an investor's shares, when redeemed, may be worth more or less than their original cost. |
The AssetMark Small/Mid Cap Growth Fund rose 24.21% for the 12 months ended 6/30/04, trailing its benchmark, the Russell 2500 Growth Index, a widely accepted unmanaged benchmark for portfolios of Small-to-Mid Cap Growth stocks, which gained 30.12%. Both Transamerica Investment Management and TCW Investment Management trailed the benchmark, returning 26.88% and 22.18%, respectively.
The AssetMark Small/Mid Cap Value Fund returned 27.64% for the 12 months ended 6/30/04, trailing the Russell 2500 Value benchmark, which returned 33.91%. This unmanaged index is a widely accepted benchmark for portfolios of Small-to-Mid Cap Value stocks. Ariel Capital Management trailed the benchmark during the period, returning 24.30%. Cramer Rosenthal McGlynn, LLC was slightly behind the benchmark, returning 31.01%.
The AssetMark International Equity Fund returned 27.40% for the 12 months ended 6/30/04, trailing the MSCI EAFE Index of developed country non-U.S. stocks, which returned 32.35%. This unmanaged benchmark is widely accepted for International Equity portfolios. Clay Finlay Inc. returned 30.17% over the period while Oppenheimer Capital, Inc. posted 24.28%.
The AssetMark Real Estate Securities Fund, sub-advised by Lend Lease Rosen Real Estate Securities, rose 24.24% for the 12 months ended 6/30/04, behind the Wilshire REIT benchmark, which gained 27.19%. The Wilshire REIT index is a widely accepted unmanaged benchmark for REIT portfolios.
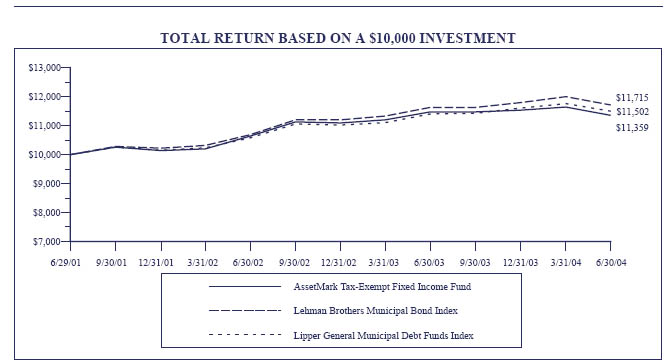
The AssetMark Tax-Exempt Income Fund, sub-advised by Weiss, Peck & Greer, posted a return of -1.01% for the 12 months ended 6/30/04, slightly underperforming the benchmark. Lehman Brothers Municipal Bond Index, a widely accepted unmanaged benchmark for municipal bond portfolios, which returned 0.76%.
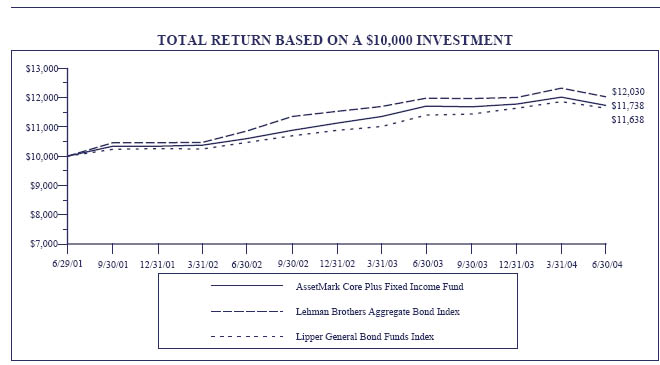
The AssetMark Core Plus Fixed Income Fund performed in line with Lehman Brothers Aggregate Bond Index for the 12 months ended 6/30/04, returning 0.21% versus 0.32% for the benchmark. The Lehman Brothers Aggregate Bond Index is a widely accepted unmanaged benchmark for Core U.S. Fixed Income portfolios. The International and High Yield portions of the Fund had a positive contribution to the Fund’s returns during the performance period.
We are pleased with the general performance of the AssetMark funds over the past year. Although the rise in interest rates dampened performance in the bond market, returns among our equity funds continued at a positive level. Looking forward to the year ahead we are confident that each Fund will remain positioned to meet the challenges offered to us as investors. As always, we thank you for your trust and the opportunity to help you fulfill your investment objectives.
Sincerely,
Ronald D. Cordes, President AssetMark Funds
AssetMark Large Cap Growth Fund
PERFORMANCE DATA
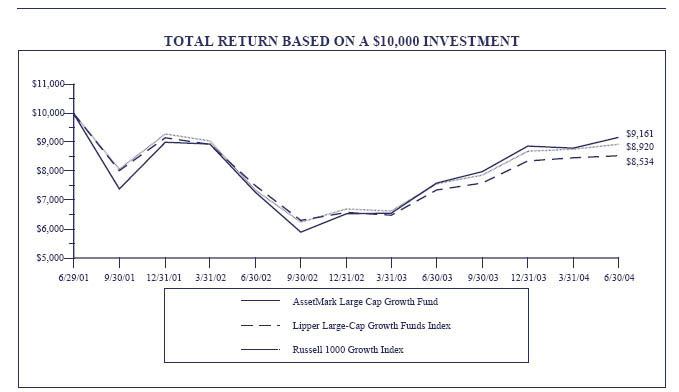
This chart assumes an initial gross investment of $10,000 made on 6/29/01 (commencement of operations). Returns shown include the reinvestment of all dividends. Returns shown do not reflect the deduction of taxes that a shareholder would pay on fund distributions or the redemption of fund shares. In the absence of fee waivers and reimbursements, total return would be reduced. Past performance is not predictive of future performance. Investment return and principal value will fluctuate, so that your shares, when redeemed, may be worth more or less than the original cost.
RUSSELL 1000 GROWTH INDEX - An unmanaged index which measures the performance of those Russell 1000 companies with higher price-to-book ratios and higher forecasted growth values. The Russell 1000 Index is an unmanaged index which measures the performance of the 1,000 largest companies in the Russell 3000 Index. The Russell 3000 Index is an unmanaged index which measures the performance of the 3,000 largest U.S. Companies, based on total market capitalization, which represents approximately 98% of the investable U.S. equity market.
LIPPER LARGE-CAP GROWTH FUNDS INDEX - An unmanaged index which measures the composite performance of the 30 largest "large-cap growth" mutual funds, as categorized by Lipper Inc.
AVERAGE ANNUAL TOTAL RETURN (for the periods ended June 30, 2004)
| | One Year | Three Year | Since Inception (6/29/01) |
| AssetMark Large Cap Growth Fund | 20.69% | -2.88% | -2.88% |
| Russell 1000 Growth Index | 17.88% | -3.74% | -3.73% |
| Lipper Large-Cap Growth Funds Index | 16.08% | -5.15% | -5.14% |
AssetMark Large Cap Growth Fund
SCHEDULE OF INVESTMENTS
June 30, 2004
Number of Shares | | | Market Value |
| | | COMMON STOCK 96.5% | |
| | | FINANCE, INSURANCE | |
| | | AND REAL ESTATE 14.82% | |
| | | Depository Institutions 0.42% | |
| 17,000 | | Bank of America Corporation | $1,438,540 |
| | | | |
| | | Insurance Carriers 9.48% | |
| 191,500 | | AFLAC Incorporated† | 7,815,115 |
| 118,000 | | American International Group, Inc. | 8,411,040 |
| 36,700 | | Lincoln National Corporation | 1,734,075 |
| 172,150 | | The Progressive Corporation | 14,684,395 |
| | | | 32,644,625 |
| | | Non-depository Credit Institutions 1.04% | |
| 70,000 | | American Express Company† | 3,596,600 |
| | | | |
| | | Security and Commodity Brokers, Dealers, Exchanges and Services 3.88% | |
| 58,900 | | A.G. Edwards, Inc.† | 2,004,367 |
| 443,215 | | The Charles Schwab Corporation | 4,259,296 |
| 51,000 | | Franklin Resources, Inc.† | 2,554,080 |
| 53,600 | | Merrill Lynch & Co., Inc. | 2,893,328 |
| 57,000 | | SEI Investments Company | 1,655,280 |
| | | | 13,366,351 |
| | | Total Finance, Insurance and Real Estate | 51,046,116 |
| | | MANUFACTURING 47.94% | |
| | | Chemicals and Allied Products 14.32% | |
| 67,400 | | Air Products and Chemicals, Inc. | 3,535,130 |
| 192,650 | | Amgen Inc. # | 10,512,911 |
| 70,100 | | Ecolab Inc. | 2,222,170 |
| 110,350 | | Eli Lilly and Company† | 7,714,569 |
| 30,700 | | The Estee Lauder Companies Inc.. | 1,497,546 |
| 210,720 | | Genentech, Inc. # | 11,842,464 |
| 157,700 | | Pfizer Inc. | 5,405,956 |
| 32,000 | | The Procter & Gamble Company | 1,742,080 |
| 45,000 | | Rohm and Haas Company | 1,871,100 |
| 160,700 | | Schering-Plough Corporation† | 2,969,736 |
| | | | 49,313,662 |
| | | Electronic and Other Electrical | |
| | | Equipment and Components, | |
| | | Except Computer Equipment 16.43% | |
| 81,300 | | American Power Conversion Corporation | 1,597,545 |
| 53,500 | | Emerson Electric Co. | 3,399,925 |
| 199,950 | | General Electric Company | 6,478,380 |
AssetMark Large Cap Growth Fund
SCHEDULE OF INVESTMENTS
June 30, 2004
Number of Shares | | | Market Value |
| | | Electronic and Other Electrical | |
| | | Equipment and Components, | |
| | | Except Computer Equipment (Continued) | |
| 263,500 | | Intel Corporation† | $7,272,600 |
| 177,700 | | Maxim Integrated Products, Inc.† | 9,315,034 |
| 96,400 | | Microchip Technology Incorporated | 3,040,456 |
| 60,100 | | Molex Incorporated† | 1,928,008 |
| 325,500 | | Network Appliance, Inc. #† | 7,008,015 |
| 62,100 | | QLogic Corporation #† | 1,651,239 |
| 110,650 | | QUALCOMM Inc. | 8,075,237 |
| 204,600 | | Xilinx, Inc. | 6,815,226 |
| | | | 56,581,665 |
| | | Fabricated Metal Products, | |
| | | Except Machinery and | |
| | | Transportation Equipment 1.36% | |
| 48,900 | | Illinois Tool Works Inc.† | 4,689,021 |
| | | Food and Kindred Products 1.64% | |
| 50,400 | | Anheuser-Busch Companies, Inc. | 2,721,600 |
| 58,000 | | The Coca-Cola Company | 2,927,840 |
| | | | 5,649,440 |
| | | Industrial and Commercial Machinery | |
| | | and Computer Equipment 10.67% | |
| 271,900 | | Applied Materials, Inc. # | 5,334,678 |
| 38,300 | | CDW Corporation† | 2,442,008 |
| 404,100 | | Cisco Systems, Inc. # | 9,577,170 |
| 297,850 | | Dell Inc. #† | 10,668,987 |
| 53,100 | | Dover Corporation | 2,235,510 |
| 96,500 | | Hewlett-Packard Company | 2,036,150 |
| 49,500 | | 3M Co. | 4,455,495 |
| | | | 36,749,998 |
| | | Measuring, Analyzing and | |
| | | Controlling Instruments; | |
| | | Photographic, Medical and Optical | |
| | | Goods; Watches and Clocks 2.32% | |
| 26,200 | | C.R. Bard, Inc. | 1,484,230 |
| 34,600 | | DENTSPLY International Inc. | 1,802,660 |
| 96,600 | | Medtronic, Inc.† | 4,706,352 |
| | | | 7,993,242 |
| | | Petroleum Refining and | |
| | | Related Industries 0.73% | |
| 56,400 | | Exxon Mobil Corporation | 2,504,724 |
| | | | |
| | | Transportation Equipment 0.47% | |
| 26,000 | | Harley-Davidson, Inc. | 1,610,440 |
| | | Total Manufacturing | 165,092,192 |
See notes to financial statements.
AssetMark Large Cap Growth Fund
SCHEDULE OF INVESTMENTS (Continued)
June 30, 2004
Number of Shares | | | Market Value |
| | | COMMON STOCK (Continued) | |
| | | MINING 1.32% | |
| | | Oil and Gas Extraction 1.32% | |
| 104,470 | | Apache Corporation | $4,549,669 |
| | | Total Mining | 4,549,669 |
| | | | |
| | | RETAIL TRADE 17.30% | |
| | | Apparel and Accessory Stores 0.89% | |
| 72,300 | | Kohl’s Corporation #† | 3,056,844 |
| | | | |
| | | Building Materials, Hardware, | |
| | | Garden Supply and Mobile | |
| | | Home Dealers 0.87% | |
| 57,200 | | Lowe’s Companies, Inc.† | 3,005,860 |
| | | Eating and Drinking Places 0.93% | |
| 94,100 | | Brinker International, Inc. # | 3,210,692 |
| | | Food Stores 1.46% | |
| 115,950 | | Starbucks Corporation #† | 5,041,506 |
| | | General Merchandise Stores 2.04% | |
| 87,300 | | Costco Wholesale Corporation† | 3,585,411 |
| 65,100 | | Wal-Mart Stores, Inc. | 3,434,676 |
| | | | 7,020,087 |
| | | Home Furniture, Furnishings | |
| | | and Equipment Stores 0.67% | |
| 60,000 | | Bed Bath & Beyond Inc. #† | 2,307,000 |
| | | Miscellaneous Retail 10.44% | |
| 235,600 | | Amazon.com, Inc. #† | 12,816,640 |
| 136,900 | | eBay Inc. #† | 12,587,955 |
| 96,500 | | Staples, Inc.† | 2,828,415 |
| 213,500 | | Walgreen Co.† | 7,730,835 |
| | | | 35,963,845 |
| | | Total Retail Trade | 59,605,834 |
| | | | |
| | | SERVICES 11.88% | |
| | | Business Services 9.56% | |
| 50,617 | | First Data Corporation† | 2,253,469 |
| 54,700 | | Fiserv, Inc. # | 2,127,283 |
| 207,400 | | Microsoft Corporation† | 5,923,344 |
| 31,800 | | Omnicom Group Inc.† | 2,413,302 |
| 61,550 | | Pixar # | 4,278,340 |
| 96,600 | | SunGard Data Systems Inc. # | 2,511,600 |
| 369,600 | | Yahoo! Inc. #† | 13,427,568 |
| | | | 32,934,906 |
| | | Health Services 2.32% | |
| 45,000 | | Apollo Group, Inc. #† | 3,973,050 |
Number of Shares | | | Market Value |
| | | Health Services (Continued) | |
| 21,900 | | Express Scripts, Inc. # | $1,735,137 |
| 101,500 | | Health Management | |
| | | Associates, Inc.† | 2,275,630 |
| | | | 7,983,817 |
| | | Total Services | 40,918,723 |
| | | | |
| | | TRANSPORTATION, | |
| | | COMMUNICATIONS, ELECTRIC, | |
| | | GAS AND SANITARY SERVICES 1.75% | |
| | | Communications 1.75% | |
| 221,305 | | XM Satellite Radio Holdings Inc. #† | 6,039,413 |
| | | Total Transportation, | |
| | | Communications, Electric, | |
| | | Gas and Sanitary Services | 6,039,413 |
| | | | |
| | | WHOLESALE TRADE 1.49% | |
| | | Wholesale Trade - | |
| | | Durable Goods 0.64% | |
| 39,800 | | Johnson & Johnson | 2,216,860 |
| | | Wholesale Trade - | |
| | | Non-Durable Goods 0.85% | |
| 81,600 | | Sysco Corporation | 2,926,992 |
| | | Total Wholesale Trade | 5,143,852 |
| | | | |
| | | Total Common Stock | |
| | | (Cost $286,293,524) | 332,395,799 |
| | | | |
| | | SHORT-TERM INVESTMENTS 2.83% | |
| | | Money Market Funds 2.83% | |
| 9,755,173 | | Federated Prime Obligations Fund | 9,755,173 |
| | | | |
| | | Total Short-Term Investments | |
| | | (Cost $9,755,173) | 9,755,173 |
| | | | |
Principal | | | |
Value | | | |
| | | INVESTMENTS PURCHASED AS SECURITIES LENDING | |
| | | COLLATERAL 36.53% | |
| | | CERTIFICATES OF DEPOSIT 1.88% | |
| $3,240,592 | | Svenska Handlsbankn, | |
| | | 1.17%, 10/21/04 | 3,240,592 |
| 3,240,592 | | Lloyds Institutional, | |
| | | 1.18%, 10/27/04 | 3,240,592 |
| | | Total Certificates of Deposit | |
| | | (Cost $6,481,184) | 6,481,184 |
See notes to financial statements.
AssetMark Large Cap Growth Fund
SCHEDULE OF INVESTMENTS (Continued)
June 30, 2004
Principal | | | | Market |
Value | | | | Value |
| | | COMMERCIAL PAPER 9.77% | | |
| $3,240,592 | | Park Granada LLC, | | |
| | | 1.14%, 9/07/04 | $ | 3,225,029 |
| 3,888,710 | | CIBC Mortgage Corp., | | |
| | | 1.11%, 9/09/04 | | 3,888,710 |
| 1,296,237 | | Lloyds Bank, 1.46%, 11/17/04 | | 1,296,237 |
| 1,620,296 | | Sigma Finance, | | |
| | | 1.51%, 11/29/04(1)(2) | | 1,607,806 |
| 3,888,710 | | Sigma Finance, | | |
| | | 1.57%, 5/17/05(1)(2) | | 3,887,932 |
| 3,240,592 | | CCN Bluegrass I, LLC, | | |
| | | 1.33%, 5/18/05 | | 3,240,592 |
| 2,916,533 | | Goldman Sachs, 1.57%, 7/02/04(2) | | 2,916,533 |
| 3,240,591 | | Lehman Brothers, | | |
| | | 1.57%, 7/19/04(2) | | 3,240,591 |
| 1,296,237 | | Lehman Brothers, | | |
| | | 1.58%, 7/23/04(2) | | 1,296,237 |
| 972,178 | | Morgan Stanley, 1.58%, 9/08/04(2) . | | 972,178 |
| 2,592,473 | | Morgan Stanley, 1.58%, 9/14/04(2) . | | 2,592,473 |
| 2,268,414 | | Morgan Stanley, 1.58%, 12/08/04(2) | | 2,268,414 |
| 3,240,592 | | Leafs LLC, 1.29%, 4/20/05 | | 3,240,592 |
| | | Total Commercial Paper | | |
| | | (Cost $33,673,324) | | 33,673,324 |
| | | CORPORATE BONDS AND NOTES 2.26% |
| 1,620,296 | | West LB, 1.41%, 10/18/04 | | 1,631,977 |
| 2,916,533 | | Northlake, 1.22%, 3/07/05 | | 2,916,533 |
| 3,240,592 | | Bayerische Landesbank, | | |
| | | 0.84%, 6/24/05 . | | 3,240,592 |
| | | Total Corporate Bonds and Notes | | |
| | | (Cost $7,789,102) | | 7,789,102 |
| | | REPURCHASE AGREEMENTS 21.83% |
| 39,859,280 | | CS First Boston Repurchase | | |
| | | Agreement, 1.58%, 7/01/04 | | |
| | | (Collateralized by Fannie Mae | | |
| | | Collateralized Mortgage | | |
| | | Obligations) | | 39,859,280 |
| 4,860,888 | | JP Morgan Repurchase Agreement, | | |
| | | 1.60%, 7/01/04(2) (Collateralized | | |
| | | by corporate bonds rated BBB or | | |
| | | better by S&P) | | 4,860,888 |
| 8,101,480 | | Lehman Brothers Repurchase | | |
| | | Agreement, 1.55%, 7/01/04 | | |
| | | (Collateralized by high yield | | |
| | | corporate bonds) | | 8,101,480 |
Principal | | | | Market |
Value | | | | Value |
| | | REPURCHASE AGREEMENTS (Continued) |
| $22,360,083 | | Lehman Brothers Repurchase | | |
| | | Agreement, 1.62%, 7/01/04 | | |
| | | (Collateralized by high yield | | |
| | | corporate bonds) | $ | 22,360,083 |
| | | Total Repurchase Agreements | | |
| | | (Cost $75,181,731) | | 75,181,731 |
Number of | | | | |
Shares | | | | |
| | | MUTUAL FUNDS 0.79% | | |
| 2,708,660 | | AIM Liquid Assets Portfolio Fund, | | |
| | | Institutional Class | | 2,708,660 |
| 4,475 | | Merrill Lynch Funds for | | |
| | | Institutions Series - Premier | | |
| | | Institutional Fund | | 4,475 |
| | | Total Mutual Funds | | |
| | | (Cost $2,713,135) | | 2,713,135 |
| | | Total Investments Purchased as | | |
| | | Securities Lending Collateral | | |
| | | (Cost $125,838,476) | 125,838,476 |
| | | Total Investments 135.86% | | |
| | | (Cost $421,887,173) | 467,989,448 |
| | | Liabilities, less | | |
| | | Other Assets (35.86)% | (123,536,678) |
| | | Net Assets 100% | $344,452,770 |
| | | | | |
# Non-income producing security.
† All or a portion of this security represents investments of securities lending collateral.
(1) Restricted under Rule 144a of the Securities Act of 1933.
(2) Variable rate security. The rate shown is the rate in effect on June 30, 2004.
See notes to financial statements.
AssetMark Large Cap Value Fund
PERFORMANCE DATA
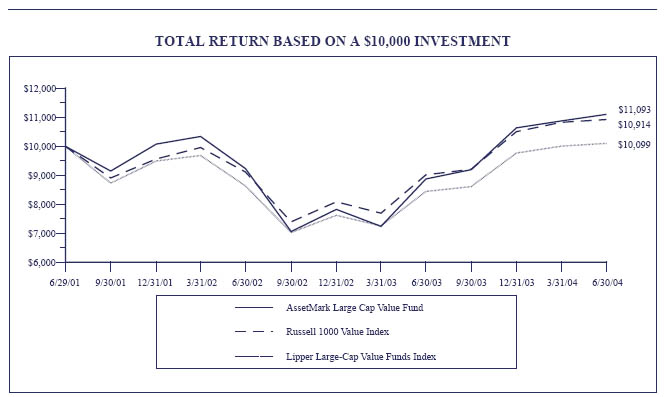
This chart assumes an initial gross investment of $10,000 made on 6/29/01 (commencement of operations). Returns shown include the reinvestment of all dividends. Returns shown do not reflect the deduction of taxes that a shareholder would pay on fund distributions or the redemption of fund shares. In the absence of fee waivers and reimbursements, total return would be reduced. Past performance is not predictive of future performance. Investment return and principal value will fluctuate, so that your shares, when redeemed, may be worth more or less than the original cost.
RUSSELL 1000 VALUE INDEX - An unmanaged index which measures the performance of those Russell 1000 companies with lower price-to-book ratios and lower forecasted growth values. The Russell 1000 Index is an unmanaged index which measures the performance of the 1,000 largest companies in the Russell 3000 Index. The Russell 3000 Index is an unmanaged index which measures the performance of the 3,000 largest U.S. Companies, based on total market capitalization, which represents approximately 98% of the investable U.S. equity market.
LIPPER LARGE-CAP VALUE FUNDS INDEX - An unmanaged index which measures the composite performance of the 30 largest "large-cap value" mutual funds, as categorized by Lipper Inc.
AVERAGE ANNUAL TOTAL RETURN (for the periods ended June 30, 2004)
| | One Year | Three Year | Since Inception (6/29/01) |
| AssetMark Large Cap Value Fund | 25.12% | 3.52% | 3.51% |
| Russell 1000 Value Index | 21.13% | 2.97% | 2.96% |
| Lipper Large-Cap Value Funds Index | 19.60% | 0.32% | 0.32% |
AssetMark Large Cap Value Fund
SCHEDULE OF INVESTMENTS
June 30, 2004
Number of | | | Market |
Shares | | | Value |
| | | COMMON STOCK 93.70% | |
| | | FINANCE, INSURANCE AND |
| | | REAL ESTATE 28.90% |
| | | Depository Institutions 11.69% | | |
| 134,300 | | Bank One Corporation | $ | 6,849,300 |
| 139,600 | | Citigroup Inc. | | 6,491,400 |
| 55,200 | | Fifth Third Bancorp | | 2,968,656 |
| 43,500 | | Golden West Financial Corporation | | 4,626,225 |
| 107,184 | | HSBC Holdings PLC† | | 8,029,153 |
| 80,040 | | J.P. Morgan Chase & Co.† | | 3,103,151 |
| 46,200 | | Lloyds TSB Group PLC† | | 1,472,856 |
| 109,100 | | Wells Fargo & Company† | | 6,243,793 |
| | | | 39,784,534 |
| | | Holding and Other | |
| | | Investment Offices 2.85% | |
| 3,281 | | Berkshire Hathaway Inc. # | | 9,695,355 |
| | | Insurance Agents, Brokers | | | |
| | | and Service 0.61% | | | |
| 59,600 | | Aon Corporation | | 1,696,812 |
| 8,200 | | Marsh & McLennan | | | |
| | | Companies, Inc. | | 372,116 |
| | | | | | 2,068,928 |
| | | Insurance Carriers 9.72% | | | |
| 136,700 | | American International Group, Inc.† | | 9,743,976 |
| 2,900 | | American National | | | |
| | | Insurance Company | | 267,757 |
| 142,790 | | Loews Corporation | | 8,561,688 |
| 111,680 | | The Phoenix Companies, Inc. † | | | 1,368,080 |
| 67,400 | | The Progressive Corporation | | | 5,749,220 |
| 34,100 | | Transatlantic Holdings, Inc.† | | | 2,761,759 |
| 289,480 | | UnumProvident Corporation† | | | 4,602,732 |
| | | | | | 33,055,212 |
| | | Non-depository | | | |
| | | Credit Institutions 3.54% | | | |
| 190,700 | | American Express Company† | | | 9,798,166 |
| 58,490 | | CIT Group Inc. | | 2,239,582 |
| | | | | | 12,037,748 |
| | | Security and Commodity | | | |
| | | Brokers, Dealers, | | | |
| | | Exchanges and Services 0.49% | | |
| 31,500 | | Morgan Stanley | | 1,662,255 |
| | | Total Finance, Insurance, | | | |
| | | and Real Estate | | 98,304,032 |
Number of | | | Market |
Shares | | | Value |
| | | MANUFACTURING 30.42% | |
| | | Chemicals and Allied Products 8.21% | |
| 226,280 | | Bristol-Myers Squibb Company | $5,543,860 |
| 36,100 | | Eli Lilly and Company† | 2,523,751 |
| 62,330 | | Great Lakes Chemical Corporation | 1,686,650 |
| 110,560 | | Merck & Co. Inc. | 5,251,600 |
| 81,850 | | Pfizer Inc. | 2,805,818 |
| 380,970 | | Schering-Plough Corporation† | 7,040,326 |
| 85,570 | | Wyeth | 3,094,211 |
| | | | 27,946,216 |
| | | Electronic and Other Electrical | |
| | | Equipment and Components, | |
| | | Except Computer Equipment 0.36% | |
| 80,400 | | Micron Technology, Inc. #† | 1,230,924 |
| | | Food and Kindred Products 2.29% | |
| 50,900 | | Diageo PLC | 2,786,775 |
| 40,000 | | Hershey Foods Corporation† | 1,850,800 |
| 99,490 | | Kraft Foods Inc.† | 3,151,843 |
| | | | 7,789,418 |
| | | Furniture and Fixtures 0.27% | |
| 38,650 | | Newell Rubbermaid Inc. | 908,275 |
| | | Industrial and Commercial Machinery |
| | | and Computer Equipment 1.41% | |
| 114,570 | | Hewlett-Packard Company | 2,417,427 |
| 24,700 | | Lexmark International, Inc. # | 2,384,291 |
| | | | 4,801,718 |
| | | Measuring, Analyzing and | |
| | | Controlling Instruments; | |
| | | Photographic, Medical and Optical | |
| | | Goods; Watches and Clocks 2.05% | |
| 141,240 | | Eastman Kodak Company† | 3,810,655 |
| 218,230 | | Xerox Corporation #† | 3,164,335 |
| | | | 6,974,990 |
| | | Miscellaneous Manufacturing | |
| | | Industries 2.62% | |
| 126,060 | | Mattel, Inc. | 2,300,595 |
| 199,200 | | Tyco International Ltd.† | 6,601,488 |
| | | | 8,902,083 |
| | | Petroleum Refining and | |
| | | Related Industries 1.77% | |
| 43,180 | | Ashland Inc. | 2,280,336 |
| 48,852 | | ConocoPhillips | 3,726,919 |
| | | | 6,007,255 |
See notes to financial statements.
AssetMark Large Cap Value Fund
SCHEDULE OF INVESTMENTS (Continued)
June 30, 2004
Number of | | | | Market |
Shares | | | | Value |
| | | COMMON STOCK (Continued) | | |
| | | MANUFACTURING (Continued) | | |
| | | Printing, Publishing and | | |
| | | Allied Industries 0.75% | | |
| 57,840 | | American Greetings Corporation #† | $ | 1,340,731 |
| 14,100 | | Gannett Co., Inc. | | 1,196,385 |
| | | | | 2,537,116 |
| | | Rubber and Miscellaneous | | |
| | | Plastics Products 2.82% | | |
| 240,330 | | The Goodyear Tire & | | |
| | | Rubber Company #† | | 2,184,600 |
| 109,900 | | Sealed Air Corporation #† | | 5,854,373 |
| 80,260 | | Tupperware Corporation . | | 1,559,452 |
| | | | | 9,598,425 |
| | | Tobacco Products 5.52% | | |
| 295,050 | | Altria Group, Inc. | | 14,767,253 |
| 23,300 | | R.J. Reynolds | | |
| | | Tobacco Holdings, Inc. | | 1,574,847 |
| 67,560 | | UST Inc. | | 2,432,160 |
| | | | | 18,774,260 |
| | | Transportation Equipment 2.35% | | |
| 136,930 | | Delphi Corporation† | | 1,462,412 |
| 249,530 | | Ford Motor Company† | | 3,905,145 |
| 56,670 | | General Motors Corporation† | | 2,640,255 |
| | | | | 8,007,812 |
| | | Total Manufacturing | 103,478,492 |
| | | MINING 2.56% | | |
| | | Mining and Quarrying | | |
| | | of Nonmetallic Minerals, | | |
| | | Except Fuels 0.39% | | |
| 28,200 | | Vulcan Materials Company | | 1,340,910 |
| | | Oil and Gas Extraction 2.17% | | |
| 51,300 | | Devon Energy Corporation | | 3,385,800 |
| 42,000 | | EOG Resources, Inc.† | | 2,507,820 |
| 30,600 | | Occidental Petroleum Corporation | | 1,481,346 |
| | | | | 7,374,966 |
| | | Total Mining | | 8,715,876 |
| | | RETAIL TRADE 6.65% | | |
| | | Automotive Dealers and Gasoline | | |
| | | Service Stations 0.44% | | |
| 18,900 | | AutoZone Inc. #† | | 1,513,890 |
| | | Food Stores 3.79% | | |
| 225,380 | | Albertson’s, Inc.† | | 5,981,585 |
Number of | | | | Market |
Shares | | | | Value |
| | | Food Stores (Continued) | | |
| 380,310 | | The Kroger Co. #† | $ | 6,921,642 |
| | | | | 12,903,227 |
| | | General Merchandise Stores 1.59% | |
| 131,500 | | Costco Wholesale Corporation† | | 5,400,705 |
| | | Miscellaneous Retail 0.83% | | |
| 176,310 | | Toys "R" Us, Inc. #† | | 2,808,618 |
| | | Total Retail Trade | | 22,626,440 |
| | | SERVICES 7.88% | | |
| | | Business Services 3.30% | | |
| 30,700 | | The Dun & Bradstreet Corporation # | | 1,655,037 |
| 186,750 | | Electronic Data | | |
| | | Systems Corporation† | | 3,576,263 |
| 78,000 | | Microsoft Corporation | | 2,227,680 |
| 270,980 | | Unisys Corporation # | | 3,761,202 |
| | | | | 11,220,182 |
| | | Engineering, Accounting, Research, | |
| | | Management and Related Services 0.62% |
| 32,700 | | Moody’s Corporation† | | 2,114,382 |
| | | Health Services 2.34% | | |
| 41,800 | | HCA Inc. | | 1,738,462 |
| 463,390 | | Tenet Healthcare Corporation #† | | 6,214,060 |
| | | | | 7,952,522 |
| | | Hotels, Rooming Houses, Camps | | |
| | | and Other Lodging Places 0.44% | | |
| 30,000 | | Marriott International, Inc. | | 1,496,400 |
| | | Personal Services 1.18% | | |
| 51,800 | | H&R Block, Inc. | | 2,469,824 |
| 210,440 | | Service Corporation International #† | | 1,550,943 |
| | | | | 4,020,767 |
| | | Total Services | | 26,804,253 |
| | | TRANSPORTATION, | | |
| | | COMMUNICATIONS, ELECTRIC, |
| | | GAS AND SANITARY SERVICES 14.64% |
| | | Communications 10.11% | | |
| 304,180 | | AT&T Corp.† | | 4,450,153 |
| 259,940 | | BellSouth Corporation | | 6,815,627 |
| 207,300 | | Comcast Corporation #† | | 5,723,553 |
| 237,020 | | SBC Communications Inc. | | 5,747,735 |
| 330,650 | | Sprint Corporation† | | 5,819,440 |
| 160,990 | | Verizon Communications Inc.† | | 5,826,228 |
| | | | | 34,382,736 |
See notes to financial statements.
AssetMark Large Cap Value Fund
SCHEDULE OF INVESTMENTS (Continued)
June 30, 2004
Number of | | | | Market |
Shares | | | | Value |
| | | COMMON STOCK (Continued) | | |
| | | TRANSPORTATION, | | |
| | | COMMUNICATIONS, ELECTRIC, |
| | | GAS AND SANITARY SERVICES (Continued) |
| | | Electric, Gas and Sanitary Services 3.22% |
| 68,330 | | American Electric | | |
| | | Power Company, Inc. | $ | 2,186,560 |
| 98,470 | | Duke Energy Corporation† | | 1,997,956 |
| 672,720 | | EL Paso Corporation† | | 5,301,034 |
| 48,090 | | Waste Management, Inc. | | 1,473,959 |
| | | | | 10,959,509 |
| | | Motor Freight Transportation | | |
| | | and Warehousing 0.40% | | |
| 18,000 | | United Parcel Service, Inc. | | 1,353,060 |
| | | Transportation by Air 0.91% | | |
| 113,120 | | AMR Corporation #† | | 1,369,883 |
| 242,080 | | Delta Air Lines, Inc. #† | | 1,723,610 |
| | | | | 3,093,493 |
| | | Total Transportation, | | |
| | | Communications, Electric, | | |
| | | Gas and Sanitary Services | | 49,788,798 |
| | | WHOLESALE TRADE 2.65% | | |
| | | Wholesale Trade - | | |
| | | Durable Goods 0.68% | | |
| 41,480 | | Johnson & Johnson | | 2,310,436 |
| | | Wholesale Trade - | | |
| | | Non-Durable Goods 1.97% | | |
| 264,580 | | Safeway Inc. #† | | 6,704,457 |
| | | Total Wholesale Trade | | 9,014,893 |
| | | Total Common Stock | | |
| | | (Cost $283,516,749) | | 318,732,784 |
| | | | |
| | | SHORT-TERM INVESTMENTS 6.05% |
| | | Money Market Funds 6.05% | | |
| 20,609,934 | | Federated Prime Obligations Fund | | 20,609,934 |
| | | Total Short-Term Investments | | |
| | | (Cost $20,609,934) | | 20,609,934 |
Principal | | | | Market |
Value | | | | Value |
| | | INVESTMENTS PURCHASED | | |
| | | AS SECURITIES LENDING | | |
| | | COLLATERAL 37.77% | | |
| | | CERTIFICATES OF DEPOSIT 1.95% |
| $3,308,933 | | Svenska Handlsbankn, | | |
| | | 1.17%, 10/21/04 | $ | 3,308,933 |
| 3,308,933 | | Lloyds Institutional, | | |
| | | 1.18%, 10/27/04 | | 3,308,933 |
| | | Total Certificates of Deposit | | |
| | | (Cost $6,617,866) | | 6,617,866 |
| | | COMMERCIAL PAPER 10.11% | | |
| 3,308,933 | | Park Granada LLC, | | |
| | | 1.14%, 9/07/04 | | 3,293,042 |
| 3,970,720 | | CIBC Mortgage Corp., | | |
| | | 1.11%, 9/09/04 | | 3,970,720 |
| 1,323,573 | | Lloyds Bank, 1.46%, 11/17/04 | | 1,323,573 |
| 1,654,467 | | Sigma Finance, | | |
| | | 1.51%, 11/29/04(1)(2) | | 1,641,713 |
| 3,970,720 | | Sigma Finance, | | |
| | | 1.57%, 5/17/05(1)(2) | | 3,969,926 |
| 3,308,933 | | CCN Bluegrass I, LLC, | | |
| | | 1.33%, 5/18/05 | | 3,308,933 |
| 2,978,040 | | Goldman Sachs, 1.57%, 7/02/04(2) | | 2,978,040 |
| 3,308,934 | | Lehman Brothers, 1.57%, 7/19/04(2) | | 3,308,934 |
| 1,323,573 | | Lehman Brothers, 1.58%, 7/23/04(2) | | 1,323,573 |
| 992,680 | | Morgan Stanley, 1.58%, 9/08/04(2) | | 992,680 |
| 2,647,147 | | Morgan Stanley, 1.58%, 9/14/04(2) | | 2,647,147 |
| 2,316,253 | | Morgan Stanley, 1.58%, 12/08/04(2) | | 2,316,253 |
| 3,308,933 | | Leafs LLC, 1.29%, 4/20/05 | | 3,308,933 |
| | | Total Commercial Paper | | |
| | | (Cost $34,383,467) | | 34,383,467 |
| | | CORPORATE BONDS AND NOTES 2.33% |
| 1,654,467 | | West LB, 1.41%, 10/18/04 | | 1,666,394 |
| 2,978,040 | | Northlake, 1.22%, 3/07/05 | | 2,978,040 |
| 3,308,933 | | Bayerische Landesbank, | | |
| | | 0.84%, 6/24/05 | | 3,308,933 |
| | | Total Corporate Bonds and Notes | | |
| | | (Cost $7,953,367) | | 7,953,367 |
See notes to financial statements.
AssetMark Large Cap Value Fund
SCHEDULE OF INVESTMENTS (Continued)
June 30, 2004
Principal | | | | Market |
Value | | | | Value |
| | | REPURCHASE AGREEMENTS 22.57% |
| $40,699,878 | | CS First Boston Repurchase | | |
| | | Agreement, 1.58%, 7/01/04 | | |
| | | (Collateralized by Fannie Mae | | |
| | | Collateralized Mortgage | | |
| | | Obligations) . . . . . . . . . . . . . . . . . | $ | 40,699,878 |
| 4,963,400 | | JP Morgan Repurchase Agreement, | | |
| | | 1.60%, 7/01/04(2) (Collateralized | | |
| | | by corporate bonds rated BBB or | | |
| | | better by S&P) . . . . . . . . . . . . . . . | | 4,963,400 |
| 8,272,333 | | Lehman Brothers Repurchase | | |
| | | Agreement, 1.55%, 7/01/04 | | |
| | | (Collateralized by high yield | | |
| | | corporate bonds) . . . . . . . . . . . . . | | 8,272,333 |
| 22,831,639 | | Lehman Brothers Repurchase | | |
| | | Agreement, 1.62%, 7/01/04 | | |
| | | (Collateralized by high yield | | |
| | | corporate bonds) . . . . . . . . . . . . . | | 22,831,639 |
| | | Total Repurchase Agreements | | |
| | | (Cost $76,767,250) . . . . . . . . . . . | | 76,767,250 |
Number of | | | | |
Shares | | | | |
| | | MUTUAL FUNDS 0.81% | | |
| 2,765,784 | | AIM Liquid Assets Portfolio | | |
| | | Fund, Institutional Class . . . . . . . | | 2,765,784 |
| 4,569 | | Merrill Lynch Funds for | | |
| | | Institutions Series - Premier | | |
| | | Institutional Fund . . . . . . . . . . . . | | 4,569 |
| | | Total Mutual Funds | | |
| | | (Cost $2,770,353) . . . . . . . . . . . . | | 2,770,353 |
| | | Total Investments Purchased as | | |
| | | Securities Lending Collateral | | |
| | | (Cost $128,492,303) . . . . . . . . . . | 128,492,303 |
| | | Total Investments 137.52% | | |
| | | (Cost $432,618,986) . . . . . . . . . . | 467,835,021 |
| | | Liabilities, less | | |
| | | Other Assets (37.52)% . . . . . . . | (127,648,582) |
| | | Net Assets 100% . . . . . . . . . . . . . | $340,186,439 |
| | | | | |
| | # | Non-income producing security. |
| | † | All or a portion of this security represents investments of securities lending collateral. |
(1) Restricted under Rule 144a of the Securities Act of 1933.
(2) Variable rate security. The rate shown is the rate in effect on June 30, 2004.
See notes to financial statements.
AssetMark Small/Mid Cap Growth Fund
PERFORMANCE DATA
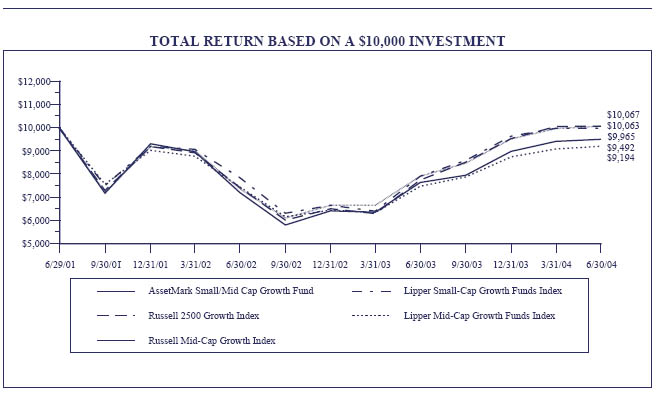
This chart assumes an initial gross investment of $10,000 made on 6/29/01 (commencement of operations). Returns shown include the reinvestment of all dividends. Returns shown do not reflect the deduction of taxes that a shareholder would pay on fund distributions or the redemption of fund shares. In the absence of fee waivers and reimbursements, total return would be reduced. Past performance is not predictive of future performance. Investment return and principal value will fluctuate, so that your shares, when redeemed, may be worth more or less than the original cost.
RUSSELL 2500 GROWTH INDEX - An unmanaged index which measures the performance of those Russell 2500 Index companies with higher price-to-book ratios and higher forecasted growth values. The Russell 2500 Index measures the performance of the 2,500 smallest companies in the Russell 3000 Index. The Russell 3000 Index is an unmanaged index which measures the performance of the 3,000 largest U.S. companies based on total market capitalization, which represents approximately 98% of the investable U.S. equity market.
LIPPER SMALL-CAP GROWTH FUNDS INDEX - An unmanaged index which measures the composite performance of the 30 largest "small-cap growth" mutual funds, as categorized by Lipper Inc.
AVERAGE ANNUAL TOTAL RETURN (for the periods ended June 30, 2004)
| | One Year | Three Year | Since Inception (6/29/01) |
| AssetMark Small/Mid Cap Growth Fund | 24.21% | -1.73% | -1.73% |
| Russell 2500 Growth Index | 30.12% | 0.21% | 0.21% |
| Russell Mid-Cap Growth Index | 27.33% | 0.23% | 0.23% |
| Lipper Small-Cap Growth Funds Index | 26.07% | -0.12% | -0.12% |
| Lipper Mid-Cap Growth Funds Index | 23.14% | -2.76% | -2.76% |
AssetMark Small/Mid Cap Growth Fund
SCHEDULE OF INVESTMENTS
June 30, 2004
Number of | | | | Market |
Shares | | | | Value |
| | | COMMON STOCK 96.04% | | |
| | | FINANCE, INSURANCE AND | | |
| | | REAL ESTATE 6.19% | | |
| | | Non-depository Credit Institutions 2.43% |
| 60,000 | | Financial Federal Corporation # | $ | 2,115,600 |
| | | Security and Commodity Brokers, | | |
| | | Dealers, Exchanges and Services 3.76% |
| 29,920 | | BlackRock, Inc. | | 1,909,793 |
| 15,200 | | SEI Investments Company | | 441,408 |
| 18,500 | | T. Rowe Price Group Inc. | | 932,400 |
| | | | | 3,283,601 |
| | | Total Finance, Insurance | | |
| | | and Real Estate | | 5,399,201 |
| | | MANUFACTURING 28.46% | | |
| | | Chemicals and Allied Products 2.89% | |
| 10,900 | | Corgentech Inc. # | | 175,708 |
| 6,675 | | Digene Corporation # | | 243,838 |
| 8,400 | | Eon Labs, Inc. # | | 343,812 |
| 16,700 | | Genentech, Inc. #† | | 938,540 |
| 12,700 | | MGI Pharma, Inc. #† | | 343,027 |
| 5,500 | | Onyx Pharmaceuticals, Inc. # | | 232,980 |
| 19,400 | | Vicuron Pharmaceuticals Inc. # | | 243,664 |
| | | | | 2,521,569 |
| | | Electronic and Other Electrical | | |
| | | Equipment and Components, | | |
| | | Except Computer Equipment 15.97% | |
| 23,700 | | Altera Corporation # | | 526,614 |
| 51,300 | | Applied Micro | | |
| | | Circuits Corporation #† | | 272,916 |
| 85,600 | | CIENA Corporation # | | 318,432 |
| 529,000 | | Gemstar-TV Guide | | |
| | | International, Inc. # | | 2,539,200 |
| 15,100 | | Intersil Corporation | | 327,066 |
| 54,900 | | Maxim Integrated Products, Inc. | | 2,877,858 |
| 40,700 | | Mindspeed Technologies Inc. # | | 201,872 |
| 35,500 | | Network Appliance, Inc. # | | 764,315 |
| 55,000 | | Network Associates, Inc. # | | 997,150 |
| 12,600 | | Novellus Systems, Inc. # | | 396,144 |
| 33,300 | | Research In Motion Limited #† | | 2,279,052 |
| 72,800 | | Xilinx, Inc. | | 2,424,968 |
| | | | 13,925,587 |
| | | Industrial and Commercial Machinery |
| | | and Computer Equipment 1.57% | | |
| 44,000 | | Graco Inc. | | 1,366,200 |
Number of | | | Market |
Shares | | | Value |
| | | Measuring, Analyzing, and | |
| | | Controlling Instruments; | |
| | | Photographic, Medical and Optical | |
| | | Goods; Watches and Clocks 2.41% | |
| 48,400 | | Techne Corporation # | $2,102,980 |
| | | Paper and Allied Products 3.50% | |
| 83,600 | | Packaging Corp. of America | 1,998,040 |
| 42,000 | | Pactiv Corporation # | 1,047,480 |
| | | | 3,045,520 |
| | | Stone, Clay, Glass and | |
| | | Concrete Products 2.12% | |
| 46,640 | | Gentex Corporation† | 1,850,675 |
| | | Total Manufacturing | 24,812,531 |
| | | MINING 2.12% | |
| | | Oil and Gas Extraction 2.12% | |
| 31,000 | | EOG Resources, Inc. | 1,851,010 |
| | | Total Mining | 1,851,010 |
| | | RETAIL TRADE 13.94% | |
| | | Eating and Drinking Places 2.71% | |
| 66,000 | | IHOP Corp.† | 2,360,160 |
| | | Home Furniture, Furnishings | |
| | | and Equipment Stores 4.48% | |
| 36,800 | | Bed Bath & Beyond Inc. #† | 1,414,960 |
| 75,000 | | RadioShack Corporation† | 2,147,250 |
| 12,000 | | Tuesday Morning Corporation # | 348,000 |
| | | | 3,910,210 |
| | | Miscellaneous Retail 6.75% | |
| 30,400 | | Amazon.com, Inc. #† | 1,653,760 |
| 46,000 | | eBay Inc. #† | 4,229,700 |
| | | | 5,883,460 |
| | | Total Retail Trade | 12,153,830 |
| | | SERVICES 30.50% | |
| | | Amusement and Recreation Services 1.23% |
| 45,100 | | Westwood One, Inc. # | 1,073,380 |
| | | Business Services 17.32% | |
| 38,700 | | Agile Software Corporation # | 338,625 |
| 13,900 | | CheckFree Corp. #† | 417,000 |
| 12,200 | | Cognex Corporation | 469,456 |
| 45,000 | | GTECH Holdings Corporation | 2,083,950 |
| 62,000 | | Juniper Networks, Inc. #† | 1,523,340 |
| 57,000 | | Opsware, Inc. #† | 451,440 |
| 325,000 | | RealNetworks, Inc. #† | 2,223,000 |
See notes to financial statements.
AssetMark Small/Mid Cap Growth Fund
SCHEDULE OF INVESTMENTS (Continued)
June 30, 2004
Number of | | | Market |
Shares | | | Value |
| | COMMON STOCK (Continued) | | |
| | SERVICES (Continued) | | |
| | Business Services (Continued) | | |
| 24,300 | Red Hat, Inc. #† | | $558,171 |
| 19,100 | Robert Half International Inc.† | | 568,607 |
| 3,000 | Salesforce.com, Inc. # | | 48,210 |
| 72,500 | Siebel Systems, Inc. # | | 774,300 |
| 300,000 | SkillSoft PLC # | | 2,280,000 |
| 92,700 | Yahoo! Inc. #† | | 3,367,791 |
| | | | 15,103,890 |
| | Educational Services 2.26% | | |
| 72,000 | DeVry, Inc. #† | | 1,974,240 |
| | Engineering, Accounting, Research, | |
| | Management and Related Services 5.70% |
| 17,500 | Affymetrix, Inc. #† | | 572,775 |
| 19,360 | Moody’s Corporation† | | 1,251,818 |
| 29,100 | Paychex, Inc.† | | 985,908 |
| 175,000 | The ServiceMaster Company | | 2,156,000 |
| | | | 4,966,501 |
| | Health Services 1.39% | | |
| 10,100 | Express Scripts, Inc. # | | 800,223 |
| 20,400 | Nektar Therapeutics # | | 407,184 |
| | | | 1,207,407 |
| | Personal Services 2.60% | | |
| 58,000 | Weight Watchers | | |
| | International, Inc. #† | | 2,270,120 |
| | Total Services | | 26,595,538 |
| | TRANSPORTATION, | | |
| | COMMUNICATIONS, ELECTRIC, | |
| | GAS AND SANITARY SERVICES 14.83% |
| | Communications 9.87% | | |
| 25,000 | Cablevision Systems | | |
| | New York Group # | | 491,250 |
| 5,800 | Citadel Broadcasting Company # | | 84,506 |
| 16,000 | Clear Channel | | |
| | Communications, Inc.† | | 591,200 |
| 26,300 | Cox Radio, Inc. # | | 457,094 |
| 57,600 | EchoStar | | |
| | Communications Corporation # | | 1,771,200 |
| 23,760 | Global Payments Inc. | | 1,069,675 |
| 39,065 | InterActiveCorp #† | | 1,177,419 |
| 27,650 | Sprint Corporation† | | 486,640 |
| 6,300 | Telephone and Data Systems, Inc. | | 448,560 |
Number of | | | Market |
Shares | | | Value |
| | | Communications (Continued) | |
| 67,400 | | Time Warner Telecom Inc. # | $282,406 |
| 54,612 | | Univision Communications Inc. #† | 1,743,762 |
| | | | 8,603,712 |
| | | Transportation Services 4.96% | |
| 48,000 | | C.H. Robinson Worldwide, Inc.† | 2,200,320 |
| 43,000 | | Expeditors International | |
| | | of Washington, Inc. | 2,124,630 |
| | | | 4,324,950 |
| | | Total Transportation, | |
| | | Communications, Electric, | |
| | | Gas and Sanitary Services | 12,928,662 |
| | | Total Common Stock | |
| | | (Cost $70,987,815) | 83,740,772 |
| | | | |
| | | WARRANTS 0.02% | |
| 422 | | InterActiveCorp Warrant # | 14,563 |
| | | Total Warrants | |
| | | (Cost $3,329) | 14,563 |
| | | | |
| | | SHORT-TERM INVESTMENTS 3.15% |
| | | Money Market Funds 3.15% | |
| 2,741,540 | | Federated Prime Obligations Fund | 2,741,540 |
| | | Total Short-Term Investments | |
| | | (Cost $2,741,540) | 2,741,540 |
| | | | |
Principal | | | |
Value | | | |
| | | INVESTMENTS PURCHASED | |
| | | AS SECURITIES LENDING | |
| | | COLLATERAL 33.07% | |
| | | CERTIFICATES OF DEPOSIT 1.70% |
| $742,589 | | Svenska Handlsbankn, | |
| | | 1.17%, 10/21/04 | 742,589 |
| 742,589 | | Lloyds Institutional, | |
| | | 1.18%, 10/27/04 | 742,589 |
| | | Total Certificates of Deposit | |
| | | (Cost $6,617,866) | 1,485,178 |
| | | COMMERCIAL PAPER 8.85% | |
| 742,589 | | Park Granada LLC, 1.14%, 9/07/04 | 739,023 |
| 891,107 | | CIBC Mortgage Corp., | |
| | | 1.11%, 9/09/04 | 891,107 |
See notes to financial statements.
AssetMark Small/Mid Cap Growth Fund
SCHEDULE OF INVESTMENTS (Continued)
June 30, 2004
Principal | | | Market |
| | Value | | | Value |
| | | COMMERCIAL PAPER (Continued) |
| $ | 297,036 | Lloyds Bank, 1.46%, 11/17/04 | $ | 297,036 |
| | 371,294 | Sigma Finance, | | |
| | | 1.51%, 11/29/04(1)(2) | | 368,432 |
| | 891,107 | Sigma Finance, | | |
| | | 1.57%, 5/17/05(1)(2) | | 890,929 |
| | 742,589 | CCN Bluegrass I, LLC, | | |
| | | 1.33%, 5/18/05 | | 742,589 |
| | 668,330 | Goldman Sachs, 1.57%, 7/02/04(2) . | | 668,330 |
| | 742,589 | Lehman Brothers, 1.57%, 7/19/04(2) | | 742,589 |
| | 297,036 | Lehman Brothers, 1.58%, 7/23/04(2) | | 297,036 |
| | 222,777 | Morgan Stanley, 1.58%, 9/08/04(2) . | | 222,777 |
| | 594,071 | Morgan Stanley, 1.58%, 9/14/04(2) . | | 594,071 |
| | 519,812 | Morgan Stanley, 1.58%, 12/08/04(2) | | 519,812 |
| | 742,589 | Leafs LLC, 1.29%, 4/20/05 | | 742,589 |
| | | Total Commercial Paper | | |
| | | (Cost $7,716,320) | | 7,716,320 |
| | | CORPORATE BONDS AND NOTES 2.05% |
| | 371,294 | West LB, 1.41%, 10/18/04 | | 373,971 |
| | 668,330 | Northlake, 1.22%, 3/07/05 | | 668,330 |
| | 742,589 | Bayerische Landesbank, | | |
| | | 0.84%, 6/24/05 | | 742,589 |
| | | Total Corporate Bonds and Notes | | |
| | | (Cost $1,784,890) | | 1,784,890 |
| | | REPURCHASE AGREEMENTS 19.76% |
| 9,133,844 | CS First Boston Repurchase | | |
| | | Agreement, 1.58%, 7/01/04 | | |
| | | (Collateralized by Fannie Mae | | |
| | | Collateralized Mortgage | | |
| | | Obligations) | | 9,133,844 |
| 1,113,883 | JP Morgan Repurchase Agreement, | | |
| | | 1.60%, 7/01/04(2) (Collateralized | | |
| | | by corporate bonds rated BBB or | | |
| | | better by S&P) | | 1,113,883 |
| 1,856,472 | Lehman Brothers Repurchase | | |
| | | Agreement, 1.55%, 7/01/04 | | |
| | | (Collateralized by high yield | | |
| | | corporate bonds) | | 1,856,472 |
| 5,123,864 | Lehman Brothers Repurchase | | |
| | | Agreement, 1.62%, 7/01/04 | | |
| | | (Collateralized by high yield | | |
| | | corporate bonds) | | 5,123,864 |
| | | Total Repurchase Agreements | | |
| | | (Cost $17,228,063) | | 17,228,063 |
Number of | | | Market |
Shares | | | Value |
| | MUTUAL FUNDS 0.71% | | |
| 620,696 | AIM Liquid Assets Portfolio | | |
| | Fund, Institutional Class | $ | 620,696 |
| 1,025 | Merrill Lynch Funds for | | |
| | Institutions Series - Premier | | |
| | Institutional Fund | | 1,025 |
| | Total Mutual Funds | | |
| | (Cost $621,721) | | 621,721 |
| | Total Investments Purchased as | | |
| | Securities Lending Collateral | | |
| | (Cost $28,836,172) | | 28,836,172 |
| | Total Investments 132.28% | | |
| | (Cost $102,568,856) | | 115,333,047 |
| | Liabilities, less | | |
| | Other Assets (32.28)% | | (28,143,459) |
| | Net Assets 100% | | $87,189,588 |
# Non-income producing security.
† All or a portion of this security represents investments of securities lending collateral.
(1) Restricted under Rule 144a of the Securities Act of 1933.
(2) Variable rate security. The rate shown is the rate in effect on June 30, 2004.
AssetMark Small/Mid Cap Value Fund
PERFORMANCE DATA
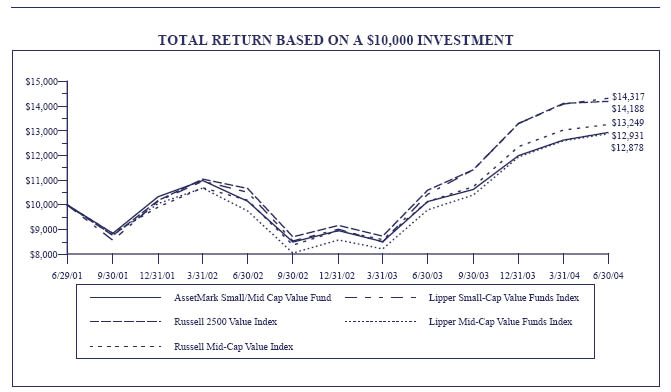
This chart assumes an initial gross investment of $10,000 made on 6/29/01 (commencement of operations). Returns shown include the reinvestment of all dividends. Returns shown do not reflect the deduction of taxes that a shareholder would pay on fund distributions or the redemption of fund shares. In the absence of fee waivers and reimbursements, total return would be reduced. Past performance is not predictive of future performance. Investment return and principal value will fluctuate, so that your shares, when redeemed, may be worth more or less than the original cost.
RUSSELL 2500 VALUE INDEX - An unmanaged index which measures the performance of those Russell 2500 Index companies with lower price-to-book ratios and lower forecasted growth values. The Russell 2500 Index is an unmanaged index which measures the performance of the 2,500 smallest companies in the Russell 3000 Index. The Russell 3000 Index is an unmanaged index which measures the performance of the 3,000 largest U.S. companies based on total market capitalization, which represents approximately 98% of the investable U.S. equity market.
LIPPER SMALL-CAP VALUE FUNDS INDEX - An unmanaged index which measures the composite performance of the 30 largest "small-cap value" mutual funds, as categorized by Lipper Inc.
AVERAGE ANNUAL TOTAL RETURN (for the periods ended June 30, 2004)
| | One Year | Three Year | Since Inception (6/29/01) |
| AssetMark Small/Mid Cap Value Fund | 27.64% | 8.94% | 8.93% |
| Russell 2500 Value Index | 33.91% | 12.37% | 12.36% |
| Russell Mid-Cap Value Index | 30.81% | 9.83% | 9.82% |
| Lipper Small-Cap Value Funds Index | 37.28% | 12.71% | 12.70% |
| Lipper Mid-Cap Value Funds Index | 31.51% | 8.80% | 8.79% |
AssetMark Small/Mid Cap Value Fund
SCHEDULE OF INVESTMENTS
June 30, 2004
Number of | | | Market |
Shares | | | Value |
| | COMMON STOCK 95.45% | | |
| | FINANCE, INSURANCE | | |
| | AND REAL ESTATE 22.28% | | |
| | Depository Institutions 5.09% | | |
| 42,400 | Banknorth Group, Inc. | | $1,377,152 |
| 25,800 | Hibernia Corporation | | 626,940 |
| 44,800 | Northern Trust Corporation | | 1,894,144 |
| 29,800 | North Fork Bancorporation, Inc.† | | 1,133,890 |
| | | | 5,032,126 |
| | Holding and Other Investment Offices 2.54% |
| 45,450 | Brascan Corporation | | 1,283,508 |
| 25,925 | The Rouse Company† | | 1,231,438 |
| | | | 2,514,946 |
| | Insurance Agents, Brokers and Services 0.86% |
| 22,800 | Willis Group Holdings Limited | | 853,860 |
| | Insurance Carriers 9.64% | | |
| 12,800 | Ambac Financial Group, Inc. | | 940,032 |
| 34,100 | Assurant, Inc. | | 899,558 |
| 20,400 | Everest Re Group, Ltd. | | 1,639,344 |
| 20,900 | Fidelity National Financial, Inc. | | 780,406 |
| 39,350 | HCC Insurance Holdings, Inc. | | 1,314,683 |
| 5,035 | Markel Corporation #† | | 1,397,213 |
| 33,200 | MBIA Inc.† | | 1,896,384 |
| 8,975 | XL Capital Ltd. | | 677,253 |
| | | | 9,544,873 |
| | Real Estate 0.24% | | |
| 6,000 | The St. Joe Company | | 238,200 |
| | Security and Commodity Brokers, | | |
| | Dealers, Exchanges and Services 3.91% |
| 33,400 | E*TRADE Financial Corporation # | | 372,410 |
| 95,200 | Janus Capital Group Inc.† | | 1,569,848 |
| 17,325 | T. Rowe Price Group Inc.† | | 873,180 |
| 47,500 | Waddell & Reed Financial, Inc. | | 1,050,225 |
| | | | 3,865,663 |
| | Total Finance, Insurance | | |
| | and Real Estate | | 22,049,668 |
| | MANUFACTURING 34.73% | | |
| | Chemicals and Allied Products 4.67% | |
| 13,100 | The Clorox Company | | 704,518 |
| 18,400 | Georgia Gulf Corporation | | 659,824 |
| 22,600 | International Flavors | | |
| | & Fragrances Inc. | | 845,240 |
| 67,200 | Lyondell Chemical Company† | | 1,168,608 |
Number of | | Market |
Shares | | Value |
| | Chemicals and Allied Products (Continued) |
| 93,800 | Methanex Corporation | $1,240,130 |
| | | 4,618,320 |
| | Electronic and Other Electrical | |
| | Equipment and Components, | |
| | Except Computer Equipment 5.01% | |
| 72,100 | Andrew Corporation #† | 1,442,721 |
| 135,700 | Arris Group Inc. #† | 806,058 |
| 180,200 | Conexant Systems, Inc. #† | 780,266 |
| 18,650 | Energizer Holdings, Inc. # | 839,250 |
| 29,450 | Moog Inc. # | 1,092,890 |
| | | 4,961,185 |
| | Fabricated Metal Products, Except Machinery |
| | and Transportation Equipment 1.92% |
| 15,300 | Snap-on Incorporated | 513,315 |
| 51,600 | Watts Water Technologies, Inc. | 1,390,620 |
| | | 1,903,935 |
| | Food and Kindred Products 1.02% | |
| 16,700 | Constellation Brands, Inc. # | 620,071 |
| 11,550 | McCormick & Company, Incorporated † | 392,700 |
| | | 1,012,771 |
| | Furniture and Fixtures 1.87% | |
| 41,750 | Herman Miller, Inc.† | 1,208,245 |
| 46,050 | Steelcase Inc.† | 644,700 |
| | | 1,852,945 |
| | Industrial and Commercial Machinery |
| | and Computer Equipment 7.52% | |
| 17,925 | The Black & Decker Corporation† . | 1,113,680 |
| 45,612 | IDEX Corporation | 1,566,772 |
| 25,900 | Kaydon Corporation† | 801,087 |
| 31,275 | Pitney Bowes Inc. | 1,383,919 |
| 22,700 | The Stanley Works | 1,034,666 |
| 35,100 | UNOVA, Inc. #† | 710,775 |
| 20,200 | York International Corporation | 829,614 |
| | | 7,440,513 |
| | Measuring, Analyzing and | |
| | Controlling Instruments; | |
| | Photographic, Medical and Optical | |
| | Goods; Watches and Clocks 2.67% | |
| 21,300 | Baxter International Inc. | 735,063 |
| 13,300 | C.R. Bard, Inc. | 753,445 |
| 25,750 | Invacare Corporation | 1,151,540 |
| | | 2,640,048 |
See notes to financial statements.
AssetMark Small/Mid Cap Value Fund
SCHEDULE OF INVESTMENTS (Continued)
June 30, 2004
Number of | | | Market |
Shares | | | Value |
| | COMMON STOCK (Continued) | | |
| | MANUFACTURING (Continued) | | |
| | Miscellaneous Manufacturing Industries 0.73% |
| 37,725 | Hasbro, Inc. | | $716,775 |
| | Paper and Allied Products 0.51% | | |
| 13,500 | Boise Cascade Corporation† | | 508,140 |
| | Printing, Publishing | | |
| | and Allied Industries 4.21% | | |
| 30,500 | Belo Corp. | | 818,925 |
| 33,000 | Harte-Hanks, Inc. | | 805,530 |
| 8,200 | Knight-Ridder, Inc. | | 590,400 |
| 8,165 | The McClatchy Company | | 572,775 |
| 23,805 | R. R. Donnelley & Sons Company† | | 786,041 |
| 19,250 | Valassis Communications, Inc. #† | | 586,547 |
| | | | 4,160,218 |
| | Transportation Equipment 4.60% | | |
| 18,900 | A.O. Smith Corporation | | 600,831 |
| 31,900 | Goodrich Corporation | | 1,031,327 |
| 15,300 | Oshkosh Truck Corporation | | 876,843 |
| 25,600 | Thor Industries, Inc. | | 856,576 |
| 33,900 | United Defense Industries, Inc. # | | 1,186,500 |
| | | | 4,552,077 |
| | Total Manufacturing | | 34,366,927 |
| | MINING 1.72% | | |
| | Oil and Gas Extraction 1.72% | | |
| 56,600 | Pride International, Inc. #† | | 968,426 |
| 16,200 | Weatherford International Ltd. # | | 728,676 |
| | | | 1,697,102 |
| | Total Mining | | 1,697,102 |
| | RETAIL TRADE 5.80% | | |
| | Automotive Dealers and | | |
| | Gasoline Service Stations 0.71% | | |
| 41,100 | CSK Auto Corporation # | | 704,454 |
| | Eating and Drinking Places 1.76% | | |
| 20,400 | ARAMARK Corporation | | 586,704 |
| 31,000 | Yum! Brands, Inc . | | 1,153,820 |
| | | | 1,740,524 |
| | General Merchandise Stores 1.44% | | |
| 25,525 | The Neiman Marcus Group, Inc. | | 1,420,466 |
| | Home Furniture, Furnishings | | |
| | and Equipment Stores 0.85% | | |
| 29,100 | Tuesday Morning Corporation # | | 843,900 |
Number of | | | Market |
Shares | | | Value |
| | Miscellaneous Retail 1.04% | | |
| 37,600 | Dollar Tree Stores, Inc. #† | | $1,031,368 |
| | Total Retail Trade | | 5,740,712 |
| | SERVICES 20.15% | | |
| | Amusement and | | |
| | Recreation Services 1.79% | | |
| 28,600 | Alliance Gaming Corporation # | | 490,776 |
| 85,300 | Caesars Entertainment, Inc. #† | | 1,279,500 |
| | | | 1,770,276 |
| | Business Services 14.91% | | |
| 21,800 | Amdocs Limited # | | 510,774 |
| 59,700 | The BISYS Group, Inc. # | | 839,382 |
| 15,300 | Brady Corporation | | 705,330 |
| 28,575 | Cendant Corporation | | 699,516 |
| 14,275 | Certegy Inc. | | 553,870 |
| 21,375 | Dun & Bradstreet Corporation # | | 1,152,326 |
| 36,550 | Equifax Inc. | | 904,613 |
| 1,657 | Grey Global Group Inc. | | 1,632,145 |
| 24,400 | Hyperion Solutions Corporation #† | | 1,066,768 |
| 83,050 | IMS Health Incorporated | | 1,946,692 |
| 92,810 | The Interpublic Group | | |
| | of Companies, Inc. #† | | 1,274,281 |
| 15,100 | Manpower Inc.† | | 766,627 |
| 27,200 | NDCHealth Corporation | | 631,040 |
| 43,150 | Sotheby’s Holdings, Inc. # | | 688,674 |
| 53,100 | SunGard Data Systems Inc. # | | 1,380,600 |
| | | | 14,752,638 |
| | Educational Services 0.54% | | |
| 19,450 | DeVry, Inc. #† | | 533,319 |
| | Engineering, Accounting, | | |
| | Research, Management | | |
| | and Related Services 1.38% | | |
| 27,950 | Accenture Ltd. # | | 768,066 |
| 48,600 | The ServiceMaster Company | | 598,752 |
| | | | 1,366,818 |
| | Health Services 0.67% | | |
| 25,000 | Kindred Healthcare, Inc. #† | | 658,750 |
| | Hotels, Rooming Houses, Camps | | |
| | and Other Lodging Places 0.86% | | |
| 53,400 | Intrawest Corporation | | 851,730 |
| | Total Service | | 19,933,531 |
See notes to financial statements.
AssetMark Small/Mid Cap Value Fund
SCHEDULE OF INVESTMENTS (Continued)
June 30, 2004
Number of | | | Market |
Shares | | | Value |
| | COMMON STOCK (Continued) | | |
| | TRANSPORTATION, | | |
| | COMMUNICATIONS, ELECTRIC, | |
| | GAS AND SANITARY SERVICES 6.07% |
| | Communications 3.43% | | |
| 20,150 | Anixter International Inc. #† | | $685,705 |
| 35,555 | Cablevision Systems | | |
| | New York Group # | | 698,656 |
| 30,000 | CenturyTel, Inc. | | 901,200 |
| 29,700 | Entercom Communications Corp. # | | 1,107,810 |
| | | | 3,393,371 |
| | Electric, Gas and Sanitary Services 0.90% |
| 31,900 | PG&E Corporation #† | | 891,286 |
| | Railroad Transportation 0.91% | | |
| 27,500 | CSX Corporation | | 901,175 |
| | Water Transportation 0.83% | | |
| 18,800 | Royal Caribbean Cruises Ltd.† | | 816,108 |
| | Total Transportation, | | |
| | Communications, Electric, | | |
| | Gas and Sanitary Services | | 6,001,940 |
| | WHOLESALE TRADE 4.70% | | |
| | Wholesale Trade-durable Goods 3.33% |
| 30,300 | Apogent Technologies Inc. # | | 969,600 |
| 30,400 | Insight Enterprises, Inc. # | | 539,904 |
| 41,750 | Omnicare, Inc.† | | 1,787,317 |
| | | | 3,296,821 |
| | Wholesale Trade-non-durable Goods 1.37% |
| 56,600 | Airgas, Inc. | | 1,353,306 |
| | Total Wholesale Trade | | 4,650,127 |
| | Total Common Stock | | |
| | (Cost $81,937,895) | | 94,440,007 |
| | | | |
| | SHORT-TERM INVESTMENTS 4.21% |
| | Money Market Funds 4.21% | | |
| 4,168,595 | Federated Prime Obligations Fund | | 4,168,595 |
| | Total Short-Term Investments | | |
| | (Cost $4,168,595) | | 4,168,595 |
Principal | | | Market |
Value | | | Value |
| | INVESTMENTS PURCHASED | | |
| | AS SECURITIES LENDING | | |
| | COLLATERAL 20.64% | | |
| | CERTIFICATES OF DEPOSIT 1.06% | |
| $525,985 | Svenska Handlsbankn, | | |
| | 1.17%, 10/21/04 | | $525,985 |
| 525,985 | Lloyds Institutional, | | |
| | 1.18%, 10/27/04 | | 525,985 |
| | Total Certificates of Deposit | | |
| | (Cost $1,051,970) | | 1,051,970 |
| | COMMERCIAL PAPER 5.52% | | |
| $525,985 | Park Granada LLC, | | |
| | 1.14%, 9/07/04 | | 523,459 |
| 631,182 | CIBC Mortgage Corp., | | |
| | 1.11%, 9/09/04 | | 631,182 |
| 210,394 | Lloyds Bank, 1.46%, 11/17/04 | | 210,394 |
| 262,993 | Sigma Finance, | | |
| | 1.51%, 11/29/04(1)(2) | | 260,965 |
| 631,182 | Sigma Finance, | | |
| | 1.57%, 5/17/05(1)(2) | | 631,056 |
| 525,985 | CCN Bluegrass I, LLC, | | |
| | 1.33%, 5/18/05 | | 525,985 |
| 473,387 | Goldman Sachs, 1.57%, 7/02/04(2) . | | 473,387 |
| 525,985 | Lehman Brothers, 1.57%, 7/19/04(2) | | 525,985 |
| 210,394 | Lehman Brothers, 1.58%, 7/23/04(2) | | 210,394 |
| 157,796 | Morgan Stanley, 1.58%, 9/08/04(2) . | | 157,795 |
| 420,788 | Morgan Stanley, 1.58%, 9/14/04(2) . | | 420,788 |
| 368,190 | Morgan Stanley, 1.58%, 12/08/04(2) | | 368,190 |
| 525,985 | Leafs LLC, 1.29%, 4/20/05 | | 525,985 |
| | Total Commercial Paper | | |
| | (Cost $5,465,565) | | 5,465,565 |
| | CORPORATE BONDS AND NOTES 1.28% |
| 262,993 | West LB, 1.41%, 10/18/04 | | 264,889 |
| 473,387 | Northlake, 1.22%, 3/07/05 | | 473,387 |
| 525,985 | Bayerische Landesbank, | | |
| | 0.84%, 6/24/05 | | 525,985 |
| | Total Corporate Bonds and Notes | | |
| | (Cost $1,264,261) | | 1,264,261 |
See notes to financial statements.
AssetMark Small/Mid Cap Value Fund
SCHEDULE OF INVESTMENTS (Continued)
June 30, 2004
Principal | | | Market |
Value | | | Value |
| | | | |
| | REPURCHASE AGREEMENTS 12.33% |
| $6,469,617 | CS First Boston Repurchase | | |
| | Agreement, 1.58%, 7/01/04 | | |
| | (Collateralized by Fannie Mae | | |
| | Collateralized Mortgage | | |
| | Obligations) | $ | 6,469,617 |
| 788,978 | JP Morgan Repurchase Agreement, | | |
| | 1.60%, 7/01/04(2) (Collateralized | | |
| | by corporate bonds rated BBB or | | |
| | better by S&P) | | 788,978 |
| 1,314,963 | Lehman Brothers Repurchase | | |
| | Agreement, 1.55%, 7/01/04 | | |
| | (Collateralized by high yield | | |
| | corporate bonds) | | 1,314,963 |
| 3,629,297 | Lehman Brothers Repurchase | | |
| | Agreement, 1.62%, 7/01/04 | | |
| | (Collateralized by high yield | | |
| | corporate bonds) | | 3,629,297 |
| | Total Repurchase Agreements | | |
| | (Cost $12,202,855) | | 12,202,855 |
| | | | |
Number of | | | Market |
Shares | | | Value |
| | MUTUAL FUNDS 0.45% | | |
| 439,646 | AIM Liquid Assets Portfolio | | |
| | Fund, Institutional Class | $ | 439,646 |
| 726 | Merrill Lynch Funds for | | |
| | Institutions Series - Premier | | |
| | Institutional Fund | | 726 |
| | Total Mutual Funds | | |
| | (Cost $440,372) | | 440,372 |
| | Total Investments Purchased as | | |
| | Securities Lending Collateral | | |
| | (Cost $20,425,023) | | 20,425,023 |
| | Total Investments 120.30% | | |
| | (Cost $106,531,513) | | 119,033,625 |
| | Liabilities, less | | |
| | Other Assets (20.30)% | | (20,084,947) |
| | Net Assets 100% | | $98,948,678 |
| | # | Non-income producing security. |
| | † | All or a portion of this security represents investments of securities lending collateral. |
(1) Restricted under Rule 144a of the Securities Act of 1933.
(2) Variable rate security. The rate shown is the rate in effect on June 30, 2004.
See notes to financial statements.
AssetMark International Equity Fund
PERFORMANCE DATA
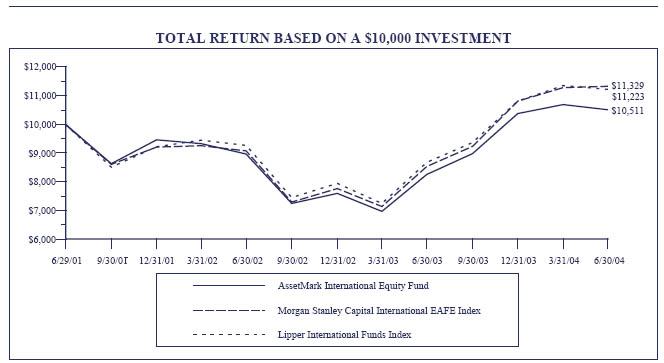
This chart assumes an initial gross investment of $10,000 made on 6/29/01 (commencement of operations). Returns shown include the reinvestment of all dividends. Returns shown do not reflect the deduction of taxes that a shareholder would pay on fund distributions or the redemption of fund shares. In the absence of fee waivers and reimbursements, total return would be reduced. Past performance is not predictive of future performance. Investment return and principal value will fluctuate, so that your shares, when redeemed, may be worth more or less than the original cost.
MORGAN STANLEY CAPITAL INTERNATIONAL EAFE INDEX - An unmanaged market-capitalization-weighted index composed of companies representative of the market structure of 20 Developed Market countries in Europe, Australia, Asia and the Far East.
LIPPER INTERNATIONAL FUNDS INDEX - An unmanaged index which measures the composite performance of the 30 largest "international" mutual funds, as categorized by Lipper Inc.
AVERAGE ANNUAL TOTAL RETURN (for the periods ended June 30, 2004)
| | One Year | Three Year | Since Inception (6/29/01) |
| AssetMark International Equity Fund | 27.40% | 1.67% | 1.67% |
| Morgan Stanley Capital International EAFE Index | 32.85% | 4.25% | 4.25% |
| Lipper International Funds Index | 29.37% | 3.92% | 3.92% |
AssetMark International Equity Fund
SCHEDULE OF INVESTMENTS
June 30, 2004
Number of | | | Market |
Shares | | | Value |
| | COMMON STOCK 96.07% | | |
| | Australia 4.15% | | |
| 136,000 | BHP Billiton Limited†* | | $2,382,720 |
| 154,600 | Boral Limited* | | 2,782,831 |
| 232,800 | Coca-Cola Amatil Limited* | | 2,247,661 |
| 97,500 | The News Corporation Limited†* | | 3,453,450 |
| | | | 10,866,662 |
| | Austria 1.71% | | |
| 70,700 | Boehler-Uddeholm AG†* | | 1,953,498 |
| 32,100 | Erste Bank der oesterreichischen | | |
| | Sparkassen AG* | | 2,520,964 |
| | | | 4,474,462 |
| | Brazil 1.83% | | |
| 147,200 | Compania Brasileira de Distribuicao | | |
| | Grupo Pao de Acucar* | | 2,546,560 |
| 49,400 | Petroleo Brasileiro SA - Petrobras #†* | 1,386,658 |
| 27,400 | Votorantim Celulose e Papel SA* | | 871,320 |
| | | | 4,804,538 |
| | Britain 15.88% | | |
| 48,500 | Anglo American PLC†* | | 1,012,195 |
| 47,500 | AstraZeneca PLC†* | | 2,167,900 |
| 118,400 | Barclays PLC†* | | 4,127,424 |
| 61,600 | BP PLC* | | 3,299,912 |
| 57,500 | Cadbury Schweppes PLC†* | | 2,017,100 |
| 336,000 | Compass Group PLC†* | | 2,050,406 |
| 72,000 | Diageo PLC†* | | 3,942,000 |
| 266,900 | EMI Group PLC†* | | 2,359,609 |
| 16,900 | GlaxoSmithKline PLC†* | | 700,674 |
| 41,100 | HSBC Holdings PLC†* | | 3,078,801 |
| 168,600 | Pearson PLC* | | 2,104,128 |
| 46,400 | Rio Tinto PLC†* | | 4,549,520 |
| 127,800 | Tesco PLC†* | | 1,851,221 |
| 300,900 | Vodafone Group PLC†* | | 6,649,890 |
| 33,100 | Warner Chilcott PLC†* | | 1,661,289 |
| | | | 41,572,069 |
| | Canada 1.32% | | |
| 83,200 | Alcan Inc. | | 3,444,480 |
| | Finland 1.59% | | |
| 159,400 | Nokia Oyj* | | 2,317,676 |
| 97,200 | UPM-Kymmene Oyj†* | | 1,857,492 |
| | | | 4,175,168 |
| | France 12.96% | | |
| 261,100 | Axa†* | | 5,780,754 |
| 229,900 | BNP Paribas SA†* | | 7,069,609 |
Number of | | | Market |
Shares | | | Value |
| | France (Continued) | | |
| 78,100 | Dassault Systemes SA†* | $ | 3,660,469 |
| 215,550 | Pernod Ricard SA†* | | 6,890,573 |
| 71,500 | Sanofi-Synthelabo SA†* | | 2,287,285 |
| 59,000 | Total SA†* | | 5,668,720 |
| 92,200 | Vivendi Universal SA* | | 2,572,380 |
| | | | 33,929,790 |
| | Germany 7.36% | | |
| 79,100 | Continental AG†* | | 3,815,792 |
| 20,500 | Deutsche Bank AG | | 1,621,755 |
| 284,500 | Deutsche Telekom AG†* | | 5,038,495 |
| 33,400 | E.ON AG* | | 2,421,166 |
| 13,200 | Puma AG Rudolf Dassler Sport* | | 3,348,460 |
| 41,600 | Siemens AG†* | | 3,016,832 |
| | | | 19,262,500 |
| | Hong Kong 4.75% | | |
| 755,200 | The Bank of East Asia, Ltd.* | | 2,159,117 |
| 462,000 | Hang Lung Properties Limited* | | 2,976,435 |
| 264,400 | Jaradine Matheson | | |
| | Holdings Limited* | | 2,908,400 |
| 1,579,000 | Sino Land Company Limited* | | 4,403,041 |
| | | | 12,446,993 |
| | India 0.58% | | |
| 125,800 | ICICI Bank Limited* | | 1,522,180 |
| | Ireland 1.39% | | |
| 67,800 | Bank of Ireland†* | | 3,650,352 |
| | Israel 0.57% | | |
| 22,100 | Teva Pharmaceutical Industries Ltd.†* | 1,487,109 |
| | Italy 3.11% | | |
| 43,500 | Eni SPA†* | | 4,364,790 |
| 223,100 | Luxottica Group SPA* | | 3,770,390 |
| | | | 8,135,180 |
| | Japan 21.41% | | |
| 110,800 | Alps Electric Co., Ltd.* | | 3,151,939 |
| 56,650 | Arisawa Mfg. Co., Ltd.* | | 2,668,572 |
| 130,100 | Canon Inc.†* | | 6,947,340 |
| 124,400 | Funai Electric Co., Ltd. †* | | 3,748,582 |
| 73,600 | ITO-Yokado Co., Ltd.†* | | 3,149,999 |
| 148,200 | Konami Corporation†* | | 3,823,560 |
| 220,000 | Matsushita Electric | | |
| | Industrial Co., Ltd.* | | 3,159,200 |
| 121,600 | Mitsubishi Corporation* | | 2,362,566 |
| 502,800 | Mitsubishi Tokyo Financial | | |
| | Group, Inc. (MTFG)†* | | 4,711,236 |
See notes to financial statements.
AssetMark International Equity Fund
SCHEDULE OF INVESTMENTS (Continued)
June 30, 2004
Number of | | | | Market |
Shares | | | | Value |
| | COMMON STOCK (Continued) | | |
| | Japan (Continued) | | | |
| 503,258 | NEC Corporation†* | $ | 3,613,392 |
| 125,600 | Nintendo Co., Ltd.* | | 1,820,145 |
| 126,000 | Nomura Holdings, Inc.†* | | 1,883,700 |
| 326,800 | NTT DoCoMo, Inc.* | | | 5,918,348 |
| 57,500 | ORIX Corporation†* | | | 3,295,900 |
| 152,000 | Shinsei Bank, Ltd. #* | | | 1,939,094 |
| 50,400 | TDK Corporation* | | 3,858,120 |
| | | | | 56,051,693 |
| | Mexico 0.69% | | | |
| 24,200 | America Movil SA de CV†* | | 880,154 |
| 31,900 | Cemex SA de CV†* | | | 928,290 |
| | | | | 1,808,444 |
| | Peru 0.44% | | | |
| 51,700 | Compania de Minas | | | |
| | Buenaventura SA* | | | 1,142,570 |
| | Russia 0.39% | | | |
| 9,800 | Lukoil* | | 1,030,960 |
| | Singapore 3.68% | | | |
| 231,100 | DBS Group Holdings Limited* | | 7,728,146 |
| 254,800 | Jardine Cycle & Carriage Limited* | | 1,893,495 |
| | | | | 9,621,641 |
| | South Africa 0.41% | | | |
| 66,000 | ABSA Group Limited* | | 1,083,667 |
| | South Korea 0.96% | | | |
| 37,700 | Kookmin Bank* | | 1,183,026 |
| 39,600 | POSCO* | | 1,326,996 |
| | | | | 2,510,022 |
| | Spain 0.97% | | | |
| 187,800 | Banco Bilbao Vizcaya | | |
| | Argentaria, SA†* | | 2,535,300 |
| | Sweden 0.93% | | | |
| 66,100 | AB SKF* | | 2,426,227 |
| | Switzerland 6.67% | | | |
| 69,000 | Credit Suisse Group†* | | 2,470,890 |
| 79,300 | Nestle SA* | | 5,287,090 |
| 83,000 | Novartis AG* | | 3,693,500 |
| 22,200 | Roche Holding AG* | . | | 2,198,020 |
| 38,100 | Swiss Re* | | 2,474,797 |
| 79,200 | Syngenta AG* | | 1,329,768 |
| | | | | 17,454,065 |
Number of | | | | Market |
Shares | | | | Value |
| | Taiwan 0.59% | | | |
| 186,189 | Taiwan Semiconductor | | | |
| | Manufacturing Company Ltd. †* | | | $1,547,235 |
| | Thailand 0.45% | | | |
| 327,000 | Shin Corporation Public | | | |
| | Company Limited* | | 1,167,717 |
| | United States 1.28% | | | |
| 77,000 | Royal Caribbean Cruises Ltd.† | | | 3,342,570 |
| | Total Common Stock | | | |
| | (Cost $231,573,213) | | 251,493,594 |
| | | | | |
| | SHORT-TERM INVESTMENTS 3.51% |
| | Money Market Funds 3.51% | | | |
| 9,184,194 | Federated Prime | | | |
| | Obligations Fund | | 9,184,194 |
| | Total Short-Term Investments | | |
| | (Cost $9,184,194) | | 9,184,194 |
| | | | | |
Principal | | | | |
Value | | | | |
| | INVESTMENTS PURCHASED | | |
| | AS SECURITIES LENDING | | |
| | COLLATERAL 26.97% | | | |
| | CERTIFICATES OF DEPOSIT 1.39% |
| $1,818,123 | Svenska Handlsbankn, | | | |
| | 1.17%, 10/21/04 | | 1,818,123 |
| 1,818,123 | Lloyds Institutional, | | | |
| | 1.18%, 10/27/04 | | 1,818,123 |
| | Total Certificates of Deposit | | | |
| | (Cost $3,636,246) | | 3,636,246 |
| | COMMERCIAL PAPER 7.22% | | |
| 1,818,123 | Park Granada LLC, | | | |
| | 1.14%, 9/07/04 | | 1,809,391 |
| 2,181,747 | CIBC Mortgage Corp., | | | |
| | 1.11%, 9/09/04 | | 2,181,747 |
| 727,249 | Lloyds Bank, 1.46%, 11/17/04 | | | 727,249 |
| 909,061 | Sigma Finance, | | | |
| | 1.51%, 11/29/04(1)(2) | | 902,054 |
| 2,181,747 | Sigma Finance, | | | |
| | 1.57%, 5/17/05(1)(2) | | 2,181,311 |
| 1,818,123 | CCN Bluegrass I, LLC, | | | |
| | 1.33%, 5/18/05 | | 1,818,122 |
| 1,636,310 | Goldman Sachs, 1.57%, 7/02/04(2) | | 1,636,310 |
See notes to financial statements.
AssetMark International Equity Fund
SCHEDULE OF INVESTMENTS (Continued)
June 30, 2004
Principal | | | Market |
Value | | | Value |
| | COMMERCIAL PAPER (Continued) | |
| $1,818,122 | Lehman Brothers, | | |
| | 1.57%, 7/19/04(2) | | $1,818,122 |
| 727,249 | Lehman Brothers, | | |
| | 1.58%, 7/23/04(2) | | 727,249 |
| 545,437 | Morgan Stanley, 1.58%, 9/08/04(2) | | 545,437 |
| 1,454,498 | Morgan Stanley, 1.58%, 9/14/04(2) | | 1,454,498 |
| 1,272,686 | Morgan Stanley, | | |
| | 1.58%, 12/08/04(2) | | 1,272,686 |
| 1,818,123 | Leafs LLC, 1.29%, 4/20/05 | | 1,818,123 |
| | Total Commercial Paper | | |
| | (Cost $18,892,299) | | 18,892,299 |
| | CORPORATE BONDS AND NOTES 1.67% |
| 909,061 | West LB, 1.41%, 10/18/04 | | 915,615 |
| 1,636,310 | Northlake, 1.22%, 3/07/05 | | 1,636,310 |
| 1,818,123 | Bayerische Landesbank, | | |
| | 0.84%, 6/24/05 | | 1,818,122 |
| | Total Corporate Bonds and Notes | | |
| | (Cost $4,370,047) | | 4,370,047 |
| | REPURCHASE AGREEMENTS 16.11% |
| 22,362,907 | CS First Boston Repurchase | | |
| | Agreement, 1.58%, 7/01/04 | | |
| | (Collateralized by Fannie Mae | | |
| | Collateralized Mortgage | | |
| | Obligations) | | 22,362,907 |
| 2,727,184 | JP Morgan Repurchase Agreement, | | |
| | 1.60%, 7/01/04(2) (Collateralized | | |
| | by corporate bonds rated BBB or | | |
| | better by S&P) | | 2,727,184 |
| 4,545,306 | Lehman Brothers Repurchase | | |
| | Agreement, 1.55%, 7/01/04 | | |
| | (Collateralized by high yield | | |
| | corporate bonds) | | 4,545,306 |
| 12,545,046 | Lehman Brothers Repurchase | | |
| | Agreement, 1.62%, 7/01/04 | | |
| | (Collateralized by high yield | | |
| | corporate bonds) | | 12,545,046 |
| | Total Repurchase Agreements | | |
| | (Cost $42,180,443) | | 42,180,443 |
Number of | | Market |
Shares | | Value |
| | MUTUAL FUNDS 0.58% | |
| 1,519,684 | AIM Liquid Assets Portfolio | |
| | Fund, Institutional Class | $ 1,519,684 |
| 2,511 | Merrill Lynch Funds for | |
| | Institutions Series - Premier | |
| | Institutional Fund | 2,511 |
| | Total Mutual Funds | |
| | (Cost $1,522,195) | 1,522,195 |
| | Total Investments Purchased as | |
| | Securities Lending Collateral | |
| | (Cost $70,601,230) | 70,601,230 |
| | Total Investments 126.55% | |
| | (Cost $311,358,637) | 331,279,018 |
| | Liabilities, less | |
| | Other Assets (26.55)% | (69,501,644) |
| | Net Assets 100% | $261,777,374 |
| | | |
| | # | Non-income producing security. |
| | † | All or a portion of this security represents investments of securities lending collateral. |
| | * | American Depositary Receipt (ADR). Receipt for the shares of a foreign-based corporation issued by a U.S. depository bank, representing foreign shares held by the bank. |
(1) Restricted under Rule 144a of the Securities Act of 1933.
(2) Variable rate security. The rate shown is the rate in effect on June 30, 2004.
See notes to financial statements.
AssetMark Real Estate Securities Fund
PERFORMANCE DATA
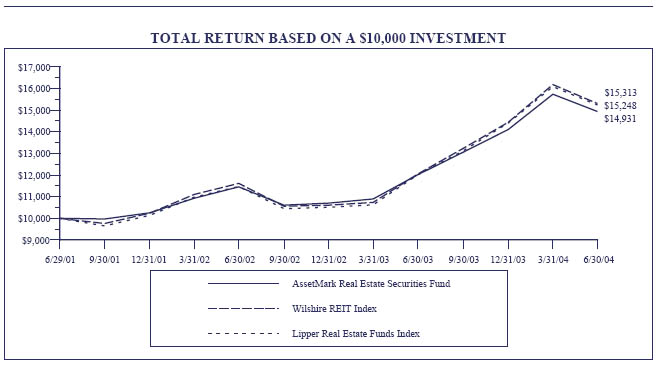
This chart assumes an initial gross investment of $10,000 made on 6/29/01 (commencement of operations). Returns shown include the reinvestment of all dividends. Returns shown do not reflect the deduction of taxes that a shareholder would pay on fund distributions or the redemption of fund shares. In the absence of fee waivers and reimbursements, total return would be reduced. Past performance is not predictive of future performance. Investment return and principal value will fluctuate, so that your shares, when redeemed, may be worth more or less than the original cost.
WILSHIRE REIT INDEX - An unmanaged index considered representative of U.S. publicly traded Real Estate Investment Trusts.
LIPPER REAL ESTATE FUNDS INDEX - An unmanaged index which measures the composite performance of the 30 largest "real estate" mutual funds, as categorized by Lipper Inc.
AVERAGE ANNUAL TOTAL RETURN (for the periods ended June 30, 2004)
| | One Year | Three Year | Since Inception (6/29/01) |
| AssetMark Real Estate Securities Fund | 24.24% | 14.30% | 14.27% |
| Wilshire REIT Index | 27.19% | 15.25% | 15.25% |
| Lipper Real Estate Funds Index | 26.80% | 15.08% | 15.08% |
AssetMark Real Estate Securities Fund
SCHEDULE OF INVESTMENTS
June 30, 2004
Number of | | | Market |
Shares | | | Value |
| | REAL ESTATE | | |
| | INVESTMENT TRUSTS 97.11% | | |
| | COMMON STOCK 89.49% | | |
| | Apartments 20.51% | | |
| 19,380 | Apartment Investment & | | |
| | Management Company | | $603,299 |
| 65,915 | Archstone-Smith Trust | | 1,933,287 |
| 37,980 | Avalonbay Communities, Inc. | | 2,146,630 |
| 27,820 | BRE Properties, Inc. | | 966,745 |
| 22,410 | Camden Property Trust | | 1,026,378 |
| 132,740 | Equity Residential | | 3,946,360 |
| 25,930 | Essex Property Trust, Inc. | | 1,772,316 |
| 11,260 | Gables Residential Trust | | 382,615 |
| 24,660 | Home Properties, Inc. | | 961,247 |
| 132,660 | United Dominion Realty Trust, Inc.† | | 2,624,015 |
| | | | 16,362,892 |
| | Diversified 11.00% | | |
| 7,020 | Colonial Properties Trust | | 270,481 |
| 50,930 | Crescent Real Estate | | |
| | Equities Company | | 820,992 |
| 24,320 | Duke Realty Corporation | | 773,619 |
| 43,420 | Liberty Property Trust | | 1,745,918 |
| 8,650 | PS Business Parks, Inc. | | 348,076 |
| 80,250 | Vornado Realty Trust† | | 4,583,078 |
| 8,010 | Washington Real Estate | | |
| | Investment Trust | | 235,334 |
| | | | 8,777,498 |
| | Office Property 17.18% | | |
| 17,360 | Alexandria Real | | |
| | Estate Equities, Inc.^ | | 985,701 |
| 45,700 | American Financial Realty Trust | | 653,053 |
| 41,890 | Arden Realty, Inc. | | 1,231,985 |
| 44,080 | Boston Properties, Inc.† | | 2,207,526 |
| 28,760 | Brandywine Realty Trust | | 781,984 |
| 35,700 | CarrAmerica Realty Corporation | | 1,079,211 |
| 33,100 | Corporate Office Properties Trust | | 822,535 |
| 12,120 | Cousins Properties, Inc. | | 399,354 |
| 64,050 | Equity Office Properties Trust | | 1,742,160 |
| 7,540 | Kilroy Realty Corporation | | 257,114 |
| 13,180 | Mack-Cali Realty Corporation | | 545,388 |
| 31,600 | Maguire Properties, Inc. | | 782,732 |
| 17,600 | Prentiss Properties Trust | | 589,952 |
| 34,840 | SL Green Realty Corp.† | | 1,630,512 |
| | | | 13,709,207 |
Number of | | | Market |
Shares | | | Value |
| | Regional Malls 20.33% | | |
| 13,940 | CBL & Associates Properties, Inc. | | $766,700 |
| 99,520 | General Growth Properties, Inc. | | 2,942,806 |
| 66,740 | The Macerich Company | | 3,194,844 |
| 32,690 | The Rouse Company† | | 1,552,775 |
| 118,410 | Simon Property Group, Inc.† | | 6,088,642 |
| 73,400 | Taubman Centers, Inc. | | 1,680,126 |
| | | | 16,225,893 |
| | Shopping Centers 11.25% | | |
| 68,100 | Acadia Realty Trust | | 935,694 |
| 10,650 | Developers Diversified | | |
| | Realty Corporation | | 376,691 |
| 41,490 | Federal Realty Investment Trust | | 1,725,569 |
| 19,270 | Kimco Realty Corporation | | 876,785 |
| 56,910 | Pan Pacific Retail Properties, Inc. | | 2,875,093 |
| 42,020 | Regency Centers Corporation | | 1,802,658 |
| 12,390 | Weingarten Realty Investors | | 387,559 |
| | | | 8,980,049 |
| | Warehouse/Industrial 9.22% | | |
| 62,100 | AMB Property Corporation† | | 2,150,523 |
| 43,300 | Catellus Development Corporation | | 1,067,345 |
| 10,210 | CenterPoint Properties Trust | | 783,617 |
| 101,870 | ProLogis | | 3,353,560 |
| | | | 7,355,045 |
| | Total Common Stock | | |
| | (Cost $60,967,165) | | 71,410,584 |
| | PREFERRED STOCK 7.62% | | |
| | Diversified 0.79% | | |
| 24,900 | Lexington Corporate Properties | | |
| | Trust, 8.05% | | 625,737 |
| | Office Property 4.25% | | |
| 45,000 | Alexandria Real Estate, 8.375% . | | 1,140,750 |
| 35,000 | Brandywine Realty Trust, 7.50%† | | 850,500 |
| 12,500 | Brandywine Realty Trust, 7.375% | | 308,750 |
| 42,900 | Equity Office | | |
| | Properties Trust, 7.75% | | 1,093,950 |
| | | | 3,393,950 |
| | Regional Malls 1.91% | | |
| 47,500 | CBL & Associates, 7.75% | | 1,201,275 |
| 12,200 | The Mills Corp., 9.00% | | 323,605 |
| | | | 1,524,880 |
See notes to financial statements.
AssetMark Real Estate Securities Fund
SCHEDULE OF INVESTMENTS (Continued)
June 30, 2004
Number of | | | Market |
Shares | | | | Value |
| | PREFERRED STOCK (Continued) | | |
| | Shopping Centers 0.67% | | | |
| 11,700 | Developers Diversified Realty, 8.00% | | $297,180 |
| 9,300 | New Plan Excel Realty Trust, 7.625% | | 235,290 |
| | | | | 532,470 |
| | Total Preferred Stock | | | |
| | (Cost $6,129,598) | | 6,077,037 |
| | Total Real Estate Investment Trusts | | |
| | (Cost $67,096,763) | | 77,487,621 |
| | SHORT-TERM INVESTMENTS 1.71% |
| | Money Market Funds 1.71% | | | |
| 1,364,880 | Federated Prime Obligations Fund | | | 1,364,880 |
| | Total Short-Term Investments | | | |
| | (Cost $1,364,880) | | 1,364,880 |
| | | | | |
Principal | | | | |
Value | | | | |
| | INVESTMENTS PURCHASED | | | |
| | AS SECURITIES LENDING | | | |
| | COLLATERAL 17.70% | | | |
| | CERTIFICATES OF DEPOSIT 0.91% |
| $363,778 | Svenska Handlsbankn, | | | |
| | 1.17%, 10/21/04 | | 363,778 |
| 363,778 | Lloyds Institutional, | | | |
| | 1.18%, 10/27/04 | | 363,778 |
| | Total Certificates of Deposit | | | |
| | (Cost $727,556) | | 727,556 |
| | COMMERCIAL PAPER 4.74% | | | |
| 363,778 | Park Granada LLC, 1.14%, 9/07/04 | | | 362,031 |
| 436,534 | CIBC Mortgage Corp., | | | |
| | 1.11%, 9/09/04 | | 436,534 |
| 145,511 | Lloyds Bank, 1.46%, 11/17/04 | | 145,511 |
| 181,889 | Sigma Finance, | | | |
| | 1.51%, 11/29/04(1)(2) | | 180,487 |
| 436,534 | Sigma Finance, | | | |
| | 1.57%, 5/17/05(1)(2) | | 436,447 |
| 363,778 | CCN Bluegrass I, LLC, | | | |
| | 1.33%, 5/18/05 | | 363,778 |
| 327,401 | Goldman Sachs, 1.57%, 7/02/04(2) | . | | 327,401 |
Principal | | | Market |
Value | | | Value |
| | COMMERCIAL PAPER (Continued) | |
| $1,818,122 | Lehman Brothers, | | |
| | 1.57%, 7/19/04(2) | | $1,818,122 |
| 727,249 | Lehman Brothers, | | |
| | 1.58%, 7/23/04(2) | | 727,249 |
| 545,437 | Morgan Stanley, 1.58%, 9/08/04(2) | | 545,437 |
| 1,454,498 | Morgan Stanley, 1.58%, 9/14/04(2) | | 1,454,498 |
| 1,272,686 | Morgan Stanley, | | |
| | 1.58%, 12/08/04(2) | | 1,272,686 |
| 1,818,123 | Leafs LLC, 1.29%, 4/20/05 | | 1,818,123 |
| | Total Commercial Paper | | |
| | (Cost $18,892,299) | | 18,892,299 |
| | CORPORATE BONDS AND NOTES 1.67% |
| 909,061 | West LB, 1.41%, 10/18/04 | | 915,615 |
| 1,636,310 | Northlake, 1.22%, 3/07/05 | | 1,636,310 |
| 1,818,123 | Bayerische Landesbank, | | |
| | 0.84%, 6/24/05 | | 1,818,122 |
| | Total Corporate Bonds and Notes | | |
| | (Cost $4,370,047) | | 4,370,047 |
| | REPURCHASE AGREEMENTS 16.11% |
| 22,362,907 | CS First Boston Repurchase | | |
| | Agreement, 1.58%, 7/01/04 | | |
| | (Collateralized by Fannie Mae | | |
| | Collateralized Mortgage | | |
| | Obligations) | | 22,362,907 |
| 2,727,184 | JP Morgan Repurchase Agreement, | | |
| | 1.60%, 7/01/04(2) (Collateralized | | |
| | by corporate bonds rated BBB or | | |
| | better by S&P) | | 2,727,184 |
| 4,545,306 | Lehman Brothers Repurchase | | |
| | Agreement, 1.55%, 7/01/04 | | |
| | (Collateralized by high yield | | |
| | corporate bonds) | | 4,545,306 |
| 12,545,046 | Lehman Brothers Repurchase | | |
| | Agreement, 1.62%, 7/01/04 | | |
| | (Collateralized by high yield | | |
| | corporate bonds) | | 12,545,046 |
| | Total Repurchase Agreements | | |
| | (Cost $42,180,443) | | 42,180,443 |
See notes to financial statements.
AssetMark Real Estate Securities Fund
SCHEDULE OF INVESTMENTS (Continued)
June 30, 2004
Number of | | | Market |
Shares | | | Value |
| | MUTUAL FUNDS 0.38% | | |
| 304,065 | AIM Liquid Assets Portfolio | | |
| | Fund, Institutional Class | | $304,065 |
| 502 | Merrill Lynch Funds for | | |
| | Institutions Series - Premier | | |
| | Institutional Fund | | 502 |
| | Total Mutual Funds | | |
| | (Cost $304,567) | | 304,567 |
| | Total Investments Purchased as | | |
| | Securities Lending Collateral | | |
| | (Cost $14,126,220) | | 14,126,220 |
| | Total Investments 116.52% | | |
| | (Cost $82,587,863) | | 92,978,721 |
| | Liabilities, less | | |
| | Other Assets (16.52)% | | (13,182,869) |
| | Net Assets 100% | | $79,795,852 |
| | | | |
† All or a portion of this security represents investments of securities lending collateral.
^ Fair valued security.
(1) Restricted under Rule 144a of the Securities Act of 1933.
(2) Variable rate security. The rate shown is the rate in effect on June 30, 2004.
See notes to financial statements.
AssetMark Tax-Exempt Fixed Income Fund
PERFORMANCE DATA
This chart assumes an initial gross investment of $10,000 made on 6/29/01 (commencement of operations). Returns shown include the reinvestment of all dividends. Returns shown do not reflect the deduction of taxes that a shareholder would pay on fund distributions or the redemption of fund shares. In the absence of fee waivers and reimbursements, total return would be reduced. Past performance is not predictive of future performance. Investment return and principal value will fluctuate, so that your shares, when redeemed, may be worth more or less than the original cost.
LEHMAN BROTHERS MUNICIPAL BOND INDEX - An unmanaged index which measures the performance of investment-grade, tax-exempt and fixed-rate bonds with long-term maturities (greater than two years) selected from issues larger than $50 million.
LIPPER GENERAL MUNICIPAL DEBT FUNDS INDEX - An unmanaged index which measures the composite performance of the 30 largest "general municipal debt" mutual funds, as categorized by Lipper Inc.
AVERAGE ANNUAL TOTAL RETURN (for the periods ended June 30, 2004)
| | One Year | Three Year | Since Inception (6/29/01) |
| AssetMark Tax-Exempt Fixed Income Fund | -1.01% | 4.34% | 4.33% |
| Lehman Brothers Municipal Bond Index | 0.76% | 5.42% | 5.41% |
| Lipper General Municipal Debt Funds Index | 0.80% | 4.77% | 4.78% |
AssetMark Tax-Exempt Fixed Income Fund
SCHEDULE OF INVESTMENTS
June 30, 2004
Principal | | | Market |
Amount | | | Value |
| | MUNICIPAL BONDS 92.39% | | |
| | Alabama 0.43% | | |
| $125,000 | Alabama State Public School | | |
| | & College Authority Revenue | | |
| | Bond, Capital Improvement Pool, | | |
| | Series A, 5.00%, 02-01-2012 | | $133,720 |
| 195,000 | Birmingham, Alabama, | | |
| | Series A, Refunding, GO, | | |
| | 5.00%, 04-01-2008 | | 208,180 |
| | | | 341,900 |
| | Arizona 4.41% | | |
| 135,000 | Maricopa County Arizona School | | |
| | District No. 3 Tempe Elementary, | | |
| | Refunding, GO, FSA Insured, | | |
| | 5.00%, 07-01-2012 | | 145,876 |
| 500,000 | Maricopa County Arizona Unified | | |
| | School District No. 48 Scottsdale, | | |
| | Series B, Refunding, GO, | | |
| | 4.75%, 07-01-2010 | | 535,160 |
| 300,000 | Navajo County Arizona Unified | | |
| | School District No. 32 Blue Ridge, | | |
| | Refunding, GO, FSA Insured, | | |
| | 5.00%, 07-01-2014 | | 323,217 |
| 500,000 | Phoenix Arizona Civic Improvement | | |
| | Corporation, Water System | | |
| | Revenue Bond, MBIA Insured, | | |
| | 5.60%, 07-01-2017 | | 534,775 |
| 895,000 | Pima County Arizona Unified | | |
| | School District No. 1 Tucson, | | |
| | GO 5.875%, 07-01-2014 | | 903,950 |
| 1,000,000 | Scottsdale Arizona Water & Sewer | | |
| | Revenue Bond, Series E, | | |
| | 5.25%, 07-01-2012 | | 1,099,950 |
| | | | 3,542,928 |
| | California 5.13% | | |
| 1,500,000 | California State Economic | | |
| | Development Authority, Series A, | | |
| | GO, 5.00%, 07-01-2015 | | 1,594,530 |
| 1,225,000 | California State Public Works | | |
| | Department of Correction | | |
| | Revenue Bond, Series A, | | |
| | 5.80%, 01-01-2013 | | 1,318,308 |
Principal | | | Market |
Amount | | | Value |
| | California (Continued) | | |
| $ 100,000 | Fallbrook California High School | | |
| | District San Diego County, | | |
| | Refunding, GO, FGIC Insured, | | |
| | 5.375%, 09-01-2014 | | $111,199 |
| 685,000 | Long Beach California Unified | | |
| | School District, Series F, | | |
| | GO, MBIA Insured, | | |
| | 5.00%, 08-01-2016 | | 722,257 |
| 350,000 | Los Angeles County California | | |
| | Metropolitan Transportation | | |
| | Authority Sales Tax Revenue | | |
| | Bond, Series A, Refunding, FSA | | |
| | Insured, 5.00%, 07-01-2014 | | 375,655 |
| | | | 4,121,949 |
| | Colorado 1.31% | | |
| 935,000 | Lower Colorado River Authority | | |
| | Revenue Bond, Series B, | | |
| | 6.00%, 05-15-2013 | | 1,050,024 |
| | Connecticut 2.05% | | |
| 425,000 | Connecticut State, Series B, GO, | | |
| | 5.25%, 06-15-2009 | | 464,929 |
| 1,150,000 | Connecticut State Special Tax | | |
| | Obligations, Transportation | | |
| | Infrastructure, Refunding, | | |
| | 4.00%, 09-01-2005 | | 1,179,382 |
| | | | 1,644,311 |
| | District of Columbia 0.68% | | |
| 100,000 | District of Columbia, Series B-2, | | |
| | Refunding, GO, FSA Insured, | | |
| | 5.50%, 06-01-2007 | | 107,968 |
| 200,000 | District of Columbia, Series B-1, | | |
| | Refunding, GO, AMBAC Insured, | | |
| | 5.50%, 06-01-2008 | | 218,356 |
| 200,000 | District of Columbia, Series B, | | |
| | GO, 5.50%, 06-01-2009 | | 220,332 |
| | | | 546,656 |
| | Florida 0.56% | | |
| 100,000 | Dane County Florida Water | | |
| | & Sewer Systems Revenue | | |
| | Bond, FGIC Insured, | | |
| | 6.25%, 10-01-2007 | | 111,122 |
See notes to financial statements.
AssetMark Tax-Exempt Fixed Income Fund
SCHEDULE OF INVESTMENTS (Continued)
June 30, 2004
Principal | | | Market |
Amount | | | Value |
| | MUNICIPAL BONDS (Continued) | | |
| | Florida (Continued) | | |
| $ 225,000 | Jacksonville Florida Excise | | |
| | Taxes Revenue Bond, | | |
| | 5.65%, 10-01-2005 | | $235,820 |
| 100,000 | Mary Esther Florida Water | | |
| | & Sewer Revenue Bond, | | |
| | Refunding, MBIA Insured, | | |
| | 4.95%, 01-01-2007 | | 105,770 |
| | | | 452,712 |
| | Georgia 2.04% | | |
| 500,000 | Atlanta Georgia Water & | | |
| | Wastewater Revenue Bond, | | |
| | Series A, Prerefunded, | | |
| | 5.00%, 11-01-2038 | | 545,575 |
| 1,000,000 | Fulton County Georgia School | | |
| | District, Refunding, GO, | | |
| | 5.25%, 01-01-2014 | | 1,094,560 |
| | | | 1,640,135 |
| | Hawaii 0.14% | | |
| 100,000 | Honolulu Hawaii City & County, | | |
| | Series A, Prerefunded, GO, | | |
| | 6.00%, 01-01-2009 | | 112,192 |
| | Illinois 8.65% | | |
| 750,000 | Chicago Illinois Neighborhoods | | |
| | Alive 21 Program A, GO, | | |
| | MBIA Insured, | | |
| | 5.00%, 01-01-2010 | | 806,482 |
| 75,000 | Chicago Illinois Park District | | |
| | Revenue Bond, ACA Insured, | | |
| | 6.25%, 01-01-2016 | | 85,334 |
| 305,000 | Chicago Illinois Project, | | |
| | Refunding, GO, FSA Insured, | | |
| | 5.50%, 01-01-2015 | | 336,171 |
| 500,000 | Chicago Illinois School Finance | | |
| | Authority, Series A, Refunding, | | |
| | GO, FGIC Insured, | | |
| | 5.20%, 06-01-2006 | | 527,890 |
| 100,000 | Chicago Illinois Metropolitan | | |
| | Water Reclamation District | | |
| | Greater Chicago, Refunding, | | |
| | GO, 6.05%, 12-01-2009 | | 113,344 |
Principal | | | | Market |
Amount | | | | Value |
| | Illinois (Continued) | | | |
| $ 625,000 | Chicago Illinois Wastewater | | | |
| | Transmission Revenue Bond, | | | |
| | Refunding, FGIC Insured, | | | |
| | 5.50%, 01-01-2010 | | $687,556 |
| 100,000 | Chicago Illinois Wastewater | | | |
| | Transmission Revenue Bond, | | | |
| | Refunding, FGIC Insured, | | | |
| | 5.375%, 01-01-2013 | | 109,736 |
| 100,000 | Chicago Illinois Metropolitan | | | |
| | Water Reclamation District | | | |
| | Greater Chicago, Capital | | | |
| | Improvement, GO, | | | |
| | 5.50%, 12-01-2012 | | 111,314 |
| 100,000 | Du Page & Cook Counties Illinois, | | |
| | GO, FGIC Insured, | | | |
| | 4.375%, 01-01-2009 | | 104,746 |
| 100,000 | Illinois State, Series 1, GO, | | | |
| | 5.25%, 08-01-2012 | | 110,807 |
| 1,000,000 | Illinois State, Series 1, GO, | | | |
| | 5.375%, 07-01-2013 | | 1,114,170 |
| 100,000 | Illinois State Sales Tax Revenue | | |
| | Bond, 5.375%, 06-15-2007 | | 107,514 |
| 220,000 | Illinois State Sales Tax | | | |
| | Revenue Bond, Series 1, | | | |
| | 5.50%, 06-15-2009 | | 242,319 |
| 775,000 | Illinois State, Series 1, GO, | | | |
| | 5.50%, 08-01-2010 | | 859,072 |
| 500,000 | Regional Transportation Authority | | |
| | Illinois Revenue Bond, Series B, | | |
| | 5.375%, 06-01-2014 | | 550,185 |
| 1,000,000 | Rock Island County Illinois School | | |
| | District No. 41 Rock Island, GO, | | |
| | 5.75%, 12-01-2006 | | 1,080,910 |
| | | | | 6,947,550 |
| | Indiana 4.32% | | | |
| 2,225,000 | Indiana Bond Bank Revenue Bond, | | |
| | Series C, 5.00%, 02-01-2012 | | | 2,390,073 |
| 200,000 | Purdue University Indiana | | | |
| | University Revenue Bond, | | | |
| | Series O, 4.25%, 07-01-2008 | | | 209,402 |
| 500,000 | Purdue University Indiana | | | |
| | University Revenue Bond, | | | |
| | 5.25%, 07-01-2008 | | 542,165 |
See notes to financial statements.
AssetMark Tax-Exempt Fixed Income Fund
SCHEDULE OF INVESTMENTS (Continued)
June 30, 2004
Principal | | | Market |
Amount | | | Value |
| | MUNICIPAL BONDS (Continued) | | |
| | Indiana (Continued) | | |
| $ 300,000 | Sunman Dearborn Indiana | | |
| | Intermediate School Building | | |
| | Revenue Bond, FGIC Insured, | | |
| | 5.375%, 07-15-2012 | | $328,206 |
| | | | 3,469,846 |
| | Iowa 0.60% | | |
| 480,000 | Polk County Iowa, Series C, GO, | | |
| | 4.00%, 06-01-2012 | | 483,446 |
| | Maryland 3.61% | | |
| 1,160,000 | Baltimore County Maryland, | | |
| | Refunding, GO, | | |
| | 5.00%, 08-01-2015 | | 1,251,350 |
| 1,500,000 | Harford County Maryland, | | |
| | Refunding, GO, | | |
| | 4.00%, 01-15-2007 | | 1,560,330 |
| 75,000 | Maryland State, Capital | | |
| | Improvement, Series A, GO, | | |
| | 5.50%, 03-01-2013 | | 84,383 |
| | | | 2,896,063 |
| | Massachusetts 5.64% | | |
| 500,000 | Massachusetts Bay Transportation | | |
| | Authority Revenue Bond, | | |
| | Refunding, FGIC Insured, | | |
| | 5.50%, 03-01-2009 | | 551,145 |
| 95,000 | Massachusetts Bay Transportation | | |
| | Authority Revenue Bond, Series | | |
| | C, 5.50%, 03-01-2012 | | 105,699 |
| 900,000 | Massachusetts Bay Transportation | | |
| | Authority Revenue Bond, Series | | |
| | A, 5.25%, 07-01-2015 | | 975,663 |
| 1,000,000 | Massachusetts Bay Transportation | | |
| | Authority Revenue Bond, Series | | |
| | C, 5.25%, 07-01-2016 | | 1,090,210 |
| 1,500,000 | Massachusetts State, Series C, | | |
| | GO, FGIC Insured, | | |
| | 5.50%, 11-01-2016 | | 1,667,625 |
| 120,000 | Massachusetts State Water | | |
| | Resources Authority Revenue | | |
| | Bond, Series B, MBIA Insured, | | |
| | 6.25%, 12-01-2011 | | 139,906 |
| | | | 4,530,248 |
Principal | | | | Market |
Amount | | | | Value |
| | Michigan 6.39% | | | |
| $1,175,000 | Clarkston Michigan Community | | |
| | Schools, GO, Qualified-School | | |
| | Bond Loan Fund Insured, | | | |
| | 5.00%, 05-01-2016 | $ | 1,241,846 |
| 430,000 | Detroit Michigan Sewer | | | |
| | Disposal Revenue Bond, | | | |
| | 7.10%, 12-15-2009 | | 479,910 |
| 150,000 | Dundee Michigan Community | | |
| | School District, GO, Qualified- | | |
| | School Bond Loan Fund Insured, | | |
| | 5.375%, 05-01-2010 | | 165,432 |
| 600,000 | Kalamazoo Michigan Public | | | |
| | Library, GO, MBIA Insured, | | | |
| | 5.40%, 05-01-2014 | | 664,026 |
| 800,000 | Lansing Michigan School District, | | |
| | Refunding, GO, Qualified-School | | |
| | Bond Loan Fund Insured, | | | |
| | 5.00%, 05-01-2017 | | 837,888 |
| 1,610,000 | Michigan State Building Authority | | |
| | Revenue Bond, Facilities Program, | | |
| | Series I, 6.00%, 10-01-2006 | | | 1,746,029 |
| | | | | 5,135,131 |
| | Minnesota 0.93% | | | |
| 400,000 | Osseo Minnesota Independent | | | |
| | School District 279, Series | | | |
| | A, GO, FSA Insured, | | | |
| | 5.00%, 02-01-2013 | | 428,860 |
| 295,000 | Prior Lake Minnesota | | | |
| | Independent School District | | | |
| | No 719, Series A, FGIC | | | |
| | Insured, 4.75%, 02-01-2010 | | | 315,665 |
| | | | | 744,525 |
| | Missouri 0.40% | | | |
| 300,000 | Kansas City Missouri Municipal | | |
| | Assistance Corporate Revenue | | |
| | Bond, Series A, AMBAC Insured, | | |
| | 5.00%, 03-01-2012 | | 324,042 |
| | Nebraska 0.14% | | | |
| 100,000 | Omaha Nebraska Special | | | |
| | Obligations Revenue Bond, | | | |
| | Riverfront Redevelopment | | | |
| | Project, Series A, | | | |
| | 5.375%, 02-01-2013 | | 109,986 |
See notes to financial statements.
AssetMark Tax-Exempt Fixed Income Fund
SCHEDULE OF INVESTMENTS (Continued)
June 30, 2004
Principal | | | | Market |
Amount | | | | Value |
| | MUNICIPAL BONDS (Continued) | | |
| | Nevada 0.18% | | | |
| $ 135,000 | Clark County Nevada School | | | |
| | District, GO, FGIC Insured, | | | |
| | 6.00%, 06-15-2007 | | $146,503 |
| | New Hampshire 2.22% | | | |
| 1,650,000 | New Hampshire State, Capital | | | |
| | Improvement, Series A, | | | |
| | 5.00%, 04-15-2012 | | 1,784,426 |
| | New Jersey 0.93% | | | |
| 700,000 | New Jersey State Turnpike | | | |
| | Authority Revenue Bond, MBIA | | | |
| | Insured, 6.75%, 01-01-2009 | | 745,549 |
| | New Mexico 1.40% | | | |
| 1,035,000 | University New Mexico | | | |
| | Revenue Bond, Refunding, | | | |
| | 5.25%, 06-01-2014 | | 1,127,829 |
| | New York 7.56% | | | |
| 100,000 | Metropolitan Transportation | | | |
| | Authority New York Dedicated | | | |
| | Tax Fund Revenue Bond, | | | |
| | Series A, MBIA Insured, | | | |
| | 5.25%, 04-01-2009 | | 107,525 |
| 375,000 | Metropolitan Transportation | | | |
| | Authority New York Service | | | |
| | Contract Revenue Bond, | | | |
| | Series B, 5.25%, 07-01-2007 | | | 401,366 |
| 350,000 | Nassau County New York Interim | | | |
| | Finance Authority, Series B, | | | |
| | Refunding, 5.00%, 11-15-2007 | | 375,550 |
| 500,000 | New York City Transit Authority, | | | |
| | Metropolitan Transportation | | | |
| | Authority Triborough, Series A, | | | |
| | AMBAC Insured, | | | |
| | 5.625%, 01-01-2012 | | 552,790 |
| 100,000 | New York, New York, Series F, | | | |
| | GO, 5.25%, 08-01-2011 | | 109,562 |
| 525,000 | New York State, Series C, | | | |
| | Refunding, GO, | | | |
| | 4.00%, 04-15-2006 | | 541,721 |
| 600,000 | New York State Dormitory | | | |
| | Authority Revenue Bond, | | | |
| | Prerefunded, 5.25%, 11-15-2023 | . | | 643,422 |
Principal | | | | Market |
Amount | | | | Value |
| | New York (Continued) | | | |
| $2,075,000 | New York State Dormitory | | | |
| | Authority Revenue Bond, | | | |
| | Series B, 5.25%, 07-01-2031 | | | $2,303,748 |
| 300,000 | New York State Tollway | | | |
| | Authority Revenue Bond, Series E, | | |
| | Refunding, 5.25%, 01-01-2010 | | 323,439 |
| 650,000 | Triborough Bridge and Tunnel | | | |
| | Authority Revenue Bond, Series B, | | |
| | Refunding, 5.25%, 11-15-2015 | | 708,656 |
| | | | | 6,067,779 |
| | North Carolina 1.75% | | | |
| 500,000 | North Carolina Municipal Power | | |
| | Agency No. 1 Catawba Electric | | |
| | Revenue Bond, MBIA Insured, | | |
| | 5.25%, 01-01-2009 | | 544,260 |
| 100,000 | North Carolina State, Public | | | |
| | School Building, GO, | | | |
| | 4.60%, 04-01-2008 | | 106,303 |
| 725,000 | Raleigh North Carolina Comb | | | |
| | Enterprise System Revenue | | | |
| | Bond, 4.00%, 03-01-2008 | | 752,434 |
| | | | | 1,402,997 |
| | Ohio 4.77% | | | |
| 100,000 | Bowling Green State University | | |
| | of Ohio Revenue Bond, FGIC | | | |
| | Insured, 5.00%, 06-01-2008 | | 107,350 |
| 900,000 | Columbus Ohio, Series B, | | | |
| | Refunding, GO, | | | |
| | 5.00%, 05-15-2014 | | 978,039 |
| 305,000 | Cleveland Ohio Waterworks | | | |
| | Revenue Bond, Series J, | | | |
| | Refunding, FSA Insured, | | | |
| | 5.00%, 01-01-2008 | | 325,673 |
| 625,000 | Ohio State Higher Education | | | |
| | Facility Revenue Bond, | | | |
| | 5.25%, 10-01-2014 | | 685,100 |
| 690,000 | Ohio State Infrastructure | | | |
| | Improvement, GO, | | | |
| | 5.75%, 02-01-2010 | | 773,483 |
| 935,000 | Ohio State Water Development | | | |
| | Authority Revenue Bond, | | | |
| | Refunding, 4.00%, 12-01-2010 | | 962,124 |
| | | | | 3,831,769 |
See notes to financial statements.
AssetMark Tax-Exempt Fixed Income Fund
SCHEDULE OF INVESTMENTS (Continued)
June 30, 2004
Principal | | | | Market |
Amount | | | | Value |
| | MUNICIPAL BONDS (Continued) | | |
| | Oregon 0.55% | | | |
| $ 175,000 | Oregon State Housing & | | | |
| | Community Services Department | | |
| | of Housing Revenue Bond, FHA | | |
| | Insured, 5.40%, 07-01-2005 | | | $177,133 |
| 245,000 | Portland Oregon Community | | | |
| | College, Series B, GO, | | | |
| | 5.125%, 06-01-2013 | | 264,076 |
| | | | | 441,209 |
| | Pennsylvania 0.63% | | | |
| 100,000 | Pennsylvania Housing Finance | | |
| | Agency Revenue Bond, Series 36, | | |
| | Private Mortgage Insured, | | | |
| | 4.95%, 10-01-2004 | | 100,891 |
| 100,000 | Philadelphia Pennsylvania Gas | | |
| | Works Revenue Bond, Series 3, | | |
| | 5.00%, 08-01-2010 | | 107,682 |
| 245,000 | Scranton Pennsylvania, Series C, | | |
| | Prerefunded, GO, | | | |
| | 6.70%, 09-01-2018 | | 294,044 |
| | | | | 502,617 |
| | Puerto Rico 3.51% | | | |
| 1,000,000 | Commonwealth of Puerto Rico, | | |
| | Refunding, GO, FGIC Insured, | | |
| | 5.00%, 07-01-2006 | | 1,054,920 |
| 1,595,000 | Puerto Rico Electric Power | | | |
| | Authority Revenue Bond, Series JJ, | | |
| | Refunding, XLCA Insured, | | | |
| | 5.25%, 07-01-2012 | | 1,761,103 |
| | | | | 2,816,023 |
| | South Carolina 0.55% | | | |
| 400,000 | Grand Strand South Carolina | | | |
| | Water & Sewer Authority | | | |
| | Revenue Bond, Refunding, | | | |
| | FSA Insured, | | | |
| | 5.375%, 06-01-2014 | | 437,788 |
| | Tennessee 0.75% | | | |
| 250,000 | Knoxville Tennessee Water | | | |
| | Revenue Bond, Series P, | | | |
| | 5.00%, 03-01-2009 | | 268,965 |
| 300,000 | Memphis Tennessee General | | | |
| | Improvement, GO, | | | |
| | 5.50%, 11-01-2010 | | 333,018 |
| | | | | 601,983 |
Principal | | | Market |
Amount | | | Value |
| | Texas 10.71% | | |
| $ 100,000 | Austin Texas Public | | |
| | Improvement, Refunding, GO, | | |
| | 5.25%, 09-01-2007 | | $107,497 |
| 515,000 | Denton Texas Utility System | | |
| | Revenue Bond, Series A, FSA | | |
| | Insured, 5.25%, 12-01-2013 | | 563,230 |
| 100,000 | Flower Mound Texas Waterworks | | |
| | & Sewer Revenue Bond, AMBAC | | |
| | Insured, 5.375%, 09-01-2006 | | 106,311 |
| 145,000 | Frisco Texas, GO, FGIC Insured, | | |
| | 5.875%, 02-15-2010 | | 162,549 |
| 165,000 | Frisco Texas, GO, FGIC Insured, | | |
| | 5.00%, 02-15-2012 | | 176,071 |
| 750,000 | Harris County Texas Permanent | | |
| | Improvement, Refunding, GO, | | |
| | 5.25%, 10-01-2013 | | 814,635 |
| 75,000 | Houston Texas Public | | |
| | Improvement, Series A-2, GO, | | |
| | 2.00%, 03-01-2006 | | 74,842 |
| 150,000 | Mansfield Texas, GO, FGIC | | |
| | Insured, 5.50%, 02-15-2008 | | 162,783 |
| 370,000 | Marble Falls Texas Independent | | |
| | School District, Series A, | | |
| | Refunding, GO, PSF-GTD | | |
| | Insured, 5.00%, 08-15-2015 | | 394,353 |
| 1,000,000 | Plano Texas Independent School | | |
| | District, GO, PSF-GTD Insured, | | |
| | 4.70%, 02-15-2013 | | 1,064,040 |
| 200,000 | Round Rock Texas Independent | | |
| | School District, GO, PSF-GTD | | |
| | Insured, 4.75%, 08-01-2010 | | 207,948 |
| 1,000,000 | San Antonio Texas Electric & | | |
| | Gas Revenue Bond, Series A, | | |
| | Refunding, 5.00%, 02-01-2008 | | 1,068,950 |
| 2,000,000 | San Antonio Texas Electric & | | |
| | Gas Revenue Bond, Refunding, | | |
| | 5.375%, 02-01-2015 | | 2,193,480 |
| 80,000 | San Antonio Texas Electric & | | |
| | Gas Revenue Bond, Prerefunded, | | |
| | 5.50%, 02-01-2013 | | 86,874 |
| 70,000 | San Antonio Texas Electric & | | |
| | Gas Revenue Bond, Unrefunded, | | |
| | 5.50%, 02-01-2013 | | 75,214 |
See notes to financial statements.
AssetMark Tax-Exempt Fixed Income Fund
SCHEDULE OF INVESTMENTS (Continued)
June 30, 2004
Principal | | | Market |
Amount | | | Value |
| | MUNICIPAL BONDS (Continued) | | |
| | Texas (Continued) | | |
| $ 200,000 | Socorro Texas Independent School | | |
| | District, Refunding, GO, | | |
| | PSF-GTD Insured, | | |
| | 5.375%, 08-15-2013 | $ | $218,282 |
| 125,000 | Spring Texas Independent School | | |
| | District, GO, PSF-GTD Insured, | | |
| | 5.875%, 08-15-2010 | | 141,121 |
| 400,000 | Texas State Public Finance | | |
| | Authority, Refunding, GO, | | |
| | 5.50%, 10-01-2009 | | 441,572 |
| 100,000 | Texas State University Systems | | |
| | Revenue Bond, FSA Insured, | | |
| | 5.25%, 03-15-2010 | | 109,063 |
| 300,000 | Texas State Water Financial | | |
| | Assistance, Series B, Refunding, | | |
| | GO, 5.00%, 08-01-2014 | | 321,315 |
| 100,000 | University of Texas Revenue Bond, | | |
| | Series B, 5.25%, 08-15-2008 | | 108,431 |
| | | | 8,598,561 |
| | Utah 3.06% | | |
| 100,000 | Jordan Utah School District School | | |
| | Bond Guarantee Program, GO, | | |
| | 5.125%, 06-15-2008 | | 108,036 |
| 2,285,000 | Utah State, Series A, Refunding, | | |
| | GO, 4.00%, 07-01-2011 | | 2,349,551 |
| | | | 2,457,587 |
| | Virginia 2.27% | | |
| 450,000 | Fairfax County Virginia Public | | |
| | Improvement, Series A, Refunding, | | |
| | GO, 5.00%, 06-01-2007 | | 481,824 |
| 325,000 | Newport News Virginia, Series B, | | |
| | GO, 5.00%, 11-01-2014 | | 350,058 |
| 100,000 | Norfolk Virginia Capital | | |
| | Improvement, Refunding, GO, | | |
| | 5.00%, 01-01-2009 | | 107,813 |
| 400,000 | Virginia State Housing | | |
| | Development Authority Revenue | | |
| | Bond, Series C, Sub-Series | | |
| | C-1-RMK, 4.85%, 07-01-2009 | | 417,988 |
| 450,000 | Virginia State Resources Authority | | |
| | Infrastructure Revenue Bond, | | |
| | 4.00%, 11-01-2005 | | 462,722 |
| | | | 1,820,405 |
Principal | | | Market |
Amount | | | Value |
| | Washington 3.29% | | |
| $ 175,000 | Bellevue Washington, Series A, | | |
| | Refunding, GO, | | |
| | 5.00%, 01-01-2006 | | $182,518 |
| 45,000 | King County Washington, | | |
| | Prerefunded, GO, | | |
| | 5.50%, 12-01-2010 | | 50,203 |
| 55,000 | King County Washington, | | |
| | Unrefunded, GO, | | |
| | 5.50%, 12-01-2010 | | 60,860 |
| 100,000 | Seattle Washington, GO, | | |
| | 5.00%, 08-01-2012 | | 106,718 |
| 200,000 | Seattle Washington, Refunding, | | |
| | GO, 5.00%, 07-01-2013 | | 213,134 |
| 100,000 | Snohomish County Washington, | | |
| | GO, 5.00%, 12-01-2006 | | 105,913 |
| 700,000 | Spokane County Washington | | |
| | School District No. 356 Cent VY, | | |
| | Refunding, GO, FSA Insured, | | |
| | 5.00%, 06-01-2011 | | 758,513 |
| 500,000 | Tacoma Washington Conservation | | |
| | System Project Revenue Bond, | | |
| | Refunding, 5.00%, 12-01-2014 | | 535,155 |
| 800,000 | Washington State Motor Vehicle | | |
| | Fuel Tax, Series C, GO, | | |
| | 0.00%, 06-01-2010 | | 632,864 |
| | | | 2,645,878 |
| | West Virginia 0.39% | | |
| 300,000 | West Virginia Economic | | |
| | Development Revenue | | |
| | Bond, 4.00%, 06-01-2007 | | 310,812 |
| | Wisconsin 0.44% | | |
| 75,000 | Douglas County Wisconsin, | | |
| | Refunding, GO, FGIC Insured, | | |
| | 5.50%, 02-01-2014 | | 82,180 |
| 150,000 | Wisconsin State, Series C, GO, | | |
| | 5.00%, 05-01-2008 | | 160,745 |
| 100,000 | Wisconsin State, Series A, GO, | | |
| | 5.50%, 05-01-2009 | | 110,051 |
| | | | 352,976 |
| | Total Municipal Bonds | | |
| | (Cost $74,386,973) | | 74,186,335 |
See notes to financial statements.
AssetMark Tax-Exempt Fixed Income Fund
SCHEDULE OF INVESTMENTS (Continued)
June 30, 2004
Principal | | | | Market |
Amount | | | | Value |
| | SHORT-TERM INVESTMENTS 5.70% |
| | REVENUE BONDS 5.49% | | | |
| | Arizona 0.63% | | | |
| $ 500,000 | Phoenix Arizona Individual | | | |
| | Development Authority, | | | |
| | 1.08%, 01-01-2031(1) | | | $500,000 |
| | Illinois 0.37% | | | |
| 300,000 | Illinois EDL Financial Authority, | | |
| | 1.11%, 10-01-2031(1) | | | 300,000 |
| | Iowa 0.37% | | | |
| 300,000 | Iowa Financial Authority Private | | |
| | College, 1.13%, 07-01-2031(1) | | | 300,000 |
| | Minnesota 0.25% | | | |
| 200,000 | Cohasset Minnesota | | | |
| | Revenue, Refunding, | | | |
| | 1.08%, 06-01-2013(1) | | | 200,000 |
| | Missouri 2.19% | | | |
| 300,000 | Kansas City Missouri Individual | | |
| | Development Authority, | | | |
| | 1.08%, 04-01-2027(1) | | | 300,000 |
| 200,000 | Kansas City Missouri Individual | | |
| | Development Authority, | | | |
| | 1.08%, 04-01-2027(1) | | | 200,000 |
| 300,000 | Kansas State Development | | | |
| | Finance Authority, Series N, | | | |
| | 1.13%, 05-15-2026(1) | | | 300,000 |
| 300,000 | Kansas State Development | | | |
| | Finance Authority, Series BB, | | | |
| | 1.08%, 11-15-2028(1) | | | 300,000 |
| 360,000 | Missouri State Health & | | | |
| | Educational Facilities, | | | |
| | St. Louis University, | | | |
| | 1.13%, 07-01-2032(1) | | | 360,000 |
| 300,000 | Missouri State Health & | | | |
| | Educational Facilities, | | | |
| | Rockhurst University, | | | |
| | 1.08%, 11-01-2032(1) | | | 300,000 |
| | | | | 1,760,000 |
| | New York 0.37% | | | |
| 300,000 | New York City Municipal Water | | |
| | Finance Authority, 2003, C-1, | | | |
| | 1.06%, 06-15-2018(1) | | | 300,000 |
Principal | | | Market |
Amount | | | Value |
| | Pennsylvania 0.75% | | |
| $ 600,000 | Pennsylvania State Higher | | |
| | Educational Facilities, Carnegie | | |
| | Mellon University, Series D, | | |
| | 1.10%, 11-01-2030(1) | | $600,000 |
| | Washington 0.56% | | |
| 450,000 | Washington State Housing | | |
| | Financial Community Nonprofit, | | |
| | 1.15%, 08-01-2019 (1) | | 450,000 |
| | Total Revenue Bonds | | |
| | (Cost $4,410,000) | | 4,410,000 |
| | | | |
Number of | | | |
Shares | | | |
| | MONEY MARKET FUNDS 0.21% | | |
| 169,056 | First American Tax Free | | |
| | Obligations Fund | | 169,056 |
| | Total Money Market Funds | | |
| | (Cost $169,056) | | 169,056 |
| | Total Short-Term Investments | | |
| | (Cost $4,579,056) | | 4,579,056 |
| | Total Investments 98.09% | | |
| | (Cost $78,966,029) | | 78,765,391 |
| | Other Assets, | | |
| | Less Liabilities 1.91% | | 1,536,165 |
| | Net Assets 100% | | $80,301,556 |
| | | | |
| (1) | Variable rate security. The rate shown is the rate in effect on June 30, 2004. |
| | |
| | | |
| Glossary of Terms |
| | ACA | American Capital Access Corporation |
| AMBAC | American Municipal Bond Assurance Corp. |
| | FGIC | Financial Guaranty Insurance Corp. |
| | FHA | Federal Housing Authority/Agency |
| | FSA | Financial Security Assistance |
| | GO | General Obligation |
| | MBIA | Municipal Bond Investors Assurance Corp. |
| PSF-GTD | Permanent School Fund Guaranteed |
| | XLCA | XL Capital Assurance |
See notes to financial statements.
LEHMAN BROTHERS AGGREGATE BOND INDEX - An unmanaged index which measures the performance of securities from the Lehman Brothers Government/Corporate Bond Index, Mortgage-Backed Securities Index and the Asset-Backed Securities Index. The Lehman Brothers Aggregate Bond Index is a broad representation of the investment-grade fixed-income market in the U.S. and includes U.S. Government and corporate debt securities, mortgage- and asset-backed securities and international U.S. dollar-denominated bonds. All securities contained in the Lehman Brothers Aggregate Bond Index have a minimum term to maturity of one year.
LIPPER GENERAL BOND FUNDS INDEX - An unmanaged index which measures the composite performance of the 10 largest "general bond" mutual funds, as categorized by Lipper Inc.
See notes to financial statements.
See notes to financial statements.