As filed with the Securities and Exchange Commission on June 9, 2008
UNITED STATES
SECURITIES AND EXCHANGE COMMISSION
Washington, D.C. 20549
FORM N-CSR
CERTIFIED SHAREHOLDER REPORT OF REGISTERED
MANAGEMENT INVESTMENT COMPANIES
Investment Company Act file number 811-10267
AssetMark Funds
(Exact name of registrant as specified in charter)
2300 Contra Costa Blvd., Suite 600
Pleasant Hill, CA 94523-3967
(Address of principal executive offices) (Zip code)
Carrie Hansen
AssetMark Investment Services, Inc.
2300 Contra Costa Blvd., Suite 600
Pleasant Hill, CA 94523-3967
(Name and address of agent for service)
800-664-5345
Registrant's telephone number, including area code
Date of fiscal year end: March 31, 2008
Date of reporting period: April 1, 2007 through March 31, 2008
Item 1. Report to Stockholders.

| Dear Shareholder, | May 7, 2008 |
We are pleased to present you with the Annual Report for the AssetMark Funds. This Annual Report covers the twelve-month period from April 1, 2007 through March 31, 2008.
Economic & Market Overview
The equity markets experienced substantial volatility over the period covered in this report, with most major equity indexes and the majority of equity asset classes delivering negative returns. Fixed income treasury securities managed to remain in positive territory as investors became more risk averse and sought the relative safety of Treasury securities.
Investors appeared to shake off the volatility experienced in early 2007 (before the reporting period began), with the equity markets recovering to near all-time highs by the summer of 2007.
By fall 2007, however, the difficult housing market and the ongoing issues within the sub-prime mortgage market sparked a second wave of declines. Bleak economic news left many investors increasingly pessimistic about future growth prospects, making rallies short-lived and ineffectual.
Turning to performance: Large capitalization companies and growth companies provided stronger relative performance within the U.S. equity markets. International equity markets benefited from the weakness of the U.S. dollar with emerging markets providing a stellar 21.65% return for the twelve month period, per the MSCI Emerging Markets Index. A beneficiary of the strength of the emerging markets was commodities, which also returned over 21% for the period, per the Dow Jones AIG Commodity IndexSM. U.S. real estate was hardest hit and had the weakest returns among the asset classes in which the Funds invest.
Within fixed income, U.S. Treasuries clearly outperformed corporate fixed income securities. Last year’s winner, high yield, provided the weakest relative returns. U.S. Treasury inflation-protected securities (TIPS) and longer-maturity securities had the strongest returns in the domestic market. The municipal market trailed the taxable bond market as it came under pressure due to a high volume of selling by non-traditional investors, such as hedge funds, and nervousness regarding the viability of the monoline insurers who insure municipal securities.
AssetMark Funds Sub-Advisor Changes
AssetMark Investment Services, Inc. seeks to consistently identify and engage highly skilled investment managers as sub-advisors for each Fund. We also seek to effectively combine managers with complementary skills to reduce volatility and achieve more consistent investment results.
During the reporting period, we made the following sub-advisor changes:
| ● | On December 21, 2007, Duff and Phelps Investment Management Company was engaged to replace AEW Management and Advisors as a sub-advisor for the AssetMark Real Estate Securities Fund. |
| ● | On March 26, 2008, Integrity Asset Management was engaged to replace First Quadrant as a sub-advisor for the AssetMark Small/Mid Cap Value Fund. |
AssetMark Funds Overview
The past fiscal year was a difficult period for active managers, including several of the Funds, due to the turbulent market conditions.
The following is a brief discussion of the performance for each of the twelve AssetMark Funds during the period:
The AssetMark Large Cap Growth Fund returned -3.88% for the twelve months ended March 31, 2008. The fund trailed the Russell 1000 Growth Index, a widely accepted unmanaged benchmark for large cap growth portfolios, which returned -0.76%.
Wellington Management Company’s portion of the fund underperformed the index. Wellington’s strategy suffered as investors lost confidence in earnings, a critical factor in their quantitative strategy, and from their exposures to the financial and consumer discretionary sectors. In the first quarter of 2008, TCW Investment Management's technology holdings negatively affected performance for the full fiscal year after having benefited during the return of the growth market in 2007. Atlanta Capital Management’s focus on high quality growth companies helped this portion of the fund outperform the index over the fiscal year.
The AssetMark Large Cap Value Fund returned -12.23% for the twelve months ended March 31, 2008. The fund trailed the Russell 1000® Value Index, a widely accepted unmanaged benchmark for large cap value portfolios, which returned -10.00%.
The long-term, value oriented investment style of Brandes Investment Partners was the main driver of the underperformance – particularly due to its stock selection in the challenging consumer discretionary sector and its decision to buy stocks at a somewhat depressed prices across various other sectors. NFJ Investment Group provided solid performance through the period, benefiting from stock selection in the energy sector and gaining some stability from its focus on dividend paying securities. Despite a large exposure to financials, Davis Selected Advisors provided strong returns due to stock selection within the sector.
The AssetMark Small/Mid Cap Growth Fund returned -10.31% for the twelve months ended March 31, 2008. The trailed the Russell 2500™ Growth Index, a widely accepted unmanaged benchmark for small-mid cap growth portfolios, which returned -6.25%.
Following a superior 2007, Copper Rock Capital Partners’ portion of the fund underperformed in the first quarter of 2008, due to a large exposure to consumer discretionary stocks. Nicholas-Applegate Capital Management underperformed during the market turmoil in the latter half of 2007, with factors used in Nicholas-Applegate Capital Management’ s systematic model that were associated with earnings and low price/book ratios being the drivers of the underperformance.
The AssetMark Small/Mid Cap Value Fund returned -19.47% for the twelve months ended March 31, 2008. The fund trailed the Russell 2500™ Value Index, a widely accepted unmanaged benchmark for small-mid cap value portfolios, which returned -16.54%.
All of the underperformance occurred in the portion of the Fund managed by First Quadrant and was primarily the result of poor stock selection decisions across all sectors. First Quadrant was removed from the fund and replaced with Integrity Asset Management on March 26, 2008. Advisory Research provided strong returns for the fiscal year, with strong stock selection in a number of sectors, especially the financials and consumer discretionary sectors.
The AssetMark International Equity Fund returned -3.85% for the twelve months ended March 31, 2008. The fund trailed the MSCI EAFE® Index, a widely accepted unmanaged benchmark for developed market international equity portfolios, which returned -2.27%
Clay Finlay outperformed the index for the period due to strong stock selection in nine of ten sectors. Oppenheimer Capital delivered a strong last quarter of 2007, benefiting from its emerging markets exposure, however trailed for the full 12 month period due to specific stock selection.
The AssetMark Real Estate Securities Fund returned -19.74% for the twelve months ended March 31, 2008. The fund trailed the Dow Jones Wilshire REIT Index, a widely accepted unmanaged benchmark for real estate security portfolios, which returned - -18.83%.
AEW Management and Advisors was the main driver of the underperformance due to its large exposure to hotels. Duff & Phelps Investment Management replaced AEW Management and Advisors as a sub-advisor for the Fund on December 21, 2007. Adelante Capital Management provided a solid year of performance, focusing on core sectors and delivering strong security selection.
2
The AssetMark Core Plus Fixed Income Fund returned 3.87% for the twelve months ended March 31, 2008. The fund trailed the Lehman Brothers® Aggregate Bond Index, a widely accepted unmanaged benchmark for core fixed income portfolios, which returned 7.67%.
Both managers trailed the index over the period, with the Goldman Sachs’ portion of the fund negatively impacted in the first quarter of 2008 by exposure to agency adjustable-rate mortgages. Western Asset Management underperformed in the latter half of 2007 as a result of its high exposure to non-Treasury sectors, especially overweight exposures to high-yield securities and mortgage related securities.
The AssetMark Tax-Exempt Fund returned 0.28% for the twelve months ended March 31, 2008. The fund trailed the Lehman U.S. Municipal Index, a widely accepted unmanaged benchmark for municipal portfolios, which returned 1.9%.
Delaware Management’s opportunistic investments in lower rated municipal securities dragged on the performance of the fund. Nuveen Asset Management’s more conservative positioning of their portion of the fund’s portfolio with higher quality securities benefited performance over the period.
The AssetMark Enhanced Fundamental Index™ Large Company Growth Fund returned -3.4% since inception on August 9, 2007 through March 31, 2008. The fund outperformed the Russell 1000® Growth Index, a widely accepted unmanaged benchmark for large cap growth portfolios, which returned -5.70%.
The AssetMark Enhanced Fundamental Index Large Company Value Fund returned -14.73% since inception on August 9, 2007 through March 31, 2008. The fund trailed the Russell 1000® Value Index, a widely accepted unmanaged benchmark for large cap value portfolios, which returned -9.60%.
The AssetMark Enhanced Fundamental Index™ Small Company Growth Fund returned -8.8% since inception on August 9, 2007 through March 31, 2008. The fund outperformed the Russell 2000® Growth Index, a widely accepted unmanaged benchmark for small cap growth portfolios, which returned -12.23%.
The AssetMark Enhanced Fundamental Index™ Small Company Value Fund returned -16.27% since inception on August 9, 2007 through March 31, 2008. The fund trailed the Russell 2000® Value Index, a widely accepted unmanaged benchmark for small value portfolios, which returned -10.90%.
The AssetMark Enhanced Fundamental IndexTM funds were launched into an unfavorable economic and market environment where growth momentum drove market returns. In this environment, the fundamental index strategies tend to trail their respective cap-weighted indices index due to the emphasis on valuations in creation of the strategy. The growth funds benefited in the first quarter as the markets reversed and the conservative growth tilt aided performance. The value funds however struggled in the first quarter due to a large exposure to financials, which detracted from performance over the period.
We greatly appreciate your decision, in working closely with your investment advisor, to include the AssetMark Funds as a component of your overall investment portfolio. We will continue to carefully evaluate our sub-advisors to ensure that each Fund is well positioned to deliver strong long-term value to our shareholders.
Sincerely,

Ronald D. Cordes Chairman AssetMark Funds
Investors should consider the Funds’ investment objectives, risks, charges and expenses carefully before investing. The prospectus contains this and other important information about the Funds. Please read the prospectus carefully before you invest or send money. The prospectus is available upon request, without charge, by calling 1-888-278-5809.
3
| AssetMark Funds |
| EXPENSE EXAMPLE (Unaudited) |
| March 31, 2008 |
As a shareholder of the AssetMark Funds (the “Funds”), you incur ongoing costs, including management fees; distribution and/or service fees; and other Fund expenses. The Expense Example shown below is intended to help you understand your ongoing costs (in dollars) of investing in the Funds and to compare these costs with the ongoing costs of investing in other mutual funds.
The Expense Example is based on an investment of $1,000 invested at the beginning of a six-month period and held for the entire period (October 1, 2007 – March 31, 2008) for the AssetMark Large Cap Growth Fund, AssetMark Large Cap Value Fund, AssetMark Small/Mid Cap Growth Fund, AssetMark Small/Mid Cap Value Fund, AssetMark International Equity Fund, AssetMark Real Estate Securities Fund, AssetMark Tax-Exempt Fixed Income Fund, AssetMark Core Plus Fixed Income Fund, AssetMark Enhanced Fundamental Index™ Large Company Growth Fund, AssetMark Enhanced Fundamental Index™ Large Company Value Fund, AssetMark Enhanced Fundamental Index™ Small Company Growth Fund and AssetMark Enhanced Fundamental Index™ Small Company Value Fund.
Actual Expenses
The first line of the Expense Example table provides information about actual account values and actual expenses. You may use the information in this line, together with the amount you invested, to estimate the expenses that you paid over the period. Simply divide your account value by $1,000 (for example, an $8,600 account value divided by $1,000 = 8.6), then multiply the result by the number in the first line under the heading entitled “Expenses Paid During Period” to estimate the expenses you paid on your account during this period.
The example includes, but is not limited to, management fees, shareholder servicing fees, distribution fees, fund accounting, custody and transfer agent fees. However, the example below does not include portfolio trading commissions and related expenses, interest expense or dividends on short positions taken by the Funds and other extraordinary expenses as determined under generally accepted accounting principles. Although the Funds charge no sales load or transactions fees, you will be assessed fees for outgoing wire transfers, returned checks or stop payment orders at prevailing rates charged by U.S. Bancorp Fund Services, LLC, the Funds’ transfer agent. To the extent that a Fund invests in shares of other investment companies as part of its investment strategy, you will indirectly bear your proportionate share of any fees and expenses charged by the underlying funds in which a Fund invests in addition to the expenses of the Fund. Actual expenses of the underlying funds are expected to vary among the various underlying funds. These expenses are not included in the example below.
Hypothetical Example for Comparison Purposes
The second line of the table below provides information about hypothetical account values and hypothetical expenses based on the Funds’ actual expense ratios and an assumed rate of return of 5% per year before expenses, which is not the Funds’ actual return. The hypothetical account values and expenses may not be used to estimate the actual ending account balance or expenses you paid for the period. You may use this information to compare the ongoing costs of investing in the Funds and other funds. To do so, compare this 5% hypothetical example with the 5% hypothetical examples that appear in the shareholder reports of the other funds.
4
| AssetMark Funds |
| EXPENSE EXAMPLE (Continued) (Unaudited) |
| March 31, 2008 |
| AssetMark Large Cap Growth Fund | |||||
| Beginning | Ending | Expenses Paid | |||
| Account Value | Account Value | During Period* | |||
| October 1, 2007 | March 31, 2008 | October 1, 2007 – March 31, 2008 | |||
| Actual | $1,000.00 | $860.90 | $6.28 | ||
| Hypothetical (5% return | |||||
| before expenses) | 1,000.00 | 1,018.25 | 6.81 | ||
| * Expenses are equal to the Fund’s annualized expense ratio of 1.35%, multiplied by the average account value over the period, multiplied by 183/366 to reflect the one-half year period. The expense ratio | |||||
| excludes the securities lending credit. | |||||
| AssetMark Large Cap Value Fund | |||||
| Beginning | Ending | Expenses Paid | |||
| Account Value | Account Value | During Period* | |||
| October 1, 2007 | March 31, 2008 | October 1, 2007 – March 31, 2008 | |||
| Actual | $1,000.00 | $847.50 | $6.24 | ||
| Hypothetical (5% return | |||||
| before expenses) | 1,000.00 | 1,018.25 | 6.81 | ||
| * Expenses are equal to the Fund’s annualized expense ratio of 1.35%, multiplied by the average account value over the period, multiplied by 183/366 to reflect the one-half year period. The expense ratio | |||||
| excludes the securities lending credit. | |||||
| AssetMark Small/Mid Cap Growth Fund | |||||
| Beginning | Ending | Expenses Paid | |||
| Account Value | Account Value | During Period* | |||
| October 1, 2007 | March 31, 2008 | October 1, 2007 – March 31, 2008 | |||
| Actual | $1,000.00 | $818.50 | $6.82 | ||
| Hypothetical (5% return | |||||
| before expenses) | 1,000.00 | 1,017.50 | 7.57 | ||
| * Expenses are equal to the Fund’s annualized expense ratio of 1.50%, multiplied by the average account value over the period, multiplied by 183/366 to reflect the one-half year period. The expense ratio | |||||
| excludes the securities lending credit. | |||||
| AssetMark Small/Mid Cap Value Fund | |||||
| Beginning | Ending | Expenses Paid | |||
| Account Value | Account Value | During Period* | |||
| October 1, 2007 | March 31, 2008 | October 1, 2007 – March 31, 2008 | |||
| Actual | $1,000.00 | $833.20 | $6.97 | ||
| Hypothetical (5% return | |||||
| before expenses) | 1,000.00 | 1,017.40 | 7.67 | ||
| * Expenses are equal to the Fund’s annualized expense ratio of 1.52%, multiplied by the average account value over the period, multiplied by 183/366 to reflect the one-half year period. The expense ratio | |||||
| excludes the securities lending credit. | |||||
5
| AssetMark Funds |
| EXPENSE EXAMPLE (Continued) (Unaudited) |
| March 31, 2008 |
| AssetMark International Equity Fund | |||||
| Beginning | Ending | Expenses Paid | |||
| Account Value | Account Value | During Period* | |||
| October 1, 2007 | March 31, 2008 | October 1, 2007 – March 31, 2008 | |||
| Actual | $1,000.00 | $896.40 | $7.02 | ||
| Hypothetical (5% return | |||||
| before expenses) | 1,000.00 | 1,017.60 | 7.47 | ||
| * Expenses are equal to the Fund’s annualized expense ratio of 1.48%, multiplied by the average account value over the period, multiplied by 183/366 to reflect the one-half year period. The expense ratio | |||||
| excludes the securities lending credit. | |||||
| AssetMark Real Estate Securities Fund | |||||
| Beginning | Ending | Expenses Paid | |||
| Account Value | Account Value | During Period* | |||
| October 1, 2007 | March 31, 2008 | October 1, 2007 – March 31, 2008 | |||
| Actual | $1,000.00 | $870.00 | $7.48 | ||
| Hypothetical (5% return | |||||
| before expenses) | 1,000.00 | 1,017.00 | 8.07 | ||
| * Expenses are equal to the Fund’s annualized expense ratio of 1.60%, multiplied by the average account value over the period, multiplied by 183/366 to reflect the one-half year period. The expense ratio | |||||
| excludes the securities lending credit. | |||||
| AssetMark Tax-Exempt Fixed Income Fund | |||||
| Beginning | Ending | Expenses Paid | |||
| Account Value | Account Value | During Period* | |||
| October 1, 2007 | March 31, 2008 | October 1, 2007 – March 31, 2008 | |||
| Actual | $1,000.00 | $1,000.00 | $6.25 | ||
| Hypothetical (5% return | |||||
| before expenses) | 1,000.00 | 1,018.75 | 6.31 | ||
* Expenses are equal to the Fund’s annualized expense ratio of 1.25%, multiplied by the average account value over the period, multiplied by 183/366 to reflect the one-half year period. | |||||
| AssetMark Core Plus Fixed Income Fund | |||||
| Beginning | Ending | Expenses Paid | |||
| Account Value | Account Value | During Period* | |||
| October 1, 2007 | March 31, 2008 | October 1, 2007 – March 31, 2008 | |||
| Actual | $1,000.00 | $1,020.30 | $6.01 | ||
| Hypothetical (5% return | |||||
| before expenses) | 1,000.00 | 1,019.05 | 6.01 | ||
| * Expenses are equal to the Fund’s annualized expense ratio of 1.19%, multiplied by the average account value over the period, multiplied by 183/366 to reflect the one-half year period. The expense ratio | |||||
| excludes the securities lending credit. | |||||
6
| AssetMark Funds |
| EXPENSE EXAMPLE (Continued) (Unaudited) |
| March 31, 2008 |
| AssetMark Enhanced Fundamental Index™ Large Company Growth Fund | |||||
| Beginning | Ending | Expenses Paid | |||
| Account Value | Account Value | During Period* | |||
| October 1, 2007 | March 31, 2008 | October 1, 2007 – March 31, 2008 | |||
| Actual | $1,000.00 | $909.60 | $5.82 | ||
| Hypothetical (5% return | |||||
| before expenses) | 1,000.00 | 1,018.90 | 6.16 | ||
* Expenses are equal to the Fund’s annualized expense ratio of 1.22%, multiplied by the average account value over the period, multiplied by 183/366 to reflect the one-half year period. | |||||
| AssetMark Enhanced Fundamental Index™ Large Company Value Fund | |||||
| Beginning | Ending | Expenses Paid | |||
| Account Value | Account Value | During Period* | |||
| October 1, 2007 | March 31, 2008 | October 1, 2007 – March 31, 2008 | |||
| Actual | $1,000.00 | $818.30 | $5.55 | ||
| Hypothetical (5% return | |||||
| before expenses) | 1,000.00 | 1,018.90 | 6.16 | ||
* Expenses are equal to the Fund’s annualized expense ratio of 1.22%, multiplied by the average account value over the period, multiplied by 183/366 to reflect the one-half year period. | |||||
| AssetMark Enhanced Fundamental Index™ Small Company Growth Fund | |||||
| Beginning | Ending | Expenses Paid | |||
| Account Value | Account Value | During Period* | |||
| October 1, 2007 | March 31, 2008 | October 1, 2007 – March 31, 2008 | |||
| Actual | $1,000.00 | $882.00 | $5.74 | ||
| Hypothetical (5% return | |||||
| before expenses) | 1,000.00 | 1,018.90 | 6.16 | ||
* Expenses are equal to the Fund’s annualized expense ratio of 1.22%, multiplied by the average account value over the period, multiplied by 183/366 to reflect the one-half year period. | |||||
| AssetMark Enhanced Fundamental Index™ Small Company Value Fund | |||||
| Beginning | Ending | Expenses Paid | |||
| Account Value | Account Value | During Period* | |||
| October 1, 2007 | March 31, 2008 | October 1, 2007 – March 31, 2008 | |||
| Actual | $1,000.00 | $816.90 | $5.54 | ||
| Hypothetical (5% return | |||||
| before expenses) | 1,000.00 | 1,018.90 | 6.16 | ||
* Expenses are equal to the Fund’s annualized expense ratio of 1.22%, multiplied by the average account value over the period, multiplied by 183/366 to reflect the one-half year period. | |||||
7
| AssetMark Funds | ||||
| ALLOCATION OF PORTFOLIO HOLDINGS (Unaudited) | ||||
| March 31, 2008 |

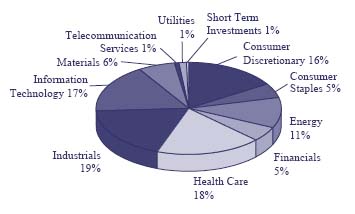
| AssetMark Large Cap Growth Fund | ||||
| Components of Portfolio Holdings | �� | |||
| Consumer Discretionary | $ | 78,669,999 | ||
| Consumer Staples | 48,242,499 | |||
| Energy | 51,706,047 | |||
| Financials | 61,670,419 | |||
| Health Care | 117,002,152 | |||
| Industrials | 78,909,507 | |||
| Information Technology | 176,424,018 | |||
| Materials | 22,098,348 | |||
| Telecommunication Services | 3,780,210 | |||
| Utilities | 1,917,972 | |||
| Short Term Investments | 9,917,926 | |||
| Total | $ | 650,339,097 | (1) | |
| (1) Total excludes $218,230,783 of Securities Lending Collateral | ||||
| Pie chart represents percentages of total portfolio. | ||||

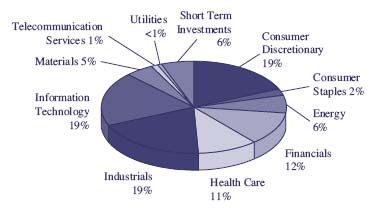
| AssetMark Large Cap Value Fund | ||||
| Components of Portfolio Holdings | ||||
| Consumer Discretionary | $ | 60,156,323 | ||
| Consumer Staples | 56,243,866 | |||
| Energy | 82,908,837 | |||
| Financials | 154,483,529 | |||
| Health Care | 46,087,335 | |||
| Industrials | 42,797,757 | |||
| Information Technology | 46,950,835 | |||
| Materials | 38,507,597 | |||
| Telecommunication Services | 28,829,622 | |||
| Utilities | 10,004,130 | |||
| Short Term Investments | 7,655,239 | |||
| Total | $ | 574,625,070 | (1) | |
| (1) Total excludes $203,239,102 of Securities Lending Collateral | ||||
| Pie chart represents percentages of total portfolio. | ||||
8
| AssetMark Funds |
| ALLOCATION OF PORTFOLIO HOLDINGS (Continued) (Unaudited) |
| March 31, 2008 |
| AssetMark Small/Mid Cap Growth Fund | ||||
| Components of Portfolio Holdings | ||||
| Consumer Discretionary | $ | 20,229,568 | ||
| Consumer Staples | 6,435,525 | |||
| Energy | 13,469,983 | |||
| Financials | 6,595,054 | |||
| Health Care | 23,140,897 | |||
| Industrials | 23,454,208 | |||
| Information Technology | 21,452,622 | |||
| Materials | 8,015,916 | |||
| Telecommunication Services | 1,039,650 | |||
| Utilities | 1,605,572 | |||
| Short Term Investments | 448,843 | |||
| Total | $125,887,838 | (1) | ||
| (1) Total excludes $49,137,718 of Securities Lending Collateral | ||||
| Pie chart represents percentages of total portfolio. | ||||

| AssetMark Small/Mid Cap Value Fund | ||||
| Components of Portfolio Holdings | ||||
| Consumer Discretionary | $ | 10,589,090 | ||
| Consumer Staples | 4,307,362 | |||
| Energy | 11,570,535 | |||
| Financials | 37,354,447 | |||
| Health Care | 3,819,230 | |||
| Industrials | 7,509,435 | |||
| Information Technology | 6,811,583 | |||
| Materials | 5,890,926 | |||
| Telecommunication Services | 2,072,930 | |||
| Utilities | 8,488,684 | |||
| Short Term Investments | 1,237,573 | |||
| Total | $ | 99,651,795 | (1) | |
| (1) Total excludes $22,802,311 of Securities Lending Collateral | ||||
| Pie chart represents percentages of total portfolio. | ||||
9
| AssetMark Funds |
| ALLOCATION OF PORTFOLIO HOLDINGS (Continued) (Unaudited) |
| March 31, 2008 |

| AssetMark International Equity Fund | ||||
| Components of Portfolio Holdings | ||||
| Asia | $ | 119,402,219 | ||
| Australia | 28,153,858 | |||
| Europe | 480,905,847 | |||
| North America | 19,384,508 | |||
| South America | 6,657,572 | |||
| Short Term Investments | 10,248,559 | |||
| Total | $ | 664,752,563 | (1) | |
| (1) Total excludes $23,570,669 of Securities Lending Collateral | ||||
| Pie chart represents percentages of total portfolio. | ||||

| AssetMark Real Estate Securities Fund | ||||
| Components of Portfolio Holdings | ||||
| Apartments | $ | 12,818,147 | ||
| Diversified | 7,889,252 | |||
| Health Care | 5,492,092 | |||
| Hotels & Motels | 2,991,667 | |||
| Office Property | 14,862,105 | |||
| Regional Malls | 16,871,726 | |||
| Shopping Centers | 9,420,656 | |||
| Storage | 2,361,696 | |||
| Warehouse/Industrial | 8,397,174 | |||
| Short Term Investments | 348,496 | |||
| Total | $ | 81,453,011 | (1) | |
| (1) Total excludes $29,497,363 of Securities Lending Collateral | ||||
| Pie chart represents percentages of total portfolio. | ||||
10
| AssetMark Funds |
| ALLOCATION OF PORTFOLIO HOLDINGS (Continued) (Unaudited) |
| March 31, 2008 |
AssetMark Tax-Exempt Fixed Income Fund

| Components of Portfolio Holdings | ||||
| Auction Rate Securities | $ | 7,250,000 | ||
| Certificate of Participation | 1,908,828 | |||
| General Obligation Bonds | 74,109,232 | |||
| Notes | 1,015,710 | |||
| Revenue Bonds | 165,274,542 | |||
| Special Assessment | 2,511,194 | |||
| Special Tax | 410,625 | |||
| Short Term Investments | 3,721,389 | |||
| Total | $ | 256,201,520 | ||
| Pie chart represents percentages of total portfolio. | ||||
AssetMark Core Plus Fixed Income Fund

| Components of Portfolio Holdings | ||||
| Asset Backed Securities | $ | 32,226,778 | ||
| Auction Rate Securities | 3,650,000 | |||
| Collateralized Mortgage Obligations | 19,170,218 | |||
| Convertible Bonds | 69,000 | |||
| Convertible Preferred Stocks | 227,214 | |||
| Corporate Bonds | 176,418,263 | |||
| Foreign Government Notes/Bonds | 5,431,730 | |||
| Mortgage Backed Securities–Non-U.S. Government | 133,248,999 | |||
| Mortgage Backed Securities–U.S. Government | 370,043,795 | |||
| Preferred Stocks | 4,295,993 | |||
| Supranational Obligations | 4,468,750 | |||
| U.S. Government Agency Issues | 20,834,180 | |||
| U.S. Treasury Obligations | 37,863,781 | |||
| Municipal Bonds | 3,390,283 | |||
| Short Term Investments | 77,039,726 | |||
| Total | $ | 888,378,710 | (1) | |
| (1) Total excludes $206,627,941 of Securities Lending Collateral | ||||
| Pie chart represents percentages of total portfolio. | ||||
11
| AssetMark Funds |
| ALLOCATION OF PORTFOLIO HOLDINGS (Continued) (Unaudited) |
| March 31, 2008 |
AssetMark Enhanced Fundamental Index™ Large Company Growth Fund

| Components of Portfolio Holdings | |||
| Consumer Discretionary | $ | 6,975,400 | |
| Consumer Staples | 8,015,120 | ||
| Energy | 5,452,986 | ||
| Financials | 3,879,476 | ||
| Health Care | 6,983,729 | ||
| Industrials | 9,437,185 | ||
| Information Technology | 9,163,445 | ||
| Materials | 2,557,245 | ||
| Telecommunication Services | 73,075 | ||
| Utilities | 1,700,075 | ||
| Short Term Investments | 3,792,672 | ||
| Total | $ | 58,030,408 | |
| Pie chart represents percentages of total portfolio. | |||
AssetMark Enhanced Fundamental Index™ Large Company Value Fund

| Components of Portfolio Holdings | |||
| Consumer Discretionary | $ | 5,178,362 | |
| Consumer Staples | 3,033,392 | ||
| Energy | 3,867,543 | ||
| Financials | 16,970,641 | ||
| Health Care | 2,558,917 | ||
| Industrials | 2,234,710 | ||
| Information Technology | 1,157,033 | ||
| Materials | 1,889,182 | ||
| Telecommunication Services | 2,530,732 | ||
| Utilities | 3,818,978 | ||
| Short Term Investments | 3,007,568 | ||
| Total | $ | 46,247,058 | |
| Pie chart represents percentages of total portfolio. | |||
12
| AssetMark Funds |
| ALLOCATION OF PORTFOLIO HOLDINGS (Continued) (Unaudited) |
| March 31, 2008 |
AssetMark Enhanced Fundamental Index™ Small Company Growth Fund
| Components of Portfolio Holdings | |||
| Consumer Discretionary | $ | 1,934,946 | |
| Consumer Staples | 236,907 | ||
| Energy | 642,466 | ||
| Financials | 1,226,141 | ||
| Health Care | 1,095,755 | ||
| Industrials | 2,011,914 | ||
| Information Technology | 1,988,233 | ||
| Materials | 506,443 | ||
| Telecommunication Services | 121,024 | ||
| Utilities | 77,214 | ||
| Short Term Investments | 596,930 | ||
| Total | $ | 10,437,973 | |
| Pie chart represents percentages of total portfolio. | |||
AssetMark Enhanced Fundamental Index™ Small Company Value Fund

| Components of Portfolio Holdings | |||
| Consumer Discretionary | $ | 955,505 | |
| Consumer Staples | 219,441 | ||
| Energy | 154,153 | ||
| Financials | 1,531,032 | ||
| Health Care | 168,273 | ||
| Industrials | 529,015 | ||
| Information Technology | 336,183 | ||
| Materials | 295,114 | ||
| Telecommunication Services | 57,572 | ||
| Utilities | 127,582 | ||
| Short Term Investments | 127,337 | ||
| Total | $ | 4,501,207 | |
| Pie chart represents percentages of total portfolio. | |||
3
| AssetMark Large Cap Growth Fund |
| PERFORMANCE DATA |
TOTAL RETURN BASED ON A $10,000 INVESTMENT

This chart assumes an initial gross investment of $10,000 made on June 29, 2001 (commencement of the Fund’s operations). Returns shown include the reinvestment of all dividends. Returns shown do not reflect the deduction of taxes that a shareholder would pay on fund distributions or the redemption of fund shares. In the absence of fee waivers and reimbursements, total return would be reduced. Past performance is not predictive of future performance. Investment return and principal value will fluctuate, so that your shares, when redeemed, may be worth more or less than the original cost.
RUSSELL 1000 GROWTH INDEX – An unmanaged index which measures the performance of those Russell 1000 companies with higher price-to-book ratios and higher forecasted growth values. The Russell 1000 Index is an unmanaged index which measures the performance of the 1,000 largest companies in the Russell 3000 Index. The Russell 3000 Index is an unmanaged index which measures the performance of the 3,000 largest U.S. Companies, based on total market capitalization, which represents approximately 98% of the investable U.S. equity market.
LIPPER LARGE-CAP GROWTH FUNDS INDEX – The Lipper Large-Cap Growth Funds Index is the average of the 30 largest funds in the Lipper Large-Cap Growth Funds Category. These funds, by portfolio practice, invest at least 75% of equity assets in companies with market capitalizations (on a three-year weighted basis) greater than 300% of the dollar-weighted median market capitalization of the middle 1,000 securities of the Standard & Poor’s (“S&P”) Super Composite 1500® Index. These funds typically invest in securities that have an above average price-to-earnings ratio, price-to-book ratio and three-year sales-per-share growth value, compared to the Standard & Poor’s 500 Composite Index (“S&P 500® Index”).
| AVERAGE ANNUAL TOTAL RETURN (for the periods ended March 31) | |||||
| One Year | Five Year | Since Inception (6/29/01) | |||
| AssetMark Large Cap Growth Fund | -3.88% | 7.69% | -0.78% | ||
| Russell 1000 Growth Index | -0.75% | 9.96% | 0.93% | ||
| Lipper Large-Cap Growth Funds Index | 1.04% | 9.76% | 0.47% | ||
14
| AssetMark Large Cap Growth Fund |
| SCHEDULE OF INVESTMENTS |
| March 31, 2008 |
| Number of | Market | |||
| Shares | Value | |||
| COMMON STOCKS - 98.63% | ||||
| Aerospace & Defense - 2.16% | ||||
| 58,200 | Honeywell International, Inc. | $ | 3,283,644 | |
| 62,500 | Lockheed Martin Corp. (b) | 6,206,250 | ||
| 44,700 | Precision Castparts Corp. (b) | 4,562,976 | ||
| 14,052,870 | ||||
| Air Freight & Logistics - 2.39% | ||||
| 152,925 | C.H. Robinson Worldwide, Inc. (b) | 8,319,120 | ||
| 159,000 | Expeditors International | |||
| Washington, Inc. (b) | 7,183,620 | |||
| 15,502,740 | ||||
| Beverages - 1.06% | ||||
| 51,900 | The Coca-Cola Company | 3,159,153 | ||
| 51,900 | PepsiCo, Inc. | 3,747,180 | ||
| 6,906,333 | ||||
| Biotechnology - 4.93% | ||||
| 54,500 | Amgen, Inc. (a)(b) | 2,277,010 | ||
| 100,900 | Cephalon, Inc. (a)(b) | 6,497,960 | ||
| 171,310 | Genentech, Inc. (a)(b) | 13,906,946 | ||
| 138,400 | Gilead Sciences, Inc. (a)(b) | 7,131,752 | ||
| 144,000 | Millennium Pharmaceuticals, | |||
| Inc. (a)(b) | 2,226,240 | |||
| 32,039,908 | ||||
| Capital Markets - 3.80% | ||||
| 77,273 | The Bank Of New York Mellon | |||
| Corp. (b) | 3,224,602 | |||
| 11,300 | BlackRock, Inc. (b) | 2,307,234 | ||
| 151,200 | The Charles Schwab Corp. (b) | 2,847,096 | ||
| 50,000 | Goldman Sachs Group, Inc. | 8,269,500 | ||
| 76,000 | SEI Investments Co. | 1,876,440 | ||
| 36,200 | State Street Corp. (b) | 2,859,800 | ||
| 65,200 | T. Rowe Price Group, Inc. (b) | 3,260,000 | ||
| 24,644,672 | ||||
| Chemicals - 1.27% | ||||
| 44,800 | Air Products & Chemicals, Inc. | 4,121,600 | ||
| 40,200 | Mosaic Co. (a) | 4,124,520 | ||
| 8,246,120 | ||||
| Commercial Services & Supplies - 1.22% | ||||
| 50,640 | Apollo Group, Inc. (a)(b) | 2,187,648 | ||
| 77,100 | Manpower, Inc. | 4,337,646 | ||
| 123,500 | Steelcase, Inc. | 1,365,910 | ||
| 7,891,204 | ||||
| Number of | Market | |||
| Shares | Value | |||
| Communications Equipment - 5.04% | ||||
| 297,680 | Cisco Systems, Inc. (a)(b) | $ | 7,171,111 | |
| 91,700 | CommScope, Inc. (a)(b) | 3,193,911 | ||
| 86,300 | Juniper Networks, Inc. (a)(b) | 2,157,500 | ||
| 366,701 | QUALCOMM, Inc. (b) . | 15,034,741 | ||
| 45,800 | Research In Motion Ltd. (a)(b) | 5,140,134 | ||
| 32,697,397 | ||||
| Computers & Peripherals - 6.45% | ||||
| 84,100 | Apple, Inc. (a)(b) | 12,068,350 | ||
| 324,090 | Hewlett-Packard Co. | 14,797,950 | ||
| 72,680 | International Business | |||
| Machines Corp. | 8,368,375 | |||
| 331,420 | NetApp, Inc. (a)(b) | 6,644,971 | ||
| 41,879,646 | ||||
| Construction & Engineering - 0.85% | ||||
| 40,700 | Foster Wheeler Ltd. (a) | 2,304,434 | ||
| 44,000 | Jacobs Engineering Group, | |||
| Inc. (a)(b) | 3,237,960 | |||
| 5,542,394 | ||||
| Consumer Finance - 0.33% | ||||
| 49,450 | American Express Co. (b) | 2,161,954 | ||
| Containers & Packaging - 0.90% | ||||
| 103,400 | Owens-Illinois, Inc. (a) | 5,834,862 | ||
| Diversified Financial Services - 1.28% | ||||
| 63,600 | IntercontinentalExchange, | |||
| Inc. (a)(b) | 8,299,800 | |||
| Diversified Telecommunication Services - 0.58% | ||||
| 98,700 | AT&T Inc. | 3,780,210 | ||
| Electric Utilities - 0.30% | ||||
| 23,600 | Exelon Corp. (b) | 1,917,972 | ||
| Electrical Equipment - 0.42% | ||||
| 53,500 | Emerson Electric Co. (b) | 2,753,110 | ||
| Electronic Equipment & Instruments - 0.49% | ||||
| 62,100 | Avnet, Inc. (a)(b) | 2,032,533 | ||
| 73,500 | Ingram Micro, Inc. (a) | 1,163,505 | ||
| 3,196,038 | ||||
| Energy Equipment & Services - 5.08% | ||||
| 49,000 | FMC Technologies, Inc. (a)(b) | 2,787,610 | ||
| 173,100 | Halliburton Co. (b) | 6,808,023 | ||
| 61,900 | National-Oilwell, Inc. (a)(b) | 3,613,722 | ||
| 196,540 | Schlumberger Ltd. | 17,098,980 | ||
| 47,600 | Unit Corp. (a) | 2,696,540 | ||
| 33,004,875 | ||||
See notes to financial statements.
15
| AssetMark Large Cap Growth Fund |
| SCHEDULE OF INVESTMENTS (Continued) |
| March 31, 2008 |
| Number of | Market | |||
| Shares | Value | |||
| COMMON STOCKS (Continued) | ||||
| Food & Staples Retailing - 3.77% | ||||
| 167,700 | BJ’s Wholesale Club, Inc. (a)(b) | $ | 5,985,213 | |
| 95,700 | CVS Corp. | 3,876,807 | ||
| 180,200 | The Kroger Co. (b) | 4,577,080 | ||
| 87,800 | Sysco Corp. | 2,547,956 | ||
| 141,870 | Wal-Mart Stores, Inc. | 7,473,712 | ||
| 24,460,768 | ||||
| Food Products - 0.59% | ||||
| 44,000 | Bunge Ltd. (b) | 3,822,720 | ||
| Health Care Equipment & Supplies - 2.93% | ||||
| 62,100 | Dentsply International, Inc. (b) | 2,397,060 | ||
| 101,900 | Medtronic, Inc. (b) | 4,928,903 | ||
| 49,300 | St. Jude Medical, Inc. (a)(b) | 2,129,267 | ||
| 173,817 | Varian Medical Systems, | |||
| Inc. (a)(b) | 8,141,588 | |||
| 18,400 | Zimmer Holdings, Inc. (a) | 1,432,624 | ||
| 19,029,442 | ||||
| Health Care Providers & Services - 3.99% | ||||
| 117,144 | Cerner Corp. (a)(b) | 4,367,128 | ||
| 71,200 | Coventry Health Care, Inc. (a)(b) | 2,872,920 | ||
| 27,600 | Laboratory Corp Of America | |||
| Holdings (a)(b) | 2,033,568 | |||
| 108,600 | McKesson Corp. (b) | 5,687,382 | ||
| 51,000 | Pharmaceutical Product | |||
| Development, Inc. | 2,136,900 | |||
| 162,700 | UnitedHealth Group, Inc. | 5,590,372 | ||
| 73,600 | Wellpoint, Inc. (a) | 3,247,968 | ||
| 25,936,238 | ||||
| Hotels, Restaurants & Leisure - 2.13% | ||||
| 57,800 | International Game Technology (b) . | 2,324,138 | ||
| 74,245 | Las Vegas Sands Corp. (a)(b) | 5,467,402 | ||
| 42,500 | Panera Bread Co. (a)(b) | 1,780,325 | ||
| 113,900 | Yum! Brands, Inc. (b) | 4,238,219 | ||
| 13,810,084 | ||||
| Household Durables - 0.26% | ||||
| 31,390 | Garmin Ltd. (b) | 1,695,374 | ||
| Household Products - 0.81% | ||||
| 75,350 | Procter & Gamble Co. | 5,279,775 | ||
| Industrial Conglomerates - 2.60% | ||||
| 360,775 | General Electric Co. | 13,352,283 | ||
| 63,100 | Textron, Inc. | 3,497,002 | ||
| 16,849,285 | ||||
| Number of | Market | |||
| Shares | Value | |||
| Insurance - 4.09% | ||||
| 63,500 | ACE Ltd. | $ | 3,496,310 | |
| 60,250 | Aflac, Inc. (b) | 3,913,237 | ||
| 66 | Berkshire Hathaway Inc. (a) | 8,804,400 | ||
| 47,200 | Everest Re Group Ltd. | 4,225,816 | ||
| 381,097 | Progressive Corp. | 6,124,229 | ||
| 26,563,992 | ||||
| Internet & Catalog Retail - 3.25% | ||||
| 163,820 | Amazon.com, Inc. (a)(b) | 11,680,366 | ||
| 266,205 | eBay, Inc. (a)(b) | 7,943,557 | ||
| 65,100 | Expedia, Inc. (a)(b) | 1,425,039 | ||
| 21,048,962 | ||||
| Internet Software & Services - 3.15% | ||||
| 33,952 | Google, Inc. (a)(b) | 14,954,837 | ||
| 166,011 | VeriSign, Inc. (a)(b) | 5,518,206 | ||
| 20,473,043 | ||||
| IT Services - 2.02% | ||||
| 184,500 | Accenture Ltd. (b) | 6,488,865 | ||
| 45,700 | Automatic Data Processing, Inc. | 1,937,223 | ||
| 34,800 | Cognizant Technology Solutions | |||
| Corp. (a) | 1,003,284 | |||
| 59,570 | Visa, Inc. (a) | 3,714,785 | ||
| 13,144,157 | ||||
| Machinery - 2.85% | ||||
| 73,770 | AGCO Corp. (a)(b) | 4,417,348 | ||
| 59,750 | Cummins, Inc. | 2,797,495 | ||
| 48,400 | Danaher Corp. (b) | 3,679,852 | ||
| 37,500 | Deere & Co. (b) | 3,016,500 | ||
| 58,900 | Dover Corp. (b) | 2,460,842 | ||
| 30,800 | Parker Hannifin Corp. (b) | 2,133,516 | ||
| 18,505,553 | ||||
| Media - 2.28% | ||||
| 257,530 | DIRECTV Group, Inc. (a) | 6,384,169 | ||
| 62,300 | Omnicom Group, Inc. (b) | 2,752,414 | ||
| 180,430 | Walt Disney Co. (b) | 5,661,893 | ||
| 14,798,476 | ||||
| Metals & Mining - 1.23% | ||||
| 46,200 | Allegheny Technologies, Inc. (b) | 3,296,832 | ||
| 34,600 | Freeport-McMoRan Copper & | |||
| Gold, Inc. (b) | 3,329,212 | |||
| 13,400 | Southern Copper Corp. (b) | 1,391,322 | ||
| 8,017,366 | ||||
See notes to financial statements.
16
| AssetMark Large Cap Growth Fund |
| SCHEDULE OF INVESTMENTS (Continued) |
| March 31, 2008 |
| Number of | Market | |||
| Shares | Value | |||
| COMMON STOCKS (Continued) | ||||
| Multiline Retail - 0.39% | ||||
| 59,000 | Kohl’s Corp. (a)(b) | $ | 2,530,510 | |
| Oil & Gas - 2.88% | ||||
| 29,900 | Apache Corp. | 3,612,518 | ||
| 47,000 | ConocoPhillips | 3,581,870 | ||
| 29,900 | EOG Resources, Inc. (b) | 3,588,000 | ||
| 37,400 | Exxon Mobil Corp. | 3,163,292 | ||
| 38,900 | Marathon Oil Corp. | 1,773,840 | ||
| 48,200 | XTO Energy, Inc. | 2,981,652 | ||
| 18,701,172 | ||||
| Pharmaceuticals - 6.16% | ||||
| 85,000 | Abbott Laboratories | 4,687,750 | ||
| 68,400 | Amylin Pharmaceuticals, Inc. (a)(b) | 1,997,964 | ||
| 281,900 | Bristol-Myers Squibb Co. | 6,004,470 | ||
| 95,700 | Eli Lilly & Co. (b) | 4,937,163 | ||
| 83,400 | Forest Laboratories, Inc. (a) | 3,336,834 | ||
| 138,700 | Genzyme Corp. (a)(b) | 10,338,698 | ||
| 88,400 | Merck & Co., Inc. | 3,354,780 | ||
| 370,500 | Schering Plough Corp. | 5,338,905 | ||
| 39,996,564 | ||||
| Semiconductor & Semiconductor | ||||
| Equipment - 2.89% | ||||
| 53,300 | Applied Materials, Inc. | 1,039,883 | ||
| 224,100 | Intel Corp. | 4,746,438 | ||
| 138,000 | Lam Research Corp. (a)(b) | 5,274,360 | ||
| 77,300 | Linear Technology Corp. (b) | 2,372,337 | ||
| 165,265 | NVIDIA Corp. (a) | 3,270,594 | ||
| 72,400 | Texas Instruments, Inc. (b) | 2,046,748 | ||
| 18,750,360 | ||||
| Software - 7.13% | ||||
| 127,600 | Autodesk, Inc. (a)(b) | 4,016,848 | ||
| 48,300 | BMC Software, Inc. (a) | 1,570,716 | ||
| 87,400 | Citrix Systems, Inc. (a)(b) | 2,563,442 | ||
| 677,150 | Microsoft Corp. | 19,217,517 | ||
| 303,300 | Oracle Corp. (a) | 5,932,548 | ||
| 173,100 | Salesforce.com, Inc. (a)(b) | 10,017,297 | ||
| 178,400 | Symantec Corp. (a)(b) | 2,965,008 | ||
| 46,283,376 | ||||
| Specialty Retail - 2.96% | ||||
| 81,000 | Abercrombie & Fitch Co. - | |||
| Class A (b) | 5,924,340 | |||
| 62,500 | GameStop Corp. - Class A (a) | 3,231,875 | ||
| 216,400 | The Gap Inc. (b) | 4,258,752 |
| Number of | Market | |||
| Shares | Value | |||
| Specialty Retail (Continued) | ||||
| 154,375 | Staples, Inc. (b) | $ | 3,413,231 | |
| 72,100 | The TJX Companies, Inc. (b) | 2,384,347 | ||
| 19,212,545 | ||||
| Textiles, Apparel & Luxury Goods - 0.52% | ||||
| 49,800 | Nike, Inc. (b) | 3,386,400 | ||
| Tobacco - 1.20% | ||||
| 106,800 | Altria Group, Inc. | 2,370,960 | ||
| 106,800 | Philip Morris International, Inc. (a) | 5,401,944 | ||
| 7,772,904 | ||||
| Total Common Stocks | ||||
| (Cost $602,322,208) | 640,421,171 | |||
| SHORT TERM INVESTMENTS - 1.53% | ||||
| Money Market Funds - 1.53% | ||||
| 9,917,926 | Federated Prime Obligations Fund, | |||
| 3.180% (e) | 9,917,926 | |||
| Total Short Term Investments | ||||
| (Cost $9,917,926) | 9,917,926 | |||
| Principal | ||||
| Amount | ||||
| INVESTMENTS PURCHASED | ||||
| AS SECURITIES LENDING | ||||
| COLLATERAL - 33.61% | ||||
| COMMERCIAL PAPER - 2.44% | ||||
| $2,680,137 | Bryant Park Funding LLC, | |||
| 3.188%, 04/03/08 (c) | 2,679,427 | |||
| 4,635,913 | Sheffield Receivables Corp., | |||
| 3.053%, 04/08/08 (c) | 4,632,771 | |||
| 1,738,468 | Thames Asset Global, | |||
| 2.287%, 06/27/08 (c) | 1,726,484 | |||
| 2,070,515 | Three Pillars Funding, | |||
| 2.906%, 04/14/08 (c) | 2,068,180 | |||
| 4,780,786 | Tulip Funding, 2.856%, 04/21/08 (c) | 4,772,838 | ||
| Total Commercial Paper | ||||
| (Cost $15,879,700) | 15,879,700 | |||
| CORPORATE BONDS AND NOTES | - 6.28% | |||
| 8,692,337 | Abbey National Trust, | |||
| 3.130%, 02/13/09 | 8,570,018 | |||
| 8,112,848 | Allstate Life Global Funding, | |||
| 3.332%, 03/20/09 | 8,117,262 | |||
| 5,794,892 | Bank of Scotland, | |||
| 4.614%, 02/06/09 | 5,794,892 | |||
| 7,533,359 | Barclays Bank, 3.361%, 03/16/09 | 7,532,779 | ||
See notes to financial statements.
17
| AssetMark Large Cap Growth Fund |
| SCHEDULE OF INVESTMENTS (Continued) |
| March 31, 2008 |
| Principal | Market | |||
| Amount | Value | |||
| CORPORATE BONDS AND NOTES (Continued) | ||||
| $2,897,446 | Bayerische Landesbank, | |||
| 4.956%, 08/23/08 | $ | 2,900,865 | ||
| 3,476,935 | Metlife Global, 4.965%, 04/28/08 | 3,476,935 | ||
| 4,346,170 | Svenska Handelsbanken, | |||
| 4.652%, 02/06/09 | 4,346,170 | |||
| Total Corporate Bonds and Notes | ||||
| (Cost $40,853,987) | 40,738,921 | |||
| CORPORATE PAYDOWN SECURITIES - 2.47% | ||||
| 8,602,093 | KKR Atlantic East Holding Group | |||
| Trust, 3.054%, 03/25/09 (d) | 7,467,087 | |||
| 9,621,687 | KKR Pacific West Holding Group | |||
| Trust, 3.054%, 03/25/09 (d) | 8,572,153 | |||
| Total Corporate Paydown Securities | ||||
| (Cost $18,223,780) | 16,039,240 | |||
| Number of | ||||
| Shares | ||||
| MONEY MARKET FUNDS - 3.28% | ||||
| 10,407,072 | AIM Short Term Liquid Asset Fund | 10,407,072 | ||
| 10,894,397 | Reserve Primary Fund | 10,894,397 | ||
| Total Money Market Funds | ||||
| (Cost $21,301,469) | 21,301,469 | |||
| Principal | ||||
| Amount | ||||
| REPURCHASE AGREEMENTS - 19.14% | ||||
| $18,833,398 | BNP Paribas Repurchase | |||
| Agreement, 3.200%, 04/01/08 | ||||
| (Collateralized by U.S. Government | ||||
| Agency Issues, value $19,128,089, | ||||
| 5.000% to 5.500%, | ||||
| 03/31/38 to 04/01/38) | 18,833,398 | |||
| 14,487,229 | Citigroup Global Repurchase | |||
| Agreement, 3.050%, 04/01/08 | ||||
| (Collateralized by Foreign Government | ||||
| Bonds, value $14,783,185, | ||||
| 0.000% to 2.375%, | ||||
| 09/15/10 to 11/15/21) | 14,487,229 | |||
| 14,487,229 | Citigroup Global Repurchase | |||
| Agreement, 3.050%, 04/01/08 | ||||
| (Collateralized by Foreign Government | ||||
| Bonds, value $14,783,407, | ||||
| 0.000% to 2.375%, | ||||
| 05/15/11 to 01/15/17) | 14,487,229 | |||
| 6,924,895 | CS First Boston Repurchase | |||
| Agreement, 2.750%, 04/01/08 | ||||
| (Collateralized by U.S. Government | ||||
| Agency Issues, value $6,927,826, | ||||
| 0.000% to 6.500%, | ||||
| 01/25/12 to 03/20/38) | 6,924,895 | |||
| Principal | Market | ||||
| Amount | Value | ||||
| REPURCHASE AGREEMENTS (Continued) | |||||
| $28,974,459 | Greenwich Capital Repurchase | ||||
| Agreement, 2.750%, 01/02/08 | |||||
| (Collateralized by U.S. Government | |||||
| Agency Issues, value $29,554,535, | |||||
| 0.000%, 12/01/33 to 04/15/37) | $ | 28,974,459 | |||
| 28,974,459 | Merrill Lynch Repurchase | ||||
| Agreement, 3.120%, 04/01/08 | |||||
| (Collateralized by non-U.S. Government | |||||
| Agency Issues, value $30,019,277, | |||||
| 3.631% to 8.125%, | |||||
| 01/15/10 to 11/15/23) . . . . . . . . . . | 28,974,459 | ||||
| 5,794,892 | Morgan Stanley Repurchase | ||||
| Agreement, 2.9000%, 04/01/08 | |||||
| (Collateralized by non-U.S. Government | |||||
| Agency Issues, value $7,003,336, | |||||
| 0.000%, 10/15/14) . . . . . . . . . . . . . | 5,794,892 | ||||
| 5,794,892 | Morgan Stanley Repurchase | ||||
| Agreement, 3.1000%, 04/01/08 | |||||
| (Collateralized by U.S. Government | |||||
| Agency Issues, value $5,910,790, | |||||
| 5.000% to 5.500%, | |||||
| 05/17/31 to 04/20/33) | 5,794,892 | ||||
| Total Repurchase Agreements | |||||
| (Cost $124,271,453) | 124,271,453 | ||||
| Total Investments Purchased as | |||||
| Securities Lending Collateral | |||||
| (Cost $220,530,389) | 218,230,783 | ||||
| Total Investments | |||||
| (Cost $832,770,523) - 133.77% | 868,569,880 | ||||
| Liabilities in Excess of | |||||
| Other Assets - (33.77)% | (219,262,428) | ||||
| TOTAL NET | |||||
| $ | ASSETS - 100.00% | 649,307,452 | |||
| Percentages are stated as a percent of net assets. | |||||
| (a) Non Income Producing. | |||||
| (b) All or a portion of this security is on loan. | |||||
| (c) Restricted securities as defined in Rule 144(a) under the | |||||
| Securities Act of 1933. Such securities are treated as liquid | |||||
| securities according to the Fund’s liquidity guidelines. The | |||||
| market value of these securities total $15,879,700, which | |||||
| represents 2.44% of total net assets. | |||||
| (d) As of March 31, 2008, the Adviser has fair valued this security. | |||||
| The market value of these securities total $16,039,240, which | |||||
| represents 2.47% of total net assets. | |||||
| (e) Variable Rate Security. The rate shown is the rate in effect on | |||||
| March 31, 2008. | |||||
See notes to financial statements.
18
| AssetMark Large Cap Value Fund |
| PERFORMANCE DATA |
This chart assumes an initial gross investment of $10,000 made on June 29, 2001 (commencement of the Fund’s operations). Returns shown include the reinvestment of all dividends. Returns shown do not reflect the deduction of taxes that a shareholder would pay on fund distributions or the redemption of fund shares. In the absence of fee waivers and reimbursements, total return would be reduced. Past performance is not predictive of future performance. Investment return and principal value will fluctuate, so that your shares, when redeemed, may be worth more or less than the original cost.
RUSSELL 1000 VALUE INDEX – An unmanaged index which measures the performance of those Russell 1000 companies with lower price-to-book ratios and lower forecasted growth values. The Russell 1000 Index is an unmanaged index which measures the performance of the 1,000 largest companies in the Russell 3000 Index. The Russell 3000 Index is an unmanaged index which measures the performance of the 3,000 largest U.S. Companies, based on total market capitalization, which represents approximately 98% of the investable U.S. equity market.
LIPPER LARGE-CAP VALUE FUNDS INDEX – The Lipper Large-Cap Value Funds Index is the average of the 30 largest funds in the Lipper Large-Cap Value Funds Category. These funds, by portfolio practice, invest at least 75% of equity assets in companies with market capitalizations (on a three-year weighted basis) greater than 300% of the dollar-weighted median market capitalization of the middle 1,000 securities of the S&P Super Composite 1500® Index. Large-cap value funds typically invest in securities that have a below-average price-to-earnings ratio, price-to-book ratio and three-year sales-per-share growth value, compared to the S&P 500® Index.
| AVERAGE ANNUAL TOTAL RETURN (for the periods ended March 31) | |||||
| One Year | Five Year | Since Inception (6/29/01) | |||
| AssetMark Large Cap Value Fund | -12.23% | 12.10% | 3.72% | ||
| Russell 1000 Value Index | -9.99% | 13.68% | 5.75% | ||
| Lipper Large-Cap Value Funds Index | -8.00% | 11.92% | 3.64% | ||
19
| AssetMark Large Cap Value Fund |
| SCHEDULE OF INVESTMENTS |
| March 31, 2008 |
| Number of | Market | |||
| Shares | Value | |||
| COMMON STOCKS - 96.90% | ||||
| Aerospace & Defense - 1.25% | ||||
| 92,200 | Northrop Grumman Corp. | $ | 7,174,082 | |
| Air Freight & Logistics - 0.65% | ||||
| 40,600 | FedEx Corp. (b) | 3,762,402 | ||
| Auto Components - 0.59% | ||||
| 1,038,246 | Delphi Corp. (a) | 45,683 | ||
| 98,100 | Johnson Controls, Inc. (b) | 3,315,780 | ||
| 3,361,463 | ||||
| Automobiles - 1.91% | ||||
| 689,582 | Ford Motor Co. (a)(b) | 3,944,409 | ||
| 146,435 | General Motors Corp. (b) | 2,789,587 | ||
| 112,950 | Harley-Davidson, Inc. (b) | 4,235,625 | ||
| 10,969,621 | ||||
| Beverages - 1.00% | ||||
| 67,300 | Anheuser-Busch Companies, Inc. | 3,193,385 | ||
| 31,150 | Diageo PLC - ADR | 2,533,118 | ||
| 5,726,503 | ||||
| Biotechnology - 0.33% | ||||
| 45,830 | Amgen, Inc. (a)(b) | 1,914,777 | ||
| Building Products - 0.51% | ||||
| 147,430 | Masco Corp. (b) | 2,923,537 | ||
| Capital Markets - 1.79% | ||||
| 26,070 | Ameriprise Financial, Inc. | 1,351,730 | ||
| 53,340 | The Bank Of New York | |||
| Mellon Corp. (b) | 2,225,878 | |||
| 31,300 | Merrill Lynch & Co., Inc. (b) | 1,275,162 | ||
| 119,300 | Morgan Stanley (b) | 5,452,010 | ||
| 10,304,780 | ||||
| Chemicals - 2.67% | ||||
| 337,730 | The Dow Chemical Co. (b) | 12,445,351 | ||
| 47,400 | PPG Industries, Inc. | 2,868,174 | ||
| 15,313,525 | ||||
| Commercial Banks - 6.26% | ||||
| 233,800 | Bank of America Corp. (b) | 8,863,358 | ||
| 141,130 | Fifth Third Bancorp (b) | 2,952,440 | ||
| 127,890 | National City Corp. | 1,272,505 | ||
| 145,630 | Popular, Inc. (b) | 1,698,046 | ||
| 395,100 | Regions Financial Corp. | 7,803,225 | ||
| 354,334 | Wachovia Corp. (b) | 9,567,018 | ||
| 130,100 | Wells Fargo & Co. (b) | 3,785,910 | ||
| 35,942,502 |
| Number of | Market | |||
| Shares | Value | |||
| Commercial Services & Supplies - 1.38% | ||||
| 14,150 | Dun & Bradstreet Corp. | $ | 1,151,527 | |
| 151,550 | H&R Block, Inc. (b) | 3,146,178 | ||
| 107,800 | Waste Management, Inc. | 3,617,768 | ||
| 7,915,473 | ||||
| Communications Equipment - 0.82% | ||||
| 367,319 | Alcatel SA - ADR (b) | 2,115,757 | ||
| 278,830 | Motorola, Inc. (b) | 2,593,119 | ||
| 4,708,876 | ||||
| Computers & Peripherals - 1.72% | ||||
| 264,390 | Dell, Inc. (a)(b) | 5,266,649 | ||
| 101,400 | Hewlett-Packard Co. | 4,629,924 | ||
| 9,896,573 | ||||
| Construction Materials - 0.16% | ||||
| 13,550 | Vulcan Materials Co. (b) | 899,720 | ||
| Consumer Finance - 1.36% | ||||
| 166,300 | American Express Co. (b) | 7,270,636 | ||
| 36,640 | SLM Corp. (a)(b) | 562,424 | ||
| 7,833,060 | ||||
| Containers & Packaging - 0.59% | ||||
| 133,200 | Sealed Air Corp. (b) | 3,363,300 | ||
| Diversified Financial Services - 2.28% | ||||
| 98,820 | CIT Group, Inc. (b) | 1,171,017 | ||
| 178,138 | Citigroup, Inc. (b) | 3,815,716 | ||
| 159,838 | JPMorgan Chase & Co. | 6,865,042 | ||
| 35,750 | Moody’s Corp. (b) | 1,245,173 | ||
| 13,096,948 | ||||
| Diversified Telecommunication Services - 5.02% | ||||
| 414,812 | AT&T Inc. | 15,887,300 | ||
| 108,100 | Sprint Corp. (b) | 723,189 | ||
| 335,230 | Verizon Communications, Inc. (b) | 12,219,133 | ||
| 28,829,622 | ||||
| Electric Utilities - 1.14% | ||||
| 133,100 | Edison International (b) | 6,524,562 | ||
| Electronic Equipment & Instruments - 0.66% | ||||
| 20,800 | Agilent Technologies, Inc. (a)(b) | 620,464 | ||
| 130,064 | Flextronics International Ltd. (a)(b) | 1,221,301 | ||
| 741,320 | Sanmina-SCI Corporation (a)(b) | 1,200,938 | ||
| 21,712 | Tyco Electronics Ltd. | 745,156 | ||
| 3,787,859 | ||||
See notes to financial statements.
20
| AssetMark Large Cap Value Fund |
| SCHEDULE OF INVESTMENTS (Continued) |
| March 31, 2008 |
| Number of | Market | |||
| Shares | Value | |||
| COMMON STOCKS (Continued) | ||||
| Energy Equipment & Services - 2.65% | ||||
| 50,600 | Diamond Offshore Drilling (b) | $ | 5,889,840 | |
| 192,600 | Halliburton Co. (b) | 7,574,958 | ||
| 13,012 | Transocean Inc. (a)(b) | 1,759,222 | ||
| 15,224,020 | ||||
| Food & Staples Retailing - 3.08% | ||||
| 129,100 | Costco Wholesale Corp. (b) | 8,387,627 | ||
| 67,217 | CVS Corp. (b) | 2,722,961 | ||
| 80,185 | Safeway, Inc. (b) | 2,353,430 | ||
| 83,830 | Supervalu, Inc. | 2,513,223 | ||
| 32,750 | Wal-Mart Stores, Inc. | 1,725,270 | ||
| 17,702,511 | ||||
| Food Products - 1.85% | ||||
| 172,200 | Archer-Daniels-Midland Co. | 7,087,752 | ||
| 254,360 | Sara Lee Corp. | 3,555,953 | ||
| 10,643,705 | ||||
| Health Care Equipment & Supplies - 0.81% | ||||
| 299,810 | Boston Scientific Corp. (a) | 3,858,555 | ||
| 17,612 | Covidien Ltd. | 779,331 | ||
| 4,637,886 | ||||
| Health Care Providers & Services - 2.04% | ||||
| 24,050 | Cardinal Health, Inc. | 1,262,866 | ||
| 145,000 | Cigna Corp. | 5,882,650 | ||
| 11,700 | Express Scripts, Inc. (a) | 752,544 | ||
| 373,500 | Tenet Healthcare Corp. (a)(b) | 2,114,010 | ||
| 49,300 | UnitedHealth Group, Inc. | 1,693,948 | ||
| 11,706,018 | ||||
| Hotels, Restaurants & Leisure - 1.40% | ||||
| 157,100 | Carnival Corp. (b) | 6,359,408 | ||
| 30,000 | McDonald’s Corp. | 1,673,100 | ||
| 8,032,508 | ||||
| Household Durables - 1.43% | ||||
| 51,400 | DR Horton, Inc. (b) | 809,550 | ||
| 43,500 | Fortune Brands, Inc. (b) | 3,023,250 | ||
| 27,380 | Lennar Corp. (b) | 515,018 | ||
| 37,140 | Pulte Homes, Inc. | 540,387 | ||
| 38,310 | Whirlpool Corp. (b) | 3,324,542 | ||
| 8,212,747 | ||||
| Number of | Market | |||
| Shares | Value | |||
| Household Products - 1.69% | ||||
| 114,100 | Kimberly-Clark Corp. | $ | 7,365,155 | |
| 33,170 | Procter & Gamble Co. | 2,324,222 | ||
| 9,689,377 | ||||
| Industrial Conglomerates - 1.67% | ||||
| 45,000 | 3M Co. | 3,561,750 | ||
| 142,600 | General Electric Co. | 5,277,626 | ||
| 17,712 | Tyco International Ltd. | 780,214 | ||
| 9,619,590 | ||||
| Insurance - 12.29% | ||||
| 248,600 | The Allstate Corp. | 11,947,716 | ||
| 118,600 | American International Group, | |||
| Inc. (b) | 5,129,450 | |||
| 25,940 | AON Corp. | 1,042,788 | ||
| 1,703 | Berkshire Hathaway, Inc. (a) | 7,617,349 | ||
| 138,880 | Conseco, Inc. (a)(b) | 1,416,576 | ||
| 96,500 | Loews Corp. | 3,881,230 | ||
| 116,800 | Marsh & McLennan Companies, | |||
| Inc. (b) | 2,844,080 | |||
| 178,800 | Metlife, Inc. (b) | 10,774,488 | ||
| 136,760 | Old Republic International Corp. (b) | 1,765,571 | ||
| 154,900 | Progressive Corp. (b) | 2,489,243 | ||
| 89,800 | Prudential Financial, Inc. | 7,026,850 | ||
| 25,836 | Transatlantic Holdings, Inc. (b) | 1,714,219 | ||
| 270,500 | Travelers Companies, Inc. | 12,943,425 | ||
| 70,592,985 | ||||
| IT Services - 1.22% | ||||
| 169,067 | Electronic Data Systems Corp. | 2,814,966 | ||
| 90,025 | Iron Mountain, Inc. (a)(b) | 2,380,261 | ||
| 415,885 | Unisys Corp. (a) | 1,842,370 | ||
| 7,037,597 | ||||
| Leisure Equipment & Products - 0.42% | ||||
| 136,817 | Eastman Kodak Co. (b) | 2,417,556 | ||
| Machinery - 1.89% | ||||
| 96,900 | Caterpillar, Inc. (b) | 7,586,301 | ||
| 72,750 | Paccar, Inc. | 3,273,750 | ||
| 10,860,051 | ||||
See notes to financial statements.
21
| AssetMark Large Cap Value Fund |
| SCHEDULE OF INVESTMENTS (Continued) |
| March 31, 2008 |
| Number of | Market | |||
| Shares | Value | |||
| COMMON STOCKS (Continued) | ||||
| Media - 2.96% | ||||
| 222,800 | CBS Corp. (b) | $ | 4,919,424 | |
| 224,425 | Comcast Corp. (a) | 4,257,342 | ||
| 118,745 | Gannett Co., Inc. (b) | 3,449,542 | ||
| 34,800 | Grupo Televisa SA - ADR | 843,552 | ||
| 90,720 | McClatchy Co. (b) | 970,704 | ||
| 137,300 | News Corp. (b) | 2,574,375 | ||
| 17,014,939 | ||||
| Metals & Mining - 2.79% | ||||
| 186,670 | Alcoa, Inc. | 6,731,320 | ||
| 65,300 | Freeport-McMoRan Copper & Gold, | |||
| Inc. (b) | 6,283,166 | |||
| 44,900 | Nucor Corp. (b) | 3,041,526 | ||
| 16,056,012 | ||||
| Multi-Utilities - 0.61% | ||||
| 85,200 | Dominion Resources, Inc. (b) | 3,479,568 | ||
| Office Electronics - 1.47% | ||||
| 562,860 | Xerox Corp. (b) | 8,426,014 | ||
| Oil & Gas - 11.78% | ||||
| 97,400 | Apache Corp. | 11,767,868 | ||
| 34,400 | Canadian Natural Resources Ltd. (b) | 2,348,144 | ||
| 221,652 | ConocoPhillips | 16,892,099 | ||
| 62,800 | Devon Energy Corp. | 6,551,924 | ||
| 50,750 | EOG Resources, Inc. (b) | 6,090,000 | ||
| 176,000 | Marathon Oil Corp. | 8,025,600 | ||
| 85,700 | Occidental Petroleum Corp. | 6,270,669 | ||
| 198,300 | Valero Energy Corp. | 9,738,513 | ||
| 67,684,817 | ||||
| Paper & Forest Products - 0.50% | ||||
| 105,700 | International Paper Co. (b) | 2,875,040 | ||
| Pharmaceuticals - 4.85% | ||||
| 101,384 | Bristol-Myers Squibb Co. | 2,159,479 | ||
| 101,400 | Johnson & Johnson | 6,577,818 | ||
| 489,016 | Pfizer, Inc. | 10,235,105 | ||
| 212,075 | Wyeth | 8,856,252 | ||
| 27,828,654 | ||||
| Road & Rail - 0.64% | ||||
| 40,000 | Burlington Northern Santa Fe Corp. | 3,688,800 |
| Number of | Market | |||
| Shares | Value | |||
| Semiconductor & Semiconductor | ||||
| Equipment - 0.94% | ||||
| 100,923 | Intel Corp. | $ | 2,137,549 | |
| 547,156 | Micron Technology, Inc. (a)(b) | 3,266,521 | ||
| 5,404,070 | ||||
| Software - 1.34% | ||||
| 270,960 | Microsoft Corp. | 7,689,845 | ||
| Specialty Retail - 1.22% | ||||
| 24,040 | Bed Bath & Beyond, Inc. (a)(b) | 709,180 | ||
| 224,960 | Home Depot, Inc. (b) | 6,292,131 | ||
| 7,001,311 | ||||
| Thrifts & Mortgage Finance - 1.10% | ||||
| 236,119 | Countrywide Financial Corp. (b) | 1,298,654 | ||
| 39,750 | Fannie Mae (b) | 1,046,220 | ||
| 74,640 | Federal Home Loan Mortgage Corp. | 1,889,885 | ||
| 199,880 | Washington Mutual, Inc. (b) | 2,058,764 | ||
| 6,293,523 | ||||
| Tobacco - 2.17% | ||||
| 171,500 | Altria Group, Inc. | 3,807,300 | ||
| 171,500 | Philip Morris International, Inc. (a) | 8,674,470 | ||
| 12,481,770 | ||||
| Total Common Stocks | ||||
| (Cost $566,230,160) | 556,550,099 | |||
| RIGHTS - 0.00% | ||||
| Auto Components - 0.00% | ||||
| 39,933 | Delphi Automotive Systems | 0 | ||
| Total Rights (Cost $0) | 0 | |||
| REAL ESTATE INVESTMENT | ||||
| TRUSTS - 1.81% | ||||
| Real Estate Investment Trusts - 1.81% | ||||
| 120,200 | ProLogis (b) | 7,074,972 | ||
| 36,000 | Simon Property Group, Inc. | 3,344,760 | ||
| 10,419,732 | ||||
| Total Real Estate Investment Trusts | ||||
| (Cost $10,584,272) | 10,419,732 | |||
| SHORT TERM INVESTMENTS - 1.33% | ||||
| Money Market Funds - 1.33% | ||||
| 7,655,239 | Federated Prime Obligations Fund, | |||
| 3.180% (e) | 7,655,239 | |||
| Total Short Term Investments | ||||
| (Cost $7,655,239) | 7,655,239 | |||
See notes to financial statements.
22
| AssetMark Large Cap Value Fund |
| SCHEDULE OF INVESTMENTS (Continued) |
| March 31, 2008 |
| Principal | Market | |||
| Amount | Value | |||
| INVESTMENTS PURCHASED | ||||
| AS SECURITIES LENDING | ||||
| COLLATERAL - 35.39% | ||||
| COMMERCIAL PAPER - 2.58% | ||||
| $2,496,365 | Bryant Park Funding LLC, | |||
| 3.188%, 04/03/08 (c) | $ | 2,495,703 | ||
| 4,318,036 | Sheffield Receivables Corp., | |||
| 3.053%, 04/08/08 (c) | 4,315,109 | |||
| 1,619,263 | Thames Asset Global, | |||
| 2.287%, 06/27/08 (c) | 1,608,101 | |||
| 1,928,543 | Three Pillars Funding, | |||
| 2.906%, 04/14/08 (c) | 1,926,368 | |||
| 4,452,974 | Tulip Funding, 2.856%, 04/21/08 (c) | 4,445,571 | ||
| Total Commercial Paper | ||||
| (Cost $14,790,852) | 14,790,852 | |||
CORPORATE BONDS AND NOTES- 6.61% | ||||
| 8,096,317 | Abbey National Trust, | |||
| 3.130%, 02/13/09 | 7,982,386 | |||
| 7,556,562 | Allstate Life Global Funding, | |||
| 3.332%, 03/20/09 | 7,560,673 | |||
| 5,397,545 | Bank of Scotland, 4.614%, 02/06/09 | 5,397,545 | ||
| 7,016,808 | Barclays Bank, 3.361%, 03/16/09 | 7,016,268 | ||
| 2,698,772 | Bayerische Landesbank, | |||
| 4.956%, 08/23/08 | 2,701,957 | |||
| 3,238,527 | Metlife Global, 4.965%, 04/28/08 | 3,238,527 | ||
| 4,048,158 | Svenska Handelsbanken, | |||
| 4.652%, 02/06/09 | 4,048,158 | |||
| Total Corporate Bonds and Notes | ||||
| (Cost $38,052,689) | 37,945,514 | |||
| CORPORATE PAYDOWN SECURITIES - 2.60% | ||||
| 8,012,260 | KKR Atlantic East Holding Group | |||
| Trust, 3.054%, 03/25/09 (d) | 6,940,574 | |||
| 8,961,942 | KKR Pacific West Holding Group | |||
| Trust, 3.054%, 03/25/09 (d) | 7,970,959 | |||
| Total Corporate Paydown Securities | ||||
| (Cost $16,974,202) | 14,911,533 | |||
| Shares | ||||
| MONEY MARKET FUNDS - 3.45% | ||||
| 9,693,475 | AIM Short Term Liquid Asset Fund | 9,693,475 | ||
| 10,147,384 | Reserve Primary Fund | 10,147,384 | ||
| Total Money Market Funds | ||||
| (Cost $19,840,859) | 19,840,859 | |||
| Principal | Market | |||
| Amount | Value | |||
| REPURCHASE AGREEMENTS - 20.15% | ||||
| $17,542,020 | BNP Paribas Repurchase Agreement, | |||
| 3.200%, 04/01/08 | ||||
| (Collateralized by U.S. Government | ||||
| Agency Issues, value $17,816,505, | ||||
| 5.000% to 5.500%, | ||||
| 03/31/38 to 04/01/38) | $ | 17,542,020 | ||
| 13,493,861 | Citigroup Global Repurchase | |||
| Agreement, 3.050%, 04/01/08 | ||||
| (Collateralized by Foreign | ||||
| Government Bonds, value | ||||
| $13,769,524, 0.000% to 2.375%, | ||||
| 09/15/10 to 11/15/21) | 13,493,861 | |||
| 13,493,861 | Citigroup Global Repurchase | |||
| Agreement, 3.050%, 04/01/08 | ||||
| (Collateralized by Foreign | ||||
| Government Bonds, | ||||
| value $13,769,731, | ||||
| 0.000% to 2.375%, | ||||
| 05/15/11 to 01/15/17) | 13,493,861 | |||
| 6,450,066 | CS First Boston Repurchase | |||
| Agreement, 2.750%, 04/01/08 | ||||
| (Collateralized by U.S. Government | ||||
| Agency Issues, value $6,452,796, | ||||
| 0.000% to 6.500%, | ||||
| 01/25/12 to 03/20/38) | 6,450,066 | |||
| 26,987,723 | Greenwich Capital Repurchase | |||
| Agreement, 2.750%, 01/02/08 | ||||
| (Collateralized by U.S. Government | ||||
| Agency Issues, value $27,528,024, | ||||
| 0.000%, 12/01/33 to 04/15/37) | 26,987,723 | |||
| 26,987,723 | Merrill Lynch Repurchase | |||
| Agreement, 3.120%, 04/01/08 | ||||
| (Collateralized by non-U.S. | ||||
| Government Agency Issues, value | ||||
| $27,960,899, 3.631% to 8.125%, | ||||
| 01/15/10 to 11/15/23) | 26,987,723 | |||
| 5,397,545 | Morgan Stanley Repurchase | |||
| Agreement, 2.9000%, 04/01/08 | ||||
| (Collateralized by non-U.S. | ||||
| Government Agency Issues, value | ||||
| $6,523,128, 0.000%, 10/15/14) | 5,397,545 | |||
| 5,397,545 | Morgan Stanley Repurchase | |||
| Agreement, 3.1000%, 04/01/08 | ||||
| (Collateralized by U.S. Government | ||||
| Agency Issues, value $5,505,496, | ||||
| 5.000% to 5.500%, | ||||
| 05/17/31 to 04/20/33) | 5,397,545 | |||
23
| AssetMark Large Cap Value Fund |
| SCHEDULE OF INVESTMENTS (Continued) |
| March 31, 2008 |
| Principal | Market | |||
| Amount | Value | |||
| REPURCHASE AGREEMENTS - (Continued) | ||||
| Total Repurchase Agreements | ||||
| (Cost $115,750,344) | $ | 115,750,344 | ||
| Total Investments Purchased as | ||||
| Securities Lending Collateral | ||||
| (Cost $ 205,408,946) | 203,239,102 | |||
| Total Investments | ||||
| (Cost $789,878,617) - 135.43% | 777,864,172 | |||
| Liabilities in Excess of | ||||
| Other Assets - (35.43)% | (203,475,583) | |||
| TOTAL NET | ||||
| ASSETS - 100.00% | $ | 574,388,589 | ||
| Percentages are stated as a percent of net assets. | ||||
| ADR - American Depositary Receipt | ||||
| (a) Non Income Producing. | ||||
| (b) All or a portion of this security is on loan. | ||||
| (c) Restricted securities as defined in Rule 144(a) under the | ||||
| Securities Act of 1933. Such securities are treated as liquid | ||||
| securities according to the Fund’s liquidity guidelines. The | ||||
| market value of these securities total $14,790,852, which | ||||
| represents 2.58% of total net assets. | ||||
| (d) As of March 31, 2008, the Adviser has fair valued this security. | ||||
| The market value of these securities total $14,911,533, which | ||||
| represents 2.60% of total net assets. | ||||
| (e) Variable Rate Security. The rate shown is the rate in effect on | ||||
| March 31, 2008. | ||||
See notes to financial statements.
24
| AssetMark Small/Mid Cap Growth Fund |
| PERFORMANCE DATA |

TOTAL RETURN BASED ON A $10,000 INVESTMENT
This chart assumes an initial gross investment of $10,000 made on June 29, 2001 (commencement of the Fund’s operations). Returns shown include the reinvestment of all dividends. Returns shown do not reflect the deduction of taxes that a shareholder would pay on fund distributions or the redemption of fund shares. In the absence of fee waivers and reimbursements, total return would be reduced. Past performance is not predictive of future performance. Investment return and principal value will fluctuate, so that your shares, when redeemed, may be worth more or less than the original cost.
RUSSELL 2500 GROWTH INDEX - An unmanaged index which measures the performance of those Russell 2500 Index companies with higher price-to-book ratios and higher forecasted growth values. The Russell 2500 Index measures the performance of the 2,500 smallest companies in the Russell 3000 Index. The Russell 3000 Index is an unmanaged index which measures the performance of the 3,000 largest U.S. companies based on total market capitalization, which represents approximately 98% of the investable U.S. equity market.
RUSSELL MID-CAP GROWTH INDEX - Measures the performance of those Russell Midcap companies with higher price-to-book ratios and higher forecasted growth values. The stocks are also members of the Russell 1000 Growth Index. The Russell 1000 Growth Index contains those securities in the Russell 1000 Index with a greater-than-average growth orientation.
LIPPER SMALL-CAP GROWTH FUNDS INDEX - The Lipper Small-Cap Growth Funds Index is the average of the 30 largest funds in the Lipper Small-Cap Growth Funds Category. These funds, by portfolio practice, invest 75% of equity assets in companies with market capitalizations (on a three-year weighted basis) less than 250% of the dollar-weighted median market capitalization of the smallest 500 of the middle 1,000 securities of the S&P Super Composite 1500® Index. These funds typically invest in securities that have an above average price-to-earnings ratio, price-to-book ratio and three-year sales-per-share growth value, compared to the S&P SmallCap 600 IndexTM.
LIPPER MID-CAP GROWTH FUNDS INDEX - Funds that, by portfolio practice, invest at least 75% of their equity assets in companies with market capitalizations (on a three-year weighted basis) of less than 300% of the dollar-weighted median market capitalization of the S&P Mid-Cap 400 Index. Mid-Cap Growth funds normally invest in companies with long-term earnings expected to grow significantly faster than the earnings of the stocks represented in a major unmanaged stock index. These funds will normally invest in securities that have an above-average price-to-earnings ratio, price-to-book ratio and three-year earnings growth figure, compared to the U.S. diversified mid-cap funds universe average.
| AVERAGE ANNUAL TOTAL RETURN (for the periods ended March 31) | |||||
| One Year | Five Year | Since Inception (6/29/01) | |||
| AssetMark Small/Mid Cap Growth Fund | –10.31% | 11.30% | 1.23% | ||
| Russell 2500 Growth Index | –6.25% | 15.45% | 3.88% | ||
| Russell Mid-Cap Growth Index | –4.55% | 15.20% | 4.55% | ||
| Lipper Small-Cap Growth Funds Index | –9.53% | 12.68% | 2.27% | ||
| Lipper Mid-Cap Growth Funds Index | 1.09% | 15.12% | 3.76% | ||
25
| AssetMark Small/Mid Cap Growth Fund |
| SCHEDULE OF INVESTMENTS |
| March 31, 2008 |
| Number of | Market | |||
| Shares | Value | |||
| COMMON STOCKS - 97.37% | ||||
| Aerospace & Defense - 4.24% | ||||
| 39,680 | AAR Corp. (a) | $ | 1,082,073 | |
| 59,024 | BE Aerospace, Inc. (a)(b) | 2,062,889 | ||
| 22,700 | DRS Technologies, Inc. (b) | 1,322,956 | ||
| 20,300 | Hexcel Corp. (a)(b) | 387,933 | ||
| 14,084 | Ladish, Inc. (a)(b) | 507,024 | ||
| 5,362,875 | ||||
| Auto Components - 0.97% | ||||
| 24,400 | Autoliv, Inc. | 1,224,880 | ||
| Banks - 0.27% | ||||
| 13,385 | Signature Bank (a) | 341,318 | ||
| Beverages - 1.04% | ||||
| 17,100 | Central European Distribution | |||
| Corp. (a) | 995,049 | |||
| 9,000 | Hansen Natural Corp. (a)(b) | 317,700 | ||
| 1,312,749 | ||||
| Biotechnology - 5.59% | ||||
| 18,930 | Alexion Pharmaceuticals, Inc. (a)(b) | 1,122,549 | ||
| 33,800 | Arqule, Inc. (a)(b) | 144,664 | ||
| 10,906 | BioMarin Pharmaceuticals, Inc. (a)(b) | 385,745 | ||
| 8,097 | Cephalon, Inc. (a)(b) | 521,447 | ||
| 17,600 | Cepheid, Inc. (a)(b) | 429,264 | ||
| 14,900 | Cubist Pharmaceuticals, Inc. (a)(b) | 274,458 | ||
| 53,800 | Dendreon Corp. (a)(b) | 259,316 | ||
| 30,118 | Lifecell Corp. (a)(b) | 1,265,860 | ||
| 18,400 | Martek Biosciences Corp. (a)(b) | 562,488 | ||
| 24,262 | Millennium Pharmaceuticals, | |||
| Inc. (a)(b) | 375,090 | |||
| 9,400 | OSI Pharmaceuticals, Inc. (a)(b) | 351,466 | ||
| 47,800 | Rigel Pharmaceuticals, Inc. (a)(b) | 891,948 | ||
| 5,671 | United Therapeutics Corp. (a)(b) | 491,676 | ||
| 7,075,971 | ||||
| Capital Markets - 1.14% | ||||
| 3,595 | Affiliated Managers Group, | |||
| Inc. (a)(b) | 326,210 | |||
| 18,265 | FCStone Group, Inc. (a) | 505,941 | ||
| 10,630 | GFI Group Inc. | 609,099 | ||
| 1,441,250 | ||||
| Chemicals - 3.49% | ||||
| 13,364 | CF Industries Holdings, Inc. (b) | 1,384,778 | ||
| 9,000 | International Flavors & | |||
| Fragrances, Inc. | 396,450 |
| Number of | Market | |||
| Shares | Value | |||
| Chemicals (Continued) | ||||
| 3,400 | Koppers Holdings, Inc. | $ | 150,654 | |
| 13,300 | Lubrizol Corp. | 738,283 | ||
| 12,175 | OM Group, Inc. (a)(b) | 664,024 | ||
| 30,400 | Terra Industries, Inc. (a)(b) | 1,080,112 | ||
| 4,414,301 | ||||
| Commercial Banks - 0.79% | ||||
| 10,890 | PrivateBancorp, Inc. (b) | 342,708 | ||
| 32,100 | Susquehanna Bancshares, Inc. | 653,877 | ||
| 996,585 | ||||
| Commercial Services & Supplies - 5.38% | ||||
| 92,000 | Allied Waste Industries, Inc. (a) | 994,520 | ||
| 7,700 | Dun & Bradstreet Corp. | 626,626 | ||
| 19,734 | FTI Consulting, Inc. (a) | 1,401,903 | ||
| 6,100 | ICF International, Inc. (a) | 122,305 | ||
| 17,100 | Navigant Consulting, Inc. (a)(b) | 324,558 | ||
| 13,300 | PeopleSupport, Inc. (a)(b) | 121,296 | ||
| 35,100 | Republic Services, Inc. | 1,026,324 | ||
| 2,880 | Ritchie Bros. Auctioneers, Inc. (a) | 236,506 | ||
| 44,515 | SAIC, Inc. (a)(b) | 827,534 | ||
| 7,396 | Strayer Education, Inc. (b) | 1,127,890 | ||
| 6,809,462 | ||||
| Communications Equipment - 2.52% | ||||
| 31,340 | Belden CDT, Inc. (b) | 1,106,929 | ||
| 32,913 | Comtech Group, Inc. (a) | 355,131 | ||
| 22,903 | Harris Corp. | 1,111,482 | ||
| 11,000 | NICE Systems Ltd. - ADR (a)(b) | 310,420 | ||
| 63,400 | Powerwave Technologies, Inc. (a)(b) | 161,670 | ||
| 9,895 | Riverbed Technology, Inc. (a) | 147,040 | ||
| 3,192,672 | ||||
| Computers & Peripherals - 1.03% | ||||
| 84,700 | QLogic Corp. (a) | 1,300,145 | ||
| Construction & Engineering - 1.88% | ||||
| 27,525 | Chicago Bridge & Iron Co. N.V. - | |||
| ADR (b) | 1,080,081 | |||
| 50,043 | Quanta Services, Inc. (a)(b) | 1,159,496 | ||
| 3,000 | The Shaw Group Inc. (a) | 141,420 | ||
| 2,380,997 | ||||
| Containers & Packaging - 0.54% | ||||
| 2,600 | Greif, Inc. | 176,618 | ||
| 8,900 | Owens-Illinois, Inc. (a) | 502,227 | ||
| 678,845 | ||||
See notes to financial statements.
26
| AssetMark Small/Mid Cap Growth Fund |
| SCHEDULE OF INVESTMENTS (Continued) |
| March 31, 2008 |
| Number of | Market | |||
| Shares | Value | |||
| COMMON STOCKS (Continued) | ||||
| Distributors - 0.48% | ||||
| 15,000 | Genuine Parts Co. | $ | 603,300 | |
| Diversified Consumer Services - 1.48% | ||||
| 22,335 | Capella Education Company (a)(b) | 1,219,491 | ||
| 10,080 | New Oriental Education & | |||
| Technology Group, Inc. - ADR (a) | 653,789 | |||
| 1,873,280 | ||||
| Diversified Financial Services - 0.46% | ||||
| 4,451 | IntercontinentalExchange, Inc. (a) . | 580,855 | ||
| Diversified Telecommunication Services - 0.82% | ||||
| 72,500 | Premiere Global Services, Inc. (a)(b) | 1,039,650 | ||
| Electric Utilities - 0.74% | ||||
| 41,100 | Westar Energy, Inc. (b) | 935,847 | ||
| Electrical Equipment - 2.06% | ||||
| 15,400 | Evergreen Solar, Inc. (a)(b) | 142,758 | ||
| 2,900 | First Solar, Inc. (a) | 670,306 | ||
| 21,140 | General Cable Corp. (a)(b) | 1,248,740 | ||
| 20,600 | Woodward Governor Co. | 550,432 | ||
| 2,612,236 | ||||
| Electronic Equipment & Instruments - 3.71% | ||||
| 35,600 | Arrow Electronics, Inc. (a) | 1,197,940 | ||
| 17,100 | FLIR Systems, Inc. (a) | 514,539 | ||
| 26,100 | Insight Enterprises, Inc. (a)(b) | 456,750 | ||
| 25,931 | Itron, Inc. (a)(b) | 2,339,754 | ||
| 4,200 | Rofin-Sinar Technologies, Inc. (a)(b) | |||
| 188,580 | ||||
| 4,697,563 | ||||
| Energy Equipment & Services - 5.28% | ||||
| 14,500 | Atwood Oceanics, Inc. (a)(b) | 1,329,940 | ||
| 43,915 | Cal Dive International, Inc. (a) | 455,838 | ||
| 6,500 | Dawson Geophysical Co. (a) | 438,750 | ||
| 34,300 | Dresser-Rand Group, Inc. (a) | 1,054,725 | ||
| 7,300 | Dril-Quip, Inc. (a)(b) | 339,231 | ||
| 22,463 | Hercules Offshore, Inc. (a)(b) | 564,271 | ||
| 25,400 | ION Geophysical Corp. (a) | 350,520 | ||
| 9,400 | Oil States International, Inc. (a) | 421,214 | ||
| 17,280 | Patterson-UTI Energy, Inc. (b) | 452,390 | ||
| 18,400 | Superior Energy Services, Inc. (a) | 729,008 | ||
| 7,905 | W-H Energy Services, Inc. (a)(b) | 544,259 | ||
| 6,680,146 | ||||
| Number of | Market | |||
| Shares | Value | |||
| Food Products - 1.58% | ||||
| 55,100 | Darling International, Inc. (a)(b) | $ | 713,545 | |
| 81,100 | Del Monte Foods Co. | 772,883 | ||
| 10,700 | Green Mountain Coffee Roasters, | |||
| Inc. (a)(b) | 338,655 | |||
| 2,900 | Ralcorp Holdings, Inc. (a)(b) | 168,635 | ||
| 1,993,718 | ||||
| Gas Utilities - 0.40% | ||||
| 7,700 | Northwest Natural Gas Co. (b) | 334,488 | ||
| 4,300 | Suburban Propane Partners LP | 166,969 | ||
| 501,457 | ||||
| Health Care Equipment & Supplies - 4.46% | ||||
| 16,580 | Abaxis, Inc. (a)(b) | 384,159 | ||
| 41,540 | Conceptus, Inc. (a)(b) | 770,982 | ||
| 2,900 | Haemonetics Corporation (a)(b) | 172,782 | ||
| 15,794 | Illumina, Inc. (a)(b) | 1,198,765 | ||
| 5,825 | Intuitive Surgical, Inc. (a) | 1,889,339 | ||
| 7,200 | Matthews International Corp. (b) | 347,400 | ||
| 14,600 | Merit Medical Systems, Inc. (a) | 231,118 | ||
| 15,485 | ResMed, Inc. (a)(b) | 653,157 | ||
| 5,647,702 | ||||
| Health Care Providers & Services - 5.27% | ||||
| 20,165 | The Advisory Board Co. (a)(b) | 1,107,865 | ||
| 21,400 | AMERIGROUP Corp. (a) | 584,862 | ||
| 35,500 | Apria Healthcare Group, Inc. (a)(b) | 701,125 | ||
| 24,400 | Health Net, Inc. (a) | 751,520 | ||
| 10,774 | Pediatrix Medical Group, Inc. (a) | 726,168 | ||
| 82,376 | Psychiatric Solutions, Inc. (a)(b) | 2,794,194 | ||
| 6,665,734 | ||||
| Hotels, Restaurants & Leisure - 0.70% | ||||
| 15,400 | Bally Technologies, Inc. (a)(b) | 528,836 | ||
| 27,939 | Pinnacle Entertainment, Inc. (a)(b) | 357,619 | ||
| 886,455 | ||||
| Household Durables - 1.36% | ||||
| 22,300 | Pulte Homes, Inc. | 324,465 | ||
| 36,100 | Tupperware Brands Corp. (b) | 1,396,348 | ||
| 1,720,813 | ||||
| Household Products - 1.04% | ||||
| 24,200 | Church & Dwight, Inc. (b) | 1,312,608 | ||
| Insurance - 0.36% | ||||
| 20,890 | eHealth, Inc. (a) | 461,042 | ||
See notes to financial statements.
27
| AssetMark Small/Mid Cap Growth Fund |
| SCHEDULE OF INVESTMENTS (Continued) |
| March 31, 2008 |
| Number of | Market | |||
| Shares | Value | |||
| COMMON STOCKS (Continued) | ||||
| Internet & Catalog Retail - 3.49% | ||||
| 13,800 | NetFlix, Inc. (a)(b) | $ | 478,170 | |
| 23,580 | Priceline.com, Inc. (a)(b) | 2,849,879 | ||
| 31,040 | VistaPrint Limited (a)(b) | 1,084,848 | ||
| 4,412,897 | ||||
| Internet Software & Services - 2.76% | ||||
| 50,400 | Blue Coat Systems, Inc. (a)(b) | 1,110,816 | ||
| 8,697 | Equinix, Inc. (a)(b) | 578,264 | ||
| 33,900 | Interwoven, Inc. (a) | 362,052 | ||
| 28,300 | S1 Corp. (a)(b) | 201,213 | ||
| 27,400 | Sohu.com, Inc. (a) | 1,236,562 | ||
| 3,488,907 | ||||
| IT Services - 0.68% | ||||
| 29,803 | Cognizant Technology Solutions | |||
| Corp. (a) | 859,220 | |||
| Life Sciences Tools & Services - 0.43% | ||||
| 16,050 | Qiagen N.V. (a) | 333,840 | ||
| 31,600 | Sequenom, Inc. (a) | 205,400 | ||
| 539,240 | ||||
| Machinery - 4.00% | ||||
| 5,600 | Actuant Corp. - Class A (b) | 169,176 | ||
| 10,700 | AGCO Corp. (a)(b) | 640,716 | ||
| 4,278 | Bucyrus International, Inc. - Class A | |||
| 434,859 | ||||
| 6,753 | Flowserve Corp | 704,878 | ||
| 14,910 | Harsco Corp. | 825,716 | ||
| 12,000 | L.B. Foster Co. (a) | 516,720 | ||
| 23,900 | Reliance Steel & Aluminum Co. (b) | 1,430,654 | ||
| 5,503 | Terex Corp. (a) | 343,937 | ||
| 5,066,656 | ||||
| Media - 0.51% | ||||
| 13,575 | Focus Media Holding Ltd. - | |||
| ADR (a)(b) | 477,161 | |||
| 15,800 | Valassis Communications, Inc. (a)(b) | 171,430 | ||
| 648,591 | ||||
| Metals & Mining - 2.31% | ||||
| 29,000 | AK Steel Holding Corp. (b) | 1,578,180 | ||
| 6,100 | Alliance Resource Partners L.P | 213,500 | ||
| 13,700 | Brush Engineered Materials, Inc. (a) | 351,679 | ||
| 4,300 | Carpenter Technology (b) | 240,671 | ||
| 14,760 | Massey Energy Co. (b) | 538,740 | ||
| 2,922,770 | ||||
| Number of | Market | |||
| Shares | Value | |||
| Multi-Utilities - 0.13% | ||||
| 4,600 | SCANA Corp. | $ | 168,268 | |
| Oil & Gas - 5.37% | ||||
| 14,253 | Arena Resources, Inc. (a)(b) | 551,734 | ||
| 19,125 | ATP Oil & Gas Corp. (a)(b) | 625,770 | ||
| 33,000 | Continental Resources, Inc. (a)(b) | 1,052,370 | ||
| 2,500 | Oneok Partners L.P | 143,750 | ||
| 52,710 | Parallel Petroleum Corp. (a)(b) | 1,031,535 | ||
| 9,345 | Penn Virginia Corp. (b) | 412,021 | ||
| 2,100 | Petroleum Development Corp. (a)(b) | 145,467 | ||
| 22,990 | Petroquest Energy, Inc. (a)(b) | 398,647 | ||
| 9,210 | Range Resources Corp. | 584,374 | ||
| 31,695 | Sandridge Energy, Inc. (a)(b) | 1,240,859 | ||
| 3,500 | Stone Energy Corp. (a)(b) | 183,085 | ||
| 6,500 | Whiting Petroleum Corp. (a)(b) | 420,225 | ||
| 6,789,837 | ||||
| Personal Products - 1.43% | ||||
| 17,500 | Chattem, Inc. (a)(b) | 1,160,950 | ||
| 13,800 | Herbalife Ltd. | 655,500 | ||
| 1,816,450 | ||||
| Pharmaceuticals - 2.54% | ||||
| 13,700 | Auxilium Pharmaceuticals, Inc. (a) | 366,338 | ||
| 37,300 | King Pharmaceuticals, Inc. (a)(b) | 324,510 | ||
| 8,500 | Medicines Co. (a)(b) | 171,700 | ||
| 21,000 | Pain Therapeutics, Inc. (a)(b) | 177,450 | ||
| 34,960 | Perrigo Co. (b) | 1,319,041 | ||
| 29,100 | Watson Pharmaceuticals, Inc. (a)(b) | 853,212 | ||
| 3,212,251 | ||||
| Semiconductor & Semiconductor | ||||
| Equipment - 2.95% | ||||
| 16,903 | Cavium Networks, Inc. (a)(b) | 277,209 | ||
| 69,500 | EMCORE Corp. (a)(b) | 400,320 | ||
| 25,810 | Microsemi Corp. (a) | 588,468 | ||
| 17,900 | Omnivision Technologies, Inc. (a)(b) | 301,078 | ||
| 58,300 | Skyworks Solutions, Inc. (a)(b) | 424,424 | ||
| 109,088 | Teradyne, Inc. (a) | 1,354,873 | ||
| 4,600 | Varian Semiconductor Equipment | |||
| Associates, Inc. (a) | 129,490 | |||
| 10,700 | Xilinx, Inc. | 254,125 | ||
| 3,729,987 | ||||
| Software - 3.67% | ||||
| 65,630 | Activision, Inc. (a)(b) | 1,792,355 | ||
| 11,100 | Ansys, Inc. (a)(b) | 383,172 |
See notes to financial statements.
28
| AssetMark Small/Mid Cap Growth Fund |
| SCHEDULE OF INVESTMENTS (Continued) |
| March 31, 2008 |
| Number of | Market | |||
| Shares | Value | |||
| COMMON STOCKS (Continued) | ||||
| Software (Continued) | ||||
| 5,600 | Concur Technologies, Inc. (a)(b) | $ | 173,880 | |
| 26,615 | Jack Henry & Associates, Inc. (b) | 656,592 | ||
| 31,200 | Secure Computing Corp. (a) | 201,240 | ||
| 23,240 | Synopsys, Inc. (a) | 527,781 | ||
| 30,135 | Ultimate Software Group, Inc. (a) | 905,858 | ||
| 4,640,878 | ||||
| Specialty Retail - 4.37% | ||||
| 9,720 | Abercrombie & Fitch Co. - Class A | 710,921 | ||
| 54,300 | Aeropostale, Inc. (a)(b) | 1,472,073 | ||
| 13,530 | GameStop Corp. - Class A (a)(b) | 699,636 | ||
| 20,210 | Guess?, Inc. (b) | 817,899 | ||
| 16,300 | Gymboree Corp. (a)(b) | 650,044 | ||
| 13,570 | J.Crew Group, Inc. (a) | 599,387 | ||
| 18,630 | Urban Outfitters, Inc. (a)(b) | 584,050 | ||
| 5,534,010 | ||||
| Textiles, Apparel & Luxury Goods - 2.27% | ||||
| 17,280 | Deckers Outdoor Corp. (a)(b) | 1,863,130 | ||
| 26,967 | Fossil, Inc. (a)(b) | 823,572 | ||
| 9,000 | Skechers U.S.A., Inc. (a) | 181,890 | ||
| 2,868,592 | ||||
| Thrifts & Mortgage Finance - 0.42% | ||||
| 23,500 | Washington Federal, Inc. (b) | 536,740 | ||
| Transportation Infrastructure - 0.96% | ||||
| 35,720 | Aegean Marine Petroleum | |||
| Network Inc. | 1,221,981 | |||
| Total Common Stocks | ||||
| (Cost $118,411,851) | 123,201,731 | |||
| EXCHANGE-TRADED FUNDS - 1.62% | ||||
| Exchange Traded Funds - 1.62% | ||||
| 28,209 | iShares Russell 2000 Growth Index | |||
| Fund (b) | 2,054,744 | |||
| Total Exchange-Traded Funds | ||||
| (Cost $1,996,156) | 2,054,744 | |||
| REAL ESTATE INVESTMENT TRUSTS - 0.14% | ||||
| Real Estate Investment Trusts - 0.14% | ||||
| 12,000 | Inland Real Estate Corp. (b) | 182,520 | ||
| Total Real Estate Investment Trusts | ||||
| (Cost $169,349) | 182,520 | |||
| Principal | Market | ||||
| Amount | Value | ||||
| SHORT TERM INVESTMENTS - 0.36% | |||||
| Money Market Funds - 0.36% | |||||
| $ | 448,843 | Federated Prime Obligations Fund, | |||
| 3.180% (e) | $ | 448,843 | |||
| Total Short Term Investments | |||||
| (Cost $448,843) | 448,843 | ||||
| INVESTMENTS PURCHASED | |||||
| AS SECURITIES LENDING | |||||
| COLLATERAL - 38.83% | |||||
| COMMERCIAL PAPER - 2.82% | |||||
| 603,491 | Bryant Park Funding LLC, | ||||
| 3.188%, 04/03/08 (c) | 603,331 | ||||
| 1,043,877 | Sheffield Receivables Corp., | ||||
| 3.053%, 04/08/08 (c) | 1,043,169 | ||||
| 391,454 | Thames Asset Global, | ||||
| 2.287%, 06/27/08 (c) | 388,755 | ||||
| 466,221 | Three Pillars Funding, | ||||
| 2.906%, 04/14/08 (c) | 465,695 | ||||
| 1,076,498 | Tulip Funding, 2.856%, 04/21/08 (c) | 1,074,708 | |||
| Total Commercial Paper | |||||
| (Cost $3,575,658) | 3,575,658 | ||||
CORPORATE BONDS AND NOTES- 7.26% | |||||
| 1,957,269 | Abbey National Trust, | ||||
| 3.130%, 02/13/09 | 1,929,727 | ||||
| 1,826,784 | Allstate Life Global Funding, | ||||
| 3.332%, 03/20/09 | 1,827,778 | ||||
| 1,304,845 | Bank of Scotland, 4.614%, 02/06/09 | 1,304,845 | |||
| 1,696,299 | Barclays Bank, 3.361%, 03/16/09 | 1,696,169 | |||
| 652,423 | Bayerische Landesbank, | ||||
| 4.956%, 08/23/08 | 653,194 | ||||
| 782,907 | Metlife Global, 4.965%, 04/28/08 | 782,907 | |||
| 978,634 | Svenska Handelsbanken, | ||||
| 4.652%, 02/06/09 | 978,634 | ||||
| Total Corporate Bonds and Notes | |||||
| (Cost $9,199,161) | 9,173,254 | ||||
| CORPORATE PAYDOWN SECURITIES - 2.85% | |||||
| 1,936,948 | KKR Atlantic East Holding Group | ||||
| Trust, 3.054%, 03/25/09 (d) | 1,680,503 | ||||
| 2,166,532 | KKR Pacific West Holding Group | ||||
| Trust, 3.054%, 03/25/09 (d) | 1,929,399 | ||||
| Total Corporate Paydown Securities | |||||
| (Cost $4,103,480) | 3,609,902 | ||||
See notes to financial statements.
29
| AssetMark Small/Mid Cap Growth Fund |
| SCHEDULE OF INVESTMENTS (Continued) |
| March 31, 2008 |
| Market | |||||
| Shares | Value | ||||
| MONEY MARKET FUNDS - 3.79% | |||||
| 2,343,378 | AIM Short Term Liquid Asset Fund $ | 2,343,378 | |||
| 2,453,110 | Reserve Primary Fund | 2,453,110 | |||
| Total Money Market Funds | |||||
| (Cost $4,796,488) | 4,796,488 | ||||
| Principal | |||||
| Amount | |||||
| REPURCHASE AGREEMENTS - 22.11% | |||||
| $ | 4,240,749 | BNP Paribas Repurchase Agreement, | |||
| 3.200%, 04/01/08 (Collateralized | |||||
| by U.S. Government Agency Issues, | |||||
| value $4,307,105, 5.000% to 5.500%, | |||||
| 03/31/38 to 04/01/38) | 4,240,749 | ||||
| 3,262,114 | Citigroup Global Repurchase | ||||
| Agreement, 3.050%, 04/01/08 | |||||
| (Collateralized by Foreign | |||||
| Government Bonds, value $3,328,755, | |||||
| 0.000% to 2.375%, | |||||
| 09/15/10 to 11/15/21) | 3,262,114 | ||||
| 3,262,114 | Citigroup Global Repurchase | ||||
| Agreement, 3.050%, 04/01/08 | |||||
| (Collateralized by Foreign | |||||
| Government Bonds, value $3,328,805, | |||||
| 0.000% to 2.375%, | |||||
| 05/15/11 to 01/15/17) | 3,262,114 | ||||
| 1,559,291 | CS First Boston Repurchase | ||||
| Agreement, 2.750%, 04/01/08 | |||||
| (Collateralized by U.S. Government | |||||
| Agency Issues, value $1,559,950, | |||||
| 0.000% to 6.500%, | |||||
| 01/25/12 to 03/20/38) | 1,559,291 | ||||
| 6,524,228 | Greenwich Capital Repurchase | ||||
| Agreement, 2.750%, 01/02/08 | |||||
| (Collateralized by U.S. Government | |||||
| Agency Issues, value $6,654,845, | |||||
| 0.000%, 12/01/33 to 04/15/37) | 6,524,228 | ||||
| Principal | Market | ||||
| Amount | Value | ||||
| REPURCHASE AGREEMENTS (Continued) | |||||
| $ | 6,524,228 | Merrill Lynch Repurchase Agreement, | |||
| 3.120%, 04/01/08 (Collateralized | |||||
| by non-U.S. Government Agency | |||||
| Issues, value $6,759,492, 3.631% to | |||||
| 8.125%, 01/15/10 to 11/15/23) | $ | 6,524,228 | |||
| 1,304,846 | Morgan Stanley Repurchase | ||||
| Agreement, 2.9000%, 04/01/08 | |||||
| (Collateralized by non-U.S. | |||||
| Government Agency Issues, value | |||||
| $1,576,953, 0.000%, 10/15/14) | 1,304,846 | ||||
| 1,304,846 | Morgan Stanley Repurchase | ||||
| Agreement, 3.1000%, 04/01/08 | |||||
| (Collateralized by U.S. Government | |||||
| Agency Issues, value $1,330,943, | |||||
| 5.000% to 5.500%, | |||||
| 05/17/31 to 04/20/33) | 1,304,846 | ||||
| Total Repurchase Agreements | |||||
| (Cost $27,982,416) | 27,982,416 | ||||
| Total Investments Purchased as | |||||
| Securities Lending Collateral | |||||
| (Cost $49,657,203) | 49,137,718 | ||||
| Total Investments | |||||
| (Cost $170,683,402) - 138.32% | 175,025,556 | ||||
| Liabilities in Excess of | |||||
| Other Assets - (38.32)% | (48,490,751) | ||||
| TOTAL NET | |||||
| ASSETS - 100.00% | $ | 126,534,805 | |||
| Percentages are stated as a percent of net assets. | |||||
| ADR - American Depository Receipt | |||||
| (a) Non Income Producing. | |||||
| (b) All or a portion of this security is on loan. | |||||
| (c) Restricted securities as defined in Rule 144(a) under the | |||||
| Securities Act of 1933. Such securities are treated as liquid | |||||
| securities according to the Fund’s liquidity guidelines. The | |||||
| market value of these securities total $3,575,658, which | |||||
| represents 2.82% of total net assets. | |||||
| (d) As of March 31, 2008, the Adviser has fair valued this security. | |||||
| The market value of these securities total $3,609,902, which | |||||
| represents 2.85% of total net assets. | |||||
| (e) Variable Rate Security. The rate shown is the rate in effect on | |||||
| March 31, 2008. | |||||
See notes to financial statements.
30
| AssetMark Small/Mid Cap Value Fund |
| PERFORMANCE DATA |
TOTAL RETURN BASED ON A $10,000 INVESTMENT

This chart assumes an initial gross investment of $10,000 made on June 29, 2001 (commencement of the Fund’s operations). Returns shown include the reinvestment of all dividends. Returns shown do not reflect the deduction of taxes that a shareholder would pay on fund distributions or the redemption of fund shares. In the absence of fee waivers and reimbursements, total return would be reduced. Past performance is not predictive of future performance. Investment return and principal value will fluctuate, so that your shares, when redeemed, may be worth more or less than the original cost.
RUSSELL 2500 VALUE INDEX - An unmanaged index which measures the performance of those Russell 2500 Index companies with lower price-to-book ratios and lower forecasted growth values. The Russell 2500 Index is an unmanaged index which measures the performance of the 2,500 smallest companies in the Russell 3000 Index. The Russell 3000 Index is an unmanaged index which measures the performance of the 3,000 largest U.S. companies based on total market capitalization, which represents approximately 98% of the investable U.S. equity market.
RUSSELL MID-CAP VALUE INDEX - Measures the performance of those Russell Midcap companies with lower price-to-book ratios and lower forecasted growth values. The stocks are also members of the Russell 1000 Value Index. The Russell 1000 Value Index contains those securities in the Russell 1000 Index with a less-than-average growth orientation.
LIPPER SMALL-CAP VALUE FUNDS INDEX - The Lipper Small-Cap Value Funds Index is the average of the 30 largest funds in the Lipper Small-Cap Value Funds Category. These funds, by portfolio practice, invest 75% of equity assets in companies with market capitalizations (on a three-year weighted basis) less than 250% of the dollar-weighted median market capitalization of the smallest 500 of the middle 1,000 securities of the S&P Super Composite 1500® Index. These funds typically have a below average price-to-earnings ratio, price-to-book ratio and three-year sales-per-share growth value, compared to the S&P SmallCap 600 IndexTM.
LIPPER MID-CAP VALUE FUNDS INDEX - Funds that, by portfolio practice, invest at least 75% of their equity assets in companies with market capitalizations (on a three-year weighted basis) of less than 300% of the dollar-weighted median market capitalization of the S&P Mid-Cap 400 Index. Mid-Cap Value funds seek long-term growth of capital by investing in companies that are considered to be undervalued relative to a major unmanaged stock index based on price-to-current earnings, book value, asset value, or other factors. These funds will normally have a below-average price-to-earnings ratio, price-to-book ratio and three-year earnings growth figure, compared to the U.S. diversified mid-cap funds universe average.
| AVERAGE ANNUAL TOTAL RETURN (for the periods ended March 31) | |||||
| One Year | Five Year | Since Inception (6/29/01) | |||
| AssetMark Small/Mid Cap Value Fund | -19.47% | 10.11% | 4.86% | ||
| Russell 2500 Value Index | -16.54% | 15.56% | 9.10% | ||
| Russell Mid-Cap Value Index | -14.12% | 16.77% | 9.67% | ||
| Lipper Small-Cap Value Funds Index | -13.51% | 16.23% | 9.11% | ||
31
| AssetMark Small/Mid Cap Value Fund |
| SCHEDULE OF INVESTMENTS |
| March 31, 2008 |
| Number of | Market | |||
| Shares | Value | |||
| COMMON STOCKS - 93.31% | ||||
| Aerospace & Defense - 2.07% | ||||
| 7,700 | BE Aerospace, Inc. (a) | $ | 269,115 | |
| 12,500 | Curtiss-Wright Corp. (b) | 518,500 | ||
| 7,700 | Esterline Technologies Corp. (a) | 387,849 | ||
| 12,300 | Moog, Inc. (a) | 519,183 | ||
| 16,400 | Spirit Aerosystems Holdings, Inc. (a) | 363,752 | ||
| 2,058,399 | ||||
| Auto Components - 0.90% | ||||
| 26,200 | Cooper Tire & Rubber Co. (b) | 392,214 | ||
| 19,700 | Goodyear Tire & Rubber Co. (a) | 508,260 | ||
| 900,474 | ||||
| Capital Markets - 3.16% | ||||
| 31,900 | Ameriprise Financial, Inc. | 1,654,015 | ||
| 16,700 | Calamos Asset Management, Inc. | 271,876 | ||
| 54,300 | E*Trade Financial Corp. (a)(b) | 209,598 | ||
| 62,880 | Jefferies Group, Inc. (b) | 1,014,254 | ||
| 3,149,743 | ||||
| Chemicals - 3.48% | ||||
| 13,100 | Airgas, Inc. | 595,657 | ||
| 35,870 | Ashland, Inc. | 1,696,651 | ||
| 2,400 | CF Industries Holdings, Inc. (b) | 248,688 | ||
| 20,800 | HB Fuller Co. | 424,528 | ||
| 9,200 | OM Group, Inc. (a) | 501,768 | ||
| 3,467,292 | ||||
| Commercial Banks - 7.63% | ||||
| 22,300 | Associated Banc-Corp. | 593,849 | ||
| 21,900 | Central Pacific Financial Corp. (b) | 412,815 | ||
| 11,400 | Citizens Banking Corp. | 141,702 | ||
| 42,300 | The Colonial BancGroup, Inc. (b) | 407,349 | ||
| 4,900 | First Community Bancorp. | 131,565 | ||
| 30,300 | First Midwest Bancorp, Inc. (b) | 841,431 | ||
| 10,400 | FirstMerit Corp. | 214,864 | ||
| 14,400 | Hancock Holding Co. (b) | 605,088 | ||
| 116,960 | Investors Bancorp, Inc. (a)(b) | 1,795,336 | ||
| 16,800 | The South Financial Group, Inc. (b) | 249,648 | ||
| 21,300 | Trustmark Corp. | 474,564 | ||
| 41,820 | UMB Financial Corp. (b) | 1,722,984 | ||
| 7,591,195 | ||||
| Commercial Services & Supplies - 1.75% | ||||
| 29,700 | Corrections Corp. of America (a) | 817,344 | ||
| 9,700 | The Geo Group Inc. (a) | 275,868 | ||
| 22,200 | Republic Services, Inc. | 649,128 | ||
| 1,742,340 |
| Number of | Market | |||
| Shares | Value | |||
| Communications Equipment - 0.83% | ||||
| 39,300 | ADC Telecommunications, Inc. (a)(b) | $ | 474,744 | |
| 10,000 | Belden CDT, Inc. | 353,200 | ||
| 827,944 | ||||
| Construction & Engineering - 1.24% | ||||
| 58,100 | MasTec, Inc. (a) | 477,001 | ||
| 32,800 | Quanta Services, Inc. (a) | 759,976 | ||
| 1,236,977 | ||||
| Consumer Finance - 0.71% | ||||
| 22,200 | World Acceptance Corp. (a) | 707,070 | ||
| Containers & Packaging - 1.55% | ||||
| 7,700 | Greif, Inc. | 523,061 | ||
| 31,400 | Myers Industries, Inc. | 412,282 | ||
| 23,100 | Pactiv Corp. (a) | 605,451 | ||
| 1,540,794 | ||||
| Diversified Financial Services - 3.03% | ||||
| 24,600 | Assured Guaranty Ltd. | 584,004 | ||
| 53,770 | Leucadia National Corp. | 2,431,479 | ||
| 3,015,483 | ||||
| Diversified Telecommunication Services - 2.08% | ||||
| 103,300 | Cincinnati Bell, Inc. (a) | 440,058 | ||
| 40,720 | Embarq Corp. | 1,632,872 | ||
| 2,072,930 | ||||
| Electric Utilities - 3.75% | ||||
| 126,650 | Centerpoint Energy, Inc. (b) | 1,807,295 | ||
| 21,100 | Cleco Corp. (b) | 467,998 | ||
| 14,200 | IDACORP, Inc. | 455,962 | ||
| 22,700 | Wisconsin Energy Corp. | 998,573 | ||
| 3,729,828 | ||||
| Electrical Equipment - 0.98% | ||||
| 9,500 | AO Smith Corp. | 312,265 | ||
| 30,390 | Encore Wire Corp. (b) | 553,402 | ||
| 3,000 | Regal-Beloit Corp. (b) | 109,890 | ||
| 975,557 | ||||
| Electronic Equipment & Instruments - 2.21% | ||||
| 16,400 | Arrow Electronics, Inc. (a)(b) | 551,860 | ||
| 29,800 | Benchmark Electronics, Inc. (a)(b) | 534,910 | ||
| 4,800 | Mettler Toledo International, Inc. (a) | 466,176 | ||
| 23,000 | Plexus Corp. (a) | 645,150 | ||
| 2,198,096 | ||||
| Energy Equipment & Services - 0.39% | ||||
| 22,600 | Matrix Service Co. (a) | 388,268 | ||
See notes to financial statements.
32
| AssetMark Small/Mid Cap Value Fund |
| SCHEDULE OF INVESTMENTS (Continued) |
| March 31, 2008 |
| Number of | Market | |||
| Shares | Value | |||
| COMMON STOCKS (Continued) | ||||
| Food & Staples Retailing - 3.49% | ||||
| 55,730 | Longs Drug Stores Corp. (b) | $ | 2,366,296 | |
| 61,450 | Winn Dixie Stores, Inc. (a)(b) | 1,103,642 | ||
| 3,469,938 | ||||
| Food Products - 0.84% | ||||
| 11,400 | Fresh Del Monte Produce, Inc. (a) | 414,960 | ||
| 16,400 | Smithfield Foods, Inc. (a) | 422,464 | ||
| 837,424 | ||||
| Gas Utilities - 2.54% | ||||
| 17,700 | AGL Resources, Inc. | 607,464 | ||
| 20,900 | New Jersey Resources Corp. | 648,945 | ||
| 13,000 | Northwest Natural Gas Co. | 564,720 | ||
| 28,200 | UGI Corp. | 702,744 | ||
| 2,523,873 | ||||
| Health Care Providers & Services - 1.43% | ||||
| 11,300 | Magellan Health Services, Inc. (a)(b) | 448,497 | ||
| 18,200 | Universal Health Services, Inc. | 977,158 | ||
| 1,425,655 | ||||
| Hotels, Restaurants & Leisure - 5.16% | ||||
| 50,080 | Boyd Gaming Corp. (b) | 1,001,600 | ||
| 13,600 | CEC Entertainment, Inc. (a)(b) | 392,768 | ||
| 28,000 | Penn National Gaming, Inc. (a) | 1,224,440 | ||
| 116,070 | Triarc Companies, Inc. | 802,044 | ||
| 35,540 | Vail Resorts, Inc. (a)(b) | 1,716,226 | ||
| 5,137,078 | ||||
| Household Durables - 0.66% | ||||
| 11,300 | Lennar Corp. | 212,553 | ||
| 91,200 | Standard-Pacific Corp. (b) | 443,232 | ||
| 655,785 | ||||
| Insurance - 8.29% | ||||
| 25,600 | American Financial Group, Inc. (b) | 654,336 | ||
| 11,500 | Arch Capital Group Ltd. (a) | 789,705 | ||
| 10,800 | Assurant, Inc. | 657,288 | ||
| 18,600 | The Hanover Insurance Group, Inc. | 765,204 | ||
| 35,200 | LandAmerica Financial | |||
| Group, Inc. (b) | 1,389,344 | |||
| 9,500 | Loews Corp. - Carolina Group | 689,225 | ||
| 107,900 | Old Republic International Corp. (b) | 1,392,989 | ||
| 4,000 | White Mountains Insurance Group Ltd. | 1,920,000 | ||
| 8,258,091 | ||||
| Number of | Market | |||
| Shares | Value | |||
| Life Science Tools & Supplies - 0.71% | ||||
| 29,100 | PerkinElmer, Inc. | $ | 705,675 | |
| Machinery - 1.50% | ||||
| 9,200 | Actuant Corp. - Class A (b) | 277,932 | ||
| 4,400 | AGCO Corp. (a) | 263,472 | ||
| 19,600 | Pall Corp. | 687,372 | ||
| 7,100 | Westinghouse Air Brake | |||
| Technologies Corp. | 267,386 | |||
| 1,496,162 | ||||
| Media - 1.91% | ||||
| 20,100 | Cinemark Holdings, Inc. | 257,079 | ||
| 66,190 | Discovery Holding Co. (a) | 1,404,552 | ||
| 24,400 | Entercom Communications Corp. (b) | 242,292 | ||
| 1,903,923 | ||||
| Multiline Retail - 1.02% | ||||
| 27,000 | J.C. Penney Co., Inc. (b) | 1,018,170 | ||
| Multi-Utilities - 2.24% | ||||
| 477,270 | Aquila, Inc. (a) | 1,532,037 | ||
| 26,200 | Vectren Corp. | 702,946 | ||
| 2,234,983 | ||||
| Oil & Gas - 11.23% | ||||
| 9,600 | Carrizo Oil & Gas, Inc. (a)(b) | 568,992 | ||
| 47,750 | CNX Gas Corp. (a) | 1,541,370 | ||
| 32,820 | Comstock Resources, Inc. (a)(b) | 1,322,646 | ||
| 6,400 | Holly Corp. | 277,824 | ||
| 25,450 | Overseas Shipholding Group, Inc. (b) | 1,782,518 | ||
| 23,390 | Pioneer Natural Resources Co. (b) | 1,148,917 | ||
| 24,190 | Plains All American Pipeline, L.P | 1,149,992 | ||
| 34,860 | Plains Exploration & | |||
| Production Co. (a) | 1,852,460 | |||
| 42,090 | Quicksilver Resources, Inc. (a) | 1,537,548 | ||
| 11,182,267 | ||||
| Paper & Forest Products - 0.89% | ||||
| 96,170 | Louisiana-Pacific Corp. (b) | 882,841 | ||
| Pharmaceuticals - 1.70% | ||||
| 25,600 | Endo Pharmaceuticals | |||
| Holdings Inc. (a)(b) | 612,864 | |||
| 21,600 | Sciele Pharma, Inc. (a) | 421,200 | ||
| 22,300 | Watson Pharmaceuticals, Inc. (a) | 653,836 | ||
| 1,687,900 | ||||
| Real Estate Management & Development - 0.00% | ||||
| 1 | Forestar Real Estate Group Inc. (a) | 25 | ||
See notes to financial statements.
33
| AssetMark Small/Mid Cap Value Fund |
| SCHEDULE OF INVESTMENTS (Continued) |
| March 31, 2008 |
| Number of | Market | |||
| Shares | Value | |||
| COMMON STOCKS (Continued) | ||||
| Semiconductor & Semiconductor | ||||
| Equipment - 2.58% | ||||
| 19,200 | Advanced Energy Industries, Inc. (a) | $ | 254,592 | |
| 334,600 | Atmel Corp. (a)(b) | 1,164,408 | ||
| 13,600 | Cypress Semiconductor Corp. (a)(b) | 321,096 | ||
| 16,800 | Diodes, Inc. (a) | 368,928 | ||
| 51,100 | Integrated Device Technology, Inc. (a) | |||
| 456,323 | ||||
| 2,565,347 | ||||
| Software - 1.23% | ||||
| 36,200 | Parametric Technology Corp. (a)(b) | 578,476 | ||
| 24,400 | Sybase, Inc. (a) | 641,720 | ||
| 1,220,196 | ||||
| Specialty Retail - 0.98% | ||||
| 10,800 | AnnTaylor Stores Corp. (a) | 261,144 | ||
| 69,780 | Borders Group, Inc. (b) | 409,609 | ||
| 20,100 | Brown Shoe Co., Inc. (b) | 302,907 | ||
| 973,660 | ||||
| Thrifts & Mortgage Finance - 9.15% | ||||
| 25,000 | BankAtlantic Bancorp, Inc. | 97,750 | ||
| 35,400 | BankUnited Financial Corp. | 177,354 | ||
| 55,530 | Capitol Federal Financial (b) | 2,081,264 | ||
| 37,000 | Dime Community Bancshares | 646,760 | ||
| 7,500 | Downey Financial Corp. | 137,850 | ||
| 7,600 | FirstFed Financial Corp. (a) | 206,340 | ||
| 1 | Guaranty Financial Group, Inc. (a) | 11 | ||
| 108,100 | Hudson City Bancorp, Inc. (b) | 1,911,208 | ||
| 48,200 | IndyMac Bancorp, Inc. (b) | 239,072 | ||
| 86,700 | New York Community Bancorp, Inc. | 1,579,674 | ||
| 24,800 | PFF Bancorp, Inc. | 206,336 | ||
| 103,590 | TFS Financial Corp. | 1,246,188 | ||
| 25,400 | Washington Federal, Inc. | 580,136 | ||
| 9,109,943 | ||||
| Total Common Stocks | ||||
| (Cost $98,037,997) | 92,891,326 | |||
| REAL ESTATE INVESTMENT TRUSTS - 5.55% | ||||
| Real Estate Investment Trusts - 5.55% | ||||
| 4,000 | Alexandria Real Estate Equities, Inc. | 370,880 | ||
| 48,700 | Anworth Mortgage Asset Corp. (b) | 298,531 | ||
| 34,100 | Chimera Investment Corp. (b) | 419,430 | ||
| 12,307 | Deerfield Capital Corp. | 17,352 | ||
| 30,900 | DuPont Fabros Technology, Inc. | 509,541 | ||
| 9,400 | Health Care REIT, Inc. | 424,222 | ||
| 26,100 | MFA Mortgage Investments, Inc. | 164,430 | ||
| Number of | Market | |||
| Shares | Value | |||
| Real Estate Investment Trusts (Continued) | ||||
| 34,600 | NorthStar Realty Finance Corp. | $ | 282,682 | |
| 48,460 | Plum Creek Timber Co., Inc. (b) | 1,972,322 | ||
| 41,017 | RAIT Investment Trust | 284,658 | ||
| 30,400 | Realty Income Corp. | 778,848 | ||
| 5,522,896 | ||||
| Total Real Estate Investment Trusts | ||||
| (Cost $5,542,099) | 5,522,896 | |||
| SHORT TERM INVESTMENTS - 1.24% | ||||
| Money Market Funds - 1.24% | ||||
| 1,237,573 | Federated Prime Obligations Fund, | |||
| 3.180% (e) | 1,237,573 | |||
| Total Short Term Investments | ||||
| (Cost $1,237,573) | 1,237,573 | |||
| Principal | ||||
| Amount | ||||
| INVESTMENTS PURCHASED | ||||
| AS SECURITIES LENDING | ||||
| COLLATERAL - 22.91% | ||||
| COMMERCIAL PAPER - 1.66% | ||||
| $279,598 | Bryant Park Funding LLC, | |||
| 3.188%, 04/03/08 (c) | 279,525 | |||
| 483,630 | Sheffield Receivables Corp., | |||
| 3.053%, 04/08/08 (c) | 483,302 | |||
| 181,361 | Thames Asset Global, | |||
| 2.287%, 06/27/08 (c) | 180,111 | |||
| 216,001 | Three Pillars Funding, | |||
| 2.906%, 04/14/08 (c) | 215,757 | |||
| 498,743 | Tulip Funding, | |||
| 2.856%, 04/21/08 (c) | 497,914 | |||
| Total Commercial Paper | ||||
| (Cost $1,656,609) | 1,656,609 | |||
CORPORATE BONDS AND NOTES - 4.27% | ||||
| 906,805 | Abbey National Trust, | |||
| 3.130%, 02/13/09 | 894,044 | |||
| 846,352 | Allstate Life Global Funding, | |||
| 3.332%, 03/20/09 | 846,812 | |||
| 604,537 | Bank of Scotland, 4.614%, 02/06/09 | 604,537 | ||
| 785,898 | Barclays Bank, 3.361%, 03/16/09 | 785,838 | ||
| 302,269 | Bayerische Landesbank, | |||
| 4.956%, 08/23/08 | 302,625 | |||
| 362,722 | Metlife Global, 4.965%, 04/28/08 | 362,722 | ||
| 453,403 | Svenska Handelsbanken, | |||
| 4.652%, 02/06/09 | 453,403 | |||
| Total Corporate Bonds and Notes | ||||
| (Cost $4,261,986) | 4,249,981 | |||
See notes to financial statements.
34
| AssetMark Small/Mid Cap Value Fund |
| SCHEDULE OF INVESTMENTS (Continued) |
| March 31, 2008 |
| Principal | Market | ||||
| Amount | Value | ||||
| INVESTMENTS PURCHASED | |||||
| AS SECURITIES LENDING | |||||
| COLLATERAL (Continued) | |||||
| CORPORATE PAYDOWN SECURITIES - 1.72% | |||||
| $ | 897,391 | KKR Atlantic East Holding Group | |||
| Trust, 3.054%, 03/25/09 (d) | $ | 797,662 | |||
| 1,003,758 | KKR Pacific West Holding Group | ||||
| Trust, 3.054%, 03/25/09 (d) | 911,540 | ||||
| Total Corporate Paydown Securities | |||||
| (Cost $1,901,149) | 1,709,202 | ||||
| Shares | |||||
| MONEY MARKET FUNDS - 2.24% | |||||
| 1,085,691 | AIM Short Term Liquid Asset Fund | 1,085,691 | |||
| 1,136,530 | Reserve Primary Fund | 1,136,530 | |||
| Total Money Market Funds | |||||
| (Cost $2,222,221) | 2,222,221 | ||||
| Principal | |||||
| Amount | |||||
REPURCHASE AGREEMENTS - 13.02% | |||||
| $1,964,746 | BNP Paribas Repurchase Agreement, | ||||
| 3.200%, 04/01/08 (Collateralized | |||||
| by U.S. Government Agency Issues, | |||||
| value $1,995,488, 5.000% to 5.500%, | |||||
| 03/31/38 to 04/01/38) | 1,964,746 | ||||
| 1,511,343 | Citigroup Global Repurchase | ||||
| Agreement, 3.050%, 04/01/08 | |||||
| (Collateralized by Foreign Government | |||||
| Bonds, value $1,542,218, | |||||
| 0.000% to 2.375%, | |||||
| 09/15/10 to 11/15/21) | 1,511,343 | ||||
| 1,511,343 | Citigroup Global Repurchase | ||||
| Agreement, 3.050%, 04/01/08 | |||||
| (Collateralized by Foreign Government | |||||
| Bonds, value $1,542,241, | |||||
| 0.000% to 2.375%, | |||||
| 05/15/11 to 01/15/17) | 1,511,343 | ||||
| 722,422 | CS First Boston Repurchase | ||||
| Agreement, 2.750%, 04/01/08 | |||||
| (Collateralized by U.S. Government | |||||
| Agency Issues, value $722,728, | |||||
| 0.000% to 6.500%, | |||||
| 01/25/12 to 03/20/38) | 722,422 | ||||
| Principal | Market | ||||
| Amount | Value | ||||
| REPURCHASE AGREEMENTS (Continued) | |||||
| $ | 3,022,685 | Greenwich Capital Repurchase | |||
| Agreement, 2.750%, 01/02/08 | |||||
| (Collateralized by U.S. Government | |||||
| Agency Issues, value $3,083,200, | |||||
| 0.000%, 12/01/33 to 04/15/37) | $ | 3,022,685 | |||
| 3,022,685 | Merrill Lynch Repurchase | ||||
| Agreement, 3.120%, 04/01/08 | |||||
| (Collateralized by non-U.S. | |||||
| Government Agency Issues, value | |||||
| $3,131,683, 3.631% to 8.125%, | |||||
| 01/15/10 to 11/15/23) | 3,022,685 | ||||
| 604,537 | Morgan Stanley Repurchase | ||||
| Agreement, 2.9000%, 04/01/08 | |||||
| (Collateralized by non-U.S. | |||||
| Government Agency Issues, value | |||||
| $730,605, 0.000%, 10/15/14) | 604,537 | ||||
| 604,537 | Morgan Stanley Repurchase | ||||
| Agreement, 3.1000%, 04/01/08 | |||||
| (Collateralized by U.S. Government | |||||
| Agency Issues, value $616,628, | |||||
| 5.000% to 5.500%, | |||||
| 05/17/31 to 04/20/33) | 604,537 | ||||
| Total Repurchase Agreements | |||||
| (Cost $12,964,298) | 12,964,298 | ||||
| Total Investments Purchased as | |||||
| Securities Lending Collateral | |||||
| (Cost $23,006,263) | 22,802,311 | ||||
| Total Investments | |||||
| (Cost $127,823,932) - 123.01% | 122,454,106 | ||||
| Liabilities in Excess of Other | |||||
| Assets - (23.01)% | (22,905,722) | ||||
| TOTAL NET ASSETS - 100.00% | $ | 99,548,384 | |||
| Percentages are stated as a percent of net assets. | |||||
| (a) Non Income Producing. | |||||
| (b) All or a portion of this security is on loan. | |||||
| (c) Restricted securities as defined in Rule 144(a) under the | |||||
| Securities Act of 1933. Such securities are treated as liquid | |||||
| securities according to the Fund’s liquidity guidelines. The | |||||
| market value of these securities total $1,656,609, which | |||||
| represents 1.66% of total net assets. | |||||
| (d) As of March 31, 2008, the Adviser has fair valued this security. | |||||
| The market value of these securities total $1,709,202, which | |||||
| represents 1.72% of total net assets. | |||||
| (e) Variable Rate Security. The rate shown is the rate in effect on | |||||
| March 31, 2008. | |||||
See notes to financial statements.
35
| AssetMark International Equity Fund |
| PERFORMANCE DATA |
TOTAL RETURN BASED ON A $10,000 INVESTMENT
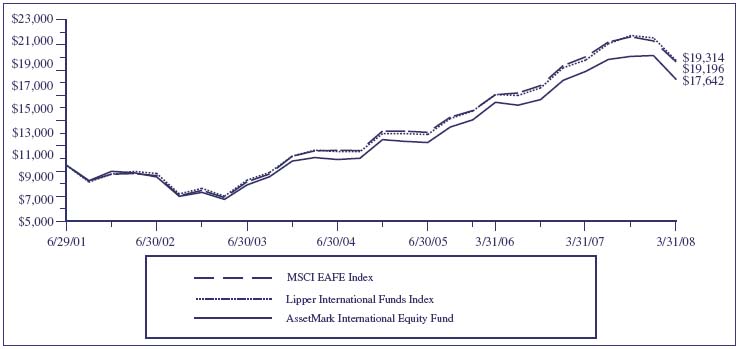
This chart assumes an initial gross investment of $10,000 made on June 29, 2001 (commencement of the Fund’s operations). Returns shown include the reinvestment of all dividends. Returns shown do not reflect the deduction of taxes that a shareholder would pay on fund distributions or the redemption of fund shares. In the absence of fee waivers and reimbursements, total return would be reduced. Past performance is not predictive of future performance. Investment return and principal value will fluctuate, so that your shares, when redeemed, may be worth more or less than the original cost.
MORGAN STANLEY CAPITAL INTERNATIONAL EAFE INDEX - The MSCI EAFE® Index (Europe, Australasia, Far East) is a free float-adjusted market capitalization index that is designed to measure developed market equity performance, excluding the US & Canada. As of June 2007, the MSCI EAFE® Index consisted of the following 21 developed market country indices: Australia, Austria, Belgium, Denmark, Finland, France, Germany, Greece, Hong Kong, Ireland, Italy, Japan, the Netherlands, New Zealand, Norway, Portugal, Singapore, Spain, Sweden, Switzerland and the United Kingdom. The Index is unmanaged and cannot be invested in directly. The Index does not reflect any deduction for fees, expenses or taxes.
LIPPER INTERNATIONAL FUNDS INDEX - An unmanaged index which measures the composite performance of the 30 largest “international” mutual funds, as categorized by Lipper Inc. These funds invest assets in securities with primary trading markets outside of the United States.
| AVERAGE ANNUAL TOTAL RETURN (for the periods ended March 31) | |||||
| One Year | Five Year | Since Inception (6/29/01) | |||
| AssetMark International Equity Fund | –3.85% | 20.43% | 8.77% | ||
| Morgan Stanley Capital International EAFE Index | –2.27% | 21.90% | 10.14% | ||
| Lipper International Funds Index | –0.22% | 21.66% | 10.24% | ||
36
| AssetMark International Equity Fund |
| SCHEDULE OF INVESTMENTS |
| March 31, 2008 |
| Number of | Market | |||
| Shares | Value | |||
| COMMON STOCKS - 96.02% | ||||
| Australia - 3.74% | ||||
| 2,092,600 | AXA Asia Pacific Holdings | $ | 10,565,577 | |
| 1,633,600 | Boart Longyear Group | 2,741,189 | ||
| 1,199,400 | Foster’s Group Ltd. | 5,621,876 | ||
| 1,620,400 | Telstra Corp. | 6,532,571 | ||
| 25,461,213 | ||||
| Austria - 0.70% | ||||
| 62,550 | Wiener Staedtische Allgemeine | |||
| Versicher AG (a) | 4,794,052 | |||
| Brazil - 0.98% | ||||
| 65,200 | Petroleo Brasileiro SA - ADR (b) | 6,657,572 | ||
| Canada - 2.84% | ||||
| 67,900 | Cameco Corp. (b) | 2,236,626 | ||
| 115,650 | Novatek OAO GDR (a) | 9,329,223 | ||
| 27,330 | Potash Corp of Saskatchewan | 4,241,889 | ||
| 31,870 | Research In Motion Ltd. (a) | 3,576,770 | ||
| 19,384,508 | ||||
| Denmark - 1.32% | ||||
| 131,150 | Novo-Nordisk A/S - Class B | 9,025,115 | ||
| Finland - 1.72% | ||||
| 166,450 | Nokia OYJ | 5,254,917 | ||
| 203,600 | Nokia OYJ - ADR | 6,480,588 | ||
| 11,735,505 | ||||
| France - 11.65% | ||||
| 51,350 | Accor SA | 3,749,188 | ||
| 38,180 | Alstom SA | 8,270,776 | ||
| 166,250 | AXA - ADR | 6,003,287 | ||
| 57,200 | BNP Paribas SA | 5,767,628 | ||
| 104,100 | Gaz De France | 6,287,002 | ||
| 66,000 | Lafarge SA | 11,468,549 | ||
| 38,100 | LVMH Moet Hennessy | |||
| Louis Vuitton SA | 4,238,559 | |||
| 99,590 | PPR SA | 14,766,589 | ||
| 119,800 | Rhodia SA (a) | 2,792,062 | ||
| 34,490 | Societe Generale | 3,374,826 | ||
| 8,622 | Societe Generale NV (a) | 829,654 | ||
| 28,100 | Vallourec | 6,815,464 | ||
| 71,950 | Veolia Environnement | 5,020,930 | ||
| 79,384,514 | ||||
| Germany - 10.81% | ||||
| 130,050 | Bayer AG | 10,424,782 | ||
| 372,500 | Deutsche Telekom AG | 6,218,225 |
| Number of | Market | |||
| Shares | Value | |||
| Germany (Continued) | ||||
| 23,710 | E.ON AG | $ | 4,422,158 | |
| 122,400 | Fresenius AG | 10,274,074 | ||
| 64,620 | Linde AG | 9,103,123 | ||
| 69,450 | Metro AG | 5,596,809 | ||
| 79,700 | RWE AG | 9,844,552 | ||
| 102,550 | SAP AG | 5,082,205 | ||
| 90,120 | Siemens AG | 9,850,515 | ||
| 112,088 | Symrise AG (a) | 2,896,714 | ||
| 73,713,157 | ||||
| Greece - 4.37% | ||||
| 300,100 | Hellenic Exchanges SA | 7,138,192 | ||
| 230,280 | National Bank of Greece SA | 12,123,638 | ||
| 294,400 | OPAP SA | 10,499,694 | ||
| 29,761,524 | ||||
| Hong Kong - 2.45% | ||||
| 408,000 | Cheung Kong (Holdings) Ltd. | 5,873,922 | ||
| 417,578 | Esprit Holdings Ltd. | 5,067,024 | ||
| 124,800 | Jardine Matheson Holdings Ltd. | 3,957,772 | ||
| 117,700 | Wing Hang Bank Limited | 1,794,812 | ||
| 16,693,530 | ||||
| Ireland (Republic of) - 0.51% | ||||
| 92,300 | CRH PLC | 3,502,555 | ||
| Israel - 1.16% | ||||
| 170,650 | Teva Pharmaceutical Industries, | |||
| Ltd. - ADR (b) | 7,882,323 | |||
| Italy - 3.60% | ||||
| 969,500 | Banca Intesa SpA | 6,839,953 | ||
| 175,250 | Saipem SpA | 7,104,534 | ||
| 1,578,300 | Unicredito Italiano SpA | 10,575,006 | ||
| 24,519,493 | ||||
| Japan - 11.82% | ||||
| 204,600 | Aeon Co., Ltd. | 2,465,173 | ||
| 829,600 | Asahi Kasei Corp. | 4,362,710 | ||
| 101,700 | Canon, Inc. | 4,743,637 | ||
| 824 | East Japan Railway | 6,870,984 | ||
| 830,400 | The Fuji Fire & Marine Insurance | |||
| Company Ltd. | 2,224,485 | |||
| 197,100 | Komatsu Ltd. | 5,549,527 | ||
| 193,000 | Mitsubishi Estate Co. Ltd. | 4,730,202 | ||
| 526,100 | Mitsui & Co. Ltd. | 10,795,896 | ||
| 42,700 | Nintendo Co. Ltd. | 22,340,837 | ||
| 425,500 | NSK Ltd. | 3,238,038 |
See notes to financial statements.
37
| AssetMark International Equity Fund |
| SCHEDULE OF INVESTMENTS (Continued) |
| March 31, 2008 |
| Number of | Market | |||
| Shares | Value | |||
| COMMON STOCKS (Continued) | ||||
| Japan (Continued) | ||||
| 861,105 | Sumitomo Metal Industries Ltd. | $ | 3,299,152 | |
| 40,800 | Toyota Motor Corp. | 2,061,535 | ||
| 28,200 | Toyota Motor Corp. - ADR (a)(b) | 2,845,098 | ||
| 58,150 | Yamada Denki Co. Ltd. | 5,069,938 | ||
| 80,597,212 | ||||
| Luxembourg - 2.42% | ||||
| 54,150 | Arcelor | 4,428,907 | ||
| 90,200 | Arcelormittal | 7,387,910 | ||
| 49,250 | Millicom International Cellular | |||
| SA (a)(b) | 4,656,587 | |||
| 16,473,404 | ||||
| New Zealand - 0.39% | ||||
| 408,200 | Fletcher Building Limited | 2,692,646 | ||
| Norway - 0.85% | ||||
| 369,271 | Prosafe ASA (a) | 5,818,426 | ||
| Russian Federation - 1.53% | ||||
| 128,700 | Gazprom OAO - ADR (a) | 6,518,655 | ||
| 130,200 | Vimpel-Communications - ADR | 3,891,678 | ||
| 10,410,333 | ||||
| Singapore - 0.56% | ||||
| 290,000 | DBS Group Holdings Ltd. | 3,818,821 | ||
| Spain - 4.77% | ||||
| 655,750 | Banco Santander Central | |||
| Hispano SA | 13,063,893 | |||
| 73,250 | Gamesa (a) | 3,343,987 | ||
| 482,500 | Iberdrola SA (a) | 7,462,354 | ||
| 300,550 | Telefonica SA | 8,635,447 | ||
| 32,505,681 | ||||
| Sweden - 2.83% | ||||
| 138,600 | ForeningsSparbank AB | 3,887,224 | ||
| 83,100 | Hennes & Mauritz AB | 5,115,548 | ||
| 88,700 | Sandvik AB - ADR | 1,544,409 | ||
| 266,700 | Sandvik AB | 4,639,742 | ||
| 204,100 | SKF AB - B Shares | 4,109,257 | ||
| 19,296,180 | ||||
| Switzerland - 8.35% | ||||
| 99,100 | Julius Baer Holding Ltd. | 7,315,027 | ||
| 52,720 | Nestle SA | 26,351,704 | ||
| 49,000 | Roche Holding AG | 9,235,026 | ||
| 110,200 | Roche Holding Ltd. - ADR | 10,412,203 |
| Number of | Market | ||||
| Shares | Value | ||||
| Switzerland (Continued) | |||||
| 12,270 | Syngenta AG | $ | 3,584,614 | ||
| 56,898,574 | |||||
| United Kingdom - 16.65% | |||||
| 667,600 | BAE Systems Plc | 6,437,562 | |||
| 153,800 | BG Group Plc | 3,562,121 | |||
| 1,294,500 | BP PLC | 13,115,386 | |||
| 467,400 | Cadbury Schweppes plc | 5,151,919 | |||
| 942,600 | Centrica PLC | 5,584,715 | |||
| 274,600 | HSBC Holdings PLC (b) | 4,523,712 | |||
| 71,950 | Lonmin Plc | 4,374,404 | |||
| 375,100 | Prudential Plc | 4,952,552 | |||
| 110,600 | Reckitt Benckiser Group Plc | 6,133,125 | |||
| 475,500 | Reed Elsevier | 6,056,115 | |||
| 484,600 | Renovo Group PLC (a) | 349,190 | |||
| 50,250 | Rio Tinto Plc | 5,222,278 | |||
| 134,700 | Standard Chartered PLC | 4,606,130 | |||
| 1,590,800 | Tesco PLC | 11,989,155 | |||
| 474,500 | Unilever PLC | 16,049,567 | |||
| 5,170,800 | Vodafone Group PLC | 15,369,735 | |||
| 113,477,666 | |||||
| Total Common Stocks | |||||
| (Cost $623,482,981) | 654,504,004 | ||||
| SHORT TERM INVESTMENTS - 1.50% | |||||
| Money Market Funds - 1.50% | |||||
| 10,248,559 | Federated Prime Obligations Fund, | ||||
| 3.180% (e) | 10,248,559 | ||||
| Total Short Term Investments | |||||
| (Cost $10,248,559) | 10,248,559 | ||||
| Principal | |||||
| Amount | |||||
| INVESTMENTS PURCHASED | |||||
| AS SECURITIES LENDING | |||||
| COLLATERAL - 3.46% | |||||
| COMMERCIAL PAPER - 0.25% | |||||
| $ | 289,932 | Bryant Park Funding LLC, | |||
| 3.188%, 04/03/08 (c) | 289,855 | ||||
| 501,504 | Sheffield Receivables Corp., | ||||
| 3.053%, 04/08/08 (c) | 501,165 | ||||
| 188,064 | Thames Asset Global, | ||||
| 2.287%, 06/27/08 (c) | 186,768 | ||||
| 223,984 | Three Pillars Funding, | ||||
| 2.906%, 04/14/08 (c) | 223,732 | ||||
See notes to financial statements.
38
| AssetMark International Equity Fund |
| SCHEDULE OF INVESTMENTS (Continued) |
| March 31, 2008 |
| Principal | Market | ||||
| Amount | Value | ||||
| COMMERCIAL PAPER (Continued) | |||||
| 517,176 | Tulip Funding, | ||||
| 2.856%, 04/21/08 (c) | $ | 516,317 | |||
| Total Commercial Paper | |||||
| (Cost $1,717,837) | 1,717,837 | ||||
| CORPORATE BONDS AND NOTES | - 0.65% | ||||
| 940,321 | Abbey National Trust, | ||||
| 3.130%, 02/13/09 | 927,090 | ||||
| 877,633 | Allstate Life Global Funding, | ||||
| 3.332%, 03/20/09 | 878,110 | ||||
| 626,880 | Bank of Scotland, 4.614%, 02/06/09 | 626,880 | |||
| 814,945 | Barclays Bank, 3.361%, 03/16/09 | 814,882 | |||
| 313,440 | Bayerische Landesbank, | ||||
| 4.956%, 08/23/08 | 313,810 | ||||
| 376,129 | Metlife Global, 4.965%, 04/28/08 | 376,129 | |||
| 470,160 | Svenska Handelsbanken, | ||||
| 4.652%, 02/06/09 | 470,160 | ||||
| Total Corporate Bonds and Notes | |||||
| (Cost $4,419,508) | 4,407,061 | ||||
| CORPORATE PAYDOWN SECURITIES - 0.25% | |||||
| 930,558 | KKR Atlantic East Holding Group | ||||
| Trust, 3.054%, 03/25/09 (d) | 788,485 | ||||
| 1,040,856 | KKR Pacific West Holding Group | ||||
| Trust, 3.054%, 03/25/09 (d) | 909,481 | ||||
| Total Corporate Paydown Securities | |||||
| (Cost $1,971,414) | 1,697,966 | ||||
| Shares | |||||
| MONEY MARKET FUNDS - 0.34% | |||||
| 1,125,818 | AIM Short Term Liquid Asset Fund | 1,125,818 | |||
| 1,178,535 | Reserve Primary Fund | 1,178,535 | |||
| Total Money Market Funds | |||||
| (Cost $2,304,353) | 2,304,353 | ||||
| Principal | |||||
| Amount | |||||
| REPURCHASE AGREEMENTS - 1.97% | |||||
| $ | 2,037,362 | BNP Paribas Repurchase Agreement, | |||
| 3.200%, 04/01/08 | |||||
| (Collateralized by U.S. Government | |||||
| Agency Issues, value $2,069,240, | |||||
| 5.000% to 5.500%, | |||||
| 03/31/38 to 04/01/38) | 2,037,362 | ||||
| Principal | Market | ||||
| Amount | Value | ||||
| REPURCHASE AGREEMENTS (Continued) | |||||
| $ | 1,567,202 | Citigroup Global Repurchase | |||
| Agreement, 3.050%, 04/01/08 | |||||
| (Collateralized by Foreign | |||||
| Government Bonds, value | |||||
| $1,599,217, 0.000% to 2.375%, | |||||
| 09/15/10 to 11/15/21) | $ | 1,567,202 | |||
| 1,567,202 | Citigroup Global Repurchase | ||||
| Agreement, 3.050%, 04/01/08 | |||||
| (Collateralized by Foreign | |||||
| Government Bonds, value | |||||
| $1,599,241, 0.000% to 2.375%, | |||||
| 05/15/11 to 01/15/17) | 1,567,202 | ||||
| 749,122 | CS First Boston Repurchase | ||||
| Agreement, 2.750%, 04/01/08 | |||||
| (Collateralized by U.S. Government | |||||
| Agency Issues, value $749,439, | |||||
| 0.000% to 6.500%, | |||||
| 01/25/12 to 03/20/38) . | 749,122 | ||||
| 3,134,402 | Greenwich Capital Repurchase | ||||
| Agreement, 2.750%, 01/02/08 | |||||
| (Collateralized by U.S. Government | |||||
| Agency Issues, value $3,197,155, | |||||
| 0.000%, 12/01/33 to 04/15/37) | 3,134,402 | ||||
| 3,134,402 | Merrill Lynch Repurchase | ||||
| Agreement, 3.120%, 04/01/08 | |||||
| (Collateralized by non-U.S. | |||||
| Government Agency Issues, | |||||
| value $3,247,429, 3.631% to 8.125%, | |||||
| 01/15/10 to 11/15/23) | 3,134,402 | ||||
| 626,880 | Morgan Stanley Repurchase | ||||
| Agreement, 2.9000%, 04/01/08 | |||||
| (Collateralized by non-U.S. | |||||
| Government Agency Issues, | |||||
| value $757,608, 0.000%, 10/15/14) | 626,880 | ||||
| 626,880 | Morgan Stanley Repurchase | ||||
| Agreement, 3.1000%, 04/01/08 | |||||
| (Collateralized by U.S. Government | |||||
| Agency Issues, value $639,418, | |||||
| 5.000% to 5.500%, | |||||
| 05/17/31 to 04/20/33) | 626,880 | ||||
| Total Repurchase Agreements | |||||
| (Cost $13,443,452) | 13,443,452 | ||||
See notes to financial statements.
39
| AssetMark International Equity Fund |
| SCHEDULE OF INVESTMENTS (Continued) |
| March 31, 2008 |
| Market | ||
| Value | ||
| Total Investments Purchased as | ||
| Securities Lending Collateral | ||
| (Cost $23,855,127) | $ | 23,570,669 |
| Total Investments | ||
| (Cost $657,588,104) - 100.98% | 688,323,232 | |
| Liabilities in Excess of Other | ||
| Assets - (0.98)% | (6,701,202) | |
| TOTAL NET | ||
| ASSETS - 100.00% | $ | 681,622,030 |
| Percentages are stated as a percent of net assets. | ||
| ADR - American Depositary Receipt | ||
| (a) Non Income Producing. | ||
| (b) All or a portion of this security is on loan. | ||
| (c) Restricted securities as defined in Rule 144(a) under the | ||
| Securities Act of 1933. Such securities are treated as liquid | ||
| securities according to the Fund’s liquidity guidelines. The | ||
| market value of these securities total $1,717,837, which | ||
| represents 0.25% of total net assets. | ||
| (d) As of March 31, 2008, the Adviser has fair valued this security. | ||
| The market value of these securities total $1,697,966, which | ||
| represents 0.25% of total net assets. | ||
| (e) Variable Rate Security. The rate shown is the rate in effect on | ||
| March 31, 2008. | ||
See notes to financial statements.
40
| AssetMark Real Estate Securities Fund |
| PERFORMANCE DATA |
TOTAL RETURN BASED ON A $10,000 INVESTMENT

This chart assumes an initial gross investment of $10,000 made on June 29, 2001 (commencement of the Fund’s operations). Returns shown include the reinvestment of all dividends. Returns shown do not reflect the deduction of taxes that a shareholder would pay on fund distributions or the redemption of fund shares. In the absence of fee waivers and reimbursements, total return would be reduced. Past performance is not predictive of future performance. Investment return and principal value will fluctuate, so that your shares, when redeemed, may be worth more or less than the original cost.
DOW JONES WILSHIRE REIT INDEX - The Dow Jones Wilshire REIT Index measures U.S. publicly traded Real Estate Investment Trusts. The Index is comprised of companies whose charters are the equity ownership and operation of commercial real estate and that derive a minimum of 75% of revenue from stated operations. The Index is composed of 93 common stocks, selected for their market capitalization, source of revenue, and liquidity. The Index is unmanaged and cannot be invested in directly. The Index does not reflect any deduction for fees, expenses or taxes.
LIPPER REAL ESTATE FUNDS INDEX - An unmanaged index which measures the composite performance of the 30 largest “real estate” mutual funds, as categorized by Lipper Inc. The index is adjusted for the reinvestment of capital gains and income dividends.
| AVERAGE ANNUAL TOTAL RETURN (for the periods ended March 31) | |||||
| One Year | Five Year | Since Inception (6/29/01) | |||
| AssetMark Real Estate Securities Fund | -19.74% | 17.07% | 13.79% | ||
| Dow Jones Wilshire REIT Index | -19.07% | 18.46% | 14.55% | ||
| Lipper Real Estate Funds Index | -16.50% | 17.93% | 14.01% | ||
41
| AssetMark Real Estate Securities Fund |
| SCHEDULE OF INVESTMENTS |
| March 31, 2008 |
| Number of | Market | |||
| Shares | Value | |||
| COMMON STOCKS - 0.80% | ||||
| Diversified - 0.10% | ||||
| 2,300 | Forest City Enterprises, Inc. (b) | $ | 84,640 | |
| Office Property - 0.70% | ||||
| 29,650 | Brookfield Properties Co. | 572,541 | ||
| Total Common Stocks | ||||
| (Cost $770,105) | 657,181 | |||
| REAL ESTATE INVESTMENT TRUSTS, | ||||
| COMMON STOCKS - 97.59% | ||||
| Apartments - 15.61% | ||||
| 35,815 | AvalonBay Communities, Inc. (b) | 3,456,864 | ||
| 40,852 | BRE Properties, Inc. (b) | 1,861,217 | ||
| 7,204 | Camden Property Trust | 361,641 | ||
| 71,182 | Equity Residential (b) | 2,953,341 | ||
| 25,429 | Essex Property Trust, Inc. (b) | 2,898,397 | ||
| 52,475 | UDR, Inc. (b) | 1,286,687 | ||
| 12,818,147 | ||||
| Diversified - 9.50% | ||||
| 1,900 | Alexander’s, Inc. (a) | 673,550 | ||
| 50,750 | Digital Realty Trust, Inc. (b) | 1,801,625 | ||
| 7,010 | Entertainment Properties Trust (b) . | 345,803 | ||
| 8,185 | Liberty Property Trust | 254,636 | ||
| 30,200 | Mission West Properties | 285,390 | ||
| 51,544 | Vornado Realty Trust (b) | 4,443,608 | ||
| 7,804,612 | ||||
| Health Care - 6.69% | ||||
| 51,810 | HCP, Inc. (b) | 1,751,696 | ||
| 31,490 | Health Care REIT, Inc. (b) | 1,421,144 | ||
| 11,460 | Nationwide Health Properties, | |||
| Inc. (b) | 386,775 | |||
| 43,030 | Ventas, Inc. (b) | 1,932,477 | ||
| 5,492,092 | ||||
| Hotels & Motels - 3.64% | ||||
| 43,990 | Diamondrock Hospitality Co. (b) | 557,353 | ||
| 9,830 | Hospitality Properties Trust (b) | 334,417 | ||
| 92,940 | Host Hotels & Resorts, Inc. (b) | 1,479,605 | ||
| 11,270 | LaSalle Hotel Properties (b) | 323,787 | ||
| 18,520 | Sunstone Hotel Investors, Inc. (b) | 296,505 | ||
| 2,991,667 | ||||
| Number of | Market | |||
| Shares | Value | |||
| Office Property - 17.03% | ||||
| 28,336 | Alexandria Real Estate Equities, | |||
| Inc. (b) | $ | 2,627,314 | ||
| 8,500 | BioMed Realty Trust, Inc. (b) | 203,065 | ||
| 39,958 | Boston Properties, Inc. (b) | 3,678,933 | ||
| 14,859 | Brandywine Realty Trust (b) | 252,009 | ||
| 62,230 | Corporate Office Properties | |||
| Trust (b) | 2,091,550 | |||
| 43,440 | Douglas Emmett, Inc. | 958,286 | ||
| 8,100 | Highwoods Properties, Inc. (b) | 251,667 | ||
| 12,087 | Kilroy Realty Corp. (b) | 593,593 | ||
| 7,006 | Mack-Cali Realty Corp. | 250,184 | ||
| 3,900 | Maguire Properties, Inc. | 55,809 | ||
| 37,095 | SL Green Realty Corp. | 3,022,130 | ||
| 13,984,540 | ||||
| Regional Malls - 20.54% | ||||
| 6,560 | CBL & Associates Properties, | |||
| Inc. (b) | 154,357 | |||
| 115,638 | General Growth Properties, Inc. (b) | 4,413,903 | ||
| 49,334 | The Macerich Co. (b) | 3,466,700 | ||
| 81,765 | Simon Property Group, Inc. (b) | 7,596,786 | ||
| 23,800 | Taubman Centers, Inc. | 1,239,980 | ||
| 16,871,726 | ||||
| Shopping Centers - 11.47% | ||||
| 33,770 | Developers Diversified Realty | |||
| Corp. (b) | 1,414,288 | |||
| 32,834 | Federal Realty Investment Trust (b) | 2,559,410 | ||
| 48,222 | Kimco Realty Corp. (b) | 1,888,856 | ||
| 33,469 | Regency Centers Corp. | 2,167,453 | ||
| 9,900 | Saul Centers, Inc. | 497,376 | ||
| 23,220 | Tanger Factory Outlet Centers, | |||
| Inc. (b) | 893,273 | |||
| 9,420,656 | ||||
| Storage - 2.88% | ||||
| 51,780 | Extra Space Storage, Inc. (b) | 838,318 | ||
| 17,190 | Public Storage, Inc. (b) | 1,523,378 | ||
| 2,361,696 | ||||
| Warehouse/Industrial - 10.23% | ||||
| 42,894 | AMB Property Corp. (b) | 2,334,291 | ||
| 65,880 | DCT Industrial Trust, Inc. (b) | 656,165 | ||
| 4,100 | EastGroup Properties, Inc. | 190,486 | ||
| 88,621 | ProLogis (b) | 5,216,232 | ||
| 8,397,174 |
See notes to financial statements.
42
| AssetMark Real Estate Securities Fund |
| SCHEDULE OF INVESTMENTS (Continued) |
| March 31, 2008 |
| Number of | Market | ||||
| Shares | Value | ||||
| Total Real Estate Investment Trusts, | |||||
| Common Stocks | |||||
| (Cost $61,689,152) | $ | 80,142,310 | |||
| REAL ESTATE INVESTMENT TRUSTS, | |||||
| PREFERRED STOCKS - 0.37% | |||||
| Office Property - 0.37% | |||||
| 12,800 | Corporate Office Properties Trust | 305,024 | |||
| Total Real Estate Investment Trusts, | |||||
| Preferred Stocks | |||||
| (Cost $305,323) | 305,024 | ||||
| SHORT TERM INVESTMENTS - 0.42% | |||||
| Money Market Funds - 0.42% | |||||
| 348,496 | Federated Prime Obligations Fund, | ||||
| 3.180% (e) | 348,496 | ||||
| Total Short Term Investments | |||||
| (Cost $348,496) | 348,496 | ||||
| Principal | |||||
| Amount | |||||
| INVESTMENTS PURCHASED | |||||
| AS SECURITIES LENDING | |||||
| COLLATERAL - 35.92% | |||||
| COMMERCIAL PAPER - 2.61% | |||||
| $ | 362,655 | Bryant Park Funding LLC, | |||
| 3.188%, 04/03/08 (c) | 362,559 | ||||
| 627,296 | Sheffield Receivables Corp., | ||||
| 3.053%, 04/08/08 (c) | 626,871 | ||||
| 235,236 | Thames Asset Global, | ||||
| 2.287%, 06/27/08 (c) | 233,614 | ||||
| 280,166 | Three Pillars Funding, | ||||
| 2.906%, 04/14/08 (c) | 279,850 | ||||
| 646,899 | Tulip Funding, | ||||
| 2.856%, 04/21/08 (c) | 645,823 | ||||
| Total Commercial Paper | |||||
| (Cost $2,148,717) | 2,148,717 | ||||
CORPORATE BONDS AND NOTES - 6.73% | |||||
| 1,176,180 | Abbey National Trust, | ||||
| 3.130%, 02/13/09 | 1,159,628 | ||||
| 1,097,768 | Allstate Life Global Funding, | ||||
| 3.332%, 03/20/09 | 1,098,365 | ||||
| 784,120 | Bank of Scotland, | ||||
| 4.614%, 02/06/09 | 784,120 | ||||
| 1,019,356 | Barclays Bank, 3.361%, 03/16/09 | 1,019,277 | |||
| Principal | Market | ||||
| Amount | Value | ||||
CORPORATE BONDS AND NOTES (Continued) | |||||
| $ | 392,060 | Bayerische Landesbank, | |||
| 4.956%, 08/23/08 | $ | 392,523 | |||
| 470,472 | Metlife Global, 4.965%, 04/28/08 | 470,472 | |||
| 588,090 | Svenska Handelsbanken, | ||||
| 4.652%, 02/06/09 | 588,090 | ||||
| Total Corporate Bonds and Notes | |||||
| (Cost $5,528,046) | 5,512,475 | ||||
| CORPORATE PAYDOWN SECURITIES - 2.60% | |||||
| 1,163,970 | KKR Atlantic East Holding Group | ||||
| Trust, 3.054%, 03/25/09 (d) | 993,798 | ||||
| 1,301,932 | KKR Pacific West Holding Group | ||||
| Trust, 3.054%, 03/25/09 (d) | 1,144,575 | ||||
| Total Corporate Paydown Securities | |||||
| (Cost $2,465,902) | 2,138,373 | ||||
| Shares | |||||
| MONEY MARKET FUNDS - 3.51% | |||||
| 1,408,204 | AIM Short Term Liquid Asset Fund | 1,408,204 | |||
| 1,474,145 | Reserve Primary Fund | 1,474,145 | |||
| Total Money Market Funds | |||||
| (Cost $2,882,349) | 2,882,349 | ||||
| Principal | |||||
| Amount | |||||
| REPURCHASE AGREEMENTS - 20.47% | |||||
| $ | 2,548,388 | BNP Paribas Repurchase | |||
| Agreement, 3.200%, 04/01/08 | |||||
| (Collateralized by U.S. Government | |||||
| Agency Issues, value $2,588,265, | |||||
| 5.000% to 5.500%, | |||||
| 03/31/38 to 04/01/38) | 2,548,388 | ||||
| 1,960,300 | Citigroup Global Repurchase | ||||
| Agreement, 3.050%, 04/01/08 | |||||
| (Collateralized by Foreign | |||||
| Government Bonds, value $2,000,346, | |||||
| 0.000% to 2.375%, | |||||
| 09/15/10 to 11/15/21) | 1,960,300 | ||||
| 1,960,300 | Citigroup Global Repurchase | ||||
| Agreement, 3.050%, 04/01/08 | |||||
| (Collateralized by Foreign | |||||
| Government Bonds, value $2,000,376, | |||||
| 0.000% to 2.375%, | |||||
| 05/15/11 to 01/15/17) | 1,960,300 | ||||
See notes to financial statements.
43
| AssetMark Real Estate Securities Fund |
| SCHEDULE OF INVESTMENTS (Continued) |
| March 31, 2008 |
| Principal | Market | |||||
| Amount | Value | |||||
| REPURCHASE AGREEMENTS (Continued) | ||||||
| $ | 937,023 | CS First Boston Repurchase | ||||
| Agreement, 2.750%, 04/01/08 | ||||||
| (Collateralized by U.S. Government | ||||||
| Agency Issues, value $937,420, | ||||||
| 0.000% to 6.500%, | ||||||
| 01/25/12 to 03/20/38) | $ | 937,023 | ||||
| 3,920,599 | Greenwich Capital Repurchase | |||||
| Agreement, 2.750%, 01/02/08 | ||||||
| (Collateralized by U.S. Government | ||||||
| Agency Issues, value $3,999,090, | ||||||
| 0.000%, 12/01/33 to 04/15/37) | 3,920,599 | |||||
| 3,920,599 | Merrill Lynch Repurchase | |||||
| Agreement, 3.120%, 04/01/08 | ||||||
| (Collateralized by non-U.S. | ||||||
| Government Agency Issues, | ||||||
| value $4,061,976, 3.631% to 8.125%, | ||||||
| 01/15/10 to 11/15/23) | 3,920,599 | |||||
| 784,120 | Morgan Stanley Repurchase | |||||
| Agreement, 2.9000%, 04/01/08 | ||||||
| (Collateralized by non-U.S. | ||||||
| Government Agency Issues, value | ||||||
| $947,637, 0.000%, 10/15/14) | 784,120 | |||||
| 784,120 | Morgan Stanley Repurchase | |||||
| Agreement, 3.1000%, 04/01/08 | ||||||
| (Collateralized by U.S. Government | ||||||
| Agency Issues, value $799,802, | ||||||
| 5.000% to 5.500%, | ||||||
| 05/17/31 to 04/20/33) | 784,120 | |||||
| Total Repurchase Agreements | ||||||
| (Cost $16,815,449) | 16,815,449 | |||||
| Market | ||
| Value | ||
| Total Investments Purchased as | ||
| Securities Lending Collateral | ||
| (Cost $29,840,463) | $ | 29,497,363 |
| Total Investments | ||
| (Cost $ 92,953,539) - 135.10% | 110,950,374 | |
| Liabilities in Excess of Other | ||
| Assets - (35.10)% | (28,825,596) | |
| TOTAL NET | ||
| ASSETS - 100.00% | $ | 82,124,778 |
| Percentages are stated as a percent of net assets. | ||
| (a) Non Income Producing. | ||
| (b) All or a portion of this security is on loan. | ||
| (c) Restricted securities as defined in Rule 144(a) under the | ||
| Securities Act of 1933. Such securities are treated as liquid | ||
| securities according to the Fund’s liquidity guidelines. The | ||
| market value of these securities total $2,148,717, which | ||
| represents 2.61% of total net assets. | ||
| (d) As of March 31, 2008, the Adviser has fair valued this security. | ||
| The market value of these securities total $2,138,373, which | ||
| represents 2.60% of total net assets. | ||
| (e) Variable Rate Security. The rate shown is the rate in effect on | ||
| March 31, 2008. | ||
See notes to financial statements.
44
| AssetMark Tax-Exempt Fixed Income Fund |
| PERFORMANCE DATA |
TOTAL RETURN BASED ON A $10,000 INVESTMENT

This chart assumes an initial gross investment of $10,000 made on June 29, 2001 (commencement of the Fund’s operations). Returns shown include the reinvestment of all dividends. Returns shown do not reflect the deduction of taxes that a shareholder would pay on fund distributions or the redemption of fund shares. In the absence of fee waivers and reimbursements, total return would be reduced. Past performance is not predictive of future performance. Investment return and principal value will fluctuate, so that your shares, when redeemed, may be worth more or less than the original cost.
LEHMAN BROTHERS MUNICIPAL BOND INDEX - An unmanaged index which measures the performance of investment-grade, tax-exempt and fixed-rate bonds with long-term maturities (greater than two years) selected from issues larger than $50 million. The Index does not reflect any deduction for fees, expenses or taxes.
LIPPER INTERMEDIATE MUNICIPAL BOND FUNDS INDEX - The Lipper Intermediate Municipal Bond Fund Index is an index of portfolios that invest in municipal debt issues with dollar-weighted average maturities of five to ten years. As of October 2005, the Lipper Intermediate Municipal Bond Fund Index has been added as an additional measure of market performance for the Tax-Exempt Fixed Income Fund.
| AVERAGE ANNUAL TOTAL RETURN (for the periods ended March 31) | |||||
| One Year | Five Year | Since Inception (6/29/01) | |||
| AssetMark Tax-Exempt Fixed Income Fund | 0.28% | 1.84% | 3.07% | ||
| Lehman Brothers Municipal Bond Index | 1.90% | 3.92% | 4.81% | ||
| Lipper Intermediate Municipal Bond Funds Index | 2.52% | 3.07% | 3.90% | ||
45
| AssetMark Tax-Exempt Fixed Income Fund |
| SCHEDULE OF INVESTMENTS |
| March 31, 2008 |
| Principal | Market | ||||
| Amount | Value | ||||
| AUCTION RATE SECURITIES - 2.82% | |||||
| $ | 725,000 | Arizona Health Facilities Authority, | |||
| Revenue Bond, AMBAC Insured, | |||||
| 6.900%, 07/01/2035 (a) | $ | 725,000 | |||
| 1,000,000 | California Educational Facilities | ||||
| Authority, Revenue Bond, | |||||
| 4.650%, 11/01/2039 (a) | 1,000,000 | ||||
| 1,000,000 | Energy Northwest, Refunding, | ||||
| Revenue Bond, XLCA Insured, | |||||
| 4.640%, 07/01/2017 (a) | 1,000,000 | ||||
| 725,000 | Illinois Finance Authority, Refunding, | ||||
| Revenue Bond, AMBAC Insured, | |||||
| 5.470%, 11/01/2022 (a) | 725,000 | ||||
| 1,000,000 | Lorain County Hospital, Revenue | ||||
| Bond, Assured Guaranty Corp. | |||||
| Insured, 8.490%, 02/01/2029 (a) | 1,000,000 | ||||
| 1,000,000 | Metropolitan Transportation | ||||
| Authority, Series B, Revenue Bond, | |||||
| AMBAC Insured, | |||||
| 5.390%, 11/01/2029 (a) | 1,000,000 | ||||
| 500,000 | Minneapolis and St. Paul Housing | ||||
| and Redevelopment Authority, | |||||
| Revenue Bond, FSA Insured, | |||||
| 6.000%, 08/15/2037 (a) | 500,000 | ||||
| 1,300,000 | Norfolk Economic Development | ||||
| Authority, Series A, Revenue Bond, | |||||
| FSA Insured, | |||||
| 5.910%, 11/01/2034 (a) | 1,300,000 | ||||
| Total Auction Rate Securities | |||||
| (Cost $7,250,000) | 7,250,000 | ||||
| MUNICIPAL BONDS - 95.26% | |||||
| Alabama - 0.80% | |||||
| 1,000,000 | Jefferson County Schools, Revenue | ||||
| Bond, FSA Insured, | |||||
| 5.500%, 01/01/2021 | 1,055,230 | ||||
| 1,000,000 | Mobile Industrial Development | ||||
| Board Pollution Control, Revenue | |||||
| Bond, 4.880%, 06/01/2034 | 1,014,710 | ||||
| 2,069,940 | |||||
| Arizona - 3.87% | |||||
| 2,710,000 | Arizona School Facilities Board, | ||||
| Refunding, Revenue Bond, | |||||
| 5.000%, 07/01/2013 | 2,972,463 | ||||
| Principal | Market | ||||
| Amount | Value | ||||
| Arizona (Continued) | |||||
| $ | 135,000 | Maricopa County Elementary School | |||
| District, Refunding, GO, FSA | |||||
| Insured, 5.000%, 07/01/2012 | $ | 145,903 | |||
| 500,000 | Maricopa County Hospital, Revenue | ||||
| Bond, 5.000%, 04/01/2018 | 500,875 | ||||
| 975,000 | Maricopa County Industrial | ||||
| Development Authority Senior | |||||
| Living Facilities, Refunding, | |||||
| Revenue Bond, | |||||
| 3.650%, 09/15/2035 | 986,983 | ||||
| 1,000,000 | Phoenix Civic Improvement | ||||
| Wastewater System, Refunding, | |||||
| Revenue Bond, | |||||
| 5.000%, 07/01/2020 | 1,062,280 | ||||
| Pinal County Industrial Development | |||||
| Authority Correctional Facilities, | |||||
| Revenue Bond, ACA Insured, | |||||
| 750,000 | 5.250%, 10/01/2014 | 757,387 | |||
| 1,000,000 | 5.250%, 10/01/2015 | 1,005,530 | |||
| 1,000,000 | Pinal County, CP, | ||||
| 5.000%, 12/01/2029 | 937,490 | ||||
| 1,500,000 | Salt River Project, Series A, Revenue | ||||
| Bond, 5.000%, 01/01/2021 | 1,596,300 | ||||
| 9,965,211 | |||||
| California - 7.24% | |||||
| 500,000 | California Communities Development | ||||
| Authority, Refunding, Revenue Bond, | |||||
| 4.900%, 05/15/2025 | 501,335 | ||||
| 1,000,000 | California Communities Development | ||||
| Authority, Revenue Bond, | |||||
| 5.500%, 07/01/2037 | 869,740 | ||||
| 5,100,000 | California Communities | ||||
| Development Authority, Series C, | |||||
| Revenue Bond, | |||||
| 3.850%, 11/01/2029 | 5,119,278 | ||||
| 600,000 | California Statewide Community | ||||
| Development Authority, Series A, | |||||
| Revenue Bond, ACA Insured, | |||||
| 5.630%, 08/01/2034 | 537,624 | ||||
| California, GO, | |||||
| 400,000 | 5.000%, 08/01/2014 | 430,716 | |||
| 1,255,000 | 5.000%, 02/01/2020 | 1,282,522 | |||
| 1,000,000 | 5.000%, 06/01/2031 | 986,430 | |||
See notes to financial statements.
46
| AssetMark Tax-Exempt Fixed Income Fund |
| SCHEDULE OF INVESTMENTS (Continued) |
| March 31, 2008 |
| Principal | Market | ||||
| Amount | Value | ||||
| California (Continued) | |||||
| $ | 735,000 | California, Refunding, GO, | |||
| 5.000%, 11/01/2021 | $ | 756,396 | |||
| Glendale Water Utility, Revenue | |||||
| Bond, FSA Insured, | |||||
| 1,020,000 | 5.000%, 02/01/2019 | 1,103,018 | |||
| 500,000 | 5.000%, 02/01/2020 | 536,070 | |||
| 2,970,000 | Golden West Schools Funding | ||||
| Authority, Refunding, GO, AMBAC | |||||
| Insured, 5.500%, 08/01/2019 | 3,334,983 | ||||
| 145,000 | Los Angeles Unified School District, | ||||
| Series A, Refunding, GO, FGIC | |||||
| Insured, 4.250%, 01/01/2028 | 129,518 | ||||
| 500,000 | Roseville Westpark Community | ||||
| Facilities, Special Tax, | |||||
| 5.250%, 09/01/2037 | 410,625 | ||||
| 1,000,000 | Sacramento County Sanitation | ||||
| District, Revenue Bond, | |||||
| 5.000%, 12/01/2036 | 987,920 | ||||
| 1,175,000 | San Francisco Steinhart Aquarium, | ||||
| Series F, GO, | |||||
| 5.000%, 06/15/2023 | 1,208,323 | ||||
| 430,000 | Santa Ana Unified School District, | ||||
| CP, MBIA Insured, | |||||
| 5.250%, 04/01/2027 | 443,683 | ||||
| 18,638,181 | |||||
| Colorado - 2.36% | |||||
| 870,000 | Antelope Heights Metropolitan | ||||
| District, Refunding, GO, Radian | |||||
| Insured, 5.000%, 12/01/2027 | 796,415 | ||||
| 1,065,000 | Colorado Department of | ||||
| Transportation, Revenue Bond, | |||||
| 5.380%, 06/15/2013 | 1,180,595 | ||||
| 1,115,000 | Colorado Health Facilities Authority, | ||||
| Revenue Bond, | |||||
| 4.500%, 09/15/2008 | 1,115,937 | ||||
| Denver City & County Justice | |||||
| System, GO, | |||||
| 1,500,000 | 5.000%, 08/01/2023 | 1,575,240 | |||
| 1,000,000 | 5.000%, 08/01/2024 | 1,040,880 | |||
| 375,000 | El Paso County School District, GO, | ||||
| MBIA & STAID Insured, | |||||
| 5.000%, 12/01/2027 | 378,698 | ||||
| 6,087,765 |
| Principal | Market | |||||
| Amount | Value | |||||
| Delaware - 0.32% | ||||||
| $ | 1,000,000 | New Castle County, Revenue Bond, | ||||
| 5.000%, 09/01/2036 | $ | 833,600 | ||||
| District of Columbia - 0.68% | ||||||
| 200,000 | District of Columbia, Series B, | |||||
| Unrefunded, GO, | ||||||
| 5.500%, 06/01/2009 | 207,518 | |||||
| 1,500,000 | Washington D.C. Airport Authority, | |||||
| Refunding, Revenue Bond, | ||||||
| 5.000%, 10/01/2021 | 1,552,065 | |||||
| 1,759,583 | ||||||
| Florida - 4.14% | ||||||
| 315,000 | Beacon Lakes Community | |||||
| Development, Series A, Special | ||||||
| Assessment, 6.000%, 05/01/2038 | . | 267,382 | ||||
| 250,000 | Boynton Village Community | |||||
| Development District, Series A, | ||||||
| Special Assessment, | ||||||
| 5.750%, 05/01/2037 | 205,295 | |||||
| 2,375,000 | Highlands County Health Facilities | |||||
| Authority, Revenue Bond, | ||||||
| 5.000%, 11/15/2029 | 2,411,789 | |||||
| 1,000,000 | Highlands County Health Facilities | |||||
| Hospital, Revenue Bond, | ||||||
| 5.000%, 11/15/2035 | 942,870 | |||||
| 2,000,000 | Miami-Dade County Aviation | |||||
| Department, Series D, Refunding, | ||||||
| Revenue Bond, FSA Insured, | ||||||
| 5.250%, 10/01/2026 | 2,058,760 | |||||
| 1,250,000 | Miami-Dade County Educational | |||||
| Facilities, Series A, Revenue Bond, | ||||||
| 5.000%, 04/01/2034 | 1,371,125 | |||||
| 645,000 | Palm Glades Community | |||||
| Development, Series B, Special | ||||||
| Assessment, | ||||||
| 4.850%, 08/01/2011 | 606,764 | |||||
| 1,200,000 | Seminole Tribe Special Obligation, | |||||
| Series A, Revenue Bond, | ||||||
| 5.750%, 10/01/2022 | 1,191,840 | |||||
| 625,000 | Tolomato Community Development | |||||
| District, Special Assessment, | ||||||
| 6.380%, 05/01/2017 | 603,906 | |||||
See notes to financial statements.
47
| AssetMark Tax-Exempt Fixed Income Fund |
| SCHEDULE OF INVESTMENTS (Continued) |
| March 31, 2008 |
| Principal | Market | ||||
| Amount | Value | ||||
| Florida (Continued) | |||||
| $ | 1,000,000 | University of Florida, Revenue Bond, | |||
| AMBAC Insured, | |||||
| 5.130%, 09/01/2033 | $ | 993,630 | |||
| 10,653,361 | |||||
| Georgia - 1.93% | |||||
| 1,500,000 | Atlanta Development Authority, | ||||
| Revenue Bond, | |||||
| 5.250%, 07/01/2027 | 1,478,445 | ||||
| 1,000,000 | Fulton County School District, | ||||
| Refunding, GO, | |||||
| 5.250%, 01/01/2014 | 1,107,300 | ||||
| 1,500,000 | Gainesville Educational Facilities | ||||
| Redevelopment Authority, | |||||
| Refunding, Revenue Bond, | |||||
| 5.130%, 03/01/2037 | 1,181,520 | ||||
| 1,115,000 | Georgia, Series E, GO, | ||||
| 5.000%, 08/01/2012 | 1,214,280 | ||||
| 4,981,545 | |||||
| Hawaii - 0.04% | |||||
| 100,000 | Honolulu City & County, Series A, | ||||
| Prerefunded, GO, | |||||
| 6.000%, 01/01/2009 | 103,089 | ||||
| Illinois - 9.32% | |||||
| 1,250,000 | Chicago Board of Education, | ||||
| Series B, Refunding, GO, | |||||
| 5.000%, 12/01/2023 | 1,294,488 | ||||
| 100,000 | Chicago Metropolitan Water | ||||
| Reclamation District Greater | |||||
| Chicago, Refunding, GO, | |||||
| 6.050%, 12/01/2009 | 106,209 | ||||
| 75,000 | Chicago Park District, Revenue | ||||
| Bond, ACA Insured, | |||||
| 6.250%, 01/01/2016 | 79,781 | ||||
| Chicago Wastewater Transmission, | |||||
| Refunding, Revenue Bond, FGIC | |||||
| Insured, | |||||
| 625,000 | 5.500%, 01/01/2010 | 643,800 | |||
| 100,000 | 5.380%, 01/01/2013 | 107,510 | |||
| Chicago, GO, | |||||
| 2,500,000 | 5.000%, 12/01/2024 | 2,552,700 | |||
| 1,000,000 | 5.000%, 01/01/2026 | 1,015,360 | |||
| Principal | Market | ||||
| Amount | Value | ||||
| Illinois (Continued) | |||||
| $ | 1,000,000 | Cook County, Series C, GO, | |||
| AMBAC Insured, | |||||
| 5.000%, 11/15/2025 | $ | 1,012,270 | |||
| 100,000 | Du Page & Cook Counties | ||||
| Community School District, GO, | |||||
| FGIC Insured, | |||||
| 4.380%, 01/01/2009 | 101,931 | ||||
| 270,000 | Illinois Finance Authority Chicago | ||||
| Schools Project, Refunding, | |||||
| Revenue Bond, | |||||
| 4.500%, 12/01/2008 | 270,019 | ||||
| 1,200,000 | Illinois Finance Authority Hospital | ||||
| Sisters Services, Series A, Revenue | |||||
| Bond, 5.000%, 03/15/2025 | 1,181,112 | ||||
| 450,000 | Illinois Finance Authority | ||||
| Resurrection Health Care, Revenue | |||||
| Bond, 3.750%, 05/15/2020 | 454,077 | ||||
| 1,050,000 | Illinois Finance Authority Sherman | ||||
| Health Systems, Refunding, | |||||
| Revenue Bond, | |||||
| 5.500%, 08/01/2037 | 959,028 | ||||
| 2,000,000 | Illinois Finance Authority, Revenue | ||||
| Bond, 5.000%, 07/01/2022 | 2,039,920 | ||||
| 1,370,000 | Illinois Finance Authority, Series A, | ||||
| Revenue Bond, | |||||
| 5.250%, 10/01/2010 | 1,453,392 | ||||
| 2,500,000 | Illinois State Toll Highway Authority, | ||||
| Series A, Revenue Bond, FSA | |||||
| Insured, 5.000%, 01/01/2026 | 2,768,300 | ||||
| 1,000,000 | Illinois, Series 1, GO, | ||||
| 5.380%, 07/01/2013 | 1,100,650 | ||||
| 2,690,000 | Lombard Public Facilities, Series B, | ||||
| Revenue, 5.250%, 01/01/2030 | 2,618,365 | ||||
| 500,000 | Northlake, GO, FGIC Insured, | ||||
| 5.000%, 12/01/2029 | 500,665 | ||||
| 500,000 | Regional Transportation Authority, | ||||
| Series B, Revenue Bond, FGIC | |||||
| Insured, 5.380%, 06/01/2014 | 548,465 | ||||
| 3,030,000 | St. Clair County High School | ||||
| District No. 203, Series A, GO, | |||||
| AMBAC Insured, | |||||
| 5.750%, 12/01/2026 | 3,183,257 | ||||
| 23,991,299 |
See notes to financial statements.
48
| AssetMark Tax-Exempt Fixed Income Fund |
| SCHEDULE OF INVESTMENTS (Continued) |
| March 31, 2008 |
| Principal | Market | ||||
| Amount | Value | ||||
| Indiana - 3.17% | |||||
| $ | 195,000 | Allen County War Memorial, | |||
| Revenue Bond, | |||||
| 4.500%, 05/01/2019 | $ | 195,899 | |||
| 400,000 | Anderson Industrial Economic | ||||
| Development, Refunding, Revenue | |||||
| Bond, 4.500%, 10/01/2008 | 400,792 | ||||
| 1,650,000 | Danville School Building, Revenue | ||||
| Bond, FSA Insured, | |||||
| 5.000%, 07/15/2023 | 1,701,810 | ||||
| 1,000,000 | Indiana Health & Educational | ||||
| Facilities Financing Authority, | |||||
| Revenue Bond, | |||||
| 5.000%, 11/15/2036 | 961,700 | ||||
| Indiana Health Facilities Financing | |||||
| Authority, Revenue Bond, | |||||
| 1,000,000 | 6.000%, 08/01/2008 | 1,004,470 | |||
| 1,000,000 | 5.000%, 05/01/2013 | 1,062,030 | |||
| Noblesville Redevelopment | |||||
| Authority, Revenue Bond, | |||||
| 200,000 | 4.500%, 02/01/2011 | 207,792 | |||
| 305,000 | 4.500%, 08/01/2012 | 319,259 | |||
| 320,000 | 4.500%, 08/01/2013 | 335,257 | |||
| 820,000 | Portage Economic Development, | ||||
| Revenue Bond, | |||||
| 5.000%, 07/15/2023 | 777,106 | ||||
| 1,135,000 | Wayne Township Marion County | ||||
| School Building Corp, Revenue | |||||
| Bond, MBIA Insured, | |||||
| 5.500%, 07/15/2023 | 1,208,037 | ||||
| 8,174,152 | |||||
| Iowa - 0.47% | |||||
| 600,000 | Iowa Finance Authority Health | ||||
| Facilities, Revenue Bond, | |||||
| 5.250%, 07/01/2010 | 600,954 | ||||
| 600,000 | Iowa Finance Authority Pollution | ||||
| Control, Refunding, Revenue Bond, | |||||
| FGIC Insured, | |||||
| 5.000%, 07/01/2014 | 603,468 | ||||
| 1,204,422 |
| Principal | Market | ||||
| Amount | Value | ||||
| Kansas - 0.52% | |||||
| $ | 765,000 | Labette County Hospital, Series A, | |||
| Revenue Bond, | |||||
| 5.750%, 09/01/2029 | $ | 725,312 | |||
| 735,000 | Wyandotte County, Revenue Bond, | ||||
| 4.880%, 10/01/2028 | 615,820 | ||||
| 1,341,132 | |||||
| Kentucky - 0.44% | |||||
| Murray Hospital Facilities, | |||||
| Refunding, Revenue Bond, | |||||
| 535,000 | 4.200%, 08/01/2010 | 533,213 | |||
| 630,000 | 4.380%, 08/01/2014 | 613,822 | |||
| 1,147,035 | |||||
| Louisiana - 1.85% | |||||
| 1,000,000 | Louisiana Office Facilities Corp., | ||||
| Revenue Bond, AMBAC Insured, | |||||
| 5.500%, 05/01/2016 | 1,059,610 | ||||
| 1,015,000 | Louisiana Offshore Term Authority, | ||||
| Refunding, Revenue Bond, | |||||
| 5.000%, 10/01/2020 | 991,959 | ||||
| 1,305,000 | Louisiana Public Facilities Authority, | ||||
| Revenue Bond, | |||||
| 5.500%, 05/15/2032 | 1,416,303 | ||||
| 1,235,000 | Louisiana, Series A, GO, | ||||
| 5.000%, 10/15/2018 | 1,297,405 | ||||
| 4,765,277 | |||||
| Maryland - 1.21% | |||||
| 1,160,000 | Maryland Department of | ||||
| Transportation County T | |||||
| Construction, Revenue Bond, | |||||
| 5.500%, 02/01/2017 | 1,313,166 | ||||
| 750,000 | Maryland Health & Higher Education | ||||
| Facilities Authority, Revenue Bond, | |||||
| 5.200%, 01/01/2024 | 691,508 | ||||
| 1,000,000 | Maryland, GO, | ||||
| 5.000%, 08/01/2014 | 1,107,160 | ||||
| 3,111,834 |
See notes to financial statements.
49
| AssetMark Tax-Exempt Fixed Income Fund |
| SCHEDULE OF INVESTMENTS (Continued) |
| March 31, 2008 |
| Principal | Market | ||||
| Amount | Value | ||||
| Massachusetts - 1.44% | |||||
| $ | 900,000 | Massachusetts Bay Transportation | |||
| Authority, Series A, Revenue Bond, | |||||
| 5.250%, 07/01/2015 | $ | 1,008,504 | |||
| 95,000 | Massachusetts Bay Transportation | ||||
| Authority, Series C, Revenue Bond, | |||||
| 5.500%, 03/01/2012 | 103,848 | ||||
| 1,250,000 | Massachusetts Health & Educational | ||||
| Facilities, Revenue Bond, MBIA | |||||
| Insured, 5.000%, 07/01/2015 | 1,352,375 | ||||
| 120,000 | Massachusetts State Water Resources | ||||
| Authority, Series B, Revenue Bond, | |||||
| 6.250%, 12/01/2011 | 135,421 | ||||
| 1,000,000 | Massachusetts, Series A, GO, | ||||
| 5.250%, 08/01/2013 | 1,103,250 | ||||
| 3,703,398 | |||||
| Michigan - 2.20% | |||||
| 155,000 | Detroit Sewer Disposal, Revenue | ||||
| Bond, 7.100%, 12/15/2009 | 162,916 | ||||
| 150,000 | Dundee Community School District, | ||||
| GO, Q-SBLF Insured, | |||||
| 5.380%, 05/01/2010 | 158,989 | ||||
| 600,000 | Kent Hospital Finance Authority, | ||||
| Series A, Revenue Bond, | |||||
| 5.500%, 01/15/2047 | 630,048 | ||||
| 800,000 | Lansing School District, Refunding, | ||||
| GO, Q-SBLF Insured, | |||||
| 5.000%, 05/01/2017 | 853,432 | ||||
| Michigan Building Authority, Series I, | |||||
| Refunding, Revenue Bond, | |||||
| 1,200,000 | 5.000%, 10/15/2009 | 1,249,452 | |||
| 915,000 | 4.750%, 10/15/2025 | 919,575 | |||
| 885,000 | Michigan Hospital Finance Authority, | ||||
| Revenue Bond, | |||||
| 7.130%, 05/01/2009 | 908,541 | ||||
| 765,000 | Michigan Hospital Financing | ||||
| Authority, Refunding, Revenue Bond, | |||||
| 5.000%, 07/15/2012 | 795,409 | ||||
| 5,678,362 |
| Principal | Market | ||||
| Amount | Value | ||||
| Minnesota - 0.67% | |||||
| $ | 295,000 | Prior Lake Independent School | |||
| District, Series A, GO, FGIC Insured, | |||||
| 4.750%, 02/01/2010 | $ | 306,133 | |||
| 1,325,000 | St. Paul Sewer, Series D, Revenue | ||||
| Bond, 5.000%, 12/01/2021 | 1,411,867 | ||||
| 1,718,000 | |||||
| Missouri - 1.05% | |||||
| Cape Girardeau County Industrial | |||||
| Development, Revenue Bond, | |||||
| 245,000 | 4.250%, 06/01/2008 | 245,110 | |||
| 350,000 | 4.250%, 06/01/2009 | 351,124 | |||
| 1,330,000 | St. Joseph Industrial Development | ||||
| Authority, Revenue Bond, | |||||
| 5.000%, 04/01/2027 | 1,298,133 | ||||
| 800,000 | St. Louis County Industrial | ||||
| Development Authority, Series A, | |||||
| Revenue Bond, | |||||
| 5.000%, 09/01/2008 | 801,976 | ||||
| 2,696,343 | |||||
| Montana - 1.05% | |||||
| 1,500,000 | Montana Department of | ||||
| Transportation, Revenue Bond, | |||||
| MBIA Insured, | |||||
| 5.250%, 06/01/2016 | 1,652,955 | ||||
| 1,000,000 | Montana Facilities Financing | ||||
| Authority, Revenue Bond, | |||||
| 5.000%, 01/01/2022 | 1,043,100 | ||||
| 2,696,055 | |||||
| Nebraska - 0.39% | |||||
| 1,000,000 | Southern Nebraska Public Power, | ||||
| Notes, 4.000%, 12/15/2008 | 1,015,710 | ||||
| New Hampshire - 0.58% | |||||
| 1,750,000 | New Hampshire Health & Education | ||||
| Facilities, Revenue Bond, | |||||
| 5.250%, 06/01/2036 | 1,494,780 | ||||
| New Jersey - 3.45% | |||||
| 600,000 | Bergen County School District, | ||||
| Revenue Bond, | |||||
| 5.000%, 04/01/2032 | 605,640 | ||||
See notes to financial statements.
50
| AssetMark Tax-Exempt Fixed Income Fund |
| SCHEDULE OF INVESTMENTS (Continued) |
| March 31, 2008 |
| Principal | Market | ||||
| Amount | Value | ||||
| New Jersey (Continued) | |||||
| $ | 700,000 | New Jersey Economic Development | |||
| Authority Cigarette Tax, Revenue | |||||
| Bond, 5.630%, 06/15/2019 | $ | 698,495 | |||
| 125,000 | New Jersey Educational Facilities | ||||
| Authority, Refunding, Revenue | |||||
| Bond, ACA-CBI Insured, | |||||
| 5.380%, 07/01/2012 | 128,569 | ||||
| 1,000,000 | New Jersey Transportation Trust | ||||
| Fund Authority, Revenue Bond, | |||||
| 5.250%, 12/15/2020 | 1,080,950 | ||||
| 1,500,000 | New Jersey, Refunding, Series N, GO, | ||||
| 5.500%, 07/15/2013 | 1,674,900 | ||||
| 3,100,000 | New Jersey, Series L, Refunding, GO, | ||||
| 5.250%, 07/15/2019 | 3,428,135 | ||||
| 1,255,000 | Tobacco Settlement Financing, | ||||
| Series A, Revenue Bond, | |||||
| 4.130%, 06/01/2010 | 1,257,384 | ||||
| 8,874,073 | |||||
| New Mexico - 0.44% | |||||
| 1,035,000 | University of New Mexico, | ||||
| Refunding, Revenue Bond, | |||||
| 5.250%, 06/01/2014 | 1,134,639 | ||||
| New York - 9.46% | |||||
| 1,000,000 | Dormitory Authority, Refunding, | ||||
| Revenue Bond, FGIC Insured, | |||||
| 5.500%, 07/01/2021 | 1,109,450 | ||||
| 1,000,000 | East Rochester Housing Authority | ||||
| Senior Living, Revenue Bond, | |||||
| 5.500%, 08/01/2033 | 859,950 | ||||
| 1,500,000 | Erie County, Series A, GO, FGIC | ||||
| Insured, 5.250%, 03/15/2018 | 1,582,035 | ||||
| 1,000,000 | Hudson Yards Infrastructure | ||||
| Corporation, Series A, Revenue | |||||
| Bond, 5.000%, 02/15/2047 | 947,600 | ||||
| Metropolitan Transportation | |||||
| Authority, Series A, Revenue Bond, | |||||
| 100,000 | 5.250%, 04/01/2009 | 102,091 | |||
| 1,000,000 | 5.000%, 11/15/2025 | 1,010,410 | |||
| 1,765,000 | Metropolitan Transportation | ||||
| Authority, Series F, Revenue Bond, | |||||
| 5.000%, 11/15/2014 | 1,926,639 | ||||
| Principal | Market | ||||
| Amount | Value | ||||
| New York (Continued) | |||||
| $ | 1,000,000 | New York City Industrial | |||
| Development Agency Queens | |||||
| Baseball Stadium, Revenue Bond, | |||||
| 4.750%, 01/01/2042 | $ | 940,780 | |||
| 500,000 | New York City Transit Authority, | ||||
| Series A, CP, AMBAC Insured, | |||||
| 5.630%, 01/01/2012 | 527,655 | ||||
| 1,100,000 | New York City Transitional Finance | ||||
| Authority, Series C, Revenue Bond, | |||||
| 5.000%, 02/01/2022 | 1,136,960 | ||||
| 1,800,000 | New York City Water & Sewer | ||||
| Systems Financing Authority, | |||||
| Series DD, Revenue Bond, | |||||
| 5.000%, 06/15/2039 | 1,785,798 | ||||
| 1,000,000 | New York City, GO, | ||||
| 5.000%, 11/01/2034 | 982,640 | ||||
| 1,250,000 | New York City, Series A, GO, | ||||
| 5.000%, 08/01/2020 | 1,303,887 | ||||
| 4,850,000 | New York Dormitory Authority, | ||||
| Series B, Revenue Bond, | |||||
| 5.250%, 11/15/2023 | 5,205,311 | ||||
| 1,000,000 | New York Thruway Authority | ||||
| Second Generation, Revenue Bond, | |||||
| AMBAC Insured, | |||||
| 5.000%, 04/01/2018 | 1,059,390 | ||||
| Sales Tax Asset Receivable Corp., | |||||
| Series A, Revenue Bond, | |||||
| 500,000 | 5.000%, 10/15/2017 | 539,215 | |||
| 1,500,000 | 5.250%, 10/15/2019 | 1,613,085 | |||
| Tobacco Settlement Financing, | |||||
| Revenue Bond, | |||||
| 650,000 | 5.000%, 06/01/2012 | 682,025 | |||
| 1,000,000 | 5.250%, 06/01/2021 | 1,029,960 | |||
| 24,344,881 | |||||
| North Carolina - 1.27% | |||||
| 2,500,000 | Eastern Municipal Power Agency, | ||||
| Series B, Refunding, Revenue Bond, | |||||
| FGIC Insured, | |||||
| 6.000%, 01/01/2022 | 2,674,100 | ||||
| 650,000 | North Carolina Medical Care | ||||
| Community, Revenue Bond, | |||||
| 5.600%, 10/01/2036 | 603,857 | ||||
| 3,277,957 | |||||
See notes to financial statements.
51
| AssetMark Tax-Exempt Fixed Income Fund |
| SCHEDULE OF INVESTMENTS (Continued) |
| March 31, 2008 |
| Principal | Market | ||||
| Amount | Value | ||||
| North Dakota - 0.44% | |||||
| $ | 500,000 | Ward County Health Care Facilities, | |||
| Revenue Bond, | |||||
| 5.000%, 07/01/2008 | $500,940 | ||||
| 685,000 | Williams County Sales Tax, Revenue | ||||
| Bond, 5.000%, 11/01/2026 | 625,275 | ||||
| 1,126,215 | |||||
| Ohio - 1.86% | |||||
| 650,000 | Cuyahoga County, Refunding, | ||||
| Revenue Bond, | |||||
| 6.000%, 01/01/2032 | 674,746 | ||||
| 700,000 | Ohio Higher Educational Facility | ||||
| Commission, Revenue Bond, | |||||
| 5.000%, 10/01/2031 | 652,057 | ||||
| Ohio, Series A, GO, | |||||
| 1,000,000 | 5.000%, 09/01/2015 | 1,104,700 | |||
| 1,385,000 | 5.000%, 09/01/2016 | 1,528,832 | |||
| 900,000 | Toledo-Lucas County Port Authority, | ||||
| Special Assessment, | |||||
| 5.380%, 12/01/2035 | 827,847 | ||||
| 4,788,182 | |||||
| Oklahoma - 0.71% | |||||
| 1,000,000 | Tulsa County Individual Authority | ||||
| Health Care, Revenue Bond, | |||||
| 5.000%, 12/15/2036 | 922,450 | ||||
| 1,000,000 | University of Tulsa Student Housing, | ||||
| Revenue Bond, | |||||
| 5.000%, 10/01/2037 | 902,420 | ||||
| 1,824,870 | |||||
| Oregon - 1.05% | |||||
| 1,000,000 | Clackamas County School District, | ||||
| GO, 5.000%, 06/15/2021 | 894,290 | ||||
| 1,500,000 | Oregon Facilities Authority, Series A, | ||||
| Refunding, Revenue Bond, | |||||
| 5.500%, 04/01/2027 | 1,518,390 | ||||
| 250,000 | Washington County School District, | ||||
| Refunding, GO, FSA Insured, | |||||
| 5.500%, 06/15/2019 | 282,847 | ||||
| 2,695,527 |
| Principal | Market | ||||
| Amount | Value | ||||
| Pennsylvania - 1.86% | |||||
| $ | 1,250,000 | Allegheny County Hospital | |||
| Development Authority, Series A, | |||||
| Revenue Bond, | |||||
| 5.000%, 09/01/2014 | $ | 1,320,025 | |||
| 430,000 | Cumberland County Authority, | ||||
| Revenue Bond, | |||||
| 5.000%, 01/01/2036 | 355,158 | ||||
| 500,000 | Lancaster County Hospital Authority, | ||||
| Series A, Refunding, Revenue | |||||
| Bond, 5.200%, 07/01/2012 | 505,645 | ||||
| 1,000,000 | Pennsylvania, Refunding, GO, | ||||
| 5.250%, 02/01/2014 | 1,107,040 | ||||
| 1,000,000 | Pennsylvania, Series A, GO, | ||||
| 5.000%, 08/01/2023 | 1,041,550 | ||||
| 500,000 | Philadelphia Hospitals & Higher | ||||
| Education Facilities, Refunding, | |||||
| Revenue Bond, | |||||
| 5.500%, 07/01/2030 | 458,010 | ||||
| 4,787,428 | |||||
| Puerto Rico - 1.63% | |||||
| 1,250,000 | Puerto Rico Commonwealth, | ||||
| Series A, GO, | |||||
| 5.250%, 07/01/2022 | 1,261,550 | ||||
| Puerto Rico Commonwealth, | |||||
| Series A, Refunding, GO, | |||||
| 1,000,000 | 5.500%, 07/01/2017 | 1,063,200 | |||
| 750,000 | 5.500%, 07/01/2018 | 793,283 | |||
| 620,000 | Puerto Rico Commonwealth, | ||||
| Series B, Prerefunded, Refunding, | |||||
| GO, 5.250%, 07/01/2032 | 702,305 | ||||
| 380,000 | Puerto Rico Commonwealth, | ||||
| Series B, Unrefunded, Refunding, | |||||
| GO, 5.250%, 07/01/2032 | 365,362 | ||||
| 4,185,700 | |||||
| South Carolina - 1.12% | |||||
| 500,000 | Charleston County Hospital Facilities, | ||||
| Revenue Bond, | |||||
| 5.500%, 08/15/2013 | 531,905 | ||||
| 2,055,000 | Greenville Waterworks, Refunding, | ||||
| Revenue Bond, | |||||
| 5.000%, 02/01/2013 | 2,238,368 |
See notes to financial statements.
52
| AssetMark Tax-Exempt Fixed Income Fund |
| SCHEDULE OF INVESTMENTS (Continued) |
| March 31, 2008 |
| Principal | Market | ||||
| Amount | Value | ||||
| South Carolina (Continued) | |||||
| $ | 100,000 | Tobacco Settlement Revenue | |||
| Management Authority, Series B, | |||||
| Revenue Bond, | |||||
| 6.380%, 05/15/2030 | $ | 97,392 | |||
| 2,867,665 | |||||
| South Dakota - 0.19% | |||||
| 465,000 | South Dakota Health & Educational | ||||
| Facilities Authority, Revenue Bond, | |||||
| 5.000%, 11/01/2010 | 484,721 | ||||
| Tennessee - 0.99% | |||||
| 300,000 | Johnson City Health & Educational | ||||
| Facilities Board, Revenue Bond, | |||||
| 6.000%, 07/01/2021 | 327,399 | ||||
| 250,000 | Knoxville Water, Series P, Revenue | ||||
| Bond, 5.000%, 03/01/2009 | 257,147 | ||||
| 1,000,000 | Memphis-Shelby County Airport | ||||
| Authority Special Facilities, | |||||
| Refunding, Revenue Bond, | |||||
| 5.050%, 09/01/2012 | 1,020,140 | ||||
| 1,000,000 | Sullivan County Health, Educational | ||||
| and Housing Facilities Board, | |||||
| Series C, Revenue Bond, | |||||
| 5.000%, 09/01/2022 | 934,570 | ||||
| 2,539,256 | |||||
| Texas - 15.10% | |||||
| 2,245,000 | Cotulla Independent School District, | ||||
| GO, PSF-GTD Insured, | |||||
| 5.250%, 02/15/2032 | 2,284,669 | ||||
| 2,740,000 | El Paso, GO, MBIA Insured, | ||||
| 5.000%, 08/15/2024 | 2,809,404 | ||||
| 145,000 | Frisco, GO, FGIC Insured, | ||||
| 5.880%, 02/15/2010 | 153,456 | ||||
| 630,000 | Gregg County Health Facilities, | ||||
| Revenue Bond, | |||||
| 4.250%, 10/01/2009 | 630,359 | ||||
| 1,300,000 | Houston Apartment System, Series B, | ||||
| Refunding, Revenue Bond, FGIC | |||||
| Insured, 5.000%, 07/01/2032 | 1,241,890 | ||||
| 225,000 | Houston, Series A, GO, | ||||
| 5.000%, 03/01/2021 | 230,434 | ||||
See notes to financial statements.
53
| Principal | Market | ||||
| Amount | Value | ||||
| Texas (Continued) | |||||
| $ | 5,000 | Lower Colorado River Authority, | |||
| Series B, Prerefunded, Revenue | |||||
| Bond, FSA Insured, | |||||
| 6.000%, 05/15/2013 | $ | 5,232 | |||
| 930,000 | Lower Colorado River Authority, | ||||
| Series B, Unrefunded, Revenue | |||||
| Bond, FSA Insured, | |||||
| 6.000%, 05/15/2013 | 973,059 | ||||
| 1,000,000 | Lubbock Educational Facilities | ||||
| Authority, Refunding, Revenue Bond, | |||||
| 5.250%, 11/01/2037 | 875,490 | ||||
| North East Independent School | |||||
| District, Series A, GO, PSF-GTD | |||||
| Insured, | |||||
| 1,500,000 | 5.000%, 08/01/2018 | 1,630,350 | |||
| 1,500,000 | 5.000%, 08/01/2020 | 1,597,695 | |||
| 2,300,000 | North Texas & Dallas Thruway | ||||
| System, Series A, Refunded, | |||||
| Revenue Bond, | |||||
| 5.380%, 01/01/2016 | 2,304,761 | ||||
| North Texas Tollway Authority, | |||||
| Series A, Refunding, Revenue Bond, | |||||
| 700,000 | 6.000%, 01/01/2019 | 761,866 | |||
| 1,000,000 | 5.630%, 01/01/2033 | 995,270 | |||
| 770,000 | North Texas Tollway Authority, | ||||
| Series E, Refunding, Revenue Bond, | |||||
| 5.750%, 01/01/2038 | 802,124 | ||||
| 3,600,000 | Round Rock Independent School | ||||
| District, GO, PSF-GTD Insured, | |||||
| 5.000%, 08/01/2018 | 3,819,816 | ||||
| 2,000,000 | San Antonio Electric & Gas, | ||||
| Refunding, Revenue Bond, | |||||
| 5.380%, 02/01/2015 | 2,238,780 | ||||
| 770,000 | San Antonio Electric & Gas, Series A, | ||||
| Prerefunded, Revenue Bond, MBIA | |||||
| Insured, 5.000%, 02/01/2017 | 798,051 | ||||
| 1,430,000 | San Antonio Electric & Gas, | ||||
| Series A, Unrefunded, Revenue | |||||
| Bond, MBIA Insured, | |||||
| 5.000%, 02/01/2017 | 1,458,815 | ||||
| 70,000 | San Antonio Electric & Gas, | ||||
| Unrefunded, Revenue Bond, | |||||
| 5.500%, 02/01/2013 | 72,117 | ||||
| AssetMark Tax-Exempt Fixed Income Fund |
| SCHEDULE OF INVESTMENTS (Continued) |
| March 31, 2008 |
| Principal | Market | ||||
| Amount | Value | ||||
| Texas (Continued) | |||||
| $ | 1,000,000 | San Leanna Educational Facilities, | |||
| Refunding, Revenue Bond, | |||||
| 4.750%, 06/01/2032 | $ | 845,190 | |||
| 1,420,000 | Sheldon Independent School District, | ||||
| Refunding, GO, PSF-GTD Insured, | |||||
| 5.000%, 02/15/2024 | 1,457,999 | ||||
| 185,000 | Socorro Independent School District, | ||||
| Prerefunded, GO, PSF-GTD Insured, | |||||
| 5.380%, 08/15/2013 | 201,754 | ||||
| 15,000 | Socorro Independent School District, | ||||
| Unrefunded, GO, PSF-GTD Insured, | |||||
| 5.380%, 08/15/2013 | 16,187 | ||||
| 2,000,000 | Tarrant County Cultural Educational | ||||
| Facilities, Refunding, Revenue | |||||
| Bond, 5.000%, 02/15/2014 | 2,104,640 | ||||
| 2,500,000 | Texas A&M University, Refunding, | ||||
| Revenue Bond, | |||||
| 5.000%, 05/15/2019 | 2,695,425 | ||||
| 1,875,000 | Texas Municipal Gas Acquisition | ||||
| and Supply Corporation, Series B, | |||||
| Revenue Bond, | |||||
| 2.210%, 12/15/2009 | 1,810,069 | ||||
| 400,000 | Texas Public Finance Authority, | ||||
| Refunding, GO, | |||||
| 5.500%, 10/01/2009 | 418,940 | ||||
| 100,000 | Texas State University System, | ||||
| Revenue Bond, FSA Insured, | |||||
| 5.250%, 03/15/2010 | 105,396 | ||||
| 500,000 | Texas Transportation Commission, | ||||
| Revenue Bond, | |||||
| 5.000%, 04/01/2018 | 541,385 | ||||
| 1,000,000 | Texas, GO, | ||||
| 5.000%, 04/01/2016 | 1,097,230 | ||||
| 400,000 | Texas, Series A, GO, | ||||
| 5.000%, 04/01/2022 | 417,668 | ||||
| 100,000 | University of Texas, Revenue Bond, | ||||
| 5.250%, 08/15/2008 | 101,308 | ||||
| 1,280,000 | Victoria, GO, MBIA Insured, | ||||
| 5.250%, 08/15/2022 | 1,365,760 | ||||
| 38,862,589 |
| Principal | Market | ||||
| Amount | Value | ||||
| Utah - 0.04% | |||||
| $ | 100,000 | Jordan School District, GO, | |||
| 5.130%, 06/15/2008 | $ | 100,708 | |||
| Virginia - 1.13% | |||||
| 1,000,000 | Fairfax County, Series A, Refunding, | ||||
| GO, STAID Insured, | |||||
| 5.250%, 04/01/2014 | 1,116,790 | ||||
| 1,000,000 | Henry County Public Service | ||||
| Authority Water & Sewer, Refunding, | |||||
| Revenue Bond, FSA Insured, | |||||
| 5.500%, 11/15/2019 | 1,138,240 | ||||
| 100,000 | Norfolk, Refunding, GO, | ||||
| 5.000%, 01/01/2009 | 102,376 | ||||
| 625,000 | Suffolk Industrial Development | ||||
| Authority Retirement Facilities, | |||||
| Revenue Bond, | |||||
| 5.300%, 09/01/2031 | 541,444 | ||||
| 2,898,850 | |||||
| Washington - 5.96% | |||||
| 1,000,000 | Clark County School District, | ||||
| Refunding, GO, FGIC Insured, | |||||
| 5.500%, 12/01/2017 | 1,087,420 | ||||
| 2,465,000 | Energy Northwest, Series A, | ||||
| Refunding, Revenue Bond, FSA | |||||
| Insured, 5.500%, 07/01/2017 | 2,621,996 | ||||
| 2,000,000 | Energy Northwest, Series A, | ||||
| Refunding, Revenue Bond, MBIA | |||||
| Insured, 5.750%, 07/01/2017 | 2,172,660 | ||||
| 500,000 | King County Hospital, Refunding, | ||||
| GO, MBIA Insured, | |||||
| 5.000%, 12/01/2021 | 516,290 | ||||
| 3,150,000 | King County Sewer, Refunding, | ||||
| Revenue Bond, FSA Insured, | |||||
| 5.250%, 01/01/2011 | 3,369,586 | ||||
| 45,000 | King County, Prerefunded, GO, | ||||
| 5.500%, 12/01/2010 | 48,671 | ||||
| 55,000 | King County, Unrefunded, GO, | ||||
| 5.500%, 12/01/2010 | 59,368 | ||||
| 2,000,000 | Klickitat County Public Utilities, | ||||
| Series B, Refunding, Revenue Bond, | |||||
| FGIC Insured, | |||||
| 5.250%, 12/01/2020 | 2,107,960 | ||||
| 1,000,000 | Port Seattle, Series A, Revenue | ||||
| Bond, 5.000%, 04/01/2031 | 990,560 |
See notes to financial statements.
54
| AssetMark Tax-Exempt Fixed Income Fund |
| SCHEDULE OF INVESTMENTS (Continued) |
| March 31, 2008 |
| Principal | Market | ||||
| Amount | Value | ||||
| Washington (Continued) | |||||
| $ | 30,000 | Seattle, Prerefunded, GO, | |||
| 5.000%, 07/01/2013 | $ | 32,572 | |||
| 1,000,000 | Skagit County Public Hospital, | ||||
| Revenue Bond, | |||||
| 5.750%, 12/01/2028 | 953,470 | ||||
| 1,250,000 | Washington, Series A, GO, | ||||
| 5.000%, 07/01/2016 | 1,371,938 | ||||
| 15,332,491 | |||||
| Wisconsin - 2.82% | |||||
| Badger Tobacco Asset Securitization, | |||||
| Revenue Bond, | |||||
| 350,000 | 5.750%, 06/01/2011 | 365,988 | |||
| 440,000 | 6.130%, 06/01/2027 | 441,474 | |||
| 1,000,000 | Middleton Cross Plains Area School | ||||
| District, Refunding, GO, FSA | |||||
| Insured, 5.000%, 04/01/2020 | 1,060,950 | ||||
| 2,000,000 | Southeast Wisconsin Professional | ||||
| Baseball Park Sales Tax, Series A, | |||||
| Revenue Bond, MBIA Insured, | |||||
| 5.500%, 12/15/2026 | 2,148,360 | ||||
| 500,000 | Wisconsin Health & Educational | ||||
| Facilities, Series A, Revenue Bond, | |||||
| 5.000%, 02/15/2018 | 493,085 | ||||
| 1,150,000 | Wisconsin Health & Educational | ||||
| Facilities, Series B, Revenue Bond, | |||||
| 5.000%, 08/15/2013 | 1,162,328 | ||||
| 1,500,000 | Wisconsin, Series A, GO, | ||||
| 5.000%, 05/01/2011 | 1,602,120 | ||||
| 7,274,305 | |||||
| Total Municipal Bonds | |||||
| (Cost $248,795,902) | 245,230,131 | ||||
SHORT TERM INVESTMENTS - 1.44% | |||||
Variable Rate Demand Obligations - 1.22% | |||||
| 50,000 | Allentown Commercial & Industrial | ||||
| Development, Revenue Bond, | |||||
| Wachovia Bank N.A. Insured, | |||||
| 1.700%, 12/01/2029 (a) | 50,000 | ||||
| 1,000,000 | Massachusetts Water Resource | ||||
| Authority, Refunding, Revenue | |||||
| Bond, FGIC Insured, | |||||
| 9.000%, 11/01/2026 (a) | 1,000,000 | ||||
| Principal | Market | ||||
| Amount | Value | ||||
| Variable Rate Demand Obligations (Continued) | |||||
| $ | 100,000 | Minnesota Higher Education | |||
| Facilities Authority, Series 5-H, | |||||
| Revenue Bond, HTSB Insured, | |||||
| 1.300%, 10/01/2030 (a) | $ | 100,000 | |||
| 1,000,000 | Northern Michigan University, | ||||
| Revenue Bond, AMBAC Insured, | |||||
| 7.000% (a) | 1,000,000 | ||||
| 1,000,000 | Olathe Medical Center, Series A, | ||||
| Refunding, Revenue Bond, | |||||
| AMBAC Insured, | |||||
| 7.000%, 09/01/2032 (a) | 1,000,000 | ||||
| 3,150,000 | |||||
| Shares | |||||
| Money Market Funds - 0.22% | |||||
| 571,389 | Fidelity Tax Exempt Portfolio, | ||||
| 3.594% (a) | 571,389 | ||||
| Total Short Term Investments | |||||
| (Cost $3,721,389) | 3,721,389 | ||||
| Total Investments | |||||
| (Cost $259,767,291) - 99.52% | 256,201,520 | ||||
| Other Assets in Excess of | |||||
| Liabilities - 0.48% | 1,238,613 | ||||
| TOTAL NET | |||||
| ASSETS - 100.00% | $ | 257,440,133 | |||
| Percentages are stated as a percent of net assets. | |||||
| (a) | Variable Rate Security. The rate shown is the rate in effect on | ||||
| March 31, 2008. | |||||
| Glossary of Terms | |||||
| AMBAC American Municipal Bond Assurance Corp. | |||||
| ACA American Capital Access | |||||
| CBI Certificate of Bond Insurance | |||||
| CP Certificate of Participation | |||||
| FGIC Financial Guaranty Insurance Corp. | |||||
| FSA Federal Housing Authority/Agency | |||||
| GO General Obligation | |||||
| HTSB Harris Trust & Savings Bank | |||||
| MBIA Municipal Bond Investors Assurance Corp. | |||||
| PSF-GTD Permanent School Fund Guaranteed | |||||
| Q-SBLF Qualified School Board Loan | |||||
| STAID State Aid Withholding | |||||
| XLCA XL Capital Assurance | |||||
See notes to financial statements.
55
| AssetMark Core Plus Fixed Income Fund |
| PERFORMANCE DATA |
TOTAL RETURN BASED ON A $10,000 INVESTMENT

This chart assumes an initial gross investment of $10,000 made on June 29, 2001 (commencement of the Fund’s operations). Returns shown include the reinvestment of all dividends. Returns shown do not reflect the deduction of taxes that a shareholder would pay on fund distributions or the redemption of fund shares. In the absence of fee waivers and reimbursements, total return would be reduced. Past performance is not predictive of future performance. Investment return and principal value will fluctuate, so that your shares, when redeemed, may be worth more or less than the original cost.
LEHMAN BROTHERS AGGREGATE BOND INDEX - An unmanaged index which measures the performance of securities from the Lehman Brothers Government/Corporate Bond Index, Mortgage-Backed Securities Index and the Asset-Backed Securities Index. The Lehman Brothers Aggregate Bond Index is a broad representation of the investment-grade fixed-income market in the U.S. and includes U.S. Government and corporate debt securities, mortgage- and asset-backed securities and international U.S. dollar-denominated bonds. All securities contained in the Lehman Brothers Aggregate Bond Index have a minimum term to maturity of one year. The index does not reflect any deduction for fees, expenses or taxes.
LIPPER INTERMEDIATE INVESTMENT-GRADE DEBT FUNDS INDEX - The Lipper Intermediate Investment-Grade Debt Funds Index is an index of portfolios that invest at least 65% of their assets in investment-grade debt issues (rated in the top four grades) with dollar-weighted average maturities of five to ten years.
| AVERAGE ANNUAL TOTAL RETURN (for the periods ended March 31) | |||||
| One Year | Five Year | Since Inception (6/29/01) | |||
| AssetMark Core Plus Fixed Income Fund | 3.87% | 3.81% | 4.76% | ||
| Lehman Brothers Aggregate Bond Index | 7.67% | 4.58% | 5.80% | ||
| Lipper Intermediate Investment-Grade Debt Funds Index | 4.01% | 4.03% | 5.14% | ||
56
| AssetMark Core Plus Fixed Income Fund |
| SCHEDULE OF INVESTMENTS |
| March 31, 2008 |
| Number of | Market | ||||
| Shares | Value | ||||
| CONVERTIBLE PREFERRED | |||||
| STOCKS - 0.03% | |||||
| Automobiles - 0.03% | |||||
| 12,000 | General Motors Corporation | $ | 198,000 | ||
| 1,800 | General Motors Corporation | 29,214 | |||
| 227,214 | |||||
| Total Convertible Preferred Stocks | |||||
| (Cost $304,161) | 227,214 | ||||
| PREFERRED STOCKS - 0.53% | |||||
| Banks - 0.09% | |||||
| 800,000 | HSBC Capital Funding LP | ||||
| 4.610%, 12/31/2049 (Callable at | |||||
| $100.00 on 06/27/2013) (a)(c)(e) | 707,141 | ||||
| Consumer Finance - 0.02% | |||||
| 12,000 | Corts Trust for Ford Motor | ||||
| Company | 171,840 | ||||
| Thrifts & Mortgage Finance - 0.42% | |||||
| 44,650 | FHLMC, 8.375% (b) | 1,089,460 | |||
| 1,300 | FNMA, 7.000% (e) | 58,906 | |||
| 94,350 | FNMA, 8.250% (a) | 2,268,646 | |||
| 3,417,012 | |||||
| Total Preferred Stocks | |||||
| (Cost $4,498,922) | 4,295,993 | ||||
| Principal | |||||
| Amount | |||||
| ASSET BACKED SECURITIES - 4.01% | |||||
| $ | 892,837 | Accredited Mortgage Loan Trust | |||
| Series 2005-3, | |||||
| 2.840%, 09/25/2035 | 854,379 | ||||
| 6,750,000 | Citibank Credit Card Insurance Trust | ||||
| Series 2006-A4, | |||||
| 5.450%, 05/10/2013 | 7,049,755 | ||||
| 93,941 | Conseco Finance Securitizations | ||||
| Corp. Series 2000-4, | |||||
| 8.310%, 04/01/2031 | 75,067 | ||||
| 393,819 | Countrywide Asset-Backed | ||||
| Certificates Series 2005-4, | |||||
| 4.460%, 09/25/2032 | 389,471 | ||||
| Countrywide Home Equity Loan | |||||
| Trust | |||||
| 307,136 | Series 2004-R, | ||||
| 3.070%, 03/15/2030 | 217,920 | ||||
| 430,296 | Series 2004-N, | ||||
| 3.100%, 02/15/2034 | 347,648 | ||||
| Principal | Market | ||||
| Amount | Value | ||||
| ASSET BACKED SECURITIES (Continued) | |||||
| $ | 474,587 | Series 2004-O, 3.100%, | |||
| 02/15/2034 | $ | 388,843 | |||
| 484,687 | Series 2005-F, | ||||
| 3.060%, 12/15/2035 | 366,017 | ||||
| 389,136 | Delta Airlines | ||||
| Series 2007-1, | |||||
| 6.820%, 08/10/2022 (c) | 376,194 | ||||
| GMAC Mortgage Corporation | |||||
| 2,891,137 | Series FLT, | ||||
| 3.350%, 02/25/2031 (c) | 2,405,137 | ||||
| 925,645 | Series 2007-HE3, | ||||
| 7.000%, 09/25/2037 | 794,616 | ||||
| 408,796 | Home Equity Loan Trust | ||||
| Series 2005-HS1, | |||||
| 3.260%, 07/25/2020 | 394,787 | ||||
| 2,081,372 | Household Home Equity Loan Trust | ||||
| Series 2007-3, | |||||
| 3.740%, 11/20/2036 | 1,757,889 | ||||
| 778,808 | Indymac Mortgage Loan Trust | ||||
| Series 2005-AR16IP, | |||||
| 3.460%, 07/25/2045 | 604,318 | ||||
| JetBlue Airways Corporation | |||||
| 778,382 | Series 2004-2, G-1, | ||||
| 3.440%, 02/15/2018 (e) | 755,030 | ||||
| 900,000 | Series 2004-2, G-2, | ||||
| 3.520%, 05/15/2018 (e) | 773,327 | ||||
| 3,168,930 | New Valley Generation | ||||
| Series 2000-1, | |||||
| 7.300%, 03/15/2019 | 3,542,443 | ||||
| 7,903,278 | New Valley Generation II | ||||
| Series 2001-1, | |||||
| 5.570%, 05/01/2020 | 8,461,645 | ||||
| 194,849 | Residential Asset Mortgage | ||||
| Products, Inc. Series FLT, | |||||
| 3.620%, 03/25/2034 | 156,361 | ||||
| Washington Mutual | |||||
| 1,620,000 | Series 2006-A3, | ||||
| 2.850%, 09/15/2013 (c) | 1,543,935 | ||||
| 1,270,660 | Series 2005-AR8, | ||||
| 2.890%, 07/25/2045 (e) | 971,996 | ||||
| Total Asset Backed Securities | |||||
| (Cost $33,582,849) | 32,226,778 | ||||
| AUCTION RATE SECURITIES - 0.45% | |||||
| 650,000 | California Health Facilities | ||||
| Financing Authority | |||||
| 6.970%, 07/01/2022 (e) | 650,000 | ||||
See notes to financial statements.
57
| AssetMark Core Plus Fixed Income Fund |
| SCHEDULE OF INVESTMENTS (Continued) |
| March 31, 2008 |
| Principal | Market | ||||
| Amount | Value | ||||
| AUCTION RATE SECURITIES (Continued) | |||||
| $ | 275,000 | Colorado Health Facilities Authority | |||
| 5.220%, 09/01/2036 (e) | $ | 275,000 | |||
| 50,000 | Illinois Finance Authority | ||||
| 7.000%, 11/15/2037 (e) | 50,000 | ||||
| 400,000 | Mississippi Development Bank | ||||
| 9.000%, 03/01/2023 (e) | 400,000 | ||||
| 1,275,000 | New Hanover County Hospital | ||||
| 6.110%, 10/01/2036 (e) | 1,275,000 | ||||
| 1,000,000 | Sacramento County Sanitation | ||||
| District Financing Authority | |||||
| 5.000%, 12/01/2038 (e) | 1,000,000 | ||||
| Total Auction Rate Securities | |||||
| (Cost $3,650,000) | 3,650,000 | ||||
| COLLATERALIZED MORTGAGE | |||||
| OBLIGATIONS - 2.38% | |||||
| 748,838 | Bank of America Corporation | ||||
| Series 2005-B, | |||||
| 5.100%, 04/25/2035 | 758,906 | ||||
| Countrywide Home Loans, Inc. | |||||
| 450,341 | Series 2005-11, | ||||
| 2.900%, 03/25/2035 | 404,002 | ||||
| 990,764 | Series 2005-R1, | ||||
| 3.490%, 03/25/2035 (c) | 876,785 | ||||
| 595,131 | Series 2005-11, | ||||
| 6.040%, 04/25/2035 | 464,017 | ||||
| FHLMC | |||||
| 59,982 | Series 1647PK, | ||||
| 6.500%, 12/15/2008 | 59,913 | ||||
| 1,700,205 | Series 2329, 6.500%, 06/15/2031 | 1,793,043 | |||
| 941,630 | Series 2338, 6.500%, 07/15/2031 | 991,201 | |||
| 1,141,931 | GSMPS Mortgage Loan Trust | ||||
| Series 2005-RP1, | |||||
| 2.950%, 01/25/2035 (c) | 856,076 | ||||
| 3,100,000 | Master Adjustable Rate Mortgages | ||||
| Trust Series 2004-13, | |||||
| 3.790%, 11/21/2034 | 2,954,164 | ||||
| 544,182 | Master Reperforming Loan Trust | ||||
| Series 2005-1, | |||||
| 7.000%, 08/25/2034 (c) | 547,401 | ||||
| 1,241,598 | MLCC Mortgage Investors, Inc. | ||||
| Series 2005-1, | |||||
| 4.970%, 04/25/2035 | 1,255,470 | ||||
| Prime Mortgage Trust | |||||
| 3,977,458 | Series 2006-DR1, | ||||
| 5.500%, 05/25/2035 (c) | 3,888,146 | ||||
| Principal | Market | ||||
| Amount | Value | ||||
| COLLATERALIZED MORTGAGE | |||||
| OBLIGATIONS (Continued) | |||||
| $ | 3,187,242 | Series 2006-DR1, | |||
| 6.000%, 05/25/2035 (c) | $ | 3,147,247 | |||
| 571,164 | Residential Asset Mortgage | ||||
| Products, Inc. Series 2004-SL4, | |||||
| 7.500%, 07/25/2032 | 559,563 | ||||
| 631,614 | Structured Adjustable Rate Mortgage | ||||
| Loan Series 2004-18, | |||||
| 7.170%, 12/25/2034 | 614,284 | ||||
| Total Collateralized Mortgage | |||||
| Obligations (Cost $19,944,734) | 19,170,218 | ||||
| CONVERTIBLE BONDS - 0.01% | |||||
| Automobiles - 0.01% | |||||
| 80,000 | Ford Motor Company | ||||
| 4.250%, 12/15/2036 | 69,000 | ||||
| Total Convertible Bonds | |||||
| (Cost $80,000) | 69,000 | ||||
| CORPORATE BONDS - 21.94% | |||||
| Aerospace & Defense - 0.01% | |||||
| 55,000 | DRS Technologies, Inc. | ||||
| 6.630%, 02/01/2016 | 54,037 | ||||
| Airlines - 0.06% | |||||
| 475,000 | International Lease Finance Corp. | ||||
| 4.950%, 02/01/2011 | 468,696 | ||||
| Auto Components - 0.05% | |||||
| 250,000 | Goodyear Tire & Rubber Co. | ||||
| 9.000%, 07/01/2015 | 265,625 | ||||
| 170,000 | Visteon Corp. | ||||
| 8.250%, 08/01/2010 | 139,825 | ||||
| 405,450 | |||||
| Automobiles - 0.43% | |||||
| 375,000 | Bombardier, Inc. | ||||
| 7.250%, 11/15/2016 | |||||
| (Acquired 05/15/2007, | |||||
| Cost $481,745) (d) | 563,912 | ||||
| DaimlerChrysler N.A. | |||||
| 5,000 | 4.050%, 06/04/2008 | 5,002 | |||
| 150,000 | 7.200%, 09/01/2009 | 155,209 | |||
| 260,000 | 5.880%, 03/15/2011 | 265,962 | |||
| 670,000 | Ford Motor Company | ||||
| 7.450%, 07/16/2031 (b) | 445,550 | ||||
| General Motors Corporation | |||||
| 2,420,000 | 8.250%, 07/15/2023 | 1,706,100 | |||
| 250,000 | 8.380%, 07/05/2033 | 265,481 |
See notes to financial statements.
58
| AssetMark Core Plus Fixed Income Fund |
| SCHEDULE OF INVESTMENTS (Continued) |
| March 31, 2008 |
| Principal | Market | ||||
| Amount | Value | ||||
| CORPORATE BONDS (Continued) | |||||
| $ | 30,000 | 8.380%, 07/15/2033 (b) | $ | 21,300 | |
| 3,428,516 | |||||
| Banks - 3.21% | |||||
| 300,000 | AIFUL Corporation | ||||
| 5.000%, 08/10/2010 (c) | 283,077 | ||||
| 750,000 | ANZ Capital Trust II | ||||
| 5.360%, 12/15/2049 (c) | 715,115 | ||||
| 30,000 | BAC Capital Trust XIV | ||||
| 5.630%, 03/15/2043 | 21,954 | ||||
| 40,000 | Bank of America Corporation | ||||
| 5.380%, 08/15/2011 (b) | 41,755 | ||||
| 1,000,000 | Barclay’s Bank PLC | ||||
| 9.470%, 05/19/2015 (Credit linked | |||||
| to Republic of Brazil Treasury | |||||
| Security) (c)(j) | 905,154 | ||||
| Countrywide Financial Corp. | |||||
| 80,000 | 3.350%, 05/05/2008 | 77,479 | |||
| 280,000 | 2.870%, 06/18/2008 (e) | 275,272 | |||
| 220,000 | 4.790%, 01/05/2009 (e) | 205,953 | |||
| Glitnir Bank Hf | |||||
| 370,000 | 6.330%, 07/28/2011 (c) | 317,957 | |||
| 760,000 | 6.690%, 06/15/2016 (Callable | ||||
| at $100.00 on 06/15/2011) (c) | 612,985 | ||||
| 375,000 | Greenpoint Bank | ||||
| 9.250%, 10/01/2010 | 392,133 | ||||
| 700,000 | HBOS Capital Funding LP | ||||
| 6.070%, 06/01/2049 (c)(e) | 615,590 | ||||
| 685,000 | HSBC Finance Corp. | ||||
| 4.130%, 11/16/2009 | 674,693 | ||||
| ICICI Bank Ltd. | |||||
| 340,000 | 6.380%, 04/30/2022 | 296,223 | |||
| 354,000 | 6.380%, 04/30/2022 (c) | 304,938 | |||
| 1,075,000 | ING Capital Funding TR III | ||||
| 8.440%, 12/31/2010 (e) | 1,073,164 | ||||
| 4,000,000 | Inter-American Development Bank | ||||
| 0.500%, 05/29/2014 | 3,303,640 | ||||
| Kaupthing Bank Hf | |||||
| 130,000 | 5.750%, 10/04/2011 (c) | 103,848 | |||
| 1,990,000 | 7.630%, 02/28/2015 (c)(k) | 1,525,972 | |||
| 250,000 | 7.130%, 05/19/2016 (c) | 168,921 | |||
| 1,080,000 | Landsbanki Islands Hf | ||||
| 6.100%, 08/25/2011 (c) | 944,240 | ||||
| 650,000 | PNC Bank NA | ||||
| 6.880%, 04/01/2018 | 662,213 |
| Principal | Market | ||||
| Amount | Value | ||||
| CORPORATE BONDS (Continued) | |||||
| Banks (Continued) | |||||
| Resona Bank | |||||
| $ | 525,000 | 5.850%, 09/29/2049 | |||
| (Acquired 09/08/2005, | |||||
| Cost $524,633) (d) | $ | 436,944 | |||
| 450,000 | 4.130%, 12/31/2049 | ||||
| (Acquired 10/05/2005, | |||||
| Cost $537,958) (d) | 600,554 | ||||
| 735,000 | Resona Preferred Global Securities | ||||
| 7.190%, 12/29/2049 | |||||
| (Callable at $100.00 on | |||||
| 07/30/2015) (c) | 642,752 | ||||
| Royal Bank of Scotland Group PLC | |||||
| 200,000 | 7.640%, 03/31/2049 | 172,512 | |||
| 1,740,000 | 9.120%, 03/31/2049 | 1,756,123 | |||
| 875,000 | 6.990%, 10/29/2049 | ||||
| (Callable at $100.00 on | |||||
| 10/05/2017) (c) | 744,004 | ||||
| 840,000 | Russ Agriculture Bank | ||||
| 6.300%, 05/15/2017 (c) | 780,150 | ||||
| 560,000 | Santander Issuances SA | ||||
| 5.810%, 06/20/2016 | |||||
| (Callable at $100.00 on | |||||
| 06/20/2011) (c) | 556,100 | ||||
| 100,000 | Santander Perpetual SA Unipersonal | ||||
| 6.670%, 10/29/2049 (c) | 90,269 | ||||
| 600,000 | Shinsei Finance Cayman Ltd. | ||||
| 6.420%, 07/20/2048 | |||||
| (Callable at $100.00 on | |||||
| 07/20/2016) (c) | 398,239 | ||||
| 550,000 | Sovereign Bank | ||||
| 4.380%, 08/01/2013 (e) | 501,103 | ||||
| 280,000 | Suntrust Capital | ||||
| 6.100%, 12/01/2066 | 222,356 | ||||
| Turanalem Finance BV | |||||
| 530,000 | 8.250%, 01/22/2037 | 419,654 | |||
| 850,000 | 8.250%, 01/22/2037 (c) | 668,780 | |||
| VTB Capital SA | |||||
| 1,120,000 | 3.840%, 08/01/2008 (c)(e) | 1,108,800 | |||
| 430,000 | 3.820%, 12/07/2009 | 413,294 | |||
| 600,000 | 6.610%, 10/31/2012 (c) | 586,050 | |||
| Wells Fargo Company | |||||
| 1,250,000 | 5.630%, 12/11/2017 | 1,280,954 | |||
| 440,000 | 5.950%, 12/01/2086 | 397,720 |
See notes to financial statements.
59
| AssetMark Core Plus Fixed Income Fund |
| SCHEDULE OF INVESTMENTS (Continued) |
| March 31, 2008 |
| Principal | Market | ||||
| Amount | Value | ||||
| CORPORATE BONDS (Continued) | |||||
| Banks (Continued) | |||||
| $ | 575,000 | ZFS Finance USA Trust II | |||
| 6.450%, 12/15/2065 (c) | $ | 523,509 | |||
| 25,822,143 | |||||
| Business Services - 0.03% | |||||
| 46,000 | Dyncorp International LLC | ||||
| 9.500%, 02/15/2013 | 47,035 | ||||
| 40,000 | Electronic Data Systems Corp. | ||||
| 7.130%, 10/15/2009 | 40,811 | ||||
| Lamar Media Corp. | |||||
| 80,000 | 7.250%, 01/01/2013 | 76,400 | |||
| 50,000 | 6.630%, 08/15/2015 | 44,250 | |||
| 208,496 | |||||
| Capital Markets - 1.67% | |||||
| Bear Stearns Companies, Inc. | |||||
| 500,000 | 5.550%, 01/22/2017 | 447,169 | |||
| 2,260,000 | 7.250%, 02/01/2018 | 2,339,559 | |||
| Goldman Sachs Group, Inc. | |||||
| 200,000 | 4.500%, 06/15/2010 | 201,620 | |||
| 80,000 | 5.450%, 11/01/2012 | 81,106 | |||
| 50,000 | 5.790%, 12/29/2049 | 33,333 | |||
| 370,000 | Lehman Brothers E-Capital Trust I | ||||
| 6.160%, 08/19/2065 (e) | 223,029 | ||||
| Lehman Brothers Holdings, Inc. | |||||
| 1,350,000 | 4.500%, 07/26/2010 | 1,291,891 | |||
| 120,000 | 5.250%, 02/06/2012 | 115,891 | |||
| 450,000 | 5.380%, 10/17/2012 | 628,625 | |||
| 275,000 | 5.630%, 01/24/2013 | 267,678 | |||
| 850,000 | 6.200%, 09/26/2014 | 839,478 | |||
| 1,110,000 | 6.750%, 12/28/2017 | 1,068,924 | |||
| 620,000 | 5.860%, 12/29/2099 | 392,475 | |||
| Merrill Lynch Co. | |||||
| 775,000 | 5.450%, 02/05/2013 | 763,291 | |||
| 550,000 | 6.400%, 08/28/2017 | 543,690 | |||
| 250,000 | Mizuho JGB Investment | ||||
| 9.870%, 06/30/2049 | |||||
| (Acquired 08/22/2005 | |||||
| and 08/23/2005, | |||||
| cost $284,874) (d)(e) | 251,054 | ||||
| Morgan Stanley | |||||
| 90,000 | 3.630%, 04/01/2008 | 89,802 | |||
| 340,000 | 5.630%, 01/09/2012 | 342,830 | |||
| 500,000 | 5.750%, 08/31/2012 | 509,543 | |||
| Principal | Market | ||||
| Amount | Value | ||||
| CORPORATE BONDS (Continued) | |||||
| Capital Markets (Continued) | |||||
| $ | 230,000 | 4.400%, 10/18/2016 (e) | $ | 207,527 | |
| 600,000 | 5.950%, 12/28/2017 | 580,927 | |||
| 1,350,000 | 6.630%, 04/01/2018 | 1,352,919 | |||
| 430,000 | Wachovia Capital Trust II | ||||
| 5.800%, 03/15/2042 | 306,565 | ||||
| 525,000 | Wachovia Corp. | ||||
| 5.750%, 02/01/2018 (b) | 515,181 | ||||
| 13,394,107 | |||||
| Chemicals - 0.15% | |||||
| 500,000 | Ferro Corp. | ||||
| 9.130%, 01/01/2009 | 515,000 | ||||
| 40,000 | Georgia Gulf Corp. | ||||
| 9.500%, 10/15/2014 (b) | 31,100 | ||||
| 500,000 | Ineos Group Holdings PLC | ||||
| 7.880%, 02/15/2016 | 576,246 | ||||
| 63,000 | Westlake Chemical Corp. | ||||
| 6.630%, 01/15/2016 | 55,440 | ||||
| 1,177,786 | |||||
| Commercial Banks - 0.17% | |||||
| 1,400,000 | Wells Fargo Company | ||||
| 4.380%, 01/31/2013 | 1,394,330 | ||||
| Commercial Services & | |||||
| Supplies - 0.09% | |||||
| 375,000 | Allied Waste North America, Inc. | ||||
| 7.130%, 05/15/2016 | 375,938 | ||||
| 325,000 | Waste Management, Inc. | ||||
| 6.380%, 11/15/2012 | 337,839 | ||||
| 713,777 | |||||
| Communications - 0.75% | |||||
| 150,000 | AMFM Inc. | ||||
| 8.000%, 11/01/2008 | 154,830 | ||||
| 295,000 | British Telecommunications PLC | ||||
| 8.380%, 12/15/2010 | 324,627 | ||||
| Deutsche Telekom International | |||||
| Finance B.V. | |||||
| 350,000 | 5.750%, 03/23/2016 | 346,582 | |||
| 675,000 | 8.250%, 06/15/2030 | 811,975 | |||
| 500,000 | Inmarsat Finance II PLC | ||||
| 10.375%, 11/15/2012 | 487,500 | ||||
| 500,000 | Intelsat Subsidiary Holding Co. | ||||
| 8.630%, 01/15/2015 | 506,250 | ||||
See notes to financial statements.
60
| AssetMark Core Plus Fixed Income Fund |
| SCHEDULE OF INVESTMENTS (Continued) |
| March 31, 2008 |
| Principal | Market | ||||
| Amount | Value | ||||
| CORPORATE BONDS (Continued) | |||||
| Communications (Continued) | |||||
| $ | 135,000 | Level 3 Financing, Inc. | |||
| 9.250%, 11/01/2014 | $ 111,038 | ||||
| Rogers Cable, Inc. | |||||
| 200,000 | 5.500%, 03/15/2014 | 188,981 | |||
| 110,000 | 6.750%, 03/15/2015 | 109,724 | |||
| Sprint Capital Corp. | |||||
| 100,000 | 7.630%, 01/30/2011 | 92,557 | |||
| 580,000 | 8.380%, 03/15/2012 (b) | 536,936 | |||
| 925,000 | 6.880%, 11/15/2028 | 690,749 | |||
| 40,000 | 8.750%, 03/15/2032 | 33,876 | |||
| �� | Telecom Italia Capital | ||||
| 125,000 | 4.000%, 01/15/2010 | 122,675 | |||
| 425,000 | 4.880%, 10/01/2010 | 418,876 | |||
| 450,000 | 6.200%, 07/18/2011 | 446,751 | |||
| 500,000 | 4.950%, 09/30/2014 | 455,645 | |||
| 190,000 | 5.250%, 10/01/2015 | 172,876 | |||
| 50,000 | Verizon Global Funding Corp. | ||||
| 7.380%, 09/01/2012 | 54,971 | ||||
| 6,067,419 | |||||
| Consumer Finance - 2.05% | |||||
| 440,000 | American Express Co. | ||||
| 6.800%, 09/01/2066 (e) | 414,347 | ||||
| 210,000 | American General Finance | ||||
| 6.900%, 12/15/2017 | 205,584 | ||||
| Countrywide Home Loans, Inc. | |||||
| 525,000 | 6.250%, 04/15/2009 (b) | 486,309 | |||
| 300,000 | 5.630%, 07/15/2009 | 275,314 | |||
| 675,000 | 4.130%, 09/15/2009 | 608,359 | |||
| Ford Motor Credit Company | |||||
| 670,000 | 6.630%, 06/16/2008 | 662,462 | |||
| 5,345,000 | 5.800%, 01/12/2009 | 5,093,031 | |||
| 460,000 | 7.380%, 10/28/2009 . . . . . . . . . . . | 419,269 | |||
| General Motors Acceptance | |||||
| Corporation | |||||
| 100,000 | 5.130%, 05/09/2008 . . . . . . . . . . . | 99,776 | |||
| 330,000 | 3.750%, 09/23/2008 (e) . . . . . . . . . | 311,372 | |||
| 2,490,000 | 5.850%, 01/14/2009 . . . . . . . . . . . | 2,322,328 | |||
| 270,000 | 7.750%, 01/19/2010 . . . . . . . . . . . | 233,633 | |||
| 625,000 | 6.880%, 09/15/2011 . . . . . . . . . . . . | 478,694 | |||
| 1,510,000 | 6.630%, 05/15/2012 . . . . . . . . . . . | 1,143,244 |
| Principal | Market | ||||
| Amount | Value | ||||
| CORPORATE BONDS (Continued) | |||||
| Consumer Finance (Continued) | |||||
| $ | 630,000 | 8.000%, 11/01/2031 . . . . . . . . . . . . | $ | 452,478 | |
| 550,000 | Nelnet, Inc. | ||||
| 7.400%, 09/15/2061 . . . . . . . . . . . | 358,566 | ||||
| SLM Corp. | |||||
| 1,750,000 | 5.000%, 10/01/2013 . . . . . . . . . . . | 1,318,711 | |||
| 1,140,000 | 5.380%, 05/15/2014 . . . . . . . . . . . | 856,573 | |||
| 120,000 | 5.050%, 11/14/2014 . . . . . . . . . . . . | 87,387 | |||
| 20,000 | 5.000%, 04/15/2015 . . . . . . . . . . . | 14,270 | |||
| 100,000 | 5.630%, 08/01/2033 . . . . . . . . . . . | 68,369 | |||
| 675,000 | Westfield Capital Corp. | ||||
| 4.380%, 11/15/2010 (c) . . . . . . . . . | 662,102 | ||||
| 16,572,178 | |||||
| Consumer Products - 0.02% | |||||
| 20,000 | American Achievement Corp. | ||||
| 8.250%, 04/01/2012 . . . . . . . . . . . | 17,950 | ||||
| Graham Packaging Co. | |||||
| 110,000 | 8.500%, 10/15/2012 . . . . . . . . . . . | 99,550 | |||
| 40,000 | 9.880%, 10/15/2014 . . . . . . . . . . . | 33,800 | |||
| 151,300 | |||||
| Diversified Consumer | |||||
| Services - 0.01% | |||||
| 130,000 | Service Corporation International | ||||
| 7.500%, 04/01/2027 . . . . . . . . . . . | 111,150 | ||||
| Diversified Financial Services - 1.57% | |||||
| 280,000 | AGFC Capital Trust I | ||||
| 6.000%, 01/15/2067 | |||||
| (Callable at $100.00 on | |||||
| 01/15/2017) (c) | |||||
| Bank of America Corporation . . . . . | 231,107 | ||||
| 675,000 | 5.750%, 12/01/2017 (b) . . . . . . . . . | 699,812 | |||
| 2,100,000 | 8.000%, 12/29/2049 (b) . . . . . . . . . | 2,106,069 | |||
| 1,000,000 | Citigroup Funding, Inc. | ||||
| 6.000%, 05/15/2015 | |||||
| (Acquired 12/07/2006, | |||||
| Cost $660,052) (Credit linked to | |||||
| an Egyptian Treasury Bill) (d)(j) . . . | 903,175 | ||||
| Citigroup, Inc. | |||||
| 1,600,000 | 5.850%, 07/02/2013 . . . . . . . . . . . | 1,625,224 | |||
| 950,000 | 6.880%, 03/05/2038 . . . . . . . . . . . | 952,331 | |||
| General Electric Capital Corporation | |||||
| 650,000 | 5.250%, 09/15/2014 (e) . . . . . . . . . | 612,807 | |||
See notes to financial statements.
61
| AssetMark Core Plus Fixed Income Fund |
| SCHEDULE OF INVESTMENTS (Continued) |
| March 31, 2008 |
| Principal | Market | ||||
| Amount | Value | ||||
| CORPORATE BONDS (Continued) | |||||
| Diversified Financial Services (Continued) | |||||
| $ | 1,160,000 | 6.380%, 11/15/2067 . . . . . . . . . . . . | $ | 1,137,090 | |
| 2,250,000 | JPMorgan Chase & Co. | ||||
| 6.000%, 01/15/2018 . . . . . . . . . . . | 2,350,690 | ||||
| 30,000 | Rabobank Capital Funding Trust II | ||||
| 5.260%, 12/29/2049 (c)(e) . . . . . . . | 25,785 | ||||
| 180,000 | Rabobank Capital Funding Trust III | ||||
| 5.250%, 10/31/2049 | |||||
| (Callable at $100.00 on | |||||
| 10/21/2016) (c)(e) . . . . . . . . . . . . . | 149,748 | ||||
| Residential Capital Corp. | |||||
| 60,000 | 6.190%, 04/17/2009 . . . . . . . . . . . | 34,500 | |||
| 180,000 | 6.190%, 05/22/2009 . . . . . . . . . . . | 103,500 | |||
| 875,000 | 8.380%, 06/30/2010 . . . . . . . . . . . | 444,063 | |||
| 1,550,000 | 8.000%, 02/22/2011 . . . . . . . . . . . . | 767,250 | |||
| 1,214,000 | UBS AG | ||||
| 6.000%, 12/31/2017 (Credit linked to a | |||||
| Republic of Brazil Treasury Security | |||||
| and IPCA Index Units) (c)(j) . . . . . | 455,518 | ||||
| 12,598,669 | |||||
| Diversified Telecommunication | |||||
| Services - 0.77% | |||||
| 700,000 | Ameritech Capital Funding Corp. | ||||
| 6.250%, 05/18/2009 . . . . . . . . . . . | 729,688 | ||||
| 440,000 | AT&T, Inc. | ||||
| 5.500%, 02/01/2018 . . . . . . . . . . . | 431,628 | ||||
| 30,000 | Bellsouth Corp. | ||||
| 4.750%, 11/15/2012 . . . . . . . . . . . . | 30,118 | ||||
| Citizens Communications Co. | |||||
| 530,000 | 9.250%, 05/15/2011 . . . . . . . . . . . . | 551,200 | |||
| 35,000 | 7.130%, 03/15/2019 . . . . . . . . . . . | 30,800 | |||
| 105,000 | 7.880%, 01/15/2027 . . . . . . . . . . . | 90,563 | |||
| Qwest Communications | |||||
| International, Inc. | |||||
| 283,000 | 6.570%, 02/15/2009 (e) . . . . . . . . . | 281,585 | |||
| 127,000 | 7.250%, 02/15/2011 . . . . . . . . . . . . | 122,555 | |||
| 520,000 | Royal KPN NV | ||||
| 8.380%, 10/01/2030 . . . . . . . . . . . | 596,642 | ||||
| 410,000 | SBC Communications, Inc. | ||||
| 5.100%, 09/15/2014 . . . . . . . . . . . | 407,876 | ||||
| 875,000 | Telefonica Emisiones | ||||
| 7.050%, 06/20/2036 . . . . . . . . . . . | 917,722 | ||||
| Principal | Market | ||||
| Amount | Value | ||||
| CORPORATE BONDS (Continued) | |||||
| Diversified Telecommunication | |||||
| Services (Continued) | |||||
| $ | 750,000 | Verizon Communications | |||
| 6.400%, 02/15/2038 | $ | 732,566 | |||
| 740,000 | Verizon New York, Inc. - Series A | ||||
| 6.880%, 04/01/2012 | 778,937 | ||||
| 515,000 | Windstream Corp. | ||||
| 8.630%, 08/01/2016 | 508,563 | ||||
| 6,210,443 | |||||
| Electric Utilities - 1.28% | |||||
| 475,000 | CenterPoint Energy Resources Corp. | ||||
| 7.880%, 04/01/2013 | 528,210 | ||||
| Commonwealth Edison Co. | |||||
| 425,000 | 5.400%, 12/15/2011 | 433,620 | |||
| 250,000 | 6.950%, 07/15/2018 | 257,500 | |||
| 275,000 | 5.900%, 03/15/2036 | 248,699 | |||
| Dominion Resources, Inc. | |||||
| 80,000 | 4.750%, 12/15/2010 | 81,927 | |||
| 300,000 | 5.700%, 09/17/2012 | 314,467 | |||
| 25,000 | Duke Energy Corp. | ||||
| 5.630%, 11/30/2012 | 26,608 | ||||
| Energy Future Holdings Corp. | |||||
| 10,000 | 10.880%, 11/01/2017 | ||||
| (Callable at $105.44 on | |||||
| 11/01/2012) (c) | 10,150 | ||||
| 3,300,000 | 11.250%, 11/01/2017 | ||||
| (Callable at $105.63 on | |||||
| 11/01/2012) (c) | 3,283,500 | ||||
| 75,000 | Exelon Corp. | ||||
| 5.630%, 06/15/2035 | 66,166 | ||||
| FirstEnergy Corp. | |||||
| 200,000 | 6.450%, 11/15/2011 | 209,520 | |||
| 1,455,000 | 7.380%, 11/15/2031 (b) | 1,587,354 | |||
| 700,000 | MidAmerican Energy Holdings | ||||
| 7.520%, 09/15/2008 | 710,874 | ||||
| Nevada Power Co. | |||||
| 375,000 | 5.880%, 01/15/2015 | 369,559 | |||
| 625,000 | 6.650%, 04/01/2036 | 591,749 | |||
| Pacific Gas & Electric Co. | |||||
| 470,000 | 5.630%, 11/30/2017 | 483,721 | |||
| 170,000 | 6.050%, 03/01/2034 | 167,194 | |||
| 290,000 | 5.800%, 03/01/2037 | 275,293 |
See notes to financial statements.
62
| AssetMark Core Plus Fixed Income Fund |
| SCHEDULE OF INVESTMENTS (Continued) |
| March 31, 2008 |
| Principal | Market | ||||
| Amount | Value | ||||
| CORPORATE BONDS (Continued) | |||||
| Electric Utilities (Continued) | |||||
| Progress Energy, Inc. | |||||
| $ | 150,000 | 5.630%, 01/15/2016 | $ | 153,207 | |
| 400,000 | 7.750%, 03/01/2031 | 470,453 | |||
| 10,269,771 | |||||
| Electrical Equipment - 0.36% | |||||
| 600,000 | L-3 Communications Corp. | ||||
| 6.380%, 10/15/2015 | 589,500 | ||||
| NXP BV / NXP Funding LLC | |||||
| 20,000 | 7.880%, 10/15/2014 | 18,375 | |||
| 70,000 | 9.500%, 10/15/2015 | 57,750 | |||
| 325,000 | Tyco Electronics Group SA | ||||
| 6.000%, 10/01/2012 (c) | 333,430 | ||||
| Tyco International Group SA | |||||
| 40,000 | 6.130%, 11/01/2008 | 40,305 | |||
| 20,000 | 6.130%, 01/15/2009 | 20,233 | |||
| 130,000 | 6.750%, 02/15/2011 | 137,077 | |||
| 455,000 | 6.380%, 10/15/2011 | 453,755 | |||
| 1,285,000 | 6.880%, 01/15/2029 | 1,259,787 | |||
| 2,910,212 | |||||
| Electronic Equipment & | |||||
| Instruments - 0.01% | |||||
| 50,000 | Freescale Semiconductor, Inc. | ||||
| 8.880%, 12/15/2014 | 39,375 | ||||
| 40,000 | Xerox Corp. | ||||
| 6.750%, 02/01/2017 | 42,295 | ||||
| 81,670 | |||||
| Energy Equipment & Services - 0.06% | |||||
| 190,000 | Complete Production Services | ||||
| 8.000%, 12/15/2016 | 183,350 | ||||
| Geophysique | |||||
| 155,000 | 7.500%, 05/15/2015 | 158,100 | |||
| 90,000 | 7.750%, 05/15/2017 | 91,800 | |||
| 50,000 | Pride International, Inc. | ||||
| 7.380%, 07/15/2014 | 52,250 | ||||
| 40,000 | SemGroup LP | ||||
| 8.750%, 11/15/2015 (c) | 36,800 | ||||
| 522,300 | |||||
| Food & Staples Retailing - 0.11% | |||||
| 797,692 | CVS Caremark Corporation | ||||
| 6.940%, 01/10/2030 (c) | 845,870 | ||||
| Principal | Market | ||||
| Amount | Value | ||||
| CORPORATE BONDS (Continued) | |||||
| Food Products - 0.29% | |||||
| $ | 925,000 | Cargill, Inc. | |||
| 5.200%, 01/22/2013 (c) | $ | 934,118 | |||
| 375,000 | Dean Foods Co. | ||||
| 7.000%, 06/01/2016 | 330,000 | ||||
| 425,000 | Kraft Foods, Inc. | ||||
| 6.500%, 08/11/2017 | 436,790 | ||||
| Land O’ Lakes, Inc. | |||||
| 125,000 | 9.000%, 12/15/2010 | 130,312 | |||
| 500,000 | 8.750%, 11/15/2011 . | 513,750 | |||
| 2,344,970 | |||||
| Health Care Providers & | |||||
| Services - 0.44% | |||||
| 100,000 | AmerisourceBergen Corp. | ||||
| 5.880%, 09/15/2015 | 98,697 | ||||
| 450,000 | Community Health Systems, Inc. | ||||
| 8.880%, 07/15/2015 | 453,938 | ||||
| 205,000 | Davita, Inc. | ||||
| 6.630%, 03/15/2013 | 199,875 | ||||
| 250,000 | FMC Finance III SA | ||||
| 6.880%, 07/15/2017 | 251,250 | ||||
| HCA, Inc. | |||||
| 234,000 | 6.250%, 02/15/2013 | 204,750 | |||
| 460,000 | 6.750%, 07/15/2013 | 409,400 | |||
| 415,000 | 9.130%, 11/15/2014 | 428,488 | |||
| 13,000 | 6.500%, 02/15/2016 | 11,017 | |||
| 340,000 | 9.250%, 11/15/2016 | 353,600 | |||
| 444,000 | 9.630%, 11/15/2016 | 461,760 | |||
| Service Corporation International | |||||
| 60,000 | 6.750%, 04/01/2016 | 58,350 | |||
| 10,000 | 7.630%, 10/01/2018 | 10,100 | |||
| 542,000 | Tenet Healthcare Corp. | ||||
| 9.250%, 02/01/2015 (b) | 509,480 | ||||
| 50,000 | Wellpoint, Inc. | ||||
| 5.880%, 06/15/2017 | 49,022 | ||||
| 3,499,727 | |||||
| Hotels, Restaurants & Leisure - 0.29% | |||||
| Boyd Gaming Corp. | |||||
| 65,000 | 6.750%, 04/15/2014 | 53,625 | |||
| 160,000 | 7.130%, 02/01/2016 | 129,600 | |||
| 550,000 | Harrahs Operating Company, Inc. | ||||
| 5.500%, 07/01/2010 | 484,000 | ||||
See notes to financial statements.
63
| AssetMark Core Plus Fixed Income Fund |
| SCHEDULE OF INVESTMENTS (Continued) |
| March 31, 2008 |
| Principal | Market | ||||
| Amount | Value | ||||
| CORPORATE BONDS (Continued) | |||||
| Hotels, Restaurants & Leisure (Continued) | |||||
| $ | 85,000 | Host Marriott LP | |||
| 6.750%, 06/01/2016 | $ | 79,900 | |||
| 60,000 | Inn of the Mountain Gods Resort & | ||||
| Casino | |||||
| 12.000%, 11/15/2010 | 58,500 | ||||
| MGM Mirage, Inc. | |||||
| 10,000 | 9.500%, 08/01/2008 | 10,050 | |||
| 180,000 | 8.500%, 09/15/2010 | 186,750 | |||
| 20,000 | 6.630%, 07/15/2015 | 17,500 | |||
| 150,000 | 7.630%, 01/15/2017 | 137,250 | |||
| 500,000 | Mohegan Tribal Gaming Authority | ||||
| 8.000%, 04/01/2012 | 460,000 | ||||
| 20,000 | River Rock Entertainment | ||||
| 9.750%, 11/01/2011 | 20,000 | ||||
| Station Casinos, Inc. | |||||
| 25,000 | 6.880%, 03/01/2016 | 14,687 | |||
| 190,000 | 7.750%, 08/15/2016 | 153,900 | |||
| 500,000 | Universal City Development Partners | ||||
| 11.750%, 04/01/2010 | 515,000 | ||||
| 2,320,762 | |||||
| Independent Power Producers & | |||||
| Energy Traders - 0.30% | |||||
| AES Corp. | |||||
| 47,000 | 7.750%, 03/01/2014 | 47,529 | |||
| 190,000 | 7.750%, 10/15/2015 | 192,375 | |||
| 1,060,000 | 8.000%, 10/15/2017 | 1,078,550 | |||
| Energy Future Holdings Corp. | |||||
| 110,000 | 5.550%, 11/15/2014 | 86,442 | |||
| 270,000 | 6.500%, 11/15/2024 | 193,071 | |||
| 1,095,000 | 6.550%, 11/15/2034 | 778,521 | |||
| 2,376,488 | |||||
| Insurance - 1.11% | |||||
| 900,000 | ACE INA Holdings, Inc. | ||||
| 5.800%, 03/15/2018 | 900,372 | ||||
| American International Group, Inc. | |||||
| 130,000 | 5.850%, 01/16/2018 | 127,809 | |||
| 425,000 | 6.250%, 03/15/2087 | 345,307 | |||
| 400,000 | Arch Capital Group Ltd. | ||||
| 7.350%, 05/01/2034 | 397,304 | ||||
| 80,000 | ASIF Global Financing XIX | ||||
| 4.900%, 01/17/2013 (c) | 78,872 | ||||
| 200,000 | Aspen Insurance Holdings, Ltd. | ||||
| 6.000%, 08/15/2014 | 211,312 | ||||
| Principal | Market | ||||
| Amount | Value | ||||
| CORPORATE BONDS (Continued) | |||||
| Insurance (Continued) | |||||
| $ | 200,000 | AXA SA | |||
| 6.460%, 12/31/2049 (c) | $ | 160,811 | |||
| 375,000 | Catlin Insurance Co. Ltd. | ||||
| 7.250%, 12/31/2049 | |||||
| (Acquired 01/11/2007, | |||||
| Cost $375,000) (d) | 313,481 | ||||
| 525,000 | Chubb Corp. | ||||
| 6.380%, 03/29/2067 | 489,844 | ||||
| 890,000 | CNA Financial Corp. | ||||
| 7.250%, 11/15/2023 | 909,561 | ||||
| 425,000 | Endurance Specialty Holdings | ||||
| 6.150%, 10/15/2015 | 441,209 | ||||
| 775,000 | Lincoln National Corp. | ||||
| 7.000%, 05/17/2066 | 711,723 | ||||
| 1,200,000 | Metlife, Inc. | ||||
| 6.400%, 12/15/2066 | 956,292 | ||||
| 125,000 | PartnerRe Finance, Inc. | ||||
| 6.440%, 12/01/2066 | 106,649 | ||||
| 500,000 | Phoenix Life Insurance Co. | ||||
| 7.150%, 12/15/2034 (c) | 511,686 | ||||
| 450,000 | QBE Insurance Group Ltd. | ||||
| 5.650%, 07/01/2023 | |||||
| (Acquired 08/23/2004, | |||||
| Cost $441,198) (d)(e) | 460,021 | ||||
| 300,000 | Reinsurance Group of America, Inc. | ||||
| 6.750%, 12/15/2065 | 263,554 | ||||
| 875,000 | Swiss Re Capital I LP | ||||
| 6.850%, 05/29/2049 (c) | 815,478 | ||||
| 840,000 | Travelers Companies, Inc. | ||||
| 6.250%, 03/15/2067 | 742,118 | ||||
| 8,943,403 | |||||
| IT Services - 0.12% | |||||
| 850,000 | Fiserv, Inc. | ||||
| 6.130%, 11/20/2012 | 876,815 | ||||
| 90,000 | SunGard Data Systems, Inc. | ||||
| 9.130%, 08/15/2013 | 91,350 | ||||
| 968,165 | |||||
| Machinery - 0.01% | |||||
| 60,000 | Terex Corp. | ||||
| 7.380%, 01/15/2014 | 59,700 | ||||
| Media - 1.61% | |||||
| 950,000 | British Sky Broadcasting Group | ||||
| 6.100%, 02/15/2018 (c) | 949,567 |
64
| AssetMark Core Plus Fixed Income Fund |
| SCHEDULE OF INVESTMENTS (Continued) |
| March 31, 2008 |
| Principal | Market | ||||
| Amount | Value | ||||
| CORPORATE BONDS (Continued) | |||||
| Media (Continued) | |||||
| $ | 140,000 | CCH Holdings LLC | |||
| 11.000%, 10/01/2015 (b) | $ | 98,000 | |||
| Clear Channel Communications, Inc. | |||||
| 50,000 | 6.250%, 03/15/2011 | 44,154 | |||
| 330,000 | 5.500%, 09/15/2014 (b) | 237,898 | |||
| 270,000 | 4.900%, 05/15/2015 | 181,148 | |||
| Comcast Cable Communications | |||||
| Holdings, Inc. | |||||
| 320,000 | 8.880%, 05/01/2017 | 366,621 | |||
| 500,000 | 9.460%, 11/15/2022 | 609,837 | |||
| Comcast Corp. | |||||
| 425,000 | 5.500%, 03/15/2011 | 428,513 | |||
| 220,000 | 6.500%, 01/15/2015 | 225,600 | |||
| 50,000 | 6.500%, 01/15/2017 | 51,151 | |||
| 20,000 | 5.880%, 02/15/2018 | 19,517 | |||
| 650,000 | Comcast Holdings Corp. | ||||
| 10.630%, 07/15/2012 | 772,132 | ||||
| COX Communications, Inc. | |||||
| 220,000 | 3.880%, 10/01/2008 | 219,744 | |||
| 1,000,000 | 4.630%, 01/15/2010 | 1,000,905 | |||
| 520,000 | COX Enterprises, Inc. | ||||
| 4.380%, 05/01/2008 | 519,863 | ||||
| CSC Holdings, Inc. | |||||
| 500,000 | 7.250%, 07/15/2008 | 501,250 | |||
| 45,000 | 7.630%, 04/01/2011 | 44,719 | |||
| 100,000 | 7.630%, 07/15/2018 | 91,750 | |||
| 110,000 | DirecTV Holdings LLC | ||||
| 8.380%, 03/15/2013 | 112,063 | ||||
| EchoStar DBS Corporation | |||||
| 40,000 | 6.630%, 10/01/2014 | 36,500 | |||
| 660,000 | 7.130%, 02/01/2016 | 618,750 | |||
| 615,000 | Idearc, Inc. | ||||
| 8.000%, 11/15/2016 | 401,287 | ||||
| Liberty Media Corp. | |||||
| 460,000 | 7.880%, 07/15/2009 | 463,898 | |||
| 20,000 | 5.700%, 05/15/2013 | 17,611 | |||
| 1,165,000 | News America, Inc. | ||||
| 6.650%, 11/15/2037 (c) | 1,178,699 | ||||
| 40,000 | Panamsat Corp. | ||||
| 9.000%, 06/15/2016 | 40,500 | ||||
| 85,000 | R H Donnelley Corp. | ||||
| 8.880%, 10/15/2017 (c) | 53,550 |
| Principal | Market | ||||
| Amount | Value | ||||
| CORPORATE BONDS (Continued) | |||||
| Media (Continued) | |||||
| $ | 70,000 | Sun Media Corp. | |||
| 7.630%, 02/15/2013 | $ | 66,500 | |||
| Time Warner Cable, Inc. | |||||
| 450,000 | 6.880%, 05/01/2012 | 464,962 | |||
| 1,350,000 | 5.400%, 07/02/2012 | 1,327,659 | |||
| 540,000 | 5.850%, 05/01/2017 | 517,786 | |||
| 405,000 | 7.700%, 05/01/2032 | 427,583 | |||
| 375,000 | 6.550%, 05/01/2037 | 355,101 | |||
| 90,000 | TL Acquisitions, Inc. | ||||
| 10.500%, 01/15/2015 | |||||
| (Callable at $105.25 | |||||
| on 01/15/2011) (c) . . . . . . . . . . . . . | 77,850 | ||||
| 400,000 | Viacom, Inc. | ||||
| 5.750%, 04/30/2011 . . . . . . . . . . . . | 404,540 | ||||
| 12,927,208 | |||||
| Metals & Mining - 0.16% | |||||
| 100,000 | Codelco, Inc. | ||||
| 4.750%, 10/15/2014 (c) . . . . . . . . . | 99,859 | ||||
| Freeport-McMoran Copper & Gold | |||||
| 10,000 | 8.250%, 04/01/2015 | 10,575 | |||
| 270,000 | 8.380%, 04/01/2017 | 287,212 | |||
| Steel Dynamics, Inc. | |||||
| 55,000 | 7.380%, 11/01/2012 (c) . . . . . . . . . | 55,825 | |||
| 150,000 | 6.750%, 04/01/2015 | 147,750 | |||
| 675,000 | Transocean Sedco Forex, Inc. | ||||
| 6.800%, 03/15/2038 | 691,781 | ||||
| 1,293,002 | |||||
| Multiline Retail - 0.00% | |||||
| 40,000 | J.C. Penney Co., Inc. | ||||
| 7.400%, 04/01/2037 | 37,077 | ||||
| Multi-Utilities - 0.33% | |||||
| 50,000 | CenterPoint Energy, Inc. | ||||
| 7.250%, 09/01/2010 | 53,163 | ||||
| Edison Mission Energy | |||||
| 160,000 | 7.000%, 05/15/2017 | 160,000 | |||
| 220,000 | 7.200%, 05/15/2019 | 218,350 | |||
| 80,000 | 7.630%, 05/15/2027 | 75,600 | |||
| 1,000,000 | Enel Finance International | ||||
| 5.700%, 01/15/2013 | 1,036,120 | ||||
| 850,000 | MidAmerican Energy Holdings | ||||
| 6.130%, 04/01/2036 | 824,247 | ||||
| NRG Energy, Inc. | |||||
| 225,000 | 7.250%, 02/01/2014 | 222,750 |
See notes to financial statements.
65
| AssetMark Core Plus Fixed Income Fund |
| SCHEDULE OF INVESTMENTS (Continued) |
| March 31, 2008 |
| Principal | Market | ||||
| Amount | Value | ||||
| CORPORATE BONDS (Continued) | |||||
| Multi-Utilities (Continued) | |||||
| $ | 30,000 | 7.380%, 02/01/2016 . . . . . . . . . . . | $ | 29,475 | |
| 20,000 | 7.380%, 01/15/2017 . . . . . . . . . . . | 19,500 | |||
| 2,639,205 | |||||
| Oil & Gas - 3.10% | |||||
| Amerada Hess Corp. | |||||
| 160,000 | 7.880%, 10/01/2029 . . . . . . . . . . . | 190,411 | |||
| 670,000 | 7.300%, 08/15/2031 . . . . . . . . . . . | 757,109 | |||
| 80,000 | Anadarko Finance Co. | ||||
| 7.500%, 05/01/2031 . . . . . . . . . . . | 90,269 | ||||
| 1,260,000 | Anadarko Petroleum Corp. | ||||
| 6.450%, 09/15/2036 (b) . . . . . . . . . | 1,287,334 | ||||
| 700,000 | Boardwalk Pipelines LP | ||||
| 5.880%, 11/15/2016 . . . . . . . . . . . . | 705,592 | ||||
| Canadian Natural Resources Ltd. | |||||
| 250,000 | 5.150%, 02/01/2013 | 255,301 | |||
| 300,000 | 5.700%, 05/15/2017 | 303,914 | |||
| 75,000 | 5.850%, 02/01/2035 | 69,125 | |||
| 475,000 | 6.500%, 02/15/2037 | 471,403 | |||
| 150,000 | 6.250%, 03/15/2038 | 144,348 | |||
| Chesapeake Energy Corp. | |||||
| 60,000 | 6.380%, 06/15/2015 | 58,500 | |||
| 80,000 | 6.250%, 01/15/2018 | 76,800 | |||
| 70,000 | Conoco Funding Co. | ||||
| 6.350%, 10/15/2011 . . . . . . . . . . . . | 76,328 | ||||
| 20,000 | ConocoPhillips, Inc. | ||||
| 6.950%, 04/15/2029 | 22,840 | ||||
| 275,000 | Dynegy, Inc. | ||||
| 7.750%, 06/01/2019 | 258,500 | ||||
| El Paso Natural Gas Co. | |||||
| 400,000 | 7.500%, 11/15/2026 . . . . . . . . . . . . | 414,860 | |||
| 309,000 | 8.380%, 06/15/2032 | 352,473 | |||
| El Paso Corp. | |||||
| 730,000 | 7.000%, 06/15/2017 | 754,462 | |||
| 217,000 | 7.800%, 08/01/2031 | 223,887 | |||
| 355,000 | 7.750%, 01/15/2032 | 366,372 | |||
| 1,050,000 | Encana Corp. | ||||
| 6.500%, 02/01/2038 | 1,046,035 | ||||
| Energy Transfer Partners LP | |||||
| 350,000 | 5.650%, 08/01/2012 | 352,034 | |||
| 1,400,000 | 5.950%, 02/01/2015 | 1,377,075 | |||
| 500,000 | 6.700%, 07/01/2018 | 504,665 | |||
| Enterprise Products Operating LP | |||||
| 750,000 | 4.950%, 06/01/2010 | 765,585 |
| Principal | Market | ||||
| Amount | Value | ||||
| CORPORATE BONDS (Continued) | |||||
| Oil & Gas (Continued) | |||||
| $ | 375,000 | 8.380%, 08/01/2066 | $ | 365,546 | |
| 450,000 | 7.030%, 01/15/2068 | 382,629 | |||
| 400,000 | Gulf South Pipeline Co. LP | ||||
| 6.300%, 08/15/2017 (c) . . . . . . . . . | 415,581 | ||||
| Intergas Finance BV | |||||
| 100,000 | 6.380%, 05/14/2017 | 88,250 | |||
| 620,000 | 6.380%, 05/14/2017 (c) . . . . . . . . . | 542,500 | |||
| Kerr-McGee Corp. | |||||
| 625,000 | 6.950%, 07/01/2024 | 664,216 | |||
| 1,215,000 | 7.880%, 09/15/2031 | 1,426,901 | |||
| Kinder Morgan Energy Partners | |||||
| 110,000 | 6.300%, 02/01/2009 | 112,174 | |||
| 470,000 | 6.750%, 03/15/2011 . . . . . . . . . . . . | 492,708 | |||
| 260,000 | 6.000%, 02/01/2017 (b) . . . . . . . . . | 259,183 | |||
| 30,000 | 6.950%, 01/15/2038 | 29,532 | |||
| 1,200,000 | Nexen, Inc. | ||||
| 5.880%, 03/10/2035 | 1,095,530 | ||||
| Oneok Partners LP | |||||
| 425,000 | 6.650%, 10/01/2036 | 411,417 | |||
| 525,000 | 6.850%, 10/15/2037 | 521,166 | |||
| OPTI Canada, Inc. | |||||
| 160,000 | 7.880%, 12/15/2014 | 157,200 | |||
| 130,000 | 8.250%, 12/15/2014 | 129,350 | |||
| Peabody Energy Corp. | |||||
| 10,000 | 6.880%, 03/15/2013 | 10,200 | |||
| 50,000 | 5.880%, 04/15/2016 | 47,500 | |||
| Pemex Project Funding Master Trust | |||||
| 301,000 | 6.630%, 06/15/2035 | 311,874 | |||
| 540,000 | 6.630%, 06/15/2035 (c) . . . . . . . . . | 561,534 | |||
| 620,000 | Petrobras International Finance Co. | ||||
| 6.130%, 10/06/2016 | 621,364 | ||||
| Southern Natural Gas Co. | |||||
| 375,000 | 7.350%, 02/15/2031 | 385,939 | |||
| 45,000 | 8.000%, 03/01/2032 | 49,392 | |||
| 140,000 | Suburban Propane Partners LP | ||||
| 6.880%, 12/15/2013 | 137,200 | ||||
| Tennessee Gas Pipeline Co. | |||||
| 250,000 | 7.000%, 10/15/2028 | 250,351 | |||
| 140,000 | 7.630%, 04/01/2037 | 147,319 | |||
| 975,000 | Teppco Partners L P | ||||
| 6.650%, 04/15/2018 | 986,659 | ||||
| 525,000 | Transocean Sedco Forex, Inc. | ||||
| 7.500%, 04/15/2031 | 580,195 |
66
| AssetMark Core Plus Fixed Income Fund |
| SCHEDULE OF INVESTMENTS (Continued) |
| March 31, 2008 |
| Principal | Market | ||||
| Amount | Value | ||||
| CORPORATE BONDS (Continued) | |||||
| Oil & Gas (Continued) | |||||
| Williams Companies, Inc. | |||||
| $ | 360,000 | 7.880%, 09/01/2021 | $ | 391,950 | |
| 770,000 | 7.500%, 01/15/2031 | 806,575 | |||
| 590,000 | 7.750%, 06/15/2031 | 629,825 | |||
| 50,000 | 8.750%, 03/15/2032 | 58,000 | |||
| XTO Energy, Inc. | |||||
| 800,000 | 7.500%, 04/15/2012 | 886,830 | |||
| 30,000 | 5.650%, 04/01/2016 | 30,824 | |||
| 24,912,636 | |||||
| Pharmaceuticals - 0.06% | |||||
| 520,000 | Wyeth | ||||
| 5.950%, 04/01/2037 | 509,796 | ||||
| Real Estate - 0.17% | |||||
| 250,000 | Arden Realty LP | ||||
| 9.150%, 03/01/2010 | 277,056 | ||||
| Forest City Enterprises, Inc. | |||||
| 10,000 | 7.630%, 06/01/2015 | 9,550 | |||
| 29,000 | 6.500%, 02/01/2017 | 26,245 | |||
| iStar Financial, Inc. | |||||
| 225,000 | 5.130%, 04/01/2011 . . . . . . . . . . . . | 173,363 | |||
| 325,000 | 5.650%, 09/15/2011 . . . . . . . . . . . . | 247,181 | |||
| 225,000 | 5.950%, 10/15/2013 | 164,429 | |||
| 100,000 | 5.700%, 03/01/2014 | 72,084 | |||
| 550,000 | Realogy Corp. | ||||
| 12.380%, 04/15/2015 (b) . . . . . . . . | 247,500 | ||||
| Ventas Realty LP | |||||
| 50,000 | 6.750%, 06/01/2010 | 50,312 | |||
| 40,000 | 9.000%, 05/01/2012 | 42,300 | |||
| 70,000 | 6.750%, 04/01/2017 | 68,775 | |||
| 1,378,795 | |||||
| Road & Rail - 0.08% | |||||
| Hertz Corp. | |||||
| 340,000 | 8.880%, 01/01/2014 | 323,850 | |||
| 35,000 | 10.500%, 01/01/2016 | 32,944 | |||
| 14,000 | Kansas City Southern Railway Co. | ||||
| 9.500%, 10/01/2008 | 14,262 | ||||
| 230,000 | Union Pacific Corp. | ||||
| 5.380%, 05/01/2014 | 237,033 | ||||
| 608,089 |
| Principal | Market | ||||
| Amount | Value | ||||
| CORPORATE BONDS (Continued) | |||||
| Special Purpose Entity - 0.56% | |||||
| $ | 1,070,000 | El Paso Performance Linked Trust | |||
| 7.750%, 07/15/2011 (c) . . . . . . . . . | $ | 1,099,360 | |||
| 187,000 | Graftech Financial, Inc. | ||||
| 10.250%, 02/15/2012 . . . . . . . . . . | 194,480 | ||||
| 375,000 | Hellas Telecom V | ||||
| 8.080%, 10/15/2012 . . . . . . . . . . . | 520,990 | ||||
| 280,000 | ILFC E-Capital Trust II | ||||
| 6.250%, 12/21/2065 (c)(e) . . . . . . . | 250,586 | ||||
| 655,000 | MUFG Capital Finance 1 Ltd. | ||||
| 6.350%, 07/29/2049 . . . . . . . . . . . | 534,570 | ||||
| 1,090,000 | Sigma Finance, Inc. | ||||
| 8.500%, 08/11/2016 | |||||
| (Callable at $100.00 | |||||
| on 08/11/2008) (c)(e) . . . . . . . . . . . | 1,024,000 | ||||
| TNK-BP Finance SA | |||||
| 100,000 | 7.500%, 07/18/2016 . . . . . . . . . . . | 95,660 | |||
| 490,000 | 7.500%, 07/18/2016 (c) . . . . . . . . . | 456,312 | |||
| 200,000 | 6.630%, 03/20/2017 (c) . . . . . . . . . | 173,500 | |||
| 240,000 | 7.880%, 03/13/2018 (c) . . . . . . . . . | 222,900 | |||
| 4,572,358 | |||||
| Textiles, Apparel & Luxury | |||||
| Goods - 0.02% | |||||
| 125,000 | INVISTA | ||||
| 9.250%, 05/01/2012 (c) . . . . . . . . . | 128,438 | ||||
| 50,000 | Oxford Industries, Inc. | ||||
| 8.880%, 06/01/2011 . . . . . . . . . . . . | 47,750 | ||||
| 176,188 | |||||
| Tobacco - 0.03% | |||||
| 230,000 | Reynolds American, Inc. | ||||
| 6.750%, 06/15/2017 . . . . . . . . . . . | 233,786 | ||||
| Transportation - 0.15% | |||||
| 86,000 | Teekay Shipping Corp. | ||||
| 8.880%, 07/15/2011 . . . . . . . . . . . . | 91,375 | ||||
| 1,116,000 | Vale Overseas Ltd. | ||||
| 6.880%, 11/21/2036 . . . . . . . . . . . . | 1,094,478 | ||||
| 1,185,853 | |||||
| Wireless Telecommunication | |||||
| Services - 0.25% | |||||
| 330,000 | America Movil SAB de CV | ||||
| 5.630%, 11/15/2017 (b) . . . . . . . . . | 327,893 | ||||
| 750,000 | AT&T Wireless Services, Inc. | ||||
| 7.880%, 03/01/2011 . . . . . . . . . . . . | 816,314 | ||||
See notes to financial statements.
67
| AssetMark Core Plus Fixed Income Fund |
| SCHEDULE OF INVESTMENTS (Continued) |
| March 31, 2008 |
| Principal | Market | ||||
| Amount | Value | ||||
| CORPORATE BONDS (Continued) | |||||
| Wireless Telecommunication | |||||
| Services (Continued) | |||||
| Nextel Communications, Inc. | |||||
| $ | 930,000 | 6.880%, 10/31/2013 | $ | 735,245 | |
| 15,000 | 5.950%, 03/15/2014 | 11,113 | |||
| 120,000 | 7.380%, 08/01/2015 | 92,463 | |||
| 40,000 | Rogers Wireless Communications, Inc. | ||||
| 6.380%, 03/01/2014 | 39,707 | ||||
| 2,022,735 | |||||
| Total Corporate Bonds | |||||
| (Cost $184,757,292) | $ 176,418,263 | ||||
| FOREIGN GOVERNMENT | |||||
| NOTES/BONDS - 0.68% | |||||
| United Mexican States | |||||
| 14,000 | 5.630%, 01/15/2017 | 14,749 | |||
| 1,256,000 | 6.750%, 09/27/2034 | 1,404,208 | |||
| Republic of Argentina | |||||
| 5,150,000 | 5.480%, 08/03/2012 (e) . . . . . . . . . | 2,748,812 | |||
| 1,700,000 | 2.000%, 01/03/2016 (Credit linked to | ||||
| Coeficiente de Estabilizacion de | |||||
| Referencia) (j) . . . . . . . . . . . . . . . . | 936,307 | ||||
| 284,130 | Russia Federation | ||||
| 5.000%, 03/31/2030 | 327,654 | ||||
| Total Foreign Government | |||||
Note/Bonds (Cost $4,990,843) . . . | $ | 5,431,730 | |||
| MORTGAGE BACKED | |||||
| SECURITIES - NON-U.S. | |||||
| GOVERNMENT - 16.57% | |||||
| 41,779 | Adjustable Rate Mortgage Trust | ||||
| Series 2004-5, | |||||
| 4.990%, 04/25/2035 | 40,589 | ||||
| Bank of America Corporation | |||||
| 770,000 | Series 2005-5, | ||||
| 5.120%, 10/10/2045 | 761,612 | ||||
| 600,000 | Series 2007-D, | ||||
| 2.820%, 06/20/2047 | 408,579 | ||||
| 3,500,000 | Series 2005-6, | ||||
| 5.180%, 09/10/2047 | 3,488,586 | ||||
| 363,619 | BCAP LLC Trust | ||||
| Series 2006-RR1, | |||||
| 3.240%, 11/25/2036 . . . . . . . . . . . . | 289,553 | ||||
| 2,526,746 | Bear Stearns Structured | ||||
| Products, Inc. | |||||
| Pool #R11A1A, | |||||
| 3.640%, 09/27/2037 (c) . . . . . . . . . | 2,406,725 | ||||
| Principal | Market | ||||
| Amount | Value | ||||
| MORTGAGE BACKED | |||||
| SECURITIES - NON-U.S. | |||||
| GOVERNMENT (Continued | |||||
| Bear Stearns Trust | |||||
| $ | 106,410 | Series 2004-1, | |||
| 4.450%, 04/25/2034 | $ | 93,108 | |||
| 596,045 | Series 2004-9, | ||||
| 5.220%, 09/25/2034 | 576,340 | ||||
| 991,147 | Series 2005-2, | ||||
| 4.710%, 04/25/2035 | 952,054 | ||||
| 245,058 | Series 2005-3, | ||||
| 5.070%, 06/25/2035 | 238,432 | ||||
| 2,263,206 | Series 2006-4, | ||||
| 5.930%, 10/25/2036 | 2,174,425 | ||||
| 3,000,000 | Series 2005-PWR10, | ||||
| 5.410%, 12/11/2040 . . . . . . . . . . . . | 3,017,416 | ||||
| 3,704,238 | Series FLT, 6.270%, 09/25/2047 . . | 3,011,834 | |||
| Chase Mortgage Financial Trust | |||||
| 1,734,713 | Series 2007-A1, | ||||
| 4.600%, 02/25/2037 | 1,705,190 | ||||
| 2,576,453 | Series 2007-A1, | ||||
| 4.820%, 02/25/2037 | 2,590,949 | ||||
| 2,610,023 | Series 2007-A1, | ||||
| 4.140%, 01/01/2049 | 2,516,633 | ||||
| 2,414,927 | Series 2007-A1, | ||||
| 4.350%, 01/01/2049 | 2,318,977 | ||||
| 793,941 | Series 2007-A1, | ||||
| 4.470%, 01/01/2049 | 761,928 | ||||
| CIT Mortgage Loan Trust | |||||
| 1,881,646 | Pool #2007A1, | ||||
| 3.600%, 10/25/2037 | |||||
| (Acquired 10/05/2007, | |||||
| Cost $1,505,318) (d) | 1,693,482 | ||||
| 550,000 | Pool #2007A2, | ||||
| 3.850%, 10/25/2037 | |||||
| (Acquired 10/05/2007, | |||||
| Cost $551,267) (d) . . . . . . . . . . . . . | 357,500 | ||||
| 1,000,000 | Pool #2007A3, | ||||
| 4.050%, 10/25/2037 | |||||
| (Acquired 10/05/2007, | |||||
| Cost $1,002,376) (d) | 550,000 | ||||
| 2,000,000 | Citigroup Commercial Mortgage Trust | ||||
| Series 2006-C4, | |||||
| 5.720%, 03/15/2049 | 2,022,590 | ||||
| 2,500,000 | Citigroup/Deutsche Bank | ||||
| Commerical Mortgage | |||||
| Series TR, 5.360%, 01/15/2046 . . . | 2,472,204 |
See notes to financial statements.
68
| AssetMark Core Plus Fixed Income Fund |
| SCHEDULE OF INVESTMENTS (Continued) |
| March 31, 2008 |
| Principal | Market | ||||
| Amount | Value | ||||
| MORTGAGE BACKED | |||||
| SECURITIES - NON-U.S. | |||||
| GOVERNMENT (Continued) | |||||
| Countrywide Alternative Loan Trust | |||||
| $ | 1,449,558 | Series 2005-63, | |||
| 5.320%, 12/25/2035 | $ | 1,388,129 | |||
| 1,625,848 | Series 2006-OA10, | ||||
| 2.790%, 08/25/2046 | 1,222,163 | ||||
| Countrywide Asset-Backed Certificates | |||||
| 790,366 | Series 2005-36, | ||||
| 4.930%, 08/25/2035 | 581,416 | ||||
| 1,484,042 | Series 2005-27, | ||||
| 6.080%, 08/25/2035 | 1,161,727 | ||||
| 696,435 | Series 2005-51, | ||||
| 2.860%, 11/20/2035 . . . . . . . . . . . . | 553,535 | ||||
| 1,141,458 | Series 2005-59, | ||||
| 3.450%, 11/20/2035 . . . . . . . . . . . . | 905,204 | ||||
| 2,039,271 | Series 2005-62, | ||||
| 2.900%, 12/25/2035 | 1,610,921 | ||||
| Countrywide Home Loans, Inc. | |||||
| 279,634 | Series 2003-52, | ||||
| 4.500%, 02/19/2034 | 265,900 | ||||
| 65,907 | Series 2004-HYB6, | ||||
| 4.550%, 11/20/2034 . . . . . . . . . . . . | 58,173 | ||||
| 345,339 | Series 2005-HYB4, | ||||
| 4.900%, 08/20/2035 | 281,996 | ||||
| 367,698 | Series 2005-38, | ||||
| 5.740%, 09/25/2035 | 280,603 | ||||
| 43,721 | First Horizon Mortgage Trust | ||||
| Series FLT, 4.750%, 12/25/2034 . . | 41,815 | ||||
| 2,945,977 | First Union National Bank | ||||
| Commercial Mortgage | |||||
| Series 2000-C2, | |||||
| 7.200%, 10/15/2032 | 3,075,204 | ||||
| 3,000,000 | GE Capital Commercial | ||||
| Mortgage Corporation | |||||
| Series 2005-C4, | |||||
| 5.330%, 11/10/2045 . . . . . . . . . . . . | 3,018,819 | ||||
| 2,500,000 | General Motors Acceptance | ||||
| Corporation | |||||
| Series 2002-C1, | |||||
| 6.280%, 11/15/2039 . . . . . . . . . . . . | 2,557,523 |
| Principal | Market | ||||
| Amount | Value | ||||
| MORTGAGE BACKED | |||||
| SECURITIES - NON-U.S. | |||||
| GOVERNMENT (Continued) | |||||
| $ | 800,000 | GS Mortgage Securities | |||
| Corporation II | |||||
| Series 2005-GG4, | |||||
| 4.680%, 07/10/2039 | $ | 767,987 | |||
| Harborview Mortgage Loan Trust | |||||
| 1,406,542 | Series 2005-10, | ||||
| 2.870%, 11/19/2035 . . . . . . . . . . . . | 1,114,329 | ||||
| 1,457,622 | Series FLT, | ||||
| 5.750%, 12/19/2035 | 1,035,308 | ||||
| 271,994 | Series 2005-16, | ||||
| 2.800%, 01/19/2036 | 211,311 | ||||
| 1,503,271 | Series 2005-16, | ||||
| 2.810%, 01/19/2036 | 1,188,521 | ||||
| 2,587,671 | Series 2006-6, | ||||
| 6.000%, 08/19/2036 | 2,127,711 | ||||
| IMPAC Secured Assets Corp. | |||||
| 1,236,994 | Series 2005-6, | ||||
| 2.850%, 10/25/2035 | 884,316 | ||||
| 1,490,328 | Series 2005-2, | ||||
| 2.920%, 03/25/2036 | 1,063,841 | ||||
| Indymac Mortgage Loan Trust | |||||
| 449,583 | Series 2005-AR15, | ||||
| 5.100%, 09/25/2035 | 345,770 | ||||
| 671,020 | Series 2005-AR15, | ||||
| 5.440%, 09/25/2035 | 500,943 | ||||
| 2,041,747 | Series 2007-AR15, | ||||
| 6.000%, 08/25/2037 | 1,408,805 | ||||
| 1,684,520 | Series 2007-AR7, | ||||
| 6.260%, 11/25/2037 . . . . . . . . . . . . | 1,516,365 | ||||
| 2,920,000 | JPMorgan Chase & Co. | ||||
| Series 2007-LDP10, | |||||
| 5.420%, 01/15/2049 | 2,831,702 | ||||
| JPMorgan Commercial Mortgage | |||||
| 1,880,000 | Series 2005-CIBC12, | ||||
| 4.900%, 09/12/2037 | 1,839,085 | ||||
| 1,500,000 | Series 2005-LDP2, | ||||
| 4.740%, 07/15/2042 | 1,474,269 | ||||
| JPMorgan Mortgage Trust | |||||
| 877,187 | Series 2007-A1, | ||||
| 4.070%, 07/25/2035 | 806,823 | ||||
| 906,768 | Series 2007-A1, | ||||
| 4.200%, 07/25/2035 | 883,489 |
See notes to financial statements.
69
| AssetMark Core Plus Fixed Income Fund |
| SCHEDULE OF INVESTMENTS (Continued) |
| March 31, 2008 |
| Principal | Market | ||||
| Amount | Value | ||||
| MORTGAGE BACKED | |||||
| SECURITIES - NON-U.S. | |||||
| GOVERNMENT (Continued) | |||||
| $ | 850,265 | Series 2007-A1, | |||
| 4.770%, 07/25/2035 | $ | 818,218 | |||
| Lehman Brothers Trust | |||||
| 1,215,547 | Series 2005-5N, | ||||
| 2.900%, 11/25/2035 . . . . . . . . . . . . | 958,286 | ||||
| 1,028,918 | Series 2005-5N, | ||||
| 3.440%, 11/25/2035 . . . . . . . . . . . . | 807,672 | ||||
| Lehman Brothers-UBS Commercial | |||||
| Mortgage Trust | |||||
| 600,000 | Series 2005-C3, | ||||
| 4.660%, 07/15/2030 | 570,147 | ||||
| 520,000 | Series 2005-C3, | ||||
| 4.740%, 07/15/2030 | 505,158 | ||||
| 2,000,000 | Series 2006-C1, | ||||
| 5.160%, 02/15/2031 | 1,950,851 | ||||
| 2,500,000 | Series 2007-C1, | ||||
| 5.420%, 02/15/2040 | 2,433,401 | ||||
| 2,953,099 | Lehman XS Trust | ||||
| Series 2007-16N, | |||||
| 3.450%, 09/25/2047 | 2,255,282 | ||||
| 683,228 | Luminent Mortgage Trust | ||||
| Series 2006-5, | |||||
| 2.790%, 07/25/2036 | 514,091 | ||||
| 1,030,000 | Merrill Lynch Mortgage Trust | ||||
| Series 2006-C1, | |||||
| 5.660%, 05/12/2039 | 1,038,954 | ||||
| MLCC Mortgage Investors, Inc. | |||||
| 937,928 | Series 2004-A3, | ||||
| 5.030%, 05/25/2034 | 849,257 | ||||
| 2,710,000 | Series 2007-7, | ||||
| 5.750%, 06/12/2050 | 2,692,774 | ||||
| Morgan Stanley | |||||
| 770,000 | Series 2005-HQ6, | ||||
| 4.990%, 08/13/2042 | 757,977 | ||||
| 910,000 | Series 2007-IQ14, | ||||
| 5.500%, 04/15/2049 | 898,021 | ||||
| 2,000,000 | Morgan Stanley Capital I | ||||
| Series 2005-HQ7, | |||||
| 5.220%, 11/14/2042 . . . . . . . . . . . . | 2,021,848 | ||||
| Residential Accredit Loans, Inc. | |||||
| 3,921,370 | Series 2007-QH9, | ||||
| 6.550%, 11/25/2037 . . . . . . . . . . . . | 3,269,563 |
| Principal | Market | ||||
| Amount | Value | ||||
| MORTGAGE BACKED | |||||
| SECURITIES - NON-U.S. | |||||
| GOVERNMENT (Continued) | |||||
| $ | 1,414,396 | Series 2005-QO4, | |||
| 2.880%, 12/25/2045 | $ | 1,107,520 | |||
| 1,734,797 | Series 2005-QO5, | ||||
| 5.330%, 01/25/2046 | 1,287,870 | ||||
| 1,553,272 | Residential Funding Mortgage | ||||
| Series FLT, | |||||
| 5.180%, 09/25/2035 | 1,459,082 | ||||
| Structured Adjustable Rate | |||||
| Mortgage Loan | |||||
| 112,663 | Series FLT, | ||||
| 4.380%, 05/25/2034 | 105,206 | ||||
| 33,800 | Series FLT, | ||||
| 5.250%, 09/25/2034 | 28,719 | ||||
| 208,125 | Series FLT, | ||||
| 5.450%, 11/25/2034 . . . . . . . . . . . . | 188,828 | ||||
| 3,946,324 | Structured Asset Mortgage | ||||
| Investments, Inc. | |||||
| Series A-1, | |||||
| 6.050%, 08/25/2047 | 2,817,922 | ||||
| Thornburg Mortgage Trust | |||||
| 3,232,337 | Series 2006-1, 3. | ||||
| 3.300%, 01/25/2036 | 3,174,115 | ||||
| 2,442,060 | Series 2006-3, | ||||
| 2.700%, 06/25/2036 | 2,398,253 | ||||
| 2,571,335 | Series 2006-3, | ||||
| 2.710%, 06/25/2036 . . . . . . . . . . . | 2,542,641 | ||||
| Washington Mutual | |||||
| 165,524 | Series 2004-AR3, | ||||
| 4.240%, 06/25/2034 | 160,773 | ||||
| 1,700,000 | Series 2005-AR4, | ||||
| 4.670%, 04/25/2035 | 1,555,657 | ||||
| 1,255,067 | Series 2007-HY4, | ||||
| 5.500%, 09/25/2036 | 1,192,974 | ||||
| 2,177,167 | Series 2007-HY2, | ||||
| 5.620%, 12/25/2036 | 2,084,934 | ||||
| 1,287,349 | Series 2005-AR13, | ||||
| 2.890%, 10/25/2045 | 1,028,394 | ||||
| 1,610,637 | Series 2005-AR15, | ||||
| 2.860%, 11/25/2045 . . . . . . . . . . . . | 1,300,143 | ||||
| 1,334,528 | Series 2005-AR15, | ||||
| 3.420%, 11/25/2045 . . . . . . . . . . . . | 1,056,174 |
See notes to financial statements.
70
| AssetMark Core Plus Fixed Income Fund |
| SCHEDULE OF INVESTMENTS (Continued) |
| March 31, 2008 |
| Principal | Market | ||||
| Amount | Value | ||||
| MORTGAGE BACKED | |||||
| SECURITIES - NON-U.S. | |||||
| GOVERNMENT (Continued) | |||||
| $ | 1,376,510 | Series 2005-AR17, | |||
| 2.870%, 12/25/2045 . . . . . . . . . . . | $ | 1,067,446 | |||
| 1,072,794 | Series 2005-AR19, | ||||
| 2.870%, 12/25/2045 . . . . . . . . . . . | 855,426 | ||||
| 763,530 | Series 2006-AR11, | ||||
| 5.250%, 09/25/2046 (k) . . . . . . . . . | 520,444 | ||||
| 832,665 | Series 2007-OA2, | ||||
| 5.030%, 03/25/2047 (k) . . . . . . . . . | 541,854 | ||||
| Wells Fargo Company | |||||
| 4,440,798 | Series 2005-AR6, | ||||
| 5.040%, 04/25/2035 . . . . . . . . . . . | 3,794,444 | ||||
| 1,075,164 | Series 2005-AR16, | ||||
| 5.570%, 10/25/2035 . . . . . . . . . . . | 1,059,397 | ||||
| 3,912,396 | Series 2006-AR2, | ||||
| 5.110%, 03/25/2036 . . . . . . . . . . . . | 3,752,264 | ||||
| 1,439,803 | Series 2006-AR10, | ||||
| 5.600%, 07/25/2036 . . . . . . . . . . . | 1,395,987 | ||||
| 3,608,588 | Series 2007-PA6, | ||||
| 6.600%, 12/28/2037 . . . . . . . . . . . | 2,978,623 | ||||
| Total Mortgage Backed Securities | |||||
| - Non-U.S. Government | |||||
| (Cost $147,847,523) . . . . . . . . . . . | 133,248,999 | ||||
| MORTGAGE BACKED | |||||
| SECURITIES - U.S. | |||||
| GOVERNMENT - 46.02% | |||||
| FHLMC | |||||
| 1,000,000 | Series 2590, 5.000%, 03/15/2018 . | 1,034,953 | |||
| 4,116,946 | Pool #1G-0058,` | ||||
| 4.600%, 01/01/2035 (b) . . . . . . . . . | 4,168,699 | ||||
| 4,000,000 | TBA, 5.500%, 04/01/2035 (g) . . . . | 4,039,376 | |||
| 1,930,065 | Pool #1H-2524, | ||||
| 4.580%, 08/01/2035 . . . . . . . . . . . | 1,971,309 | ||||
| 208,499 | Series 3013, 5.900%, 08/15/2035 | ||||
| (Acquired 05/01/2007, | |||||
| Cost $213,037) (d) . . . . . . . . . . . . . | 214,983 | ||||
| 2,493,322 | Pool #1Q-0160, | ||||
| 5.060%, 09/01/2035 . . . . . . . . . . . | 2,536,335 | ||||
| 296,943 | Series 3167, 6.360%, 06/15/2036 | ||||
| (Acquired 04/13/2007, | |||||
| Cost $271,774) (d) . . . . . . . . . . . . . | 276,781 |
| Principal | Market | ||||
| Amount | Value | ||||
| MORTGAGE BACKED | |||||
| SECURITIES - U.S. | |||||
| GOVERNMENT (Continued) | |||||
| $ | 91,902 | Series 3268, 6.180%, 01/15/2037 | |||
| (Acquired 05/30/2007, | |||||
| Cost $87,652) (d) | $ | 84,806 | |||
| 83,246 | Series 3271, 11.700%, 02/15/2037 | ||||
| (Acquired 07/17/2007, | |||||
| Cost $87,204) (d) | 114,620 | ||||
| 1,405,680 | Pool #1N-1582, | ||||
| 5.940%, 05/01/2037 | 1,430,499 | ||||
| 2,920,361 | Pool #1G-2201, | ||||
| 6.120%, 09/01/2037 | 2,966,866 | ||||
| 2,653,250 | Pool #G0-3600, | ||||
| 7.000%, 11/01/2037 | 2,787,845 | ||||
| FHLMC Gold | |||||
| 34,271 | Pool #B1-2301, | ||||
| 4.000%, 02/01/2014 | 34,491 | ||||
| 61,902 | Pool #B1-2730, | ||||
| 4.000%, 03/01/2014 | 62,300 | ||||
| 57,071 | Pool #B1-2772, | ||||
| 4.000%, 03/01/2014 | 57,431 | ||||
| 50,097 | Pool #B1-2818, | ||||
| 4.000%, 03/01/2014 | 50,426 | ||||
| 58,428 | Pool #B1-2819, | ||||
| 4.000%, 03/01/2014 | 58,804 | ||||
| 51,969 | Pool #B1-2883, | ||||
| 4.000%, 03/01/2014 | 52,308 | ||||
| 42,024 | Pool #B1-2910, | ||||
| 4.000%, 03/01/2014 | 42,299 | ||||
| 47,903 | Pool #B1-2911, | ||||
| 4.000%, 03/01/2014 | 48,218 | ||||
| 202,450 | Pool #B1-3066, | ||||
| 4.000%, 03/01/2014 | 203,778 | ||||
| 26,737 | Pool #B1-3343, | ||||
| 4.000%, 04/01/2014 | 26,901 | ||||
| 36,889 | Pool #B1-3344, | ||||
| 4.000%, 04/01/2014 | 37,126 | ||||
| 49,370 | Pool #B1-3360, | ||||
| 4.000%, 04/01/2014 | 49,680 | ||||
| 224,880 | Pool #E9-6057, | ||||
| 4.500%, 05/01/2018 | 224,655 | ||||
| 66,756 | Pool #E9-6247, | ||||
| 4.500%, 05/01/2018 | 66,795 | ||||
| 72,214 | Pool #E9-6248, | ||||
| 4.500%, 05/01/2018 | 72,256 |
See notes to financial statements.
71
| AssetMark Core Plus Fixed Income Fund |
| SCHEDULE OF INVESTMENTS (Continued) |
| March 31, 2008 |
| Principal | Market | ||||
| Amount | Value | ||||
| MORTGAGE BACKED | |||||
| SECURITIES - U.S. | |||||
| GOVERNMENT (Continued) | |||||
| $ | 87,688 | Pool #E9-7034, | |||
| 4.500%, 06/01/2018 | $ | 87,600 | |||
| 31,296 | Pool #E9-9763, | ||||
| 4.500%, 09/01/2018 | 31,264 | ||||
| 29,902 | Pool #E9-9764, | ||||
| 4.500%, 09/01/2018 | 29,872 | ||||
| 22,201 | Pool #E9-9765, | ||||
| 4.500%, 09/01/2018 | 22,179 | ||||
| 139,104 | Pool #E9-9768, | ||||
| 4.500%, 09/01/2018 | 138,965 | ||||
| 70,561 | Pool #E9-9769, | ||||
| 4.500%, 09/01/2018 | 70,490 | ||||
| 45,610 | Pool #E9-9770, | ||||
| 4.500%, 09/01/2018 | 45,564 | ||||
| 78,072 | Pool #B1-0170, | ||||
| 4.500%, 10/01/2018 | 77,994 | ||||
| 89,245 | Pool #B1-0207, | ||||
| 4.500%, 10/01/2018 | 89,155 | ||||
| 87,848 | Pool #E0-1481, | ||||
| 4.500%, 10/01/2018 | 87,799 | ||||
| 5.000%, 10/01/2018 | 472,880 | ||||
| 88,323 | Pool #B1-0931, | ||||
| 4.500%, 11/01/2018 | 88,234 | ||||
| 175,765 | Pool #E0-1489, | ||||
| 4.500%, 11/01/2018 | 175,640 | ||||
| 759,100 | Pool #E0-1538, | ||||
| 5.000%, 12/01/2018 | 770,519 | ||||
| 95,802 | Pool #B1-1801, | ||||
| 4.500%, 01/01/2019 | 95,706 | ||||
| 95,284 | Pool #E0-1602, | ||||
| 4.500%, 03/01/2019 | 95,180 | ||||
| 97,043 | Pool #G1-1526, | ||||
| 4.500%, 03/01/2019 | 96,946 | ||||
| 4,787,859 | Pool #G1-2251, | ||||
| 4.000%, 06/01/2019 (b) | 4,698,923 | ||||
| 1,268,018 | Pool #G1-1719, | ||||
| 5.000%, 06/01/2020 | 1,285,358 | ||||
| 1,316,446 | Pool #G1-1733, | ||||
| 5.000%, 07/01/2020 | 1,332,799 | ||||
| 780,221 | Pool #D9-6291, | ||||
| 4.500%, 09/01/2023 | 768,691 |
| Principal | Market | ||||
| Amount | Value | ||||
| MORTGAGE BACKED | |||||
| SECURITIES - U.S. | |||||
| GOVERNMENT (Continued) | |||||
| $ | 530,765 | Pool #C0-1385, | |||
| 6.500%, 08/01/2032 | $ | 554,176 | |||
| 198,637 | Pool #C7-0562, | ||||
| 6.500%, 09/01/2032 | 207,398 | ||||
| 233,942 | Pool #C7-0760, | ||||
| 6.500%, 09/01/2032 | 244,260 | ||||
| 1,725,522 | Pool #78-0447, | ||||
| 4.440%, 04/01/2033 | 1,749,436 | ||||
| 3,400,974 | Pool #G0-8085, | ||||
| 5.000%, 10/01/2035 (b) | 3,373,402 | ||||
| 726,775 | Pool #A3-9756, | ||||
| 5.000%, 11/01/2035 | 720,883 | ||||
| 100,000 | Pool #TBA, | ||||
| 5.000%, 04/15/2036 (g) | 99,016 | ||||
| 515,176 | Pool #1N-1447, | ||||
| 5.820%, 02/01/2037 | 523,612 | ||||
| 3,000,001 | Pool #A5-8420, | ||||
| 5.500%, 03/01/2037 (b) | 3,032,729 | ||||
| 1,085,656 | Pool #1N-1463, | ||||
| 5.950%, 05/01/2037 | 1,108,000 | ||||
| 20,999,988 | Pool #G0-3812, | ||||
| 5.500%, 02/01/2038 (b) | 21,229,084 | ||||
| FNCL | |||||
| 6,800,000 | Pool #TBA, | ||||
| 5.500%, 04/01/2019 (g) | 6,941,311 | ||||
| 2,000,000 | Pool #TBA, | ||||
| 5.000%, 05/01/2037 (g) | 1,975,312 | ||||
| 773,594 | Pool #928872, | ||||
| 8.000%, 12/01/2037 | 826,623 | ||||
| FNMA | |||||
| 2,573,005 | Pool #668357, | ||||
| 5.000%, 12/01/2017 | 2,611,786 | ||||
| 140,041 | Pool #695826, | ||||
| 5.000%, 04/01/2018 | 142,048 | ||||
| 3,521,387 | Pool #555549, | ||||
| 5.000%, 06/01/2018 (b) | 3,571,845 | ||||
| 3,917,588 | Pool #734788, | ||||
| 4.000%, 09/01/2018 (b) | 3,851,113 | ||||
| 38,000,000 | Pool #TBA, | ||||
| 5.000%, 04/01/2019 (g) | 38,362,178 | ||||
| 781,800 | Pool #745387, | ||||
| 5.000%, 04/01/2019 | 793,002 |
See notes to financial statements.
72
| AssetMark Core Plus Fixed Income Fund |
| SCHEDULE OF INVESTMENTS (Continued) |
| March 31, 2008 |
| Principal | Market | ||||
| Amount | Value | ||||
| MORTGAGE BACKED | |||||
| SECURITIES - U.S. | |||||
| GOVERNMENT (Continued) | |||||
| $ | 400,000 | Pool #TBA, | |||
| 6.000%, 04/01/2019 (g) | $ | 411,688 | |||
| 116,332 | Pool #735985, | ||||
| 5.000%, 06/01/2019 | 117,999 | ||||
| 1,392,476 | Pool #735439, | ||||
| 6.000%, 09/01/2019 | 1,437,517 | ||||
| 1,752,665 | Pool #745238, | ||||
| 6.000%, 12/01/2020 | 1,809,357 | ||||
| 20,135 | Pool #446275, | ||||
| 7.500%, 07/01/2027 | 21,778 | ||||
| 90,829 | Pool #251925, | ||||
| 6.500%, 07/01/2028 | 95,003 | ||||
| 29,364 | Pool #435151, | ||||
| 6.500%, 07/01/2028 | 30,713 | ||||
| 237,318 | Pool #433575, | ||||
| 6.500%, 09/01/2028 | 248,223 | ||||
| 318,476 | Pool #251985, | ||||
| 6.500%, 10/01/2028 | 333,110 | ||||
| 520,115 | Pool #446107, | ||||
| 6.500%, 11/01/2028 . . . . . . . . . . . . | 544,014 | ||||
| 538,484 | Pool #452955, | ||||
| 6.500%, 11/01/2028 . . . . . . . . . . . . | 563,228 | ||||
| 318,027 | Pool #457553, | ||||
| 6.500%, 01/01/2029 | 332,640 | ||||
| 209,556 | Pool #252255, | ||||
| 6.500%, 02/01/2029 | 219,185 | ||||
| 131,760 | Pool #252342, | ||||
| 6.500%, 04/01/2029 | 137,762 | ||||
| 482,156 | Pool #323632, | ||||
| 6.500%, 04/01/2029 | 504,651 | ||||
| 615,418 | Pool #494339, | ||||
| 6.500%, 04/01/2029 | 643,455 | ||||
| 116,355 | Pool #252497, | ||||
| 6.500%, 06/01/2029 | 121,656 | ||||
| 67,670 | Pool #498092, | ||||
| 6.500%, 06/01/2029 | 70,753 | ||||
| 446,115 | Pool #500441, | ||||
| 6.500%, 06/01/2029 | 466,439 | ||||
| 686,068 | Pool #501198, | ||||
| 6.500%, 06/01/2029 | 717,324 | ||||
| 236,530 | Pool #503223, | ||||
| 6.500%, 07/01/2029 | 247,306 |
| Principal | Market | ||||
| Amount | Value | ||||
| MORTGAGE BACKED | |||||
| SECURITIES - U.S. | |||||
| GOVERNMENT (Continued) | |||||
| $ | 82,670 | Pool #504708, | |||
| 6.500%, 07/01/2029 | $ | 86,437 | |||
| 74,085 | Pool #535476, | ||||
| 6.500%, 07/01/2029 | 77,489 | ||||
| 973,723 | Pool #544859, | ||||
| 5.830%, 08/01/2029 | 982,886 | ||||
| 63,561 | Pool #535506, | ||||
| 6.500%, 08/01/2030 | 66,457 | ||||
| 20,711 | Pool #580992, | ||||
| 7.500%, 05/01/2031 | 22,343 | ||||
| 1,146,909 | Pool #786848, | ||||
| 7.000%, 10/01/2031 | 1,221,511 | ||||
| 778,230 | Pool #607398, | ||||
| 6.500%, 11/01/2031 . . . . . . . . . . . . | 812,210 | ||||
| 671,497 | Pool #888504, | ||||
| 5.480%, 04/01/2034 | 678,388 | ||||
| 604,727 | Series 2004-71, | ||||
| 4.000%, 04/25/2034 | |||||
| (Acquired 04/07/2006, | |||||
| Cost $39,505) (d)(i) . . . . . . . . . . . . | 26,420 | ||||
| 1,357,196 | Pool #782284, | ||||
| 6.000%, 09/01/2034 | 1,397,583 | ||||
| 1,126,346 | Pool #791563, | ||||
| 6.000%, 09/01/2034 | 1,157,994 | ||||
| 51,985 | Pool #794371, | ||||
| 6.000%, 09/01/2034 | 53,446 | ||||
| 297,268 | Pool #798711, | ||||
| 6.000%, 10/01/2034 | 305,621 | ||||
| 759,066 | Pool #802783, | ||||
| 6.210%, 10/01/2034 | 766,787 | ||||
| 1,046,678 | Pool #802493, | ||||
| 6.000%, 11/01/2034 . . . . . . . . . . . . | 1,076,088 | ||||
| 8,459,730 | Pool #735224, | ||||
| 5.500%, 02/01/2035 (b) . . . . . . . . . | 8,568,936 | ||||
| 3,019,372 | Pool #808057, | ||||
| 6.000%, 02/01/2035 (b) . . . . . . . . . | 3,098,982 | ||||
| 1,475,683 | Pool #773306, | ||||
| 6.000%, 05/01/2035 | 1,514,592 | ||||
| 88,596 | Series 2007-27, | ||||
| 6.500%, 05/25/2035 | |||||
| (Acquired 05/29/2007, | |||||
| Cost $83,834) (d) . . . . . . . . . . . . . . | 89,131 |
See notes to financial statements.
73
| AssetMark Core Plus Fixed Income Fund |
| SCHEDULE OF INVESTMENTS (Continued) |
| March 31, 2008 |
| Principal | Market | ||||
| Amount | Value | ||||
| MORTGAGE BACKED | |||||
| SECURITIES - U.S. | |||||
| GOVERNMENT (Continued) | |||||
| $ | 4,142,827 | Pool #827741, | |||
| 5.500%, 06/01/2035 (b) . . . . . . . . . $ | 4,191,125 | ||||
| 1,542,341 | Pool #829334, | ||||
| 4.600%, 09/01/2035 | 1,551,573 | ||||
| 5,202,457 | Pool #820345, | ||||
| 5.000%, 09/01/2035 (b) . . . . . . . . . | 5,157,541 | ||||
| 11,838,857 | Pool #832738, | ||||
| 5.500%, 09/01/2035 (b) . . . . . . . . . | 11,976,875 | ||||
| 465,469 | Pool #836273, | ||||
| 5.500%, 10/01/2035 | 470,895 | ||||
| 139,878 | Pool #745000, | ||||
| 6.000%, 10/01/2035 | 143,566 | ||||
| 1,107,352 | Pool #836852, | ||||
| 6.510%, 10/01/2035 | 1,139,173 | ||||
| 1,654,142 | Pool #836464, | ||||
| 6.540%, 10/01/2035 | 1,701,756 | ||||
| 243,442 | Pool #833593, | ||||
| 7.000%, 10/01/2035 | 256,669 | ||||
| 3,394,423 | Pool #844158, | ||||
| 5.000%, 11/01/2035 (b) . . . . . . . . . | 3,365,117 | ||||
| 732,561 | Pool #843823, | ||||
| 6.500%, 11/01/2035 . . . . . . . . . . . . | 754,426 | ||||
| 121,221 | Pool #843997, | ||||
| 6.510%, 11/01/2035 . . . . . . . . . . . . | 124,839 | ||||
| 122,806 | Pool #844052, | ||||
| 6.520%, 11/01/2035 . . . . . . . . . . . . | 126,335 | ||||
| 125,383 | Pool #844148, | ||||
| 6.520%, 11/01/2035 . . . . . . . . . . . . | 128,989 | ||||
| 123,183 | Pool #844237, | ||||
| 6.520%, 11/01/2035 . . . . . . . . . . . . | 126,722 | ||||
| 124,762 | Pool #844789, | ||||
| 6.540%, 11/01/2035 . . . . . . . . . . . . | 128,356 | ||||
| 251,225 | Pool #848939, | ||||
| 6.500%, 01/01/2036 | 260,727 | ||||
| 58,918 | Pool #851639, | ||||
| 6.500%, 01/01/2036 | 61,085 | ||||
| 3,370,465 | Pool #745275, | ||||
| 5.000%, 02/01/2036 (b) . . . . . . . . . | 3,341,366 | ||||
| 627,090 | Pool #888022, | ||||
| 5.000%, 02/01/2036 | 621,676 | ||||
| 3,227,539 | Pool #256219, | ||||
| 5.500%, 04/01/2036 (b) . . . . . . . . . | 3,221,885 |
| Principal | Market | ||||
| Amount | Value | ||||
| MORTGAGE BACKED | |||||
| SECURITIES - U.S. | |||||
| GOVERNMENT (Continued) | |||||
| $ | 2,925,645 | Pool #868993, | |||
| 7.010%, 05/01/2036 | $ | 2,995,328 | |||
| 3,680,852 | Pool #872236, | ||||
| 6.880%, 05/01/2036 | 3,763,761 | ||||
| 3,558,773 | Pool #885961, | ||||
| 6.920%, 07/01/2036 | 3,640,698 | ||||
| 3,838,980 | Pool #886376, | ||||
| 7.010%, 08/01/2036 | 3,930,495 | ||||
| 650,963 | Pool #897776, | ||||
| 6.500%, 09/01/2036 | 674,899 | ||||
| 3,808,367 | Pool #886891, | ||||
| 6.880%, 09/01/2036 (b) . . . . . . . . . | 3,911,080 | ||||
| 33,611 | Pool #898131, | ||||
| 7.000%, 09/01/2036 | 35,315 | ||||
| 81,287 | Series 2006-81, | ||||
| 6.640%, 09/25/2036 | |||||
| (Acquired 05/29/2007, | |||||
| Cost $80,627) (d) . . . . . . . . . . . . . . | 82,203 | ||||
| 1,355,662 | Pool #893681, | ||||
| 6.000%, 10/01/2036 | 1,390,523 | ||||
| 2,795,502 | Pool #893923, | ||||
| 6.000%, 10/01/2036 | 2,867,389 | ||||
| 3,565,682 | Pool #894005, | ||||
| 6.000%, 10/01/2036 (b) . . . . . . . . . | 3,657,375 | ||||
| 776,920 | Pool #908124, | ||||
| 5.000%, 12/01/2036 | 769,937 | ||||
| 358,541 | Pool #905857, | ||||
| 5.650%, 12/01/2036 | 365,216 | ||||
| 605,067 | Pool #897505, | ||||
| 6.500%, 12/01/2036 | 627,316 | ||||
| 1,297,972 | Pool #907252, | ||||
| 7.000%, 12/01/2036 | 1,363,779 | ||||
| 726,802 | Pool #871054, | ||||
| 6.500%, 01/01/2037 | 753,526 | ||||
| 223,180 | Pool #888218, | ||||
| 5.000%, 03/01/2037 | 221,174 | ||||
| 284,350 | Pool #888367, | ||||
| 7.000%, 03/01/2037 | 298,766 | ||||
| 248,880 | Pool #888369, | ||||
| 7.000%, 03/01/2037 | 261,498 | ||||
| 100,651 | Pool #899082, | ||||
| 7.000%, 03/01/2037 | 105,756 |
See notes to financial statements.
74
| AssetMark Core Plus Fixed Income Fund |
| SCHEDULE OF INVESTMENTS (Continued) |
| March 31, 2008 |
| Principal | Market | ||||
| Amount | Value | ||||
| MORTGAGE BACKED | |||||
| SECURITIES - U.S. | |||||
| GOVERNMENT (Continued) | |||||
| $ | 350,446 | Pool #917324, | |||
| 7.000%, 03/01/2037 | $ | 368,220 | |||
| 330,396 | Pool #917560, | ||||
| 6.500%, 04/01/2037 | 342,545 | ||||
| 2,554,886 | Pool #256689, | ||||
| 7.000%, 04/01/2037 | 2,684,468 | ||||
| 14,445,868 | Pool #888366, | ||||
| 7.000%, 04/01/2037 (b) . . . . . . . . . | 15,178,271 | ||||
| 779,044 | Pool #923303, | ||||
| 7.000%, 04/01/2037 | 818,557 | ||||
| 782,528 | Pool #923834, | ||||
| 7.000%, 04/01/2037 | 822,217 | ||||
| 58,319 | Pool #936750, | ||||
| 6.500%, 05/01/2037 | 60,460 | ||||
| 843,451 | Pool #919187, | ||||
| 6.500%, 06/01/2037 | 874,406 | ||||
| 815,873 | Pool #256774, | ||||
| 7.000%, 06/01/2037 | 857,254 | ||||
| 308,247 | Pool #888593, | ||||
| 7.000%, 06/01/2037 | 323,881 | ||||
| 86,313 | Series 2007-56, | ||||
| 6.690%, 06/25/2037 | |||||
| (Acquired 06/11/2007, | |||||
| Cost $94,076) (d) . . . . . . . . . . . . . . | 89,201 | ||||
| 9,850,022 | Pool #941428, | ||||
| 6.000%, 07/01/2037 (b) . . . . . . . . . | 10,100,868 | ||||
| 2,364,588 | Pool #950385, | ||||
| 5.870%, 08/01/2037 | 2,407,032 | ||||
| 996,463 | Pool #945069, | ||||
| 6.500%, 08/01/2037 | 1,033,034 | ||||
| 690,228 | Pool #949629, | ||||
| 6.500%, 08/01/2037 | 715,559 | ||||
| 12,555,705 | Pool #948348, | ||||
| 7.000%, 08/01/2037 (b) . . . . . . . . . | 13,192,522 | ||||
| 30,001 | Pool #950302, | ||||
| 7.000%, 08/01/2037 | 31,631 | ||||
| 120,893 | Pool #966381, | ||||
| 7.000%, 09/01/2037 | 127,025 | ||||
| 2,261,560 | Pool #888890, | ||||
| 6.500%, 10/01/2037 | 2,344,718 | ||||
| 2,746,559 | Pool #933027, | ||||
| 7.000%, 10/01/2037 | 2,885,863 |
| Principal | Market | ||||
| Amount | Value | ||||
| MORTGAGE BACKED | |||||
| SECURITIES - U.S. | |||||
| GOVERNMENT (Continued) | |||||
| $ | 4,750,310 | Pool #933134, | |||
| 7.000%, 10/01/2037 (b) . . . . . . . . . | $ | 4,991,243 | |||
| 809,853 | Pool #955142, | ||||
| 7.000%, 10/01/2037 | 850,928 | ||||
| 39,763 | Pool #257087, | ||||
| 8.000%, 10/01/2037 | 42,488 | ||||
| 644,930 | Pool #959897, | ||||
| 7.000%, 11/01/2037 . . . . . . . . . . . . | 677,640 | ||||
| 3,618,152 | Pool #888892, | ||||
| 7.500%, 11/01/2037 (b) . . . . . . . . . | 3,828,882 | ||||
| 7,993,637 | Pool #899949, | ||||
| 7.000%, 12/01/2037 (b) . . . . . . . . . | 8,399,069 | ||||
| 740,541 | Pool #928940, | ||||
| 7.000%, 12/01/2037 | 778,101 | ||||
| 56,995 | Pool #955221, | ||||
| 7.000%, 12/01/2037 | 59,886 | ||||
| 66,150 | Pool #965934, | ||||
| 7.000%, 12/01/2037 | 69,505 | ||||
| 1,612,557 | Pool #967667, | ||||
| 7.000%, 12/01/2037 | 1,694,345 | ||||
| 950,573 | Pool #928953, | ||||
| 7.500%, 12/01/2037 | 1,005,937 | ||||
| 41,956 | Pool #959397, | ||||
| 8.000%, 12/01/2037 | 44,832 | ||||
| 43,590 | Pool #959538, | ||||
| 8.000%, 12/01/2037 | 46,578 | ||||
| 76,895 | Pool #966818, | ||||
| 8.000%, 12/01/2037 | 82,166 | ||||
| 999,901 | Pool #889150, | ||||
| 5.500%, 01/01/2038 | 1,010,465 | ||||
| 19,998,006 | Pool #967131, | ||||
| 5.500%, 01/01/2038 (b) . . . . . . . . . | 20,209,281 | ||||
| 4,855,606 | Pool #257050, | ||||
| 7.000%, 01/01/2038 | 5,101,879 | ||||
| 29,434 | Pool #973335, | ||||
| 5.000%, 02/01/2038 | 29,162 | ||||
| 299,915 | Pool #972548, | ||||
| 7.000%, 02/01/2038 | 315,135 | ||||
| 28,741 | Pool #257130, | ||||
| 5.000%, 03/01/2038 | 28,475 | ||||
| 2,000,200 | Pool #965598, | ||||
| 5.000%, 03/01/2038 | 1,981,742 |
See notes to financial statements.
75
| AssetMark Core Plus Fixed Income Fund |
| SCHEDULE OF INVESTMENTS (Continued) |
| March 31, 2008 |
| Principal | Market | ||||
| Amount | Value | ||||
| MORTGAGE BACKED | |||||
| SECURITIES - U.S. | |||||
| GOVERNMENT (Continued) | |||||
| $ | 941,825 | Pool #975439, | |||
| 5.000%, 03/01/2038 | $ | 933,134 | |||
| 837,625 | Pool #257137, | ||||
| 7.000%, 03/01/2038 | 880,133 | ||||
| 18,500,000 | Pool #TBA, | ||||
| 5.000%, 04/01/2038 (g) | 18,312,114 | ||||
| 2,800,000 | Pool #TBA, | ||||
| 5.500%, 04/14/2038 (g) | 2,826,687 | ||||
| 1,000,000 | Pool #TBA, | ||||
| 6.500%, 04/14/2038 (g) | 1,035,781 | ||||
| GNMA | |||||
| 4,000,000 | Pool #TBA, | ||||
| 6.500%, 04/01/2029 (g) | 4,158,124 | ||||
| 2,700,000 | Pool #TBA, | ||||
| 6.000%, 04/01/2034 (g) | 2,786,484 | ||||
| 4,700,000 | Pool #TBA, | ||||
| 5.000%, 05/01/2034 (g) | 4,687,517 | ||||
| 1,050,000 | Pool #TBA, | ||||
| 6.000%, 05/01/2034 (g) | 1,081,008 | ||||
| Total Mortgage Backed Securities | |||||
| - U.S. Government | |||||
| (Cost $365,160,123) | 370,043,795 | ||||
| MUNICIPAL BONDS - 0.42% | |||||
| 1,400,000 | Michigan State University | ||||
| 2.680%, 02/15/2037 | 980,112 | ||||
| 2,409,809 | Virginia Housing Development | ||||
| Authority | |||||
| 6.000%, 06/25/2034 | 2,410,171 | ||||
| Total Municipal Bonds | |||||
| (Cost $3,349,897) | 3,390,283 | ||||
| SUPRANATIONAL OBLIGATIONS - 0.56% | |||||
| $ | 2,500,000 | African Development Bank | |||
| 0.500%, 02/27/2014 | $ | 2,084,235 | |||
| GazInvest | |||||
| 820,000 | 7.250%, 10/30/2008 | 831,890 | |||
| 1,250,000 | 6.210%, 11/22/2016 (c) | 1,159,375 | |||
| 440,000 | 6.510%, 03/07/2022 (b)(c) | 393,250 | |||
| Total Supranational Obligations | |||||
| (Cost $4,375,999) | 4,468,750 |
| Principal | Market | ||||
| Amount | Value | ||||
| U.S. GOVERNMENT AGENCY ISSUES - 2.59% | |||||
| $ | 420,000 | FAMC | |||
| 4.250%, 07/29/2008 . . . . . . . . . . . | $ | 422,496 | |||
| FFCB | |||||
| 5,300,000 | 5.300%, 02/06/2017 (b) . . . . . . . . . | 5,806,277 | |||
| 1,400,000 | 5.130%, 04/19/2017 (c) . . . . . . . . . | 1,501,884 | |||
| 760,000 | FHLB | ||||
| 5.130%, 06/13/2008 (b) . . . . . . . . . | 764,089 | ||||
| FHLMC | |||||
| 460,000 | 5.600%, 09/26/2013 . . . . . . . . . . . | 466,781 | |||
| 210,000 | 5.600%, 10/17/2013 . . . . . . . . . . . | 213,106 | |||
| 880,000 | 5.630%, 11/23/2035 (b) . . . . . . . . . | 917,872 | |||
| 220,000 | FNMA | ||||
| 7.250%, 01/15/2010 (b) . . . . . . . . . | 239,160 | ||||
| GNMA | |||||
| 112,449 | 5.000%, 08/15/2033 . . . . . . . . . . . | 112,678 | |||
| 1,421,466 | 5.000%, 09/15/2033 (b) . . . . . . . . . | 1,424,361 | |||
| 229,789 | 5.000%, 03/15/2034 . . . . . . . . . . . | 230,192 | |||
| 325,219 | 4.750%, 10/20/2034 . . . . . . . . . . . | 325,362 | |||
| 147,548 | 5.000%, 11/15/2034 . . . . . . . . . . . . | 147,806 | |||
| 427,551 | 4.750%, 11/20/2034 . . . . . . . . . . . . | 427,552 | |||
| 1,048,635 | 4.750%, 11/20/2034 (b) . . . . . . . . . | 1,049,054 | |||
| 3,600,241 | 6.000%, 05/15/2035 (b) . . . . . . . . . | 3,723,058 | |||
| Tennessee Valley Authority | |||||
| 830,000 | 5.980%, 04/01/2036 . . . . . . . . . . . | 937,164 | |||
| 2,000,000 | 5.380%, 04/01/2056 . . . . . . . . . . . | 2,125,288 | |||
| Total U.S. Government Agency Issues | |||||
(Cost $20,082,964) . . . . . . . . . . . . | 20,834,180 | ||||
| U.S. TREASURY OBLIGATIONS - 4.71% | |||||
| U.S. Treasury Bond - 0.71% | |||||
| 80,000 | 8.880%, 08/15/2017 (b) . . . . . . . . . | 113,987 | |||
| 918,097 | 2.380%, 01/15/2025 (b)(h) . . . . . . | 999,219 | |||
| 404,065 | 2.000%, 01/15/2026 (b)(h) . . . . . . | 416,693 | |||
| 1,077,916 | 2.380%, 01/15/2027 (b)(h) . . . . . . | 1,176,950 | |||
| 785,772 | 1.750%, 01/15/2028 (h) . . . . . . . . . | 779,204 | |||
| 230,000 | 4.750%, 02/15/2037 (b) . . . . . . . . . | 247,448 | |||
| 1,930,000 | 4.380%, 02/15/2038 (b) . . . . . . . . . | 1,953,523 | |||
| 5,687,024 | |||||
| U.S. Treasury Note - 3.79% | |||||
| 420,000 | 4.630%, 07/31/2009 (b) . . . . . . . . . | 437,128 | |||
| 90,000 | 4.630%, 10/31/2011 (b) . . . . . . . . . | 98,065 | |||
| 170,000 | 4.500%, 03/31/2012 (b) . . . . . . . . . | 184,676 | |||
| 40,000 | 4.880%, 06/30/2012 (b) . . . . . . . . . | 44,091 | |||
See notes to financial statements.
76
| AssetMark Core Plus Fixed Income Fund |
| SCHEDULE OF INVESTMENTS (Continued) |
| March 31, 2008 |
| Principal | Market | ||||
| Amount | Value | ||||
| U.S. TREASURY OBLIGATIONS (Continued) | |||||
| U.S. Treasury Note (Continued) | |||||
| $ | 24,620,000 | 2.500%, 03/31/2013 . . . . . . . . . . . $ | 24,664,242 | ||
| 616,783 | 2.000%, 01/15/2014 (b)(h) . . . . . . | 668,246 | |||
| 22,393 | 2.000%, 07/15/2014 (h) . . . . . . . . . | 24,326 | |||
| 33,158 | 1.630%, 01/15/2015 (h) . . . . . . . . . | 35,181 | |||
| 130,202 | 1.880%, 07/15/2015 (b)(h) . . . . . . | 140,588 | |||
| 499,765 | 2.000%, 01/15/2016 (b)(h) . . . . . . | 542,050 | |||
| 428,462 | 2.500%, 07/15/2016 (b)(h) . . . . . . | 482,790 | |||
| 2,667,920 | 2.630%, 07/15/2017 (b)(h) . . . . . . | 3,041,012 | |||
| 90,000 | 4.750%, 08/15/2017 (b) . . . . . . . . . | 99,605 | |||
| 30,462,000 | |||||
| U.S. Treasury Strip - 0.21% | |||||
| 3,640,000 | Effective yield, 4.580%, | ||||
| 11/15/2024 (b) . . . . . . . . . . . . . . . . | 1,714,757 | ||||
| Total U.S. Treasury Obligations | |||||
(Cost $36,670,669) . . . . . . . . . . . . | 37,863,781 | ||||
| SHORT TERM INVESTMENTS - 9.58% | |||||
| Repurchase Agreements - 9.23% | |||||
| 55,200,000 | Lehman Brothers Repurchase | ||||
| Agreement | |||||
| 2.250% (Collateralized by U.S. | |||||
| Government Agency Issue, | |||||
| value $55,203,450, | |||||
| 0.000%, 01/15/2030) (e) . . . . . . . . . | 55,200,000 | ||||
| 19,000,000 | UBS Warburg Repurchase Agreement | ||||
| 2.500% (Collateralized by non-U.S. | |||||
| Government Agency Issue, value | |||||
| $19,319,798, 0.000%, 03/01/2038) (e) . . | 19,000,000 | ||||
| 74,200,000 | |||||
| U.S. Government Agency Issues - 0.18% | |||||
| 1,530,000 | FNMA | ||||
| 2.001%, 12/15/2008 (e)(f) . . . . . . . | 1,508,290 | ||||
| Shares | |||||
| Money Market Funds - 0.17% | |||||
| 1,331,436 | Federated Prime Obligations Fund,, | ||||
| 3.180% (e) . . . . . . . . . . . . . . . . . . . | 1,331,436 | ||||
| Total Short Term Investments | |||||
(Cost $77,042,419) . . . . . . . . . . . . | 77,039,726 | ||||
| Principal | Market | ||||
| Amount | Value | ||||
| INVESTMENTS PURCHASED | |||||
| AS SECURITIES LENDING | |||||
| COLLATERAL - 25.70% | |||||
| COMMERCIAL PAPER - 1.87% | |||||
| $ | 2,537,822 | Bryant Park Funding LLC, | |||
| 3.188%, 04/03/08 (c) . . . . . . . . . . . | $ | 2,537,149 | |||
| 4,389,744 | Sheffield Receivables Corp., | ||||
| 3.053%, 04/08/08 (c) . . . . . . . . . . . | 4,386,769 | ||||
| 1,646,154 | Thames Asset Global, | ||||
| 2.287%, 06/27/08 (c) . . . . . . . . . . . | 1,634,807 | ||||
| 1,960,570 | Three Pillars Funding, | ||||
| 2.906%, 04/14/08 (c) . . . . . . . . . . . | 1,958,359 | ||||
| 4,526,924 | Tulip Funding, | ||||
| 2.856%, 04/21/08 (c) . . . . . . . . . . | 4,519,398 | ||||
| Total Commercial Paper | |||||
(Cost $15,036,482) . . . . . . . . . . . . | 15,036,482 | ||||
CORPORATE BONDS AND NOTES - 4.80% | |||||
| 8,230,771 | Abbey National Trust, | ||||
| 3.130%, 02/13/09 . . . . . . . . . . . . . | 8,114,947 | ||||
| 7,682,053 | Allstate Life Global Funding, | ||||
| 3.332%, 03/20/09 . . . . . . . . . . . . . | 7,686,232 | ||||
| 5,487,181 | Bank of Scotland, | ||||
| 4.614%, 02/06/09 . . . . . . . . . . . . . | 5,487,181 | ||||
| 7,133,335 | Barclays Bank, | ||||
| 3.361%, 03/16/09 . . . . . . . . . . . . . | 7,132,785 | ||||
| 2,743,590 | Bayerische Landesbank, | ||||
| 4.956%, 08/23/08 . . . . . . . . . . . . . | 2,746,828 | ||||
| 3,292,308 | Metlife Global, | ||||
| 4.965%, 04/28/08 . . . . . . . . . . . . . | 3,292,308 | ||||
| 4,115,385 | Svenska Handelsbanken, | ||||
| 4.652%, 02/06/09 . . . . . . . . . . . . . | 4,115,385 | ||||
| Total Corporate Bonds and Notes | |||||
(Cost $38,684,623) . . . . . . . . . . . . | 38,575,666 | ||||
| CORPORATE PAYDOWN SECURITIES - 1.89% | |||||
| 8,145,318 | KKR Atlantic East Holding | ||||
| Group Trust, | |||||
| 3.054%, 03/25/09 (k) . . . . . . . . . . | 7,062,947 | ||||
| 9,110,771 | KKR Pacific West Holding | ||||
| Group Trust, | |||||
| 3.054%, 03/25/09 (k) . . . . . . . . . . | 8,109,907 | ||||
| Total Corporate Paydown Securities | |||||
(Cost $17,256,089) . . . . . . . . . . . . | 15,172,854 | ||||
| MONEY MARKET FUNDS - 2.51% | |||||
| 9,854,452 | AIM Short Term Liquid Asset Fund | $ | 9,854,452 | ||
| 10,315,899 | Reserve Primary Fund . . . . . . . . . . | 10,315,899 | |||
| Total Money Market Funds | |||||
(Cost $20,170,351) . . . . . . . . . . . . | 20,170,351 | ||||
See notes to financial statements.
77
| AssetMark Core Plus Fixed Income Fund |
| SCHEDULE OF INVESTMENTS (Continued) |
| March 31, 2008 |
| Principal | Market | ||||
| Amount | Value | ||||
| REPURCHASE AGREEMENTS - 14.63% | |||||
| $ | 17,833,337 | BNP Paribas Repurchase Agreement, | |||
| 3.200%, 04/01/08 | |||||
| (Collateralized by U.S. Government | |||||
| Agency Issues, value $18,112,380, | |||||
| 5.000% to 5.500%, | |||||
| 03/31/38 to 04/01/38) . . . . . . . . . . | 17,833,337 | ||||
| 13,717,951 | Citigroup Global Repurchase | ||||
| Agreement, 3.050%, 04/01/08 | |||||
| (Collateralized by Foreign | |||||
| Government Bonds, | |||||
| value $13,998,192, | |||||
| 0.000% to 2.375%, | |||||
| 09/15/10 to 11/15/21) . . . . . . . . . . | 13,717,951 | ||||
| 13,717,951 | Citigroup Global Repurchase | ||||
| Agreement, 3.050%, 04/01/08 | |||||
| (Collateralized by Foreign | |||||
| Government Bonds, | |||||
| value $13,998,402, | |||||
| 0.000% to 2.375%, | |||||
| 05/15/11 to 01/15/17) . . . . . . . . . . | 13,717,951 | ||||
| 6,557,181 | CS First Boston Repurchase | ||||
| Agreement, 2.750%, 04/01/08 | |||||
| (Collateralized by U.S. | |||||
| Government Agency Issues, | |||||
| value $6,559,956, | |||||
| 0.000% to 6.500%, | |||||
| 01/25/12 to 03/20/38) . . . . . . . . . . | 6,557,181 | ||||
| 27,435,904 | Greenwich Capital Repurchase | ||||
| Agreement, 2.750%, 01/02/08 | |||||
| (Collateralized by U.S. Government | |||||
| Agency Issues, value $27,985,176, | |||||
| 0.000%, 12/01/33 to 04/15/37) . . . | 27,435,904 | ||||
| 27,435,904 | Merrill Lynch Repurchase | ||||
| Agreement, 3.120%, 04/01/08 | |||||
| (Collateralized by non-U.S. | |||||
| Government Agency Issues, | |||||
| value $28,425,240, | |||||
| 3.631% to 8.125%, | |||||
| 01/15/10 to 11/15/23) . . . . . . . . . . | 27,435,904 | ||||
| 5,487,180 | Morgan Stanley Repurchase | ||||
| Agreement, 2.9000%, 04/01/08 | |||||
| (Collateralized by non-U.S. | |||||
| Government Agency Issues, | |||||
| value $6,631,456, | |||||
| 0.000%, 10/15/14) . . . . . . . . . . . . . | 5,487,180 | ||||
| Principal | Market | ||||
| Amount | Value | ||||
REPURCHASE AGREEMENTS (Continued) | |||||
| $ | 5,487,180 | Morgan Stanley Repurchase | |||
| Agreement, 3.1000%, 04/01/08 | |||||
| (Collateralized by U.S. | |||||
| Government Agency Issues, | |||||
| value $5,596,924, | |||||
| 5.000% to 5.500%, | |||||
| 05/17/31 to 04/20/33) . . . . . . . . . . | $ | 5,487,180 | |||
| Total Repurchase Agreements | |||||
(Cost $117,672,588) . . . . . . . . . . . | 117,672,588 | ||||
| Total Investments Purchased as | |||||
| Securities Lending Collateral | |||||
(Cost $208,820,133) . . . . . . . . . . . | 206,627,941 | ||||
| Total Investments | |||||
| (Cost $1,115,146,528) - 136.18% | 1,095,006,651 | ||||
| Liabilities in Excess of | |||||
Other Assets - (36.18)% . . . . . . . | (290,920,733) | ||||
| TOTAL NET | |||||
ASSETS - 100.00% . . . . . . . . . . . | $ | 804,085,918 | |||
| Percentages are stated as a percent of net assets. | ||
| (a) | Non Income Producing. | |
| (b) | All or a portion of this security is on loan. | |
| (c) | Restricted securities as defined in Rule 144(a) under the | |
| Securities Act of 1933. Such securities are treated as liquid | ||
| securities according to the Fund’s liquidity guidelines. The | ||
| market value of these securities total $63,267,265, which | ||
| represents 7.87% of total net assets. | ||
| (d) | Restricted securities as defined in Rule 144(a) under the | |
| Securities Act of 1933. Such securities are treated as illiquid | ||
| securities according to the Fund’s liquidity guidelines. The | ||
| market value of these securities total $7,108,268, which | ||
| represents 0.88% of total net assets. | ||
| (e) | Variable Rate Security. The rate shown is the rate in effect on | |
| March 31, 2008. | ||
| (f) | Assigned as collateral for certain futures and options contracts. | |
| (g) | Security purchased on a when-issued basis. On March 31, 2008, | |
| the total value of the investments purchased on a when-issued | ||
| basis was $86,716,596 or 10.78% of total net assets. | ||
| (h) | Represents a U.S. Treasury Inflation Protected Security. | |
| (i) | Represents an interest only security that entitles holders to receive | |
| only interest payments on the underlying mortgages. The yield to | ||
| maturity of an interest only security is extremely sensitive to the | ||
| rate of principal payments on the underlying mortgage assets. A | ||
| rapid (slow) rate of principal repayments may have an adverse | ||
| (positive) effect on yield to maturity. The principal amount shown | ||
| is the notional amount of the underlying mortgage. Interest rate | ||
| disclosed represents yield upon the estimated timing and amount | ||
| of future cash flows at March 31, 2008. The security is illiquid and | ||
| represents less than 0.1% of net assets. | ||
| (j) | Credit linked note. Investment performance is wholly or | |
| partially derived from an underlying source. | ||
| (k) | As of March 31, 2008, the Adviser has fair valued this security. | |
| The market value of these securities total $17,761,124, which | ||
| represents 2.21% of total net assets. | ||
See notes to financial statements.
78
| AssetMark Core Plus Fixed Income Fund |
| SCHEDULE OF OPTIONS WRITTEN |
| March 31, 2008 |
| Contracts | Value | |||||
| CALL OPTIONS | ||||||
| 47 | Eurodollar 90 Day Future | |||||
| Expiration: September, 2008, | ||||||
| Exercise Price: $97.25 | $ | 81,075 | ||||
| 94 | U.S. Treasury 10 Year Note Future | |||||
| Expiration: June, 2008, | ||||||
| Exercise Price: $121.00 | 79,312 | |||||
| 160,387 | ||||||
| PUT OPTIONS | ||||||
| 65 | U.S. Treasury 10 Year Note Future | |||||
| Expiration: June, 2008, | ||||||
| Exercise Price: $113.00 | 9,141 | |||||
| Total Options Written | ||||||
| (Premiums received $167,014) | $169,528 | |||||
| AssetMark Core Plus Fixed Income Fund |
| SCHEDULE OF FORWARD SALE COMMITMENTS |
| March 31, 2008 |
| Principal | Settlement | Proceeds | |||||
| Description | Amount | Date | Received | Value | |||
| FNMA, 5.500%, 04/14/2038 | (15,000,000) | 04/14/2008 | $15,112,500 | $(15,142,965) | |||
| FNMA, 5.000%, 04/01/2038 | (4,200,000) | 04/14/2008 | 4,172,438 | (4,157,345) | |||
| FHLMC, 5.500%, 04/01/2035 | (6,000,000) | 04/14/2008 | 6,045,469 | (6,059,064) | |||
| (25,200,000) | $25,330,407 | $(25,359,374) | |||||
See notes to financial statements.
79
| AssetMark Core Plus Fixed Income Fund |
| SCHEDULE OF OPEN FORWARD CURRENCY CONTRACTS |
| March 31, 2008 |
| Amount of | Amount of | Unrealized | ||||||||
| Forward | Currency to | Currency to be | Currency to | Currency to | Appreciation | |||||
| expiration date | be received | received | be delivered | be delivered | (Depreciation) | |||||
| 05/15/08 | U.S. Dollars | 3.658,228 | Brazil Real | 6,614,077 | $(81,839) | |||||
| 05/15/08 | U.S. Dollars | 1,790,426 | Brazil Real | 3,257,680 | (40,309) | |||||
| 05/15/08 | Brazil Real | 5,287,652 | U.S. Dollars | 3,032,432 | 65,427 | |||||
| 04/30/08 | U.S. Dollars | 3,727,758 | European Monetary Unit | 2,362,795 | 1,716 | |||||
| 04/15/08 | U.S. Dollars | 4,906,251 | Mexican Peso | 54,049,715 | (163,072) | |||||
| 04/15/08 | Mexican Peso | 43,257,071 | U.S. Dollars | 4,006,714 | 130,510 | |||||
| 04/15/08 | Mexican Peso | 7,358,896 | U.S. Dollars | 679,492 | 22,202 | |||||
$(65,365) | ||||||||||
| AssetMark Core Plus Fixed Income Fund |
| SCHEDULE OF OPEN FUTURES CONTRACTS |
| March 31, 2008 |
| Number of | |||||||
| Contracts | Unrealized | ||||||
| Purchased | Notional | Settlement | Appreciation | ||||
| Description | (Sold) | Value | Month | (Depreciation) | |||
| Chicago Board of Trade 10 Year Swap Futures | 327 | $ 37,650,986 | Jun-08 | $ 616,592 | |||
| Euro BOBL Futures | 29 | 5,053,859 | Jun-08 | (51,726) | |||
| Euro Bond Futures | 89 | 33,548,353 | Jun-08 | (135,723) | |||
| Euro Bond Futures | 31 | 11,731,876 | Sep-08 | (75,057) | |||
| Euro Bond Futures | 39 | 14,779,467 | Dec-08 | (20,300) | |||
| Eurodollar 90 Day Futures | 96 | 23,475,601 | Mar-09 | 146,783 | |||
| Eurodollar 90 Day Futures | 112 | 27,364,400 | Jun-08 | 712,134 | |||
| Eurodollar 90 Day Futures | 23 | 5,613,725 | Jun-09 | 120,711 | |||
| Eurodollar 90 Day Futures | 115 | 28,147,688 | Sep-08 | 289,104 | |||
| Eurodollar 90 Day Futures | 10 | 2,435,625 | Sep-09 | 36,300 | |||
| Eurodollar 90 Day Futures | 39 | 9,539,400 | Dec-08 | 135,459 | |||
| LIBOR 90 Day Futures | 44 | 10,355,548 | Sep-08 | (47,103) | |||
| LIBOR 90 Day Futures | 97 | 22,899,061 | Dec-08 | (44,744) | |||
| U.S. Treasury 2 Year Note Futures | 130 | 27,905,314 | Jun-08 | 146,001 | |||
| U.S. Treasury 5 Year Note Futures | 661 | 75,508,925 | Jun-08 | 1,029,595 | |||
| U.S. Treasury 10 Year Note Futures | 52 | 6,185,563 | Jun-08 | 125,583 | |||
| U.S. Treasury 10 Year Note Futures | (464) | (55,194,252) | Jun-08 | (346,252) | |||
| U.S. Treasury Long Bond Futures | 348 | 41,341,314 | Jun-08 | 163,622 | |||
| $2,800,979 | |||||||
See notes to financial statements.
80
AssetMark Enhanced Fundamental IndexTM Large Company Growth Fund |
| PERFORMANCE DATA |
TOTAL RETURN BASED ON A $10,000 INVESTMENT

This chart assumes an initial gross investment of $10,000 made on August 9, 2007 (commencement of the Fund’s operations). Returns shown include the reinvestment of all dividends. Returns shown do not reflect the deduction of taxes that a shareholder would pay on fund distributions or the redemption of fund shares. In the absence of fee waivers and reimbursements, total return would be reduced. Past performance is not predictive of future performance. Investment return and principal value will fluctuate, so that your shares, when redeemed, may be worth more or less than the original cost.
RUSSELL 1000 GROWTH INDEX – An unmanaged index which measures the performance of those Russell 1000 companies with higher price-to-book ratios and higher forecasted growth values. The Russell 1000 Index is an unmanaged index which measures the performance of the 1,000 largest companies in the Russell 3000 Index. The Russell 3000 Index is an unmanaged index which measures the performance of the 3,000 largest U.S. Companies, based on total market capitalization, which represents approximately 98% of the investable U.S. equity market.
LIPPER LARGE-CAP GROWTH FUNDS INDEX – The Lipper Large-Cap Growth Funds Index is the average of the 30 largest funds in the Lipper Large-Cap Growth Funds Category. These funds, by portfolio practice, invest at least 75% of equity assets in companies with market capitalizations (on a three-year weighted basis) greater than 300% of the dollar-weighted median market capitalization of the middle 1,000 securities of the Standard & Poor’s (“S&P”) Super Composite 1500® Index. These funds typically invest in securities that have an above average price-to-earnings ratio, price-to-book ratio and three-year sales-per-share growth value, compared to the Standard & Poor’s 500 Composite Index (“S&P 500® Index”).
| TOTAL RETURN (for the period ended March 31) | |
| Since Inception (8/9/07) | |
AssetMark Enhanced Fundamental IndexTM Large Company Growth Fund | -3.40% |
| Russell 1000 Growth Index | -5.70% |
| Lipper Large-Cap Growth Funds Index | -4.32% |
81
| AssetMark Fundamental Index™ Large Company Growth Fund |
| SCHEDULE OF INVESTMENTS |
| March 31, 2008 |
| Number of | Market | |||
| Shares | Value | |||
| COMMON STOCKS - 79.47% | ||||
| Aerospace & Defense - 3.35% | ||||
| 210 | Alliant Techsystems, Inc. (a) . . . . . . | $ | 21,741 | |
| 6,310 | Boeing Co. . . . . . . . . . . . . . . . . . . . . | 469,275 | ||
| 2,923 | General Dynamics Corp. . . . . . . . . . | 243,690 | ||
| 1,074 | Goodrich Corp. . . . . . . . . . . . . . . . . | 61,766 | ||
| 7,362 | Honeywell International, Inc. . . . . . | 415,364 | ||
| 2,556 | KBR, Inc. . . . . . . . . . . . . . . . . . . . . . | 70,878 | ||
| 451 | L-3 Communications Holdings, Inc. | 49,312 | ||
| 3,266 | Lockheed Martin Corp. . . . . . . . . . . | 324,314 | ||
| 224 | Precision Castparts Corp. . . . . . . . . | 22,866 | ||
| 855 | Rockwell Collins, Inc. . . . . . . . . . . . | 48,863 | ||
| 7,807 | United Technologies Corp. . . . . . . . | 537,278 | ||
| 2,265,347 | ||||
| Air Freight & Logistics - 1.57% | ||||
| 814 | C.H. Robinson Worldwide, Inc. . . . | 44,282 | ||
| 786 | Expeditors International | |||
| Washington, Inc. . . . . . . . . . . . . . . | 35,511 | |||
| 3,336 | FedEx Corp. . . . . . . . . . . . . . . . . . . . | 309,147 | ||
| 8,971 | United Parcel Service, Inc. . . . . . . . | 655,062 | ||
| 971 | UTI Worldwide, Inc. . . . . . . . . . . . . | 19,498 | ||
| 1,063,500 | ||||
| Auto Components - 0.35% | ||||
| 1,036 | BorgWarner, Inc. . . . . . . . . . . . . . . . | 44,579 | ||
| 998 | Gentex Corp. . . . . . . . . . . . . . . . . . . | 17,116 | ||
| 4,084 | Johnson Controls, Inc. . . . . . . . . . . . | 138,039 | ||
| 1,263 | Tenneco Automotive, Inc. (a) . . . . . | 35,288 | ||
| 235,022 | ||||
| Automobiles - 0.07% | ||||
| 1,334 | Harley-Davidson, Inc. . . . . . . . . . . . | 50,025 | ||
| Beverages - 2.56% | ||||
| 4,461 | Anheuser-Busch Companies, Inc. . . | 211,675 | ||
| 329 | Brown-Forman Corp. - Class B . . . . | 21,786 | ||
| 12,994 | The Coca-Cola Company . . . . . . . . | 790,945 | ||
| 1,726 | Constellation Brands, Inc. - Class A (a) | 30,498 | ||
| 9,356 | PepsiCo, Inc. . . . . . . . . . . . . . . . . . . | 675,503 | ||
| 1,730,407 | ||||
| Biotechnology - 0.57% | ||||
| 3,107 | Amgen, Inc. (a) . . . . . . . . . . . . . . . . | 129,811 | ||
| 815 | Biogen Idec, Inc. (a) . . . . . . . . . . . . | 50,277 | ||
| 299 | Charles River Laboratories | |||
| International, Inc. (a) . . . . . . . . . . . | 17,623 | |||
| 1,211 | Genentech, Inc. (a) . . . . . . . . . . . . . | 98,309 |
| Number of | Market | |||
| Shares | Value | |||
| Biotechnology (Continued) | ||||
| 1,163 | Gilead Sciences, Inc. (a) . . . . . . . . . | $ | 59,929 | |
| 340 | Invitrogen Corp. (a) . . . . . . . . . . . . . | 29,060 | ||
| 385,009 | ||||
| Building Products - 0.12% | ||||
| 1,761 | Trane, Inc. . . . . . . . . . . . . . . . . . . . . | 80,830 | ||
| Capital Markets - 1.84% | ||||
| 2,487 | Ameriprise Financial, Inc. . . . . . . . . | 128,951 | ||
| 146 | BlackRock, Inc. . . . . . . . . . . . . . . . . | 29,810 | ||
| 4,847 | The Charles Schwab Corp. . . . . . . . | 91,269 | ||
| 18,545 | E*Trade Financial Corp. (a) . . . . . . | 71,584 | ||
| 529 | Eaton Vance Corp. . . . . . . . . . . . . . . | 16,140 | ||
| 528 | Federated Investors, Inc. . . . . . . . . . | 20,677 | ||
| 1,327 | Franklin Resources, Inc. . . . . . . . . . | 128,706 | ||
| 1,385 | Goldman Sachs Group, Inc. . . . . . . | 229,065 | ||
| 1,185 | Janus Capital Group, Inc. . . . . . . . . | 27,575 | ||
| 471 | Lazard Ltd. . . . . . . . . . . . . . . . . . . . | 17,992 | ||
| 867 | Legg Mason, Inc. . . . . . . . . . . . . . . . | 48,535 | ||
| 1,341 | Northern Trust Corp. . . . . . . . . . . . . | 89,136 | ||
| 1,158 | Raymond James Financial, Inc. . . . . | 26,611 | ||
| 1,874 | State Street Corp. . . . . . . . . . . . . . . . | 148,046 | ||
| 778 | T. Rowe Price Group, Inc. . . . . . . . . | 38,900 | ||
| 6,714 | TD Ameritrade Holding Corp. (a) . . | 110,848 | ||
| 542 | Waddell & Reed Financial, Inc. . . . | 17,414 | ||
| 1,241,259 | ||||
| Chemicals - 2.25% | ||||
| 963 | Air Products & Chemicals, Inc. . . . . | 88,596 | ||
| 580 | Albemarle Corp. . . . . . . . . . . . . . . . | 21,182 | ||
| 1,118 | Celanese Corp. . . . . . . . . . . . . . . . . . | 43,658 | ||
| 484 | Cytec Industries, Inc. . . . . . . . . . . . . | 26,063 | ||
| 10,853 | E.I. du Pont de Nemours & Co. . . . . | 507,486 | ||
| 1,327 | Ecolab, Inc. . . . . . . . . . . . . . . . . . . . | 57,632 | ||
| 479 | FMC Corp. . . . . . . . . . . . . . . . . . . . . | 26,580 | ||
| 1,167 | Hercules, Inc. . . . . . . . . . . . . . . . . . . | 21,344 | ||
| 764 | International Flavors & | |||
| Fragrances, Inc. . . . . . . . . . . . . . . . | 33,654 | |||
| 741 | Lubrizol Corp. . . . . . . . . . . . . . . . . . | 41,133 | ||
| 1,115 | Monsanto Co. . . . . . . . . . . . . . . . . . | 124,322 | ||
| 557 | Mosaic Co. (a) . . . . . . . . . . . . . . . . . | 57,148 | ||
| 1,263 | Nalco Holding Company . . . . . . . . . | 26,712 | ||
| 2,607 | PPG Industries, Inc. . . . . . . . . . . . . . | 157,750 | ||
| 978 | Praxair, Inc. . . . . . . . . . . . . . . . . . . . | 82,377 | ||
| 2,448 | Rohm & Haas Co. . . . . . . . . . . . . . . | 132,388 | ||
| 290 | Sigma-Aldrich Corp. . . . . . . . . . . . . | 17,299 |
See notes to financial statements.
82
| AssetMark Fundamental Index™ Large Company Growth Fund | ||||
| SCHEDULE OF INVESTMENTS (Continued) | ||||
| March 31, 2008 |
| Number of | Market | |||
| Shares | Value | |||
| COMMON STOCKS (Continued) | ||||
| Chemicals (Continued) | ||||
| 391 | Terra Industries, Inc. (a) . . . . . . . . . | $ | 13,892 | |
| 1,144 | Valhi, Inc. . . . . . . . . . . . . . . . . . . . . | 26,758 | ||
| 802 | Valspar Corp. . . . . . . . . . . . . . . . . . . | 15,912 | ||
| 1,521,886 | ||||
| Commercial Banks - 1.29% | ||||
| 553 | Bank of Hawaii Corp. . . . . . . . . . . . | 27,407 | ||
| 519 | BOK Financial Corp. . . . . . . . . . . . . | 27,108 | ||
| 635 | City National Corp. . . . . . . . . . . . . . | 31,407 | ||
| 532 | Cullen/Frost Bankers, Inc. . . . . . . . . | 28,217 | ||
| 613 | First Midwest Bancorp, Inc. . . . . . . | 17,023 | ||
| 1,390 | M&T Bank Corp. . . . . . . . . . . . . . . . | 111,867 | ||
| 7,587 | Synovus Financial Corp. . . . . . . . . . | 83,912 | ||
| 551 | Toronto-Dominion Bank . . . . . . . . . | 33,822 | ||
| 15,309 | U.S. Bancorp . . . . . . . . . . . . . . . . . . | 495,399 | ||
| 323 | Westamerica Bancorporation . . . . . . | 16,990 | ||
| 873,152 | ||||
| Commercial Services & Supplies - 1.23% | ||||
| 1,204 | ACCO Brands Corp. (a) . . . . . . . . . | 16,338 | ||
| 571 | Apollo Group, Inc. (a) . . . . . . . . . . . | 24,667 | ||
| 1,141 | Avery Dennison Corp. . . . . . . . . . . . | 56,194 | ||
| 327 | The Brink’s Co. . . . . . . . . . . . . . . . . | 21,968 | ||
| 1,977 | Career Education Corp. (a) . . . . . . . | 25,148 | ||
| 801 | Cenveo, Inc. (a) . . . . . . . . . . . . . . . . | 8,379 | ||
| 933 | Cintas Corp. . . . . . . . . . . . . . . . . . . . | 26,628 | ||
| 197 | Dun & Bradstreet Corp. . . . . . . . . . . | 16,032 | ||
| 466 | Equifax, Inc. . . . . . . . . . . . . . . . . . . | 16,068 | ||
| 4,583 | H&R Block, Inc. . . . . . . . . . . . . . . . | 95,143 | ||
| 541 | Herman Miller, Inc. . . . . . . . . . . . . . | �� | 13,292 | |
| 552 | HNI Corp. . . . . . . . . . . . . . . . . . . . . | 14,843 | ||
| 1,682 | Manpower, Inc. . . . . . . . . . . . . . . . . | 94,629 | ||
| 824 | Monster Worldwide, Inc. (a) . . . . . . | 19,949 | ||
| 3,146 | Pitney Bowes, Inc. . . . . . . . . . . . . . . | 110,173 | ||
| 1,614 | Republic Services, Inc. . . . . . . . . . . | 47,193 | ||
| 1,261 | Robert Half International, Inc. . . . . | 32,458 | ||
| 787 | United Stationers, Inc. (a) . . . . . . . . | 37,540 | ||
| 4,628 | Waste Management, Inc. . . . . . . . . . | 155,316 | ||
| 831,958 | ||||
| Number of | Market | |||
| Shares | Value | |||
| Communications Equipment - 1.45% | ||||
| 460 | Belden CDT, Inc. . . . . . . . . . . . . . . . | $ | 16,247 | |
| 13,002 | Cisco Systems, Inc. (a) . . . . . . . . . . | 313,218 | ||
| 3,201 | Corning, Inc. . . . . . . . . . . . . . . . . . . | 76,952 | ||
| 334 | Harris Corp. . . . . . . . . . . . . . . . . . . . | 16,209 | ||
| 2,734 | Juniper Networks, Inc. (a) . . . . . . . . | 68,350 | ||
| 40,834 | Motorola, Inc. . . . . . . . . . . . . . . . . . | 379,757 | ||
| 2,164 | QUALCOMM, Inc. . . . . . . . . . . . . . | 88,724 | ||
| 3,787 | Tellabs, Inc. (a) . . . . . . . . . . . . . . . . | 20,639 | ||
| 980,096 | ||||
| Computers & Peripherals - 4.66% | ||||
| 1,365 | Apple, Inc. (a) . . . . . . . . . . . . . . . . . | 195,878 | ||
| 21,578 | Dell, Inc. (a) . . . . . . . . . . . . . . . . . . . | 429,834 | ||
| 1,244 | Diebold, Inc. . . . . . . . . . . . . . . . . . . | 46,712 | ||
| 8,307 | EMC Corp. (a) . . . . . . . . . . . . . . . . . | 119,122 | ||
| 18,545 | Hewlett-Packard Co. . . . . . . . . . . . . | 846,765 | ||
| 9,845 | International Business | |||
| Machines Corp. . . . . . . . . . . . . . . . | 1,133,553 | |||
| 1,846 | Lexmark International, Inc. (a) . . . . | 56,709 | ||
| 2,665 | NCR Corp. (a) . . . . . . . . . . . . . . . . . | 60,842 | ||
| 1,762 | NetApp, Inc. (a) . . . . . . . . . . . . . . . . | 35,328 | ||
| 955 | SanDisk Corp. (a) . . . . . . . . . . . . . . | 21,554 | ||
| 4,943 | Seagate Technology . . . . . . . . . . . . . | 103,507 | ||
| 4,439 | Sun Microsystems, Inc. (a) . . . . . . . | 68,938 | ||
| 1,058 | Western Digital Corp. (a) . . . . . . . . | 28,608 | ||
| 3,147,350 | ||||
| Construction & Engineering - 0.41% | ||||
| 866 | AECOM Technology Corp. (a) . . . . | 22,525 | ||
| 590 | Fluor Corp. . . . . . . . . . . . . . . . . . . . | 83,284 | ||
| 356 | Foster Wheeler Ltd. (a) . . . . . . . . . . | 20,157 | ||
| 716 | Granite Construction, Inc. . . . . . . . . | 23,420 | ||
| 647 | Jacobs Engineering Group, Inc. (a) . | 47,613 | ||
| 729 | Quanta Services, Inc. (a) . . . . . . . . . | 16,891 | ||
| 540 | The Shaw Group Inc. (a) . . . . . . . . . | 25,455 | ||
| 1,094 | URS Corp. (a) . . . . . . . . . . . . . . . . . | 35,763 | ||
| 275,108 | ||||
| Construction Materials - 0.10% | ||||
| 206 | Martin Marietta Materials, Inc. . . . . | 21,871 | ||
| 653 | Vulcan Materials Co. . . . . . . . . . . . . | 43,359 | ||
| 65,230 |
See notes to financial statements.
83
| AssetMark Fundamental Index™ Large Company Growth Fund | ||||
| SCHEDULE OF INVESTMENTS (Continued) | ||||
| March 31, 2008 |
| Number of | Market | |||
| Shares | Value | |||
| COMMON STOCKS (Continued) | ||||
| Consumer Finance - 0.45% | ||||
| 6,292 | American Express Co. . . . . . . . . . . . | $ | 275,086 | |
| 1,776 | SLM Corp. (a) . . . . . . . . . . . . . . . . . | 27,262 | ||
| 302,348 | ||||
| Containers & Packaging - 0.48% | ||||
| 615 | Ball Corp. . . . . . . . . . . . . . . . . . . . . | 28,253 | ||
| 2,422 | Crown Holdings, Inc. (a) . . . . . . . . . | 60,938 | ||
| 329 | Greif, Inc. . . . . . . . . . . . . . . . . . . . . | 22,349 | ||
| 1,028 | Owens-Illinois, Inc. (a) . . . . . . . . . . | 58,010 | ||
| 1,714 | Pactiv Corp. (a) . . . . . . . . . . . . . . . . | 44,924 | ||
| 1,726 | Sealed Air Corp. . . . . . . . . . . . . . . . | 43,581 | ||
| 5,204 | Temple-Inland, Inc. . . . . . . . . . . . . . | 66,195 | ||
| 324,250 | ||||
| Distributors - 0.16% | ||||
| 2,700 | Genuine Parts Co. . . . . . . . . . . . . . . | 108,594 | ||
| Diversified Financial Services - 0.12% | ||||
| 31 | CME Group, Inc. . . . . . . . . . . . . . . . | 14,542 | ||
| 1,093 | Moody’s Corp. . . . . . . . . . . . . . . . . . | 38,069 | ||
| 446 | NYSE Euronext . . . . . . . . . . . . . . . . | 27,523 | ||
| 80,134 | ||||
| Electric Utilities - 1.45% | ||||
| 657 | Allegheny Energy, Inc. . . . . . . . . . . | 33,178 | ||
| 1,739 | DPL, Inc. . . . . . . . . . . . . . . . . . . . . . | 44,588 | ||
| 5,958 | Exelon Corp. . . . . . . . . . . . . . . . . . . | 484,207 | ||
| 4,345 | FirstEnergy Corp. . . . . . . . . . . . . . . | 298,154 | ||
| 2,560 | PPL Corp. . . . . . . . . . . . . . . . . . . . . | 117,555 | ||
| 977,682 | ||||
| Electrical Equipment - 0.69% | ||||
| 527 | Acuity Brands, Inc. . . . . . . . . . . . . . | 22,635 | ||
| 1,881 | Cooper Industries Ltd. . . . . . . . . . . . | 75,522 | ||
| 4,395 | Emerson Electric Co. . . . . . . . . . . . . | 226,167 | ||
| 277 | General Cable Corp. (a) . . . . . . . . . . | 16,362 | ||
| 601 | Hubbell, Inc. . . . . . . . . . . . . . . . . . . | 26,258 | ||
| 1,394 | Rockwell Automation, Inc. . . . . . . . | 80,043 | ||
| 577 | Thomas & Betts Corp. (a) . . . . . . . . | 20,986 | ||
| 467,973 | ||||
| Electronic Equipment & Instruments - 0.21% | ||||
| 1,767 | Agilent Technologies, Inc. (a) . . . . . | 52,710 | ||
| 243 | Anixter International, Inc. (a) . . . . . | 15,562 | ||
| 1,737 | AVX Corp. . . . . . . . . . . . . . . . . . . . . | 22,251 | ||
| Number of | Market | |||
| Shares | Value | |||
| Electronic Equipment & Instruments | ||||
| (Continued) | ||||
| 238 | Mettler Toledo International, Inc. (a) . | $ | 23,114 | |
| 1,191 | Molex, Inc. . . . . . . . . . . . . . . . . . . . | 27,583 | ||
| 141,220 | ||||
| Energy Equipment & Services - 1.24% | ||||
| 1,299 | Baker Hughes, Inc. . . . . . . . . . . . . . | 88,982 | ||
| 1,086 | BJ Services Co. . . . . . . . . . . . . . . . . | 30,962 | ||
| 886 | Cameron International Corp. (a) . . . | 36,893 | ||
| 220 | Diamond Offshore Drilling . . . . . . . | 25,608 | ||
| 532 | Dresser-Rand Group, Inc. (a) . . . . . | 16,359 | ||
| 362 | ENSCO International, Inc. . . . . . . . | 22,669 | ||
| 587 | FMC Technologies, Inc. (a) . . . . . . . | 33,394 | ||
| 922 | Global Industries Ltd. (a) . . . . . . . . | 14,835 | ||
| 5,389 | Halliburton Co. . . . . . . . . . . . . . . . . | 211,949 | ||
| 686 | Helix Energy Solutions Group, Inc. (a) | 21,609 | ||
| 801 | National-Oilwell, Inc. (a) . . . . . . . . | 46,762 | ||
| 431 | Noble Corp. . . . . . . . . . . . . . . . . . . . | 21,408 | ||
| 458 | Pride International, Inc. (a) . . . . . . . | 16,007 | ||
| 398 | Rowan Companies, Inc. . . . . . . . . . . | 16,390 | ||
| 1,339 | Schlumberger Ltd. . . . . . . . . . . . . . . | 116,493 | ||
| 349 | Smith International, Inc. . . . . . . . . . | 22,416 | ||
| 311 | Tidewater, Inc. . . . . . . . . . . . . . . . . . | 17,139 | ||
| 235 | Transocean Inc. (a) . . . . . . . . . . . . . | 31,772 | ||
| 631 | Weatherford International Ltd. (a) . . | 45,729 | ||
| 837,376 | ||||
| Food & Staples Retailing - 0.83% | ||||
| 8,330 | Sysco Corp. . . . . . . . . . . . . . . . . . . . | 241,737 | ||
| 981 | United Natural Foods, Inc. (a) . . . . . | 18,354 | ||
| 7,228 | Walgreen Co. . . . . . . . . . . . . . . . . . . | 275,315 | ||
| 821 | Whole Foods Market, Inc. . . . . . . . . | 27,068 | ||
| 562,474 | ||||
| Food Products - 2.77% | ||||
| 4,265 | Archer-Daniels-Midland Co. . . . . . . | 175,547 | ||
| 3,796 | Campbell Soup Co. . . . . . . . . . . . . . | 128,874 | ||
| 9,430 | ConAgra Foods, Inc. . . . . . . . . . . . . | 225,849 | ||
| 422 | Corn Products International, Inc. . . | 15,673 | ||
| 1,862 | General Mills, Inc. . . . . . . . . . . . . . . | 111,497 | ||
| 2,332 | Hershey Foods Corp. . . . . . . . . . . . . | 87,846 | ||
| 3,527 | HJ Heinz Co. . . . . . . . . . . . . . . . . . . | 165,663 | ||
| 916 | Hormel Foods Corp. . . . . . . . . . . . . | 38,161 | ||
| 3,370 | Kellogg Co. . . . . . . . . . . . . . . . . . . . | 177,127 | ||
| 15,292 | Kraft Foods, Inc. . . . . . . . . . . . . . . . | 474,205 | ||
See notes to financial statements.
84
| AssetMark Fundamental Index™ Large Company Growth Fund | |||||
| SCHEDULE OF INVESTMENTS (Continued) | |||||
| March 31, 2008 |
| Number of | Market | |||
| Shares | Value | |||
| COMMON STOCKS (Continued) | ||||
| Food Products (Continued) | ||||
| 755 | McCormick & Co, Inc. . . . . . . . . . . | $ | 27,912 | |
| 12,468 | Sara Lee Corp. . . . . . . . . . . . . . . . . . | 174,303 | ||
| 1,075 | Wm. Wrigley Jr. Co. . . . . . . . . . . . . | 67,553 | ||
| 1,870,210 | ||||
| Gas Utilities - 0.12% | ||||
| 265 | Energen Corp. . . . . . . . . . . . . . . . . . | 16,509 | ||
| 602 | Equitable Resources, Inc. . . . . . . . . | 35,458 | ||
| 564 | Questar Corp. . . . . . . . . . . . . . . . . . . | 31,900 | ||
| 83,867 | ||||
| Health Care Equipment & Supplies - 1.22% | ||||
| 3,454 | Baxter International, Inc. . . . . . . . . . | 199,710 | ||
| 330 | Beckman Coulter, Inc. . . . . . . . . . . . | 21,302 | ||
| 809 | Becton, Dickinson & Co. . . . . . . . . | 69,453 | ||
| 4,640 | Boston Scientific Corp. (a) . . . . . . . | 59,717 | ||
| 396 | C.R. Bard, Inc. . . . . . . . . . . . . . . . . . | 38,174 | ||
| 429 | Dentsply International, Inc. . . . . . . . | 16,559 | ||
| 364 | Edwards Lifesciences Corp. (a) . . . . | 16,216 | ||
| 741 | Hillenbrand Industries, Inc. . . . . . . . | 35,420 | ||
| 1,014 | Hospira, Inc. (a) . . . . . . . . . . . . . . . . | 43,369 | ||
| 325 | Kinetic Concepts, Inc. (a) . . . . . . . . | 15,025 | ||
| 2,901 | Medtronic, Inc. . . . . . . . . . . . . . . . . | 140,321 | ||
| 244 | Respironics, Inc. (a) . . . . . . . . . . . . . | 16,104 | ||
| 901 | St. Jude Medical, Inc. (a) . . . . . . . . . | 38,914 | ||
| 791 | Stryker Corp. . . . . . . . . . . . . . . . . . . | 51,455 | ||
| 449 | Varian Medical Systems, Inc. (a) . . . | 21,031 | ||
| 565 | Zimmer Holdings, Inc. (a) . . . . . . . . | 43,991 | ||
| 826,761 | ||||
| Health Care Providers & Services - 2.36% | ||||
| 3,622 | Aetna, Inc. . . . . . . . . . . . . . . . . . . . . | 152,450 | ||
| 4,038 | Cigna Corp. . . . . . . . . . . . . . . . . . . . | 163,822 | ||
| 1,783 | Coventry Health Care, Inc. (a) . . . . | 71,944 | ||
| 588 | DaVita, Inc. (a) . . . . . . . . . . . . . . . . | 28,083 | ||
| 1,986 | Express Scripts, Inc. (a) . . . . . . . . . . | 127,739 | ||
| 2,542 | Health Net, Inc. (a) . . . . . . . . . . . . . | 78,294 | ||
| 569 | Henry Schein, Inc. (a) . . . . . . . . . . . | 32,661 | ||
| 419 | Laboratory Corp Of America | |||
| Holdings (a) . . . . . . . . . . . . . . . . . . | 30,872 | |||
| 552 | Lincare Holdings, Inc. (a) . . . . . . . . | 15,517 | ||
| 6,895 | Medco Health Solutions, Inc. (a) . . . | 301,932 | ||
| 616 | Patterson Companies, Inc. (a) . . . . . | 22,361 | ||
| 802 | Quest Diagnostics . . . . . . . . . . . . . . | 36,306 | ||
| Number of | Market | |||
| Shares | Value | |||
| Health Care Providers & Services | ||||
| (Continued) | ||||
| 2,660 | Service Corp. International . . . . . . . | $ | 26,972 | |
| 14,706 | Tenet Healthcare Corp. (a) . . . . . . . | 83,236 | ||
| 10,997 | UnitedHealth Group, Inc. . . . . . . . . | 377,857 | ||
| 415 | Universal Health Services, Inc. . . . . | 22,281 | ||
| 592 | WellCare Health Plans, Inc. (a) . . . . | 23,058 | ||
| 1,595,385 | ||||
| Health Care Technology - 0.03% | ||||
| 986 | IMS Health, Inc. . . . . . . . . . . . . . . . | 20,716 | ||
| Hotels, Restaurants & Leisure - 1.21% | ||||
| 1,134 | Boyd Gaming Corp. . . . . . . . . . . . . | 22,680 | ||
| 1,231 | Burger King Holdings, Inc. . . . . . . . | 34,049 | ||
| 1,631 | Darden Restaurants, Inc. . . . . . . . . . | 53,089 | ||
| 972 | International Game Technology . . . | 39,084 | ||
| 866 | Jack in the Box, Inc. (a) . . . . . . . . . . | 23,269 | ||
| 2,742 | Marriott International, Inc. - Class A | 94,215 | ||
| 4,706 | McDonald’s Corp. . . . . . . . . . . . . . . | 262,454 | ||
| 931 | MGM Mirage (a) . . . . . . . . . . . . . . . | 54,715 | ||
| 2,137 | Starbucks Corp. (a) . . . . . . . . . . . . . | 37,398 | ||
| 1,405 | Starwood Hotels & Resorts | |||
| Worldwide, Inc. . . . . . . . . . . . . . . . | 72,709 | |||
| 1,124 | Wendy’s International, Inc. . . . . . . . | 25,919 | ||
| 2,671 | Yum! Brands, Inc. . . . . . . . . . . . . . . | 99,388 | ||
| 818,969 | ||||
| Household Durables - 0.50% | ||||
| 908 | The Black & Decker Corp. . . . . . . . | 60,019 | ||
| 1,252 | Brookfield Homes Corp. . . . . . . . . . | 21,034 | ||
| 906 | Fortune Brands, Inc. . . . . . . . . . . . . | 62,967 | ||
| 612 | Harman International Industries, Inc. | 26,646 | ||
| 4,645 | Newell Rubbermaid, Inc. . . . . . . . . . | 106,231 | ||
| 449 | Snap-On, Inc. . . . . . . . . . . . . . . . . . . | 22,832 | ||
| 773 | The Stanley Works . . . . . . . . . . . . . . | 36,810 | ||
| 336,539 | ||||
| Household Products - 2.13% | ||||
| 1,523 | Clorox Co. . . . . . . . . . . . . . . . . . . . . | 86,263 | ||
| 3,025 | Colgate-Palmolive Co. . . . . . . . . . . | 235,678 | ||
| 370 | Energizer Holdings, Inc. (a) . . . . . . | 33,478 | ||
| 5,535 | Kimberly-Clark Corp. . . . . . . . . . . . | 357,284 | ||
| 10,349 | Procter & Gamble Co. . . . . . . . . . . . | 725,154 | ||
| 1,437,857 | ||||
See notes to financial statements.
85
| AssetMark Fundamental Index™ Large Company Growth Fund | ||||
| SCHEDULE OF INVESTMENTS (Continued) | ||||
| March 31, 2008 |
| Number of | Market | |||
| Shares | Value | |||
| COMMON STOCKS (Continued) | ||||
| Independent Power Producers & | ||||
| Energy Traders - 0.58% | ||||
| 7,342 | The AES Corp. (a) . . . . . . . . . . . . . . | $ | 122,391 | |
| 1,860 | Constellation Energy Group, Inc. . . | 164,182 | ||
| 2,726 | Dynegy Inc. (a) . . . . . . . . . . . . . . . . | 21,508 | ||
| 2,207 | Mirant Corp. (a) . . . . . . . . . . . . . . . . | 80,313 | ||
| 388,394 | ||||
| Industrial Conglomerates - 2.78% | ||||
| 6,103 | 3M Co. . . . . . . . . . . . . . . . . . . . . . . . | 483,052 | ||
| 477 | Carlisle Companies, Inc. . . . . . . . . . | 15,951 | ||
| 32,466 | General Electric Co. . . . . . . . . . . . . | 1,201,567 | ||
| 421 | McDermott International, Inc. (a) . . | 23,079 | ||
| 638 | Teleflex, Inc. . . . . . . . . . . . . . . . . . . | 30,439 | ||
| 2,275 | Textron, Inc. . . . . . . . . . . . . . . . . . . . | 126,081 | ||
| 1,880,169 | ||||
| Insurance - 1.17% | ||||
| 3,144 | AON Corp. . . . . . . . . . . . . . . . . . . . | 126,389 | ||
| 1,328 | Arthur J. Gallagher & Co. . . . . . . . . | 31,367 | ||
| 532 | Erie Indemnity Co. . . . . . . . . . . . . . | 27,233 | ||
| 938 | Loews Corp. - Carolina Group . . . . | 68,052 | ||
| 7,078 | Loews Corp. . . . . . . . . . . . . . . . . . . | 284,677 | ||
| 5,905 | Marsh & McLennan Companies, Inc. | 143,787 | ||
| 321 | ProAssurance Corp. (a) . . . . . . . . . . | 17,279 | ||
| 139 | White Mountains Insurance | |||
| Group Ltd. . . . . . . . . . . . . . . . . . . . | 66,720 | |||
| 623 | Zenith National Insurance Corp. . . . | 22,341 | ||
| 787,845 | ||||
| Internet & Catalog Retail - 0.27% | ||||
| 889 | Amazon.com, Inc. (a) . . . . . . . . . . . | 63,386 | ||
| 4,044 | eBay, Inc. (a) . . . . . . . . . . . . . . . . . . | 120,673 | ||
| 184,059 | ||||
| Internet Software & Services - 0.24% | ||||
| 146 | Google, Inc. (a) . . . . . . . . . . . . . . . . | 64,309 | ||
| 633 | VeriSign, Inc. (a) . . . . . . . . . . . . . . . | 21,041 | ||
| 2,558 | Yahoo!, Inc. (a) . . . . . . . . . . . . . . . . | 74,003 | ||
| 159,353 | ||||
| IT Services - 1.12% | ||||
| 3,815 | Accenture Ltd. . . . . . . . . . . . . . . . . . | 134,174 | ||
| 647 | Affiliated Computer Services, Inc. (a) | 32,421 | ||
| 351 | Alliance Data Systems Corp. (a) . . . | 16,676 | ||
| 4,296 | Automatic Data Processing, Inc. . . . | 182,108 | ||
| 1,434 | Broadridge Financial Solutions, Inc. | 25,238 | ||
| Number of | Market | |||
| Shares | Value | |||
| IT Services (Continued) | ||||
| 241 | DST Systems, Inc. (a) . . . . . . . . . . . | $ | 15,843 | |
| 550 | Fidelity National Information | |||
| Services, Inc. . . . . . . . . . . . . . . . . . | 20,977 | |||
| 1,194 | Fiserv, Inc. (a) . . . . . . . . . . . . . . . . . | 57,420 | ||
| 813 | Hewitt Associates, Inc. (a) . . . . . . . . | 32,333 | ||
| 789 | Iron Mountain, Inc. (a) . . . . . . . . . . | 20,861 | ||
| 184 | Mastercard, Inc. . . . . . . . . . . . . . . . . | 41,030 | ||
| 2,377 | Paychex, Inc. . . . . . . . . . . . . . . . . . . | 81,436 | ||
| 1,224 | Total System Services, Inc. . . . . . . . | 28,960 | ||
| 2,290 | Western Union Co. . . . . . . . . . . . . . | 48,708 | ||
| 558 | Wright Express Corp. (a) . . . . . . . . . | 17,147 | ||
| 755,332 | ||||
| Leisure Equipment & Products - 0.22% | ||||
| 1,427 | Hasbro, Inc. . . . . . . . . . . . . . . . . . . . | 39,814 | ||
| 4,510 | Mattel, Inc. . . . . . . . . . . . . . . . . . . . | 89,749 | ||
| 421 | Polaris Industries, Inc. . . . . . . . . . . . | 17,265 | ||
| 146,828 | ||||
| Life Science Tools & Services - 0.14% | ||||
| 799 | Applera Corp. - Applied | |||
| Biosystems Group . . . . . . . . . . . . . | 26,255 | |||
| 197 | Covance, Inc. (a) . . . . . . . . . . . . . . . | 16,345 | ||
| 504 | Thermo Electron Corp. (a) . . . . . . . | 28,647 | ||
| 362 | Waters Corp. (a) . . . . . . . . . . . . . . . . | 20,164 | ||
| 91,411 | ||||
| Life Science Tools & Supplies - 0.04% | ||||
| 1,141 | PerkinElmer, Inc. . . . . . . . . . . . . . . . | 27,669 | ||
| Machinery - 2.28% | ||||
| 3,609 | Caterpillar, Inc. . . . . . . . . . . . . . . . . | 282,549 | ||
| 537 | Crane Co. . . . . . . . . . . . . . . . . . . . . . | 21,668 | ||
| 1,597 | Cummins, Inc. . . . . . . . . . . . . . . . . . | 74,772 | ||
| 596 | Danaher Corp. . . . . . . . . . . . . . . . . . | 45,314 | ||
| 1,152 | Deere & Co. . . . . . . . . . . . . . . . . . . . | 92,667 | ||
| 393 | Donaldson Company, Inc. . . . . . . . . | 15,830 | ||
| 1,289 | Dover Corp. . . . . . . . . . . . . . . . . . . . | 53,854 | ||
| 1,512 | Eaton Corp. . . . . . . . . . . . . . . . . . . . | 120,461 | ||
| 325 | Flowserve Corp. . . . . . . . . . . . . . . . | 33,923 | ||
| 488 | Harsco Corp. . . . . . . . . . . . . . . . . . . | 27,025 | ||
| 2,374 | Illinois Tool Works, Inc. . . . . . . . . . | 114,498 | ||
| 3,264 | Ingersoll-Rand Co. . . . . . . . . . . . . . | 145,509 | ||
| 1,372 | ITT Industries, Inc. . . . . . . . . . . . . . | 71,083 | ||
| 310 | Joy Global, Inc. . . . . . . . . . . . . . . . . | 20,200 | ||
| 558 | Kennametal, Inc. . . . . . . . . . . . . . . . | 16,422 | ||
| 521 | Manitowoc Co. . . . . . . . . . . . . . . . . | 21,257 | ||
See notes to financial statements.
86
| AssetMark Fundamental Index™ Large Company Growth Fund | ||||
| SCHEDULE OF INVESTMENTS (Continued) | ||||
| March 31, 2008 |
| Number of | Market | |||
| Shares | Value | |||
| COMMON STOCKS (Continued) | ||||
| Machinery (Continued) | ||||
| 415 | Oshkosh Corp. . . . . . . . . . . . . . . . . . | $ | 15,056 | |
| 3,141 | Paccar, Inc. . . . . . . . . . . . . . . . . . . . | 141,345 | ||
| 588 | Pall Corp. . . . . . . . . . . . . . . . . . . . . . | 20,621 | ||
| 933 | Parker Hannifin Corp. . . . . . . . . . . . | 64,629 | ||
| 680 | Pentair, Inc. . . . . . . . . . . . . . . . . . . . | 21,692 | ||
| 514 | SPX Corp. . . . . . . . . . . . . . . . . . . . . | 53,919 | ||
| 823 | Terex Corp. (a) . . . . . . . . . . . . . . . . . | 51,438 | ||
| 362 | Toro Co. . . . . . . . . . . . . . . . . . . . . . . | 14,983 | ||
| 1,540,715 | ||||
| Marine - 0.02% | ||||
| 379 | Alexander & Baldwin, Inc. . . . . . . . | 16,327 | ||
| Media - 2.62% | ||||
| 2,659 | Clear Channel Communications, Inc. | 77,696 | ||
| 1,029 | Clear Channel Outdoor | |||
| Holdings, Inc. (a) . . . . . . . . . . . . . . | 19,561 | |||
| 26,822 | Comcast Corp. (a) . . . . . . . . . . . . . . | 518,738 | ||
| 5,806 | DIRECTV Group, Inc. (a) . . . . . . . . | 143,931 | ||
| 1,278 | Discovery Holding Co. (a) . . . . . . . | 27,119 | ||
| 2,497 | Dish Network Corp. (a) . . . . . . . . . . | 71,739 | ||
| 640 | The E.W. Scripps Company . . . . . . | 26,886 | ||
| 634 | Getty Images, Inc. (a) . . . . . . . . . . . | 20,288 | ||
| 3,940 | Interpublic Group of | |||
| Companies, Inc. (a) . . . . . . . . . . . . | 33,135 | |||
| 1,335 | Liberty Global, Inc. (a) . . . . . . . . . . | 45,497 | ||
| 3,336 | McGraw-Hill Companies, Inc. . . . . | 123,265 | ||
| 17,956 | News Corp. . . . . . . . . . . . . . . . . . . . | 336,675 | ||
| 3,082 | Omnicom Group, Inc. . . . . . . . . . . . | 136,163 | ||
| 3,091 | Viacom, Inc. (a) . . . . . . . . . . . . . . . . | 122,465 | ||
| 5,122 | Warner Music Group Corp. . . . . . . . | 25,508 | ||
| 62 | The Washington Post Company - | |||
| Class B . . . . . . . . . . . . . . . . . . . . . . | 41,013 | |||
| 1,769,679 | ||||
| Metals & Mining - 0.54% | ||||
| 523 | AK Steel Holding Corp. . . . . . . . . . | 28,462 | ||
| 530 | Allegheny Technologies, Inc. . . . . . | 37,821 | ||
| 274 | Carpenter Technology . . . . . . . . . . . | 15,336 | ||
| 136 | Cleveland-Cliffs, Inc. . . . . . . . . . . . | 16,295 | ||
| 920 | Commercial Metals Co. . . . . . . . . . . | 27,572 | ||
| 468 | Consol Energy, Inc. . . . . . . . . . . . . . | 32,381 | ||
| 1,360 | Newmont Mining Corp. . . . . . . . . . | 61,608 | ||
| 637 | Peabody Energy Corp. . . . . . . . . . . . | 32,487 |
| Number of | Market | |||
| Shares | Value | |||
| Metals & Mining (Continued) | ||||
| 1,088 | Southern Copper Corp. . . . . . . . . . . | $ | 112,967 | |
| 364,929 | ||||
| Multiline Retail - 1.14% | ||||
| 2,128 | Big Lots, Inc. (a) . . . . . . . . . . . . . . . | 47,454 | ||
| 818 | Dollar Tree, Inc. (a) . . . . . . . . . . . . . | 22,569 | ||
| 2,526 | Family Dollar Stores, Inc. . . . . . . . . | 49,257 | ||
| 4,055 | J.C. Penney Co., Inc. . . . . . . . . . . . . | 152,914 | ||
| 2,798 | Kohl’s Corp. (a) . . . . . . . . . . . . . . . . | 120,006 | ||
| 2,076 | Nordstrom, Inc. . . . . . . . . . . . . . . . . | 67,678 | ||
| 6,105 | Target Corp. . . . . . . . . . . . . . . . . . . . | 309,401 | ||
| 769,279 | ||||
| Multi-Utilities - 0.37% | ||||
| 646 | NRG Energy, Inc. (a) . . . . . . . . . . . . | 25,188 | ||
| 5,597 | Public Service Enterprise Group, Inc. | 224,943 | ||
| 250,131 | ||||
| Office Electronics - 0.21% | ||||
| 9,664 | Xerox Corp. . . . . . . . . . . . . . . . . . . . | 144,670 | ||
| Oil & Gas - 6.87% | ||||
| 576 | EOG Resources, Inc. . . . . . . . . . . . . | 69,120 | ||
| 47,608 | Exxon Mobil Corp. . . . . . . . . . . . . . | 4,026,684 | ||
| 521 | Foundation Coal Holdings, Inc. . . . | 26,222 | ||
| 903 | Frontier Oil Corp. . . . . . . . . . . . . . . | 24,616 | ||
| 475 | Holly Corp. . . . . . . . . . . . . . . . . . . . | 20,620 | ||
| 876 | Murphy Oil Corp. . . . . . . . . . . . . . . | 71,954 | ||
| 926 | Pioneer Natural Resources Co. . . . . | 45,485 | ||
| 405 | Plains Exploration & | |||
| Production Co. (a) . . . . . . . . . . . . . | 21,522 | |||
| 5,600 | Spectra Energy Corp. . . . . . . . . . . . . | 127,400 | ||
| 1,376 | Western Refining, Inc. . . . . . . . . . . . | 18,535 | ||
| 4,562 | Williams Companies, Inc. . . . . . . . . | 150,455 | ||
| 634 | XTO Energy, Inc. . . . . . . . . . . . . . . . | 39,219 | ||
| 4,641,832 | ||||
| Paper & Forest Products - 0.38% | ||||
| 9,365 | International Paper Co. . . . . . . . . . . | 254,728 | ||
| Personal Products - 0.41% | ||||
| 1,164 | Alberto-Culver Co. . . . . . . . . . . . . . | 31,905 | ||
| 2,999 | Avon Products, Inc. . . . . . . . . . . . . . | 118,580 | ||
| 1,462 | The Estee Lauder Cos., Inc. . . . . . . | 67,033 | ||
| 365 | Herbalife Ltd. . . . . . . . . . . . . . . . . . | 17,338 | ||
| 724 | NBTY, Inc. (a) . . . . . . . . . . . . . . . . . | 21,684 | ||
| 957 | Nu Skin Enterprises, Inc. . . . . . . . . . | 17,245 | ||
| `273,785 |
See notes to financial statements.
87
| AssetMark Fundamental Index™ Large Company Growth Fund | |||||
| SCHEDULE OF INVESTMENTS (Continued) | |||||
| March 31, 2008 |
| Number of | Market | |||
| Shares | Value | |||
| COMMON STOCKS (Continued) | ||||
| Pharmaceuticals - 6.02% | ||||
| 4,609 | Abbott Laboratories . . . . . . . . . . . . . | $ | 254,186 | |
| 719 | Alpharma, Inc. (a) . . . . . . . . . . . . . . | 18,845 | ||
| 30,719 | Bristol-Myers Squibb Co. . . . . . . . . | 654,315 | ||
| 10,372 | Eli Lilly & Co. . . . . . . . . . . . . . . . . . | 535,091 | ||
| 873 | Endo Pharmaceuticals | |||
| Holdings Inc. (a) . . . . . . . . . . . . . . | 20,900 | |||
| 1,123 | Forest Laboratories, Inc. (a) . . . . . . | 44,931 | ||
| 506 | Genzyme Corp. (a) . . . . . . . . . . . . . | 37,717 | ||
| 15,476 | Johnson & Johnson . . . . . . . . . . . . . | 1,003,928 | ||
| 22,425 | Merck & Co., Inc. . . . . . . . . . . . . . . | 851,029 | ||
| 6,311 | Schering Plough Corp. . . . . . . . . . . | 90,942 | ||
| 1,244 | Valeant Pharmaceuticals | |||
| International (a) . . . . . . . . . . . . . . . | 15,961 | |||
| 12,833 | Wyeth . . . . . . . . . . . . . . . . . . . . . . . . | 535,906 | ||
| 4,063,751 | ||||
| Real Estate - 0.06% | ||||
| 218 | Jones Lang LaSalle, Inc. . . . . . . . . . | 16,860 | ||
| 528 | Rayonier, Inc. . . . . . . . . . . . . . . . . . | 22,936 | ||
| 39,796 | ||||
| Road & Rail - 1.58% | ||||
| 2,723 | Burlington Northern Santa Fe Corp. | 251,115 | ||
| 3,271 | CSX Corp. . . . . . . . . . . . . . . . . . . . . | 183,405 | ||
| 8,642 | Hertz Global Holdings, Inc. (a) . . . . | 104,223 | ||
| 563 | JB Hunt Transport Services, Inc. . . . | 17,695 | ||
| 455 | Kansas City Southern (a) . . . . . . . . . | 18,250 | ||
| 339 | Landstar System, Inc. . . . . . . . . . . . | 17,682 | ||
| 3,434 | Norfolk Southern Corp. . . . . . . . . . . | 186,535 | ||
| 2,310 | Union Pacific Corp. . . . . . . . . . . . . . | 289,628 | ||
| 1,068,533 | ||||
| Semiconductor & Semiconductor | ||||
| Equipment - 2.14% | ||||
| 1,515 | Altera Corp. . . . . . . . . . . . . . . . . . . . | 27,922 | ||
| 1,545 | Analog Devices, Inc. . . . . . . . . . . . . | 45,608 | ||
| 5,831 | Applied Materials, Inc. . . . . . . . . . . | 113,763 | ||
| 3,041 | Broadcom Corp. (a) . . . . . . . . . . . . . | 58,600 | ||
| 1,963 | Fairchild Semiconductor | |||
| International, Inc. (a) . . . . . . . . . . . | 23,399 | |||
| 30,558 | Intel Corp. . . . . . . . . . . . . . . . . . . . . | 647,218 | ||
| 726 | International Rectifier Corp. (a) . . . | 15,609 | ||
| 1,138 | KLA-Tencor Corp. . . . . . . . . . . . . . | 42,220 | ||
| 558 | Lam Research Corp. (a) . . . . . . . . . . | 21,327 | ||
| 1,125 | Linear Technology Corp. . . . . . . . . . | 34,526 |
| Number of | Market | |||
| Shares | Value | |||
| Semiconductor & Semiconductor | ||||
| Equipment (Continued) | ||||
| 4,081 | LSI Logic Corp. (a) . . . . . . . . . . . . . | $ 20,201 | ||
| 1,472 | Marvell Technology Group Ltd. (a) | 16,015 | ||
| 1,797 | Maxim Integrated Products, Inc. . . . | 36,641 | ||
| 338 | MEMC Electronic Materials, Inc. (a) | 23,964 | ||
| 665 | Microchip Technology, Inc. . . . . . . . | 21,765 | ||
| 1,783 | National Semiconductor Corp. . . . . | 32,665 | ||
| 1,161 | NVIDIA Corp. (a) . . . . . . . . . . . . . . | 22,976 | ||
| 3,897 | ON Semiconductor Corp. (a) . . . . . . | 22,135 | ||
| 1,891 | Teradyne, Inc. (a) . . . . . . . . . . . . . . . | 23,486 | ||
| 5,874 | Texas Instruments, Inc. . . . . . . . . . . | 166,058 | ||
| 1,174 | Xilinx, Inc. . . . . . . . . . . . . . . . . . . . . | 27,883 | ||
| 1,443,981 | ||||
| Software - 3.54% | ||||
| 483 | Adobe Systems, Inc. (a) . . . . . . . . . | 17,190 | ||
| 1,463 | Amdocs Ltd. (a) . . . . . . . . . . . . . . . . | 41,491 | ||
| 654 | Autodesk, Inc. (a) . . . . . . . . . . . . . . | 20,588 | ||
| 1,127 | BEA Systems, Inc. (a) . . . . . . . . . . . | 21,582 | ||
| 630 | BMC Software, Inc. (a) . . . . . . . . . . | 20,488 | ||
| 2,603 | CA, Inc. . . . . . . . . . . . . . . . . . . . . . . | 58,568 | ||
| 2,428 | Cadence Design Systems, Inc. (a) . . | 25,931 | ||
| 504 | Citrix Systems, Inc. (a) . . . . . . . . . . | 14,782 | ||
| 2,830 | Compuware Corp. (a) . . . . . . . . . . . | 20,772 | ||
| 1,480 | Electronic Arts, Inc. (a) . . . . . . . . . . | 73,882 | ||
| 1,622 | Intuit, Inc. (a) . . . . . . . . . . . . . . . . . . | 43,810 | ||
| 626 | McAfee, Inc. (a) . . . . . . . . . . . . . . . | 20,714 | ||
| 56,356 | Microsoft Corp. . . . . . . . . . . . . . . . . | 1,599,383 | ||
| 19,403 | Oracle Corp. (a) . . . . . . . . . . . . . . . . | 379,523 | ||
| 624 | Sybase, Inc. (a) . . . . . . . . . . . . . . . . | 16,411 | ||
| 719 | Synopsys, Inc. (a) . . . . . . . . . . . . . . | 16,328 | ||
| 2,391,443 | ||||
| Specialty Retail - 2.89% | ||||
| 293 | Abercrombie & Fitch Co. - Class A | 21,430 | ||
| 962 | Advance Auto Parts . . . . . . . . . . . . . | 32,756 | ||
| 899 | American Eagle Outfitters . . . . . . . . | 15,742 | ||
| 1,111 | AnnTaylor Stores Corp. (a) . . . . . . . | 26,864 | ||
| 627 | AutoZone, Inc. (a) . . . . . . . . . . . . . . | 71,371 | ||
| 1,887 | Bed Bath & Beyond, Inc. (a) . . . . . . | 55,667 | ||
| 5,598 | Best Buy Co., Inc. . . . . . . . . . . . . . . | 232,093 | ||
| 867 | CarMax, Inc. (a) . . . . . . . . . . . . . . . | 16,837 | ||
| 858 | Dick’s Sporting Goods, Inc. (a) . . . . | 22,977 | ||
| 697 | GameStop Corp. - Class A (a) . . . . . | 36,042 | ||
| 8,437 | The Gap Inc. . . . . . . . . . . . . . . . . . . | 166,040 | ||
| 14,819 | Home Depot, Inc. . . . . . . . . . . . . . . | 414,487 |
See notes to financial statements.
88
| AssetMark Fundamental Index™ Large Company Growth Fund | ||||
| SCHEDULE OF INVESTMENTS (Continued) | ||||
| March 31, 2008 |
| Number of | Market | |||
| Shares | Value | |||
| COMMON STOCKS (Continued) | ||||
| Specialty Retail (Continued) | ||||
| 6,088 | Limited Brands, Inc. . . . . . . . . . . . . | $ | 104,105 | |
| 9,123 | Lowe’s Companies, Inc. . . . . . . . . . | 209,282 | ||
| 760 | Men’s Wearhouse, Inc. . . . . . . . . . . | 17,685 | ||
| 595 | O’Reilly Automotive, Inc. (a) . . . . . | 16,969 | ||
| 1,407 | Pacific Sunwear Of | |||
| California, Inc. (a) . . . . . . . . . . . . . | 17,742 | |||
| 1,055 | Petsmart, Inc. . . . . . . . . . . . . . . . . . . | 21,564 | ||
| 1,324 | Ross Stores, Inc. . . . . . . . . . . . . . . . | 39,667 | ||
| 2,302 | Sally Beauty Holdings, Inc. (a) . . . . | 15,884 | ||
| 1,475 | The Sherwin-Williams Co. . . . . . . . | 75,284 | ||
| 6,324 | Staples, Inc. . . . . . . . . . . . . . . . . . . . | 139,824 | ||
| 577 | Tiffany & Co. . . . . . . . . . . . . . . . . . | 24,142 | ||
| 3,969 | The TJX Companies, Inc. . . . . . . . . | 131,255 | ||
| 1,193 | Williams-Sonoma, Inc. . . . . . . . . . . | 28,918 | ||
| 1,954,627 | ||||
| Textiles, Apparel & Luxury Goods - 0.67% | ||||
| 765 | Coach, Inc. (a) . . . . . . . . . . . . . . . . . | 23,065 | ||
| 341 | Fossil, Inc. (a) . . . . . . . . . . . . . . . . . | 10,414 | ||
| 981 | Hanesbrands, Inc. (a) . . . . . . . . . . . . | 28,645 | ||
| 3,779 | Nike, Inc. . . . . . . . . . . . . . . . . . . . . . | 256,972 | ||
| 475 | Phillips-Van Heusen . . . . . . . . . . . . | 18,012 | ||
| 556 | Polo Ralph Lauren Corp. . . . . . . . . . | 32,409 | ||
| 1,557 | Timberland Co. (a) . . . . . . . . . . . . . | 21,378 | ||
| 827 | VF Corp. . . . . . . . . . . . . . . . . . . . . . | 64,101 | ||
| 454,996 | ||||
| Tobacco - 3.17% | ||||
| 26,066 | Altria Group, Inc. . . . . . . . . . . . . . . | 578,665 | ||
| 26,066 | Philip Morris International, Inc. (a) . | 1,318,418 | ||
| 2,193 | Reynolds American, Inc. . . . . . . . . . | 129,453 | ||
| 1,804 | UST, Inc. . . . . . . . . . . . . . . . . . . . . . | 98,354 | ||
| 881 | Vector Group Ltd. . . . . . . . . . . . . . . | 15,497 | ||
| 2,140,387 | ||||
| Trading Companies & Distributors - 0.10% | ||||
| 871 | W.W. Grainger, Inc. . . . . . . . . . . . . . | 66,536 | ||
| Wireless Telecommunication Services - 0.11% | ||||
| 443 | American Tower Corp. - Class A (a) | 17,370 | ||
| 621 | NII Holdings, Inc. (a) . . . . . . . . . . . | 19,735 | ||
| 654 | United States Cellular Corp. (a) . . . | 35,970 | ||
| 73,075 | ||||
| Total Common Stocks | ||||
(Cost $56,641,985) . . . . . . . . . . . . | 53,682,794 | |||
| Number of | Market | |||
| Shares | Value | |||
| REAL ESTATE INVESTMENT TRUSTS - 0.82% | ||||
| Real Estate Investment Trusts - 0.82% | ||||
| 283 | AvalonBay Communities, Inc. . . . . | $ | 27,315 | |
| 661 | Boston Properties, Inc. . . . . . . . . . . | 60,858 | ||
| 432 | Camden Property Trust . . . . . . . . . . | 21,686 | ||
| 971 | Developers Diversified Realty Corp. | |||
| 40,666 | ||||
| 733 | Duke Realty Corp. . . . . . . . . . . . . . . | 16,720 | ||
| 984 | Equity Residential . . . . . . . . . . . . . . | 40,826 | ||
| 538 | First Industrial Realty Trust, Inc. . . . | 16,619 | ||
| 803 | General Growth Properties, Inc. . . . | 30,651 | ||
| 345 | Kilroy Realty Corp. . . . . . . . . . . . . . | 16,943 | ||
| 461 | Kimco Realty Corp. . . . . . . . . . . . . . | 18,057 | ||
| 953 | Plum Creek Timber Co., Inc. . . . . . . | 38,787 | ||
| 599 | ProLogis . . . . . . . . . . . . . . . . . . . . . | 35,257 | ||
| 340 | Public Storage, Inc. . . . . . . . . . . . . . | 30,131 | ||
| 725 | Regency Centers Corp. . . . . . . . . . . | 46,951 | ||
| 621 | Simon Property Group, Inc. . . . . . . | 57,697 | ||
| 647 | Vornado Realty Trust . . . . . . . . . . . . | 55,778 | ||
| 554,942 | ||||
| Total Real Estate Investment Trusts | ||||
(Cost $571,053) . . . . . . . . . . . . . . . | 554,942 | |||
| SHORT TERM INVESTMENTS - 5.62% | ||||
| Money Market Funds - 5.62% | ||||
| 3,792,672 | Federated Prime Obligations Fund,, | |||
| 3.180% (b) . . . . . . . . . . . . . . . . . . . | 3,792,672 | |||
| Total Short Term Investments | ||||
(Cost $3,792,672) . . . . . . . . . . . . . | 3,792,672 | |||
| Total Investments | ||||
(Cost $61,005,710) - 85.91% . . . . | 58,030,408 | |||
| Other Assets in Excess of | ||||
Liabilities - 14.09% . . . . . . . . . . . | 9,516,531 | |||
| TOTAL NET | ||||
ASSETS - 100.00% . . . . . . . . . . . | $ | 67,546,939 | ||
| Percentages are stated as a percent of net assets. | ||||
| (a) Non Income Producing. | ||||
| (b) Variable Rate Security. The rate shown is the rate in effect on | ||||
| March 31, 2008. | ||||
See notes to financial statements.
89
| AssetMark Fundamental Index™ Large Company Growth Fund |
| SCHEDULE OF OPEN FUTURES CONTRACTS |
| March 31, 2008 |
| Number of | |||||||
| Contracts | Notional | Settlement | Unrealized | ||||
| Description | Purchased | Value | Month | Depreciation | |||
| S&P 500 Mini Futures | 69 | $4,567,803 | Jun-08 | $(3) |
See notes to financial statements.
90
AssetMark Enhanced Fundamental IndexTM Large Company Value Fund |
| PERFORMANCE DATA |
TOTAL RETURN BASED ON A $10,000 INVESTMENT

This chart assumes an initial gross investment of $10,000 made on August 9, 2007 (commencement of the Fund’s operations). Returns shown include the reinvestment of all dividends. Returns shown do not reflect the deduction of taxes that a shareholder would pay on fund distributions or the redemption of fund shares. In the absence of fee waivers and reimbursements, total return would be reduced. Past performance is not predictive of future performance. Investment return and principal value will fluctuate, so that your shares, when redeemed, may be worth more or less than the original cost.
RUSSELL 1000 VALUE INDEX – An unmanaged index which measures the performance of those Russell 1000 companies with lower price-to-book ratios and lower forecasted growth values. The Russell 1000 Index is an unmanaged index which measures the performance of the 1,000 largest companies in the Russell 3000 Index. The Russell 3000 Index is an unmanaged index which measures the performance of the 3,000 largest U.S. Companies, based on total market capitalization, which represents approximately 98% of the investable U.S. equity market.
LIPPER LARGE-CAP VALUE FUNDS INDEX – The Lipper Large-Cap Value Funds Index is the average of the 30 largest funds in the Lipper Large-Cap Value Funds Category. These funds, by portfolio practice, invest at least 75% of equity assets in companies with market capitalizations (on a three-year weighted basis) greater than 300% of the dollar-weighted median market capitalization of the middle 1,000 securities of the S&P Super Composite 1500® Index. Large-cap value funds typically invest in securities that have a below-average price-to-earnings ratio, price-to-book ratio and three-year sales-per-share growth value, compared to the S&P 500® Index.
| TOTAL RETURN (for the period ended March 31) | ||
| Since Inception (8/9/07) | ||
AssetMark Enhanced Fundamental IndexTM Large Company Value Fund | -14.73% | |
| Russell 1000 Value Index | -9.60% | |
| Lipper Large-Cap Value Funds Index | -9.51% | |
91
| AssetMark Fundamental Index™ Large Company Value Fund |
| SCHEDULE OF INVESTMENTS |
| March 31, 2008 |
| Number of | Market | |||
| Shares | Value | |||
| COMMON STOCKS - 78.47% | ||||
| Aerospace & Defense - 0.90% | ||||
| 3,594 | Northrop Grumman Corp. . . . . . . . . | $ | 279,649 | |
| 3,290 | Raytheon Co. . . . . . . . . . . . . . . . . . . | 212,567 | ||
| 492,216 | ||||
| Air Freight & Logistics - 0.08% | ||||
| 266 | Atlas Air Worldwide | |||
| Holdings, Inc. (a) . . . . . . . . . . . . . . | 14,630 | |||
| 517 | Ryder System, Inc. . . . . . . . . . . . . . . | 31,491 | ||
| 46,121 | ||||
| Airlines - 0.54% | ||||
| 695 | Alaska Air Group, Inc. (a) . . . . . . . . | 13,636 | ||
| 5,944 | AMR Corp. (a) . . . . . . . . . . . . . . . . | 53,615 | ||
| 1,665 | Continental Airlines, Inc. (a) . . . . . . | 32,018 | ||
| 7,340 | ExpressJet Holdings, Inc. (a) . . . . . . | 19,304 | ||
| 6,670 | Southwest Airlines Co. . . . . . . . . . . | 82,708 | ||
| 2,279 | UAL Corp. . . . . . . . . . . . . . . . . . . . . | 49,067 | ||
| 5,192 | US Airways Group, Inc. (a) . . . . . . . | 46,261 | ||
| 296,609 | ||||
| Auto Components - 0.73% | ||||
| 599 | American Axle & Manufacturing | |||
| Holdings, Inc. . . . . . . . . . . . . . . . . | 12,279 | |||
| 3,684 | ArvinMeritor, Inc. . . . . . . . . . . . . . . | 46,087 | ||
| 776 | Autoliv, Inc. . . . . . . . . . . . . . . . . . . . | 38,955 | ||
| 745 | Cooper Tire & Rubber Co. . . . . . . . | 11,153 | ||
| 1,846 | Exide Technologies (a) . . . . . . . . . . | 24,183 | ||
| 2,170 | Goodyear Tire & Rubber Co. (a) . . . | 55,986 | ||
| 2,869 | Lear Corp. (a) . . . . . . . . . . . . . . . . . | 74,336 | ||
| 1,070 | Modine Manufacturing Co. . . . . . . . | 15,504 | ||
| 3,877 | TRW Automotive Holdings Corp. (a) | 90,605 | ||
| 8,442 | Visteon Corp. (a) . . . . . . . . . . . . . . . | 31,742 | ||
| 400,830 | ||||
| Automobiles - 1.58% | ||||
| 67,224 | Ford Motor Co. (a) . . . . . . . . . . . . . | 384,521 | ||
| 24,613 | General Motors Corp. . . . . . . . . . . . | 468,878 | ||
| 429 | Thor Industries, Inc. . . . . . . . . . . . . | 12,771 | ||
| 866,170 | ||||
| Beverages - 0.52% | ||||
| 5,635 | Coca-Cola Enterprises, Inc. . . . . . . . | 136,367 | ||
| 839 | Molson Coors Brewing Co. . . . . . . . | 44,106 | ||
| 2,607 | Pepsi Bottling Group, Inc. . . . . . . . . | 88,403 | ||
| 671 | PepsiAmericas, Inc. . . . . . . . . . . . . . | 17,131 | ||
| 286,007 |
| Number of | Market | |||
| Shares | Value | |||
| Building Products - 0.54% | ||||
| 1,260 | Armstrong World Industries, Inc. (a) | $ | 44,932 | |
| 600 | Lennox International, Inc. . . . . . . . . | 21,582 | ||
| 5,270 | Masco Corp. . . . . . . . . . . . . . . . . . . | 104,504 | ||
| 4,300 | Owens Corning (a) . . . . . . . . . . . . . | 77,959 | ||
| 1,288 | USG Corp. (a) . . . . . . . . . . . . . . . . . | 47,424 | ||
| 296,401 | ||||
| Capital Markets - 1.11% | ||||
| 1,064 | Allied Capital Corp. . . . . . . . . . . . . | 19,609 | ||
| 363 | American Capital Strategies Ltd. . . | 12,400 | ||
| 4,498 | The Bank Of New York Mellon Corp. | 187,702 | ||
| 830 | The Bear Stearns Companies Inc. . . | 8,707 | ||
| 1,515 | Lehman Brothers Holdings, Inc. . . . | 57,025 | ||
| 2,843 | Merrill Lynch & Co., Inc. . . . . . . . . | 115,824 | ||
| 4,256 | Morgan Stanley . . . . . . . . . . . . . . . . | 194,499 | ||
| 339 | Piper Jaffray Cos. (a) . . . . . . . . . . . . | 11,512 | ||
| 607,278 | ||||
| Chemicals - 1.60% | ||||
| 1,661 | Ashland, Inc. . . . . . . . . . . . . . . . . . . | 78,565 | ||
| 634 | Cabot Corp. . . . . . . . . . . . . . . . . . . . | 17,752 | ||
| 3,538 | Chemtura Corp. . . . . . . . . . . . . . . . . | 25,969 | ||
| 13,251 | The Dow Chemical Co. . . . . . . . . . . | 488,299 | ||
| 1,043 | Eastman Chemical Co. . . . . . . . . . . | 65,135 | ||
| 463 | GenTek, Inc. (a) . . . . . . . . . . . . . . . . | 13,927 | ||
| 3,549 | Huntsman Corp. . . . . . . . . . . . . . . . . | 83,579 | ||
| 1,140 | Olin Corp. . . . . . . . . . . . . . . . . . . . . | 22,527 | ||
| 422 | Rockwood Holdings, Inc. (a) . . . . . | 13,829 | ||
| 1,274 | RPM International, Inc. . . . . . . . . . . | 26,678 | ||
| 372 | The Scotts Co. . . . . . . . . . . . . . . . . . | 12,060 | ||
| 861 | Westlake Chemical Corp. . . . . . . . . | 11,236 | ||
| 608 | WR Grace & Co. (a) . . . . . . . . . . . . | 13,875 | ||
| 873,431 | ||||
| Commercial Banks - 10.69% | ||||
| 1,001 | Associated Banc-Corp . . . . . . . . . . . | 26,657 | ||
| 746 | BancorpSouth, Inc. . . . . . . . . . . . . . | 17,277 | ||
| 60,016 | Bank of America Corp. . . . . . . . . . . | 2,275,207 | ||
| 5,055 | BB&T Corp. . . . . . . . . . . . . . . . . . . | 162,063 | ||
| 1,064 | Citizens Banking Corp. . . . . . . . . . . | 13,226 | ||
| 2,571 | The Colonial BancGroup, Inc. . . . . | 24,759 | ||
| 2,962 | Comerica, Inc. . . . . . . . . . . . . . . . . . | 103,907 | ||
| 613 | Commerce Bancshares, Inc. . . . . . . | 25,764 | ||
| 9,601 | Fifth Third Bancorp . . . . . . . . . . . . . | 200,853 | ||
| 1,344 | First Bancorp Puerto Rico . . . . . . . . | 13,655 | ||
| 97 | First Citizens BancShares, Inc. . . . . | 13,517 |
See notes to financial statements.
92
| AssetMark Fundamental Index™ Large Company Value Fund |
| SCHEDULE OF INVESTMENTS (Continued) |
| March 31, 2008 |
| Number of | Market | |||
| Shares | Value | |||
| COMMON STOCKS (Continued) | ||||
| Commercial Banks (Continued) | ||||
| 1,169 | First Commonwealth Financial Corp. | $ | 13,549 | |
| 3,451 | First Horizon National Corp. . . . . . . | 48,349 | ||
| 1,075 | FirstMerit Corp. . . . . . . . . . . . . . . . . | 22,209 | ||
| 2,150 | Fulton Financial Corp. . . . . . . . . . . . | 26,423 | ||
| 5,147 | Huntington Bancshares, Inc. . . . . . . | 55,330 | ||
| 4,479 | KeyCorp . . . . . . . . . . . . . . . . . . . . . | 98,314 | ||
| 2,205 | Marshall & Ilsley Corp. . . . . . . . . . . | 51,156 | ||
| 11,577 | National City Corp. . . . . . . . . . . . . . | 115,191 | ||
| 767 | Old National Bancorp . . . . . . . . . . . | 13,806 | ||
| 203 | Park National Corp. . . . . . . . . . . . . . | 14,383 | ||
| 3,148 | PNC Financial Services Group . . . . | 206,414 | ||
| 3,194 | Popular, Inc. . . . . . . . . . . . . . . . . . . . | 37,242 | ||
| 10,160 | Regions Financial Corp. . . . . . . . . . | 200,660 | ||
| 1,166 | The South Financial Group, Inc. . . . | 17,327 | ||
| 4,416 | SunTrust Banks, Inc. . . . . . . . . . . . . | 243,498 | ||
| 648 | Susquehanna Bancshares, Inc. . . . . . | 13,200 | ||
| 1,140 | TCF Financial Corp. . . . . . . . . . . . . | 20,429 | ||
| 837 | Trustmark Corp. . . . . . . . . . . . . . . . | 18,648 | ||
| 1,752 | UnionBanCal Corp. . . . . . . . . . . . . . | 85,988 | ||
| 499 | United Bankshares, Inc. . . . . . . . . . . | 13,298 | ||
| 672 | Valley National Bancorp . . . . . . . . . | 12,909 | ||
| 10,468 | W Holding Co., Inc. . . . . . . . . . . . . | 12,457 | ||
| 20,338 | Wachovia Corp. . . . . . . . . . . . . . . . . | 549,126 | ||
| 33,869 | Wells Fargo & Co. . . . . . . . . . . . . . . | 985,588 | ||
| 710 | Whitney Holding Corp. . . . . . . . . . . | 17,601 | ||
| 698 | Wilmington Trust Corp. . . . . . . . . . . | 21,708 | ||
| 1,227 | Zions Bancorporation . . . . . . . . . . . | 55,890 | ||
| 5,847,578 | ||||
| Commercial Services & Supplies - 0.75% | ||||
| 641 | ABM Industries, Inc. . . . . . . . . . . . . | 14,384 | ||
| 5,114 | Allied Waste Industries, Inc. (a) . . . | 55,282 | ||
| 4,430 | Avis Budget Group (a) . . . . . . . . . . . | 47,047 | ||
| 634 | Deluxe Corp. . . . . . . . . . . . . . . . . . . | 12,179 | ||
| 2,912 | IKON Office Solutions, Inc. . . . . . . | 22,131 | ||
| 1,117 | Kelly Services, Inc. . . . . . . . . . . . . . | 22,966 | ||
| 713 | PHH Corp. (a) . . . . . . . . . . . . . . . . . | 12,428 | ||
| 1,965 | RR Donnelley & Sons Co. . . . . . . . | 59,559 | ||
| 2,944 | SAIC, Inc. (a) . . . . . . . . . . . . . . . . . | 54,729 | ||
| 2,132 | Spherion Corp. (a) . . . . . . . . . . . . . . | 13,048 | ||
| 1,830 | Steelcase, Inc. . . . . . . . . . . . . . . . . . | 20,240 | ||
| 2,474 | United Rentals, Inc. (a) . . . . . . . . . . | 46,610 | ||
| 400 | Viad Corp. . . . . . . . . . . . . . . . . . . . . | 14,404 | ||
| Number of | Market | |||
| Shares | Value | |||
| Commercial Services & Supplies (Continued) | ||||
| 892 | Volt Information Sciences, Inc. (a) . | $ | 15,128 | |
| 410,135 | ||||
| Computers & Peripherals - 0.05% | ||||
| 607 | Imation Corp. . . . . . . . . . . . . . . . . . . | 13,803 | ||
| 2,382 | Palm, Inc. . . . . . . . . . . . . . . . . . . . . . | 11,910 | ||
| 25,713 | ||||
| Construction & Engineering - 0.05% | ||||
| 1,148 | EMCOR Group, Inc. (a) . . . . . . . . . | 25,497 | ||
| Consumer Finance - 0.45% | ||||
| 2,680 | Capital One Financial Corp. . . . . . . | 131,910 | ||
| 6,868 | Discover Financial Services . . . . . . | 112,429 | ||
| 244,339 | ||||
| Containers & Packaging - 0.22% | ||||
| 879 | Bemis Co. . . . . . . . . . . . . . . . . . . . . | 22,353 | ||
| 944 | Packaging Corp. of America . . . . . . | 21,080 | ||
| 5,646 | Smurfit-Stone Container Corp. (a) . | 43,474 | ||
| 1,254 | Sonoco Products Co. . . . . . . . . . . . . | 35,902 | ||
| 122,809 | ||||
| Distributors - 0.05% | ||||
| 862 | Core-Mark Holding Co., Inc. (a) . . . | 24,774 | ||
| Diversified Financial Services - 4.86% | ||||
| 1,224 | CIT Group, Inc. . . . . . . . . . . . . . . . . | 14,504 | ||
| 58,413 | Citigroup, Inc. . . . . . . . . . . . . . . . . . | 1,251,206 | ||
| 601 | GATX Corp. . . . . . . . . . . . . . . . . . . | 23,481 | ||
| 400 | Interactive Brokers Group, Inc. (a) . | 10,268 | ||
| 28,890 | JPMorgan Chase & Co. . . . . . . . . . . | 1,240,826 | ||
| 2,123 | Principal Financial Group, Inc. . . . . | 118,294 | ||
| 2,658,579 | ||||
| Diversified Telecommunication Services - 4.54% | ||||
| 9,200 | AT&T Inc. . . . . . . . . . . . . . . . . . . . . | 352,360 | ||
| 883 | CenturyTel, Inc. . . . . . . . . . . . . . . . . | 29,351 | ||
| 3,192 | Cincinnati Bell, Inc. (a) . . . . . . . . . . | 13,598 | ||
| 4,898 | Citizens Communications Co. . . . . . | 51,380 | ||
| 1,619 | Embarq Corp. . . . . . . . . . . . . . . . . . | 64,922 | ||
| 28,790 | Qwest Communications | |||
| International . . . . . . . . . . . . . . . . . . | 130,419 | |||
| 55,443 | Sprint Corp. . . . . . . . . . . . . . . . . . . . | 370,914 | ||
| 40,383 | Verizon Communications, Inc. . . . . | 1,471,960 | ||
| 2,484,904 | ||||
See notes to financial statements.
93
| AssetMark Fundamental Index™ Large Company Value Fund | |||
| SCHEDULE OF INVESTMENTS (Continued) | |||
| March 31, 2008 |
| Number of | Market | |||
| Shares | Value | |||
| COMMON STOCKS (Continued) | ||||
| Electric Utilities - 4.90% | ||||
| 358 | ALLETE, Inc. . . . . . . . . . . . . . . . . . | $ | 13,826 | |
| 1,587 | Alliant Energy Corp. . . . . . . . . . . . . | 55,561 | ||
| 2,430 | Ameren Corp. . . . . . . . . . . . . . . . . . | 107,017 | ||
| 6,027 | American Electric Power Co, Inc. . . | 250,904 | ||
| 4,497 | Centerpoint Energy, Inc. . . . . . . . . . | 64,172 | ||
| 350 | CH Energy Group, Inc. . . . . . . . . . . | 13,615 | ||
| 762 | Cleco Corp. . . . . . . . . . . . . . . . . . . . | 16,901 | ||
| 3,210 | Consolidated Edison, Inc. . . . . . . . . | 127,437 | ||
| 3,400 | DTE Energy Co. . . . . . . . . . . . . . . . | 132,226 | ||
| 4,391 | Edison International . . . . . . . . . . . . | 215,247 | ||
| 2,200 | Entergy Corp. . . . . . . . . . . . . . . . . . | 239,976 | ||
| 1,682 | FPL Group, Inc. . . . . . . . . . . . . . . . . | 105,529 | ||
| 690 | Great Plains Energy, Inc. . . . . . . . . . | 17,008 | ||
| 1,527 | Hawaiian Electric Industries, Inc. . . | 36,449 | ||
| 415 | IDACORP, Inc. . . . . . . . . . . . . . . . . | 13,326 | ||
| 1,722 | Northeast Utilities . . . . . . . . . . . . . . | 42,258 | ||
| 1,682 | NSTAR . . . . . . . . . . . . . . . . . . . . . . | 51,183 | ||
| 1,498 | OGE Energy Corp. . . . . . . . . . . . . . | 46,693 | ||
| 2,418 | Pepco Holdings, Inc. . . . . . . . . . . . . | 59,773 | ||
| 5,106 | PG&E Corp. . . . . . . . . . . . . . . . . . . | 188,003 | ||
| 1,950 | Pinnacle West Capital Corp. . . . . . . | 68,406 | ||
| 1,312 | PNM Resources, Inc. . . . . . . . . . . . . | 16,361 | ||
| 1,117 | Portland General Electric Co. . . . . . | 25,188 | ||
| 4,675 | Progress Energy, Inc. . . . . . . . . . . . . | 194,948 | ||
| 1,133 | Puget Energy, Inc. . . . . . . . . . . . . . . | 29,311 | ||
| 2,024 | Reliant Energy, Inc. (a) . . . . . . . . . . | 47,868 | ||
| 1,389 | Sierra Pacific Resources . . . . . . . . . | 17,543 | ||
| 6,510 | The Southern Co. . . . . . . . . . . . . . . . | 231,821 | ||
| 1,409 | TECO Energy, Inc. . . . . . . . . . . . . . | 22,474 | ||
| 590 | Unisource Energy Corp. . . . . . . . . . | 13,133 | ||
| 1,490 | Westar Energy, Inc. . . . . . . . . . . . . . | 33,927 | ||
| 886 | Wisconsin Energy Corp. . . . . . . . . . | 38,975 | ||
| 7,278 | Xcel Energy, Inc. . . . . . . . . . . . . . . . | 145,196 | ||
| 2,682,255 | ||||
| Electronic Equipment & Instruments - 1.17% | ||||
| 2,208 | Arrow Electronics, Inc. (a) . . . . . . . | 74,299 | ||
| 1,720 | Avnet, Inc. (a) . . . . . . . . . . . . . . . . . | 56,296 | ||
| 4,893 | Bell Microproducts, Inc. (a) . . . . . . | 9,982 | ||
| 744 | Benchmark Electronics, Inc. (a) . . . | 13,355 | ||
| 8,939 | Ingram Micro, Inc. (a) . . . . . . . . . . . | 141,504 | ||
| 3,070 | Jabil Circuit, Inc. . . . . . . . . . . . . . . . | 29,042 | ||
| 31,537 | Sanmina-SCI Corporation (a) . . . . . | 51,090 | ||
| Number of | Market | |||
| Shares | Value | |||
| Electronic Equipment & Instruments | ||||
| (Continued) | ||||
| 1,215 | SYNNEX Corp. (a) . . . . . . . . . . . . . | $ | 25,782 | |
| 2,922 | Tech Data Corp. (a) . . . . . . . . . . . . . | 95,842 | ||
| 3,434 | Tyco Electronics Ltd. . . . . . . . . . . . . | 117,855 | ||
| 2,791 | Vishay Intertechnology, Inc. (a) . . . | 25,286 | ||
| 640,333 | ||||
| Energy Equipment & Services - 0.06% | ||||
| 698 | Nabors Industries Ltd. (a) . . . . . . . . | 23,571 | ||
| 135 | SEACOR Holdings, Inc. (a) . . . . . . | 11,524 | ||
| 35,095 | ||||
| Food & Staples Retailing - 4.59% | ||||
| 1,318 | BJ’s Wholesale Club, Inc. (a) . . . . . | 47,039 | ||
| 5,032 | Costco Wholesale Corp. . . . . . . . . . | 326,929 | ||
| 2,055 | CVS Corp. . . . . . . . . . . . . . . . . . . . . | 83,248 | ||
| 1,012 | Great Atlantic & Pacific Tea Co. (a) | 26,535 | ||
| 13,925 | The Kroger Co. . . . . . . . . . . . . . . . . | 353,695 | ||
| 545 | Longs Drug Stores Corp. . . . . . . . . . | 23,141 | ||
| 505 | Nash Finch Co. . . . . . . . . . . . . . . . . | 17,160 | ||
| 1,061 | Performance Food Group Co. (a) . . | 34,673 | ||
| 27,031 | Rite Aid Corp. (a) . . . . . . . . . . . . . . | 79,471 | ||
| 4,439 | Safeway, Inc. . . . . . . . . . . . . . . . . . . | 130,285 | ||
| 1,362 | Supervalu, Inc. . . . . . . . . . . . . . . . . . | 40,833 | ||
| 25,583 | Wal-Mart Stores, Inc. . . . . . . . . . . . | 1,347,712 | ||
| 2,510,721 | ||||
| Food Products - 0.39% | ||||
| 627 | Bunge Ltd. . . . . . . . . . . . . . . . . . . . . | 54,474 | ||
| 459 | Chiquita Brands International, Inc. (a) | 10,608 | ||
| 1,437 | Dean Foods Co. . . . . . . . . . . . . . . . . | 28,869 | ||
| 648 | Fresh Del Monte Produce, Inc. (a) . | 23,587 | ||
| 336 | The JM Smucker Co. . . . . . . . . . . . . | 17,005 | ||
| 724 | Pilgrim’s Pride Corp. . . . . . . . . . . . . | 14,647 | ||
| 953 | Smithfield Foods, Inc. (a) . . . . . . . . | 24,549 | ||
| 2,651 | Tyson Foods, Inc. . . . . . . . . . . . . . . | 42,283 | ||
| 216,022 | ||||
| Gas Utilities - 0.61% | ||||
| 988 | AGL Resources, Inc. . . . . . . . . . . . . | 33,908 | ||
| 829 | Atmos Energy Corp. . . . . . . . . . . . . | 21,140 | ||
| 545 | National Fuel Gas Co. . . . . . . . . . . . | 25,729 | ||
| 699 | New Jersey Resources Corp. . . . . . . | 21,704 | ||
| 902 | Nicor, Inc. . . . . . . . . . . . . . . . . . . . . | 30,226 | ||
| 6,587 | NiSource, Inc. . . . . . . . . . . . . . . . . . | 113,560 | ||
| 304 | Northwest Natural Gas Co. . . . . . . . | 13,206 | ||
See notes to financial statements.
94
| AssetMark Fundamental Index™ Large Company Value Fund | |||
| SCHEDULE OF INVESTMENTS (Continued) | |||
| March 31, 2008 |
| Number of | Market | |||
| Shares | Value | |||
| COMMON STOCKS (Continued) | ||||
| Gas Utilities (Continued) | ||||
| 689 | Piedmont Natural Gas Co. . . . . . . . . | $ | 18,093 | |
| 479 | Southwest Gas Corp. . . . . . . . . . . . . | 13,393 | ||
| 1,007 | UGI Corp. . . . . . . . . . . . . . . . . . . . . | 25,094 | ||
| 535 | WGL Holdings, Inc. . . . . . . . . . . . . | 17,152 | ||
| 333,205 | ||||
| Health Care Equipment & Supplies - 0.19% | ||||
| 2,306 | Covidien Ltd. . . . . . . . . . . . . . . . . . . | 102,041 | ||
| Health Care Providers & Services - 2.49% | ||||
| 546 | AMERIGROUP Corp. (a) . . . . . . . . | 14,922 | ||
| 5,153 | AmerisourceBergen Corp. . . . . . . . . | 211,170 | ||
| 5,549 | Cardinal Health, Inc. . . . . . . . . . . . . | 291,378 | ||
| 405 | Community Health Systems, Inc. (a) | 13,596 | ||
| 520 | Emergency Medical Services | |||
| Corp. (a) . . . . . . . . . . . . . . . . . . . . . | 12,839 | |||
| 3,153 | Health Management | |||
| Associates, Inc. (a) . . . . . . . . . . . . | 16,679 | |||
| 2,187 | Humana, Inc. (a) . . . . . . . . . . . . . . . | 98,109 | ||
| 1,367 | Kindred Healthcare, Inc. (a) . . . . . . | 29,896 | ||
| 448 | �� | Magellan Health Services, Inc. (a) . | 17,781 | |
| 5,480 | McKesson Corp. . . . . . . . . . . . . . . . | 286,988 | ||
| 1,264 | Omnicare, Inc. . . . . . . . . . . . . . . . . . | 22,954 | ||
| 300 | Owens & Minor, Inc. . . . . . . . . . . . . | 11,802 | ||
| 7,516 | Wellpoint, Inc. (a) . . . . . . . . . . . . . . | 331,681 | ||
| 1,359,795 | ||||
| Hotels, Restaurants & Leisure - 0.38% | ||||
| 995 | Brinker International, Inc. . . . . . . . . | 18,457 | ||
| 2,989 | Carnival Corp. . . . . . . . . . . . . . . . . . | 120,995 | ||
| 896 | Royal Caribbean Cruises Ltd. . . . . . | 29,478 | ||
| 1,875 | Wyndham Worldwide Corp. . . . . . . | 38,775 | ||
| 207,705 | ||||
| Household Durables - 1.50% | ||||
| 955 | American Greetings . . . . . . . . . . . . . | 17,715 | ||
| 1,776 | Beazer Homes USA, Inc. . . . . . . . . | 16,783 | ||
| 671 | Blyth, Inc. . . . . . . . . . . . . . . . . . . . . | 13,232 | ||
| 2,457 | Centex Corp. . . . . . . . . . . . . . . . . . . | 59,484 | ||
| 3,121 | DR Horton, Inc. . . . . . . . . . . . . . . . . | 49,156 | ||
| 1,173 | Furniture Brands International, Inc. | 13,724 | ||
| 1,959 | Hovnanian Enterprises, Inc. (a) . . . . | 20,765 | ||
| 792 | Jarden Corp. (a) . . . . . . . . . . . . . . . . | 17,218 | ||
| 2,030 | KB Home . . . . . . . . . . . . . . . . . . . . . | 50,202 | ||
| 1,687 | Leggett & Platt, Inc. . . . . . . . . . . . . | 25,727 | ||
| Number of | Market | |||
| Shares | Value | |||
| Household Durables (Continued) | ||||
| 6,387 | Lennar Corp. . . . . . . . . . . . . . . . . . . | $ | 120,140 | |
| 674 | MDC Holdings, Inc. . . . . . . . . . . . . | 29,514 | ||
| 981 | Meritage Homes Corp. (a) . . . . . . . . | 18,953 | ||
| 508 | Mohawk Industries, Inc. (a) . . . . . . | 36,378 | ||
| 94 | NVR, Inc. (a) . . . . . . . . . . . . . . . . . . | 56,165 | ||
| 5,055 | Pulte Homes, Inc. . . . . . . . . . . . . . . | 73,550 | ||
| 798 | Ryland Group, Inc. . . . . . . . . . . . . . | 26,246 | ||
| 3,375 | Standard-Pacific Corp. . . . . . . . . . . | 16,403 | ||
| 1,532 | Toll Brothers, Inc. (a) . . . . . . . . . . . | 35,971 | ||
| 504 | Tupperware Brands Corp. . . . . . . . . | 19,495 | ||
| 1,200 | Whirlpool Corp. . . . . . . . . . . . . . . . . | 104,136 | ||
| 820,957 | ||||
| Industrial Conglomerates - 0.71% | ||||
| 61 | Alleghany Corp. (a) . . . . . . . . . . . . . | 20,900 | ||
| 8,328 | Tyco International Ltd. . . . . . . . . . . | 366,848 | ||
| 387,748 | ||||
| Insurance - 11.13% | ||||
| 3,126 | ACE Ltd. . . . . . . . . . . . . . . . . . . . . . | 172,118 | ||
| 2,423 | Aflac, Inc. . . . . . . . . . . . . . . . . . . . . | 157,374 | ||
| 585 | Alfa Corp. . . . . . . . . . . . . . . . . . . . . | 12,858 | ||
| 822 | Allied World Assurance | |||
| Holdings, Ltd. . . . . . . . . . . . . . . . . | 32,633 | |||
| 8,476 | The Allstate Corp. . . . . . . . . . . . . . . | 407,357 | ||
| 4,344 | AMBAC Financial Group, Inc. . . . . | 24,978 | ||
| 1,692 | American Financial Group, Inc. . . . | 43,248 | ||
| 33,358 | American International Group, Inc. | 1,442,734 | ||
| 319 | American National Insurance | |||
| Company . . . . . . . . . . . . . . . . . . . . | 34,037 | |||
| 637 | Arch Capital Group Ltd. (a) . . . . . . | 43,743 | ||
| 768 | Aspen Insurance Holdings Ltd. . . . . | 20,260 | ||
| 976 | Assurant, Inc. . . . . . . . . . . . . . . . . . . | 59,399 | ||
| 1,201 | Axis Capital Holdings Ltd. . . . . . . . | 40,810 | ||
| 3,866 | Chubb Corp. . . . . . . . . . . . . . . . . . . | 191,290 | ||
| 2,235 | Cincinnati Financial Corp. . . . . . . . | 85,019 | ||
| 4,443 | CNA Financial Corp. . . . . . . . . . . . . | 114,585 | ||
| 705 | Commerce Group, Inc. . . . . . . . . . . | 25,422 | ||
| 5,281 | Conseco, Inc. (a) . . . . . . . . . . . . . . . | 53,866 | ||
| 461 | Delphi Financial Group . . . . . . . . . . | 13,475 | ||
| 678 | Endurance Specialty Holdings Ltd. . | 24,815 | ||
| 546 | Everest Re Group Ltd. . . . . . . . . . . . | 48,883 | ||
| 7,100 | Fidelity National Financial, Inc. . . . | 130,143 | ||
| 1,811 | First American Corp. . . . . . . . . . . . . | 61,465 | ||
| 991 | Flagstone Reinsurance Holdings Ltd. | 11,991 |
See notes to financial statements.
95
| AssetMark Fundamental Index™ Large Company Value Fund | ||||
| SCHEDULE OF INVESTMENTS (Continued) | ||||
| March 31, 2008 |
| Number of | Market | |||
| Shares | Value | |||
| COMMON STOCKS (Continued) | ||||
| Insurance (Continued) | ||||
| 510 | The Hanover Insurance Group, Inc. | $ | 20,981 | |
| 3,656 | Hartford Financial Services | |||
| Group, Inc. . . . . . . . . . . . . . . . . . . . | 277,015 | |||
| 1,160 | HCC Insurance Holdings, Inc. . . . . | 26,320 | ||
| 467 | IPC Holdings Ltd. . . . . . . . . . . . . . . | 13,076 | ||
| 749 | LandAmerica Financial Group, Inc. | 29,563 | ||
| 2,824 | Lincoln National Corp. . . . . . . . . . . | 146,848 | ||
| 76 | Markel Corp. (a) . . . . . . . . . . . . . . . | 33,438 | ||
| 481 | Max Capital Group Ltd. . . . . . . . . . | 12,597 | ||
| 2,948 | MBIA, Inc. . . . . . . . . . . . . . . . . . . . | 36,025 | ||
| 773 | Mercury General Corp. . . . . . . . . . . | 34,252 | ||
| 7,083 | Metlife, Inc. . . . . . . . . . . . . . . . . . . . | 426,822 | ||
| 1,867 | Montpelier Re Holdings Ltd. . . . . . . | 29,965 | ||
| 1,668 | Nationwide Financial Services . . . . | 78,863 | ||
| 715 | Odyssey Re Holdings Corp. . . . . . . | 26,276 | ||
| 5,239 | Old Republic International Corp. . . | 67,636 | ||
| 1,366 | OneBeacon Insurance Group, Ltd. . | 25,981 | ||
| 617 | PartnerRe Ltd. . . . . . . . . . . . . . . . . . | 47,077 | ||
| 536 | Philadelphia Consolidated | |||
| Holding Co. (a) . . . . . . . . . . . . . . . | 17,259 | |||
| 2,311 | The Phoenix Companies, Inc. . . . . . | 28,217 | ||
| 509 | Platinum Underwriters Holdings Ltd. | 16,522 | ||
| 7,450 | Progressive Corp. . . . . . . . . . . . . . . | 119,722 | ||
| 872 | Protective Life Corp. . . . . . . . . . . . . | 35,368 | ||
| 4,571 | Prudential Financial, Inc. . . . . . . . . . | 357,681 | ||
| 649 | Reinsurance Group Of America . . . | 35,332 | ||
| 566 | RenaissanceRe Holdings Ltd. . . . . . | 29,381 | ||
| 1,678 | Safeco Corp. . . . . . . . . . . . . . . . . . . | 73,631 | ||
| 699 | Selective Insurance Group . . . . . . . . | 16,692 | ||
| 564 | Stancorp Financial Group, Inc. . . . . | 26,908 | ||
| 621 | Stewart Information Services Corp. | 17,382 | ||
| 873 | Torchmark Corp. . . . . . . . . . . . . . . . | 52,476 | ||
| 521 | Transatlantic Holdings, Inc. . . . . . . | 34,568 | ||
| 6,664 | Travelers Companies, Inc. . . . . . . . . | 318,872 | ||
| 1,253 | Unitrin, Inc. . . . . . . . . . . . . . . . . . . . | 44,281 | ||
| 4,548 | UnumProvident Corp. . . . . . . . . . . . | 100,102 | ||
| 44 | Wesco Financial Corp. . . . . . . . . . . . | 17,776 | ||
| 1,681 | WR Berkley Corp. . . . . . . . . . . . . . . | 46,547 | ||
| 3,912 | XL Capital Ltd. . . . . . . . . . . . . . . . . | 115,600 | ||
| 6,089,555 |
| Number of | Market | |||
| Shares | Value | |||
| Internet & Catalog Retail - 0.61% | ||||
| 1,609 | Expedia, Inc. (a) . . . . . . . . . . . . . . . | $ | 35,221 | |
| 4,812 | IAC/InterActiveCorp (a) . . . . . . . . . | 99,897 | ||
| 7,748 | Liberty Media Corp. (a) . . . . . . . . . . | 125,053 | ||
| 3,712 | Liberty Media Corp. (a) . . . . . . . . . . | 58,427 | ||
| 1,109 | Systemax, Inc. . . . . . . . . . . . . . . . . . | 13,374 | ||
| 331,972 | ||||
| IT Services - 0.58% | ||||
| 2,855 | Computer Sciences Corp. (a) . . . . . . | 116,455 | ||
| 1,181 | Convergys Corp. (a) . . . . . . . . . . . . | 17,786 | ||
| 9,255 | Electronic Data Systems Corp. . . . . | 154,096 | ||
| 936 | Perot Systems Corp. (a) . . . . . . . . . . | 14,077 | ||
| 3,029 | Unisys Corp. (a) . . . . . . . . . . . . . . . | 13,419 | ||
| 315,833 | ||||
| Leisure Equipment & Products - 0.24% | ||||
| 2,750 | Brunswick Corp. . . . . . . . . . . . . . . . | 43,918 | ||
| 4,942 | Eastman Kodak Co. . . . . . . . . . . . . . | 87,325 | ||
| 131,243 | ||||
| Machinery - 0.20% | ||||
| 425 | AGCO Corp. (a) . . . . . . . . . . . . . . . | 25,449 | ||
| 1,246 | Briggs & Stratton Corp. . . . . . . . . . . | 22,303 | ||
| 455 | Mueller Industries, Inc. . . . . . . . . . . | 13,127 | ||
| 234 | NACCO Industries, Inc. . . . . . . . . . | 18,940 | ||
| 1,024 | Timken Co. . . . . . . . . . . . . . . . . . . . | 30,433 | ||
| 110,252 | ||||
| Media - 2.19% | ||||
| 1,597 | Belo Corp. . . . . . . . . . . . . . . . . . . . . | 16,880 | ||
| 2,406 | Cablevision Systems Corp. (a) . . . . | 51,561 | ||
| 11,574 | CBS Corp. . . . . . . . . . . . . . . . . . . . . | 255,554 | ||
| 23,918 | Charter Communications, Inc. (a) . . | 20,378 | ||
| 2,569 | Gannett Co., Inc. . . . . . . . . . . . . . . . | 74,630 | ||
| 597 | Hearst-Argyle Television, Inc. . . . . . | 12,316 | ||
| 1,201 | Live Nation, Inc. (a) . . . . . . . . . . . . | 14,568 | ||
| 2,175 | New York Times Co. . . . . . . . . . . . . | 41,064 | ||
| 2,645 | Regal Entertainment Group . . . . . . . | 51,022 | ||
| 614 | Scholastic Corp. (a) . . . . . . . . . . . . . | 18,586 | ||
| 4,621 | Time Warner Cable, Inc. (a) . . . . . . | 115,433 | ||
| 21,922 | Time Warner, Inc. . . . . . . . . . . . . . . | 307,346 | ||
| 916 | Virgin Media, Inc. . . . . . . . . . . . . . . | 12,888 | ||
| 6,642 | Walt Disney Co. . . . . . . . . . . . . . . . . | 208,426 | ||
| 1,200,652 | ||||
See notes to financial statements.
96
| AssetMark Fundamental Index™ Large Company Value Fund | |||
| SCHEDULE OF INVESTMENTS (Continued) | |||
| March 31, 2008 |
| Number of | Market | |||
| Shares | Value | |||
| COMMON STOCKS (Continued) | ||||
| Metals & Mining - 0.98% | ||||
| 5,475 | Alcoa, Inc. . . . . . . . . . . . . . . . . . . . . | $ | 197,429 | |
| 992 | Freeport-McMoRan Copper & | |||
| Gold, Inc. . . . . . . . . . . . . . . . . . . . . | 95,450 | |||
| 486 | Massey Energy Co. . . . . . . . . . . . . . | 17,739 | ||
| 1,188 | Nucor Corp. . . . . . . . . . . . . . . . . . . . | 80,475 | ||
| 828 | United States Steel Corp. . . . . . . . . . | 105,048 | ||
| 3,670 | USEC, Inc. (a) . . . . . . . . . . . . . . . . . | 13,579 | ||
| 1,568 | Worthington Industries . . . . . . . . . . | 26,452 | ||
| 536,172 | ||||
| Multiline Retail - 1.00% | ||||
| 2,938 | Dillard’s, Inc. . . . . . . . . . . . . . . . . . . | 50,563 | ||
| 7,340 | Macy’s, Inc. . . . . . . . . . . . . . . . . . . . | 169,260 | ||
| 2,175 | Retail Ventures, Inc. (a) . . . . . . . . . . | 10,549 | ||
| 3,635 | Saks, Inc. (a) . . . . . . . . . . . . . . . . . . | 45,329 | ||
| 2,637 | Sears Holdings Corp. (a) . . . . . . . . . | 269,211 | ||
| 544,912 | ||||
| Multi-Utilities - 1.47% | ||||
| 667 | Avista Corp. . . . . . . . . . . . . . . . . . . . | 13,046 | ||
| 2,511 | CMS Energy Corp. . . . . . . . . . . . . . | 33,999 | ||
| 5,520 | Dominion Resources, Inc. . . . . . . . . | 225,437 | ||
| 8,743 | Duke Energy Corp New . . . . . . . . . | 156,063 | ||
| 2,717 | Energy East Corp. . . . . . . . . . . . . . . | 65,534 | ||
| 653 | Integrys Energy Group, Inc. . . . . . . | 30,456 | ||
| 1,008 | MDU Resources Group, Inc. . . . . . . | 24,746 | ||
| 510 | Northwestern Corp. . . . . . . . . . . . . . | 12,429 | ||
| 808 | Oneok, Inc. . . . . . . . . . . . . . . . . . . . | 36,061 | ||
| 1,264 | SCANA Corp. . . . . . . . . . . . . . . . . . | 46,237 | ||
| 2,668 | Sempra Energy . . . . . . . . . . . . . . . . | 142,151 | ||
| 647 | Vectren Corp. . . . . . . . . . . . . . . . . . . | 17,359 | ||
| 803,518 | ||||
| Oil & Gas - 7.01% | ||||
| 556 | Anadarko Petroleum Corp. . . . . . . . | 35,045 | ||
| 792 | Apache Corp. . . . . . . . . . . . . . . . . . . | 95,689 | ||
| 711 | Chesapeake Energy Corp. . . . . . . . . | 32,813 | ||
| 19,901 | ChevronTexaco Corp. . . . . . . . . . . . | 1,698,749 | ||
| 276 | Cimarex Energy Co. . . . . . . . . . . . . | 15,108 | ||
| 6,469 | ConocoPhillips . . . . . . . . . . . . . . . . | 493,003 | ||
| 1,169 | Devon Energy Corp. . . . . . . . . . . . . | 121,962 | ||
| 3,899 | El Paso Corp. . . . . . . . . . . . . . . . . . . | 64,879 | ||
| 363 | Forest Oil Corp. (a) . . . . . . . . . . . . . | 17,773 | ||
| 781 | General Maritime Corp. . . . . . . . . . | 18,439 | ||
| 2,332 | Hess Corp. . . . . . . . . . . . . . . . . . . . . | 205,636 |
| Number of | Market | |||
| Shares | Value | |||
| Oil & Gas (Continued) | ||||
| 7,075 | Marathon Oil Corp. . . . . . . . . . . . . . | $ | 322,620 | |
| 423 | Newfield Exploration Co. (a) . . . . . | 22,356 | ||
| 548 | Noble Energy, Inc. . . . . . . . . . . . . . . | 39,894 | ||
| 2,113 | Occidental Petroleum Corp. . . . . . . | 154,608 | ||
| 224 | Overseas Shipholding Group, Inc. . | 15,689 | ||
| 274 | Stone Energy Corp. (a) . . . . . . . . . . | 14,333 | ||
| 2,317 | Sunoco, Inc. . . . . . . . . . . . . . . . . . . . | 121,573 | ||
| 2,125 | Tesoro Petroleum Corp. . . . . . . . . . . | 63,750 | ||
| 5,212 | Valero Energy Corp. . . . . . . . . . . . . | 255,961 | ||
| 804 | World Fuel Services Corp. . . . . . . . | 22,568 | ||
| 3,832,448 | ||||
| Paper & Forest Products - 0.65% | ||||
| 1,851 | AbitibiBowater, Inc. (a) . . . . . . . . . . | 23,896 | ||
| 4,784 | Domtar Corp. (a) . . . . . . . . . . . . . . . | 32,675 | ||
| 2,267 | Louisiana-Pacific Corp. . . . . . . . . . . | 20,811 | ||
| 1,471 | MeadWestvaco Corp. . . . . . . . . . . . | 40,041 | ||
| 3,680 | Weyerhaeuser Co. . . . . . . . . . . . . . . | 239,347 | ||
| 356,770 | ||||
| Pharmaceuticals - 2.01% | ||||
| 1,919 | King Pharmaceuticals, Inc. (a) . . . . | 16,695 | ||
| 51,619 | Pfizer, Inc. . . . . . . . . . . . . . . . . . . . . | 1,080,386 | ||
| 1,097,081 | ||||
| Road & Rail - 0.28% | ||||
| 413 | AMERCO (a) . . . . . . . . . . . . . . . . . | 23,578 | ||
| 459 | Arkansas Best Corp. . . . . . . . . . . . . | 14,624 | ||
| 627 | Con-Way, Inc. . . . . . . . . . . . . . . . . . | 31,024 | ||
| 1,059 | Dollar Thrifty Automotive | |||
| Group, Inc. (a) . . . . . . . . . . . . . . . . | 14,445 | |||
| 723 | Werner Enterprises, Inc. . . . . . . . . . | 13,419 | ||
| 4,180 | YRC Worldwide, Inc. (a) . . . . . . . . . | 54,841 | ||
| 151,931 | ||||
| Semiconductor & Semiconductor | ||||
| Equipment - 0.11% | ||||
| 3,311 | Advanced Micro Devices, Inc. (a) . . | 19,502 | ||
| 4,585 | Micron Technology, Inc. (a) . . . . . . | 27,372 | ||
| 582 | Novellus Systems, Inc. (a) . . . . . . . . | 12,251 | ||
| 59,125 | ||||
| Software - 0.21% | ||||
| 2,096 | Novell, Inc. (a) . . . . . . . . . . . . . . . . . | 13,184 | ||
| 6,188 | Symantec Corp. (a) . . . . . . . . . . . . . | 102,845 | ||
| 116,029 |
See notes to financial statements.
97
| AssetMark Fundamental Index™ Large Company Value Fund | |||
| SCHEDULE OF INVESTMENTS (Continued) | |||
| March 31, 2008 |
| Number of | Market | |||
| Shares | Value | |||
| COMMON STOCKS (Continued) | ||||
| Specialty Retail - 1.10% | ||||
| 913 | Asbury Automotive Group, Inc. . . . | $ | 12,563 | |
| 8,901 | AutoNation, Inc. (a) . . . . . . . . . . . . . | 133,248 | ||
| 944 | Barnes & Noble, Inc. . . . . . . . . . . . . | 28,934 | ||
| 5,714 | Blockbuster, Inc. (a) . . . . . . . . . . . . | 18,628 | ||
| 1,549 | Borders Group, Inc. . . . . . . . . . . . . . | 9,093 | ||
| 1,003 | Brown Shoe Co., Inc. . . . . . . . . . . . | 15,115 | ||
| 1,253 | Cabela’s, Inc. (a) . . . . . . . . . . . . . . . | 17,742 | ||
| 4,150 | Charming Shoppes (a) . . . . . . . . . . . | 20,044 | ||
| 12,389 | Circuit City Stores, Inc. . . . . . . . . . . | 49,308 | ||
| 1,678 | Collective Brands, Inc. (a) . . . . . . . . | 20,337 | ||
| 2,656 | Foot Locker, Inc. . . . . . . . . . . . . . . . | 31,261 | ||
| 8,303 | Office Depot, Inc. (a) . . . . . . . . . . . . | 91,748 | ||
| 2,656 | OfficeMax, Inc. . . . . . . . . . . . . . . . . | 50,836 | ||
| 585 | The Pantry, Inc. (a) . . . . . . . . . . . . . | 12,332 | ||
| 929 | Penske Automotive Group, Inc. . . . | 18,078 | ||
| 2,283 | RadioShack Corp. . . . . . . . . . . . . . . | 37,099 | ||
| 901 | Sonic Automotive, Inc. . . . . . . . . . . | 18,516 | ||
| 803 | Zale Corp. (a) . . . . . . . . . . . . . . . . . | 15,867 | ||
| 600,749 | ||||
| Textiles, Apparel & Luxury Goods - 0.09% | ||||
| 958 | Jones Apparel Group, Inc. . . . . . . . . | 12,856 | ||
| 829 | Kellwood Co. . . . . . . . . . . . . . . . . . . | 17,409 | ||
| 999 | Liz Claiborne, Inc. . . . . . . . . . . . . . . | 18,132 | ||
| 48,397 | ||||
| Thrifts & Mortgage Finance - 2.21% | ||||
| 653 | Astoria Financial Corp. . . . . . . . . . . | 17,735 | ||
| 1,315 | Corus Bankshares, Inc. . . . . . . . . . . | 12,795 | ||
| 16,133 | Countrywide Financial Corp. . . . . . | 88,732 | ||
| 8,499 | Fannie Mae . . . . . . . . . . . . . . . . . . . | 223,694 | ||
| 9,985 | Federal Home Loan Mortgage Corp. | 252,820 | ||
| 1,072 | First Niagara Financial Group, Inc. . | 14,568 | ||
| 2,768 | Flagstar Bancorp, Inc. . . . . . . . . . . . | 19,985 | ||
| 20,268 | Fremont General Corp. (a) . . . . . . . | 9,729 | ||
| 1,854 | Hudson City Bancorp, Inc. . . . . . . . | 32,779 | ||
| 2,528 | IndyMac Bancorp, Inc. . . . . . . . . . . | 12,539 | ||
| 1,977 | MGIC Investment Corp. . . . . . . . . . | 20,818 | ||
| 3,670 | New York Community Bancorp, Inc. | 66,867 | ||
| 1,036 | Peoples United Financial, Inc. . . . . . | 17,933 | ||
| 3,553 | The PMI Group, Inc. . . . . . . . . . . . . | 20,678 | ||
| 4,652 | Radian Group, Inc. . . . . . . . . . . . . . | 30,564 | ||
| 4,560 | Sovereign Bancorp, Inc. . . . . . . . . . | 42,499 | ||
| 1,063 | TFS Financial Corp. . . . . . . . . . . . . | 12,788 | ||
| Number of | Market | |||
| Shares | Value | |||
| Thrifts & Mortgage Finance (Continued) | ||||
| 934 | Washington Federal, Inc. . . . . . . . . . | $ | 21,333 | |
| 26,701 | Washington Mutual, Inc. . . . . . . . . . | 275,020 | ||
| 462 | Webster Financial Corp. . . . . . . . . . | 12,876 | ||
| 1,206,752 | ||||
| Tobacco - 0.04% | ||||
| 315 | Universal Corp. . . . . . . . . . . . . . . . . | 20,642 | ||
| Trading Companies & Distributors - 0.03% | ||||
| 1,004 | BlueLinx Holdings, Inc. . . . . . . . . . | 5,110 | ||
| 331 | UAP Holding Corp. . . . . . . . . . . . . . | 12,691 | ||
| 17,801 | ||||
| Wireless Telecommunication Services - 0.08% | ||||
| 1,167 | Telephone & Data Systems, Inc. . . . | 45,828 | ||
| Total Common Stocks | ||||
(Cost $48,741,016) . . . . . . . . . . . . | 42,922,930 | |||
| MANAGEMENT INVESTMENT | ||||
| COMPANIES - 0.04% | ||||
| Investment Companies - 0.04% | ||||
| 1,415 | Apollo Investment Corp. . . . . . . . . . | 22,399 | ||
| Total Management Investment Companies | ||||
(Cost $25,529) . . . . . . . . . . . . . . . . | 22,399 | |||
| REAL ESTATE INVESTMENT TRUSTS - 0.54% | ||||
| Real Estate Investment Trusts - 0.54% | ||||
| 173 | AMB Property Corp. . . . . . . . . . . . . | 9,415 | ||
| 1,730 | American Financial Realty Trust . . . | 13,736 | ||
| 829 | Annaly Mortgage Management, Inc. | 12,700 | ||
| 362 | Apartment Investment & | |||
| Management Co. . . . . . . . . . . . . . . | 12,963 | |||
| 621 | CapitalSource, Inc. . . . . . . . . . . . . . | 6,005 | ||
| 525 | Colonial Properties Trust . . . . . . . . . | 12,626 | ||
| 6,261 | Friedman Billings Ramsey Group, Inc. | 10,644 | ||
| 444 | HCP, Inc. . . . . . . . . . . . . . . . . . . . . . | 15,012 | ||
| 497 | Hospitality Properties Trust . . . . . . . | 16,908 | ||
| 787 | Host Hotels & Resorts, Inc. . . . . . . . | 12,529 | ||
| 779 | iStar Financial, Inc. . . . . . . . . . . . . . | 10,929 | ||
| 1,648 | Liberty Property Trust . . . . . . . . . . . | 51,269 | ||
| 741 | Mack-Cali Realty Corp. . . . . . . . . . | 26,461 | ||
| 423 | National Health Investors, Inc. . . . . | 13,219 | ||
| 739 | Potlatch Corp. . . . . . . . . . . . . . . . . . | 30,499 | ||
| 949 | Redwood Trust, Inc. . . . . . . . . . . . . | 34,496 | ||
| 4,481 | Thornburg Mortgage, Inc. . . . . . . . . | 4,750 | ||
| 294,161 | ||||
| Total Real Estate Investments | ||||
(Cost $331,687) . . . . . . . . . . . . . . . | 294,161 | |||
See notes to financial statements.
98
| AssetMark Fundamental Index™ Large Company Value Fund | |||
| SCHEDULE OF INVESTMENTS (Continued) | |||
| March 31, 2008 |
| Number of | Market | |||
| Shares | Value | |||
| SHORT TERM INVESTMENTS - 5.50% | ||||
| Money Market Funds - 5.50% | ||||
| 3,007,568 | Federated Prime Obligations Fund,, | |||
| 3.180% (b) . . . . . . . . . . . . . . . . . . . | $ | 3,007,568 | ||
| Total Short Term Investments | ||||
(Cost $3,007,568) . . . . . . . . . . . . . | 3,007,568 | |||
| Total Investments | ||||
(Cost $52,105,800) - 84.55% . . . . | 46,247,058 | |||
| Other Assets in Excess of | ||||
Liabilities - 15.45% . . . . . . . . . . . | 8,450,022 | |||
| TOTAL NET | ||||
ASSETS - 100.00% . . . . . . . . . . . | $54,697,080 | |||
| Percentages are stated as a percent of net assets. | ||||
| (a) Non Income Producing. | ||||
| (b) Variable Rate Security. The rate shown is the rate in effect on | ||||
| March 31, 2008. | ||||
See notes to financial statements.
99
| AssetMark Fundamental Index™ Large Company Value Fund |
| SCHEDULE OF OPEN FUTURES CONTRACTS |
| March 31, 2008 |
| Number of | |||||||
| Contracts | Notional | Settlement | Unrealized | ||||
| Description | Purchased | Value | Month | Appreciation | |||
| S&P 500 Mini Futures | 56 | $3,706,751 | Jun-08 | $449 |
See notes to financial statements.
100
AssetMark Enhanced Fundamental IndexTM Small Company Growth Fund |
| PERFORMANCE DATA |
TOTAL RETURN BASED ON A $10,000 INVESTMENT

This chart assumes an initial gross investment of $10,000 made on August 9, 2007 (commencement of the Fund’s operations). Returns shown include the reinvestment of all dividends. Returns shown do not reflect the deduction of taxes that a shareholder would pay on fund distributions or the redemption of fund shares. In the absence of fee waivers and reimbursements, total return would be reduced. Past performance is not predictive of future performance. Investment return and principal value will fluctuate, so that your shares, when redeemed, may be worth more or less than the original cost.
RUSSELL 2000 GROWTH INDEX - An unmanaged index which measures the performance of those Russell 2,000 Index companies with higher price-to-book ratios and higher forecasted growth values. The Russell 2,000 Index measures the performance of the 2,000 smallest companies in the Russell 3000 Index. The Russell 3000 Index is an unmanaged index which measures the performance of the 3,000 largest U.S. companies based on total market capitalization, which represents approximately 98% of the investable U.S. equity market.
LIPPER SMALL-CAP GROWTH FUNDS INDEX - The Lipper Small-Cap Growth Funds Index is the average of the 30 largest funds in the Lipper Small-Cap Growth Funds Category. These funds, by portfolio practice, invest 75% of equity assets in companies with market capitalizations (on a three-year weighted basis) less than 250% of the dollar-weighted median market capitalization of the smallest 500 of the middle 1,000 securities of the S&P Super Composite 1500® Index. These funds typically invest in securities that have an above average price-to-earnings ratio, price-to-book ratio and three-year sales-per-share growth value, compared to the S&P SmallCap 600 IndexTM.
| TOTAL RETURN (for the period ended March 31) | |
| Since Inception (8/9/07) | |
AssetMark Enhanced Fundamental IndexTM Small Company Growth Fund | -8.80% |
| Russell 2000 Growth Index | -12.23% |
| Lipper Small-Cap Growth Funds Index | -14.24% |
101
| AssetMark Fundamental Index™ Small Company Growth Fund | |||
| SCHEDULE OF INVESTMENTS | |||
| March 31, 2008 |
| Number of | Market | |||
| Shares | Value | |||
| COMMON STOCKS - 75.18% | ||||
| Aerospace & Defense - 1.84% | ||||
| 493 | AAR Corp. (a) . . . . . . . . . . . . . . . . . | $ | 13,444 | |
| 127 | American Science & Engineering, Inc. | 6,930 | ||
| 514 | BE Aerospace, Inc. (a) . . . . . . . . . . . | 17,964 | ||
| 666 | Cubic Corp. . . . . . . . . . . . . . . . . . . . | 18,934 | ||
| 633 | Curtiss-Wright Corp. . . . . . . . . . . . . | 26,257 | ||
| 1,653 | DynCorp International, Inc. (a) . . . . | 27,572 | ||
| 1,067 | Hexcel Corp. (a) . . . . . . . . . . . . . . . | 20,390 | ||
| 183 | Ladish, Inc. (a) . . . . . . . . . . . . . . . . . | 6,588 | ||
| 480 | Moog, Inc. (a) . . . . . . . . . . . . . . . . . | 20,261 | ||
| 1,006 | Orbital Sciences Corp. (a) . . . . . . . . | 24,245 | ||
| 1,159 | Spirit Aerosystems Holdings, Inc. (a) | 25,707 | ||
| 295 | Teledyne Technologies, Inc. (a) . . . . | 13,865 | ||
| 172 | Triumph Group, Inc. . . . . . . . . . . . . | 9,792 | ||
| 231,949 | ||||
| Air Freight & Logistics - 0.25% | ||||
| 971 | HUB Group, Inc. (a) . . . . . . . . . . . . | 31,936 | ||
| Airlines - 0.08% | ||||
| 256 | Copa Holdings, S.A. . . . . . . . . . . . . | 9,756 | ||
| Auto Components - 0.21% | ||||
| 949 | Aftermarket Technology Corp. (a) . | 18,448 | ||
| 341 | Drew Industries, Inc. (a) . . . . . . . . . | 8,341 | ||
| 26,789 | ||||
| Automobiles - 0.15% | ||||
| 1,132 | Winnebago Industries, Inc. . . . . . . . | 19,131 | ||
| Banks - 0.11% | ||||
| 526 | Signature Bank (a) . . . . . . . . . . . . . . | 13,413 | ||
| Beverages - 0.36% | ||||
| 233 | Boston Beer Company, Inc. (a) . . . . | 11,077 | ||
| 257 | Central European Distribution | |||
| Corp. (a) . . . . . . . . . . . . . . . . . . . . . | 14,955 | |||
| 2,467 | National Beverage Corp. . . . . . . . . . | 18,922 | ||
| 44,954 | ||||
| Biotechnology - 0.70% | ||||
| 400 | Affymetrix, Inc. (a) . . . . . . . . . . . . . | 6,964 | ||
| 593 | Celgene Corp. (a) . . . . . . . . . . . . . . | 36,345 | ||
| 375 | Cephalon, Inc. (a) . . . . . . . . . . . . . . | 24,150 | ||
| 256 | ImClone Systems, Inc. (a) . . . . . . . . | 10,859 | ||
| 654 | Millennium Pharmaceuticals, Inc. (a) | 10,111 | ||
| 88,429 |
| Number of | Market | |||
| Shares | Value | |||
| Building Products - 0.42% | ||||
| 182 | Ameron International Corp. . . . . . . | $ | 17,023 | |
| 976 | Apogee Enterprises, Inc. . . . . . . . . . | 15,030 | ||
| 778 | Simpson Manufacturing Co., Inc. . . | 21,146 | ||
| 53,199 | ||||
| Capital Markets - 1.67% | ||||
| 267 | Affiliated Managers Group, Inc. (a) | 24,228 | ||
| 1,163 | Calamos Asset Management, Inc. . . | 18,934 | ||
| 438 | Cohen & Steers, Inc. . . . . . . . . . . . . | 11,603 | ||
| 567 | FCStone Group, Inc. (a) . . . . . . . . . | 15,706 | ||
| 214 | Gamco Investors, Inc. . . . . . . . . . . . | 10,777 | ||
| 275 | GFI Group Inc. . . . . . . . . . . . . . . . . | 15,757 | ||
| 234 | Greenhill & Co, Inc. . . . . . . . . . . . . | 16,277 | ||
| 263 | Investment Technology Group, | |||
| Inc. (a) . . . . . . . . . . . . . . . . . . . . . . | 12,145 | |||
| 1,255 | Jefferies Group, Inc. . . . . . . . . . . . . | 20,243 | ||
| 675 | KBW, Inc. (a) . . . . . . . . . . . . . . . . . | 14,884 | ||
| 816 | National Financial Partners Corp. . . | 18,336 | ||
| 806 | Penson Worldwide, Inc. (a) . . . . . . . | 7,439 | ||
| 963 | SEI Investments Co. . . . . . . . . . . . . | 23,776 | ||
| 210,105 | ||||
| Chemicals - 1.11% | ||||
| 690 | Airgas, Inc. . . . . . . . . . . . . . . . . . . . | 31,374 | ||
| 378 | CF Industries Holdings, Inc. . . . . . . | 39,168 | ||
| 1,370 | HB Fuller Co. . . . . . . . . . . . . . . . . . | 27,962 | ||
| 633 | Innophos Holdings, Inc. . . . . . . . . . | 10,185 | ||
| 962 | Innospec, Inc. . . . . . . . . . . . . . . . . . | 20,395 | ||
| 206 | OM Group, Inc. (a) . . . . . . . . . . . . . | 11,235 | ||
| 140,319 | ||||
| Commercial Banks - 1.76% | ||||
| 423 | Bank of the Ozarks, Inc. . . . . . . . . . | 10,110 | ||
| 675 | Cascade Bancorp . . . . . . . . . . . . . . . | 6,453 | ||
| 631 | CoBiz, Inc. . . . . . . . . . . . . . . . . . . . . | 8,216 | ||
| 1,366 | East West Bancorp, Inc. . . . . . . . . . . | 24,246 | ||
| 533 | First Financial Bankshares, Inc. . . . | 21,842 | ||
| 1,348 | Frontier Financial Corp. . . . . . . . . . | 23,833 | ||
| 701 | Glacier Bancorp, Inc. . . . . . . . . . . . . | 13,438 | ||
| 1,092 | Investors Bancorp, Inc. (a) . . . . . . . | 16,762 | ||
| 745 | Nara Bancorp, Inc. . . . . . . . . . . . . . . | 9,677 | ||
| 364 | Old Second Bancorp, Inc. . . . . . . . . | 9,668 | ||
| 312 | Suffolk Bancorp . . . . . . . . . . . . . . . . | 9,884 | ||
| 704 | SVB Financial Group (a) . . . . . . . . . | 30,723 | ||
| 382 | SY Bancorp, Inc. . . . . . . . . . . . . . . . | 8,878 |
See notes to financial statements.
102
| AssetMark Fundamental Index™ Small Company Growth Fund | |||
| SCHEDULE OF INVESTMENTS (Continued) | |||
| March 31, 2008 |
| Number of | Market | |||
| Shares | Value | |||
| COMMON STOCKS (Continued) | ||||
| Commercial Banks (Continued) | ||||
| 658 | Texas Capital Bancshares, Inc. (a) . | $ | 11,107 | |
| 2,190 | UCBH Holdings, Inc. . . . . . . . . . . . | 16,994 | ||
| 221,831 | ||||
| Commercial Services & Supplies - 6.30% | ||||
| 761 | Administaff, Inc. . . . . . . . . . . . . . . . | 17,967 | ||
| 567 | American Reprographics Co. (a) . . . | 8,414 | ||
| 386 | Brady Corp. . . . . . . . . . . . . . . . . . . . | 12,904 | ||
| 233 | Bright Horizons Family Solutions, | |||
| Inc. (a) . . . . . . . . . . . . . . . . . . . . . . | 10,028 | |||
| 783 | ChoicePoint, Inc. (a) . . . . . . . . . . . . | 37,271 | ||
| 344 | Clean Harbors, Inc. (a) . . . . . . . . . . | 22,360 | ||
| 630 | Coinstar, Inc. (a) . . . . . . . . . . . . . . . | 17,728 | ||
| 1,423 | COMSYS IT Partners, Inc. (a) . . . . | 12,039 | ||
| 250 | Consolidated Graphics, Inc. (a) . . . . | 14,012 | ||
| 504 | Copart, Inc. (a) . . . . . . . . . . . . . . . . . | 19,535 | ||
| 3,990 | Corinthian Colleges, Inc. (a) . . . . . . | 28,848 | ||
| 552 | The Corporate Executive Board Co. | 22,345 | ||
| 1,028 | Corrections Corp. of America (a) . . | 28,291 | ||
| 384 | CPI Corp. . . . . . . . . . . . . . . . . . . . . . | 6,632 | ||
| 476 | CRA International, Inc. (a) . . . . . . . | 15,299 | ||
| 527 | DeVry, Inc. . . . . . . . . . . . . . . . . . . . . | 22,050 | ||
| 664 | First Advantage Corp. (a) . . . . . . . . | 14,070 | ||
| 159 | FTI Consulting, Inc. (a) . . . . . . . . . . | 11,295 | ||
| 472 | The Geo Group Inc. (a) . . . . . . . . . . | 13,424 | ||
| 535 | Healthcare Services Group . . . . . . . | 11,042 | ||
| 467 | Heidrick & Struggles | |||
| International, Inc. . . . . . . . . . . . . . | 15,192 | |||
| 399 | IHS, Inc. (a) . . . . . . . . . . . . . . . . . . . | 25,660 | ||
| 491 | ITT Educational Services, Inc. (a) . . | 22,552 | ||
| 875 | Jackson Hewitt Tax Service, Inc. . . | 10,036 | ||
| 1,367 | Korn/Ferry International (a) . . . . . . | 23,102 | ||
| 242 | Layne Christensen Co. (a) . . . . . . . . | 8,475 | ||
| 344 | M&F Worldwide Corp. (a) . . . . . . . | 12,862 | ||
| 509 | McGrath RentCorp . . . . . . . . . . . . . | 12,272 | ||
| 485 | Mobile Mini, Inc. (a) . . . . . . . . . . . . | 9,215 | ||
| 796 | Navigant Consulting, Inc. (a) . . . . . | 15,108 | ||
| 361 | PICO Holdings, Inc. (a) . . . . . . . . . . | 10,913 | ||
| 771 | Pike Electric Corp. (a) . . . . . . . . . . . | 10,740 | ||
| 189 | Pre-Paid Legal Services, Inc. (a) . . . | 8,015 | ||
| 1,324 | Resources Connection, Inc. . . . . . . . | 23,660 | ||
| 1,239 | Rollins, Inc. . . . . . . . . . . . . . . . . . . . | 21,918 | ||
| 1,663 | RSC Holdings, Inc. (a) . . . . . . . . . . | 18,127 | ||
| 684 | Sotheby’s . . . . . . . . . . . . . . . . . . . . . | 19,774 | ||
| Number of | Market | |||
| Shares | Value | |||
| Commercial Services & Supplies (Continued) | ||||
| 416 | Standard Parking Corp. (a) . . . . . . . | $ | 8,719 | |
| 279 | Stericycle, Inc. (a) . . . . . . . . . . . . . . | 14,368 | ||
| 78 | Strayer Education, Inc. . . . . . . . . . . | 11,895 | ||
| 1,131 | TeleTech Holdings, Inc. (a) . . . . . . . | 25,402 | ||
| 1,837 | Tetra Tech, Inc. (a) . . . . . . . . . . . . . . | 35,840 | ||
| 2,809 | TrueBlue, Inc. (a) . . . . . . . . . . . . . . | 37,753 | ||
| 755 | Waste Connections, Inc. (a) . . . . . . . | 23,209 | ||
| 425 | Watson Wyatt Worldwide, Inc. . . . . | 24,119 | ||
| 794,480 | ||||
| Communications Equipment - 1.89% | ||||
| 1,382 | ADC Telecommunications, Inc. (a) . | 16,695 | ||
| 1,349 | ADTRAN, Inc. . . . . . . . . . . . . . . . . | 24,957 | ||
| 2,743 | Arris Group, Inc. (a) . . . . . . . . . . . . | 15,964 | ||
| 527 | Avocent Corp. (a) . . . . . . . . . . . . . . | 8,906 | ||
| 760 | CommScope, Inc. (a) . . . . . . . . . . . . | 26,471 | ||
| 294 | Comtech Telecommunications | |||
| Corp. (a) . . . . . . . . . . . . . . . . . . . . . | 11,466 | |||
| 2,489 | Extreme Networks, Inc. (a) . . . . . . . | 7,716 | ||
| 426 | F5 Networks, Inc. (a) . . . . . . . . . . . . | 7,740 | ||
| 1,756 | Foundry Networks, Inc. (a) . . . . . . . | 20,335 | ||
| 926 | InterDigital, Inc. (a) . . . . . . . . . . . . . | 18,344 | ||
| 716 | Netgear, Inc. (a) . . . . . . . . . . . . . . . . | 14,284 | ||
| 839 | Plantronics, Inc. . . . . . . . . . . . . . . . . | 16,201 | ||
| 1,689 | Polycom, Inc. (a) . . . . . . . . . . . . . . . | 38,070 | ||
| 496 | ViaSat, Inc. (a) . . . . . . . . . . . . . . . . . | 10,773 | ||
| 237,922 | ||||
| Computers & Peripherals - 1.44% | ||||
| 1,369 | Avid Technology, Inc. (a) . . . . . . . . | 33,321 | ||
| 3,745 | Brocade Communications Systems, | |||
| Inc. (a) . . . . . . . . . . . . . . . . . . . . . . | 27,339 | |||
| 1,832 | Electronics For Imaging, Inc. (a) . . . | 27,333 | ||
| 1,307 | Emulex Corp. (a) . . . . . . . . . . . . . . . | 21,226 | ||
| 1,313 | Intermec, Inc. (a) . . . . . . . . . . . . . . . | 29,135 | ||
| 5,865 | Iomega Corp. (a) . . . . . . . . . . . . . . . | 20,938 | ||
| 1,416 | QLogic Corp. (a) . . . . . . . . . . . . . . . | 21,736 | ||
| 181,028 | ||||
| Construction & Engineering - 0.66% | ||||
| 1,532 | Dycom Industries, Inc. (a) . . . . . . . . | 18,399 | ||
| 1,501 | Great Lakes Dredge & Dock Corp. . | 7,760 | ||
| 2,615 | MasTec, Inc. (a) . . . . . . . . . . . . . . . . | 21,469 | ||
| 985 | Perini Corp. (a) . . . . . . . . . . . . . . . . | 35,687 | ||
| 83,315 | ||||
See notes to financial statements.
103
| AssetMark Fundamental Index™ Small Company Growth Fund |
| SCHEDULE OF INVESTMENTS (Continued) |
| March 31, 2008 |
| Number of | Market | |||
| Shares | Value | |||
| COMMON STOCKS (Continued) | ||||
| Construction Materials - 0.32% | ||||
| 709 | Eagle Materials, Inc. . . . . . . . . . . . . | $ | 25,205 | |
| 249 | Texas Industries, Inc. . . . . . . . . . . . . | 14,967 | ||
| 40,172 | ||||
| Consumer Finance - 0.63% | ||||
| 1,880 | Advance America, Cash Advance | |||
| Centers, Inc. . . . . . . . . . . . . . . . . . . | 14,194 | |||
| 238 | Cash America International, Inc. . . . | 8,663 | ||
| 15,787 | MoneyGram International, Inc. . . . . | 29,364 | ||
| 275 | Student Loan Corp. . . . . . . . . . . . . . | 27,198 | ||
| 79,419 | ||||
| Containers & Packaging - 0.80% | ||||
| 878 | AptarGroup, Inc. . . . . . . . . . . . . . . . | 34,181 | ||
| 12,424 | Graphic Packaging Hldg Co. (a) . . . | 36,278 | ||
| 623 | Silgan Holdings, Inc. . . . . . . . . . . . . | 30,919 | ||
| 101,378 | ||||
| Distributors - 0.18% | ||||
| 608 | WESCO International, Inc. (a) . . . . | 22,186 | ||
| Diversified Consumer Services - 0.14% | ||||
| 282 | Steiner Leisure Ltd. (a) . . . . . . . . . . | 9,306 | ||
| 714 | Universal Technical Institute, Inc. (a) | 8,375 | ||
| 17,681 | ||||
| Diversified Financial Services - 0.75% | ||||
| 875 | Asset Acceptance Capital Corp. . . . | 8,426 | ||
| 863 | eSpeed, Inc. - Class A (a) . . . . . . . . | 10,063 | ||
| 1,228 | The First Marblehead Corp. . . . . . . | 9,161 | ||
| 62 | IntercontinentalExchange, Inc. (a) . | 8,091 | ||
| 482 | Leucadia National Corp. . . . . . . . . . | 21,796 | ||
| 487 | Nasdaq Stock Market, Inc. (a) . . . . . | 18,827 | ||
| 202 | Nymex Holdings, Inc. . . . . . . . . . . . | 18,307 | ||
| 94,671 | ||||
| Diversified Telecommunication Services - 0.40% | ||||
| 1,885 | General Communication (a) . . . . . . | 11,574 | ||
| 13,057 | Level 3 Communications, Inc. (a) . . | 27,681 | ||
| 755 | Premiere Global Services, Inc. (a) . . | 10,826 | ||
| 50,081 | ||||
| Electric Utilities - 0.26% | ||||
| 1,507 | El Paso Electric Co. (a) . . . . . . . . . . | 32,205 | ||
| Number of | Market | |||
| Shares | Value | |||
| Electrical Equipment - 0.93% | ||||
| 510 | AMETEK, Inc. . . . . . . . . . . . . . . . . | $ | 22,394 | |
| 594 | Baldor Electric Co. . . . . . . . . . . . . . | 16,632 | ||
| 224 | Franklin Electric Co., Inc. . . . . . . . . | 7,654 | ||
| 1,223 | GrafTech International Ltd. (a) . . . . | 19,825 | ||
| 205 | II-VI, Inc. (a) . . . . . . . . . . . . . . . . . . | 7,786 | ||
| 302 | Roper Industries, Inc. . . . . . . . . . . . | 17,951 | ||
| 580 | Vicor Corp. . . . . . . . . . . . . . . . . . . . | 6,925 | ||
| 668 | Woodward Governor Co. . . . . . . . . . | 17,849 | ||
| 117,016 | ||||
| Electronic Equipment & Instruments - 2.31% | ||||
| 920 | Amphenol Corp. . . . . . . . . . . . . . . . | 34,270 | ||
| 1,122 | Checkpoint Systems, Inc. (a) . . . . . . | 30,126 | ||
| 628 | Cognex Corp. . . . . . . . . . . . . . . . . . . | 13,709 | ||
| 760 | CPI International, Inc. (a) . . . . . . . . | 7,539 | ||
| 551 | Dolby Laboratories, Inc. (a) . . . . . . | 19,979 | ||
| 527 | Electro Scientific Industries, Inc. (a) | 8,685 | ||
| 531 | FLIR Systems, Inc. (a) . . . . . . . . . . | 15,978 | ||
| 107 | Itron, Inc. (a) . . . . . . . . . . . . . . . . . . | 9,655 | ||
| 404 | Littelfuse, Inc. (a) . . . . . . . . . . . . . . | 14,128 | ||
| 398 | MTS Systems Corp. . . . . . . . . . . . . | 12,839 | ||
| 512 | National Instruments Corp. . . . . . . . | 13,384 | ||
| 1,545 | Plexus Corp. (a) . . . . . . . . . . . . . . . . | 43,337 | ||
| 260 | Rofin-Sinar Technologies, Inc. (a) . | 11,674 | ||
| 261 | Rogers Corp. (a) . . . . . . . . . . . . . . . | 8,720 | ||
| 2,861 | Smart Modular Technologies, Inc. (a) | 17,767 | ||
| 639 | Trimble Navigation Ltd. (a) . . . . . . | 18,269 | ||
| 703 | Veeco Instruments, Inc. (a) . . . . . . . | 11,691 | ||
| 291,750 | ||||
| Energy Equipment & Services - 2.67% | ||||
| 85 | Atwood Oceanics, Inc. (a) . . . . . . . . | 7,796 | ||
| 316 | Bristow Group, Inc. (a) . . . . . . . . . . | 16,960 | ||
| 184 | CARBO Ceramics, Inc. . . . . . . . . . . | 7,378 | ||
| 708 | Complete Production Services (a) . . | 16,242 | ||
| 260 | Dril-Quip, Inc. (a) . . . . . . . . . . . . . . | 12,082 | ||
| 585 | Grant Prideco, Inc. (a) . . . . . . . . . . . | 28,794 | ||
| 4,038 | Grey Wolf, Inc. (a) . . . . . . . . . . . . . . | 27,378 | ||
| 188 | GulfMark Offshore, Inc. (a) . . . . . . | 10,287 | ||
| 513 | Helmerich & Payne, Inc. . . . . . . . . . | 24,044 | ||
| 310 | Hercules Offshore, Inc. (a) . . . . . . . | 7,787 | ||
| 298 | Hornbeck Offshore Services, Inc. (a) | 13,610 | ||
| 159 | Lufkin Industries, Inc. . . . . . . . . . . . | 10,147 | ||
| 432 | Matrix Service Co. (a) . . . . . . . . . . . | 7,422 | ||
| 268 | NATCO Group, Inc. (a) . . . . . . . . . . | 12,529 | ||
See notes to financial statements.
104
| AssetMark Fundamental Index™ Small Company Growth Fund |
| SCHEDULE OF INVESTMENTS (Continued) |
| March 31, 2008 |
| Number of | Market | |||
| Shares | Value | |||
| COMMON STOCKS (Continued) | ||||
| Energy Equipment & Services (Continued) | ||||
| 2,023 | Newpark Resources, Inc. (a) . . . . . . | $ | 10,317 | |
| 368 | Oceaneering International, Inc. (a) . | 23,184 | ||
| 524 | Oil States International, Inc. (a) . . . | 23,481 | ||
| 2,369 | Parker Drilling Co. (a) . . . . . . . . . . . | 15,304 | ||
| 317 | Superior Energy Services, Inc. (a) . . | 12,560 | ||
| 580 | Tetra Technologies, Inc. (a) . . . . . . . | 9,187 | ||
| 465 | Unit Corp. (a) . . . . . . . . . . . . . . . . . | 26,342 | ||
| 204 | W-H Energy Services, Inc. (a) . . . . . | 14,045 | ||
| 336,876 | ||||
| Food Products - 0.86% | ||||
| 1,165 | Flowers Foods, Inc. . . . . . . . . . . . . . | 28,834 | ||
| 265 | J&J Snack Foods Corp. . . . . . . . . . . | 7,280 | ||
| 348 | Ralcorp Holdings, Inc. (a) . . . . . . . . | 20,236 | ||
| 19 | Seaboard Corp. . . . . . . . . . . . . . . . . | 29,735 | ||
| 899 | Tootsie Roll Industries, Inc. . . . . . . . | 22,659 | ||
| 108,744 | ||||
| Health Care Equipment & Supplies - 2.60% | ||||
| 1,110 | Advanced Medical Optics, Inc. (a) . | 22,533 | ||
| 616 | American Medical Systems | |||
| Holdings, Inc. (a) . . . . . . . . . . . . . . | 8,741 | |||
| 259 | Analogic Corp. . . . . . . . . . . . . . . . . | 17,234 | ||
| 501 | The Cooper Companies, Inc. . . . . . . | 17,249 | ||
| 203 | Gen-Probe, Inc. (a) . . . . . . . . . . . . . | 9,785 | ||
| 407 | Greatbatch, Inc. (a) . . . . . . . . . . . . . | 7,493 | ||
| 407 | Haemonetics Corporation (a) . . . . . | 24,249 | ||
| 332 | IDEXX Laboratories, Inc. (a) . . . . . | 16,354 | ||
| 404 | Immucor, Inc. (a) . . . . . . . . . . . . . . . | 8,621 | ||
| 291 | Matthews International Corp. . . . . . | 14,041 | ||
| 1,064 | Mentor Corp. . . . . . . . . . . . . . . . . . . | 27,366 | ||
| 216 | Meridian Bioscience, Inc. . . . . . . . . | 7,221 | ||
| 599 | Mine Safety Appliances Co. . . . . . . | 24,673 | ||
| 487 | ResMed, Inc. (a) . . . . . . . . . . . . . . . | 20,542 | ||
| 1,166 | Steris Corp. . . . . . . . . . . . . . . . . . . . | 31,284 | ||
| 748 | Varian, Inc. (a) . . . . . . . . . . . . . . . . . | 43,324 | ||
| 410 | West Pharmaceutical Services, Inc. . | 18,134 | ||
| 399 | Wright Medical Group, Inc. (a) . . . . | 9,632 | ||
| 328,476 | ||||
| Health Care Providers & Services - 2.90% | ||||
| 157 | The Advisory Board Co. (a) . . . . . . | 8,626 | ||
| 197 | Amedisys, Inc. (a) . . . . . . . . . . . . . . | 7,750 | ||
| 1,047 | AMN Healthcare Services, Inc. (a) . | 16,145 | ||
| 450 | AmSurg Corp. (a) . . . . . . . . . . . . . . | 10,656 | ||
| Number of | Market | |||
| Shares | Value | |||
| Health Care Providers & Services (Continued) | ||||
| 1,830 | Apria Healthcare Group, Inc. (a) . . . | $ | 36,142 | |
| 759 | Cerner Corp. (a) . . . . . . . . . . . . . . . . | 28,296 | ||
| 485 | Chemed Corp. . . . . . . . . . . . . . . . . . | 20,467 | ||
| 258 | Corvel Corp. (a) . . . . . . . . . . . . . . . . | 7,892 | ||
| 748 | HealthExtras, Inc. (a) . . . . . . . . . . . . | 18,580 | ||
| 254 | Healthways, Inc. (a) . . . . . . . . . . . . . | 8,976 | ||
| 307 | inVentiv Health, Inc. (a) . . . . . . . . . | 8,845 | ||
| 212 | Landauer, Inc. . . . . . . . . . . . . . . . . . | 10,672 | ||
| 335 | National Healthcare Corp. . . . . . . . . | 16,314 | ||
| 1,073 | Odyssey HealthCare, Inc. (a) . . . . . | 9,657 | ||
| 683 | Parexel International Corp. (a) . . . . | 17,826 | ||
| 276 | Pediatrix Medical Group, Inc. (a) . . | 18,602 | ||
| 620 | Pharmaceutical Product | |||
| Development, Inc. . . . . . . . . . . . . . | 25,978 | |||
| 301 | Psychiatric Solutions, Inc. (a) . . . . . | 10,210 | ||
| 1,814 | Skilled Healthcare Group, Inc. (a) . . | 19,918 | ||
| 1,276 | Sun Healthcare Group, Inc. (a) . . . . | 16,767 | ||
| 1,440 | Sunrise Senior Living, Inc. (a) . . . . | 32,083 | ||
| 562 | VCA Antech, Inc. (a) . . . . . . . . . . . . | 15,371 | ||
| 365,773 | ||||
| Health Care Technology - 0.31% | ||||
| 353 | Eclipsys Corp. (a) . . . . . . . . . . . . . . | 6,922 | ||
| 2,534 | HLTH Corporation (a) . . . . . . . . . . . | 24,175 | ||
| 490 | Trizetto Group (a) . . . . . . . . . . . . . . | 8,178 | ||
| 39,275 | ||||
| Hotels, Restaurants & Leisure - 3.96% | ||||
| 867 | Ameristar Casinos, Inc. . . . . . . . . . . | 15,823 | ||
| 188 | Bally Technologies, Inc. (a) . . . . . . . | 6,456 | ||
| 579 | California Pizza Kitchen, Inc. (a) . . | 7,591 | ||
| 1,632 | Carrols Restaurant Group, Inc. (a) . | 14,574 | ||
| 829 | CEC Entertainment, Inc. (a) . . . . . . | 23,941 | ||
| 1,139 | The Cheesecake Factory (a) . . . . . . | 24,819 | ||
| 120 | Chipotle Mexican Grill, Inc. (a) . . . | 11,651 | ||
| 752 | Choice Hotels International, Inc. . . . | 25,651 | ||
| 1,868 | CKE Restaurants, Inc. . . . . . . . . . . . | 20,959 | ||
| 813 | Gaylord Entertainment Co. (a) . . . . | 24,626 | ||
| 299 | IHOP Corp. . . . . . . . . . . . . . . . . . . . | 14,322 | ||
| 602 | International Speedway Corp. - | |||
| Class A . . . . . . . . . . . . . . . . . . . . . . | 24,802 | |||
| 3,415 | Krispy Kreme Doughnuts, Inc. (a) . | 10,416 | ||
| 322 | Las Vegas Sands Corp. (a) . . . . . . . . | 23,712 | ||
| 271 | Life Time Fitness, Inc. (a) . . . . . . . . | 8,458 | ||
| 413 | Marcus Corp. . . . . . . . . . . . . . . . . . . | 7,929 | ||
See notes to financial statements.
105
| AssetMark Fundamental Index™ Small Company Growth Fund |
| SCHEDULE OF INVESTMENTS (Continued) |
| March 31, 2008 |
| Number of | Market | |||
| Shares | Value | |||
| COMMON STOCKS (Continued) | ||||
| Hotels, Restaurants & Leisure (Continued) | ||||
| 474 | Panera Bread Co. (a) . . . . . . . . . . . . | $ | 19,856 | |
| 776 | Papa John’s International, Inc. (a) . . | 18,787 | ||
| 642 | Penn National Gaming, Inc. (a) . . . . | 28,075 | ||
| 441 | PF Chang’s China Bistro, Inc. (a) . . | 12,542 | ||
| 794 | RC2 Corp. (a) . . . . . . . . . . . . . . . . . | 16,650 | ||
| 617 | Scientific Games Corp. - Class A (a) | 13,025 | ||
| 601 | Sonic Corp. (a) . . . . . . . . . . . . . . . . | 13,246 | ||
| 904 | Speedway Motorsports, Inc. . . . . . . | 22,663 | ||
| 808 | Tim Hortons, Inc. . . . . . . . . . . . . . . | 27,512 | ||
| 1,810 | Town Sports International Holdings, | |||
| Inc. (a) . . . . . . . . . . . . . . . . . . . . . . | 11,602 | |||
| 777 | Vail Resorts, Inc. (a) . . . . . . . . . . . . | 37,521 | ||
| 125 | Wynn Resorts, Limited . . . . . . . . . . | 12,580 | ||
| 499,789 | ||||
| Household Durables - 0.84% | ||||
| 1,492 | Blount International, Inc. (a) . . . . . . | 18,456 | ||
| 1,756 | Champion Enterprises, Inc. (a) . . . . | 17,613 | ||
| 576 | Garmin Ltd. . . . . . . . . . . . . . . . . . . . | 31,110 | ||
| 985 | Interface, Inc. . . . . . . . . . . . . . . . . . . | 13,839 | ||
| 953 | Russ Berrie & Company, Inc. (a) . . | 13,399 | ||
| 1,016 | Tempur-Pedic International, Inc. . . . | 11,176 | ||
| 105,593 | ||||
| Household Products - 0.23% | ||||
| 336 | Church & Dwight, Inc. . . . . . . . . . . | 18,225 | ||
| 336 | WD-40 Co. . . . . . . . . . . . . . . . . . . . | 11,172 | ||
| 29,397 | ||||
| Industrial Conglomerates - 0.19% | ||||
| 393 | Walter Industries, Inc. . . . . . . . . . . . | 24,614 | ||
| Insurance - 1.23% | ||||
| 722 | Amtrust Financial Services, Inc. . . . | 11,704 | ||
| 1,966 | Brown & Brown, Inc. . . . . . . . . . . . | 34,169 | ||
| 916 | Covanta Holding Corp. (a) . . . . . . . | 25,190 | ||
| 1,958 | Employers Holdings, Inc. . . . . . . . . | 36,301 | ||
| 1,057 | Hilb, Rogal & Hobbs Co. . . . . . . . . | 33,264 | ||
| 335 | National Interstate Corp. . . . . . . . . . | 7,822 | ||
| 270 | Tower Group, Inc. . . . . . . . . . . . . . . | 6,796 | ||
| 155,246 | ||||
| Internet & Catalog Retail - 0.56% | ||||
| 4,375 | Coldwater Creek, Inc. (a) . . . . . . . . | 22,094 | ||
| 877 | NetFlix, Inc. (a) . . . . . . . . . . . . . . . . | 30,388 | ||
| 150 | Priceline.com, Inc. (a) . . . . . . . . . . . | 18,129 | ||
| 70,611 | ||||
| Number of | Market | |||
| Shares | Value | |||
| Internet Software & Services - 0.62% | ||||
| 254 | Akamai Technologies, Inc. (a) . . . . . | $ | 7,153 | |
| 621 | Digital River, Inc. (a) . . . . . . . . . . . . | 19,233 | ||
| 616 | Interwoven, Inc. (a) . . . . . . . . . . . . . | 6,579 | ||
| 372 | j2 Global Communications, Inc. (a) | 8,303 | ||
| 141 | Sohu.com, Inc. (a) . . . . . . . . . . . . . . | 6,363 | ||
| 749 | Valueclick, Inc. (a) . . . . . . . . . . . . . . | 12,920 | ||
| 687 | Vignette Corp. (a) . . . . . . . . . . . . . . | 9,075 | ||
| 492 | Websense, Inc. (a) . . . . . . . . . . . . . . | 9,225 | ||
| 78,851 | ||||
| IT Services - 2.20% | ||||
| 1,987 | Acxiom Corp. . . . . . . . . . . . . . . . . . | 23,586 | ||
| 652 | Cognizant Technology Solutions | |||
| Corp. (a) . . . . . . . . . . . . . . . . . . . . . | 18,797 | |||
| 2,171 | CSG Systems International (a) . . . . | 24,684 | ||
| 750 | Euronet Worldwide, Inc. (a) . . . . . . | 14,445 | ||
| 852 | Gartner, Inc. (a) . . . . . . . . . . . . . . . . | 16,478 | ||
| 2,563 | Global Cash Access Holdings, | |||
| Inc. (a) . . . . . . . . . . . . . . . . . . . . . . | 15,019 | |||
| 584 | Global Payments, Inc. . . . . . . . . . . . | 24,154 | ||
| 399 | Heartland Payment Systems, Inc. . . | 9,181 | ||
| 409 | Mantech International Corp. - | |||
| Class A (a) . . . . . . . . . . . . . . . . . . . | 18,552 | |||
| 523 | MAXIMUS, Inc. . . . . . . . . . . . . . . . | 19,199 | ||
| 1,321 | Sapient Corp. (a) . . . . . . . . . . . . . . . | 9,194 | ||
| 1,186 | SRA International, Inc. - Class A (a) | 28,832 | ||
| 1,069 | SYKES Enterprises, Inc. (a) . . . . . . | 18,804 | ||
| 826 | Syntel, Inc. . . . . . . . . . . . . . . . . . . . . | 22,013 | ||
| 925 | Verifone Holdings, Inc. (a) . . . . . . . | 14,680 | ||
| 277,618 | ||||
| Leisure Equipment & Products - 0.33% | ||||
| 1,082 | Marine Products Corp. . . . . . . . . . . | 8,743 | ||
| 1,142 | Pool Corporation . . . . . . . . . . . . . . . | 21,572 | ||
| 1,347 | Sturm, Ruger & Company, Inc. (a) . | 11,099 | ||
| 41,414 | ||||
| Life Sciences Tools & Services - 0.78% | ||||
| 399 | Bio-Rad Laboratories, Inc. (a) . . . . . | 35,491 | ||
| 981 | Bruker BioSciences Corp. (a) . . . . . | 15,098 | ||
| 184 | Dionex Corp. (a) . . . . . . . . . . . . . . . | 14,166 | ||
| 220 | Millipore Corp. (a) . . . . . . . . . . . . . | 14,830 | ||
| 425 | PharmaNet Development Group, | |||
| Inc. (a) . . . . . . . . . . . . . . . . . . . . . . | 10,723 | |||
| 112 | Techne Corp. (a) . . . . . . . . . . . . . . . | 7,544 | ||
| 97,852 | ||||
See notes to financial statements.
106
| AssetMark Fundamental Index™ Small Company Growth Fund |
| SCHEDULE OF INVESTMENTS (Continued) |
| March 31, 2008 |
| Number of | Market | |||
| Shares | Value | |||
| COMMON STOCKS (Continued) | ||||
| Machinery - 3.86% | ||||
| 413 | Actuant Corp. - Class A . . . . . . . . . . | $ | 12,477 | |
| 583 | Albany International Corp. . . . . . . . | 21,070 | ||
| 195 | Ampco-Pittsburgh Corp. . . . . . . . . . | 8,383 | ||
| 316 | Astec Industries, Inc. (a) . . . . . . . . . | 12,248 | ||
| 169 | Badger Meter, Inc. . . . . . . . . . . . . . . | 7,301 | ||
| 670 | Barnes Group, Inc. . . . . . . . . . . . . . . | 15,376 | ||
| 95 | Bucyrus International, Inc. - Class A | |||
| 9,657 | ||||
| 199 | Cascade Corp. . . . . . . . . . . . . . . . . . | 9,813 | ||
| 345 | Chart Industries, Inc. (a) . . . . . . . . . | 11,675 | ||
| 165 | CIRCOR International, Inc. . . . . . . . | 7,631 | ||
| 524 | Clarcor, Inc. . . . . . . . . . . . . . . . . . . . | 18,628 | ||
| 619 | Columbus McKinnon | |||
| Corporation (a) . . . . . . . . . . . . . . . | 19,177 | |||
| 975 | EnPro Industries, Inc. (a) . . . . . . . . . | 30,410 | ||
| 299 | ESCO Technologies, Inc. (a) . . . . . . | 11,876 | ||
| 831 | Gardner Denver, Inc. (a) . . . . . . . . . | 30,830 | ||
| 294 | The Gorman-Rupp Co. . . . . . . . . . . | 9,670 | ||
| 861 | Graco, Inc. . . . . . . . . . . . . . . . . . . . . | 31,220 | ||
| 622 | IDEX Corp. . . . . . . . . . . . . . . . . . . . | 19,089 | ||
| 530 | Kaydon Corp. . . . . . . . . . . . . . . . . . | 23,272 | ||
| 494 | Lincoln Electric Holdings, Inc. . . . . | 31,858 | ||
| 669 | Nordson Corp. . . . . . . . . . . . . . . . . . | 36,026 | ||
| 510 | Robbins & Myers, Inc. . . . . . . . . . . | 16,651 | ||
| 435 | Tennant Co. . . . . . . . . . . . . . . . . . . . | 17,317 | ||
| 1,041 | Trinity Industries, Inc. . . . . . . . . . . . | 27,743 | ||
| 214 | Valmont Industries, Inc. . . . . . . . . . . | 18,808 | ||
| 745 | Westinghouse Air Brake | |||
| Technologies Corp. . . . . . . . . . . . . | 28,057 | |||
| 486,263 | ||||
| Marine - 0.46% | ||||
| 1,363 | American Commercial Lines, Inc. (a) | 21,535 | ||
| 896 | Horizon Lines, Inc. - Class A . . . . . | 16,675 | ||
| 345 | Kirby Corp. (a) . . . . . . . . . . . . . . . . | 19,665 | ||
| 57,875 | ||||
| Media - 3.10% | ||||
| 313 | Arbitron, Inc. . . . . . . . . . . . . . . . . . . | 13,509 | ||
| 156 | Central European Media Enterprises | |||
| Ltd. (a) . . . . . . . . . . . . . . . . . . . . . . | 13,296 | |||
| 333 | CTC Media, Inc. (a) . . . . . . . . . . . . | 9,241 | ||
| 675 | DreamWorks Animation SKG, | |||
| Inc. (a) . . . . . . . . . . . . . . . . . . . . . . | 17,402 |
107
| Number of | Market | |||
| Shares | Value | |||
| Media (Continued) | ||||
| 3,838 | Entravision Communications | |||
| Corp. (a) . . . . . . . . . . . . . . . . . . . . . | $ | 25,561 | ||
| 1,594 | Gemstar-TV Guide International, | |||
| Inc. (a) . . . . . . . . . . . . . . . . . . . . . . | 7,492 | |||
| 1,508 | Harte-Hanks, Inc. . . . . . . . . . . . . . . | 20,614 | ||
| 952 | Interactive Data Corp. . . . . . . . . . . . | 27,103 | ||
| 312 | John Wiley & Sons, Inc. . . . . . . . . . | 12,386 | ||
| 830 | Lamar Advertising Co. (a) . . . . . . . . | 29,822 | ||
| 1,026 | Marvel Entertainment, Inc. (a) . . . . | 27,487 | ||
| 875 | Meredith Corp. . . . . . . . . . . . . . . . . | 33,469 | ||
| 220 | Morningstar, Inc. (a) . . . . . . . . . . . . | 13,497 | ||
| 1,280 | Playboy Enterprises, Inc. (a) . . . . . . | 10,662 | ||
| 1,896 | PRIMEDIA Inc. . . . . . . . . . . . . . . . . | 13,936 | ||
| 1,874 | RH Donnelley Corp. (a) . . . . . . . . . | 9,482 | ||
| 1,852 | Sinclair Broadcast Group, Inc. . . . . | 16,501 | ||
| 3,275 | Valassis Communications, Inc. (a) . | 35,534 | ||
| 621 | Value Line, Inc. . . . . . . . . . . . . . . . . | 28,504 | ||
| 1,336 | World Wrestling Entertainment, Inc. | 24,863 | ||
| 390,361 | ||||
| Metals & Mining - 1.39% | ||||
| 235 | AMCOL International Corp. . . . . . . | 7,339 | ||
| 321 | Brush Engineered Materials, Inc. (a) | 8,240 | ||
| 451 | Century Aluminum Co. (a) . . . . . . . | 29,874 | ||
| 1,942 | Coeur d’Alene Mines Corp. (a) . . . . | 7,846 | ||
| 160 | Haynes International, Inc. (a) . . . . . | 8,781 | ||
| 917 | Hecla Mining Co. (a) . . . . . . . . . . . . | 10,234 | ||
| 310 | Kaiser Aluminum Corp. . . . . . . . . . | 21,483 | ||
| 192 | RTI International Metals, Inc. (a) . . | 8,680 | ||
| 149 | Schnitzer Steel Industries, Inc. . . . . | 10,582 | ||
| 1,098 | Steel Dynamics, Inc. . . . . . . . . . . . . | 36,278 | ||
| 733 | Stillwater Mining Co. (a) . . . . . . . . . | 11,340 | ||
| 946 | Titanium Metals Corp. . . . . . . . . . . . | 14,237 | ||
| 174,914 | ||||
| Multiline Retail - 0.15% | ||||
| 1,192 | Conn’s, Inc. (a) . . . . . . . . . . . . . . . . | 19,441 | ||
| Office Electronics - 0.15% | ||||
| 566 | Zebra Technologies Corp. (a) . . . . . | 18,859 | ||
| Oil & Gas - 2.60% | ||||
| 507 | Alpha Natural Resources, Inc. (a) . . | 22,024 | ||
| 749 | Arch Coal, Inc. . . . . . . . . . . . . . . . . | 32,582 | ||
| 211 | Barrett Bill Corp. (a) . . . . . . . . . . . . | 9,970 | ||
| 190 | Berry Petroleum Co. - Class A . . . . | 8,833 |
See notes to financial statements.
| AssetMark Fundamental Index™ Small Company Growth Fund | |||
| SCHEDULE OF INVESTMENTS (Continued) |
| March 31, 2008 | ||||
| Number of | Market | |||
| Shares | Value | |||
| COMMON STOCKS (Continued) | ||||
| Oil & Gas (Continued) | ||||
| 534 | Bois d’Arc Energy, Inc. (a) . . . . . . . | $ | 11,476 | |
| 567 | Cabot Oil & Gas Corp. . . . . . . . . . . | 28,826 | ||
| 470 | CNX Gas Corp. (a) . . . . . . . . . . . . . | 15,172 | ||
| 472 | Continental Resources, Inc. (a) . . . . | 15,052 | ||
| 741 | Denbury Resources, Inc. (a) . . . . . . | 21,156 | ||
| 555 | Encore Acquisition Co. (a) . . . . . . . | 22,355 | ||
| 646 | EXCO Resources, Inc. (a) . . . . . . . . | 11,951 | ||
| 800 | Harvest Natural Resources, Inc. (a) . | 9,648 | ||
| 502 | Nordic American Tanker Shipping . | 14,056 | ||
| 224 | Penn Virginia Corp. . . . . . . . . . . . . . | 9,876 | ||
| 168 | Petroleum Development Corp. (a) . . | 11,637 | ||
| 262 | Quicksilver Resources, Inc. (a) . . . . | 9,571 | ||
| 223 | Range Resources Corp. . . . . . . . . . . | 14,149 | ||
| 976 | Southwestern Energy Co. (a) . . . . . . | 32,881 | ||
| 427 | St Mary Land & Exploration Co. . . | 16,440 | ||
| 1,355 | VeraSun Energy Corp. (a) . . . . . . . . | 9,959 | ||
| 327,614 | ||||
| Paper & Forest Products - 0.06% | ||||
| 303 | Neenah Paper, Inc. . . . . . . . . . . . . . . | 7,811 | ||
| Personal Products - 0.32% | ||||
| 658 | Bare Escentuals, Inc. (a) . . . . . . . . . | 15,410 | ||
| 108 | Chattem, Inc. (a) . . . . . . . . . . . . . . . | 7,165 | ||
| 500 | Inter Parfums, Inc. . . . . . . . . . . . . . . | 11,040 | ||
| 333 | USANA Health Sciences, Inc. (a) . . | 7,336 | ||
| 40,951 | ||||
| Pharmaceuticals - 1.59% | ||||
| 382 | Allergan, Inc. . . . . . . . . . . . . . . . . . . | 21,541 | ||
| 601 | APP Pharmaceuticals, Inc. (a) . . . . . | 7,260 | ||
| 580 | Barr Pharmaceuticals, Inc. (a) . . . . . | 28,020 | ||
| 339 | KV Pharmaceutical Co. (a) . . . . . . . | 8,461 | ||
| 4,490 | Mylan Laboratories, Inc. . . . . . . . . . | 52,084 | ||
| 811 | Par Pharmaceutical Cos., Inc. (a) . . | 14,103 | ||
| 550 | Perrigo Co. . . . . . . . . . . . . . . . . . . . . | 20,752 | ||
| 636 | Warner Chilcott Limited (a) . . . . . . | 11,448 | ||
| 1,266 | Watson Pharmaceuticals, Inc. (a) . . | 37,119 | ||
| 200,788 | ||||
| Real Estate - 0.58% | ||||
| 1,412 | CB Richard Ellis Group, Inc. (a) . . . | 30,556 | ||
| 1,260 | Grubb & Ellis Co. . . . . . . . . . . . . . . | 8,656 | ||
| 803 | The St. Joe Co. . . . . . . . . . . . . . . . . | 34,473 | ||
| 73,685 | ||||
| Number of | Market | |||
| Shares | Value | |||
| Road & Rail - 0.41% | ||||
| 735 | Genesee & Wyoming, Inc. (a) . . . . . | $ | 25,284 | |
| 727 | Knight Transportation, Inc. . . . . . . . | 11,966 | ||
| 443 | Old Dominion Freight Line (a) . . . . | 14,101 | ||
| 51,351 | ||||
| Semiconductor & Semiconductor | ||||
| Equipment - 3.46% | ||||
| 1,257 | Advanced Energy Industries, Inc. (a) | 16,668 | ||
| 3,718 | Amkor Technology, Inc. (a) . . . . . . . | 39,783 | ||
| 7,444 | Atmel Corp. (a) . . . . . . . . . . . . . . . . | 25,905 | ||
| 386 | ATMI, Inc. (a) . . . . . . . . . . . . . . . . . | 10,742 | ||
| 302 | Cabot Microelectronics Corp. (a) . . | 9,709 | ||
| 429 | Cree, Inc. (a) . . . . . . . . . . . . . . . . . . | 11,995 | ||
| 746 | Cymer, Inc. (a) . . . . . . . . . . . . . . . . . | 19,426 | ||
| 834 | Cypress Semiconductor Corp. (a) . . | 19,691 | ||
| 408 | FEI Co. (a) . . . . . . . . . . . . . . . . . . . . | 8,907 | ||
| 1,170 | FormFactor, Inc. (a) . . . . . . . . . . . . . | 22,347 | ||
| 1,549 | Integrated Device Technology, | |||
| Inc. (a) . . . . . . . . . . . . . . . . . . . . . . | 13,833 | |||
| 1,322 | Intersil Corp. . . . . . . . . . . . . . . . . . . | 33,936 | ||
| 2,808 | Kulicke & Soffa Industries, Inc. (a) | 13,422 | ||
| 1,278 | Mattson Technology, Inc. (a) . . . . . . | 7,783 | ||
| 1,665 | Micrel, Inc. . . . . . . . . . . . . . . . . . . . | 15,434 | ||
| 310 | Microsemi Corp. (a) . . . . . . . . . . . . | 7,068 | ||
| 795 | MKS Instruments, Inc. (a) . . . . . . . . | 17,013 | ||
| 1,784 | Omnivision Technologies, Inc. (a) . | 30,007 | ||
| 2,735 | ON Semiconductor Corp. (a) . . . . . . | 15,535 | ||
| 1,033 | Semtech Corp. (a) . . . . . . . . . . . . . . | 14,803 | ||
| 391 | Silicon Laboratories, Inc. (a) . . . . . . | 12,332 | ||
| 1,104 | SiRF Technology Holdings, Inc. (a) | 5,619 | ||
| 1,398 | Skyworks Solutions, Inc. (a) . . . . . . | 10,177 | ||
| 313 | Standard Microsystems Corp. (a) . . | 9,133 | ||
| 764 | Tessera Technologies, Inc. (a) . . . . . | 15,891 | ||
| 1,020 | Varian Semiconductor Equipment | |||
| Associates, Inc. (a) . . . . . . . . . . . . | 28,713 | |||
| 435,872 | ||||
| Software - 3.54% | ||||
| 990 | ACI Worldwide, Inc. (a) . . . . . . . . . | 19,721 | ||
| 1,336 | Activision, Inc. (a) . . . . . . . . . . . . . . | 36,486 | ||
| 311 | Blackbaud, Inc. . . . . . . . . . . . . . . . . | 7,551 | ||
| 944 | Epicor Software Corp. (a) . . . . . . . . | 10,573 | ||
| 269 | Factset Research Systems, Inc. . . . . | 14,491 | ||
| 787 | Fair Isaac Corp. . . . . . . . . . . . . . . . . | 16,936 | ||
| 942 | I2 Technologies, Inc. (a) . . . . . . . . . | 10,607 |
See notes to financial statements.
108
| AssetMark Fundamental Index™ Small Company Growth Fund |
| SCHEDULE OF INVESTMENTS (Continued) |
| March 31, 2008 |
| Number of | Market | |||
| Shares | Value | |||
| COMMON STOCKS (Continued) | ||||
| Software (Continued) | ||||
| 1,079 | Jack Henry & Associates, Inc. . . . . . | $ | 26,619 | |
| 1,033 | Lawson Software, Inc. (a) . . . . . . . . | 7,778 | ||
| 868 | MICRO Systems, Inc. (a) . . . . . . . . | 29,217 | ||
| 179 | MicroStrategy, Inc. (a) . . . . . . . . . . . | 13,244 | ||
| 931 | MSC.Software Corp. (a) . . . . . . . . . | 12,094 | ||
| 195 | NAVTEQ Corp. (a) . . . . . . . . . . . . . | 13,260 | ||
| 421 | Net 1 UEPS Technologies, Inc. (a) . | 9,494 | ||
| 1,773 | Parametric Technology Corp. (a) . . | 28,332 | ||
| 456 | Progress Software Corp. (a) . . . . . . | 13,643 | ||
| 303 | Quality Systems, Inc. . . . . . . . . . . . . | 9,051 | ||
| 1,909 | Quest Software, Inc. (a) . . . . . . . . . . | 24,951 | ||
| 988 | Red Hat, Inc. (a) . . . . . . . . . . . . . . . | 18,169 | ||
| 993 | Renaissance Learning, Inc. . . . . . . . | 13,892 | ||
| 273 | SPSS, Inc. (a) . . . . . . . . . . . . . . . . . . | 10,587 | ||
| 1,904 | Take-Two Interactive Software, | |||
| Inc. (a) . . . . . . . . . . . . . . . . . . . . . . | 48,590 | |||
| 1,236 | THQ, Inc. (a) . . . . . . . . . . . . . . . . . . | 26,945 | ||
| 2,470 | TIBCO Software, Inc. (a) . . . . . . . . | 17,636 | ||
| 471 | Tyler Technologies, Inc. (a) . . . . . . . | 6,585 | ||
| 446,452 | ||||
| Specialty Retail - 4.11% | ||||
| 1,044 | Aaron Rents, Inc. . . . . . . . . . . . . . . . | 22,488 | ||
| 1,491 | Aeropostale, Inc. (a) . . . . . . . . . . . . | 40,421 | ||
| 652 | bebe stores, inc. . . . . . . . . . . . . . . . . | 7,009 | ||
| 1,434 | Build-A-Bear Workshop, Inc. (a) . . | 13,035 | ||
| 694 | Cache, Inc. (a) . . . . . . . . . . . . . . . . . | 7,835 | ||
| 2,000 | Casual Male Retail Group, Inc. (a) . | 8,400 | ||
| 4,032 | Chico’s FAS, Inc. (a) . . . . . . . . . . . . | 28,667 | ||
| 1,494 | Christopher & Banks Corp. . . . . . . . | 14,925 | ||
| 3,936 | CSK Auto Corp. (a) . . . . . . . . . . . . . | 36,644 | ||
| 1,523 | Dress Barn, Inc. (a) . . . . . . . . . . . . . | 19,708 | ||
| 2,066 | DSW, Inc. (a) . . . . . . . . . . . . . . . . . . | 26,755 | ||
| 1,096 | Genesco, Inc. (a) . . . . . . . . . . . . . . . | 25,329 | ||
| 765 | Guess?, Inc. . . . . . . . . . . . . . . . . . . . | 30,960 | ||
| 520 | Gymboree Corp. (a) . . . . . . . . . . . . . | 20,738 | ||
| 849 | Hibbett Sports, Inc. (a) . . . . . . . . . . | 13,109 | ||
| 379 | J.Crew Group, Inc. (a) . . . . . . . . . . . | 16,740 | ||
| 457 | JoS. A. Bank Clothiers, Inc. (a) . . . . | 9,368 | ||
| 531 | Maidenform Brands, Inc. (a) . . . . . . | 8,639 | ||
| 1,995 | Rent-A-Center, Inc. (a) . . . . . . . . . . | 36,608 | ||
| 4,297 | Select Comfort Corp. (a) . . . . . . . . . | 15,469 | ||
| 915 | Tractor Supply Co. (a) . . . . . . . . . . . | 36,161 |
| Number of | Market | |||
| Shares | Value | |||
| Specialty Retail (Continued) | ||||
| 1,216 | Tween Brands, Inc. (a) . . . . . . . . . . . | $ | 30,084 | |
| 701 | Urban Outfitters, Inc. (a) . . . . . . . . . | 21,976 | ||
| 337 | Weight Watchers International, Inc. | 15,613 | ||
| 3,276 | The Wet Seal, Inc. (a) . . . . . . . . . . . | 11,106 | ||
| 517,787 | ||||
| Textiles, Apparel & Luxury Goods - 1.51% | ||||
| 1,654 | Carter’s, Inc. (a) . . . . . . . . . . . . . . . . | 26,712 | ||
| 277 | Cherokee, Inc. . . . . . . . . . . . . . . . . . | 9,326 | ||
| 543 | Columbia Sportswear Co. . . . . . . . . | 23,908 | ||
| 1,265 | K-Swiss, Inc. . . . . . . . . . . . . . . . . . . | 20,012 | ||
| 901 | Movado Group, Inc. . . . . . . . . . . . . | 17,560 | ||
| 1,033 | Skechers U.S.A., Inc. (a) . . . . . . . . . | 20,877 | ||
| 221 | Under Armour, Inc. (a) . . . . . . . . . . | 8,089 | ||
| 422 | Volcom, Inc. (a) . . . . . . . . . . . . . . . . | 8,529 | ||
| 479 | Warnaco Group, Inc. (a) . . . . . . . . . | 18,892 | ||
| 1,261 | Wolverine World Wide, Inc. . . . . . . | 36,582 | ||
| 190,487 | ||||
| Thrifts & Mortgage Finance - 0.28% | ||||
| 1,078 | Kearny Financial Corp. . . . . . . . . . . | 11,804 | ||
| 474 | Roma Financial Corp. . . . . . . . . . . . | 7,067 | ||
| 663 | Wauwatosa Holdings, Inc. (a) . . . . . | 7,890 | ||
| 182 | WSFS Financial Corp. . . . . . . . . . . . | 8,969 | ||
| 35,730 | ||||
| Trading Companies & Distributors - 0.74% | ||||
| 753 | Electro Rent Corp. . . . . . . . . . . . . . . | 11,408 | ||
| 604 | Fastenal Co. . . . . . . . . . . . . . . . . . . . | 27,742 | ||
| 1,107 | H&E Equipment Services, Inc. (a) . | 13,915 | ||
| 573 | Interline Brands, Inc. (a) . . . . . . . . . | 10,629 | ||
| 392 | MSC Industrial Direct Co., Inc. - | |||
| Class A . . . . . . . . . . . . . . . . . . . . . . | 16,562 | |||
| 346 | TransDigm Group, Inc. (a) . . . . . . . | 12,819 | ||
| 93,075 | ||||
| Water Utilities - 0.36% | ||||
| 1,908 | Aqua America, Inc. . . . . . . . . . . . . . | 35,832 | ||
| 321 | SJW Corp. . . . . . . . . . . . . . . . . . . . . | 9,178 | ||
| 45,010 | ||||
| Wireless Telecommunication Services - 0.56% | ||||
| 2,694 | Centennial Communications Corp. (a) | 15,922 | ||
| 463 | Crown Castle International Corp. (a) | 15,969 | ||
| 275 | Leap Wireless International, Inc. (a) | 12,815 | ||
| 973 | MetroPCS Communications, Inc. (a) | 16,541 | ||
See notes to financial statements.
109
| AssetMark Fundamental Index™ Small Company Growth Fund |
| SCHEDULE OF INVESTMENTS (Continued) |
| March 31, 2008 |
| Number of | Market | |||
| Shares | Value | |||
| COMMON STOCKS (Continued) | ||||
| Wireless Telecommunication Services (Continued) | ||||
| 582 | Syniverse Holdings, Inc. (a) . . . . . . | $ | 9,696 | |
| 70,943 | ||||
| Total Common Stocks | ||||
(Cost $10,167,360) . . . . . . . . . . . . | 9,480,513 | |||
| REAL ESTATE INVESTMENT TRUSTS - 2.86% | ||||
| Real Estate Investment Trusts - 2.86% | ||||
| 179 | Alexandria Real Estate Equities, Inc. | 16,597 | ||
| 656 | BRE Properties, Inc. . . . . . . . . . . . . | 29,887 | ||
| 335 | Corporate Office Properties Trust . . | 11,259 | ||
| 199 | EastGroup Properties, Inc. . . . . . . . . | 9,246 | ||
| 459 | Equity Lifestyle Properties, Inc. . . . | 22,661 | ||
| 130 | Essex Property Trust, Inc. . . . . . . . . | 14,818 | ||
| 314 | Federal Realty Investment Trust . . . | 24,476 | ||
| 348 | Forest City Enterprises, Inc. . . . . . . | 12,806 | ||
| 1,098 | Glimcher Realty Trust . . . . . . . . . . . | 13,132 | ||
| 355 | LaSalle Hotel Properties . . . . . . . . . | 10,199 | ||
| 437 | The Macerich Co. . . . . . . . . . . . . . . | 30,708 | ||
| 652 | Maguire Properties, Inc. . . . . . . . . . | 9,330 | ||
| 674 | PS Business Parks, Inc. . . . . . . . . . . | 34,981 | ||
| 318 | Saul Centers, Inc. . . . . . . . . . . . . . . . | 15,976 | ||
| 215 | SL Green Realty Corp. . . . . . . . . . . | 17,516 | ||
| 182 | Tanger Factory Outlet Centers, Inc. | 7,002 | ||
| 253 | Taubman Centers, Inc. . . . . . . . . . . . | 13,181 | ||
| 831 | UDR, Inc. . . . . . . . . . . . . . . . . . . . . | 20,376 | ||
| 399 | Ventas, Inc. . . . . . . . . . . . . . . . . . . . | 17,919 | ||
| 292 | Washington Real Estate Investment | |||
| Trust . . . . . . . . . . . . . . . . . . . . . . . . | 9,759 | |||
| 543 | Weingarten Realty Investors . . . . . . | 18,701 | ||
| 360,530 | ||||
| Total Real Estate Investment Trusts | ||||
(Cost $378,632) . . . . . . . . . . . . . . . | 360,530 | |||
| Number of | Market | |||
| Shares | Value | |||
| SHORT TERM INVESTMENTS - 4.73% | ||||
| Money Market Funds - 4.73% | ||||
| 596,930 | Federated Prime Obligations Fund, | |||
| 3.180% (b) . . . . . . . . . . . . . . . . . . . | $ | 596,930 | ||
| Total Short Term Investments | ||||
(Cost $596,930) . . . . . . . . . . . . . . . | 596,930 | |||
| Total Investments | ||||
(Cost $11,142,922) - 82.77% . . . . | 10,437,973 | |||
| Other Assets in Excess of | ||||
Liabilities - 17.23% . . . . . . . . . . . | 2,172,925 | |||
| TOTAL NET | ||||
ASSETS - 100.00% . . . . . . . . . . . | $ | 12,610,898 | ||
| Percentages are stated as a percent of net assets. | ||||
| (a) Non Income Producing. | ||||
| (b) Variable Rate Security. The rate shown is the rate in effect on | ||||
| March 31, 2008. | ||||
See notes to financial statements.
110
| AssetMark Fundamental Index™ Small Company Growth Fund | |||||||
| SCHEDULE OF OPEN FUTURES CONTRACTS | |||||||
| March 31, 2008 | |||||||
| Number of | |||||||
| Contracts | Notional | Settlement | Unrealized | ||||
| Description | Purchased | Value | Month | Appreciation | |||
| Russell 2000 Mini Futures | 10 | $685,105 | Jun-08 | $4,895 | |||
See notes to financial statements.
111
AssetMark Enhanced Fundamental IndexTM Small Company Value Fund |
| PERFORMANCE DATA |
TOTAL RETURN BASED ON A $10,000 INVESTMENT

This chart assumes an initial gross investment of $10,000 made on August 9, 2007 (commencement of the Fund’s operations). Returns shown include the reinvestment of all dividends. Returns shown do not reflect the deduction of taxes that a shareholder would pay on fund distributions or the redemption of fund shares. In the absence of fee waivers and reimbursements, total return would be reduced. Past performance is not predictive of future performance. Investment return and principal value will fluctuate, so that your shares, when redeemed, may be worth more or less than the original cost.
RUSSELL 2000 VALUE INDEX - An unmanaged index which measures the performance of those Russell 2000 Index companies with lower price-to-book ratios and lower forecasted growth values. The Russell 2000 Index is an unmanaged index which measures the performance of the 2,000 smallest companies in the Russell 3000 Index. The Russell 3000 Index is an unmanaged index which measures the performance of the 3,000 largest U.S. companies based on total market capitalization, which represents approximately 98% of the investable U.S. equity market.
LIPPER SMALL-CAP VALUE FUNDS INDEX - The Lipper Small-Cap Value Funds Index is the average of the 30 largest funds in the Lipper Small-Cap Value Funds Category. These funds, by portfolio practice, invest 75% of equity assets in companies with market capitalizations (on a three-year weighted basis) less than 250% of the dollar-weighted median market capitalization of the smallest 500 of the middle 1,000 securities of the S&P Super Composite 1500® Index. These funds typically invest in securities that have a below average price-to-earnings ratio, price-to-book ratio and three-year sales-per-share growth value, compared to the S&P SmallCap 600 IndexTM.
| TOTAL RETURN (for the period ended March 31) | |
| Since Inception (8/9/07) | |
AssetMark Enhanced Fundamental IndexTM Small Company Value Fund | -16.27% |
| Russell 2000 Value Index | -10.90% |
| Lipper Small-Cap Value Funds Index | -10.60% |
112
| AssetMark Fundamental Index™ Small Company Value Fund | ||
| SCHEDULE OF INVESTMENTS | ||
| March 31, 2008 |
| Number of | Market | |||
| Shares | Value | |||
| COMMON STOCKS - 67.68% | ||||
| Aerospace & Defense - 0.50% | ||||
| 220 | DRS Technologies, Inc. . . . . . . . . . . | $ 12,822 | ||
| 128 | Esterline Technologies Corp. (a) . . . | 6,447 | ||
| 383 | Kaman Corp. . . . . . . . . . . . . . . . . . . | 10,835 | ||
| 30,104 | ||||
| Air Freight & Logistics - 0.48% | ||||
| 4,449 | ABX Holdings, Inc. (a) . . . . . . . . . . | 13,080 | ||
| 677 | Pacer International, Inc. . . . . . . . . . . | 11,123 | ||
| 296 | Park-Ohio Holdings Corp. (a) . . . . . | 4,650 | ||
| 28,853 | ||||
| Airlines - 0.76% | ||||
| 538 | AirTran Holdings, Inc. (a) . . . . . . . . | 3,551 | ||
| 1,943 | Frontier Airlines Holdings, Inc. (a) . | 4,916 | ||
| 1,298 | JetBlue Airways Corp. (a) . . . . . . . . | 7,528 | ||
| 2,843 | Mesa Air Group, Inc. (a) . . . . . . . . . | 6,681 | ||
| 289 | Pinnacle Airlines Corp. (a) . . . . . . . | 2,523 | ||
| 309 | Republic Airways Holdings, Inc. (a) | 6,693 | ||
| 661 | Skywest, Inc. . . . . . . . . . . . . . . . . . . | 13,960 | ||
| 45,852 | ||||
| Auto Components - 1.07% | ||||
| 1,443 | Accuride Corp. (a) . . . . . . . . . . . . . . | 11,804 | ||
| 4,152 | Hayes Lemmerz International, | |||
| Inc. (a) . . . . . . . . . . . . . . . . . . . . . . | 11,584 | |||
| 477 | Sauer-Danfoss, Inc. . . . . . . . . . . . . . | 10,561 | ||
| 1,224 | Standard Motor Products, Inc. . . . . . | 7,491 | ||
| 611 | Stoneridge, Inc. (a) . . . . . . . . . . . . . | 8,218 | ||
| 101 | Strattec Security Corp. . . . . . . . . . . | 4,275 | ||
| 520 | Superior Industries International, Inc. | 10,790 | ||
| 64,723 | ||||
| Automobiles - 0.25% | ||||
| 1,894 | Fleetwood Enterprises, Inc. (a) . . . . | 8,712 | ||
| 675 | Monaco Coach Corp. . . . . . . . . . . . . | 6,399 | ||
| 15,111 | ||||
| Beverages - 0.17% | ||||
| 169 | Coca-Cola Bottling Co. | |||
| Consolidated . . . . . . . . . . . . . . . . . | 10,414 | |||
| Biotechnology - 0.07% | ||||
| 303 | Applera Corp. (a) . . . . . . . . . . . . . . . | 4,454 | ||
| Building Products - 0.93% | ||||
| 415 | American Woodmark Corp. . . . . . . . | 8,532 | ||
| 2,011 | Builders Firstsource, Inc. (a) . . . . . . | 14,600 |
| Number of | Market | |||
| Shares | Value | |||
| Building Products (Continued) | ||||
| 1,457 | Griffon Corp. (a) . . . . . . . . . . . . . . . | $ | 12,530 | |
| 308 | NCI Building Systems, Inc. (a) . . . . | 7,454 | ||
| 401 | Universal Forest Products, Inc. . . . . | 12,912 | ||
| 56,028 | ||||
| Capital Markets - 0.77% | ||||
| 25 | Capital Southwest Corp. . . . . . . . . . | 3,093 | ||
| 634 | Cowen Group, Inc. (a) . . . . . . . . . . . | 4,495 | ||
| 422 | Knight Capital Group, Inc. (a) . . . . . | 6,853 | ||
| 1,060 | LaBranche & Co., Inc. (a) . . . . . . . . | 4,611 | ||
| 590 | MCG Capital Corp. . . . . . . . . . . . . . | 5,363 | ||
| 375 | SWS Group, Inc. . . . . . . . . . . . . . . . | 4,586 | ||
| 9,111 | W.P. Stewart & Co., Ltd. . . . . . . . . . | 17,676 | ||
| 46,677 | ||||
| Chemicals - 2.80% | ||||
| 741 | A. Schulman, Inc. . . . . . . . . . . . . . . | 15,213 | ||
| 251 | Arch Chemicals, Inc. . . . . . . . . . . . . | 9,352 | ||
| 1,052 | Ferro Corp. . . . . . . . . . . . . . . . . . . . | 15,633 | ||
| 1,049 | Georgia Gulf Corp. . . . . . . . . . . . . . | 7,269 | ||
| 925 | Headwaters, Inc. (a) . . . . . . . . . . . . . | 12,201 | ||
| 135 | Koppers Holdings, Inc. . . . . . . . . . . | 5,982 | ||
| 728 | Kronos Worldwide, Inc. . . . . . . . . . . | 17,581 | ||
| 195 | Minerals Technologies, Inc. . . . . . . | 12,246 | ||
| 149 | NewMarket Corp. . . . . . . . . . . . . . . | 11,242 | ||
| 907 | NL Industries . . . . . . . . . . . . . . . . . . | 9,904 | ||
| 1,630 | Omnova Solutions, Inc. (a) . . . . . . . | 6,504 | ||
| 2,043 | PolyOne Corp. (a) . . . . . . . . . . . . . . | 13,014 | ||
| 228 | Quaker Chemical Corp. . . . . . . . . . . | 7,134 | ||
| 381 | Sensient Technologies Corp. . . . . . . | 11,236 | ||
| 1,062 | Spartech Corp. . . . . . . . . . . . . . . . . . | 8,974 | ||
| 151 | Stepan Co. . . . . . . . . . . . . . . . . . . . . | 5,773 | ||
| 169,258 | ||||
| Commercial Banks - 9.96% | ||||
| 388 | 1st Source Corp. . . . . . . . . . . . . . . . | 8,167 | ||
| 292 | AMCORE Financial, Inc. . . . . . . . . | 5,942 | ||
| 255 | Ameris Bancorp . . . . . . . . . . . . . . . . | 4,095 | ||
| 200 | Arrow Financial Corp. . . . . . . . . . . . | 4,498 | ||
| 163 | BancFirst Corp. . . . . . . . . . . . . . . . . | 7,462 | ||
| 325 | Banco Latinoamericano de | |||
| Exportaciones, S.A. . . . . . . . . . . . . | 5,005 | |||
| 339 | Bank of Granite Corp. . . . . . . . . . . . | 3,722 | ||
| 224 | Banner Corp. . . . . . . . . . . . . . . . . . . | 5,161 | ||
| 6,042 | BFC Financial Corp. (a) . . . . . . . . . | 7,311 |
See notes to financial statements.
113
| AssetMark Fundamental Index™ Small Company Value Fund | ||
| SCHEDULE OF INVESTMENTS (Continued) | ||
| March 31, 2008 |
| Number of | Market | |||
| Shares | Value | |||
| COMMON STOCKS (Continued) | ||||
| Commercial Banks (Continued) | ||||
| 379 | Boston Private Financial | |||
| Holdings, Inc. . . . . . . . . . . . . . . . . | $ | 4,014 | ||
| 115 | Camden National Corp. . . . . . . . . . . | 3,892 | ||
| 236 | Capital City Bank Group, Inc. . . . . . | 6,844 | ||
| 214 | Capitol Bancorp Ltd. . . . . . . . . . . . . | 4,524 | ||
| 699 | Cathay General Bancorp . . . . . . . . . | 14,490 | ||
| 839 | Centennial Bank Holdings, Inc. (a) . | 5,269 | ||
| 631 | Central Pacific Financial Corp. . . . . | 11,894 | ||
| 537 | Chemical Financial Corp. . . . . . . . . | 12,802 | ||
| 221 | City Holding Co. . . . . . . . . . . . . . . . | 8,818 | ||
| 177 | Columbia Banking System, Inc. . . . | 3,961 | ||
| 461 | Community Bank System, Inc. . . . . | 11,322 | ||
| 257 | Community Trust Bancorp, Inc. . . . | 7,530 | ||
| 1,289 | CVB Financial Corp. . . . . . . . . . . . . | 13,418 | ||
| 538 | Eurobancshares, Inc. (a) . . . . . . . . . | 2,862 | ||
| 758 | F.N.B. Corp. . . . . . . . . . . . . . . . . . . . | 11,832 | ||
| 199 | Financial Institutions, Inc. . . . . . . . . | 3,771 | ||
| 251 | First Bancorp . . . . . . . . . . . . . . . . . . | 5,002 | ||
| 277 | First Charter Corp. . . . . . . . . . . . . . . | 7,399 | ||
| 587 | First Community Bancorp . . . . . . . . | 15,761 | ||
| 158 | First Community Bancshares, Inc. . | 5,754 | ||
| 880 | First Financial Bancorp . . . . . . . . . . | 11,836 | ||
| 210 | First Financial Corp. . . . . . . . . . . . . | 6,464 | ||
| 184 | First Merchants Corp. . . . . . . . . . . . | 5,251 | ||
| 268 | FNB United Corp. . . . . . . . . . . . . . . | 2,814 | ||
| 161 | Great Southern Bancorp, Inc. . . . . . | 2,513 | ||
| 190 | Greene County Bancshares, Inc. . . . | 3,361 | ||
| 332 | Hancock Holding Co. . . . . . . . . . . . | 13,951 | ||
| 1,036 | Hanmi Financial Corp. . . . . . . . . . . | 7,656 | ||
| 428 | Harleysville National Corp. . . . . . . . | 6,172 | ||
| 220 | Heartland Financial USA, Inc. . . . . | 4,655 | ||
| 128 | IBERIABANK Corp. . . . . . . . . . . . | 5,664 | ||
| 119 | Independent Bank Corp. . . . . . . . . . | 3,516 | ||
| 743 | Independent Bank Corporation . . . . | 7,712 | ||
| 252 | Integra Bank Corp. . . . . . . . . . . . . . | 4,082 | ||
| 628 | International Bancshares Corp. . . . . | 14,180 | ||
| 311 | Intervest Bancshares Corp. . . . . . . . | 2,982 | ||
| 2,189 | Irwin Financial Corp. . . . . . . . . . . . | 11,624 | ||
| 143 | Lakeland Financial Corp. . . . . . . . . | 3,239 | ||
| 213 | MainSource Financial Group, Inc. . | 3,301 | ||
| 456 | MB Financial Corp. . . . . . . . . . . . . . | 14,036 | ||
| 553 | MBT Financial Corp. . . . . . . . . . . . . | 4,756 | ||
| 515 | Midwest Banc Holdings, Inc. . . . . . | 6,582 |
| Number of | Market | |||
| Shares | Value | |||
| Commercial Banks (Continued) | ||||
| 711 | National Penn Bancshares, Inc. . . . . | $ | 12,933 | |
| 384 | NBT Bancorp, Inc. . . . . . . . . . . . . . | 8,525 | ||
| 217 | Omega Financial Corp. . . . . . . . . . . | 6,770 | ||
| 252 | Oriental Financial Group . . . . . . . . . | 4,967 | ||
| 505 | Pacific Capital Bancorp . . . . . . . . . . | 10,857 | ||
| 342 | Prosperity Bancshares, Inc. . . . . . . . | 9,802 | ||
| 851 | Provident Bankshares Corp. . . . . . . | 9,140 | ||
| 162 | Renasant Corp. . . . . . . . . . . . . . . . . | 3,645 | ||
| 178 | Republic Bancorp Inc. . . . . . . . . . . . | 3,361 | ||
| 308 | Royal Bancshares of Pennsylvania . | 4,457 | ||
| 473 | S&T Bancorp, Inc. . . . . . . . . . . . . . . | 15,216 | ||
| 223 | Sandy Spring Bancorp, Inc. . . . . . . . | 6,137 | ||
| 110 | SCBT Financial Corp. . . . . . . . . . . . | 3,718 | ||
| 474 | Seacoast Banking Corp of Florida . . | 5,190 | ||
| 549 | Security Bank Corp. . . . . . . . . . . . . | 4,365 | ||
| 205 | Simmons First National Corp. . . . . . | 6,095 | ||
| 248 | Southwest Bancorp, Inc. . . . . . . . . . | 4,342 | ||
| 351 | Sterling Bancorp . . . . . . . . . . . . . . . | 5,451 | ||
| 790 | Sterling Bancshares, Inc. . . . . . . . . . | 7,853 | ||
| 477 | Sterling Financial Corp. - PA . . . . . | 8,324 | ||
| 292 | Sun Bancorp, Inc. (a) . . . . . . . . . . . . | 3,846 | ||
| 269 | Taylor Capital Group, Inc. . . . . . . . . | 4,417 | ||
| 118 | Tompkins Financial Corp. . . . . . . . . | 5,806 | ||
| 247 | TriCo Bancshares . . . . . . . . . . . . . . | 4,276 | ||
| 380 | UMB Financial Corp. . . . . . . . . . . . | 15,656 | ||
| 1,009 | Umpqua Holdings Corp. . . . . . . . . . | 15,650 | ||
| 234 | Union Bankshares Corp. . . . . . . . . . | 4,533 | ||
| 402 | United Community Banks, Inc. . . . . | 6,826 | ||
| 210 | Univest Corporation of Pennsylvania | 5,500 | ||
| 253 | WesBanco, Inc. . . . . . . . . . . . . . . . . | 6,252 | ||
| 325 | West Bancorporation, Inc. . . . . . . . . | 4,277 | ||
| 284 | West Coast Bancorp . . . . . . . . . . . . | 4,144 | ||
| 560 | Western Alliance Bancorp (a) . . . . . | 7,202 | ||
| 386 | Wilshire Bancorp, Inc. . . . . . . . . . . . | 2,949 | ||
| 317 | Wintrust Financial Corp. . . . . . . . . . | 11,079 | ||
| 602,430 | ||||
| Commercial Services & Supplies - 1.68% | ||||
| 104 | AMREP Corp. . . . . . . . . . . . . . . . . . | 5,439 | ||
| 669 | Bowne & Co, Inc. . . . . . . . . . . . . . . | 10,202 | ||
| 599 | CBIZ, Inc. (a) . . . . . . . . . . . . . . . . . | 4,864 | ||
| 450 | CDI Corp. . . . . . . . . . . . . . . . . . . . . | 11,273 | ||
| 649 | Comfort Systems USA, Inc. . . . . . . | 8,443 | ||
| 294 | Ennis, Inc. . . . . . . . . . . . . . . . . . . . . | 4,933 | ||
See notes to financial statements.
114
| AssetMark Fundamental Index™ Small Company Value Fund | ||
| SCHEDULE OF INVESTMENTS (Continued) | ||
| March 31, 2008 |
| Number of | Market | |||
| Shares | Value | |||
| COMMON STOCKS (Continued) | ||||
| Commercial Services & Supplies (Continued) | ||||
| 151 | G&K Services, Inc. . . . . . . . . . . . . . | $ | 5,377 | |
| 1,222 | Hudson Highland Group, Inc. (a) . . | 10,350 | ||
| 338 | ICT Group, Inc. (a) . . . . . . . . . . . . . | 3,410 | ||
| 914 | Knoll, Inc. . . . . . . . . . . . . . . . . . . . . | 10,548 | ||
| 668 | On Assignment, Inc. (a) . . . . . . . . . . | 4,242 | ||
| 284 | Schawk, Inc. . . . . . . . . . . . . . . . . . . | 4,541 | ||
| 177 | School Specialty, Inc. (a) . . . . . . . . . | 5,583 | ||
| 1,549 | The Standard Register Co. . . . . . . . . | 12,067 | ||
| 101,272 | ||||
| Communications Equipment - 0.94% | ||||
| 2,251 | 3Com Corp. (a) . . . . . . . . . . . . . . . . | 5,155 | ||
| 353 | Audiovox Corp. (a) . . . . . . . . . . . . . | 3,770 | ||
| 136 | Bel Fuse, Inc. . . . . . . . . . . . . . . . . . . | 3,789 | ||
| 139 | Black Box Corp. . . . . . . . . . . . . . . . | 4,288 | ||
| 161 | EMS Technologies, Inc. (a) . . . . . . . | 4,369 | ||
| 215 | Loral Space & Communications | |||
| Ltd. (a) . . . . . . . . . . . . . . . . . . . . . . | 5,126 | |||
| 363 | Superior Essex, Inc. (a) . . . . . . . . . . | 10,207 | ||
| 866 | Sycamore Networks, Inc. (a) . . . . . . | 3,170 | ||
| 4,671 | UTStarcom, Inc. (a) . . . . . . . . . . . . . | 13,266 | ||
| 2,360 | Westell Technologies, Inc. (a) . . . . . | 3,540 | ||
| 56,680 | ||||
| Computers & Peripherals - 0.06% | ||||
| 841 | Hypercom Corp. (a) . . . . . . . . . . . . . | 3,650 | ||
| Construction & Engineering - 0.31% | ||||
| 643 | Insituform Technologies, Inc. (a) . . | 8,893 | ||
| 371 | Integrated Electrical Services, | |||
| Inc. (a) . . . . . . . . . . . . . . . . . . . . . . | 5,828 | |||
| 186 | Michael Baker Corp. (a) . . . . . . . . . | 4,178 | ||
| 18,899 | ||||
| Consumer Finance - 0.57% | ||||
| 1,544 | Advanta Corp. - Class B . . . . . . . . . | 10,854 | ||
| 805 | AmeriCredit Corp. (a) . . . . . . . . . . . | 8,106 | ||
| 864 | CompuCredit Corp. (a) . . . . . . . . . . | 7,664 | ||
| 331 | Nelnet, Inc. . . . . . . . . . . . . . . . . . . . | 3,889 | ||
| 901 | Rewards Network, Inc. (a) . . . . . . . | 4,037 | ||
| 34,550 | ||||
| Number of | Market | |||
| Shares | Value | |||
| Containers & Packaging - 0.75% | ||||
| 111 | AEP Industries, Inc. (a) . . . . . . . . . . | $ | 3,362 | |
| 2,862 | Caraustar Industries, Inc. (a) . . . . . . | 3,864 | ||
| 2,040 | Chesapeake Corp. . . . . . . . . . . . . . . | 9,812 | ||
| 2,288 | Constar International, Inc. (a) . . . . . | 5,995 | ||
| 746 | Myers Industries, Inc. . . . . . . . . . . . | 9,795 | ||
| 422 | Rock-Tenn Co. . . . . . . . . . . . . . . . . . | 12,647 | ||
| 45,475 | ||||
| Distributors - 0.44% | ||||
| 2,961 | Building Material Holding Corp. . . | 12,969 | ||
| 4,900 | Handleman Co. . . . . . . . . . . . . . . . . | 1,176 | ||
| 692 | Prestige Brands Holdings, Inc. (a) . . | 5,661 | ||
| 3,525 | Source Interlink Companies, Inc. (a) | 6,697 | ||
| 26,503 | ||||
| Diversified Consumer Services - 0.48% | ||||
| 469 | Carriage Services, Inc. (a) . . . . . . . . | 3,663 | ||
| 518 | Regis Corp. . . . . . . . . . . . . . . . . . . . | 14,240 | ||
| 1,765 | Stewart Enterprises, Inc. . . . . . . . . . | 11,331 | ||
| 29,234 | ||||
| Diversified Financial Services - 0.24% | ||||
| 619 | Assured Guaranty Ltd. . . . . . . . . . . | 14,695 | ||
| Diversified Telecommunication Services - 0.69% | ||||
| 416 | Alaska Communications Systems | |||
| Group, Inc. . . . . . . . . . . . . . . . . . . . | 5,092 | |||
| 270 | Consolidated Communications | |||
| Holdings, Inc. . . . . . . . . . . . . . . . . | 4,085 | |||
| 395 | Fairpoint Communications, Inc. . . . | 3,563 | ||
| 1,892 | IDT Corp. . . . . . . . . . . . . . . . . . . . . | 7,322 | ||
| 326 | Iowa Telecommunications | |||
| Services, Inc. . . . . . . . . . . . . . . . . . | 5,780 | |||
| 291 | SureWest Communications . . . . . . . | 4,499 | ||
| 975 | Windstream Corp. . . . . . . . . . . . . . . | 11,651 | ||
| 41,992 | ||||
| Electric Utilities - 1.10% | ||||
| 431 | Black Hills Corp. . . . . . . . . . . . . . . . | 15,421 | ||
| 262 | Central Vermont Public Service | |||
| Corp. . . . . . . . . . . . . . . . . . . . . . . . | 6,262 | |||
| 368 | The Empire District Electric Co. . . . | 7,452 | ||
| 244 | MGE Energy, Inc. . . . . . . . . . . . . . . | 8,311 | ||
| 383 | Otter Tail Corp. . . . . . . . . . . . . . . . . | 13,554 | ||
| 519 | UIL Holdings Corp. . . . . . . . . . . . . . | 15,637 | ||
| 66,637 | ||||
See notes to financial statements.
115
| AssetMark Fundamental Index™ Small Company Value Fund | ||
| SCHEDULE OF INVESTMENTS (Continued) | ||
| March 31, 2008 |
| Number of | Market | |||
| Shares | Value | |||
| COMMON STOCKS (Continued) | ||||
| Electrical Equipment - 0.55% | ||||
| 308 | AO Smith Corp. . . . . . . . . . . . . . . . . | $ | 10,124 | |
| 491 | EnerSys (a) . . . . . . . . . . . . . . . . . . . | 11,745 | ||
| 68 | Preformed Line Products Co. . . . . . | 3,310 | ||
| 224 | Regal-Beloit Corp. . . . . . . . . . . . . . . | 8,205 | ||
| 33,384 | ||||
| Electronic Equipment & Instruments - 1.85% | ||||
| 523 | Agilysys, Inc. . . . . . . . . . . . . . . . . . . | 6,067 | ||
| 1,701 | Brightpoint, Inc. (a) . . . . . . . . . . . . . | 14,220 | ||
| 781 | CTS Corp. . . . . . . . . . . . . . . . . . . . . | 8,357 | ||
| 648 | Gerber Scientific, Inc. (a) . . . . . . . . | 5,761 | ||
| 449 | GTSI Corp. (a) . . . . . . . . . . . . . . . . . | 3,242 | ||
| 725 | Insight Enterprises, Inc. (a) . . . . . . . | 12,688 | ||
| 682 | Kemet Corp. (a) . . . . . . . . . . . . . . . . | 2,755 | ||
| 1,419 | Merix Corp. (a) . . . . . . . . . . . . . . . . | 2,895 | ||
| 474 | Methode Electronics, Inc. . . . . . . . . | 5,541 | ||
| 332 | Newport Corp. (a) . . . . . . . . . . . . . . | 3,708 | ||
| 320 | Park Electrochemical Corp. . . . . . . . | 8,272 | ||
| 1,348 | PC Connection, Inc. (a) . . . . . . . . . . | 10,676 | ||
| 364 | Scansource, Inc. (a) . . . . . . . . . . . . . | 13,173 | ||
| 302 | Technitrol, Inc. . . . . . . . . . . . . . . . . . | 6,985 | ||
| 257 | Tessco Technologies, Inc. (a) . . . . . | 3,855 | ||
| 476 | Zones, Inc. (a) . . . . . . . . . . . . . . . . . | 3,908 | ||
| 112,103 | ||||
| Energy Equipment & Services - 0.56% | ||||
| 141 | Basic Energy Services, Inc. (a) . . . . | 3,113 | ||
| 663 | Patterson-UTI Energy, Inc. . . . . . . . | 17,358 | ||
| 326 | Pioneer Drilling Co. (a) . . . . . . . . . . | 5,193 | ||
| 204 | Trico Marine Service, Inc. (a) . . . . . | 7,950 | ||
| 33,614 | ||||
| Food & Staples Retailing - 1.60% | ||||
| 134 | Andersons, Inc. . . . . . . . . . . . . . . . . | 5,978 | ||
| 683 | Casey’s General Stores, Inc. . . . . . . | 15,436 | ||
| 519 | Ingles Markets, Inc. . . . . . . . . . . . . . | 12,762 | ||
| 202 | PriceSmart, Inc. . . . . . . . . . . . . . . . . | 5,597 | ||
| 523 | Ruddick Corp. . . . . . . . . . . . . . . . . . | 19,278 | ||
| 426 | Spartan Stores, Inc. . . . . . . . . . . . . . | 8,882 | ||
| 303 | Susser Holdings Corp. (a) . . . . . . . . | 5,687 | ||
| 144 | Village Super Market, Inc. . . . . . . . | 7,416 | ||
| 457 | Weis Markets, Inc. . . . . . . . . . . . . . . | 15,753 | ||
| 96,789 | ||||
| Number of | Market | |||
| Shares | Value | |||
| Food Products - 1.10% | ||||
| 1,859 | Del Monte Foods Co. . . . . . . . . . . . | $ | 17,716 | |
| 424 | Diamond Foods, Inc. . . . . . . . . . . . . | 7,691 | ||
| 173 | The Hain Celestial Group, Inc. (a) . | 5,104 | ||
| 403 | Imperial Sugar Co. . . . . . . . . . . . . . | 7,584 | ||
| 337 | Lancaster Colony Corp. . . . . . . . . . . | 13,467 | ||
| 400 | Lance, Inc. . . . . . . . . . . . . . . . . . . . . | 7,840 | ||
| 217 | Reddy Ice Holdings, Inc. . . . . . . . . . | 2,828 | ||
| 184 | TreeHouse Foods, Inc. (a) . . . . . . . . | 4,206 | ||
| 66,436 | ||||
| Gas Utilities - 0.52% | ||||
| 379 | The Laclede Group Inc. . . . . . . . . . . | 13,504 | ||
| 326 | South Jersey Industries, Inc. . . . . . . | 11,446 | ||
| 271 | Southern Union Co. . . . . . . . . . . . . . | 6,306 | ||
| 31,256 | ||||
| Health Care Equipment & Supplies - 0.38% | ||||
| 261 | Conmed Corp. (a) . . . . . . . . . . . . . . | 6,692 | ||
| 96 | Datascope Corp. . . . . . . . . . . . . . . . | 3,977 | ||
| 1,503 | HealthTronics, Inc. (a) . . . . . . . . . . . | 4,870 | ||
| 334 | Invacare Corp. . . . . . . . . . . . . . . . . . | 7,442 | ||
| 22,981 | ||||
| Health Care Providers & Services - 2.08% | ||||
| 643 | Alliance Imaging, Inc. (a) . . . . . . . . | 5,530 | ||
| 694 | America Service Group, Inc. (a) . . . | 4,206 | ||
| 176 | Brookdale Senior Living, Inc. . . . . . | 4,206 | ||
| 782 | Centene Corp. (a) . . . . . . . . . . . . . . | 10,901 | ||
| 447 | Cross Country Healthcare, Inc. (a) . | 5,529 | ||
| 221 | Gentiva Health Services, Inc. (a) . . . | 4,809 | ||
| 394 | Hanger Orthopedic Group, Inc. (a) . | 4,247 | ||
| 335 | HealthSouth Corp. (a) . . . . . . . . . . . | 5,960 | ||
| 1,041 | HealthSpring, Inc. (a) . . . . . . . . . . . | 14,657 | ||
| 545 | LifePoint Hospitals, Inc. (a) . . . . . . | 14,971 | ||
| 388 | MedCath Corp. (a) . . . . . . . . . . . . . . | 7,062 | ||
| 660 | Molina Healthcare, Inc. (a) . . . . . . . | 16,117 | ||
| 498 | National Medical Health Card | |||
| Systems, Inc. (a) . . . . . . . . . . . . . . | 5,070 | |||
| 435 | PDI, Inc. (a) . . . . . . . . . . . . . . . . . . . | 3,663 | ||
| 690 | PSS World Medical, Inc. (a) . . . . . . | 11,495 | ||
| 238 | Res-Care, Inc. (a) . . . . . . . . . . . . . . . | 4,082 | ||
| 1,433 | Rural/Metro Corp. (a) . . . . . . . . . . . | 3,339 | ||
| 125,844 | ||||
See notes to financial statements.
116
| AssetMark Fundamental Index™ Small Company Value Fund | ||
| SCHEDULE OF INVESTMENTS (Continued) | ||
| March 31, 2008 |
| Number of | Market | |||
| Shares | Value | |||
| COMMON STOCKS (Continued) | ||||
| Hotels, Restaurants & Leisure - 2.17% | ||||
| 582 | Bluegreen Corp. (a) . . . . . . . . . . . . . | $ 3,899 | ||
| 420 | Bob Evans Farms, Inc. . . . . . . . . . . | 11,588 | ||
| 554 | CBRL Group, Inc. . . . . . . . . . . . . . . | 19,817 | ||
| 117 | Churchill Downs, Inc. . . . . . . . . . . . | 5,527 | ||
| 1,537 | Denny’s Corp. (a) . . . . . . . . . . . . . . | 4,580 | ||
| 814 | Domino’s Pizza, Inc. . . . . . . . . . . . . | 10,981 | ||
| 1,187 | Interstate Hotels & Resorts, Inc. (a) | 5,674 | ||
| 971 | Isle of Capri Casinos, Inc. (a) . . . . . | 6,943 | ||
| 341 | Landry’s Restaurants, Inc. . . . . . . . . | 5,551 | ||
| 494 | Luby’s, Inc. (a) . . . . . . . . . . . . . . . . | 3,498 | ||
| 457 | Morton’s Restaurant Group, Inc. (a) | 3,624 | ||
| 654 | O’Charleys, Inc. . . . . . . . . . . . . . . . | 7,534 | ||
| 446 | Pinnacle Entertainment, Inc. (a) . . . | 5,709 | ||
| 1,389 | Ruby Tuesday, Inc. . . . . . . . . . . . . . | 10,417 | ||
| 3,939 | Six Flags, Inc. (a) . . . . . . . . . . . . . . | 6,460 | ||
| 463 | The Steak n Shake Co. (a) . . . . . . . . | 3,644 | ||
| 180 | Sunstone Hotel Investors, Inc. . . . . . | 2,882 | ||
| 944 | Triarc Companies, Inc. . . . . . . . . . . | 6,523 | ||
| 1,840 | Trump Entertainment Resorts, | |||
| Inc. (a) . . . . . . . . . . . . . . . . . . . . . . | 6,624 | |||
| 131,475 | ||||
| Household Durables - 1.93% | ||||
| 183 | Avatar Holdings, Inc. (a) . . . . . . . . . | 7,977 | ||
| 637 | California Coastal Communities, | |||
| Inc. (a) . . . . . . . . . . . . . . . . . . . . . . | 3,083 | |||
| 209 | CSS Industries, Inc. . . . . . . . . . . . . . | 7,307 | ||
| 813 | Ethan Allen Interiors, Inc. . . . . . . . . | 23,113 | ||
| 371 | Helen of Troy Ltd. (a) . . . . . . . . . . . | 6,222 | ||
| 1,511 | Kimball International, Inc. . . . . . . . | 16,198 | ||
| 1,766 | La-Z-Boy, Inc. . . . . . . . . . . . . . . . . . | 14,728 | ||
| 379 | M/I Homes, Inc. . . . . . . . . . . . . . . . . | 6,435 | ||
| 98 | National Presto Industries, Inc. . . . . | 5,135 | ||
| 904 | Sealy Corp. . . . . . . . . . . . . . . . . . . . | 6,870 | ||
| 124 | Skyline Corp. . . . . . . . . . . . . . . . . . . | 3,450 | ||
| 309 | Stanley Furniture Co, Inc. . . . . . . . . | 3,835 | ||
| 3,659 | WCI Communities, Inc. (a) . . . . . . . | 12,258 | ||
| 116,611 | ||||
| Household Products - 0.34% | ||||
| 1,455 | Central Garden & Pet Co. (a) . . . . . | 6,460 | ||
| 3,021 | Spectrum Brands, Inc. (a) . . . . . . . . | 13,806 | ||
| 20,266 |
| Number of | Market | |||
| Shares | Value | |||
| Industrial Conglomerates - 0.28% | ||||
| 319 | Standex International Corp. . . . . . . . | $ | 7,126 | |
| 531 | Tredegar Corp. . . . . . . . . . . . . . . . . . | 9,670 | ||
| 16,796 | ||||
| Insurance - 5.83% | ||||
| 493 | Affirmative Insurance Holdings, Inc. | 3,934 | ||
| 275 | Amcomp, Inc. (a) . . . . . . . . . . . . . . . | 3,360 | ||
| 1,120 | American Equity Investment Life | |||
| Holding Co. . . . . . . . . . . . . . . . . . . | 10,394 | |||
| 110 | American Physicians Capital, Inc. . | 5,100 | ||
| 315 | Amerisafe, Inc. (a) . . . . . . . . . . . . . . | 3,981 | ||
| 90 | Argo Group International Holdings, | |||
| Ltd. (a) . . . . . . . . . . . . . . . . . . . . . . | 3,197 | |||
| 357 | Baldwin & Lyons, Inc. . . . . . . . . . . | 9,168 | ||
| 580 | CNA Surety Corp. (a) . . . . . . . . . . . | 8,920 | ||
| 1,414 | Crawford & Co. (a) . . . . . . . . . . . . . | 7,423 | ||
| 150 | Darwin Professional Underwriters, | |||
| Inc. (a) . . . . . . . . . . . . . . . . . . . . . . | 3,373 | |||
| 381 | Donegal Group, Inc. . . . . . . . . . . . . | 6,629 | ||
| 322 | EMC Insurance Group, Inc. . . . . . . | 8,658 | ||
| 569 | FBL Financial Group, Inc. . . . . . . . . | 16,211 | ||
| 275 | First Mercury Financial Corp. (a) . . | 4,788 | ||
| 139 | FPIC Insurance Group, Inc. (a) . . . . | 6,552 | ||
| 321 | Greenlight Capital Re, Ltd. (a) . . . . | 5,971 | ||
| 536 | Harleysville Group, Inc. . . . . . . . . . | 19,344 | ||
| 860 | Horace Mann Educators Corp. . . . . | 15,033 | ||
| 326 | Independence Holding Co. . . . . . . . | 3,886 | ||
| 410 | Infinity Property & Casualty Corp. . | 17,056 | ||
| 255 | Kansas City Life Insurance Co. . . . . | 12,255 | ||
| 605 | Meadowbrook Insurance Group, Inc. | 4,725 | ||
| 202 | The Midland Co. . . . . . . . . . . . . . . . | 13,116 | ||
| 602 | National Atlantic Holdings Corp. (a) | 3,576 | ||
| 81 | National Western Life Insurance Co. | 17,560 | ||
| 181 | Navigators Group, Inc. (a) . . . . . . . . | 9,846 | ||
| 180 | NYMAGIC, Inc. . . . . . . . . . . . . . . . | 4,088 | ||
| 867 | PMA Capital Corp. (a) . . . . . . . . . . . | 7,404 | ||
| 647 | Presidential Life Corp. . . . . . . . . . . | 11,284 | ||
| 273 | RLI Corp. . . . . . . . . . . . . . . . . . . . . . | 13,533 | ||
| 377 | Safety Insurance Group, Inc. . . . . . . | 12,867 | ||
| 54,399 | Scottish Re Group Limited (a) . . . . | 5,168 | ||
| 294 | Seabright Insurance Holdings, | |||
| Inc. (a) . . . . . . . . . . . . . . . . . . . . . . | 4,331 | |||
| 16,234 | Security Capital Assurance . . . . . . . | 8,442 | ||
| 573 | State Auto Financial Corp. . . . . . . . | 16,691 |
See notes to financial statements.
117
| AssetMark Fundamental Index™ Small Company Value Fund | |||
| SCHEDULE OF INVESTMENTS (Continued) | |||
| March 31, 2008 |
| Number of | Market | |||
| Shares | Value | |||
| COMMON STOCKS (Continued) | ||||
| Insurance (Continued) | ||||
| 2,182 | Triad Guaranty, Inc. (a) . . . . . . . . . . | $ | 10,910 | |
| 564 | United America Indemnity, Ltd. (a) | 10,863 | ||
| 342 | United Fire & Casualty Co. . . . . . . . | 12,791 | ||
| 956 | Universal American Financial | |||
| Corp. (a) . . . . . . . . . . . . . . . . . . . . . | 10,134 | |||
| 352,562 | ||||
| Internet & Catalog Retail - 0.29% | ||||
| 300 | FTD Group, Inc. . . . . . . . . . . . . . . . | 4,026 | ||
| 905 | PC Mall, Inc. (a) . . . . . . . . . . . . . . . | 9,620 | ||
| 703 | ValueVision Media, Inc. (a) . . . . . . . | 3,895 | ||
| 17,541 | ||||
| Internet Software & Services - 0.79% | ||||
| 708 | CMGI, Inc. (a) . . . . . . . . . . . . . . . . . | 9,388 | ||
| 1,477 | EarthLink, Inc. (a) . . . . . . . . . . . . . . | 11,151 | ||
| 616 | InfoSpace, Inc. . . . . . . . . . . . . . . . . . | 7,127 | ||
| 1,792 | RealNetworks, Inc. (a) . . . . . . . . . . . | 10,268 | ||
| 933 | United Online, Inc. . . . . . . . . . . . . . | 9,853 | ||
| 47,787 | ||||
| IT Services - 1.01% | ||||
| 4,247 | BearingPoint, Inc. (a) . . . . . . . . . . . | 7,135 | ||
| 224 | CACI International, Inc. - | |||
| Class A (a) . . . . . . . . . . . . . . . . . . . | 10,203 | |||
| 1,447 | CIBER, Inc. (a) . . . . . . . . . . . . . . . . | 7,090 | ||
| 947 | Gevity HR, Inc. . . . . . . . . . . . . . . . . | 8,201 | ||
| 1,145 | Lionbridge Technologies (a) . . . . . . | 3,836 | ||
| 1,192 | MPS Group, Inc. (a) . . . . . . . . . . . . | 14,090 | ||
| 451 | Ness Technologies, Inc. (a) . . . . . . . | 4,280 | ||
| 668 | StarTek, Inc. (a) . . . . . . . . . . . . . . . . | 6,152 | ||
| 60,987 | ||||
| Leisure Equipment & Products - 0.59% | ||||
| 1,019 | Arctic Cat, Inc. . . . . . . . . . . . . . . . . | 7,429 | ||
| 433 | Callaway Golf Co. . . . . . . . . . . . . . . | 6,357 | ||
| 300 | Jakks Pacific, Inc. (a) . . . . . . . . . . . | 8,271 | ||
| 700 | Leapfrog Enterprises, Inc. (a) . . . . . | 4,935 | ||
| 277 | MarineMax, Inc. (a) . . . . . . . . . . . . . | 3,451 | ||
| 1,598 | Nautilus Group, Inc. . . . . . . . . . . . . | 5,257 | ||
| 35,700 | ||||
| Life Sciences Tools & Services - 0.10% | ||||
| 863 | Cambrex Corp. . . . . . . . . . . . . . . . . | 5,981 | ||
| Number of | Market | |||
| Shares | Value | |||
| Machinery - 1.67% | ||||
| 579 | Commercial Vehicle Group, Inc. (a) | $ | 5,738 | |
| 976 | Federal Signal Corp. . . . . . . . . . . . . | 13,625 | ||
| 177 | Freightcar America, Inc. . . . . . . . . . | 6,071 | ||
| 213 | Gehl Co. (a) . . . . . . . . . . . . . . . . . . . | 3,608 | ||
| 180 | The Greenbrier Companies, Inc. . . . | 4,774 | ||
| 129 | Kadant, Inc. (a) . . . . . . . . . . . . . . . . | 3,790 | ||
| 305 | Lydall, Inc. (a) . . . . . . . . . . . . . . . . . | 3,492 | ||
| 310 | Miller Industries, Inc. (a) . . . . . . . . . | 2,985 | ||
| 1,089 | Mueller Water Products, Inc. - | |||
| Class A . . . . . . . . . . . . . . . . . . . . . . | 8,908 | |||
| 231 | Reliance Steel & Aluminum Co. . . . | 13,828 | ||
| 378 | Tecumseh Products Co. (a) . . . . . . . | 11,597 | ||
| 1,277 | Trimas Corp. (a) . . . . . . . . . . . . . . . | 6,730 | ||
| 730 | Wabash National Corp. . . . . . . . . . . | 6,563 | ||
| 275 | Watts Water Technologies, Inc. . . . . | 7,708 | ||
| 1,300 | Xerium Technologies, Inc. . . . . . . . | 1,677 | ||
| 101,094 | ||||
| Marine - 0.07% | ||||
| 70 | Genco Shipping & Trading Ltd. . . . | 3,950 | ||
| Media - 2.94% | ||||
| 414 | Cinemark Holdings, Inc. . . . . . . . . . | 5,295 | ||
| 7,222 | Citadel Broadcasting Corp. . . . . . . . | 11,989 | ||
| 1,306 | Cox Radio, Inc. (a) . . . . . . . . . . . . . | 15,515 | ||
| 1,090 | Cumulus Media, Inc. (a) . . . . . . . . . | 6,954 | ||
| 4,794 | Emmis Communications Corp. (a) . | 16,683 | ||
| 683 | Entercom Communications Corp. . . | 6,782 | ||
| 832 | Gray Television, Inc. . . . . . . . . . . . . | 4,734 | ||
| 1,326 | Journal Communications, Inc. . . . . . | 9,786 | ||
| 3,654 | Journal Register Co. . . . . . . . . . . . . | 2,010 | ||
| 1,427 | Lee Enterprises, Inc. . . . . . . . . . . . . | 14,284 | ||
| 1,364 | LIN TV Corp. (a) . . . . . . . . . . . . . . . | 13,108 | ||
| 932 | McClatchy Co. . . . . . . . . . . . . . . . . . | 9,973 | ||
| 507 | Media General, Inc. . . . . . . . . . . . . . | 7,108 | ||
| 1,884 | Mediacom Communications | |||
| Corp. (a) . . . . . . . . . . . . . . . . . . . . . | 8,158 | |||
| 2,714 | Navarre Corp. (a) . . . . . . . . . . . . . . . | 4,777 | ||
| 7,158 | Radio One, Inc. (a) . . . . . . . . . . . . . | 10,880 | ||
| 518 | RCN Corp. . . . . . . . . . . . . . . . . . . . . | 5,791 | ||
| 2,630 | Spanish Broadcasting System (a) . . | 4,655 | ||
| 8,250 | Sun-Times Media Group, Inc. (a) . . | 5,940 | ||
| 6,419 | Westwood One, Inc. . . . . . . . . . . . . | 13,480 | ||
| 177,902 |
See notes to financial statements.
118
| AssetMark Fundamental Index™ Small Company Value Fund | ||
| SCHEDULE OF INVESTMENTS (Continued) | ||
| March 31, 2008 |
| Number of | Market | |||
| Shares | Value | |||
| COMMON STOCKS (Continued) | ||||
| Metals & Mining - 0.63% | ||||
| 177 | Compass Minerals International, Inc. | $ | 10,440 | |
| 474 | Esmark, Inc. (a) . . . . . . . . . . . . . . . . | 5,356 | ||
| 680 | Gibraltar Industries, Inc. . . . . . . . . . | 7,976 | ||
| 271 | Quanex Corp. . . . . . . . . . . . . . . . . . . | 14,022 | ||
| 37,794 | ||||
| Multiline Retail - 0.65% | ||||
| 728 | 99 Cents Only Stores (a) . . . . . . . . . | 7,200 | ||
| 1,556 | The Bon-Ton Stores, Inc. . . . . . . . . . | 8,511 | ||
| 847 | Fred’s, Inc. . . . . . . . . . . . . . . . . . . . . | 8,682 | ||
| 2,156 | Gottschalks, Inc. (a) . . . . . . . . . . . . . | 6,403 | ||
| 1,655 | Tuesday Morning Corp. (a) . . . . . . . | 8,573 | ||
| 39,369 | ||||
| Multi-Utilities - 0.18% | ||||
| 3,464 | Aquila, Inc. (a) . . . . . . . . . . . . . . . . . | 11,119 | ||
| Oil & Gas - 1.99% | ||||
| 827 | Alon USA Energy, Inc. . . . . . . . . . . | 12,579 | ||
| 700 | Aventine Renewable Energy (a) . . . | 3,640 | ||
| 131 | Comstock Resources, Inc. (a) . . . . . | 5,279 | ||
| 103 | Crosstex Energy, Inc. . . . . . . . . . . . . | 3,497 | ||
| 550 | Delek US Holdings, Inc. . . . . . . . . . | 6,969 | ||
| 330 | Energy Partners Ltd. (a) . . . . . . . . . | 3,125 | ||
| 732 | International Coal Group, Inc. (a) . . | 4,648 | ||
| 323 | Knightsbridge Tankers Ltd. . . . . . . . | 8,618 | ||
| 227 | Mariner Energy, Inc. (a) . . . . . . . . . | 6,131 | ||
| 4,284 | Meridian Resource Corp. (a) . . . . . . | 6,340 | ||
| 444 | Petrohawk Energy Corp. (a) . . . . . . | 8,956 | ||
| 257 | Rosetta Resources, Inc. (a) . . . . . . . | 5,055 | ||
| 364 | Ship Finance International Ltd. . . . . | 9,566 | ||
| 154 | Swift Energy Co. (a) . . . . . . . . . . . . | 6,928 | ||
| 283 | Teekay Shipping Corp. . . . . . . . . . . | 12,019 | ||
| 195 | W & T Offshore, Inc. . . . . . . . . . . . . | 6,651 | ||
| 163 | Whiting Petroleum Corp. (a) . . . . . . | 10,538 | ||
| 120,539 | ||||
| Paper & Forest Products - 0.61% | ||||
| 516 | Buckeye Technologies, Inc. (a) . . . . | 5,758 | ||
| 344 | Glatfelter . . . . . . . . . . . . . . . . . . . . . | 5,198 | ||
| 406 | Schweitzer-Mauduit | |||
| International, Inc. . . . . . . . . . . . . . | 9,395 | |||
| 1,968 | Wausau-Mosinee Paper Corp. . . . . . | 16,256 | ||
| 36,607 |
| Number of | Market | |||
| Shares | Value | |||
| Personal Products - 0.20% | ||||
| 396 | Elizabeth Arden, Inc. (a) . . . . . . . . . | $ | 7,900 | |
| 585 | Mannatech, Inc. . . . . . . . . . . . . . . . . | 4,171 | ||
| 12,071 | ||||
| Road & Rail - 0.66% | ||||
| 489 | Covenant Transport, Inc. (a) . . . . . . | 2,494 | ||
| 588 | Frozen Food Express Industries, Inc. | 4,669 | ||
| 387 | Heartland Express, Inc. . . . . . . . . . . | 5,519 | ||
| 284 | Marten Transport Ltd. (a) . . . . . . . . | 4,408 | ||
| 277 | PAM Transportation Services (a) . . | 4,310 | ||
| 1,197 | Quality Distribution, Inc. (a) . . . . . . | 3,818 | ||
| 731 | Saia, Inc. (a) . . . . . . . . . . . . . . . . . . . | 11,594 | ||
| 229 | USA Truck, Inc. (a) . . . . . . . . . . . . . | 2,956 | ||
| 39,768 | ||||
| Semiconductor & Semiconductor | ||||
| Equipment - 0.98% | ||||
| 7,501 | Conexant Systems, Inc. (a) . . . . . . . | 4,350 | ||
| 1,189 | Entegris, Inc. (a) . . . . . . . . . . . . . . . | 8,549 | ||
| 542 | Exar Corp. (a) . . . . . . . . . . . . . . . . . | 4,461 | ||
| 561 | IXYS Corp. (a) . . . . . . . . . . . . . . . . | 3,832 | ||
| 395 | Photronics, Inc. (a) . . . . . . . . . . . . . | 3,772 | ||
| 3,036 | RF Micro Devices, Inc. (a) . . . . . . . | 8,076 | ||
| 6,494 | Spansion, Inc. (a) . . . . . . . . . . . . . . . | 17,858 | ||
| 976 | TriQuint Semiconductor, Inc. (a) . . . | 4,938 | ||
| 247 | Zoran Corp. (a) . . . . . . . . . . . . . . . . | 3,374 | ||
| 59,210 | ||||
| Software - 0.28% | ||||
| 2,575 | Borland Software Corp. (a) . . . . . . . | 5,202 | ||
| 359 | Dynamics Research Corp. (a) . . . . . | 3,629 | ||
| 886 | Mentor Graphics Corp. (a) . . . . . . . | 7,823 | ||
| 16,654 | ||||
| Specialty Retail - 4.10% | ||||
| 811 | AC Moore Arts & Crafts, Inc. (a) . . | 5,531 | ||
| 815 | Big 5 Sporting Goods Corp. . . . . . . | 7,148 | ||
| 528 | Books-A-Million, Inc. . . . . . . . . . . . | 4,615 | ||
| 180 | The Buckle, Inc. . . . . . . . . . . . . . . . | 8,051 | ||
| 754 | The Cato Corp. . . . . . . . . . . . . . . . . | 11,265 | ||
| 389 | Charlotte Russe Holding, Inc. (a) . . | 6,745 | ||
| 855 | The Childrens Place Retail Stores, | |||
| Inc. (a) . . . . . . . . . . . . . . . . . . . . . . | 20,999 | |||
| 1,265 | Eddie Bauer Holdings, Inc. (a) . . . . | 4,921 | ||
| 4,448 | Finish Line . . . . . . . . . . . . . . . . . . . . | 21,172 | ||
| 594 | Group 1 Automotive, Inc. . . . . . . . . | 13,947 |
See notes to financial statements.
119
| AssetMark Fundamental Index™ Small Company Value Fund | ||
| SCHEDULE OF INVESTMENTS (Continued) | ||
| March 31, 2008 |
| Number of | Market | |||
| Shares | Value | |||
| COMMON STOCKS (Continued) | ||||
| Specialty Retail (Continued) | ||||
| 599 | Haverty Furniture Cos., Inc. . . . . . . | $ | 6,373 | |
| 1,145 | HOT Topic, Inc. (a) . . . . . . . . . . . . . | 4,935 | ||
| 901 | Jo-Ann Stores, Inc. (a) . . . . . . . . . . . | 13,272 | ||
| 1,071 | Lithia Motors, Inc. . . . . . . . . . . . . . . | 10,881 | ||
| 228 | Mothers Work, Inc. (a) . . . . . . . . . . | 3,810 | ||
| 2,494 | New York & Co, Inc. (a) . . . . . . . . . | 14,316 | ||
| 1,314 | PEP Boys . . . . . . . . . . . . . . . . . . . . . | 13,087 | ||
| 1,846 | Pier 1 Imports, Inc. (a) . . . . . . . . . . . | 11,593 | ||
| 981 | Pomeroy IT Solutions, Inc. (a) . . . . | 5,425 | ||
| 1,018 | Restoration Hardware, Inc. (a) . . . . | 4,418 | ||
| 378 | Rush Enterprises, Inc. - Class A (a) . | 5,987 | ||
| 594 | Shoe Carnival, Inc. (a) . . . . . . . . . . . | 8,037 | ||
| 674 | Stage Stores, Inc. . . . . . . . . . . . . . . . | 10,919 | ||
| 3,177 | Stein Mart, Inc. . . . . . . . . . . . . . . . . | 17,855 | ||
| 879 | The Talbots, Inc. . . . . . . . . . . . . . . . | 9,476 | ||
| 465 | West Marine, Inc. (a) . . . . . . . . . . . . | 3,241 | ||
| 248,019 | ||||
| Textiles, Apparel & Luxury Goods - 0.84% | ||||
| 457 | Culp, Inc. (a) . . . . . . . . . . . . . . . . . . | 3,437 | ||
| 1,124 | Hartmarx Corp. (a) . . . . . . . . . . . . . | 3,282 | ||
| 495 | Kenneth Cole Productions, Inc. . . . . | 8,385 | ||
| 547 | Oxford Industries, Inc. . . . . . . . . . . . | 12,324 | ||
| 244 | Perry Ellis International, Inc. (a) . . . | 5,327 | ||
| 1,323 | Quiksilver, Inc. (a) . . . . . . . . . . . . . . | 12,979 | ||
| 138 | UniFirst Corp. . . . . . . . . . . . . . . . . . | 5,118 | ||
| 50,852 | ||||
| Thrifts & Mortgage Finance - 3.23% | ||||
| 478 | Anchor BanCorp Wisconsin, Inc. . . | 9,068 | ||
| 451 | Bank Mutual Corp. . . . . . . . . . . . . . | 4,844 | ||
| 1,381 | BankAtlantic Bancorp, Inc. . . . . . . . | 5,400 | ||
| 965 | BankUnited Financial Corp. . . . . . . | 4,835 | ||
| 166 | Berkshire Hills Bancorp, Inc. . . . . . | 4,182 | ||
| 817 | Brookline Bancorp, Inc. . . . . . . . . . | 9,379 | ||
| 336 | Capitol Federal Financial . . . . . . . . | 12,593 | ||
| 730 | Centerline Holding Co. . . . . . . . . . . | 2,964 | ||
| 386 | City Bank . . . . . . . . . . . . . . . . . . . . . | 8,596 | ||
| 576 | Dime Community Bancshares . . . . . | 10,068 | ||
| 427 | Doral Financial Corp. (a) . . . . . . . . . | 8,617 | ||
| 737 | Downey Financial Corp. . . . . . . . . . | 13,546 | ||
| 288 | First Busey Corp. . . . . . . . . . . . . . . . | 6,083 | ||
| 171 | First Defiance Financial Corp. . . . . | 3,138 | ||
| Number of | Market | |||
| Shares | Value | |||
| Thrifts & Mortgage Finance (Continued) | ||||
| 148 | First Financial Holdings, Inc. . . . . . | $ | 3,472 | |
| 467 | First Place Financial Corp. . . . . . . . | 6,071 | ||
| 287 | FirstFed Financial Corp. (a) . . . . . . | 7,792 | ||
| 1,107 | Franklin Bank Corp. (a) . . . . . . . . . . | 3,354 | ||
| 774 | NewAlliance Bancshares, Inc. . . . . . | 9,489 | ||
| 262 | Northwest Bancorp, Inc. . . . . . . . . . | 7,160 | ||
| 1,194 | Ocwen Financial Corp. (a) . . . . . . . | 5,301 | ||
| 1,053 | PFF Bancorp, Inc. . . . . . . . . . . . . . . | 8,761 | ||
| 651 | Provident Financial Services, Inc. . . | 9,205 | ||
| 238 | Provident New York Bancorp . . . . . | 3,213 | ||
| 403 | Sterling Financial Corp. - WA . . . . . | 6,291 | ||
| 273 | TierOne Corp. . . . . . . . . . . . . . . . . . | 3,079 | ||
| 1,674 | TrustCo Bank Corp NY . . . . . . . . . . | 14,882 | ||
| 620 | United Community Financial Corp. | 3,844 | ||
| 195,227 | ||||
| Tobacco - 0.32% | ||||
| 3,219 | Alliance One International, Inc. (a) . | 19,443 | ||
| Trading Companies & Distributors - 0.77% | ||||
| 493 | Aceto Corp. . . . . . . . . . . . . . . . . . . . | 3,421 | ||
| 578 | Applied Industrial Technologies, Inc. | 17,276 | ||
| 355 | Beacon Roofing Supply, Inc. (a) . . . | 3,550 | ||
| 232 | Lawson Products . . . . . . . . . . . . . . . | 6,392 | ||
| 184 | TAL International Group, Inc. . . . . . | 4,337 | ||
| 278 | Watsco, Inc. . . . . . . . . . . . . . . . . . . . | 11,515 | ||
| 46,491 | ||||
| Water Utilities - 0.31% | ||||
| 182 | American States Water Co. . . . . . . . | 6,552 | ||
| 315 | California Water Service Group . . . | 12,017 | ||
| 18,569 | ||||
| Wireless Telecommunication Services - 0.26% | ||||
| 2,182 | USA Mobility, Inc. . . . . . . . . . . . . . | 15,579 | ||
| Total Common Stocks | ||||
(Cost $4,471,937) . . . . . . . . . . . . . | 4,091,861 | |||
| MANAGEMENT INVESTMENT | ||||
| COMPANIES - 0.06% | ||||
| Capital Markets - 0.06% | ||||
| 275 | Ares Capital Corp. . . . . . . . . . . . . . . | 3,457 | ||
| Total Management Investment | ||||
Companies (Cost $3,967) . . . . . . | 3,457 | |||
See notes to financial statements.
120
| AssetMark Fundamental Index™ Small Company Value Fund | ||
| SCHEDULE OF INVESTMENTS (Continued) | ||
| March 31, 2008 |
| Number of | Market | |||
| Shares | Value | |||
| REAL ESTATE INVESTMENT TRUSTS - 4.61% | ||||
| Real Estate Investment Trusts - 4.61% | ||||
| 607 | Anthracite Capital, Inc. . . . . . . . . . . | $ 4,006 | ||
| 822 | Anworth Mortgage Asset Corp. . . . . | 5,039 | ||
| 162 | BioMed Realty Trust, Inc. . . . . . . . . | 3,870 | ||
| 428 | Brandywine Realty Trust . . . . . . . . . | 7,259 | ||
| 537 | CBL & Associates Properties, Inc. . | 12,636 | ||
| 1,079 | CBRE Realty Finance, Inc. . . . . . . . | 4,348 | ||
| 449 | Cousins Properties, Inc. . . . . . . . . . . | 11,095 | ||
| 379 | DCT Industrial Trust, Inc. . . . . . . . . | 3,775 | ||
| 2,659 | Deerfield Capital Corp. . . . . . . . . . . | 3,749 | ||
| 262 | Diamondrock Hospitality Co. . . . . . | 3,319 | ||
| 626 | Douglas Emmett, Inc. . . . . . . . . . . . | 13,810 | ||
| 175 | Entertainment Properties Trust . . . . | 8,633 | ||
| 371 | Equity One, Inc. . . . . . . . . . . . . . . . . | 8,893 | ||
| 723 | FelCor Lodging Trust, Inc. . . . . . . . | 8,698 | ||
| 495 | Franklin Street Properties Corp. . . . | 7,088 | ||
| 187 | Getty Realty Corp. . . . . . . . . . . . . . . | 2,979 | ||
| 323 | Health Care REIT, Inc. . . . . . . . . . . | 14,577 | ||
| 402 | Healthcare Realty Trust, Inc. . . . . . . | 10,512 | ||
| 287 | Highwoods Properties, Inc. . . . . . . . | 8,917 | ||
| 145 | Home Properties, Inc. . . . . . . . . . . . | 6,958 | ||
| 2,272 | HRPT Properties Trust . . . . . . . . . . | 15,291 | ||
| 276 | Inland Real Estate Corp. . . . . . . . . . | 4,198 | ||
| 396 | Lexington Corporate Properties Trust | 5,706 | ||
| 350 | LTC Properties, Inc. . . . . . . . . . . . . | 8,998 | ||
| 5,100 | Luminent Mortgage Capital, Inc. . . | 3,111 | ||
| 417 | MFA Mortgage Investments, Inc. . . | 2,627 | ||
| 87 | Mid-America Apartment | |||
| Communities, Inc. . . . . . . . . . . . . . | 4,336 | |||
| 313 | Mission West Properties . . . . . . . . . | 2,958 | ||
| 435 | National Retail Properties, Inc. . . . . | 9,592 | ||
| 236 | Nationwide Health Properties, Inc. . | 7,965 | ||
| 488 | Newcastle Investment Corp. . . . . . . | 4,031 | ||
| 240 | Pennsylvania Real Estate | |||
| Investment Trust . . . . . . . . . . . . . . | 5,854 | |||
| 432 | PMC Commercial Trust . . . . . . . . . . | 3,046 | ||
| 160 | Post Properties, Inc. . . . . . . . . . . . . . | 6,179 | ||
| 1,130 | RAIT Investment Trust . . . . . . . . . . | 7,842 | ||
| 447 | Realty Income Corp. . . . . . . . . . . . . | 11,452 | ||
| 523 | Senior Housing Properties Trust . . . | 12,395 | ||
| 114 | Sovran Self Storage, Inc. . . . . . . . . . | 4,869 | ||
| 238 | Strategic Hotels & Resorts, Inc. . . . | 3,125 | ||
| 228 | Sun Communities, Inc. . . . . . . . . . . | 4,674 | ||
| 278,410 | ||||
| Number of | Market | ||||
| Shares | Value | ||||
| Total Real Estate Investment Trusts | |||||
(Cost $300,730) . . . . . . . . . . . . . . . | $ | 278,410 | |||
| RIGHTS - 0.00% | |||||
| Capital Markets - 0.00% | |||||
| 92 | Ares Capital Corp. - Rights (a) | 52 | |||
| 84 | MCG Capital Corp. - Rights (a) | 90 | |||
| 142 | |||||
Total Rights (Cost $0) . . . . . . . . . . | 142 | ||||
| SHORT TERM INVESTMENTS - 2.11% | |||||
| Money Market Funds - 2.11% | |||||
| 127,337 | Federated Prime Obligations Fund, | ||||
| 3.180% (b) . . . . . . . . . . . . . . . . . . . | 127,337 | ||||
| Total Short Term Investments | |||||
(Cost $127,337) . . . . . . . . . . . . . . . | 127,337 | ||||
| Total Investments | |||||
(Cost $4,904,044) - 74.46% . . . . . | 4,501,207 | ||||
| Other Assets in Excess of | |||||
Liabilities - 25.54% . . . . . . . . . . . | 1,544,254 | ||||
| TOTAL NET | |||||
ASSETS - 100.00% . . . . . . . . . . . | $ | 6,045,461 | |||
| Percentages are stated as a percent of net assets. | |||||
| (a) Non Income Producing. | |||||
| (b) Variable Rate Security. The rate shown is the rate in effect on | |||||
| March 31, 2008. | |||||
See notes to financial statements.
121
| AssetMark Fundamental Index™ Small Company Value Fund |
| SCHEDULE OF OPEN FUTURES CONTRACTS |
| March 31, 2008 |
| Number of | |||||||
| Contracts | Notional | Settlement | Unrealized | ||||
| Description | Purchased | Value | Month | Appreciation | |||
| Russell 2000 Mini Futures | 2 | $136,118 | Jun-08 | $1,882 |
See notes to financial statements.
122
| AssetMark Funds | |||||||
| STATEMENTS OF ASSETS & LIABILITIES | |||||||
| March 31, 2008 |
| Large Cap | Large Cap | Small/Mid Cap | Small/Mid Cap | ||||||
| Growth Fund | Value Fund | Growth Fund | Value Fund | ||||||
| ASSETS: | |||||||||
| Investments, at value (cost $708,499,070, | |||||||||
| $674,128,273, $142,700,986 and | |||||||||
$114,859,634, respectively)1 . . . . . . . . . . . . . . . . . . | $ | 744,298,427 | $ | 662,113,828 | $ | 147,043,140 | $ | 109,489,808 | |
| Repurchase Agreements (cost $124,271,453, | |||||||||
| $115,750,344, $27,982,416 and | |||||||||
| $12,964,298, respectively) . . . . . . . . . . . . . . . . . . . . | 124,271,453 | 115,750,344 | 27,982,416 | 12,964,298 | |||||
| Cash . . . . . . . . . . . . . . . . . . . . . . . . . . . . . . . . . . . . . . . | — | — | — | 1,488 | |||||
| Receivable for investment securities sold . . . . . . . . . . | 3,099,620 | 3,588,827 | 2,464,590 | 8,830 | |||||
| Income receivable . . . . . . . . . . . . . . . . . . . . . . . . . . . . | 591,023 | 1,182,022 | 52,514 | 71,214 | |||||
| Receivable for fund shares sold . . . . . . . . . . . . . . . . . . | 1,116,601 | 970,458 | 275,419 | 227,968 | |||||
| Other assets . . . . . . . . . . . . . . . . . . . . . . . . . . . . . . . . . | 34,345 | 37,131 | 49,967 | 25,730 | |||||
| Total Assets . . . . . . . . . . . . . . . . . . . . . . . . . . . . . . . | 873,411,469 | 783,642,610 | 177,868,046 | 122,789,336 | |||||
| LIABILITIES: | |||||||||
| Collateral on securities loaned . . . . . . . . . . . . . . . . . . . | 220,517,115 | 205,396,582 | 49,654,216 | 23,004,877 | |||||
| Cash overdraft . . . . . . . . . . . . . . . . . . . . . . . . . . . . . . . | 756,914 | 2,539,208 | 20,518 | — | |||||
| Payable to Investment Advisor . . . . . . . . . . . . . . . . . . | 501,462 | 451,050 | 102,315 | 83,508 | |||||
| Payable to Custodian . . . . . . . . . . . . . . . . . . . . . . . . . . | 12,707 | 10,387 | 7,282 | 4,693 | |||||
| Payable for investment securities purchased . . . . . . . . | 1,338,623 | — | 1,373,775 | — | |||||
| Payable for fund shares redeemed . . . . . . . . . . . . . . . . | 666,067 | 565,594 | 94,094 | 79,899 | |||||
| Other accrued expenses . . . . . . . . . . . . . . . . . . . . . . . . | 311,129 | 291,200 | 81,041 | 67,975 | |||||
| Total Liabilities . . . . . . . . . . . . . . . . . . . . . . . . . . . . | 224,104,017 | 209,254,021 | 51,333,241 | 23,240,952 | |||||
| NET ASSETS . . . . . . . . . . . . . . . . . . . . . . . . . . . . . . . . . | $ | 649,307,452 | 574,388,589 | 126,534,805 | 99,548,384 | ||||
| NET ASSETS CONSIST OF: | |||||||||
| Capital stock . . . . . . . . . . . . . . . . . . . . . . . . . . . . . . . . | 631,342,491 | 597,157,129 | 132,324,305 | 121,099,050 | |||||
| Unrealized appreciation (depreciation) | |||||||||
| on investments . . . . . . . . . . . . . . . . . . . . . . . . . . . . . | 35,799,357 | (12,014,445) | 4,342,154 | (5,369,826) | |||||
| Accumulated undistributed net investment | |||||||||
| income . . . . . . . . . . . . . . . . . . . . . . . . . . . . . . . . . . . | 14,780 | 2,178,548 | 88,037 | 64,600 | |||||
| Accumulated undistributed net realized loss . . . . . . . . | (17,849,176) | (12,932,643) | (10,219,691) | (16,245,440) | |||||
| Total Net Assets . . . . . . . . . . . . . . . . . . . . . . . . . . . . | $ | 649,307,452 | 574,388,589 | 126,534,805 | 99,548,384 | ||||
| Shares outstanding (unlimited shares of no par | |||||||||
| value authorized) . . . . . . . . . . . . . . . . . . . . . . . . . . . | 73,736,258 | 58,329,748 | 15,717,936 | 10,776,821 | |||||
| Net asset value, offering and redemption price | |||||||||
| per share . . . . . . . . . . . . . . . . . . . . . . . . . . . . . . . . . . | $ | 8.81 | $ | 9.85 | $ | 8.05 | $ | 9.24 | |
| 1 | Includes loaned securities with a market value of: . . . | $ | 215,113,841 | $ | 200,136,152 | $ | 48,090,171 | $ | 22,344,873 |
See notes to financial statements.
123
| AssetMark Funds |
| STATEMENTS OF ASSETS & LIABILITIES (Continued) |
| March 31, 2008 |
| International | Real Estate | Tax-Exempt | Core Plus | ||||||
| Equity | Securities | Fixed Income | Fixed Income | ||||||
| Fund | Fund | Fund | Fund | ||||||
| ASSETS: | |||||||||
| Investments, at value (cost $644,144,652, | |||||||||
| $76,138,090, $259,767,291 and | |||||||||
$923,285,940, respectively)1 | $ | 674,879,780 | $ | 94,134,925 | $ | 256,201,520 | $ | 903,134,063 | |
| Repurchase Agreements (cost $13,443,452, | |||||||||
| $16,815,449, $0 and $191,872,588, respectively) | 13,443,452 | 16,815,449 | — | 191,872,588 | |||||
| Variation margin on futures contracts | — | — | — | 402,288 | |||||
| Appreciation of forward foreign currency contracts | — | — | — | 219,855 | |||||
| Cash | — | 3,600 | — | 1,137,123 | |||||
| Foreign currency | 1,266,676 | — | — | — | |||||
| Receivable for investment securities and foreign | |||||||||
| currency sold | 12,543,052 | 1,231,344 | 923,892 | 55,192,321 | |||||
| Income receivable | 2,529,161 | 336,077 | 3,318,866 | 6,104,511 | |||||
| Receivable for fund shares sold | 8,395,757 | 109,965 | 768,892 | 1,622,460 | |||||
| Deposits with brokers for options | — | — | — | 263,000 | |||||
| Other assets | 29,159 | 18,088 | 18,121 | 92,708 | |||||
| Total Assets | 713,087,037 | 112,649,448 | 261,231,291 | 1,160,040,917 | |||||
| LIABILITIES: | |||||||||
| Options written at value (Premium received $0, | |||||||||
| $0, $0 and $167,014, respectively) | — | — | — | 169,528 | |||||
| Foreign currencies deliverable (cost $2,475,118, | |||||||||
| $0, $0 and $3,530, respectively) | 2,557,059 | — | — | 77,122 | |||||
| Forward sale commitments (Proceeds received | |||||||||
| $0, $0, $0 and $25,330,407) (See Note 2) | — | — | — | 25,359,374 | |||||
| Collateral on securities loaned | 23,855,127 | 29,838,665 | — | 208,807,563 | |||||
| Cash overdraft | 35,182 | — | 7,127 | — | |||||
| Depreciation of forward foreign currency contracts | — | — | — | 285,220 | |||||
| Payable to Investment Advisor | 531,945 | 90,584 | 223,596 | 631,572 | |||||
| Payable to Custodian | 123,176 | 7,038 | 7,850 | 65,017 | |||||
| Payable for investment securities purchased | 3,536,475 | 496,725 | 3,162,357 | 118,158,078 | |||||
| Payable for fund shares redeemed | 474,841 | 34,981 | 243,148 | 1,995,138 | |||||
| Other accrued expenses | 351,202 | 56,677 | 147,080 | 406,387 | |||||
| Total Liabilities | 31,465,007 | 30,524,670 | 3,791,158 | 355,954,999 | |||||
| NET ASSETS | $ | 681,622,030 | $ | 82,124,778 | $ | 257,440,133 | $ | 804,085,918 | |
| NET ASSETS CONSIST OF: | |||||||||
| Capital stock | 651,259,596 | 67,634,760 | 263,709,698 | 813,033,213 | |||||
| Unrealized appreciation (depreciation) on: | |||||||||
| Investments | 30,735,128 | 17,996,835 | (3,565,771) | (20,151,877) | |||||
| Written options | — | — | — | (2,514) | |||||
| Foreign currencies | 81,941 | — | — | (55,058) | |||||
| Futures contracts | — | — | — | 2,800,979 | |||||
| Forward currency exchange contracts | — | — | — | (65,365) | |||||
| Forward sale commitments | — | — | — | (28,967) | |||||
| Accumulated undistributed net investment | |||||||||
| income | 2,826,522 | — | 196,192 | 65,365 | |||||
| Accumulated undistributed net realized gain (loss) | (3,281,157) | (3,506,817) | (2,899,986) | 8,490,142 | |||||
| Total Net Assets | $ | 681,622,030 | $ | 82,124,778 | $ | 257,440,133 | $ | 804,085,918 | |
| Shares outstanding (unlimited shares | |||||||||
| of no par value authorized) | 56,971,149 | 5,936,200 | 24,193,954 | 87,396,817 | |||||
| Net asset value, offering and redemption | |||||||||
| price per share | $ | 11.96 | $ | 13.83 | $ | 10.64 | $ | 9.20 | |
| 1 | Includes loaned securities with a market value of | $ | 23,272,875 | $ | 29,071,654 | $ | — | $ | 203,102,207 |
See notes to financial statements.
124
| AssetMark Funds |
| STATEMENTS OF ASSETS & LIABILITIES (Continued) |
| March 31, 2008 |
| Enhanced | Enhanced | Enhanced | Enhanced | |||||
| Fundamental | Fundamental | Fundamental | Fundamental | |||||
IndexTM | IndexTM | IndexTM | IndexTM | |||||
| Large Company | Large Company | Small Company | Small Company | |||||
| Growth Fund | Value Fund | Growth Fund | Value Fund | |||||
| ASSETS: | ||||||||
| Investments, at value (cost $61,005,710, | ||||||||
| $52,105,800, $11,142,922 and | ||||||||
| $4,904,044, respectively) . . . . . . . . . . . . . . . . . . | $ | 58,030,408 | $ | 46,247,058 | $ | 10,437,973 | $ | 4,501,207 |
| Variation margin on futures contracts . . . . . . . . . . . | 17,235 | 13,965 | 5,757 | 1,180 | ||||
| Cash . . . . . . . . . . . . . . . . . . . . . . . . . . . . . . . . . . . . . | — | 1,566 | 214 | — | ||||
| Income receivable . . . . . . . . . . . . . . . . . . . . . . . . . . | 96,357 | 70,229 | 6,069 | 7,620 | ||||
| Receivable for fund shares sold . . . . . . . . . . . . . . . | 9,139,730 | 8,166,982 | 2,111,305 | 1,518,463 | ||||
| Receivable from Investment Advisor . . . . . . . . . . . | — | — | 1,689 | 2,674 | ||||
| Deposits with brokers for futures contracts . . . . . . | 345,000 | 280,000 | 80,000 | 40,000 | ||||
| Other assets . . . . . . . . . . . . . . . . . . . . . . . . . . . . . . . | 16,582 | 1,532 | 108 | 275 | ||||
| Total Assets . . . . . . . . . . . . . . . . . . . . . . . . . . . . . | 67,645,312 | 54,781,332 | 12,643,115 | 6,071,419 | ||||
| LIABILITIES: | ||||||||
| Payable to Investment Advisor . . . . . . . . . . . . . . . . | 9,912 | 9,766 | — | — | ||||
| Payable to Custodian . . . . . . . . . . . . . . . . . . . . . . . . | 1,448 | 1,184 | 273 | 290 | ||||
| Payable for fund shares redeemed . . . . . . . . . . . . . | 36,228 | 28,240 | 6,435 | 2,534 | ||||
| Other accrued expenses . . . . . . . . . . . . . . . . . . . . . . | 50,785 | 45,062 | 25,509 | 23,134 | ||||
| Total Liabilities . . . . . . . . . . . . . . . . . . . . . . . . . . | 98,373 | 84,252 | 32,217 | 25,958 | ||||
| NET ASSETS . . . . . . . . . . . . . . . . . . . . . . . . . . . . . . . | $ | 67,546,939 | $ | 54,697,080 | $ | 12,610,898 | $ | 6,045,461 |
| NET ASSETS CONSIST OF: | ||||||||
| Capital stock . . . . . . . . . . . . . . . . . . . . . . . . . . . . . . | 71,188,181 | 60,877,568 | 13,408,793 | 6,550,161 | ||||
| Unrealized appreciation (depreciation) | ||||||||
| on investments | ||||||||
| Investments . . . . . . . . . . . . . . . . . . . . . . . . . . . . . | (2,975,302) | (5,858,742) | (704,949) | (402,837) | ||||
| Futures contracts . . . . . . . . . . . . . . . . . . . . . . . . .. | (3) | 449 | 4,895 | 1,882 | ||||
| Accumulated undistributed net investment income | 100,352 | 199,295 | — | 12,297 | ||||
| Accumulated undistributed net realized loss . . . . . | (766,289) | (521,490) | (97,841) | (116,042) | ||||
| Total Net Assets . . . . . . . . . . . . . . . . . . . . . . . . . . . | $ | 67,546,939 | $ | 54,697,080 | $ | 12,610,898 | $ | 6,045,461 |
| Shares outstanding (unlimited shares of | ||||||||
| no par value authorized) . . . . . . . . . . . . . . . . . . .. | 7,011,344 | 6,441,036 | 1,385,791 | 725,454 | ||||
| Net asset value, offering and redemption price | ||||||||
| per share . . . . . . . . . . . . . . . . . . . . . . . . . . . . . . . | $ | 9.63 | $ | 8.49 | $ | 9.10 | $ | 8.33 |
See notes to financial statements.
125
| AssetMark Funds |
| STATEMENTS OF OPERATIONS |
| For the Year Ended March 31, 2008 |
| Large Cap | Large Cap | Small/Mid Cap | Small/Mid Cap | |||||
| Growth Fund | Value Fund | Growth Fund | Value Fund | |||||
| INVESTMENT INCOME: | ||||||||
| Dividend income (net of withholding tax of | ||||||||
| $0, $42,097, $341 and $0, respectively) . . . . . . . . . | $ | 8,508,482 | $ | 15,885,225 | $ | 603,822 | $ | 2,261,543 |
| Interest income . . . . . . . . . . . . . . . . . . . . . . . . . . . . . . | 620,324 | 1,032,709 | 182,413 | 217,463 | ||||
| Total investment income . . . . . . . . . . . . . . . . . . . . .. | 9,128,806 | 16,917,934 | 786,235 | 2,479,006 | ||||
| EXPENSES: | ||||||||
| Investment advisory fees . . . . . . . . . . . . . . . . . . . . . . .. | 7,099,590 | 6,224,443 | 1,624,142 | 1,154,663 | ||||
| Distribution (12b-1) fees . . . . . . . . . . . . . . . . . . . . . . . | 1,935,342 | 1,697,268 | 428,653 | 296,072 | ||||
| Shareholder servicing fees . . . . . . . . . . . . . . . . . . . . . . | 387,069 | 339,454 | 85,730 | 59,214 | ||||
| Administration fees . . . . . . . . . . . . . . . . . . . . . . . . . . . | 259,947 | 227,366 | 58,120 | 39,480 | ||||
| Legal fees . . . . . . . . . . . . . . . . . . . . . . . . . . . . . . . . . . . | 143,412 | 123,375 | 31,944 | 26,026 | ||||
| Reports to shareholders . . . . . . . . . . . . . . . . . . . . . . . . | 92,533 | 86,397 | 32,693 | 21,933 | ||||
| Fund accounting fees . . . . . . . . . . . . . . . . . . . . . . . . . . | 90,547 | 78,708 | 22,934 | 16,084 | ||||
| Custody fees . . . . . . . . . . . . . . . . . . . . . . . . . . . . . . . . | 88,396 | 80,959 | 105,185 | 60,105 | ||||
| Directors’ fees and expenses . . . . . . . . . . . . . . . . . . . . | 60,499 | 54,526 | 15,359 | 12,736 | ||||
| Federal and state registration fees . . . . . . . . . . . . . . . .. | 51,304 | 45,395 | 23,834 | 25,022 | ||||
| Audit and tax fees . . . . . . . . . . . . . . . . . . . . . . . . . . . . | 28,406 | 28,410 | 23,383 | 25,051 | ||||
| Transfer agent fees and expenses . . . . . . . . . . . . . . . . | 25,590 | 23,917 | 14,729 | 13,935 | ||||
| Insurance fees . . . . . . . . . . . . . . . . . . . . . . . . . . . . . . . | 21,072 | 19,270 | 5,386 | 4,662 | ||||
| Payroll expense . . . . . . . . . . . . . . . . . . . . . . . . . . . . . . | 11,346 | 10,614 | 3,263 | 2,928 | ||||
| Compliance fees . . . . . . . . . . . . . . . . . . . . . . . . . . . . . | 1,769 | 1,556 | 361 | 194 | ||||
| Total expenses before securities lending credit . . . . | 10,296,822 | 9,041,658 | 2,475,716 | 1,758,105 | ||||
| Less securities lending credit (See Note 6) . . . . . . . . . | (408,836) | (343,051) | (258,441) | (102,997) | ||||
| Net expenses . . . . . . . . . . . . . . . . . . . . . . . . . . . . . . | 9,887,986 | 8,698,607 | 2,217,275 | 1,655,108 | ||||
| Net investment income (loss) . . . . . . . . . . . . . . . . . . . | (759,180) | 8,219,327 | (1,431,040) | 823,898 | ||||
| NET REALIZED AND UNREALIZED | ||||||||
| GAIN/(LOSS) ON INVESTMENTS: | ||||||||
| Net realized gain (loss) on investments . . . . . . . . . . . .. | 7,678,370 | 21,347,107 | 6,846,628 | (14,634,783) | ||||
| Net change in unrealized depreciation | ||||||||
| on investments . . . . . . . . . . . . . . . . . . . . . . . . . . . . . | (30,454,010) | (112,363,301) | (17,455,601) | (11,187,750) | ||||
| Net realized and unrealized losses . . . . . . . . . . . . . . | (22,775,640) | (91,016,194) | (10,608,973) | (25,822,533) | ||||
| NET DECREASE IN NET ASSETS | ||||||||
| RESULTING FROM OPERATIONS . . . . . . . . . . . . . . | $ | (23,534,820) | $ | (82,796,867) | $ | (12,040,013) | $ | (24,998,635) |
See notes to financial statements.
126
| AssetMark Funds |
| STATEMENTS OF OPERATIONS (Continued) |
| For the Year Ended March 31, 2008 |
| International | Real Estate | Tax-Exempt | Core Plus | |||||
| Equity | Securities | Fixed Income | Fixed Income | |||||
| Fund | Fund | Fund | Fund | |||||
| INVESTMENT INCOME: | ||||||||
| Dividend income (net of withholding tax of | ||||||||
| $2,128,625, $5,754, $0 and $0, respectively) . . . . . | $ | 17,160,170 | $ | 1,913,357 | $ | — | $ | 142,210 |
| Interest income . . . . . . . . . . . . . . . . . . . . . . . . . . . . . . | 510,004 | 114,860 | 11,059,345 | 43,092,492 | ||||
| Total investment income . . . . . . . . . . . . . . . . . . . . .. | 17,670,174 | 2,028,217 | 11,059,345 | 43,234,702 | ||||
| EXPENSES: | ||||||||
| Investment advisory fees . . . . . . . . . . . . . . . . . . . . . . .. | 7,155,044 | 781,414 | 2,126,061 | 5,737,214 | ||||
| Distribution (12b-1) fees . . . . . . . . . . . . . . . . . . . . . . . | 1,922,632 | 205,635 | 664,394 | 1,949,574 | ||||
| Shareholder servicing fees . . . . . . . . . . . . . . . . . . . . . . | 384,527 | 41,127 | 132,879 | 389,915 | ||||
| Administration fees . . . . . . . . . . . . . . . . . . . . . . . . . . . | 258,100 | 27,567 | 89,505 | 261,202 | ||||
| Legal fees . . . . . . . . . . . . . . . . . . . . . . . . . . . . . . . . . . . | 141,134 | 24,371 | 57,348 | 189,120 | ||||
| Reports to shareholders . . . . . . . . . . . . . . . . . . . . . . . . | 88,812 | 49,909 | 30,100 | 95,881 | ||||
| Fund accounting fees . . . . . . . . . . . . . . . . . . . . . . . . . . | 78,864 | 10,336 | 30,764 | 121,599 | ||||
| Custody fees . . . . . . . . . . . . . . . . . . . . . . . . . . . . . . . . | 769,269 | 44,694 | 36,451 | 212,533 | ||||
| Directors’ fees and expenses . . . . . . . . . . . . . . . . . . . . | 61,506 | 6,340 | 23,668 | 75,144 | ||||
| Federal and state registration fees . . . . . . . . . . . . . . . .. | 47,761 | 21,932 | 23,132 | 54,541 | ||||
| Audit and tax fees . . . . . . . . . . . . . . . . . . . . . . . . . . . . | 25,302 | 22,832 | 22,841 | 29,190 | ||||
| Transfer agent fees and expenses . . . . . . . . . . . . . . . . | 25,435 | 13,297 | 16,886 | 26,671 | ||||
| Insurance fees . . . . . . . . . . . . . . . . . . . . . . . . . . . . . . . | 21,265 | 1,954 | 7,155 | 19,398 | ||||
| Payroll expense . . . . . . . . . . . . . . . . . . . . . . . . . . . . . . | 8,784 | 1,098 | 2,928 | 10,024 | ||||
| Compliance fees . . . . . . . . . . . . . . . . . . . . . . . . . . . . . | 1,842 | 140 | 570 | 1,338 | ||||
| Total expenses before securities lending credit . . . . . . | 10,990,277 | 1,252,646 | 3,264,682 | 9,173,344 | ||||
| Less securities lending credit (See Note 6) . . . . . . . . . | (85,802) | (53,632) | — | (418,888) | ||||
| Net expenses . . . . . . . . . . . . . . . . . . . . . . . . . . . . . . | 10,904,475 | 1,199,014 | 3,264,682 | 8,754,456 | ||||
| Net investment income . . . . . . . . . . . . . . . . . . . . . . . . | 6,765,699 | 829,203 | 7,794,663 | 34,480,246 | ||||
| NET REALIZED AND UNREALIZED | ||||||||
| GAIN (LOSS) ON INVESTMENTS: | ||||||||
| Net realized gain (loss) on: | ||||||||
| Investments . . . . . . . . . . . . . . . . . . . . . . . . . . . . . . . . . | 68,900,234 | 4,575,407 | (2,108,329) | 11,002,992 | ||||
| Written options . . . . . . . . . . . . . . . . . . . . . . . . . . . . . . | — | — | — | 461,378 | ||||
| Foreign currencies . . . . . . . . . . . . . . . . . . . . . . . . . . . . | (893,984) | — | — | 4,641 | ||||
| Futures contracts . . . . . . . . . . . . . . . . . . . . . . . . . . . . . | — | — | — | 6,061,103 | ||||
| Forward currency contracts . . . . . . . . . . . . . . . . . . . . . | (409,682) | — | — | (2,846,995) | ||||
| Total . . . . . . . . . . . . . . . . . . . . . . . . . . . . . . . . . . . . . | 67,596,568 | 4,575,407 | (2,108,329) | 14,683,119 | ||||
| Net change in unrealized appreciation | ||||||||
| (depreciation) on: | ||||||||
| Investments . . . . . . . . . . . . . . . . . . . . . . . . . . . . . . . . . | (101,653,447) | (22,665,897) | (4,983,804) | (23,828,484) | ||||
| Written options . . . . . . . . . . . . . . . . . . . . . . . . . . . . . . | — | — | — | (16,197) | ||||
| Foreign currencies . . . . . . . . . . . . . . . . . . . . . . . . . . . . | 98,246 | — | — | (73,554) | ||||
| Futures contracts . . . . . . . . . . . . . . . . . . . . . . . . . . . . . | — | — | — | 3,376,575 | ||||
| Forward currency contracts . . . . . . . . . . . . . . . . . . . . . | — | — | — | 274,492 | ||||
| Forward Sale Commitments . . . . . . . . . . . . . . . . . . . . | — | — | — | (28,967) | ||||
| Total . . . . . . . . . . . . . . . . . . . . . . . . . . . . . . . . . . . . . | (101,555,201) | (22,665,897) | (4,983,804) | (20,296,135) | ||||
| Net realized and unrealized loss . . . . . . . . . . . . . . . . . | (33,958,633) | (18,090,490) | (7,092,133) | (5,613,016) | ||||
| NET INCREASE (DECREASE) IN NET ASSETS | ||||||||
| RESULTING FROM OPERATIONS . . . . . . . . . . . . . . | $ | (27,192,934) | $ | (17,261,287) | $ | 702,530 | $ | 28,867,230 |
See notes to financial statements.
127
| AssetMark Funds |
| STATEMENTS OF OPERATIONS (Continued) |
| For the Period Ended March 31, 2008 |
| Enhanced | Enhanced | Enhanced | Enhanced | |||||
| Fundamental | Fundamental | Fundamental | Fundamental | |||||
| Index™ | Index™ | Index™ | Index™ | |||||
| Large Company | Large Company | Small Company | Small Company | |||||
| Growth Fund | Value Fund | Growth Fund | Value Fund | |||||
| INVESTMENT INCOME: | ||||||||
| Dividend income (net of withholding tax of $0, $82, | ||||||||
| $0 and $5, respectively) . . . . . . . . . . . . . . . . . . . . . . | $ | 409,749 | $ | 493,770 | $ | 25,088 | $ | 37,516 |
| Interest income . . . . . . . . . . . . . . . . . . . . . . . . . . . . . . | 51,348 | 41,945 | 9,129 | 3,816 | ||||
| Total investment income . . . . . . . . . . . . . . . . . . . . .. | 461,097 | 535,715 | 34,217 | 41,332 | ||||
| EXPENSES: | ||||||||
| Investment advisory fees . . . . . . . . . . . . . . . . . . . . . . .. | 164,937 | 128,237 | 27,610 | 12,020 | ||||
| Distribution (12b-1) fees . . . . . . . . . . . . . . . . . . . . . . . | 54,979 | 42,746 | 9,203 | 4,007 | ||||
| Shareholder servicing fees . . . . . . . . . . . . . . . . . . . . . . | 11,249 | 8,753 | 1,879 | 821 | ||||
| Administration fees . . . . . . . . . . . . . . . . . . . . . . . . . . . | 19,898 | 15,184 | 3,266 | 1,412 | ||||
| Legal fees . . . . . . . . . . . . . . . . . . . . . . . . . . . . . . . . . . . | 70,784 | 60,131 | 29,670 | 25,752 | ||||
| Reports to shareholders . . . . . . . . . . . . . . . . . . . . . . . . | 1,460 | 1,173 | 508 | 335 | ||||
| Fund accounting fees . . . . . . . . . . . . . . . . . . . . . . . . . . | 14,182 | 11,818 | 2,494 | 1,098 | ||||
| Custody fees . . . . . . . . . . . . . . . . . . . . . . . . . . . . . . . . | 5,173 | 3,046 | 708 | 599 | ||||
| Directors’ fees and expenses . . . . . . . . . . . . . . . . . . . . | 7,152 | 6,894 | 6,090 | 6,165 | ||||
| Federal and state registration fees . . . . . . . . . . . . . . . .. | 25,442 | 25,112 | 23,482 | 23,236 | ||||
| Audit and tax fees . . . . . . . . . . . . . . . . . . . . . . . . . . . . | 21,704 | 21,700 | 21,700 | 21,707 | ||||
| Transfer agent fees and expenses . . . . . . . . . . . . . . . . | 4,000 | 4,082 | 3,694 | 3,573 | ||||
| Insurance fees . . . . . . . . . . . . . . . . . . . . . . . . . . . . . . . | 62 | 62 | 31 | 31 | ||||
| Payroll expense . . . . . . . . . . . . . . . . . . . . . . . . . . . . . . | 235 | 235 | 235 | 235 | ||||
| Total expenses before expense reimbursements . . . . . | 401,257 | 329,173 | 130,570 | 100,991 | ||||
| Less expense reimbursement by Advisor | ||||||||
| (See Note 3) . . . . . . . . . . . . . . . . . . . . . . . . . . . . . . . | (132,884) | (120,516) | (85,646) | (81,433) | ||||
| Net expenses . . . . . . . . . . . . . . . . . . . . . . . . . . . . | 268,373 | 208,657 | 44,924 | 19,558 | ||||
| Net investment income/(loss) . . . . . . . . . . . . . . . . . . . | 192,724 | 327,058 | (10,707) | 21,774 | ||||
| NET REALIZED AND UNREALIZED | ||||||||
| LOSS ON INVESTMENTS: | ||||||||
| Net realized gain (loss) on investments | ||||||||
| Investments . . . . . . . . . . . . . . . . . . . . . . . . . . . . . . . . . | (513,465) | (349,750) | (58,472) | (91,709) | ||||
| Futures contracts . . . . . . . . . . . . . . . . . . . . . . . . . . . . . | (212,102) | (152,289) | (19,240) | (18,239) | ||||
| Total . . . . . . . . . . . . . . . . . . . . . . . . . . . . . . . . . . . . . | (725,567) | (502,039) | (77,712) | (109,948) | ||||
| Net change in unrealized appreciation (depreciation) | ||||||||
| on investments | ||||||||
| Investments . . . . . . . . . . . . . . . . . . . . . . . . . . . . . . . . . | (2,975,302) | (5,858,742) | (704,949) | (402,837) | ||||
| Futures contracts . . . . . . . . . . . . . . . . . . . . . . . . . . . . . | (3) | 449 | 4,895 | 1,882 | ||||
| Total . . . . . . . . . . . . . . . . . . . . . . . . . . . . . . . . . . . . . | (2,975,305) | (5,858,293) | (700,054) | (400,955) | ||||
| Net realized and unrealized losses . . . . . . . . . . . . . . . . | (3,700,872) | (6,360,332) | (777,766) | (510,903) | ||||
| NET DECREASE IN NET ASSETS | ||||||||
| RESULTING FROM OPERATIONS . . . . . . . . . . . . . | $ | (3,508,148) | $ | (6,033,274) | $ | (788,473) | $ | (489,129) |
See notes to financial statements.
128
| AssetMark Funds |
| STATEMENTS OF CHANGES IN NET ASSETS |
| Large Cap Growth Fund | Large Cap Value Fund | |||||||
| Year | Year | Year | Year | |||||
| Ended | Ended | Ended | Ended | |||||
| March 31, | March 31, | March 31, | March 31, | |||||
| 2008 | 2007 | 2008 | 2007 | |||||
| OPERATIONS: | ||||||||
| Net investment income/(loss) . . . . . . . . . . . . . . . . . . . | $ | (759,180) | $ | (1,709,860) | $ | 8,219,327 | $ | 6,814,925 |
| Net realized gain on investment transactions . . . . . . . | 7,678,370 | 15,036,136 | 21,347,107 | 37,154,587 | ||||
| Change in unrealized appreciation (depreciation) | ||||||||
| on investments . . . . . . . . . . . . . . . . . . . . . . . . . . . . . | (30,454,010) | (11,322,116) | (112,363,301) | 49,683,330 | ||||
| Net increase (decrease) in net assets resulting from | ||||||||
| operations . . . . . . . . . . . . . . . . . . . . . . . . . . . . . . . | (23,534,820) | 2,004,160 | (82,796,867) | 93,652,842 | ||||
| CAPITAL SHARE TRANSACTIONS: | ||||||||
| Shares sold . . . . . . . . . . . . . . . . . . . . . . . . . . . . . . . . . . | 267,447,139 | 347,544,018 | 279,650,404 | 241,132,362 | ||||
| Shares issued to holders in reinvestment of dividends | 19,666,815 | 10,257,279 | 31,097,566 | 33,955,890 | ||||
| Shares redeemed . . . . . . . . . . . . . . . . . . . . . . . . . . . . . | (330,121,453) | (241,421,753) | (275,853,508) | (283,517,492) | ||||
| Net increase (decrease) . . . . . . . . . . . . . . . . . . . . . . | (43,007,499) | 116,379,544 | 34,894,462 | (8,429,240) | ||||
| DIVIDENDS AND DISTRIBUTIONS | ||||||||
| TO SHAREHOLDERS: | ||||||||
| Net investment income . . . . . . . . . . . . . . . . . . . . . . . . | — | — | (7,869,450) | (7,114,128) | ||||
| From net realized gains . . . . . . . . . . . . . . . . . . . . . . . . | (37,788,532) | (18,666,939) | (52,248,534) | (55,830,479) | ||||
| Total dividends and distributions . . . . . . . . . . . . . . . | (37,788,532) | (18,666,939) | (60,117,984) | (62,944,607) | ||||
| INCREASE (DECREASE) IN NET ASSETS . . . . . . . . | (104,330,851) | 99,716,765 | (108,020,389) | 22,278,995 | ||||
| NET ASSETS: | ||||||||
| Beginning of year . . . . . . . . . . . . . . . . . . . . . . . . . . . . | $ | 753,638,303 | $ | 653,921,538 | $ | 682,408,978 | $ | 660,129,983 |
| End of year (including undistributed net investment | ||||||||
| income of $14,780, $14,784, | ||||||||
| $2,178,548 and $1,823,473, respectively) . . . . . . . . | $ | 649,307,452 | $ | 753,638,303 | $ | 574,388,589 | $ | 682,408,978 |
| CHANGES IN SHARES OUTSTANDING | ||||||||
| Shares sold . . . . . . . . . . . . . . . . . . . . . . . . . . . . . . . . . . | 26,481,564 | 37,074,341 | 23,618,236 | 19,578,975 | ||||
| Shares issued to holders in reinvestment of dividends . . | 1,933,807 | 1,070,697 | 2,850,373 | 2,738,378 | ||||
| Shares redeemed . . . . . . . . . . . . . . . . . . . . . . . . . . . . . | (32,988,348) | (25,567,414) | (23,419,381) | (23,146,431) | ||||
| Net increase (decrease) . . . . . . . . . . . . . . . . . . . . . . | (4,572,977) | 12,577,624 | 3,049,228 | (829,078) | ||||
See notes to financial statements.
129
| AssetMark Funds |
| STATEMENTS OF CHANGES IN NET ASSETS (Continued) |
| Small/Mid Cap Growth Fund | Small/Mid Cap Value Fund | |||||||
| Year | Year | Year | Year | |||||
| Ended | Ended | Ended | Ended | |||||
| March 31, | March 31, | March 31, | March 31, | |||||
| 2008 | 2007 | 2008 | 2007 | |||||
| OPERATIONS: | ||||||||
| Net investment income (loss) . . . . . . . . . . . . . . . . . . . | $ | (1,431,040) | $ | (1,179,373) | $ | 823,898 | $ | 2,703,980 |
| Net realized gain (loss) on investment transactions . . | 6,846,628 | 11,591,748 | (14,634,783) | 25,993,393 | ||||
| Change in unrealized depreciation on investments . . . | (17,455,601) | (8,817,990) | (11,187,750) | (20,194,858) | ||||
| Net increase (decrease) in net assets resulting | ||||||||
| from operations . . . . . . . . . . . . . . . . . . . . . . . . . . | (12,040,013) | 1,594,385 | (24,998,635) | 8,502,515 | ||||
| CAPITAL SHARE TRANSACTIONS: | ||||||||
| Shares sold . . . . . . . . . . . . . . . . . . . . . . . . . . . . . . . . . . | 121,019,326 | 89,530,789 | 106,059,903 | 66,656,437 | ||||
| Shares issued to holders in reinvestment of dividends . . | 13,201,828 | 3,600,261 | 2,328,482 | 14,357,797 | ||||
| Shares redeemed . . . . . . . . . . . . . . . . . . . . . . . . . . . . . | (142,278,921) | (132,302,419) | (89,598,633) | (134,065,122) | ||||
| Net increase (decrease) . . . . . . . . . . . . . . . . . . . . . . | (8,057,767) | (39,171,369) | 18,789,752 | (53,050,888) | ||||
| DIVIDENDS AND DISTRIBUTIONS | ||||||||
| TO SHAREHOLDERS: | ||||||||
| Net investment income . . . . . . . . . . . . . . . . . . . . . . . . | — | — | (785,895) | (2,693,593) | ||||
| From net realized gains . . . . . . . . . . . . . . . . . . . . . . . . | (24,771,347) | (6,534,072) | (3,510,280) | (28,268,174) | ||||
| Return of capital . . . . . . . . . . . . . . . . . . . . . . . . . . . . . | — | — | (26,098) | — | ||||
| Total dividends and distributions . . . . . . . . . . . . . . . | (24,771,347) | (6,534,072) | (4,322,273) | (30,961,767) | ||||
| DECREASE IN NET ASSETS . . . . . . . . . . . . . . . . . . . . | (44,869,127) | (44,111,056) | (10,531,156) | (75,510,140) | ||||
| NET ASSETS: | ||||||||
| Beginning of year . . . . . . . . . . . . . . . . . . . . . . . . . . . . | $ | 171,403,932 | 215,514,988 | $ | 110,079,540 | 185,589,680 | ||
| End of year (including undistributed net investment | ||||||||
| income of $88,037, $0, $64,600 and | ||||||||
| $38,800, respectively) . . . . . . . . . . . . . . . . . . . . . . .. | $ | 126,534,805 | $ | 171,403,932 | $ | 99,548,384 | $ | 110,079,540 |
| CHANGES IN SHARES OUTSTANDING | ||||||||
| Shares sold . . . . . . . . . . . . . . . . . . . . . . . . . . . . . . . . . . | 11,341,229 | 8,874,843 | 9,416,408 | 4,991,302 | ||||
| Shares issued to holders in reinvestment of dividends . . | 1,349,880 | 357,169 | 227,169 | 1,193,499 | ||||
| Shares redeemed . . . . . . . . . . . . . . . . . . . . . . . . . . . . . | (13,063,069) | (13,478,510) | (8,078,699) | (9,849,525) | ||||
| Net increase (decrease) . . . . . . . . . . . . . . . . . . . . . . | (371,960) | (4,246,498) | 1,564,878 | (3,664,724) | ||||
See notes to financial statements.
130
| AssetMark Funds |
| STATEMENTS OF CHANGES IN NET ASSETS (Continued) |
| International Equity Fund | Real Estate Securities Fund | |||||||
| Year | Year | Year | Year | |||||
| Ended | Ended | Ended | Ended | |||||
| March 31, | March 31, | March 31, | March 31, | |||||
| 2008 | 2007 | 2008 | 2007 | |||||
| OPERATIONS: | ||||||||
| Net investment income . . . . . . . . . . . . . . . . . . . . . . . . | $ | 6,765,699 | $ | 6,842,511 | $ | 829,203 | $ | 660,581 |
| Net realized gain on investment transactions . . . . . . . | 67,596,568 | 98,009,719 | 4,575,407 | 10,301,737 | ||||
| Change in unrealized appreciation (depreciation) | ||||||||
| on investments . . . . . . . . . . . . . . . . . . . . . . . . . . . . . | (101,555,201) | 13,849,066 | (22,665,897) | 7,585,486 | ||||
| Net increase (decrease) in net assets resulting | ||||||||
| from operations . . . . . . . . . . . . . . . . . . . . . . . . . . | (27,192,934) | 118,701,296 | (17,261,287) | 18,547,804 | ||||
| CAPITAL SHARE TRANSACTIONS: | ||||||||
| Shares sold . . . . . . . . . . . . . . . . . . . . . . . . . . . . . . . . . . | 376,680,277 | 357,626,736 | 69,172,227 | 61,137,806 | ||||
| Shares issued to holders in reinvestment of dividends . . | 65,618,856 | 46,838,067 | 6,744,175 | 3,888,581 | ||||
| Shares redeemed . . . . . . . . . . . . . . . . . . . . . . . . . . . . . | (387,608,629) | (272,240,775) | (80,079,926) | (48,653,364) | ||||
| Net increase (decrease) . . . . . . . . . . . . . . . . . . . . . . | 54,690,504 | 132,224,028 | (4,163,524) | 16,373,023 | ||||
| DIVIDENDS AND DISTRIBUTIONS | ||||||||
| TO SHAREHOLDERS: | ||||||||
| Net investment income . . . . . . . . . . . . . . . . . . . . . . . . | (7,020,606) | (8,971,421) | (1,002,153) | (1,121,696) | ||||
| From net realized gains . . . . . . . . . . . . . . . . . . . . . . . . | (118,277,258) | (74,819,797) | (12,664,277) | (5,953,056) | ||||
| Return of capital . . . . . . . . . . . . . . . . . . . . . . . . . . . . . | — | — | (246,102) | — | ||||
| Total dividends and distributions . . . . . . . . . . . . . . . | (125,297,864) | (83,791,218) | (13,912,532) | (7,074,752) | ||||
| INCREASE (DECREASE) IN NET ASSETS . . . . . . . . | (97,800,294) | 167,134,106 | (35,337,343) | 27,846,075 | ||||
| NET ASSETS: | ||||||||
| Beginning of year . . . . . . . . . . . . . . . . . . . . . . . . . . . . | $ | 779,422,324 | $ | 612,288,218 | $ | 117,462,121 | $ | 89,616,046 |
| End of year (including undistributed net | ||||||||
| investment income of $2,826,522, $1,340,053, | ||||||||
| $1,344,655 and $0, respectively) . . . . . . . . . . . . . . . | $ | 681,622,030 | $ | 779,422,324 | $ | 82,124,778 | $ | 117,462,121 |
| CHANGES IN SHARES OUTSTANDING | ||||||||
| Shares sold . . . . . . . . . . . . . . . . . . . . . . . . . . . . . . . . . . | 25,945,984 | 25,260,683 | 4,337,540 | 3,085,833 | ||||
| Shares issued to holders in reinvestment of dividends . . | 4,915,270 | 3,326,567 | 489,063 | 192,599 | ||||
| Shares redeemed . . . . . . . . . . . . . . . . . . . . . . . . . . . . . | (26,810,144) | (19,203,610) | (4,506,792) | (2,515,969) | ||||
| Net increase . . . . . . . . . . . . . . . . . . . . . . . . . . . . . . . | 4,051,110 | 9,383,640 | 319,811 | 762,463 | ||||
See notes to financial statements.
131
| AssetMark Funds |
| STATEMENTS OF CHANGES IN NET ASSETS (Continued) |
| Tax-Exempt Fixed Income Fund | Core Plus Fixed Income Fund | |||||||
| Year | Year | Year | Year | |||||
| Ended | Ended | Ended | Ended | |||||
| March 31, | March 31, | March 31, | March 31, | |||||
| 2008 | 2007 | 2008 | 2007 | |||||
| OPERATIONS: | ||||||||
| Net investment income | $ | 7,794,663 | $ | 5,634,894 | $ | 34,480,246 | $ | 27,219,073 |
| Net realized gain (loss) on investment transactions | (2,108,329) | (501,893) | 14,683,119 | 437,575 | ||||
| Change in unrealized appreciation (depreciation) | ||||||||
| on investments | (4,983,804) | 3,528,011 | (20,296,135) | 11,525,919 | ||||
| Net increase in net assets resulting from operations | 702,530 | 8,661,012 | 28,867,230 | 39,182,567 | ||||
| CAPITAL SHARE TRANSACTIONS: | ||||||||
| Shares sold | 129,349,672 | 112,068,712 | 575,136,422 | 345,088,680 | ||||
| Shares issued to holders in reinvestment of dividends | 3,602,262 | 2,703,893 | 17,309,826 | 14,064,652 | ||||
| Shares redeemed | (116,384,384) | (83,186,911) | (497,859,399) | (268,111,990) | ||||
| Net increase | 16,567,550 | 31,585,694 | 94,586,849 | 91,041,342 | ||||
| DIVIDENDS AND DISTRIBUTIONS | ||||||||
| TO SHAREHOLDERS: | ||||||||
| Net investment income | (7,671,793) | (5,575,058) | (34,075,503) | (27,047,513) | ||||
| From net realized gains | — | — | (1,310,487) | — | ||||
| Total dividends and distributions | (7,671,793) | (5,575,058) | (35,385,990) | (27,047,513) | ||||
| INCREASE IN NET ASSETS | 9,598,287 | 34,671,648 | 88,068,089 | 103,176,396 | ||||
| NET ASSETS: | ||||||||
| Beginning of year | $ | 247,841,846 | 213,170,198 | $ | 716,017,829 | 612,841,433 | ||
| End of year (including undistributed net | ||||||||
| investment income (loss) of $196,192, $201,306, | ||||||||
| $65,365 and $(484,341), respectively) | $ | 257,440,133 | $ | 247,841,846 | $ | 804,085,918 | $ | 716,017,829 |
| CHANGES IN SHARES OUTSTANDING | ||||||||
| Shares sold | 11,933,757 | 10,295,601 | 61,619,151 | 37,525,129 | ||||
| Shares issued to holders in reinvestment of dividends | 335,715 | 248,714 | 1,885,334 | 1,531,705 | ||||
| Shares redeemed | (10,763,968) | (7,656,887) | (53,307,504) | (29,138,674) | ||||
| Net increase | 1,505,504 | 2,887,428 | 10,196,981 | 9,918,160 | ||||
See notes to financial statements.
132
| AssetMark Funds |
| STATEMENTS OF CHANGES IN NET ASSETS (Continued) |
| Enhanced | Enhanced | Enhanced | Enhanced | |||||
| Fundamental | Fundamental | Fundamental | Fundamental | |||||
| Index™ Large | Index™ Large | Index™ Small | Index™ Small | |||||
| Company | Company | Company | Company | |||||
| Growth Fund | Value Fund | Growth Fund | Value Fund | |||||
| August 9, | August 9, | August 9, | August 9, | |||||
2007(1) | 2007(1) | 2007(1) | 2007(1) | |||||
| through | through | through | through | |||||
| March 31, | March 31, | March 31, | March 31, | |||||
| 2008 | 2008 | 2008 | 2008 | |||||
| OPERATIONS: | ||||||||
| Net investment income (loss) | $ | 192,724 | $ | 327,058 | $ | (10,707) | $ | 21,774 |
| Net realized loss on investment transactions | (725,567) | (502,039) | (77,712) | (109,948) | ||||
| Change in unrealized depreciation on investments | (2,975,305) | (5,858,293) | (700,054) | (400,955) | ||||
| Net decrease in net assets resulting from operations | (3,508,148) | (6,033,274) | (788,473) | (489,129) | ||||
| CAPITAL SHARE TRANSACTIONS: | ||||||||
| Shares sold | 82,829,264 | 66,112,635 | 14,685,334 | 7,696,840 | ||||
| Shares issued to holders in reinvestment of dividends | 67,537 | 74,619 | 8,549 | 8,061 | ||||
| Shares redeemed | (11,708,504) | (5,309,522) | (1,277,849) | (1,154,716) | ||||
| Net increase | 71,188,297 | 60,877,732 | 13,416,034 | 6,550,185 | ||||
| DIVIDENDS AND DISTRIBUTIONS TO | ||||||||
| SHAREHOLDERS: | ||||||||
| Net investment income | (92,376) | (127,896) | — | (9,436) | ||||
| From net realized gains | (40,834) | (19,482) | (9,434) | (6,159) | ||||
| Return of capital | — | — | (7,229) | — | ||||
| Total dividends and distributions | (133,210) | (147,378) | (16,663) | (15,595) | ||||
| INCREASE IN NET ASSETS | 67,546,939 | 54,697,080 | 12,610,898 | 6,045,461 | ||||
| NET ASSETS: | ||||||||
| Beginning of year | $ | 0 | $ | 0 | $ | 0 | $ | 0 |
| End of year (including undistributed net investment | ||||||||
| income of $100,352, $199,295, $0 and $12,297 | ||||||||
| respectively) | $ | 67,546,939 | $ | 54,697,080 | $ | 12,610,898 | $ | 6,045,461 |
| CHANGES IN SHARES OUTSTANDING | ||||||||
| Shares sold | 8,150,747 | 6,992,038 | 1,517,164 | 850,720 | ||||
| Shares issued to holders in reinvestment of dividends | 6,426 | 7,830 | 859 | 888 | ||||
| Shares redeemed | (1,145,829) | (558,832) | (132,232) | (126,154) | ||||
| Net increase | 7,011,344 | 6,441,036 | 1,385,791 | 725,454 | ||||
| (1) Commencement of Operations. |
See notes to financial statements.
133
| AssetMark Funds |
| FINANCIAL HIGHLIGHTS |
| Large Cap Growth Fund | ||||||||||
| Year Ended | Year Ended | Period Ended | Year Ended | Year Ended | ||||||
| March 31, 2008 | March 31, 2007 | March 31, 2006 | June 30, 2005 | June 30, 2004 | ||||||
| Per share data for a share of capital | ||||||||||
| stock outstanding for the entire period | ||||||||||
| and selected information for the period | ||||||||||
| are as follows: | ||||||||||
| Net asset value, beginning of period | $ | 9.62 | $ | 9.95 | $ | 9.20 | $ | 9.16 | $ | 7.59 |
| Income from investment operations: | ||||||||||
| Net investment loss | (0.01) | (0.02) | (0.03) | (0.03) | (0.04) | |||||
| Net realized and unrealized | ||||||||||
| gains/(losses) on investments | (0.30) | (0.06) | 0.78 | 0.07 | 1.61 | |||||
| Total from investment operations | (0.31) | (0.08) | 0.75 | 0.04 | 1.57 | |||||
| Less distributions: | ||||||||||
| Dividends from net investment | ||||||||||
| income | — | — | — | — | — | |||||
| Dividends from net realized gains | (0.50) | (0.25) | — | — | — | |||||
| Total distributions | (0.50) | (0.25) | — | — | — | |||||
| Net asset value, end of period | $ | 8.81 | $ | 9.62 | $ | 9.95 | $ | 9.20 | $ | 9.16 |
| Total return | -3.88% | -0.80% | 8.15%(1) | 0.44% | 20.69% | |||||
| Supplemental data and ratios: | ||||||||||
| Net assets, end of period | $ | 649,307,452 | $ | 753,638,303 | $ | 653,921,538 | $ | 570,471,545 | $ | 344,452,770 |
| Ratio of expenses to average net assets | ||||||||||
| Before Expense Reimbursement, | ||||||||||
| including (Recapture) | 1.33% | 1.33% | 1.35%(2) | 1.39% | 1.51% | |||||
| After Expense Reimbursement/ | ||||||||||
| (Recapture) and Securities | ||||||||||
| Lending Credit | 1.28% | 1.31% | 1.32%(2) | 1.37% | 1.49% | |||||
| Ratio of net investment loss | ||||||||||
| to average net assets | ||||||||||
| Before Expense Reimbursement, | ||||||||||
| including (Recapture) | -0.15% | -0.27% | -0.38%(2) | -0.41% | -0.83% | |||||
| After Expense | ||||||||||
| Reimbursement/(Recapture) | -0.10% | -0.25% | -0.35%(2) | -0.39% | -0.81% | |||||
| Portfolio turnover rate | 62.86% | 142.66% | 72.34% | 21.63% | 24.66% | |||||
| (1) Not Annualized. | ||||||||||
| (2) Annualized. | ||||||||||
See notes to financial statements.
134
| AssetMark Funds |
| FINANCIAL HIGHLIGHTS |
| Large Cap Value Fund | ||||||||||
| Year Ended | Year Ended | Period Ended | Year Ended | Year Ended | ||||||
| March 31, 2008 | March 31, 2007 | March 31, 2006 | June 30, 2005 | June 30, 2004 | ||||||
| Per share data for a share of capital | ||||||||||
| stock outstanding for the entire period | ||||||||||
| and selected information for the period | ||||||||||
| are as follows: | ||||||||||
| Net asset value, beginning of period | $ | 12.34 | $ | 11.77 | $ | 11.24 | $ | 10.96 | $ | 8.78 |
| Income from investment operations: | ||||||||||
| Net investment income | 0.15 | 0.14 | 0.07 | 0.07 | 0.03 | |||||
| Net realized and unrealized | ||||||||||
| gains (losses) on investments | (1.55) | 1.67 | 0.79 | 0.56 | 2.17 | |||||
| Total from investment operations | (1.40) | 1.81 | 0.86 | 0.63 | 2.20 | |||||
| Less distributions: | ||||||||||
| Dividends from net investment | ||||||||||
| income | (0.14) | (0.14) | (0.07) | (0.05) | (0.02) | |||||
| Dividends from net realized gains | (0.95) | (1.10) | (0.26) | (0.30) | — | |||||
| Total distributions | (1.09) | (1.24) | (0.33) | (0.35) | (0.02) | |||||
| Net asset value, end of period | $ | 9.85 | $ | 12.34 | $ | 11.77 | $ | 11.24 | $ | 10.96 |
| Total return | -12.23% | 15.32% | 7.85%(1) | 5.69% | 25.12% | |||||
| Supplemental data and ratios: | ||||||||||
| Net assets, end of period | $ | 574,388,589 | $ | 682,408,978 | $ | 660,129,983 | $ | 570,849,575 | $ | 340,186,439 |
| Ratio of expenses to average net assets | ||||||||||
| Before Expense Reimbursement, | ||||||||||
| including (Recapture) | 1.33% | 1.32% | 1.36%(2) | 1.38% | 1.51% | |||||
| After Expense Reimbursement/ | ||||||||||
| (Recapture) and Securities | ||||||||||
| Lending Credit | 1.28% | 1.28% | 1.30%(2) | 1.33% | 1.49% | |||||
| Ratio of net investment income to | ||||||||||
| average net assets | ||||||||||
| Before Expense Reimbursement, | ||||||||||
| including (Recapture) | 1.16% | 1.00% | 0.86%(2) | 0.67% | 0.47% | |||||
| After Expense | ||||||||||
| Reimbursement/(Recapture) | 1.21% | 1.04% | 0.92%(2) | 0.72% | 0.49% | |||||
| Portfolio turnover rate | 40.54% | 30.25% | 64.61% | 20.06% | 26.27% | |||||
| (1) Not Annualized. | ||||||||||
| (2) Annualized. | ||||||||||
See notes to financial statements.1
135
| AssetMark Funds |
| FINANCIAL HIGHLIGHTS |
| Small/Mid Cap Growth Fund | |||||||||||
| Year Ended | Year Ended | Period Ended | Year Ended | Year Ended | |||||||
| March 31, 2008 | March 31, 2007 | March 31, 2006 | June 30, 2005 | June 30, 2004 | |||||||
| Per share data for a share of capital | |||||||||||
| stock outstanding for the entire period | |||||||||||
| and selected information for the period | |||||||||||
| are as follows: | |||||||||||
| Net asset value, beginning of period | $ | 10.65 | $ | 10.60 | $ | 9.56 | $ | 9.49 | $ | 7.64 | |
| Income from investment operations: | |||||||||||
| Net investment loss | (0.09) | (0.07) | (0.06) | (0.06) | (0.06) | ||||||
| Net realized and unrealized | |||||||||||
| gains (losses) on investments | (0.69) | 0.56 | 1.95 | 0.13 | 1.91 | ||||||
| Total from investment operations | (0.78) | 0.49 | 1.89 | 0.07 | 1.85 | ||||||
| Less distributions: | |||||||||||
| Dividends from net investment | |||||||||||
| income | — | — | — | — | — | ||||||
| Dividends from net realized gains | (1.82) | (0.44) | (0.85) | — | — | ||||||
| Total distributions | (1.82) | (0.44) | (0.85) | — | — | ||||||
| Net asset value, end of period | $ | 8.05 | $ | 10.65 | $ | 10.60 | $ | 9.56 | $ | 9.49 | |
| Total return | -10.31% | 4.84% | 20.82%(1) | 0.74% | 24.21% | ||||||
| Supplemental data and ratios: | |||||||||||
| Net assets, end of period | $ | 126,534,805 | $ | 171,403,932 | $ | 215,514,988 | $ | 148,571,261 | $ | 87,189,588 | |
| Ratio of expenses to average net assets | |||||||||||
| Before Expense Reimbursement, | |||||||||||
| including (Recapture) | 1.44% | 1.43% | 1.43%(2) | 1.54% | 1.61% | ||||||
| After Expense Reimbursement/ | |||||||||||
| (Recapture) and Securities | |||||||||||
| Lending Credit | 1.29% | 1.37% | 1.38%(2) | 1.50% | 1.57% | ||||||
| Ratio of net investment loss | |||||||||||
| to average net assets | |||||||||||
| Before Expense Reimbursement, | |||||||||||
| including (Recapture) | -0.99% | -0.75% | -0.92%(2) | -0.85% | -0.97% | ||||||
| After Expense | |||||||||||
| Reimbursement/(Recapture) | -0.84% | -0.69% | -0.87%(2) | -0.81% | -0.93% | ||||||
| Portfolio turnover rate | 209.64% | 213.08% | 180.64% | 99.09% | 56.19% | ||||||
| (1) Not Annualized. | |||||||||||
| (2) Annualized. | |||||||||||
See notes to financial statements.
136
| AssetMark Funds |
| FINANCIAL HIGHLIGHTS |
| Small/Mid Cap Value Fund | |||||||||||
| Year Ended | Year Ended | Period Ended | Year Ended | Year Ended | |||||||
| March 31, 2008 | March 31, 2007 | March 31, 2006 | June 30, 2005 | June 30, 2004 | |||||||
| Per share data for a share of capital | |||||||||||
| stock outstanding for the entire period | |||||||||||
| and selected information for the period | |||||||||||
| are as follows: | |||||||||||
| Net asset value, beginning of period | $ | 11.95 | $ | 14.41 | $ | 13.89 | $ | 12.93 | $ | 10.13 | |
| Income from investment operations: | |||||||||||
| Net investment income (loss) | 0.08 | 0.31 | (0.04) | (0.04) | (0.04) | ||||||
| Net realized and unrealized | |||||||||||
| gains (losses) on investments | (2.36) | 0.81 | 1.52 | 1.40 | 2.84 | ||||||
| Total from investment operations | (2.28) | 1.12 | 1.48 | 1.36 | 2.80 | ||||||
| Less distributions: | |||||||||||
| Dividends from net investment | |||||||||||
| income | (0.08) | (0.31) | — | — | — | ||||||
| Dividends from net realized gains . . | (0.35) | (3.27) | (0.96) | (0.40) | — | ||||||
| Return of capital | — * | — | — | — | — | ||||||
| Total distributions | (0.43) | (3.58) | (0.96) | (0.40) | — | ||||||
| Net asset value, end of period | $ | 9.24 | $ | 11.95 | $ | 14.41 | $ | 13.89 | $ | 12.93 | |
| Total return | -19.47% | 7.63% | 11.18%(1) | 10.56% | 27.64% | ||||||
| Supplemental data and ratios: | |||||||||||
| Net assets, end of period | $ | 99,548,384 | $ | 110,079,540 | $ | 185,589,680 | $ | 131,103,625 | $ | 98,948,678 | |
| Ratio of expenses to average net assets | |||||||||||
| Before Expense Reimbursement, | |||||||||||
| including (Recapture) | 1.48% | 1.47% | 1.55%(2) | 1.61% | 1.66% | ||||||
| After Expense Reimbursement/ | |||||||||||
| (Recapture) and Securities | |||||||||||
| Lending Credit | 1.40% | 1.41% | 1.53%(2) | 1.59% | 1.56% | ||||||
| Ratio of net investment income (loss) | |||||||||||
| to average net assets | |||||||||||
| Before Expense Reimbursement, | |||||||||||
| including (Recapture) | 0.61% | 1.68% | -0.45%(2) | -0.32% | -0.53% | ||||||
| After Expense | |||||||||||
| Reimbursement/(Recapture) | 0.69% | 1.75% | -0.43%(2) | -0.30% | -0.43% | ||||||
| Portfolio turnover rate | 127.62% | 174.94% | 72.42% | 92.42% | 82.83% | ||||||
| (1) | Not Annualized. | ||||||||||
| (2) | Annualized. | ||||||||||
| * | Amount represents less than $0.01 per share. | ||||||||||
See notes to financial statements.
137
| AssetMark Funds |
| FINANCIAL HIGHLIGHTS |
| International Equity Fund | |||||||||||
| Year Ended | Year Ended | Period Ended | Year Ended | Year Ended | |||||||
| March 31, 2008 | March 31, 2007 | March 31, 2006 | June 30, 2005 | June 30, 2004 | |||||||
| Per share data for a share of capital | |||||||||||
| stock outstanding for the entire period | |||||||||||
| and selected information for the period | |||||||||||
| are as follows: | |||||||||||
| Net asset value, beginning of period | $ | 14.73 | $ | 14.06 | $ | 11.79 | $ | 10.43 | $ | 8.22 | |
| Income from investment operations: | |||||||||||
| Net investment income (loss) | 0.13 | 0.16 | (0.01) | 0.10 | 0.02 | ||||||
| Net realized and unrealized | |||||||||||
| gains (losses) on investments | (0.44) | 2.24 | 3.40 | 1.40 | 2.23 | ||||||
| Total from investment operations | (0.31) | 2.40 | 3.39 | 1.50 | 2.25 | ||||||
| Less distributions: | |||||||||||
| Dividends from net investment | |||||||||||
| income | (0.14) | (0.18) | (0.15) | (0.06) | (0.04) | ||||||
| Dividends from net realized gains | (2.32) | (1.55) | (0.97) | (0.08) | — | ||||||
| Total distributions | (2.46) | (1.73) | (1.12) | (0.14) | (0.04) | ||||||
| Net asset value, end of period | $ | 11.96 | $ | 14.73 | $ | 14.06 | $ | 11.79 | $ | 10.43 | |
| Total return | -3.85% | 17.65% | 29.75%(1) | 14.37% | 27.40% | ||||||
| Supplemental data and ratios: | |||||||||||
| Net assets, end of period | $ | 681,622,030 | $ | 779,422,324 | $ | 612,288,218 | $ | 412,985,571 | $ | 261,777,374 | |
| Ratio of expenses to average net assets | |||||||||||
| Before Expense Reimbursement, | |||||||||||
| including (Recapture) | 1.43% | 1.39% | 1.38%(2) | 1.38% | 1.53% | ||||||
| After Expense Reimbursement/ | |||||||||||
| (Recapture) and Securities | |||||||||||
| Lending Credit | 1.42% | 1.37% | 1.34%(2) | 1.33% | 1.47% | ||||||
| Ratio of net investment income (loss) | |||||||||||
| to average net assets | |||||||||||
| Before Expense Reimbursement, | |||||||||||
| including (Recapture) | 0.87% | 0.95% | -0.16%(2) | 1.01% | 0.56% | ||||||
| After Expense | |||||||||||
| Reimbursement/(Recapture) | 0.88% | 0.97% | -0.12%(2) | 1.06% | 0.62% | ||||||
| Portfolio turnover rate | 119.13% | 89.16% | 66.98% | 80.32% | 60.74% | ||||||
| (1) Not Annualized. | |||||||||||
| (2) Annualized. | |||||||||||
See notes to financial statements.
138
| AssetMark Funds |
| FINANCIAL HIGHLIGHTS |
Real Estate Securities Fund | ||||||||||
| Year Ended | Year Ended | Period Ended | Year Ended | Year Ended | ||||||
| March 31, 2008 | March 31, 2007 | March 31, 2006 | June 30, 2005 | June 30, 2004 | ||||||
| Per share data for a share of capital | ||||||||||
| stock outstanding for the entire period | ||||||||||
| and selected information for the period | ||||||||||
| are as follows: | ||||||||||
| Net asset value, beginning of period | $ | 20.91 | $ | 18.46 | $ | 17.31 | $ | 13.66 | $ | 11.27 |
| Income from investment operations: | ||||||||||
| Net investment income | 0.43 | 0.16 | 0.33 | 0.44 | 0.44 | |||||
| Net realized and unrealized | ||||||||||
| gains (losses) on investments | (4.58) | 3.84 | 3.27 | 4.04 | 2.27 | |||||
| Total from investment operations | (4.15) | 4.00 | 3.60 | 4.48 | 2.71 | |||||
| Less distributions: | ||||||||||
| Dividends from net investment | ||||||||||
| income | (0.21) | (0.25) | (0.32) | (0.43) | (0.32) | |||||
| Dividends from net realized gains | (2.68) | (1.30) | (2.13) | (0.40) | — | |||||
| Return of capital | (0.04) | — | — | — | — | |||||
| Total distributions | (2.93) | (1.55) | (2.45) | (0.83) | (0.32) | |||||
| Net asset value, end of period | $ | 13.83 | $ | 20.91 | $ | 18.46 | $ | 17.31 | $ | 13.66 |
| Total return | -19.74% | 21.96% | 22.94%(1) | 33.22% | 24.24% | |||||
| Supplemental data and ratios: | ||||||||||
| Net assets, end of period | $ | 82,124,778 | $ | 117,462,121 | $ | 89,616,046 | $ | 75,043,878 | $ | 79,795,852 |
| Ratio of expenses to average net assets | ||||||||||
| Before Expense Reimbursement, | ||||||||||
| including (Recapture) | 1.52% | 1.49% | 1.51%(2) | 1.51% | 1.56% | |||||
| After Expense Reimbursement/ | ||||||||||
| (Recapture) and Securities | ||||||||||
| Lending Credit | 1.46% | 1.46% | 1.49%(2) | 1.49% | 1.49% | |||||
| Ratio of net investment income to | ||||||||||
| average net assets | ||||||||||
| Before Expense Reimbursement, | ||||||||||
| including (Recapture) | 0.99% | 0.67% | 2.46%(2) | 2.83% | 3.35% | |||||
| After Expense | ||||||||||
| Reimbursement/(Recapture) | 1.05% | 0.70% | 2.48%(2) | 2.85% | 3.41% | |||||
| Portfolio turnover rate | 81.59% | 43.86% | 41.09% | 77.64% | 24.30% | |||||
| (1) Not Annualized. | ||||||||||
| (2) Annualized. | ||||||||||
See notes to financial statements.
139
| AssetMark Funds |
| FINANCIAL HIGHLIGHTS |
| Tax-Exempt Fixed Income Fund | ||||||||||
| Year Ended | Year Ended | Period Ended | Year Ended | Year Ended | ||||||
| March 31, 2008 | March 31, 2007 | March 31, 2006 | June 30, 2005 | June 30, 2004 | ||||||
| Per share data for a share of capital | ||||||||||
| stock outstanding for the entire period | ||||||||||
| and selected information for the period | ||||||||||
| are as follows: | ||||||||||
| Net asset value, beginning of period | $ | 10.92 | $ | 10.77 | $ | 11.01 | $ | 10.75 | $ | 11.05 |
| Income from investment operations: | ||||||||||
| Net investment income | 0.31 | 0.27 | 0.17 | 0.20 | 0.17 | |||||
| Net realized and unrealized | ||||||||||
| gains (losses) on investments | (0.28) | 0.15 | (0.24) | 0.26 | (0.28) | |||||
| Total from investment operations | 0.03 | 0.42 | (0.07) | 0.46 | (0.11) | |||||
| Less distributions: | ||||||||||
| Dividends from net investment | ||||||||||
| income | (0.31) | (0.27) | (0.17) | (0.20) | (0.17) | |||||
| Dividends from net realized gains | — | — | — | — | (0.02) | |||||
| Total distributions | (0.31) | (0.27) | (0.17) | (0.20) | (0.19) | |||||
| Net asset value, end of period | $ | 10.64 | $ | 10.92 | $ | 10.77 | $ | 11.01 | $ | 10.75 |
| Total return | 0.28% | 3.92% | -0.64%(1) | 4.29% | -1.01% | |||||
| Supplemental data and ratios: | ||||||||||
| Net assets, end of period | $ | 257,440,133 | $ | 247,841,846 | $ | 213,170,198 | $ | 157,544,853 | $ | 80,301,556 |
| Ratio of expenses to average net assets | ||||||||||
| Before Expense Reimbursement, | ||||||||||
| including (Recapture) | 1.23% | 1.28% | 1.29%(2) | 1.33% | 1.41% | |||||
| After Expense Reimbursement/ | ||||||||||
| (Recapture) and Securities | ||||||||||
| Lending Credit | 1.23% | 1.28% | 1.29%(2) | 1.29% | 1.29% | |||||
| Ratio of net investment income to | ||||||||||
| average net assets | ||||||||||
| Before Expense Reimbursement, | ||||||||||
| including (Recapture) | 2.93% | 2.53% | 2.15%(2) | 1.90% | 1.65% | |||||
| After Expense | ||||||||||
| Reimbursement/(Recapture) | 2.93% | 2.53% | 2.15%(2) | 1.94% | 1.77% | |||||
| Portfolio turnover rate | 66.26% | 50.36% | 14.61% | 30.05% | 18.90% | |||||
| (1) Not Annualized. | ||||||||||
| (2) Annualized. | ||||||||||
See notes to financial statements.
140
| AssetMark Funds |
| FINANCIAL HIGHLIGHTS |
| Core Plus Fixed Income Fund | ||||||||||
| Year Ended | Year Ended | Period Ended | Year Ended | Year Ended | ||||||
| March 31, 2008 | March 31, 2007 | March 31, 2006 | June 30, 2005 | June 30, 2004 | ||||||
| Per share data for a share of capital | ||||||||||
| stock outstanding for the entire period | ||||||||||
| and selected information for the period | ||||||||||
| are as follows: | ||||||||||
| Net asset value, beginning of period | $ | 9.27 | $ | 9.11 | $ | 10.73 | $ | 10.38 | $ | 10.71 |
| Income from investment operations: | ||||||||||
| Net investment income | 0.41 | 0.38 | 0.34 | 0.25 | 0.36 | |||||
| Net realized and unrealized | ||||||||||
| gains (losses) on investments | (0.06) | 0.15 | (0.39) | 0.41 | (0.34) | |||||
| Total from investment operations | 0.35 | 0.53 | (0.05) | 0.66 | 0.02 | |||||
| Less distributions: | ||||||||||
| Dividends from net investment | ||||||||||
| income | (0.41) | (0.37) | (0.26) | (0.27) | (0.35) | |||||
| Dividends from net realized gains | (0.01) | — | (0.08) | (0.04) | — | |||||
| Return of Capital | — | — | (1.23) | — | — | |||||
| Total distributions | (0.42) | (0.37) | (1.57) | (0.31) | (0.35) | |||||
| Net asset value, end of period | $ | 9.20 | $ | 9.27 | $ | 9.11 | $ | 10.73 | $ | 10.38 |
| Total return | 3.87% | 5.96% | -0.48%(1) | 6.47% | 0.21% | |||||
| Supplemental data and ratios: | ||||||||||
| Net assets, end of period | $ | 804,085,918 | $ | 716,017,829 | $ | 612,841,433 | $ | 508,047,802 | $ | 284,788,044 |
| Ratio of expenses to average net assets | ||||||||||
| Before Expense Reimbursement, | ||||||||||
| including (Recapture) | 1.18% | 1.16% | 1.19%(2) | 1.24% | 1.29% | |||||
| After Expense Reimbursement/ | ||||||||||
| (Recapture) and Securities | ||||||||||
| Lending Credit | 1.13% | 1.14% | 1.16%(2) | 1.20% | 1.29% | |||||
| Ratio of net investment income to | ||||||||||
| average net assets | ||||||||||
| Before Expense Reimbursement, | ||||||||||
| including (Recapture) | 4.37% | 4.14% | 3.43%(2) | 2.51% | 3.71% | |||||
| After Expense | ||||||||||
| Reimbursement/(Recapture) | 4.42% | 4.16% | 3.47%(2) | 2.55% | 3.71% | |||||
| Portfolio turnover rate | 307.52% | 280.55% | 261.52% | 471.24% | 11.82% | |||||
| (1) Not Annualized. | ||||||||||
| (2) Annualized. | ||||||||||
See notes to financial statements.
141
| AssetMark Funds | ||||||||
| FINANCIAL HIGHLIGHTS | ||||||||
| Enhanced | Enhanced | Enhanced | Enhanced | |||||
| Fundamental | Fundamental | Fundamental | Fundamental | |||||
| Index™ | Index™ | Index™ | Index™ | |||||
| Large Company | Large Company | Small Company | Small Company | |||||
| Growth Fund | Value Fund | Growth Fund | Value Fund | |||||
August 9, 2007(1) | August 9, 2007(1) | August 9, 2007(1) | August 9, 2007(1) | |||||
| through | through | through | through | |||||
| March 31, | March 31, | March 31, | March 31, | |||||
| 2008 | 2008 | 2008 | 2008 | |||||
| Per share data for a share of capital stock | ||||||||
| outstanding for the entire period and | ||||||||
| selected information for the period are | ||||||||
| as follows: | ||||||||
| Net asset value, beginning of period | $ | 10.00 | $ | 10.00 | $ | 10.00 | $ | 10.00 |
| Income from investment operations: | ||||||||
| Net investment income (loss) | 0.04 | 0.07 | (0.01) | 0.05 | ||||
| Net realized and unrealized losses | ||||||||
| on investments | (0.38) | (1.53) | (0.87) | (1.67) | ||||
| Total from investment operations | (0.34) | (1.46) | (0.88) | (1.62) | ||||
| Less distributions: | ||||||||
| Dividends from net investment income | (0.02) | (0.04) | — | (0.03) | ||||
| Dividends from net realized gains | (0.01) | (0.01) | (0.02) | (0.02) | ||||
| Return of capital | — | — | —* | — | ||||
| Total distributions | (0.03) | (0.05) | (0.02) | (0.05) | ||||
| Net asset value, end of period | $ | 9.63 | $ | 8.49 | $ | 9.10 | $ | 8.33 |
| Total return | -3.40%(2) | -14.73%(2) | -8.80%(2) | -16.27%(2) | ||||
| Supplemental data and ratios: | ||||||||
| Net assets, end of period | $ | 67,546,939 | $ | 54,697,080 | $ | 12,610,898 | $ | 6,045,461 |
| Ratio of expenses to average net assets | ||||||||
| Before Expense Reimbursement | 1.82%(3) | 1.92%(3) | 3.55%(3) | 6.30%(3) | ||||
| After Expense Reimbursement | 1.22%(3) | 1.22%(3) | 1.22%(3) | 1.22%(3) | ||||
| Ratio of net investment income (loss) to average | ||||||||
| net assets | ||||||||
| Before Expense Reimbursement | 0.28%(3) | 1.21%(3) | -2.62%(3) | -3.72%(3) | ||||
| After Expense Reimbursement | 0.88%(3) | 1.91%(3) | -0.29%(3) | 1.36%(3) | ||||
| Portfolio turnover rate | 22.70% | 7.67% | 11.86% | 16.18% | ||||
| (1) Commencement of Operations. | ||||||||
| (2) Not Annualized. | ||||||||
| (3) Annualized. | ||||||||
| * Amount represents less than $0.01 per share. | ||||||||
See notes to financial statements.
142
| AssetMark Funds |
| NOTES TO FINANCIAL STATEMENTS |
| March 31, 2008 |
| 1. | Organization |
AssetMark Funds (the “Trust”) is organized as a Delaware statutory trust under a Declaration of Trust dated January 2, 2001. The Trust is registered under the Investment Company Act of 1940, as amended (the “1940 Act”), as an open-end management investment company with twelve funds (the “Funds”). The following eight funds are non-diversified: AssetMark Large Cap Growth Fund, AssetMark Large Cap Value Fund, AssetMark Small/Mid Cap Growth Fund, AssetMark Small/Mid Cap Value Fund, AssetMark International Equity Fund, AssetMark Real Estate Securities Fund, AssetMark Tax-Exempt Fixed Income Fund, AssetMark Core Plus Fixed Income Fund. The following four funds are diversified: AssetMark Enhanced Fundamental Index™ Large Company Growth Fund, AssetMark Enhanced Fundamental Index™ Large Company Value Fund, AssetMark Enhanced Fundamental Index™ Small Company Growth Fund and AssetMark Enhanced Fundamental Index™ Small Company Value Fund. Each Fund represents a distinct portfolio with its own investment objectives and policies. The assets of each Fund are segregated, and a shareholder’s interest is limited to the Fund in which shares are held. The Enhanced Fundamental Index Funds commenced operations on August 9, 2007. The other eight Funds commenced operations on June 29, 2001.
| 2. | Significant Accounting Policies |
The following is a summary of significant accounting policies consistently followed by the Funds in the preparation of the financial statements. These policies are in conformity with U.S. generally accepted accounting principles (“GAAP”).
| (a) | Investment Valuation |
Portfolio securities listed on a national or foreign securities exchange, except those listed on NASDAQ, for which market quotations are available are valued at the last quoted sale price on each business day. Portfolio securities traded on NASDAQ are valued at the NASDAQ Official Closing Price (“NOCP”) on each business day. If there is no reported sale on an exchange or NASDAQ, the portfolio security will be valued at the mean between the most recent quoted bid and asked price. Price information on listed securities is taken from the exchange where the security is primarily traded.
All equity securities that are not traded on a listed exchange are valued at the last sale price in the over-the-counter market. If a non-exchange traded security does not trade on a particular day, then the mean between the last quoted closing bid and asked price will be used. Non-exchange traded ADRs are priced with an evaluated price as determined by the current evaluated pricing procedures of, and provided by, the pricing vendor.
U.S. government and agency securities are valued at the mean between the most recent bid and asked prices. Other fixed-income securities that have a maturity of greater than 60 days are normally valued on the basis of quotes obtained from pricing services, which take into account appropriate factors such as institutional sized trading in similar groups of securities, yield, quality, coupon rate, maturity, type of issue, trading characteristics and other market data. Fixed income debt instruments, such as commercial paper, bankers’ acceptances and U.S. Treasury Bills, having a maturity of less than 60 days are valued at amortized cost.
Investments in mutual funds are valued at the closing net asset value per share of each mutual fund on the day of valuation.
Securities for which no market quotations are readily available or when a significant event has occurred between the time of the security’s last close and the time that a Fund next calculates its net asset value will be valued at their fair market value as determined by the Valuation Committee.
In September 2006, the Financial Accounting Standards Board (FASB) issued Statement on Financial Accounting Standards No. 157, “Fair Value Measurements” (FAS 157). This standard clarifies the definition of fair value for financial reporting, establishes a framework for measuring fair value and requires additional disclosures about the use of fair value measurements. FAS 157 is effective for financial statements issued for fiscal years beginning after November 15, 2007 and interim periods within those fiscal years. At March 31, 2008, the Funds do not believe the adoption of FAS 157 will impact the amounts reported in the financial statements, however, additional disclosures will be required about the inputs used to develop the measurements of fair value and the effect of certain measurements reported in the statement of operations for a fiscal period.
143
| AssetMark Funds |
| NOTES TO FINANCIAL STATEMENTS (Continued) |
| March 31, 2008 |
| (b) | Repurchase Agreements |
Each Fund may enter into repurchase agreements with banks and securities dealers. These transactions involve the purchase of securities with a simultaneous commitment to sell the securities to the bank or the dealer at an agreed-upon date and price. A repurchase agreement is accounted for as an investment by the Fund, collateralized by securities, which are delivered to the Fund’s Custodian or to an agent bank under a tri-party agreement. The securities are marked-to-market daily and additional securities are acquired as needed, to ensure that their value equals or exceeds the repurchase price plus accrued interest. The Core Plus Fixed Income Fund entered into repurchase agreements during the period ended March 31, 2008. For all Funds engaged in securities lending, portions of cash collateral for securities on loan were invested in repurchase agreements at March 31, 2008.
| (c) | Federal Income Taxes |
The Funds intend to continue to comply with the requirements of sub chapter M of the Internal Revenue Code necessary to qualify as regulated investment companies and to make the requisite distributions of income and capital gains to their shareholders sufficient to relieve the Funds from all or substantially all Federal income taxes. Therefore, no Federal income tax provision is required.
Effective September 30, 2007, the Trust adopted Financial Accounting Standards Board (FASB) Interpretation No. 48 (FIN 48), Accounting for Uncertainty in Income Taxes, a clarification of FASB Statement No. 109, Accounting for Income Taxes. FIN 48 establishes financial reporting rules regarding recognition and measurement of tax positions taken or expected to be taken on a tax return. The adoption of FIN 48 had no impact on the Trust’s net assets or results of operations. As of March 31, 2008, open Federal tax years include the tax years ended March 31, 2005 through 2007.
| (d) | Use of Estimates |
The preparation of financial statements in conformity with GAAP requires management to make estimates and assumptions that affect the reported amounts of assets and liabilities and disclosure of contingent assets and liabilities at the date of the financial statements and the reported amounts of revenues and expenses during the reporting period. Actual results could differ from those estimates.
| (e) | Indemnifications |
Under the Trust’s organizational documents, its officers and trustees are indemnified against certain liability arising out of the performance of their duties to the Trust. In addition, in the normal course of business, the Trust enters into contracts that contain a variety of representations and warranties which provide general indemnifications. The Trust’s maximum exposure under these arrangements are unknown as this would involve future claims that may be made against the Trust that have not yet occurred. However, the Trust expects the risk of loss to be remote.
| (f) | Expenses |
Many expenses of the Trust can be directly attributed to a specific Fund. Expenses that cannot be directly attributed to a specific Fund are apportioned among all the Funds in the Trust based on relative net assets.
| (g) | Security Transactions and Income Recognition |
Security transactions are accounted for on trade date. Dividend income is recognized on the ex-dividend date, and interest income recorded using the effective yield method is accrued daily. Realized gains and losses on investment transactions are determined using the high cost method. Return of capital distributions received from REIT securities are recorded as an adjustment to the cost of the security and thus may impact unrealized or realized gains or losses on the security. Gains and losses from paydowns on mortgage and asset backed securities are recorded as adjustments to interest income.
| (h) | Distributions to Shareholders |
The Funds, with the exception of the Tax-Exempt Fixed Income Fund and Core Plus Fixed Income Fund, will distribute any net investment income at least annually. The Tax-Exempt Fixed Income Fund and Core Plus Fixed Income Fund will distribute any net investment income quarterly. All of the Funds will distribute any net realized long or short-term capital gains at least annually. Distributions to shareholders are recorded on the ex-dividend date. The Funds may also pay a special distribution at the end of the calendar year to comply with Federal tax requirements.
144
| AssetMark Funds |
| NOTES TO FINANCIAL STATEMENTS (Continued) |
| March 31, 2008 |
| (i) | Derivatives |
Each Fund may invest in derivative securities including call and put options, futures, forward currency contracts and swaps. These instruments may be used by a Fund for hedging purposes as well as direct investment.
Forward Currency Contracts
The Funds may enter into forward currency contracts, obligating the Funds to deliver and receive currency at a specified future date. Transactions involving forward currency contracts may serve as long hedges (for example, if a Fund seeks to buy a security denominated in a foreign currency, it may purchase a forward currency contract to lock in the U.S. dollar price of the security) or as short hedges (if a Fund anticipates selling a security denominated in a foreign currency it may sell a forward currency contract to lock in the U.S. dollar equivalent of the anticipated sales proceeds). Forward contracts are valued daily and unrealized appreciation or depreciation is recorded daily as the difference between the contract exchange rate and the closing forward rate applied to the face amount of the contract.
Options
Exchange traded options are valued at the last reported sale price on the exchange on which the security underlying the option is principally traded. If no sales are reported on a particular day for exchange traded options, or the options are not exchange traded, the options are valued at the mean between the most recent quoted bid and asked quotations at the close of the exchange.
The premium that a Fund pays when purchasing a call option or receives when writing a call option will reflect, among other things, the market price of the security, the relationship of the exercise price to the market price of the security, the relationship of the exercise price to the volatility of the security, the length of the option period and supply and demand factors. The premium is the market value of an option at the date of purchase.
A purchaser (holder) of a put option pays a non-refundable premium to the seller (writer) of a put option to obtain the right to sell a specified amount of a security at a fixed price (the exercise price) during a specified period (exercise period). Conversely, the seller (writer) of a put option, upon payment by the holder of the premium, has the obligation to buy the security from the holder of the put option at the exercise price during the exercise period.
As of March 31, 2008, the Core Plus Fixed Income Fund has entered into written call options, for which sufficient collateral was set aside, as disclosed in the Schedule of Investments.
Futures
Each actively managed Fund has the ability to buy and sell stock index futures contracts traded on domestic stock exchanges to hedge the value of its portfolio against changes in market conditions. Each Enhanced Fundamental Index™ Fund will typically invest net cash inflows in stock index futures over the short term until the Fund can invest its assets in common stock in a cost effective manner in accordance with its principal investment strategies. A stock index futures contract is an agreement between two parties to take or make delivery of an amount of cash equal to a specified dollar amount, times the difference between the stock index value at the close of the last trading day of the contract and the price at which the futures contract is originally struck. A stock index futures contract does not involve the physical delivery of the underlying stocks in the index. Although stock index futures contracts call for the actual taking or delivery of cash, in most cases a Fund expects to liquidate its stock index futures positions through offsetting transactions, which may result in a gain or a loss, before cash settlement is required.
145
| AssetMark Funds |
| NOTES TO FINANCIAL STATEMENTS (Continued) |
| March 31, 2008 |
The Core Plus Fixed Income Fund may also purchase or sell other types of futures contracts, including those based on particular interest rates, securities, foreign currencies, securities indices and other financial instruments and indices. The Core Plus Fixed Income Fund may also purchase and write call and put options on such futures contracts, in order to seek to increase total return or to hedge against changes in interest rates, securities prices, or currency exchange rates, or, to the extent permitted by its investment policies, to otherwise manage its portfolio of investments.
Futures contracts are valued at the daily quoted settlement prices.
Swaps
The Core Plus Fixed Income Fund may enter into interest rate, mortgage, credit, currency and total return swaps, interest rate caps, floors and collars. The Core Plus Fixed Income Fund may also purchase and write (sell) options contracts on swaps, referred to as “swaptions”. The Fund may enter into swap transactions for hedging purposes or to seek to increase total return. Since interest rate, mortgage, credit and currency swaps and interest rate caps, floors and collars are individually negotiated, the Fund expects to achieve an acceptable degree of correlation between its portfolio investments and its swap, cap, floor and collar positions.
Swap agreements are valued daily and unrealized appreciation or depreciation is recorded daily as the difference between the prior day and current day closing price.
During the year ended March 31, 2008, the Funds had no open or outstanding swap contracts.
| (j) | Securities Purchased or Sold on a Forward-Commitment Basis |
The Funds may enter into when-issued or other purchase or sale transactions that specify forward delivery of a financial security. In connection with this ability, the Funds may enter into mortgage ‘‘dollar rolls’’ in which the Funds sell securities in the current month for delivery and simultaneously contract with the same counterparty to repurchase similar (same type, coupon and maturity) but not identical securities on a specified future date. The party that is obligated to buy a security in the future will retain the use of their funds, and will benefit from any interest that is earned on those funds from the day that they enter into the forward contract until the day that they take delivery and pay for the security.
| (k) | Foreign Currency Translation |
The accounting records of the Funds are maintained in U.S. dollars. Investment securities and all other assets and liabilities of the Funds denominated in a foreign currency are translated into U.S. dollars at current exchange rates. Purchases and sales of securities, income receipts, and expense payments are translated into U.S. dollars at the exchange rate in effect on the dates of the respective transactions. The Funds do not isolate the portion of the fluctuations on investments resulting from changes in foreign currency exchange rates from the fluctuations in market prices of investments held. Such fluctuations are included with the net realized and unrealized gain or loss from investments.
| (l) | Restricted and Illiquid Securities |
Each Fund may invest up to 15% of its net assets in securities that are illiquid at the time of purchase, which includes securities with legal or contractual restrictions on their disposition, and securities for which there are no readily available market quotations. The Board of Trustees, with the assistance of the Advisor, sub-advisors and/or pricing services, will determine the value of such securities in good faith in accordance with the provisions of the 1940 Act. Illiquid securities present the risks that a Fund may have difficulty valuing these holdings and/or may be unable to sell these holdings at the time or price desired. There are no restrictions on each Fund’s ability to invest in restricted securities (that is, securities that are not registered pursuant to the Securities Act of 1933), except to the extent such securities may be considered illiquid. Securities issued pursuant to Rule 144A of the Securities Act of 1933 will be considered liquid if determined to be so under procedures adopted by the Board of Trustees.
146
| AssetMark Funds |
| NOTES TO FINANCIAL STATEMENTS (Continued) |
| March 31, 2008 |
| (m) | Auction Rate Securities |
The Tax-Except Fixed Income Fund and the Core Plus Fixed Income Fund each may invest in auction rate municipal securities. Auction rate securities usually permit the holder to sell the securities in an auction at par value at specified intervals. The dividend is reset by “Dutch” auction in which bids are made by broker-dealers and other institutions for a certain amount of securities at a specified minimum yield. The dividend rate set by the auction is the lowest interest or dividend rate that covers all securities offered for sale. While this process is designed to permit auction rate securities to be traded at par value, there is the risk that an auction will fail due to insufficient demand for the securities.
| (n) | Short Sales |
Although not currently part of any of the Fund’s investment strategies, each Fund has the ability to make short sales. Short sales are transactions where a Fund sells securities it does not own in anticipation of a decline in the market value of the securities.
| (o) | Trustee Compensation |
For their service as Trustees of the Trust, the Independent Trustees receive a retainer fee of $42,000 per year and $3,500 per in-person meeting attended, as well as reimbursement for expenses incurred in connection with attendance at such meetings. The Board contains a lead Trustee who receives a retainer fee of $48,000 per year. Telephonic meeting fees are determined according to length of the meeting as follows: $1,500 for one to two hours, $2,000 for two to three hours and $3,500 for three hours or longer. Interested persons who serve as Trustees of the Trust receive no compensation from the Trust for their service as Trustees.
| 3. | Investment Advisor |
The Trust has an Investment Advisory Agreement (the “Agreement”) with AssetMark Investment Services, Inc. (the “Advisor”), with whom certain officers and trustees of the Trust are affiliated, to furnish investment advisory services to the Funds. The Advisor is a wholly owned subsidiary of Genworth Financial, Inc. Under the terms of the Agreement, the Trust, on behalf of the Funds, compensates the Advisor for its management services at the following contractual rates, based on each Fund’s average daily net assets:
| Large Cap Growth Fund | 0.95% | |
| Large Cap Value Fund | 0.95% | |
| Small/Mid Cap Growth Fund | 0.95% | |
| Small/Mid Cap Value Fund | 1.00% | |
| International Equity Fund | 0.95% | |
| Real Estate Securities Fund | 0.95% | |
| Tax-Exempt Fixed Income Fund | 0.80% | |
| Core Plus Fixed Income Fund | 0.75% | |
| Enhanced Fundamental Index™ | ||
| Large Company Growth Fund | 0.75% | |
| Enhanced Fundamental Index™ | ||
| Large Company Value Fund | 0.75% | |
| Enhanced Fundamental Index™ | ||
| Small Company Growth Fund | 0.75% | |
| Enhanced Fundamental Index™ | ||
| Small Company Value Fund | 0.75% |
In addition, the Trust and Advisor have also entered into a Fee Waiver Agreement designed to provide Fund shareholders with the economic benefits of economies of scale that may be realized as Fund assets increase. Under the Fee Waiver Agreement, the Advisor has contractually agreed to: (1) waive 0.025% of each Fund’s annual advisory fee on Trust assets in excess of $6 billion, and an additional 0.025% of each Fund’s annual advisory fee on Trust assets in excess of $12 billion; and (2) waive portions of its advisory fee to the extent necessary to pass on certain breakpoints in the underlying sub-advisory fee arrangements that are reached as Fund assets grow.
147
| AssetMark Funds |
| NOTES TO FINANCIAL STATEMENTS (Continued) |
| March 31, 2008 |
The Advisor has agreed to waive, through October 31, 2008, its management fee and/or reimburse each Fund’s other expenses to the extent necessary to ensure that the Funds’ operating expenses do not exceed the following rates, based on each Fund’s average daily net assets:
| Large Cap Growth Fund | 1.49% | |
| Large Cap Value Fund | 1.49% | |
| Small/Mid Cap Growth Fund | 1.59% | |
| Small/Mid Cap Value Fund | 1.59% | |
| International Equity Fund | 1.59% | |
| Real Estate Securities Fund | 1.49% | |
| Tax-Exempt Fixed Income Fund | 1.29% | |
| Core Plus Fixed Income Fund | 1.29% | |
| Enhanced Fundamental Index™ | ||
| Large Company Growth Fund | 1.22% | |
| Enhanced Fundamental Index™ | ||
| Large Company Value Fund | 1.22% | |
| Enhanced Fundamental Index™ | ||
| Small Company Growth Fund | 1.22% | |
| Enhanced Fundamental Index™ | ||
| Small Company Value Fund | 1.22% |
Any such waiver or reimbursement is subject to later adjustment to allow the Advisor to recoup amounts waived or reimbursed to the extent actual fees and expenses for a fiscal period are less than each Fund’s expense limitation cap, provided, however, that the Advisor shall only be entitled to recoup such amounts for a period of three years from the date such amount was waived or reimbursed. As of March 31, 2008, the Large Cap Growth Fund, Large Cap Value Fund, Small/Mid Cap Growth Fund, Small/Mid Cap Value Fund, International Equity Fund, Real Estate Securities Fund, Tax-Exempt Fixed Income Fund and Core Plus Fixed Income Fund have recouped all potential recoverable waivers or reimbursed expenses.
The Advisor is currently waiving expenses in the Enhanced Fundamental Index™ Large Company Growth Fund, Enhanced Fundamental Index™ Large Company Value Fund, Enhanced Fundamental Index™ Small Company Growth Fund and Enhanced Fundamental Index™ Small Company Value Fund to keep these Funds at their expense cap. Waived expenses subject to potential recovery are as follows:
| Year of | ||
| Expiration | ||
| 03/31/2011 | ||
| Enhanced Fundamental Index™ | ||
| Large Company Growth Fund | $132,884 | |
| Enhanced Fundamental Index™ | ||
| Large Company Value Fund | 120,516 | |
| Enhanced Fundamental Index™ | ||
| Small Company Growth Fund | 85,646 | |
| Enhanced Fundamental Index™ | ||
| Small Company Value Fund | 81,433 |
Sub-advisory services are provided to the Funds, pursuant to agreements between the Advisor and various sub-advisors. Under the terms of these sub-advisory agreements, the Advisor compensates each sub-advisor based on the portion of each Fund’s average daily net assets that is allocated to the sub-advisor.
| 4. | Distribution Plan |
The Trust, on behalf of the Funds, has adopted a distribution plan pursuant to Rule 12b-1 under the 1940 Act (the “12b-1 Plan”), which provides for each Fund to pay distribution fees at an annual rate of 0.25% of the average daily net assets of the Funds. Payments under the 12b-1 Plan shall be used to compensate persons who provide support services in connection with the distribution of the Funds’ shares and servicing of the Funds’ shareholders. For example, these amounts are paid to mutual fund supermarkets that perform back office shareholder servicing and recordkeeping services that facilitate the operation of the AssetMark Investment Services Program through which the Funds are primarily distributed. The Advisor (and its affiliates) similarly receive portions of such payments for their services provided in connection with the program. Capital Brokerage Corp., an affiliate of the Advisor, serves as principal underwriter and distributor for the Funds. Quasar Distributors, LLC serves as sub-distributor for the Funds. Quasar Distributors, LLC is an affiliated company of U.S. Bank, N.A.
| 5. | Service and Custody Agreements |
The Trust has entered into Service Agreements with U.S. Bancorp Fund Services, LLC (“USBFS”) and a Custody Agreement with U.S. Bank, N.A., an affiliate of USBFS. Under these agreements, USBFS and U.S. Bank, N.A. provide certain transfer agency, administrative, accounting and custody services.
148
| AssetMark Funds |
| NOTES TO FINANCIAL STATEMENTS (Continued) |
| March 31, 2008 |
| 6. | Securities Lending |
Effective July 1, 2003 the Funds entered into a securities lending arrangement with U.S. Bank, N.A. (the “Custodian”). Under the terms of the agreement, the Custodian is authorized to loan securities on behalf of the Funds to approved brokers. In exchange, the Funds receive cash collateral in the amount of at least 102% of the value of the securities loaned. The cash collateral is invested in short term instruments as noted in the Schedule of Investments. Although risk is mitigated by the collateral, the Funds could experience a delay in recovering their securities and possible loss of income or value if the borrower fails to return them. The agreement provides that after predetermined rebates to brokers, a percentage of the net securities lending revenue shall be solely paid as credits to the Funds to be used as an offset against custody costs and other charges incurred by the Funds from the custodian, administration, fund accounting and transfer agent fees and shall not, in any event, be paid as cash to the Funds. The Custodian shall be paid a fee for administering a securities lending program for the Funds, equal to the remaining percentage of the net securities lending revenues generated under the agreement. A portion of the fee to be paid to the Custodian in fiscal year 2009 will be waived.
As of March 31, 2008, the Funds (excluding the Tax-Exempt Fund and the Fundamental Index™ Funds) had loaned securities which were collateralized by cash. The cash collateral received was invested in securities as listed in each Fund’s Schedule of Investments. Income earned from these investments is allocated to each Fund based on each Fund’s portion of the total cash collateral received. Securities lending income is disclosed in each Fund’s Statement of Operations as a securities lending expense offset.
In addition, the Funds bear the risk of loss associated with the investment of cash collateral received. During the year ended March 31, 2008, the Funds incurred unrealized depreciation on security lending collateral investments of:
| Unrealized | ||
| Depreciation | ||
| Large Cap Growth Fund | $2,299,606 | |
| Large Cap Value Fund | 2,169,844 | |
| Small/Mid Cap Growth Fund | 519,485 | |
| Small/Mid Cap Value Fund | 203,952 | |
| International Equity Fund | 284,458 | |
| Real Estate Securities Fund | 343,100 | |
| Core Plus Fixed Income Fund | 2,192,192 | |
| As of March 31, 2008, the values of securities loaned | ||
| and collateral held were as follows: | ||
| Market Value | ||||
| of Securities | ||||
| Loaned | Collateral | |||
| Large Cap Growth Fund | $215,113,841 | $218,230,783 | ||
| Large Cap Value Fund | 200,136,152 | 203,239,102 | ||
| Small/Mid Cap | ||||
| Growth Fund | 48,090,171 | 49,137,718 | ||
| Small/Mid Cap | ||||
| Value Fund | 22,344,873 | 22,802,311 | ||
| International | ||||
| Equity Fund | 23,272,875 | 23,570,669 | ||
| Real Estate | ||||
| Securities Fund | 29,071,654 | 29,497,363 | ||
| Core Plus Fixed | ||||
| Income Fund | 203,102,207 | 206,627,941 |
| 7. | Investment Transactions |
The aggregate purchases and sales of securities, excluding short-term investments, for the year ended March 31, 2008 are summarized below.
| Purchases | Sales | |||
| Large Cap Growth Fund | 476,670,480 | 558,359,257 | ||
| Large Cap Value Fund | 268,230,988 | 266,251,233 | ||
| Small/Mid Cap | ||||
| Growth Fund | 350,354,184 | 384,473,097 | ||
| Small/Mid Cap Value Fund | 163,465,153 | 145,942,370 | ||
| International Equity Fund | 897,760,771 | 968,244,160 | ||
| Real Estate Securities Fund | 67,296,436 | 81,475,985 | ||
| Tax-Exempt Fixed | ||||
| Income Fund | 184,732,545 | 167,013,325 | ||
| Core Plus Fixed | ||||
| Income Fund* | 2,234,493,499 | 2,134,590,450 |
149
| AssetMark Funds | |||
| NOTES TO FINANCIAL STATEMENTS (Continued) | |||
| March 31, 2008 |
| Purchases | Sales | |||
| Enhanced Fundamental | ||||
| Index™ Large Company | ||||
| Growth Fund | 64,823,162 | 7,050,135 | ||
| Enhanced Fundamental | ||||
| Index™ Large Company | ||||
| Value Fund | 51,341,005 | 1,876,738 | ||
| Enhanced Fundamental | ||||
| Index™ Small Company | ||||
| Growth Fund | 11,259,885 | 628,911 | ||
| Enhanced Fundamental | ||||
| Index™ Small Company | ||||
| Value Fund | 5,263,258 | 376,328 | ||
* Included in these amounts were $247,687,354 of purchases and $274,199,358 of sales of U.S. Government Securities. | ||||
| 8. | Option Contracts Written |
The premium amount and number of option contracts written during the year ended March 31, 2008 in the AssetMark Core Plus Fixed Income Fund, were as follows:
| Amount of | Number of | |||
| Premiums | Contracts | |||
| Outstanding at 3/31/07 | $ | (46,308) | (232) | |
| Options written | (808,514) | (1,481) | ||
| Options expired | 104,275 | 320 | ||
| Options exercised | — | — | ||
| Options closed | 583,533 | 1,187 | ||
| Outstanding at 3/31/08 | $ | (167,014) | (206) | |
| 9. | Other Tax Information |
Net investment income and realized gains and losses for federal income tax purposes may differ from that reported on the financial statements because of permanent book-to-tax differences. GAAP requires that permanent differences between financial reporting and tax reporting be reclassified between various components of net assets.
These differences are primarily due to net operating losses and foreign currency. On the Statements of Assets and Liabilities, the following adjustments were made:
| Accumulated | |||||||
| Net | Accumulated | ||||||
| Investment | Realized | ||||||
| Income | Gain or | Capital | |||||
| or (Loss) | (Loss) | Stock | |||||
| Large Cap | |||||||
| Growth | |||||||
| Fund | $ | 756,492 | $ | (757,160) | $ | 668 | |
| Large Cap | |||||||
| Value Fund | 5,197 | (5,197) | — | ||||
| Small/Mid | |||||||
| Cap | |||||||
| Growth | |||||||
| Fund | 1,519,077 | (1,518,891) | (186) | ||||
| Small/Mid | |||||||
| Cap Value | |||||||
| Fund | (12,203) | 21,801 | (9,598) | ||||
| International | |||||||
| Equity | |||||||
| Fund | 1,741,377 | (1,741,376) | (1) | ||||
| Real Estate | |||||||
| Securities | |||||||
| Fund | 172,950 | 73,152 | (246,102) | ||||
| Tax-Exempt | |||||||
| Fixed | |||||||
| Income | |||||||
| Fund | — | — | — | ||||
| Core Plus | |||||||
| Fixed | |||||||
| Income | |||||||
| Fund | 144,963 | (144,963) | — | ||||
| Enhanced | |||||||
| Fundamental | |||||||
| Index™ | |||||||
| Large | |||||||
| Company | |||||||
| Growth | |||||||
| Fund | 4 | 112 | (116) |
150
| AssetMark Funds |
| NOTES TO FINANCIAL STATEMENTS (Continued) |
| March 31, 2008 |
| Accumulated | |||||||
| Net | Accumulated | ||||||
| Investment | Realized | ||||||
| Income | Gain or | Capital | |||||
| or (Loss) | (Loss) | Stock | |||||
| Enhanced | |||||||
| Fundamental | |||||||
| Index™ | |||||||
| Large | |||||||
| Company | |||||||
| Value | |||||||
| Fund | 133 | 31 | (164) | ||||
| Enhanced | |||||||
| Funda- | |||||||
| mental | |||||||
| Index™ | |||||||
| Small | |||||||
| Company | |||||||
| Growth | |||||||
| Fund | 10,707 | (3,466) | (7,241) | ||||
| Enhanced | |||||||
| Funda- | |||||||
| mental | |||||||
| Index™ | |||||||
| Small | |||||||
| Company | |||||||
| Value | |||||||
| Fund | (41) | 65 | (24) | ||||
| The Funds intend to utilize provisions of the Federal | |||||||
| income tax laws which allow the Funds to carry | |||||||
| realized capital losses forward for eight years following | |||||||
| the year of loss and offset such losses against any future | |||||||
| realized capital gains. Capital loss carryforwards | |||||||
| available for Federal income tax purposes are as | |||||||
| follows: | |||||||
| Capital losses expiring: | |||||||
| 3/31/12 | 3/31/13 | 3/31/14 | |||||
| Large Cap Growth | |||||||
| Fund | — | — | — | ||||
| Large Cap Value | |||||||
| Fund | — | — | — | ||||
| Small/Mid Cap | |||||||
| Growth Fund | — | — | — | ||||
| Small/Mid Cap | |||||||
| Value Fund | — | — | — | ||||
| International Equity | |||||||
| Fund | — | — | — | ||||
| Real Estate Securities | |||||||
| Fund | — | — | — | ||||
| Tax-Exempt Fixed | |||||||
| Income Fund | (16,163) | (128,240) | (10,395) | ||||
| Core Plus Fixed | |||||||
| Income Fund | — | — | — | ||||
| Enhanced Fundamental | |||||||
| Index™ Large Company | |||||||
| Growth Fund | — | — | — | ||||
| Enhanced Fundamental | |||||||
| Index™ Large Company | |||||||
| Value Fund | — | — | — | ||||
| Enhanced Fundamental | |||||||
| Index™ Small Company | |||||||
| Growth Fund | — | — | — | ||||
| Enhanced Fundamental | |||||||
| Index™ Small Company | |||||||
| Value Fund | — | — | — | ||||
151
| AssetMark Funds | ||||
| NOTES TO FINANCIAL STATEMENTS (Continued) | ||||
| March 31, 2008 | ||||
| 3/31/15 | 3/31/16 | |||
| Large Cap Growth Fund | — | — | ||
| Large Cap Value Fund | — | — | ||
| Small/Mid Cap Growth Fund | — | — | ||
| Small/Mid Cap Value Fund | — | — | ||
| International Equity Fund | — | — | ||
| Real Estate Securities Fund | — | — | ||
| Tax-Exempt Fixed | ||||
| Income Fund | (573,575) | (1,190,258) | ||
| Core Plus Fixed | ||||
| Income Fund | — | — | ||
| Enhanced Fundamental | ||||
| Index™ Large Company | ||||
| Growth Fund | — | — | ||
| Enhanced Fundamental | ||||
| Index™ Large Company | ||||
| Value Fund | — | — | ||
| Enhanced Fundamental | ||||
| Index™ Small Company | ||||
| Growth Fund | — | — | ||
| Enhanced Fundamental | ||||
| Index™ Small Company | ||||
| Value Fund | — | — | ||
| Additionally, at March 31, 2008, the Funds deferred on | ||||
| a tax basis post-October 2007 losses are as follows: | ||||
| Large Cap Growth Fund | 12,948,707 | |||
| Large Cap Value Fund | 5,115,990 | |||
| Small/Mid Cap Growth Fund | 7,762,446 | |||
| Small/Mid Cap Value Fund | 15,796,190 | |||
| International Equity Fund | — | |||
| Real Estate Securities Fund | 491,579 | |||
| Tax-Exempt Fixed Income Fund* | 936,627 | |||
| Core Plus Fixed Income Fund | — | |||
| Enhanced Fundamental Index™ Large | ||||
| Company Growth Fund | 184,773 | |||
| Enhanced Fundamental Index™ Large | ||||
| Company Value Fund | 152,917 | |||
| Enhanced Fundamental Index™ Small | ||||
| Company Growth Fund | 14,155 | |||
| Enhanced Fundamental Index™ Small | ||||
| Company Value Fund | 36,007 | |||
| Year Ended March 31, 2008 | |||||||
| Ordinary | Long-Term | ||||||
| Income | Capital Gain | Return of | |||||
| Distributions | Distributions | Capital | |||||
| Large Cap | |||||||
| Growth Fund | 12,083,393 | 25,705,139 | — | ||||
| Large Cap | |||||||
| Value Fund | 19,771,698 | 40,346,286 | — | ||||
| Small/Mid Cap | |||||||
| Growth Fund | 16,312,992 | 8,458,355 | — | ||||
| Small/Mid Cap | |||||||
| Value Fund | 2,644,017 | 1,652,158 | 26,098 | ||||
| International | |||||||
| Equity Fund | 35,604,336 | 89,693,528 | — | ||||
| Real Estate | |||||||
| Securities Fund | 1,838,967 | 11,827,463 | 246,102 | ||||
| Tax-Exempt Fixed | |||||||
| Income Fund* | 7,671,793 | — | — | ||||
| Core Plus Fixed | |||||||
| Income Fund | 34,075,503 | 1,310,487 | — | ||||
| Enhanced | |||||||
| Fundamental | |||||||
| Index™ Large | |||||||
| Company | |||||||
| Growth Fund | 120,947 | 12,263 | — | ||||
| Enhanced | |||||||
| Fundamental | |||||||
| Index™ Large | |||||||
| Company | |||||||
| Value Fund | 138,841 | 8,537 | — | ||||
152
| Year Ended March 31, 2008 | |||||||
| Ordinary | Long-Term | ||||||
| Income | Capital Gain | Return of | |||||
| Enhanced | Distributions | Distributions | Capital | ||||
| Fundamental | |||||||
| Index™ Small | |||||||
| Company | |||||||
| Growth Fund | 2,725 | 6,709 | 7,229 | ||||
| Enhanced | |||||||
| Fundamental | |||||||
| Index™ Small | |||||||
| Company | |||||||
| Value Fund | 15,595 | — | — | ||||
| * Contains $7,671,793 of tax-exempt income for year ended | ||||||||
| 3/31/2008. | ||||||||
| The fund designated as long-term captial gain dividend, pursuant | ||||||||
| to Internal Revenue Code Section 852(b)(3), the amount | ||||||||
| necessary to reduce the earnings and profits of the Fund related | ||||||||
| to net capital gain to zero for the tax year ended 3/31/08. |
| Year Ended | ||||
| March 31, 2007 | ||||
| Ordinary | Long-Term | |||
| Income | Capital Gains | |||
| Distributions | Distributions | |||
| Large Cap | ||||
| Growth Fund | — | $18,666,939 | ||
| Large Cap | ||||
| Value Fund | $21,479,966 | 41,464,641 | ||
| Small/Mid Cap | ||||
| Growth Fund | 5,361,435 | 1,172,637 | ||
| Small/Mid Cap | ||||
| Value Fund | 10,109,223 | 20,852,544 | ||
| International | ||||
| Equity Fund | 45,260,017 | 38,531,201 | ||
| Real Estate | ||||
| Securities Fund | 1,993,621 | 5,081,132 | ||
| Tax-Exempt Fixed | ||||
| Income Fund* | 5,575,058 | — | ||
| Core Plus Fixed | ||||
| Income Fund | 27,047,513 | — | ||
| * Contains $5,575,058 of tax-exempt income. |
153
| AssetMark Funds |
| NOTES TO FINANCIAL STATEMENTS (Continued) |
| March 31, 2008 |
| At March 31, 2008 the components of accumulated earnings (losses) on a tax basis were as follows: | |||||||||||
| Large Cap | Large Cap | Small/Mid | Small/Mid | International | Real Estate | ||||||
| Growth | Value | Cap Growth | Cap Value | Equity | Securities | ||||||
| Fund | Fund | Fund | Fund | Fund | Fund | ||||||
| Cost of Investments | 712,783,727 | 681,954,049 | 145,060,607 | 115,056,655 | 650,470,524 | 78,983,229 | |||||
| Gross Unrealized | |||||||||||
| Appreciation | 86,037,643 | 79,449,050 | 12,561,674 | 5,134,460 | 74,137,782 | 20,189,260 | |||||
| Gross Unrealized | |||||||||||
| Depreciation | (54,522,943) | (99,289,271) | (10,578,541) | (10,701,307) | (49,728,526) | (5,037,564) | |||||
| Net Unrealized | |||||||||||
| Apprec (Deprec) | 31,514,700 | (19,840,221) | 1,982,533 | (5,566,847) | 24,409,256 | 15,151,696 | |||||
| Undistributed | |||||||||||
| Tax-Exempt | |||||||||||
| Ordinary Income | — | — | — | — | — | — | |||||
| Undistributed | |||||||||||
| Ordinary Income | 41,519 | 2,178,548 | — | — | 2,923,670 | — | |||||
| Undistributed | |||||||||||
| Long-Term | |||||||||||
| Cap Gains | — | 9,123 | 132,585 | — | 3,267,351 | — | |||||
| Total Distributable | |||||||||||
| Earnings | 41,519 | 2,187,671 | 132,585 | — | 6,191,021 | — | |||||
| Other Accumulated | |||||||||||
| Gains (Losses) | (13,591,258) | (5,115,990) | (7,904,618) | (15,983,819) | (237,843) | (661,678) | |||||
| Total Accumulated | |||||||||||
| Earnings (Losses) | 17,964,961 | (22,768,540) | (5,789,500) | (21,550,666) | 30,362,434 | 14,490,018 | |||||
154
| Enhanced | Enhanced | Enhanced | Enhanced | |||||||
| Fundamental | Fundamental | Fundamental | Fundamental | |||||||
| Tax-Exempt | Core Plus | Index™ Large | Index™ Large | Index™ Small | Index™ Small | |||||
| Fixed Income | Fixed Income | Company | Company | Company | Company | |||||
| Fund | Fund | Growth Fund | Value Fund | Growth Fund | Value Fund | |||||
| 259,812,019 | 923,300,055 | 61,587,066 | 52,473,944 | 11,221,716 | 4,981,975 | |||||
| 2,348,063 | 15,651,425 | 1,528,123 | 1,056,370 | 603,590 | 254,922 | |||||
| (5,958,562) | (35,817,417) | (5,084,781) | (7,283,256) | (1,387,333) | (735,690) | |||||
| (3,610,499) | (20,165,992) | (3,556,658) | (6,226,886) | (783,743) | (480,768) | |||||
| 192,750 | — | — | — | — | — | |||||
| 3,442 | 3,385,993 | 100,022 | 199,295 | — | 12,074 | |||||
| — | 8,060,419 | 165 | 19 | — | — | |||||
| 196,192 | 11,446,412 | 100,187 | 199,314 | — | 12,074 | |||||
| (2,855,258) | (227,715) | (184,771) | (152,916) | (14,152) | (36,006) | |||||
| (6,269,565) | (8,947,295) | (3,641,242) | (6,180,488) | (797,895) | (504,700) | |||||
155
| AssetMark Funds |
| REPORT OF INDEPENDENT REGISTERED PUBLIC ACCOUNTING FIRM |
The Board of Trustees and Shareholders
AssetMark Funds:
We have audited the accompanying statements of assets and liabilities, including the schedules of investments, of AssetMark Large Cap Growth Fund, AssetMark Large Cap Value Fund, AssetMark Small/Mid Cap Growth Fund, AssetMark Small/Mid Cap Value Fund, AssetMark International Equity Fund, AssetMark Real Estate Securities Fund, AssetMark Tax-Exempt Fixed Income Fund, AssetMark Core Plus Fixed Income Fund, AssetMark Enhanced Fundamental Index Large Company Growth Fund, AssetMark Enhanced Fundamental Index Large Company Value Fund, AssetMark Enhanced Fundamental Index Small Company Growth Fund and AssetMark Enhanced Fundamental Index Small Company Value Fund as of March 31, 2008, and the related statements of operations, statements of changes in net assets, and the financial highlights for the periods presented. These financial statements and financial highlights are the responsibility of fund management. Our responsibility is to express an opinion on these financial statements and financial highlights based on our audits. The financial highlights for the periods presented through March 31, 2006, were audited by other auditors whose report dated May 26, 2006, expressed an unqualified opinion on those financial highlights.
We conducted our audits in accordance with the standards of the Public Company Accounting Oversight Board (United States). Those standards require that we plan and perform the audit to obtain reasonable assurance about whether the financial statements and financial highlights are free of material misstatement. An audit includes examining, on a test basis, evidence supporting the amounts and disclosures in the financial statements. Our procedures included confirmation of securities owned as of March 31, 2008, by correspondence with the custodian and brokers or by other appropriate auditing procedures. An audit also includes assessing the accounting principles used and significant estimates made by management, as well as evaluating the overall financial statement presentation. We believe that our audits provide a reasonable basis for our opinion.
In our opinion, the financial statements and financial highlights referred to above present fairly, in all material respects, the financial position of as of AssetMark Large Cap Growth Fund, AssetMark Large Cap Value Fund, AssetMark Small/Mid Cap Growth Fund, AssetMark Small/Mid Cap Value Fund, AssetMark International Equity Fund, AssetMark Real Estate Securities Fund, AssetMark Tax-Exempt Fixed Income Fund, AssetMark Core Plus Fixed Income Fund, AssetMark Enhanced Fundamental Index Large Company Growth Fund, AssetMark Enhanced Fundamental Index Large Company Value Fund, AssetMark Enhanced Fundamental Index Small Company Growth Fund and AssetMark Enhanced Fundamental Index Small Company Value Fund as of March 31, 2008, the results of their operations, the changes in their net assets, and the financial highlights for the periods presented, in conformity with U.S. generally accepted accounting principles.
(signed) KPMG LLP
Milwaukee, Wisconsin
May 29, 2008
156
| AssetMark Funds |
| ADDITIONAL INFORMATION (Continued) |
| March 31, 2008 |
| 1. | Shareholder Notification of Federal Tax Status (Unaudited) |
The Large Cap Growth Fund, Large Cap Value Fund, Small/Mid Cap Growth Fund, Small/Mid Cap Value Fund, Real Estate Securities Fund, Enhanced Fundamental Index™ Large Company Growth Fund, Enhanced Fundamental Index™ Large Company Value Fund, Enhanced Fundamental Index™ Small Company Growth Fund and Enhanced Fundamental Index™ Small Company Value Fund designates 66%, 81%, 8%, 61%, 26%, 100%, 100%, 100% and 100%, respectively, of dividends during the fiscal year ended March 31, 2008, as dividends qualifying for the dividends received deduction available to corporate shareholders.
The Large Cap Growth Fund, Large Cap Value Fund, Small/Mid Cap Growth Fund, Small/Mid Cap Value Fund, International Equity Fund, Real Estate Securities Fund, Enhanced Fundamental Index™ Large Company Growth Fund, Enhanced Fundamental Index™ Large Company Value Fund, Enhanced Fundamental Index™ Small Company Growth Fund and Enhanced Fundamental Index™ Small Company Value Fund designates 70%, 82%, 8%, 61%, 60%, 29%, 100%, 100%, 100% and 100%, respectively, of dividends declared from net investment income during the fiscal year ended March 31, 2008, as qualified income under the Jobs and Growth Tax Relief Reconciliation Act of 2003.
| 2. | Foreign Tax Credit Pass Through (Unaudited) |
For the year ended March 31, 2008, the International Equity Fund earned foreign source income and paid foreign taxes, which they intend to pass through to their shareholders pursuant to Section 853 of the Internal Revenue Code as follows:
| Foreign Sourced Income Earned | Taxes Paid | |||||
| Austria | $ | 433,267 | $ | 77,993 | ||
| Australia | 681,725 | 25,082 | ||||
| Belgium | 125,861 | 20,222 | ||||
| Bermuda | 56,160 | — | ||||
| Brazil | 397,090 | 60,585 | ||||
| Canada | 3,999 | 600 | ||||
| Denmark | 123,116 | 18,467 | ||||
| France | 2,554,408 | 404,122 | ||||
| Germany | 1,925,266 | 287,021 | ||||
| Greece | 856,951 | — | ||||
| Hong Kong | 332,264 | — | ||||
| Indonesia | 130,419 | 19,563 | ||||
| India | 10,513 | 1,040 | ||||
| Ireland | 132,173 | 10,025 | ||||
| Israel | 43,910 | 7,177 | ||||
| Italy | 1,168,267 | 176,955 | ||||
| Japan | 2,061,760 | 147,356 | ||||
| Luxemburg | 42,130 | 6,320 | ||||
| Mexico | 105,728 | — | ||||
| Netherlands | 588,339 | 88,251 | ||||
| Philippines | 52,422 | 13,105 | ||||
| Portugal | 92,876 | 13,931 | ||||
| Norway | 1,141,781 | 168,472 | ||||
| Spain | 566,778 | 85,036 | ||||
| Sweden | 1,654,750 | 184,627 | ||||
| Switzerland | 943,741 | 143,188 | ||||
| Taiwan | — | 10,351 |
157
157
| AssetMark Funds |
| ADDITIONAL INFORMATION (Continued) |
| March 31, 2008 |
| 3. | Disclosure Regarding Fund Trustees and Officers (Unaudited) |
| # of | ||||||||||
| Portfolios | ||||||||||
| in Fund | Other | |||||||||
| Position(s) | Term of Office | Complex | Director/ | |||||||
| Name, Age | Held with | and Length of | Principal | Overseen | Trustee | |||||
| and Address | the Trust | Time Served | Occupation During Past Five Years | by Trustee | Positions | |||||
| Independent Trustees | ||||||||||
| R. Thomas DeBerry, 66 | Trustee | Indefinite Term | President, DeBerry Consulting (a | 12 | None | |||||
| c/o AssetMark | since January | securities consulting firm) (1988-present); | ||||||||
| Investment Services, Inc. | 2001. | |||||||||
| 2300 Contra Costa | ||||||||||
| Boulevard, Suite 600 | ||||||||||
| Pleasant Hill, CA 94523 | ||||||||||
| William J. Klipp, 52 | Trustee | Indefinite Term | Retired; President and Chief Operating | 12 | Trustee of | |||||
| c/o AssetMark | since January | Officer, Charles Schwab Investment | Adelante | |||||||
| Investment Services, Inc. | 2001. | Management, Inc. and Executive Vice | Funds | |||||||
| 2300 Contra Costa | President, Schwab Funds (1993-1999). | (2000-present). | ||||||||
| Boulevard, Suite 600 | ||||||||||
| Pleasant Hill, CA 94523 | ||||||||||
| Leonard H. Rossen, 75 | Trustee | Indefinite Term | President, Len Rossen Consulting (a legal | 12 | None | |||||
| c/o AssetMark | since January | consulting firm) (1999-present). | ||||||||
| Investment Services, Inc. | 2001. | |||||||||
| 2300 Contra Costa | ||||||||||
| Boulevard, Suite 600 | ||||||||||
| Pleasant Hill, CA 94523 | ||||||||||
| Dennis G. Schmal, 61 | Trustee | Indefinite Term | Self-employed consultant. | 12 | Director/Chairman, | |||||
| c/o AssetMark | Since July 2007. | Pacific Metrics Corp. | ||||||||
| Investment Services, Inc. | (Educational | |||||||||
| 2300 Contra Costa | Services) (2005 to | |||||||||
| Boulevard, Suite 600 | present); Director, | |||||||||
| Pleasant Hill, CA 94523 | Varian Semiconductor | |||||||||
| Equipment Associates, | ||||||||||
| Inc. (2004 to present); | ||||||||||
| Director, MCF Corp. | ||||||||||
| (Financial Services) | ||||||||||
| (2003 to present). | ||||||||||
| Interested Trustees | ||||||||||
| Ronald Cordes*, 48 | Chairperson, | Indefinite Term | Principal, AssetMark Investment | 12 | None | |||||
| AssetMark Investment | Trustee | since January | Services, Inc. (1994-present). | |||||||
| Services, Inc. | 2001. | |||||||||
| 2300 Contra Costa | ||||||||||
| Boulevard, Suite 600 | ||||||||||
| Pleasant Hill, CA 94523 |
158
| AssetMark Funds |
| ADDITIONAL INFORMATION (Continued) |
| March 31, 2008 |
| # of | ||||||||||
| Portfolios | ||||||||||
| in Fund | Other | |||||||||
| Position(s) | Term of Office | Complex | Director/ | |||||||
| Name, Age | Held with | and Length of | Principal | Overseen | Trustee | |||||
| and Address | the Trust | Time Served | Occupation During Past Five Years | by Trustee | Positions | |||||
| Officers | ||||||||||
| Carrie E. Hansen, 37 | President and | 1-Year Term | Senior Vice President, Chief Operations Officer | N/A | Chairman of | |||||
| AssetMark | Treasurer | since January | AssetMark Investment Services, Inc. (2008- | the Board of | ||||||
| Investment Services, Inc. | 2001 | present); Senior Vice President, Managing | Genworth | |||||||
| 2300 Contra Costa | Director of the AssetMark Funds, Chief | Financial Trust | ||||||||
| Boulevard, Suite 600 | Compliance Officer, AssetMark Investment | Company | ||||||||
| Pleasant Hill, CA 94523 | Services, Inc. (2007 to present); Senior Vice | |||||||||
| President, CFO/CCO, AssetMark Investment | ||||||||||
| Services, Inc. (2004 to 2007); Vice President, | ||||||||||
| CFO/Director of Operations, AssetMark | ||||||||||
| Investment Services, Inc. (2000 to 2004). | ||||||||||
| Deborah Djeu, 45 | Chief | 1-Year Term | Deputy Chief Compliance Officer, the | N/A | N/A | |||||
| AssetMark | Compliance | since May | AssetMark Funds, (2007 to 2008); Compliance | |||||||
| Investment Services, Inc. | Officer and | 2008 | Manager, GE Money, (2006 to 2007); Vice President, | |||||||
| 2300 Contra Costa | AML | Wells Fargo Investments LLC, (2004 to 2006); | ||||||||
| Boulevard, Suite 600 | Compliance | Senior Enforcement Attorney, Pacific | ||||||||
| Pleasant Hill, CA 94523 | Officer | Exchange, (2002 to 2004). | ||||||||
| Chris Villas-Chernak, 39 | Secretary | 1-Year Term | Senior Compliance Officer, AssetMark | N/A | N/A | |||||
| AssetMark | since September | Investment Services, Inc., (2005 to present); Fund | ||||||||
| Investment Services, Inc. | 2006 | Administration and Compliance Manager, | ||||||||
| 2300 Contra Costa | AssetMark Investment Services, Inc., (2004 to | |||||||||
| Boulevard, Suite 600 | 2005); Fund Administration and Compliance | |||||||||
| Pleasant Hill, CA 94523 | Specialist, AssetMark Investment Services, Inc., | |||||||||
| (2002 to 2004). | ||||||||||
| * Ronald Cordes is an “interested person” of the Funds as defined in the 1940 Act due to his relationship with the Advisor. | ||||||||||
The Statement of Additional Information includes additional information about the Funds’ Trustees and is available free of charge upon request by calling the Funds toll free at (888) 278-5809. Information shown above reflect changes in the Officers of the Trust approved by the Trustees on May 6, 2008.
| 4. | Proxy Voting Policies and Procedures and Proxy Voting Record (Unaudited) |
A description of the policies and procedures that the Funds use to determine how to vote proxies related to the Funds’ portfolio securities as well as information regarding how the Funds voted proxies relating to portfolio securities during the most recent 12-month period ended June 30 is available without charge, upon request, by calling (888) 278-5809. Furthermore, you can obtain the Funds’ proxy voting records on the SEC’s website at http://www.sec.gov.
159
| 5. | Availability of Quarterly Portfolio Holdings Schedules (Unaudited) |
The Funds file their complete schedules of portfolio holdings with the SEC for their first and third fiscal quarters on Form N-Q. Once filed, the Funds’ Form N-Q is available without charge, upon request on the SEC’s website (http://www.sec.gov) and is available by calling (888) 278-5809. You can also obtain copies of Form N-Q by (i) visiting the SEC’s Public Reference Room in Washington, DC (information on the operation of the Public Reference Room may be obtained by calling 1-800-SEC-0330); (ii) sending your request and a duplicating fee to the SEC’s Public Reference Room, Washington, DC 20549-0102; or (iii) sending your request electronically to publicinfosec.gov.
159
| AssetMark Funds |
| ADDITIONAL INFORMATION (Continued) |
| March 31, 2008 |
| 6. | Statement Regarding the Basis for Approval of Sub-Advisory Agreements (Unaudited) |
During the six-month period ended March 31, 2008, the Board of Trustees (the “Board” or the “Trustees”) of AssetMark Funds (the “Trust”) approved two new sub-advisory agreements between the Trust’s investment advisor, AssetMark Investment Services, Inc. (the “Advisor”), on behalf of two of the Trust’s series, the AssetMark Real Estate Securities Fund and the AssetMark Small/Mid Cap Value Fund. The AssetMark Real Estate Securities Fund and the AssetMark Small/Mid Cap Value Fund are collectively referred to herein as the “Funds.” At a meeting held on December 18, 2007, the Board appointed Duff & Phelps Investment Management Co. (“Duff & Phelps”) to replace AEW Management and Advisors, L.P. as one of the sub-advisors for the AssetMark Real Estate Securities Fund. At the meeting, the Board reviewed, considered and approved a new sub-advisory agreement between Duff & Phelps and the Advisor, on behalf of the AssetMark Real Estate Securities Fund.
At a meeting held on March 14, 2008, the Board appointed Integrity Asset Management, LLC (“Integrity”) to replace First Quadrant, L.P. as one of the sub-advisors for the AssetMark Small/Mid Cap Value Fund. At the meeting, the Board reviewed, considered and approved a new sub-advisory agreement between Integrity and the Advisor, on behalf of the AssetMark Small/Mid Cap Value Fund.
The Funds are managed using a “manager of managers” structure that generally involves the use of one or more sub-advisors to manage allocated portions of the Funds’ portfolios. Under this structure, the Advisor is responsible for evaluating and selecting sub-advisors on an ongoing basis and making any decisions to recommend hiring, retaining or replacing sub-advisors. The Board of Trustees is engaged in monitoring this process in connection with quarterly meetings held throughout the year and, under the manager of managers structure, all parties understand that sub-advisors are being monitored and evaluated, and are subject to replacement, at all times.
The information, the material factors considered and the conclusions that formed the basis of the Board’s approval of each sub-advisory agreement are described below. This summary describes the most important, but not all, of the factors evaluated by the Board. In deciding to approve each sub-advisory agreement, the Trustees did not identify any particular information or any single factor or conclusion that was controlling.
Materials Reviewed and the Review Process
Assisted by independent legal counsel, the Trustees specifically requested and were furnished with materials for purposes of their review. The materials provided to the Board related to, among other things: (a) the terms and conditions of each proposed sub-advisory agreement; (b) the nature, quality and scope of the services to be provided by each sub-advisor, as well as the schedule of fees to be charged for such services; (c) each sub-advisor’s investment performance compared to an industry peer group, as well as other sub-advisor client accounts; (d) comparative sub-advisory fee information; (e) information regarding each sub-advisor’s personnel, operations, financial position and business operations; (f) information regarding each sub-advisor’s brokerage and compliance practices; and (g) information regarding each sub-advisor’s interactions with the Advisor.
The Trustees received assistance and advice regarding legal and industry standards from both independent counsel and from counsel to the Trust, and had previously received a detailed memorandum prepared by counsel to the Trust that described the Trustees’ legal duties and obligations in considering the approval of the sub-advisory agreements. The Independent Trustees discussed in detail, in executive sessions with independent counsel at which no representatives of the Advisor or the sub-advisors were present, their legal duties and the materials provided by each sub-advisor.
Factors Considered
The Trustees considered and reached conclusions on a number of factors in making the decision to approve each of the sub-advisory agreements. In so doing, the Trustees considered the Advisor’s active role as a “manager of managers,” which includes, among other functions, monitoring and evaluating the performance of the sub-advisors, recommending that sub-advisors not performing as expected be replaced, and negotiating advantageous fee arrangements that could permit the AssetMark Funds to realize economies of scale without compromising the quality of services. The Trustees considered the process by which the Advisor reviewed, selected and recommended each sub-advisor for the Board’s approval. These factors and the Board’s conclusions are set forth below.
160
| AssetMark Funds |
| ADDITIONAL INFORMATION (Continued) |
| March 31, 2008 |
Nature, Extent and Quality of Services
The Trustees reviewed the nature, extent and quality of the services to be provided to the respective Funds by the sub-advisors. The Trustees considered each sub-advisor’s investment management process, including (a) the experience and capability of the sub-advisor’s management and other personnel; (b) the financial position of the sub-advisor; (c) the quality and commitment of the sub-advisor’s regulatory and legal compliance policies, procedures and systems; and (d) the sub-advisor’s brokerage practices. The Trustees also considered the Advisor’s favorable assessment as to the nature, extent and quality of the sub-advisory services expected to be provided by each sub-advisor. Based on their review and consideration of the foregoing information, the Trustees concluded that the nature, extent and quality of the services provided by each sub-advisor will likely benefit each Fund and its shareholders.
Investment Performance
At the time of the Board’s consideration of each sub-advisory agreement, neither sub-advisor had commenced managing its allocated portion of the respective Fund. Therefore, there was no record of each sub-advisor’s specific performance with respect to the Funds. However, the Board was provided with, and considered, performance information for other accounts managed by each sub-advisor that have similar investment objectives and policies to the respective Fund. The Trustees also considered each sub-advisor’s investment performance record relative to benchmark indices. The Trustees concluded that each sub-advisor’s performance record supported the approval of the applicable sub-advisory agreement.
Sub-Advisory Fees and Economies of Scale
The Trustees considered the proposed fee schedule for each sub-advisor. The Trustees also considered individual reports prepared for each sub-advisor containing comparative information regarding fees. In order to consider comparative advisory fees, the Trustees generally compared the fees in the sub-advisory agreements to peer groups of funds with similar investment objectives and policies. The Trustees considered that the sub-advisory fees would be paid by the Advisor from the fees it receives from the Funds, and would not result in additional fees borne by the Funds. The Trustees also considered that breakpoints in the sub-advisory agreement fee schedules represented potential economies of scale that could be shared with Fund shareholders under an agreement with the Advisor. The Trustees concluded that the sub-advisory fees to be paid to each of the sub-advisors were reasonable in light of the services to be provided to each Fund.
Ancillary Benefits
The Trustees considered other benefits that each sub-advisor might receive as a result of their relationship with the Funds. The Board observed that, consistent with each sub-advisor’s fiduciary obligations to the Fund for which it serves as a sub-advisor, each sub-advisor may direct Fund brokerage transactions to certain broker-dealers to obtain research and other services.
Conclusions
Based on their full evaluation of the relevant factors, the Board and the Independent Trustees concluded that all of the factors above favored approval of the sub-advisory agreements with Duff & Phelps and Integrity. The Board and the Independent Trustees also concluded that each sub-advisory fee is reasonable; and that the approval of each sub-advisory agreement is in the best interests of the applicable Fund and its shareholders.
161
[This Page Intentionally Left Blank]
[This Page Intentionally Left Blank]
[This Page Intentionally Left Blank]

Item 2. Code of Ethics.
As of the end of the period covered by the report, the registrant has adopted a code of ethics that applies to the registrant’s principal executive officer and principal financial officer. During the period covered by the report, there were no: (i) amendments to the code of ethics that apply to the registrant’s principal executive officer or principal financial officer, or (ii) waivers (including implicit waivers) granted from the provisions of the code of ethics to the registrant’s principal executive officer or principal financial officer.
Item 3. Audit Committee Financial Expert.
The registrant’s board of trustees has determined that there is at least one audit committee financial expert serving on its audit committee. Dennis Schmal is the “audit committee financial expert” and is considered to be “independent” as each term is defined in Item 3 of Form N-CSR.
Item 4. Principal Accountant Fees and Services.
(a)-(d) The registrant has engaged its principal accountant to perform audit services and tax services during the past two fiscal years. “Audit services” refer to performing an audit of the registrant's annual financial statements or services that are normally provided by the accountant in connection with statutory and regulatory filings or engagements for those fiscal years. “Tax services” refer to professional services rendered by the principal accountant for tax compliance, tax advice and tax planning. The following table details the aggregate fees billed or expected to be billed for each of the last two fiscal years for audit fees, audit-related fees, tax fees and other fees by the principal accountant.
| FYE 03/31/2008 | FYE 03/31/07 | |
| Audit Fees | $239,920 | $173,000 |
| Audit-Related Fees | $0 | $0 |
| Tax Fees | $57,720 | $37,000 |
| All Other Fees | $0 | $0 |
(e)(1) The audit committee has adopted an Audit Committee Charter that provides that the audit committee shall approve, prior to appointment, the engagement of the auditor to provide audit services to the registrant and non-audit services to the registrant, its investment adviser or any entity controlling, controlled by or under common control with the investment adviser that provides ongoing services to the registrant if the engagement relates directly to the operations and financial reporting of the registrant.
(e)(2) None of the services described above in each of paragraphs (b) through (d) of this Item were approved by the registrant’s audit committee pursuant to paragraph (c)(7)(i)(C) of Rule 2-01 of Regulation S-X.
(f) All of the principal accountant’s hours spent on auditing the registrant’s financial statements for the most recent fiscal year were attributed to work performed by full-time, permanent employees of the principal accountant.
(g) The following table indicates the aggregate non-audit fees billed or expected to be billed by the registrant’s accountant for services to the registrant and to the registrant’s investment adviser (not including any sub-advisers) and any entity controlling, controlled by or under common control with the investment adviser that provides ongoing services to the registrant for each of the last two fiscal years of the registrant.
| Non-Audit Fees | FYE 03/31/2008 | FYE 03/31/2007 |
| Registrant | $57,720 | $37,000 |
| Registrant’s investment adviser | $0 | $0 |
Any entity controlling, controlled by or under common control with the investment adviser that provides services to the registrant | $0 | $0 |
(h) The audit committee of the Board of Trustees has considered whether the provision of non-audit services that were rendered to the registrant's investment adviser (not including any sub-advisers) and any entity controlling, controlled by or under common control with the investment adviser that provides ongoing services to the registrant that were not pre-approved pursuant to paragraph (c)(7)(ii) of Rule 2-01 of Regulation S-X is compatible with maintaining the principal accountant's independence and has concluded that the provision of such non-audit services by the principal accountant has not compromised the principal accountant’s independence.
Item 5. Audit Committee of Listed Registrants.
Not applicable.
Item 6. Schedule of Investments.
Schedule of Investments is included as part of the report to shareholders filed under Item 1 of this Form.
Item 7. Disclosure of Proxy Voting Policies and Procedures for Closed-End Management Investment Companies.
Not applicable to open-end investment companies.
Item 8. Portfolio Managers of Closed-End Management Investment Companies.
Not applicable to open-end investment companies.
Item 9. Purchases of Equity Securities by Closed-End Management Investment Company and Affiliated Purchasers.
Not applicable to open-end investment companies.
Item 10. Submission of Matters to a Vote of Security Holders.
None.
Item 11. Controls and Procedures.
| (a) | Based on their evaluation of the registrant’s disclosure controls and procedures as of a date within 90 days of the filing date of this Form N-CSR (the “Report”), the registrant’s President/Principal Executive Officer and Treasurer/Principal Financial Officer believe that the registrant’s disclosure controls and procedures (as defined in Rule 30a-3(c) under the Investment Company Act of 1940, as amended (the “1940 Act”)) are effectively designed to ensure that information required to be disclosed by the registrant in the Report is recorded, processed, summarized and reported by the filing date, including ensuring that information required to be disclosed in the Report is accumulated and communicated to the registrant’s officers who are making certifications in the Report, as appropriate to allow timely decisions regarding required disclosure. |
| (b) | There were no changes in the registrant’s internal control over financial reporting (as defined in Rule 30a-3(d) under the 1940 Act) that occurred during the registrant’s second fiscal quarter of the period covered by this Report that have materially affected, or are reasonably likely to materially affect, the registrant’s internal control over financial reporting. |
Item 12. Exhibits.
| (a) | (1) Any code of ethics, or amendment thereto, that is the subject of the disclosure required by Item 2, to the extent that the registrant intends to satisfy the Item 2 requirements through filing an exhibit. Filed herewith. |
(2) Certifications pursuant to Section 302 of the Sarbanes-Oxley Act of 2002. Filed herewith.
| (b) | Certification pursuant to Section 906 of the Sarbanes-Oxley Act of 2002. Furnished herewith. |
SIGNATURES
Pursuant to the requirements of the Securities Exchange Act of 1934 and the Investment Company Act of 1940, the registrant has duly caused this report to be signed on its behalf by the undersigned, thereunto duly authorized.
(Registrant) AssetMark Funds
By (Signature and Title)* /s/ Carrie E. Hansen
Carrie E. Hansen
President
Principal Executive Officer
Date 5/29/2008 0;
Pursuant to the requirements of the Securities Exchange Act of 1934 and the Investment Company Act of 1940, this report has been signed below by the following person on behalf of the registrant and in the capacities and on the date indicated.
By (Signature and Title)* /s/ Carrie E. Hansen
Carrie E. Hansen
President & Treasurer
Principal Executive Officer & Principal Financial Officer
Date 5/29/2008