Washington, D.C. 20549
GENWORTH FINANCIAL WEALTH MANAGEMENT, INC.
May 6, 2009
Dear Shareholder,
Enclosed is the Annual Report for the AssetMark Funds (“Funds”) covering the one year period from April 1, 2008 through March 31, 2009.
The period was characterized by extreme volatility and historic changes within the financial industry. By April 2008, the stock market, as measured by the S&P 500 Index1, had declined substantially from its October 2007 high, flirting with what is generally considered bear market territory. During April and into May 2008, the S&P 500 Index rose slightly before settling into a steep decline that lasted from mid-May through mid-July 2008 as the markets tried to price in concerns regarding the growing subprime mortgage crisis, tightening credit across all sectors, deflating housing prices and the slowdown in consumer spending. These concerns were coupled with rising energy and commodities prices and a number of corporate earnings estimate downgrades.
From July through early September 2008, the markets seemed to stabilize. In retrospect, the period can be seen as an uneasy stalemate between pessimism and optimism that ended resoundingly in favor of the pessimists with the bankruptcy of Lehman Brothers. The headlines were dominated by one financial shock after another, including the U.S. government moving to bail out insurance giant AIG; the reorganization of Goldman Sachs and Morgan Stanley as commercial banks; and the first version of a massive federal program to stabilize the U.S. credit markets. Despite a strong rally from late November through the end of 2008, the S&P 500 posted a loss of 21.94% for the fourth quarter of 2008.
The final quarter of the Funds’ annual reporting period, January 1 through March 31, 2009, saw further decline in the stock market, as corporate earnings dropped, credit disappeared, consumer spending dried up and financial assets lost value due to massive sell-offs in every sector. For the entire fiscal year, the S&P 500 posted a loss of 38.09%. The overall bear market, measured from the October 2007 high through the March 2009 low, was down over 50%.
Economic and Market Overview
Part of the difficulty encountered during the reporting period was not only the depth of the bear market, but its breadth as well. Each of the ten S&P 500 industry sectors posted a loss from April 1, 2008 through March 31 2009, ranging from - -18.96% for Health Care to -60.41% for Financials. Small cap stocks lost 37.50% (as measured by the Russell 2000 Index2) for the period, faring slightly better than mid caps, which lost 40.81% (as measured by the Russell Midcap Index3).
The Morgan Stanley Capital International (“MSCI”) EAFE Index4 declined 46.20%, with the various sub-indexes sharing broadly in the suffering, with the MCSI Japan Index5 becoming the “top performer” with a loss of 35.89%.
Turning to growth and value returns, large cap growth equities (-34.28%, as measured by the Russell 1000 Growth Index6) outperformed large cap value equities (-42.42%, as measured by the Russell 1000 Value Index7), although the differences narrowed among mid and small caps.
The only strong winner for the period was long-term U.S. Treasury bonds, which saw a robust 13.05% gain (as measured by the Barclays Capital Long U.S. Treasury Index8). Other Treasury categories, as well as U.S. municipal bonds (as measured by the Barclays Capital U.S. Municipal Bond Index9), showed modest returns, while investment grade corporate bonds, as measured by the Barclays Capital U.S. Corporate Investment Grade Index10, lost 6.63%.
Not surprisingly, considering the headlines garnered by falling real estate values and the challenges in the mortgage industry, REITs were the biggest losers for the one year period, with U.S. REITs declining 60.66% and Global, non-U.S. REITs falling 57.06%. (Dow Jones Wilshire REIT Index11 and Dow Jones Wilshire REIT ex U.S. Index12, respectively.)
Where do we go from here?
Investors are understandably wary, but there have been signs of improvement. The last month of the fiscal year, March 2009, the S&P 500 returned 8.76%, the best month in six years, while emerging markets showed a one-month return of 14.38% (as measured by the MSCI Emerging Markets Index13). Over recent months, we have seen better than expected numbers on housing sales, housing starts, consumer spending and sentiment, and durable goods manufacturing.
No one is willing to declare the bear market over or point to a definitive end to the recession. Nonetheless, there is a growing consensus that we may have emerged from the vortex of the financial “perfect storm” that started in September 2008. If the equity markets and the economy continue toward recovery, we can expect new opportunities to emerge. We will continue to manage the AssetMark Funds in order to capture value as an integral component of your diversified asset allocation portfolio.
We appreciate the trust you and your advisor have placed in us by including the AssetMark Funds as part of your portfolio. We look forward to the rest of 2009 as we face the challenges and opportunities that lie ahead.
Sincerely,
Carrie E. Hansen
President
AssetMark Funds
1 | The S&P 500 Index, a registered trademark of the McGraw Hill Companies, is an unmanaged basket of 500 stocks that are |
| | considered to be widely held and thus believed to be a good indicator of overall market performance. You cannot invest |
| | directly into an index. |
| | |
2 | The Russell 2000 Index is a subset of the Russell 3000® Index representing approximately 10% of the total market |
| | capitalization of that index. It includes approximately 2000 of the smallest securities based on a combination of their market |
| | cap and current index membership. |
| | |
3 | The Russell Midcap Index is a subset of the Russell 1000® Index. It includes approximately 800 of the smallest securities |
| | based on a combination of their market cap and current index membership. The Russell Midcap Index represents |
| | approximately 31% of the total market capitalization of the Russell 1000 companies. |
| | |
4 | The MSCI Europe, Australia and Far East Index (MSCI EAFE) is a free float-adjusted market capitalization index that is |
| | designed to measure the equity market performance of developed markets, excluding the US & Canada. |
| | |
5 | The MSCI Japan Index seeks to measure the performance of the Japanese equity market. It is a capitalization-weighted |
| | index that aims to capture 85% of the (publicly available) total market capitalization. Component companies are adjusted for |
| | available float and must meet objective criteria for inclusion to the Index, taking into consideration unavailable strategic |
| | shareholdings and limitations to foreign ownership. |
| | |
6 | The Russell 1000 Growth Index measures the performance of the large-cap growth segment of the U.S. equity universe. It |
| | includes those Russell 1000 companies with higher price-to-book ratios and higher forecasted growth values. |
| | |
7 | The Russell 1000 Value Index measures the performance of the large-cap value segment of the U.S. equity universe. It |
| | includes those Russell 1000 companies with lower price-to-book ratios and lower expected growth values. |
| | |
8 | The Barclays Capital Long U.S. Treasury Index includes all publicly issued, U.S. Treasury securities that have a remaining |
| | maturity of 10 or more years, are rated investment grade, and have $250 million or more of outstanding face value. In |
| | addition, the securities must be denominated in U.S. dollars and must be fixed rate and non-convertible. Excluded from the |
| | Barclays Capital Long U.S. Treasury Index are certain special issues, such as flower bonds, targeted investor notes (TINs), |
| | state and local government series bonds, U.S. Treasury Inflation-Protected Securities (TIPS), and coupon issues that have |
| | been stripped from bonds included in the index. The Barclays Long U.S. Treasury Index is market capitalization weighted |
| | and the securities in the index are updated on the last business day of each month. |
| | |
9 | The Barclays Capital U.S. Municipal Bond Index is a market-value-weighted index for the long-term tax-exempt bond |
| | market. To be included in the index, bonds must have a minimum credit rating of Baa. They must have an outstanding par |
| | value of at least $7 million and be issued as part of a transaction of at least $75 million. The bonds must be fixed rate, have a |
| | date after December 31, 1990, and must be at least one year from their maturity date. |
| | |
10 | The Barclays Capital U.S. Corporate Investment Grade Index, which is a subset of the broader Barclays Capital U.S. Credit |
| | Index, is representative of publicly issued, investment-grade, fixed rate, dollar-denominated, non-convertible, U.S. corporate |
| | debt securities that have at least $250 million par amount outstanding. To qualify, bonds must be registered with the U.S. |
| | Securities and Exchange Commission (SEC). |
| | |
11 | The Dow Jones Wilshire REIT Index is a broad measure of the performance of publicly traded U.S. real estate securities, |
| | such as Real Estate Investment Trusts (REITs) and Real Estate Operating Companies. |
| | |
12 | The Dow Jones Wilshire REIT ex U.S. Index is a broad measure of the performance of publicly traded real estate securities |
| | from around the world excluding the U.S., such as Real Estate Investment Trusts (REITs) and Real Estate Operating |
| | Companies. |
| | |
13 | The MSCI Emerging Markets Index is a free float-adjusted market capitalization index that is designed to measure equity |
| | market performance of emerging markets. As of January 2009 the MSCI Emerging Markets Index consisted of the |
| | following 23 emerging market country indices: Argentina, Brazil, Chile, China, Colombia, Czech Republic, Egypt, |
| | Hungary, India, Indonesia, Israel, Korea, Malaysia, Mexico, Morocco, Peru, Philippines, Poland, Russia, South Africa, |
| | Taiwan, Thailand, and Turkey. |
Investors should consider the Funds’ Investment objectives, risks, charges and expenses carefully before investing. The prospectus contains this and other important information about the Funds. Please read the prospectus carefully before you invest or send money. The prospectus is available upon request, without charge, by calling 1-800-238-0810.
48598 042909
| AssetMark Large Cap Growth Fund |
| MANAGER’S DISCUSSION OF FUND PERFORMANCE (Unaudited) |
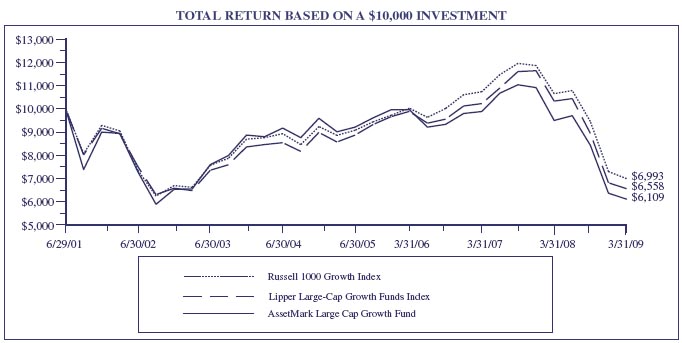
This chart assumes an initial gross investment of $10,000 made on June 29, 2001 (commencement of the Fund’s operations). Returns shown include the reinvestment of all dividends. Returns shown do not reflect the deduction of taxes that a shareholder would pay on fund distributions or the redemption of fund shares. In the absence of fee waivers and reimbursements, total return would be reduced. Past performance is not predictive of future performance. Investment return and principal value will fluctuate, so that your shares, when redeemed, may be worth more or less than the original cost. Index returns do not reflect the effects of fees or expenses (excluding Lipper). It is not possible to invest directly in an index.
RUSSELL 1000 GROWTH INDEX – An unmanaged index which measures the performance of those Russell 1000 companies with higher price-to-book ratios and higher forecasted growth values. The Russell 1000 Index is an unmanaged index which measures the performance of the 1,000 largest companies in the Russell 3000 Index. The Russell 3000 Index is an unmanaged index which measures the performance of the 3,000 largest U.S. Companies, based on total market capitalization, which represents approximately 98% of the investable U.S. equity market.
LIPPER LARGE-CAP GROWTH FUNDS INDEX – The Lipper Large-Cap Growth Funds Index is the average of the 30 largest funds in the Lipper Large-Cap Growth Funds Category. These funds, by portfolio practice, invest at least 75% of their equity assets in companies with market capitalizations (on a three-year weighted basis) greater than 300% of the dollar-weighted median market capitalization of the middle 1,000 securities of the Standard & Poor’s (“S&P”) Super Composite 1500® Index. These funds typically invest in securities that have an above average price-to-earnings ratio, price-to-book ratio and three-year sales-per-share growth value, compared to the Standard & Poor’s 500 Composite Index (“S&P 500® Index”).
| AVERAGE ANNUAL TOTAL RETURN (for the period ended March 31) | | | | |
| | One Year | | Five Year | | Since Inception (6/29/01) |
| AssetMark Large Cap Growth Fund | -35.63% | | -7.03% | | -6.16% |
| Russell 1000 Growth Index | -34.28% | | -4.38% | | -4.51% |
| Lipper Large-Cap Growth Funds Index | -36.45% | | -4.95% | | -5.30% |
AssetMark Large Cap Growth Fund
MANAGER’S DISCUSSION OF FUND PERFORMANCE (Continued) (Unaudited)
For the 12 months ended March 31, 2009, the Fund returned -35.63%, trailing the Russell 1000 Growth Index at -34.28% but outperforming the Lipper Large-Cap Growth Funds Index at -36.45%.
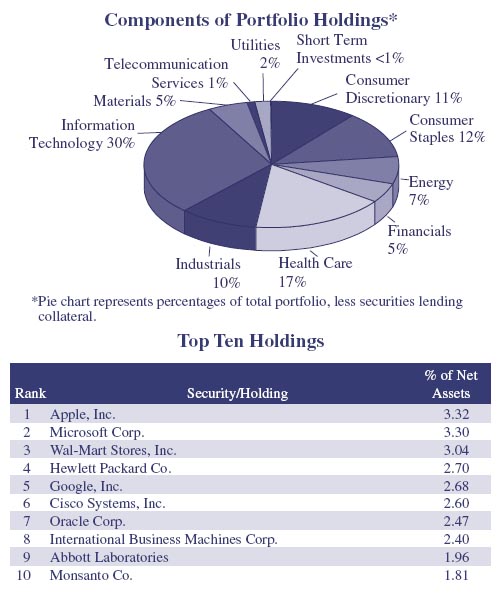
| ● | Overweight exposures to financials and healthcare detracted from returns while underweight exposures to consumer staples, industrials, utilities and energy were beneficial to performance. |
| ● | Qualcomm, Google and Apple were among the largest positions over the year that benefited performance while an average position size of 3% to Microsoft detracted from returns. |
| ● | Rainier Investment Management replaced TCW Investment Management Co. as a sub-advisor to the Fund in October 2008. |
| ● | The Fund experienced impairment of a securities lending collateral investment, which negatively impacted the Fund’s performance. |
AssetMark Large Cap Value Fund
MANAGER’S DISCUSSION OF FUND PERFORMANCE (Unaudited)
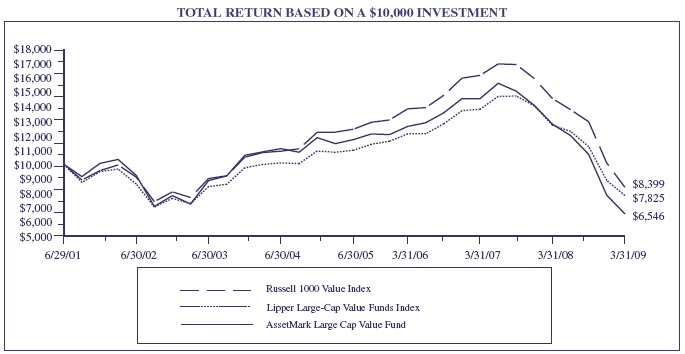
This chart assumes an initial gross investment of $10,000 made on June 29, 2001 (commencement of the Fund’s operations) Returns shown include the reinvestment of all dividends. Returns shown do not reflect the deduction of taxes that a shareholder would pay on fund distributions or the redemption of fund shares. In the absence of fee waivers and reimbursements, total return would be reduced. Past performance is not predictive of future performance. Investment return and principal value will fluctuate, so that your shares, when redeemed, may be worth more or less than the original cost. Index returns do not reflect the effects of fees or expenses (excluding Lipper). It is not possible to invest directly in an index.
RUSSELL 1000 VALUE INDEX – An unmanaged index which measures the performance of those Russell 1000 companies with lower price-to-book ratios and lower forecasted growth values. The Russell 1000 Index is an unmanaged index which measures the performance of the 1,000 largest companies in the Russell 3000 Index. The Russell 3000 Index is an unmanaged index which measures the performance of the 3,000 largest U.S. Companies, based on total market capitalization, which represents approximately 98% of the investable U.S. equity market.
LIPPER LARGE-CAP VALUE FUNDS INDEX – The Lipper Large-Cap Value Funds Index is the average of the 30 largest funds in the Lipper Large-Cap Value Funds Category. These funds, by portfolio practice, invest at least 75% of their equity assets in companies with market capitalizations (on a three-year weighted basis) greater than 300% of the dollar-weighted median market capitalization of the middle 1,000 securities of the S&P Super Composite 1500® Index. Large-cap value funds typically invest in securities that have a below-average price-to-earnings ratio, price-to-book ratio and three-year sales-per-share growth value, compared to the S&P 500® Index.
| AVERAGE ANNUAL TOTAL RETURN (for the period ended March 31) | | | | |
| | One Year | | Five Year | | Since Inception (6/29/01) |
| AssetMark Large Cap Value Fund | -48.85% | | -9.65% | | -5.32% |
| Russell 1000 Value Index | -42.42% | | -4.94% | | -2.22% |
| Lipper Large-Cap Value Funds Index | -38.54% | | -4.78% | | -3.12% |
AssetMark Large Cap Value Fund
MANAGER’S DISCUSSION OF FUND PERFORMANCE (Continued) (Unaudited)
For the 12 months ended March 31, 2009, the Fund returned -48.85%, trailing the Russell 1000 Value Index at -42.42% and the Lipper Large-Cap Value Funds Index at - -38.54%.
| ● | Over the period, security selection was the largest detractor to performance with positions in Valero Energy Corp, CBS, Dow Chemical, Prologis and American International Group being among the largest detractors. |
| ● | Consumer discretionary was an area of underperformance, not only due to its average overweight exposure relative to the Russell 1000 Value Index, but also due to security selection within the sector. |
| ● | Diamond Hill Capital Management replaced Brandes Investment Partners as a sub-advisor to the Fund in December 2008. |
| ● | The Fund experienced impairment of a securities lending collateral investment, which negatively impacted the Fund’s performance. |
AssetMark Small/Mid Cap Growth Fund
MANAGER’S DISCUSSION OF FUND PERFORMANCE (Unaudited)
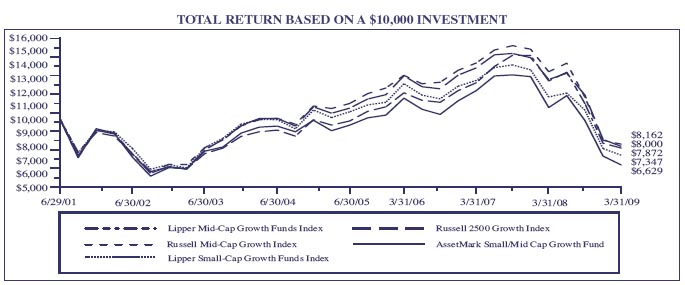
This chart assumes an initial gross investment of $10,000 made on June 29, 2001 (commencement of the Fund’s operations). Returns shown include the reinvestment of all dividends. Returns shown do not reflect the deduction of taxes that a shareholder would pay on fund distributions or the redemption of fund shares. In the absence of fee waivers and reimbursements, total return would be reduced. Past performance is not predictive of future performance. Investment return and principal value will fluctuate, so that your shares, when redeemed, may be worth more or less than the original cost. Index returns do not reflect the effects of fees or expenses (excluding Lipper). It is not possible to invest directly in an index.
RUSSELL 2500 GROWTH INDEX – An unmanaged index which measures the performance of those Russell 2500 Index companies with higher price-to-book ratios and higher forecasted growth values. The Russell 2500 Index measures the performance of the 2,500 smallest companies in the Russell 3000 Index. The Russell 3000 Index is an unmanaged index which measures the performance of the 3,000 largest U.S. companies based on total market capitalization, which represents approximately 98% of the investable U.S. equity market.
RUSSELL MID-CAP GROWTH INDEX – Measures the performance of those Russell Midcap companies with higher price-to-book ratios and higher forecasted growth values. The stocks are also members of the Russell 1000 Growth Index. The Russell 1000 Growth Index contains those securities in the Russell 1000 Index with a greater-than-average growth orientation.
LIPPER SMALL-CAP GROWTH FUNDS INDEX – The Lipper Small-Cap Growth Funds Index is the average of the 30 largest funds in the Lipper Small-Cap Growth Funds Category. These funds, by portfolio practice, invest 75% of their equity assets in companies with market capitalizations (on a three-year weighted basis) less than 250% of the dollar-weighted median market capitalization of the smallest 500 of the middle 1,000 securities of the S&P Super Composite 1500® Index. These funds typically invest in securities that have an above average price-to-earnings ratio, price-to-book ratio and three-year sales-per-share growth value, compared to the S&P SmallCap 600 IndexTM.
LIPPER MID-CAP GROWTH FUNDS INDEX – Funds that, by portfolio practice, invest at least 75% of their equity assets in companies with market capitalizations (on a three-year weighted basis) of less than 300% of the dollar-weighted median market capitalization of the S&P Mid-Cap 400 Index. Mid-Cap Growth funds normally invest in companies with long-term earnings expected to grow significantly faster than the earnings of the stocks represented in a major unmanaged stock index. These funds will normally invest in securities that have an above-average price-to-earnings ratio, price-to-book ratio and three-year earnings growth figure, compared to the U.S. diversified mid-cap funds universe average.
| AVERAGE ANNUAL TOTAL RETURN (for the period ended March 31) | | | | |
| | One Year | | Five Year | | Since Inception (6/29/01) |
| AssetMark Small/Mid Cap Growth Fund | –38.98% | | –6.77% | | –5.17% |
| Russell 2500 Growth Index | –38.14% | | –4.47% | | –2.84% |
| Russell Mid-Cap Growth Index | –39.58% | | –3.91% | | –2.59% |
| Lipper Small-Cap Growth Funds Index | –36.88% | | –5.94% | | –3.90% |
| Lipper Mid-Cap Growth Funds Index | –38.63% | | –2.80% | | –3.04% |
AssetMark Small/Mid Cap Growth Fund
MANAGER’S DISCUSSION OF FUND PERFORMANCE (Continued) (Unaudited)
For the 12 months ended March 31, 2009, the Fund returned -38.98%, trailing the Russell 2500 Growth Index at -38.14%, the Russell Mid-Cap Growth Index at -39.58%, the Lipper Mid-Cap Growth Funds Index at -38.63% and the Lipper Small-Cap Growth Funds Index at -36.88%.
| • | Energy and industrials were two sectors that provided significant outperformance due to stock selection. |
| • | While benefiting from exposure to momentum related stocks, the Fund’s performance was hurt from its exposure to stocks with higher price-to-earnings ratios than the Russell 2500 Growth Index. |
| • | The Fund experienced impairment of a securities lending collateral investment, which negatively impacted the Fund’s performance. |
AssetMark Small/Mid Cap Value Fund
MANAGER’S DISCUSSION OF FUND PERFORMANCE (Unaudited)
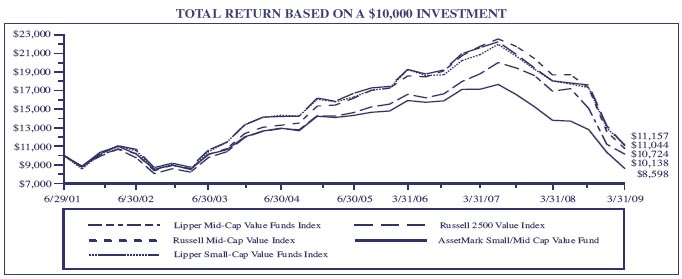
This chart assumes an initial gross investment of $10,000 made on June 29, 2001 (commencement of the Fund’s operations). Returns shown include the reinvestment of all dividends. Returns shown do not reflect the deduction of taxes that a shareholder would pay on fund distributions or the redemption of fund shares. In the absence of fee waivers and reimbursements, total return would be reduced. Past performance is not predictive of future performance. Investment return and principal value will fluctuate, so that your shares, when redeemed, may be worth more or less than the original cost. Index returns do not reflect the effects of fees or expenses (excluding Lipper). It is not possible to invest directly in an index.
RUSSELL 2500 VALUE INDEX – An unmanaged index which measures the performance of those Russell 2500 Index companies with lower price-to-book ratios and lower forecasted growth values. The Russell 2500 Index is an unmanaged index which measures the performance of the 2,500 smallest companies in the Russell 3000 Index. The Russell 3000 Index is an unmanaged index which measures the performance of the 3,000 largest U.S. companies based on total market capitalization, which represents approximately 98% of the investable U.S. equity market.
RUSSELL MID-CAP VALUE INDEX – Measures the performance of those Russell Midcap companies with lower price-to-book ratios and lower forecasted growth values. The stocks are also members of the Russell 1000 Value Index. The Russell 1000 Value Index contains those securities in the Russell 1000 Index with a less-than-average growth orientation.
LIPPER SMALL-CAP VALUE FUNDS INDEX – The Lipper Small-Cap Value Funds Index is the average of the 30 largest funds in the Lipper Small-Cap Value Funds Category. These funds, by portfolio practice, invest 75% of their equity assets in companies with market capitalizations (on a three-year weighted basis) less than 250% of the dollar-weighted median market capitalization of the smallest 500 of the middle 1,000 securities of the S&P Super Composite 1500® Index. These funds typically have a below average price-to-earnings ratio, price-to-book ratio and three-year sales-per-share growth value, compared to the S&P SmallCap 600 IndexTM.
LIPPER MID-CAP VALUE FUNDS INDEX – Funds that, by portfolio practice, invest at least 75% of their equity assets in companies with market capitalizations (on a three-year weighted basis) of less than 300% of the dollar-weighted median market capitalization of the S&P Mid-Cap 400 Index. Mid-Cap Value funds seek long-term growth of capital by investing in companies that are considered to be undervalued relative to a major unmanaged stock index based on price-to-current earnings, book value, asset value, or other factors. These funds will normally have a below-average price-to-earnings ratio, price-to-book ratio and three-year earnings growth figure, compared to the U.S. diversified mid-cap funds universe average.
| AVERAGE ANNUAL TOTAL RETURN (for the period ended March 31) | | | | |
| | One Year | | Five Year | | Since Inception (6/29/01) |
| AssetMark Small/Mid Cap Value Fund . . . . . . . . . . . . . . . . . . | -37.59% | | -7.39% | | -1.93% |
| Russell 2500 Value Index . . . . . . . . . . . . . . . . . . . . . . . . . . . . | -38.66% | | -4.79% | | 1.29% |
| Russell Mid-Cap Value Index . . . . . . . . . . . . . . . . . . . . . . . . . | -42.51% | | -3.81% | | 0.90% |
| Lipper Small-Cap Value Funds Index . . . . . . . . . . . . . . . . . . . | -38.07% | | -4.56% | | 1.42% |
| Lipper Mid-Cap Value Funds Index . . . . . . . . . . . . . . . . . . . . | -40.02% | | -4.25% | | 0.18% |
AssetMark Small/Mid Cap Value Fund
MANAGER’S DISCUSSION OF FUND PERFORMANCE (Continued) (Unaudited)
For the 12 months ended March 31, 2009, the Fund returned -37.59%, outperforming the Russell 2500 Value Index at -38.66%, the Russell Mid-Cap Value Index at -42.51%, the Lipper Mid-Cap Value Funds Index at -40.02% and the Lipper Small-Cap Value Funds Index -38.07%.
| • | Security selection was a large driver of the strong relative returns. Emphasis of stocks with higher price-to-book ratios and lower volatility relative to the Russell 2500 Value Index significantly contributed to returns. |
| • | Strong stock selection within the energy, consumer discretionary and utilities sectors was beneficial to the Fund, while stock selection within financials was detrimental to performance. |
| • | The Fund experienced impairment of a securities lending collateral investment, which negatively impacted the Fund’s performance. |
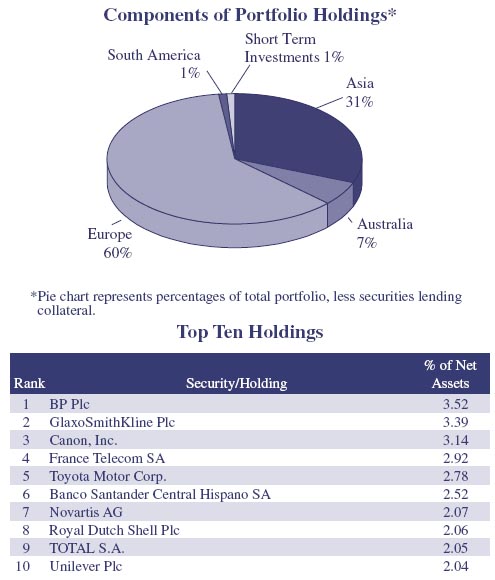
AssetMark International Equity Fund
MANAGER’S DISCUSSION OF FUND PERFORMANCE (Unaudited)
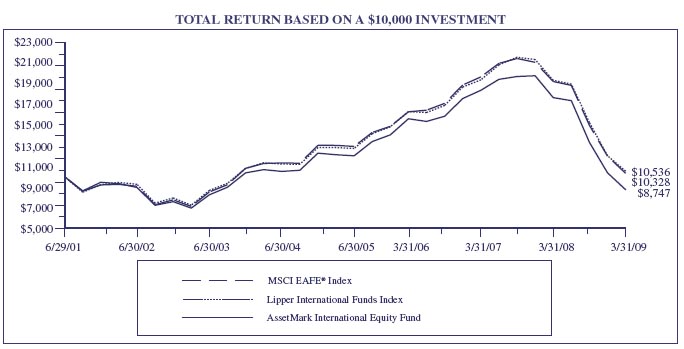
This chart assumes an initial gross investment of $10,000 made on June 29, 2001 (commencement of the Fund’s operations). Returns shown include the reinvestment of all dividends. Returns shown do not reflect the deduction of taxes that a shareholder would pay on fund distributions or the redemption of fund shares. In the absence of fee waivers and reimbursements, total return would be reduced. Past performance is not predictive of future performance. Investment return and principal value will fluctuate, so that your shares, when redeemed, may be worth more or less than the original cost. Index returns do not reflect the effects of fees or expenses (excluding Lipper). It is not possible to invest directly in an index.
MSCI EAFE® INDEX – The MSCI Europe, Australia and Far East Index (MSCI EAFE®) is a free float-adjusted market capitalization index that is designed to measure the equity market performance of developed countries, excluding the US & Canada.
LIPPER INTERNATIONAL FUNDS INDEX – An unmanaged index which measures the composite performance of the 30 largest “international” mutual funds, as categorized by Lipper Inc. These funds invest assets in securities with primary trading markets outside of the United States.
| AVERAGE ANNUAL TOTAL RETURN (for the period ended March 31) | | | | |
| | One Year | | Five Year | | Since Inception (6/29/01) |
| AssetMark International Equity Fund | -50.42% | | -3.92% | | -1.71% |
MSCI EAFE® Index | -46.20% | | -1.75% | | 0.42% |
| Lipper International Funds Index | -45.45% | | -1.47% | | 0.68% |
AssetMark International Equity Fund
MANAGER’S DISCUSSION OF FUND PERFORMANCE (Continued) (Unaudited)
For the 12 months ended March 31, 2009, the Fund returned -50.42%, trailing the MSCI EAFE Index at -46.20% and the Lipper International Funds Index at - -45.45%.
| • | The biggest driver of the lagging returns was security selection with a bias towards larger cap companies which significantly detracted from returns. Saipem, Roche, Ppr, LaFarge and Novo-Nordisk were among the largest detractors from returns for the 12 month period. |
| • | Underweight exposure to UK, and overweight exposures to Greece and Russia detracted from returns over the period, as did an overweight exposure to the UK Pound and an underweight exposure to the Japanese Yen. |
| • | Martin Currie and Mondrian Investment Partners replaced Clay Finlay and Oppenheimer Capital as sub-advisors to the Fund in December 2008. |
| • | The Fund experienced impairment of a securities lending collateral investment, which negatively impacted the Fund’s performance. |
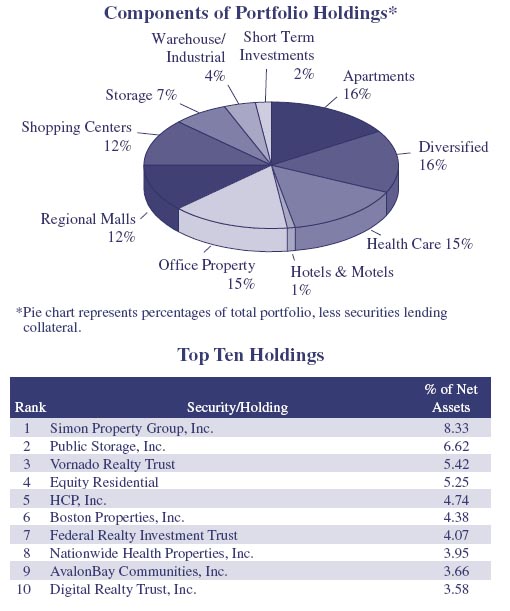
AssetMark Real Estate Securities Fund
MANAGER’S DISCUSSION OF FUND PERFORMANCE (Unaudited)
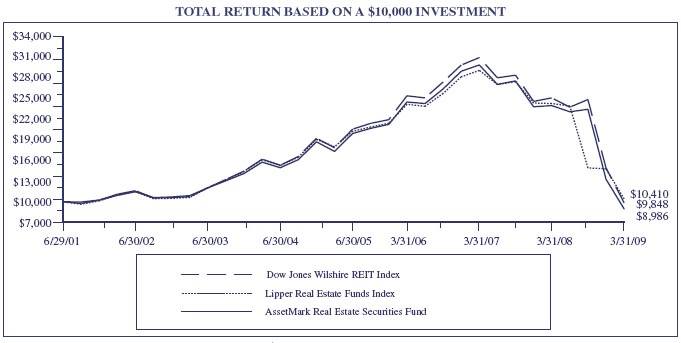
This chart assumes an initial gross investment of $10,000 made on June 29, 2001 (commencement of the Fund’s operations). Returns shown include the reinvestment of all dividends. Returns shown do not reflect the deduction of taxes that a shareholder would pay on fund distributions or the redemption of fund shares. In the absence of fee waivers and reimbursements, total return would be reduced. Past performance is not predictive of future performance. Investment return and principal value will fluctuate, so that your shares, when redeemed, may be worth more or less than the original cost. Index returns do not reflect the effects of fees or expenses (excluding Lipper). It is not possible to invest directly in an index.
DOW JONES WILSHIRE REIT INDEX – The Dow Jones U.S. Select REIT Index measures U.S. publicly traded Real Estate Investment Trusts. The Index is comprised of companies whose charters are the equity ownership and operation of commercial real estate and that derive a minimum of 75% of revenue from stated operations. The Index is composed of 93 common stocks, selected for their market capitalization, source of revenue, and liquidity.
LIPPER REAL ESTATE FUNDS INDEX – An unmanaged index which measures the composite performance of the 30 largest “real estate” mutual funds, as categorized by Lipper Inc. The index is adjusted for the reinvestment of capital gains and income dividends.
| AVERAGE ANNUAL TOTAL RETURN (for the period ended March 31) | | | | |
| | One Year | | Five Year | | Since Inception (6/29/01) |
| AssetMark Real Estate Securities Fund | -62.46% | | -10.60% | | -1.37% |
| Dow Jones Wilshire REIT Index | -60.66% | | -9.44% | | -0.19% |
| Lipper Real Estate Funds Index | -57.05% | | -8.33% | | 0.52% |
AssetMark Real Estate Securities Fund
MANAGER’S DISCUSSION OF FUND PERFORMANCE (Continued) (Unaudited)
For the 12 months ended March 31, 2009, the Fund returned -62.46%, trailing the Dow Jones U.S. Select REIT Index at -60.67% and the Lipper Real Estate Funds Index at -57.05%.
| • | Exposure to General Growth Properties, Prologis and Macerich were the largest detractors to performance over the period. |
| • | Lower exposure to the health care and storage sectors and higher exposure to retail was detrimental to performance. |
| • | The Fund experienced impairment of a securities lending collateral investment, which negatively impacted the Fund’s performance. |
AssetMark Tax-Exempt Fixed Income Fund
MANAGER’S DISCUSSION OF FUND PERFORMANCE (Unaudited)
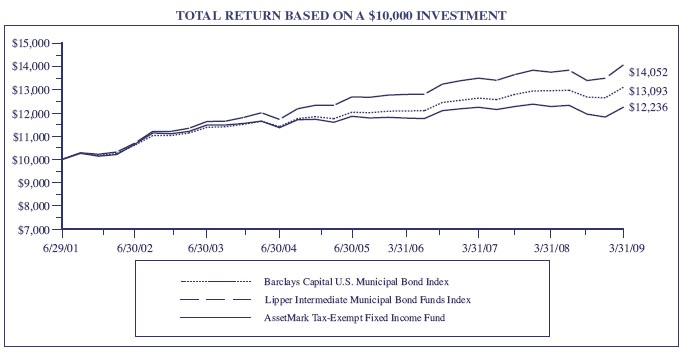
This chart assumes an initial gross investment of $10,000 made on June 29, 2001 (commencement of the Fund’s operations). Returns shown include the reinvestment of all dividends. Returns shown do not reflect the deduction of taxes that a shareholder would pay on fund distributions or the redemption of fund shares. In the absence of fee waivers and reimbursements, total return would be reduced. Past performance is not predictive of future performance. Investment return and principal value will fluctuate, so that your shares, when redeemed, may be worth more or less than the original cost. Index returns do not reflect the effects of fees or expenses (excluding Lipper). It is not possible to invest directly in an index.
BARCLAYS CAPITAL U.S. MUNICIPAL BOND INDEX – The Barclays Capital U.S. Municipal Bond Index is a market-value-weighted index for the long-term tax-exempt bond market. To be included in the index, bonds must have a minimum credit rating of Baa. They must have an outstanding par value of at least $7 million and be issued as part of a transaction of at least $75 million. The bonds must be fixed rate, have a date after December 31, 1990, and must be at least one year from their maturity date.
LIPPER INTERMEDIATE MUNICIPAL BOND FUNDS INDEX – The Lipper Intermediate Municipal Bond Fund Index is an index of portfolios that invest in municipal debt issues with dollar-weighted average maturities of five to ten years.
| AVERAGE ANNUAL TOTAL RETURN (for the period ended March 31) | | | | |
| | One Year | | Five Year | | Since Inception (6/29/01) |
| AssetMark Tax-Exempt Fixed Income Fund | -0.25% | | 1.01% | | 2.64% |
| Barclays Capital U.S. Municipal Bond Index | 2.27% | | 3.21% | | 4.48% |
| Lipper Intermediate Municipal Bond Funds Index | 1.12% | | 2.39% | | 3.54% |
AssetMark Tax-Exempt Fixed Income Fund
MANAGER’S DISCUSSION OF FUND PERFORMANCE (Continued) (Unaudited)
For the 12 months ended March 31, 2009, the Fund returned -0.25%, trailing the Barclays Capital U.S. Municipal Bond Index at 2.27% and the Lipper Intermediate Municipal Bond Funds Index at 1.12%.
| • | A combination of exposure to some lower quality credits and exposure to insured bonds detracted from returns over the period. |
| • | The flight to quality in the fixed income markets hurt performance as the Fund had lower exposure to the highest quality bonds and pre-refunded bonds. |
| • | Additionally, the shorter duration and average maturity of the Fund relative to the broad Barclays Capital U.S. Municipal Bond Index detracted from performance versus the Index. |
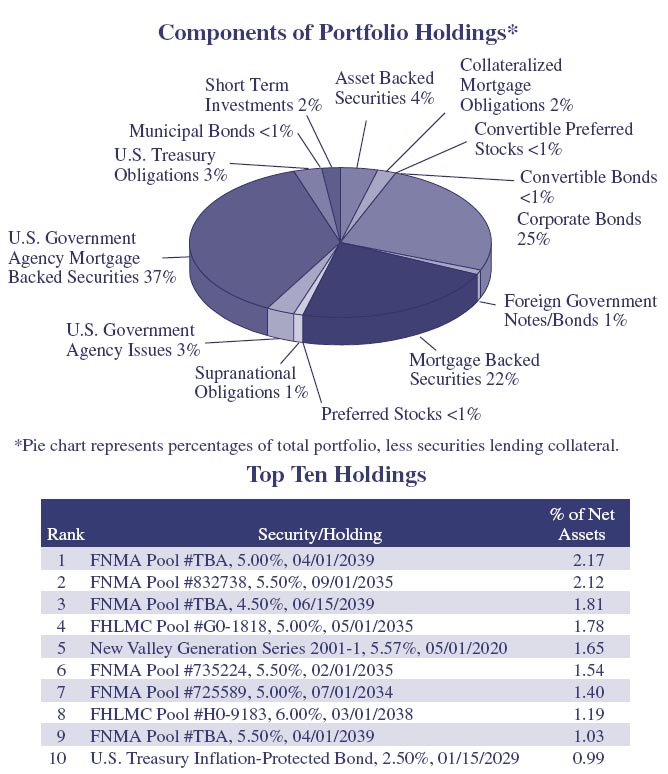
AssetMark Core Plus Fixed Income Fund
MANAGER’S DISCUSSION OF FUND PERFORMANCE (Unaudited)

This chart assumes an initial gross investment of $10,000 made on June 29, 2001 (commencement of the Fund’s operations). Returns shown include the reinvestment of all dividends. Returns shown do not reflect the deduction of taxes that a shareholder would pay on fund distributions or the redemption of fund shares. In the absence of fee waivers and reimbursements, total return would be reduced. Past performance is not predictive of future performance. Investment return and principal value will fluctuate, so that your shares, when redeemed, may be worth more or less than the original cost. Index returns do not reflect the effects of fees or expenses (excluding Lipper). It is not possible to invest directly in an index.
BARCLAYS CAPITAL U.S. AGGREGATE BOND INDEX – An unmanaged index which measures the performance of securities from the Barclays Capital Government/Corporate Bond Index, Mortgage-Backed Securities Index and the Asset-Backed Securities Index. The Barclays Capital U.S. Aggregate Bond Index is a broad representation of the investment-grade fixed-income market in the U.S. and includes U.S. Government and corporate debt securities, mortgage- and asset-backed securities and international U.S. dollar-denominated bonds. All securities contained in the Barclays Capital U.S. Aggregate Bond Index have a minimum term to maturity of one year.
LIPPER INTERMEDIATE INVESTMENT-GRADE DEBT FUNDS INDEX – The Lipper Intermediate Investment-Grade Debt Funds Index is an index of portfolios that invest at least 65% of their assets in investment-grade debt issues (rated in the top four grades) with dollar-weighted average maturities of five to ten years.
| AVERAGE ANNUAL TOTAL RETURN (for the period ended March 31) | | | | |
| | One Year | | Five Year | | Since Inception (6/29/01) |
| AssetMark Core Plus Fixed Income Fund | -7.57% | | 1.00% | | 3.07% |
| Barclays Capital U.S. Aggregate Bond Index | 3.13% | | 4.13% | | 5.46% |
| Lipper Intermediate Investment-Grade Debt Funds Index | -4.25% | | 1.90% | | 3.88% |
AssetMark Core Plus Fixed Income Fund
MANAGER’S DISCUSSION OF FUND PERFORMANCE (Continued) (Unaudited)
For the 12 months ended March 31, 2009, the Fund returned -7.57%, trailing the Barclays Capital U.S. Aggregate Bond Index at 3.13% and the Lipper Intermediate Investment-Grade Debt Funds Index at -4.25%.
| • | An emphasis of spread sectors within the portfolio and significantly lower exposure to Treasuries was detrimental to performance over the period. |
| • | The largest detractor to performance was exposure to non-agency mortgage-backed securities. |
| • | The Fund also had a larger exposure to corporate bonds, with an emphasis on the financials sector which caused a drag on returns. |
| • | The Fund experienced impairment of a securities lending collateral investment, which negatively impacted the Fund’s performance. |
AssetMark Enhanced Fundamental IndexTM Large Company Growth Fund
MANAGER’S DISCUSSION OF FUND PERFORMANCE (Unaudited)
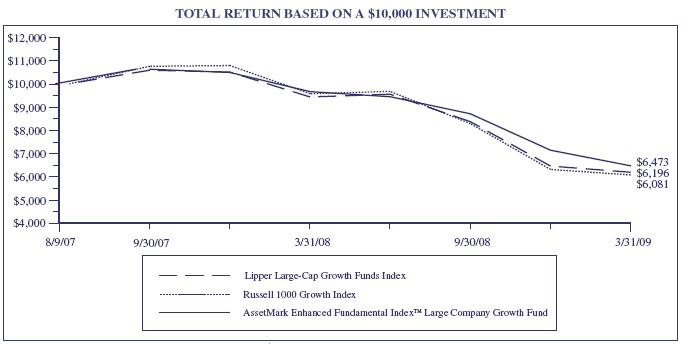
This chart assumes an initial gross investment of $10,000 made on August 9, 2007 (commencement of the Fund’s operations). Returns shown include the reinvestment of all dividends. Returns shown do not reflect the deduction of taxes that a shareholder would pay on fund distributions or the redemption of fund shares. In the absence of fee waivers and reimbursements, total return would be reduced. Past performance is not predictive of future performance. Investment return and principal value will fluctuate, so that your shares, when redeemed, may be worth more or less than the original cost. Index returns do not reflect the effects of fees or expenses (excluding Lipper). It is not possible to invest directly in an index.
RUSSELL 1000 GROWTH INDEX – An unmanaged index which measures the performance of those Russell 1000 companies with higher price-to-book ratios and higher forecasted growth values. The Russell 1000 Index is an unmanaged index which measures the performance of the 1,000 largest companies in the Russell 3000 Index. The Russell 3000 Index is an unmanaged index which measures the performance of the 3,000 largest U.S. Companies, based on total market capitalization, which represents approximately 98% of the investable U.S. equity market.
LIPPER LARGE-CAP GROWTH FUNDS INDEX – The Lipper Large-Cap Growth Funds Index is the average of the 30 largest funds in the Lipper Large-Cap Growth Funds Category. These funds, by portfolio practice, invest at least 75% of their equity assets in companies with market capitalizations (on a three-year weighted basis) greater than 300% of the dollar-weighted median market capitalization of the middle 1,000 securities of the Standard & Poor’s (“S&P”) Super Composite 1500® Index. These funds typically invest in securities that have an above average price-to-earnings ratio, price-to-book ratio and three-year sales-per-share growth value, compared to the Standard & Poor’s 500 Composite Index (“S&P 500® Index”).
| AVERAGE ANNUAL TOTAL RETURN (for the period ended March 31) | | | |
| | | | Since Inception |
| | One Year | | (8/9/07) |
AssetMark Enhanced Fundamental IndexTM Large Company Growth Fund | -32.99% | | -23.25% |
| Russell 1000 Growth Index | -34.28% | | -25.26% |
| Lipper Large-Cap Growth Funds Index | -36.45% | | -26.13% |
AssetMark Enhanced Fundamental IndexTM Large Company Growth Fund
MANAGER’S DISCUSSION OF FUND PERFORMANCE (Continued) (Unaudited)
For the 12 months ended March 31, 2009, the Fund returned -32.99%, outperforming the Russell 1000 Growth Index at -34.28% and the Lipper Large-Cap Growth Funds Index at -36.45%.
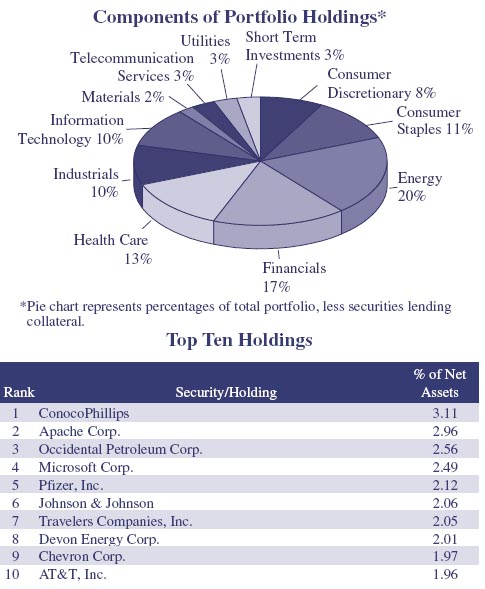
| • | Security positioning was the biggest driver of returns, with the largest two contributors to performance being Exxon Mobil (at an average position size of 8%) and Chevron (at an average position size of 2%). |
| • | Exposure to securities with lower volatility than the Russell 1000 Growth Index was a significant contributor to performance. |
| • | Overweight exposures to financials, industrials and energy detracted from performance. |
AssetMark Enhanced Fundamental IndexTM Large Company Value Fund
MANAGER’S DISCUSSION OF FUND PERFORMANCE Unaudited)
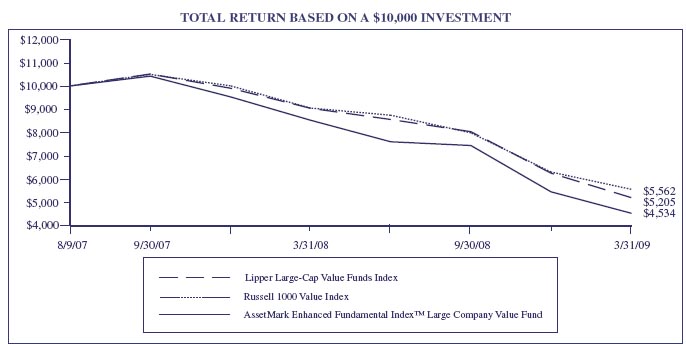
This chart assumes an initial gross investment of $10,000 made on August 9, 2007 (commencement of the Fund’s operations). Returns shown include the reinvestment of all dividends. Returns shown do not reflect the deduction of taxes that a shareholder would pay on fund distributions or the redemption of fund shares. In the absence of fee waivers and reimbursements, total return would be reduced. Past performance is not predictive of future performance. Investment return and principal value will fluctuate, so that your shares, when redeemed, may be worth more or less than the original cost. Index returns do not reflect the effects of fees or expenses (excluding Lipper). It is not possible to invest directly in an index.
RUSSELL 1000 VALUE INDEX – An unmanaged index which measures the performance of those Russell 1000 companies with lower price-to-book ratios and lower forecasted growth values. The Russell 1000 Index is an unmanaged index which measures the performance of the 1,000 largest companies in the Russell 3000 Index. The Russell 3000 Index is an unmanaged index which measures the performance of the 3,000 largest U.S. Companies, based on total market capitalization, which represents approximately 98% of the investable U.S. equity market.
LIPPER LARGE-CAP VALUE FUNDS INDEX – The Lipper Large-Cap Value Funds Index is the average of the 30 largest funds in the Lipper Large-Cap Value Funds Category. These funds, by portfolio practice, invest at least 75% of their equity assets in companies with market capitalizations (on a three-year weighted basis) greater than 300% of the dollar-weighted median market capitalization of the middle 1,000 securities of the S&P Super Composite 1500® Index. Large-cap value funds typically invest in securities that have a below-average price-to-earnings ratio, price-to-book ratio and three-year sales-per-share growth value, compared to the S&P 500® Index.
| AVERAGE ANNUAL TOTAL RETURN (for the period ended March 31) | | | |
| | | | Since Inception |
| | One Year | | (8/9/07) |
AssetMark Enhanced Fundamental IndexTM Large Company Value Fund | -46.83% | | -38.19% |
| Russell 1000 Value Index | -42.42% | | -32.78% |
| Lipper Large-Cap Value Funds Index | -38.54% | | -30.04% |
AssetMark Enhanced Fundamental IndexTM Large Company Value Fund
MANAGER’S DISCUSSION OF FUND PERFORMANCE (Continued) (Unaudited)
For the 12 months ended March 31, 2009, the Fund returned -46.83%, trailing the Russell 1000 Value Index at -42.42% and the Lipper Large-Cap Value Funds Index at - -38.54%.
| • | Exposure to securities with lower price-to-book ratios and that experienced greater volatility relative to the Russell 1000 Value Index was a significant detractor to returns for the period. |
| • | Overweight exposures in financials and consumer discretionary detracted from performance. |
| • | The five biggest detractors to performance were all within the financials sector and were American International Group, Wachovia, Washington Mutual, Fannie Mae and Freddie Mac. |
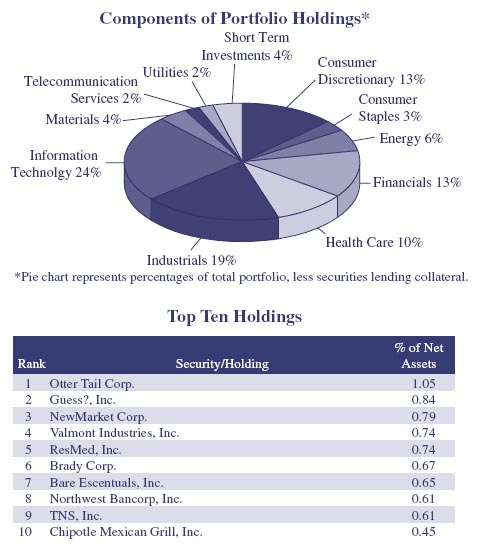
AssetMark Enhanced Fundamental IndexTM Small Company Growth Fund
MANAGER’S DISCUSSION OF FUND PERFORMANCE (Unaudited)

This chart assumes an initial gross investment of $10,000 made on August 9, 2007 (commencement of the Fund’s operations). Returns shown include the reinvestment of all dividends. Returns shown do not reflect the deduction of taxes that a shareholder would pay on fund distributions or the redemption of fund shares. In the absence of fee waivers and reimbursements, total return would be reduced. Past performance is not predictive of future performance. Investment return and principal value will fluctuate, so that your shares, when redeemed, may be worth more or less than the original cost. Index returns do not reflect the effects of fees or expenses (excluding Lipper). It is not possible to invest directly in an index.
RUSSELL 2000 GROWTH INDEX – An unmanaged index which measures the performance of those Russell 2000 Index companies with higher price-to-book ratios and higher forecasted growth values. The Russell 2000 Index measures the performance of the 2,000 smallest companies in the Russell 3000 Index. The Russell 3000 Index is an unmanaged index which measures the performance of the 3,000 largest U.S. companies based on total market capitalization, which represents approximately 98% of the investable U.S. equity market.
LIPPER SMALL-CAP GROWTH FUNDS INDEX – The Lipper Small-Cap Growth Funds Index is the average of the 30 largest funds in the Lipper Small-Cap Growth Funds Category. These funds, by portfolio practice, invest 75% of their equity assets in companies with market capitalizations (on a three-year weighted basis) less than 250% of the dollar-weighted median market capitalization of the smallest 500 of the middle 1,000 securities of the S&P Super Composite 1500® Index. These funds typically invest in securities that have an above average price-to-earnings ratio, price-to-book ratio and three-year sales-per-share growth value, compared to the S&P SmallCap 600 IndexTM.
| AVERAGE ANNUAL TOTAL RETURN (for the period ended March 31) | | | |
| | | | Since Inception |
| | One Year | | (8/9/07) |
AssetMark Enhanced Fundamental IndexTM Small Company Growth Fund | -36.04% | | -27.96% |
| Russell 2000 Growth Index | -36.36% | | -29.84% |
| Lipper Small-Cap Growth Funds Index | -36.88% | | -31.18% |
AssetMark Enhanced Fundamental IndexTM Small Company Growth Fund
MANAGER’S DISCUSSION OF FUND PERFORMANCE (Continued) (Unaudited)
For the 12 months ended March 31, 2009, the Fund returned -36.04%, outperforming the Russell 2000 Growth Index at -36.36% and the Lipper Small-Cap Growth Funds Index at -36.88%.
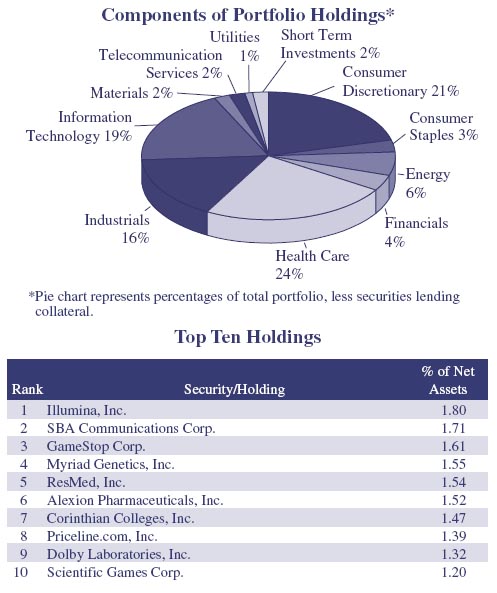
| • | Security positioning was the biggest driver of returns with the largest two contributors to performance being associated with education services, Corinthian Colleges and ITT Educational Services. |
| • | Exposure to securities with lower volatility and lower P/E ratios relative to the Russell 2000 Growth Index was a significant contributor to performance. |
AssetMark Enhanced Fundamental IndexTM Small Company Value Fund
MANAGER’S DISCUSSION OF FUND PERFORMANCE (Unaudited)
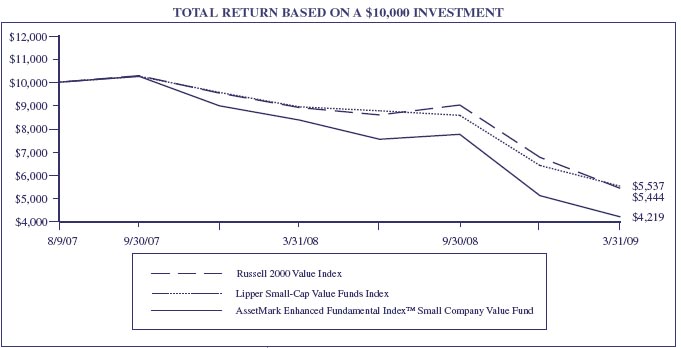
This chart assumes an initial gross investment of $10,000 made on August 9, 2007 (commencement of the Fund’s operations). Returns shown include the reinvestment of all dividends. Returns shown do not reflect the deduction of taxes that a shareholder would pay on fund distributions or the redemption of fund shares. In the absence of fee waivers and reimbursements, total return would be reduced. Past performance is not predictive of future performance. Investment return and principal value will fluctuate, so that your shares, when redeemed, may be worth more or less than the original cost. Index returns do not reflect the effects of fees or expenses (excluding Lipper). It is not possible to invest directly in an index.
RUSSELL 2000 VALUE INDEX – An unmanaged index which measures the performance of those Russell 2000 Index companies with lower price-to-book ratios and lower forecasted growth values. The Russell 2000 Index is an unmanaged index which measures the performance of the 2,000 smallest companies in the Russell 3000 Index. The Russell 3000 Index is an unmanaged index which measures the performance of the 3,000 largest U.S. companies based on total market capitalization, which represents approximately 98% of the investable U.S. equity market.
LIPPER SMALL-CAP VALUE FUNDS INDEX – The Lipper Small-Cap Value Funds Index is the average of the 30 largest funds in the Lipper Small-Cap Value Funds Category. These funds, by portfolio practice, invest 75% of equity assets in companies with market capitalizations (on a three-year weighted basis) less than 250% of the dollar-weighted median market capitalization of the smallest 500 of the middle 1,000 securities of the S&P Super Composite 1500® Index. These funds typically invest in securities that have a below average price-to-earnings ratio, price-to-book ratio and three-year sales-per-share growth value, compared to the S&P SmallCap 600 IndexTM.
| AVERAGE ANNUAL TOTAL RETURN (for the period ended March 31) | | | |
| | | | Since Inception |
| | One Year | | (8/9/07) |
AssetMark Enhanced Fundamental IndexTM Small Company Value Fund | -49.62% | | -40.85% |
| Russell 2000 Value Index | -38.89% | | -30.91% |
| Lipper Small-Cap Value Funds Index | -38.07% | | -30.23% |
AssetMark Enhanced Fundamental IndexTM Small Company Value Fund
MANAGER’S DISCUSSION OF FUND PERFORMANCE (Continued) (Unaudited)
For the 12 months ended March 31, 2009, the Fund returned -49.62%, trailing the Russell 2000 Value Index at -38.89% and the Lipper Small-Cap Value Funds Index - -38.07%.
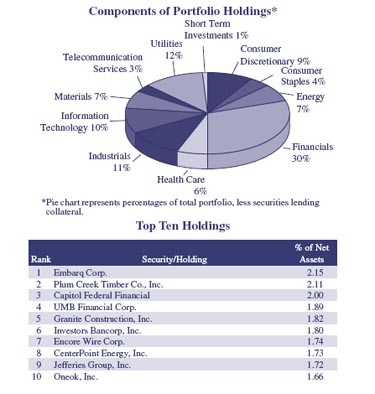
| • | Overweight exposure to securities with lower price-to-book ratios and higher volatility relative to the Russell 2000 Value Index were significant detractors to performance. |
| • | Financials, industrials and information technology were the sectors where security positioning was weak. |
| • | An overweight exposure to consumer discretionary was a large detractor to performance. |
| AssetMark Funds |
| EXPENSE EXAMPLE (Unaudited) |
| March 31, 2009 |
As a shareholder of the AssetMark Funds (the “Funds”), you incur ongoing costs, including management fees; distribution and/or service fees; and other Fund expenses. The Expense Example shown in this section is intended to help you understand your ongoing costs (in dollars) of investing in the Funds and to compare these costs with the ongoing costs of investing in other mutual funds.
The Expense Example is based on an investment of $1,000 invested at the beginning of a six-month period and held for the entire period (October 1, 2008 – March 31, 2009) for the AssetMark Large Cap Growth Fund, AssetMark Large Cap Value Fund, AssetMark Small/Mid Cap Growth Fund, AssetMark Small/Mid Cap Value Fund, AssetMark International Equity Fund, AssetMark Real Estate Securities Fund, AssetMark Tax-Exempt Fixed Income Fund, AssetMark Core Plus Fixed Income Fund, AssetMark Enhanced Fundamental Index™ Large Company Growth Fund, AssetMark Enhanced Fundamental Index™ Large Company Value Fund, AssetMark Enhanced Fundamental Index™ Small Company Growth Fund and AssetMark Enhanced Fundamental Index™ Small Company Value Fund.
Actual Expenses
The first line of the Expense Example table provides information about actual account values and actual expenses. You may use the information in this line, together with the amount you invested, to estimate the expenses that you paid over the period. Simply divide your account value by $1,000 (for example, an $8,600 account value divided by $1,000 = 8.6), then multiply the result by the number in the first line under the heading entitled “Expenses Paid During Period” to estimate the expenses you paid on your account during this period.
The example includes, but is not limited to, management fees, shareholder servicing fees, distribution fees, fund accounting, custody and transfer agent fees. However, the example below does not include portfolio trading commissions and related expenses, interest expense or dividends on short positions taken by the Funds and other extraordinary expenses as determined under generally accepted accounting principles. To the extent that a Fund invests in shares of other investment companies as part of its investment strategy, you will indirectly bear your proportionate share of any fees and expenses charged by the underlying funds in which a Fund invests in addition to the expenses of the Fund. Actual expenses of the underlying funds are expected to vary among the various underlying funds. These expenses are not included in the example below.
Hypothetical Example for Comparison Purposes
The second line of the table below provides information about hypothetical account values and hypothetical expenses based on the Funds’ actual expense ratios and an assumed rate of return of 5% per year before expenses, which is not the Funds’ actual return. The hypothetical account values and expenses may not be used to estimate the actual ending account balance or expenses you paid for the period. You may use this information to compare the ongoing costs of investing in the Funds and other funds. To do so, compare this 5% hypothetical example with the 5% hypothetical examples that appear in the shareholder reports of the other funds.
AssetMark Funds
EXPENSE EXAMPLE (Continued) (Unaudited)
March 31, 2009
| | | | | Annualized | |
| | | Beginning | Ending | Expense Ratio1 | |
| | | Account | Account | based on | Expenses Paid |
| | | Value | Value | the period | During Period2 |
| | | October 1, | March 31, | October 1, 2008 - | October 1, 2008 - |
| | | 2008 | 2009 | March 31, 2009 | March 31, 2009 |
| AssetMark Large Cap | Actual | $1,000.00 | $ 725.20 | | 1.52% | $6.54 |
| Growth Fund | Hypothetical3 | $1,000.00 | $ 1,017.35 | | 1.52% | $7.64 |
| | | | | | | |
| AssetMark Large Cap | Actual | $1,000.00 | $ 612.10 | | 1.46% | $5.87 |
| Value Fund | Hypothetical3 | $1,000.00 | $ 1,017.65 | | 1.46% | $7.34 |
| | | | | | | |
| AssetMark Small/Mid Cap | Actual | $1,000.00 | $ 669.20 | | 1.69% | $7.03 |
| Growth Fund | Hypothetical3 | $1,000.00 | $ 1,016.50 | | 1.69% | $8.50 |
| | | | | | | |
| AssetMark Small/Mid Cap | Actual | $1,000.00 | $ 672.90 | | 1.76% | $7.34 |
| Value Fund | Hypothetical3 | $1,000.00 | $ 1,016.16 | | 1.76% | $8.85 |
| | | | | | | |
| AssetMark International | Actual | $1,000.00 | $ 656.60 | | 1.73% | $7.15 |
| Equity Fund | Hypothetical3 | $1,000.00 | $ 1,016.31 | | 1.73% | $8.70 |
| | | | | | | |
| AssetMark Real Estate | Actual | $1,000.00 | $ 384.00 | | 1.80% | $6.21 |
| Securities Fund | Hypothetical3 | $1,000.00 | $ 1,015.96 | | 1.80% | $9.05 |
| | | | | | | |
| Assetmark Tax-Exempt | Actual | $1,000.00 | $ 1,024.80 | | 1.35% | $6.81 |
| Fixed Income Fund | Hypothetical3 | $1,000.00 | $ 1,018.20 | | 1.35% | $6.79 |
| | | | | | | |
| AssetMark Core Plus | Actual | $1,000.00 | $ 972.00 | | 1.34% | $6.59 |
| Fixed Income Fund | Hypothetical3 | $1,000.00 | $ 1,018.25 | | 1.34% | $6.74 |
| | | | | | | |
| AssetMark Enhanced Fundamental | Actual | $1,000.00 | $ 743.50 | | 1.31% | $5.69 |
IndexTM Large Company Growth Fund | Hypothetical3 | $1,000.00 | $ 1,018.40 | | 1.31% | $6.59 |
| | | | | | | |
| AssetMark Enhanced Fundamental | Actual | $1,000.00 | $ 609.20 | | 1.70% | $6.82 |
IndexTM Large Company Value Fund | Hypothetical3 | $1,000.00 | $ 1,016.45 | | 1.70% | $8.55 |
| | | | | | | |
| AssetMark Enhanced Fundamental | Actual | $1,000.00 | $ 676.00 | | 1.53% | $6.39 |
IndexTM Small Company Growth Fund | Hypothetical3 | $1,000.00 | $ 1,017.30 | | 1.53% | $7.70 |
| | | | | | | |
| AssetMark Enhanced Fundamental | Actual | $1,000.00 | $ 543.60 | | 1.65% | $6.35 |
IndexTM Small Company Value Fund | Hypothetical3 | $1,000.00 | $ 1,016.70 | | 1.65% | $8.30 |
1 The expense ratio excludes the securities lending credit. | | | | | |
2 Expenses are equal to the Fund’s annualized expense ratio, multiplied by the average account value over the period, multiplied by 182/365 to relfect the one-half year period. |
3 5% return before expenses. | | | | | | |
AssetMark Large Cap Growth Fund
SCHEDULE OF INVESTMENTS
| Number of | | | | | |
| Shares | | | | Value | |
| | | COMMON STOCKS - 103.18% | | | |
| | | Aerospace & Defense - 3.94% | | | |
| | 4,300 | | Boeing Co. | | $ | 152,994 | |
| | 58,700 | | Honeywell International, Inc. (b) | | | 1,635,382 | |
| | 24,400 | | Lockheed Martin Corp. | | | 1,684,332 | |
| | 45,300 | | Precision Castparts Corp. | | | 2,713,470 | |
| | 20,700 | | Raytheon Co. | | | 806,058 | |
| | 23,900 | | United Technologies Corp. | | | 1,027,222 | |
| | | | | | | 8,019,458 | |
| | | | Air Freight & Logistics - 1.24% | | | | |
| | 24,950 | | Expeditors International | | | | |
| | | | Washington, Inc. (b) | | | 705,835 | |
| | 16,250 | | FedEx Corp. (b) | | | 722,963 | |
| | 22,200 | | United Parcel Service, Inc. | | | 1,092,684 | |
| | | | | | | 2,521,482 | |
| | | | Beverages - 2.45% | | | | |
| | 29,100 | | The Coca-Cola Company | | | 1,278,945 | |
| | 19,200 | | Molson Coors Brewing Co. (b) | | | 658,176 | |
| | 40,600 | | Pepsi Bottling Group, Inc. | | | 898,884 | |
| | 41,900 | | PepsiCo, Inc. | | | 2,157,012 | |
| | | | | | | 4,993,017 | |
| | | | Biotechnology - 2.94% | | | | |
| | 36,500 | | Amgen, Inc. (a)(b) | | | 1,807,480 | |
| | 22,850 | | Celgene Corp. (a) | | | 1,014,540 | |
| | 7,270 | | Cephalon, Inc. (a)(b) | | | 495,087 | |
| | 57,350 | | Gilead Sciences, Inc. (a) | | | 2,656,452 | |
| | | | | | | 5,973,559 | |
| | | | Capital Markets - 3.91% | | | | |
| | 38,100 | | Ameriprise Financial, Inc. | | | 780,669 | |
| | 27,073 | | The Bank of New York | | | | |
| | | | Mellon Corp. | | | 764,812 | |
| | 5,300 | | BlackRock, Inc. | | | 689,212 | |
| | 114,650 | | The Charles Schwab Corp. | | | 1,777,075 | |
| | 4,900 | | Goldman Sachs Group, Inc. | | | 519,498 | |
| | 58,200 | | Invesco Ltd. | | | 806,652 | |
| | 55,100 | | Morgan Stanley | | | 1,254,627 | |
| | 6,600 | | Northern Trust Corp. | | | 394,812 | |
| | 28,700 | | SEI Investments Co. | | | 350,427 | |
| | 21,400 | | T. Rowe Price Group, Inc. (b) | | | 617,604 | |
| | | | | | | 7,955,388 | |
| Number of | | | | | |
| Shares | | | | Value | |
| | | Chemicals - 4.04% | | | |
| | 20,100 | | Air Products & Chemicals, Inc. | | $ | 1,130,625 | |
| | 21,100 | | FMC Corp. | | | 910,254 | |
| | 44,400 | | Monsanto Co. | | | 3,689,640 | |
| | 31,700 | | Mosaic Co. (b) | | | 1,330,766 | |
| | 17,250 | | Praxair, Inc. (b) | | | 1,160,752 | |
| | | | | | | 8,222,037 | |
| | | | Commercial Banks - 0.26% | | | | |
| | 37,400 | | Wells Fargo & Co. (b) | | | 532,576 | |
| | | | Commercial Services & Supplies - 1.60% | |
| | 12,900 | | Apollo Group, Inc. (a)(b) | | | 1,010,457 | |
| | 11,400 | | ITT Educational Services, Inc. (a) | | | 1,384,188 | |
| | 27,100 | | Manpower, Inc. | | | 854,463 | |
| | | | | | | 3,249,108 | |
| | | | Communications Equipment - 4.24% | | | | |
| | 315,680 | | Cisco Systems, Inc. (a) | | | 5,293,954 | |
| | 85,450 | | QUALCOMM, Inc. | | | 3,324,859 | |
| | | | | | | 8,618,813 | |
| | | | Computers & Peripherals - 9.43% | | | | |
| | 64,350 | | Apple, Inc. (a)(b) | | | 6,764,472 | |
| | 112,000 | | Dell, Inc. (a) | | | 1,061,760 | |
| | 61,550 | | EMC Corp. (a)(b) | | | 701,670 | |
| | 171,490 | | Hewlett Packard Co. | | | 5,497,970 | |
| | 50,380 | | International Business | | | | |
| | | | Machines Corp. | | | 4,881,318 | |
| | 18,800 | | NetApp, Inc. (a)(b) | | | 278,992 | |
| | | | | | | 19,186,182 | |
| | | | Construction & Engineering - 0.35% | | | | |
| | 14,250 | | Foster Wheeler AG (a) | | | 248,947 | |
| | 12,200 | | Jacobs Engineering Group, | | | | |
| | | | Inc. (a)(b) | | | 471,652 | |
| | | | | | | 720,599 | |
| | | | Construction Materials - 0.29% | | | | |
| | 13,500 | | Vulcan Materials Co. (b) | | | 597,915 | |
| | | | Containers & Packaging - 0.26% | | | | |
| | 36,800 | | Owens-Illinois, Inc. (a) | | | 531,392 | |
| | | | Diversified Financial Services - 0.16% | | | | |
| | 4,350 | | Intercontinental Exchange, | | | | |
| | | | Inc. (a)(b) | | | 323,945 | |
See notes to financial statements.
AssetMark Large Cap Growth Fund
SCHEDULE OF INVESTMENTS (Continued)
| Number of | | | | | |
| Shares | | | | Value | |
| | | COMMON STOCKS (Continued) | | | |
| | | Electric Utilities - 1.22% | | | |
| | 27,000 | | Entergy Corp. | | $ | 1,838,430 | |
| | 14,100 | | Exelon Corp. | | | 639,999 | |
| | | | | | | 2,478,429 | |
| | | | Electrical Equipment - 0.89% | | | | |
| | 29,600 | | ABB Ltd. – ADR | | | 412,624 | |
| | 24,150 | | Emerson Electric Co. | | | 690,207 | |
| | 5,300 | | First Solar, Inc. (a)(b) | | | 703,310 | |
| | | | | | | 1,806,141 | |
| | | | Electronic Equipment & Instruments - 0.28% | | | | |
| | 19,750 | | Amphenol Corp. | | | 562,677 | |
| | | | Energy Equipment & Services - 2.69% | | | | |
| | 42,200 | | Halliburton Co. | | | 652,834 | |
| | 60,500 | | National-Oilwell Varco, Inc. (a) | | | 1,736,955 | |
| | 35,200 | | Noble Corp. | | | 847,968 | |
| | 18,900 | | Schlumberger Ltd. (b) | | | 767,718 | |
| | 25,100 | | Transocean Ltd. (a)(b) | | | 1,476,884 | |
| | | | | | | 5,482,359 | |
| | | | Food & Staples Retailing - 6.11% | | | | |
| | 38,100 | | BJ’s Wholesale Club, Inc. (a) | | | 1,218,819 | |
| | 91,050 | | CVS Corp. | | | 2,502,965 | |
| | 33,250 | | The Kroger Co. | | | 705,565 | |
| | 52,100 | | Supervalu, Inc. | | | 743,988 | |
| | 47,100 | | SYSCO Corp. | | | 1,073,880 | |
| | 118,870 | | Wal-Mart Stores, Inc. | | | 6,193,127 | |
| | | | | | | 12,438,344 | |
| | | | Gas Utilities - 0.75% | | | | |
| | 64,700 | | UGI Corp. | | | 1,527,567 | |
| | | | Health Care Equipment & Supplies - 3.50% | | | | |
| | 3,100 | | Alcon, Inc. (b) | | | 281,821 | |
| | 6,050 | | Becton, Dickinson & Co. | | | 406,802 | |
| | 34,600 | | Dentsply International, Inc. (b) | | | 929,010 | |
| | 5,100 | | Intuitive Surgical, Inc. (a)(b) | | | 486,336 | |
| | 92,500 | | Medtronic, Inc. | | | 2,725,975 | |
| | 43,900 | | St. Jude Medical, Inc. (a)(b) | | | 1,594,887 | |
| | 20,400 | | Stryker Corp. | | | 694,416 | |
| | | | | | | 7,119,247 | |
| Number of | | | | | |
| Shares | | | | Value | |
| | | Health Care Providers & Services - 3.12% | | | |
| | 32,950 | | Aetna, Inc. | | $ | 801,673 | |
| | 15,700 | | Express Scripts, Inc. (a)(b) | | | 724,869 | |
| | 27,700 | | Humana, Inc. (a) | | | 722,416 | |
| | 16,100 | | Laboratory Corporation of America | | | | |
| | | | Holdings (a) | | | 941,689 | |
| | 41,500 | | McKesson Corp. | | | 1,454,160 | |
| | 22,300 | | Pharmaceutical Product | | | | |
| | | | Development, Inc. | | | 528,956 | |
| | 56,100 | | UnitedHealth Group, Inc. | | | 1,174,173 | |
| | | | | | | 6,347,936 | |
| | | | Hotels, Restaurants & Leisure - 0.74% | | | | |
| | 14,050 | | Darden Restaurants, Inc. | | | 481,353 | |
| | 18,750 | | McDonald’s Corp. | | | 1,023,188 | |
| | | | | | | 1,504,541 | |
| | | | Household Products - 1.83% | | | | |
| | 16,100 | | Colgate-Palmolive Co. | | | 949,578 | |
| | 20,000 | | Kimberly-Clark Corp. | | | 922,200 | |
| | 39,400 | | Procter & Gamble Co. | | | 1,855,346 | |
| | | | | | | 3,727,124 | |
| | | | Insurance - 1.01% | | | | |
| | 19,000 | | ACE Ltd. | | | 767,600 | |
| | 27,950 | | Aflac, Inc. | | | 541,112 | |
| | 32,900 | | Axis Capital Holdings Ltd. | | | 741,566 | |
| | | | | | | 2,050,278 | |
| | | | Internet & Catalog Retail - 1.08% | | | | |
| | 30,000 | | Amazon.com, Inc. (a)(b) | | | 2,203,200 | |
| | | | Internet Software & Services - 2.68% | | | | |
| | 15,640 | | Google, Inc. (a) | | | 5,443,658 | |
| | | | IT Services - 4.11% | | | | |
| | 77,900 | | Accenture Ltd. | | | 2,141,471 | |
| | 18,000 | | Alliance Data Systems Corp. (a)(b) | | | 665,100 | |
| | 13,200 | | Automatic Data Processing, Inc. (b) | | | 464,112 | |
| | 36,050 | | Cognizant Technology Solutions | | | | |
| | | | Corp. (a) | | | 749,479 | |
| | 8,620 | | Mastercard, Inc. (b) | | | 1,443,678 | |
| | 26,650 | | Visa, Inc. (b) | | | 1,481,740 | |
| | 113,200 | | Western Union Co. | | | 1,422,924 | |
| | | | | | | 8,368,504 | |
See notes to financial statements.
AssetMark Large Cap Growth Fund
SCHEDULE OF INVESTMENTS (Continued)
| Number of | | | | | |
| Shares | | | | Value | |
| | | COMMON STOCKS (Continued) | | | |
| | | Machinery - 2.51% | | | |
| | 39,770 | | AGCO Corp. (a)(b) | | $ | 779,492 | |
| | 11,100 | | Bucyrus International, Inc. | | | 168,498 | |
| | 27,450 | | Cummins, Inc. | | | 698,603 | |
| | 14,000 | | Deere & Co. | | | 460,180 | |
| | 67,885 | | Dover Corp. | | | 1,790,806 | |
| | 20,200 | | Parker Hannifin Corp. | | | 686,396 | |
| | 11,000 | | SPX Corp. | | | 517,110 | |
| | | | | | | 5,101,085 | |
| | | | Media - 2.12% | | | | |
| | 119,930 | | The DIRECTV Group, Inc. (a)(b) | | | 2,733,205 | |
| | 81,000 | | Dish Network Corp. (a) | | | 899,910 | |
| | 28,700 | | Omnicom Group, Inc. (b) | | | 671,580 | |
| | | | | | | 4,304,695 | |
| | | | Metals & Mining - 0.72% | | | | |
| | 21,500 | | Cliffs Natural Resources Inc. | | | 390,440 | |
| | 18,600 | | Consol Energy, Inc. | | | 469,464 | |
| | 15,600 | | Nucor Corp. (b) | | | 595,452 | |
| | | | | | | 1,455,356 | |
| | | | Multiline Retail - 1.41% | | | | |
| | 32,500 | | Big Lots, Inc. (a)(b) | | | 675,350 | |
| | 38,700 | | Kohl’s Corp. (a)(b) | | | 1,637,784 | |
| | 16,200 | | Target Corp. | | | 557,118 | |
| | | | | | | 2,870,252 | |
| | | | Oil & Gas - 4.37% | | | | |
| | 18,100 | | Apache Corp. | | | 1,160,029 | |
| | 26,050 | | Devon Energy Corp. | | | 1,164,175 | |
| | 20,100 | | EOG Resources, Inc. | | | 1,100,676 | |
| | 28,075 | | Hess Corp. | | | 1,521,665 | |
| | 48,300 | | Occidental Petroleum Corp. | | | 2,687,895 | |
| | 19,300 | | Range Resources Corp. (b) | | | 794,388 | |
| | 13,000 | | Ultra Petroleum Corp. (a) | | | 466,570 | |
| | | | | | | 8,895,398 | |
| | | | Personal Products - 0.17% | | | | |
| | 17,950 | | Avon Products, Inc. (b) | | | 345,179 | |
| | | | Pharmaceuticals - 7.51% | | | | |
| | 83,600 | | Abbott Laboratories | | | 3,987,720 | |
| | 15,500 | | Allergan, Inc. (b) | | | 740,280 | |
| | 126,400 | | Bristol Myers Squibb Co. | | | 2,770,688 | |
| | 63,910 | | Eli Lilly & Co. | | | 2,135,233 | |
| | 48,700 | | Forest Laboratories, Inc. (a)(b) | | | 1,069,452 | |
| Number of | | | | | |
| Shares | | | | Value | |
| | | Pharmaceuticals (Continued) | | | |
| | 26,250 | | Genzyme Corp. (a)(b) | | $ | 1,558,987 | |
| | 73,800 | | Schering Plough Corp. | | | 1,737,990 | |
| | 28,450 | | Teva Pharmaceutical Industries, | | | | |
| | | | Ltd. - ADR (b) | | | 1,281,673 | |
| | | | | | | 15,282,023 | |
| | | | Road & Rail - 0.91% | | | | |
| | 76,700 | | J.B. Hunt Transport Services, Inc. (b) | | | 1,849,237 | |
| | | | Semiconductor & Semiconductor | | | | |
| | | | Equipment - 3.40% | | | | |
| | 93,650 | | Broadcom Corp. (a)(b) | | | 1,871,127 | |
| | 156,700 | | Intel Corp. (b) | | | 2,358,335 | |
| | 14,400 | | Intersil Corp. | | | 165,600 | |
| | 43,800 | | Lam Research Corp. (a)(b) | | | 997,326 | |
| | 18,600 | | Linear Technology Corp. | | | 427,428 | |
| | 25,800 | | Microchip Technology, Inc. (b) | | | 546,702 | |
| | 62,600 | | Taiwan Semiconductor | | | | |
| | | | Manufacturing Co., Ltd. - ADR (b) | | | 560,270 | |
| | | | | | | 6,926,788 | |
| | | | Software - 7.20% | | | | |
| | 45,700 | | Activision Blizzard, Inc. (a) | | | 478,022 | |
| | 47,400 | | BMC Software, Inc. (a)(b) | | | 1,564,200 | |
| | 20,600 | | Check Point Software | | | | |
| | | | Technologies (a) | | | 457,526 | |
| | 12,550 | | McAfee, Inc. (a) | | | 420,425 | |
| | 365,000 | | Microsoft Corp. | | | 6,705,050 | |
| | 277,900 | | Oracle Corp. (a) | | | 5,021,653 | |
| | | | | | | 14,646,876 | |
| | | | Specialty Retail - 3.72% | | | | |
| | 22,500 | | Abercrombie & Fitch Co. | | | 535,500 | |
| | 15,000 | | Best Buy Co., Inc. (b) | | | 569,400 | |
| | 19,150 | | GameStop Corp. (a)(b) | | | 536,583 | |
| | 143,300 | | The Gap Inc. (b) | | | 1,861,467 | |
| | 55,950 | | Lowe’s Companies, Inc. (b) | | | 1,021,088 | |
| | 25,000 | | Ross Stores, Inc. (b) | | | 897,000 | |
| | 68,375 | | Staples, Inc. (b) | | | 1,238,271 | |
| | 35,800 | | The TJX Companies, Inc. (b) | | | 917,912 | |
| | | | | | | 7,577,221 | |
| | | | Textiles, Apparel & Luxury Goods - 1.34% | |
| | 27,600 | | Coach, Inc. (a) | | | 460,920 | |
| | 48,500 | | Nike, Inc. (b) | | | 2,274,165 | |
| | | | | | | 2,735,085 | |
See notes to financial statements.
AssetMark Large Cap Growth Fund
SCHEDULE OF INVESTMENTS (Continued)
| Number of | | | | | |
Shares | | | | Value | |
| | | COMMON STOCKS (Continued) | | | |
| | | Tobacco - 2.24% | | | |
| | 66,800 | | Altria Group, Inc. | | $ | 1,070,136 | |
| | 97,900 | | Philip Morris International, Inc. | | | 3,483,282 | |
| | | | | | | 4,553,418 | |
| | | | Wireless Telecommunication Services - 0.44% | |
| | 10,950 | | America Movil S.A.B. de | | | | |
| | | | C.V. - ADR (b) | | | 296,526 | |
| | 19,950 | | American Tower Corp. (a) | | | 607,078 | |
| | | | | | | 903,604 | |
| | | | Total Common Stocks | | | | |
| | | | (Cost $246,495,198) | | | 209,951,693 | |
| | | | EXCHANGE TRADED FUNDS - 0.28% | |
| | | | Exchange Traded Funds - 0.28% | | | | |
| | 16,500 | | iShares Russell 1000 Growth | | | | |
| | | | Index Fund . . . . . . . . . . . . . . . . . . . | | | 578,655 | |
| | | | Total Exchange Traded Funds | | | | |
| | | | (Cost $553,905) | | | 578,655 | |
| | | | SHORT TERM INVESTMENTS - 0.41% | |
| | | | Money Market Fund - 0.41% | | | | |
| | 826,803 | | Federated Prime Obligations Fund | | | 826,803 | |
| | | | Total Short Term Investments | | | | |
| | | | (Cost $826,803) | | | 826,803 | |
| Principal | | | | | | |
| Amount | | | | | | |
| | | | INVESTMENTS PURCHASED | | | | |
| | | | AS SECURITIES LENDING | | | | |
| | | | COLLATERAL - 16.26% | | | | |
| | | | Corporate Bonds and Notes - 6.37% | | | | |
| $ | 7,422,855 | | Bank of Scotland, | | | | |
| | | | 1.446%, 05/06/09 | | | 7,422,855 | |
| | 5,567,141 | | Svenska Handelsbanken, | | | | |
| | | | 4.418%, 08/06/09 (c) | | | 5,537,635 | |
| | | | Total Corporate Bonds and Notes | | | | |
| | | | (Cost $12,989,996) | | | 12,960,490 | |
| | | | Corporate Paydown Securities - 3.45% | |
| | 6,830,003 | | KKR Atlantic East Holding Group | | | | |
| | | | Trust, 3.059%, 03/25/10 (d) | | | 3,701,179 | |
| | 7,712,992 | | KKR Pacific West Holding Group | | | | |
| | | | Trust, 3.059%, 03/25/10 (d) | | | 3,320,443 | |
| | | | Total Corporate Paydown Securities | | | | |
| | | | (Cost $14,542,995) | | | 7,021,622 | |
| | | | | | | | |
| Number of | | | | | |
| Shares | | | | Value | |
| | | Money Market Funds - 6.43% | | | |
| | 11,958,200 | | Mount Vernon Prime Portfolio | | $ | 11,958,200 | |
| | 1,296,890 | | Reserve Primary Fund (d) | | | 1,117,271 | |
| | | | Total Money Market Funds | | | | |
| | | | (Cost $13,255,090) | | | 13,075,471 | |
| Principal | | | | | | |
| Amount | | | | | | |
| | | | Cash - 0.01% | | | | |
| $ | 20,397 | | Cash | | | 20,397 | |
| | | | Total Cash | | | | |
| | | | (Cost $20,397) | | | 20,397 | |
| | | | Total Investments Purchased as | | | | |
| | | | Securities Lending Collateral | | | | |
| | | | (Cost $40,808,478) | | | 33,077,980 | |
| | | | Total Investments | | | | |
| | | | (Cost $288,684,384) - 120.13% | | | 244,435,131 | |
| | | | Liabilities in Excess of Other | | | | |
| | | | Assets - (20.13)% | | | (40,955,912 | ) |
| | | | TOTAL NET ASSETS - 100.00% | | $ | 203,479,219 | |
| | | | | | | | |
| Percentages are stated as a percent of net assets. |
| ADR - American Depositary Receipt |
| (a) Non-Income producing. |
| (b) All or a portion of this security is on loan. |
| (c) Restricted securities as defined in Rule 144(a) under the |
| Securities Act of 1933. Such securities are treated as liquid |
| securities according to the Fund’s liquidity guidelines. The value |
| of these securities total $5,537,635, which represents 2.72% of |
| total net assets. |
| (d) As of March 31, 2009, the Adviser has fair valued this security |
| and deemed it illiquid. The value of these securities were |
| $8,138,893, which represent 4.00% of total net assets. |
See notes to financial statements.
AssetMark Large Cap Value Fund
SCHEDULE OF INVESTMENTS
| Number of | | | | | |
| Shares | | | | Value | |
| | | COMMON STOCKS - 99.51% | | | |
| | | Aerospace & Defense - 2.52% | | | |
| | 66,400 | | Northrop Grumman Corp. | | $ | 2,897,696 | |
| | 38,395 | | United Technologies Corp. | | | 1,650,217 | |
| | | | | | | 4,547,913 | |
| | | | Air Freight & Logistics - 0.48% | | | | |
| | 19,600 | | FedEx Corp. (b) | | | 872,004 | |
| | | | Airlines - 0.44% | | | | |
| | 123,960 | | Southwest Airlines Co. (b) | | | 784,667 | |
| | | | Auto Components - 0.55% | | | | |
| | 82,400 | | Johnson Controls, Inc. | | | 988,800 | |
| | | | Automobiles - 0.71% | | | | |
| | 96,050 | | Harley-Davidson, Inc. (b) | | | 1,286,110 | |
| | | | Beverages - 1.28% | | | | |
| | 20,500 | | Diageo PLC - ADR | | | 917,375 | |
| | 26,100 | | Molson Coors Brewing Co. | | | 894,708 | |
| | 9,570 | | PepsiCo, Inc. | | | 492,664 | |
| | | | | | | 2,304,747 | |
| | | | Capital Markets - 1.42% | | | | |
| | 14,970 | | Ameriprise Financial, Inc. | | | 306,736 | |
| | 79,705 | | The Bank of New York | | | | |
| | | | Mellon Corp. | | | 2,251,666 | |
| | | | | | | 2,558,402 | |
| | | | Chemicals - 0.56% | | | | |
| | 27,500 | | PPG Industries, Inc. | | | 1,014,750 | |
| | | | Commercial Banks - 2.58% | | | | |
| | 58,100 | | PNC Financial Services Group | | | 1,701,749 | |
| | 20,070 | | SunTrust Banks, Inc. | | | 235,622 | |
| | 25,380 | | U.S. Bancorp | | | 370,802 | |
| | 163,920 | | Wells Fargo & Co. (b) | | | 2,334,220 | |
| | | | | | | 4,642,393 | |
| | | | Commercial Services & Supplies - 2.32% | |
| | 36,360 | | Avery Dennison Corp. | | | 812,282 | |
| | 14,150 | | The Dun & Bradstreet | | | | |
| | | | Corporation (b) | | | 1,089,550 | |
| | 29,050 | | H&R Block, Inc. | | | 528,420 | |
| | 68,400 | | Waste Management, Inc. | | | 1,751,040 | |
| | | | | | | 4,181,292 | |
| Number of | | | | | |
| Shares | | | | Value | |
| | | Communications Equipment - 1.33% | | | |
| | 86,845 | | Cisco Systems, Inc. (a) | | $ | 1,456,391 | |
| | 62,943 | | Juniper Networks, Inc. (a)(b) | | | 947,921 | |
| | | | | | | 2,404,312 | |
| | | | Computers & Peripherals - 1.87% | | | | |
| | 75,230 | | Dell, Inc. (a)(b) | | | 713,180 | |
| | 55,300 | | Hewlett Packard Co. | | | 1,772,918 | |
| | 9,100 | | International Business | | | | |
| | | | Machines Corp. | | | 881,699 | |
| | | | | | | 3,367,797 | |
| | | | Construction & Engineering - 0.23% | | | | |
| | 12,130 | | Fluor Corp. | | | 419,092 | |
| | | | Construction Materials - 0.28% | | | | |
| | 11,361 | | Vulcan Materials Co. (b) | | | 503,179 | |
| | | | Consumer Finance - 1.34% | | | | |
| | 177,480 | | American Express Co. (b) | | | 2,419,052 | |
| | | | Containers & Packaging - 0.63% | | | | |
| | 81,800 | | Sealed Air Corp. | | | 1,128,840 | |
| | | | Diversified Financial Services - 1.98% | | | | |
| | 113,778 | | J.P. Morgan Chase & Co. | | | 3,024,219 | |
| | 23,550 | | Moody’s Corp. (b) | | | 539,766 | |
| | | | | | | 3,563,985 | |
| | | | Diversified Telecommunication Services - 3.44% | |
| | 140,400 | | AT&T, Inc. | | | 3,538,080 | |
| | 88,200 | | Verizon Communications, Inc. | | | 2,663,640 | |
| | | | | | | 6,201,720 | |
| | | | Electric Utilities - 1.42% | | | | |
| | 88,700 | | Edison International | | | 2,555,447 | |
| | | | Electrical Equipment - 0.35% | | | | |
| | 22,100 | | Emerson Electric Co. | | | 631,618 | |
| | | | Electronic Equipment & Instruments - 0.30% | |
| | 35,300 | | Agilent Technologies, Inc. (a) | | | 542,561 | |
| | | | Energy Equipment & Services - 2.39% | | | | |
| | 28,100 | | Diamond Offshore Drilling | | | 1,766,366 | |
| | 98,700 | | Halliburton Co. | | | 1,526,889 | |
| | 17,352 | | Transocean Ltd. (a)(b) | | | 1,020,992 | |
| | | | | | | 4,314,247 | |
See notes to financial statements.
AssetMark Large Cap Value Fund
SCHEDULE OF INVESTMENTS (Continued)
| Number of | | | | | |
| Shares | | | | Value | |
| | | COMMON STOCKS (Continued) | | | |
| | | Food & Staples Retailing - 5.51% | | | |
| | 65,170 | | Costco Wholesale Corp. (b) | | $ | 3,018,675 | |
| | 118,037 | | CVS Corp. | | | 3,244,837 | |
| | 129,700 | | Safeway, Inc. | | | 2,618,643 | |
| | 45,445 | | SYSCO Corp. | | | 1,036,146 | |
| | | | | | | 9,918,301 | |
| | | | Food Products - 1.11% | | | | |
| | 64,250 | | ConAgra Foods, Inc. (b) | | | 1,083,897 | |
| | 18,225 | | General Mills, Inc. (b) | | | 909,063 | |
| | | | | | | 1,992,960 | |
| | | | Health Care Equipment & Supplies - 1.59% | |
| | 97,000 | | Medtronic, Inc. (b) . . . . . . . . . . . . . . | | | 2,858,590 | |
| | | | Health Care Providers & Services - 2.74% | |
| | 101,195 | | Cardinal Health, Inc. | | | 3,185,619 | |
| | 4,500 | | Express Scripts, Inc. (a)(b) | | | 207,765 | |
| | 73,915 | | UnitedHealth Group, Inc. | | | 1,547,041 | |
| | | | | | | 4,940,425 | |
| | | | Hotels, Restaurants & Leisure - 0.54% | | | | |
| | 17,655 | | McDonald’s Corp. | | | 963,433 | |
| | | | Household Durables - 1.21% | | | | |
| | 24,825 | | The Black & Decker Corp. | | | 783,477 | |
| | 57,050 | | Fortune Brands, Inc. (b) | | | 1,400,577 | |
| | | | | | | 2,184,054 | |
| | | | Household Products - 2.73% | | | | |
| | 55,950 | | Kimberly-Clark Corp. | | | 2,579,855 | |
| | 49,615 | | Procter & Gamble Co. | | | 2,336,370 | |
| | | | | | | 4,916,225 | |
| | | | Industrial Conglomerates - 1.16% | | | | |
| | 20,100 | | 3M Co. | | | 999,372 | |
| | 87,000 | | General Electric Co. | | | 879,570 | |
| | 11,112 | | Tyco International Ltd. | | | 217,351 | |
| | | | | | | 2,096,293 | |
| | | | Insurance - 9.32% | | | | |
| | 136,095 | | The Allstate Corp. | | | 2,606,219 | |
| | 1,008 | | Berkshire Hathaway, Inc. (a)(b) | | | 2,842,560 | |
| | 64,050 | | Loews Corp. | | | 1,415,505 | |
| | 115,600 | | MetLife, Inc. | | | 2,632,212 | |
| | 101,900 | | Progressive Corp. (a) | | | 1,369,536 | |
| | 83,000 | | Prudential Financial, Inc. | | | 1,578,660 | |
| Number of | | | | | |
| Shares | | | | Value | |
| | | Insurance (Continued) | | | |
| | 18,311 | | Transatlantic Holdings, Inc. | | $ | 653,153 | |
| | 90,910 | | Travelers Companies, Inc. | | | 3,694,583 | |
| | | | | | | 16,792,428 | |
| | | | Internet Software & Services - 0.46% | | | | |
| | 2,370 | | Google, Inc. (a) | | | 824,902 | |
| | | | IT Services - 1.12% | | | | |
| | 22,330 | | Alliance Data Systems Corp. (a)(b) | | | 825,093 | |
| | 53,505 | | Iron Mountain, Inc. (a)(b) | | | 1,186,206 | |
| | | | | | | 2,011,299 | |
| | | | Machinery - 2.69% | | | | |
| | 66,600 | | Caterpillar, Inc. (b) | | | 1,862,136 | |
| | 37,410 | | Dover Corp. | | | 986,876 | |
| | 32,060 | | Illinois Tool Works, Inc. | | | 989,051 | |
| | 29,785 | | Parker Hannifin Corp. | | | 1,012,094 | |
| | | | | | | 4,850,157 | |
| | | | Media - 3.42% | | | | |
| | 341,800 | | CBS Corp. (b) | | | 1,312,512 | |
| | 124,825 | | Comcast Corp. | | | 1,606,498 | |
| | 50,860 | | Grupo Televisa SA - ADR | | | 693,730 | |
| | 95,840 | | News Corporation | | | 634,461 | |
| | 18,826 | | Time Warner Cable, Inc. | | | 466,879 | |
| | 75,000 | | Time Warner, Inc. | | | 1,447,500 | |
| | | | | | | 6,161,580 | |
| | | | Metals & Mining - 0.83% | | | | |
| | 11,815 | | Freeport-McMoran Copper & | | | | |
| | | | Gold, Inc. (b) | | | 450,270 | |
| | 27,400 | | Nucor Corp. (b) | | | 1,045,858 | |
| | | | | | | 1,496,128 | |
| | | | Multi-Utilities - 1.11% | | | | |
| | 64,380 | | Dominion Resources, Inc. | | | 1,995,136 | |
| | | | Office Electronics - 0.78% | | | | |
| | 307,700 | | Xerox Corp. | | | 1,400,035 | |
| | | | Oil & Gas - 18.58% | | | | |
| | 49,830 | | Anadarko Petroleum Corp. (b) | | | 1,937,888 | |
| | 83,355 | | Apache Corp. | | | 5,342,222 | |
| | 24,900 | | Canadian Natural Resources Ltd. | | | 960,144 | |
| | 52,800 | | Chevron Corporation | | | 3,550,272 | |
| | 143,142 | | ConocoPhillips | | | 5,605,441 | |
| | 81,215 | | Devon Energy Corp. | | | 3,629,498 | |
See notes to financial statements.
AssetMark Large Cap Value Fund
SCHEDULE OF INVESTMENTS (Continued)
| Number of | | | | | |
| Shares | | | | Value | |
| | | COMMON STOCKS (Continued) | | | |
| | | Oil & Gas (Continued) | | | |
| | 31,030 | | EOG Resources, Inc. | | $ | 1,699,203 | |
| | 107,600 | | Marathon Oil Corp. | | | 2,828,804 | |
| | 83,020 | | Occidental Petroleum Corp. | | | 4,620,063 | |
| | 16,080 | | Southwestern Energy Co. (a)(b) | | | 477,415 | |
| | 92,135 | | XTO Energy, Inc. (b) | | | 2,821,174 | |
| | | | | | | 33,472,124 | |
| | | | Pharmaceuticals - 9.49% | | | | |
| | 30,380 | | Abbott Laboratories | | | 1,449,126 | |
| | 84,700 | | Eli Lilly & Co. | | | 2,829,827 | |
| | 70,445 | | Johnson & Johnson | | | 3,705,407 | |
| | 16,020 | | Merck & Co., Inc. | | | 428,535 | |
| | 280,510 | | Pfizer, Inc. | | | 3,820,546 | |
| | 101,410 | | Schering Plough Corp. | | | 2,388,206 | |
| | 57,500 | | Wyeth | | | 2,474,800 | |
| | | | | | | 17,096,447 | |
| | | | Road & Rail - 0.56% | | | | |
| | 16,900 | | Burlington Northern Santa Fe Corp. | | | 1,016,535 | |
| | | | Semiconductor & Semiconductor | | | | |
| | | | Equipment - 1.46% | | | | |
| | 39,555 | | KLA-Tencor Corp. | | | 791,100 | |
| | 111,555 | | Texas Instruments, Inc. (b) | | | 1,841,773 | |
| | | | | | | 2,632,873 | |
| | | | Software - 2.49% | | | | |
| | 244,025 | | Microsoft Corp. (b) | | | 4,482,739 | |
| | | | Specialty Retail - 0.64% | | | | |
| | 10,270 | | Bed Bath & Beyond, Inc. (a)(b) | | | 254,182 | |
| | 38,500 | | Home Depot, Inc. | | | 907,060 | |
| | | | | | | 1,161,242 | |
| | | | Textiles, Apparel & Luxury Goods - 0.37% | |
| | 70,265 | | Hanesbrands, Inc. (a) | | | 672,436 | |
| | | | Tobacco - 1.18% | | | | |
| | 99,100 | | Altria Group, Inc. | | | 1,587,582 | |
| | 15,260 | | Philip Morris International, Inc. | | | 542,951 | |
| | | | | | | 2,130,533 | |
| | | | Total Common Stocks (Cost $225,751,155) | | | | |
| | | | | | | 179,299,803 | |
| Number of | | | | | |
| Shares | | | | Value | |
| | | REAL ESTATE INVESTMENT TRUSTS - 1.24% | |
| | | Real Estate Investment Trusts - 1.24% | | | |
| | 99,700 | | Annaly Mortgage | | | |
| | | | Management, Inc. | | $ | 1,382,839 | |
| | 24,670 | | Simon Property Group, Inc. (b) | | | 854,569 | |
| | | | | | | 2,237,408 | |
| | | | Total Real Estate Investment Trusts | | | | |
| | | | (Cost $3,531,160) | | | 2,237,408 | |
| | | | SHORT TERM INVESTMENTS - 2.56% | |
| | | | Money Market Fund - 2.56% | | | | |
| | 4,612,665 | | Federated Prime Obligations Fund | | | 4,612,665 | |
| | | | Total Short Term Investments | | | | |
| | | | (Cost $4,612,665) | | | 4,612,665 | |
| Principal | | | | | | |
| Amount | | | | | | |
| | | | INVESTMENTS PURCHASED | | | | |
| | | | AS SECURITIES LENDING | | | | |
| | | | COLLATERAL - 12.98% | | | | |
| | | | Corporate Bonds and Notes - 4.52% | | | | |
| $ | 4,662,432 | | Bank of Scotland, | | | | |
| | | | 1.446%, 05/06/09 | | | 4,662,432 | |
| | 3,496,824 | | Svenska Handelsbanken, | | | | |
| | | | 4.418%, 08/06/09 (c) | | | 3,478,291 | |
| | | | Total Corporate Bonds and Notes | | | | |
| | | | (Cost $8,159,256) | | | 8,140,723 | |
| | | | Corporate Paydown Securities - 3.57% | | | | |
| | 6,262,070 | | KKR Atlantic East Holding Group | | | | |
| | | | Trust, 3.059%, 03/25/10 (d) | | | 3,393,415 | |
| | 7,071,637 | | KKR Pacific West Holding Group | | | | |
| | | | Trust, 3.059%, 03/25/10 (d) | | | 3,044,340 | |
| | | | Total Corporate Paydown Securities | | | | |
| | | | (Cost $13,333,707) | | | 6,437,755 | |
| Shares | | | | | | |
| | | | Money Market Funds - 4.88% | | | | |
| | 7,511,166 | | Mount Vernon Prime Portfolio | | | 7,511,166 | |
| | 1,483,950 | | Reserve Primary Fund (d) | | | 1,278,423 | |
| | | | Total Money Market Funds | | | | |
| | | | (Cost $8,995,116) | | | 8,789,589 | |
See notes to financial statements.
AssetMark Large Cap Value Fund
SCHEDULE OF INVESTMENTS (Continued)
| Principal | | | | | |
| Amount | | | | Value | |
| | | INVESTMENTS PURCHASED | | | |
| | | AS SECURITIES LENDING | | | |
| | | COLLATERAL (Continued) | | | |
| | | Cash - 0.01% | | | |
| $ | 12,810 | | Cash | | $ | 12,810 | |
| | | | Total Cash | | | | |
| | | | (Cost $12,810) | | | 12,810 | |
| | | | Total Investments Purchased as | | | | |
| | | | Securities Lending Collateral | | | | |
| | | | (Cost $30,500,889) | | | 23,380,877 | |
| | | | Total Investments | | | | |
| | | | (Cost $264,395,869) - 116.29% . . | | | 209,530,753 | |
| | | | Liabilities in Excess of | | | | |
| | | | Other Assets - (16.29)% | | | (29,349,389 | ) |
| | | | TOTAL NET | | | | |
| | | | ASSETS - 100.00% | | $ | 180,181,364 | |
| | | | | | | | |
| Percentages are stated as a percent of net assets. |
| ADR - American Depositary Receipt |
| (a) Non-Income producing. |
| (b) All or a portion of this security is on loan. |
| (c) Restricted securities as defined in Rule 144(a) under the |
| Securities Act of 1933. Such securities are treated as liquid |
| securities according to the Fund’s liquidity guidelines. The value |
| of these securities total $3,478,291, which represents 1.93% of |
| total net assets. |
| (d) As of March 31, 2009, the Adviser has fair valued this security |
| and deemed it illiquid. The value of these securities were |
| $7,716,178, which represent 4.28% of total net assets. |
See notes to financial statements.
AssetMark Small/Mid Cap Growth Fund
SCHEDULE OF INVESTMENTS
| Number of | | | | | |
| Shares | | | | Value | |
| | | COMMON STOCKS - 101.75% | | | |
| | | Aerospace & Defense - 0.65% | | | |
| | 2,800 | | American Science & | | | |
| | | | Engineering, Inc. | | $ | 156,240 | |
| | 3,500 | | Axsys Technologies, Inc. (a) | | | 147,140 | |
| | | | | | | 303,380 | |
| | | | Beverages - 0.16% | | | | |
| | 2,100 | | Hansen Natural Corp. (a)(b) | | | 75,600 | |
| | | | Biotechnology - 6.82% | | | | |
| | 18,780 | | Alexion Pharmaceuticals, | | | | |
| | | | Inc. (a)(b) | | | 707,255 | |
| | 5,300 | | Alkermes, Inc. (a) | | | 64,289 | |
| | 5,002 | | Cephalon, Inc. (a)(b) | | | 340,636 | |
| | 20,100 | | Cubist Pharmaceuticals, Inc. (a)(b) | | | 328,836 | |
| | 11,141 | | ISIS Pharmaceuticals, Inc. (a)(b) | | | 167,226 | |
| | 10,300 | | Martek Biosciences Corp. (b) | | | 187,975 | |
| | 15,880 | | Myriad Genetics, Inc. (a) | | | 722,063 | |
| | 8,385 | | Onyx Pharmaceuticals, Inc. (a)(b) | | | 239,392 | |
| | 5,441 | | OSI Pharmaceuticals, Inc. (a) | | | 208,173 | |
| | 23,700 | | PDL BioPharma Inc. | | | 167,796 | |
| | 1,600 | | Vertex Pharmaceuticals, Inc. (a)(b) | | | 45,968 | |
| | | | | | | 3,179,609 | |
| | | | Capital Markets - 1.41% | | | | |
| | 9,133 | | Affiliated Managers Group, | | | | |
| | | | Inc. (a)(b) | | | 380,937 | |
| | 3,736 | | Greenhill & Co, Inc. (b) | | | 275,904 | |
| | | | | | | 656,841 | |
| | | | Commercial Banks - 0.50% | | | | |
| | 8,174 | | Signature Bank (a) | | | 230,752 | |
| | | | Commercial Services & Supplies -6.53% | | | | |
| | 8,647 | | DeVry, Inc. (b) | | | 416,612 | |
| | 5,203 | | The Dun & Bradstreet | | | | |
| | | | Corporation (b) | | | 400,631 | |
| | 5,091 | | FTI Consulting, Inc. (a) | | | 251,903 | |
| | 10,515 | | IHS, Inc. (a) | | | 433,008 | |
| | 13,800 | | Manpower, Inc. . | | | 435,114 | |
| | 23,608 | | Monster Worldwide, Inc. (a) | | | 192,405 | |
| | 27,500 | | Navigant Consulting, Inc. (a) | | | 359,425 | |
| | 5,978 | | Stericycle, Inc. (a) | | | 285,330 | |
| | 1,486 | | Strayer Education, Inc. | | | 267,287 | |
| | | | | | | 3,041,715 | |
| Number of | | | | | |
| Shares | | | | Value | |
| | | Communications Equipment - 0.74% | | | |
| | 16,900 | | Arris Group, Inc. (a) | | $ | 124,553 | |
| | 6,200 | | NICE Systems Ltd. - ADR (a) | | | 154,132 | |
| | 7,400 | | Palm, Inc. (a) | | | 63,788 | |
| | | | | | | 342,473 | |
| | | | Computers & Peripherals - 2.47% | | | | |
| | 12,800 | | NCR Corp. (a)(b) | | | 101,760 | |
| | 13,195 | | NetApp, Inc. (a)(b) | | | 195,814 | |
| | 19,100 | | Synaptics, Inc. (a)(b) | | | 511,116 | |
| | 16,400 | | Teradata Corp. (a) | | | 266,008 | |
| | 4,000 | | Western Digital Corp. (a) | | | 77,360 | |
| | | | | | | 1,152,058 | |
| | | | Construction & Engineering - 0.35% | | | | |
| | 2,800 | | EMCOR Group, Inc. (a)(b) | | | 48,076 | |
| | 2,800 | | URS Corp. (a) | | | 113,148 | |
| | | | | | | 161,224 | |
| | | | Construction Materials - 0.88% | | | | |
| | 16,890 | | Eagle Materials, Inc. (b) | | | 409,583 | |
| | | | Consumer Finance - 0.34% | | | | |
| | 31,900 | | SLM Corp. (a)(b) | | | 157,905 | |
| | | | Containers & Packaging - 0.21% | | | | |
| | 4,600 | | Sonoco Products Co. | | | 96,508 | |
| | | | Distributors - 0.14% | | | | |
| | 3,700 | | WESCO International, Inc. (a) | | | 67,044 | |
| | | | Diversified Consumer Services - 3.57% | | | | |
| | 5,871 | | Capella Education Company (a) | | | 311,163 | |
| | 4,400 | | Career Education Corp. (a) | | | 105,424 | |
| | 35,304 | | Corinthian Colleges, Inc. (a)(b) | | | 686,663 | |
| | 3,100 | | ITT Educational Services, | | | | |
| | | | Inc. (a)(b) | | | 376,402 | |
| | 3,595 | | New Oriental Education & | | | | |
| | | | Technology Group, | | | | |
| | | | Inc. - ADR (a)(b) | | | 180,649 | |
| | | | | | | 1,660,301 | |
| | | | Diversified Financial Services - 1.71% | | | | |
| | 7,417 | | Huron Consulting Group, Inc. (a) | | | 314,703 | |
| | 28,614 | | MSCI, Inc. (a) | | | 483,863 | |
| | | | | | | 798,566 | |
| | | | Diversified Telecommunication Services - 0.78% | | | | |
| | 41,000 | | Premiere Global Services, Inc. (a) | | | 361,620 | |
See notes to financial statements.
AssetMark Small/Mid Cap Growth Fund
SCHEDULE OF INVESTMENTS (Continued)
| Number of | | | | | |
| Shares | | | | Value | |
| | | COMMON STOCKS (Continued) | | | |
| | | Electric Utilities - 0.52% | | | |
| | 5,573 | | ITC Holdings Corp. | | $ | 243,094 | |
| | | | Electrical Equipment - 1.13% | | | | |
| | 8,341 | | General Cable Corp. (a) | | | 165,319 | |
| | 10,014 | | Regal-Beloit Corp. | | | 306,829 | |
| | 2,200 | | Thomas & Betts Corp. (a) | | | 55,044 | |
| | | | | | | 527,192 | |
| | | | Electronic Equipment & Instruments - 1.85% | | | | |
| | 14,100 | | Avnet, Inc. (a) | | | 246,891 | |
| | 18,039 | | Dolby Laboratories, Inc. (a)(b) | | | 615,310 | |
| | | | | | | 862,201 | |
| | | | Energy Equipment & Services - 2.14% | | | | |
| | 3,027 | | Core Laboratories NV (b) | | | 221,455 | |
| | 19,400 | | Dresser-Rand Group, Inc. (a)(b) | | | 428,740 | |
| | 17,900 | | Oil States International, Inc. (a)(b) | | | 240,218 | |
| | 8,200 | | Superior Energy Services, | | | | |
| | | | Inc. (a)(b) | | | 105,698 | |
| | | | | | | 996,111 | |
| | | | Food Products - 2.27% | | | | |
| | 1,900 | | American Italian Pasta Co. (a)(b) | | | 66,139 | |
| | 7,900 | | Casey’s General Stores, Inc. | | | 210,614 | |
| | 45,200 | | Del Monte Foods Co. (b) | | | 329,508 | |
| | 4,700 | | Diamond Foods, Inc. | | | 131,271 | |
| | 4,171 | | Green Mountain Coffee | | | | |
| | | | Roasters, Inc. (a)(b) | | | 200,208 | |
| | 2,900 | | Lancaster Colony Corp. | | | 120,292 | |
| | | | | | | 1,058,032 | |
| | | | Gas Utilities - 0.43% | | | | |
| | 11,600 | | NiSource, Inc. | | | 113,680 | |
| | 2,400 | | Suburban Propane Partners LP | | | 87,744 | |
| | | | | | | 201,424 | |
| | | | Health Care Equipment & Supplies - 8.22% | | | | |
| | 7,500 | | Align Technology, Inc. (a) | | | 59,475 | |
| | 41,000 | | American Medical Systems | | | | |
| | | | Holdings, Inc. (a) | | | 457,150 | |
| | 26,350 | | Conceptus, Inc. (a)(b) | | | 309,613 | |
| | 3,700 | | Gen-Probe, Inc. (a) | | | 168,646 | |
| | 22,556 | | Illumina, Inc. (a)(b) | | | 839,986 | |
| | 9,522 | | Immucor, Inc. (a)(b) | | | 239,478 | |
| | 2,115 | | Intuitive Surgical, Inc. (a)(b) | | | 201,686 | |
| | 5,900 | | Invacare Corp. | | | 94,577 | |
| Number of | | | | | |
| Shares | | | | Value | |
| | | Health Care Equipment & Supplies (Continued) | | | |
| | 8,200 | | Merit Medical Systems, Inc. (a) | | $ | 100,122 | |
| | 9,253 | | NuVasive, Inc. (a) | | | 290,359 | |
| | 20,345 | | ResMed, Inc. (a)(b) | | | 718,992 | |
| | 10,900 | | Steris Corp. (b) | | | 253,752 | |
| | 3,650 | | Thoratec Corp. (a) | | | 93,769 | |
| | | | | | | 3,827,605 | |
| | | | Health Care Providers & Services - 3.66% | | | | |
| | 1,900 | | Amedisys, Inc. (a)(b) | | | 52,231 | |
| | 4,000 | | Centene Corp. (a) | | | 72,080 | |
| | 3,776 | | Cerner Corp. (a) | | | 166,031 | |
| | 4,000 | | CIGNA Corp. | | | 70,360 | |
| | 7,900 | | Emergency Medical Services | | | | |
| | | | Corp. (a)(b) | | | 247,981 | |
| | 2,100 | | Genoptix, Inc. (a) | | | 57,288 | |
| | 4,000 | | Gentiva Health Services, Inc. (a) | | | 60,800 | |
| | 7,865 | | HMS Holdings Corp. (a) | | | 258,758 | |
| | 13,600 | | Humana, Inc. (a) | | | 354,688 | |
| | 7,100 | | LHC Group, Inc. (a) | | | 158,188 | |
| | 6,200 | | Omnicare, Inc. (b) | | | 151,838 | |
| | 1,400 | | Universal Health Services, Inc. (b) | | | 53,676 | |
| | | | | | | 1,703,919 | |
| | | | Hotels, Restaurants & Leisure - 3.16% | | | | |
| | 5,000 | | Bally Technologies, Inc. (a) | | | 92,100 | |
| | 5,662 | | Buffalo Wild Wings, Inc. (a)(b) | | | 207,116 | |
| | 1,000 | | Chipotle Mexican Grill, Inc. (a)(b) | | | 66,380 | |
| | 5,382 | | Darden Restaurants, Inc. | | | 184,387 | |
| | 3,509 | | Panera Bread Co. (a) | | | 196,153 | |
| | 7,381 | | PF Chang’s China Bistro, Inc. (a)(b) | | | 168,877 | |
| | 46,122 | | Scientific Games Corp. (a) | | | 558,538 | |
| | | | | | | 1,473,551 | |
| | | | Household Durables - 1.64% | | | | |
| | 42,400 | | D.R. Horton, Inc. | | | 411,280 | |
| | 32,400 | | Pulte Homes, Inc. | | | 354,132 | |
| | | | | | | 765,412 | |
| | | | Insurance - 0.78% | | | | |
| | 14,400 | | Assurant, Inc. | | | 313,632 | |
| | 2,200 | | Stancorp Financial Group, Inc. | | | 50,116 | |
| | | | | | | 363,748 | |
See notes to financial statements.
AssetMark Small/Mid Cap Growth Fund
SCHEDULE OF INVESTMENTS (Continued)
| Number of | | | | | |
| Shares | | | | Value | |
| | | COMMON STOCKS (Continued) | | | |
| | | Internet & Catalog Retail - 2.58% | | | |
| | 5,356 | | NetFlix, Inc. (a)(b) | | $ | 229,879 | |
| | 8,218 | | Priceline.com, Inc. (a)(b) | | | 647,414 | |
| | 11,869 | | VistaPrint Limited (a) | | | 326,279 | |
| | | | | | | 1,203,572 | |
| | | | Internet Software & Services - 1.84% | | | | |
| | 9,303 | | Akamai Technologies, Inc. (a) | | | 180,478 | |
| | 3,851 | | Equinix, Inc. (a) | | | 216,234 | |
| | 16,000 | | S1 Corp. (a) | | | 82,400 | |
| | 9,200 | | Sohu.com, Inc. (a)(b) | | | 380,052 | |
| | | | | | | 859,164 | |
| | | | IT Services - 3.70% | | | | |
| | 4,783 | | Alliance Data Systems | | | | |
| | | | Corp. (a)(b) | | | 176,732 | |
| | 24,200 | | Broadridge Financial | | | | |
| | | | Solutions, Inc. | | | 450,362 | |
| | 18,234 | | Cognizant Technology Solutions | | | | |
| | | | Corp. (a) | | | 379,085 | |
| | 5,600 | | ManTech International Corp. (a) | | | 234,640 | |
| | 20,062 | | SAIC, Inc. (a)(b) | | | 374,557 | |
| | 5,300 | | Syntel, Inc. (b) | | | 109,074 | |
| | | | | | | 1,724,450 | |
| | | | Leisure Equipment & Products - 0.33% | | | | |
| | 6,200 | | Hasbro, Inc. | | | 155,434 | |
| | | | Life Sciences Tools & Services - 2.92% | | | | |
| | 2,800 | | Kendle International, Inc. (a) | | | 58,688 | |
| | 16,067 | | Life Technologies Corp. (a)(b) | | | 521,856 | |
| | 4,506 | | Millipore Corp. (a) | | | 258,690 | |
| | 10,130 | | QIAGEN N.V. (a) | | | 161,675 | |
| | 25,300 | | Sequenom, Inc. (a)(b) | | | 359,766 | |
| | | | | | | 1,360,675 | |
| | | | Machinery - 3.12% | | | | |
| | 15,700 | | Bucyrus International, Inc. | | | 238,326 | |
| | 18,928 | | IDEX Corp. | | | 413,955 | |
| | 6,800 | | L.B. Foster Co. (a) | | | 168,844 | |
| | 13,600 | | Navistar International Corp. (a) | | | 455,056 | |
| | 6,791 | | Westinghouse Air Brake | | | | |
| | | | Technologies Corp. | | | 179,147 | |
| | | | | | | 1,455,328 | |
| | | | Metals & Mining - 1.64% | | | | |
| | 6,700 | | Compass Minerals International, | | | | |
| | | | Inc. (b) | | | 377,679 | |
| | 44,000 | | Steel Dynamics, Inc. | | | 387,640 | |
| | | | | | | 765,319 | |
| Number of | | | | | |
| Shares | | | | Value | |
| | | Multiline Retail - 0.32% | | | |
| | 3,361 | | Dollar Tree, Inc. (a)(b) | | $ | 149,733 | |
| | | | Oil & Gas - 3.73% | | | | |
| | 11,582 | | Arena Resources, Inc. (a) | | | 295,109 | |
| | 9,228 | | Concho Resources, Inc. (a) | | | 236,144 | |
| | 6,217 | | Continental Resources, Inc. (a)(b) | | | 131,863 | |
| | 14,853 | | EXCO Resources, Inc. (a) | | | 148,530 | |
| | 22,900 | | McMoRan Exploration Co. (a) | | | 107,630 | |
| | 1,900 | | NuStar Energy L.P | | | 87,609 | |
| | 11,991 | | Petrohawk Energy Corp. (a)(b) | | | 230,587 | |
| | 11,796 | | Whiting Petroleum Corp. (a) | | | 304,927 | |
| | 6,200 | | World Fuel Services Corp. | | | 196,106 | |
| | | | | | | 1,738,505 | |
| | | | Personal Products - 0.42% | | | | |
| | 12,900 | | Herbalife Ltd. | | | 193,242 | |
| | | | Pharmaceuticals - 3.35% | | | | |
| | 8,421 | | Auxilium Pharmaceuticals, | | | | |
| | | | Inc. (a)(b) | | | 233,430 | |
| | 31,500 | | Medicines Co. (a) | | | 341,460 | |
| | 20,500 | | Mylan Laboratories, Inc. (a)(b) | | | 274,905 | |
| | 9,000 | | Sepracor, Inc. (a)(b) | | | 131,940 | |
| | 12,700 | | Valeant Pharmaceuticals | | | | |
| | | | International (a)(b) | | | 225,933 | |
| | 11,400 | | Watson Pharmaceuticals, Inc. (a) | | | 354,654 | |
| | | | | | | 1,562,322 | |
| | | | Road & Rail - 1.59% | | | | |
| | 8,219 | | J.B. Hunt Transport Services, Inc. | | | 198,160 | |
| | 16,253 | | Landstar System, Inc. | | | 543,988 | |
| | | | | | | 742,148 | |
| | | | Semiconductor & Semiconductor | | | | |
| | | | Equipment - 5.64% | | | | |
| | 14,400 | | Atheros Communications, Inc. (a) | | | 211,104 | |
| | 69,400 | | Integrated Device Technology, | | | | |
| | | | Inc. (a) | | | 315,770 | |
| | 20,366 | | Lam Research Corp. (a)(b) | | | 463,734 | |
| | 12,006 | | Microchip Technology, Inc. (b) | | | 254,407 | |
| | 48,213 | | PMC-Sierra, Inc. (a)(b) | | | 307,599 | |
| | 12,301 | | Power Integrations, Inc. | | | 211,577 | |
| | 12,328 | | Silicon Laboratories, Inc. (a)(b) | | | 325,459 | |
| | 13,300 | | Skyworks Solutions, Inc. (a) | | | 107,198 | |
| | 22,538 | | Xilinx, Inc. | | | 431,828 | |
| | | | | | | 2,628,676 | |
See notes to financial statements.
AssetMark Small/Mid Cap Growth Fund
SCHEDULE OF INVESTMENTS (Continued)
| Number of | | | | | |
| Shares | | | | Value | |
| | | COMMON STOCKS (Continued) | | | |
| | | Software - 4.10% | | | |
| | 37,700 | | Compuware Corp. (a) | | $ | 248,443 | |
| | 13,604 | | Macrovision Solutions Corp. (a) | | | 242,015 | |
| | 16,200 | | Mentor Graphics Corp. (a) | | | 71,928 | |
| | 30,230 | | Nuance Communications, | | | | |
| | | | Inc. (a)(b) | | | 328,298 | |
| | 15,170 | | Solera Holdings, Inc. (a)(b) | | | 375,913 | |
| | 16,991 | | Sybase, Inc. (a)(b) | | | 514,657 | |
| | 22,200 | | Tibco Software, Inc. (a) | | | 130,314 | |
| | | | | | | 1,911,568 | |
| | | | Specialty Retail - 8.73% | | | | |
| | 19,570 | | Aeropostale, Inc. (a)(b) | | | 519,779 | |
| | 29,285 | | American Eagle Outfitters | | | 358,448 | |
| | 13,000 | | The Buckle, Inc. | | | 415,090 | |
| | 13,800 | | The Childrens Place Retail | | | | |
| | | | Stores, Inc. (a) | | | 302,082 | |
| | 26,828 | | GameStop Corp. (a) | | | 751,721 | |
| | 19,178 | | Guess?, Inc. | | | 404,272 | |
| | 4,100 | | Jo-Ann Stores, Inc. (a) | | | 66,994 | |
| | 8,200 | | Jos. A. Bank Clothiers, Inc. (a)(b) | | | 228,042 | |
| | 36,700 | | Limited Brands, Inc. (b) | | | 319,290 | |
| | 17,400 | | Rent-A-Center, Inc. (a) | | | 337,038 | |
| | 1,900 | | Ross Stores, Inc. (b) | | | 68,172 | |
| | 8,200 | | Tractor Supply Co. (a) | | | 295,692 | |
| | | | | | | 4,066,620 | |
| | | | Textiles, Apparel & Luxury Goods - 1.99% | | | | |
| | 4,300 | | Deckers Outdoor Corp. (a) | | | 228,072 | |
| | 12,246 | | Phillips-Van Heusen Corp. (b) | | | 277,739 | |
| | 11,600 | | True Religion Apparel, Inc. (a) | | | 136,996 | |
| | 11,892 | | Warnaco Group, Inc. (a) | | | 285,408 | |
| | | | | | | 928,215 | |
| | | | Trading Companies & Distributors - 0.21% | | | | |
| | 3,100 | | MSC Industrial Direct Co., Inc. | | | 96,317 | |
| | | | Transportation Infrastructure - 0.59% | | | | |
| | 16,301 | | Aegean Marine Petroleum | | | | |
| | | | Network Inc. (b) | | | 273,042 | |
| Number of | | | | | |
| Shares | | | | Value | |
| | | Wireless Telecommunication Services - 1.89% | | | |
| | 34,204 | | SBA Communications Corp. (a)(b) | | $ | 796,953 | |
| | 5,400 | | Syniverse Holdings, Inc. (a) | | | 85,104 | |
| | | | | | | 882,057 | |
| | | | Total Common Stocks | | | | |
| | | | (Cost $49,666,284) | | | 47,413,855 | |
| | | | REAL ESTATE INVESTMENT TRUSTS - 0.29% | | | | |
| | | | Real Estate Investment Trusts - 0.29% | | | | |
| | 14,400 | | Anworth Mortgage Asset Corp. | | | 88,272 | |
| | 6,800 | | Inland Real Estate Corp. | | | 48,212 | |
| | | | | | | 136,484 | |
| | | | Total Real Estate Investment Trusts | | | | |
| | | | (Cost $181,052) | | | 136,484 | |
| | | | SHORT TERM INVESTMENTS - 1.95% | | | | |
| | | | Money Market Fund - 1.95% | | | | |
| | 909,490 | | Federated Prime Obligations Fund | | | 909,490 | |
| | | | Total Short Term Investments | | | | |
| | | | (Cost $909,490) | | | 909,490 | |
| Principal | | | | | | |
| Amount | | | | | | |
| | | | INVESTMENTS PURCHASED | | | | |
| | | | AS SECURITIES LENDING | | | | |
| | | | COLLATERAL - 23.18% | | | | |
| | | | Corporate Bonds and Notes - 9.75% | | | | |
| $ | 2,601,594 | | Bank of Scotland, | | | | |
| | | | 1.446%, 05/06/09 | | | 2,601,594 | |
| | 1,951,195 | | Svenska Handelsbanken, | | | | |
| | | | 4.418%, 08/06/09 (c) | | | 1,940,855 | |
| | | | Total Corporate Bonds and Notes | | | | |
| | | | (Cost $4,552,789) | | | 4,542,449 | |
| | | | Corporate Paydown Securities - 3.68% | | | | |
| | 1,669,227 | | KKR Atlantic East Holding Group | | | | |
| | | | Trust, 3.059%, 03/25/10 (d) | | | 904,554 | |
| | 1,885,026 | | KKR Pacific West Holding Group | | | | |
| | | | Trust, 3.059%, 03/25/10 (d) | | | 811,504 | |
| | | | Total Corporate Paydown Securities | | | | |
| | | | (Cost $3,554,253) | | | 1,716,058 | |
See notes to financial statements.
AssetMark Small/Mid Cap Growth Fund
SCHEDULE OF INVESTMENTS (Continued)
| Number of | | | | | |
| Shares | | | | Value | |
| | | Money Market Funds - 9.73% | | | |
| | 4,191,161 | | Mount Vernon Prime Portfolio | | $ | 4,191,161 | |
| | 398,733 | | Reserve Primary Fund (d) | | | 343,508 | |
| | | | Total Money Market Funds | | | | |
| | | | (Cost $4,589,894) | | | 4,534,669 | |
| Principal | | | | | | |
| Amount | | | | | | |
| | | | Cash - 0.02% | | | | |
| $ | 7,149 | | Cash | | | 7,149 | |
| | | | Total Cash | | | | |
| | | | (Cost $7,149) | | | 7,149 | |
| | | | Total Investments Purchased as | | | | |
| | | | Securities Lending Collateral | | | | |
| | | | (Cost $12,704,085) | | | 10,800,325 | |
| | | | Total Investments | | | | |
| | | | (Cost $63,460,911) - 127.17% | | | 59,260,154 | |
| | | | Liabilities in Excess of | | | | |
| | | | Other Assets - (27.17)% | | | (12,662,598 | ) |
| | | | TOTAL NET | | | | |
| | | | ASSETS - 100.00% | | $ | 46,597,556 | |
| | | | | | | | |
| Percentages are stated as a percent of net assets. |
| ADR - American Depositary Receipt |
| (a) Non-Income producing. |
| (b) All or a portion of this security is on loan. |
| (c) Restricted securities as defined in Rule 144(a) under the |
| Securities Act of 1933. Such securities are treated as liquid |
| securities according to the Fund’s liquidity guidelines. The value |
| of these securities total $1,940,855, which represents 4.17% of |
| total net assets. |
| (d) As of March 31, 2009, the Adviser has fair valued this security |
| and deemed it illiquid. The value of these securities were |
| $2,059,566, which represent 4.42% of total net assets. |
See notes to financial statements.
AssetMark Small/Mid Cap Value Fund
SCHEDULE OF INVESTMENTS
| Number of | | | | | |
| Shares | | | | Value | |
| | | COMMON STOCKS - 94.19% | | | |
| | | Aerospace & Defense - 0.62% | | | |
| | 17,915 | | BE Aerospace, Inc. (a) | | $ | 155,323 | |
| | 19,085 | | Hexcel Corp. (a) | | | 125,389 | |
| | | | | | | 280,712 | |
| | | | Air Freight & Logistics - 0.31% | | | | |
| | 4,999 | | Ryder System, Inc. | | | 141,522 | |
| | | | Airlines - 0.37% | | | | |
| | 19,075 | | Continental Airlines, Inc. (a)(b) | | | 168,051 | |
| | | | Building Products - 0.81% | | | | |
| | 6,940 | | Ameron International Corp. | | | 365,460 | |
| | | | Capital Markets - 3.60% | | | | |
| | 22,780 | | Calamos Asset Management, | | | | |
| | | | Inc. (b) | | | 109,572 | |
| | 7,417 | | Investment Technology Group, | | | | |
| | | | Inc. (a) | | | 189,282 | |
| | 56,370 | | Jefferies Group, Inc. (b) | | | 777,906 | |
| | 5,430 | | KBW, Inc. (a)(b) | | | 110,500 | |
| | 14,550 | | Knight Capital Group, Inc. (a)(b) | | | 214,467 | |
| | 16,093 | | Penson Worldwide, Inc. (a)(b) | | | 103,478 | |
| | 6,240 | | Raymond James Financial, Inc. (b). | | | 122,928 | |
| | | | | | | 1,628,133 | |
| | | | Chemicals - 3.48% | | | | |
| | 7,708 | | Airgas, Inc. | | | 260,608 | |
| | 9,371 | | Albemarle Corp. | | | 204,007 | |
| | 20,863 | | Celanese Corp. | | | 278,938 | |
| | 2,619 | | CF Industries Holdings, Inc. | | | 186,290 | |
| | 49,441 | | Huntsman Corp. | | | 154,750 | |
| | 11,230 | | Innophos Holdings, Inc. | | | 126,674 | |
| | 5,595 | | Intrepid Potash, Inc. (a) | | | 103,228 | |
| | 19,566 | | Rockwood Holdings, Inc. (a) | | | 155,354 | |
| | 56,115 | | Solutia, Inc. (a) | | | 104,935 | |
| | | | | | | 1,574,784 | |
| | | | Commercial Banks - 7.67% | | | | |
| | 23,394 | | Central Pacific Financial Corp. (b) | | | 131,006 | |
| | 28,648 | | First Horizon National Corp. | | | 307,682 | |
| | 16,889 | | First Midwest Bancorp, Inc. (b) | | | 145,077 | |
| | 12,987 | | FirstMerit Corp. | | | 236,363 | |
| | 6,976 | | Hancock Holding Co. (b) | | | 218,209 | |
| | 13,059 | | Huntington Bancshares, Inc. (b) | | | 21,678 | |
| | 96,150 | | Investors Bancorp, Inc. (a)(b) | | | 814,391 | |
| | 5,238 | | PacWest Bancorp | | | 75,061 | |
| Number of | | | | | |
| Shares | | | | Value | |
| | | Commercial Banks (Continued) | | | |
| | 6,284 | | Trustmark Corp. (b) | | $ | 115,500 | |
| | 140,510 | | UCBH Holdings, Inc. (b) | | | 212,170 | |
| | 20,070 | | UMB Financial Corp. | | | 852,774 | |
| | 10,000 | | Whitney Holding Corp. | | | 114,500 | |
| | 22,281 | | Zions Bancorporation (b) | | | 219,022 | |
| | | | | | | 3,463,433 | |
| | | | Commercial Services & Supplies - 0.57% | | | | |
| | 17,598 | | CBIZ, Inc. (a) | | | 122,658 | |
| | 10,785 | | Consolidated Graphics, Inc. (a) | | | 137,185 | |
| | | | | | | 259,843 | |
| | | | Communications Equipment - 2.24% | | | | |
| | 140,183 | | ADC Telecommunications (a)(b) | | | 615,403 | |
| | 8,934 | | Belden, Inc. | | | 111,764 | |
| | 15,643 | | CommScope, Inc. (a)(b) | | | 177,705 | |
| | 23,478 | | Tellabs, Inc. (a) | | | 107,529 | |
| | | | | | | 1,012,401 | |
| | | | Computers & Peripherals - 0.59% | | | | |
| | 9,451 | | Diebold, Inc. | | | 201,779 | |
| | 6,633 | | Electronics For Imaging, Inc. (a) | | | 65,003 | |
| | | | | | | 266,782 | |
| | | | Construction & Engineering - 2.15% | | | | |
| | 26,033 | | Dycom Industries, Inc. (a) | | | 150,731 | |
| | 21,880 | | Granite Construction, Inc. (b) | | | 820,062 | |
| | | | | | | 970,793 | |
| | | | Containers & Packaging - 0.64% | | | | |
| | 5,799 | | Greif, Inc. | | | 193,048 | |
| | 15,598 | | Myers Industries, Inc. | | | 95,772 | |
| | | | | | | 288,820 | |
| | | | Diversified Consumer Services - 1.13% | | | | |
| | 10,940 | | Brink’s Home Security Holdings, | | | | |
| | | | Inc. (a) | | | 247,244 | |
| | 29,040 | | Sotheby’s (b) | | | 261,360 | |
| | | | | | | 508,604 | |
| | | | Diversified Financial Services - 2.06% | | | | |
| | 46,630 | | Leucadia National Corp. (a) | | | 694,321 | |
| | 13,875 | | World Acceptance Corp. (a) | | | 237,263 | |
| | | | | | | | |
| | | | | | | 931,584 | |
| | | | Diversified Telecommunication Services - 2.47% | | | | |
| | 62,928 | | Cincinnati Bell, Inc. (a) | | | 144,734 | |
| | 25,720 | | Embarq Corp. | | | 973,502 | |
| | | | | | | 1,118,236 | |
See notes to financial statements.
AssetMark Small/Mid Cap Value Fund
SCHEDULE OF INVESTMENTS (Continued)
| Number of | | | | | |
| Shares | | | | Value | |
| | | COMMON STOCKS (Continued) | | | |
| | | Electric Utilities - 5.38% | | | |
| | 14,496 | | Cleco Corp. | | $ | 314,418 | |
| | 38,613 | | Great Plains Energy, Inc. | | | 520,117 | |
| | 11,781 | | IDACORP, Inc. | | | 275,204 | |
| | 19,287 | | Northeast Utilities | | | 416,407 | |
| | 15,990 | | Portland General Electric Co. | | | 281,264 | |
| | 15,087 | | Wisconsin Energy Corp. (b) | | | 621,132 | |
| | | | | | | 2,428,542 | |
| | | | Electrical Equipment - 2.11% | | | | |
| | 3,380 | | A.O. Smith Corp. | | | 85,108 | |
| | 36,640 | | Encore Wire Corp. (b) | | | 785,195 | |
| | 2,760 | | Regal-Beloit Corp. | | | 84,567 | |
| | | | | | | 954,870 | |
| | | | Electronic Equipment & Instruments - 4.76% | | | | |
| | 14,202 | | Arrow Electronics, Inc. (a) | | | 270,690 | |
| | 37,220 | | Avnet, Inc. (a) | | | 651,722 | |
| | 27,352 | | Benchmark Electronics, Inc. (a) | | | 306,343 | |
| | 19,725 | | Jabil Circuit, Inc. | | | 109,671 | |
| | 4,070 | | Mettler Toledo International, | | | | |
| | | | Inc. (a)(b) | | | 208,913 | |
| | 17,650 | | Molex, Inc. | | | 223,096 | |
| | 17,216 | | Plexus Corp. (a) | | | 237,925 | |
| | 7,220 | | SYNNEX Corp. (a) | | | 142,017 | |
| | | | | | | 2,150,377 | |
| | | | Energy Equipment & Services - 0.73% | | | | |
| | 9,083 | | Hornbeck Offshore Services, | | | | |
| | | | Inc. (a) | | | 138,425 | |
| | 10,791 | | T-3 Energy Services, Inc. (a) | | | 127,118 | |
| | 6,431 | | Willbros Group, Inc. (a) | | | 62,381 | |
| | | | | | | 327,924 | |
| | | | Food & Staples Retailing - 2.19% | | | | |
| | 20,610 | | Andersons, Inc. (b) | | | 291,426 | |
| | 4,030 | | Casey’s General Stores, Inc. | | | 107,440 | |
| | 61,450 | | Winn Dixie Stores, Inc. (a) | | | 587,462 | |
| | | | | | | 986,328 | |
| | | | Food Products - 0.84% | | | | |
| | 11,752 | | Dean Foods Co. (a) | | | 212,476 | |
| | 3,097 | | Ralcorp Holdings, Inc. (a) | | | 166,866 | |
| | | | | | | 379,342 | |
| Number of | | | | | |
| Shares | | | | Value | |
| | | Gas Utilities - 4.64% | | | |
| | 12,051 | | AGL Resources, Inc. (b) | | $ | 319,713 | |
| | 7,183 | | New Jersey Resources Corp. | | | 244,078 | |
| | 9,475 | | Northwest Natural Gas Co. | | | 411,405 | |
| | 33,190 | | Oneok, Inc. | | | 751,090 | |
| | 15,754 | | UGI Corp. | | | 371,952 | |
| | | | | | | 2,098,238 | |
| | | | Health Care Providers & Services - 3.37% | | | | |
| | 7,520 | | AMERIGROUP Corp. (a) | | | 207,101 | |
| | 9,150 | | AmSurg Corp. (a) | | | 145,027 | |
| | 37,828 | | Assisted Living Concepts, Inc. (a) | | | 512,948 | |
| | 5,690 | | Magellan Health Services, Inc. (a) | | | 207,344 | |
| | 13,023 | | PerkinElmer, Inc. | | | 166,304 | |
| | 7,384 | | Universal Health Services, Inc. (b) | | | 283,102 | |
| | | | | | | 1,521,826 | |
| | | | Hotels, Restaurants & Leisure - 4.34% | | | | |
| | 19,921 | | Callaway Golf Co. | | | 143,033 | |
| | 9,631 | | CEC Entertainment, Inc. (a) | | | 249,250 | |
| | 10,730 | | Cracker Barrel Old Country | | | | |
| | | | Store, Inc. | | | 307,307 | |
| | 15,370 | | Penn National Gaming, Inc. (a) | | | 371,186 | |
| | 13,740 | | Royal Caribbean Cruises Ltd. (b) | | | 110,057 | |
| | 21,070 | | Vail Resorts, Inc. (a) | | | 430,460 | |
| | 69,638 | | Wendy’s Arby’s Group, Inc. | | | 350,279 | |
| | | | | | | 1,961,572 | |
| | | | Household Durables - 0.92% | | | | |
| | 19,700 | | D.R. Horton, Inc. | | | 191,090 | |
| | 10,886 | | Ryland Group, Inc. | | | 181,361 | |
| | 47,025 | | Standard-Pacific Corp. (a)(b) | | | 41,382 | |
| | | | | | | 413,833 | |
| | | | Insurance - 5.66% | | | | |
| | 13,887 | | AMBAC Financial Group, Inc. (b) | | | 10,832 | |
| | 17,968 | | American Financial Group, Inc. | | | 288,386 | |
| | 9,530 | | Arch Capital Group Ltd. (a) | | | 513,286 | |
| | 6,690 | | Aspen Insurance Holdings Ltd | | | 150,257 | |
| | 14,074 | | Fidelity National Financial, Inc. | | | 274,584 | |
| | 15,680 | | The Hanover Insurance Group, Inc. | | | 451,898 | |
| | 3,800 | | White Mountains Insurance | | | | |
| | | | Group Ltd. | | | 653,258 | |
| | 9,510 | | WR Berkley Corp. | | | 214,450 | |
| | | | | | | 2,556,951 | |
See notes to financial statements.
AssetMark Small/Mid Cap Value Fund
SCHEDULE OF INVESTMENTS (Continued)
| Number of | | | | | |
| Shares | | | | Value | |
| | | COMMON STOCKS (Continued) | | | |
| | | Machinery - 2.68% | | | |
| | 5,550 | | Kennametal, Inc. (b) | | $ | 89,965 | |
| | 23,195 | | Manitowoc Co. (b) | | | 75,848 | |
| | 59,310 | | Mueller Water Products, | | | | |
| | | | Inc. - Class A | | | 195,723 | |
| | 10,564 | | Pall Corp. | | | 215,823 | |
| | 8,930 | | Robbins & Myers, Inc. | | | 135,468 | |
| | 13,750 | | Terex Corp. (a)(b) | | | 127,187 | |
| | 40,840 | | Trinity Industries, Inc. (b) | | | 373,278 | |
| | | | | | | 1,213,292 | |
| | | | Media - 1.03% | | | | |
| | 15,112 | | Cinemark Holdings, Inc. (b) | | | 141,902 | |
| | 18,490 | | Discovery Communications Inc. (a) | | | 296,210 | |
| | 23,330 | | Entercom Communications | | | | |
| | | | Corp. (b) | | | 25,663 | |
| | | | | | | 463,775 | |
| | | | Metals & Mining - 3.32% | | | | |
| | 15,960 | | Allegheny Technologies, Inc. | | | 350,003 | |
| | 37,950 | | Commercial Metals Co. | | | 438,322 | |
| | 6,460 | | Kaiser Aluminum Corp. (b) | | | 149,355 | |
| | 12,190 | | Schnitzer Steel Industries, Inc. | | | 382,644 | |
| | 20,612 | | Steel Dynamics, Inc. | | | 181,592 | |
| | | | | | | 1,501,916 | |
| | | | Multi-Utilities - 2.48% | | | | |
| | 75,040 | | CenterPoint Energy, Inc. | | | 782,667 | |
| | 16,010 | | Vectren Corp. | | | 337,651 | |
| | | | | | | 1,120,318 | |
| | | | Oil & Gas - 6.56% | | | | |
| | 9,599 | | Carrizo Oil & Gas, Inc. (a)(b) | | | 85,239 | |
| | 22,910 | | CNX Gas Corp. (a) | | | 543,196 | |
| | 11,750 | | Comstock Resources, Inc. (a)(b) | | | 350,150 | |
| | 31,450 | | Denbury Resources, Inc. (a) | | | 467,347 | |
| | 15,709 | | Encore Acquisition Co. (a) | | | 365,549 | |
| | 16,990 | | Overseas Shipholding Group, Inc. | | | 385,163 | |
| | 15,130 | | Plains All American | | | | |
| | | | Pipeline, L.P. (b) | | | 556,179 | |
| | 26,380 | | Quicksilver Resources, Inc. (a)(b) | | | 146,145 | |
| | 2,445 | | Whiting Petroleum Corp. (a)(b) | | | 63,203 | |
| | | | | | | 2,962,171 | |
| Number of | | | | | |
| Shares | | | | Value | |
| | | Pharmaceuticals - 2.20% | | | |
| | 30,360 | | King Pharmaceuticals, Inc. (a) | | $ | 214,645 | |
| | 8,344 | | Perrigo Co. | | | 207,182 | |
| | 13,200 | | Sepracor, Inc. (a)(b) | | | 193,512 | |
| | 12,212 | | Watson Pharmaceuticals, Inc. (a) | | | 379,915 | |
| | | | | | | 995,254 | |
| | | | Road & Rail - 0.86% | | | | |
| | 7,720 | | AMERCO (a) | | | 258,851 | |
| | 5,622 | | Old Dominion Freight Line (a)(b) | | | 132,061 | |
| | | | | | | 390,912 | |
| | | | Semiconductor & Semiconductor | | | | |
| | | | Equipment - 2.21% | | | | |
| | 19,520 | | Advanced Energy Industries, | | | | |
| | | | Inc. (a) | | | 146,986 | |
| | 35,629 | | Atmel Corp. (a) | | | 129,333 | |
| | 9,274 | | Brooks Automation, Inc. (a) | | | 42,753 | |
| | 15,280 | | Cypress Semiconductor Corp. (a) | | | 103,446 | |
| | 24,458 | | Diodes, Inc. (a)(b) | | | 259,499 | |
| | 49,481 | | Integrated Device Technology, | | | | |
| | | | Inc. (a) | | | 225,139 | |
| | 6,244 | | MKS Instruments, Inc. (a) | | | 91,599 | |
| | | | | | | 998,755 | |
| | | | Software - 0.44% | | | | |
| | 6,986 | | Novell, Inc. (a) | | | 29,760 | |
| | 16,772 | | Parametric Technology Corp. (a) | | | 167,385 | |
| | | | | | | 197,145 | |
| | | | Specialty Retail - 1.85% | | | | |
| | 3,267 | | Abercrombie & Fitch Co. | | | 77,754 | |
| | 21,270 | | Brown Shoe Co., Inc. (b) | | | 79,762 | |
| | 30,983 | | Chico’s FAS, Inc. (a) | | | 166,379 | |
| | 16,268 | | Foot Locker, Inc. (b) | | | 170,489 | |
| | 22,600 | | Men’s Wearhouse, Inc. | | | 342,164 | |
| | | | | | | 836,548 | |
| | | | Textiles, Apparel & Luxury Goods - 0.75% | | | | |
| | 49,724 | | Jones Apparel Group, Inc. | | | 209,836 | |
| | 5,615 | | Phillips-Van Heusen Corp. (b) | | | 127,348 | |
| | | | | | | 337,184 | |
| | | | Thrifts & Mortgage Finance - 5.10% | | | | |
| | 23,920 | | Capitol Federal Financial | | | 904,415 | |
| | 2,889 | | Dime Community Bancshares | | | 27,099 | |
| | 59,580 | | Hudson City Bancorp, Inc. | | | 696,490 | |
| | 39,044 | | TFS Financial Corp. | | | 473,604 | |
See notes to financial statements.
AssetMark Small/Mid Cap Value Fund
SCHEDULE OF INVESTMENTS (Continued)
| Number of | | | | | |
| Shares | | | | Value | |
| | | COMMON STOCKS (Continued) | | | |
| | | Thrifts & Mortgage Finance (Continued) | | | |
| $ | 11,012 | | Washington Federal, Inc. | | $ | 146,349 | |
| | 12,868 | | Webster Financial Corp. | | | 54,689 | |
| | | | | | | 2,302,646 | |
| | | | Tobacco - 0.81% | | | | |
| | 5,935 | | Lorillard, Inc. | | | 366,427 | |
| | | | Wireless Telecommunication Services - 0.25% | | | | |
| | 7,045 | | Syniverse Holdings, Inc. (a) | | | 111,029 | |
| | | | Total Common Stocks | | | | |
| | | | (Cost $61,460,198) | | | 42,556,333 | |
| | | | REAL ESTATE INVESTMENT TRUSTS - 7.04% | | | | |
| | | | Real Estate Investment Trusts - 7.04% | | | | |
| | 3,620 | | Alexandria Real Estate Equities, | | | | |
| | | | Inc. (b) | | | 131,768 | |
| | 7,247 | | American Campus Communities, Inc. | | | 125,808 | |
| | 59,050 | | Anworth Mortgage Asset Corp. | | | 361,976 | |
| | 5,430 | | Digital Realty Trust, Inc. (b) | | | 180,167 | |
| | 18,859 | | First Potomac Realty Trust | | | 138,614 | |
| | 7,750 | | Health Care REIT, Inc. (b) | | | 237,072 | |
| | 4,099 | | Healthcare Realty Trust, Inc. (b) | | | 61,444 | |
| | 43,535 | | MFA Mortgage Investments, Inc. | | | 255,986 | |
| | 10,204 | | National Retail Properties, Inc. (b) | | | 161,631 | |
| | 32,760 | | Plum Creek Timber Co., Inc. (b) | | | 952,333 | |
| | 17,196 | | Realty Income Corp. (b) | | | 323,629 | |
| | 3,831 | | Senior Housing Properties Trust | | | 53,711 | |
| | 14,160 | | SL Green Realty Corp. (b) | | | 152,928 | |
| | 16,209 | | Sunstone Hotel Investors, Inc. | | | 42,630 | |
| | | | | | | 3,179,697 | |
| | | | Total Real Estate Investment Trusts | | | | |
| | | | (Cost $5,369,834) | | | 3,179,697 | |
| | | | SHORT TERM INVESTMENTS - 1.16% | | | | |
| | | | Money Market Fund - 1.16% | | | | |
| | 525,896 | | Federated Prime Obligations Fund | | | 525,896 | |
| | | | Total Short Term Investments | | | | |
| | | | (Cost $525,896) | | | 525,896 | |
| Principal | | | | | | |
| Amount | | | | | | |
| | | | INVESTMENTS PURCHASED | | | | |
| | | | AS SECURITIES LENDING | | | | |
| | | | COLLATERAL - 15.85% | | | | |
| | | | Corporate Bonds and Notes - 6.68% | | | | |
| $ | 1,729,366 | | Bank of Scotland, | | | | |
| | | | 1.446%, 05/06/09 | | | 1,729,366 | |
| Principal | | | | | |
| Amount | | | | Value | |
| | | Corporate Bonds and Notes (Continued) | | | |
| $ | 1,297,025 | | Svenska Handelsbanken, | | | |
| | | | 4.418%, 08/06/09 (c) | | $ | 1,290,150 | |
| | | | Total Corporate Bonds and Notes | | | | |
| | | | (Cost $3,026,391) | | | 3,019,516 | |
| | | | | | | | |
| | | | Corporate Paydown Securities - 2.22% | | | | |
| | 975,362 | | KKR Atlantic East Holding Group | | | | |
| | | | Trust, 3.059%, 03/25/10 (d) | | | 528,549 | |
| | 1,101,458 | | KKR Pacific West Holding Group | | | | |
| | | | Trust, 3.059%, 03/25/10 (d) | | | 474,177 | |
| | | | Total Corporate Paydown Securities | | | | |
| | | | (Cost $2,076,820) | | | 1,002,726 | |
| Shares | | | | | | |
| | | | Money Market Funds - 6.94% | | | | |
| | 2,786,005 | | Mount Vernon Prime Portfolio | | | 2,786,005 | |
| | 403,656 | | Reserve Primary Fund (d) | | | 347,750 | |
| | | | Total Money Market Funds | | | | |
| | | | (Cost $3,189,661) | | | 3,133,755 | |
| Principal | | | | | | |
| Amount | | | | | | |
| | | | Cash - 0.01% | | | | |
| $ | 4,752 | | Principal Cash | | | 4,752 | |
| | | | Total Cash | | | | |
| | | | (Cost $4,752) | | | 4,752 | |
| | | | Total Investments Purchased as | | | | |
| | | | Securities Lending Collateral | | | | |
| | | | (Cost $8,297,624) | | | 7,160,749 | |
| | | | Total Investments | | | | |
| | | | (Cost $75,653,552) - 118.24% | | | 53,422,675 | |
| | | | Liabilities in Excess of | | | | |
| | | | Other Assets - (18.24)% | | | (8,243,021 | ) |
| | | | TOTAL NET | | | | |
| | | | ASSETS - 100.00% | | | | |
| | | | | | $ | 45,179,654 | |
| Percentages are stated as a percent of net assets. |
| (a) Non-income producing. |
| (b) All or a portion of this security is on loan. |
| (c) Restricted securities as defined in Rule 144(a) under the |
| Securities Act of 1933. Such securities are treated as liquid |
| securities according to the Fund’s liquidity guidelines. The value |
| of these securities total $1,290,150, which represents 2.86% of |
| total net assets. |
| (d) As of March 31, 2009, the Adviser has fair valued this security |
| and deemed it illiquid. The value of these securities were |
| $1,350,476, which represent 2.99% of total net assets. |
See notes to financial statements.
AssetMark International Equity Fund
SCHEDULE OF INVESTMENTS
| Number of | | | | | |
| Shares | | | | Value | |
| | | COMMON STOCKS - 97.40% | | | |
| | | Australia - 6.55% | | | |
| | 98,453 | | CSL Ltd. | | $ | 2,224,703 | |
| | 214,828 | | National Australia Bank Ltd. | | | 2,998,865 | |
| | 115,611 | | Newcrest Mining Ltd. (a) | | | 2,661,299 | |
| | 1,760,962 | | Telstra Corp. | | | 3,930,918 | |
| | 215,075 | | Wesfarmers Ltd. | | | 2,822,166 | |
| | | | | | | 14,637,951 | |
| | | | China - 2.09% | | | | |
| | 7,359,000 | | Bank Of China Ltd. | | | 2,439,770 | |
| | 676,000 | | China Life Insurance | | | | |
| | | | Company Ltd. | | | 2,223,372 | |
| | | | | | | 4,663,142 | |
| | | | Czech Republic - 0.86% | | | | |
| | 53,571 | | CEZ | | | 1,915,943 | |
| | | | Finland - 0.36% | | | | |
| | 141,043 | | UPM-Kymmene Corp. | | | 814,023 | |
| | | | France - 12.40% | | | | |
| | 109,414 | | Carrefour SA | | | 4,268,247 | |
| | 31,238 | | Casino Guichard Perrachon SA | | | 2,032,576 | |
| | 286,244 | | France Telecom SA | | | 6,525,564 | |
| | 77,887 | | GDF Suez SA | | | 2,671,109 | |
| | 57,310 | | Renault SA . | | | 1,178,417 | |
| | 93,253 | | Saint-Gobain SA | | | 2,612,863 | |
| | 35,836 | | Sanofi-Aventis SA | | | 2,011,162 | |
| | 46,066 | | Societe Generale SA | | | 1,801,962 | |
| | 92,697 | | TOTAL SA | | | 4,583,823 | |
| | | | | | | 27,685,723 | |
| | | | Germany - 5.88% | | | | |
| | 39,397 | | Allianz AG | | | 3,297,637 | |
| | 41,816 | | Deutsche Telekom AG | | | 517,934 | |
| | 99,693 | | E.ON AG | | | 2,764,902 | |
| | 54,786 | | RWE AG | | | 3,836,702 | |
| | 31,471 | | Siemens AG | | | 1,796,671 | |
| | 104,906 | | Tognum AG (a) | | | 909,936 | |
| | | | | | | 13,123,782 | |
| | | | Hong Kong - 2.31% | | | | |
| | 473,000 | | Hongkong Electric Holdings Ltd. | | | 2,810,276 | |
| | 263,000 | | Sun Hung Kai Properties Ltd. | | | 2,359,894 | |
| | | | | | | 5,170,170 | |
| Number of | | | | | | |
| Shares | | | | Value | |
| | | | Italy - 2.94% | | | | |
| | 135,816 | | ENI SpA | | $ | 2,629,708 | |
| | 934,710 | | Intesa Sanpaolo SpA | | | 2,570,908 | |
| | 123,836 | | UBI Banca ScpA | | | 1,363,579 | |
| | | | | | | 6,564,195 | |
| | | | Japan - 20.61% | | | | |
| | 240,900 | | Canon, Inc. | | | 7,022,675 | |
| | 36,600 | | East Japan Railway | | | 1,908,113 | |
| | 274 | | Inpex Holdings, Inc. | | | 1,940,438 | |
| | 495,000 | | Itochu Corp. | | | 2,442,342 | |
| | 190,000 | | Kao Corp. | | | 3,707,356 | |
| | 862 | | KDDI Corp. | | | 4,059,279 | |
| | 122,400 | | Millea Holdings, Inc. | | | 3,014,588 | |
| | 151,000 | | Mitsui Fudosan Co., Ltd. | | | 1,656,449 | |
| | 275,000 | | Sekisui House Ltd. | | | 2,105,245 | |
| | 113,300 | | Seven & i Holdings Co., Ltd. | | | 2,501,331 | |
| | 49,600 | | Shin-Etsu Chemical Co. Ltd. | | | 2,436,863 | |
| | 46,737 | | Sumitomo Mitsui Financial | | | | |
| | | | Group, Inc. | | | 1,645,674 | |
| | 114,500 | | Takeda Pharmaceutical Co. Ltd. | | | 3,972,528 | |
| | 195,300 | | Toyota Motor Corp. | | | 6,203,482 | |
| | 35,960 | | Yamada Denki Co. Ltd. | | | 1,419,159 | |
| | | | | | | 46,035,522 | |
| | | | Netherlands - 2.03% | | | | |
| | 196,237 | | Reed Elsevier NV | | | 2,099,905 | |
| | 124,050 | | Unilever NV | | | 2,443,935 | |
| | | | | | | 4,543,840 | |
| | | | Singapore - 3.38% | | | | |
| | 853,000 | | Oversea-Chinese Banking | | | | |
| | | | Corp. Ltd. | | | 2,719,329 | |
| | 1,175,000 | | Singapore Telecommunications Ltd. | | | 1,958,570 | |
| | 449,000 | | United Overseas Bank Ltd. | | | 2,880,015 | |
| | | | | | | 7,557,914 | |
| | | | Spain - 5.63% | | | | |
| | 816,564 | | Banco Santander Central | | | | |
| | | | Hispano SA | | | 5,630,047 | |
| | 460,383 | | Iberdrola Renovables (a) | | | 1,906,789 | |
| | 111,656 | | Iberdrola SA | | | 783,379 | |
| | 212,955 | | Telefonica SA | | | 4,246,614 | |
| | | | | | | 12,566,829 | |
| | | | Sweden - 0.93% | | | | |
| | 55,400 | | Hennes & Mauritz AB | | | 2,076,954 | |
See notes to financial statements.
AssetMark International Equity Fund
SCHEDULE OF INVESTMENTS (Continued)
| Number of | | | | | |
| Shares | | | | Value | |
| | | COMMON STOCKS (Continued) | | | |
| | | Switzerland - 7.92% | | | |
| | 125,769 | | Nestle SA | | $ | 4,249,026 | |
| | 122,423 | | Novartis AG | | | 4,631,699 | |
| | 32,342 | | Roche Holding AG | | | 4,438,944 | |
| | 7,335 | | Swisscom AG | | | 2,059,499 | |
| | 14,551 | | Zurich Financial Services AG | | | 2,299,688 | |
| | | | | | | 17,678,856 | |
| | | | Taiwan - 2.15% | | | | |
| | 537,300 | | Taiwan Semiconductor | | | | |
| | | | Manufacturing Co., Ltd. - ADR | | | 4,808,835 | |
| | | | United Kingdom - 21.36% | | | | |
| | 127,454 | | Autonomy Corp. Plc (a) | | | 2,379,505 | |
| | 484,360 | | Aviva Plc | | | 1,501,996 | |
| | 255,259 | | Babcock International Group Plc | | | 1,570,271 | |
| | 440,056 | | BAE Systems Plc | | | 2,110,553 | |
| | 160,596 | | BHP Billiton Plc | | | 3,167,847 | |
| | 1,171,026 | | BP Plc | | | 7,852,147 | |
| | 465,733 | | Compass Group Plc | | | 2,129,889 | |
| | 485,431 | | GlaxoSmithKline Plc | | | 7,560,413 | |
| | 374,339 | | HSBC Holdings Plc | | | 2,084,152 | |
| | 250,443 | | Reed Elsevier Plc | | | 1,795,677 | |
| | 94,800 | | Rio Tinto Plc | | | 3,183,192 | |
| | 205,818 | | Royal Dutch Shell Plc | | | 4,591,618 | |
| | 240,767 | | Unilever Plc | | | 4,552,824 | |
| | 1,843,967 | | Vodafone Group Plc | | | 3,214,862 | |
| | | | | | | 47,694,946 | |
| | | | Total Common Stocks | | | | |
| | | | (Cost $263,912,552) | | | 217,538,625 | |
| | | | PREFERRED STOCKS - 0.86% | | | | |
| | | | Brazil - 0.86% | | | | |
| | 78,300 | | Petroleo Brasileiro SA | | | 1,918,350 | |
| | | | Total Preferred Stocks | | | | |
| | | | (Cost $2,118,949) | | | 1,918,350 | |
| | | | RIGHTS - 0.14% | | | | |
| | | | United Kingdom - 0.14% | | | | |
| | 155,975 | | HSBC Holdings Plc | | | 315,557 | |
| | | | Total Rights (Cost $304,249) | | | 315,557 | |
| | | | SHORT TERM INVESTMENTS - 1.38% | |
| | | | Money Market Fund - 1.38% | | | | |
| | 3,082,411 | | Federated Prime Obligations Fund | | | 3,082,411 | |
| | | | Total Short Term Investments | | | | |
| | | | (Cost $3,082,411) | | | 3,082,411 | |
| Principal | | | | | |
| Amount | | | | Value | |
| | | INVESTMENTS PURCHASED | | | |
| | | AS SECURITIES LENDING | | | |
| | | COLLATERAL - 0.59% | | | |
| | | Corporate Paydown Securities - 0.45% | | | |
| $ | 987,708 | | KKR Atlantic East Holding Group | | | |
| | | | Trust, 3.059%, 03/25/10 (b) | | $ | 535,239 | |
| | 1,115,400 | | KKR Pacific West Holding Group | | | | |
| | | | Trust, 3.059%, 03/25/10 (b) | | | 480,180 | |
| | | | Total Corporate Paydown Securities | | | | |
| | | | (Cost $2,103,108) | | | 1,015,419 | |
| Shares | | | | | | |
| | | | Money Market Fund - 0.14% | | | | |
| | 353,535 | | Reserve Primary Fund (b) | | | 304,570 | |
| | | | Total Money Market Funds | | | | |
| | | | (Cost $353,535) | | | 304,570 | |
| | | | Total Investments Purchased as | | | | |
| | | | Securities Lending Collateral | | | | |
| | | | (Cost $2,456,643) | | | 1,319,989 | |
| | | | Total Investments | | | | |
| | | | (Cost $271,874,804) - 100.37% | | | 224,174,932 | |
| | | | Liabilities in Excess of | | | | |
| | | | Other Assets - (0.37)% | | | (835,731 | ) |
| | | | TOTAL NET | | | | |
| | | | ASSETS - 100.00% | | $ | 223,339,201 | |
| | | | | | | | |
| Percentages are stated as a percent of net assets. |
| ADR - American Depositary Receipt |
| (a) | Non-Income producing. |
| (b) | As of March 31, 2009, the Adviser has fair valued this security |
| | and deemed it illiquid. The value of these securities were |
| | $1,319,989, which represent 0.59% of total net assets |
See notes to financial statements.
AssetMark Real Estate Securities Fund
SCHEDULE OF INVESTMENTS
| Number of | | | | | |
| Shares | | | | Value | |
| | | COMMON STOCKS - 0.19% | | | |
| | | Office Property - 0.19% | | | |
| | 15,025 | | Brookfield Properties Co. | | $ | 86,244 | |
| | | | Total Common Stocks | | | | |
| | | | (Cost $83,213) | | | 86,244 | |
| | | | REAL ESTATE INVESTMENT | | | | |
| | | | TRUSTS, COMMON STOCKS - 98.08% | | | | |
| | | | Apartments - 16.16% | | | | |
| | 35,911 | | AvalonBay Communities, Inc. (a) | | | 1,689,972 | |
| | 41,912 | | BRE Properties, Inc. | | | 822,733 | |
| | 132,242 | | Equity Residential (a) | | | 2,426,641 | |
| | 25,219 | | Essex Property Trust, Inc. (a) | | | 1,446,057 | |
| | 9,110 | | Home Properties, Inc. | | | 279,221 | |
| | 9,700 | | Post Properties, Inc. | | | 98,358 | |
| | 81,200 | | UDR, Inc. | | | 699,132 | |
| | | | | | | 7,462,114 | |
| | | | Diversified - 14.22% | | | | |
| | 1,090 | | Alexander’s, Inc. | | | 185,714 | |
| | 12,820 | | American Campus | | | | |
| | | | Communities, Inc. | | | 222,555 | |
| | 49,790 | | Digital Realty Trust, Inc. (a) | | | 1,652,032 | |
| | 26,567 | | Entertainment Properties Trust (a). | | | 418,696 | |
| | 9,000 | | Equity Lifestyle Properties, Inc. | | | 342,900 | |
| | 48,175 | | Liberty Property Trust (a) | | | 912,435 | |
| | 2,700 | | PS Business Parks, Inc. | | | 99,495 | |
| | 75,360 | | Vornado Realty Trust (a) | | | 2,504,966 | |
| | 13,200 | | Washington Real Estate | | | | |
| | | | Investment Trust | | | 228,360 | |
| | | | | | | 6,567,153 | |
| | | | Health Care - 15.24% | | | | |
| | 122,595 | | HCP, Inc. (a) | | | 2,188,320 | |
| | 47,176 | | Health Care REIT, Inc. | | | 1,443,114 | |
| | 14,400 | | Healthcare Realty Trust, Inc. (a) | | | 215,856 | |
| | 82,280 | | Nationwide Health Properties, | | | | |
| | | | Inc. (a) | | | 1,825,793 | |
| | 60,326 | | Ventas, Inc. (a) | | | 1,363,971 | |
| | | | | | | 7,037,054 | |
| | | | Hotels & Motels - 1.24% | | | | |
| | 21,170 | | Diamondrock Hospitality Co. | | | 84,892 | |
| | 124,820 | | Host Hotels & Resorts, Inc. (a) | | | 489,294 | |
| | | | | | | 574,186 | |
| Number of | | | | | |
| Shares | | | | Value | |
| | | Office Property - 14.45% | | | |
| | 36,176 | | Alexandria Real Estate | | | |
| | | | Equities, Inc. (a) | | $ | 1,316,806 | |
| | 54,520 | | BioMed Realty Trust, Inc. | | | 369,100 | |
| | 57,768 | | Boston Properties, Inc. (a) | | | 2,023,613 | |
| | 25,500 | | Brandywine Realty Trust | | | 72,675 | |
| | 58,036 | | Corporate Office Properties | | | | |
| | | | Trust (a) | | | 1,441,034 | |
| | 43,120 | | Douglas Emmett, Inc. | | | 318,657 | |
| | 11,700 | | Highwoods Properties, Inc. (a) | | | 250,614 | |
| | 21,077 | | Kilroy Realty Corp. | | | 362,314 | |
| | 6,980 | | Mack-Cali Realty Corp. | | | 138,274 | |
| | 35,281 | | SL Green Realty Corp. (a) | | | 381,035 | |
| | | | | | | 6,674,122 | |
| | | | Paper & Forest Products - 1.91% | | | | |
| | 30,340 | | Plum Creek Timber Co., Inc. (a) | | | 881,984 | |
| | | | Regional Malls - 11.66% | | | | |
| | 16,300 | | CBL & Associates Properties, Inc.. | | | 38,468 | |
| | 90,626 | | The Macerich Co. (a) | | | 567,319 | |
| | 111,001 | | Simon Property Group, Inc. (a) | | | 3,845,075 | |
| | 54,860 | | Taubman Centers, Inc. (a) | | | 934,814 | |
| | | | | | | 5,385,676 | |
| | | | Shopping Centers - 11.53% | | | | |
| | 10,360 | | Developers Diversified Realty Corp. | | | 22,067 | |
| | 11,900 | | Equity One, Inc. (a) | | | 145,061 | |
| | 40,844 | | Federal Realty Investment Trust (a) | | | 1,878,824 | |
| | 47,630 | | Kimco Realty Corp. (a) | | | 362,941 | |
| | 34,470 | | National Retail Properties, Inc. (a) | | | 546,005 | |
| | 37,346 | | Regency Centers Corp. (a) | | | 992,283 | |
| | 16,900 | | Saul Centers, Inc. | | | 388,193 | |
| | 32,010 | | Tanger Factory Outlet Centers, | | | | |
| | | | Inc. (a) | | | 987,828 | |
| | | | | | | 5,323,202 | |
| | | | Storage - 7.33% | | | | |
| | 60,176 | | Extra Space Storage, Inc. | | | 331,570 | |
| | 55,320 | | Public Storage, Inc. (a) | | | 3,056,430 | |
| | | | | | | 3,388,000 | |
See notes to financial statements.
AssetMark Real Estate Securities Fund
SCHEDULE OF INVESTMENTS (Continued)
| Number of | | | | | |
| Shares | | | | Value | |
| | | COMMON STOCKS (Continued) | | | |
| | | Warehouse/Industrial - 4.34% | | | |
| | 62,104 | | AMB Property Corp. | | $ | 894,298 | |
| | 29,570 | | DCT Industrial Trust, Inc. (a) | | | 93,737 | |
| | 13,750 | | EastGroup Properties, Inc. | | | 385,962 | |
| | 96,962 | | ProLogis (a) | | | 630,253 | |
| | | | | | | 2,004,250 | |
| | | | Total Real Estate Investment | | | | |
| | | | Trusts, Common Stocks | | | | |
| | | | (Cost $55,524,447) | | | 45,297,741 | |
| | | | REAL ESTATE INVESTMENT | | | | |
| | | | TRUSTS, PREFERRED STOCKS - 1.95% | | | | |
| | | | Diversified - 0.35% | | | | |
| | 10,700 | | Vornado Realty Trust (a) | | | 162,105 | |
| | | | Office Property - 1.09% | | | | |
| | 18,400 | | Corporate Office Properties Trust (a) | | | 330,648 | |
| | 8,800 | | Kilroy Realty Corp. | | | 114,840 | |
| | 5,500 | | SL Green Realty Corp. (a) | | | 56,925 | |
| | | | | | | 502,413 | |
| | | | Regional Malls - 0.35% | | | | |
| | 10,600 | | Taubman Centers, Inc. (a) | | | 161,226 | |
| | | | Shopping Centers - 0.16% | | | | |
| | 4,500 | | Regency Centers LP (a) | | | 74,250 | |
| | | | Total Real Estate Investment | | | | |
| | | | Trusts, Preferred Stocks | | | | |
| | | | (Cost $1,130,963) | | | 899,994 | |
| | | | SHORT TERM INVESTMENTS - 1.55% | | | | |
| | | | Money Market Fund - 1.55% | | | | |
| | 714,368 | | Federated Prime Obligations Fund . | | | 714,368 | |
| | | | Total Short Term Investments | | | | |
| | | | (Cost $714,368) | | | 714,368 | |
| Principal | | | | | | |
| Amount | | | | | | |
| | | | INVESTMENTS PURCHASED | | | | |
| | | | AS SECURITIES LENDING | | | | |
| | | | COLLATERAL - 22.12% | | | | |
| | | | Corporate Bonds and Notes - 10.21% | | | | |
| $ | 2,701,391 | | Bank of Scotland, | | | | |
| | | | 1.446%, 05/06/09 | | | 2,701,391 | |
| | 2,026,043 | | Svenska Handelsbanken, | | | | |
| | | | 4.418%, 08/06/09 (b) | | | 2,015,305 | |
| | | | Total Corporate Bonds and Notes | | | | |
| | | | (Cost $4,727,434) | | | 4,716,696 | |
| Principal | | | | | |
| Amount | | | | Value | |
| | | Corporate Paydown Securities - 2.04% | | | |
| $ | 918,569 | | KKR Atlantic East Holding Group | | | |
| | | | Trust, 3.059%, 03/25/10 (c) | | $ | 497,773 | |
| | 1,037,322 | | KKR Pacific West Holding Group | | | | |
| | | | Trust, 3.059%, 03/25/10 (c) | | | 446,567 | |
| | | | Total Corporate Paydown Securities | | | | |
| | | | (Cost $1,955,891) | | | 944,340 | |
| Shares | | | | | | |
| | | | Money Market Funds - 9.85% | | | | |
| | 4,351,934 | | Mount Vernon Prime Portfolio | | | 4,351,934 | |
| | 226,441 | | Reserve Primary Fund (c) | | | 195,079 | |
| | | | Total Money Market Funds | | | | |
| | | | (Cost $4,578,375) | | | 4,547,013 | |
| Principal | | | | | | |
| Amount | | | | | | |
| | | | Cash - 0.02% | | | | |
| $ | 7,423 | | Cash | | | 7,423 | |
| | | | Total Cash | | | | |
| | | | (Cost $7,423) | | | 7,423 | |
| | | | Total Investments Purchased as | | | | |
| | | | Securities Lending Collateral | | | | |
| | | | (Cost $11,269,123) | | | 10,215,472 | |
| | | | Total Investments | | | | |
| | | | (Cost $68,722,114) - 123.89% | | | 57,213,819 | |
| | | | Liabilities in Excess of | | | | |
| | | | Other Assets - (23.89)% | | | (11,032,141 | ) |
| | | | TOTAL NET | | | | |
| | | | ASSETS - 100.00% | | $ | 46,181,678 | |
| Percentages are stated as a percent of net assets. |
| (a) | All or a portion of this security is on loan. |
| (b) | Restricted securities as defined in Rule 144(a) under the |
| | Securities Act of 1933. Such securities are treated as liquid |
| | securities according to the Fund’s liquidity guidelines. The value |
| | of these securities total $2,015,305, which represents 4.36% of |
| | total net assets. |
| (c) | As of March 31, 2009, the Adviser has fair valued this security |
| | and deemed it illiquid. The value of these securities were |
| | $1,139,419, which represent 2.47% of total net assets |
See notes to financial statements.
AssetMark Tax-Exempt Fixed Income Fund
SCHEDULE OF INVESTMENTS
| Principal | | | | | |
| Amount | | | | Value | |
| | | MUNICIPAL BONDS - 97.76% | | | |
| | | Alabama - 0.95% | | | |
| $ | 1,000,000 | | Jefferson County Schools, | | | |
| | | | Revenue Bond, FSA Insured, | | | |
| | | | 5.500%, 01/01/2021 | | $ | 795,960 | |
| | 1,000,000 | | Mobile Industrial Development | | | | |
| | | | Board Pollution Control, Revenue | | | | |
| | | | Bond, 4.880%, 06/01/2034 | | | 1,040,290 | |
| | | | | | | 1,836,250 | |
| | | | Arizona - 3.24% | | | | |
| | 135,000 | | Maricopa County Elementary | | | | |
| | | | School District, Refunding, | | | | |
| | | | GO, FSA Insured, | | | | |
| | | | 5.000%, 07/01/2012 | | | 147,702 | |
| | 965,000 | | Maricopa County Industrial | | | | |
| | | | Development Authority Senior | | | | |
| | | | Living Facilities, Refunding, | | | | |
| | | | Revenue Bond, | | | | |
| | | | 3.650%, 09/15/2035 | | | 969,391 | |
| | 1,000,000 | | Phoenix Civic Improvement | | | | |
| | | | Wastewater System, Refunding, | | | | |
| | | | Revenue Bond, | | | | |
| | | | 5.000%, 07/01/2020 | | | 1,071,760 | |
| | | | Pinal County Industrial Development | | | | |
| | | | Authority Correctional Facilities, | | | | |
| | | | Revenue Bond, ACA Insured, | | | | |
| | 750,000 | | 5.250%, 10/01/2014 | | | 694,192 | |
| | 1,000,000 | | 5.250%, 10/01/2015 | | | 903,130 | |
| | 1,000,000 | | Pinal County, CP, | | | | |
| | | | 5.000%, 12/01/2029 | | | 851,550 | |
| | 1,500,000 | | Salt River Project, Series A, | | | | |
| | | | Revenue Bond, | | | | |
| | | | 5.000%, 01/01/2021 | | | 1,635,105 | |
| | | | | | | 6,272,830 | |
| | | | California - 9.10% | | | | |
| | 1,000,000 | | California Communities Development | | | | |
| | | | Authority, Revenue Bond, | | | | |
| | | | 5.500%, 07/01/2037 | | | 658,530 | |
| | 3,600,000 | | California Communities Development | | | | |
| | | | Authority, Series C, Revenue Bond, | | | | |
| | | | 3.850%, 11/01/2029 | | | 3,581,856 | |
| | 920,000 | | California Community College of | | | | |
| | | | the Desert District, Series C, | | | | |
| | | | GO, FSA Insured, | | | | |
| | | | 5.000%, 08/01/2037 | | | 866,843 | |
| Principal | | | | | |
| Amount | | | | Value | |
| | | California (Continued) | | | |
| $ | 1,000,000 | | California Educational Facilities | | | |
| | | | Authority, Revenue Bond, | | | |
| | | | 5.000%, 10/01/2039 | | $ | 975,550 | |
| | | | California, GO, | | | | |
| | 1,000,000 | | 5.000%, 06/01/2031 | | | 887,500 | |
| | 1,000,000 | | 6.500%, 04/01/2033 | | | 1,051,750 | |
| | 600,000 | | California Statewide Community | | | | |
| | | | Development Authority, Series A, | | | | |
| | | | Revenue Bond, ACA Insured, | | | | |
| | | | 5.630%, 08/01/2034 | | | 433,650 | |
| | 1,000,000 | | Gilroy Unified School District, GO, | | | | |
| | | | Assured Guaranty Inured, | | | | |
| | | | 6.000%, 08/01/2025 | | | 1,084,860 | |
| | 2,970,000 | | Golden West Schools Funding | | | | |
| | | | Authority, Refunding, GO, | | | | |
| | | | AMBAC Insured, | | | | |
| | | | 5.500%, 08/01/2019 | | | 3,408,758 | |
| | 1,000,000 | | Los Angeles Community College | | | | |
| | | | District, Series F, GO, | | | | |
| | | | 5.000%, 08/01/2033 | | | 931,980 | |
| | 145,000 | | Los Angeles Unified School District, | | | | |
| | | | Series A, Refunding, GO, | | | | |
| | | | FGIC Insured, | | | | |
| | | | 4.250%, 01/01/2028 | | | 123,257 | |
| | 1,210,000 | | Los Angeles Unified School | | | | |
| | | | District, Series F, GO, | | | | |
| | | | 5.000%, 01/01/2034 | | | 1,139,530 | |
| | 500,000 | | Roseville Westpark Community | | | | |
| | | | Facilities, Special Tax, | | | | |
| | | | 5.250%, 09/01/2037 | | | 316,255 | |
| | 1,000,000 | | Sacramento County Sanitation | | | | |
| | | | District, Revenue Bond, | | | | |
| | | | 5.000%, 12/01/2036 | | | 936,020 | |
| | 1,175,000 | | San Francisco Steinhart Aquarium, | | | | |
| | | | Series F, GO, | | | | |
| | | | 5.000%, 06/15/2023 | | | 1,213,998 | |
| | | | | | | 17,610,337 | |
| | | | Colorado - 1.12% | | | | |
| | | | Denver City & County Justice | | | | |
| | | | System, GO, | | | | |
| | 1,500,000 | | 5.000%, 08/01/2023 | | | 1,624,245 | |
| | 500,000 | | 5.000%, 08/01/2024 | | | 535,365 | |
| | | | | | | 2,159,610 | |
See notes to financial statements.
AssetMark Tax-Exempt Fixed Income Fund
SCHEDULE OF INVESTMENTS (Continued)
| Principal | | | | | |
| Amount | | | | Value | |
| | | MUNICIPAL BONDS (Continued) | | | |
| | | Connecticut - 0.52% | | | |
| $ | 1,000,000 | | Connecticut Health & Educational | | | |
| | | | Facilities Authority, Revenue Bond, | | | |
| | | | 4.700%, 07/01/2029 | | $ | 1,012,210 | |
| | | | Delaware - 0.32% | | | | |
| | 1,000,000 | | New Castle County, Revenue Bond, | | | | |
| | | | 5.000%, 09/01/2036 | | | 627,280 | |
| | | | District of Columbia - 0.10% | | | | |
| | 200,000 | | District of Columbia, Series B, | | | | |
| | | | Unrefunded, GO, | | | | |
| | | | 5.500%, 06/01/2009 | | | 201,162 | |
| | | | Florida - 3.04% | | | | |
| | 315,000 | | Beacon Lakes Community | | | | |
| | | | Development, Series A, | | | | |
| | | | Special Assessment, | | | | |
| | | | 6.000%, 05/01/2038 | | | 185,589 | |
| | 245,000 | | Boynton Village Community | | | | |
| | | | Development District, Series A, | | | | |
| | | | Special Assessment, | | | | |
| | | | 5.750%, 05/01/2037 | | | 140,133 | |
| | 1,375,000 | | Highlands County Health Facilities | | | | |
| | | | Authority, Revenue Bond, | | | | |
| | | | 5.000%, 11/15/2029 | | | 1,405,827 | |
| | 1,250,000 | | Miami-Dade County Educational | | | | |
| | | | Facilities, Series A, Revenue Bond, | | | | |
| | | | 5.000%, 04/01/2034 | | | 1,418,488 | |
| | 625,000 | | Palm Glades Community | | | | |
| | | | Development, Series B, | | | | |
| | | | Special Assessment, | | | | |
| | | | 4.850%, 08/01/2011 | | | 420,531 | |
| | 1,200,000 | | Seminole Tribe Special Obligation, | | | | |
| | | | Series A, Revenue Bond, | | | | |
| | | | 5.750%, 10/01/2022 | | | 923,616 | |
| | 625,000 | | Tolomato Community Development | | | | |
| | | | District, Special Assessment, | | | | |
| | | | 6.380%, 05/01/2017 | | | 499,606 | |
| | 1,000,000 | | University of Florida, Revenue Bond, | | | | |
| | | | AMBAC Insured, | | | | |
| | | | 5.130%, 09/01/2033 | | | 888,590 | |
| | | | | | | 5,882,380 | |
| Principal | | | | | |
| Amount | | | | Value | |
| | | Georgia - 2.95% | | | |
| $ | 350,000 | | Chatham County Hospital Authority, | | | |
| | | | Revenue Bond, | | | |
| | | | 6.130%, 01/01/2024 | | $ | 288,722 | |
| | 1,000,000 | | Fulton County School District, | | | | |
| | | | Refunding, GO, | | | | |
| | | | 5.250%, 01/01/2014 | | | 1,133,770 | |
| | 1,400,000 | | Gainesville Educational Facilities | | | | |
| | | | Redevelopment Authority, | | | | |
| | | | Refunding, Revenue Bond, | | | | |
| | | | 5.130%, 03/01/2037 | | | 752,794 | |
| | 1,500,000 | | Georgia, Series B, GO, | | | | |
| | | | 5.000%, 01/01/2027 | | | 1,579,110 | |
| | 470,000 | | Marietta Development Authority, | | | | |
| | | | Revenue Bond, | | | | |
| | | | 7.000%, 06/15/2039 | | | 350,474 | |
| | 1,500,000 | | Municipal Electric Authority of | | | | |
| | | | Georgia, Series A, Refunding, | | | | |
| | | | Revenue Bond, | | | | |
| | | | 5.250%, 01/01/2018 | | | 1,614,180 | |
| | | | | | | 5,719,050 | |
| | | | Idaho - 0.54% | | | | |
| | 1,000,000 | | Boise-Kuna District, Revenue Bond, | | | | |
| | | | 7.380%, 06/01/2034 | | | 1,040,670 | |
| | | | Illinois - 11.98% | | | | |
| | 1,250,000 | | Chicago Board of Education, | | | | |
| | | | Series B, Refunding, GO, | | | | |
| | | | 5.000%, 12/01/2023 | | | 1,268,350 | |
| | 100,000 | | Chicago Metropolitan Water | | | | |
| | | | Reclamation District Greater | | | | |
| | | | Chicago, Refunding, GO, | | | | |
| | | | 6.050%, 12/01/2009 | | | 103,603 | |
| | 75,000 | | Chicago Park District, Revenue Bond, | | | | |
| | | | ACA Insured, | | | | |
| | | | 6.250%, 01/01/2016 | | | 78,084 | |
| | | | Chicago Wastewater Transmission, | | | | |
| | | | Refunding, Revenue Bond, | | | | |
| | | | FGIC Insured, | | | | |
| | 625,000 | | 5.500%, 01/01/2010 | | | 644,037 | |
| | 100,000 | | 5.380%, 01/01/2013 | | | 108,694 | |
| | | | Chicago, GO, | | | | |
| | 2,500,000 | | 5.000%, 12/01/2024 | | | 2,509,300 | |
| | 1,000,000 | | 5.000%, 01/01/2026 | | | 1,010,360 | |
See notes to financial statements.
AssetMark Tax-Exempt Fixed Income Fund
SCHEDULE OF INVESTMENTS (Continued)
| Principal | | | | | |
| Amount | | | | Value | |
| | | MUNICIPAL BONDS (Continued) | | | |
| | | Illinois (Continued) | | | |
| $ | 1,050,000 | | Illinois Finance Authority Sherman | | | |
| | | | Health Systems, Refunding, | | | |
| | | | Revenue Bond, | | | |
| | | | 5.500%, 08/01/2037 | | $ | 699,836 | |
| | | | Illinois Finance Authority, Series A, | | | | |
| | | | Revenue Bond, | | | | |
| | 1,370,000 | | 5.250%, 10/01/2010 | | | 1,428,622 | |
| | 250,000 | | 5.000%, 04/01/2017 | | | 228,800 | |
| | 650,000 | | Illinois Finance Authority, Series B, | | | | |
| | | | Revenue Bond, | | | | |
| | | | 5.500%, 08/15/2028 | | | 582,485 | |
| | 1,000,000 | | Illinois State Sales Tax, Revenue Bond, | | | | |
| | | | 5.250%, 06/15/2024 | | | 1,038,420 | |
| | 2,500,000 | | Illinois State Toll Highway | | | | |
| | | | Authority, Series A, Revenue Bond, | | | | |
| | | | FSA Insured, | | | | |
| | | | 5.000%, 01/01/2026 | | | 2,895,550 | |
| | 1,000,000 | | Illinois, Series 1, GO, | | | | |
| | | | 5.380%, 07/01/2013 | | | 1,130,050 | |
| | 2,690,000 | | Lombard Public Facilities, | | | | |
| | | | Series B, Revenue Bond, | | | | |
| | | | 5.250%, 01/01/2030 | | | 2,508,398 | |
| | 675,000 | | Markham, Series C, GO, | | | | |
| | | | 4.750%, 02/01/2017 | | | 637,038 | |
| | 500,000 | | Northlake, GO, FGIC Insured, | | | | |
| | | | 5.000%, 12/01/2029 | | | 483,705 | |
| | 500,000 | | Regional Transportation Authority, | | | | |
| | | | Series B, Revenue Bond, | | | | |
| | | | FGIC Insured, | | | | |
| | | | 5.380%, 06/01/2014 | | | 549,000 | |
| | 2,000,000 | | Southwestern Illinois Development | | | | |
| | | | Authority, Revenue Bond, | | | | |
| | | | 5.750%, 02/01/2029 | | | 2,100,920 | |
| | 3,030,000 | | St. Clair County High School | | | | |
| | | | District No. 203, Series A, | | | | |
| | | | GO, AMBAC Insured, | | | | |
| | | | 5.750%, 12/01/2026 | | | 3,194,468 | |
| | | | | | | 23,199,720 | |
| | | | Indiana - 2.71% | | | | |
| | 195,000 | | Allen County War Memorial, | | | | |
| | | | Revenue Bond, | | | | |
| | | | 4.500%, 05/01/2019 | | | 200,162 | |
| Principal | | | | | |
| Amount | | | | Value | |
| | | Indiana (Continued) | | | |
| | | Noblesville Redevelopment | | | |
| | | Authority, Revenue Bond, | | | |
| $ | 200,000 | | 4.500%, 02/01/2011 | | $ | 209,404 | |
| | 305,000 | | 4.500%, 08/01/2012 | | | 326,368 | |
| | 820,000 | | Portage Economic Development, | | | | |
| | | | Revenue Bond, | | | | |
| | | | 5.000%, 07/15/2023 | | | 583,471 | |
| | 1,155,000 | | Sheridan Community School’s | | | | |
| | | | Building Corporation, Revenue | | | | |
| | | | Bond, FSA Insured, | | | | |
| | | | 5.500%, 07/15/2020 | | | 1,293,877 | |
| | 1,285,000 | | Tri-Creek Middle School Building | | | | |
| | | | Corporation, Revenue Bond, | | | | |
| | | | FSA Insured, | | | | |
| | | | 5.250%, 07/15/2021 | | | 1,416,841 | |
| | 1,135,000 | | Wayne Township Marion County | | | | |
| | | | School Building Corporation, | | | | |
| | | | Revenue Bond, MBIA Insured, | | | | |
| | | | 5.500%, 07/15/2023 | | | 1,224,211 | |
| | | | | | | 5,254,334 | |
| | | | Iowa - 0.62% | | | | |
| | 600,000 | | Iowa Finance Authority Health | | | | |
| | | | Facilities, Revenue Bond, | | | | |
| | | | 5.250%, 07/01/2010 | | | 585,618 | |
| | 600,000 | | Iowa Finance Authority Pollution | | | | |
| | | | Control, Revenue Bond, | | | | |
| | | | FGIC Insured, | | | | |
| | | | 5.000%, 07/01/2014 | | | 611,586 | |
| | | | | | | 1,197,204 | |
| | | | Kansas - 0.22% | | | | |
| | 720,000 | | Wyandotte County, Revenue Bond, | | | | |
| | | | 4.880%, 10/01/2028 | | | 431,662 | |
| | | | Kentucky - 0.82% | | | | |
| | 500,000 | | Kentucky Economic Development | | | | |
| | | | Finance Authority, Revenue Bond, | | | | |
| | | | 5.750%, 12/01/2028 | | | 505,275 | |
| | | | Murray Hospital Facilities, | | | | |
| | | | Refunding, Revenue Bond, | | | | |
| | 535,000 | | 4.200%, 08/01/2010 | | | 519,940 | |
| | 630,000 | | 4.380%, 08/01/2014 | | | 558,986 | |
| | | | | | | 1,584,201 | |
See notes to financial statements.
AssetMark Tax-Exempt Fixed Income Fund
SCHEDULE OF INVESTMENTS (Continued)
| Principal | | | | | |
| Amount | | | | Value | |
| | | MUNICIPAL BONDS (Continued) | | | |
| | | Louisiana - 2.86% | | | |
| $ | 1,000,000 | | Louisiana Office Facilities Corp., | | | |
| | | | Revenue Bond, AMBAC Insured, | | | |
| | | | 5.500%, 05/01/2016 | | $ | 1,055,630 | |
| | 2,805,000 | | Louisiana Public Facilities Authority, | | | | |
| | | | Revenue Bond, | | | | |
| | | | 5.500%, 05/15/2032 | | | 3,169,566 | |
| | 1,235,000 | | Louisiana, Series A, GO, | | | | |
| | | | 5.000%, 10/15/2018 | | | 1,305,790 | |
| | | | | | | 5,530,986 | |
| | | | Maine - 0.24% | | | | |
| | 500,000 | | South Berwick Education, | | | | |
| | | | Revenue Bond, | | | | |
| | | | 5.250%, 08/01/2013 | | | 465,995 | |
| | | | Maryland - 1.96% | | | | |
| | 1,160,000 | | Maryland Department of | | | | |
| | | | Transportation County T | | | | |
| | | | Construction, Revenue Bond, | | | | |
| | | | 5.500%, 02/01/2017 | | | 1,364,473 | |
| | 1,000,000 | | Maryland Health & Higher | | | | |
| | | | Education Facilities Authority, | | | | |
| | | | Refunding, Revenue Bond, | | | | |
| | | | 5.000%, 07/01/2013 | | | 999,970 | |
| | | | Maryland Health & Higher | | | | |
| | | | Education Facilities Authority, | | | | |
| | | | Revenue Bond, | | | | |
| | 750,000 | | 5.200%, 01/01/2024 | | | 544,058 | |
| | 245,000 | | 5.000%, 05/15/2048 | | | 258,438 | |
| | 860,000 | | Maryland Student Housing Economic | | | | |
| | | | Development, Revenue Bond, | | | | |
| | | | 5.750%, 06/01/2033 | | | 619,570 | |
| | | | | | | 3,786,509 | |
| | | | Massachusetts - 2.38% | | | | |
| | 95,000 | | Massachusetts Bay Transportation | | | | |
| | | | Authority, Series C, Revenue Bond, | | | | |
| | | | 5.500%, 03/01/2012 | | | 105,783 | |
| | 785,000 | | Massachusetts Health & Educational | | | | |
| | | | Facilities Authority, Series A, | | | | |
| | | | Refunding, Revenue Bond, | | | | |
| | | | 5.500%, 11/15/2036 | | | 833,097 | |
| | 1,000,000 | | Massachusetts Health & Educational | | | | |
| | | | Facilities Authority, Series A, | | | | |
| | | | Revenue Bond, | | | | |
| | | | 5.000%, 07/15/2036 | | | 1,011,750 | |
| Principal | | | | | |
| Amount | | | | Value | |
| | | Massachusetts (Continued) | | | |
| $ | 1,000,000 | | Massachusetts Health & Educational | | | |
| | | | Facilities Authority, Series B, | | | |
| | | | Revenue Bond, | | | |
| | | | 5.000%, 10/01/2038 | | $ | 1,015,210 | |
| | 120,000 | | Massachusetts State Water Resources | | | | |
| | | | Authority, Series B, Revenue Bond, | | | | |
| | | | 6.250%, 12/01/2011 | | | 136,468 | |
| | 1,500,000 | | Massachusetts, Series A | | | | |
| | | | Refunding, GO, | | | | |
| | | | 5.000%, 09/01/2032 | | | 1,497,885 | |
| | | | | | | 4,600,193 | |
| | | | Michigan - 1.45% | | | | |
| | 75,000 | | Detroit Sewer Disposal, | | | | |
| | | | Revenue Bond, | | | | |
| | | | 7.100%, 12/15/2009 | | | 75,782 | |
| | 150,000 | | Dundee Community School District, | | | | |
| | | | GO, Q-SBLF Insured, | | | | |
| | | | 5.380%, 05/01/2010 | | | 157,332 | |
| | 600,000 | | Kent Hospital Finance Authority, | | | | |
| | | | Series A, Revenue Bond, | | | | |
| | | | 5.500%, 01/15/2047 | | | 609,438 | |
| | 800,000 | | Lansing School District, Refunding, | | | | |
| | | | GO, Q-SBLF Insured, | | | | |
| | | | 5.000%, 05/01/2017 | | | 868,928 | |
| | 730,000 | | Michigan Building Authority, | | | | |
| | | | Series I, Refunding, Revenue Bond, | | | | |
| | | | 4.750%, 10/15/2025 | | | 642,918 | |
| | 455,000 | | Michigan State Hospital Finance | | | | |
| | | | Authority, Revenue Bond, | | | | |
| | | | 7.130%, 05/01/2009 | | | 455,933 | |
| | | | | | | 2,810,331 | |
| | | | Minnesota - 1.33% | | | | |
| | 800,000 | | Minneapolis Health Care, Series A, | | | | |
| | | | Refunding, Revenue Bond, | | | | |
| | | | 6.625%, 11/15/2028 | | | 823,696 | |
| | 295,000 | | Prior Lake Independent School | | | | |
| | | | District, Series A, GO, FGIC Insured, | | | | |
| | | | 4.750%, 02/01/2010 | | | 303,396 | |
| | 1,325,000 | | St. Paul Sewer, Series D, | | | | |
| | | | Revenue Bond, | | | | |
| | | | 5.000%, 12/01/2021 | | | 1,456,665 | |
| | | | | | | 2,583,757 | |
See notes to financial statements.
AssetMark Tax-Exempt Fixed Income Fund
SCHEDULE OF INVESTMENTS (Continued)
| Principal | | | | | |
| Amount | | | | Value | |
| | | MUNICIPAL BONDS (Continued) | | | |
| | | Missouri - 2.64% | | | |
| $ | 350,000 | | Cape Girardeau County Industrial | | | |
| | | | Development, Revenue Bond, | | | |
| | | | 4.250%, 06/01/2009 | | $ | 349,573 | |
| | 500,000 | | Carroll County Public Water Supply | | | | |
| | | | District, Series B, Revenue Bond, | | | | |
| | | | 4.625%, 03/01/2012 | | | 500,025 | |
| | 900,000 | | Missouri Development Finance | | | | |
| | | | Board, Revenue Bond, | | | | |
| | | | 5.750%, 06/01/2034 | | | 878,877 | |
| | 1,000,000 | | Missouri Health & Educational | | | | |
| | | | Facilities Authority, Series A, | | | | |
| | | | Revenue Bond, | | | | |
| | | | 5.375%, 03/15/2039 | | | 1,036,990 | |
| | 1,000,000 | | Missouri Highway & Transportation | | | | |
| | | | Commission, Series B, Revenue Bond, | | | | |
| | | | 5.000%, 05/01/2024 | | | 1,055,400 | |
| | 1,330,000 | | St. Joseph Industrial Development | | | | |
| | | | Authority, Revenue Bond, | | | | |
| | | | 5.000%, 04/01/2027 | | | 1,285,578 | |
| | | | | | | 5,106,443 | |
| | | | New Hampshire - 0.63% | | | | |
| | 1,750,000 | | New Hampshire Health & Education | | | | |
| | | | Facilities, Revenue Bond, | | | | |
| | | | 5.250%, 06/01/2036 | | | 1,212,470 | |
| | | | New Jersey - 2.96% | | | | |
| | 700,000 | | New Jersey Economic Development | | | | |
| | | | Authority Cigarette Tax, | | | | |
| | | | Revenue Bond, | | | | |
| | | | 5.630%, 06/15/2019 | | | 603,449 | |
| | 500,000 | | New Jersey Economic Development | | | | |
| | | | Authority, Revenue Bond, | | | | |
| | | | FSA Insured, | | | | |
| | | | 5.000%, 09/01/2020 | | | 541,795 | |
| | 1,000,000 | | New Jersey Transportation Trust | | | | |
| | | | Fund Authority, Series A, | | | | |
| | | | Revenue Bond, | | | | |
| | | | 5.875%, 12/15/2038 | | | 1,043,850 | |
| | 1,600,000 | | New Jersey, Series L, Refunding, GO, | | | | |
| | | | 5.250%, 07/15/2019 | | | 1,835,520 | |
| | 1,500,000 | | New Jersey, Series N, GO, | | | | |
| | | | 5.500%, 07/15/2013 | | | 1,700,580 | |
| | | | | | | 5,725,194 | |
| Principal | | | | | |
| Amount | | | | Value | |
| | | New Mexico - 0.59% | | | |
| $ | 1,035,000 | | University of New Mexico, | | | |
| | | | Refunding, Revenue Bond, | | | |
| | | | 5.250%, 06/01/2014 | | $ | 1,143,768 | |
| | | | New York - 8.79% | | | | |
| | 1,000,000 | | East Rochester Housing Authority | | | | |
| | | | Senior Living, Revenue Bond, | | | | |
| | | | 5.500%, 08/01/2033 | | | 634,680 | |
| | 1,000,000 | | Hudson Yards Infrastructure | | | | |
| | | | Corporation, Series A, | | | | |
| | | | Revenue Bond, | | | | |
| | | | 5.000%, 02/15/2047 | | | 813,280 | |
| | 220,000 | | Long Island Power Authority, | | | | |
| | | | Series A, Revenue Bond, | | | | |
| | | | 5.750%, 04/01/2039 | | | 220,662 | |
| | 1,765,000 | | Metropolitan Transportation Authority, | | | | |
| | | | Series F, Revenue Bond, | | | | |
| | | | 5.000%, 11/15/2014 | | | 1,883,096 | |
| | 1,000,000 | | New York City Industrial | | | | |
| | | | Development Agency Queens | | | | |
| | | | Baseball Stadium, Revenue Bond, | | | | |
| | | | 4.750%, 01/01/2042 | | | 758,400 | |
| | 800,000 | | New York City Municipal Water | | | | |
| | | | Finance Authority, Series A, | | | | |
| | | | Revenue Bond, | | | | |
| | | | 5.750%, 06/15/2040 | | | 842,544 | |
| | 500,000 | | New York City Transit Authority, | | | | |
| | | | Series A, CP, AMBAC Insured, | | | | |
| | | | 5.630%, 01/01/2012 | | | 519,950 | |
| | 1,100,000 | | New York City Transitional Finance | | | | |
| | | | Authority, Series C, Revenue Bond, | | | | |
| | | | 5.000%, 02/01/2022 | | | 1,139,974 | |
| | 1,250,000 | | New York City, Series A, GO, | | | | |
| | | | 5.000%, 08/01/2020 | | | 1,280,712 | |
| | 1,000,000 | | New York Dormitory Authority, | | | | |
| | | | Refunding, Revenue Bond, | | | | |
| | | | FGIC Insured, | | | | |
| | | | 5.500%, 07/01/2021 | | | 1,068,950 | |
| | 500,000 | | New York Dormitory Authority, | | | | |
| | | | Revenue Bond, | | | | |
| | | | 6.130%, 12/01/2029 | | | 382,870 | |
| | | | New York Dormitory Authority, | | | | |
| | | | Series B, Revenue Bond, | | | | |
| | 1,000,000 | | 5.250%, 11/15/2023 | | | 1,056,050 | |
| | 1,000,000 | | 5.250%, 03/15/2038 | | | 1,003,050 | |
See notes to financial statements.
AssetMark Tax-Exempt Fixed Income Fund
SCHEDULE OF INVESTMENTS (Continued)
| Principal | | | | | |
| Amount | | | | Value | |
| | | MUNICIPAL BONDS (Continued) | | | |
| | | New York (Continued) | | | |
| $ | 500,000 | | New York Environmental Facilities, | | | |
| | | | Revenue Bond, | | | |
| | | | 5.500%, 10/15/2027 | | $ | 553,720 | |
| | 1,000,000 | | New York, GO, | | | | |
| | | | 5.000%, 02/15/2039 | | | 990,750 | |
| | | | Sales Tax Asset Receivable Corp., | | | | |
| | | | Series A, Revenue Bond, | | | | |
| | 500,000 | | 5.000%, 10/15/2017 | | | 547,960 | |
| | 1,500,000 | | 5.250%, 10/15/2019 | | | 1,630,200 | |
| | | | Tobacco Settlement Financing, | | | | |
| | | | Revenue Bond, | | | | |
| | 650,000 | | 5.000%, 06/01/2012 | | | 685,081 | |
| | 1,000,000 | | 5.250%, 06/01/2021 | | | 1,013,340 | |
| | | | | | | 17,025,269 | |
| | | | North Carolina - 4.48% | | | | |
| | 2,500,000 | | Eastern Municipal Power Agency, | | | | |
| | | | Series B, Refunding, Revenue | | | | |
| | | | Bond, FGIC Insured, | | | | |
| | | | 6.000%, 01/01/2022 | | | 2,639,025 | |
| | 1,480,000 | | North Carolina Capital Facilities | | | | |
| | | | Finance Agency, Series B, | | | | |
| | | | Revenue Bond, Refunding, | | | | |
| | | | 5.000%, 10/01/2038 | | | 1,485,772 | |
| | 1,000,000 | | North Carolina Grant, Revenue | | | | |
| | | | Bond, MBIA Insured, | | | | |
| | | | 5.000%, 03/01/2015 | | | 1,120,220 | |
| | | | North Carolina Medical Care | | | | |
| | | | Community, Revenue Bond, | | | | |
| | 700,000 | | 5.500%, 10/01/2017 | | | 624,526 | |
| | 650,000 | | 5.600%, 10/01/2036 | | | 472,537 | |
| | 1,500,000 | | North Carolina Municipal Power | | | | |
| | | | Agency, Series C, Revenue Bond, | | | | |
| | | | 5.250%, 01/01/2019 | | | 1,565,040 | |
| | 750,000 | | Raleigh North Carolina Comb | | | | |
| | | | Enterprise, Series A, Revenue Bond, | | | | |
| | | | 5.000%, 03/01/2031 | | | 762,675 | |
| | | | | | | 8,669,795 | |
| | | | North Dakota - 0.25% | | | | |
| | 685,000 | | Williams County Sales Tax, | | | | |
| | | | Revenue Bond, | | | | |
| | | | 5.000%, 11/01/2026 | | | 481,247 | |
| Principal | | | | | |
| Amount | | | | Value | |
| | | Ohio - 1.96% | | | |
| $ | 1,000,000 | | American Municipal Power, | | | |
| | | | Refunding, Revenue Bond, | | | |
| | | | 5.250%, 02/15/2023 | | $ | 1,022,700 | |
| | 750,000 | | Lorain, Refunding, GO, | | | | |
| | | | 6.750%, 12/01/2023 | | | 802,627 | |
| | 700,000 | | Ohio Higher Educational Facility | | | | |
| | | | Commission, Revenue Bond, | | | | |
| | | | 5.000%, 10/01/2031 | | | 643,426 | |
| | 1,000,000 | | Ohio, Series A, GO, | | | | |
| | | | 5.000%, 09/01/2015 | | | 1,134,540 | |
| | 250,000 | | Toledo-Lucas County Port Authority, | | | | |
| | | | Special Assessment, | | | | |
| | | | 5.380%, 12/01/2035 | | | 184,158 | |
| | | | | | | 3,787,451 | |
| | | | Oregon - 0.64% | | | | |
| | 1,000,000 | | Clackamas County School District, GO, | | | | |
| | | | 5.000%, 06/15/2021 | | | 953,070 | |
| | 250,000 | | Washington County School District, | | | | |
| | | | GO, FSA Insured, | | | | |
| | | | 5.500%, 06/15/2019 | | | 295,392 | |
| | | | | | | 1,248,462 | |
| | | | Pennsylvania - 3.22% | | | | |
| | 1,250,000 | | Allegheny County Hospital | | | | |
| | | | Development Authority, Series A, | | | | |
| | | | Revenue Bond, | | | | |
| | | | 5.000%, 09/01/2014 | | | 1,314,587 | |
| | 500,000 | | Erie Higher Education Building | | | | |
| | | | Authority, Revenue Bond, | | | | |
| | | | 5.350%, 03/15/2028 | | | 391,735 | |
| | 500,000 | | Lancaster County Hospital Authority, | | | | |
| | | | Series A, Refunding, Revenue Bond, | | | | |
| | | | 5.200%, 07/01/2012 | | | 478,540 | |
| | 1,000,000 | | Pennsylvania, Refunding, GO, | | | | |
| | | | 5.250%, 02/01/2014 | | | 1,135,500 | |
| | 1,000,000 | | Pennsylvania, Series A, GO, | | | | |
| | | | 5.000%, 08/01/2023 | | | 1,067,260 | |
| | 500,000 | | Philadelphia Hospitals & Higher | | | | |
| | | | Education Facilities, Refunding, | | | | |
| | | | Revenue Bond, | | | | |
| | | | 5.500%, 07/01/2030 | | | 360,450 | |
| | 1,500,000 | | Warwick School District, GO, | | | | |
| | | | 4.375%, 02/01/2025 | | | 1,482,195 | |
| | | | | | | 6,230,267 | |
See notes to financial statements.
AssetMark Tax-Exempt Fixed Income Fund
SCHEDULE OF INVESTMENTS (Continued)
| Principal | | | | | |
| Amount | | | | Value | |
| | | MUNICIPAL BONDS (Continued) | | | |
| | | Puerto Rico - 1.90% | | | |
| $ | 1,250,000 | | Puerto Rico Commonwealth, | | | |
| | | | Series A, GO, | | | |
| | | | 5.250%, 07/01/2022 | | $ | 1,076,713 | |
| | 1,000,000 | | Puerto Rico Commonwealth, | | | | |
| | | | Series A, Refunding, GO, | | | | |
| | | | 5.500%, 07/01/2017 | | | 944,780 | |
| | 625,000 | | Puerto Rico Commonwealth, | | | | |
| | | | Series A, Rerefunding, Revenue | | | | |
| | | | Bond, Assured Guaranty Inured, | | | | |
| | | | 5.000%, 07/01/2016 | | | 628,350 | |
| | 620,000 | | Puerto Rico Commonwealth, Series B, | | | | |
| | | | Prerefunded, Refunding, GO, | | | | |
| | | | 5.250%, 07/01/2032 | | | 735,022 | |
| | 380,000 | | Puerto Rico Commonwealth, Series B, | | | | |
| | | | Unrefunded, Refunding, GO, | | | | |
| | | | 5.250%, 07/01/2032 | | | 301,462 | |
| | | | | | | 3,686,327 | |
| | | | South Dakota - 0.25% | | | | |
| | 465,000 | | South Dakota Health & Educational | | | | |
| | | | Facilities Authority, Revenue Bond, | | | | |
| | | | 5.000%, 11/01/2010 | | | 475,821 | |
| | | | Tennessee - 0.68% | | | | |
| | 300,000 | | Johnson City Health & Educational | | | | |
| | | | Facilities Board, Revenue Bond, | | | | |
| | | | 6.000%, 07/01/2021 | | | 311,313 | |
| | 1,000,000 | | Memphis-Shelby County Airport | | | | |
| | | | Authority Special Facilities, | | | | |
| | | | Refunding, Revenue Bond, | | | | |
| | | | 5.050%, 09/01/2012 | | | 995,630 | |
| | | | | | | 1,306,943 | |
| | | | Texas - 11.15% | | | | |
| | 500,000 | | Dallas Area Rapid Transit, | | | | |
| | | | Refunding, Revenue Bond, | | | | |
| | | | 5.250%, 12/01/2038 | | | 507,155 | |
| | 1,000,000 | | Dallas, GO, | | | | |
| | | | 5.000%, 02/15/2018 | | | 999,990 | |
| | 635,000 | | Forney Independent School District, | | | | |
| | | | GO, PSF-GTD Insured, | | | | |
| | | | 0.000%, 08/15/2025 (a) | | | 267,183 | |
| | 145,000 | | Frisco, GO, FGIC Insured, | | | | |
| | | | 5.880%, 02/15/2010 | | | 151,445 | |
| Principal | | | | | |
| Amount | | | | Value | |
| | | Texas (Continued) | | | |
| $ | 630,000 | | Gregg County Health Facilities, | | | |
| | | | Revenue Bond, | | | |
| | | | 4.250%, 10/01/2009 | | $ | 625,212 | |
| | 1,280,000 | | La Porte Independent School | | | | |
| | | | District, GO, | | | | |
| | | | 5.250%, 02/15/2024 | | | 1,372,723 | |
| | 5,000 | | Lower Colorado River Authority, | | | | |
| | | | Series B, Prerefunded, Revenue | | | | |
| | | | Bond, FSA Insured, | | | | |
| | | | 6.000%, 05/15/2013 | | | 5,072 | |
| | 930,000 | | Lower Colorado River Authority, | | | | |
| | | | Series B, Unrefunded, Revenue | | | | |
| | | | Bond, FSA Insured, | | | | |
| | | | 6.000%, 05/15/2013 | | | 943,402 | |
| | | | North Texas Tollway Authority, | | | | |
| | | | Series A, Refunded, Revenue Bond, | | | | |
| | 700,000 | | 6.000%, 01/01/2019 | | | 780,514 | |
| | 1,000,000 | | 5.630%, 01/01/2033 | | | 957,630 | |
| | 770,000 | | North Texas Tollway Authority, | | | | |
| | | | Series E, Refunding, Revenue Bond, | | | | |
| | | | 5.750%, 01/01/2038 | | | 786,301 | |
| | 1,500,000 | | North Texas Tollway Authority, | | | | |
| | | | Series L, Refunding, Revenue Bond, | | | | |
| | | | 5.500%, 01/01/2038 | | | 1,543,320 | |
| | 2,000,000 | | San Antonio Electric & Gas, | | | | |
| | | | Refunding, Revenue Bond, | | | | |
| | | | 5.380%, 02/01/2015 | | | 2,269,320 | |
| | 1,430,000 | | San Antonio Electric & Gas, | | | | |
| | | | Series A, Unrefunded, Revenue | | | | |
| | | | Bond, MBIA Insured, | | | | |
| | | | 5.000%, 02/01/2017 | | | 1,437,436 | |
| | 1,000,000 | | San Leanna Educational Facilities, | | | | |
| | | | Refunding, Revenue Bond, | | | | |
| | | | 4.750%, 06/01/2032 | | | 655,860 | |
| | 185,000 | | Socorro Independent School District, | | | | |
| | | | Prerefunded, GO, PSF-GTD Insured, | | | | |
| | | | 5.380%, 08/15/2013 | | | 204,064 | |
| | 15,000 | | Socorro Independent School District, | | | | |
| | | | Unrefunded, GO, PSF-GTD Insured, | | | | |
| | | | 5.380%, 08/15/2013 | | | 16,200 | |
| | 2,000,000 | | Tarrant County Cultural Educational | | | | |
| | | | Facilities, Refunding, Revenue Bond, | | | | |
| | | | 5.000%, 02/15/2014 | | | 2,112,000 | |
See notes to financial statements.
AssetMark Tax-Exempt Fixed Income Fund
SCHEDULE OF INVESTMENTS (Continued)
| Principal | | | | | |
| Amount | | | | Value | |
| | | MUNICIPAL BONDS (Continued) | | | |
| | | Texas (Continued) | | | |
| $ | 2,000,000 | | Texas A&M University, Refunding, | | | |
| | | | Revenue Bond, | | | |
| | | | 5.000%, 05/15/2019 | | $ | 2,257,340 | |
| | 400,000 | | Texas Public Finance Authority, | | | | |
| | | | Refunding, GO, | | | | |
| | | | 5.500%, 10/01/2009 | | | 409,704 | |
| | 100,000 | | Texas State University System, | | | | |
| | | | Revenue Bond, FSA Insured, | | | | |
| | | | 5.250%, 03/15/2010 | | | 104,251 | |
| | 500,000 | | Texas Transportation Commission, | | | | |
| | | | Revenue Bond, | | | | |
| | | | 5.000%, 04/01/2018 | | | 563,040 | |
| | 1,000,000 | | Texas Water Development Board, | | | | |
| | | | Series B, Revenue Bond, | | | | |
| | | | 5.250%, 07/15/2027 | | | 1,048,490 | |
| | 1,000,000 | | Texas, GO, | | | | |
| | | | 5.000%, 04/01/2016 | | | 1,140,910 | |
| | 400,000 | | Texas, Series A, GO, | | | | |
| | | | 5.000%, 04/01/2022 | | | 428,268 | |
| | | | | | | 21,586,830 | |
| | | | Virginia - 1.13% | | | | |
| | 1,000,000 | | Henry County Public Service Authority | | | | |
| | | | Water & Sewer, Refunding, | | | | |
| | | | Revenue Bond, FSA Insured, | | | | |
| | | | 5.500%, 11/15/2019 | | | 1,090,680 | |
| | 1,000,000 | | Virginia College Building Authority | | | | |
| | | | Educational Facilities, Revenue Bond, | | | | |
| | | | 5.750%, 01/01/2034 | | | 1,101,180 | |
| | | | | | | 2,191,860 | |
| | | | Washington - 4.12% | | | | |
| | 1,000,000 | | Clark County School District, | | | | |
| | | | Refunding, GO, FGIC Insured, | | | | |
| | | | 5.500%, 12/01/2017 | | | 1,094,600 | |
| | 2,465,000 | | Energy Northwest, Series A, | | | | |
| | | | Revenue Bond, FSA Insured, | | | | |
| | | | 5.500%, 07/01/2017 | | | 2,634,641 | |
| | 2,000,000 | | Energy Northwest, Series A, | | | | |
| | | | Revenue Bond, MBIA Insured, | | | | |
| | | | 5.750%, 07/01/2017 | | | 2,155,880 | |
| | 500,000 | | King County Hospital, Refunding, | | | | |
| | | | GO, MBIA Insured, | | | | |
| | | | 5.000%, 12/01/2021 | | | 510,495 | |
| Principal | | | | | |
| Amount | | | | Value | |
| | | Washington (Continued) | | | |
| $ | 45,000 | | King County, Prerefunded, GO, | | | |
| | | | 5.500%, 12/01/2010 | | $ | 48,522 | |
| | 55,000 | | King County, Unrefunded, GO, | | | | |
| | | | 5.500%, 12/01/2010 | | | 58,887 | |
| | 30,000 | | Seattle, Prerefunded, GO, | | | | |
| | | | 5.000%, 07/01/2013 | | | 33,545 | |
| | 1,250,000 | | Washington, Series A, GO, | | | | |
| | | | 5.000%, 07/01/2016 | | | 1,430,012 | |
| | | | | | | 7,966,582 | |
| | | | Wisconsin - 3.53% | | | | |
| | | | Badger Tobacco Asset Securitization, | | | | |
| | | | Revenue Bond, | | | | |
| | 1,350,000 | | 5.750%, 06/01/2011 | | | 1,443,757 | |
| | 405,000 | | 6.130%, 06/01/2027 | | | 434,646 | |
| | 330,000 | | Middleton Cross Plains Area | | | | |
| | | | School District, Refunding, | | | | |
| | | | GO, FSA Insured, | | | | |
| | | | 5.000%, 04/01/2020 | | | 358,740 | |
| | 2,000,000 | | Southeast Wisconsin Professional | | | | |
| | | | Baseball Park Sales Tax, Series A, | | | | |
| | | | Revenue Bond, MBIA Insured, | | | | |
| | | | 5.500%, 12/15/2026 | | | 1,991,160 | |
| | 150,000 | | Wisconsin Health & Educational | | | | |
| | | | Facilities Authority, Refunding, | | | | |
| | | | Revenue Bond, | | | | |
| | | | 5.250%, 08/15/2024 | | | 147,354 | |
| | 400,000 | | Wisconsin Health & Educational | | | | |
| | | | Facilities, Series A, Revenue Bond, | | | | |
| | | | 5.000%, 02/15/2018 | | | 343,492 | |
| | 1,150,000 | | Wisconsin Health & Educational | | | | |
| | | | Facilities, Series B, Revenue Bond, | | | | |
| | | | 5.000%, 08/15/2013 | | | 1,059,357 | |
| | 1,000,000 | | Wisconsin Transportation, Series A, | | | | |
| | | | Revenue Bond, FGIC Insured, | | | | |
| | | | 5.500%, 07/01/2016 | | | 1,061,940 | |
| | | | | | | 6,840,446 | |
| | | | Wyoming - 0.39% | | | | |
| | 750,000 | | Wyoming Municipal Power Agency, | | | | |
| | | | Series A, Revenue Bond, | | | | |
| | | | 5.500%, 01/01/2028 | | | 748,193 | |
| | | | Total Municipal Bonds | | | | |
| | | | (Cost $195,757,884) | | | 189,240,039 | |
See notes to financial statements.
AssetMark Tax-Exempt Fixed Income Fund
SCHEDULE OF INVESTMENTS (Continued)
| Principal | | | | | |
| Amount | | | | Value | |
| | | SHORT TERM INVESTMENTS - 0.54% | | | |
| | | Money Market Fund - 0.54% | | | |
| $ | 1,050,061 | | Fidelity Tax Exempt Portfolio | | $ | 1,050,061 | |
| | | | Total Short Term Investments | | | | |
| | | | (Cost $1,050,061) | | | 1,050,061 | |
| | | | Total Investments | | | | |
| | | | (Cost $196,807,945) - 98.30% | | | 190,290,100 | |
| | | | Other Assets in Excess of | | | | |
| | | | Liabilities - 1.70% | | | 3,289,810 | |
| | | | TOTAL NET | | | | |
| | | | ASSETS - 100.00% | | $ | 193,579,910 | |
| | | | | | | | |
| Percentages are stated as a percent of net assets. | | |
| | | | | |
| (a) Zero coupon bond. | | |
| | | | | |
| Glossary of Terms | | |
| AMBAC | — | American Municipal Bond Assurance Corp. | | |
| ACA | | American Capital Access | | |
| CP | | Certificate of Participation | | |
| FGIC | | Financial Guaranty Insurance Corp. | | |
| FSA | | Federal Housing Authority/Agency | | |
| GO | | General Obligation | | |
| MBIA | | Municipal Bond Investors Assurance Corp. |
| PSF-GTD | | Permanent School Fund Guaranteed | | |
| Q-SBLF | | Qualified School Board Loan | | |
See notes to financial statements.
AssetMark Core Plus Fixed Income Fund
SCHEDULE OF INVESTMENTS
| Number of | | | | | |
| Shares | | | | Value | |
| | | CONVERTIBLE PREFERRED | | | |
| | | STOCKS - 0.01% | | | |
| | | Automobiles - 0.01% | | | |
| | 12,000 | | General Motors Corporation | | $ | 30,480 | |
| | 1,800 | | General Motors Corporation | | | 4,572 | |
| | | | | | | 35,052 | |
| | | | Total Convertible Preferred Stocks | | | | |
| | | | (Cost $304,161) | | | 35,052 | |
| | | | PREFERRED STOCKS - 0.09% | | | | |
| | | | Banks - 0.06% | | | | |
| | 800,000 | | HSBC Capital Funding LP | | | | |
| | | | 4.610%, 12/31/2049 (Callable at | | | | |
| | | | $100.00 on 06/27/2013) (a)(c)(e) | | | 286,927 | |
| | | | Consumer Finance - 0.02% | | | | |
| | 12,000 | | Corts Trust for Ford Motor Company | | | 66,960 | |
| | 329 | | Preferred Blocker, Inc. (a)(c) | | | 65,523 | |
| | | | | | | 132,483 | |
| | | | Thrifts & Mortgage Finance - 0.01% | | | | |
| | 44,650 | | FHLMC, 8.375% | | | 20,539 | |
| | 1,300 | | FNMA, 7.000% (e) | | | 1,468 | |
| | 32,350 | | FNMA, 8.250% | | | 22,968 | |
| | | | | | | 44,975 | |
| | | | Total Preferred Stocks | | | | |
| | | | (Cost $2,948,922) | | | 464,385 | |
| Principal | | | | | |
| Amount | | | | | |
| | | ASSET BACKED SECURITIES - 3.75% | |
| | | Accredited Mortgage Loan Trust | | | |
| $ | 547,549 | | Series 2005-3, | | | |
| | | | 0.762%, 09/25/2035 (e) | | | 407,166 | |
| | | | Conseco Finance Securitizations Corp. | | | | |
| | 86,123 | | Series 2000-4, | | | | |
| | | | 8.310%, 04/01/2031 | | | 44,383 | |
| | | | Countrywide Asset-Backed | | | | |
| | | | Certificates | | | | |
| | 267,529 | | Series 2005-4, | | | | |
| | | | 4.456%, 09/25/2032 | | | 224,523 | |
| | | | Countrywide Home Equity | | | | |
| | | | Loan Trust | | | | |
| | 272,359 | | Series 2004-R, | | | | |
| | | | 2.687%, 03/15/2030 | | | 84,687 | |
| | 362,038 | | Series 2004-N, | | | | |
| | | | 2.150%, 02/15/2034 | | | 128,811 | |
| Principal | | | | | |
| Amount | | | | Value | |
| | | ASSET BACKED SECURITIES (Continued) | |
| $ | 399,265 | | Series 2004-O, | | | |
| | | | 2.150%, 02/15/2034 | | $ | 181,026 | |
| | 380,629 | | Series 2005-F, | | | | |
| | | | 0.796%, 12/15/2035 (e) | | | 145,365 | |
| | | | Delta Air Lines, Inc. | | | | |
| | 363,024 | | Pool #081022, | | | | |
| | | | 6.820%, 02/10/2024 | | | 243,226 | |
| | | | Household Home Equity Loan Trust | | | | |
| | 1,729,028 | | Series 2007-3, | | | | |
| | | | 1.670%, 11/20/2036 | | | 1,105,686 | |
| | | | JetBlue Airways Corporation | | | | |
| | 706,872 | | Series 2004-2, G-1, | | | | |
| | | | 2.665%, 02/15/2018 (e) | | | 498,176 | |
| | 900,000 | | Series 2004-2, G-2, | | | | |
| | | | 2.740%, 05/15/2018 (e) | | | 496,176 | |
| | | | Morgan Stanley | | | | |
| | 924,950 | | Series M-1, | | | | |
| | | | 1.542%, 10/25/2033 | | | 499,279 | |
| | | | Nelnet, Inc. | | | | |
| | 830,000 | | Series 2008-4, | | | | |
| | | | 2.639%, 04/25/2024 | | | 722,738 | |
| | | | New Valley Generation | | | | |
| | 3,028,774 | | Series 2000-1, | | | | |
| | | | 7.300%, 03/15/2019 | | | 3,331,651 | |
| | 7,590,324 | | Series 2001-1, | | | | |
| | | | 5.570%, 05/01/2020 | | | 8,333,558 | |
| | | | Residential Asset Mortgage | | | | |
| | | | Products, Inc. | | | | |
| | 179,872 | | Series FLT, | | | | |
| | | | 1.002%, 03/25/2034 | | | 65,731 | |
| | | | SLC Student Loan Trust | | | | |
| | 550,000 | | Series 2008-1, | | | | |
| | | | 2.920%, 12/15/2032 | | | 493,232 | |
| | | | SLM Private Loan Trust | | | | |
| | 400,000 | | Series 2003-7, | | | | |
| | | | 2.520%, 12/15/2033 (c) | | | 337,420 | |
| | | | Washington Mutual | | | | |
| | 1,620,000 | | Series 2006-A3, | | | | |
| | | | 0.586%, 09/15/2013 (c)(e) | | | 1,558,332 | |
| | | | Total Asset Backed Securities | | | | |
| | | | (Cost $21,124,509) | | | 18,901,166 | |
See notes to financial statements.
AssetMark Core Plus Fixed Income Fund
SCHEDULE OF INVESTMENTS (Continued)
| Principal | | | | | |
| Amount | | | | Value | |
| | | COLLATERALIZED MORTGAGE | | | |
| | | OBLIGATIONS - 2.11% | | | |
| | | Bank of America Corporation | | | |
| $ | 692,842 | | Series 2005-B, | | | |
| | | | 5.100%, 04/25/2035 | | $ | 353,603 | |
| | | | Countrywide Home Loans, Inc. | | | | |
| | 340,628 | | Series 2005-11, | | | | |
| | | | 0.774%, 03/25/2035 (e) | | | 139,708 | |
| | 873,023 | | Series 2005-R1, | | | | |
| | | | 0.882%, 03/25/2035 (c)(e) | | | 460,923 | |
| | 508,029 | | Series 2005-11, | | | | |
| | | | 5.924%, 04/25/2035 | | | 164,008 | |
| | | | GSMPS Mortgage Loan Trust | | | | |
| | 1,012,358 | | Series 2005-RP1, | | | | |
| | | | 0.824%, 01/25/2035 (c)(e) | | | 816,648 | |
| | | | Master Adjustable Rate Mortgages | | | | |
| | | | Trust | | | | |
| | 3,100,000 | | Series 2004-13, | | | | |
| | | | 3.788%, 11/21/2034 | | | 1,938,060 | |
| | | | Master Reperforming Loan Trust | | | | |
| | 468,623 | | Series 2005-1, | | | | |
| | | | 7.000%, 08/25/2034 (c) | | | 490,954 | |
| | | | MLCC Mortgage Investors, Inc. | | | | |
| | 995,187 | | Series 2005-1, | | | | |
| | | | 4.964%, 04/25/2035 | | | 688,053 | |
| | | | Prime Mortgage Trust | | | | |
| | 3,506,942 | | Series 2006-DR1, | | | | |
| | | | 5.500%, 05/25/2035 (c) | | | 2,577,678 | |
| | 2,866,979 | | Series 2006-DR1, | | | | |
| | | | 6.000%, 05/25/2035 (c) | | | 2,066,144 | |
| | | | Residential Asset Mortgage | | | | |
| | | | Products, Inc. | | | | |
| | 512,472 | | Series 2004-SL4, | | | | |
| | | | 7.500%, 07/25/2032 | | | 469,421 | |
| | | | Washington Mutual | | | | |
| | 1,113,708 | | Series 2005-AR8, | | | | |
| | | | 0.810%, 07/25/2045 (e) | | | 467,406 | |
| | | | Total Collateralized Mortgage | | | | |
| | | | Obligations (Cost $15,908,469) | | | 10,632,606 | |
| | | | CONVERTIBLE BONDS - 0.01% | | | | |
| | | | Automobiles - 0.01% | | | | |
| | | | Ford Motor Company | | | | |
| | 80,000 | | 4.250%, 12/15/2036 | | | 28,300 | |
| | | | Total Convertible Bonds | | | | |
| | | | (Cost $80,000) | | | 28,300 | |
| Principal | | | | | |
| Amount | | | | Value | |
| | | CORPORATE BONDS - 26.81% | | | |
| | | Aerospace & Defense - 0.11% | | | |
| | | Boeing Co. | | | |
| $ | 240,000 | | 6.000%, 03/15/2019 | | $ | 246,960 | |
| | | | International Lease Finance Corp. | | | | |
| | 475,000 | | 4.950%, 02/01/2011 | | | 313,948 | |
| | | | | | | 560,908 | |
| | | | Auto Components - 0.04% | | | | |
| | | | The Goodyear Tire & Rubber | | | | |
| | | | Company | | | | |
| | 250,000 | | 9.000%, 07/01/2015 | | | 193,750 | |
| | | | Visteon Corp. | | | | |
| | 33,000 | | 8.250%, 08/01/2010 | | | 1,944 | |
| | 24,000 | | 12.250%, 12/31/2016 (Callable at | | | | |
| | | | $100.00 on 12/31/2013) (c) | | | 1,320 | |
| | | | | | | 197,014 | |
| | | | Automobiles - 0.16% | | | | |
| | | | DaimlerChrysler N.A. | | | | |
| | 260,000 | | 5.880%, 03/15/2011 | | | 248,986 | |
| | | | Ford Motor Company | | | | |
| | 670,000 | | 7.450%, 07/16/2031 | | | 216,075 | |
| | | | General Motors Corporation | | | | |
| | 2,420,000 | | 8.250%, 07/15/2023 | | | 296,450 | |
| | 250,000 | | 8.380%, 07/05/2033 | | | 63,108 | |
| | 30,000 | | 8.380%, 07/15/2033 | | | 3,750 | |
| | | | | | | 828,369 | |
| | | | Banks - 2.61% | | | | |
| | | | AIFUL Corporation | | | | |
| | 300,000 | | 5.000%, 08/10/2010 (c) | | | 105,023 | |
| | | | ANZ Capital Trust | | | | |
| | 750,000 | | 5.359%, 12/15/2049 (Callable at | | | | |
| | | | $100.00 on 12/15/2013) (c) | | | 452,270 | |
| | | | BAC Capital Trust | | | | |
| | 30,000 | | 5.630%, 12/31/2099 (e) | | | 6,603 | |
| | | | Glitnir Bank | | | | |
| | 370,000 | | 6.330%, 07/28/2011 (d)(f) | | | 41,625 | |
| | 760,000 | | 6.690%, 06/15/2016 (d)(f) | | | 456 | |
| | | | Greenpoint Bank | | | | |
| | 375,000 | | 9.250%, 10/01/2010 | | | 360,835 | |
| | | | HBOS Capital Funding LP | | | | |
| | 700,000 | | 6.070%, 06/01/2049 (Callable at | | | | |
| | | | $100.00 on 06/30/2014) (c)(e) | | | 125,870 | |
See notes to financial statements.
AssetMark Core Plus Fixed Income Fund
SCHEDULE OF INVESTMENTS (Continued)
March 31, 2009
| Principal | | | | | |
| Amount | | | | Value | |
| | | CORPORATE BONDS (Continued) | | | |
| | | Banks (Continued) | | | |
| | | HSBC Finance Corp. | | | |
| $ | 685,000 | | 4.130%, 11/16/2009 | | $ | 678,132 | |
| | | | ICICI Bank Ltd. | | | | |
| | 340,000 | | 6.380%, 04/30/2022 | | | 187,799 | |
| | 354,000 | | 6.380%, 04/30/2022 (c)(e) | | | 199,572 | |
| | | | ING Capital Funding TR III | | | | |
| | 1,075,000 | | 8.440%, 12/31/2010 (e) | | | 313,604 | |
| | 4,000,000 | | Inter-American Development Bank | | | | |
| | | | 0.500%, 05/29/2014 | | | 3,458,976 | |
| | | | Kaupthing Bank Hf | | | | |
| | 130,000 | | 5.750%, 10/04/2011 (d)(f) | | | 7,313 | |
| | 1,990,000 | | 7.630%, 02/28/2015 (d)(f) | | | 119,400 | |
| | 250,000 | | 7.130%, 05/19/2016 (d)(f) | | | 625 | |
| | | | Landsbanki Islands Hf | | | | |
| | 1,080,000 | | 6.100%, 08/25/2011 (d)(f) | | | 6,750 | |
| | | | PNC Bank N.A. | | | | |
| | 650,000 | | 6.880%, 04/01/2018 | | | 634,719 | |
| | | | Resona Bank | | | | |
| | 450,000 | | 4.130%, 12/31/2049 (Acquired | | | | |
| | | | 10/05/2005, Cost $536,375) (d) | | | 215,789 | |
| | 525,000 | | 5.850%, 09/29/2049 (Acquired | | | | |
| | | | 09/08/2005, Cost $524,633) (d)(e) | | | 268,074 | |
| | | | Resona Preferred Global Securities | | | | |
| | 735,000 | | 7.190%, 12/29/2049 (Callable at | | | | |
| | | | $100.00 on 07/30/2015) (c)(e) | | | 338,423 | |
| | | | Royal Bank of Scotland Group PLC | | | | |
| | 200,000 | | 7.640%, 03/31/2049 | | | 45,035 | |
| | 1,740,000 | | 9.120%, 03/31/2049 | | | 629,947 | |
| | 875,000 | | 6.990%, 10/29/2049 (Callable at | | | | |
| | | | $100.00 on 10/05/2017) (c) | | | 385,468 | |
| | | | Russ Agriculture Bank | | | | |
| | 840,000 | | 6.300%, 05/15/2017 (c) | | | 585,564 | |
| | | | Santander Issuances SA | | | | |
| | 560,000 | | 5.810%, 06/20/2016 (Callable at | | | | |
| | | | $100.00 on 06/20/2011) (c) | | | 416,729 | |
| | | | Shinsei Finance Cayman Ltd. | | | | |
| | 600,000 | | 6.420%, 07/20/2048 (Callable at | | | | |
| | | | $100.00 on 07/20/2016) (c) | | | 102,070 | |
| | | | Sovereign Bank | | | | |
| | 300,000 | | 2.880%, 08/01/2013 | | | 227,814 | |
| | | | Suntrust Capital | | | | |
| | 280,000 | | 6.100%, 12/01/2066 | | | 157,332 | |
| Principal | | | | | |
| Amount | | | | Value | |
| | | Banks (Continued) | | | |
| | | TuranAlem | | | |
| $ | 530,000 | | 8.250%, 01/22/2037 | | $ | 119,250 | |
| | 850,000 | | 8.250%, 01/22/2037 (c) | | | 178,500 | |
| | | | Wells Fargo Company | | | | |
| | 1,250,000 | | 5.630%, 12/11/2017 | | | 1,142,418 | |
| | 840,000 | | 9.750%, 09/26/2044 | | | 613,702 | |
| | 500,000 | | 7.700%, 12/29/2049 | | | 238,325 | |
| | 440,000 | | 5.950%, 12/01/2086 | | | 297,795 | |
| | | | Zurich Financial Services | | | | |
| | 675,000 | | 6.150%, 12/15/2065 (c) | | | 264,746 | |
| | 575,000 | | 6.450%, 12/15/2065 (Callable at | | | | |
| | | | $100.00 on 06/15/2016) (c) | | | 248,742 | |
| | | | | | | 13,175,295 | |
| | | | Beverages - 0.44% | | | | |
| | | | Anheuser-Busch InBev NV | | | | |
| | 600,000 | | 7.750%, 01/15/2019 (c). | | | 599,274 | |
| | | | Diageo Plc | | | | |
| | 960,000 | | 7.375%, 01/15/2014 | | | 1,055,832 | |
| | | | PepsiCo, Inc. | | | | |
| | 470,000 | | 7.900%, 11/01/2018 | | | 578,483 | |
| | | | | | | 2,233,589 | |
| | | | Business Services - 0.01% | | | | |
| | | | Dyncorp International LLC | | | | |
| | 46,000 | | 9.500%, 02/15/2013 | | | 43,355 | |
| | | | Lamar Media Corp. | | | | |
| | 10,000 | | 6.630%, 08/15/2015 | | | 7,250 | |
| | | | | | | 50,605 | |
| | | | Capital Markets - 1.74% | | | | |
| | | | Bear Stearns Companies, Inc. | | | | |
| | 815,000 | | 6.400%, 10/02/2017 | | | 794,473 | |
| | 3,570,000 | | 7.250%, 02/01/2018 | | | 3,692,783 | |
| | | | Goldman Sachs Group, Inc. | | | | |
| | 200,000 | | 4.500%, 06/15/2010 | | | 199,629 | |
| | 80,000 | | 5.450%, 11/01/2012 | | | 77,061 | |
| | 50,000 | | 5.790%, 12/29/2049 (e) | | | 20,829 | |
| | | | Lehman Brothers Holdings, Inc. | | | | |
| | 120,000 | | 5.250%, 02/06/2012 (f) | | | 15,900 | |
| | 1,820,000 | | 6.750%, 12/28/2017 (f) | | | 182 | |
| | 370,000 | | 5.954%, 08/19/2065 (e)(f) | | | 37 | |
| | 270,000 | | 5.860%, 11/29/2049 (f) | | | 27 | |
| | | | Merrill Lynch Co. | | | | |
| | 775,000 | | 5.450%, 02/05/2013 | | | 635,836 | |
| | 550,000 | | 6.400%, 08/28/2017 | | | 395,156 | |
See notes to financial statements.
AssetMark Core Plus Fixed Income Fund
SCHEDULE OF INVESTMENTS (Continued)
March 31, 2009
| Principal | | | | | |
| Amount | | | | Value | |
| | | CORPORATE BONDS (Continued) | | | |
| | | Capital Markets (Continued) | | | |
| | | Morgan Stanley | | | |
| $ | 340,000 | | 5.630%, 01/09/2012 | | | 327,359 | |
| | 500,000 | | 5.750%, 08/31/2012 | | | 483,783 | |
| | 230,000 | | 4.950%, 10/18/2016 (e) | | | 154,461 | |
| | 600,000 | | 5.950%, 12/28/2017 | | | 545,941 | |
| | 1,350,000 | | 6.630%, 04/01/2018 | | | 1,289,366 | |
| | | | Wachovia Capital Trust | | | | |
| | 430,000 | | 5.800%, 03/15/2042 | | | 154,852 | |
| | | | | | | 8,787,675 | |
| | | | Chemicals - 0.02% | | | | |
| | | | Westlake Chemical Corp. | | | | |
| | 63,000 | | 6.630%, 01/15/2016 | | | 44,415 | |
| | | | Ineos Group Holdings PLC | | | | |
| | 500,000 | | 7.880%, 02/15/2016 | | | 56,466 | |
| | | | | | | 100,881 | |
| | | | Commercial Services & Supplies - 0.13% | |
| | | | Allied Waste North America, Inc. | | | | |
| | 375,000 | | 7.130%, 05/15/2016 | | | 350,162 | |
| | | | Waste Management, Inc. | | | | |
| | 325,000 | | 6.380%, 11/15/2012 | | | 327,524 | |
| | | | | | | 677,686 | |
| | | | Communications - 0.95% | | | | |
| | | | British Telecommunications PLC | | | | |
| | 295,000 | | 8.625%, 12/15/2010 | | | 307,136 | |
| | | | Deutsche Telekom International | | | | |
| | | | Finance B.V. | | | | |
| | 350,000 | | 5.750%, 03/23/2016 | | | 343,877 | |
| | | | Inmarsat PLC | | | | |
| | 500,000 | | 10.380%, 11/15/2012 | | | 515,000 | |
| | | | Level 3 Financing, Inc. | | | | |
| | 135,000 | | 9.250%, 11/01/2014 | | | 93,825 | |
| | | | News America Marketing, Inc. | | | | |
| | 40,000 | | 6.650%, 11/15/2037 | | | 30,053 | |
| | | | Rogers Cable, Inc. | | | | |
| | 110,000 | | 6.750%, 03/15/2015 | | | 108,355 | |
| | | | Sprint Capital Corp. | | | | |
| | 580,000 | | 8.380%, 03/15/2012 | | | 524,900 | |
| | 40,000 | | 8.750%, 03/15/2032 | | | 27,000 | |
| | | | Telecom Italia Capital | | | | |
| | 450,000 | | 6.200%, 07/18/2011 | | | 442,134 | |
| | 500,000 | | 4.950%, 09/30/2014 | | | 432,216 | |
| | 190,000 | | 5.250%, 10/01/2015 | | | 160,410 | |
| Principal | | | | | |
| Amount | | | | Value | |
| | | Communications (Continued) | | | |
| $ | 430,000 | | 7.000%, 06/04/2018 | | $ | 390,382 | |
| | 1,200,000 | | 7.720%, 06/04/2038 | | | 1,000,634 | |
| | | | Verizon Global Funding Corp. | | | | |
| | 50,000 | | 7.380%, 09/01/2012 | | | 54,081 | |
| | | | VIP Finance Vipelcom | | | | |
| | 400,000 | | 9.125%, 04/30/2018 | | | 250,000 | |
| | | | Virgin Media Finance PLC | | | | |
| | 100,000 | | 9.130%, 08/15/2016 | | | 93,500 | |
| | | | | | | 4,773,503 | |
| | | | Consumer Finance - 1.34% | | | | |
| | | | American Express Credit Corp. | | | | |
| | 60,000 | | 5.880%, 05/02/2013 | | | 52,725 | |
| | | | American Express Co. | | | | |
| | 440,000 | | 6.800%, 09/01/2066 (e) | | | 212,458 | |
| | | | American General Finance | | | | |
| | 210,000 | | 6.900%, 12/15/2017 | | | 73,684 | |
| | | | Caterpillar Financial Services Corp. | | | | |
| | 690,000 | | 6.200%, 09/30/2013 | | | 691,331 | |
| | | | Countrywide Home Loans, Inc. | | | | |
| | 525,000 | | 6.250%, 04/15/2009 | | | 524,609 | |
| | 300,000 | | 5.630%, 07/15/2009 | | | 298,258 | |
| | 675,000 | | 4.130%, 09/15/2009 | | | 667,094 | |
| | | | Ford Motor Credit Company LLC | | | | |
| | 460,000 | | 7.380%, 10/28/2009 | | | 412,603 | |
| | 540,000 | | 12.000%, 05/15/2015 | | | 409,615 | |
| | | | GMAC Mortgage, LLC | | | | |
| | 176,000 | | 7.750%, 01/19/2010 (c) | | | 147,886 | |
| | 956,000 | | 6.625%, 05/15/2012 (c) | | | 641,715 | |
| | 245,000 | | 7.500%, 12/31/2013 (c) | | | 117,862 | |
| | 194,000 | | 8.000%, 12/31/2018 (c) | | | 56,374 | |
| | 386,000 | | 8.000%, 11/01/2031 (c) | | | 186,010 | |
| | | | SLM Corp. | | | | |
| | 1,750,000 | | 5.000%, 10/01/2013 | | | 931,409 | |
| | 1,140,000 | | 5.380%, 05/15/2014 | | | 591,315 | |
| | 120,000 | | 5.050%, 11/14/2014 | | | 63,590 | |
| | 20,000 | | 5.000%, 04/15/2015 | | | 9,410 | |
| | 100,000 | | 5.630%, 08/01/2033 | | | 40,097 | |
| | | | Westfield Capital Corp. | | | | |
| | 675,000 | | 4.380%, 11/15/2010 (c) | | | 625,774 | |
| | | | | | | 6,753,819 | |
| | | | Diversified Consumer Services - 0.02% | | | | |
| | | | Service Corporation International | | | | |
| | 130,000 | | 7.500%, 04/01/2027 | | | 96,200 | |
See notes to financial statements.
AssetMark Core Plus Fixed Income Fund
SCHEDULE OF INVESTMENTS (Continued)
March 31, 2009
| Principal | | | | | |
| Amount | | | | Value | |
| | | CORPORATE BONDS (Continued) | | | |
| | | Diversified Financial Services - 2.56% | | | |
| | | AGFC Capital Trust | | | |
| $ | 280,000 | | 6.000%, 01/15/2067 (Callable at | | | |
| | | | $100.00 on 01/15/2017) (c) (e) | | $ | 25,385 | |
| | | | Bank Of America Corporation | | | | |
| | 1,200,000 | | 2.100%, 04/30/2012 | | | 1,203,330 | |
| | 675,000 | | 5.750%, 12/01/2017 | | | 567,776 | |
| | 550,000 | | 8.000%, 12/29/2049 | | | 220,511 | |
| | 40,000 | | 8.130%, 12/29/2049(e) | | | 16,454 | |
| | | | Bank Of The West | | | | |
| | 4,200,000 | | 2.150%, 03/27/2012 | | | 4,210,865 | |
| | | | Citigroup, Inc. | | | | |
| | 1,600,000 | | 5.850%, 07/02/2013 | | | 1,433,426 | |
| | 1,030,000 | | 6.500%, 08/19/2013 | | | 947,358 | |
| | 1,120,000 | | 5.000%, 09/15/2014 | | | 743,259 | |
| | 950,000 | | 6.880%, 03/05/2038 | | | 830,619 | |
| | | | GE Capital Corp. | | | | |
| | 650,000 | | 1.580%, 09/15/2014 (e) | | | 469,700 | |
| | 1,160,000 | | 6.380%, 11/15/2067 | | | 564,022 | |
| | | | JP Morgan Chase & Co. | | | | |
| | 40,000 | | 2.125%, 06/22/2012 | | | 40,224 | |
| | 500,000 | | 6.125%, 06/27/2017 | | | 460,710 | |
| | 850,000 | | 6.000%, 01/15/2018 | | | 860,025 | |
| | | | Rabobank Capital Funding Trust | | | | |
| | 180,000 | | 5.250%, 10/31/2049 (Callable at | | | | |
| | | | $100.00 on 10/21/2016) (c)(e) | | | 81,103 | |
| | 30,000 | | 5.260%, 12/29/2049 (c)(e) | | | 13,512 | |
| | | | UBS AG | | | | |
| | 1,214,000 | | 6.000%, 12/31/2017 (credit linked | | | | |
| | | | to a Republic of Brazil Treasury | | | | |
| | | | Security and IPCA Index Units) | | | | |
| | | | (Acquired 11/05/2007, | | | | |
| | | | Cost $378,952) (d)(j) | | | 221,527 | |
| | | | | | | 12,909,806 | |
| | | | Diversified Telecommunication Services - 1.57% | | | | |
| | | | Ameritech Capital Funding Corp. | | | | |
| | 700,000 | | 6.250%, 05/18/2009 | | | 701,769 | |
| | | | AT&T, Inc. | | | | |
| | 310,000 | | 5.500%, 02/01/2018 | | | 300,272 | |
| | 750,000 | | 6.400%, 05/15/2038 | | | 669,331 | |
| | | | AT&T, Inc. | | | | |
| | 560,000 | | 5.800%, 02/15/2019 | | | 549,217 | |
| | 690,000 | | 6.550%, 02/15/2039 | | | 627,746 | |
| | | | BellSouth Corp. | | | | |
| | 30,000 | | 4.750%, 11/15/2012 | | | 30,544 | |
| Principal | | | | | |
| Amount | | | | Value | |
| | | Diversified Telecommunication | | | |
| | | Services (Continued) | | | |
| | | Citizens Communications Co. | | | |
| $ | 530,000 | | 9.250%, 05/15/2011 | | $ | 540,600 | |
| | 35,000 | | 7.130%, 03/15/2019 | | | 27,650 | |
| | 105,000 | | 7.880%, 01/15/2027 | | | 71,400 | |
| | | | KPN Mobile NV | | | | |
| | 520,000 | | 8.380%, 10/01/2030 | | | 540,128 | |
| | | | SBC Communications, Inc. | | | | |
| | 410,000 | | 5.100%, 09/15/2014 | | | 411,865 | |
| | | | Verizon Communications, Inc. | | | | |
| | 80,000 | | 5.500%, 02/15/2018 | | | 76,317 | |
| | 1,025,000 | | 6.400%, 02/15/2038 | | | 932,097 | |
| | 540,000 | | 8.950%, 03/01/2039 | | | 622,339 | |
| | | | Verizon New York, Inc. | | | | |
| | 740,000 | | 6.880%, 04/01/2012 | | | 758,459 | |
| | | | Verizon Wireless Capital LLC | | | | |
| | 465,000 | | 8.500%, 11/15/2018 (c) | | | 532,076 | |
| | | | Windstream Corp. | | | | |
| | 515,000 | | 8.630%, 08/01/2016 | | | 508,562 | |
| | | | | | | 7,900,372 | |
| | | | Electric Utilities - 1.81% | | | | |
| | | | AES Corp. | | | | |
| | 47,000 | | 7.750%, 03/01/2014 | | | 42,300 | |
| | 190,000 | | 7.750%, 10/15/2015 | | | 166,725 | |
| | 1,060,000 | | 8.000%, 10/15/2017 | | | 914,250 | |
| | 1,100,000 | | 8.000%, 06/01/2020 (c) | | | 896,500 | |
| | | | CenterPoint Energy Resources Corp. | | | | |
| | 475,000 | | 7.880%, 04/01/2013 | | | 486,732 | |
| | | | Commonwealth Edison Co. | | | | |
| | 425,000 | | 5.400%, 12/15/2011 | | | 426,200 | |
| | 250,000 | | 6.950%, 07/15/2018 | | | 234,368 | |
| | 275,000 | | 5.900%, 03/15/2036 | | | 225,877 | |
| | | | Dominion Resources, Inc. | | | | |
| | 80,000 | | 4.750%, 12/15/2010 | | | 80,601 | |
| | 300,000 | | 5.700%, 09/17/2012 | | | 306,076 | |
| | | | Duke Energy Corp. | | | | |
| | 25,000 | | 5.630%, 11/30/2012 | | | 26,453 | |
| | | | Energy Future Holdings Corp. | | | | |
| | 110,000 | | 5.550%, 11/15/2014 | | | 41,480 | |
| | 10,000 | | 10.875%, 11/01/2017 | | | 6,500 | |
| | 3,440,000 | | 11.250%, 11/01/2017 | | | 1,470,600 | |
| | 270,000 | | 6.500%, 11/15/2024 | | | 77,092 | |
| | 915,000 | | 6.550%, 11/15/2034 | | | 252,567 | |
See notes to financial statements.
AssetMark Core Plus Fixed Income Fund
SCHEDULE OF INVESTMENTS (Continued)
| Principal | | | | | |
| Amount | | | | Value | |
| | | CORPORATE BONDS (Continued) | | | |
| | | Electric Utilities (Continued) | | | |
| | | Exelon Corp. | | | |
| $ | 75,000 | | 5.630%, 06/15/2035 | | $ | 50,237 | |
| | | | FirstEnergy Corp. | | | | |
| | 200,000 | | 6.450%, 11/15/2011 | | | 200,300 | |
| | 1,005,000 | | 7.380%, 11/15/2031 | | | 819,837 | |
| | | | Nevada Power Co. | | | | |
| | 375,000 | | 5.880%, 01/15/2015 | | | 355,834 | |
| | 625,000 | | 6.650%, 04/01/2036 | | | 523,572 | |
| | | | Pacific Gas & Electric Co. | | | | |
| | 470,000 | | 5.630%, 11/30/2017 | | | 476,842 | |
| | 170,000 | | 6.050%, 03/01/2034 | | | 166,880 | |
| | 290,000 | | 5.800%, 03/01/2037 | | | 276,706 | |
| | | | Progress Energy, Inc. | | | | |
| | 225,000 | | 7.050%, 03/15/2019 | | | 229,643 | |
| | 400,000 | | 7.750%, 03/01/2031 | | | 402,270 | |
| | | | | | | 9,156,442 | |
| | | | Electrical Equipment - 0.35% | | | | |
| | | | L-3 Communications Holdings, Inc. | | | | |
| | 100,000 | | 6.380%, 10/15/2015 | | | 94,750 | |
| | | | NXP BV / NXP Funding LLC | | | | |
| | 20,000 | | 7.880%, 10/15/2014 (c) | | | 4,725 | |
| | 70,000 | | 9.500%, 10/15/2015 (c) | | | 7,875 | |
| | | | Tyco International Group | | | | |
| | 130,000 | | 6.750%, 02/15/2011 | | | 131,131 | |
| | 455,000 | | 6.380%, 10/15/2011 | | | 461,251 | |
| | | | Tyco International Ltd. | | | | |
| | 1,285,000 | | 6.875%, 01/15/2021 | | | 1,076,513 | |
| | | | | | | 1,776,245 | |
| | | | Electronic Equipment & Instruments - 0.01% | | | | |
| | | | Freescale Semiconductor, Inc. | | | | |
| | 50,000 | | 8.880%, 12/15/2014 | | | 10,750 | |
| | | | Xerox Corp. | | | | |
| | 40,000 | | 6.750%, 02/01/2017 | | | 30,593 | |
| | | | | | | 41,343 | |
| | | | Energy Equipment & Services - 0.32% | | | | |
| | | | Baker Hughes, Inc. | | | | |
| | 620,000 | | 7.500%, 11/15/2018 | | | 705,866 | |
| | | | Complete Production Services | | | | |
| | 190,000 | | 8.000%, 12/15/2016 | | | 121,600 | |
| | | | Geophysique | | | | |
| | 155,000 | | 7.500%, 05/15/2015 | | | 123,225 | |
| Principal | | | | | |
| Amount | | | | Value | |
| | | Energy Equipment & Services (Continued) | | | |
| $ | 90,000 | | 7.750%, 05/15/2017 | | $ | 69,300 | |
| | | | Pride International, Inc. | | | | |
| | 50,000 | | 7.380%, 07/15/2014 | | | 49,500 | |
| | | | SemGroup LP | | | | |
| | 100,000 | | 8.750%, 11/15/2015 (c)(f) | | | 4,000 | |
| | | | Smith International, Inc. | | | | |
| | 500,000 | | 9.750%, 03/15/2019 | | | 523,117 | |
| | | | | | | 1,596,608 | |
| | | | Food & Staples Retailing - 0.22% | | | | |
| | | | CVS Caremark Corporation | | | | |
| | 500,000 | | 6.600%, 03/15/2019 | | | 504,868 | |
| | 781,532 | | 6.940%, 01/10/2030 (c) | | | 597,261 | |
| | | | | | | 1,102,129 | |
| | | | Food Products - 0.37% | | | | |
| | | | Dean Foods Co. | | | | |
| | 375,000 | | 7.000%, 06/01/2016 (b) | | | 358,125 | |
| | | | General Mills, Inc. | | | | |
| | 425,000 | | 5.650%, 02/15/2019 | | | 433,488 | |
| | | | Kraft Foods, Inc. | | | | |
| | 425,000 | | 6.500%, 08/11/2017 | | | 438,341 | |
| | | | Land O’ Lakes, Inc. | | | | |
| | 125,000 | | 9.000%, 12/15/2010 | | | 125,781 | |
| | 500,000 | | 8.750%, 11/15/2011 | | | 497,500 | |
| | | | | | | 1,853,235 | |
| | | | Health Care Providers & Services - 0.53% | | | | |
| | | | AmerisourceBergen Corp. | | | | |
| | 100,000 | | 5.880%, 09/15/2015 | | | 94,716 | |
| | | | Community Health Systems, Inc. | | | | |
| | 200,000 | | 8.880%, 07/15/2015 | | | 190,000 | |
| | | | Davita, Inc. | | | | |
| | 205,000 | | 6.630%, 03/15/2013 | | | 199,875 | |
| | | | FMC Finance III SA | | | | |
| | 250,000 | | 6.880%, 07/15/2017 | | | 245,625 | |
| | | | HCA, Inc. | | | | |
| | 13,000 | | 6.300%, 10/01/2012 | | | 10,920 | |
| | 234,000 | | 6.250%, 02/15/2013 | | | 176,670 | |
| | 460,000 | | 6.750%, 07/15/2013 | | | 346,150 | |
| | 40,000 | | 9.130%, 11/15/2014 | | | 37,700 | |
| | 340,000 | | 9.250%, 11/15/2016 | | | 310,250 | |
| | 444,000 | | 9.630%, 11/15/2016 | | | 355,200 | |
| | | | Service Corporation International | | | | |
| | 60,000 | | 6.750%, 04/01/2016 | | | 52,500 | |
See notes to financial statements.
AssetMark Core Plus Fixed Income Fund
SCHEDULE OF INVESTMENTS (Continued)
| Principal | | | | | |
| Amount | | | | Value | |
| | | CORPORATE BONDS (Continued) | | | |
| | | Health Care Providers & Services (Continued) | |
| $ | 10,000 | | 7.630%, 10/01/2018 | | $ | 8,650 | |
| | | | Tenet Healthcare Corp. | | | | |
| | 542,000 | | 9.250%, 02/01/2015 (b) | | | 420,050 | |
| | | | Unitedhealth Group, Inc. | | | | |
| | 160,000 | | 6.000%, 02/15/2018 | | | 153,981 | |
| | | | WellPoint, Inc. | | | | |
| | 50,000 | | 5.880%, 06/15/2017 | | | 47,078 | |
| | | | | | | 2,649,365 | |
| | | | Hotels, Restaurants & Leisure - 0.16% | | | | |
| | | | Boyd Gaming Corp. | | | | |
| | 65,000 | | 6.750%, 04/15/2014 | | | 38,025 | |
| | 160,000 | | 7.130%, 02/01/2016 | | | 87,200 | |
| | | | Host Marriott Services Corp. | | | | |
| | 85,000 | | 6.750%, 06/01/2016 | | | 62,475 | |
| | | | Inn of the Mountain Gods | | | | |
| | | | Resort & Casino | | | | |
| | 60,000 | | 12.000%, 11/15/2010 | | | 6,600 | |
| | | | MGM Mirage, Inc. | | | | |
| | 180,000 | | 8.500%, 09/15/2010 | | | 74,700 | |
| | 20,000 | | 6.630%, 07/15/2015 | | | 7,200 | |
| | 100,000 | | 7.630%, 01/15/2017 | | | 36,000 | |
| | | | River Rock Entertainment | | | | |
| | 20,000 | | 9.750%, 11/01/2011 | | | 10,100 | |
| | | | Station Casinos, Inc. | | | | |
| | 25,000 | | 6.880%, 03/01/2016 (f) | | | 937 | |
| | 190,000 | | 7.750%, 08/15/2016 (f) | | | 55,813 | |
| | | | Universal City Development Partners | | | | |
| | 500,000 | | 11.750%, 04/01/2010 | | | 430,000 | |
| | | | | | | 809,050 | |
| | | | Industrials - 0.55% | | | | |
| | | | Reed Elsevier Capital | | | | |
| | 340,000 | | 8.625%, 01/15/2019 | | | 349,179 | |
| | | | Roche Holding Inc. | | | | |
| | 2,370,000 | | 6.000%, 03/01/2019 (c) | | | 2,443,894 | |
| | | | | | | 2,793,073 | |
| | | | Insurance - 0.82% | | | | |
| | | | ACE INA Holdings, Inc. | | | | |
| | 900,000 | | 5.800%, 03/15/2018 | | | 814,441 | |
| | | | American International Group, Inc. | | | | |
| | 130,000 | | 5.850%, 01/16/2018 | | | 50,961 | |
| | 390,000 | | 8.250%, 08/15/2018 (c) | | | 167,071 | |
| Principal | | | | | |
| Amount | | | | Value | |
| | | Insurance Continued) | | | |
| $ | 150,000 | | 6.250%, 03/15/2087 (e) | | $ | 15,000 | |
| | | | Arch Capital Group Ltd. | | | | |
| | 400,000 | | 7.350%, 05/01/2034 | | | 258,376 | |
| | | | ASIF Global Financing XIX | | | | |
| | 80,000 | | 4.900%, 01/17/2013 (c) | | | 52,176 | |
| | | | AXA Group | | | | |
| | 200,000 | | 6.460%, 12/31/2049 (c)(e) | | | 71,164 | |
| | | | Catlin Insurance Co. Ltd. | | | | |
| | 375,000 | | 7.250%, 12/31/2049 | | | | |
| | | | (Acquired 01/11/2007, | | | | |
| | | | Cost $375,000) (d)(e) | | | 101,759 | |
| | | | CNA Financial Corp. | | | | |
| | 890,000 | | 7.250%, 11/15/2023 | | | 533,937 | |
| | | | Endurance Specialty Holdings Ltd. | | | | |
| | 425,000 | | 6.150%, 10/15/2015 | | | 335,735 | |
| | | | Lincoln National Corp. | | | | |
| | 275,000 | | 7.000%, 05/17/2066 | | | 62,441 | |
| | | | Metlife, Inc. | | | | |
| | 1,200,000 | | 6.400%, 12/15/2066 | | | 504,853 | |
| | | | Phoenix Life Insurance Co. | | | | |
| | 500,000 | | 7.150%, 12/15/2034 (c) | | | 71,286 | |
| | | | QBE Insurance Group Ltd. | | | | |
| | 450,000 | | 5.650%, 07/01/2023 (Acquired | | | | |
| | | | 08/23/04, Cost $441,198) (d)(e) | | | 256,189 | |
| | | | Reinsurance Group of America, Inc. | | | | |
| | 300,000 | | 6.750%, 12/15/2065 | | | 117,258 | |
| | | | Swiss Reinsurance Company | | | | |
| | 875,000 | | 6.850%, 05/29/2049 (c)(e) | | | 267,128 | |
| | | | Travelers Companies, Inc. | | | | |
| | 840,000 | | 6.250%, 03/15/2067 | | | 446,338 | |
| | | | | | | 4,126,113 | |
| | | | IT Services - 0.11% | | | | |
| | | | Fiserv, Inc. | | | | |
| | 575,000 | | 6.130%, 11/20/2012 | | | 569,330 | |
| | | | Machinery - 0.01% | | | | |
| | | | American Achievement Corp. | | | | |
| | 20,000 | | 8.250%, 04/01/2012 (Callable at | | | | |
| | | | $102.06 on 04/01/2009) (c) | | | 14,600 | |
| | | | Terex Corp. | | | | |
| | 60,000 | | 7.380%, 01/15/2014 | | | 52,200 | |
| | | | | | | 66,800 | |
See notes to financial statements.
AssetMark Core Plus Fixed Income Fund
SCHEDULE OF INVESTMENTS (Continued)
March 31, 2009
| Principal | | | | | |
| Amount | | | | Value | |
| | | CORPORATE BONDS (Continued) | | | |
| | | Media - 1.22% | | | |
| | | British Sky Broadcasting Group | | | |
| $ | 950,000 | | 6.100%, 02/15/2018 (c) | | $ | 828,015 | |
| | | | CCH Holdings LLC | | | | |
| | 140,000 | | 11.000%, 10/01/2015 | | | 15,750 | |
| | | | Clear Channel Communications, Inc. | | | | |
| | 50,000 | | 6.250%, 03/15/2011 | | | 10,250 | |
| | 330,000 | | 5.500%, 09/15/2014 | | | 51,150 | |
| | 270,000 | | 4.900%, 05/15/2015 | | | 39,150 | |
| | | | Comcast Cable Communications | | | | |
| | | | Holdings, Inc. | | | | |
| | 320,000 | | 8.880%, 05/01/2017 | | | 347,455 | |
| | 500,000 | | 9.460%, 11/15/2022 | | | 550,343 | |
| | | | Comcast Corp. | | | | |
| | 220,000 | | 6.500%, 01/15/2015 | | | 219,022 | |
| | 50,000 | | 6.500%, 01/15/2017 | | | 49,570 | |
| | 20,000 | | 5.880%, 02/15/2018 | | | 19,048 | |
| | | | Comcast Holdings Corp. | | | | |
| | 650,000 | | 10.630%, 07/15/2012 | | | 715,861 | |
| | | | CSC Holdings, Inc. | | | | |
| | 45,000 | | 7.630%, 04/01/2011 | | | 44,887 | |
| | 70,000 | | 8.625%, 02/15/2019 (c) | | | 67,725 | |
| | | | DIRECTV Holdings LLC | | | | |
| | 110,000 | | 8.380%, 03/15/2013 | | | 111,788 | |
| | | | EchoStar DBS Corporation | | | | |
| | 40,000 | | 6.630%, 10/01/2014 | | | 35,900 | |
| | 500,000 | | 7.130%, 02/01/2016 | | | 450,000 | |
| | | | Liberty Media Corp. | | | | |
| | 20,000 | | 5.700%, 05/15/2013 | | | 14,947 | |
| | | | Sun Media Corp. | | | | |
| | 70,000 | | 7.630%, 02/15/2013 | | | 40,250 | |
| | | | Time Warner Cable, Inc. | | | | |
| | 450,000 | | 6.880%, 05/01/2012 | | | 458,325 | |
| | 775,000 | | 5.400%, 07/02/2012 | | | 749,155 | |
| | 540,000 | | 5.850%, 05/01/2017 | | | 484,861 | |
| | 40,000 | | 8.750%, 02/14/2019 | | | 42,544 | |
| | 300,000 | | 8.250%, 04/01/2019 | | | 308,809 | |
| | 155,000 | | 7.700%, 05/01/2032 | | | 139,734 | |
| | 375,000 | | 6.550%, 05/01/2037 | | | 316,512 | |
| | | | TL Acquisitions, Inc. | | | | |
| | 90,000 | | 10.500%, 01/15/2015 (Callable at | | | | |
| | | | $105.25 on 01/15/2011) (c) | | | 46,575 | |
| | | | | | | 6,157,626 | |
| Principal | | | | | |
| Amount | | | | Value | |
| | | Metals & Mining - 0.90% | | | |
| | | Alcoa, Inc. | | | |
| $ | 570,000 | | 6.000%, 07/15/2013 | | $ | 455,359 | |
| | | | ArcelorMittal SA | | | | |
| | 1,075,000 | | 6.125%, 06/01/2018 | | | 778,952 | |
| | | | Barrick Gold Corp. | | | | |
| | 200,000 | | 6.950%, 04/01/2019 | | | 201,271 | |
| | | | BHP Billiton Ltd. | | | | |
| | 640,000 | | 6.500%, 04/01/2019 | | | 649,593 | |
| | | | Codelco | | | | |
| | 100,000 | | 4.750%, 10/15/2014 (c) | | | 99,384 | |
| | | | Evraz Group SA | | | | |
| | 740,000 | | 8.880%, 04/24/2013 (c) | | | 473,600 | |
| | | | Freeport-McMoRan Copper & Gold Inc. | | | | |
| | 10,000 | | 8.250%, 04/01/2015 | | | 9,586 | |
| | 270,000 | | 8.380%, 04/01/2017 | | | 252,806 | |
| | | | Rio Tinto Ltd. | | | | |
| | 670,000 | | 6.500%, 07/15/2018 | | | 587,335 | |
| | | | Steel Dynamics, Inc. | | | | |
| | 55,000 | | 7.380%, 11/01/2012 | | | 43,175 | |
| | 150,000 | | 6.750%, 04/01/2015 | | | 102,375 | |
| | | | Transocean, Inc. | | | | |
| | 675,000 | | 6.800%, 03/15/2038 | | | 594,737 | |
| | | | Vedanta Resources Plc | | | | |
| | 400,000 | | 8.750%, 01/15/2014 (c) | | | 298,000 | |
| | | | | | | 4,546,173 | |
| | | | Multi-Utilities - 0.40% | | | | |
| | | | CenterPoint Energy, Inc. | | | | |
| | 50,000 | | 7.250%, 09/01/2010 | | | 50,139 | |
| | | | Dominion Resources, Inc. | | | | |
| | 550,000 | | 8.875%, 01/15/2019 | | | 623,697 | |
| | | | Edison Mission Energy | | | | |
| | 160,000 | | 7.000%, 05/15/2017 | | | 117,600 | |
| | 220,000 | | 7.200%, 05/15/2019 | | | 154,000 | |
| | 80,000 | | 7.630%, 05/15/2027 | | | 48,400 | |
| | | | MidAmerican Energy Holding Co. | | | | |
| | 850,000 | | 6.130%, 04/01/2036 | | | 756,119 | |
| | | | NRG Energy, Inc. | | | | |
| | 225,000 | | 7.250%, 02/01/2014 | | | 212,063 | |
| | 30,000 | | 7.380%, 02/01/2016 | | | 27,975 | |
| | 20,000 | | 7.380%, 01/15/2017 | | | 18,650 | |
| | | | | | | 2,008,643 | |
See notes to financial statements.
AssetMark Core Plus Fixed Income Fund
SCHEDULE OF INVESTMENTS (Continued)
March 31, 2009
| Principal | | | | | |
| Amount | | | | Value | |
| | | CORPORATE BONDS (Continued) | | | |
| | | Oil & Gas - 4.65% | | | |
| | | Amerada Hess Corp. | | | |
| $ | 160,000 | | 7.880%, 10/01/2029 | | $ | 145,151 | |
| | 670,000 | | 7.300%, 08/15/2031 | | | 584,320 | |
| | | | Anadarko Finance Co. | | | | |
| | 80,000 | | 7.500%, 05/01/2031 | | | 62,630 | |
| | | | Anadarko Petroleum Corp. | | | | |
| | 1,160,000 | | 6.450%, 09/15/2036 | | | 812,879 | |
| | | | Apache Corp. | | | | |
| | 480,000 | | 6.000%, 09/15/2013 | | | 513,620 | |
| | | | Boardwalk Pipelines LP | | | | |
| | 700,000 | | 5.880%, 11/15/2016 | | | 593,970 | |
| | | | BP Capital PLC | | | | |
| | 890,000 | | 5.250%, 11/07/2013 | | | 953,582 | |
| | | | Canadian Natural Resources Ltd. | | | | |
| | 250,000 | | 5.150%, 02/01/2013 | | | 237,460 | |
| | 75,000 | | 5.850%, 02/01/2035 | | | 52,652 | |
| | 475,000 | | 6.500%, 02/15/2037 | | | 370,661 | |
| | 150,000 | | 6.250%, 03/15/2038 | | | 115,866 | |
| | | | Chesapeake Energy Corp. | | | | |
| | 55,000 | | 9.500%, 02/15/2015 | | | 53,762 | |
| | 60,000 | | 6.380%, 06/15/2015 | | | 50,850 | |
| | 80,000 | | 6.250%, 01/15/2018 | | | 62,800 | |
| | 95,000 | | 7.250%, 12/15/2018 | | | 78,494 | |
| | | | Conoco Funding Co. | | | | |
| | 70,000 | | 6.350%, 10/15/2011 | | | 75,785 | |
| | | | ConocoPhillips | | | | |
| | 20,000 | | 6.950%, 04/15/2029 | | | 19,967 | |
| | 890,000 | | 6.500%, 02/01/2039 | | | 870,984 | |
| | | | Dynegy, Inc. | | | | |
| | 275,000 | | 7.750%, 06/01/2019 | | | 180,125 | |
| | | | El Paso Natural Gas Co. | | | | |
| | 400,000 | | 7.500%, 11/15/2026 | | | 350,361 | |
| | 309,000 | | 8.380%, 06/15/2032 | | | 295,536 | |
| | | | El Paso Corp. | | | | |
| | 730,000 | | 7.000%, 06/15/2017 | | | 625,377 | |
| | 217,000 | | 7.800%, 08/01/2031 | | | 163,228 | |
| | 355,000 | | 7.750%, 01/15/2032 | | | 266,263 | |
| | | | Energy Transfer Partners LP | | | | |
| | 350,000 | | 5.650%, 08/01/2012 | | | 333,140 | |
| | 1,400,000 | | 5.950%, 02/01/2015 | | | 1,270,237 | |
| | 500,000 | | 6.700%, 07/01/2018 | | | 453,316 | |
| | | | Enterprise Products Operating LP | | | | |
| | 375,000 | | 8.380%, 08/01/2066(e) | | | 251,551 | |
| Principal | | | | | |
| Amount | | | | Value | |
| | | Oil & Gas (Continued) | | | |
| $ | 450,000 | | 7.030%, 01/15/2068(e) | | $ | 281,647 | |
| | | | Hess Corp. | | | | |
| | 400,000 | | 8.125%, 02/15/2019 | | | 413,046 | |
| | | | Intergas Finance BV | | | | |
| | 100,000 | | 6.380%, 05/14/2017 | | | 58,500 | |
| | 620,000 | | 6.380%, 05/14/2017 (c) | | | 362,700 | |
| | | | Kazmunaigaz Finance BV | | | | |
| | 780,000 | | 8.380%, 07/02/2013 (c) | | | 651,300 | |
| | | | Kerr-McGee Corp. | | | | |
| | 150,000 | | 6.950%, 07/01/2024 | | | 115,180 | |
| | 1,215,000 | | 7.880%, 09/15/2031 | | | 990,619 | |
| | | | Kinder Morgan Energy Partners | | | | |
| | 360,000 | | 6.750%, 03/15/2011 | | | 367,276 | |
| | 110,000 | | 5.850%, 09/15/2012 | | | 108,713 | |
| | 260,000 | | 6.000%, 02/01/2017 | | | 244,559 | |
| | 730,000 | | 6.950%, 01/15/2038 | | | 626,422 | |
| | | | Noble Energy, Inc. | | | | |
| | 590,000 | | 8.250%, 03/01/2019 | | | 605,351 | |
| | | | Occidental Petroleum Corp. | | | | |
| | 790,000 | | 7.000%, 11/01/2013 | | | 882,904 | |
| | | | Oneok Partners LP | | | | |
| | 425,000 | | 6.650%, 10/01/2036 | | | 318,965 | |
| | 525,000 | | 6.850%, 10/15/2037 | | | 403,494 | |
| | | | OPTI Canada, Inc. | | | | |
| | 160,000 | | 7.880%, 12/15/2014 | | | 70,800 | |
| | 130,000 | | 8.250%, 12/15/2014 | | | 58,825 | |
| | | | Peabody Energy Corp. | | | | |
| | 10,000 | | 6.880%, 03/15/2013 | | | 9,800 | |
| | 50,000 | | 5.880%, 04/15/2016 | | | 44,750 | |
| | | | Pemex Project Funding Master Trust | | | | |
| | 841,000 | | 6.630%, 06/15/2035 | | | 602,366 | |
| | | | Petrobras International Finance Co. | | | | |
| | 620,000 | | 6.130%, 10/06/2016 | | | 623,100 | |
| | | | Petróleos Mexicanos | | | | |
| | 980,000 | | 8.000%, 05/03/2019 (c) | | | 960,400 | |
| | | | Southern Natural Gas Co. | | | | |
| | 45,000 | | 8.000%, 03/01/2032 | | | 41,005 | |
| | | | Suburban Propane Partners LP | | | | |
| | 140,000 | | 6.880%, 12/15/2013 | | | 133,700 | |
| | | | Tennessee Gas Pipeline Co. | | | | |
| | 250,000 | | 7.000%, 10/15/2028 | | | 213,914 | |
| | 140,000 | | 7.630%, 04/01/2037 | | | 121,506 | |
| | | | Teppco Partners LP | | | | |
| | 975,000 | | 6.650%, 04/15/2018 | | | 839,903 | |
See notes to financial statements.
AssetMark Core Plus Fixed Income Fund
SCHEDULE OF INVESTMENTS (Continued)
March 31, 2009
| Principal | | | | | |
| Amount | | | | Value | |
| | | CORPORATE BONDS (Continued) | | | |
| | | Oil & Gas (Continued) | | | |
| | | Transocean, Inc. | | | |
| $ | 525,000 | | 7.500%, 04/15/2031 | | | 480,590 | |
| | | | Williams Companies, Inc. | | | | |
| | 360,000 | | 7.880%, 09/01/2021 | | | 333,635 | |
| | 770,000 | | 7.500%, 01/15/2031 | | | 609,724 | |
| | 590,000 | | 7.750%, 06/15/2031 | | | 479,016 | |
| | 50,000 | | 8.750%, 03/15/2032 | | | 45,480 | |
| | | | XTO Energy, Inc. | | | | |
| | 800,000 | | 7.500%, 04/15/2012 | | | 838,438 | |
| | 30,000 | | 5.650%, 04/01/2016 | | | 28,672 | |
| | 575,000 | | 6.500%, 12/15/2018 | | | 572,277 | |
| | 70,000 | | 6.750%, 08/01/2037 | | | 63,898 | |
| | | | | | | 23,447,042 | |
| | | | Pharmaceuticals - 0.72% | | | | |
| | | | Abbott Labs | | | | |
| | 820,000 | | 5.125%, 04/01/2019 | | | 826,299 | |
| | | | Pfizer, Inc. | | | | |
| | 2,165,000 | | 6.200%, 03/15/2019 | | | 2,311,588 | |
| | | | Wyeth | | | | |
| | 520,000 | | 5.950%, 04/01/2037 | | | 491,314 | |
| | | | | | | 3,629,201 | |
| | | | Real Estate - 0.32% | | | | |
| | | | Arden Realty LP | | | | |
| | 250,000 | | 9.150%, 03/01/2010 | | | 247,759 | |
| | | | Forest City Enterprises, Inc. | | | | |
| | 10,000 | | 7.630%, 06/01/2015 | | | 4,350 | |
| | 29,000 | | 6.500%, 02/01/2017 | | | 10,875 | |
| | | | Realogy Corp. | | | | |
| | 550,000 | | 12.380%, 04/15/2015 | | | 96,250 | |
| | | | Simon Property Group, Inc. | | | | |
| | 1,375,000 | | 6.130%, 05/30/2018 | | | 1,082,627 | |
| | | | Ventas Realty LP | | | | |
| | 70,000 | | 6.750%, 04/01/2017 (Callable at | | | | |
| | | | $103.38 on 04/01/2012) | | | 60,200 | |
| | 90,000 | | 9.000%, 05/01/2012 | | | 90,225 | |
| | | | | | | 1,592,286 | |
| | | | Retail - 0.01% | | | | |
| | | | J.C. Penney Co., Inc. | | | | |
| | 40,000 | | 7.400%, 04/01/2037 | | | 25,457 | |
| Principal | | | | | |
| Amount | | | | Value | |
| | | Road & Rail - 0.12% | | | |
| | | Hertz Corp. | | | |
| $ | 340,000 | | 8.880%, 01/01/2014 | | $ | 207,825 | |
| | 35,000 | | 10.500%, 01/01/2016 | | | 15,400 | |
| | | | Kansas City Southern de Mexico, | | | | |
| | | | S.A. de C.V. | | | | |
| | 165,000 | | 12.500%, 04/01/2016 (c) | | | 157,163 | |
| | | | TFM SA de CV | | | | |
| | 10,000 | | 9.375%, 05/01/2012 | | | 9,150 | |
| | | | Union Pacific Corp. | | | | |
| | 230,000 | | 5.380%, 05/01/2014 | | | 231,535 | |
| | | | | | | 621,073 | |
| | | | Special Purpose Entity - 0.46% | | | | |
| | | | El Paso Performance Linked Trust | | | | |
| | 1,070,000 | | 7.750%, 07/15/2011 (c) | | | 1,031,016 | |
| | | | GrafTech Financial, Inc. | | | | |
| | 50,000 | | 10.250%, 02/15/2012 | | | 45,500 | |
| | | | Hellas Telecom V | | | | |
| | 375,000 | | 6.112%, 10/15/2012 | | | 246,622 | |
| | | | ILFC E-Capital Trust II | | | | |
| | 280,000 | | 6.250%, 12/21/2065 (c)(e) | | | 44,939 | |
| | | | MUFG Capital Finance 1 Ltd. | | | | |
| | 330,000 | | 6.350%, 07/29/2049 | | | 221,390 | |
| | | | TNK-BP | | | | |
| | 100,000 | | 7.500%, 07/18/2016 | | | 71,000 | |
| | 490,000 | | 7.500%, 07/18/2016 (c) | | | 357,700 | |
| | 200,000 | | 6.630%, 03/20/2017 (c) | | | 133,000 | |
| | 240,000 | | 7.880%, 03/13/2018 (c) | | | 169,200 | |
| | | | | | | 2,320,367 | |
| | | | Telecommunications - 0.29% | | | | |
| | | | Echostar DBS Corporation | | | | |
| | 125,000 | | 7.750%, 05/31/2015 | | | 115,625 | |
| | | | Telefonica Emisiones SAU | | | | |
| | 875,000 | | 6.420%, 06/20/2016 | | | 905,992 | |
| | | | VIP Finance Ireland Ltd. | | | | |
| | 590,000 | | 8.380%, 04/30/2013 (c) | | | 430,700 | |
| | | | | | | 1,452,317 | |
| | | | Textiles, Apparel & Luxury Goods - 0.03% | |
| | | | INVISTA | | | | |
| | 125,000 | | 9.250%, 05/01/2012 (c) | | | 112,500 | |
| | | | Oxford Industries, Inc. | | | | |
| | 50,000 | | 8.880%, 06/01/2011 | | | 36,750 | |
| | | | | | | 149,250 | |
See notes to financial statements.
AssetMark Core Plus Fixed Income Fund
SCHEDULE OF INVESTMENTS (Continued)
March 31, 2009
| Principal | | | | | |
| Amount | | | | Value | |
| | | CORPORATE BONDS (Continued) | | | |
| | | Tobacco - 0.24% | | | |
| | | Altria Group, Inc. | | | |
| $ | 940,000 | | 9.700%, 11/10/2018 | | $ | 1,024,813 | |
| | | | Reynolds American, Inc. | | | | |
| | 230,000 | | 6.750%, 06/15/2017 | | | 196,643 | |
| | | | | | | 1,221,456 | |
| | | | Transportation - 0.25% | | | | |
| | | | Bombardier, Inc. | | | | |
| | 375,000 | | 7.250%, 11/15/2016 (Acquired | | | | |
| | | | 05/15/2007, Cost $481,745) (d) | | | 331,320 | |
| | | | Teekay Shipping Corp. | | | | |
| | 86,000 | | 8.880%, 07/15/2011 | | | 82,990 | |
| | | | Vale Overseas Ltd. | | | | |
| | 966,000 | | 6.880%, 11/21/2036 | | | 839,009 | |
| | | | | | | 1,253,319 | |
| | | | Wireless Telecommunication Services - 0.24% | |
| | | | America Movil SAB de CV | | | | |
| | 330,000 | | 5.630%, 11/15/2017 | | | 300,922 | |
| | | | Rogers Communications Inc. | | | | |
| | 70,000 | | 6.800%, 08/15/2018 | | | 70,083 | |
| | | | Rogers Wireless Communications, Inc. | | | | |
| | 240,000 | | 6.380%, 03/01/2014 | | | 243,225 | |
| | | | Sprint Nextel Corporation | | | | |
| | 930,000 | | 6.880%, 10/31/2013 | | | 534,750 | |
| | 15,000 | | 5.950%, 03/15/2014 | | | 8,400 | |
| | 120,000 | | 7.380%, 08/01/2015 | | | 64,200 | |
| | | | | | | 1,221,580 | |
| | | | Total Corporate Bonds | | | | |
| | | | (Cost $179,517,887) | | | 135,231,245 | |
| | | | FOREIGN GOVERNMENT | | | | |
| | | | NOTES/BONDS - 0.42% | | | | |
| | | | United Mexican States | | | | |
| | 14,000 | | 5.630%, 01/15/2017 | | | 13,762 | |
| | 1,256,000 | | 6.750%, 09/27/2034 | | | 1,189,181 | |
| | | | Republic Of Indonesia | | | | |
| | 320,000 | | 11.625%, 03/04/2019 (c) | | | 349,600 | |
| | | | Republic of Peru | | | | |
| | 570,000 | | 7.125%, 03/30/2019 | | | 578,407 | |
| | | | Total Foreign Government | | | | |
| | | | Notes/Bonds (Cost $2,091,851) | | | 2,130,950 | |
| Principal | | | | | |
| Amount | | | | Value | |
| | | MORTGAGE BACKED | | | |
| | | SECURITIES - NON-U.S. | | | |
| | | GOVERNMENT AGENCY - 14.06% | | | |
| | | Adjustable Rate Mortgage Trust | | | |
| $ | 36,935 | | Series 2004-5, | | | |
| | | | 5.000%, 04/25/2035 | | $ | 20,543 | |
| | | | Bank of America Corporation | | | | |
| | 550,000 | | Series 2005-5, | | | | |
| | | | 5.120%, 10/10/2045 | | | 422,454 | |
| | 2,500,000 | | Series 2005-6, | | | | |
| | | | 5.180%, 09/10/2047 | | | 1,929,419 | |
| | 110,000 | | Series 2007-5, | | | | |
| | | | 5.620%, 02/10/2051 | | | 81,162 | |
| | | | BCAP LLC Trust | | | | |
| | 295,828 | | Series 2006-RR1, | | | | |
| | | | 1.114%, 11/25/2036 | | | 157,217 | |
| | | | Bear Stearns Trust | | | | |
| | 73,898 | | Series 2004-1, | | | | |
| | | | 4.861%, 04/25/2034 | | | 49,341 | |
| | 502,922 | | Series 2004-9, | | | | |
| | | | 5.220%, 09/25/2034 | | | 320,986 | |
| | 868,539 | | Series 2005-2, | | | | |
| | | | 4.710%, 04/25/2035 | | | 406,443 | |
| | 217,998 | | Series 2005-3, | | | | |
| | | | 5.083%, 06/25/2035 | | | 126,663 | |
| | 1,809,658 | | Series 2006-4, | | | | |
| | | | 5.379%, 10/25/2036 | | | 802,388 | |
| | 3,000,000 | | Series 2005-PWR10, | | | | |
| | | | 5.410%, 12/11/2040 | | | 2,367,012 | |
| | 3,375,372 | | Series FLT, | | | | |
| | | | 6.140%, 09/25/2047 | | | 1,424,926 | |
| | | | Chase Mortgage Financial Trust | | | | |
| | 1,441,380 | | Series 2007-A1, | | | | |
| | | | 4.604%, 02/25/2037 | | | 914,972 | |
| | 2,088,600 | | Series 2007-A1, | | | | |
| | | | 4.825%, 02/25/2037 | | | 1,317,924 | |
| | 2,085,094 | | Series 2007-A1, | | | | |
| | | | 4.134%, 01/01/2049 | | | 1,501,805 | |
| | 442,770 | | Series 2007-A1, | | | | |
| | | | 4.831%, 01/01/2049 | | | 364,762 | |
| | 1,574,639 | | Series 2007-A1, | | | | |
| | | | 4.933%, 01/01/2049 | | | 1,232,076 | |
See notes to financial statements.
AssetMark Core Plus Fixed Income Fund
SCHEDULE OF INVESTMENTS (Continued)
March 31, 2009
| Principal | | | | | |
| Amount | | | | Value | |
| | | MORTGAGE BACKED | | | |
| | | SECURITIES - NON-U.S. | | | |
| | | GOVERNMENT AGENCY (Continued) | |
| | | CIT Mortgage Loan Trust | | | |
| $ | 1,408,452 | | Pool #2007A1, 1.474%, 10/25/2037 | | | |
| | | | (Acquired 10/05/2007, | | | |
| | | | Cost $1,408,452) (d)(e) | | $ | 1,055,676 | |
| | 550,000 | | Pool #2007A2, 1.724%, 10/25/2037 | | | | |
| | | | (Acquired 10/05/2007, | | | | |
| | | | Cost $550,000) (d)(e) | | | 160,267 | |
| | 1,000,000 | | Pool #2007A3, 1.924%, 10/25/2037 | | | | |
| | | | (Acquired 10/05/2007, | | | | |
| | | | Cost $1,000,000) (d)(e) | | | 268,384 | |
| | | | Citigroup Commercial Mortgage Trust | | | | |
| | 2,000,000 | | Series 2006-C4, | | | | |
| | | | 5.725%, 03/15/2049 | | | 1,506,156 | |
| | | | Citigroup/Deutsche Bank | | | | |
| | | | Commerical Mortgage | | | | |
| | 2,500,000 | | Series TR, | | | | |
| | | | 5.362%, 01/15/2046 | | | 1,934,626 | |
| | | | Countrywide Alternative Loan Trust | | | | |
| | 708,579 | | Series 2005-36, | | | | |
| | | | 4.970%, 08/25/2035 | | | 446,565 | |
| | 1,340,299 | | Series 2005-27, | | | | |
| | | | 6.123%, 08/25/2035 | | | 495,022 | |
| | 331,216 | | Series 2005-38, | | | | |
| | | | 3.323%, 09/25/2035 | | | 222,319 | |
| | 1,056,159 | | Series 2005-59, | | | | |
| | | | 0.880%, 11/20/2035(e) | | | 425,421 | |
| | 631,209 | | Series 2005-51, | | | | |
| | | | 0.870%, 11/20/2035(e) | | | 259,043 | |
| | 1,905,108 | | Series 2005-62, | | | | |
| | | | 0.820%, 12/25/2035(e) | | | 715,631 | |
| | 1,275,783 | | Series 2005-63, | | | | |
| | | | 5.309%, 12/25/2035 | | | 597,088 | |
| | 2,660,140 | | Series 2007-16CB, | | | | |
| | | | 6.000%, 08/25/2037 | | | 1,454,449 | |
| | 1,491,471 | | Series 2006-OA10, | | | | |
| | | | 0.710%, 08/25/2046 (e) | | | 537,694 | |
| | | | Countrywide Home Loans, Inc. | | | | |
| | 170,715 | | Series 2003-52, | | | | |
| | | | 5.290%, 02/19/2034 | | | 113,879 | |
| | 57,201 | | Series 2004-HYB6, | | | | |
| | | | 4.537%, 11/20/2034 | | | 31,123 | |
| | 308,386 | | Series 2005-HYB4, | | | | |
| | | | 4.899%, 08/20/2035 | | | 171,145 | |
| Principal | | | | | |
| Amount | | | | Value | |
| | | MORTGAGE BACKED | | | |
| | | SECURITIES - NON-U.S. | | | |
| | | GOVERNMENT AGENCY (Continued) | |
| | | First Horizon Mortgage Trust | | | |
| | $34,906 | | Series FLT, 4.750%, 12/25/2034 | | | $28,792 | |
| | | | First Union National Bank | | | | |
| | | | Commercial Mortgage | | | | |
| | 2,854,555 | | Series 2000-C2, | | | | |
| | | | 7.200%, 10/15/2032 | | | 2,900,013 | |
| | | | GE Capital Commercial Mortgage | | | | |
| | | | Corporation | | | | |
| | 3,000,000 | | Series 2005-C4, | | | | |
| | | | 5.334%, 11/10/2045 | | | 2,314,709 | |
| | | | General Motors Acceptance | | | | |
| | | | Corporation | | | | |
| | 2,414,710 | | Series FLT, | | | | |
| | | | 1.224%, 02/25/2031 (c) | | | 1,180,243 | |
| | 1,290,000 | | Series 1998-C2, | | | | |
| | | | 6.500%, 05/15/2035 | | | 1,264,540 | |
| | 2,500,000 | | Series 2002-C1, | | | | |
| | | | 6.280%, 11/15/2039 | | | 2,471,850 | |
| | 737,195 | | Series 2007-HE3, | | | | |
| | | | 7.000%, 09/25/2037 | | | 256,987 | |
| | | | GS Mortgage Securities Corporation | | | | |
| | 800,000 | | Series 2005-GG4, | | | | |
| | | | 4.680%, 07/10/2039 | | | 668,846 | |
| | | | Harborview Mortgage Loan Trust | | | | |
| | 1,259,398 | | Series 2005-10, | | | | |
| | | | 3.980%, 11/19/2035 | | | 480,460 | |
| | 1,369,146 | | Series FLT, | | | | |
| | | | 5.731%, 12/19/2035 | | | 611,858 | |
| | 1,352,851 | | Series 2005-16, | | | | |
| | | | 0.810%, 01/19/2036 (e) | | | 510,924 | |
| | 249,124 | | Series 2005-16, | | | | |
| | | | 4.460%, 01/19/2036 | | | 103,600 | |
| | | | IMPAC Secured Assets Corp. | | | | |
| | 1,010,048 | | Series 2005-6, | | | | |
| | | | 0.770%, 10/25/2035 (e) | | | 424,057 | |
| | 1,196,521 | | Series 2005-2, | | | | |
| | | | 0.840%, 03/25/2036 (e) | | | 501,027 | |
| | | | IndyMac Mortgage Loan Trust | | | | |
| | 417,600 | | Series 2005-AR15, | | | | |
| | | | 5.099%, 09/25/2035 | | | 194,227 | |
| | 623,284 | | Series 2005-AR15, | | | | |
| | | | 5.369%, 09/25/2035 | | | 308,001 | |
See notes to financial statements.
AssetMark Core Plus Fixed Income Fund
SCHEDULE OF INVESTMENTS (Continued)
March 31, 2009
| Principal | | | | | |
| Amount | | | | Value | |
| | | MORTGAGE BACKED | | | |
| | | SECURITIES - NON-U.S. | | | |
| | | GOVERNMENT AGENCY (Continued) | |
| $ | 1,897,451 | | Series 2007-AR15, | | | |
| | | | 5.836%, 08/25/2037 | | $ | 779,363 | |
| | 1,399,749 | | Series 2007-AR7, | | | | |
| | | | 6.164%, 11/25/2037 | | | 771,325 | |
| | 661,165 | | Series 2005-AR16IP, | | | | |
| | | | 0.794%, 07/25/2045 (e) | | | 252,060 | |
| | | | JP Morgan Chase & Co. | | | | |
| | 300,000 | | Series 2007-LDP10, | | | | |
| | | | 5.420%, 01/15/2049 | | | 174,352 | |
| | | | JP Morgan Commercial Mortgage | | | | |
| | 1,380,000 | | Series 2005-CIBC12, | | | | |
| | | | 4.900%, 09/12/2037 | | | 1,043,047 | |
| | 1,500,000 | | Series 2005-LDP2, | | | | |
| | | | 4.740%, 07/15/2042 | | | 1,106,106 | |
| | | | JP Morgan Mortgage Trust | | | | |
| | 726,137 | | Series 2007-A1, | | | | |
| | | | 4.067%, 07/25/2035 | | | 501,716 | |
| | 788,542 | | Series 2007-A1, | | | | |
| | | | 4.196%, 07/25/2035 | | | 543,809 | |
| | 692,527 | | Series 2007-A1, | | | | |
| | | | 4.768%, 07/25/2035 | | | 458,242 | |
| | | | Lehman Brothers Trust | | | | |
| | 1,061,762 | | Series 2005-5N, | | | | |
| | | | 0.820%, 11/25/2035 (e) | | | 436,453 | |
| | 891,722 | | Series 2005-5N, | | | | |
| | | | 0.820%, 11/25/2035 (e) | | | 354,287 | |
| | 233,053 | | Series 2005-7N, | | | | |
| | | | 0.790%, 12/25/2035 (e) | | | 94,524 | |
| | 2,811,938 | | Series 2007-16N, | | | | |
| | | | 1.370%, 09/25/2047 (e) | | | 1,025,571 | |
| | | | Lehman Brothers-UBS Commercial | | | | |
| | | | Mortgage Trust | | | | |
| | 600,000 | | Series 2005-C3, | | | | |
| | | | 4.660%, 07/15/2030 | | | 540,068 | |
| | | | Luminent Mortgage Trust | | | | |
| | 630,278 | | Series 2006-5, | | | | |
| | | | 0.710%, 07/25/2036 (e) | | | 215,708 | |
| | | | Merrill Lynch Mortgage Trust | | | | |
| | 1,030,000 | | Series 2006-C1, | | | | |
| | | | 5.844%, 05/12/2039 | | | 748,429 | |
| Principal | | | | | |
| Amount | | | | Value | |
| | | MORTGAGE BACKED | | | |
| | | SECURITIES - NON-U.S. | | | |
| | | GOVERNMENT AGENCY (Continued) | |
| | | MLCC Mortgage Investors, Inc. | | | |
| $ | 812,860 | | Series 2004-A3, | | | |
| | | | 5.041%, 05/25/2034 | | $ | 665,525 | |
| | 2,710,000 | | Series 2007-7, | | | | |
| | | | 5.750%, 06/12/2050 | | | 1,475,399 | |
| | | | Morgan Stanley | | | | |
| | 480,000 | | Series 2005-HQ6, | | | | |
| | | | 4.990%, 08/13/2042 | | | 387,511 | |
| | 2,000,000 | | Series 2005-HQ7, | | | | |
| | | | 5.210%, 11/14/2042 | | | 1,567,939 | |
| | | | Residential Accredit Loans, Inc. | | | | |
| | 3,810,199 | | Series 2007-QH9, | | | | |
| | | | 6.546%, 11/25/2037 | | | 1,237,662 | |
| | 1,291,206 | | Series 2005-QO4, | | | | |
| | | | 0.800%, 12/25/2045(e) | | | 512,175 | |
| | 1,593,564 | | Series 2005-QO5, | | | | |
| | | | 1.191%, 01/25/2046 | | | 572,744 | |
| | | | Residential Funding Mortgage | | | | |
| | 1,398,844 | | Series FLT, 5.180%,09/25/2035 | | | 905,003 | |
| | | | Structured Adjustable Rate | | | | |
| | | | Mortgage Loan | | | | |
| | 94,008 | | Series FLT, 4.380%, 05/25/2034 | | | 57,470 | |
| | 29,260 | | Series FLT, 5.250%, 09/25/2034 | | | 21,104 | |
| | 3,594,965 | | Series A-1, 3.323%, | | | | |
| | | | 08/25/2047 (e) | | | 1,305,857 | |
| | | | Thornburg Mortgage Trust | | | | |
| | 4,227,865 | | Series 2006-3, | | | | |
| | | | 0.637% to 0.584%, 06/25/2036 (e) | | | 4,097,739 | |
| | | | Washington Mutual | | | | |
| | 134,676 | | Series 2004-AR3, | | | | |
| | | | 4.176%, 06/25/2034 | | | 104,396 | |
| | 1,700,000 | | Series 2005-AR4, | | | | |
| | | | 4.670%, 04/25/2035 | | | 786,398 | |
| | 1,132,678 | | Series 2007-HY4, | | | | |
| | | | 5.505%, 09/25/2036 | | | 629,128 | |
| | 2,034,782 | | Series 2007-HY2, | | | | |
| | | | 5.588%, 12/25/2036 | | | 1,017,726 | |
| | 1,171,343 | | Series 2005-AR13, | | | | |
| | | | 0.810%, 10/25/2045 (e) | | | 483,427 | |
| | 1,470,405 | | Series 2005-AR15, | | | | |
| | | | 0.780%, 11/25/2045 (e) | | | 598,784 | |
See notes to financial statements.
AssetMark Core Plus Fixed Income Fund
SCHEDULE OF INVESTMENTS (Continued)
March 31, 2009
| | Principal | | | | |
| | Amount | | | | Value |
| | | | MORTGAGE BACKED | | |
| | | | SECURITIES - NON-U.S. | | |
| | | | GOVERNMENT AGENCY (Continued) |
| $ | 1,218,335 | | Series 2005-AR15, | | |
| | | | 0.802%, 11/25/2045 (e) | $ | 392,411 |
| | 1,234,857 | | Series 2005-AR17, | | |
| | | | 0.790%, 12/25/2045 (e) | | 504,260 |
| | 969,518 | | Series 2005-AR19, | | |
| | | | 0.790%, 12/25/2045 (e) | | 401,239 |
| | 710,917 | | Series 2006-AR11, | | |
| | | | 2.743%, 09/25/2046 | | 235,292 |
| | 770,736 | | Series 2007-OA2, | | |
| | | | 2.523%, 03/25/2047 | | 269,075 |
| | | | Wells Fargo Company | | |
| | 3,257,321 | | Series 2005-AR6, | | |
| | | | 5.034%, 04/25/2035 | | 2,441,924 |
| | 812,302 | | Series 2005-AR16, | | |
| | | | 4.610%, 10/25/2035 | | 610,905 |
| | 1,250,766 | | Series 2006-AR10, | | |
| | | | 5.593%, 07/25/2036 | | 749,599 |
| | 3,236,585 | | Series 2007-PA6, | | |
| | | | 6.599%, 12/25/2037 | | 1,790,872 |
| | | | Total Mortgage Backed Securities - | | |
| | | | Non-U.S. Government | | |
| | | | (Cost $118,854,636) | | 70,921,339 |
| | | | MORTGAGE BACKED | | |
| | | | SECURITIES - U.S. | | |
| | | | GOVERNMENT AGENCY - 50.32% | |
| | | | FHLMC | | |
| | 1,000,000 | | Series 2590, | | |
| | | | 5.000%, 03/15/2018 | | 1,065,497 |
| | 1,420,124 | | Series 2329, | | |
| | | | 6.500%, 06/15/2031 | | 1,513,413 |
| | 796,053 | | Series 2338, | | |
| | | | 6.500%, 07/15/2031 | | 843,673 |
| | 3,531,118 | | Pool #1G-0058, | | |
| | | | 4.610%, 01/01/2035 | | 3,607,993 |
| | 1,576,692 | | Pool #1H-2524, | | |
| | | | 4.580%, 08/01/2035 | | 1,581,857 |
| | 192,582 | | Series 3013, 0.000%, 08/15/2035 | | |
| | | | (Acquired 05/01/2007, | | |
| | | | Cost $196,620) (d)(l) | | 187,130 |
| | 2,116,245 | | Pool #1Q-0160, | | |
| | | | 5.050%, 09/01/2035 | | 2,173,294 |
| | Principal | | | | |
| | Amount | | | | Value |
| | | | MORTGAGE BACKED | | |
| | | | SECURITIES - U.S. | | |
| | | | GOVERNMENT AGENCY (Continued) |
| $ | 224,707 | | Series 3167, 0.000%, 06/15/2036 | | |
| | | | (Acquired 04/13/2007, | | |
| | | | Cost $206,307) (d)(l) | $ | 207,793 |
| | 179,035 | | Pool #A5-1729, | | |
| | | | 6.500%, 08/01/2036 | | 188,998 |
| | 606,348 | | Pool #A5-7803, | | |
| | | | 6.500%, 02/01/2037 | | 640,088 |
| 1,173,421 | | Pool #1N-1582, | | |
| | | | 5.940%, 05/01/2037 | | 1,221,187 |
| 2,518,778 | | Pool #1G-2201, | | |
| | | | 6.120%, 09/01/2037 | | 2,621,406 |
| | 155,078 | | Pool #A6-6284, | | |
| | | | 6.500%, 09/01/2037 | | 163,699 |
| 5,768,509 | | Pool #H0-9183, | | |
| | | | 6.000%, 03/01/2038 | | 6,009,445 |
| 8,699,161 | | Pool #G0-1818, | | |
| | | | 5.000%, 05/01/2035 | | 8,995,900 |
| | 85,822 | | Pool #G0-3449, | | |
| | | | 6.000%, 10/01/2037 (g) | | 89,836 |
| | 48,259 | | Pool #G0-4212, | | |
| | | | 6.000%, 11/01/2037 (g) | | 50,516 |
| 1,868,323 | | Pool #G0-4346, | | |
| | | | 6.000%, 05/01/2038 (g) | | 1,955,595 |
| | 284,728 | | Pool #G0-4544, | | |
| | | | 6.000%, 08/01/2038 (g) | | 298,044 |
| | 181,190 | | Pool #G0-5281, | | |
| | | | 6.000%, 11/01/2038 (g) | | 189,664 |
| | | | FHLMC Gold | | |
| | 25,909 | | Pool #B1-2301, | | |
| | | | 4.000%, 02/01/2014 | | 26,463 |
| | 45,284 | | Pool #B1-2730, | | |
| | | | 4.000%, 03/01/2014 | | 46,252 |
| | 44,162 | | Pool #B1-2772, | | |
| | | | 4.000%, 03/01/2014 | | 45,106 |
| | 36,274 | | Pool #B1-2818, | | |
| | | | 4.000%, 03/01/2014 | | 37,050 |
| | 43,652 | | Pool #B1-2819, | | |
| | | | 4.000%, 03/01/2014 | | 44,586 |
| | 38,197 | | Pool #B1-2883, | | |
| | | | 4.000%, 03/01/2014 | | 39,008 |
| | 30,048 | | Pool #B1-2910, | | |
| | | | 4.000%, 03/01/2014 | | 30,685 |
See notes to financial statements.
AssetMark Core Plus Fixed Income Fund
SCHEDULE OF INVESTMENTS (Continued)
March 31, 2009
| | Principal | | | | |
| | Amount | | | | Value |
| | | | MORTGAGE BACKED | | |
| | | | SECURITIES - U.S. | | |
| | | | GOVERNMENT AGENCY (Continued) |
| $ | 32,043 | | Pool #B1-2911, | | |
| | | | 4.000%, 03/01/2014 | $ | 32,722 |
| | 148,806 | | Pool #B1-3066, | | |
| | | | 4.000%, 03/01/2014 | | 151,993 |
| | 19,994 | | Pool #B1-3343, | | |
| | | | 4.000%, 04/01/2014 | | 20,422 |
| | 26,884 | | Pool #B1-3344, | | |
| | | | 4.000%, 04/01/2014 | | 27,459 |
| | 36,424 | | Pool #B1-3360, | | |
| | | | 4.000%, 04/01/2014 | | 37,202 |
| | 195,226 | | Pool #E9-6057, | | |
| | | | 4.500%, 05/01/2018 | | 202,258 |
| | 56,238 | | Pool #E9-6247, | | |
| | | | 4.500%, 05/01/2018 | | 58,299 |
| | 60,064 | | Pool #E9-6248, | | |
| | | | 4.500%, 05/01/2018 | | 62,265 |
| | 69,139 | | Pool #E9-7034, | | |
| | | | 4.500%, 06/01/2018 | | 71,630 |
| | 26,434 | | Pool #E9-9763, | | |
| | | | 4.500%, 09/01/2018 | | 27,386 |
| | 25,462 | | Pool #E9-9764, | | |
| | | | 4.500%, 09/01/2018 | | 26,379 |
| | 17,600 | | Pool #E9-9765, | | |
| | | | 4.500%, 09/01/2018 | | 18,234 |
| | 115,984 | | Pool #E9-9768, | | |
| | | | 4.500%, 09/01/2018 | | 120,162 |
| | 54,072 | | Pool #E9-9769, | | |
| | | | 4.500%, 09/01/2018 | | 56,020 |
| | 37,623 | | Pool #E9-9770, | | |
| | | | 4.500%, 09/01/2018 | | 38,979 |
| | 65,619 | | Pool #B1-0170, | | |
| | | | 4.500%, 10/01/2018 | | 67,982 |
| | 77,090 | | Pool #B1-0207, | | |
| | | | 4.500%, 10/01/2018 | | 79,867 |
| | 74,265 | | Pool #E0-1481, | | |
| | | | 4.500%, 10/01/2018 | | 76,762 |
| | 397,658 | | Pool #B1-0178, | | |
| | | | 5.000%, 10/01/2018 | | 415,524 |
| | 75,704 | | Pool #B1-0931, | | |
| | | | 4.500%, 11/01/2018 | | 78,430 |
| | 147,162 | | Pool #E0-1489, | | |
| | | | 4.500%, 11/01/2018 | | 151,592 |
| | Principal | | | | |
| | Amount | | | | Value |
| | | | MORTGAGE BACKED | | |
| | | | SECURITIES - U.S. | | |
| | | | GOVERNMENT AGENCY (Continued) |
| $ | 632,172 | | Pool #E0-1538, | | |
| | | | 5.000%, 12/01/2018 | $ | 657,670 |
| | 82,436 | | Pool #B1-1801, | | |
| | | | 4.500%, 01/01/2019 | | 85,405 |
| | 80,062 | | Pool #E0-1602, | | |
| | | | 4.500%, 03/01/2019 | | 83,041 |
| | 82,226 | | Pool #G1-1526, | | |
| | | | 4.500%, 03/01/2019 | | 85,188 |
| 1,060,000 | | Pool #G1-1719, | | |
| | | | 5.000%, 06/01/2020 | | 1,105,635 |
| 1,093,171 | | Pool #G1-1733, | | |
| | | | 5.000%, 07/01/2020 | | 1,137,501 |
| | 664,633 | | Pool #D9-6291, | | |
| | | | 4.500%, 09/01/2023 | | 682,322 |
| | 452,395 | | Pool #C0-1385, | | |
| | | | 6.500%, 08/01/2032 | | 480,608 |
| | 170,618 | | Pool #C7-0562, | | |
| | | | 6.500%, 09/01/2032 | | 181,258 |
| | 212,487 | | Pool #C7-0760, | | |
| | | | 6.500%, 09/01/2032 | | 225,738 |
| 1,008,684 | | Pool #78-0447, | | |
| | | | 4.770%, 04/01/2033 | | 1,009,263 |
| 3,080,282 | | Pool #G0-8085, | | |
| | | | 5.000%, 10/01/2035 | | 3,185,354 |
| | 660,185 | | Pool #A3-9756, | | |
| | | | 5.000%, 11/01/2035 | | 682,705 |
| | 100,000 | | Pool #TBA, | | |
| | | | 5.000%, 04/15/2036 (g) | | 103,141 |
| | 900,000 | | Pool #TBA, | | |
| | | | 6.000%, 04/15/2038 (g) | | 940,922 |
| | 455,950 | | Pool #1N-1447, | | |
| | | | 5.810%, 02/01/2037 | | 473,999 |
| | 894,142 | | Pool #1N-1463, | | |
| | | | 5.950%, 05/01/2037 | | 929,777 |
| | 337,435 | | Pool #G0-3812, | | |
| | | | 5.500%, 02/01/2038 | | 350,561 |
| | | | FNMA | | |
| | 111,774 | | Pool #695826, | | |
| | | | 5.000%, 04/01/2018 | | 116,831 |
| 3,296,676 | | Pool #734788, | | |
| | | | 4.000%, 09/01/2018 | | 3,381,978 |
See notes to financial statements.
AssetMark Core Plus Fixed Income Fund
SCHEDULE OF INVESTMENTS (Continued)
March 31, 2009
| | Principal | | | | |
| | Amount | | | | Value |
| | | | MORTGAGE BACKED | | |
| | | | SECURITIES - U.S. | | |
| | | | GOVERNMENT AGENCY (Continued) |
| $ | 52,270 | | Pool #713830, | | |
| | | | 4.500%, 10/01/2018 | $ | 54,218 |
| | 111,928 | | Pool #734743, | | |
| | | | 4.500%, 10/01/2018 | | 116,099 |
| | 52,720 | | Pool #740468, | | |
| | | | 4.500%, 10/01/2018 | | 54,685 |
| | 48,380 | | Pool #769278, | | |
| | | | 4.500%, 11/01/2018 | | 50,183 |
| | 81,280 | | Pool #752853, | | |
| | | | 4.500%, 12/01/2018 | | 84,309 |
| | 650,210 | | Pool #745387, | | |
| | | | 5.000%, 04/01/2019 | | 679,625 |
| | 135,647 | | Pool #772684, | | |
| | | | 4.500%, 05/01/2019 | | 140,533 |
| | 18,716 | | Pool #775653, | | |
| | | | 4.500%, 05/01/2019 | | 19,390 |
| | 102,523 | | Pool #775688, | | |
| | | | 4.500%, 05/01/2019 | | 106,216 |
| | 57,395 | | Pool #777358, | | |
| | | | 4.500%, 05/01/2019 | | 59,462 |
| | 155,097 | | Pool #779081, | | |
| | | | 4.500%, 06/01/2019 | | 160,684 |
| | 95,723 | | Pool #735985, | | |
| | | | 5.000%, 06/01/2019 | | 100,053 |
| | 109,137 | | Pool #725792, | | |
| | | | 4.500%, 08/01/2019 | | 113,068 |
| 1,100,594 | | Pool #735439, | | |
| | | | 6.000%, 09/01/2019 | | 1,159,671 |
| 1,380,096 | | Pool #745238, | | |
| | | | 6.000%, 12/01/2020 | | 1,454,176 |
| 3,782,427 | | Pool #981272, | | |
| | | | 4.500%, 04/01/2023 | | 3,899,257 |
| 1,936,820 | | Pool #889428, | | |
| | | | 5.000%, 05/01/2023 | | 2,013,547 |
| 1,366,366 | | Pool #981644, | | |
| | | | 4.500%, 06/01/2023 | | 1,408,889 |
| | 687,696 | | Pool #966689, | | |
| | | | 5.000%, 06/01/2023 | | 714,148 |
| | 76,759 | | Pool #251925, | | |
| | | | 6.500%, 07/01/2028 | | 81,868 |
| | 22,803 | | Pool #435151, | | |
| | | | 6.500%, 07/01/2028 | | 24,320 |
| | Principal | | | | |
| | Amount | | | | Value |
| | | | MORTGAGE BACKED | | |
| | | | SECURITIES - U.S. | | |
| | | | GOVERNMENT AGENCY (Continued) |
| $ | 229,874 | | Pool #433575, | | |
| | | | 6.500%, 09/01/2028 | $ | 245,173 |
| | 277,385 | | Pool #251985, | | |
| | | | 6.500%, 10/01/2028 | | 295,846 |
| | 452,114 | | Pool #446107, | | |
| | | | 6.500%, 11/01/2028 | | 482,203 |
| | 348,052 | | Pool #452955, | | |
| | | | 6.500%, 11/01/2028 | | 371,215 |
| | 301,701 | | Pool #457553, | | |
| | | | 6.500%, 01/01/2029 | | 321,781 |
| | 177,567 | | Pool #252255, | | |
| | | | 6.500%, 02/01/2029 | | 189,385 |
| | 110,356 | | Pool #252342, | | |
| | | | 6.500%, 04/01/2029 | | 117,424 |
| | 401,866 | | Pool #323632, | | |
| | | | 6.500%, 04/01/2029 | | 428,611 |
| | 523,882 | | Pool #494339, | | |
| | | | 6.500%, 04/01/2029 | | 557,438 |
| | 101,399 | | Pool #252497, | | |
| | | | 6.500%, 06/01/2029 | | 107,894 |
| | 29,073 | | Pool #498092, | | |
| | | | 6.500%, 06/01/2029 | | 30,935 |
| | 315,182 | | Pool #500441, | | |
| | | | 6.500%, 06/01/2029 | | 335,370 |
| | 619,836 | | Pool #501198, | | |
| | | | 6.500%, 06/01/2029 | | 659,538 |
| | 173,702 | | Pool #503223, | | |
| | | | 6.500%, 07/01/2029 | | 184,828 |
| | 80,544 | | Pool #504708, | | |
| | | | 6.500%, 07/01/2029 | | 85,703 |
| | 60,076 | | Pool #535476, | | |
| | | | 6.500%, 07/01/2029 | | 64,074 |
| | 805,767 | | Pool #544859, | | |
| | | | 5.930%, 08/01/2029 | | 806,269 |
| | 50,782 | | Pool #535506, | | |
| | | | 6.500%, 08/01/2030 | | 54,035 |
| | 895,262 | | Pool #786848, | | |
| | | | 7.000%, 10/01/2031 | | 967,214 |
| | 704,493 | | Pool #607398, | | |
| | | | 6.500%, 11/01/2031 | | 748,737 |
| | 4,466 | | Pool #741862, | | |
| | | | 5.500%, 09/01/2033 | | 4,655 |
See notes to financial statements.
AssetMark Core Plus Fixed Income Fund
SCHEDULE OF INVESTMENTS (Continued)
March 31, 2009
| | Principal | | | | |
| | Amount | | | | Value |
| | | | MORTGAGE BACKED | | |
| | | | SECURITIES - U.S. | | |
| | | | GOVERNMENT AGENCY (Continued) | | |
| $ | 30,657 | | Pool #745944, | | |
| | | | 5.000%, 12/01/2033 | $ | 31,766 |
| | 5,722 | | Pool #766197, | | |
| | | | 5.500%, 02/01/2034 | | 5,958 |
| | 541,787 | | Pool #888504, | | |
| | | | 4.236%, 04/01/2034 | | 550,091 |
| | 902 | | Pool #776974, | | |
| | | | 5.500%, 04/01/2034 | | 939 |
| | 541,072 | | Series 2004-71, | | |
| | | | 0.000%, 04/25/2034 (Acquired | | |
| | | | 04/07/2006, Cost $39,505) (d)(i)(l) | | 2,932 |
| | 6,844,542 | | Pool #725589, | | |
| | | | 5.000%, 07/01/2034 | | 7,080,357 |
| | 1,059,222 | | Pool #725705, | | |
| | | | 5.000%, 08/01/2034 | | 1,095,843 |
| | 988,197 | | Pool #888283, | | |
| | | | 5.000%, 08/01/2034 | | 1,023,169 |
| | 1,329,307 | | Pool #782284, | | |
| | | | 6.000%, 09/01/2034 | | 1,395,837 |
| | 1,071,713 | | Pool #791563, | | |
| | | | 6.000%, 09/01/2034 | | 1,124,011 |
| | 46,765 | | Pool #794371, | | |
| | | | 6.000%, 09/01/2034 | | 49,047 |
| | 543,034 | | Pool #802783, | | |
| | | | 6.220%, 10/01/2034 | | 556,351 |
| | 1,024,329 | | Pool #802493, | | |
| | | | 6.000%, 11/01/2034 | | 1,074,315 |
| | 64,475 | | Pool #781629, | | |
| | | | 5.500%, 12/01/2034 | | 67,130 |
| | 2,513 | | Pool #806098, | | |
| | | | 6.000%, 12/01/2034 | | 2,635 |
| | 7,467,675 | | Pool #735224, | | |
| | | | 5.500%, 02/01/2035 | | 7,784,468 |
| | 2,961,978 | | Pool #808057, | | |
| | | | 6.000%, 02/01/2035 | | 3,100,966 |
| | 43,717 | | Pool #798085, | | |
| | | | 6.500%, 03/01/2035 | | 46,271 |
| | 53,188 | | Pool #814918, | | |
| | | | 5.000%, 04/01/2035 (g) | | 55,012 |
| | 910,221 | | Pool #735504, | | |
| | | | 6.000%, 04/01/2035 | | 956,345 |
| | Principal | | | | |
| | Amount | | | | Value |
| | | | MORTGAGE BACKED | | |
| | | | SECURITIES - U.S. | | |
| | | | GOVERNMENT AGENCY (Continued) | | |
| $ | 346,589 | | Pool #735484, | | |
| | | | 5.000%, 05/01/2035 (g) | $ | 358,476 |
| 1,227,594 | | Pool #773306, | | |
| | | | 6.000%, 05/01/2035 | | 1,285,197 |
| | 76,576 | | Series 2007-27, | | |
| | | | 0.000%, 05/25/2035 (Acquired | | |
| | | | 05/29/2007, Cost $72,460) (d)(l) | | 72,091 |
| 2,656,378 | | Pool #735591, | | |
| | | | 5.000%, 06/01/2035 | | 2,747,898 |
| 3,527,180 | | Pool #827741, | | |
| | | | 5.500%, 06/01/2035 | | 3,669,094 |
| | 70,875 | | Pool #820242, | | |
| | | | 5.000%, 07/01/2035 (g) | | 73,306 |
| | 45,614 | | Pool #829196, | | |
| | | | 5.000%, 07/01/2035 (g) | | 47,179 |
| | 39,583 | | Pool #829202, | | |
| | | | 5.000%, 07/01/2035 (g) | | 40,940 |
| | 19,390 | | Pool #833958, | | |
| | | | 5.000%, 07/01/2035 (g) | | 20,055 |
| | 20,190 | | Pool #835738, | | |
| | | | 5.000%, 07/01/2035 (g) | | 20,883 |
| | 203,927 | | Pool #357842, | | |
| | | | 6.000%, 07/01/2035 | | 213,496 |
| | 48,552 | | Pool #255813, | | |
| | | | 5.000%, 08/01/2035 (g) | | 50,217 |
| | 21,293 | | Pool #834513, | | |
| | | | 5.000%, 08/01/2035 (g) | | 22,023 |
| 1,092,795 | | Pool #829334, | | |
| | | | 4.450%, 09/01/2035 | | 1,112,783 |
| 4,773,631 | | Pool #820345, | | |
| | | | 5.000%, 09/01/2035 | | 4,937,351 |
| | 31,761 | | Pool #840001, | | |
| | | | 5.000%, 09/01/2035 (g) | | 32,850 |
| | 20,160 | | Pool #840696, | | |
| | | | 5.000%, 09/01/2035 (g) | | 20,851 |
| 10,264,022 | | Pool #832738, | | |
| | | | 5.500%, 09/01/2035 | | 10,676,989 |
| | 7,564 | | Pool #838452, | | |
| | | | 5.500%, 09/01/2035 | | 7,868 |
| 1,007,096 | | Pool #836852, | | |
| | | | 3.788%, 10/01/2035 | | 1,030,345 |
See notes to financial statements.
AssetMark Core Plus Fixed Income Fund
SCHEDULE OF INVESTMENTS (Continued)
March 31, 2009
| | Principal | | | | |
| | Amount | | | | Value |
| | | | MORTGAGE BACKED | | |
| | | | SECURITIES - U.S. | | |
| | | | GOVERNMENT AGENCY (Continued) |
| | $1,482,940 | | Pool #836464, | | |
| | | | 3.811%, 10/01/2035 | $ | 1,517,286 |
| | 25,283 | | Pool #843833, | | |
| | | | 5.000%, 10/01/2035 (g) | | 26,150 |
| | 71,814 | | Pool #880609, | | |
| | | | 5.000%, 10/01/2035 (g) | | 74,277 |
| | 139,536 | | Pool #817534, | | |
| | | | 5.500%, 10/01/2035 | | 145,151 |
| | 404,503 | | Pool #836273, | | |
| | | | 5.500%, 10/01/2035 | | 420,777 |
| | 130,824 | | Pool #745000, | | |
| | | | 6.000%, 10/01/2035 | | 137,697 |
| | 113,313 | | Pool #844052, | | |
| | | | 3.780%, 11/01/2035 | | 115,928 |
| | 665,963 | | Pool #843823, | | |
| | | | 3.794%, 11/01/2035 | | 681,354 |
| | 111,369 | | Pool #844237, | | |
| | | | 3.790%, 11/01/2035 | | 113,943 |
| | 114,256 | | Pool #844789, | | |
| | | | 3.797%, 11/01/2035 | | 116,897 |
| | 115,130 | | Pool #843997, | | |
| | | | 3.805%, 11/01/2035 | | 117,794 |
| | 111,849 | | Pool #844148, | | |
| | | | 3.810%, 11/01/2035 | | 114,440 |
| | 3,110,933 | | Pool #844158, | | |
| | | | 5.000%, 11/01/2035 | | 3,217,629 |
| | 1,347,861 | | Pool #745755, | | |
| | | | 5.000%, 12/01/2035 | | 1,394,299 |
| | 162,086 | | Pool #846512, | | |
| | | | 5.000%, 12/01/2035 (g) | | 167,645 |
| | 26,950 | | Pool #863913, | | |
| | | | 5.500%, 12/01/2035 | | 28,035 |
| | 1,728,103 | | Pool #846513, | | |
| | | | 6.500%, 12/01/2035 | | 1,824,482 |
| | 211,032 | | Pool #848939, | | |
| | | | 6.500%, 01/01/2036 | | 222,802 |
| | 47,776 | | Pool #851639, | | |
| | | | 6.500%, 01/01/2036 | | 50,396 |
| | 3,056,189 | | Pool #745275, | | |
| | | | 5.000%, 02/01/2036 | | 3,161,007 |
| | 571,097 | | Pool #888022, | | |
| | | | 5.000%, 02/01/2036 | | 590,684 |
| | Principal | | | | |
| | Amount | | | | Value |
| | | | MORTGAGE BACKED | | |
| | | | SECURITIES - U.S. | | |
| | | | GOVERNMENT AGENCY (Continued) |
| $ | 281,148 | | Pool #852263, | | |
| | | | 5.000%, 03/01/2036 | $ | 290,526 |
| | 72,622 | | Pool #865854, | | |
| | | | 6.000%, 03/01/2036 | | 75,996 |
| 2,913,272 | | Pool #256219, | | |
| | | | 5.500%, 04/01/2036 | | 3,010,111 |
| | 450,836 | | Pool #869843, | | |
| | | | 5.500%, 04/01/2036 | | 468,552 |
| | 30,008 | | Pool #880627, | | |
| | | | 5.500%, 04/01/2036 | | 31,187 |
| | 84,931 | | Pool #891474, | | |
| | | | 6.000%, 04/01/2036 | | 88,877 |
| 3,449,596 | | Pool #872236, | | |
| | | | 4.160%, 05/01/2036 | | 3,488,606 |
| 2,757,967 | | Pool #868993, | | |
| | | | 4.287%, 05/01/2036 | | 2,789,508 |
| | 42,448 | | Pool #872499, | | |
| | | | 6.500%, 06/01/2036 | | 44,776 |
| 3,298,846 | | Pool #885961, | | |
| | | | 4.189%, 07/01/2036 | | 3,325,484 |
| 3,644,348 | | Pool #886376, | | |
| | | | 4.278%, 08/01/2036 | | 3,673,948 |
| | 71,882 | | Pool #887046, | | |
| | | | 6.000%, 08/01/2036 | | 75,221 |
| 3,521,111 | | Pool #886891, | | |
| | | | 4.157%, 09/01/2036 | | 3,550,613 |
| 1,224,512 | | Pool #831808, | | |
| | | | 6.000%, 09/01/2036 | | 1,281,396 |
| | 507,573 | | Pool #745876, | | |
| | | | 6.500%, 09/01/2036 | | 535,405 |
| | 542,932 | | Pool #897776, | | |
| | | | 6.500%, 09/01/2036 | | 572,703 |
| | 66,653 | | Series 2006-81, | | |
| | | | 0.000%, 09/25/2036 (Acquired | | |
| | | | 05/29/2007, Cost $66,112) (d)(l) | | 65,172 |
| | 952,070 | | Pool #745873, | | |
| | | | 5.500%, 10/01/2036 | | 989,484 |
| | 49,490 | | Pool #898601, | | |
| | | | 5.500%, 10/01/2036 | | 51,435 |
| 1,133,811 | | Pool #893681, | | |
| | | | 6.000%, 10/01/2036 | | 1,186,482 |
See notes to financial statements.
AssetMark Core Plus Fixed Income Fund
SCHEDULE OF INVESTMENTS (Continued)
March 31, 2009
| | Principal | | | | |
| | Amount | | | | Value |
| | | | MORTGAGE BACKED | | |
| | | | SECURITIES - U.S. | | |
| | | | GOVERNMENT AGENCY (Continued) |
| $ | 437,460 | | Pool #893898, | | |
| | | | 6.000%, 10/01/2036 | $ | 457,782 |
| 2,359,386 | | Pool #893923, | | |
| | | | 6.000%, 10/01/2036 | | 2,468,992 |
| 2,998,585 | | Pool #894005, | | |
| | | | 6.000%, 10/01/2036 | | 3,137,885 |
| | 902,968 | | Pool #190375, | | |
| | | | 5.500%, 11/01/2036 | | 938,452 |
| | 308,893 | | Pool #905215, | | |
| | | | 5.500%, 11/01/2036 | | 319,161 |
| | 129,960 | | Pool #870962, | | |
| | | | 6.000%, 11/01/2036 | | 135,997 |
| | 181,212 | | Pool #898809, | | |
| | | | 6.000%, 11/01/2036 (g) | | 189,631 |
| | 84,785 | | Pool #902663, | | |
| | | | 6.000%, 11/01/2036 | | 88,724 |
| | 23,623 | | Pool #889659, | | |
| | | | 5.000%, 12/01/2036 (g) | | 24,434 |
| | 3,184 | | Pool #902853, | | |
| | | | 5.500%, 12/01/2036 | | 3,309 |
| | 20,412 | | Pool #903059, | | |
| | | | 5.500%, 12/01/2036 | | 21,214 |
| | 22,133 | | Pool #928041, | | |
| | | | 5.500%, 12/01/2036 | | 23,003 |
| | 310,415 | | Pool #905857, | | |
| | | | 5.576%, 12/01/2036 | | 319,416 |
| | 254,554 | | Pool #905110, | | |
| | | | 6.000%, 12/01/2036 | | 266,380 |
| | 227,549 | | Pool #905111, | | |
| | | | 6.000%, 12/01/2036 | | 238,120 |
| | 524,192 | | Pool #897505, | | |
| | | | 6.500%, 12/01/2036 | | 552,936 |
| | 4,501 | | Pool #906225, | | |
| | | | 5.500%, 01/01/2037 | | 4,678 |
| | 223,138 | | Pool #906055, | | |
| | | | 6.000%, 01/01/2037 | | 233,503 |
| | 675,669 | | Pool #871054, | | |
| | | | 6.500%, 01/01/2037 | | 712,719 |
| | 12,654 | | Pool #907701, | | |
| | | | 5.500%, 02/01/2037 | | 13,151 |
| | 5,617 | | Pool #908880, | | |
| | | | 5.500%, 02/01/2037 | | 5,837 |
| | Principal | | | | |
| | Amount | | | | Value |
| | | | MORTGAGE BACKED | | |
| | | | SECURITIES - U.S. | | |
| | | | GOVERNMENT AGENCY (Continued) |
| $ | 12,193 | | Pool #912864, | | |
| | | | 5.500%, 02/01/2037 | $ | 12,670 |
| | 13,725 | | Pool #912866, | | |
| | | | 5.500%, 02/01/2037 | | 14,261 |
| | 1,158 | | Pool #928062, | | |
| | | | 5.500%, 02/01/2037 | | 1,203 |
| | 9,058 | | Pool #897608, | | |
| | | | 5.500%, 03/01/2037 | | 9,414 |
| | 9,824 | | Pool #909990, | | |
| | | | 5.500%, 03/01/2037 | | 10,208 |
| | 101,021 | | Pool #911392, | | |
| | | | 5.500%, 03/01/2037 | | 104,969 |
| | 5,626 | | Pool #912443, | | |
| | | | 5.500%, 03/01/2037 | | 5,846 |
| | 4,871 | | Pool #914497, | | |
| | | | 5.500%, 03/01/2037 | | 5,061 |
| | 16,915 | | Pool #928119, | | |
| | | | 5.500%, 03/01/2037 | | 17,576 |
| | 6,054 | | Pool #928125, | | |
| | | | 5.500%, 03/01/2037 | | 6,290 |
| | 4,412 | | Pool #899117, | | |
| | | | 5.500%, 04/01/2037 | | 4,584 |
| | 1,858 | | Pool #899119, | | |
| | | | 5.500%, 04/01/2037 | | 1,930 |
| | 170,219 | | Pool #899147, | | |
| | | | 5.500%, 04/01/2037 | | 176,872 |
| | 46,557 | | Pool #914899, | | |
| | | | 5.500%, 04/01/2037 | | 48,377 |
| | 12,281 | | Pool #915565, | | |
| | | | 5.500%, 04/01/2037 | | 12,761 |
| | 4,435 | | Pool #915959, | | |
| | | | 5.500%, 04/01/2037 | | 4,608 |
| | 10,639 | | Pool #916979, | | |
| | | | 5.500%, 04/01/2037 | | 11,055 |
| | 15,044 | | Pool #916983, | | |
| | | | 5.500%, 04/01/2037 | | 15,632 |
| | 5,508 | | Pool #917571, | | |
| | | | 5.500%, 04/01/2037 | | 5,723 |
| | 6,929 | | Pool #918858, | | |
| | | | 5.500%, 04/01/2037 | | 7,201 |
| | 4,968 | | Pool #923817, | | |
| | | | 5.500%, 04/01/2037 | | 5,163 |
See notes to financial statements.
AssetMark Core Plus Fixed Income Fund
SCHEDULE OF INVESTMENTS (Continued)
March 31, 2009
| | Principal | | | | |
| | Amount | | | | Value |
| | | | MORTGAGE BACKED | | |
| | | | SECURITIES - U.S. | | |
| | | | GOVERNMENT AGENCY (Continued) |
| $ | 17,599 | | Pool #928182, | | |
| | | | 5.500%, 04/01/2037 | $ | 18,291 |
| | 307,622 | | Pool #917560, | | |
| | | | 6.500%, 04/01/2037 | | 324,490 |
| | 4,998 | | Pool #888352, | | |
| | | | 5.500%, 05/01/2037 | | 5,193 |
| | 2,355 | | Pool #918238, | | |
| | | | 5.500%, 05/01/2037 | | 2,447 |
| | 2,463 | | Pool #928293, | | |
| | | | 5.500%, 05/01/2037 | | 2,559 |
| | 1,850 | | Pool #938488, | | |
| | | | 5.500%, 05/01/2037 | | 1,923 |
| | 46,594 | | Pool #936750, | | |
| | | | 6.500%, 05/01/2037 | | 49,146 |
| | 11,768 | | Pool #918503, | | |
| | | | 5.500%, 06/01/2037 | | 12,228 |
| | 488,660 | | Pool #938776, | | |
| | | | 5.500%, 06/01/2037 | | 507,759 |
| | 875,933 | | Pool #936501, | | |
| | | | 6.000%, 06/01/2037 | | 916,027 |
| | 770,924 | | Pool #919187, | | |
| | | | 6.500%, 06/01/2037 | | 813,153 |
| | 73,841 | | Series 2007-56, | | |
| | | | 0.000%, 06/25/2037 (Acquired | | |
| | | | 06/11/2007, Cost $80,246) (d)(l) | | 73,087 |
| | 631,604 | | Pool #915790, | | |
| | | | 5.500%, 07/01/2037 | | 652,598 |
| | 3,207 | | Pool #928469, | | |
| | | | 5.500%, 07/01/2037 | | 3,332 |
| | 21,737 | | Pool #938034, | | |
| | | | 5.500%, 07/01/2037 | | 22,587 |
| | 4,609 | | Pool #938039, | | |
| | | | 5.500%, 07/01/2037 | | 4,790 |
| | 29,159 | | Pool #942569, | | |
| | | | 6.000%, 08/01/2037 (g) | | 30,493 |
| | 21,515 | | Pool #942786, | | |
| | | | 6.000%, 08/01/2037 (g) | | 22,500 |
| | 845,586 | | Pool #943996, | | |
| | | | 6.000%, 08/01/2037 | | 880,111 |
| | 48,661 | | Pool #945621, | | |
| | | | 6.000%, 08/01/2037 | | 50,647 |
| | Principal | | | | |
| | Amount | | | | Value |
| | | | MORTGAGE BACKED | | |
| | | | SECURITIES - U.S. | | |
| | | | GOVERNMENT AGENCY (Continued) |
| $ | 25,765 | | Pool #888602, | | |
| | | | 6.500%, 08/01/2037 | $ | 27,176 |
| | 731,502 | | Pool #945069, | | |
| | | | 6.500%, 08/01/2037 | | 771,572 |
| | 583,821 | | Pool #949629, | | |
| | | | 6.500%, 08/01/2037 | | 615,802 |
| | 788,141 | | Pool #888637, | | |
| | | | 6.000%, 09/01/2037 | | 824,217 |
| | 553,993 | | Pool #915802, | | |
| | | | 6.000%, 09/01/2037 | | 576,613 |
| | 84,492 | | Pool #942950, | | |
| | | | 6.000%, 09/01/2037 (g) | | 88,359 |
| | 973,559 | | Pool #952502, | | |
| | | | 6.500%, 09/01/2037 | | 1,026,888 |
| | 39,691 | | Pool #928781, | | |
| | | | 5.500%, 10/01/2037 | | 41,242 |
| | 7,842 | | Pool #955789, | | |
| | | | 6.000%, 10/01/2037 | | 8,201 |
| | 42,015 | | Pool #955771, | | |
| | | | 6.500%, 10/01/2037 | | 44,316 |
| | 35,657 | | Pool #953725, | | |
| | | | 6.000%, 11/01/2037 (g) | | 37,289 |
| 1,722,732 | | Pool #899949, | | |
| | | | 7.000%, 12/01/2037 | | 1,835,246 |
| | 616,781 | | Pool #928872, | | |
| | | | 8.000%, 12/01/2037 | | 656,885 |
| | 33,706 | | Pool #959397, | | |
| | | | 8.000%, 12/01/2037 | | 35,898 |
| | 43,234 | | Pool #959538, | | |
| | | | 8.000%, 12/01/2037 | | 46,045 |
| | 67,635 | | Pool #966818, | | |
| | | | 8.000%, 12/01/2037 | | 72,033 |
| | 434,477 | | Pool #953586, | | |
| | | | 5.000%, 01/01/2038 | | 448,878 |
| | 60,345 | | Pool #961299, | | |
| | | | 5.500%, 01/01/2038 | | 62,703 |
| | 31,399 | | Pool #257087, | | |
| | | | 8.000%, 01/01/2038 | | 33,440 |
| | 16,081 | | Pool #933376, | | |
| | | | 5.000%, 02/01/2038 | | 16,614 |
| | 58,774 | | Pool #929239, | | |
| | | | 5.500%, 02/01/2038 | | 61,071 |
See notes to financial statements.
AssetMark Core Plus Fixed Income Fund
SCHEDULE OF INVESTMENTS (Continued)
March 31, 2009
| | Principal | | | | |
| | Amount | | | | Value |
| | | | MORTGAGE BACKED | | |
| | | | SECURITIES - U.S. | | |
| | | | GOVERNMENT AGENCY (Continued) | |
| $ | 26,094 | | Pool #969376, | | |
| | | | 5.500%, 02/01/2038 | $ | 27,114 |
| | 161,138 | | Pool #889116, | | |
| | | | 6.000%, 02/01/2038 | | 168,514 |
| | 24,846 | | Pool #933506, | | |
| | | | 6.000%, 02/01/2038 (g) | | 25,983 |
| | 977,567 | | Pool #976735, | | |
| | | | 5.000%, 03/01/2038 | | 1,009,970 |
| | 200,926 | | Pool #929187, | | |
| | | | 5.500%, 03/01/2038 | | 208,779 |
| | 43,462 | | Pool #961935, | | |
| | | | 5.500%, 03/01/2038 | | 45,161 |
| | 2,096 | | Pool #970131, | | |
| | | | 5.500%, 03/01/2038 | | 2,178 |
| | 47,890 | | Pool #972446, | | |
| | | | 5.500%, 03/01/2038 | | 49,762 |
| | 12,215 | | Pool #973832, | | |
| | | | 5.500%, 03/01/2038 | | 12,693 |
| | 9,266 | | Pool #973894, | | |
| | | | 5.500%, 03/01/2038 | | 9,628 |
| | 446,906 | | Pool #889276, | | |
| | | | 6.000%, 03/01/2038 (g) | | 467,363 |
| | 12,558 | | Pool #889273, | | |
| | | | 5.500%, 04/01/2038 | | 13,049 |
| | 343,616 | | Pool #889443, | | |
| | | | 5.500%, 04/01/2038 | | 357,046 |
| | 24,534 | | Pool #962510, | | |
| | | | 5.500%, 04/01/2038 | | 25,492 |
| | 24,230 | | Pool #962562, | | |
| | | | 5.500%, 04/01/2038 | | 25,177 |
| | 21,859 | | Pool #962797, | | |
| | | | 5.500%, 04/01/2038 | | 22,713 |
| | 16,021 | | Pool #972606, | | |
| | | | 5.500%, 04/01/2038 | | 16,647 |
| | 16,813 | | Pool #975802, | | |
| | | | 5.500%, 04/01/2038 | | 17,471 |
| | 938,004 | | Pool #982817, | | |
| | | | 5.000%, 05/01/2038 | | 969,096 |
| | 502,177 | | Pool #982833, | | |
| | | | 5.000%, 05/01/2038 | | 518,823 |
| | 253,853 | | Pool #983077, | | |
| | | | 5.000%, 05/01/2038 | | 262,267 |
| | Principal | | | | |
| | Amount | | | | Value |
| | | | MORTGAGE BACKED | | |
| | | | SECURITIES - U.S. | | |
| | | | GOVERNMENT AGENCY (Continued) |
| $ | 10,844 | | Pool #963271, | | |
| | | | 5.500%, 05/01/2038 | $ | 11,268 |
| | 97,610 | | Pool #975118, | | |
| | | | 5.500%, 05/01/2038 | | 101,424 |
| | 156,718 | | Pool #975339, | | |
| | | | 5.500%, 05/01/2038 | | 162,844 |
| | 4,256 | | Pool #977014, | | |
| | | | 5.500%, 05/01/2038 | | 4,422 |
| | 35,671 | | Pool #977036, | | |
| | | | 5.500%, 05/01/2038 | | 37,065 |
| | 4,358 | | Pool #984317, | | |
| | | | 5.500%, 05/01/2038 | | 4,528 |
| | 968,265 | | Pool #934302, | | |
| | | | 5.000%, 06/01/2038 | | 1,000,360 |
| | 53,738 | | Pool #929626, | | |
| | | | 5.500%, 06/01/2038 | | 55,839 |
| | 2,098 | | Pool #934276, | | |
| | | | 5.500%, 06/01/2038 | | 2,180 |
| | 1,105 | | Pool #963831, | | |
| | | | 5.500%, 06/01/2038 | | 1,149 |
| | 24,288 | | Pool #975100, | | |
| | | | 5.500%, 06/01/2038 | | 25,237 |
| | 5,249 | | Pool #981291, | | |
| | | | 5.500%, 06/01/2038 | | 5,454 |
| | 1,346 | | Pool #981313, | | |
| | | | 5.500%, 06/01/2038 | | 1,399 |
| | 137,266 | | Pool #981602, | | |
| | | | 5.500%, 06/01/2038 | | 142,631 |
| | 7,501 | | Pool #983408, | | |
| | | | 5.500%, 06/01/2038 | | 7,794 |
| | 1,712 | | Pool #984017, | | |
| | | | 5.500%, 06/01/2038 | | 1,779 |
| | 8,504 | | Pool #985515, | | |
| | | | 5.500%, 06/01/2038 | | 8,836 |
| | 68,961 | | Pool #985516, | | |
| | | | 5.500%, 06/01/2038 | | 71,656 |
| | 10,766 | | Pool #985517, | | |
| | | | 5.500%, 06/01/2038 | | 11,187 |
| | 260,118 | | Pool #934073, | | |
| | | | 6.000%, 06/01/2038 | | 270,738 |
| | 41,049 | | Pool #889658, | | |
| | | | 6.500%, 06/01/2038 | | 43,298 |
See notes to financial statements.
AssetMark Core Plus Fixed Income Fund
SCHEDULE OF INVESTMENTS (Continued)
March 31, 2009
| | Principal | | | | |
| | Amount | | | | Value |
| | | | MORTGAGE BACKED | | |
| | | | SECURITIES - U.S. | | |
| | | | GOVERNMENT AGENCY (Continued) |
| $ | 483,321 | | Pool #975639, | | |
| | | | 5.000%, 07/01/2038 | $ | 499,342 |
| | 47,009 | | Pool #986758, | | |
| | | | 5.000%, 07/01/2038 | | 48,567 |
| | 3,783 | | Pool #889858, | | |
| | | | 5.500%, 07/01/2038 | | 3,931 |
| | 1,325 | | Pool #963959, | | |
| | | | 5.500%, 07/01/2038 | | 1,377 |
| | 16,044 | | Pool #964239, | | |
| | | | 5.500%, 07/01/2038 | | 16,671 |
| | 1,884 | | Pool #964451, | | |
| | | | 5.500%, 07/01/2038 | | 1,958 |
| | 2,229 | | Pool #964461, | | |
| | | | 5.500%, 07/01/2038 | | 2,316 |
| | 22,479 | | Pool #981336, | | |
| | | | 5.500%, 07/01/2038 | | 23,357 |
| | 2,054 | | Pool #985108, | | |
| | | | 5.500%, 07/01/2038 | | 2,135 |
| | 2,471 | | Pool #985109, | | |
| | | | 5.500%, 07/01/2038 | | 2,568 |
| | 7,655 | | Pool #986760, | | |
| | | | 5.500%, 07/01/2038 | | 7,954 |
| | 85,369 | | Pool #986761, | | |
| | | | 5.500%, 07/01/2038 | | 88,706 |
| | 173,435 | | Pool #987002, | | |
| | | | 5.500%, 07/01/2038 | | 180,213 |
| | 287,015 | | Pool #987015, | | |
| | | | 5.500%, 07/01/2038 | | 296,555 |
| | 186,450 | | Pool #889697, | | |
| | | | 6.000%, 07/01/2038 | | 194,984 |
| | 54,698 | | Pool #889987, | | |
| | | | 5.500%, 08/01/2038 | | 56,836 |
| | 145,200 | | Pool #889988, | | |
| | | | 5.500%, 08/01/2038 | | 150,875 |
| | 1,149 | | Pool #964930, | | |
| | | | 5.500%, 08/01/2038 | | 1,194 |
| | 1,842 | | Pool #987032, | | |
| | | | 5.500%, 08/01/2038 | | 1,914 |
| | 9,950 | | Pool #988564, | | |
| | | | 5.500%, 08/01/2038 | | 10,339 |
| | 8,574 | | Pool #988575, | | |
| | | | 5.500%, 08/01/2038 | | 8,909 |
| | Principal | | | | |
| | Amount | | | | Value |
| | | | MORTGAGE BACKED | | |
| | | | SECURITIES - U.S. | | |
| | | | GOVERNMENT AGENCY (Continued) |
| $ | 214,912 | | Pool #964867, | | |
| | | | 6.000%, 08/01/2038 | $ | 224,750 |
| | 159,169 | | Pool #964949, | | |
| | | | 6.000%, 08/01/2038 | | 166,455 |
| 1,964,651 | | Pool #988565, | | |
| | | | 6.000%, 08/01/2038 | | 2,054,581 |
| 2,171,339 | | Pool #988566, | | |
| | | | 6.000%, 08/01/2038 | | 2,270,730 |
| 2,655,843 | | Pool #988567, | | |
| | | | 6.000%, 08/01/2038 | | 2,777,411 |
| | 4,172 | | Pool #965092, | | |
| | | | 5.500%, 09/01/2038 | | 4,335 |
| | 1,594 | | Pool #968371, | | |
| | | | 5.500%, 09/01/2038 | | 1,656 |
| | 24,368 | | Pool #986094, | | |
| | | | 5.500%, 09/01/2038 | | 25,320 |
| | 5,038 | | Pool #990644, | | |
| | | | 5.500%, 09/01/2038 | | 5,235 |
| | 1,782 | | Pool #990646, | | |
| | | | 5.500%, 09/01/2038 | | 1,851 |
| | 82,781 | | Pool #982922, | | |
| | | | 6.000%, 09/01/2038 | | 86,570 |
| | 100,873 | | Pool #987097, | | |
| | | | 6.000%, 09/01/2038 | | 105,490 |
| | 334,288 | | Pool #990208, | | |
| | | | 6.000%, 09/01/2038 | | 349,589 |
| | 32,714 | | Pool #930035, | | |
| | | | 5.500%, 10/01/2038 | | 33,993 |
| | 8,807 | | Pool #934576, | | |
| | | | 5.500%, 10/01/2038 | | 9,151 |
| | 1,136 | | Pool #970581, | | |
| | | | 5.500%, 10/01/2038 | | 1,180 |
| | 48,952 | | Pool #979549, | | |
| | | | 5.500%, 10/01/2038 | | 50,866 |
| | 975 | | Pool #979565, | | |
| | | | 5.500%, 10/01/2038 | | 1,013 |
| | 71,529 | | Pool #992140, | | |
| | | | 5.500%, 10/01/2038 | | 74,324 |
| | 521,431 | | Pool #970518, | | |
| | | | 6.000%, 10/01/2038 | | 545,299 |
| | 13,581 | | Pool #930133, | | |
| | | | 5.500%, 11/01/2038 | | 14,112 |
See notes to financial statements.
AssetMark Core Plus Fixed Income Fund
SCHEDULE OF INVESTMENTS (Continued)
March 31, 2009
| | Principal | | | | |
| | Amount | | | | Value |
| | | | MORTGAGE BACKED | | |
| | | | SECURITIES - U.S. | | |
| | | | GOVERNMENT AGENCY (Continued) |
| $ | 38,327 | | Pool #930137, | | |
| | | | 5.500%, 11/01/2038 | $ | 39,825 |
| | 10,802 | | Pool #934621, | | |
| | | | 5.500%, 11/01/2038 | | 11,225 |
| | 24,338 | | Pool #970789, | | |
| | | | 5.500%, 11/01/2038 | | 25,289 |
| | 15,372 | | Pool #988155, | | |
| | | | 5.500%, 11/01/2038 | | 15,973 |
| | 49,612 | | Pool #992268, | | |
| | | | 5.500%, 11/01/2038 | | 51,551 |
| | 12,521 | | Pool #992536, | | |
| | | | 5.500%, 11/01/2038 | | 13,010 |
| | 950,394 | | Pool #934640, | | |
| | | | 6.000%, 11/01/2038 | | 993,897 |
| | 106,618 | | Pool #987922, | | |
| | | | 6.000%, 11/01/2038 | | 111,499 |
| | 653,040 | | Pool #991528, | | |
| | | | 6.000%, 11/01/2038 | | 682,933 |
| 1,033,038 | | Pool #992232, | | |
| | | | 6.000%, 11/01/2038 | | 1,080,324 |
| 1,929,747 | | Pool #994452, | | |
| | | | 6.000%, 11/01/2038 | | 2,018,079 |
| | 154,291 | | Pool #994763, | | |
| | | | 6.000%, 11/01/2038 | | 161,354 |
| | 43,057 | | Pool #934649, | | |
| | | | 6.500%, 11/01/2038 | | 45,415 |
| | 47,783 | | Pool #930247, | | |
| | | | 5.500%, 12/01/2038 | | 49,651 |
| | 22,175 | | Pool #930305, | | |
| | | | 5.500%, 12/01/2038 | | 23,042 |
| | 41,862 | | Pool #970875, | | |
| | | | 5.500%, 12/01/2038 | | 43,498 |
| | 40,912 | | Pool #991104, | | |
| | | | 5.500%, 12/01/2038 | | 42,511 |
| | 995 | | Pool #993050, | | |
| | | | 5.500%, 12/01/2038 | | 1,034 |
| | 13,266 | | Pool #993080, | | |
| | | | 5.500%, 12/01/2038 | | 13,785 |
| | 16,328 | | Pool #993648, | | |
| | | | 5.500%, 12/01/2038 | | 16,967 |
| | 41,961 | | Pool #994430, | | |
| | | | 5.500%, 12/01/2038 | | 43,601 |
| | Principal | | | | |
| | Amount | | | | Value |
| | | | MORTGAGE BACKED | | |
| | | | SECURITIES - U.S. | | |
| | | | GOVERNMENT AGENCY (Continued) |
| $ | 15,277 | | Pool #AA0692, | | |
| | | | 5.500%, 12/01/2038 | $ | 15,874 |
| | 1,005 | | Pool #MC0018, | | |
| | | | 5.500%, 12/01/2038 | | 1,044 |
| | 119,423 | | Pool #257552, | | |
| | | | 6.000%, 12/01/2038 | | 124,300 |
| | 94,226 | | Pool #AA0530, | | |
| | | | 6.000%, 12/01/2038 | | 98,073 |
| | 728,983 | | Pool #930395, | | |
| | | | 5.500%, 01/01/2039 | | 757,475 |
| | 215,064 | | Pool #930400, | | |
| | | | 5.500%, 01/01/2039 | | 223,470 |
| | 28,690 | | Pool #930402, | | |
| | | | 5.500%, 01/01/2039 | | 29,811 |
| | 46,267 | | Pool #934235, | | |
| | | | 5.500%, 01/01/2039 | | 48,075 |
| | 27,125 | | Pool #971046, | | |
| | | | 5.500%, 01/01/2039 | | 28,185 |
| | 34,662 | | Pool #993122, | | |
| | | | 5.500%, 01/01/2039 | | 36,017 |
| | 17,314 | | Pool #994033, | | |
| | | | 5.500%, 01/01/2039 | | 17,989 |
| | 19,967 | | Pool #994301, | | |
| | | | 5.500%, 01/01/2039 | | 20,745 |
| | 26,840 | | Pool #AA0302, | | |
| | | | 5.500%, 01/01/2039 | | 27,886 |
| | 298,779 | | Pool #AA0845, | | |
| | | | 5.500%, 01/01/2039 | | 310,456 |
| | 72,365 | | Pool #AA0875, | | |
| | | | 5.500%, 01/01/2039 | | 75,193 |
| | 11,375 | | Pool #AA1148, | | |
| | | | 5.500%, 01/01/2039 | | 11,819 |
| | 29,812 | | Pool #AA1607, | | |
| | | | 5.500%, 01/01/2039 | | 30,977 |
| | 370,677 | | Pool #AA1729, | | |
| | | | 5.500%, 01/01/2039 | | 385,165 |
| | 17,584 | | Pool #AA1825, | | |
| | | | 5.500%, 01/01/2039 | | 18,270 |
| | 17,796 | | Pool #AA1826, | | |
| | | | 5.500%, 01/01/2039 | | 18,490 |
| | 56,973 | | Pool #AA1922, | | |
| | | | 5.500%, 01/01/2039 | | 59,200 |
See notes to financial statements.
AssetMark Core Plus Fixed Income Fund
SCHEDULE OF INVESTMENTS (Continued)
March 31, 2009
| | Principal | | | | |
| | Amount | | | | Value |
| | | | MORTGAGE BACKED | | |
| | | | SECURITIES - U.S. | | |
| | | | GOVERNMENT AGENCY (Continued) |
| $ | 63,022 | | Pool #AA1934, | | |
| | | | 5.500%, 01/01/2039 | $ | 65,486 |
| | 17,051 | | Pool #AA1942, | | |
| | | | 5.500%, 01/01/2039 | | 17,717 |
| | 23,120 | | Pool #930407, | | |
| | | | 6.000%, 01/01/2039 (g) | | 24,178 |
| | 45,611 | | Pool #930569, | | |
| | | | 5.500%, 02/01/2039 | | 47,393 |
| | 4,131 | | Pool #930574, | | |
| | | | 5.500%, 02/01/2039 | | 4,292 |
| | 11,990 | | Pool #AA3264, | | |
| | | | 5.500%, 02/01/2039 | | 12,459 |
| 1,000,000 | | Pool #935050, | | |
| | | | 5.000%, 03/01/2039 (g) | | 1,033,047 |
| | 9,292 | | Pool #AA0325, | | |
| | | | 5.500%, 03/01/2039 | | 9,655 |
| 10,600,000 | | Pool #TBA, | | |
| | | | 5.000%, 04/01/2039 (g) | | 10,939,529 |
| 5,000,000 | | Pool #TBA, | | |
| | | | 5.500%, 04/01/2039 (g) | | 5,213,280 |
| | 300,000 | | Pool #TBA, | | |
| | | | 6.000%, 04/01/2039 (g) | | 313,359 |
| 4,549,399 | | Series 2007-16, | | |
| | | | 1.272%, 03/25/2047 | | 4,404,611 |
| 2,696,140 | | Pool #200822, | | |
| | | | 1.314%, 04/25/2048 | | 2,650,492 |
| | | | GNMA | | |
| 2,800,000 | | Pool #TBA, | | |
| | | | 6.500%, 04/01/2029 (g) | | 2,937,813 |
| 4,200,000 | | Pool #TBA, | | |
| | | | 5.000%, 04/01/2034 (g) | | 4,355,530 |
| 1,550,000 | | Pool #TBA, | | |
| | | | 6.000%, 04/01/2039 (g) | | 1,619,508 |
| 9,000,000 | | Pool #TBA, | | |
| | | | 4.500%, 06/15/2039 (g) | | 9,143,442 |
| | 800,000 | | Pool #TBA, | | |
| | | | 6.000%, 04/15/2039 (g) | | 835,000 |
| | | | Total Mortgage Backed Securities - | | |
| | | | U.S. Government | | |
| | | | (Cost $247,419,057) | | 253,865,832 |
| |
| | Principal | | | | |
| | Amount | | | | Value |
| | | | MUNICIPAL BONDS - 0.38% | | |
| | | | Virginia Housing Development | | |
| | | | Authority, Series C, Revenue Bond, | | |
| | $2,025,300 | | 6.000%, 06/25/2034 | $ | 1,900,298 |
| | | | Total Municipal Bonds | | |
| | | | (Cost $1,991,756) | | 1,900,298 |
| | | | SUPRANATIONAL OBLIGATIONS - 0.70% |
| | | | Supranational Obligation - 0.70% | | |
| | | | African Development Bank | | |
| | 2,500,000 | | 0.500%, 02/27/2014 | | 2,222,357 |
| | | | GazInvest | | |
| | 970,000 | | 6.210%, 11/22/2016 (c) | | 708,100 |
| | 440,000 | | 6.510%, 03/07/2022 (c) | | 286,000 |
| | | | HSBK Europe B V | | |
| | 570,000 | | 9.250%, 10/16/2013 (c) | | 313,500 |
| | | | | | 3,529,957 |
| | | | Total Supranational Obligations | | |
| | | | (Cost $3,933,928) | | 3,529,957 |
| | | | U.S. GOVERNMENT AGENCY | | |
| | | | ISSUES - 3.16% | | |
| | | | FFCB | | |
| | 1,400,000 | | 5.130%, 04/19/2017 (c) | | 1,516,594 |
| | | | FHLB | | |
| | 3,000,000 | | 1.050%, 02/23/2010 | | 3,003,111 |
| | 700,000 | | 3.750%, 03/27/2019 | | 710,873 |
| | | | FHLMC | | |
| | 880,000 | | 5.630%, 11/23/2035 | | 908,943 |
| | | | FNMA | | |
| | 220,000 | | 7.250%, 01/15/2010 | | 230,790 |
| | 600,000 | | 1.750%, 03/23/2011 | | 604,154 |
| | | | GNMA | | |
| | 84,698 | | 5.000%, 08/15/2033 | | 88,222 |
| | 1,218,296 | | 5.000%, 09/15/2033 (b) | | 1,268,995 |
| | 205,938 | | 5.000%, 03/15/2034 | | 214,379 |
| | 218,836 | | 3.750%, 10/20/2034 | | 219,071 |
| | 126,827 | | 5.000%, 11/15/2034 | | 132,026 |
| | 1,123,795 | | 3.750%, 11/20/2034 | | 1,124,932 |
| | 2,935,863 | | 6.000%, 05/15/2035 (b) | | 3,076,554 |
| | 688,352 | | 6.000%, 12/15/2038 | | 720,839 |
| | | | Tennessee Valley Authority | | |
| | 830,000 | | 5.980%, 04/01/2036 | | 948,438 |
| | 1,100,000 | | 5.380%, 04/01/2056 | | 1,157,827 |
| | | | Total U.S. Government Agency Issues | |
| | | | (Cost $15,507,407) | | 15,925,748 |
See notes to financial statements.
AssetMark Core Plus Fixed Income Fund
SCHEDULE OF INVESTMENTS (Continued)
March 31, 2009
| | Principal | | | | |
| | Amount | | | | Value |
| | | | U.S. TREASURY OBLIGATIONS - 2.93% |
| | | | U.S. Treasury Bond - 2.44% | | |
| $ | 918,384 | | 2.380%, 01/15/2025 (h) | $ | 957,415 |
| | 404,191 | | 2.000%, 01/15/2026 (b)(h) | | 400,907 |
| | 1,078,256 | | 2.380%, 01/15/2027 (h)(m) | | 1,129,809 |
| | 2,650,304 | | 1.750%, 01/15/2028 (h)(m) | | 2,546,777 |
| | 4,611,677 | | 2.500%, 01/15/2029 (h) | | 5,009,434 |
| | 2,270,000 | | 3.500%, 02/15/2039 | | 2,243,766 |
| | | | | | 12,288,108 |
| | | | U.S. Treasury Note - 0.49% | | |
| | 616,977 | | 2.000%, 01/15/2014 (h) | | 636,836 |
| | 130,243 | | 1.880%, 07/15/2015 (h) | | 133,865 |
| | 499,920 | | 2.000%, 01/15/2016 (h) | | 516,637 |
| | 219,528 | | 2.500%, 07/15/2016 (h) | | 235,101 |
| | 723,213 | | 2.630%, 07/15/2017 (h) | | 786,946 |
| | 181,000 | | 2.750%, 02/15/2019 (b) | | 182,047 |
| | | | | | 2,491,432 |
| | | | Total U.S. Treasury Obligations | | |
| | | | (Cost $13,496,273) | | 14,779,540 |
| | | | SHORT TERM INVESTMENTS - 2.64% |
| | | | Repurchase Agreements - 1.01% | | |
| | 5,100,000 | | Merrill Lynch Repurchase Agreement | | |
| | | | 0.090%, 04/01/2009 (Collateralized | | |
| | | | by a U.S. Government Agency | | |
| | | | Issue, value $5,100,013, 5.45%, | | |
| | | | 10/18/2021) | | 5,100,000 |
| | Shares | | | | |
| | | | Money Market Fund - 1.63% | | |
| | 8,231,468 | | Federated Prime Obligations Fund | | 8,231,468 |
| | | | Total Short Term Investments | | |
| | | | (Cost $13,331,468) | | 13,331,468 |
| | Principal | | | | |
| | Amount | | | | |
| | | | INVESTMENTS PURCHASED | | |
| | | | AS SECURITIES LENDING | | |
| | | | COLLATERAL - 2.08% | | |
| | | | Corporate Bonds and Notes - 0.30% | | |
| | $882,362 | | Bank of Scotland, | | |
| | | | 1.446%, 05/06/09 | | 882,362 |
| | 661,772 | | Svenska Handelsbanken, | | |
| | | | 4.418%, 08/06/09 (c) | | 658,264 |
| | | | Total Corporate Bonds and Notes | | |
| | | | (Cost $1,544,134) | | 1,540,626 |
| | Principal | | | | |
| | Amount | | | | Value |
| | | | Corporate Paydown Securities - 1.44% | |
| | $7,049,768 | | KKR Atlantic East Holding Group | | |
| | | | Trust, 3.059%, 03/25/10 (k) | $ | 3,820,269 |
| | 7,961,169 | | KKR Pacific West Holding Group | | |
| | | | Trust, 3.059%, 03/25/10 (k) | | 3,427,283 |
| | | | Total Corporate Paydown Securities | |
| | | | (Cost $15,010,937) | | 7,247,552 |
| | Shares | | | | |
| | | | Money Market Funds - 0.34% | | |
| | 1,421,484 | | Mount Vernon Prime Portfolio | | 1,421,484 |
| | 311,917 | | Reserve Primary Fund (k) | | 268,717 |
| | | | Total Money Market Funds | | |
| | | | (Cost $1,733,401) | | 1,690,201 |
| | Principal | | | | |
| | Amount | | | | |
| | | | Cash - 0.00% | | |
| | $2,425 | | Cash | | 2,425 |
| | | | Total Cash | | |
| | | | (Cost $2,425) | | 2,425 |
| | | | Total Investments Purchased as | | |
| | | | Securities Lending Collateral | | |
| | | | (Cost $18,290,897) | | 10,480,804 |
| | | | Total Investments | | |
| | | | (Cost $654,801,221) - 109.46% | | 552,158,690 |
| | | | Liabilities in Excess of | | |
| | | | Other Assets - (9.46)% | | (47,707,261) |
| | | | TOTAL NET | | |
| | | | ASSETS - 100.00% | | $504,451,429 |
| | | | | | |
| | Percentages are stated as a percent of net assets. | |
| (a) | Non-Income producing. | | |
| (b) | All or a portion of this security is on loan. | | |
| (c) | Restricted securities as defined in Rule 144(a) under the |
| | Securities Act of 1933. Such securities are treated as liquid |
| | securities according to the Fund’s liquidity guidelines. The value |
| | of these securities total $30,915,715, which represents 6.13% of |
| | total net assets. | | |
| (d) | Restricted securities as defined in Rule 144(a) under the |
| | Securities Act of 1933. Such securities are treated as illiquid |
| | securities according to the Fund’s liquidity guidelines. The value |
| | of these securities total $3,663,359, which represents 0.73% of |
| | total net assets. | | |
| (e) | Variable Rate Security. The rate shown is the rate in effect on |
| | March 31, 2009. | | |
See notes to financial statements.
AssetMark Core Plus Fixed Income Fund
SCHEDULE OF INVESTMENTS (Continued)
March 31, 2009
| (f) | Non-income producing. Item identified as in default as to |
| | payment of interest. |
| (g) | Security purchased on a when-issued basis. On March 31, 2009, |
| | the total value of the investments purchased on a when-issued |
| | basis was $41,938,320 or 8.31% of total net assets. |
| (h) | Represents a U.S. Treasury Inflation Protected Security. |
| (i) | Represents an interest only security that entitles holders to |
| | receive only interest payments on the underlying mortgages. |
| | The yield to maturity of an interest only security is extremely |
| | sensitive to the rate of principal payments on the underlying |
| | mortgage assets. A rapid (slow) rate of principal repayments |
| | may have an adverse (positive) effect on yield to maturity. The |
| | principal amount shown is the notional amount of the |
| | underlying mortgage. Interest rate disclosed represents yield |
| | upon the estimated timing and amount of future cash flows at |
| | March 31, 2009. The security is illiquid and represents less than |
| | 0.1% of net assets. |
| (j) | Credit linked note. Investment performance is wholly or |
| | partially derived from an underlying source. |
| (k) | As of March 31, 2009, the Adviser has fair valued this security |
| | and deemed it illiquid. The value of these securities were |
| | $7,516,269, which represent 1.49% of total net assets |
| (l) | Zero coupon bond. |
| (m) | Partially assigned as collateral for certain futures and options |
| | contracts. |
See notes to financial statements.
AssetMark Core Plus Fixed Income Fund
SCHEDULE OF OPTIONS WRITTEN
March 31, 2009
| | Contracts | | | | Value |
| | | | CALL OPTIONS | | |
| | 10 | | Eurodollar 90 Day Future | | |
| | | | Expiration: September, 2009, | | |
| | | | Exercise Price: $97.63 | | $32,625 |
| | Contracts | | | | Value |
| | | | PUT OPTIONS | | |
| | 29 | | U.S. Treasury 10 Year Note Future | | |
| | | | Expiration: May, 2009, | | |
| | | | Exercise Price: $124.00 | | $32,172 |
| | 46 | | U.S. Treasury Long Bond Future | | |
| | | | Expiration: June, 2009, | | |
| | | | Exercise Price: $121.00 | | 24,437 |
| | | | | | 56,609 |
| | | | Total Options Written | | |
| | | | (Premiums received $182,450) | | $89,234 |
| | | | | | |
AssetMark Core Plus Fixed Income Fund
SCHEDULE OF FORWARD SALE COMMITMENTS
March 31, 2009
| | | Principal | | Settlement | | Proceeds | | | | |
| Description | | Amount | | Date | | Received | | | Value | |
| FNMA, 4.500%, 04/01/2034 | | $ | (2,000,000 | ) | 4/13/09 | | $ | 2,042,500 | | | $ | (2,044,376 | ) |
| FNMA, 5.000%, 04/01/2039 | | | (9,800,000 | ) | 4/13/09 | | | 10,068,828 | | | | (10,113,903 | ) |
| FNMA, 6.000%, 04/01/2039 | | | (9,000,000 | ) | 4/13/09 | | | 9,305,625 | | | | (9,400,779 | ) |
| FNMA, 6.500%, 04/01/2039 | | | (1,000,000 | ) | 4/13/09 | | | 1,043,438 | | | | (1,053,282 | ) |
| | | $ | (21,800,000 | ) | | | $ | 22,460,391 | | | $ | (22,612,340 | ) |
| | | | | | | | | | | | | | |
See notes to financial statements.
AssetMark Core Plus Fixed Income Fund
SCHEDULE OF OPEN FORWARD CURRENCY CONTRACTS
March 31, 2009
| | | | | Amount of | | | | Amount of | | | Unrealized | |
| Forward | | Currency to | | Currency to be | | Currency to | | Currency to | | | Appreciation | |
| expiration date | | be received | | received | | be delivered | | be delivered | | | (Depreciation) | |
| 05/05/09 | | U.S. Dollars | | | 291,474 | | Brazil Real | | | 694,000 | | | $ | (5,270 | ) |
| 04/17/09 | | U.S. Dollars | | | 1,062,392 | | European Monetary Unit | | | 832,596 | | | | (43,656 | ) |
| 05/12/09 | | U.S. Dollars | | | 663,818 | | European Monetary Unit | | | 513,493 | | | | (18,280 | ) |
| 05/12/09 | | European Monetary Unit | | | 541,716 | | U.S. Dollars | | | 713,359 | | | | 6,230 | |
| | | | | | | | | | | | | | $ | (60,976 | ) |
| | | | | | | | | | | | | | | | |
| | | | |
| AssetMark Core Plus Fixed Income Fund | | | |
| SCHEDULE OF OPEN FUTURES CONTRACTS | | | |
| March 31, 2009 | | | | |
| | | Number of | | | | | | | Unrealized |
| | | Contracts | | | Notional | | Settlement | | Appreciation |
| Description | | Purchased (Sold) | | | Value | | Month | | (Depreciation) |
| Euro-Bund Futures | | | 38 | | | $ | 6,422,845 | | Jun-09 | | $ | 39,965 | |
| Euro-Schatz Futures | | | 74 | | | | 10,854,801 | | Jun-09 | | | 15,993 | |
| Eurodollar 90 Day Futures | | | 34 | | | | 8,399,684 | | Apr-09 | | | 2,566 | |
| Eurodollar 90 Day Futures | | | 34 | | | | 8,402,341 | | May-09 | | | 2,034 | |
| Eurodollar 90 Day Futures | | | 23 | | | | 5,493,014 | | Jun-09 | | | 193,736 | |
| Eurodollar 90 Day Futures | | | 10 | | | | 2,399,325 | | Sep-09 | | | 73,300 | |
| Gilt Bond Futures | | | 27 | | | | 4,736,143 | | Jun-09 | | | 79,588 | |
| U.S. Treasury 2 Year Note Futures | | | 154 | | | | 33,414,011 | | Jun-09 | | | 141,144 | |
| U.S. Treasury 5 Year Note Futures | | | 253 | | | | 29,749,275 | | Jun-09 | | | 298,430 | |
| U.S. Treasury 5 Year Note Futures | | | (122) | | | | (14,285,734 | ) | Jun-09 | | | (203,673 | ) |
| U.S. Treasury 10 Year Note Futures | | | 137 | | | | 16,751,234 | | Jun-09 | | | 247,471 | |
| U.S. Treasury Long Bond Futures | | | 101 | | | | 12,764,674 | | Jun-09 | | | 335,342 | |
| | | | | | | | | | | | $ | 1,225,896 | |
| | | | | | | | | | | | | | |
See notes to financial statements.
AssetMark Enhanced Fundamental Index™ Large Company Growth Fund
SCHEDULE OF INVESTMENTS
March 31, 2009
| | Number of | | | | |
| | Shares | | | | Value |
| | | | COMMON STOCKS - 93.63% | | |
| | | | Aerospace & Defense - 4.33% | | |
| | 267 | | Alliant Techsystems, Inc. (a) | $ | 17,884 |
| | 9,975 | | Boeing Co. | | 354,911 |
| | 4,367 | | General Dynamics Corp. | | 181,624 |
| | 1,571 | | Goodrich Corp. | | 59,525 |
| | 1,556 | | Hexcel Corp. (a) | | 10,223 |
| | 7,984 | | Honeywell International, Inc. | | 222,434 |
| | 3,629 | | KBR, Inc. | | 50,116 |
| | 610 | | L-3 Communications | | |
| | | | Holdings, Inc. | | 41,358 |
| | 4,335 | | Lockheed Martin Corp. | | 299,245 |
| | 385 | | Precision Castparts Corp. | | 23,062 |
| | 5,042 | | Raytheon Co. | | 196,335 |
| | 1,294 | | Rockwell Collins, Inc. | | 42,236 |
| | 1,848 | | Spirit Aerosystems | | |
| | | | Holdings, Inc. (a) | | 18,425 |
| | 427 | | Teledyne Technologies, Inc. (a) | | 11,392 |
| | 10,658 | | United Technologies Corp. | | 458,081 |
| | | | | | 1,986,851 |
| | | | Air Freight & Logistics - 0.94% | | |
| | 1,047 | | C.H. Robinson Worldwide, Inc. | | 47,754 |
| | 1,067 | | Expeditors International | | |
| | | | Washington, Inc. (b) | | 30,185 |
| | 5,761 | | FedEx Corp. | | 256,307 |
| | 1,498 | | United Parcel Service, Inc. | | 73,731 |
| | 1,784 | | UTI Worldwide, Inc. | | 21,319 |
| | | | | | 429,296 |
| | | | Airlines - 0.31% | | |
| | 22,127 | | Southwest Airlines Co. (b) | | 140,064 |
| | | | Auto Components - 0.55% | | |
| | 2,116 | | BorgWarner, Inc | | 42,955 |
| | 2,600 | | Gentex Corp. | | 25,896 |
| | 13,911 | | Johnson Controls, Inc. (b) | | 166,932 |
| | 1,334 | | WABCO Holdings, Inc | | 16,421 |
| | | | | | 252,204 |
| | | | Automobiles - 0.09% | | |
| | 3,167 | | Harley-Davidson, Inc. (b) | | 42,406 |
| | | | Beverages - 1.15% | | |
| | 585 | | Brown-Forman Corp. | | 22,715 |
| | 2,777 | | The Coca-Cola Company | | 122,049 |
| | 1,170 | | Molson Coors Brewing Co. (b) | | 40,108 |
| | 6,694 | | PepsiCo, Inc. | | 344,607 |
| | | | | | 529,479 |
| | Number of | | | | |
| | Shares | | | | Value |
| | | | Biotechnology - 0.40% | | |
| | 2,211 | | Amgen, Inc. (a) | $ | 109,489 |
| | 454 | | Biogen Idec, Inc. (a) | | 23,799 |
| | 337 | | Celgene Corp. (a) | | 14,963 |
| | 220 | | Cephalon, Inc. (a) | | 14,982 |
| | 458 | | Gilead Sciences, Inc. (a) | | 21,214 |
| | | | | | 184,447 |
| | | | Capital Markets - 2.98% | | |
| | 6,734 | | The Bank of New York | | |
| | | | Mellon Corp. | | 190,235 |
| | 619 | | BlackRock, Inc. | | 80,495 |
| | 7,873 | | The Charles Schwab Corp. | | 122,031 |
| | 893 | | Eaton Vance Corp. (b) | | 20,405 |
| | 1,183 | | Federated Investors, Inc. | | 26,334 |
| | 2,174 | | Franklin Resources, Inc. | | 117,113 |
| | 1,583 | | Goldman Sachs Group, Inc. (b) | | 167,830 |
| | 3,302 | | Invesco Ltd. | | 45,766 |
| | 1,092 | | Knight Capital Group, Inc. (a) | | 16,096 |
| | 1,021 | | Northern Trust Corp. | | 61,076 |
| | 2,770 | | Raymond James Financial, Inc. (b) | | 54,569 |
| | 1,218 | | SEI Investments Co. | | 14,872 |
| | 4,150 | | State Street Corp. | | 127,737 |
| | 909 | | T. Rowe Price Group, Inc. (b) | | 26,234 |
| | 20,266 | | TD Ameritrade Holding Corp. (a)(b) | | 279,873 |
| | 738 | | Waddell & Reed Financial, Inc. | | 13,336 |
| | | | | | 1,364,002 |
| | | | Chemicals - 2.38% | | |
| | 788 | | Air Products & Chemicals, Inc. | | 44,325 |
| | 497 | | Albemarle Corp. | | 10,820 |
| | 2,990 | | Celanese Corp. | | 39,976 |
| | 180 | | CF Industries Holdings, Inc. | | 12,803 |
| | 1,292 | | Cytec Industries, Inc. | | 19,406 |
| | 20,191 | | E.I. du Pont de Nemours & Co. (b) | | 450,865 |
| | 2,959 | | Ecolab, Inc. | | 102,766 |
| | 529 | | FMC Corp. | | 22,821 |
| | 782 | | International Flavors & | | |
| | | | Fragrances, Inc. | | 23,820 |
| | 645 | | Monsanto Co. | | 53,599 |
| | 818 | | Mosaic Co. (b) | | 34,340 |
| | 1,975 | | Nalco Holding Company | | 25,813 |
| | 1,316 | | Olin Corp. | | 18,779 |
| | 782 | | Praxair, Inc. | | 52,621 |
| | 2,595 | | Rockwood Holdings, Inc. (a) | | 20,604 |
| | 777 | | Rohm & Haas Co. | | 61,259 |
| | 2,560 | | RPM International, Inc. | | 32,589 |
See notes to financial statements.
AssetMark Enhanced Fundamental Index™ Large Company Growth Fund
SCHEDULE OF INVESTMENTS (Continued)
March 31, 2009
| | Number of | | | | |
| | Shares | | | | Value |
| | | | COMMON STOCKS (Continued) | | |
| | | | Chemicals (Continued) | | |
| | 797 | | Terra Industries, Inc. | $ | 22,388 |
| | 1,228 | | Valhi, Inc. | | 11,519 |
| | 4,498 | | WR Grace & Co. (a) | | 28,427 |
| | | | | | 1,089,540 |
| | | | Commercial Banks - 0.38% | | |
| | 601 | | Bank of Hawaii Corp. (b) | | 19,821 |
| | 750 | | BOK Financial Corp. | | 25,912 |
| | 990 | | Commerce Bancshares, Inc. | | 35,937 |
| | 628 | | Cullen/Frost Bankers, Inc. | | 29,478 |
| | 154 | | First Citizens BancShares, Inc. | | 20,297 |
| | 393 | | UMB Financial Corp. | | 16,699 |
| | 2,032 | | Valley National Bancorp (b) | | 25,136 |
| | | | | | 173,280 |
| | | | Commercial Services & Supplies - 1.29% | | |
| | 270 | | Apollo Group, Inc. (a) | | 21,149 |
| | 1,120 | | The Brink’s Co. | | 29,635 |
| | 1,695 | | Cintas Corp. | | 41,900 |
| | 489 | | Coinstar, Inc. (a) | | 16,020 |
| | 307 | | DeVry, Inc. (b) | | 14,791 |
| | 153 | | The Dun & Bradstreet | | |
| | | | Corporation (b) | | 11,781 |
| | 2,630 | | H&R Block, Inc. | | 47,840 |
| | 889 | | Herman Miller, Inc. | | 9,477 |
| | 1,612 | | Monster Worldwide, Inc. (a) | | 13,138 |
| | 2,651 | | Pitney Bowes, Inc. (b) | | 61,901 |
| | 1,918 | | Republic Services, Inc. | | 32,894 |
| | 1,166 | | Resources Connection, Inc. (a)(b) | | 17,583 |
| | 2,922 | | Robert Half International, Inc. | | 52,099 |
| | 1,034 | | Rollins, Inc. | | 17,733 |
| | 4,281 | | SAIC, Inc. (a)(b) | | 79,926 |
| | 769 | | Tetra Tech, Inc. (a) | | 15,672 |
| | 4,201 | | Waste Management, Inc. | | 107,546 |
| | | | | | 591,085 |
| | | | Communications Equipment - 1.08% | | |
| | 3,261 | | ADC Telecommunications (a)(b) | | 14,316 |
| | 16,643 | | Cisco Systems, Inc. (a) | | 279,103 |
| | 4,101 | | Corning, Inc. (b) | | 54,420 |
| | 3,291 | | Juniper Networks, Inc. (a) | | 49,562 |
| | 1,355 | | Plantronics, Inc. | | 16,355 |
| | 799 | | Polycom, Inc. (a) | | 12,297 |
| | 1,761 | | QUALCOMM, Inc. | | 68,521 |
| | | | | | 494,574 |
| | Number of | | | | |
| | Shares | | | | Value |
| | | | Computers & Peripherals - 4.05% | | |
| | 1,644 | | Apple, Inc. (a)(b) | $ | 172,817 |
| | 27,887 | | Dell, Inc. (a)(b) | | 264,369 |
| | 797 | | Diebold, Inc. | | 17,016 |
| | 15,151 | | EMC Corp. (a) | | 172,721 |
| | 12,777 | | Hewlett Packard Co. | | 409,631 |
| | 7,276 | | International Business | | |
| | | | Machines Corp. | | 704,972 |
| | 4,126 | | NCR Corp. (a) | | 32,802 |
| | 1,778 | | NetApp, Inc. (a)(b) | | 26,385 |
| | 1,341 | | QLogic Corp. (a) | | 14,912 |
| | 2,067 | | Western Digital Corp. (a) | | 39,976 |
| | | | | | 1,855,601 |
| | | | Construction & Engineering - 0.39% | | |
| | 1,485 | | AECOM Technology Corp. (a) | | 38,729 |
| | 2,305 | | Fluor Corp. | | 79,638 |
| | 1,162 | | Foster Wheeler Ag (a) | | 20,300 |
| | 1,077 | | Jacobs Engineering Group, Inc. (a) | | 41,637 |
| | | | | | 180,304 |
| | | | Construction Materials - 0.03% | | |
| | 294 | | Vulcan Materials Co. (b) | | 13,021 |
| | | | Consumer Finance - 0.44% | | |
| | 14,725 | | American Express Co. (b) | | 200,702 |
| | | | Containers & Packaging - 0.50% | | |
| | 1,150 | | Ball Corp. | | 49,910 |
| | 2,430 | | Crown Holdings, Inc. (a) | | 55,234 |
| | 533 | | Greif, Inc. | | 17,744 |
| | 3,364 | | Owens-Illinois, Inc. (a) | | 48,576 |
| | 2,942 | | Packaging Corp. of America | | 38,305 |
| | 365 | | Silgan Holdings, Inc. | | 19,177 |
| | | | | | 228,946 |
| | | | Diversified Financial Services - 0.32% | | |
| | 124 | | CME Group, Inc. | | 30,553 |
| | 384 | | GATX Corp. (b) | | 7,768 |
| | 932 | | Interactive Brokers Group, Inc. (a) | | 15,033 |
| | 1,383 | | Moody’s Corp. (b) | | 31,698 |
| | 2,214 | | MSCI, Inc. (a) | | 37,439 |
| | 1,185 | | Nasdaq Stock Market, Inc. (a) | | 23,202 |
| | | | | | 145,693 |
| | | | Diversified Telecommunication Services - 3.97% | | |
| | 70,190 | | AT&T, Inc. | | 1,768,788 |
| | 10,788 | | Cincinnati Bell, Inc. (a) | | 24,813 |
| | 3,268 | | Windstream Corp. | | 26,340 |
| | | | | | 1,819,941 |
See notes to financial statements.
AssetMark Enhanced Fundamental Index™ Large Company Growth Fund
SCHEDULE OF INVESTMENTS (Continued)
March 31, 2009
| | Number of | | | | |
| | Shares | | | | Value |
| | | | COMMON STOCKS (Continued) | | |
| | | | Electric Utilities - 2.08% | | |
| | 683 | | Allegheny Energy, Inc. | $ | 15,825 |
| | 1,277 | | DPL, Inc. | | 28,784 |
| | 5,455 | | Edison International | | 157,159 |
| | 2,181 | | Entergy Corp. | | 148,504 |
| | 5,954 | | Exelon Corp. | | 270,252 |
| | 2,983 | | FirstEnergy Corp. | | 115,144 |
| | 2,744 | | FPL Group, Inc. (b) | | 139,203 |
| | 2,800 | | PPL Corp. | | 80,388 |
| | | | | | 955,259 |
| | | | Electrical Equipment - 0.84% | | |
| | 1,278 | | Acuity Brands, Inc. | | 28,806 |
| | 1,388 | | Cooper Industries Ltd. | | 35,894 |
| | 8,416 | | Emerson Electric Co. | | 240,529 |
| | 2,511 | | Rockwell Automation, Inc. | | 54,840 |
| | 542 | | Roper Industries, Inc. | | 23,008 |
| | | | | | 383,077 |
| | | | Electronic Equipment & Instruments - 0.40% | | |
| | 3,348 | | Agilent Technologies, Inc. (a)(b) | | 51,459 |
| | 558 | | Mettler Toledo International, Inc. (a) | | 28,642 |
| | 1,238 | | Molex, Inc. | | 17,010 |
| | 1,426 | | Plexus Corp. (a) | | 19,707 |
| | 6,193 | | Tyco Electronics Ltd. | | 68,371 |
| | | | | | 185,189 |
| | | | Energy Equipment & Services - 1.62% | | |
| | 2,864 | | Baker Hughes, Inc. | | 81,767 |
| | 1,425 | | BJ Services Co. (b) | | 14,179 |
| | 1,784 | | Cameron International Corp. (a)(b) | | 39,123 |
| | 1,069 | | Diamond Offshore Drilling (b) | | 67,197 |
| | 918 | | Dresser-Rand Group, Inc. (a) | | 20,288 |
| | 606 | | ENSCO International, Inc. | | 15,998 |
| | 836 | | FMC Technologies, Inc. (a)(b) | | 26,225 |
| | 2,980 | | Global Industries Ltd. (a)(b) | | 11,443 |
| | 8,334 | | Halliburton Co. | | 128,927 |
| | 2,363 | | Nabors Industries Ltd. (a) | | 23,606 |
| | 2,602 | | National-Oilwell Varco, Inc. (a) | | 74,704 |
| | 567 | | Oil States International, Inc. (a) | | 7,609 |
| | 978 | | Patterson-UTI Energy, Inc. | | 8,763 |
| | 1,122 | | Pride International, Inc. (a) | | 20,174 |
| | 1,117 | | Rowan Companies, Inc. | | 13,371 |
| | 1,723 | | Schlumberger Ltd. | | 69,988 |
| | 1,592 | | Smith International, Inc. (b) | | 34,196 |
| | 438 | | Tidewater, Inc. (b) | | 16,263 |
| | Number of | | | | |
| | Shares | | | | Value |
| | | | Energy Equipment & Services (Continued) | | |
| | 1,158 | | Transocean Ltd. (a)(b) | $ | 68,137 |
| | | | | | 741,958 |
| | | | Food & Staples Retailing - 4.95% | | |
| | 1,910 | | BJ’s Wholesale Club, Inc. (a) | | 61,101 |
| | 804 | | Costco Wholesale Corp. (b) | | 37,241 |
| | 4,187 | | CVS Corp. | | 115,101 |
| | 804 | | Ruddick Corp. | | 18,050 |
| | 9,635 | | SYSCO Corp. | | 219,678 |
| | 6,894 | | Walgreen Co. | | 178,968 |
| | 31,444 | | Wal-Mart Stores, Inc. | | 1,638,232 |
| | | | | | 2,268,371 |
| | | | Food Products - 1.44% | | |
| | 865 | | Bunge Ltd. | | 49,002 |
| | 3,722 | | Campbell Soup Co. | | 101,834 |
| | 965 | | Corn Products International, Inc. | | 20,458 |
| | 2,213 | | General Mills, Inc. | | 110,385 |
| | 2,383 | | Hershey Foods Corp. (b) | | 82,809 |
| | 4,071 | | HJ Heinz Co. | | 134,587 |
| | 972 | | Hormel Foods Corp. | | 30,822 |
| | 2,561 | | Kellogg Co. | | 93,810 |
| | 902 | | McCormick & Co, Inc. (b) | | 26,672 |
| | 11 | | Seaboard Corp. | | 11,110 |
| | | | | | 661,489 |
| | | | Gas Utilities - 0.19% | | |
| | 393 | | Energen Corp. | | 11,448 |
| | 512 | | EQT Corp. | | 16,041 |
| | 720 | | National Fuel Gas Co. (b) | | 22,083 |
| | 684 | | Questar Corp. | | 20,130 |
| | 449 | | South Jersey Industries, Inc. | | 15,715 |
| | | | | | 85,417 |
| | | | Health Care Equipment & Supplies - 1.40% | | |
| | 3,109 | | Baxter International, Inc. | | 159,243 |
| | 361 | | Beckman Coulter, Inc. | | 18,415 |
| | 730 | | Becton, Dickinson & Co. | | 49,085 |
| | 11,344 | | Boston Scientific Corp. (a) | | 90,185 |
| | 326 | | C.R. Bard, Inc. (b) | | 25,989 |
| | 2,116 | | Covidien Ltd. | | 70,336 |
| | 721 | | Kinetic Concepts, Inc. (a)(b) | | 15,228 |
| | 1,871 | | Medtronic, Inc. | | 55,138 |
| | 804 | | Mine Safety Appliances Co. | | 16,096 |
| | 485 | | St. Jude Medical, Inc. (a) | | 17,620 |
| | 695 | | Steris Corp. | | 16,180 |
| | 775 | | Stryker Corp. | | 26,381 |
See notes to financial statements.
AssetMark Enhanced Fundamental Index™ Large Company Growth Fund
SCHEDULE OF INVESTMENTS (Continued)
March 31, 2009
| | Number of | | | | |
| | Shares | | | | Value |
| | | | COMMON STOCKS (Continued) | | |
| | | | Health Care Equipment & Supplies (Continued) | | |
| | 805 | | Varian Medical Systems, Inc. (a)(b) | $ | 24,504 |
| | 730 | | Varian, Inc. (a) | | 17,330 |
| | 1,079 | | Zimmer Holdings, Inc. (a) | | 39,383 |
| | | | | | 641,113 |
| | | | Health Care Providers & Services - 1.37% | | |
| | 5,821 | | Aetna, Inc. | | 141,625 |
| | 597 | | Cerner Corp. (a)(b) | | 26,250 |
| | 465 | | DaVita, Inc. (a) | | 20,437 |
| | 1,809 | | Express Scripts, Inc. (a)(b) | | 83,522 |
| | 1,249 | | Henry Schein, Inc. (a)(b) | | 49,972 |
| | 364 | | Laboratory Corporation of America | | |
| | | | Holdings (a) | | 21,290 |
| | 3,550 | | Medco Health Solutions, Inc. (a) | | 146,757 |
| | 1,247 | | Owens & Minor, Inc. | | 41,313 |
| | 1,555 | | Patterson Companies, Inc. (a)(b) | | 29,327 |
| | 1,200 | | PerkinElmer, Inc. | | 15,324 |
| | 347 | | Quest Diagnostics | | 16,476 |
| | 5,857 | | Service Corp. International (b) | | 20,441 |
| | 445 | | Universal Health Services, Inc. (b) | | 17,061 |
| | | | | | 629,795 |
| | | | Health Care Technology - 0.04% | | |
| | 1,391 | | IMS Health, Inc. | | 17,346 |
| | | | Hotels, Restaurants & Leisure - 1.25% | | |
| | 1,083 | | Burger King Holdings, Inc. | | 24,855 |
| | 3,906 | | Carnival Corp. (b) | | 84,370 |
| | 2,682 | | International Game Technology | | 24,728 |
| | 4,138 | | Marriott International, Inc. | | 67,698 |
| | 3,401 | | McDonald’s Corp. | | 185,593 |
| | 3,829 | | Starbucks Corp. (a) | | 42,540 |
| | 4,315 | | Starwood Hotels & Resorts | | |
| | | | Worldwide, Inc. | | 54,800 |
| | 3,226 | | Yum! Brands, Inc. | | 88,650 |
| | | | | | 573,234 |
| | | | Household Durables - 0.21% | | |
| | 882 | | Garmin Ltd. | | 18,707 |
| | 2,638 | | Harman International Industries, Inc. | | 35,692 |
| | 928 | | Snap-On, Inc. | | 23,293 |
| | 1,013 | | Tupperware Brands Corp. (b) | | 17,211 |
| | | | | | 94,903 |
| | Number of | | | | |
| | Shares | | | | Value |
| | | | Household Products - 2.57% | | |
| | 851 | | Clorox Co. (b) | $ | 43,810 |
| | 2,538 | | Colgate-Palmolive Co. | | 149,691 |
| | 776 | | Energizer Holdings, Inc. (a)(b) | | 38,559 |
| | 5,893 | | Kimberly-Clark Corp. | | 271,726 |
| | 14,333 | | Procter & Gamble Co. | | 674,941 |
| | | | | | 1,178,727 |
| | | | Independent Power Producers & | | |
| | | | Energy Traders - 0.28% | | |
| | 2,112 | | Calpine Corp. (a) | | 14,383 |
| | 4,731 | | Constellation Energy Group, Inc. | | 97,742 |
| | 1,488 | | Mirant Corp. (a) | | 16,963 |
| | | | | | 129,088 |
| | | | Industrial Conglomerates - 1.92% | | |
| | 4,809 | | 3M Co. | | 239,103 |
| | 58,635 | | General Electric Co. | | 592,800 |
| | 1,453 | | McDermott International, Inc. (a) | | 19,456 |
| | 4,636 | | Textron, Inc. | | 26,611 |
| | | | | | 877,970 |
| | | | Insurance - 1.98% | | |
| | 8,772 | | Aflac, Inc. | | 169,826 |
| | 2,408 | | AON Corp. | | 98,295 |
| | 1,387 | | Arthur J. Gallagher & Co. (b) | | 23,579 |
| | 2,336 | | Assurant, Inc. | | 50,878 |
| | 1,326 | | Erie Indemnity Co. | | 45,323 |
| | 10,241 | | Loews Corp. | | 226,326 |
| | 8,419 | | Marsh & McLennan Companies, Inc. | | 170,485 |
| | 294 | | RLI Corp. | | 14,759 |
| | 1,853 | | Stancorp Financial Group, Inc. | | 42,211 |
| | 1,549 | | Torchmark Corp. | | 40,630 |
| | 97 | | Wesco Financial Corp. | | 26,772 |
| | | | | | 909,084 |
| | | | Internet & Catalog Retail - 0.54% | | |
| | 1,455 | | Amazon.com, Inc. (a)(b) | | 106,855 |
| | 9,341 | | eBay, Inc. (a) | | 117,323 |
| | 496 | | NetFlix, Inc. (a)(b) | | 21,289 |
| | | | | | 245,467 |
| | | | Internet Software & Services - 0.32% | |
| | 216 | | Google, Inc. (a) | | 75,181 |
| | 1,464 | | VeriSign, Inc. (a)(b) | | 27,626 |
| | 3,276 | | Yahoo!, Inc. (a)(b) | | 41,965 |
| | | | | | 144,772 |
See notes to financial statements.
AssetMark Enhanced Fundamental Index™ Large Company Growth Fund
SCHEDULE OF INVESTMENTS (Continued)
March 31, 2009
| | Number of | | | | |
| | Shares | | | | Value |
| | | | COMMON STOCKS (Continued) | | |
| | | | IT Services - 1.60% | | |
| | 6,656 | | Accenture Ltd. | $ | 182,973 |
| | 685 | | Affiliated Computer Services, | | |
| | | | Inc. (a) | | 32,805 |
| | 387 | | Alliance Data Systems Corp. (a)(b) | | 14,300 |
| | 3,921 | | Automatic Data Processing, Inc. | | 137,862 |
| | 1,396 | | Broadridge Financial Solutions, Inc. | | 25,980 |
| | 479 | | Fiserv, Inc. (a) | | 17,464 |
| | 911 | | Hewitt Associates, Inc. (a) | | 27,111 |
| | 721 | | Iron Mountain, Inc. (a)(b) | | 15,985 |
| | 395 | | Lender Processing Services, Inc. | | 12,091 |
| | 238 | | Mastercard, Inc. | | 39,860 |
| | 1,094 | | Metavante Technologies, Inc. (a) | | 21,836 |
| | 2,501 | | Paychex, Inc. | | 64,201 |
| | 931 | | SYKES Enterprises, Inc. (a) | | 15,482 |
| | 3,196 | | Total System Services, Inc. | | 44,137 |
| | 766 | | Visa, Inc. (b) | | 42,590 |
| | 3,041 | | Western Union Co. | | 38,225 |
| | | | | | 732,902 |
| | | | Leisure Equipment & Products - 0.46% | |
| | 2,457 | | Hasbro, Inc. | | 61,597 |
| | 10,099 | | Mattel, Inc. | | 116,441 |
| | 837 | | Polaris Industries, Inc. (b) | | 17,945 |
| | 1,024 | | Pool Corporation | | 13,722 |
| | | | | | 209,705 |
| | | | Life Sciences Tools & Services - 0.27% | |
| | 526 | | Covance, Inc. (a)(b) | | 18,741 |
| | 458 | | Life Technologies Corp. (a) | | 14,876 |
| | 1,677 | | Thermo Electron Corp. (a)(b) | | 59,819 |
| | 825 | | Waters Corp. (a)(b) | | 30,484 |
| | | | | | 123,920 |
| | | | Machinery - 2.60% | | |
| | 3,977 | | AGCO Corp. (a)(b) | | 77,949 |
| | 10,322 | | Caterpillar, Inc. | | 288,603 |
| | 1,285 | | Crane Co. | | 21,691 |
| | 2,476 | | Cummins, Inc. | | 63,014 |
| | 598 | | Danaher Corp. (b) | | 32,424 |
| | 1,643 | | Deere & Co. (b) | | 54,005 |
| | 531 | | Donaldson Company, Inc. | | 14,252 |
| | 1,413 | | Dover Corp. | | 37,275 |
| | 1,384 | | Eaton Corp. (b) | | 51,014 |
| | 429 | | Flowserve Corp. | | 24,076 |
| | 605 | | Harsco Corp. | | 13,413 |
| | Number of | | | | |
| | Shares | | | | Value |
| | | | Machinery (Continued) | | |
| | 2,943 | | Illinois Tool Works, Inc. | $ | 90,792 |
| | 1,686 | | ITT Industries, Inc. | | 64,860 |
| | 964 | | Joy Global, Inc. (b) | | 20,533 |
| | 886 | | Kennametal, Inc. (b) | | 14,362 |
| | 482 | | Lincoln Electric Holdings, Inc. | | 15,275 |
| | 2,949 | | Manitowoc Co. (b) | | 9,643 |
| | 3,198 | | Paccar, Inc. | | 82,381 |
| | 1,569 | | Pall Corp. | | 32,055 |
| | 1,078 | | Parker Hannifin Corp. | | 36,630 |
| | 724 | | Pentair, Inc. | | 15,689 |
| | 743 | | Reliance Steel & Aluminum Co. | | 19,563 |
| | 646 | | SPX Corp. | | 30,368 |
| | 6,625 | | Terex Corp. (a)(b) | | 61,281 |
| | 488 | | Toro Co. (b) | | 11,800 |
| | 729 | | Trinity Industries, Inc. (b) | | 6,663 |
| | | | | | 1,189,611 |
| | | | Marine - 0.04% | | |
| | 968 | | Alexander & Baldwin, Inc. | | 18,421 |
| | | | Media - 2.94% | | |
| | 1,247 | | Cablevision Systems Corp. (b) | | 16,136 |
| | 5,754 | | Clear Channel Outdoor | | |
| | | | Holdings, Inc. (a) | | 21,117 |
| | 6,709 | | The DIRECTV Group, Inc. (a)(b) | | 152,898 |
| | 6,624 | | Dish Network Corp. (a) | | 73,593 |
| | 956 | | Interactive Data Corp. | | 23,766 |
| | 480 | | John Wiley & Sons, Inc. | | 14,294 |
| | 1,300 | | Lamar Advertising Co. (a)(b) | | 12,675 |
| | 4,277 | | McGraw-Hill Companies, Inc. | | 97,815 |
| | 37,767 | | News Corporation | | 250,017 |
| | 4,357 | | Omnicom Group, Inc. (b) | | 101,954 |
| | 5,565 | | Viacom, Inc. (a)(b) | | 96,720 |
| | 24,863 | | Walt Disney Co. (b) | | 451,512 |
| | 96 | | The Washington Post Company | | 34,282 |
| | | | | | 1,346,779 |
| | | | Metals & Mining - 1.46% | | |
| | 5,234 | | AK Steel Holding Corp. | | 37,266 |
| | 18,513 | | Alcoa, Inc. (b) | | 135,885 |
| | 823 | | Allegheny Technologies, Inc. | | 18,048 |
| | 808 | | Carpenter Technology | | 11,409 |
| | 1,540 | | Century Aluminum Co. (a) | | 3,249 |
| | 2,802 | | Commercial Metals Co. | | 32,363 |
| | 1,127 | | Consol Energy, Inc. | | 28,446 |
See notes to financial statements.
AssetMark Enhanced Fundamental Index™ Large Company Growth Fund
SCHEDULE OF INVESTMENTS (Continued)
March 31, 2009
| | Number of | | | | |
| | Shares | | | | Value |
| | | | COMMON STOCKS (Continued) | | |
| | | | Metals & Mining (Continued) | | |
| | 661 | | Freeport-McMoran Copper & | | |
| | | | Gold, Inc. | $ | 25,191 |
| | 1,114 | | Massey Energy Co. | | 11,274 |
| | 1,407 | | Newmont Mining Corp. | | 62,977 |
| | 1,493 | | Nucor Corp. (b) | | 56,988 |
| | 1,467 | | Peabody Energy Corp. | | 36,734 |
| | 9,602 | | Southern Copper Corp. (b) | | 167,267 |
| | 2,097 | | United States Steel Corp. (b) | | 44,310 |
| | | | | | 671,407 |
| | | | Multiline Retail - 0.92% | | |
| | 1,579 | | Big Lots, Inc. (a)(b) | | 32,811 |
| | 785 | | Dollar Tree, Inc. (a) | | 34,972 |
| | 1,379 | | Family Dollar Stores, Inc. | | 46,017 |
| | 1,056 | | Kohl’s Corp. (a)(b) | | 44,690 |
| | 2,592 | | Nordstrom, Inc. (b) | | 43,416 |
| | 6,397 | | Target Corp. (b) | | 219,993 |
| | | | | | 421,899 |
| | | | Multi-Utilities - 1.29% | | |
| | 5,907 | | Dominion Resources, Inc. (b) | | 183,058 |
| | 1,396 | | MDU Resources Group, Inc. (b) | | 22,531 |
| | 2,343 | | NRG Energy, Inc. (a) | | 41,237 |
| | 6,934 | | Public Service Enterprise | | |
| | | | Group, Inc. | | 204,345 |
| | 3,022 | | Sempra Energy | | 139,737 |
| | | | | | 590,908 |
| | | | Office Electronics - 0.10% | | |
| | 10,359 | | Xerox Corp. | | 47,133 |
| | | | Oil & Gas - 13.42% | | |
| | 4,396 | | Anadarko Petroleum Corp. (b) | | 170,961 |
| | 1,288 | | Apache Corp. | | 82,548 |
| | 652 | | Arch Coal, Inc. | | 8,717 |
| | 1,888 | | Chesapeake Energy Corp. (b) | | 32,209 |
| | 21,847 | | Chevron Corporation | | 1,468,992 |
| | 868 | | Cimarex Energy Co. | | 15,954 |
| | 4,029 | | Devon Energy Corp. | | 180,056 |
| | 5,505 | | El Paso Corp. | | 34,406 |
| | 690 | | EOG Resources, Inc. | | 37,784 |
| | 47,105 | | Exxon Mobil Corp. | | 3,207,851 |
| | 1,395 | | Foundation Coal Holdings, Inc. | | 20,018 |
| | 1,654 | | Frontline Ltd. (b) | | 28,763 |
| | 4,941 | | Hess Corp. | | 267,802 |
| | 737 | | Murphy Oil Corp. | | 32,996 |
| | Number of | | | | |
| | Shares | | | | Value |
| | | | Oil & Gas (Continued) | | |
| | 1,350 | | Newfield Exploration Co. (a) | $ | 30,645 |
| | 1,215 | | Noble Energy, Inc. | | 65,464 |
| | 3,300 | | Occidental Petroleum Corp. | | 183,645 |
| | 1,243 | | Pioneer Natural Resources Co. | | 20,472 |
| | 6,486 | | Spectra Energy Corp. (b) | | 91,712 |
| | 1,512 | | W & T Offshore, Inc. | | 9,299 |
| | 1,817 | | Weatherford International Ltd. (a) | | 20,114 |
| | 10,112 | | Williams Companies, Inc. | | 115,075 |
| | 789 | | XTO Energy, Inc. (b) | | 24,159 |
| | | | | | 6,149,642 |
| | | | Personal Products - 0.51% | | |
| | 6,016 | | Avon Products, Inc. (b) | | 115,688 |
| | 2,314 | | The Estee Lauder Cos., Inc. | | 57,040 |
| | 1,294 | | Herbalife Ltd. | | 19,384 |
| | 1,092 | | NBTY, Inc. (a) | | 15,375 |
| | 2,699 | | Nu Skin Enterprises, Inc. | | 28,313 |
| | | | | | 235,800 |
| | | | Pharmaceuticals - 6.80% | | |
| | 8,669 | | Abbott Laboratories | | 413,511 |
| | 665 | | Allergan, Inc. (b) | | 31,760 |
| | 22,609 | | Bristol Myers Squibb Co. | | 495,589 |
| | 6,945 | | Eli Lilly & Co. | | 232,033 |
| | 759 | | Endo Pharmaceuticals | | |
| | | | Holdings Inc. (a) | | 13,419 |
| | 1,100 | | Forest Laboratories, Inc. (a) | | 24,156 |
| | 389 | | Genzyme Corp. (a)(b) | | 23,103 |
| | 16,264 | | Johnson & Johnson | | 855,486 |
| | 22,230 | | Merck & Co., Inc. | | 594,653 |
| | 898 | | Schering Plough Corp. | | 21,148 |
| | 645 | | Watson Pharmaceuticals, Inc. (a) | | 20,066 |
| | 9,127 | | Wyeth | | 392,826 |
| | | | | | 3,117,750 |
| | | | Real Estate - 0.17% | | |
| | 7,206 | | CB Richard Ellis Group, Inc. (a) | | 29,040 |
| | 617 | | Jones Lang LaSalle, Inc. | | 14,352 |
| | 804 | | Rayonier, Inc. | | 24,297 |
| | 683 | | The St. Joe Co. (a) | | 11,433 |
| | | | | | 79,122 |
| | | | Road & Rail - 1.94% | | |
| | 5,461 | | Burlington Northern Santa Fe Corp. | | 328,479 |
| | 5,092 | | CSX Corp. | | 131,628 |
| | 1,201 | | Heartland Express, Inc. (b) | | 17,787 |
| | 719 | | J.B. Hunt Transport Services, Inc. (b) | | 17,335 |
See notes to financial statements.
AssetMark Enhanced Fundamental Index™ Large Company Growth Fund
SCHEDULE OF INVESTMENTS (Continued)
March 31, 2009
| Number of | | | | |
| Shares | | | | Value |
| | | COMMON STOCKS (Continued) | | |
| | | Road & Rail (Continued) | | |
| 494 | | Landstar System, Inc. | $ | 16,534 |
| 4,804 | | Norfolk Southern Corp. | | 162,135 |
| 5,206 | | Union Pacific Corp. (b) | | 214,019 |
| | | | | 887,917 |
| | | Semiconductor & Semiconductor | | |
| | | Equipment - 2.75% | | |
| 1,087 | | Altera Corp. | | 19,077 |
| 2,540 | | Analog Devices, Inc. | | 48,946 |
| 5,527 | | Applied Materials, Inc. | | 59,415 |
| 2,148 | | Broadcom Corp. (a)(b) | | 42,917 |
| 1,145 | | FormFactor, Inc. (a)(b) | | 20,633 |
| 50,765 | | Intel Corp. (b) | | 764,013 |
| 1,887 | | KLA-Tencor Corp. | | 37,740 |
| 1,324 | | Lam Research Corp. (a)(b) | | 30,147 |
| 1,193 | | Linear Technology Corp. | | 27,415 |
| 1,699 | | Marvell Technology Group Ltd. (a) | | 15,563 |
| 1,120 | | MEMC Electronic Materials, Inc. (a) | | 18,469 |
| 786 | | Microchip Technology, Inc. | | 16,655 |
| 2,115 | | National Semiconductor Corp. | | 21,721 |
| 2,467 | | NVIDIA Corp. (a)(b) | | 24,325 |
| 4,384 | | Teradyne, Inc. (a) | | 19,202 |
| 3,222 | | Texas Instruments, Inc. | | 53,195 |
| 2,142 | | Xilinx, Inc. | | 41,041 |
| | | | | 1,260,474 |
| | | Software - 2.82% | | |
| 3,439 | | Activision Blizzard, Inc. (a) | | 35,972 |
| 2,546 | | Adobe Systems, Inc. (a) | | 54,459 |
| 2,498 | | Amdocs Ltd. (a) | | 46,263 |
| 1,234 | | Autodesk, Inc. (a) | | 20,744 |
| 785 | | BMC Software, Inc. (a) | | 25,905 |
| 3,107 | | CA, Inc. | | 54,714 |
| 2,528 | | Compuware Corp. (a) | | 16,660 |
| 2,527 | | Electronic Arts, Inc. (a) | | 45,966 |
| 736 | | McAfee, Inc. (a) | | 24,656 |
| 1,166 | | MICRO Systems, Inc. (a) | | 21,863 |
| 25,239 | | Microsoft Corp. | | 463,640 |
| 4,558 | | Novell, Inc. (a) | | 19,417 |
| 11,982 | | Oracle Corp. (a) | | 216,515 |
| 841 | | Quest Software, Inc. (a) | | 10,664 |
| 674 | | Sybase, Inc. (a) | | 20,415 |
| 8,536 | | Symantec Corp. (a) | | 127,528 |
| 1,169 | | Synopsys, Inc. (a) | | 24,233 |
| Number of | | | | |
| Shares | | | | Value |
| | | Software (Continued) | | |
| 1,543 | | Teradata Corp. (a) | $ | 25,027 |
| 3,575 | | THQ, Inc. (a) | | 10,868 |
| 1,175 | | VMware, Inc. (a) | | 27,754 |
| | | | | 1,293,263 |
| | | Specialty Retail - 2.52% | | |
| 1,414 | | Abercrombie & Fitch Co. | | 33,653 |
| 711 | | Advance Auto Parts, Inc. | | 29,208 |
| 851 | | Aeropostale, Inc. (a)(b) | | 22,603 |
| 2,432 | | American Eagle Outfitters | | 29,768 |
| 327 | | AutoZone, Inc. (a) | | 53,177 |
| 2,506 | | Bed Bath & Beyond, Inc. (a)(b) | | 62,023 |
| 5,629 | | Best Buy Co., Inc. (b) | | 213,677 |
| 1,378 | | The Childrens Place Retail | | |
| | | Stores, Inc. (a) | | 30,164 |
| 1,271 | | Dick’s Sporting Goods, Inc. (a) | | 18,137 |
| 1,477 | | GameStop Corp. (a) | | 41,386 |
| 12,028 | | The Gap Inc. | | 156,244 |
| 607 | | O’Reilly Automotive, Inc. (a) | | 21,251 |
| 963 | | PetSmart, Inc. | | 20,184 |
| 1,593 | | Ross Stores, Inc. (b) | | 57,157 |
| 1,567 | | The Sherwin-Williams Co. | | 81,437 |
| 4,730 | | Staples, Inc. (b) | | 85,660 |
| 996 | | Tiffany & Co. | | 21,474 |
| 6,918 | | The TJX Companies, Inc. (b) | | 177,377 |
| | | | | 1,154,580 |
| | | Textiles, Apparel & Luxury Goods - 0.78% |
| 888 | | Coach, Inc. (a) | | 14,830 |
| 519 | | Columbia Sportswear Co. | | 15,528 |
| 1,913 | | Fossil, Inc. (a) | | 30,034 |
| 3,088 | | Nike, Inc. | | 144,796 |
| 2,155 | | Phillips-Van Heusen Corp. (b) | | 48,875 |
| 682 | | Polo Ralph Lauren Corp. (b) | | 28,815 |
| 2,167 | | Skechers U.S.A., Inc. (a) | | 14,454 |
| 707 | | VF Corp. | | 40,377 |
| 845 | | Warnaco Group, Inc. (a) | | 20,280 |
| | | | | 357,989 |
| | | Thrifts & Mortgage Finance - 0.21% | |
| 2,074 | | Hudson City Bancorp, Inc. | | 24,245 |
| 2,515 | | Peoples United Financial, Inc. (b) | | 45,195 |
| 2,145 | | TFS Financial Corp. | | 26,019 |
| | | | | 95,459 |
See notes to financial statements.
AssetMark Enhanced Fundamental Index™ Large Company Growth Fund
SCHEDULE OF INVESTMENTS (Continued)
March 31, 2009
| Number of | | | | |
| Shares | | | | Value |
| | | COMMON STOCKS (Continued) | | |
| | | Tobacco - 0.81% | | |
| 2,551 | | Lorillard, Inc. | $ | 157,499 |
| 5,599 | | Philip Morris International, Inc. | | 199,212 |
| 1,178 | | Vector Group Ltd. | | 15,302 |
| | | | | 372,013 |
| | | Trading Companies & Distributors - 0.11% |
| 961 | | Applied Industrial Technologies, Inc. | | 16,212 |
| 517 | | W.W. Grainger, Inc. (b) | | 36,283 |
| | | | | 52,495 |
| | | Water Utilities - 0.04% | | |
| 403 | | California Water Service Group | | 16,870 |
| | | Wireless Telecommunication Services - 0.09% |
| 584 | | American Tower Corp. (a) | | 17,771 |
| 1,028 | | MetroPCS Communications, Inc. (a) | | 17,558 |
| 507 | | NII Holdings, Inc. (a)(b) | | 7,605 |
| | | | | 42,934 |
| | | Total Common Stocks | | |
| | | (Cost $57,689,635) | | 42,912,688 |
| | | REAL ESTATE INVESTMENT | | |
| | | TRUSTS - 0.46% | | |
| | | Real Estate Investment Trusts - 0.46% | |
| 1,094 | | Annaly Mortgage Management, Inc. | | 15,174 |
| 1,131 | | Boston Properties, Inc. (b) | | 39,619 |
| 1,095 | | Equity Residential (b) | | 20,093 |
| 1,331 | | Plum Creek Timber Co., Inc. (b) | | 38,692 |
| 933 | | Potlatch Corp. | | 21,636 |
| 1,655 | | ProLogis | | 10,758 |
| 521 | | Public Storage, Inc. | | 28,785 |
| 628 | | Simon Property Group, Inc. | | 21,754 |
| 435 | | Vornado Realty Trust (b) | | 14,459 |
| | | | | 210,970 |
| | | Total Real Estate Investment Trusts | |
| | | (Cost $338,918) | | 210,970 |
| Number of | | | | |
| Shares | | | | Value |
| | | SHORT TERM INVESTMENTS - 4.69% |
| | | Money Market Fund - 4.69% | | |
| 2,148,673 | | Federated Prime Obligations Fund | $ | 2,148,673 |
| | | Total Short Term Investments | | |
| | | (Cost $2,148,673) | | 2,148,673 |
| | | INVESTMENTS PURCHASED | | |
| | | AS SECURITIES LENDING | | |
| | | COLLATERAL - 17.66% | | |
| | | Money Market Fund - 17.66% | | |
| 8,094,704 | | Mount Vernon Prime Portfolio | | 8,094,704 |
| | | Total Money Market Funds | | |
| | | (Cost $8,094,704) | | 8,094,704 |
| | | Total Investments Purchased as | | |
| | | Securities Lending Collateral | | |
| | | (Cost $8,094,704) | | 8,094,704 |
| | | Total Investments | | |
| | | (Cost $68,271,930) - 116.44% | | 53,367,035 |
| | | Liabilities in Excess of | | |
| | | Other Assets - (16.44)% | | (7,536,858) |
| | | TOTAL NET | | |
| | | ASSETS - 100.00% | $ | 45,830,177 |
| | | | | |
| Percentages are stated as a percent of net assets. | | |
| (a) Non-income producing. | | |
| (b) All or a portion of this security is on loan. | | |
See notes to financial statements.
AssetMark Enhanced Fundamental Index™ Large Company Growth Fund
SCHEDULE OF OPEN FUTURES CONTRACTS
March 31, 2009
| | Number of | | | | | | | |
| | Contracts | | Notional | | Settlement | | | Unrealized |
| Description | | Purchased | | Value | | Month | | | Appreciation |
| S&P 500 Index Futures | 6 | | $1,176,450 | | Jun-09 | | $ | 75,426 |
| S&P 500 Index Mini Futures | 38 | | 1,490,170 | | Jun-09 | | | 59,002 |
| | | | | | | | | $134,428 |
| | | | | | | | | |
See notes to financial statements.
AssetMark Enhanced Fundamental Index™ Large Company Value Fund
SCHEDULE OF INVESTMENTS
March 31, 2009
| Number of | | | | |
| Shares | | | | Value |
| | | COMMON STOCKS - 93.02% | | |
| | | Aerospace & Defense - 0.72% | | |
| 6,123 | | Northrop Grumman Corp. | $ | 267,208 |
| | | Air Freight & Logistics - 0.17% | | |
| 1,098 | | Atlas Air Worldwide Holdings, | | |
| | | Inc. (a) | | 19,050 |
| 1,501 | | Ryder System, Inc. | | 42,494 |
| | | | | 61,544 |
| | | Airlines - 0.68% | | |
| 1,016 | | Alaska Air Group, Inc. (a) | | 17,851 |
| 15,043 | | AMR Corp. (a)(b) | | 47,987 |
| 4,651 | | Continental Airlines, Inc. (a) | | 40,975 |
| 9,078 | | Delta Air Lines, Inc. (a) | | 51,109 |
| 15,305 | | UAL Corp. (a) | | 68,567 |
| 10,487 | | US Airways Group, Inc. (a) | | 26,532 |
| | | | | 253,021 |
| | | Auto Components - 1.24% | | |
| 7,466 | | American Axle & Manufacturing | | |
| | | Holdings, Inc. | | 9,855 |
| 10,940 | | ArvinMeritor, Inc. | | 8,643 |
| 2,266 | | Autoliv, Inc. (b) | | 42,080 |
| 4,101 | | Cooper Tire & Rubber Co. | | 16,568 |
| 3,694 | | Exide Technologies (a) | | 11,082 |
| 8,352 | | Federal Mogul Corp. (a)(b) | | 55,791 |
| 23,373 | | Goodyear Tire & Rubber Co. (a) | | 146,315 |
| 46,511 | | Lear Corp. (a) | | 34,883 |
| 3,675 | | Modine Manufacturing Co. | | 9,187 |
| 1,114 | | Stoneridge, Inc. (a) | | 2,351 |
| 6,950 | | Tenneco Automotive, Inc. (a) | | 11,328 |
| 32,053 | | TRW Automotive Holdings | | |
| | | Corp. (a) | | 103,211 |
| 64,682 | | Visteon Corp. (a) | | 8,085 |
| | | | | 459,379 |
| | | Automobiles - 0.97% | | |
| 76,233 | | Ford Motor Co. (a)(b) | | 200,493 |
| 63,518 | | General Motors Corp. (b) | | 123,225 |
| 2,224 | | Thor Industries, Inc. | | 34,739 |
| | | | | 358,457 |
| | | Beverages - 1.00% | | |
| 421 | | Coca-Cola Bottling Co. | | 21,913 |
| 9,579 | | Coca-Cola Enterprises, Inc. | | 126,347 |
| 5,088 | | Dr Pepper Snapple Group, Inc. (a) | | 86,038 |
| 4,913 | | Pepsi Bottling Group, Inc. | | 108,774 |
| Number of | | | | |
| Shares | | | | Value |
| | | Beverages (Continued) | | |
| 1,603 | | PepsiAmericas, Inc. | $ | 27,652 |
| | | | | 370,724 |
| | | Building Products - 0.78% | | |
| 2,564 | | Armstrong World Industries, | | |
| | | Inc. (a) | | 28,230 |
| 19,432 | | Builders FirstSource, Inc. (a)(b) | | 39,253 |
| 1,107 | | Lennox International, Inc. | | 29,291 |
| 15,590 | | Masco Corp. | | 108,818 |
| 3,462 | | Owens Corning (a)(b) | | 31,296 |
| 6,969 | | USG Corp. (a) | | 53,034 |
| | | | | 289,922 |
| | | Capital Markets - 0.60% | | |
| 8,385 | | Allied Capital Corp. | | 13,332 |
| 1,776 | | Ameriprise Financial, Inc. | | 36,390 |
| 7,646 | | E*Trade Financial Corp. (a)(b) | | 9,787 |
| 1,535 | | Legg Mason, Inc. | | 24,407 |
| 1,531 | | MF Global Ltd. (a)(b) | | 6,476 |
| 5,712 | | Morgan Stanley | | 130,062 |
| | | | | 220,454 |
| | | Chemicals - 2.13% | | |
| 571 | | A. Schulman, Inc. | | 7,737 |
| 589 | | Arch Chemicals, Inc. | | 11,167 |
| 8,044 | | Ashland, Inc. | | 83,094 |
| 1,925 | | Cabot Corp. | | 20,232 |
| 20,162 | | Chemtura Corp. | | 958 |
| 31,745 | | The Dow Chemical Co. | | 267,610 |
| 2,712 | | Eastman Chemical Co. (b) | | 72,682 |
| 2,894 | | Ferro Corp. | | 4,138 |
| 1,316 | | GenTek, Inc. (a) | | 23,017 |
| 992 | | H.B. Fuller Co. (b) | | 12,896 |
| 21,828 | | Huntsman Corp. | | 68,322 |
| 654 | | Lubrizol Corp. | | 22,243 |
| 694 | | OM Group, Inc. (a)(b) | | 13,408 |
| 4,477 | | PolyOne Corp. (a) | | 10,342 |
| 2,802 | | PPG Industries, Inc. | | 103,394 |
| 1,093 | | The Scotts Miracle-Gro Co. | | 37,927 |
| 1,319 | | Valspar Corp. (b) | | 26,340 |
| | | | | 785,507 |
| | | Commercial Banks - 8.37% | | |
| 505 | | 1st Source Corp. (b) | | 9,115 |
| 2,568 | | Associated Banc-Corp (b) | | 39,650 |
| 493 | | BancorpSouth, Inc. | | 10,274 |
See notes to financial statements.
AssetMark Enhanced Fundamental Index™ Large Company Value Fund
SCHEDULE OF INVESTMENTS (Continued)
March 31, 2009
| Number of | | | | |
| Shares | | | | Value |
| | | COMMON STOCKS (Continued) | | |
| | | Commercial Banks (Continued) | | |
| 159,562 | | Bank of America Corp. | $ | 1,088,213 |
| 14,137 | | BB&T Corp. (b) | | 239,198 |
| 274 | | Cathay General Bancorp (b) | | 2,858 |
| 370 | | City National Corp. (b) | | 12,495 |
| 30,921 | | The Colonial BancGroup, Inc. (b) | | 27,829 |
| 2,798 | | Comerica, Inc. | | 51,231 |
| 19,006 | | Fifth Third Bancorp (b) | | 55,498 |
| 5,692 | | First Horizon National Corp. | | 61,131 |
| 326 | | First Midwest Bancorp, Inc. (b) | | 2,800 |
| 541 | | FirstMerit Corp. | | 9,846 |
| 5,015 | | Fulton Financial Corp. (b) | | 33,249 |
| 12,792 | | Huntington Bancshares, Inc. (b) | | 21,235 |
| 9,210 | | KeyCorp (b) | | 72,483 |
| 1,977 | | M&T Bank Corp. (b) | | 89,439 |
| 3,906 | | Marshall & Ilsley Corp. | | 21,991 |
| 853 | | PacWest Bancorp | | 12,223 |
| 326 | | Park National Corp. (b) | | 18,175 |
| 1,942 | | PNC Financial Services Group | | 56,881 |
| 22,572 | | Popular, Inc. (b) | | 49,207 |
| 31,192 | | Regions Financial Corp. | | 132,878 |
| 305 | | S&T Bancorp, Inc. (b) | | 6,469 |
| 9,555 | | The South Financial Group, Inc. | | 10,511 |
| 11,280 | | SunTrust Banks, Inc. | | 132,427 |
| 15,357 | | Synovus Financial Corp. (b) | | 49,910 |
| 4,413 | | TCF Financial Corp. (b) | | 51,897 |
| 549 | | Trustmark Corp. (b) | | 10,091 |
| 31,023 | | U.S. Bancorp | | 453,246 |
| 940 | | United Bankshares, Inc. (b) | | 16,206 |
| 12,841 | | Wells Fargo & Co. (b) | | 182,856 |
| 672 | | Whitney Holding Corp. | | 7,694 |
| 523 | | Wilmington Trust Corp. (b) | | 5,068 |
| 4,928 | | Zions Bancorporation (b) | | 48,442 |
| | | | | 3,092,716 |
| | | Commercial Services & Supplies - 1.57% |
| 1,100 | | ABM Industries, Inc. | | 18,040 |
| 3,423 | | ACCO Brands Corp. (a) | | 3,354 |
| 97,779 | | Avis Budget Group (a) | | 88,979 |
| 1,743 | | Career Education Corp. (a) | | 41,762 |
| 784 | | CDI Corp. | | 7,620 |
| 1,404 | | Deluxe Corp. | | 13,520 |
| 1,883 | | HNI Corp. | | 19,583 |
| 2,709 | | Kelly Services, Inc. | | 21,807 |
| Number of | | | | |
| Shares | | | | Value |
| | | Commercial Services & Supplies (Continued) |
| 3,347 | | Manpower, Inc. | $ | 105,531 |
| 6,072 | | PHH Corp. (a) | | 85,312 |
| 4,566 | | RR Donnelley & Sons Co. | | 33,469 |
| 2,350 | | RSC Holdings, Inc. (a)(b) | | 12,361 |
| 8,056 | | Steelcase, Inc. | | 40,361 |
| 2,163 | | TrueBlue, Inc. (a) | | 17,845 |
| 3,060 | | United Rentals, Inc. (a) | | 12,883 |
| 1,063 | | United Stationers, Inc. (a) | | 29,849 |
| 633 | | Viad Corp. | | 8,938 |
| 2,635 | | Volt Information Sciences, Inc. (a) | | 17,523 |
| | | | | 578,737 |
| | | Communications Equipment - 0.72% | | |
| 53,837 | | Motorola, Inc. (b) | | 227,731 |
| 8,168 | | Tellabs, Inc. (a) | | 37,409 |
| | | | | 265,140 |
| | | Computers & Peripherals - 0.98% | | |
| 1,460 | | Lexmark International, Inc. (a) | | 24,630 |
| 4,257 | | SanDisk Corp. (a) | | 53,851 |
| 21,695 | | Seagate Technology | | 130,387 |
| 20,944 | | Sun Microsystems, Inc. (a) | | 153,310 |
| | | | | 362,178 |
| | | Construction & Engineering - 0.29% | | |
| 1,944 | | EMCOR Group, Inc. (a) | | 33,378 |
| 1,091 | | Granite Construction, Inc. (b) | | 40,891 |
| 847 | | Perini Corp. (a) | | 10,418 |
| 524 | | URS Corp. (a) | | 21,175 |
| | | | | 105,862 |
| | | Consumer Finance - 0.35% | | |
| 7,344 | | Capital One Financial Corp. (b) | | 89,891 |
| 830 | | CompuCredit Corp. (a)(b) | | 2,033 |
| 4,145 | | Discover Financial Services | | 26,155 |
| 2,180 | | SLM Corp. (a)(b) | | 10,791 |
| | | | | 128,870 |
| | | Containers & Packaging - 0.48% | | |
| 1,685 | | Bemis Co. | | 35,335 |
| 9,782 | | Graphic Packaging Holding Co. (a) | | 8,510 |
| 3,003 | | Sealed Air Corp. | | 41,441 |
| 130,632 | | Smurfit-Stone Container Corp. (a) . | | 4,833 |
| 1,445 | | Sonoco Products Co. | | 30,316 |
| 10,861 | | Temple-Inland, Inc. | | 58,324 |
| | | | | 178,759 |
See notes to financial statements.
AssetMark Enhanced Fundamental Index™ Large Company Value Fund
SCHEDULE OF INVESTMENTS (Continued)
March 31, 2009
| Number of | | | | |
| Shares | | | | Value |
| | | COMMON STOCKS (Continued) | | |
| | | Distributors - 0.37% | | |
| 1,687 | | Core-Mark Holding Co., Inc. (a) | $ | 30,737 |
| 2,583 | | Genuine Parts Co. | | 77,128 |
| 1,557 | | WESCO International, Inc. (a) | | 28,213 |
| | | | | 136,078 |
| | | Diversified Consumer Services - 0.03% | |
| 729 | | Regis Corp. | | 10,534 |
| | | Diversified Financial Services - 5.16% | |
| 4,835 | | CIT Group, Inc. | | 13,780 |
| 80,415 | | Citigroup, Inc. (b) | | 203,450 |
| 61,292 | | JPMorgan Chase & Co. | | 1,629,141 |
| 7,236 | | Principal Financial Group, Inc. | | 59,191 |
| | | | | 1,905,562 |
| | | Diversified Telecommunication Services - 4.55% |
| 1,597 | | CenturyTel, Inc. (b) | | 44,908 |
| 2,315 | | Embarq Corp. | | 87,623 |
| 9,547 | | Frontier Communications Corp. | | 68,547 |
| 31,380 | | Qwest Communications | | |
| | | International (b) | | 107,319 |
| 53,482 | | Sprint Corp. (a) | | 190,931 |
| 39,131 | | Verizon Communications, Inc. | | 1,181,756 |
| | | | | 1,681,084 |
| | | Electric Utilities - 5.90% | | |
| 9,687 | | The AES Corp. (a) | | 56,282 |
| 2,741 | | Alliant Energy Corp. | | 67,675 |
| 4,465 | | Ameren Corp. | | 103,543 |
| 7,000 | | American Electric Power | | |
| | | Company, Inc. | | 176,820 |
| 12,075 | | CenterPoint Energy, Inc. | | 125,942 |
| 6,915 | | Consolidated Edison, Inc. | | 273,903 |
| 2,890 | | DTE Energy Co. | | 80,053 |
| 2,018 | | Great Plains Energy, Inc. | | 27,183 |
| 2,197 | | Hawaiian Electric Industries, Inc. | | 30,187 |
| 1,127 | | IDACORP, Inc. | | 26,327 |
| 2,814 | | Northeast Utilities | | 60,754 |
| 1,665 | | NSTAR (b) | | 53,080 |
| 2,826 | | NV Energy, Inc. | | 26,536 |
| 1,737 | | OGE Energy Corp. | | 41,375 |
| 5,525 | | Pepco Holdings, Inc. | | 68,952 |
| 4,896 | | PG&E Corp. (b) | | 187,125 |
| 2,490 | | Pinnacle West Capital Corp. | | 66,135 |
| 1,278 | | Portland General Electric Co. | | 22,480 |
| Number of | | | | |
| Shares | | | | Value |
| | | Electric Utilities (Continued) | | |
| 3,877 | | Progress Energy, Inc. | $ | 140,580 |
| 13,435 | | Reliant Energy, Inc. (a) | | 42,858 |
| 8,079 | | The Southern Co. (b) | | 247,379 |
| 4,022 | | TECO Energy, Inc. | | 44,845 |
| 1,704 | | Westar Energy, Inc. | | 29,871 |
| 1,586 | | Wisconsin Energy Corp. | | 65,296 |
| 6,072 | | Xcel Energy, Inc. (b) | | 113,121 |
| | | | | 2,178,302 |
| | | Electrical Equipment - 0.11% | | |
| 627 | | A.O. Smith Corp. | | 15,788 |
| 897 | | Hubbell, Inc. | | 24,183 |
| | | | | 39,971 |
| | | Electronic Equipment & Instruments - 1.70% |
| 838 | | Anixter International, Inc. (a) | | 26,548 |
| 4,322 | | Arrow Electronics, Inc. (a) | | 82,377 |
| 5,142 | | Avnet, Inc. (a) | | 90,036 |
| 3,057 | | AVX Corp. | | 27,758 |
| 1,162 | | Benchmark Electronics, Inc. (a) | | 13,014 |
| 9,028 | | Ingram Micro, Inc. (a) | | 114,114 |
| 5,136 | | Insight Enterprises, Inc. (a) | | 15,716 |
| 7,546 | | Jabil Circuit, Inc. | | 41,956 |
| 1,818 | | PC Connection, Inc. (a) | | 6,908 |
| 126,852 | | Sanmina-SCI Corporation (a) | | 38,690 |
| 1,437 | | SYNNEX Corp. (a) | | 28,266 |
| 4,489 | | Tech Data Corp. (a) | | 97,770 |
| 2,833 | | Technitrol, Inc. | | 4,845 |
| 11,269 | | Vishay Intertechnology, Inc. (a) | | 39,216 |
| | | | | 627,214 |
| | | Energy Equipment & Services - 0.14% | |
| 1,849 | | Exterran Holdings, Inc. (a)(b) | | 29,621 |
| 356 | | Seacor Holdings, Inc. (a) | | 20,758 |
| | | | | 50,379 |
| | | Food & Staples Retailing - 1.86% | | |
| 1,884 | | Great Atlantic & Pacific | | |
| | | Tea Co. (a)(b) | | 10,004 |
| 1,213 | | Ingles Markets, Inc. | | 18,110 |
| 10,169 | | The Kroger Co. | | 215,786 |
| 562 | | Nash Finch Co. | | 15,787 |
| 80,618 | | Rite Aid Corp. (a) | | 29,022 |
| 8,841 | | Safeway, Inc. | | 178,500 |
| 10,430 | | Supervalu, Inc. | | 148,940 |
| 564 | | Weis Markets, Inc. | | 17,507 |
See notes to financial statements.
AssetMark Enhanced Fundamental Index™ Large Company Value Fund
SCHEDULE OF INVESTMENTS (Continued)
March 31, 2009
| Number of | | | | |
| Shares | | | | Value |
| | | COMMON STOCKS (Continued) | | |
| | | Food & Staples Retailing (Continued) | |
| 5,757 | | Wendy’s Arby’s Group, Inc. | $ | 28,958 |
| 2,657 | | Winn Dixie Stores, Inc. (a) | | 25,401 |
| | | | | 688,015 |
| | | Food Products - 2.20% | | |
| 4,404 | | Archer Daniels Midland Co. (b) | | 122,343 |
| 1,080 | | Casey’s General Stores, Inc. | | 28,793 |
| 1,351 | | Chiquita Brands International, | | |
| | | Inc. (a) | | 8,957 |
| 6,452 | | ConAgra Foods, Inc. | | 108,845 |
| 3,149 | | Dean Foods Co. (a) | | 56,934 |
| 3,442 | | Del Monte Foods Co. | | 25,092 |
| 205 | | Fresh Del Monte Produce, Inc. (a) . | | 3,366 |
| 7,392 | | Kraft Foods, Inc. | | 164,768 |
| 21,594 | | Sara Lee Corp. | | 174,480 |
| 3,042 | | Smithfield Foods, Inc. (a)(b) | | 28,777 |
| 9,494 | | Tyson Foods, Inc. | | 89,149 |
| | | | | 811,504 |
| | | Gas Utilities - 0.95% | | |
| 1,226 | | AGL Resources, Inc. (b) | | 32,526 |
| 988 | | Atmos Energy Corp. | | 22,842 |
| 325 | | The Laclede Group Inc. | | 12,668 |
| 1,038 | | New Jersey Resources Corp. | | 35,271 |
| 1,425 | | Nicor, Inc. | | 47,353 |
| 6,610 | | NiSource, Inc. | | 64,778 |
| 335 | | Northwest Natural Gas Co. | | 14,546 |
| 883 | | Piedmont Natural Gas Co. (b) | | 22,861 |
| 1,728 | | Southwest Gas Corp. | | 36,409 |
| 1,564 | | UGI Corp. | | 36,926 |
| 757 | | WGL Holdings, Inc. | | 24,830 |
| | | | | 351,010 |
| | | Health Care Equipment & Supplies - 0.04% |
| 1,594 | | Hill-Rom Holdings, Inc. | | 15,765 |
| | | Health Care Providers & Services - 4.26% |
| 891 | | AMERIGROUP Corp. (a) | | 24,538 |
| 4,806 | | AmerisourceBergen Corp. | | 156,964 |
| 5,518 | | Cardinal Health, Inc. | | 173,707 |
| 999 | | Centene Corp. (a) | | 18,002 |
| 6,510 | | CIGNA Corp. | | 114,511 |
| 5,596 | | Coventry Health Care, Inc. (a) | | 72,412 |
| 17,198 | | Health Management Associates, | | |
| | | Inc. (a) | | 44,371 |
| Number of | | | | |
| Shares | | | | Value |
| | | Health Care Providers & Services (Continued) |
| 4,463 | | Health Net, Inc. (a) | $ | 64,624 |
| 3,093 | | Humana, Inc. (a) | | 80,665 |
| 2,521 | | Kindred Healthcare, Inc. (a) | | 37,689 |
| 1,044 | | LifePoint Hospitals, Inc. (a) | | 21,778 |
| 1,232 | | Magellan Health Services, Inc. (a) | | 44,894 |
| 4,382 | | McKesson Corp. | | 153,545 |
| 1,066 | | Molina Healthcare, Inc. (a)(b) | | 20,275 |
| 1,354 | | Omnicare, Inc. | | 33,160 |
| 36,430 | | Tenet Healthcare Corp. (a)(b) | | 42,259 |
| 1,082 | | Triple-S Management Corp. (a) | | 13,330 |
| 7,878 | | UnitedHealth Group, Inc. | | 164,887 |
| 1,853 | | WellCare Health Plans, Inc. (a) | | 20,846 |
| 7,184 | | Wellpoint, Inc. (a) | | 272,777 |
| | | | | 1,575,234 |
| | | Hotels, Restaurants & Leisure - 0.51% | |
| 3,740 | | Boyd Gaming Corp. | | 13,950 |
| 2,401 | | Brinker International, Inc. | | 36,255 |
| 764 | | Cracker Barrel Old Country | | |
| | | Store, Inc. | | 21,881 |
| 3,248 | | Domino’s Pizza, Inc. (a) | | 21,274 |
| 701 | | Jack in the Box, Inc. (a) | | 16,326 |
| 4,433 | | MGM Mirage (a)(b) | | 10,329 |
| 5,560 | | Royal Caribbean Cruises Ltd. (b) | | 44,536 |
| 5,404 | | Wyndham Worldwide Corp. (b) | | 22,697 |
| | | | | 187,248 |
| | | Household Durables - 2.26% | | |
| 3,140 | | American Greetings Corp. | | 15,888 |
| 16,931 | | Beazer Homes USA, Inc. (a) | | 17,100 |
| 1,793 | | The Black & Decker Corp. (b) | | 56,587 |
| 2,996 | | Centex Corp. | | 22,470 |
| 9,716 | | D.R. Horton, Inc. | | 94,245 |
| 1,070 | | Ethan Allen Interiors, Inc. | | 12,048 |
| 2,419 | | Fortune Brands, Inc. | | 59,387 |
| 10,959 | | Hovnanian Enterprises, Inc. (a)(b) | | 17,096 |
| 1,088 | | KB Home | | 14,340 |
| 1,743 | | Kimball International, Inc. | | 11,434 |
| 3,756 | | Leggett & Platt, Inc. | | 48,790 |
| 3,700 | | Lennar Corp. | | 27,787 |
| 448 | | MDC Holdings, Inc. | | 13,951 |
| 1,730 | | Mohawk Industries, Inc. (a)(b) | | 51,675 |
| 6,637 | | Newell Rubbermaid, Inc. | | 42,344 |
| 159 | | NVR, Inc. (a) | | 68,012 |
| 3,849 | | Pulte Homes, Inc. | | 42,070 |
See notes to financial statements.
AssetMark Enhanced Fundamental Index™ Large Company Value Fund
SCHEDULE OF INVESTMENTS (Continued)
March 31, 2009
| Number of | | | | |
| Shares | | | | Value |
| | | COMMON STOCKS (Continued) | | |
| | | Household Durables (Continued) | | |
| 5,711 | | Standard-Pacific Corp. (a) | $ | 5,026 |
| 1,154 | | The Stanley Works (b) | | 33,605 |
| 3,895 | | Toll Brothers, Inc. (a)(b) | | 70,733 |
| 3,763 | | Whirlpool Corp. | | 111,347 |
| | | | | 835,935 |
| | | Industrial Conglomerates - 0.88% | | |
| 152 | | Alleghany Corp. (a) | | 41,161 |
| 705 | | Carlisle Companies, Inc. | | 13,839 |
| 13,780 | | Tyco International Ltd. | | 269,537 |
| | | | | 324,537 |
| | | Insurance - 11.10% | | |
| 1,222 | | Allied World Assurance | | |
| | | Holdings, Ltd. | | 46,473 |
| 15,910 | | The Allstate Corp. | | 304,677 |
| 2,745 | | American Financial Group, Inc. | | 44,057 |
| 163 | | American National Insurance | | |
| | | Company | | 8,543 |
| 1,063 | | Arch Capital Group Ltd. (a) | | 57,253 |
| 564 | | Argo Group International Holdings, | | |
| | | Ltd. (a) | | 16,993 |
| 1,649 | | Aspen Insurance Holdings Ltd. | | 37,037 |
| 4,849 | | Axis Capital Holdings Ltd. | | 109,297 |
| 6,045 | | Chubb Corp. | | 255,824 |
| 4,721 | | Cincinnati Financial Corp. | | 107,969 |
| 15,837 | | CNA Financial Corp. (b) | | 145,067 |
| 864 | | CNA Surety Corp. (a) | | 15,932 |
| 9,604 | | Conseco, Inc. (a) | | 8,836 |
| 1,431 | | Delphi Financial Group | | 19,261 |
| 1,405 | | Endurance Specialty Holdings | | |
| | | Ltd. (b) | | 35,041 |
| 1,192 | | Everest Re Group Ltd. | | 84,394 |
| 1,336 | | FBL Financial Group, Inc. | | 5,544 |
| 6,925 | | Fidelity National Financial, Inc. | | 135,107 |
| 1,934 | | First American Corp. | | 51,270 |
| 567 | | The Hanover Insurance Group, Inc. | | 16,341 |
| 917 | | Harleysville Group, Inc. | | 29,170 |
| 21,152 | | Hartford Financial Services | | |
| | | Group, Inc. | | 166,043 |
| 1,707 | | HCC Insurance Holdings, Inc. | | 42,999 |
| 328 | | Infinity Property & Casualty Corp. | | 11,129 |
| 112 | | Kansas City Life Insurance Co. | | 4,015 |
| 9,928 | | Lincoln National Corp. | | 66,418 |
| 181 | | Markel Corp. (a) | | 51,382 |
| Number of | | | | |
| Shares | | | | Value |
| | | Insurance (Continued) | | |
| 1,104 | | Max Capital Group Ltd. | $ | 19,033 |
| 2,225 | | Mercury General Corp. | | 66,083 |
| 11,317 | | MetLife, Inc. (b) | | 257,688 |
| 2,679 | | Montpelier Re Holdings Ltd. | | 34,720 |
| 100 | | National Western Life Insurance | | |
| | | Co. (b) | | 11,300 |
| 825 | | Odyssey Re Holdings Corp. | | 31,292 |
| 8,087 | | Old Republic International Corp. | | 87,501 |
| 4,112 | | OneBeacon Insurance Group, Ltd. | | 39,722 |
| 1,071 | | PartnerRe Ltd. (b) | | 66,477 |
| 11,205 | | The Phoenix Companies, Inc. | | 13,110 |
| 854 | | Platinum Underwriters | | |
| | | Holdings Ltd. | | 24,220 |
| 489 | | ProAssurance Corp. (a) | | 22,797 |
| 9,679 | | Progressive Corp. (a) | | 130,086 |
| 696 | | Protective Life Corp. | | 3,654 |
| 16,065 | | Prudential Financial, Inc. | | 305,556 |
| 1,636 | | Reinsurance Group of America | | 52,990 |
| 953 | | RenaissanceRe Holdings Ltd. | | 47,116 |
| 626 | | Safety Insurance Group, Inc. | | 19,456 |
| 1,135 | | Selective Insurance Group | | 13,802 |
| 755 | | State Auto Financial Corp. | | 13,288 |
| 1,431 | | Transatlantic Holdings, Inc. | | 51,044 |
| 11,155 | | Travelers Companies, Inc. | | 453,339 |
| 561 | | United Fire & Casualty Co. | | 12,320 |
| 2,603 | | Unitrin, Inc. (b) . | | 36,390 |
| 2,334 | | Universal American Financial | | |
| | | Corp. (a) | | 19,769 |
| 8,422 | | UnumProvident Corp. (b) | | 105,275 |
| 288 | | White Mountains Insurance | | |
| | | Group Ltd. | | 49,510 |
| 2,398 | | WR Berkley Corp. | | 54,075 |
| 27,157 | | XL Capital Ltd. | | 148,277 |
| 1,465 | | Zenith National Insurance Corp. | | 35,321 |
| | | | | 4,101,283 |
| | | Internet & Catalog Retail - 0.14% | | |
| 3,782 | | Expedia, Inc. (a) | | 34,340 |
| 1,341 | | Systemax, Inc. (b) | | 17,326 |
| | | | | 51,666 |
| | | Internet Software & Services - 0.23% | |
| 1,907 | | EarthLink, Inc. (a) | | 12,529 |
| 4,750 | | IAC/InterActiveCorp (a) | | 72,342 |
| | | | | 84,871 |
See notes to financial statements.
AssetMark Enhanced Fundamental Index™ Large Company Value Fund
SCHEDULE OF INVESTMENTS (Continued)
March 31, 2009
| Number of | | | | |
| Shares | | | | Value |
| | | COMMON STOCKS (Continued) | | |
| | | IT Services - 0.53% | | |
| 2,634 | | Computer Sciences Corp. (a) | $ | 97,036 |
| 4,695 | | Convergys Corp. (a) | | 37,936 |
| 2,596 | | Fidelity National Information | | |
| | | Services, Inc. | | 47,247 |
| 23,168 | | Unisys Corp. (a) | | 12,279 |
| | | | | 194,498 |
| | | Leisure Equipment & Products - 0.18% | |
| 9,622 | | Brunswick Corp. | | 33,196 |
| 8,707 | | Eastman Kodak Co. | | 33,087 |
| | | | | 66,283 |
| | | Life Sciences Tools & Services - 0.02% | |
| 3,830 | | Cambrex Corp. (a) | | 8,732 |
| | | Machinery - 0.32% | | |
| 4,771 | | Ingersoll-Rand Co. | | 65,840 |
| 207 | | Mueller Industries, Inc. | | 4,490 |
| 128 | | NACCO Industries, Inc. | | 3,479 |
| 2,318 | | Timken Co. | | 32,359 |
| 608 | | Watts Water Technologies, Inc. | | 11,892 |
| | | | | 118,060 |
| | | Media - 4.92% | | |
| 12,005 | | Belo Corp. | | 7,323 |
| 37,601 | | CBS Corp. (b) | | 144,388 |
| 19,814 | | Comcast Corp. | | 270,263 |
| 2,434 | | Cox Radio, Inc. - Class A (a) | | 9,979 |
| 16,458 | | The E.W. Scripps Co. | | 22,218 |
| 15,073 | | Gannett Co., Inc. (b) | | 33,161 |
| 3,322 | | Hearst-Argyle Television, Inc. | | 13,820 |
| 12,228 | | Interpublic Group of Companies, | | |
| | | Inc. (a) | | 50,379 |
| 3,232 | | Liberty Global, Inc. (a) | | 47,058 |
| 9,342 | | Liberty Media Corporation - | | |
| | | Capital (a) | | 65,207 |
| 33,748 | | Liberty Media Corporation - | | |
| | | Interactive (a) | | 97,869 |
| 18,090 | | McClatchy Co. (b) | | 8,864 |
| 1,361 | | Meredith Corp. (b) | | 22,647 |
| 8,660 | | New York Times Co. (b) | | 39,143 |
| 5,762 | | Regal Entertainment Group | | 77,268 |
| 1,918 | | Scholastic Corp. | | 28,904 |
| 11,254 | | Time Warner Cable, Inc. (b) | | 279,092 |
| 27,416 | | Time Warner, Inc. (b) | | 529,129 |
| 246 | | Value Line, Inc. (b) | | 6,726 |
| Number of | | | | |
| Shares | | | | Value |
| | | Media (Continued) | | |
| 8,401 | | Virgin Media, Inc. | $ | 40,325 |
| 10,656 | | Warner Music Group Corp. | | 25,042 |
| | | | | 1,818,805 |
| | | Metals & Mining - 0.07% | | |
| 1,767 | | USEC, Inc. (a) | | 8,482 |
| 1,798 | | Worthington Industries | | 15,660 |
| | | | | 24,142 |
| | | Multiline Retail - 1.82% | | |
| 7,608 | | Dillard’s, Inc. (b) | | 43,365 |
| 6,504 | | J.C. Penney Co., Inc. | | 130,535 |
| 19,332 | | Macy’s, Inc. | | 172,055 |
| 7,261 | | Retail Ventures, Inc. (a) | | 11,037 |
| 6,303 | | Saks, Inc. (a)(b) | | 11,787 |
| 6,683 | | Sears Holdings Corp. (a) | | 305,480 |
| | | | | 674,259 |
| | | Multi-Utilities - 1.71% | | |
| 738 | | Avista Corp. | | 10,170 |
| 3,467 | | CMS Energy Corp. | | 41,049 |
| 29,175 | | Duke Energy Corp. | | 417,786 |
| 995 | | Integrys Energy Group, Inc. | | 25,910 |
| 2,177 | | Oneok, Inc. | | 49,265 |
| 2,218 | | SCANA Corp. . . . . . . . . . . . . . . . . . | | 68,514 |
| 930 | | Vectren Corp. . . . . . . . . . . . . . . . . . . | | 19,614 |
| | | | | 632,308 |
| | | Oil & Gas - 5.59% | | |
| 1,852 | | Alon USA Energy, Inc. . . . . . . . . . . | | 25,372 |
| 32,293 | | ConocoPhillips . . . . . . . . . . . . . . . . | | 1,264,594 |
| 4,255 | | CVR Energy, Inc. (a) . . . . . . . . . . . . | | 23,573 |
| 2,502 | | Frontier Oil Corp. . . . . . . . . . . . . . . | | 32,000 |
| 1,188 | | Holly Corp. | | 25,186 |
| 3,769 | | Marathon Oil Corp. . . . . . . . . . . . . . | | 99,087 |
| 473 | | Overseas Shipholding Group, Inc. . . | | 10,723 |
| 2,163 | | Stone Energy Corp. (a) . . . . . . . . . . | | 7,203 |
| 4,349 | | Sunoco, Inc. | | 115,161 |
| 4,438 | | Tesoro Petroleum Corp. . . . . . . . . . . | | 59,780 |
| 20,089 | | Valero Energy Corp. (b) . . . . . . . . . | | 359,593 |
| 1,314 | | World Fuel Services Corp. . . . . . . . | | 41,562 |
| | | | | 2,063,834 |
| | | Paper & Forest Products - 1.25% | | |
| 18,215 | | Domtar Corp. (a) . . . . . . . . . . . . . . . | | 17,304 |
| 1,084 | | Glatfelter . . | | 6,764 |
| 22,897 | | International Paper Co. . . . . . . . . . . | | 161,195 |
See notes to financial statements.
AssetMark Enhanced Fundamental Index™ Large Company Value Fund
SCHEDULE OF INVESTMENTS (Continued)
March 31, 2009
| Number of | | | | |
| Shares | | | | Value |
| | | COMMON STOCKS (Continued) | | |
| | | Paper & Forest Products (Continued) | |
| 7,806 | | Louisiana-Pacific Corp. . . . . . . . . . . | $ | 17,408 |
| 7,273 | | MeadWestvaco Corp. . . . . . . . . . . . . | | 87,203 |
| 6,273 | | Weyerhaeuser Co. . . . . . . . . . . . . . . | | 172,947 |
| | | | | 462,821 |
| | | Personal Products - 0.24% | | |
| 3,921 | | Alberto-Culver Co. . . . . . . . . . . . . . | | 88,654 |
| | | Pharmaceuticals - 3.45% | | |
| 2,040 | | King Pharmaceuticals, Inc. (a) . . . . | | 14,423 |
| 92,641 | | Pfizer, Inc. . | | 1,261,770 |
| | | | | 1,276,193 |
| | | Road & Rail - 0.64% | | |
| 1,069 | | AMERCO (a) . . . . . . . . . . . . . . . . . | | 35,843 |
| 760 | | Arkansas Best Corp. . . . . . . . . . . . . | | 14,455 |
| 1,033 | | Con-Way, Inc. . . . . . . . . . . . . . . . . . | | 18,522 |
| 22,120 | | Hertz Global Holdings, Inc. (a) . . . . | | 86,932 |
| 2,717 | | Werner Enterprises, Inc. (b) . . . . . . . | | 41,081 |
| 9,030 | | YRC Worldwide, Inc. (a)(b) . . . . . . | | 40,545 |
| | | | | 237,378 |
| | | Semiconductor & Semiconductor | | |
| | | Equipment - 0.48% | | |
| 21,206 | | Advanced Micro Devices, | | |
| | | Inc. (a)(b) . | | 64,678 |
| 8,603 | | Amkor Technology, Inc. (a)(b) . . . . | | 23,056 |
| 4,536 | | Atmel Corp. (a) . . . . . . . . . . . . . . . . | | 16,466 |
| 10,843 | | Micron Technology, Inc. (a) . . . . . . | | 44,023 |
| 1,797 | | Novellus Systems, Inc. (a)(b) . . . . . | | 29,884 |
| | | | | 178,107 |
| | | Software - 0.08% | | |
| 6,932 | | Cadence Design Systems, Inc. (a) . . | | 29,114 |
| | | Specialty Retail - 4.72% | | |
| 5,409 | | AnnTaylor Stores Corp. (a) . . . . . . . | | 28,127 |
| 10,663 | | AutoNation, Inc. (a) . . . . . . . . . . . . . | | 148,003 |
| 2,730 | | Barnes & Noble, Inc. (b) . . . . . . . . . | | 58,367 |
| 21,129 | | Blockbuster, Inc. (a)(b) . . . . . . . . . . | | 15,213 |
| 31,351 | | Borders Group, Inc. (a) . . . . . . . . . . | | 19,751 |
| 1,973 | | Brown Shoe Co., Inc. . . . . . . . . . . . | | 7,399 |
| 3,171 | | CarMax, Inc. (a)(b) . . . . . . . . . . . . . | | 39,447 |
| 701 | | The Cato Corp. . . . . . . . . . . . . . . . . | | 12,814 |
| 7,106 | | Charming Shoppes, Inc. (a) . . . . . . . | | 9,948 |
| 1,075 | | Dress Barn, Inc. (a)(b) . . . . . . . . . . . | | 13,212 |
| 948 | | DSW, Inc. (a)(b) . . . . . . . . . . . . . . . | | 8,807 |
| Number of | | | | |
| Shares | | | | Value |
| | | Specialty Retail (Continued) | | |
| 1,755 | | The Finish Line, Inc. . . . . . . . . . . . . | $ | 11,618 |
| 4,377 | | Foot Locker, Inc. (b) . . . . . . . . . . . . | | 45,871 |
| 27,021 | | Home Depot, Inc. (b) . . . . . . . . . . . . | | 636,615 |
| 1,486 | | Jo-Ann Stores, Inc. (a) . . . . . . . . . . . | | 24,281 |
| 16,375 | | Limited Brands, Inc. (b) . . . . . . . . . | | 142,463 |
| 7,452 | | Lowe’s Companies, Inc. . . . . . . . . . | | 135,999 |
| 37,220 | | Office Depot, Inc. (a) . . . . . . . . . . . . | | 48,758 |
| 12,984 | | OfficeMax, Inc. . . . . . . . . . . . . . . . . | | 40,510 |
| 9,722 | | Pacific Sunwear Of California, | | |
| | | Inc. (a)(b) . | | 16,139 |
| 4,028 | | Penske Automotive Group, Inc. (b) . | | 37,581 |
| 1,195 | | PEP Boys . . | | 5,270 |
| 4,597 | | RadioShack Corp. . . . . . . . . . . . . . . | | 39,396 |
| 2,079 | | Rent-A-Center, Inc. (a) . . . . . . . . . . | | 40,270 |
| 1,724 | | Rush Enterprises, Inc. - | | |
| | | Class A (a) | | 15,378 |
| 5,079 | | Sonic Automotive, Inc. . . . . . . . . . . | | 8,126 |
| 18,341 | | Stein Mart, Inc. (a) . . . . . . . . . . . . . | | 53,006 |
| 448 | | Tractor Supply Co. (a) . . . . . . . . . . . | | 16,155 |
| 2,169 | | Tween Brands, Inc. (a) . . . . . . . . . . . | | 4,642 |
| 4,880 | | Williams-Sonoma, Inc. . . . . . . . . . . | | 49,190 |
| 5,634 | | Zale Corp. (a)(b) . . . . . . . . . . . . . . . | | 10,986 |
| | | | | 1,743,342 |
| | | Textiles, Apparel & Luxury Goods - 0.34% |
| 842 | | Carter’s, Inc. (a) . . . . . . . . . . . . . . . . | | 15,838 |
| 3,501 | | Hanesbrands, Inc. (a) . . . . . . . . . . . . | | 33,505 |
| 8,268 | | Jones Apparel Group, Inc. . . . . . . . . | | 34,891 |
| 6,878 | | Liz Claiborne, Inc. . . . . . . . . . . . . . . | | 16,989 |
| 2,192 | | Timberland Co. (a) . . . . . . . . . . . . . | | 26,172 |
| | | | | 127,395 |
| | | Thrifts & Mortgage Finance - 0.25% | | |
| 1,337 | | Astoria Financial Corp. . . . . . . . . . . | | 12,287 |
| 3,243 | | Corus Bankshares, Inc. (b) . . . . . . . | | 876 |
| 346 | | First Niagara Financial Group, Inc. . | | 3,771 |
| 4,470 | | New York Community Bancorp, | | |
| | | Inc. (b) . . . | | 49,930 |
| 677 | | Provident Financial Services, Inc. . . | | 7,318 |
| 774 | | Washington Federal, Inc. . . . . . . . . . | | 10,287 |
| 1,945 | | Webster Financial Corp. . . . . . . . . . | | 8,266 |
| | | | | 92,735 |
| | | Tobacco - 2.49% | | |
| 46,636 | | Altria Group, Inc. . . . . . . . . . . . . . . | | 747,109 |
| 4,168 | | Reynolds American, Inc. . . . . . . . . . | | 149,381 |
See notes to financial statements.
AssetMark Enhanced Fundamental Index™ Large Company Value Fund
SCHEDULE OF INVESTMENTS (Continued)
March 31, 2009
| Number of | | | | |
| Shares | | | | Value |
| | | COMMON STOCKS (Continued) | | |
| | | Tobacco (Continued) | | |
| 739 | | Universal Corp. . . . . . . . . . . . . . . . . | $ | 22,111 |
| | | | | 918,601 |
| | | Water Utilities - 0.17% | | |
| 3,308 | | American Water Works Co., Inc. . . . | | 63,646 |
| | | Wireless Telecommunication Services - 0.31% |
| 2,228 | | Telephone & Data Systems, Inc. . . . | | 59,064 |
| 1,135 | | United States Cellular Corp. (a) . . . | | 37,841 |
| 2,027 | | USA Mobility, Inc. . . . . . . . . . . . . . | | 18,669 |
| | | | | 115,574 |
| | | Total Common Stocks | | |
| | | (Cost $52,359,189) . . . . . . . . . . . . | | 34,369,151 |
| | | REAL ESTATE INVESTMENT | | |
| | | TRUSTS - 1.08% | | |
| | | Real Estate Investment Trusts - 1.08% | |
| 1,499 | | Apartment Investment & | | |
| | | Management Co. . . . . . . . . . . . . . . | | 8,214 |
| 2,415 | | Colonial Properties Trust . . . . . . . . . | | 9,201 |
| 2,341 | | Duke Realty Corp. . . . . . . . . . . . . . . | | 12,875 |
| 37,298 | | DuPont Fabros Technology, Inc. . . . | | 256,610 |
| 17,608 | | Friedman Billings Ramsey Group, | | |
| | | Inc. (a)(b) . | | 3,522 |
| 13,137 | | Host Hotels & Resorts, Inc. (b) . . . . | | 51,497 |
| 4,295 | | HRPT Properties Trust . . . . . . . . . . | | 13,701 |
| 4,032 | | iStar Financial, Inc. . . . . . . . . . . . . . | | 11,330 |
| 1,221 | | Liberty Property Trust (b) . . . . . . . . | | 23,126 |
| 186 | | National Health Investors, Inc. . . . . | | 4,998 |
| 297 | | Redwood Trust, Inc. . . . . . . . . . . . . | | 4,559 |
| | | | | 399,633 |
| | | Total Real Estate Investment Trusts | | |
| | | (Cost $398,536) . . . . . . . . . . . . . . . | | 399,633 |
| Number of | | | | |
| Shares | | | | Value |
| | | SHORT TERM INVESTMENTS - 4.91% |
| | | Money Market Fund - 4.91% | | |
| 1,813,600 | | Federated Prime Obligations Fund | $ | 1,813,600 |
| | | Total Short Term Investments | | |
| | | (Cost $1,813,600) . . . . . . . . . . . . . | | 1,813,600 |
| | | INVESTMENTS PURCHASED | | |
| | | AS SECURITIES LENDING | | |
| | | COLLATERAL - 16.42% | | |
| | | Money Market Fund - 16.42% | | |
| 6,067,022 | | Mount Vernon Prime Portfolio . . . . | | 6,067,022 |
| | | Total Money Market Funds | | |
| | | (Cost $6,067,022) . . . . . . . . . . . . . | | 6,067,022 |
| | | Total Investments Purchased as | | |
| | | Securities Lending Collateral | | |
| | | (Cost $6,067,022) . . . . . . . . . . . . . | | 6,067,022 |
| | | Total Investments | | |
| | | (Cost $60,638,347) - 115.43% . . . | | 42,649,406 |
| | | Liabilities in Excess of | | |
| | | Other Assets - (15.43)% . . . . . . . | | (5,701,092) |
| | | TOTAL NET | | |
| | | ASSETS - 100.00% . . . . . . . . . . . | $ | 36,948,314 |
| | | | | |
| Percentages are stated as a percent of net assets. | | |
| (a) Non-income producing. | | |
| (b) All or a portion of this security is on loan. | | |
See notes to financial statements.
AssetMark Enhanced Fundamental Index™ Large Company Value Fund
SCHEDULE OF OPEN FUTURES CONTRACTS
March 31, 2009
| | Number of | | | | | | |
| | Contracts | | Notional | | Settlement | | Unrealized |
| Description | | Purchased | | Value | | Month | | Appreciation |
| S&P 500 Index Futures | 4 | $ | 784,300 | | Jun-09 | $ | 50,284 |
| S&P 500 Index Mini Futures | 37 | | 1,450,955 | | Jun-09 | | 50,118 |
| | | | | | | | $100,402 |
| | | | | | | | |
See notes to financial statements.
AssetMark Enhanced Fundamental Index™ Small Company Growth Fund
SCHEDULE OF INVESTMENTS
March 31, 2009
| Number of | | | | |
| Shares | | | | Value |
| | | COMMON STOCKS - 92.91% | | |
| | | Aerospace & Defense - 1.70% | | |
| 332 | | AeroVironment, Inc. (a)(b) . . . . . . . | $ | 6,939 |
| 108 | | American Science & | | |
| | | Engineering, Inc. . . . . . . . . . . . . . . | | 6,026 |
| 607 | | Argon ST, Inc. (a) . . . . . . . . . . . . . . | | 11,515 |
| 189 | | Axsys Technologies, Inc. (a) . . . . . . | | 7,946 |
| 888 | | Ceradyne, Inc. (a) . . . . . . . . . . . . . . | | 16,099 |
| 672 | | Cubic Corp. | | 17,022 |
| 745 | | Curtiss-Wright Corp. . . . . . . . . . . . . | | 20,897 |
| 1,180 | | Esterline Technologies Corp. (a) . . . | | 23,824 |
| 220 | | Heico Corp. | | 5,346 |
| 619 | | Ladish, Inc. (a) . . . . . . . . . . . . . . . . . | | 4,494 |
| 1,240 | | Moog, Inc. (a) . . . . . . . . . . . . . . . . . | | 28,359 |
| 2,030 | | Orbital Sciences Corp. (a) . . . . . . . . | | 24,137 |
| 318 | | Stanley, Inc. (a) . . . . . . . . . . . . . . . . | | 8,074 |
| | | | | 180,678 |
| | | Air Freight & Logistics - 0.48% | | |
| 1,170 | | Dynamex, Inc. (a) . . . . . . . . . . . . . . | | 15,304 |
| 346 | | Forward Air Corp. (b) . . . . . . . . . . . | | 5,615 |
| 1,777 | | Hub Group, Inc. (a) . . . . . . . . . . . . . | | 30,209 |
| | | | | 51,128 |
| | | Airlines - 0.40% | | |
| 361 | | Allegiant Travel Co. (a)(b) . . . . . . . | | 16,411 |
| 658 | | Copa Holdings, S.A. . . . . . . . . . . . . | | 18,865 |
| 1,900 | | Hawaiian Holdings, Inc. (a) . . . . . . . | | 7,087 |
| | | | | 42,363 |
| | | Auto Components - 0.40% | | |
| 950 | | LKQ Corp. (a) . . . . . . . . . . . . . . . . . | | 13,557 |
| 1,762 | | Midas, Inc. (a) . . . . . . . . . . . . . . . . . | | 13,955 |
| 5,866 | | Sauer-Danfoss, Inc. . . . . . . . . . . . . . | | 14,313 |
| | | | | 41,825 |
| | | Beverages - 0.24% | | |
| 1,332 | | Central European Distribution | | |
| | | Corp. (a)(b) . . . . . . . . . . . . . . . . . . | | 14,332 |
| 316 | | Hansen Natural Corp. (a) . . . . . . . . . | | 11,376 |
| | | | | 25,708 |
| | | Biotechnology - 0.95% | | |
| 4,678 | | Affymetrix, Inc. (a) . . . . . . . . . . . . . | | 15,297 |
| 2,266 | | Albany Molecular Research, | | |
| | | Inc. (a) . . . | | 21,368 |
| 1,431 | | Alkermes, Inc. (a) . . . . . . . . . . . . . . | | 17,358 |
| 315 | | Emergent Biosolutions, Inc. (a) . . . . | | 4,256 |
| Number of | | | | |
| Shares | | | | Value |
| | | Biotechnology (Continued) | | |
| 493 | | Kendle International, Inc. (a) . . . . . . | $ | 10,333 |
| 544 | | Martek Biosciences Corp. (b) . . . . . | | 9,928 |
| 208 | | Myriad Genetics, Inc. (a) . . . . . . . . . | | 9,458 |
| 1,257 | | PDL BioPharma Inc. . . . . . . . . . . . . | | 8,900 |
| 640 | | ViroPharma, Inc. (a) . . . . . . . . . . . . | | 3,360 |
| | | | | 100,258 |
| | | Building Products - 0.37% | | |
| 581 | | Aaon, Inc. . | | 10,528 |
| 537 | | Ameron International Corp. . . . . . . | | 28,278 |
| | | | | 38,806 |
| | | Capital Markets - 1.69% | | |
| 2,448 | | BGC Partners, Inc. (b) . . . . . . . . . . . | | 5,410 |
| 1,142 | | Cohen & Steers, Inc. (b) . . . . . . . . . | | 12,745 |
| 3,897 | | FCStone Group, Inc. (a) . . . . . . . . . | | 8,885 |
| 516 | | Gamco Investors, Inc. . . . . . . . . . . . | | 16,847 |
| 4,565 | | GFI Group Inc. . . . . . . . . . . . . . . . . | | 14,654 |
| 176 | | Greenhill & Co., Inc. (b) . . . . . . . . . | | 12,998 |
| 1,154 | | Investment Technology Group, | | |
| | | Inc. (a) . . . | | 29,450 |
| 871 | | KBW, Inc. (a) . . . . . . . . . . . . . . . . . | | 17,725 |
| 1,229 | | Lazard Ltd. (b) . . . . . . . . . . . . . . . . . | | 36,132 |
| 1,137 | | optionsXpress Holdings, Inc. . . . . . | | 12,928 |
| 252 | | Stifel Financial Corp. (a) . . . . . . . . . | | 10,914 |
| 10 | | Teton Advisors, Inc. (a) . . . . . . . . . . | | 0 |
| | | | | 178,688 |
| | | Chemicals - 1.79% | | |
| 1,426 | | Innophos Holdings, Inc. . . . . . . . . . | | 16,085 |
| 2,367 | | Koppers Holdings, Inc. . . . . . . . . . . | | 34,369 |
| 1,485 | | LSB Industries, Inc. (a) . . . . . . . . . . | | 14,687 |
| 1,190 | | Minerals Technologies, Inc. . . . . . . | | 38,139 |
| 1,892 | | NewMarket Corp. . . . . . . . . . . . . . . | | 83,816 |
| 1,466 | | Solutia, Inc. (a) . . . . . . . . . . . . . . . . | | 2,741 |
| | | | | 189,837 |
| | | Commercial Banks - 4.67% | | |
| 588 | | BancFirst Corp. (b) . . . . . . . . . . . . . | | 21,403 |
| 558 | | Bank of the Ozarks, Inc. . . . . . . . . . | | 12,879 |
| 1,072 | | BankFinancial Corp. . . . . . . . . . . . . | | 10,688 |
| 918 | | Beneficial Mutual Bancorp, | | |
| | | Inc. (a)(b) . | | 9,042 |
| 530 | | City Holding Co. . . . . . . . . . . . . . . . | | 14,464 |
| 2,037 | | CVB Financial Corp. (b) . . . . . . . . . | | 13,505 |
| 366 | | First Financial Bankshares, Inc. (b) . | | 17,630 |
See notes to financial statements.
AssetMark Enhanced Fundamental Index™ Small Company Growth Fund
SCHEDULE OF INVESTMENTS (Continued)
March 31, 2009
| Number of | | | | |
| Shares | | | | Value |
| | | COMMON STOCKS (Continued) | | |
| | | Commercial Banks (Continued) | | |
| 453 | | First Financial Corp. . . . . . . . . . . . . | $ | 16,716 |
| 1,449 | | Glacier Bancorp, Inc. . . . . . . . . . . . . | | 22,764 |
| 1,052 | | Hampton Roads Bankshares, | | |
| | | Inc. (b) . . . | | 8,195 |
| 617 | | Hancock Holding Co. (b) . . . . . . . . | | 19,300 |
| 251 | | IBERIABANK Corp. . . . . . . . . . . . | | 11,531 |
| 745 | | Independent Bank Corp. . . . . . . . . . | | 10,989 |
| 1,437 | | Investors Bancorp, Inc. (a) . . . . . . . | | 12,171 |
| 490 | | Lakeland Financial Corp. . . . . . . . . | | 9,403 |
| 3,329 | | National Penn Bancshares, Inc. (b) . | | 27,631 |
| 957 | | Northfield Bancorp, Inc. . . . . . . . . . | | 10,460 |
| 455 | | Pinnacle Financial Partners, | | |
| | | Inc. (a)(b) . | | 10,788 |
| 514 | | PrivateBancorp, Inc. (b) . . . . . . . . . . | | 7,432 |
| 965 | | Prosperity Bancshares, Inc. . . . . . . . | | 26,393 |
| 462 | | Republic Bancorp Inc. (b) . . . . . . . . | | 8,625 |
| 314 | | SCBT Financial Corp. . . . . . . . . . . . | | 6,563 |
| 583 | | Signature Bank (a) . . . . . . . . . . . . . . | | 16,458 |
| 728 | | Simmons First National Corp. . . . . . | | 18,338 |
| 685 | | Smithtown Bancorp, Inc. (b) . . . . . . | | 7,727 |
| 433 | | Southside Bancshares, Inc. . . . . . . . | | 8,184 |
| 3,299 | | Sterling Bancshares, Inc. . . . . . . . . . | | 21,575 |
| 427 | | Suffolk Bancorp . . . . . . . . . . . . . . . . | | 11,098 |
| 1,951 | | SVB Financial Group (a) . . . . . . . . . | | 39,039 |
| 473 | | SY Bancorp, Inc. . . . . . . . . . . . . . . . | | 11,494 |
| 929 | | Texas Capital Bancshares, Inc. (a) . | | 10,461 |
| 330 | | Tompkins Financial Corp. (b) . . . . . | | 14,190 |
| 605 | | Westamerica Bancorporation (b) . . . | | 27,564 |
| | | | | 494,700 |
| | | Commercial Services & Supplies - 7.49% |
| 1,297 | | Administaff, Inc. . . . . . . . . . . . . . . . | | 27,406 |
| 1,934 | | American Reprographics Co. (a) . . . | | 6,846 |
| 2,375 | | ATC Technology Corp. (a) . . . . . . . | | 26,600 |
| 4,017 | | Brady Corp. | | 70,820 |
| 2,202 | | CBIZ, Inc. (a) . . . . . . . . . . . . . . . . . | | 15,348 |
| 596 | | Clean Harbors, Inc. (a) . . . . . . . . . . | | 28,608 |
| 893 | | Copart, Inc. (a)(b) . . . . . . . . . . . . . . | | 26,486 |
| 2,099 | | Corinthian Colleges, Inc. (a)(b) . . . . | | 40,825 |
| 571 | | Cornell Cos., Inc. (a) . . . . . . . . . . . . | | 9,347 |
| 1,238 | | The Corporate Executive Board Co. | | 17,951 |
| 784 | | CRA International, Inc. (a) . . . . . . . | | 14,802 |
| 3,961 | | EnergySolutions, Inc. . . . . . . . . . . . | | 34,263 |
| 2,046 | | First Advantage Corp. (a) . . . . . . . . | | 28,194 |
| Number of | | | | |
| Shares | | | | Value |
| | | Commercial Services & Supplies (Continued) |
| 349 | | FTI Consulting, Inc. (a) . . . . . . . . . . $ | | 17,268 |
| 701 | | The Geo Group Inc. (a) . . . . . . . . . . | | 9,288 |
| 691 | | Healthcare Services Group . . . . . . . | | 10,344 |
| 912 | | Heidrick & Struggles | | |
| | | International, Inc. . . . . . . . . . . . . . | | 16,179 |
| 548 | | IHS, Inc. (a) | | 22,567 |
| 297 | | ITT Educational Services, | | |
| | | Inc. (a)(b) . | | 36,062 |
| 3,230 | | Korn/Ferry International (a) . . . . . . | | 29,264 |
| 991 | | Layne Christensen Co. (a) . . . . . . . . | | 15,925 |
| 1,180 | | M&F Worldwide Corp. (a) . . . . . . . | | 13,818 |
| 864 | | McGrath RentCorp (b) . . . . . . . . . . | | 13,617 |
| 1,072 | | Mobile Mini, Inc. (a) . . . . . . . . . . . . | | 12,349 |
| 1,898 | | Navigant Consulting, Inc. (a) . . . . . | | 24,807 |
| 1,855 | | Pike Electric Corp. (a) . . . . . . . . . . . | | 17,159 |
| 465 | | Pre-Paid Legal Services, Inc. (a) . . . | | 13,499 |
| 4,215 | | Sotheby’s (b) . . . . . . . . . . . . . . . . . . | | 37,935 |
| 720 | | Standard Parking Corp. (a) . . . . . . . | | 11,808 |
| 444 | | Stericycle, Inc. (a) . . . . . . . . . . . . . . | | 21,192 |
| 70 | | Strayer Education, Inc. (b) . . . . . . . | | 12,591 |
| 3,666 | | TeleTech Holdings, Inc. (a) . . . . . . . | | 39,923 |
| 1,431 | | Waste Connections, Inc. (a) . . . . . . . | | 36,777 |
| 680 | | Watson Wyatt Worldwide, Inc. . . . . | | 33,571 |
| | | | | 793,439 |
| | | Communications Equipment - 3.45% | | |
| 7,919 | | 3Com Corp. (a) . . . . . . . . . . . . . . . . | | 24,470 |
| 1,827 | | ADTRAN, Inc. . . . . . . . . . . . . . . . . | | 29,616 |
| 1,752 | | Airvana, Inc. (a) . . . . . . . . . . . . . . . . | | 10,249 |
| 3,121 | | Arris Group, Inc. (a) . . . . . . . . . . . . | | 23,002 |
| 2,227 | | Avocent Corp. (a) . . . . . . . . . . . . . . | | 27,036 |
| 2,673 | | Ciena Corp. (a)(b) . . . . . . . . . . . . . . | | 20,796 |
| 878 | | Comtech Telecommunications | | |
| | | Corp. (a) . . | | 21,748 |
| 651 | | EMS Technologies, Inc. (a) . . . . . . . | | 11,366 |
| 7,191 | | Extreme Networks, Inc. (a) . . . . . . . | | 10,930 |
| 850 | | F5 Networks, Inc. (a)(b) . . . . . . . . . | | 17,807 |
| 2,148 | | Harmonic, Inc. (a) . . . . . . . . . . . . . . | | 13,962 |
| 1,002 | | Hughes Communications, Inc. (a) . . | | 12,054 |
| 396 | | InterDigital, Inc. (a) . . . . . . . . . . . . . | | 10,225 |
| 2,715 | | Ixia (a) . . . . | | 14,037 |
| 4,372 | | JDS Uniphase Corp. (a) . . . . . . . . . . | | 14,209 |
| 5,562 | | Opnext, Inc. (a) . . . . . . . . . . . . . . . . | | 9,511 |
| 28,086 | | Powerwave Technologies, Inc. (a) . . | | 16,683 |
| 1,097 | | Riverbed Technology, Inc. (a) . . . . . | | 14,349 |
See notes to financial statements.
AssetMark Enhanced Fundamental Index™ Small Company Growth Fund
SCHEDULE OF INVESTMENTS (Continued)
March 31, 2009
| Number of | | | | |
| Shares | | | | Value |
| | | COMMON STOCKS (Continued) | | |
| | | Communications Equipment (Continued) |
| 5,183 | | Sonus Networks, Inc. (a) . . . . . . . . . | $ | 8,137 |
| 4,293 | | Sycamore Networks, Inc. (a) . . . . . . | | 11,462 |
| 1,434 | | Tekelec (a) . | | 18,972 |
| 1,219 | | ViaSat, Inc. (a) . . . . . . . . . . . . . . . . . | | 25,380 |
| | | | | 366,001 |
| | | Computers & Peripherals - 0.91% | | |
| 5,608 | | Emulex Corp. (a) . . . . . . . . . . . . . . . | | 28,208 |
| 2,945 | | Intermec, Inc. (a) . . . . . . . . . . . . . . . | | 30,628 |
| 1,388 | | Novatel Wireless, Inc. (a) . . . . . . . . | | 7,800 |
| 2,393 | | Palm, Inc. (a)(b) . . . . . . . . . . . . . . . . | | 20,628 |
| 1,814 | | Super Micro Computer, Inc. (a) . . . . | | 8,925 |
| | | | | 96,189 |
| | | Construction & Engineering - 0.53% | | |
| 3,250 | | Great Lakes Dredge & Dock Corp. . | | 9,782 |
| 2,477 | | MasTec, Inc. (a) . . . . . . . . . . . . . . . . | | 29,947 |
| 656 | | Orion Marine Group, Inc. (a) . . . . . | | 8,594 |
| 295 | | Texas Industries, Inc. . . . . . . . . . . . . | | 7,375 |
| | | | | 55,698 |
| | | Consumer Finance - 0.35% | | |
| 587 | | Cash America International, Inc. . . . | | 9,192 |
| 1,338 | | Dollar Financial Corp. (a)(b) . . . . . . | | 12,738 |
| 609 | | EZCORP, Inc. (a) . . . . . . . . . . . . . . . | | 7,046 |
| 576 | | First Cash Financial Services, Inc. (a) | | 8,594 |
| | | | | 37,570 |
| | | Diversified Consumer Services - 0.43% | |
| 430 | | Lincoln Educational Services | | |
| | | Corp. (a) . . | | 7,878 |
| 1,101 | | Steiner Leisure Ltd. (a) . . . . . . . . . . | | 26,875 |
| 893 | | Universal Technical Institute, | | |
| | | Inc. (a) . . . | | 10,716 |
| | | | | 45,469 |
| | | Diversified Financial Services - 0.20% | |
| 1,731 | | Assured Guaranty Ltd. . . . . . . . . . . | | 11,719 |
| 1,228 | | MarketAxess Holdings Inc. (a) . . . . | | 9,382 |
| | | | | 21,101 |
| | | Diversified Telecommunication Services - 1.13% | | |
| 1,086 | | Cbeyond Communications, | | |
| | | Inc. (a)(b) . | | 20,450 |
| 1,173 | | Global Crossing Ltd. (a) . . . . . . . . . | | 8,211 |
| 867 | | Neustar, Inc. (a) . . . . . . . . . . . . . . . . | | 14,522 |
| 617 | | NTELOS Holdings Corp. . . . . . . . . | | 11,192 |
| Number of | | | | |
| Shares | | | | Value |
| | | Diversified Telecommunication | | |
| | | Services (Continued) | | |
| 10,394 | | PAETEC Holding Corp. (a) . . . . . . . | $ | 14,967 |
| 1,643 | | Premiere Global Services, Inc. (a) . . | | 14,491 |
| 519 | | Shenandoah Telecommunications Co. | | 11,833 |
| 2,810 | | tw telecom inc. (a) . . . . . . . . . . . . . . | | 24,588 |
| | | | | 120,254 |
| | | Electric Utilities - 1.18% | | |
| 314 | | ITC Holdings Corp. . . . . . . . . . . . . . | | 13,697 |
| 5,070 | | Otter Tail Corp. . . . . . . . . . . . . . . . . | | 111,793 |
| | | | | 125,490 |
| | | Electrical Equipment - 2.30% | | |
| 279 | | AZZ, Inc. (a) . . . . . . . . . . . . . . . . . . | | 7,363 |
| 1,525 | | Baldor Electric Co. . . . . . . . . . . . . . | | 22,097 |
| 3,015 | | C&D Technologies, Inc. (a) . . . . . . . | | 5,578 |
| 3,922 | | EnerSys (a) | | 47,535 |
| 98 | | First Solar, Inc. (a)(b) . . . . . . . . . . . | | 13,005 |
| 457 | | Franklin Electric Co., Inc. . . . . . . . . | | 10,113 |
| 4,673 | | GrafTech International Ltd. (a) . . . . | | 28,786 |
| 530 | | II-VI, Inc. (a) . . . . . . . . . . . . . . . . . . | | 9,105 |
| 862 | | LaBarge, Inc. (a) . . . . . . . . . . . . . . . | | 7,215 |
| 352 | | Ormat Technologies, Inc. . . . . . . . . | | 9,666 |
| 2,942 | | Polypore International, Inc. (a) . . . . | | 11,827 |
| 272 | | Powell Industries, Inc. (a) . . . . . . . . | | 9,604 |
| 894 | | Regal-Beloit Corp. . . . . . . . . . . . . . . | | 27,392 |
| 3,785 | | Vicor Corp. | | 18,509 |
| 1,442 | | Woodward Governor Co. . . . . . . . . . | | 16,121 |
| | | | | 243,916 |
| | | Electronic Equipment & Instruments - 3.44% | | |
| 2,751 | | Checkpoint Systems, Inc. (a) . . . . . . | | 24,676 |
| 927 | | Cogent, Inc. (a) . . . . . . . . . . . . . . . . | | 11,031 |
| 1,643 | | Cognex Corp. . . . . . . . . . . . . . . . . . . | | 21,934 |
| 1,176 | | Daktronics, Inc. . . . . . . . . . . . . . . . . | | 7,703 |
| 938 | | Dolby Laboratories, Inc. (a) . . . . . . | | 31,995 |
| 1,139 | | Electro Rent Corp. . . . . . . . . . . . . . . | | 10,980 |
| 2,882 | | Electro Scientific Industries, | | |
| | | Inc. (a) . . . | | 17,061 |
| 1,033 | | FLIR Systems, Inc. (a)(b) . . . . . . . . | | 21,156 |
| 1,517 | | L-1 Identity Solutions, Inc. (a) . . . . | | 7,752 |
| 2,377 | | Littelfuse, Inc. (a) . . . . . . . . . . . . . . | | 26,123 |
| 721 | | MTS Systems Corp. . . . . . . . . . . . . | | 16,403 |
| 818 | | Multi-Fineline Electronix, Inc. (a) . | | 13,775 |
| 378 | | National Instruments Corp. . . . . . . . | | 7,050 |
| 2,419 | | Newport Corp. (a) . . . . . . . . . . . . . . | | 10,692 |
See notes to financial statements.
AssetMark Enhanced Fundamental Index™ Small Company Growth Fund
SCHEDULE OF INVESTMENTS (Continued)
March 31, 2009
| Number of | | | | |
| Shares | | | | Value |
| | | COMMON STOCKS (Continued) | | |
| | | Electronic Equipment & | | |
| | | Instruments (Continued) | | |
| 582 | | Rofin-Sinar Technologies, Inc. (a) . | $ | 9,382 |
| 541 | | Rogers Corp. (a) . . . . . . . . . . . . . . . | | 10,214 |
| 1,891 | | Scansource, Inc. (a)(b) . . . . . . . . . . . | | 35,135 |
| 317 | | SunPower Corp. (a)(b) . . . . . . . . . . . | | 7,538 |
| 1,384 | | Trimble Navigation Ltd. (a)(b) . . . . | | 21,148 |
| 3,231 | | TTM Technologies, Inc. (a) . . . . . . . | | 18,740 |
| 1,588 | | Veeco Instruments, Inc. (a) . . . . . . . | | 10,592 |
| 1,260 | | Zebra Technologies Corp. (a) . . . . . | | 23,965 |
| | | | | 365,045 |
| | | Energy Equipment & Services - 2.88% | |
| 2,500 | | Allis Chalmers Energy, Inc. (a) . . . . | | 4,825 |
| 1,001 | | Atwood Oceanics, Inc. (a) . . . . . . . . | | 16,607 |
| 1,593 | | Basic Energy Services, Inc. (a) . . . . | | 10,307 |
| 1,035 | | Bristow Group, Inc. (a) . . . . . . . . . . | | 22,180 |
| 2,359 | | Cal Dive International, Inc. (a) . . . . | | 15,970 |
| 211 | | CARBO Ceramics, Inc. (b) . . . . . . . | | 6,001 |
| 687 | | Dril-Quip, Inc. (a) . . . . . . . . . . . . . . | | 21,091 |
| 706 | | Gulf Island Fabrication, Inc. . . . . . . | | 5,655 |
| 651 | | GulfMark Offshore, Inc. (a) . . . . . . | | 15,533 |
| 469 | | Helmerich & Payne, Inc. (b) . . . . . . | | 10,679 |
| 1,103 | | Hornbeck Offshore Services, | | |
| | | Inc. (a) . . . | | 16,810 |
| 8,487 | | ION Geophysical Corp. (a)(b) . . . . . | | 13,240 |
| 526 | | Lufkin Industries, Inc. . . . . . . . . . . . | | 19,925 |
| 1,548 | | Matrix Service Co. (a) . . . . . . . . . . . | | 12,725 |
| 948 | | NATCO Group, Inc. (a) . . . . . . . . . . | | 17,946 |
| 4,039 | | Newpark Resources, Inc. (a) . . . . . . | | 10,219 |
| 7,106 | | Parker Drilling Co. (a) . . . . . . . . . . . | | 13,075 |
| 928 | | PHI, Inc. (a) | | 9,261 |
| 2,380 | | Pioneer Drilling Co. (a) . . . . . . . . . . | | 7,806 |
| 1,504 | | RPC, Inc. . . | | 9,971 |
| 816 | | Superior Well Services, Inc. (a) . . . . | | 4,186 |
| 5,601 | | Tetra Technologies, Inc. (a) . . . . . . . | | 18,203 |
| 1,593 | | Union Drilling, Inc. (a) . . . . . . . . . . | | 6,053 |
| 1,771 | | Willbros Group Inc. (a) . . . . . . . . . . | | 17,179 |
| | | | | 305,447 |
| | | Food & Staples Retailing - 0.36% | | |
| 179 | | Arden Group, Inc. . . . . . . . . . . . . . . | | 20,914 |
| 944 | | PriceSmart, Inc. . . . . . . . . . . . . . . . . | | 17,002 |
| | | | | 37,916 |
| Number of | | | | |
| Shares | | | | Value |
| | | Food Products - 1.10% | | |
| 323 | | Cal-Maine Foods, Inc. . . . . . . . . . . . | $ | 7,232 |
| 2,582 | | Darling International, Inc. (a) . . . . . | | 9,579 |
| 377 | | Farmer Bros Co. . . . . . . . . . . . . . . . | | 6,711 |
| 1,235 | | The Hain Celestial Group, Inc. (a) . | | 17,586 |
| 385 | | J&J Snack Foods Corp. . . . . . . . . . . | | 13,317 |
| 453 | | Ralcorp Holdings, Inc. (a) . . . . . . . . | | 24,408 |
| 1,750 | | Tootsie Roll Industries, Inc. . . . . . . . | | 38,001 |
| | | | | 116,834 |
| | | Health Care Equipment & Supplies - 3.81% |
| 1,179 | | Align Technology, Inc. (a) . . . . . . . . | | 9,349 |
| 1,191 | | American Medical Systems | | |
| | | Holdings, Inc. (a) . . . . . . . . . . . . . . | | 13,280 |
| 640 | | Analogic Corp. . . . . . . . . . . . . . . . . | | 20,493 |
| 1,327 | | Arthrocare Corp. (a) . . . . . . . . . . . . | | 6,502 |
| 1,238 | | CONMED Corp. (a) . . . . . . . . . . . . | | 17,840 |
| 349 | | Gen-Probe, Inc. (a) . . . . . . . . . . . . . | | 15,907 |
| 486 | | Greatbatch, Inc. (a) . . . . . . . . . . . . . | | 9,404 |
| 357 | | Haemonetics Corporation (a) . . . . . | | 19,664 |
| 1,826 | | Hologic, Inc. (a) . . . . . . . . . . . . . . . . | | 23,902 |
| 623 | | IDEXX Laboratories, Inc. (a)(b) . . . | | 21,543 |
| 585 | | Immucor, Inc. (a) . . . . . . . . . . . . . . . | | 14,713 |
| 379 | | Integra LifeSciences Holdings | | |
| | | Corp. (a) . . | | 9,373 |
| 117 | | Intuitive Surgical, Inc. (a)(b) . . . . . . | | 11,157 |
| 473 | | Masimo Corp. (a) . . . . . . . . . . . . . . | | 13,708 |
| 623 | | Matthews International Corp. . . . . . | | 17,949 |
| 465 | | Meridian Bioscience, Inc. . . . . . . . . | | 8,426 |
| 2,216 | | ResMed, Inc. (a)(b) . . . . . . . . . . . . . | | 78,313 |
| 1,633 | | Sirona Dental Systems, Inc. (a) . . . . | | 23,385 |
| 363 | | Thoratec Corp. (a)(b) . . . . . . . . . . . . | | 9,325 |
| 5,281 | | Tomotherapy, Inc. (a)(b) . . . . . . . . . | | 13,995 |
| 713 | | West Pharmaceutical Services, Inc. . | | 23,393 |
| 605 | | Wright Medical Group, Inc. (a) . . . . | | 7,883 |
| 1,023 | | Zoll Medical Corp. (a) . . . . . . . . . . . | | 14,690 |
| | | | | 404,194 |
| | | Health Care Providers & Services - 3.12% |
| 327 | | Amedisys, Inc. (a)(b) . . . . . . . . . . . . | | 8,989 |
| 6,299 | | AMN Healthcare Services, Inc. (a) . | | 32,125 |
| 770 | | AmSurg Corp. (a) . . . . . . . . . . . . . . | | 12,205 |
| 1,454 | | Catalyst Health Solutions Inc. (a) . . | | 28,818 |
| 409 | | Chemed Corp. . . . . . . . . . . . . . . . . . | | 15,910 |
| 492 | | Corvel Corp. (a)(b) . . . . . . . . . . . . . | | 9,948 |
| 1,147 | | eResearch Technology, Inc. (a) . . . . | | 6,033 |
See notes to financial statements.
AssetMark Enhanced Fundamental Index™ Small Company Growth Fund
SCHEDULE OF INVESTMENTS (Continued)
March 31, 2009
| Number of | | | | |
| Shares | | | | Value |
| | | COMMON STOCKS (Continued) | | |
| | | Health Care Providers & Services (Continued) |
| 929 | | Gentiva Health Services, Inc. (a) . . . | $ | 14,121 |
| 837 | | Healthways, Inc. (a) . . . . . . . . . . . . . | | 7,341 |
| 1,573 | | inVentiv Health, Inc. (a) . . . . . . . . . | | 12,836 |
| 145 | | Landauer, Inc. . . . . . . . . . . . . . . . . . | | 7,349 |
| 874 | | Mednax, Inc. (a) . . . . . . . . . . . . . . . | | 25,757 |
| 540 | | MWI Veterinary Supply, Inc. (a) . . . | | 15,379 |
| 243 | | National Healthcare Corp. . . . . . . . . | | 9,756 |
| 2,315 | | PSS World Medical, Inc. (a) . . . . . . | | 33,220 |
| 666 | | Psychiatric Solutions, Inc. (a)(b) . . . | | 10,476 |
| 1,255 | | Sun Healthcare Group, Inc. (a) . . . . | | 10,592 |
| 60,972 | | Sunrise Senior Living, Inc. (a)(b) . . | | 41,461 |
| 671 | | VCA Antech, Inc. (a) . . . . . . . . . . . . | | 15,131 |
| 614 | | WebMD Health Corp. (a) . . . . . . . . | | 13,692 |
| | | | | 331,139 |
| | | Health Care Technology - 0.28% | | |
| 557 | | Eclipsys Corp. (a) . . . . . . . . . . . . . . | | 5,648 |
| 1,545 | | HLTH Corporation (a) . . . . . . . . . . . | | 15,991 |
| 1,013 | | Omnicell, Inc. (a) . . . . . . . . . . . . . . . | | 7,921 |
| | | | | 29,560 |
| | | Hotels, Restaurants & Leisure - 4.03% | |
| 780 | | Bally Technologies, Inc. (a) . . . . . . . | | 14,368 |
| 819 | | BJ’s Restaurants, Inc. (a) . . . . . . . . . | | 11,392 |
| 356 | | Buffalo Wild Wings, Inc. (a)(b) . . . . | | 13,022 |
| 3,979 | | The Cheesecake Factory (a) . . . . . . | | 45,560 |
| 720 | | Chipotle Mexican Grill, Inc. (a)(b) . | | 47,794 |
| 957 | | Choice Hotels International, | | |
| | | Inc. (b) . . . | | 24,710 |
| 2,316 | | Einstein Noah Rest Group, Inc. (a) . | | 13,502 |
| 2,996 | | Gaylord Entertainment Co. (a) . . . . | | 24,957 |
| 1,584 | | International Speedway Corp. . . . . . | | 34,943 |
| 7,084 | | Krispy Kreme Doughnuts, Inc. (a) . | | 11,334 |
| 1,142 | | Life Time Fitness, Inc. (a)(b) . . . . . . | | 14,343 |
| 1,322 | | Monarch Casino & Resort, | | |
| | | Inc. (a)(b) . | | 6,821 |
| 1,301 | | Orient-Express Hotels Ltd. . . . . . . . | | 5,334 |
| 373 | | Panera Bread Co. (a)(b) . . . . . . . . . . | | 20,851 |
| 893 | | Papa John’s International, Inc. (a) . . | | 20,423 |
| 894 | | PF Chang’s China Bistro, | | |
| | | Inc. (a)(b) . | | 20,455 |
| 2,073 | | Scientific Games Corp. (a) . . . . . . . | | 25,104 |
| 1,147 | | Sonic Corp. (a) . . . . . . . . . . . . . . . . | | 11,493 |
| 1,775 | | Texas Roadhouse, Inc. (a) . . . . . . . . | | 16,916 |
| Number of | | | | |
| Shares | | | | Value |
| | | Hotels, Restaurants & Leisure (Continued) |
| 1,593 | | Vail Resorts, Inc. (a) . . . . . . . . . . . . | $ | 32,545 |
| 544 | | WMS Industries, Inc. (a)(b) . . . . . . | | 11,375 |
| | | | | 427,242 |
| | | Household Durables - 0.54% | | |
| 4,138 | | Blount International, Inc. (a) . . . . . . | | 19,118 |
| 7,169 | | Interface, Inc. . . . . . . . . . . . . . . . . . . | | 21,435 |
| 917 | | Universal Electronics, Inc. (a) . . . . . | | 16,598 |
| | | | | 57,151 |
| | | Household Products - 0.25% | | |
| 1,102 | | WD-40 Co. | | 26,602 |
| | | Industrial Conglomerates - 0.22% | | |
| 657 | | Raven Industries, Inc. (b) . . . . . . . . | | 13,652 |
| 424 | | Walter Industries, Inc. . . . . . . . . . . . | | 9,697 |
| | | | | 23,349 |
| | | Insurance - 1.24% | | |
| 304 | | American Physicians Capital, Inc. . | | 12,440 |
| 845 | | Amerisafe, Inc. (a) . . . . . . . . . . . . . . | | 12,945 |
| 1,712 | | Amtrust Financial Services, Inc. (b) | | 16,350 |
| 1,139 | | Employers Holdings, Inc. . . . . . . . . | | 10,866 |
| 338 | | Enstar Group Limited (a) . . . . . . . . | | 19,036 |
| 678 | | Greenlight Capital Re, Ltd. (a)(b) . . | | 10,828 |
| 612 | | National Interstate Corp. . . . . . . . . . | | 10,349 |
| 542 | | Navigators Group, Inc. (a) . . . . . . . . | | 25,571 |
| 517 | | Tower Group, Inc. . . . . . . . . . . . . . . | | 12,734 |
| | | | | 131,119 |
| | | Internet & Catalog Retail - 1.03% | | |
| 342 | | Blue Nile, Inc. (a)(b) . . . . . . . . . . . . | | 10,311 |
| 5,323 | | Coldwater Creek, Inc. (a) . . . . . . . . | | 13,361 |
| 2,390 | | Gaiam, Inc. (a) . . . . . . . . . . . . . . . . . | | 7,839 |
| 1,239 | | GSI Commerce, Inc. (a)(b) . . . . . . . | | 16,231 |
| 646 | | NutriSystem Inc. (b) . . . . . . . . . . . . | | 9,218 |
| 349 | | Priceline.com, Inc. (a)(b) . . . . . . . . . | | 27,494 |
| 1,369 | | Shutterfly, Inc. (a) . . . . . . . . . . . . . . | | 12,828 |
| 418 | | VistaPrint Limited (a) . . . . . . . . . . . | | 11,491 |
| | | | | 108,773 |
| | | Internet Software & Services - 1.73% | |
| 1,049 | | Akamai Technologies, Inc. (a) . . . . . | | 20,350 |
| 1,994 | | Ariba, Inc. (a) . . . . . . . . . . . . . . . . . | | 17,408 |
| 519 | | AsiaInfo Holdings, Inc. (a) . . . . . . . | | 8,745 |
| 646 | | DealerTrack Holdings, Inc. (a) . . . . | | 8,462 |
| 2,556 | | Dice Holdings, Inc. (a)(b) . . . . . . . . | | 7,106 |
See notes to financial statements.
AssetMark Enhanced Fundamental Index™ Small Company Growth Fund
SCHEDULE OF INVESTMENTS (Continued)
March 31, 2009
| Number of | | | | |
| Shares | | | | Value |
| | | COMMON STOCKS (Continued) | | |
| | | Internet Software & Services (Continued) |
| 1,030 | | Digital River, Inc. (a) . . . . . . . . . . . . | $ | 30,715 |
| 133 | | Equinix, Inc. (a)(b) . . . . . . . . . . . . . | | 7,468 |
| 856 | | j2 Global Communications, | | |
| | | Inc. (a) . . . | | 18,738 |
| 5,724 | | RealNetworks, Inc. (a) . . . . . . . . . . . | | 13,337 |
| 1,940 | | S1 Corp. (a) | | 9,991 |
| 1,352 | | SAVVIS, Inc. (a)(b) . . . . . . . . . . . . . | | 8,369 |
| 212 | | Sohu.com, Inc. (a)(b) . . . . . . . . . . . . | | 8,758 |
| 2,082 | | Valueclick, Inc. (a) . . . . . . . . . . . . . . | | 17,718 |
| 996 | | Vignette Corp. (a) . . . . . . . . . . . . . . | | 6,653 |
| | | | | 183,818 |
| | | IT Services - 3.40% | | |
| 1,425 | | CSG Systems International (a) . . . . | | 20,349 |
| 1,657 | | Euronet Worldwide, Inc. (a)(b) . . . . | | 21,640 |
| 967 | | ExlService Holdings, Inc. (a) . . . . . | | 8,336 |
| 406 | | Forrester Research, Inc. (a) . . . . . . . | | 8,347 |
| 1,307 | | Gartner, Inc. (a) . . . . . . . . . . . . . . . . | | 14,390 |
| 3,521 | | Genpact Limited (a) . . . . . . . . . . . . . | | 31,196 |
| 5,647 | | Global Cash Access Holdings, | | |
| | | Inc. (a) . . . | | 21,572 |
| 1,116 | | Global Payments, Inc. . . . . . . . . . . . | | 37,286 |
| 4,846 | | Hackett Group, Inc. (a) . . . . . . . . . . | | 9,789 |
| 1,452 | | Heartland Payment Systems, Inc. . . | | 9,598 |
| 3,197 | | iGATE Corp. . . . . . . . . . . . . . . . . . . | | 10,358 |
| 234 | | ManTech International Corp. (a) . . . | | 9,805 |
| 639 | | MAXIMUS, Inc. . . . . . . . . . . . . . . . | | 25,470 |
| 2,648 | | Sapient Corp. (a) . . . . . . . . . . . . . . . | | 11,837 |
| 2,575 | | SRA International, Inc. (a) . . . . . . . | | 37,852 |
| 875 | | Syntel, Inc. (b) . . . . . . . . . . . . . . . . . | | 18,007 |
| 7,854 | | TNS, Inc. (a) . . . . . . . . . . . . . . . . . . | | 64,246 |
| | | | | 360,078 |
| | | Leisure Equipment & Products - 0.08% | |
| 2,024 | | Marine Products Corp. . . . . . . . . . . | | 8,582 |
| | | Life Sciences Tools & Services - 0.76% | |
| 3,656 | | Bruker BioSciences Corp. (a) . . . . . | | 22,521 |
| 551 | | Dionex Corp. (a) . . . . . . . . . . . . . . . | | 26,035 |
| 2,505 | | Parexel International Corp. (a) . . . . | | 24,374 |
| 133 | | Techne Corp. . . . . . . . . . . . . . . . . . . | | 7,276 |
| | | | | 80,206 |
| | | Machinery - 4.12% | | |
| 1,319 | | Actuant Corp. . . . . . . . . . . . . . . . . . | | 13,625 |
| 1,128 | | Altra Holdings, Inc. (a) . . . . . . . . . . | | 4,377 |
| Number of | | | | |
| Shares | | | | Value |
| | | Machinery (Continued) | | |
| 1,687 | | American Railcar Industries, Inc. . . | $ | 12,872 |
| 546 | | Ampco-Pittsburgh Corp. . . . . . . . . . | | 7,240 |
| 556 | | Astec Industries, Inc. (a) . . . . . . . . . | | 14,584 |
| 533 | | Badger Meter, Inc. . . . . . . . . . . . . . . | | 15,398 |
| 2,464 | | Barnes Group, Inc. . . . . . . . . . . . . . . | | 26,340 |
| 791 | | Bucyrus International, Inc. . . . . . . . | | 12,007 |
| 2,444 | | Chart Industries, Inc. (a) . . . . . . . . . | | 19,259 |
| 787 | | CIRCOR International, Inc. . . . . . . . | | 17,723 |
| 957 | | Clarcor, Inc. | | 24,107 |
| 1,797 | | Colfax Corp. (a)(b) . . . . . . . . . . . . . | | 12,345 |
| 488 | | ESCO Technologies, Inc. (a) . . . . . . | | 18,886 |
| 378 | | The Gorman-Rupp Co. . . . . . . . . . . | | 7,484 |
| 1,011 | | Kaydon Corp. . . . . . . . . . . . . . . . . . | | 27,631 |
| 125 | | K-Tron International, Inc. (a)(b) . . . | | 7,584 |
| 459 | | L.B. Foster Co. (a) . . . . . . . . . . . . . . | | 11,397 |
| 743 | | Nordson Corp. (b) . . . . . . . . . . . . . . | | 21,123 |
| 411 | | RBC Bearings Inc. (a) . . . . . . . . . . . | | 6,280 |
| 1,151 | | Robbins & Myers, Inc. . . . . . . . . . . | | 17,461 |
| 655 | | Sun Hydraulics, Inc. . . . . . . . . . . . . | | 9,570 |
| 1,939 | | Titan International, Inc. . . . . . . . . . . | | 9,753 |
| 1,447 | | Twin Disc, Inc. . . . . . . . . . . . . . . . . | | 10,013 |
| 1,571 | | Valmont Industries, Inc. . . . . . . . . . . | | 78,880 |
| 1,183 | | Westinghouse Air Brake | | |
| | | Technologies Corp. . . . . . . . . . . . . | | 31,208 |
| | | | | 437,147 |
| | | Marine - 0.63% | | |
| 2,141 | | Eagle Bulk Shipping, Inc. . . . . . . . . | | 9,099 |
| 961 | | Genco Shipping & Trading Ltd. (b) | | 11,859 |
| 1,263 | | Kirby Corp. (a) . . . . . . . . . . . . . . . . | | 33,646 |
| 781 | | TBS International Limited (a) . . . . . | | 5,740 |
| 2,517 | | Ultrapetrol Bahamas Ltd. (a)(b) . . . | | 6,796 |
| | | | | 67,140 |
| | | Media - 1.73% | | |
| 1,224 | | Arbitron, Inc. . . . . . . . . . . . . . . . . . . | | 18,372 |
| 2,065 | | CKX, Inc. (a) . . . . . . . . . . . . . . . . . . | | 8,466 |
| 6,719 | | CTC Media, Inc. (a) . . . . . . . . . . . . | | 30,639 |
| 1,478 | | DreamWorks Animation SKG, | | |
| | | Inc. (a) . . . | | 31,984 |
| 493 | | Fisher Communications, Inc. . . . . . . | | 4,812 |
| 4,126 | | Global Sources Ltd. (a) . . . . . . . . . . | | 16,050 |
| 890 | | Marvel Entertainment, Inc. (a) . . . . | | 23,629 |
| 445 | | Morningstar, Inc. (a)(b) . . . . . . . . . . | | 15,197 |
See notes to financial statements.
AssetMark Enhanced Fundamental Index™ Small Company Growth Fund
SCHEDULE OF INVESTMENTS (Continued)
March 31, 2009
| Number of | | | | |
| Shares | | | | Value |
| | | COMMON STOCKS (Continued) | | |
| | | Media - 1.73% | | |
| 2,968 | | World Wrestling | | |
| | | Entertainment, Inc. . . . . . . . . . . . . | $ | 34,251 |
| | | | | 183,400 |
| | | Metals & Mining - 1.54% | | |
| 764 | | AMCOL International Corp. . . . . . . | | 11,338 |
| 298 | | Compass Minerals International, | | |
| | | Inc. (b) . . . | | 16,798 |
| 836 | | Haynes International, Inc. (a) . . . . . | | 14,898 |
| 7,785 | | Hecla Mining Co. (a) . . . . . . . . . . . . | | 15,570 |
| 242 | | Northwest Pipe Co. (a) . . . . . . . . . . | | 6,890 |
| 1,098 | | Olympic Steel, Inc. . . . . . . . . . . . . . | | 16,657 |
| 1,502 | | RTI International Metals, Inc. (a) . . | | 17,573 |
| 855 | | Schnitzer Steel Industries, Inc. . . . . | | 26,838 |
| 3,861 | | Stillwater Mining Co. (a)(b) . . . . . . | | 14,286 |
| 4,086 | | Titanium Metals Corp. . . . . . . . . . . . | | 22,350 |
| | | | | 163,198 |
| | | Oil & Gas - 3.89% | | |
| 2,505 | | Alpha Natural Resources, Inc. (a) . . | | 44,464 |
| 304 | | Apco Argentina Inc. (b) . . . . . . . . . . | | 3,350 |
| 980 | | Atlas America, Inc. . . . . . . . . . . . . . | | 8,575 |
| 2,890 | | ATP Oil & Gas Corp. (a) . . . . . . . . . | | 14,826 |
| 1,164 | | Barrett Bill Corp. (a) . . . . . . . . . . . . | | 25,887 |
| 3,631 | | Berry Petroleum Co. . . . . . . . . . . . . | | 39,796 |
| 3,967 | | Brigham Exploration Co. (a) . . . . . . | | 7,537 |
| 404 | | Clayton Williams Energy, Inc. (a) . . | | 11,813 |
| 1,182 | | CNX Gas Corp. (a) . . . . . . . . . . . . . | | 28,025 |
| 901 | | Comstock Resources, Inc. (a)(b) . . . | | 26,850 |
| 986 | | Concho Resources, Inc. (a) . . . . . . . | | 25,232 |
| 1,586 | | Continental Resources, Inc. (a)(b) . . | | 33,639 |
| 4,353 | | Crosstex Energy, Inc. (b) . . . . . . . . . | | 7,139 |
| 1,226 | | EXCO Resources, Inc. (a) . . . . . . . . | | 12,260 |
| 1,742 | | Golar LNG Ltd. . . . . . . . . . . . . . . . . | | 5,975 |
| 8,089 | | International Coal Group, Inc. (a)(b) . | | 13,023 |
| 1,075 | | Penn Virginia Corp. . . . . . . . . . . . . . | | 11,804 |
| 1,030 | | Petroleum Development Corp. (a) . . | | 12,164 |
| 4,177 | | PetroQuest Energy, Inc. (a) . . . . . . . | | 10,025 |
| 4,039 | | Quicksilver Resources, Inc. (a)(b) . . | | 22,376 |
| 4,334 | | Rosetta Resources, Inc. (a) . . . . . . . | | 21,453 |
| 595 | | Teekay Tankers Ltd. . . . . . . . . . . . . . | | 5,659 |
| 1,639 | | Vaalco Energy, Inc. (a) . . . . . . . . . . | | 8,670 |
| 3,607 | | Venoco, Inc. (a) . . . . . . . . . . . . . . . . | | 11,831 |
| | | | | 412,373 |
| Number of | | | | |
| Shares | | | | Value |
| | | Personal Products - 0.90% | | |
| 16,899 | | Bare Escentuals, Inc. (a) . . . . . . . . . | $ | 69,286 |
| 129 | | Chattem, Inc. (a)(b) . . . . . . . . . . . . . | | 7,230 |
| 1,643 | | Inter Parfums, Inc. . . . . . . . . . . . . . . | | 9,579 |
| 430 | | USANA Health Sciences, Inc. (a) . . | | 9,615 |
| | | | | 95,710 |
| | | Pharmaceuticals - 1.16% | | |
| 1,956 | | American Oriental Bioengineering, | | |
| | | Inc. (a) . . . | | 7,550 |
| 4,031 | | KV Pharmaceutical Co. (a)(b) . . . . . | | 6,651 |
| 902 | | Medicines Co. (a) . . . . . . . . . . . . . . | | 9,778 |
| 599 | | Medicis Pharmaceutical . . . . . . . . . | | 7,410 |
| 1,011 | | Perrigo Co. . | | 25,103 |
| 1,851 | | Salix Pharmaceuticals, Ltd. (a) . . . . | | 17,585 |
| 791 | | Sepracor, Inc. (a)(b) . . . . . . . . . . . . . | | 11,596 |
| 2,108 | | Valeant Pharmaceuticals | | |
| | | International (a)(b) . . . . . . . . . . . . | | 37,501 |
| | | | | 123,174 |
| | | Real Estate - 0.13% | | |
| 1,020 | | Forestar Group, Inc. (a) . . . . . . . . . . | | 7,803 |
| 8,844 | | Grubb & Ellis Co. . . . . . . . . . . . . . . | | 5,572 |
| | | | | 13,375 |
| | | Road & Rail - 0.79% | | |
| 1,161 | | Genesee & Wyoming, Inc. (a) . . . . . | | 24,671 |
| 1,179 | | Knight Transportation, Inc. . . . . . . . | | 17,874 |
| 1,185 | | Old Dominion Freight Line (a) . . . . | | 27,836 |
| 956 | | Universal Truckload Services, Inc. . | | 13,709 |
| | | | | 84,090 |
| | | Semiconductor & Semiconductor | | |
| | | Equipment - 5.13% | | |
| 1,814 | | Advanced Energy Industries, Inc. (a) | | 13,660 |
| 918 | | Atheros Communications, Inc. (a) . | | 13,458 |
| 2,043 | | ATMI, Inc. (a) . . . . . . . . . . . . . . . . . | | 31,524 |
| 21,965 | | Axcelis Technologies, Inc. (a) . . . . . | | 8,347 |
| 937 | | Cabot Microelectronics Corp. (a) . . | | 22,516 |
| 2,337 | | Cohu, Inc. . | | 16,826 |
| 536 | | Cree, Inc. (a)(b) . . . . . . . . . . . . . . . . | | 12,612 |
| 1,016 | | Cymer, Inc. (a) . . . . . . . . . . . . . . . . . | | 22,616 |
| 1,098 | | Diodes, Inc. (a)(b) . . . . . . . . . . . . . . | | 11,650 |
| 1,551 | | FEI Co. (a) . | | 23,932 |
| 265 | | Hittite Microwave Corp. (a) . . . . . . | | 8,268 |
| 2,082 | | IXYS Corp. | | 16,781 |
| 13,373 | | Kulicke & Soffa Industries, | | |
| | | Inc. (a)(b) . | | 35,037 |
See notes to financial statements.
AssetMark Enhanced Fundamental Index™ Small Company Growth Fund
SCHEDULE OF INVESTMENTS (Continued)
March 31, 2009
| Number of | | | | |
| Shares | | | | Value |
| | | COMMON STOCKS (Continued) | | |
| | | Semiconductor & Semiconductor | | |
| | | Equipment (Continued) | | |
| 2,834 | | Micrel, Inc. | $ | 19,951 |
| 1,289 | | Microsemi Corp. (a) . . . . . . . . . . . . | | 14,952 |
| 1,911 | | MKS Instruments, Inc. (a) . . . . . . . . | | 28,034 |
| 11,833 | | ON Semiconductor Corp. (a)(b) . . . | | 46,149 |
| 1,562 | | Pericom Semiconductor Corp. (a) . . | | 11,418 |
| 2,098 | | PMC-Sierra, Inc. (a)(b) . . . . . . . . . . | | 13,385 |
| 652 | | Power Integrations, Inc. . . . . . . . . . . | | 11,214 |
| 1,226 | | Semtech Corp. (a) . . . . . . . . . . . . . . | | 16,367 |
| 2,709 | | Silicon Image, Inc. (a) . . . . . . . . . . . | | 6,502 |
| 814 | | Silicon Laboratories, Inc. (a) . . . . . . | | 21,490 |
| 3,929 | | Skyworks Solutions, Inc. (a)(b) . . . . | | 31,668 |
| 1,086 | | Standard Microsystems Corp. (a) . . | | 20,200 |
| 10,005 | | TriQuint Semiconductor, Inc. (a) . . . | | 24,712 |
| 1,867 | | Varian Semiconductor Equipment | | |
| | | Associates, Inc. (a) . . . . . . . . . . . . | | 40,439 |
| | | | | 543,708 |
| | | Software - 5.84% | | |
| 533 | | ACI Worldwide, Inc. (a) . . . . . . . . . | | 9,994 |
| 3,440 | | Actuate Corp. (a) . . . . . . . . . . . . . . . | | 10,526 |
| 262 | | Advent Software, Inc. (a) . . . . . . . . | | 8,727 |
| 1,211 | | ANSYS, Inc. (a) . . . . . . . . . . . . . . . | | 30,396 |
| 981 | | Blackbaud, Inc. . . . . . . . . . . . . . . . . | | 11,390 |
| 422 | | Blackboard, Inc. (a) . . . . . . . . . . . . . | | 13,394 |
| 662 | | CommVault Systems, Inc. (a) . . . . . | | 7,262 |
| 315 | | Concur Technologies, Inc. (a) . . . . . | | 6,045 |
| 2,339 | | Epicor Software Corp. (a) . . . . . . . . | | 8,912 |
| 556 | | EPIQ Systems, Inc. (a) . . . . . . . . . . | | 10,025 |
| 456 | | Factset Research Systems, Inc. (b) . | | 22,796 |
| 1,278 | | I2 Technologies, Inc. (a)(b) . . . . . . . | | 10,096 |
| 2,155 | | Informatica Corp. (a) . . . . . . . . . . . . | | 28,575 |
| 2,254 | | Jack Henry & Associates, Inc. . . . . . | | 36,785 |
| 1,560 | | JDA Software Group, Inc. (a) . . . . . | | 18,018 |
| 7,019 | | Lawson Software, Inc. (a) . . . . . . . . | | 29,831 |
| 824 | | Macrovision Solutions Corp. (a) . . . | | 14,659 |
| 1,095 | | Manhattan Associates, Inc. (a) . . . . | | 18,965 |
| 2,778 | | Mentor Graphics Corp. (a) . . . . . . . | | 12,334 |
| 256 | | MicroStrategy, Inc. (a) . . . . . . . . . . . | | 8,753 |
| 2,752 | | MSC Software Corp. (a) . . . . . . . . . | | 15,521 |
| 971 | | Net 1 UEPS Technologies, Inc. (a) . | | 14,769 |
| 790 | | Nuance Communications, Inc. (a)(b) | | 8,579 |
| 3,030 | | Parametric Technology Corp. (a) . . . | | 30,239 |
| Number of | | | | |
| Shares | | | | Value |
| | | Software (Continued) | | |
| 684 | | Phase Forward, Inc. (a) . . . . . . . . . . | $ | 8,748 |
| 1,154 | | Progress Software Corp. (a) . . . . . . | | 20,034 |
| 4,563 | | QAD, Inc. . | | 11,544 |
| 229 | | Quality Systems, Inc. . . . . . . . . . . . . | | 10,362 |
| 2,509 | | Red Hat, Inc. (a)(b) . . . . . . . . . . . . . | | 44,761 |
| 1,540 | | Renaissance Learning, Inc. . . . . . . . | | 13,814 |
| 657 | | salesforce.com, inc. (a) . . . . . . . . . . | | 21,504 |
| 524 | | Solera Holdings, Inc. (a)(b) . . . . . . . | | 12,985 |
| 145 | | SPSS Inc. (a) . . . . . . . . . . . . . . . . . . | | 4,122 |
| 2,335 | | Take-Two Interactive Software, Inc. | | 19,497 |
| 7,657 | | Tibco Software, Inc. (a) . . . . . . . . . . | | 44,947 |
| 1,003 | | Tyler Technologies, Inc. (a) . . . . . . . | | 14,674 |
| 853 | | Wind River Systems, Inc. (a) . . . . . . | | 5,459 |
| | | | | 619,042 |
| | | Specialty Retail - 3.62% | | |
| 3,293 | | bebe stores, inc. . . . . . . . . . . . . . . . . | | 21,964 |
| 924 | | The Buckle, Inc. . . . . . . . . . . . . . . . | | 29,503 |
| 953 | | Citi Trends, Inc. (a) . . . . . . . . . . . . . | | 21,814 |
| 4,223 | | Guess?, Inc. | | 89,021 |
| 1,111 | | Gymboree Corp. (a)(b) . . . . . . . . . . | | 23,720 |
| 1,008 | | Hibbett Sports, Inc. (a) . . . . . . . . . . | | 19,374 |
| 2,658 | | J.Crew Group, Inc. (a)(b) . . . . . . . . | | 35,033 |
| 828 | | Jos. A. Bank Clothiers, Inc. (a) . . . . | | 23,027 |
| 695 | | Lumber Liquidators, Inc. (a) . . . . . . | | 8,861 |
| 1,307 | | Maidenform Brands, Inc. (a) . . . . . . | | 11,972 |
| 395 | | Monro Muffler, Inc. . . . . . . . . . . . . . | | 10,795 |
| 5,147 | | Sally Beauty Holdings, Inc. (a) . . . . | | 29,235 |
| 2,377 | | Ulta Salon, Cosmetics & Fragrance, | | |
| | | Inc. (a) . . . | | 15,736 |
| 1,141 | | Weight Watchers International, Inc. | | 21,166 |
| 6,690 | | The Wet Seal, Inc. (a) . . . . . . . . . . . | | 22,478 |
| | | | | 383,699 |
| | | Textiles, Apparel & Luxury Goods - 0.96% |
| 6,762 | | Crocs, Inc. (a) . . . . . . . . . . . . . . . . . | | 8,047 |
| 156 | | Deckers Outdoor Corp. (a) . . . . . . . | | 8,274 |
| 573 | | Under Armour, Inc. (a)(b) . . . . . . . . | | 9,414 |
| 539 | | UniFirst Corp. . . . . . . . . . . . . . . . . . | | 15,006 |
| 1,466 | | Volcom, Inc. (a) . . . . . . . . . . . . . . . . | | 14,220 |
| 409 | | Weyco Group, Inc. . . . . . . . . . . . . . . | | 10,601 |
| 2,310 | | Wolverine World Wide, Inc. . . . . . . | | 35,990 |
| | | | | 101,552 |
| | | Thrifts & Mortgage Finance - 1.79% | | |
| 667 | | Capitol Federal Financial . . . . . . . . | | 25,219 |
See notes to financial statements.
AssetMark Enhanced Fundamental Index™ Small Company Growth Fund
SCHEDULE OF INVESTMENTS (Continued)
March 31, 2009
| Number of | | | | |
| Shares | | | | Value |
| | | COMMON STOCKS (Continued) | | |
| | | Thrifts & Mortgage Finance (Continued) |
| 2,114 | | Dime Community Bancshares . . . . . | $ | 19,829 |
| 974 | | Flushing Financial Corp. . . . . . . . . . | | 5,864 |
| 1,425 | | Kearny Financial Corp. . . . . . . . . . . | | 14,934 |
| 2,141 | | NewAlliance Bancshares, Inc. . . . . . | | 25,135 |
| 3,833 | | Northwest Bancorp, Inc. . . . . . . . . . | | 64,778 |
| 1,358 | | Oritani Financial Corp. (a)(b) . . . . . | | 19,012 |
| 923 | | Provident New York Bancorp . . . . . | | 7,892 |
| 571 | | United Financial Bancorp, Inc. . . . . | | 7,474 |
| | | | | 190,137 |
| | | Trading Companies & Distributors - 0.74% |
| 1,093 | | Houston Wire & Cable Co. . . . . . . . | | 8,471 |
| 1,632 | | Textainer Group Holdings Ltd. (b) . | | 11,016 |
| 436 | | TransDigm Group Inc. (a) . . . . . . . . | | 14,318 |
| 1,318 | | Watsco, Inc. | | 44,851 |
| | | | | 78,656 |
| | | Water Utilities - 0.50% | | |
| 869 | | American States Water Co. . . . . . . . | | 31,562 |
| 429 | | Connecticut Water Service, Inc. . . . | | 8,700 |
| 491 | | SJW Corp. . | | 12,486 |
| | | | | 52,748 |
| | | Wireless Telecommunication Services - 0.51% |
| 1,924 | | Centennial Communications | | |
| | | Corp. (a) . . | | 15,892 |
| 1,620 | | iPCS, Inc. (a) . . . . . . . . . . . . . . . . . . | | 15,730 |
| 513 | | SBA Communications Corp. (a)(b) . | | 11,953 |
| 642 | | Syniverse Holdings, Inc. (a) . . . . . . | | 10,118 |
| | | | | 53,693 |
| | | Total Common Stocks | | |
| | | (Cost $12,819,622) . . . . . . . . . . . . | | 9,849,015 |
| | | REAL ESTATE INVESTMENT | | |
| | | TRUSTS - 2.52% | | |
| | | Real Estate Investment Trusts - 2.52% | |
| 48 | | Alexander’s, Inc. . . . . . . . . . . . . . . . | | 8,178 |
| 1,938 | | BioMed Realty Trust, Inc. . . . . . . . . | | 13,120 |
| 487 | | Corporate Office Properties | | |
| | | Trust (b) . . | | 12,092 |
| 256 | | Digital Realty Trust, Inc. (b) . . . . . . | | 8,494 |
| 311 | | EastGroup Properties, Inc. . . . . . . . . | | 8,730 |
| 567 | | Equity Lifestyle Properties, Inc. . . . | | 21,603 |
| 878 | | Extra Space Storage, Inc. . . . . . . . . | | 4,838 |
| 2,613 | | Inland Real Estate Corp. . . . . . . . . . | | 18,526 |
| 1,022 | | Kilroy Realty Corp. . . . . . . . . . . . . . | | 17,568 |
| Number of | | | | |
| Shares | | | | Value |
| | | Real Estate Investment Trusts (Continued) |
| 839 | | LTC Properties, Inc. . . . . . . . . . . . . | $ | 14,716 |
| 2,063 | | MFA Mortgage Investments, Inc. | | 12,131 |
| 871 | | Mid-America Apartment | | |
| | | Communities, Inc. . . . . . . . . . . . . . | | 26,853 |
| 1,524 | | Omega Healthcare Investors, Inc. | | 21,458 |
| 506 | | PS Business Parks, Inc. . . . . . . . . . . | | 18,646 |
| 534 | | Saul Centers, Inc. . . . . . . . . . . . . . . . | | 12,266 |
| 518 | | Tanger Factory Outlet Centers, | | |
| | | Inc. (b) . . . | | 15,986 |
| 682 | | Taubman Centers, Inc. (b) . . . . . . . . | | 11,621 |
| 345 | | Universal Health Realty Income | | |
| | | Trust . . . . . | | 10,084 |
| 573 | | Washington Real Estate Investment | | |
| | | Trust . . . . . | | 9,913 |
| | | | | 266,823 |
| | | Total Real Estate Investment Trusts | | |
| | | (Cost $386,182) . . . . . . . . . . . . . . . | | 266,823 |
| | | SHORT TERM INVESTMENTS - 4.10% |
| | | Money Market Fund - 4.10% | | |
| 434,554 | | Federated Prime Obligations Fund | | 434,554 |
| | | Total Short Term Investments | | |
| | | (Cost $434,554) . . . . . . . . . . . . . . . | | 434,554 |
| | | INVESTMENTS PURCHASED | | |
| | | AS SECURITIES LENDING | | |
| | | COLLATERAL - 17.07% | | |
| | | Money Market Fund - 17.07% | | |
| 1,810,126 | | Mount Vernon Prime Portfolio . . . . | | 1,810,126 |
| | | Total Money Market Funds | | |
| | | (Cost $1,810,126) . . . . . . . . . . . . . | | 1,810,126 |
| | | Total Investments Purchased as | | |
| | | Securities Lending Collateral | | |
| | | (Cost $1,810,126) . . . . . . . . . . . . . | | 1,810,126 |
| | | Total Investments | | |
| | | (Cost $15,450,484) — 116.60% | | 12,360,518 |
| | | Liabilities in Excess of | | |
| | | Other Assets - (16.60)% . . . . . . . | | (1,759,819) |
| | | TOTAL NET | | |
| | | ASSETS - 100.00% . . . . . . . . . . . | $ | 10,600,699 |
| | | | | |
| Percentages are stated as a percent of net assets. | | |
| (a) Non-income producing. | | |
| (b) All or a portion of this security is on loan. | | |
See notes to financial statements.
AssetMark Enhanced Fundamental Index™ Small Company Growth Fund
SCHEDULE OF OPEN FUTURES CONTRACTS
March 31, 2009
| | Number of | | | | | | |
| | Contracts | | Notional | | Settlement | | Unrealized |
| Description | | Purchased | | Value | | Month | | Appreciation |
| Russell 2000 Index Mini Futures | 12 | | $497,760 | | Jun-09 | | $49,009 |
See notes to financial statements.
AssetMark Enhanced Fundamental Index™ Small Company Value Fund
SCHEDULE OF INVESTMENTS
March 31, 2009
| Number of | | | | |
| Shares | | | | Value |
| | | COMMON STOCKS - 91.54% | | |
| | | Aerospace & Defense - 1.28% | | |
| 836 | | AAR Corp. (a) . . . . . . . . . . . . . . . . . | $ | 10,483 |
| 403 | | Ducommun, Inc. . . . . . . . . . . . . . . . | | 5,860 |
| 1,912 | | DynCorp International, Inc. (a) . . . . | | 25,487 |
| 312 | | Hawk Corp. (a) . . . . . . . . . . . . . . . . | | 3,603 |
| 538 | | Herley Industries, Inc. (a) . . . . . . . . | | 6,434 |
| 994 | | Kaman Corp. . . . . . . . . . . . . . . . . . . | | 12,465 |
| 278 | | Triumph Group, Inc. . . . . . . . . . . . . | | 10,620 |
| | | | | 74,952 |
| | | Air Freight & Logistics - 0.74% | | |
| 36,344 | | Air Transport Services Group, | | |
| | | Inc. (a) . . . | | 27,985 |
| 2,027 | | Pacer International, Inc. . . . . . . . . . . | | 7,094 |
| 2,527 | | Park-Ohio Holdings Corp. (a) . . . . . | | 8,238 |
| | | | | 43,317 |
| | | Airlines - 0.50% | | |
| 3,810 | | AirTran Holdings, Inc. (a)(b) . . . . . | | 17,336 |
| 2,923 | | Pinnacle Airlines Corp. (a) . . . . . . . | | 4,063 |
| 1,234 | | Republic Airways Holdings, | | |
| | | Inc. (a) . . . | | 7,996 |
| | | | | 29,395 |
| | | Auto Components - 0.98% | | |
| 514 | | Dorman Products, Inc. (a) . . . . . . . . | | 4,796 |
| 1,117 | | Drew Industries, Inc. (a) . . . . . . . . . | | 9,696 |
| 63,618 | | Hayes Lemmerz International, | | |
| | | Inc. (a) . . . | | 11,769 |
| 4,137 | | Shiloh Industries, Inc. (a) . . . . . . . . | | 8,481 |
| 2,256 | | Standard Motor Products, Inc. . . . . . | | 6,204 |
| 1,358 | | Superior Industries | | |
| | | International, Inc. . . . . . . . . . . . . . | | 16,092 |
| | | | | 57,038 |
| | | Automobiles - 0.29% | | |
| 15,576 | | Monaco Coach Corp. . . . . . . . . . . . . | | 2,336 |
| 2,729 | | Winnebago Industries, Inc. . . . . . . . | | 14,491 |
| | | | | 16,827 |
| | | Beverages - 0.28% | | |
| 1,752 | | National Beverage Corp. (a) . . . . . . | | 16,066 |
| | | Building Products - 1.95% | | |
| 875 | | American Woodmark Corp. . . . . . . . | | 15,365 |
| 1,571 | | Apogee Enterprises, Inc. . . . . . . . . . | | 17,250 |
| 3,310 | | Dayton Superior Corp. (a) . . . . . . . . | | 1,357 |
| 3,126 | | Griffon Corp. (a) . . . . . . . . . . . . . . . | | 23,445 |
| Number of | | | | |
| Shares | | | | Value |
| | | Building Products (Continued) | | |
| 423 | | Insteel Industries, Inc. . . . . . . . . . . . | $ | 2,944 |
| 1,559 | | NCI Building Systems, Inc. (a) . . . . | | 3,461 |
| 7,286 | | PGT, Inc. (a) . . . . . . . . . . . . . . . . . . | | 10,127 |
| 981 | | Simpson Manufacturing Co., | | |
| | | Inc. (b) . . . | | 17,678 |
| 847 | | Universal Forest Products, Inc. . . . . | | 22,539 |
| | | | | 114,166 |
| | | Capital Markets - 1.31% | | |
| 798 | | Cowen Group, Inc. (a) . . . . . . . . . . . | | 3,886 |
| 2,875 | | FBR Capital Markets Corp. (a) . . . . | | 9,459 |
| 2,628 | | HFF, Inc. (a) . . . . . . . . . . . . . . . . . . | | 5,256 |
| 5,203 | | National Financial Partners Corp. . . | | 16,649 |
| 679 | | Penson Worldwide, Inc. (a)(b) . . . . . | | 4,366 |
| 682 | | Piper Jaffray Cos. (a) . . . . . . . . . . . . | | 17,589 |
| 1,153 | | Sanders Morris Harris Group, Inc. . | | 4,497 |
| 457 | | SWS Group, Inc. . . . . . . . . . . . . . . . | | 7,097 |
| 2,181 | | Thomas Weisel Partners Group, | | |
| | | Inc. (a) . . . | | 7,808 |
| | | | | 76,607 |
| | | Chemicals - 2.05% | | |
| 30,236 | | Georgia Gulf Corp. . . . . . . . . . . . . . | | 21,468 |
| 360 | | Hawkins, Inc. . . . . . . . . . . . . . . . . . . | | 5,555 |
| 4,550 | | Headwaters, Inc. (a)(b) . . . . . . . . . . | | 14,287 |
| 2,709 | | ICO, Inc. (a) | | 5,581 |
| 2,046 | | Innospec, Inc. . . . . . . . . . . . . . . . . . | | 7,713 |
| 840 | | NL Industries . . . . . . . . . . . . . . . . . . | | 8,400 |
| 8,098 | | Omnova Solutions, Inc. (a) . . . . . . . | | 14,091 |
| 707 | | Penford Corp. . . . . . . . . . . . . . . . . . | | 2,566 |
| 1,309 | | Quaker Chemical Corp. . . . . . . . . . . | | 10,393 |
| 589 | | Sensient Technologies Corp. . . . . . . | | 13,842 |
| 3,255 | | Spartech Corp. . . . . . . . . . . . . . . . . . | | 8,007 |
| 298 | | Stepan Co. . | | 8,135 |
| | | | | 120,038 |
| | | Commercial Banks - 12.03% | | |
| 4,444 | | AMCORE Financial, Inc. . . . . . . . . | | 7,110 |
| 282 | | American National Bankshares, Inc. | | 4,399 |
| 612 | | Ameris Bancorp . . . . . . . . . . . . . . . . | | 2,883 |
| 261 | | Ames National Corp. . . . . . . . . . . . . | | 4,460 |
| 243 | | Arrow Financial Corp. . . . . . . . . . . . | | 5,757 |
| 613 | | Atlantic Southern Financial | | |
| | | Group, Inc. | | 3,004 |
| 1,107 | | Banco Latinoamericano de | | |
| | | Exportaciones, S.A. . . . . . . . . . . . . | | 10,373 |
See notes to financial statements.
AssetMark Enhanced Fundamental Index™ Small Company Value Fund
SCHEDULE OF INVESTMENTS (Continued)
March 31, 2009
| Number of | | | | |
| Shares | | | | Value |
| | | COMMON STOCKS (Continued) | | |
| | | Commercial Banks (Continued) | | |
| 199 | | Bancorp Rhode Island, Inc. . . . . . . . | $ | 3,596 |
| 566 | | BancTrust Financial Group, Inc. . . . | | 3,583 |
| 1,349 | | Banner Corp. (b) . . . . . . . . . . . . . . . | | 3,926 |
| 1,587 | | Boston Private Financial | | |
| | | Holdings, Inc. . . . . . . . . . . . . . . . . | | 5,570 |
| 1,262 | | Cadence Financial Corp. . . . . . . . . . | | 5,578 |
| 681 | | Capital City Bank Group, Inc. (b) . . | | 7,804 |
| 1,324 | | Capitol Bancorp Ltd. . . . . . . . . . . . . | | 5,495 |
| 1,121 | | Cascade Bancorp (b) . . . . . . . . . . . . | | 1,827 |
| 742 | | Center Bancorp, Inc. . . . . . . . . . . . . | | 5,357 |
| 2,677 | | Central Pacific Financial Corp. . . . . | | 14,991 |
| 741 | | Chemical Financial Corp. . . . . . . . . | | 15,420 |
| 758 | | Columbia Banking System, Inc. . . . | | 4,851 |
| 620 | | Community Bank System, Inc. . . . . | | 10,385 |
| 436 | | Community Trust Bancorp, Inc. . . . | | 11,663 |
| 2,172 | | East West Bancorp, Inc. . . . . . . . . . . | | 9,926 |
| 550 | | Eastern Virginia Bankshares, Inc. . . | | 4,614 |
| 2,629 | | F.N.B. Corp. | | 20,164 |
| 232 | | Farmers Capital Bank Corp. . . . . . . | | 3,635 |
| 665 | | Financial Institutions, Inc. . . . . . . . . | | 5,067 |
| 462 | | First Bancorp . . . . . . . . . . . . . . . . . . | | 5,530 |
| 617 | | First Citizens Banc Corp. . . . . . . . . | | 4,631 |
| 2,314 | | First Commonwealth Financial Corp. | | 20,525 |
| 289 | | First Community Bancshares, Inc. . | | 3,373 |
| 2,464 | | First Financial Bancorp . . . . . . . . . . | | 23,482 |
| 971 | | First M & F Corp. . . . . . . . . . . . . . . | | 5,943 |
| 1,027 | | First Merchants Corp. . . . . . . . . . . . | | 11,081 |
| 7,685 | | First State Bancorp. . . . . . . . . . . . . . | | 10,836 |
| 387 | | First United Corp. . . . . . . . . . . . . . . | | 3,243 |
| 5,471 | | Frontier Financial Corp. (b) . . . . . . . | | 6,018 |
| 503 | | German American Bancorp . . . . . . . | | 6,011 |
| 604 | | Great Southern Bancorp, Inc. (b) . . | | 8,462 |
| 1,088 | | Greene County Bancshares, | | |
| | | Inc. (b) . . . | | 9,574 |
| 4,358 | | Guaranty Bancorp (a)(b) . . . . . . . . . | | 7,626 |
| 3,793 | | Hanmi Financial Corp. . . . . . . . . . . | | 4,931 |
| 693 | | Harleysville National Corp. . . . . . . . | | 4,200 |
| 284 | | Hawthorn Bancshares, Inc. . . . . . . . | | 3,223 |
| 425 | | Heartland Financial USA, Inc. . . . . | | 5,754 |
| 4,155 | | Independent Bank Corporation . . . . | | 9,723 |
| 4,081 | | Integra Bank Corp. . . . . . . . . . . . . . | | 7,713 |
| 4,509 | | Irwin Financial Corp. (a) . . . . . . . . . | | 8,793 |
| 1,042 | | Lakeland Bancorp, Inc. . . . . . . . . . . | | 8,367 |
| Number of | | | | |
| Shares | | | Value |
| | | Commercial Banks (Continued) | | |
| 1,319 | | Macatawa Bank Corp. . . . . . . . . . . . | $ | 4,880 |
| 463 | | MainSource Financial Group, Inc. . | | 3,723 |
| 1,618 | | MB Financial Corp. . . . . . . . . . . . . . | | 22,005 |
| 1,901 | | MBT Financial Corp. . . . . . . . . . . . | | 3,517 |
| 1,460 | | Mercantile Bank Corp. . . . . . . . . . . | | 7,840 |
| 4,504 | | Midwest Banc Holdings, Inc. (b) . . | | 4,549 |
| 1,257 | | Nara Bancorp, Inc. . . . . . . . . . . . . . . | | 3,696 |
| 239 | | National Bankshares, Inc. . . . . . . . . | | 4,510 |
| 558 | | NBT Bancorp, Inc. . . . . . . . . . . . . . | | 12,075 |
| 1,614 | | Newbridge Bancorp . . . . . . . . . . . . . | | 3,406 |
| 338 | | Old Point Financial Corp. . . . . . . . . | | 6,368 |
| 1,132 | | Old Second Bancorp, Inc. (b) . . . . . | | 7,188 |
| 816 | | Oriental Financial Group (b) . . . . . . | | 3,982 |
| 1,749 | | Pacific Capital Bancorp . . . . . . . . . . | | 11,841 |
| 395 | | Peoples Bancorp Inc. . . . . . . . . . . . . | | 5,127 |
| 500 | | Porter Bancorp, Inc. . . . . . . . . . . . . . | | 5,700 |
| 1,535 | | Preferred Bank Los Angeles . . . . . . | | 8,043 |
| 2,417 | | Provident Bankshares Corp. . . . . . . | | 17,040 |
| 747 | | Renasant Corp. . . . . . . . . . . . . . . . . | | 9,382 |
| 1,018 | | Royal Bancshares of Pennsylvania . | | 2,138 |
| 898 | | Sandy Spring Bancorp, Inc. . . . . . . . | | 10,022 |
| 1,661 | | Santander BanCorp (b) . . . . . . . . . . | | 13,089 |
| 1,239 | | Seacoast Banking Corp of | | |
| | | Florida (b) | | 3,754 |
| 3,774 | | Security Bank Corp. . . . . . . . . . . . . | | 1,472 |
| 2,653 | | Security National Financial | | |
| | | Corp. (a) . . | | 4,245 |
| 628 | | Southwest Bancorp, Inc. . . . . . . . . . | | 5,891 |
| 1,003 | | Sterling Bancorp . . . . . . . . . . . . . . . | | 9,930 |
| 2,450 | | Sun Bancorp, Inc. (a) . . . . . . . . . . . . | | 12,716 |
| 1,081 | | Taylor Capital Group, Inc. . . . . . . . . | | 4,810 |
| 286 | | TriCo Bancshares . . . . . . . . . . . . . . | | 4,788 |
| 4,570 | | UCBH Holdings, Inc. (b) . . . . . . . . | | 6,901 |
| 2,057 | | Umpqua Holdings Corp. (b) . . . . . . | | 18,636 |
| 540 | | Union Bankshares Corp. . . . . . . . . . | | 7,479 |
| 359 | | Union Bankshares, Inc. . . . . . . . . . . | | 6,417 |
| 1,591 | | United Community Banks, Inc. (b) . | | 6,619 |
| 392 | | Univest Corporation of | | |
| | | Pennsylvania . . . . . . . . . . . . . . . . . | | 6,860 |
| 571 | | Washington Trust Bancorp, Inc. . . . | | 9,279 |
| 1,086 | | WesBanco, Inc. . . . . . . . . . . . . . . . . | | 24,793 |
| 563 | | West Bancorporation, Inc. (b) . . . . . | | 4,194 |
| 1,295 | | West Coast Bancorp . . . . . . . . . . . . | | 2,875 |
| 2,012 | | Western Alliance Bancorp (a)(b) . . . | | 9,175 |
See notes to financial statements.
AssetMark Enhanced Fundamental Index™ Small Company Value Fund
SCHEDULE OF INVESTMENTS (Continued)
March 31, 2009
| Number of | | | | |
| Shares | | | | Value |
| | | COMMON STOCKS (Continued) | | |
| | | Commercial Banks (Continued) | | |
| 722 | | Wilshire Bancorp, Inc. . . . . . . . . . . . | $ | 3,726 |
| 1,447 | | Wintrust Financial Corp. . . . . . . . . . | | 17,798 |
| | | | | 702,956 |
| | | Commercial Services & Supplies - 4.18% | |
| 128 | | AMREP Corp. (a) . . . . . . . . . . . . . . | | 2,010 |
| 508 | | Barrett Business Services, Inc. . . . . | | 4,887 |
| 1,672 | | Bowne & Co, Inc. . . . . . . . . . . . . . . | | 5,367 |
| 2,928 | | Casella Waste Systems, Inc. (a) . . . . | | 5,007 |
| 2,623 | | Cenveo, Inc. (a) . . . . . . . . . . . . . . . . | | 8,525 |
| 1,860 | | Comfort Systems USA, Inc. . . . . . . | | 19,288 |
| 1,181 | | CompX International, Inc. . . . . . . . . | | 6,708 |
| 4,344 | | COMSYS IT Partners, Inc. (a) . . . . | | 9,600 |
| 743 | | Consolidated Graphics, Inc. (a) . . . . | | 9,451 |
| 1,065 | | CPI Corp. . . | | 7,870 |
| 1,473 | | Diamond Mgt. & Technology | | |
| | | Consultants, Inc. . . . . . . . . . . . . . . | | 3,756 |
| 726 | | Ennis, Inc. . | | 6,432 |
| 1,658 | | Franklin Covey Co. (a) . . . . . . . . . . | | 7,279 |
| 765 | | G&K Services, Inc. . . . . . . . . . . . . . | | 14,466 |
| 5,545 | | Hudson Highland Group, Inc. (a) . . | | 6,155 |
| 197 | | ICF International, Inc. (a) . . . . . . . . | | 4,525 |
| 2,457 | | ICT Group, Inc. (a) . . . . . . . . . . . . . | | 13,685 |
| 639 | | Jackson Hewitt Tax Service, Inc. . . . | | 3,336 |
| 1,720 | | Kforce, Inc. (a) . . . . . . . . . . . . . . . . | | 12,092 |
| 2,308 | | Knoll, Inc. . | | 14,148 |
| 2,336 | | LECG Corp. (a) . . . . . . . . . . . . . . . . | | 5,933 |
| 1,029 | | Mac-Gray Corp. (a) . . . . . . . . . . . . . | | 5,382 |
| 1,240 | | Nashua Corp. (a) . . . . . . . . . . . . . . . | | 1,240 |
| 1,757 | | Protection One, Inc. (a)(b) . . . . . . . . | | 5,605 |
| 3,010 | | RCM Technologies, Inc. (a) . . . . . . | | 3,100 |
| 948 | | Schawk, Inc. . . . . . . . . . . . . . . . . . . | | 5,726 |
| 620 | | School Specialty, Inc. (a) . . . . . . . . . | | 10,906 |
| 11,072 | | Spherion Corp. (a) . . . . . . . . . . . . . . | | 23,030 |
| 2,333 | | The Standard Register Co. . . . . . . . . | | 10,685 |
| 1,131 | | Waste Services, Inc. (a) . . . . . . . . . . | | 4,841 |
| 2,092 | | WCA Waste Corp. (a) . . . . . . . . . . . | | 3,452 |
| | | | | 244,487 |
| | | Communications Equipment - 1.46% | | |
| 1,330 | | Audiovox Corp. (a) . . . . . . . . . . . . . | | 4,562 |
| 398 | | Bel Fuse, Inc. . . . . . . . . . . . . . . . . . . | | 5,349 |
| 1,075 | | Belden, Inc. | | 13,448 |
| 618 | | Black Box Corp. . . . . . . . . . . . . . . . | | 14,591 |
| 1,032 | | Cogo Group, Inc. (a) . . . . . . . . . . . . | | 6,894 |
| Number of | | | | |
| Shares | | | | Value |
| | | Communications Equipment (Continued) | |
| 736 | | Harris Stratex Networks, Inc. (a) . . . | $ | 2,834 |
| 1,105 | | Loral Space & Communications | | |
| | | Ltd. (a) . . . | | 23,603 |
| 845 | | Netgear, Inc. (a)(b) . . . . . . . . . . . . . | | 10,182 |
| 1,176 | | Symmetricom, Inc. (a) . . . . . . . . . . . | | 4,116 |
| | | | | 85,579 |
| | | Computers & Peripherals - 1.18% | | |
| 2,108 | | Avid Technology, Inc. (a) . . . . . . . . | | 19,267 |
| 1,028 | | Electronics For Imaging, Inc. (a) . . . | | 10,074 |
| 3,998 | | Hutchinson Technology, Inc. (a)(b) . | | 10,395 |
| 2,353 | | Imation Corp. . . . . . . . . . . . . . . . . . . | | 18,001 |
| 16,482 | | Quantum Corp. (a) . . . . . . . . . . . . . . | | 11,043 |
| | | | | 68,780 |
| | | Construction & Engineering - 0.73% | | |
| 3,338 | | Dycom Industries, Inc. (a) . . . . . . . . | | 19,327 |
| 739 | | Insituform Technologies, Inc. (a) . . | | 11,558 |
| 447 | | Michael Baker Corp. (a) . . . . . . . . . | | 11,622 |
| | | | | 42,507 |
| | | Construction Materials - 0.43% | | |
| 755 | | Eagle Materials, Inc. (b) . . . . . . . . . | | 18,309 |
| 3,453 | | U.S. Concrete, Inc. (a) . . . . . . . . . . . | | 6,906 |
| | | | | 25,215 |
| | | Consumer Finance - 0.42% | | |
| 7,238 | | Advance America, Cash Advance | | |
| | | Centers, Inc. . . . . . . . . . . . . . . . . . . | | 12,232 |
| 10,680 | | Advanta Corp. . . . . . . . . . . . . . . . . . | | 7,049 |
| 615 | | Nelnet, Inc. (a) . . . . . . . . . . . . . . . . . | | 5,437 |
| | | | | 24,718 |
| | | Containers & Packaging - 1.13% | | |
| 679 | | AEP Industries, Inc. (a) . . . . . . . . . . | | 10,368 |
| 2,580 | | Bway Holding Company (a) . . . . . . | | 20,356 |
| 23,807 | | Caraustar Industries, Inc. (a) . . . . . . | | 3,333 |
| 2,061 | | Myers Industries, Inc. . . . . . . . . . . . | | 12,655 |
| 725 | | Rock-Tenn Co. . . . . . . . . . . . . . . . . . | | 19,611 |
| | | | | 66,323 |
| | | Distributors - 0.23% | | |
| 1,370 | | Prestige Brands Holdings, Inc. (a) . . | | 7,096 |
| 35,836 | | Source Interlink Companies, | | |
| | | Inc. (a)(b) . | | 6,630 |
| | | | | 13,726 |
See notes to financial statements.
AssetMark Enhanced Fundamental Index™ Small Company Value Fund
SCHEDULE OF INVESTMENTS (Continued)
March 31, 2009
| Number of | | | | |
| Shares | | | | Value |
| | | COMMON STOCKS (Continued) | | |
| | | Diversified Consumer Services - 0.46% | | |
| 1,624 | | Carriage Services, Inc. (a) . . . . . . . . | $ | 2,484 |
| 3,125 | | Chinacast Education Corp. (a) . . . . . | | 10,625 |
| 4,278 | | Stewart Enterprises, Inc. . . . . . . . . . | | 13,861 |
| | | | | 26,970 |
| | | Diversified Financial Services - 0.50% | | |
| 1,110 | | Asset Acceptance Capital | | |
| | | Corp. (a)(b) . . . . . . . . . . . . . . . . . . | | 5,894 |
| 926 | | Compass Diversified Holdings . . . . | | 8,260 |
| 11,682 | | The First Marblehead Corp. (a) . . . . | | 15,070 |
| | | | | 29,224 |
| | | Diversified Telecommunication Services - 1.26% |
| 2,087 | | Alaska Communications Systems | | |
| | | Group, Inc. (b) . . . . . . . . . . . . . . . . | | 13,983 |
| 2,777 | | Arbinet-thexchange, Inc. (a) . . . . . . | | 4,415 |
| 870 | | Consolidated Communications | | |
| | | Holdings, Inc. . . . . . . . . . . . . . . . . | | 8,926 |
| 940 | | D&E Communications, Inc. . . . . . . | | 5,048 |
| 1,825 | | Fairpoint Communications, Inc. (b) | | 1,423 |
| 1,699 | | General Communication (a) . . . . . . | | 11,349 |
| 9,472 | | IDT Corp. (a) . . . . . . . . . . . . . . . . . . | | 10,988 |
| 1,072 | | Iowa Telecommunications | | |
| | | Services, Inc. . . . . . . . . . . . . . . . . . | | 12,285 |
| 672 | | SureWest Communications . . . . . . . | | 5,242 |
| | | | | 73,659 |
| | | Electric Utilities - 2.42% | | |
| 333 | | Central Vermont Public | | |
| | | Service Corp. . . . . . . . . . . . . . . . . . | | 5,761 |
| 441 | | CH Energy Group, Inc. . . . . . . . . . . | | 20,683 |
| 3,295 | | El Paso Electric Co. (a) . . . . . . . . . . | | 46,426 |
| 1,059 | | The Empire District Electric Co. . . . | | 15,292 |
| 340 | | MGE Energy, Inc. . . . . . . . . . . . . . . | | 10,666 |
| 1,472 | | UIL Holdings Corp. . . . . . . . . . . . . . | | 32,855 |
| 472 | | Unitil Corp. | | 9,478 |
| | | | | 141,161 |
| | | Electrical Equipment - 0.37% | | |
| 1,607 | | Coleman Cable, Inc. (a) . . . . . . . . . . | | 3,423 |
| 572 | | Encore Wire Corp. (b) . . . . . . . . . . . | | 12,258 |
| 1,139 | | LSI Industries, Inc. . . . . . . . . . . . . . | | 5,889 |
| | | | | 21,570 |
| Number of | | | | |
| Shares | | | | Value |
| | | Electronic Equipment & Instruments - 2.26% |
| 1,150 | | Agilysys, Inc. . . . . . . . . . . . . . . . . . . | $ | 4,945 |
| 1,177 | | Coherent, Inc. (a) . . . . . . . . . . . . . . . | | 20,303 |
| 1,032 | | CPI International, Inc. (a) . . . . . . . . | | 9,701 |
| 2,451 | | CTS Corp. . | | 8,848 |
| 3,991 | | Gerber Scientific, Inc. (a) . . . . . . . . | | 9,538 |
| 810 | | GTSI Corp. (a) . . . . . . . . . . . . . . . . . | | 3,127 |
| 1,591 | | LoJack Corp. (a) . . . . . . . . . . . . . . . | | 7,207 |
| 12,520 | | Merix Corp. (a) . . . . . . . . . . . . . . . . | | 3,506 |
| 2,914 | | Methode Electronics, Inc. . . . . . . . . | | 10,432 |
| 4,796 | | Nu Horizons Electronics Corp. (a) . | | 9,592 |
| 968 | | Park Electrochemical Corp. . . . . . . . | | 16,727 |
| 7,452 | | Smart Modular Technologies, | | |
| | | Inc. (a) . . . | | 10,284 |
| 586 | | Spectrum Control, Inc. (a) . . . . . . . . | | 4,120 |
| 1,237 | | Tessco Technologies, Inc. (a) . . . . . | | 9,599 |
| 846 | | Zygo Corp. (a) . . . . . . . . . . . . . . . . . | | 3,883 |
| | | | | 131,812 |
| | | Energy Equipment & Services - 0.13% | |
| 1,032 | | Bronco Drilling Co, Inc. (a) . . . . . . | | 5,428 |
| 967 | | Trico Marine Service, Inc. (a)(b) . . . | | 2,031 |
| | | | | 7,459 |
| | | Food & Staples Retailing - 0.99% | | |
| 729 | | Andersons, Inc. . . . . . . . . . . . . . . . . | | 10,308 |
| 1,050 | | Spartan Stores, Inc. (b) . . . . . . . . . . | | 16,180 |
| 807 | | Susser Holdings Corp. (a) . . . . . . . . | | 10,846 |
| 794 | | United Natural Foods, Inc. (a) . . . . . | | 15,062 |
| 174 | | Village Super Market, Inc. . . . . . . . . | | 5,424 |
| | | | | 57,820 |
| | | Food Products - 1.47% | | |
| 939 | | B&G Foods, Inc. . . . . . . . . . . . . . . . | | 4,883 |
| 330 | | Diamond Foods, Inc. . . . . . . . . . . . . | | 9,217 |
| 1,563 | | Imperial Sugar Co. . . . . . . . . . . . . . | | 11,238 |
| 400 | | Lancaster Colony Corp. . . . . . . . . . . | | 16,592 |
| 886 | | Lance, Inc. . | | 18,446 |
| 4,280 | | Reddy Ice Holdings, Inc. . . . . . . . . . | | 6,292 |
| 220 | | Sanderson Farms, Inc. . . . . . . . . . . . | | 8,261 |
| 261 | | TreeHouse Foods, Inc. (a) . . . . . . . . | | 7,514 |
| 623 | | Zapata Corp. (a) . . . . . . . . . . . . . . . . | | 3,557 |
| | | | | 86,000 |
See notes to financial statements.
AssetMark Enhanced Fundamental Index™ Small Company Value Fund
SCHEDULE OF INVESTMENTS (Continued)
March 31, 2009
| Number of | | | | |
| Shares | | | | Value |
| | | COMMON STOCKS (Continued) | | |
| | | Health Care Equipment & Supplies - 0.86% |
| 7,825 | | Candela Corp. (a) . . . . . . . . . . . . . . | $ | 3,286 |
| 590 | | The Cooper Companies, Inc. . . . . . . | | 15,600 |
| 2,294 | | HealthTronics, Inc. (a) . . . . . . . . . . . | | 3,120 |
| 985 | | Invacare Corp. . . . . . . . . . . . . . . . . . | | 15,790 |
| 1,150 | | National Dentex Corp. (a) . . . . . . . . | | 4,473 |
| 437 | | Orthofix International NV (a) . . . . . | | 8,093 |
| | | | | 50,362 |
| | | Health Care Providers & Services - 2.50% | |
| 1,211 | | Alliance Healthcare Services, | | |
| | | Inc. (a) . . . | | 8,235 |
| 708 | | America Service Group, Inc. (a) . . . | | 9,204 |
| 7,651 | | BioScrip, Inc. (a) . . . . . . . . . . . . . . . | | 17,903 |
| 2,393 | | Cross Country Healthcare, Inc. (a) . | | 15,674 |
| 439 | | The Ensign Group, Inc. . . . . . . . . . . | | 6,787 |
| 6,359 | | Five Star Quality Care, Inc. (a) . . . . | | 6,614 |
| 741 | | Hanger Orthopedic Group, Inc. (a) . | | 9,818 |
| 1,471 | | HealthSpring, Inc. (a) . . . . . . . . . . . | | 12,312 |
| 1,371 | | LCA-Vision, Inc. (b) . . . . . . . . . . . . | | 3,990 |
| 1,719 | | MedCath Corp. (a) . . . . . . . . . . . . . . | | 12,497 |
| 726 | | Odyssey HealthCare, Inc. (a) . . . . . . | | 7,042 |
| 1,224 | | PDI, Inc. (a) | | 3,721 |
| 680 | | RehabCare Group, Inc. (a) . . . . . . . | | 11,859 |
| 544 | | Res-Care, Inc. (a) . . . . . . . . . . . . . . . | | 7,921 |
| 3,428 | | Rural/Metro Corp. (a) . . . . . . . . . . . | | 2,948 |
| 1,173 | | Skilled Healthcare Group, Inc. (a) . . | | 9,630 |
| | | | | 146,155 |
| | | Hotels, Restaurants & Leisure - 6.50% | | |
| 4,091 | | AFC Enterprises (a) . . . . . . . . . . . . . | | 18,450 |
| 991 | | Ameristar Casinos, Inc. . . . . . . . . . . | | 12,467 |
| 4,280 | | Bluegreen Corp. (a) . . . . . . . . . . . . . | | 7,447 |
| 1,057 | | Bob Evans Farms, Inc. . . . . . . . . . . . | | 23,698 |
| 926 | | California Pizza Kitchen, Inc. (a) . . | | 12,112 |
| 6,675 | | Callaway Golf Co. . . . . . . . . . . . . . . | | 47,927 |
| 572 | | CEC Entertainment, Inc. (a) . . . . . . | | 14,803 |
| 198 | | Churchill Downs, Inc. . . . . . . . . . . . | | 5,952 |
| 2,334 | | CKE Restaurants, Inc. . . . . . . . . . . . | | 19,606 |
| 11,189 | | Denny’s Corp. (a) . . . . . . . . . . . . . . | | 18,686 |
| 633 | | DineEquity, Inc. . . . . . . . . . . . . . . . . | | 7,507 |
| 257 | | Frisch’s Restaurants, Inc. . . . . . . . . . | | 5,204 |
| 8,716 | | Interstate Hotels & Resorts, Inc. (a) | | 3,486 |
| 2,525 | | Isle of Capri Casinos, Inc. (a) . . . . . | | 13,357 |
| 878 | | Landry’s Restaurants, Inc. . . . . . . . . | | 4,583 |
| Number of | | | | |
| Shares | | | | Value |
| | | Hotels, Restaurants & Leisure (Continued) |
| 1,950 | | Lodgian, Inc. (a) . . . . . . . . . . . . . . . | $ | 4,095 |
| 2,466 | | Luby’s, Inc. (a) . . . . . . . . . . . . . . . . | | 12,108 |
| 351 | | Marcus Corp. . . . . . . . . . . . . . . . . . . | | 2,984 |
| 1,348 | | McCormick & Schmick’s Seafood | | |
| | | Restaurants, Inc. (a) . . . . . . . . . . . . | | 5,284 |
| 1,831 | | Morton’s Restaurant Group, Inc. (a) | | 4,889 |
| 4,516 | | O’Charleys, Inc. . . . . . . . . . . . . . . . . | | 13,593 |
| 1,612 | | Pinnacle Entertainment, Inc. (a) . . . | | 11,349 |
| 2,160 | | RC2 Corp. (a) . . . . . . . . . . . . . . . . . | | 11,383 |
| 2,491 | | Red Lion Hotels Corp. (a) . . . . . . . . | | 7,299 |
| 725 | | Red Robin Gourmet Burgers, | | |
| | | Inc. (a) . . . | | 12,782 |
| 10,597 | | Ruby Tuesday, Inc. (a) . . . . . . . . . . . | | 30,943 |
| 1,552 | | Speedway Motorsports, Inc. . . . . . . | | 18,345 |
| 1,995 | | The Steak n Shake Co. (a)(b) . . . . . | | 15,102 |
| 3,797 | | Town Sports International | | |
| | | Holdings, Inc. (a)(b) . . . . . . . . . . . | | 11,353 |
| 35,901 | | Trump Entertainment Resorts, | | |
| | | Inc. (a)(b) . | | 2,872 |
| | | | | 379,666 |
| | | Household Durables - 2.98% | | |
| 480 | | Avatar Holdings, Inc. (a) . . . . . . . . . | | 7,190 |
| 797 | | Blyth, Inc. . | | 20,826 |
| 18,444 | | Champion Enterprises, Inc. (a) . . . . | | 8,853 |
| 623 | | CSS Industries, Inc. . . . . . . . . . . . . . | | 10,591 |
| 3,409 | | Dixie Group, Inc. (a) . . . . . . . . . . . . | | 3,750 |
| 638 | | Helen of Troy Ltd. (a) . . . . . . . . . . . | | 8,772 |
| 9,315 | | La-Z-Boy, Inc. . . . . . . . . . . . . . . . . . | | 11,644 |
| 4,752 | | Libbey, Inc. | | 4,372 |
| 2,255 | | M/I Homes, Inc. . . . . . . . . . . . . . . . . | | 15,762 |
| 122 | | National Presto Industries, Inc. . . . . | | 7,443 |
| 4,463 | | Orleans Homebuilders, Inc. (b) . . . . | | 10,667 |
| 1,398 | | Palm Harbor Homes, Inc. (a) . . . . . . | | 3,118 |
| 2,076 | | Russ Berrie & Company, Inc. (a) . . | | 2,740 |
| 7,520 | | Sealy Corp. (a) . . . . . . . . . . . . . . . . . | | 11,205 |
| 564 | | Skyline Corp. . . . . . . . . . . . . . . . . . . | | 10,722 |
| 1,845 | | Stanley Furniture Co, Inc. . . . . . . . . | | 13,874 |
| 3,070 | | Tempur-Pedic International, Inc. . . . | | 22,411 |
| | | | | 173,940 |
| | | Household Products - 0.37% | | |
| 2,153 | | Central Garden & Pet Co. (a) . . . . . | | 16,191 |
| 383 | | Oil-Dri Corporation of America . . . | | 5,649 |
| | | | | 21,840 |
See notes to financial statements.
AssetMark Enhanced Fundamental Index™ Small Company Value Fund
SCHEDULE OF INVESTMENTS (Continued)
March 31, 2009
| Number of | | | | |
| Shares | | | | Value |
| | | COMMON STOCKS (Continued) | | |
| | | Industrial Conglomerates - 0.40% | | |
| 1,182 | | Standex International Corp. . . . . . . . | | $ 10,875 |
| 758 | | Tredegar Corp. . . . . . . . . . . . . . . . . . | | 12,378 |
| | | | | 23,253 |
| | | Insurance - 3.77% | | |
| 2,352 | | Affirmative Insurance Holdings, Inc. | | 7,479 |
| 3,196 | | American Equity Investment Life | | |
| | | Holding Co. . . . . . . . . . . . . . . . . . . | | 13,295 |
| 946 | | Baldwin & Lyons, Inc. . . . . . . . . . . | | 17,898 |
| 973 | | Crawford & Co. (a) . . . . . . . . . . . . . | | 6,539 |
| 909 | | Donegal Group, Inc. (b) . . . . . . . . . . | | 13,971 |
| 702 | | EMC Insurance Group, Inc. . . . . . . | | 14,791 |
| 4,352 | | First Acceptance Corp. (a) . . . . . . . . | | 10,532 |
| 584 | | First Mercury Financial Corp. (a) . . | | 8,433 |
| 1,137 | | Flagstone Reinsurance Holdings Ltd. | | 8,857 |
| 205 | | FPIC Insurance Group, Inc. (a) . . . . | | 7,591 |
| 977 | | Hallmark Financial Services, | | |
| | | Inc. (a) . . . | | 6,771 |
| 2,789 | | Horace Mann Educators Corp. . . . . | | 23,344 |
| 1,927 | | Independence Holding Co. (b) . . . . | | 9,654 |
| 1,845 | | Meadowbrook Insurance | | |
| | | Group, Inc. | | 11,255 |
| 505 | | NYMAGIC, Inc. (b) . . . . . . . . . . . . | | 6,161 |
| 3,115 | | PMA Capital Corp. (a) . . . . . . . . . . | | 12,990 |
| 2,075 | | Presidential Life Corp. . . . . . . . . . . | | 16,164 |
| 896 | | Seabright Insurance Holdings, | | |
| | | Inc. (a) . . . | | 9,372 |
| 3,789 | | United America Indemnity, | | |
| | | Ltd. (a) . . . | | 15,232 |
| | | | | 220,329 |
| | | Internet & Catalog Retail - 0.93% | | |
| 2,846 | | 1-800-FLOWERS.COM, Inc. (a) . . | | 5,891 |
| 1,471 | | Alloy, Inc. (a) . . . . . . . . . . . . . . . . . . | | 6,178 |
| 5,139 | | Orbitz Worldwide, Inc. (a) . . . . . . . . | | 6,629 |
| 2,664 | | PC Mall, Inc. (a) . . . . . . . . . . . . . . . | | 12,095 |
| 33,844 | | ValueVision Media, Inc. (a) . . . . . . . | | 23,353 |
| | | | | 54,146 |
| | | Internet Software & Services - 0.46% | | |
| 5,024 | | iBasis, Inc. (a) . . . . . . . . . . . . . . . . . | | 3,366 |
| 1,102 | | InfoSpace, Inc. (a) . . . . . . . . . . . . . . | | 5,730 |
| 3,963 | | United Online, Inc. . . . . . . . . . . . . . | | 17,675 |
| | | | | 26,771 |
| Number of | | | | |
| Shares | | | | Value |
| | | IT Services - 3.11% | | |
| 1,952 | | Acxiom Corp. . . . . . . . . . . . . . . . . . | $ | 14,445 |
| 7,756 | | Analysts International Corp. (a) . . . | | 3,490 |
| 3,164 | | CIBER, Inc. (a) . . . . . . . . . . . . . . . . | | 8,638 |
| 3,004 | | Computer Task Group, Inc. (a) . . . . | | 10,364 |
| 1,952 | | Gevity HR, Inc. . . . . . . . . . . . . . . . . | | 7,710 |
| 2,182 | | infoGROUP, Inc. (a) . . . . . . . . . . . . | | 9,077 |
| 5,777 | | Lionbridge Technologies (a) . . . . . . | | 5,661 |
| 7,645 | | ModusLink Global Solutions, | | |
| | | Inc. (a) . . . | | 19,801 |
| 2,521 | | Ness Technologies, Inc. (a) . . . . . . . | | 7,437 |
| 720 | | StarTek, Inc. (a) . . . . . . . . . . . . . . . . | | 2,232 |
| 5,087 | | Wright Express Corp. (a) . . . . . . . . . | | 92,685 |
| | | | | 181,540 |
| | | Leisure Equipment & Products - 0.75% | |
| 1,095 | | Arctic Cat, Inc. . . . . . . . . . . . . . . . . | | 4,194 |
| 1,421 | | Jakks Pacific, Inc. (a) . . . . . . . . . . . . | | 17,549 |
| 4,667 | | MarineMax, Inc. (a) . . . . . . . . . . . . . | | 9,147 |
| 2,236 | | Nautilus Group, Inc. (a) . . . . . . . . . . | | 1,409 |
| 564 | | Steinway Musical Instruments (a) . . | | 6,751 |
| 396 | | Sturm, Ruger & Company, Inc. (a) . | | 4,883 |
| | | | | 43,933 |
| | | Machinery - 3.04% | | |
| 367 | | Alamo Group, Inc. . . . . . . . . . . . . . . | | 3,912 |
| 1,694 | | Albany International Corp. . . . . . . . | | 15,331 |
| 317 | | Cascade Corp. . . . . . . . . . . . . . . . . . | | 5,589 |
| 965 | | Columbus McKinnon | | |
| | | Corporation (a) . . . . . . . . . . . . . . . | | 8,415 |
| 6,119 | | Commercial Vehicle Group, Inc. (a) | | 3,365 |
| 1,008 | | EnPro Industries, Inc. (a) . . . . . . . . . | | 17,237 |
| 2,381 | | Federal Signal Corp. . . . . . . . . . . . . | | 12,548 |
| 582 | | Freightcar America, Inc. . . . . . . . . . | | 10,202 |
| 1,411 | | The Greenbrier Companies, Inc. . . . | | 5,164 |
| 1,023 | | Hardinge, Inc. . . . . . . . . . . . . . . . . . | | 2,854 |
| 722 | | Kadant, Inc. (a) . . . . . . . . . . . . . . . . | | 8,317 |
| 1,110 | | Lydall, Inc. (a) . . . . . . . . . . . . . . . . . | | 3,297 |
| 1,263 | | Miller Industries, Inc. (a) . . . . . . . . . | | 8,210 |
| 3,749 | | Tecumseh Products Co. (a) . . . . . . . | | 16,945 |
| 933 | | Tennant Co. | | 8,742 |
| 1,297 | | Thermadyne Holdings Corp. (a) . . . | | 2,750 |
| 17,269 | | Trimas Corp. (a) . . . . . . . . . . . . . . . | | 30,221 |
| 4,207 | | Wabash National Corp. . . . . . . . . . . | | 5,175 |
| 14,033 | | Xerium Technologies, Inc. (a) . . . . . | | 9,402 |
| | | | | 177,676 |
See notes to financial statements.
AssetMark Enhanced Fundamental Index™ Small Company Value Fund
SCHEDULE OF INVESTMENTS (Continued)
March 31, 2009
| Number of | | | | |
| Shares | | | | Value |
| | | COMMON STOCKS (Continued) | | |
| | | Marine - 0.27% | | |
| 2,608 | | American Commercial Lines, | | |
| | | Inc. (a)(b) . | $ | 8,267 |
| 2,484 | | Horizon Lines, Inc. . . . . . . . . . . . . . | | 7,527 |
| | | | | 15,794 |
| | | Media - 4.67% | | |
| 4,536 | | A. H. Belo Corp. . . . . . . . . . . . . . . . | | 4,445 |
| 1,332 | | Beasley Broadcasting Group, Inc. . . | | 2,810 |
| 3,715 | | Carmike Cinemas, Inc. . . . . . . . . . . | | 9,622 |
| 280 | | Courier Corp. . . . . . . . . . . . . . . . . . . | | 4,248 |
| 3,872 | | Cumulus Media, Inc. (a) . . . . . . . . . | | 3,911 |
| 26,484 | | Emmis Communications Corp. (a) . | | 10,329 |
| 7,929 | | Entercom Communications Corp. . . | | 8,722 |
| 10,483 | | Entravision Communications | | |
| | | Corp. (a) . . | | 2,726 |
| 72,580 | | Gray Television, Inc. (b) . . . . . . . . . | | 23,226 |
| 19,534 | | Harris Interactive, Inc. (a) . . . . . . . . | | 4,883 |
| 2,979 | | Harte-Hanks, Inc. . . . . . . . . . . . . . . | | 15,938 |
| 8,938 | | Journal Communications, Inc. . . . . . | | 6,703 |
| 9,060 | | LIN TV Corp. (a) . . . . . . . . . . . . . . . | | 10,147 |
| 8,981 | | Media General, Inc. (b) . . . . . . . . . . | | 17,243 |
| 5,471 | | Mediacom Communications | | |
| | | Corp. (a) . . | | 22,048 |
| 18,852 | | Navarre Corp. (a) . . . . . . . . . . . . . . . | | 8,483 |
| 7,859 | | Playboy Enterprises, Inc. (a) . . . . . . | | 15,482 |
| 18,168 | | PRIMEDIA Inc. . . . . . . . . . . . . . . . . | | 44,875 |
| 26,842 | | Radio One, Inc. (a) . . . . . . . . . . . . . | | 12,079 |
| 2,373 | | RCN Corp. (a) . . . . . . . . . . . . . . . . . | | 8,780 |
| 818 | | Saga Communications, Inc. (a) . . . . | | 3,076 |
| 8,762 | | Salem Communications Corp. (a) . . | | 4,907 |
| 7,191 | | Sinclair Broadcast Group, Inc. . . . . | | 7,407 |
| 69,677 | | Spanish Broadcasting System (a) . . | | 10,452 |
| 6,741 | | Valassis Communications, Inc. (a) . | | 10,583 |
| | | | | 273,125 |
| | | Metals & Mining - 1.09% | | |
| 919 | | AM Castle & Co. . . . . . . . . . . . . . . . | | 8,198 |
| 871 | | Brush Engineered Materials, Inc. (a) | | 12,081 |
| 14,931 | | Coeur d’Alene Mines Corp. (a) . . . . | | 14,035 |
| 1,210 | | Gibraltar Industries, Inc. . . . . . . . . . | | 5,711 |
| 1,928 | | Horsehead Holding Corp. (a) . . . . . | | 10,604 |
| 416 | | Kaiser Aluminum Corp. . . . . . . . . . | | 9,618 |
| 2,635 | | NN, Inc. . . . | | 3,320 |
| | | | | 63,567 |
| Number of | | | | |
| Shares | | | Value |
| | | Multiline Retail - 1.15% | | |
| 923 | | 99 Cents Only Stores (a) . . . . . . . . . | $ | 8,528 |
| 10,987 | | The Bon-Ton Stores, Inc. (b) . . . . . . | | 19,227 |
| 1,173 | | Conn’s, Inc. (a)(b) . . . . . . . . . . . . . . | | 16,469 |
| 1,202 | | Fred’s, Inc. . | | 13,559 |
| 7,426 | | Tuesday Morning Corp. (a) . . . . . . . | | 9,431 |
| | | | | 67,214 |
| | | Oil & Gas - 1.04% | | |
| 1,402 | | Adams Resources & Energy, Inc. . . | | 19,642 |
| 15,271 | | Aventine Renewable Energy (a) . . . | | 1,298 |
| 2,399 | | Callon Petroleum Co. (a) . . . . . . . . . | | 2,615 |
| 221 | | Chesapeake Utilities Corp. . . . . . . . | | 6,736 |
| 15,370 | | Edge Petroleum Corp. (a) . . . . . . . . | | 2,986 |
| 6,048 | | Energy Partners Ltd. (a) . . . . . . . . . | | 544 |
| 13,242 | | Energy XXI (Bermuda) Ltd. . . . . . . | | 4,966 |
| 1,481 | | Harvest Natural Resources, Inc. (a) . | | 5,021 |
| 969 | | Knightsbridge Tankers Ltd. . . . . . . . | | 14,099 |
| 14,840 | | Meridian Resource Corp. (a) . . . . . . | | 3,116 |
| | | | | 61,023 |
| | | Paper & Forest Products - 0.64% | | |
| 3,269 | | Buckeye Technologies, Inc. (a) . . . . | | 6,963 |
| 2,897 | | Mercer International, Inc. (a) . . . . . | | 1,912 |
| 1,025 | | Neenah Paper, Inc. . . . . . . . . . . . . . . | | 3,721 |
| 716 | | Schweitzer-Mauduit | | |
| | | International, Inc. . . . . . . . . . . . . . | | 13,217 |
| 2,243 | | Wausau Paper Corp. . . . . . . . . . . . . | | 11,798 |
| | | | | 37,611 |
| | | Personal Products - 0.44% | | |
| 1,421 | | Elizabeth Arden, Inc. (a) . . . . . . . . . | | 8,285 |
| 2,776 | | Mannatech, Inc. (b) . . . . . . . . . . . . . | | 9,244 |
| 1,780 | | Schiff Nutrition International, | | |
| | | Inc. (a) . . . | | 8,010 |
| | | | | 25,539 |
| | | Pharmaceuticals - 0.16% | | |
| 971 | | Par Pharmaceutical Cos., Inc. (a) . . | | 9,195 |
| | | Real Estate - 0.38% | | |
| 1,225 | | Hilltop Holdings, Inc. (a) . . . . . . . . | | 13,965 |
| 312 | | United Capital Corp. (a) . . . . . . . . . | | 5,382 |
| 1,369 | | U-Store-It Trust . . . . . . . . . . . . . . . . | | 2,765 |
| | | | | 22,112 |
| | | Road & Rail - 1.11% | | |
| 571 | | Celadon Group, Inc. (a) . . . . . . . . . . | | 3,169 |
| 2,070 | | Covenant Transport, Inc. (a) . . . . . . | | 4,057 |
See notes to financial statements.
AssetMark Enhanced Fundamental Index™ Small Company Value Fund
SCHEDULE OF INVESTMENTS (Continued)
March 31, 2009
| Number of | | | | |
| Shares | | | | Value |
| | | COMMON STOCKS (Continued) | | |
| | | Road & Rail (Continued) | | |
| 924 | | Marten Transport Ltd. (a) . . . . . . . . | $ | 17,260 |
| 2,484 | | PAM Transportation Services (a) . . | | 13,637 |
| 2,326 | | Quality Distribution, Inc. (a) . . . . . . | | 4,606 |
| 1,364 | | Saia, Inc. (a) | | 16,300 |
| 473 | | USA Truck, Inc. (a) . . . . . . . . . . . . . | | 6,116 |
| | | | | 65,145 |
| | | Semiconductor & Semiconductor | | |
| | | Equipment - 1.74% | | |
| 3,975 | | Brooks Automation, Inc. (a) . . . . . . | | 18,325 |
| 11,106 | | Entegris, Inc. (a) . . . . . . . . . . . . . . . | | 9,551 |
| 6,888 | | Mattson Technology, Inc. (a) . . . . . . | | 5,793 |
| 2,243 | | Omnivision Technologies, Inc. (a) . | | 15,073 |
| 5,410 | | Photronics, Inc. (a)(b) . . . . . . . . . . . | | 5,193 |
| 7,514 | | RF Micro Devices, Inc. (a) . . . . . . . | | 9,994 |
| 5,511 | | Silicon Storage Technology, | | |
| | | Inc. (a) . . . | | 9,093 |
| 3,149 | | SiRF Technology Holdings, | | |
| | | Inc. (a) . . . | | 7,243 |
| 3,443 | | Ultra Clean Holdings, Inc. (a) . . . . . | | 3,684 |
| 1,821 | | White Electronic Designs Corp. (a) | | 7,302 |
| 1,154 | | Zoran Corp. (a) . . . . . . . . . . . . . . . . | | 10,155 |
| | | | | 101,406 |
| | | Software - 0.41% | | |
| 1,255 | | American Software, Inc. . . . . . . . . . | | 6,614 |
| 1,228 | | Fair Isaac Corp. . . . . . . . . . . . . . . . . | | 17,278 |
| | | | | 23,892 |
| | | Specialty Retail - 6.30% | | |
| 7,687 | | AC Moore Arts & Crafts, Inc. (a) . . | | 14,528 |
| 2,124 | | Big 5 Sporting Goods Corp. . . . . . . | | 12,468 |
| 2,339 | | Books-A-Million, Inc. . . . . . . . . . . . | | 10,759 |
| 2,695 | | Build-A-Bear Workshop, Inc. (a) . . | | 16,359 |
| 2,690 | | Cache, Inc. (a) . . . . . . . . . . . . . . . . . | | 7,747 |
| 10,060 | | Casual Male Retail Group, Inc. (a) . | | 4,929 |
| 1,312 | | Charlotte Russe Holding, Inc. (a) . . | | 10,693 |
| 2,897 | | Christopher & Banks Corp. . . . . . . . | | 11,849 |
| 9,621 | | Cost Plus, Inc. (a)(b) . . . . . . . . . . . . | | 9,140 |
| 2,525 | | Destination Maternity Corp. (a) . . . | | 15,933 |
| 15,063 | | Eddie Bauer Holdings, Inc. (a)(b) . . | | 6,477 |
| 943 | | Genesco, Inc. (a) . . . . . . . . . . . . . . . | | 17,757 |
| 8,020 | | Hastings Entertainment, Inc. (a) . . . | | 20,210 |
| 1,318 | | Haverty Furniture Cos., Inc. . . . . . . | | 13,879 |
| Number of | | | | |
| Shares | | | | Value |
| | | Specialty Retail (Continued) | | |
| 1,194 | | hhgregg, Inc. (a) . . . . . . . . . . . . . . . | $ | 16,895 |
| 1,033 | | Hot Topic, Inc. (a) . . . . . . . . . . . . . . | | 11,559 |
| 6,078 | | Lithia Motors, Inc. . . . . . . . . . . . . . . | | 13,675 |
| 6,143 | | New York & Co, Inc. (a) . . . . . . . . . | | 21,808 |
| 844 | | Perfumania Holdings, Inc. (a) . . . . . | | 1,756 |
| 28,291 | | Pier 1 Imports, Inc. (a) . . . . . . . . . . . | | 15,843 |
| 1,350 | | Rex Stores Corp. (a) . . . . . . . . . . . . | | 14,472 |
| 40,479 | | Select Comfort Corp. (a) . . . . . . . . . | | 29,145 |
| 1,758 | | Shoe Carnival, Inc. (a) . . . . . . . . . . . | | 18,195 |
| 12,050 | | Sport Chalet, Inc. (a) . . . . . . . . . . . . | | 2,290 |
| 2,240 | | Stage Stores, Inc. . . . . . . . . . . . . . . . | | 22,579 |
| 1,291 | | Syms Corp. (a) . . . . . . . . . . . . . . . . . | | 7,901 |
| 4,157 | | Trans World Entertainment (a) . . . . | | 2,536 |
| 3,175 | | West Marine, Inc. (a) . . . . . . . . . . . . | | 16,986 |
| | | | | 368,368 |
| | | Textiles, Apparel & Luxury Goods - 1.18% |
| 831 | | G-III Apparel Group, Ltd. (a) . . . . . | | 4,587 |
| 2,690 | | Heelys, Inc. (a) . . . . . . . . . . . . . . . . | | 4,600 |
| 1,429 | | Kenneth Cole Productions, Inc. . . . . | | 9,131 |
| 1,564 | | K-Swiss, Inc. . . . . . . . . . . . . . . . . . . | | 13,357 |
| 1,817 | | Movado Group, Inc. . . . . . . . . . . . . . | | 13,700 |
| 810 | | Oxford Industries, Inc. . . . . . . . . . . . | | 4,998 |
| 2,611 | | Perry Ellis International, Inc. (a) . . . | | 9,034 |
| 387 | | Steven Madden Ltd. (a) . . . . . . . . . . | | 7,268 |
| 3,586 | | Unifi, Inc. (a) . . . . . . . . . . . . . . . . . . | | 2,295 |
| | | | | 68,970 |
| | | Thrifts & Mortgage Finance - 2.76% | | |
| 4,257 | | Anchor BanCorp Wisconsin, Inc. . . | | 5,747 |
| 1,489 | | Bank Mutual Corp. . . . . . . . . . . . . . | | 13,490 |
| 1,938 | | BankAtlantic Bancorp, Inc. (b) . . . . | | 3,895 |
| 16,115 | | BankUnited Financial Corp. (b) . . . | | 3,707 |
| 175 | | Berkshire Hills Bancorp, Inc. . . . . . | | 4,011 |
| 1,790 | | Brookline Bancorp, Inc. . . . . . . . . . | | 17,005 |
| 2,265 | | City Bank (b) . . . . . . . . . . . . . . . . . . | | 7,475 |
| 1,428 | | Doral Financial Corp. (a) . . . . . . . . . | | 2,570 |
| 1,380 | | First Busey Corp. . . . . . . . . . . . . . . . | | 10,709 |
| 906 | | First Defiance Financial Corp. . . . . | | 5,472 |
| 391 | | First Financial Holdings, Inc. . . . . . | | 2,991 |
| 636 | | First Financial Northwest, Inc. . . . . | | 5,304 |
| 3,030 | | First Place Financial Corp. . . . . . . . | | 10,181 |
| 2,880 | | FirstFed Financial Corp. (a)(b) . . . . | | 1,037 |
| 286 | | NASB Financial, Inc. . . . . . . . . . . . | | 7,124 |
| 511 | | OceanFirst Financial Corp. . . . . . . . | | 5,223 |
See notes to financial statements.
AssetMark Enhanced Fundamental Index™ Small Company Value Fund
SCHEDULE OF INVESTMENTS (Continued)
March 31, 2009
| Number of | | | | |
| Shares | | | | Value |
| | | COMMON STOCKS (Continued) | | |
| | | Thrifts & Mortgage Finance (Continued) | |
| 851 | | Ocwen Financial Corp. (a) . . . . . . . | $ | 9,727 |
| 4,556 | | Sterling Financial Corp. (b) . . . . . . . | | 9,431 |
| 2,066 | | TierOne Corp. . . . . . . . . . . . . . . . . . | | 4,421 |
| 3,534 | | TrustCo Bank Corp. . . . . . . . . . . . . . | | 21,275 |
| 6,496 | | United Community Financial Corp. | | 7,860 |
| 109 | | WSFS Financial Corp. . . . . . . . . . . . | | 2,437 |
| | | | | 161,092 |
| | | Tobacco - 0.21% | | |
| 3,131 | | Alliance One International, Inc. (a) . | | 12,023 |
| | | Trading Companies & Distributors - 1.02% |
| 1,130 | | Aceto Corp. | | 6,735 |
| 1,249 | | Beacon Roofing Supply, Inc. (a) . . . | | 16,724 |
| 1,776 | | H&E Equipment Services, Inc. (a) . | | 11,633 |
| 881 | | Interline Brands, Inc. (a) . . . . . . . . . | | 7,427 |
| 421 | | Lawson Products . . . . . . . . . . . . . . . | | 5,123 |
| 1,666 | | TAL International Group, Inc. . . . . . | | 12,195 |
| | | | | 59,837 |
| | | Water Utilities - 0.27% | | |
| 500 | | Middlesex Water Co. . . . . . . . . . . . . | | 7,200 |
| 1,957 | | Southwest Water Co. . . . . . . . . . . . . | | 8,415 |
| | | | | 15,615 |
| | | Total Common Stocks | | |
| | | (Cost $8,072,307) . . . . . . . . . . . . . | | 5,349,511 |
| | | MANAGEMENT INVESTMENT | | |
| | | COMPANIES - 0.28% | | |
| | | Capital Markets - 0.28% | | |
| 1,308 | | Ares Capital Corp. . . . . . . . . . . . . . . | | 6,331 |
| 1,474 | | Blackrock Kelso Capital Corp. . . . . | | 6,176 |
| 48 | | Capital Southwest Corp. (b) . . . . . . | | 3,667 |
| | | | | 16,174 |
| | | Total Management Investment | | |
| | | Companies (Cost $31,851) . . . . . | | 16,174 |
| | | RIGHTS - 0.00% | | |
| | | Commercial Banks - 0.00% | | |
| 503 | | German American Bancorp Inc. (c) | | 0 |
| | | Insurance - 0.00% | | |
| 3,789 | | United Americal Indemnity Ltd. (c) | | 0 |
| | | Total Rights (Cost $6,277) . . . . . . . | | 0 |
| Number of | | | | |
| Shares | | | | Value |
| | | REAL ESTATE INVESTMENT | | |
| | | TRUSTS - 2.70% | | |
| | | Real Estate Investment Trusts - 2.70% | | |
| 532 | | Agree Realty Corp. . . . . . . . . . . . . . | $ | 8,347 |
| 4,322 | | Anthracite Capital, Inc. . . . . . . . . . . | | 1,469 |
| 1,325 | | Anworth Mortgage Asset Corp. . . . . | | 8,122 |
| 1,716 | | Arbor Realty Trust, Inc. (b) . . . . . . . | | 1,236 |
| 7,082 | | Ashford Hospitality Trust, Inc. . . . . | | 10,906 |
| 1,520 | | BRT Realty Trust . . . . . . . . . . . . . . . | | 5,396 |
| 1,418 | | Capital Trust, Inc. . . . . . . . . . . . . . . | | 1,560 |
| 3,218 | | Diamondrock Hospitality Co. . . . . . | | 12,904 |
| 4,918 | | FelCor Lodging Trust, Inc. . . . . . . . | | 6,688 |
| 716 | | First Potomac Realty Trust . . . . . . . | | 5,263 |
| 466 | | Getty Realty Corp. . . . . . . . . . . . . . . | | 8,551 |
| 3,477 | | Glimcher Realty Trust . . . . . . . . . . . | | 4,868 |
| 3,862 | | Gramercy Capital Corp. . . . . . . . . . . | | 3,746 |
| 571 | | Investors Real Estate Trust . . . . . . . | | 5,630 |
| 1,552 | | LaSalle Hotel Properties . . . . . . . . . | | 9,064 |
| 2,416 | | Maguire Properties, Inc. (a) . . . . . . . | | 1,740 |
| 869 | | Mission West Properties . . . . . . . . . | | 5,562 |
| 335 | | Parkway Properties, Inc. . . . . . . . . . | | 3,450 |
| 1,041 | | PMC Commercial Trust (b) . . . . . . . | | 5,778 |
| 982 | | Ramco-Gershenson Properties Trust | | 6,334 |
| 875 | | Sovran Self Storage, Inc. . . . . . . . . . | | 17,570 |
| 6,751 | | Strategic Hotels & Resorts, Inc. . . . | | 4,658 |
| 633 | | Sun Communities, Inc. . . . . . . . . . . | | 7,488 |
| 2,189 | | Sunstone Hotel Investors, Inc. . . . . . | | 5,757 |
| 417 | | Urstadt Biddle Properties, Inc. . . . . | | 5,596 |
| | | | | 157,683 |
| | | Total Real Estate Investment Trusts | | |
| | | (Cost $320,930) . . . . . . . . . . . . . . . | | 157,683 |
| | | SHORT TERM INVESTMENTS - 4.20% |
| | | Money Market Fund - 4.20% | | |
| 245,586 | | Federated Prime Obligations Fund . | | 245,586 |
| | | Total Short Term Investments | | |
| | | (Cost $245,586) . . . . . . . . . . . . . . . | | 245,586 |
See notes to financial statements.
AssetMark Enhanced Fundamental Index™ Small Company Value Fund
SCHEDULE OF INVESTMENTS (Continued)
March 31, 2009
| Number of | | | | |
| Shares | | | | Value |
| | | INVESTMENTS PURCHASED | | |
| | | AS SECURITIES LENDING | | |
| | | COLLATERAL - 8.11% | | |
| | | Money Market Fund - 8.11% | | |
| 473,981 | | Mount Vernon Prime Portfolio | $ | 473,981 |
| | | Total Money Market Funds | | |
| | | (Cost $473,981) . . . . . . . . . . . . . . . | | 473,981 |
| | | Total Investments Purchased as | | |
| | | Securities Lending Collateral | | |
| | | (Cost $473,981) . . . . . . . . . . . . . . . | | 473,981 |
| | | Total Investments | | |
| | | (Cost $9,150,932) - 106.83% | | 6,242,935 |
| | | Liabilities in Excess of | | |
| | | Other Assets - (6.83)% . . . . . . . . | | (398,977) |
| | | TOTAL NET | | |
| | | ASSETS - 100.00% . . . . . . . . . . . | $ | 5,843,958 |
| | | | | |
| Percentages are stated as a percent of net assets. |
| (a) Non-income producing. |
| (b) All or a portion of this security is on loan. |
| (c) As of March 31, 2009, the Adviser has fair valued this security. |
| The value of these securities were $0, which represent 0.00% of |
| total net assets. |
See notes to financial statements.
AssetMark Enhanced Fundamental Index™ Small Company Value Fund SCHEDULE OF OPEN FUTURES CONTRACTS
March 31, 2009
| | Number of | | | | | | |
| | Contracts | | Notional | | Settlement | | Unrealized |
| Description | | Purchased | | Value | | Month | | Appreciation |
| Russell 2000 Index Mini Futures | 7 | | $290,360 | | Jun-09 | | $9,713 |
See notes to financial statements.
| AssetMark Funds | | | | | | | | |
| STATEMENTS OF ASSETS & LIABILITIES | | | | | | | | |
| March 31, 2009 | | | | | | | | |
| | | | Large Cap | | Large Cap | | Small/Mid Cap | | Small/Mid Cap |
| | | | Growth Fund | | Value Fund | | Growth Fund | | Value Fund |
| ASSETS: | | | | | | | | |
| | Investments, at value (cost $288,684,384, | | | | | | | | |
| | $264,395,869, $63,460,911 and | | | | | | | | |
| | $75,653,552, respectively)1 | $ | 244,435,131 | $ | 209,530,753 | $ | 59,260,154 | $ | 53,422,675 |
| | Cash . | | 4,247 | | 545,534 | | — | | — |
| | Income receivable . . . . . . . . . | | 262,030 | | 389,893 | | 28,797 | | 42,768 |
| | Receivable for investment securities sold . . . . . . . . . . | | 585,603 | | 663,998 | | 1,003,631 | | 169,365 |
| | Receivable for fund shares sold . . . . . . . . . . . . . . . . . . | | 194,605 | | 212,263 | | 50,687 | | 57,825 |
| | Receivable from securities lending agent (See Note 6) . | | 5,334,860 | | — | | 3,468,429 | | 2,452,785 |
| | Other assets . . . . . . . . . . . . . . | | 14,298 | | 17,068 | | 39,527 | | 20,471 |
| | Total Assets . . . . . . . . . . . . | | 250,830,774 | | 211,359,509 | | 63,851,225 | | 56,165,889 |
| LIABILITIES: | | | | | | | | |
| | Payable for collateral on securities loaned . . . . . . . . . | | 46,143,338 | | 28,983,482 | | 16,172,514 | | 10,750,409 |
| | Payable to securities lending agent (See Note 6) . . . . | | — | | 1,517,407 | | — | | — |
| | Payable for investment securities purchased . . . . . . . . | | 460,933 | | — | | 889,942 | | 51,077 |
| | Payable for fund shares redeemed . . . . . . . . . . . . . . . . | | 465,533 | | 381,680 | | 90,182 | | 88,852 |
| | Payable to Investment Advisor . . . . . . . . . . . . . . . . . . | | 144,518 | | 140,401 | | 36,022 | | 35,614 |
| | Payable to Custodian . . . . . . . | | 9,969 | | 8,593 | | 6,132 | | 3,873 |
| | Other accrued expenses . . . . . | | 127,264 | | 146,582 | | 58,877 | | 56,410 |
| | Total Liabilities . . . . . . . . . | | 47,351,555 | | 31,178,145 | | 17,253,669 | | 10,986,235 |
| NET ASSETS . . . . . . . . . . . . . . | $ | 203,479,219 | $ | 180,181,364 | $ | 46,597,556 | $ | 45,179,654 |
| | | | | | | | | | |
| NET ASSETS CONSIST OF: | | | | | | | | |
| | Capital stock . . . . . . . . . . . . . | | 366,682,170 | | 443,241,033 | | 86,619,309 | | 100,861,844 |
| | Unrealized depreciation on investments . . . . . . . . . . . | | (44,249,253) | | (54,865,116) | | (4,200,757) | | (22,230,877) |
| | Accumulated undistributed net investment | | | | | | | | |
| | income . . . . . . . . . . . . . . . . | | 5,185 | | 1,019,418 | | 46,395 | | 124,833 |
| | Accumulated undistributed net realized (loss) . . . . . . | | (118,958,883) | | (209,213,971) | | (35,867,391) | | (33,576,146) |
| | Total Net Assets . . . . . . . . . | $ | 203,479,219 | $ | 180,181,364 | $ | 46,597,556 | $ | 45,179,654 |
| | | | | | | | | | |
| | Shares outstanding (unlimited shares of no par | | | | | | | | |
| | value authorized) . . . . . . . . | | 35,879,073 | | 37,115,279 | | 9,509,134 | | 7,933,952 |
| | Net asset value, offering and redemption price | | | | | | | | |
| | per share . . . . . . . . . . . . . . . | $ | 5.67 | $ | 4.85 | $ | 4.90 | $ | 5.69 |
| | | | | | | | | | |
| 1 | Includes loaned securities with a value of: . . . . . . . . . | $ | 44,718,874 | $ | 28,198,085 | $ | 15,624,996 | $ | 10,393,791 |
| | | | | | | | | | |
See notes to financial statements.
| AssetMark Funds | | | | | | | | |
| STATEMENTS OF ASSETS & LIABILITIES (Continued) | | | | | | |
| March 31, 2009 | | | | | | | | |
| | | | International | | Real Estate | | Tax-Exempt | | Core Plus |
| | | | Equity | | Securities | | Fixed Income | | Fixed Income |
| | | | Fund | | Fund | | Fund | | Fund |
| ASSETS: | | | | | | | | |
| | Investments, at value (cost $271,874,804, $68,722,114, | | | | | | | | |
| | $196,807,945 and $649,701,221, respectively)1 . . . | $ | 224,174,932 | $ | 57,213,819 | $ | 190,290,100 | $ | 547,058,690 |
| | Repurchase Agreements (cost $0, $0, $0 and | | | | | | | | |
| | $5,100,000, respectively) . . | | — | | — | | — | | 5,100,000 |
| | Appreciation of forward foreign currency contracts . . | | — | | — | | — | | 6,230 |
| | Variation margin on futures contracts . . . . . . . . . . . . . | | — | | — | | — | | 222,844 |
| | Foreign currencies (cost $383,286, $0, $0 and | | | | | | | | |
| | $0, respectively) . . . . . . . . . | | 381,227 | | — | | — | | — |
| | Foreign currencies due from brokers for futures | | | | | | | | |
| | (cost $0, $0, $0 and $1,383,390, respectively) . . . . | | — | | — | | — | | 1,186,321 |
| | Cash . | | — | | 2,375 | | — | | 96,948 |
| | Income receivable . . . . . . . . . | | 1,620,527 | | 355,991 | | 2,595,802 | | 5,017,691 |
| | Receivable for dividend reclaims . . . . . . . . . . . . . . . . | | 523,659 | | — | | — | | — |
| | Receivable for investment securities and foreign | | | | | | | | |
| | currencies sold . . . . . . . . . . | | 323,531 | | — | | 2,337,210 | | 65,522,942 |
| | Receivable for fund shares sold . . . . . . . . . . . . . . . . . . | | 241,043 | | 83,365 | | 202,160 | | 593,078 |
| | Deposits with brokers for futures and options . . . . . . . | | — | | — | | — | | 880,312 |
| | Receivable from securities lending agent (See Note 6) | | — | | 5,523,767 | | — | | — |
| | Other assets . . . . . . . . . . . . . . | | 10,573 | | 22,062 | | 13,031 | | 35,057 |
| | Total Assets . . . . . . . . . . . . | | 227,275,492 | | 63,201,379 | | 195,438,303 | | 625,720,113 |
| LIABILITIES: | | | | | | | | |
| | Options written at value (Premium received $0, | | | | | | | | |
| | $0, $0 and $182,450, respectively) . . . . . . . . . . . . . | | — | | — | | — | | 89,234 |
| | Forward sale commitments (cost $0, $0, $0 and | | | | | | | | |
| | $22,460,391, respectively) . | | — | | — | | — | | 22,612,340 |
| | Depreciation of forward foreign currency contracts . . | | — | | — | | — | | 67,205 |
| | Foreign currencies deliverable | | 161,524 | | — | | — | | 89,335 |
| | Payable for collateral on securities loaned . . . . . . . . . | | — | | 16,792,890 | | — | | 5,485,106 |
| | Payable to securities lending agent (See Note 6) . . . . | | 2,456,643 | | — | | — | | 12,805,791 |
| | Payable for investment securities purchased . . . . . . . . | | 325,657 | | — | | 1,045,001 | | 78,444,618 |
| | Payable for fund shares redeemed . . . . . . . . . . . . . . . . | | 556,115 | | 102,574 | | 527,044 | | 879,192 |
| | Payable to Investment Advisor . . . . . . . . . . . . . . . . . . | | 175,342 | | 36,432 | | 101,217 | | 320,143 |
| | Payable to Custodian . . . . . . . | | 90,770 | | 6,495 | | 5,466 | | 23,165 |
| | Other accrued expenses . . . . . | | 170,240 | | 81,310 | | 179,665 | | 452,555 |
| | Total Liabilities . . . . . . . . . | | 3,936,291 | | 17,019,701 | | 1,858,393 | | 121,268,684 |
| NET ASSETS . . . . . . . . . . . . . . | $ | 223,339,201 | $ | 46,181,678 | $ | 193,579,910 | $ | 504,451,429 |
| NET ASSETS CONSIST OF: | | | | | | | | |
| | Capital stock . . . . . . . . . . . . . | | 502,855,581 | | 68,905,005 | | 207,874,830 | | 606,306,514 |
| | Unrealized appreciation (depreciation) on: | | | | | | | | |
| | Investments . . . . . . . . . . . . | | (47,699,872) | | (11,508,295) | | (6,517,845) | | (102,642,531) |
| | Written options . . . . . . . . . | | — | | — | | — | | 93,216 |
| | Foreign currencies . . . . . . . | | (37,260) | | — | | — | | (182,452) |
| | Futures contracts . . . . . . . . | | — | | — | | — | | 1,225,896 |
| | Forward currency exchange contracts . . . . . . . . . . . | | — | | — | | — | | (60,976) |
| | Forward sale commitments | | — | | — | | — | | (151,949) |
| | Accumulated undistributed net investment income . . . . . | | 6,512,687 | | — | | 98,780 | | 947,533 |
| | Accumulated undistributed net realized (loss) . . . . . . | | (238,291,935) | | (11,215,032) | | (7,875,855) | | (1,083,822) |
| | Total Net Assets . . . . . . . . . | $ | 223,339,201 | $ | 46,181,678 | $ | 193,579,910 | $ | 504,451,429 |
| | Shares outstanding (unlimited shares | | | | | | | | |
| | of no par value authorized) | | 38,481,836 | | 8,961,808 | | 18,842,674 | | 63,661,497 |
| | Net asset value, offering and redemption | | | | | | | | |
| | price per share . . . . . . . . . . | $ | 5.80 | $ | 5.15 | $ | 10.27 | $ | 7.92 |
| 1 | Includes loaned securities with a value of: . . . . . . . . . | $ | — | $ | 17,445,386 | $ | — | $ | 5,264,206 |
| | | | | | | | | | |
| | See notes to financial statements. | | | | | |
See notes to financial statements.
| AssetMark Funds | | | | | | | | |
| STATEMENTS OF ASSETS & LIABILITIES (Continued) | | | | | | |
| March 31, 2009 | | | | | | | | |
| | | | Enhanced | | Enhanced | | Enhanced | | Enhanced |
| | | | Fundamental | | Fundamental | | Fundamental | | Fundamental |
| | | | IndexTM | | IndexTM | | IndexTM | | IndexTM |
| | | | Large Company | | Large Company | | Small Company | | Small Company |
| | | | Growth Fund | | Value Fund | | Growth Fund | | Value Fund |
| ASSETS: | | | | | | | | |
| | Investments, at value (cost $68,271,930, | | | | | | | | |
| | $60,638,347, $15,450,484 and | | | | | | | | |
| | $9,150,932, respectively) . . . . . . . . . . . . . . . . . . | $ | 53,367,035 | $ | 42,649,406 | $ | 12,360,518 | $ | 6,242,935 |
| | Variation margin on futures contracts . . . . . . . . . . . | | 35,055 | | 29,925 | | 7,800 | | 4,550 |
| | Cash . . . . . . . . . . . . . . . . . . | | — | | 4,796 | | — | | 45 |
| | Income receivable . . . . . . . | | 82,322 | | 68,925 | | 8,084 | | 8,342 |
| | Receivable for investment securities sold . . . . . . . . | | 73,720 | | — | | — | | 5,060 |
| | Receivable for fund shares sold . . . . . . . . . . . . . . . | | 52,111 | | 46,918 | | 13,724 | | 11,474 |
| | Receivable from Investment Advisor . . . . . . . . . . . | | 6,681 | | — | | 7,152 | | 6,806 |
| | Deposits with brokers for futures contracts . . . . . . | | 610,645 | | 446,986 | | 93,130 | | 90,000 |
| | Other assets . . . . . . . . . . . . | | 11,010 | | 23,811 | | 6,271 | | 5,481 |
| | Total Assets . . . . . . . . . . | | 54,238,579 | | 43,270,767 | | 12,496,679 | | 6,374,693 |
| LIABILITIES: | | | | | | | | |
| | Payable for collateral on securities loaned . . . . . . . | | 8,094,704 | | 6,067,022 | | 1,810,126 | | 473,981 |
| | Payable for fund shares redeemed . . . . . . . . . . . . . | | 228,567 | | 170,890 | | 48,931 | | 25,936 |
| | Payable to Investment Advisor . . . . . . . . . . . . . . . . | | — | | 13,043 | | — | | — |
| | Payable to Custodian . . . . . | | 4,493 | | 2,653 | | 959 | | 435 |
| | Other accrued expenses . . . | | 80,638 | | 68,845 | | 35,964 | | 30,383 |
| | Total Liabilities . . . . . . . | | 8,408,402 | | 6,322,453 | | 1,895,980 | | 530,735 |
| NET ASSETS . . . . . . . . . . . . | $ | 45,830,177 | $ | 36,948,314 | $ | 10,600,699 | $ | 5,843,958 |
| | | | | | | | | | |
| NET ASSETS CONSIST OF: | | | | | | | | |
| | Capital stock . . . . . . . . . . . | | 78,715,064 | | 79,024,986 | | 17,047,651 | | 11,467,400 |
| | Unrealized appreciation (depreciation) on investments | | | | | | | |
| | Investments . . . . . . . . . . | | (14,904,895) | | (17,988,941) | | (3,089,966) | | (2,907,997) |
| | Futures contracts . . . . . . | | 134,428 | | 100,402 | | 49,009 | | 9,713 |
| | Accumulated undistributed net investment | | | | | | | | |
| | income . . . . . . . . . . . . . . | | 175,874 | | 277,943 | | 383 | | 579 |
| | Accumulated undistributed net realized (loss) . . . . | | (18,290,294) | | (24,466,076) | | (3,406,378) | | (2,725,737) |
| | Total Net Assets . . . . . . | $ | 45,830,177 | $ | 36,948,314 | $ | 10,600,699 | $ | 5,843,958 |
| | | | | | | | | | |
| | Shares outstanding (unlimited shares | | | | | | | | |
| | of no par value authorized) . . . . . . . . . . . . . . . . . | | 7,184,124 | | 8,422,643 | | 1,820,341 | | 1,414,559 |
| | Net asset value, offering and redemption | | | | | | | | |
| | price per share . . . . . . . . | $ | 6.38 | $ | 4.39 | $ | 5.82 | $ | 4.13 |
| | | | | | | | | | |
| 1 | Includes loaned securities with a value of: . . . . . . . | $ | 7,797,424 | $ | 5,638,470 | $ | 1,705,293 | $ | 326,924 |
| | | | | | | | | | |
See notes to financial statements.
| AssetMark Funds | | | | | | | | |
| STATEMENTS OF OPERATIONS | | | | | | | | |
| For the Year Ended March 31, 2009 | | | | | | | | |
| | | Large Cap | | Large Cap | | Small/Mid Cap | | Small/Mid Cap |
| | | Growth Fund | | Value Fund | | Growth Fund | | Value Fund |
| INVESTMENT INCOME: | | | | | | | | |
| Dividend income (net of withholding tax of | | | | | | | | |
| $8,459, $8,188, $990 and $0, respectively) . . . . . . . | $ | 5,506,391 | $ | 11,381,971 | $ | 406,887 | $ | 1,654,253 |
| Interest income . . . . . . . . . . . | | 133,817 | | 224,490 | | 36,500 | | 44,390 |
| Total investment income . . | | 5,640,208 | | 11,606,461 | | 443,387 | | 1,698,643 |
| EXPENSES: | | | | | | | | |
| Investment advisory fees . . . . | | 4,156,126 | | 3,560,881 | | 785,977 | | 762,992 |
| Distribution (12b-1) fees . . . . | | 1,127,802 | | 974,202 | | 207,733 | | 195,724 |
| Shareholder servicing fees . . . | | 269,484 | | 222,820 | | 59,430 | | 50,766 |
| Administration fees . . . . . . . . | | 156,682 | | 135,612 | | 29,002 | | 27,840 |
| Custody fees . . . . . . . . . . . . . | | 150,921 | | 96,673 | | 52,403 | | 26,228 |
| Legal fees . . . . . . . . . . . . . . . . | | 142,990 | | 118,437 | | 34,664 | | 36,110 |
| Reports to shareholders . . . . . | | 80,640 | | 49,249 | | 15,921 | | 47,171 |
| Fund accounting fees . . . . . . . | | 71,736 | | 63,313 | | 19,409 | | 16,723 |
| Directors’ fees and expenses . | | 60,113 | | 53,033 | | 11,478 | | 9,701 |
| Audit and tax fees . . . . . . . . . | | 32,479 | | 32,479 | | 27,395 | | 29,074 |
| Federal and state registration fees . . . . . . . . . . . . . . . .. | | 31,790 | | 34,423 | | 20,101 | | 21,173 |
| Insurance fees . . . . . . . . . . . . | | 22,685 | | 18,394 | | 4,566 | | 3,731 |
| Transfer agent fees and expenses . . . . . . . . . . . . . . . . . | | 16,500 | | 15,694 | | 12,954 | | 12,849 |
| Compliance fees . . . . . . . . . . | | 10,220 | | 9,125 | | 2,190 | | 1,825 |
| Total expenses . . . . . . . . . . | | 6,330,168 | | 5,384,335 | | 1,283,223 | | 1,241,907 |
| Less securities lending credit (See Note 6) . . . . . . . . . | | (588,002) | | (625,737) | | (237,367) | | (236,246) |
| Net expenses . . . . . . . . . . . | | 5,742,166 | | 4,758,598 | | 1,045,856 | | 1,005,661 |
| Net investment income (loss) | | (101,958) | | 6,847,863 | | (602,469) | | 692,982 |
| NET REALIZED AND UNREALIZED | | | | | | | | |
| (LOSS) ON INVESTMENTS: | | | | | | | | |
| Net realized (loss) on investments . . . . . . . . . . . . . . . . | | (101,077,784) | | (196,277,402) | | (25,626,820) | | (17,333,806) |
| Net change in unrealized (depreciation) | | | | | | | | |
| on investments . . . . . . . . . . | | (80,048,610) | | (42,850,671) | | (8,542,911) | | (16,861,051) |
| Net realized and unrealized (loss) . . . . . . . . . . . . . . . . | | (181,126,394) | | (239,128,073) | | (34,169,731) | | (34,194,857) |
| NET (DECREASE) IN NET ASSETS | | | | | | | | |
| RESULTING FROM OPERATIONS . . . . . . . . . . . . . . | $ | (181,228,352) | $ | (232,280,210) | $ | (34,772,200) | $ | (33,501,875) |
| | | | | | | | | |
See notes to financial statements.
| AssetMark Funds | | | | | | | | |
| STATEMENTS OF OPERATIONS (Continued) | | | | | | | | |
| For the Year Ended March 31, 2009 | | | | | | | | |
| | | International | | Real Estate | | Tax-Exempt | | Core Plus |
| | | Equity | | Securities | | Fixed Income | | Fixed Income |
| | | Fund | | Fund | | Fund | | Fund |
| INVESTMENT INCOME: | | | | | | | | |
| Dividend income (net of withholding tax of | | | | | | | | |
| $1,782,920, $1,822, $0 and $0, respectively) . . . . . | $ | 15,680,370 | $ | 2,054,954 | $ | — | $ | 107,416 |
| Interest income . . . . . . . . . . . | | 218,629 | | 35,674 | | 9,953,439 | | 35,928,289 |
| Total investment income . . | | 15,898,999 | | 2,090,628 | | 9,953,439 | | 36,035,705 |
| EXPENSES: | | | | | | | | |
| Investment advisory fees . . . . | | 4,307,910 | | 472,111 | | 1,814,431 | | 4,625,651 |
| Distribution (12b-1) fees . . . . | | 1,143,978 | | 124,240 | | 567,010 | | 1,553,602 |
| Shareholder servicing fees . . . | | 271,746 | | 30,811 | | 144,795 | | 428,707 |
| Administration fees . . . . . . . . | | 161,716 | | 18,098 | | 79,919 | | 219,902 |
| Custody fees . . . . . . . . . . . . . | | 699,619 | | 29,400 | | 30,682 | | 120,185 |
| Legal fees . . . . . . . . . . . . . . . . | | 126,718 | | 38,470 | | 97,138 | | 245,186 |
| Reports to shareholders . . . . . | | 56,302 | | 37,701 | | 58,499 | | 106,570 |
| Fund accounting fees . . . . . . . | | 91,567 | | 9,267 | | 40,298 | | 252,358 |
| Directors’ fees and expenses . | | 58,688 | | 10,803 | | 41,474 | | 102,084 |
| Audit and tax fees . . . . . . . . . | | 30,964 | | 26,814 | | 26,814 | | 36,178 |
| Federal and state registration fees . . . . . . . . . . . . . . . .. | | 31,711 | | 25,544 | | 30,257 | | 55,048 |
| Insurance fees . . . . . . . . . . . . | | 21,179 | | 1,749 | | 8,604 | | 22,583 |
| Transfer agent fees and expenses . . . . . . . . . . . . . . . . . | | 17,557 | | 12,457 | | 14,355 | | 22,170 |
| Compliance fees . . . . . . . . . . | | 10,585 | | 1,460 | | 4,265 | | 12,775 |
| Total expenses . . . . . . . . . . . . | | 7,030,240 | | 838,925 | | 2,958,541 | | 7,802,999 |
| Less reimbursement by Advisor (See Note 3) . . . . . . . | | — | | — | | (32,770) | | — |
| Less securities lending credit (See Note 6) . . . . . . . . . | | (63,975) | | (99,785) | | — | | (453,436) |
| Net expenses . . . . . . . . . . . | | 6,966,265 | | 739,140 | | 2,925,771 | | 7,349,563 |
| Net investment income . . . . . | | 8,932,734 | | 1,351,488 | | 7,027,668 | | 28,686,142 |
| NET REALIZED AND UNREALIZED | | | | | | | | |
| GAIN (LOSS) ON INVESTMENTS: | | | | | | | | |
| Net realized gain (loss) on: | | | | | | | | |
| Investments . . . . . . . . . . . . . . | | (231,643,209) | | (7,077,632) | | (4,975,869) | | (6,642,834) |
| Written options . . . . . . . . . . . | | — | | — | | — | | 692,746 |
| Foreign currencies . . . . . . . . . | | (2,422,402) | | — | | — | | (257,937) |
| Futures contracts . . . . . . . . . . | | — | | — | | — | | 8,281,011 |
| Forward currency contracts . . | | — | | — | | — | | 688,846 |
| Total . . . . . . . . . . . . . . . . . . | | (234,065,611) | | (7,077,632) | | (4,975,869) | | 2,761,832 |
| Net change in unrealized appreciation (depreciation) on: | | | | | | | | |
| Investments . . . . . . . . . . . . . . | | (78,435,000) | | (29,505,130) | | (2,952,074) | | (82,490,654) |
| Written options . . . . . . . . . . . | | — | | — | | — | | 95,730 |
| Foreign currencies . . . . . . . . . | | (119,201) | | — | | — | | (127,394) |
| Futures contracts . . . . . . . . . . | | — | | — | | — | | (1,575,083) |
| Forward currency contracts . . | | — | | — | | — | | 4,389 |
| Forward sale commitments . . | | — | | — | | — | | (122,982) |
| Total . . . . . . . . . . . . . . . . . . | | (78,554,201) | | (29,505,130) | | (2,952,074) | | (84,215,994) |
| Net realized and unrealized loss . . . . . . . . . . . . . . . . . | | (312,619,812) | | (36,582,762) | | (7,927,943) | | (81,454,162) |
| NET DECREASE IN NET ASSETS | | | | | | | | |
| RESULTING FROM OPERATIONS . . . . . . . . . . . . . . | $ | (303,687,078) | $ | (35,231,274) | $ | (900,275) | $ | (52,768,020) |
| | | | | | | | | |
See notes to financial statements.
| AssetMark Funds | | | | | | | | |
| STATEMENTS OF OPERATIONS (Continued) | | | | | | | | |
| For the Year Ended March 31, 2009 | | | | | | | | |
| | | Enhanced | | Enhanced | | Enhanced | | Enhanced |
| | | Fundamental | | Fundamental | | Fundamental | | Fundamental |
| | | IndexTM | | IndexTM | | IndexTM | | IndexTM |
| | | Large Company | | Large Company | | Small Company | | Small Company |
| | | Growth Fund | | Value Fund | | Growth Fund | | Value Fund |
| INVESTMENT INCOME: | | | | | | | | |
| Dividend income (net of withholding tax of | | | | | | | | |
| $55, $402, $0 and $20, respectively) . . . . . . . . . . . . | $ | 1,445,475 | $ | 1,930,220 | $ | 117,034 | $ | 144,497 |
| Interest income . . . . . . . . . . . | | 67,452 | | 37,768 | | 12,174 | | 7,669 |
| Total investment income . . | | 1,512,927 | | 1,967,988 | | 129,208 | | 152,166 |
| EXPENSES: | | | | | | | | |
| Investment advisory fees . . . . | | 508,070 | | 416,560 | | 91,239 | | 51,561 |
| Distribution (12b-1) fees . . . . | | 169,357 | | 138,853 | | 30,413 | | 17,187 |
| Shareholder servicing fees . . . | | 47,744 | | 38,628 | | 8,111 | | 4,273 |
| Administration fees . . . . . . . . | | 82,473 | | 67,816 | | 15,119 | | 8,611 |
| Custody fees . . . . . . . . . . . . . | | 24,616 | | 18,143 | | 4,747 | | 2,179 |
| Legal fees . . . . . . . . . . . . . . . . | | 23,922 | | 19,819 | | 5,510 | | 4,035 |
| Reports to shareholders . . . . . | | 20,204 | | 16,600 | | 6,099 | | 3,325 |
| Fund accounting fees . . . . . . . | | 66,533 | | 54,099 | | 12,068 | | 6,858 |
| Directors’ fees and expenses . | | 12,024 | | 9,519 | | 2,482 | | 1,094 |
| Audit and tax fees . . . . . . . . . | | 23,057 | | 23,051 | | 23,051 | | 23,046 |
| Federal and state registration fees . . . . . . . . . . . . . . . .. | | 18,862 | | 18,529 | | 12,621 | | 12,132 |
| Insurance fees . . . . . . . . . . . . | | 2,652 | | 2,192 | | 381 | | 315 |
| Transfer agent fees and expenses . . . . . . . . . . . . . . . . . | | 13,435 | | 13,234 | | 12,362 | | 12,402 |
| Compliance fees . . . . . . . . . . | | 1,095 | | 1,095 | | 730 | | 730 |
| Total expenses . . . . . . . . . . . . | | 1,014,044 | | 838,138 | | 224,933 | | 147,748 |
| Less expense reimbursement by Advisor (See Note 3) . | | (162,651) | | (58,628) | | (59,941) | | (50,363) |
| Less securities lending credit (See Note 6) . . . . . . . . . | | (24,932) | | (101,910) | | (16,576) | | (13,513) |
| Net expenses . . . . . . . . . . . | | 826,461 | | 677,600 | | 148,416 | | 83,872 |
| Net investment income (loss) | | 686,466 | | 1,290,388 | | (19,208) | | 68,294 |
| NET REALIZED AND UNREALIZED | | | | | | | | |
| GAIN (LOSS) ON INVESTMENTS: | | | | | | | | |
| Net realized (loss) on: | | | | | | | | |
| Investments . . . . . . . . . . . . . . | | (15,791,099) | | (22,349,323) | | (2,956,064) | | (2,440,811) |
| Futures contracts . . . . . . . . . . | | (1,733,141) | | (1,595,244) | | (352,472) | | (152,753) |
| Total . . . . . . . . . . . . . . . . . . | | (17,524,240) | | (23,944,567) | | (3,308,536) | | (2,593,564) |
| Net change in unrealized appreciation (depreciation) on: | | | | | | | | |
| Investments . . . . . . . . . . . . . . | | (11,929,593) | | (12,130,199) | | (2,385,017) | | (2,505,160) |
| Futures contracts . . . . . . . . . . | | 134,431 | | 99,953 | | 44,114 | | 7,831 |
| Total . . . . . . . . . . . . . . . . . . | | (11,795,162) | | (12,030,246) | | (2,340,903) | | (2,497,329) |
| Net realized and unrealized (loss) . . . . . . . . . . . . . . . . | | (29,319,402) | | (35,974,813) | | (5,649,439) | | (5,090,893) |
| NET (DECREASE) IN NET ASSETS | | | | | | | | |
| RESULTING FROM OPERATIONS . . . . . . . . . . . . . . | $ | (28,632,936) | $ | (34,684,425) | $ | (5,668,647) | $ | (5,022,599) |
| | | | | | | | | |
See notes to financial statements.
| AssetMark Funds | | | | | | | | |
| STATEMENTS OF CHANGES IN NET ASSETS | | | | | | | | |
| | | Large Cap Growth Fund | | Large Cap Value Fund |
| | | Year | | Year | | Year | | Year |
| | | Ended | | Ended | | Ended | | Ended |
| | | March 31, | | March 31, | | March 31, | | March 31, |
| | | 2009 | | 2008 | | 2009 | | 2008 |
| OPERATIONS: | | | | | | | | |
| Net investment income (loss) | $ | (101,958) | $ | (759,180) | $ | 6,847,863 | $ | 8,219,327 |
| Net realized gain (loss) on investment transactions . . . | | (101,077,784) | | 7,678,370 | | (196,277,402) | | 21,347,107 |
| Change in unrealized (depreciation) on investments . . | | (80,048,610) | | (30,454,010) | | (42,850,671) | | (112,363,301) |
| Net (decrease) in net assets resulting from operations | | (181,228,352) | | (23,534,820) | | $(232,280,210) | | (82,796,867) |
| CAPITAL SHARE TRANSACTIONS: | | | | | | | | |
| Shares sold . . . . . . . . . . . . . . . | | 115,002,964 | | 267,447,139 | | 132,367,268 | | 279,650,404 |
| Shares issued to holders in reinvestment of dividends | | 21,374 | | 19,666,815 | | 4,035,189 | | 31,097,566 |
| Shares redeemed . . . . . . . . . . | | (379,582,696) | | (330,121,453) | | (290,318,553) | | (275,853,508) |
| Net increase (decrease) . . . | | (264,558,358) | | (43,007,499) | | (153,916,096) | | 34,894,462 |
| DIVIDENDS AND DISTRIBUTIONS | | | | | | | | |
| TO SHAREHOLDERS: | | | | | | | | |
| Net investment income . . . . . | | — | | — | | (8,006,947) | | (7,869,450) |
| From net realized gains . . . . . | | (41,523) | | (37,788,532) | | (3,972) | | (52,248,534) |
| Total dividends and distributions . . . . . . . . . . . . . . . | | (41,523) | | (37,788,532) | | (8,010,919) | | (60,117,984) |
| | | | | | | | | |
| (DECREASE) IN NET ASSETS | | (445,828,233) | | (104,330,851) | | (394,207,225) | | (108,020,389) |
| | | | | | | | | |
| NET ASSETS: | | | | | | | | |
| Beginning of year . . . . . . . . . . . . . . . . . . . . . . . . . . . . | $ | 649,307,452 | $ | 753,638,303 | $ | 574,388,589 | $ | 682,408,978 |
| End of year (including undistributed net investment | | | | | | | | |
| income of $5,185, $14,780, $1,019,418 and | | | | | | | | |
| $2,178,548, respectively) . . . . . . . . . . . . . . . . . . . . . | $ | 203,479,219 | $ | 649,307,452 | $ | 180,181,364 | $ | 574,388,589 |
| | | | | | | | | |
| | | | | | | | | |
| CHANGES IN SHARES OUTSTANDING | | | | | | | | |
| Shares sold . . . . . . . . . . | | 15,129,303 | | 26,481,564 | | 17,638,533 | | 23,618,236 |
| Shares issued to holders in reinvestment of dividends | | 3,783 | | 1,933,807 | | 732,339 | | 2,850,373 |
| Shares redeemed . . . . . | | (52,990,271) | | (32,988,348) | | (39,585,341) | | (23,419,381) |
| Net increase (decrease) . . . . . . . . . . . . . . . . . . . . . . | | (37,857,185) | | (4,572,977) | | (21,214,469) | | 3,049,228 |
| | | | | | | | | |
See notes to financial statements.
| AssetMark Funds | | | | | | | | |
| STATEMENTS OF CHANGES IN NET ASSETS (Continued) | | | | | | |
| | | Small/Mid Cap Growth Fund | | Small/Mid Cap Value Fund |
| | | Year | | Year | | Year | | Year |
| | | Ended | | Ended | | Ended | | Ended |
| | | March 31, | | March 31, | | March 31, | | March 31, |
| | | 2009 | | 2008 | | 2009 | | 2008 |
| OPERATIONS: | | | | | | | | |
| Net investment income (loss) . . . . . . . . . . . . . . . . . . . | $ | (602,469) | $ | (1,431,040) | $ | 692,982 | $ | 823,898 |
| Net realized gain (loss) on investment transactions . . . | | (25,626,820) | | 6,846,628 | | (17,333,806) | | (14,634,783) |
| Change in unrealized (depreciation) on investments . . | | (8,542,911) | | (17,455,601) | | (16,861,051) | | (11,187,750) |
| Net (decrease) in net assets resulting from operations | | (34,772,200) | | (12,040,013) | | (33,501,875) | | (24,998,635) |
| CAPITAL SHARE TRANSACTIONS: | | | | | | | | |
| Shares sold . . . . . . . . . . | | 35,335,158 | | 121,019,326 | | 40,458,584 | | 106,059,903 |
| Shares issued to holders in reinvestment of dividends | | 68,972 | | 13,201,828 | | 340,873 | | 2,328,482 |
| Shares redeemed . . . . . | | (80,436,506) | | (142,278,921) | | (61,005,517) | | (89,598,633) |
| Net increase (decrease) . . . . . . . . . . . . . . . . . . . . . . | | (45,032,376) | | (8,057,767) | | (20,206,060) | | 18,789,752 |
| DIVIDENDS AND DISTRIBUTIONS | | | | | | | | |
| TO SHAREHOLDERS: | | | | | | | | |
| Net investment income . . . . . . . . . . . . . . . . . . . . . . . . | | — | | — | | (629,649) | | (785,895) |
| From net realized gains . . . . . . . . . . . . . . . . . . . . . . . . | | (132,673) | | (24,771,347) | | — | | (3,510,280) |
| Return of capital . . . . . . . . . . . . . . . . . . . . . . . . . . . . . | | — | | — | | (31,146) | | (26,098) |
| Total dividends and distributions . . . . . . . . . . . . . . . | | (132,673) | | (24,771,347) | | (660,795) | | (4,322,273) |
| | | | | | | | | |
| DECREASE IN NET ASSETS . . . . . . . . . . . . . . . . . . . . | | (79,937,249) | | (44,869,127) | | (54,368,730) | | (10,531,156) |
| | | | | | | | | |
| NET ASSETS: | | | | | | | | |
| Beginning of year . . . . . . . . . . . . . . . . . . . . . . . . . . . . | $ | 126,534,805 | $ | 171,403,932 | $ | 99,548,384 | $ | 110,079,540 |
| End of year (including undistributed net investment | | | | | | | | |
| income of $46,395, $88,037, $124,833 and | | | | | | | | |
| $64,600, respectively) . . . . . . . . . . . . . . . . . . . . . . .. | $ | 46,597,556 | $ | 126,534,805 | $ | 45,179,654 | $ | 99,548,384 |
| | | | | | | | | |
| | | | | | | | | |
| CHANGES IN SHARES OUTSTANDING | | | | | | | | |
| Shares sold . . . . . | | 5,246,578 | | 11,341,229 | | 5,003,895 | | 9,416,408 |
| Shares issued to holders in reinvestment of dividends | | 13,658 | | 1,349,880 | | 53,681 | | 227,169 |
| Shares redeemed | | (11,469,038) | | (13,063,069) | | (7,900,445) | | (8,078,699) |
| Net increase (decrease) . . . . . . . . . . . . . . . . . . . . . . | | (6,208,802) | | (371,960) | | (2,842,869) | | 1,564,878 |
| | | | | | | | | |
See notes to financial statements.
| AssetMark Funds | | | | | | | | |
| STATEMENTS OF CHANGES IN NET ASSETS (Continued) | | | | | | |
| | | International Equity Fund | | Real Estate Securities Fund |
| | | Year | | Year | | Year | | Year |
| | | Ended | | Ended | | Ended | | Ended |
| | | March 31, | | March 31, | | March 31, | | March 31, |
| | | 2009 | | 2008 | | 2009 | | 2008 |
| OPERATIONS: | | | | | | | | |
| Net investment income . . . . . . . . . . . . . . . . . . . . . . . . | $ | 8,932,734 | $ | 6,765,699 | $ | 1,351,488 | $ | 829,203 |
| Net realized gain (loss) on investment transactions . . . | | (234,065,611) | | 67,596,568 | | (7,077,632) | | 4,575,407 |
| Change in unrealized (depreciation) on investments . . | | (78,554,201) | | (101,555,201) | | (29,505,120) | | (22,665,897) |
| Net (decrease) in net assets resulting from operations . . | | (303,687,078) | | (27,192,934) | | (35,231,274) | | (17,261,287) |
| CAPITAL SHARE TRANSACTIONS: | | | | | | | | |
| Shares sold . . . . . | | 194,365,038 | | 376,680,277 | | 76,749,848 | | 69,172,227 |
| Shares issued to holders in reinvestment of dividends | | 3,227,760 | | 65,618,856 | | 285,858 | | 6,744,175 |
| Shares redeemed | | (345,996,813) | | (387,608,629) | | (77,204,383) | | (80,079,926) |
| Net increase (decrease) . . . . . . . . . . . . . . . . . . . . . . | | (148,404,015) | | 54,690,504 | | (168,677) | | (4,163,524) |
| DIVIDENDS AND DISTRIBUTIONS | | | | | | | | |
| TO SHAREHOLDERS: | | | | | | | | |
| Net investment income . . . . . . . . . . . . . . . . . . . . . . . . | | (2,826,522) | | (7,020,606) | | (543,149) | | (1,002,153) |
| From net realized gains . . . . . . . . . . . . . . . . . . . . . . . . | | (3,365,214) | | (118,277,258) | | — | | (12,664,277) |
| Return of capital | | — | | — | | — | | (246,102) |
| Total dividends and distributions . . . . . . . . . . . . . . . | | (6,191,736) | | (125,297,864) | | (543,149) | | (13,912,532) |
| | | | | | | | | |
| (DECREASE) IN NET ASSETS . . . . . . . . . . . . . . . . . . . | | (458,282,829) | | (97,800,294) | | (35,943,100) | | (35,337,343) |
| | | | | | | | | |
| NET ASSETS: | | | | | | | | |
| Beginning of year . . . . . . . . . . . . . . . . . . . . . . . . . . . . | $ | 681,622,030 | $ | 779,422,324 | $ | 82,124,778 | $ | 117,462,121 |
| End of year (including undistributed net investment | | | | | | | | |
| income of $6,512,687, $2,826,522, $0 and | | | | | | | | |
| $0, respectively) . . . . . . . . . . . . . . . . . . . . . . . . . . . . | $ | 223,339,201 | $ | 681,622,030 | $ | 46,181,678 | $ | 82,124,778 |
| | | | | | | | | |
| | | | | | | | | |
| CHANGES IN SHARES OUTSTANDING | | | | | | | | |
| Shares sold . . . . . | | 22,784,286 | | 25,945,984 | | 10,505,784 | | 4,337,540 |
| Shares issued to holders in reinvestment of dividends | | 489,054 | | 4,915,270 | | 39,703 | | 489,063 |
| Shares redeemed | | (41,762,653) | | (26,810,144) | | (7,519,879) | | (4,506,792) |
| Net increase (decrease) . . . . . . . . . . . . . . . . . . . . . . | | (18,489,313) | | 4,051,110 | | 3,025,608 | | 319,811 |
| | | | | | | | | |
See notes to financial statements.
| AssetMark Funds | | | | | | | | |
| STATEMENTS OF CHANGES IN NET ASSETS (Continued) | | | | | | |
| | | Tax-Exempt Fixed Income Fund | | Core Plus Fixed Income Fund |
| | | Year | | Year | | Year | | Year |
| | | Ended | | Ended | | Ended | | Ended |
| | | March 31, | | March 31, | | March 31, | | March 31, |
| | | 2009 | | 2008 | | 2009 | | 2008 |
| OPERATIONS: | | | | | | | | |
| Net investment income . . . . . . . . . . . . . . . . . . . . . . . . | $ | 7,027,668 | $ | 7,794,663 | $ | 28,686,142 | $ | 34,480,246 |
| Net realized gain (loss) on investment transactions . . . | | (4,975,869) | | (2,108,329) | | 2,761,832 | | 14,683,119 |
| Change in unrealized (depreciation) on investments . . | | (2,952,074) | | (4,983,804) | | (84,215,994) | | (20,296,135) |
| Net increase (decrease) in net assets resulting | | | | | | | | |
| from operations . . . . . . . . . . . . . . . . . . . . . . . . . . | | (900,275) | | 702,530 | | (52,768,020) | | 28,867,230 |
| CAPITAL SHARE TRANSACTIONS: | | | | | | | | |
| Shares sold . . . . . | | 151,089,362 | | 129,349,672 | | 367,493,809 | | 575,136,422 |
| Shares issued to holders in reinvestment of dividends | | 3,578,566 | | 3,602,262 | | 20,027,049 | | 17,309,826 |
| Shares redeemed | | (210,502,796) | | (116,384,384) | | (594,635,630) | | (497,859,399) |
| Net increase (decrease) . . . . . . . . . . . . . . . . . . . . . . | | (55,834,868) | | 16,567,550 | | (207,114,772) | | 94,586,849 |
| DIVIDENDS AND DISTRIBUTIONS | | | | | | | | |
| TO SHAREHOLDERS: | | | | | | | | |
| Net investment income . . . . . . . . . . . . . . . . . . . . . . . . | | (7,125,080) | | (7,671,793) | | (28,304,294) | | (34,075,503) |
| From net realized gains . . . . . . . . . . . . . . . . . . . . . . . . | | — | | — | | (11,447,403) | | (1,310,487) |
| Total dividends and distributions . . . . . . . . . . . . . . . | | (7,125,080) | | (7,671,793) | | (39,751,697) | | (35,385,990) |
| | | | | | | | | |
| INCREASE (DECREASE) IN NET ASSETS . . . . . . . . | | (63,860,223) | | 9,598,287 | | (299,634,489) | | 88,068,089 |
| | | | | | | | | |
| NET ASSETS: | | | | | | | | |
| Beginning of year . . . . . . . . . . . . . . . . . . . . . . . . . . . . | $ | 257,440,133 | $ | 247,841,846 | $ | 804,085,918 | $ | 716,017,829 |
| End of year (including undistributed net | | | | | | | | |
| investment income of $98,780, $196,192, | | | | | | | | |
| $947,533 and $65,365, respectively) . . . . . . . . . . . . | $ | 193,579,910 | $ | 257,440,133 | $ | 504,451,429 | $ | 804,085,918 |
| | | | | | | | | |
| | | | | | | | | |
| CHANGES IN SHARES OUTSTANDING | | | | | | | | |
| Shares sold . . . . . | | 14,687,220 | | 11,933,757 | | 43,769,031 | | 61,619,151 |
| Shares issued to holders in reinvestment of dividends | | 349,712 | | 335,715 | | 2,431,720 | | 1,885,334 |
| Shares redeemed | | (20,388,213) | | (10,763,968) | | (69,936,071) | | (53,307,504) |
| Net increase (decrease) | | (5,351,281) | | 1,505,504 | | (23,735,320) | | 10,196,981 |
| | | | | | | | | |
See notes to financial statements.
| AssetMark Funds | | | | | | | | |
| STATEMENTS OF CHANGES IN NET ASSETS (Continued) | | | | | | |
| | | | | | | | | |
| | | Enhanced | | Enhanced |
| | | Fundamental IndexTM Large | | Fundamental IndexTM Large |
| | | Company Growth Fund | | Company Value Fund |
| | | | | August 9, | | | | August 9, |
| | | Year | | 2007(1) | | Year | | 2007(1) |
| | | Ended | | through | | Ended | | through |
| | | March 31, | | March 31, | | March 31, | | March 31, |
| | | 2009 | | 2008 | | 2009 | | 2008 |
| OPERATIONS: | | | | | | | | |
| Net investment income | $ | 686,466 | $ | 192,724 | $ | 1,290,388 | $ | 327,058 |
| Net realized loss on investment transactions | | (17,524,240) | | (725,567) | | (23,944,567) | | (502,039) |
| Change in unrealized (depreciation) on investments | | (11,795,162) | | (2,975,305) | | (12,030,246) | | (5,858,293) |
| Net (decrease) in net assets resulting from operations | | (28,632,936) | | (3,508,148) | | (34,684,425) | | (6,033,274) |
| CAPITAL SHARE TRANSACTIONS: | | | | | | | | |
| Shares sold | | 69,899,546 | | 82,829,264 | | 67,799,021 | | 66,112,635 |
| Shares issued to holders in reinvestment of dividends | | 354,616 | | 67,537 | | 694,237 | | 74,619 |
| Shares redeemed | | (62,727,279) | | (11,708,504) | | (50,345,840) | | (5,309,522) |
| Net increase | | 7,526,883 | | 71,188,297 | | 18,147,418 | | 60,877,732 |
| DIVIDENDS AND DISTRIBUTIONS | | | | | | | | |
| TO SHAREHOLDERS: | | | | | | | | |
| Net investment income | | (610,709) | | (92,376) | | (1,211,759) | | (127,896) |
| From net realized gains | | — | | (40,834) | | — | | (19,482) |
| Total dividends and distributions | | (610,709) | | (133,210) | | (1,211,759) | | (147,378) |
| | | | | | | | | |
| INCREASE (DECREASE) IN NET ASSETS | | (21,716,762) | | 67,546,939 | | (17,748,766) | | 54,697,080 |
| | | | | | | | | |
| NET ASSETS: | | | | | | | | |
| Beginning of year | $ | 67,546,939 | $ | — | $ | 54,697,080 | $ | — |
| End of year (including undistributed net investment | | | | | | | | |
income of $175,874, $100,352, $277,943 and | | | | | | | | |
| $199,295, respectively) | $ | 45,830,177 | $ | 67,546,939 | $ | 36,948,314 | $ | 54,697,080 |
| | | | | | | | | |
| | | | | | | | | |
| CHANGES IN SHARES OUTSTANDING | | | | | | | | |
| Shares sold | | 8,530,402 | | 8,150,747 | | 10,406,162 | | 6,992,038 |
| Shares issued to holders in reinvestment of dividends | | 52,849 | | 6,426 | | 139,686 | | 7,830 |
| Shares redeemed | | (8,410,471) | | (1,145,829) | | (8,564,241) | | (558,832) |
| Net increase | | 172,780 | | 7,011,344 | | 1,981,607 | | 6,441,036 |
| | | | | | | | | |
(1) Commencement of operations.
See notes to financial statements.
STATEMENTS OF CHANGES IN NET ASSETS (Continued)
| | | Enhanced | | | Enhanced | |
| | | Fundamental IndexTM Small | | | Fundamental Index TM Small | |
| | | Company Growth Fund | | | Company Value Fund | |
| | | | | | August 9, | | | | | | August 9, | |
| | | Year | | | 2007(1) | | | Year | | | 2007(1) | |
| | | Ended | | | through | | | Ended | | | through | |
| | | March 31, | | | March 31, | | | March 31, | | | March 31, | |
| | | 2009 | | | 2008 | | | 2009 | | | 2008 | |
| OPERATIONS: | | | | | | | | | | | | |
| Net investment income (loss) | | $ | (19,208 | ) | | $ | (10,707 | ) | | $ | 68,294 | | | $ | 21,774 | |
| Net realized (loss) on investment transactions | | | (3,308,536 | ) | | | (77,712 | ) | | | (2,593,564 | ) | | | (109,948 | ) |
| Change in unrealized depreciation on investments | | | (2,340,903 | ) | | | (700,054 | ) | | | (2,497,329 | ) | | | (400,955 | ) |
| Net (decrease) in net assets resulting from operations . | | | (5,668,647 | ) | | | (788,473 | ) | | | (5,022,599 | ) | | | (489,129 | ) |
| CAPITAL SHARE TRANSACTIONS: | | | | | | | | | | | | | | | | |
| Shares sold | | | 15,292,704 | | | | 14,685,334 | | | | 11,270,413 | | | | 7,696,840 | |
| Shares issued to holders in reinvestment of dividends . | | | — | | | | 8,549 | | | | 56,966 | | | | 8,061 | |
| Shares redeemed | | | (11,634,256 | ) | | | (1,277,849 | ) | | | (6,403,312 | ) | | | (1,154,716 | ) |
| Net increase | | | 3,658,448 | | | | 13,416,034 | | | | 4,924,067 | | | | 6,550,185 | |
| DIVIDENDS AND DISTRIBUTIONS | | | | | | | | | | | | | | | | |
| TO SHAREHOLDERS: | | | | | | | | | | | | | | | | |
| Net investment income | | | — | | | | — | | | | (86,041 | ) | | | (9,436 | ) |
| From net realized gains | | | — | | | | (9,434 | ) | | | — | | | | (6,159 | ) |
| Return of capital | | | — | | | | (7,229 | ) | | | (16,930 | ) | | | — | |
| Total dividends and distributions | | | — | | | | (16,663 | ) | | | (102,971 | ) | | | (15,595 | ) |
| | | | | | | | | | | | | | | | | |
| INCREASE (DECREASE) IN NET ASSETS | | | (2,010,199 | ) | | | 12,610,898 | | | | (201,503 | ) | | | 6,045,461 | |
| | | | | | | | | | | | | | | | | |
| NET ASSETS: | | | | | | | | | | | | | | | | |
| Beginning of year | | $ | 12,610,898 | | | $ | — | | | $ | 6,045,461 | | | $ | — | |
| End of year (including undistributed net investment | | | | | | | | | | | | | | | | |
| income of $383, $0, $579 and $12,297, | | | | | | | | | | | | | | | | |
| respectively) | | $ | 10,600,699 | | | $ | 12,610,898 | | | $ | 5,843,958 | | | $ | 6,045,461 | |
| | | | | | | | | | | | | | | | | |
| | | | | | | | | | | | | | | | | |
| CHANGES IN SHARES OUTSTANDING | | | | | | | | | | | | | | | | |
| Shares sold. | | | 2,072,271 | | | | 1,517,164 | | | | 1,875,381 | | | | 850,720 | |
| Shares issued to holders in reinvestment of dividends. | | | — | | | | 859 | | | | 12,043 | | | | 888 | |
| Shares redeemed | | | (1,637,721 | ) | | | (132,232 | ) | | | (1,198,319 | ) | | | (126,154 | ) |
| Net increase | | | 434,550 | | | | 1,385,791 | | | | 689,105 | | | | 725,454 | |
(1) Commencement of operations.
See notes to financial statements.
AssetMark Funds
FINANCIAL HIGHLIGHTS
| | | LargeCap Growth Fund | |
| | | Year Ended | | | Year Ended | | | Year Ended | | | Period Ended | | | Year Ended | |
| | | March 31, 2009 | | | March 31, 2008 | | | March 31, 2007 | | | March 31, 2006 | | | June 30, 2005 | |
| Per share data for a share of capital | | | | | | | | | | | | | | | |
| stock outstanding for the entire period | | | | | | | | | | | | | | | |
| and selected information for the period | | | | | | | | | | | | | | | |
| are as follows: | | | | | | | | | | | | | | | |
| Net asset value, beginning of period | | $ | 8.81 | | | $ | 9.62 | | | $ | 9.95 | | | $ | 9.20 | | | $ | 9.16 | |
| | | | | | | | | | | | | | | | | | | | | |
| Income from investment operations: | | | | | | | | | | | | | | | | | | | | |
| Net investment loss | | | — | | | | (0.01 | ) | | | (0.02 | ) | | | (0.03 | ) | | | (0.03 | ) |
| Net realized and unrealized gains | | | | | | | | | | | | | | | | | | | | |
| (losses) on investments | | | (3.14 | ) | | | (0.30 | ) | | | (0.06 | ) | | | 0.78 | | | | 0.07 | |
| Total from investment operations | | | (3.14 | ) | | | (0.31 | ) | | | (0.08 | ) | | | 0.75 | | | | 0.04 | |
| Less distributions: | | | | | | | | | | | | | | | | | | | | |
| Dividends from net investment | | | | | | | | | | | | | | | | | | | | |
| income | | | — | | | | — | | | | — | | | | — | | | | — | |
| Dividends from net realized gains | | | — | * | | | (0.50 | ) | | | (0.25 | ) | | | — | | | | — | |
| Total distributions | | | — | | | | (0.50 | ) | | | (0.25 | ) | | | — | | | | — | |
| Net asset value, end of period | | $ | 5.67 | | | $ | 8.81 | | | $ | 9.62 | | | $ | 9.95 | | | $ | 9.20 | |
| | | | | | | | | | | | | | | | | | | | | |
| | | | | | | | | | | | | | | | | | | | | |
| Total return | | | –35.63 | % | | | –3.88 | % | | | –0.80 | % | | | 8.15 | %(1) | | | 0.44 | % |
| | | | | | | | | | | | | | | | | | | | | |
| Supplemental data and ratios: | | | | | | | | | | | | | | | | | | | | |
| Net assets, end of period | | $ | 203,479,219 | | | $ | 649,307,452 | | | $ | 753,638,303 | | | $ | 653,921,538 | | | $ | 570,471,545 | |
| | | | | | | | | | | | | | | | | | | | | |
| Ratio of expenses to average net assets | | | | | | | | | | | | | | | | | | | | |
| Before Expense Reimbursement, | | | | | | | | | | | | | | | | | | | | |
| including (Recapture) | | | 1.40 | % | | | 1.33 | % | | | 1.33 | % | | | 1.35 | %(2) | | | 1.39 | % |
| After Expense Reimbursement | | | | | | | | | | | | | | | | | | | | |
| (Recapture) and Securities | | | | | | | | | | | | | | | | | | | | |
| Lending Credit | | | 1.27 | % | | | 1.28 | % | | | 1.31 | % | | | 1.32 | %(2) | | | 1.37 | % |
| | | | | | | | | | | | | | | | | | | | | |
| Ratio of net investment loss | | | | | | | | | | | | | | | | | | | | |
| to average net assets | | | | | | | | | | | | | | | | | | | | |
| Before Expense Reimbursement, | | | | | | | | | | | | | | | | | | | | |
| including (Recapture) | | | –0.15 | % | | | –0.15 | % | | | –0.27 | % | | | –0.38 | %(2) | | | –0.41 | % |
| After Expense Reimbursement | | | | | | | | | | | | | | | | | | | | |
| (Recapture) and Securities | | | | | | | | | | | | | | | | | | | | |
| Lending Credit | | | –0.02 | % | | | –0.10 | % | | | –0.25 | % | | | –0.35 | %(2) | | | –0.39 | % |
| | | | | | | | | | | | | | | | | | | | | |
| Portfolio turnover rate | | | 98.67 | % | | | 62.86 | % | | | 142.66 | % | | | 72.34 | % | | | 21.63 | % |
(1) Not Annualized.
(2) Annualized.
| | Amount represents less than $0.01 per share. |
See notes to financial statements.
FINANCIAL HIGHLIGHTS
| | | Large Cap Value Fund | |
| | | Year Ended | | | Year Ended | | | Year ended | | | Period Ended | | | Year Ended | |
| | | March 31, 2009 | | | March 31, 2008 | | | March 31, 2007 | | | March 31, 2006 | | | June 30, 2005 | |
| Per share data for a share of capital | | | | | | | | | | | | | | | |
| stock outstanding for the entire period | | | | | | | | | | | | | | | |
| and selected information for the period | | | | | | | | | | | | | | | |
| are as follows: | | | | | | | | | | | | | | | |
| Net asset value, beginning of period | | $ | 9.85 | | | $ | 12.34 | | | $ | 11.77 | | | $ | 11.24 | | | $ | 10.96 | |
| | | | | | | | | | | | | | | | | | | | | |
| Income from investment operations: | | | | | | | | | | | | | | | | | | | | |
| Net investment income | | | 0.19 | | | | 0.15 | | | | 0.14 | | | | 0.07 | | | | 0.07 | |
| Net realized and unrealized | | | | | | | | | | | | | | | | | | | | |
| gains (losses) on investments | | | (4.99 | ) | | | (1.55 | ) | | | 1.67 | | | | 0.79 | | | | 0.56 | |
| Total from investment operations | | | (4.80 | ) | | | (1.40 | ) | | | 1.81 | | | | 0.86 | | | | 0.63 | |
| Less distributions: | | | | | | | | | | | | | | | | | | | | |
| Dividends from net investment | | | | | | | | | | | | | | | | | | | | |
| income | | | (0.20 | ) | | | (0.14 | ) | | | (0.14 | ) | | | (0.07 | ) | | | (0.05 | ) |
| Dividends from net realized gains | | | — | * | | | (0.95 | ) | | | (1.10 | ) | | | (0.26 | ) | | | (0.30 | ) |
| Total distributions | | | (0.20 | ) | | | (1.09 | ) | | | (1.24 | ) | | | (0.33 | ) | | | (0.35 | ) |
| Net asset value, end of period | | $ | 4.85 | | | $ | 9.85 | | | $ | 12.34 | | | $ | 11.77 | | | $ | 11.24 | |
| | | | | | | | | | | | | | | | | | | | | |
| | | | | | | | | | | | | | | | | | | | | |
| Total return | | | –48.85 | % | | | –12.23 | % | | | 15.32 | % | | | 7.85 | %(1) | | | 5.69 | % |
| | | | | | | | | | | | | | | | | | | | | |
| Supplemental data and ratios: | | | | | | | | | | | | | | | | | | | | |
| Net assets, end of period | | $ | 180,181,364 | | | $ | 574,388,589 | | | $ | 682,408,978 | | | $ | 660,129,983 | | | $ | 570,849,575 | |
| | | | | | | | | | | | | | | | | | | | | |
| Ratio of expenses to average net assets | | | | | | | | | | | | | | | | | | | | |
| Before Expense Reimbursement, | | | | | | | | | | | | | | | | | | | | |
| including (Recapture) | | | 1.38 | % | | | 1.33 | % | | | 1.32 | % | | | 1.36 | %(2) | | | 1.38 | % |
| After Expense Reimbursement | | | | | | | | | | | | | | | | | | | | |
| (Recapture) and Securities | | | | | | | | | | | | | | | | | | | | |
| Lending Credit | | | 1.22 | % | | | 1.28 | % | | | 1.28 | % | | | 1.30 | %(2) | | | 1.33 | % |
| | | | | | | | | | | | | | | | | | | | | |
| Ratio of net investment income to | | | | | | | | | | | | | | | | | | | | |
| average net assets | | | | | | | | | | | | | | | | | | | | |
| Before Expense Reimbursement, | | | | | | | | | | | | | | | | | | | | |
| including (Recapture) | | | 1.60 | % | | | 1.16 | % | | | 1.00 | % | | | 0.86 | %(2) | | | 0.67 | % |
| After Expense Reimbursement | | | | | | | | | | | | | | | | | | | | |
| (Recapture) and Securities | | | | | | | | | | | | | | | | | | | | |
| Lending Credit | | | 1.76 | % | | | 1.21 | % | | | 1.04 | % | | | 0.92 | %(2) | | | 0.72 | % |
| | | | | | | | | | | | | | | | | | | | | |
| Portfolio turnover rate | | | 58.45 | % | | | 40.54 | % | | | 30.25 | % | | | 64.61 | % | | | 20.06 | % |
(1) Not Annualized.
(2) Annualized.
| | Amount represents less than $0.01 per share. |
See notes to financial statements.
| | | Small/Mid Cap Growth Fund | |
| | | Year Ended | | | Year Ended | | | Year Ended | | | Period Ended | | | Year Ended | |
| | | March 31, 2009 | | | March 31, 2008 | | | March 31, 2007 | | | March 31, 2006 | | | June 30, 2005 | |
| Per share data for a share of capital | | | | | | | | | | | | | | | |
| stock outstanding for the entire period | | | | | | | | | | | | | | | |
| and selected information for the period | | | | | | | | | | | | | | | |
| are as follows: | | | | | | | | | | | | | | | |
| Net asset value, beginning of period | | $ | 8.05 | | | $ | 10.65 | | | $ | 10.60 | | | $ | 9.56 | | | $ | 9.49 | |
| | | | | | | | | | | | | | | | | | | | | |
| Income from investment operations: | | | | | | | | | | | | | | | | | | | | |
| Net investment loss | | | (0.06 | ) | | | (0.09 | ) | | | (0.07 | ) | | | (0.06 | ) | | | (0.06 | ) |
| Net realized and unrealized | | | | | | | | | | | | | | | | | | | | |
| gains (losses) on investments | | | (3.08 | ) | | | (0.69 | ) | | | 0.56 | | | | 1.95 | | | | 0.13 | |
| Total from investment operations | | | (3.14 | ) | | | (0.78 | ) | | | 0.49 | | | | 1.89 | | | | 0.07 | |
| Less distributions: | | | | | | | | | | | | | | | | | | | | |
| Dividends from net investment | | | | | | | | | | | | | | | | | | | | |
| income | | | — | | | | — | | | | — | | | | — | | | | — | |
| Dividends from net realized gains | | | (0.01 | ) | | | (1.82 | ) | | | (0.44 | ) | | | (0.85 | ) | | | — | |
| Total distributions | | | (0.01 | ) | | | (1.82 | ) | | | (0.44 | ) | | | (0.85 | ) | | | — | |
| Net asset value, end of period | | $ | 4.90 | | | $ | 8.05 | | | $ | 10.65 | | | $ | 10.60 | | | $ | 9.56 | |
| | | | | | | | | | | | | | | | | | | | | |
| | | | | | | | | | | | | | | | | | | | | |
| Total return | | | –38.98 | % | | | –10.31 | % | | | 4.84 | % | | | 20.82 | %(1) | | | 0.74 | % |
| | | | | | | | | | | | | | | | | | | | | |
| Supplemental data and ratios: | | | | | | | | | | | | | | | | | | | | |
| Net assets, end of period | | $ | 46,597,556 | | | $ | 126,534,805 | | | $ | 171,403,932 | | | $ | 215,514,988 | | | $ | 148,571,261 | |
| | | | | | | | | | | | | | | | | | | | | |
| Ratio of expenses to average net assets | | | | | | | | | | | | | | | | | | | | |
| Before Expense Reimbursement, | | | | | | | | | | | | | | | | | | | | |
| including (Recapture) | | | 1.54 | % | | | 1.44 | % | | | 1.43 | % | | | 1.43 | %(2) | | | 1.54 | % |
| After Expense Reimbursement | | | | | | | | | | | | | | | | | | | | |
| (Recapture) and Securities | | | | | | | | | | | | | | | | | | | | |
| Lending Credit | | | 1.26 | % | | | 1.29 | % | | | 1.37 | % | | | 1.38 | %(2) | | | 1.50 | % |
| | | | | | | | | | | | | | | | | | | | | |
| Ratio of net investment loss | | | | | | | | | | | | | | | | | | | | |
| to average net assets | | | | | | | | | | | | | | | | | | | | |
| Before Expense Reimbursement, | | | | | | | | | | | | | | | | | | | | |
| including (Recapture) | | | –1.01 | % | | | –0.99 | % | | | –0.75 | % | | | –0.92 | %(2) | | | –0.85 | % |
| After Expense Reimbursement | | | | | | | | | | | | | | | | | | | | |
| (Recapture) and Securities | | | | | | | | | | | | | | | | | | | | |
| Lending Credit | | | –0.73 | % | | | –0.84 | % | | | –0.69 | % | | | –0.87 | %(2) | | | –0.81 | % |
| | | | | | | | | | | | | | | | | | | | | |
| Portfolio turnover rate | | | 219.24 | % | | | 209.64 | % | | | 213.08 | % | | | 180.64 | % | | | 99.09 | % |
(1) Not Annualized.
(2) Annualized.
See notes to financial statements.
| AssetMark Funds |
| FINANCIAL HIGHLIGHTS |
| | | Small/Mid Cap Value Fund | |
| | | Year Ended | | | Year Ended | | | Year Ended | | | Period Ended | | | Year Ended | |
| | | March 31, 2009 | | | March 31, 2008 | | | March 31, 2007 | | | March 31, 2006 | | | June 30, 2005 | |
| Per share data for a share of capital | | | | | | | | | | | | | | | |
| stock outstanding for the entire period | | | | | | | | | | | | | | | |
| and selected information for the period | | | | | | | | | | | | | | | |
| are as follows: | | | | | | | | | | | | | | | |
| Net asset value, beginning of period | | $ | 9.24 | | | $ | 11.95 | | | $ | 14.41 | | | $ | 13.89 | | | $ | 12.93 | |
| Income from investment operations: | | | | | | | | | | | | | | | | | | | | |
| Net investment income (loss) | | | 0.08 | | | | 0.08 | | | | 0.31 | | | | (0.04 | ) | | | (0.04 | ) |
| Net realized and unrealized | | | | | | | | | | | | | | | | | | | | |
| gains (losses) on investments | | | –3.56 | | | | (2.36 | ) | | | 0.81 | | | | 1.52 | | | | 1.40 | |
| Total from investment operations | | | (3.48 | ) | | | (2.28 | ) | | | 1.12 | | | | 1.48 | | | | 1.36 | |
| Less distributions: | | | | | | | | | | | | | | | | | | | | |
| Dividends from net investment | | | | | | | | | | | | | | | | | | | | |
| income | | | (0.07 | ) | | | (0.08 | ) | | | (0.31 | ) | | | — | | | | — | |
| Dividends from net realized gains | | | — | | | | (0.35 | ) | | | (3.27 | ) | | | (0.96 | ) | | | (0.40 | ) |
| Return of capital | | | — | * | | | — | * | | | — | | | | — | | | | — | |
| Total distributions | | | (0.07 | ) | | | (0.43 | ) | | | (3.58 | ) | | | (0.96 | ) | | | (0.40 | ) |
| Net asset value, end of period | | $ | 5.69 | | | $ | 9.24 | | | $ | 11.95 | | | $ | 14.41 | | | $ | 13.89 | |
| | | | | | | | | | | | | | | | | | | | | |
| | | | | | | | | | | | | | | | | | | | | |
| Total return | | | –37.59 | % | | | –19.47 | % | | | 7.63 | % | | | 11.18 | %(1) | | | 10.56 | % |
| | | | | | | | | | | | | | | | | | | | | |
| Supplemental data and ratios: | | | | | | | | | | | | | | | | | | | | |
| Net assets, end of period | | $ | 45,179,654 | | | $ | 99,548,384 | | | $ | 110,079,540 | | | $ | 185,589,680 | | | $ | 131,103,625 | |
| | | | | | | | | | | | | | | | | | | | | |
| Ratio of expenses to average net assets | | | | | | | | | | | | | | | | | | | | |
| Before Expense Reimbursement, | | | | | | | | | | | | | | | | | | | | |
| including (Recapture) | | | 1.59 | % | | | 1.48 | % | | | 1.47 | % | | | 1.55 | %(2) | | | 1.61 | % |
| After Expense Reimbursement | | | | | | | | | | | | | | | | | | | | |
| (Recapture) and Securities | | | | | | | | | | | | | | | | | | | | |
| Lending Credit | | | 1.28 | % | | | 1.40 | % | | | 1.41 | % | | | 1.53 | %(2) | | | 1.59 | % |
| | | | | | | | | | | | | | | | | | | | | |
| Ratio of net investment income (loss) | | | | | | | | | | | | | | | | | | | | |
| to average net assets | | | | | | | | | | | | | | | | | | | | |
| Before Expense Reimbursement, | | | | | | | | | | | | | | | | | | | | |
| including (Recapture) | | | 0.58 | % | | | 0.61 | % | | | 1.68 | % | | | –0.45 | %(2) | | | –0.32 | % |
| After Expense Reimbursement | | | | | | | | | | | | | | | | | | | | |
| (Recapture) and Securities | | | | | | | | | | | | | | | | | | | | |
| Lending Credit | | | 0.89 | % | | | 0.69 | % | | | 1.75 | % | | | –0.43 | %(2) | | | –0.30 | % |
| | | | | | | | | | | | | | | | | | | | | |
| Portfolio turnover rate | | | 65.97 | % | | | 127.62 | % | | | 174.94 | % | | | 72.42 | % | | | 92.42 | % |
(1) Not Annualized. (2) Annualized.
| | * | Amount represents less than $0.01 per share. |
See notes to financial statements.
| | | | | | International Equity Fund | | | | |
| | | Year Ended | | | Year Ended | | | Year Ended | | | Period Ended | | | Year Ended | |
| | | March 31, 2009 | | | March 31, 2008 | | | March 31, 2007 | | | March 31, 2006 | | | June 30, 2005 | |
| Per share data for a share of capital | | | | | | | | | | | | | | | |
| stock outstanding for the entire period | | | | | | | | | | | | | | | |
| and selected information for the period | | | | | | | | | | | | | | | |
| are as follows: | | | | | | | | | | | | | | | |
| Net asset value, beginning of period | | $ | 11.96 | | | $ | 14.73 | | | $ | 14.06 | | | $ | 11.79 | | | $ | 10.43 | |
| | | | | | | | | | | | | | | | | | | | | |
| Income from investment operations: | | | | | | | | | | | | | | | | | | | | |
| Net investment income (loss) | | | 0.25 | | | | 0.13 | | | | 0.16 | | | | (0.01 | ) | | | 0.10 | |
| Net realized and unrealized | | | | | | | | | | | | | | | | | | | | |
| gains (losses) on investments | | | (6.26 | ) | | | (0.44 | ) | | | 2.24 | | | | 3.40 | | | | 1.40 | |
| Total from investment operations | | | (6.01 | ) | | | (0.31 | ) | | | 2.40 | | | | 3.39 | | | | 1.50 | |
| Less distributions: | | | | | | | | | | | | | | | | | | | | |
| Dividends from net investment | | | | | | | | | | | | | | | | | | | | |
| income | | | (0.07 | ) | | | (0.14 | ) | | | (0.18 | ) | | | (0.15 | ) | | | (0.06 | ) |
| Dividends from net realized gains | | | (0.08 | ) | | | (2.32 | ) | | | (1.55 | ) | | | (0.97 | ) | | | (0.08 | ) |
| Total distributions | | | (0.15 | ) | | | (2.46 | ) | | | (1.73 | ) | | | (1.12 | ) | | | (0.14 | ) |
| Net asset value, end of period | | $ | 5.80 | | | $ | 11.96 | | | $ | 14.73 | | | $ | 14.06 | | | $ | 11.79 | |
| | | | | | | | | | | | | | | | | | | | | |
| | | | | | | | | | | | | | | | | | | | | |
| Total return | | | –50.42 | % | | | –3.85 | % | | | 17.65 | % | | | 29.75 | %(1) | | | 14.37 | % |
| | | | | | | | | | | | | | | | | | | | | |
| Supplemental data and ratios: | | | | | | | | | | | | | | | | | | | | |
| Net assets, end of period | | $ | 223,339,201 | | | $ | 681,622,030 | | | $ | 779,422,324 | | | $ | 612,288,218 | | | $ | 412,985,571 | |
| | | | | | | | | | | | | | | | | | | | | |
| Ratio of expenses to average net assets | | | | | | | | �� | | | | | | | | | | | | |
| Before Expense Reimbursement, | | | | | | | | | | | | | | | | | | | | |
| including (Recapture) | | | 1.53 | % | | | 1.43 | % | | | 1.39 | % | | | 1.38 | %(2) | | | 1.38 | % |
| After Expense Reimbursement | | | | | | | | | | | | | | | | | | | | |
| (Recapture) and Securities | | | | | | | | | | | | | | | | | | | | |
| Lending Credit | | | 1.52 | % | | | 1.42 | % | | | 1.37 | % | | | 1.34 | %(2) | | | 1.33 | % |
| | | | | | | | | | | | | | | | | | | | | |
| Ratio of net investment income (loss) | | | | | | | | | | | | | | | | | | | | |
| to average net assets | | | | | | | | | | | | | | | | | | | | |
| Before Expense Reimbursement, | | | | | | | | | | | | | | | | | | | | |
| including (Recapture) | | | 1.94 | % | | | 0.87 | % | | | 0.95 | % | | | –0.16 | %(2) | | | 1.01 | % |
| After Expense | | | | | | | | | | | | | | | | | | | | |
| Reimbursement (Recapture) | | | | | | | | | | | | | | | | | | | | |
| and Securities Lending Credit | | | 1.95 | % | | | 0.88 | % | | | 0.97 | % | | | –0.12 | %(2) | | | 1.06 | % |
| | | | | | | | | | | | | | | | | | | | | |
| Portfolio turnover rate | | | 144.98 | % | | | 119.13 | % | | | 89.16 | % | | | 66.98 | % | | | 80.32 | % |
(1) Not Annualized.
(2) Annualized.
See notes to financial statements.
| | | | | | Real Estate Securities Fund | | | | |
| | | Year Ended | | | Year Ended | | | Year Ended | | | Period Ended | | | Year Ended | |
| | | March 31, 2009 | | | March 31, 2008 | | | March 31, 2007 | | | March 31, 2006 | | | June 30, 2005 | |
| Per share data for a share of capital | | | | | | | | | | | | | | | |
| stock outstanding for the entire period | | | | | | | | | | | | | | | |
| and selected information for the period | | | | | | | | | | | | | | | |
| are as follows: | | | | | | | | | | | | | | | |
| Net asset value, beginning of period | | $ | 13.83 | | | $ | 20.91 | | | $ | 18.46 | | | $ | 17.31 | | | $ | 13.66 | |
| | | | | | | | | | | | | | | | | | | | | |
| Income from investment operations: | | | | | | | | | | | | | | | | | | | | |
| Net investment income | | | 0.15 | | | | 0.43 | | | | 0.16 | | | | 0.33 | | | | 0.44 | |
| Net realized and unrealized | | | | | | | | | | | | | | | | | | | | |
| gains (losses) on investments | | | (8.77 | ) | | | (4.58 | ) | | | 3.84 | | | | 3.27 | | | | 4.04 | |
| Total from investment operations | | | (8.62 | ) | | | (4.15 | ) | | | 4.00 | | | | 3.60 | | | | 4.48 | |
| Less distributions: | | | | | | | | | | | | | | | | | | | | |
| Dividends from net investment | | | | | | | | | | | | | | | | | | | | |
| income | | | (0.06 | ) | | | (0.21 | ) | | | (0.25 | ) | | | (0.32 | ) | | | (0.43 | ) |
| Dividends from net realized gains | | | — | | | | (2.68 | ) | | | (1.30 | ) | | | (2.13 | ) | | | (0.40 | ) |
| Return of capital | | | — | | | | (0.04 | ) | | | — | | | | — | | | | — | |
| Total distributions | | | (0.06 | ) | | | (2.93 | ) | | | (1.55 | ) | | | (2.45 | ) | | | (0.83 | ) |
| Net asset value, end of period | | $ | 5.15 | | | $ | 13.83 | | | $ | 20.91 | | | $ | 18.46 | | | $ | 17.31 | |
| | | | | | | | | | | | | | | | | | | | | |
| | | | | | | | | | | | | | | | | | | | | |
| Total return | | | –62.46 | % | | | –19.74 | % | | | 21.96 | % | | | 22.94 | %(1) | | | 33.22 | % |
| | | | | | | | | | | | | | | | | | | | | |
| Supplemental data and ratios: | | | | | | | | | | | | | | | | | | | | |
| Net assets, end of period | | $ | 46,181,678 | | | $ | 82,124,778 | | | $ | 117,462,121 | | | $ | 89,616,046 | | | $ | 75,043,878 | |
| | | | | | | | | | | | | | | | | | | | | |
| Ratio of expenses to average net assets | | | | | | | | | | | | | | | | | | | | |
| Before Expense Reimbursement, | | | | | | | | | | | | | | | | | | | | |
| including (Recapture) | | | 1.69 | % | | | 1.52 | % | | | 1.49 | % | | | 1.51 | %(2) | | | 1.51 | % |
| After Expense Reimbursement | | | | | | | | | | | | | | | | | | | | |
| (Recapture) and Securities | | | | | | | | | | | | | | | | | | | | |
| Lending Credit | | | 1.49 | % | | | 1.46 | % | | | 1.46 | % | | | 1.49 | %(2) | | | 1.49 | % |
| | | | | | | | | | | | | | | | | | | | | |
| Ratio of net investment income to | | | | | | | | | | | | | | | | | | | | |
| average net assets | | | | | | | | | | | | | | | | | | | | |
| Before Expense Reimbursement, | | | | | | | | | | | | | | | | | | | | |
| including (Recapture) | | | 2.52 | % | | | 0.99 | % | | | 0.67 | % | | | 2.46 | %(2) | | | 2.83 | % |
| After Expense | | | | | | | | | | | | | | | | | | | | |
| Reimbursement (Recapture) and | | | | | | | | | | | | | | | | | | | | |
| Securities Lending Credit | | | 2.72 | % | | | 1.05 | % | | | 0.70 | % | | | 2.48 | %(2) | | | 2.85 | % |
| | | | | | | | | | | | | | | | | | | | | |
| Portfolio turnover rate | | | 126.60 | % | | | 81.59 | % | | | 43.86 | % | | | 41.09 | % | | | 77.64 | % |
(1) Not Annualized.
(2) Annualized.
See notes to financial statements.
| | | Tax-Exempt Fixed Income Fund | |
| | | Year Ended | | | Year Ended | | | Year Ended | | | Period Ended | | | Year Ended | |
| | | March 31, 2009 | | | March 31, 2008 | | | March 31, 2007 | | | March 31, 2006 | | | June 30, 2005 | |
| Per share data for a share of capital | | | | | | | | | | | | | | | |
| stock outstanding for the entire period | | | | | | | | | | | | | | | |
| and selected information for the period | | | | | | | | | | | | | | | |
| are as follows: | | | | | | | | | | | | | | | |
| Net asset value, beginning of period | | $ | 10.64 | | | $ | 10.92 | | | $ | 10.77 | | | $ | 11.01 | | | $ | 10.75 | |
| | | | | | | | | | | | | | | | | | | | | |
| Income from investment operations: | | | | | | | | | | | | | | | | | | | | |
| Net investment income | | | 0.34 | | | | 0.31 | | | | 0.27 | | | | 0.17 | | | | 0.20 | |
| Net realized and unrealized | | | | | | | | | | | | | | | | | | | | |
| gains (losses) on investments | | | (0.37 | ) | | | (0.28 | ) | | | 0.15 | | | | (0.24 | ) | | | 0.26 | |
| Total from investment operations | | | (0.03 | ) | | | 0.03 | | | | 0.42 | | | | (0.07 | ) | | | 0.46 | |
| Less distributions: | | | | | | | | | | | | | | | | | | | | |
| Dividends from net investment income | | | (0.34 | ) | | | (0.31 | ) | | | (0.27 | ) | | | (0.17 | ) | | | (0.20 | ) |
| Dividends from net realized gains | | | — | | | | — | | | | — | | | | — | | | | — | |
| Total distributions | | | (0.34 | ) | | | (0.31 | ) | | | (0.27 | ) | | | (0.17 | ) | | | (0.20 | ) |
| Net asset value, end of period | | $ | 10.27 | | | $ | 10.64 | | | $ | 10.92 | | | $ | 10.77 | | | $ | 11.01 | |
| | | | | | | | | | | | | | | | | | | | | |
| | | | | | | | | | | | | | | | | | | | | |
| Total return | | | –0.25 | % | | | 0.28 | % | | | 3.92 | % | | | –0.64 | %(1) | | | 4.29 | % |
| | | | | | | | | | | | | | | | | | | | | |
| Supplemental data and ratios: | | | | | | | | | | | | | | | | | | | | |
| Net assets, end of period | | $ | 193,579,910 | | | $ | 257,440,133 | | | $ | 247,841,846 | | | $ | 213,170,198 | | | $ | 157,544,853 | |
| | | | | | | | | | | | | | | | | | | | | |
| Ratio of expenses to average net assets | | | | | | | | | | | | | | | | | | | | |
| Before Expense Reimbursement, | | | | | | | | | | | | | | | | | | | | |
| including (Recapture) | | | 1.30 | % | | | 1.23 | % | | | 1.28 | % | | | 1.29 | %(2) | | | 1.33 | % |
| After Expense | | | | | | | | | | | | | | | | | | | | |
| Reimbursement (Recapture) | | | 1.29 | % | | | 1.23 | % | | | 1.28 | % | | | 1.29 | %(2) | | | 1.29 | % |
| | | | | | | | | | | | | | | | | | | | | |
| Ratio of net investment income to | | | | | | | | | | | | | | | | | | | | |
| average net assets | | | | | | | | | | | | | | | | | | | | |
| Before Expense Reimbursement, | | | | | | | | | | | | | | | | | | | | |
| including (Recapture) | | | 3.09 | % | | | 2.93 | % | | | 2.53 | % | | | 2.15 | %(2) | | | 1.90 | % |
| After Expense | | | | | | | | | | | | | | | | | | | | |
| Reimbursement (Recapture) | | | 3.10 | % | | | 2.93 | % | | | 2.53 | % | | | 2.15 | %(2) | | | 1.94 | % |
| | | | | | | | | | | | | | | | | | | | | |
| Portfolio turnover rate | | | 44.37 | % | | | 66.26 | % | | | 50.36 | % | | | 14.61 | % | | | 30.05 | % |
(1) Not Annualized.
(2) Annualized.
See notes to financial statements.
| | | Core Plus Fixed Income Fund | |
| | | Year Ended | | | Year Ended | | | Year Ended | | | Period Ended | | | Year Ended | |
| | | March 31, 2009 | | | March 31, 2008 | | | March 31, 2007 | | | March 31, 2006 | | | June 30, 2005 | |
| Per share data for a share of capital | | | | | | | | | | | | | | | |
| stock outstanding for the entire period | | | | | | | | | | | | | | | |
| and selected information for the period | | | | | | | | | | | | | | | |
| are as follows: | | | | | | | | | | | | | | | |
| Net asset value, beginning of period | | $ | 9.20 | | | $ | 9.27 | | | $ | 9.11 | | | $ | 10.73 | | | $ | 10.38 | |
| | | | | | | | | | | | | | | | | | | | | |
| Income from investment operations: | | | | | | | | | | | | | | | | | | | | |
| Net investment income | | | 0.41 | | | | 0.41 | | | | 0.38 | | | | 0.34 | | | | 0.25 | |
| Net realized and unrealized | | | | | | | | | | | | | | | | | | | | |
| gains (losses) on investments | | | (1.11 | ) | | | (0.06 | ) | | | 0.15 | | | | (0.39 | ) | | | 0.41 | |
| Total from investment operations | | | (0.70 | ) | | | 0.35 | | | | 0.53 | | | | (0.05 | ) | | | 0.66 | |
| Less distributions: | | | | | | | | | | | | | | | | | | | | |
| Dividends from net investment income | | | (0.40 | ) | | | (0.41 | ) | | | (0.37 | ) | | | (0.26 | ) | | | (0.27 | ) |
| Dividends from net realized gains | | | (0.18 | ) | | | (0.01 | ) | | | — | | | | (0.08 | ) | | | (0.04 | ) |
| Return of Capital | | | — | | | | — | | | | — | | | | (1.23 | ) | | | — | |
| Total distributions | | | (0.58 | ) | | | (0.42 | ) | | | (0.37 | ) | | | (1.57 | ) | | | (0.31 | ) |
| Net asset value, end of period | | $ | 7.92 | | | $ | 9.20 | | | $ | 9.27 | | | $ | 9.11 | | | $ | 10.73 | |
| | | | | | | | | | | | | | | | | | | | | |
| | | | | | | | | | | | | | | | | | | | | |
| Total return | | | –7.57 | % | | | 3.87 | % | | | 5.96 | % | | | –0.48 | %(1) | | | 6.47 | % |
| | | | | | | | | | | | | | | | | | | | | |
| Supplemental data and ratios: | | | | | | | | | | | | | | | | | | | | |
| Net assets, end of period | | $ | 504,451,429 | | | $ | 804,085,918 | | | $ | 716,017,829 | | | $ | 612,841,433 | | | $ | 508,047,802 | |
| | | | | | | | | | | | | | | | | | | | | |
| Ratio of expenses to average net assets | | | | | | | | | | | | | | | | | | | | |
| Before Expense Reimbursement, | | | | | | | | | | | | | | | | | | | | |
| including (Recapture) | | | 1.26 | % | | | 1.18 | % | | | 1.16 | % | | | 1.19 | %(2) | | | 1.24 | % |
| After Expense Reimbursement | | | | | | | | | | | | | | | | | | | | |
| (Recapture) and Securities | | | | | | | | | | | | | | | | | | | | |
| Lending Credit | | | 1.18 | % | | | 1.13 | % | | | 1.14 | % | | | 1.16 | %(2) | | | 1.20 | % |
| | | | | | | | | | | | | | | | | | | | | |
| Ratio of net investment income to | | | | | | | | | | | | | | | | | | | | |
| average net assets | | | | | | | | | | | | | | | | | | | | |
| Before Expense Reimbursement, | | | | | | | | | | | | | | | | | | | | |
| including (Recapture) | | | 4.54 | % | | | 4.37 | % | | | 4.14 | % | | | 3.43 | %(2) | | | 2.51 | % |
| After Expense | | | | | | | | | | | | | | | | | | | | |
| Reimbursement (Recapture) and | | | | | | | | | | | | | | | | | | | | |
| Securities Lending Credit | | | 4.62 | % | | | 4.42 | % | | | 4.16 | % | | | 3.47 | %(2) | | | 2.55 | % |
| | | | | | | | | | | | | | | | | | | | | |
| Portfolio turnover rate | | | 261.77 | % | | | 307.52 | % | | | 280.55 | % | | | 261.52 | % | | | 471.24 | % |
(1) Not Annualized.
(2) Annualized.
See notes to financial statements.
| | | Enhanced Fundamental IndexTM | | | Enhanced Fundamental IndexTM | |
| | | Large Company Growth Fund | | | Large Company Value Fund | |
| | | Year | | | August 9, 2007(1) | | | Year | | | August 9, 2007(1) | |
| | | Ended | | | through | | | Ended | | | through | |
| | | March 31, | | | March 31, | | | March 31, | | | March 31, | |
| | | 2009 | | | 2008 | | | 2009 | | | 2008 | |
| Per share data for a share of capital stock | | | | | | | | | | | | |
| outstanding for the entire period and | | | | | | | | | | | | |
| selected information for the period are | | | | | | | | | | | | |
| as follows: | | | | | | | | | | | | |
| Net asset value, beginning of period | | $ | 9.63 | | | $ | 10.00 | | | $ | 8.49 | | | $ | 10.00 | |
| | | | | | | | | | | | | | | | | |
| Income from investment operations: | | | | | | | | | | | | | | | | |
| Net investment income | | | 0.09 | | | | 0.04 | | | | 0.14 | | | | 0.07 | |
| Net realized and unrealized losses | | | | | | | | | | | | | | | | |
| on investments | | | (3.26 | ) | | | (0.38 | ) | | | (4.10 | ) | | | (1.53 | ) |
| Total from investment operations | | | (3.17 | ) | | | (0.34 | ) | | | (3.96 | ) | | | (1.46 | ) |
| Less distributions: | | | | | | | | | | | | | | | | |
| Dividends from net investment income | | | (0.08 | ) | | | (0.02 | ) | | | (0.14 | ) | | | (0.04 | ) |
| Dividends from net realized gains | | | — | | | | (0.01 | ) | | | — | | | | (0.01 | ) |
| Total distributions | | | (0.08 | ) | | | (0.03 | ) | | | (0.14 | ) | | | (0.05 | ) |
| Net asset value, end of period | | $ | 6.38 | | | $ | 9.63 | | | $ | 4.39 | | | $ | 8.49 | |
| | | | | | | | | | | | | | | | | |
| | | | | | | | | | | | | | | | | |
| Total return | | | –32.99 | % | | | –3.40 | %(2) | | | –46.83 | % | | | –14.73 | %(2) |
| | | | | | | | | | | | | | | | | |
| Supplemental data and ratios: | | | | | | | | | | | | | | | | |
| Net assets, end of period | | $ | 45,830,177 | | | $ | 67,546,939 | | | $ | 36,948,314 | | | $ | 54,697,080 | |
| | | | | | | | | | | | | | | | | |
| Ratio of expenses to average net assets | | | | | | | | | | | | | | | | |
| Before Expense Reimbursement | | | 1.50 | % | | | 1.82 | %(3) | | | 1.51 | % | | | 1.92 | %(3) |
| After Expense Reimbursement and | | | | | | | | | | | | | | | | |
| before securities lending credit | | | 1.26 | % | | | 1.22 | %(3) | | | 1.40 | % | | | 1.22 | %(3) |
| After Expense Reimbursement and | | | | | | | | | | | | | | | | |
| securities lending credit | | | 1.22 | % | | | 1.22 | %(3) | | | 1.22 | % | | | 1.22 | %(3) |
| | | | | | | | | | | | | | | | | |
| Ratio of net investment income to | | | | | | | | | | | | | | | | |
| average net assets | | | | | | | | | | | | | | | | |
| Before Expense Reimbursement | | | 0.73 | % | | | 0.28 | %(3) | | | 2.03 | % | | | 1.21 | %(3) |
| After Expense Reimbursement and | | | | | | | | | | | | | | | | |
| Securities Lending Credit | | | 1.01 | % | | | 0.88 | %(3) | | | 2.32 | % | | | 1.91 | %(3) |
| | | | | | | | | | | | | | | | | |
| Portfolio turnover rate | | | 98.22 | % | | | 22.70 | % | | | 104.24 | % | | | 7.67 | % |
(1) Commencement of Operations.
(2) Not Annualized.
(3) Annualized.
See notes to financial statements.
| | | Enhanced Fundamental IndexTM | | | Enhanced Fundamental IndexTM | |
| | | Small Company Growth Fund | | | Small Company Value Fund | |
| | | Year | | | August 9, 2007(1) | | | Year | | | August 9, 2007(1) | |
| | | Ended | | | through | | | Ended | | | through | |
| | | March 31, | | | March 31, | | | March 31, | | | March 31, | |
| | | 2009 | | | 2008 | | | 2009 | | | 2008 | |
| Per share data for a share of capital stock | | | | | | | | | | | | |
| outstanding for the entire period and | | | | | | | | | | | | |
| selected information for the period are | | | | | | | | | | | | |
| as follows: | | | | | | | | | | | | |
| Net asset value, beginning of period | | $ | 9.10 | | | $ | 10.00 | | | $ | 8.33 | | | $ | 10.00 | |
| | | | | | | | | | | | | | | | | |
| Income from investment operations: | | | | | | | | | | | | | | | | |
| Net investment income (loss) | | | (0.01 | ) | | | (0.01 | ) | | | 0.05 | | | | 0.05 | |
| Net realized and unrealized losses | | | | | | | | | | | | | | | | |
| on investments | | | (3.27 | ) | | | (0.87 | ) | | | (4.17 | ) | | | (1.67 | ) |
| Total from investment operations | | | (3.28 | ) | | | (0.88 | ) | | | (4.12 | ) | | | (1.62 | ) |
| Less distributions: | | | | | | | | | | | | | | | | |
| Dividends from net investment income | | | — | | | | — | | | | (0.07 | ) | | | (0.03 | ) |
| Dividends from net realized gains | | | — | | | | (0.02 | ) | | | — | | | | (0.02 | ) |
| Return of Capital | | | — | | | | — | * | | | (0.01 | ) | | | — | |
| Total distributions | | | — | | | | (0.02 | ) | | | (0.08 | ) | | | (0.05 | ) |
| Net asset value, end of period | | $ | 5.82 | | | $ | 9.10 | | | $ | 4.13 | | | $ | 8.33 | |
| | | | | | | | | | | | | | | | | |
| | | | | | | | | | | | | | | | | |
| Total return | | | –36.04 | % | | | –8.80 | %(2) | | | –49.62 | % | | | –16.27 | %(2) |
| | | | | | | | | | | | | | | | | |
| Supplemental data and ratios: | | | | | | | | | | | | | | | | |
| Net assets, end of period | | $ | 10,600,699 | | | $ | 12,610,898 | | | $ | 5,843,958 | | | $ | 6,045,461 | |
| | | | | | | | | | | | | | | | | |
| Ratio of expenses to average net assets | | | | | | | | | | | | | | | | |
| Before Expense Reimbursement | | | 1.85 | % | | | 3.55 | %(3) | | | 2.15 | % | | | 6.30 | %(3) |
| After Expense Reimbursement and before | | | | | | | | | | | | | | | | |
| securities lending credit | | | 1.36 | % | | | 1.22 | %(3) | | | 1.42 | % | | | 1.22 | %(3) |
| After Expense Reimbursement and securities | | | | | | | | | | | | | | | | |
| lending credit | | | 1.22 | % | | | 1.22 | %(3) | | | 1.22 | % | | | 1.22 | %(3) |
| | | | | | | | | | | | | | | | | |
| Ratio of net investment income (loss) to | | | | | | | | | | | | | | | | |
| average net assets | | | | | | | | | | | | | | | | |
| Before Expense Reimbursement | | | –0.79 | % | | | –2.62 | %(3) | | | 0.06 | % | | | –3.72 | %(3) |
| After Expense Reimbursement and | | | | | | | | | | | | | | | | |
| Securities Lending Credit | | | –0.16 | % | | | –0.29 | %(3) | | | 0.99 | % | | | 1.36 | %(3) |
| | | | | | | | | | | | | | | | | |
| Portfolio turnover rate | | | 122.95 | % | | | 11.86 | % | | | 112.49 | % | | | 16.18 | % |
(1) Commencement of Operations.
(2) Not Annualized.
(3) Annualized.
* Amount represents less than $0.01 per share.
See notes to financial statements.
AssetMark Funds
NOTES TO FINANCIAL STATEMENTS
March 31, 2009
AssetMark Funds (the “Trust”) is organized as a Delaware statutory trust under a Declaration of Trust dated January 2, 2001. The Trust is registered under the Investment Company Act of 1940, as amended (the “1940 Act”), as an open-end management investment company with twelve funds (the “Funds”). The following eight funds are non-diversified: AssetMark Large Cap Growth Fund, AssetMark Large Cap Value Fund, AssetMark Small/Mid Cap Growth Fund, AssetMark Small/Mid Cap Value Fund, AssetMark International Equity Fund, AssetMark Real Estate Securities Fund, AssetMark Tax-Exempt Fixed Income Fund, AssetMark Core Plus Fixed Income Fund. The following four funds are diversified: AssetMark Enhanced Fundamental Index™ Large Company Growth Fund, AssetMark Enhanced Fundamental Index™ Large Company Value Fund, AssetMark Enhanced Fundamental Index™ Small Company Growth Fund and AssetMark Enhanced Fundamental Index™ Small Company Value Fund. Each Fund represents a distinct portfolio with its own investment objectives and policies. The assets of each Fund are segregated, and a shareholder’s interest is limited to the Fund in which shares are held. The Enhanced Fundamental Index™ Funds commenced operations on August 9, 2007. The other eight Funds commenced operations on June 29, 2001.
| | Significant Accounting Policies |
The following is a summary of significant accounting policies consistently followed by the Funds in the preparation of the financial statements. These policies are in conformity with U.S. generally accepted accounting principles (“GAAP”).
(a) Investment Valuation
Portfolio securities listed on a national or foreign securities exchange, except those listed on NASDAQ, for which market quotations are available are valued at the last quoted sale price on each business day. Portfolio securities traded on NASDAQ are valued at the NASDAQ Official Closing Price (“NOCP”) on each business day. If there is no reported sale on an exchange or NASDAQ, the portfolio security will be valued at the mean between the most recent quoted bid and asked price. Price information on listed securities is taken from the exchange where the security is primarily traded.
All equity securities that are not traded on a listed exchange are valued at the last sale price in the over-the-counter market. If a non-exchange traded security does not trade on a particular day, then the mean between the last quoted closing bid and asked price will be used. Non-exchange traded ADRs are priced with an evaluated price as determined by the current evaluated pricing procedures of, and provided by, the pricing vendor.
Fixed-income securities that have a maturity of greater than 60 days are generally valued on the basis of evaluations obtained from third party pricing services, which take into account appropriate factors such as institutional sized trading in similar groups of securities, yield, quality, coupon rate, maturity, type of issue, trading characteristics and other market data. Short-term instruments having a maturity of less than 60 days are valued at amortized cost.
Investments in mutual funds are valued at the closing net asset value per share of each mutual fund on the day of valuation.
Securities for which no market quotations are readily available or when a significant event has occurred between the time of the security’s last close and the time that a Fund next calculates its net asset value will be valued at their fair value as determined by the Valuation Committee. Securities for which no market prices are readily available will be valued at their fair value as determined by the Valuation Committee under procedures adopted by the Board of Trustees.
In September 2006, the Financial Accounting Standards Board issued Standard No. 157, “Fair Value Measurements” (“FAS 157”) effective for fiscal years beginning after November 15, 2007. FAS 157 clarifies the definition of fair value for financial
AssetMark Funds
NOTES TO FINANCIAL STATEMENTS (Continued)
March 31, 2009
reporting, establishes a framework for measuring fair value and requires additional disclosure about the use of fair value measurements in an effort to make the measurement of fair value more consistent and comparable. The Funds have adopted FAS 157 effective April 1, 2008. A summary of the fair value hierarchy under FAS 157 is described below:
FAS 157 - Summary of Fair Value Exposure at March 31, 2009
Various inputs are used in determining the value of the Fund’s investments. These inputs are summarized in the three broad levels listed below:
Level 1 - Quoted prices in active markets for identical securities. |
| |
Level 2 - Other significant observable inputs (including quoted prices for similar securities, interest rates, prepayment speeds, credit risk, etc.) |
| |
Level 3 - Significant unobservable inputs (including the Fund’s own assumptions in determining the fair value of investments) |
The inputs or methodology used for valuing securities are not an indication of the risk associated with investing in those securities. For example, money market securities are valued using amortized cost, in accordance with the Investment Company Act of 1940. Generally, amortized cost reflects the current fair value of a security, but since the value is not obtained from a quoted price in an active market, such securities are reflected as Level 2.
The following is a summary of the inputs used to value the Fund’s net assets as of March 31, 2009:
AssetMark Large Cap Growth Fund
| | | | | | Other | |
| | | Investments | | | Financial | |
| Description | | in Securities | | | Instruments | |
| Level 1 | | $ | 223,335,748 | | | $ | — | |
| Level 2 | | | 12,960,490 | | | | — | |
| Level 3 | | | 8,138,893 | | | | — | |
| Total | | $ | 244,435,131 | | | $ | — | |
| | | | | | | | | |
Level 3 Reconciliation Disclosure
Following is a reconciliation of Level 3 assets for which significant unobservable inputs were used to determine fair value.
| | | | | | Other | |
| | | Investments | | | Financial | |
| Description | | in Securities | | | Instruments | |
| Balance as of | | | | | | |
| March 31, 2008 | | $ | 16,039,240 | | | $ | — | |
| Change in allocation | | | | | | | | |
| of securities lending | | | | | | | | |
| collateral pool | | | (749,049 | ) | | | | |
| Realized gain (loss) | | | — | | | | — | |
| Change in unrealized | | | | | | | | |
| (depreciation) | | | (5,594,145 | ) | | | — | |
| Net (sales) | | | (12,451,550 | ) | | | — | |
| Transfers in and/or | | | | | | | | |
| (out) of Level 3 | | | 10,894,397 | | | | — | |
| Balance as of | | | | | | | | |
| March 31, 2009 | | $ | 8,138,893 | | | $ | — | |
| | | | | | | | | |
| Change in unrealized | | | | | | | | |
| (depreciation) during | | | | | | | | |
| the year for Level 3 | | | | | | | | |
| investments held at | | | | | | | | |
| March 31, 2009. | | $ | (5,594,145 | ) | | $ | — | |
| | | | | | | | | |
AssetMark Funds
NOTES TO FINANCIAL STATEMENTS (Continued)
March 31, 2009
AssetMark Large Cap Value Fund
| | | | | | Other | |
| | | Investments | | | Financial | |
| Description | | in Securities | | | Instruments | |
| Level 1 | | $ | 193,673,852 | | | $ | — | |
| Level 2 | | | 8,140,723 | | | | — | |
| Level 3 | | | 7,716,178 | | | | — | |
| Total | | $ | 209,530,753 | | | $ | — | |
| | | | | | | | | |
Level 3 Reconciliation Disclosure
Following is a reconciliation of Level 3 assets for which significant unobservable inputs were used to determine fair value.
| | | | | | Other | |
| | | Investments | | | Financial | |
| Description | | in Securities | | | Instruments | |
| Balance as of | | | | | | |
| March 31, 2008 | | $ | 14,911,533 | | | $ | — | |
| Change in allocation | | | | | | | | |
| of securities lending | | | | | | | | |
| collateral pool | | | (892,762 | ) | | | | |
| Realized gain (loss) | | | — | | | | — | |
| Change in unrealized | | | | | | | | |
| (depreciation) | | | (5,169,821 | ) | | | — | |
| Net (sales) | | | (11,280,156 | ) | | | — | |
| Transfers in and/or | | | | | | | | |
| (out) of Level 3 | | | 10,147,384 | | | | — | |
| Balance as of | | | | | | | | |
| March 31, 2009 | | $ | 7,716,178 | | | $ | — | |
| | | | | | | | | |
| Change in unrealized | | | | | | | | |
| (depreciation) during | | | | | | | | |
| the year for Level 3 | | | | | | | | |
| investments held at | | | | | | | | |
| March 31, 2009. | | $ | (5,169,821 | ) | | $ | — | |
| | | | | | | | | |
| AssetMark Small/Mid Cap Growth Fund | |
| | | | | | Other | |
| | | Investments | | | Financial | |
| Description | | in Securities | | | Instruments | |
| Level 1 | | $ | 52,658,139 | | | $ | — | |
| Level 2 | | | 4,542,449 | | | | — | |
| Level 3 | | | 2,059,566 | | | | — | |
| Total | | $ | 59,260,154 | | | $ | — | |
| | | | | | | | | |
Level 3 Reconciliation Disclosure
Following is a reconciliation of Level 3 assets for which significant unobservable inputs were used to determine fair value.
| | | | | | Other | |
| | | Investments | | | Financial | |
| Description | | in Securities | | | Instruments | |
| Balance as of | | | | | | |
| March 31, 2008 | | $ | 3,609,902 | | | $ | — | |
| Change in allocation | | | | | | | | |
| of securities lending | | | | | | | | |
| collateral pool | | | 126,963 | | | | | |
| Realized gain (loss) | | | — | | | | — | |
| Change in unrealized | | | | | | | | |
| (depreciation) | | | (1,378,514 | ) | | | — | |
| Net (sales) | | | (2,751,895 | ) | | | — | |
| Transfers in and/or | | | | | | | | |
| (out) of Level 3 | | | 2,453,110 | | | | — | |
| Balance as of | | | | | | | | |
| March 31, 2009 | | $ | 2,059,566 | | | $ | — | |
| | | | | | | | | |
| Change in unrealized | | | | | | | | |
| (depreciation) during | | | | | | | | |
| the year for Level 3 | | | | | | | | |
| investments held at | | | | | | | | |
| March 31, 2009. | | $ | (1,378,514 | ) | | $ | — | |
| | | | | | | | | |
AssetMark Funds
NOTES TO FINANCIAL STATEMENTS (Continued)
March 31, 2009
| AssetMark Small/Mid Cap Value Fund | | | | |
| | | | | | Other | |
| | | Investments | | | Financial | |
| Description | | in Securities | | | Instruments | |
| Level 1 | | $ | 49,052,683 | | | $ | — | |
| Level 2 | | | 3,019,516 | | | | — | |
| Level 3 | | | 1,350,476 | | | | — | |
| Total | | $ | 53,422,675 | | | $ | — | |
| | | | | | | | | |
Level 3 Reconciliation Disclosure
Following is a reconciliation of Level 3 assets for which significant unobservable inputs were used to determine fair value.
| | | | | | Other | |
| | | Investments | | | Financial | |
| Description | | in Securities | | | Instruments | |
| Balance as of | | | | | | |
| March 31, 2008 | | $ | 1,709,202 | | | $ | — | |
| Change in allocation | | | | | | | | |
| of securities lending | | | | | | | | |
| collateral pool | | | 474,321 | | | | | |
| Realized gain (loss) | | | — | | | | — | |
| Change in unrealized | | | | | | | | |
| (depreciation) | | | (829,130 | ) | | | — | |
| Net (sales) | | | (1,140,447 | ) | | | — | |
| Transfers in and/or | | | | | | | | |
| (out) of Level 3 | | | 1,136,530 | | | | — | |
| Balance as of | | | | | | | | |
| March 31, 2009 | | $ | 1,350,476 | | | $ | — | |
| | | | | | | | | |
| Change in unrealized | | | | | | | | |
| (depreciation) during | | | | | | | | |
| the year for Level 3 | | | | | | | | |
| investments held at | | | | | | | | |
| March 31, 2009. | | $ | (829,130 | ) | | $ | — | |
| | | | | | | | | |
| AssetMark International Equity Fund | | | | |
| | | | | | Other | |
| | | Investments | | | Financial | |
| Description | | in Securities | | | Instruments | |
| Level 1 | | $ | 55,449,790 | | | $ | — | |
| Level 2 | | | 167,405,153 | | | | — | |
| Level 3 | | | 1,319,989 | | | | — | |
| Total | | $ | 224,174,932 | | | $ | — | |
| | | | | | | | | |
Level 3 Reconciliation Disclosure
Following is a reconciliation of Level 3 assets for which significant unobservable inputs were used to determine fair value.
| | | | | | Other | |
| | | Investments | | | Financial | |
| Description | | in Securities | | | Instruments | |
| Balance as of | | | | | | |
| March 31, 2008 | | $ | 1,697,966 | | | $ | — | |
| Change in allocation | | | | | | | | |
| of securities lending | | | | | | | | |
| collateral pool | | | 513,197 | | | | | |
| Realized gain (loss) | | | — | | | | — | |
| Change in unrealized | | | | | | | | |
| (depreciation) | | | (831,976 | ) | | | — | |
| Net (sales) | | | (1,237,733 | ) | | | — | |
| Transfers in and/or | | | | | | | | |
| (out) of Level 3 | | | 1,178,535 | | | | — | |
| Balance as of | | | | | | | | |
| March 31, 2009 | | $ | 1,319,989 | | | $ | — | |
| | | | | | | | | |
| Change in unrealized | | | | | | | | |
| (depreciation) during | | | | | | | | |
| the year for Level 3 | | | | | | | | |
| investments held at | | | | | | | | |
| March 31, 2009. | | $ | (831,976 | ) | | $ | — | |
| | | | | | | | | |
AssetMark Funds
NOTES TO FINANCIAL STATEMENTS (Continued)
March 31, 2009
AssetMark Real Estate Securities Fund
| | | | | | Other | |
| | | Investments | | | Financial | |
| Description | | in Securities | | | Instruments | |
| Level 1 | | $ | 51,357,704 | | | $ | — | |
| Level 2 | | | 4,716,696 | | | | — | |
| Level 3 | | | 1,139,419 | | | | — | |
| Total | | $ | 57,213,819 | | | $ | — | |
| | | | | | | | | |
Level 3 Reconciliation Disclosure
Following is a reconciliation of Level 3 assets for which significant unobservable inputs were used to determine fair value.
| | | | | | Other | |
| | | Investments | | | Financial | |
| Description | | in Securities | | | Instruments | |
| Balance as of | | | | | | |
| March 31, 2008 | | $ | 2,138,373 | | | $ | — | |
| Change in allocation | | | | | | | | |
| of securities lending | | | | | | | | |
| collateral pool | | | (81,991 | ) | | | | |
| Realized gain (loss) | | | — | | | | — | |
| Change in unrealized | | | | | | | | |
| (depreciation) | | | (759,563 | ) | | | — | |
| Net (sales) | | | (1,631,545 | ) | | | — | |
| Transfers in and/or | | | | | | | | |
| (out) of Level 3 | | | 1,474,145 | | | | — | |
| Balance as of | | | | | | | | |
| March 31, 2009 | | $ | 1,139,419 | | | $ | — | |
| | | | | | | | | |
| Change in unrealized | | | | | | | | |
| (depreciation) during | | | | | | | | |
| the year for Level 3 | | | | | | | | |
| investments held at | | | | | | | | |
| March 31, 2009. | | $ | (759,563 | ) | | $ | — | |
| | | | | | | | | |
AssetMark Tax-Exempt Fixed Income Fund
| | | | | | Other | |
| | | Investments | | | Financial | |
| Description | | in Securities | | | Instruments | |
| Level 1 | | $ | 1,050,061 | | | $ | — | |
| Level 2 | | | 189,240,039 | | | | — | |
| Level 3 | | | — | | | | — | |
| Total | | $ | 190,290,100 | | | $ | — | |
| | | | | | | | | |
AssetMark Core Plus Fixed Income Fund
| | | | | | Forward | | | Other | |
| | | Investments | | | Sale | | | Financial | |
| Description | | in Securities | | | Commitments | | | Instruments* | |
| Level 1 | | $ | 9,866,419 | | | $ | — | | | $ | 1,075,686 | |
| Level 2 | | | 524,725,384 | | | | (22,612,340 | ) | | | — | |
| Level 3 | | | 17,566,887 | | | | — | | | | — | |
| Total | | $ | 552,158,690 | | | $ | (22,612,340 | ) | | $ | 1,075,686 | |
| | | | | | | | | | | | | |
* Other financial instruments are derivative instruments not reflected in the Schedule of Investments, such as written options, forward contracts and futures contracts.
All derivatives, except for written options are reflected at the unrealized appreciation (depreciation) on the instrument. Written options are reflected at value.
AssetMark Funds
NOTES TO FINANCIAL STATEMENTS (Continued)
March 31, 2009
Level 3 Reconciliation Disclosure
Following is a reconciliation of Level 3 assets for which significant unobservable inputs were used to determine fair value.
| | | | | | Other | |
| | | Investments | | | Financial | |
| Description | | in Securities | | | Instruments | |
| Balance as of | | | | | | |
| March 31, 2008 | | $ | 38,937,796 | | | $ | — | |
| Accreted discount/ | | | | | | | | |
| (amortization of | | | | | | | | |
| premium), net | | | 24,028 | | | | — | |
| Change in allocation | | | | | | | | |
| of securities lending | | | | | | | | |
| collateral pool | | | 609,320 | | | | | |
| Realized (loss) | | | (865,859 | ) | | | — | |
| Change in unrealized | | | | | | | | |
| (depreciation) | | | (18,420,581 | ) | | | — | |
| Net (sales) | | | (21,412,698 | ) | | | — | |
| Transfers in of Level 3 | | | 18,694,881 | | | | — | |
| Balance as of | | | | | | | | |
| March 31, 2009 | | $ | 17,566,887 | | | $ | — | |
| | | | | | | | | |
| Change in unrealized | | | | | | | | |
| (depreciation) during | | | | | | | | |
| the year for Level 3 | | | | | | | | |
| investments held at | | | | | | | | |
| March 31, 2009. | | $ | (12,187,704 | ) | | $ | — | |
| | | | | | | | | |
AssetMark Enhanced Fundamental IndexTM
Large Company Growth Fund
| | | | | | Other | |
| | | Investments | | | Financial | |
| Description | | in Securities | | | Instruments* | |
| Level 1 | | $ | 53,367,035 | | | $ | 134,428 | |
| Level 2 | | | — | | | | — | |
| Level 3 | | | — | | | | — | |
| Total | | $ | 53,367,035 | | | $ | 134,428 | |
| | | | | | | | | |
* Other financial instruments are derivative instruments not reflected in the Schedule of Investments, such as futures contracts, which are reflected at the unrealized appreciation (depreciation) on the instrument.
AssetMark Enhanced Fundamental IndexTM
| | | | | | Other | |
| | | Investments | | | Financial | |
| Description | | in Securities | | | Instruments* | |
| Level 1 | | $ | 42,649,406 | | | $ | 100,402 | |
| Level 2 | | | — | | | | — | |
| Level 3 | | | — | | | | — | |
| Total | | $ | 42,649,406 | | | $ | 100,402 | |
| | | | | | | | | |
* Other financial instruments are derivative instruments not reflected in the Schedule of Investments, such as futures contracts, which are reflected at the unrealized appreciation (depreciation) on the instrument.
AssetMark Funds
NOTES TO FINANCIAL STATEMENTS (Continued)
March 31, 2009
AssetMark Enhanced Fundamental IndexTM | |
| Small Company Growth Fund | | | | |
| | | | | | Other | |
| | | Investments | | | Financial | |
| Description | | in Securities | | | Instruments* | |
| Level 1 | | $ | 12,360,518 | | | $ | 49,009 | |
| Level 2 | | | — | | | | — | |
| Level 3 | | | — | | | | — | |
| Total | | $ | 12,360,518 | | | $ | 49,009 | |
| | | | | | | | | |
* Other financial instruments are derivative instruments not reflected in the Schedule of Investments, such as futures contracts, which are reflected at the unrealized appreciation (depreciation) on the instrument.
AssetMark Enhanced Fundamental IndexTM | |
| Small Company Value Fund | | | | |
| | | | | | Other | |
| | | Investments | | | Financial | |
| Description | | in Securities | | | Instruments* | |
| Level 1 | | $ | 6,242,935 | | | $ | 9,713 | |
| Level 2 | | | — | | | | — | |
| Level 3 | | | — | | | | — | |
| Total | | $ | 6,242,935 | | | $ | 9,713 | |
| | | | | | | | | |
* Other financial instruments are derivative instruments not reflected in the Schedule of Investments, such as futures contracts, which are reflected at the unrealized appreciation (depreciation) on the instrument.
In March 2008, Statement of Financial Accounting Standards No. 161, “Disclosures about Derivative Instruments and Hedging Activities” (“FAS 161”) was issued and is effective for fiscal years and interim periods beginning after November 15, 2008. FAS 161 is intended to improve financial reporting for derivative instruments by requiring enhanced disclosure that enables investors to understand how and why an entity uses derivatives, how derivatives are accounted for, and how derivative instruments affect an entity’s results of operations and financial position. Management is currently evaluating the implications of FAS 161 and the impact on the Fund’s financial statement disclosures, if any.
(b) Repurchase Agreements
Each Fund may enter into repurchase agreements with banks and securities dealers. These transactions involve the purchase of securities with a simultaneous commitment to sell the securities to the bank or the dealer at an agreed-upon date and price. A repurchase agreement is accounted for as an investment by the Fund, collateralized by securities, which are delivered to the Fund’s Custodian or to an agent bank under a tri-party agreement. The securities are marked-to-market daily and additional securities are acquired as needed, to ensure that their value equals or exceeds the repurchase price plus accrued interest. The Core Plus Fixed Income Fund entered into repurchase agreements at March 31, 2009.
(c) Federal Income Taxes
The Funds intend to continue to comply with the requirements of sub chapter M of the Internal Revenue Code necessary to qualify as regulated investment companies and to make the requisite distributions of income and capital gains to their shareholders sufficient to relieve the Funds from all or substantially all Federal income taxes. Therefore, no Federal income tax provision is required.
Effective September 30, 2007, the Trust adopted Financial Accounting Standards Board (“FASB”) Interpretation No. 48 (“FIN 48”), Accounting for Uncertainty in Income Taxes, a clarification of FASB Statement No. 109, Accounting for Income Taxes. FIN 48 establishes financial reporting rules regarding recognition and measurement of tax positions taken or expected to be taken on a tax return. Management has analyzed the Funds’ tax positions taken on federal income taxes for all open tax years and has concluded that as of March 31, 2009, no provision for income tax would be required in the Funds’ financial statements. The Funds’ federal and state income and federal excise tax returns for tax years for which the applicable statutes of limitations have not expired are subject to examination by the Internal Revenue Service and state departments of revenue. As of March 31, 2009, open Federal tax years include the tax years ended March 31, 2005 through 2009.
(d) Use of Estimates
The preparation of financial statements in conformity with GAAP requires management to make estimates and assumptions that affect the reported amounts of assets and liabilities and disclosure of contingent assets and liabilities at the date of the financial statements and the reported amounts of revenues and expenses during the reporting period. Actual results could differ from those estimates.
AssetMark Funds
NOTES TO FINANCIAL STATEMENTS (Continued)
March 31, 2009
(e) Indemnifications
Under the Trust’s organizational documents, its officers and trustees are indemnified against certain liability arising out of the performance of their duties to the Trust. In addition, in the normal course of business, the Trust enters into contracts that contain a variety of representations and warranties which provide general indemnifications. The Trust’s maximum exposure under these arrangements are unknown as this would involve future claims that may be made against the Trust that have not yet occurred. However, the Trust expects the risk of loss to be remote.
(f) Expenses
Many expenses of the Trust can be directly attributed to a specific Fund. Expenses that cannot be directly attributed to a specific Fund are apportioned among all the Funds in the Trust based on relative net assets.
(g) Security Transactions and Income Recognition
Security transactions are accounted for on trade date. Dividend income is recognized on the ex-dividend date, and interest income recorded using the effective yield method is accrued daily. Realized gains and losses on investment transactions are determined using the high cost method. Return of capital distributions received from REIT securities are recorded as an adjustment to the cost of the security and thus may impact unrealized or realized gains or losses on the security. Gains and losses from paydowns on mortgage and asset backed securities are recorded as adjustments to interest income.
(h) Distributions to Shareholders
The Funds, with the exception of the Tax-Exempt Fixed Income Fund and Core Plus Fixed Income Fund, will distribute any net investment income at least annually. The Tax-Exempt Fixed Income Fund and Core Plus Fixed Income Fund will distribute any net investment income quarterly. All of the Funds will distribute any net realized long or short-term capital gains at least annually. Distributions to shareholders are recorded on the ex-dividend date. The Funds may also pay a special distribution at the end of the calendar year to comply with Federal tax requirements.
(i) Derivatives
Each Fund may invest in derivative securities including call and put options, futures, forward currency contracts and swaps. These instruments may be used by a Fund for hedging purposes as well as direct investment.
Forward Currency Contracts
The Funds may enter into forward currency contracts, obligating the Funds to deliver and receive currency at a specified future date. Transactions involving forward currency contracts may serve as long hedges (for example, if a Fund seeks to buy a security denominated in a foreign currency, it may purchase a forward currency contract to lock in the U.S. dollar price of the security) or as short hedges (if a Fund anticipates selling a security denominated in a foreign currency it may sell a forward currency contract to lock in the U.S. dollar equivalent of the anticipated sales proceeds). Forward contracts are valued daily and unrealized appreciation or depreciation is recorded daily as the difference between the contract exchange rate and the closing forward rate applied to the face amount of the contract.
Options
Exchange-traded options are valued at the last reported sale price on the exchange on which the security underlying the option is principally traded. If no sales are reported on a particular day for exchange traded options, or the options are not exchange traded, the options are valued at the mean between the most recent quoted bid and asked quotations at the close of the exchange.
The premium that a Fund pays when purchasing a call option or receives when writing a call option will reflect, among other things, the market price of the security, the relationship of the exercise price to the market price of the security, the relationship of the exercise price to the volatility of the security, the length of the option period and supply and demand factors. The premium is the value of an option at the date of purchase.
AssetMark Funds
NOTES TO FINANCIAL STATEMENTS (Continued)
March 31, 2009
A purchaser (holder) of a put option pays a non-refundable premium to the seller (writer) of a put option to obtain the right to sell a specified amount of a security at a fixed price (the exercise price) during a specified period (exercise period). Conversely, the seller (writer) of a put option, upon payment by the holder of the premium, has the obligation to buy the security from the holder of the put option at the exercise price during the exercise period.
As of March 31, 2009, the Core Plus Fixed Income Fund has entered into written call options, for which sufficient collateral was set aside, as disclosed in the Schedule of Investments.
Futures
Each actively managed Fund has the ability to buy and sell stock index futures contracts traded on domestic stock exchanges to hedge the value of its portfolio against changes in market conditions. Each Enhanced Fundamental Index™ Fund will typically invest net cash inflows in stock index futures over the short term until the Fund can invest its assets in common stock in a cost effective manner in accordance with its principal investment strategies. A stock index futures contract is an agreement between two parties to take or make delivery of an amount of cash equal to a specified dollar amount, times the difference between the stock index value at the close of the last trading day of the contract and the price at which the futures contract is originally struck. A stock index futures contract does not involve the physical delivery of the underlying stocks in the index. Although stock index futures contracts call for the actual taking or delivery of cash, in most cases a Fund expects to liquidate its stock index futures positions through offsetting transactions, which may result in a gain or a loss, before cash settlement is required.
The Core Plus Fixed Income Fund may also purchase or sell other types of futures contracts, including those based on particular interest rates, securities, foreign currencies, securities indices and other financial instruments and indices. The Core Plus Fixed Income Fund may also purchase and write call and put options on such futures contracts, in order to seek to increase total return or to hedge against changes in interest rates, securities prices, or currency exchange rates, or, to the extent permitted by its investment policies, to otherwise manage its portfolio of investments.
Futures contracts are valued at the daily quoted settlement prices.
Swaps
The Core Plus Fixed Income Fund may enter into interest rate, mortgage, credit, currency and total return swaps, interest rate caps, floors and collars. The Core Plus Fixed Income Fund may also purchase and write (sell) options contracts on swaps, referred to as “swaptions”. The Fund may enter into swap transactions for hedging purposes or to seek to increase total return. Since interest rate, mortgage, credit and currency swaps and interest rate caps, floors and collars are individually negotiated, the Fund expects to achieve an acceptable degree of correlation between its portfolio investments and its swap, cap, floor and collar positions.
Swap agreements are valued daily and unrealized appreciation or depreciation is recorded daily as the difference between the prior day and current day closing price.
During the period ended March 31, 2009, the Funds had no open or outstanding swap contracts.
(j) Securities Purchased or Sold on a Forward-Commitment Basis
The Funds may enter into when-issued or other purchase or sale transactions that specify forward delivery of a financial security. In connection with this ability, the Funds may enter into mortgage “dollar rolls’’ in which the Funds sell securities in the current March 31, 2009 month for delivery and simultaneously contract with the same counterparty to repurchase similar (same type, coupon and maturity) but not identical securities on a specified future date. The party that is obligated to buy a security in the future will retain the use of their funds, and will benefit from any interest that is earned on those funds from the day that they enter into the forward contract until the day that they take delivery and pay for the security.
AssetMark Funds
NOTES TO FINANCIAL STATEMENTS (Continued)
(k) Foreign Currency Translation
The accounting records of the Funds are maintained in U.S. dollars. Investment securities and all other assets and liabilities of the Funds denominated in a foreign currency are translated into U.S. dollars at current exchange rates. Purchases and sales of securities, income receipts, and expense payments are translated into U.S. dollars at the exchange rate in effect on the dates of the respective transactions. The Funds do not isolate the portion of the fluctuations on investments resulting from changes in foreign currency exchange rates from the fluctuations in market prices of investments held. Such fluctuations are included with the net realized and unrealized gain or loss from investments.
(l) Restricted and Illiquid Securities
Each Fund may invest up to 15% of its net assets in securities that are illiquid at the time of purchase, which includes securities with legal or contractual restrictions on their disposition, and securities for which there are no readily available market quotations. The Board of Trustees, with the assistance of the Advisor, sub-advisors and/or pricing services, will determine the value of such securities in good faith in accordance with the provisions of the 1940 Act. Illiquid securities present the risks that a Fund may have difficulty valuing these holdings and/or may be unable to sell these holdings at the time or price desired. There are no restrictions on each Fund’s ability to invest in restricted securities (that is, securities that are not registered pursuant to the Securities Act of 1933), except to the extent such securities may be considered illiquid. Securities issued pursuant to Rule 144A of the Securities Act of 1933 will be considered liquid if determined to be so under procedures adopted by the Board of Trustees.
(m) Auction Rate Securities
The Tax-Except Fixed Income Fund and the Core Plus Fixed Income Fund each may invest in auction rate municipal securities. Auction rate securities usually permit the holder to sell the securities in an auction at par value at specified intervals. The dividend is reset by “Dutch” auction in which bids are made by broker-dealers and other institutions for a certain amount of securities at a specified minimum yield. The dividend rate set by the auction is the lowest interest or dividend rate that covers all securities offered for sale. While this process is designed to permit auction rate securities to be traded at par value, there is the risk that an auction will fail due to insufficient demand for the securities. Neither Fund was invested in any auction rate securities at March 31, 2009.
(n) Short Sales
Although not currently part of any of the Fund’s investment strategies, each Fund has the ability to make short sales. Short sales are transactions where a Fund sells securities it does not own in anticipation of a decline in the value of the securities.
(o) Trustee Compensation
For their service as Trustees of the Trust, the Independent Trustees receive a retainer fee of $45,000 per year and $4,500 per in-person meeting attended, as well as reimbursement for expenses incurred in connection with attendance at such meetings. The Board has appointed a lead Trustee and an audit committee chair who receive a retainer fee of $55,000 and $50,000 per year, respectively. Telephonic meeting fees are determined according to length of the meeting as follows: $2,000 for one to two hours, $3,000 for two to three hours and $4,000 for three hours or longer. Interested persons who serve as Trustees of the Trust receive no compensation from the Trust for their service as Trustees.
AssetMark Funds
NOTES TO FINANCIAL STATEMENTS (Continued)
March 31, 2009
The Trust has an Investment Advisory Agreement (the “Agreement”) with Genworth Financial Wealth Management, Inc. (the “Advisor”), with whom certain officers and trustees of the Trust are affiliated, to furnish investment advisory services to the Funds. The Advisor is a wholly owned subsidiary of Genworth Financial, Inc. In August 2008, the Trust’s investment advisor, AssetMark Investment Services, Inc., was renamed Genworth Financial Wealth Management, Inc. Under the terms of the Agreement, the Trust, on behalf of the Funds, compensates the Advisor for its management services at the following contractual rates, based on each Fund’s average daily net assets:
| Large Cap Growth Fund | 0.95% |
| Large Cap Value Fund | 0.95% |
| Small/Mid Cap Growth Fund | 0.95% |
| Small/Mid Cap Value Fund | 1.00% |
| International Equity Fund | 0.95% |
| Real Estate Securities Fund | 0.95% |
| Tax-Exempt Fixed Income Fund | 0.80% |
| Core Plus Fixed Income Fund | 0.75% |
| Enhanced Fundamental Index™ | |
| Large Company Growth Fund | 0.75% |
| Enhanced Fundamental Index™ | |
| Large Company Value Fund | 0.75% |
| Enhanced Fundamental Index™ | |
| Small Company Growth Fund | 0.75% |
| Enhanced Fundamental Index™ | |
| Small Company Value Fund | 0.75% |
In addition, the Trust and Advisor have also entered into a Fee Waiver Agreement designed to provide Fund shareholders with the economic benefits of economies of scale that may be realized as Fund assets increase. Under the Fee Waiver Agreement, the Advisor has contractually agreed to: (1) waive 0.025% of each Fund’s annual advisory fee on Trust assets in excess of $6 billion, and an additional 0.025% of each Fund’s annual advisory fee on Trust assets in excess of $12 billion; and (2) waive portions of its advisory fee to the extent necessary to pass on certain savings in the underlying sub-advisory fee arrangements that are reached as Fund assets grow.
The Trust and Advisor have also entered into an Expense Waiver and Reimbursement Agreement under which the Advisor has agreed to waive, through October 31, 2009, its management fee and/or reimburse each Fund’s other expenses to the extent necessary to ensure that the Funds’ operating expenses do not exceed the following rates, based on each Fund’s average daily net assets:
| Large Cap Growth Fund | 1.49% |
| Large Cap Value Fund | 1.49% |
| Small/Mid Cap Growth Fund | 1.59% |
| Small/Mid Cap Value Fund | 1.59% |
| International Equity Fund | 1.59% |
| Real Estate Securities Fund | 1.49% |
| Tax-Exempt Fixed Income Fund | 1.29% |
| Core Plus Fixed Income Fund | 1.29% |
| Enhanced Fundamental Index™ | |
| Large Company Growth Fund | 1.22% |
| Enhanced Fundamental Index™ | |
| Large Company Value Fund | 1.22% |
| Enhanced Fundamental Index™ | |
| Small Company Growth Fund | 1.22% |
| Enhanced Fundamental Index™ | |
| Small Company Value Fund | 1.22% |
Any such waiver or reimbursement is subject to later adjustment to allow the Advisor to recoup amounts waived or reimbursed to the extent actual fees and expenses for a fiscal period are less than each Fund’s expense limitation cap, provided, however, that the Advisor shall only be entitled to recoup such amounts for a period of three years from the date such amount was waived or reimbursed. As of March 31, 2009, the Large Cap Growth Fund, Large Cap Value Fund, Small/Mid Cap Growth Fund, Small/Mid Cap Value Fund, International Equity Fund, Real Estate Securities Fund and Core Plus Fixed Income Fund have recouped all potential recoverable waivers or reimbursed expenses.
The Advisor is currently waiving expenses in the Tax-Exempt Fixed Income Fund, Enhanced Fundamental Index™ Large Company Growth Fund, Enhanced Fundamental Index™ Large Company Value Fund, Enhanced Fundamental Index™ Small Company Growth Fund and Enhanced Fundamental Index™ Small Company Value Fund to keep these Funds at their expense cap. Waived expenses subject to potential recovery are as follows:
AssetMark Funds
NOTES TO FINANCIAL STATEMENTS (Continued)
March 31, 2009
| | | Year of | | | Year of | |
| | | Expiration | | | Expiration | |
| | | 03/31/2011 | | | 03/31/2012 | |
| Tax-Exempt Fixed | | | | | | |
| Income Fund | | $ | — | | | $ | 32,770 | |
| Enhanced Fundamental | | | | | | | | |
| Index™ Large Company | | | | | | | | |
| Growth Fund | | | 132,884 | | | | 162,651 | |
| Enhanced Fundamental | | | | | | | | |
| Index™ Large Company | | | | | | | | |
| Value Fund | | | 101,523 | | | | 58,628 | |
| Enhanced Fundamental | | | | | | | | |
| Index™ Small Company | | | | | | | | |
| Growth Fund | | | 85,646 | | | | 59,941 | |
| Enhanced Fundamental | | | | | | | | |
| Index™ Small Company | | | | | | | | |
| Value Fund | | | 81,433 | | | | 50,363 | |
Sub-advisory services are provided to the Funds, pursuant to agreements between the Advisor and various sub-advisors. Under the terms of these sub-advisory agreements, the Advisor compensates each sub-advisor based on the portion of each Fund’s average daily net assets that is allocated to the sub-advisor.
The Trust, on behalf of the Funds, has adopted a distribution plan pursuant to Rule 12b-1 under the 1940 Act (the “12b-1 Plan”), which provides for each Fund to pay distribution fees at an annual rate of 0.25% of the average daily net assets of the Funds. Payments under the 12b-1 Plan shall be used to compensate persons (including affiliates of the Trust) who provide support services in connection with the distribution of the Funds’ shares and servicing of the Funds’ shareholders. For example, these amounts are paid to financial intermediaries that perform back office shareholder servicing and recordkeeping services that facilitate the operation of the Genworth Financial Wealth Management Program through which the Funds are primarily distributed. The Advisor (and its affiliates) similarly receive portions of such payments for their services provided that facilitate the operation of the program. These financial intermediaries and affiliates of the Trust also receive payments from the Trust outside of the 12b-1 Plan for Shareholder services that are unrelated to distribution services. Capital Brokerage Corp., an affiliate of the Advisor, serves as principal underwriter and distributor for the Funds. Quasar Distributors, LLC serves as sub-distributor for the Funds. Quasar Distributors, LLC is an affiliated company of U.S. Bank, N.A.
| | Service and Custody Agreements |
The Trust has entered into Service Agreements with U.S. Bancorp Fund Services, LLC (“USBFS”) and a Custody Agreement with U.S. Bank, N.A., an affiliate of USBFS. Under these agreements, USBFS and U.S. Bank, N.A. provide certain transfer agency, administrative, accounting and custody services.
Effective July 1, 2003 the actively managed Funds entered into a collective securities lending arrangement with U.S. Bank, N.A. (the “Custodian”). Effective September 17, 2008, the Enhanced Fundamental IndexTM Funds entered into a collective securities lending arrangement with the custodian. Under the terms of the agreement, the Custodian is authorized to loan securities on behalf of the Funds to approved brokers. In exchange, under normal market conditions, the Funds receive cash collateral in the amount of at least 102% of the value of the securities loaned. The cash collateral is invested in short term instruments as noted in the Schedule of Investments. Although risk is mitigated by the collateral, the Funds could experience a delay in recovering their securities and possible loss of income or value if the borrower fails to return the borrowed securities. In addition, the Funds bear the risk of loss associated with the investment of cash collateral received. After predetermined rebates to brokers, a percentage of the net securities lending revenue is credited to the Funds to be used as an offset against custody costs and other charges incurred by the Funds. The Custodian is paid a fee for administering a securities lending program for the Funds, equal to the remaining percentage of the net securities lending revenues generated under the agreement. A portion of the fee to be paid to the Custodian in fiscal year 2009 was waived.
As of March 31, 2009, the Funds (excluding the International Equity and Tax-Exempt Fund) had loaned securities which were collateralized by cash. The cash collateral received was invested in securities as listed in each Fund’s Schedule of Investments. Income earned
AssetMark Funds
NOTES TO FINANCIAL STATEMENTS (Continued)
March 31, 2009
from these investments is allocated to each Fund based on each Fund’s portion of the total cash collateral received. Securities lending income is disclosed in each Fund’s Statement of Operations as a securities lending expense offset.
As of March 31, 2009, the values of securities loaned and collateral received were as follows:
| | | | | | | | | Collateral | | | | | | | | | Value | |
| | | | | | | | | Excess | | | Cost of | | | | | | of | |
| | | | | | Payable | | | (Deficit) Due | | | Securities | | | | | | Securities | |
| | | | | | for | | | To (From) | | | Purchased | | | | | | Purchased | |
| | | Value of | | | Collateral | | | Securities | | | as Securities | | | | | | as Securities | |
| | | Securities | | | on Securities | | | Lending | | | Lending | | | Unrealized | | | Lending | |
| | | Loaned | | | Loaned | | | Agent | | | Collateral | | | Depreciation | | | Collateral | |
| Large Cap | | | | | | | | | | | | | | | | | | |
| Growth Fund | | $ | 44,718,874 | | | $ | 46,143,338 | | | $ | (5,334,860 | ) | | $ | 40,808,478 | | | $ | (7,730,498 | ) | | $ | 33,077,980 | |
| Large Cap | | | | | | | | | | | | | | | | | | | | | | | | |
| Value Fund | | | 28,198,085 | | | | 28,983,482 | | | | 1,517,407 | | | | 30,500,889 | | | | (7,120,012 | ) | | | 23,380,877 | |
| Small/Mid Cap | | | | | | | | | | | | | | | | | | | | | | | | |
| Growth Fund | | | 15,624,996 | | | | 16,172,514 | | | | (3,468,429 | ) | | | 12,704,085 | | | | (1,903,760 | ) | | | 10,800,325 | |
| Small/Mid Cap | | | | | | | | | | | | | | | | | | | | | | | | |
| Value Fund | | | 10,393,791 | | | | 10,750,409 | | | | (2,452,785 | ) | | | 8,297,624 | | | | (1,136,875 | ) | | | 7,160,749 | |
| International | | | | | | | | | | | | | | | | | | | | | | | | |
| Equity Fund | | | — | | | | — | | | | 2,456,643 | | | | 2,456,643 | | | | (1,136,654 | ) | | | 1,319,989 | |
| Real Estate | | | | | | | | | | | | | | | | | | | | | | | | |
| Securities Fund* | | | 17,445,386 | | �� | | 16,792,890 | | | | (5,523,767 | ) | | | 11,269,123 | | | | (1,053,651 | ) | | | 10,215,472 | |
| Core Plus Fixed | | | | | | | | | | | | | | | | | | | | | | | | |
| Income Fund | | | 5,264,206 | | | | 5,485,106 | | | | 12,805,791 | | | | 18,290,897 | | | | (7,810,093 | ) | | | 10,480,804 | |
| Enhanced Fundamental | | | | | | | | | | | | | | | | | | | | | | | | |
IndexTM Large | | | | | | | | | | | | | | | | | | | | | | | | |
| Company Growth Fund | | | 7,797,424 | | | | 8,094,704 | | | | — | | | | 8,094,704 | | | | — | | | | 8,094,704 | |
| Enhanced Fundamental | | | | | | | | | | | | | | | | | | | | | | | | |
IndexTM Large | | | | | | | | | | | | | | | | | | | | | | | | |
| Company Value Fund | | | 5,638,470 | | | | 6,067,022 | | | | — | | | | 6,067,022 | | | | — | | | | 6,067,022 | |
| Enhanced Fundamental | | | | | | | | | | | | | | | | | | | | | | | | |
IndexTM Small | | | | | | | | | | | | | | | | | | | | | | | | |
| Company Growth Fund | | | 1,705,293 | | | | 1,810,126 | | | | — | | | | 1,810,126 | | | | — | | | | 1,810,126 | |
| Enhanced Fundamental | | | | | | | | | | | | | | | | | | | | | | | | |
IndexTM Small | | | | | | | | | | | | | | | | | | | | | | | | |
| Company Value Fund | | | 326,924 | | | | 473,981 | | | | — | | | | 473,981 | | | | — | | | | 473,981 | |
| | | $ | 137,113,449 | | | $ | 140,773,572 | | | $ | — | | | $ | 140,773,572 | | | $ | (27,891,543 | ) | | $ | 112,882,029 | |
| * | At March 31, 2009, the Real Estate Securities Fund was under-collateralized due to market value fluctuations. On April 1, 2009, the Fund had cash collateral of at least 102% of the value of the securities loaned. |
AssetMark Funds
NOTES TO FINANCIAL STATEMENTS (Continued)
March 31, 2009
The aggregate purchases and sales of securities, excluding short-term investments, for the year ended March 31, 2009 are summarized below.
| | | Purchases | | | Sales | |
| Large Cap Growth Fund | | $ | 445,183,930 | | | $ | 699,356,808 | |
| Large Cap Value Fund | | | 224,745,761 | | | | 375,867,159 | |
| Small/Mid Cap | | | | | | | | |
| Growth Fund | | | 184,466,033 | | | | 229,526,675 | |
| Small/Mid Cap Value Fund | | | 51,476,043 | | | | 69,980,432 | |
| International Equity Fund | | | 657,049,817 | | | | 779,620,831 | |
| Real Estate Securities Fund | | | 65,037,075 | | | | 62,990,601 | |
| Tax-Exempt Fixed | | | | | | | | |
| Income Fund | | | 96,930,806 | | | | 151,025,105 | |
| Core Plus Fixed | | | | | | | | |
| Income Fund* | | | 1,494,224,795 | | | | 1,689,043,061 | |
| Enhanced Fundamental | | | | | | | | |
| Index™ Large Company | | | | | | | | |
| Growth Fund | | | 79,724,446 | | | | 62,628,370 | |
| Enhanced Fundamental | | | | | | | | |
| Index™ Large Company | | | | | | | | |
| Value Fund | | | 80,761,874 | | | | 54,359,740 | |
| Enhanced Fundamental | | | | | | | | |
| Index™ Small Company | | | | | | | | |
| Growth Fund | | | 19,909,946 | | | | 14,083,884 | |
| Enhanced Fundamental | | | | | | | | |
| Index™ Small Company | | | | | | | | |
| Value Fund | | | 13,404,058 | | | | 7,236,521 | |
* Included in these amounts were $57,968,798 of purchases and $55,191,169 of sales of U.S. Government Securities.
| 8. | | Option Contracts Written |
The premium amount and number of option contracts written during the year ended March 31, 2009 in the AssetMark Core Plus Fixed Income Fund, were as follows:
| | | Amount of | | | Number of | |
| | | Premiums | | | Contracts | |
| Outstanding at 3/31/08 | | $ | (167,014 | ) | | | (206 | ) |
| Options written | | | (1,137,240 | ) | | | (1,177 | ) |
| Options expired | | | 458,141 | | | | 400 | |
| Options exercised | | | — | | | | — | |
| Options closed | | | 663,663 | | | | 898 | |
| Outstanding at 3/31/09 | | $ | (182,450 | ) | | | (85 | ) |
Net investment income and realized gains and losses for federal income tax purposes may differ from that reported on the financial statements because of permanent book-to-tax differences. GAAP requires that permanent differences between financial reporting and tax reporting be reclassified between various components of net assets.
These differences are primarily due to net operating losses, foreign currency and the use of equalization. On the Statements of Assets and Liabilities, the following adjustments were made:
| | | Accumulated | | | | | | | |
| | | Net | | | Accumulated | | | | |
| | | Investment | | | Realized | | | | |
| | | Income | | | Gain or | | | Capital | |
| | | or (Loss) | | | (Loss) | | | Stock | |
| Large Cap | | | | | | | | | |
| Growth | | | | | | | | | |
| Fund | | $ | 92,362 | | | $ | 9,601 | | | $ | (101,963 | ) |
| Large Cap | | | | | | | | | | | | |
| Value Fund | | | (46 | ) | | | 46 | | | | — | |
| Small/Mid | | | | | | | | | | | | |
| Cap Growth | | | | | | | | | | | | |
| Fund | | | 560,827 | | | | 111,793 | | | | (672,620 | ) |
| Small/Mid | | | | | | | | | | | | |
| Cap Value | | | | | | | | | | | | |
| Fund | | | (3,100 | ) | | | 3,100 | | | | — | |
| International | | | | | | | | | | | | |
| Equity | | | | | | | | | | | | |
| Fund | | | (2,420,047 | ) | | | 2,420,047 | | | | — | |
| Real Estate | | | | | | | | | | | | |
| Securities | | | | | | | | | | | | |
| Fund | | | (808,339 | ) | | | (630,583 | ) | | | 1,438,922 | |
| Tax-Exempt | | | | | | | | | | | | |
| Fixed | | | | | | | | | | | | |
| Income | | | | | | | | | | | | |
| Fund | | | — | | | | — | | | | — | |
| Core Plus | | | | | | | | | | | | |
| Fixed | | | | | | | | | | | | |
| Income | | | | | | | | | | | | |
| Fund | | | 500,320 | | | | (888,393 | ) | | | 388,073 | |
| Enhanced | | | | | | | | | | | | |
| Fundamental | | | | | | | | | | | | |
| Index™ | | | | | | | | | | | | |
| Large | | | | | | | | | | | | |
| Company | | | | | | | | | | | | |
| Growth | | | | | | | | | | | | |
| Fund | | | (235 | ) | | | 235 | | | | — | |
AssetMark Funds
NOTES TO FINANCIAL STATEMENTS (Continued)
March 31, 2009
| | | Accumulated | | | | | | | |
| | | Net | | | Accumulated | | | | |
| | | Investment | | | Realized | | | | |
| | | Income | | | Gain or | | | Capital | |
| | | or (Loss) | | | (Loss) | | | Stock | |
| Enhanced | | | | | | | | | |
| Fundamental | | | | | | | | | |
| Index™ | | | | | | | | | |
| Large | | | | | | | | | |
| Company | | | | | | | | | |
| Value Fund | | $ | 19 | | | $ | (19 | ) | | | — | |
| Enhanced | | | | | | | | | | | | |
| Fundamental | | | | | | | | | | | | |
| Index™ | | | | | | | | | | | | |
| Small | | | | | | | | | | | | |
| Company | | | | | | | | | | | | |
| Growth Fund | | | 19,591 | | | | (1 | ) | | $ | (19,590 | ) |
| Enhanced | | | | | | | | | | | | |
| Fundamental | | | | | | | | | | | | |
| Index™ | | | | | | | | | | | | |
| Small | | | | | | | | | | | | |
| Company | | | | | | | | | | | | |
| Value Fund | | | 6,029 | | | | (16,131 | ) | | | 10,102 | |
The Funds intend to utilize provisions of the Federal income tax laws which allow the Funds to carry realized capital losses forward for eight years following the year of loss and offset such losses against any future realized capital gains. Capital loss carryforwards available for Federal income tax purposes are as follows:
| | | Capital losses expiring: | |
| | | 3/31/12 | | | 3/31/13 | | | 3/31/14 | |
| Large Cap Growth | | | | | | | | | |
| Fund | | | — | | | | — | | | | — | |
| Large Cap Value | | | | | | | | | | | | |
| Fund | | | — | | | | — | | | | — | |
| Small/Mid Cap | | | | | | | | | | | | |
| Growth Fund | | | — | | | | — | | | | — | |
| Small/Mid Cap | | | | | | | | | | | | |
| Value Fund | | | — | | | | — | | | | — | |
| International Equity | | | | | | | | | | | | |
| Fund | | | — | | | | — | | | | — | |
| Real Estate Securities | | | | | | | | | | | | |
| Fund | | | — | | | | — | | | | — | |
| Tax-Exempt Fixed | | | | | | | | | | | | |
| Income Fund | | | (16,163 | ) | | | (128,240 | ) | | | (10,395 | ) |
| Core Plus Fixed | | | | | | | | | | | | |
| Income Fund | | | — | | | | — | | | | — | |
| Enhanced Fundamental | | | | | | | | | | | | |
| Index™ Large Company | | | | | | | | | | | | |
| Growth Fund | | | — | | | | — | | | | — | |
| Enhanced Fundamental | | | | | | | | | | | | |
| Index™ Large Company | | | | | | | | | | | | |
| Value Fund | | | — | | | | — | | | | — | |
| Enhanced Fundamental | | | | | | | | | | | | |
| Index™ Small Company | | | | | | | | | | | | |
| Growth Fund | | | — | | | | — | | | | — | |
| Enhanced Fundamental | | | | | | | | | | | | |
| Index™ Small Company | | | | | | | | | | | | |
| Value Fund | | | — | | | | — | | | | — | |
AssetMark Funds
NOTES TO FINANCIAL STATEMENTS (Continued)
March 31, 2009
| | | 3/31/15 | | | 3/31/16 | | | 3/31/17 | |
| Large Cap Growth | | | | | | | | | |
| Fund | | | — | | | | — | | | | (46,208,208 | ) |
| Large Cap Value | | | | | | | | | | | | |
| Fund | | | — | | | | — | | | | (55,440,627 | ) |
| Small/Mid Cap | | | | | | | | | | | | |
| Growth Fund | | | — | | | | — | | | | (12,394,827 | ) |
| Small/Mid Cap | | | | | | | | | | | | |
| Value Fund | | | — | | | | — | | | | (23,187,887 | ) |
| International Equity | | | | | | | | | | | | |
| Fund | | | — | | | | — | | | | (85,366,736 | ) |
| Real Estate Securities | | | | | | | | | | | | |
| Fund | | | — | | | | — | | | | — | |
| Tax-Exempt Fixed | | | | | | | | | | | | |
| Income Fund | | | (573,575 | ) | | | (1,190,258 | ) | | | (3,325,230 | ) |
| Core Plus Fixed | | | | | | | | | | | | |
| Income Fund | | | — | | | | — | | | | — | |
| Enhanced | | | | | | | | | | | | |
| Fundamental | | | | | | | | | | | | |
| Index™ Large | | | | | | | | | | | | |
| Company | | | | | | | | | | | | |
| Growth Fund | | | — | | | | — | | | | (9,014,609 | ) |
| Enhanced | | | | | | | | | | | | |
| Fundamental | | | | | | | | | | | | |
| Index™ Large | | | | | | | | | | | | |
| Company | | | | | | | | | | | | |
| Value Fund | | | — | | | | — | | | | (11,944,558 | ) |
| Enhanced | | | | | | | | | | | | |
| Fundamental | | | | | | | | | | | | |
| Index™ Small | | | | | | | | | | | | |
| Company | | | | | | | | | | | | |
| Growth Fund | | | — | | | | — | | | | (1,103,169 | ) |
| Enhanced | | | | | | | | | | | | |
| Fundamental | | | | | | | | | | | | |
| Index™ Small | | | | | | | | | | | | |
| Company | | | | | | | | | | | | |
| Value Fund | | | — | | | | — | | | | (879,255 | ) |
Additionally, at March 31, 2009, the Funds deferred on a tax basis post-October 2008 losses are as follows:
| Large Cap Growth Fund | | | 58,021,138 | |
| Large Cap Value Fund | | | 141,094,184 | |
| Small/Mid Cap Growth Fund | | | 20,344,081 | |
| Small/Mid Cap Value Fund | | | 8,994,164 | |
| International Equity Fund | | | 147,004,549 | |
| Real Estate Securities Fund | | | 3,229,975 | |
| Tax-Exempt Fixed Income Fund* | | | 2,587,266 | |
| Core Plus Fixed Income Fund | | | — | |
| Enhanced Fundamental Index™ Large | | | | |
| Company Growth Fund | | | 5,759,701 | |
| Enhanced Fundamental Index™ Large | | | | |
| Company Value Fund | | | 6,737,956 | |
| Enhanced Fundamental Index™ Small | | | | |
| Company Growth Fund | | | 705,654 | |
| Enhanced Fundamental Index™ Small | | | | |
| Company Value Fund | | | 692,070 | |
The tax components of distributions paid during the fiscal years ended March 31, 2009 and March 31, 2008 are as follows:
| | | Year Ended March 31, 2009 | |
| | | Ordinary | | | Long-Term | | | | |
| | | Income | | | Capital Gain | | | Return of | |
| | | Distributions | | | Distributions | | | Capital | |
| Large Cap | | | | | | | | | |
| Growth Fund | | | 41,523 | | | | — | | | | — | |
| Large Cap | | | | | | | | | | | | |
| Value Fund | | | 8,006,993 | | | | 3,926 | | | | — | |
| Small/Mid Cap | | | | | | | | | | | | |
| Growth Fund | | | — | | | | 132,673 | | | | — | |
| Small/Mid Cap | | | | | | | | | | | | |
| Value Fund | | | 629,649 | | | | — | | | | 31,146 | |
| International | | | | | | | | | | | | |
| Equity Fund | | | 2,924,385 | | | | 3,267,351 | | | | — | |
| Real Estate | | | | | | | | | | | | |
| Securities Fund | | | 543,149 | | | | — | | | | — | |
| Tax-Exempt Fixed | | | | | | | | | | | | |
| Income Fund* | | | 7,125,080 | | | | — | | | | — | |
| Core Plus Fixed | | | | | | | | | | | | |
| Income Fund | | | 31,691,278 | | | | 8,060,419 | | | | — | |
| Enhanced | | | | | | | | | | | | |
| Fundamental | | | | | | | | | | | | |
IndexTM Large | | | | | | | | | | | | |
| Company | | | | | | | | | | | | |
| Growth Fund | | | 610,544 | | | | 165 | | | | — | |
| * | Contains $7,119,528 of tax-exempt income for year ended 3/31/2009. |
AssetMark Funds
NOTES TO FINANCIAL STATEMENTS (Continued)
March 31, 2009
| | | Year Ended March 31, 2009 | |
| | | Ordinary | | | Long-Term | | | | |
| | | Income | | | Capital Gain | | | Return of | |
| | | Distributions | | | Distributions | | | Capital | |
| Enhanced | | | | | | | | | |
| Fundamental | | | | | | | | | |
IndexTM Large | | | | | | | | | |
| Company | | | | | | | | | |
| Value Fund | | | 1,211,740 | | | | 19 | | | | — | |
| Enhanced | | | | | | | | | | | | |
| Fundamental | | | | | | | | | | | | |
IndexTM Small | | | | | | | | | | | | |
| Company | | | | | | | | | | | | |
| Growth Fund | | | — | | | | — | | | | — | |
| Enhanced | | | | | | | | | | | | |
| Fundamental | | | | | | | | | | | | |
IndexTM Small | | | | | | | | | | | | |
| Company | | | | | | | | | | | | |
| Value Fund | | | 86,041 | | | | — | | | | 16,930 | |
The Core Plus Fixed Income Fund and Real Estate Securities Fund had additional earnings and profits of $388,073 and $1,276,355, respectively, distributed to shareholders on redemptions. The Funds designated as long-term capital gain and ordinary income dividends, pursuant to Internal Revenue Code Section 852(b)(3), the amount necessary to reduce the earnings and profits of the Funds related to net capital gain and ordinary income to zero for the tax year ended 3/31/09.
| | | Year Ended March 31, 2008 | |
| | | Ordinary | | | Long-Term | | | | |
| | | Income | | | Capital Gain | | | Return of | |
| | | Distributions | | | Distributions | | | Capital | |
| Large Cap | | | | | | | | | |
| Growth Fund | | | 12,083,393 | | | | 25,705,139 | | | | — | |
| Large Cap | | | | | | | | | | | | |
| Value Fund | | | 19,771,698 | | | | 40,346,286 | | | | — | |
| Small/Mid Cap | | | | | | | | | | | | |
| Growth Fund | | | 16,312,992 | | | | 8,458,355 | | | | — | |
| Small/Mid Cap | | | | | | | | | | | | |
| Value Fund | | | 2,644,017 | | | | 1,652,158 | | | | 26,098 | |
| International | | | | | | | | | | | | |
| Equity Fund | | | 35,604,336 | | | | 89,693,528 | | | | — | |
| | | Year Ended March 31, 2008 | |
| | | Ordinary | | | Long-Term | | | | |
| | | Income | | | Capital Gain | | | Return of | |
| | | Distributions | | | Distributions | | | Capital | |
| Real Estate | | | | | | | | | |
| Securities Fund | | | 1,838,967 | | | | 11,827,463 | | | | 246,102 | |
| Tax-Exempt Fixed | | | | | | | | | | | | |
| Income Fund* | | | 7,595,946 | | | | 75,847 | | | | — | |
| Core Plus Fixed | | | | | | | | | | | | |
| Income Fund | | | 34,075,503 | | | | 1,310,487 | | | | — | |
| Enhanced | | | | | | | | | | | | |
| Fundamental | | | | | | | | | | | | |
| Index™ Large | | | | | | | | | | | | |
| Company | | | | | | | | | | | | |
| Growth Fund | | | 120,947 | | | | 12,263 | | | | — | |
| Enhanced | | | | | | | | | | | | |
| Fundamental | | | | | | | | | | | | |
| Index™ Large | | | | | | | | | | | | |
| Company | | | | | | | | | | | | |
| Value Fund | | | 138,841 | | | | 8,537 | | | | — | |
| Enhanced | | | | | | | | | | | | |
| Fundamental | | | | | | | | | | | | |
| Index™ Small | | | | | | | | | | | | |
| Company | | | | | | | | | | | | |
| Growth Fund | | | 2,725 | | | | 6,709 | | | | 7,229 | |
| Enhanced | | | | | | | | | | | | |
| Fundamental | | | | | | | | | | | | |
| Index™ Small | | | | | | | | | | | | |
| Company | | | | | | | | | | | | |
| Value Fund | | | 15,595 | | | | — | | | | — | |
| * | Contains $7,595,946 of tax-exempt income. |
AssetMark Funds
NOTES TO FINANCIAL STATEMENTS (Continued)
March 31, 2009
At March 31, 2009 the components of accumulated earnings (losses) on a tax basis were as follows:
| | | Large Cap | | | Large Cap | | | Small/Mid | | | Small/Mid | | | International | | | Real Estate | |
| | | Growth | | | Value | | | Cap Growth | | | Cap Value | | | Equity | | | Securities | |
| | | Fund | | | Fund | | | Fund | | | Fund | | | Fund | | | Fund | |
| Cost of Investments | | | 303,408,736 | | | | 277,075,029 | | | | 66,542,999 | | | | 76,922,814 | | | | 277,795,454 | | | | 76,707,171 | |
| Gross Unrealized | | | | | | | | | | | | | | | | | | | | | | | | |
| Appreciation | | | 11,067,294 | | | | 11,424,571 | | | | 4,094,571 | | | | 2,220,861 | | | | 5,422,481 | | | | 1,396,295 | |
| Gross Unrealized | | | | | | | | | | | | | | | | | | | | | | | | |
| Depreciation | | | (70,040,899 | ) | | | (78,968,847 | ) | | | (11,377,416 | ) | | | (25,721,000 | ) | | | (59,043,003 | ) | | | (20,889,647 | ) |
| Net Unrealized | | | | | | | | | | | | | | | | | | | | | | | | |
| (Depreciation) | | | (58,973,605 | ) | | | (67,544,276 | ) | | | (7,282,845 | ) | | | (23,500,139 | ) | | | (53,620,522 | ) | | | (19,493,352 | ) |
| | | | | | | | | | | | | | | | | | | | | | | | | |
| Undistributed | | | | | | | | | | | | | | | | | | | | | | | | |
| Tax-Exempt | | | | | | | | | | | | | | | | | | | | | | | | |
| Ordinary Income | | | — | | | | — | | | | — | | | | — | | | | — | | | | — | |
| Undistributed | | | | | | | | | | | | | | | | | | | | | | | | |
| Ordinary Income | | | — | | | | 1,019,418 | | | | — | | | | — | | | | 6,512,687 | | | | — | |
| Undistributed | | | | | | | | | | | | | | | | | | | | | | | | |
| Long-Term | | | | | | | | | | | | | | | | | | | | | | | | |
| Cap Gains | | | — | | | | — | | | | — | | | | — | | | | — | | | | — | |
| Total Distributable | | | | | | | | | | | | | | | | | | | | | | | | |
| Earnings | | | — | | | | 1,019,418 | | | | — | | | | — | | | | 6,512,687 | | | | — | |
| | | | | | | | | | | | | | | | | | | | | | | | | |
| Other Accumulated | | | | | | | | | | | | | | | | | | | | | | | | |
| (Losses) | | | (104,229,346 | ) | | | (196,534,811 | ) | | | (32,738,908 | ) | | | (32,182,051 | ) | | | (232,408,545 | ) | | | (3,229,975 | ) |
| Total Accumulated | | | | | | | | | | | | | | | | | | | | | | | | |
| (Losses) | | | (163,202,951 | ) | | | (263,059,669 | ) | | | (40,021,753 | ) | | | (55,682,190 | ) | | | (279,516,380 | ) | | | (22,723,327 | ) |
| | | | | | | | | | | | | | | | | | | | | | | | | |
| | | | | | | Enhanced | | | Enhanced | | | Enhanced | | | Enhanced | |
| | | | | | | Fundamental | | | Fundamental | | | Fundamental | | | Fundamental | |
| Tax-Exempt | | | Core Plus | | | Index™ Large | | | Index™ Large | | | Index™ Small | | | Index™ Small | |
| Fixed Income | | | Fixed Income | | | Company | | | Company | | | Company | | | Company | |
| Fund | | | Fund | | | Growth Fund | | | Value Fund | | | Growth Fund | | | Value Fund | |
| | 196,852,673 | | | | 649,753,426 | | | | 71,653,494 | | | | 66,321,507 | | | | 16,998,647 | | | | 10,294,841 | |
| | | | | | | | | | | | | | | | | | | | | | | |
| | 3,628,887 | | | | 11,713,074 | | | | 956,791 | | | | 1,249,152 | | | | 672,317 | | | | 437,870 | |
| | | | | | | | | | | | | | | | | | | | | | | |
| | (10,191,460 | ) | | | (114,407,810 | ) | | | (19,243,250 | ) | | | (24,921,253 | ) | | | (5,310,446 | ) | | | (4,489,776 | ) |
| | | | | | | | | | | | | | | | | | | | | | | |
| | (6,562,573 | ) | | | (102,694,736 | ) | | | (18,286,459 | ) | | | (23,672,101 | ) | | | (4,638,129 | ) | | | (4,051,906 | ) |
| | | | | | | | | | | | | | | | | | | | | | | |
| | | | | | | | | | | | | | | | | | | | | | | |
| | | | | | | | | | | | | | | | | | | | | | | |
| | 94,437 | | | | — | | | | — | | | | — | | | | — | | | | — | |
| | | | | | | | | | | | | | | | | | | | | | | |
| | 4,343 | | | | 886,557 | | | | 175,882 | | | | 277,943 | | | | — | | | | — | |
| | | | | | | | | | | | | | | | | | | | | | | |
| | | | | | | | | | | | | | | | | | | | | | | |
| | — | | | | — | | | | — | | | | — | | | | — | | | | — | |
| | | | | | | | | | | | | | | | | | | | | | | |
| | 98,780 | | | | 886,557 | | | | 175,882 | | | | 277,943 | | | | — | | | | — | |
| | | | | | | | | | | | | | | | | | | | | | | |
| | | | | | | | | | | | | | | | | | | | | | | |
| | (7,831,127 | ) | | | (46,906 | ) | | | (14,774,310 | ) | | | (18,682,514 | ) | | | (1,808,823 | ) | | | (1,571,536 | ) |
| | | | | | | | | | | | | | | | | | | | | | | |
| | (14,294,920 | ) | | | (101,855,085 | ) | | | (32,884,887 | ) | | | (42,076,672 | ) | | | (6,446,952 | ) | | | (5,623,442 | ) |
| | | | | | | | | | | | | | | | | | | | | | | |
AssetMark Funds
REPORT OF INDEPENDENT REGISTERED PUBLIC ACCOUNTING FIRM
The Board of Trustees and Shareholders
AssetMark Funds:
We have audited the accompanying statements of assets and liabilities, including the schedules of investments, of AssetMark Large Cap Growth Fund, AssetMark Large Cap Value Fund, AssetMark Small/Mid Cap Growth Fund, AssetMark Small/Mid Cap Value Fund, AssetMark International Equity Fund, AssetMark Real Estate Securities Fund, AssetMark Tax-Exempt Fixed Income Fund, AssetMark Core Plus Fixed Income Fund, AssetMark Enhanced Fundamental Index Large Company Growth Fund, AssetMark Enhanced Fundamental Index Large Company Value Fund, AssetMark Enhanced Fundamental Index Small Company Growth Fund and AssetMark Enhanced Fundamental Index Small Company Value Fund as of March 31, 2009, and the related statements of operations for the year then ended, statements of changes in net assets for each of the periods presented in the two-year period then ended, and the financial highlights for each of the periods presented in the three-year period then ended. These financial statements and financial highlights are the responsibility of fund management. Our responsibility is to express an opinion on these financial statements and financial highlights based on our audits. The financial highlights for the periods presented through March 31, 2006, were audited by other auditors whose report dated May 26, 2006, expressed an unqualified opinion on those financial highlights.
We conducted our audits in accordance with the standards of the Public Company Accounting Oversight Board (United States). Those standards require that we plan and perform the audit to obtain reasonable assurance about whether the financial statements and financial highlights are free of material misstatement. An audit includes examining, on a test basis, evidence supporting the amounts and disclosures in the financial statements. Our procedures included confirmation of securities owned as of March 31, 2009, by correspondence with the custodian and brokers or by other appropriate auditing procedures. An audit also includes assessing the accounting principles used and significant estimates made by management, as well as evaluating the overall financial statement presentation. We believe that our audits provide a reasonable basis for our opinion.
In our opinion, the financial statements and financial highlights referred to above present fairly, in all material respects, the financial position of as of AssetMark Large Cap Growth Fund, AssetMark Large Cap Value Fund, AssetMark Small/Mid Cap Growth Fund, AssetMark Small/Mid Cap Value Fund, AssetMark International Equity Fund, AssetMark Real Estate Securities Fund, AssetMark Tax-Exempt Fixed Income Fund, AssetMark Core Plus Fixed Income Fund, AssetMark Enhanced Fundamental Index Large Company Growth Fund, AssetMark Enhanced Fundamental Index Large Company Value Fund, AssetMark Enhanced Fundamental Index Small Company Growth Fund and AssetMark Enhanced Fundamental Index Small Company Value Fund as of March 31, 2009, the results of their operations, the changes in their net assets, and the financial highlights for each of the periods described in the first paragraph above, in conformity with U.S. generally accepted accounting principles.
KPMG LLP
Milwaukee, Wisconsin
May 27, 2009
AssetMark Funds
ADDITIONAL INFORMATION
March 31, 2009
| | Shareholder Notification of Federal Tax Status (Unaudited) |
The Large Cap Growth Fund, Large Cap Value Fund, Small/Mid Cap Growth Fund, Small/Mid Cap Value Fund, Enhanced Fundamental Index™ Large Company Value Fund and Enhanced Fundamental Index™ Small Company Value Fund designates 66%, 100%, 5%, 100%, 100% and 100%, respectively, of dividends during the fiscal year ended March 31, 2009, as dividends qualifying for the dividends received deduction available to corporate shareholders.
The Large Cap Growth Fund, Large Cap Value Fund, Small/Mid Cap Growth Fund, Small/Mid Cap Value Fund, International Equity Fund, Real Estate Securities Fund, Enhanced Fundamental Index™ Large Company Value Fund and Enhanced Fundamental Index™ Small Company Value Fund designates 70%, 100%, 5%, 100%, 88%, 1%, 100% and 100%, respectively, of dividends declared from net investment income during the fiscal year ended March 31, 2009, as qualified income under the Jobs and Growth Tax Relief Reconciliation Act of 2003.
| | Foreign Tax Credit Pass Through (Unaudited) |
For the year ended March 31, 2009, the International Equity Fund earned foreign source income and paid foreign taxes, which they intend to pass through to their shareholders pursuant to Section 853 of the Internal Revenue Code as follows:
| | Foreign Sourced Income Earned | Taxes Paid |
| Austria | 107,295 | | 16,094 | |
| Australia | 679,338 | | — | |
| Bermuda | 29,952 | | — | |
| Brazil | 141,267 | | — | |
| Britian | 3,746,091 | | — | |
| Canada | 7,987 | | 1,198 | |
| Finland | 349,311 | | 52,397 | |
| France | 2,089,505 | | 313,426 | |
| Germany | 1,890,935 | | 283,640 | |
| Greece | 1,159,103 | | — | |
| Hong Kong | 312,228 | | — | |
| Ireland | — | | — | |
| Isreal | 57,737 | | 8,917 | |
| Italy | 1,284,974 | | 192,746 | |
| Japan | 1,829,903 | | 128,012 | |
| Luxembourg | 119,229 | | 17,884 | |
| New Zealand | — | | — | |
| Russia | 242,508 | | 24,251 | |
| Singapore | 217,587 | | — | |
| South Korea | 4,318 | | 712 | |
| Spain | 1,160,778 | | 174,117 | |
| Sweden | 810,262 | | 121,539 | |
| Switzerland | 1,260,411 | | 189,062 | |
AssetMark Funds
ADDITIONAL INFORMATION (Continued)
March 31, 2009
| 3. Disclosure Regarding Fund Trustees and Officers (Unaudited) | | |
| | | | | # of | |
| | | | | Portfolios | |
| | | | | in Fund | Other |
| | Position(s) | Term of Office | | Complex | Director/ |
| Name, Age | Held with | and Length of | Principal | Overseen | Trustee |
| and Address | the Trust | Time Served | Occupation During Past Five Years | by Trustee | Positions |
| | | | | | |
| Independent Trustees | | | | | |
| | | | | | |
| R. Thomas DeBerry | Trustee | Indefinite Term | Retired. | 12 | None |
| c/o Genworth Financial | | since January | | | |
| Wealth Management, Inc. | | 2001. | | | |
| 2300 Contra Costa | | | | | |
| Boulevard, Suite 600 | | | | | |
| Pleasant Hill, CA 94523 | | | | | |
Year of Birth: 1941 | | | | | |
| William J. Klipp | Trustee | Indefinite Term | Retired. | 12 | Trustee of |
| c/o Genworth Financial | | since January | | | Adelante |
| Wealth Management, Inc. | | 2001. | | | Funds |
| 2300 Contra Costa | | | | | (2000-present). |
| Boulevard, Suite 600 | | | | | |
| Pleasant Hill, CA 94523 | | | | | |
Year of Birth: 1955 | | | | | |
| Leonard H. Rossen | Trustee | Indefinite Term | President, Len Rossen Consulting (a legal | 12 | None |
| c/o Genworth Financial | | since January | consulting firm) (1999-present). | | |
| Wealth Management, Inc. | | 2001. | | | |
| 2300 Contra Costa | | | | | |
| Boulevard, Suite 600 | | | | | |
| Pleasant Hill, CA 94523 | | | | | |
Year of Birth: 1932 | | | | | |
| Dennis G. Schmal | Trustee | Indefinite Term | Self-employed consultant. | 12 | Trustee, Grail |
| c/o Genworth Financial | | since July 2007. | | | Advisors ETF Trust |
| Wealth Management, Inc. | | | | | (2009 to present); |
| 2300 Contra Costa | | | | | Trustee, Wells Fargo |
| Boulevard, Suite 600 | | | | | Multi-Strategy 100 |
| Pleasant Hill, CA 94523 | | | | | Fund (closed-end |
| Year of Birth: 1947 | | | | | hedge fund) (2008 to |
| | | | | | present); Director/ |
| | | | | | Chairman, Pacific |
| | | | | | Metrics Corp. |
| | | | | | (Educational |
| | | | | | Services) (2005 to |
| | | | | | present); Director, |
| | | | | | Varian Semiconductor |
| | | | | | Equipment Associates, |
| | | | | | Inc. (2004 to present); |
| | | | | | Director, MCF Corp. |
| | | | | | (Financial Services) |
| | | | | | (2003 to present). |
AssetMark Funds
ADDITIONAL INFORMATION (Continued)
March 31, 2009
| | | | | # of | |
| | | | | Portfolios | |
| | | | | in Fund | Other |
| | Position(s) | Term of Office | | Complex | Director/ |
| Name, Age | Held with | and Length of | Principal | Overseen | Trustee |
| and Address | the Trust | Time Served | Occupation During Past Five Years | by Trustee | Positions |
| | | | | | |
| Interested Trustees | | | | | |
| Ronald Cordes* | Chairperson, | Indefinite Term | Principal, Genworth Financial | 12 | None |
| Genworth Financial | Trustee | since January | Wealth Management, Inc. | | |
| Wealth Management, Inc. | 2001. | (1994-present); President, | | |
| 2300 Contra Costa | | | AssetMark Funds 2001-2008 | | |
| Boulevard, Suite 600 | | | | | |
| Pleasant Hill, CA 94523 | | | | | |
| Year of Birth: 1959 | | | | | |
| | | | | | |
Officers | | | | | |
| Carrie E. Hansen | President | 1-Year Term | President, Genworth Financial Asset | N/A | N/A |
| Genworth Financial | | since 2007 | Management (GFAM) Funds (2008 to | | |
| Wealth Management, Inc. | | present); President, Genworth Variable | | |
| 2300 Contra Costa | | | Insurance Trust (2008 to Present); Senior | | |
| Boulevard, Suite 600 | | | Vice President and Chief Operations | | |
| Pleasant Hill, CA 94523 | | | Officer, GFWM (2008 to present); Senior | | |
| Year of Birth: 1970 | | | Vice President and Managing Director, | | |
| | | | AssetMark Funds (2007 to 2008); Treasurer | | |
| | | | and Chief Compliance Officer, GFAM Funds | | |
| | | | (2007 to 2008; Chief Compliance Officer, | | |
| | | | AssetMark Funds (2005 to 2008); Treasurer, | | |
| | | | AssetMark Funds (2001 to 2008); Senior | | |
| | | | Vice President, Chief Financial Officer and | | |
| | | | Chief Compliance Officer, AssetMark | | |
| | | | Investment Services, Inc. (2004 to 2007). | | |
| | | | | | |
| Deborah Djeu | Vice President, | 1-Year Term | Vice President, Chief Compliance Officer | N/A | N/A |
| Genworth Financial | Chief | since May | and AML Compliance Officer, Genworth | | |
| Wealth Management, Inc. | Compliance | 2008 | Financial Asset Management Funds (2008 to | | |
| 2300 Contra Costa | Officer and | | present); Vice President, Chief Compliance | | |
| Boulevard, Suite 600 | AML | | Officer and AML Compliance Officer, | | |
| Pleasant Hill, CA 94523 | Compliance | | Genworth Variable Insurance Trust (2008 to | | |
| Year of Birth: 1962 | Officer | | present); Deputy Chief Compliance Officer, | | |
| | | | AssetMark Funds (2007 to 2008); Compliance | |
| | | | Manager, GE Money (2006 to 2007); Vice | | |
| | | | President, Wells Fargo Investments LLC | | |
| | | | (2004 to 2006). | | |
AssetMark Funds
ADDITIONAL INFORMATION (Continued)
March 31, 2009
| | | | | # of | |
| | | | | Portfolios | |
| | | | | in Fund | Other |
| | Position(s) | Term of Office | | Complex | Director/ |
| Name, Age | Held with | and Length of | Principal | Overseen | Trustee |
| and Address | the Trust | Time Served | Occupation During Past Five Years | by Trustee | Positions |
| | | | | | |
| Danell J. Doty | Vice President, | 1-Year Term | Director of Fund Adminstration, GFWM | N/A | N/A |
| Genworth Financial | Treasurer | since 2008 | (2008-present); Vice President and | | |
| Wealth Management, Inc. | | Treasurer, Genworth Financial Asset | | |
| 2300 Contra Costa | | | Management Funds (2008-present); Vice | | |
| Boulevard, Suite 600 | | | President and Treasurer, Genworth Variable | | |
| Pleasant Hill, CA 94523 | | | Insurance Trust (2008-present); Consultant, | | |
| Year of Birth: 1962 | | | Barclays Global Investors (2007-2008); | | |
| | | | Fund Chief Compliance Officer, Barclays | | |
| | | | Global Investors Funds, Master Investment | | |
| | | | Portfolio, iShares Trust and iShares, Inc., | | |
| | | | Barclays Global Investors (2004-2007); | | |
| | | | Head of Mutual Fund Administrator, | | |
| | | | Barclays Global Investors (1999-2004). | | |
| | | | | | |
| Chris Villas-Chernak | Secretary | 1-Year Term | Secretary, Genworth Financial Asset | N/A | N/A |
| Genworth Financial | | since September | Management Funds (2009-present); Secretary, | | |
| Wealth Management, Inc. | 2006 | Genworth Variable Insurance Trust (2008- | | |
| 2300 Contra Costa | | | present); Senior Compliance Officer, Genworth | |
| Boulevard, Suite 600 | | | Financial Wealth Management, Inc., (2005- | | |
| Pleasant Hill, CA 94523 | | | 2009); Fund Administration & Compliance | | |
| Year of Birth: 1968 | | | Manager, AssetMark Investment Services, | | |
| | | | Inc. (2004-2005); Fund Administration & | | |
| | | | Compliance Specialist, AssetMark | | |
| | | | Investment Services, Inc. (2002-2004). | | |
| * | Ronald Cordes is an “interested person” of the Funds as defined in the 1940 Act due to his relationship with the Advisor. |
The Statement of Additional Information includes additional information about the Funds’ Trustees and is available free of charge upon request by calling the Funds toll free at (888) 278-5809.
| | Proxy Voting Policies and Procedures and Proxy Voting Record (Unaudited) |
A description of the policies and procedures that the Funds use to determine how to vote proxies related to the Funds’ portfolio securities as well as information regarding how the Funds voted proxies relating to portfolio securities during the most recent 12-month period ended June 30 is available without charge, upon request, by calling (888) 278-5809. Furthermore, you can obtain the Funds’ proxy voting records on the SEC’s website at http://www.sec.gov.
| | Availability of Quarterly Portfolio Holdings Schedules (Unaudited) |
The Funds file their complete schedules of portfolio holdings with the SEC for their first and third fiscal quarters on Form N-Q. Once filed, the Funds’ Form N-Q is available without charge, upon request on the SEC’s website (http://www.sec.gov) and is available by calling (888) 278-5809. You can also obtain copies of Form N-Q by (i) visiting the SEC’s Public Reference Room in Washington, DC (information on the operation of the Public Reference Room may be obtained by calling 1-800-SEC-0330); (ii) sending your request and a duplicating fee to the SEC’s Public Reference Room, Washington, DC 20549-0102; or (iii) sending your request electronically to publicinfosec.gov.
AssetMark Funds
ADDITIONAL INFORMATION (Continued)
March 31, 2009
| | Statement Regarding the Basis for Approval of Sub-Advisory Agreements (Unaudited) |
During the six-month period ended March 31, 2009, the Board of Trustees (the “Board” or the “Trustees”) of AssetMark Funds (the “Trust”) approved three new sub-advisory agreements between the Trust’s investment advisor, Genworth Financial Wealth Management, Inc. (the “Advisor”), on behalf of two of the Trust’s series, the AssetMark Large Cap Value Fund and the AssetMark International Equity Fund. The AssetMark Large Cap Value Fund and the AssetMark International Equity Fund are collectively referred to herein as the “Funds.”
At a meeting held on December 5, 2008, the Board appointed Diamond Hill Capital Management, Inc. (“Diamond Hill”) to replace Brandes Investment Partners, L.P. as one of the three sub-advisors for the AssetMark Large Cap Value Fund. At the meeting, the Board reviewed, considered and approved a new sub-advisory agreement between Diamond Hill and the Advisor, on behalf of the AssetMark Large Cap Value Fund.
Also at the meeting held on December 5, 2008, the Board appointed Mondrian Investment Partners Limited (“Mondrian”) and Martin Currie Inc. (“Martin Currie”) to replace Oppenheimer Capital LLC and Clay Finlay, LLC as the sub-advisors for the AssetMark International Equity Fund. At the meeting, the Board reviewed, considered and approved the new sub-advisory agreements between Mondrian and the Advisor and between Martin Currie and the Advisor, each on behalf of the AssetMark International Equity Fund.
The Funds are managed using a “manager-of-managers” structure that generally involves the use of one or more sub-advisors to manage allocated portions of the Funds’ portfolios. Under this structure, the Advisor is responsible for evaluating and selecting sub-advisors on an ongoing basis and making any decisions to recommend hiring, retaining or replacing sub-advisors. The Board is engaged in monitoring this process in connection with meetings held throughout the year and, under the manager-of-managers structure, all parties understand that sub-advisors are being monitored and evaluated, and are subject to replacement, at all times.
The material factors considered and the conclusions that formed the basis of the Board’s approval of each sub-advisory agreement are described below. This summary describes the most significant, but not all, of the factors evaluated by the Board. In deciding to approve each sub-advisory agreement, the Trustees did not identify any particular information or any single factor or conclusion that was controlling.
Materials Reviewed and the Review Process
Assisted by independent legal counsel, the Trustees specifically requested and were furnished with materials for purposes of their review. The materials provided to the Board related to, among other things: (a) the terms and conditions of each proposed sub-advisory agreement; (b) the nature, quality and scope of the services to be provided by each sub-advisor, as well as the schedule of fees to be charged for such services; (c) each sub-advisor’s investment performance compared to an industry peer group, as well as other sub-advisor client accounts; (d) comparative sub-advisory fee information; (e) information regarding each sub-advisor’s personnel, operations, financial position and business operations; (f) information regarding each sub-advisor’s brokerage and compliance practices; and (g) information regarding each sub-advisor’s interactions with the Advisor regarding management of the respective Fund as well as the sub-advisor’s compliance program.
The Trustees received assistance and advice regarding legal and industry standards from both independent counsel and from counsel to the Trust, and had previously received a detailed memorandum prepared by counsel to the Trust that described the Trustees’ legal duties and obligations in considering the approval of sub-advisory agreements. The Independent Trustees discussed in detail, in executive sessions with independent counsel at which no representatives of the Advisor or the sub-advisors were present, the materials provided by each sub-advisor and their legal duties in considering the approval of the sub-advisory agreements.
AssetMark Funds
ADDITIONAL INFORMATION (Continued)
March 31, 2009
Factors Considered
The Trustees considered and reached conclusions on a number of factors in making the decision to approve each of the sub-advisory agreements. In so doing, the Trustees considered the Advisor’s active role as a “manager-of-managers,” which includes, among other functions, monitoring and evaluating the performance of the sub-advisors, recommending that sub-advisors not performing as expected be replaced, and negotiating advantageous fee arrangements that could permit the Funds to realize economies of scale without compromising the quality of services. The Trustees considered the process by which the Advisor reviewed, selected and recommended each sub-advisor for the Board’s approval. These factors and the Board’s conclusions are set forth below.
Nature, Extent and Quality of Services
The Trustees reviewed the nature, extent and quality of the services to be provided to the respective Funds by the sub-advisors. The Trustees considered each sub-advisor’s investment management process, including (a) the experience and capability of the sub-advisor’s management and other personnel; (b) the financial position of the sub-advisor; (c) the quality and commitment of the sub-advisor’s regulatory and legal compliance policies, procedures and systems; and (d) the sub-advisor’s brokerage practices. The Trustees also considered the Advisor’s favorable assessment as to the nature, extent and quality of the sub-advisory services expected to be provided by each sub-advisor. Based on their review and consideration of the foregoing information, the Trustees concluded that the nature, extent and quality of the services to be provided by each sub-advisor would likely benefit each Fund and its shareholders.
Investment Performance
At the time of the Board’s consideration of each sub-advisory agreement, none of the sub-advisors had commenced managing its allocated portion of the respective Funds. Therefore, there was no record of each sub-advisor’s specific performance with respect to the Funds. However, the Board was provided with, and considered, performance information for other accounts managed by each sub-advisor that have similar investment objectives and policies to the applicable Fund. The Trustees also considered each sub-advisor’s investment performance record relative to benchmark indices. The Trustees concluded that each sub-advisor’s performance record supported the approval of the applicable sub-advisory agreement.
Sub-Advisory Fees and Economies of Scale
The Trustees considered the proposed fee schedule for each sub-advisor. The Trustees also considered individual reports prepared for each sub-advisor containing comparative information regarding fees. The Trustees compared the fees in the sub-advisory agreements to those charged by each respective sub-advisor for managing other funds or accounts with comparable investment objectives and policies. In addition, the Trustees compared the proposed fees for each sub-advisor to the fees charged by the present sub-advisors to the respective Funds. The Trustees considered that the sub-advisory fees would be paid by the Advisor from the fees it receives from the Funds, and would not result in additional fees borne by the Funds. The Trustees also considered that, where applicable, breakpoints in the sub-advisory agreement fee schedules represented potential economies of scale that could be shared with Fund shareholders under an agreement between the Advisor and the Funds. The Trustees concluded that the sub-advisory fees to be paid to each of the sub-advisors are reasonable in light of the services to be provided to each Fund.
AssetMark Funds
ADDITIONAL INFORMATION (Continued)
March 31, 2009
Ancillary Benefits
The Trustees considered other benefits that each sub-advisor might receive as a result of its relationship with the Funds. The Board observed that, consistent with each sub-advisor’s fiduciary obligations to the Fund for which it serves as a sub-advisor, the sub-advisors may direct Fund brokerage transactions to certain broker-dealers to obtain research and other services.
Conclusions
Based on their full evaluation of the relevant factors, the Board and the Independent Trustees concluded that all of the factors above supported approval of the sub-advisory agreements with Diamond Hill, Mondrian, and Martin Currie. The Board and the Independent Trustees also concluded that each sub-advisory fee is reasonable and that the approval of each sub-advisory agreement is in the best interests of the applicable Fund and its shareholders.
[This Page Intentionally Left Blank]
Item 2. Code of Ethics.
As of the end of the period covered by this report, the registrant has adopted a code of ethics that applies to the registrant’s principal executive officer and principal financial officer. The registrant has not made any amendments to its code of ethics during the period covered by this report that apply to the registrant’s principal executive officer or principal financial officer. The registrant has not granted any waivers from any provisions of the code of ethics during the period covered by this report to the registrant’s principal executive officer or principal financial officer.
Item 3. Audit Committee Financial Expert.
The registrant’s board of trustees has determined that there is at least one audit committee financial expert serving on its audit committee. Dennis Schmal is the “audit committee financial expert” and is considered to be “independent” as each term is defined in Item 3 of Form N-CSR.
Item 4. Principal Accountant Fees and Services.
For the fiscal year ended March 31, 2009, the registrant’s principal accountant billed the registrant $289,380 for professional services rendered for the audit of the registrant’s annual financial statements or services that are normally provided by the principal accountant in connection with statutory and regulatory filings or engagements.
For the fiscal year ended March 31, 2008, the registrant’s principal accountant billed the registrant $239,920 for professional services rendered for the audit of the registrant’s annual financial statements or services that are normally provided by the principal accountant in connection with statutory and regulatory filings or engagements.
None.
For the fiscal year ended March 31, 2009, the registrant’s principal accountant billed the registrant $57,720 for professional services rendered for tax compliance, tax advice and tax planning.
For the fiscal year ended March 31, 2008, the registrant’s principal accountant billed the registrant $57,720 for professional services rendered for tax compliance, tax advice and tax planning.
None.
Item 5. Audit Committee of Listed Registrants.
Not applicable to registrants who are not listed issuers (as defined in Rule 10A-3 under the Securities Exchange Act of 1934).
Item 6. Investments.
Schedule of Investments is included as part of the report to shareholders filed under Item 1 of this Form.
Item 7. Disclosure of Proxy Voting Policies and Procedures for Closed-End Management Investment Companies.
Not applicable to open-end investment companies.
Item 8. Portfolio Managers of Closed-End Management Investment Companies.
Not applicable to open-end investment companies.
Item 9. Purchases of Equity Securities by Closed-End Management Investment Company and Affiliated Purchasers.
Not applicable to open-end investment companies.
Item 10. Submission of Matters to a Vote of Security Holders.
None.
Item 11. Controls and Procedures.
Item 12. Exhibits.
Pursuant to the requirements of the Securities Exchange Act of 1934 and the Investment Company Act of 1940, the registrant has duly caused this report to be signed on its behalf by the undersigned, thereunto duly authorized.
Carrie E. Hansen, President
Pursuant to the requirements of the Securities Exchange Act of 1934 and the Investment Company Act of 1940, this report has been signed below by the following persons on behalf of the registrant and in the capacities and on the dates indicated.
Carrie E. Hansen, President
Danell J. Doty, Treasurer