Exhibit 15.2

| | | | | | | | | | |
| | | | |
| | Our mission | | | | | | |
| | | | | |
| | | | | | | | | | |
| | At GSK our mission is to improve the quality of human life by enabling people to do more, feel better and live longer. Front cover image | | | | Notice regarding limitations on Director Liability under English Law Under the UK Companies Act 2006, a safe harbour limits the liability of Directors in respect of statements in and omissions from the Report of the Directors contained on pages 1-136 and 239-244 which includes a business review on pages 1 to 86. Under English law the Directors would be liable to the company, but not to any third party, if the Report of the Directors contains errors as a result of recklessness or knowing misstatement or dishonest concealment of a material fact, but would not otherwise be liable. Report of the Directors Pages 1-136 and 239-244 inclusive comprise the Report of the Directors that has been drawn up and presented in accordance with and in reliance upon English company law and the liabilities of the Directors in connection with that report shall be subject to the limitations and restrictions provided by such law. Website GlaxoSmithKline’s websitewww.gsk.com gives additional information on the Group. Notwithstanding the references we make in this Annual Report to GlaxoSmithKline’s website, none of the information made available on the website constitutes part of this Annual Report or shall be deemed to be incorporated by reference herein. Cautionary statement regarding forward-looking statements The Group’s reports filed with or furnished to the US Securities and Exchange Commission (SEC), including this document and written information released, or oral statements made, to the public in the future by or on behalf of the Group, may contain forward-looking statements. Forward-looking statements give the Group’s current expectations or forecasts of future events. An investor can identify these statements by the fact that they do not relate strictly to historical or current facts. They use words such as ‘anticipate’, ‘estimate’, ‘expect’, ‘intend’, ‘will’, ‘project’, ‘plan’, ‘believe’ and other words and terms of similar meaning in connection with any discussion of future operating or financial performance. In particular, these include statements relating to future actions, prospective products or product approvals, future performance or results of current and anticipated products, sales efforts, expenses, the outcome of contingencies such as legal proceedings, and financial results. The Group undertakes no obligation to update any forward-looking statements, whether as a result of new information, future events or otherwise. Forward-looking statements involve inherent risks and uncertainties. The Group cautions investors that a number of important factors, including those in this document, could cause actual results to differ materially from those contained in any forward-looking statement. Such factors include, but are not limited to, those discussed under ‘Risk factors’ on pages 78-86 of this Annual Report. A number of adjusted measures are used to report the performance of our business. These measures are defined on page 56. Brand names Brand names appearing in italics throughout this report are trademarks either owned by and/or licensed to GlaxoSmithKline or associated companies, with the exception ofBoniva/Bonviva, a trademark of Roche,NicoDerm, a trademark of Johnson & Johnson, Merrell, Novartis, Sanofi or GlaxoSmithKline,Potiga, a trademark of Valeant,Proliaand Xgeva trademarks of Amgen,Vesicare, a trademark of Astellas Pharmaceuticals in many countries and of Yamanouchi Pharmaceuticals in certain countries,Volibris, a trademark of Gilead,Xyzal, a trademark of UCB or GlaxoSmithKline andZyrtec, a trademark of UCB or GlaxoSmithKline all of which are used in certain countries under licence by the Group. | | |
| | 
| | A child being seen by a doctor working for Brazil’s unified health system, which provides 95% of scheduled vaccinations in the country. We have a long-standing relationship with the government-funded science institution, Oswaldo Cruz Foundation, to manufacture vaccines for public health priorities in Brazil. This began with our first alliance in the 1980s on polio vaccines and continues through to recent technology transfers for products like our pneumococcal vaccine. Brazil is one of a number of large emerging market countries in which we are present and more than a quarter of the Group’s total revenues are now generated in these countries. | | | | |
| | | | | | | | | |
| | | | | | | | | |
| | | | | | | | | |
| | | | | | | | | |
| | | | | | | | | |
| | | | | | | | | | |
|
| GSK Annual Report 2012 | 1 |
Overview
GSK in 2012
As a global healthcare company, our commercial success depends on us creating innovative new medicines, vaccines and healthcare products and making these accessible to as many people who need them as possible.
2012 was characterised by a challenging global economic climate. Despite this, we have continued to make good progress in our strategy to grow our business in a sustainable way, deliver new medicines and healthcare products that are valued by those who use them, and simplify our operations.
All of this has allowed us to deliver significant returns to our shareholders.
 Read more atwww.gsk.com
Highlights
| | | | | | | | |
| £26.4bn | | | | £8.3bn | | | | £7.4bn |
| Total Group turnover | | | | Core* operating profit | | | | Total operating profit |
| | | | |
| £6.3bn | | | | 112.7p | | | | 92.9p |
Returned to shareholders | | | | Core* earnings per share | | | | Total earnings per share |
| | | | |
| 6 | | | | 1st | | | | |
Key medicines submitted for regulatory approval | | | | in Access to Medicines Index | | | | |
| * | The calculation of core results is described on page 56 and a reconciliation is provided on page 62. |
2 | GSK Annual Report 2012
Chairman’s statement
Despite a challenging environment, I believe 2012 marked another
year of progress for GSK in the delivery of our strategy and in
generating more sustainable returns to shareholders

Over the past five years, under Sir Andrew’s leadership, the Group has been fundamentally changing to improve growth prospects, reduce risk and deliver enhanced returns to shareholders.
The benefits of this strategy were evident during the year, with strong performances in our emerging markets, and other growth businesses offsetting much of the impact of the significantly worsening outlook in Europe. At the same time, GSK’s R&D organisation delivered unparalleled output with six key new products submitted for approval and there is growing evidence that we can replenish the late stage pipeline on a sustainable basis. This is clearly of critical importance to the longer-term prospects of the Group.
Ultimately the aim of our strategy is to deliver sustainable earnings per share growth (EPS) and improved returns to shareholders. GSK delivered flat core EPS of 112.7p but returned £6.3 billion to shareholders via dividends and buybacks in 2012. This brings to nearly £25 billion the amount returned to shareholders since Sir Andrew joined the Board at the start of 2008.
Operating in a responsible and ethical way is essential for the commercial success of GSK. As Chairman of the Corporate Responsibility Committee, I was pleased to see the continued progress during the year in our efforts to improve global access to our medicines, with further agreements reached to supply our vaccines to the world’s poorest countries at low prices and to encourage research into neglected diseases. The Group also took industry-leading steps to improve transparency of its clinical trial research.
Oversight and management of risk remains a key focus for the Board. In July 2012, the Group successfully resolved a series of long-standing legal matters with the US Government. These primarily related to historical sales and marketing practices.
The Board recognises that these matters do not reflect the company that GSK is today. Fundamental changes have been made to compliance, marketing and selling procedures in recent years and significant progress made to embed a culture in the company that puts patients first and demands integrity in all behaviours and activities.
We continue to make changes to the Board as we plan for the future and implement proactive succession planning. I would like to thank both Sir Crispin Davis, who is standing down at this year’s AGM, and Larry Culp, who retired from the Board in September, for their outstanding contributions over recent years.
In April, we appointed Lynn Elsenhans and Jing Ulrich as Non-Executive Directors. Respectively Lynn and Jing have brought experience running global companies and deep knowledge of emerging markets to Board discussions. Additionally in January, we announced that Hans Wijers, currently chairman designate of Heineken and previously CEO of Akzo Nobel, will join GSK as a Non-Executive Director from this year’s AGM.
I would also like to thank Sir Robert Wilson for agreeing to remain on the Board for an additional year to provide continuity and advice as new Board members settle into their roles.
We have now met our original aspiration to have more than 25% female representation on the Board by 2013, and we remain committed to continuing to improve geographic and gender diversity at Board level.
In summary, while our operating environment remains challenging, it is also not without substantial opportunity for companies that deliver innovation and act with responsibility. The Board has every confidence in the strength and resilience of Sir Andrew and his senior management team, and believes the Group is taking all the necessary steps to build a stronger GSK that can generate sustainable value for shareholders and society.

Sir Christopher Gent
Chairman
|
| GSK Annual Report 2012 | 3 |
CEO’s review
We have diversified our sources of growth, our R&D productivity
has significantly improved and our processes are simpler and more
efficient. We are confident that our strategy is delivering

Five years ago we set out a strategy to re-shape GSK to increase growth, reduce risk and improve our long-term financial performance. We have made good progress and 2012 provided further evidence of this.
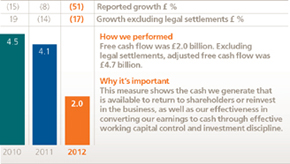
However, there is no doubt that we are operating in a very challenging environment and in 2012 this was particularly evident in Europe. Despite this, we were able to maintain core earnings per share (CER), generate net cash inflows from operating activities of £7 billion (before legal settlements) and return over £6.3 billion to shareholders.
We also made outstanding progress in research and development during the year to advance potential new medicines across multiple disease areas including respiratory, oncology, diabetes and HIV.
Investment in growth markets
Although reported sales for the year were down 1% (CER), sales were flat adjusting for the disposal of our non-core Consumer Healthcare brands. This reflects continued strong performance from our ‘growth’ businesses, helping to offset pressure in Western markets.
In emerging markets, the benefits of investments made to increase our exposure in Pharmaceuticals and Vaccines, as well as Consumer Healthcare, were very evident. Total sales in emerging markets now account for 26% of our business and grew 10% during the year. At a divisional level, Consumer Healthcare sales were flat, but grew 5%, excluding divested OTC products.
In Pharmaceutical and Vaccines, Japan’s sales fell 6%, reflecting the impact of theCervarix vaccine sales for the catch up programme in the prior year. ExcludingCervarix, sales grew 5%. Sales in the USA were down 2%; this was an improvement over 2011 when sales declined 5%. We have been re-shaping our US business to reflect changing market dynamics and to prepare for the launch of multiple new products. We continue to view the USA and Japan very positively, as markets that reward and are willing to pay for healthcare innovation.
The clear adverse impact to our performance in 2012 was weaker than expected sales from our European business, down 7%. Here, government austerity measures adversely impacted growth by approximately 6 percentage points during the year.
R&D productivity
provides platform for growth
In R&D, the Group made significant progress in 2012. We now have six key new products under regulatory review and expect Phase III data on 14 assets in 2013 and 2014. In total, over the next three years, GSK has the potential to launch around 15 new medicines and vaccines globally.
We are also confident that we can sustain this level of productivity and that we can deliver our long-term goal of improving returns on R&D investment to around 14%.
Simplifying and changing our business
We continue to make changes to simplify our operating model. Our Operational Excellence programme has now delivered annual savings of £2.5 billion and remains on track to hit the target we set of £2.8 billion of annual savings by 2014. In February 2013 we announced a new major change programme, which we expect to produce incremental annual cost savings of at least £1 billion by 2016.
This programme will include a series of technological advances and opportunities to eliminate complexity, which we believe can transform our long-term cost competitiveness in both manufacturing and R&D. The programme will help us simplify our supply chain processes, shorten cycle times, lower inventory levels and reduce our carbon footprint.

4 | GSK Annual Report 2012
Strategic review
In addition, given the sustained shift we have witnessed in the European reimbursement and pricing environment, we plan to initiate further restructuring of our European pharmaceuticals business to reduce costs, improve efficiencies and reallocate resources to support identified growth opportunities in these markets. We are also evaluating further strategic options to ensure we are able to maximise the value of our current and future portfolio in Europe.
This additional restructuring supports our strategy to change the shape of our business and deliver sustainable long-term growth. In the short term, it will also help to offset some of the pressure we are seeing on our margin structure resulting from changes in our business mix. We remain confident that as our pipeline begins to contribute from the end of 2013, we can drive improvement in the core operating margin over the medium term.
Strengthening our core business
Our Consumer Healthcare business continues to make excellent progress as we increase focus around a core portfolio of healthcare brands and emerging markets, where we are seeing very positive consumption trends and benefit from sales and distribution synergies with pharmaceuticals.
Investments to maximise returns in these markets continue. Last year, we opened a new innovation centre in China and have now increased our shareholding in our Indian subsidiary. In line with this strategic focus, we have decided to initiate a review evaluating all strategic options for theLucozade andRibena drinks brands, which are primarily marketed in established Western markets. These brands are iconic and the review will look at the best ways to ensure their continued growth.
Outside Consumer Healthcare, we continue to strengthen our core business through acquisitions and equity investments. In 2012 we completed three significant transactions with Human Genome Sciences, Shionogi and Theravance to increase our share of the economics on key future growth assets. At the same time, we delivered targeted divestments at the periphery of the Group to realise value for shareholders, divestingVesicare, multiple non-core OTC brands and Australian pharmaceutical ‘tail’ products.
Operating with responsibility
We remain committed to operating responsibly and during the year we made further advances on our agenda to ensure our behaviour and actions meet or exceed the expectations of society.
For example, we have taken several steps to increase transparency of our clinical research. We already publish all our trial results whether positive or negative. We have now committed to go further and enable independent researchers to access the very detailed data that lies behind these results. By being more open, we hope to help further scientific understanding and research.
We also continue to expand access to our medicines to people living in the poorest countries in the world. In 2012 GSK was again ranked number 1 in the Access to Medicines (ATM) Index which assesses healthcare companies’ activities in this field. In addition, we expanded our efforts to tackle neglected tropical diseases and supply low-price vaccines to the GAVI alliance for use in the world’s poorest countries. We also received further data on our candidate malaria vaccine. While additional analysis is needed, this vaccine continues to have the potential to save the lives of hundreds of thousands of children in Africa.
As the Chairman notes in his review, in July we also settled multiple investigations with the US Government and states, primarily relating to historical sales and marketing practices. These matters originated in a different era for the company, but we continue to take action at all levels to improve our procedures for compliance, marketing and selling and embed a values-based culture in GSK.
Outlook
GSK’s globally diversified sales base and improved R&D output provide a clear platform for growth, with 2013 marking the start of what should be a series of growth years for the Group.
Specifically we expect to deliver core EPS growth of 3-4% CER and sales growth of around 1% CER during the year.* We also expect to deliver further strong cash generation in 2013 and remain committed to using free cash flow to support increasing dividends, share repurchases or, where returns are more attractive, bolt-on acquisitions.
In closing, I would like to thank all our employees, partners and suppliers for their continued commitment and support. We are more confident than ever that GSK is well placed to succeed in emerging and pro-innovation markets and that our R&D model is working. This is creating clear, long-term capacity for GSK to deliver continued innovation and benefit to patients, and sustained performance and returns to shareholders.

Sir Andrew Witty
Chief Executive Officer
| * | All forward looking statements are based on 2012 restated numbers adjusted for IAS 19R (EPS of 111.4p), at CER and barring unforeseen circumstances. |
| | See ‘Cautionary statement regarding forward-looking statements’ on the inside front cover and page 56 for an explanation of CER. |
|
| GSK Annual Report 2012 | 5 |
6 | GSK Annual Report 2012
Strategic review
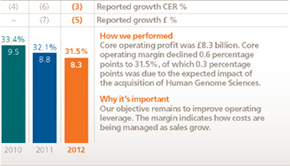
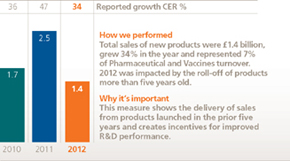
How we performed
We measure our performance against a number of key indicators, and use core results for our planning and reporting purposes
Group turnover
£26.4bn
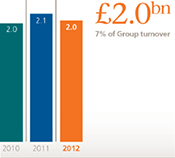
Free cash flowb,c
£2.0bn
Core operating profit and margina
£8.3bn
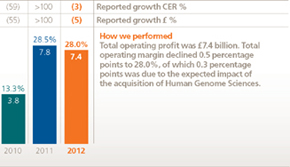
Total operating profit and margin
£7.4bn
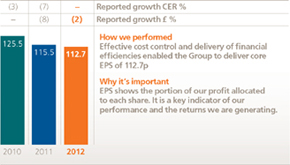
Core earnings per sharea
112.7p
Total earnings per share
92.9p

|
| GSK Annual Report 2012 | 7 |
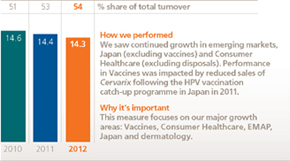
Turnover in our major growth areasb
£14.3bn
New Pharmaceuticals and Vaccines product performanceb
£1.4bn
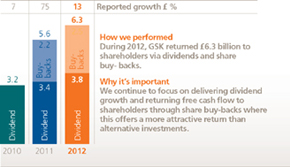
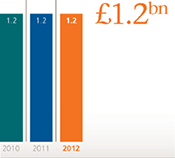
Cash returned to shareholders
£6.3bn
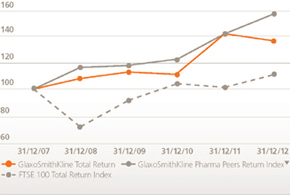
Relative total shareholder returnb,d
| a | We use a number of adjusted measures to report the performance of our business. These include core results, which are used by management for planning and reporting purposes and may not be directly comparable with similarly described measures used by other companies. Core results exclude a number of items from total results. A full definition of core results can be found on page 56 and a reconciliation between core results and total results is provided on page 62. |
| b | The remuneration of our executives is linked to the marked key indicators. Further information on our executive pay policy can be found in our Remuneration report on page 109. |
| c | The calculation of free cash flow is described on page 56 and a reconciliation is provided on page 69. The calculation of CER is described on page 56. |
| d | The constituents of the Pharma Peers Return Index are listed on page 115. |
8 | GSK Annual Report 2012
Strategic review
What we do
We are a science-led global healthcare company that researches and develops a broad range of innovative products
Our business
| | | | |
| We have three primary areas of business Pharmaceuticals, Vaccines and Consumer Healthcare. Our objective is to deliver sustainable growth across this portfolio. | | £26.4bn Group turnover |
| | | | | | | | | | | | | | | | | | | | |
Pharmaceuticals | | | | Vaccines | | | | Consumer Healthcare |
£18.0bn Turnover | | 68% Of Group | | | | | | £3.3bn Turnover | | 13% Of Group | | | | | | £5.1bn Turnover | | 19% Of Group | | |
| | | | |
| Our Pharmaceuticals business develops and makes available medicines to treat a broad range of serious and chronic diseases. Our portfolio is made up of established brands and newer innovative patent-protected medicines. | | | | Our Vaccines business is one of the largest in the world, producing paediatric and adult vaccines against a range of infectious diseases. In 2012, we distributed nearly 900 million doses to 170 countries, of which over 80% were supplied to developing countries. | | | | We develop and market a range of consumer health products based on scientific innovation. We have brands in four main categories: Total wellness, Oral care, Nutrition and Skin health. |
| | | | |
| Sales by therapy area | | | | Sales by vaccine | | | | Sales by category |
| | | | | £m | | | | | | | | £m | | | | | | | | £m |
| | | | | | | |
Respiratory | | 7,291 | | | | Boostrix | | 238 | | | | Total wellness | | 2,008 |
Anti-virals | | 753 | | | | Cervarix | | 270 | | | | Oral care | | 1,797 |
Central nervous system | | 1,670 | | | | Fluarix, FluLaval | | 200 | | | | Nutrition | | 1,050 |
Cardiovascular and urogenital | | 2,431 | | | | Hepatitis | | 646 | | | | Skin health | | 255 |
Metabolic | | 171 | | | | Infanrix, Pediarix | | 775 | | | | | | |
Anti-bacterials | | 1,247 | | | | Rotarix | | 360 | | | | | | |
Oncology and emesis | | 798 | | | | Synflorix | | 385 | | | | | | |
Dermatology | | 850 | | | | Other | | 451 | | | | | | |
Rare diseases | | 495 | | | | | | | | | | | | |
Immuno-inflammation | | 70 | | | | | | | | | | | | |
ViiV Healthcare (HIV) | | 1,374 | | | | | | | | | | | | |
Other | | 846 | | | | | | | | | | |
| | | | | | | | | | | | | |
| Read more on page 57 | | | | Read more on page 58 | | | | Read more on page 59 |
R&D
Our business is sustained through investment in R&D. In 2012 we spent £3.5 billion before non-core items*, £4.0 billion in total, in our search to develop new medicines, vaccines and innovative consumer products.
During the year we saw significant delivery from our late stage pipeline, with six key medicines filed with regulators.
We have dedicated research programmes for diseases that affect the developing world. We are one of the few healthcare companies researching both new vaccines and new medicines for all three of the World Health Organization’s priority diseases: HIV/AIDS, malaria and tuberculosis.
| | |
£3.5bn Core R&D expenditure in 2012 | | c.30 Assets in late stage pipeline |
| | | | | | | | |
| Core R&D expenditure allocation in 2012 | |
| | | £m | | | % | |
Pharmaceuticals | | | 2,821 | | | | 81 | |
Vaccines | | | 498 | | | | 14 | |
Consumer Healthcare | | | 155 | | | | 5 | |
| | |
| | | | | | | | | |
| Read more on page 32 | |
| * | The calculation of core results and non-core items is set out on page 56. |
|
| GSK Annual Report 2012 | 9 |
Where we do it
Our geographic presence covers more than 100 countries
Our global reach
| | | | | | |
The shape of our business is shifting to capitalise on markets with high-growth potential including those in Asia Pacific, Latin America and Japan. Territories outside the USA and Europe now account for 40% of our total sales. We have a significant global manufacturing and R&D presence with a network of 87 manufacturing sites and large R&D centres in the UK, USA, Spain, Belgium and China. 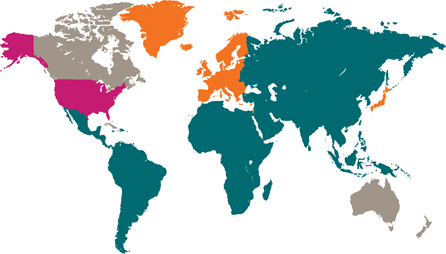
| | | | 99,488 |
| | | Employees |
| | | Employees by region |
| | | 
|
| | | | | No. |
| | | 1 USA | | 17,201 |
| | | 2 Europe | | 38,788 |
| | | 3 EMAP | | 36,738 |
| | | 4 Japan | | 3,515 |
| | | 5 Other | | 3,246 |
| | | Turnover by region |
| | | 
|
| | | | | £m |
| | | 1 USA | | 8,446 |
| | | 2 Europe | | 7,320 |
| | | 3 EMAP | | 6,780 |
| | | | 4 Japan | | 2,225 |
| | | | 5 Other | | 1,660 |
How we’re structured
| | | | |
Our commercial businesses are structured around
regional units or areas of focus. For Pharmaceuticals and Vaccines, we operate in
geographical segments that combine these two
businesses. Our Consumer Healthcare business
functions as a global unit, as does ViiV Healthcare,
the specialist HIV company we founded with Pfizer in 2009. Other trading turnover includes Canada, Puerto Rico,
Australasia, central vaccine tender sales and
contract manufacturing sales. | | Turnover by segment | | £bn |
| | US Pharmaceuticals and Vaccines | | 7.0 |
| | Europe Pharmaceuticals and Vaccines | | 5.0 |
| | EMAP Pharmaceuticals and Vaccines | | 4.7 |
| | Japan Pharmaceuticals and Vaccines | | 2.0 |
| | ViiV Healthcare | | 1.4 |
| | Other trading | | 1.2 |
| | Consumer Healthcare | | 5.1 |
| | | | |
| | Read more on page 151 | | |
10 | GSK Annual Report 2012
Overview
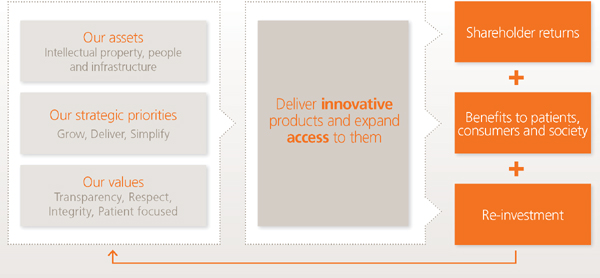
How we create value
By delivering innovation and expanding access to our
products we create value for society and our shareholders
The context
We see both opportunities and challenges in our operating environment. Scientific research is continuously uncovering new understandings about disease processes and technologies.
Meanwhile, the world’s population continues to grow as do pressures on healthcare costs, with a notable intensification in developed markets following the recent macro-economic downturn.
Innovation
At the core of our business model is the use of knowledge and development of intellectual property. We create value by researching, manufacturing and making available products that improve people’s health and well-being.
A healthier society enables people to live life to its fullest, allowing them and their communities to prosper. A sustained flow of innovative products enables our business to grow profits and deliver improved returns to our shareholders.
We aim to develop new products that offer significant improvements over existing treatment options and therefore provide value to patients and those who pay for them such as governments, insurers or other third parties.
In 2012, we invested £3.5 billion in core research and development of new medicines, vaccines and consumer products, and we are currently evaluating around 50 investigational medicines for diseases such as cancer, diabetes, heart disease and respiratory illnesses. Over the next three years, we have the potential to bring around 15 new medicines to patients.
For more on our R&D and the discovery process see pages 30 to 41.
Access
We manufacture and distribute more than 4 billion packs of products to over 150 countries around the world. With this extensive global presence, we are striving to make our products as widely accessible as possible.
In Western markets, we have developed new reimbursement approaches for our medicines where we agree risk-sharing arrangements with payers.
We have adopted more flexible pricing approaches to reflect countries’ wealth and ability to pay. This has resulted in significant increases in demand for our products in emerging economies.
To increase access to our products in the world’s least-developed countries, we have held the price of our patented medicines in this region at no more than 25% of our developed world prices and we re-invest a fifth of the profits we make from sales in these territories back into local healthcare infrastructure projects.
Sustainable
Developing a new medicine takes many years and substantial investment. We are able to bring the scale, significant resources and expertise required. On average each successful medicine will require significant investment over a 10-12 year period.
Sustainability in our business performance is critically important if we are to deliver continued innovation and access to our products. We must produce profitable performance to ensure we remain competitive and have the funds to invest in our people and assets. A key element of this is an environment that appropriately rewards innovation across both patent-protected and branded products.
For more on our approach to intellectual property see page 15.
How we do it
We can only achieve our objectives by utilising our assets, executing our strategic priorities and operating our business responsibly.
In the past five years, we have made significant progress in the delivery of our strategic priorities.
We have developed a balanced business with geographic diversity and new platforms for growth, in particular through advancement of our late-stage pipeline and changes to our R&D model. At the same time, we have also simplified our business to reduce costs and ensure we retain long-term competitiveness.
Our commitment to be a responsible, values-based business underlies everything we do. Our values are applied across the Group and we are focused on integrating them into our culture, decision-making and how we work. These values are to operate with transparency, demonstrate respect for people, act with integrity and be patient-focused. We ask every one of our employees to embody these values.
For more on our approach to responsible business see page 49 to 54.
|
| GSK Annual Report 2012 | 11 |
How we create value
Wider contributions
While our primary contribution is to develop new products that improve people’s health, we also create value as a global company by making direct and indirect economic and social contributions in the countries in which we operate.
We have a global and diverse employee base consisting of close to 100,000 employees, and we contract goods and services on a significant scale. Last year, our manufacturing supply chain spent around £9 billion with 6,000 suppliers across 73 countries.
The company also contributes to the countries in which we operate through the tax system. In 2012, the charge for taxation on our profits amounted to £1.95 billion. Direct contributions to support the health and well-being of local communities relevant to GSK are also made via our global community programmes which amount to over £200 million a year.
Finally, we believe we can create value by acting as a catalyst or partner for other organisations. We value the new and different perspectives that other groups can bring to our thinking. We are open to working with research charities, academia, companies and non-governmental organisations.
Progress highlights
£25bn
Amount returned to shareholders via dividends and buybacks over past five years
23
Number of new product approvals in the USA and Europe in past five years
1st
in Access to Medicines Index
12 | GSK Annual Report 2012
Strategic review
Our market
While our environment remains challenging we are optimistic
about the long-term future of the healthcare market
General overview
There remains a significant need for medicines and healthcare treatments around the world, and we are optimistic about our ability to grow our business in the long-term by researching, manufacturing and selling innovative healthcare treatments, especially given the work we have done to re-shape and geographically rebalance our business.
Nevertheless, many factors can affect the performance and success of our sector and our business. The exact impact of these is difficult to forecast.
Global economic overview
The difficult market conditions stemming from the international financial crisis continued to impact the world’s economies during 2012, while sales growth in world pharmaceutical markets showed significant regional variation.
Economies across the globe remained weak in 2012 as governments continued to struggle with the long-term effects of the 2008 financial crisis. Overall growth for 2012 slowed to 3.2%, according to the International Monetary Fund (IMF).*
In the USA, markets stagnated at the end of the year, ahead of fears about the “fiscal cliff” created by federal budget legislation. Though the crisis was averted, significant uncertainty remains over the strength of the economy and over the likely impact of legislation intended to stimulate economic growth.
In Japan, the economy contracted as demand for Japanese exports was impacted by the global economic slowdown, particularly in Europe. In the Eurozone, economies continued to contract as the recession deepened, and even revised growth forecasts proved optimistic. For the first time since the single currency was launched, the region failed to grow in any quarter during the calendar year. Growth in emerging markets was weaker than expected. China continued to grow, but at 7.8% was the lowest level for more than a decade, according to the IMF.
Based on IMF assessments, the outlook for global economic growth in 2013 is 3.5%. There is no immediate sign of an end to the weak global economy or to improvements in budget deficits among many of the world’s richest nations. Other factors such as political turbulence within the European Union and instability in the Middle East, are likely to affect the international business environment.
Healthcare market
While the healthcare industry remains one of the world’s largest industries, it has felt the effects of government austerity measures such as mandated price reductions in Europe, Japan and a number of emerging markets. As a result of these developments, companies faced significant pressure in growing sales, although new products and growth elsewhere in the emerging markets helped to partly offset the challenges.
Sales in the world pharmaceutical market were worth £516 billion at constant exchange rates (CER) in the 12 months to the end of September 2012, increasing from £503 billion in the previous year. The share of global sales grew to 42.8% in North America, which remained the top pharmaceutical market, and declined in Europe (to 23.3%), while emerging markets also increased their share to 21.7%.**
During the year many of the largest pharmaceutical companies encountered generic competition for a significant number of products. It is estimated that $35 billion in sales were lost as products lost patent protection and experienced competition from generics.
| | | | | | | | | | | | |
Figure 1 | | | | | | | | | | | | |
World pharmaceutical market by geographic region | | Value
£bn | | | % of
total | | | % compound growth Sep 2007–Sep 2012 | |
North America | | | 221 | | | | 42.8 | | | | 3.4 | |
Europe | | | 120 | | | | 23.3 | | | | 2.6 | |
EMAP | | | 112 | | | | 21.7 | | | | 14.7 | |
Japan | | | 63 | | | | 12.2 | | | | 3.8 | |
Total | | | 516 | | | | 100.0 | | | | 5.1 | |
| | | |
| World market – top therapeutic classes | | Sales £bn | | | % of total | | | | |
Central nervous system | | | 78 | | | | 15.1 | | | | | |
Antineoplastic/Immunomodulatory | | | 76 | | | | 14.7 | | | | | |
Cardiovascular | | | 69 | | | | 13.4 | | | | | |
Alimentary tract and metabolic | | | 63 | | | | 12.2 | | | | | |
Anti-infectives (bacterial, viral and fungal excluding vaccines) | | | 52 | | | | 10.1 | | | | | |
Respiratory | | | 36 | | | | 7.0 | | | | | |
| ** | Data for market share and market growth rates are GSK estimates based on the most recent data from independent external
sources including IMS Health. Values are based at CER (constant exchange rate). |
| * | IMF data taken from World Economic Outlook Update, January 2013. |
|
| GSK Annual Report 2012 | 13 |
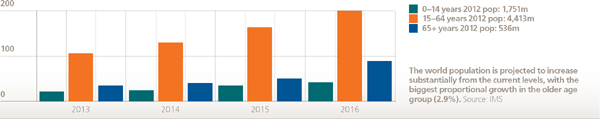
Population growth
According to the United Nation’s 2010 revision to its population projections, world population will peak at 10.1 billion in 2100 compared with 7 billion in 2011. While some countries are seeing declining birth rates – particularly those in Europe and Japan – many other regions have seen a sharp rise in populations, particularly in the Middle East and southern Asia.
These countries with rising populations are the same economies that are experiencing improved economic outlooks. The IMF forecasts that emerging markets will grow 5.5% in 2013 and 5.9% in 2014 compared with figures of 1.4% and 2.2%, respectively, for developed markets.
Governments in developing countries are under pressure to improve healthcare infrastructure and provide basic universal coverage and many have made significant commitments to do this. However, where strong healthcare systems are missing, people in developing countries buy their medicines directly. As a result, households in emerging markets spend a significantly higher proportion of their personal income on medicines than is spent by richer countries. Pharma Futures report ‘Perspectives from Emerging Markets’ estimates this can be as high as 40% in China and India, and 25% in Brazil, for example.
Demand for medicines, vaccines and consumer healthcare products is expected to continue to grow significantly faster than in more mature markets over the next few years.
Lifestyle changes
As populations increase, people are also living longer, partly aided by the success of medical interventions treating and preventing diseases that previously caused significant mortality in infants (see figure 2). With this increasing age, comes increasing infirmity and illness.
Other lifestyle changes are affecting health risks as well. As people become less physically active and alter their consumption of food, alcohol and tobacco, there is a growing incidence of chronic, non-communicable conditions such as type 2 diabetes and heart disease.
In emerging markets, where increasingly people are moving away from a subsistence/agricultural lifestyle to find paid work in the cities, there is a growth in disposable incomes and expansion of the middle-class sections of populations. This is significant as a large proportion of healthcare spending in these countries comes directly from the patient.
Price controls
In many countries, the prices of pharmaceutical products are controlled by law. Governments may also influence prices through their control of national healthcare organisations, which can bear a large part of the cost of supplying medicines to consumers.
In Europe, governments are responding to increasing austerity pressures. Healthcare reforms in countries such as France, Spain and Germany have restricted pricing and mandated generic substitutions.
In Japan the government implemented its mandatory bi-annual price review of pharmaceutical products in 2012.
In the USA there are no government price controls over private sector purchases, but federal law requires pharmaceutical manufacturers to pay rebates on certain medicines to be eligible for reimbursement under several state and federal healthcare programmes. Those rebates increased and were expanded in 2011 as an affect of the Affordable Care Act (ACA). In 2012 and continuing into 2013, the government is finalising additional details for implementing the ACA. Expansion of the government’s insurance programme for low-income Americans, new health insurance marketplaces, and a financial penalty for certain Americans who choose not to purchase health insurance are scheduled for 2014.
Figure 2
Estimated change to world population (millions)
14 | GSK Annual Report 2012
Strategic review
Our market continued
Additionally, cross-border trade, the acceleration of generics to market, comparative effectiveness research, value-based care delivery, pharmaceutical pricing and other issues of importance to our industry are part of the continuing healthcare debate in the USA.
Regulatory pressures
The pharmaceuticals and vaccines industry is highly regulated. Regional and country-specific laws and regulations are important in determining whether a product can be successfully developed and approved.
The number and impact of regulatory agency requirements is increasing, particularly across aspects of product quality and safety. The evaluation of benefit and risk continues to be of paramount consideration in the approval of a new medicine, and regulatory authorities are increasingly focusing on the safety of medicines in the post-approval phase.
Regulatory agencies’ criteria for evaluating benefit and risk can also vary widely, making it challenging for pharmaceutical companies to meet the requirements for each country.
Figure 3
US FDA approvals of new molecular entities
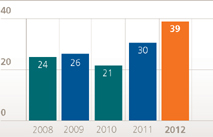
Nature Reviews Drug Discovery 12, 87-90 (February 2013)
| doi:10.1038/nrd3946
USA
In the USA, the fifth reauthorisation of the Prescription Drug User Fee Act (PDUFA) was passed in 2012 with the signing into law of the Food and Drug Administration Safety and Innovation Act (FDASIA). The law establishes new user-fee statutes for generic medicines and follow-on versions of biopharmaceuticals, commonly referred to as biosimilars. It also equips the FDA with tools intended to accelerate the development and review of innovative new medicines, and gives the agency new authority concerning drug shortages.
The FDA approved 39 new molecular entities in 2012 with the majority of these representing the first market approval. (See figure 3).
Europe
In the European Union (EU), 2012 saw significant new legislation and regulatory requirements. Implementation of the revised EU pharmacovigilance legislation, which brings in new measures aimed at strengthening the safety monitoring of medicines, started in July 2012.
The European Medicines Agency (EMA) approved 31 novel medicines in 2012. Of these approvals, nine were medicines for rare diseases.
The European Commission adopted proposals in July for a new regulation aimed at boosting clinical research in Europe by simplifying the rules for conducting trials. The proposals are currently under review and industry will be seeking to ensure that new legislation – expected to come into effect in 2016 – will create a favourable environment for R&D in Europe.
The new Falsified Medicines Directive became effective on 2 January 2013 and introduced measures to prevent the entry of falsified medicines into the legal supply chain. These include requirements for the importation of active substances into the EU from third countries (non-EU member states), which may present challenges to pharmaceutical manufacturers.
Emerging markets
As the demand for patient access to new drugs in emerging markets grows, so does the importance of conducting clinical trials in these countries to provide data on a medicine’s profile in local populations.
A growing number of emerging markets are requiring that studies be conducted in-country to assess any variation in ethno-sensitivity to new medicines. This is in addition to evidence that a highly regulated authority such as the EMA or FDA has approved a new medicine before they initiate their own review.
The regulatory requirements in these markets can be challenging, both in terms of the volume and pace of change, and the consistency of guidance. Nevertheless, we continue to take part in regional and national regulatory initiatives that provide opportunities for scientific and regulatory dialogue between industry, agencies and other stakeholders. We aim to include broader sets of patient populations from countries in medicine development programmes to increase global patient access to new innovative medicines, and optimise regulatory approvals.
|
| GSK Annual Report 2012 | 15 |
Consumer Healthcare
The consumer healthcare industry is subject to national regulation comparable to that for prescription medicines for the testing, approval, manufacturing, labelling and marketing of products. High standards of technical appraisal frequently involve a lengthy review and approval process, which can delay product launches.
Intellectual property and trademarks
The process of discovering and developing a new medicine or vaccine takes many years and can cost up to £1 billion.
Intellectual property and the effective legal protection of our intellectual property – via patents, trademarks, registered designs, copyrights and domain name registrations – is critical in ensuring a reasonable reward for innovation and to fund R&D. (See pages 33 to 38 for the pharmaceutical and vaccines development process.)
Patent protection for new active ingredients is available in major markets, and patents can often be obtained for new drug formulations, manufacturing processes, medical uses and devices for administering products.
Emerging markets are not all aligned on their approach to recognising patent-protected medicines.
Although we may obtain patents for our products, this does not prevent them from being challenged before they expire. Further, the grant of a patent does not mean that it will be held valid and enforceable by a court. If a court determines that a patent we hold is invalid, non-infringed or unenforceable, it will not protect our innovation in that legal jurisdiction. Significant litigation concerning such patent challenges is summarised in Note 44 to the Financial statements, ‘Legal proceedings’.
The life of a patent in most countries is 20 years from the filing date. However, the long development time for new medicines can mean that a substantial amount of this patent life has been eroded before launch. In some markets it is possible to have some of this lost time restored and this leads to variations in the amount of patent life available for each product we market.
In addition all of our commercial products are protected by registered trademarks in major markets, and our trademarks are important for maintaining the brand identity of our products. There may be local variations. For example, in the USA the trademarkAdvair covers the same product sold in the EU asSeretide.
Trademark protection may generally be extended as long as the trademark is used by renewing it when necessary. We enforce our trademark rights to prevent infringements.
Generic pressures
When patents expire on medicines, these medicines can be subject to competition from generic products. The effect of this is particularly acute in Western markets, where generic products can rapidly capture a large share of the market. As generic manufacturers typically do not incur significant costs for R&D, education or market development, they are able to offer their products at considerably lower prices than branded competitors. The same pressures do not apply as significantly to vaccines, or to products where patents exist on both active ingredients and the delivery device, such as inhaled respiratory medicines.
Competition
Within the pharmaceutical industry, competition can come from other companies making patent-protected medicines with indications to treat similar diseases to our medicines, or from manufacturers making generic copies of our medicines following patent expiration.
Our principal pharmaceutical and vaccines competitors include: Abbott Laboratories, Amgen, AstraZeneca, Bristol-Myers Squibb, Eli Lilly, Johnson & Johnson, Merck, Novartis, Pfizer, Roche Holdings, Sanofi and Takeda.
The Consumer Healthcare market has become more challenging. Consumers are demanding better quality and better value. Retailers have consolidated and globalised, which has strengthened their negotiation power. Our principle competitors in these markets include: Colgate-Palmolive, Johnson & Johnson, Procter & Gamble, Unilever, Pfizer and Novartis.
In addition, many other smaller companies compete with GSK in certain markets.
Outlook
GSK’s globally diversified sales base and improved R&D output provides a clear platform for growth, with 2013 marking the start of what should be a series of growth years for the Group.
Specifically we expect to deliver core EPS growth of 3-4% CER and sales growth of around 1% CER during the year (based on the IAS 19 (Revised) adjusted EPS for 2012 of 111.4p). We also expect to deliver further strong cash generation in 2013 and remain committed to using free cash flow to support increasing dividends, share repurchases or, where returns are more attractive, bolt-on acquisitions.
We are more confident than ever that GSK is well placed to succeed in emerging and pro-innovation markets and that our R&D model is working. This is creating clear, long-term capacity for GSK to deliver continued innovation and benefit to patients, and sustained performance and returns to shareholders. For risks to this outlook, see ‘Risk factors’ on pages 78 to 86.
16 | GSK Annual Report 2012
Strategic review
How we deliver
Our strategy is designed to deliver sustainable growth,
reduce risk and improve long-term financial performance
and returns to shareholders
| | | | | | | | |

| | Grow a diversified global business | | How we will grow | | |
| | | Over the past five years we have created a
more balanced business and product
portfolio, capable of delivering
sustainable sales growth. This is centred
on our three business areas of
Pharmaceuticals, Vaccines and Consumer
Healthcare, which provide us with
significant competitive advantages and
opportunities for synergy. We have substantially increased our
investment in higher-growth areas such as
emerging markets and Japan and in our
global Vaccines and Consumer Healthcare
businesses. | | At the same time, we have re-shaped our
US Pharmaceuticals and Vaccines
business to reflect the changing market
dynamics there and to prepare for the
launch of multiple new products. In
Europe, we are restructuring to improve
efficiency and focus resources to growth
opportunities in what continues to be a
challenging market environment. | | |
Read more on page 18 | | | | | | |

| | Deliver more products of value | | How we will deliver | | |
| | | We have changed our R&D organisation so that it is better able to sustain a pipeline of products that offer valuable improvements in treatment for patients and healthcare providers. We have increased the externalisation of our research, allowing us to access new areas of science and to share the risk of development with our partners. We have also changed our processes to make decisions earlier, so that only those medicines which are significantly differentiated from existing therapies are progressed. | | We have broken up the traditional hierarchical R&D business model and created smaller, more agile groups of scientists who are accountable for their projects. All of this has been underpinned with a focus on improving the rates of return in R&D and being more rigorous in how we allocate investment across Pharmaceuticals, Vaccines and Consumer Healthcare R&D. | | |
Read more on page 30 | | | | | | |

| | Simplify the operating model | | How we will simplify | | |
| | | As our business continues to change shape, we are transforming how we operate so that we can reduce complexity and become more efficient. Over the past four years we have implemented a global restructuring programme designed to deliver significant savings to support investment in our priority growth businesses as well as offset pressures on the Group’s margin resulting from changes in the shape and mix of our business. | | Savings from this programme have been generated across the business. As this programme comes to an end, we are continuing to examine ways to simplify our operating model and increase efficiencies. We have therefore begun a new, major change programme across manufacturing, R&D and Europe to deliver further savings. The new programme includes a series of technological advances and opportunities to eliminate complexities and improve our competitiveness further. | | |
Read more on page 42 | | | | | | |
|
| GSK Annual Report 2012 | 17 |
£26.4bn
Group turnover
26%
of sales from
emerging markets
6
Key product filings
£1.4bn
New product sales
£2.5bn
Annual benefits from restructuring
194days
Working capital cycle down
from 202 days in 2011
Financial architecture
Our financial architecture is designed to support the delivery and execution of the Group’s strategy, and drive sustainable growth in core earnings per share and free cash flow in order to maximise total returns to shareholders.
The architecture has established four key financial priorities for GSK in delivering sustainable sales growth, improving our operating leverage, improving our financial efficiency and converting more of our earnings into cash.
By applying this framework we can drive better and more consistent decision making across the company and improve delivery of our key financial objectives of earnings per share growth and free cash flow generation. This can then be returned to shareholders or reinvested in bolt-on acquisitions, wherever the most attractive returns are available. Our decisions are rigorously benchmarked using a cash flow return on investment (CFROI) returns based framework.
We have also improved our financial reporting to align it more closely with our architecture. We are providing more data and insights into the progress we are making in each of our businesses and regions and on our progress against the key drivers of operational and financial efficiency.
In 2012 we transitioned our reporting to a core basis, enabling greater visibility of the underlying performance of the business.
Read more on page 46
Our values and behaviours
As we work towards our goals, how we deliver success is just as important as what we achieve. There are many ethical issues associated with the research and development, manufacture and sale of our products, and our relationships with healthcare professionals, patients and regulators. Ethical conduct is a priority for GSK and we put the interests of patients and consumers first and are driven by our values – transparency, respect, integrity, patient-focus – in everything we do.
We understand that without the application of these values by a talented, diverse and engaged workforce, we cannot execute our strategy. We are focused on supporting our employees and creating a culture where values-based decision making guides all business practices. These values are backed up by a clear Code of Conduct, robust compliance systems, and training and support that help employees make the right decisions.
Our strong policy and compliance programmes help to embed these behaviours, as does the leadership from our Board and Central Executive Team. Our board is active in ensuring corporate governance that oversees and informs sound decision making by executive management.
Read more on page 49
18 | GSK Annual Report 2012
Strategic review

| | |

| | Grow a diversified global business |
| |
| | Overview Over the past five years we have created a more balanced business and product portfolio, capable of delivering sustainable sales growth. This is centred on our three business areas of Pharmaceuticals, Vaccines and Consumer Healthcare, which we believe offer significant competitive advantage and opportunity for synergies. We have substantially increased our investment in higher-growth areas such as emerging markets and Japan and in our global Vaccines and Consumer Healthcare businesses. At the same time, we have re-shaped our US Pharmaceuticals and Vaccines business to reflect changing market dynamics and to prepare for the launch of multiple new products. In Europe, we are restructuring to improve efficiencies and focus resources on growth opportunities in what continues to be a challenging environment. |
|
| GSK Annual Report 2012 | 19 |
| | | | |
| | |
| | Progress | | |
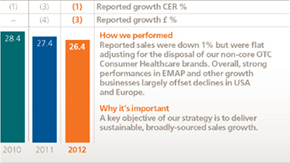
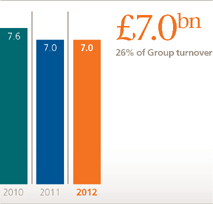
| | Reported turnover for the year was down 1% but was flat adjusting for the disposal of our non-core OTC brands. Overall, strong performances in EMAP and other growth businesses largely offset declines in the USA and Europe. Total sales in emerging markets now account for 26% of our business and grew 10% during the year. Our vulnerability to generic competition has been declining, with sales of ‘White pills in Western markets’ now accounting for only 21% of turnover, down from 36% in 2008. |
| | |
| | Group turnover £bn 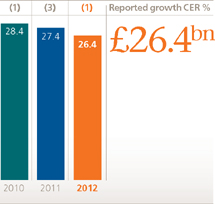
| | White pills in Western markets £bn* 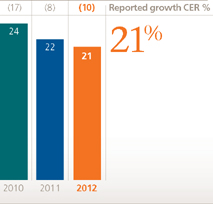
|
| | |
| | Turnover in major growth areas £bn** 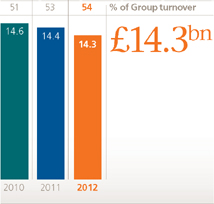
| | Sales in emerging markets £bn 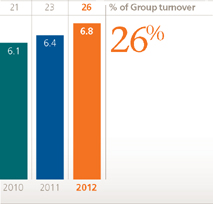
|
| | |
| | Priorities | | |
| | Our globally diversified sales base, coupled with strong R&D output, provides us with a platform for sustainable future growth. We will continue to invest in our key growth businesses such as emerging markets and Consumer Healthcare to support this outlook. In pro-innovation markets like the USA and Japan, our priority during the year is to prepare for the launch of multiple new products from the pipeline. In Europe, our focus is on restructuring our pharmaceutical business to reduce costs and reallocate resources. We are also considering other strategic options to maximise the value of our portfolio in the region. * See page 56 (Financial Review) ** See page 7 |
20 | GSK Annual Report 2012
Strategic reviewGrow a diversified global business
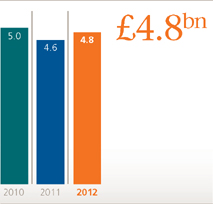
US
Pharmaceuticals and Vaccines
Turnover £bn
Operating profit £bn
Pharmaceuticals and Vaccines turnover 2012
| | | | | | | | |
| | | £m | | | Growth
CER % | |
1 Respiratory | | | 3,388 | | | | 1 | |
2 Anti-virals | | | 57 | | | | (42 | ) |
3 Central nervous system | | | 510 | | | | 6 | |
4 Cardiovascular and
urogenital | | | 1,461 | | | | (5 | ) |
5 Metabolic | | | (12 | ) | | | – | |
6 Anti-bacterials | | | 20 | | | | (63 | ) |
7 Oncology and emesis | | | 321 | | | | 18 | |
8 Vaccines | | | 826 | | | | – | |
9 Dermatology | | | 228 | | | | (14 | ) |
10 Rare diseases | | | 117 | | | | 10 | |
11 Immuno-inflammation | | | 65 | | | | >100 | |
The fundamentals of our US business are strong despite pressure from generics and product discontinuations.
We remain confident in our ability to deliver growth through our pipeline of new medicines and performance of newly launched products.
Marketplace
The US healthcare market continued to change rapidly in 2012 as patients, providers and payers sought improved care and lower costs. This drive for value, along with the implementation of healthcare reform, has spurred consolidation among healthcare organisations and providers, including hospitals, health maintenance organisations, preferred provider organisations, home health agencies and hospices. This is changing the way care is provided and paid for in the USA.
In this environment, decisions on purchasing and prescribing increasingly are being made at a central point, and the pharmaceutical industry is having to adapt its approach to product marketing if it is to continue to work effectively with healthcare providers and payers.
Performance
Throughout the year, we have continued to transform our business so that we can effectively market and sell our medicines and vaccines and provide the value our customers demand in this challenging healthcare environment.
The business has demonstrated its underlying strength with strong performance from products serving the respiratory, neuroscience, vaccine and oncology markets. Overall sales were down 2%, although excluding the impact ofAvandia, sales were flat.
Operating profit increased 1% to £4.8 billion as a result of our continuing efforts to simplify our processes and produce efficiencies in our operations.
In the respiratory market, sales of medicines increased and our business grew 1% as the respiratory controller segment returned to overall prescription volume growth during the year. This followed a decline in 2011 after the Food and Drug Administration revised its class labeling of controllers. Sales ofAdvair, our largest product, increased 1%, whileFlovent sales declined 1%. Sales ofVentolin were up 14%.
Strong performances byLovaza (up 5%),Lamictal (up 18%),Promacta (up 66%),Votrient (up 59%) andArzerra (up 23%), also helped us offset the loss of patent exclusivity forArixtra and argatroban and the loss ofAvandia sales. Our new treatment for lupus,Benlysta, contributed sales of £65 million during the year.
In our Vaccines business, turnover was flat. A decline in flu vaccine sales was offset by sales ofPediarix, which increased 32% andBoostrix which grew by 35%.
During the year, our pipeline continued its strong momentum with several products receiving FDA approval including:Votrient for sarcoma,Promacta for hepatitis C thrombocytopenia,MenHibrixvaccine for meningitis (C&Y) and infuenza type b, raxibacumab for anthrax inhalation andFabiorfoam in dermatology. In addition during the year, we submitted five medicines to the FDA: respiratory medicinesBreo andAnoro; oncology medicines dabrafenib and trametinib (BRAF and MEK), and albiglutide for diabetes.
The year was also significant as we completed settlements with the US Government on a broad range of longstanding legal cases. Over the past several years, we have taken actions at all levels of the business to change our procedures for compliance, marketing and selling to embed a new way for the business to operate. By instilling a values-based culture within our organisation, we are committed to operating our business with transparency, integrity and respect and to focus on the best interests of patients. Throughout the year, we continued to transform our business model.
In 2012, we also provided £100 million worth of GSK medicines and vaccines to over 350,000 uninsured or under insured patients enrolled in our patient assistance programmes.
|
| GSK Annual Report 2012 | 21 |
Europe
Pharmaceuticals and Vaccines
Turnover £bn
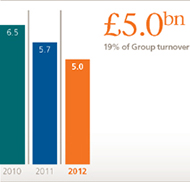
Operating profit £bn

Pharmaceuticals and Vaccines turnover 2012
| | | | | | | | |
| | | £m | | | Growth
CER % | |
1 Respiratory | | | 1,906 | | | | (5 | ) |
2 Anti-virals | | | 74 | | | | (23 | ) |
3 Central nervous system | | | 386 | | | | (15 | ) |
4 Cardiovascular
and urogenital | | | 504 | | | | 1 | |
5 Metabolic | | | 29 | | | | (49 | ) |
6 Anti-bacterials | | | 403 | | | | (17 | ) |
7 Oncology and
emesis | | | 256 | | | | 11 | |
8 Vaccines | | | 980 | | | | (4 | ) |
9 Dermatology | | | 156 | | | | 5 | |
10 Rare diseases | | | 123 | | | | (6 | ) |
11 Immuno-
inflammation | | | 4 | | | | >100 | |
The economic climate and government austerity measures continue to impact our performance. We maintain our determination to develop our business and build on the opportunity provided by the flow of new products from our pipeline.
Marketplace
The economic climate in Europe continues to pose challenges for pharmaceutical companies and a wide range of businesses and industries. Austerity programmes are pressuring governments to find new ways of tightening healthcare budgets. The stringent austerity measures implemented by some countries affected not only the pricing of medicines but also patients’ access to new treatments.
One particular concern is that the operation of reference pricing, where prices are set in reference to those charged in other countries, could create additional pressure if levels set for a country under severe austerity measures are adopted by others.
Performance
Our European business continued to be affected by austerity measures, with overall sales down 7%.
To respond to the challenging business climate, we continued to invest in our products while reducing operating costs by 3% compared with 2011. Despite these initiatives, operating profit fell by 11%, primarily owing to the loss of sales.
In our Pharmaceuticals business, turnover declined 8%. Sales by volume ofSeretide, our asthma and COPD product, increased but revenue declined 4% because of price cuts. Our oncology products –Votrient, Promacta andArzerra – performed well, and sales ofDuodart andAvodart, which treat benign prostatic hyperplasia, grew 9%, even thoughDuodart did not have market access approval in France and Italy.
While gaining approval from governments to market products continues to be a challenge, we did see improvements in 2012.Prolia, a treatment for osteoporosis, andBenlysta, for lupus, have now been launched in almost all markets in Europe.
In our Vaccines business, reported turnover declined by 4%, reflecting the austerity-driven price cuts and the introduction of national tenders in several countries.
Throughout Europe, we have sought to work with those governments implementing austerity measures to find ways to manage both patient demand and healthcare expenditure. Over 2012, this partnership approach resulted in no interruption to supply to those countries and an overall reduction in our overdue receivables.
Our support for charitable programmes that strengthen healthcare in the communities and regions where we operate remains an important part of our business. Our financial support each year totals more than €1 million in Europe (excluding the UK).
Following a review in 2012, we will be further restructuring our European business to reduce costs, improve efficiency and re-allocate resource to support growth opportunities in Europe. As we reduce our European cost base, we will also be evaluating further strategic options to ensure we are able to maximise the value of our current and future portfolio.
22 | GSK Annual Report 2012
Strategic review Grow a diversified global business
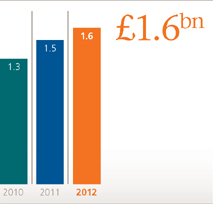
EMAP
Pharmaceuticals and Vaccines
Turnover £bn
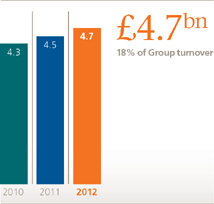
Operating profit £bn
Pharmaceuticals and Vaccines turnover 2012
| | | | | | | | |
| | | £m | | | Growth
CER % | |
1 Respiratory | | | 858 | | | | 13 | |
2 Anti-virals | | | 360 | | | | 2 | |
3 Central nervous system | | | 329 | | | | 8 | |
4 Cardiovascular and urogenital | | | 292 | | | | 18 | |
5 Metabolic | | | 65 | | | | 10 | |
6 Anti-bacterials | | | 735 | | | | 5 | |
7 Oncology and emesis | | | 131 | | | | 48 | |
8 Vaccines | | | 1,107 | | | | 14 | |
9 Dermatology | | | 388 | | | | 7 | |
10 Rare diseases | | | 48 | | | | 20 | |
Despite volatility across the region, our Emerging Markets and Asia Pacific business continues to perform very strongly with growth across both vaccines and pharmaceuticals.
Marketplace
In 2012 overall market growth in the EMAP region slowed somewhat. Global economic factors played a part, but increasing price controls, funding constraints and aggressive local competition also contributed.
However, we believe the business environment in the region remains strong, with growing populations, expanding middle classes and higher spending on healthcare, and we are confident that the region will continue to provide a significant contribution to growth in the pharmaceutical industry over the long term.
Performance
We have a strong presence in many high-growth EMAP markets across both our Vaccines and Pharmaceuticals businesses.
We made good progress in 2012 with Pharmaceuticals and Vaccines turnover growth of 10%. Throughout the region, growth was strong across the three main pillars of our business: innovative brands (up 15%), classic brands (up 5%) and vaccines (up 14%).
Regionally, we saw strong growth in Latin America (up 11% to £1,257 million), China (up 17% to £759 million) and India (up 10% to £304 million) partly offset by the effect of mandatory price reductions in a number of markets, including Turkey and Korea.
Our Developing Countries Market Access (DCMA) unit, which manages our commercial business in the world’s 50 poorest countries and focuses on volume rather than profit growth, also performed well. DCMA unit sales increased 61% in 2012 to £158 million.
Overall, EMAP Pharmaceuticals turnover increased 8%, with improved momentum after a slow first quarter, as strong growth in respiratory combined with good performances in a number of established brands and the newer oncology portfolio.
Sales of our innovative brands continue to outpace the market withSeretide,Avodart/Duodart andAvamysall gaining market share. We have also seen a number of very promising product launches across the region, with strong uptake ofDuodart in the Philippines andProlia in Brazil, Russia and Argentina.
Benlysta, our treatment for lupus, is now approved in ten countries in the region including Russia and Taiwan and launched in four. We are also preparing for the launch of several products within our late-stage pipeline, with regulatory filings completed forRelvar in the Philippines, Taiwan and Brazil.
Our classic brands business grew 5% with strong performances fromAugmentin (up 8%)Ventolin (up 10%) andZeffix(up 3%) including successful tender wins for medicines such asAugmentin andVentolin in Saudi Arabia, Russia, South Korea and Kazakhstan.
Despite some quarterly volatility, Vaccines growth of 14% was driven bySynflorix, Rotarix and Cervarix.Synflorix has proven to be a particularly successful launch and we also saw solid performance from our base paediatric Vaccines business.
|
| GSK Annual Report 2012 | 23 |
Operating profit grew 9% to £1.6 billion, broadly in line with sales growth.
Our commitment to increase access to our medicines across the EMAP region while sustaining operating profit growth was demonstrated by the continuing expansion of our flexible pricing initiatives and affordability partnerships. For example in 2012 we launched a new, lower-cost pack of fourVentolin rotacaps with a low-cost inhaler in Indonesia. This will provide patients with an affordable and effective treatment and will now be rolled out across other EMAP markets.
GSK’s contracts with the GAVI Alliance are central to our strategy to increase access to vaccines in developing countries.
We anticipate that the programmes resulting from this partnership will vaccinate more than 75 million children against gastrointestinal diarrhoea caused by rotavirus over the coming five years, and 160 million children against pneumococcal disease by 2020. (See page 24 for more information on this programme in Yemen).
We have committed to supply to GAVI 132 million doses ofRotarix over five years and 480 million doses ofSynflorix over ten years. During 2012, six new GAVI-eligible countries introducedRotarix and two additional countries, Pakistan and Madagascar, introducedSynflorix.
This represents a substantial contribution to the United Nation’s Millennium Development Goal to reduce child mortality.
In the 49 least-developed countries covered by our DCMA unit, we price GSK medicines at 25% of developed market prices for innovative brands and vaccines. We also reinvest 20% of the profits we make in those countries back into local healthcare infrastructure.
24 | GSK Annual Report 2012
Strategic reviewGrow a diversified global business
EMAP Pharmaceuticals and Vaccines continued
| | | | |
Case study Wider access to vaccines In August the government of Yemen introduced rotavirus vaccines in its national immunisation programme to help prevent thousands of children’s deaths from severe diarrhoea. This programme was made possible through our commitment to the GAVI Alliance. We committed to supply GAVI with up to 132 million doses of our rotavirus vaccine over the next five years and a minimum of 480 million doses of our pneumococcal vaccine over the next ten years. The vaccines are priced at a small fraction of developed world prices, as they are intended to reach children in the world’s poorest countries where the burden of illness is often the highest. By partnering with GAVI, our vaccines can reach more children. The arrangement provides us with security around high volume and long term supply, allowing us to operate a sustainable business model. Pictured: Infant receiving a vaccine in Yemen. | | | | |

|
| GSK Annual Report 2012 | 25 |
Japan
Pharmaceuticals and Vaccines
Turnover £bn
Operating profit £bn
Pharmaceuticals and Vaccines turnover 2012
| | | | | | | | |
| | | | | | Growth | |
| | | £m | | | CER % | |
1 Respiratory | | | 624 | | | | 6 | |
2 Anti-virals | | | 221 | | | | (9) | |
3 Central nervous system | | | 391 | | | | (3) | |
4 Cardiovascular and urogenital | | | 116 | | | | 32 | |
5 Metabolic | | | 72 | | | | (20) | |
6 Anti-bacterials | | | 29 | | | | (6) | |
7 Oncology and emesis | | | 56 | | | | 38 | |
8 Vaccines | | | 176 | | | | (50) | |
9 Dermatology | | | 33 | | | | – | |
10 Rare diseases | | | 188 | | | | 15 | |
Despite scheduled government price revisions and the completion of the cervical cancer vaccine catch up programme in March, our Japanese business performed strongly during 2012.
Marketplace
Japan’s pharmaceutical market grew by about 2% in 2012, affected by the government’s scheduled reimbursement price revisions, which take place every two years.
A state-funded cervical cancer vaccination programme for girls, and Hib and pneumococcal vaccine for infants and young children, also had an impact on pharmaceutical companies’ earnings during the year.
Performance
The market in Japan continues to encourage innovation, and our business performed strongly. While our turnover fell 6% in 2012 to £1,969 million, this largely reflected an adverse comparison with 2011 which benefited from particularly strongCervarixsales due to an HPV vaccination catch up programme. ExcludingCervarix, turnover increased by 5%.
The price revision was conducted under the new provisional drug pricing system, which provides premiums to patent-protected medicines so that prices are maintained during the exclusivity period. The new system means pharmaceutical manufacturers with off-patent products suffer a larger reduction in the reimbursement prices compared with manufacturers with strong innovation portfolios.
We benefited from this revision system, with 23 compounds, 51 formulations receiving the premium.
Pharmaceuticals turnover grew 3% with strong growth from the recently launched products,Lamictal, Avodart andVolibris, partly offset by the impact of the mandatory biennial price cuts, which impacted growth by approximately 4 percentage points, and increasing generic competition toPaxil. The respiratory portfolio grew 6% to £624 million, with strong contributions fromAdoair sales (6%) andXyzal offsetting declines inFlixonase andZyrtec.
Paxil, our leading CNS product, faced strong challenges from newly launched anti-depressants and from a generic version entering the market in June. While sales fell 20%,Paxil together with newly introducedPaxil CR, remains a leader in the anti-depressants market.
On the approval ofReQuip CR, the Ministry of Health, Labour and Welfare recommended switching patients from regularReQuip based on the benefits the new formulation offered.
We have had 72 regulatory approvals since 2000, and six of those approvals coming in 2012. New approvals granted in the year include:Samtirel for pneumocystis pneumonia,Paxil CR for depression,ReQuip CR for Parkinson’s disease,Votrient for soft tissue sarcoma,Botox for hyperhydrosis andMalaron for malaria. New product filings were made forRelvar in asthma/COPD andArzerra for chronic lymphocytic leukemia.
Our Vaccines business recorded sales of £176 million, boosted by the government-funded immunisation programmes, though the completion of the HPV catch-up programme impacted total sales.Rotarix, which launched in late 2011, contributed sales of £44 million.
26 | GSK Annual Report 2012
Strategic reviewGrow a diversified global business
Japan Pharmaceuticals and Vaccines continued
| | | | |
Operating profit of £1.2 billion fell 7%, reflecting the loss of sales compared with 2011. GSK and Daiichi Sankyo Co., Ltd started a new vaccines joint venture, Japan Vaccine Co Ltd (JVC). The venture, in which GSK has a 50% stake, will hold the commercial rights in the market for existing vaccines from both parent companies and is responsible for late-stage development. It creates significant economies of scale in the development and distribution of vaccines in the Japanese market. The country continues to recover from the earthquake and tsunami of March 2011. Our employees’ volunteer team, Team Orange, which formed following the catastrophe, continued to provide help and support to people in the affected areas. We also worked to raise funds for a scholarship programme targeting students impacted by the disaster. The year ended with GSK Japan being designated 2012 company of the year by the British Chamber of Commerce in Japan. | | | | Case study Japan: a market rewarding innovation Japan is a market that rewards healthcare innovation and we have significantly grown sales and market share in the country over recent years as we have launched multiple new products. In 2012, we had six approvals, bringing our total number of regulatory approvals to 72 since 2000. We have the potential for approximately 30 more launches in Japan over the next three years. A key focus for our Japanese business has been to reduce the time lag between the submission of new medicines in the USA/EU and submissions to the Japanese regulatory authorities. Previously, this time frame had been several years, but through better global collaboration on development and safety studies, we have been able to reduce this to a matter of months. Our new asthma/COPD medicineRelvar, for example, was filed in Japan only three months after its first western submission by taking this global approach. If approved, it will add to our established respiratory medicine portfolio in the country. |
| | | |
| | |  |
| | | | |
|
| GSK Annual Report 2012 | 27 |
Consumer Healthcare
Turnover £bn
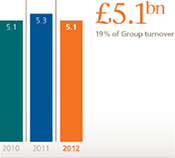
Operating profit £bn
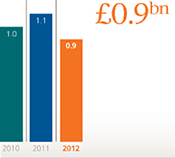
Breakdown of turnover
| | | | | | | | |
| | | | | | Growth | |
| | | £m | | | CER % | |
1 Total wellness | | | 2,008 | | | | (10) | |
2 Oral care | | | 1,797 | | | | 8 | |
3 Nutrition | | | 1,050 | | | | 8 | |
4 Skin health | | | 255 | | | | (1) | |
Our Consumer Healthcare business continues to perform strongly, particularly in emerging markets.
Marketplace
The market for consumer healthcare products operated at two distinct speeds in 2012, with strong growth in emerging economies contrasting sharply with challenging environments in western Europe and North America. Competition was intense as companies sought to outpace market growth in developed economies and improve their presence in the emerging markets.
Performance
Our Consumer Healthcare business was restructured in late 2011 into four large, high-value categories: Total wellness, Oral care, Nutrition and Skin health. The benefit of this new structure began to be realised in 2012. Total turnover, excluding the sales of the non-core OTC brands, increased 5% to £5.1 billion with relatively consistent performance over the quarters. This reflected continued growth in Oral care, Nutrition and Total wellness, partly offset by a small decline in Skin health. In addition, we took steps to increase the global availability of our brands with 44 innovations that reached nearly 90 countries.
On a regional basis, US sales grew 2% and European sales were flat, both impacted by continuing economic pressures and the drag from supply interruptions toalli during the year. The rest of world markets grew 12%, with India, the Middle East and China making strong contributions. By early 2013, we had completed our plans to increase our stake in our Indian Consumer Healthcare subsidiary from 43.2% to 72.5%, increasing our presence in this important and fast-growing market.
Sales from our Total wellness business fell 10%, but when sales from the divested non-core OTC brands were excluded, sales grew 2%. Within this business, our gastro-intestinal products registered 11% growth through the launch ofTums Freshers in the USA and strong performance ofENO in emerging
markets. In 2012, our weight-loss productalli experienced a major interruption from our supplier, impacting our sales.
Our smoking reduction and cessation products also performed well in the year, gaining share in both North America and Europe. Another contributor was our pain management category. Sales in this category continued to benefit from the roll-out of our patentedOptizorb technology toPanadol concept brands, includingPanadol in Europe, Asia and Latin America,Dolex in Colombia andCrocin in India.
The Oral care category led growth at 8% versus market growth of approximately 4%.Sensodyne became the business’s first ‘billion-dollar brand’ in 2012, boosted by the global roll-out ofSensodyne Repair & Protect and the launch ofSensodyne Repair & Protect Whitening and Extra Fresh. Our denture care business also registered strong growth in 2012 (up 12%), with particularly positive results from expansion in emerging markets (up 17%).
In Nutrition, which registered global growth of 8%,Horlicks continued to grow in the Indian sub-continent. In 2012, theHorlicks Family Nutrition range sold close to 300 million sachets in India.
TheMaxinutrition range, which we acquired in 2011, continued strong growth in 2012 of 21%. We have announced a review evaluating strategic options for ourLucozade andRibena drinks brands, which are primarily marketed in established western markets. These brands are iconic and the review will look at the best ways to ensure their continued growth.
Our Skin health business registered a 1% decline in 2012. Strong performances in wound care withBactroban in China and good growth on lip care withZovirax and the introduction ofAbreva Conceal in the USA were offset by declines onHinds in Latin America andOilatum in the UK.
Operating profit of £0.9 billion fell 9%, reflecting the disposal of the non-core OTC brands.
28 | GSK Annual Report 2012
Strategic reviewGrow a diversified global business
Consumer Healthcare continued
| | | | |
Case study Reaching into rural communities Our Indian business is our fastest-growing Consumer Healthcare business, with average sales growth of 18% over the past five years. The business generated revenues of over £400 million in 2012. Operating across Nutrition, Total wellness and Oral care categories we have a number of leading brands in India, but the biggest by far isHorlicks. In 2012, we sold close to 150 million drink sachets ofHorlicks. But in India,Horlicksis more than a drink. We have evolved this iconic household brand into a range of nutritional products, including breakfast cereals, biscuits and instant noodles. The original trademark product has diversified into specialised formulations for different consumers including JuniorHorlicks, Women’sHorlicks and Mother’sHorlicks. We have been increasing availability ofHorlicks in rural markets, reaching an additional 10,000 villages in 2012. In addition, harnessing the popularity and strong reputation with Indian consumers of the brand, we are working with community organisations, schools, mothers’ groups, local doctors, pharmacies, and mobile vans to provide advice and education on health and nutrition in remote rural communities where up to 70% of the population lives. Through this network, we are also working with local healthcare providers to increase these communities’ access to key medicines to treat diseases that greatly worsen the blight of malnutrition. We are concentrating efforts on improving access to medicines such asZentel for worm infestations,Fesovit for iron deficiency, other vitamin and mineral supplements and treatments for respiratory problems. | | | | |

|
| GSK Annual Report 2012 | 29 |
ViiV Healthcare
Turnover £bn
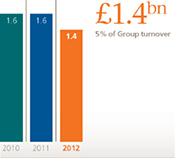
Operating profit £bn
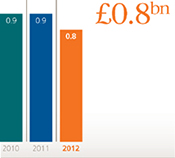
Breakdown of turnover
| | | | | | | | |
| | | | | | Growth | |
| | | £m | | | CER % | |
1Combivir | | | 179 | | | | (43 | ) |
2Epivir | | | 49 | | | | (54 | ) |
3Epzicom/Kivexa | | | 665 | | | | 10 | |
4Lexiva | | | 127 | | | | (9 | ) |
5Selzentry | | | 128 | | | | 20 | |
6Trizivir | | | 107 | | | | (13 | ) |
Our HIV/AIDS business withstood generic competition on a number of products, finishing the year with a significant filing.
Marketplace
In 2012 an estimated 34 million people worldwide were reported as living with HIV.
The market for HIV medicines is highly competitive with multiple new market entrants and an increasing number of generic competitors in the USA and Europe. Scientific progress in HIV is marked by new therapies that can provide benefits over existing medicines’ efficacy, tolerability and resistance profiles.
Performance
In 2012, turnover for ViiV Healthcare was £1.4 billion, down 10% from the previous year. The decline in sales was anticipated as our mature product portfolio includingCombivir, Epivir andZiagen in the USA experienced generic competition. This impact was partly offset by strong performances fromEpzicom/Kivexa andSelzentry/Celsentri.
Sales ofEpzicom/Kivexa grew by 10% to £665 million, while sales ofSelzentry/Celsentriwere £128 million, up 20%. This was driven by increasing early-line use in the USA and broader uptake of genotypic tropism testing in Europe. Rapid expansion ofSelzentry/Celsentricontinued in the international region with first-line approvals in several large markets including Japan, Argentina and Australia.
Despite the fall in sales, operating profit of £0.8 billion was flat in CER terms, primarily reflecting robust cost control and changes in the mix of products sold.
ViiV Healthcare was established by GSK and Pfizer in 2009. In October 2012 ViiV Healthcare and Shionogi agreed that ViiV Healthcare would acquire exclusive global rights to the co-developed portfolio of investigational integrase inhibitors, including dolutegravir.
The new agreement enables ViiV Healthcare to advance the portfolio most effectively and efficiently while maximising the full potential long-term value of the assets. In return Shionogi receives representation on the ViiV Healthcare board and becomes a 10% shareholder in the company.
Regulatory submissions for our investigational integrase inhibitor dolutegravir in Europe, the USA and Canada were completed following receipt of Phase III data from the comprehensive trial programme in naive and treatment-experienced patients. The FDA has now granted this priority review. Submission of regulatory files for a dolutegravir fixed-dose combination withEpzicom/Kivexa is anticipated in 2013.
Providing a comprehensive, sustainable approach to improving access to HIV medicines remains a key priority for ViiV Healthcare. This commitment covers 135 countries including middle-income countries, low-income countries, least-developed countries and sub-Saharan Africa. We offer royalty-free voluntary licences and not-for-profit pricing in all low-income and least-developed countries and in sub-Saharan Africa, where 75% of all people with HIV currently live. In middle-income countries, the approach is on a case-by-case basis, taking into account the local needs, with a tiered-pricing policy based on Gross Domestic Product and the burden of the epidemic to improve affordability. All marketed and pipeline HIV medicines are covered by our access policy.
ViiV Healthcare also spearheaded initiatives to address paediatric HIV in 2012. These include a collaboration with the Clinton Health Access Initiative (CHAI) and Mylan Pharmaceuticals to produce a taste-masked, dispersible medicine for paediatric use in resource-limited settings. Significant unrestricted educational grants were also provided to five organisations to support the collection of paediatric data, information and research. Through the Positive Action programme and Positive Action for Children Fund, ViiV Healthcare also continued to make important progress in supporting the community response to HIV/AIDS.
30 | GSK Annual Report 2012
Strategic review

| | |

| | Deliver more products of value |
| |
| | Overview We have changed our R&D organisation so that it is better able to sustain a pipeline of products that offer valuable improvements in treatment for patients and healthcare providers. We have increased the level of externalisation of our research, allowing us to access new areas of science and to share the risk of development with our partners. We have also changed our processes to make decisions earlier around pipeline progressions, so that only those medicines that are significantly differentiated from existing therapies are progressed. We have broken up the traditional hierarchical R&D business model and created smaller, more agile groups of scientists who are accountable for delivering their projects. All of this has been underpinned with a focus on improving the rates of return in R&D and being more rigorous in how we allocate investment across Pharmaceutical, Vaccine and Consumer Healthcare R&D. |
|
| GSK Annual Report 2012 | 31 |
| | | | |
| | | Progress During 2012, new vaccines were approved for flu, meningitis and meningitis-Hib. We received two significant new indications for existing medicines treating cancer and hepatitis. We also filed six key new products for approval with regulators, including treatments for respiratory disease, cancer, HIV and diabetes. This is an unprecedented level of late-stage pipeline delivery for the company. Overall, our return on R&D investment has been increasing and we remain confident we can reach our long-term goal of 14%. |
| | |
| | Sales of new Pharmaceuticals and Vaccines products £bn 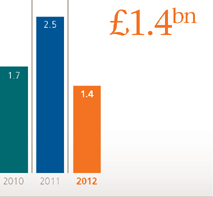
| | Core R&D expenditure £bn 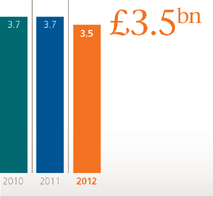
|
| | |
| | New product approvals in the USA 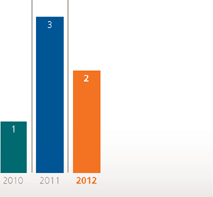
| | Estimated rate of return in R&D % 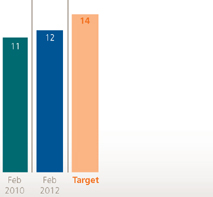
|
| |
| | Priorities A key focus for 2013 will be to successfully progress the six key product filings we have made, although clearly decisions on approval of these assets will be made by regulators. We are increasingly confident in our ability to sustain pipeline delivery and we expect to receive Phase III data on a further 14 assets in 2013 and 2014. Delivery of this data-flow over the next two years is a priority for the Group. We will also continue to drive improvements in ways of working across the R&D organisation, so that the increasing levels of output can be maintained without increased expenditure. |
32 | GSK Annual Report 2012
Strategic review Deliver more products of value
Investment in R&D
Research and development is critical to ensuring we have a sustainable business, and that we can continue to offer new medicines, vaccines and consumer products that can help people live longer and healthier lives.
Core R&D expenditure 2012

| | | | |
| | | £m | |
1 Pharmaceuticals | | | 2,821 | |
2 Vaccines | | | 498 | |
3 Consumer Healthcare | | | 155 | |
Our primary goal in R&D is to develop our pipeline products safely and efficiently to produce innovative new medicines that provide improved treatments that are valued by both patients and payers.
More than 12,500 people work across our R&D organisation, with many of these based in our large R&D centres in the UK, USA, Belgium and China. In 2012, our R&D expenditure before non-core items was £3.5 billion, representing 13.1% of total turnover.
Our R&D expenditure is split into three parts, with proportions devoted to our three areas of business: Pharmaceuticals, Vaccines and Consumer Healthcare. We allocate R&D investment consistently and rationally across the three businesses. Investment in R&D is based on where we see the best opportunities in both the market and the science, rather than as a fixed proportion of sales. Overall, our R&D budget has remained relatively flat for the past four years.
The discovery and development process is long, expensive and uncertain – especially in Pharmaceuticals and Vaccines R&D – and it is not possible to predict which projects will succeed or fail. Further information is discussed in pages 33 to 41.
Rate of return in R&D
Declining R&D productivity is an issue that the pharmaceutical industry as a whole has faced in the past decade. As a result it has become more important for companies to provide a greater level of transparency on the returns that their R&D organisations make to determine capital investment allocation.
The returns generated from R&D are primarily determined by the commercial success of new medicines and vaccines as they achieve regulatory approval and are launched.
In 2010, GSK became the first major pharmaceutical company to publish an internal rate of return (IRR) on our R&D investment, to indicate the positive value being realised from our choices within the R&D organisation. IRR provides a measurement offering an insight into how we manage our R&D business. This is based on a complex methodology that weighs the R&D costs incurred to discover and develop our late stage pipeline projects against the profits of new medicines and vaccines as they achieve regulatory approval and are made available to patients. It incorporates actual and predicted sales figures on probabilities of success for medicines in the pipeline. We also take into account an estimate of attributable R&D costs, estimated profit margins, capital investment and working capital requirements.
We have stated our long-term aim of increasing our rate of return on R&D investment to 14%. In February 2012 we announced an IRR of around 12%. This was an increase from an 11% IRR calculated in February 2010. The IRR figure will be updated every 2-3 years, with the next published figure in 2014.
The calculation at February 2012 of the estimated rate of return on R&D spending included products launched from 1 January 2009 to 31 December 2011 and compounds in phases IIb and III of the development process. The calculation is based on actual sales from 2009 to 2011, and forecast sales up to 2032, adjusted to reflect expected failure rates, which are broadly in line with standard industry failure rates. The cost base used in this calculation comprises an estimate of attributable R&D costs and actual and projected milestone payments where appropriate. Estimated working capital requirements are factored into the calculation, based on our historical performance.
We are confident we are on track to deliver our long-term goal to improve returns to around 14%.
Details of the full product development pipeline, made up of both pharmaceutical and vaccine assets, are set out on pages 225 to 228 and on our website. The performance of marketed products is discussed in detail under ‘Financial review 2012’ on pages 57 to 59.
|
| GSK Annual Report 2012 | 33 |
Pharmaceuticals R&D
To be successful over the long term, we need the investments we are making in our pipeline to lead to new medicines that will be valued by patients and those who pay for the treatments.
Highlights
| • | | Two new significant indications for existing medicinesPromacta andVotrient |
| • | | Filing for six new medicines, treating respiratory disease, cancer, HIV and diabetes, submitted to regulators |
| • | | New areas for early stage research identified following investment review |
Core Pharmaceutical R&D investment in 2012

| | | | |
| | | £m | |
1 Discovery | | | 800 | |
2 Development | | | 1,655 | |
3 Facilities and central support | | | 366 | |
2012 was a year of significant progress for our R&D organisation.
In the course of the year, we received two new significant indications for existing medicines;Promacta for thrombocytopenia associated with hepatitis C andVotrient for the treatment of soft tissue sarcoma. In addition, we submitted six key new medicines to regulators: respiratory medicinesRelvar/Breo andAnoro; oncology medicines dabrafenib and trametinib (BRAF and MEK); dolutegravir for HIV; and albiglutide for diabetes.
Two new chemical entities moved into Phase III development in 2012, while no assets were terminated from Phase III development, as listed on page 40.
Our Core Pharmaceuticals R&D expenditure was £2.8 billion in 2012, a decline of 5% from 2011. We continue to move towards sustainable replenishment of our late-stage pipeline.
More than 10,000 people work in Pharmaceuticals R&D, and we view our research projects as early stage – discovery – or late-stage – development.
Discovering new medicines
Our early stage R&D (drug discovery) seeks to identify the biological targets involved with the development of diseases, and then to create small molecules or biopharmaceuticals that interact with these disease targets, ultimately leading to new medicines. The sheer scale of scientific discoveries makes it essential that we are highly selective in where we invest our drug discovery resources. We focus on those areas we consider most likely to lead to significant medical advances.
Over the last six years, we have transformed our R&D organisation to become more efficient and productive.
The process began in 2007, when all therapy areas were reviewed to seek the most scientifically promising areas for drug discovery and to move the organisation from a culture predisposed to reinvest in existing areas. In 2008, as a result of this therapy area rebalancing process, we changed our business model, moving to smaller, more agile and focused Discovery Performance Units (DPUs) of between five and 70 scientists. Each DPU works on a particular disease or pathway, and is responsible for discovery and development of potential new medicines through to early stage clinical trials (up to the completion of Phase lla).
As part of this new model, DPUs were given their own budgets and a three-year window to complete specific tasks. The business plans of each DPU identified specific targets and investment across multiple years. The plans also included opportunities for collaboration with external organisations, such as large and small companies and academia. Our internal R&D expertise gives us a strong basis in identifying and forming these collaborations, which in drug discovery are typically in-licensing or option-based.
The three-year mark for most DPUs was reached in late 2011/early 2012 and their business plans were reviewed by the Discovery Investment Board (DIB), which identified areas for improvement and suggested agreed progress targets and investment levels. Membership of the DIB comprises senior R&D and commercial management, and external individuals with expertise including life science investment experience and understanding of payer perspectives. It is chaired by the President of R&D.
The overall review of the DPUs was positive and led to a number of new investment allocations in discovery research. Over the course of 2012, four new DPUs have been created and three have been closed. In addition, scientists submitted more than 50 proposals for new discovery performance units.
34 | GSK Annual Report 2012
Strategic review Deliver more products of value
Pharmaceuticals R&D continued
This outcome is consistent with our intentions of the DPU structure and DIB review – to retain flexibility in our discovery research investment and to ensure we remain focused on where the scientific opportunity remains greatest. This will be our way of working in the future so we can remain flexible as the landscape changes.
Overall our discovery expenditure remained flat at approximately £800 million. No individual project has annual expenditure of more than 10% of the total annual R&D expenditure. Investment decisions have been made where the science presents a compelling case and there remains a need for new treatments.
We have learned a great deal from the first DIB review and we now expect to deliver up to 30 assets to ‘commit to medicine development’ (typically Phase IIb) over the next three years.
This increase in productivity would mean GSK is moving towards sustainable replenishment of its late-stage pipeline, with no increase in cost.
Developing medicines for patients
A compound that advances into late-stage development (typically after Phase IIa) will undergo much larger-scale studies in humans to investigate further its efficacy and safety.
At the same time, we work to optimise the compound’s physical properties and its formulation so that it can be produced efficiently and in sufficient quantities through the manufacturing process. We then convert the results of these activities into a regulatory file for submission to regulatory agencies.
Medicines Development Teams (MDTs) are small units of six to ten people who have responsibility for a compound through the later stages of development to filing with the regulatory agencies. There are over 30 assets in late-stage development.
We also actively seek opportunities to add products to our pipeline through alliances with other companies. For late-stage assets, these typically take the form of in-licensing or co-promotion arrangements and are most likely to be aligned to existing areas of therapy expertise or investment.
The Portfolio Investment Board (PIB) assesses the technical, commercial and investment case for each project to progress in development. The PIB is co-chaired by the Chairman of R&D and the President of North America Pharmaceuticals, and includes the heads of each pharmaceutical region along with the head of global manufacturing.
The PIB is accountable for investment decisions and funding allocation across all late-stage Pharma R&D investments (Medicines Discovery and Development, Biopharm R&D, Oncology, Stiefel, Rare Diseases and Emerging Markets R&D). This allows investment decisions to be made in a holistic way, ensuring a balance and diversity of assets of differing risk profile, novelty, opportunity, development cost and potential to be reimbursed by payers.
Projects are reviewed by the PIB at certain key decision points: ‘Commit to Medicine Development’, ‘Commit to Phase III’ and ‘Commit to File and Launch’. Funding is generally allocated up to the next key decision point, typically between two and four years ahead. The PIB also carries out an annual late-stage funding review, where investment in all projects is reviewed, adjusted if necessary and prioritised. No individual late-stage project has incurred annual expenditure of more than 10% of the total annual R&D expenditure.
Timeline and development stages for pharmaceutical research
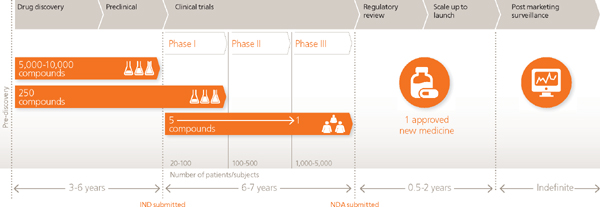
|
| GSK Annual Report 2012 | 35 |
| | | | |
Case study Concentrating on development It is estimated that it takes between nine and 15 years to take a medicine from initial research to the point it is approved by regulators and made available to patients. Our R&D organisation has been working to reduce this time. Two cancer medicines recently submitted to regulatory authorities, dabrafenib, our BRAF inhibitor, and tramatenib, our MEK inhibitor, both for malignant melanoma have shown that this can be done. Submissions to regulators took place less than seven years from the time our teams selected these compounds as potential anti-cancer treatments. We were able to do this by developing a deep understanding of how these compounds worked so that we could design clinical trials to include patients whose tumours had a specific genetic mutation that made them susceptible to these investigational medicines. Because both compounds worked against tumours with a genetic mutation, we collaborated with another company to develop a diagnostic test to identify tumours carrying this mutation. Pictured: Representation of melanoma cells. | | | | |

36 | GSK Annual Report 2012
Strategic review Deliver more products of value
Pharmaceuticals R&D continued
| | | | |
Sales of new pharmaceutical products launched over the last 5 years grew by 34% and represented 7% of total pharmaceutical sales. Governance The R&D governance structure has been developed to ensure clearer accountabilities and product reviews. The oversight of strategic issues and overall budget management across R&D is owned by the R&D Executive team (RADEX). DIB and PIB control investment decisions in early and late-stage R&D, as described above. The Scientific Review Board (SRB) is the governing body accountable for the scientific assessment of the R&D portfolio to support investment decision making at the Portfolio Investment Board (PIB). At the SRB, there will be a debate, review and endorsement of a unified R&D view on the scientific aspects of all assets. The SRB establishes a view on the overall scientific promise of the asset; development plan to deliver the asset; cost effectiveness of the clinical plan; opportunities and risks to the likely product profile; and gaps where evidence is missing or remains uncertain. The SRB view is the formal R&D position communicated at PIB. Two other important governance boards in R&D are the Technology Investment Board (TIB), which makes investment decisions for new platform technologies and licensing or options-based collaborations up to the point of entry into clinical trials; and The New Product Supply (NPS) Board, which is the governing body accountable for the technical feasibility and infrastructure assessments covering all aspects of the physical product and supply chain. In 2012 we developed and launched a global regulatory board to enhance compliance with company-wide standards, make regulatory services more efficient and agile, and further align capabilities with business needs at global and local levels. This organisation is led by the Chief Regulatory Officer. | | | | Case study Opening up access to trial data Clinical trials are a vital part of the development process for all new medicines and vaccines. We recognise the importance of sharing research from trials to help advance scientific understanding and inform medical judgment. Access to patient-level data from clinical trials can be valuable for researchers who want to learn about existing medicines and improve patient care. For a number of years GSK has responded to external requests for patient-level data on a case-by-case basis. Now we will be more proactive, allowing researchers to request anonymised patient-level data from our published clinical trials of approved or terminated medicines. This will enable researchers to examine trial data more closely or combine data from different studies to conduct further research. Researchers will be able to submit their requests via a dedicated website. To ensure these requests have a valid scientific basis we have established a fully independent panel to oversee requests and grant access. Expanding on this, in 2013, we were the first company to sign up to the AllTrials campaign, which calls for registration of clinical trials, the disclosure of clinical trial results and publication of clinical study reports which detail the design, methods and results of clinical trials and form the basis of submissions to regulators. We also announced plans to make clinical study reports for our medicines publically available through the GSK Clinical Study Register once the medicines have been approved or discontinued from development and the results have been published. We will put in place a dedicated team to work back over time to post reports for all approved medicines dating back to the formation of GSK, starting with those most commonly prescribed. Patient data in the clinical study reports will be removed to ensure patient confidentiality is maintained. These steps further advance our long standing commitment to openness and transparency of clinical trials. We already publish summary results – whether these are perceived to be positive or negative – of every research trial on the GSK Clinical Study Register. Almost 5,000 clinical trial result summaries are now available and the site receives on average almost 11,000 visitors each month. Individuals participate in our research in the hope they might bring advances in healthcare. Our new plans acknowledge their commitment and reflect our desire to ensure that their contribution can lead to health gains, while safeguarding their confidentiality. |
| | | |
| | |
| | GSK Annual Report 2012 | 37 |
Vaccines R&D
Our Vaccines R&D is centred on discovering and developing prophylactic and therapeutic vaccines to protect people against infectious diseases, cancers and chronic disorders.
Highlights
| • | | Three newly approved vaccines inNimenrix, MenHibrix and Fluarix Quadrivalent |
| • | | Additional Phase III data on malaria vaccine announced |
We invested £498 million in core vaccines R&D in 2012 and we have more than 1,600 scientists working on the development of new vaccines.
During the year three new vaccines were approved;Nimenrix for meningitis andMenHibrix for menigitis Hib and a quadrivalent flu vaccine.
In addition we currently have around 20 vaccines in development for a range of diseases, from malaria to tuberculosis and cancer. We currently have four vaccine candidates in late-stage development: with trials in zoster, malaria, MMR (USA) and our therapeutic vaccine MAGE-A3.
In November we published the latest results from the Phase III study into our adjuvanted malaria vaccine candidate (RTS,S) which is ongoing in seven countries in Africa.
Our R&D effort is focused on the development of new prophylactic and therapeutic vaccines.
Discovery research
The discovery and development of a new vaccine is a complex process requiring long-term investment. Typically it takes 10–12 years to develop a new vaccine.
Vaccine discovery begins by identifying new antigens, which are specific structures on pathogens (viruses, bacteria or parasites) or on cancer cells that are recognised by the immune system. We then produce these pathogens in yeast, bacteria or mammalian cells and genetically manipulate them so that they can be purified and formulated into a vaccine. It is the antigen that creates the body’s immune response.
We often work with academia and the biotech industry to identify these new vaccine antigens. In some cases, formulation of the vaccine into clinical lots involves mixing antigens with GSK proprietary adjuvant systems.
Vaccine manufacturers use adjuvants to improve the specific immune system’s response to antigens contained in vaccines. We have been innovating in the area of adjuvant systems for more than 20 years.
Our proprietary adjuvant systems combine adjuvants to give the most appropriate immune response to a specific antigen. Our expertise allows us to understand which combinations of antigen and adjuvant system can help the body mobilise the most effective immunological pathway, and so provide maximum protection against specific diseases in targeted populations.
Candidate vaccines are usually a combination of several antigens, and the final composition of the vaccine (antigens and adjuvant) may change over time. The preclinical research usually takes two to five years and later stage clinical trials usually take another 8-10 years.
As well as the discovery of new vaccines in early development projects, R&D supports late-stage projects such as the inclusion of new antigens in existing vaccines to create new generation vaccines.
Traditionally, vaccines have been used to prevent illness. However, we are pioneering a different approach designed to programme the body’s immune system to fight existing diseases and so represents a new treatment model as a therapeutic vaccine. We are evaluating the immunotherapeutic concept against a variety of tumour types.
38 | GSK Annual Report 2012
Strategic reviewDeliver more products of value
Vaccines R&D continued
Governance
In 2012 we further consolidated the organisation of vaccine discovery and development teams, to simplify the infrastructure, focus on timely decision making and enhance clarity and accountability. Vaccines research and development are led by Project Teams and Vaccine Leadership Teams, which are responsible for day-to-day progress, including identifying and developing new products.
There are several key decision points in the vaccine development process: commit to research (decide to initiate full research program), commit to candidate development (decide to invest resources to move to clinical development); commit to early clinical development; commit to Phase III; registration and launch.
Oversight of these key decisions rests with two bodies: the Vaccine Development and Commercial Board (VDCB) and the Vaccine Investment Board (VIB). The VDCB reviews the research project strategy and advises on its scientific, technical and commercial feasibility.
The board has an overall view on all projects, from early to advanced projects. The VDCB’s core members come from across the organisation. The VDCB recommendation to progress a project is submitted to the VIB.
The VIB has the final decision on whether to invest in a project, taking into account the scientific and commercial perspectives reviewed by the VDCB. The VIB evaluates the public health benefit, business opportunity, development costs and risks, the project timing and the overall evolution of our portfolio of vaccines. The VIB is also responsible for assessing the overall fit of the project in our vaccines portfolio.
Vaccines research and development cycle
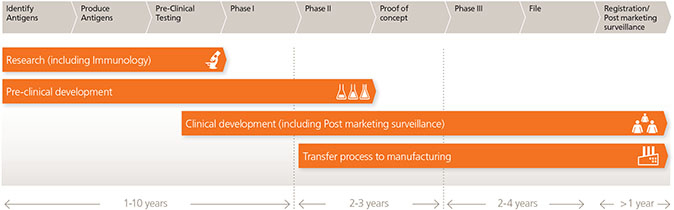
|
| GSK Annual Report 2012 | 39 |
Consumer Healthcare R&D
While innovation timelines in consumer healthcare products are significantly shorter than those in Pharmaceuticals, satisfying the needs of the consumer remains our central focus.
Highlights
| • | | 44 new product-market combinations |
| • | | Total proportion of sales from innovation products was 13% |
| • | | New R&D centre in China based on meeting the needs of the Chinese consumer market |
Investment in our core Consumer Healthcare R&D was £155 million in 2012, up from £146 million in 2011. With more than 600 people in the UK, USA, India and China working on consumer R&D, our intention is to develop innovative, category-defining products, differentiated by science and informed by consumer insights.
Our innovation portfolio is a critical element of our Consumer Healthcare strategy, ensuring a sustainable flow of new, scientifically-differentiated products. These often include new technologies and formulations as well as product line extensions.
Sales from our innovative products launched in recent years were 13% of Consumer Healthcare global sales in 2012, with key contributions coming fromSensodyneRepair & Protect,PanadolExtra Advance and Smoking reduction and Cessation Mini Lozenges.
Innovative new products launched in 2012 included:
| • | | Tums Freshers –developed following consumer insights, this first-of-its-kind product combines the therapeutic benefits of calcium carbonate for heartburn relief with effective breath fresheners. |
| • | | Abreva Conceal –a clear, non-medicated patch that instantly conceals cold sores, met consumer desire to address appearance concerns from a troubling, recurring condition. Designed to be used over Abreva cream, the patented MicroAir technology in the patch provides a protective barrier against contaminants for eight hours while allowing air in to promote healing. |
| • | | HorlicksGrowth+ – this new addition to theHorlicksrange contains 100% milk protein, 30 micronutrients, a balanced macronutrient energy profile and other ingredients important for growth. The formulation was developed following research on the impact of nutritional supplementation in children, including a major study testing the benefits ofHorlicks. |
Through our partnership with the McLaren Group, our nutrition scientists developed two bespokeLucozadeformulations to support the specific nutritional needs of their Formula One drivers. TheLucozadeHydration Formulation contains a determined mix of essential hydration salts, carbohydrates and proteins to support optimal performance; theLucozadeRace Formulation enhances performance in high temperatures while addressing needs for weight management, mental focus and speed of absorption. These formulations will be launched in 2013, targeting the unique needs of athletes, serious sports people, and those involved in high-intensity endurance exercise.
Given the importance of the Chinese market we have opened an R&D Innovation Centre in the country that will be concentrating on developing new products for this fast-growing market. Researchers will focus on innovations specifically developed to meet the needs of consumers in China.
40 | GSK Annual Report 2012
Strategic review Deliver more products of value
Late stage pipeline summary
We have a full and diverse product development pipeline
We identified below projects comprising new chemical entities, biological entities or vaccines, new combinations and new indications for existing compounds that are in Phase III, have been filed for approval or have been recently approved. The most advanced status is shown and includes 2013 approvals.
| | | | | | | | | | | | |
8 | | | | 6 | | | | 14 | | | | 2 |
approvals in USA or EU since January 2012 | | | | key medicines filed since January 2012 | | | | Phase III assets delivered key data during 2011 and 2012 | | | | new first Phase III starts since January 2012 |
| | | | | | |
• Fabiorfor acne vulgaris (USA) • MenHibrixfor N.meningitis (C&Y) and H.influenza type b disease prophylaxis (USA) • Nimenrixfor N.meningitis (A,C, W &Y) disease prophylaxis (EU) • Promacta†for hepatitis C induced thrombocytopaenia (USA) • Quadrivalent flu vaccine for seasonal influenza prophylaxis (USA) • raxibacumab for treatment & prophylaxis of anthrax inhalation (USA) • Soriluxfor scalp psoriasis (USA) • Votrientfor sarcoma (USA & EU) | | | | • albiglutide for type II diabetes • Anoro†for COPD • dabrafenib for metastatic melanoma • dolutegravir† for HIV • Relvar/Breo†for COPD and asthma • trametinib† for metastatic melanoma | | | | • Anoro†for COPD • albiglutide for type II diabetes • dabrafenib for metastatic melanoma • dolutegravir† for HIV • drisapersen† for Duchenne muscular dystrophy • Patrome(IPX066†) for Parkinson’s disease • migalastat† for Fabry disease • Mosquirixfor malaria • otelixizumab for type I diabetes • Promacta†for hepatitis C induced thrombocytopaenia • Relvar/Breo†for COPD and asthma • trametinib† for metastatic melanoma • Tykerbfor adjuvant breast cancer • Votrientfor sarcoma | | | | • mepolizumab for severe asthma • sirukumab† for rheumatoid arthritis |
| | | | | | | | | | 0 |
| | | | | | | | | | medicines in Phase III development or registration terminated |
Key:
Phase III
Large comparative study (compound versus placebo and/or established treatment) in patients to establish clinical benefit and safety.
Filed
Following successful Phase III trials, we file the product for approval by the regulatory authorities.
Approval
Only when approval is granted can we begin to market the medicine or vaccine.
Our full pipeline is on pages 225 to 228 and on our website.
| † | In-licence or other alliance relationship with a third party |
| | |
| | GSK Annual Report 2012 | 41 |
| | | | | | | | | | |
| Phase III/registration Pharmaceuticals and Vaccines pipeline summary |
| Therapeutic area | | Compound | | Indication | | Phase III | | Filed | | Approved |
| Biopharmaceuticals | | Arzerra(ofatumumab)† | | chronic lymphocytic leukaemia, first line therapy & use in relapsed patients | | • | | | | |
| | | Arzerra(ofatumumab)† | | diffuse large B cell lymphoma (relapsed patients) | | • | | | | |
| | | Arzerra(ofatumumab)† | | follicular lymphoma (refractory & relapsed patients) | | • | | | | |
| | | Benlysta(belimumab) | | systemic lupus erythematosus | | • | | | | |
| | | Benlysta(belimumab) | | vasculitis | | • | | | | |
| | | mepolizumab | | severe asthma | | • | | | | |
| | | sirukumab† | | rheumatoid arthritis | | • | | | | |
| | | albiglutide | | type 2 diabetes | | | | • | | |
| | | raxibacumab | | inhalation anthrax | | | | | | • |
| Cardiovascular & metabolic | | darapladib | | atherosclerosis | | • | | | | |
| Immuno-inflammation | | vercirnon (1605786)† | | Crohn’s disease | | • | | | | |
| Infectious diseases | | Relenza i.v.(zanamivir)† | | influenza | | • | | | | |
| Neurosciences | | Patrome(IPX066†) | | Parkinson’s disease | | • | | | | |
| Oncology | | trametinib† + dabrafenib | | metastatic melanoma, adjuvant therapy | | • | | | | |
| | | Tyverb/Tykerb(lapatinib) | | breast cancer, adjuvant therapy | | • | | | | |
| | | Tyverb/Tykerb(lapatinib) | | gastric cancer | | • | | | | |
| | | Tyverb/Tykerb(lapatinib) | | head & neck squamous cell carcinoma (resectable disease) | | • | | | | |
| | | Votrient(pazopanib) | | ovarian cancer, maintenance therapy | | • | | | | |
| | | Votrient(pazopanib) | | renal cell cancer, adjuvant therapy | | • | | | | |
| | | dabrafenib | | metastatic melanoma | | | | • | | |
| | | trametinib† | | metastatic melanoma | | | | • | | |
| | | trametinib† + dabrafenib | | metastatic melanoma | | | | • | | |
| | | Tyverb/Tykerb(lapatinib) | | metastatic breast cancer, in combination with trastuzumab | | | | • | | |
| | | Votrient(pazopanib) | | sarcoma | | | | | | • |
| | | Revolade/Promacta (eltrombopag)† | | hepatitis C induced thrombocytopaenia | | | | | | • |
| Respiratory & | | fluticasone furoate (685698) | | asthma | | • | | | | |
| immuno-inflammation | | Relvar/Breo | | COPD – mortality outcomes | | • | | | | |
| | | (vilanterol† + fluticasone furoate) | | | | | | | | |
| | | umeclidinium (573719) | | COPD | | • | | | | |
| | | vilanterol† | | COPD | | • | | | | |
| | Relvar/Breo | | asthma | | | | • | | |
| | | (vilanterol† + fluticasone furoate) | | | | | | | | |
| | Relvar/Breo | | COPD | | | | • | | |
| | | (vilanterol† + fluticasone furoate) | | | | | | | | |
| | | Anoro(umeclidinium + vilanterol†) | | COPD | | | | • | | |
| Paediatric vaccines | | MMR | | measles, mumps, rubella prophylaxis | | • | | | | |
| | | Mosquirix(Malaria RTS,S) | | malaria prophylaxis (Plasmodium falciparum) | | • | | | | |
| | | MenHibrix(Hib-MenCY-TT) | | Neisseria meningitis groups C & Y & Haemophilus influenzae type b disease prophylaxis | | | | | | • |
| | | Nimenrix(MenACWY-TT) | | Neisseria meningitis groups A, C, W & Y disease prophylaxis | | | | | | • |
| Other vaccines | | Zoster | | Herpes Zoster prevention | | • | | | | |
| | | Flu (pre-) pandemic | | pre-pandemic & pandemic influenza prophylaxis | | | | • | | |
| | | Flu vaccine | | seasonal influenza prophylaxis | | | | | | • |
| Antigen-Specific Cancer | | MAGE-A3 immunotherapeutic† | | treatment of melanoma | | • | | | | |
| Immunotherapeutic | | MAGE-A3 immunotherapeutic† | | treatment of non-small cell lung cancer | | • | | | | |
| Rare diseases | | drisapersen (2402968)† | | Duchenne muscular dystrophy | | • | | | | |
| | | 2696273† | | adenosine deaminase severe combined immune deficiency (ADA-SCID) | | • | | | | |
| | | migalastat HCl† | | Fabry disease | | • | | | | |
| Dermatology | | alitretinoin† | | chronic hand eczema | | • | | | | |
| | | Duaclow dose | | acne vulgaris | | | | • | | |
| | | Fabior(tazarotene foam) | | acne vulgaris | | | | | | • |
| | | Sorilux | | scalp psoriasis | | | | | | • |
| HIV | | dolutegravir† + abacavir sulphate | | HIV infections – fixed dose combination | | • | | | | |
| | | + lamivudine | | | | | | | | |
| | | dolutegravir† | | HIV infections | | | | • | | |
† In-licence or other alliance relationship with third party
42 | GSK Annual Report 2012
Strategic review

| | |
 | | Simplify the operating model |
| |
| | Overview As our business continues to change shape, we are transforming how we operate so that we can reduce complexity and become more efficient. Over the past four years we have implemented a global restructuring programme designed to deliver significant savings to support investment in our priority growth businesses as well as offset pressures on the Group’s margin resulting from changes in the shape and mix of our business. Savings from this programme have been generated across the business, including in R&D, manufacturing and through the centralisation and streamlining of our support functions such as finance, HR and IT. As this programme comes to an end, we are continuing to examine further ways to simplify our operating model and increase efficiencies. We have begun a new major change programme across manufacturing, R&D and Europe to deliver further savings and build capabilities. The new programme includes a series of technological advances and opportunities to eliminate complexities and further improve our competitiveness. |
|
| GSK Annual Report 2012 | 43 |
| | | | |
| | Progress Our restructuring programme has now delivered annual savings of
£2.5 billion and remains on track to hit the target we set of
£2.8 billion of annual savings by 2014. Costs for support functions have been reduced by one-fifth since
2008. We have also reduced our fixed infrastructure R&D footprint
by 50% while increasing productivity and output from the pipeline. Despite reducing our carbon footprint from energy use by 15%
since 2010, our total carbon footprint (excluding that from raw
materials) increased by 7% compared to 2010 driven by higher
inhaler sales. However, current carbon reduction projects should
enable us to reach our interim target to cut our value chain carbon
footprint by 10% to 13.5 million tonnes of CO2 equivalent by 2015. |
| | |
| | Operational Excellence annual savings £bn 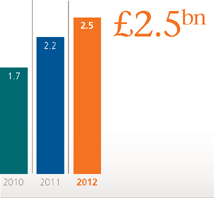
| | Major change programme anticipated savings £bn 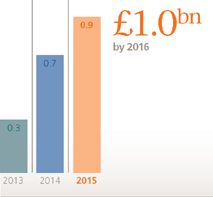
|
| | |
| | Working capital days 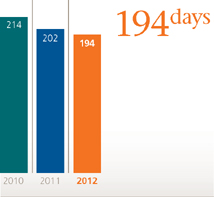
| | Pharmaceuticals R&D footprint 000m2 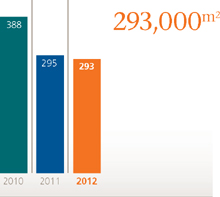
|
| |
| | Priorities Through our new major change programme, we have identified
£1 billion of additional annual savings by 2016 across manufacturing, R&D and our European pharmaceutical business. Delivering this programme is a key priority over the next three years. During 2013 we will also be focused on the reform of our supply chain to simplify processes and reduce inventory, cost and complexity. |
44 | GSK Annual Report 2012
Strategic reviewsimplify the operating model
Reducing cost and
increasing efficiency
In 2012 we continued to transform our operating model to reduce costs and complexity, and improve efficiency.
The transformation of our operating model and processes has been a key business strategy, enabling us to standardise and streamline important aspects of our business, including our supply chain.
We have been implementing a restructuring programme to deliver significant savings to support investment in our priority growth businesses as well as offset pressures on the Group’s margin resulting from changes in the shape and mix of our business.
Restructuring programme
A key objective of the Operational Excellence restructuring programme that we began in 2007 was to release resources to invest in our growth strategy. To date, the restructuring programme has delivered approximately £2.5 billion of annual savings and remains on track to deliver £2.8 billion of annual savings by 2014.
A significant portion of the savings generated has been reinvested into business areas that offer potential for future profitable growth, such as emerging markets, Vaccines and Consumer Healthcare. Similarly, some of the savings in R&D costs have been reinvested back into discovery and development research.
The existing Operational Excellence programme is coming to a close and will be superseded by a new major change programme. This will focus on opportunities to simplify our supply chain processes, as previously announced in 2012 and on building the Group’s capabilities in manufacturing and R&D, as well as restructuring our European business.
2012 also saw £165 million of restructuring charges relating to the acquisition of Human Genome Sciences (HGS). Total restructuring charges related to HGS are expected to be approximately £204 million, of which most is expected to be a cash cost. The majority of the remaining HGS restructuring charges will be booked in 2013.
Core Business Services
In early 2011, we created the Core Business Services (CBS) group to centralise our support functions. This brought together functions such as facilities management, HR, IT, finance and procurement in one centralised team, allowing us to streamline those elements and standardise processes. Our intention was to increase our productivity and free up time in the businesses to focus on the execution of business strategy in their local markets.
In 2012 there has been steady progress on the implementation of the CBS platform. A key element of the CBS strategy is the creation of a series of regional multifunctional business service centres (BSCs) to improve service delivery. Three of a planned six centres went online in 2012 and the remainder are expected to be established in 2013. This will mean we need fewer support staff globally while providing more standard and cost effective processes to the Group.
We have also been standardising our processes through the introduction of an enterprise-wide resource planning (ERP) system. By the end of 2012, nine European pharmaceutical markets were enrolled on the commercial ERP system, equating to 43% of our turnover in Europe. We anticipate adding further markets in 2013, covering most of the European markets by the end of the year.
We also introduced improved forecasting and planning processes to 40 Latin American markets, with expected reduction in supply chain operating costs, reduced inventory levels and improved forecasting. The roll-out of the platform across the Group is being accelerated in 2013.
Supply chain and global manufacturing
We have 87 sites in 34 countries manufacturing our vaccines, pharmaceuticals and consumer healthcare products. A large part of our network – 74 sites – is the responsibility of Global Manufacturing and Supply (GMS) with more than 27,000 people involved in the manufacture and supply of our pharmaceutical and consumer healthcare products. A further 13 sites are operated by our Vaccines business.
|
| GSK Annual Report 2012 | 45 |
| | |
A key focus within our manufacturing organisation has been supply chain restructuring to create better end-to-end processes which reduce costs and are more responsive to customer demand. In 2012, our Consumer Healthcare business established a fully integrated supply chain, a first for GSK. Significantly greater operating flexibility is already apparent and has allowed the business to respond more effectively to some supply related challenges during the year. We are now extending this approach to our pharmaceuticals and vaccines supply chains. Our Inventory Reduction Programme, which is focused on the improvement of our manufacturing and supply processes, helped to reduce our days inventory outstanding by 9% (calculated on a CER basis) over the course of the year. Throughout 2011 and 2012 we have also sought to reduce cost through simplification of our product portfolio by removing small volume, least commercially important packs and standardising pack presentation formats. We have now set a revised target to remove a further 25% of packs by 2016 and to achieve a 50% improvement in standardisation in the same period. Over the past five years, our manufacturing organisation has restructured and rationalised its network, streamlined the operating model and improved site performance to deliver savings of approximately £930 million per annum. Environmental efficiencies Environmental sustainability is a priority for GSK. By reducing our footprint, using resources more efficiently, and working with others to tackle these challenges, we can reduce costs, build competitiveness and create trust in our business. Despite reducing our carbon from energy use by 15% since 2010, our total carbon footprint (excluding that from raw materials) has increased by 7% from 2010 driven by higher inhaler sales. (More on page 54). | | Case study Squeezing production times Our manufacturing network is a lynchpin in our ability to both make and distribute products around the world. It also offers an important opportunity to make efficiencies, as work done at our toothpaste manufacturing plant in Maidenhead in the UK last year has demonstrated. Through a step-by-step analysis of the process involved in changing from the manufacture of one product to another, our staff on the production line identified changes that could cut the time taken to changeover by 60%, saving 250 hours of production time per year. Shaving this time off freed-up production time, helping to provide manufacturing capacity to produce an additional 6.7 million tubes of toothpaste per year. We’re now looking at ways that we can share this learning to create a standard of performance excellence across all of our supply chains. |
| | 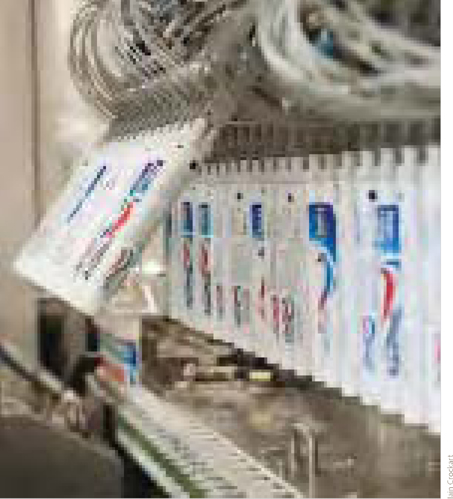
|
46 | GSK Annual Report 2012
Strategic reviewsimplify the operating model
Our financial architecture
Our financial architecture is designed to support the execution of the Group’s strategy, and to enhance the returns it delivers to shareholders.
GSK’s financial architecture has established four key financial priorities for GSK in delivering sustainable sales growth, improving our operating leverage, improving financial efficiency and converting more of our earnings into cash. By applying this framework we can drive better and more consistent decision making across the company and improve delivery of our key financial objectives of earnings per share growth and free cash flow generation, which can then be returned to shareholders or reinvested in bolt on acquisitions, wherever the most attractive returns are available. Our decisions are rigorously benchmarked using a CFROI returns based framework.
Sales growth
Although reported sales for the year were down 1% for 2012, sales were flat adjusting for the disposal of our non-core Consumer Healthcare brands. This reflects continued strong performance from our ‘growth’ businesses in the emerging markets helping to offset pressure in western markets, especially weaker than expected performance in Europe. As we move into 2013 we expect to deliver sales growth of around 1% CER.
Operating leverage
In 2012 the core operating margin declined by 0.6 percentage points to 31.5%, of which 0.3 percentage points was due to the expected impact of the HGS acquisition. The remaining 0.3 percentage points was due primarily to the impact of maintaining flat SG&A on lower turnover, partially mitigated by lower R&D expenditure. We remain focused on managing our cost base more effectively. Our Operational Excellence programme started in 2008 and has now delivered annual savings of £2.5 billion. We have also launched a new change programme to deliver further annual savings of £1 billion by 2016.
We continue to balance cost savings with continued investment in the business to support preparedness to launch our R&D pipeline which will be a key driver of future sales growth. With increasing pipeline sales contribution from the end of 2013, we remain confident that we can drive improvement in the core operating margin over the medium term.
Financial efficiency
Despite the pressure on the operating margin in 2012, financial efficiencies delivered significant value in 2012 and contributed positive leverage to the Group’s reported earnings per share for the year.
In 2011 we set out a target to reduce by 200 basis points our net funding costs which were over 8% in 2010. We have delivered this a year earlier than expected. Our net funding costs for 2012 were around 6%, despite our net debt position growing from £9 billion to £14 billion. This has enabled net interest payments for the year to remain broadly flat.
We also continue to develop our tax strategy and a number of moves to update our structure and settle outstanding claims have allowed us to reduce our 2012 core tax rate to 24.4%, a rate that delivered our target of 25% two years earlier than expected. We expect a core rate of 24% in 2013.
We continue to focus on the alignment of our tax strategy with our future business and have implemented a number of measures to centralise our Pharmaceutical intellectual property and product inventory ownership in the UK.
Earnings per share
In 2012, the significant progress in improving our financial efficiency, together with our reinitiated share buyback programme, enabled us to maintain flat core EPS compared with 2011 (on a CER basis), despite the decline in sales. In 2013, we expect to deliver core EPS growth of 3-4% CER, based on the IAS 19 (Revised) adjusted EPS for 2012 of 111.4p.
|
| GSK Annual Report 2012 | 47 |
Financial architecture to drive improved returns
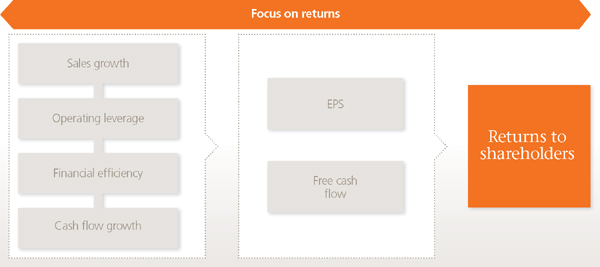
Cash conversion
We see significant opportunity to enhance cash conversion through greater focus on cash generation and capital allocation. A particular focus is on our working capital and in 2012 we made significant progress. We reduced the working capital cash conversion cycle from 202 to 194 days. We have already made good progress on payables and receivables and are now focused on addressing the Group’s inventory position in a sustainable and secure way. We are developing an end-to-end supply chain that joins our manufacturing and commercial businesses and increases visibility to improve flexibility and responsiveness, reducing the inventory required and releasing cash we can reinvest in the business.
Returns to shareholders
Free cash flow is available to invest in the business or to return to shareholders consistent with maintaining our targeted credit profile. The priority is to cover the dividend but we intend free cash flow above and beyond this requirement to be available for share buybacks or bolt-on acquisitions, wherever the most attractive returns are available. The decision as to how to allocate such cash flow is rigorously benchmarked using a returns-based framework based on CFROI comparisons.
In 2012 we returned £6.3 billion of cash to shareholders. We paid £3.8 billion in dividends, with our ordinary dividend up 6% to 74p per share. In addition we bought back £2.5 billion of shares as part of the long term programme we started in 2011.
In 2013 we expect to deliver continued dividend growth and we are targeting share repurchases of £1–2 billion.
Measurement and reporting
We have improved our financial reporting to align it more closely with our financial architecture. We are providing more data and insights into the progress we are making in each of our businesses and regions and on our progress against the key drivers of operational and financial efficiency. From 2012, we transitioned our reporting to a core basis, enabling greater visibility of the underlying performance of the business.
More details on the transition to core reporting are provided on page 56.
48 | GSK Annual Report 2012
Strategic reviewsimplify the operating model
Identifying and managing risk
| | | | |
| We manage risk to our business by embedding clear processess to do this in our management practices. | | Our risk management processes 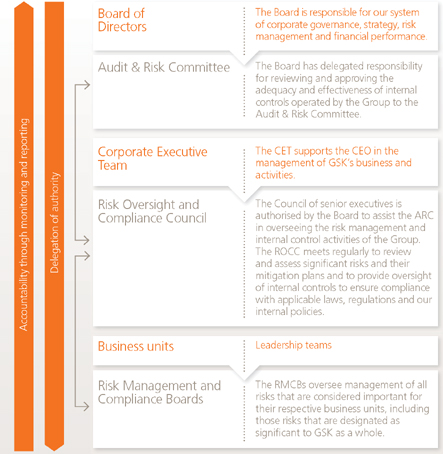
|
| | | |
| | | We have a clear framework for identifying and managing risk, both at an operational and strategic level. Our risk identification and mitigation processes have been designed to be responsive to the constantly changing environment. The Group’s key risks are categorised as follows and full descriptions and specific mitigating activities are set out on pages 78 to 86. • Delivering commercially successful new products • Protecting intellectual property rights • Ensuring product quality • Maintaining product supply • Securing adequate pricing and reimbursement • Compliance with relevant laws and regulations | | • Changing global political and economic conditions • Managing alliances and acquisitions • Compliance with financial reporting and disclosure requirements • Compliance with tax law and managing treasury investments • Compliance with anti-bribery and corruption legislation • Potential litigation • Managing environmental, health, safety and sustainability compliance • Concentration of sales to wholesalers • Protecting our information |
|
| GSK Annual Report 2012 | 49 |
Responsible business
In 2012, we made substantive moves to increase access and transparency.
|
|
1st |
in ATM index |
For the third consecutive report, GSK scored highest in the bi-annual Access to Medicines (ATM) Index, released in 2012. The index, prepared by the Access to Medicines Foundation, provides a ranking of pharmaceutical companies’ access to medicine activities, measuring seven technical aspects such as R&D activities, pricing schemes and patents & licensing policies. |
See our Corporate responsibility report.
Our commercial success is directly linked to operating in a trustworthy and responsible way. We report our approach and the progress we are making across four areas:
| • | | Health for all – Innovating to address currently unmet health needs; improving access to our products, irrespective of where people live or their ability to pay; controlling or eliminating diseases affecting the worlds’ most vulnerable people. |
| • | | Our behaviour – Putting the interests of patients and consumers first, driven by our values in everything we do and backed by robust policies and strong compliance processes. |
| • | | Our people – Enabling our people to thrive and develop as individuals to deliver our mission. |
| • | | Our planet – Growing our business while reducing our environmental impact across our value chain. |
Highlights about our approach and examples of progress in these four areas follow. Additional information on our approach and performance is published in our Corporate Responsibility Report, which can be found on our website.
Health for all
We are working to make our medicines and healthcare products available and affordable to as many people who need them as possible. We aim to do this while also generating the returns we need to sustain our business and invest in R&D.
We continue to evolve our business model to address the increasing need for new and existing treatments. The way we price our products is more flexible and more reflective of different healthcare needs in developed and developing countries and we have changed the way we conduct R&D to be more open than ten years ago.
Using innovative science to create value
The biggest contribution we can make to improving health is through scientific innovation. In 2012 we announced further initiatives in open innovation, where we seek to share intellectual property and knowledge with external researchers to help stimulate R&D into areas where traditional commercial approaches have met difficulties. These include:
| • | | Submitting for publication 200 promising inhibitors for tuberculosis (TB) from our library of compounds to help stimulate research. TB still kills 1.5 million people each year. |
| • | | Awarding a further £5 million to the Tres Cantos ‘Open Lab’ Foundation to help independent researchers advance their own projects. There are now 16 research projects in the portfolio |
| • | | Joining forces on NewDrugs4BadBugs – an innovative public-private collaboration launched to tackle antibiotic resistance. Supported by the European Innovative Medicines Initiative (IMI), the project will be funded by a joint budget of £180m. |
Improving access to our products and to healthcare
Access to medicines and healthcare is a priority for us, and we recognise that there can be challenges to providing sustainable access to healthcare across the world.
Cost can be a barrier to people in both developed and developing countries. Having a flexible approach to pricing is one way to create access and build our business by increasing the overall volume of products we sell. We offer tiered pricing for our vaccines and medicines, capped prices in the UN’s Least Developed Countries (LDCs) and preferential pricing by ViiV Healthcare of our anti-retrovirals for HIV/AIDS in LDCs, sub-Saharan Africa and all low-income countries.
50 | GSK Annual Report 2012
Strategic reviewsimplify the operating model
Responsible business continued
Case study
Giving children a better start
Soil-transmitted helminths – commonly known as intestinal worms – affect more than two billion people worldwide and are one of the biggest causes of ill health in school-age children. The World Health Organization estimates that 890 million children are at risk of infection. Infection with worms can cause stomach pain, sickness and malnutrition, as well as stunting physical growth and long-term brain development.
Through our membership of a global coalition of pharmaceutical companies and non-government organisations – including the Bill & Melinda Gates Foundation and the World Bank – as well as governments and global health organisations, we committed to work together to control or eliminate ten of the 17 neglected tropical diseases by 2020.
Our contribution includes donating our anti-parasitic treatment, albendazole to help fight intestinal worms in school-age children. Healthier children are more likely to attend school and get a better education – giving them a better chance of getting good jobs and becoming productive members of society.
In 2012, the first year of this donation programme, we provided albendazole treatment for over 120 million school age children – including these children in Ghana (pictured).

Through our Developing Countries and Market Access (DCMA) unit we have created a business group dedicated to increasing patient access to GSK medicines in the world’s poorest countries. In these countries we invest 20% of the profits made there back into community programmes to strengthen local healthcare infrastructure. This investment – in resources like clinics, hospitals, doctors, nurses, and training programmes – increases the number of people who can get much-needed healthcare and medicines. By October 2012, we had a programme in place in all 34 of the LDCs where our business had made a profit.
The 20% reinvestment programme is delivered through our partnership with three non-governmental organisations (NGOs) with regional expertise. We work with Save the Children in West Africa, AMREF in East and Southern Africa, and CARE International in Asia.
Increasing people’s access to medicines is also about the availability of the medicines or products in a country. To address this, we are increasing registration of new and existing products across markets and using local manufacturing options whenever possible to make sure people in a range of countries can get the medicines they need.
Targeting neglected tropical diseases
Neglected tropical diseases (NTDs) threaten more than one billion people in developing countries. In 2012, GSK united with other private and public partners to create the London Declaration Initiative to control or eliminate ten of the 17 neglected tropical diseases by the end of the decade. Our initial focus is extending access to medicines for five diseases where treatments already exist, including lymphatic filariasis and intestinal worms. In 2012, we donated our three billionth albendazole tablet in the fight against this disfiguring disease.
|
| GSK Annual Report 2012 | 51 |
Malaria is responsible for more than 655,000 deaths a year, mainly among children in sub-Saharan Africa. Our holistic approach to malaria control includes vaccine development, promoting preventive measures such as bed nets and mosquito control, and preferential pricing for anti-malarials in LDCs. In 2012 we published late-stage clinical trial results showing that our RTS,S vaccine candidate can help protect African children against malaria.
Supporting health and well-being in our communities
We fund and support local programmes that make a significant contribution to the health and well-being of communities. Our contributions support disaster relief, medicine donations, engagement programmes to change behaviour and improve health and science education to help develop our health professionals, scientists and engineers of the future.
Our giving in 2012

| | | | |
| | | £m | |
1 Product and in-kind | | | 131 | |
2 Cash | | | 54 | |
3 Management | | | 19 | |
4 Time | | | 3 | |
Cash giving by type of programme
supported in 2012

| | | | |
| | | % | |
1 Health | | | 56 | |
2 Education | | | 28 | |
3 Other | | | 16 | |
In 2012 GSK donated medicines valued at £131 million (at cost) and £54 million in cash. Product donations of £3.3 million were distributed to 86 countries for humanitarian aid. Supplies of antibiotics, basic medicines and oral hygiene items were distributed to those affected by conflicts, a cholera epidemic in Niger, floods in the Philippines and hurricanes Isaac and Sandy in the USA.
We continue to invest in a programme to prevent diarrhoea and pneumonia by teaching children the importance of hand washing. The programme has been running for 15 years, and has reached 1.5 million children in 16 countries. In 2012, we began integrating oral health education and school de-worming into the programme.
Our behaviour
How we deliver success is just as important to us as what we achieve. We will put the interests of patients and consumers first and be driven by our values of:
Ethical conduct
Ethical conduct is a priority for GSK. Failure to uphold high ethical standards can erode trust in our company and our products, damage our reputation, and result in serious financial or legal consequences.
In 2012 we revised and simplified our Code of Conduct to make it very clear to employees how to apply GSK Values and Behaviours. The code is available in 28 languages and supported by a new Policy Resource Centre on the company’s intranet that provides information, support and training.
Our Annual Business Ethics Certifications for managers is being revised and will be re-launched in 2013. Over 33,000 managers will be asked to undertake this training, confirming their compliance with the code of conduct.
Our employee survey results from 2012 reflect our efforts to integrate a values-based culture at GSK. More than 90% of respondents stated they understand what constitutes ethical business practices and conduct in their job, and more than 80% agreed that their work environment encourages ethical behaviour in the face of pressures to meet business objectives.
All GSK employees have access to whistleblowing mechanisms that they can use to get advice, and to report suspected cases of misconduct – anonymously if required. Our global confidential reporting line is available in 70 different languages.
We continue to support the Guiding Principles on Business and Human Rights endorsed by the United Nations Human Rights Council in 2011. Our aim is to apply the guiding principles across our own operations and our supplier relationships.
Sales and marketing
We launched a new Global Code of Practices for Promotion and Customer Interactions last year. The code covers payments to health care professionals, samples, hospitality, grants and donations. Activities must conform to our ethical, medical and scientific standards and all applicable laws, regulations and industry codes. All sales and marketing employees are being trained on the revised code.
In 2012 we entered into a settlement with the US federal government related to past sales and marketing practices. While the actions triggering these issues originated in a different era for our company, they cannot and will not be ignored. In the USA, we have taken action at all levels and improved our procedures for compliance, marketing and selling. As part of the settlement we entered into a Corporate Integrity Agreement with the US Department of Health and Human Services, under which we are building improvements into our existing compliance programmes.
52 | GSK Annual Report 2012
Strategic reviewsimplify the operating model
Responsible business continued
Working with healthcare professionals
Healthcare professionals (HCPs) are valuable partners for GSK, providing us with scientific and medical expertise and insights into patient care. Our work with HCPs can include conducting research on our behalf or acting in an advisory and consulting capacity such as providing expertise at GSK advisory boards or speaking on our behalf about diseases or therapy areas relevant to us. We believe HCPs should be fairly compensated and we have clear standards, aligned with industry codes of practice and appropriate laws and regulations, which govern these payments. We have committed to publishing the payments we make to HCPs and were one of the first companies to start to do this in the USA, commencing in 2009.
Transparency of research
We are committed to reporting the results of our clinical research, irrespective of whether the outcomes are perceived to be positive or negative for our medicines. To further increase this transparency, we announced plans in 2012 to enable researchers to access anonymised patient-level data from published clinical trials of our medicines. Requests for data will be reviewed by an independent panel of experts to evaluate the scientific merit of each proposal. We already publish summary results of every research trial on the GSK Clinical Study Register, and in early 2013 we outlined our plans to add Clinical Study Reports onto the Register in the future (see page 36).
We conduct regular clinical-quality assurance assessments to confirm that the conduct of trials upholds our standards. In 2012 we conducted 293 assessments, including review of investigator sites, GSK local operating companies and clinical research organisations carrying out clinical trials on our behalf. GSK fully investigates any concerns identified, and performed 47 investigations in 2012 in response to suspected irregularities, taking corrective action where appropriate.
Manufacturing and supply
Suppliers to GSK are required to adhere to our Third Party Code of Conduct and must demonstrate ethical standards within their business and their own supply chains. In 2012 we carried out in-depth environment, health and safety audits of critical suppliers to improve sustainability in the supply chain and strengthen supplier relationships. We also conducted assessments to understand geographical risks and plan for any potential interruptions to supply. Supply continuity was assessed for 20 key suppliers in 2012 and another 20 are scheduled for 2013.
We continue to address the problem of counterfeit medicines. In China, we added serial numbers to 31 products, resulting in a significant reduction in the number of reports of counterfeit medicines. This ‘track and trace’ technology will help us implement similar initiatives elsewhere in the world.
Our people
GSK wants to be an employer of choice. Our ability to attract, retain and motivate the best people is essential to achieving our objectives and executing our strategy. Our employment practices are designed to help us create the right workplace culture in which all employees feel valued, respected, empowered and inspired.
Recruiting, developing and rewarding our people
GSK is committed to supporting employees to perform to their best and we ensure that appropriate programmes and mechanisms are in place to deliver overall performance. Individuals meet 90% of their development needs through challenging on-the-job projects, mentoring and coaching, with 10% derived from formal development such as training programmes.
Our performance and development planning process means employees have business-aligned objectives and behavioural goals. Reward systems promote high performance and help to attract and retain the best people.
Performance-based pay, bonuses and share-based equity plans align employee interests with business targets.
We have invested significantly in the development of our leadership through interventions at every stage of the pipeline from our most senior executives to first line leaders.
Our early career development programmes include graduate schemes, internships, industrial placements, apprenticeships and ESPRIT, our global MBA programme. In 2012 we employed 52 apprentices and recruited 317 graduates.
A diverse workforce
We focus on creating an inclusive, engaging environment that empowers employees to continually contribute to the organisation that enables us to achieve our strategic business objectives. An inclusive environment is good for business as it brings together different knowledge, perspectives, experiences and working styles that enhance creativity and innovation.
We aim to attract a diverse workforce that reflects the communities in which we operate.
| • | | The percentage of women in higher-level positions grew in 2012, reflecting our goal to increase the proportion at the most senior levels. |
| • | | The number of people we employ in our Emerging Markets, Asia Pacific and Japan regions represent 42% of our total workforce. |
| • | | Ethnic minorities accounted for 20% of UK and 22.1% of US employees in 2012. |
Women in management positions (%)
| | | | | | | | | | | | | | | | | | | | |
| | | 2012 | | | 2011 | | | 2010 | | | 2009 | | | 2008 | |
SVP, VP | | | 27 | | | | 26 | | | | 25 | | | | 25 | | | | 25 | |
Director | | | 39 | | | | 38 | | | | 37 | | | | 36 | | | | 36 | |
Manager | | | 43 | | | | 42 | | | | 42 | | | | 42 | | | | 41 | |
Total | | | 40 | | | | 39 | | | | 38 | | | | 38 | | | | 38 | |
Ethnic minorities – UK and USA employees (%)
| | | | | | | | | | | | | | | | | | | | |
| | | 2012 | | | 2011 | | | 2010 | | | 2009 | | | 2008 | |
UK | | | 20.0 | | | | 19.6 | | | | 19.4 | | | | 19.4 | | | | 19.2 | |
USA | | | 22.1 | | | | 21.9 | | | | 20.4 | | | | 20.4 | | | | 20.5 | |
|
| GSK Annual Report 2012 | 53 |
| | | | | | |
| |  | | | | Case study Fair play in sport We were proud to play an important role in the London 2012 Olympic and Paralympic Games as the Official Laboratory Services Provider – using our scientific expertise and facilities to support the integrity of the Games and the health of competing athletes. Working with King’s College London, we provided the facilities and equipment that allowed the expert analysts from King’s to independently operate a World Anti-Doping Agency (WADA) accredited laboratory. More than 6,000 anti-doping tests were carried out, which was more than at any other Games. By the end of the Olympics, every medalist who stepped on the podium and up to half of all competing athletes had been tested. Being a science-led organisation, we were well placed to provide the testing facilities, offering one of our research and development sites located about 45 minutes north of the Olympic Park. This was the first time a pharmaceutical company had been involved in the provision of anti-doping services for an Olympic or Paralympic Games. |
| | | | | |
| | | | | |
| | | | | |
| | | | | |
| | | | | |
| | | | | |
| | | | | |
| | | | | |
| | | | | |
| | | | | |
| | | | | |
| | | | | |
| | | | | |
54 | GSK Annual Report 2012
Strategic reviewsimplify the operating model
Responsible business continued
We are committed to employment policies free from discrimination and to an environment that does not tolerate harassment or discrimination of: actual or perceived race, colour, ethnic or national origin, age, gender, sexual orientation, gender identity and/or expression, religion or belief, physical ability/disability and/ or chronic health conditions, genetic make-up or other protected characteristics as relevant in a country.
Engaging our employees
In 2012 we maintained a rate of 85% of employees saying they are proud to work for GSK based on a 72% participation rate in our global employee survey.
Our volunteering programmes continue to provide employees with a strong sense of purpose. PULSE gives employees the chance to join a charity or non governmental organisation (NGO) for three or six month, full-time placements. The GSK Orange Day allows all employees to commit a day of their time to a local charity either individually or as part of a team.
As a corporate partner for the London 2012 Olympic Games, all our allocated tickets went to our employees. We ran a global ‘Golden Ticket’ competition asking employees to nominate colleagues who demonstrated actions in their daily lives or work showing the Olympic values of friendship, equality, integrity and excellence.
Managing change
We are very conscious of the effect restructuring has on employees. We aim to achieve organisational and financial goals without eliminating positions and to redeploy employees where possible. We remain committed to consulting on changes via a number of consultation forums, as well as discussions with the European Works Council and similar bodies in countries where this is national practice. If jobs are lost through business change, we offer compensation and other support such as outplacement in line with local requirements and employment legislation. We also offer employees support through resilience training and an Employee Assistance Programme.
A healthy high-performing workforce with zero harm
To improve the quality of life of our employees and their families, in 2012 we piloted a groundbreaking Preventative Health programme, to be phased in globally across GSK over the next five years. This partnership with our employees and their families is designed to reduce personal health risks through access to a set of core preventive health services.
We continue to aim for zero harm to our employees and we continue to develop risk reduction programmes, including upgrades to guard equipment on machinery, and dust-reduction activities in our manufacturing sites in 2012.
Our employee injury and illness rate reduced by 10%.
Our planet
Environmental sustainability is a priority for GSK. Our focus is to reduce carbon, water and waste. We have set ambitious targets in these areas and we are working to create change, from our use of raw materials, to the use and disposal of our products by consumers.
Carbon
Our goal is to reduce our value chain carbon footprint by 10% in 2015 and by 25% by 2020. Our carbon footprint excluding the contribution from raw materials (which we cannot currently measure on an annual basis) has increased by 7% compared to 2010, however we remain confident on hitting our 2015 target.
| • | | We have reduced our carbon footprint from energy for operations by 15%. |
| • | | Increased sales of metered dose inhalers have resulted in a 12% rise in greenhouse gas emissions from inhaler use. |
| • | | For our 2011 performance, we achieved global certification to the Carbon Trust Standard, which certifies that we are making year-on-year overall reductions in emissions associated with operations and transport. GSK is the only multinational to have achieved this standard to date. |
Water
Our goal is to reduce our water impact across the value chain by 20% relative to 2010. In 2012 we reduced water consumption in our operations by 14% (compared to 2010). We recognise that water is an important natural resource and that we can play a positive role in managing our use of it more sustainably. We have begun to develop longer-term strategies with input from several international organisations. We have also signed the UN CEO Water Mandate, an initiative designed to help companies develop, implement and disclose sustainable water practices.
Waste
Our goal is for zero waste to be sent to landfill by 2020 from our operations. In 2012 we reduced waste generation in our operations by 9% and reduced the waste sent to landfill by 41% (compared to 2010). We established an inhaler collection service (Complete the Cycle) in the UK that has collected over 90,000 inhalers to date. We have recently expanded a pilot inhaler collection service in the USA from five to 31 cities.
Managing other impacts
Alongside our priority issues of carbon, water and waste, we also manage a range of other important environmental issues. One is ‘green chemistry’ which aims to replace the use of hazardous chemicals and processes with those that have a lower environmental impact. In 2012 we created a Green Chemistry Performance Unit to put green chemistry theories into practice. The unit has published 12 internal guides that help employees make better chemical choices when designing or developing new products.
|
| GSK Annual Report 2012 | 55 |
56 | GSK Annual Report 2012
Financial review
Group performance
Our financial review discusses the operating and financial performance of the Group, the financial outlook and our financial resources. We compare the results for each year primarily with results of the preceding year and on a CER basis. In this review we discuss the results on both a core basis and a total basis.
All growth rates included in this Report are at constant exchange rates (CER) unless otherwise stated. CER growth is discussed below.
We use a number of adjusted measures to report the performance of our business. These measures are used by management for planning and reporting purposes and in discussions with and presentations to investment analysts and rating agencies and are defined below. These measures are not defined in IFRS and may not be comparable with similarly described measures used by other companies.
Core results reporting
Core results exclude the following items from total results: amortisation and impairment of intangible assets (excluding computer software) and goodwill; major restructuring costs, including those costs following material acquisitions; legal charges (net of insurance recoveries) on the settlement of litigation and government investigations; other operating income other than royalty income; disposals of associates, products and businesses, and acquisition accounting adjustments for material acquisitions, together with the tax effects of these items.
Major restructuring costs charged in arriving at operating profit include costs arising under the Operational Excellence restructuring programme, initiated in 2007 and expanded in 2009, 2010 and 2011, and restructuring costs following the acquisitions of Human Genome Sciences, Inc. in August 2012 and Stiefel Laboratories, Inc. in July 2009.
Reconciliations of core results to total results are presented on page 62.
Core results reporting aligns business performance reporting around the underlying trading performance of the Group and its primary growth drivers by removing the volatilty inherent in many of the non-core items. Core results reporting is utilised as the basis for internal performance reporting and the core results are presented and discussed in this Financial review as management believes that this approach provides investors with a clearer view of the underlying trading performance of the Group. Management also believes that this approach should make the Group’s results more comparable with the majority of its peers, many of which use similar forms of underlying performance reporting to discuss their results, although the precise calculations may differ. The Financial review also presents and discusses the total results of the Group.
Free cash flow
Free cash flow is the net cash inflow from operating activities less capital expenditure, interest and dividends paid to non-controlling interests plus proceeds from the sale of property, plant and equipment and dividends received from joint ventures and associated undertakings. Free cash flow growth is calculated on a sterling basis. A reconciliation is presented on page 69.
Working capital conversion cycle
The working capital conversion cycle is calculated as the number of days sales outstanding plus days inventory outstanding, less days purchases outstanding.
White pills in Western markets
White pills in Western markets refers to sales of tablets and simple injectables (excluding biopharmaceuticals and vaccines) in North America and Europe.
CER growth
In order to illustrate underlying performance, it is our practice to discuss the results in terms of constant exchange rate (CER) growth. This represents growth calculated as if the exchange rates used to determine the results of overseas companies in Sterling had remained unchanged from those used in the previous year. CER% represents growth at constant exchange rates. £% represents growth at actual exchange rates.
Restatement of comparative information
As set out in Note 6 to the Financial statements, ‘Segment information’ the segments for which turnover and operating profit are disclosed have been amended to reflect changes in the Group’s internal management structure together with certain changes to the therapeutic classifications of turnover by product. In addition, charges for amortisation and impairment of intangible assets related to marketed products are now reported in cost of sales rather than in SG&A. Comparative information has been restated accordingly. The adjustment for 2011 increases cost of sales and decreases SG&A by £316 million from the amounts previously reported.
Financial review 2012
Group turnover by business
| | | | | | | | | | | | | | | | |
| | | 2012 £m | | | 2011 (restated) £m | | | Growth CER% | | | Growth £% | |
Pharmaceuticals | | | 17,996 | | | | 18,615 | | | | (2 | ) | | | (3 | ) |
Vaccines | | | 3,325 | | | | 3,497 | | | | (2 | ) | | | (5 | ) |
Pharmaceuticals and Vaccines | | | 21,321 | | | | 22,112 | | | | (2 | ) | | | (4 | ) |
Consumer Healthcare | | | 5,110 | | | | 5,275 | | | | – | | | | (3 | ) |
| | | | 26,431 | | | | 27,387 | | | | (1 | ) | | | (3 | ) |
| * | CER% represents growth at constant exchange rates. £% represents growth at actual exchange rates. |
Total Group turnover for 2012 was broadly in line with last year (down 1% to £26,431 million), with a 2% decline in Pharmaceuticals and Vaccines turnover partly offset by flat reported turnover in Consumer Healthcare. Pharmaceuticals turnover was down 2%, primarily as a result of the increased pressure from austerity measures in Europe. Vaccines turnover declined 2%, reflecting the impact of lower sales ofCervarix in Japan (2012 – £132 million; 2011 – £344 million) following the completion of the 2011 HPV vaccination catch-up programme. ExcludingCervarix, Vaccines turnover increased 4%. Reported Consumer Healthcare turnover was flat at £5,110 million, but excluding the non-core OTC brands divested in early 2012, Consumer Healthcare turnover grew 5%.
Group turnover by geographic region
| | | | | | | | | | | | | | | | |
| | | 2012 £m | | | 2011 (restated) £m | | | Growth CER% | | | Growth £% | |
USA | | | 8,446 | | | | 8,684 | | | | (4 | ) | | | (3 | ) |
Europe | | | 7,320 | | | | 8,271 | | | | (7 | ) | | | (11 | ) |
EMAP | | | 6,780 | | | | 6,403 | | | | 10 | | | | 6 | |
Japan | | | 2,225 | | | | 2,318 | | | | (5 | ) | | | (4 | ) |
Other | | | 1,660 | | | | 1,711 | | | | (3 | ) | | | (3 | ) |
| | | | 26,431 | | | | 27,387 | | | | (1 | ) | | | (3 | ) |
Group sales outside the USA and Europe accounted for 40% of total turnover and reported growth of 5%.
|
| GSK Annual Report 2012 | 57 |
Group turnover by segment
| | | | | | | | | | | | | | | | |
| | | 2012 £m | | | 2011 (restated) £m | | | Growth CER% | | | Growth £% | |
Pharmaceuticals and Vaccines: | | | | | | | | | | | | | | | | |
USA | | | 7,000 | | | | 7,022 | | | | (2 | ) | | | – | |
Europe | | | 5,001 | | | | 5,700 | | | | (7 | ) | | | (12 | ) |
EMAP | | | 4,736 | | | | 4,459 | | | | 10 | | | | 6 | |
Japan | | | 1,969 | | | | 2,082 | | | | (6 | ) | | | (5 | ) |
ViiV Healthcare | | | 1,374 | | | | 1,569 | | | | (10 | ) | | | (12 | ) |
Other trading and unallocated | | | 1,241 | | | | 1,280 | | | | (3 | ) | | | (3 | ) |
Pharmaceuticals and Vaccines | | | 21,321 | | | | 22,112 | | | | (2 | ) | | | (4 | ) |
Consumer Healthcare | | | 5,110 | | | | 5,275 | | | | – | | | | (3 | ) |
| | | | 26,431 | | | | 27,387 | | | | (1 | ) | | | (3 | ) |
US Pharmaceuticals and Vaccines turnover declined 2%. Excluding the impact ofAvandia, Pharmaceuticals and Vaccines sales were flat. Pharmaceuticals turnover fell 2%, as sales declines forAvandia as well as a number of older products includingArixtra andValtrex, were partly offset by an encouraging performance from new products, particularly in Oncology which grew 18%, a £65 million sales contribution fromBenlysta and improved Respiratory sales, which grew 1%. Turnover also benefited from the net effect of the incremental revenue from the conclusion of theVesicare co-promotion agreement in the first quarter of 2012. Vaccines sales were flat as the growth in sales ofInfanrix/Pediarix andBoostrix was offset by lower flu vaccines sales and adverse comparisons for Hepatitis vaccines andRotarix, which benefited from significant stockpile purchases by the US Centers for Disease Control (CDC) in 2011.
Europe Pharmaceuticals and Vaccines turnover declined 7%, primarily driven by the impact of various ongoing government austerity measures including price cuts, parallel trade and generic substitution. This decline resulted from adverse pricing effects of 6% and a 1% volume decline. Pharmaceuticals sales declined 8% and Vaccines sales declined 4%. Despite a slight reduction in the rate of decline in the fourth quarter, the underlying economic environment continued to be challenging.
EMAP Pharmaceuticals and Vaccines turnover increased 10% as strong growth in Latin America (up 11% to £1,257 million), China (up 17% to £759 million) and India (up 10% to £304 million) was partly offset by the effect of mandatory price reductions in a number of markets, including Turkey and Korea. Pharmaceuticals turnover increased 8%, with improved momentum after a slow first quarter, as strong growth in Respiratory combined with good performances in a number of established brands and the newer Oncology portfolio. The Vaccines business recorded a strong performance but with expected uneven delivery across the quarters, reflecting the phasing of tender sales and a particular concentration towards the end of the year.
Japan Pharmaceuticals and Vaccines turnover fell 6% reflecting an adverse comparison with strongCervarix sales in 2011 despite a material contribution from the third phase of the programme benefiting the first quarter of 2012. The catch-up programme is now complete. ExcludingCervarix, Japan Pharmaceuticals and Vaccines turnover increased 5%. Pharmaceuticals turnover grew 3% with strong growth from the recently launched products,Lamictal, Avodart andVolibris, partly offset by the impact of the mandatory biennial price cuts, which impacted growth by approximately four percentage points, and increasing generic competition toPaxil. The Respiratory portfolio grew 6%, driven by a strong performance fromXyzal, offsetting declines inFlixonase andZyrtec. Adoair (Seretide) grew 6% to £309 million. In Vaccines,Rotarix, which launched in the fourth quarter of 2011, contributed sales of £44 million.
ViiV Healthcare turnover declined by 10% primarily reflecting generic competition in the USA toCombivir andEpivir offsetting growth generated byEpzicom andSelzentry.
Consumer Healthcare turnover, excluding the sales of the non-core OTC brands that were divested in early 2012, increased 5% with relatively consistent performance over the quarters. This reflected continued growth in Oral care, Nutrition and Wellness, partly offset by a small decline in Skin health. On a regional basis, US sales grew 2% and Europe sales were flat, both impacted by continuing economic pressures and the drag fromalli. The Rest of World markets, particularly India, the Middle East and China, continued to make a strong contribution and grew 12%. Reported turnover for Consumer Healthcare was flat at £5,110 million.
Pharmaceuticals turnover
| | | | | | | | | | | | | | | | |
| | | 2012 £m | | | 2011 (restated) £m | | | Growth CER% | | | Growth £% | |
Respiratory | | | 7,291 | | | | 7,298 | | | | 1 | | | | – | |
Anti-virals | | | 753 | | | | 842 | | | | (11 | ) | | | (11 | ) |
Central nervous system | | | 1,670 | | | | 1,721 | | | | (2 | ) | | | (3 | ) |
Cardiovascular and urogenital | | | 2,431 | | | | 2,454 | | | | – | | | | (1 | ) |
Metabolic | | | 171 | | | | 331 | | | | (47 | ) | | | (48 | ) |
Anti-bacterials | | | 1,247 | | | | 1,390 | | | | (7 | ) | | | (10 | ) |
Oncology and emesis | | | 798 | | | | 683 | | | | 19 | | | | 17 | |
Dermatology | | | 850 | | | | 898 | | | | (2 | ) | | | (5 | ) |
Rare diseases | | | 495 | | | | 463 | | | | 8 | | | | 7 | |
Immuno-inflammation | | | 70 | | | | 15 | | | | >100 | | | | >100 | |
Other pharmaceuticals | | | 846 | | | | 951 | | | | (6 | ) | | | (11 | ) |
ViiV Healthcare (HIV) | | | 1,374 | | | | 1,569 | | | | (10 | ) | | | (12 | ) |
| | | | 17,996 | | | | 18,615 | | | | (2 | ) | | | (3 | ) |
Respiratory
Respiratory sales increased 1%, with growth in the USA, EMAP and Japan offset by a decline in Europe. Total sales ofSeretide/Advair grew 1% to £5,046 million,Ventolin sales increased 6% to £631 million whileFlixotide/Flovent sales fell 4% to £779 million.Xyzal sales, almost exclusively made in Japan, doubled to £129 million.
In the USA, sales ofAdvair were £2,533 million, up 1% compared with 2% estimated underlying growth for the year (5% volume decline more than offset by a 7% positive impact of price and mix).Flovent sales declined 1% to £448 million, compared with estimated underlying growth of 3% (4% volume increase partly offset by a 1% negative impact of price and mix).Ventolin grew 14% to £277 million, while estimated underlying growth was 11%, driven mostly by volume.
European Respiratory sales were down 5% reflecting the impact of ongoing austerity measures.Seretide sales were down 4% to £1,447 million, as price cuts more than offset volume growth of approximately 2%.
In EMAP, Respiratory sales grew 13%, with growth across most products in the portfolio.Seretide grew 12% to £417 million with strong growth in China and Latin America offsetting the impact of some price reductions, principally in Turkey.Ventolin sales increased 10% to £171 million.
Anti-virals
The 11% decline in Anti-virals sales largely resulted from generic competition toValtrex, which was down 25% to £252 million.

58 | GSK Annual Report 2012
Financial review
Central nervous system (CNS)
Declines inSeroxat/Paxil sales of 14% to £374 million andRequip sales of 22% to £164 million, primarily as a result of generic competition, were only partially offset by the 14% growth ofLamictal to £610 million.
In the USA, theLamictal franchise increased 18% to £332 million as strong growth ofLamictal XR, approximately 45% of the US franchise, more than offset the impact of generic competition to the immediate release (twice a day) formulation. Generic competition toLamictal XR began during the first quarter of 2013. In Japan, sales ofLamictal IR grew 88% to £78 million, in part due to sales for the recently launched bipolar indication.
Cardiovascular and urogenital
Sales in the category were flat as the net benefit of the conclusion of theVesicare co-promotion agreement combined with growth in sales ofAvodart andLovaza were offset by the impact of generic competition toArixtra andCoreg.
TheAvodart franchise grew 7% to £790 million with growth driven by strong contributions from the recent launches of the combination productDuodart/Jalyn in Europe and ofAvodart in Japan. In the USA, the decline inAvodart sales, in part due to the impact of labelling changes implemented in 2011 and the availability of a generic competitor in the same class, was partially offset by growth inJalyn, and combined sales fell 5%.
Lovaza grew 5% to £607 million primarily reflecting the benefit of improved pricing.Lovaza continues to hold broadly flat market share in a market which has declined approximately 7% compared with 2011, as economic pressures have resulted in fewer doctor visits and reduced testing for asymptomatic conditions such as very high triglycerides.
Metabolic
The decline in Metabolic product sales continued to reflect the loss of sales ofAvandia, and the impact of declining sales ofBonviva in Europe following the change in the deal structure.
Anti-bacterials
Anti-bacterials sales grew 5% in EMAP, primarily fromAugmentin, but this was more than offset by the impact of austerity measures in Europe, which encouraged pharmacy-level generic substitution, and generic competition in both Europe and the USA.
Oncology and emesis
Three new products,Votrient (up 88% to £183 million),Promacta (up 76% to £130 million) andArzerra (up 36% to £60 million) all continued to grow strongly in the USA, Europe and EMAP.Tykerb/Tyverb also grew (up 6% to £239 million), with growth in the USA, EMAP and Japan offsetting a small decline in Europe. BothHycamtin in Europe and argatroban in the USA were adversely affected by generic competition.
In the USA,Votrient (up 59% to £91 million) benefited from the launch of a new indication for use in advanced soft-tissue sarcoma. Sales ofPromacta grew 66% to £54 million, reflecting the continued effect of longer-term use data that was added to the label in 2011.
Dermatology
Sales declined 2% to £850 million, primarily as a result of the decline in the USA (down 14% to £228 million) which suffered from the impact of generic competition toEvoclin, Extina andDuac. European sales (up 5% to £156 million) benefited from the acquisition ofToctino in the second half of the year. EMAP sales grew 7% to £388 million, reflecting strong growth in the promoted brands ofDermovate andBactroban.
Rare diseases
Volibris grew 35% to £127 million, led by a strong performance in Japan.Mepron sales increased 26% to £93 million primarily as a result of a favourable adjustment to US accruals for returns and rebates recorded in the fourth quarter.Flolan sales fell 25% to £135 million, largely as a result of the biennial price reduction in Japan and generic competition in Europe.
Immuno-inflammation
In August 2012, we acquired Human Genome Sciences, Inc. (‘HGS’) and from that time recorded all sales ofBenlysta. Prior to acquisition, in the USA we recorded as turnover our share of gross profit under the co-promotion agreement with HGS. ReportedBenlysta turnover was £70 million, of which £65 million arose in the USA. Total in-market sales ofBenlysta in the USA for the year were £96 million.
ViiV Healthcare (HIV)
ViiV Healthcare sales declined by 10%, with the USA down 22%, Europe down 3%, and EMAP up 3%. Sales growth inEpzicom/ Kivexa (up 10% to £665 million) andSelzentry (up 20% to £128 million) were more than offset by a 30% decline in the mature portfolio, primarily as a result of generic competition in the USA toCombivir andEpivir.
Vaccines turnover
| | | | | | | | | | | | | | | | |
| | | 2012 £m | | | 2011 £m | | | Growth CER% | | | Growth £% | |
Total Vaccines sales | | | 3,325 | | | | 3,497 | | | | (2 | ) | | | (5 | ) |
Performance of the Vaccines business improved towards the end of the year, with a significant increase in tender sales in the fourth quarter. The 2% overall decline in sales was primarily attributable to the adverse comparison with strongCervarix sales in 2011, which benefited from the HPV vaccination catch-up programme in Japan, now complete.Cervarix sales declined 46% to £270 million. ExcludingCervarix, Vaccines sales increased by 4%.
Infanrix/Pediarix sales increased 17% to £775 million, primarily reflecting strong tender orders in EMAP and growth in the USA, which benefited from a competitor supply shortage.
Rotarix sales grew 21% to £360 million, with strong sales growth throughout EMAP as well as initial launch sales in Japan. In the USA, despite market share gains, sales declined 11%, primarily due to a comparison with a very strong 2011, when sales benefited from a large stockpile purchase from the CDC.
Synflorix sales increased 17% to £385 million, largely reflecting continued strong growth in EMAP.
Boostrix sales increased 25% to £238 million, largely driven by the USA where the product continues to benefit from the expanded indication for use in adults of 65 and older.
|
| GSK Annual Report 2012 | 59 |
Sales of hepatitis vaccines fell 5% to £646 million as declines in mature markets, partly the result of reduced government funding, offset growth in EMAP of 21%.
Fluarix/Flulaval sales were down 11% to £200 million, primarily the result of a 35% decline in the USA, which reflected a reduction in the number of doses sold (approximately 21 million doses) compared with 2011 (approximately 34 million doses). Sales grew 15% in Europe and 35% in EMAP.
The previously announced Japanese Vaccines joint venture between GSK and Daiichi Sankyo Co., Ltd started operations on 2 July. The JV holds the development and commercial rights for existing preventative vaccines from both parent companies. We sell vaccines into the JV at an agreed upon price, and this is reflected in turnover in the second half of 2012, which was reduced by approximately £12 million by the change in structure. Both companies have an equal stake in the joint venture and share the profits equally.
Sales from new pharmaceutical and vaccine launches
| | | | | | | | | | | | | | | | |
| | | 2012 £m | | | 2011 £m | | | Growth CER% | | | Growth £% | |
Arzerra | | | 60 | | | | 44 | | | | 36 | | | | 36 | |
Benlysta | | | 70 | | | | 15 | | | | >100 | | | | >100 | |
Duodart/Jalyn | | | 157 | | | | 104 | | | | 57 | | | | 51 | |
Lamictal XR | | | 148 | | | | 109 | | | | 34 | | | | 36 | |
Nimenrix | | | 1 | | | | – | | | | – | | | | – | |
Potiga/Trobalt | | | 7 | | | | 1 | | | | >100 | | | | >100 | |
Prolia | | | 26 | | | | 11 | | | | >100 | | | | >100 | |
Promacta | | | 130 | | | | 75 | | | | 76 | | | | 73 | |
Requip XL | | | 89 | | | | 139 | | | | (32 | ) | | | (36 | ) |
Synflorix | | | 385 | | | | 350 | | | | 17 | | | | 10 | |
Treximet | | | 49 | | | | 57 | | | | (14 | ) | | | (14 | ) |
Volibris | | | 127 | | | | 97 | | | | 35 | | | | 31 | |
Votrient | | | 183 | | | | 100 | | | | 88 | | | | 83 | |
Dermatology | | | 7 | | | | 8 | | | | (15 | ) | | | (13 | ) |
| | | | 1,439 | | | | 1,110 | | | | 34 | | | | 30 | |
New products in 2012 are those launched in the last five years (2008 to 2012 inclusive). Total sales of new products were £1,439 million, grew 34% in the year and represented 7% of Pharmaceuticals and Vaccines turnover.
Nimenrix was approved by the European Medicines Agency in April 2012 for active immunization against invasive meningococcal disease caused by Neisseria meningitides serogroups A,C, W-135 and Y. Launches are now underway in several countries throughout Europe including the UK, Germany and the Netherlands.
MenHibrix, a combination vaccine to help prevent meningococcal serogroups C and Y and Hib disease, was approved by the FDA in June 2012. In October 2012, the Advisory Committee on Immunization Practices of the Centers for Disease Control and Prevention voted for a limited recommendation for immunisation of infants at an increased risk for meningococcal disease. The product is not yet available.
FluarixQuadrivalent, the first four-strain intramuscular influenza vaccine to help prevent disease caused by seasonal influenza, was approved by the FDA in December 2012 for use in adults and children (three years and older). Launch ofFluarixQuadrivalent is expected in time for the 2013/14 influenza season.
Consumer Healthcare turnover
| | | | | | | | | | | | | | | | |
| | | 2012 £m | | | 2011 (restated) £m | | | Growth CER% | | | Growth £% | |
Total wellness | | | 2,008 | | | | 2,278 | | | | (10 | ) | | | (12 | ) |
Oral care | | | 1,797 | | | | 1,711 | | | | 8 | | | | 5 | |
Nutrition | | | 1,050 | | | | 1,025 | | | | 8 | | | | 2 | |
Skin health | | | 255 | | | | 261 | | | | (1 | ) | | | (2 | ) |
| | | | 5,110 | | | | 5,275 | | | | – | | | | (3 | ) |
| | | | |
| | | 2012 £m | | | 2011 (restated) £m | | | Growth CER% | | | Growth £% | |
USA | | | 926 | | | | 1,002 | | | | (9 | ) | | | (8 | ) |
Europe | | | 1,796 | | | | 1,997 | | | | (6 | ) | | | (10 | ) |
ROW | | | 2,388 | | | | 2,276 | | | | 9 | | | | 5 | |
| | | | 5,110 | | | | 5,275 | | | | – | | | | (3 | ) |
Consumer Healthcare turnover was flat for the year. Excluding the non-core OTC brands that were divested in early 2012, turnover increased by 5%, reflecting strong growth in Rest of World markets (47% of 2012 sales) of 12%, while the USA, excluding the non-core OTC brands, grew 2% for the year and Europe was flat.
Total wellness
Total wellness sales were down 10% to £2,008 million, but excluding the non-core OTC brands that were divested in early 2012, the category delivered 2% growth despite a number of supply interruptions. Gastro-intestinal health, includingTums andEno, led category growth at 11%. Pain Management, includingPanadol, also registered strong growth of 8% driven by growth in emerging markets. The Smoking reduction and cessation and Respiratory health categories both delivered 4% growth. Sales ofalli declined by 72% as a result of the supply interruption that was not resolved until late in the third quarter of 2012.
Oral care
Oral care sales grew 8% to £1,797 million. TheSensodyne Sensitivity & Acid Erosion was the strongest performing brand, with sales up 15% to £706 million. Strong results from Denture care products also helped to offset a 2% decline inAquafresh sales.
Nutrition
Nutrition sales grew 8%. Family nutrition (Horlicks) grew 14% due to strong growth in India. TheMaxinutrition adult nutrition business delivered 21% sales growth for the year. Strong emerging market growth ofLucozade offset declines in Europe.
Skin health
Skin health sales declined 1% to £255 million. StrongBactroban growth in China and solid results in Lip care (includingAbreva) were offset by a decline in sales ofHinds in Mexico.
Regional performance
Growth in Rest of World markets of 12% excluding the non-core OTC products that were divested in early 2012 was broadly based with strong growth across most categories. In Europe overall growth in Oral care and Wellness brands was almost entirely offset by the loss ofalli sales due to a supply issue. In the USA growth in Oral care, Gastro-intestinal health and Smoking reduction and cessation brands was also significantly offset by a decline inalli sales as a result of the supply interruption.
60 | GSK Annual Report 2012
Financial review
Core results
We use the core reporting basis to manage the performance of the Group and the definition of core results is set out on page 56. A review of the Group’s total results is set out on pages 63 to 64. The reconciliation of total results to core results is presented on page 62.
| | | | | | | | | | | | | | | | | | | | | | | | |
| | | | | | 2012 | | | | | | 2011 | | | | | | Growth | |
| | | £m | | | % of turnover | | | (restated) £m | | | % of turnover | | | CER% | | | £% | |
Turnover | | | 26,431 | | | | 100.0 | | | | 27,387 | | | | 100.0 | | | | (1 | ) | | | (3 | ) |
Cost of sales | | | (7,078 | ) | | | (26.8 | ) | | | (7,259 | ) | | | (26.5 | ) | | | 1 | | | | (2 | ) |
Selling, general and administration | | | (7,855 | ) | | | (29.7 | ) | | | (7,956 | ) | | | (29.1 | ) | | | – | | | | (1 | ) |
Research and development | | | (3,474 | ) | | | (13.1 | ) | | | (3,678 | ) | | | (13.4 | ) | | | (5 | ) | | | (6 | ) |
Royalty income | | | 306 | | | | 1.1 | | | | 309 | | | | 1.1 | | | | – | | | | (1 | ) |
Core operating profit | | | 8,330 | | | | 31.5 | | | | 8,803 | | | | 32.1 | | | | (3 | ) | | | (5 | ) |
| | | | | | |
Net finance costs | | | (724 | ) | | | | | | | (707 | ) | | | | | | | | | | | | |
Share of after tax profits of associates and joint ventures | | | 29 | | | | | | | | 15 | | | | | | | | | | | | | |
Core profit before tax | | | 7,635 | | | | | | | | 8,111 | | | | | | | | (4 | ) | | | (6 | ) |
Taxation | | | (1,864 | ) | | | | | | | (2,104 | ) | | | | | | | | | | | | |
Core profit after tax | | | 5,771 | | | | | | | | 6,007 | | | | | | | | (2 | ) | | | (4 | ) |
Core profit attributable to shareholders | | | 5,536 | | | | | | | | 5,810 | | | | | | | | | | | | | |
Core earnings per share | | | 112.7 | p | | | | | | | 115.5 | p | | | | | | | – | | | | (2 | ) |
Cost of sales
Core cost of sales increased to 26.8% of turnover (2011 – 26.5%). This primarily reflected the impact of lower sales, lower volumes and adverse regional and product mix partially offset by ongoing cost management and one-off royalty and pension adjustments.
Selling, general and administration
Core SG&A costs as a percentage of sales were 29.7% compared with 29.1% in 2011 reflecting flat costs on a turnover decline of 1%. Investments in growth businesses and new product launches as well as additional HGS costs were funded by ongoing cost management and one-off benefits.
Advertising and promotion decreased 4%, Selling and distribution was flat and general administration increased 5%.
Research and development
We remain focused on delivering an improved return on our investment in R&D and sales contribution, reduced attrition and cost reduction are all important drivers of an improving internal rate of return. R&D expenditure is not determined as a percentage of sales, but instead capital is allocated using strict returns based criteria.
The operations of Pharmaceuticals R&D are broadly split into Discovery activities (up to the completion of Phase IIa trials) and Development work (from Phase IIb onwards).
The table below analyses the Group R&D expenditure by these categories:
| | | | | | | | |
| | | 2012 £m | | | 2011 (restated) £m | |
Discovery | | | 800 | | | | 822 | |
Development | | | 1,655 | | | | 1,669 | |
Facilities and central support functions | | | 366 | | | | 477 | |
Pharmaceuticals R&D | | | 2,821 | | | | 2,968 | |
Vaccines R&D | | | 498 | | | | 564 | |
Consumer Healthcare R&D | | | 155 | | | | 146 | |
Core R&D | | | 3,474 | | | | 3,678 | |
Amortisation and impairment of
intangible assets | | | 483 | | | | 234 | |
Major restructuring | | | 11 | | | | 97 | |
Total R&D | | | 3,968 | | | | 4,009 | |
The proportion of Pharmaceuticals R&D investment made in the late-stage portfolio continues to grow from 56% of the total Pharmaceuticals R&D costs in 2011 to 59% in 2012.
Core R&D expenditure declined 5% to £3,474 million (13.1% of turnover) compared with £3,678 million in 2011 (13.4% of turnover). Ongoing cost management, including one-off benefits, and some beneficial phasing effects, more than funded additional HGS costs.
Royalty income
Royalty income was £306 million compared with £309 million in 2011.
Operating profit
Core operating profit was £8,330 million, a 3% decrease in CER terms on a turnover decline of 1% CER. The operating margin declined by 0.6 percentage points to 31.5% compared with the 12 months to December 2011 of which 0.3 percentage points was due to the expected impact of the HGS acquisition. The remaining 0.3 percentage points arose from flat SG&A on lower turnover, partially mitigated by lower R&D expenditure. Operating profit also benefited from a number of one-off items which were recognised in cost of sales, SG&A and R&D including favourable adjustments totalling £395 million related to the capping of future pensionable salary increases and a change in the basis of future discretionary pension increases from RPI to CPI in certain legacy plans.
Core operating profit by business
| | | | | | | | | | | | | | | | | | | | | | | | |
| | | | | | 2012 | | | | | | 2011 | | | | | | Growth | |
| | | £m | | | Margin % | | | (restated) £m | | | Margin % | | | CER% | | | £% | |
Pharmaceuticals | | | 6,622 | | | | 36.8 | | | | 7,155 | | | | 38.4 | | | | (6 | ) | | | (7 | ) |
Vaccines | | | 1,169 | | | | 35.2 | | | | 1,184 | | | | 33.9 | | | | (1 | ) | | | (1 | ) |
Pharmaceuticals and Vaccines | | | 7,791 | | | | 36.5 | | | | 8,339 | | | | 37.7 | | | | (5 | ) | | | (7 | ) |
Consumer Healthcare | | | 938 | | | | 18.4 | | | | 1,084 | | | | 20.5 | | | | (9 | ) | | | (13 | ) |
| | | 8,729 | | | | 33.0 | | | | 9,423 | | | | 34.4 | | | | (5 | ) | | | (7 | ) |
Corporate & other unallocated costs | | | (399 | ) | | | | | | | (620 | ) | | | | | | | (32 | ) | | | (36 | ) |
Core operating profit | | | 8,330 | | | | 31.5 | | | | 8,803 | | | | 32.1 | | | | (3 | ) | | | (5 | ) |
|
| GSK Annual Report 2012 | 61 |
Core operating profit by segment
| | | | | | | | | | | | | | | | | | | | | | | | |
| | | | | | 2012 | | | | | | 2011 | | | Growth | |
| | | £m | | | % of turnover | | | (restated) £m | | | % of turnover | | | CER% | | | £% | |
Pharmaceuticals and Vaccines | | | | | | | | | | | | | | | | | | | | | | | | |
USA | | | 4,786 | | | | 68.4 | | | | 4,646 | | | | 66.2 | | | | 1 | | | | 3 | |
Europe | | | 2,629 | | | | 52.6 | | | | 3,154 | | | | 55.3 | | | | (11 | ) | | | (17 | ) |
EMAP | | | 1,564 | | | | 33.0 | | | | 1,481 | | | | 33.2 | | | | 9 | | | | 6 | |
Japan | | | 1,179 | | | | 59.9 | | | | 1,249 | | | | 60.0 | | | | (7 | ) | | | (6 | ) |
ViiV Healthcare | | | 849 | | | | 61.8 | | | | 882 | | | | 56.2 | | | | – | | | | (4 | ) |
Pharmaceutical R&D | | | (2,778 | ) | | | | | | | (2,801 | ) | | | | | | | (1 | ) | | | (1 | ) |
Other trading and unallocated pharmaceuticals | | | (438 | ) | | | (35.3 | ) | | | (272 | ) | | | (21.5 | ) | | | 75 | | | | 61 | |
Pharmaceuticals and Vaccines | | | 7,791 | | | | 36.5 | | | | 8,339 | | | | 37.7 | | | | (5 | ) | | | (7 | ) |
Consumer Healthcare | | | 938 | | | | 18.4 | | | | 1,084 | | | | 20.5 | | | | (9 | ) | | | (13 | ) |
| | | 8,729 | | | | 33.0 | | | | 9,423 | | | | 34.4 | | | | (5 | ) | | | (7 | ) |
Corporate & other unallocated costs | | | (399 | ) | | | | | | | (620 | ) | | | | | | | (32 | ) | | | (36 | ) |
Core operating profit | | | 8,330 | | | | 31.5 | | | | 8,803 | | | | 32.1 | | | | (3 | ) | | | (5 | ) |
The decline in the Pharmaceuticals and Vaccines core operating margin primarily reflects the changing regional mix of the businesses towards lower margin markets. The decline in Consumer Healthcare core operating margin primarily reflects the decline in sales following the disposal of the non-core OTC brands during the year.
Net finance costs
| | | | | | | | |
| Finance income | | 2012 £m | | | 2011 £m | |
Interest and other income | | | 77 | | | | 90 | |
Fair value movements | | | 2 | | | | – | |
| | | | 79 | | | | 90 | |
| | |
Finance expense | | | | | | | | |
Interest expense | | | (745 | ) | | | (744 | ) |
Unwinding of discounts on liabilities | | | (10 | ) | | | (10 | ) |
Remeasurements and fair value movements | | | (24 | ) | | | (23 | ) |
Other finance expense | | | (24 | ) | | | (20 | ) |
| | | | (803 | ) | | | (797 | ) |
Despite an increase in net debt of £5.0 billion in 2012, net finance expense for the year was broadly similar to 2011 at £724 million, reflecting the benefits of our strategy to improve the funding profile of the Group.
The target to reduce the average effective annual net funding ratio by approximately 200 basis points to around 6% in 2013 has been achieved one-year earlier than planned.
Net debt increased by £5.0 billion in the twelve months primarily due to payments of £1.9 billion to settle the Group’s most significant ongoing US federal government investigations within existing provisions and the £2.0 billion cash cost of the acquisition of HGS. The balance, as well as the Group’s strong cash generation and the proceeds from the disposal of the Consumer Healthcare OTC brands enabled the financing of share repurchases of £2.5 billion and increased dividend payments of £3.8 billion.
Share of after tax profits of associates and joint ventures
The share of after tax profits of associates of £29 million (2011 – £15 million) principally arose from the Group’s holdings in Aspen Pharmacare.
Profit before taxation
Taking account of net finance costs, the profit on disposal of interest in associates and the share of profits in associates, profit before taxation was £7,635 million compared with £8,111 million in 2011, a 4% CER decline and a 6% decline in sterling terms.
Taxation
Tax on core profit amounted to £1,864 million and represented an effective core tax rate of 24.4% (2011 – 25.9%), meeting the target core rate of 25% two years ahead of expectations. GSK is now targeting a core tax rate of around 24% for the full year 2013.
GSK continues to believe that it has made adequate provision for the liabilities likely to arise from periods which are open and not yet agreed by tax authorities. The ultimate liability for such matters may vary from the amounts provided and is dependent upon the outcome of agreements with relevant tax authorities or litigation.
Earnings per share
Core earnings per share of 112.7 pence was flat in CER terms and down 2% at actual rates. The currency impact reflected the strengthening of Sterling against the Euro and a number of other currencies, partially offset by the weakening of Sterling against the US dollar and the Japanese Yen.
Dividend
The Board declared four interim dividends resulting in a dividend for the year of 74 pence, a 4 pence increase on the ordinary dividends for 2011. In 2011, the Board also declared a supplemental interim dividend of 5 pence per share related to the disposal of certain non-core OTC brands in North America. See Note 16 ‘Dividends’ on page 163.
Revision of IAS 19 ‘Employee benefits’
IAS 19 (Revised) will be implemented by GSK from 1 January 2013. The main effect will be that the expected returns on pension scheme assets will no longer be recognised in the income statement. Expected returns will be replaced by income calculated using the same discount rate as that used to measure the pension obligations. This discount rate is based on market rates for high quality corporate bonds. As a consequence, pension scheme costs will be higher under IAS 19 (Revised). For 2013 reporting, the results for 2012 will be restated retrospectively, and the effect of the change, on 2012 results, would have been to reduce core operating profit for the year by approximately £92 million and core EPS by approximately 1.3p to 111.4p. It is estimated that core operating profit in 2013 will be reduced by approximately £160 million and core EPS by approximately 2.5p by the change.
62 | GSK Annual Report 2012
Financial review
Core results reconciliation – 31 December 2012
| | | | | | | | | | | | | | | | | | | | | | | | | | | | | | | | |
| | | Core results £m | | | Intangible amortisation £m | | | Intangible impairment £m | | | Major restructuring £m | | | Legal charges £m | | | Other operating income £m | | | Acquisition adjust- ments £m | | | Total results £m | |
Turnover | | | 26,431 | | | | | | | | | | | | | | | | | | | | | | | | | | | | 26,431 | |
Cost of sales | | | (7,078 | ) | | | (378 | ) | | | (309 | ) | | | (128 | ) | | | | | | | | | | | (1 | ) | | | (7,894 | ) |
Gross profit | | | 19,353 | | | | (378 | ) | | | (309 | ) | | | (128 | ) | | | | | | | | | | | (1 | ) | | | 18,537 | |
| | | | | | | | |
Selling, general and administration | | | (7,855 | ) | | | | | | | | | | | (418 | ) | | | (436 | ) | | | (2 | ) | | | (28 | ) | | | (8,739 | ) |
Research and development | | | (3,474 | ) | | | (99 | ) | | | (384 | ) | | | (11 | ) | | | | | | | | | | | | | | | (3,968 | ) |
Royalty income | | | 306 | | | | | | | | | | | | | | | | | | | | | | | | | | | | 306 | |
Other operating income | | | | | | | | | | | | | | | | | | | | | | | 1,256 | | | | | | | | 1,256 | |
Operating profit | | | 8,330 | | | | (477 | ) | | | (693 | ) | | | (557 | ) | | | (436 | ) | | | 1,254 | | | | (29 | ) | | | 7,392 | |
| | | | | | | | |
Net finance costs | | | (724 | ) | | | | | | | | | | | (1 | ) | | | | | | | | | | | (4 | ) | | | (729 | ) |
Share of after tax profits of associates and joint ventures | | | 29 | | | | | | | | | | | | | | | | | | | | | | | | | | | | 29 | |
Profit before taxation | | | 7,635 | | | | (477 | ) | | | (693 | ) | | | (558 | ) | | | (436 | ) | | | 1,254 | | | | (33 | ) | | | 6,692 | |
| | | | | | | | |
Taxation | | | (1,864 | ) | | | 145 | | | | 196 | | | | (285 | ) | | | 150 | | | | (290 | ) | | | | | | | (1,948 | ) |
Tax rate | | | 24.4 | % | | | | | | | | | | | | | | | | | | | | | | | | | | | 29.1 | % |
Profit after taxation | | | 5,771 | | | | (332 | ) | | | (497 | ) | | | (843 | ) | | | (286 | ) | | | 964 | | | | (33 | ) | | | 4,744 | |
| | | | | | | | |
Profit attributable to non-controlling interests | | | 235 | | | | | | | | (136 | ) | | | 10 | | | | | | | | 70 | | | | | | | | 179 | |
Profit attributable to shareholders | | | 5,536 | | | | (332 | ) | | | (361 | ) | | | (853 | ) | | | (286 | ) | | | 894 | | | | (33 | ) | | | 4,565 | |
| | | | | | | | |
Earnings per share | | | 112.7 | p | | | (6.8 | )p | | | (7.3 | )p | | | (17.4 | )p | | | (5.8 | )p | | | 18.2 | p | | | (0.7 | )p | | | 92.9 | p |
| | | | | | | | |
Weighted average number of shares (millions) | | | 4,912 | | | | | | | | | | | | | | | | | | | | | | | | | | | | 4,912 | |
Core results reconciliation – 31 December 2011 | |
| | | Core results £m | | | Intangible amortisation £m | | | Intangible impairment £m | | | Major restructuring £m | | | Legal charges £m | | | Other operating income £m | | | Acquisition adjust- ments £m | | | Total results (restated) £m | |
Turnover | | | 27,387 | | | | | | | | | | | | | | | | | | | | | | | | | | | | 27,387 | |
Cost of sales | | | (7,259 | ) | | | (304 | ) | | | (12 | ) | | | (73 | ) | | | | | | | | | | | | | | | (7,648 | ) |
Gross profit | | | 20,128 | | | | (304 | ) | | | (12 | ) | | | (73 | ) | | | | | | | | | | | | | | | 19,739 | |
| | | | | | | | |
Selling, general and administration | | | (7,956 | ) | | | | | | | | | | | (397 | ) | | | (157 | ) | | | | | | | | | | | (8,510 | ) |
Research and development | | | (3,678 | ) | | | (137 | ) | | | (97 | ) | | | (97 | ) | | | | | | | | | | | | | | | (4,009 | ) |
Royalty income | | | 309 | | | | | | | | | | | | | | | | | | | | | | | | | | | | 309 | |
Other operating income | | | – | | | | | | | | | | | | (23 | ) | | | | | | | 301 | | | | | | | | 278 | |
Operating profit | | | 8,803 | | | | (441 | ) | | | (109 | ) | | | (590 | ) | | | (157 | ) | | | 301 | | | | | | | | 7,807 | |
| | | | | | | | |
Net finance costs | | | (707 | ) | | | | | | | | | | | (2 | ) | | | | | | | | | | | | | | | (709 | ) |
Profit on disposal of interests in associates | | | – | | | | | | | | | | | | | | | | | | | | 585 | | | | | | | | 585 | |
Share of after tax profits of associates and joint ventures | | | 15 | | | | | | | | | | | | | | | | | | | | | | | | | | | | 15 | |
Profit before taxation | | | 8,111 | | | | (441 | ) | | | (109 | ) | | | (592 | ) | | | (157 | ) | | | 886 | | | | | | | | 7,698 | |
| | | | | | | | |
Taxation | | | (2,104 | ) | | | 137 | | | | 41 | | | | 114 | | | | 22 | | | | (450 | ) | | | | | | | (2,240 | ) |
Tax rate | | | 25.9 | % | | | | | | | | | | | | | | | | | | | | | | | | | | | 29.1 | % |
Profit after taxation | | | 6,007 | | | | (304 | ) | | | (68 | ) | | | (478 | ) | | | (135 | ) | | | 436 | | | | | | | | 5,458 | |
| | | | | | | | |
Profit attributable to non-controlling interests | | | 197 | | | | | | | | | | | | | | | | | | | | | | | | | | | | 197 | |
Profit attributable to shareholders | | | 5,810 | | | | (304 | ) | | | (68 | ) | | | (478 | ) | | | (135 | ) | | | 436 | | | | | | | | 5,261 | |
| | | | | | | | |
Earnings per share | | | 115.5 | p | | | (6.0 | )p | | | (1.4 | )p | | | (9.5 | )p | | | (2.7 | )p | | | 8.7 | p | | | | | | | 104.6 | p |
| | | | | | | | |
Weighted average number of shares (millions) | | | 5,028 | | | | | | | | | | | | | | | | | | | | | | | | | | | | 5,028 | |
|
| GSK Annual Report 2012 | 63 |
Total results
| | | | | | | | | | | | | | | | | | | | | | | | |
| | | | | | 2012 | | | | | | 2011 | | | | | | Growth | |
| | | £m | | | % of turnover | | | (restated) £m | | | % of turnover | | | CER% | | | £% | |
Turnover | | | 26,431 | | | | 100 | | | | 27,387 | | | | 100 | | | | (1 | ) | | | (3 | ) |
Cost of sales | | | (7,894 | ) | | | (29.9 | ) | | | (7,648 | ) | | | (27.9 | ) | | | 6 | | | | 3 | |
Selling, general and administration | | | (8,739 | ) | | | (33.1 | ) | | | (8,510 | ) | | | (31.1 | ) | | | 4 | | | | 3 | |
Research and development | | | (3,968 | ) | | | (15.0 | ) | | | (4,009 | ) | | | (14.6 | ) | | | (1 | ) | | | (1 | ) |
Royalty income | | | 306 | | | | 1.2 | | | | 309 | | | | 1.1 | | | | – | | | | (1 | ) |
Other operating income | | | 1,256 | | | | 4.8 | | | | 278 | | | | 1.0 | | | | >100 | | | | >100 | |
Operating profit | | | 7,392 | | | | 28.0 | | | | 7,807 | | | | 28.5 | | | | (3 | ) | | | (5 | ) |
Net finance costs | | | (729 | ) | | | | | | | (709 | ) | | | | | | | | | | | | |
Profit on disposal of interest in associates | | | – | | | | | | | | 585 | | | | | | | | | | | | | |
Share of after tax profits of associates and joint ventures | | | 29 | | | | | | | | 15 | | | | | | | | | | | | | |
Profit before taxation | | | 6,692 | | | | | | | | 7,698 | | | | | | | | (11 | ) | | | (13 | ) |
Taxation | | | (1,948 | ) | | | | | | | (2,240 | ) | | | | | | | | | | | | |
Total profit after taxation for the year | | | 4,744 | | | | | | | | 5,458 | | | | | | | | (11 | ) | | | (13 | ) |
Total profit attributable to shareholders | | | 4,565 | | | | | | | | 5,261 | | | | | | | | | | | | | |
Earnings per share (p) | | | 92.9 | | | | | | | | 104.6 | | | | | | | | (9 | ) | | | (11 | ) |
Earnings per ADS (US$) | | | $2.95 | | | | | | | | $3.37 | | | | | | | | | | | | | |
Cost of sales
Cost of sales increased to 29.9% of turnover (2011 – 27.9%). This primarily reflected the impact of lower sales, higher intangible asset impairments, lower volumes, higher restructuring costs and adverse regional and product mix partially offset by ongoing cost management and one-off royalty and pension adjustments.
Selling, general and administration
SG&A costs as a percentage of sales were 33.1% compared with 31.1% in 2011 reflecting a 4% increase in costs on a turnover decline of 1%. Investments in growth businesses and new product launches, higher legal and restructuring charges as well as additional HGS costs were partly offset by ongoing cost management and one-off benefits.
Advertising and promotion decreased 4%, Selling and distribution decreased 2% and general and administration increased 17%, primarily reflecting increased legal costs in the year.
Research and development
R&D expenditure declined 1% to £3,968 million (15.0% of turnover) compared with £4,009 million in 2011 (14.6% of turnover). Ongoing cost management, including one-off benefits, lower restructuring and some beneficial phasing effects, more than offset additional HGS costs and higher intangible asset impairments.
Other operating income
Other operating income of £1,256 million (2011 – £278 million) included the profit on disposal of the non-core OTC brands of £559 million and the non-cash gains of £582 million arising on the settlement of pre-existing collaborations as part of the HGS and ViiV Healthcare/Shionogi joint venture acquisitions.
Operating profit
Total operating profit was £7,392 million, a 3% decrease in CER terms on a turnover decline of 1% CER. The operating margin decreased by 0.5 percentage points to 28.0% compared with the 12 months to December 2011 of which 0.3 percentage points was due to the expected impact of the HGS acquisition. The remaining 0.2 percentage points arose from a 4% growth in SG&A on lower turnover, partially mitigated by lower R&D expenditure and higher other operating income. Operating profit also benefited from a number of one-off items which were recognised in cost of sales, SG&A and R&D including favourable adjustments totalling £395 million related to the capping of future pensionable salary increases and a change in the basis of future discretionary pension increases from RPI to CPI in certain legacy plans.
At the operating profit level the non-core charges totalled £938 million in the year (2011 – £996 million).
The intangible asset amortisation of £477 million (2011 – £441 million) included £39 million related to the amortisation of theBenlysta intangible asset acquired as part of the HGS acquisition.
Intangible asset impairment charges of £693 million (2011 – £109 million) included the impairments of Horizant,alli and the ViiV Healthcare compound, lersivirine, totalling £491 million. Major restructuring charges of £557 million (2011 – £590 million) included £165 million related to the acquisition of HGS and other charges arising from the Operational Excellence programme.
Legal charges were £436 million (2011 – £157 million). Various Federal government investigations were resolved in Q2 2012 within the existing pre-tax provision and the after tax cost was approximately $150 million lower than provided. As a result, a credit was recorded as a non-core tax charge in Q2 2012. However, due to the evolving state litigation environment, GSK utilised the tax benefit arising in recording an offsetting additional pre-tax provision of approximately $180 million (equating to an after tax cost of $150 million) related to these matters. This was recorded as a non-core legal charge in SG&A in Q2 2012. The net effect of these movements on total earnings was neutral. Other legal charges of £323 million principally related to provisions for existing product liability and anti-trust matters.
Other operating income of £1,254 million (2011: £301 million) included the profit on disposal of the non-core OTC brands of £559 million and the non-cash gains of £582 million arising on the settlement of pre-existing collaborations as part of the HGS and Shionogi-ViiV Healthcare joint venture acquisitions. Acquisition accounting adjustments of £29 million (2011 – £nil) relate to the acquisition of HGS. All acquisition accounting related adjustments related to this acquisition will be reported as non-core items.
Net finance costs
| | | | | | | | |
| Finance income | | 2012 £m | | | 2011 £m | |
Interest and other finance income | | | 77 | | | | 90 | |
Fair value movements | | | 2 | | | | – | |
| | | | 79 | | | | 90 | |
| | |
Finance expense | | | | | | | | |
Interest expense | | | (745 | ) | | | (744 | ) |
Unwinding of discounts on liabilities | | | (15 | ) | | | (12 | ) |
Remeasurements and fair value movements | | | (24 | ) | | | (23 | ) |
Other finance expense | | | (24 | ) | | | (20 | ) |
| | | | (808 | ) | | | (799 | ) |
Despite an increase in net debt of £5.0 billion in 2012, net finance expense for the year was broadly similar to 2011 at £729 million, reflecting the benefits of our strategy to improve the funding profile of the Group.
64 | GSK Annual Report 2012
Financial review
Profit on disposal of interest in associates
The pre-tax profit on disposal of interest in associates was £nil, compared with £585 million in 2011, reflecting the disposal of the remaining shares in Quest Diagnostics in 2011.
Share of after tax profits of associates and joint ventures
The share of after tax profits of associates of £29 million (2011 – £15 million) principally arose from the Group’s holdings in Aspen Pharmacare.
Profit before taxation
Taking account of net finance costs, the profit on disposal of interest in associates and the share of profits of associates, profit before taxation was £6,692 million compared with £7,698 million in 2011, a 11% CER decline and a 13% decline in sterling terms.
Taxation
| | | | | | | | |
| | | 2012 £m | | | 2011 £m | |
UK corporation tax at the UK statutory rate | | | 365 | | | | 647 | |
Less double taxation relief | | | (180 | ) | | | (164 | ) |
| | | 185 | | | | 483 | |
Overseas taxation | | | 1,521 | | | | 1,603 | |
Current taxation | | | 1,706 | | | | 2,086 | |
Deferred taxation | | | 242 | | | | 154 | |
Taxation on total profits | | | 1,948 | | | | 2,240 | |
The charge for taxation on total profits amounted to £1,948 million and represented an effective tax rate of 29.1% (2011 – 29.1%). The Group’s balance sheet at 31 December 2012 included a tax payable liability of £1,374 million and a tax recoverable asset of £103 million.
Within the tax charge on non-core items there is a charge of £420 million, comprising predominantly deferred tax and hence non-cash, relating to centralisation of our Pharmaceutical intellectual property and product inventory ownership into the UK. This restructuring of our trading arrangements and increased investment in the UK reflects terms that GSK has agreed to in discussions with various tax authorities and has been facilitated by the introduction of the UK Patent Box rules. In particular, we have agreed to enter into a bilateral Advance Pricing Agreement with the Internal Revenue Service in the USA and HM Revenue & Customs in the UK, which will give us considerable certainty over our future tax affairs. The restructuring will simplify our business and internal trading arrangements by substantially decreasing administrative complexity and will deliver supply chain and working capital efficiencies. There will be non-core, non-cash tax charges totalling approximately £600 million over the next two years arising from the unwinding of deferred profit in inventory, as existing inventory produced prior to the restructuring leaves the supply chain.
We continue to believe that we have made adequate provision for the liabilities likely to arise from periods which are open and not yet agreed by tax authorities. The ultimate liability for such matters may vary from the amounts provided and is dependent upon the outcome of agreements with relevant tax authorities or litigation.
Earnings per share
Total earnings per share was 92.9p for the year, compared with 104.6p in 2011 and non-core charges totalled 19.8p (2011 – 10.9p). Non-core items included a tax charge of £420 million (8.6p) arising from the centralisation of Pharmaceutical intellectual property and product inventory ownership in the UK. Transactions completed in 2012 resulted in a number of significant non-cash accounting entries. However, these largely offset each other.
Critical accounting policies
The consolidated financial statements are prepared in accordance with IFRS, as adopted for use in the European Union, and also with IFRS as issued by the IASB, following the accounting policies approved by the Board and described in Note 2 to the financial statements, ‘Accounting principles and policies’. We are required to make estimates and assumptions that affect the amounts of assets, liabilities, revenue and expenses reported in the financial statements. Actual amounts and results could differ from those estimates.
The critical accounting policies, for which information on the judgements and estimates made is given in Note 3 to the financial statements, ‘Key accounting judgements and estimates’, and in the relevant detailed notes to the financial statements as indicated below, relate to the following areas:
| • | | Legal and other disputes (Notes 29 and 44) |
| • | | Property, plant & equipment (Note 17) |
| • | | Other intangible assets (Note 19) |
| • | | Pensions and other post-employment benefits (Note 28). |
Information on the judgements and estimates made in these areas is given in Note 3 to the financial statements, ‘Key accounting judgements and estimates’.
Turnover
In respect of the Turnover accounting policy, our largest business is US Pharmaceuticals and Vaccines, and the US market has the most complex arrangements for rebates, discounts and allowances. The following briefly describes the nature of the arrangements in existence in our US Pharmaceuticals and Vaccines business:
| • | | We have arrangements with certain indirect customers whereby the customer is able to buy products from wholesalers at reduced prices. A chargeback represents the difference between the invoice price to the wholesaler and the indirect customer’s contractual discounted price. Accruals for estimating chargebacks are calculated based on the terms of each agreement, historical experience and product growth rates |
| • | | Customer rebates are offered to key managed care and group purchasing organisations (GPO) and other direct and indirect customers. These arrangements require the customer to achieve certain performance targets relating to the value of product purchased, formulary status or pre-determined market shares relative to competitors. The accrual for customer rebates is estimated based on the specific terms in each agreement, historical experience and product growth rates |
| • | | The US Medicaid programme is a state-administered programme providing assistance to certain poor and vulnerable patients. In 1990, the Medicaid Drug Rebate Program was established to reduce state and federal expenditure on prescription drugs. In 2010, the Patient and Affordable Care Act became law. We participate by providing rebates to states. Accruals for Medicaid rebates are calculated based on the specific terms of the relevant regulations or the Patient and Affordable Care Act |
|
| GSK Annual Report 2012 | 65 |
| • | | Cash discounts are offered to customers to encourage prompt payment. These are accrued for at the time of invoicing and adjusted subsequently to reflect actual experience |
| • | | We record an accrual for estimated sales returns by applying historical experience of customer returns to the amounts invoiced, together with market related information such as stock levels at wholesalers, anticipated price increases and competitor activity. |
A reconciliation of gross turnover to net turnover for the US Pharmaceuticals and Vaccines business is as follows:
| | | | | | | | | | | | | | | | | | | | | | | | |
| | | | | | 2012 | | | | | | 2011 | | | | | | 2010 | |
| | | £m | | | Margin % | | | £m (restated) | | | Margin % | | | £m (restated) | | | % | |
Gross turnover | | | 9,758 | | | | 100 | | | | 9,770 | | | | 100 | | | | 10,783 | | | | 100 | |
| | | | | | |
Market driven segments | | | (1,121 | ) | | | (11 | ) | | | (1,012 | ) | | | (10 | ) | | | (1,044 | ) | | | (10 | ) |
Government mandated and state programs | | | (1,377 | ) | | | (14 | ) | | | (1,394 | ) | | | (14 | ) | | | (1,592 | ) | | | (15 | ) |
Cash discounts | | | (177 | ) | | | (2 | ) | | | (176 | ) | | | (2 | ) | | | (193 | ) | | | (2 | ) |
Customer returns | | | (147 | ) | | | (1 | ) | | | (105 | ) | | | (1 | ) | | | (180 | ) | | | (1 | ) |
Prior year adjustments | | | 129 | | | | 1 | | | | 94 | | | | 1 | | | | 38 | | | | – | |
Other items | | | (65 | ) | | | (1 | ) | | | (155 | ) | | | (2 | ) | | | (183 | ) | | | (1 | ) |
Total deductions | | | (2,758 | ) | | | (28 | ) | | | (2,748 | ) | | | (28 | ) | | | (3,154 | ) | | | (29 | ) |
Net turnover | | | 7,000 | | | | 72 | | | | 7,022 | | | | 72 | | | | 7,629 | | | | 71 | |
Market driven segments consist primarily of Managed Care and Medicare plans with which GSK negotiates contract pricing that is honoured via rebates and chargebacks. Mandated segments consist primarily of Medicaid and Federal government programs which receive government mandated pricing via rebates and chargebacks.
The total balance sheet accruals for rebates, discounts, allowances and returns in the US Pharmaceuticals and Vaccines business at 31 December 2012 and 31 December 2011 were as follows:
| | | | | | | | |
| | | At 31 December 2012 £m | | | At 31 December 2011 £m | |
Chargebacks | | | 30 | | | | 43 | |
Managed care, Medicare
Part D and GPO rebates | | | 390 | | | | 372 | |
US government and state programmes | | | 529 | | | | 578 | |
Cash discounts | | | 21 | | | | 18 | |
Customer returns | | | 217 | | | | 234 | |
Other | | | 23 | | | | 24 | |
Total | | | 1,210 | | | | 1,269 | |
A monthly process is operated to monitor inventory levels at wholesalers for any abnormal movements. This process uses gross sales volumes, prescription volumes based on third party data sources and information received from key wholesalers. The aim of this is to maintain inventories at a consistent level from year to year based on the pattern of consumption.
On this basis, US Pharmaceuticals and Vaccines inventory levels at wholesalers and in other distribution channels at 31 December 2012 were estimated to amount to approximately one month of turnover. This calculation uses third party information, the accuracy of which cannot be totally verified, but is believed to be sufficiently reliable for this purpose.
Legal and other disputes
In respect of the accounting policy for Legal and other disputes, the following briefly describes the process by which we determine the level of provision that is necessary.
In accordance with the requirements of IAS 37, ‘Provisions, contingent liabilities and contingent assets’, we provide for anticipated settlement costs where an outflow of resources is considered probable and a reliable estimate may be made of the likely outcome of the dispute and legal and other expenses arising from claims against the Group. We may become involved in significant legal proceedings, in respect of which it is not possible to make a reliable estimate of the expected financial effect, if any, that could result from ultimate resolution of the proceedings. In these cases, appropriate disclosure about such cases would be included in the Annual Report, but no provision would be made.
This position could change over time and, therefore, there can be no assurance that any losses that result from the outcome of any legal proceedings will not exceed by a material amount the amount of the provisions reported in the Group’s financial statements.
Like many pharmaceutical companies, we are faced with various complex product liability, anti-trust and patent litigation, as well as investigations of its operations conducted by various governmental regulatory agencies. Throughout the year, the General Counsel of the Group, as head of the Group’s legal function, and the Senior Vice President and Head of Global Litigation for the Group, who is responsible for all litigation and government investigations, routinely brief the Chief Executive Officer, the Chief Financial Officer and the Board of Directors on the significant litigation pending against the Group and governmental investigations of the Group.
These meetings, as appropriate, detail the status of significant litigation and governmental investigations and review matters such as the number of claims notified to us, information on potential claims not yet notified, assessment of the validity of claims, progress made in settling claims, recent settlement levels and potential reimbursement by insurers.
The meetings also include an assessment of whether or not there is sufficient information available for us to be able to make a reliable estimate of the potential outcomes of the disputes. Often, external counsel assisting us with various litigation matters and investigations will also assist in the briefing of the Board and senior management. Following these discussions, for those matters where it is possible to make a reliable estimate of the amount of a provision, if any, that may be required, the level of provision for legal and other disputes is reviewed and adjusted as appropriate.
66 | GSK Annual Report 2012
Financial review
Financial position and resources
| | | | | | | | |
| | |
| | | 2012 £m | | | 2011 £m | |
Assets | | | | | | | | |
Non-current assets | | | | | | | | |
Property, plant and equipment | | | 8,776 | | | | 8,748 | |
Goodwill | | | 4,359 | | | | 3,754 | |
Other intangible assets | | | 10,161 | | | | 7,802 | |
Investments in associates and joint ventures | | | 579 | | | | 560 | |
Other investments | | | 787 | | | | 590 | |
Deferred tax assets | | | 2,385 | | | | 2,849 | |
Derivative financial instruments | | | 54 | | | | 85 | |
Other non-current assets | | | 682 | | | | 525 | |
Total non-current assets | | | 27,783 | | | | 24,913 | |
| | |
Current assets | | | | | | | | |
Inventories | | | 3,969 | | | | 3,873 | |
Current tax recoverable | | | 103 | | | | 85 | |
Trade and other receivables | | | 5,242 | | | | 5,576 | |
Derivative financial instruments | | | 49 | | | | 70 | |
Liquid investments | | | 81 | | | | 184 | |
Cash and cash equivalents | | | 4,184 | | | | 5,714 | |
Assets held for sale | | | 64 | | | | 665 | |
Total current assets | �� | | 13,692 | | | | 16,167 | |
Total assets | | | 41,475 | | | | 41,080 | |
| | |
Liabilities | | | | | | | | |
Current liabilities | | | | | | | | |
Short-term borrowings | | | (3,631 | ) | | | (2,698 | ) |
Trade and other payables | | | (8,054 | ) | | | (7,359 | ) |
Derivative financial instruments | | | (63 | ) | | | (175 | ) |
Current tax payable | | | (1,374 | ) | | | (1,643 | ) |
Short-term provisions | | | (693 | ) | | | (3,135 | ) |
Total current liabilities | | | (13,815 | ) | | | (15,010 | ) |
| | |
Non-current liabilities | | | | | | | | |
Long-term borrowings | | | (14,671 | ) | | | (12,203 | ) |
Deferred tax liabilities | | | (1,004 | ) | | | (822 | ) |
Pensions and other post-employment benefits | | | (3,105 | ) | | | (3,091 | ) |
Other provisions | | | (699 | ) | | | (499 | ) |
Derivative financial instruments | | | (2 | ) | | | (2 | ) |
Other non-current liabilities | | | (1,432 | ) | | | (626 | ) |
Total non-current liabilities | | | (20,913 | ) | | | (17,243 | ) |
Total liabilities | | | (34,728 | ) | | | (32,253 | ) |
Net assets | | | 6,747 | | | | 8,827 | |
| | |
Equity | | | | | | | | |
Share capital | | | 1,349 | | | | 1,387 | |
Share premium account | | | 2,022 | | | | 1,673 | |
Retained earnings | | | 652 | | | | 3,370 | |
Other reserves | | | 1,787 | | | | 1,602 | |
Shareholders’ equity | | | 5,810 | | | | 8,032 | |
Non-controlling interests | | | 937 | | | | 795 | |
| | |
Total equity | | | 6,747 | | | | 8,827 | |
Property, plant and equipment
Our business is science-based, technology-intensive and highly regulated by governmental authorities. We allocate significant financial resources to the renewal and maintenance of its property, plant and equipment to minimise risks of interruption of production and to achieve compliance with regulatory standards. A number of its processes use chemicals and hazardous materials.
The total cost of our property, plant and equipment at 31 December 2012 was £18,742 million, with a net book value of £8,776 million. Of this, land and buildings represented £4,043 million, plant and equipment £2,854 million and assets in construction £1,879 million. In 2012, we invested £1,165 million in new and renewal property, plant and equipment. This is mainly related to a large number of projects for the renewal, improvement and expansion of facilities at various worldwide sites. Property is mainly held freehold. New investment is financed from our liquid resources. At 31 December 2012, we had capital contractual commitments for future expenditure of £572 million and operating lease commitments of £849 million. We believe that our facilities are adequate for our current needs.
We observe stringent procedures and use specialist skills to manage environmental risks from these activities. Environmental issues, sometimes dating from operations now modified or discontinued, are reported under ‘Environmental sustainability’ on page 54 and in Note 44 to the financial statements, ‘Legal proceedings’.
Goodwill
Goodwill increased during the year to £4,359 million at December 2012, from £3,754 million. The increase primarily reflects the goodwill arising on the acquisition of HGS of £791 million, partly offset by a weakening of overseas currencies.
Other intangible assets
Other intangible assets include the cost of intangibles acquired from third parties and computer software. The net book value of other intangible assets as at 31 December 2012 was £10,161 million (2011 – £7,802 million). The increase in 2012 reflected assets acquired from the acquisition of HGS of £1,249 million and from the acquisition of the global rights to the Shionogi – ViiV Healthcare LLC joint venture assets of £1,777 million, partly offset by the amortisation and impairment of existing intangibles.
Investments
We held investments, including associates and joint ventures, with a carrying value at 31 December 2012 of £1,366 million (2011 – £1,150 million). The market value at 31 December 2012 was £1,968 million (2011 – £1,355 million). The largest of these investments are in an associate, Aspen Pharmacare Holdings Limited, which had a book value at 31 December 2012 of £430 million (2011 – £393 million) and an investment in Theravance, Inc. which had a book value at 31 December 2012 of £362 million (2011 – £226 million). The investments include equity stakes in companies where the Group has research collaborations, which provide access to biotechnology developments of potential interest and interests in companies that arise from business divestments.
|
| GSK Annual Report 2012 | 67 |
Derivative financial instruments: assets
We had both non-current and current derivative financial instruments held at fair value of £103 million (2011 – £155 million). The majority of this amount relates to interest rate swaps and foreign exchange contracts designated as accounting hedges.
Inventories
Inventory of £3,969 million has increased by £96 million during the year. The increase reflects the impact of the acquisition of HGS together with higher Vaccine stocks, partly offset by initiatives to reduce manufacturing cycle times and reduce stockholding days through more efficient use of inventory throughout the supply chain.
Trade and other receivables
Trade and other receivables of £5,242 million have decreased from 2011 reflecting specific actions taken to reduce overdue and other receivables as part of our initiative to reduce working capital.
Derivative financial instruments: liabilities
We held current and non-current derivative financial instruments held at fair value of £65 million (2011 – £177 million) relating primarily to foreign exchange contracts which represent hedges of inter-company loans and deposits, external debt and legal provisions, but are not designated as accounting hedges.
Trade and other payables
Trade and other payables amounting to £8,054 million have increased from £7,359 million in 2011, reflecting the amount payable to non-controlling shareholders in GSK Consumer Healthcare Ltd. in India under the offer to purchase additional shares and also the benefits of our working capital initiatives.
Provisions
We carried deferred tax provisions and other short-term and non-current provisions of £2,396 million at 31 December 2012 (2011 – £4,456 million) in respect of estimated future liabilities, of which £527 million (2011 – £2,772 million) related to legal and other disputes. Provision has been made for legal and other disputes, indemnified disposal liabilities, employee related liabilities and the costs of restructuring programmes to the extent that at the balance sheet date a legal or constructive obligation existed and could be reliably estimated.
Pensions and other post-employment benefits
We account for pension and other post-employment arrangements in accordance with IAS 19. The deficits, net of surpluses before allowing for deferred taxation were £1,313 million (2011 – £1,476 million) on pension arrangements and £1,668 million (2011 – £1,595 million) on unfunded post-employment liabilities.
The pension liabilities decreased following an increase in asset values in the UK, deficit reduction contributions of £368 million (2011 – £450 million) and the one-off adjustments to the UK pension obligations made during the year, partly offset by reductions in the rates used to discount UK pension liabilities from 4.8% to 4.4% and US pension liabilities from 4.4% to 3.8%.
In December 2010, the UK scheme purchased an insurance contract that will guarantee payment of specified pensioner liabilities. This contract was valued at £751 million at 31 December 2012.
Net debt
| | | | | | | | |
| | | 2012 £m | | | 2011 £m | |
Cash, cash equivalents and liquid investments | | | 4,265 | | | | 5,898 | |
Borrowings – repayable within one year | | | (3,631 | ) | | | (2,698 | ) |
Borrowings – repayable after one year | | | (14,671 | ) | | | (12,203 | ) |
Net debt | | | (14,037 | ) | | | (9,003 | ) |
Net debt increased by £5,034 million and reflected the acquisition of HGS for £2,031 million, net of cash acquired, together with the legal settlements in the year of £2,610 million which included the previously announced payments to the US Government of £1.9 billion ($3 billion) in settlement of certain investigations.
The Group’s strong cash generation together with the proceeds from the disposal of the Consumer Healthcare OTC brands also enabled the financing of share repurchases of £2.5 billion and increased dividend payments of £3.8 billion.
Movements in net debt
| | | | | | | | |
| | | 2012 £m | | | 2011 £m | |
Net debt at beginning of year | | | (9,003 | ) | | | (8,859 | ) |
Decrease in cash and bank overdrafts | | | (1,607 | ) | | | (94 | ) |
Cash inflow from liquid investments | | | (224 | ) | | | (30 | ) |
Net increase in long-term loans | | | (4,430 | ) | | | – | |
Net repayment of/(increase in) short-term loans | | | 816 | | | | (37 | ) |
Debt of subsidiary undertakings acquired | | | (3 | ) | | | (10 | ) |
Exchange movements | | | 385 | | | | (10 | ) |
Other movements | | | 29 | | | | 37 | |
Net debt at end of year | | | (14,037 | ) | | | (9,003 | ) |
Total equity
At 31 December 2012, total equity had decreased from £8,827 million at 31 December 2011 to £6,747 million. The decrease arose principally from share repurchases in the year.
A summary of the movements in equity is set out below.
| | | | | | | | |
| | | 2012 £m | | | 2011 £m | |
Total equity at beginning of year | | | 8,827 | | | | 9,745 | |
Total comprehensive income for the year | | | 4,011 | | | | 4,424 | |
Dividends to shareholders | | | (3,814 | ) | | | (3,406 | ) |
Shares issued | | | 356 | | | | 250 | |
Changes in non-controlling interests | | | (218 | ) | | | 18 | |
Forward contract relating to non-controlling interest | | | 8 | | | | (29 | ) |
Shares purchased and cancelled or held as Treasury shares | | | (2,493 | ) | | | (2,191 | ) |
Consideration received for shares transferred by ESOP Trusts | | | 58 | | | | 45 | |
Shares acquired by ESOP Trusts | | | (37 | ) | | | (36 | ) |
Share-based incentive plans | | | 211 | | | | 191 | |
Tax on share-based incentive plans | | | 9 | | | | 50 | |
Distributions to non-controlling interests | | | (171 | ) | | | (234 | ) |
Total equity at end of year | | | 6,747 | | | | 8,827 | |
The changes in non-controlling interests in the year primarily arise from the acquisitions of the Shionogi-ViiV Healthcare joint venture and further shares in GSK Consumer Healthcare Ltd, the Group’s Consumer Healthcare subsidiary in India.
68 | GSK Annual Report 2012
Financial review
Share purchases
In 2012, the Employee Share Ownership Plan (ESOP) Trusts acquired £37 million of shares in GlaxoSmithKline plc (2011 – £36 million). Shares are held by the Trusts to satisfy future exercises of options and awards under the Group share option and award schemes. A proportion of the shares held by the Trusts are in respect of awards where the rules of the scheme require us to satisfy exercises through market purchases rather than the issue of new shares. The shares held by the Trusts are matched to options and awards granted.
At 31 December 2012, the ESOP Trusts held 75 million (2011 – 91 million) GSK shares against the future exercise of share options and share awards. The carrying value of £391 million (2011 – £492 million) has been deducted from other reserves. The market value of these shares was £1,004 million (2011 – £1,337 million).
During 2011, we commenced a new long-term share buy-back programme. 174 million shares were repurchased in 2012 at a cost of £2,493 million (see Note 33 ‘Share capital’). We are currently targetting further repurchases of £1-2 billion during 2013. The exact amount and timing of future purchases, and whether the shares will be held as Treasury shares or be cancelled, will be determined by the company and is dependent on market conditions and other factors. At 31 December 2012, we held 495 million shares as Treasury shares (2011 – 501.2 million shares), at a cost of £6,602 million (2011 – £6,661 million), which has been deducted from retained earnings.
No shares were purchased in the period 1 January 2013 to 28 February 2013.
Commitments and contingent liabilities
Financial commitments are summarised in Note 39 to the financial statements, ‘Commitments’. Other contingent liabilities and obligations in respect of short and long-term debt are set out in Note 31 to the financial statements, ‘Contingent liabilities’ and Note 32 to the financial statements, ‘Net debt’.
Amounts provided for pensions and post-retirement benefits are set out in Note 28 to the financial statements, ‘Pensions and other post-employment benefits’. Amounts provided for restructuring programmes and legal, environmental and other disputes are set out in Note 29 to the financial statements, ‘Other provisions’.
Contractual obligations and commitments
The following table sets out our contractual obligations and commitments at 31 December 2012 as they fall due for payment.
| | | | | | | | | | | | | | | | | | | | |
| | | Total £m | | | Under 1 yr £m | | | 1-3 yrs
£m | | | 3-5 yrs £m | | | 5 yrs+ £m | |
Loans | | | 18,302 | | | | 3,607 | | | | 2,834 | | | | 2,243 | | | | 9,618 | |
Interest on loans | | | 10,207 | | | | 690 | | | | 1,243 | | | | 1,107 | | | | 7,167 | |
Finance lease obligations | | | 76 | | | | 27 | | | | 34 | | | | 10 | | | | 5 | |
Finance lease charges | | | 9 | | | | 3 | | | | 4 | | | | 1 | | | | 1 | |
Operating lease commitments | | | 849 | | | | 146 | | | | 175 | | | | 115 | | | | 413 | |
Intangible assets | | | 7,780 | | | | 551 | | | | 889 | | | | 1,365 | | | | 4,975 | |
Property, plant & equipment | | | 572 | | | | 473 | | | | 99 | | | | – | | | | – | |
Investments | | | 72 | | | | 19 | | | | 32 | | | | 21 | | | | – | |
Purchase commitments | | | 762 | | | | 209 | | | | 293 | | | | 260 | | | | – | |
Pensions | | | 368 | | | | 368 | | | | – | | | | – | | | | – | |
Other commitments | | | 268 | | | | 90 | | | | 109 | | | | 67 | | | | 2 | |
Total | | | 39,265 | | | | 6,183 | | | | 5,712 | | | | 5,189 | | | | 22,181 | |
Commitments in respect of loans and future interest payable on loans are disclosed before taking into account the effect of derivatives.
We have entered into a number of research collaborations to develop new compounds with other pharmaceutical companies. The terms of these arrangements can include upfront fees, equity investments, loans and commitments to fund specified levels of research. In addition, we will often agree to make further payments if future ‘milestones’ are achieved.
As some of these agreements relate to compounds in the early stages of development, milestone payments will continue for a number of years if the compounds move successfully through the development process. Generally the closer the product is to marketing approval the greater the possibility of success. The amounts shown above within intangible assets represent the maximum that would be paid if all milestones were achieved, and include £6.0 billion which relates to externalised projects in the discovery portfolio. A number of new commitments were made in 2012 under licensing and other agreements, including arrangements with Angiochem, Inc., Five Prime Therapuetics, Inc., MD Anderson Cancer Centre and Morphotek, Inc.
In 2009, we reached an agreement with the trustees of the UK pension schemes to make additional contributions over a five year period, to eliminate the pension deficit identified at the 31 December 2008 actuarial funding valuation. The table above includes this commitment but excludes the normal ongoing annual funding requirement in the UK of approximately £120 million. For further information on pension obligations, see Note 28 to the financial statements, ‘Pensions and other post-employment benefits’.
Contingent liabilities
The following table sets out contingent liabilities, comprising discounted bills, performance guarantees, letters of credit and other items arising in the normal course of business, and when they are expected to expire.
| | | | | | | | | | | | | | | | | | | | |
| | | Total
£m | | | Under 1 yr
£m | | | 1-3 yrs
£m | | | 3-5 yrs
£m | | | 5 yrs+
£m | |
Guarantees | | | 132 | | | | 79 | | | | 3 | | | | 1 | | | | 49 | |
Other contingent liabilities | | | 77 | | | | 3 | | | | 41 | | | | 17 | | | | 16 | |
Total | | | 209 | | | | 82 | | | | 44 | | | | 18 | | | | 65 | |
In the normal course of business, we have provided various indemnification guarantees in respect of business disposals in which legal and other disputes have subsequently arisen. A provision is made where an outflow of resources is considered probable and a reliable estimate can be made of the likely outcome of the dispute and this is included in Note 29 to the financial statements, ‘Other provisions’.
We provide for the outcome of tax, legal and other disputes when an outflow of resources is considered probable and a reliable estimate of the outflow may be made. At 31 December 2012, other than for those disputes where provision has been made, it was not possible to make a reliable estimate of the potential outflow of funds that might be required to settle disputes where the possibility of there being an outflow was more than remote.
The ultimate liability for such matters may vary significantly from the amounts provided and is dependent upon the outcome of litigation proceedings and negotiations with the relevant tax authorities. This is discussed further in ‘Risk factors’ on pages 78 to 86 and Notes 14 and 44 to the financial statements, ‘Taxation’ and ‘Legal proceedings’.
|
| GSK Annual Report 2012 | 69 |
Cash generation and conversion
A summary of the consolidated cash flow is set out below.
| | | | | | | | |
| | | 2012
£m | | | 2011
£m | |
Net cash inflow from operating activities | | | 4,375 | | | | 6,250 | |
Net cash outflow from investing activities | | | (2,631 | ) | | | (112 | ) |
Net cash outflow from financing activities | | | (3,351 | ) | | | (6,232 | ) |
Decrease in cash and bank overdrafts | | | (1,607 | ) | | | (94 | ) |
| | |
Exchange adjustments | | | (92 | ) | | | (108 | ) |
Cash and bank overdrafts at beginning of year | | | 5,605 | | | | 5,807 | |
Cash and bank overdrafts at end of year | | | 3,906 | | | | 5,605 | |
| | |
Cash and bank overdrafts at end of year comprise: | | | | | | | | |
Cash and cash equivalents | | | 4,184 | | | | 5,714 | |
Overdrafts | | | (278 | ) | | | (109 | ) |
| | | | 3,906 | | | | 5,605 | |
The net cash inflow from operating activities after taxation paid was £4,375 million, a decrease of £1,875 million in sterling terms compared with 2011 and reflected the impact of a reduced operating profit and the phasing of tax payments.
The net cash outflow from investing activities was £2,631 million, £2,519 million higher than 2011, which primarily reflected the acquisition of HGS and the sale of the non-core OTC brands during the year, partly offset by the proceeds from the disposal of our shareholding in Quest Diagnostics Inc. during 2011.
The net cash outflow from financing activities was £3,351 million and primarily reflected a net increase in external borrowing of £3,614 million offset by the repurchase of shares and dividends to shareholders totalling £6,307 million.
Free cash flow
Free cash flow is the amount of cash generated by the business after meeting its obligations for interest, tax and dividends paid to non-controlling interests, and after capital expenditure on property, plant and equipment and intangible assets.
| | | | | | | | |
| | | 2012 | | | 2011 | |
Free cash flow (£m) | | | 2,049 | | | | 4,141 | |
Free cash flow growth (%) | | | (51)% | | | | (8)% | |
Free cash flow was adversely impacted by legal settlements of £2,610 million (2011 – £1,466 million). Free cash flow excluding legal settlements was £4,659 million in 2012 (2011 – £5,607 million), and this, together with £904 million from the disposal of the non-core OTC brands, enabled the Group to pay dividends to shareholders of £3.8 billion, and spend £2.5 billion on repurchasing shares.
Our commitment is to continue to use free cash flow to support increasing dividends, undertake share repurchases or, where returns are more attractive, reinvest in the business, including bolt-on acquisitions.
A reconciliation of net cash inflow from operating activities, which is the closest equivalent IFRS measure, to free cash flow is shown below.
Reconciliation of free cash flow
| | | | | | | | |
| | | 2012
£m | | | 2011
£m | |
Net cash inflow from operating activities | | | 4,375 | | | | 6,250 | |
Purchase of property, plant and equipment | | | (1,051 | ) | | | (923 | ) |
Purchase of intangible assets | | | (469 | ) | | | (405 | ) |
Disposal of property, plant and equipment | | | 68 | | | | 100 | |
Interest paid | | | (779 | ) | | | (769 | ) |
Interest received | | | 30 | | | | 97 | |
Dividends received from joint ventures and associated undertakings | | | 46 | | | | 25 | |
Distributions to non-controlling interests | | | (171 | ) | | | (234 | ) |
Free cash flow | | | 2,049 | | | | 4,141 | |
Investment appraisal
We have a formal process for assessing potential investment proposals in order to ensure decisions are aligned with our overall strategy. This process includes an assessment of the cash flow return on investment (CFROI), as well as its net present value (NPV) and internal rate of return (IRR) where the timeline for the project is very long term. We also consider the impact on earnings and credit profile where relevant.
The discount rate used to perform financial analyses is decided internally, to allow determination of the extent to which investments cover our cost of capital. For specific investments the discount rate may be adjusted to take into account country or other risk weightings.
Capital expenditure and financial investment
Cash payments for tangible and intangible fixed assets amounted to £1,520 million (2011 – £1,328 million) and disposals realised £1,124 million (2011 – £337 million). Cash payments to acquire equity investments of £229 million (2011 – £76 million) were made in the year and sales of equity investments realised £28 million (2011 – £68 million).
Future cash flow
We expect that future operating cash flow will be sufficient to fund our operating and debt service costs, to satisfy normal levels of capital expenditure, to meet obligations under existing licensing agreements, to meet the expenditure arising from the major restructuring programmes (the precise timing of which is uncertain) outlined in Note 10 to the financial statements, ‘Major restructuring costs’ and to meet other routine outflows including tax and dividends, subject to the ‘Risk factors’ discussed on pages 78 to 86. We may from time to time have additional demands for finance, such as for acquisitions and share repurchases. We have access to other sources of liquidity from short and long-term capital markets and banks and other financial institutions, in addition to the cash flow from operations, for such needs.
Working capital
| | | | | | | | |
| | | 2012 | | | 2011
(restated) | |
Working capital percentage of turnover (%) | | | 21% | | | | 21% | |
Working capital conversion cycle (days) | | | 194 | | | | 202 | |
Working capital reduced by £397 million in 2012 compared with a reduction of £477 million in 2011. Working capital conversion cycle reduced by eight days reflecting improvements in conversion for receivables, payables and inventory. This was partly offset by the acquisition of HGS, which added three days to the conversion cycle.
70 | GSK Annual Report 2012
Financial review
Maturity profile of gross debt
£m equivalent
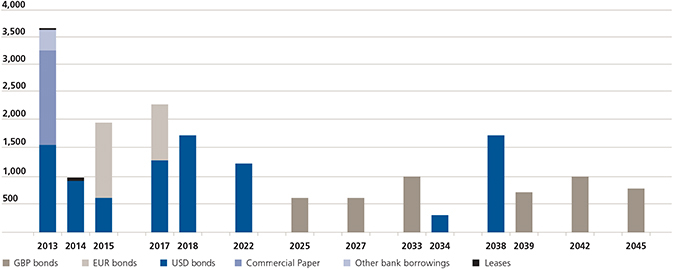
Payment policies
Group companies are responsible for monitoring and managing their working capital. The terms of sales collections and supplier payments reflect local commercial practice.
In the UK, the company and each of its UK subsidiaries have policies to ensure that suppliers are paid on time. In particular, the UK companies seek:
| • | | to settle terms of payment with suppliers when agreeing the terms of the transaction |
| • | | to ensure that suppliers are made aware of the agreed terms of payment |
| • | | to abide by the terms of payment. |
The policy permits arrangements for accelerated payment to small suppliers.
Payment performance
At 31 December 2012, the average number of days’ payable outstanding represented by trade payables of the parent company was nil (2011 – nil) and in respect of the company and its UK subsidiaries in aggregate was 56 days (2011 – 61 days).
Treasury policies
GSK reports in Sterling and pays dividends out of Sterling profits. The role of Corporate Treasury is to monitor and manage our external and internal funding requirements and financial risks in support of our strategic objectives. GSK operates on a global basis, primarily through subsidiary companies, and we manage our capital to ensure that our subsidiaries are able to operate as going concerns and to optimise returns to shareholders through an appropriate balance of debt and equity. Treasury activities are governed by policies and procedures approved by the Board of Directors, most recently on 11 July 2012. A Treasury Management Group (TMG) meeting chaired by our Chief Financial Officer, takes place on a monthly basis to review treasury activities. Its members receive management information relating to treasury activities.
Capital management
Our financial strategy supports the Group’s strategic priorities and it is regularly reviewed by the Board. We manage the capital structure of the Group through an appropriate mix of debt and equity in order to optimise returns to shareholders whilst maintaining credit ratings that provide us with flexibility to access debt capital markets on attractive terms. Our financial architecture is designed to drive growth in earnings per share and cash generation in order to maximise the returns from the Group’s strategy. The free cash flow we generate is then deployed to deliver returns to shareholders and reinvested in the business depending on where returns are most attractive. We continue to apply strict financial and returns-based criteria such as cash flow return on investment in order to allocate capital and assess investment opportunities.
The capital structure of the Group consists of net debt of £14.0 billion (see Note 32, ‘Net debt’) and shareholders’ equity of £5.8 billion (see ’Consolidated statement of changes in equity‘ on page 142). Total capital, including that provided by non-controlling interests of £0.9 billion, is £20.7 billion.
For further details see Note 41 to the financial statements ‘Financial instruments and related disclosures’.
Liquidity
As at 31 December 2012, our cash and liquid investments were held as follows:
| | | | | | | | |
| | | 2012
£m | | | 2011
£m | |
Bank balances and deposits | | | 3,456 | | | | 3,875 | |
US Treasury and Treasury repo only
money market funds | | | 728 | | | | 1,839 | |
Corporate debt instruments | | | 7 | | | | 9 | |
Government securities | | | 74 | | | | 175 | |
| | | | 4,265 | | | | 5,898 | |
|
| GSK Annual Report 2012 | 71 |
We had net debt of £14.0 billion at 31 December 2012. The table below summarises cash and gross debt after the effects of hedging.
| | | | | | | | |
| | | 2012
£m | | | 2011
£m | |
Cash and liquid investments | | | 4,265 | | | | 5,898 | |
Gross debt – fixed | | | (15,205 | ) | | | (13,621 | ) |
– floating | | | (3,090 | ) | | | (1,279 | ) |
– non-interest bearing | | | (7 | ) | | | (1 | ) |
Net debt | | | (14,037 | ) | | | (9,003 | ) |
GSK’s policy is to borrow centrally in order to meet anticipated funding requirements. The cash flow forecast and funding requirements are monitored by the TMG on a monthly basis. Our strategy is to diversify liquidity sources using a range of facilities and to maintain broad access to funding markets.
At 31 December 2012,GSK had £4.3 billion of cash, cash equivalents and liquid investments and £3.6 billion of borrowings repayable within one year. GSK also has access to short-term finance under a US$10 billion commercial paper programme and $2.9 billion (£1.7 billion) was in issue under this programme at 31 December 2012. GSK has £1.9 billion five year committed medium term facilities and $2.5 billion of 364-day committed facilities. These facilities were put in place in September 2012. We consider this level of committed facilities to be adequate given current liquidity requirements.
We have a European Medium Term Note programme of £15 billion and at 31 December 2012, £7.0 billion of notes were in issue under this programme. We also have a US shelf registration statement and at 31 December 2012, we had $15.0 billion (£9.2 billion) of notes in issue under this programme. GSK’s long-term borrowings mature at dates between 2014 and 2045.
GSK’s long-term credit ratings have remained unchanged since February 2008 and currently GSK is rated A+ stable outlook by Standard and Poor’s and A1 stable outlook by Moody’s Investors Service (‘Moody’s’). Our short-term credit ratings are A-1 and P-1 with Standard and Poor’s and Moody’s respectively.
Treasury operations
The objective of treasury activity is to manage the post-tax net cost or income of financial operations to the benefit of earnings. We use a variety of financial instruments to finance our operations and derivative financial instruments to manage market risks from these operations. These derivatives, principally comprising forward foreign currency contracts, interest rate and currency swaps, are used to swap borrowings and liquid assets into currencies required for Group purposes and to manage exposure to financial risks from changes in foreign exchange and interest rates.
Corporate Treasury does not operate as a profit centre. We do not hold or issue derivatives for speculative purposes. Our Treasury policies specifically prohibit such activity. All transactions in financial instruments are undertaken to manage the risks arising from underlying business activities, not for speculation.
Interest rate risk management
GSK’s objective is to reduce our effective net interest cost and to rebalance the mix of debt at fixed and floating interest rates over time. The policy on interest rate risk management limits the amount of floating interest payments to a prescribed percentage of operating profit.
We use a series of interest rate swaps to redenominate one of our bonds into floating interest rates. The duration of these swaps matches the duration of the principal instrument. These interest rate derivative instruments are accounted for as fair value hedges of the relevant liability.
Foreign exchange risk management
Foreign currency transaction exposures arising on internal and external trade flows are not hedged. The exposure of overseas operating subsidiaries to transaction risk is minimised by matching local currency income with local currency costs. For this purpose, our internal trading transactions are matched centrally and we manage inter-company payment terms to reduce foreign currency risk. Foreign currency cash flows can be hedged selectively under the management of Corporate Treasury and the TMG. Where possible, we manage the cash surpluses or borrowing requirements of subsidiary companies centrally using forward contracts to hedge future repayments back into the originating currency.
In order to reduce foreign currency translation exposure, we seek to denominate borrowings in the currencies of our principal assets and cash flows. These are primarily denominated in US dollars, Euros and Sterling. Certain borrowings can be swapped into other currencies as required.
Borrowings denominated in, or swapped into, foreign currencies that match investments in overseas Group assets may be treated as a hedge against the relevant assets. Forward contracts in major currencies are also used to reduce our exposure to our investment in overseas Group assets. The TMG reviews the ratio of borrowings to assets for major currencies monthly.
Counterparty risk management
GSK sets global counterparty limits for each of GSK’s banking and investment counterparties based on long-term credit ratings from Moody’s and Standard and Poor’s. Corporate Treasury’s usage of these limits is monitored daily by a Corporate Compliance Officer (CCO) who operates independently of Corporate Treasury. Any breach of these limits would be reported to the CFO immediately. The CCO also monitors the credit rating of these counterparties and, when changes in ratings occur, notifies Corporate Treasury so that changes can be made to investment levels or to authority limits as appropriate. In addition, a report on relationship banks and their credit ratings is presented annually to the TMG for approval and reviewed regularly.
72 | GSK Annual Report 2012
Financial review
Financial review 2011
In accordance with US SEC disclosure requirements, the following discussion compares results for the year to 31 December 2011 with the results for the year to 31 December 2010.
Following the introduction of core measures to report the performance of the Group and changes to reflect the new reporting structure of the Group (see page 56) this financial review has been restated on a consistent basis.
All growth rates included in the financial review are at constant exchange rates (CER) unless otherwise stated. CER growth is discussed on page 56.
Group turnover by division
| | | | | | | | | | | | | | | | |
| | | 2011
£m | | | 2010
£m | | | Growth
CER% | | | Growth
£% | |
Pharmaceuticals | | | 18,615 | | | | 18,973 | | | | (1 | ) | | | (2 | ) |
Vaccines | | | 3,497 | | | | 4,326 | | | | (19 | ) | | | (19 | ) |
Pharmaceuticals and Vaccines | | | 22,112 | | | | 23,299 | | | | (4 | ) | | | (5 | ) |
Consumer Healthcare | | | 5,275 | | | | 5,093 | | | | 5 | | | | 4 | |
| | | | 27,387 | | | | 28,392 | | | | (3 | ) | | | (4 | ) |
Group turnover by geographic region
| | | | | | | | | | | | | | | | |
| | | 2011
£m | | | 2010
£m | | | Growth
CER% | | | Growth
£% | |
USA | | | 8,684 | | | | 9,345 | | | | (4 | ) | | | (7 | ) |
Europe | | | 8,271 | | | | 9,091 | | | | (10 | ) | | | (9 | ) |
EMAP | | | 6,403 | | | | 6,074 | | | | 8 | | | | 5 | |
Japan | | | 2,318 | | | | 2,155 | | | | 1 | | | | 8 | |
Other | | | 1,711 | | | | 1,727 | | | | (5 | ) | | | (1 | ) |
| | | | 27,387 | | | | 28,392 | | | | (3 | ) | | | (4 | ) |
|
Group turnover by segment | |
| | | 2011
£m | | | 2010
£m | | | Growth
CER% | | | Growth
£% | |
Pharmaceuticals and Vaccines: | | | | | | | | | | | | | | | | |
USA | | | 7,022 | | | | 7,629 | | | | (4 | ) | | | (8 | ) |
Europe | | | 5,700 | | | | 6,479 | | | | (13 | ) | | | (12 | ) |
EMAP | | | 4,459 | | | | 4,347 | | | | 5 | | | | 3 | |
Japan | | | 2,082 | | | | 1,959 | | | | – | | | | 6 | |
ViiV Healthcare | | | 1,569 | | | | 1,566 | | | | 1 | | | | – | |
Other trading and unallocated | | | 1,280 | | | | 1,319 | | | | (7 | ) | | | (3 | ) |
Pharmaceuticals and Vaccines | | | 22,112 | | | | 23,299 | | | | (4 | ) | | | (5 | ) |
Consumer Healthcare | | | 5,275 | | | | 5,093 | | | | 5 | | | | 4 | |
| | | | 27,387 | | | | 28,392 | | | | (3 | ) | | | (4 | ) |
Pharmaceuticals turnover by therapeutic area
Turnover declined 1% to £18.6 billion, with growth in Cardiovascular and urogenital, Respiratory, Dermatology, Antibacterials, HIV and Oncology and emesis, more than offset by declines in Metabolic, Anti-virals and Central nervous system.
Pharmaceuticals turnover by therapeutic area
| | | | | | | | | | | | | | | | |
| | | 2011
£m | | | 2010
£m | | | Growth
CER% | | | Growth
£% | |
Respiratory | | | 7,298 | | | | 7,238 | | | | 2 | | | | 1 | |
Anti-virals | | | 842 | | | | 1,167 | | | | (29 | ) | | | (28 | ) |
Central nervous system | | | 1,721 | | | | 1,753 | | | | (2 | ) | | | (2 | ) |
Cardiovascular and urogenital | | | 2,454 | | | | 2,314 | | | | 8 | | | | 6 | |
Metabolic | | | 331 | | | | 647 | | | | (49 | ) | | | (49 | ) |
Anti-bacterials | | | 1,390 | | | | 1,396 | | | | 1 | | | | – | |
Oncology and emesis | | | 683 | | | | 679 | | | | 2 | | | | 1 | |
Dermatology | | | 898 | | | | 849 | | | | 8 | | | | 6 | |
Rare diseases | | | 463 | | | | 408 | | | | 12 | | | | 14 | |
Immuno-inflammation | | | 15 | | | | – | | | | – | | | | – | |
Other pharmaceuticals | | | 951 | | | | 956 | | | | 1 | | | | (1 | ) |
ViiV Healthcare (HIV) | | | 1,569 | | | | 1,566 | | | | 1 | | | | – | |
| | | | 18,615 | | | | 18,973 | | | | (1 | ) | | | (2 | ) |
Respiratory
Respiratory sales increased 2% to £7.3 billion reflecting strong performances in Japan, Emerging Markets and Asia Pacific.Seretide/Advair sales were flat as growth in Japan and Asia Pacific offset small declines in the USA and Europe. In addition,Ventolin grew 17% to £602 million andAvamys/Veramyst sales were up 24% to £241 million.
In the USA, sales ofAdvair were £2.5 billion, down 1% which was in line with estimated underlying growth for the year (6% volume decline partly offset by 5% positive impact of price and mix).Flovent grew 8% to £447 million andVentolin grew 39% to £239 million.
In Europe, Respiratory sales were down 2%.Seretide sales were down 2% at £1.6 billion as the impact of price reductions by European governments offset volume increases.
In Emerging Markets, Respiratory sales grew 8%, with growth in many products in the portfolio.Seretide sales were flat at £317 million as volume growth was offset by the continuing impact of price cuts, particularly in Russia and Turkey.
Anti-virals
Anti-virals decreased 29% to £0.8 billion. Sales growth was impacted by lower sales ofRelenza (down 79% to £27 million) compared with significant sales in 2010 related to pandemic flu. In addition,Valtrex sales continued to decline as a result of generic competition in the USA and Europe (down 38% to £339 million). Sales ofZeffix grew 1% to £237 million with strong growth in Emerging Markets being offset by small declines in most other markets.
Central nervous system (CNS)
CNS sales decreased 2% to £1.7 billion. Performance was primarily impacted by a decline inSeroxat/Paxil sales (down 13% to £435 million), partially offset byLamictal sales growth (up 8% to £536 million) benefiting from growth in Japan where product sales more than doubled to £41 million and a continuing strong performance ofLamictal XR in the USA.
|
| GSK Annual Report 2012 | 73 |
Cardiovascular and urogenital
Cardiovascular and urogenital sales increased 8% to £2.5 billion, primarily driven by theAvodart franchise, up 20% to £748 million, with the launches of the new combination productDuodart/Jalyn in the USA and Europe and ofAvodart in Japan, andLovaza, up 12% to £569 million.Arixtra declined 7% to £276 million as a result of the start of generic competition in the USA in the third quarter of 2011.
Metabolic
Metabolic sales decreased 49% to £0.3 billion, primarily reflecting the loss of sales ofAvandia. In addition, sales ofBoniva were negatively impacted by the termination of co-promotion agreements in certain European countries.
Anti-bacterials
Anti-bacterial sales grew 1% to £1.4 billion with growth in the category led by sales ofAugmentin in Emerging Markets (up 11% to £311 million). The category was held back by austerity price cuts and the mild flu season in the northern hemisphere.
Oncology and emesis
Oncology and emesis sales increased 2% to £0.7 billion reflecting strong growth from new productsVotrient, Promacta/Revolade andArzerra which together more than doubled to £219 million, partly offset by generic competition to older products.
Ongoing launches ofPromacta/Revolade continued throughout 2011 as sales outside the USA grew from £6 million in 2010 to £43 million in 2011. Sales in the USA grew 36% to £32 million.
The strong performances of the new oncology products were partly offset by the impact of generic competition in the USA toHycamtin which was down 92%, and the continued decline ofZofran, which fell 12% to £83 million.
Dermatology
Dermatology sales grew 8% to £0.9 billion as growth in Emerging Markets (which is benefiting from ongoing launches of Stiefel products in new markets) offset the impact of price cuts in Europe and generic competition toEvoclin in the USA.
Rare diseases
Sales grew 12% to £0.5 billion, with the majority of the growth coming fromVolibris, where sales more than doubled to £97 million.
Immuno-inflammation
Benlysta was launched in the year in the USA and Germany and recorded turnover of £15 million.
ViiV Healthcare (HIV)
ViiV Healthcare sales grew 1% to £1.6 billion, with USA up 4%, Europe down 3%, Emerging Markets up 9% and Rest of World down 4%. Growth was primarily driven byEpzicom/Kivexa (up 12% to £617 million) andSelzentry (up 39% to £110 million), partly offset by a decline in the mature portfolio (down 8% to £842 million).
TheEpzicom/Kivexa sales growth was driven by strong performance in the USA and Europe. In the USA sales ofEpzicom were £230 million, up 14%, reflecting a relatively equal mix of volume and price growth. The volume growth in Europe benefited from an improved positioning in regional and local guidelines.Kivexa continued to grow in Japan and Mexico and a number of developing markets in Asia Pacific.
TheSelzentry sales growth was primarily driven by an increase in market share. In the USA, sales were £45 million, up 38% and in Europe sales were £51 million, up 24%.
The decline in the mature portfolio (includingCombivir which declined 10% to £322 million) was primarily driven by a decline in the western markets as a result of newer treatment options.
Vaccines turnover
| | | | | | | | | | | | | | | | |
| | | 2011
£m | | | 2010
£m | | | Growth
CER% | | | Growth
£% | |
Vaccines sales | | | 3,497 | | | | 4,326 | | | | (19 | ) | | | (19 | ) |
Vaccines
The loss of flu pandemic vaccine sales in the year resulted in a decline in reported vaccines sales of 19% to £3.5 billion. Excluding the effect of the flu pandemic vaccine sales, underlying sales grew by 11% reflecting the growth ofCervarix, Synflorix andRotarix partly offset by lower sales of the Hepatitis franchise andInfanrix and the impact of changes to the Pharmacopeia in China.
Consumer Healthcare turnover
| | | | | | | | | | | | | | | | |
| | | 2011 £m | | | 2010 £m | | | Growth* | |
| | | | CER% | | | £% | |
Total wellness | | | 2,278 | | | | 2,202 | | | | 4 | | | | 3 | |
Oral care | | | 1,711 | | | | 1,596 | | | | 7 | | | | 7 | |
Nutrition | | | 1,025 | | | | 953 | | | | 10 | | | | 8 | |
Skin health | | | 261 | | | | 342 | | | | (23 | ) | | | (24 | ) |
| | | | 5,275 | | | | 5,093 | | | | 5 | | | | 4 | |
Consumer Healthcare sales grew 5% to £5.3 billion compared with an estimated market growth of 4% (for markets where we compete). The net impact of acquisitions and disposals was not significant. Excluding the OTC brands targeted for divestment, Consumer Healthcare sales grew approximately 7%. The disposal of the North American OTC brands was completed in January 2012.
Total wellness
Total wellness sales increased 4% at £ 2.3 billion with strong growth in several sub-categories, offset by a decline inalli. ThePanadol franchise registered growth of 7% and in gastrointestinal care, the core brandsTums andEno were up 17% and 15%, respectively.
Oral care
Oral care sales increased 7% to £1.7 billion, again led bySensodyne, which continued to benefit from the successful launch ofRepair & Protect and the ongoing geographic expansion of thePronamelAcid Erosion business.
Nutrition
Nutrition grew by 10% to £1.0 billion led by strong growth inHorlicks combined with the inclusion of Maxinutrition from February 2011. Nutrition growth excluding Maxinutrition was 7%.
Skin health
Skin health sales declined 23% to £0.3 billion.
74 | GSK Annual Report 2012
Financial review
Core results
The definition of core results is set out on page 56. The reconciliation of total results to core results is presented on page 75.
| | | | | | | | | | | | | | | | | | | | | | | | |
| | | | | | 2011 | | | | | | 2010 | | | | | | Growth | |
| | £m | | | % of
turnover | | | £m | | | % of
turnover | | | CER% | | | £% | |
Turnover | | | 27,387 | | | | 100 | | | | 28,392 | | | | 100 | | | | (3 | ) | | | (4 | ) |
Cost of sales | | | (7,259 | ) | | | (26.5 | ) | | | (7,405 | ) | | | (26.1 | ) | | | (2 | ) | | | (2 | ) |
Selling, general and administration | | | (7,956 | ) | | | (29.1 | ) | | | (8,081 | ) | | | (28.5 | ) | | | (1 | ) | | | (2 | ) |
Research and development | | | (3,678 | ) | | | (13.4 | ) | | | (3,705 | ) | | | (13.0 | ) | | | 1 | | | | (1 | ) |
Royalty income | | | 309 | | | | 1.1 | | | | 296 | | | | 1.0 | | | | 5 | | | | 5 | |
Core operating profit | | | 8,803 | | | | 32.1 | | | | 9,497 | | | | 33.4 | | | | (6 | ) | | | (7 | ) |
Net finance costs | | | (707 | ) | | | | | | | (712 | ) | | | | | | | | | | | | |
Share of after tax profits of associates and joint ventures | | | 15 | | | | | | | | 81 | | | | | | | | | | | | | |
Core profit before tax | | | 8,111 | | | | | | | | 8,866 | | | | | | | | (8 | ) | | | (9 | ) |
Taxation | | | (2,104 | ) | | | | | | | (2,266 | ) | | | | | | | | | | | | |
Core profit after tax | | | 6,007 | | | | | | | | 6,600 | | | | | | | | (8 | ) | | | (9 | ) |
Core profit attributable to shareholders | | | 5,810 | | | | | | | | 6,381 | | | | | | | | | | | | | |
Core earnings per share | | | 115.5p | | | | | | | | 125.5p | | | | | | | | (7 | ) | | | (8 | ) |
Cost of sales
Core cost of sales increased to 26.5% of turnover (2010 – 26.1%). This reflected the impact of the reduction of higher margin sales of pandemic related products,Avandia andValtrex, together with the effect of regional mix and the impact of US healthcare reform and European austerity price cuts. These adverse impacts were partially offset by lower inventory write-offs and greater savings from the Operational Excellence programme.
Selling, general and administration
Core SG&A costs decreased by 1%, but were 29.1% of turnover compared with 28.5% in 2010. This reflected the impact of the reduction in sales of pandemic related products,Avandia andValtrex, the US healthcare reform levy of £100 million and continuing investment in growth businesses and new product launches, partly offset by ongoing cost savings.
Advertising and promotion declined 5%, selling and distribution declined 1% and general and administration increased 4%.
Research and development
Core R&D expenditure increased 1% to £3,678 million (13.4% of turnover) compared with £3,705 million in 2010 (13.0% of turnover). The increase reflected investment in the late-stage pipeline partly offset by efficiency savings.
Core operating profit
Core operating profit was £8,803 million, a 6% decrease in CER terms over 2010.
Net finance costs
| | | | | | | | |
| Finance income | | 2011
£m | | | 2010
£m | |
Interest and other income | | | 90 | | | | 103 | |
Fair value movements | | | – | | | | 13 | |
| | | | 90 | | | | 116 | |
| | |
| Finance expense | | | | | | |
Interest expense | | | (744 | ) | | | (767 | ) |
Unwinding of discounts on liabilities | | | (10 | ) | | | (18 | ) |
Remeasurements and fair value movements | | | (23 | ) | | | (18 | ) |
Other finance expense | | | (20 | ) | | | (25 | ) |
| | | | (797 | ) | | | (828 | ) |
Net finance expense fell slightly to £707 million from £712 million in 2010. This reflected relatively stable levels of net debt as the Group’s strong cash generation funded share repurchases of £2.2 billion and increased dividend payments.
Share of after tax profits of associates and joint ventures
The share of after tax profits of associates of £15 million (2010 – £81 million) arose principally from the Group’s holding in Aspen Pharmacare. The decline in 2011 reflected the disposal of the share in Quest Diagnostics in February 2011.
Profit before taxation
Taking account of net finance costs and the share of profits of associates, core profit before taxation was £8,111 million compared with £8,866 million in 2010, a 8% CER decline and a 9% decline in sterling terms.
Taxation
Tax on core profit amounted to £2,104 million and represented an effective core tax rate of 25.9% (2010 – 25.6%).
GSK continues to believe that it has made adequate provision for the liabilities likely to arise from periods which are open and not yet agreed by tax authorities. The ultimate liability for such matters may vary from the amounts provided and is dependent upon the outcome of agreements with relevant tax authorities or litigation.
Earnings per share
Core earnings per share of 115.5 pence was down 7% in CER terms and 8% at actual rates. The currency impact reflected the strengthening of Sterling against the US dollar, partially offset by the weakening of Sterling against the Japanese Yen.
Dividend
The Board declared four interim dividends resulting in a dividend for the year of 70 pence, a 5 pence increase on the 65 pence per share for 2010. The Board has also declared a supplemental interim dividend of 5 pence per share related to the disposal of certain non-core OTC brands in North America, which was completed on 31 January 2012, to be paid at the same time as the fourth interim dividend. See Note 16 ‘Dividends’ on page 163.
|
| GSK Annual Report 2012 | 75 |
Core results reconciliation – 31 December 2011
| | | | | | | | | | | | | | | | | | | | | | | | | | | | |
| | | Core
results
£m | | | Intangible
amortisation
£m | | | Intangible
impairment
£m | | | Major
restructuring
£m | | | Legal
charges
£m | | | Other
operating
income
£m | | | Total
results
(restated)
£m | |
Turnover | | | 27,387 | | | | | | | | | | | | | | | | | | | | | | | | 27,387 | |
Cost of sales | | | (7,259 | ) | | | (304 | ) | | | (12 | ) | | | (73 | ) | | | | | | | | | | | (7,648 | ) |
Gross profit | | | 20,128 | | | | (304 | ) | | | (12 | ) | | | (73 | ) | | | | | | | | | | | 19,739 | |
| | | | | | | |
Selling, general and administration | | | (7,956 | ) | | | | | | | | | �� | | (397 | ) | | | (157 | ) | | | | | | | (8,510 | ) |
Research and development | | | (3,678 | ) | | | (137 | ) | | | (97 | ) | | | (97 | ) | | | | | | | | | | | (4,009 | ) |
Royalty income | | | 309 | | | | | | | | | | | | | | | | | | | | | | | | 309 | |
Other operating income | | | | | | | | | | | | | | | (23 | ) | | | | | | | 301 | | | | 278 | |
Operating profit | | | 8,803 | | | | (441 | ) | | | (109 | ) | | | (590 | ) | | | (157 | ) | | | 301 | | | | 7,807 | |
| | | | | | | |
Net finance costs | | | (707 | ) | | | | | | | | | | | (2 | ) | | | | | | | | | | | (709 | ) |
Profit on disposal of interests in associates | | | – | | | | | | | | | | | | | | | | | | | | 585 | | | | 585 | |
Share of after tax profits of associates and joint ventures | | | 15 | | | | | | | | | | | | | | | | | | | | | | | | 15 | |
Profit before taxation | | | 8,111 | | | | (441 | ) | | | (109 | ) | | | (592 | ) | | | (157 | ) | | | 886 | | | | 7,698 | |
| | | | | | | |
Taxation | | | (2,104 | ) | | | 137 | | | | 41 | | | | 114 | | | | 22 | | | | (450 | ) | | | (2,240 | ) |
Tax rate % | | | 25.9 | % | | | | | | | | | | | | | | | | | | | | | | | 29.1 | % |
Profit after taxation | | | 6,007 | | | | (304 | ) | | | (68 | ) | | | (478 | ) | | | (135 | ) | | | 436 | | | | 5,458 | |
| | | | | | | |
Profit attributable to
non-controlling interests | | | 197 | | | | | | | | | | | | | | | | | | | | | | | | 197 | |
Profit attributable to shareholders | | | 5,810 | | | | (304 | ) | | | (68 | ) | | | (478 | ) | | | (135 | ) | | | 436 | | | | 5,261 | |
| | | | | | | |
Earnings per share | | | 115.5 | p | | | (6.0 | )p | | | (1.4 | )p | | | (9.5 | )p | | | (2.7 | )p | | | 8.7 | p | | | 104.6 | p |
| | | | | | | |
Weighted average number of shares (millions) | | | 5,028 | | | | | | | | | | | | | | | | | | | | | | | | 5,028 | |
|
Core results reconciliation – 31 December 2010 | |
| | | Core
results
£m | | | Intangible
amortisation
£m | | | Intangible
impairment
£m | | | Major
restructuring
£m | | | Legal
charges
£m | | | Other
operating
income
£m | | | Total
results
(restated)
£m | |
Turnover | | | 28,392 | | | | | | | | | | | | | | | | | | | | | | | | 28,392 | |
Cost of sales | | | (7,405 | ) | | | (295 | ) | | | (11 | ) | | | (187 | ) | | | | | | | | | | | (7,898 | ) |
Gross profit | | | 20,987 | | | | (295 | ) | | | (11 | ) | | | (187 | ) | | | | | | | | | | | 20,494 | |
| | | | | | | |
Selling, general and administration | | | (8,081 | ) | | | | | | | | | | | (665 | ) | | | (4,001 | ) | | | | | | | (12,747 | ) |
Research and development | | | (3,705 | ) | | | (133 | ) | | | (126 | ) | | | (493 | ) | | | | | | | | | | | (4,457 | ) |
Royalty income | | | 296 | | | | | | | | | | | | | | | | | | | | | | | | 296 | |
Other operating income | | | | | | | | | | | | | | | | | | | | | | | 197 | | | | 197 | |
Operating profit | | | 9,497 | | | | (428 | ) | | | (137 | ) | | | (1,345 | ) | | | (4,001 | ) | | | 197 | | | | 3,783 | |
| | | | | | | |
Net finance costs | | | (712 | ) | | | | | | | | | | | (3 | ) | | | | | | | | | | | (715 | ) |
Profit on disposal of interests in associates | | | | | | | | | | | | | | | | | | | | | | | 8 | | | | 8 | |
Share of after tax profits of associates and joint ventures | | | 81 | | | | | | | | | | | | | | | | | | | | | | | | 81 | |
Profit before taxation | | | 8,866 | | | | (428 | ) | | | (137 | ) | | | (1,348 | ) | | | (4,001 | ) | | | 205 | | | | 3,157 | |
| | | | | | | |
Taxation | | | (2,266 | ) | | | 136 | | | | 39 | | | | 240 | | | | 600 | | | | (53 | ) | | | (1,304 | ) |
Tax rate % | | | 25.6 | % | | | | | | | | | | | | | | | | | | | | | | | 41.3 | % |
Profit after taxation | | | 6,600 | | | | (292 | ) | | | (98 | ) | | | (1,108 | ) | | | (3,401 | ) | | | 152 | | | | 1,853 | |
| | | | | | | |
Profit attributable to
non-controlling interests | | | 219 | | | | | | | | | | | | | | | | | | | | | | | | 219 | |
Profit attributable to shareholders | | | 6,381 | | | | (292 | ) | | | (98 | ) | | | (1,108 | ) | | | (3,401 | ) | | | 152 | | | | 1,634 | |
| | | | | | | |
Earnings per share | | | 125.5 | p | | | (5.7 | )p | | | (1.9 | )p | | | (21.8 | )p | | | (66.9 | )p | | | 2.9 | p | | | 32.1 | p |
| | | | | | | |
Weighted average number of shares (millions) | | | 5,085 | | | | | | | | | | | | | | | | | | | | | | | | 5,085 | |
76 | GSK Annual Report 2012
Financial review
Total results
| | | | | | | | | | | | | | | | | | | | | | | | |
| | | | | | 2011 | | | | | | 2010 | | | | | | Growth | |
| | | (restated)
£m | | | % of
turnover | | | (restated)
£m | | | % of
turnover | | | CER% | | | £% | |
Turnover | | | 27,387 | | | | 100 | | | | 28,392 | | | | 100 | | | | (3 | ) | | | (4 | ) |
Cost of sales | | | (7,648 | ) | | | (27.9 | ) | | | (7,898 | ) | | | (27.8 | ) | | | (3 | ) | | | (3 | ) |
Selling, general and administration | | | (8,510 | ) | | | (31.1 | ) | | | (12,747 | ) | | | (44.9 | ) | | | (33 | ) | | | (33 | ) |
Research and development | | | (4,009 | ) | | | (14.6 | ) | | | (4,457 | ) | | | (15.7 | ) | | | (9 | ) | | | (10 | ) |
Royalty income | | | 309 | | | | 1.1 | | | | 296 | | | | 1.0 | | | | | | | | | |
Other operating income | | | 278 | | | | 1.0 | | | | 197 | | | | 0.7 | | | | | | | | | |
Operating profit | | | 7,807 | | | | 28.5 | | | | 3,783 | | | | 13.3 | | | | >100 | | | | >100 | |
Net finance cost | | | (709 | ) | | | | | | | (715 | ) | | | | | | | | | | | | |
Profit on disposal of interest in associates | | | 585 | | | | | | | | 8 | | | | | | | | | | | | | |
Share of after tax profits of associates and joint ventures | | | 15 | | | | | | | | 81 | | | | | | | | | | | | | |
Profit before taxation | | | 7,698 | | | | | | | | 3,157 | | | | | | | | >100 | | | | >100 | |
Taxation | | | (2,240 | ) | | | | | | | (1,304 | ) | | | | | | | | | | | | |
Profit after taxation for the year | | | 5,458 | | | | | | | | 1,853 | | | | | | | | >100 | | | | >100 | |
Total profit attributable to shareholders | | | 5,261 | | | | | | | | 1,634 | | | | | | | | | | | | | |
Earnings per share (p) | | | 104.6 | | | | | | | | 32.1 | | | | | | | | >100 | | | | >100 | |
Earnings per ADS (US$) | | | 3.37 | | | | | | | | 1.00 | | | | | | | | | | | | | |
Cost of sales
Cost of sales increased to 27.9% of turnover (2010 – 27.8%). This reflected the impact of the reduction of higher margin sales of pandemic related products,Avandia andValtrex, together with the effect of regional mix and the impact of US healthcare reform and European austerity price cuts. These adverse impacts were partially offset by lower restructuring costs, lower inventory write-offs and greater savings from the Operational Excellence programme.
Selling, general and administration
SG&A costs decreased 33% and were 31.1% of turnover compared with 44.9% in 2010. Legal costs of £157 million (2010 – £4,001 million) primarily arose from additional charges in the year for product liability cases regardingPaxil, Poligrip and other products and various government investigations and reflect the best estimates of the additional amounts expected to be necessary to resolve those disputes. Excluding legal costs, SG&A costs were 30.5% of turnover, 0.3 percentage points lower than in 2010. This reflected lower restructuring charges and ongoing cost savings, including from the Operational Excellence programme, partly offset by the impact of the reduction in sales of pandemic related products,Avandia andValtrex, the US healthcare reform levy of £100 million and continuing investment in growth businesses and new product launches.
Advertising and promotion declined 5%, selling and distribution declined 7% and general and administration excluding legal increased 2%. Collectively these items accounted for a 4% decline in SG&A before legal costs.
Research and development
We remain focused on delivering an improved return on our investment in R&D and sales contribution, reduced attrition and cost reduction are all important drivers of an improving internal rate of return. R&D expenditure is not determined as a percentage of sales, but instead capital is allocated using strict returns based criteria.
R&D expenditure decreased 9% to £4,009 million (14.6% of turnover) compared with £4,457 million in 2010 (15.7% of turnover), reflecting lower restructuring costs, efficiency savings and lower intangible asset impairments, partly offset by increased investment in the late-stage pipeline.
Other operating income
Other operating income was £278 million (2010 – £197 million) primarily comprising profits on asset disposals of £355 million (2010 – £244 million) partly offset by equity investment impairments of £78 million (2010 – £65 million) and restructuring costs of £23 million (2010 – £nil) associated with the proposed divestment of the non-core Consumer Healthcare brands.
Operating profit
Operating profit for 2011 was £7,807 million, an increase of over 100% in CER and sterling terms compared with 2010. Excluding legal costs of £157 million (2010 – £4,001 million), operating profit was £7,964 million a 3% increase in CER terms (2% in sterling terms) principally reflecting a 3% decline in turnover, lower cost of sales, lower R&D expenditure and higher other operating income.
Non-core items comprised intangible asset amortisation of £441 million (2010 – £428 million), intangible asset impairment of £109 million (2010 – £137 million), major restructuring costs of £590 million (2010 – £1,345 million), legal costs of £157 million (2010 – £4,001 million) and other operating income of £301 million (2010 – £197 million).
Net finance costs
| | | | | | | | |
| Finance income | | 2011
£m | | | 2010
£m | |
Interest and other finance income | | | 90 | | | | 103 | |
Fair value movements | | | – | | | | 13 | |
| | | | 90 | | | | 116 | |
| | |
| Finance expense | | | | | | |
Interest expense | | | (744 | ) | | | (767 | ) |
Unwinding of discounts on liabilities | | | (12 | ) | | | (18 | ) |
Remeasurements and fair value movements | | | (23 | ) | | | (21 | ) |
Other finance expense | | | (20 | ) | | | (25 | ) |
| | | | (799 | ) | | | (831 | ) |
Net finance expense fell slightly to £709 million from £715 million in 2010. This reflected relatively stable levels of net debt as the Group’s strong cash generation funded share repurchases of £2.2 billion and increased dividend payments. Profit on disposal of interest in associates
Profit on disposal of interest in associates
The pre-tax profit on the disposal of interests in associates was £585 million (£246 million after tax), primarily reflecting the disposal of the remaining shares in Quest Diagnostics.
Share of after tax profits of associates and joint ventures
The share of after tax profits of associates of £15 million (2010 – £81 million) arose principally from the Group’s holding in Aspen Pharmacare. The decline in 2011 reflected the disposal of the shares in Quest Diagnostics in February 2011.
Profit before taxation
Taking account of net finance costs, the profit on disposal of interest in associates and the share of profits of associates, total profit before taxation was £7,698 million compared with £3,157 million in 2010. The more than 100% increase in CER and sterling terms reflected the impact of lower legal charges in 2011.
|
| GSK Annual Report 2012 | 77 |
Taxation
| | | | | | | | |
| | | 2011
£m | | | 2010
£m | |
UK corporation tax at the UK statutory rate | | | 647 | | | | 82 | |
Less double taxation relief | | | (164 | ) | | | (156 | ) |
| | | 483 | | | | (74 | ) |
Overseas taxation | | | 1,603 | | | | 1,496 | |
Current taxation | | | 2,086 | | | | 1,422 | |
Deferred taxation | | | 154 | | | | (118 | ) |
Taxation on total profits | | | 2,240 | | | | 1,304 | |
The charge for taxation on total profits amounted to £2,240 million and represented an effective tax rate of 29.1% (2010 – 41.3%).
GSK continues to believe that it has made adequate provision for the liabilities likely to arise from periods which are open and not yet agreed by tax authorities. The ultimate liability for such matters may vary from the amounts provided and is dependent upon the outcome of agreements with relevant tax authorities or litigation.
Earnings per share
Total earnings per share was 104.6 pence for the year compared with 32.1 pence in 2010. Non-core charges totalled 10.9 pence (2010 – 93.4 pence) and included legal charges of £157 million (2.7 pence) (2010 – £4,001 million, 66.9 pence) in the year.
Financial position and resources
Property, plant and equipment
The total cost of our property, plant and equipment at 31 December 2011 was £18,832 million, with a net book value of £8,748 million. Of this, land and buildings represented £3,817 million, plant and equipment £2,905 million and assets in construction £2,026 million. In 2011, we invested £1,061 million in new and renewal property, plant and equipment. At 31 December 2011, we had capital contractual commitments for future expenditure of £504 million and operating lease commitments of £354 million.
Goodwill
Goodwill increased during the year to £3,754 million at 31 December 2011 from £3,606 million. The increase primarily reflects the goodwill arising on the acquisition of Maxinutrition Group Holdings Limited of £114 million, partly offset by a weakening of overseas currencies.
Other intangible assets
Other intangible assets include the cost of intangibles acquired from third parties and computer software. The net book value of other intangible assets as at 31 December 2011 was £7,802 million (2010 – £8,532 million). The decrease in 2011 reflected amortisation and impairment of existing intangibles partly offset by additions of £363 million through business combinations and other additions.
Investments
We held investments, including associates and joint ventures, with a carrying value at 31 December 2011 of £1,150 million (2010 – £1,792 million). The market value at 31 December 2011 was £1,355 million (2010 – £2,688 million).
Derivative financial instruments: assets
We had both non-current and current derivative financial instruments held at fair value of £155 million (2010 – £190 million). The majority of this amount relates to interest rate swaps and foreign exchange contracts designated as accounting hedges.
Inventories
Inventory of £3,873 million has increased by £36 million during the year. The increase reflects higher Vaccine stocks, partly offset by initiatives to reduce manufacturing cycle times and reduce stockholding days.
Trade and other receivables
Trade and other receivables of £5,576 million have decreased from 2010 reflecting specific actions taken to reduce overdue and other receivables as part of our initiative to reduce working capital.
Derivative financial instruments: liabilities
We held current and non-current derivative financial instruments held at fair value of £177 million (2010 – £193 million) relating primarily to foreign exchange contracts which represent hedges of inter-company loans, deposits and legal provisions, but are not designated as accounting hedges.
Trade and other payables
Trade and other payables amounting to £7,359 million have increased from 2010, reflecting working capital initiatives to extend supplier terms towards our 60-day term objective.
Provisions
We carried deferred tax provisions and other short-term and non-current provisions of £4,456 million at 31 December 2011 (2010 – £5,991 million) in respect of estimated future liabilities, of which £2,772 million (2010 – £4,000 million) related to legal and other disputes. Provision has been made for legal and other disputes, indemnified disposal liabilities, employee related liabilities and the costs of restructuring programmes to the extent that at the balance sheet date a legal or constructive obligation existed and could be reliably estimated.
Net debt
Net debt increased by £144 million to £9,003 million, as free cash flow and asset disposal proceeds largely funded dividends to shareholders and share repurchases.
Total equity
At 31 December 2011, total equity had decreased from £9,745 million at 31 December 2010 to £8,827 million. The decrease arose principally from share repurchases in the year.
Cash flow
The net cash inflow from operating activities after taxation paid was £6,250 million, a decrease of £547 million in sterling terms compared with 2010.
The net cash outflow from investing activities was £112 million, £1,756 million lower than 2010, which primarily reflected the proceeds from the disposal of our shareholding in Quest Diagnostics Inc. and lower purchases of intangible assets during the year of £405 million (2010 – £621 million).
Capital expenditure and financial investment
Cash payments for tangible and intangible fixed assets amounted to £1,328 million (2010 – £1,635 million). Disposals realised £337 million (2010 – £218 million). Cash payments to acquire equity investments of £76 million (2010 – £279 million) were made in the year and sales of equity investments realised £68 million (2010 – £27 million).
78 | GSK Annual Report 2012
Risk factors
Principal risk factors and uncertainties
There are risks and uncertainties relevant to the Group’s business, financial condition and results of operations that may affect the Group’s performance and ability to achieve its objectives. The factors below are among those that the Group believes could cause its actual results to differ materially from expected and historical results. There are other risks and uncertainties that may affect the Group’s performance and ability to achieve its objectives that are not currently known to the Group, or which are deemed immaterial.
The Group reviews and assesses significant risks on a regular basis and has implemented an oversight programme to help ensure that there is a system of internal controls in place. This system includes policies and procedures, communication and training programmes, supervision and monitoring and processes for escalating issues to the appropriate level of senior management. Such a system helps facilitate the Group’s ability to respond appropriately to risks and to achieve Group objectives and helps ensure compliance with applicable laws, regulations and internal policies. In addition, the Group’s Audit & Assurance function is responsible for independently assessing the adequacy and effectiveness of the management of significant risks and reporting outcomes to business management, the Risk Oversight & Compliance Council, and the Audit & Risk Committee as necessary. The Group’s management of risks is further discussed on pages 100 to 102 ‘Corporate Governance’.
The principal risks and uncertainties that might affect the Group’s business are identified below. United Kingdom regulations require a discussion of mitigating activities a company takes to address these risks and uncertainties. However, it is not possible for the Group to implement controls to respond to all the risks that it may face, and complete assurance cannot be provided that the steps the Group has taken to address certain risks, including those listed below under “Mitigating activities include,” will manage these risks effectively or at all. The principal risk factors and uncertainties are not listed in order of significance.
Delivering commercially successful new products
Risk description: Risk that R&D will not deliver commercially successful new products
The Group operates in highly competitive markets. In the Pharmaceuticals and Vaccines businesses, it faces competition from proprietary products of large, international manufacturers and from producers of generic pharmaceuticals. The Pharmaceuticals and Vaccines businesses also face increasing competition from manufacturers in emerging markets, with a lower cost manufacturing base than that of the Group. Significant product innovations, technical advances or the intensification of price competition by competitors may materially and adversely affect the Group’s financial results. The Group cannot always predict the timing or impact of competitive products or their potential impact on sales of the Group’s products. In light of the competitive environment in which the Group operates, continued development of commercially viable new products as well as the development of additional uses for existing products is critical to the Group’s ability to replace sales of older products that decline upon expiration of exclusive rights, and to increase overall sales.
Developing new pharmaceutical and vaccine products is a costly, lengthy and uncertain process. A new product candidate can fail at any stage of the development process, and one or more late stage product candidates could fail to receive regulatory approval. New product candidates may appear promising in development but, after significant investment of Group economic and human resources, may fail to reach the market or may have only limited commercial success. This could be, for example, as a result of efficacy or safety concerns, an inability to obtain necessary regulatory approvals, difficulty manufacturing or excessive manufacturing costs, erosion of patent coverage as a result of a lengthy development period, infringement of patents or other intellectual property rights of others or an inability to differentiate the product adequately from those with which it competes.
Furthermore, health authorities have increased their focus on safety and product differentiation when assessing the benefit/risk balance of drugs, which has made it more difficult for pharmaceutical and vaccine products to gain regulatory approval. There is also increasing pressure on healthcare budgets as a result of the financial crisis, the increase in the average age of the population in developed markets, and the increase in the absolute population in developing markets. Payers, therefore, increasingly have demanded greater incremental benefit from pharmaceutical and vaccine products before agreeing to reimburse drug manufacturers at prices manufacturers consider appropriate. A failure to develop commercially successful products or to develop additional uses for existing products for any of these reasons could materially and adversely affect the Group’s financial results.
Mitigating activities include
The Group has changed the Pharmaceuticals and Vaccines R&D organisation in recent years in an attempt to deliver a large and diverse late-stage pipeline and a discovery organisation structure that can sustain a flow of innovative new medicines and vaccines. To do this, the Group has evolved from our traditional hierarchical Pharmaceuticals and Vaccines R&D business model to an R&D business model based on smaller units in an attempt to encourage greater entrepreneurialism and accountability for our scientists, which the Group believes will create an environment that will be more conducive to the development of commercially viable new products and the development of additional uses for existing products.
In addition, the Group plans to continue collaborating with partners in academia, biotechnology companies and other pharmaceutical companies, which the Group believes can both improve our ability to develop competitive products and decrease the amount of time it takes to do so. The Group is also increasing consultation with patients and payers to ensure the medicines it develops provide improvements that healthcare systems will value and reward.
The Group reviews both product development and external collaborations through a series of formal governance committees. These committees progressively evaluate both the scientific and financial considerations for a product as well as the potential benefits/risks associated with the continued development of the assets. These committees include R&D executives as well as medical, scientific and commercial specialists for relevant therapy and business areas.
Protecting intellectual property rights
Risk description: Risks of failing to secure and protect intellectual property rights
Failure to obtain effective intellectual property protection for our products.
As an innovator Pharmaceutical, Vaccine and Consumer Healthcare company, the Group seeks to obtain appropriate intellectual property protection for our products. Our ability to obtain and enforce patents and other proprietary rights with regard to our products is critical to the Group’s business strategy and success.
In a number of markets in which the Group operates, the intellectual property laws and patent offices are still developing, and some markets may be unwilling to extend intellectual property protection to innovative products in a fashion similar to markets in more developed regions such as the EU, Japan and the USA or to enforce previously granted intellectual property rights.
|
| GSK Annual Report 2012 | 79 |
The Group’s inability to obtain and enforce effective intellectual property protection for our products in certain markets could have a material adverse result on the Group’s financial results.
In some of the countries in which the Group operates, patent protection and data exclusivity may be significantly weaker than in the USA or the EU. Some developing countries have reduced, or threatened to reduce, effective patent protection for pharmaceutical products generally, or in particular therapeutic areas, to facilitate early competition within their markets from generic manufacturers. Any loss of patent protection, including reducing the scope of patent rights or compulsory licensing (in which a government forces a manufacturer to license its patents to a competitor), could materially and adversely affect the Group’s financial results in those markets. Absence of adequate patent or data exclusivity protection could limit the opportunity to rely on such markets for future sales growth for the Group’s products.
Expiry of intellectual property rights protection on the Group’s products and on competitive products; Competition from generic manufacturers.
Pharmaceutical and vaccine products are usually only protected from being copied by generic manufacturers during the period of exclusivity provided by an issued patent or related intellectual property rights such as Regulatory Data Protection or Orphan Drug status. Following expiry of intellectual property rights protection, a generic manufacturer may produce a generic version of the product.
The Group faces intense competition from manufacturers of generic pharmaceutical products in all of its major markets. Introduction of generic products, particularly in the USA where the Group has its highest turnover and margins, typically leads to a dramatic loss of sales and reduces the Group’s revenues and margins for its proprietary products. The Group had 10 pharmaceutical and vaccine products with over £500 million in annual global sales in 2012. For certain of these products, there is generic competition in the USA and some markets in Europe.
The timing and impact of entry in the USA and major markets in Europe for a ‘follow-on’ product toSeretide/Advair that contains the same active ingredients is uncertain. The US patent for compositions containing the combination of active substances inSeretide/Advair expired during 2010. The Group has not been notified of any acceptance by the US Food & Drug Administration (FDA) of an application for a ‘follow-on’ product that refers toSeretide/Advair and contains the same active ingredients and is not able to predict when this may occur or when any such ‘follow-on’ product may enter the US market.
Generic drug manufacturers have also exhibited a readiness to market generic versions of many of the Group’s most important products prior to the expiration of the Group’s patents. Their efforts may involve challenges to the validity or enforceability of a Group patent or assertions that their generic product does not infringe the Group’s patents. If the Group is not successful in defending an attack on its patents and maintaining exclusive rights to market one or more of its major products, particularly in the USA and Europe, the Group’s financial results would be adversely affected. The expiration dates for patents for the Group’s major products and a description of litigation settlements which may affect the dates on which generic versions of the Group’s products may be introduced are set out on pages 229 to 230. Legal proceedings involving patent challenges are set out in Note 44 to the financial statements, ‘Legal proceedings’.
The Group may also experience an impact on sales of one of its products due to the expiry or loss of patent protection for a product marketed by a competitor in a similar product class or for treatment of a similar disease condition. The availability of generic products in the same or similar product class in which one of the Group’s products competes could have a material adverse impact on sales of the Group’s products.
Regulations outlining the requirements for establishing biosimilars and interchangeable products, as well as the operation of complicated patent litigation provisions, have not yet been proposed by the FDA, although the FDA currently is implementing the biosimilar pathway without such regulations, based on the statute and guidance documents. In Europe, the European Medicines Agency (EMA) has finalised guidelines for similar biological medicinal products containing monoclonal antibodies (mAbs). Such new regulations for establishing biosimilars and interchangeable products could allow for earlier competition for certain of the Group’s products.
The loss of patent or data exclusivity protection for some or all of the Group’s products could have a material adverse impact on sales of the Group’s products.
Mitigating activities include
The Group is supported by a global patents organisation within the legal group whose focus is to seek to ensure and protect the intellectual property rights of the Group. Beginning in 2011 and continuing through 2012, the Global Patents group sought to implement improvements to certain time-driven processes and controls in order to better manage its ability to obtain and maintain patent protection for the Group’s key assets and to minimize risk of invalidity or unenforceability of its patents. These processes relate to (1) implementing a new review process designed to help with obtaining and maintaining appropriate patent protection for key assets; (2) identifying opportunities for and obtaining patent term extensions; (3) ensuring timely payment of required renewal fees; and (4) ensuring appropriate listing of patents in the Orange Book.
The enhanced processes seek to ensure that all key patent applications are reviewed by senior management prior to worldwide filing and prior to grant and that senior management approval is obtained prior to listing of patents in the Orange Book or the initiation of Abbreviated New Drug Application (ANDA) litigation. In addition, the Group has initiated a post approval patent review process to ensure ongoing review of the quality of patents after grant.
The Global Patents group maintains internal litigation processes designed to ensure successful enforcement and defence of patents with the goal of maintaining exclusive rights to market major products.
The Global Patents group monitors new developments in patent law in the major markets in which the Group operates to seek to ensure appropriate protection of the Group’s assets. The Group (sometimes acting through trade associations) works with local governments to seek to secure effective and balanced intellectual property protection designed to meet the needs of patients and payers while supporting long-term investment in innovation.
Ensuring product quality
Risk description: Risk to the patient or consumer as a result of the failure by GSK, its contractors or suppliers to comply with good manufacturing practice regulations in commercial manufacturing or through inadequate governance of quality through product development
Patients, consumers and healthcare professionals trust the quality of our products at the point of use. A failure to ensure product quality is an enterprise risk which is applicable across all of the Group.
A failure to ensure product quality could have far reaching implications in terms of the health of our patients and customers, reputation, regulatory, legal, and financial consequences for the Group.
80 | GSK Annual Report 2012
Risk factors
Product quality may be influenced by many factors including product and process understanding, consistency of manufacturing components, compliance with current Good Manufacturing Practice (cGMP), accuracy of labelling, reliability and security of the supply chain, and the embodiment of an overarching quality culture. The internal and external environment continues to evolve as new products, new markets and new legislation are introduced. Particular attention is currently being focused on global supply. In the EU, the new Falsified Medicines Directive is focused on security of supply. In the USA, the passage of the Food Drug and Administration Safety and Innovation Act (FDASIA) will focus attention on reducing current levels of drug shortages in the marketplace, and new cGMP legislation is being introduced in many emerging markets including China and Brazil. On the inspection front, pharmaceutical inspectors are increasingly looking for global application of corrective actions beyond the original site of inspection.
Mitigating activities include
The Group has adopted a single Quality Management System (QMS) that defines Corporate quality standards and systems for the business units associated with Pharmaceuticals and Consumer Healthcare products, vaccines and R&D investigational materials. The QMS has a broad scope, covering the end to end supply chain from starting materials to distributed product, and is applicable throughout the complete life cycle of products from R&D to mature commercial supply.
The QMS is periodically updated based on experience, new regulation and improved scientific understanding to seek to ensure operations comply with cGMP requirements globally, and supports the delivery of consistent and reliable products.
A large network of Quality and Compliance professionals are aligned with each business unit to provide oversight and assist the delivery of quality performance and operational compliance. Management oversight of those activities is accomplished through a hierarchy of Quality Council Meetings. Staff are trained to seek to assure that standards, as well as expected behaviours based on the Group’s values, are followed.
The Group’s Chief Product Quality Officer oversees the activities of the GSK Quality Council which serves as a forum to escalate emerging risks, share experiences of handling quality issues from all business units and ensure that the learnings are assessed and deployed across the Group.
The Group has implemented a risk-based approach to assessing and managing its third-party suppliers that provide materials used in finished products. Contract manufacturers making Group products are audited to help assure expected standards are met.
Maintaining product supply
Risk description: Risk of interruption of product supply
The manufacture of pharmaceutical and vaccine products and their constituent materials requires compliance with good manufacturing practice regulations. The Group’s manufacturing sites are subject to review and approval by the FDA and other regulatory agencies. Compliance failure by the Group’s manufacturing facilities or by suppliers of key services and materials could lead to product recalls and seizures, interruption of production, delays in the approval of new products, and revoking of license to operate pending resolution of manufacturing issues. For example, non-compliance with cGMP requirements for US supply could ultimately result, in the most severe circumstances, in fines and disgorgement of profits. Any interruption of supply or the incurring of fines or disgorgement impacting significant products or markets could materially and adversely affect the Group’s financial results.
Materials and services provided by third-party suppliers are necessary for the commercial production of our products, including specialty chemicals, commodities and components necessary for the manufacture and packaging of many of the Group’s pharmaceutical, vaccine and consumer healthcare products. Some of the third-party services procured, for example, services provided by clinical research organisations to support development of key products, are very important to the operation of the Group’s businesses. Although the Group undertakes business continuity planning, single sourcing for certain components, bulk active materials, finished products, and services creates a risk of failure of supply in the event of regulatory non-compliance or physical disruption at the manufacturing sites. The failure of a small number of single-source, third-party suppliers or service providers to fulfil their contractual obligations in a timely manner or as a result of regulatory non-compliance or physical disruption at the manufacturing sites may result in delays or service interruptions, which may materially and adversely affect the Group’s financial results.
Mitigating activities include
Our supply chain model is designed to help ensure the supply, quality and security of the Group’s products globally, and the Group closely monitors the delivery of our products with the intent of ensuring that our customers have the medicines and products they need.
Safety stocks and backup supply arrangements for high revenue and critical products are in place to help mitigate this risk. In addition, the standing of manufacturing external suppliers is also routinely monitored in order to identify and manage supply base risks.
Where practical, dependencies on single sources of critical items are removed.
Securing adequate pricing and reimbursement
Risk description: Risk that the Group may fail to secure adequate pricing/reimbursement for its products or existing regimes of pricing laws and regulations become more unfavourable
Pharmaceutical and vaccine products are subject to price controls or pressures and other restrictions in many markets, around the world. Some governments intervene directly in setting prices. In addition, in some markets, major purchasers of pharmaceutical or vaccine products (whether governmental agencies or private health care providers) have the economic power to exert substantial pressure on prices or the terms of access to formularies. Difficult economic conditions, particularly in the major markets in Europe, could increase the pricing pressures on the Group’s pharmaceutical and vaccine products. The Group cannot accurately predict whether existing controls, pressures or restrictions will increase or whether new controls, pressures or restrictions will be introduced. Such measures may materially and adversely affect the Group’s ability to introduce new products profitably and its financial results.
In the USA, where the Group has its highest margins and the most sales of any country, there are no direct government price controls over private sector purchases, but federal law requires pharmaceutical manufacturers to pay prescribed rebates on certain drugs to be eligible for reimbursement under several state and federal healthcare programmes, primarily Medicare and Medicaid. Pricing pressures are likely to increase as the US Government’s share of national health spending continues to increase.
Additionally, due to passage of comprehensive health care reform in 2010, the US Government’s role in providing or subsidising health insurance is expected to significantly expand in 2014, which indicates the growing role and leverage the government will bring to bear on the Group’s rebate liability with respect to US federal programs.
|
| GSK Annual Report 2012 | 81 |
As part of ongoing deficit reduction discussions in the USA, the Obama administration recently has suggested that pharmaceutical manufacturers be required to offer federally mandated rebates to the government on drugs for people who are elderly and disabled and who qualify for both Medicare and Medicaid (known as ‘dual eligibles’). These individuals currently receive drug benefits through Medicare Part D. A manufacturer’s Medicare Part D rebates are negotiated with health plans and typically are lower than the federally mandated Medicaid rebates. If legislation passes requiring manufacturers to pay mandated Medicaid level rebates for the dual eligibles, there would be a significant additional rebate liability for pharmaceutical companies such as the Group.
In recent years, a number of states have also proposed or implemented various schemes to control the pharmacy budget for drugs used by their low-income and senior citizens’ programmes, including increasing the rebate liability of pharmaceutical companies, importation from other countries and bulk purchases of drugs.
Given the possible expansion of Medicaid under the US health care reform law and the economic pressures on state government budgets, pricing pressures on the Group’s pharmaceutical and vaccine products are likely to increase. Any of these trends may materially and adversely affect the Group’s financial results.
Mitigating activities include
The Group’s effort to improve reimbursement evidence for development assets is designed to help defend our future innovation. More clearly demonstrating the value our medicines and vaccines provide to patients, providers and payers using relevant comparators, meaningful endpoints and targeted patient populations will help to support appropriate price levels and formulary access.
The Group communicates with governments to reinforce their awareness of the value of medicines, and also works with national industry associations to reinforce these messages. In addition, the Group monitors the global economic environment to identify areas with potential pricing pressure. The Group will continue to explore different pricing models for innovative products and support more modest pricing of older products. This provides an opportunity for new products to be reimbursed and rewards companies that invest in R&D to meet unmet patient needs.
Given the sustained shift witnessed in the European reimbursement and pricing environment, the Group plans to initiate further restructuring of our European Pharmaceuticals business to reduce costs, improve efficiencies and reallocate resources to support identified growth opportunities in these markets. As the Group reduces its European cost base, the Group is also evaluating further strategic options to ensure the development of new capabilities and the ability to maximise the value of the Group’s current and future portfolio in this region. This initiative is expected to progress in 2013. This additional restructuring supports our strategy to change the shape of our business and deliver sustainable long-term growth. In the short term, it will also help to offset some of the pressure the Group is seeing on our margin structure resulting from changes in our business mix.
In selected developed markets, the Group has engaged in new reimbursement approaches for our medicines, where the Group agrees to outcomes-based risk-sharing arrangements with payers.
From a policy and advocacy perspective, the Group works with our trade associations to help support government adoption of policies that are fair, balanced, transparent, and that do not unfairly impact innovative pharmaceutical companies.
Compliance with relevant laws and regulations
Risk description: Risks arising from non-compliance with laws and regulations affecting the Group
The Group operates on a global basis and must comply with a broad range of laws and regulatory controls on the development, manufacturing, testing, approval, distribution and marketing of many of its pharmaceutical, vaccine and consumer healthcare products that affect not only the cost of product development but also the time required to reach the market and the uncertainty of successfully doing so. The Group operates globally in complex legal and regulatory environments that often vary among jurisdictions.
As those rules and regulations change or as governmental interpretation of those rules and regulations evolve, the potential exists for conduct of the Group to be called into question.
Historically, there have been more stringent regulatory requirements in developed markets. However, in recent years, emerging markets have been increasing their regulatory expectations based on their own national interpretations of US and EU standards. Stricter regulatory controls heighten the risk of changes in product profile or withdrawal by regulators on the basis of post-approval concerns over product safety, which could reduce revenues and result in product recalls and product liability lawsuits. There is also greater regulatory scrutiny, especially in the USA, on advertising and promotion and in particular on direct-to-consumer advertising.
Furthermore, interaction and exchange of information between the Group and external communities in order to advance scientific and medical understanding may be, or may be perceived to be, promotional in intent by regulators, potentially resulting in a loss of credibility with authorities, prescribers, and patients. Such an interpretation could result in a regulatory action or a government investigation which could have far-reaching effects including impacting product liability actions, the regulatory pathway for assets, significant fines, exclusion from government programs, and even individual criminal liability.
Additionally, the development of the post-approval adverse event profile for a product or the product class may materially and adversely affect the Group’s financial results.
The Group is also subject to laws of the USA, the EU and other jurisdictions regulating the export of its products to certain countries. For instance, Iran is subject to wide-ranging sanctions under the laws of the USA, the EU, and other jurisdictions. The Group has exported certain pharmaceutical and vaccine products from its Pharmaceuticals and Vaccines businesses, and certain healthcare products including over-the counter-medicines and medical devices from its Consumer Healthcare business, to Iran via sales by non-US entities to three privately held Iranian distributors. US law requires specific disclosure of certain dealings with Iran, including transactions or dealings with government-owned entities and entities sanctioned for activities related to terrorism or proliferation of weapons of mass destruction. We do not believe that our Iranian distributors fall within any of the relevant categories. The Group also does business, via non-US entities, in other jurisdictions targeted by sanctions laws, including Cuba, Syria, and Sudan. Failure to comply with these laws could expose the Group to civil and criminal penalties, including fines, prosecution, the imposition of export or economic sanctions against the Group and reputational damage, all of which could materially and adversely affect the Group’s financial results.
82 | GSK Annual Report 2012
Risk factors
Mitigating activities include
The Group’s internal control framework is designed to help ensure we adhere to legal and regulatory requirements. While significant work has been accomplished to strengthen the Group’s compliance programme, the Group continuously evaluates and enhances it based on changes to the healthcare marketplace, changes to the Group’s commercial model, guidance by governmental agencies, and requirements set out by the Corporate Integrity Agreement (CIA) entered into in 2012 to which the Group is subject.
The Group has implemented numerous mechanisms to support our compliance with legal and regulatory requirements. The following represent some examples of these mechanisms.
The Group’s Chief Regulatory Officer oversees the activities of the Regulatory Governance Board which includes promoting compliance with regulatory requirements and companywide standards, making regulatory services more efficient and agile, and further aligning regulatory capabilities with business needs at global and local levels.
The Medical Governance Executive Committee, accountable to the Chief Medical Officer, oversees the system of principles, policies and accountabilities to help ensure the Group applies the generally recognized principles of good medical science, integrity and ethics to the discovery, development and marketing of products. This includes reinforcing the Group’s commitment to respecting a clear distinction between scientific engagement on the one hand, and product promotion on the other.
The Group has implemented an above-country medical governance risk management framework which covers relevant Group activities and supports the development and implementation of appropriate management controls for applicable policies, with a focus on ensuring patient safety. For additional mitigating activities related to the medical governance framework, please see the ‘Potential Litigation and Government Investigations’ risk factor.
With regards to sales and marketing activities, the Group has defined and communicated its expectations for pharmaceutical marketing and promotional activities in its global code of practice. The code sets the minimum Group standard for these activities, but requires all activities to comply with applicable laws, regulations, and industry codes in effect.
In both the Pharmaceutical and Consumer Healthcare business units, the copy review process is used to review materials to help assure those materials are accurate and fairly portray our products, including ensuring that no off-label claims are made with respect to the Group’s over the counter products. The legal group, as a member of certain US pharmaceutical and consumer healthcare committees, advises on appropriate policies to help mitigate this risk in the USA. Working with the business and compliance groups, legal also undertakes a periodic assessment of current sales and promotional activities.
With regards to the economic sanctions risk, the Group has implemented a global policy and procedure that reflects the Group’s commitment to strict adherence to applicable sanctions and export control laws relevant to its business. The global policy requires each business unit and global support function to perform appropriate risk assessments. Following a review of its business with Iran, the Group has ceased sales of products from its Consumer Healthcare business and intends to supply only products of high medical/public health need (as determined using criteria set by the World Health Organization) from its Pharmaceuticals and Vaccines businesses.
Changing global political and economic conditions
Risk description: Risk of exposure to various external political and economic conditions, as well as natural disaster that may impact the Group’s performance and ability to achieve its objectives
Many of the world’s largest economies, including the major markets in which the Group operates, and financial institutions have recently faced extreme financial difficulty, including a decline in asset prices, liquidity problems and limited availability of credit. In addition, the Group operates across a wide range of markets and these markets have the potential to encounter natural disasters that could impact business operations.
The economic uncertainty of 2011 continued into 2012, particularly in Europe. It is uncertain how long these effects will last, or whether economic and financial trends will worsen or improve. The austerity measures in certain countries in Europe have increased pressures on the payers in those countries to force healthcare companies such as the Group to decrease the price of its products. The debt crisis has given rise to concerns that some countries may not be able to pay for our products. Current economic conditions may also adversely affect the ability of our distributors, customers, suppliers and service providers to pay for our products, or otherwise to buy necessary inventory or raw materials, and to perform their obligations under agreements with the Group, which could disrupt our operations, and negatively impact our business and cash flow. Some of our distributors, customers, suppliers and service providers may be unable to pay their bills in a timely manner, or may even become insolvent, which could also negatively impact our business and results of operations. These risks may be elevated with respect to our interactions with third parties with substantial operations in countries where current economic conditions are the most severe, particularly where such third parties are themselves exposed to risk from business interactions directly with fiscally-challenged government payers.
Such continued economic weakness and uncertainty could materially and adversely affect the Group’s revenues, results of operations and financial condition. The Group’s businesses, including Pharmaceuticals, Vaccines and Consumer Healthcare, may be particularly sensitive to declines in consumer or government spending. In addition, further or renewed declines in asset prices may result in a lower return on the Group’s financial investments and may cause the value of the Group’s investments in its pension plans to decrease, requiring the Group to increase its funding of those pension plans. See Note 28 to the financial statements, ‘Pensions and other post-employment benefits’ for a discussion of the investment strategy and general pension overview.
The Group has no control over changes in inflation and interest rates, foreign currency exchange rates and controls or other economic factors affecting its businesses or the possibility of political unrest, legal and regulatory changes or nationalisation in jurisdictions in which the Group operates.
Mitigating activities include
The extent of the Group’s portfolio and geographic footprint assist in mitigating our exposure to any specific localised risk to a certain degree. External uncertainties are carefully considered when developing strategy and reviewing performance.
The Group has continued the conscious commercial decision to maintain supply to countries with funding problems within agreed limits on total receivables. The Group has designated a cross- business team to specifically evaluate the European economic risk. That team has developed response plans to different European economic events to attempt to ensure preparedness and with the aim of reducing the potential impact to the Group of such events.
|
| GSK Annual Report 2012 | 83 |
Several mitigating steps have also been taken to attempt to reduce the Group’s financial exposure in certain key countries including exercising additional caution in counterparty exposures, taking prudent balance sheet measures in relation to high risk countries, and proactively managing our short-term liquidity positions. For additional mitigating activities related to European prices pressures, please see the ‘Government Payers and Pricing’ risk factor.
The Group has a formal Crisis and Continuity Management strategy and global policy and procedure that are managed centrally. The strategy requires documentation of crisis and continuity plans and periodic review of those plans. The Crisis and Continuity Management team assists in critical crisis preparedness and response efforts globally and incorporates lessons learned into the global strategy.
Managing alliances and acquisitions
Risk description: Risks from alliances and acquisitions
As part of the Group’s strategy to diversify into new product areas and markets, the Group has grown, and expects to continue to grow, in part through acquisitions and business alliances. There is intense competition for alliance and acquisition candidates in the pharmaceutical industry, and, as such, the Group may be unable to make these deals on acceptable terms or at all. In acquiring or forming alliances with companies, the Group may assume significant debt, become subject to unknown or contingent liabilities or fail to realise the benefits expected from these transactions. For example, most pharmaceutical or biotech companies, including those that the Group may consider acquiring, are involved in patent disputes, product liability litigation, government investigations and other legal proceedings whose outcome is subject to considerable uncertainty.
The assumption of debt or unknown or contingent liabilities or the failure to realise the expected benefits may materially and adversely affect the Group’s financial results.
The process of integrating companies the Group may acquire may result in disruption to the ongoing business as the effort of integrating organisations in different locations and with, among other things, differing systems and corporate cultures may divert attention and resources, result in the loss of key employees or have other adverse consequences, any of which may materially and adversely affect the Group’s financial results.
Mitigating activities include
The Group engages in significant due diligence prior to any alliance or acquisition to assess the operational, financial and reputational risk that may result from any alliance or acquisition. Such diligence includes documentary review and discussions with employees and representatives of collaborator companies. Group employees with key roles in diligence are required to complete training prior to working on any transactions.
Major transactions entered into by the Group are reviewed by various management boards throughout the Group including, for instance, the Technology Investment Board, the Product Management Board, the Corporate Executive Team and the Board.
The contractual arrangements that the Group enters into include provisions to reduce or eliminate the Group’s financial exposure from a particular transaction.
Integration of acquired companies is managed by the Group’s Corporate Strategy group pursuant to specific standards, working with the responsible management for each business affected by the acquisition. An integration team is appointed for each company acquisition to seek to ensure a smooth integration and minimise disruption to the business. The integration team attempts to ensure that the Group attains the maximum value that may be generated from a deal, whilst ensuring that key risks are managed in a timely manner.
Compliance with financial reporting and disclosure requirements
Risk description: Risk associated with financial reporting and disclosure and changes to accounting standards
New or revised accounting standards, rules and interpretations issued from time to time by the International Accounting Standards Board could result in changes to the recognition of income and expense that may materially and adversely affect the Group’s financial results.
Under International Financial Reporting Standards, changes in the market valuation of certain financial instruments are required to be reflected in the Group’s reported results before those gains or losses are actually realised. This could have a significant impact on the income statement in any given period. Accounting for deferred taxation on inter-company inventory may give rise to volatility depending upon the Group entity that owns the inventory.
Regulators regularly review the financial statements of listed companies for compliance with accounting and regulatory requirements. The Group believes that it complies with the appropriate regulatory requirements concerning its financial statements and disclosures. However, other companies have experienced investigations into potential non-compliance with accounting and disclosure requirements that have resulted in restatements of previously reported results and sometimes significant penalties. Any such investigation and required restatement could materially and adversely affect the Group’s financial results.
Mitigating activities include
The Group maintains a control environment designed to identify material errors. Management periodically tests the design and operating effectiveness of key financial reporting controls. This provides management with the assurance that controls have operated effectively over key financial reporting and disclosure processes.
The Group keeps up to date with the latest developments for financial reporting requirements by working with the external auditor and other advisors to ensure adherence to relevant reporting requirements.
There is a shared accountability for financial results across the Group. Financial results are reviewed and signed off by regions and then reviewed with the Corporate Controller and the Chief Financial Officer (CFO). This allows both the Corporate Controller and the CFO to assess the evolution of the business over time, and to evaluate performance to plan. Significant judgments are reviewed and confirmed by senior management.
Compliance with tax law and managing treasury investments
Risk description: Risk that as the Group’s business models and tax law and practice change over time, the Group’s existing tax policies and operating models are no longer appropriate, or that significant losses arise from treasury investments
The Group’s effective tax rate is driven by rates of tax in jurisdictions that are both higher and lower than that applied in the UK. In addition, many jurisdictions such as the UK, Belgium and the USA currently offer regimes that encourage innovation and new scientific endeavours by providing tax incentives, for example R&D tax credits, and lower tax rates on income derived from patents.
84 | GSK Annual Report 2012
Risk factors
Furthermore, given the scale and international nature of the Group’s business, intra-group transfer pricing is an inherent tax risk as it is for other international businesses. Changes in tax laws or in their application with respect to matters such as transfer pricing, foreign dividends, controlled companies, R&D tax credits, taxation of intellectual property or a restriction in tax relief allowed on the interest on intra-group debt, could impact the Group’s effective tax rate and materially and adversely affect its financial results.
The tax charge included in the financial statements is the Group’s best estimate of its tax liability, but until such time as audits by tax authorities are concluded, there is a degree of uncertainty regarding the final tax liability for the period. The Group’s policy is to submit tax returns within the statutory time limits and engage with tax authorities to ensure that the Group’s tax affairs are as current as possible, and that any differences in the interpretation of tax legislation and regulation are resolved as quickly as possible. In exceptional cases where matters cannot be settled by agreement with tax authorities, the Group may have to resolve disputes through formal appeals or other proceedings. For example, in October 2012, the Supreme Court of Canada delivered its decision on an appeal in respect of the Group’s transfer pricing, as discussed in Note 14 to the financial statements, ‘Taxation’. The Group, like other international businesses, is also subject to a range of other duties and taxes for which it incurs similar types of risk.
The Group deals in high value transactions on a frequent basis which may result in an increased risk of financial loss due to the mismanagement of cash or entering into high risk positions on hedge transactions, any of which could materially and adversely affect the Group’s financial results.
Mitigating activities include
The Group monitors Government debate on tax policy in its key jurisdictions to deal proactively with any potential future changes in tax law.
Tax risk is managed by a set of policies and procedures to ensure consistency and compliance with tax legislation. The Group engages advisors and legal counsel to review tax legislation and applicability to the Group. The Group has attempted to mitigate the risk of more aggressive audits by being as up to date as possible with our tax affairs and working in real time with tax authorities where possible.
The Group has undertaken a number of projects to move to a more centralised and simplified intellectual property ownership and trading model. The new model centralises our pharmaceutical intellectual property into the UK, reducing the complexity of our intercompany arrangements and enabling us to drive more bilateral Advance Pricing Agreements (‘APAs’) in the future between the UK and other jurisdictions in which the Group operates. APAs give greater certainty to the application of transfer pricing and our direct tax affairs and hence reduce the risks the Group faces.
The Treasury department does not act as a profit centre for the Group, which reduces the incentive to take risks in order to increase returns. The department strives to minimise risk and centralise financial transactions.
Treasury risk is managed by a detailed set of Treasury policies that is reviewed and approved by the Board on an annual basis. The Group proactively monitors Treasury activities with the intent of identifying exceptions to policy.
Compliance with anti-bribery and corruption legislation
Risk description: Risk of failing to create a corporate environment opposed to corruption or failing to instil business practices that prevent corruption and comply with anti-corruption legislation
The Group’s extensive and increasingly international operations may give rise to possible claims of bribery and corruption. The Group operates in a number of markets where the corruption risk has been identified as high by groups such as Transparency International. Failure to comply with applicable legislation such as the US Foreign Corrupt Practices Act and the UK Bribery Act, or similar legislation in other countries, could expose the Group and senior officers to civil and criminal sanction.
This could potentially include fines, prosecution, debarment from public procurement and reputational damage, all of which could materially and adversely affect the Group’s financial results.
Mitigating activities include
The Group has implemented a global Anti-Bribery/Anti-Corruption (ABAC) programme. The programme includes a global ABAC policy, ongoing training, and detailed requirements in respect to third-party due diligence, contracting and oversight. In addition, the programme has strengthened controls over interactions with Government Officials and when entering into business development transactions. Operational performance is reviewed by the Group’s ABAC Oversight Committee.
A dedicated ABAC team is responsible for driving implementation of the programme and the design and execution of the ABAC audit strategy and methodology. They are supported by an extended team of functional experts within the legal group, Compliance and Audit & Assurance. The ABAC team provides continued support to the business through ongoing training and communication of guidance. A community of experts meet to provide timely guidance to the business on issues that they have escalated. The ABAC programme continues to evolve in response to the external environment, ongoing benchmarking and internal stakeholder feedback.
Potential litigation
Risk description: Risk of substantial adverse outcome of litigation and government investigations
Note 44 to the financial statements, ‘Legal proceedings’, contains a discussion of material proceedings and governmental investigations currently involving the Group which, if proven, could give rise to civil and/or criminal liabilities. Unfavourable resolution of these and similar future proceedings or investigations may have a material adverse effect on the Group’s financial condition and results of operations. As an example, in 2012, the Group entered into a settlement agreement with the US federal government resulting in a payment of US$3 billion by the Group. The Group has made provisions related to such legal proceedings and investigations, which have reduced its earnings.
In the future, the Group may also make additional significant provisions related to legal proceedings and investigations which would reduce its earnings. In many cases, the Group believes that it is the practice of the plaintiff bar to claim damages in amounts that bear no reasonable relationship to the underlying harm allegedly caused by the Group’s products or its actions. Accordingly, it may be potentially misleading for the Group to quantify, based on the amount of damages claimed, its potential exposure to claims, proceedings and investigations of the type described in Note 44 to the financial statements, ‘Legal proceedings’.
|
| GSK Annual Report 2012 | 85 |
Recent insurance loss experience, including pharmaceutical product liability exposures, has increased the cost, and reduced the capacity, of insurers to provide coverage for pharmaceutical companies generally, including the Group.
Product liability litigation
Pre-clinical and clinical trials are conducted during the development of potential pharmaceutical, vaccine and consumer healthcare products to determine the safety and efficacy of the products for use by humans following approval by regulatory authorities. Notwithstanding the efforts the Group makes to determine the safety of its products through regulated clinical trials, unanticipated side effects may become evident only when drugs and vaccines are widely introduced into the marketplace.
In other instances, third-parties may perform analyses of published clinical trial results which, although not necessarily accurate or meaningful, may raise questions regarding the safety of pharmaceutical, vaccine or consumer healthcare products which may be publicised by the media and may result in product liability claims. The Group is currently a defendant in a substantial number of product liability lawsuits, including class actions, that involve significant claims for damages related to the Group’s pharmaceutical and consumer healthcare products. Litigation, particularly in the US, is inherently unpredictable. Class actions that sweep together all persons who were prescribed the Group’s products can inflate the potential liability by the force of numbers. Claims for pain and suffering and punitive damages are frequently asserted in product liability actions and, if allowed, can represent potentially open ended exposure and thus could materially and adversely affect the Group’s financial results.
In some cases, the Group may voluntarily cease marketing a product or face declining sales based on concerns about efficacy or safety, even in the absence of regulatory action.
Anti-trust litigation
In the USA, it has become increasingly common for patent infringement actions to prompt claims that anti-trust laws have been violated during the prosecution of the patent or during litigation involving the defence of that patent. Such claims by direct and indirect purchasers and other payers are typically filed as class actions. The relief sought may include treble damages and restitution claims. Similarly, anti-trust claims may be brought by government entities or private parties following settlement of patent litigation, alleging that such settlements are anti-competitive and in violation of anti-trust laws. In the USA and Europe, regulatory authorities have continued to challenge as anti-competitive so-called “reverse payment” settlements between innovator (branded) and generic drug manufacturers. The US Supreme Court is currently reviewing the legality of such settlement agreements. The Group may also be subject to other anti-trust litigation involving competition claims unrelated to patent infringement and prosecution. A successful anti-trust claim by a private party or government entity against the Group could materially and adversely affect the Group’s financial results.
Sales and marketing litigation
The Group operates globally in complex legal and regulatory environments that often vary among jurisdictions. The failure to comply with applicable laws, rules and regulations in these jurisdictions may result in civil and criminal legal proceedings brought against the Group by governmental entities at the federal and state levels and by private plaintiffs. As those rules and regulations change or as governmental interpretation of those rules and regulations evolve, conduct of the Group may be called into question.
In the USA, for example, the Group settled a number of federal and state investigations into the marketing of certain of its products and entered into a CIA with the federal government relating to the Group’s marketing and promotion of its products in the USA.
While the Group reached agreement in 2012 to resolve certain federal and state governmental investigations into the pricing, marketing and reimbursement of its prescription drug products, as detailed in Note 44 to the financial statements, ‘Legal proceedings’, additional related state investigations that have been initiated on the basis of the same factual claims could result in restitution or civil litigation on behalf of state governments, and could also result in related proceedings initiated against the Group by or on behalf of consumers and private payers. Such proceedings may result in trebling of damages awarded or fines in respect to each violation of law. The conduct of the Group could result in additional investigations in the future by the US federal and state governments and similar civil litigation. Any of these consequences could materially and adversely affect the Group’s financial results.
Mitigating activities include
The Group attempts to mitigate the risks inherent in drug development through conscientious approaches to product development and distribution that focus on patient safety as an overriding priority, and that include accurate documentation of the exercise of careful medical governance.
The Group has constructed a system of medical governance to help ensure the safety and efficacy of the drugs, vaccines and consumer products it produces. The Group’s Chief Medical Officer (CMO) is responsible for medical governance for the Group under a global policy. Under that policy, safeguarding human subjects in Group clinical trials and patients who take Group products is of paramount importance, and the CMO has the authoritative role for evaluating and addressing matters of human safety. The Global Safety Board (GSB), comprising senior physicians and representatives of supportive functions, as well as the lawyer who leads legal support for Pharmaceuticals R&D, is an integral component of the system.
The GSB reviews investigational and marketed products within the Pharmaceuticals R&D portfolio; subsidiary boards accountable to GSB, also with legal delegates, perform similar reviews for the consumer healthcare products and vaccines.
In addition to the medical governance framework within the Group as described above, the Group uses several mechanisms to foster the early resolution of new disputes as they arise and reduce the number of such disputes that actually proceed to litigation.
The Group formalised processes for proactive risk/dispute management. The programme aims to drive a more standardised practice to the early resolution of disputes and consistent use across the organisation, and establishes a specific vocabulary and identity for the concept of early analysis and resolution, thereby accelerating the desired culture shift. The Legal group also routinely trains the Group’s employees on strategies to attempt to minimize the Group’s litigation exposure.
In response to the execution of the CIA, the Group implemented an enterprise steering committee to ensure oversight and governance for CIA compliance. Additionally, the Group appointed a senior executive within its US-based Compliance group whose role is to provide assurance to senior management and the Board that the Group is complying with its obligations under the CIA.
The Group continues to evaluate its commercial practices, not only to ensure compliance with the CIA, but to also find opportunities to limit or eliminate commercial activities that may not effectively align to our commercial strategy, values, and/or that may result in unnecessary risks. For example, the Group implemented a system for evaluating and compensating our sales professionals in the USA for the quality of their interactions with healthcare professionals, including an element of customer evaluation, rather than for achieving individual sales targets.
86 | GSK Annual Report 2012
Risk factors
Managing environmental, health, safety and sustainability compliance
Risk description: Risk of ineffectively managing environment, health, safety, and sustainability (‘EHSS’) objectives and requirements
The environmental laws of various jurisdictions impose actual and potential obligations on the Group to remediate contaminated sites. The Group has also been identified as a potentially responsible party under the US Comprehensive Environmental Response Compensation and Liability Act at a number of sites for remediation costs relating to the Group’s use or ownership of such sites.
Failure to manage properly the environmental risks could result in additional remedial costs that may materially and adversely affect the Group’s financial results. See Note 44 to the financial statements, ‘Legal proceedings’, for a discussion of environmental related proceedings in which the Group is involved. The Group routinely accrues amounts related to its liabilities for such matters.
The impact of this risk, should the risk occur, could lead to significant harm to people, the environment and communities in which the Group operates and the failure to meet stakeholder expectations and regulatory requirements.
Mitigating activities include
Management of EHSS risk is fundamental to the Group’s performance and reputation. The Group is committed to appropriately managing EHSS risk and has embedded its importance into its mission to help people “do more, feel better, live longer”.
The Group operates rigorous procedures to seek to eliminate hazards where practicable and protect employees’ health and well-being, but the right culture is our essential starting point. Our employment practices are designed to create a work place culture in which all Group employees feel valued, respected, empowered and inspired to achieve our goals.
The Group’s continuing efforts to improve environmental sustainability have reduced the Group’s water consumption, hazardous waste, and energy consumption. The Group actively manages our environmental remediation obligations to ensure practices are environmentally sustainable and compliant.
The Group’s EHSS performance results are shared with the public each year in our Corporate Responsibility Report.
Concentration of sales to wholesalers
Risk description: Risk from the Group’s sale of products to a small number of wholesalers
In the USA, similar to other pharmaceutical and vaccine companies, the Group sells its products through a small number of wholesalers in addition to hospitals, pharmacies, physicians and other groups. Sales to the three largest wholesalers amounted to approximately 81% of the Group’s US Pharmaceuticals and Vaccines turnover in 2012.
At 31 December 2012, the Group had trade receivables due from these three wholesalers totalling £815 million (31 December 2011 – £934 million). The Group is exposed to a concentration of credit risk in respect of these wholesalers such that, if one or more are affected by financial difficulty, it could materially and adversely affect the Group’s financial results.
Mitigating activities include
The Group regularly engages in credit risk monitoring activities relating to these wholesalers, including review of periodic financial information and credit ratings, develops and monitors Group internal risk ratings, and establishes and periodically reviews credit limits.
Protecting our information
Risk description: Risk of exposing business critical or sensitive data due to inadequate data governance or information systems security
The Group relies on critical and sensitive data, such as corporate strategic plans, personally identifiable information, trade secrets and intellectual property, to drive planning and operations. Security of this type of data is exposed to escalating external threats that are increasing in sophistication and changing from a goal of disruption to being financially or politically motivated.
Failure to implement appropriate safeguards to adequately protect against any unauthorised or unintentional access, acquisition, use, modification, loss or disclosure of this critical or sensitive data may adversely impact the Group’s ability to maintain patent rights and competitive advantages and may result in legal non-compliance resulting in fines and penalties or inability to sell product in a particular market.
Mitigating activities include
The Group assesses changes in our risk environment through briefings by government agencies, subscription to commercial threat intelligence services and security information sharing with other companies – both in our industry and beyond.
The Group’s policies and controls on information protection are regularly reviewed and employees are routinely trained. The Group has dedicated information security expertise and resources. In response to the changing external risk environment, the Group has implemented a global programme to further increase business awareness of information protection requirements, further define minimum information security expectations for third-party agreements, implement additional technical controls to protect data, and improve its security event monitoring.
The Group is also subject to various laws that govern the processing of Personally Identifiable Information (‘Pll’). To ensure compliance with cross-border transfer requirements for Pll, the Group has submitted an application for Binding Corporate Rules (‘BCRs’), which is under review by the UK Information Commissioner’s Office. The Group’s BCRs would simplify the internal processing of Pll for human resource and research activities by creating one global standard.
|
| GSK Annual Report 2012 | 87 |
88 | GSK Annual Report 2012
Governance & remuneration
Our Board
Our Board is responsible for the long-term success of the
company, corporate governance, strategy, risk management
and financial performance
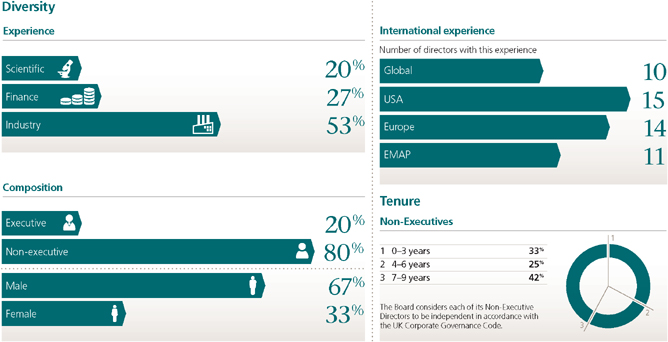
| | | | | | |
 | | Sir Christopher Gent64 Chairman NationalityBritish Appointment date 1 June 2004 and as Chairman on 1 January 2005 Committee membership Chairman of the Nominations and Corporate Responsibility Committees and a member of the Remuneration and Finance Committees | | Skills and experience Sir Christopher has many years’ experience of leading global businesses and a track record of delivering outstanding performance in highly competitive industries. He was appointed Managing Director of Vodafone plc in 1985 and then became its Chief Executive Officer in 1997 until his retirement in 2003. External appointments Sir Christopher is a Non-Executive Director of Ferrari SpA, a Senior Adviser at Bain & Co and a member of the British Airways International Business Advisory Board. Sir Christopher was formerly a member of KPMG’s Chairman’s Advisory Group and a Non-Executive Director of Lehman Brothers Holdings Inc. |
| | | | |
| | |


| | Sir Andrew Witty48 Chief Executive Officer NationalityBritish Appointment date 31 January 2008 and as Chief Executive Officer on 21 May 2008 Committee membership Member of the Finance Committee | | Skills and experience Sir Andrew joined GSK in 1985. He has worked in the UK, South Africa, the USA and Singapore in various senior roles. In 2003, he was appointed President of GSK Europe and joined GSK’s Corporate Executive Team. He was appointed CEO in May 2008. While in Singapore, Sir Andrew was a Board Member of the Singapore Economic Development Board and the Singapore Land Authority. In 2003 he was awarded the Public Service Medal by the Government of Singapore and in August 2012 was also awarded the Public Service Star. In the 2012 New Year Honours list, he was awarded a Knighthood for services to the economy and to the UK pharmaceutical industry. He is currently a member of the Prime Minister’s Business Advisory Group and was a board member of INSEAD Business School until January 2012. External appointments Sir Andrew is currently the Lead Non-Executive Board Member for the Department for Business, Innovation and Skills. He is also President of the European Federation of Pharmaceutical Industries and Associations and Chancellor of the University of Nottingham. |
| | | | | | |
|
| GSK Annual Report 2012 | 89 |
| | | | | | |
 | | | | Simon Dingemans49 | | Skills and experience |
| | | Chief Financial Officer NationalityBritish Appointment date 4 January 2011 and as Chief Financial Officer on 1 April 2011 Committee membership Member of the Finance Committee | | Prior to joining GSK, Simon had over 25 years’ experience in investment banking at SG Warburg and Goldman Sachs. During this time, he advised a broad range of large corporates across a number of industry sectors, including pharmaceuticals and consumer healthcare. Simon advised GSK for over a decade before his appointment and was closely involved in a number of GSK’s key strategic projects, including the establishment of ViiV Healthcare. External appointments Simon is a member of the Corporate Development Council for the National Theatre. |
| | | | | | |
| | | | | | |
| | | | | | |
 | | | | Dr Moncef Slaoui53 | | Skills and experience |
| | | Chairman, Global R&D & Vaccines NationalityMoroccan, Belgian & American Appointment date 17 May 2006 Committee membership Member of the Finance Committee | | Moncef joined GSK Vaccines in 1988 where he engineered the development of a robust vaccines pipeline. He then led Worldwide Business Development for pharmaceutical products before his appointment to lead R&D in 2006. He was given overall responsibility for GSK’s Oncology Business in 2010; for GSK Vaccines in 2011; and for all Global Franchises in 2012. He has a PhD in Molecular Biology and Immunology from Université Libre de Bruxelles and has published more than 100 scientific papers and presentations. Prior to joining GSK, Moncef was Professor of Immunology at the University of Mons, Belgium. External appointments Moncef is a member of the PhRMA and the Biotechnology Industry Organization boards in the USA and a member of the Advisory Committee to the Director of National Institutes of Health. He is also an adviser to the Qatar Foundation. Moncef has advised the US President’s Council of Advisors on Science and Technology and he was a member of the Board of the Agency for Science, Technology & Research (A*STAR) until January 2011. |
| | | |
| | | | | | |
 | | | | Sir Robert Wilson69 | | Skills and experience |
| | | Senior Independent
Non-Executive Director NationalityBritish Appointment date 1 November 2003 Committee membership Member of the Nominations, Audit & Risk and Finance Committees | | Sir Robert has had a long and distinguished career in industry, mainly with Rio Tinto, where he became Chief Executive Officer in 1991 and then Executive Chairman in 1997 until his retirement in October 2003. Sir Robert then became Non-Executive Chairman of BG Group plc from January 2004 until May 2012. He was also Chairman of The Economist Group between 2003 and 2009. He has been a Non-Executive Director at BP, Diageo and Boots. He will stand down as the Senior Independent Non-Executive Director, and as a member of the Audit & Risk Committee, on 1 May 2013. External appointments Sir Robert is a senior adviser to Morgan Stanley and Chairman of the Accenture Global Mining Executive Council. |
| | | | | | |
| | | | | | |
| | | | | | |
 | | | | Professor Sir Roy | | Skills and experience |
| | | Anderson65 Independent Non-Executive Director & Scientific Expert NationalityBritish Appointment date 1 October 2007 Committee membership Member of the Audit & Risk, Nominations and Finance Committees | | Professor Sir Roy is a world-renowned medical scientist with advanced knowledge of infectious disease epidemiology and is currently Professor of Infectious Disease in the Faculty of Medicine, Imperial College, London. He is a fellow and member of the Policy Advisory Board of the Royal Society, and fellow of the Academy of Medical Sciences and the Royal Statistical Society. He is an Honorary Fellow of the Institute of Actuaries and a Foreign Associate Member of the Institute of Medicine at the US National Academy of Sciences and the French Academy of Sciences. Professor Sir Roy brings scientific expertise to the Board and the Audit & Risk Committee’s deliberations. He will stand down as a member of the Audit & Risk Committee on 1 May 2013. External appointments Professor Sir Roy is a member of the International Advisory Board of Hakluyt & Co Ltd and he is a Trustee of the Natural History Museum, London. |

90 | GSK Annual Report 2012
Governance & remuneration
Our Board continued
| | | | | | |
 | | | | Dr Stephanie Burns58 | | Skills and experience |
| | | Independent Non-Executive Director NationalityAmerican Appointment date 12 February 2007 Committee membership Member of the Corporate Responsibility and Finance Committees and, with effect from 1 May 2013, a member of the Remuneration Committee | | Stephanie is a recognised global business leader, having served as Chairman, President and CEO of Dow Corning Corporation until her retirement at the end of 2011. She has a strong scientific background, with a PhD in organic chemistry with an organosilican speciality, and is a staunch advocate for science education. External appointments Stephanie was appointed a Non-Executive Director of Corning Inc in January 2012. She sits on the US President’s Export Council. Stephanie is also an officer of the Society of Chemical Industry, America Section, and is the past Honorary President of the UK-based parent society. |
| | | | | |
| | | | | | |
| | | | | | |
| | | | | | |
 | | | | Stacey Cartwright49 | | Skills and experience |
| | | Independent Non-Executive Director NationalityBritish Appointment date 1 April 2011 Committee membership Member of the Audit & Risk and Finance Committees | | Stacey is a Chartered Accountant and has extensive experience of global consumer businesses and of corporate finance. She is the Executive Vice President, Chief Financial Officer of Burberry Group plc. Prior to joining Burberry Group plc in 2003, Stacey held the role of Chief Financial Officer at Egg plc between 1999 and 2003, and from 1988 to 1999 she worked in various finance-related positions at Granada Group plc. In accordance with the UK Corporate Governance Code, the Board has determined that Stacey has recent and relevant financial experience. The Board has also agreed that she has the appropriate qualifications and background to be an audit committee financial expert as defined by the US Sarbanes-Oxley Act of 2002. |
| | | | | |
| | | | | | |
| | | | | | |
 | | | | Sir Crispin Davis63 | | Skills and experience |
| | | Independent Non-Executive Director NationalityBritish Appointment date 1 July 2003 Committee membership Member of the Nominations and Finance Committees | | Sir Crispin has industry expertise in the food and beverage sector and previously focused on industrial, consumer, restructurings and global businesses sectors, having served as Chief Executive Officer at Reed Elsevier plc from September 1999 to March 2009. Sir Crispin served as Chief Executive Officer at Aegis Group plc from 1994 to 1999 and from 1990 to 1993, he worked at Guinness Group plc, where he served as Group Managing Director at United Distillers and was a member of the Board. In his earlier career, Sir Crispin served for 20 years at Proctor & Gamble, where he was President of North American Food Division. He was previously Chairman and Director of StarBev Netherlands BV. He will retire from the Board at the AGM on 1 May 2013. External appointments Sir Crispin is an adviser to CVC Capital Partners. He also serves on the councils of Oxford University and of The National Trust. |
| | | | | | |
 | | | | Lynn Elsenhans56 | | Skills and experience |
| | | Independent Non-Executive Director NationalityAmerican Appointment date 1 July 2012 Committee membership Member of the Corporate Responsibility and Finance Committees | | Lynn has a wealth of experience of running a global business and significant knowledge of the global markets in which GSK operates. She served as Chair, President and Chief Executive Officer of Sunoco Inc from 2009 to 2012. Prior to joining Sunoco in 2008 as President and Chief Executive Officer, Lynn worked for Royal Dutch Shell which she joined in 1980 and where she held a number of senior roles, including Executive Vice President, Global Manufacturing from 2005 to 2008. External appointments Lynn is a Non-Executive Director of Baker Hughes Inc, a director of the Texas Medical Center, and a director of The First Tee of Greater Houston. She is also a Trustee of the United Way of Greater Houston and a Trustee of Rice University. |
| | | | | | |
| | | | | | |

| | | | Judy Lewent64 | | Skills and experience |
| | | Independent Non-Executive Director NationalityAmerican Appointment date 1 April 2011 Committee membership Chairman of the Audit & Risk Committee and a member of the Remuneration and Finance Committees | | Judy has extensive knowledge of the global pharmaceutical industry and of corporate finance, having joined Merck & Co in 1980 and then served as Chief Financial Officer from 1990 to 2007 when she retired. In accordance with the UK Corporate Governance Code, the Board has determined that Judy has recent and relevant financial experience. The Board has also agreed that she has the appropriate qualifications and background to be an audit committee financial expert as defined by the US Sarbanes-Oxley Act of 2002. External appointments Judy is a director of Thermo Fisher Scientific Inc and Motorola Solutions Inc. She is also a Trustee of the Rockefeller Family Trust and Chairperson of the Audit Committee of Rockefeller Financial Services, a life member of the Massachusetts Institute of Technology Corporation and a member of the American Academy of Arts and Sciences. Judy is a Non-Executive Director of Purdue Pharma Inc, Napp Pharmaceutical Holdings Limited and certain Mundipharma International Limited companies and a past Non-Executive Director of Motorola Inc, Dell Inc and Quaker Oats Company. |
|
| GSK Annual Report 2012 | 91 |
| | | | | | |
 | | | | Sir Deryck Maughan65 | | Skills and experience |
| | | Independent Non-Executive Director NationalityBritish Appointment date 1 June 2004 Committee membership Member of the Audit & Risk, Nominations, Remuneration and Finance Committees | | Sir Deryck has a wealth of international corporate and investment banking experience, having previously served as Chairman and Chief Executive Officer of Citigroup International and of Salomon Brothers Inc. He served as Vice Chairman of the New York Stock Exchange from 1996 to 2000. He will take over from Sir Robert Wilson as Senior Independent Non-Executive Director on 1 May 2013. External appointments Sir Deryck is a Senior Adviser to, and former partner of, Kohlberg Kravis Roberts & Co. He is a Non-Executive Director of BlackRock Inc and Thomson Reuters, as well as serving on the Board of Directors of the Lincoln Center, and is a Trustee of New York University Langone Medical Center. |
| | | | | |
| | | | | | |
 | | | | Dr Daniel Podolsky59 | | Skills and experience |
| | | Independent Non-Executive Director and Scientific Expert NationalityAmerican Appointment date 1 July 2006 Committee membership Member of the Audit & Risk, Corporate Responsibility and
Finance Committees | | Daniel is a world-renowned researcher who has advanced knowledge of underlying mechanisms of disease and new therapies for gastrointestinal disorders. He was formerly Mallinckrodt Professor of Medicine and Chief of Gastroenterology at Massachusetts General Hospital and Harvard Medical School, and previously served as the Chief Academic Officer of Partners Healthcare System. Daniel’s current responsibilities in leading a large academic medical centre give him relevant insight into healthcare delivery. Daniel brings scientific expertise to the Board and the Audit & Risk Committee’s deliberations. External appointments Daniel is President of the University of Texas Southwestern Medical Center and holds the Philip O’Bryan Montgomery, Jr., M.D. Distinguished Presidential Chair in Academic Administration, and the Doris and Bryan Wildenthal Distinguished Chair in Medical Science. He is a member of the Institute of Medicine of the US National Academy of Sciences, member of the Board of the Southwestern Medical Foundation and is a Director of Antibe Therapeutics, Inc. |
| | | | | | |
| | | | | | |
 | | | | Tom de Swaan66 | | Skills and experience |
| | | Independent Non-Executive Director NationalityDutch Appointment date 1 January 2006 Committee membership Chairman of the Remuneration Committee and a member of the Audit & Risk, Nominations and Finance Committees | | Tom has had a long and distinguished career in the European banking industry, having been a member of the Managing Board and Chief Financial Officer of ABN AMRO. Tom has held various executive positions at the Dutch Central Bank and was a Non-Executive Director of the Financial Services Authority from 2001 to 2007. In accordance with the UK Corporate Governance Code, the Board has determined that Tom has recent and relevant financial experience. The Board has also agreed that he has the appropriate qualifications and background to be an audit committee financial expert as defined by the US Sarbanes-Oxley Act of 2002. External appointments Tom is Chairman of the Supervisory Board of VanLanschot Bankiers, Vice Chairman of the Board of Directors of Zurich Insurance Group and a Non-Executive Director of KPMG’s Public Interest Committee. He is also Vice Chairman of the Supervisory Board and Chairman of the Audit Committee of Royal Ahold and a member of the Supervisory Board of Royal DSM. |
| | | | | | |
| | | | | | |
 | | | | Jing Ulrich45 | | Skills and experience |
| | | Independent Non-Executive Director NationalityAmerican Appointment date 1 July 2012 Committee membership Member of the Finance Committee and, with effect from 1 May 2013,
a member of the Audit & Risk Committee | | Since 2005, Jing has been Managing Director and Chairwoman of Global Markets, China at JP Morgan. In her current role, she acts as an adviser to the world’s largest asset management firms and multinational companies. She also advises Chinese institutions making investments overseas. From 2003 to 2005, Jing worked for Deutsche Bank as Managing Director, Head of Greater China Equities. She previously held financial positions, specialising in the Asia Pacific region, with CLSA and the Emerging Markets Investors Corporation. She was educated at Harvard and Stanford Universities. External appointments Jing is an independent director of Ermenegildo Zegna SpA. |
| | | | | |
| | | | | |
| | | | | | |
| | | | Hans Wijers62 | | Skills and experience |
| | | Independent Non-Executive Director NationalityDutch Appointment date With effect from 1 April 2013 Committee membership Member of the Finance Committee | | Hans has a broad range of business, economic and political experience, having served as Chief Executive Officer and Chairman at Akzo Nobel NV from 2002 to 2012. Hans had a long and distinguished career in academia, public service and strategy consulting. He served as a senior vice president of the Boston Consulting Group from 1998 to 2002. External appointments Hans is a Non-Executive Director and Chairman designate of Heineken NV and also Deputy Chairman and Non-Executive Director of Royal Dutch Shell. He is also Chairman of the supervisory board of AFC Ajax. |
92 | GSK Annual Report 2012
Governance & remuneration
Our Corporate Executive Team
Our Corporate Executive Team supports our Chief Executive Officer
in the management of the business and our activities
| | | | | | |
 | |  | |  | |  |
| | | |
| Sir Andrew Witty | | Simon Bicknell | | Deirdre Connelly | | Roger Connor |
Chief Executive Officer See ‘Our Board’ on page 88. | | Senior Vice President,Governance, Ethics andAssurance Simon was appointed Senior Vice President, Governance, Ethics and Assurance in January 2011 and he is responsible for risk management, compliance and strategic auditing. Simon joined the Company Secretariat in 1984 and became Deputy Company Secretary of Glaxo Wellcome in 1995. He was appointed Company Secretary of GlaxoSmithKline plc in May 2000 and combined this position with his role as Corporate Compliance Officer from 2006 until his current appointment. After gaining his Law degree, Simon qualified as a barrister in 1983 and is a member of Middle Temple. | | President, North AmericaPharmaceuticals Deirdre joined GSK as President, North America Pharmaceuticals in February 2009 after working at Eli Lilly and Company for 24 years. She held a variety of positions including sales professional, General Manager of Puerto Rico, Senior Vice President of Human Resources and, most recently, President of US Operations. A native of San Juan, Deirdre received a bachelor’s degree in economics and marketing from Lycoming College in Pennsylvania in 1983. She graduated from the Harvard University’s Advanced Management Programme in 2000, and in January 2013 was appointed to the Harvard University Public Health Policy Council. Deirdre is also a member of the Board of Directors of Macy’s Inc., the US department store chain. | | President, GlobalManufacturing & Supply Roger Connor is President, Global Manufacturing & Supply (GMS). He was appointed to this role in January 2013, after working for a year as President Designate, GMS. Roger joined GSK in 1998 from AstraZeneca and has worked in a number of roles within finance and manufacturing strategy, including at GSK sites at Cork in Ireland and Ware in the UK. Prior to his role in GMS, Roger was Vice President, Office of the CEO and Corporate Strategy from February 2010. He holds a degree in Mechanical and Manufacturing Engineering from Queen’s University Belfast and a Masters in Manufacturing Leadership from Cambridge University. He is also a Chartered Accountant. |
| | | | | | |
| | | | | | |
| | | | | | |
 | |  | |  | |  |
| | | |
| Simon Dingemans | | Marc Dunoyer | | Abbas Hussain | | Bill Louv |
Chief Financial Officer See ‘Our Board’ on page 89. 
| | Head of Rare Diseases Unitand Chairman of GSK Japan Marc was appointed to lead the new rare diseases business from R&D to commercialisation in February 2010. He has also served as Chairman of GSK Japan since January 2010 where he was previously Representative Director and President, Pharmaceuticals Japan. Marc joined the company from Hoechst Marion Roussel in 1999 and was President, Pharmaceuticals Japan from January 2000 until May 2008. He was also President, Pharmaceuticals Asia Pacific/ Japan from May 2008 to July 2010. Marc has an MBA from the Hautes Etudes Commerciales. He has a Bachelor of Law degree from Paris University and also qualified as a Junior CPA in France in 1977. | | President, Europe and EMAP Abbas was appointed President, Europe and EMAP in September 2012. He joined the company as President, Emerging Markets & Asia Pacific in June 2008. Previously Abbas spent 20 years at Eli-Lilly where he held positions including President, Europe and before that Vice President, Europe with specific responsibility for the Western European Mid-Size countries, Africa & Middle East Area/Commonwealth of Independent States and Central & Eastern Europe regions. He also held positions in sales and marketing across Australasia and India. Abbas was appointed to ViiV Healthcare Ltd. Board in October 2009 and the Aspen Board in December 2009. He is also a Board Member of the Singapore Duke-NUS Governing Board and Audit & Risk Committee Board. Born in Madras, India, Abbas has a degree in Medicinal Chemistry & Pharmacology from Loughborough University. | | Senior Vice President, CoreBusiness Services Bill was appointed to create and lead Core Business Services (CBS) in April 2010. CBS integrates the shared services of the global support functions. He was previously Chief Information Officer. Bill joined the company in 1994 as Vice President of Medical Data Sciences, and has held a number of increasingly senior roles in R&D and IT. Bill has a Bachelor of Science degree in Biology from the College of William and Mary, and Master of Science and Doctor of Philosophy degrees in Statistics from the University of Florida. |
|
| GSK Annual Report 2012 | 93 |
| | | | | | |
 | |  | |  | |  |
| | | |
| David Redfern | | Dr Moncef Slaoui | | Claire Thomas | | Phil Thomson |
Chief Strategy Officer David was appointed Chief Strategy Officer in May 2008 and is responsible for proactive exploration of new business opportunities, strategic planning and the leadership of the dermatology business. In addition to his current role, he was appointed Chairman of the Board of ViiV Healthcare Ltd. in April 2011. Previously, he was Senior Vice President, Northern Europe with responsibility for managing GSK’s pharmaceutical businesses in that region and prior to that Senior Vice President for Central and Eastern Europe. David joined the company in 1994 and held a series of finance roles before becoming Finance Director of the European business from 1999-2002. David has a Bachelor of Science degree from Bristol University in the UK and is a Chartered Accountant. | | Chairman, Global R&D & Vaccines See ‘Our Board’ on page 89. | | Senior Vice President,Human Resources Claire was appointed Senior Vice President, Human Resources in May 2008 and is responsible for GSK’s Environmental Sustainability Strategy. She was previously Senior Vice President, Human Resources, Pharmaceuticals International. Claire joined the company in 1996 and was appointed Senior Vice President, Human Resources, and Pharmaceuticals Europe in 2001, where she successfully led the HR function through the merger. Prior to joining the company she worked for Ford Motor Company, holding various positions. Claire has a Bachelor of Science degree in Economics, Management and Industrial Relations from the University of Wales. Claire was honoured as an Outstanding European Woman of Achievement in 2007. | | Senior Vice President, GlobalCommunications Phil was appointed Senior Vice President, Global Communications in August 2010. He has responsibility for Media Relations, Investor Relations, Corporate Responsibility, Internal Communications and Product Communications. Phil joined Glaxo Wellcome as a commercial trainee in 1996, moving from pharmaceutical brand marketing to product communications. In 1999 he became a Director of Media Relations for Glaxo Wellcome plc and in 2001, took up the position of Director, Investor Relations for GSK. In 2004, he returned to Corporate Media Relations as Vice President. Phil earned his degree in English and History from Durham University. |
| | | | | | |
| | | | | | |
 | |  | |  | |  |
| | | |
| Dan Troy | | Patrick Vallance | | Emma Walmsley | | Christophe Weber |
Senior Vice President &General Counsel Dan joined the company as Senior Vice President & General Counsel in September 2008. He was previously a Partner at the Washington law firm Sidley Austin LLP, where he represented mainly pharmaceutical companies and trade associations on matters related to the US Food and Drug Administration (FDA) and government regulations. Dan was formerly Chief Counsel for the FDA, where he served as a primary liaison to the White House and the US Department of Health and Human Services. Dan is a graduate from Cornell University’s School of Industrial and Labor Relations, and earned his law degree from Columbia University School of Law. | | President, PharmaceuticalsR&D Patrick was appointed President, Pharmaceuticals R&D, in January 2012. Prior to his appointment he was Senior Vice President, Medicines Discovery and Development. Patrick joined the company in 2006 as Head of Drug Discovery. He focused the organisation on science that has the best chance of leading to new medicines, and created small, multidisciplinary teams called Discovery Performance Units. Prior to joining GSK Patrick was a clinical academic at University College London. Patrick is a member of the Board of the Agency for Science, Technology & Research (A*STAR) and is a director of Genome Research Limited. He is also a member of the International Scientific Advisory Board of the Cambridge Institute for Medical Research. | | President, ConsumerHealthcare Worldwide Emma assumed the role of President, Consumer Healthcare Worldwide in October 2011 after joining GSK in May 2010 as President of Consumer Healthcare Europe. Under Emma’s leadership the business has a new strategic direction to become the first and best Fast Moving Consumer Healthcare company, driven by science and values, combining the very best of GSK’s scientific knowledge with the speed and marketing excellence of the Fast Moving Consumer Goods world. Prior to joining GSK, Emma worked with L’Oreal for 17 years where she held a variety of marketing and general management roles in Paris, London and New York. From 2007 she was based in Shanghai as General Manager, Consumer Products, L’Oreal China. She has a degree in Classics and Modern Languages from Oxford University. | | President, Vaccines Christophe was appointed President, Vaccines in April 2012. He was named President Designate of Vaccines in January 2011. Prior to this, he was Senior Vice President and Regional Director, Asia Pacific, responsible for GSK operations in Asia Pacific from 2008. He joined the company in 1993 and held increasingly senior commercial positions including General Manager of the company’s Swiss subsidiary and, from 2003 to 2008, Chairman and CEO of GSK France. Christophe started his career in Australia, working for Rhône-Poulenc- Rorer Pharmaceuticals. He is a Doctor of Pharmacy & Pharmacokinetics, holds a Master of Pharmaceutical Marketing, a Master of Finance and a degree in statistics. |
94 | GSK Annual Report 2012
Corporate governance
| | |
 | | Dear Shareholder |
| | As Chairman of the Board, I am committed to GSK seeking to operate to the highest standards of corporate governance. We believe it is our governance structure that underpins our ability to deliver our strategy to grow a diversified business, deliver more products of value and simplify our operating model. The following pages outline our approach to governance. The structure of the Corporate Governance Report has been modified this year and my report begins with an overview which summarises the key highlights from 2012 and future actions. Thereafter, our disclosures seek to mirror the structure of the Financial Reporting Council’s UK Corporate Governance Code, while several of the statutory disclosures that have appeared within this report in the past have been consolidated into the Shareholder Information section of the Annual Report on pages 239 to 246. I wish to draw attention to the following key areas which were addressed by the Board during the year. |
| |
| | Board refreshment and diversity |
| | Last year, I discussed the Board’s review of its composition and the changes initiated as a result. I am pleased to report that our proactive refreshment of the Board has led to further important changes to its composition. James Murdoch and Larry Culp stood down from the Board in May and September 2012 respectively and Sir Crispin Davis will not stand for re-election at the AGM in May 2013. In their places, we are pleased to welcome Lynn Elsenhans and Jing Ulrich, who joined the Board on 1 July 2012, and Hans Wijers, who will join the Board on 1 April 2013. These appointments close two significant gaps in the Board’s composition that had been identified during the 2011 external evaluation of the Board; namely global CEO experience and knowledge of, and experience in, emerging markets. We are also very pleased that Sir Robert Wilson has agreed to stand for re-election by shareholders for one further year before he steps down from the Board at the 2014 AGM. Given his significant knowledge and experience of GSK, this will provide a period of continuity as the new Non-Executive Directors settle into their roles. We have also taken the opportunity to refresh the composition of our Board Committees, details of which are set out in my Nominations Committee Report on pages 106 to 107. Although we view diversity in its widest sense (and at Board level we specifically look for diversity of geographical background, ethnicity, gender and types of experience), we are pleased that our Board refreshment programme has further increased our gender diversity. With the recruitment of Lynn and Jing, we have taken the cadre of women on the Board to 33%, which places GSK firmly in the upper quartile of the FTSE 100 in terms of female Board representation. I am also pleased to report that we continue to have a good representation of women in management positions and we actively encourage programmes such as GSK Women’s Leadership Initiative to help increase the pipeline of women at senior levels of the organisation. |
| |
| | Corporate reporting |
| | We fully support the Department for Business, Innovation and Skills’ (BIS) efforts to improve narrative and remuneration reporting in so far as they seek to raise the bar in reporting and this view was reflected in our submissions to the consultations they have conducted on these new proposals. In addition, we have been fully engaged in representing the company’s views on developing these initiatives, including as a participating member on the Financial Lab project, run jointly by the Financial Reporting Council (FRC) and BIS, to develop example best practice formats of remuneration disclosures. |
| |
| | Corporate Integrity Agreement |
| | Finally, the Board, in conjunction with our Audit & Risk Committee and the CET, has been fully involved in overseeing the conclusion of settlements with the US Federal Government on a broad range of long-standing legal cases and the implementation of the Corporate Integrity Agreement (CIA) signed with the US Department of Health and Human Services. The requirements of the CIA have been built into our governance structures. The Board completed its first training programme on the CIA and how it would operate in 2012 and will continue to receive ongoing training each year. The Board will also be apprised of our compliance with the CIA on a quarterly basis. Further details on the CIA and its implications for GSK can be found on pages 51 and 214. |
| | I commend the following report to all our shareholders. |
| | Sir Christopher Gent Chairman 5 March 2013 |
|
| GSK Annual Report 2012 | 95 |
Board report to shareholders – Oversight and stewardship in 2012 and future actions
The Board
The Board is pleased to report that it was in full compliance with the requirements of the UK Corporate Governance Code.
The Board is responsible for the long-term success of GSK and is accountable to shareholders for ensuring that the Group is appropriately managed and governed and delivers GSK’s strategy to Grow, Deliver & Simplify.
2012 Board programme
The Board met six times in 2012 and each Board member attended all scheduled Board meetings with the exception of Judy Lewent, who was unable to attend one meeting due to personal circumstances. She conveyed her views and comments to the Chairman on the matters to be discussed, which he shared with the other Directors at the meeting.
The Board agendas were shaped to create more time for strategic discussion and debate, including ‘deep dive’ reviews of key issues for the business, to ensure focused consideration of our strategic priorities. During 2012, the agendas for Board meetings included the following business:
| | | | | | | | |
Month | | Strategy | | Board oversight | | Governance | | Risk oversight |
| January | | Review expansion of Operational Excellence Restructuring Programme | | Review of 2011 financial results and outlook for 2012 Review of Notice of AGM Re-appointment of auditors | | Review of external 2011 Board evaluation report Secretary’s report | | Review of risk and internal controls process |
| March | | Review of Respiratory strategy Review of Business Development projects Deep dive – future of animals in research | | Annual Global Manufacturing and Supply (GMS) and US Pharma business reviews | | Secretary’s report | | |
| May | | | | Annual European operations and Vaccines business reviews | | Preparation for AGM Secretary’s report | | |
| July | | Review of long range forecast Review of changes to Finance strategy Review of funding and tax strategies Review of talent and leadership development strategy | | Annual R&D review Review of capital and licensing proposals | | Secretary’s report | | Corporate Integrity Agreement training |
| October | | Review of output from the Annual Board & CET strategy meeting Deep dive – working capital | | Annual business reviews of Consumer Healthcare, Emerging Markets and Japan | | Review of projects and transactions approved by the Board Secretary’s report | | Corporate Integrity Agreement training |
| December | | Review and approval of 2013-15 plan Update on tax, GMS and R&D strategies | | | | Review of investor activity and IR strategy Secretary’s report | | |
2012 Board performance
During 2011, the Board identified certain actions as central to increasing its ability to add further value. The performance of the Board in 2012 against these actions is set out below:
| | |
Actions | | Progress/Achievement |
(i) The external landscape | | |
Increase consideration of major external influences and GSK’s relative strengths and weaknesses to help expand the Board’s knowledge. Increase understanding and knowledge through individual Non- Executive Director and Board site visits. Ensure that Non-Executive Directors continue to engage both formally and informally with the company. Management should demonstrate to the Board that it is embedding the culture of risk awareness within Emerging Markets and how the emerging risks are captured. | | The Board programme was expanded to include consideration of major influences on GSK. The Board visited India in October as part of the Board & CET strategy meeting. Specific site visits for individual directors were arranged to the Group’s sites at Stevenage, Wavre, Research Triangle Park (RTP) and Zebulon. Directors were offered full access to senior executive meetings and enjoyed attending and meeting with GSK’s executives to learn more about the business and its culture. The Board’s visit to India provided an opportunity to appreciate how risk management is embedded in the business and emerging risks are captured. |
| |
(ii) Board contribution and composition | | |
The Board to plan its composition over the next five to six years, to optimise its effectiveness. Close two significant gaps identified in the Board’s current composition: global CEO experience and knowledge of, and experience in, emerging markets. | | The Nominations Committee is focused on long-term recruitment of Non-Executive Directors. The Board was pleased to welcome two new Non-Executive Directors, Lynn Elsenhans and Jing Ulrich, who add CEO and emerging markets experience to the Board’s deliberations. |
These actions are set out in full on page 90 of GSK’s 2011 annual report, which discusses the externally facilitated evaluation of the Board’s activities by Dr Tracy Long.
96 | GSK Annual Report 2012
Corporate governance
Board report to shareholders – Oversight and stewardship in 2012 and future actionscontinued
2012 & 2013 AGMs – Key highlights at a glance
| | |
2012 AGM – held on 3 May 2012 at QEII Conference Centre, London | | 2013 AGM – to be held on 1 May 2013 at QEII Conference Centre, London |
• Full Director attendance • 3.8 to 3.9 billion votes cast for each resolution (77% of issued share capital) • James Murdoch stood down from the Board • All other Directors retired and were re-elected to the Board, receiving at least 96.9% of the votes cast in favour • Remuneration Report resolution passed, with 95.7% of the votes cast in favour • Highest votes in favour: 99.9% to re-elect a number of Directors • Lowest votes in favour: 90.8% to reduce notice of a General Meeting. | | • Sir Crispin Davis will stand down from the Board after nine years’ service • Lynn Elsenhans, Jing Ulrich and Hans Wijers will stand for election to the Board • All other Directors will stand for re-election to the Board • Each Director has been formally evaluated by the Chairman before standing for re-election • The Board believes that each Director is effective and demonstrates commitment to his or her role. |
Strategic focus – Board & CET strategy meeting in Delhi, India
Emerging markets provide a significant growth opportunity for GSK. During 2012, turnover in the region grew by 10% and now accounts for 26% of Group turnover. The Board chose to hold its 2012 annual strategy review meeting in India. This gave the Board, who were joined by the CET, the opportunity to have a firsthand view of the Group’s local business and its future potential. The Board and CET were also pleased to be able to meet with highly respected government and business figures to gain further insight into the country’s political and economic outlook.
Induction programmes – Lynn Elsenhans and Jing Ulrich
| (i) | Individually designed and facilitated: by the Chairman and the Company Secretary. |
| (ii) | Purpose: to orientate and familiarise Lynn and Jing, who were appointed to the Board in 2012, with our strategy to Grow, Deliver & Simplify and with the industry, our organisation and our governance arrangements. |
| (iii) | Customised:to take account of their respective experience, different geographical backgrounds and business perspectives, together with the Committees on which they would serve. |
Key elements of their one-to-one induction briefing sessions and site visits undertaken in 2012 are set out below:
| | |
Contact/Activity | | Induction content |
| Executive Directors | | GSK’s strategic, financial and R&D priorities |
| CET members | | Wide spectrum of GSK operations, including Pharmaceuticals, Vaccines and Consumer Healthcare businesses, strategic |
| | | development, investor relations, global communications and corporate responsibilty |
| Senior Executives | | Focused on a number of core functions such as finance, tax, treasury, audit and assurance, risk management |
| | | and investor relations |
| Company Secretary | | Legal and regulatory duties of a UK listed company director and the corporate governance practices within GSK |
| Site visits | | Tours of our GMS, R&D and Vaccines sites in RTP, Zebulon and Wavre |
| Investor meetings | | Meetings with investors as requested |
The induction and training programmes for Lynn and Jing have continued in 2013, with a focus on internal management meeting attendance and operational site visits in order to give them a good perspective on how management operates and to provide them with opportunities to meet key talent and to deepen their understanding of key business issues.
Board performance action points for 2013
The agreed action points arising from the 2012 Board evaluation review facilitated by our Senior Independent Non-Executive Director, Sir Robert Wilson, against which progress will be disclosed in GSK’s 2013 Annual Report, are set out below:
| (i) | The external landscape |
Board members were keen to supplement their understanding of the external landscape with ‘teach-ins’ on a range of topics, such as various therapeutic areas, the design of Phase III trials, pricing, biopharmaceuticals, pharmacogenomics and emerging technology in R&D.
| (ii) | Oversight of strategy |
The Board wished to spend more time on business unit strategy, competitor analysis, pricing regimes, acquisition strategy and emerging issues.
The Nominations Committee was tasked with identifying further suitable candidates to replace Board members due to retire in the next few years.
|
| GSK Annual Report 2012 | 97 |
Leadership and effectiveness
The Board
The Board met six times in 2012, with each member attending as follows:
| | | | | | | | |
| | | Number of
meetings held whilst
a Board member | | | Number of
meetings
attended | |
Sir Christopher Gent | | | 6 | | | | 6/6 | |
Sir Andrew Witty | | | 6 | | | | 6/6 | |
Simon Dingemans | | | 6 | | | | 6/6 | |
Dr Moncef Slaoui | | | 6 | | | | 6/6 | |
Professor Sir Roy Anderson | | | 6 | | | | 6/6 | |
Dr Stephanie Burns | | | 6 | | | | 6/6 | |
Stacey Cartwright | | | 6 | | | | 6/6 | |
Sir Crispin Davis | | | 6 | | | | 6/6 | |
Lynn Elsenhans* | | | 3 | | | | 3/3 | |
Judy Lewent | | | 6 | | | | 5/6 | |
Sir Deryck Maughan | | | 6 | | | | 6/6 | |
Dr Daniel Podolsky | | | 6 | | | | 6/6 | |
Tom de Swaan | | | 6 | | | | 6/6 | |
Jing Ulrich* | | | 3 | | | | 3/3 | |
Sir Robert Wilson | | | 6 | | | | 6/6 | |
Larry Culp** | | | 4 | | | | 4/4 | |
James Murdoch*** | | | 3 | | | | 3/3 | |
In addition to the scheduled meetings, the Board also met on a quorate basis on four occasions.
| * | Lynn Elsenhans and Jing Ulrich were appointed as Non-Executive Directors with effect from 1 July 2012. |
| ** | Larry Culp resigned from the Board on 30 September 2012. |
| *** | James Murdoch retired from the Board on 3 May 2012. |
The Chairman
Sir Christopher’s role as Chairman is to lead and manage the business of the Board and to provide direction and focus, while ensuring that there is a clear structure for the effective operation of the Board and its Committees. He sets the agenda for Board discussions to promote effective and constructive debate and to support a sound decision-making process, ensuring that the Board receives accurate, timely and clear information, in particular about the company’s performance.
Sir Christopher works closely with Sir Andrew Witty to ensure that the strategies and actions agreed by the Board are effectively implemented and provides support and advice to Sir Andrew, while respecting his executive responsibility for managing the Group. The division of responsibilities between the Chairman and the CEO has been agreed by the Board and is set out in the governance section of our website.
Sir Christopher is responsible for the performance of the Group to shareholders and leads discussions and the development of relations with them.
Non-Executive Directors
The Non-Executive Directors provide a strong, independent element on the Board. They are well placed to constructively challenge and support management and to shape proposals on strategy and succession planning. Between them, they bring independent judgement and a breadth of skills and experience gained at the most senior levels of international business operations and academia.
Senior Independent Director
Sir Robert Wilson has been our Senior Independent Director (SID) since 20 May 2009. His role is to act as a sounding board for Sir Christopher and a trusted intermediary for the other Directors. He is also available as an additional point of contact for shareholders. His responsibilities include the evaluation of the performance of the Chairman, and at the request of the Chairman, evaluating the Board and its Committees (in collaboration with the Committee Chairmen) in years when the evaluation is conducted internally.
The SID also works with the Chairman on the process for the selection of a new Chairman as appropriate and he chairs the Nominations Committee when agreeing the recommendation to the Board for the Chairman’s successor.
Sir Robert maintains an understanding of the issues and concerns of our major shareholders through meetings with them and reports from our investor relations team.
Sir Deryck Maughan will succeed Sir Robert as SID with effect from the end of the AGM on 1 May 2013.
CEO
Sir Andrew is responsible for the management of the business, developing the Group’s strategic direction for consideration and approval by the Board and implementing the agreed strategy. He is assisted by other members of the CET, which meets at least 11 times a year and more often if required.
Short biographies of the members of the CET are given under ‘Our Corporate Executive Team’ on pages 92 and 93.
Company Secretary
The Company Secretary, Victoria Whyte, is a solicitor and a Fellow of the Institute of Chartered Secretaries and Administrators. Victoria was formerly Deputy Secretary and Secretary to the Remuneration Committee. She has acted as Secretary to the Board and all the Board’s Committees since her appointment as Company Secretary on 1 January 2011.
Victoria supports the Chairman in designing the induction for new Directors, in the delivery of the corporate governance agenda, in particular in the planning of agendas for the annual cycle of Board and Committee meetings, and in ensuring that information is made available to Board members on a timely basis. She advises the Directors on Board procedures and corporate governance matters, and arranges for the Non-Executive Directors to attend internal management meetings and make visits to our business operations to enhance their knowledge and understanding of the business.
During 2012, Victoria responded to various consultations on the evolving global governance and reporting agenda on behalf of the Group. She also engaged with shareholders to ensure they fully understood GSK’s governance and remuneration arrangements.
98 | GSK Annual Report 2012
Corporate governance
Corporate governance framework
The Board has a coherent corporate governance framework with clearly defined responsibilities and accountabilities designed to safeguard and enhance long-term shareholder value and provide a robust platform to realise the Group’s strategy. Our internal control and risk management arrangements, which are described on pages 100 to 102, are an integral part of GSK’s governance framework.
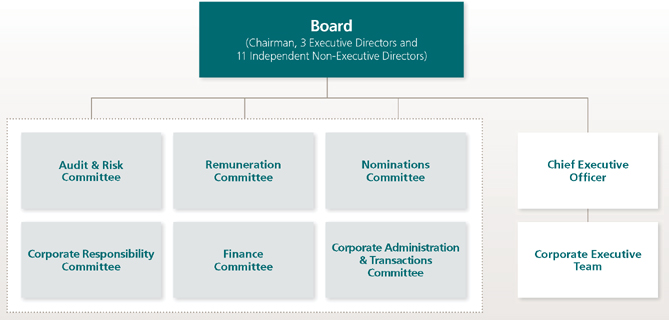
Board Committees
In order for the Board to operate effectively and to give full consideration to key matters, Board Committees have been established. A summary of the role of each Board Committee is set out in the table below. The full terms of reference of each Committee are available on our website and reports on the membership and work undertaken by the Audit & Risk, Remuneration, Nominations and Corporate Responsibility Committees during 2012 are given on pages 103 to 136.
| | | | | | | | | | |
| Audit & Risk | | Remuneration | | Nominations | | Corporate Responsibility | | Finance | | Corporate Administration & Transactions |
Reviews: Financial and internal reporting processes, integrity of the financial statements, system of internal controls, identification and management of risks and external and internal audit processes Proposes: Appointment of external auditors Responsible for: Initiating an audit tender, the selection of external auditors, their remuneration and oversight of their work | | Reviews and recommends: To the Board the overall executive remuneration policy To the Board the appropriate fees for the Chairman Determines: Terms of service and remuneration of Executive Directors and other members of the CET Reviews and approves: The Remuneration Report | | Reviews and recommends: Structure, size and composition of the Board and the appointment of members to the Board, its Committees and the CET Monitors: Succession to the Board and CET | | Reviews: External issues that have the potential for serious impact upon GSK’s business Oversight of: Reputation management | | Reviews and approves: The Annual Report and Form 20-F, the convening of the AGM, the preliminary and quarterly results announcements Approves: Certain major licensing and capital transactions and changes to the Group’s Investment Instrument and Counterparty Limits | | Reviews and approves: Matters in connection with the administration of the Group’s business and certain corporate transactions |
|
| GSK Annual Report 2012 | 99 |
Board induction, business awareness and training
The induction programmes for Lynn Elsenhans and Jing Ulrich presented on page 96 illustrate the typical induction format for a new Director.
To ensure that Non-Executive Directors develop and maintain a greater insight and understanding of the business, they are invited to attend internal management meetings, including meetings of the CET, the Research & Development Executive, the Product Executive, the Scientific Review Board, the Portfolio Investment Board, the Commercial Accountability Board and the Risk Oversight and Compliance Council. They also meet employees informally during visits to the Group’s operations and receptions held around Board meetings.
The Board is kept up-to-date on legal, regulatory and governance matters through regular papers from the Company Secretary and presentations by internal and external advisers.
During the year, the Board was briefed on various developments in narrative reporting and executive remuneration, risk management, board diversity, the impact of the UK and EU reviews of the audit market, market abuse and insider trading, shareholder engagement and other developments in corporate governance reporting, including the publication of the September 2012 update to the UK Corporate Governance Code.
The Board undertook specific training on the CIA in 2012. Going forward, the Board has committed to further refresher training each year. Each new Board member will, as part of his or her induction programme, receive comprehensive training on the CIA.
Sir Christopher also meets with each director annually on a one-to-one basis to discuss his or her ongoing training and development requirements.
Board composition
We seek to build an effective and complementary Board, whose capability is appropriate for the scale, complexity and strategic positioning of our business. The process for Board appointments is led by the Nominations Committee and is described on pages 106 to 107.
We are mindful of the need to balance the composition of the Board and its Committees and to refresh them progressively over time so that we can draw upon the experience of longer serving Directors, while tapping into the new external perspectives and insights which more recent appointees bring to the Board’s deliberations.
Non-Executive Directors are drawn from a wide range of industries and backgrounds, including pharmaceutical and healthcare, medical research and academia, retail and financial services, and have appropriate experience of complex organisations with global reach. Some have considerable experience of the pharmaceutical industry and the more recent appointees bring a new approach to the Group and to the Board’s discussions.
Board diversity
We are committed to the diversity of our boardroom and we are similarly committed to equal opportunities for all our employees at all levels of the organisation and the diversity and inclusiveness of our workforce are promoted throughout GSK.
We believe that a key requirement of an effective board is that it comprises a range and balance of skills, experience, knowledge, gender and independence, with individuals that are prepared to challenge as well as work as a team. This needs to be backed up by a diversity of personal attributes, including character, intellect, sound judgement, honesty and courage.
In May 2011, we announced our aspiration to increase the female representation on the Board to at least 25% by 2013. We were able to report in the 2011 Annual Report that encouraging progress had been made towards this target, with 20% of our Directors being women at that stage. As part of the continued refreshment of the Board, both Lynn Elsenhans and Jing Ulrich were appointed as new Non-Executive Directors in July 2012, taking the cadre of women on our Board to 33%. We are pleased to have delivered early on our aspiration and to have exceeded the target we set ourselves. This places GSK firmly in the upper quartile of the FTSE 100 in terms of female Board representation.
Time allocation
Each Non-Executive Director has a letter of appointment which sets out the terms and conditions of his or her directorship.
Sir Christopher and the Non-Executive Directors are expected to devote such time as is necessary for the proper performance of their duties. No precise timings are given as this will vary from year to year depending on the company’s activities. Directors are expected to attend all Board meetings, and any additional meetings as required.
They are also expected to attend meetings of the Committees of which they are members, part two of the Audit & Risk Committee meetings (which are open to all Directors in furtherance of their risk responsibilities) and strategy sessions and to make visits to operational sites. In addition, Board members are invited to attend at least one CET meeting a year and may attend certain Research & Development Executive and other operational meetings.
2012 Board and Chairman’s evaluation
The Board carries out an evaluation of its performance and the performance of its Committees every year which is facilitated externally every third year. The progress of the Board against the outcomes of the 2011 evaluation, which was externally facilitated by Dr Tracy Long, is reported on page 95. The action points arising from the 2012 evaluation of the Board by the SID, Sir Robert Wilson, are disclosed on page 96.
The Board has now entered a period of change with two Non-Executive Directors departing in 2012 and two new appointments. The Board believes that it continues to function well: it is well-chaired; the culture is both open and inclusive; relations between Executive Directors and Non-Executive Directors are constructive and mutually respectful, with Non-Executive Directors having a notably high level of confidence in the Executive Directors. Importantly, there are no domineering personalities and Board engagement and dialogue is constructive.
GSK is unusual in welcoming Non–Executive Directors to attend at its key internal management meetings. This is appreciated by Non-Executive Directors and over time may give the Board a different character to most of its peers. It offers Non-Executive Directors the opportunity to witness management interaction and culture firsthand and to see some issues debated or reviewed in much greater depth than is normally possible in the context of a relatively rigid Board agenda.
The Board is now more balanced by gender and more diversified internationally.
In terms of further improvement, the Board felt that it wanted to continue to focus on forward strategy and wished to spend more time on business unit strategy, competitor analysis, pricing regimes, acquisition strategy, and emerging issues.
100 | GSK Annual Report 2012
Corporate governance
The Board was keen to continue to supplement its understanding of the business and the industry, with voluntary “teach-ins” on a range of topics, including specific therapeutic areas, the design of phase III trials, pricing, biopharmaceuticals, pharmacogenomics and emerging technology in R&D.
The Chairmen of each of the Board Committees undertook separate evaluations of their Committees and the outcome of each was reported and discussed with the respective Committee and the Board. A summary of the conclusions of each review is included in the respective Committee report.
The Non-Executive Directors, led by Sir Robert, met separately, without Sir Christopher being present, to discuss his performance. They considered his leadership, performance and overall contribution to be of a high standard.
In addition, Sir Christopher met with all the Non-Executive Directors independently of the Executive Directors.
Relations with shareholders
We work to engage effectively with shareholders through our regular communications, the AGM and other investor relations activities.
We announce our financial results on a quarterly basis. The annual results are included in our Annual Report. All shareholders receive an annual summary leaflet which advises them that our Annual Report and Notice of our Annual General Meeting are available on our website.
Sir Andrew and Simon Dingemans give live presentations to institutional investors, analysts and the media with the full year results, which are also available via webcast and teleconference. After the first, second and third quarter results, we hold webcast teleconferences for the same audience. Our results are available on our website.
Our investor relations department, with offices in London and Philadelphia, acts as a focal point for communications with investors. Sir Andrew, Simon and Sir Christopher maintain a continuous dialogue with institutional shareholders on performance, plans and objectives through a programme of regular meetings. During the year they held over 100 individual meetings with investors and they have also hosted approximately 30 group meetings with investors and potential investors.
Victoria Whyte acts as a focal point for communications on corporate governance matters. We also have a small central Corporate Responsibility (CR) team which co-ordinates strategy, policy development and reporting specifically with respect to CR. The team communicates with socially responsible investors and other stakeholders.
Sir Christopher also meets regularly with institutional shareholders to hear their views and discuss issues of mutual importance and communicates their views to the other members of the Board. The SID and all the Non-Executive Directors are available to meet with shareholders.
The Remuneration Committee Chairman, the Chairman, the Head of Human Resources and the Company Secretary hold annual meetings with major shareholders to discuss executive remuneration and governance matters.
We have a briefing process in place, managed by Sir Christopher, for Non-Executive Directors to focus on sector specific issues and general shareholder preferences.
Accountability
Internal control framework
The Board recognises its responsibility to present a balanced and understandable assessment of the Group’s position and prospects.
The Board has accountability for reviewing and approving the adequacy and effectiveness of internal controls operated by the Group, including financial, operational and compliance controls and risk management. The Board has delegated responsibility for such review to the Audit & Risk Committee (the Committee), which receives regular reporting aligned with our Assurance Programme.
It is the responsibility of management, through the CET, to implement Board policies on risk and control. The CET is responsible for identifying, approving, monitoring and enforcing key policies that go to the heart of how the Group conducts business.
The internal control framework includes central direction, resource allocation, oversight and risk management of the key activities of R&D, manufacturing, marketing and sales, legal, human resources, information systems and financial practice. As part of this framework, there is a financial planning system with an annual budget approved by the Board. The results of operating units are reported monthly and compared with the budget. Forecasts are prepared regularly during the year.
Established procedures are in place to identify and consolidate reporting entities. Our control activities include policies and practices covering appropriate authorisation and approval of transactions, the application of financial reporting standards and reviews of significant judgments and financial performance.
Extensive financial, regulatory and operational controls, procedures and risk activities are reviewed by the Group’s internal auditors. Responsibility for risk management and control is clearly delegated to local business units, supported by our regional management structure. These principles are designed to provide an environment of central leadership, coupled with local operating autonomy, as the framework for the exercise of accountability and control within the Group.
Importance is attached to clear principles and procedures designed to achieve appropriate accountability and control. A Group policy, ‘Risk Management and Legal Compliance’, mandates that our business units establish processes for managing and monitoring risks significant to their businesses and the Group.
The business units and the majority of global support functions prepare reports annually, in collaboration with Global Ethics and Compliance (see page 101), summarising risk management activities. These reports are reviewed by the relevant Risk Management and Compliance Board (RMCB) for each operation and subsequently reported to the Risk Oversight and Compliance Council (ROCC) and the Committee.
|
| GSK Annual Report 2012 | 101 |
Risk Oversight and Compliance Council
The ROCC is a council of senior executives authorised by the Board to assist the Committee in overseeing the risk management and internal control activities of the Group. Membership comprises several CET members, the Company Secretary and some of the heads of departments with internal control, risk management, assurance, audit and compliance responsibilities. The ROCC is chaired by the Head of Governance, Ethics and Assurance.
The ROCC meets on a regular basis to review and assess significant risks and their mitigation plans and to provide oversight of internal controls to ensure compliance with applicable laws, regulations and internal policies. The ROCC, responding to our Group ‘Risk Management and Legal Compliance’ policy, has provided the business units with a framework for risk management and upward reporting of significant risks. Each business unit assigns individual responsibility for the management of risks inherent to the business unit. For enterprise emerging risks, mitigation planning and the identification of an individual with overall GSK responsibility is mandatory.
Risk Management and Compliance Boards
RMCBs have been established in each of the major business units. Membership often comprises members of the senior executive team of the respective business unit, augmented by specialists where appropriate. The RMCBs oversee the management of all risks that are considered important for their respective business units, including those risks that are designated as significant to GSK as a whole, thus increasing the number of risks that are actively managed across the Group.
Each business unit and corporate function must periodically review the significant risks facing our businesses. This review generally includes identifying operational risks, legal compliance risks and risks to the achievement of strategic goals and objectives. The reviews are scheduled at least annually and should be embedded within, and aligned to, the annual planning process to ensure that significant risks are identified with changes in management direction and the external environment.
Global Ethics and Compliance
The ROCC and the RMCBs are assisted by Global Ethics and Compliance, which is responsible for supporting the development and implementation of practices that facilitate employees’ compliance with laws and Group policy.
Global Ethics and Compliance provides assistance to help employees meet our high ethical standards and comply with applicable laws and regulations and corporate responsibility. The thrust of Global Ethics and Compliance’s efforts is the promotion of ethical behaviour and corporate responsibility in accordance with our values, due diligence to prevent and detect misconduct or non-compliance with laws or regulations and effective compliance systems.
Global Ethics and Compliance is led by the Head of Governance, Ethics and Assurance, a CET member, who reports directly to the CEO. He has a further direct reporting line to the Committee that provides a mechanism for bypassing the executive management should the need ever arise. He also chairs the ROCC and provides summary reports on the ROCC’s activities and the Group’s significant risks to the CET and the Committee on a regular basis.
In 2012, Global Ethics and Compliance completed a review of its global strategy in order to ensure consistency across all business units and local operating companies. Compliance strategies were developed and agreed to ensure global alignment of inherent risks.
This global approach will ensure core compliance elements are proactively evaluated against common global expectations regardless of the business area, region or risk, while raising the visibility of best practices across the compliance programmes.
A global standard operating procedure was approved by Global Ethics and Compliance, Human Resources, Legal and Business Leaders to harmonise the coordination, conduct, tracking, reporting and communication of internal investigations related to actual, alleged or potential infractions of laws or regulations, GSK Policy, Code of Conduct or other wrong-doing.
To support the new procedure, a practical guide to undertaking investigations was implemented. A significant training programme was conducted to improve the technical and forensic investigative abilities of the Central Investigations Team. Additionally, a new Investigations Governance Board was formed in 2012 to enable analysis of trends, root cause analyses and to make recommendations to executive management for remedial enterprise-wide action.
Global Product Quality Office
The Global Product Quality Office (GPQO) oversees the activities of the GSK Quality Council (GSK QC) which serves as a forum to escalate emerging risks, share experiences of handling quality issues and ensure that the learnings are assessed and deployed across the organisation as appropriate. This has included reviews and mitigations of regulatory inspections, major investigations relating to external suppliers, and harmonisation of company recall procedures. The GSK QC has representation from the Executive Quality Councils in GMS, Vaccines and R&D, together with members of Audit and Assurance, Legal, R&D and Supply Chain Leaders, and provides insight to the ROCC and the Committee on product quality matters.
The GPQO has oversight responsibility for developing common quality standards and systems across GSK. There is an ongoing review of GSK’s Quality Management System to ensure that its content is reflective of the detailed requirements for the manufacture of pharmaceuticals, consumer healthcare products, vaccines and investigative clinical trials materials, while providing applicable and appropriate content for Quality Activities in Commercial Local Operating Companies.
Audit & Assurance
Audit & Assurance has responsibility for independently assessing the adequacy and effectiveness of the management of significant risk areas and reporting outcomes to the Committee in line with an agreed assurance plan. The internal audit group comprises seven principal teams focused in the following areas:
| • | | Commercial and Financial internal audit |
| • | | Information Technology internal audit |
| • | | Manufacturing internal audit (including Environment, Health, Safety and Sustainability) |
| • | | Assurance excellence & operations |
| • | | Anti-Bribery & Corruption |
All internal audit activity is conducted by a single organisation under the leadership of the Head of Audit & Assurance, who has a dual Committee reporting line into the Head of Governance, Ethics and Assurance and the Committee Chairman.
102 | GSK Annual Report 2012
Corporate governance
Audit & Assurance undertakes a continuous process of risk assessment that contributes to the evolution of our audit strategies and compilation and delivery of the audit schedule. This approach allows Audit & Assurance to respond expeditiously to changes in our business and risk environment and to ensure that our audit strategies are fit-for-purpose. The internal audit universe and audit programmes are managed using the Lead Audit Group principle where each business unit is aligned with an audit group for coordination and management of key communications. Programmes are reviewed and approved collectively by the Assurance Leadership Team, and the schedule is endorsed by the Committee.
When issues or control deficiencies are identified during audit engagements, Internal Audit recommends processes for improvement. Business unit management develops corrective action plans to address the causes of non-compliance and gaps in internal controls. These plans are tracked to completion and results reported to executive management and the Committee.
Assurance reporting
Assurance reporting to the Committee follows a structured programme, integrating reporting from business units and Audit & Assurance.
Business units and global support functions are required to present reports annually to the ROCC and the Committee detailing their risk management and compliance approach, providing an assessment of the status of internal controls over key risks, and highlighting any significant compliance issues. Management must oversee risks that are considered important for their respective business units, including those risks that are designated as significant to the Group. Information regarding the controls in place to manage these risks is provided to assure the Committee that these risks are adequately managed within the internal control framework.
In addition to business unit reporting, significant compliance issues and internal audit results and investigations are escalated to the ROCC and the Committee at the earliest opportunity.
Anti-Bribery and Corruption
The Anti-Bribery and Corruption Programme (ABAC) is part of our response to the risk of bribery and corruption. It builds on our values and existing standards to form a comprehensive and practical approach to compliance in this complex risk area. The programme is overseen by the ABAC team, who provide advisory support and routine audits of this risk. To ensure the programme’s independence, it will be regularly audited by an external firm that specialises in this risk area. Details of our ABAC programme are available on our website.
Risk management
Our risk management programme extends beyond legal and regulatory issues and considers our overall strategy and changes in the external environment. Furthermore, risk management principles are embedded within management practices and are part of the business strategy and objective setting process.
The Head of Audit & Assurance acts as the Global Risk Officer with support from the Director, Risk Management. Risk Management is responsible for maintaining GSK’s risk management framework and supporting the business in identifying key risks. The management of risks is owned by the business with support from Compliance Business Partners. For details of risks affecting the Group, see ‘Risk factors’ on pages 78 to 86 and Note 44 to the financial statements, ‘Legal proceedings’.
Monitoring risk and effectiveness of controls
The internal control framework (the Framework) has been in operation for the whole of the year and continues to operate up to the date of approval of this report. The Framework assists in the identification, evaluation, and management of significant risks as required by the UK Corporate Governance Code (UK Code) and is designed to manage rather than eliminate the risk of not achieving business objectives. The Framework provides reasonable, but not absolute assurance against material misstatement or loss.
The Committee receives reports on areas of significant risk to the Group and on related internal controls. Following consideration of these reports and those received via the Assurance framework, the Committee reports annually to the Board on the effectiveness of controls.
There are areas of our business where it is necessary to take risks to achieve a satisfactory return for shareholders, such as investment in R&D and in acquiring new products or businesses. During 2012, the Committee, in conjunction with the full Board, considered and reviewed the nature and extent of these risks and the risks associated with achieving the company’s strategic objectives.
In these cases, it is our objective to apply expertise in the prudent management, rather than elimination, of risk. The Board’s review focuses on the company and its subsidiaries and does not extend to material associated undertakings, joint ventures or other investments, although it considers the risk of the company’s participation in these activities.
The Board, through the Committee, has reviewed the assessment of risks and the internal control framework that operates in GSK and has considered the effectiveness of the system of internal controls in operation in the Group for the year covered by this report and up to the date of its approval by the Board. The process followed by the Board in reviewing the system of internal controls accords with the guidance on internal control issued by the Turnbull Committee.
This is in accordance with the provisions of the UK Code, which provide that the Board is responsible for determining the nature and extent of the significant risks it is willing to take in achieving its strategic objectives. The Board provides oversight to ensure that GSK maintains sound risk management and internal control systems.
Remuneration
Our Remuneration Report, which describes the level and components of the remuneration of the Directors, is set out on pages 109 to 136.
|
| GSK Annual Report 2012 | 103 |
The reports of the Audit & Risk, Nominations and Corporate Responsibility Committees, describing the activities of those Committees during the year, are set out below.
Audit & Risk Committee Report

Dear Shareholder
I would like to thank my predecessor, Tom de Swaan, for his strong leadership of the Committee over the course of the last six years. Tom continues to serve as a member of the Committee and I will value his wise counsel.
The continuing effects of an uncertain global political and economic environment make it even more important to maintain a sharp focus on the robustness of the company’s internal control and compliance models. During the year, Global Ethics and Compliance concluded a review of its global strategy, which led to the establishment of “One Compliance”, a single, consistent global compliance framework independent of the business. “One Compliance” will champion GSK’s values and seek to foster values-based decision making across the Group’s business units and local operating companies.
During 2012, the Committee’s agenda has included the usual review of our financial results and controls, our business operations across the world and their management of risk, as well as focusing consideration on new emerging risks. At each meeting, a proactive approach was taken to the identification and discussion of emerging risks.
In 2012, GSK entered into a Corporate Integrity Agreement (CIA) with the US Department of Health and Human Services in relation to past sales and marketing practices. Under the CIA, the company is building improvements into its existing compliance programmes. The Committee has supported the Board in overseeing and scrutinising the implementation of these improvements through the receipt of quarterly CIA compliance updates. It also receives annual training on the CIA and its compliance obligations.
In line with the Group’s strategy to expand further and deeper into emerging markets, members of the Committee visited the Group’s Indian operations in Delhi and were pleased to have the opportunity to meet with locally based executives. During this visit, the Committee members were able to gain a deeper understanding of the distinctive business and cultural dynamics of this emerging market and to learn at firsthand how risk management is embedded in our operations in India.
In my role as the new Chair, I will increase my understanding of the Group by meeting with senior executives from GSK’s operations to discuss issues that have been brought to the Committee by management. I also intend to continue Tom’s work in making the Committee more visible to the Group’s employees and to deepen my knowledge of the internal control and assurance framework through working with the CET members and connecting with the network of Compliance Officers.
Judy Lewent
Audit & Risk Committee Chairman
Membership
The membership of the Committee, together with appointment dates and attendance at meetings, is set out below:
| | | | | | | | |
| Members | | Committee member since | | | Attendance
at full
meetings during
2012 | |
| Judy Lewent (Chairman from 1 January 2013) | | | 1 April 2011 | | | | 5/6 | |
| Professor Sir Roy Anderson | | | 20 May 2009 | | | | 6/6 | |
| Stacey Cartwright | | | 1 April 2011 | | | | 6/6 | |
| Sir Deryck Maughan | | | 21 January 2005 | | | | 6/6 | |
| Dr Daniel Podolsky | | | 1 January 2007 | | | | 6/6 | |
| Tom de Swaan (Chairman from September 2006 to 31 December 2012) | | | 1 January 2006 | | | | 6/6 | |
| Sir Robert Wilson | | | 12 December 2003 | | | | 6/6 | |
The Committee’s meetings are split into two parts:
| • | | Part one deals with the more fundamental aspects of internal financial control and considers standing items, such as receiving reports from the external auditors and GSK’s Audit & Assurance team. |
| • | | In furtherance of its risk responsibilities, the entire Board is invited to attend Part two of the Committee’s meetings. This usually considers developments in the external risk environment and receives legal updates, business unit and corporate function reports and reports on the outcome of Strategic Risk Evaluations and other topical issues. |
In addition to the six scheduled meetings, the Committee also met on a quorate basis on five occasions.
Other attendees at Committee meetings include:
| | | | | | | | |
| Attendee | | Regular
attendee | | | Attends as required | |
Chairman | | | ü | | | | | |
CEO | | | ü | | | | | |
CFO | | | ü | | | | | |
Chairman, Global R&D & Vaccines | | | ü | | | | | |
General Counsel | | | ü | | | | | |
Financial Controller | | | ü | | | | | |
Head of Governance, Ethics & Assurance | | | ü | | | | | |
Head of Audit & Assurance | | | ü | | | | | |
Company Secretary – Secretary to the Committee | | | ü | | | | | |
Chief Medical Officer – Part two only | | | | | | | ü | |
Chief Product Quality Officer | | | | | | | ü | |
External auditors | | | ü | | | | | |
Main responsibilities
The main responsibilities of the Committee are set out on page 98.
The Committee’s oversight role requires it to address regularly the relationships between management and the internal and external auditors and to understand and monitor the reporting relationships and tiers of accountability between them.
The Committee receives regular reports from members of the CET and senior managers covering key risk management and compliance activities of the Group, including those covering R&D, manufacturing, sales and marketing and corporate functions. Further details of the reporting framework to the Committee are set out on pages 100 to 102 under ‘Accountability’.
104 | GSK Annual Report 2012
Corporate governance
The Committee also reviews the quarterly results of the Group prepared by management and considers reports on key accounting issues.
The Committee reviews its terms of reference on an annual basis. They were revised in December 2012 to reflect corporate governance best practice developments.
In 2012, the Committee worked to a structured programme of activities, with standing items that the Committee is required to consider at each meeting, together with other matters timed to coincide with key events of the annual financial reporting cycle.
| | |
External auditors | | Reported on all critical accounting policies, significant judgements and practices used by the Group, alternative accounting treatments which had been discussed with management and their resultant conclusion, material written communications with management and any restrictions on access to information. |
CFO | | Reported on the financial performance of the Group and on technical financial and accounting matters. |
General Counsel | | Reported on material litigation. |
Company Secretary | | Reported on corporate governance, securities and disclosure practices. |
Heads of Audit and Assurance and the Group’s compliance and audit groups | | The majority of the heads of these groups reported on the audit scope, annual coverage and audit resources and on the results of audits conducted during the year. |
Company Secretary as Chair of the Disclosure Committee* | | Reported on matters that affected the quality and timely disclosure of financial and other material information to the Board, to the public markets and to shareholders. This enabled the Committee to review the clarity and completeness of the disclosures in the published annual financial statements, interim reports, quarterly and preliminary results announcements and other formal announcements relating to financial performance prior to approval by the Board. |
Head of Audit & Assurance | | Reported on the progress of GSK’s global assurance plan to review the assurance for each significant risk throughout the Group. |
| * | See ‘Sarbanes-Oxley Act of 2002’ on page 242. |
Qualifications of Audit & Risk Committee members
Details of the members’ financial, accounting or scientific experience are given in their biographies under ‘Our Board’ on pages 88 to 91.
Committee independence
The Committee, management, internal auditors and the full Board work together to ensure the quality of the company’s corporate accounting and financial reporting. The Committee serves as the primary link between the Board and the external and internal auditors. This facilitates the necessary independence from management and encourages the external and internal auditors to communicate freely and regularly with the Committee. In 2012, the Committee met both collectively and separately with the external auditors, the Head of Audit & Assurance and the Head of Governance, Ethics and Assurance without members of management being present.
Both Judy Lewent and Tom de Swaan are also members of the Remuneration Committee, which allows them to provide input on the Committee’s review of the Group’s performance and oversight on any risk factors relevant to remuneration matters.
External auditors
The Committee has primary responsibility for oversight of the external auditors. This includes deciding whether to seek to re-tender the audit and making a recommendation to shareholders on the appointment, re-appointment or removal of the external auditors by assessing, on an annual basis, their qualifications, expertise, resources and independence and the effectiveness of the previous audit process.
Effectiveness of external auditors
In evaluating the effectiveness of the audit process prior to making a recommendation on the re-appointment of the external auditors, the Committee reviews the effectiveness of their performance against criteria which it agrees, in conjunction with management, at the beginning of each year’s audit.
As part of this process, the Committee considers feedback on the prior year’s external audit gathered through a client satisfaction survey facilitated by the auditors’ client service review team, which is independent of the engagement team that undertook the audit work. The survey seeks feedback from the financial management team at corporate and business unit level. Having reviewed the feedback, provided the Committee is satisfied with the effectiveness of the external audit process, it will recommend the re-appointment of the auditors at the forthcoming AGM.
Details of the current criteria for judging the effectiveness of the external auditors are set out below:
| • | | deliver a smooth-running, thorough and efficiently executed audit |
| • | | provide accurate, up-to-date knowledge of technical issues on a timely basis |
| • | | serve as an industry resource, communicating best practice and industry trends in reporting |
| • | | adhere to all independence policies, including GSK’s policies, ISA (UK&I) 220 and SEC requirements |
| • | | deliver a focused and consistent audit approach globally that reflects local risks and materiality |
| • | | liaise with GSK’s Audit & Assurance function to avoid duplication of work and |
| • | | provide consistency of advice at all levels. |
Fee review
Before agreeing the audit fee proposed by the external auditors, which is reviewed by management, the Committee considers cost comparisons to ensure that it is fair and appropriate for GSK. There are no contractual obligations that restrict the Committee’s capacity to recommend a particular firm as external auditor to the Group.
Qualifications
In making its assessment, the Committee considers papers which detail the relevant UK legislative, regulatory and professional requirements relating to external auditors and evaluates reports from the external auditors on their compliance with the requirements, on the safeguards that have been established and on their own internal quality control procedures.
Consideration is also given by the Committee to the need to include the risk of the withdrawal of the external auditors from the market in its risk evaluation and planning.
|
| GSK Annual Report 2012 | 105 |
Audit partner rotation
The external auditors are required to rotate the audit engagement partner every five years. The current audit partner commenced his engagement on 1 January 2008 and will step down from his position after the audit of GSK’s financial statements for 2012 has been concluded.
After a robust review process by the Committee, together with the involvement of the CEO and CFO to select his replacement, the Committee has approved the appointment of a new audit engagement partner with effect from the financial year commencing on 1 January 2013.
Audit firm tendering
PricewaterhouseCoopers LLP have remained in place as auditors since the Group’s inception in December 2000 and the audit contract has not been put out to tender in that period. Their performance has been reviewed annually by the Committee since that time. As part of its review of the implications of the end of the current audit partner’s five year term, the Committee considered the appropriateness of putting in place a tender process. This included assessing the FRC’s most recent guidance on the subject, the level of change currently underway inside the Group and improvements to the auditors’ services, including fee levels proposed by the auditors. The review concluded that a tender was not in the company’s interests at this time and the Committee consequently approved the appointment of the new audit partner. However, the Committee agreed that this issue should be reviewed regularly as part of the annual appointment process.
Non-audit services
The Sarbanes-Oxley Act of 2002 prohibits the engagement of the external auditors for the provision of certain services such as legal, actuarial, internal audit outsourcing, or financial information systems design. Where the external auditors are permitted to provide non-audit services, the Committee ensures that auditor objectivity and independence are safeguarded by a policy requiring pre-approval by the Committee for such services. The total fees for non-audit work can not exceed 50% of the audit fee, except in special circumstances where there would be clear advantage in the company’s auditors undertaking such additional work. These services may include audit, audit-related, tax and other services.
Pre-approval is detailed as to the particular service or categories of service, and is subject to a specific budget.
Provision of non-audit services
There are guidelines which set out the Group’s policy on engaging the external auditors to provide non-audit services, which include:
| • | | ascertaining that the skills and experience of the external auditors make them a suitable supplier of the non-audit services |
| • | | ensuring adequate safeguards are in place so that the objectivity and independence of the Group audit are not threatened or compromised and |
| • | | ensuring that the fee levels do not exceed 50% of the annual audit fee. |
The external auditors and management report regularly to the Committee regarding the extent of services provided in accordance with this pre-approval and the fees for the services performed. The Committee may also pre-approve additional services on a case-by-case basis. Fees paid to the company’s auditor and its associates are set out below. Further details are given in Note 8 to the financial statements, ‘Operating profit’.
Where possible, other accounting firms are engaged to undertake non-audit services.
(£m)
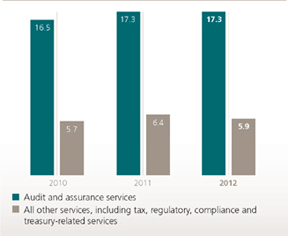
Code of Conduct and reporting lines
We also have a number of well established policies, including a Code of Conduct, which is available on our website, and confidential reporting lines for the reporting and investigation of unlawful conduct. No waivers to the Code of Conduct were made in 2012.
Committee evaluation
The Committee’s annual evaluation was carried out by the Committee Chairman and concluded that the Committee continued to operate effectively. In particular, the Committee’s agendas were thought to be comprehensive with helpful presentations on each area of the business on a rolling basis that addressed risk and audit concerns. The Committee felt that this provided a solid framework within which it could continue to operate effectively to fulfil its role.
In terms of enhancements to the Committee’s deliberations, the Committee members felt it would be helpful to find additional time for, and apply greater focus on, particular issues such as pipeline risk, vaccines, clinical practices and local regulatory requirements.
It was agreed that the business assurance reports could be simplified further, with a clear focus on key risks and that management presentations to the Committee should be more focused on risk.
106 | GSK Annual Report 2012
Corporate governance
Nominations Committee Report

Sir Christopher Gent
Nominations Committee Chairman
Membership
The membership of the Nominations Committee (the Committee), together with appointment dates and attendance at meetings, is set out below:
| | | | | | | | |
| Members | | Committee member since | | | Attendance at
full meetings
during 2012 | |
Sir Christopher Gent | | | | | | | | |
(Chairman since | | | | | | | | |
1 January 2005) | | | 9 December 2004 | | | | 4/4 | |
Professor Sir Roy Anderson | | | 1 October 2012 | | | | 2/2 | |
Sir Crispin Davis | | | 9 July 2009 | | | | 4/4 | |
Sir Deryck Maughan | | | 9 July 2009 | | | | 3/4 | |
Tom de Swaan | | | 1 October 2012 | | | | 2/2 | |
Sir Robert Wilson | | | 28 March 2008 | | | | 4/4 | |
Larry Culp* | | | 28 March 2008 | | | | 2/2 | |
| * | Larry Culp resigned from the Board on 30 September 2012. |
In addition to the four scheduled meetings, the Committee met on a quorate basis on two occasions.
Other attendees at Committee meetings may include:
| | | | | | |
| Attendee | | Regular
attendee | | | Attends
as required |
Chief Executive Officer | | | ü | | | |
Head of Human Resources | | | ü | | | |
Company Secretary – Secretary to the Committee | | | ü | | | |
Appropriate external advisers | | | | | | ü |
Main responsibilities
The main responsibilities of the Committee are set out on page 98.
Work of the Committee during 2012
Appointment of new Non-Executive Directors
During 2012, the Committee’s particular area of focus was the search for new Non-Executive Directors to refresh the Board in advance of the planned retirements of long-serving Board members.
When recruiting Non-Executive Directors, the Committee evaluates the particular skills, knowledge, independence, experience and diversity, including gender, that would benefit and balance the Board most appropriately for each appointment.
During the search process, broad selection criteria are generally used which focus on achieving a balance between Continental European, UK, US and emerging markets experience on the Board, and having individuals with expertise and capabilities developed in various sectors and specialities.
In fulfilment of the specific observations made during the most recent external evaluation of the Board and the Committee in 2011, the search process for new Non-Executive Directors to replace the retiring Non-Executive Directors gave priority to candidates with global CEO experience and/or knowledge of, and experience in, emerging markets.
Egon Zhender and MWM, who specialise in the recruitment of high calibre executives and Non-Executive Directors, were engaged to ensure that the widest possible pools of Non-Executive candidates were available to select from. Egon Zhender has a good understanding of GSK’s business and also assists in the identification of talented individuals to fill other executive roles in the Group.
A dossier of potential Non-Executive appointees was considered by the Committee and candidates were short-listed for interview on merit and against objective criteria, after assessing their relevant qualifications and time commitments.
After interviewing suitable candidates, the Committee was pleased to recommend to the Board Lynn Elsenhans and Jing Ulrich as potential Non-Executive Directors. They were both appointed to the Board with effect from 1 July 2012. The Board considered that these appointments, together with the appointment of Hans Wijers, who will join the Board on 1 April 2013, achieved the aim of appointing candidates who have either a deep knowledge of emerging markets or experience of running a global company.
It is currently intended that Sir Christopher will step down as Chairman at the end of 2015 and the Committee has therefore commenced the search for his successor.
Board and Committee changes
The Committee’s proactive approach to the refreshment of the Board has resulted in orderly changes in the composition of the Board and its Committees. The changes are detailed below.
James Murdoch did not stand for re-election at the AGM in May, Larry Culp decided to step down from the Board on 30 September 2012 after almost nine years of service and Sir Crispin Davis will not stand for re-election at the AGM in 2013 after nine years of service. Given the number of recent appointments and that two longstanding Board members will have stepped down from the Board by May 2013, Sir Robert Wilson agreed to stand for re-election by shareholders for one further year before stepping down from the Board at the 2014 AGM. Sir Robert has significant knowledge of GSK’s business affairs and will provide continuity as the new Board members settle into their roles. The Board has confirmed that Sir Robert continues to demonstrate the characteristics of independence in carrying out his role. Sir Robert will be succeeded by Sir Deryck Maughan as Senior Independent Non-Executive Director, with effect from the closure of the AGM in May 2013.
Tom de Swaan succeeded Sir Crispin Davis as Chairman of the Remuneration Committee and Judy Lewent succeeded Tom de Swaan as Chairman of the Audit & Risk Committee on 1 January 2013. Tom has been a member of the Remuneration Committee since May 2009 and will continue to be a member of the Audit & Risk Committee following Judy’s appointment. Judy has been a member of the Audit & Risk Committee since April 2011.
Tom de Swaan and Professor Sir Roy Anderson were both appointed to the Nominations Committee and Lynn Elsenhans was appointed to the Corporate Responsibility Committee, all with effect from 1 October 2012. Judy Lewent was appointed as a member of the Remuneration Committee on 1 January 2013, while Dr Stephanie Burns’ appointment to the Remuneration Committee will take effect from 1 May 2013. Finally, Jing Ulrich has been appointed to join the Audit & Risk Committee with effect from 1 May 2013 on the same date that Professor Sir Roy Anderson will step down from the Audit & Risk Committee.
|
| GSK Annual Report 2012 | 107 |
CET succession
In terms of Executive succession planning, the Committee also recommended the appointment of Christophe Weber and Roger Connor to the CET in May and September 2012 as President, Vaccines and President Designate, Global Manufacturing & Supply (GMS), respectively.
Christophe Weber joined the Company in 1993 and has held increasingly senior commercial positions, including Chairman and CEO of GSK France and Senior Vice President and Regional Director, Asia Pacific. He was appointed President Designate of Vaccines in January 2011 and he subsequently assumed the role of President, Vaccines in May 2012.
Roger Connor joined GSK in 1998 from AstraZeneca and has worked in a number of roles within finance and manufacturing strategy. He was appointed Site Director of GMS’ site at Barnard Castle in 2008 and Vice President, Office of the CEO and Corporate Strategy in February 2010, where he assisted the CEO with various projects. To ensure an orderly succession in GMS, Roger was appointed President Designate, GMS, with effect from 1 January 2012 and he assumed the role of President, GMS, in January 2013 in advance of David Pulman’s retirement from GSK.
Committee evaluation
The annual evaluation of the Committee’s effectiveness was undertaken by the Chairman. The responses were shared with the Committee and it was concluded that the Committee continued to operate effectively. The Committee had successfully addressed the actions from the previous year’s review with the appointment of Lynn Elsenhans and Jing Ulrich. Having mapped out the optimum composition of the Board for the future, the Committee’s next challenge is to select suitable candidates for the roles identified.
Corporate Responsibility Committee Report

Sir Christopher Gent
Corporate Responsibility Committee Chairman
Membership
The membership of the Corporate Responsibility Committee (the Committee), together with appointment dates and attendance at meetings, is set out below:
| | | | | | | | |
| Members | | Committee member since | | | Attendance at
full meetings
during 2012 | |
Sir Christopher Gent | | | | | | | | |
(Chairman from | | | | | | | | |
1 January 2005) | | | 9 December 2004 | | | | 4/4 | |
Dr Stephanie Burns | | | 6 December 2007 | | | | 4/4 | |
Lynn Elsenhans | | | 1 October 2012 | | | | 1/1 | |
Dr Daniel Podolsky | | | 1 July 2006 | | | | 4/4 | |
James Murdoch* | | | 20 May 2009 | | | | 0/2 | |
| * | James Murdoch retired from the Board on 3 May 2012. |
Other attendees at Committee meetings may include:
| | | | | | | | |
| Attendee | | Regular
attendee | | | Attends
as required | |
Chief Executive Officer | | | ü | | | | | |
Chairman, Global R&D & Vaccines | | | ü | | | | | |
General Counsel | | | ü | | | | | |
Head of Governance, Ethics & Assurance | | | ü | | | | | |
Head of Global Communications | | | ü | | | | | |
Head of Global Corporate Responsibility | | | ü | | | | | |
Company Secretary – Secretary to the Committee | | | ü | | | | | |
Other Executives | | | | | | | ü | |
Main responsibilities
The main responsibilities of the Corporate Responsibility Committee are set out on page 98.
The Committee has a rolling agenda and receives reports from members of the CET and senior managers to ensure that progress on meeting GSK’s Corporate Responsibility (CR) Principles is reviewed.
The Committee annually reviews progress on the following five CR Principles:
| • | | standards of ethical conduct |
| • | | research and innovation |
| • | | employment practices and |
GSK’s other CR Principles are discussed at least once every two years. The Committee also reviews and approves the Corporate Responsibility Report.
108 | GSK Annual Report 2012
Corporate governance
Work of the Committee during 2012
During 2012, the Committee focused its attention on several issues including:
| | |
| GSK’s CR Principles | | Committee’s area of focus during 2012 |
| Access to medicines | | R&D investment, including diseases of the developing world and open innovation strategy New business models and performance, including developing countries, middle-income countries and ViiV Healthcare Developing health systems for the future in the developing world Access challenges and performance in Europe and the USA |
| Standards of ethical conduct | | Patient First incentive compensation programme and selling competency model Further embedding ethical values in the organisation Reinforcing values-based decision making in the business |
| Research and innovation | | Replacement, refinement and reduction in use of animals in research and development Conduct and public disclosure of clinical research, transparency of detailed data behind trial results Scientific engagement – ensuring distinction between scientific dialogue and promotional activity by the business Enhancing the assessment of the safety and effectiveness of our medicines |
| Employment practices | | Organisational change Employee relations and human rights Inclusion and diversity Leadership and employee development Employee health, safety and well-being |
| Community investment | | Reinvestment of 20% of profits made in Least Developed Countries back into healthcare infrastructure Pulse volunteering programme |
| Social impacts in supply chain | | Supplier standards, working practices and diversity Energy, water, waste reduction programmes in GMS Environmental performance of our suppliers Product formats, including sustainable packaging, reducing inhaler propellant and child-resistant packaging |
Work of the Committee in 2013
In 2013, the Committee will move to review progress on GSK’s Corporate Responsibility (CR) commitments across four core themes, which reflect the most important issues for responsible and sustainable business growth:
| • | | Health for all: innovating to address currently unmet health needs; improving access to our products, irrespective of where people live or their ability to pay; and controlling or eliminating diseases affecting the world’s most vulnerable people |
| • | | Our behaviour: putting the interest of patients and consumers first, driven by our values in everything we do and backed by robust policies and strong compliance processes |
| • | | Our people: enabling our people to thrive and develop as individuals to deliver our mission |
| • | | Our planet: growing our business, while reducing our environmental impact across our value chain. |
Committee evaluation
The annual evaluation of the Committee’s views on its effectiveness was undertaken by the Chairman. The responses were shared with the Committee and it was concluded that the Committee continued to operate effectively. As part of the review, it was agreed that the Terms of Reference and Committee Programme would be updated to reflect the four core themes of CR. In addition, a further meeting would be added into the Committee’s annual programme.
|
| GSK Annual Report 2012 | 109 |
Remuneration report
| | |

| | Dear Shareholder |
| | As the Chairman of GSK’s Remuneration Committee (the Committee), I am pleased to present our Remuneration Report for 2012, for which we will be seeking your approval at our AGM in May 2013. On behalf of the Committee, I want to thank my predecessor, Sir Crispin Davis, for his strong leadership of the Committee over the last three and a half years in developing our current executive remuneration structure. We feel that the current structure strikes a good balance between motivating and retaining our Executives, while at the same time incentivising them to deliver long-term sustainable returns to shareholders. |
| | Executive remuneration |
| | The economic and remuneration environments continued to evolve during 2012 and, accordingly, we have made a number of adjustments to certain aspects of our executive remuneration arrangements to ensure they remain appropriate for GSK and in the long-term interests of shareholders. From 2013 onwards, we have capped the increases in pensionable earnings within our legacy UK defined benefit pension schemes at 2% per annum for all participants, including Executives. This will limit GSK’s overall future liabilities under these schemes. In response to our undertakings within the Corporate Integrity Agreement (CIA) with the US Federal Government, we have further strengthened our deferral mechanism and our ‘clawback’ ability for Executives and senior US staff. Further details on this are set out on page 116 of our Annual Report. Given the current external environment, the Committee decided that it would be appropriate to award our Executive Directors salary increases of 2% for 2013. These increases are in line with average salary increases for other UK and US employees across our business. During the year, the Committee reviewed the competitiveness of Executives’ pay. As a result of this review, the Committee decided that it would be appropriate to increase the maximum reward opportunity for our CFO, Simon Dingemans, under the Performance Share Plan (PSP), from 350% to 400% of base salary. This will position his total remuneration more competitively against his UK peers. It also reflects his increased experience in the role and will bring his PSP opportunity in line with that of his predecessor. |
| | 2012 performance |
| | Executive annual bonus awards and the values earned from long-term incentive (LTI) plans for 2012 were lower than 2011. This reflected a very challenging operating environment, particularly in Europe, where the outlook for the Group significantly worsened during the year. Despite this, management delivered strong sales performance in Emerging Markets, Consumer Healthcare (adjusting for the disposal of the non-core OTC brands) and other growth businesses. In addition, delivery of cost and financial efficiencies helped the Group maintain core EPS (at constant exchange rates) and return £6.3 billion to shareholders. The Committee also recognised the continued strong output from R&D, with six key new products filed with regulators since January 2012 – an unprecedented level of productivity for the Group. |
| | Agenda for 2013 |
| | During the course of 2013, the Committee will continue to keep the structure of our remuneration arrangements under review and will prepare for the new executive remuneration reporting requirements being introduced in the UK. We continue to be committed to regular dialogue with shareholders and will hold our annual meetings with GSK’s largest investors later in 2013 to listen to feedback on our remuneration policy. |
| |
| | Tom de Swaan Remuneration Committee Chairman 5 March 2013 |

110 | GSK Annual Report 2012
Remuneration report
Total remuneration for 2012
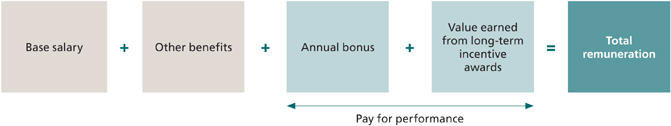
The total remuneration for 2012 for each of the current Executive Directors is set out in the table below:
| | | | | | | | | | | | | | | | | | | | | | | | | | | | | | | | | | | | | | | | | | | | | | | | |
| | | Sir Andrew Witty, CEO | | | Simon Dingemans, CFO | | | Dr Moncef Slaoui, Chairman, Global R&D & Vaccines | |
| | | 2012
£000 | | | % of
total | | | 2011
£000 | | | % of
total | | | 2012
£000 | | | % of
total | | | 2011
£000 | | | % of
total | | | 2012
$000 | | | % of
total | | | 2011
$000 | | | % of
total | |
Salary | | | 1,033 | | | | | | | | 1,000 | | | | | | | | 682 | | | | | | | | 656 | | | | | | | | 1,153 | | | | | | | | 1,093 | | | | | |
Other benefits | | | 49 | | | | | | | | 36 | | | | | | | | 161 | | | | | | | | 157 | | | | | | | | 363 | | | | | | | | 302 | | | | | |
| | | | | | | | | | | | | | | | | | | | | | | | | | | | | | | | | | | | | | | | | | | | | | | | | |
| | | | 1,082 | | | | 28% | | | | 1,036 | | | | 15% | | | | 843 | | | | 71% | | | | 813 | | | | 50% | | | | 1,516 | | | | 33% | | | | 1,395 | | | | 28% | |
Pay for performance | | | | | | | | | | | | | | | | | | | | | | | | | | | | | | | | | | | | | | | | | | | | | | | | |
Annual bonus – including the amount deferred (see below) | | | 905 | | | | | | | | 2,000 | | | | | | | | 343 | | | | | | | | 827 | | | | | | | | 1,404 | | | | | | | | 1,747 | | | | | |
Value earned from LTI awards: | | | | | | | | | | | | | | | | | | | | | | | | | | | | | | | | | | | | | | | | | | | | | | | | |
Deferred Annual Bonus Plan(1) | | | 125 | | | | | | | | n/a | | | | | | | | n/a | | | | | | | | n/a | | | | | | | | n/a | | | | | | | | n/a | | | | | |
Performance Share Plan(2) | | | 1,780 | | | | | | | | 3,738 | | | | | | | | n/a | | | | | | | | n/a | | | | | | | | 1,690 | | | | | | | | 1,753 | | | | | |
Share Option Plan | | | – | | | | | | | | – | | | | | | | | n/a | | | | | | | | n/a | | | | | | | | – | | | | | | | | – | | | | | |
ShareSave | | | – | | | | | | | | 5 | | | | | | | | n/a | | | | | | | | n/a | | | | | | | | – | | | | | | | | – | | | | | |
| | | | | | | | | | | | | | | | | | | | | | | | | | | | | | | | | | | | | | | | | | | | | | | | | |
| | | | 2,810 | | | | 72% | | | | 5,743 | | | | 85% | | | | 343 | | | | 29% | | | | 827 | | | | 50% | | | | 3,094 | | | | 67% | | | | 3,500 | | | | 72% | |
| | | | | | | | | | | | | | | | | | | | | | | | | | | | | | | | | | | | | | | | | | | | | | | | | |
Total remuneration | | | 3,892 | | | | | | | | 6,779 | | | | | | | | 1,186 | | | | | | | | 1,640 | | | | | | | | 4,610 | | | | | | | | 4,895 | | | | | |
| | | | | | | | | | | | | | | | | | | | | | | | | | | | | | | | | | | | | |
| | | % | | | £000 | | | Number
of shares | | | % | | | £000 | | | Number
of shares | | | % | | | $000 | | | Number
of ADS | |
Deferral of 2012 annual bonus | | | | | | | | | | | | | | | | | | | | | | | | | | | | | | | | | | | | | | | | | | | | | | | | |
Amount deferred | | | 50% | | | | 452 | | | | | | | | 50% | | | | 171 | | | | | | | | 50% | | | | 702 | | | | | |
Number of shares or ADS purchased | | | | | | | | | | | | | | | 31,114 | | | | | | | | | | | | | | | | 11,783 | | | | | | | | | | | | | | | | 15,859 | |
Maximum matching award(3) | | | | | | | | | | | | | | | 31,114 | | | | | | | | | | | | | | | | 11,783 | | | | | | | | | | | | | | | | 15,859 | |
Full details of each of the elements of ‘Total remuneration’ above are given on the following pages of this Report.
| | | | | | |
| | | Details | | Pay for performance | | Details |
| Base salary | | Pages 115 and 127 | | Annual bonus | | Pages 111, 116 and 127 |
| Other benefits | | Pages 116 and 127 | | Investment of bonus in Deferred Annual Bonus Plan | | See table above and pages 117 and 132 |
| | | | | Value earned from LTI awards: | | |
| | | | | Deferred Annual Bonus Plan | | Pages 112, 117, 130 and 132 |
| | | | | Performance Share Plan | | Pages 112, 117, 130 and 133 to 135 |
| | | | | Share Option Plan | | Pages 112 and 130 to 131 |
| | | | | ShareSave | | Pages 119 and 130 to 131 |
Notes:
| (1) | The performance periods for Dr Moncef Slaoui’s and Simon Dingemans’ first awards under the Deferred Annual Bonus Plan (DABP) end on 31 December 2013 and 31 December 2014 respectively. The earliest periods for which remuneration will be recorded under the DABP will therefore be the year ending 31 December 2013 for Dr Moncef Slaoui and the year ending 31 December 2014 for Simon Dingemans. |
| (2) | The performance period for Simon Dingemans’ first award under the Performance Share Plan ends on 31 December 2013. The earliest period for which remuneration will be recorded for Simon Dingemans under this Plan will therefore be the year ending 31 December 2013. |
| (3) | The matching award is subject to performance targets. The maximum number of shares or ADS shown for the matching award does not include dividends reinvested over the performance period. |
| (4) | Details of the pensions accrued to date for each of the Executive Directors are given on pages 135 and 136. |
|
| GSK Annual Report 2012 | 111 |
Pay for performance for 2012
Annual bonus
For 2012, the annual bonus was based on the following performance targets:
| | | | | | |
| Executive Director | | Financial performance | | Personal performance |
| Sir Andrew Witty | | 75% on core Group operating profit | | 25% on core Group profit
before interest and tax | | Individual objectives |
| Simon Dingemans | | | |
| Dr Moncef Slaoui | | 50% on R&D performance and 25% on Vaccines performance | | |
| | |
Performance against targets | | | | |
| Financial performance | | Core Group operating profit and core Group profit before interest and tax 2012 presented a challenging operating environment with austerity measures in Europe, including price cuts and generic substitution. Despite this and the stretch targets set for the year by the Committee, the levels achieved for core Group operating profit and core Group profit before interest and tax were between threshold and target for 2012. This reflects strong sales growth in Emerging Markets, Asia Pacific, Japan (excluding the adverse comparison ofCervarixwith the prior year) and our Consumer Healthcare business, adjusting for the disposal of the non-core OTC brands, as well as effective cost control and financial efficiencies. |
| | |
| | | R&D and Vaccines performance |
| | | Targets for the year around pipeline growth and value were exceeded. Since January 2012, six new products have been filed for approval and Phase III data is expected on 14 new assets in the next two years, including nine new drugs/vaccines. Over the next three years, there is potential to launch 15 new assets and GSK is on track to deliver its target long-term rate of return on R&D spend of 14%. |
The table below sets out the matters the Committee considered in respect of the individual objectives set for each Executive Director. |
| Personal performance | | CEO Sir Andrew showed strong leadership and resilience in a challenging operating environment, as conditions in Europe deteriorated, to secure flat year on year sales (excluding disposals of over the counter (OTC) products), with growth across Emerging Markets, Asia Pacific, Japan (excludingCervarix) and the Consumer Healthcare business, adjusting for the disposal of the non-core OTC brands. Positive cash generation from operations and disposal of non-core OTC products enabled £6.3 billion to be returned to shareholders (dividends of £3.8 billion and shares repurchased of £2.5 billion). The ongoing US Federal Government investigations with the US Department of Health & Human Services were concluded with the signing of the Corporate Integrity Agreement. Sir Andrew strengthened the core business through acquisitions and investments, completing three significant transactions (HGS, Shionogi and Theravance) to increase GSK’s share of key future growth assets. During the year, Sir Andrew also continued to advance the Group’s leadership position on corporate responsibility issues, including action to increase the transparency of our clinical research and to improve access to our medicines. GSK was again ranked in first position in the prestigious Access to Medicines Index. Sir Andrew recommended the appointments of successors to two key Corporate Executive Team roles and the Board subsequently approved the appointment of Roger Connor as the new President, Global Manufacturing & Supply and Christophe Weber, as the new President, Vaccines. |
| | |
| | | CFO |
| | | One of Simon Dingemans’ main objectives for 2012 was to implement further Group-wide cost control and financial efficiencies. These were delivered, contributing significantly towards 2012 overall performance and enabling GSK to maintain its core earnings per share on a constant currency basis. He also achieved reductions in our effective core tax rate to 24.4% (2011 – 25.9%), meeting our targeted rate of 25% two years ahead of expectations. Simon drove the continued delivery of the Operational Excellence restructuring programme, which has delivered approximately £2.5 billion of annual savings and remains on track to deliver £2.8 billion of annual savings by 2014. He also made good progress towards improving the Group’s funding profile, with net finance expenses for the year broadly similar to 2011 at £729 million, despite an increase in net debt of £5 billion in 2012. |
| | |
| | | Chairman, Global R&D & Vaccines |
| | | Dr Moncef Slaoui led R&D and Vaccines through a very successful year. R&D exceeded the pipeline development and value targets for the year (as detailed above). He also designed and implemented, with effect from January 2013, a new integrated way of working between R&D and other parts of the business to create a strong, global product launch capability for GSK’s pipeline of new medicines. Moncef also worked closely with Christophe Weber, as he transitioned successfully into his new role as President, Vaccines. |
112 | GSK Annual Report 2012
Remuneration report
Pay for performance for 2012continued
Value earned from long-term incentive awards
Deferred Annual Bonus Plan
The structure of the award granted to Sir Andrew Witty in 2010 and the performance level achieved in the three years ended 31 December 2012 are set out below:
| | | | | | | | | | | | |
| 2010 award | | | | | | Vesting | |
| Performance measure | | % of
award | | Performance achieved | | % of
maximum | | | % of
award | |
| Relative TSR over 3 years | | 100% | | GSK’s TSR rank position was 6th in the comparator group of 11 pharmaceutical companies (GSK and 10 other companies). | | | 30% | | | | 30% | |
Total vested in respect of 2012 | | | | | | | 30% | |
|
Performance Share Plan The structures of the awards granted to Executives in 2009 and 2010 and the performance levels achieved in the three and four year periods ended 31 December 2012 are set out below: | |
| |
| 2009 award | | | | | | Vesting | |
| Performance measure | | % of award | | Performance achieved | | % of maximum | | | % of
award | |
| Relative TSR over 4 years | | 30% | | GSK’s TSR rank position was 8th in the comparator group of 11 pharmaceutical companies (GSK and 10 other companies). | | | 0% | | | | 0% | |
Total vested in respect of 2012 | | | | | | | 0% | |
| Total vested in respect of 2011 | | | | | | | 49% | |
| Total vested for 2009 award | | | | | | | 49% | |
| | | | | | | | |
| 2010 award | | | | | | Vesting | |
| Adjusted free cash flow | | 40% | | Adjusted free cash flow for the three years was £17.6 billion, which included adjustments for a number of material distorting items, including legal settlements, favourable exchange rate movements and special pension contributions. | | | 40% | | | | 16% | |
| Relative TSR over 3 years | | 30% | | GSK’s TSR rank position was 6th in the comparator group of 11 pharmaceutical companies (GSK and 10 other companies). | | | 30% | | | | 9% | |
Total vested in respect of 2012 | | | | | | | 25% | |
| Relative TSR over 4 years to 31 December 2013 | | 30% | | If performance is maintained in line with that over three years (above), GSK’s TSR rank position would be 6th out of 10 using the revised pharmaceutical comparator group of GSK and nine other companies set out on page 115. This would be below the threshold vesting level set out in the revised vesting schedule on page 135. | | | 0% | | | | 0% | |
| Potential total vesting for 2010 award | | | | | | | 25% | |
|
Share Option Plan The Share Option Plan awards granted to the Executives in 2009 were split into two elements, with 50% being dependent on performance over the three year period ended 31 December 2011 and 50% on performance over the four year period ended 31 December 2012. | |
| | | | | | | | |
| | | | | | | Vesting | |
| Performance measure | | % of
award | | Performance achieved | | % of
maximum | | | % of
award | |
| Comparison of compound annual increase in EPS with the increase in RPI over 4 years | | 50% | | GSK’s annualised EPS growth was below the threshold vesting level of growth in RPI plus 3%. | | | 0% | | | | 0% | |
Total vested in respect of 2012 | | | | | | | 0% | |
| Total vested in respect of 2011 | | | | | | | 0% | |
| Total vested for 2009 award | | | | | | | 0% | |
|
| GSK Annual Report 2012 | 113 |
Remuneration policy for 2013
The table below summarises how the Committee sets remuneration for the members of the CET (the Executives), the key elements of their remuneration, including the requirement for them to hold minimum levels of shares in GSK, and the principal pension arrangements.
| | | | | | | | | | | | | | | | |
| | | | | | | | | | | | | | | | | Page(s) |
| How the Committee sets remuneration | | The Committee reviews the total remuneration of each Executive against that of executives from comparable companies, with a focus on local rather than global comparisons. The Committee aims to ensure that total remuneration levels are competitive and are set by reference to the median of the appropriate comparator group. The balance between fixed elements and pay for performance is carefully considered, with overall packages weighted heavily towards the latter. | | 115 |
Fixed pay | | | | | | | | | | | | | | | | |
| Base salary | | Salaries are reviewed annually, with data from relevant comparator groups, and are influenced by: • the Executive’s role, experience and performance; and • the average increases for the broader GSK workforce. | | 115 |
| Other benefits | | Principally healthcare, car, personal financial advice, life assurance and, where relevant, cash in lieu of a money purchase pension contribution and secondment and travel expenses. | | 116 |
Pay for performance |
| Safeguards and risk management | | A ‘clawback’ mechanism is incorporated into the annual bonus award process and this existing mechanism has been extended under the terms of the CIA. The Committee retains the discretion to reduce the grant or vesting levels of performance awards if appropriate. | | 116 |
| Annual bonus | | The target and maximum bonus opportunities for the Executive Directors are as follows: | | Targets: • The majority of the bonus is based on achievement of challenging financial targets (core Group/business unit operating profit and core Group profit before interest and tax) as agreed by the Board and the Committee • Individual performance against pre-determined personal objectives • R&D-specific key performance indicators • Vaccines-specific measures. | | 116 |
| | | | | Target % of salary | | Maximum % of salary | | | |
| | | | | | | | |
| | | | | | | | |
| | | CEO | | 125 | | 200 | | | |
| | | CFO | | 80 | | 180 | | | |
| | | Chairman, Global R&D
& Vaccines | | 85 | | 200 | | | |
| Deferred Annual Bonus Plan (DABP) | | From 2014, individuals must invest 25%, and may invest up to a total of 50%, of any bonus earned. Deferred bonuses may be matched up to one-for-one subject to performance criteria. | | • Awards vest at the end of a three-year performance period based on four equally weighted performance measures: – Business diversification performance*; – R&D new product performance*; – Adjusted free cash flow*; and – Relative TSR+. | | 117
to
119 |
| Performance Share Plan (PSP) | | The performance share awards for the Executive Directors are as follows: | | * 25% vests at threshold, rising to 100% for stretching performance exceeding the set threshold by a specified margin. + Against comparator group comprising GSK and nine other pharmaceutical companies, with 44% vesting at threshold, rising to 100% vesting for upper quartile performance. | | 117
to
119 |
| | | | | | | | | % of | | | |
| | | | | | | | | salary | | | |
| | | CEO | | | | | | 600 | | | |
| | | CFO | | | | | | 400 | | | |
| | | Chairman, Global R&D
& Vaccines | | 500 | | | |
| | | | | | | | | |
| Share ownership requirements | | To align the interests of Executives with shareholders, Executives are required to build up and maintain significant holdings of shares in GSK. | | 119 |
| | | • CEO | | 4 x base salary | | |
| | | • Other Executive Directors | | 3 x base salary | | |
| | | • Other CET members | | 2 x base salary | | |
Pensions | | | | | | | | | | |
| UK Executives | | GSK operates a defined contribution plan. UK Executives participating in the defined contribution plan benefit from Company contributions of 20% of base salary, plus matched contributions of up to 5% of base salary. Certain Executives are members of legacy final salary plans, which have been closed to new entrants since 2001. From 2013, increases in pensionable earnings will be limited to 2% per annum. This limit applies to all employees, including Executives, in legacy final salary plans in the UK. | | 120 |
| US Executives | | GSK operates a Cash Balance Pension Plan (US Plan), a US Retirement Savings Plan (RSP), which is a 401k savings scheme, and the Executive Supplemental Savings Plan (ESSP), a savings scheme open to Executives to accrue benefits above US Government limits imposed on the RSP. US Executives participating in the US Plan benefit from contributions of up to 38% of base salary. Those in the RSP and ESSP benefit from contributions of up to 6% (2% plus matched contributions up to 4%) of the total of base salary and bonus, less any bonus deferred under the DABP. | | 120 |
114 | GSK Annual Report 2012
Remuneration report
Estimates of total future potential remuneration from 2013 remuneration packages
The tables below provide estimates of the potential total future remuneration for each of our Executive Directors in respect of the remuneration opportunity granted to them in 2013. A range of potential outcomes is provided for each Executive Director.
Sir Andrew Witty, CEO
| | | | | | | | | | | | | | | | | | | | | | | | | | | | | | | | |
| | | Salary
£000 | | | Other
benefits
£000 | | | Total
fixed pay
£000 | | | Annual
bonus
£000 | | | DABP
£000 | | | PSP
£000 | | | Total pay for performance £000 | | | Total £000 | |
Below threshold | | | 1,059 | | | | 49 | | | | 1,108 | | | | – | | | | – | | | | – | | | | – | | | | 1,108 | |
Threshold | | | 1,059 | | | | 49 | | | | 1,108 | | | | 424 | | | | 63 | | | | 1,894 | | | | 2,381 | | | | 3,489 | |
Maximum | | | 1,059 | | | | 49 | | | | 1,108 | | | | 2,121 | | | | 1,061 | | | | 6,365 | | | | 9,547 | | | | 10,655 | |
| | | | | | | | |
Simon Dingemans, CFO | | | | | | | | | | | | | | | | | | | | | | | | | | | | | | | | |
| | | Salary
£000 | | | Other
benefits
£000 | | | Total
fixed pay
£000 | | | Annual
bonus
£000 | | | DABP
£000 | | | PSP
£000 | | | Total pay for
performance
£000 | | | Total
£000 | |
Below threshold | | | 699 | | | | 164 | | | | 863 | | | | – | | | | – | | | | – | | | | – | | | | 863 | |
Threshold | | | 699 | | | | 164 | | | | 863 | | | | 179 | | | | 27 | | | | 833 | | | | 1,039 | | | | 1,902 | |
Maximum | | | 699 | | | | 164 | | | | 863 | | | | 1,260 | | | | 630 | | | | 2,801 | | | | 4,691 | | | | 5,554 | |
|
Dr Moncef Slaoui, Chairman, Global R&D & Vaccines | |
| | | Salary
$000 | | | Other
benefits
$000 | | | Total
fixed pay
$000 | | | Annual
bonus
$000 | | | DABP
$000 | | | PSP
$000 | | | Total pay for
performance
$000 | | | Total
$000 | |
Below threshold | | | 1,180 | | | | 450 | | | | 1,630 | | | | – | | | | – | | | | – | | | | – | | | | 1,630 | |
Threshold | | | 1,180 | | | | 450 | | | | 1,630 | | | | 322 | | | | 48 | | | | 1,758 | | | | 2,128 | | | | 3,758 | |
Maximum | | | 1,180 | | | | 450 | | | | 1,630 | | | | 2,365 | | | | 1,182 | | | | 5,911 | | | | 9,458 | | | | 11,088 | |
The assumptions underlying each scenario are outlined below:
All scenarios:
| • | | Other benefits have been estimated based upon actual amounts received in respect of 2012. The totals include all items required to be included as taxable benefits, including those related to carrying out the Executive Director’s role such as secondment expenses |
| • | | Each Executive Director is assumed to defer 50% of his 2013 annual bonus (the maximum permitted amount) and the matching award shown under DABP reflects this. The amount shown under DABP reflects the matching award only (the amount of bonus deferred by the individual is included under annual bonus) |
| • | | The amounts shown above under DABP and PSP are based on the bonus amounts for 2013 and the relevant multiples of 2013 salary respectively. They do not include amounts in respect of dividends reinvested over the performance periods. The actual amounts recorded as remuneration from the DABP and PSP in 2016 and 2015 respectively will be calculated using the share or ADS prices on the vesting dates and will include amounts in respect of related dividends reinvested over the relevant performance periods |
| • | | The DABP and PSP are subject to performance measures over the three year periods 2014 to 2016 and 2013 to 2015 respectively. |
Below threshold:
| • | | None of the pay for performance would be payable. |
Threshold:
| • | | The minimum levels of pay for performance would be payable. It is assumed that the performance of each Executive Director would result in an individual performance multiplier of 100% and therefore there is no increase to the financial performance element of the bonus |
| • | | The threshold levels for the vesting of the awards under the DABP and PSP are discussed in detail on page 118. |
Maximum:
| • | | It is assumed that the annual bonus is payable at the maximum percentages set out on page 113 and that the awards under the DABP and PSP vest in full. |
The remuneration granted in 2013 will be recorded as follows:
| | | | | | | | |
| | | Earned or awarded
in respect of | | | Recorded as remuneration
in annual report for | |
Salary, other benefits and annual bonus | | | 2013 | | | | 2013 | |
DABP (2013 bonus will be deferred in 2014) | | | 2014–2016 | | | | 2016 | |
PSP | | | 2013–2015 | | | | 2015 | |
|
| GSK Annual Report 2012 | 115 |
How the Committee sets remuneration
The Committee gives consideration to remuneration policy and levels for the wider employee population of the Group, as well as ensuring that remuneration is consistent with industry and broader market norms. The Committee sets total remuneration with reference to the median level of each Executive’s pay comparator group. When benchmarking total remuneration, the following principal elements are considered:
| • | | Annual bonus – for comparison purposes it is assumed that each company achieves target performance |
| • | | DABP and PSP awards – it is assumed that these awards vest at 50% of the maximum amount. For the DABP, it is assumed that the Executive chooses to defer the maximum 50% of his or her annual bonus. |
The Committee also considers pension arrangements.
A significant proportion of an Executive’s total remuneration package is based on pay for performance, with a particular emphasis on long-term share-based incentives to closely align Executives’ interests with those of shareholders. The balance between the fixed pay and pay for performance elements of remuneration varies depending on performance. The Committee uses two primary pay comparator groups:
| | | | |
UK cross-industry comparator group | | Global pharmaceutical comparator group |
| Anglo American | | France | | Sanofi |
| AstraZeneca | | Switzerland | | Novartis |
| Barclays | | | | Roche Holdings |
| BG Group | | UK | | AstraZeneca |
| BHP Billiton | | USA | | AbbVie* |
| BP | | | | Amgen** |
| British American Tobacco | | | | Bristol-Myers Squibb |
| Diageo | | | | Eli Lilly |
| HSBC | | | | Johnson & Johnson |
| Reckitt Benckiser | | | | Merck |
| Rio Tinto | | | | Pfizer |
| Royal Dutch Shell | | | | |
| Standard Chartered | | | | |
| Tesco | | | | |
| Unilever | | | | |
| Vodafone | | | | |
| * | Abbott Laboratories was included in the global pharmaceutical comparator group for 2012. From 1 January 2013, Abbott Laboratories separated into two publicly traded companies. Going forward, it is anticipated that AbbVie, the research-based pharmaceuticals company, will be included in the remuneration benchmarking group, but will not be included in the TSR comparator group. |
| ** | Amgen is included for remuneration benchmarking, but is not included in the TSR comparator group. |
As noted under the table above, the Global pharmaceutical comparator group is also used as the basis for the TSR comparator group which features in our long-term incentive awards. The Committee has decided for 2013 and onwards to exclude AbbVie as well as Amgen from the TSR comparator group, but will undertake a full review of the constituents of this group during the year.
The primary pay comparator group for each of the Executive Directors is shown in the table below:
| | | | |
| | | Primary pay comparator group |
| | | UK | | Global |
| Director | | cross-industry | | pharmaceutical |
| Sir Andrew Witty | | ü | | |
| Simon Dingemans | | ü | | |
| Dr Moncef Slaoui | | | | ü |
When reviewing the CEO’s remuneration for 2013, which is primarily set with reference to the UK cross-industry comparator group, the Committee also referenced pay for a group of 23 European companies selected based on their size and complexity.
As was the case in 2012, the Committee’s review of the CEO’s proposed remuneration for 2013 continued to identify a competitive gap in relation to the Global pharmaceutical and European cross-industry groups, as highlighted by the diagram below.
Summary of total package competitive positioning for the CEO
Total remuneration based on benchmarking criteria(£m)
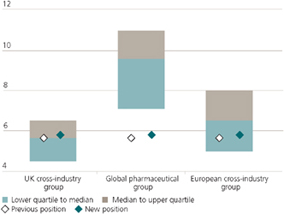
Fixed pay
Base salary
Base salaries are set by reference to the relevant comparator group at a level considered appropriate to secure and retain the talent needed to deliver GSK’s strategic priorities. Salary levels are reviewed annually and are influenced by the wider pay environment and the Executive’s role, experience and performance.
The Committee considers the prevailing economic conditions, the market competitiveness of each Executive’s package and the positioning and relativities of pay across the broader GSK workforce.
For 2013, the average salary increases for employees other than Executive Directors will be approximately 2% in both the UK and USA.
The Committee decided to give the Executive Directors salary increases in line with these average salary increases. Sir Andrew Witty, Simon Dingemans and Dr Moncef Slaoui each received a base salary increase of 2%.
The table below sets out the base salaries of the Executive Directors over the last three years (or since appointment to the Board) and the salaries for 2013. Salary increases typically take effect in the first quarter of each year.
| | | | | | | | | | | | | | | | | | | | |
| | | | | | | | | | | | | | | | Base salary | | |
| %
change |
|
| | | | 2010 | | | | 2011 | | | | 2012 | | | | 2013 | | | | 2013 | |
Sir Andrew Witty | | | £1,000,000 | | | | £1,000,000 | | | | £1,040,000 | | | | £1,060,800 | | | | 2% | |
Simon Dingemans* | | | n/a | | | | £660,000 | | | | £686,400 | | | | £700,150 | | | | 2% | |
Dr Moncef Slaoui | | | $975,000 | | | | $1,125,000 | | | | $1,159,000 | | | | $1,182,200 | | | | 2% | |
| * | Simon Dingemans joined the Board on 4 January 2011. |

116 | GSK Annual Report 2012
Remuneration report
Other benefits
The Executives receive other benefits, including healthcare, car, personal financial advice, life assurance and matching shares under the ShareReward Plan.
Simon Dingemans is not accumulating benefits in any of GSK’s pension plans and he receives cash in lieu of a money purchase pension contribution.
Dr Moncef Slaoui was seconded to the UK in November 2010. At the time, it was intended that the secondment would be for a period of two years. During the course of 2012, it emerged that there was a business need for him to remain in the UK during the coming year. He will oversee the implementation of a new integrated way of working between R&D and other parts of the business to create a strong, global new product launch capability for GSK’s pipeline of new medicines. The length of his secondment will remain under review. In line with other senior GSK expatriates, he receives appropriate secondment and travel expenses.
The cash value of the benefits received by the Executive Directors in 2012 is shown on page 127.
Pay for performance
Safeguards and risk management
The Committee believes in payment for performance. Specifically, the Committee does not want to reward failure and views it as important that incentive payouts are only made in circumstances when performance outcomes reflect genuine achievements against the original targets.
Given the nature of GSK’s business and the increased focus on risk within the Group, the Committee has taken a number of steps to ensure that our performance related pay underpins effective risk management:
| • | | The Chairman of the Audit & Risk Committee provides input on the Audit & Risk Committee’s review of the Group’s performance and oversight on any risk factors relevant to remuneration decisions |
| • | | Under the terms of the CIA, the existing ‘clawback’ mechanism has been strengthened. The extensions of the mechanism include that, with effect from the 2013 annual bonus (payable in 2014), Executive Directors and other CET members will be required to defer a minimum of 25% of their annual bonus into the DABP. A separate recoupment committee has also been established to investigate relevant claims of misconduct |
| • | | There are also further safeguards relating to each of the business-specific performance measures under the LTI plans which are set out in detail on page 117 |
| • | | Long-term incentive awards for good leavers will normally vest at the end of the original vesting period, rather than in the year of departure. This ensures continued alignment with shareholders’ interests following cessation of employment. |
Annual bonus
The annual bonus is designed to drive the achievement of GSK’s annual financial and strategic business targets and delivery of personal objectives.
The majority of the annual bonus opportunity is based on a formal review of performance against stretching financial targets. This outcome is then adjusted to reflect individual performance by applying an individual performance multiplier.
For the financial measures, the bonus threshold is 90% of target, with the maximum being payable for achievement of 110% of target. The bonus threshold of 90% reflects the stretching nature of the bonus targets.
The measures for each Executive Director are set out below:
| | | | | | |
| Executive Director | | Financial performance | | Personal performance |
| Sir Andrew Witty | | 75% on core Group operating profit | | 25% on core Group profit before interest and tax | | Individual objectives |
Simon Dingemans | | | |
Dr Moncef Slaoui | | 50% on R&D performance 25% on Vaccines performance | | |
CEO
Individual performance objectives for Sir Andrew Witty are set by the Board in January each year. The Board focuses on the strategic priorities that have been developed for the Group, which are set out on page 16. For reasons of commercial sensitivity, his specific objectives are kept confidential. Following the end of the financial year, the Board reviews his performance generally and against the set objectives to determine the appropriate bonus payable for his performance.
Chairman, Global R&D & Vaccines
Bonus measures for R&D employees, including Dr Moncef Slaoui, are linked to pipeline performance. A robust governance structure has been established to ensure that the bonus payable fairly reflects R&D productivity and performance as well as achievement of profit targets. Performance and targets are reviewed by the R&D Bonus Compensation Review Committee, which includes Sir Andrew Witty and the company’s two designated scientific expert Non-Executive Directors, Professor Sir Roy Anderson and Dr Daniel Podolsky.
Other Executives
The CEO sets individual objectives for the other Executives in line with company strategy, and makes recommendations to the Committee regarding their performance against those objectives at the end of the year. Those recommendations are then considered by the Committee before it determines the level of bonuses payable.
For 2013, the on-target and maximum bonuses for the Executive Directors are given in the table below.
| | | | | | | | |
| | | On-target bonus as
a % of base salary | | | Maximum as a %
of base salary | |
Sir Andrew Witty | | | 125% | | | | 200% | |
Simon Dingemans | | | 80% | | | | 180% | |
Dr Moncef Slaoui | | | 85% | | | | 200% | |
The table below sets out the bonuses earned by the Executive Directors over the last three years, or since appointment.
| | | | | | | | | | | | |
| | | 2010
000 | | | 2011
000 | | | 2012
000 | |
Sir Andrew Witty | | | £1,177 | | | | £2,000 | | | | £905 | |
Simon Dingemans* | | | n/a | | | | £827 | | | | £343 | |
Dr Moncef Slaoui | | | $1,434 | | | | $1,747 | | | | $1,404 | |
| * | Simon Dingemans was appointed to the Board on 4 January 2011. |
|
| GSK Annual Report 2012 | 117 |
Long-term incentive plans
Long-term incentives take the form of a maximum number of shares (on award). The number of shares received by an Executive depends on performance over the performance period.
To provide a closer link between shareholder returns and payments to the Executives, notional dividends are reinvested and paid out in proportion to the shares earned.
Deferred Annual Bonus Plan
The Deferred Annual Bonus Plan encourages long-term shareholding, discourages excessive risk taking and helps focus on GSK’s key strategic priorities.
Up to 50% of any annual bonus earned may be deferred into shares, or ADS where appropriate, for three years. The company will match shares or ADS up to one-for-one depending on the company’s performance against the measures outlined on page 118 during the three year performance period.
The levels of participation for the last three years for the Executive Directors are shown in the table below, together with the maximum matching awards granted in 2013 in respect of the deferrals of the 2012 bonuses.
| | | | | | | | | | | | | | | | |
| | | % of total bonus deferred | | | 2013 Matching | |
| Executive Director | | 2010 | | | 2011 | | | 2012 | | | award | |
Sir Andrew Witty | | | 32% | | | | 35% | | | | 50% | | | | 31,114 shares | |
Simon Dingemans | | | n/a | | | | 50% | | | | 50% | | | | 11,783 shares | |
Dr Moncef Slaoui | | | 50% | | | | 50% | | | | 50% | | | | 15,859 ADS | |
Under the terms of the CIA, for awards made in 2014 and beyond, Executives are required to defer 25% of any bonus earned into shares, or ADS where appropriate, for three years. They may also choose to invest up to a further 25% of any bonus earned (i.e. up to a maximum of 50%).
Performance Share Plan
The Performance Share Plan ensures focus on the delivery of GSK’s strategic priorities and long-term shareholder returns relative to other pharmaceutical companies.
Under the Performance Share Plan, awards are made which vest depending on the company’s performance over a three year performance period against the measures outlined below.
There is a limit of six times base salary on the maximum initial value of performance shares that may be granted to an individual in any one year.
The table below shows award levels for 2011, 2012 and 2013 for each Executive Director in line with that policy:
| | | | | | | | | | | | | | | | |
| | | 2011
Award level as % of
base salary | | | 2012
Award level as % of
base salary | | | 2013
Award level as % of
base salary | | | 2013
Award | |
Sir Andrew Witty* | | | 500% | | | | 600% | | | | 600% | | | | 437,744 | |
| | | | | | | | | | | | | | | shares | |
Simon Dingemans | | | 350% | | | | 350% | | | | 400% | | | | 192,613 | |
| | | | | | | | | | | | | | | shares | |
Dr Moncef Slaoui | | | 500% | | | | 500% | | | | 500% | | | | 133,521 | |
| | | | | | | | | | | | | | | | ADS | |
| * | 25% of Sir Andrew Witty’s 2012 and 2013 PSP awards are subject to a further 2 year vesting period (5 years in total). No additional performance criteria apply during this period. |
Performance measures
The focus of the Committee has been to improve the alignment of Executive remuneration arrangements with our key strategic priorities.
After consultation with shareholders, from 2011, DABP and PSP awards made to Executives comprise two business-specific performance measures on business diversification performance and R&D new product performance, together with adjusted free cash flow and relative TSR.
The Board recognises the possibility that the company’s goals may evolve over time. Therefore the Committee intends to review the performance measures periodically to ensure that they remain appropriate.
Details of the performance measures, targets and the performance thresholds for the 2013 long-term incentive awards are given in the table set out on page 118.
Safeguards on vesting
In addition to setting robust targets, the Committee has also implemented a number of safeguards to ensure that targets are met in a sustainable way and that any performance outcome reflects genuine achievement against the original targets and therefore represents the delivery of value for shareholders.
For each performance measure, the impact of any acquisition or divestment will be quantified and adjusted for after the event. Any major adjustment in the calculation of performance measures will be disclosed to shareholders on vesting.
The table below sets out the principal safeguards for the performance measures.
| | |
| Performance measure | | Safeguards on vesting |
| Business diversification performance | | • Include the impact of revenue from opportunistic events, e.g. pandemics, unless the Committee considers that this did not add to shareholder value and provided that underlying performance was sufficiently positive. • Adjust for major distorting events. • Despite reaching target, vesting will normally be reduced if above market growth has not been achieved. |
| R&D new product performance | | • Vesting may be reduced if insufficient progress has been made during the period towards GSK’s target of a return on R&D investment of 14%. • Include the impact of revenue from opportunistic events, e.g. pandemics, unless the Committee considers that this did not add to shareholder value and provided that underlying performance was sufficiently positive. |
| Adjusted free cash flow | | • Adjust for materially distorting items, which may include exchange rate movements, major legal and taxation settlements and special pension contributions. |
118 | GSK Annual Report 2012
Remuneration report
2013 performance targets
Inevitably, measures linked directly to strategy are commercially sensitive. In particular, the Committee does not consider it appropriate to disclose the targets for business diversification performance and R&D new product performance at grant, as it may result in competitive harm. However, the targets will be disclosed fully in the 2015 Remuneration Report at the end of the performance period, together with details of the extent to which they have been met. The Committee has also undertaken to provide updates on achievements to date against the targets during the performance period. The 2013 performance targets are set out in the table below.
For awards made in 2013 and onwards, Dermatology will be removed as a separate category from the business diversification performance measure. Dermatology brands are commercialised within our Pharma and Consumer Healthcare regional organisations and much of our focus for this business is in Emerging Markets. The principal contribution of Dermatology will continue to be captured within the Emerging Markets, Consumer Healthcare and Japan elements of the diversification measure.
| | | | | | | | | | | | |
| Strategic objectives | | Long-term incentive measures for 2013 awards | | % of award | | Vesting schedule for 2013 awards | | |
Grow 
| | Business diversification performance Incentivises growth of a global, diversified business Designed to focus on turnover in our major growth areas: Vaccines; Consumer Healthcare; and Emerging Markets, Asia Pacific and Japan Pharmaceuticals businesses (excluding Vaccines). Aggregate revenue target for these business divisions over three-year performance period should reflect strong growth against previous periods and above market growth. | | 25% | | | | | | | | |
| | | | | | | | | | |
| | | | | | | | | | |
| | | | | | | | Proportion of | | |
| | | | | | | | award | | |
| | | | | | Achievement | | available | | |
| | | | | | Below threshold | | 0% | | |
| | | | | | Threshold | | 25% | | |
| | | | | | Maximum | | 100% | | |
| | | | | | | | | | |
| | | | | | | | | | |
| | | | | | | | | | |
Deliver 
| | R&D new product performance Recognises importance of R&D to future business growth Revenue target based on New Product Sales to incentivise better R&D performance. New Products are defined as products launched in the performance period and the two preceding years. Therefore, for the 2013-15 performance period, products launched in the years 2011-15 will be included in the measurement. Aggregate three-year revenue target for 2013 awards for New Product Sales should reflect growth on historic performance. | | 25% | | | | | | | | |
| | | | | | | | Maximum | | |
| | | | | | | | expressed as % | | |
| | | | | | Measure | | of threshold | | |
| | | | | | Business diversification | | 114% | | |
| | | | | | performance | | | | |
| | | | | | | | | | |
| | | | | | R&D new product | | 122% | | |
| | | | | | performance | | | | |
| | | | | | | | | | |
| | | | | | | | | | |
| | | | | | | | | | |
| | | | | | | | | | |
| | | | | | | | | | |
Simplify 
| | Adjusted free cash flow Recognises importance of effective working capital and cash management The reductions in the targets reflect a number of factors, including adjustment for the loss of certain product sales that will not recur (including a number of older genericised brands), revised expectations of the performances of our European businesses and the higher levels of capital investment and working capital required to commercialise the product pipeline. | | 25% | | | | | | | | |
| | | | | | | | | | |
| | | | | | Three year | | | | |
| | | | | | adjusted free | | | | |
| | | | | | cash flow targets | | % vesting | | |
| | | | Below threshold | | | | 0% | | |
| | | | Threshold | | £ 14.06 billion | | 25% | | |
| | | | | | £ 14.49 billion | | 50% | | |
| | | | | | £ 15.94 billion | | 75% | | |
| | | | Maximum | | £ 16.66 billion | | 100% | | |
| | | | | | | | | | |
| | | | | | | | | | |
| | | Relative TSR Focuses on delivery of value to shareholders Relative TSR using a comparator group comprising GSK and nine other global pharmaceutical companies. Relative TSR is measured over three years, using a twelve-month averaging period. TSR is measured in local currency. | | 25% | | 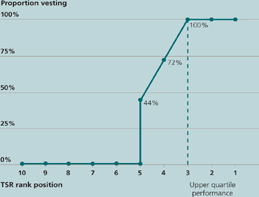 | | |
|
| GSK Annual Report 2012 | 119 |
Historical vesting for GSK’s LTIs
The following table shows the vesting levels of GSK’s deferred annual bonus, performance share and share option awards to Executives since 2004. A TSR vesting percentage of 0% indicates that GSK’s relative TSR performance was below the median of the comparator group for that performance period.
| | | | | | | | | | | | |
| | | Deferred Annual Bonus Plan | | Performance Share Plan | | Share Option Plan |
Year of grant | | Performance period | | Vesting under TSR measure % | | Vesting under TSR measure % | | Vesting under adjusted free cash flow measure % | | Total vesting % | | Vesting under EPS measure % |
2004 | | 2005 – 2007 | | n/a | | 38.5 | | n/a | | 38.5 | | 100 |
2006 | | 2006 – 2008 | | n/a | | 0 | | n/a | | 0 | | 50.7 |
2007 | | 2007 – 2009 | | n/a | | 35 | | n/a | | 35 | | 0 |
2008 | | 2008 – 2010 | | n/a | | 35 | | n/a | | 35 | | 0 |
2009 | | 2009 – 2011/12 | | n/a | | 9 | | 40 | | 49 | | 0 |
2010* | | 2010 – 2012/13 | | 30 | | 9 | | 16 | | 25 | | 0 |
| * | The PSP awards made in 2010 included 30% in respect of relative TSR and 40% in respect of adjusted free cash flow, both with a three year performance period. The remaining 30% was in respect of relative TSR over a four year performance period ending 31 December 2013 and this will not be assessed until next year. |
Other all-employee share plans
The Executives participate in various all-employee share plans in either the UK or the USA, including ShareReward and ShareSave.
The ShareReward Plan is a UK HM Revenue & Customs approved plan open to all UK employees on the same terms. Participants contribute up to £125 a month from their gross salaries to purchase GSK shares and the company matches the number of GSK shares bought each month under this arrangement. Sir Andrew Witty and Simon Dingemans each contribute £125 a month to buy shares under the ShareReward Plan.
The ShareSave plan is a UK HM Revenue & Customs approved plan open to all UK employees. Participants may save up to £250 a month from their net salaries for a fixed term of three years and at the end of the savings period they have the option to buy GSK shares at a discount of up to 20% of the market price set at the launch of each savings contract. Sir Andrew Witty and Simon Dingemans make monthly contributions into the ShareSave Plan.
Dilution limits
All awards are made under plans which incorporate dilution limits consistent with the guidelines provided by the Association of British Insurers. These limits are 10% in any rolling ten year period for all plans and 5% in any rolling ten year period for executive share plans. Estimated dilution from existing awards made over the last 10 years up to 31 December 2012 is as follows:
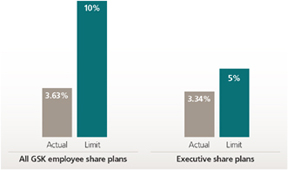
Share ownership requirements
To align the interests of Executives with those of shareholders, Executives are required to build up and maintain significant holdings of shares in GSK over time.
Current share ownership requirements (SOR) are set out in the table below:
| | | | |
| | | Share ownership requirement | |
CEO | | | 4 x base salary | |
Other Executive Directors | | | 3 x base salary | |
Other CET members | | | 2 x base salary | |
Shareholdings for the purpose of SOR as at 1 March 2013 and achievement of SOR, based upon an average share price for the 90 working days preceding that date, were:
| | | | | | | | | | | | | | | | |
| | | Holdings for SOR purposes as at | | | | | | | |
| | | 31 December 2011 | | | 1 March 2013 | | | Increase in shareholding % | | | Achievement of SOR % | |
Sir Andrew Witty | | | 253,794 | | | | 554,278 | | | | 118 | | | | 182 | |
Simon Dingemans | | | 40,171 | | | | 82,583 | | | | 106 | | | | 55 | |
Dr Moncef Slaoui | | | 192,105 | | | | 373,224 | | | | 94 | | | | 233 | |
Executives are required to continue to satisfy these shareholding requirements for a minimum of twelve months following retirement from the company.
120 | GSK Annual Report 2012
Remuneration report
Pensions
Pensions provide an important tool for creating a long-term culture and loyalty.
The Executives participate in the Group’s senior executive pension plans. The pension arrangements are structured in accordance with the plans operated for Executives in the country in which they are likely to retire. Details of individual arrangements for the Executive Directors are set out on pages 135 and 136.
New Executives will be eligible to participate in either a defined contribution scheme in the UK (depending on personal circumstances against relevant tax restrictions) or a cash balance pension plan in the USA.
Existing obligations under legacy defined benefit schemes in the UK will continue to be honoured.
UK pension arrangements
The company currently operates a defined contribution plan and legacy final salary plans, which are closed to new entrants.
Executives participating in the defined contribution plan receive a company contribution of 20% of base salary. They will also have the opportunity to receive up to a further 5% in matched contributions in line with the policy for all other members of the pension plan.
Since 2010, the UK Government has announced a series of changes to the taxation of pensions which continue to impact the pensions of employees within GSK. The taxation changes will have significant negative consequences and the effectiveness of pensions will be much reduced.
Pensions have been, and continue to be, an important tool for creating a long-term culture and promoting employee retention. Therefore, the Committee decided that existing pension promises would be honoured and employees with pensions impacted by the changes would have the opportunity for their pension above the new limit to be delivered via GSK’s existing unfunded scheme at that time. The legacy final salary plans provide for up to two-thirds of final salary at normal retirement age. Under these plans, actuarial reduction factors apply where a participant leaves employment of his or her own accord before the age of 60.
With effect from April 2013, a cap on pensionable earnings will be introduced, which limits pensionable earnings increases to 2% per annum. This cap applies to all employees, including Executive Directors, in legacy defined benefit schemes in the UK.
US pension arrangements
In the USA, GSK operates a Cash Balance Pension Plan which provides for an annual contribution and interest on the sum accumulated in the cash balance account, but no contractual promise to provide specific levels of retirement income. The plan incorporates an Executive Pension Credit for senior US executives. Contribution rates under the plan range from 15% to 38% of base salary depending on grade. All current senior US executives are eligible for the Executive Pension Credit.
For capped employees in the USA, benefits above the cap are provided through an unfunded non-qualified plan.
GSK also operates a US Retirement Savings Plan (RSP), a 401k savings scheme open to all US employees, and the Executive Supplemental Savings Plan, a savings scheme open to Executives to accrue benefits above US Government limits imposed on the RSP. Contributions to both plans are invested in a range of funds and the value of the accumulated funds is paid out after leaving the company. The combined contribution rates under the plans are up to 6% (2% plus matched contributions up to 4%) of the total of base salary and bonus, less any bonus deferred under the DABP.
|
| GSK Annual Report 2012 | 121 |
Update on performance of ongoing awards
Following the introduction of the LTI performance measures directly linked to GSK’s strategic objectives, the Committee undertook to provide an update on performance for outstanding LTI awards. It should be noted that the actual vesting levels will only be determined based on performance over the full three year performance periods.
The interim positions provided below should only be regarded as an indication of how management has performed to date and should not be regarded as predictions of the final vesting levels.
2011 awards with a performance period to 31 December 2013
The Committee reviewed the performance of the Deferred Annual Bonus Plan and Performance Share Plan awards granted to the Executive Directors in 2011. The performance achieved in the two years to 31 December 2012 was as follows:
| | | | | | | | | | |
| | | | | Estimate of likely vesting based on performance
to date |
Strategic objectives | | Performance measures | | % of award | | Performance achieved to date | | % of maximum vesting | | % of total award |
Grow 
| | Business diversification performance | | 25% | | Sales across Vaccines, Consumer Heathcare, Dermatology and Emerging Markets, Asia Pacific and Japan were £28.2 billion for 2011 and 2012. If continued at this level, this would deliver vesting between threshold and maximum. A more detailed update on performance for 2012 is provided on page 122 and the 2011 annual report sets out details of performance in 2011. | | 42% | | 11% |
Deliver 
| | R&D new product performance | | 25% | | The performance target for the 2011 award measures sales in new R&D products launched from 2009 – 2013. On this basis, total sales for 2011 and 2012 were £2.3 billion. If continued at this level, this would deliver performance below threshold with no vesting. A more detailed update on performance for 2012 is provided on page 122 and the 2011 annual report sets out details of performance in 2011. | | 0% | | 0% |
Simplify 
| | Adjusted free cash flow | | 25% | | The target range for the aggregate three-year adjusted free cash flow is between £16.15 billion for threshold vesting and £19.15 billion for maximum vesting. Based on the performance measure definition, the adjusted free cash flow for 2011 and 2012 is £10.95 billion. If continued at this level, this would deliver vesting between threshold and maximum. | | 66% | | 16% |
| | | Relative TSR | | 25% | | For the period from 1 January 2011 to 31 December 2012, GSK’s TSR was ranked 4th using the revised pharmaceutical comparator group of GSK and nine other companies set out on page 115. If the ranking position remains at this level, this would deliver vesting under the revised vesting schedule set out on page 135 of between threshold and maximum. | | 72% | | 18% |
| | Potential total vesting for 2011 awards | | 45% |
The vesting schedules for each of the performance criteria are given on pages 134 and 135 of this report.
If the above levels of performance under each measure are maintained until the end of the performance period on 31 December 2013, vesting of the 2011 awards would be as shown. However, performance is only measured at the end of the three year period and performance to date is not necessarily an indication of the final vesting level.
The Committee, having reviewed performance for the two year period, remains of the view that the targets for the 2011 awards under both new measures remain suitably robust and stretching. The actual targets, together with details of the extent to which they have been met, will be disclosed in full at the time of vesting.
122 | GSK Annual Report 2012
Remuneration report
2012 awards with a performance period to 31 December 2014
The Committee reviewed the performance of the Deferred Annual Bonus Plan and Performance Share Plan awards granted to the Executive Directors in 2012. The performance achieved in the year to 31 December 2012 was as follows:
| | | | | | | | | | |
| | | | | | | | | Estimate of likely vesting
based on performance to date |
Strategic
objectives | | Performance
measures | | % of
award | | Performance achieved to date | | % of
maximum vesting | | % of total
award |
| Grow 
| | Business
diversification
performance | | 25% | | Vaccines Cervarixsales in 2012 were lower than in 2011, which benefited from the HPV vaccination catch-up programme in Japan, now complete. This led to an overall decline in Vaccines sales of 2% to £3.3 billion. ExcludingCervarix, Vaccines sales performed well, increasing by 4%. This increase was driven by strong sales inInfanrix/Pediarix,Rotarix,BoostrixandSynflorix. Consumer Healthcare Consumer Healthcare sales were flat for the year at £5.1 billion. Excluding the non-core OTC brands that were divested in 2012, sales increased by 5%, reflecting strong growth across Oral care, Nutrition and Total wellness, but partly offset by a small decline in Skin health. On a regional basis, growth in Europe was flat, growth in the USA was 2% and growth in the Rest of World was 12%. Emerging Markets, Asia Pacific and Japan (excluding Vaccines and Dermatology) The Emerging Markets, Asia Pacific Pharmaceuticals businesses (excluding Vaccines and Dermatology) had sales of £3.6 billion for the year, representing strong growth in Respiratory, combined with good performance in a number of established brands and the newer Oncology business. For Japan, sales (excluding Vaccines and Dermatology) were £1.7 billion. Japan pharmaceuticals sales grew by 3%, with strong performances from the recently launched products,Lamictal,AvodartandVolibris. This was partly offset by the impact of the mandatory biennial price cut and increasing generic competition toPaxil. Dermatology Sales in Dermatology declined 2% to £850 million, primarily as a result of the decline in the USA, which suffered from the impact of generic competition toEvoclin,ExtinaandDuac. EMAP sales grew 7% to £388 million, reflecting strong growth in the promoted brands ofDermovateandBactroban. EMAP performance continued to be impacted by ongoing supply issues which are now close to resolution. Overall, if performance continued at this level, this would deliver vesting between threshold and maximum. | | 51% | | 13% |
| Deliver 
| | R&D new
product performance | | 25% | | The performance target for the 2012 awards measures sales in new R&D products launched from 2010 – 2014. On this basis, sales for new products in 2012 were £1.2 billion. This includes strong sales fromVotrient,Duodart/Jalyn,PromactaandLamictal XR. GSK is on track to deliver its target long-term rate of return on R&D spend of 14%. Overall, if performance continued at this level, this would deliver vesting between threshold and maximum. | | 63% | | 16% |
| Simplify | | Adjusted free
cash flow | | 25% | | For the 2012 awards, the target range for the aggregate three-year adjusted free cash flow is between £17.30 billion for threshold vesting and £20.52 billion for maximum vesting. Based on the performance measure definition, the adjusted free cash flow for the period is £5.05 billion. If performance continued at this level, this would deliver vesting between threshold and maximum. | | 52% | | 13% |
| | | Relative TSR | | 25% | | For the period from 1 January 2012 to 31 December 2012, GSK’s TSR was ranked 7th using the revised pharmaceutical comparator group of GSK and nine other companies set out on page 115. If the ranking position remains at this level, this would deliver vesting under the revised vesting schedule set out on page 135 of below threshold. | | 0% | | 0% |
| | Potential total vesting for 2012 awards | | 42% |
The vesting schedules for each of the performance criteria are given on pages 134 and 135 of this report.
If the above levels of performance under each measure are maintained until the end of the performance period on 31 December 2014, vesting of the 2012 awards would be as shown. However, performance is only measured at the end of the three year period and performance to date is not necessarily an indication of the final vesting level. The Committee, having reviewed performance for the year, remains of the view that the targets for the 2012 awards under both new measures remain suitably robust and stretching. The actual targets, together with details of the extent to which they have been met, will be disclosed in full at the time of vesting.
|
| GSK Annual Report 2012 | 123 |
The Remuneration Committee
Role of the Committee
The role of the Committee is to set the company’s remuneration policy so that GSK is able to recruit, retain and motivate its Executives. The policy is regularly reviewed to ensure that it is consistent with the company’s scale and scope of operations, supports the business strategy and growth plans and helps drive the creation of shareholder value.
Terms of reference
The Committee’s full terms of reference are available on the company’s website. The terms of reference, which are reviewed as a minimum on an annual basis, were last revised in December 2012 in the light of best practice and corporate governance developments.
Governance
The Board considers all of the members of the Committee to be independent Non-Executive Directors in accordance with the UK Corporate Governance Code, with the exception of Sir Christopher Gent, Chairman of the company, who was independent on appointment.
The Committee met six times during 2012, with each member attending as follows:
| | | | | | |
| Members | | Committee
member since | | Attendance
at full
meetings
during 2012 | |
Tom de Swaan*+ | | 20 May 2009 | | | 6/6 | |
(Chairman from 1 January 2013) | | | | | | |
Sir Crispin Davisq | | | | | | |
(Chairman from 20 May 2009 | | 1 July 2003 | | | 6/6 | |
to 31 December 2012) | | | | | | |
Sir Christopher Gent | | 1 January 2007 | | | 6/6 | |
Judy Lewent+ | | 1 January 2013 | | | N/A | |
Sir Deryck Maughan* | | 1 July 2012 | | | 2/3 | |
Larry Culpq | | 1 January 2004 | | | 4/4 | |
James Murdoch*q | | 1 October 2009 | | | 2/3 | |
| * | Tom de Swaan, Sir Deryck Maughan and James Murdoch were each unable to attend one meeting for personal reasons. For the meetings they were unable to attend, they reviewed the papers and provided their views on the matters under consideration to the Committee Chairman in advance. |
| + | Tom de Swaan was also the Chairman of the Audit & Risk Committee until 31 December 2012 when he was succeeded by Judy Lewent. |
| q | Sir Crispin Davis stepped down from the Committee on 31 December 2012. James Murdoch retired from the Board on 3 May 2012 and Larry Culp resigned from the Board on 30 September 2012. |
In addition to the six scheduled meetings, the Committee also met on a quorate basis on four occasions, principally to approve the formal grant and, based on performance, the vesting of long-term incentive awards in accordance with GSK’s remuneration policy.
Committee meetings usually begin with a closed session, during which only members of the Committee, the Company Secretary and the external adviser are present. Other individuals may also be invited to attend Committee meetings during the year. Executives and other Committee attendees are not involved in any decisions, and are not present at any discussions, regarding their own remuneration.
Other attendees at Committee meetings include:
| | | | | | | | |
| Attendee | | Regular attendee | | | Attends as required | |
CEO | | | | | | | ü | |
CFO | | | | | | | ü | |
Head of Human Resources | | | | | | | ü | |
Head of Reward | | | | | | | ü | |
Company Secretary – Secretary to the Committee | | | ü | | | | | |
Committee Adviser – Deloitte LLP | | | ü | | | | | |
Adviser to the Committee
The Committee has access to external advice as required. Deloitte LLP (Deloitte) has been appointed by the Committee to provide it with independent advice on executive remuneration. During the year, Deloitte provided independent commentary on matters under consideration by the Committee and updates on best practice, legislative requirements and market practice.
Deloitte also provided other consulting, tax and assurance services to GSK during the year, but did not provide advice on executive remuneration matters other than for the Committee.
The Committee conducted a formal review of Deloitte’s performance in July 2011 against an established set of criteria that enabled a full consideration of the Committee’s needs.
Deloitte is a member of the Remuneration Consultants’ Group and, as such, voluntarily operates under the code of conduct in relation to executive remuneration consulting in the UK. The code of conduct can be found at www.remunerationconsultantsgroup.com.
Towers Watson and Pay Governance provided additional market data to the Committee.
Commitment to shareholders
The Committee engages in regular dialogue with shareholders and holds annual meetings with GSK’s largest investors to discuss and take feedback on its remuneration policy and governance matters. In particular, the Committee discusses any significant changes to the policy or the measures used to assess performance.
The annual meetings were held in November 2012. Sir Crispin Davis shared progress on remuneration matters in the last 12 months and proposals for 2013. Sir Christopher Gent, Chairman, updated attendees on corporate governance developments. Tom de Swaan was also in attendance.
At the company’s AGM in May 2012, the resolution to approve the Remuneration Report was passed, with 95.7% of the votes cast in favour.
124 | GSK Annual Report 2012
Remuneration report
Principal activities and matters addressed during 2012
The Committee’s principal activities and matters addressed during 2012 are set out below:
| | | | | | | | |
Month | | Remuneration | | |
| | | | Items specific to: | | |
| | Overall | | Annual bonus | | LTIs | | Governance and other matters |
January | | Approve Executives’ 2012 remuneration, including salaries of CEO, CFO and Chairman, R&D Remuneration environment update | | Review and approve Executives’ 2011 bonuses Approve bonus calculation principles Set CEO 2012 bonus objectives | | Review LTI measures and targets for 2012 | | Set Committee’s agenda for 2012 Review draft Remuneration Report |
February | | | | Overview of bonuses for employees below CET | | Review LTI performance targets and outcomes and approve 2009 LTI award vesting Set 2012-2014 LTI award targets | | |
March | | | | | | Grant 2012 LTI awards to Executives and below Approve Deferred Annual Bonus Plan elections and matching awards | | Approve Remuneration Report |
May | | Review CIA ‘clawback’ draft requirements | | Consider review of annual bonus plan | | | | Review of voting outcomes on 2011 Remuneration Report Review of UK Government remuneration consultations |
July | | Review CIA final ‘clawback’ arrangements Approve remuneration for new CET appointee Review of general market developments Review of CEO’s and CFO’s pay competitiveness | | | | Grant interim 2012 LTI awards (below Executives) | | Review AGM feedback |
October | | Review of Chairman’s fees Agree 2013 salary review process for Executives Review of CFO’s pay competitiveness | | Review of 2012 bonus approval process for Executives | | Approve changes to LTI plans to give effect to CIA’s executive financial recoupment plan | | Review of UK Government remuneration proposals Planning Committee work for 2013 |
November | | Annual meetings with investors |
December | | Review Executives’ remuneration market data and competitiveness | | | | | | Consider feedback from annual meetings with investors Annual Committee evaluation results 2012 |
|
| GSK Annual Report 2012 | 125 |
Executive Director terms and conditions
Executive Director contracts
The policy set out below provides the framework for contracts for Executive Directors.
| | |
| | | Policy |
Notice period on termination by employing company or Executive | | 12 calendar months |
| Termination payment | | 1 x annual salary payable on termination by the company |
| Vesting of LTIs | | Rules of relevant incentive plan, as approved by shareholders |
| Pension | | Based on existing arrangements and terms of relevant pension plan |
| Non-compete clause | | 12 months from termination notice date* |
| * | The ability to impose a 12-month non-compete period (and a non-solicitation restriction) on an Executive is considered important by the company to have the ability to protect the Group’s intellectual property and staff. In light of this, the Committee believes that it would not be appropriate to provide for mitigation in the contracts. |
The contracts for new Executives will not normally include a bonus element in any termination payment.
The terms of the contracts seek to balance commercial imperatives and best practice. Where the company considers it important that an individual does not work elsewhere during his or her notice period, it may make a compensatory payment in respect of bonus for the period of restraint.
The following table sets out the details of the Executive Directors’ service contracts:
| | | | | | | | | | | | |
| Current Directors | | Date of contract | | | Effective date | | | Expiry date | |
Sir Andrew Witty | | | 18 June 2008 | | | | 22 May 2008 | | | | 31 August 2024 | |
Simon Dingemans | | | 8 September 2010 | | | | 4 January 2011 | | | | 30 April 2028 | |
Dr Moncef Slaoui | | | 21 December 2010 | | | | 21 December 2010 | | | | 1 August 2019 | |
No termination payments will be made in respect of any part of a notice period extending beyond the contract expiry date.
Other entitlements
In addition to the contractual provisions outlined above, in the event that Dr Moncef Slaoui’s service agreement is terminated by his employing company, the following will apply:
| • | | in the case of outstanding awards due under the GlaxoSmithKline Annual Investment Plan (which was closed to new deferrals with effect from the first quarter of 2006), provided that his agreement is terminated other than for cause, Dr Moncef Slaoui must exercise any Bonus Investment Rights within six months of termination to receive any deferred amounts, and any income and gains; and |
| • | | in line with the policy applicable to US senior executives, Dr Moncef Slaoui may become eligible, at a future date, to receive continuing medical and dental insurance after retirement. |
Outside appointments for Executives
The Board encourages Executives to hold one external directorship once they have become established in their role to broaden their experience and development, and help increase the pool of candidates for non-executive directors.
Any outside appointments are considered by the Nominations Committee to ensure they would not cause a conflict of interest and are then approved by the Chairman on behalf of the Board. It is the company’s policy that remuneration earned from such appointments may be kept by the individual Executive.
Chairman and other Non-Executive Directors
How their fees are set
The company aims to provide the Chairman and other Non-Executive Directors with fees that are competitive with those paid by other companies of equivalent size and complexity, subject to the limits contained in GSK’s Articles of Association.
The Chairman and the CEO are responsible for evaluating and making recommendations to the Board on the fees payable to the Non-Executive Directors.
Review of the Chairman’s fees
Sir Christopher Gent took up the role of Chairman in January 2005, since when his fees have only been increased once, in March 2008, when they were increased from £575,000 to £675,000. Under this arrangement, Sir Christopher received 20% of his fees as shares, which are deferred until he steps down from the Board.
In 2012, following a review of Sir Christopher Gent’s performance and independently sourced data, the Board decided to increase the Chairman’s fees from £675,000 to £710,000. The change took effect from 1 January 2013. At the request of the Chairman, the increase of £35,000 is being delivered in GSK shares. Therefore £170,000 (or approximately 24%) of Sir Christopher’s total fee per annum is now delivered in shares.
Review of Non-Executive Director fees
Non-Executive Director fees were last increased in March 2008. Since then there has been an increase in the time commitment, demands and responsibility placed on non-executive directors. The fees were reviewed in July 2011, and although a market shortfall was noted, it was decided that fees would not be increased at that time.
Following a further review of independently sourced data in 2012, the Board agreed that it was appropriate to increase the standard annual fee by £10,000 to £85,000, with effect from 1 January 2013 (25% of fees will continue to be delivered as shares deferred until the Non-Executive Director steps down from the Board). There were no increases to the supplemental fees.
The Non-Executive Directors’ fees applying from 1 January 2013 are as follows:
| | | | |
| | | Per annum | |
Standard annual cash retainer fee | | | £85,000 | |
| |
Supplemental fees | | | | |
| |
Chairman of the Audit & Risk Committee | | | £80,000 | |
| |
Senior Independent Director and Scientific/Medical Experts | | | £30,000 | |
| |
Chairmen of the Remuneration and | | | | |
Corporate Responsibility Committees† | | | £20,000 | |
| |
Non-Executive Director undertaking | | | £7,500 | |
intercontinental travel to meetings | | | per meeting | |
| † | Sir Christopher Gent is the Chairman of the Corporate Responsibility Committee, but does not receive the additional fee listed above. |
126 | GSK Annual Report 2012
Remuneration report
Non-Executive Directors’ share allocation plan
To enhance the link between Directors and shareholders, GSK requires Non-Executive Directors to receive a significant part of their fees in the form of shares or ADS. At least 25% of the Non-Executive Directors’ total fees, excluding those of the Chairman, are paid in the form of shares or ADS and allocated to a share or ADS account. The Non-Executive Directors may also take the opportunity to invest part or all of the balance of their fees into the same share or ADS account.
The shares or ADS which are notionally awarded to the Non-Executive Directors and allocated to their interest accounts are set out in the table on page 128 and are included within the Directors’ interests table on page 129. The accumulated balances of these shares or ADS, together with notional dividends subsequently reinvested, are not paid out to the Non-Executive Directors until they leave the Board. Upon leaving, the Non-Executive Directors will receive either the shares or ADS, or a cash amount equal to the value of the shares or ADS at the date of leaving, or date of payment if later.
Letters of appointment
The terms of engagement of the Non-Executive Directors are set out in letters of appointment which are available for inspection at the company’s registered office and at the AGM. For each Non-Executive Director, his or her initial appointment and any subsequent re-appointment are subject to election and, thereafter, periodic re-election by shareholders.
The Non-Executive Directors’ letters of appointment do not contain provision for notice periods or for compensation if their appointments are terminated.
The following table shows the date of the initial letter of appointment of each Non-Executive Director:
| | |
| Non-Executive Director | | Date of letter of appointment |
Sir Christopher Gent | | 26 May 2004 |
Professor Sir Roy Anderson | | 28 September 2007 |
Dr Stephanie Burns | | 12 February 2007 |
Stacey Cartwright | | 3 March 2011 |
Sir Crispin Davis | | 9 June 2003 |
Lynn Elsenhans | | 3 May 2012 |
Judy Lewent | | 3 March 2011 |
Sir Deryck Maughan | | 26 May 2004 |
Dr Daniel Podolsky | | 3 July 2008 |
Tom de Swaan | | 21 December 2005 |
Jing Ulrich | | 3 May 2012 |
Hans Wijers* | | 29 January 2013 |
Sir Robert Wilson | | 9 June 2003 |
| * | Appointed with effect from 1 April 2013. |
In Sir Christopher Gent’s letter of appointment, it was agreed that he would serve the company as Deputy Chairman until 31 December 2004 and from 1 January 2005 as Chairman until the conclusion of the AGM following the third anniversary of his appointment. This was extended for a term of three years by mutual agreement, with effect from his re-election as a Director at the AGM held on 21 May 2008. As previously announced, this has been further extended for a period of five years with effect from 1 January 2011, subject to annual re-election at AGMs.
Exchange rate
Fees that are paid in US dollars were converted at the following exchange rates:
| | | | |
| Period rate applied | | Exchange rate £/US$ | |
1 January 2011 – 31 December 2011 | | | US$1.5798 | |
1 January 2012 – 31 December 2012 | | | US$1.5718 | |
1 January 2013 – 31 December 2013 | | | US$1.6060 | |
The exchange rate is set annually based on the average daily rate for the last quarter of the year prior to payment. The rate will be reviewed if it moves significantly during the year.
TSR performance graph
The following graph sets out the performance of the company relative to the FTSE 100 Index, of which the company is a constituent, and to the pharmaceutical performance comparator group for the five year period to 31 December 2012, measured on a common currency basis. The graph has been prepared in accordance with the Regulations as defined in ’Basis of preparation’ on page 136 and is not an indication of the likely vesting of awards granted under any of the company’s incentive plans.
TSR performance
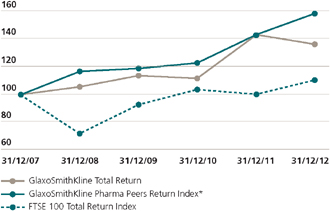
| * | This index includes Abbott Laboratories, AstraZeneca, Bristol-Myers Squibb, Eli Lilly, Johnson & Johnson, Merck, Novartis, Pfizer, Roche Holdings and Sanofi. |
|
| GSK Annual Report 2012 | 127 |
Directors’ emoluments and total remuneration
In addition to the statutory disclosure of total emoluments for the year, we have also provided figures for ‘total remuneration’, which includes the value of LTIs earned where the relevant performance periods ended during the year.
| | | | | | | | | | | | | | | | | | | | | | | | | | | | | | | | | | | | | | | | | | | | | | | | | | | | | | | | |
| | | | | | | | | | | | | | | | | | | | | 2012 | | | | | | | | | | | | | | | | | | | | | 2011 | |
| | | Footnote | | | Fees or
salary
000 | | | Other
benefits
000 | | | Annual
bonus
000 | | | Total
emolu-
ments
000 | | | (a) Value
of LTIs
earned
000 | | | Total
remune-
ration 000 | | | Fees or
salary
000 | | | Other
benefits
000 | | | Annual
bonus
000 | | | Compen-
sation
for loss
of office
000 | | | Total
emolu-
ments
000 | | | (a) Value
of LTIs
earned
000 | | | Total
remune-
ration 000 | |
Executive Directors | | | | | | | | | | | | | | | | | | | | | | | | | | | | | | | | | | | | | | | | | | | | | | | | | | | | | | | | |
Sir Andrew Witty | | | a,b,c | | | | £1,033 | | | | £49 | | | | £905 | | | | £1,987 | | | | £1,905 | | | | £3,892 | | | | £1,000 | | | | £36 | | | | £2,000 | | | | – | | | | £3,036 | | | | £3,743 | | | | £6,779 | |
Simon Dingemans | | | b,c,d | | | | £682 | | | | £161 | | | | £343 | | | | £1,186 | | | | – | | | | £1,186 | | | | £656 | | | | £157 | | | | £827 | | | | – | | | | £1,640 | | | | – | | | | £1,640 | |
Dr Moncef Slaoui | | | a,c | | | | $1,153 | | | | $363 | | | | $1,404 | | | | $2,920 | | | | $1,690 | | | | $4,610 | | | | $1,093 | | | | $302 | | | | $1,747 | | | | – | | | | $3,142 | | | | $1,753 | | | | $4,895 | |
Total Executive Directors | | | | | | | £2,440 | | | | £439 | | | | £2,131 | | | | £5,010 | | | | £2,968 | | | | £7,978 | | | | £2,335 | | | | £381 | | | | £3,912 | | | | – | | | | £6,628 | | | | £4,832 | | | | £11,460 | |
Non-Executive Directors | | | | | | | | | | | | | | | | | | | | | | | | | | | | | | | | | | | | | | | | | | | | | | | | | | | | | | | | |
Professor Sir Roy Anderson | | | | | | | £120 | | | | – | | | | – | | | | £120 | | | | – | | | | £120 | | | | £135 | | | | – | | | | – | | | | – | | | | £135 | | | | – | | | | £135 | |
Stacey Cartwright | | | e | | | | £75 | | | | – | | | | – | | | | £75 | | | | – | | | | £75 | | | | £56 | | | | – | | | | – | | | | – | | | | £56 | | | | – | | | | £56 | |
Sir Crispin Davis | | | | | | | £110 | | | | – | | | | – | | | | £110 | | | | – | | | | £110 | | | | £125 | | | | – | | | | – | | | | – | | | | £125 | | | | – | | | | £125 | |
Sir Christopher Gent | | | | | | | £675 | | | | – | | | | – | | | | £675 | | | | – | | | | £675 | | | | £675 | | | | – | | | | – | | | | – | | | | £675 | | | | – | | | | £675 | |
James Murdoch | | | f | | | | £33 | | | | – | | | | – | | | | £33 | | | | – | | | | £33 | | | | £90 | | | | – | | | | – | | | | – | | | | £90 | | | | – | | | | £90 | |
Tom de Swaan | | | | | | | £170 | | | | – | | | | – | | | | £170 | | | | – | | | | £170 | | | | £185 | | | | £1 | | | | – | | | | – | | | | £186 | | | | – | | | | £186 | |
Sir Robert Wilson | | | | | | | £120 | | | | – | | | | – | | | | £120 | | | | – | | | | £120 | | | | £135 | | | | – | | | | – | | | | – | | | | £135 | | | | – | | | | £135 | |
| | | | | | | | | | | | | | |
Lynn Elsenhans | | | e | | | | £38 | | | | – | | | | – | | | | £38 | | | | – | | | | £38 | | | | – | | | | – | | | | – | | | | – | | | | – | | | | – | | | | – | |
| | | | | | | | | | | | | | |
Dr Stephanie Burns | | | | | | | $165 | | | | – | | | | – | | | | $165 | | | | – | | | | $165 | | | | $154 | | | | – | | | | – | | | | – | | | | $154 | | | | – | | | | $154 | |
Larry Culp | | | f | | | | $124 | | | | – | | | | – | | | | $124 | | | | – | | | | $124 | | | | $154 | | | | – | | | | – | | | | – | | | | $154 | | | | – | | | | $154 | |
Judy Lewent | | | e | | | | $165 | | | | – | | | | – | | | | $165 | | | | – | | | | $165 | | | | $101 | | | | – | | | | – | | | | – | | | | $101 | | | | – | | | | $101 | |
Sir Deryck Maughan | | | | | | | $165 | | | | – | | | | – | | | | $165 | | | | – | | | | $165 | | | | $130 | | | | – | | | | – | | | | – | | | | $130 | | | | – | | | | $130 | |
Dr Daniel Podolsky | | | | | | | $212 | | | | – | | | | – | | | | $212 | | | | – | | | | $212 | | | | $201 | | | | – | | | | – | | | | – | | | | $201 | | | | – | | | | $201 | |
Jing Ulrich | | | e | | | | $71 | | | | – | | | | – | | | | $71 | | | | – | | | | $71 | | | | – | | | | – | | | | – | | | | – | | | | – | | | | – | | | | – | |
Total Non-Executive Directors | | | | | | | £1,908 | | | | – | | | | – | | | | £1,908 | | | | – | | | | £1,908 | | | | £1,861 | | | | £1 | | | | – | | | | – | | | | £1,862 | | | | – | | | | £1,862 | |
Former Directors | | | | | | | | | | | | | | | | | | | | | | | | | | | | | | | | | | | | | | | | | | | | | | | | | | | | | | | | |
Julian Heslop | | | a,b,g | | | | – | | | | – | | | | – | | | | – | | | | £748 | | | | £748 | | | | £141 | | | | £31 | | | | £104 | | | | £945 | | | | £1,221 | | | | £1,571 | | | | £2,792 | |
| | | | | | | | | | | | | | |
Dr Jean-Pierre Garnier | | | | | | | – | | | | $118 | | | | – | | | | $118 | | | | – | | | | $118 | | | | – | | | | $118 | | | | – | | | | – | | | | $118 | | | | – | | | | $118 | |
Total Former Directors | | | | | | | – | | | | £74 | | | | – | | | | £74 | | | | £748 | | | | £822 | | | | £141 | | | | £104 | | | | £104 | | | | £945 | | | | £1,294 | | | | £1,571 | | | | £2,865 | |
Total | | | | | | | £4,348 | | | | £513 | | | | £2,131 | | | | £6,992 | | | | £3,716 | | | | £10,708 | | | | £4,337 | | | | £486 | | | | £4,016 | | | | £945 | | | | £9,784 | | | | £6,403 | | | | £16,187 | |
Remuneration for Directors on the US payroll is reported in Dollars and translated at the average exchange rate for each year. None of the above Directors received reimbursement for expenses during the year requiring separate disclosure under the Regulations as defined in ‘Basis of Preparation’ on page 136.
| a) | An analysis of the value of LTIs earned by Sir Andrew Witty, Dr Moncef Slaoui and Julian Heslop is set out on page 130. |
| b) | Sir Andrew Witty and Simon Dingemans participate in salary sacrifice schemes, including ShareReward. Julian Heslop also participated until his early retirement on 31 March 2011. |
| c) | Sir Andrew Witty, Simon Dingemans and Dr Moncef Slaoui have elected to participate in GSK’s Deferred Annual Bonus Plan in respect of their 2012 bonuses. Sir Andrew Witty deferred 50% of his 2012 bonus (2011 – 35%), Simon Dingemans deferred 50% of his 2012 bonus (2011 – 50%) and Dr Moncef Slaoui deferred 50% of his 2012 bonus (2011 – 50%). |
| d) | Simon Dingemans joined the Board on 4 January 2011 and his remuneration is recorded from this date. He does not participate in any of GSK’s pension plans and instead received £136,400 (2011 – £132,000) in lieu of a money purchase pension contribution and £12,958 (2011 – £12,540) in respect of life assurance contributions, which are both included in ‘Other benefits’ above. |
| e) | Lynn Elsenhans and Jing Ulrich joined the Board on 1 July 2012. Stacey Cartwright and Judy Lewent joined the Board on 1 April 2011. Their fees are recorded from these dates. |
| f) | James Murdoch retired from the Board on 3 May 2012 and Larry Culp resigned from the Board on 30 September 2012. |
| g) | Julian Heslop retired early on 31 March 2011. He received one year’s annual salary and 12 months’ on-target bonus as compensation for loss of office, as set out under the terms of his contract. |
128 | GSK Annual Report 2012
Remuneration report
Non-Executive Directors’ fees
The table below sets out the value of fees received by the Non-Executive Directors in the form of cash and shares or ADS. Further details of the Non-Executive Directors’ share allocation plan are set out on page 126.
| | | | | | | | | | | | | | | | | | | | | | | | |
| | | | | | | | | 2012 | | | | | | | | | 2011 | |
| Fees | | Cash
000 | | | Shares/ADS
000 | | | Total
000 | | | Cash
000 | | | Shares/ADS
000 | | | Total
000 | |
Non-Executive Directors | | | | | | | | | | | | | | | | | | | | | | | | |
Professor Sir Roy Anderson | | | £90 | | | | £30 | | | | £120 | | | | £101 | | | | £34 | | | | £135 | |
Stacey Cartwright | | | £56 | | | | £19 | | | | £75 | | | | £42 | | | | £14 | | | | £56 | |
Sir Crispin Davis | | | – | | | | £110 | | | | £110 | | | | – | | | | £125 | | | | £125 | |
Sir Christopher Gent | | | £540 | | | | £135 | | | | £675 | | | | £540 | | | | £135 | | | | £675 | |
James Murdoch | | | – | | | | £33 | | | | £33 | | | | – | | | | £90 | | | | £90 | |
Tom de Swaan | | | £127 | | | | £43 | | | | £170 | | | | £139 | | | | £46 | | | | £185 | |
Sir Robert Wilson | | | £90 | | | | £30 | | | | £120 | | | | £101 | | | | £34 | | | | £135 | |
| | | | | | |
Lynn Elsenhans | | | £4 | | | | $54 | | | | £38 | | | | – | | | | – | | | | – | |
| | | | | | |
Dr Stephanie Burns | | | $82 | | | | $83 | | | | $165 | | | | $77 | | | | $77 | | | | $154 | |
Larry Culp | | | – | | | | $124 | | | | $124 | | | | – | | | | $154 | | | | $154 | |
Judy Lewent | | | $124 | | | | $41 | | | | $165 | | | | $76 | | | | $25 | | | | $101 | |
Sir Deryck Maughan | | | – | | | | $165 | | | | $165 | | | | – | | | | $130 | | | | $130 | |
Dr Daniel Podolsky | | | $53 | | | | $159 | | | | $212 | | | | $50 | | | | $151 | | | | $201 | |
Jing Ulrich | | | $53 | | | | $18 | | | | $71 | | | | – | | | | – | | | | – | |
Total fees | | | £1,103 | | | | £805 | | | | £1,908 | | | | £1,049 | | | | £812 | | | | £1,861 | |
The table below sets out the accumulated number of shares or ADS held by the Non-Executive Directors as at 31 December 2012 under the share allocation plan in relation to their fees received as Board members, together with the movements in their accounts during the year.
| | | | | | | | | | | | | | | | | | | | | | | | |
| | | | | | | | | | | | | | | Number of shares or ADS | |
| Share allocation plan | | Footnote | | | 31 December
2011 | | | Allocated
& elected | | | Dividends
reinvested | | | Paid out | | | 31 December
2012 | |
Non-Executive Directors | | | | | | | | | | | | | | | | | | | | | | | | |
Shares | | | | | | | | | | | | | | | | | | | | | | | | |
Professor Sir Roy Anderson | | | | | | | 11,597 | | | | 2,132 | | | | 672 | | | | – | | | | 14,401 | |
Stacey Cartwright | | | | | | | 1,028 | | | | 1,331 | | | | 67 | | | | – | | | | 2,426 | |
Sir Crispin Davis | | | | | | | 66,701 | | | | 7,817 | | | | 3,835 | | | | – | | | | 78,353 | |
Sir Christopher Gent | | | | | | | 80,021 | | | | 9,581 | | | | 4,610 | | | | – | | | | 94,212 | |
James Murdoch | | | a | | | | 16,504 | | | | 2,331 | | | | 971 | | | | – | | | | 19,806 | |
Tom de Swaan | | | | | | | 17,155 | | | | 3,019 | | | | 994 | | | | – | | | | 21,168 | |
Sir Robert Wilson | | | | | | | 18,623 | | | | 2,132 | | | | 1,070 | | | | – | | | | 21,825 | |
| | | | | | |
ADS | | | | | | | | | | | | | | | | | | | | | | | | |
Dr Stephanie Burns | | | | | | | 9,567 | | | | 1,826 | | | | 550 | | | | – | | | | 11,943 | |
Larry Culp | | | b | | | | 28,259 | | | | 2,711 | | | | – | | | | (30,970 | ) | | | – | |
Lynn Elsenhans | | | | | | | – | | | | 1,181 | | | | – | | | | – | | | | 1,181 | |
Judy Lewent | | | | | | | 588 | | | | 913 | | | | 41 | | | | – | | | | 1,542 | |
Sir Deryck Maughan | | | | | | | 25,608 | | | | 3,652 | | | | 1,460 | | | | – | | | | 30,720 | |
Dr Daniel Podolsky | | | | | | | 16,888 | | | | 3,524 | | | | 971 | | | | – | | | | 21,383 | |
Jing Ulrich | | | | | | | – | | | | 396 | | | | – | | | | – | | | | 396 | |
| a) | James Murdoch retired from the Board on 3 May 2012. He has elected to receive his shares from the share allocation plan after the end of the first quarter of 2013. |
| b) | Larry Culp resigned from the Board on 30 September 2012 and the balance of his share allocation plan, net of tax, was transferred to him in December 2012. |
|
| GSK Annual Report 2012 | 129 |
Directors’ interests
The following interests of the Directors of the company in office at 31 December 2012 and their connected persons are shown in accordance with the FSA Listing Rules.
| | | | | | | | | | | | | | | | | | | | | | | | | | | | |
| | | | | | | | | | | | Shares | | | | | | | | | ADS | |
| | | Footnote | | | 1 March
2013 | | | 31 December
2012 | | | 1 January
2012 | | | 1 March
2013 | | | 31 December
2012 | | | 1 January
2012 | |
Executive Directors | | | | | | | | | | | | | | | | | | | | | | | | | | | | |
Sir Andrew Witty | | | a,b,c | | | | 554,278 | | | | 449,987 | | | | 253,794 | | | | – | | | | – | | | | – | |
Simon Dingemans | | | a,b | | | | 82,583 | | | | 70,362 | | | | 40,171 | | | | – | | | | – | | | | – | |
Dr Moncef Slaoui | | | b,c,d,e,f | | | | 63,734 | | | | 63,472 | | | | 61,119 | | | | 154,745 | | | | 116,556 | | | | 65,493 | |
| | | | | | | |
Non-Executive Directors | | | | | | | | | | | | | | | | | | | | | | | | | | | | |
Professor Sir Roy Anderson | | | g | | | | 14,401 | | | | 14,401 | | | | 11,597 | | | | – | | | | – | | | | – | |
Dr Stephanie Burns | | | g | | | | 44 | | | | 44 | | | | 44 | | | | 12,008 | | | | 12,008 | | | | 9,632 | |
Stacey Cartwright | | | g | | | | 2,547 | | | | 2,547 | | | | 1,149 | | | | – | | | | – | | | | – | |
Sir Crispin Davis | | | g | | | | 85,112 | | | | 85,112 | | | | 73,460 | | | | – | | | | – | | | | – | |
Lynn Elsenhans | | | g,h | | | | – | | | | – | | | | – | | | | 2,181 | | | | 2,181 | | | | 1,000 | |
Sir Christopher Gent | | | g | | | | 94,212 | | | | 94,212 | | | | 80,021 | | | | – | | | | – | | | | – | |
Judy Lewent | | | g | | | | – | | | | – | | | | – | | | | 11,542 | | | | 11,542 | | | | 588 | |
Sir Deryck Maughan | | | g | | | | – | | | | – | | | | – | | | | 30,720 | | | | 30,720 | | | | 25,608 | |
Dr Daniel Podolsky | | | g | | | | – | | | | – | | | | – | | | | 21,383 | | | | 21,383 | | | | 16,888 | |
Tom de Swaan | | | g | | | | 21,168 | | | | 21,168 | | | | 17,155 | | | | – | | | | – | | | | – | |
Jing Ulrich | | | g,h | | | | – | | | | – | | | | – | | | | 734 | | | | 734 | | | | 338 | |
Sir Robert Wilson | | | g | | | | 27,953 | | | | 27,953 | | | | 24,751 | | | | – | | | | – | | | | – | |
One GlaxoSmithKline ADS represents two GlaxoSmithKline shares.
| a) | Includes shares purchased through the GlaxoSmithKline ShareReward Plan as follows: |
| | | | | | | | | | | | |
| | | 1 March
2013 | | | 31 December
2012 | | | 1 January
2012 | |
Sir Andrew Witty | | | 2,194 | | | | 2,134 | | | | 2,946 | |
Simon Dingemans | | | 433 | | | | 392 | | | | 171 | |
| b) | Includes shares or ADS resulting from the deferral of bonus (and the subsequent re-investment of dividends) under the Deferred Annual Bonus Plan. The totals shown below include vested but not exercised bonus deferrals and matching awards, but exclude unvested matching awards which are subject to ongoing performance criteria. The amounts represent the gross share and ADS balances prior to the sale of any shares or ADS to satisfy tax liabilities on exercise. |
| | | | | | | | | | | | |
| | | 1 March
2013 | | | 31 December
2012 | | | 1 January
2012 | |
Shares | | | | | | | | | | | | |
Sir Andrew Witty | | | 154,384 | | | | 112,833 | | | | 58,909 | |
Simon Dingemans | | | 42,150 | | | | 29,970 | | | | – | |
ADS | | | | | | | | | | | | |
Dr Moncef Slaoui | | | 56,655 | | | | 40,269 | | | | 19,218 | |
| c) | The totals at 1 March 2013 include shares or ADS which vested under elements of the 2010 awards of the Performance Share Plan and the Deferred Annual Bonus Plan, less those sold to satisfy tax liabilities on the vested amounts (see pages 132 and 133). |
| d) | Includes shares under the Annual Investment Plan which have reached the end of their deferral periods, but have not been exercised, for Dr Moncef Slaoui totalling 25,642 shares at 1 March 2013 and 31 December 2012 (1 January 2012 – 26,431 shares). These amounts include reinvested dividends and represent the gross share balances prior to the sale of any shares to satisfy tax liabilities on exercise. |
| e) | Includes ADS purchased within the US Retirement Savings Plan and the US Executive Supplemental Savings Plan (ESSP) totalling 8,484 ADS at 1 March 2013 and 8,249 ADS at 31 December 2012 (1 January 2012 – 6,424 ADS). The ADS in respect of the ESSP were not included in the totals for Directors’ interests in the 2011 annual report and the brought forward numbers for Dr Moncef Slaoui have been increased by 4,963 ADS accordingly. |
| f) | Includes ADS awarded to Dr Moncef Slaoui’s connected person under the Share Value Plan (SVP) – see page 135 – totalling 4,750 ADS at 1 March 2013 and 5,390 ADS at 31 December 2012 (1 January 2012 – 3,730 ADS). The ADS in respect of the SVP were not included in the totals for Directors’ interests in the 2011 annual report and the brought forward numbers for Dr Moncef Slaoui have been increased by 3,730 ADS accordingly. |
| g) | Includes shares or ADS received as part or all of their fees, as described under ‘Non-Executive Directors’ share allocation plan’ on page 126. Dividends received on these shares or ADS during 2012 were converted into shares or ADS as at 31 December 2012. |
| h) | Lynn Elsenhans and Jing Ulrich joined the Board on 1 July 2012 and their holdings are disclosed from this date. |
130 | GSK Annual Report 2012
Remuneration report
Long-Term Incentive plans
Value of LTIs earned
The value of LTIs earned for current and former Executive Directors includes the amounts vesting under GSK’s LTI plans (the Deferred Annual Bonus Plan and the Performance Share Plan) where the relevant performance period(s) ended during the reporting year, together with the amounts vesting under the ShareSave Plan where the contract(s) ended during the year. The totals are analysed as follows:
| | | | | | | | | | | | | | | | | | | | | | | | | | |
| Executive Directors | | | | Sir Andrew Witty | | | Dr Moncef Slaoui | | | Total | |
| Vesting of: | | Page(s) | | 2012 000 | | | 2011 000 | | | 2012 000 | | | 2011 000 | | | 2012 000 | | | 2011 000 | |
2010 Deferred Annual Bonus Plan award | | 132 | | | £125 | | | | – | | | | – | | | | – | | | | £125 | | | | – | |
2009 Performance Share Plan award | | 133 to 135 | | | – | | | | £3,738 | | | | – | | | | $1,753 | | | | – | | | | £4,827 | |
2010 Performance Share Plan award | | 133 to 135 | | | £1,780 | | | | – | | | | $1,690 | | | | – | | | | £2,843 | | | | – | |
ShareSave | | 131 | | | – | | | | £5 | | | | – | | | | – | | | | – | | | | £5 | |
Total Executive Directors | | | | | £1,905 | | | | £3,743 | | | | $1,690 | | | | $1,753 | | | | £2,968 | | | | £4,832 | |
| | | | | | | | | | | | | | | | | | | | | | | | | | |
| Former Directors | | | | | | | | | | | | | | | | Julian Heslop | |
| Vesting of: | | | | | | | | | | | | | | | | 2012
000 | | | 2011
000 | |
2009 Performance Share Plan award | | 134 to 135 | | | | | | | | | | | | | | | | | | | – | | | | £1,570 | |
2010 Performance Share Plan award | | 134 to 135 | | | | | | | | | | | | | | | | | | | £748 | | | | – | |
ShareSave | | | | | | | | | | | | | | | | | | | | | – | | | | £1 | |
Total Former Directors | | | | | | | | | | | | | | | | | | | | | £748 | | | | £1,571 | |
Share Option and ShareSave Plan awards
In respect of options granted under the Share Option Plan (SOP) and the ShareSave Plan (ShareSave), the remuneration receivable by an Executive Director is calculated on the date that the options first vest. The remuneration is the difference between the amount the Executive Director is required to pay to buy the shares or ADS and the total value of the shares or ADS on the vesting date.
If the Executive Director chooses not to exercise the options on the vesting date, any subsequent increase or decrease in the amount realised will be due to movements in the share or ADS price between the vesting date and the date of exercise. This increase or decrease in value is the result of an investment decision by the Executive Director and, as such, is not recorded as remuneration.
The options outstanding at 31 December 2012 and 1 March 2013, the movements during the periods and the gains realised on exercise are shown below:
Executive Directors
| | | | | | | | | | | | | | | | | | | | | | | | | | | | |
| Options – shares | | | | | | | | | | | 31 December
2011 | | | Granted | | | Exercised | | | 31 December
2012 and
1 March 2013 | |
Sir Andrew Witty | | | | | | | | | | | | | | | 404,502 | | | | 776 | | | | (1,009 | ) | | | 404,269 | |
Simon Dingemans | | | | | | | | | | | | | | | – | | | | 310 | | | | – | | | | 310 | |
Dr Moncef Slaoui | | | | | | | | | | | | | | | 95,320 | | | | – | | | | – | | | | 95,320 | |
| | | | | | | | | | | | | | | | | | | | | | | | | | | | |
Granted options – shares 2012 | | | | | Plan | | | Date of grant | | | Grant price | | | Number
of shares | | | Vesting
date | | | Lapse date | |
Sir Andrew Witty | | | | | | | ShareSave | | | | 01.12.12 | | | | £11.59 | | | | 776 | | | | 01.12.15 | | | | 30.05.16 | |
Simon Dingemans | | | | | | | ShareSave | | | | 01.12.12 | | | | £11.59 | | | | 310 | | | | 01.12.15 | | | | 30.05.16 | |
| | | | | | | | | | | | | | | | | | | | | | | | | | | | |
Exercised options – shares 2012 | | | | | Date of grant | | | Date of
exercise | | | Number
of shares | | | Grant price | | | Market
price at
exercise | | | Gain 000 | |
Sir Andrew Witty | | | | | | | 01.12.08 | | | | 07.02.12 | | | | 1,009 | | | | £9.51 | | | | £14.06 | | | | £5 | |
| | | | | | | | | | | | | | | | | | | | | | | | | | | | |
| Options – ADS | | Footnote | | | | | | 31 December
2011 | | | Lapsed | | | 31 December
2012 | | | Lapsed | | | 1 March 2013 | |
Dr Moncef Slaoui | | | a | | | | | | | | 162,985 | | | | (79,375 | ) | | | 83,610 | | | | (79,375 | ) | | | 4,235 | |
| a) | The total of ADS options for Dr Moncef Slaoui includes the interests of his connected person, who is also an employee of GSK. |
|
| GSK Annual Report 2012 | 131 |
Share Option and ShareSave Plan awardscontinued
The following table shows the gain on the exercise of the options set out above analysed between remuneration and the subsequent gain/ (loss) as a result of the investment decision.
| | | | | | | | | | | | | | | | | | | | | | | | | | | | | | | | | | | | |
| | | | | | Date of | | | Vesting | | | Market
price at | | | Date of | | | Remuneration | | | Investment
gain/(loss) | | | Net
gain | |
| 2012 | | Plan | | | grant | | | date | | | vesting | | | exercise | | | Year | | | 000 | | | 000 | | | 000 | |
Sir Andrew Witty | | | ShareSave | | | | 01.12.08 | | | | 01.12.11 | | | | £14.07 | | | | 07.02.12 | | | | 2011 | | | | £5 | | | | – | | | | £5 | |
| | | | |
| Former Directors | | | |
| Options – shares | | 31 December 2011 and 2012 and 1 March 2013 | |
Julian Heslop | | | 117,117 | |
For those options outstanding at 31 December 2012, the earliest and latest vesting and lapse dates for options below and above the market price for a GlaxoSmithKline share or ADS at the year-end are given in the table below:
| | | | | | | | | | | | | | | | | | | | | | | | | | |
| Executive Directors | | | | | | | | | | | | | | | | | | | | |
| | | | | Weighted average | | | | | | | | | Vesting date | | | | | | Lapse date | |
| Sir Andrew Witty | | | | grant price | | | Number | | | earliest | | | latest | | | earliest | | | latest | |
Options below market price at
year-end | | vested | | | £11.87 | | | | 313,500 | | | | 21.02.07 | | | | 20.02.08 | | | | 14.12.13 | | | | 01.12.14 | |
| | | unvested | | | £11.59 | | | | 776 | | | | 01.12.15 | | | | 01.12.15 | | | | 30.05.16 | | | | 30.05.16 | |
Options above market price at
year-end | | vested | | | £14.68 | | | | 89,993 | | | | 21.02.09 | | | | 21.02.09 | | | | 20.02.16 | | | | 20.02.16 | |
Total share options at 31 December 2012 | | | | | £12.49 | | | | 404,269 | | | | | | | | | | | | | | | | | |
| | | | | | | | | | | | | | | | | | | | | | | | | | |
| | | | | Weighted average | | | | | | | | | Vesting date | | | | | | Lapse date | |
| Simon Dingemans | | | | grant price | | | Number | | | earliest | | | latest | | | earliest | | | latest | |
Total share options and options below market price at year-end | | unvested | | | £11.59 | | | | 310 | | | | 01.12.15 | | | | 01.12.15 | | | | 30.05.16 | | | | 30.05.16 | |
| | | | | | | | | | | | | | | | | | | | | | | | | | |
| | | | | Weighted average | | | | | | | | | Vesting date | | | | | | Lapse date | |
| Dr Moncef Slaoui | | | | grant price | | | Number | | | earliest | | | latest | | | earliest | | | latest | |
Shares | | | | | | | | | | | | | | | | | | | | | | | | | | |
Options below market price at
year-end | | vested | | | £11.23 | | | | 26,800 | | | | 02.12.07 | | | | 02.12.07 | | | | 01.12.14 | | | | 01.12.14 | |
Options above market price at
year-end | | vested | | | £14.68 | | | | 68,520 | | | | 21.02.09 | | | | 21.02.09 | | | | 20.02.16 | | | | 20.02.16 | |
Total share options at 31 December 2012 | | | | | £13.71 | | | | 95,320 | | | | | | | | | | | | | | | | | |
ADS* | | | | | | | | | | | | | | | | | | | | | | | | | | |
Options below market price at
year-end | | vested | | | $33.42 | | | | 1,100 | | | | 17.02.12 | | | | 17.02.12 | | | | 16.02.19 | | | | 16.02.19 | |
| | | unvested | | | $33.47 | | | | 80,475 | | | | 22.02.13 | | | | 01.03.13 | | | | 16.02.19 | | | | 21.02.20 | |
Options above market price at
year-end | | vested | | | $50.34 | | | | 2,035 | | | | 28.07.09 | | | | 19.02.11 | | | | 27.07.16 | | | | 18.02.18 | |
Total ADS options as at 31 December 2012 | | | | | $33.88 | | | | 83,610 | | | | | | | | | | | | | | | | | |
* The ADS option totals include those ADS options held by Dr Moncef Slaoui’s connected person, who is also an employee of GSK.
| | | | | | | | | | | | | | | | | | | | | | | | | | | | |
| Former Directors | | | | | | | | | | | | | | | | | | | | | |
| | | | | | Weighted average | | | | | | | | | Vesting date | | | | | | Lapse date | |
| Julian Heslop | | | | | grant price | | | Number | | | earliest | | | latest | | | earliest | | | latest | |
Total share options and options above market price at year-end | | | vested | | | | £14.68 | | | | 117,117 | | | | 21.02.09 | | | | 21.02.09 | | | | 31.03.13 | | | | 31.03.13 | |
GSK granted share options to Executive Directors on an annual basis until 2009. The Directors hold these options under the various share option plans referred to in Note 42 to the financial statements, ‘Employee share schemes’. None of the Non-Executive Directors had an interest in any option over the company’s shares. The highest and lowest closing prices during the year ended 31 December 2012 for GlaxoSmithKline shares and ADS were £15.08 and £13.18 and $47.45 and $41.90 respectively. The market price for a GlaxoSmithKline share on 31 December 2012 was £13.35 (31 December 2011 – £14.72) and for a GlaxoSmithKline ADS was $43.47 (31 December 2011 – $45.63).
The table below sets out, for share options granted in 2009, the performance periods, the performance targets and whether or not the options have vested at 31 December 2012 and 1 March 2013.
| | | | | | | | | | | | | | | | | | | | | | | | |
| | | | | | | | | | | | | | | | | | Performance target | |
| | | | | | | | | | | | Vesting status | | | Annualised growth | | | Percentage of | |
| Grant | | Footnote | | | Performance period | | | at 1 March 2013 | | | at 31 December 2012 | | | in EPS | | | award vesting | |
February 2009 – 50% of award | | | a | | | | 2009 – 2011 | | | | Lapsed | | | | Lapsed | | | | > RPI + 6% | | | | 100% | |
February 2009 – 50% of award | | | a | | | | 2009 – 2012 | | | | Lapsed | | | | Unvested | | | | RPI + 5% | | | | 85% | |
| | | | | | | | | | | | | | | | | | | RPI + 4% | | | | 65% | |
| | | | | | | | | | | | | | | | | | | RPI + 3% | | | | 30% | |
| | | | | | | | | | | | | | | | | | | | < RPI + 3% | | | | 0% | |
| a) | The performance targets for these options were not met, and as a result they lapsed on the third and fourth anniversaries of the date of grant. |
132 | GSK Annual Report 2012
Remuneration report
Deferred Annual Bonus Plan awards
Deferred Annual Bonus Plan (DABP) awards in the form of nil-cost options are made to Executive Directors annually based on the individual’s voluntary bonus deferral election. The company will match shares or ADS up to one-for-one depending on the company’s performance during a three year performance period. Once an award vests, the Executive Director may choose to exercise the award at any time up to 10 years from the date of grant. The amount of remuneration receivable in respect of the matching shares or ADS is calculated using the share or ADS price on the date the relevant DABP award vests. If the Executive Director chooses not to exercise the nil-cost options on the vesting date, any subsequent increase or decrease in the amount realised will be due to movements in the share or ADS price between the vesting date and the date of exercise. This increase or decrease in value is the result of an investment decision by the Executive Director and, as such, is not recorded as remuneration.
| | | | | | | | | | | | | | | | |
| Sir Andrew Witty – Shares | | | | | | | | | | | Performance period | |
| | | 2010-2012 | | | 2011-2013 | | | 2012-2014 | | | 2013-2015 | |
Market price at grant | | | £12.35 | | | | £11.80 | | | | £14.12 | | | | £14.54 | |
Unvested at 31 December 2011 | | | 26,229 | | | | 32,680 | | | | – | | | | – | |
Granted | | | – | | | | – | | | | 49,575 | | | | – | |
Dividends reinvested | | | 1,420 | | | | 1,771 | | | | 1,158 | | | | – | |
Unvested at 31 December 2012 | | | 27,649 | | | | 34,451 | | | | 50,733 | | | | – | |
Granted | | | – | | | | – | | | | – | | | | 31,114 | |
Dividends reinvested | | | 780 | | | | 456 | | | | 672 | | | | – | |
Vested | | | (8,529 | ) | | | – | | | | – | | | | – | |
Lapsed | | | (19,900 | ) | | | – | | | | – | | | | – | |
Unvested at 1 March 2013 | | | – | | | | 34,907 | | | | 51,405 | | | | 31,114 | |
| | | | |
Sir Andrew Witty – Vested shares | | | | | | | | | | | | | | | | |
Number of shares | | | 8,529 | | | | | | | | | | | | | |
Market price at vesting | | | £14.66 | | | | | | | | | | | | | |
| | | | | | | | | | | | | | | | |
Gain: | | | 000 | | | | | | | | | | | | | |
Remuneration for 2012 | | | £125 | | | | | | | | | | | | | |
Sir Andrew Witty has not exercised those shares that have vested and at 1 March 2013, 8,529 shares in respect of the matching award granted in 2010 remain within the DABP as vested, but unexercised.
| | | | | | | | | | | | |
| Simon Dingemans – Shares | | | | | | | | Performance period | |
| | | | | | 2012-2014 | | | 2013-2015 | |
Market price at grant | | | | | | | £14.12 | | | | £14.54 | |
Unvested at 31 December 2011 | | | | | | | – | | | | – | |
Granted | | | | | | | 29,286 | | | | – | |
Dividends reinvested | | | | | | | 684 | | | | – | |
Unvested at 31 December 2012 | | | | | | | 29,970 | | | | – | |
Granted | | | | | | | – | | | | 11,783 | |
Dividends reinvested | | | | | | | 397 | | | | – | |
Unvested at 1 March 2013 | | | | | | | 30,367 | | | | 11,783 | |
| | | | | | | | | | | | |
| | | |
| Dr Moncef Slaoui – ADS | | | | | | | | Performance period | |
| | | 2011-2013 | | | 2012-2014 | | | 2013-2015 | |
Market price at grant | | | $38.22 | | | | $44.68 | | | | $44.27 | |
Unvested at 31 December 2011 | | | 19,218 | | | | – | | | | – | |
Granted | | | – | | | | 19,555 | | | | – | |
Dividends reinvested | | | 1,041 | | | | 455 | | | | – | |
Unvested at 31 December 2012 | | | 20,259 | | | | 20,010 | | | | – | |
Granted | | | – | | | | – | | | | 15,859 | |
Dividends reinvested | | | 265 | | | | 262 | | | | – | |
Unvested at 1 March 2013 | | | 20,524 | | | | 20,272 | | | | 15,859 | |
Vesting schedules of DABP awards
The 2010 award vested in line with the three year relative TSR vesting schedule applied to the 2010 PSP award (see page 135). The 2011 and 2012 awards have the same vesting criteria as for the 2011 and 2012 PSP awards respectively (see pages 134 and 135). The vesting schedule for the 2013 DABP award is set out in detail on page 118.
|
| GSK Annual Report 2012 | 133 |
Performance Share Plan awards
Performance Share Plan (PSP) awards are made to Executive Directors on an annual basis. The Directors hold these awards under the various PSP plans referred to in Note 42 to the financial statements, ‘Employee share schemes’. The amount of remuneration receivable in respect of performance shares is calculated using the share or ADS price on the date the relevant PSP award vests.
The PSP awards made to Sir Andrew Witty in 2012 and 2013 have three year performance periods. However, the deeds of award specify that 25% of the awards will be subject to a further two year vesting period (five years in total). During this two year period, there are no additional performance criteria and the awards will only lapse if Sir Andrew is dismissed for cause. The remuneration in respect of these awards will therefore be considered to be realised in full following the determination by the Remuneration Committee of the vesting levels of the initial 75% of the awards (i.e. full remuneration will be recognised at the end of the three year performance periods).
Executive Directors
| | | | | | | | | | | | | | | | | | | | | | | | | | | | | | | | |
| Sir Andrew Witty – Shares | | | | | | | | | | | | | | | | | | | | Performance period | |
| | | | | | 2009-2011 | | | 2009-2012 | | | 2010-2012 | | | 2010-2013 | | | 2011-2013 | | | 2012-2014 | | | 2013-2015 | |
Market price at grant | | | | | | | £10.62 | | | | £10.62 | | | | £12.04 | | | | £12.04 | | | | £11.78 | | | | £14.12 | | | | £14.54 | |
Unvested at 31 December 2011 | | | | | | | 368,958 | | | | 158,125 | | | | 313,803 | | | | 134,487 | | | | 434,451 | | | | – | | | | – | |
Granted | | | | | | | – | | | | – | | | | – | | | | – | | | | – | | | | 441,926 | | | | – | |
Dividends reinvested | | | | | | | 11,060 | | | | 8,523 | | | | 16,915 | | | | 7,249 | | | | 23,418 | | | | 10,260 | | | | – | |
Vested | | | | | | | (266,013 | ) | | | – | | | | – | | | | – | | | | – | | | | – | | | | – | |
Lapsed | | | | | | | (114,005 | ) | | | – | | | | – | | | | – | | | | – | | | | – | | | | – | |
Unvested at 31 December 2012 | | | | | | | – | | | | 166,648 | | | | 330,718 | | | | 141,736 | | | | 457,869 | | | | 452,186 | | | | – | |
Granted | | | | | | | | | | | – | | | | – | | | | – | | | | – | | | | – | | | | 437,744 | |
Dividends reinvested | | | | | | | | | | | 4,700 | | | | 9,327 | | | | 1,871 | | | | 6,045 | | | | 5,969 | | | | – | |
Vested | | | | | | | | | | | – | | | | (121,445 | ) | | | – | | | | – | | | | – | | | | – | |
Lapsed | | | | | | | | | | | (171,348 | ) | | | (218,600 | ) | | | – | | | | – | | | | – | | | | – | |
Unvested at 1 March 2013 | | | | | | | | | | | – | | | | – | | | | 143,607 | | | | 463,914 | | | | 458,155 | | | | 437,744 | |
| | | | | | | | |
| Sir Andrew Witty – Vested shares: | | | | | | | | | | | | | | | | | | | | | | | | |
Number of shares | | | | | | | 266,013 | | | | – | | | | 121,445 | | | | | | | | | | | | | | | | | |
Market price at vesting | | | | | | | £14.05 | | | | £14.66 | | | | £14.66 | | | | | | | | | | | | | | | | | |
| | | | | | | | |
Gain: | | | | | | | 000 | | | | 000 | | | | 000 | | | | | | | | | | | | | | | | | |
Remuneration for 2011 | | | | | | | £3,738 | | | | | | | | | | | | | | | | | | | | | | | | | |
| | | | | | | | | | | – | | | | £1,780 | | | | | | | | | | | | | | | | | |
Remuneration for 2012 | | | | | | | | | | | | | | | £1,780 | | | | | | | | | | | | | | | | | |
| | | | | | | | | | | | | | | | | | | | | | | | | | | | | | | | |
| Simon Dingemans – Shares | | | | | | | | | | | | | | | | | | | | Performance period | |
| | | | | | | | | | | | | | | | | | 2011-2013 | | | 2012-2014 | | | 2013-2015 | |
Market price at grant | | | | | | | | | | | | | | | | | | | | | | | £11.78 | | | | £14.12 | | | | £14.54 | |
Unvested at 31 December 2011 | | | | | | | | | | | | | | | | | | | | | | | 200,716 | | | | – | | | | – | |
Granted | | | | | | | | | | | | | | | | | | | | | | | – | | | | 170,141 | | | | – | |
Dividends reinvested | | | | | | | | | | | | | | | | | | | | | | | 10,819 | | | | 3,950 | | | | – | |
Unvested at 31 December 2012 | | | | | | | | | | | | | | | | | | | | | | | 211,535 | | | | 174,091 | | | | – | |
Granted | | | | | | | | | | | | | | | | | | | | | | | – | | | | – | | | | 192,613 | |
Dividends reinvested | | | | | | | | | | | | | | | | | | | | | | | 2,793 | | | | 2,298 | | | | – | |
Unvested at 1 March 2013 | | | | | | | | | | | | | | | | | | | | | | | 214,328 | | | | 176,389 | | | | 192,613 | |
| | | | | | | | | | | | | | | | | | | | | | | | | | | | | | | | |
| Dr Moncef Slaoui – ADS* | | | | | | | | | | | | | | | | | | | | Performance period | |
| | | 2009-2011 | | | 2009-2012 | | | 2010-2012 | | | 2010-2013 | | | 2011-2013 | | | 2012-2014 | | | 2012-2014 | | | 2013-2015 | |
Market price at grant | | | $33.71 | | | | $33.71 | | | | $37.32 | | | | $37.32 | | | | $38.13 | | | | $44.68 | | | | $44.90 | | | | $44.27 | |
Unvested at 31 December 2011 | | | 54,156 | | | | 23,210 | | | | 98,705 | | | | 42,303 | | | | 151,125 | | | | – | | | | – | | | | – | |
Granted | | | – | | | | – | | | | – | | | | – | | | | – | | | | 129,700 | | | | 1,692 | | | | – | |
Dividends reinvested | | | 1,650 | | | | 1,252 | | | | 5,324 | | | | 2,281 | | | | 8,151 | | | | 3,008 | | | | 19 | | | | – | |
Vested | | | (39,065 | ) | | | – | | | | – | | | | – | | | | – | | | | – | | | | – | | | | – | |
Lapsed | | | (16,741 | ) | | | – | | | | – | | | | – | | | | – | | | | – | | | | – | | | | – | |
Unvested at 31 December 2012 | | | – | | | | 24,462 | | | | 104,029 | | | | 44,584 | | | | 159,276 | | | | 132,708 | | | | 1,711 | | | | – | |
Granted | | | | | | | – | | | | – | | | | – | | | | – | | | | – | | | | – | | | | 133,521 | |
Dividends reinvested | | | | | | | 699 | | | | 2,973 | | | | 587 | | | | 2,097 | | | | 1,747 | | | | 22 | | | | – | |
Vested | | | | | | | – | | | | (38,215 | ) | | | – | | | | – | | | | – | | | | – | | | | – | |
Lapsed | | | | | | | (25,161 | ) | | | (68,787 | ) | | | – | | | | – | | | | – | | | | – | | | | – | |
Unvested at 1 March 2013 | | | | | | | – | | | | – | | | | 45,171 | | | | 161,373 | | | | 134,455 | | | | 1,733 | | | | 133,521 | |
| * | The PSP totals include those PSP awards held by Dr Moncef Slaoui’s connected person, who is also an employee of GSK. These awards are subject to performance criteria relevant to employees below the CET. |
134 | GSK Annual Report 2012
Remuneration report
Performance Share Plan awardscontinued
| | | | | | | | | | | | | | | | |
| Dr Moncef Slaoui – Vested ADS | | | | | Performance period | | | | |
| | 2009-2011 | | | 2009-2012 | | | 2010-2012 | | | | |
Number of ADS | | | 39,065 | | | | – | | | | 38,215 | | | | | |
Market price at vesting | | | $44.87 | | | | $44.22 | | | | $44.22 | | | | | |
| | | | |
Gain: | | | 000 | | | | 000 | | | | 000 | | | | | |
Remuneration for 2011 | | | $1,753 | | | | | | | | | | | | | |
| | | | | | | – | | | | $1,690 | | | | | |
Remuneration for 2012 | | | | | | | | | | | $1,690 | | | | | |
| | | | | | | | | | | | | | | | |
| Former Directors | | | | | | | | | | | | |
| Julian Heslop – Shares | | | | | | | | Performance period | |
| | | 2009-2011 | | | 2009-2012 | | | 2010-2012 | | | 2010-2013 | |
Market price at grant | | | £10.62 | | | | £10.62 | | | | £12.04 | | | | £12.04 | |
Unvested at 31 December 2011 | | | 154,963 | | | | 66,412 | | | | 131,798 | | | | 56,484 | |
Dividends reinvested | | | 4,645 | | | | 3,581 | | | | 7,105 | | | | 3,044 | |
Vested | | | (111,726 | ) | | | – | | | | – | | | | – | |
Lapsed | | | (47,882 | ) | | | – | | | | – | | | | – | |
Unvested at 31 December 2012 | | | – | | | | 69,993 | | | | 138,903 | | | | 59,528 | |
Dividends reinvested | | | | | | | 1,974 | | | | 3,917 | | | | 787 | |
Vested | | | | | | | – | | | | (51,007 | ) | | | – | |
Lapsed | | | | | | | (71,967 | ) | | | (91,813 | ) | | | – | |
Unvested at 1 March 2013 | | | | | | | – | | | | – | | | | 60,315 | |
| | | | | | | | | | | | | | | | |
| Julian Heslop – Vested shares | | | | | | | | | | | | |
Number of shares | | | 111,726 | | | | – | | | | 51,007 | | | | | |
Market price at vesting | | | £14.05 | | | | £14.66 | | | | £14.66 | | | | | |
| | | | |
Gain: | | | 000 | | | | 000 | | | | 000 | | | | | |
Remuneration for 2011 | | | £1,570 | | | | | | | | | | | | | |
| | | | | | | – | | | | £748 | | | | | |
Remuneration for 2012 | | | | | | | | | | | £748 | | | | | |
Under the terms of the PSP, the number of shares or ADS vesting is determined following the end of the relevant performance period and is dependent on GSK’s performance during that period. The Committee adjusted the comparator group for relative TSR by removing Schering-Plough and Wyeth following their de-listings during 2009 and revised the vesting schedule accordingly. From 1 January 2013, Abbott Laboratories separated into two publicly traded companies. The Committee concluded that neither of these companies was a relevant comparator for performance purposes and that they should be excluded from the TSR comparator group for both outstanding and future awards. The vesting schedule has been revised accordingly and now comprises GSK and nine other companies. The revised comparator group is set out on page 115.
Dividends are reinvested on the performance shares or ADS awarded to Executives throughout the performance period and up to the date of the final award. Under the terms of the PSP, US participants may defer receipt of all or part of their vested awards.
The following vesting schedules apply to the PSP awards made to Executive Directors and other CET members in 2009, 2010, 2011 and 2012. The vesting schedule for the 2013 PSP award is set out in detail on page 118.
| | | | | | | | | | | | | | | | |
| | | | | | | | | *Business diversification performance vesting schedule | |
| Award | | % of award | | | Performance period | | | Percentage of award vesting | | | Maximum performance expressed as percentage of threshold | |
2011 | | | 25 | | | | 2011 – 2013 | | | | 0% –100% | | | | 114% | |
2012 | | | 25 | | | | 2012 – 2014 | | | | 0% –100% | | | | 114% | |
| | | |
| | | | | | | | | *R&D new product performance vesting schedule | |
| Award | | % of award | | | Performance period | | | Percentage of award vesting | | | Maximum performance expressed as
percentage of threshold | |
2011 | | | 25 | | | | 2011 – 2013 | | | | 0% –100% | | | | 122% | |
2012 | | | 25 | | | | 2012 – 2014 | | | | 0% –100% | | | | 122% | |
| | | |
| | | | | | | | | Adjusted free cash flow vesting schedule | |
| Award | | % of award | | | Performance period | | | Cash flow targets £bn | | | Percentage of award vesting | |
2010 | | | 40 | | | | 2010 – 2012 | | | | 17.3 – 20.5 | | | | 0% – 100% | |
2011 | | | 25 | | | | 2011 – 2013 | | | | 16.15 – 19.15 | | | | 0% – 100% | |
2012 | | | 25 | | | | 2012 – 2014 | | | | 17.30 – 20.52 | | | | 0% – 100% | |
|
| GSK Annual Report 2012 | 135 |
Performance Share Plan awardscontinued
| | | | | | | | | | | | | | | | |
| | | | | | | | | | | | Relative TSR vesting schedule | |
| Award | | % of award | | | Performance period | | | TSR rank with 10 other companies | | | Percentage of award vesting | |
2009 | | | 30 | | | | 2009 – 2012 | | | | 1-3 | | | | 100% | |
2010 | | | 30 | | | | 2010 – 2012 | | | | 4 | | | | 80% | |
| | | | | | | | | | | 5 | | | | 55% | |
| | | | | | | | | | | Median | | | | 30% | |
| | | | | | | | | | | | Below median | | | | 0% | |
| | | | |
| Award | | % of award | | | Performance period | | | TSR rank with nine other companies | | | Percentage of award vesting | |
2010 | | | 30 | | | | 2010 – 2013 | | | | 1-3 | | | | 100% | |
2011 | | | 25 | | | | 2011 – 2013 | | | | 4 | | | | 72% | |
2012 | | | 25 | | | | 2012 – 2014 | | | | 5 | | | | 44% | |
| | | | | | | | | | | | 6-10 | | | | 0% | |
| * | Due to commercial sensitivity, the targets for the business diversification performance and R&D new product performance measures will be disclosed along with outcomes in the 2013 and 2014 Remuneration Reports. |
Share Value Plan awards
| | | | | | | | | | | | | | | | | | | | | | | | | | | | |
| Dr Moncef Slaoui – ADS | | Market | | | | | | | | | | | | | | | | | | | |
| Plan year | | price on date of grant | | | Unvested at 31 December 2011 | | | Granted | | | Vested | | | Unvested at 31 December 2012 | | | Vested | | | Unvested at 1 March 2013 | |
2009 | | | $33.42 | | | | 640 | | | | – | | | | (640 | ) | | | – | | | | | | | | | |
2010 | | | $37.32 | | | | 640 | | | | – | | | | – | | | | 640 | | | | (640 | ) | | | – | |
2011 | | | $38.13 | | | | 2,450 | | | | – | | | | – | | | | 2,450 | | | | – | | | | 2,450 | |
2012 | | | $45.86 | | | | – | | | | 2,300 | | | | – | | | | 2,300 | | | | – | | | | 2,300 | |
Total | | | | | | | 3,730 | | | | 2,300 | | | | (640 | ) | | | 5,390 | | | | (640 | ) | | | 4,750 | |
As an Executive Director, Dr Moncef Slaoui is not eligible to receive awards under the Share Value Plan. The awards shown above reflect the holdings of Dr Moncef Slaoui’s connected person, who is also an employee of GSK. The awards are subject to three-year vesting periods and vesting is contingent on continued employment with GSK. The gains arising on vesting are not included in the total remuneration for Dr Moncef Slaoui as set out on page 127.
Pension benefits
Defined benefit plans
The accrued annual pension benefits and transfer values on retirement for Executive Directors in office during the year are set out below.
The Companies Act 2006 requires disclosure of the accrued benefit at the end of the year, the change in accrued benefit over the year, the transfer value at both the beginning and end of the year and the change in the transfer value over the year. The FSA’s Listing Rules require additional disclosure of the change in the accrued benefit, net of inflation and the transfer value of this change. Pensions for the Executive Directors have been disclosed in the currency in which the pension is payable.
| | | | | | | | | | | | | | | | | | | | | | | | | | | | | | | | | | | | |
| Executive Director | | Accrued benefit at 31 December 2011 000 | | | Accrued benefit at 31 December 2012 000 | | | Change in accrued benefit over year 000 | | | Personal contributions made during the year 000 | | | Transfer value at 31 December 2011 000 | | | Transfer value at 31 December 2012 000 | | | *Change in transfer value 000 | | | Change in accrued benefit over year net of inflation 000 | | | *Transfer value of change in accrued benefit net of inflation 000 | |
Sir Andrew Witty | | | £530 | | | | £582 | | | | £52 | | | | £31 | | | | £12,950 | | | | £13,704 | | | | £723 | | | | £22 | | | | £512 | |
Dr Moncef Slaoui | | | $263 | | | | $350 | | | | $87 | | | | n/a | | | | $2,003 | | | | $2,540 | | | | $537 | | | | $82 | | | | $601 | |
Dr Moncef Slaoui | | | €71 | | | | €78 | | | | €7 | | | | n/a | | | | €732 | | | | €785 | | | | €53 | | | | €6 | | | | €71 | |
| * | These are shown net of contributions made by the individual. |
136 | GSK Annual Report 2012
Remuneration report
Pension benefitscontinued
Sir Andrew Witty participates in the Glaxo Wellcome final salary plan with an accrual rate of 1/30th of final pensionable salary per annum. In 2000, all benefits accrued under the Glaxo Wellcome UK pension arrangements were augmented by the Trustees of the plans by 5% to reflect a distribution of surplus. This augmentation will apply to that element of Sir Andrew Witty’s pension earnings before 31 March 2000.
The transfer value for Sir Andrew Witty is calculated in accordance with pensions’ regulation and represents the present value of potential payments under the pension plan.
Dr Moncef Slaoui is a member of the US Cash Balance Pension Plan and the Supplemental Cash Balance Pension Plan which provides for an Executive Pension Credit. GSK makes annual contributions to Dr Moncef Slaoui’s pension plans of 38% of his base salary. The fund increases at an interest rate set annually in advance, based on the 30 year US Treasury bond rate, to provide a cash sum at retirement. The plan has no entitlement to a spouse’s pension or to pension increases.
The transfer value, or cash sum, has increased by $537,246 for Dr Moncef Slaoui over the year as a result of contributions of $437,190 paid by the company and further accumulation of interest of $100,056.
Dr Moncef Slaoui was an active participant in the Belgium Fortis Plan until 31 May 2006. This plan is a defined benefit plan with a lump sum payable at normal retirement, which is age 60 for the plan. The transfer value, or cash sum, of Dr Moncef Slaoui’s plan has increased by€53,346 over the year as a result of further accumulation of interest. There are no further company contributions to this plan.
Defined contribution plans
Dr Moncef Slaoui is also a member of the US Retirement Savings Plan, a 401k savings scheme open to all US employees and the Executive Supplemental Savings Plan, a savings scheme open to Executives to accrue benefits above US government limits imposed on the US Retirement Savings Plan. Contributions to both plans are invested in a range of funds and the value of the accumulated funds is paid at retirement. During 2012, contributions of $121,571 (£76,460) were paid into these two schemes by GSK in respect of Dr Moncef Slaoui.
Simon Dingemans joined GSK in January 2011. He is not accumulating benefits in any of GSK’s pension plans and receives a cash contribution in lieu of a money purchase pension contribution.
Directors’ interests in contracts
Except as described in Note 35 to the financial statements, ‘Related party transactions’, during or at the end of the financial year no Director or connected person had any material interest in any contract of significance with a Group company.
Directors and senior management
Further information is provided on compensation and interests of Directors and Senior Management as a group (‘the group’). For this purpose, the group is defined as the Non-Executive and Executive Directors, other members of the CET and the Company Secretary. For the financial year 2012, the total compensation paid to members of the group for the periods during which they served in that capacity was £19,627,494, the aggregate increase in accrued pension benefits, net of inflation, was £1,265,822 and the aggregate payment to defined contribution schemes was £680,188.
During 2012, the members of the group were awarded 160,460 shares and 41,789 ADS under the Deferred Annual Bonus Plan, 1,424,375 shares and 344,909 ADS under the Performance Share Plan and 15,905 shares and 2,300 ADS under the Share Value Plan. No options were granted to members of the group under the Share Option Plan in 2012. No notional shares or ADS were granted under the Deferred Investment Award Plan in 2012. Members of the group were awarded, through the reinvestment of dividends, 8,646 shares and 2,898 ADS in the Deferred Annual Bonus Plan, 202,340 shares and 61,631 ADS in the Performance Share Plan and 7,652 notional shares in the Deferred Investment Award Plan.
At 1 March 2013, the group (comprising 29 persons) owned 1,548,255 shares and 390,044 ADS, constituting less than 1% of the issued share capital of the company. The group also held, at that date: options to purchase 1,582,846 shares and 52,975 ADS; 328,663 shares and 106,503 ADS awarded under the Deferred Annual Bonus Plan, including those shares and ADS that are vested but not exercised; 4,754,964 shares and 1,163,766 ADS awarded under the Performance Share Plan, including those shares and ADS that are vested and deferred; 96,515 shares and 4,750 ADS awarded under the Share Value Plan and 92,812 notional shares awarded under the Deferred Investment Award Plan. These holdings were issued under the various executive share plans described in Note 42 to the financial statements, ‘Employee share schemes’.
Basis of preparation
The Remuneration Report has been prepared in accordance with the Companies Act 2006 and The Large and Medium-sized Companies and Groups (Accounts and Reports) Regulations 2008 (the Regulations) and meets the relevant requirements of the FSA Listing Rules. In accordance with the Regulations, the following sections of the Remuneration Report are subject to audit: Directors’ emoluments and total remuneration, Non-Executive Directors’ fees, Long-Term Incentive plans (including Share Option and ShareSave Plan awards, Deferred Annual Bonus Plan awards, Performance Share Plan awards and Share Value Plan awards) and Pension benefits for which the opinion thereon is expressed on page 139. The remaining sections are not subject to audit nor are the pages referred to from within the audited sections. The Remuneration Report has been approved by the Board of Directors and signed on its behalf by
Tom de Swaan
Remuneration Committee Chairman
5 March 2013
|
| GSK Annual Report 2012 | 137 |
138 | GSK Annual Report 2012
Directors’ statement of responsibilities
Directors’ statement of responsibilities in relation to the Group financial statements
The Directors are responsible for preparing the Annual Report, the Remuneration Report and the Group financial statements in accordance with applicable law and regulations.
Company law requires the Directors to prepare financial statements for each financial year. Under that law the Directors are required to prepare the Group financial statements in accordance with International Financial Reporting Standards (IFRS) as adopted by the European Union. In preparing the Group financial statements, the Directors have also elected to comply with IFRS, as issued by the International Accounting Standards Board (IASB). Under company law the Directors must not approve the Group financial statements unless they are satisfied that they give a true and fair view of the state of affairs of the Group and of the profit or loss of the Group for that period.
In preparing those financial statements, the Directors are required to:
| • | | select suitable accounting policies and then apply them consistently; |
| • | | make judgements and accounting estimates that are reasonable and prudent; |
| • | | state that the Group financial statements comply with IFRS as adopted by the European Union and IFRS as issued by the IASB, subject to any material departures disclosed and explained in the Group financial statements. |
The Directors are responsible for keeping adequate accounting records that are sufficient to show and explain the company’s transactions and disclose with reasonable accuracy at any time the financial position of the Group and to enable them to ensure that the Group financial statements and the Remuneration Report comply with the Companies Act 2006 and Article 4 of the IAS Regulation. They are also responsible for safeguarding the assets of the Group and hence for taking reasonable steps for the prevention and detection of fraud and other irregularities.
The Group financial statements for the year ended 31 December 2012, comprising principal statements and supporting notes, are set out in ‘Financial statements’ on pages 140 to 223 of this report. The responsibilities of the auditors in relation to the Group financial statements are set out in the Independent Auditors’ report on page 139.
The Group financial statements for the year ended 31 December 2012 are included in the Annual Report, which is published in hard-copy printed form and made available on our website. The Directors are responsible for the maintenance and integrity of the Annual Report on our website in accordance with UK legislation governing the preparation and dissemination of financial statements. Access to the website is available from outside the UK, where comparable legislation may be different.
Each of the current Directors, whose names and functions are listed in the Corporate Governance section of the Annual Report 2012 confirms that, to the best of his or her knowledge:
| • | | the Group financial statements, which have been prepared in accordance with IFRS as adopted by the EU and IFRS as issued by the IASB, give a true and fair view of the assets, liabilities, financial position and profit of the Group; and |
| • | | the Strategic review and Financial review and risk sections on pages 1 to 86 include a fair review of the development and performance of the business and the position of the Group, together with a description of the principal risks and uncertainties that it faces. |
Disclosure of information to auditors
The Directors in office at the date of this Report have each confirmed that:
| • | | so far as he or she is aware, there is no relevant audit information of which the company’s auditors are unaware; and |
| • | | he or she has taken all the steps that he or she ought to have taken as a Director to make himself or herself aware of any relevant audit information and to establish that the company’s auditors are aware of that information. |
This confirmation is given and should be interpreted in accordance with the provisions of section 418 of the Companies Act 2006.
Going concern basis
Pages 1 to 86 contain information on the performance of the Group, its financial position, cash flows, net debt position and borrowing facilities. Further information, including Treasury risk management policies, exposures to market and credit risk and hedging activities, is given in Note 41 to the financial statements, ‘Financial instruments and related disclosures’. After making enquiries, the Directors have a reasonable expectation that the Group has adequate resources to continue in operational existence for the foreseeable future. For this reason, they continue to adopt the going concern basis in preparing the financial statements.
Internal control
The Board, through the Audit & Risk Committee, has reviewed the assessment of risks and the internal control framework that operates in GSK and has considered the effectiveness of the system of internal control in operation in the Group for the year covered by this report and up to the date of its approval by the Board of Directors.
The UK Corporate Governance Code
The Board considers that GlaxoSmithKline plc applies the principles and provisions of the UK Corporate Governance Code maintained by the Financial Reporting Council, as described in the Corporate Governance section on pages 94 to 108, and has complied with its provisions. As required by the Financial Services Authority’s Listing Rules, the auditors have considered the Directors’ statement of compliance in relation to those points of the UK Corporate Governance Code which are specified for their review.
Annual Report
The Annual Report for the year ended 31 December 2012, comprising the Report of the Directors, the Remuneration Report, the Financial statements and additional information for investors, has been approved by the Board of Directors and signed on its behalf by
Sir Christopher Gent
Chairman
5 March 2013
|
| GSK Annual Report 2012 | 139 |
Independent Auditors’ report
Independent Auditors’ report
to the members of GlaxoSmithKline plc
We have audited the Group financial statements of GlaxoSmithKline plc for the year ended 31 December 2012 which comprise the consolidated income statement, the consolidated statement of comprehensive income, the consolidated balance sheet, the consolidated statement of changes in equity, the consolidated cash flow statement, and the related Notes 1-44. The financial reporting framework that has been applied in their preparation is applicable law and International Financial Reporting Standards (IFRSs) as adopted by the European Union.
Respective responsibilities of directors and auditors
As explained more fully in the Directors’ statement of responsibilities set out on page 138 the directors are responsible for the preparation of the Group financial statements and for being satisfied that they give a true and fair view. Our responsibility is to audit and express an opinion on the Group financial statements in accordance with applicable law and International Standards on Auditing (UK and Ireland). Those standards require us to comply with the Auditing Practices Board’s Ethical Standards for Auditors.
This report, including the opinions, has been prepared for and only for the company’s members as a body in accordance with Chapter 3 of Part 16 of the Companies Act 2006 and for no other purpose. We do not, in giving these opinions, accept or assume responsibility for any other purpose or to any other person to whom this report is shown or into whose hands it may come save where expressly agreed by our prior consent in writing.
Scope of the audit of the financial statements
An audit involves obtaining evidence about the amounts and disclosures in the financial statements sufficient to give reasonable assurance that the financial statements are free from material misstatement, whether caused by fraud or error. This includes an assessment of: whether the accounting policies are appropriate to the Group’s circumstances and have been consistently applied and adequately disclosed; the reasonableness of significant accounting estimates made by the directors; and the overall presentation of the financial statements. In addition, we read all the financial and non-financial information in the Annual Report to identify material inconsistencies with the audited financial statements. If we become aware of any apparent material misstatements or inconsistencies we consider the implications for our report.
Opinion on financial statements
In our opinion the Group financial statements:
| • | | give a true and fair view of the state of the Group’s affairs as at 31 December 2012 and of its profit and cash flows for the year then ended; |
| • | | have been properly prepared in accordance with IFRS as adopted by the European Union; and |
| • | | have been prepared in accordance with the requirements of the Companies Act 2006 and Article 4 of the lAS Regulation. |
Separate opinion in relation to IFRS as issued by the IASB
As explained in Note 1 to the Group financial statements, the Group in addition to complying with its legal obligation to apply IFRS as adopted by the European Union, has also applied IFRS as issued by the International Accounting Standards Board (IASB).
In our opinion the Group financial statements comply with IFRSs as issued by the IASB.
Opinion on other matter prescribed by the Companies Act 2006
In our opinion the information given in the Directors’ Report for the financial year for which the Group financial statements are prepared is consistent with the Group financial statements.
Matters on which we are required to report by exception
We have nothing to report in respect of the following:
Under the Companies Act 2006 we are required to report to you if, in our opinion:
| • | | certain disclosures of directors’ remuneration specified by law are not made; or |
| • | | we have not received all the information and explanations we require for our audit. |
Under the Listing Rules we are required to review:
| • | | the directors’ statement, set out on page 138, in relation to going concern; |
| • | | the part of the Corporate Governance Statement relating to the company’s compliance with the nine provisions of the UK Corporate Governance Code specified for our review; and |
| • | | certain elements of the report to shareholders by the Board on directors’ remuneration. |
Other matters
We have reported separately on the parent company financial statements of GlaxoSmithKline plc for the year ended 31 December 2012 and on the information in the Directors’ Remuneration Report that is described as having been audited.
The company has passed a resolution in accordance with section 506 of the Companies Act 2006 that the senior statutory auditor’s name should not be stated.
PricewaterhouseCoopers LLP
Chartered Accountants and Statutory Auditors
London
5 March 2013

140 | GSK Annual Report 2012
Financial statements
Consolidated income statement for the year ended 31 December 2012
| | | | | | | | | | | | | | | | |
| | | Notes | | | 2012 £m | | | 2011 (restated) £m | | | 2010
(restated)
£m | |
Turnover | | | 6 | | | | 26,431 | | | | 27,387 | | | | 28,392 | |
Cost of sales | | | | | | | (7,894 | ) | | | (7,648 | ) | | | (7,898 | ) |
Gross profit | | | | | | | 18,537 | | | | 19,739 | | | | 20,494 | |
Selling, general and administration | | | | | | | (8,739 | ) | | | (8,510 | ) | | | (12,747 | ) |
Research and development | | | | | | | (3,968 | ) | | | (4,009 | ) | | | (4,457 | ) |
Royalty income | | | | | | | 306 | | | | 309 | | | | 296 | |
Other operating income | | | 7 | | | | 1,256 | | | | 278 | | | | 197 | |
Operating profit | | | 8 | | | | 7,392 | | | | 7,807 | | | | 3,783 | |
| | | | |
Finance income | | | 11 | | | | 79 | | | | 90 | | | | 116 | |
Finance expense | | | 12 | | | | (808 | ) | | | (799 | ) | | | (831 | ) |
Profit on disposal of interest in associates | | | | | | | – | | | | 585 | | | | 8 | |
Share of after tax profits of associates and joint ventures | | | 13 | | | | 29 | | | | 15 | | | | 81 | |
Profit before taxation | | | | | | | 6,692 | | | | 7,698 | | | | 3,157 | |
| | | | |
Taxation | | | 14 | | | | (1,948 | ) | | | (2,240 | ) | | | (1,304 | ) |
| | | | |
Profit after taxation for the year | | | | | | | 4,744 | | | | 5,458 | | | | 1,853 | |
Profit attributable to non-controlling interests | | | | | | | 179 | | | | 197 | | | | 219 | |
Profit attributable to shareholders | | | | | | | 4,565 | | | | 5,261 | | | | 1,634 | |
| | | | | | | | 4,744 | | | | 5,458 | | | | 1,853 | |
| | | | |
Basic earnings per share (pence) | | | 15 | | | | 92.9 | p | | | 104.6 | p | | | 32.1 | p |
Diluted earnings per share (pence) | | | 15 | | | | 91.5 | p | | | 103.2 | p | | | 31.9 | p |
Comparative information has been restated for consistency of presentation as set out in Note 1, ‘Presentation of the financial statements’.
Consolidated statement of comprehensive income for the year ended 31 December 2012
| | | | | | | | | | | | |
| | | 2012
£m | | | 2011 £m | | | 2010
£m | |
Profit for the year | | | 4,744 | | | | 5,458 | | | | 1,853 | |
| | | |
Exchange movements on overseas net assets and net investment hedges | | | (257 | ) | | | (299 | ) | | | 166 | |
Reclassification of exchange on liquidation or disposal of overseas subsidiaries | | | – | | | | (1 | ) | | | (2 | ) |
Fair value movements on available-for-sale investments | | | 77 | | | | (20 | ) | | | 94 | |
Deferred tax on fair value movements on available-for-sale investments | | | (10 | ) | | | 23 | | | | (25 | ) |
Reclassification of fair value movements on available-for-sale investments | | | (19 | ) | | | (29 | ) | | | 1 | |
Deferred tax reversed on reclassification of available-for-sale investments | | | 10 | | | | – | | | | (3 | ) |
Actuarial losses on defined benefit plans | | | (781 | ) | | | (969 | ) | | | (1 | ) |
Deferred tax on actuarial movements in defined benefit plans | | | 221 | | | | 268 | | | | 1 | |
Fair value movements on cash flow hedges | | | (6 | ) | | | – | | | | (8 | ) |
Deferred tax on fair value movements on cash flow hedges | | | – | | | | – | | | | 1 | |
Reclassification of cash flow hedges to income statement | | | 2 | | | | 1 | | | | 3 | |
Cash flow hedge reclassified to goodwill | | | – | | | | – | | | | 6 | |
Share of other comprehensive income/(expense) of associates and joint ventures | | | 30 | | | | (8 | ) | | | – | |
Other comprehensive (expense)/income for the year | | | (733 | ) | | | (1,034 | ) | | | 233 | |
| | | |
Total comprehensive income for the year | | | 4,011 | | | | 4,424 | | | | 2,086 | |
| | | |
Total comprehensive income for the year attributable to: | | | | | | | | | | | | |
Shareholders | | | 3,862 | | | | 4,271 | | | | 1,847 | |
Non-controlling interests | | | 149 | | | | 153 | | | | 239 | |
Total comprehensive income for the year | | | 4,011 | | | | 4,424 | | | | 2,086 | |
|
| GSK Annual Report 2012 | 141 |
Consolidated balance sheet as at 31 December 2012
| | | | | | | | | | | | |
| | | Notes | | | 2012 £m | | | 2011 £m | |
Non-current assets | | | | | | | | | | | | |
Property, plant and equipment | | | 17 | | | | 8,776 | | | | 8,748 | |
Goodwill | | | 18 | | | | 4,359 | | | | 3,754 | |
Other intangible assets | | | 19 | | | | 10,161 | | | | 7,802 | |
Investments in associates and joint ventures | | | 20 | | | | 579 | | | | 560 | |
Other investments | | | 21 | | | | 787 | | | | 590 | |
Deferred tax assets | | | 14 | | | | 2,385 | | | | 2,849 | |
Derivative financial instruments | | | 41 | | | | 54 | | | | 85 | |
Other non-current assets | | | 22 | | | | 682 | | | | 525 | |
Total non-current assets | | | | | | | 27,783 | | | | 24,913 | |
| | | |
Current assets | | | | | | | | | | | | |
Inventories | | | 23 | | | | 3,969 | | | | 3,873 | |
Current tax recoverable | | | 14 | | | | 103 | | | | 85 | |
Trade and other receivables | | | 24 | | | | 5,242 | | | | 5,576 | |
Derivative financial instruments | | | 41 | | | | 49 | | | | 70 | |
Liquid investments | | | 32 | | | | 81 | | | | 184 | |
Cash and cash equivalents | | | 25 | | | | 4,184 | | | | 5,714 | |
Assets held for sale | | | 26 | | | | 64 | | | | 665 | |
Total current assets | | | | | | | 13,692 | | | | 16,167 | |
Total assets | | | | | | | 41,475 | | | | 41,080 | |
| | | |
Current liabilities | | | | | | | | | | | | |
Short-term borrowings | | | 32 | | | | (3,631 | ) | | | (2,698 | ) |
Trade and other payables | | | 27 | | | | (8,054 | ) | | | (7,359 | ) |
Derivative financial instruments | | | 41 | | | | (63 | ) | | | (175 | ) |
Current tax payable | | | 14 | | | | (1,374 | ) | | | (1,643 | ) |
Short-term provisions | | | 29 | | | | (693 | ) | | | (3,135 | ) |
Total current liabilities | | | | | | | (13,815 | ) | | | (15,010 | ) |
| | | |
Non-current liabilities | | | | | | | | | | | | |
Long-term borrowings | | | 32 | | | | (14,671 | ) | | | (12,203 | ) |
Deferred tax liabilities | | | 14 | | | | (1,004 | ) | | | (822 | ) |
Pensions and other post-employment benefits | | | 28 | | | | (3,105 | ) | | | (3,091 | ) |
Other provisions | | | 29 | | | | (699 | ) | | | (499 | ) |
Derivative financial instruments | | | 41 | | | | (2 | ) | | | (2 | ) |
Other non-current liabilities | | | 30 | | | | (1,432 | ) | | | (626 | ) |
Total non-current liabilities | | | | | | | (20,913 | ) | | | (17,243 | ) |
Total liabilities | | | | | | | (34,728 | ) | | | (32,253 | ) |
Net assets | | | | | | | 6,747 | | | | 8,827 | |
| | | |
Equity | | | | | | | | | | | | |
Share capital | | | 33 | | | | 1,349 | | | | 1,387 | |
Share premium account | | | 33 | | | | 2,022 | | | | 1,673 | |
Retained earnings | | | 34 | | | | 652 | | | | 3,370 | |
Other reserves | | | 34 | | | | 1,787 | | | | 1,602 | |
Shareholders’ equity | | | | | | | 5,810 | | | | 8,032 | |
Non-controlling interests | | | | | | | 937 | | | | 795 | |
Total equity | | | | | | | 6,747 | | | | 8,827 | |
Approved by the Board on 5 March 2013
Sir Christopher Gent
Chairman
142 | GSK Annual Report 2012
Financial statements
Consolidated statement of changes in equity for the year ended 31 December 2012
| | | | | | | | | | | | | | | | | | | | | | | | | | | | |
| | | Shareholders’ equity | | | | | | | |
| | | Share
capital
£m | | | Share
premium
£m | | | Retained
earnings
£m | | | Other
reserves
£m | | | Total
£m | | | Non-
controlling
interests
£m | | | Total
equity
£m | |
At 1 January 2010 | | | 1,416 | | | | 1,368 | | | | 6,321 | | | | 900 | | | | 10,005 | | | | 737 | | | | 10,742 | |
| | | | | | | |
Profit for the year | | | – | | | | – | | | | 1,634 | | | | – | | | | 1,634 | | | | 219 | | | | 1,853 | |
Other comprehensive income for the year | | | – | | | | – | | | | 144 | | | | 69 | | | | 213 | | | | 20 | | | | 233 | |
Total comprehensive income for the year | | | – | | | | – | | | | 1,778 | | | | 69 | | | | 1,847 | | | | 239 | | | | 2,086 | |
| | | | | | | |
Distributions to non-controlling interests | | | – | | | | – | | | | – | | | | – | | | | – | | | | (118 | ) | | | (118 | ) |
Dividends to shareholders | | | – | | | | – | | | | (3,205 | ) | | | – | | | | (3,205 | ) | | | – | | | | (3,205 | ) |
Ordinary shares issued | | | 2 | | | | 60 | | | | – | | | | – | | | | 62 | | | | – | | | | 62 | |
Ordinary shares acquired by ESOP Trusts | | | – | | | | – | | | | – | | | | (16 | ) | | | (16 | ) | | | – | | | | (16 | ) |
Ordinary shares transferred by ESOP Trusts | | | – | | | | – | | | | – | | | | 17 | | | | 17 | | | | – | | | | 17 | |
Write-down of shares held by ESOP Trusts | | | – | | | | – | | | | (292 | ) | | | 292 | | | | – | | | | – | | | | – | |
Share-based incentive plans | | | – | | | | – | | | | 175 | | | | – | | | | 175 | | | | – | | | | 175 | |
Tax on share-based incentive plans | | | – | | | | – | | | | 2 | | | | – | | | | 2 | | | | – | | | | 2 | |
At 31 December 2010 | | | 1,418 | | | | 1,428 | | | | 4,779 | | | | 1,262 | | | | 8,887 | | | | 858 | | | | 9,745 | |
| | | | | | | |
Profit for the year | | | – | | | | – | | | | 5,261 | | | | – | | | | 5,261 | | | | 197 | | | | 5,458 | |
Other comprehensive expense for the year | | | – | | | | – | | | | (969 | ) | | | (21 | ) | | | (990 | ) | | | (44 | ) | | | (1,034 | ) |
Total comprehensive income/(expense) for the year | | | – | | | | – | | | | 4,292 | | | | (21 | ) | | | 4,271 | | | | 153 | | | | 4,424 | |
| | | | | | | |
Distributions to non-controlling interests | | | – | | | | – | | | | – | | | | – | | | | – | | | | (234 | ) | | | (234 | ) |
Dividends to shareholders | | | – | | | | – | | | | (3,406 | ) | | | – | | | | (3,406 | ) | | | – | | | | (3,406 | ) |
Changes in non-controlling interests | | | – | | | | – | | | | – | | | | – | | | | – | | | | 18 | | | | 18 | |
Forward contract relating to non-controlling interest | | | – | | | | – | | | | – | | | | (29 | ) | | | (29 | ) | | | – | | | | (29 | ) |
Ordinary shares issued | | | 5 | | | | 245 | | | | – | | | | – | | | | 250 | | | | – | | | | 250 | |
Ordinary shares purchased and cancelled or held as Treasury shares | | | (36 | ) | | | – | | | | (2,191 | ) | | | 36 | | | | (2,191 | ) | | | – | | | | (2,191 | ) |
Ordinary shares acquired by ESOP Trusts | | | – | | | | – | | | | – | | | | (36 | ) | | | (36 | ) | | | – | | | | (36 | ) |
Ordinary shares transferred by ESOP Trusts | | | – | | | | – | | | | – | | | | 45 | | | | 45 | | | | – | | | | 45 | |
Write-down of shares held by ESOP Trusts | | | – | | | | – | | | | (345 | ) | | | 345 | | | | – | | | | – | | | | – | |
Share-based incentive plans | | | – | | | | – | | | | 191 | | | | – | | | | 191 | | | | – | | | | 191 | |
Tax on share-based incentive plans | | | – | | | | – | | | | 50 | | | | – | | | | 50 | | | | – | | | | 50 | |
At 1 January 2012 | | | 1,387 | | | | 1,673 | | | | 3,370 | | | | 1,602 | | | | 8,032 | | | | 795 | | | | 8,827 | |
| | | | | | | |
Profit for the year | | | – | | | | – | | | | 4,565 | | | | – | | | | 4,565 | | | | 179 | | | | 4,744 | |
Other comprehensive (expense)/income for the year | | | – | | | | – | | | | (734 | ) | | | 31 | | | | (703 | ) | | | (30 | ) | | | (733 | ) |
Total comprehensive income for the year | | | – | | | | – | | | | 3,831 | | | | 31 | | | | 3,862 | | | | 149 | | | | 4,011 | |
| | | | | | | |
Distributions to non-controlling interests | | | – | | | | – | | | | – | | | | – | | | | – | | | | (171 | ) | | | (171 | ) |
Dividends to shareholders | | | – | | | | – | | | | (3,814 | ) | | | – | | | | (3,814 | ) | | | – | | | | (3,814 | ) |
Changes in non-controlling interests | | | – | | | | – | | | | (382 | ) | | | – | | | | (382 | ) | | | 164 | | | | (218 | ) |
Forward contract relating to non-controlling interest | | | – | | | | – | | | | – | | | | 8 | | | | 8 | | | | – | | | | 8 | |
Ordinary shares issued | | | 7 | | | | 349 | | | | – | | | | – | | | | 356 | | | | – | | | | 356 | |
Ordinary shares purchased and cancelled or held as Treasury shares | | | (45 | ) | | | – | | | | (2,493 | ) | | | 45 | | | | (2,493 | ) | | | – | | | | (2,493 | ) |
Ordinary shares acquired by ESOP Trusts | | | – | | | | – | | | | – | | | | (37 | ) | | | (37 | ) | | | – | | | | (37 | ) |
Ordinary shares transferred by ESOP Trusts | | | – | | | | – | | | | – | | | | 58 | | | | 58 | | | | – | | | | 58 | |
Write-down of shares held by ESOP Trusts | | | – | | | | – | | | | (80 | ) | | | 80 | | | | – | | | | – | | | | – | |
Share-based incentive plans | | | – | | | | – | | | | 211 | | | | – | | | | 211 | | | | – | | | | 211 | |
Tax on share-based incentive plans | | | – | | | | – | | | | 9 | | | | – | | | | 9 | | | | – | | | | 9 | |
At 31 December 2012 | | | 1,349 | | | | 2,022 | | | | 652 | | | | 1,787 | | | | 5,810 | | | | 937 | | | | 6,747 | |
|
| GSK Annual Report 2012 | 143 |
Consolidated cash flow statement for the year ended 31 December 2012
| | | | | | | | | | | | | | | | |
| | | Notes | | | 2012 £m | | | 2011 £m | | | 2010 £m | |
Cash flow from operating activities | | | | | | | | | | | | | | | | |
Profit after taxation for the year | | | | | | | 4,744 | | | | 5,458 | | | | 1,853 | |
Adjustments reconciling profit after tax to operating cash flows | | | 36 | | | | 1,304 | | | | 2,255 | | | | 6,778 | |
Cash generated from operations | | | | | | | 6,048 | | | | 7,713 | | | | 8,631 | |
Taxation paid | | | | | | | (1,673 | ) | | | (1,463 | ) | | | (1,834 | ) |
Net cash inflow from operating activities | | | | | | | 4,375 | | | | 6,250 | | | | 6,797 | |
| | | | |
Cash flow from investing activities | | | | | | | | | | | | | | | | |
Purchase of property, plant and equipment | | | | | | | (1,051 | ) | | | (923 | ) | | | (1,014 | ) |
Proceeds from sale of property, plant and equipment | | | | | | | 68 | | | | 100 | | | | 92 | |
Purchase of intangible assets | | | | | | | (469 | ) | | | (405 | ) | | | (621 | ) |
Proceeds from sale of intangible assets | | | | | | | 1,056 | | | | 237 | | | | 126 | |
Purchase of equity investments | | | | | | | (229 | ) | | | (76 | ) | | | (279 | ) |
Proceeds from sale of equity investments | | | | | | | 28 | | | | 68 | | | | 27 | |
Purchase of businesses, net of cash acquired | | | 38 | | | | (2,235 | ) | | | (264 | ) | | | (354 | ) |
Investments in associates and joint ventures | | | 38 | | | | (99 | ) | | | (35 | ) | | | (61 | ) |
Proceeds from disposal of subsidiary and interest in associate | | | | | | | – | | | | 1,034 | | | | – | |
Decrease in liquid investments | | | | | | | 224 | | | | 30 | | | | 91 | |
Interest received | | | | | | | 30 | | | | 97 | | | | 107 | |
Dividends from associates and joint ventures | | | | | | | 46 | | | | 25 | | | | 18 | |
Net cash outflow from investing activities | | | | | | | (2,631 | ) | | | (112 | ) | | | (1,868 | ) |
| | | | |
Cash flow from financing activities | | | | | | | | | | | | | | | | |
Proceeds from own shares for employee share options | | | | | | | 58 | | | | 45 | | | | 17 | |
Shares acquired by ESOP Trusts | | | | | | | (37 | ) | | | (36 | ) | | | (16 | ) |
Issue of share capital | | | 33 | | | | 356 | | | | 250 | | | | 62 | |
Purchase of own shares for cancellation or to be held as Treasury shares | | | | | | | (2,493 | ) | | | (2,191 | ) | | | – | |
Purchase of non-controlling interests | | | | | | | (14 | ) | | | – | | | | – | |
Increase in long-term loans | | | | | | | 4,430 | | | | – | | | | – | |
Increase in short-term loans | | | | | | | 1,743 | | | | 45 | | | | 6 | |
Repayment of short-term loans | | | | | | | (2,559 | ) | | | (8 | ) | | | (1,296 | ) |
Net repayment of obligations under finance leases | | | | | | | (35 | ) | | | (38 | ) | | | (45 | ) |
Interest paid | | | | | | | (779 | ) | | | (769 | ) | | | (775 | ) |
Dividends paid to shareholders | | | | | | | (3,814 | ) | | | (3,406 | ) | | | (3,205 | ) |
Distributions to non-controlling interests | | | | | | | (171 | ) | | | (234 | ) | | | (118 | ) |
Other financing cash flows | | | | | | | (36 | ) | | | 110 | | | | (201 | ) |
Net cash outflow from financing activities | | | | | | | (3,351 | ) | | | (6,232 | ) | | | (5,571 | ) |
| | | | | | | | | | | | | | | | | |
Decrease in cash and bank overdrafts | | | 37 | | | | (1,607 | ) | | | (94 | ) | | | (642 | ) |
| | | | |
Cash and bank overdrafts at beginning of year | | | | | | | 5,605 | | | | 5,807 | | | | 6,368 | |
Exchange adjustments | | | | | | | (92 | ) | | | (108 | ) | | | 81 | |
Decrease in cash and bank overdrafts | | | | | | | (1,607 | ) | | | (94 | ) | | | (642 | ) |
Cash and bank overdrafts at end of year | | | | | | | 3,906 | | | | 5,605 | | | | 5,807 | |
| | | | |
Cash and bank overdrafts at end of year comprise: | | | | | | | | | | | | | | | | |
Cash and cash equivalents | | | | | | | 4,184 | | | | 5,714 | | | | 6,057 | |
Overdrafts | | | | | | | (278 | ) | | | (109 | ) | | | (250 | ) |
| | | | | | | | 3,906 | | | | 5,605 | | | | 5,807 | |
144 | GSK Annual Report 2012
Notes to the financial statements
| 1 | Presentation of the financial statements |
Description of business
GlaxoSmithKline is a major global healthcare group which is engaged in the creation and discovery, development, manufacture and marketing of pharmaceutical products including vaccines, Over-the-counter (OTC) medicines and health-related consumer products. GSK’s principal pharmaceutical products include medicines in the following therapeutic areas: respiratory, anti-virals, central nervous system, cardiovascular and urogenital, metabolic, antibacterials, oncology and emesis, dermatology, rare diseases, immuno-inflammation, vaccines and HIV.
Compliance with applicable law and IFRS
The financial statements have been prepared in accordance with the Companies Act 2006, Article 4 of the IAS Regulation and International Accounting Standards (IAS) and International Financial Reporting Standards (IFRS) and related interpretations, as adopted by the European Union.
The financial statements are also in compliance with IFRS as issued by the International Accounting Standards Board.
Composition of financial statements
The consolidated financial statements are drawn up in Sterling, the functional currency of GlaxoSmithKline plc, and in accordance with IFRS accounting presentation. The financial statements comprise:
| • | | Consolidated income statement |
| • | | Consolidated statement of comprehensive income |
| • | | Consolidated balance sheet |
| • | | Consolidated statement of changes in equity |
| • | | Consolidated cash flow statement |
| • | | Notes to the financial statements. |
Composition of the Group
A list of the subsidiary and associated undertakings which, in the opinion of the Directors, principally affected the amount of profit or the net assets of the Group is given in Note 43, ‘Principal Group companies’.
Accounting principles and policies
The financial statements have been prepared using the historical cost convention modified by the revaluation of certain items, as stated in the accounting policies, and on a going concern basis.
The financial statements have been prepared in accordance with the Group’s accounting policies approved by the Board and described in Note 2, ‘Accounting principles and policies’. Information on the application of these accounting policies, including areas of estimation and judgement is given in Note 3, ‘Key accounting judgements and estimates’.
The preparation of the financial statements in conformity with generally accepted accounting principles requires management to make estimates and assumptions that affect the reported amounts of assets and liabilities and disclosure of contingent assets and liabilities at the date of the financial statements and the reported amounts of revenues and expenses during the reporting period. Actual results could differ from those estimates.
As set out in Note 6, ‘Segment information’ the segments for which turnover and operating profit are disclosed have been amended to reflect changes in the Group’s internal management structure together with certain changes to the therapeutic classifications of turnover by product. In addition, charges for amortisation and impairment of intangible assets related to marketed products are now reported in cost of sales rather than in SG&A. Comparative information has been restated accordingly. The adjustment for 2011 increases cost of sales and decreases SG&A by £316 million from the amounts previously reported.
Implementation of new accounting standards
With effect from 1 January 2012, GSK has implemented amendments to IFRS 7 ‘Disclosures – Transfers of financial assets’ and IAS 12 ‘Deferred tax: recovery of underlying assets’. These revisions had no material impact on the current period.
Financial period
These financial statements cover the financial year from 1 January to 31 December 2012, with comparative figures for the financial years from 1 January to 31 December 2011 and, where appropriate, from 1 January to 31 December 2010.
Parent company financial statements
The financial statements of the parent company, GlaxoSmithKline plc, have been prepared in accordance with UK GAAP and with UK accounting presentation. The company balance sheet is presented on page 220 and the accounting policies are given on page 221.
| 2 | Accounting principles and policies |
Consolidation
The consolidated financial statements include:
| • | | the assets and liabilities, and the results and cash flows, of the company and its subsidiaries, including ESOP Trusts |
| • | | the Group’s share of the results and net assets of associates and joint ventures. |
The financial statements of entities consolidated are made up to 31 December each year.
Entities over which the Group has the power to govern the financial and operating policies are accounted for as subsidiaries. Where the Group has the ability to exercise joint control, the entities are accounted for as joint ventures, and where the Group has the ability to exercise significant influence, they are accounted for as associates. The results and assets and liabilities of associates and joint ventures are incorporated into the consolidated financial statements using the equity method of accounting.
Interests acquired in entities are consolidated from the date the Group acquires control and interests sold are de-consolidated from the date control ceases.
|
| GSK Annual Report 2012 | 145 |
| 2 | Accounting principles and policiescontinued |
Transactions and balances between subsidiaries are eliminated and no profit before tax is taken on sales between subsidiaries until the products are sold to customers outside the Group. The relevant proportion of profits on transactions with joint ventures and associates is also deferred until the products are sold to third parties. Transactions with non-controlling interests are recorded directly in equity. Deferred tax relief on unrealised intra-Group profit is accounted for only to the extent that it is considered recoverable.
Goodwill is capitalised as a separate item in the case of subsidiaries and as part of the cost of investment in the case of joint ventures and associates. Goodwill is denominated in the currency of the operation acquired.
Where the cost of acquisition is below the fair value of the net assets acquired, the difference is recognised directly in the income statement.
Business combinations
Business combinations are accounted for using the acquisition accounting method. Identifiable assets, liabilities and contingent liabilities acquired are measured at fair value at acquisition date. The consideration transferred is measured at fair value and includes the fair value of any contingent consideration. Where the consideration transferred exceeds the fair value of the net assets, liabilities and contingent liabilities acquired together with the non-controlling interest, the excess is recorded as goodwill. The costs of acquisition are charged to the income statement in the period in which they are incurred.
Where not all of the equity of a subsidiary is acquired the non-controlling interest is recognised either at fair value or at the non-controlling interest’s share of the net assets of the subsidiary, on a case-by-case basis. Changes in the Group’s ownership percentage of subsidiaries are accounted for within equity.
Foreign currency translation
Foreign currency transactions are booked in the functional currency of the Group company at the exchange rate ruling on the date of transaction. Foreign currency monetary assets and liabilities are retranslated into the functional currency at rates of exchange ruling at the balance sheet date. Exchange differences are included in the income statement.
On consolidation, assets and liabilities, including related goodwill, of overseas subsidiaries, associates and joint ventures, are translated into Sterling at rates of exchange ruling at the balance sheet date. The results and cash flows of overseas subsidiaries, associates and joint ventures are translated into Sterling using average rates of exchange.
Exchange adjustments arising when the opening net assets and the profits for the year retained by overseas subsidiaries, associates and joint ventures are translated into Sterling, less exchange differences arising on related foreign currency borrowings which hedge the Group’s net investment in these operations, are taken to a separate component of equity.
When translating into Sterling the assets, liabilities, results and cash flows of overseas subsidiaries, associates and joint ventures which are reported in currencies of hyper-inflationary economies, adjustments are made where material to reflect current price levels. Any loss on net monetary assets is charged to the consolidated income statement.
Revenue
Revenue is recognised in the income statement when goods or services are supplied or made available to external customers against orders received, title and risk of loss is passed to the customer, reliable estimates can be made of relevant deductions and all relevant obligations have been fulfilled, such that the earnings process is regarded as being complete.
Turnover represents net invoice value after the deduction of discounts and allowances given and accruals for estimated future rebates and returns. The methodology and assumptions used to estimate rebates and returns are monitored and adjusted regularly in the light of contractual and legal obligations, historical trends, past experience and projected market conditions. Market conditions are evaluated using wholesaler and other third-party analyses, market research data and internally generated information. Value added tax and other sales taxes are excluded from revenue.
Where the Group co-promotes a product and the third party records the sale, the Group records its share of revenue as co-promotion income within turnover. The nature of co-promotion activities is such that the Group records no costs of sales. Pharmaceutical turnover includes co-promotion revenue of £234 million (2011 – £221 million; 2010 – £294 million).
Royalty income is recognised on an accruals basis in accordance with the terms of the relevant licensing agreements.
Expenditure
Expenditure is recognised in respect of goods and services received when supplied in accordance with contractual terms. Provision is made when an obligation exists for a future liability in respect of a past event and where the amount of the obligation can be reliably estimated. Manufacturing start-up costs between validation and the achievement of normal production are expensed as incurred. Advertising and promotion expenditure is charged to the income statement as incurred. Shipment costs on inter-company transfers are charged to cost of sales; distribution costs on sales to customers are included in selling, general and administrative expenditure.
Restructuring costs are recognised and provided for, where appropriate, in respect of the direct expenditure of a business reorganisation where the plans are sufficiently detailed and well advanced, and where appropriate communication to those affected has been undertaken.
Research and development
Research and development expenditure is charged to the income statement in the period in which it is incurred. Development expenditure is capitalised when the criteria for recognising an asset are met, usually when a regulatory filing has been made in a major market and approval is considered highly probable. Property, plant and equipment used for research and development is capitalised and depreciated in accordance with the Group’s policy.
Environmental expenditure
Environmental expenditure related to existing conditions resulting from past or current operations and from which no current or future benefit is discernible is charged to the income statement. The Group recognises its liability on a site-by-site basis when it can be reliably estimated. This liability includes the Group’s portion of the total costs and also a portion of other potentially responsible parties’ costs when it is probable that they will not be able to satisfy their respective shares of the clean-up obligation. Recoveries of reimbursements are recorded as assets when virtually certain.
146 | GSK Annual Report 2012
Notes to the financial statements
| 2 | Accounting principles and policies continued |
Legal and other disputes
Provision is made for the anticipated settlement costs of legal or other disputes against the Group where an outflow of resources is considered probable and a reliable estimate can be made of the likely outcome. In addition, provision is made for legal or other expenses arising from claims received or other disputes. In respect of product liability claims related to certain products, there is sufficient history of claims made and settlements to enable management to make a reliable estimate of the provision required to cover unasserted claims. In certain cases, an incurred but not reported (IBNR) actuarial technique is used to determine this estimate.
The Group may become involved in legal proceedings, in respect of which it is not possible to make a reliable estimate of the expected financial effect, if any, that could result from ultimate resolution of the proceedings. In these cases, appropriate disclosure about such cases would be included but no provision would be made. Costs associated with claims made by the Group against third parties are charged to the income statement as they are incurred.
Pensions and other post-employment benefits
The costs of providing pensions under defined benefit schemes are calculated using the projected unit credit method and spread over the period during which benefit is expected to be derived from the employees’ services, consistent with the advice of qualified actuaries. Pension obligations are measured as the present value of estimated future cash flows discounted at rates reflecting the yields of high quality corporate bonds.
Pension scheme assets are measured at fair value at the balance sheet date. Actuarial gains and losses, differences between the expected and actual returns of assets and the effect of changes in actuarial assumptions, are recognised in the statement of comprehensive income in the year in which they arise.
The Group’s contributions to defined contribution plans are charged to the income statement as incurred. The costs of other post-employment liabilities are calculated in a similar way to defined benefit pension schemes and spread over the period during which benefit is expected to be derived from the employees’ services, in accordance with the advice of qualified actuaries.
Employee share plans
Incentives in the form of shares are provided to employees under share option and share award schemes.
The fair values of these options and awards are calculated at their grant dates using a Black-Scholes option pricing model and charged to the income statement over the relevant vesting periods.
The Group provides finance to ESOP Trusts to purchase company shares on the open market to meet the obligation to provide shares when employees exercise their options or awards. Costs of running the ESOP Trusts are charged to the income statement. Shares held by the ESOP Trusts are deducted from other reserves. A transfer is made between other reserves and retained earnings over the vesting periods of the related share options or awards to reflect the ultimate proceeds receivable from employees on exercise.
Property, plant and equipment
Property, plant and equipment (PP&E) is stated at the cost of purchase or construction less provisions for depreciation and impairment. Financing costs are capitalised within the cost of qualifying assets in construction.
Depreciation is calculated to write off the cost less residual value of PP&E, excluding freehold land, using the straight-line basis over the expected useful life. Residual values and lives are reviewed, and where appropriate adjusted, annually. The normal expected useful lives of the major categories of PP&E are:
| | |
Freehold buildings | | 20 to 50 years |
Leasehold land and buildings | | Lease term or 20 to 50 years |
Plant and machinery | | 10 to 20 years |
Equipment and vehicles | | 3 to 10 years |
On disposal of PP&E, the cost and related accumulated depreciation and impairments are removed from the financial statements and the net amount, less any proceeds, is taken to the income statement.
Leases
Leasing agreements which transfer to the Group substantially all the benefits and risks of ownership of an asset are treated as finance leases, as if the asset had been purchased outright. The assets are included in PP&E or computer software and the capital elements of the leasing commitments are shown as obligations under finance leases. Assets held under finance leases are depreciated on a basis consistent with similar owned assets or the lease term if shorter. The interest element of the lease rental is included in the income statement. All other leases are operating leases and the rental costs are charged to the income statement on a straight-line basis over the lease term.
Goodwill
Goodwill is stated at cost less impairments. Goodwill is deemed to have an indefinite useful life and is tested for impairment at least annually.
Where the fair value of the interest acquired in an entity’s assets, liabilities and contingent liabilities exceeds the consideration paid, this excess is recognised immediately as a gain in the income statement.
Other intangible assets
Intangible assets are stated at cost less provisions for amortisation and impairments.
Licences, patents, know-how and marketing rights separately acquired or acquired as part of a business combination are amortised over their estimated useful lives, generally not exceeding 20 years, using the straight-line basis, from the time they are available for use. The estimated useful lives for determining the amortisation charge take into account patent lives, where applicable, as well as the value obtained from periods of non-exclusivity. Asset lives are reviewed, and where appropriate adjusted, annually. Contingent milestone payments are recognised at the point that the contingent event becomes certain. Any development costs incurred by the Group and associated with acquired licences, patents, know-how or marketing rights are written off to the income statement when incurred, unless the criteria for recognition of an internally generated intangible asset are met, usually when a regulatory filing has been made in a major market and approval is considered highly probable.
|
| GSK Annual Report 2012 | 147 |
| 2 | Accounting principles and policiescontinued |
Acquired brands are valued independently as part of the fair value of businesses acquired from third parties where the brand has a value which is substantial and long-term and where the brands either are contractual or legal in nature or can be sold separately from the rest of the businesses acquired. Brands are amortised over their estimated useful lives of up to 20 years, except where it is considered that the useful economic life is indefinite.
The costs of acquiring and developing computer software for internal use and internet sites for external use are capitalised as intangible fixed assets where the software or site supports a significant business system and the expenditure leads to the creation of a durable asset. ERP systems software is amortised over seven to ten years and other computer software over three to five years.
Impairment of non-current assets
The carrying values of all non-current assets are reviewed for impairment, either on a stand-alone basis or as part of a larger cash generating unit, when there is an indication that the assets might be impaired. Additionally, goodwill, intangible assets with indefinite useful lives and intangible assets which are not yet available for use are tested for impairment annually. Any provision for impairment is charged to the income statement in the year concerned.
Impairments of goodwill are not reversed. Impairment losses on other non-current assets are only reversed if there has been a change in estimates used to determine recoverable amounts and only to the extent that the revised recoverable amounts do not exceed the carrying values that would have existed, net of depreciation or amortisation, had no impairments been recognised.
Investments in associates and joint ventures
Investments in associates and joint ventures are carried in the consolidated balance sheet at the Group’s share of their net assets at date of acquisition and of their post-acquisition retained profits or losses together with any goodwill arising on the acquisition.
Available-for-sale investments
Liquid investments and other investments are classified as available-for-sale investments and are initially recorded at fair value plus transaction costs and then remeasured at subsequent reporting dates to fair value. Unrealised gains and losses on available-for-sale investments are recognised directly in other comprehensive income. Impairments arising from the significant or prolonged decline in fair value of an equity investment reduce the carrying amount of the asset directly and are charged to the income statement.
On disposal or impairment of the investments, any gains and losses that have been deferred in other comprehensive income are reclassified to the income statement. Dividends on equity investments are recognised in the income statement when the Group’s right to receive payment is established. Equity investments are recorded in non-current assets unless they are expected to be sold within one year.
Purchases and sales of equity investments are accounted for on the trade date and purchases and sales of other available-for-sale investments are accounted for on settlement date.
Inventories
Inventories are included in the financial statements at the lower of cost (including raw materials, direct labour, other direct costs and related production overheads) and net realisable value. Cost is generally determined on a first in, first out basis. Pre-launch inventory is held as an asset when there is a high probability of regulatory approval for the product. Before that point a provision is made against the carrying value to its recoverable amount; the provision is then reversed at the point when a high probability of regulatory approval is determined.
Trade receivables
Trade receivables are carried at original invoice amount less any provisions for doubtful debts. Provisions are made where there is evidence of a risk of non-payment, taking into account ageing, previous experience and general economic conditions. When a trade receivable is determined to be uncollectable it is written off, firstly against any provision available and then to the income statement.
Subsequent recoveries of amounts previously provided for are credited to the income statement. Long-term receivables are discounted where the effect is material.
Trade payables
Trade payables are initially recognised at fair value and then held at amortised cost which equates to nominal value. Long-term payables are discounted where the effect is material.
Cash and cash equivalents
Cash and cash equivalents comprise cash in hand, current balances with banks and similar institutions and highly liquid investments generally with maturities of three months or less. They are readily convertible into known amounts of cash and have an insignificant risk of changes in value.
Borrowings
All borrowings are initially recorded at the amount of proceeds received, net of transaction costs. Borrowings are subsequently carried at amortised cost, with the difference between the proceeds, net of transaction costs, and the amount due on redemption being recognised as a charge to the income statement over the period of the relevant borrowing.
Taxation
Current tax is provided at the amounts expected to be paid applying tax rates that have been enacted or substantively enacted by the balance sheet date.
Deferred tax is provided in full, using the liability method, on temporary differences arising between the tax bases of assets and liabilities and their carrying amounts in the financial statements. Deferred tax assets are recognised to the extent that it is probable that future taxable profits will be available against which the temporary differences can be utilised. Deferred tax is provided on temporary differences arising on investments in subsidiaries, associates and joint ventures, except where the timing of the reversal of the temporary difference can be controlled and it is probable that the temporary difference will not reverse in the foreseeable future. Deferred tax is provided using rates of tax that have been enacted or substantively enacted by the balance sheet date.
148 | GSK Annual Report 2012
Notes to the financial statements
| 2 | Accounting principles and policies continued |
Derivative financial instruments and hedging
Derivative financial instruments are used to manage exposure to market risks. The principal derivative instruments used by GSK are foreign currency swaps, interest rate swaps and forward foreign exchange contracts. The Group does not hold or issue derivative financial instruments for trading or speculative purposes.
Derivative financial instruments are classified as held-for-trading and are carried in the balance sheet at fair value. Derivatives designated as hedging instruments are classified on inception as cash flow hedges, net investment hedges or fair value hedges.
Changes in the fair value of derivatives designated as cash flow hedges are recognised in other comprehensive income to the extent that the hedges are effective. Ineffective portions are recognised in profit or loss immediately. Amounts deferred in other comprehensive income are reclassified to the income statement when the hedged item affects profit or loss.
Net investment hedges are accounted for in a similar way to cash flow hedges.
Changes in the fair value of derivatives designated as fair value hedges are recorded in the income statement, together with the changes in the fair value of the hedged asset or liability.
Changes in the fair value of any derivative instruments that do not qualify for hedge accounting are recognised immediately in the income statement.
Discounting
Where the time effect of money is material, balances are discounted to current values using appropriate rates of interest. The unwinding of the discounts is recorded in finance income and finance expense.
| 3 | Key accounting judgements and estimates |
In preparing the financial statements, management is required to make estimates and assumptions that affect the amounts of assets, liabilities, revenue and expenses reported in the financial statements. Actual amounts and results could differ from those estimates. The following are considered to be the key accounting judgements and estimates made.
Turnover
Revenue is recognised when title and risk of loss is passed to the customer, reliable estimates can be made of relevant deductions and all relevant obligations have been fulfilled, such that the earnings process is regarded as being complete.
Gross turnover is reduced by rebates, discounts, allowances and product returns given or expected to be given, which vary by product arrangements and buying groups. These arrangements with purchasing organisations are dependent upon the submission of claims some time after the initial recognition of the sale. Accruals are made at the time of sale for the estimated rebates, discounts or allowances payable or returns to be made, based on available market information and historical experience.
Because the amounts are estimated they may not fully reflect the final outcome, and the amounts are subject to change dependent upon, amongst other things, the types of buying group and product sales mix.
The level of accrual is reviewed and adjusted regularly in the light of contractual and legal obligations, historical trends, past experience and projected market conditions. Market conditions are evaluated using wholesaler and other third-party analyses, market research data and internally generated information. Future events could cause the assumptions on which the accruals are based to change, which could affect the future results of the Group.
Taxation
Current tax is provided at the amounts expected to be paid, and deferred tax is provided on temporary differences between the tax bases of assets and liabilities and their carrying amounts, at the rates that have been enacted or substantively enacted by the balance sheet date.
Deferred tax assets are recognised to the extent that it is probable that future taxable profits will be available against which the temporary differences can be utilised, based on management’s assumptions relating to the amounts and timing of future taxable profits. Factors affecting the tax charge in future years are set out in Note 14, ‘Taxation’. A 1% change in the Group’s effective tax rate in 2012 would have changed the total tax charge for the year by approximately £67 million.
The Group has open tax issues with a number of revenue authorities. Where an outflow of funds is believed to be probable and a reliable estimate of the outcome of the dispute can be made, management provides for its best estimate of the liability. These estimates take into account the specific circumstances of each dispute and relevant external advice, are inherently judgemental and could change substantially over time as new facts emerge and each dispute progresses. Details relating to significant unresolved disputes are set out in Note 14, ‘Taxation’. GSK continues to believe that it has made adequate provision for the liabilities likely to arise from open assessments. Where open issues exist the ultimate liability for such matters may vary from the amounts provided and is dependent upon the outcome of negotiations with the relevant tax authorities or, if necessary, litigation proceedings.
Legal and other disputes
GSK provides for anticipated settlement costs where an outflow of resources is considered probable and a reliable estimate may be made of the likely outcome of the dispute and legal and other expenses arising from claims against the Group. These estimates take into account the specific circumstances of each dispute and relevant external advice, are inherently judgmental and could change substantially over time as new facts emerge and each dispute progresses. Details of the status and various uncertainties involved in the significant unresolved disputes are set out in Note 44, ‘Legal proceedings’.
|
| GSK Annual Report 2012 | 149 |
| 3 | Key accounting judgements and estimatescontinued |
The company’s Directors, having taken legal advice, have established provisions after taking into account the relevant facts and circumstances of each matter and in accordance with accounting requirements. In respect of product liability claims related to certain products there is sufficient history of claims made and settlements to enable management to make a reliable estimate of the provision required to cover unasserted claims. The Group may become involved in legal proceedings, in respect of which it is not possible to make a reliable estimate of the expected financial effect, if any, that will result from ultimate resolution of the proceedings. In these cases, appropriate disclosure about such cases would be included, but no provision would be made and no contingent liability can be quantified. At 31 December 2012 provisions for legal and other disputes amounted to £0.5 billion (2011 – £2.8 billion).
The ultimate liability for legal claims may vary from the amounts provided and is dependent upon the outcome of litigation proceedings, investigations and possible settlement negotiations. The position could change over time and, therefore, there can be no assurance that any losses that result from the outcome of any legal proceedings will not exceed the amount of the provisions reported in the Group’s financial statements by a material amount.
Property, plant and equipment
As set out in Note 17, ‘Property, plant and equipment’ the carrying values of property, plant and equipment are tested for impairment when there is an indication that the values of the assets might be impaired. Impairment is determined by reference to the higher of fair value less costs to sell and value in use, measured by assessing risk-adjusted future cash flows over the estimated useful life of the asset, discounted using appropriate interest rates. The ranges of estimated useful lives applied for each category of property, plant and equipment are set out in Note 2, ‘Accounting principles and policies’. The assumptions relating to future cash flows, estimated useful lives and discount rates are based on business forecasts and are therefore inherently judgemental. Given the large number of individual items of property, plant and equipment, it is not considered likely that a reasonably possible change in the assumptions applied in the impairment test of any one item would lead to a material adverse effect on the future results of the Group. However, future events could cause the assumptions used in these impairment tests to change, with a consequent adverse effect on the future results of the Group.
Goodwill
Goodwill arising on business combinations is capitalised and allocated to an appropriate cash generating unit. It is deemed to have an indefinite life and so is not amortised.
Annual impairment tests of the relevant cash generating units are performed. Impairment tests are based on established market multiples or risk-adjusted future cash flows discounted using appropriate interest rates. The assumptions used in these impairment tests are set out in Note 18, ‘Goodwill’.
In each case the valuations indicate sufficient headroom such that a reasonably possible change to key assumptions is unlikely to result in an impairment of the related goodwill. The assumptions relating to future cash flows and discount rates are based on business forecasts and are therefore inherently judgemental. Future events could cause the assumptions used in these impairment tests to change with a consequent adverse effect on the future results of the Group.
Other intangible assets
Where intangible assets are acquired by GSK from third parties the costs of acquisition are capitalised. Licences to compounds in development are amortised from the point at which they are available for use, over their estimated useful lives, which may include periods of non-exclusivity. Estimated useful lives are reviewed annually and impairment tests are undertaken if events occur which call into question the carrying values of the assets. Brands acquired with businesses are capitalised independently where they are separable and have an expected life of more than one year. Brands are amortised on a straight-line basis over their estimated useful lives, not exceeding 20 years, except where the end of the useful economic life cannot be foreseen. Where brands are not amortised, they are subject to annual impairment tests.
Both initial valuations and valuations for subsequent impairment tests are based on established market multiples or risk-adjusted future cash flows over the estimated useful life of the asset, where limited, discounted using appropriate interest rates as set out in Note 19, ‘Other intangible assets’. The assumptions relating to future cash flows, estimated useful lives and discount rates are based on business forecasts and are therefore inherently judgemental. Future events could cause the assumptions used in these impairment reviews to change with a consequent adverse effect on the future results of the Group.
Pensions and other post-employment benefits
The costs of providing pensions and other post-employment benefits are charged to the income statement in accordance with IAS 19 ‘Employee benefits’ over the period during which benefit is derived from the employee’s services. The costs are assessed on the basis of assumptions selected by management. These assumptions include future earnings and pension increases, discount rates, expected long term rates of return on assets and mortality rates, and are disclosed in Note 28, ‘Pensions and other post-employment benefits’.
The expected long term rates of return on bonds are determined based on the portfolio mix of index-linked, government and corporate bonds. An equity risk premium is added to this for equities.
Discount rates are derived from AA rated corporate bond yields except in countries where there is no deep market in corporate bonds where government bond yields are used. Sensitivity analysis is provided in Note 28, ‘Pensions and other post-employment benefits’, but a 0.25% reduction in the discount rate would lead to an increase in the net pension deficit of approximately £555 million and an increase in the annual pension cost of approximately £27 million. The selection of different assumptions could affect the future results of the Group.
150 | GSK Annual Report 2012
Notes to the financial statements
| 4 | New accounting requirements |
An amendment to IAS 19 ‘Employee benefits’ was issued in June 2011 and will be implemented by GSK from 1 January 2013. The amendment eliminates the ability to defer the recognition of gains and losses (the ‘corridor’ method), requires remeasurements to be presented in other comprehensive income, requires past service cost to be recognised in the income statement in the year of the plan amendment rather than deferring the portion related to unvested benefits, requires the return on plan assets recognised in the income statement to be calculated using the same rate as the discount rate applied to the pension obligation and makes several other minor accounting and disclosure changes.
The revised Standard is expected to increase the pension charge in 2013 by approximately £160 million. Had the Standard been applied in 2012 it is estimated that the pension charge would have increased by approximately £92 million (2011 – £73 million). The increase in effect in 2013 reflects the reduction in UK and US discount rates compared with 2012.
When the revised Standard is implemented in 2013, prior year information will be restated onto a comparable basis.
The following new and amended accounting standards and IFRIC interpretations have been issued by the IASB and are likely to affect future Annual Reports, although, in their current forms, none is expected to have a material impact on the results or financial position of the Group.
IFRS 10 ‘Consolidated financial statements’ was issued in May 2011 and replaces the parts of IAS 27 ‘Separate financial statements’ that previously dealt with consolidated financial statements and SIC 12 ‘Consolidation – Special purpose entities’. The Standard uses control as the single basis for determining whether or not an entity should be consolidated.
IFRS 11 ‘Joint arrangements’ was issued in May 2011. The Standard requires an entity to report its share of assets, liabilities, revenue and expenses of a joint operation in its financial statements and to apply the equity method of accounting to joint ventures in its consolidated financial statements.
IFRS 12 ‘Disclosures of interests in other entities’ was issued in May 2011. The Standard requires disclosures related to the financial effects of and risks associated with an entity’s investments in subsidiaries, joint arrangements, associates and unconsolidated structured entities.
An amendment to IAS 28 ‘Investments in associates and joint ventures’ was issued in May 2011. The Standard requires the equity method of accounting to be applied to investments in associates and joint ventures in consolidated accounts.
The EU endorsements of IFRS 10, IFRS 11, IFRS 12 and the amended IAS 28 do not require implementation until 1 January 2014, but they will be implemented by GSK from 1 January 2013 in accordance with the IASB’s implementation timetable.
IFRS 13 ‘Fair value measurement’ was issued in May 2011 and will be implemented by GSK from 1 January 2013. The Standard provides guidance on fair value measurement and introduces consistent disclosure requirements for those situations where another standard permits or requires fair value measurement.
An amendment to IAS 1 ‘Presentation of items of other comprehensive income’ was issued in June 2011 and will be implemented by GSK from 1 January 2013. This amendment changes some of the required disclosures in the financial statements, particularly in respect of the statement of comprehensive income.
An amendment to IFRS 7 ‘Disclosures – Offsetting financial assets and financial liabilities’ was issued in December 2011 and will be implemented by GSK from 1 January 2013. The amendment requires additional disclosures where financial assets and financial liabilities are offset in the balance sheet.
An amendment to IAS 32 ‘Offsetting financial assets and financial liabilities’ was issued in December 2011 and will be implemented by GSK from 1 January 2014. The amendment provides additional guidance on when financial assets and financial liabilities may be offset.
IFRS 9 ‘Financial instruments’ was first issued in November 2009 and amended in October 2010 and will be implemented by GSK from its current effective date on 1 January 2015. The Standard will eventually replace IAS 39 and covers the classification, measurement and derecognition of financial assets and financial liabilities. The IASB intends to expand IFRS 9 to add new requirements for impairment and hedge accounting and for it to become a complete replacement of IAS 39 in due course.
The Group uses the average of exchange rates prevailing during the period to translate the results and cash flows of overseas subsidiaries, joint ventures and associated undertakings into Sterling and period end rates to translate the net assets of those undertakings. The currencies which most influence these translations and the relevant exchange rates were:
| | | | | | | | | | | | |
| | | 2012 | | | 2011 | | | 2010 | |
Average rates: | | | | | | | | | | | | |
US$/£ | | | 1.59 | | | | 1.61 | | | | 1.55 | |
Euro/£ | | | 1.23 | | | | 1.15 | | | | 1.16 | |
Yen/£ | | | 127 | | | | 128 | | | | 136 | |
| | | |
Period end rates: | | | | | | | | | | | | |
US$/£ | | | 1.63 | | | | 1.55 | | | | 1.56 | |
Euro/£ | | | 1.23 | | | | 1.20 | | | | 1.17 | |
Yen/£ | | | 141 | | | | 120 | | | | 127 | |
|
| GSK Annual Report 2012 | 151 |
The Group has revised its segment information disclosures to reflect changes in the internal reporting structures with effect from 1 January 2012. The Pharmaceuticals and Vaccines businesses in Emerging Markets and Asia Pacific (excluding Australasia) have been combined into one segment (EMAP). In addition, the classification of certain products has been changed in 2012, including:
| • | | The transfer of OTC dermatology brands acquired with the Stiefel business from the Pharmaceuticals and Vaccines business to Consumer Healthcare in the USA and Europe; |
| • | | The creation of a Rare diseases therapy area; and |
| • | | The transfer ofZoviraxfrom the Dermatology therapy area to the Anti-virals therapy area. |
Comparative information has been restated on a consistent basis.
GSK’s operating segments are being reported based on the financial information provided to the Chief Executive Officer and the responsibilities of the Corporate Executive Team (CET). Individual members of the CET are responsible for each geographic segment of the Pharmaceuticals and Vaccines business, ViiV Healthcare and the Consumer Healthcare business as a whole, respectively.
R&D investment is essential for the sustainability of the pharmaceutical businesses. However, for segment reporting, the US, Europe, Emerging Markets Asia Pacific and Japan Pharmaceuticals and Vaccines operating profits exclude allocations of globally funded R&D as well as central costs, principally corporate functions and unallocated manufacturing costs. GSK’s management reporting process allocates intra-Group profit on a product sale to the market in which that sale is recorded, and the profit analyses below have been presented on that basis.
Other trading and unallocated pharmaceuticals and vaccines includes Canada, Puerto Rico, Australasia, central vaccine tender sales and contract manufacturing sales, together with costs such as vaccines R&D, central dermatology costs and central manufacturing costs not attributed to other segments.
The Pharmaceuticals R&D segment is the responsibility of the Chairman, Research & Development and is reported as a separate segment.
Corporate and other unallocated costs and disposal profits include corporate functions, costs for legal matters, amortisation and impairment of intellectual property, major restructuring costs, acquisition accounting adjustments on major acquisitions, fair value movements on financial instruments and investments, profits on global asset disposals and other items of other operating income.
| | | | | | | | | | | | |
| Turnover by segment | | 2012 £m | | | 2011
(restated)
£m | | | 2010
(restated)
£m | |
Pharmaceuticals and Vaccines | | | | | | | | | | | | |
USA | | | 7,000 | | | | 7,022 | | | | 7,629 | |
Europe | | | 5,001 | | | | 5,700 | | | | 6,479 | |
EMAP | | | 4,736 | | | | 4,459 | | | | 4,347 | |
Japan | | | 1,969 | | | | 2,082 | | | | 1,959 | |
ViiV Healthcare | | | 1,374 | | | | 1,569 | | | | 1,566 | |
Other trading and unallocated | | | 1,241 | | | | 1,280 | | | | 1,319 | |
Pharmaceuticals and Vaccines turnover | | | 21,321 | | | | 22,112 | | | | 23,299 | |
Consumer Healthcare turnover | | | 5,110 | | | | 5,275 | | | | 5,093 | |
| | | | 26,431 | | | | 27,387 | | | | 28,392 | |
| | | | | | | | | | | | |
| Pharmaceuticals and Vaccines turnover by therapeutic area | | 2012 £m | | | 2011
(restated)
£m | | | 2010
(restated)
£m | |
Respiratory | | | 7,291 | | | | 7,298 | | | | 7,238 | |
Anti-virals | | | 753 | | | | 842 | | | | 1,167 | |
Central nervous system | | | 1,670 | | | | 1,721 | | | | 1,753 | |
Cardiovascular and urogenital | | | 2,431 | | | | 2,454 | | | | 2,314 | |
Metabolic | | | 171 | | | | 331 | | | | 647 | |
Anti-bacterials | | | 1,247 | | | | 1,390 | | | | 1,396 | |
Oncology and emesis | | | 798 | | | | 683 | | | | 679 | |
Dermatology | | | 850 | | | | 898 | | | | 849 | |
Rare diseases | | | 495 | | | | 463 | | | | 408 | |
Immuno-inflammation | | | 70 | | | | 15 | | | | – | |
Other pharmaceuticals | | | 846 | | | | 951 | | | | 956 | |
Vaccines | | | 3,325 | | | | 3,497 | | | | 4,326 | |
ViiV Healthcare (HIV) | | | 1,374 | | | | 1,569 | | | | 1,566 | |
| | | | 21,321 | | | | 22,112 | | | | 23,299 | |
152 | GSK Annual Report 2012
Notes to the financial statements
| 6 | Segment informationcontinued |
| | | | | | | | | | | | |
| Consumer Healthcare turnover by category | | 2012
£m | | | 2011
(restated)
£m | | | 2010
(restated)
£m | |
Total wellness | | | 2,008 | | | | 2,278 | | | | 2,202 | |
Oral care | | | 1,797 | | | | 1,711 | | | | 1,596 | |
Nutrition | | | 1,050 | | | | 1,025 | | | | 953 | |
Skin health | | | 255 | | | | 261 | | | | 342 | |
| | | | 5,110 | | | | 5,275 | | | | 5,093 | |
During 2012, US pharmaceuticals and ViiV Healthcare made sales to three wholesalers of approximately £2,447 million
(2011 – £2,215 million; 2010 – £2,412 million), £2,303 million (2011 – £2,360 million; 2010 – £2,561 million) and £1,318 million
(2011 – £1,374 million; 2010 – £1,642 million) respectively, after allocating final-customer discounts to the wholesalers.
| | | | | | | | | | | | |
| Segment profit | | 2012 £m | | | 2011
(restated) £m | | | 2010
(restated) £m | |
Pharmaceuticals and Vaccines | | | | | | | | | | | | |
USA | | | 4,786 | | | | 4,646 | | | | 5,043 | |
Europe | | | 2,629 | | | | 3,154 | | | | 3,743 | |
EMAP | | | 1,564 | | | | 1,481 | | | | 1,266 | |
Japan | | | 1,179 | | | | 1,249 | | | | 1,234 | |
ViiV Healthcare | | | 849 | | | | 882 | | | | 851 | |
Pharmaceuticals R&D | | | (2,778 | ) | | | (2,801 | ) | | | (3,037 | ) |
Other trading and unallocated costs | | | (438 | ) | | | (272 | ) | | | (350 | ) |
Pharmaceuticals and Vaccines operating profit | | | 7,791 | | | | 8,339 | | | | 8,750 | |
Consumer Healthcare operating profit | | | 938 | | | | 1,084 | | | | 1,044 | |
Segment profit | | | 8,729 | | | | 9,423 | | | | 9,794 | |
| | | |
Corporate and other unallocated costs and disposal profits | | | (399 | ) | | | (620 | ) | | | (297 | ) |
Core operating profit | | | 8,330 | | | | 8,803 | | | | 9,497 | |
Non-core items | | | (938 | ) | | | (996 | ) | | | (5,714 | ) |
Total operating profit | | | 7,392 | | | | 7,807 | | | | 3,783 | |
| | | |
Finance income | | | 79 | | | | 90 | | | | 116 | |
Finance costs | | | (808 | ) | | | (799 | ) | | | (831 | ) |
Profit on disposal of interest in associates | | | – | | | | 585 | | | | 8 | |
Share of after tax profits of associates and joint ventures | | | 29 | | | | 15 | | | | 81 | |
Profit before taxation | | | 6,692 | | | | 7,698 | | | | 3,157 | |
Taxation | | | (1,948 | ) | | | (2,240 | ) | | | (1,304 | ) |
Profit after taxation for the year | | | 4,744 | | | | 5,458 | | | | 1,853 | |
| | | |
| | | | | | | | | | | | |
| Depreciation and amortisation by segment | | 2012
£m | | | 2011
(restated)
£m | | | 2010
(restated)
£m | |
Pharmaceuticals and Vaccines | | | | | | | | | | | | |
USA | | | 22 | | | | 31 | | | | 33 | |
Europe | | | 24 | | | | 29 | | | | 28 | |
EMAP | | | 31 | | | | 34 | | | | 30 | |
Japan | | | 7 | | | | 7 | | | | 7 | |
ViiV Healthcare | | | 2 | | | | 4 | | | | – | |
Pharmaceuticals R&D | | | 178 | | | | 180 | | | | 217 | |
Other trading and unallocated | | | 553 | | | | 555 | | | | 592 | |
Pharmaceuticals and Vaccines depreciation and amortisation | | | 817 | | | | 840 | | | | 907 | |
Consumer Healthcare depreciation and amortisation | | | 43 | | | | 43 | | | | 41 | |
Segment depreciation and amortisation | | | 860 | | | | 883 | | | | 948 | |
| | | |
Corporate and other unallocated depreciation and amortisation | | | 108 | | | | 99 | | | | 84 | |
Core depreciation and amortisation | | | 968 | | | | 982 | | | | 1,032 | |
Non-core depreciation and amortisation | | | 477 | | | | 441 | | | | 647 | |
Total depreciation and amortisation | | | 1,445 | | | | 1,423 | | | | 1,679 | |
|
| GSK Annual Report 2012 | 153 |
| 6 | Segment informationcontinued |
| | | | | | | | | | | | |
| PP&E, intangible asset and goodwill impairment by segment | | 2012
£m | | | 2011
(restated) £m | | | 2010
(restated) £m | |
Pharmaceuticals and Vaccines | | | | | | | | | | | | |
USA | | | 1 | | | | 1 | | | | – | |
Europe | | | 1 | | | | 1 | | | | 1 | |
EMAP | | | 1 | | | | – | | | | 1 | |
Japan | | | – | | | | 1 | | | | 1 | |
ViiV Healthcare | | | – | | | | 1 | | | | – | |
Pharmaceuticals R&D | | | 2 | | | | 2 | | | | 8 | |
Other trading and unallocated | | | 31 | | | | 45 | | | | 121 | |
Pharmaceuticals and Vaccines impairment | | | 36 | | | | 51 | | | | 132 | |
Consumer Healthcare impairment | | | – | | | | 3 | | | | 3 | |
Segment impairment | | | 36 | | | | 54 | | | | 135 | |
| | | |
Corporate and other unallocated impairment | | | 18 | | | | 9 | | | | 4 | |
Core impairment | | | 54 | | | | 63 | | | | 139 | |
Non-core impairment | | | 700 | | | | 240 | | | | 226 | |
Total impairment | | | 754 | | | | 303 | | | | 365 | |
| | | |
| | | | | | | | | | | | |
| PP&E and intangible asset impairment reversals by segment | | 2012
£m | | | 2011
(restated)
£m | | | 2010
(restated)
£m | |
Pharmaceuticals and Vaccines | | | | | | | | | | | | |
USA | | | – | | | | – | | | | – | |
Europe | | | – | | | | – | | | | – | |
EMAP | | | – | | | | – | | | | – | |
Japan | | | – | | | | – | | | | – | |
ViiV Healthcare | | | – | | | | – | | | | – | |
Pharmaceuticals R&D | | | (4 | ) | | | (3 | ) | | | (1 | ) |
Other trading and unallocated | | | (60 | ) | | | (32 | ) | | | (4 | ) |
Pharmaceuticals and Vaccines impairment reversals | | | (64 | ) | | | (35 | ) | | | (5 | ) |
Consumer Healthcare impairment reversals | | | – | | | | – | | | | – | |
Segment impairment reversals | | | (64 | ) | | | (35 | ) | | | (5 | ) |
| | | |
Corporate and other unallocated core impairment reversals | | | (3 | ) | | | – | | | | – | |
Core impairment reversals | | | (67 | ) | | | (35 | ) | | | (5 | ) |
Non-core impairment reversals | | | (59 | ) | | | – | | | | (14 | ) |
Total impairment reversals | | | (126 | ) | | | (35 | ) | | | (19 | ) |
154 | GSK Annual Report 2012
Notes to the financial statements
| 6 | Segment informationcontinued |
| | | | | | | | |
| Net assets by segment | | 2012 £m | | | 2011
(restated)
£m | |
Pharmaceuticals and Vaccines | | | | | | | | |
USA | | | 515 | | | | 580 | |
Europe | | | 887 | | | | 895 | |
EMAP | | | 2,326 | | | | 2,332 | |
Japan | | | 409 | | | | 525 | |
ViiV Healthcare | | | 1,529 | | | | 754 | |
Pharmaceuticals R&D | | | 650 | | | | 1,044 | |
Other trading and unallocated | | | 14,713 | | | | 12,933 | |
Pharmaceuticals and Vaccines net operating assets | | | 21,029 | | | | 19,063 | |
Consumer Healthcare net operating assets | | | 2,272 | | | | 2,406 | |
Segment net operating assets | | | 23,301 | | | | 21,469 | |
| | |
Corporate and other unallocated net operating assets | | | (3,308 | ) | | | (5,311 | ) |
Net operating assets | | | 19,993 | | | | 16,158 | |
| | |
Net debt | | | (14,037 | ) | | | (9,003 | ) |
Investments in associates and joint ventures | | | 579 | | | | 560 | |
Derivative financial instruments | | | 38 | | | | (22 | ) |
Current and deferred taxation | | | 110 | | | | 469 | |
Assets held for sale | | | 64 | | | | 665 | |
Net assets | | | 6,747 | | | | 8,827 | |
The other trading and unallocated pharmaceuticals segment includes assets for the centrally managed pharmaceutical and vaccine manufacturing operations, the depreciation on which, totalling £601 million (2011 – £599 million; 2010 – £616 million) is recovered through the standard cost of product charged to businesses.
Geographical information
The UK is regarded as being the Group’s country of domicile.
| | | | | | | | | | | | |
| Turnover by location of customer | | 2012
£m | | | 2011
(restated)
£m | | | 2010
(restated)
£m | |
UK | | | 1,525 | | | | 1,612 | | | | 2,161 | |
USA | | | 8,446 | | | | 8,684 | | | | 9,345 | |
Rest of World | | | 16,460 | | | | 17,091 | | | | 16,886 | |
External turnover | | | 26,431 | | | | 27,387 | | | | 28,392 | |
| | | |
| | | | | | | | | | | | |
| Turnover by location of subsidiary | | 2012
£m | | | 2011 £m | | | 2010 £m | |
UK | | | 3,738 | | | | 3,850 | | | | 4,965 | |
USA | | | 11,250 | | | | 11,797 | | | | 13,072 | |
Rest of World | | | 19,719 | | | | 20,986 | | | | 21,220 | |
Turnover including inter-segment turnover | | | 34,707 | | | | 36,633 | | | | 39,257 | |
| | | |
UK | | | 1,508 | | | | 1,557 | | | | 2,032 | |
USA | | | 2,886 | | | | 3,140 | | | | 3,717 | |
Rest of World | | | 3,882 | | | | 4,549 | | | | 5,116 | |
Inter-segment turnover | | | 8,276 | | | | 9,246 | | | | 10,865 | |
| | | |
UK | | | 2,230 | | | | 2,293 | | | | 2,933 | |
USA | | | 8,364 | | | | 8,657 | | | | 9,355 | |
Rest of World | | | 15,837 | | | | 16,437 | | | | 16,104 | |
External turnover | | | 26,431 | | | | 27,387 | | | | 28,392 | |
|
| GSK Annual Report 2012 | 155 |
| 6 | Segment informationcontinued |
| | | | | | | | | | | | |
| Operating profit by location | | 2012 £m | | | 2011 £m | | | 2010
£m | |
UK | | | 1,516 | | | | 1,063 | | | | 1,033 | |
USA | | | 1,421 | | | | 3,298 | | | | 420 | |
Rest of World | | | 4,455 | | | | 3,446 | | | | 2,330 | |
Total operating profit | | | 7,392 | | | | 7,807 | | | | 3,783 | |
| | | |
| | | | | | | | | | | | |
| Net operating assets by location | | 2012
£m | | | 2011 (restated) £m | | | | |
UK | | | 2,686 | | | | 2,927 | | | | | |
USA | | | 5,635 | | | | 2,085 | | | | | |
Rest of World | | | 11,672 | | | | 11,146 | | | | | |
Net operating assets | | | 19,993 | | | | 16,158 | | | | | |
| | | |
| | | | | | | | | | | | |
| Non-current assets by location | | 2012
£m | | | 2011 (restated) £m | | | | |
UK | | | 6,888 | | | | 5,041 | | | | | |
USA | | | 7,312 | | | | 5,881 | | | | | |
Rest of World | | | 9,875 | | | | 10,101 | | | | | |
Non-current assets | | | 24,075 | | | | 21,023 | | | | | |
Non-current assets by location excludes amounts relating to other investments, deferred tax assets, derivative financial instruments, pension assets, amounts receivable under insurance contracts and certain other non-current receivables.
| | | | | | | | | | | | |
| | | 2012
£m | | | 2011
£m | | | 2010
£m | |
Milestone income | | | 3 | | | | 10 | | | | 7 | |
Impairment of equity investments | | | (26 | ) | | | (78 | ) | | | (65 | ) |
Disposal of equity investments | | | 19 | | | | 10 | | | | 17 | |
Disposal of businesses and assets and legal settlements | | | 661 | | | | 322 | | | | 227 | |
Gain on settlement of pre-existing collaborations on acquisition of HGS | | | 233 | | | | – | | | | – | |
Gain on acquisition of the Shionogi-ViiV Healthcare joint venture | | | 349 | | | | – | | | | – | |
Fair value remeasurements on contingent consideration recognised in business combinations | | | (13 | ) | | | – | | | | – | |
Fair value adjustments on derivative financial instruments | | | 3 | | | | 10 | | | | (6 | ) |
Other income | | | 27 | | | | 4 | | | | 17 | |
| | | | 1,256 | | | | 278 | | | | 197 | |
Disposal of businesses, other assets and legal settlements in 2012 includes the profit on the disposal of the non-core Consumer Healthcare brands of £559 million (2011 – £23 million of costs reported associated with the disposal).
The gain on acquisition of the Shionogi-ViiV Healthcare joint venture in 2012 includes a non-cash gain of £256 million arising from the fair value of the Group’s existing shareholding together with negative goodwill of £124 million and a loss on settlement of pre-existing relationships of £31 million. See Note 38, ‘Acquisitions and disposals’.
Other income in 2012 includes a £30 million non-cash exchange gain in relation to the centralisation of the Group’s Pharmaceutical intellectual property and product inventory ownership into the UK.
156 | GSK Annual Report 2012
Notes to the financial statements
| | | | | | | | | | | | |
| The following items have been included in operating profit: | | 2012
£m | | | 2011
£m | | | 2010
£m | |
Employee costs (Note 9) | | | 6,843 | | | | 6,751 | | | | 6,994 | |
Advertising | | | 839 | | | | 910 | | | | 971 | |
Distribution costs | | | 386 | | | | 432 | | | | 413 | |
Depreciation of property, plant and equipment | | | 871 | | | | 893 | | | | 1,146 | |
Impairment of property, plant and equipment, net of reversals | | | (68 | ) | | | 155 | | | | 186 | |
Amortisation of intangible assets | | | 574 | | | | 530 | | | | 533 | |
Impairment of intangible assets and goodwill, net of reversals | | | 696 | | | | 113 | | | | 160 | |
Net foreign exchange losses | | | 61 | | | | 25 | | | | 60 | |
Inventories: | | | | | | | | | | | | |
Cost of inventories included in cost of sales | | | 6,820 | | | | 6,768 | | | | 7,014 | |
Write-down of inventories | | | 302 | | | | 85 | | | | 305 | |
Reversal of prior year write-down of inventories | | | (61 | ) | | | (62 | ) | | | (66 | ) |
Operating lease rentals: | | | | | | | | | | | | |
Minimum lease payments | | | 156 | | | | 139 | | | | 136 | |
Contingent rents | | | 14 | | | | 11 | | | | 14 | |
Sub-lease payments | | | 3 | | | | 4 | | | | 7 | |
Fees payable to the company’s auditor and its associates in relation to the Group (see below) | | | 23.2 | | | | 23.7 | | | | 22.2 | |
The reversals of prior year write-downs of inventories principally arise from the reassessment of usage or demand expectations prior to inventory expiration.
Included within operating profit are major restructuring charges of £557 million (2011 – £590 million; 2010 – £1,345 million). See Note 10, ‘Major restructuring costs’.
| | | | | | | | | | | | |
| Fees payable to the company’s auditor and its associates: | | 2012
£m | | | 2011
£m | | | 2010
£m | |
Audit of parent company and consolidated financial statements | | | 3.9 | | | | 3.7 | | | | 3.7 | |
Audit of the company’s subsidiaries | | | 10.1 | | | | 10.2 | | | | 9.5 | |
Audit-related assurance services, including attestation under s.404 of Sarbanes-Oxley Act 2002 | | | 3.3 | | | | 3.4 | | | | 3.3 | |
Audit and audit-related services | | | 17.3 | | | | 17.3 | | | | 16.5 | |
Taxation compliance | | | 0.4 | | | | 0.2 | | | | 1.0 | |
Taxation advice | | | 3.2 | | | | 2.5 | | | | 1.6 | |
Other assurance services | | | 1.7 | | | | 2.8 | | | | 0.8 | |
All other services | | | 0.6 | | | | 0.9 | | | | 2.3 | |
| | | | 23.2 | | | | 23.7 | | | | 22.2 | |
In addition to the above, fees paid in respect of the GSK pension schemes were:
| | | | | | | | | | | | |
| | | 2012
£m | | | 2011 £m | | | 2010
£m | |
Audit | | | 0.6 | | | | 0.4 | | | | 0.4 | |
Other services | | | – | | | | – | | | | – | |
|
| GSK Annual Report 2012 | 157 |
| | | | | | | | | | | | |
| | | 2012 £m | | | 2011 £m | | | 2010 £m | |
Wages and salaries | | | 5,846 | | | | 5,312 | | | | 5,079 | |
Social security costs | | | 643 | | | | 641 | | | | 600 | |
Pension and other post-employment costs, including augmentations (Note 28) | | | 3 | | | | 341 | | | | 554 | |
Cost of share-based incentive plans | | | 220 | | | | 198 | | | | 179 | |
Severance and other costs from integration and restructuring activities | | | 131 | | | | 259 | | | | 582 | |
| | | | 6,843 | | | | 6,751 | | | | 6,994 | |
The Group provides benefits to employees, commensurate with local practice in individual countries, including, in some markets, healthcare insurance, subsidised car schemes and personal life assurance.
The charge for pension and other post-employment costs in the year includes a credit of £395 million following a change in policy relating to discretionary pension increases under certain UK pension schemes and the introduction of a limit on future pensionable pay increases in all UK pension schemes, as set out in Note 28, ‘Pensions and other post-employment benefits’.
The cost of share-based incentive plans is analysed as follows:
| | | | | | | | | | | | |
| | | 2012 £m | | | 2011 £m | | | 2010 £m | |
Share Value Plan | | | 156 | | | | 146 | | | | 119 | |
Performance Share Plan | | | 45 | | | | 23 | | | | 21 | |
Share Option plans | | | 11 | | | | 20 | | | | 27 | |
Other plans | | | 8 | | | | 9 | | | | 12 | |
| | | | 220 | | | | 198 | | | | 179 | |
The average number of persons employed by the Group (including Directors) during the year was:
| | | | | | | | | | | | |
| | | 2012
Number | | | 2011
Number | | | 2010
Number | |
Manufacturing | | | 31,033 | | | | 30,939 | | | | 30,883 | |
Selling, general and administration | | | 54,803 | | | | 53,826 | | | | 53,778 | |
Research and development | | | 12,845 | | | | 12,636 | | | | 13,824 | |
| | | | 98,681 | | | | 97,401 | | | | 98,485 | |
The average number of Group employees excludes temporary and contract staff. The numbers of Group employees at the end of each financial year are given in the financial record on page 238. The average number of persons employed by GlaxoSmithKline plc in 2012 was nil (2011 – nil).
The compensation of the Directors and Senior Management (members of the CET) in aggregate, was as follows:
| | | | | | | | | | | | |
| | | 2012 £m | | | 2011 £m | | | 2010 £m | |
Wages and salaries | | | 20 | | | | 24 | | | | 20 | |
Social security costs | | | 2 | | | | 2 | | | | 2 | |
Pension and other post-employment costs | | | 3 | | | | 3 | | | | 3 | |
Cost of share-based incentive plans | | | 13 | | | | 11 | | | | 11 | |
| | | | 38 | | | | 40 | | | | 36 | |
158 | GSK Annual Report 2012
Notes to the financial statements
| 10 | Major restructuring costs |
Major restructuring costs charged in arriving at operating profit include costs arising under the Operational Excellence restructuring programme, initiated in 2007 and expanded in 2009, 2010 and 2011, restructuring costs following the acquisition of Human Genome Sciences, Inc. (HGS) in August 2012 and restructuring costs following the acquisition of Stiefel Laboratories, Inc. in July 2009.
Of the total restructuring costs of £557 million incurred in 2012, £356 million was incurred under the Operational Excellence programme in the following areas:
| • | | Restructuring of the Pharmaceuticals business in Europe leading to staff reductions in sales force and administration. |
| • | | Projects to rationalise Core Business Services and to simplify or eliminate processes leading to staff reduction in support functions. |
| • | | The closure of a number of manufacturing sites including sites in the USA and India. |
| • | | The rationalisation of the Consumer Healthcare business. |
Costs of £165 million were incurred under the restructuring programme related to the integration of HGS. The remaining costs of £36 million were incurred under the restructuring programme related to the integration of the Stiefel business.
The analysis of the costs charged to operating profit under these programmes is as follows:
| | | | | | | | | | | | |
| | | 2012
£m | | | 2011
£m | | | 2010
£m | |
Increase in provision for major restructuring programmes (see Note 29) | | | (268 | ) | | | (249 | ) | | | (837 | ) |
Amount of provision reversed unused (see Note 29) | | | 12 | | | | 11 | | | | 40 | |
Impairment losses recognised | | | (7 | ) | | | (131 | ) | | | (75 | ) |
Other non-cash charges | | | (18 | ) | | | (48 | ) | | | (240 | ) |
Other cash costs | | | (276 | ) | | | (173 | ) | | | (233 | ) |
| | | | (557 | ) | | | (590 | ) | | | (1,345 | ) |
Asset impairments of £7 million (2011 – £131 million; 2010 – £75 million) and other non-cash charges totalling £18 million (2011 – £48 million; 2010 – £240 million) are non-cash items, principally accelerated depreciation where asset lives have been shortened as a result of the major restructuring programmes. All other charges have been or will be settled in cash and include the termination of leases, site closure costs, consultancy and project management fees.
| | | | | | | | | | | | |
| | | 2012
£m | | | 2011
£m | | | 2010
£m | |
Interest income arising from: | | | | | | | | | | | | |
cash and cash equivalents | | | 59 | | | | 63 | | | | 58 | |
available-for-sale investments | | | 5 | | | | 7 | | | | 8 | |
derivatives at fair value through profit or loss | | | – | | | | – | | | | 24 | |
loans and receivables | | | 9 | | | | 15 | | | | 13 | |
Realised gains on liquid investments | | | 4 | | | | 5 | | | | – | |
Fair value adjustments on derivatives at fair value through profit or loss | | | 2 | | | | – | | | | 13 | |
| | | | 79 | | | | 90 | | | | 116 | |
All derivatives at fair value through profit or loss other than designated and effective hedging instruments (see Note 41, ‘Financial instruments and related disclosures’) are classified as held-for-trading financial instruments under IAS 39. Interest income arising from derivatives at fair value through profit or loss relates to swap interest income.
|
| GSK Annual Report 2012 | 159 |
| | | | | | | | | | | | |
| | | 2012
£m | | | 2011
£m | | | 2010
£m | |
Interest expense arising on: | | | | | | | | | | | | |
financial liabilities at amortised cost | | | (731 | ) | | | (718 | ) | | | (767 | ) |
derivatives at fair value through profit or loss | | | (14 | ) | | | (26 | ) | | | – | |
Fair value hedges: | | | | | | | | | | | | |
fair value movements on derivatives designated as hedging instruments | | | (28 | ) | | | (12 | ) | | | 26 | |
fair value adjustments on hedged items | | | 27 | | | | 11 | | | | (27 | ) |
Fair value movements on other derivatives at fair value through profit or loss | | | (13 | ) | | | (15 | ) | | | (17 | ) |
Reclassification of cash flow hedge from other comprehensive income | | | – | | | | – | | | | (3 | ) |
Unwinding of discounts on provisions | | | (15 | ) | | | (12 | ) | | | (18 | ) |
Movements on amounts owed to non-controlling interests | | | (10 | ) | | | (7 | ) | | | – | |
Other finance expense | | | (24 | ) | | | (20 | ) | | | (25 | ) |
| | | | (808 | ) | | | (799 | ) | | | (831 | ) |
All derivatives at fair value through profit or loss other than designated and effective hedging instruments (see Note 41, ‘Financial instruments and related disclosures’) are classified as held-for-trading financial instruments under IAS 39. Interest expense arising on derivatives at fair value through profit or loss relates to swap interest expense.
| 13 | Associates and joint ventures |
| | | | | | | | | | | | |
| | | 2012
£m | | | 2011
£m | | | 2010
£m | |
Associates: | | | | | | | | | | | | |
Share of after tax profits of Aspen Pharmacare Holdings Limited | | | 58 | | | | 41 | | | | 32 | |
Share of after tax profits of Quest Diagnostics Inc. | | | – | | | | 9 | | | | 79 | |
Share of after tax profits/(losses) of other associates | | | 1 | | | | (4 | ) | | | (7 | ) |
| | | 59 | | | | 46 | | | | 104 | |
Share of after tax losses of joint ventures | | | (30 | ) | | | (31 | ) | | | (23 | ) |
| | | | 29 | | | | 15 | | | | 81 | |
| | | | | | | | | | | | |
Share of turnover of joint ventures | | | 203 | | | | 14 | | | | 18 | |
Sales to joint ventures and associates | | | 124 | | | | 104 | | | | 90 | |
The increase in 2012 primarily relates to the new joint venture, Japan Vaccine Co., Ltd., with Daiichi Sankyo Co., Ltd., which started trading in July 2012.
Summarised income statement information in respect of the Group’s associates is set out below:
| | | | | | | | | | | | |
| | | 2012
£m | | | 2011
£m | | | 2010
£m | |
Total turnover: | | | | | | | | | | | | |
Aspen Pharmacare Holdings Limited | | | 1,280 | | | | 1,164 | | | | 1,171 | |
Quest Diagnostics Inc. | | | – | | | | 440 | | | | 4,754 | |
Others | | | 106 | | | | 112 | | | | 65 | |
| | | | 1,386 | | | | 1,716 | | | | 5,990 | |
| | | | | | | | | | | | |
Total profit: | | | | | | | | | | | | |
Aspen Pharmacare Holdings Limited | | | 235 | | | | 231 | | | | 233 | |
Quest Diagnostics Inc. | | | – | | | | 36 | | | | 465 | |
Others | | | (5 | ) | | | (21 | ) | | | (23 | ) |
| | | | 230 | | | | 246 | | | | 675 | |
The results of Aspen Pharmacare Holdings Limited included in the summarised income statement information above represent the estimated earnings of the Aspen group in the year.
160 | GSK Annual Report 2012
Notes to the financial statements
| | | | | | | | | | | | |
| Taxation charge based on profits for the year | | 2012
£m | | | 2011
£m | | | 2010
£m | |
UK corporation tax at the UK statutory rate | | | 365 | | | | 647 | | | | 82 | |
Less double taxation relief | | | (180 | ) | | | (164 | ) | | | (156 | ) |
| | | 185 | | | | 483 | | | | (74 | ) |
Overseas taxation | | | 1,521 | | | | 1,603 | | | | 1,496 | |
Current taxation | | | 1,706 | | | | 2,086 | | | | 1,422 | |
Deferred taxation | | | 242 | | | | 154 | | | | (118 | ) |
| | | | 1,948 | | | | 2,240 | | | | 1,304 | |
| | | |
| | | | | | | | | | | | | |
| | | |
| Reconciliation of the taxation rate on Group profits | | 2012 % | | | 2011 % | | | 2010 % | |
UK statutory rate of taxation | | | 24.5 | | | | 26.5 | | | | 28.0 | |
Differences in overseas taxation rates | | | 4.2 | | | | 2.5 | | | | 8.1 | |
Benefit of special tax status | | | (1.7 | ) | | | (1.4 | ) | | | (2.6 | ) |
R&D credits | | | (1.1 | ) | | | (1.6 | ) | | | (3.7 | ) |
Inter-company stock profit | | | 1.1 | | | | (0.7 | ) | | | 1.7 | |
Impact of share based payments | | | – | | | | (0.2 | ) | | | 1.4 | |
Tax on profit of associates | | | – | | | | – | | | | (1.2 | ) |
(Reduction)/increase in tax rate for (recognised)/unrecognised losses | | | (0.6 | ) | | | (0.4 | ) | | | 5.5 | |
Other permanent differences | | | (1.8 | ) | | | (0.3 | ) | | | 6.2 | |
Prior year items | | | (2.2 | ) | | | 1.7 | | | | (6.5 | ) |
Disposal of associate | | | – | | | | 1.7 | | | | – | |
Tax on unremitted earnings | | | 0.4 | | | | 1.1 | | | | – | |
Restructuring | | | 6.3 | | | | 0.2 | | | | 4.4 | |
Tax rate | | | 29.1 | | | | 29.1 | | | | 41.3 | |
In 2012, within restructuring there is a charge of £420 million, comprising predominantly deferred tax and hence non cash, relating to centralisation of our Pharmaceutical intellectual property and product inventory ownership into the UK.
The disposal of associate undertaking in 2011 reflected the impact of the disposal of the shareholding in Quest Diagnostics, Inc.
The Group operates in countries where the tax rate differs from the UK tax rate. The impact of these overseas taxes on the overall rate of tax is shown above. Profits arising from certain operations in Singapore are accorded special status and are taxed at reduced rates compared with the normal rates of tax in that territory. The effect of this reduction in the taxation charge increased earnings per share by 2.3p in 2012, 2.1p in 2011 and 1.6p in 2010. The Group is required under IFRS to create a deferred tax asset in respect of unrealised inter-company profit arising on inventory held by the Group at the year-end by applying the tax rate of the country in which the inventory is held (rather than the tax rate of the country where the profit was originally made and the tax paid, which is the practice under UK and US GAAP). As a result of this difference in accounting treatment the Group tax rate on current period inter-company profit under IFRS increased by 1.1% in 2012 (2011 – 0.7% decrease; 2010 – 1.7% increase) arising from changes in the location of work-in-progress and finished goods.
| | | | | | | | | | | | |
| Tax on items charged to equity and statement of comprehensive income | | 2012 £m | | | 2011 £m | | | 2010 £m | |
Current taxation | | | | | | | | | | | | |
Share based payments | | | 34 | | | | 3 | | | | – | |
| | | | 34 | | | | 3 | | | | – | |
| | | | | | | | | | | | |
Deferred taxation | | | | | | | | | | | | |
Share based payments | | | (25 | ) | | | 47 | | | | 2 | |
Defined benefit plans | | | 221 | | | | 268 | | | | 1 | |
Fair value movements on cash flow hedges | | | – | | | | – | | | | 1 | |
Fair value movements on available-for-sale investments | | | – | | | | 23 | | | | (28 | ) |
| | | | 196 | | | | 338 | | | | (24 | ) |
Total credit/(charge) to equity and statement of comprehensive income | | | 230 | | | | 341 | | | | (24 | ) |
All of the above items have been charged to the statement of comprehensive income except for tax on share based payments.
|
| GSK Annual Report 2012 | 161 |
14 Taxationcontinued
Issues relating to taxation
The integrated nature of the Group’s worldwide operations involves significant investment in research and strategic manufacture at a limited number of locations, with consequential cross-border supply routes into numerous end-markets. This gives rise to complexity and delay in negotiations with revenue authorities as to the profits on which individual Group companies are liable to tax. Resolution of such issues is a continuing fact of life for GSK.
During the year, GSK agreed and settled further open years with major tax authorities. In October 2012, the Supreme Court of Canada issued a decision in GSK’s case with the Canada Revenue Agency (CRA) regarding ranitidine transfer pricing. The Court rejected the CRA’s appeal and sent the case back to the Tax Court for redetermination.
GSK continues to believe that it has made adequate provision for the liabilities likely to arise from periods which are open and not yet agreed by tax authorities. The ultimate liability for such matters may vary from the amounts provided and is dependent upon the outcome of agreements with relevant tax authorities or litigation where appropriate.
Provision for deferred tax liabilities of £109 million have been made in respect of taxation that would arise on the distribution of profits retained by certain overseas subsidiaries. No further provision is made, on the grounds that the Group is able to control the timing of the reversal of remaining temporary differences and it is probable that they will not reverse in the foreseeable future. The aggregate amount of these unremitted profits at the balance sheet date was approximately £18 billion (2011 – £28 billion). The unprovided deferred tax on unremitted earnings at 31 December 2012 is estimated to be £500 million (2011 – £500 million), which relates to taxes payable on repatriation and dividend withholding taxes levied by overseas tax jurisdictions. UK legislation relating to company distributions provides for exemption from tax for most repatriated profits, subject to certain exceptions.
Movement in deferred tax assets and liabilities
| | | | | | | | | | | | | | | | | | | | | | | | | | | | | | | | | | | | | | | | | | | | | | | | |
| | | Accelerated capital allowances £m | | | Intangibles £m | | | Intra- group profit £m | | | Pensions & other post employment benefits £m | | | Tax losses £m | | | Legal & other disputes £m | | | Manu- facturing restruct- uring £m | | | Stock valuation adjustments £m | | | Share option and award schemes £m | | | Other net temporary differences £m | | | Offset within countries £m | | | Total £m | |
Deferred tax assets at 1 January 2012 | | | 58 | | | | 338 | | | | 1,197 | | | | 1,249 | | | | 120 | | | | 194 | | | | 79 | | | | 132 | | | | 167 | | | | 893 | | | | (1,578 | ) | | | 2,849 | |
Deferred tax liabilities at 1 January 2012 | | | (579 | ) | | | (1,592 | ) | | | – | | | | – | | | | – | | | | (91 | ) | | | (3 | ) | | | (17 | ) | | | – | | | | (118 | ) | | | 1,578 | | | | (822 | ) |
At 1 January 2012 | | | (521 | ) | | | (1,254 | ) | | | 1,197 | | | | 1,249 | | | | 120 | | | | 103 | | | | 76 | | | | 115 | | | | 167 | | | | 775 | | | | – | | | | 2,027 | |
Exchange adjustments | | | 9 | | | | 37 | | | | (65 | ) | | | (48 | ) | | | (33 | ) | | | (5 | ) | | | (1 | ) | | | – | | | | (6 | ) | | | (1 | ) | | | – | | | | (113 | ) |
(Charge)/credit to income statement | | | (11 | ) | | | 410 | | | | (53 | ) | | | (22 | ) | | | (545 | ) | | | 30 | | | | (16 | ) | | | (150 | ) | | | (4 | ) | | | 119 | | | | – | | | | (242 | ) |
(Charge)/credit to equity | | | – | | | | – | | | | – | | | | – | | | | – | | | | – | | | | – | | | | – | | | | (25 | ) | | | – | | | | – | | | | (25 | ) |
Credit to statement of comprehensive income | | | – | | | | – | | | | – | | | | 221 | | | | – | | | | – | | | | – | | | | – | | | | – | | | | – | | | | – | | | | 221 | |
Acquisitions | | | – | | | | (1,058 | ) | | | – | | | | – | | | | 703 | | | | – | | | | – | | | | – | | | | – | | | | 105 | | | | – | | | | (250 | ) |
Transfer to current tax | | | | | | | | | | | | | | | (237 | ) | | | | | | | | | | | | | | | | | | | | | | | | | | | | | | | (237 | ) |
At 31 December 2012 | | | (523 | ) | | | (1,865 | ) | | | 1,079 | | | | 1,163 | | | | 245 | | | | 128 | | | | 59 | | | | (35 | ) | | | 132 | | | | 998 | | | | – | | | | 1,381 | |
| | | | | | | | | | | | | | | | | | | | | | | | | | | | | | | | | | | | | | | | | | | | | | | | |
Deferred tax assets at 31 December 2012 | | | – | | | | 726 | | | | 1,079 | | | | 1,163 | | | | 245 | | | | 215 | | | | 63 | | | | 47 | | | | 132 | | | | 1,341 | | | | (2,626 | ) | | | 2,385 | |
Deferred tax liabilities at 31 December 2012 | | | (523 | ) | | | (2,591 | ) | | | – | | | | – | | | | – | | | | (87 | ) | | | (4 | ) | | | (82 | ) | | | – | | | | (343 | ) | | | 2,626 | | | | (1,004 | ) |
| | | | (523 | ) | | | (1,865 | ) | | | 1,079 | | | | 1,163 | | | | 245 | | | | 128 | | | | 59 | | | | (35 | ) | | | 132 | | | | 998 | | | | – | | | | 1,381 | |
The deferred tax credit to income relating to changes in tax rates is £52 million (2011 – £11 million, 2010 – £11 million). All other deferred tax movements arise from the origination and reversal of temporary differences. Other net temporary differences mainly include accrued expenses for which a tax deduction is only available on a paid basis.
162 | GSK Annual Report 2012
Notes to the financial statements
| | | | | | | | | | | | | | | | |
| Tax losses | | | | | Recognised | | | | | | Unrecognised | |
| | | 2012 £m | | | 2011 £m | | | 2012 £m | | | 2011 £m | |
Trading losses expiring: | | | | | | | | | | | | | | | | |
Within 10 years | | | 190 | | | | 199 | | | | 150 | | | | 303 | |
In more than 10 years | | | 421 | | | | 217 | | | | 549 | | | | 494 | |
Available indefinitely | | | 237 | | | | 81 | | | | 4,053 | | | | 4,426 | |
At 31 December | | | 848 | | | | 497 | | | | 4,752 | | | | 5,223 | |
Deferred tax asset | | | 245 | | | | 120 | | | | – | | | | – | |
In addition, the Group had capital losses at 31 December 2012 of approximately £4.3 billion (2011 – £4.3 billion) in respect of which no deferred tax asset has been recognised. Deferred tax assets are recognised where it is probable that future taxable profit will be available to utilise losses.
Factors affecting the tax charge in future years
As a global organisation there are many factors which could affect the future effective tax rate of the Group. The mix of profits across different territories, transfer pricing and other disputes with tax authorities and the location of research and development activity can all have a significant impact on the Group’s effective tax rate.
Changes to tax legislation in territories where GSK has business operations could also impact the Group’s effective tax rate. The UK Government has enacted some significant changes to the UK taxation system. In December 2012, the UK Government announced that as part of the ongoing phased reduction in the main rate of corporation tax, the main rate will reduce further to 21% from April 2014. The deferred tax movements reflect the reduction in the UK tax rate from 26% to 24% with effect from 1 April 2012, and to 23% with effect from 1 April 2013, as these have been substantively enacted. In July 2012, the UK Government enacted legislation to introduce a patent box regime which will apply a reduced rate of corporation tax to income from patents with effect from April 2013. In July 2012, the UK Government also enacted legislation relating to controlled foreign companies, which will come into effect from 1 January 2013.
In 2012, GSK undertook a restructuring of trading arrangements relating to the centralisation of Pharmaceutical intellectual property and product inventory ownership into the UK. This restructuring of trading arrangements and increased investment in the UK reflects terms that GSK has agreed to in discussions with various tax authorities and has been facilitated by the introduction of the UK Patent Box rules. In particular, GSK has agreed to enter into a bilateral Advance Pricing Agreement with the Internal Revenue Service in the USA and HM Revenue & Customs in the UK, which will give considerable certainty over the Group’s future tax affairs. The restructuring will simplify the business and internal trading arrangements by substantially decreasing administrative complexity and will deliver supply chain and working capital efficiencies. Non-cash tax charges totalling approximately £600 million are expected over the next two years arising from the unwinding of deferred profit in inventory, as existing inventory produced prior to the restructuring leaves the supply chain.
| | | | | | | | | | | | |
| | | 2012 pence | | | 2011 pence | | | 2010 pence | |
Basic earnings per share | | | 92.9 | | | | 104.6 | | | | 32.1 | |
Diluted earnings per share | | | 91.5 | | | | 103.2 | | | | 31.9 | |
Basic earnings per share has been calculated by dividing the profit attributable to shareholders by the weighted average number of shares in issue during the period after deducting shares held by the ESOP Trusts and Treasury shares. The trustees have waived their rights to dividends on the shares held by the ESOP Trusts.
Diluted earnings per share has been calculated after adjusting the weighted average number of shares used in the basic calculation to assume the conversion of all potentially dilutive shares. A potentially dilutive share forms part of the employee share schemes where its exercise price is below the average market price of GSK shares during the period and any performance conditions attaching to the scheme have been met at the balance sheet date.
The numbers of shares used in calculating basic and diluted earnings per share are reconciled below.
| | | | | | | | | | | | |
| Weighted average number of shares in issue | | 2012
millions | | | 2011
millions | | | 2010
millions | |
Basic | | | 4,912 | | | | 5,028 | | | | 5,085 | |
Dilution for share options and awards | | | 77 | | | | 71 | | | | 43 | |
Diluted | | | 4,989 | | | | 5,099 | | | | 5,128 | |
|
| GSK Annual Report 2012 | 163 |
| | | | | | | | | | | | | | | | | | | | | | | | | | | | | | | | | | | | |
| | | | | | | | | 2012 | | | | | | | | | 2011 | | | | | | | | | 2010 | |
| | | Paid/payable | | | Dividend per share (pence) | | | Total dividend £m | | | Paid/payable | | | Dividend per share (pence) | | | Total dividend £m | | | Paid/payable | | | Dividend per share (pence) | | | Total dividend £m | |
First interim | | | 5 July 2012 | | | | 17 | | | | 846 | | | | 7 July 2011 | | | | 16 | | | | 814 | | | | 8 July 2010 | | | | 15 | | | | 764 | |
Second interim | | | 4 October 2012 | | | | 17 | | | | 830 | | | | 6 October 2011 | | | | 16 | | | | 809 | | | | 7 October 2010 | | | | 15 | | | | 759 | |
Third interim | | | 3 January 2013 | | | | 18 | | | | 870 | | | | 5 January 2012 | | | | 17 | | | | 847 | | | | 6 January 2011 | | | | 16 | | | | 816 | |
Fourth interim | | | 11 April 2013 | | | | 22 | | | | 1,062 | | | | 12 April 2012 | | | | 21 | | | | 1,043 | | | | 7 April 2011 | | | | 19 | | | | 967 | |
Annual total | | | | | | | 74 | | | | 3,608 | | | | | | | | 70 | | | | 3,513 | | | | | | | | 65 | | | | 3,306 | |
Supplemental | | | | | | | | | | | | | | | 12 April 2012 | | | | 5 | | | | 248 | | | | | | | | | | | | | |
Total | | | | | | | 74 | | | | 3,608 | | | | | | | | 75 | | | | 3,761 | | | | | | | | 65 | | | | 3,306 | |
Under IFRS interim dividends are only recognised in the financial statements when paid and not when declared. GSK normally pays a dividend two quarters after the quarter to which it relates and one quarter after it is declared. The 2012 financial statements recognise those dividends paid in 2012, namely the third and fourth interim dividends for 2011, the supplemental dividend for 2011 and the first and second interim dividends for 2012.
The amounts recognised in each year are as follows:
| | | | | | | | | | | | | | | | |
| | | | | | 2012 £m | | | 2011 £m | | | 2010 £m | |
Dividends to shareholders | | | | | | | 3,814 | | | | 3,406 | | | | 3,205 | |
17 Property, plant and equipment | | | | | | | | | | | | | | | | |
| | | | |
| | | Land and buildings £m | | | Plant, equipment and vehicles £m | | | Assets in construction £m | | | Total £m | |
Cost at 1 January 2011 | | | 6,118 | | | | 10,541 | | | | 2,236 | | | | 18,895 | |
Exchange adjustments | | | (78 | ) | | | (155 | ) | | | (15 | ) | | | (248 | ) |
Additions | | | 113 | | | | 294 | | | | 654 | | | | 1,061 | |
Additions through business combinations | | | 18 | | | | 5 | | | | 28 | | | | 51 | |
Capitalised borrowing costs | | | – | | | | – | | | | 8 | | | | 8 | |
Disposals and write-offs | | | (91 | ) | | | (443 | ) | | | (58 | ) | | | (592 | ) |
Reclassifications | | | 334 | | | | 339 | | | | (757 | ) | | | (84 | ) |
Transfer to assets held for sale | | | (63 | ) | | | (192 | ) | | | (4 | ) | | | (259 | ) |
Cost at 31 December 2011 | | | 6,351 | | | | 10,389 | | | | 2,092 | | | | 18,832 | |
Exchange adjustments | | | (186 | ) | | | (239 | ) | | | (57 | ) | | | (482 | ) |
Additions | | | 85 | | | | 209 | | | | 871 | | | | 1,165 | |
Additions through business combinations | | | 18 | | | | 15 | | | | – | | | | 33 | |
Capitalised borrowing costs | | | – | | | | – | | | | 9 | | | | 9 | |
Disposals and write-offs | | | (250 | ) | | | (630 | ) | | | (3 | ) | | | (883 | ) |
Reclassifications | | | 533 | | | | 376 | | | | (977 | ) | | | (68 | ) |
Transfer from assets held for sale | | | 81 | | | | 49 | | | | 6 | | | | 136 | |
Cost at 31 December 2012 | | | 6,632 | | | | 10,169 | | | | 1,941 | | | | 18,742 | |
164 | GSK Annual Report 2012
Notes to the financial statements
| 17 | Property, plant and equipmentcontinued |
| | | | | | | | | | | | | | | | |
| | | Land and buildings £m | | | Plant, equipment and vehicles £m | | | Assets in construction £m | | | Total £m | |
| | | | |
Depreciation at 1 January 2011 | | | (2,289 | ) | | | (6,959 | ) | | | – | | | | (9,248 | ) |
Exchange adjustments | | | 16 | | | | 88 | | | | – | | | | 104 | |
Charge for the year | | | (202 | ) | | | (691 | ) | | | – | | | | (893 | ) |
Disposals and write-offs | | | 51 | | | | 397 | | | | – | | | | 448 | |
Transfer to assets held for sale | | | 28 | | | | 124 | | | | – | | | | 152 | |
| | | | |
Depreciation at 31 December 2011 | | | (2,396 | ) | | | (7,041 | ) | | | – | | | | (9,437 | ) |
Exchange adjustments | | | 73 | | | | 164 | | | | – | | | | 237 | |
Charge for the year | | | (228 | ) | | | (643 | ) | | | – | | | | (871 | ) |
Disposals and write-offs | | | 150 | | | | 491 | | | | – | | | | 641 | |
Transfer from assets held for sale | | | (36 | ) | | | (20 | ) | | | – | | | | (56 | ) |
Depreciation at 31 December 2012 | | | (2,437 | ) | | | (7,049 | ) | | | – | | | | (9,486 | ) |
| | | | |
Impairment at 1 January 2011 | | | (100 | ) | | | (438 | ) | | | (64 | ) | | | (602 | ) |
Exchange adjustments | | | 3 | | | | 6 | | | | 1 | | | | 10 | |
Disposals and write-offs | | | 21 | | | | 59 | | | | – | | | | 80 | |
Impairment losses | | | (66 | ) | | | (121 | ) | | | (3 | ) | | | (190 | ) |
Reversal of impairments | | | 4 | | | | 31 | | | | – | | | | 35 | |
Transfer to assets held for sale | | | – | | | | 20 | | | | – | | | | 20 | |
| | | | |
Impairment at 31 December 2011 | | | (138 | ) | | | (443 | ) | | | (66 | ) | | | (647 | ) |
Exchange adjustments | | | 3 | | | | 9 | | | | 2 | | | | 14 | |
Disposals and write-offs | | | 21 | | | | 103 | | | | 1 | | | | 125 | |
Impairment losses | | | (18 | ) | | | (38 | ) | | | (2 | ) | | | (58 | ) |
Reversal of impairments | | | 19 | | | | 104 | | | | 3 | | | | 126 | |
Transfer from assets held for sale | | | (39 | ) | | | (1 | ) | | | – | | | | (40 | ) |
Impairment at 31 December 2012 | | | (152 | ) | | | (266 | ) | | | (62 | ) | | | (480 | ) |
| | | | |
Total depreciation and impairment at 31 December 2011 | | | (2,534 | ) | | | (7,484 | ) | | | (66 | ) | | | (10,084 | ) |
| | | | |
Total depreciation and impairment at 31 December 2012 | | | (2,589 | ) | | | (7,315 | ) | | | (62 | ) | | | (9,966 | ) |
| | | | |
Net book value at 1 January 2011 | | | 3,729 | | | | 3,144 | | | | 2,172 | | | | 9,045 | |
| | | | |
Net book value at 31 December 2011 | | | 3,817 | | | | 2,905 | | | | 2,026 | | | | 8,748 | |
| | | | |
Net book value at 31 December 2012 | | | 4,043 | | | | 2,854 | | | | 1,879 | | | | 8,776 | |
The net book value at 31 December 2012 of the Group’s land and buildings comprises freehold properties £3,611 million (2011 – £3,580 million), properties with leases of 50 years or more £376 million (2011 – £143 million) and properties with leases of less than 50 years £56 million (2011 – £94 million).
Included in land and buildings at 31 December 2012 are leased assets with a cost of £766 million (2011 – £559 million), accumulated depreciation of £315 million (2011 – £303 million), impairment of £19 million (2011 – £19 million) and a net book value of £432 million (2011 –£237 million). Included in plant, equipment and vehicles at 31 December 2012 are leased assets with a cost of £110 million (2011 – £81 million), accumulated depreciation of £55 million (2011 – £64 million), impairment of £nil (2011 – £14 million) and a net book value of £55 million (2011 – £3 million). Some lease agreements include renewal or purchase options or escalation clauses.
The impairment losses principally arise from decisions to rationalise facilities and are calculated based on either fair value less costs to sell or value in use. The value in use calculations determine the net present value of the projected risk-adjusted, post-tax cash flows of the relevant asset or cash generating unit, applying a discount rate of the Group post-tax weighted average cost of capital (WACC) of 7%, adjusted where appropriate for relevant specific risks. Where an impairment is indicated and a pre-tax cash flow calculation is expected to give a materially different result, the test would be reperformed using pre-tax cash flows and a pre-tax discount rate. The Group WACC is equivalent to a pre-tax discount rate of approximately 10%. The impairment losses have been charged to cost of sales £25 million (2011 – £31 million), R&D £9 million (2011 – £89 million) and SG&A £24 million (2011 – £70 million), and include £7 million (2011 – £131 million) arising from the major restructuring programmes.
Reversals of impairment arise from subsequent reviews of the impaired assets where the conditions which gave rise to the original impairments are deemed no longer to apply. All of the reversals have been credited to cost of sales.
|
| GSK Annual Report 2012 | 165 |
| | | | | | | | |
| | | 2012
£m | | | 2011
£m | |
Cost at 1 January | | | 3,754 | | | | 3,606 | |
Exchange adjustments | | | (177 | ) | | | (30 | ) |
Additions through business combinations (Note 38) | | | 873 | | | | 176 | |
Movements in contingent consideration balances | | | (91 | ) | | | 2 | |
Cost at 31 December | | | 4,359 | | | | 3,754 | |
| | |
Net book value at 1 January | | | 3,754 | | | | 3,606 | |
| | |
Net book value at 31 December | | | 4,359 | | | | 3,754 | |
The movement in the contingent consideration balance arises in respect of the acquisition of Pfizer Inc’s HIV business on 14 April 2009.
The carrying value of goodwill, translated at year-end exchange rates, is made up of balances arising on acquisition of the following businesses:
| | | | | | | | | | |
| | | Cash generating unit | | 2012
£m | | | 2011
£m | |
Stiefel Laboratories, Inc. | | US, Europe, EMAP, Other Pharmaceuticals and Vaccines | | | 845 | | | | 891 | |
Human Genome Sciences, Inc. | | US, Europe, EMAP, Japan, Other Pharmaceuticals and Vaccines | | | 779 | | | | – | |
ID Biomedical Corporation | | US, Europe, EMAP, Japan, Other Pharmaceuticals and Vaccines | | | 444 | | | | 456 | |
Reliant Pharmaceuticals, Inc. | | US Pharmaceuticals and Vaccines | | | 429 | | | | 451 | |
Sirtris Pharmaceuticals, Inc. | | US, Europe, EMAP, Japan, Other Pharmaceuticals and Vaccines | | | 291 | | | | 306 | |
GlaxoSmithKline K.K. | | Japan Pharmaceuticals and Vaccines | | | 221 | | | | 260 | |
Domantis Limited | | US, Europe, EMAP, Japan, Other Pharmaceuticals and Vaccines | | | 181 | | | | 181 | |
Pfizer HIV business | | ViiV Healthcare | | | 152 | | | | 252 | |
CNS, Inc. | | Consumer Healthcare | | | 135 | | | | 142 | |
Maxinutrition Group Holdings Limited | | Consumer Healthcare | | | 114 | | | | 114 | |
Polfa Poznan S.A. | | Europe Pharmaceuticals and Vaccines | | | 109 | | | | 102 | |
Certain businesses from UCB S.A. | | EMAP Pharmaceuticals and Vaccines | | | 88 | | | | 88 | |
Laboratories Phoenix S.A.I.C.yF. | | EMAP Pharmaceuticals and Vaccines | | | 55 | | | | 66 | |
NovaMin Technology, Inc. | | Consumer Healthcare | | | 50 | | | | 52 | |
Others | | | | | 466 | | | | 393 | |
| | | | | | 4,359 | | | | 3,754 | |
The goodwill arising on the acquisition of Stiefel has been allocated to the US, Europe, EMAP and Other Pharmaceuticals and Vaccines cash generating units for impairment testing purposes as the benefits of the acquired business are are split between these cash generating units.
The goodwill arising on the acquisitions of Human Genome Sciences, ID Biomedical, Sirtris Pharmaceuticals and Domantis has been split between the US, Europe, EMAP, Japan and Other Pharmaceutical and Vaccines cash generating units for impairment testing purposes as either the benefit of the acquired businesses is split between these cash generating units or the acquired businesses do not generate independent cash flows.
The total of goodwill allocated to US Pharmaceuticals and Vaccines amounted to £1,878 million (2011 – £1,470 million). The amounts allocated to the other cash generating units were not significant relative to the total balance.
166 | GSK Annual Report 2012
Notes to the financial statements
The recoverable amounts of the cash generating units are assessed using either a fair value less costs to sell model or a value in use model. Value in use is calculated as the net present value of the projected risk-adjusted post-tax cash flows plus a terminal value of the cash generating unit to which the goodwill is allocated. Initially a post-tax discount rate is applied to calculate the net present value of the post-tax cash flows. The discount rate used is based on the Group WACC of 7%, as most cash generating units have integrated operations across large parts of the Group. The discount rate is adjusted where appropriate for specific country or currency risks.
Fair value less costs to sell is calculated using a similar discounted cash flow approach based on the Group’s acquisition valuation model. A post-tax discount rate is applied to the projected risk-adjusted post-tax cash flows and terminal value.
Details relating to the discounted cash flow models used in the impairment tests of the Pharmaceuticals and Vaccines and Consumer Healthcare cash generating units are as follows:
| | | | | | | | | | | | |
Valuation basis | | | | Higher of fair value less costs to sell and value in use | |
Key assumptions | | | | Sales growth rates Advertising and promotion investment Profit margins Terminal growth rate Discount rate | |
Determination of assumptions | | | | Growth rates are internal forecasts based on both internal and external market information. Margins reflect past experience, adjusted for expected changes. Advertising and promotion investment based on historical levels adjusted for management’s view of support needed for innovation and expansion. Terminal growth rates based on management’s estimate of future long-term average growth rates. Discount rates based on Group WACC, adjusted where appropriate. | |
Period of specific projected cash flows | | | | 5 years | |
Terminal growth rate and discount rate | | | | | | | Terminal growth rate | | | | Discount rate | |
| | | | US Pharmaceuticals and Vaccines | | | 1% p.a. | | | | 7% | |
| | | | Europe Pharmaceuticals and Vaccines | | | 1% p.a. | | | | 8% | |
| | | | EMAP Pharmaceuticals and Vaccines | | | 1.5% p.a. | | | | 10% | |
| | | | Japan Pharmaceuticals and Vaccines | | | 0.5% p.a. | | | | 6% | |
| | | | ViiV Healthcare | | | 2.5% p.a. | | | | 10% | |
| | | | Other Pharmaceuticals and Vaccines | | | 1% p.a. | | | | 7% | |
| | | | Consumer Healthcare | | | 3% p.a. | | | | 7% | |
| | | | | | | | | | | | | |
The terminal growth rates do not exceed the long-term projected growth rates for the relevant markets. The terminal growth rates used in the fair value less costs to sell calculations for the cash generating units reflect the impact of future generic competition and take account of new product launches.
The Pharmaceutical and Vaccines cash generating units comprise a collection of smaller cash generating units including assets with indefinite lives with a carrying value of £609 million (2011 – £679 million). The Consumer Healthcare cash generating unit also comprises a collection of smaller cash generating units including brands with indefinite lives with a carrying value of £1.52 billion. (2011 – £1.57 billion).
Details of indefinite life brands are given in Note 19 ‘Other intangible assets’.
In each case the valuations indicate sufficient headroom such that a reasonably possible change to key assumptions is unlikely to result in an impairment of the related goodwill.
|
| GSK Annual Report 2012 | 167 |
| 19 | Other intangible assets |
| | | | | | | | | | | | | | | | | | | | |
| | | Computer software £m | | | Licences, patents, etc. £m | | | Amortised brands £m | | | Indefinite life brands £m | | | Total £m | |
Cost at 1 January 2011 | | | 1,174 | | | | 7,671 | | | | 377 | | | | 2,564 | | | | 11,786 | |
Exchange adjustments | | | 2 | | | | (15 | ) | | | (2 | ) | | | (51 | ) | | | (66 | ) |
Capitalised internal development costs | | | 81 | | | | – | | | | – | | | | – | | | | 81 | |
Additions through business combinations | | | – | | | | 5 | | | | 62 | | | | 61 | | | | 128 | |
Capitalised borrowing costs | | | 5 | | | | 6 | | | | – | | | | – | | | | 11 | |
Other additions | | | 17 | | | | 218 | | | | – | | | | – | | | | 235 | |
Disposals and asset write-offs | | | (5 | ) | | | (106 | ) | | | – | | | | – | | | | (111 | ) |
Reclassifications | | | 84 | | | | – | | | | – | | | | – | | | | 84 | |
Transfer to assets held for sale | | | – | | | | (3 | ) | | | (309 | ) | | | (296 | ) | | | (608 | ) |
Cost at 31 December 2011 | | | 1,358 | | | | 7,776 | | | | 128 | | | | 2,278 | | | | 11,540 | |
Exchange adjustments | | | (30 | ) | | | (233 | ) | | | (8 | ) | | | (67 | ) | | | (338 | ) |
Capitalised internal development costs | | | 62 | | | | 74 | | | | – | | | | – | | | | 136 | |
Additions through business combinations | | | 2 | | | | 3,258 | | | | – | | | | – | | | | 3,260 | |
Capitalised borrowing costs | | | 5 | | | | 7 | | | | – | | | | – | | | | 12 | |
Other additions | | | 49 | | | | 209 | | | | – | | | | – | | | | 258 | |
Disposals and asset write-offs | | | (13 | ) | | | (487 | ) | | | – | | | | – | | | | (500 | ) |
Reclassifications | | | 68 | | | | – | | | | – | | | | – | | | | 68 | |
Transfer from/(to) assets held for sale | | | – | | | | – | | | | 292 | | | | (27 | ) | | | 265 | |
Cost at 31 December 2012 | | | 1,501 | | | | 10,604 | | | | 412 | | | | 2,184 | | | | 14,701 | |
| | | | | |
Amortisation at 1 January 2011 | | | (862 | ) | | | (1,689 | ) | | | (53 | ) | | | – | | | | (2,604 | ) |
Exchange adjustments | | | – | | | | 3 | | | | (2 | ) | | | – | | | | 1 | |
Charge for the year | | | (89 | ) | | | (419 | ) | | | (22 | ) | | | – | | | | (530 | ) |
Disposals and asset write-offs | | | 5 | | | | – | | | | – | | | | – | | | | 5 | |
Transfer to assets held for sale | | | – | | | | – | | | | 45 | | | | – | | | | 45 | |
Amortisation at 31 December 2011 | | | (946 | ) | | | (2,105 | ) | | | (32 | ) | | | – | | | | (3,083 | ) |
Exchange adjustments | | | 20 | | | | 70 | | | | – | | | | – | | | | 90 | |
Charge for the year | | | (97 | ) | | | (453 | ) | | | (24 | ) | | | – | | | | (574 | ) |
Disposals and asset write-offs | | | 11 | | | | 15 | | | | – | | | | – | | | | 26 | |
Transfer from assets held for sale | | | – | | | | – | | | | (50 | ) | | | – | | | | (50 | ) |
Amortisation at 31 December 2012 | | | (1,012 | ) | | | (2,473 | ) | | | (106 | ) | | | – | | | | (3,591 | ) |
| | | | | |
Impairment at 1 January 2011 | | | (36 | ) | | | (587 | ) | | | – | | | | (27 | ) | | | (650 | ) |
Exchange adjustments | | | 1 | | | | (5 | ) | | | – | | | | – | | | | (4 | ) |
Impairment losses | | | (2 | ) | | | (133 | ) | | | – | | | | – | | | | (135 | ) |
Reversal of impairments | | | – | | | | 22 | | | | – | | | | – | | | | 22 | |
Disposals and asset write-offs | | | 1 | | | | 101 | | | | – | | | | – | | | | 102 | |
Transfer to assets held for sale | | | – | | | | 10 | | | | – | | | | – | | | | 10 | |
Impairment at 31 December 2011 | | | (36 | ) | | | (592 | ) | | | – | | | | (27 | ) | | | (655 | ) |
Exchange adjustments | | | – | | | | 20 | | | | 2 | | | | 1 | | | | 23 | |
Impairment losses | | | (3 | ) | | | (536 | ) | | | (131 | ) | | | (26 | ) | | | (696 | ) |
Disposals and asset write-offs | | | – | | | | 379 | | | | – | | | | – | | | | 379 | |
Impairment at 31 December 2012 | | | (39 | ) | | | (729 | ) | | | (129 | ) | | | (52 | ) | | | (949 | ) |
| | | | | |
Total amortisation and impairment at 31 December 2011 | | | (982 | ) | | | (2,697 | ) | | | (32 | ) | | | (27 | ) | | | (3,738 | ) |
Total amortisation and impairment at 31 December 2012 | | | (1,051 | ) | | | (3,202 | ) | | | (235 | ) | | | (52 | ) | | | (4,540 | ) |
| | | | | |
Net book value at 1 January 2011 | | | 276 | | | | 5,395 | | | | 324 | | | | 2,537 | | | | 8,532 | |
| | | | | |
Net book value at 31 December 2011 | | | 376 | | | | 5,079 | | | | 96 | | | | 2,251 | | | | 7,802 | |
| | | | | |
Net book value at 31 December 2012 | | | 450 | | | | 7,402 | | | | 177 | | | | 2,132 | | | | 10,161 | |
168 | GSK Annual Report 2012
Notes to the financial statements
| 19 | Other intangible assetscontinued |
Amortisation and impairment losses, net of reversals, have been charged in the income statement as follows:
| | | | | | | | | | | | | | | | | | |
| | | | | | Amortisation | | | | | Net impairment losses | |
| | | 2012 £m | | | 2011 (restated) £m | | | | | 2012 £m | | | 2011 (restated) £m | |
Cost of sales | | | 378 | | | | 304 | | | | | | 309 | | | | 12 | |
Selling, general and administration | | | 97 | | | | 89 | | | | | | 3 | | | | 3 | |
Research and development | | | 99 | | | | 137 | | | | | | 384 | | | | 98 | |
| | | | 574 | | | | 530 | | | | | | 696 | | | | 113 | |
The charge for impairments in the year includes the impairments of Horizant,alli and the ViiV Healthcare compound, lersivirine.
The net book value of computer software includes £303 million (2011 – £277 million) of internally generated costs.
Licences, patents, etc. includes a large number of acquired licences, patents, know-how agreements and marketing rights, which are either marketed or in use, or still in development. The net book value includes £8 million (2011 – £5 million) of internally generated costs. Note 38, ‘Acquisitions and disposals’ gives details of additions through business combinations in the year. The book values of the largest individual items are as follows:
| | | | | | | | |
| | | 2012 £m | | | 2011 £m | |
dolutegravir | | | 1,777 | | | | – | |
Benlysta | | | 1,183 | | | | – | |
FluLaval/Fluviral | | | 549 | | | | 606 | |
Lovaza | | | 445 | | | | 536 | |
Selzentry | | | 251 | | | | 274 | |
Arzerra | | | 276 | | | | 284 | |
Duac | | | 130 | | | | 148 | |
Toctino | | | 128 | | | | – | |
Fraxiparine | | | 91 | | | | 113 | |
Others | | | 2,572 | | | | 3,118 | |
| | | | 7,402 | | | | 5,079 | |
Indefinite life brands comprise a portfolio of Consumer Healthcare products primarily acquired with the acquisitions of Sterling Winthrop, Inc. in 1994, Block Drug Company, Inc. in 2001 and CNS, Inc. in 2006, together with a number of pharmaceutical brands from the acquisition of Stiefel Laboratories, Inc. in 2009. The book values of the major brands are as follows:
| | | | | | | | |
| | | 2012 £m | | | 2011 £m | |
Panadol | | | 413 | | | | 424 | |
Sensodyne | | | 256 | | | | 266 | |
Stiefeltrade name | | | 201 | | | | 209 | |
Breathe Right | | | 191 | | | | 201 | |
Physiogel | | | 174 | | | | 169 | |
Polident | | | 108 | | | | 112 | |
Corega | | | 97 | | | | 100 | |
Biotene | | | 106 | | | | 110 | |
Poligrip | | | 66 | | | | 69 | |
Others | | | 520 | | | | 591 | |
| | | | 2,132 | | | | 2,251 | |
Each of these brands is considered to have an indefinite life, given the strength and durability of the brand and the level of marketing support. The brands are in relatively similar stable and profitable market sectors, with similar risk profiles, and their size, diversification and market shares mean that the risk of market-related factors causing a reduction in the lives of the brands is considered to be relatively low. The Group is not aware of any material legal, regulatory, contractual, competitive, economic or other factor which could limit their useful lives. Accordingly, they are not amortised.
Each brand is tested annually for impairment applying a fair value less costs to sell methodology, generally using five year post-tax cash flow forecasts with a terminal value calculation and a discount rate equal to the Group post-tax WACC of 7%, adjusted where appropriate for country and currency specific risks. The main assumptions include future sales price and volume growth, product contribution and the future expenditure required to maintain the product’s marketability and registration in the relevant jurisdictions. These assumptions are based on past experience and are reviewed as part of management’s budgeting and strategic planning cycle for changes in market conditions and sales erosion through competition. The terminal growth rates applied of between nil and 3% are management’s estimates of future long-term average growth rates of the relevant markets. In each case the valuations indicate sufficient headroom such that a reasonably possible change to key assumptions is unlikely to result in an impairment of these brands.
|
| GSK Annual Report 2012 | 169 |
| 20 | Investments in associates and joint ventures |
| | | | | | | | | | | | | | | | | | | | | | | | |
| | | Joint ventures £m | | | Associated undertakings £m | | | 2012 Total £m | | | Joint ventures £m | | | Associated undertakings £m | | | 2011 Total £m | |
At 1 January | | | 29 | | | | 531 | | | | 560 | | | | 54 | | | | 1,027 | | | | 1,081 | |
Exchange adjustments | | | (3 | ) | | | (32 | ) | | | (35 | ) | | | – | | | | (61 | ) | | | (61 | ) |
Additions | | | 58 | | | | 41 | | | | 99 | | | | 33 | | | | 2 | | | | 35 | |
Disposals | | | – | | | | – | | | | – | | | | (25 | ) | | | (460 | ) | | | (485 | ) |
Transfer from other investments | | | – | | | | – | | | | – | | | | – | | | | 3 | | | | 3 | |
Distributions received | | | (25 | ) | | | (21 | ) | | | (46 | ) | | | (2 | ) | | | (23 | ) | | | (25 | ) |
Other movements | | | (7 | ) | | | (21 | ) | | | (28 | ) | | | – | | | | (3 | ) | | | (3 | ) |
(Loss)/profit after tax recognised in the consolidated income statement | | | (30 | ) | | | 59 | | | | 29 | | | | (31 | ) | | | 46 | | | | 15 | |
At 31 December | | | 22 | | | | 557 | | | | 579 | | | | 29 | | | | 531 | | | | 560 | |
The Group held one significant associated undertaking at 31 December 2012.
At 31 December 2012, the Group owned 84.7 million shares or 19% of Aspen Pharmacare Holdings Limited. Aspen, listed on the Johannesburg Stock Exchange, is Africa’s largest pharmaceutical manufacturer and a major supplier of branded and generic pharmaceutical, healthcare and nutritional products to the southern African and selected international markets. The investment had a book value at 31 December 2012 of £430 million (2011 – £393 million) and a market value of £1,037 million (2011 – £627 million). Although the Group holds less than 20% of the ownership interest and voting control of Aspen, the Group has the ability to exercise significant influence through both its shareholding and its nominated director’s active participation on the Aspen Board of Directors.
Other movements in the year includes deferred profit provided on the sale of the Classic Brands business of a Group market to Aspen.
During 2012, GSK made additional capital contributions of £39 million to the Shionogi-ViiV Healthcare joint venture (2011 – £32 million).
On 29 October 2012, GSK acquired the 50% share of the Shionogi-ViiV Healthcare joint venture previously held by Shionogi & Co Ltd., and from that date has accounted for the entity as a subsidiary company. See Note 38, ‘Acquisitions and disposals’.
Summarised balance sheet information in respect of the Group’s associates is set out below:
| | | | | | | | |
| | | 2012 £m | | | 2011 £m | |
Total assets: | | | | | | | | |
Aspen Pharmacare Holdings Limited | | | 2,439 | | | | 2,165 | |
Others | | | 363 | | | | 356 | |
| | | | 2,802 | | | | 2,521 | |
| | |
Total liabilities: | | | | | | | | |
Aspen Pharmacare Holdings Limited | | | (1,085 | ) | | | (988 | ) |
Others | | | (78 | ) | | | (84 | ) |
| | | | (1,163 | ) | | | (1,072 | ) |
| | |
Net assets | | | 1,639 | | | | 1,449 | |
The summarised balance sheet information in respect of Aspen Pharmacare Holdings Limited is based on preliminary results information and analysts forecasts available at 31 December 2012.
Investments in joint ventures comprise £112 million share of gross assets (2011 – £49 million) and £90 million share of gross liabilities (2011 – £20 million). These principally arise from a 50% interest in one joint venture, Japan Vaccine Co., Ltd., with Daiichi Sankyo Co., Ltd. The joint venture holds the development and commercial rights for existing preventative vaccines from both parent companies. It will supply globally recommended vaccines including Human Papillomavirus (HPV) vaccine, Rotavirus vaccine, Seasonal flu vaccine, Mumps vaccine, Diptheria Pertussis (DTP) vaccine and Measles Rubella vaccine (MRV) in Japan.
170 | GSK Annual Report 2012
Notes to the financial statements
| | | | | | | | |
| | | 2012 £m | | | 2011 £m | |
At 1 January | | | 590 | | | | 711 | |
Exchange adjustments | | | (31 | ) | | | (2 | ) |
Additions | | | 229 | | | | 73 | |
Net fair value movements | | | 78 | | | | (24 | ) |
Impairment losses | | | (28 | ) | | | (97 | ) |
Transfer to investments in associates and joint ventures | | | – | | | | (3 | ) |
Equity investments converted into subsidiary on acquisition of business | | | (23 | ) | | | – | |
Disposals | | | (28 | ) | | | (68 | ) |
At 31 December | | | 787 | | | | 590 | |
Other investments comprise non-current equity investments which are available-for-sale investments recorded at fair value at each balance sheet date. For investments traded in an active market, the fair value is determined by reference to the relevant stock exchange quoted bid price. For other investments, the fair value is estimated by management with reference to relevant available information, including the current market value of similar instruments and discounted cash flows of the underlying net assets. The Group holds a number of equity investments in entities where the Group has entered into research collaborations. Other investments include listed investments of £589 million (2011 – £385 million), the increase primarily arising from additions and fair value adjustments.
Additions in the year include further investments in Theravance Inc. of £146 million.
On disposal of investments, fair value movements are reclassified from equity to the income statement based on average cost for shares acquired at different times.
The impairment losses recorded above have been recognised in the income statement for the year within other operating income, together with amounts reclassified from the fair value reserve on recognition of the impairments. These impairments initially result from prolonged or significant declines in the fair value of the equity investments below acquisition cost, subsequent to which any further declines in fair value are immediately taken to the income statement.
Other investments include assets that have been impaired, as follows:
| | | | | | | | |
| | | 2012 £m | | | 2011 £m | |
Original cost | | | 481 | | | | 509 | |
Cumulative impairments recognised in the income statement | | | (381 | ) | | | (386 | ) |
Subsequent fair value increases | | | 71 | | | | 27 | |
Carrying value at 31 December | | | 171 | | | | 150 | |
22 Other non-current assets
| | | | | | | | |
| | | |
| | | 2012 £m | | | 2011 £m | |
Amounts receivable under insurance contracts | | | 359 | | | | 337 | |
Pension schemes in surplus | | | 124 | | | | 20 | |
Other receivables | | | 199 | | | | 168 | |
| | | | 682 | | | | 525 | |
23 Inventories
| | | | | | | | |
| | | |
| | | 2012 £m | | | 2011 £m | |
Raw materials and consumables | | | 965 | | | | 1,114 | |
Work in progress | | | 1,337 | | | | 1,168 | |
Finished goods | | | 1,667 | | | | 1,591 | |
| | | | 3,969 | | | | 3,873 | |
|
| GSK Annual Report 2012 | 171 |
| 24 | Trade and other receivables |
| | | | | | | | |
| | | 2012 £m | | | 2011 £m | |
Trade receivables, net of provision for bad and doubtful debts | | | 4,115 | | | | 4,441 | |
Prepaid pension contributions | | | 1 | | | | 2 | |
Other prepayments and accrued income | | | 284 | | | | 339 | |
Interest receivable | | | 11 | | | | 8 | |
Employee loans and advances | | | 40 | | | | 41 | |
Other receivables | | | 791 | | | | 745 | |
| | | | 5,242 | | | | 5,576 | |
Trade receivables include £257 million (2011 – £293 million) after provision for bad and doubtful debts (£315 million before provision, 2011 – £335 million) due from state hospital authorities in Greece, Ireland, Italy, Portugal and Spain. Trade receivables also include £31 million (2011 – £42 million) due from associates and joint ventures.
| | | | | | | | |
| Bad and doubtful debt provision | | 2012 £m | | | 2011 £m | |
At 1 January | | | 152 | | | | 150 | |
Exchange adjustments | | | (5 | ) | | | (2 | ) |
Charge for the year | | | 34 | | | | 56 | |
Subsequent recoveries of amounts provided for | | | (12 | ) | | | (49 | ) |
Utilised | | | (4 | ) | | | (3 | ) |
At 31 December | | | 165 | | | | 152 | |
| 25 | Cash and cash equivalents |
| | | | | | | | |
| | | 2012 £m | | | 2011 £m | |
Cash at bank and in hand | | | 1,465 | | | | 841 | |
Short-term deposits | | | 2,719 | | | | 4,873 | |
| | | | 4,184 | | | | 5,714 | |
| | | | | | | | |
| | | 2012 £m | | | 2011 £m | |
Land and buildings | | | 10 | | | | 35 | |
Plant, equipment and vehicles | | | 9 | | | | 48 | |
Assets in construction | | | – | | | | 4 | |
Intangible assets | | | 45 | | | | 546 | |
Inventory | | | – | | | | 32 | |
| | | | 64 | | | | 665 | |
Non-current assets are transferred to assets held for sale when it is expected that their carrying amounts will be recovered principally through disposal and a sale is considered likely. They are held at the lower of carrying amount and fair value less costs to sell.
The decrease in assets held for sale primarily results from the divestment of certain non-core Consumer Healthcare OTC products and the transfer of retained assets related toalli out of assets held for sale.
The disposal of the OTC brands was completed during 2012 for gross proceeds of £950 million. The profit on the disposal was £559 million before tax.
172 | GSK Annual Report 2012
Notes to the financial statements
| 27 | Trade and other payables |
| | | | | | | | |
| | | 2012 £m | | | 2011 £m | |
Trade payables | | | 2,666 | | | | 2,568 | |
Wages and salaries | | | 915 | | | | 974 | |
Social security | | | 112 | | | | 112 | |
Other payables | | | 881 | | | | 304 | |
Deferred income | | | 162 | | | | 38 | |
Customer return and rebate accruals | | | 1,640 | | | | 1,669 | |
Other accruals | | | 1,678 | | | | 1,694 | |
| | | | 8,054 | | | | 7,359 | |
Other payables include £585 million (2011 – £nil) in respect of the maximum potential amount payable to non-controlling shareholders in GSK Consumer Healthcare Ltd, the Group’s consumer healthcare subsidiary in India, under a voluntary open offer to purchase additional shares announced in November 2012. The purchase was completed in February 2013 and is discussed in Note 40, ‘Post balance sheet events’.
Customer return and rebate accruals are provided for by the Group at the point of sale in respect of the estimated rebates, discounts or allowances payable to customers, principally in the USA. Accruals are made at the time of sale but the actual amounts paid are based on claims made some time after the initial recognition of the sale. As the amounts are estimated they may not fully reflect the final outcome and are subject to change dependent upon, amongst other things, the types of buying group and product sales mix. The level of accrual is reviewed and adjusted quarterly in the light of historical experience of actual rebates, discounts or allowances given and returns made and any changes in arrangements. Future events could cause the assumptions on which the accruals are based to change, which could affect the future results of the Group.
Trade and other payables include £19 million (2011 – £16 million) due to associates and joint ventures.
| 28 | Pensions and other post-employment benefits |
| | | | | | | | | | | | |
| Pension and other post-employment costs | | 2012 £m | | | 2011 £m | | | 2010 £m | |
UK pension schemes | | | (294 | ) | | | 52 | | | | 158 | |
US pension schemes | | | 58 | | | | 61 | | | | 115 | |
Other overseas pensions schemes | | | 133 | | | | 132 | | | | 125 | |
Unfunded post-retirement healthcare schemes | | | 106 | | | | 96 | | | | 156 | |
| | | | 3 | | | | 341 | | | | 554 | |
Analysed as: | | | | | | | | | | | | |
Funded defined benefit/hybrid pension schemes | | | (161 | ) | | | 173 | | | | 325 | |
Unfunded defined benefit pension schemes | | | 14 | | | | 26 | | | | 28 | |
Unfunded post-retirement healthcare schemes | | | 106 | | | | 96 | | | | 156 | |
Defined benefit schemes | | | (41 | ) | | | 295 | | | | 509 | |
Defined contribution pension schemes | | | 44 | | | | 46 | | | | 45 | |
| | | | 3 | | | | 341 | | | | 554 | |
The reduction in the UK pension scheme cost in 2012 relates to the one-off adjustments arising from the capping of future pensionable salary increases and a change in the basis of future discretionary pension increases from RPI to CPI in certain legacy plans. For further details see page 173.
The costs of the defined benefit pension and post-retirement healthcare schemes are charged in the income statement as follows:
| | | | | | | | | | | | |
| | | 2012 £m | | | 2011 £m | | | 2010 £m | |
Cost of sales | | | (33 | ) | | | 93 | | | | 117 | |
Selling, general and administration | | | 64 | | | | 159 | | | | 254 | |
Research and development | | | (72 | ) | | | 43 | | | | 138 | |
| | | | (41 | ) | | | 295 | | | | 509 | |
GSK entities operate pension arrangements which cover the Group’s material obligations to provide pensions to retired employees. These arrangements have been developed in accordance with local practices in the countries concerned. Pension benefits can be provided by state schemes; by defined contribution schemes, whereby retirement benefits are determined by the value of funds arising from contributions paid in respect of each employee; or by defined benefit schemes, whereby retirement benefits are based on employee pensionable remuneration and length of service. Some ‘hybrid’ defined benefit schemes also include defined contribution sections.
|
| GSK Annual Report 2012 | 173 |
| 28 | Pensions and other post-employment benefitscontinued |
Pension costs of defined benefit schemes for accounting purposes have been calculated using the projected unit method. In certain countries pension benefits are provided on an unfunded basis, some administered by trustee companies. Formal, independent, actuarial valuations of the Group’s main plans are undertaken regularly, normally at least every three years.
Actuarial movements in the year are recognised through the statement of comprehensive income. Discount rates are derived from AA rated corporate bond yields except in countries where there is no deep market in corporate bonds where government bond yields are used. Discount rates are selected to reflect the term of the expected benefit payments. The expected rate of return on bonds reflects the portfolio mix of index-linked, government and corporate bonds. The expected rate of return on equities represents the Group’s long term view and includes a higher risk premium over bonds than in the past reflecting current low bond yields. Projected inflation rate and pension increases are long-term predictions based on the yield gap between long-term index-linked and fixed interest Gilts. In the UK, mortality rates are determined by adjusting the SAPS standard mortality tables to reflect recent scheme experience. These rates are then projected to reflect improvements in life expectancy in line with the CMI projections with a long term rate of improvement of 1% per year for both males and females. In the USA, mortality rates are calculated using the RP2000 fully generational table, projected using scale AA, with the white collar adjustment.
The average life expectancy assumed now for an individual at the age of 60 and projected to apply in 2032 for an individual then at the age of 60 is as follows:
| | | | | | | | | | | | | | | | |
| | | | | | UK | | | | | | USA | |
| | | Male Years | | | Female Years | | | Male Years | | | Female Years | |
Current | | | 27.4 | | | | 29.6 | | | | 24.8 | | | | 26.4 | |
Projected for 2032 | | | 29.0 | | | | 31.2 | | | | 26.7 | | | | 27.5 | |
The assets of funded schemes are generally held in separately administered trusts, either as specific assets or as a proportion of a general fund, or are insurance contracts. Assets are invested in different classes in order to maintain a balance between risk and return. Investments are diversified to limit the financial effect of the failure of any individual investment. The Group reviewed the investment strategy of the UK plans in 2011 and the asset allocation for the UK plans has been adjusted to approximately 55% return seeking assets and 45% liability matching assets. The target asset allocation of the US plans is currently 50% return seeking assets and 50% liability matching assets.
In the UK the defined benefit pension schemes operated for the benefit of former Glaxo Wellcome employees and former SmithKline Beecham employees remain separate. These schemes were closed to new entrants in 2001 and subsequent UK employees are entitled to join a defined contribution scheme. In the USA the former Glaxo Wellcome and SmithKline Beecham defined benefit schemes were merged during 2001. In addition, the Group operates a number of post-retirement healthcare schemes, the principal one of which is in the USA.
During 2012, the Group changed its policy towards granting discretionary pension increases in the Smithkline Beecham defined benefit schemes. As a result of the change, discretionary pension increases for pensions accruing prior to 1997 will be based on increases in the Consumer Price Index instead of the Retail Price Index. This change will also apply to revaluation of some of the deferred pensions of certain scheme participants who left service prior to 1991.
In the year, the Group has also introduced a limit for all UK defined benefit schemes of 2% per year on the rate at which pensionable pay may increase. The consequence of this is that those benefits which are related to final pensionable pay are now expected to be lower than was previously the case.
The combined impact of these two changes in 2012 is a credit to the income statement of £395 million and a similar reduction in the pension obligation.
The Group has applied the following financial assumptions in assessing the defined benefit liabilities:
| | | | | | | | | | | | | | | | | | | | | | | | | | | | | | | | | | | | |
| | | UK | | | USA | | | Rest of World | |
| | | 2012 % pa | | | 2011 % pa | | | 2010 % pa | | | 2012 % pa | | | 2011 % pa | | | 2010 % pa | | | 2012 % pa | | | 2011 % pa | | | 2010 % pa | |
Rate of increase of future earnings | | | 2.00 | | | | 4.00 | | | | 4.50 | | | | 4.00 | | | | 4.00 | | | | 4.50 | | | | 3.00 | | | | 2.90 | | | | 3.50 | |
Discount rate | | | 4.40 | | | | 4.80 | | | | 5.50 | | | | 3.80 | | | | 4.40 | | | | 5.20 | | | | 3.30 | | | | 4.20 | | | | 4.50 | |
Expected pension increases | | | 3.00 | | | | 3.00 | | | | 3.50 | | | | n/a | | | | n/a | | | | n/a | | | | 1.90 | | | | 1.90 | | | | 2.20 | |
Cash balance credit/conversion rate | | | n/a | | | | n/a | | | | n/a | | | | 3.35 | | | | 3.75 | | | | 4.20 | | | | 1.30 | | | | 1.20 | | | | 1.30 | |
Inflation rate | | | 3.00 | | | | 3.00 | | | | 3.50 | | | | 2.25 | | | | 2.25 | | | | 2.25 | | | | 1.70 | | | | 1.60 | | | | 1.70 | |
174 | GSK Annual Report 2012
Notes to the financial statements
| 28 | Pensions and other post-employment benefitscontinued |
The amounts recorded in the income statement and statement of comprehensive income for the three years ended 31 December 2012 in relation to the defined benefit pension and post-retirement healthcare schemes were as follows:
| | | | | | | | | | | | | | | | | | | | |
| | | | | | | | | | | | Pensions | | | Post-retirement benefits | |
| 2012 | | UK £m | | | USA £m | | | Rest of World £m | | | Group £m | | | Group £m | |
Amounts charged to operating profit | | | | | | | | | | | | | | | | | | | | |
Current service cost | | | 130 | | | | 66 | | | | 75 | | | | 271 | | | | 36 | |
Past service (credit)/cost | | | (395 | ) | | | – | | | | – | | | | (395 | ) | | | 4 | |
Expected return on pension scheme assets | | | (445 | ) | | | (131 | ) | | | (51 | ) | | | (627 | ) | | | – | |
Interest on scheme liabilities | | | 412 | | | | 123 | | | | 65 | | | | 600 | | | | 66 | |
Settlements and curtailments | | | 4 | | | | – | | | | – | | | | 4 | | | | – | |
| | | | (294 | ) | | | 58 | | | | 89 | | | | (147 | ) | | | 106 | |
| | | | | |
Actuarial (losses)/gains recorded in the statement of comprehensive income | | | (448 | ) | | | 14 | | | | (228 | ) | | | (662 | ) | | | (119 | ) |
| | | | | |
| | | | | | | | | | | | | | | | | | | | |
| | | | | | | | | | | | Pensions | | | Post-retirement benefits | |
| 2011 | | UK £m | | | USA £m | | | Rest of World £m | | | Group £m | | | Group £m | |
Amounts charged to operating profit | | | | | | | | | | | | | | | | | | | | |
Current service cost | | | 123 | | | | 64 | | | | 75 | | | | 262 | | | | 31 | |
Past service credit | | | (48 | ) | | | (1 | ) | | | – | | | | (49 | ) | | | (1 | ) |
Expected return on pension scheme assets | | | (465 | ) | | | (136 | ) | | | (52 | ) | | | (653 | ) | | | – | |
Interest on scheme liabilities | | | 437 | | | | 134 | | | | 64 | | | | 635 | | | | 71 | |
Settlements and curtailments | | | 5 | | | | – | | | | (1 | ) | | | 4 | | | | (5 | ) |
| | | | 52 | | | | 61 | | | | 86 | | | | 199 | | | | 96 | |
| | | | | |
Actuarial losses recorded in the statement of comprehensive income | | | (637 | ) | | | (97 | ) | | | (102 | ) | | | (836 | ) | | | (133 | ) |
| | | | | |
| | | | | | | | | | | | | | | | | | | | |
| | | | | | | | | | | | Pensions | | | Post-retirement benefits | |
| 2010 | | UK £m | | | USA £m | | | Rest of World £m | | | Group £m | | | Group £m | |
Amounts charged to operating profit | | | | | | | | | | | | | | | | | | | | |
Current service cost | | | 130 | | | | 68 | | | | 70 | | | | 268 | | | | 31 | |
Past service cost | | | – | | | | – | | | | – | | | | – | | | | 5 | |
Expected return on pension scheme assets | | | (427 | ) | | | (134 | ) | | | (51 | ) | | | (612 | ) | | | – | |
Interest on scheme liabilities | | | 425 | | | | 151 | | | | 64 | | | | 640 | | | | 73 | |
Settlements and curtailments | | | 30 | | | | 30 | | | | (3 | ) | | | 57 | | | | 47 | |
| | | | 158 | | | | 115 | | | | 80 | | | | 353 | | | | 156 | |
| | | | | |
Actuarial gains/(losses) recorded in the statement of comprehensive income | | | 73 | | | | 43 | | | | (37 | ) | | | 79 | | | | (80 | ) |
The past service credit of £395 million in 2012 reflects the adjustments related to the capping of future pensionable salary increases and a change in the basis of future discretionary pension increases from RPI to CPI in certain legacy plans. For further details see page 173.
The amounts included within settlements and curtailments include £4 million (2011 – £5 million; 2010 – £110 million) of augmentation costs arising from major restructuring programmes (see Note 29 ‘Other provisions’).
The total actuarial losses recorded in the statement of comprehensive income since 1 January 2003 amount to £3,798 million.
|
| GSK Annual Report 2012 | 175 |
| 28 | Pensions and other post-employment benefitscontinued |
A summarised balance sheet presentation of the Group defined benefit pension schemes and other post-retirement benefits is set out in the table below:
| | | | | | | | | | | | |
| | | 2012 £m | | | 2011 £m | | | 2010 £m | |
Recognised in Other non-current assets: | | | | | | | | | | | | |
Pension schemes in surplus | | | 124 | | | | 20 | | | | 23 | |
Recognised in Pensions and other post-employment benefits: | | | | | | | | | | | | |
Pension schemes in deficit | | | (1,437 | ) | | | (1,496 | ) | | | (1,247 | ) |
Post-retirement benefits | | | (1,668 | ) | | | (1,595 | ) | | | (1,425 | ) |
| | | | (3,105 | ) | | | (3,091 | ) | | | (2,672 | ) |
The fair values of the assets and liabilities of the UK and US defined benefit pension schemes, together with aggregated data for other defined benefit pension schemes in the Group are as follows:
| | | | | | | | | | | | | | | | | | | | | | | | | | | | |
| | | UK | | | USA | | | Rest of World | | | Group | |
| At 31 December 2012 | | Expected rate of return % | | | Fair value £m | | | Expected rate of return % | | | Fair value £m | | | Average expected rate of return % | | | Fair value £m | | | Fair value £m | |
Equities | | | 8.00 | | | | 5,270 | | | | 7.75 | | | | 1,018 | | | | 7.20 | | | | 276 | | | | 6,564 | |
Property | | | 7.00 | | | | 265 | | | | 6.75 | | | | 116 | | | | 6.50 | | | | 5 | | | | 386 | |
Bonds | | | 3.40 | | | | 3,493 | | | | 3.75 | | | | 1,013 | | | | 2.60 | | | | 676 | | | | 5,182 | |
Other assets | | | 3.60 | | | | 953 | | | | 0.25 | | | | 374 | | | | 3.20 | | | | 420 | | | | 1,747 | |
Fair value of assets | | | | | | | 9,981 | | | | | | | | 2,521 | | | | | | | | 1,377 | | | | 13,879 | |
Present value of scheme obligations | | | | | | | (10,298 | ) | | | | | | | (2,979 | ) | | | | | | | (1,914 | ) | | | (15,191 | ) |
| | | | | | | | (317 | ) | | | | | | | (458 | ) | | | | | | | (537 | ) | | | (1,312 | ) |
Unrecognised past service cost | | | | | | | – | | | | | | | | (1 | ) | | | | | | | – | | | | (1 | ) |
Recognised on the balance sheet | | | | | | | (317 | ) | | | | | | | (459 | ) | | | | | | | (537 | ) | | | (1,313 | ) |
| | | | | | | |
Included in other non-current assets | | | | | | | 103 | | | | | | | | – | | | | | | | | 21 | | | | 124 | |
Included in pensions and other post-employment benefits | | | | | | | (420 | ) | | | | | | | (459 | ) | | | | | | | (558 | ) | | | (1,437 | ) |
| | | | | | | | (317 | ) | | | | | | | (459 | ) | | | | | | | (537 | ) | | | (1,313 | ) |
| | | | | | | |
Actual return on plan assets | | | | | | | 665 | | | | | | | | 308 | | | | | | | | 116 | | | | 1,089 | |
In December 2010, the UK scheme purchased an insurance contract that will guarantee payment of specified pensioner liabilities. This is included within ‘Other assets’ and the ‘Present value of scheme obligations’ in the table above at a value of £751 million (2011 – £735 million).
| | | | | | | | | | | | | | | | | | | | | | | | | | | | |
| | | UK | | | USA | | | Rest of World | | | Group | |
| At 31 December 2011 | | Expected rate of return % | | | Fair value £m | | | Expected rate of return % | | | Fair value £m | | | Average expected rate of return % | | | Fair value £m | | | Fair value £m | |
Equities | | | 8.00 | | | | 4,349 | | | | 8.25 | | | | 907 | | | | 7.30 | | | | 254 | | | | 5,510 | |
Property | | | 7.00 | | | | 274 | | | | 7.25 | | | | 163 | | | | 7.00 | | | | 6 | | | | 443 | |
Bonds | | | 3.40 | | | | 3,354 | | | | 4.00 | | | | 1,224 | | | | 3.00 | | | | 673 | | | | 5,251 | |
Other assets | | | 3.35 | | | | 1,142 | | | | 0.25 | | | | 161 | | | | 3.30 | | | | 351 | | | | 1,654 | |
Fair value of assets | | | | | | | 9,119 | | | | | | | | 2,455 | | | | | | | | 1,284 | | | | 12,858 | |
Present value of scheme obligations | | | | | | | (9,779 | ) | | | | | | | (2,945 | ) | | | | | | | (1,610 | ) | | | (14,334 | ) |
| | | | | | | | (660 | ) | | | | | | | (490 | ) | | | | | | | (326 | ) | | | (1,476 | ) |
Unrecognised past service cost | | | | | | | – | | | | | | | | (1 | ) | | | | | | | 1 | | | | – | |
Recognised on the balance sheet | | | | | | | (660 | ) | | | | | | | (491 | ) | | | | | | | (325 | ) | | | (1,476 | ) |
| | | | | | | |
Included in other non-current assets | | | | | | | – | | | | | | | | – | | | | | | | | 20 | | | | 20 | |
Included in pensions and other post-employment benefits | | | | | | | (660 | ) | | | | | | | (491 | ) | | | | | | | (345 | ) | | | (1,496 | ) |
| | | | | | | | (660 | ) | | | | | | | (491 | ) | | | | | | | (325 | ) | | | (1,476 | ) |
| | | | | | | |
Actual return on plan assets | | | | | | | 285 | | | | | | | | 188 | | | | | | | | 20 | | | | 493 | |
176 | GSK Annual Report 2012
Notes to the financial statements
| 28 | Pensions and other post-employment benefitscontinued |
| | | | | | | | | | | | | | | | | | | | | | | | | | | | |
| | | UK | | | USA | | | Rest of World | | | Group | |
| At 31 December 2010 | | Expected rate of return % | | | Fair value £m | | | Expected rate of return % | | | Fair value £m | | | Average expected rate of return % | | | Fair value £m | | | Fair value £m | |
Equities | | | 8.00 | | | | 4,698 | | | | 8.25 | | | | 1,092 | | | | 7.40 | | | | 251 | | | | 6,041 | |
Property | | | 7.00 | | | | 272 | | | | 7.25 | | | | 147 | | | | 7.00 | | | | 6 | | | | 425 | |
Bonds | | | 4.50 | | | | 2,460 | | | | 4.75 | | | | 1,012 | | | | 3.10 | | | | 572 | | | | 4,044 | |
Other assets | | | 3.50 | | | | 1,188 | | | | 0.25 | | | | 59 | | | | 3.80 | | | | 399 | | | | 1,646 | |
Fair value of assets | | | | | | | 8,618 | | | | | | | | 2,310 | | | | | | | | 1,228 | | | | 12,156 | |
Present value of scheme obligations | | | | | | | (9,119 | ) | | | | | | | (2,781 | ) | | | | | | | (1,479 | ) | | | (13,379 | ) |
| | | | | | | | (501 | ) | | | | | | | (471 | ) | | | | | | | (251 | ) | | | (1,223 | ) |
Unrecognised past service cost | | | | | | | – | | | | | | | | (2 | ) | | | | | | | 1 | | | | (1 | ) |
Recognised on the balance sheet | | | | | | | (501 | ) | | | | | | | (473 | ) | | | | | | | (250 | ) | | | (1,224 | ) |
| | | | | | | |
Included in other non-current assets | | | | | | | – | | | | | | | | – | | | | | | | | 23 | | | | 23 | |
Included in pensions and other post-employment benefits | | | | | | | (501 | ) | | | | | | | (473 | ) | | | | | | | (273 | ) | | | (1,247 | ) |
| | | | | | | | (501 | ) | | | | | | | (473 | ) | | | | | | | (250 | ) | | | (1,224 | ) |
| | | | | | | |
Actual return on plan assets | | | | | | | 881 | | | | | | | | 240 | | | | | | | | 43 | | | | 1,164 | |
| | | | | | | | | | | | | | | | | | | | |
| | | | | | | | | | | | Pensions | | | Post-retirement benefits | |
| Movements in fair values of assets | | UK £m | | | USA £m | | | Rest of World £m | | | Group £m | | | Group £m | |
Assets at 1 January 2010 | | | 7,499 | | | | 2,072 | | | | 1,123 | | | | 10,694 | | | | – | |
Exchange adjustments | | | – | | | | 66 | | | | 26 | | | | 92 | | | | – | |
Expected return on assets | | | 427 | | | | 134 | | | | 51 | | | | 612 | | | | – | |
Actuarial gains | | | 454 | | | | 106 | | | | (8 | ) | | | 552 | | | | – | |
Employer contributions | | | 531 | | | | 175 | | | | 108 | | | | 814 | | | | 60 | |
Scheme participants’ contributions | | | 20 | | | | – | | | | 8 | | | | 28 | | | | 13 | |
Benefits paid | | | (313 | ) | | | (243 | ) | | | (80 | ) | | | (636 | ) | | | (73 | ) |
Assets at 31 December 2010 | | | 8,618 | | | | 2,310 | | | | 1,228 | | | | 12,156 | | | | – | |
Exchange adjustments | | | – | | | | 18 | | | | (10 | ) | | | 8 | | | | – | |
Expected return on assets | | | 465 | | | | 136 | | | | 52 | | | | 653 | | | | – | |
Actuarial (losses)/gains | | | (180 | ) | | | 52 | | | | (32 | ) | | | (160 | ) | | | – | |
Employer contributions | | | 530 | | | | 146 | | | | 108 | | | | 784 | | | | 70 | |
Scheme participants’ contributions | | | 7 | | | | – | | | | 9 | | | | 16 | | | | 12 | |
Benefits paid | | | (321 | ) | | | (207 | ) | | | (71 | ) | | | (599 | ) | | | (82 | ) |
Assets at 31 December 2011 | | | 9,119 | | | | 2,455 | | | | 1,284 | | | | 12,858 | | | | – | |
Exchange adjustments | | | – | | | | (125 | ) | | | (54 | ) | | | (179 | ) | | | – | |
Expected return on assets | | | 445 | | | | 131 | | | | 51 | | | | 627 | | | | – | |
Actuarial (losses)/gains | | | 220 | | | | 177 | | | | 65 | | | | 462 | | | | – | |
Employer contributions | | | 497 | | | | 52 | | | | 86 | | | | 635 | | | | 76 | |
Scheme participants’ contributions | | | 33 | | | | – | | | | 9 | | | | 42 | | | | 15 | |
Benefits paid | | | (333 | ) | | | (169 | ) | | | (58 | ) | | | (560 | ) | | | (91 | ) |
Settlements and curtailments | | | – | | | | – | | | | (6 | ) | | | (6 | ) | | | – | |
Assets at 31 December 2012 | | | 9,981 | | | | 2,521 | | | | 1,377 | | | | 13,879 | | | | – | |
The UK defined benefit schemes include defined contribution sections with account balances totalling £1,112 million at 31 December 2012 (2011 – £957 million; 2010 – £961 million).
During 2012, the Group made special funding contributions to the UK pension schemes totalling £366 million (2011 – £368 million; 2010 – £365 million) and £32 million (2011 – £82 million; 2010 – £91 million) to the US scheme. In 2009, GSK reached an agreement with the trustees of the UK pension schemes to make additional contributions to eliminate the pension deficit identified at the 31 December 2008 actuarial funding valuation. Based on the funding agreement following the 2008 valuation, the additional contributions are expected to be £368 million in 2013. The contributions are based on a discount rate of 5.25% and an inflation assumption of 2.8%. The next review of contribution levels is in progress and will be based on the actuarial valuation at 31 December 2011.
Employer contributions for 2013, including special funding contributions, are estimated to be approximately £660 million in respect of defined benefit pension schemes and £70 million in respect of post-retirement benefits.
|
| GSK Annual Report 2012 | 177 |
| 28 | Pensions and other post-employment benefitscontinued |
| | | | | | | | | | | | | | | | | | | | |
| | | | | | | | | | | | Pensions | | | Post-retirement benefits | |
| Movements in defined benefit obligations | | UK £m | | | USA £m | | | Rest of World £m | | | Group £m | | | Group £m | |
Obligations at 1 January 2010 | | | (8,446 | ) | | | (2,628 | ) | | | (1,364 | ) | | | (12,438 | ) | | | (1,253 | ) |
Exchange adjustments | | | – | | | | (84 | ) | | | (27 | ) | | | (111 | ) | | | (38 | ) |
Service cost | | | (130 | ) | | | (68 | ) | | | (70 | ) | | | (268 | ) | | | (31 | ) |
Interest cost | | | (425 | ) | | | (151 | ) | | | (64 | ) | | | (640 | ) | | | (73 | ) |
Settlements and curtailments | | | (30 | ) | | | (30 | ) | | | 3 | | | | (57 | ) | | | (44 | ) |
Actuarial losses | | | (381 | ) | | | (63 | ) | | | (29 | ) | | | (473 | ) | | | (80 | ) |
Scheme participants’ contributions | | | (20 | ) | | | – | | | | (8 | ) | | | (28 | ) | | | (13 | ) |
Benefits paid | | | 313 | | | | 243 | | | | 80 | | | | 636 | | | | 73 | |
Obligations at 31 December 2010 | | | (9,119 | ) | | | (2,781 | ) | | | (1,479 | ) | | | (13,379 | ) | | | (1,459 | ) |
Exchange adjustments | | | – | | | | (24 | ) | | | 15 | | | | (9 | ) | | | (10 | ) |
Service cost | | | (123 | ) | | | (64 | ) | | | (75 | ) | | | (262 | ) | | | (31 | ) |
Past service cost | | | 48 | | | | – | | | | – | | | | 48 | | | | 13 | |
Interest cost | | | (437 | ) | | | (134 | ) | | | (64 | ) | | | (635 | ) | | | (71 | ) |
Settlements and curtailments | | | (5 | ) | | | – | | | | 1 | | | | (4 | ) | | | 5 | |
Actuarial losses | | | (457 | ) | | | (149 | ) | | | (70 | ) | | | (676 | ) | | | (133 | ) |
Scheme participants’ contributions | | | (7 | ) | | | – | | | | (9 | ) | | | (16 | ) | | | (12 | ) |
Benefits paid | | | 321 | | | | 207 | | | | 71 | | | | 599 | | | | 82 | |
Obligations at 31 December 2011 | | | (9,779 | ) | | | (2,945 | ) | | | (1,610 | ) | | | (14,334 | ) | | | (1,616 | ) |
Exchange adjustments | | | – | | | | 149 | | | | 74 | | | | 223 | | | | 78 | |
Service cost | | | (130 | ) | | | (66 | ) | | | (75 | ) | | | (271 | ) | | | (36 | ) |
Past service cost | | | 395 | | | | – | | | | – | | | | 395 | | | | (2 | ) |
Interest cost | | | (412 | ) | | | (123 | ) | | | (65 | ) | | | (600 | ) | | | (66 | ) |
Settlements and curtailments | | | (4 | ) | | | – | | | | 6 | | | | 2 | | | | – | |
Actuarial losses | | | (668 | ) | | | (163 | ) | | | (293 | ) | | | (1,124 | ) | | | (119 | ) |
Scheme participants’ contributions | | | (33 | ) | | | – | | | | (9 | ) | | | (42 | ) | | | (15 | ) |
Benefits paid | | | 333 | | | | 169 | | | | 58 | | | | 560 | | | | 91 | |
Obligations at 31 December 2012 | | | (10,298 | ) | | | (2,979 | ) | | | (1,914 | ) | | | (15,191 | ) | | | (1,685 | ) |
Unrecognised past service cost | | | – | | | | (1 | ) | | | – | | | | (1 | ) | | | 17 | |
Recognised on the balance sheet at 31 December 2012 | | | (10,298 | ) | | | (2,980 | ) | | | (1,914 | ) | | | (15,192 | ) | | | (1,668 | ) |
The UK defined benefit schemes include defined contribution sections with obligations totalling £1,112 million at 31 December 2012 (2011 – £957 million; 2010 – £961 million).
The liability for the US post-retirement healthcare scheme has been assessed using the same assumptions as for the US pension scheme, together with the assumption for future medical inflation of 7% (2011 – 7.5%), grading down to 5.0% in 2017 and thereafter. During 2009, both the US pension and post-retirement healthcare schemes were amended. The changes resulted in a one-off gain of £37 million recognised in the income statement. At 31 December 2012 the US post-retirement healthcare scheme obligation was £1,504 million (2011 – £1,446 million; 2010 – £1,288 million). However, in accordance with IAS 19 the unvested part of a benefit improvement is not recognised immediately on the balance sheet but is recognised gradually through the income statement. At 31 December 2012, for the Group, the unrecognised past service cost of £17 million (2011 – £21 million; 2010 – £34 million) primarily relates to the effect of the change in the US post-retirement healthcare scheme, which amounted to £25 million (2011 – £31 million; 2010 – £36 million).
The defined benefit pension obligation is analysed as follows:
| | | | | | | | | | | | |
| | | 2012 £m | | | 2011 £m | | | 2010 £m | |
Funded | | | (14,789 | ) | | | (13,956 | ) | | | (13,033 | ) |
Unfunded | | | (402 | ) | | | (378 | ) | | | (346 | ) |
| | | | (15,191 | ) | | | (14,334 | ) | | | (13,379 | ) |
Post-retirement benefits are unfunded.
178 | GSK Annual Report 2012
Notes to the financial statements
| 28 | Pensions and other post-employment benefitscontinued |
| | | | | | | | | | | | | | | | | | | | |
| | | | | | | | | | | | Pensions | | | Post-retirement benefits | |
| History of experience gains and losses | | UK £m | | | USA
£m | | | Rest of World £m | | | Group
£m | | | Group £m | |
2012 | | | | | | | | | | | | | | | | | | | | |
Experience gains of scheme assets | | | 220 | | | | 177 | | | | 65 | | | | 462 | | | | | |
Percentage of scheme assets at 31 December 2012 | | | 2 | % | | | 7 | % | | | 5 | % | | | 3 | % | | | | |
| | | | | |
Experience (losses)/gains of scheme liabilities | | | (30 | ) | | | (29 | ) | | | (26 | ) | | | (85 | ) | | | 12 | |
Percentage of scheme obligations at 31 December 2012 | | | – | | | | 1 | % | | | 1 | % | | | 1 | % | | | 1 | % |
| | | | | |
Fair value of assets | | | 9,981 | | | | 2,521 | | | | 1,377 | | | | 13,879 | | | | – | |
Present value of scheme obligations | | | (10,298 | ) | | | (2,979 | ) | | | (1,914 | ) | | | (15,191 | ) | | | (1,685 | ) |
Deficits in the schemes | | | (317 | ) | | | (458 | ) | | | (537 | ) | | | (1,312 | ) | | | (1,685 | ) |
| | | | | |
2011 | | | | | | | | | | | | | | | | | | | | |
Experience (losses)/gains of scheme assets | | | (180 | ) | | | 52 | | | | (32 | ) | | | (160 | ) | | | | |
Percentage of scheme assets at 31 December 2011 | | | 2 | % | | | 2 | % | | | 2 | % | | | 1 | % | | | | |
| | | | | |
Experience (losses)/gains of scheme liabilities | | | (66 | ) | | | (3 | ) | | | (21 | ) | | | (90 | ) | | | 5 | |
Percentage of scheme obligations at 31 December 2011 | | | 1 | % | | | – | | | | 1 | % | | | 1 | % | | | – | |
| | | | | |
Fair value of assets | | | 9,119 | | | | 2,455 | | | | 1,284 | | | | 12,858 | | | | – | |
Present value of scheme obligations | | | (9,779 | ) | | | (2,945 | ) | | | (1,610 | ) | | | (14,334 | ) | | | (1,616 | ) |
Deficits in the schemes | | | (660 | ) | | | (490 | ) | | | (326 | ) | | | (1,476 | ) | | | (1,616 | ) |
| | | | | |
2010 | | | | | | | | | | | | | | | | | | | | |
Experience gains/(losses) of scheme assets | | | 454 | | | | 106 | | | | (8 | ) | | | 552 | | | | | |
Percentage of scheme assets at 31 December 2010 | | | 5 | % | | | 5 | % | | | 1 | % | | | 5 | % | | | | |
| | | | | |
Experience (losses)/gains of scheme liabilities | | | (45 | ) | | | 5 | | | | (3 | ) | | | (43 | ) | | | (14 | ) |
Percentage of scheme obligations at 31 December 2010 | | | – | | | | – | | | | – | | | | – | | | | 1 | % |
| | | | | |
Fair value of assets | | | 8,618 | | | | 2,310 | | | | 1,228 | | | | 12,156 | | | | – | |
Present value of scheme obligations | | | (9,119 | ) | | | (2,781 | ) | | | (1,479 | ) | | | (13,379 | ) | | | (1,459 | ) |
Deficits in the schemes | | | (501 | ) | | | (471 | ) | | | (251 | ) | | | (1,223 | ) | | | (1,459 | ) |
| | | | | |
2009 | | | | | | | | | | | | | | | | | | | | |
Experience gains of scheme assets | | | 729 | | | | 122 | | | | 19 | | | | 870 | | | | | |
Percentage of scheme assets at 31 December 2009 | | | 10 | % | | | 6 | % | | | 2 | % | | | 8 | % | | | | |
| | | | | |
Experience gains/(losses) of scheme liabilities | | | 162 | | | | (27 | ) | | | (15 | ) | | | 120 | | | | 6 | |
Percentage of scheme obligations at 31 December 2009 | | | 2 | % | | | 1 | % | | | 1 | % | | | 1 | % | | | – | |
| | | | | |
Fair value of assets | | | 7,499 | | | | 2,072 | | | | 1,123 | | | | 10,694 | | | | – | |
Present value of scheme obligations | | | (8,446 | ) | | | (2,628 | ) | | | (1,364 | ) | | | (12,438 | ) | | | (1,253 | ) |
Deficits in the schemes | | | (947 | ) | | | (556 | ) | | | (241 | ) | | | (1,744 | ) | | | (1,253 | ) |
| | | | | |
2008 | | | | | | | | | | | | | | | | | | | | |
Experience losses of scheme assets | | | (1,691 | ) | | | (614 | ) | | | (134 | ) | | | (2,439 | ) | | | | |
Percentage of scheme assets at 31 December 2008 | | | 28 | % | | | 30 | % | | | 12 | % | | | 26 | % | | | | |
| | | | | |
Experience (losses)/gains of scheme liabilities | | | (148 | ) | | | 2 | | | | 1 | | | | (145 | ) | | | (14 | ) |
Percentage of scheme obligations at 31 December 2008 | | | 2 | % | | | – | | | | – | | | | 1 | % | | | 1 | % |
| | | | | |
Fair value of assets | | | 6,135 | | | | 2,016 | | | | 1,137 | | | | 9,288 | | | | – | |
Present value of scheme obligations | | | (6,885 | ) | | | (2,738 | ) | | | (1,357 | ) | | | (10,980 | ) | | | (1,354 | ) |
Deficits in the schemes | | | (750 | ) | | | (722 | ) | | | (220 | ) | | | (1,692 | ) | | | (1,354 | ) |
|
| GSK Annual Report 2012 | 179 |
| 28 | Pensions and other post-employment benefitscontinued |
Sensitivity analysis
Effect of changes in assumptions used on the benefit obligations and on the 2013 annual defined benefit pension and post retirement costs after the revisions to IAS 19.
| | | | |
| | | £m | |
| |
A 0.25% decrease in discount rate would have the following approximate effect: | | | | |
| |
Increase in annual pension cost | | | 27 | |
Decrease in annual post-retirement benefits cost | | | (1 | ) |
Increase in pension obligation | | | 555 | |
Increase in post-retirement benefits obligation | | | 52 | |
| |
A one year increase in life expectancy would have the following approximate effect: | | | | |
| |
Increase in annual pension cost | | | 18 | |
Increase in annual post-retirement benefits cost | | | 3 | |
Increase in pension obligation | | | 362 | |
Increase in post-retirement benefits obligation | | | 50 | |
| |
A 1% increase in the rate of future healthcare inflation would have the following approximate effect: | | | | |
| |
Decrease in annual post-retirement benefits cost | | | – | |
Increase in post-retirement benefits obligation | | | 18 | |
| |
A 0.25% increase in inflation would have the following approximate effect: | | | | |
| |
Increase in annual pension cost | | | 18 | |
Increase in pension obligation | | | 334 | |
| | | | | | | | | | | | | | | | | | | | |
| | | Legal and other disputes £m | | | Major restructuring programmes £m | | | Employee related provisions £m | | | Other provisions £m | | | Total £m | |
At 1 January 2012 | | | 2,772 | | | | 404 | | | | 232 | | | | 226 | | | | 3,634 | |
Exchange adjustments | | | (54 | ) | | | (10 | ) | | | (7 | ) | | | (10 | ) | | | (81 | ) |
Charge for the year | | | 449 | | | | 150 | | | | 16 | | | | 52 | | | | 667 | |
Reversed unused | | | (13 | ) | | | (12 | ) | | | (2 | ) | | | (8 | ) | | | (35 | ) |
Unwinding of discount | | | 4 | | | | 5 | | | | – | | | | 6 | | | | 15 | |
Utilised | | | (2,610 | ) | | | (274 | ) | | | (12 | ) | | | (43 | ) | | | (2,939 | ) |
Acquisition of subsidiary | | | – | | | | 118 | | | | – | | | | – | | | | 118 | |
Reclassifications and other movements | | | (21 | ) | | | (4 | ) | | | – | | | | 42 | | | | 17 | |
Transfer to pension obligations | | | – | | | | (4 | ) | | | – | | | | – | | | | (4 | ) |
At 31 December 2012 | | | 527 | | | | 373 | | | | 227 | | | | 265 | | | | 1,392 | |
| | | | | |
To be settled within one year | | | 358 | | | | 220 | | | | 10 | | | | 105 | | | | 693 | |
To be settled after one year | | | 169 | | | | 153 | | | | 217 | | | | 160 | | | | 699 | |
At 31 December 2012 | | | 527 | | | | 373 | | | | 227 | | | | 265 | | | | 1,392 | |
180 | GSK Annual Report 2012
Notes to the financial statements
| 29 | Other provisionscontinued |
Legal and other disputes
The Group is involved in a substantial number of legal and other disputes, including notification of possible claims, as set out in Note 44 ‘Legal proceedings’. Provisions for legal and other disputes include amounts relating to product liability (principally relating toAvandia,PaxilandPoligrip), anti-trust (principally relating toWellbutrin, Flonase andLamictal), government investigations (principally relating to the ‘Colorado investigation’ settlement,Avandia-related investigations, AWP and nominal price investigations and the Cidra, Puerto Rico manufacturing settlement), contract terminations, self-insurance, environmental clean-up and property rental.
The charge for the year of £449 million (£435 million net of reversals and estimated insurance recoveries) primarily related to provisions for product liability cases regardingPaxil, Poligrip and other products and various government investigations. Various Federal government investigations were resolved in the year within the existing pre-tax provision and the after tax cost was approximately $150 million lower than provided. As a result, a tax credit was recorded in the year. However, due to the evolving state litigation environment, GSK utilised the tax benefit arising in recording an offsetting additional pre-tax provision of approximately $180 million (equating to an after tax cost of $150 million) related to these matters. This was recorded as a legal charge in SG&A. The net effect of these movements on total earnings was neutral.
The discount on the provisions decreased by £3 million in 2012 (2011 – £12 million) and was calculated using risk-adjusted projected cash flows and risk-free rates of return. The movement in 2012 includes a decrease of £1 million (2011 – £5 million) arising from a change in the discount rate in the year.
In respect of product liability claims related to certain products, there is sufficient history of claims made and settlements to enable management to make a reliable estimate of the provision required to cover unasserted claims. The ultimate liability for such matters may vary from the amounts provided and is dependent upon the outcome of litigation proceedings, investigations and possible settlement negotiations.
It is in the nature of the Group’s business that a number of these matters may be the subject of negotiation and litigation over many years. Litigation proceedings, including the various appeal procedures, often take many years to reach resolution, and out-of-court settlement discussions can also often be protracted. The Group is in potential settlement discussions in a number of the disputes for which amounts have been provided and, based on its current assessment of the progress of these disputes, estimates that £0.4 billion of the amount provided at 31 December 2012 will be settled within one year.
At 31 December 2012, it was expected that £3 million (2011 – £29 million) of the provision made for legal and other disputes will be reimbursed by third party insurers. This amount is included within the Other receivables balances in Note 22, ‘Other non-current assets’ and Note 24, ‘Trade and other receivables’. For a discussion of legal issues, see Note 44 ‘Legal proceedings’.
Major restructuring programmes
In October 2007 the Group announced a significant new Operational Excellence programme to improve the effectiveness and productivity of its operations (see Note 10 ‘Major restructuring costs’). Following several expansions, the estimated total costs are expected to be approximately £4.85 billion and the expanded programme is expected to deliver annual pre-tax savings of approximately £2.8 billion by the time it is substantially complete in 2014.
Provisions for staff severance payments are made when management has made a formal decision to eliminate certain positions and this has been communicated to the groups of employees affected. No provision is made for staff severance payments that are made immediately.
Pension augmentations arising from staff redundancies of £4 million (2011 – £5 million) have been charged during the year and then transferred to the pension obligations provision as shown in Note 28 ‘Pensions and other post-employment benefits’. Asset write-downs have been recognised as impairments of property, plant and equipment in Note 17 ‘Property, plant and equipment’. The majority of the amounts provided are expected to be utilised in the next two years.
Employee related provisions
Employee related provisions include certain medical benefits to disabled employees and their spouses in the USA. At 31 December 2012, the provision for these benefits amounted to £113 million (2011 – £121 million). Other employee benefits reflect a variety of provisions for severance costs, jubilee awards and other long-service benefits.
Other provisions
Included in other provisions is contingent consideration in respect of business acquisitions, principally of Stiefel Laboratories Inc. in 2009. The contingent consideration is payable upon certain criteria being met by certain specified dates in the future. The aggregate provision for these items amounts to £43 million at 31 December 2012 (2011 – £42 million).
|
| GSK Annual Report 2012 | 181 |
| 30 | Other non-current liabilities |
| | | | | | | | |
| | | 2012 £m | | | 2011 £m | |
Accruals and deferred income | | | 73 | | | | 128 | |
Other payables | | | 1,359 | | | | 498 | |
| | | | 1,432 | | | | 626 | |
The increase in other payables primarily arises from contingent consideration of £670 million (2011 – £nil) relating to the acquisition of the Shionogi-ViiV Healthcare joint venture.
At 31 December 2012, contingent liabilities, comprising guarantees, discounted bills and other items arising in the normal course of business, amounted to £209 million (2011 – £205 million). At 31 December 2012, £nil (2011 – £1 million) of financial assets were pledged as collateral for contingent liabilities. Provision is made for the outcome of tax, legal and other disputes where it is both probable that the Group will suffer an outflow of funds and it is possible to make a reliable estimate of that outflow. At 31 December 2012, other than for those disputes where provision has been made, it was not possible to make a reliable estimate of the potential outflow of funds that might be required to settle disputes where the possibility of there being an outflow was more than remote. Descriptions of the significant tax, legal and other disputes to which the Group is a party are set out in Note 14, ‘Taxation’ and Note 44, ‘Legal proceedings’.
| | | | | | | | | | |
| | | Listing exchange | | 2012 £m | | | 2011 £m | |
Current assets: | | | | | | | | | | |
Liquid investments | | | | | 81 | | | | 184 | |
Cash and cash equivalents | | | | | 4,184 | | | | 5,714 | |
| | | | | | 4,265 | | | | 5,898 | |
Short-term borrowings: | | | | | | | | | | |
Bank loans and overdrafts | | | | | (323 | ) | | | (165 | ) |
Commercial paper | | | | | (1,748 | ) | | | – | |
Obligations under finance leases | | | | | (27 | ) | | | (34 | ) |
3.00%€ European Medium Term Note 2012 | | London Stock Exchange | | | – | | | | (626 | ) |
5.125%€ European Medium Term Note 2012 | | London Stock Exchange | | | – | | | | (1,873 | ) |
4.85% US$ US Medium Term Note 2013 | | New York Stock Exchange | | | (1,533 | ) | | | – | |
| | | | | | (3,631 | ) | | | (2,698 | ) |
Long-term borrowings: | | | | | | | | | | |
4.85% US$ US Medium Term Note 2013 | | New York Stock Exchange | | | – | | | | (1,611 | ) |
4.375% US$ US Medium Term Note 2014 | | London Stock Exchange | | | (970 | ) | | | (1,046 | ) |
0.75% US$ US Medium Term Note 2015 | | New York Stock Exchange | | | (611 | ) | | | – | |
3.875%€ European Medium Term Note 2015 | | London Stock Exchange | | | (1,296 | ) | | | (1,326 | ) |
1.50% US$ US Medium Term Note 2017 | | New York Stock Exchange | | | (1,219 | ) | | | – | |
5.625%€ European Medium Term Note 2017 | | London Stock Exchange | | | (1,013 | ) | | | (1,037 | ) |
5.65% US$ US Medium Term Note 2018 | | New York Stock Exchange | | | (1,683 | ) | | | (1,768 | ) |
2.85% US$ US Medium Term Note 2022 | | New York Stock Exchange | | | (1,214 | ) | | | – | |
4.00%€ European Medium Term Note 2025 | | London Stock Exchange | | | (602 | ) | | | (616 | ) |
3.375% £ European Medium Term Note 2027 | | London Stock Exchange | | | (590 | ) | | | – | |
5.25% £ European Medium Term Note 2033 | | London Stock Exchange | | | (982 | ) | | | (981 | ) |
5.375% US$ US Medium Term Note 2034 | | London Stock Exchange | | | (305 | ) | | | (320 | ) |
6.375% US$ US Medium Term Note 2038 | | New York Stock Exchange | | | (1,670 | ) | | | (1,756 | ) |
6.375% £ European Medium Term Note 2039 | | London Stock Exchange | | | (694 | ) | | | (694 | ) |
5.25% £ European Medium Term Note 2042 | | London Stock Exchange | | | (986 | ) | | | (986 | ) |
4.25% £ European Medium Term Note 2045 | | London Stock Exchange | | | (787 | ) | | | – | |
Bank loans | | | | | – | | | | (1 | ) |
Obligations under finance leases | | | | | (49 | ) | | | (61 | ) |
| | | | | | (14,671 | ) | | | (12,203 | ) |
Net debt | | | | | (14,037 | ) | | | (9,003 | ) |
182 | GSK Annual Report 2012
Notes to the financial statements
Current assets
Liquid investments are classified as available-for-sale investments. At 31 December 2012, they included US Treasury Notes and other government bonds. The effective interest rate on liquid investments at 31 December 2012 was approximately 2.6% (2011 – approximately 1.0%). Liquid investment balances at 31 December 2012 earning interest at floating and fixed rates amount to £74 million and £7 million respectively (2011 – £1 million and £183 million).
The effective interest rate on cash and cash equivalents at 31 December 2012 was approximately 1.7% (2011 – approximately 1.3%). Cash and cash equivalents balances at 31 December 2012 earning interest at floating and fixed rates amount to £3,876 million and £1 million respectively (2011 – £5,466 million and £21 million).
GSK’s policy regarding the credit quality of cash and cash equivalents is referred to in Note 41, ‘Financial instruments and related disclosures’.
Short-term borrowings
GSK has a US $10 billion (£6.1 billion) commercial paper programme (2011 – $10 billion (£6.5 billion)), of which $2.9 billion (£1.7 billion) was in issue at 31 December 2012. We also have £1.9 billion of five year committed medium-term facilities and $2.5 billion (£1.5 billion) of 364 day committed facilities. These facilities were put in place in September 2012 and at 31 December 2012 were undrawn. Liquid investments, cash and cash equivalents were as shown in the table on page 181.
The weighted average interest rate on current bank loans and overdrafts at 31 December 2012 was 2.1% (2011 – 5.5%).
Long-term borrowings
At the year-end, GSK had long-term borrowings of £14.7 billion (2011 – £12.2 billion) of which £9.5 billion (2011 – £8.2 billion) falls due in more than five years. The average effective pre-swap interest rate of all notes in issue at 31 December 2012 was approximately 4.9% (2011 – approximately 5.2%).
Long-term borrowings repayable after five years carry interest at effective rates between 2.99% and 6.57%. The repayment dates range from 2018 to 2045.
Pledged assets
The Group has pledged investments in US Treasury Notes with a par value of $119 million (£74 million) (2011 – $119 million (£77 million)) as security against irrevocable letters of credit issued on the Group’s behalf in respect of the Group’s self-insurance activity. Provisions in respect of self-insurance are included within the provisions for legal and other disputes discussed in Note 29, ‘Other provisions’. At 31 December 2012, £66 million of the Group’s cash balance was held in an escrow account in connection with the Group’s offer to purchase shares in GSK Consumer Healthcare Ltd, the Group’s consumer healthcare subsidiary in India, from non-controlling shareholders. In addition, £49 million of assets included in Note 22, ‘Other non-current assets’, which do not form part of Net debt, were pledged as collateral against future rental payments under operating lease arrangements entered into by Human Genome Sciences, Inc. which was acquired during the year.
| | | | | | | | |
| Finance lease obligations | | 2012 £m | | | 2011 £m | |
Rental payments due within one year | | | 30 | | | | 37 | |
Rental payments due between one and two years | | | 21 | | | | 27 | |
Rental payments due between two and three years | | | 17 | | | | 18 | |
Rental payments due between three and four years | | | 9 | | | | 12 | |
Rental payments due between four and five years | | | 2 | | | | 4 | |
Rental payments due after five years | | | 6 | | | | 8 | |
Total future rental payments | | | 85 | | | | 106 | |
Future finance charges | | | (9 | ) | | | (11 | ) |
Total finance lease obligations | | | 76 | | | | 95 | |
Finance lease obligations at 31 December 2012 bearing interest at floating and fixed rates amount to £55 million and £21 million, respectively (2011 – £67 million and £28 million).
|
| GSK Annual Report 2012 | 183 |
| 33 | Share capital and share premium account |
| | | | | | | | | | | | |
| | | Ordinary Shares of 25p each | | | Share premium | |
| | | Number | | | £m | | | £m | |
Share capital authorised | | | | | | | | | | | | |
At 31 December 2010 | | | 10,000,000,000 | | | | 2,500 | | | | | |
At 31 December 2011 | | | 10,000,000,000 | | | | 2,500 | | | | | |
At 31 December 2012 | | | 10,000,000,000 | | | | 2,500 | | | | | |
Share capital issued and fully paid | | | | | | | | | | | | |
At 1 January 2010 | | | 5,665,128,719 | | | | 1,416 | | | | 1,368 | |
Issued under employee share schemes | | | 5,329,458 | | | | 2 | | | | 60 | |
| | | |
At 31 December 2010 | | | 5,670,458,177 | | | | 1,418 | | | | 1,428 | |
Issued under employee share schemes | | | 21,949,144 | | | | 5 | | | | 245 | |
Share capital cancelled | | | (142,204,223 | ) | | | (36 | ) | | | – | |
At 31 December 2011 | | | 5,550,203,098 | | | | 1,387 | | | | 1,673 | |
Issued under employee share schemes | | | 28,045,821 | | | | 7 | | | | 349 | |
Share capital cancelled | | | (180,652,950 | ) | | | (45 | ) | | | – | |
At 31 December 2012 | | | 5,397,595,969 | | | | 1,349 | | | | 2,022 | |
| | | |
| | | | | | | | | | | | |
| | | 31 December 2012 000 | | | | | | 31 December 2011 000 | |
Number of shares issuable under employee share schemes (Note 42) | | | 114,985 | | | | | | | | 126,810 | |
Number of unissued shares not under option | | | 4,487,419 | | | | | | | | 4,322,987 | |
At 31 December 2012, of the issued share capital, 75,205,594 shares were held in the ESOP Trusts, 494,951,327 shares were held as Treasury shares and 4,827,439,048 shares were in free issue. All issued shares are fully paid. The nominal, carrying and market values of the shares held in the ESOP Trusts are disclosed in Note 42, ‘Employee share schemes’.
A total of 174 million shares were purchased by the company during 2012 at a cost of £2,493 million and 181 million shares were cancelled.
Monthly purchases of shares during 2012 were as follows:
| | | | | | | | |
| | | Number of shares 000 | | | Average share price excluding commission and stamp duty £ | |
February | | | 7,410,000 | | | | 14.10 | |
March | | | 8,475,000 | | | | 14.17 | |
April | | | 2,150,000 | | | | 14.26 | |
May | | | 33,265,000 | | | | 14.18 | |
June | | | 25,850,000 | | | | 14.51 | |
July | | | 5,400,000 | | | | 14.46 | |
August | | | 19,301,000 | | | | 14.66 | |
September | | | 29,606,500 | | | | 14.29 | |
October | | | 17,175,000 | | | | 14.22 | |
November | | | 19,583,175 | | | | 13.56 | |
December | | | 6,230,675 | | | | 13.55 | |
Total | | | 174,446,350 | | | | 14.22 | |
The company expects to make further share repurchases of £1–2 billion during 2013. The exact amount and timing of further purchases and whether the shares will be held as Treasury shares or be cancelled will be determined by the company and is dependent on market conditions and other factors. No shares were purchased in the period 1 January 2013 to 28 February 2013.
For details of substantial shareholdings refer to page 239.
184 | GSK Annual Report 2012
Notes to the financial statements
Retained earnings and other reserves amounted to £2,439 million at 31 December 2012 (2011 – £4,972 million; 2010 – £6,041 million) of which £372 million (2011 – £421 million; 2010 – £472 million) relates to joint ventures and associated undertakings. The cumulative translation exchange in equity is shown below in the following table:
| | | | | | | | | | | | | | | | |
| | | Net translation exchange included in: | | | | |
| | | Retained earnings £m | | | Fair value reserve £m | | | Non- controlling interests £m | | | Total translation exchange £m | |
At 1 January 2010 | | | 1,166 | | | | 11 | | | | (45 | ) | | | 1,132 | |
Exchange movements on overseas net assets | | | 145 | | | | – | | | | 21 | | | | 166 | |
Reclassification of exchange on liquidation of overseas subsidiary | | | (2 | ) | | | – | | | | – | | | | (2 | ) |
At 31 December 2010 | | | 1,309 | | | | 11 | | | | (24 | ) | | | 1,296 | |
Exchange movements on overseas net assets | | | (259 | ) | | | 4 | | | | (44 | ) | | | (299 | ) |
Reclassification of exchange on liquidation of overseas subsidiary | | | (1 | ) | | | – | | | | – | | | | (1 | ) |
At 31 December 2011 | | | 1,049 | | | | 15 | | | | (68 | ) | | | 996 | |
Exchange movements on overseas net assets | | | (204 | ) | | | (23 | ) | | | (30 | ) | | | (257 | ) |
At 31 December 2012 | | | 845 | | | | (8 | ) | | | (98 | ) | | | 739 | |
The analysis of other comprehensive income by equity category is as follows: | | | | | | | | | | | | | | | | |
| 2012 | | Retained earnings £m | | | Other reserves £m | | | Non- controlling interests £m | | | Total £m | |
Exchange movements on overseas net assets and net investment hedges | | | (204 | ) | | | (23 | ) | | | (30 | ) | | | (257 | ) |
Fair value movements on available-for-sale investments | | | – | | | | 77 | | | | – | | | | 77 | |
Deferred tax on fair value movements on available-for-sale investments | | | – | | | | (10 | ) | | | – | | | | (10 | ) |
Reclassification of fair value movements on available-for-sale investments | | | – | | | | (19 | ) | | | – | | | | (19 | ) |
Deferred tax on reclassification of fair value movements on available-for-sale investments | | | – | | | | 10 | | | | – | | | | 10 | |
Reclassification of cash flow hedges to income statement | | | – | | | | 2 | | | | – | | | | 2 | |
Fair value movements on cash flow hedges | | | – | | | | (6 | ) | | | – | | | | (6 | ) |
Actuarial losses on defined benefit plans | | | (781 | ) | | | – | | | | – | | | | (781 | ) |
Deferred tax on actuarial movements in defined benefit plans | | | 221 | | | | – | | | | – | | | | 221 | |
Share of other comprehensive expense of associates and joint ventures | | | 30 | | | | – | | | | – | | | | 30 | |
Other comprehensive expense for the year | | | (734 | ) | | | 31 | | | | (30 | ) | | | (733 | ) |
| | | | | | | | | | | | | | | | |
| 2011 | | Retained earnings £m | | | Other reserves £m | | | Non- controlling interests £m | | | Total £m | |
Exchange movements on overseas net assets and net investment hedges | | | (259 | ) | | | 4 | | | | (44 | ) | | | (299 | ) |
Reclassification of exchange on liquidation or disposal of overseas subsidiaries | | | (1 | ) | | | – | | | | – | | | | (1 | ) |
Fair value movements on available-for-sale investments | | | – | | | | (20 | ) | | | – | | | | (20 | ) |
Deferred tax on fair value movements on available-for-sale investments | | | – | | | | 23 | | | | – | | | | 23 | |
Reclassification of fair value movements on available-for-sale investments | | | – | | | | (29 | ) | | | – | | | | (29 | ) |
Reclassification of cash flow hedges to income statement | | | – | | | | 1 | | | | – | | | | 1 | |
Actuarial losses on defined benefit plans | | | (969 | ) | | | – | | | | – | | | | (969 | ) |
Deferred tax on actuarial movements in defined benefit plans | | | 268 | | | | – | | | | – | | | | 268 | |
Share of other comprehensive expense of associates and joint ventures | | | (8 | ) | | | – | | | | – | | | | (8 | ) |
Other comprehensive expense for the year | | | (969 | ) | | | (21 | ) | | | (44 | ) | | | (1,034 | ) |
|
| GSK Annual Report 2012 | 185 |
| 34 | Movements in equitycontinued |
| | | | | | | | | | | | | | | | |
2010 | | Retained earnings £m | | | Other reserves £m | | | Non- controlling interests £m | | | Total £m | |
Exchange movements on overseas net assets and net investment hedges | | | 145 | | | | – | | | | 21 | | | | 166 | |
Reclassification of exchange on liquidation or disposal of overseas subsidiaries | | | (2 | ) | | | – | | | | – | | | | (2 | ) |
Tax on exchange movements | | | – | | | | 94 | | | | – | | | | 94 | |
Fair value movements on available-for-sale investments | | | – | | | | (25 | ) | | | – | | | | (25 | ) |
Deferred tax on fair value movements on available-for-sale investments | | | – | | | | 1 | | | | – | | | | 1 | |
Deferred tax reversed on reclassification of available-for-sale investments | | | – | | | | (3 | ) | | | – | | | | (3 | ) |
Fair value movements on cash flow hedges | | | – | | | | (8 | ) | | | – | | | | (8 | ) |
Deferred tax on fair value movements on cash flow hedges | | | – | | | | 1 | | | | – | | | | 1 | |
Reclassification of cash flow hedges to income statement | | | – | | | | 3 | | | | – | | | | 3 | |
Fair value movement on subsidiary acquisition | | | – | | | | 6 | | | | – | | | | 6 | |
Actuarial losses on defined benefit plans | | | – | | | | – | | | | (1 | ) | | | (1 | ) |
Deferred tax on actuarial movements in defined benefit plans | | | 1 | | | | – | | | | – | | | | 1 | |
Other comprehensive (expense)/income for the year | | | 144 | | | | 69 | | | | 20 | | | | 233 | |
The analysis of other reserves is as follows:
| | | | | | | | | | | | | | | | | | | | |
| | | ESOP Trust shares £m | | | Fair value reserve £m | | | Cash flow hedge reserve £m | | | Other reserves £m | | | Total £m | |
At 1 January 2010 | | | (1,138 | ) | | | 22 | | | | (6 | ) | | | 2,022 | | | | 900 | |
Transferred to income and expense in the year on disposals | | | – | | | | (5 | ) | | | 3 | | | | – | | | | (2 | ) |
Transferred to income and expense in the year on impairment | | | – | | | | 5 | | | | – | | | | – | | | | 5 | |
Net fair value movement in the year | | | – | | | | 67 | | | | (1 | ) | | | – | | | | 66 | |
Ordinary Shares acquired by ESOP Trusts | | | (16 | ) | | | – | | | | – | | | | – | | | | (16 | ) |
Ordinary Shares transferred by ESOP Trusts | | | 17 | | | | – | | | | – | | | | – | | | | 17 | |
Write-down of shares held by ESOP Trusts | | | 292 | | | | – | | | | – | | | | – | | | | 292 | |
At 31 December 2010 | | | (845 | ) | | | 89 | | | | (4 | ) | | | 2,022 | | | | 1,262 | |
Transferred to income and expense in the year on disposals | | | – | | | | (10 | ) | | | 3 | | | | – | | | | (7 | ) |
Transferred to income and expense in the year on impairment | | | – | | | | (19 | ) | | | – | | | | – | | | | (19 | ) |
Net fair value movement in the year | | | – | | | | 10 | | | | (5 | ) | | | – | | | | 5 | |
Ordinary Shares purchased and cancelled | | | – | | | | – | | | | – | | | | 36 | | | | 36 | |
Ordinary Shares acquired by ESOP Trusts | | | (36 | ) | | | – | | | | – | | | | – | | | | (36 | ) |
Ordinary Shares transferred by ESOP Trusts | | | 44 | | | | – | | | | – | | | | – | | | | 44 | |
Write-down of shares held by ESOP Trusts | | | 345 | | | | – | | | | – | | | | – | | | | 345 | |
Forward contract on non-controlling interest | | | – | | | | – | | | | – | | | | (28 | ) | | | (28 | ) |
At 31 December 2011 | | | (492 | ) | | | 70 | | | | (6 | ) | | | 2,030 | | | | 1,602 | |
Transferred to income and expense in the year on disposals | | | – | | | | (18 | ) | | | 2 | | | | – | | | | (16 | ) |
Transferred to income and expense in the year on impairment | | | – | | | | (1 | ) | | | – | | | | – | | | | (1 | ) |
Net fair value movement in the year | | | – | | | | 54 | | | | (6 | ) | | | – | | | | 48 | |
Ordinary Shares purchased and cancelled | | | – | | | | – | | | | – | | | | 45 | | | | 45 | |
Ordinary Shares acquired by ESOP Trusts | | | (37 | ) | | | – | | | | – | | | | – | | | | (37 | ) |
Ordinary Shares transferred by ESOP Trusts | | | 58 | | | | – | | | | – | | | | – | | | | 58 | |
Write-down of shares held by ESOP Trusts | | | 80 | | | | – | | | | – | | | | – | | | | 80 | |
Forward contract on non-controlling interest | | | – | | | | – | | | | – | | | | 8 | | | | 8 | |
At 31 December 2012 | | | (391 | ) | | | 105 | | | | (10 | ) | | | 2,083 | | | | 1,787 | |
Other reserves include various non-distributable merger and pre-merger reserves amounting to £1,849 million at 31 December 2012 (2011 – £1,849 million; 2010 – £1,849 million). Other reserves also include the capital redemption reserve created as a result of the share buy-back programme amounting to £256 million at 31 December 2012 (2011 – £211 million; 2010 – £175 million).
186 | GSK Annual Report 2012
Notes to the financial statements
| 35 | Related party transactions |
GSK held a 19% interest in Aspen Pharmacare Holdings Limited at 31 December 2012 (2011 – 19%).
During 2012, GSK distributed £68 million (2011 – £95 million) of its products through Aspen’s extensive distribution network. At 31 December 2012, the balance due to GSK from Aspen was £12 million (2011 – £16 million) and the balance payable by GSK to Aspen was £3 million (2011 – £11 million). In 2012, GSK also disposed of the majority of its ‘Classic Brands’ business in Australia to Aspen for £164 million in cash.
In October 2012, GSK acquired the 50% shareholding in the Shionogi – ViiV Healthcare joint venture from Shionogi & Co. Ltd in return for a 10% minority shareholding in ViiV Healthcare Company. This was accounted for as a business acquisition and intangible assets and other net liabilities of £1,777 million and £1,051 million, respectively were recognised. A gain of £225 million arising primarily from the fair value of GSK’s existing shareholding was recorded in the income statement, together with negative goodwill of £124 million.
At 31 December 2012, GSK held a 50% interest in ViiV Healthcare Shire Canada, through its subsidiary ViiV Healthcare ULC, which primarily co-marketsCombivir, Trizivir andEpivir in certain territories. At 31 December 2012, the balance payable to ViiV Healthcare Shire Canada was £4 million (2011 – £5 million).
At 31 December 2012, GSK held a 50% interest in Japan Vaccine Co. Ltd (JVC) through its subsidiary GlaxoSmithKline K.K. This joint venture with Daiichi Sankyo Co., Ltd is primarily responsible for the development and marketing of certain prophylactic vaccines in Japan. During 2012, GSK sold £48 million of its vaccine products into the joint venture. At 31 December 2012, the balance due to GSK from JVC was £19 million and the balance payable by GSK to JVC was £12 million.
The aggregate compensation of the Directors and CET is given in Note 9, ‘Employee Costs’.
| 36 | Adjustments reconciling profit after tax to operating cash flows |
| | | | | | | | | | | | |
| | | 2012 £m | | | 2011 £m | | | 2010 £m | |
Profit after tax | | | 4,744 | | | | 5,458 | | | | 1,853 | |
| | | |
Tax on profits | | | 1,948 | | | | 2,240 | | | | 1,304 | |
Share of after tax profits of associates and joint ventures | | | (29 | ) | | | (15 | ) | | | (81 | ) |
Finance income net of finance expense | | | 729 | | | | 709 | | | | 715 | |
Depreciation | | | 871 | | | | 893 | | | | 1,146 | |
Amortisation of intangible assets | | | 574 | | | | 530 | | | | 533 | |
Impairment and assets written off | | | 654 | | | | 346 | | | | 411 | |
Profit on sale of intangible assets | | | (652 | ) | | | (236 | ) | | | (118 | ) |
Profit on sale of investments in associates | | | – | | | | (585 | ) | | | (8 | ) |
Profit on sale of equity investments | | | (16 | ) | | | (10 | ) | | | (17 | ) |
Changes in working capital: | | | | | | | | | | | | |
Decrease/(increase) in inventories | | | 37 | | | | (157 | ) | | | 238 | |
Decrease in trade receivables | | | 183 | | | | 192 | | | | 905 | |
(Increase)/decrease in other receivables | | | (27 | ) | | | (69 | ) | | | 6 | |
Increase in trade payables | | | 177 | | | | 442 | | | | 154 | |
Increase/(decrease) in other payables | | | 132 | | | | 2 | | | | (179 | ) |
(Decrease)/increase in pension and other provisions | | | (2,931 | ) | | | (2,181 | ) | | | 1,653 | |
Share-based incentive plans | | | 220 | | | | 198 | | | | 179 | |
Fair value adjustments | | | (575 | ) | | | (10 | ) | | | 6 | |
Other | | | 9 | | | | (34 | ) | | | (69 | ) |
| | | | 1,304 | | | | 2,255 | | | | 6,778 | |
| | | |
Cash generated from operations | | | 6,048 | | | | 7,713 | | | | 8,631 | |
The decrease in pension and other provisions primarily reflects legal settlements of £2.6 billion and further special contributions to the defined benefit pension schemes.
|
| GSK Annual Report 2012 | 187 |
| 37 | Reconciliation of net cash flow to movement in net debt |
| | | | | | | | | | | | |
| | | 2012 £m | | | 2011 £m | | | 2010 £m | |
Net debt at beginning of year | | | (9,003 | ) | | | (8,859 | ) | | | (9,444 | ) |
| | | |
Decrease in cash and bank overdrafts | | | (1,607 | ) | | | (94 | ) | | | (642 | ) |
Cash inflow from liquid investments | | | (224 | ) | | | (30 | ) | | | (91 | ) |
Net increase in long-term loans | | | (4,430 | ) | | | – | | | | – | |
Net repayment of/(increase in) short-term loans | | | 816 | | | | (37 | ) | | | 1,290 | |
Net repayment of obligations under finance leases | | | 35 | | | | 38 | | | | 45 | |
Net non-cash funds of subsidiary undertakings acquired | | | (3 | ) | | | (10 | ) | | | (20 | ) |
Exchange adjustments | | | 385 | | | | (10 | ) | | | 61 | |
Other non-cash movements | | | (6 | ) | | | (1 | ) | | | (58 | ) |
Movement in net debt | | | (5,034 | ) | | | (144 | ) | | | 585 | |
| | | |
Net debt at end of year | | | (14,037 | ) | | | (9,003 | ) | | | (8,859 | ) |
| | | | | | | | | | | | | | | | | | | | | | | | | | | | |
| Analysis of changes in net debt | | At 31.12.11 £m | | | Exchange £m | | | Other £m | | | Reclassifications £m | | | Acquisitions £m | | | Cash flow £m | | | At 31.12.12 £m | |
Liquid investments | | | 184 | | | | (8 | ) | | | | | | | | | | | 129 | | | | (224 | ) | | | 81 | |
| | | | | | | |
Cash and cash equivalents | | | 5,714 | | | | (98 | ) | | | – | | | | – | | | | – | | | | (1,432 | ) | | | 4,184 | |
Overdrafts | | | (109 | ) | | | 6 | | | | – | | | | – | | | | – | | | | (175 | ) | | | (278 | ) |
| | | | 5,605 | | | | (92 | ) | | | – | | | | – | | | | – | | | | (1,607 | ) | | | 3,906 | |
| | | | | | | |
Debt due within one year: | | | | | | | | | | | | | | | | | | | | | | | | | | | | |
Commercial paper | | | – | | | | – | | | | – | | | | – | | | | – | | | | (1,748 | ) | | | (1,748 | ) |
Eurobonds and Medium-Term Notes | | | (2,498 | ) | | | 110 | | | | (2 | ) | | | (1,570 | ) | | | – | | | | 2,427 | | | | (1,533 | ) |
Other | | | (91 | ) | | | 6 | | | | (2 | ) | | | (20 | ) | | | (132 | ) | | | 167 | | | | (72 | ) |
| | | | (2,589 | ) | | | 116 | | | | (4 | ) | | | (1,590 | ) | | | (132 | ) | | | 846 | | | | (3,353 | ) |
| | | | | | | |
Debt due after one year: | | | | | | | | | | | | | | | | | | | | | | | | | | | | |
Eurobonds and Medium-Term Notes | | | (12,142 | ) | | | 367 | | | | 13 | | | | 1,570 | | | | – | | | | (4,430 | ) | | | (14,622 | ) |
Other | | | (61 | ) | | | 2 | | | | (15 | ) | | | 20 | | | | – | | | | 5 | | | | (49 | ) |
| | | | (12,203 | ) | | | 369 | | | | (2 | ) | | | 1,590 | | | | – | | | | (4,425 | ) | | | (14,671 | ) |
| | | | | | | |
Net debt | | | (9,003 | ) | | | 385 | | | | (6 | ) | | | – | | | | (3 | ) | | | (5,410 | ) | | | (14,037 | ) |
For further information on significant changes in net debt see Note 32 ‘Net debt’.
188 | GSK Annual Report 2012
Notes to the financial statements
| 38 | Acquisitions and disposals |
Details of the acquisition and disposal of significant subsidiaries and associates, joint ventures and other businesses are given below:
2012
Acquisitions
Human Genome Sciences, Inc.
On 3 August 2012, GSK completed the acquisition of 100% of the issued share capital of Human Genome Sciences, Inc. (HGS), a US based biopharmaceutical company focused on the development of protein and anti-body drugs for the treatment of immuno-inflammation diseases, for cash. The total consideration was £2,515 million and represented £251 million of cash acquired, £1,249 million of intangible assets, £791 million of goodwill and £224 million of other net assets. The consideration comprised cash of £2,282 million and a gain of £233 million arising on the settlement of pre-existing collaborations. The gain was recognised within Other operating income in the income statement. The goodwill arising on the acquisition of this business reflects the potential business synergies and realisation of the full value ofBenlysta, albiglutide, darapladib and other assets by simplifying and optimising R&D, commercial and manufacturing operations through complete ownership of the assets. The goodwill recognised is not expected to be deductible for income tax purposes.
The results of the acquired business are reported as part of the US, Europe, EMAP, Japan and Other Pharmaceuticals and Vaccines operating segments. The transaction has been accounted for using the purchase method of accounting.
The pro-forma turnover for the HGS business for the full year 2012 was £154 million. Since the acquisition, GSK recorded turnover of £69 million from HGS products. As the HGS products have been fully integrated into the GSK business, it is not practicable to separately identify the impact of the acquisition on the Group profit for the year.
Acquisition costs expensed in 2012 arising on this acquisition amounted to £28 million.
| | | | | | | | | | | | |
| | | Book value £m | | | Fair value adjustments £m | | | Fair value £m | |
Net assets acquired | | | | | | | | | | | | |
Intangible assets | | | – | | | | 1,249 | | | | 1,249 | |
Property, plant and equipment | | | 21 | | | | 10 | | | | 31 | |
Trade and other receivables | | | 33 | | | | – | | | | 33 | |
Other assets including cash and cash equivalents | | | 431 | | | | 83 | | | | 514 | |
Deferred tax asset | | | – | | | | 156 | | | | 156 | |
Trade and other liabilities | | | (86 | ) | | | (173 | ) | | | (259 | ) |
| | | 399 | | | | 1,325 | | | | 1,724 | |
Goodwill | | | | | | | 791 | | | | 791 | |
| | | | 399 | | | | 2,116 | | | | 2,515 | |
| | | |
Cash consideration | | | | | | | | | | | 2,282 | |
Gain on settlement of pre-existing collaborations | | | | | | | | | | | 233 | |
Total consideration | | | | | | | | | | | 2,515 | |
Shionogi-ViiV Healthcare joint venture
On 29 October 2012, GSK acquired the 50% share of the Shionogi-ViiV Healthcare joint venture previously held by Shionogi & Co, Ltd. The assets acquired include the investigational medicine dolutegravir and early stage integrase inhibitor compounds. The compounds are in development and do not currently generate revenue.
The net assets acquired comprise £1,777 million of intangible assets and £628 million of deferred tax liability. Negative goodwill of £124 million, arising from the differing assessments of valuations between the parties, was recognised as a gain within Other operating income in the income statement.
Total consideration comprised a 10% equity stake in ViiV Healthcare valued at £377 million, the fair value of GSK’s existing 50% investment in the joint venture of £256 million and contingent consideration payable in cash in the future valued at £659 million, together with a deferred tax asset of £236 million and a loss on settlement of pre-existing relationships of £31 million.
The contingent consideration is payable based on a percentage of the future sales performance of compounds developed by the joint venture, if they become marketed products, and so the total amount payable is unlimited.
The results of the acquired business are reported as part of ViiV Healthcare. The transaction has been accounted for using the purchase method of accounting.
Acquisition costs expensed in 2012 arising on this acquisition amounted to £2 million.
|
| GSK Annual Report 2012 | 189 |
| 38 | Acquisitions and disposalscontinued |
| | | | | | | | | | | | |
| | | Book value £m | | | Fair value adjustments £m | | | Fair value £m | |
Net assets acquired | | | | | | | | | | | | |
Intangible assets | | | – | | | | 1,777 | | | | 1,777 | |
Deferred tax provision | | | – | | | | (628 | ) | | | (628 | ) |
| | | – | | | | 1,149 | | | | 1,149 | |
Negative goodwill | | | – | | | | (124 | ) | | | (124 | ) |
| | | | – | | | | 1,025 | | | | 1,025 | |
| | | |
Consideration settled by shares in ViiV Healthcare | | | | | | | | | | | 377 | |
Contingent consideration | | | | | | | | | | | 659 | |
Deferred tax on contingent consideration | | | | | | | | | | | (236 | ) |
Fair value of investment in joint venture converted into subsidiary | | | | | | | | | | | 256 | |
Loss on settlement of pre-existing relationships | | | | | | | | | | | (31 | ) |
Total consideration | | | | | | | | | | | 1,025 | |
Other acquisitions
During the year, GSK completed two smaller acquisitions for cash. The total purchase price of £206 million included £2 million of cash acquired.
| | | | | | | | | | | | |
| | | Book value £m | | | Fair value adjustments
£m | | | Fair value
£m | |
Net assets acquired | | | | | | | | | | | | |
Intangible assets | | | – | | | | 232 | | | | 232 | |
Property, plant and equipment | | | 2 | | | | – | | | | 2 | |
Trade and other receivables | | | 2 | | | | – | | | | 2 | |
Other assets including cash and cash equivalents | | | 2 | | | | – | | | | 2 | |
Deferred tax provision | | | – | | | | (14 | ) | | | (14 | ) |
Trade and other liabilities | | | (8 | ) | | | 4 | | | | (4 | ) |
| | | (2 | ) | | | 222 | | | | 220 | |
Goodwill | | | – | | | | 82 | | | | 82 | |
| | | | (2 | ) | | | 304 | | | | 302 | |
| | | |
Cash consideration | | | | | | | | | | | 206 | |
Contingent consideration | | | | | | | | | | | 37 | |
Fair value of equity investment converted into subsidiary | | | | | | | | | | | 23 | |
Gain on settlement of pre-existing relationships | | | | | | | | | | | 36 | |
Total consideration | | | | | | | | | | | 302 | |
If the other acquisitions had been made at the beginning of the year, it is estimated that Group turnover would have increased by £27 million for the year. As some of the acquisitions have been fully integrated into the GSK business it is not practicable to separately identify the impact of the acquisitions on the Group profit for the year.
The goodwill arising on the acquisitions reflects the potential for business synergies and further sales growth through the increase in GSK’s market presence following the acquisitions of these market participants. None of the goodwill recognised is expected to be deductible for income tax purposes.
The results of the acquisitions are reported as part of the Europe Pharma and Research & Development reportable operating segments.
The Group recognised a settlement gain of £36 million as a result of measuring at fair value relationships that had existed prior to the acquisition date. The gain is recognised in Other operating income on the income statement.
Acquisition costs expensed in 2012 arising on other acquisitions totalled £9 million.
| | | | | | | | |
| Contingent consideration | | 2012 £m | | | 2011 £m | |
At 1 January | | | 78 | | | | 204 | |
Exchange adjustments | | | 1 | | | | (1 | ) |
Additions | | | 696 | | | | – | |
Remeasurement through goodwill | | | (91 | ) | | | (1 | ) |
Remeasurement through income statement | | | 13 | | | | – | |
Settlement | | | – | | | | (124 | ) |
At 31 December | | | 697 | | | | 78 | |
190 | GSK Annual Report 2012
Notes to the financial statements
| 38 | Acquisitions and disposalscontinued |
Investments in associates and joint ventures
GSK made cash contributions of £39 million into the Shionogi-ViiV Healthcare joint venture prior to its acquisition as a subsidiary and made cash investments of £19 million into a new joint venture in which the Group holds a share of 50%. GSK also made cash investments of £41 million into associates, increasing the share in one associate from 27% to 30%.
| | | | | | | | | | | | | | | | | | | | |
| Cash flows | | Human Genome Sciences £m | | | Shionogi- ViiV joint venture £m | | | Other acquisitions £m | | | Associates and joint ventures £m | | | Total £m | |
Cash consideration paid | | | 2,282 | | | | – | | | | 206 | | | | 99 | | | | 2,587 | |
Cash and cash equivalents acquired | | | (251 | ) | | | – | | | | (2 | ) | | | – | | | | (253 | ) |
Cash consideration, net of cash acquired | | | 2,031 | | | | – | | | | 204 | | | | 99 | | | | 2,334 | |
| | | | | |
Total cash consideration payable | | | 2,031 | | | | 659 | | | | 241 | | | | 99 | | | | 3,030 | |
Contingent consideration | | | – | | | | (659 | ) | | | (37 | ) | | | – | | | | (696 | ) |
Cash consideration, net of cash acquired | | | 2,031 | | | | – | | | | 204 | | | | 99 | | | | 2,334 | |
2011
Acquisitions
During the year GSK completed four subsidiary acquisitions for cash. The total purchase price of £299 million included £16 million of cash acquired.
| | | | | | | | | | | | |
| | | Book value £m | | | Fair value adjustments £m | | | Fair value £m | |
Net assets acquired | | | | | | | | | | | | |
Intangible assets | | | 6 | | | | 122 | | | | 128 | |
Property, plant and equipment | | | 52 | | | | (1 | ) | | | 51 | |
Trade and other receivables | | | 16 | | | | – | | | | 16 | |
Other assets including cash and cash equivalents | | | 23 | | | | 1 | | | | 24 | |
Deferred tax provision | | | – | | | | (31 | ) | | | (31 | ) |
Other liabilities | | | (32 | ) | | | (1 | ) | | | (33 | ) |
| | | 65 | | | | 90 | | | | 155 | |
Goodwill | | | – | | | | 168 | | | | 168 | |
| | | | 65 | | | | 258 | | | | 323 | |
| | | |
Cash consideration | | | | | | | | | | | 299 | |
Fair value of investment in joint venture converted into subsidiary | | | | | | | | | | | 24 | |
Total consideration | | | | | | | | | | | 323 | |
If the acquisitions had been made at the beginning of the year, it is estimated that Group turnover would have increased by £75 million for the year. As some of the subsidiaries have been fully integrated into the GSK business it is not practicable to separately identify the impact of the acquisitions on the Group profit for the year.
The goodwill arising on the acquisitions reflects the potential for business synergies and further sales growth through the increase in GSK’s market presence following the acquisitions of these businesses. In addition, goodwill of £10 million was recognised in respect of fair value adjustments to prior year acquisitions. None of the goodwill recognised is expected to be deductible for income tax purposes.
The results of the acquisitions are reported as part of the Consumer Healthcare and the Emerging Markets Pharmaceuticals and Vaccines reportable operating segments.
The Group recognised a loss of £1 million as a result of remeasuring to fair value an associate held prior to the acquisition date. This loss is reported as a loss on disposal of interest in associates in the income statement.
Acquisition costs expensed in 2011 arising on acquisitions totalled £2 million.
|
| GSK Annual Report 2012 | 191 |
| 38 | Acquisitions and disposalscontinued |
Investments in associates and joint ventures
GSK made cash contributions of £33 million in a joint venture in which the Group has a 50% share, made cash investments in associates totalling £2 million and transferred a £3 million equity investment into associates as the Group has increased its shareholding from 5% to 37%.
Disposals
GSK disposed of one subsidiary. The cash outflow on disposal was £10 million net of cash disposed. On 1 February 2011 GSK disposed of its entire 18% shareholding in Quest Diagnostics Inc., a US clinical laboratory business listed on the New York Stock Exchange. The sale comprised a secondary public offering and an accompanying repurchase of shares by Quest Diagnostics which together generated a profit on disposal of £584 million before tax.
| | | | | | | | | | | | |
Cash flows | | Other acquisitions £m | | | Associates and joint ventures £m | | | Total £m | |
Cash consideration paid | | | 299 | | | | 35 | | | | 334 | |
Cash and cash equivalents acquired | | | (16 | ) | | | – | | | | (16 | ) |
Cash consideration, net of cash acquired | | | 283 | | | | 35 | | | | 318 | |
| | | |
Total cash consideration payable | | | 264 | | | | 35 | | | | 299 | |
Deferred consideration | | | 19 | | | | – | | | | 19 | |
Cash consideration, net of cash acquired | | | 283 | | | | 35 | | | | 318 | |
| | | |
Net cash (outflow)/proceeds from disposals, net of cash disposed | | | (10 | ) | | | 1,044 | | | | 1,034 | |
2010
Acquisitions
Laboratorios Phoenix S.A.C.yF.
On 10 June 2010, GSK acquired 100% of the issued share capital of Laboratorios Phoenix S.A.C.yF., a leading pharmaceutical business focused on the development, marketing and sale of branded generic and over-the-counter products in Latin America, for cash. The purchase price of £174 million included £11 million of net cash, £121 million of intangible assets, £72 million of goodwill and £30 million of other net liabilities. The goodwill arising on the acquisition of this business reflects the potential for business synergies and further sales growth through the increase in GSK’s market presence following the acquisition of an established market participant. None of the goodwill recognised is expected to be deductible for income tax purposes.
The results of Phoenix are reported as part of the Emerging Markets Pharmaceuticals and Vaccines operating segment. This transaction has been accounted for by using the purchase method of accounting.
The pro-forma results of Laboratorios Phoenix S.A C.yF. for the full year are turnover of £60 million and loss after tax (before major restructuring) of £2 million.
Since acquisition, GSK recorded turnover of £35 million and after tax losses (before major restructuring) of £0.5 million from the business. Transaction costs expensed in 2010 arising on the acquisition of Laboratorios Phoenix S.A.C.yF. amounted to £3 million.
| | | | | | | | | | | | |
| | | Book value £m | | | Fair value adjustments £m | | | Fair value £m | |
Net assets acquired | | | | | | | | | | | | |
Intangible assets | | | – | | | | 121 | | | | 121 | |
Property, plant and equipment | | | 6 | | | | 10 | | | | 16 | |
Other assets including cash and cash equivalents | | | 39 | | | | 7 | | | | 46 | |
Deferred tax provision | | | (1 | ) | | | (41 | ) | | | (42 | ) |
Other liabilities | | | (27 | ) | | | (12 | ) | | | (39 | ) |
| | | 17 | | | | 85 | | | | 102 | |
Goodwill | | | – | | | | 72 | | | | 72 | |
Total cash consideration | | | 17 | | | | 157 | | | | 174 | |
192 | GSK Annual Report 2012
Notes to the financial statements
| 38 | Acquisitions and disposalscontinued |
Other acquisitions
During the year, GSK completed three smaller subsidiary acquisitions for cash. The total purchase price of £198 million included £1 million of net cash.
| | | | | | | | | | | | |
| | | Book value £m | | | Fair value adjustments £m | | | Fair value £m | |
Net assets acquired | | | | | | | | | | | | |
Intangible assets | | | 3 | | | | 128 | | | | 131 | |
Property, plant and equipment | | | 9 | | | | 2 | | | | 11 | |
Other assets including cash and cash equivalents | | | 20 | | | | 12 | | | | 32 | |
Deferred tax provision | | | – | | | | (33 | ) | | | (33 | ) |
Other liabilities | | | (10 | ) | | | – | | | | (10 | ) |
| | | 22 | | | | 109 | | | | 131 | |
Goodwill | | | – | | | | 75 | | | | 75 | |
| | | | 22 | | | | 184 | | | | 206 | |
| | | |
Cash consideration | | | | | | | | | | | 198 | |
Fair value of investment in associate converted to subsidiary | | | | | | | | | | | 8 | |
Total consideration | | | | | | | | | | | 206 | |
If the other acquisitions had been made at the beginning of the year, it is estimated that Group turnover would have increased by £51 million for the year. As some of the subsidiaries have been fully integrated into the GSK business it is not practicable to separately identify the impact of the acquisitions on the Group profit for the year.
The goodwill arising on the acquisitions reflects the potential for business synergies and further sales growth through the increase in GSK’s market presence following the acquisition of these established market participants. In addition, goodwill of £13 million was recognised in respect of further consideration for a prior year acquisition. None of the goodwill recognised is expected to be deductible for income tax purposes.
The results of the other acquisitions are reported primarily as part of the Emerging Markets Pharmaceuticals and Vaccines reportable operating segment.
The Group recognised a gain of £8 million as a result of measuring at fair value an associate held prior to the acquisition date. This gain is reported as Profit on disposal of interest in associates in the income statement.
Acquisition costs expensed in 2010 arising on other acquisitions totalled £7 million.
Investments in associates and joint ventures
GSK made cash and non-cash contributions of £24 million in a joint venture in which the Group has a 50% share, £6 million in a joint venture in which the Group has a 49% share, an investment in an associate of £32 million to increase the Group’s share to 27% and other investments in associates totalling £3 million.
| | | | | | | | | | | | | | | | |
Cash flows | | Phoenix £m | | | Other acquisitions £m | | | Associates and joint ventures £m | | | Total £m | |
Cash consideration paid | | | 174 | | | | 198 | | | | 61 | | | | 433 | |
Cash and cash equivalents acquired | | | (11 | ) | | | (1 | ) | | | – | | | | (12 | ) |
Cash consideration, net of cash acquired | | | 163 | | | | 197 | | | | 61 | | | | 421 | |
| | | | |
Total cash consideration payable | | | 163 | | | | 191 | | | | 61 | | | | 415 | |
Deferred consideration | | | – | | | | 6 | | | | – | | | | 6 | |
Cash consideration, net of cash acquired | | | 163 | | | | 197 | | | | 61 | | | | 421 | |
|
| GSK Annual Report 2012 | 193 |
| | | | | | | | |
| Contractual obligations and commitments | | 2012 £m | | | 2011 £m | |
Contracted for but not provided in the financial statements: | | | | | | | | |
Intangible assets | | | 7,780 | | | | 7,968 | |
Property, plant and equipment | | | 572 | | | | 504 | |
Investments | | | 72 | | | | 64 | |
Purchase commitments | | | 762 | | | | 882 | |
Pensions | | | 368 | | | | 730 | |
Other commitments | | | 268 | | | | 190 | |
Interest on loans | | | 10,207 | | | | 9,491 | |
Finance lease charges | | | 9 | | | | 11 | |
| | | | 20,038 | | | | 19,840 | |
The commitments related to intangible assets include milestone payments, which are dependent on successful clinical development or on meeting specified sales targets, and which represent the maximum that would be paid if all milestones, however unlikely, are achieved. The amounts are not risk-adjusted or discounted. A number of commitments were made in 2012 under licensing and other agreements, including arrangements with Angiochem, Inc. Five Prime Therapeutics, Inc., and MD Anderson Cancer Centre. These new arrangements were more than offset by reduced commitments due on prior year transactions including amendments to the agreements with Amicus Therapeutics, Inc., Astex Pharmaceuticals, Inc., Chroma Therapeutics, Inc., Regulus Therapeutics, Inc., and Xenoport, Inc.
In 2009, GSK reached an agreement with the trustees of the UK pension schemes to make additional contributions to eliminate the pension deficit identified at the 31 December 2008 actuarial funding valuation. The table above includes this commitment, but excludes the normal ongoing annual funding requirement in the UK of approximately £120 million.
The Group also has other commitments which principally relate to revenue payments to be made under licences and other alliances.
Commitments in respect of future interest payable on loans are disclosed before taking into account the effect of interest rate swaps.
Commitments under non-cancellable operating leases are disclosed below. £343 million (2011 – £62 million) of these commitments are provided against on the Group’s balance sheet.
| | | | | | | | |
| Commitments under non-cancellable operating leases | | 2012 £m | | | 2011 £m | |
Rental payments due within one year | | | 146 | | | | 113 | |
Rental payments due between one and two years | | | 98 | | | | 65 | |
Rental payments due between two and three years | | | 77 | | | | 46 | |
Rental payments due between three and four years | | | 61 | | | | 30 | |
Rental payments due between four and five years | | | 54 | | | | 17 | |
Rental payments due after five years | | | 413 | | | | 83 | |
Total commitments under non-cancellable operating leases | | | 849 | | | | 354 | |
| 40 | Post balance sheet event |
On 5 February 2013, GSK announced completion of the acquisition of further shares in GlaxoSmithKline Consumer Healthcare Ltd in India to take the Group’s shareholding from 43.2% to 72.5%, at a cost of approximately £570 million.
194 | GSK Annual Report 2012
Notes to the financial statements
| 41 | Financial instruments and related disclosures |
GSK reports in Sterling and pays dividends out of Sterling profits. The role of Corporate Treasury is to monitor and manage our external and internal funding requirements and financial risks in support of our strategic objectives. GSK operates on a global basis, primarily through subsidiary companies and we manage our capital to ensure that our subsidiaries are able to operate as going concerns and to optimise returns to shareholders through an appropriate balance of debt and equity. Treasury activities are governed by policies and procedures approved by the Board of Directors, most recently on 11 July 2012.
A Treasury Management Group (TMG) meeting, chaired by our Chief Financial Officer, takes place on a monthly basis to review treasury activities. Its members receive management information relating to treasury activities. Internal audit reviews the Treasury internal control environment regularly.
GSK uses a variety of financial instruments to finance its operations and derivative financial instruments to manage market risks from these operations. These derivatives, principally comprising forward foreign currency contracts, interest rate and currency swaps, are used to swap borrowings and liquid assets into currencies required for Group purposes and to manage exposure to financial risks from changes in foreign exchange rates and interest rates.
GSK does not hold or issue derivatives for speculative purposes and our Treasury policies specifically prohibit such activity. All transactions in financial instruments are undertaken to manage the risks arising from underlying business activities, not for speculation.
Capital management
GSK’s financial strategy supports the Group’s strategic priorities and it is regularly reviewed by the Board. GSK manages the capital structure of the Group through an appropriate mix of debt and equity in order to optimise returns to shareholders whilst maintaining credit ratings that provide us with flexibility to access debt capital markets on attractive terms. Our financial architecture is designed to drive growth in earnings per share and to generate cash in order to maximise the returns from the Group’s strategy. The free cash flow we generate is then deployed to deliver returns to shareholders and to be reinvested in the business depending on where returns are most attractive. We continue to apply strict financial and returns-based criteria such as cash flow return on investment in order to allocate capital and assess investment opportunities.
The capital structure of the Group consists of net debt of £14.0 billion (see Note 32, ‘Net debt’) and shareholders’ equity of £5.8 billion (see ’Consolidated statement of changes in equity‘ on page 142). Total capital, including that provided by non-controlling interests of £0.9 billion, is £20.7 billion.
Net debt increased by £5.0 billion during the year primarily due to payments of £1.9 billion to settle the Group’s most significant ongoing US federal government investigations within existing provisions and the £2.0 billion cash cost of the acquisition of HGS. The balance, as well as the Group’s strong cash generation and the proceeds from the disposal of the Consumer Healthcare OTC brands enabled the financing of share repurchases of £2.5 billion and increased dividend payments of £3.8 billion.
Despite an increase in net debt of £5.0 billion in 2012, the net finance expense for the year was broadly similar to 2011, reflecting the benefits of our strategy to improve the funding profile of the Group. The target to reduce the average effective net funding cost by approximately 200 basis points to around 6% in 2013 has been achieved one year earlier than planned.
In 2012, net cash inflow from operating activities was £4.4 billion (£7.0 billion excluding legal settlements) and free cash flow was £2.0 billion (£4.7 billion excluding legal settlements).
In 2013, we expect to deliver continued dividend growth and as part of our long-term share buyback programme we are targeting share repurchases of £1-2 billion depending on market conditions.
Liquidity risk
GSK’s policy is to borrow centrally in order to meet anticipated funding requirements. The cash flow forecast and funding requirements are monitored by the TMG on a monthly basis. Our strategy is to diversify liquidity sources using a range of facilities and to maintain broad access to funding markets.
At 31 December 2012, GSK had £4.3 billion of cash, cash equivalents and liquid investments and £3.6 billion of borrowings repayable within one year. GSK also has access to short-term finance under a US$10 billion commercial paper programme and $2.9 billion (£1.7 billion) was in issue under this programme at 31 December 2012. GSK has £1.9 billion five year committed medium term facilities and $2.5 billion of 364-day committed facilities. These facilities were put in place in September 2012 and at 31 December were undrawn. We consider this level of committed facilities to be adequate given current liquidity requirements.
We have a European Medium Term Note programme of £15 billion and at 31 December 2012, £7.0 billion of notes were in issue under this programme. We also have a US shelf registration statement and at 31 December 2012, we had $15.0 billion (£9.2 billion) of notes in issue under this programme. GSK’s long-term borrowings mature at dates between 2014 and 2045.
GSK’s long-term credit ratings have remained unchanged since February 2008 and currently GSK is rated A+ stable outlook by Standard and Poor’s and A1 stable outlook by Moody’s Investors Service (‘Moody’s’). Our short-term credit ratings are A-1 and P-1 with Standard and Poor’s and Moody’s respectively.
Market risk
Interest rate risk management
GSK’s objective is to reduce the effective net interest cost and to rebalance the mix of debt at fixed and floating interest rates over time. The policy on interest rate risk management limits the amount of floating interest payments to a prescribed percentage of operating profit.
We use a series of interest rate swaps to redenominate one of our bonds into floating interest rates. The duration of these swaps matches the duration of the principal instrument. These interest rate derivative instruments are accounted for as fair value hedges of the relevant liability.
|
| GSK Annual Report 2012 | 195 |
| 41 | Financial instruments and related disclosurescontinued |
Foreign exchange risk management
Foreign currency transaction exposures arising on internal and external trade flows are not hedged. The exposure of overseas operating subsidiaries to transaction risk is minimised by matching local currency income with local currency costs. For this purpose, our internal trading transactions are matched centrally and we manage inter-company payment terms to reduce foreign currency risk. Foreign currency cash flows can be hedged selectively under the management of Corporate Treasury and the TMG. Where possible, we manage the cash surpluses or borrowing requirements of subsidiary companies centrally using forward contracts to hedge future repayments back into the originating currency. In order to reduce foreign currency translation exposure, we seek to denominate borrowings in the currencies of our principal assets and cash flows. These are primarily denominated in US dollars, Euros and Sterling. Certain borrowings can be swapped into other currencies as required. Borrowings denominated in, or swapped into, foreign currencies that match investments in overseas Group assets may be treated as a hedge against the relevant assets. Forward contracts in major currencies are also used to reduce our exposure to our investment in overseas Group assets (see ‘Net investment hedges’ section of this note for further details). The TMG reviews the ratio of borrowings to assets for major currencies monthly.
Credit risk
The Group considers its maximum credit risk at 31 December 2012 to be £9,469 million (31 December 2011 – £11,541 million) which is the total of the Group’s financial assets with the exception of ’Other investments’ (comprising equity investments) which bear equity risk rather than credit risk. See page 197 for details on the Group’s total financial assets. At 31 December 2012, GSK’s greatest concentration of credit risk was £1.2 billion of bank deposits with HSBC
(Aa3/AA-). In 2011, the greatest concentration of credit risk was £2.0 billion of investments bearing credit exposure to the US Government (rated Aaa/AA+ with Moody’s and Standard and Poor’s respectively).
Treasury-related credit risk
GSK sets global counterparty limits for each of GSK’s banking and investment counterparties based on long-term credit ratings from Moody’s and Standard and Poor’s. Corporate Treasury’s usage of these limits is monitored daily by a Corporate Compliance Officer (CCO) who operates independently of Corporate Treasury. Any breach of these limits would be reported to the CFO immediately. The CCO also monitors the credit rating of these counterparties and, when changes in ratings occur, notifies Corporate Treasury so that changes can be made to investment levels or to authority limits as appropriate. In addition, a report on relationship banks and their credit ratings is presented annually to the TMG for approval and reviewed regularly.
GSK has managed its exposure to credit risk more actively in recent years, reducing surplus cash balances in particular in the USA, Europe, Middle East and Africa. This is part of our Treasury strategy to regionalise our cash management and to concentrate cash centrally as much as possible. GSK has continued to maintain its conservative approach to counterparty risk throughout this period. The table below sets out the credit exposure to counterparties by rating for liquid investments, cash and cash equivalents and derivatives. The gross asset position on each derivative contract is considered for the purpose of this table, although, under ISDA agreements, the amount at risk is the net position with each counterparty.
The £158 million invested in Baa3/BBB- rated investments includes bank deposits with HDFC Bank, State Bank of India, BBVA Venezuela and China Merchants Bank. These counterparties are used either for local cash management purposes or for local investment purposes where GSK is not the sole shareholder.
The £5 million invested in Ba2/BB rated counterparties at 31 December 2012 and £17m at 31 December 2011 comprise bank balances held by operating companies overseas.
| | | | | | | | | | | | | | | | | | | | | | | | | | | | | | | | | | | | | | | | |
| 2012 | | Aa1/AA+ £m | | | Aa3/AA- £m | | | A1/A+ £m | | | A2/A £m | | | A3/A- £m | | | Baa1/BBB+ £m | | | Baa2/BBB £m | | | Baa3/BBB- £m | | | Ba2/BB £m | | | Total
£m | |
Bank balances and deposits | | | – | | | | 1,189 | | | | 825 | | | | 412 | | | | 860 | | | | 7 | | | | – | | | | 158 | | | | 5 | | | | 3,456 | |
US Treasury and Treasury repo only money market funds | | | 728 | | | | – | | | | – | | | | – | | | | – | | | | – | | | | – | | | | – | | | | – | | | | 728 | |
Corporate debt instruments | | | – | | | | 7 | | | | – | | | | – | | | | – | | | | – | | | | – | | | | – | | | | – | | | | 7 | |
Government securities | | | 74 | | | | – | | | | – | | | | – | | | | – | | | | – | | | | – | | | | – | | | | – | | | | 74 | |
3rd party financial derivatives | | | – | | | | 8 | | | | 37 | | | | 33 | | | | 20 | | | | – | | | | – | | | | – | | | | – | | | | 98 | |
Total | | | 802 | | | | 1,204 | | | | 862 | | | | 445 | | | | 880 | | | | 7 | | | | – | | | | 158 | | | | 5 | | | | 4,363 | |
| | | | | | | | | | | | | | | | | | | | | | | | | | | | | | | | | | | | | | | | |
| 2011 | | Aa1/AA+ £m | | | Aa3/AA- £m | | | A1/A+ £m | | | A2/A £m | | | A3/A- £m | | | Baa1/BBB+ £m | | | Baa2/BBB £m | | | Baa3/BBB- £m | | | Ba2/BB £m | | | Total £m | |
Bank balances and deposits | | | – | | | | 812 | | | | 2,183 | | | | 720 | | | | 39 | | | | 3 | | | | 5 | | | | 96 | | | | 17 | | | | 3,875 | |
US Treasury and Treasury repo only money market funds | | | 1,839 | | | | – | | | | – | | | | – | | | | – | | | | – | | | | – | | | | – | | | | – | | | | 1,839 | |
Corporate debt instruments | | | – | | | | 9 | | | | – | | | | – | | | | – | | | | – | | | | – | | | | – | | | | – | | | | 9 | |
Government securities | | | 169 | | | | – | | | | – | | | | – | | | | – | | | | – | | | | – | | | | 6 | | | | – | | | | 175 | |
3rd party financial derivatives | | | – | | | | 12 | | | | 68 | | | | 34 | | | | 24 | | | | – | | | | – | | | | – | | | | – | | | | 138 | |
Total | | | 2,008 | | | | 833 | | | | 2,251 | | | | 754 | | | | 63 | | | | 3 | | | | 5 | | | | 102 | | | | 17 | | | | 6,036 | |
The credit ratings in the above tables are as assigned by Moody’s and Standard and Poor’s respectively. Where the opinion of the two rating agencies differ, GSK assigns the lower rating of the two to the counterparty. Where local rating agency data is the only source available, the ratings are converted to global ratings equivalent to those of Moody’s or Standard and Poor’s using published conversion tables.
196 | GSK Annual Report 2012
Notes to the financial statements
| 41 | Financial instruments and related disclosurescontinued |
Our centrally managed cash reserves amounted to £1.7 billion at 31 December 2012, all available within 3 months. This excludes £0.7 billion centrally managed cash held by ViiV Healthcare, a 76.5% owned subsidiary. The Group has invested centrally managed liquid assets in bank deposits and Aaa/AAA rated US Treasury and Treasury repo only money market funds (these bear credit exposure to the US Government (Aaa/AA+ rated)).
Wholesale and retail credit risk
Outside the USA, no customer accounts for more than 5% of the Group’s trade receivables balance.
In the USA, in line with other pharmaceutical companies, the Group sells its products through a small number of wholesalers in addition to hospitals, pharmacies, physicians and other groups. Sales to the three largest wholesalers amount to approximately 81% of the Group’s US Pharmaceuticals and Vaccines turnover. At 31 December 2012, the Group had trade receivables due from these three wholesalers totalling £815 million (2011 – £934 million). The Group is exposed to a concentration of credit risk in respect of these wholesalers such that, if one or more of them encounters financial difficulty, it could materially and adversely affect the Group’s financial results.
The Group’s credit risk monitoring activities relating to these wholesalers include review of their quarterly financial information and Standard & Poor’s credit ratings, development of GSK internal risk ratings, and establishment and periodic review of credit limits. However, the Group believes there is no further credit risk provision required in excess of the normal provision for bad and doubtful debts (see Note 24, ‘Trade and other receivables’).
Fair value of financial assets and liabilities
The table on page 197 presents the carrying amounts and the fair values of the Group’s financial assets and liabilities at 31 December 2012 and 31 December 2011.
The fair values of the financial assets and liabilities are included at the amount at which the instrument could be exchanged in a current transaction between willing parties, other than in a forced or liquidation sale.
The following methods and assumptions were used to estimate the fair values:
| • | | Cash and cash equivalents – approximates to the carrying amount |
| • | | Liquid investments – based on quoted market prices or calculated based on observable inputs in the case of marketable securities; based on principal amounts in the case of non-marketable securities because of their short repricing periods |
| • | | Other investments – equity investments traded in an active market determined by reference to the relevant stock exchange quoted bid price; other equity investments determined by reference to the current market value of similar instruments or by reference to the discounted cash flows of the underlying net assets |
| • | | Short-term loans, overdrafts and commercial paper – approximates to the carrying amount because of the short maturity of these instruments |
| • | | Long-term loans – based on quoted market prices in the case of European and US Medium term notes and other fixed rate borrowings; approximates to the carrying amount in the case of floating rate bank loans and other loans |
| • | | Contingent consideration for business acquisitions after 1 January 2010 – based on present values of expected future contractual cash flows |
| • | | Interest rate swaps and foreign exchange contracts - based on contractual cash flows using market sourced data (exchange rates or interest rates) at the balance sheet date |
| • | | Receivables and payables – approximates to the carrying amount |
| • | | Company-owned life insurance policies – based on cash surrender value |
| • | | Lease obligations – approximates to the carrying amount. |
Fair value of investments in GSK shares
At 31 December 2012, the Employee Share Ownership Plan (ESOP) Trusts held GSK shares with a carrying value of £391 million (2011 – £492 million) and a fair value of £1,004 million (2011 – £1,337 million) based on quoted market price. The shares represent purchases by the ESOP Trusts to satisfy future exercises of options and awards under employee incentive schemes. The carrying value, which is the lower of cost or expected proceeds, of these shares has been recognised as a deduction from other reserves. At 31 December 2012, GSK held Treasury shares at a cost of £6,602 million (2011 – £6,661 million) which has been deducted from retained earnings.
|
| GSK Annual Report 2012 | 197 |
| 41 | Financial instruments and related disclosurescontinued |
| | | | | | | | | | | | | | | | | | | | |
| | | | | | | | | 2012 | | | | | | 2011 | |
| | | Notes | | | Carrying value £m | | | Fair value £m | | | Carrying value £m | | | Fair value £m | |
Cash and cash equivalents | | | | | | | 4,184 | | | | 4,184 | | | | 5,714 | | | | 5,714 | |
| | | | | |
Available-for-sale investments: | | | | | | | | | | | | | | | | | | | | |
Liquid investments: | | | | | | | | | | | | | | | | | | | | |
– Government bonds | | | | | | | 74 | | | | 74 | | | | 175 | | | | 175 | |
– other | | | | | | | 7 | | | | 7 | | | | 9 | | | | 9 | |
Total liquid investments | | | a | | | | 81 | | | | 81 | | | | 184 | | | | 184 | |
Other investments | | | a | | | | 787 | | | | 787 | | | | 590 | | | | 590 | |
| | | | | |
Loans and receivables: | | | | | | | | | | | | | | | | | | | | |
Trade and other receivables and certain Other non-current assets in scope of IAS 39 | | | b | | | | 4,907 | | | | 4,907 | | | | 5,312 | | | | 5,312 | |
| | | | | |
Financial assets at fair value through profit or loss: | | | | | | | | | | | | | | | | | | | | |
Other non-current assets in scope of IAS 39 | | | a,b | | | | 194 | | | | 194 | | | | 176 | | | | 176 | |
Derivatives designated as at fair value through profit or loss | | | a,d | | | | 80 | | | | 80 | | | | 107 | | | | 107 | |
Derivatives classified as held for trading under IAS 39 | | | a,d | | | | 23 | | | | 23 | | | | 48 | | | | 48 | |
Total financial assets | | | | | | | 10,256 | | | | 10,256 | | | | 12,131 | | | | 12,131 | |
| | | | | |
Financial liabilities measured at amortised cost: | | | | | | | | | | | | | | | | | | | | |
Borrowings excluding obligations under finance leases: | | | | | | | | | | | | | | | | | | | | |
– bonds in a designated hedging relationship | | | d | | | | (3,279 | ) | | | (3,619 | ) | | | (5,907 | ) | | | (6,290 | ) |
– other bonds | | | | | | | (12,876 | ) | | | (14,951 | ) | | | (8,733 | ) | | | (10,627 | ) |
– bank loans and overdrafts | | | | | | | (323 | ) | | | (323 | ) | | | (166 | ) | | | (166 | ) |
– commercial paper | | | | | | | (1,748 | ) | | | (1,748 | ) | | | – | | | | – | |
| | | | | |
Total borrowings excluding obligations under finance leases | | | e | | | | (18,226 | ) | | | (20,641 | ) | | | (14,806 | ) | | | (17,083 | ) |
Obligations under finance leases | | | | | | | (76 | ) | | | (76 | ) | | | (95 | ) | | | (95 | ) |
| | | | | | | | | | | | | | | | | | | | | |
| | | | | |
Total borrowings | | | | | | | (18,302 | ) | | | (20,717 | ) | | | (14,901 | ) | | | (17,178 | ) |
Trade and other payables, Other provisions and certain
Other non-current liabilities in scope of IAS 39 | | | c | | | | (7,730 | ) | | | (7,730 | ) | | | (7,105 | ) | | | (7,105 | ) |
| | | | | |
Financial liabilities at fair value through profit or loss: | | | | | | | | | | | | | | | | | | | | |
Other non-current liabilities in scope of IAS 39 | | | a,c | | | | (709 | ) | | | (709 | ) | | | – | | | | – | |
Derivatives designated as at fair value through profit or loss | | | a,d | | | | (8 | ) | | | (8 | ) | | | – | | | | – | |
Derivatives classified as held for trading under IAS 39 | | | a,d | | | | (57 | ) | | | (57 | ) | | | (177 | ) | | | (177 | ) |
| | | | | | | | | | | | | | | | | | | | | |
| | | | | |
Total financial liabilities | | | | | | | (26,806 | ) | | | (29,221 | ) | | | (22,183 | ) | | | (24,460 | ) |
| | | | | |
Net financial assets and financial liabilities | | | | | | | (16,550 | ) | | | (18,965 | ) | | | (10,052 | ) | | | (12,329 | ) |
The valuation methodology used to measure fair value in the above table is described and categorised on page 196. Trade and other receivables and Other non-current assets as well as Trade and other payables, Other provisions and Other non-current liabilities are reconciled to the relevant Notes on page 199.
198 | GSK Annual Report 2012
Notes to the financial statements
| 41 | Financial instruments and related disclosurescontinued |
(a) Financial instruments held at fair value
The following tables categorise the Group’s financial assets and liabilities held at fair value by the valuation methodology applied in determining their fair value. Where possible, quoted prices in active markets are used (Level 1). Where such prices are not available, the asset or liability is classified as Level 2, provided all significant inputs to the valuation model used are based on observable market data. If one or more of the significant inputs to the valuation model is not based on observable market data, the instrument is classified as Level 3. Other investments classified as Level 3 in the tables below comprise equity investments in unlisted entities with which the Group has entered into research collaborations and also investments in emerging life science companies. Other non-current liabilities classified as level 3 comprise contingent consideration for business acquisitions.
| | | | | | | | | | | | | | | | |
| At 31 December 2012 | | Level 1 £m | | | Level 2 £m | | | Level 3 £m | | | Total £m | |
| Financial assets at fair value | | | | | | | | | | | | | | | | |
Available–for–sale financial assets: | | | | | | | | | | | | | | | | |
Liquid investments | | | 74 | | | | 7 | | | | – | | | | 81 | |
Other investments | | | 589 | | | | – | | | | 198 | | | | 787 | |
Financial assets at fair value through profit or loss: | | | | | | | | | | | | | | | | |
Other non-current assets | | | – | | | | 194 | | | | – | | | | 194 | |
Derivatives designated as at fair value through profit or loss | | | – | | | | 80 | | | | – | | | | 80 | |
Derivatives classified as held for trading under IAS 39 | | | – | | | | 22 | | | | 1 | | | | 23 | |
| | | | 663 | | | | 303 | | | | 199 | | | | 1,165 | |
| | | | |
| Financial liabilities at fair value | | | | | | | | | | | | | | | | |
Financial liabilities at fair value through profit or loss: | | | | | | | | | | | | | | | | |
Other non-current liabilities | | | – | | | | – | | | | (709 | ) | | | (709 | ) |
Derivatives designated as at fair value through profit or loss | | | – | | | | (8 | ) | | | – | | | | (8 | ) |
Derivatives classified as held for trading under IAS 39 | | | – | | | | (55 | ) | | | (2 | ) | | | (57 | ) |
| | | | – | | | | (63 | ) | | | (711 | ) | | | (774 | ) |
| | | | | | | | | | | | | | | | | |
| At 31 December 2011 | | Level 1
£m | | | Level 2
£m | | | Level 3
£m | | | Total
£m | |
| Financial assets at fair value | | | | | | | | | | | | | | | | |
Available–for–sale financial assets: | | | | | | | | | | | | | | | | |
Liquid investments | | | 172 | | | | 12 | | | | – | | | | 184 | |
Other investments | | | 385 | | | | – | | | | 205 | | | | 590 | |
Financial assets at fair value through profit or loss: | | | | | | | | | | | | | | | | |
Other non-current assets | | | – | | | | 176 | | | | – | | | | 176 | |
Derivatives designated as at fair value through profit or loss | | | – | | | | 107 | | | | – | | | | 107 | |
Derivatives classified as held for trading under IAS 39 | | | – | | | | 47 | | | | 1 | | | | 48 | |
| | | | 557 | | | | 342 | | | | 206 | | | | 1,105 | |
| | | | |
| Financial liabilities at fair value | | | | | | | | | | | | | | | | |
Financial liabilities at fair value through profit or loss: | | | | | | | | | | | | | | | | |
Derivatives designated as at fair value through profit or loss | | | – | | | | – | | | | – | | | | – | |
Derivatives classified as held for trading under IAS 39 | | | – | | | | (176 | ) | | | (1 | ) | | | (177 | ) |
| | | | – | | | | (176 | ) | | | (1 | ) | | | (177 | ) |
Movements in the year for financial instruments measured using Level 3 valuation methods are presented below:
| | | | | | | | |
| | | 2012 £m | | | 2011 £m | |
At 1 January | | | 205 | | | | 220 | |
Losses recognised in the income statement | | | (32 | ) | | | (29 | ) |
Gains recognised in other comprehensive income | | | 4 | | | | 7 | |
Contingent consideration liabilities for businesses acquired during the year | | | (696 | ) | | | – | |
Equity investment converted into subsidiary on acquisition of business | | | (23 | ) | | | – | |
Equity investment additions | | | 44 | | | | 31 | |
Equity investment disposals | | | (7 | ) | | | (14 | ) |
Transfers from Level 3 | | | – | | | | (10 | ) |
Exchange | | | (7 | ) | | | – | |
At 31 December | | | (512 | ) | | | 205 | |
The £717 million movement in total financial instruments measured at fair value using Level 3 valuation methods over the year arises principally from contingent consideration liabilities of £696 million entered into as a result of business acquisitions during the year. Net losses of £24 million (2011 – £25 million) attributable to Level 3 financial instruments held at the end of the year were reported in Other operating income.
|
| GSK Annual Report 2012 | 199 |
| 41 | Financial instruments and related disclosurescontinued |
£670 million of the total carrying value of financial liabilities measured using Level 3 valuation methods at 31 December 2012 is contingent consideration for the acquisition of the former Shionogi-ViiV Healthcare joint venture. This consideration is expected to be paid over several years and will vary in line with sales of dolutegravir, for which regulatory applications for marketing approval were submitted in the European Union, the USA and Canada in December 2012. A probability of success has been applied in valuing the contingent consideration and success in obtaining regulatory approval would result in an increase in the liability and a charge to the Income Statement of approximately £74 million. If regulatory approval is not obtained, no contingent consideration will be payable and the liability will be released through the income statement. The table below shows on an indicative basis the income statement and balance sheet sensitivity to reasonably possible changes in other key inputs to the valuation of this liability.
| | | | |
| Increase/(decrease) in financial liability and loss/(gain) in Income statement from change in key inputs | | 2012 £m | |
10% increase in sales forecasts | | | 78 | |
10% decrease in sales forecasts | | | (77 | ) |
1% increase in market interest rates | | | (60 | ) |
1% decrease in market interest rates | | | 68 | |
(b) Trade and other receivables and Other non-current assets in scope of IAS 39
The following table reconciles financial instruments within Trade and other receivables and Other non-current assets which fall within the scope of IAS 39 to the relevant balance sheet amounts. The financial assets are predominantly non-interest earning. Financial instruments within the Other non-current assets balance include company-owned life insurance policies. Other assets include tax receivables, pension surplus balances and prepayments, which are outside the scope of IAS 39.
| | | | | | | | | | | | | | | | | | | | | | | | | | | | | | | | | | | | | | | | |
| | | | | | | | | | | | | | | 2012 | | | | | | | | | | | | | | | 2011 | |
| | | At fair value
through
profit or loss
£m | | | Loans and
receivables
£m | | | Financial
instruments
£m | | | Other
£m | | | Total
£m | | | At fair value
through
profit or loss
£m | | | Loans and
receivables
£m | | | Financial
instruments
£m | | | Other
£m | | | Total
£m | |
Trade and other receivables | | | | | | | | | | | | | | | | | | | | | | | | | | | | | | | | | | | | | | | | |
(Note 24) | | | – | | | | 4,577 | | | | 4,577 | | | | 665 | | | | 5,242 | | | | – | | | | 5,055 | | | | 5,055 | | | | 521 | | | | 5,576 | |
Other non-current assets | | | | | | | | | | | | | | | | | | | | | | | | | | | | | | | | | | | | | | | | |
(Note 22) | | | 194 | | | | 330 | | | | 524 | | | | 158 | | | | 682 | | | | 176 | | | | 257 | | | | 433 | | | | 92 | | | | 525 | |
| | | | 194 | | | | 4,907 | | | | 5,101 | | | | 823 | | | | 5,924 | | | | 176 | | | | 5,312 | | | | 5,488 | | | | 613 | | | | 6,101 | |
The following table shows the age of such financial assets which are past due and for which no provision for bad or doubtful debts has been made:
| | | | | | | | |
| | | 2012 £m | | | 2011 £m | |
Past due by 1–30 days | | | 118 | | | | 191 | |
Past due by 31–90 days | | | 129 | | | | 92 | |
Past due by 91–180 days | | | 100 | | | | 80 | |
Past due by 181–365 days | | | 71 | | | | 60 | |
Past due by more than 365 days | | | 41 | | | | 81 | |
| | | | 459 | | | | 504 | |
Amounts past due by greater than 90 days and for which no provision for bad or doubtful debts has been made total £212 million (2011 – £221 million). Of this balance £99 million (2011 – £136 million) relates to receivables due from state hospital authorities in Greece, Ireland, Italy, Portugal and Spain. The total receivables due from state hospital authorities in these countries (current and past due, net of provisions) is £257 million (2011 – £293 million).
(c) Trade and other payables, Other provisions and Other non-current liabilities in scope
of IAS 39
The following table reconciles financial instruments within Trade and other payables, Other provisions and Other non-current liabilities which fall within the scope of IAS 39 to the relevant balance sheet amounts. The financial liabilities are predominantly non-interest bearing. Accrued wages and salaries are included within financial liabilities. Other liabilities include payments on account, tax and social security payables and provisions which do not arise from contractual obligations to deliver cash or another financial asset, which are outside the scope of IAS 39. At 31 December 2011, no financial liabilities were measured at fair value through profit or loss.
| | | | | | | | | | | | | | | | | | | | | | | | | | | | | | | | |
| | | | | | | | | | | | | | | 2012 | | | | | | | | | 2011 | |
| | | At fair value through profit or loss
£m | | | Other liabilities £m | | | Financial instruments £m | | | Other £m | | | Total £m | | | Financial instruments £m | | | Other £m | | | Total £m | |
Trade and other payables (Note 27) | | | – | | | | (7,485 | ) | | | (7,485 | ) | | | (569 | ) | | | (8,054 | ) | | | (6,951 | ) | | | (408 | ) | | | (7,359 | ) |
Other provisions (Note 29) | | | – | | | | (157 | ) | | | (157 | ) | | | (1,235 | ) | | | (1,392 | ) | | | (62 | ) | | | (3,572 | ) | | | (3,634 | ) |
Other non-current liabilities (Note 30) | | | (709 | ) | | | (88 | ) | | | (797 | ) | | | (635 | ) | | | (1,432 | ) | | | (92 | ) | | | (534 | ) | | | (626 | ) |
| | | | (709 | ) | | | (7,730 | ) | | | (8,439 | ) | | | (2,439 | ) | | | (10,878 | ) | | | (7,105 | ) | | | (4,514 | ) | | | (11,619 | ) |
200 | GSK Annual Report 2012
Notes to the financial statements
| 41 | Financial instruments and related disclosurescontinued |
(d) Derivative financial instruments and hedging programmes
The following table sets out the fair values of derivatives held by GSK.
| | | | | | | | | | | | | | | | |
| | | | | | 2012 | | | | | | 2011 | |
| | | | | | Fair value | | | | | | Fair value | |
| | | Assets £m | | | Liabilities £m | | | Assets £m | | | Liabilities £m | |
Fair value hedges – Interest rate swaps
(principal amount – £920 million (2011 – £968 million)) | | | 54 | | | | – | | | | 84 | | | | – | |
| | | | |
Net investment hedges – Foreign exchange contracts
(principal amount – £7,529 million (2011 – £4,260 million)) | | | 25 | | | | (8 | ) | | | 23 | | | | – | |
| | | | |
Cash flow hedges – Foreign exchange contracts
(principal amount – £242 million (2011 – £nil) | | | 1 | | | | – | | | | – | | | | – | |
Derivatives designated as at fair value through profit or loss | | | 80 | | | | (8 | ) | | | 107 | | | | – | |
Foreign exchange contracts
(principal amount – £10,270 million (2011 – £13,280 million)) | | | 18 | | | | (53 | ) | | | 44 | | | | (172 | ) |
| | | | |
Embedded and other derivatives | | | 5 | | | | (4 | ) | | | 4 | | | | (5 | ) |
| | | | |
Derivatives classified as held for trading under IAS 39 | | | 23 | | | | (57 | ) | | | 48 | | | | (177 | ) |
Total derivative instruments | | | 103 | | | | (65 | ) | | | 155 | | | | (177 | ) |
| | | | |
Analysed as: | | | | | | | | | | | | | | | | |
Current | | | 49 | | | | (63 | ) | | | 70 | | | | (175 | ) |
Non-current | | | 54 | | | | (2 | ) | | | 85 | | | | (2 | ) |
Total | | | 103 | | | | (65 | ) | | | 155 | | | | (177 | ) |
Foreign exchange contracts classified as held for trading under IAS 39
The principal amount on foreign exchange contracts is the absolute total of outstanding positions at the balance sheet date. The Group’s foreign exchange contracts are for periods of 12 months or less. At 31 December 2012, the Group held outstanding foreign exchange contracts consisting primarily of currency swaps with a net liability fair value of £35 million (2011 – £128 million net liability) which represent hedges of inter-company loans and deposits, external debt and legal provisions, that are not designated as accounting hedges. Fair value movements are taken to the income statement in the period to offset the exchange gains and losses on the related inter-company lending and borrowing, external debt and legal provisions.
Fair value hedges
The Group has designated a series of interest rate swaps as a fair value hedge. The risk being hedged is the variability of the fair value of the bond arising from interest rate fluctuations. Gains and losses on fair value hedges are disclosed in Note 12, ‘Finance expense’.
The carrying value of bonds in a designated hedging relationship on page 197 includes £970 million (2011 – £1,046 million) that is deemed a hedged item in a fair value hedge relationship.
Net investment hedges
During the year, certain foreign exchange contracts were designated as net investment hedges in respect of the foreign currency translation risk arising on consolidation of the Group’s net investment in its European (Euro) and Japanese (Yen) foreign operations as shown in the table above.
The carrying value of bonds in a designated hedging relationship on page 197 includes £2,309 million (2011 – £4,861 million) that is deemed a hedging instrument in a net investment hedge relationship.
Cash flow hedges
During December 2012, the Group entered into a non-deliverable foreign exchange contract which it designated as a cash flow hedge of a foreign exchange exposure arising on the recognition of a liability denominated in Indian Rupee in the Group’s consolidated financial statements.
At 31 December 2011, the Group had no designated cash flow hedges.
|
| GSK Annual Report 2012 | 201 |
| 41 | Financial instruments and related disclosurescontinued |
(e) Debt interest rate repricing table
The following table sets out the exposure of the Group to interest rates on debt, including commercial paper, before and after the effect of interest rate swaps. The maturity analysis of fixed rate debt is stated by contractual maturity and of floating rate debt by interest rate repricing dates. For the purpose of this table, debt is defined as all classes of borrowings other than obligations under finance leases.
| | | | | | | | | | | | | | | | | | | | | | | | |
| | | | | | | | | 2012 | | | | | | | | | 2011 | |
| | | Debt £m | | | Effect of interest rate swaps £m | | | Total £m | | | Debt £m | | | Effect of interest rate swaps £m | | | Total £m | |
Floating and fixed rate debt less than one year | | | (3,604 | ) | | | (970 | ) | | | (4,574 | ) | | | (2,664 | ) | | | (1,046 | ) | | | (3,710 | ) |
Between one and two years | | | (970 | ) | | | 970 | | | | – | | | | (1,611 | ) | | | – | | | | (1,611 | ) |
Between two and three years | | | (1,907 | ) | | | – | | | | (1,907 | ) | | | (1,046 | ) | | | 1,046 | | | | – | |
Between three and four years | | | – | | | | – | | | | – | | | | (1,326 | ) | | | – | | | | (1,326 | ) |
Between four and five years | | | (2,232 | ) | | | – | | | | (2,232 | ) | | | – | | | | – | | | | – | |
Between five and ten years | | | (2,897 | ) | | | – | | | | (2,897 | ) | | | (2,806 | ) | | | – | | | | (2,806 | ) |
Greater than ten years | | | (6,616 | ) | | | – | | | | (6,616 | ) | | | (5,353 | ) | | | – | | | | (5,353 | ) |
Total | | | (18,226 | ) | | | – | | | | (18,226 | ) | | | (14,806 | ) | | | – | | | | (14,806 | ) |
Original issuance profile: | | | | | | | | | | | | | | | | | | | | | | | | |
Fixed rate interest | | | (16,155 | ) | | | 970 | | | | (15,185 | ) | | | (14,639 | ) | | | 1,046 | | | | (13,593 | ) |
Floating rate interest | | | (2,064 | ) | | | (970 | ) | | | (3,034 | ) | | | (166 | ) | | | (1,046 | ) | | | (1,212 | ) |
Total interest bearing | | | (18,219 | ) | | | – | | | | (18,219 | ) | | | (14,805 | ) | | | – | | | | (14,805 | ) |
Non-interest bearing | | | (7 | ) | | | – | | | | (7 | ) | | | (1 | ) | | | – | | | | (1 | ) |
| | | | (18,226 | ) | | | – | | | | (18,226 | ) | | | (14,806 | ) | | | – | | | | (14,806 | ) |
The Group holds interest rate swaps, designated as fair value hedges, to convert £970 million of fixed rate debt with a maturity between one and two years (2011 – £1,046 million with a maturity between two and three years) into a floating rate exposure.
(f) Sensitivity analysis
Foreign exchange and interest rate sensitivity analysis has been prepared on the assumption that the amount of net debt, the ratio of fixed to floating interest rates of the debt and derivatives portfolio and the proportion of financial instruments in foreign currencies are all constant and on the basis of the hedge designations as at 31 December. Financial instruments affected by market risk include cash and cash equivalents, borrowings, trade receivables and payables and derivative financial instruments.
The following analyses are intended to illustrate the sensitivity of such financial instruments to changes in foreign exchange and interest rates.
Foreign exchange sensitivity
The table below shows on an indicative basis the Group’s sensitivity to foreign exchange rates on its US dollar, Euro and Yen financial instruments.
These three currencies are the major foreign currencies in which GSK’s financial instruments are denominated. GSK has considered movements in these currencies and has concluded that a 10 cent or 10 yen movement in rates against Sterling is reasonable.
In this analysis, financial instruments are only considered sensitive to foreign exchange rates where they are not in the functional currency of the entity that holds them. Obligations under finance leases, inter-company loans that are fully hedged to maturity and certain non-derivative financial instruments not in net debt are excluded as they do not present a material exposure. Foreign exchange sensitivity on Group assets and liabilities other than financial instruments is not included in the calculation.
The movement in the income statement in the table below relates primarily to hedging instruments for legal provisions and to trade receivables and payables. Whilst the hedging instruments provide economic hedges, the related remeasurement of provisions is not included in the calculation.
| | | | | | | | |
| | | 2012 | | | 2011 | |
| Income statement impact of non-functional currency foreign exchange exposures | | Increase in income £m | | | Increase in income £m | |
10 cent appreciation of the US dollar (2011: 10 cent) | | | 41 | | | | 137 | |
10 cent appreciation of the Euro (2011: 10 cent) | | | 29 | | | | 16 | |
10 yen appreciation of the Yen (2011: 20 yen) | | | – | | | | 1 | |
An equivalent depreciation in the above currencies would cause the following increase/(decrease) in income £(36) million, £(25) million and £nil for US dollar, Euro and Yen exchange rates respectively (2011 – £(129) million, £(14) million and £(1) million).
202 | GSK Annual Report 2012
Notes to the financial statements
| 41 | Financial instruments and related disclosurescontinued |
The movements in equity in the table below relate to hedging instruments (foreign exchange derivatives and external debt) designated as a net investment hedge to hedge the Group assets denominated in Euro and Yen.
| | | | | | | | |
| | | 2012 | | | 2011 | |
| Equity impact of non-functional currency foreign exchange exposures | | (Decrease) in equity £m | | | (Decrease) in equity £m | |
10 cent appreciation of the US dollar (2011: 10 cent) | | | – | | | | – | |
10 cent appreciation of the Euro (2011: 10 cent) | | | (814 | ) | | | (760 | ) |
10 yen appreciation of the Yen (2011: 20 yen) | | | (49 | ) | | | – | |
An equivalent depreciation in the above currencies would cause the following increase in equity: £nil, £691 million and £42 million for US dollar, Euro and Yen exchange rates respectively (2011 –£nil, £702 million and £nil).
The table below presents the Group’s sensitivity to foreign exchange rates based on the composition of net debt as shown in Note 32 adjusting for the effects of foreign exchange derivatives that are not part of net debt but affect future foreign currency cash flows.
| | | | | | | | |
| | | 2012 | | | 2011 | |
| Net debt impact of non-functional foreign currency exchange exposures | | (Increase)/ decrease in net debt £m | | | (Increase)/ decrease in net debt £m | |
10 cent appreciation of the US dollar (2011: 10 cent) | | | (460 | ) | | | (392 | ) |
10 cent appreciation of the Euro (2011: 10 cent) | | | 248 | | | | 21 | |
10 yen appreciation of the Yen (2011: 20 yen) | | | 15 | | | | 70 | |
An equivalent depreciation in the above currencies would cause the following (increase)/decrease in net debt: £407 million, £(211) million and £(13) million for US dollar, Euro and Yen exchange rates respectively (2011 – £344 million, £(29) million and £(50) million).
Interest rate sensitivity
The table below shows on an indicative basis the Group’s sensitivity to interest rates on its floating rate Sterling, US dollar and Euro financial instruments, being the currencies in which GSK has historically issued debt and held investments. GSK has considered movements in these interest rates over the last three years and has concluded that a 1% (100 basis points) increase is a reasonable benchmark. Debt with a maturity of less than one year is floating rate for this calculation. Interest rate movements on derivative financial instruments designated as fair value hedges are deemed to have an immaterial effect on the Group Income Statement due to compensating amounts in the carrying value of debt. A 1% (100 basis points) movement in interest rates is not deemed to have a material effect on equity.
| | | | | | | | |
| | | 2012 | | | 2011 | |
| Income statement impact of interest rate movements | | Increase/ (decrease) in income £m | | | Increase/ (decrease) in income £m | |
1% (100 basis points) increase in Sterling interest rates (2011: 1%) | | | 5 | | | | 7 | |
1% (100 basis points) increase in US dollar interest rates (2011: 1%) | | | – | | | | 12 | |
1% (100 basis points) increase in Euro interest rates (2011: 1%) | | | (12 | ) | | | (15 | ) |
These interest rates could not be decreased by 1% (100 basis points) as they are currently less than 1.0%. The maximum increase/(decrease) in income would therefore be limited to £(2) million, £nil and £nil for Sterling, US dollar and Euro interest rates respectively (2011 – £(5) million, £(1) million and £14 million).
(g) Contractual cash flows for non-derivative financial liabilities and derivative instruments
The following tables provides an analysis of the anticipated contractual cash flows including interest payable for the Group’s non-derivative financial liabilities on an undiscounted basis. The impact of interest rate swaps has been excluded. For the purpose of this table, debt is defined as all classes of borrowings except for obligations under finance leases. Interest is calculated based on debt held at 31 December without taking account of future issuance. Floating rate interest is estimated using the prevailing interest rate at the balance sheet date. Cash flows in foreign currencies are translated using spot rates at 31 December. Contractual cash flows in respect of operating lease vacant space provisions are excluded from the table below as they are included in the Commitments under non-cancellable operating leases table in Note 39 ‘Commitments’.
| | | | | | | | | | | | | | | | | | | | | | | | |
| At 31 December 2012 | | Debt £m | | | Interest on debt £m | | | Obligations under finance leases £m | | | Finance charge on obligations under finance leases £m | | | Trade payables
and other
liabilities not in net debt £m | | | Total £m | |
Due in less than one year | | | (3,607 | ) | | | (690 | ) | | | (27 | ) | | | (3 | ) | | | (7,485 | ) | | | (11,812 | ) |
Between one and two years | | | (920 | ) | | | (633 | ) | | | (19 | ) | | | (2 | ) | | | (129 | ) | | | (1,703 | ) |
Between two and three years | | | (1,914 | ) | | | (610 | ) | | | (15 | ) | | | (2 | ) | | | (10 | ) | | | (2,551 | ) |
Between three and four years | | | – | | | | (558 | ) | | | (8 | ) | | | (1 | ) | | | (34 | ) | | | (601 | ) |
Between four and five years | | | (2,243 | ) | | | (549 | ) | | | (2 | ) | | | – | | | | (60 | ) | | | (2,854 | ) |
Between five and ten years | | | (2,914 | ) | | | (1,967 | ) | | | (5 | ) | | | (1 | ) | | | (583 | ) | | | (5,470 | ) |
Greater than ten years | | | (6,704 | ) | | | (5,200 | ) | | | – | | | | – | | | | (853 | ) | | | (12,757 | ) |
Gross contractual cash flows | | | (18,302 | ) | | | (10,207 | ) | | | (76 | ) | | | (9 | ) | | | (9,154 | ) | | | (37,748 | ) |
|
| GSK Annual Report 2012 | 203 |
| 41 | Financial instruments and related disclosurescontinued |
Contractual cash flows for non-derivative financial liabilities and derivative instruments
| | | | | | | | | | | | | | | | | | | | | | | | |
| At 31 December 2011 | | Debt £m | | | Interest on debt £m | | | Obligations under finance leases £m | | | Finance charge on obligations under finance leases £m | | | Trade payables and other liabilities not in net debt £m | | | Total £m | |
Due in less than one year | | | (2,665 | ) | | | (750 | ) | | | (34 | ) | | | (3 | ) | | | (6,730 | ) | | | (10,182 | ) |
Between one and two years | | | (1,613 | ) | | | (636 | ) | | | (24 | ) | | | (3 | ) | | | (223 | ) | | | (2,499 | ) |
Between two and three years | | | (968 | ) | | | (558 | ) | | | (15 | ) | | | (3 | ) | | | (59 | ) | | | (1,603 | ) |
Between three and four years | | | (1,333 | ) | | | (515 | ) | | | (11 | ) | | | (1 | ) | | | (61 | ) | | | (1,921 | ) |
Between four and five years | | | – | | | | (463 | ) | | | (3 | ) | | | (1 | ) | | | (5 | ) | | | (472 | ) |
Between five and ten years | | | (2,816 | ) | | | (1,784 | ) | | | (8 | ) | | | – | | | | (22 | ) | | | (4,630 | ) |
Greater than ten years | | | (5,422 | ) | | | (4,785 | ) | | | – | | | | – | | | | (5 | ) | | | (10,212 | ) |
Gross contractual cash flows | | | (14,817 | ) | | | (9,491 | ) | | | (95 | ) | | | (11 | ) | | | (7,105 | ) | | | (31,519 | ) |
The increase in contractual cash flows for non-derivative financial liabilities of £6.2 billion over the year results in part from the issuance in 2012 of £4.5 billion of new US and European Medium Term Notes and their future interest cash flows and the issuance of £1.7 billion of short-term commercial paper, offset by the repayment of £2.5 billion of European Medium Term Notes which matured in 2012. Contingent consideration liabilities arising on business acquisitions in 2012 add a further £1.6 billion of undiscounted expected future cash flows.
The following table below provides an analysis of the anticipated contractual cash flows for the Group’s derivative instruments, excluding embedded derivatives and equity options which are not material, using undiscounted cash flows. Cash flows in foreign currencies are translated using spot rates at 31 December. The gross cash flows of foreign exchange contracts are presented for the purposes of this table, though, in practice, the Group uses standard settlement arrangements to reduce its liquidity requirements on these instruments.
The amounts receivable and payable in less than one year have increased compared to 31 December 2011 due to higher levels of hedging of inter-company loans and external debt. This is reflected in the increased principal amounts shown in the table below.
| | | | | | | | | | | | | | | | |
| | | | | | 2012 | | | | | | 2011 | |
| | | Receivables £m | | | Payables £m | | | Receivables £m | | | Payables £m | |
Due in less than one year | | | 17,822 | | | | (18,047 | ) | | | 17,141 | | | | (17,209 | ) |
Between one and two years | | | 20 | | | | (2 | ) | | | 38 | | | | (4 | ) |
Between two and three years | | | – | | | | – | | | | 19 | | | | (2 | ) |
Gross contractual cash flows | | | 17,842 | | | | (18,049 | ) | | | 17,198 | | | | (17,215 | ) |
The Group operates share option schemes, whereby options are granted to employees to acquire shares or ADS in GlaxoSmithKline plc at the grant price, savings-related share option schemes and share award schemes. In addition, GSK operates the Performance Share Plan, whereby awards are granted to employees to acquire shares or ADS in GlaxoSmithKline plc at no cost, subject to the achievement by the Group of specified performance targets and the Share Value Plan, whereby awards are granted to employees to acquire shares or ADS in GlaxoSmithKline plc at no cost after a three year vesting period. The granting of restricted share awards has replaced the granting of options to employees as the cost of the scheme more readily equates to the potential gain to be made by the employee.
Grants under share option schemes are normally exercisable between three and ten years from the date of grant. Grants of restricted shares and share awards are normally exercisable at the end of the three year vesting/performance period. Grants under savings-related share option schemes are normally exercisable after three years’ saving. Grants under share option schemes and awards under the Performance Share Plan are normally granted to employees to acquire shares or ADS in GSK plc but in some circumstances will be settled in cash. Options under the share option schemes were granted at the market price ruling at the date of grant. In accordance with UK practice, the majority of options under the savings-related share option schemes are granted at a price 20% below the market price ruling at the date of grant. Share options awarded to the Directors and, with effect from the 2004 grant, the CET are subject to performance criteria.
Option pricing
For the purposes of valuing options and awards to arrive at the share based payment charge, the Black-Scholes option pricing model has been used. The assumptions used in the model for 2010, 2011 and 2012 are as follows:
| | | | | | | | | | | | |
| | | 2012 | | | 2011 | | | 2010 | |
Risk-free interest rate | | | 0.1% – 0.5% | | | | 0.5% – 1.9% | | | | 0.8% – 1.9% | |
Dividend yield* | | | 5.2% | | | | 5.8% | | | | 5.3% | |
Volatility | | | 18% – 23% | | | | 24% – 28% | | | | 26% – 29% | |
Expected lives of options granted under: | | | | | | | | | | | | |
Share option schemes | | | 4 years | | | | 5 years | | | | 5 years | |
Savings-related share option and share award schemes | | | 3-4 years | | | | 3-4 years | | | | 3-4 years | |
Weighted average share price for grants in the year: | | | | | | | | | | | | |
Shares | | | £14.35 | | | | £11.90 | | | | £12.04 | |
ADS | | | $45.57 | | | | $39.10 | | | | $37.29 | |
| * | 0% for those plans where dividends are reinvested. |
204 | GSK Annual Report 2012
Notes to the financial statements
| 42 | Employee share schemescontinued |
Volatility is determined based on the three and five year share price history where appropriate. The fair value of performance share plan grants take into account market conditions. Expected lives of options were determined based on weighted average historic exercises of options.
| | | | | | | | | | | | | | | | | | | | | | | | | | | | | | | | | | | | |
| Options outstanding | | Share option schemes – shares | | | Share option schemes – ADS | | | Savings-related share option schemes | |
| | | | | | | | | |
| | | Number 000 | | | Weighted exercise price | | | Weighted fair value | | | Number 000 | | | Weighted exercise price | | | Weighted fair value | | | Number 000 | | | Weighted exercise price | | | Weighted fair value | |
At 1 January 2010 | | | 124,019 | | | | £14.32 | | | | | | | | 73,419 | | | | $46.88 | | | | | | | | 8,065 | | | | £9.77 | | | | | |
Options granted | | | 11,257 | | | | £12.04 | | | | £1.19 | | | | 7,384 | | | | $37.29 | | | | $3.95 | | | | – | | | | – | | | | – | |
Options exercised | | | (3,625 | ) | | | £11.86 | | | | | | | | (916 | ) | | | $36.59 | | | | | | | | (1,310 | ) | | | £10.45 | | | | | |
Options lapsed | | | (21,551 | ) | | | £15.10 | | | | | | | | (7,776 | ) | | | $49.62 | | | | | | | | (800 | ) | | | £10.02 | | | | | |
At 31 December 2010 | | | 110,100 | | | | £14.02 | | | | | | | | 72,111 | | | | $45.73 | | | | | | | | 5,955 | | | | £9.59 | | | | | |
Options granted | | | – | | | | – | | | | – | | | | – | | | | – | | | | – | | | | – | | | | – | | | | – | |
Options exercised | | | (14,618 | ) | | | £11.97 | | | | | | | | (3,883 | ) | | | $38.61 | | | | | | | | (4,068 | ) | | | £9.55 | | | | | |
Options lapsed | | | (35,112 | ) | | | £17.27 | | | | | | | | (23,338 | ) | | | $51.21 | | | | | | | | (317 | ) | | | £9.70 | | | | | |
At 31 December 2011 | | | 60,370 | | | | £12.62 | | | | | | | | 44,890 | | | | $43.50 | | | | | | | | 1,570 | | | | £9.68 | | | | | |
Options granted | | | – | | | | – | | | | – | | | | – | | | | – | | | | – | | | | 4,210 | | | | £11.59 | | | | £1.76 | |
Options exercised | | | (12,473 | ) | | | £11.97 | | | | | | | | (9,698 | ) | | | $39.33 | | | | | | | | (1,230 | ) | | | £9.67 | | | | | |
Options lapsed | | | (5,168 | ) | | | £13.28 | | | | | | | | (4,593 | ) | | | $45.99 | | | | | | | | (89 | ) | | | £9.82 | | | | | |
At 31 December 2012 | | | 42,729 | | | | £12.72 | | | | | | | | 30,599 | | | | $44.36 | | | | | | | | 4,461 | | | | £11.48 | | | | | |
Range of exercise prices on
options outstanding at year end | | | £10.76 | | | | – £14.93 | | | | | | | | $33.42 | | | | – $58.00 | | | | | | | | £9.51 | | | | – £11.59 | | | | | |
Weighted average market price on exercise | | | | | | | £14.24 | | | | | | | | | | | | $45.26 | | | | | | | | | | | | £13.93 | | | | | |
Weighted average remaining contractual life | | | | | | | 4.4 years | | | | | | | | | | | | 4.2 years | | | | | | | | | | | | 3.2 years | | | | | |
| | | | |
Options outstanding at 31 December 2012 | | Share option schemes – shares | | | Share option schemes – ADS | | | Savings-related share option schemes | |
| | | | | | | | | |
| Year of grant | | Number 000 | | | Weighted exercise price | | | Latest exercise date | | | Number 000 | | | Weighted exercise price | | | Latest exercise date | | | Number 000 | | | Weighted exercise price | | | Latest exercise date | |
2003 | | | 7,774 | | | | £12.67 | | | | 14.12.13 | | | | 5,119 | | | | $43.77 | | | | 14.12.13 | | | | – | | | | – | | | | – | |
2004 | | | 2,537 | | | | £11.22 | | | | 03.12.14 | | | | 3,150 | | | | $43.31 | | | | 02.12.14 | | | | – | | | | – | | | | – | |
2005 | | | 94 | | | | £13.22 | | | | 01.11.15 | | | | 265 | | | | $47.28 | | | | 31.10.15 | | | | – | | | | – | | | | – | |
2006 | | | 5,236 | | | | £14.69 | | | | 27.11.16 | | | | 3,943 | | | | $51.30 | | | | 28.07.16 | | | | – | | | | – | | | | – | |
2007 | | | 6,074 | | | | £14.82 | | | | 25.07.17 | | | | 4,331 | | | | $57.48 | | | | 25.07.17 | | | | – | | | | – | | | | – | |
2008 | | | 4,432 | | | | £11.49 | | | | 27.07.18 | | | | 4,074 | | | | $45.02 | | | | 03.11.18 | | | | – | | | | – | | | | – | |
2009 | | | 7,089 | | | | £11.76 | | | | 22.07.19 | | | | 3,554 | | | | $33.76 | | | | 21.07.19 | | | | 261 | | | | £9.72 | | | | 22.04.13 | |
2010 | | | 9,493 | | | | £12.03 | | | | 21.07.20 | | | | 6,163 | | | | $37.28 | | | | 21.07.20 | | | | – | | | | – | | | | – | |
2011 | | | – | | | | – | | | | – | | | | – | | | | – | | | | – | | | | – | | | | – | | | | – | |
2012 | | | – | | | | – | | | | – | | | | – | | | | – | | | | – | | | | 4,200 | | | | £11.59 | | | | 02.05.16 | |
Total | | | 42,729 | | | | £12.72 | | | | | | | | 30,599 | | | | $44.36 | | | | | | | | 4,461 | | | | £11.48 | | | | | |
Options normally become exercisable from three years from the date of grant but may, under certain circumstances, vest earlier as set out within the various scheme rules.
There has been no change in the effective exercise price of any outstanding options during the year.
| | | | | | | | | | | | | | | | | | | | | | | | |
| | | | |
| Options exercisable | | Share option schemes – shares | | | Share option schemes – ADS | | | Savings-related share option schemes | |
| | | | | | |
| | | Number 000 | | | Weighted exercise price | | | Number 000 | | | Weighted exercise price | | | Number 000 | | | Weighted exercise price | |
At 31 December 2010 | | | 81,362 | | | | £14.80 | | | | 53,831 | | | | $48.26 | | | | 175 | | | | £10.50 | |
| | | | | | |
At 31 December 2011 | | | 42,432 | | | | £12.92 | | | | 33,143 | | | | $46.33 | | | | – | | | | – | |
| | | | | | |
At 31 December 2012 | | | 33,930 | | | | £12.90 | | | | 24,706 | | | | $46.10 | | | | 261 | | | | £9.72 | |
|
| GSK Annual Report 2012 | 205 |
| 42 | Employee share schemescontinued |
GlaxoSmithKline share award schemes
Performance Share Plan
The Group operates a Performance Share Plan whereby awards are granted to Directors and senior executives at no cost. The percentage of each award that vests is based upon the performance of the Group over a defined measurement period with dividends reinvested during the same period. For awards granted from 2011 onwards to Directors and members of the CET, the performance conditions are based on four equally weighted measures over a three year performance period. The first measure is based on the achievement of adjusted free cash flow targets. The second measure is based on relative TSR performance against a comparator group. The remaining two measures are based on business-specific performance measures on business diversification and R&D new product performance. For details on the calculation of these measures, see the Remuneration Report on pages 109 to 136.
For awards granted in 2009 and 2010 to Directors and members of the CET, 40% of the award is based on the achievement of adjusted free cash flow targets over a three year measurement period. The remaining 60% of the award is based on relative TSR performance against a comparator group as described on pages 115 and 117. Half of the TSR element of each award is measured over three years and half over four years. Awards granted to Directors and members of the CET prior to 2009 are subject to a single performance condition which compares GSK’s TSR over the period with the TSR of companies in the comparator group over the same period.
For those awards made to all other eligible employees prior to 2009 the performance conditions consist of two parts, each of which applies to 50% of the award. The first part of the performance condition compares GSK’s EPS growth to the increase in the UK Retail Prices Index over the three year measurement period. The second part of the performance condition compares GSK’s TSR over the period with the TSR of companies in the comparator group over the same period. For awards granted from 2009 onwards, the first part of the performance condition continues to be based on EPS. The second part of the performance condition is based on strategic or operational business measures, over a three year measurement period, specific to the employee’s business area.
| | | | | | | | | | | | | | | | |
| Number of shares and ADS issuable | | Shares Number (000) | | | Weighted fair value | | | ADS Number (000) | | | Weighted fair value | |
At 1 January 2010 | | | 7,606 | | | | | | | | 3,732 | | | | | |
Awards granted | | | 3,812 | | | | £9.13 | | | | 1,624 | | | | $29.91 | |
Awards exercised | | | (440 | ) | | | | | | | (386 | ) | | | | |
Awards cancelled | | | (2,085 | ) | | | | | | | (1,357 | ) | | | | |
At 31 December 2010 | | | 8,893 | | | | | | | | 3,613 | | | | | |
Awards granted | | | 4,712 | | | | £9.66 | | | | 1,740 | | | | $31.65 | |
Awards exercised | | | (660 | ) | | | | | | | (315 | ) | | | | |
Awards cancelled | | | (2,404 | ) | | | | | | | (1,112 | ) | | | | |
At 31 December 2011 | | | 10,541 | | | | | | | | 3,926 | | | | | |
Awards granted | | | 4,797 | | | | £11.43 | | | | 1,645 | | | | $37.63 | |
Awards exercised | | | (1,388 | ) | | | | | | | (485 | ) | | | | |
Awards cancelled | | | (1,794 | ) | | | | | | | (710 | ) | | | | |
At 31 December 2012 | | | 12,156 | | | | | | | | 4,376 | | | | | |
During the year 529,000 shares and 225,000 ADS were awarded through dividends reinvested. These are included above.
Share Value Plan
The Group operates a Share Value Plan whereby awards are granted, in the form of shares, to certain employees at no cost. The awards vest after three years. There are no performance criteria attached.
| | | | | | | | | | | | | | | | |
| | | Shares Number (000) | | | Weighted fair value | | | ADS Number (000) | | | Weighted fair value | |
At 1 January 2010 | | | 14,235 | | | | | | | | 11,309 | | | | | |
Awards granted | | | 5,844 | | | | £10.04 | | | | 4,355 | | | | $31.30 | |
Awards exercised | | | (4,993 | ) | | | | | | | (3,939 | ) | | | | |
Awards cancelled | | | (834 | ) | | | | | | | (747 | ) | | | | |
At 31 December 2010 | | | 14,252 | | | | | | | | 10,978 | | | | | |
Awards granted | | | 10,923 | | | | £9.78 | | | | 7,481 | | | | $32.02 | |
Awards exercised | | | (4,677 | ) | | | | | | | (3,698 | ) | | | | |
Awards cancelled | | | (1,040 | ) | | | | | | | (680 | ) | | | | |
At 31 December 2011 | | | 19,458 | | | | | | | | 14,081 | | | | | |
Awards granted | | | 11,411 | | | | £11.96 | | | | 7,595 | | | | $38.51 | |
Awards exercised | | | (4,650 | ) | | | | | | | (3,410 | ) | | | | |
Awards cancelled | | | (901 | ) | | | | | | | (478 | ) | | | | |
At 31 December 2012 | | | 25,318 | | | | | | | | 17,788 | | | | | |
206 | GSK Annual Report 2012
Notes to the financial statements
| 42 | Employee share schemescontinued |
Deferred Investment Award Plan
The Group operates a Deferred Investment Award Plan whereby awards are granted, in the form of notional shares, to certain senior executives at no cost. Awards typically vest over a three-year period commencing on the fourth anniversary from date of grant with 50% of the award initially vesting and then 25% in each of the subsequent two years. There are no performance criteria attached.
| | | | | | | | | | | | | | | | |
| Number of shares and ADS issuable | | Shares Number (000) | | | Weighted fair value | | | ADS Number (000) | | | Weighted fair value | |
At 1 January 2010 | | | 549 | | | | | | | | 209 | | | | | |
Awards granted | | | 290 | | | | £12.20 | | | | 96 | | | | $36.85 | |
Awards exercised | | | (72 | ) | | | | | | | (9 | ) | | | | |
Awards cancelled | | | (23 | ) | | | | | | | (16 | ) | | | | |
At 31 December 2010 | | | 744 | | | | | | | | 280 | | | | | |
Awards granted | | | 114 | | | | £12.54 | | | | 50 | | | | $42.98 | |
Awards exercised | | | (77 | ) | | | | | | | (19 | ) | | | | |
Awards cancelled | | | (19 | ) | | | | | | | (16 | ) | | | | |
At 31 December 2011 | | | 762 | | | | | | | | 295 | | | | | |
Awards granted | | | 106 | | | | £13.97 | | | | 4 | | | | $45.60 | |
Awards exercised | | | (220 | ) | | | | | | | (26 | ) | | | | |
Awards cancelled | | | (85 | ) | | | | | | | (86 | ) | | | | |
At 31 December 2012 | | | 563 | | | | | | | | 187 | | | | | |
During the year 46,000 additional shares and 14,000 additional ADS were awarded through dividends reinvested.
Employee Share Ownership Plan Trusts
The Group sponsors Employee Share Ownership Plan (ESOP) Trusts to acquire and hold shares in GlaxoSmithKline plc to satisfy awards made under employee incentive plans and options granted under employee share option schemes. The trustees of the ESOP Trusts purchase shares on the open market with finance provided by the Group by way of loans or contributions. Costs of running the ESOP Trusts are charged to the income statement. Shares held by the ESOP Trusts are deducted from other reserves and held at the value of proceeds receivable from employees on exercise. If there is deemed to be a permanent diminution in value this is reflected by a transfer to retained earnings. The Trusts also acquire and hold shares to meet notional dividends re-invested on deferred awards under the SmithKline Beecham Mid-Term Incentive Plan. The trustees have waived their rights to dividends on the shares held by the ESOP Trusts.
| | | | | | | | |
| Shares held for share award schemes | | 2012 | | | 2011 | |
Number of shares (000) | | | 75,066 | | | | 60,358 | |
| | |
| | | £m | | | £m | |
Nominal value | | | 19 | | | | 15 | |
Carrying value | | | 390 | | | | 296 | |
Market value | | | 1,002 | | | | 887 | |
| | | | | | | | |
| Shares held for share option schemes | | 2012 | | | 2011 | |
Number of shares (000) | | | 139 | | | | 30,565 | |
| | |
| | | £m | | | £m | |
Nominal value | | | – | | | | 8 | |
Carrying value | | | 1 | | | | 196 | |
Market value | | | 2 | | | | 450 | |
|
| GSK Annual Report 2012 | 207 |
| 43 | Principal Group companies |
The following represent the principal subsidiary and associated undertakings of the GlaxoSmithKline Group at 31 December 2012. Details are given of the principal country of operation, the location of the headquarters, the business sector and the business activities. The equity share capital of these undertakings is wholly owned by the Group except where its percentage interest is shown otherwise. All companies are incorporated in their principal country of operation except where stated.
| | | | | | | | | | | | | | | | |
| Europe | | Location | | Subsidiary | | Sector | | | Activity | | | % | |
England | | Brentford | | GlaxoSmithKline Holdings Limited * | | | Ph,CH | | | | h | | | | | |
| | Brentford | | GlaxoSmithKline Holdings (One) Limited * | | | Ph,CH | | | | h | | | | | |
| | Brentford | | GlaxoSmithKline Services Unlimited * | | | Ph,CH | | | | s | | | | | |
| | Brentford | | GlaxoSmithKline Mercury Limited * | | | Ph | | | | h | | | | | |
| | Brentford | | GlaxoSmithKline Finance plc | | | Ph,CH | | | | f | | | | | |
| | Brentford | | GlaxoSmithKline Capital plc | | | Ph,CH | | | | f | | | | | |
| | Brentford | | SmithKline Beecham Limited | | | Ph,CH | | | | d e h m p r | | | | | |
| | Brentford | | Wellcome Limited | | | Ph,CH | | | | h | | | | | |
| | Brentford | | Glaxo Group Limited | | | Ph | | | | h | | | | | |
| | Brentford | | Glaxo Operations UK Limited | | | Ph | | | | p | | | | | |
| | Brentford | | GlaxoSmithKline Export Limited | | | Ph | | | | e | | | | | |
| | Brentford | | GlaxoSmithKline Research & Development Limited | | | Ph | | | | d r | | | | | |
| | Brentford | | GlaxoSmithKline UK Limited | | | Ph | | | | m p | | | | | |
| | Brentford | | Glaxochem Pte Ltd (i) | | | Ph | | | | h | | | | | |
| | Brentford | | Setfirst Limited | | | Ph,CH | | | | h | | | | | |
| | Brentford | | The Wellcome Foundation Limited | | | Ph | | | | p | | | | | |
| | Cambridge | | Domantis Limited | | | Ph | | | | d r | | | | | |
| | Brentford | | ViiV Healthcare Limited | | | Ph | | | | h | | | | 77 | |
| | Brentford | | ViiV Healthcare UK Limited | | | Ph | | | | m s | | | | 77 | |
| | | Brentford | | ViiV Healthcare Trading Services UK Limited | | | Ph | | | | e f | | | | 77 | |
Austria | | Vienna | | GlaxoSmithKline Pharma GmbH | | | Ph | | | | m | | | | | |
Belgium | | Wavre | | GlaxoSmithKline Pharmaceuticals S.A. | | | Ph | | | | m | | | | | |
| | | Rixensart | | GlaxoSmithKline Biologicals S.A. | | | Ph | | | | d e m p r | | | | | |
Czech Republic | | Prague | | GlaxoSmithKline s.r.o. | | | Ph,CH | | | | m | | | | | |
Denmark | | Brøndby | | GlaxoSmithKline Consumer Healthcare A/S | | | CH | | | | e m | | | | | |
| | Brøndby | | GlaxoSmithKline Pharma A/S | | | Ph | | | | m | | | | | |
Finland | | Espoo | | GlaxoSmithKline Oy | | | Ph | | | | m | | | | | |
France | | Marly le Roi | | Groupe GlaxoSmithKline S.A.S. | | | Ph | | | | h | | | | | |
| | Marly le Roi | | Laboratoire GlaxoSmithKline S.A.S. | | | Ph | | | | m r d | | | | | |
| | Marly le Roi | | Glaxo Wellcome Production S.A.S. | | | Ph | | | | p | | | | | |
| | Marly le Roi | | GlaxoSmithKline Sante Grand Public S.A.S. | | | CH | | | | m | | | | | |
| | Marly le Roi | | ViiV Healthcare S.A.S. | | | Ph | | | | m | | | | 77 | |
| | | St. Amand Les Eaux | | GlaxoSmithKline Biologicals S.A.S. | | | Ph | | | | p | | | | | |
Germany | | Buehl | | GlaxoSmithKline Consumer Healthcare GmbH & Co. KG | | | CH | | | | h m s | | | | | |
| | | Munich | | GlaxoSmithKline GmbH & Co. KG | | | Ph | | | | d h m s | | | | | |
Greece | | Athens | | GlaxoSmithKline A.E.B.E | | | Ph,CH | | | | m | | | | | |
Hungary | | Budapest | | GlaxoSmithKline Medicine and Healthcare Products Limited | | | Ph,CH | | | | e m | | | | | |
Italy | | Verona | | GlaxoSmithKline S.p.A. | | | Ph | | | | d h m | | | | | |
| | Milan | | GlaxoSmithKline Consumer Healthcare S.p.A. | | | CH | | | | m | | | | | |
| | | Verona | | GlaxoSmithKline Manufacturing S.p.A. | | | Ph | | | | p | | | | | |
Luxembourg | | Mamer | | GlaxoSmithKline International (Luxembourg) S.A.R.L | | | Ph,CH | | | | f h | | | | | |
Netherlands | | Zeist | | GlaxoSmithKline B.V. | | | Ph | | | | m | | | | | |
| | | Zeist | | GlaxoSmithKline Consumer Healthcare B.V. | | | CH | | | | m | | | | | |
Norway | | Oslo | | GlaxoSmithKline AS | | | Ph | | | | m | | | | | |
Poland | | Poznan | | GlaxoSmithKline Pharmaceuticals S.A. | | | Ph | | | | p | | | | | |
| | Poznan | | GSK Services Sp.z o.o. | | | Ph | | | | m s | | | | | |
| | | Warsaw | | GlaxoSmithKline Consumer Healthcare Sp.z o.o. | | | CH | | | | m e | | | | | |
Portugal | | Alges | | GlaxoSmithKline-Produtos Farmaceuticos, Limitada | | | Ph | | | | m | | | | | |
208 | GSK Annual Report 2012
Notes to the financial statements
| 43 | Principal Group companiescontinued |
| | | | | | | | | | | | | | | | |
| Europe | | Location | | Subsidiary | | Sector | | | Activity | | | % | |
Republic of | | Carrigaline | | SmithKline Beecham (Cork) Limited (ii) | | | Ph | | | | d p r | | | | | |
Ireland | | Cork | | GlaxoSmithKline Trading Services Limited (ii) | | | Ph | | | | e | | | | | |
| | Dublin | | GlaxoSmithKline Consumer Healthcare (Ireland) Limited (ii) | | | CH | | | | m | | | | | |
| | Dublin | | GlaxoSmithKline (Ireland) Limited (ii) | | | Ph | | | | m | | | | | |
| | Dungarvan | | Stafford Miller (Ireland) Limited (ii) | | | CH | | | | p | | | | | |
| | Dungarvan | | GlaxoSmithKline Dungarvan Limited (ii) | | | CH | | | | p | | | | | |
| | | Sligo | | Stiefel Laboratories (Ireland) Limited (ii) | | | Ph | | | | p | | | | | |
Romania | | Brasov | | Europharm Holding S.A. | | | Ph,CH | | | | s | | | | | |
| | | Bucharest | | GlaxoSmithKline (GSK) S.R.L. | | | Ph | | | | m r s | | | | | |
Russian | | Moscow | | GlaxoSmithKline Trading ZAO | | | Ph | | | | m | | | | | |
Federation | | Moscow | | GlaxoSmithKline Healthcare ZAO | | | CH | | | | m | | | | | |
Spain | | Madrid | | GlaxoSmithKline S.A. | | | Ph | | | | m | | | | | |
| | Madrid | | GlaxoSmithKline Consumer Healthcare S.A. | | | CH | | | | m | | | | | |
| | | Aranda de Duero | | Glaxo Wellcome, S.A. | | | Ph | | | | p | | | | | |
Sweden | | Solna | | GlaxoSmithKline AB | | | Ph | | | | m | | | | | |
Switzerland | | Muenchenbuchsee | | GlaxoSmithKline AG | | | Ph | | | | m | | | | | |
| | | | | | | | | | | | | | | | | |
USA | | | | | | | | | | | | | | | | |
USA | | Research Triangle Park | | Stiefel Laboratories, Inc. | | | Ph | | | | m p | | | | | |
| | Marietta | | Corixa Corporation | | | Ph | | | | p r | | | | | |
| | Philadelphia | | GlaxoSmithKline LLC | | | Ph,CH | | | | d e m p r s | | | | | |
| | Pittsburgh | | GlaxoSmithKline Consumer Healthcare, L.P. | | | CH | | | | m p | | | | 88 | |
| | Pittsburgh | | Block Drug Company, Inc. | | | CH | | | | m | | | | | |
| | Wilmington | | GlaxoSmithKline Holdings (Americas) Inc. | | | Ph,CH | | | | h | | | | | |
| | Wilmington | | GlaxoSmithKline Capital Inc. | | | Ph,CH | | | | f | | | | | |
| | Cambridge | | Sirtris Pharmaceuticals Inc. | | | Ph | | | | r | | | | | |
| | Research Triangle Park | | ViiV Healthcare Company | | | Ph | | | | m | | | | 77 | |
| | | Rockville | | Human Genome Sciences, Inc. | | | Ph | | | | d m p r | | | | | |
| | | | | | | | | | | | | | | | | |
Americas | | | | | | | | | | | | | | | | |
Bermuda | | Hamilton | | GlaxoSmithKline Insurance Ltd | | | Ph,CH | | | | i | | | | | |
Canada | | Mississauga | | GlaxoSmithKline Inc. | | | Ph | | | | m p r | | | | | |
| | Mississauga | | GlaxoSmithKline Consumer Healthcare Inc. | | | CH | | | | m | | | | | |
| | | Laval | | ID Biomedical Corporation of Quebec | | | Ph | | | | d e p r | | | | | |
Mexico | | Mexico City | | GlaxoSmithKline Mexico S.A. de C.V. | | | Ph,CH | | | | e m p s | | | | | |
| | | | | | | | | | | | | | | | | |
Asia Pacific | | | | | | | | | | | | | | | | |
Australia | | Boronia | | GlaxoSmithKline Australia Pty Ltd | | | Ph,CH | | | | d e m p r | | | | | |
China | | Beijing | | GlaxoSmithKline (China) Investment Co. Ltd | | | Ph,CH | | | | d h m r s | | | | | |
| | Hong Kong | | GlaxoSmithKline Limited | | | Ph,CH | | | | m | | | | | |
| | Shanghai | | GlaxoSmithKline Biologicals (Shanghai) Ltd | | | Ph | | | | m p | | | | | |
| | | Tianjin | | Sino-American Tianjin Smith Kline & French Laboratories Ltd | | | CH | | | | e m p | | | | 55 | |
India | | Mumbai | | GlaxoSmithKline Pharmaceuticals Limited | | | Ph | | | | m p | | | | 51 | |
| | | New Delhi | | GlaxoSmithKline Consumer Healthcare Limited (iii) | | | CH | | | | d e m p r s | | | | 43 | |
Malaysia | | Petaling Jaya | | GlaxoSmithKline Pharmaceutical Sdn Bhd | | | Ph | | | | m | | | | | |
| | | Selangor | | GlaxoSmithKline Consumer Healthcare Sdn Bhd | | | CH | | | | m | | | | | |
New Zealand | | Auckland | | GlaxoSmithKline NZ Limited | | | Ph,CH | | | | d m | | | | | |
Pakistan | | Karachi | | GlaxoSmithKline Pakistan Limited | | | Ph,CH | | | | e m p r | | | | 83 | |
Philippines | | Makati | | GlaxoSmithKline Philippines Inc | | | Ph,CH | | | | d e m | | | | | |
Singapore | | Singapore | | Glaxo Wellcome Manufacturing Pte Ltd | | | Ph | | | | d e p r s | | | | | |
| | | Singapore | | GlaxoSmithKline Pte Ltd | | | Ph,CH | | | | d e m s | | | | | |
South Korea | | Seoul | | GlaxoSmithKline Korea Limited | | | Ph,CH | | | | m | | | | | |
Thailand | | Bangkok | | GlaxoSmithKline (Thailand) Limited | | | Ph,CH | | | | m | | | | | |
|
| GSK Annual Report 2012 | 209 |
| 43 | Principal Group companiescontinued |
| | | | | | | | | | | | | | | | |
| Japan | | Location | | Subsidiary | | Sector | | | Activity | | | % | |
Japan | | Tokyo | | GlaxoSmithKline K.K. | | | Ph,CH | | | | d m p | | | | | |
| | | | | | | | | | | | | | | | | |
Latin America | | | | | | | | | | | | | | |
Argentina | | Buenos Aires | | GlaxoSmithKline Argentina S.A. | | | Ph,CH | | | | e m p r | | | | | |
| | Buenos Aires | | Laboratorios Phoenix Sociedad Anonima Industrial | | | | | | | | | | | | |
| | | | | Comercial y Financiera | | | Ph | | | | d e m p | | | | | |
Brazil | | Rio de Janeiro | | GlaxoSmithKline Brasil Limitada | | | Ph,CH | | | | d e m p | | | | | |
Colombia | | Bogota | | GlaxoSmithKline Colombia S.A. | | | Ph,CH | | | | m | | | | | |
Venezuela | | Caracas | | GlaxoSmithKline Venezuela, C.A. | | | Ph,CH | | | | m | | | | | |
| | | | | | | | | | | | | | | | | |
Middle East & Africa | | | | | | | | | | | | | | |
Egypt | | Cairo | | GlaxoSmithKline S.A.E | | | Ph,CH | | | | e m p | | | | 91 | |
Nigeria | | Lagos | | GlaxoSmithKline Consumer Nigeria plc | | | Ph,CH | | | | e m p | | | | 46 | |
South Africa | | Johannesburg | | GlaxoSmithKline South Africa (Pty) Limited | | | Ph,CH | | | | e m p | | | | | |
Turkey | | Istanbul | | GlaxoSmithKline Ilaclari Sanayi ve Ticaret A.S. | | | Ph,CH | | | | m | | | | | |
| | | | |
Middle East & Africa | | Associate | | | | | | | | | | | | |
South Africa | | Johannesburg | | Aspen Pharmacare Holdings Limited (iv) | | | Ph,CH | | | | m p r | | | | 19 | |
| | | | | | | | | | | | | | | | | |
| (i) | Incorporated in Singapore. |
| (ii) | Exempt from the provisions of section 7 of the Companies (Amendment) Act 1986 (Ireland). |
| (iii) | Consolidated as a subsidiary undertaking in accordance with section 1162 (4)(a) of the Companies Act 2006 on the grounds of dominant influence. On 5 February 2013, GSK announced an increase in the Group’s shareholding to 72.5% following the completion of an open offer undertaken by GlaxoSmithKline Pte. Ltd. |
| (iv) | Equity accounted on the grounds of significant influence. |
| * | Directly held wholly owned subsidiary of GlaxoSmithKline plc. |
Key
| | |
Business sector: | | Ph Pharmaceuticals, CH Consumer Healthcare |
Business activity: | | d development, e exporting, f finance, h holding company, i insurance, m marketing, p production, r research, s service |
Full details of all Group subsidiary and associated undertakings will be attached to the company’s Annual Return to be filed with the Registrar of Companies. Each of GlaxoSmithKline Capital Inc. and GlaxoSmithKline Capital plc is a wholly-owned finance subsidiary of the company, and the company has fully and unconditionally guaranteed the securities issued by each of GlaxoSmithKline Capital Inc. and GlaxoSmithKline Capital plc.
210 | GSK Annual Report 2012
Notes to the financial statements
The Group is involved in significant legal and administrative proceedings, principally product liability, intellectual property, tax, anti-trust and governmental investigations, as well as related private litigation. The Group makes provision for these proceedings on a regular basis as summarised in Note 2, ‘Accounting principles and policies’ and Note 29, ‘Other provisions’. The Group may become involved in significant legal proceedings in respect of which it is not possible to make a reliable estimate of the expected financial effect, if any, that could result from ultimate resolution of the proceedings. In these cases, appropriate disclosures about such cases would be included but no provision would be made.
With respect to each of the legal proceedings described below, other than those for which a provision has been made, the Group is unable to make a reliable estimate of the expected financial effect at this stage. The Group does not believe that information about the amount sought by the plaintiffs, if that is known, would be meaningful with respect to those legal proceedings. This is due to a number of factors, including, but not limited to, the stage of proceedings, the entitlement of parties to appeal a decision and clarity as to theories of liability, damages and governing law. Intellectual property claims include challenges to the validity and enforceability of the Group’s patents on various products or processes as well as assertions of non-infringement of those patents. A loss in any of these cases could result in loss of patent protection for the product at issue. The consequences of any such loss could be a significant decrease in sales of that product and could materially affect future results of operations for the Group.
Legal expenses incurred and provisions related to legal claims are charged to selling, general and administration costs. Provisions are made, after taking appropriate legal and other specialist advice, where an outflow of resources is considered probable and a reliable estimate can be made of the likely outcome of the dispute. In respect of product liability claims related to certain products, there is sufficient history of claims made and settlements to enable management to make a reliable estimate of the provision required to cover unasserted claims. At 31 December 2012, the Group’s aggregate provision for legal and other disputes (not including tax matters described in Note 14, ‘Taxation’) was £0.5 billion. The ultimate liability for legal claims may vary from the amounts provided and is dependent upon the outcome of litigation proceedings, investigations and possible settlement negotiations.
The Group’s position could change over time, and, therefore, there can be no assurance that any losses that result from the outcome of any legal proceedings will not exceed by a material amount, the amount of the provisions reported in the Group’s financial accounts. If this were to happen, it could have a material adverse impact on the results of operation of the Group in the reporting period in which the judgments are incurred or the settlements entered into. The most significant of these matters are described below.
Intellectual property
Advair/Seretide
A number of companies have challenged the Group’s patents coveringAdvair/Seretide (salmeterol/fluticasone propionate) in certain European jurisdictions, including in the UK, Belgium, France, Germany, Ireland and the Netherlands. On 23 February 2010, in actions brought by Mylan Pharmaceuticals, Inc., Hexal Pharmaceuticals (‘Hexal’), Neolab Ltd. and Ivax International, the Federal Court in Munich revoked the Group’s GermanSeretide combination patent for lack of inventive step.
In the Netherlands, in an action brought by Sandoz Pharmaceuticals (‘Sandoz’) and Hexal, the District Court of The Hague on 26 January 2011 revoked the Supplementary Protection Certificate (‘SPC’) which extends protection for the product until September 2013.
A revocation action against the basic patent covering theSeretide combination in Ireland was filed in the High Court in Dublin on behalf of Ivax in July 2008. The High Court handed down a decision on 26 June 2009 finding the patent invalid for obviousness. The Group filed an appeal of this decision in October 2009. No trial date has been set for the appeal.
There are currently no generic salmeterol/fluticasone propionate fixed combination products in the UK, Belgium, France, Germany, Ireland or the Netherlands.
On 4 July 2011, the Group entered into a settlement agreement with Sandoz pursuant to which the parties resolved all pending litigation relating to the Group’s combination patents forSeretide in Europe. The settlement agreement provides that the Group will not pursue legal action under its combination patents against Sandoz to block its launch of a generic salmeterol/fluticasone propionate product in any European country. Sandoz has not received regulatory approval for a salmeterol/fluticasone propionate product in any European country as of this date.
Argatroban
In December 2007, Encysive Pharmaceuticals Inc. (‘Encysive’), Mitsubishi Kasei Corporation (‘Mitsubishi’) and the Group filed an action in the United States District Court for the Southern District of New York against Barr Laboratories, Inc. (‘Barr’) for infringement of Mitsubishi’s pharmaceutical composition patent covering argatroban. Pursuant to a licence from Mitsubishi, Encysive developed argatroban for the treatment of heparin-induced thrombocytopenia and holds the New Drug Application approved by the US Food and Drug Administration (‘FDA’). Encysive licensed the US marketing rights for argatroban to the Group. The Mitsubishi patent expires in June 2014. Barr (now Teva Pharmaceuticals, Inc. (‘Teva’)) filed an Abbreviated New Drug Application (‘ANDA’) with the FDA with a certification of invalidity, unenforceability and non-infringement of the Mitsubishi patent. On 17 June 2010, the Group and its partners prevailed against Teva, with the trial judge ruling that Mitsubishi’s patent covering the formulation for injectable argatroban was infringed and not invalid. On 2 August 2011, the United States Court of Appeal for the Federal Circuit affirmed the decision. As a result of the Court’s decision, Teva is precluded from launching its generic product until 20 June 2014.
On 30 March 2012, the Group filed suit in the US District Court for the District of New Jersey to enjoin Hikma Pharmaceuticals (‘Hikma’) from launching a generic argatroban product. Pfizer (which had acquired Encysive) and Mitsubishi were joined in the suit as the Group’s licensors. A trial was held on 10 July 2012. On 31 July 2012, the Court found the patent valid, but not infringed. Hikma announced that it was launching its product on 13 December 2012.
Arzerra/Benlysta/Cabillypatents
On 17 February 2010, the Group filed a declaratory action in the United States District Court for the Northern District of California for a declaration that US Patent No. 6,331,415 (known as the ‘Cabilly II’ patent), which is owned jointly by Genentech, Inc. and the City of Hope, is invalid, unenforceable, or not infringed by the Group’s productArzerra (ofatumumab), which is approved by the FDA for refractory chronic lymphocytic leukaemia (‘CLL’). Genentech and the City of Hope counterclaimed for infringement. The suit subsequently was transferred to the United States District Court for the Middle District of California.
|
| GSK Annual Report 2012 | 211 |
| 44 | Legal proceedingscontinued |
On 12 April 2011, after obtaining a third Cabilly patent (the ‘Cabilly III’ patent), Genentech filed suit against the Group in the United States District Court for the Middle District of California alleging that the Group and Lonza, the manufacturer ofArzerra, infringed the Cabilly III patent by making and sellingArzerra. The Group is contractually required to defend and indemnify Lonza for claims related toArzerra under the Cabilly patents. Genentech also sued the Group and Human Genome Sciences, Inc. (‘HGS’) claiming infringement by the making and selling ofBenlysta under the Cabilly II and III patents. HGS, the Group’s prior licensor forBenlysta, was acquired by the Group in 2012.
The Group settled its litigation with Genentech over the Cabilly II and Cabilly III patents relating toArzerra in May 2012 and relating toBenlysta in December 2012. The Group has obtained a worldwide, royalty-bearing license with regard to both products.
On 23 March 2010, Genentech and Biogen Idec filed suit against the Group in the United States District Court for the Southern District of California alleging that the Group’s sale ofArzerra induces and contributes to infringement of their patent that claims the treatment of CLL with an anti-CD-20 monoclonal antibody. The Group counterclaimed that the patent is invalid or not infringed. On 18 October 2011, the District Court issued a ruling that construed the claims in a manner such thatArzerra would not infringe the patent. Genentech and Biogen Idec stipulated to a judgment of no infringement, and filed an appeal of the claim construction issue to the United States Court of Appeals for the Federal Circuit on 5 December 2011. The appeal was heard on 8 November 2012. A decision has not yet been rendered.
Avodart/Jalyn
On 29 November 2010, Banner Pharmacaps, Inc. (‘Banner’) notified the Group that it had filed an ANDA to market a generic version ofAvodart (dutasteride). Banner’s notification contained a Paragraph IV certification alleging that two patents expiring in 2013 and one patent expiring in 2015 (the ‘467 patent) covering the compound dutasteride were invalid or not infringed by Banner’s proposed generic dutasteride product.
The Group subsequently received similar notices from Anchen Pharmaceuticals (‘Anchen’), Roxane Laboratories (‘Roxane’), Watson Laboratories, Inc. (‘Watson’), Mylan Pharmaceuticals, Inc. (‘Mylan’), and Apotex, Inc. (‘Apotex’) each variously challenging either the ‘467 patent or all 3 patents.
The Group filed suit against Banner and Anchen in the United States District Court for the District of Delaware on 13 January 2011 for infringement of theAvodart patents. As a consequence, a stay against FDA approval of Banner’s and Anchen’s products will be in effect until the earlier of May 2013 or a decision adverse to the Group. A separate complaint was filed against Roxane and Watson in the same court on 17 June 2011. On 8 September 2011, the Group filed suit against Mylan and Impax. On 31 August 2012, the Group filed suit against Apotex. Thirty-month stays against FDA approval of these subsequent generic products will extend past the Anchen/Banner stay of May 2013.
Except for the August, 2012 suit against Apotex, all of the cases forAvodart andJalyn (described below) have been consolidated with the original case against Anchen and Banner. A trial was held on 28 January 2013. A decision has not yet been rendered.
In May, 2010, the Group settled an earlier patent challenge againstAvodart by Teva Pharmaceuticals, Inc. (‘Teva’). Under the terms of the settlement, Teva will be permitted to launch its generic dutasteride product in the fourth quarter of 2015 or earlier under certain circumstances. Teva’s generic dutasteride product was approved by the FDA on 21 December 2010.
On 29 December 2010, Anchen notified the Group that it had filed an ANDA forJalyn with a Paragraph IV certification alleging that the ‘467 patent, which expires in 2015, was invalid, unenforceable or not infringed.Jalyn, a combination of dutasteride and tamsulosin, is covered by the same three patents that coverAvodart. Subsequently, the Group received similar notices from Impax Laboratories, Inc. and Watson challenging one or more of the patents coveringJalyn. The Group sued all the ANDA applicants forJalyn in the United States District Court for the District of Delaware. These cases have been consolidated for trial with theAvodart cases. On 17 January 2013, the Group and Anchen settled the litigation on terms that would allow Anchen to enter the market forJalyn in the fourth quarter of 2015 or earlier under certain circumstances. A trial was held on
28 January 2013 with the remaining defendants. A decision has not yet been rendered.
Benlysta
In September, 2012, the UK Court of Appeal refused an appeal by Eli Lilly and Company (‘Eli Lilly’) asserting that Human Genome Sciences, Inc. (‘HGS’) UK Patent No. EP0939804 forBenlysta was invalid on the grounds that it lacked the necessary information required to work the invention described in the claims which covered antibodies (the ‘antibody claim insufficiency argument’). The UK High Court and the UK Supreme Court previously had decided that the patent was valid on all other grounds. The initial revocation was brought by Eli Lilly in 2006 on the patent which claims the cytokine BLyS and any antibody that binds to BLyS, such asBenlysta (belimumab). Eli Lilly has petitioned the UK Supreme Court to hear an appeal on its antibody claim insufficiency argument. The decision of the UK Supreme Court whether to grant the appeal is pending.
Eli Lilly has also requested a declaration that any Supplementary Protection Certificate (‘SPC’) filed by HGS to extend its UK patent based upon Eli Lilly’s anti-BLyS mAb will be invalid. On 3 August 2012, a decision was issued by the UK Court of Appeal to refer questions to the Court of Justice of the European Union (‘CJEU’) relating to whether the product is protected by a basic patent in force. The judge ordered that the remaining issues, which are not included in the referral, should go to a fact-finding trial at the UK High Court. A trial date has been set for July 2013 at the UK High Court. The CJEU reference is likely to be heard in early 2014.
On 2 November 2011, Eli Lilly brought an action in the UK Patents Court for revocation of a European patent owned by Biogen Idec covering the use of an antibody against B Lymphocyte Stimulatory (also known as BLyS) for the treatment of autoimmune diseases. The Group is exclusively licensed under this patent and is responsible for defending the action. In March 2012, a similar action was brought by Lilly against the equivalent Biogen Idec patent in Ireland. The European patent was also challenged in parallel proceedings by Merck Serono at the European Patent Office. On 20 October 2012, the Biogen patent was revoked by the Technical Board of Appeal at the EPO, which automatically rendered the various national patents invalid and the cases moot. This proceeding is now closed because the European patent was revoked in parallel proceedings by the European Patent Office. The revocation action will have no direct effect on the ability of the Group to marketBenlysta, or on the validity of the other patents which coverBenlysta.
212 | GSK Annual Report 2012
Notes to the financial statements
| 44 | Legal proceedingscontinued |
Epzicom
On 30 November 2007, the Group received notice that Teva Pharmaceuticals USA, Inc. (‘Teva’) had filed an ANDA with a Paragraph IV certification forEpzicom (the combination of lamivudine and abacavir). The certification challenged only the patent covering the hemisulfate salt of abacavir, which expires in 2018. The Group did not sue Teva under this patent. On 27 June 2011, ViiV Healthcare received notice that Teva had amended its ANDA forEpzicom to contain a Paragraph IV certification for two additional patents listed in the Orange Book, alleging the patents were invalid, unenforceable or not infringed. The patents challenged in this new certification relate to a method of treating HIV using the combination (expiring in 2016), and a certain crystal form of lamivudine (expiring in 2016). On 5 August 2011, ViiV Healthcare filed suit against Teva under the combination patent in the United States District Court for the District of Delaware. A stay is in place against FDA approval of Teva’s ANDA until the earlier of December 2013 or a decision adverse to ViiV Healthcare in the matter. The District Court has consolidated discovery in theEpzicom case with ViiV Healthcare’s patent infringement suit against Lupin Ltd relating toTrizivir, as both cases involve the same patent covering the combination of lamivudine and abacavir. Trial is scheduled for either 23 September 2013 or, if the judge decides to join the case with theTrizivir matter, for trial on 24 June 2013.
Lexiva
On 23 April 2012, Ranbaxy Laboratories Limited (‘Ranbaxy’) notified ViiV Healthcare that it had filed a Paragraph IV certification alleging that a patent claiming a polymorphic form of fosamprenavir calcium, the active ingredient inLexiva, was invalid or not infringed. The patent expires in 2020. ViiV Healthcare did not sue under this patent.
On 30 July 2012, Mylan Pharmaceuticals, Inc. (‘Mylan’) notified ViiV Healthcare that it had filed an ANDA forLexiva with a Paragraph IV certification asserting that patents claiming (i) the active ingredient (expiring in 2018) and (ii) a polymorphic form of the active ingredient (expiring 2020), are invalid, unenforceable, or not infringed. Mylan is the second generic to file an ANDA forLexiva, but the first generic company to challenge the basic compound patent on the active ingredient.
On 23 August 2012, ViiV Healthcare and its licensor, Vertex Pharmaceuticals Incorporated, filed a patent infringement suit against Mylan on the patent claiming the active ingredient (but not the patent claiming the polymorph) in the US District Court for the District of Delaware. Mylan subsequently filed a declaratory judgment action against ViiV Healthcare alleging that the polymorph patent is invalid and not infringed. ViiV Healthcare stipulated to noninfringement of the patent claiming the polymorph. Trial is scheduled for 17 May 2014 for infringement of the basic active ingredient patent forLexiva.
On 18 October 2012, Ranbaxy filed a Petition for Inter Parties Review in the US Patent & Trademark Office (‘USPTO’) alleging that the basic compound patent covering the active ingredient is invalid. This is a collateral attack on the patent and will run in parallel to the court challenge. ViiV Healthcare has responded to the USPTO and has asserted that the petition should not be granted.
Lovaza
In March 2009, the Group received notice that Teva Pharmaceuticals USA, Inc. (‘Teva’), Par Pharmaceuticals, Inc. (‘Par’), and Apotex Inc. (‘Apotex’) had filed ANDAs with a Paragraph IV certification alleging that two patents coveringLovaza (omega-3-acid ethyl esters) are invalid, unenforceable, or not infringed. The patents expire in March 2013 and April 2017. The Group is the licensee under these patents and has marketing rights in the USA and Puerto Rico. Pronova BioPharma Norge AS (‘Pronova’), the owner of the patents, sued Teva, Par and Apotex in the United States District Court for the District of Delaware. The Group was not a party to these suits.
On 30 March 2011, Pronova entered into an agreement with Apotex to settle their patent litigation in the USA related toLovaza.The settlement grants Apotex a licence to enter the US market with a generic version ofLovaza in the first quarter of 2015. Other terms of the settlement are confidential.
A trial involving Teva and Par was held in March and April 2011. On 28 May 2012, the United States District Court for the District of Delaware ruled in Pronova’s favour, finding Pronova’s patent claims are valid and would be infringed by Teva and Par. The court enjoined FDA approval of Teva’s and Par’s products until 2017. Par and Teva appealed to the Court of Appeals for the Federal Circuit on 27 June 2012. Briefing was completed on 15 January 2013, and the parties await a hearing.
Pronova and the Group also have received Paragraph IV notices from Endo Pharmaceuticals (‘Endo’), Mylan Pharmaceuticals, Inc. (‘Mylan’), Sandoz, Inc. (‘Sandoz’) and Strides Arcolab, Ltd. (‘Strides’) advising that they have submitted ANDAs to the FDA for a generic form ofLovaza. Pronova has chosen not to assert its patents against Endo, Mylan, Sandoz and Strides while awaiting the ruling in the litigation against Teva and Par in the United States District Court for the District of Delaware.
Trizivir
On 18 May 2011, ViiV Healthcare received notice that Lupin Ltd. (‘Lupin’) had filed an ANDA containing a Paragraph IV certification forTrizivir (the triple combination of lamivudine, AZT and abacavir) alleging that three patents listed in the Orange Book forTrizivir are either invalid, unenforceable or not infringed. These patents relate to a method of treating HIV using the triple combination (expiring in 2016), the hemisulfate salt of abacavir (expiring in 2018), and a certain crystal form of lamivudine (expiring in 2016). On 29 June 2011, ViiV Healthcare filed suit against Lupin under the patent covering the triple combination in the United States District Court for the District of Delaware. On 31 October 2011, the District Court consolidated the case for discovery with ViiV Healthcare’s patent infringement suit involving Teva Pharmaceuticals USA, Inc. andEpzicom pending in the same court. A stay is in place against FDA approval of Lupin’s ANDA until the earlier of November 2013 or a decision adverse to ViiV Healthcare in the matter. Trial is scheduled to begin on 24 June 2013.
Veramyst
On 9 November 2011, the Group received notice that Sandoz, Inc. had filed an ANDA with a Paragraph IV certification forVeramyst (fluticasone furoate) Nasal Spray, challenging the three patents listed in the Orange Book forVeramyst as invalid, unenforceable, or not infringed. All three patents expire in 2021. On 23 December 2011, the Group filed suit against Sandoz in the United States District Court for the District of Delaware on all three patents. A stay against FDA approval of Sandoz’s generic product will be in place until the earlier of a court decision adverse to the Group or May 2014. Trial is scheduled to begin on 2 December 2013.
|
| GSK Annual Report 2012 | 213 |
| 44 | Legal proceedingscontinued |
Product liability
Pre-clinical and clinical trials are conducted during the development of potential products to determine the safety and efficacy of products for use by humans following approval by regulatory bodies. Notwithstanding these efforts, when drugs and vaccines are introduced into the marketplace, unanticipated safety issues may become, or be believed by some to be, evident. The Group is currently a defendant in a number of product liability lawsuits related to the Group’s Pharmaceutical and Consumer Healthcare products. The most significant of those matters are described below. The Group has been able to make a reliable estimate of the expected financial effect of the matters discussed in this category and has included a provision for the matters below in the provision for legal and other disputes, as also noted in Note 29, ‘Other provisions’.
Avandia
The Group has been named in product liability lawsuits on behalf of individuals asserting personal injury claims arising out of the use ofAvandia. The federal cases filed against the Group are part of a multi-district litigation proceeding pending in the United States District Court for the Eastern District of Pennsylvania. Cases have also been filed in a number of state courts. Cases filed in state court in Philadelphia have been coordinated in the Mass Tort Program; cases in state court in California have been coordinated in Los Angeles. Additionally, there are a number of purported class actions seeking economic damages on behalf of third party payers and consumers asserting claims arising under various state and federal laws, including the Racketeer Influenced and Corrupt Organizations Act (‘RICO’), state unfair trade practices and/or consumer protection laws. In addition, three subrogation actions initiated by United Health Group, Inc. and Humana have been brought against the Group. On 28 June 2012, the United States Court of Appeals for the Third Circuit ruled that Medicare Advantage organisations such as United Health Group and Humana Medical Plan have a federal cause of action under the Medicare Act. On 5 December 2012, the Group filed a petition for certiorari with the US Supreme Court seeking review of the Third Circuit’s decision. On 13 December 2012, Humana asked the District Court to certify its action as a class action on behalf of Medicare Advantage organisations; the Group has opposed this motion.
As of February 2013, the Group has reached agreements to settle the substantial majority of federal and state cases pending in the USA. Eleven purported class actions onAvandia are pending in Canada. The Group has reached an agreement in principle to resolve the single purported consumer class action in Israel.
Paxil andPaxil CR
The Group has received numerous lawsuits and claims alleging that use ofPaxil (paroxetine) has caused a variety of injuries. Most of these lawsuits in recent years have alleged that the use ofPaxil during pregnancy resulted in the birth of a child with birth defects or health issues. Other lawsuits and claims have alleged that patients who tookPaxil committed or attempted to commit suicide or acts of violence or that patients suffered symptoms on discontinuing treatment withPaxil.
The Group has reached agreements to settle the substantial majority of the US claims relating toPaxil use during pregnancy as of February 2013, but a number of claims related to use during pregnancy are still pending, including several scheduled for trial in the Philadelphia Mass Tort Program. Other matters have been dismissed without payment.
In Canada, a nationwide class action was certified in a British Columbia lawsuit alleging cardiovascular defects in children whose mothers had takenPaxil during pregnancy. Another purported class action in Canada making similar allegations is pending.
Final court approval of a class settlement was received in a certified statewide class action seeking restitution for alleged violations of the California Unfair Competition Law relating to symptoms on discontinuing use ofPaxil.
In the UK, in late 2010, public funding was withdrawn from the hundreds of claimants who had received funding to pursue litigation alleging thatPaxil had caused them to suffer from withdrawal reactions and dependency. The Legal Services Commission’s decision to withdraw funding remains the subject of an appeal to a Special Cases Review Panel by some claimants. Other claimants have discontinued their claims.
Poligrip
Beginning in 2005, a number of product liability lawsuits and claims were filed against the Group in both state and federal courts in the USA, including purported class actions, alleging that the zinc inSuper Poligrip causes copper depletion and permanent neurologic injury. The federal cases were consolidated in the Denture Cream Adhesive multi-district litigation (‘MDL’) in the United States District Court for the Southern District of Florida which was established in June 2009. Both the Group and Procter & Gamble are defendants in this litigation. Included in the MDL were four purported class actions asserting economic loss claims under state consumer protection laws and claims for medical monitoring, and all of the putative class actions have now been dismissed. With two current exceptions (one state court case in Pennsylvania, and one state court case in small claims court in Tennessee), all of the state court cases were consolidated in the Philadelphia Mass Tort Program (‘MTP’). As of 31 January 2013, the vast majority of individual cases previously pending in both the MDL and MTP have been dismissed, with fewer than ten active cases in the MDL and three active cases in the MTP still pending against the Group. One individual lawsuit, as well as five purported class actions asserting consumer fraud claims were also filed and remain pending in Canada. There are a few unfiled claims in the UK and elsewhere. The Group voluntarily withdrew all zinc-containing formulations ofSuper Poligrip from the market in early 2010.
214 | GSK Annual Report 2012
Notes to the financial statements
| 44 | Legal proceedingscontinued |
Sales and marketing and regulation
The Group has been able to make a reliable estimate of the expected financial effect of the matters discussed in this category and has included a provision for such matters in the provision for legal and other disputes, except as noted below. Matters for which the Group has made a provision are also noted in Note 29, ‘Other provisions’.
‘Colorado investigation’
In February 2004, the Group received a subpoena from the United States Attorney’s office in Colorado regarding the Group’s sales and promotional practices relating to nine of its largest selling products, for the period from January 1997 to 2004. That investigation was later taken over by the United States Attorney’s Office for the District of Massachusetts and expanded to the present with respect toAdvair. On 2 July 2012, the Group announced that it had reached an agreement with the United States Government, multiple states and the District of Columbia to conclude the Group’s most significant ongoing United States federal government investigations, specifically, (i) the Colorado investigation into the Group’s sales and marketing practices begun in February 2004; (ii) the United States Department of Justice’s investigation of possible inappropriate use of the nominal price exception under the Medicaid Rebate Program; and (iii) the Department of Justice’s investigation of the development and marketing ofAvandia, for a settlement payment of $3 billion. The settlement resolved criminal and civil liabilities related to these investigations. The payment was covered by the Group’s existing provisions and funded through existing cash resources.
Under the terms of the settlement, GSK pleaded guilty to misdemeanour violations of the US Federal Food, Drug and Cosmetic Act related to certain aspects of the marketing ofPaxil for paediatric use and ofWellbutrin for certain uses, and for failure to include information about the initiation or status of certainAvandia studies in periodic and annual reports submitted to the FDA. Additionally, as part of the agreement, the Group entered into a Corporate Integrity Agreement (‘CIA’) with the Office of Inspector General (‘OIG’) of the US Department of Health and Human Services. The CIA also covers a portion of GSK’s manufacturing operations related to the Group’s settlement in 2010 of events in the early 2000s at the Group’s former manufacturing facility in Cidra, Puerto Rico.
To date, 44 states and the District of Columbia have agreed to join the federal settlement agreement and receive all or a portion of their share of the settlement payment under the agreement.
Avandia-related matters
As noted above, on 2 July 2012, the Group reached agreement with the US Government, a number of states, and the District of Columbia to resolve the federal government’sAvandia investigation. The settlement resolved claims under federal/state Medicaid programs. On 15 November 2012, the Group agreed to pay $90 million to settle claims by 37 states and the District of Columbia under state consumer protection laws regarding the marketing and promotion ofAvandia.
The Attorneys General Offices of the states of Kentucky, Louisiana, Maryland, Mississippi, New Mexico, South Carolina, Utah, and West Virginia have each filed suit against the Group asserting various statutory and common law claims relating to the development and marketing ofAvandia and, with regard to the state of Louisiana, other of the Group’s products. The Group is also defending an action by the County of Santa Clara, California, which was brought under California’s consumer protection laws seeking civil penalties and restitution.
Average wholesale price
The United States Department of Justice (‘DOJ’), a number of states and putative classes of private payers have for several years been investigating and/or bringing civil litigation regarding allegations that numerous pharmaceutical companies, including the Group, violated federal or state fraud and abuse laws as a result of the way ‘average wholesale price’ (‘AWP’) and ‘wholesale acquisition cost’ (‘WAC’) have been determined and reported for various drugs reimbursed under the Medicare, Medicaid and other insurance programmes. In 2005, the Group reached a $149 million civil settlement with the federal government to resolve allegations relating to the pricing and marketing ofZofran andKytril (the ‘DOJ Settlement’). The Group also amended its then-existing Corporate Integrity Agreement as a requirement of the settlement. In 2007, the Group received final approval of a $70 million nationwide private payer class action settlement relating to the Group’s price reporting in a multi-district litigation proceeding in the United States District Court for the District of Massachusetts.
A number of states through their respective Attorneys General, and most of the counties in New York State, filed civil lawsuits in state and federal courts against the Group and many other drug companies claiming damages and restitution due to AWP and/or WAC price reporting for pharmaceutical products covered by the states’ Medicaid programmes. The states seek recovery on behalf of the states as payers and, in some cases, on behalf of in-state patients as consumers.
The Group has separately resolved AWP claims by state Medicaid programmes in almost all of the states through the DOJ Settlement or separate negotiations. Litigation concerning AWP issues is continuing with two states, Illinois and Wisconsin.
Cidra, Puerto Rico manufacturing site
On 26 October 2010, the Group finalised an agreement with the US Attorney’s Office for the District of Massachusetts and the US Department of Justice with respect to the investigation of the Group’s former manufacturing facility in Cidra, Puerto Rico. Under the agreement and as a comprehensive settlement of pending claims against the Group arising from the investigation, the Group paid a total of $750 million (£500 million) to resolve all civil and criminal allegations, and SB Pharmco Puerto Rico, Inc., a subsidiary of the Group, pleaded guilty to certain charges. The CIA with the US Government entered into in July 2012 covers a portion of the manufacturing operations and compliance matters related to the Group’s 2010 settlement of this investigation.
HIV division enquiry
On 26 July 2010, the Group received a subpoena from the Eastern District of New York’s US Attorney’s Office regarding sales and marketing practices for three HIV products, as well as educational programmes, grants or payments to physicians regarding any drug used to treat HIV-infected adults. On 5 September 2012, the Group was advised that the US Government had concluded its investigation and declined to intervene in a qui tam lawsuit filed in the United States District Court for the Eastern District of New York. On 14 February 2013, the Group moved to dismiss the lawsuit.
|
| GSK Annual Report 2012 | 215 |
| 44 | Legal proceedingscontinued |
Nominal pricing
In May, 2004, the Group was advised by the US Department of Justice that it was investigating certain of the Group’s nominal pricing and bundled sale arrangements under the nominal price exception to the best price reporting requirements of the Medicaid Drug Rebate Programme. The Group also received subpoenas and requests for documents and information from Delaware and Michigan related to the Group’s nominal price arrangements. These matters were resolved as part of the Group’s settlement agreement with the federal government announced on 2 July 2012. The Group has not entered into any nominal price arrangements since December 2003.
Lovaza
On 18 April 2011, the Group received a subpoena from the Office of the Inspector General of the US Department of Health and Human Services requesting production of documents relating to the Group’s marketing and promotion ofLovaza. The Group complied with the request and the US Government declined to take any further action in the investigation. The matter was finally resolved at approximately the same time as the Group’s settlement agreement with the federal government announced on 2 July 2012.
Paxil/Seroxat
In 2004, the Group settled a lawsuit filed by the New York State Attorney General’s office alleging that the Group failed to disclose data on the use ofPaxil in children and adolescents. In 2007 and 2008, the Group made class settlements of lawsuits brought by consumers and third-party payers, respectively, for economic damages allegedly resulting from prescriptions ofPaxil to children and adolescents. The Group denied liability in these settlements. In 2010, plaintiffs voluntarily dismissed a similar purported class action filed on behalf of governmental entities that paid for prescriptions ofPaxil to minors. There remains a similar purported class action in Canada seeking economic damages on behalf of individuals, third party payers and governmental entities that purchasedPaxil for use by patients under the age of 18.
SEC/DOJ FCPA enquiry
The US Securities and Exchange Commission (‘SEC’) and the US Department of Justice initiated an industry-wide enquiry in 2010 into whether pharmaceutical companies may have engaged in violations of the Foreign Corrupt Practices Act relating to the sale of pharmaceuticals, including in Argentina, Brazil, Canada, China, Germany, Italy, Poland, Russia and Saudi Arabia. The Group is one of the companies that have been asked to respond to this enquiry and is cooperating with the SEC and DOJ. No provision has been made for this matter.
Anti-trust/competition
The Group has been able to make a reliable estimate of the expected financial effect of the matters discussed in this category and has included a provision for such matters in the provision for legal and other disputes, except as noted below. Matters for which the Group has made a provision are also noted in Note 29, ‘Other provisions’.
EU sector enquiry
On 17 January 2011, the European Commission requested information from the Group and a number of other pharmaceutical companies relating to patent settlement agreements affecting European Union and European Economic Area markets. The request for information was the second monitoring exercise by the Commission of patent settlement agreements in the pharmaceuticals sector. The results of the 2011 exercise were published on 6 July 2011. On 23 January 2012, the Commission repeated this exercise (its third patent settlement monitoring exercise). The Group responded on 3 February 2012. On 22 January 2013, the Commission again repeated this exercise and requested information from the Group. The Group responded on 5 February 2013. No provision has been made for this matter.
EU enquiry:Tyverb andCombivir
On 17 December 2012, the Group and ViiV Healthcare received a request for information from the European Commission regarding the application of ‘direct to pharmacy’ distribution of the Group’s product,Tyverb, and ViiV Healthcare’s product,Combivir. The Group and ViiV Healthcare have provided the requested information. No provision has been made for this matter.
UK Office of Fair Trading Competition Act investigation
On 12 August 2011, the UK Office of Fair Trading (‘OFT’) launched a formal investigation of the Group and other pharmaceutical companies for potential infringement of the Competition Act. The investigation focuses on whether: (i) litigation settlements between the Group and potential suppliers of generic paroxetine formulations, entered between 2001 and 2003, had as their object or effect the prevention, restriction, or distortion of competition in the UK, and (ii) the Group has infringed its dominant position by making payments to potential suppliers of generic paroxetine with the aim of restricting the development of full generic competition in the UK. The Group terminated the agreements at issue in 2004. The OFT investigation covers issues that were also investigated by the European Commission in 2005 – 2006 in respect of paroxetine in the European Union, and also in 2008, as part of the European Commission Pharmaceutical Sector enquiry. On 2 March 2012, the Commission announced that it had formally concluded its enquiry with no further action. In March 2012, the OFT decided to focus its investigation on potential anti-competitive aspects of the paroxetine settlement agreements and dropped the investigation in relation to potential abuse of dominance. However, in February 2013, the OFT decided to re-open the dominance aspects of the matter.
The Group is cooperating with the OFT In the investigation. The Group has provided information and documentation in response to the OFT’s requests and has held meetings with the OFT in 2011 and September 2012 to discuss the matter. In November 2012, the OFT advised that it will proceed to a Statement of Objection (‘SO’), to be issued in April 2013, subject to OFT’s final internal review. No provision has been made for this matter.
216 | GSK Annual Report 2012
Notes to the financial statements
| 44 | Legal proceedingscontinued |
Wellbutrin SR
In December 2004, January 2005 and February 2005, lawsuits, several of which purported to be class actions, were filed in the United States District Court for the Eastern District of Pennsylvania against the Group on behalf of direct and indirect purchasers ofWellbutrin SR. The complaints alleged violations of US anti-trust laws through sham litigation and fraud on the patent office by the Group in obtaining and enforcing patents coveringWellbutrin SR. The complaints followed the introduction of generic competition toWellbutrin SR in April 2004, after district and appellate court rulings that a generic manufacturer did not infringe the Group’s patents.
On 21 November 2011, the District Court approved the Group’s settlement with the certified class of direct purchasers and the settlement has been concluded. On 11 January 2012, the Group reached agreement in principle to settle the claims of all the indirect purchasers for $21.5 million. Hearing on final approval of the settlement by the District Court is scheduled for 27 June 2013.
Wellbutrin XL
Actions have been filed against Biovail Corporation (‘Biovail’) and the Group in the United States District Court for the Eastern District of Pennsylvania by purported classes of direct and indirect purchasers who allege unlawful monopolisation and other anti-trust violations related to the enforcement of Biovail’sWellbutrin XL patents and the filing, by Biovail, of citizen petitions. Both direct and indirect purchaser classes have been certified. The District Court granted the Group’s motion for partial summary judgement primarily on immunity grounds. On 7 November 2012, the District Court also granted the Group’s motion for a stay of all proceedings (except for a limited amount of ongoing discovery) in light of the US Supreme Court’s grant of a petition in the FTC v. Watson ‘reverse payment’ patent litigation case.
Flonase
Purported direct and indirect purchaser class actions were filed in the United States District Court for the Eastern District of Pennsylvania alleging the Group illegally maintained monopoly power in the ‘market’ forFlonase and charged plaintiffs supracompetitive prices. Additionally, a suit was filed by Roxane Laboratories, Inc., a generic competitor, seeking lost profits from the Group’s alleged actions unlawfully delaying Roxane’s entry into the market. The predicate for all of these allegations was the filing by the Group of allegedly sham citizen petitions and subsequent litigation. On 20 December 2012, the Group reached agreement to settle the litigation with the direct purchasers for a payment of $150 million and an agreement to settle with the indirect purchaser class and other indirect purchasers for a payment of $45 million. Hearings to approve the class action settlements are scheduled for 3 June 2013.
Lamictal
Purported direct and indirect purchaser class actions were filed in the United States District Court for the District of New Jersey alleging that the Group and Teva Pharmaceuticals unlawfully conspired to delay generic competition forLamictal, resulting in their being overcharged. A separate count accuses the Group of monopolising the market. The motions of the Group and Teva to dismiss the amended complaint of the purported direct purchaser class have been granted. The purported direct purchaser class has appealed the decision. The Group also plans to move to have the purported indirect purchaser class dismissed.
Commercial and corporate
Where the Group is able to make a reliable estimate of the expected financial effect, if any, for the matters discussed in this category, it has included a provision in respect of such matters in the provision for legal and other disputes as set out in Note 29, ‘Other provisions’. No provision has been made for any of the following matters except as indicated below.
Securities/ERISA class actions
Stiefel
On 6 July 2009, a class action suit brought on behalf of current and former employees of Stiefel Laboratories, Inc. (‘Stiefel’) was filed in the United States District Court for the Southern District of Florida. The complaint alleges that Stiefel and its officers and directors violated US Employee Retirement Income Security Act (‘ERISA’) and federal and state securities laws by inducing Stiefel employees to sell their shares in the employee stock plan back to Stiefel at a greatly undervalued price and without disclosing to employees that Stiefel was about to be sold to the Group. On 21 July 2011, the District Court denied plaintiffs’ motion for class certification. In October 2011, the District Court granted the defendants’ motions for summary judgment, dismissing all but one of the remaining plaintiffs in the litigation. Trial of claims of that one plaintiff, Timothy Finnerty, took place in May 2012 and resulted in a $1.5 million jury verdict in favour of Mr. Finnerty on his securities claims. The Group has appealed the verdict. Separately, the Group has settled Mr. Finnerty’s ERISA claims.
Five separate lawsuits against Stiefel and Charles Stiefel, the former CEO of Stiefel, also have been filed by individual, former Stiefel employees. Each case asserts claims similar to those contained in the class action. These lawsuits are pending in federal court in Florida and Georgia.
On 12 December 2011, the US Securities and Exchange Commission (‘SEC’) filed a formal complaint against Stiefel and Charles Stiefel in the United States District Court for the District of Florida alleging that Stiefel and its principals violated federal securities laws by inducing Stiefel employees to sell their shares in the employee stock plan back to the company at a greatly undervalued price and without disclosing to employees that the company was about to be sold. A trial date has not yet been scheduled. The Group has made a provision for the Stiefel litigation.
Avandia ERISA litigation
A putative class action suit was filed against the Group on 27 August 2010 in the United States District Court for the Southern District of New York. The complaint alleged that the Group and its officers, directors and certain employees made misleading public statements aboutAvandia, and that when these alleged ‘misleading statements’ were exposed, the value of the Group’s stock dropped. Plaintiff brought suit on behalf of himself and all other participants in the Group’s retirement plans, claiming that the Group and the individual defendants breached their fiduciary duties to plan participants under the Employee Retirement Income Security Act (‘ERISA’).
Plaintiffs subsequently amended their complaint to add allegations concerningWellbutrin SR andPaxil and to include additional Group defendants and individual members of the Group’s benefits committees. On 5 May 2011, the District Court dismissed the plaintiffs’ complaint with prejudice. On 8 June 2011, plaintiffs filed an appeal with the United States Court of Appeals for the Second Circuit. On 4 September 2012, the Court of Appeals ruled in the Group’s favour, affirming the lower court’s dismissal of the complaint. The matter has now been concluded.
|
| GSK Annual Report 2012 | 217 |
| 44 | Legal proceedingscontinued |
Benlysta securities litigation
On 10 November 2011, a class action suit was filed in the United States District Court for the District of Maryland alleging that Human Genome Sciences, Inc. (‘HGS’), certain of its individual officers and directors and the Group made statements about the clinical trials forBenlysta that failed to disclose suicides among trial participants, and that, by withholding this information, the defendants caused HGS’ stock to be artificially inflated, harming anyone who purchased HGS stock at the inflated price. In November 2011, a second action was filed in the same federal court. The two cases have been combined. In May, 2012, the Group and HGS filed motions to dismiss the suits. Oral argument was heard in September 2012. The Court’s ruling is awaited.
Wage and hour claims
In December 2006, two purported class actions were filed against the Group on behalf of all of the Group’s US pharmaceutical sales representatives. These actions, which were filed in or transferred to the United States District Court for the Central District of California, initially alleged that those representatives are not ‘exempt’ employees under California law and/or the US Fair Labor Standards Act (‘FLSA’) and, consequently, are entitled to overtime pay, among other things. Plaintiffs subsequently amended their complaints to assert a class action, limited solely to pharmaceutical sales representatives working in California, and only asserting claims under California’s wage and hour laws.
The Group moved for summary judgment dismissing the claims of the putative class representatives on the ground that they were exempt employees. Because of appeals pending in the United States Court of Appeals for the Ninth Circuit in cases involving other manufacturers with virtually the same factual and legal arguments, the District Court deferred ruling on the summary judgment motion and stayed any further activity in the case until the appellate court ruled in at least one of the other companies’ pending cases. The Ninth Circuit deferred ruling on the other companies’ pending cases until the California Supreme Court issued an opinion in a case addressing the application of the administrative exemption under California state law. In January 2012, the California Supreme Court issued a ruling in the case, requesting briefing about the effect of the ruling of the California Supreme Court on the other companies’ pending pharmaceutical sales representative cases.
A third case, filed in the United States District Court for the District of Arizona in August 2008, sought to establish a nationwide collective action on behalf of all of the Group’s US pharmaceutical sales representatives on the ground that those representatives were not exempt employees under the FLSA.
In November 2009, the District Court granted the Group’s motion for summary judgment and dismissed the lawsuit on the ground that the sales representatives were ‘exempt’ employees under the outside sales exemption to the FLSA. Plaintiffs appealed the decision to the United States Court of Appeals for the Ninth Circuit. On 14 February 2011, the Ninth Circuit issued an opinion in favour of the Group affirming the judgment of the United States District Court for the District of Arizona and finding that the Group’s pharmaceutical sales representatives are exempt employees under the outside sales exemption to the FLSA and, therefore, not entitled to overtime pay. Plaintiffs filed a petition seeking review of the decision by the United States Supreme Court. On 28 June 2012, the United States Supreme Court affirmed the decision of the Ninth Circuit.
In November 2010, a purported class action was filed against the Group in the United States District Court for the Northern District of New York on behalf of the Group’s pharmaceutical sales representatives working in New York during the previous six years. The plaintiff makes similar allegations as those set forth in the other FLSA cases as well as claims under the New York wage and hour laws which closely follow the FLSA. In January 2011, a plaintiff filed a similar purported class action in Florida state court alleging that the Group’s pharmaceutical sales representatives are entitled to overtime under the FLSA. The court issued a stay of most activities in the New York case, and the parties agreed to ask the court to stay all activities in the Florida case until the United States Supreme Court has decided the applicability of the outside sales exemption to pharmaceutical sales representatives. Now that the United States Supreme Court has found in favour of the Group and determined that pharmaceutical sales representatives are exempt from overtime under the FLSA, all of the wage and hour lawsuits described above (Arizona, California, Florida, and New York) have been dismissed without any payment to the plaintiffs.
Environmental matters
The Group has been notified of its potential responsibility relating to past operations and its past waste disposal practices at certain sites, primarily in the USA. Some of these matters are the subject of litigation, including proceedings initiated by the US federal or state governments for waste disposal, site remediation costs and tort actions brought by private parties.
The Group has been advised that it may be a responsible party at approximately 23 sites, of which 12 appear on the National Priority List created by the Comprehensive Environmental Response Compensation and Liability Act (Superfund). These proceedings seek to require the operators of hazardous waste facilities, transporters of waste to the sites and generators of hazardous waste disposed of at the sites to clean up the sites or to reimburse the US Government for cleanup costs. In most instances, the Group is involved as an alleged generator of hazardous waste.
Although Superfund provides that the defendants are jointly and severally liable for cleanup costs, these proceedings are frequently resolved on the basis of the nature and quantity of waste disposed of by the generator at the site. The Group’s proportionate liability for cleanup costs has been substantially determined for about 19 of the sites referred to above.
The Group’s potential liability varies greatly from site to site. While the cost of investigation, study and remediation at such sites could, over time, be substantial, the Group routinely accrues amounts related to its share of the liability for such matters.
218 | GSK Annual Report 2012
Financial statements of GlaxoSmithKline plc prepared under UK GAAP
Directors’ statement of responsibilities in relation to the company’s financial statements
The Directors are responsible for preparing the parent company, GlaxoSmithKline plc, financial statements and the Remuneration Report in accordance with applicable law and regulations.
Company law requires the Directors to prepare financial statements for each financial year. Under that law the Directors have elected to prepare the parent company financial statements in accordance with United Kingdom Accounting Standards and applicable law (United Kingdom Generally Accepted Accounting Practice). Under company law the Directors must not approve the parent company financial statements unless they are satisfied that they give a true and fair view of the state of affairs of the company for that period.
In preparing those financial statements, the Directors are required to:
| • | | select suitable accounting policies and then apply them consistently; |
| • | | make judgements and accounting estimates that are reasonable and prudent; |
| • | | state with regard to the parent company financial statements that applicable UK Accounting Standards have been followed, subject to any material departures disclosed and explained in the parent company financial statements. |
The Directors are responsible for keeping adequate accounting records that are sufficient to show and explain the company’s transactions and disclose with reasonable accuracy at any time the financial position of the company and to enable them to ensure that the parent company financial statements and Remuneration Report comply with the Companies Act 2006. They are also responsible for safeguarding the assets of the company and hence for taking reasonable steps for the prevention and detection of fraud and other irregularities.
The parent company financial statements for the year ended 31 December 2012, comprising the balance sheet for the year ended 31 December 2012 and supporting notes, are set out on pages 220 to 223 of this report.
The responsibilities of the auditors in relation to the parent company financial statements are set out in the Independent Auditors’ report on page 219.
The financial statements for the year ended 31 December 2012 are included in the Annual Report, which is published in hard-copy printed form and made available on our website. The Directors are responsible for the maintenance and integrity of the Annual Report on our website in accordance with UK legislation governing the preparation and dissemination of financial statements. Access to the website is available from outside the UK, where comparable legislation may be different.
The Strategic review and Financial review and risk sections of the Annual Report include a fair review of the development and performance of the business and the position of the company and the Group taken as a whole, together with a description of the principal risks and uncertainties that it faces.
Disclosure of information to auditors
The Directors in office at the date of this Report have each confirmed that:
| • | | so far as he or she is aware, there is no relevant audit information of which the company’s auditors are unaware; and |
| • | | he or she has taken all the steps that he or she ought to have taken as a Director to make himself or herself aware of any relevant audit information and to establish that the company’s auditors are aware of that information. |
This confirmation is given and should be interpreted in accordance with the provisions of section 418 of the Companies Act 2006.
Going concern basis
After making enquiries, the Directors have a reasonable expectation that the company has adequate resources to continue in operational existence for the foreseeable future. For this reason, they continue to adopt the going concern basis in preparing the financial statements.
The UK Corporate Governance Code
The Board considers that GlaxoSmithKline plc applies the principles and provisions of the UK Corporate Governance Code maintained by the Financial Reporting Council, as described in the Corporate Governance section on pages 94 to 108, and has complied with its provisions. As required by the Financial Services Authority’s Listing Rules, the auditors have considered the Directors’ statement of compliance in relation to those points of the UK Corporate Governance Code which are specified for their review.
Sir Christopher Gent
Chairman
5 March 2013
|
| GSK Annual Report 2012 | 219 |
Independent Auditors’ report
Independent Auditors’ report
to the members of GlaxoSmithKline plc
We have audited the parent company financial statements of GlaxoSmithKline plc for the year ended 31 December 2012 which comprise the Company balance sheet – UK GAAP and the related notes A-H. The financial reporting framework that has been applied in their preparation is applicable law and United Kingdom Accounting Standards (United Kingdom Generally Accepted Accounting Practice).
Respective responsibilities of directors and auditors
As explained more fully in the Directors’ statement of responsibilities set out on page 218, the directors are responsible for the preparation of the parent company financial statements and for being satisfied that they give a true and fair view. Our responsibility is to audit and express an opinion on the parent company financial statements in accordance with applicable law and International Standards on Auditing (UK and Ireland). Those standards require us to comply with the Auditing Practices Board’s Ethical Standards for Auditors.
This report, including the opinions, has been prepared for and only for the company’s members as a body in accordance with Chapter 3 of Part 16 of the Companies Act 2006 and for no other purpose. We do not, in giving these opinions, accept or assume responsibility for any other purpose or to any other person to whom this report is shown or into whose hands it may come save where expressly agreed by our prior consent in writing.
Scope of the audit of the financial statements
An audit involves obtaining evidence about the amounts and disclosures in the financial statements sufficient to give reasonable assurance that the financial statements are free from material misstatement, whether caused by fraud or error. This includes an assessment of: whether the accounting policies are appropriate to the parent company’s circumstances and have been consistently applied and adequately disclosed; the reasonableness of significant accounting estimates made by the directors; and the overall presentation of the financial statements. In addition, we read all the financial and non-financial information in the Annual Report to identify material inconsistencies with the audited financial statements. If we become aware of any apparent material misstatements or inconsistencies we consider the implications for our report.
Opinion on financial statements
In our opinion the parent company financial statements:
| • | | give a true and fair view of the state of the company’s affairs as at 31 December 2012; |
| • | | have been properly prepared in accordance with United Kingdom Generally Accepted Accounting Practice; and |
| • | | have been prepared in accordance with the requirements of the Companies Act 2006. |
Opinion on other matters prescribed by the Companies Act 2006
In our opinion:
| • | | the part of the Directors’ Remuneration Report to be audited has been properly prepared in accordance with the Companies Act 2006; and |
| • | | the information given in the Directors’ Report for the financial year for which the parent company financial statements are prepared is consistent with the parent company financial statements. |
Matters on which we are required to report by exception
We have nothing to report in respect of the following matters where the Companies Act 2006 requires us to report to you if, in our opinion:
| • | | adequate accounting records have not been kept by the parent company, or returns adequate for our audit have not been received from branches not visited by us; or |
| • | | the parent company financial statements and the part of the Directors’ Remuneration Report to be audited are not in agreement with the accounting records and returns; or |
| • | | certain disclosures of directors’ remuneration specified by law are not made; or |
| • | | we have not received all the information and explanations we require for our audit. |
Other matters
We have reported separately on the Group financial statements of GlaxoSmithKline plc for the year ended 31 December 2012.
The company has passed a resolution in accordance with section 506 of the Companies Act 2006 that the senior statutory auditor’s name should not be stated.
PricewaterhouseCoopers LLP
Chartered Accountants and Statutory Auditors
London
5 March 2013
220 | GSK Annual Report 2012
Financial statements of GlaxoSmithKline plc prepared under UK GAAP
Company balance sheet – UK GAAPat 31 December 2012
| | | | | | | | | | | | |
| | | Notes | | | 2012 £m | | | 2011 £m | |
Fixed assets – investments | | | D | | | | 19,689 | | | | 19,680 | |
| | | |
Debtors | | | E | | | | 7,872 | | | | 3,870 | |
Cash at bank | | | | | | | 10 | | | | 19 | |
Current assets | | | | | | | 7,882 | | | | 3,889 | |
| | | |
Creditors: amounts due within one year | | | F | | | | (406 | ) | | | (481 | ) |
Net current assets/(liabilities) | | | | | | | 7,476 | | | | 3,408 | |
| | | |
Net assets | | | | | | | 27,165 | | | | 23,088 | |
| | | |
Capital and reserves | | | | | | | | | | | | |
Called up share capital | | | G | | | | 1,349 | | | | 1,387 | |
Share premium account | | | G | | | | 2,022 | | | | 1,673 | |
Other reserves | | | H | | | | 1,393 | | | | 1,339 | |
Profit and loss account | | | H | | | | 22,401 | | | | 18,689 | |
| | | |
Equity shareholders’ funds | | | | | | | 27,165 | | | | 23,088 | |
Approved by the Board on 5 March 2013
Sir Christopher Gent
Chairman
GlaxoSmithKline plc
Registered number: 3888792
|
| GSK Annual Report 2012 | 221 |
Notes to the company balance sheet – UK GAAP
A) Presentation of the financial statements
Description of business
GlaxoSmithKline plc is the parent company of GSK, a major global healthcare group which is engaged in the creation and discovery, development, manufacture and marketing of pharmaceutical products, including vaccines, over-the-counter (OTC) medicines and health-related consumer products.
Preparation of financial statements
The financial statements, which are prepared on a going concern basis, are drawn up in accordance with UK Generally Accepted Accounting Practice (UK GAAP) and with UK accounting presentation as at 31 December 2012, with comparative figures as at 31 December 2011. Where appropriate, comparative figures are reclassified to ensure a consistent presentation with current year information.
As permitted by section 408 of the Companies Act 2006, the profit and loss account of the company is not presented in this Annual Report.
Accounting convention and standards
The balance sheet has been prepared using the historical cost convention and complies with applicable UK accounting standards.
Accounting principles and policies
The preparation of the balance sheet in conformity with generally accepted accounting principles requires management to make estimates and assumptions that affect the reported amounts of assets and liabilities and disclosure of contingent assets and liabilities at the date of the balance sheet. Actual amounts could differ from those estimates.
The balance sheet has been prepared in accordance with the company’s accounting policies approved by the Board and described in Note B.
B) Accounting policies
Foreign currency transactions
Foreign currency transactions are recorded at the exchange rate ruling on the date of transaction, or at the forward rate if hedged by a forward exchange contract. Foreign currency assets and liabilities are translated at rates of exchange ruling at the balance sheet date, or at the forward rate.
Dividends paid and received
Dividends paid and received are included in the accounts in the period in which the related dividends are actually paid or received.
Expenditure
Expenditure is recognised in respect of goods and services received when supplied in accordance with contractual terms. Provision is made when an obligation exists for a future liability in respect of a past event and where the amount of the obligation can be reliably estimated.
Investments in subsidiary companies
Investments in subsidiary companies are held at cost less any provision for impairment.
Impairment of investments
The carrying value of investments are reviewed for impairment when there is an indication that the investment might be impaired. Any provision resulting from an impairment review is charged to the income statement in the year concerned.
Share based payments
The issuance by the company to its subsidiaries of a grant over the company’s shares, represents additional capital contributions by the company in its subsidiaries. An additional investment in subsidiaries results in a corresponding increase in shareholders’ equity. The additional capital contribution is based on the fair value of the grant issued, allocated over the underlying grant’s vesting period.
Taxation
Current tax is provided at the amounts expected to be paid applying tax rates that have been enacted or substantially enacted by the balance sheet date.
The company accounts for taxation which is deferred or accelerated by reason of timing differences which have originated but not reversed by the balance sheet date. Deferred tax assets are only recognised to the extent that they are considered recoverable against future taxable profits.
Deferred tax is measured at the average tax rates that are expected to apply in the periods in which the timing differences are expected to reverse. Deferred tax liabilities and assets are not discounted.
Financial guarantees
Liabilities relating to guarantees issued by the company on behalf of its subsidiaries are initially recognised at fair value and amortised over the life of the guarantee.
C) Operating profit
A fee of £10,132 (2011 – £11,474) relating to the audit of the company has been charged in operating profit.
222 | GSK Annual Report 2012
Financial statements of GlaxoSmithKline plc prepared under UK GAAP
Notes to the company balance sheet – UK GAAPcontinued
D) Fixed assets – investments
| | | | | | | | |
| | | 2012
£m | | | 2011
£m | |
Shares in GlaxoSmithKline Services Unlimited | | | 613 | | | | 613 | |
Shares in GlaxoSmithKline Holdings (One) Limited | | | 18 | | | | 18 | |
Shares in GlaxoSmithKline Holdings Limited | | | 17,888 | | | | 17,888 | |
Shares in GlaxoSmithKline Mercury Limited | | | 33 | | | | 33 | |
| | | 18,552 | | | | 18,552 | |
Capital contribution relating to share based payments | | | 1,137 | | | | 1,128 | |
| | | | 19,689 | | | | 19,680 | |
|
E) Debtors | |
| | |
| | | 2012 £m | | | 2011 £m | |
Amounts due within one year: | | | | | | | | |
UK Corporation tax recoverable | | | 206 | | | | 227 | |
Amounts owed by Group undertakings | | | 7,319 | | | | 3,236 | |
| | | 7,525 | | | | 3,463 | |
Amounts due after more than one year: | | | | | | | | |
Amounts owed by Group undertakings | | | 347 | | | | 407 | |
| | | | 7,872 | | | | 3,870 | |
|
F) Creditors | |
| | |
| | | 2012 £m | | | 2011 £m | |
Amounts due within one year: | | | | | | | | |
Bank overdraft | | | 10 | | | | 9 | |
Amounts owed to Group undertakings | | | – | | | | 4 | |
Other creditors | | | 396 | | | | 468 | |
| | | | 406 | | | | 481 | |
The company has guaranteed debt issued by one of its subsidiary companies for which it receives an annual fee from the subsidiary. In aggregate, the company has outstanding guarantees over $10 billion of debt instruments.
The amount due from the subsidiary companies in relation to these guarantee fees will be recovered over the life of the bonds and are disclosed within debtors (see Note E).
|
| GSK Annual Report 2012 | 223 |
Notes to the company balance sheet – UK GAAPcontinued
G) Share capital and share premium account
| | | | | | | | | | | | |
| | | Ordinary Shares of 25p each | | | Share
premium | |
| | | Number | | | £m | | | £m | |
Share capital authorised | | | | | | | | | | | | |
At 31 December 2011 | | | 10,000,000,000 | | | | 2,500 | | | | | |
At 31 December 2012 | | | 10,000,000,000 | | | | 2,500 | | | | | |
Share capital issued and fully paid | | | | | | | | | | | | |
At 1 January 2011 | | | 5,670,458,177 | | | | 1,418 | | | | 1,428 | |
Issued under employee share schemes | | | 21,949,144 | | | | 5 | | | | 245 | |
Share capital cancelled | | | (142,204,223 | ) | | | (36 | ) | | | – | |
At 31 December 2011 | | | 5,550,203,098 | | | | 1,387 | | | | 1,673 | |
Issued under employee share schemes | | | 28,045,821 | | | | 7 | | | | 349 | |
Share capital cancelled | | | (180,652,950 | ) | | | (45 | ) | | | – | |
At 31 December 2012 | | | 5,397,595,969 | | | | 1,349 | | | | 2,022 | |
| | | |
| | | 31 December 2012 000 | | | | | | 31 December
2011 000 | |
Number of shares issuable under outstanding options | | | 114,985 | | | | | | | | 126,810 | |
Number of unissued shares not under option | | | 4,487,419 | | | | | | | | 4,322,987 | |
|
At 31 December 2012, of the issued share capital, 75,205,594 shares were held in the ESOP Trusts, 494,951,327 shares were held as Treasury shares and 4,827,439,048 shares were in free issue. All issued shares are fully paid. The nominal, carrying and market values of the shares held in the ESOP Trusts are disclosed in Note 42, ‘Employee share schemes’. A total of 174 million shares were purchased by the company during 2012 at a cost of £2,493 million and 181 million shares were cancelled. The company expects to make further share repurchases of £1–2 billion during 2013. The exact amount and timing of further purchases and whether the shares will be held as Treasury shares or be cancelled will be determined by the company and is dependent on market conditions and other factors. No shares were purchased in the period 1 January 2013 to 28 February 2013. H) Reserves | |
| | | |
| | | Other reserves £m | | | Profit and
loss account
£m | | | Total £m | |
At 1 January 2011 | | | 1,282 | | | | 10,031 | | | | 11,313 | |
Profit attributable to shareholders | | | – | | | | 14,255 | | | | 14,255 | |
Dividends to shareholders | | | – | | | | (3,406 | ) | | | (3,406 | ) |
Shares purchased and cancelled or held as Treasury share | | | 36 | | | | (2,191 | ) | | | (2,155 | ) |
Capital contribution relating to share based payments | | | 21 | | | | – | | | | 21 | |
At 31 December 2011 | | | 1,339 | | | | 18,689 | | | | 20,028 | |
Profit attributable to shareholders | | | – | | | | 10,019 | | | | 10,019 | |
Dividends to shareholders | | | – | | | | (3,814 | ) | | | (3,814 | ) |
Shares purchased and cancelled or held as Treasury share | | | 45 | | | | (2,493 | ) | | | (2,448 | ) |
Capital contribution relating to share based payments | | | 9 | | | | – | | | | 9 | |
At 31 December 2012 | | | 1,393 | | | | 22,401 | | | | 23,794 | |
The profit of GlaxoSmithKline plc for the year was £10,019 million (2011 – £14,255 million), which after dividends of £3,814 million (2011 – £3,406 million), gave a retained profit of £6,205 million (2011 – £10,849 million). After the cost of shares purchased and cancelled or held as Treasury shares of £2,493 million (2011 – £2,191), the profit and loss account reserve at 31 December 2012 stood at £22,401 million (2011 – £18,689 million), of which £4,096 million is unrealised (2011 – £4,096 million).
224 | GSK Annual Report 2012

|
| GSK Annual Report 2012 | 225 |
Pipeline
Pharmaceuticals and Vaccines product development pipeline
| | | | | | | | |
| Key | | | | | | | | |
| | | | |
| † | | In-license or other alliance relationship with third party | | | | NDA | | New Drug Application (USA) |
| S | | Month of first submission | | | | Phase I | | Evaluation of clinical pharmacology, usually conducted in volunteers |
| A | | Month of first regulatory approval (for MAA, this is the first EU approval letter) | | | | Phase II | | Determination of dose and initial evaluation of efficacy, conducted in a small number of patients |
| BLA | | Biological License Application | | | | Phase III | | Large comparative study (compound versus placebo and/or established |
| MAA | | Marketing Authorisation Application (Europe) | | | | | | treatment) in patients to establish clinical benefit and safety |
MAA and NDA/BLA regulatory review milestones shown in the table below are those that have been achieved. Future filing dates are not included in this list.
| | | | | | | | | | |
| | | | | | | | | Achieved regulatory
review milestones |
| Compound | | Type | | Indication | | Phase | | MAA | | NDA/BLA |
| Biopharmaceuticals | | | | | | | | |
| 1995057 | | tumour necrosis factor receptor-1 (TNFR1) domain antibody | | acute lung injury | | I | | | | |
| 2374697 | | glucagon like peptide-1 (GLP 1) agonist with half-life improving domain antibody | | obesity | | I | | | | |
| 2661380† | | immunomodulator | | solid tumours | | I | | | | |
| 3052230† | | fibroblast growth factor ligand trap | | cancer | | I | | | | |
| otelixizumab | | CD3 monoclonal antibody (s.c. & i.v.) | | rheumatoid arthritis | | I | | | | |
| 249320 | | myelin-associated glycoprotein monoclonal antibody | | stroke | | II | | | | |
| 2586881† | | recombinant human angiotensin converting enzyme 2 | | acute lung injury | | II | | | | |
| 933776 | | beta amyloid monoclonal antibody | | geographic retinal atrophy | | II | | | | |
| 1070806 | | IL18 monoclonal antibody | | type 2 diabetes | | II | | | | |
| belimumab | | B lymphocyte stimulator monoclonal
antibody (i.v.) | | idiopathic membranous nephropathy | | II | | | | |
| belimumab | | B lymphocyte stimulator monoclonal
antibody (i.v.) | | myaesthenia gravis | | II | | | | |
| mapatumumab | | tumor necrosis factor–related apoptosis- inducing ligand receptor 1 (TRAIL-R1) monoclonal antibody | | advanced hepatocellular carcinoma | | II | | | | |
| mepolizumab | | IL5 monoclonal antibody | | nasal polyposis | | II | | | | |
| ofatumumab† | | CD20 human monoclonal antibody (s.c.) | | multiple sclerosis | | II | | | | |
| ozanezumab (1223249) | | neurite outgrowth inhibitor (NOGO-A) monoclonal antibody | | amyotrophic lateral sclerosis | | II | | | | |
| Arzerra (ofatumumab)† | | CD20 human monoclonal antibody | | chronic lymphocytic leukaemia, first line therapy & use in relapsed patients | | III | | | | |
| Arzerra (ofatumumab)† | | CD20 human monoclonal antibody | | diffuse large B cell lymphoma (relapsed patients) | | III | | | | |
| Arzerra (ofatumumab)† | | CD20 human monoclonal antibody | | follicular lymphoma (refractory & relapsed patients) | | III | | | | |
| Benlysta (belimumab) | | B lymphocyte stimulator monoclonal
antibody (s.c.) | | systemic lupus erythematosus | | III | | | | |
| Benlysta (belimumab) | | B lymphocyte stimulator monoclonal
antibody (i.v.) | | vasculitis | | III | | | | |
| mepolizumab | | IL5 monoclonal antibody | | severe asthma | | III | | | | |
| sirukumab† | | IL6 human monoclonal antibody (s.c.) | | rheumatoid arthritis | | III | | | | |
| albiglutide | | GLP 1 agonist | | type 2 diabetes | | Submitted | | | | S: Jan13 |
| raxibacumab | | protective antigen inhibitor | | inhalation anthrax | | Approved | | | | A: Dec12 |
| Cardiovascular & Metabolic | | | | | | | | |
| 1614235† + 2330672 | | sodium dependent glucose transport (SGLT1) inhibitor + ileal bile acid transport (iBAT) inhibitor | | type 2 diabetes | | I | | | | |
| 2849466 | | selective androgen receptor modulator | | heart failure | | I | | | | |
| 2890457 | | endogenous gut peptide stimulator | | obesity | | I | | | | |
| 1278863 | | prolyl hydroxylase inhibitor | | anaemia associated with chronic renal disease | | II | | | | |
| camicinal (962040) | | motilin receptor agonist | | delayed gastric emptying | | II | | | | |
| losmapimod | | p38 kinase inhibitor | | acute coronary syndrome (also COPD) | | II | | | | |
| retosiban | | oxytocin antagonist | | threatened pre-term labour | | II | | | | |
| ronacaleret† | | calcium receptor antagonist | | allogeneic haematopoietic stem cell mobilisation | | II | | | | |
| darapladib | | Lp-PLA2 inhibitor | | atherosclerosis (also diabetic macular oedema) | | III | | | | |
| Immuno-inflammation | | | | | | | | |
| 2245840 | | SIRT1 activator | | psoriasis | | II | | | | |
| 2586184† | | Janus kinase 1 (JAK1) inhibitor | | systemic lupus erythematosus & psoriasis | | II | | | | |
| 2941266† | | CCR1 chemokine receptor antagonist | | rheumatoid arthritis | | II | | | | |
| vercinon (1605786)† | | CCR9 chemokine receptor antagonist | | Crohn’s disease | | III | | | | |

226 | GSK Annual Report 2012
Investor information
Pharmaceuticals and Vaccines product development pipelinecontinued
| | | | | | | | | | |
| | | | | | | | | Achieved regulatory
review milestones |
| Compound | | Type | | Indication | | Phase | | MAA | | NDA/BLA |
| Infectious Diseases | | | | | | | | |
2140944 | | type 2 topoisomerase inhibitor | | bacterial infections | | I | | | | |
2696266† | | cephalosporin | | bacterial infections | | I | | | | |
1322322 | | polypeptide deformylase inhibitor | | bacterial infections | | II | | | | |
2336805† | | hepatitis C virus inhibitor | | hepatitis C | | II | | | | |
tafenoquine† | | 8-aminoquinoline | | Plasmodium vivax malaria | | II | | | | |
| Relenzai.v. (zanamivir)† | | neuraminidase inhibitor (i.v.) | | influenza | | III | | | | |
Neurosciences | | | | | | | | |
356278 | | phoshodiesterase 4 inhibitor | | Huntington’s disease | | I | | | | |
2647544 | | Lp-PLA2 inhibitor | | Alzheimer’s disease | | I | | | | |
239512 | | H3 receptor antagonist | | multiple sclerosis | | II | | | | |
742457 | | 5HT6 antagonist | | dementia | | II | | | | |
firategrast† | | dual alpha 4 integrin antagonist (VLA4) | | multiple sclerosis | | II | | | | |
rilapladib | | Lp-PLA2 inhibitor | | Alzheimer’s disease | | II | | | | |
| Patrome(IPX066)† | | dopamine precursor + DOPA decarboxylase inhibitor | | Parkinson’s disease | | III | | | | N/A |
Oncology | | | | | | | | |
525762 | | bromodomain inhibitor | | NUT gene midline carcinoma | | I | | | | |
2110183 | | AKT protein kinase inhibitor | | multiple myeloma | | I | | | | |
2256098 | | focal adhesion kinase inhibitor | | cancer | | I | | | | |
2636771 | | phosphatidylinositol 3-kinase (PI3K) inhibitor | | cancer | | I | | | | |
trametinib† + 2141795 | | MEK1/2 inhibitor + AKT protein kinase inhibitor | | cancer | | I | | | | |
2110183 | | AKT protein kinase inhibitor | | Langerhan cell histiocytosis | | II | | | | |
2110183 | | AKT protein kinase inhibitor | | ovarian cancer | | II | | | | |
dabrafenib | | BRAF protein kinase inhibitor | | non-small cell lung cancer | | II | | | | |
foretinib† | | mesenchymal-epithelial transition factor
(C-met) kinase inhibitor | | cancer | | II | | | | |
Revolade/Promacta(eltrombopag)† | | thrombopoietin receptor agonist | | acute myeloid leukaemia | | II | | | | |
Revolade/Promacta(eltrombopag)† | | thrombopoietin receptor agonist | | aplastic anaemia | | II | | | | |
Revolade/Promacta(eltrombopag)† | | thrombopoietin receptor agonist | | myelodysplastic syndromes | | II | | | | |
trametinib† | | MEK1/2 inhibitor | | KRAS mutant non-small cell lung cancer, second line therapy | | II | | | | |
trametinib† + dabrafenib | | MEK1/2 inhibitor + BRAF protein kinase inhibitor | | colorectal cancer | | II | | | | |
trametinib†+ dabrafenib | | MEK1/2 inhibitor + BRAF protein kinase inhibitor | | metastatic melanoma, adjuvant therapy | | III | | | | |
Tyverb/Tykerb (lapatinib) | | human epidermal growth factor receptor-2 (Her2) and epidermal growth factor receptor (EGFR) dual kinase inhibitor | | breast cancer, adjuvant therapy | | III | | | | |
Tyverb/Tykerb(lapatinib) | | Her2 and EGFR dual kinase inhibitor | | gastric cancer | | III | | | | |
Tyverb/Tykerb(lapatinib) | | Her2 and EGFR dual kinase inhibitor | | head & neck squamous cell carcinoma (resectable disease) | | III | | | | |
Votrient(pazopanib) | | multi-kinase angiogenesis inhibitor | | ovarian cancer, maintenance therapy | | III | | | | |
Votrient(pazopanib) | | multi-kinase angiogenesis inhibitor | | renal cell cancer, adjuvant therapy | | III | | | | |
dabrafenib | | BRAF protein kinase inhibitor | | metastatic melanoma | | Submitted | | S: Jul12 | | S:Jul12 |
trametinib† | | MEK1/2 inhibitor | | metastatic melanoma | | Submitted | | S: Feb13 | | S: Aug12 |
trametinib†+ dabrafenib | | MEK1/2 inhibitor + BRAF protein kinase inhibitor | | metastatic melanoma | | Submitted | | S: Feb13 | | |
Tyverb/Tykerb(lapatinib) | | Her2 and EGFR dual kinase inhibitor | | metastatic breast cancer, in combination with trastuzumab | | Submitted | | S: Feb12 | | |
Votrient(pazopanib) | | multi-kinase angiogenesis inhibitor | | sarcoma | | Approved | | A: Aug12 | | A: Apr12 |
Revolade/Promacta
(eltrombopag)† | | thrombopoietin receptor agonist | | hepatitis C induced thrombocytopaenia | | Approved | | S: May12 | | A: Nov12 |
Ophthalmology | | | | | | | | | | |
| darapladib | | Lp-PLA2 inhibitor | | diabetic macular oedema (also atherosclerosis) | | II | | | | |
|
| GSK Annual Report 2012 | 227 |
| | | | | | | | | | |
| | | | | | | | | Achieved regulatory
review milestones |
| Compound | | Type | | Indication | | Phase | | MAA | | NDA/BLA |
| Respiratory | | | | | | | | |
1325756 | | CXCR2 chemokine receptor antagonist | | COPD | | I | | | | |
2256294 | | soluble epoxide hydrolase inhibitor | | COPD | | I | | | | |
2269557 | | phosphoinositide 3 kinase inhibitor | | asthma & COPD | | I | | | | |
2339345 | | sodium channel blocker | | cough | | I | | | | |
fluticasone furoate (685698) + vilanterol† + umeclidinium (573719) | | glucocorticoid agonist + long-acting beta2 agonist + muscarinic acetylcholine antagonist | | COPD | | I | | | | |
961081† | | muscarinic antagonist, beta2 agonist | | COPD | | II | | | | |
2190915† | | 5-lipoxygenase-activating protein (FLAP) inhibitor | | asthma | | II | | | | |
2245035 | | toll-like receptor 7 agonist | | asthma | | II | | | | |
dilmapimod | | p38 kinase inhibitor (i.v.) | | acute lung injury & acute respiratory distress syndrome | | II | | | | |
fluticasone furoate (685698) + umeclidinium (573719) | | glucocorticoid agonist + muscarinic acetylcholine antagonist | | asthma | | II | | | | |
losmapimod | | p38 kinase inhibitor (oral) | | COPD (also acute coronary syndrome) | | II | | | | |
fluticasone furoate (685698) | | glucocorticoid agonist | | asthma | | III | | | | |
Relvar/Breo
(vilanterol†+ fluticasone furoate) | | long-acting beta2 agonist + glucocorticoid agonist | | COPD – mortality outcomes | | III | | | | |
umeclidinium (573719) | | muscarinic acetylcholine antagonist | | COPD | | III | | | | |
vilanterol† | | long-acting beta2 agonist | | COPD | | III | | | | |
Relvar/Breo
(vilanterol†+ fluticasone furoate) | | long-acting beta2 agonist + glucocorticoid agonist | | asthma | | Submitted | | S: Jun12 | | |
Relvar/Breo
(vilanterol†+ fluticasone furoate) | | long-acting beta2 agonist + glucocorticoid agonist | | COPD | | Submitted | | S: Jun12 | | S: Jul12 |
| Anoro(umeclidinium + vilanterol†) | | muscarinic acetylcholine antagonist + long-acting beta2 agonist | | COPD | | Submitted | | S: Jan13 | | S: Dec12 |
| Paediatric Vaccines | | | | | | | | |
S. pneumoniae paediatric next generation† | | recombinant – conjugated | | Streptococcus pneumoniae disease prophylaxis | | II | | | | |
MMR | | live attenuated | | measles, mumps, rubella prophylaxis | | III (USA) | | A: Nov97 | | |
Mosquirix(Malaria RTS,S)† | | recombinant | | malaria prophylaxis (Plasmodium falciparum) | | III | | | | N/A |
MenHibrix(Hib-MenCY-TT) | | conjugated | | Neisseria meningitis groups C & Y & Haemophilus influenzae type b disease prophylaxis | | Approved | | N/A | | A: Jun12 |
| Nimenrix(MenACWY-TT) | | conjugated | | Neisseria meningitis groups A, C, W & Y disease prophylaxis | | Approved (II, USA) | | A: Apr12 | | |
| Other Vaccines | | | | | | | | |
HIV† | | recombinant | | HIV disease prophylaxis | | I | | | | |
NTHi† | | recombinant | | non-typeable Haemophilus influenzae prophylaxis | | I | | | | |
Staphylococcus Aureus | | recombinant – conjugated | | Staphylococcus aureus prophylaxis | | I | | | | |
HIV† | | recombinant | | HIV disease immunotherapy | | II | | | | |
Tuberculosis† | | recombinant | | tuberculosis prophylaxis | | II | | | | |
Zoster† | | recombinant | | Herpes Zoster prophylaxis | | III | | | | |
Flu (pre-) pandemic | | H5N1 inactivated split – monovalent (Quebec) | | pre-pandemic & pandemic influenza prophylaxis | | Submitted | | N/A | | S:Feb12 |
| Flu vaccine | | inactivated split – quadrivalent | | seasonal influenza prophylaxis | | Approved | | S: Mar12 | | A: Dec12 |
| Antigen-Specific Cancer Immunotherapeutic | | | | | | | | |
PRAME
immunotherapeutic† | | recombinant | | treatment of resectable non-small cell lung cancer | | I | | | | |
WT1
immunotherapeutic | | recombinant | | treatment of breast cancer | | I | | | | |
MAGE-A3 immunotherapeutic† | | recombinant | | treatment of bladder cancer | | II | | | | |
MAGE-A3 immunotherapeutic† | | recombinant | | treatment of melanoma | | III | | | | |
MAGE-A3 immunotherapeutic† | | recombinant | | treatment of non-small cell lung cancer | | III | | | | |
228 | GSK Annual Report 2012
Investor information
Pharmaceuticals and Vaccines product development pipelinecontinued
| | | | | | | | | | |
| | | | | | | | | Achieved regulatory
review milestones |
| Compound | | Type | | Indication | | Phase | | MAA | | NDA/BLA |
| Rare Diseases | | | | | | | | |
migalastat HCl†+ ERT | | pharmacological chaperone + enzyme
replacement therapy (ERT) | | Fabry disease | | II | | | | |
drisapersen (2402968)† | | antisense oligonucleotide | | Duchenne muscular dystrophy | | III | | | | |
2696273† | | ex-vivo stem cell gene therapy | | adenosine deaminase severe combined immune deficiency (ADA-SCID) | | III | | | | |
| migalastat HCl† | | pharmacological chaperone | | Fabry disease | | III | | | | |
| Stiefel (late-stage assets only) | | | | | | | | |
2894512† | | non-steroidal anti-inflammatory | | atopic dermatitis | | II | | | | |
alitretinoin† | | retinoic acid receptor modulator | | chronic hand eczema | | III | | N/A | | |
Duaclow dose | | clindamycin/benzoyl peroxide gel | | acne vulgaris | | Submitted | | S: Nov11 | | S: Nov10 |
Fabior(tazarotene foam) | | retinoid foam | | acne vulgaris | | Approved | | N/A | | A: May12 |
| Sorilux | | vitamin D3 analog | | scalp psoriasis | | Approved | | N/A | | A: Sep12 |
| HIV (ViiV Healthcare) | | | | | | | | |
1265744 | | HIV integrase inhibitor (long-acting parenteral formulation) | | HIV infections | | II | | | | |
dolutegravir + abacavir sulphate + lamivudine | | HIV integrase inhibitor + reverse transcriptase inhibitors (fixed dose combination) | | HIV infections | | III | | | | |
| dolutegravir | | HIV integrase inhibitor | | HIV infections | | Submitted | | S: Dec12 | | S: Dec12 |
Brand names appearing in italics are trademarks either owned by and/or licensed to GlaxoSmithKline or associated companies.
Option-based alliances with third parties that include assets in Phase I or later development:
| | | | |
Company | | Disease Area | | Phase |
| Cancer Research UK | | cancer | | I |
| ChemoCentryx | | inflammatory disease | | II* |
| Dynavax Technologies | | cutaneous & systemic lupus erythematosus | | II |
| ISIS Pharmaceuticals | | transthyretin-mediated amyloidosis | | II/III |
| OncoMed Pharmaceuticals | | oncology | | I** |
| Prosensa Therapeutics | | neuroscience | | II |
| Ranbaxy Laboratories | | respiratory | | II |
| Telethon Institute for Gene Therapy | | stem cell gene therapy | | II** |
| Affiris | | Alzheimer’s disease treatment vaccine | | II |
|
| GSK Annual Report 2012 | 229 |
Pharmaceutical products, competition and intellectual property
| | | | | | | | | | |
| | | | | | | Major competitor brands | | Patent expiry dates |
| Products | | Compounds | | Indication(s) | | | USA | | EU |
| Respiratory | | | | | | |
| Veramyst | | fluticasone propionate | | rhinitis | | Nasonex | | 2021 | | 2023 |
| Flixotide/Flovent | | fluticasone propionate | | asthma/COPD | | Qvar, Singulair | | expired (compound) 2016 (Diskus device) 2013-2025 (HFA-device/ formulation) | | expired (compound) expired (Diskus device) 2017 (HFA-device/ formulation) |
| Seretide/Advair* | | salmeterol xinafoate/ fluticasone propionate | | asthma/COPD | | Singulair, Symbicort, Spiriva, Onbrez, Pulmicort, Foster | | expired (combination) 2016 (Diskus device) 2013-2025 (HFA-device/ formulation) | | 20131 (combination) expired (Diskus device) 2017 (HFA-device/ formulation) |
| Serevent | | salmeterol xinafoate | | asthma/COPD | | Foradil, Spiriva, Onbrez | | expired (compound) 2016 (Diskus device) | | expired (compound) expired (Diskus device) 2019 (HFA-device/ formulation) |
| Ventolin HFA | | albuterol sulphate | | asthma/COPD | | generic companies | | 2015-2025 (HFA-device/ formulation) | | 2012-2017 (HFA-device/ formulation) |
| Anti-virals | | | | | | |
| Relenza | | zanamivir | | influenza | | Tamiflu | | 2013 (July) | | 2014 |
| Valtrex | | valaciclovir | | genital herpes, coldsores, shingles | | Famvir | | expired | | expired |
| Zeffix/Epivir-HBV | | lamivudine | | chronic hepatitis B | | Hepsera | | 2014 (use) | | expired (use) |
| Central nervous system | | | | | | |
| Lamictal | | lamotrigine | | epilepsy, bipolar disorder | | Keppra, Dilantin | | expired | | expired |
| Imigran/Imitrex | | sumatriptan | | migraine | | Zomig, Maxalt, Relpax | | expired | | expired |
| Requip XL | | ropinirole | | Parkinson’s disease | | Mirapex | | expired | | expired |
| Seroxat/Paxil | | paroxetine | | depression, various anxiety disorders | | Effexor, Cymbalta, Lexapro | | expired | | expired |
| Treximet | | sumatriptan and naproxen | | migraine | | Zomig, Maxalt, Relpax | | 2017 (combination and use) | | NA |
| Wellbutrin | | bupropion | | depression | | Effexor, Cymbalta, Lexapro | | expired | | expired |
| Cardiovascular and urogenital | | | | | | |
| Arixtra | | fondaparinux | | deep vein thrombosis, pulmonary embolism | | Lovenox, Fragmin, Innohep | | expired | | expired |
| Avodart | | dutasteride | | benign prostatic hyperplasia | | Proscar, Flomax, finasteride | | 20151 | | 2017 |
| Benlysta | | belimumab | | systemic lupus erythematosus | | | | 2023 | | 2021 |
| Coreg CR | | carvedilol phosphate | | mild-to-severe heart failure, hypertension, left ventricular dysfunction post MI | | Toprol XL | | 2016† (formulation) | | NA |
| Fraxiparine | | nadroparin | | deep vein thrombosis, pulmonary embolism | | Lovenox, Fragmin, Innohep | | expired | | expired |
| * | See ‘Risk factors’ on page 79 for details of uncertainty on the timing of follow-on competition. |
| † | Generic competition possible in 2013. |
230 | GSK Annual Report 2012
Investor information
Pharmaceutical products, competition and intellectual propertycontinued
| | | | | | | | | | |
| | | | | | | Major competitor brands | | Patent expiry dates |
| Products | | Compounds | | Indication(s) | | | USA | | EU |
| Lovaza | | omega-3 acid ethyl esters | | very high triglycerides | | Tricor | | 20171 (formulation) | | NA |
| Volibris | | ambrisentan | | pulmonary hypertension | | Tracleer, Revatio | | NA | | 2020 |
| Anti-bacterials | | | | | | |
| Augmentin | | amoxicillin/clavulanate potassium | | common bacterial infections | | generic products | | NA | | expired |
| Oncology | | | | | | |
| Arzerra | | ofatumumab | | refractory chronic lymphocytic leukaemia | | MabThera/Rituxan | | pending | | 2023 |
| Hycamtin | | topotecan | | ovarian cancer, small cell lung cancer, cervical cancer | | Doxil, Gemzar | | expired | | expired |
| Promacta/Revolade | | eltrombopag | | idiopathic thrombocytopenic purpura | | Nplate | | 2021 | | 2021 |
| Tykerb/Tyverb | | lapatanib | | advanced and metastatic breast cancer in HER2 positive patients | | Herceptin | | 2020 | | 2023 |
| Votrient | | pazopanib | | soft tissue sarcoma metastatic renal cell carcinoma | | Yondelis, Sutent, Nexavar, Afinitor | | 2021 | | 2021 |
| Vaccines | | | | | | |
| Boostrix | | diphtheria, tetanus, acellular pertussis | | booster vaccination | | Adacel | | 2017 | | 2017 |
| Infanrix/Pediarix | | diphtheria, tetanus, pertussis, polio, hepatitis B (HepB), inactivated antigens | | diphtheria, tetanus, pertussis, polio, hepatitis B (HepB) | | Pentacel, Pediacel, Pentaxim, Pentavac | | 2017 | | 2014 |
| Cervarix | | HPV 16 & 18 virus like particles (VLPs), AS04 adjuvant (MPL + aluminium hydroxide) | | human papilloma virus type 16 and 18 | | Gardasil (Silgard) | | 2020 | | 2020 |
| Fluarix | | split inactivated influenza virus subtypes A and type B antigens | | seasonal influenza | | Vaxigrip, Mutagrip, Fluzone, Influvac, Aggripal, Fluad | | 2022 | | 2022 |
| FluLaval | | split inactivated influenza virus subtypes A and type B antigens | | seasonal influenza | | Vaxigrip, Mutagrip, Fluzone, Influvac, Aggripal, Fluad | | none | | none |
| Pandemrix | | derived split inactivated influenza virus antigen, AS03 adjuvant | | A(H1N1)v2009 influenza prophylaxis | | Focetria, Celvapan, emerflu | | 2014 | | 2014 |
| Prepandrix | | derived split inactivated influenza virus antigen, AS03 adjuvant | | influenza prophylaxis | | Aflunov | | 2014 | | 2014 |
| Synflorix | | conjugated pneumococcal polysaccharide | | invasive pneumococcal disease | | Prevenar (Prevnar) | | NA | | 2021 |
| HIV | | | | | | |
| Combivir | | lamivudine and zidovudine | | HIV/AIDS | | Truvada, Atripla | | expired (combination) | | expired (combination) |
| Epivir | | lamivudine | | HIV/AIDS | | Truvada, Atripla | | expired | | expired |
| Epzicom/Kivexa | | lamivudine and abacavir | | HIV/AIDS | | Truvada, Atripla | | 20161 (combination) | | 2019 (combination) |
| Lexiva | | fosamprenavir | | HIV/AIDS | | Prezista, Kaletra, Reyataz | | 20171 | | 2019 |
| Selzentry | | maraviroc | | HIV/AIDS | | Isentress, Intelence, Prezista | | 2021 | | 2022 |
| Trizivir | | lamivudine, zidovudine and abacavir | | HIV/AIDS | | Truvada, Atripla | | 20161 (combination) | | 2016 (combination) |
| 1 | See Note 44 to the financial statements, ‘Legal proceedings’. |
|
| GSK Annual Report 2012 | 231 |
Consumer Healthcare products and competition
| | | | | | | | |
| Brand | | Products | | Application | | Markets | | Competition |
| Total wellness | | | | | | | | |
| Panadol | | tablets, caplets, infant drops | | paracetamol-based treatment of headache and joint pain, fever, cold symptoms | | global except USA | | Reckitt-Benckiser’s Nurofen |
| NicoDerm, | | gum, patch, mini lozenge, | | treatment of nicotine | | global | | Novartis’ Nicotinell |
| NiQuitin CQ, | | original lozenge | | withdrawal as an aid to | | | | Nicorette in Europe |
| andNicabate. | | | | quitting smoking | | | | retailers’ own brands |
| AlsoNicorette | | | | | | | | |
| (US only) | | | | | | | | |
| ENO | | effervescent and | | rapid relief antacid | | global | | Hypermarcas’ Estomazil |
| Tums | | chewable tablets | | | | | | Pfizer’s Gelusil |
| | | | | | | | Sanofi’s Rolaids |
| | | | | | | | | Johnson & Johnson’s Mylanta |
| Oral care | | | | | | | | |
| Sensodyne | | toothpastes, toothbrushes | | prevention of dental | | global | | Colgate-Palmolive’s |
| | | mouthwashes | | sensitivity | | | | Colgate Pro Relief |
| Polident | | denture adhesive, denture | | improve comfort of | | global | | none |
| Poligrip | | cleanser | | fitted dentures and to | | | | |
| Corega | | | | clean dentures | | | | |
| Aquafresh | | toothpastes, toothbrushes | | prevention of caries, gum | | global | | Colgate-Palmolive’s Colgate |
| | mouthwashes | | disease and bad breath | | | | Procter & Gamble’s Crest |
| | | | | | | | | and Oral-B |
| Parodontax | | toothpastes, mouthwashes | | help stop bleeding gums | | global | | Colgate-Palmolives’s |
| | | | | gum health | | | | Colgate Pro-Gum |
| Nutrition | | | | | | | | |
| Lucozade | | energy and sports drinks | | energy and hydration | | UK, Ireland, | | Pepsico’s Gatorade |
| | | | | | Africa | | Coca-Cola’s Powerade |
| | | | | | | | | Red Bull |
| Horlicks | | malted, milk-based drinks | | nutrition | | UK, Ireland, India | | Mondelez’s Bournvita |
| | | and foods | | | | | | Nestle’s Milo |
| Maxinutrition | | sports nutrition, protein | | nutrition | | UK | | Myprotein |
| | | powder, bars | | | | | | Optimum Nutrition |
| Skin health | | | | | | | | |
| Physiogel | | moisturising, creams, | | face and body care for dry, | | Germany, France, | | L’Oreal’s La Roche Posay |
| | lotions and cleansers | | sensitive and irritated skin | | Italy, Poland, Spain | | Beiersdorf’s Eucerin |
| | | | | | | | | Pierre Fabre’s Avene |
| Oilatum | | emollient bath and creams, | | soothing treatment for | | UK, Poland, | | Reckitt-Benckiser’s E45 |
| | | shampoo | | eczema and dry skin conditions | | other markets | | Sanofi’s Emolium |
232 | GSK Annual Report 2012
Financial record
Quarterly trend
An unaudited analysis of the Group results is provided by quarter in Sterling for the financial year 2012.
| | | | | | | | | | | | | | | | | | | | | | | | | | |
| Income statement – total | | 12 months 2012 | | | | | Q4 2012 | |
| | £m | | | CER% | | | £% | | | | | £m | | | CER% | | | £% | |
Turnover – Pharmaceuticals and Vaccines | | | 21,321 | | | | (2 | ) | | | (4 | ) | | | | | 5,553 | | | | – | | | | (2 | ) |
– Consumer Healthcare | | | 5,110 | | | | – | | | | (3 | ) | | | | | 1,249 | | | | – | | | | (3 | ) |
Total turnover | | | 26,431 | | | | (1 | ) | | | (3 | ) | | | | | 6,802 | | | | – | | | | (3 | ) |
Cost of sales | | | (7,894 | ) | | | 6 | | | | 3 | | | | | | (2,011 | ) | | | 6 | | | | 3 | |
Selling, general and administration | | | (8,739 | ) | | | 4 | | | | 3 | | | | | | (2,198 | ) | | | 3 | | | | 1 | |
Research and development | | | (3,968 | ) | | | (1 | ) | | | (1 | ) | | | | | (1,141 | ) | | | 5 | | | | 4 | |
Royalty income | | | 306 | | | | – | | | | (1 | ) | | | | | 76 | | | | (16 | ) | | | (16 | ) |
Other operating income | | | 1,256 | | | | | | | | | | | | | | 412 | | | | | | | | | |
Operating profit | | | 7,392 | | | | (3 | ) | | | (5 | ) | | | | | 1,940 | | | | 7 | | | | 3 | |
Net finance costs | | | (729 | ) | | | | | | | | | | | | | (199 | ) | | | | | | | | |
Share of after tax profits of associates and joint ventures | | | 29 | | | | | | | | | | | | | | 10 | | | | | | | | | |
Profit before taxation | | | 6,692 | | | | (11 | ) | | | (13 | ) | | | | | 1,751 | | | | 8 | | | | 3 | |
Taxation | | | (1,948 | ) | | | | | | | | | | | | | (912 | ) | | | | | | | | |
Tax rate % | | | 29.1 | % | | | | | | | | | | | | | 52.1 | % | | | | | | | | |
Profit after taxation for the period | | | 4,744 | | | | (11 | ) | | | (13 | ) | | | | | 839 | | | | (30 | ) | | | (35 | ) |
Profit attributable to non-controlling interests | | | 179 | | | | | | | | | | | | | | (25 | ) | | | | | | | | |
Profit attributable to shareholders | | | 4,565 | | | | | | | | | | | | | | 864 | | | | | | | | | |
Basic earnings per share (pence) | | | 92.9 | p | | | (9 | ) | | | (11 | ) | | | | | 17.8 | p | | | (24 | ) | | | (29 | ) |
Diluted earnings per share (pence) | | | 91.5 | p | | | | | | | | | | | | | 17.6 | p | | | | | | | | |
| | | | | | | |
| Income statement – core | | | | | | | | | | | | | | | | | | | | | | | | | | |
| | | | | | | | | | | | | | | | | | | | | | | | | | |
Total turnover | | | 26,431 | | | | (1 | ) | | | (3 | ) | | | | | 6,802 | | | | – | | | | (3 | ) |
Cost of sales | | | (7,078 | ) | | | 1 | | | | (2 | ) | | | | | (1,830 | ) | | | – | | | | (2 | ) |
Selling, general and administration | | | (7,855 | ) | | | – | | | | (1 | ) | | | | | (1,927 | ) | | | 2 | | | | – | |
Research and development | | | (3,474 | ) | | | (5 | ) | | | (6 | ) | | | | | (834 | ) | | | (15 | ) | | | (16 | ) |
Royalty income | | | 306 | | | | – | | | | (1 | ) | | | | | 76 | | | | (15 | ) | | | (16 | ) |
Operating profit | | | 8,330 | | | | (3 | ) | | | (5 | ) | | | | | 2,287 | | | | 5 | | | | 1 | |
Net finance costs | | | (724 | ) | | | | | | | | | | | | | (194 | ) | | | | | | | | |
Share of after tax profits of associates and joint ventures | | | 29 | | | | | | | | | | | | | | 10 | | | | | | | | | |
Profit before taxation | | | 7,635 | | | | (4 | ) | | | (6 | ) | | | | | 2,103 | | | | 5 | | | | 1 | |
Taxation | | | (1,864 | ) | | | | | | | | | | | | | (468 | ) | | | | | | | | |
Tax rate % | | | 24.4 | % | | | | | | | | | | | | | 22.3 | % | | | | | | | | |
Profit after taxation for the period | | | 5,771 | | | | (2 | ) | | | (4 | ) | | | | | 1,635 | | | | 7 | | | | 3 | |
Profit attributable to non-controlling interests | | | 235 | | | | | | | | | | | | | | 58 | | | | | | | | | |
Profit attributable to shareholders | | | 5,536 | | | | | | | | | | | | | | 1,577 | | | | | | | | | |
Adjusted earnings per share (pence) | | | 112.7 | p | | | – | | | | (2 | ) | | | | | 32.6 | p | | | 9 | | | | 4 | |
The calculation of core results is described on page 56.
|
| GSK Annual Report 2012 | 233 |
| | | | | | | | | | | | | | | | | | | | | | | | | | | | | | | | | | | | | | |
| Q3 2012 | | | | | Q2 2012 | | | | | Q1 2012 | |
| | £m | | | | CER% | | | | £% | | | | | | £m | | | | CER% | | | | £% | | | | | | £m | | | | CER% | | | | £% | |
| | 5,259 | | | | (6 | ) | | | (9 | ) | | | | | 5,205 | | | | (3 | ) | | | (4 | ) | | | | | 5,304 | | | | 2 | | | | 1 | |
| | 1,268 | | | | (2 | ) | | | (6 | ) | | | | | 1,257 | | | | – | | | | (3 | ) | | | | | 1,336 | | | | 1 | | | | – | |
| | 6,527 | | | | (5 | ) | | | (8 | ) | | | | | 6,462 | | | | (2 | ) | | | (4 | ) | | | | | 6,640 | | | | 2 | | | | 1 | |
| | (2,081 | ) | | | 5 | | | | – | | | | | | (1,992 | ) | | | 18 | | | | 14 | | | | | | (1,810 | ) | | | (1 | ) | | | (3 | ) |
| | (2,224 | ) | | | 13 | | | | 10 | | | | | | (2,187 | ) | | | (1 | ) | | | – | | | | | | (2,130 | ) | | | 1 | | | | 2 | |
| | (934 | ) | | | (4 | ) | | | (5 | ) | | | | | (922 | ) | | | (10 | ) | | | (9 | ) | | | | | (971 | ) | | | 6 | | | | 6 | |
| | 92 | | | | 12 | | | | 8 | | | | | | 66 | | | | 6 | | | | 6 | | | | | | 72 | | | | (4 | ) | | | – | |
| | 299 | | | | | | | | | | | | | | 309 | | | | | | | | | | | | | | 236 | | | | | | | | | |
| | 1,679 | | | | (18 | ) | | | (21 | ) | | | | | 1,736 | | | | (1 | ) | | | (2 | ) | | | | | 2,037 | | | | 2 | | | | – | |
| | (178 | ) | | | | | | | | | | | | | (184 | ) | | | | | | | | | | | | | (168 | ) | | | | | | | | |
| | 9 | | | | | | | | | | | | | | – | | | | | | | | | | | | | | 10 | | | | | | | | | |
| | 1,510 | | | | (20 | ) | | | (22 | ) | | | | | 1,552 | | | | (1 | ) | | | (3 | ) | | | | | 1,879 | | | | (22 | ) | | | (24 | ) |
| | (314 | ) | | | | | | | | | | | | | (233 | ) | | | | | | | | | | | | | (489 | ) | | | | | | | | |
| | 20.8 | % | | | | | | | | | | | | | 15.0 | % | | | | | | | | | | | | | 26.0 | % | | | | | | | | |
| | 1,196 | | | | (15 | ) | | | (17 | ) | | | | | 1,319 | | | | 16 | | | | 15 | | | | | | 1,390 | | | | (11 | ) | | | (12 | ) |
| | 74 | | | | | | | | | | | | | | 65 | | | | | | | | | | | | | | 65 | | | | | | | | | |
| | 1,122 | | | | | | | | | | | | | | 1,254 | | | | | | | | | | | | | | 1,325 | | | | | | | | | |
| | 22.9 | p | | | (14 | ) | | | (17 | ) | | | | | 25.4 | p | | | 17 | | | | 17 | | | | | | 26.7 | p | | | (10 | ) | | | (11 | ) |
| | 22.6 | p | | | | | | | | | | | | | 25.1 | p | | | | | | | | | | | | | 26.3 | p | | | | | | | | |
| | | | | | | | | | |
| | | | | | | | | | | | | | | | | | | | | | | | | | | | | | | | | | | | | | | |
| | | | | | | | | | | | | | | | | | | | | | | | | | | | | | | | | | | | | | | |
| | 6,527 | | | | (5 | ) | | | (8 | ) | | | | | 6,462 | | | | (2 | ) | | | (4 | ) | | | | | 6,640 | | | | 2 | | | | 1 | |
| | (1,847 | ) | | | (2 | ) | | | (7 | ) | | | | | (1,690 | ) | | | 8 | | | | 4 | | | | | | (1,711 | ) | | | (2 | ) | | | (4 | ) |
| | (1,934 | ) | | | 2 | | | | (1 | ) | | | | | (1,956 | ) | | | (4 | ) | | | (6 | ) | | | | | (2,038 | ) | | | 2 | | | | 3 | |
| | (868 | ) | | | (5 | ) | | | (6 | ) | | | | | (880 | ) | | | (3 | ) | | | (3 | ) | | | | | (892 | ) | | | 4 | | | | 4 | |
| | 92 | | | | 12 | | | | 8 | | | | | | 66 | | | | 6 | | | | 6 | | | | | | 72 | | | | – | | | | – | |
| | 1,970 | | | | (13 | ) | | | (15 | ) | | | | | 2,002 | | | | (7 | ) | | | (8 | ) | | | | | 2,071 | | | | 3 | | | | 1 | |
| | (178 | ) | | | | | | | | | | | | | (184 | ) | | | | | | | | | | | | | (168 | ) | | | | | | | | |
| | 9 | | | | | | | | | | | | | | – | | | | | | | | | | | | | | 10 | | | | | | | | | |
| | 1,801 | | | | (14 | ) | | | (16 | ) | | | | | 1,818 | | | | (7 | ) | | | (8 | ) | | | | | 1,913 | | | | 3 | | | | 1 | |
| | (437 | ) | | | | | | | | | | | | | (464 | ) | | | | | | | | | | | | | (495 | ) | | | | | | | | |
| | 24.3 | % | | | | | | | | | | | | | 25.5 | % | | | | | | | | | | | | | 25.9 | % | | | | | | | | |
| | 1,364 | | | | (12 | ) | | | (15 | ) | | | | | 1,354 | | | | (6 | ) | | | (7 | ) | | | | | 1,418 | | | | 5 | | | | 3 | |
| | 64 | | | | | | | | | | | | | | 48 | | | | | | | | | | | | | | 65 | | | | | | | | | |
| | 1,300 | | | | | | | | | | | | | | 1,306 | | | | | | | | | | | | | | 1,353 | | | | | | | | | |
| | 26.5 | p | | | (11 | ) | | | (13 | ) | | | | | 26.4 | p | | | (5 | ) | | | (5 | ) | | | | | 27.3 | p | | | 7 | | | | 5 | |
234 | GSK Annual Report 2012
Investor information
Pharmaceuticals and Vaccines turnover by therapeutic area 2012
| | | | | | | | | | | | | | | | | | | | | | | | | | | | | | | | | | | | | | | | | | | | | | | | | | | | | | | | | | | | | | | | |
| | | | | | | | | Total | | | | | | USA | | | | | | Europe | | | | | | EMAP | | | | | | Rest of World | |
| | | | | | 2011 | | | | | | | | | | | | | | | | | | | | | | | | | | | | | | | | | | | | | | | | | | | |
| Therapeutic area/ | | 2012 | | | (restated) | | | | | | Growth | | | 2012 | | | | | | Growth | | | 2012 | | | | | | Growth | | | 2012 | | | | | | Growth | | | 2012 | | | | | | Growth | |
| major products | | £m | | | £m | | | CER% | | | £% | | | £m | | | CER% | | | £% | | | £m | | | CER% | | | £% | | | £m | | | CER% | | | £% | | | £m | | | CER% | | | £% | |
Respiratory | | | 7,291 | | | | 7,298 | | | | 1 | | | | – | | | | 3,388 | | | | 1 | | | | 3 | | | | 1,906 | | | | (5 | ) | | | (10 | ) | | | 858 | | | | 13 | | | | 10 | | | | 1,139 | | | | 3 | | | | 3 | |
Avamys/Veramyst | | | 246 | | | | 241 | | | | 5 | | | | 2 | | | | 59 | | | | (6 | ) | | | (5 | ) | | | 62 | | | | 2 | | | | (5 | ) | | | 63 | | | | 24 | | | | 17 | | | | 62 | | | | 2 | | | | 3 | |
Flixonase/Flonase | | | 133 | | | | 138 | | | | (3 | ) | | | (4 | ) | | | 14 | | | | 100 | | | | 100 | | | | 32 | | | | (11 | ) | | | (14 | ) | | | 57 | | | | 14 | | | | 16 | | | | 30 | | | | (31 | ) | | | (33 | ) |
Flixotide/Flovent | | | 779 | | | | 813 | | | | (4 | ) | | | (4 | ) | | | 448 | | | | (1 | ) | | | – | | | | 122 | | | | (15 | ) | | | (19 | ) | | | 55 | | | | 8 | | | | 6 | | | | 154 | | | | (6 | ) | | | (6 | ) |
Seretide/Advair | | | 5,046 | | | | 5,061 | | | | 1 | | | | – | | | | 2,533 | | | | 1 | | | | 2 | | | | 1,447 | | | | (4 | ) | | | (8 | ) | | | 417 | | | | 12 | | | | 10 | | | | 649 | | | | 3 | | | | 4 | |
Serevent | | | 145 | | | | 182 | | | | (19 | ) | | | (20 | ) | | | 51 | | | | (19 | ) | | | (18 | ) | | | 64 | | | | (22 | ) | | | (25 | ) | | | 3 | | | | – | | | | – | | | | 27 | | | | (13 | ) | | | (16 | ) |
Ventolin | | | 631 | | | | 602 | | | | 6 | | | | 5 | | | | 277 | | | | 14 | | | | 16 | | | | 126 | | | | (6 | ) | | | (11 | ) | | | 171 | | | | 10 | | | | 7 | | | | 57 | | | | (8 | ) | | | (8 | ) |
Xyzal | | | 129 | | | | 64 | | | | 100 | | | | >100 | | | | – | | | | – | | | | – | | | | – | | | | – | | | | – | | | | 16 | | | | – | | | | – | | | | 113 | | | | >100 | | | | >100 | |
Zyrtec | | | 81 | | | | 96 | | | | (16 | ) | | | (16 | ) | | | – | | | | – | | | | – | | | | – | | | | – | | | | – | | | | 36 | | | | 28 | | | | 24 | | | | 45 | | | | (34 | ) | | | (33 | ) |
Other | | | 101 | | | | 101 | | | | 6 | | | | – | | | | 6 | | | | (33 | ) | | | (33 | ) | | | 53 | | | | 4 | | | | (5 | ) | | | 40 | | | | 16 | | | | 8 | | | | 2 | | | | (100 | ) | | | (100 | ) |
Anti-virals | | | 753 | | | | 842 | | | | (11 | ) | | | (11 | ) | | | 57 | | | | (42 | ) | | | (41 | ) | | | 74 | | | | (23 | ) | | | (27 | ) | | | 360 | | | | 2 | | | | 3 | | | | 262 | | | | (12 | ) | | | (12 | ) |
Hepsera | | | 126 | | | | 127 | | | | (2 | ) | | | (1 | ) | | | – | | | | – | | | | – | | | | – | | | | – | | | | – | | | | 95 | | | | (3 | ) | | | (1 | ) | | | 31 | | | | – | | | | – | |
Zovirax | | | 89 | | |
| 109
|
| | | (16 | ) | | | (18 | ) | | | 3 | | | | (73 | ) | | | (73 | ) | | | 21 | | | | (19 | ) | | | (22 | ) | | | 35 | | | | (3 | ) | | | (5 | ) | | | 30 | | | | (9 | ) | | | (12 | ) |
Valtrex | | | 252 | | |
| 339
|
| | | (25 | ) | | | (26 | ) | | | 35 | | | | (51 | ) | | | (51 | ) | | | 33 | | | | (27 | ) | | | (31 | ) | | | 37 | | | | – | | | | (3 | ) | | | 147 | | | | (19 | ) | | | (19 | ) |
Zeffix | | | 243 | | | | 237 | | | | – | | | | 3 | | | | 15 | | | | 27 | | | | 36 | | | | 16 | | | | (29 | ) | | | (33 | ) | | | 188 | | | | 3 | | | | 7 | | | | 24 | | | | (4 | ) | | | (8 | ) |
Other | | | 43 | | | | 30 | | | | 37 | | | | 43 | | | | 4 | | | | 100 | | | | 100 | | | | 4 | | | | 100 | | | | 100 | | | | 5 | | | | >100 | | | | >100 | | | | 30 | | | | 12 | | | | 20 | |
Central nervous system | | | 1,670 | | | | 1,721 | | | | (2 | ) | | | (3 | ) | | | 510 | | | | 6 | | | | 8 | | | | 386 | | | | (15 | ) | | | (20 | ) | | | 329 | | | | 8 | | | | 6 | | | | 445 | | | | (3 | ) | | | (2 | ) |
Imigran/Imitrex | | | 190 | | | | 210 | | | | (8 | ) | | | (10 | ) | | | 72 | | | | (13 | ) | | | (12 | ) | | | 67 | | | | (4 | ) | | | (9 | ) | | | 7 | | | | – | | | | – | | | | 44 | | | | (6 | ) | | | (6 | ) |
Lamictal | | | 610 | | | | 536 | | | | 14 | | | | 14 | | | | 332 | | | | 18 | | | | 20 | | | | 112 | | | | (9 | ) | | | (15 | ) | | | 75 | | | | 7 | | | | 6 | | | | 91 | | | | 58 | | | | 60 | |
Requip | | | 164 | | | | 218 | | | | (22 | ) | | | (25 | ) | | | 19 | | | | (55 | ) | | | (55 | ) | | | 76 | | | | (29 | ) | | | (33 | ) | | | 14 | | | | 25 | | | | 17 | | | | 55 | | | | 8 | | | | 8 | |
Seroxat/Paxil | | | 374 | | | | 435 | | | | (14 | ) | | | (14 | ) | | | (1 | ) | | | 100 | | | | 67 | | | | 57 | | | | (9 | ) | | | (14 | ) | | | 84 | | | | (5 | ) | | | (5 | ) | | | 234 | | | | (19 | ) | | | (18 | ) |
Treximet | | | 49 | | | | 57 | | | | (14 | ) | | | (14 | ) | | | 49 | | | | (16 | ) | | | (14 | ) | | | – | | | | – | | | | – | | | | – | | | | – | | | | – | | | | – | | | | – | | | | – | |
Wellbutrin | | | 84 | | | | 85 | | | | 4 | | | | (1 | ) | | | 12 | | | | (25 | ) | | | (25 | ) | | | 44 | | | | 4 | | | | (2 | ) | | | 28 | | | | 26 | | | | 22 | | | | – | | | | – | | | | – | |
Other | | | 199 | | | | 180 | | | | 13 | | | | 11 | | | | 27 | | | | >100 | | | | >100 | | | | 30 | | | | (39 | ) | | | (41 | ) | | | 121 | | | | 15 | | | | 10 | | | | 21 | | | | 31 | | | | 31 | |
Cardiovascular and urogenital | | | 2,431 | | | | 2,454 | | | | – | | | | (1 | ) | | | 1,461 | | | | (5 | ) | | | (4 | ) | | | 504 | | | | 1 | | | | (6 | ) | | | 292 | | | | 18 | | | | 16 | | | | 174 | | | | 23 | | | | 23 | |
Arixtra | | | 195 | | | | 276 | | | | (27 | ) | | | (29 | ) | | | 68 | | | | (54 | ) | | | (54 | ) | | | 91 | | | | – | | | | (6 | ) | | | 28 | | | | 33 | | | | 33 | | | | 8 | | | | (27 | ) | | | (27 | ) |
Avodart | | | 790 | | | | 748 | | | | 7 | | | | 6 | | | | 317 | | | | (5 | ) | | | (4 | ) | | | 228 | | | | 9 | | | | 2 | | | | 84 | | | | 26 | | | | 22 | | | | 161 | | | | 28 | | | | 29 | |
Coreg | | | 133 | | | | 155 | | | | (15 | ) | | | (14 | ) | | | 132 | | | | (15 | ) | | | (14 | ) | | | – | | | | – | | | | – | | | | – | | | | – | | | | – | | | | 1 | | | | – | | | | – | |
Fraxiparine | | | 233 | | | | 234 | | | | 4 | | | | – | | | | – | | | | – | | | | – | | | | 145 | | | | (4 | ) | | | (10 | ) | | | 87 | | | | 26 | | | | 24 | | | | 1 | | | | (50 | ) | | | (50 | ) |
Lovaza | | | 607 | | | | 569 | | | | 5 | | | | 7 | | | | 604 | | | | 5 | | | | 7 | | | | – | | | | – | | | | – | | | | – | | | | – | | | | – | | | | 3 | | | | – | | | | 50 | |
Vesicare | | | 175 | | | | 126 | | | | 37 | | | | 39 | | | | 174 | | | | 37 | | | | 38 | | | | – | | | | – | | | | – | | | | 1 | | | | – | | | | – | | | | – | | | | – | | | | – | |
Other | | | 298 | | | | 346 | | | | (13 | ) | | | (14 | ) | | | 166 | | | | (20 | ) | | | (18 | ) | | | 40 | | | | (17 | ) | | | (23 | ) | | | 92 | | | | 1 | | | | 1 | | | | – | | | | – | | | | – | |
Metabolic | | | 171 | | | | 331 | | | | (47 | ) | | | (48 | ) | | | (12 | ) | | | – | | | | – | | | | 29 | | | | (49 | ) | | | (52 | ) | | | 65 | | | | 10 | | | | 3 | | | | 89 | | | | (24 | ) | | | (24 | ) |
Avandiaproducts | | | 6 | | | | 123 | | | | (94 | ) | | | (95 | ) | | | (12 | ) | | | – | | | | – | | | | – | | | | – | | | | – | | | | 12 | | | | (33 | ) | | | (33 | ) | | | 6 | | | | (59 | ) | | | (65 | ) |
Other | | | 165 | | | | 208 | | | | (18 | ) | | | (21 | ) | | | – | | | | – | | | | – | | | | 29 | | | | (52 | ) | | | (55 | ) | | | 53 | | | | 27 | | | | 18 | | | | 83 | | | | (18 | ) | | | (17 | ) |
Anti-bacterials | | | 1,247 | | | | 1,390 | | | | (7 | ) | | | (10 | ) | | | 20 | | | | (63 | ) | | | (63 | ) | | | 403 | | | | (17 | ) | | | (21 | ) | | | 735 | | | | 5 | | | | 2 | | | | 89 | | | | (12 | ) | | | (11 | ) |
Augmentin | | | 608 | | | | 641 | | | | (1 | ) | | | (5 | ) | | | 1 | | | | – | | | | – | | | | 202 | | | | (13 | ) | | | (19 | ) | | | 367 | | | | 8 | | | | 4 | | | | 38 | | | | (10 | ) | | | (7 | ) |
Other | | | 639 | | | | 749 | | | | (12 | ) | | | (15 | ) | | | 19 | | | | (65 | ) | | | (65 | ) | | | 201 | | | | (20 | ) | | | (24 | ) | | | 368 | | | | 2 | | | | (1 | ) | | | 51 | | | | (14 | ) | | | (14 | ) |
Oncology and emesis | | | 798 | | | | 683 | | | | 19 | | | | 17 | | | | 321 | | | | 18 | | | | 20 | | | | 256 | | | | 11 | | | | 4 | | | | 131 | | | | 48 | | | | 42 | | | | 90 | | | | 15 | | | | 15 | |
Arzerra | | | 60 | | | | 44 | | | | 36 | | | | 36 | | | | 38 | | | | 23 | | | | 23 | | | | 21 | | | | 83 | | | | 75 | �� | | | – | | | | – | | | | – | | | | 1 | | | | (100 | ) | | | – | |
Promacta | | | 130 | | | | 75 | | | | 76 | | | | 73 | | | | 54 | | | | 66 | | | | 69 | | | | 36 | | | | 65 | | | | 57 | | | | 12 | | | | >100 | | | | >100 | | | | 28 | | | | 87 | | | | 87 | |
Tyverb/Tykerb | | | 239 | | | | 231 | | | | 6 | | | | 3 | | | | 68 | | | | 5 | | | | 6 | | | | 87 | | | | (5 | ) | | | (10 | ) | | | 54 | | | | 36 | | | | 29 | | | | 30 | | | | 7 | | | | 7 | |
Votrient | | | 183 | | | | 100 | | | | 88 | | | | 83 | | | | 91 | | | | 59 | | | | 63 | | | | 66 | | | | 89 | | | | 78 | | | | 22 | | | | >100 | | | | >100 | | | | 4 | | | | – | | | | – | |
Other | | | 186 | | | | 233 | | | | (19 | ) | | | (20 | ) | | | 70 | | | | (18 | ) | | | (18 | ) | | | 46 | | | | (34 | ) | | | (39 | ) | | | 43 | | | | 11 | | | | 13 | | | | 27 | | | | (21 | ) | | | (21 | ) |
Dermatology | | | 850 | | | | 898 | | | | (2 | ) | | | (5 | ) | | | 228 | | | | (14 | ) | | | (13 | ) | | | 156 | | | | 5 | | | | – | | | | 388 | | | | 7 | | | | 1 | | | | 78 | | | | (19 | ) | | | (19 | ) |
Bactroban | | | 124 | | | | 123 | | | | 3 | | | | 1 | | | | 51 | | | | (2 | ) | | | – | | | | 26 | | | | – | | | | (7 | ) | | | 39 | | | | 17 | | | | 11 | | | | 8 | | | | (11 | ) | | | (11 | ) |
Duac | | | 87 | | | | 109 | | | | (19 | ) | | | (20 | ) | | | 38 | | | | (38 | ) | | | (37 | ) | | | 24 | | | | 4 | | | | – | | | | 13 | | | | 8 | | | | – | | | | 12 | | | | – | | | | – | |
Other | | | 639 | | | | 666 | | | | – | | | | (4 | ) | | | 139 | | | | (9 | ) | | | (9 | ) | | | 106 | | | | 6 | | | | 1 | | | | 336 | | | | 6 | | | | 1 | | | | 58 | | | | (23 | ) | | | (23 | ) |
Rare diseases | | | 495 | | | | 463 | | | | 8 | | | | 7 | | | | 117 | | | | 10 | | | | 11 | | | | 123 | | | | (6 | ) | | | (12 | ) | | | 48 | | | | 20 | | | | 17 | | | | 207 | | | | 16 | | | | 16 | |
Flolan | | | 135 | | | | 179 | | | | (25 | ) | | | (25 | ) | | | 33 | | | | (14 | ) | | | (11 | ) | | | 23 | | | | (42 | ) | | | (47 | ) | | | – | | | | – | | | | – | | | | 79 | | | | (21 | ) | | | (20 | ) |
Volibris | | | 127 | | | | 97 | | | | 35 | | | | 31 | | | | – | | | | – | | | | – | | | | 73 | | | | 12 | | | | 6 | | | | 9 | | | | 80 | | | | 80 | | | | 45 | | | | 96 | | | | 96 | |
Other | | | 233 | | | | 187 | | | | 26 | | | | 25 | | | | 84 | | | | 22 | | | | 24 | | | | 27 | | | | 4 | | | | – | | | | 39 | | | | 11 | | | | 8 | | | | 83 | | | | 50 | | | | 48 | |
Immuno-inflammation | | | 70 | | | | 15 | | | | >100 | | | | >100 | | | | 65 | | | | >100 | | | | >100 | | | | 4 | | | | >100 | | | | >100 | | | | – | | | | – | | | | – | | | | 1 | | | | – | | | | – | |
Benlysta | | | 70 | | | | 15 | | | | >100 | | | | >100 | | | | 65 | | | | >100 | | | | >100 | | | | 4 | | | | >100 | | | | >100 | | | | – | | | | – | | | | – | | | | 1 | | | | – | | | | – | |
Other pharmaceuticals | | | 846 | | | | 951 | | | | (6 | ) | | | (11 | ) | | | 19 | | | | 25 | | | | 19 | | | | 180 | | | | (23 | ) | | | (32 | ) | | | 423 | | | | (2 | ) | | | (7 | ) | | | 224 | | | | 3 | | | | 4 | |
Vaccines | | | 3,325 | | | | 3,497 | | | | (2 | ) | | | (5 | ) | | | 826 | | | | – | | | | 1 | | | | 980 | | | | (4 | ) | | | (10 | ) | | | 1,107 | | | | 14 | | | | 9 | | | | 412 | | | | (29 | ) | | | (29 | ) |
Boostrix | | | 238 | | | | 192 | | | | 25 | | | | 24 | | | | 147 | | | | 35 | | | | 36 | | | | 53 | | | | 17 | | | | 10 | | | | 16 | | | | 78 | | | | 78 | | | | 22 | | | | (19 | ) | | | (19 | ) |
Cervarix | | | 270 | | | | 506 | | | | (46 | ) | | | (47 | ) | | | 6 | | | | (25 | ) | | | (25 | ) | | | 53 | | | | (2 | ) | | | (9 | ) | | | 75 | | | | (19 | ) | | | (20 | ) | | | 136 | | | | (61 | ) | | | (61 | ) |
Fluarix, FluLaval | | | 200 | | | | 230 | | | | (11 | ) | | | (13 | ) | | | 88 | | | | (35 | ) | | | (33 | ) | | | 43 | | | | 15 | | | | 8 | | | | 44 | | | | 35 | | | | 29 | | | | 25 | | | | 8 | | | | 4 | |
Hepatitis | | | 646 | | | | 688 | | | | (5 | ) | | | (6 | ) | | | 266 | | | | (10 | ) | | | (9 | ) | | | 197 | | | | (8 | ) | | | (13 | ) | | | 128 | | | | 21 | | | | 15 | | | | 55 | | | | (11 | ) | | | (4 | ) |
Infanrix, Pediarix | | | 775 | | | | 690 | | | | 17 | | | | 12 | | | | 218 | | | | 32 | | | | 34 | | | | 376 | | | | – | | | | (7 | ) | | | 120 | | | | 85 | | | | 76 | | | | 61 | | | | 9 | | | | 9 | |
Nimenrix | | | 1 | | | | – | | | | – | | | | – | | | | – | | | | – | | | | – | | | | 1 | | | | – | | | | – | | | | – | | | | – | | | | – | | | | – | | | | – | | | | – | |
Rotarix | | | 360 | | | | 300 | | | | 21 | | | | 20 | | | | 100 | | | | (11 | ) | | | (9 | ) | | | 39 | | | | 2 | | | | (5 | ) | | | 159 | | | | 25 | | | | 23 | | | | 62 | | | | >100 | | | | >100 | |
Synflorix | | | 385 | | | | 350 | | | | 17 | | | | 10 | | | | – | | | | – | | | | – | | | | 45 | | | | (8 | ) | | | (13 | ) | | | 334 | | | | 22 | | | | 14 | | | | 6 | | | | – | | | | – | |
Other | | | 450 | | | | 541 | | | | (13 | ) | | | (17 | ) | | | 1 | | | | – | | | | – | | | | 173 | | | | (18 | ) | | | (22 | ) | | | 231 | | | | (12 | ) | | | (16 | ) | | | 45 | | | | 7 | | | | 2 | |
| | | 19,947 | | | | 20,543 | | | | (1 | ) | | | (3 | ) | | | 7,000 | | | | (2 | ) | | | – | | | | 5,001 | | | | (7 | ) | | | (12 | ) | | | 4,736 | | | | 10 | | | | 6 | | | | 3,210 | | | | (5 | ) | | | (5 | ) |
ViiV Healthcare (HIV) | | | 1,374 | | | | 1,569 | | | | (10 | ) | | | (12 | ) | | | | | | | | | | | | | | | | | | | | | | | | | | | | | | | | | | | | | | | | | | | | | | | | |
| | | 21,321 | | | | 22,112 | | | | (2 | ) | | | (4 | ) | | | | | | | | | | | | | | | | | | | | | | | | | | | | | | | | | | | | | | | | | | | | | | | | |
CER% represents growth at constant exchange rates. £% represents growth at actual exchange rates.
|
| GSK Annual Report 2012 | 235 |
Pharmaceuticals and Vaccines turnover by therapeutic area 2011 (restated)
| | | | | | | | | | | | | | | | | | | | | | | | | | | | | | | | | | | | | | | | | | | | | | | | | | | | | | | | | | | | | | | | |
| | | | | | | | | Total | | | | | | USA | | | | | | Europe | | | | | | EMAP | | | | | | Rest of World | |
| | | | | | | | | | | | | | | | | | | | | | | | | | | | | | | | | | | | | | | | | | | | | | | | | |
| Therapeutic area/ | | 2011 | | | 2010 | | | | | | Growth | | | 2011 | | | | | | Growth | | | 2011 | | | | | | Growth | | | 2011 | | | | | | Growth | | | 2011 | | | | | | Growth | |
| major products | | £m | | | £m | | | CER% | | | £% | | | £m | | | CER% | | | £% | | | £m | | | CER% | | | £% | | | £m | | | CER% | | | £% | | | £m | | | CER% | | | £% | |
Respiratory | | | 7,298 | | | | 7,238 | | | | 2 | | | | 1 | | | | 3,301 | | | | 1 | | | | (3 | ) | | | 2,115 | | | | (2 | ) | | | (2 | ) | | | 779 | | | | 9 | | | | 6 | | | | 1,103 | | | | 9 | | | | 15 | |
Avamys/Veramyst | | | 241 | | | | 193 | | | | 24 | | | | 25 | | | | 62 | | | | (6 | ) | | | (10 | ) | | | 65 | | | | 14 | | | | 16 | | | | 54 | | | | 42 | | | | 42 | | | | 60 | | | | 90 | | | | 100 | |
Flixonase/Flonase | | | 138 | | | | 164 | | | | (17 | ) | | | (16 | ) | | | 7 | | | | (78 | ) | | | (81 | ) | | | 37 | | | | (8 | ) | | | (8 | ) | | | 49 | | | | 11 | | | | 11 | | | | 45 | | | | (2 | ) | | | 5 | |
Flixotide/Flovent | | | 813 | | | | 804 | | | | 3 | | | | 1 | | | | 447 | | | | 8 | | | | 4 | | | | 151 | | | | (6 | ) | | | (5 | ) | | | 52 | | | | 8 | | | | 2 | | | | 163 | | | | (4 | ) | | | – | |
Seretide/Advair | | | 5,061 | | | | 5,139 | | | | – | | | | (2 | ) | | | 2,475 | | | | (1 | ) | | | (5 | ) | | | 1,580 | | | | (2 | ) | | | (1 | ) | | | 379 | | | | 2 | | | | (1 | ) | | | 627 | | | | 9 | | | | 14 | |
Serevent | | | 182 | | | | 201 | | | | (9 | ) | | | (9 | ) | | | 62 | | | | 2 | | | | (3 | ) | | | 85 | | | | (14 | ) | | | (13 | ) | | | 3 | | | | 50 | | | | 50 | | | | 32 | | | | (19 | ) | | | (14 | ) |
Ventolin | | | 602 | | | | 522 | | | | 17 | | | | 15 | | | | 239 | | | | 39 | | | | 34 | | | | 141 | | | | (1 | ) | | | (1 | ) | | | 160 | | | | 14 | | | | 10 | | | | 62 | | | | 4 | | | | 11 | |
Xyzal | | | 64 | | | | 33 | | | | 85 | | | | 94 | | | | – | | | | – | | | | – | | | | – | | | | – | | | | – | | | | 16 | | | | 7 | | | | 7 | | | | 48 | | | | >100 | | | | >100 | |
Zyrtec | | | 96 | | | | 82 | | | | 12 | | | | 17 | | | | – | | | | – | | | | – | | | | – | | | | – | | | | – | | | | 29 | | | | 36 | | | | 32 | | | | 67 | | | | 3 | | | | 12 | |
Other | | | 101 | | | | 100 | | | | 1 | | | | 1 | | | | 9 | | | | (40 | ) | | | (10 | ) | | | 56 | | | | 6 | | | | 6 | | | | 37 | | | | 12 | | | | 9 | | | | (1 | ) | | | 33 | | | | >(100 | ) |
Anti-virals | | | 842 | | | | 1,167 | | | | (29 | ) | | | (28 | ) | | | 96 | | | | (73 | ) | | | (73 | ) | | | 101 | | | | (24 | ) | | | (22 | ) | | | 348 | | | | (1 | ) | | | (1 | ) | | | 297 | | | | (13 | ) | | | (9 | ) |
Hepsera | | | 127 | | | | 128 | | | | (3 | ) | | | (1 | ) | | | – | | | | – | | | | – | | | | – | | | | – | | | | – | | | | 96 | | | | (4 | ) | | | (3 | ) | | | 31 | | | | 4 | | | | 11 | |
Zovirax | | | 109 | | | | 152 | | | | (29 | ) | | | (28 | ) | | | 11 | | | | (79 | ) | | | (79 | ) | | | 27 | | | | (4 | ) | | | – | | | | 37 | | | | 12 | | | | 12 | | | | 34 | | | | (13 | ) | | | (13 | ) |
Valtrex | | | 339 | | | | 532 | | | | (38 | ) | | | (36 | ) | | | 72 | | | | (70 | ) | | | (71 | ) | | | 48 | | | | (31 | ) | | | (29 | ) | | | 38 | | | | 11 | | | | 9 | | | | 181 | | | | (4 | ) | | | 2 | |
Zeffix | | | 237 | | | | 233 | | | | 1 | | | | 2 | | | | 11 | | | | (15 | ) | | | (15 | ) | | | 24 | | | | (8 | ) | | | (8 | ) | | | 176 | | | | 5 | | | | 6 | | | | 26 | | | | (11 | ) | | | (7 | ) |
Other | | | 30 | | | | 122 | | | | (76 | ) | | | (75 | ) | | | 2 | | | | (95 | ) | | | (95 | ) | | | 2 | | | | (75 | ) | | | (75 | ) | | | 1 | | | | (94 | ) | | | (94 | ) | | | 25 | | | | (55 | ) | | | (53 | ) |
Central nervous system | | | 1,721 | | | | 1,753 | | | | (2 | ) | | | (2 | ) | | | 474 | | | | (3 | ) | | | (6 | ) | | | 480 | | | | (12 | ) | | | (11 | ) | | | 311 | | | | 12 | | | | 10 | | | | 456 | | | | 2 | | | | 7 | |
Imigran/Imitrex | | | 210 | | | | 212 | | | | (2 | ) | | | (1 | ) | | | 82 | | | | 12 | | | | 9 | | | | 74 | | | | (14 | ) | | | (13 | ) | | | 7 | | | | – | | | | – | | | | 47 | | | | (4 | ) | | | 4 | |
Lamictal | | | 536 | | | | 504 | | | | 8 | | | | 6 | | | | 277 | | | | 12 | | | | 8 | | | | 131 | | | | (10 | ) | | | (8 | ) | | | 71 | | | | 3 | | | | – | | | | 57 | | | | 61 | | | | 73 | |
Requip | | | 218 | | | | 233 | | | | (7 | ) | | | (6 | ) | | | 42 | | | | (2 | ) | | | (5 | ) | | | 113 | | | | (18 | ) | | | (18 | ) | | | 12 | | | | – | | | | – | | | | 51 | | | | 23 | | | | 28 | |
Seroxat/Paxil | | | 435 | | | | 482 | | | | (13 | ) | | | (10 | ) | | | (3 | ) | | | <(100 | ) | | | <(100 | ) | | | 66 | | | | (20 | ) | | | (20 | ) | | | 88 | | | | 7 | | | | 7 | | | | 284 | | | | (8 | ) | | | (2 | ) |
Treximet | | | 57 | | | | 56 | | | | 5 | | | | 2 | | | | 57 | | | | 7 | | | | 4 | | | | – | | | | – | | | | – | | | | – | | | | – | | | | – | | | | – | | | | (100 | ) | | | (100 | ) |
Wellbutrin | | | 85 | | | | 81 | | | | 6 | | | | 5 | | | | 16 | | | | (33 | ) | | | (33 | ) | | | 45 | | | | 15 | | | | 15 | | | | 23 | | | | 35 | | | | 35 | | | | 1 | | | | 100 | | | | – | |
Other | | | 180 | | | | 185 | | | | (2 | ) | | | (3 | ) | | | 3 | | | | (87 | ) | | | (87 | ) | | | 51 | | | | (9 | ) | | | (6 | ) | | | 110 | | | | 20 | | | | 17 | | | | 16 | | | | 21 | | | | 14 | |
Cardiovascular and urogenital | | | 2,454 | | | | 2,314 | | | | 8 | | | | 6 | | | | 1,527 | | | | 4 | | | | – | | | | 534 | | | | 8 | | | | 9 | | | | 252 | | | | 24 | | | | 22 | | | | 141 | | | | 43 | | | | 48 | |
Arixtra | | | 276 | | | | 301 | | | | (7 | ) | | | (8 | ) | | | 147 | | | | (14 | ) | | | (17 | ) | | | 97 | | | | (3 | ) | | | (2 | ) | | | 21 | | | | 47 | | | | 40 | | | | 11 | | | | (10 | ) | | | 10 | |
Avodart | | | 748 | | | | 629 | | | | 20 | | | | 19 | | | | 331 | | | | 2 | | | | (2 | ) | | | 223 | | | | 26 | | | | 27 | | | | 69 | | | | 27 | | | | 23 | | | | 125 | | | | 93 | | | | >100 | |
Coreg | | | 155 | | | | 171 | | | | (6 | ) | | | (9 | ) | | | 154 | | | | (6 | ) | | | (9 | ) | | | – | | | | – | | | | – | | | | – | | | | – | | | | – | | | | 1 | | | | – | | | | – | |
Fraxiparine | | | 234 | | | | 222 | | | | 5 | | | | 5 | | | | – | | | | – | | | | – | | | | 162 | | | | 5 | | | | 5 | | | | 70 | | | | 29 | | | | 25 | | | | 2 | | | | (92 | ) | | | (83 | ) |
Lovaza | | | 569 | | | | 530 | | | | 12 | | | | 7 | | | | 567 | | | | 12 | | | | 7 | | | | – | | | | – | | | | – | | | | – | | | | – | | | | – | | | | 2 | | | | – | | | | – | |
Vesicare | | | 126 | | | | 114 | | | | 15 | | | | 11 | | | | 126 | | | | 16 | | | | 12 | | | | – | | | | – | | | | – | | | | – | | | | – | | | | – | | | | – | | | | – | | | | – | |
Other | | | 346 | | | | 347 | | | | 2 | | | | – | | | | 202 | | | | 4 | | | | 1 | | | | 52 | | | | (15 | ) | | | (13 | ) | | | 92 | | | | 15 | | | | 16 | | | | – | | | | (38 | ) | | | >(100 | ) |
Metabolic | | | 331 | | | | 647 | | | | (49 | ) | | | (49 | ) | | | 90 | | | | (60 | ) | | | (62 | ) | | | 61 | | | | (62 | ) | | | (62 | ) | | | 63 | | | | (36 | ) | | | (37 | ) | | | 117 | | | | (27 | ) | | | (22 | ) |
Avandiaproducts | | | 123 | | | | 440 | | | | (71 | ) | | | (72 | ) | | | 91 | | | | (60 | ) | | | (62 | ) | | | (3 | ) | | | <(100 | ) | | | <(100 | ) | | | 18 | | | | (71 | ) | | | (71 | ) | | | 17 | | | | (68 | ) | | | (68 | ) |
Other | | | 208 | | | | 207 | | | | (1 | ) | | | – | | | | (1 | ) | | | – | | | | – | | | | 64 | | | | (11 | ) | | | (11 | ) | | | 45 | | | | 21 | | | | 18 | | | | 100 | | | | 4 | | | | 3 | |
Anti-bacterials | | | 1,390 | | | | 1,396 | | | | 1 | | | | – | | | | 54 | | | | (25 | ) | | | (28 | ) | | | 513 | | | | (5 | ) | | | (4 | ) | | | 724 | | | | 9 | | | | 5 | | | | 99 | | | | – | | | | 3 | |
Augmentin | | | 641 | | | | 625 | | | | 4 | | | | 3 | | | | – | | | | <(100 | ) | | | – | | | | 248 | | | | 3 | | | | 3 | | | | 352 | | | | 10 | | | | 6 | | | | 41 | | | | (5 | ) | | | (2 | ) |
Other | | | 749 | | | | 771 | | | | (1 | ) | | | (3 | ) | | | 54 | | | | (13 | ) | | | (16 | ) | | | 265 | | | | (11 | ) | | | (10 | ) | | | 372 | | | | 9 | | | | 4 | | | | 58 | | | | 4 | | | | 7 | |
Oncology and emesis | | | 683 | | | | 679 | | | | 1 | | | | 1 | | | | 268 | | | | (20 | ) | | | (23 | ) | | | 245 | | | | 22 | | | | 24 | | | | 92 | | | | 25 | | | | 23 | | | | 78 | | | | 25 | | | | 30 | |
Arzerra | | | 44 | | | | 31 | | | | 45 | | | | 42 | | | | 31 | | | | 23 | | | | 19 | | | | 12 | | | | >100 | | | | >100 | | | | – | | | | – | | | | – | | | | 1 | | | | – | | | | – | |
Promacta | | | 75 | | | | 31 | | | | >100 | | | | >100 | | | | 32 | | | | 36 | | | | 28 | | | | 23 | | | | >100 | | | | >100 | | | | 5 | | | | – | | | | – | | | | 15 | | | | >100 | | | | >100 | |
Tyverb/Tykerb | | | 231 | | | | 227 | | | | 2 | | | | 2 | | | | 64 | | | | (6 | ) | | | (9 | ) | | | 97 | | | | 2 | | | | 3 | | | | 42 | | | | 26 | | | | 20 | | | | 28 | | | | (7 | ) | | | – | |
Votrient | | | 100 | | | | 38 | | | | >100 | | | | >100 | | | | 56 | | | | 76 | | | | 70 | | | | 37 | | | | >100 | | | | >100 | | | | 7 | | | | – | | | | – | | | | – | | | | – | | | | – | |
Other | | | 233 | | | | 352 | | | | (33 | ) | | | (34 | ) | | | 85 | | | | (54 | ) | | | (56 | ) | | | 76 | | | | (19 | ) | | | (16 | ) | | | 38 | | | | – | | | | – | | | | 34 | | | | 21 | | | | 17 | |
Dermatologicals | | | 898 | | | | 849 | | | | 8 | | | | 6 | | | | 263 | | | | (4 | ) | | | (8 | ) | | | 157 | | | | 3 | | | | 3 | | | | 382 | | | | 26 | | | | 22 | | | | 96 | | | | (9 | ) | | | (3 | ) |
Bactroban | | | 123 | | | | 119 | | | | 6 | | | | 3 | | | | 51 | | | | 4 | | | | – | | | | 28 | | | | 4 | | | | 4 | | | | 35 | | | | 9 | | | | 3 | | | | 9 | | | | 14 | | | | 29 | |
Duac | | | 109 | | | | 116 | | | | (3 | ) | | | (6 | ) | | | 60 | | | | (6 | ) | | | (10 | ) | | | 24 | | | | – | | | | 4 | | | | 13 | | | | 8 | | | | – | | | | 12 | | | | (8 | ) | | | (8 | ) |
Other | | | 666 | | | | 614 | | | | 10 | | | | 8 | | | | 152 | | | | (6 | ) | | | (10 | ) | | | 105 | | | | 4 | | | | 3 | | | | 334 | | | | 29 | | | | 26 | | | | 75 | | | | (11 | ) | | | (5 | ) |
Rare diseases | | | 463 | | | | 408 | | | | 12 | | | | 13 | | | | 105 | | | | (4 | ) | | | (7 | ) | | | 140 | | | | 1 | | | | 2 | | | | 40 | | | | 40 | | | | 33 | | | | 178 | | | | 30 | | | | 39 | |
Flolan | | | 179 | | | | 195 | | | | (11 | ) | | | 8 | | | | 37 | | | | (15 | ) | | | (20 | ) | | | 43 | | | | (37 | ) | | | (36 | ) | | | – | | | | – | | | | – | | | | 99 | | | | 13 | | | | 21 | |
Volibris | | | 97 | | | | 46 | | | | >100 | | | | >100 | | | | – | | | | – | | | | – | | | | 69 | | | | 70 | | | | 73 | | | | 5 | | | | >100 | | | | >100 | | | | 23 | | | | >100 | | | | >100 | |
Other | | | 187 | | | | 167 | | | | 12 | | | | 12 | | | | 68 | | | | 4 | | | | 1 | | | | 28 | | | | (7 | ) | | | (7 | ) | | | 35 | | | | 24 | | | | 21 | | | | 56 | | | | 29 | | | | 37 | |
Other pharmaceuticals | | | 966 | | | | 956 | | | | 2 | | | | 1 | | | | 30 | | | | 29 | | | | 25 | | | | 263 | | | | (15 | ) | | | (15 | ) | | | 456 | | | | 14 | | | | 8 | | | | 217 | | | | 1 | | | | 8 | |
Vaccines | | | 3,497 | | | | 4,326 | | | | (19 | ) | | | (19 | ) | | | 814 | | | | 11 | | | | 7 | | | | 1,091 | | | | (36 | ) | | | (35 | ) | | | 1,012 | | | | (11 | ) | | | (12 | ) | | | 580 | | | | (26 | ) | | | (21 | ) |
Boostrix | | | 192 | | | | 181 | | | | 7 | | | | 6 | | | | 108 | | | | 2 | | | | (2 | ) | | | 48 | | | | 9 | | | | 12 | | | | 9 | | | | – | | | | (10 | ) | | | 27 | | | | 33 | | | | 50 | |
Cervarix | | | 506 | | | | 242 | | | | >100 | | | | >100 | | | | 8 | | | | (31 | ) | | | (38 | ) | | | 58 | | | | (50 | ) | | | (50 | ) | | | 94 | | | | 70 | | | | 68 | | | | 346 | | | | >100 | | | | >100 | |
Fluarix, FluLaval | | | 230 | | | | 241 | | | | (2 | ) | | | (5 | ) | | | 132 | | | | 25 | | | | 20 | | | | 40 | | | | (38 | ) | | | (37 | ) | | | 34 | | | | (20 | ) | | | (23 | ) | | | 24 | | | | – | | | | – | |
Hepatitis | | | 688 | | | | 720 | | | | (3 | ) | | | (4 | ) | | | 293 | | | | (1 | ) | | | (5 | ) | | | 227 | | | | (7 | ) | | | (6 | ) | | | 111 | | | | (2 | ) | | | (2 | ) | | | 57 | | | | (3 | ) | | | (2 | ) |
Infanrix, Pediarix | | | 690 | | | | 700 | | | | (2 | ) | | | (1 | ) | | | 163 | | | | 16 | | | | 12 | | | | 403 | | | | (7 | ) | | | (6 | ) | | | 68 | | | | (4 | ) | | | (6 | ) | | | 56 | | | | (4 | ) | | | 6 | |
Rotarix | | | 300 | | | | 235 | | | | 31 | | | | 28 | | | | 110 | | | | 55 | | | | 49 | | | | 41 | | | | 8 | | | | 8 | | | | 129 | | | | 16 | | | | 12 | | | | 20 | | | | >100 | | | | >100 | |
Synflorix | | | 350 | | | | 221 | | | | 57 | | | | 58 | | | | – | | | | – | | | | – | | | | 52 | | | | 21 | | | | 21 | | | | 292 | | | | 81 | | | | 81 | | | | 6 | | | | (76 | ) | | | (65 | ) |
Other | | | 541 | | | | 1,786 | | | | (70 | ) | | | (70 | ) | | | – | | | | <(100 | ) | | | <(100 | ) | | | 222 | | | | (69 | ) | | | (69 | ) | | | 275 | | | | (51 | ) | | | (52 | ) | | | 44 | | | | (91 | ) | | | (91 | ) |
| | | 20,543 | | | | 21,733 | | | | (5 | ) | | | (5 | ) | | | 7,022 | | | | (4 | ) | | | (8 | ) | | | 5,700 | | | | (13 | ) | | | (12 | ) | | | 4,459 | | | | 5 | | | | 3 | | | | 3,362 | | | | (3 | ) | | | 3 | |
ViiV Healthcare (HIV) | | | 1,569 | | | | 1,566 | | | | 1 | | | | – | | | | | | | | | | | | | | | | | | | | | | | | | | | | | | | | | | | | | | | | | | | | | | | | | |
| | | 22,112 | | | | 23,299 | | | | (4 | ) | | | (5 | ) | | | | | | | | | | | | | | | | | | | | | | | | | | | | | | | | | | | | | | | | | | | | | | | | |
CER% represents growth at constant exchange rates. £% represents growth at actual exchange rates.
236 | GSK Annual Report 2012
Investor information
ViiV Healthcare turnover
| | | | | | | | | | | | | | | | | | | | | | | | | | | | | | | | | | | | | | | | | | | | | | | | | | | | | | | | | | | | | | | | |
| | | | | | | | | | | | Total | | | | | | | | | USA | | | | | | | | | Europe | | | | | | | | | EMAP | | | | | | Rest of World | |
| Therapeutic area/ | | 2012 | | | 2011
(restated) | | | | | | Growth | | | 2012 | | | | | | Growth | | | 2012 | | | | | | Growth | | | 2012 | | | | | | Growth | | | 2012 | | | | | | Growth | |
| major products | | £m | | | £m | | | CER% | | | £% | | | £m | | | CER% | | | £% | | | £m | | | CER% | | | £% | | | £m | | | CER% | | | £% | | | £m | | | CER% | | | £% | |
Combivir | | | 179 | | | | 322 | | | | (43 | ) | | | (44 | ) | | | 24 | | | | (81 | ) | | | (81 | ) | | | 64 | | | | (27 | ) | | | (31 | ) | | | 79 | | | | (2 | ) | | | (5 | ) | | | 12 | | | | (42 | ) | | | (37 | ) |
Epivir | | | 49 | | | | 110 | | | | (54 | ) | | | (55 | ) | | | 8 | | | | (81 | ) | | | (81 | ) | | | 21 | | | | (31 | ) | | | (35 | ) | | | 12 | | | | (55 | ) | | | (56 | ) | | | 8 | | | | (23 | ) | | | (38 | ) |
Epzicom/Kivexa | | | 665 | | | | 617 | | | | 10 | | | | 8 | | | | 243 | | | | 4 | | | | 6 | | | | 285 | | | | 11 | | | | 5 | | | | 57 | | | | 37 | | | | 34 | | | | 80 | | | | 10 | | | | 11 | |
Lexiva | | | 127 | | | | 142 | | | | (9 | ) | | | (11 | ) | | | 68 | | | | (9 | ) | | | (8 | ) | | | 33 | | | | (20 | ) | | | (26 | ) | | | 19 | | | | 25 | | | | 21 | | | | 7 | | | | (14 | ) | | | – | |
Selzentry | | | 128 | | | | 110 | | | | 20 | | | | 16 | | | | 57 | | | | 25 | | | | 26 | | | | 56 | | | | 16 | | | | 9 | | | | 4 | | | | 9 | | | | 2 | | | | 11 | | | | 30 | | | | 10 | |
Trizivir | | | 107 | | | | 126 | | | | (13 | ) | | | (15 | ) | | | 61 | | | | (11 | ) | | | (10 | ) | | | 37 | | | | (21 | ) | | | (25 | ) | | | 5 | | | | 4 | | | | (1 | ) | | | 4 | | | | 25 | | | | – | |
Other | | | 119 | | | | 142 | | | | (16 | ) | | | (16 | ) | | | 59 | | | | (24 | ) | | | (24 | ) | | | 27 | | | | (10 | ) | | | (13 | ) | | | 22 | | | | 5 | | | | 5 | | | | 11 | | | | (17 | ) | | | (8 | ) |
| | | 1,374 | | | | 1,569 | | | | (10 | ) | | | (12 | ) | | | 520 | | | | (22 | ) | | | (21 | ) | | | 523 | | | | (3 | ) | | | (9 | ) | | | 198 | | | | 3 | | | | – | | | | 133 | | | | (2 | ) | | | (3 | ) |
| | | | | | | | | | | | | | | | | | | | | | | | | | | | | | | | | | | | | | | | | | | | | | | | | | | | | | | | | | | | | | | | |
| | | | | | | | | | | | Total | | | | | | | | | USA | | | | | | | | | Europe | | | | | | | | | EMAP | | | | | | Rest of World | |
| Therapeutic area/ | | 2011 (restated) | | | 2010 (restated) | | | | | | Growth | | | 2011 | | | | | | Growth | | | 2011 | | | | | | Growth | | | 2011 | | | | | | Growth | | | 2011 | | | | | | Growth | |
| major products | | £m | | | £m | | | CER% | | | £% | | | £m | | | CER% | | | £% | | | £m | | | CER% | | | £% | | | £m | | | CER% | | | £% | | | £m | | | CER% | | | £% | |
Combivir | | | 322 | | | | 363 | | | | (10 | ) | | | (11 | ) | | | 127 | | | | (8 | ) | | | (11 | ) | | | 93 | | | | (21 | ) | | | (21 | ) | | | 83 | | | | 6 | | | | 4 | | | | 19 | | | | (26 | ) | | | (17 | ) |
Epivir | | | 110 | | | | 115 | | | | (3 | ) | | | (4 | ) | | | 39 | | | | 3 | | | | (3 | ) | | | 32 | | | | (14 | ) | | | (14 | ) | | | 27 | | | | 13 | | | | 13 | | | | 12 | | | | (21 | ) | | | (14 | ) |
Epzicom/Kivexa | | | 617 | | | | 555 | | | | 12 | | | | 11 | | | | 230 | | | | 14 | | | | 10 | | | | 272 | | | | 10 | | | | 11 | | | | 43 | | | | 13 | | | | 13 | | | | 72 | | | | 10 | | | | 16 | |
Lexiva | | | 142 | | | | 155 | | | | (7 | ) | | | (8 | ) | | | 74 | | | | (4 | ) | | | (8 | ) | | | 45 | | | | (14 | ) | | | (12 | ) | | | 16 | | | | 23 | | | | 23 | | | | 7 | | | | (36 | ) | | | (36 | ) |
Selzentry | | | 110 | | | | 80 | | | | 39 | | | | 38 | | | | 45 | | | | 38 | | | | 32 | | | | 51 | | | | 24 | | | | 24 | | | | 4 | | | | 100 | | | | 100 | | | | 10 | | | | >100 | | | | >100 | |
Trizivir | | | 126 | | | | 144 | | | | (11 | ) | | | (13 | ) | | | 67 | | | | (4 | ) | | | (8 | ) | | | 50 | | | | (18 | ) | | | (17 | ) | | | 5 | | | | 25 | | | | 25 | | | | 4 | | | | (43 | ) | | | (43 | ) |
Other | | | 142 | | | | 154 | | | | (6 | ) | | | (8 | ) | | | 78 | | | | (1 | ) | | | (3 | ) | | | 31 | | | | (12 | ) | | | (9 | ) | | | 21 | | | | (10 | ) | | | – | | | | 12 | | | | (11 | ) | | | (37 | ) |
| | | 1,569 | | | | 1,566 | | | | 1 | | | | – | | | | 660 | | | | 4 | | | | – | | | | 574 | | | | (3 | ) | | | (2 | ) | | | 199 | | | | 9 | | | | 9 | | | | 136 | | | | (4 | ) | | | (2 | ) |
Five year record
A record of financial performance is provided, analysed in accordance with current reporting practice. The information included in the Five year record is prepared in accordance with IFRS as adopted by the European Union and also with IFRS as issued by the International Accounting Standards Board.
| | | | | | | | | | | | | | | | | | | | |
| Turnover by division | | 2012 £m | | | 2011
(restated)
£m | | | 2010
(restated)
£m | | | 2009
(restated)
£m | | | 2008
(restated)
£m | |
Pharmaceuticals | | | 17,996 | | | | 18,615 | | | | 18,973 | | | | 19,962 | | | | 17,842 | |
Vaccines | | | 3,325 | | | | 3,497 | | | | 4,326 | | | | 3,706 | | | | 2,539 | |
Pharmaceuticals and Vaccines | | | 21,321 | | | | 22,112 | | | | 23,299 | | | | 23,668 | | | | 20,381 | |
Consumer Healthcare | | | 5,110 | | | | 5,275 | | | | 5,093 | | | | 4,700 | | | | 3,971 | |
| | | | 26,431 | | | | 27,387 | | | | 28,392 | | | | 28,368 | | | | 24,352 | |
| | | | | |
Group turnover by geographic region | | | | | | | | | | | | | | | | | | | | |
USA | | | 8,446 | | | | 8,684 | | | | 9,345 | | | | 10,315 | | | | 9,746 | |
Europe | | | 7,320 | | | | 8,271 | | | | 9,091 | | | | 9,696 | | | | 8,262 | |
EMAP | | | 6,780 | | | | 6,403 | | | | 6,074 | | | | 5,019 | | | | 4,013 | |
Japan | | | 2,225 | | | | 2,318 | | | | 2,155 | | | | 1,782 | | | | 1,127 | |
Other | | | 1,660 | | | | 1,711 | | | | 1,727 | | | | 1,556 | | | | 1,204 | |
| | | | 26,431 | | | | 27,387 | | | | 28,392 | | | | 28,368 | | | | 24,352 | |
| | | | | |
Group turnover by segment | | | | | | | | | | | | | | | | | | | | |
USA | | | 7,000 | | | | 7,022 | | | | 7,629 | | | | 8,571 | | | | 8,254 | |
Europe | | | 5,001 | | | | 5,700 | | | | 6,479 | | | | 7,063 | | | | 5,847 | |
EMAP | | | 4,736 | | | | 4,459 | | | | 4,347 | | | | 3,615 | | | | 2,748 | |
Japan | | | 1,969 | | | | 2,082 | | | | 1,959 | | | | 1,605 | | | | 995 | |
ViiV Healthcare (HIV) | | | 1,374 | | | | 1,569 | | | | 1,566 | | | | 1,605 | | | | 1,513 | |
Other trading and unallocated pharmaceuticals | | | 1,241 | | | | 1,280 | | | | 1,319 | | | | 1,209 | | | | 1,024 | |
Pharmaceuticals and Vaccines | | | 21,321 | | | | 22,112 | | | | 23,299 | | | | 23,668 | | | | 20,381 | |
Consumer Healthcare | | | 5,110 | | | | 5,275 | | | | 5,093 | | | | 4,700 | | | | 3,971 | |
| | | | 26,431 | | | | 27,387 | | | | 28,392 | | | | 28,368 | | | | 24,352 | |
|
| GSK Annual Report 2012 | 237 |
| | | | | | | | | | | | | | | | | | | | |
| Pharmaceuticals and Vaccines turnover by therapeutic area | | 2012
£m | | | 2011
(restated)
£m | | | 2010
(restated)
£m | | | 2009
(restated)
£m | | | 2008
(restated)
£m | |
Respiratory | | | 7,291 | | | | 7,298 | | | | 7,238 | | | | 6,977 | | | | 5,817 | |
Anti-virals | | | 753 | | | | 842 | | | | 1,167 | | | | 2,474 | | | | 1,638 | |
Central nervous system | | | 1,670 | | | | 1,721 | | | | 1,753 | | | | 1,870 | | | | 2,897 | |
Cardiovascular and urogenital | | | 2,431 | | | | 2,454 | | | | 2,314 | | | | 2,077 | | | | 1,674 | |
Metabolic | | | 171 | | | | 331 | | | | 647 | | | | 1,151 | | | | 1,156 | |
Anti-bacterials | | | 1,247 | | | | 1,390 | | | | 1,396 | | | | 1,457 | | | | 1,301 | |
Oncology and emesis | | | 798 | | | | 683 | | | | 679 | | | | 620 | | | | 489 | |
Dermatology | | | 850 | | | | 898 | | | | 849 | | | | 547 | | | | 305 | |
Rare diseases | | | 495 | | | | 463 | | | | 408 | | | | 364 | | | | 298 | |
Immuno-inflammation | | | 70 | | | | 15 | | | | – | | | | – | | | | – | |
Other pharmaceuticals | | | 846 | | | | 951 | | | | 956 | | | | 820 | | | | 754 | |
Vaccines | | | 3,325 | | | | 3,497 | | | | 4,326 | | | | 3,706 | | | | 2,539 | |
ViiV Healthcare (HIV) | | | 1,374 | | | | 1,569 | | | | 1,566 | | | | 1,605 | | | | 1,513 | |
| | | | 21,321 | | | | 22,112 | | | | 23,299 | | | | 23,668 | | | | 20,381 | |
| | | | | |
Consumer Healthcare turnover | | | | | | | | | | | | | | | | | | | | |
Total wellness | | | 2,008 | | | | 2,278 | | | | 2,202 | | | | 2,157 | | | | 1,776 | |
Oral care | | | 1,797 | | | | 1,711 | | | | 1,596 | | | | 1,479 | | | | 1,240 | |
Nutrition | | | 1,050 | | | | 1,025 | | | | 953 | | | | 851 | | | | 796 | |
Skin health | | | 255 | | | | 261 | | | | 342 | | | | 213 | | | | 159 | |
| | | | 5,110 | | | | 5,275 | | | | 5,093 | | | | 4,700 | | | | 3,971 | |
| | | | | |
| | | | | | | | | | | | | | | | | | | | |
| | | | | | |
| Financial results – total | | 2012
£m | | | 2011 £m | | | 2010 £m | | | 2009 £m | | | 2008 £m | |
Turnover | | | 26,431 | | | | 27,387 | | | | 28,392 | | | | 28,368 | | | | 24,352 | |
Operating profit | | | 7,392 | | | | 7,807 | | | | 3,783 | | | | 8,425 | | | | 7,141 | |
Profit before taxation | | | 6,692 | | | | 7,698 | | | | 3,157 | | | | 7,891 | | | | 6,659 | |
Profit after taxation | | | 4,744 | | | | 5,458 | | | | 1,853 | | | | 5,669 | | | | 4,712 | |
| | | | | |
| | | | | | | | | | | | | | | | | | | | |
| | | pence | | | pence | | | pence | | | pence | | | pence | |
Basic earnings per share | | | 92.9 | | | | 104.6 | | | | 32.1 | | | | 109.1 | | | | 88.6 | |
Diluted earnings per share | | | 91.5 | | | | 103.2 | | | | 31.9 | | | | 108.2 | | | | 88.1 | |
| | | | | |
| | | | | | | | | | | | | | | | | | | | |
| Financial results – core | | 2012
£m | | | 2011 £m | | | 2010 £m | | | | | | | |
Turnover | | | 26,431 | | | | 27,387 | | | | 28,392 | | | | | | | | | |
Operating profit | | | 8,330 | | | | 8,803 | | | | 9,497 | | | | | | | | | |
Profit before taxation | | | 7,635 | | | | 8,111 | | | | 8,866 | | | | | | | | | |
Profit after taxation | | | 5,771 | | | | 6,007 | | | | 6,600 | | | | | | | | | |
| | | | | |
| | | | | | | | | | | | | | | | | | | | |
| | | pence | | | pence | | | pence | | | | | | | |
Core earnings per share | | | 112.7 | | | | 115.5 | | | | 125.5 | | | | | | | | | |
Core diluted earnings per share | | | 111.0 | | | | 113.9 | | | | 124.4 | | | | | | | | | |
| | | | | |
| | | | | | | | | | | | | | | | | | | | |
| | | 2012
millions | | | 2011
millions | | | 2010
millions | | | 2009
millions | | | 2008
millions | |
Weighted average number of shares in issue: | | | | | | | | | | | | | | | | | | | | |
Basic | | | 4,912 | | | | 5,028 | | | | 5,085 | | | | 5,069 | | | | 5,195 | |
Diluted | | | 4,989 | | | | 5,099 | | | | 5,128 | | | | 5,108 | | | | 5,226 | |
| | | | | |
| | | | | | | | | | | | | | | | | | | | |
| | | % | | | % | | | % | | | % | | | % | |
Return on capital employed | | | 85.9 | | | | 82.9 | | | | 30.8 | | | | 82.8 | | | | 73.1 | |
Return on capital employed is calculated as total profit before taxation as a percentage of average net assets over the year.
238 | GSK Annual Report 2012
Investor information
Five year recordcontinued
| | | | | | | | | | | | | | | | | | | | |
| Balance sheet | | 2012 £m | | | 2011 £m | | | 2010 £m | | | 2009 £m | | | 2008 £m | |
Non-current assets | | | 27,783 | | | | 24,913 | | | | 26,194 | | | | 25,292 | | | | 22,124 | |
Current assets | | | 13,692 | | | | 16,167 | | | | 16,036 | | | | 17,570 | | | | 17,269 | |
Total assets | | | 41,475 | | | | 41,080 | | | | 42,230 | | | | 42,862 | | | | 39,393 | |
| | | | | |
Current liabilities | | | (13,815 | ) | | | (15,010 | ) | | | (12,794 | ) | | | (12,118 | ) | | | (10,017 | ) |
Non-current liabilities | | | (20,913 | ) | | | (17,243 | ) | | | (19,691 | ) | | | (20,002 | ) | | | (21,058 | ) |
Total liabilities | | | (34,728 | ) | | | (32,253 | ) | | | (32,485 | ) | | | (32,120 | ) | | | (31,075 | ) |
| | | | | |
Net assets | | | 6,747 | | | | 8,827 | | | | 9,745 | | | | 10,742 | | | | 8,318 | |
| | | | | |
Shareholders’ equity | | | 5,810 | | | | 8,032 | | | | 8,887 | | | | 10,005 | | | | 7,931 | |
Non-controlling interests | | | 937 | | | | 795 | | | | 858 | | | | 737 | | | | 387 | |
Total equity | | | 6,747 | | | | 8,827 | | | | 9,745 | | | | 10,742 | | | | 8,318 | |
Number of employees
| | | | | | | | | | | | | | | | | | | | |
| | | 2012 | | | 2011 | | | 2010 | | | 2009 | | | 2008 | |
USA | | | 17,201 | | | | 16,707 | | | | 17,555 | | | | 22,594 | | | | 21,176 | |
Europe | | | 38,788 | | | | 38,696 | | | | 39,910 | | | | 42,048 | | | | 44,677 | |
EMAP | | | 36,738 | | | | 35,080 | | | | 31,992 | | | | 28,327 | | | | 26,162 | |
Japan | | | 3,515 | | | | 3,573 | | | | 3,461 | | | | 3,264 | | | | 3,174 | |
Other | | | 3,246 | | | | 3,333 | | | | 3,543 | | | | 3,680 | | | | 3,814 | |
| | | | 99,488 | | | | 97,389 | | | | 96,461 | | | | 99,913 | | | | 99,003 | |
Manufacturing | | | 31,369 | | | | 30,664 | | | | 30,611 | | | | 31,162 | | | | 32,622 | |
Selling | | | 45,601 | | | | 45,155 | | | | 43,918 | | | | 44,621 | | | | 42,430 | |
Administration | | | 9,607 | | | | 8,883 | | | | 8,850 | | | | 9,405 | | | | 8,787 | |
Research and development | | | 12,911 | | | | 12,687 | | | | 13,082 | | | | 14,725 | | | | 15,164 | |
| | | | 99,488 | | | | 97,389 | | | | 96,461 | | | | 99,913 | | | | 99,003 | |
The geographic distribution of employees in the table above is based on the location of GSK’s subsidiary companies. The number of employees is the number of permanent employed staff at the end of the financial period. It excludes those employees who are employed and managed by GSK on a contract basis.
Exchange rates
As a guide to holders of ADS, the following tables set out, for the periods indicated, information on the exchange rate of US dollars for Sterling as reported by the Federal Reserve Bank of New York (‘noon buying rate’)*.
| | | | | | | | | | | | | | | | | | | | |
| | | 2012 | | | 2011 | | | 2010 | | | 2009 | | | 2008 | |
Average | | | 1.59 | | | | 1.60 | | | | 1.55 | | | | 1.56 | | | | 1.85 | |
The average rate for the year is calculated as the average of the noon buying rates for each day of the year.
| | | | | | | | | | | | | | | | | | | | | | | | |
| | | 2013
Feb | | | 2013
Jan | | | 2012
Dec | | | 2012
Nov | | | 2012
Oct | | | 2012
Sep | |
High | | | 1.58 | | | | 1.63 | | | | 1.60 | | | | 1.58 | | | | 1.59 | | | | 1.59 | |
Low | | | 1.51 | | | | 1.57 | | | | 1.63 | | | | 1.61 | | | | 1.62 | | | | 1.63 | |
| * | On 31 December 2008, the Federal Reserve Bank of New York ceased publishing noon buying rates. The Bank of England 4pm buying rates have been used for subsequent calculations. |
The 4pm buying rate on 28 February 2013 was £1= US$1.51.
|
| GSK Annual Report 2012 | 239 |
Shareholder information
Share capital and control
Details of our issued share capital and the number of shares held in Treasury as at 31 December 2012 can be found in Note 33 to the financial statements, ‘Share capital and share premium account’.
Our shares are listed on the London Stock Exchange and are also quoted on the New York Stock Exchange (NYSE) in the form of American Depositary Shares (ADS). Each ADS represents two Ordinary Shares. For details of listed debt and where it is listed refer to Note 32 to the financial statements, ‘Net debt’.
Holders of Ordinary Shares are entitled to receive dividends, when declared, the company’s Annual Report, to attend and speak at general meetings of the company, to appoint proxies and to exercise voting rights.
There are no restrictions on the transfer, or limitations on the holding, of Ordinary Shares and no requirements to obtain approval prior to any transfers. No Ordinary Shares carry any special rights with regard to control of the company and there are no restrictions on voting rights. Major shareholders have the same voting rights per share as all other shareholders.
There are no known arrangements under which financial rights are held by a person other than the holder of the shares and no known agreements on restrictions on share transfers or on voting rights.
Shares acquired through our share schemes and plans rank equally with the other shares in issue and have no special rights. The trustees of our Employee Share Ownership Plan trusts have waived their rights to dividends on shares held by those trusts.
Exchange controls and other limitations affecting security holders
Other than certain economic sanctions which may be in force from time to time, there are currently no applicable laws, decrees or regulations restricting the import or export of capital or affecting the remittance of dividends or other payments to holders of the company’s shares who are non-residents of the UK. Similarly, other than certain economic sanctions which may be in force from time to time, there are no limitations relating only to non-residents of the UK under English law or the company’s Articles of Association on the right to be a holder of, and to vote in respect of, the company’s shares.
Interests in voting rights
Other than as stated below, as far as we are aware, there are no persons with significant direct or indirect holdings in the company. Information provided to the company pursuant to the Financial Services Authority’s (FSA) Disclosure and Transparency Rules (DTRs) is published on a Regulatory Information Service and on the company’s website.
At 28 February 2013, the company had received notifications in accordance with the FSA’s DTRs of the following notifiable interests in the voting rights in the company’s issued share capital:
| | | | | | | | |
| | | No. of shares | | | *Percentage of
issued capital (%) | |
BlackRock, Inc. | | | 271,061,000 | | | | 5.52 | |
Legal & General Group Plc | | | 153,140,293 | | | | 3.12 | |
| * | Percentage of Ordinary Shares in issue, excluding Treasury shares. |
BNY Mellon Depositary Receipts is the Depositary for the company’s ADS, which are listed on the NYSE. Ordinary Shares representing the company’s ADR programme, which is managed by the Depositary,
are registered in the name of BNY (Nominees) Limited. Details of the number of Ordinary Shares held by the Depositary can be found on page 244.
We have not acquired or disposed of any interests in our own shares during the period under review, other than in connection with our share buy-back programme.
Share buy-back programme
The Board has been authorised to issue and allot Ordinary Shares under Article 9 of the company’s Articles of Association. The power under Article 9 and the authority for the company to make purchases of its own shares are subject to shareholder authorities which are sought on an annual basis at our Annual General Meeting (AGM). Any shares purchased by the company may be cancelled or held as Treasury shares.
During 2012, we continued our long-term share buy-back programme and 174 million shares were purchased at a total cost of £2,493 million. No shares were purchased in the period 1 January to 28 February 2013.
Our programme covers purchases of shares for cancellation or to be held as Treasury shares, in accordance with the authority renewed by shareholders at the AGM in May 2012, when the company was authorised to purchase a maximum of just under 505 million shares. Details of shares purchased, expectations of future repurchases, those cancelled, and those held as Treasury shares are disclosed in Note 33 to the financial statements ‘Share capital and share premium account’.
The exact amount and timing of any future purchases, and the extent to which repurchased shares will be held as Treasury shares rather than being cancelled, will be determined by the company and is dependent on market conditions and other factors.
Market capitalisation
The market capitalisation, based on shares in issue excluding Treasury shares, of GSK at 31 December 2012 was £65.47 billion. At that date, GSK was the fifth largest company by market capitalisation in the FTSE index.
Share price
| | | | | | | | | | | | |
| | | 2012 £ | | | 2011 £ | | | 2010 £ | |
At 1 January | | | 14.72 | | | | 12.40 | | | | 13.20 | |
At 31 December | | | 13.35 | | | | 14.72 | | | | 12.40 | |
(Decrease)/increase | | | (9.3% | ) | | | 18.7% | | | | (6.1% | ) |
High during the year | | | 15.08 | | | | 14.74 | | | | 13.40 | |
Low during the year | | | 13.18 | | | | 11.28 | | | | 10.95 | |
The table above sets out the middle market closing prices. The company’s share price decreased by 9.3% in 2012. This compares with an increase in the FTSE 100 index of 5.8% during the year. The share price on 28 February 2013 was £14.56.
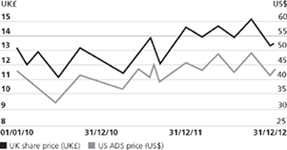
240 | GSK Annual Report 2012
Shareholder information
Nature of trading market
The following tables set out, for the periods indicated, the high and low middle market closing quotations in pence for the shares on the London Stock Exchange, and the high and low closing prices in US dollars for the ADS on the NYSE.
| | | | | | | | |
| | | Pence per share | |
| Ordinary Shares | | High | | | Low | |
Quarter ended 31 March 2013* | | | 1486 | | | | 1359 | |
February 2013 | | | 1486 | | | | 1438 | |
January 2013 | | | 1450 | | | | 1359 | |
December 2012 | | | 1377 | | | | 1335 | |
November 2012 | | | 1400 | | | | 1318 | |
October 2012 | | | 1465 | | | | 1387 | |
September 2012 | | | 1457 | | | | 1409 | |
Quarter ended 31 December 2012 | | | 1465 | | | | 1318 | |
Quarter ended 30 September 2012 | | | 1508 | | | | 1409 | |
Quarter ended 30 June 2012 | | | 1479 | | | | 1392 | |
Quarter ended 31 March 2012 | | | 1497 | | | | 1387 | |
Quarter ended 31 December 2011 | | | 1474 | | | | 1312 | |
Quarter ended 30 September 2011 | | | 1385 | | | | 1205 | |
Quarter ended 30 June 2011 | | | 1349 | | | | 1201 | |
Quarter ended 31 March 2011 | | | 1270 | | | | 1128 | |
Year ended 31 December 2010 | | | 1340 | | | | 1095 | |
Year ended 31 December 2009 | | | 1334 | | | | 987 | |
Year ended 31 December 2008 | | | 1385 | | | | 995 | |
| | | | | | | | |
| | | US dollars per ADS | |
| ADS | | High | | | Low | |
Quarter ended 31 March 2013* | | | 45.98 | | | | 43.93 | |
February 2013 | | | 45.98 | | | | 44.03 | |
January 2013 | | | 45.61 | | | | 43.93 | |
December 2012 | | | 44.37 | | | | 43.01 | |
November 2012 | | | 44.86 | | | | 41.90 | |
October 2012 | | | 47.45 | | | | 44.80 | |
September 2012 | | | 47.11 | | | | 45.14 | |
Quarter ended 31 December 2012 | | | 47.45 | | | | 41.90 | |
Quarter ended 30 September 2012 | | | 47.23 | | | | 44.26 | |
Quarter ended 30 June 2012 | | | 47.29 | | | | 43.45 | |
Quarter ended 31 March 2012 | | | 46.35 | | | | 43.73 | |
Quarter ended 31 December 2011 | | | 45.74 | | | | 40.53 | |
Quarter ended 30 September 2011 | | | 44.91 | | | | 38.84 | |
Quarter ended 30 June 2011 | | | 43.74 | | | | 38.78 | |
Quarter ended 31 March 2011 | | | 39.86 | | | | 36.33 | |
Year ended 31 December 2010 | | | 42.97 | | | | 32.34 | |
Year ended 31 December 2009 | | | 42.91 | | | | 27.27 | |
Year ended 31 December 2008 | | | 54.36 | | | | 32.02 | |
* to 28 February 2013
Dividends
The company pays dividends quarterly. It continues to increase cash returns to shareholders through its dividend policy and ongoing long-term share buy-back programme. Dividends remain an essential component of total shareholder return and the company is committed to increasing its dividend over the long-term. Details of the dividends declared, the amounts and the payment dates are given in Note 16 to the financial statements, ‘Dividends’.
Dividends per share
The table below sets out the dividend per share and per ADS for the last five years. The dividend per ADS is translated into US dollars at applicable exchange rates.
| | | | | | | | | | |
| Year | | Dividend | | pence | | | US$ | |
2012 | | | | | 74 | | | | 2.35 | |
2011 | | | | | 70 | | | | 2.25 | |
2011 | | Supplemental* | | | 5 | | | | 0.16 | |
2010 | | | | | 65 | | | | 2.04 | |
2009 | | | | | 61 | | | | 1.99 | |
2008 | | | | | 57 | | | | 2.01 | |
| * | The 2011 supplemental dividend related to the disposal of certain non-core OTC brands in North America. This was paid with the fourth quarter ordinary dividend for 2011. |
Dividend calendar
| | | | | | | | | | | | |
| Quarter | | Ex-dividend date | | | Record date | | | Payment date | |
Q4 2012 | | | 20 February 2013 | | | | 22 February 2013 | | | | 11 April 2013 | |
Q1 2013 | | | 8 May 2013 | | | | 10 May 2013 | | | | 11 July 2013 | |
Q2 2013 | | | 7 August 2013 | | | | 9 August 2013 | | | | 3 October 2013 | |
Q3 2013 | | | 13 November 2013 | | | | 15 November 2013 | | | | 9 January 2014 | |
Financial reporting calendar
| | | | |
| Publication | | Date | |
Results announcements | | | | |
Quarter 1 | | | April 2013 | |
Quarter 2 | | | July 2013 | |
Quarter 3 | | | October 2013 | |
Preliminary/Quarter 4 | | | February 2014 | |
Annual Report/Summary | | | February/March 2014 | |
Results announcements
Results announcements are issued to the London Stock Exchange and are available on its news service. They are also sent to the US Securities and Exchange Commission and the NYSE, issued to the media and made available on our website.
Financial reports
The company publishes an Annual Report and, for the shareholder not needing the full detail of the Annual Report, a Summary. These documents are available on the website from the date of publication. The Summary is sent to all shareholders. Shareholders may elect to receive the Annual Report by contacting the registrar. Alternatively, shareholders may elect to receive notification by email of the publication of financial reports by registering on www.shareview.co.uk.
Copies of previous financial reports are available on our website. Printed copies can be obtained from our registrar in the UK and from the GSK Response Center in the USA, (see pages 245 and 246 for the contact details).
|
| GSK Annual Report 2012 | 241 |
Directors
Our Directors’ powers are determined by UK legislation and our Articles of Association, which are available on our website. The Articles may be amended by a special resolution of the members. The Directors may exercise all the company’s powers provided that the Articles or applicable legislation do not stipulate that any such powers must be exercised by the members.
The rules about the appointment and replacement of Directors are contained in our Articles. They provide that Directors may be appointed by an ordinary resolution of the members or by a resolution of the Directors, provided that, in the latter instance, a Director appointed in this way retires at the first AGM following his or her appointment.
Our Articles also provide that Directors should normally be subject to re-election at the AGM at intervals of three years or annually if they have held office for a continuous period of nine years or more. However, the Board agreed in 2011 that all Directors, who wish to continue as members of the Board, should seek re-election annually in accordance with the UK Corporate Governance Code. Members may remove a Director by passing an ordinary resolution of which special notice has been given, or by passing a special resolution. A Director may automatically cease to be a Director if:
| • | | he or she becomes bankrupt or compounds with his or her creditors generally |
| • | | he or she ceases to be a Director by virtue of the Companies Act or the Articles |
| • | | he or she is suffering from mental or physical ill health |
| • | | he or she has missed Directors’ meetings for a continuous period of six months without permission and the Board resolves that he or she shall cease to be a Director |
| • | | he or she is prohibited from being a Director by law |
| • | | he or she offers to resign and the Board accepts that offer |
| • | | all other Directors (being at least three in number) require him or her to resign. |
Directors’ conflicts of interest
All Directors have a duty under the Companies Act 2006 to avoid a situation in which they have, or could have, a direct or indirect conflict of interest or possible conflict with the company. The duty applies, in particular, to the exploitation of any property, information or opportunity whether or not the company could take advantage of it. Our Articles provide a general power for the Board to authorise such conflicts.
The Nominations Committee has been authorised by the Board to grant and periodically, but in any event annually, to review any potential or actual conflict authorisations. Directors are not counted in the quorum for the authorisation of their own actual or potential conflicts. Authorisations granted are recorded by the Company Secretary in a register and are noted by the Board at its next meeting.
On an ongoing basis, the Directors are responsible for informing the Company Secretary of any new actual or potential conflicts that may arise or if there are any changes in circumstances that may affect an authorisation previously given. Even when provided with authorisation, a Director is not absolved from his or her statutory duty to promote the success of the company.
If an actual conflict arises post-authorisation, the Board may choose to exclude the Director from receipt of the relevant information and participation in the debate, or suspend the Director from the Board, or, as a last resort, require the Director to resign.
The Nominations Committee reviewed the register of potential conflict authorisations in October 2012 and reported to the Board that the conflicts had been appropriately authorised and that the process for authorisation continues to operate effectively.
Independent advice
The Board recognises that there may be occasions when one or more of the Directors feel it is necessary to take independent legal and/or financial advice at the company’s expense. There is an agreed procedure, which is set out on our website, to enable them to do so.
Indemnification of Directors
Qualifying third party indemnity provisions (as defined in the Companies Act 2006) are in force for the benefit of Directors and former Directors who held office during 2012 and up to the signing of the Annual Report.
Change of control and essential contracts
We do not have contracts or other arrangements which individually are fundamental to the ability of the business to operate effectively, nor is the company party to any material agreements that would take effect, be altered, or terminate upon a change of control following a takeover bid.
We do not have agreements with any Director that would provide compensation for loss of office or employment resulting from a takeover, except that provisions of the company’s share plans may cause options and awards granted under such plans to vest on a takeover. Details of the termination provisions in the company’s framework for contracts for Executive Directors are given on page 125.
Annual General Meeting 2013
Wednesday, 1 May 2013
The Queen Elizabeth II Conference Centre
Broad Sanctuary, Westminster, London SW1P 3EE
The AGM is the company’s principal forum for communication with private shareholders. In addition to the formal business, there will be a presentation by the CEO on the performance of the Group and its future development. There will be an opportunity for questions to be asked to the Board. Chairmen of the Board’s Committees will take questions relating to those Committees.
Investors holding shares through a nominee service should arrange with that nominee service to be appointed as a proxy in respect of their shareholding in order to attend and vote at the meeting.
ADR holders wishing to attend the meeting must obtain a proxy from BNY Mellon Depositary Receipts. This will enable them to attend and vote on the business to be transacted. ADR holders may instruct BNY Mellon Depositary Receipts as to the way in which the shares represented by their ADR should be voted by completing and returning the voting card provided by the bank.
Documents on display
The Articles of Association of the company and other documents referred to in this Annual Report are available for inspection at the company’s registered office and on our website and will be made available for inspection at the AGM.
242 | GSK Annual Report 2012
Shareholder information
Donations to political organisations and political expenditure
With effect from 1 January 2009, to ensure a consistent approach to political contributions across the Group, we introduced a global policy to stop voluntarily all corporate political contributions.
In the period from 1 January 2009 to 31 December 2012, the Group did not make any political donations to EU or non-EU organisations.
Notwithstanding the introduction of this policy, in accordance with the Federal Election Campaign Act in the USA, we continue to support an employee-operated Political Action Committee (PAC) that facilitates voluntary political donations by eligible GSK employees.
The PAC is not controlled by GSK. Decisions on the amounts and recipients of contributions are made by participating employees exercising their legal right to pool their resources and make political contributions, which are subject to strict limitations. In 2012, a total of US$565,630 (US$612,500 in 2011) was donated to political organisations by the GSK employee PAC.
At the AGM in May 2001, shareholders first authorised the company to make donations to EU political organisations and to incur EU political expenditure, under the provisions of the Political Parties, Elections and Referendums Act 2000, of up to £100,000 each year. This authority has since been renewed annually. The Companies Act 2006 requires companies to continue to obtain shareholder approval before they can make donations to EU political organisations or incur EU political expenditure.
However, we do not make and do not intend to make donations to political parties or independent election candidates, nor do we make any donations to EU political organisations or incur EU political expenditure.
The definitions of political donations, political expenditure and political organisations used in the legislation are very wide. In particular, the definition of EU political organisations may extend to bodies such as those concerned with policy review, law reform, the representation of the business community and special interest groups such as those concerned with the environment, which the company and its subsidiaries might wish to support. As a result, the definitions may cover legitimate business activities not in the ordinary sense considered to be political donations or political expenditure.
Such activities are not designed to support any political party or independent election candidate. The authority which the Board has sought annually is a precautionary measure to ensure that the company and its subsidiaries do not inadvertently breach the legislation.
US law and regulation
A number of provisions of US law and regulation apply to the company because our shares are quoted on the New York Stock Exchange (NYSE) in the form of ADS.
NYSE rules
In general, the NYSE rules permit the company to follow UK corporate governance practices instead of those applied in the USA, provided that we explain any significant variations. This explanation is contained in our Form 20-F filing, which can be accessed from the Securities and Exchange Commission’s (SEC) EDGAR database or via our website. NYSE rules that came into effect in 2005 require us to file annual and interim written affirmations concerning the Audit & Risk Committee and our statement on significant differences in corporate governance.
Sarbanes-Oxley Act of 2002
Following a number of corporate and accounting scandals in the USA, Congress passed the Sarbanes-Oxley Act of 2002. Sarbanes-Oxley is a wide-ranging piece of legislation concerned largely with financial reporting and corporate governance.
As recommended by the SEC, the company has established a Disclosure Committee. The Committee reports to the CEO, the CFO and to the Audit & Risk Committee. It is chaired by the Company Secretary and the members consist of senior managers from finance, legal, corporate communications and investor relations.
External legal counsel, the external auditors and internal experts are invited to attend its meetings periodically. It has responsibility for considering the materiality of information and, on a timely basis, determining the disclosure of that information. It has responsibility for the timely filing of reports with the SEC and the formal review of the Annual Report and Form 20-F. In 2012, the Committee met 10 times.
Sarbanes-Oxley requires that the Annual Report contains a statement as to whether a member of our Audit & Risk Committee (ARC) is an audit committee financial expert as defined by Sarbanes-Oxley. Such a statement for each of the relevant members of the ARC (Stacey Cartwright, Judy Lewent and Tom de Swaan) is included in each of their biographies on pages 90 and 91. Additional disclosure requirements arise under section 302 and section 404 of Sarbanes-Oxley in respect of disclosure controls and procedures and internal control over financial reporting.
Section 302: Corporate responsibility for financial reports
Sarbanes-Oxley also introduced a requirement for the CEO and the CFO to complete formal certifications, confirming that:
| • | | they have each reviewed the Annual Report and Form 20-F |
| • | | based on their knowledge, the Annual Report and Form 20-F contains no material misstatements or omissions |
| • | | based on their knowledge, the financial statements and other financial information fairly present, in all material respects, the financial condition, results of operations and cash flows as of the dates, and for the periods, presented in the Annual Report and Form 20-F |
| • | | they are responsible for establishing and maintaining disclosure controls and procedures that ensure that material information is made known to them, and have evaluated the effectiveness of these controls and procedures as at the year-end, the results of such evaluation being contained in the Annual Report and Form 20-F |
| • | | they are responsible for establishing and maintaining internal control over financial reporting that provides reasonable assurance regarding the reliability of financial reporting and the preparation of financial statements for external purposes in accordance with generally accepted accounting principles |
| • | | they have disclosed in the Annual Report and Form 20-F any changes in internal controls over financial reporting during the period covered by the Annual Report and Form 20-F that have materially affected, or are reasonably likely to affect materially, the company’s internal control over financial reporting, and |
|
| GSK Annual Report 2012 | 243 |
| • | | they have disclosed, based on their most recent evaluation of internal control over financial reporting, to the external auditors and the ARC, all significant deficiencies and material weaknesses in the design or operation of internal controls over financial reporting which are reasonably likely to affect adversely the company’s ability to record, process, summarise and report financial information, and any fraud (regardless of materiality) involving persons that have a significant role in the company’s internal control over financial reporting. |
The Group has carried out an evaluation under the supervision and with the participation of its management, including the CEO and CFO, of the effectiveness of the design and operation of the Group’s disclosure controls and procedures as at 31 December 2012.
There are inherent limitations to the effectiveness of any system of disclosure controls and procedures, including the possibility of human error and the circumvention or overriding of the controls and procedures. Accordingly, even effective disclosure controls and procedures can only provide reasonable assurance of achieving their control objectives.
The CEO and CFO expect to complete these certifications and report their conclusions on the effectiveness of disclosure controls and procedures in March 2013, following which the certificates will be filed with the SEC as part of the Group’s Form 20-F.
Section 404: Management’s annual report on internal control over financial reporting
In accordance with the requirements of section 404 of Sarbanes-Oxley, the following report is provided by management in respect of the company’s internal control over financial reporting (as defined in Rules 13a-15(f) and 15d-15(f) under the US Securities Exchange Act of 1934):
| • | | management is responsible for establishing and maintaining adequate internal control over financial reporting for the Group. Internal control over financial reporting is designed to provide reasonable assurance regarding the reliability of financial reporting and the preparation of financial statements for external purposes in accordance with IFRS |
| • | | management conducted an evaluation of the effectiveness of internal control over financial reporting based on the framework, Internal Control – Integrated Framework issued by the Committee of Sponsoring Organisations of the Treadway Commission |
| • | | there have been no changes in the Group’s internal control over financial reporting during 2012 that have materially affected, or are reasonably likely to affect materially, the Group’s internal control over financial reporting |
| • | | management has assessed the effectiveness of internal control over financial reporting as at 31 December 2012 and its conclusion will be filed as part of the Group’s Form 20-F, and |
PricewaterhouseCoopers LLP, which has audited the consolidated financial statements of the Group for the year ended 31 December 2012, has also assessed the effectiveness of the Group’s internal control over financial reporting under Auditing Standard No. 5 of the Public Company Accounting Oversight Board (United States). Their audit report will be filed with the Group’s Form 20-F.
Tax information for shareholders
A summary of certain UK tax and US federal income tax consequences for holders of shares and ADR who are citizens of the UK or the USA is set out below. It is not a complete analysis of all the possible tax consequences of the purchase, ownership or sale of these securities. It is intended only as a general guide. Holders are advised to consult their advisers with respect to the tax consequences of the purchase, ownership or sale of their shares or ADR and the consequences under state and local tax laws in the USA and the implications of the current UK/US tax conventions.
US holders of ADR generally will be treated as the owners of the underlying shares for the purposes of the current USA/UK double taxation conventions relating to income and gains (Income Tax Convention), estate and gift taxes (Estate and Gift Tax Convention), and for purposes of the Internal Revenue Code of 1986, as amended (the Code).
UK shareholders
This summary only applies to a UK resident shareholder that holds shares as capital assets.
Taxation of dividends
UK resident shareholders will generally be subject to UK income tax on the full amount of dividends paid, grossed up for the amount of a tax credit. The tax credit may be set against the individual’s income tax liability in respect of the gross dividend, but is not repayable to shareholders with a tax liability of less than the associated tax credit. For the tax year 2010-11 and subsequent tax years, an additional rate of income tax on dividends was imposed for taxpayers whose income is above £150,000. UK resident shareholders that are corporation taxpayers should note that dividends are generally entitled to exemption from corporation tax.
Taxation of capital gains
UK shareholders may be liable for UK tax on gains on the disposal of shares or ADR. For disposals by individuals and subject to the availability of any exemption or relief such as the annual exempt amount, a taxable capital gain accruing on a disposal of shares or ADR will be taxed at 28% if, after all allowable deductions, such shareholder’s taxable income for the tax year exceeds the basic rate income tax limit. In other cases, a taxable capital gain accruing on a disposal of shares or ADR may be taxed at 18% or 28% or at a combination of both rates. Corporation taxpayers may be entitled to an indexation allowance which applies to reduce capital gains to the extent that such gains arise due to inflation. Indexation allowance may reduce a chargeable gain but will not create an allowable loss.
Inheritance tax
Individual shareholders may be liable to inheritance tax on the transfer of shares or ADR. Tax may be charged on the amount by which the value of the shareholder’s estate is reduced as a result of any transfer by way of gift or other disposal at less than full market value. If such a gift or other disposal were subject to both UK inheritance tax and US estate or gift tax, the Estate and Gift Tax Convention would generally provide for tax paid in the USA to be credited against tax payable in the UK.
Stamp duty
UK stamp duty or stamp duty reserve tax (SDRT) will, subject to certain exemptions, be payable on the transfer of shares at a rate of 0.5% of the consideration for the transfer.
244 | GSK Annual Report 2012
Shareholder information
US shareholders
This summary only applies to a shareholder (who is a citizen or resident of the USA or a domestic corporation or a person that is otherwise subject to US federal income tax on a net income basis in respect of the shares or ADR) that holds shares or ADR as capital assets, is not resident in the UK for UK tax purposes and does not hold shares for the purposes of a trade, profession or vocation that is carried on in the UK through a branch or agency.
The summary also does not address the tax treatment of holders that are subject to special tax rules, such as banks, tax-exempt entities, insurance companies, dealers in securities or currencies, persons that hold shares or ADR as part of an integrated investment (including a ‘straddle’) comprised of a share or ADR and one or more other positions, and persons that own (directly or indirectly) 10% or more of the voting stock of the company.
Taxation of dividends
The gross amount of dividends received is treated as foreign source dividend income for US tax purposes. It is not eligible for the dividend received deduction allowed to US corporations. Dividends on ADR are payable in US dollars; dividends on shares are payable in pounds Sterling. Dividends paid in pounds Sterling will be included in income in the US dollar amount calculated by reference to the exchange rate on the day the dividends are received by the holder. Subject to certain exceptions for short-term or hedged positions, an individual eligible US holder will be subject to US taxation at a maximum rate of 23.8% in respect of qualified dividends.
Taxation of capital gains
Generally, US holders will not be subject to UK capital gains tax, but will be subject to US tax on capital gains realised on the sale or other disposal of shares or ADR. Such gains will be long-term capital gains (subject to reduced rates of taxation for individual holders) if the shares or ADR were held for more than one year.
Information reporting and backup withholding
Dividends and payments of the proceeds on a sale of shares or ADR, paid within the USA or through certain US-related financial intermediaries are subject to information reporting and may be subject to backup withholding unless the US holder is a corporation or other exempt recipient or provides a taxpayer identification number and certifies that no loss of exemption has occurred. Non-US holders generally are not subject to information reporting or backup withholding, but may be required to provide a certification of their non-US status in connection with payments received. Any amounts withheld will be allowed as a refund or credit against a holder’s US federal income tax liability provided the required information is furnished to the IRS.
Estate and gift taxes
Under the Estate and Gift Tax Convention, a US shareholder is not generally subject to UK inheritance tax.
Stamp duty
UK stamp duty or SDRT will, subject to certain exemptions, be payable on any transfer of shares to the ADR custodian or depository at a rate of 1.5% of the amount of any consideration provided (if transferred on sale), or their value (if transferred for no consideration).
No SDRT would be payable on the transfer of, or agreement to transfer an ADR. No UK stamp duty should be payable on the transfer of an ADR provided that any instrument of transfer is executed and remains at all times outside the UK. Any stamp duty on the transfer of an ADR would be payable at a rate of 0.5% of the consideration for the transfer. Any sale of the underlying shares would, subject to certain exceptions, result in liability to UK stamp duty or, as the case may be, SDRT at a rate of 0.5%.
Analysis of shareholdings at 31 December 2012
| | | | | | | | | | | | | | | | | | | | | | |
| | | Number of
accounts | | | | | % of total
accounts | | | | | % of total
shares | | | | | Number of shares | |
Holding of shares | | | | | | | | | | | | | | | | | | | | | | |
Up to 1,000 | | | 103,283 | | | | | | 71 | | | | | | 1 | | | | | | 37,927,294 | |
1,001 to 5,000 | | | 33,509 | | | | | | 23 | | | | | | 1 | | | | | | 71,925,595 | |
5,001 to 100,000 | | | 7,439 | | | | | | 5 | | | | | | 2 | | | | | | 106,883,853 | |
100,001 to 1,000,000 | | | 757 | | | | | | 1 | | | | | | 5 | | | | | | 262,970,591 | |
Over 1,000,000 | | | 367 | | | | | | 0 | | | | | | 91 | | | | | | 4,917,888,636 | |
| | | | 145,355 | | | | | | 100 | | | | | | 100 | | | | | | 5,397,595,969 | |
Held by | | | | | | | | | | | | | | | | | | | | | | |
Nominee companies | | | 25,175 | | | | | | 17 | | | | | | 71 | | | | | | 3,833,796,077 | |
Investment and trust companies | | | 38 | | | | | | 0 | | | | | | 0 | | | | | | 4,688,382 | |
Insurance companies | | | 9 | | | | | | 0 | | | | | | 0 | | | | | | 5,971 | |
Individuals and other corporate bodies | | | 120,131 | | | | | | 83 | | | | | | 5 | | | | | | 248,039,527 | |
BNY (Nominees) Limited | | | 1 | | | | | | 0 | | | | | | 15 | | | | | | 816,114,685 | |
Held as Treasury shares by GlaxoSmithKline | | | 1 | | | | | | 0 | | | | | | 9 | | | | | | 494,951,327 | |
| | | | 145,355 | | | | | | 100 | | | | | | 100 | | | | | | 5,397,595,969 | |
BNY Mellon Depositary Receipts’ holding held through BNY (Nominees) Limited represents the company’s ADR programme, whereby each ADS represents two Ordinary Shares of 25p nominal value. At 28 February 2013, BNY (Nominees) Limited held 816,909,301 Ordinary Shares representing 16.65% of the issued share capital (excluding Treasury shares) held at that date.
At 28 February 2013, the number of holders of shares in the USA was 1,075 with holdings of 1,191,611 shares, and the number of registered holders of ADS was 28,804 with holdings of 408,454,650 ADS. Certain of these shares and ADS were held by brokers or other nominees. As a result, the number of holders of record or registered holders in the USA is not representative of the number of beneficial holders or of the residence of beneficial holders.
|
| GSK Annual Report 2012 | 245 |
Shareholder services and contacts
Registrar
The company’s registrar is:
Equiniti Limited
Aspect House, Spencer Road, Lancing, BN99 6DA
www.shareview.co.uk
Tel: 0871 384 2991 (in the UK)*
Tel: +44(0)121 415 7067 (outside the UK)
Equiniti provides a range of services for shareholders:
| | | | |
Service | | What it offers | | How to participate |
| Shareview service | | This enables you to create a free online portfolio to view your share balance and movements, update your address and dividend payment instructions and register your votes for our AGM. | | You can register at: www.shareview.co.uk |
| Corporate Sponsored Nominee Account | | This is a convenient way to manage your shares without requiring a share certificate. The service provides a facility for you to hold your shares in a nominee company sponsored by the company. You will continue to receive dividend payments, annual reports and can attend and vote at the company’s general meetings. Shareholders’ names do not appear on the publicly available share register and the service is free to join. | | An application form can be downloaded from www.shareview.co.uk or requested by telephoning Equiniti. |
| Dividend payment direct to your bank account | | If you currently receive your dividends by cheque through the post, you can instead have them paid directly into your bank or building society account. This is quicker, more secure and avoids the risk of your cheque going astray. | | A dividend bank mandate form can be downloaded from www.shareview.co.uk or requested by telephoning Equiniti. |
| Dividend payment direct to bank account for overseas shareholders | | Instead of waiting for a sterling cheque to arrive by post, Equiniti will convert your dividend into your local currency and send it direct to your local bank account. This service is available in over 100 countries worldwide. | | For more details on this service and the costs involved please contact Equiniti. |
| Dividend Reinvestment Plan (DRIP) | | As an alternative to receiving cash dividends you may choose to reinvest your dividends to buy more GSK shares. | | A DRIP election form can be downloaded from www.shareview.co.uk or requested by telephoning Equiniti. |
| Duplicate publications or mailings | | If you receive duplicate copies of this report or other mailings, please contact Equiniti and they will arrange for your accounts to be merged into one for your convenience and to avoid waste and unnecessary costs. | | Please contact Equiniti. |
| Share dealing service† (please note that market trading hours are from 8.00am to 4.30pm UK time, Monday to Friday, excluding UK public holidays) | | Shareholders may trade shares, either held as certificates or held in our Corporate Sponsored Nominee, by internet or telephone through the share dealing service provided by Equiniti Financial Services Limited. | | For internet transactions, please log on to www.shareview.co.uk/dealing. For telephone transactions, please call 0845 603 7037 (in the UK) or +44 (0)121 415 7560 (outside the UK) |
| Individual Savings Accounts (ISAs)† | | The company has arranged for Equiniti Financial Services Limited to provide a GSK Corporate ISA to hold GSK Ordinary Shares. | | Details are available from www.shareview.co.uk or can be requested by telephoning Equiniti. |
| * | UK lines are open from 8.30am to 5.30pm, Monday to Friday, except UK public holidays, and calls to the number are charged at 8p per minute plus network extras. |
| † | The provision of share dealing details is not intended to be an invitation or inducement to engage in an investment activity. Advice on share dealing should be obtained from a stockbroker or independent financial adviser. |
246 | GSK Annual Report 2012
Shareholder information
ADR Depositary
The ADR programme is administered by:
BNY Mellon Depositary Receipts
PO Box 43006
Providence, RI 02940-3006
www.bnymellon.com/shareowner
Tel: 1 877 353 1154 (US toll free)
Tel: +1 201 680 6825 (outside the USA)
email: shrrelations@bnymellon.com
The Depositary also provides Global BuyDIRECT†, a direct ADS purchase/sale and dividend reinvestment plan for ADR holders.
Glaxo Wellcome and SmithKline Beecham Corporate PEPs
The Share Centre Limited
Oxford House, Oxford Road, Aylesbury, Bucks HP21 8SZ
Tel: +44 (0)1296 414 141
ShareGift
17 Carlton House Terrace, London, SW1Y 5AH
Tel: +44 (0)20 7930 3737
www.sharegift.org
Shareholders with a small number of shares, the value of which makes it uneconomical to sell, may wish to consider donating them to the charity ShareGift (registered charity no. 1052686). Donated shares are aggregated and sold by ShareGift, who pass on the proceeds to a wide range of charities.†
Share scam alert
If you receive an unsolicited telephone call offering to sell or buy your shares, please take extra care. The caller may be part of a highly organised financial scam.
If you are a UK shareholder, please contact the Financial Services Authority for further information on this, or other similar activities, on its consumer helpline:
Tel: 0845 606 1234 (in the UK)
Lines are open from 8.00am to 6.00pm, UK time,
Monday to Friday, except UK public holidays.
Corporate Responsibility Report
We are publishing our Corporate Responsibility Report 2012 online in 2013. This will outline GSK’s approach to, and performance in, our key corporate responsibility areas, Health for all, Our behaviour, Our people and Our planet.
Internet
Information about the company, including the share price, is available on our website at www.gsk.com. Information made available on the website does not constitute part of this Annual Report.
| † | The provision of share dealing details is not intended to be an invitation or inducement to engage in an investment activity. Advice on share dealing should be obtained from a stockbroker or independent financial adviser. |
Contacts
GSK Response Center
Tel: 1 888 825 5249 (US toll free)
Investor relations
Investor relations may be contacted as follows:
UK
980 Great West Road,
Brentford
Middlesex
TW8 9GS
Tel: +44 (0)20 8047 5000
USA
Five Crescent Drive
Philadelphia PA 19112
Tel: 1 888 825 5249 (US toll free)
Tel: +1 215 751 4000 (outside the USA)
|
| GSK Annual Report 2012 | 247 |
Glossary of terms
| | |
Terms used in the Annual Report | | US equivalent or brief description |
| Accelerated capital allowances | | Tax allowance in excess of depreciation arising from the purchase of fixed assets that delay the charging and payment of tax. The US equivalent of tax depreciation. |
| American Depositary Receipt (ADR) | | Receipt evidencing title to an ADS. Each GlaxoSmithKline ADR represents two Ordinary Shares. |
| American Depositary Shares (ADS) | | Listed on the New York Stock Exchange; represents two Ordinary Shares. |
| Basic earnings per share | | Basic income per share. |
| Called-up share capital | | Ordinary Shares, issued and fully paid. |
| CER growth | | Growth at constant exchange rates. |
| The company | | GlaxoSmithKline plc. |
| Corporate Integrity Agreement (CIA) | | In 2012, the company entered into a settlement with the US Federal Government related to past sales and marketing practices. As part of the settlement the company entered into a Corporate Integrity Agreement with the US Department of Health and Human Services, under which improvements are being built into its existing compliance programmes. |
| Currency swap | | An exchange of two currencies, coupled with a subsequent re-exchange of those currencies, at agreed exchange rates and dates. |
| Defined benefit plan | | Pension plan with specific employee benefits, often called ‘final salary scheme’. |
| Defined contribution plan | | Pension plan with specific contributions and a level of pension dependent upon the growth of the pension fund. |
| Derivative financial instrument | | A financial instrument that derives its value from the price or rate of some underlying item. |
| Diluted earnings per share | | Diluted income per share. |
| Employee Share Ownership Plan Trusts | | Trusts established by the Group to satisfy share-based employee incentive plans. |
| Finance lease | | Capital lease. |
| Freehold | | Ownership with absolute rights in perpetuity. |
| Gearing ratio | | Net debt as a percentage of total equity. |
| The Group | | GlaxoSmithKline plc and its subsidiary undertakings. |
| Hedging | | The reduction of risk, normally in relation to foreign currency or interest rate movements, by making off-setting commitments. |
| Intangible fixed assets | | Assets without physical substance, such as computer software, brands, licences, patents, know-how and marketing rights purchased from outside parties. |
| Profit | | Income. |
| Profit attributable to shareholders | | Net income. |
| Share capital | | Ordinary Shares, capital stock or common stock issued and fully paid. |
| Shareholders’ funds | | Shareholders’ equity. |
| Share option | | Stock option. |
| Share premium account | | Additional paid-up capital or paid-in surplus (not distributable). |
| Shares in issue | | The number of shares outstanding. |
| Subsidiary | | An entity in which GlaxoSmithKline holds a majority shareholding and/or exercises control. |
| Treasury share | | Treasury stock. |
| Turnover | | Revenue. |
| UK Corporate Governance Code | | As required by the UK Listing Authority, the company has disclosed in the Annual Report how it has applied the best practice corporate governance provisions of the Financial Reporting Council’s UK Corporate Governance Code. |
248 | GSK Annual Report 2012
Shareholder information
Index
| | | | |
| | | Page | |
Access to medicines | | | 10 | |
Accounting principles and policies | | | 144 | |
Acquisitions and disposals | | | 188 | |
Adjustments reconciling profit after tax to operating cash flows | | | 186 | |
Annual General Meeting | | | 241 | |
Assets held for sale | | | 171 | |
Associates and joint ventures | | | 159 | |
Board | | | 88 | |
Business review | | | 01 | |
Cash and cash equivalents | | | 171 | |
Chairman and othe Non-Executive Directors | | | 125 | |
Chairman’s statement | | | 02 | |
Chief Executive’s review | | | 03 | |
Commitments | | | 193 | |
Committee reports | | | 103 | |
Competition | | | 15 | |
Consolidated balance sheet | | | 141 | |
Consolidated cash flow statement | | | 143 | |
Consolidated income statement | | | 140 | |
Consolidated statement of changes in equity | | | 142 | |
Consolidated statement of comprehensive income | | | 140 | |
Consumer Healthcare products and competition | | | 231 | |
Contingent liabilities | | | 181 | |
Corporate Executive Team | | | 92 | |
Corporate governance | | | 94 | |
Critical accounting policies | | | 64 | |
Directors and senior management | | | 136 | |
Directors’ emoluments and total remuneration | | | 127 | |
Directors’ interests | | | 129 | |
Directors’ interests in contracts | | | 136 | |
Directors’ statement of responsibilities | | | 138,218 | |
Dividends | | | 163,240 | |
Donations to political organisations and political expenditure | | | 242 | |
Earnings per share | | | 162 | |
Employee costs | | | 157 | |
Employee share schemes | | | 203 | |
Employees | | | 52 | |
Exchange rates | | | 150 | |
Executive Director terms and conditions | | | 125 | |
Finance expense | | | 159 | |
Finance income | | | 158 | |
Financial instruments and related disclosures | | | 194 | |
Financial position and resources | | | 66 | |
Financial review | | | 56 | |
Financial review 2011 | | | 72 | |
Financial statements of GlaxoSmithKline plc, prepared under UK GAAP | | | 220 | |
Five year record | | | 236 | |
Glossary of terms | | | 247 | |
Goodwill | | | 165 | |
Independent Auditors’ report | | | 139,219 | |
Intellectual property and trademarks | | | 15 | |
Inventories | | | 170 | |
| | | | |
| | | Page | |
Investments in associates and joint ventures | | | 169 | |
Investor relations | | | 246 | |
Key accounting judgements and estimates | | | 148 | |
Key performance indicators | | | 06 | |
Late-stage pipeline summary | | | 40 | |
Legal proceedings | | | 210 | |
Long-Term Incentive plans | | | 130 | |
Major restructuring costs | | | 158 | |
Movements in equity | | | 184 | |
Net debt | | | 181 | |
New accounting requirements | �� | | 150 | |
Non-Executive Director terms and conditions | | | 130 | |
Non-Executive Directors’ fees | | | 128 | |
Notes to the financial statements | | | 144 | |
Operating profit | | | 156 | |
Other intangible assets | | | 167 | |
Other investments | | | 170 | |
Other non-current assets | | | 170 | |
Other non-current liabilities | | | 181 | |
Other operating income | | | 155 | |
Other provisions | | | 179 | |
Outlook | | | 15 | |
Pensions and other post-employment benefits | | | 172 | |
Pharmaceutical products, competition and intellectual property | | | 229 | |
Pipeline | | | 225 | |
Post balance sheet event | | | 193 | |
Presentation of the financial statements | | | 144 | |
Principal Group companies | | | 207 | |
Product development pipeline | | | 225 | |
Products | | | 229 | |
Property, plant and equipment | | | 163 | |
Quarterly trend | | | 232 | |
Reconciliation of net cash flow to movement in net debt | | | 187 | |
Registrar | | | 245 | |
Related party transactions | | | 186 | |
Relations with shareholders | | | 100 | |
Remuneration Report | | | 109 | |
Research and development | | | 30 | |
Responsible business | | | 49 | |
Risk factors | | | 78 | |
Segment information | | | 151 | |
Segment reviews | | | 20 | |
Share capital and control | | | 239 | |
Share capital and share premium account | | | 183 | |
Share price | | | 239 | |
Shareholder information | | | 239 | |
Strategy | | | 16 | |
Taxation | | | 160 | |
Taxation information for shareholders | | | 243 | |
Trade and other payables | | | 172 | |
Trade and other receivables | | | 171 | |
US law and regulation | | | 242 | |
World market | | | 12 | |
| | | | |
About GSK
| | |
GlaxoSmithKline plc was incorporated as an English public limited company on December 6, 1999. We were formed by a merger between Glaxo Wellcome plc and SmithKline Beecham plc. GSK acquired these two English companies on 27 December 2000 as part of the merger arrangements. Our shares are listed on the London Stock Exchange and the New York Stock Exchange. Read more atwww.gsk.com | | |

|
Giving children a better start GSK is part of a global coalition working to eliminate ten of the 17 neglected tropical diseases by 2020. We have committed to donate up to 600 million treatments of our anti-parasitic treatment, albendazole, each year to help eliminate lymphatic filariasis and up to 400 million treatments to fight intestinal worms in school age children. In 2012, we provided albendazole treatment for over 120 million school age children – including these children in Ghana (see page 50). Printed on Amadeus 100 silk, a 100% recycled paper with full FSC certification. All pulps used are made from 100% de-inked, post-consumer waste and are elemental chlorine free. The manufacturing mill holds the ISO 14001 and EU Eco-label certificates for environmental management. | | |

| | |
| www.gsk.com | | |
| |
Here you will find down-loadable PDFs of: • Annual Report 2012 • Annual Summary 2012 • Form 20-F • Corporate Responsibility Report Head Office and Registered Office GlaxoSmithKline plc 980 Great West Road Brentford, Middlesex TW8 9GS United Kingdom Tel: +44 (0)20 8047 5000 Registered number: 3888792 | | |
| | | | |
You can also search for us here 
Printed on Amadeus 100 silk, a 100% recycled paper with full FSC certification. All pulps used are made from 100% de-inked, post-consumer waste and are Elemental Chlorine Free (ECF). The manufacturing mill holds the ISO 14001 and EU Eco-label certificates for environmental management. The mill has zero landfill and extremely low carbon emissions, leading the WWF to approve its papers as the most environmentally sustainable of uncoated recycled paper. | | |