
As filed with the Securities and Exchange Commission on September 21, 2015
UNITED STATES
SECURITIES AND EXCHANGE COMMISSION
WASHINGTON, DC 20549
FORM 20-F/A
(Amendment No. 1)
| ¨ | REGISTRATION STATEMENT PURSUANT TO SECTION 12(b) OR (g) OF THE SECURITIES EXCHANGE ACT OF 1934 |
OR
| x | ANNUAL REPORT PURSUANT TO SECTION 13 OR 15(d) OF THE SECURITIES EXCHANGE ACT OF 1934 |
For the fiscal year ended December 31, 2014
OR
| ¨ | TRANSITION REPORT PURSUANT TO SECTION 13 OR 15(d) OF THE SECURITIES EXCHANGE ACT OF 1934 |
OR
| ¨ | SHELL COMPANY REPORT PURSUANT TO SECTION 13 OR 15(d) OF THE SECURITIES EXCHANGE ACT OF 1934 |
Commission file number: 001-15276
ITAÚ UNIBANCO HOLDING S.A.
(Exact name of Registrant as specified in its charter)
Federative Republic of Brazil
(Jurisdiction of incorporation or organization)
Praça Alfredo Egydio de Souza Aranha, 100
04344-902 São Paulo, SP, Brazil
(Address of principal executive offices)
Marcelo Kopel
Investor Relations Officer
Itaú Unibanco Holding S.A.
Praça Alfredo Egydio de Souza Aranha, 100
04344-902 São Paulo, SP, Brazil
+55 11 2794 3547
drinvest@itau-unibanco.com.br
(Name, Telephone, E-mail and/or Facsimilie number and Address of Company Contact Person)
Securities registered or to be registered pursuant to Section 12(b) of the Act:
| Title of each class | Name of each exchange on which registered | |
| Preferred Shares, no par value | New York Stock Exchange(*) | |
| American Depositary Shares (as evidenced by American Depositary Receipts), each representing 1 (one) Preferred Share | New York Stock Exchange |
(*) Not for trading purposes, but only in connection with the listing of American Depositary Shares pursuant to the requirements of the Securities and Exchange Commission.
Securities registered or to be registered pursuant to Section 12(g) of the Act:
None
(Title of Class)
Securities for which there is a reporting obligation pursuant to Section 15(d) of the Act:
None
(Title of Class)
Indicate the number of outstanding shares of each of the issuer’s classes of capital or common stock as of the close of the period covered by the annual report.
2,770,034,003 Common Shares, no par value
2,706,967,586 Preferred Shares, no par value
Indicate by check mark if the registrant is a well-known seasoned issuer, as defined in Rule 405 of the Securities Act.
x Yes¨ No
If this report is an annual or transition report, indicate by check mark if the registrant is not required to file reports pursuant to Section 13 or 15(d) of the Securities Exchange Act of 1934.
¨ Yes x No
Indicate by check mark whether the registrant (1) has filed all reports required to be filed by Section 13 or 15(d) of the Securities Exchange Act of 1934 during the preceding 12 months (or for such shorter period that the registrant was required to file such reports) and (2) has been subject to such filing requirements for the past 90 days.
x Yes ¨ No
Indicate by check mark whether the registrant has submitted electronically and posted on its corporate Web site, if any, every Interactive Data File required to be submitted and posted pursuant to Rule 405 of Regulation S-T (§232405 of this chapter) during the preceding 12 months (or for such shorter period that the registrant was required to submit and post such files).
¨ Yes ¨ No
Indicate by check mark whether the registrant is a large accelerated filer, an accelerated filer, or a non-accelerated filer See definition of “accelerated filer and large accelerated filer” in Rule 12b-2 of the Exchange Act (Check one):
| x Large accelerated filer | ¨ Accelerated filer | ¨ Non-accelerated filer |
Indicate by check mark which basis of accounting the registrant has used to prepare the financial statements included in this filing:
| ¨ U.S. GAAP | x International Financial Reporting Standards | ¨ Other |
| as issued by the International Accounting | ||
| Standards Board |
If “Other” has been checked in response to the previous question, indicate by check mark which financial statement item the registrant has elected to follow.
¨ Item 17 ¨ Item 18
If this is an annual report, indicate by check mark whether the registrant is a shell company (as defined in Rule 12b-2 of the Exchange Act).
¨ Yes x No
EXPLANATORY NOTE
Itaú Unibanco Holding S.A. is filing this Amendment No. 1 to its annual report on Form 20-F for the fiscal year ended December 31, 2014, as filed with the U.S. Securities and Exchange Commission (the “SEC”) on April 3, 2015 (the “2014 Form 20-F”), to amend and restate the section entitled “Risk and Capital Management” solely to correct figures in the “Exchange Rate Sensitivity” table on page A-75 appearing under Item 11 “Quantitative and Qualitative Disclosures About Market Risk”, in the “Distribution of our Financial Assets by Currency” table on page A-102 appearing under “Maturity profile” of Part II, “Investment Portfolio”, of Guide 3 and to include a reference in the “Indexation” text on page A-104 appearing under “Risk Elements” of Part III, “Loan Portfolio”, of Guide 3 of the 2014 Form 20-F.
Other than as expressly set forth above, this Form 20-F/A does not, and does not purport to, amend, update or restate the information in any part of the 2014 Form 20-F or reflect any events that have occurred after the 2014 Form 20-F was filed on April 3, 2015. The filing of this Form 20-F/A, and the inclusion of newly executed certifications, should not be understood to mean that any other statements contained in the 2014 Form 20-F are true and complete as of any date subsequent to April 3, 2015.
This Form 20-F/A should be read in conjunction with the 2014 Form 20-F and our other filings with the SEC.

FORM 20-F
Item 11. Quantitative and Qualitative Disclosures About Market Risk
Market Risk
Market risk is the possibility of losses resulting from fluctuations in the market value of positions held by a financial institution, most typically caused by variations in foreign exchange rates, interest rates, Brazilian inflation indexes, equity and commodity prices, along with various indexes for these risk factors. Market risk management is the process by which our management monitors and controls risk of variations in the value of financial instruments due to market movements, while aiming to optimize the risk-return ratio through an adequate limit and alert structure (described below), effective risk management models and related management tools.
Our policies and general market risk management framework are consistent with the principles contained in CMN regulations and applying all business units and legal entities of the Itaú Unibanco Group.
Our market risk management strategy is aimed at balancing corporate business goals, taking into account, among other things:
| · | Political, economic and market conditions; |
| · | The market risk profile of the portfolio; and |
| · | Expertise within the Itaú Unibanco Group to support operations in specific markets. |
| Annual Report2014 | A-71 |
Our market risk management framework is subject to the governance and hierarchy of committees, with specific limits assigned to different portfolios and levels (for example, Banking Portfolio, Trading Portfolio, Equities Desk), as well as classes of market risk (such as interest rate risk, foreign exchange risk, among others). Daily risk reports, used by the business and control units, are also sent to senior management. In addition, our market risk management and control process is subject to periodic reviews. The key principles underlying our market risk control are as follows:
| · | Provide visibility and comfort for all senior management levels that market risks assumed must be in line with our risk-return objectives; |
| · | Provide disciplined and informed dialogue of the overall market risk profile and its evolution over time; |
| · | There must be transparency as to how the business works to optimize results; |
| · | The market risk control structure must provide early warning mechanisms to facilitate effective risk management, without obstructing the business objectives; and |
| · | Concentration of risks must be monitored and avoided. |
Market risk is controlled by a unit that is independent from our “risk originating” business units and is responsible for performing the daily activities of: (i) risk measurement, and assessment; (ii) monitoring of stress scenarios, limits and alerts; (iii) application of stress scenarios, analysis and tests; (iv) reporting of risk findings to responsible individuals within the relevant business unit, in accordance with our governance requirements; (v) monitoring the necessary actions to readjust positions and/or levels of risk to make them viable; and (vi) providing support for the launch of new financial products. To this end, we have a structured process of communication and information flow that provides information to our Superior Committees and monitors compliance with the requirements of Brazilian and relevant foreign regulatory agencies.
Our structure of limits and alerts follows the guidelines of the Board of Directors and is approved by the Superior Risk Policies Committee (CSRisc), that meets at least every two months, after endorsement by the Superior Institutional Treasury Committee (CSTI). This structure of limits and alerts promotes the effectiveness and coverage of control and is reviewed at least annually. The limits range from aggregated risk indicators at the portfolio level to more granular limits at the individual desk level. The market risk limits framework extends to the risk factor level, with specific limits that aim to improve the process of risk monitoring and understanding as well as prevent risk concentration. Limits and alerts are calibrated based on projections of future balance sheets, stockholders’ equity, liquidity, complexity and market volatility and our risk appetite. The process of setting these limit levels and breach reporting follows the procedures approved by our financial conglomerate´s internal policies. There is a structured process of communication and information flow, which provides information for all executive levels at our institution, including the Board of Directors members through the CGRC, that meets every two months. Market risk limits are monitored on a daily basis and breaches and potential breaches of limits are reported and discussed in appropriate committees in accordance with the following procedure:
| · | Within one business day, to the management of the relevant business units and to the risk control and the business unit executives; and |
| · | On a monthly basis, to the Superior Institutional Treasury Committee (CSTI), which is chaired by our Chief Executive Officer. |
We hedge transactions with clients and proprietary positions, including foreign investments, in order to mitigate risks arising from fluctuations in market risk factors (e.g., prices) and maintain the positions on the breaching limits. Derivatives are commonly used for these hedging activities. When these transactions are classified as hedges for accounting purposes, specific supporting documentation is reviewed, allowing for an ongoing follow up of the hedge effectiveness (retrospectively and prospectively) and of any changes in the accounting process. The accounting and managerial hedging procedures are governed by our internal institutional polices. Our market risk framework categorizes transactions as part of either the Banking Portfolio or the Trading Portfolio, in accordance with criteria established by specific regulation.
Our Trading Portfolio is composed of all transactions with financial and commodity instruments (including derivatives) held with the intention of trading, to benefit from arbitrage opportunities, or using such transactions to hedge risk within this portfolio, and that have no restriction on trading. Profits are based on changes in actual or expected prices in the short term.
Our Banking Portfolio is predominantly characterized by trades originated from the banking business and related to the management of our balance sheet. As a general rule, this desk’s portfolios are held without intent of trading and time horizon of medium and long term.
Market risk exposures that are inherent to many financial instruments, including derivatives, are composed of various risk factors. A risk factor refers to a market parameter whose variation impacts the evaluation of a certain position. The main risk factors measured by us are:
| · | Interest rates: the risk of losses from transactions that are subject to interest rate variations; |
| · | Other foreign interest rates: the risk of losses from transactions subject to foreign interest rate variations; |
| · | FX rates: the risk of losses from positions subject to foreign exchange rate variation (e.g., foreign currency positions); |
| · | Brazilian inflation indexes: the risk of losses from transactions subject to variations in inflation linked indexes; and |
| · | Equities and commodities: the risk of losses from transactions that are subject to equity and commodity price variations. |
The CMN has regulations establishing the segregation of market risk exposure at a minimum into the following categories: interest rates, FX rates, equities and commodities. Brazilian inflation indexes are treated as a group of risk indicators and receive the same treatment of the others risk indicators, such as interest rates and FX rates and follows the governance and risk limits framework adopted by our management for market risk assessment.
Market risk is analyzed based on the following key metrics:
| · | Value at Risk (VaR): a statistical metric that quantifies potential economic losses based on normal market conditions, considering a defined holding period and confidence level; |
| Annual Report2014 | A-72 |
| • | Losses in Stress Scenarios (Stress Testing): a simulation technique to evaluate the impact on assets, liabilities and derivatives portfolios of various risk factors in extreme market situations (based on prospective and historic scenarios); |
| • | Stop Loss: a mechanism that triggers a management review of positions, if the accumulated losses in a given period reach specified levels; |
| • | Concentration: cumulative exposure of certain financial instrument or risk factors calculated at market value (MtM – Mark to Market); and |
| • | Stressed VaR: a statistical metric derived from VaR, aimed at capturing the largest risk in simulations of the current portfolio, taking into consideration observable returns in historical scenarios of extreme volatility. |
In addition to the risk metrics described above, sensitivity and loss control measures are also analyzed. They include:
| • | Gap Analysis: accumulated exposure of cash flows by risk factor, which are marked-to-market and positioned by settlement dates; |
| • | Sensitivity (DV01 – Delta Variation Risk): impact on the market value of cash flows when a one annual basis point change is applied to current interest rates or index rates; and |
| • | Sensitivities to Various Risk Factors (Greek): partial derivatives of a portfolio of options in connection with the prices of the underlying assets, implied volatilities, interest rates and time. |
Please refer to our Consolidated Financial Statements (IFRS), Note 36 – Management of Financial Risks for further details about Market Risk.
VaR – Consolidated Itaú Unibanco Holding
We improved our internal methodology to calculate Consolidated VaR, migrating from the “parametric” approach to a “historical simulation” approach (except with respect to our Foreign Units, which are in the process of migrating to the historical simulation methodology). This new methodology carries out the full repricing of all positions, using the real historical distribution of assets.
The table below shows the Consolidated Total VaR (utilizing both approaches), comprising our Trading Portfolio and Banking Portfolio, and our subsidiaries abroad, namely Itaú BBA International, Banco Itaú Argentina, Banco Itaú Chile, Banco Itaú Uruguay, Banco Itaú Paraguay and Itaú BBA Colombia showing where there are higher concentrations of market risk. We adhered to our policy of operating within low limits in relation to capital and maintained our conservative management and portfolio diversification approach through the period.
| (In millions of R$) | ||||||||||||||||||||||||||||||||||||||||||||||||
| GLOBAL VAR (PARAMETRIC APPROACH) | AVERAGE | MINIMUM | MAXIMUM | DECEMBER 31, 2014 | AVERAGE | MINIMUM | MAXIMUM | DECEMBER 31, 2013 | AVERAGE | MINIMUM | MAXIMUM | DECEMBER 31, 2012 | ||||||||||||||||||||||||||||||||||||
| Group of Risk Factor | ||||||||||||||||||||||||||||||||||||||||||||||||
| Brazilian Interest rate | 89.0 | 37.0 | 193.0 | 127.8 | 172.4 | 65.6 | 416.9 | 69.1 | 191.2 | 71.8 | 427.6 | 348.7 | ||||||||||||||||||||||||||||||||||||
| Other Interest rate | 43.8 | 21.1 | 149.4 | 90.4 | 26.2 | 8.6 | 76.7 | 45.2 | 20.4 | 7.3 | 49.6 | 11.4 | ||||||||||||||||||||||||||||||||||||
| FX rate | 28.7 | 3.6 | 110.6 | 8.9 | 34.5 | 4.4 | 70.2 | 10.4 | 25.7 | 4.6 | 53.9 | 8.8 | ||||||||||||||||||||||||||||||||||||
| Brazilian Inflation Indexes | 89.0 | 45.9 | 144.7 | 82.9 | 76.1 | 37.3 | 155.5 | 65.7 | 110.3 | 14.8 | 325.0 | 51.2 | ||||||||||||||||||||||||||||||||||||
| Equities and commodities | 19.1 | 10.4 | 35.0 | 24.8 | 29.6 | 14.0 | 60.1 | 20.4 | 24.2 | 13.6 | 43.5 | 16.8 | ||||||||||||||||||||||||||||||||||||
| Foreign Units | ||||||||||||||||||||||||||||||||||||||||||||||||
| Itaú BBA International | 1.1 | 0.4 | 2.3 | 1.6 | 2.4 | 1.6 | 4.1 | 1.9 | 1.7 | 0.7 | 5.1 | 1.1 | ||||||||||||||||||||||||||||||||||||
| Banco Itaú Argentina | 4.0 | 0.9 | 18.8 | 1.9 | 4.0 | 2.2 | 7.4 | 5.7 | 3.0 | 1.7 | 5.6 | 5.5 | ||||||||||||||||||||||||||||||||||||
| Banco Itaú Chile | 3.3 | 1.3 | 5.5 | 5.3 | 5.6 | 2.1 | 13.6 | 2.1 | 5.5 | 3.2 | 9.6 | 4.4 | ||||||||||||||||||||||||||||||||||||
| Banco Itaú Uruguai | 1.6 | 0.8 | 2.6 | 2.1 | 2.8 | 1.5 | 8.9 | 1.7 | 1.7 | 0.3 | 3.4 | 2.0 | ||||||||||||||||||||||||||||||||||||
| Banco Itaú Paraguai | 1.3 | 0.6 | 3.6 | 3.5 | 0.9 | 0.4 | 1.8 | 0.9 | 0.4 | 0.2 | 1.4 | 1.0 | ||||||||||||||||||||||||||||||||||||
| Banco Itaú BBA Colombia | 0.4 | 0.1 | 1.2 | 0.5 | 0.4 | 0.0 | 1.3 | 0.2 | - | - | - | - | ||||||||||||||||||||||||||||||||||||
| Diversification effect(1) | (169.3 | ) | (113.0 | ) | (77.1 | ) | ||||||||||||||||||||||||||||||||||||||||||
| Total | 125.5 | 59.0 | 231.4 | 180.4 | 224.5 | 97.9 | 443.4 | 110.4 | 289.7 | 118.0 | 601.4 | 373.7 | ||||||||||||||||||||||||||||||||||||
(1) Reduction of risk due to the combination of all risk factors.
| GLOBAL VAR (HISTORICAL | DECEMBER | |||||||||||||||
| SIMULATION APPROACH)1 | AVERAGE | MINIMUM | MAXIMUM | 31, 2014 | ||||||||||||
| Group of Risk Factor | ||||||||||||||||
| Brazilian Interest rate | 92.4 | 37.0 | 161.8 | 124.8 | ||||||||||||
| Other Interest rate | 60.4 | 21.1 | 93.2 | 83.6 | ||||||||||||
| FX rate | 36.1 | 3.6 | 141.2 | 26.5 | ||||||||||||
| Brazilian Inflation Indexes | 99.1 | 45.9 | 162.9 | 115.7 | ||||||||||||
| Equities and commodities | 22.8 | 10.4 | 60.7 | 22.5 | ||||||||||||
| Foreign Units | ||||||||||||||||
| Itaú BBA International | 1.1 | 0.4 | 2.3 | 1.6 | ||||||||||||
| Banco Itaú Argentina | 4.0 | 0.9 | 18.8 | 1.9 | ||||||||||||
| Banco Itaú Chile | 3.3 | 1.3 | 5.5 | 5.3 | ||||||||||||
| Banco Itaú Uruguai | 1.6 | 0.8 | 2.6 | 2.1 | ||||||||||||
| Banco Itaú Paraguai | 1.3 | 0.6 | 3.6 | 3.5 | ||||||||||||
| Banco Itaú BBA Colombia | 0.4 | 0.1 | 1.2 | 0.5 | ||||||||||||
| Diversification effect(2) | (194.9 | ) | ||||||||||||||
| Total | 131.9 | 59.0 | 227.7 | 193.1 | ||||||||||||
(1) Except for the “Foreign Units” (calculated by the parametric methodology).
(2) Reduction of risk due to the combination of all risk factors.
On December 31, 2014, our average global VaR (parametric) was R$125.5 million, or 0.12% of our consolidated stockholders’ equity on December 31, 2014, compared to our average global VaR (parametric) of R$224.5 million on December 31, 2013 or 0.27% of our consolidated stockholders’ equity on December 31, 2013, and to R$289.7 million on December 31, 2012, or 0.38% of our consolidated stockholders’ equity on December 31, 2012. On December 31, 2014, our average global VaR (historical simulation) was R$131.9 million, or 0.13% of our consolidated stockholders’ equity on December 31, 2014.
VaR – Trading Portfolio
The table below presents risks arising from all positions with the intention of trading, following the criteria defined above for our trading portfolio, or the Trading Portfolio.
Our total average Trading Portfolio VaR was R$25.7 million on December 31, 2014, compared to R$40.2 million on December 31, 2013 and to R$54.3 million on December 31, 2012.
| Annual Report2014 | A-73 |
| (In millions of R$) | |||||||||||||||||||||||||||||||||||||||||||||||||
| TRADING PORTFOLIO VAR | AVERAGE | MINIMUM | MAXIMUM | DECEMBER 31, 2014 | AVERAGE | MINIMUM | MAXIMUM | DECEMBER 31, 2013 | AVERAGE | MINIMUM | MAXIMUM | DECEMBER 31, 2012 | |||||||||||||||||||||||||||||||||||||
| Group of Risk Factor | |||||||||||||||||||||||||||||||||||||||||||||||||
| Brazilian Interest rate | 22.2 | 7.8 | 44.8 | 16.6 | 38.2 | 15.7 | 104.9 | 20.1 | 38.3 | 12.8 | 95.4 | 25.2 | |||||||||||||||||||||||||||||||||||||
| Other Foreign Interest rate | 12.1 | 3.6 | 35.0 | 3.6 | 13.7 | 4.5 | 31.7 | 21.7 | 10.7 | 4.2 | 27.2 | 6.4 | |||||||||||||||||||||||||||||||||||||
| FX rates | 7.9 | 2.4 | 22.8 | 10.7 | 31.8 | 6.2 | 68.1 | 9.4 | 25.1 | 4.9 | 55.6 | 9.9 | |||||||||||||||||||||||||||||||||||||
| Brazilian Inflation Indexes | 15.9 | 8.1 | 27.3 | 8.1 | 12.0 | 3.1 | 30.4 | 21.4 | 9.4 | 1.8 | 22.2 | 7.1 | |||||||||||||||||||||||||||||||||||||
| Equities and commodities | 10.3 | 1.7 | 57.2 | 4.3 | 19.2 | 5.8 | 38.2 | 13.7 | 23.3 | 13.8 | 41.5 | 14.8 | |||||||||||||||||||||||||||||||||||||
| Diversification effect(1) | (26.4 | ) | (56.0 | ) | (38.6 | ) | |||||||||||||||||||||||||||||||||||||||||||
| Total | 25.7 | 13.1 | 54.3 | 16.9 | 40.2 | 17.7 | 71.7 | 30.3 | 54.3 | 21.3 | 112.3 | 24.7 | |||||||||||||||||||||||||||||||||||||
(1) Reduction of risk due to the combination of all risk factors.
Sensitivity Analyses (Trading and Banking Portfolios)
As required by Brazilian regulation, we conduct sensitivity analysis for market risk factors considered important. The highest resulting losses are presented below, with impact on result, by risk factor, in each such scenario and are calculated net of tax effects, providing a view of our exposure under different circumstances.
The sensitivity analyses of the Trading Portfolio and Banking Portfolio presented here are based on a static assessment of the portfolio exposure. Therefore, such analyses do not consider the dynamic response capacity of management (e.g., treasury and market risk control unit) to initiate mitigating measures and minimize the possibility of significant losses. In addition, the analysis is intended to assess risk exposure, regardless of whether or not financial instruments are accounted for on an accrual basis.
| (In thousands of R$) | ||||||||||||||||||||||||||
| TRADING PORTFOLIO(1) | TRADING AND BANKING PORTFOLIOS(1) | |||||||||||||||||||||||||
| EXPOSURES | DECEMBER 31, 2014 | DECEMBER 31, 2014 | ||||||||||||||||||||||||
| RISK FACTORS | RISK OF CHANGE | SCENARIO I | SCENARIO II | SCENARIO III | SCENARIO I | SCENARIO II | SCENARIO III | |||||||||||||||||||
| Interest Rate | Fixed Income Interest Rates in reais | (540 | ) | (126,764 | ) | (237,705 | ) | (5,493 | ) | (1,417,835 | ) | (2,688,954 | ) | |||||||||||||
| Foreign Exchange Linked | Foreign Exchange Linked Interest Rates | 22 | (1,729 | ) | (3,374 | ) | - | (19,266 | ) | (34,458 | ) | |||||||||||||||
| Foreign Exchange Rates | Prices of Foreign Currencies | 610 | 165,600 | 337,463 | (17,308 | ) | (247,730 | ) | (414,333 | ) | ||||||||||||||||
| Price Index Linked | Prices Indexes Linked Interest Rates | (16 | ) | (5,703 | ) | (11,680 | ) | (1,700 | ) | (238,647 | ) | (430,973 | ) | |||||||||||||
| TR | TR Linked Interest Rates | (20 | ) | (5,093 | ) | (9,579 | ) | 705 | (224,170 | ) | (473,074 | ) | ||||||||||||||
| Equities | Prices of Equities | (78 | ) | (11,769 | ) | (35,990 | ) | 1,661 | (49,699 | ) | (122,034 | ) | ||||||||||||||
| Total | (22 | ) | 14,542 | 39,135 | (22,135 | ) | (2,197,347 | ) | (4,163,826 | ) | ||||||||||||||||
(1) Amounts net of tax effects.
In order to measure these sensitivities, the following scenarios (modified on the second quarter of 2014), are used:
| · | Scenario I: Addition of one basis point to interest rates and associated indexes and one percentage point to currency and equity prices; |
| · | Scenario II: Shocks of 25 percent in fixed interest rates, currency coupon, inflation, interest rate indexes and currency and share prices, both for growth and fall, considering the largest resulting losses per risk factor; and |
| · | Scenario III: Shocks of 50 percent in fixed interest rates, currency coupon, inflation, interest rate indexes and currency and share prices, both for growth and fall, considering the largest resulting losses per risk factor. |
Interest rate sensitivity
Interest rate sensitivity is the relationship between market interest rates and net interest income arising from the maturity or the characteristics of the renegotiation of prices of interest-bearing assets and liabilities.
Our strategy for interest rate sensitivity considers the return rates, the underlying risk level and the liquidity requirements, including our minimum regulatory cash reserves, mandatory liquidity ratios, withdrawals and maturity of deposits, capital costs and additional demand for funds.
The pricing structure is matched when equal amounts of these assets or liabilities mature or are renegotiated. Any mismatch of interest-bearing assets and liabilities is known as a gap position. A negative gap position indicates liability sensitivity and normally means that a decline in interest rates would have a positive effect on net interest income, while a positive gap position indicates asset sensitivity and normally means that an increase in interest rates would have a positive effect on net interest income. Additionally, the interest rate sensitivity may vary in the renegotiation periods presented due to the different renegotiation dates within the period. Also, variations among the different currencies in which the interest rate positions are denominated may arise.
These relationships are material for a particular date, and significant fluctuations may occur on a daily basis as a result of both the market forces and management decisions. Our Superior Institutional Treasury and Liquidity Committee (CSTIL) analyzes the Itaú Unibanco Group’s mismatch position on a monthly basis and establishes limits for market risk exposure, interest rate positions and foreign currency positions.
Please refer to section Performance, item Consolidated Financial Statements (IFRS), Note 36 – Management of Financial Risks for further details about the position of our interest-bearing assets and liabilities as of December 31, 2014. Note 36 to our audited interim consolidated financial statements provides a snapshot view, and accordingly, does not reflect the interest rate gaps that may exist at other times, due to changing asset and liability positions, and management’s actions to manage the risk in these changing positions.
| Annual Report2014 | A-74 |
Exchange rate sensitivity
Most of our banking operations are denominated in or indexed to Brazilianreais. We also have assets and liabilities denominated in foreign currency, mainly in U.S. dollars, as well as assets and liabilities that, although denominated in Brazilianreais, are indexed to U.S. dollars and, therefore, expose us to exchange rate risk. The Central Bank regulates our maximum open, short and long foreign currency positions. Please refer to section Performance, item Consolidated Financial Statements (IFRS), Note 36 – Management of financial risks for further details.
The gap management policy adopted by the Superior Institutional Treasury and Liquidity Committee takes into consideration the tax effects with respect to our foreign exchange positions. Since the gains from the foreign exchange rate variation on investments abroad are not taxed, we set up a hedge (a liability in foreign currency derivative instruments) in an amount sufficient so that our total foreign exchange exposure, net of tax effects, is consistent with our low risk exposure strategy.
Our foreign exchange position on the liability side is composed of various elements, including the issuance of securities in international capital markets, credit from foreign banks used to finance import and export transactions, and dollar-linked on-lendings from government financial institutions. The proceeds of these financial operations are usually invested in loans and in the purchase of dollar-linked securities.
The information set below was prepared on a consolidated basis, eliminating transactions between related parties. Our investments abroad, which are eliminated when we consolidate the accounting information, represented R$43.7 billion as of December 31, 2014, under the gap management policy adopted, as mentioned above. Note that the bank applies either economic hedges or hedge accounting to those net investments abroad.
| (In millions of R$, except percentages) | ||||||||||||||||||||
| AS OF DECEMBER 31, 2014 | BRAZILIAN CURRENCY | DENOMINATED IN FOREIGN CURRENCY(1) | INDEXED TO FOREIGN CURRENCY(1) | TOTAL | % OF AMOUNTS DENOMINATED IN AND INDEXED TO FOREIGN CURRENCY OF TOTAL | |||||||||||||||
| Assets | 923,281 | 178,292 | 25,630 | 1,127,203 | 18.1 | |||||||||||||||
| Cash and deposits on demand | 7,391 | 8,842 | 1,294 | 17,527 | 57.8 | |||||||||||||||
| Central Bank compulsory deposits | 58,476 | 4,630 | - | 63,106 | 7.3 | |||||||||||||||
| Interbank deposits | 7,874 | 15,207 | - | 23,081 | 65.9 | |||||||||||||||
| Securities purchased under agreements to resell | 208,752 | 166 | - | 208,918 | 0.1 | |||||||||||||||
| Held-for-trading financial assets | 126,404 | 4,350 | 2,190 | 132,944 | 4.9 | |||||||||||||||
| Financial assets designated at fair value through profit or loss | 626 | 107 | - | 733 | 14.6 | |||||||||||||||
| Derivatives | 5,519 | 5,689 | 2,948 | 14,156 | 61.0 | |||||||||||||||
| Available-for-sale financial assets | 55,152 | 22,637 | 571 | 78,360 | 29.6 | |||||||||||||||
| Held-to-maturity financial assets | 24,102 | 10,332 | - | 34,434 | 30.0 | |||||||||||||||
| Loan operations and lease operations portfolio | 344,785 | 95,295 | 12,351 | 452,431 | 23.8 | |||||||||||||||
| Allowance for loan losses | (19,924 | ) | (2,131 | ) | (337 | ) | (22,392 | ) | 11.0 | |||||||||||
| Other financial assets | 38,130 | 8,919 | 6,600 | 53,649 | 28.9 | |||||||||||||||
| Investments in associates and joint ventures | 4,090 | - | - | 4,090 | - | |||||||||||||||
| Goodwill | 1,748 | 213 | - | 1,961 | 10.9 | |||||||||||||||
| Fixed assets, net | 8,314 | 397 | - | 8,711 | 4.6 | |||||||||||||||
| Intangibles assets, net | 5,724 | 410 | - | 6,134 | 6.7 | |||||||||||||||
| Tax assets | 34,601 | 642 | - | 35,243 | 1.8 | |||||||||||||||
| Assets held for sale | 182 | 14 | - | 196 | 7.1 | |||||||||||||||
| Other assets | 11,335 | 2,573 | 13 | 13,921 | 18.6 | |||||||||||||||
| Percentage of total assets | 81.9 | % | 15.8 | % | 2.3 | % | 100.0 | % | ||||||||||||
| Liabilities and Stockholders’ Equity | 889,574 | 209,830 | 27,799 | 1,127,203 | 21.1 | |||||||||||||||
| Deposits | 195,511 | 98,617 | 645 | 294,773 | 33.7 | |||||||||||||||
| Securities sold under repurchase agreements | 273,340 | 15,343 | - | 288,683 | 5.3 | |||||||||||||||
| Financial liabilities held for trading | - | 520 | - | 520 | 100.0 | |||||||||||||||
| Derivatives | 7,966 | 6,006 | 3,378 | 17,350 | 54.1 | |||||||||||||||
| Interbank market debt | 79,288 | 40,430 | 2,868 | 122,586 | 35.3 | |||||||||||||||
| Institutional market debt | 36,087 | 35,385 | 1,770 | 73,242 | 50.7 | |||||||||||||||
| Other financial liabilities | 46,209 | 8,751 | 16,532 | 71,492 | 35.4 | |||||||||||||||
| Reserves for insurance and private pension | 109,716 | 59 | 3 | 109,778 | 0.1 | |||||||||||||||
| Liabilities for capitalization plans | 3,010 | - | - | 3,010 | - | |||||||||||||||
| Provisions | 16,995 | 32 | - | 17,027 | 0.2 | |||||||||||||||
| Tax liabilities | 3,925 | 540 | - | 4,465 | 12.1 | |||||||||||||||
| Other liabilities | 16,910 | 4,147 | 2,603 | 23,660 | 28.5 | |||||||||||||||
| Non-controlling interests | 1,357 | - | - | 1,357 | - | |||||||||||||||
| Stockholders’equity | 99,260 | - | - | 99,260 | - | |||||||||||||||
| Percentage of total liabilities and stockholders’equity | 78.9 | % | 18.6 | % | 2.5 | % | 100.0 | % | ||||||||||||
Note that the information presented in the table above is not prepared on the same basis as presented in the Consolidated Financial Statements.
(1) Predominantly U.S. dollar.
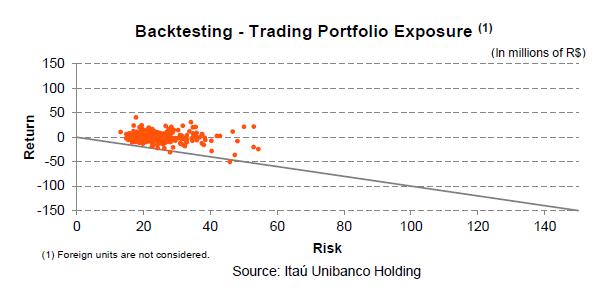
Backtesting
The effectiveness of the VaR model is validated by the use of backtesting techniques that compare hypothetical daily results with the estimated daily VaR. The number of exceptions (i.e. deviations) with respect to the pre-established VaR limits should be consistent, within an acceptable margin, with the hypothesis of 99.0% confidence intervals (i.e., there is a 1.0% probability that the financial losses are higher than the losses estimated by the model), considering a period of 250 business days (ending on December 31, 2014). The backtesting analysis presented below takes into consideration the ranges suggested on the document
| Annual Report2014 | A-75 |
“Supervisory Framework for the use of backtesting in conjunction with the internal models approach to market risk capital requirements”, published by the Basel Committee.
The ranges are divided into:
| · | Green (0 to 4 exceptions): corresponds to backtesting results that do not suggest any problems with the quality or accuracy of the models adopted; |
| · | Yellow (5 to 9 exceptions): refers to an intermediate range group, which indicates the need to pay attention and/or monitor and may indicate the need for improvement actions and/or monitoring and may indicate the need of reviewing the model; and |
| · | Red (10 or more exceptions): demonstrates the need for an improvement action. |
The exposure graph below illustrates the reliability of risk measures generated by the models we use in the Trading Portfolio (foreign units are not included in the graph below given the immateriality of amounts involved).
The graph shows the adequacy level of the market risk models used by us, presenting the risk (absolute value) versus return pairs for the period considered. Since the diagonal line represents the threshold where risk equals return, all the dots below this line indicate exceptions to the estimated risk. For the exposure of the Trading Portfolio, the hypothetical losses exceeded the VaR estimated by the model on 2 days during the 250 day period ended on December 31, 2014.
| Annual Report2014 | A-76 |

GUIDE 3
Part II Investment Portfolio
Performance
Financial Performance
Significant Accounting Policies
General Aspects
The preparation of the consolidated financial statements included in this annual report involves some assumptions that are based on our historical experience and other factors that we deem reasonable and material. Although we review these estimates and assumptions in the ordinary course of business, the presentation of our financial condition and results of operations often requires our management to make judgments regarding the effects on our financial condition and results of operations of matters that are uncertain by nature. The comments below describe those aspects that require significant judgment or involve a higher degree of complexity in the application of the accounting policies that currently affect our financial condition and results of operations. Actual results may differ from those estimated under different variables, assumptions or conditions.
Use of Estimates and Assumptions
The preparation of financial statements in accordance with IFRS requires management to make estimates and assumptions that affect the reported amounts of assets and liabilities at the date of the consolidated financial statements, as well as the reported amounts of revenue, expenses and gains and losses during the reporting period because the actual results may differ from those determined based on such estimates and assumptions.
All estimates and assumptions made by management are in accordance with IFRS and represent our best estimates made in conformity with applicable standards. Estimates and judgments are evaluated on an ongoing basis, based on past experience and other factors.
Allowance for Loan and Lease Losses
The allowance for loan and lease losses represents our estimate of the probable losses inherent to our loan portfolio at the end of each reporting period. In order to determine the amount of the allowance for loan and lease losses, a portfolio is classified into two categories with respect to which specific methodologies are used to estimate losses. Loans and leases are analyzed on an individual or portfolio basis.
| · | Loans and leases analyzed on an individual basis (corresponding to our corporate portfolio) are individually analyzed for impairment. For those considered to be impaired, we determine the amount of the allowance based on the expected cash flows of the company that will receive the loan. The loans that are not impaired are rated based on risk factors, and the inherent losses for each rating are estimated based on our historical experience, which involves judgments related to identifying risk factors and assigning a rating. |
| · | Loans analyzed on a portfolio basis (corresponding to the following portfolios: (i) Individuals, (ii) Very Small, Small and Medium Business and (iii) Foreign Units – Latin America) are further segregated into classes, when appropriate, based on their underlying risks and characteristics. The allowance for loan and lease losses is determined by portfolio based on historical experience, which also involves judgments and assumptions. |
Many factors affect the estimate of losses in each of the categories for which we estimate the allowance on a portfolio basis, such as the methodology used to measure historical delinquency and the historical period to be used. Additionally, factors affecting the specific amount of the allowances to be recorded are subjective and include economic and political conditions, credit quality trends and volume and growth observed in each portfolio. We present information on our allowance for loan and lease losses in the table below:
| (In millions of R$) | ||||||||||||
| ALLOWANCE FOR LOAN AND LEASES LOSSES | 2014 | 2013 | 2012 | |||||||||
| Amount Recognized in the Balance Sheet | 22,392 | 22,235 | 25,713 | |||||||||
| Expense Recognized in the Income Statement | 18,832 | 17,856 | 23,982 | |||||||||
Fair Value of Financial Instruments
Financial instruments recorded at fair value on our balance sheet include mainly securities classified as held-for-trading and available-for-sale as well as other trading assets, including derivatives. Securities classified as held-to-maturity are recorded at amortized historical cost on our balance sheet, and their corresponding fair values are shown in the notes to our consolidated financial statements. We present information on the fair value of our financial instruments in the table below as of December 31, 2014, 2013 and 2012.
| (In millions of R$, except percentages) | ||||||||||||
| FINANCIAL INSTRUMENTS | AS OF DECEMBER 31, | |||||||||||
| RECORDED AT FAIR VALUE | 2014 | 2013 | 2012 | |||||||||
| Assets | ||||||||||||
| Held-for-trading | 132,944 | 148,860 | 145,516 | |||||||||
| Designated at fair value through profit or loss | 733 | 371 | 220 | |||||||||
| Derivatives | 14,156 | 11,366 | 11,597 | |||||||||
| Available-for-sale | 78,360 | 96,626 | 90,869 | |||||||||
| Total | 226,193 | 257,223 | 248,202 | |||||||||
| Share (derivatives/total – %) | 6.3 | 4.4 | 4.7 | |||||||||
| Liabilities | ||||||||||||
| Held-for-trading | 520 | 371 | 642 | |||||||||
| Derivatives | 17,350 | 11,405 | 11,069 | |||||||||
| Total | 17,870 | 11,776 | 11,711 | |||||||||
| Share (derivatives/total – %) | 97.1 | 96.8 | 94.5 | |||||||||
We determine the fair value of our financial instruments based on International Financial Reporting Standard 13 (IFRS 13), which defines fair value as the amount for which an asset could be exchanged or a liability transferred in an orderly transaction between market participants.
According to IFRS 13, there are different levels of inputs that may be used to measure the fair value of financial instruments classified as levels 1, 2 and 3.
| • | Level 1: observable inputs reflect the quoted prices (unadjusted) of identical assets or liabilities in active markets; |
| • | Level 2: observable inputs reflect the information on assets and liabilities that are either directly (such as prices) or indirectly (derived from prices) observable, except for the quoted prices included in Level 1; and |
| • | Level 3: information on assets and liabilities that are not based on observable market data due to little market activity on the |
| Annual Report2014 | A-97 |
| measurement date. We present information on our level 3 financial instruments in the table below as of December 31, 2014, 2013 and 2012. |
| (In millions of R$, except percentages) | ||||||||||||
| AS OF DECEMBER 31, | ||||||||||||
| LEVEL 3 | 2014 | 2013 | 2012 | |||||||||
| Held-for-trading | 790 | 27 | 20 | |||||||||
| Available-for-sale securities | 5,404 | 6,489 | 2,489 | |||||||||
| Net position of derivatives | 77 | 119 | 144 | |||||||||
| Total | 6,271 | 6,635 | 2,653 | |||||||||
| (Held-for-trading + Available-for-sale securities)/Total Level 3 (%) | 98.8 | 98.2 | 94.6 | |||||||||
Please refer to section Performance, item Consolidated Financial Statements (IFRS), Note 31 – Fair Value of Financial Instruments for further details.
Judgments are also required to determine whether there is objective evidence that a financial asset or a group of financial assets is impaired. If there is any evidence of impairment for available-for-sale or held-to-maturity financial assets, the cumulative loss, measured as the difference between the acquisition cost and current fair value, is recognized in the statement of income. The primary factors that are used by management to determine whether there is objective evidence that a financial asset is impaired include the observed period of the loss, the level of the loss, whether we were required to sell the securities before the recovery and the expectation, on the date of analysis, of the possibility of realization of the security. Please refer to section Performance, item Consolidated Financial Statements (IFRS), Note 2 – Significant Accounting Policies for further details about other significant accounting policies.
Contingent Liabilities
Contingent liabilities arise mainly from judicial and administrative proceedings inherent to the ordinary course of our business and that are filed by third parties, including former employees and public bodies related to civil, labor, tax and social security claims.
These contingencies are assessed based on the best estimates of our management, taking into consideration the opinion of legal advisors when there is a probability that financial resources will be required to settle obligations and the amount of such obligations can be reliably measured.
Contingencies are classified as follows, based on likelihood of loss:
| · | Probable: liabilities are recognized under “provisions” on our consolidated balance sheet. |
| · | Possible: liabilities are disclosed on our financial statements but no provisions are recorded. |
| · | Remote: liabilities do not require provision or disclosure. |
Contingent liabilities for which provisions are recorded and those classified as having a “possible” likelihood of loss are evaluated based on our best estimates, using models and criteria that allow for their proper evaluation despite the uncertainty that is inherent to terms and amounts.
Significant Changes in Accounting Standards
Please refer to section Performance, item Consolidated Financial Statements (IFRS), Note 2.2 – New Pronouncements; Changes to and Interpretations of Existing Pronouncements for further details about information on significant changes in accounting standards.
Accounting Practices Adopted in Brazil
Our books and records are maintained in Brazilianreais, the official currency in Brazil, and our consolidated financial statements, for statutory and regulatory purposes, are prepared in accordance with accounting practices adopted in Brazil, or Brazilian GAAP, which are applicable to institutions authorized to operate by the Central Bank. The accounting principles and standards generally applicable under Brazilian GAAP include those established under Brazilian Corporate Law, by the Accounting Pronouncements Committee, or CPC, which started issuing standards in 2007, and by the Federal Accounting Council. In the case of companies subject to regulation by the Central Bank, such as Itaú Unibanco Holding, the effectiveness of the accounting pronouncements issued by entities such as the CPC depends on approval of the pronouncement by the CMN, which also establishes the date of effectiveness of any pronouncements with respect to financial institutions. Additionally, the CVM and other regulatory bodies, such as the SUSEP and the Central Bank, provide additional industry-specific guidelines.
Regulation Applicable to the Presentation of the Financial Statements
Brazilian regulations establish specific rules for the consolidation of financial statements by financial institutions. Under current Central Bank regulations, financial institutions, except for credit cooperatives, are required to prepare consolidated financial statements including investments directly or indirectly held in other companies, individually or jointly controlled, and with respect to which such financial institutions have (i) the right to appoint or designate the majority of the company’s board of directors; (ii) the right to appoint or remove the majority of the company’s executives and directors; and/or (iii) operational or shareholding control. These regulations apply to the entire group to which a financial institution belongs.
Assets
Portfolio of Securities and Derivative Financial Instruments
General information
We present below our portfolio of held-for-trading financial assets, available-for-sale financial assets, held-to-maturity financial assets and derivative financial instruments as of December 31, 2014, 2013 and 2012.
The amounts exclude our investments in securities of unconsolidated companies. For further information on our investments in unconsolidated companies, see section Performance, item consolidated financial statement (IFRS), Note 13 – Investments in associates and joint ventures. Held-for-trading and available-for-sale financial assets are stated at fair value and held-to-maturity financial assets are stated at amortized cost. Please refer to section Performance, item Consolidated Financial Statements (IFRS), Note 2 – Significant Accounting Policies for further details.
As of December 31, 2014, we held securities issued by the Brazilian federal government classified as “Government Securities – Domestic” with an aggregate book value and an aggregate market value of R$134,791 million and R$135,587 million, respectively, which represented 134.0% of our consolidated stockholders’ equity
| Annual Report2014 | A-98 |
as of that date. As of December 31, 2014, we did not hold securities of any other issuer the book value of which in the aggregate represented more than 10.0% of our consolidated stockholders’ equity. This is due to our conservative assets and liabilities management and our liquidity in local currency maintained in securities issued by the Brazilian federal government. Additionally, securities issued by the Brazilian federal government are accepted as deposits in our operations in the market on BM&FBovespa.
Held-for-trading
Listed below are the assets acquired and accrued mainly for the purpose of selling in the short term or when they are part of a portfolio of financial instruments that are managed as a whole and for which there is a recent history of sales in the short term. Please refer to section Performance, item Consolidated Financial Statements (IFRS), Note 7 – Financial Assets Held for Trading and Designated at Fair Value Through Profit or Loss, for further details.
| (In millions of R$, except percentages) | ||||||||||||||||||||||||
| AS OF DECEMBER 31, | ||||||||||||||||||||||||
| 2014 | % OF TOTAL | 2013 | % OF TOTAL | 2012 | % OF TOTAL | |||||||||||||||||||
| Held-for-trading financial assets | 132,944 | 100.0 | 148,860 | 100.0 | 145,516 | 100.0 | ||||||||||||||||||
| Investment funds | 870 | 0.7 | 1,062 | 0.7 | 1,468 | 1.0 | ||||||||||||||||||
| Government securities – domestic | 88,307 | 66.4 | 113,039 | 75.9 | 112,492 | 77.3 | ||||||||||||||||||
| Brazilian government securities | 86,393 | 65.0 | 111,135 | 74.7 | 111,206 | 76.4 | ||||||||||||||||||
| Brazilian external debt bonds | 1,914 | 1.4 | 1,904 | 1.3 | 1,286 | 0.9 | ||||||||||||||||||
| Government securities – abroad | 1,540 | 1.2 | 679 | 0.5 | 872 | 0.6 | ||||||||||||||||||
| Argentina | 628 | 0.5 | 99 | 0.1 | 106 | 0.1 | ||||||||||||||||||
| United States | 448 | 0.3 | 18 | 0.0 | 345 | 0.2 | ||||||||||||||||||
| Mexico | 3 | 0.0 | 182 | 0.1 | 225 | 0.2 | ||||||||||||||||||
| Chile | 132 | 0.1 | 6 | 0.0 | 108 | 0.1 | ||||||||||||||||||
| Paraguay | 128 | 0.1 | - | - | - | - | ||||||||||||||||||
| Uruguay | 41 | 0.0 | 41 | 0.0 | 33 | 0.0 | ||||||||||||||||||
| Colombia | 88 | 0.1 | 226 | 0.2 | 34 | 0.0 | ||||||||||||||||||
| Belgium | - | - | 107 | 0.1 | - | - | ||||||||||||||||||
| Peru | - | - | - | - | 21 | 0.0 | ||||||||||||||||||
| Other | 72 | 0.1 | - | - | - | - | ||||||||||||||||||
| Corporate securities | 42,227 | 31.8 | 34,080 | 22.9 | 30,684 | 21.1 | ||||||||||||||||||
| Shares | 2,351 | 1.8 | 2,896 | 1.9 | 2,815 | 1.9 | ||||||||||||||||||
| Securitized real estate loans | 3,281 | 2.5 | 3,006 | 2.0 | 21 | 0.0 | ||||||||||||||||||
| Bank deposit certificates | 1 | 0.0 | 12 | 0.0 | 2,933 | 2.0 | ||||||||||||||||||
| Debentures | 4,243 | 3.2 | 5,097 | 3.4 | 4,636 | 3.2 | ||||||||||||||||||
| Eurobonds and other | 1,061 | 0.8 | 1,278 | 0.9 | 1,612 | 1.1 | ||||||||||||||||||
| Financial credit bills | 30,711 | 23.1 | 21,566 | 14.5 | 18,441 | 12.7 | ||||||||||||||||||
| Promissory Notes | 577 | 0.4 | 27 | 0.0 | 20 | 0.0 | ||||||||||||||||||
| Other | 2 | 0.0 | 198 | 0.1 | 206 | 0.1 | ||||||||||||||||||
| Held-for-trading financial assets as a percentage of total assets (%) | 11.8 | 14.5 | 15.2 | |||||||||||||||||||||
We note that Brazilian government bonds represented over 65.0% of our portfolio of held-for-trading securities in 2014. Brazilian government bonds represented 7.7% of total assets in the same period.
Available-for-sale
Listed below are financial assets that, according to management’s understanding, may be sold in response to, or before changes in, market conditions and are not classified as financial assets at fair value through profit or loss, loans and receivables or held to maturity. Please refer to section Performance, item Consolidated Financial Statements (IFRS), Note 10 – Available for Sale Financial Assets, for further details.
| (In millions of R$, except percentages) | ||||||||||||||||||||||||
| AS OF DECEMBER 31, | ||||||||||||||||||||||||
| 2014 | % OF TOTAL | 2013 | % OF TOTAL | 2012 | % OF TOTAL | |||||||||||||||||||
| Available-for-sale financial assets | 78,360 | 100.0 | 96,626 | 100.0 | 90,869 | 100.0 | ||||||||||||||||||
| Investment funds | 141 | 0.2 | 211 | 0.2 | 255 | 0.3 | ||||||||||||||||||
| Government securities – domestic | 25,625 | 32.7 | 39,648 | 41.0 | 43,527 | 47.9 | ||||||||||||||||||
| Brazilian government securities | 14,391 | 18.4 | 27,939 | 28.9 | 25,462 | 28.0 | ||||||||||||||||||
| Brazilian external debt bonds | 11,234 | 14.3 | 11,709 | 12.1 | 18,065 | 19.9 | ||||||||||||||||||
| Government securities – abroad | 8,619 | 11.0 | 8,658 | 9.0 | 7,137 | 7.9 | ||||||||||||||||||
| United States | 726 | 0.9 | 1,101 | 1.1 | 375 | 0.4 | ||||||||||||||||||
| Italy | 70 | 0.1 | 94 | 0.1 | - | - | ||||||||||||||||||
| Denmark | 2,699 | 3.4 | 2,631 | 2.7 | 2,554 | 2.8 | ||||||||||||||||||
| Spain | 783 | 1.0 | - | - | - | - | ||||||||||||||||||
| Korea | 1,782 | 2.3 | 2,455 | 2.5 | 1,662 | 1.8 | ||||||||||||||||||
| Chile | 1,119 | 1.4 | 1,047 | 1.1 | 1,534 | 1.7 | ||||||||||||||||||
| Paraguay | 849 | 1.1 | 638 | 0.7 | 491 | 0.5 | ||||||||||||||||||
| Annual Report2014 | A-99 |
| (In millions of R$, except percentages) | ||||||||||||||||||||||||
| AS OF DECEMBER 31, | ||||||||||||||||||||||||
| 2014 | % OF TOTAL | 2013 | % OF TOTAL | 2012 | % OF TOTAL | |||||||||||||||||||
| Uruguay | 243 | 0.3 | 420 | 0.4 | 294 | 0.3 | ||||||||||||||||||
| Belgium | 57 | 0.1 | 51 | 0.1 | 71 | 0.1 | ||||||||||||||||||
| France | 133 | 0.2 | 88 | 0.1 | 57 | 0.1 | ||||||||||||||||||
| United Kingdon | - | - | - | - | 83 | 0.1 | ||||||||||||||||||
| Netherlands | 151 | 0.2 | 126 | 0.1 | - | - | ||||||||||||||||||
| Other | 7 | 0.0 | 7 | 0.0 | 16 | 0.0 | ||||||||||||||||||
| Corporate securities | 43,975 | 56.1 | 48,109 | 49.8 | 39,950 | 44.0 | ||||||||||||||||||
| Shares | 1,999 | 2.6 | 2,025 | 2.1 | 3,812 | 4.2 | ||||||||||||||||||
| Securitized real estate loans | 2,522 | 3.2 | 12,275 | 12.7 | 8,568 | 9.4 | ||||||||||||||||||
| Bank deposit certificates | 1,281 | 1.6 | 2,181 | 2.3 | 391 | 0.4 | ||||||||||||||||||
| Debentures | 20,245 | 25.8 | 15,507 | 16.0 | 13,964 | 15.4 | ||||||||||||||||||
| Eurobonds and others | 6,707 | 8.6 | 4,896 | 5.1 | 5,596 | 6.2 | ||||||||||||||||||
| Promissory notes | 1,397 | 1.8 | 1,227 | 1.3 | 777 | 0.9 | ||||||||||||||||||
| Rural Product Note | 1,408 | 1.8 | 625 | 0.6 | 778 | 0.9 | ||||||||||||||||||
| Financial credit bills | 8,005 | 10.2 | 8,804 | 9.1 | 5,720 | 6.3 | ||||||||||||||||||
| Other | 411 | 0.5 | 569 | 0.6 | 344 | 0.4 | ||||||||||||||||||
| Available-for-sale financial assets as a percentage of total assets (%) | 7.0 | 9.4 | 9.5 | |||||||||||||||||||||
Brazilian government bonds and debt securities of companies represented 18.4% and 56.1%, respectively, of our portfolio of available-for-sale securities in 2014. Brazilian government bonds and debt securities of companies classified as available-for-sale securities, which are used a hedge for our subordinated debt portfolio, represented 1.3% and 3.9%, respectively, of total assets in the same period.
Held-to-maturity
Listed below are non-derivative financial assets that with respect to which we have the intention and financial ability to held to maturity. Please refer to section Performance, item Consolidated Financial Statements (IFRS), Note 11 – Held to Maturity Financial Assets, for further details.
| (In millions of R$, except percentages) | ||||||||||||||||||||||||
| AS OF DECEMBER 31, | ||||||||||||||||||||||||
| 2014 | % OF TOTAL | 2013 | % OF TOTAL | 2012 | % OF TOTAL | |||||||||||||||||||
| Held-to-maturity financial assets | 34,434 | 100.0 | 10,116 | 100.0 | 3,202 | 100.0 | ||||||||||||||||||
| Government securities – domestic | 20,859 | 60.6 | 10,092 | 99.8 | 3,131 | 97.8 | ||||||||||||||||||
| Brazilian government securities | 10,555 | 30.7 | 3,778 | 37.4 | 3,013 | 94.1 | ||||||||||||||||||
| Brazilian external debt bonds | 10,304 | 29.9 | 6,314 | 62.4 | 118 | 3.7 | ||||||||||||||||||
| Government securities – abroad – Uruguay | 26 | 0.1 | 23 | 0.2 | 20 | 0.6 | ||||||||||||||||||
| Corporate securities | 13,549 | 39.3 | 1 | 0.0 | 51 | 1.6 | ||||||||||||||||||
| Debentures | - | - | - | - | - | - | ||||||||||||||||||
| Eurobonds and others | 2 | 0.0 | 1 | 0.0 | 51 | 1.6 | ||||||||||||||||||
| Securitized real estate loans | 13,547 | 39.3 | - | - | - | - | ||||||||||||||||||
| Held-to-maturity financial assets as a percentage of total assets (%) | 3.1 | 1.0 | 0.3 | |||||||||||||||||||||
Derivatives
Derivatives are classified on the date of their acquisition in accordance with management’s intention to use them as a hedging instrument, as determined by Brazilian regulations. Our derivatives portfolio (assets and liabilities) is composed of futures, forward, swaps, options and credit derivatives, as stated in the table below (Please refer to section Performance, item Consolidated Financial Statements (IFRS), Note 8 – Derivatives for further details):
| (In millions of R$, except percentages) | ||||||||||||||||||||||||
| AS OF DECEMBER 31, | ||||||||||||||||||||||||
| DERIVATIVE FINANCIAL INSTRUMENTS | 2014 | % OF TOTAL | 2013 | % OF TOTAL | 2012 | % OF TOTAL | ||||||||||||||||||
| Assets | ||||||||||||||||||||||||
| Futures | - | - | - | - | - | - | ||||||||||||||||||
| Options premiums | 2,872 | 20.3 | 1,717 | 15.1 | 1,906 | 16.4 | ||||||||||||||||||
| Forwards (Brazil) | 2,394 | 16.9 | 3,315 | 29.2 | 3,530 | 30.4 | ||||||||||||||||||
| Swaps – difference receivable | 4,816 | 34.0 | 4,442 | 39.1 | 3,686 | 31.8 | ||||||||||||||||||
| Credit derivative | 122 | 0.9 | 686 | 6.0 | 728 | 6.3 | ||||||||||||||||||
| Forwards (offshore) | 2,106 | 14.9 | 555 | 4.9 | 379 | 3.3 | ||||||||||||||||||
| Check of swap – companies | 93 | 0.7 | 88 | 0.8 | 35 | 0.3 | ||||||||||||||||||
| Others | 1,753 | 12.4 | 563 | 5.0 | 1,333 | 11.5 | ||||||||||||||||||
| Total derivative financial instruments assets | 14,156 | 100.0 | 11,366 | 100.0 | 11,597 | 100.0 | ||||||||||||||||||
| Derivative financial instruments as percentage of total assets (%) | 1.3 | 1.1 | 1.2 | |||||||||||||||||||||
| Annual Report2014 | A-100 |
| (In millions of R$, except percentages) | ||||||||||||||||||||||||
| AS OF DECEMBER 31, | ||||||||||||||||||||||||
| DERIVATIVE FINANCIAL INSTRUMENTS | 2014 | % OF TOTAL | 2013 | % OF TOTAL | 2012 | % OF TOTAL | ||||||||||||||||||
| Liabilities | ||||||||||||||||||||||||
| Futures | (354 | ) | 2.0 | (33 | ) | 0.3 | (23 | ) | 0.2 | |||||||||||||||
| Options premiums | (3,057 | ) | 17.6 | (1,921 | ) | 16.8 | (2,281 | ) | 20.6 | |||||||||||||||
| Forwards (Brazil) | (682 | ) | 3.9 | (1,862 | ) | 16.3 | (2,293 | ) | 20.7 | |||||||||||||||
| Swaps – difference payable | (9,534 | ) | 55.0 | (6,111 | ) | 53.6 | (5,068 | ) | 45.8 | |||||||||||||||
| Credit derivative | (179 | ) | 1.0 | (391 | ) | 3.4 | (90 | ) | 0.8 | |||||||||||||||
| Forwards (offshore) | (1,693 | ) | 9.8 | (560 | ) | 4.9 | (346 | ) | 3.1 | |||||||||||||||
| Swaps with USD check – companies | (229 | ) | 1.3 | (145 | ) | 1.3 | (42 | ) | 0.4 | |||||||||||||||
| Others | (1,622 | ) | 9.3 | (382 | ) | 3.3 | (926 | ) | 8.4 | |||||||||||||||
| Total derivative financial instruments liabilities | (17,350 | ) | 100.0 | (11,405 | ) | 100.0 | (11,069 | ) | 100.0 | |||||||||||||||
| Derivative financial instruments as percentage of total liabilities and stockholder’s equity (%) | 1.5 | 1.1 | 1.2 | |||||||||||||||||||||
| (In millions of R$, except percentages) | ||||||||||||||||||||||||||||||||||||||||||||||||
| AS OF DECEMBER 31, 2014 | ||||||||||||||||||||||||||||||||||||||||||||||||
| NO STATED | DUE IN 1 YEAR | DUE AFTER 1 YEAR | DUE AFTER 5 YEARS | DUE AFTER | ||||||||||||||||||||||||||||||||||||||||||||
| MATURITY | OR LESS | TO 5 YEARS | TO 10 YEARS | 10 YEARS | TOTAL | |||||||||||||||||||||||||||||||||||||||||||
| DISTRIBUTION OF OUR FINANCIAL | AVERAGE | AVERAGE | AVERAGE | AVERAGE | AVERAGE | AVERAGE | ||||||||||||||||||||||||||||||||||||||||||
| ASSETS BY MATURITY | R$ | YIELD (%) | R$ | YIELD (%) | R$ | YIELD (%) | R$ | YIELD (%) | R$ | YIELD (%) | R$ | YIELD (%) | ||||||||||||||||||||||||||||||||||||
| Held-for-trading financial assets, at fair value | 3,220 | - | 50,231 | - | 57,074 | - | 16,279 | - | 6,140 | - | 132,944 | - | ||||||||||||||||||||||||||||||||||||
| Investment funds(1) | 870 | 0.0 | - | - | - | - | - | - | - | - | 870 | 0.0 | ||||||||||||||||||||||||||||||||||||
| Government securities – domestic | - | 35,863 | 31,002 | 15,410 | 6,032 | 88,307 | ||||||||||||||||||||||||||||||||||||||||||
| Brazilian government securities | - | 0.0 | 35,167 | 0.2 | 29,985 | 3.9 | 15,393 | 5.9 | 5,848 | 3.3 | 86,393 | 2.7 | ||||||||||||||||||||||||||||||||||||
| Brazilian external debt bonds | - | 0.0 | 696 | 7.8 | 1,017 | 5.9 | 17 | 0.6 | 184 | 4.3 | 1,914 | 6.4 | ||||||||||||||||||||||||||||||||||||
| Government securities – abroad | - | 1,279 | 245 | 13 | 4 | 1,540 | ||||||||||||||||||||||||||||||||||||||||||
| Argentina | - | 0.0 | 553 | 23.5 | 71 | 21.0 | 4 | 25.2 | 0 | 1.6 | 628 | 23.2 | ||||||||||||||||||||||||||||||||||||
| United States | - | 0.0 | 390 | 2.4 | 58 | 0.1 | - | 0.0 | - | 0.0 | 448 | 2.1 | ||||||||||||||||||||||||||||||||||||
| Mexico | - | 0.0 | - | - | 2 | 6.0 | 1 | 4.8 | 0 | 5.9 | 3 | 6.6 | ||||||||||||||||||||||||||||||||||||
| Chile | - | 0.0 | 132 | 3.9 | - | 0.0 | - | 0.0 | - | 0.0 | 132 | 3.9 | ||||||||||||||||||||||||||||||||||||
| Paraguay | - | 0.0 | 128 | 5.9 | 0 | 0.0 | - | 0.0 | - | 0.0 | 128 | 5.9 | ||||||||||||||||||||||||||||||||||||
| Uruguay | - | 0.0 | 34 | 12.3 | 4 | 12.8 | 1 | 6.5 | 2 | 7.2 | 41 | 12.0 | ||||||||||||||||||||||||||||||||||||
| Colombia | - | 0.0 | 27 | 0.0 | 55 | 0.2 | 7 | 0.6 | 0 | 6.1 | 88 | 0.2 | ||||||||||||||||||||||||||||||||||||
| Other | - | 0.0 | 16 | 0.2 | 54 | 1.0 | - | 0.0 | 2 | 7.4 | 72 | 1.0 | ||||||||||||||||||||||||||||||||||||
| Corporate securities | 2,351 | 13,088 | 25,829 | 855 | 104 | 42,227 | ||||||||||||||||||||||||||||||||||||||||||
| Shares | 2,351 | 0.0 | - | - | - | - | - | - | - | - | 2,351 | 0.0 | ||||||||||||||||||||||||||||||||||||
| Securitized real estate loans | - | 0.0 | - | 0.0 | - | - | 1 | 0.0 | - | 0.0 | 1 | 0.0 | ||||||||||||||||||||||||||||||||||||
| Bank deposit certificates | - | 0.0 | 1,198 | 0.0 | 2,083 | 0.0 | - | - | - | 0.0 | 3,281 | 0.0 | ||||||||||||||||||||||||||||||||||||
| Debentures | - | 0.0 | 794 | 0.0 | 2,521 | 0.1 | 832 | 0.2 | 96 | 0.5 | 4,243 | 0.1 | ||||||||||||||||||||||||||||||||||||
| Eurobonds and other | - | 0.0 | 390 | 6.9 | 641 | 7.7 | 21 | 6.4 | 8 | 5.6 | 1,061 | 7.3 | ||||||||||||||||||||||||||||||||||||
| Financial credit bills | - | 0.0 | 10,128 | 0.0 | 20,583 | 0.0 | - | 0.0 | - | 0.0 | 30,711 | 0.0 | ||||||||||||||||||||||||||||||||||||
| Promissory notes | - | 0.0 | 577 | 0.0 | - | 0.0 | - | - | - | 0.0 | 577 | 0.0 | ||||||||||||||||||||||||||||||||||||
| Other | - | 0.0 | - | 0.0 | - | 0.0 | 2 | - | - | 0.0 | 2 | 0.0 | ||||||||||||||||||||||||||||||||||||
| Financial assets designated at fair value through profit or loss – Government securities – domestic – Brazilian external debt bonds | 733 | - | - | - | - | 733 | ||||||||||||||||||||||||||||||||||||||||||
| Derivatives | 2,408 | 6,311 | 3,682 | 1,755 | 14,156 | |||||||||||||||||||||||||||||||||||||||||||
| Available-for-sale financial assets, at fair value | 2,141 | - | 20,079 | - | 29,743 | - | 12,650 | - | 13,747 | - | 78,360 | |||||||||||||||||||||||||||||||||||||
| Investment funds(1) | 142 | 0.0 | (1 | ) | 0.0 | - | - | - | - | - | - | 141 | ||||||||||||||||||||||||||||||||||||
| Government securities – domestic | - | 300 | 8,693 | 5,007 | 11,625 | 25,625 | ||||||||||||||||||||||||||||||||||||||||||
| Brazilian government securities | - | - | 260 | 0.1 | 6,358 | 1.7 | 2,415 | 5.0 | 5,358 | 4.2 | 14,391 | 3.2 | ||||||||||||||||||||||||||||||||||||
| Brazilian external debt bonds | - | - | 40 | 0.1 | 2,335 | 2.1 | 2,592 | 5.9 | 6,266 | 8.3 | 11,234 | 6.3 | ||||||||||||||||||||||||||||||||||||
| Government securities – abroad | - | 6,679 | 1,891 | 50 | 0 | 8,619 | ||||||||||||||||||||||||||||||||||||||||||
| United States | - | 0.0 | 181 | 0.0 | 545 | 0.6 | - | 0.0 | - | 0.0 | 726 | 0.5 | ||||||||||||||||||||||||||||||||||||
| Italy | - | 0.0 | - | - | 70 | 0.0 | - | 0.0 | - | 0.0 | 70 | 0.0 | ||||||||||||||||||||||||||||||||||||
| Denmark | - | 0.0 | 2,459 | 8.4 | 241 | 9.5 | - | 0.0 | - | 0.0 | 2,699 | 8.5 | ||||||||||||||||||||||||||||||||||||
| Spain | - | 0.0 | 783 | 0.0 | - | �� | 0.0 | - | 0.0 | - | 0.0 | 783 | 0.0 | |||||||||||||||||||||||||||||||||||
| Korea | - | 0.0 | 1,328 | 0.0 | 454 | 0.0 | - | 0.0 | - | 0.0 | 1,782 | 0.0 | ||||||||||||||||||||||||||||||||||||
| Annual Report2014 | A-101 |
| (In millions of R$, except percentages) | ||||||||||||||||||||||||||||||||||||||||||||||||
| AS OF DECEMBER 31, 2014 | ||||||||||||||||||||||||||||||||||||||||||||||||
| NO STATED | DUE IN 1 YEAR | DUE AFTER 1 YEAR | DUE AFTER 5 YEARS | DUE AFTER | ||||||||||||||||||||||||||||||||||||||||||||
| MATURITY | OR LESS | TO 5 YEARS | TO 10 YEARS | 10 YEARS | TOTAL | |||||||||||||||||||||||||||||||||||||||||||
| DISTRIBUTION OF OUR FINANCIAL | AVERAGE | AVERAGE | AVERAGE | AVERAGE | AVERAGE | AVERAGE | ||||||||||||||||||||||||||||||||||||||||||
| ASSETS BY MATURITY | R$ | YIELD (%) | R$ | YIELD (%) | R$ | YIELD (%) | R$ | YIELD (%) | R$ | YIELD (%) | R$ | YIELD (%) | ||||||||||||||||||||||||||||||||||||
| Chile | - | 0.0 | 1,103 | 2.9 | 16 | 1.4 | - | 0.0 | - | 0.0 | 1,119 | 2.9 | ||||||||||||||||||||||||||||||||||||
| Paraguay | - | 0.0 | 566 | 7.1 | 283 | 8.4 | - | 0.0 | - | 0.0 | 849 | 7.5 | ||||||||||||||||||||||||||||||||||||
| Uruguay | - | 0.0 | 152 | 0.1 | 41 | 0.1 | 50 | 0.1 | 0 | 0.1 | 243 | 0.1 | ||||||||||||||||||||||||||||||||||||
| Belgium | - | 0.0 | 57 | 2.8 | - | 0.0 | - | 0.0 | - | 0.0 | 57 | 2.7 | ||||||||||||||||||||||||||||||||||||
| France | - | 0.0 | 49 | 2.7 | 84 | 1.0 | - | 0.0 | - | 0.0 | 133 | 1.6 | ||||||||||||||||||||||||||||||||||||
| Netherlands | - | 0.0 | - | 0.0 | 151 | 0.0 | - | 0.0 | - | 0.0 | 151 | 0.0 | ||||||||||||||||||||||||||||||||||||
| Other | - | 0.0 | 0 | 1.2 | 7 | 1.1 | - | 0.0 | 0 | 1.2 | 7 | 1.0 | ||||||||||||||||||||||||||||||||||||
| Corporate securities | 1,999 | 13,101 | 19,160 | 7,594 | 2,122 | 43,975 | ||||||||||||||||||||||||||||||||||||||||||
| Shares | 1,999 | 0.0 | - | 0.0 | - | - | - | - | - | 0.0 | 1,999 | 0.0 | ||||||||||||||||||||||||||||||||||||
| Securitized real estate loans | - | 0.0 | 30 | 0.0 | 500 | 0.0 | 668 | 0.0 | 1,324 | 0.0 | 2,522 | 0.0 | ||||||||||||||||||||||||||||||||||||
| Bank deposit certificates | - | 0.0 | 1,262 | 0.3 | 20 | 3.6 | - | - | - | 0.0 | 1,281 | 0.4 | ||||||||||||||||||||||||||||||||||||
| Debentures | - | 0.0 | 3,478 | 3.2 | 9,761 | 2.1 | 6,238 | 2.6 | 767 | 5.1 | 20,245 | 2.6 | ||||||||||||||||||||||||||||||||||||
| Eurobonds and others | - | 0.0 | 2,560 | 0.1 | 3,558 | 0.1 | 589 | 0.1 | - | 0.0 | 6,707 | 0.1 | ||||||||||||||||||||||||||||||||||||
| Promissory notes | - | 0.0 | 1,397 | 0.0 | - | 0.0 | - | 0.0 | - | 0.0 | 1,397 | 0.0 | ||||||||||||||||||||||||||||||||||||
| Rural product note | - | 0.0 | 779 | 9.9 | 531 | 9.8 | 99 | 11.7 | - | 0.0 | 1,408 | 9.9 | ||||||||||||||||||||||||||||||||||||
| Financial credit bills | - | 0.0 | 3,500 | 1.7 | 4,505 | 0.8 | - | - | - | 0.0 | 8,005 | 1.2 | ||||||||||||||||||||||||||||||||||||
| Other | - | 0.0 | 95 | 0.0 | 286 | 0.0 | 0 | 0.0 | 30 | 0.0 | 411 | 0.0 | ||||||||||||||||||||||||||||||||||||
| Held-to-maturity financial assets, at amortized cost | - | - | 980 | - | 13,609 | - | 11,582 | - | 8,263 | - | 34,434 | - | ||||||||||||||||||||||||||||||||||||
| Government securities – domestic | - | 50 | 10,089 | 6,789 | 3,931 | 20,859 | ||||||||||||||||||||||||||||||||||||||||||
| Brazilian government securities | - | - | 50 | - | 6,700 | 0.0 | 1,307 | 0.0 | 2,498 | 0.0 | 10,555 | 0.0 | ||||||||||||||||||||||||||||||||||||
| Brazilian external debt bonds | - | - | - | 0.0 | 3,389 | 4.4 | 5,481 | 5.4 | 1,434 | 8.8 | 10,304 | 5.5 | ||||||||||||||||||||||||||||||||||||
| Government securities – abroad | - | 16 | - | - | 10 | 26 | ||||||||||||||||||||||||||||||||||||||||||
| Uruguay | - | - | 16 | 0.1 | - | - | - | - | 10 | 0.1 | 26 | 0.1 | ||||||||||||||||||||||||||||||||||||
| Corporate securities | - | 913 | 3,520 | 4,794 | 4,322 | 13,549 | ||||||||||||||||||||||||||||||||||||||||||
| Debentures | - | 0.0 | - | 0.0 | - | 0.0 | - | 0.0 | - | 0.0 | - | 0.0 | ||||||||||||||||||||||||||||||||||||
| Eurobonds and others | - | 0.0 | - | 0.0 | - | 0.0 | - | 0.1 | - | 0.0 | - | 0.0 | ||||||||||||||||||||||||||||||||||||
| Securitized real estate loans | - | - | 913 | 0.0 | 3,520 | 0.0 | 4,794 | 0.0 | 4,322 | 0.0 | 13,549 | 0.0 | ||||||||||||||||||||||||||||||||||||
(1) Average yields are not shown for these securities, as such yields are not meaningful because future yields are not quantifiable. These securities have been excluded from the calculation of the total yield.
| (In millions of R$) | ||||||||||||||||||||||||
| FAIR VALUE | AMORTIZED COST | |||||||||||||||||||||||
| DISTRIBUTION OF OUR FINANCIAL ASSETS BY CURRENCY | HELD-FOR- TRADING FINANCIAL ASSETS | FINANCIAL ASSETS DESIGNATED AT FAIR VALUE | DERIVATIVES | AVAILABLE-FOR- SALE FINANCIAL ASSETS | HELD-TO- MATURITY FINANCIAL ASSETS | TOTAL | ||||||||||||||||||
| As of December 31, 2014 | 132,944 | 733 | 14,156 | 78,360 | 34,434 | 260,627 | ||||||||||||||||||
| Denominated in Brazilian currency | 126,404 | 626 | 5,519 | 55,152 | 24,102 | 211,803 | ||||||||||||||||||
| Denominated in Brazilian currency and indexed by foreign currency(1) | 2,190 | - | 2,948 | 571 | - | 5,709 | ||||||||||||||||||
| Denominated in foreign currency(1) | 4,350 | 107 | 5,689 | 22,637 | 10,332 | 43,115 | ||||||||||||||||||
| As of December 31, 2013 | 148,860 | 371 | 11,366 | 96,626 | 10,116 | 267,339 | ||||||||||||||||||
| Denominated in Brazilian currency | 141,958 | 263 | 5,682 | 73,799 | 3,779 | 225,481 | ||||||||||||||||||
| Denominated in Brazilian currency and indexed by foreign currency(1) | 2,114 | - | 2,627 | 484 | - | 5,225 | ||||||||||||||||||
| Denominated in foreign currency(1) | 4,788 | 108 | 3,057 | 22,343 | 6,337 | 36,633 | ||||||||||||||||||
| As of December 31, 2012 | 145,516 | 220 | 11,597 | 90,869 | 3,202 | 251,404 | ||||||||||||||||||
| Denominated in Brazilian currency | 140,987 | 220 | 7,029 | 63,101 | 2 ,995 | 214,332 | ||||||||||||||||||
| Denominated in Brazilian currency and indexed by foreign currency(1) | 142 | - | 1,227 | 301 | 19 | 1,689 | ||||||||||||||||||
| Denominated in foreign currency(1) | 4,387 | - | 3,341 | 27,467 | 188 | 35,383 | ||||||||||||||||||
(1) Predominantly U.S. dollars.
For the purpose of analyzing the exposure of variations in foreign exchange rates, the table below presents the composition of our derivative financial instruments on December 31, 2014 inreais and in foreign currency, including the instruments denominated in foreign currencies. For the fair value of derivative financial instruments, please refer to section Performance, item Consolidated Financial Statements (IFRS), Note 7 – Financial Assets Held for Trading and Designated at Fair Value Through Profit or Loss and Note 36 – Management of Financial Risks.
| Annual Report2014 | A-102 |
| (In millions of R$) | ||||||||||||
| DERIVATIVE FINANCIAL INSTRUMENTS (NOTIONAL AMOUNTS) | BRAZILIAN CURRENCY | DENOMINATED IN OR LINKED TO FOREIGN CURRENCY | TOTAL | |||||||||
| Swap contracts | ||||||||||||
| Buy (Sale) commitments, net | 7,607 | (12,739 | ) | (5,132 | ) | |||||||
| Forward contracts | ||||||||||||
| Buy (Sale) commitments, net | (7,547 | ) | 6,922 | (625 | ) | |||||||
| Future contracts | ||||||||||||
| Buy (Sale) commitments, net | (29,889 | ) | (105,271 | ) | (135,160 | ) | ||||||
| Option contracts | ||||||||||||
| Buy (Sale) commitments, net | (44,853 | ) | 2,417 | (42,436 | ) | |||||||
| Others | ||||||||||||
| Buy (Sale) commitments, net | 4,536 | 968 | 5,504 | |||||||||
Exposure to GIIPS
Our gross exposure to the sovereign bonds of the GIIPS (Greece, Ireland, Italy, Portugal and Spain) countries as well as to financial institutions and other corporations and small businesses and individuals domiciled in those countries as of December 31, 2014, is set forth in the table below:
| (In millions of R$) | ||||||||||||||||||||||||
| AS OF DECEMBER 31, 2014 | ||||||||||||||||||||||||
| SEGMENT | CREDIT | CO-OBLIGATION | SOVEREIGN | BOND | DERIVATIVE | TOTAL EXPOSURE | ||||||||||||||||||
| Italy | 57 | - | 70 | - | - | 127 | ||||||||||||||||||
| Corporate | 57 | - | 70 | - | - | 127 | ||||||||||||||||||
| Financial | - | - | - | - | - | - | ||||||||||||||||||
| Portugal | 97 | 1 | - | 8 | - | 106 | ||||||||||||||||||
| Corporate | 97 | - | - | - | - | 97 | ||||||||||||||||||
| Financial | - | 1 | - | 8 | - | 9 | ||||||||||||||||||
| Spain | 1,207 | 1,152 | - | 783 | 8 | 3,150 | ||||||||||||||||||
| Corporate | 1,207 | 1,075 | - | - | 1 | 2,283 | ||||||||||||||||||
| Financial | - | 77 | - | 783 | 7 | 867 | ||||||||||||||||||
| Total | 1,361 | 1,153 | 70 | 791 | 8 | 3,383 | ||||||||||||||||||
The gross exposure presented above, primarily related to our exposure to corporate credits, amounted R$3,383 million as of December 31, 2014, with co-obligations in the amount of R$1,153 million. The exposure presented above has been calculated based on our estimated realizable value, which is updated depending on its nature (such as pledged amounts in current accounts used to collect customer receivables, financial investments, real estate, machinery and equipment or others), except for guarantees provided by third parties, in which case the amount corresponds to the outstanding debt. Our derivatives related to GIIPS countries amounted to R$8.0 million as of December 31, 2014.
Compulsory Deposits with the Central Bank
The Central Bank requires compulsory deposits from Brazilian financial institutions. The compulsory deposits are mechanisms to control the liquidity of the Brazilian financial system as well as a monetary policy resource of the Brazilian government. These requirements are applied to banking transactions, such as demand deposits, savings account deposits and time deposits. See below the compulsory deposit rates required for each type of investment:
| COMPULSORY DEPOSITS | REGULATION(1) | YIELD | 2014 (%) | 2013 (%) | 2012(%) | |||||||||||
| Demand Deposits | ||||||||||||||||
| Compulsory | Circular No. 3,632 | Zero | 45 | 44 | 45 | |||||||||||
| Additional Compulsory | Circular No. 3,655 | SELIC | 0 | 0 | 5 | |||||||||||
| Rural(2) | Resolution No. 4,096 | Zero | 34 | 34 | 30 | |||||||||||
| Microcredit(2) | Resolution No. 4,000 | Zero | 2 | 2 | 2 | |||||||||||
| Savings Accounts(3) | ||||||||||||||||
| Compulsory | Circular No. 3,093 | TR + 6.17 p.a. | 20 | 20 | 20 | |||||||||||
| Additional Compulsory | Circular No. 3,655 | SELIC | 10 | 10 | 10 | |||||||||||
| Real estate financing(2) | Resolution No. 3,932 | Zero | 65 | 65 | 65 | |||||||||||
| Time and Interbank Deposits Received from Leasing Companies | ||||||||||||||||
| Compulsory | Circular No. 3,569 | SELIC | 20 | 20 | 14 | |||||||||||
| Additional Compulsory | Circular No. 3,655 | SELIC | 11 | 11 | 4 | |||||||||||
(1) Most recent regulation on the matter.
(2) This is a compulsory investment of resources that is made in eligible transactions, that is, the funds are granted to other economic entities.
(3) Remuneration on funds in savings deposits:
For deposits made until March 5, 2012, inclusive: TR + 6.17 per annum.
For deposits made after March 5, 2012: (a) If the target of the Selic rate is higher than 8.5 per annum: TR + 6.17 per annum; (b) If the target of the Selic rate is lower than 8.5 per annum: TR + 70 of the target of the Selic rate per annum.
The most recent changes to the compulsory deposit rates were:
| · | The additional requirement on demand deposits was reduced from 6% to 0% in November 2012; |
| · | The additional requirement on time deposits was reduced from 12% to 11% in November 2012; |
| · | The compulsory on demand deposits were increased from 44% to 45% in July 2014; and |
| Annual Report2014 | A-103 |
| · | Adjustment of the non-interest-bearing portion of time deposits in August 2014. |
The regulations that govern the compulsory deposit rates are frequently changed by the Central Bank in accordance with the economic scenario and in response to its views on Brazilian monetary policy. On December 31, 2014, we recorded the amount of R$63,106 million in compulsory deposits in cash compared with R$77,010 million on December 31, 2013, R$59,714 million and R$71,877 million, respectively, of which are interest-bearing. Please refer to section Performance, item Consolidated Financial Statements (IFRS), Note 5 – Central Bank Compulsory Deposits for further details.
| (In millions of R$, except percentages) | ||||||||||||||||||||||||
| 2014 | 2013 | 2012 | ||||||||||||||||||||||
| % OF TOTAL | % OF TOTAL | % OF TOTAL | ||||||||||||||||||||||
| COMPULSORY | COMPULSORY | COMPULSORY | ||||||||||||||||||||||
| R$ | DEPOSITS | R$ | DEPOSITS | R$ | DEPOSITS | |||||||||||||||||||
| Non-interest bearing deposits(1) | 3,392 | 5.4 | 5,133 | 6.7 | 6,448 | 10.1 | ||||||||||||||||||
| Interest-bearing deposits(2) | 59,714 | 94.6 | 71,877 | 93.3 | 57,253 | 89.9 | ||||||||||||||||||
| Total | 63,106 | 100.0 | 77,010 | 100.0 | 63,701 | 100.0 | ||||||||||||||||||
(1) Mainly related to demand deposits.
(2) Mainly related to time and savings deposits.
GUIDE 3
Part III Loan Portfolio
Loan and lease operations
Substantially all of our loans are granted to clients domiciled in Brazil and are denominated in Brazilianreais. Additionally, 59.0% of our credit portfolio consists of transactions with fixed interest rates and 41.0% of transactions with variable interest rates.
Indexation
Most of our portfolio is denominated in Brazilianreais. However, a portion of our portfolio is indexed to foreign currencies, primarily the U.S. dollar. The foreign currency portion of our portfolio consists of loans and financing for foreign trade and onlending operations. Our loan and lease operations abroad represented 24.7%, 28.7% and 23.9% of our loan portfolio as of December 31, 2014, 2013 and 2012, respectively, according to section Performance, item Consolidated Financial Statements (IFRS), Note 36 – Management of financial risks – 5. Credit risk exposure.
Loan and lease operations by type
The following table sets out the distribution of our credit portfolio according to the type of loan and lease operations, as follows:
| · | The Individuals portfolio consists primarily of credit cards, personal loans (primarily including consumer finance and overdrafts), vehicle financing and residential mortgage loans; |
| · | The Corporate portfolio consists primarily of loans made to large corporate clients; |
| · | The Small and Medium Businesses portfolio consists primarily of loans to small and medium-sized companies; and |
| · | The Foreign Loans – Latin America portfolio consists primarily of loans granted primarily to individuals by our operations in Argentina, Chile, Paraguay and Uruguay. |
| (In millions of R$) | ||||||||||||||||||||||||||||||||||||||||
| LOAN AND LEASE OPERATIONS, | 2014 | 2013 | 2012 | 2011 | 2010 | |||||||||||||||||||||||||||||||||||
| BY TYPE(1) | LOAN | ALLOWANCE | LOAN | ALLOWANCE | LOAN | ALLOWANCE | LOAN | ALLOWANCE | LOAN | ALLOWANCE | ||||||||||||||||||||||||||||||
| Individuals | 185,953 | 13,385 | 167,431 | 13,853 | 150,921 | 14,844 | 149,391 | 13,684 | 126,805 | 11,146 | ||||||||||||||||||||||||||||||
| Credit card | 59,321 | 3,740 | 53,149 | 2,952 | 40,531 | 2,863 | 38,961 | 3,825 | 33,041 | 3,306 | ||||||||||||||||||||||||||||||
| Personal loans | 27,953 | 7,024 | 26,635 | 6,488 | 26,749 | 6,841 | 25,876 | 4,842 | 17,144 | 3,590 | ||||||||||||||||||||||||||||||
| Payroll Loans | 40,525 | 1,107 | 22,571 | 1,133 | 13,550 | 867 | 10,107 | 556 | 8,402 | 429 | ||||||||||||||||||||||||||||||
| Vehicles | 29,047 | 1,469 | 40,584 | 3,245 | 51,646 | 4,227 | 60,463 | 4,415 | 60,151 | 3,709 | ||||||||||||||||||||||||||||||
| Mortgage loans | 29,107 | 45 | 24,492 | 35 | 18,445 | 46 | 13,984 | 46 | 8,067 | 112 | ||||||||||||||||||||||||||||||
| Corporate | 144,910 | 2,926 | 126,413 | 1,783 | 103,729 | 1,362 | 91,965 | 703 | 74,565 | 544 | ||||||||||||||||||||||||||||||
| Small and Medium Businesses | 79,912 | 5,373 | 81,601 | 6,085 | 85,185 | 9,091 | 85,649 | 9,197 | 79,950 | 8,041 | ||||||||||||||||||||||||||||||
| Foreign Loans Latin America | 41,656 | 708 | 36,257 | 514 | 27,149 | 416 | 19,259 | 289 | 13,517 | 263 | ||||||||||||||||||||||||||||||
| Total loans and advances to clients | 452,431 | 22,392 | 411,702 | 22,235 | 366,984 | 25,713 | 346,264 | 23,873 | 294,837 | 19,994 | ||||||||||||||||||||||||||||||
(1) We classify all loans and leases more than 60 days overdue as non-accrual loans and we discontinue accruing financial income related to them. The contractual amount of non-accrual loans were R$16,514 million, R$18,065 million, R$20,791 million, R$20,439 million and R$14,736 million as of December 31, 2014, 2013, 2012, 2011 and 2010, respectively. The total of renegotiated loans in the balance of non-accrual loans reflected herein was R$3,346 million, R$4,627 million, R$5,734 million, R$4,365 million and R$3,147 million as of December 31, 2014, 2013, 2012, 2011 and 2010, respectively. Non-accrual loans are presented herein in the appropriate category of loan and lease operations. The interest income foregone on our non-accrual loans net of allowance for loan losses for 2014, 2013, 2012, 2011 and 2010 was R$1,623 million, R$1,681 million, R$1,852 million, R$1,914 million and R$1,548 million, respectively.
Loan and lease operations by maturity
The following table sets out the distribution of our credit portfolio by maturity, including non-overdue and overdue, according to the type of loan and lease:
| (In millions of R$) | ||||||||||||||||||||||||||||
| NON-OVERDUE INSTALLMENTS | 12/31/2014 | |||||||||||||||||||||||||||
| TYPE OF LOAN AND LEASE | DUE IN 30 DAYS OR LESS | DUE IN 31-90 DAYS | DUE IN 91-180 DAYS | DUE IN 181-360 DAYS | DUE IN ONE YEAR TO FIVE YEARS | DUE AFTER FIVE YEARS | TOTAL NON-OVERDUE INSTALLMENTS | |||||||||||||||||||||
| Individuals | 29,985 | 25,941 | 20,510 | 23,392 | 54,906 | 22,651 | 177,385 | |||||||||||||||||||||
| Credit card | 21,658 | 17,658 | 9,841 | 4,740 | 217 | - | 54,114 | |||||||||||||||||||||
| Personal loans | 5,137 | 3,074 | 3,488 | 5,346 | 8,749 | 18 | 25,812 | |||||||||||||||||||||
| Payroll loans | 1,259 | 2,328 | 3,290 | 6,082 | 25,614 | 1,744 | 40,317 | |||||||||||||||||||||
| Vehicles | 1,482 | 2,516 | 3,496 | 6,348 | 14,267 | 1 | 28,110 | |||||||||||||||||||||
| Annual Report2014 | A-104 |
| (In millions of R$) | ||||||||||||||||||||||||||||
| NON-OVERDUE INSTALLMENTS | 12/31/2014 | |||||||||||||||||||||||||||
| TYPE OF LOAN AND LEASE | DUE IN 30 DAYS OR LESS | DUE IN 31-90 DAYS | DUE IN 91-180 DAYS | DUE IN 181-360 DAYS | DUE IN ONE YEAR TO FIVE YEARS | DUE AFTER FIVE YEARS | TOTAL NON-OVERDUE INSTALLMENTS | |||||||||||||||||||||
| Mortgage loans | 449 | 365 | 395 | 876 | 6,059 | 20,888 | 29,032 | |||||||||||||||||||||
| Corporate | 13,551 | 18,756 | 14,560 | 19,907 | 61,163 | 15,676 | 143,613 | |||||||||||||||||||||
| Small and Medium Businesses | 11,018 | 16,891 | 9,835 | 13,802 | 25,564 | 440 | 77,550 | |||||||||||||||||||||
| Foreign Loans Latin America | 7,340 | 5,344 | 4,438 | 4,648 | 10,337 | 8,701 | 40,808 | |||||||||||||||||||||
| Total(1) | 61,894 | 66,932 | 49,343 | 61,749 | 151,970 | 47,468 | 439,356 | |||||||||||||||||||||
(1) Includes R$7,533 million related to non-overdue installments of the non-accrual loans.
| (In millions of R$) | ||||||||||||||||||||||||||||
| NON-OVERDUE INSTALLMENTS | 12/31/2013 | |||||||||||||||||||||||||||
| TYPE OF LOAN AND LEASE | DUE IN 30 DAYS OR LESS | DUE IN 31-90 DAYS | DUE IN 91-180 DAYS | DUE IN 181-360 DAYS | DUE IN ONE YEAR TO FIVE YEARS | DUE AFTER FIVE YEARS | TOTAL NON-OVERDUE INSTALLMENTS | |||||||||||||||||||||
| Individuals | 27,605 | 22,520 | 17,913 | 21,482 | 52,209 | 17,294 | 159,023 | |||||||||||||||||||||
| Credit card | 20,182 | 15,184 | 8,625 | 4,357 | 159 | - | 48,507 | |||||||||||||||||||||
| Personal loans | 4,553 | 2,760 | 2,757 | 4,565 | 10,032 | 12 | 24,679 | |||||||||||||||||||||
| Payroll loans | 730 | 1,203 | 1,725 | 3,266 | 15,486 | 24 | 22,434 | |||||||||||||||||||||
| Vehicles | 1,942 | 3,098 | 4,389 | 8,333 | 21,266 | 2 | 39,030 | |||||||||||||||||||||
| Mortgage loans | 198 | 275 | 417 | 961 | 5,266 | 17,256 | 24,373 | |||||||||||||||||||||
| Corporate | 11,572 | 16,420 | 12,525 | 20,453 | 50,146 | 14,346 | 125,462 | |||||||||||||||||||||
| Small and Medium Businesses | 12,705 | 15,235 | 9,470 | 14,091 | 26,808 | 431 | 78,740 | |||||||||||||||||||||
| Foreign Loans Latin America | 5,139 | 4,325 | 3,722 | 3,613 | 7,687 | 11,000 | 35,486 | |||||||||||||||||||||
| Total(1) | 57,021 | 58,500 | 43,630 | 59,639 | 136,850 | 43,071 | 398,711 | |||||||||||||||||||||
(1) Includes R$9,045 million related to non-overdue installments of the non-accrual loans.
| (In millions of R$) | ||||||||||||||||||||||||||||
| NON-OVERDUE INSTALLMENTS | 12/31/2012 | |||||||||||||||||||||||||||
| TYPE OF LOAN AND LEASE | DUE IN 30 DAYS OR LESS | DUE IN 31-90 DAYS | DUE IN 91-180 DAYS | DUE IN 181-360 DAYS | DUE IN ONE YEAR TO FIVE YEARS | DUE AFTER FIVE YEARS | TOTAL NON-OVERDUE INSTALLMENTS | |||||||||||||||||||||
| Individuals | 23,323 | 18,434 | 15,188 | 19,356 | 54,228 | 12,568 | 143,097 | |||||||||||||||||||||
| Credit card | 15,791 | 11,861 | 6,340 | 3,032 | 95 | - | 37,119 | |||||||||||||||||||||
| Personal loans | 4,117 | 2,124 | 2,484 | 4,162 | 11,144 | 261 | 24,292 | |||||||||||||||||||||
| Payroll loans | 465 | 692 | 983 | 1,931 | 9,340 | 9 | 13,420 | |||||||||||||||||||||
| Vehicles | 2,350 | 3,524 | 4,962 | 9,509 | 29,531 | 5 | 49,881 | |||||||||||||||||||||
| Mortgage loans | 600 | 233 | 419 | 722 | 4,118 | 12,293 | 18,385 | |||||||||||||||||||||
| Corporate | 10,212 | 13,194 | 14,524 | 16,103 | 39,169 | 9,663 | 102,865 | |||||||||||||||||||||
| Small and Medium Businesses | 14,305 | 14,383 | 10,163 | 14,100 | 27,987 | 323 | 81,261 | |||||||||||||||||||||
| Foreign Loans Latin America | 4,570 | 3,153 | 2,832 | 2,084 | 5,508 | 8,380 | 26,527 | |||||||||||||||||||||
| Total(1) | 52,410 | 49,164 | 42,707 | 51,643 | 126,892 | 30,934 | 353,750 | |||||||||||||||||||||
(1) Includes R$11,611 million related to non-overdue installments of the non-accrual loans.
| (In millions of R$) | ||||||||||||||||||||||||||||||||||||||||
| OVERDUE INSTALLMENTS(1) | 12/31/2014 | |||||||||||||||||||||||||||||||||||||||
| TYPE OF LOAN AND LEASE | 01-30 DAYS | 31-60 DAYS | 61-90 DAYS | 91-180 DAYS | 181-360 DAYS | ONE YEAR OR MORE | TOTAL OVERDUE INSTALLMENTS | TOTAL GROSS LOANS | ALLOWANCE FOR LOAN LOSSES | TOTAL NET | ||||||||||||||||||||||||||||||
| Individuals | 1,843 | 910 | 791 | 1,980 | 2,973 | 71 | 8,568 | 185,953 | (13,385 | ) | 172,568 | |||||||||||||||||||||||||||||
| Credit card | 990 | 467 | 422 | 1,166 | 2,114 | 48 | 5,207 | 59,321 | (3,740 | ) | 55,581 | |||||||||||||||||||||||||||||
| Personal loans | 433 | 240 | 243 | 574 | 645 | 6 | 2,141 | 27,953 | (7,024 | ) | 20,929 | |||||||||||||||||||||||||||||
| Payroll loans | 56 | 30 | 24 | 50 | 42 | 6 | 208 | 40,525 | (1,107 | ) | 39,418 | |||||||||||||||||||||||||||||
| Vehicles | 333 | 161 | 95 | 179 | 161 | 8 | 937 | 29,047 | (1,469 | ) | 27,578 | |||||||||||||||||||||||||||||
| Mortgage loans | 31 | 12 | 7 | 11 | 11 | 3 | 75 | 29,107 | (45 | ) | 29,062 | |||||||||||||||||||||||||||||
| Corporate | 673 | 48 | 78 | 245 | 253 | - | 1,297 | 144,910 | (2,926 | ) | 141,984 | |||||||||||||||||||||||||||||
| Small and Medium Businesses | 522 | 256 | 264 | 575 | 702 | 43 | 2,362 | 79,912 | (5,373 | ) | 74,539 | |||||||||||||||||||||||||||||
| Foreign Loans Latin America | 440 | 82 | 56 | 126 | 103 | 41 | 848 | 41,656 | (708 | ) | 40,948 | |||||||||||||||||||||||||||||
| Total(2) | 3,478 | 1,296 | 1,189 | 2,926 | 4,031 | 155 | 13,075 | 452,431 | (22,392 | ) | 430,039 | |||||||||||||||||||||||||||||
(1) Defined as loans and leases contractually past due as to payment of interest or principal.
(2) Includes R$8,981 million related to overdue installments of the non-accrual loans.
| Annual Report2014 | A-105 |
| (In millions of R$) | ||||||||||||||||||||||||||||||||||||||||
| OVERDUE INSTALLMENTS(1) | 12/31/2013 | |||||||||||||||||||||||||||||||||||||||
| TYPE OF LOAN AND LEASE | 01-30 DAYS | 31-60 DAYS | 61-90 DAYS | 91-180 DAYS | 181-360 DAYS | ONE YEAR OR MORE | TOTAL OVERDUE INSTALLMENTS | TOTAL GROSS LOANS | ALLOWANCE FOR LOAN LOSSES | TOTAL NET | ||||||||||||||||||||||||||||||
| Individuals | 1,875 | 849 | 781 | 1,993 | 2,820 | 91 | 8,409 | 167,431 | (13,853 | ) | 153,578 | |||||||||||||||||||||||||||||
| Credit card | 932 | 344 | 375 | 1,114 | 1,840 | 36 | 4,641 | 53,149 | (2,952 | ) | 50,197 | |||||||||||||||||||||||||||||
| Personal loans | 353 | 223 | 226 | 534 | 616 | 3 | 1,955 | 26,635 | (6,488 | ) | 20,147 | |||||||||||||||||||||||||||||
| Payroll loans | 34 | 17 | 14 | 32 | 40 | 2 | 139 | 22,571 | (1,133 | ) | 21,438 | |||||||||||||||||||||||||||||
| Vehicles | 481 | 252 | 159 | 302 | 314 | 47 | 1,555 | 40,584 | (3,245 | ) | 37,339 | |||||||||||||||||||||||||||||
| Mortgage loans | 75 | 13 | 7 | 11 | 10 | 3 | 119 | 24,492 | (35 | ) | 24,457 | |||||||||||||||||||||||||||||
| Corporate | 341 | 204 | 135 | 173 | 97 | 2 | 952 | 126,413 | (1,783 | ) | 124,630 | |||||||||||||||||||||||||||||
| Small and Medium Businesses | 610 | 292 | 285 | 658 | 981 | 35 | 2,861 | 81,601 | (6,085 | ) | 75,516 | |||||||||||||||||||||||||||||
| Foreign Loans Latin America | 537 | 76 | 40 | 51 | 59 | 6 | 769 | 36,257 | (514 | ) | 35,743 | |||||||||||||||||||||||||||||
| Total(2) | 3,363 | 1,421 | 1,241 | 2,875 | 3,957 | 134 | 12,991 | 411,702 | (22,235 | ) | 389,467 | |||||||||||||||||||||||||||||
(1) Defined as loans and leases contractually past due as to payment of interest or principal.
(2) Includes R$9,020 million related to overdue installments of the non-accrual loans.
| (In millions of R$) | ||||||||||||||||||||||||||||||||||||||||
| OVERDUE INSTALLMENTS(1) | 12/31/2012 | |||||||||||||||||||||||||||||||||||||||
| TYPE OF LOAN AND LEASE | 01-30 DAYS | 31-60 DAYS | 61-90 DAYS | 91-180 DAYS | 181-360 DAYS | ONE YEAR OR MORE | TOTAL OVERDUE INSTALLMENTS | TOTAL GROSS LOANS | ALLOWANCE FOR LOAN LOSSES | TOTAL NET | ||||||||||||||||||||||||||||||
| Individuals | 1,791 | 818 | 711 | 1,827 | 2,605 | 72 | 7,824 | 150,921 | (14,844 | ) | 136,077 | |||||||||||||||||||||||||||||
| Credit card | 634 | 231 | 261 | 848 | 1,430 | 8 | 3,412 | 40,531 | (2,863 | ) | 37,668 | |||||||||||||||||||||||||||||
| Personal loans | 500 | 277 | 259 | 615 | 802 | 4 | 2,457 | 26,749 | (6,841 | ) | 19,908 | |||||||||||||||||||||||||||||
| Payroll loans | 34 | 17 | 15 | 37 | 26 | 1 | 130 | 13,550 | (867 | ) | 12,683 | |||||||||||||||||||||||||||||
| Vehicles | 597 | 280 | 171 | 319 | 340 | 58 | 1,765 | 51,646 | (4,227 | ) | 47,419 | |||||||||||||||||||||||||||||
| Mortgage loans | 26 | 13 | 5 | 8 | 7 | 1 | 60 | 18,445 | (46 | ) | 18,399 | |||||||||||||||||||||||||||||
| Corporate | 476 | 203 | 7 | 84 | 94 | - | 864 | 103,729 | (1,362 | ) | 102,367 | |||||||||||||||||||||||||||||
| Small and Medium Businesses | 801 | 447 | 406 | 1,027 | 1,222 | 21 | 3,924 | 85,185 | (9,091 | ) | 76,094 | |||||||||||||||||||||||||||||
| Foreign Loans Latin America | 457 | 64 | 21 | 31 | 46 | 3 | 622 | 27,149 | (416 | ) | 26,733 | |||||||||||||||||||||||||||||
| Total(2) | 3,525 | 1,532 | 1,145 | 2,969 | 3,967 | 96 | 13,234 | 366,984 | (25,713 | ) | 341,271 | |||||||||||||||||||||||||||||
(1) Defined as loans and leases contractually past due as to payment of interest or principal.
(2) Includes R$9,180 million related to overdue installments of the non-accrual loans.
Loan and Lease Operations by interest rate
The following table sets out the classification of our credit portfolio into fixed and variables rates, including non-overdue and overdue installments:
| (In millions of R$) | ||||||||||||||||||||||||||||
| 12/31/2014 | ||||||||||||||||||||||||||||
| NON-OVERDUE INSTALLMENTS | DUE IN 30 DAYS OR LESS | DUE IN 31-90 DAYS | DUE IN 91-180 DAYS | DUE IN 181-360 DAYS | DUE IN ONE YEAR TO FIVE YEARS | DUE AFTER FIVE YEARS | TOTAL NON-OVERDUE INSTALLMENTS | |||||||||||||||||||||
| Interest rate of loans to customers by maturity | ||||||||||||||||||||||||||||
| Variable rates | 13,506 | 23,137 | 15,346 | 21,499 | 66,894 | 42,765 | 183,147 | |||||||||||||||||||||
| Fixed rates | 48,388 | 43,795 | 33,997 | 40,250 | 85,076 | 4,703 | 256,209 | |||||||||||||||||||||
| Total(1) | 61,894 | 66,932 | 49,343 | 61,749 | 151,970 | 47,468 | 439,356 | |||||||||||||||||||||
(1) Includes R$7,533 million related to non-overdue installments of the non-accrual loans.
| (In millions of R$) | ||||||||||||||||||||||||||||
| 12/31/2013 | ||||||||||||||||||||||||||||
| NON-OVERDUE INSTALLMENTS | DUE IN 30 DAYS OR LESS | DUE IN 31-90 DAYS | DUE IN 91-180 DAYS | DUE IN 181-360 DAYS | DUE IN ONE YEAR TO FIVE YEARS | DUE AFTER FIVE YEARS | TOTAL NON-OVERDUE INSTALLMENTS | |||||||||||||||||||||
| Interest rate of loans to customers by maturity | ||||||||||||||||||||||||||||
| Variable rates | 11,263 | 19,553 | 12,867 | 22,402 | 55,621 | 40,443 | 162,149 | |||||||||||||||||||||
| Fixed rates | 45,758 | 38,947 | 30,763 | 37,237 | 81,229 | 2,628 | 236,562 | |||||||||||||||||||||
| Total(1) | 57,021 | 58,500 | 43,630 | 59,639 | 136,850 | 43,071 | 398,711 | |||||||||||||||||||||
(1) Includes R$9,045 million related to non-overdue installments of the non-accrual loans.
| Annual Report2014 | A-106 |
| (In millions of R$) | ||||||||||||||||||||||||||||
| 12/31/2012 | ||||||||||||||||||||||||||||
| NON-OVERDUE INSTALLMENTS | DUE IN 30 DAYS OR LESS | DUE IN 31-90 DAYS | DUE IN 91-180 DAYS | DUE IN 181-360 DAYS | DUE IN ONE YEAR TO FIVE YEARS | DUE AFTER FIVE YEARS | TOTAL NON-OVERDUE INSTALLMENTS | |||||||||||||||||||||
| Interest rate of loans to customers by maturity | ||||||||||||||||||||||||||||
| Variable rates | 10,007 | 16,207 | 12,713 | 16,379 | 48,581 | 29,569 | 133,456 | |||||||||||||||||||||
| Fixed rates | 42,403 | 32,957 | 29,994 | 35,264 | 78,311 | 1,365 | 220,294 | |||||||||||||||||||||
| Total(1) | 52,410 | 49,164 | 42,707 | 51,643 | 126,892 | 30,934 | 353,750 | |||||||||||||||||||||
(1) Includes R$11,611 million related to non-overdue installments of the non-accrual loans.
| (In millions of R$) | ||||||||||||||||||||||||||||||||
| 12/31/2014 | ||||||||||||||||||||||||||||||||
| 01-30 | 31-60 | 61-90 | 91-180 | 181-360 | ONE YEAR | TOTAL OVERDUE | TOTAL GROSS | |||||||||||||||||||||||||
| OVERDUE INSTALLMENTS(1) | DAYS | DAYS | DAYS | DAYS | DAYS | OR MORE | INSTALLMENTS | LOANS | ||||||||||||||||||||||||
| Interest rate of loans to customers by maturity | ||||||||||||||||||||||||||||||||
| Variable rates | 972 | 146 | 164 | 375 | 324 | 44 | 2,025 | 185,172 | ||||||||||||||||||||||||
| Fixed rates | 2,506 | 1,150 | 1,025 | 2,551 | 3,707 | 111 | 11,050 | 267,259 | ||||||||||||||||||||||||
| Total(2) | 3,478 | 1,296 | 1,189 | 2,926 | 4,031 | 155 | 13,075 | 452,431 | ||||||||||||||||||||||||
(1) Defined as loans and leases contractually past due as to payment of interest or principal.
(2) Includes R$8,981 million related to overdue installments of the non-accrual loans.
| (In millions of R$) | ||||||||||||||||||||||||||||||||
| 12/31/2013 | ||||||||||||||||||||||||||||||||
| 01-30 | 31-60 | 61-90 | 91-180 | 181-360 | ONE YEAR | TOTAL OVERDUE | TOTAL GROSS | |||||||||||||||||||||||||
| OVERDUE INSTALLMENTS(1) | DAYS | DAYS | DAYS | DAYS | DAYS | OR MORE | INSTALLMENTS | LOANS | ||||||||||||||||||||||||
| Interest rate of loans to customers by maturity | ||||||||||||||||||||||||||||||||
| Variable rates | 755 | 195 | 165 | 258 | 185 | 12 | 1,570 | 163,717 | ||||||||||||||||||||||||
| Fixed rates | 2,608 | 1,226 | 1,076 | 2,617 | 3,772 | 122 | 11,421 | 247,985 | ||||||||||||||||||||||||
| Total(2) | 3,363 | 1,421 | 1,241 | 2,875 | 3,957 | 134 | 12,991 | 411,702 | ||||||||||||||||||||||||
(1) Defined as loans and leases contractually past due as to payment of interest or principal.
(2) Includes R$9,020 million related to overdue installments of the non-accrual loans.
| (In millions of R$) | ||||||||||||||||||||||||||||||||
| 12/31/2012 | ||||||||||||||||||||||||||||||||
| 01-30 | 31-60 | 61-90 | 91-180 | 181-360 | ONE YEAR | TOTAL OVERDUE | TOTAL GROSS | |||||||||||||||||||||||||
| OVERDUE INSTALLMENTS(1) | DAYS | DAYS | DAYS | DAYS | DAYS | OR MORE | INSTALLMENTS | LOANS | ||||||||||||||||||||||||
| Interest rate of loans to customers by maturity | ||||||||||||||||||||||||||||||||
| Variable rates | 714 | 263 | 39 | 119 | 153 | 7 | 1,295 | 134,751 | ||||||||||||||||||||||||
| Fixed rates | 2,811 | 1,269 | 1,106 | 2,850 | 3,814 | 89 | 11,939 | 232,233 | ||||||||||||||||||||||||
| Total(2) | 3,525 | 1,532 | 1,145 | 2,969 | 3,967 | 96 | 13,234 | 366,984 | ||||||||||||||||||||||||
(1) Defined as loans and leases contractually past due as to payment of interest or principal.
(2) Includes R$9,180 million related to overdue installments of the non-accrual loans.
Loan and Lease Operations by economic activity
The following table sets out the composition of our credit portfolio, including non-accrual loan operations, by economic activity of the borrower:
| (In millions of R$, except percentages) | ||||||||||||||||||||||||
| 12/31/2014 | 12/31/2013 | 12/31/2012 | ||||||||||||||||||||||
| LOAN | % OF LOAN | LOAN | % OF LOAN | LOAN | % OF LOAN | |||||||||||||||||||
| ECONOMIC ACTIVITIES | PORTFOLIO | PORTFOLIO | PORTFOLIO | PORTFOLIO | PORTFOLIO | PORTFOLIO | ||||||||||||||||||
| Public sector | 4,389 | 1.0 | 3,981 | 1.0 | 877 | 0.2 | ||||||||||||||||||
| Industry and commerce | 116,506 | 25.7 | 115,025 | 27.8 | 107,405 | 29.3 | ||||||||||||||||||
| Services | 99,855 | 22.1 | 87,103 | 21.2 | 77,922 | 21.2 | ||||||||||||||||||
| Primary sector | 23,345 | 5.2 | 20,492 | 5.0 | 16,649 | 4.5 | ||||||||||||||||||
| Individuals | 206,094 | 45.5 | 183,548 | 44.6 | 161,937 | 44.2 | ||||||||||||||||||
| Other sectors | 2,242 | 0.5 | 1,553 | 0.4 | 2,194 | 0.6 | ||||||||||||||||||
| Total | 452,431 | 100.0 | 411,702 | 100.0 | 366,984 | 100.0 | ||||||||||||||||||
| Annual Report2014 | A-107 |
On December 31, 2014, there was no concentration of loan and lease operations exceeding 10% of the total portfolio that had not been disclosed in a category of loan and losses.
Rating of the Loan and Lease Portfolio
The following table presents the rating of our loan and lease portfolio based on the probability of default for the periods indicated below.
| (In millions of R$, except percentages) | ||||||||||||||||
| 12/31/2014 | ||||||||||||||||
| INTERNAL RATING | LOANS NEITHER OVERDUE NOR IMPAIRED | LOANS OVERDUE NOT IMPAIRED(1) | LOANS IMPAIRED | TOTAL LOANS | ||||||||||||
| Lower Risk | 324,908 | 4,042 | - | 328,950 | ||||||||||||
| Satisfactory | 81,994 | 6,989 | - | 88,983 | ||||||||||||
| Higher Risk | 11,439 | 5,853 | - | 17,292 | ||||||||||||
| Impaired(2) | - | - | 17,206 | 17,206 | ||||||||||||
| Total | 418,341 | 16,884 | 17,206 | 452,431 | ||||||||||||
| % | 92.5 | 3.7 | 3.8 | 100.0 | ||||||||||||
| (In millions of R$, except percentages) | ||||||||||||||||
| 12/31/2013 | ||||||||||||||||
INTERNAL RATING | LOANS NEITHER OVERDUE NOR IMPAIRED | LOANS OVERDUE NOT IMPAIRED(1) | LOANS IMPAIRED | TOTAL LOANS | ||||||||||||
| Lower Risk | 300,816 | 4,354 | - | 305,170 | ||||||||||||
| Satisfactory | 64,722 | 7,676 | - | 72,398 | ||||||||||||
| Higher Risk | 11,273 | 6,556 | - | 17,829 | ||||||||||||
| Impaired(2) | - | - | 16,305 | 16,305 | ||||||||||||
| Total | 376,811 | 18,586 | 16,305 | 411,702 | ||||||||||||
| % | 91.5 | 4.5 | 4.0 | 100.0 | ||||||||||||
| (In millions of R$, except percentages) | ||||||||||||||||
| 12/31/2012 | ||||||||||||||||
| INTERNAL RATING | LOANS NEITHER OVERDUE NOR IMPAIRED | LOANS OVERDUE NOT IMPAIRED(1) | LOANS IMPAIRED | TOTAL LOANS | ||||||||||||
| Lower Risk | 249,282 | 5,438 | - | 254,720 | ||||||||||||
| Satisfactory | 61,075 | 9,436 | - | 70,511 | ||||||||||||
| Higher Risk | 14,190 | 8,052 | - | 22,242 | ||||||||||||
| Impaired(2) | - | - | 19,511 | 19,511 | ||||||||||||
| Total | 324,547 | 22,926 | 19,511 | 366,984 | ||||||||||||
| % | 88.5 | 6.2 | 5.3 | 100.0 | ||||||||||||
(1) The operations classified as Loans Overdue Not Impaired are past due between 1 day and 90 days and the balance is the total of outstanding principal amount (Overdue and Non-Overdue).
(2) We consider loans as impaired when (i) corporate transactions have a probability of default higher than 31.84%; (ii) transactions are overdue for more than 90 days; or (iii) renegotiated transactions are overdue for more than 60 days.
The credit rating in corporate transactions is based on information such as the economic and financial condition of the counterparty, its cash-generating capabilities, the economic group to which it belongs, the current and prospective situation of the economic sector in which it operates, the collateral offered and the use of proceeds. The credit proposals are analyzed on a case by case basis, through an approval-level mechanism reporting to the Superior Credit Committee.
Regarding retail transactions (individuals, small and middle-market companies) the rating is assigned based on application and behavior score statistical models. Decisions are made based on scoring models that are continuously updated by an independent unit. In limited instances, there may also be an individualized analysis of specific cases where approval is subject to competent credit approval levels. The risk ratings are grouped in four categories: (i) lower risk, (ii) satisfactory, (iii) higher risk and (iv) impaired. Please refer to section Performance, item Financial Performance – Allowance for Loan and Lease Losses, for further details on the individual and collective analyses.
Non-accrual Loans
We consider all loans overdue for 60 days or more as non-accrual loans and, accordingly, cease the accrual of financial charges on such loans. In 2014, we did not have any material non-accrual loans.
Write-offs
Loans and leases are written off against the allowance for loan and lease losses when the loan is not collected or is considered permanently impaired. We typically write off loans when they are overdue for 360 days, except for loans having an original maturity in excess of 36 months, which are written off when they are overdue for 540 days. However, write-offs may be recognized earlier than 360 days if we conclude that the loan is not recoverable.
Please refer to section Performance, item Assets – Loan and Lease Operations – Renegotiated Loans for further details.
Information on the Quality of Loans and Leases
The table below shows our non-accrual loans together with certain asset quality ratios.
| (In millions of R$, except percentages) | ||||||||||||||||||||
| 12/31/2014 | 12/31/2013 | 12/31/2012 | 12/31/2011 | 12/31/2010 | ||||||||||||||||
| Non-accrual loans | 16,514 | 18,065 | 20,791 | 20,439 | 14,736 | |||||||||||||||
| Allowance for loan losses | 22,392 | 22,235 | 25,713 | 23,873 | 19,994 | |||||||||||||||
| Total loans and leases operations portfolio | 452,431 | 411,702 | 366,984 | 346,264 | 294,837 | |||||||||||||||
| Non-accrual loans as a percentage of total loans (%) | 3.7 | 4.4 | 5.7 | 5.9 | 5.0 | |||||||||||||||
| Allowance for loan losses as a percentage of total loans (%) | 4.9 | 5.4 | 7.0 | 6.9 | 6.8 | |||||||||||||||
| Allowance for loan losses as a percentage of non-accrual loans (%) | 135.6 | 123.1 | 123.7 | 116.8 | 135.7 | |||||||||||||||
| Annual Report2014 | A-108 |
Allowance for Loan and Lease Losses
| (In millions of R$, except percentages) | ||||||||||||||||||||
| 12/31/2014 | 12/31/2013 | 12/31/2012 | 12/31/2011 | 12/31/2010 | ||||||||||||||||
| Balance at the beginning of period | 22,235 | 25,713 | 23,873 | 19,994 | 20,245 | |||||||||||||||
| Write-offs | (18,675 | ) | (21,769 | ) | (22,142 | ) | (16,159 | ) | (15,798 | ) | ||||||||||
| Individuals | (12,668 | ) | (13,541 | ) | (12,317 | ) | (8,655 | ) | (9,407 | ) | ||||||||||
| Credit card | (3,784 | ) | (3,513 | ) | (4,073 | ) | (3,038 | ) | (2,731 | ) | ||||||||||
| Personal loans | (5,150 | ) | (6,247 | ) | (4,895 | ) | (3,222 | ) | (3,908 | ) | ||||||||||
| Payroll loans | (429 | ) | (480 | ) | (472 | ) | (308 | ) | (316 | ) | ||||||||||
| Vehicles | (3,254 | ) | (3,263 | ) | (2,840 | ) | (2,013 | ) | (2,377 | ) | ||||||||||
| Mortgage loans | (51 | ) | (38 | ) | (37 | ) | (74 | ) | (75 | ) | ||||||||||
| Corporate | (672 | ) | (478 | ) | (556 | ) | (122 | ) | (150 | ) | ||||||||||
| Small and Medium Businesses | (4,992 | ) | (7,573 | ) | (9,209 | ) | (7,118 | ) | (5,793 | ) | ||||||||||
| Foreign Loans Latin America | (343 | ) | (177 | ) | (60 | ) | (264 | ) | (448 | ) | ||||||||||
| Increase Allowance for loan and lease losses | 18,832 | 17,856 | 23,982 | 20,038 | 15,547 | |||||||||||||||
| Balance at the end of period | 22,392 | 22,235 | 25,713 | 23,873 | 19,994 | |||||||||||||||
| Recoveries from Loans Writen Off | 5,054 | 5,061 | 4,664 | 5,477 | 4,195 | |||||||||||||||
| Individuals | 2,077 | 2,058 | 1,918 | 2,362 | 1,804 | |||||||||||||||
| Credit card | 663 | 653 | 515 | 616 | 470 | |||||||||||||||
| Personal loans | 577 | 525 | 427 | 446 | 184 | |||||||||||||||
| Payroll loans | 453 | 278 | 173 | 160 | 120 | |||||||||||||||
| Vehicles | 324 | 499 | 656 | 956 | 856 | |||||||||||||||
| Mortgage loans | 60 | 103 | 147 | 184 | 174 | |||||||||||||||
| Corporate | 1,619 | 1,554 | 1,318 | 1,455 | 1,061 | |||||||||||||||
| Small and Medium Businesses | 893 | 1,003 | 1,083 | 1,355 | 1,138 | |||||||||||||||
| Foreign Loans Latin America | 465 | 446 | 345 | 305 | 192 | |||||||||||||||
| Net Write-offs | (13,621 | ) | (16,708 | ) | (17,478 | ) | (10,682 | ) | (11,603 | ) | ||||||||||
| Ratio of Write-offs during the period to average loans outstanding during the period (%) | 4.4 | 5.7 | 6.2 | 5.1 | 5.9 | |||||||||||||||
| Ratio of net write-offs during the period to average loans outstanding during the period (%) | 3.2 | 4.4 | 4.9 | 3.3 | 4.3 | |||||||||||||||
| Ratio of allowance for loan losses to total loans and leases (%) | 4.9 | 5.4 | 7.0 | 6.9 | 6.8 | |||||||||||||||
During the year ended December 31, 2014, we wrote off a total amount of R$18,675 million from our loan portfolio and our ratio of the allowance for loan and lease losses to total loans and leases was 4.9%. The decrease in loans written off is a result of the adoption of a policy of stricter selectivity in origination, which gave rise to lower default levels compared to the previous year.
During the year ended December 31, 2013, we wrote off a total amount of R$21,769 million from our loan portfolio and our ratio of the allowance for loan and lease losses to total loans and leases was 5.4%. The decrease in loans written off is a result of the adoption of a policy of stricter selectivity in origination, which gave rise to lower default levels compared to the previous year.
During the year ended December 31, 2012, we wrote off a total amount of R$22,142 million from our loan portfolio and our ratio of the allowance for loan and lease losses to total loans and leases was 7.0%. The increase in loans written off is due to the increase in defaults in 2011 and beginning of 2012, associated with the increase in the volume of our portfolio of credit card, personal loans, small and medium businesses.
During the year ended December 31, 2011, we wrote off a total amount of R$16,159 million from our loan portfolio and our ratio of the allowance for loan and lease losses to total loans and leases was 6.9%. Our ratio of allowance for loan and lease losses to total loans increased by 10 basis points when compared to the previous year, since the volume of loans and leases written off was maintained at the same level in 2011. This level was maintained as a result of the increase in default rates in 2009 and 2010, together with a strong growth of the loan and lease portfolio in 2011.
During the year ended December 31, 2010, we wrote off a total amount of R$15,798 million from our loan portfolio and, on December 31, 2010, our ratio of the allowance for loan and lease losses to total loans and leases was 6.8%.
Assessment
We first assess whether there is objective evidence of loss individually allocated to individually significant loans or collectively allocated to loans that are not individually significant.
To determine the amount of the allowance for individually significant loans with objective evidence of impairment, we use methodologies that consider both the client quality and the nature of the financing, including its collateral, to estimate the cash flow expected from these loans.
If there is no objective evidence of loss for an individually assessed loan, whether significant or not, the loan is included in a group of loans with similar credit risk characteristics which are then collectively tested for impairment. Individually assessed loans for which an impairment loss is recognized are not included in the collective assessment. The amount of loss is measured as the difference between the carrying amount of the asset and the present value of the estimated future cash flows (excluding future loan losses that have not been incurred), discounted at the financial asset’s effective interest rate.
For collectively assessed loans, the calculation of the present value of the estimated future cash flows, for which collateral is received, reflects the historical performance and recovery of the fair value,
| Annual Report2014 | A-109 |
considering the cash flows that may arise from the performances less costs for obtaining and selling that collateral.
For the purpose of collectively assessing impairment, loans are aggregated based on similar credit risk characteristics. These characteristics are relevant to estimate the future cash flows of these loans since they may be an indicator of the difficulty of the debtor in paying the amounts due, in accordance with the contractual conditions of the loan that is being assessed. The future cash flows of a group of loans that are collectively assessed in order to identify the need for recognizing an impairment are estimated based on the contractual cash flows of the group of loans and the historical experience of loss for loans with similar credit risk characteristics. The historical loss experience is adjusted, based on current observable data, to reflect the effects of current conditions that have not impacted the period on which the historical loss experience is based and to exclude the effects of conditions in the historical period that are not currently in place.
For individually significant loans with no objective evidence of impairment, such loans are classified into certain credit ratings based on several qualitative and quantitative factors applied to internally developed models. Considering the size and the different risk characteristics of each credit agreement, the ratings determined under internal models may be reviewed and modified by our Credit Committee, the members of which are executives and experts in corporate credit risk. We estimate the losses inherent in every rating, using the approach internally developed to low-default portfolios, which uses our historical experience to design internal models that are used to estimate the probability of default and the potential for recovery of non-performing loans.
To determine the amount of the allowance for items that are not individually significant, loans are segregated into classes based on the underlying risks and the characteristics of each group. The allowance for loan and lease losses is determined for each of these classes through a process that considers the historical delinquency and the loan loss experience in the last years.
Allocation of the Allowance for Loan and Lease Losses
The table below presents the details, by segment and class, as defined in the segmentation of our portfolio, of the allowance for loan and lease losses, of this allowance as a percentage of the total loan and lease losses for the corresponding segment or class, and the percentage of the total loan and leases in each segment and class in relation to the total loans and leases.
| (In millions of R$, except percentages) | ||||||||||||||||||||||||||||||||||||||||||||||||||||||||||||
| 12/31/2014 | 12/31/2013 | 12/31/2012 | 12/31/2011 | 12/31/2010 | ||||||||||||||||||||||||||||||||||||||||||||||||||||||||
| ALLOCATED ALLOWANCE | ALLOCATED ALLOWANCE AS A % OF TOTAL LOANS AND LEASES | LOANS CATEGORY AS A % OF TOTAL LOANS | ALLOCATED ALLOWANCE | ALLOCATED ALLOWANCE AS A % OF TOTAL LOANS AND LEASES | LOANS CATEGORY AS A % OF TOTAL LOANS | ALLOCATED ALLOWANCE | ALLOCATED ALLOWANCE AS A % OF TOTAL LOANS AND LEASES | LOANS CATEGORY AS A % OF TOTAL LOANS | ALLOCATED ALLOWANCE | ALLOCATED ALLOWANCE AS A % OF TOTAL LOANS AND LEASES | LOANS CATEGORY AS A % OF TOTAL LOANS | ALLOCATED ALLOWANCE | ALLOCATED ALLOWANCE AS A % OF TOTAL LOANS AND LEASES | LOANS CATEGORY AS A % OF TOTAL LOANS | ||||||||||||||||||||||||||||||||||||||||||||||
| Individuals | 13,385 | 3.0 | 41.1 | 13,853 | 3.4 | 40.7 | 14,844 | 4.0 | 41.1 | 13,684 | 4.0 | 43.1 | 11,146 | 3.8 | 43.0 | |||||||||||||||||||||||||||||||||||||||||||||
| Credit card | 3,740 | 0.8 | 13.1 | 2,952 | 0.7 | 12.9 | 2,863 | 0.8 | 11.0 | 3,825 | 1.1 | 11.3 | 3,306 | 1.1 | 11.2 | |||||||||||||||||||||||||||||||||||||||||||||
| Personal loans | 7,024 | 1.6 | 6.2 | 6,488 | 1.6 | 6.5 | 6,841 | 1.9 | 7.3 | 4,842 | 1.4 | 7.5 | 3,590 | 1.2 | 5.8 | |||||||||||||||||||||||||||||||||||||||||||||
| Payroll loans | 1,107 | 0.2 | 9.0 | 1,133 | 0.3 | 5.5 | 867 | 0.2 | 3.7 | 556 | 0.2 | 2.9 | 429 | 0.1 | 2.8 | |||||||||||||||||||||||||||||||||||||||||||||
| Vehicles | 1,469 | 0.3 | 6.4 | 3,245 | 0.8 | 9.9 | 4,227 | 1.2 | 14.1 | 4,415 | 1.3 | 17.5 | 3,709 | 1.3 | 20.4 | |||||||||||||||||||||||||||||||||||||||||||||
| Mortgage loans | 45 | - | 6.4 | 35 | - | 5.9 | 46 | - | 5.0 | 46 | - | 4.0 | 112 | - | 2.7 | |||||||||||||||||||||||||||||||||||||||||||||
| Corporate | 2,926 | 0.6 | 32.0 | 1,783 | 0.4 | 30.7 | 1,362 | 0.4 | 28.3 | 703 | 0.2 | 26.6 | 544 | 0.2 | 25.3 | |||||||||||||||||||||||||||||||||||||||||||||
| Small and Medium Businesses | 5,373 | 1.2 | 17.7 | 6,085 | 1.5 | 19.8 | 9,091 | 2.5 | 23.2 | 9,197 | 2.7 | 24.7 | 8,041 | 2.7 | 27.1 | |||||||||||||||||||||||||||||||||||||||||||||
| Foreign Loans Latin America | 708 | 0.2 | 9.2 | 514 | 0.1 | 8.8 | 416 | 0.1 | 7.4 | 289 | 0.1 | 5.6 | 263 | 0.1 | 4.6 | |||||||||||||||||||||||||||||||||||||||||||||
| Total | 22,392 | 4.9 | 100.0 | 22,235 | 5.4 | 100.0 | 25,713 | 7.0 | 100.0 | 23,873 | 6.9 | 100.0 | 19,994 | 6.8 | 100.0 | |||||||||||||||||||||||||||||||||||||||||||||
Renegotiated Loans
| (In millions of R$, except percentages) | ||||||||||||||||
| YEAR ENDED DECEMBER 31, | ||||||||||||||||
| 2014 | 2013 | 2012 | 2011 | |||||||||||||
| Renegotiated loans(1) | 11,572 | 12,880 | 14,519 | 11,844 | ||||||||||||
| Allowance for loan and lease losses | 5,459 | 6,284 | 6,767 | 5,355 | ||||||||||||
| Allowance for loan and lease losses/ renegotiated loans (%) | 47.2 | 48.8 | 46.6 | 45.2 | ||||||||||||
(1) Includes debt consolidation, deferment or any other arrangement that modifies the periods or conditions, of operations originally overdue.
Renegotiated loans include both loans for which the credit agreement’s original terms were amended (agreements) and new loans originated in order to settle contracts or transactions with the same client (restructured loans), which were originally past due.
Amendments and restructured loans usually reflect changes in contract terms, rates or payment conditions.
In almost all cases for loan products, renegotiated loans require that at least one payment be made under the renegotiated terms in order for it to be removed from non-performing and non-accrual status. Renegotiated loans return to non-performing and non-accrual status when they reach 60 days past due under the renegotiated terms, which typically corresponds to the borrower missing two or more payments.
The fact that a loan or lease has been renegotiated is also taken into consideration when determining the allowance for loan and lease losses after the renegotiation. The past performance and the payment history of the client and the transaction, including the probability
| Annual Report2014 | A-110 |
of another default for renegotiated transactions, are considered in our risk models in order to determine the probability of default. This probability of default is generally higher than the probability assigned to similar transactions that have never been renegotiated. Another factor considered in determining the appropriate level of the allowance for loan and lease losses is the additional collateral to be offered by the debtor. The resulting allowance levels are compatible with the risk profile of each transaction.
Our renegotiated loan portfolio decreased to 2.56% of our total loan portfolio as of December 31, 2014, compared to 3.13% as of December 31, 2013. At the end of 2014, the ratio of the renegotiated portfolio to the allowance for loan and lease losses was 47.2% compared to 48.8% as of December 31, 2013. Throughout 2014, the allowance for loan and lease losses followed the evolution of the “mix” of portfolio credit risk in the renegotiated loan portfolio.
Our renegotiated loan portfolio decreased to 3.13% of our total loan portfolio as of December 31, 2013, compared to 3.96% as of December 31, 2012. At the end of 2013, the ratio of the renegotiated portfolio to the allowance for loan and lease losses was 48.8% compared to 46.6% as of December 31, 2012. Throughout the year 2013, the allowance for loan and lease losses followed the evolution of the “mix” of portfolio credit risk in the renegotiated loan portfolio.
Our renegotiated loan portfolio increased to 3.96% of our total loan portfolio as of December 31, 2012, compared to 3.42% as of December 31, 2011. At the end of 2012, the ratio of the renegotiated portfolio to the allowance for loan and lease losses was 46.6% compared to 45.2% as of December 31, 2011. This ratio increased in 2012 mainly because of an increase in the redefaulted renegotiated loans to total renegotiated loans ratio, from 29.8% as of December 31, 2011 compared to 35.4% as of December 31, 2012.
During 2014, we maintained our policy for the recovery of overdue loans, including loans already written off as losses, and to reduce losses, we enhanced our collection and recovery initiatives. However, we still require that at least one installment is paid to consider the renegotiation to be valid and to treat it as a renegotiated agreement. We also adopted a policy of stricter selectivity in origination of loans, which led to lower levels of delinquency and a decreased volume of renegotiated loans.
During 2013, our policy for recovery of overdue loans was maintained, including loans already written off as losses, and to reduce losses, we enhanced our collection and recovery initiatives. However, we still require that at least one installment is paid to consider the renegotiation to be valid and to treat it as a renegotiated agreement. We also adopted a policy of stricter selectivity in origination of loans, which led to lower levels of delinquency and decreased volume of renegotiated loans.
During 2012, the Brazilian economy experienced an increase in the default levels for individuals, mainly with respect to vehicle financing and personal loan portfolios. As one of the largest banks in Brazil, our loan portfolio was impacted by this increase in defaults. In order to increase the recovery of overdue loans, including loans already written off as losses, and to reduce losses, we enhanced our collection and recovery initiatives. However, we require that at least one installment is paid to consider the renegotiation to be valid and to treat it as a renegotiated agreement.
The total amount of each type of renegotiated loan as of December 31, 2014, 2013 and 2012 is shown in the tables below.
| (In millions of R$, except percentages) | ||||||||||||||||||||
| AS OF DECEMBER 31, 2014 | ||||||||||||||||||||
| TYPE OF LOAN | TOTAL RENEGOTIATED LOANS | TOTAL ALLOWANCE FOR LOAN LOSSES | ALLOWANCE FOR LOAN LOSSES/ RENEGOTIATED LOANS (%) | TOTAL REDEFAULTED RENEGOTIATED LOANS(1) | REDEFAULTED RENEGOTIATED LOANS (%) | |||||||||||||||
| Restructured Loans | 10,284 | 5,051 | 49.1 | 2,744 | 26.7 | |||||||||||||||
| Agreements | 1,288 | 408 | 31.7 | 602 | 46.7 | |||||||||||||||
| Total | 11,572 | 5,459 | 47.2 | 3,346 | 28.9 | |||||||||||||||
(1) Our redefaulted renegotiated loans are renegotiated transactions 60 days or more overdue.
| (In millions of R$, except percentages) | ||||||||||||||||||||
| AS OF DECEMBER 31, 2013 | ||||||||||||||||||||
| TYPE OF LOAN | TOTAL RENEGOTIATED LOANS | TOTAL ALLOWANCE FOR LOAN LOSSES | ALLOWANCE FOR LOAN LOSSES/ RENEGOTIATED LOANS (%) | TOTAL REDEFAULTED RENEGOTIATED LOANS(1) | REDEFAULTED RENEGOTIATED LOANS (%) | |||||||||||||||
| Restructured Loans | 10,325 | 5,064 | 49.0 | 3,072 | 29.8 | |||||||||||||||
| Agreements | 2,555 | 1,220 | 47.7 | 1,555 | 60.9 | |||||||||||||||
| Total | 12,880 | 6,284 | 48.8 | 4,627 | 35.9 | |||||||||||||||
(1) Our redefaulted renegotiated loans are renegotiated transactions 60 days or more overdue.
| (In millions of R$, except percentages) | ||||||||||||||||||||
| AS OF DECEMBER 31, 2012 | ||||||||||||||||||||
| TYPE OF LOAN | TOTAL RENEGOTIATED LOANS | TOTAL ALLOWANCE FOR LOAN LOSSES | ALLOWANCE FOR LOAN LOSSES/ RENEGOTIATED LOANS (%) | TOTAL REDEFAULTED RENEGOTIATED LOANS(1) | REDEFAULTED RENEGOTIATED LOANS (%) | |||||||||||||||
| Restructured Loans | 11,343 | 5,287 | 46.6 | 4,012 | 35.4 | |||||||||||||||
| Agreements | 3,176 | 1,480 | 46.6 | 1,722 | 54.2 | |||||||||||||||
| Total | 14,519 | 6,767 | 46.6 | 5,734 | 39.5 | |||||||||||||||
(1) Our redefaulted renegotiated loans are renegotiated transactions 60 days or more overdue.
| Annual Report2014 | A-111 |
The tables below present an additional breakdown of renegotiated loans by portfolio, in segments and types, based on the type of modification, as of December 31, 2014, 2013 and 2012:
| (In millions of R$) | ||||||||||||||||
| AS OF DECEMBER 31, 2014 | ||||||||||||||||
| PAYMENT | MULTIPLE | MULTIPLE | ||||||||||||||
| RENEGOTIATED LOAN AND LEASE OPERATIONS | EXTENSION(1) | CONCESSIONS(2) | MODIFICATIONS(3) | TOTAL | ||||||||||||
| Individuals | 649 | 2,352 | 4,330 | 7,331 | ||||||||||||
| Credit card | - | 403 | - | 403 | ||||||||||||
| Personal loans | - | 1,906 | 4,330 | 6,236 | ||||||||||||
| Payroll loans | - | 43 | - | 43 | ||||||||||||
| Vehicles | 578 | - | - | 578 | ||||||||||||
| Mortgage loans | 71 | - | - | 71 | ||||||||||||
| Corporate | - | - | 870 | 870 | ||||||||||||
| Small and medium businesses | 55 | 2,610 | 620 | 3,285 | ||||||||||||
| Foreign loans – Latin America | - | 86 | - | 86 | ||||||||||||
| Total renegotiated loan and lease operations | 704 | 5,048 | 5,820 | 11,572 | ||||||||||||
(1) Represents loan and lease transactions subject to an amendment of contractual terms relating exclusively to payment due dates.
(2) Represents multiple loan and lease transactions which have been restructured, i.e., all such outstanding transactions are terminated and a single new transaction consolidating the terminated loan and lease transactions is entered into.
(3) Represents individual loan and lease transactions entered into with a customer that are renegotiated for an amendment of the original contractual terms, which may include amendment of interest rates, discounts of outstanding amounts due and payment extensions.
| (In millions of R$) | ||||||||||||||||
| AS OF DECEMBER 31, 2013 | ||||||||||||||||
| PAYMENT | MULTIPLE | MULTIPLE | ||||||||||||||
| RENEGOTIATED LOAN AND LEASE OPERATIONS | EXTENSION(1) | CONCESSIONS(2) | MODIFICATIONS(3) | TOTAL | ||||||||||||
| Individuals | 1,979 | 2,046 | 4,513 | 8,538 | ||||||||||||
| Credit card | - | 335 | - | 335 | ||||||||||||
| Personal loans | 1 | 1,710 | 4,513 | 6,224 | ||||||||||||
| Payroll loans | - | 1 | - | 1 | ||||||||||||
| Vehicles | 1,907 | - | - | 1,907 | ||||||||||||
| Mortgage loans | 71 | - | - | 71 | ||||||||||||
| Corporate | - | - | 476 | 476 | ||||||||||||
| Small and medium businesses | 102 | 3,247 | 481 | 3,830 | ||||||||||||
| Foreign loans – Latin America | - | 36 | - | 36 | ||||||||||||
| Total renegotiated loan and lease operations | 2,081 | 5,329 | 5,470 | 12,880 | ||||||||||||
(1) Represents loan and lease transactions subject to an amendment of contractual terms relating exclusively to payment due dates.
(2) Represents multiple loan and lease transactions which have been restructured, i.e., all such outstanding transactions are terminated and a single new transaction consolidating the terminated loan and lease transactions is entered into.
(3) Represents individual loan and lease transactions entered into with a customer that are renegotiated for an amendment of the original contractual terms, which may include amendment of interest rates, discounts of outstanding amounts due and payment extensions.
| (In millions of R$) | ||||||||||||||||
| AS OF DECEMBER 31, 2012 | ||||||||||||||||
| PAYMENT | MULTIPLE | MULTIPLE | ||||||||||||||
| RENEGOTIATED LOAN AND LEASE OPERATIONS | EXTENSION(1) | CONCESSIONS(2) | MODIFICATIONS(3) | TOTAL | ||||||||||||
| Individuals | 2,095 | 1,743 | 4,625 | 8,463 | ||||||||||||
| Credit card | - | 460 | - | 460 | ||||||||||||
| Personal loans | 14 | 1,283 | 4,625 | 5,922 | ||||||||||||
| Payroll loans | - | - | - | - | ||||||||||||
| Vehicles | 2,025 | - | - | 2,025 | ||||||||||||
| Mortgage loans | 56 | - | - | 56 | ||||||||||||
| Corporate | - | - | 495 | 495 | ||||||||||||
| Small and medium businesses | 136 | 5,137 | 259 | 5,532 | ||||||||||||
| Foreign loans – Latin America | - | 29 | - | 29 | ||||||||||||
| Total renegotiated loan and lease operations | 2,231 | 6,909 | 5,379 | 14,519 | ||||||||||||
(1) Represents loan and lease transactions subject to an amendment of contractual terms relating exclusively to payment due dates.
(2) Represents multiple loan and lease transactions which have been restructured, i.e., all such outstanding transactions are terminated and a single new transaction consolidating the terminated loan and lease transactions is entered into.
(3) Represents individual loan and lease transactions entered into with a customer that are renegotiated for an amendment of the original contractual terms, which may include amendment of interest rates, discounts of outstanding amounts due and payment extensions.
The following tables present an additional breakdown of renegotiated loans and leases by segment and class, as of December 31, 2014, 2013 and 2012:
| Annual Report2014 | A-112 |
| (In millions of R$) | ||||||||||||||||||||
| AS OF DECEMBER 31, 2014 | ||||||||||||||||||||
| IMPAIRED | NON-IMPAIRED | IMPAIRED | NON-IMPAIRED | |||||||||||||||||
| RENEGOTIATED LOAN AND LEASE OPERATIONS | PERFORMING | PERFORMING | NON-PERFORMING | NON-PERFORMING | TOTAL | |||||||||||||||
| Individuals | - | 3,921 | 2,019 | 1,390 | 7,330 | |||||||||||||||
| Credit card | - | 403 | - | - | 403 | |||||||||||||||
| Personal loans | - | 3,445 | 1,486 | 1,306 | 6,237 | |||||||||||||||
| Payroll loans | - | 22 | 17 | 3 | 42 | |||||||||||||||
| Vehicles | - | 37 | 478 | 62 | 577 | |||||||||||||||
| Mortgage loans | - | 14 | 38 | 19 | 71 | |||||||||||||||
| Corporate | 236 | 408 | 227 | - | 871 | |||||||||||||||
| Small and medium businesses | - | 1,406 | 1,116 | 763 | 3,285 | |||||||||||||||
| Foreign loans – Latin America | - | 55 | 12 | 19 | 86 | |||||||||||||||
| Total renegotiated loan and lease operations | 236 | 5,790 | 3,374 | 2,172 | 11,572 | |||||||||||||||
| (In millions of R$) | ||||||||||||||||||||
| AS OF DECEMBER 31, 2013 | ||||||||||||||||||||
| IMPAIRED | NON-IMPAIRED | IMPAIRED | NON-IMPAIRED | |||||||||||||||||
| RENEGOTIATED LOAN AND LEASE OPERATIONS | PERFORMING | PERFORMING | NON-PERFORMING | NON-PERFORMING | TOTAL | |||||||||||||||
| Individuals | - | 3,832 | 3,097 | 1,609 | 8,538 | |||||||||||||||
| Credit card | - | 335 | - | - | 335 | |||||||||||||||
| Personal loans | - | 3,324 | 1,642 | 1,258 | 6,224 | |||||||||||||||
| Payroll loans | - | 1 | - | - | 1 | |||||||||||||||
| Vehicles | - | 162 | 1,417 | 328 | 1,907 | |||||||||||||||
| Mortgage loans | - | 10 | 38 | 23 | 71 | |||||||||||||||
| Corporate | 111 | 261 | 51 | 54 | 477 | |||||||||||||||
| Small and medium businesses | - | 1,515 | 1,486 | 828 | 3,829 | |||||||||||||||
| Foreign loans – Latin America | - | 20 | 6 | 10 | 36 | |||||||||||||||
| Total renegotiated loan and lease operations | 111 | 5,628 | 4,640 | 2,501 | 12,880 | |||||||||||||||
| (In millions of R$) | ||||||||||||||||||||
| AS OF DECEMBER 31, 2012 | ||||||||||||||||||||
| IMPAIRED | NON-IMPAIRED | IMPAIRED | NON-IMPAIRED | |||||||||||||||||
| RENEGOTIATED LOAN AND LEASE OPERATIONS | PERFORMING | PERFORMING | NON-PERFORMING | NON-PERFORMING | TOTAL | |||||||||||||||
| Individuals | - | 3,995 | 2,966 | 1,502 | 8,463 | |||||||||||||||
| Credit card | - | 460 | - | - | 460 | |||||||||||||||
| Personal loans | - | 3,142 | 1,654 | 1,126 | 5,922 | |||||||||||||||
| Payroll loans | - | - | - | - | - | |||||||||||||||
| Vehicles | - | 379 | 1,284 | 362 | 2,025 | |||||||||||||||
| Mortgage loans | - | 14 | 28 | 14 | 56 | |||||||||||||||
| Corporate | 87 | 247 | 161 | - | 495 | |||||||||||||||
| Small and medium businesses | - | 1,792 | 2,659 | 1,081 | 5,532 | |||||||||||||||
| Foreign loans – Latin America | - | 15 | 4 | 10 | 29 | |||||||||||||||
| Total renegotiated loan and lease operations | 87 | 6,049 | 5,790 | 2,593 | 14,519 | |||||||||||||||
The table below presents the changes in our loan and lease portfolio with loss event, including the changes of the renegotiated loans and leases with loss event related to each year as of December 31, 2014, 2013 and 2012:
| (In millions of R$) | ||||||||||||
| IMPAIRED LOANS | 2014 | 2013 | 2012 | |||||||||
| Balance at the beginning of the period | 16,305 | 19,511 | 18,385 | |||||||||
| (+) Loan operations added | 12,521 | 9,882 | 11,441 | |||||||||
| (+) Loan operations added due to redefault | 3,915 | 5,029 | 6,873 | |||||||||
| (-) Loans removed due to write-off | (10,006 | ) | (12,460 | ) | (12,867 | ) | ||||||
| (-) Loans removed due to renegotiation (including amendments) | (4,506 | ) | (4,595 | ) | (622 | ) | ||||||
| (-) Loans removed due to total or partial pay-off | (1,024 | ) | (1,062 | ) | (3,699 | ) | ||||||
| Balance at the end of the period | 17,205 | 16,305 | 19,511 | |||||||||
Please refer to section Performance, item Consolidated Financial Statements (IFRS), Note 12 – Loan operations and lease operations portfolio for further details.
Cross border outstanding
Cross border outstanding are monetary assets which are denominated in non-local currency and exceeded 1% of our total assets in the case of transactions with foreign clients entered into by our subsidiaries in the United Kingdom (our former subsidiary in Portugal), Cayman and Bahamas. The aggregate cross border outstanding breakdown of these subsidiaries for the period indicated below is as follows:
| Annual Report2014 | A-113 |
| (In millions of R$, except percentages) | ||||||||||||||||||||||||
| 12/31/2014 | % | 12/31/2013(1) | % | 12/31/2012 | % | |||||||||||||||||||
| Cash and deposits on demand | 4,187 | 0.3 | 4,897 | 0.4 | 3,349 | 0.3 | ||||||||||||||||||
| Interbank deposits | 64,491 | 5.3 | 33,630 | 3.0 | 23,684 | 2.3 | ||||||||||||||||||
| Securities purchased under agreements to resell | 24,606 | 2.0 | 2,877 | 0.3 | 4,302 | 0.4 | ||||||||||||||||||
| Central Bank compulsory deposits | 3 | 0.0 | 3 | 0.0 | - | 0.0 | ||||||||||||||||||
| Financial assets held for trading | 5,978 | 0.5 | 5,854 | 0.5 | 5,689 | 0.6 | ||||||||||||||||||
| Derivatives | 9,321 | 0.8 | 8,008 | 0.7 | 9,450 | 0.9 | ||||||||||||||||||
| Available for sale financial assets | 39,850 | 3.3 | 38,290 | 3.5 | 40,512 | 4.0 | ||||||||||||||||||
| Financial assets held to maturity | 10,767 | 0.9 | 6,723 | 0.6 | 527 | 0.1 | ||||||||||||||||||
| Loan and lease operations | 97,740 | 8.1 | 57,834 | 5.2 | 34,933 | 3.4 | ||||||||||||||||||
| Total outstanding | 256,943 | 21.3 | 158,116 | 14.3 | 122,446 | 12.1 | ||||||||||||||||||
(1) On February 1, 2013, Banco Itaú BBA International S.A., headquartered in Portugal, was merged into Itau BBA International Limited, headquartered in the United Kingdom. On May 17, 2013, the entity was registered as a public limited company under the trade name Itau BBA International plc. The purpose of this restructuring process is to allow Itaú BBA International to improve its performance and sources of funding, expand its client base, strengthen its position as an international platform for Itaú Unibanco Group, achieve greater diversification of risk and increase profitability indicators. 2011 and 2012 data reflects cross-border outstandings (non-euro) for former Portuguese subsidiary and 2013 data reflects non-British pound sterling cross-border outstandings.
Short-term borrowings
Short-term borrowings are included in our balance sheet under the “Securities sold under repurchase agreement” line item. The main category for short-term borrowings is “Deposits Received under Securities Repurchase Agreements with Own and Third-Party Financial Assets.” The table below shows our short-term borrowings as of December 31, 2014, 2013 and 2012:
| (In millions of R$, except percentages) | ||||||||||||
| SECURITIES SOLD UNDER REPURCHASE AGREEMENTS | 2014 | 2013 | 2012 | |||||||||
| Amount outstanding (as of December 31) | 288,683 | 266,682 | 267,405 | |||||||||
| Maximum amount outstanding during the period | 288,683 | 271,621 | 267,405 | |||||||||
| Weighted average interest rate at period-end (%) | 9.9 | 9.4 | 9.0 | |||||||||
| Average amount outstanding during period | 266,527 | 256,025 | 204,358 | |||||||||
| Weighted average interest rate (%) | 9.5 | 9.2 | 9.4 | |||||||||
Liabilities
Funding
Main sources
Our current funding strategy is to continue to use all of our sources of funds in accordance with their costs and availability and our general asset and liability management strategy. In order to fund our operations, we intensified the use of the liquidity generated by savings deposits, interbank deposits, debt in the interbank market and debt in the institutional market during 2014, 2013 and 2012.
We also used Brazilian debentures subject to repurchase as a source of funding, reported as deposits received under securities repurchase agreements and offered to institutional clients as well as private banking, corporate banking and retail clients. This funding is designed to provide increased profitability through higher spreads in our savings deposits and higher fees earned on market funds.
Our ability to obtain funding depends on several factors, including credit ratings, general economic conditions and investors’ perception of emerging markets in general and of Brazil (particularly, current political and economic conditions in Brazil and government regulations for foreign currency funding).
Part of our long-term debt provides for the advance payment of the outstanding principal balance upon the occurrence of certain facts, as is customary for long-term financing agreements. As of December 31, 2014, none of these events, including default events and non-compliance with any financial covenant, had occurred, and we have no reason to believe that any of these events are likely to occur in 2015.
Our main sources of funding are our deposits, which are split into demand deposits, savings deposits, time deposits and interbank deposits. As of December 31, 2014, total deposits were R$294,773 million, which represented 37.8% of total funding. As of December 31, 2013, total deposits amounted to R$274,383 million, representing 37.9% of total funding. As of December 31, 2012, total deposits amounted to R$243,200 million, representing 35.8% of our total funding. Our time deposits represent one of our major sources of funding which, as of December 31, 2014, 2013 and 2012 accounted for 13.9%, 16.2% and 17.2% of total funding, respectively.
The table below shows the breakdown of our main sources of funds as of December 31, 2014, 2013 and 2012:
| (In millions of R$, except percentages) | ||||||||||||||||||||||||
| BREAKDOWN OF THE MAIN SOURCES OF FUNDS | 2014 | % OF TOTAL FUNDING | 2013 | % OF TOTAL FUNDING | 2012 | % OF TOTAL FUNDING | ||||||||||||||||||
| Deposits | 294,773 | 37.8 | 274,383 | 37.9 | 243,200 | 35.8 | ||||||||||||||||||
| Demand deposits | 48,733 | 6.3 | 42,892 | 5.9 | 34,916 | 5.1 | ||||||||||||||||||
| Savings deposits | 118,449 | 15.1 | 106,166 | 14.7 | 83,451 | 12.3 | ||||||||||||||||||
| Time deposits | 108,466 | 13.9 | 117,131 | 16.2 | 117,232 | 17.2 | ||||||||||||||||||
| Interbank deposits | 19,125 | 2.5 | 8,194 | 1.1 | 7,601 | 1.1 | ||||||||||||||||||
| Securities sold under repurchase agreements | 288,683 | 37.0 | 266,682 | 36.8 | 267,405 | 39.3 | ||||||||||||||||||
| Interbank market debt | 122,586 | 15.8 | 111,376 | 15.4 | 97,073 | 14.3 | ||||||||||||||||||
| Mortgage notes | 143 | - | 181 | 0.0 | 227 | 0.0 | ||||||||||||||||||
| Real estate credit bills | 10,832 | 1.4 | 8,919 | 1.2 | 13,296 | 2.0 | ||||||||||||||||||
| Agribusiness credit bills | 7,811 | 1.0 | 7,273 | 1.0 | 5,321 | 0.8 | ||||||||||||||||||
| Financial credit bills | 10,645 | 1.4 | 13,823 | 1.9 | 18,695 | 2.8 | ||||||||||||||||||
| Import and export Financing | 43,381 | 5.6 | 33,614 | 4.6 | 23,053 | 3.4 | ||||||||||||||||||
| Onlending-domestic | 45,230 | 5.8 | 43,015 | 5.9 | 36,048 | 5.3 | ||||||||||||||||||
| Annual Report2014 | A-114 |

Selected Statistical Information
The following information is included for analytical purposes and should be read in together with our section Performance, item Financial Performance, Significant Accounting Policies, Assets and Liabilities and Item Consolidated Financial Statements (IFRS).
The data included or referenced in this section are presented in accordance with IFRS, unless otherwise indicated.
Average Balance Sheet and Interest Rate Data
The following table presents the average balances of our interest-earning assets and interest-bearing liabilities, other assets and liabilities accounts, the related interest income and expense amounts and the average real yield/rate for each period.
We calculated the average balances using monthly book balances as we believe such balances are representative of our operations and it would be too costly to produce average balances using daily book balances in IFRS.
The majority of our business is composed of retail banking operations, which have grown organically and without significant fluctuations over short periods. Non-accrual loans and leases are disclosed as a non-interest earning asset for the periods indicated in the table below:
| (In millions of R$, except percentages) | ||||||||||||||||||||||||||||||||||||
| 2014 | 2013 | 2012 | ||||||||||||||||||||||||||||||||||
| AVERAGE | AVERAGE | AVERAGE | AVERAGE | AVERAGE | AVERAGE | |||||||||||||||||||||||||||||||
| ASSETS | BALANCE | INTEREST | YIELD/RATE (%) | BALANCE | INTEREST | YIELD/RATE (%) | BALANCE | INTEREST | YIELD/RATE (%) | |||||||||||||||||||||||||||
| Interest-earning assets(1) | 955,416 | 120,115 | 12.6 | 882,472 | 94,127 | 10.7 | 784,686 | 96,364 | 12.3 | |||||||||||||||||||||||||||
| Interbank deposits | 24,019 | 1,286 | 5.4 | 19,880 | 583 | 2.9 | 24,873 | 1,042 | 4.2 | |||||||||||||||||||||||||||
| Securities purchased under agreements to resell | 170,327 | 17,929 | 10.5 | 162,865 | 12,630 | 7.8 | 122,546 | 10,096 | 8.2 | |||||||||||||||||||||||||||
| Central Bank compulsory deposits | 69,882 | 5,904 | 8.4 | 62,492 | 4,314 | 6.9 | 70,416 | 5,334 | 7.6 | |||||||||||||||||||||||||||
| Financial assets held for trading | 134,695 | 15,128 | 11.2 | 138,667 | 10,860 | 7.8 | 126,160 | 13,324 | 10.6 | |||||||||||||||||||||||||||
| Available-for-sale financial assets | 78,559 | 7,272 | 9.3 | 86,571 | 5,067 | 5.9 | 62,527 | 3,771 | 6.0 | |||||||||||||||||||||||||||
| Held-to-maturity financial assets | 24,317 | 2,347 | 9.7 | 4,473 | 486 | 10.9 | 3,094 | 471 | 15.2 | |||||||||||||||||||||||||||
| Loan operations and lease operations (accrual) | 403,447 | 69,248 | 17.2 | 362,330 | 59,546 | 16.4 | 335,127 | 61,139 | 18.2 | |||||||||||||||||||||||||||
| Other Financial Assets | 50,170 | 1,001 | 2.0 | 45,193 | 641 | 1.4 | 39,943 | 1,187 | 3.0 | |||||||||||||||||||||||||||
| Non-interest-earning assets | 97,526 | 83,025 | 70,758 | |||||||||||||||||||||||||||||||||
| Cash and deposits on demand | 17,038 | 13,806 | 12,814 | |||||||||||||||||||||||||||||||||
| Central Bank compulsory deposits | 4,025 | 3,850 | 4,141 | |||||||||||||||||||||||||||||||||
| Derivatives | 12,647 | 11,224 | 9,502 | |||||||||||||||||||||||||||||||||
| Non-accrual loans | 17,040 | 19,216 | 20,055 | |||||||||||||||||||||||||||||||||
| Allowance for loan and lease losses | (21,655 | ) | (24,103 | ) | (24,962 | ) | ||||||||||||||||||||||||||||||
| Fixed assets, net | 7,145 | 5,958 | 5,360 | |||||||||||||||||||||||||||||||||
| Investments in unconsolidated companies | 3,964 | 3,233 | 3,032 | |||||||||||||||||||||||||||||||||
| Goodwill | 1,798 | 147 | - | |||||||||||||||||||||||||||||||||
| Intangible assets, net | 6,019 | 5,110 | 4,243 | |||||||||||||||||||||||||||||||||
| Tax assets | 35,000 | 33,155 | 28,151 | |||||||||||||||||||||||||||||||||
| Assets held for sale | 137 | 119 | 100 | |||||||||||||||||||||||||||||||||
| Other assets | 14,369 | 11,311 | 8,423 | |||||||||||||||||||||||||||||||||
| Total | 1,052,942 | 965,497 | 855,444 | |||||||||||||||||||||||||||||||||
(1) For the net yield on total average interest-earning assets, see “Net Interest Margin and Spread”.
| (In millions of R$, except percentages) | ||||||||||||||||||||||||||||||||||||
| 2014 | 2013 | 2012 | ||||||||||||||||||||||||||||||||||
| AVERAGE | AVERAGE | AVERAGE | AVERAGE | AVERAGE | AVERAGE | |||||||||||||||||||||||||||||||
| LIABILITIES | BALANCE | INTEREST | YIELD/RATE (%) | BALANCE | INTEREST | YIELD/RATE (%) | BALANCE | INTEREST | YIELD/RATE (%) | |||||||||||||||||||||||||||
| Interest-bearing liabilities | 793,069 | 72,977 | 9.2 | % | 738,535 | 46,361 | 6.3 | % | 649,026 | 48,067 | 7.4 | % | ||||||||||||||||||||||||
| Interest-bearing deposits | 234,000 | 12,064 | 5.2 | % | 209,347 | 9,802 | 4.7 | % | 206,652 | 10,544 | 5.1 | % | ||||||||||||||||||||||||
| Savings deposits | 111,473 | 6,905 | 6.2 | % | 92,964 | 5,014 | 5.4 | % | 73,404 | 4,069 | 5.5 | % | ||||||||||||||||||||||||
| Interbank Deposits | 6,131 | 692 | 11.3 | % | 7,446 | 300 | 4.0 | % | 8,661 | 286 | 3.3 | % | ||||||||||||||||||||||||
| Time deposits | 116,395 | 4,467 | 3.8 | % | 108,937 | 4,488 | 4.1 | % | 124,587 | 6,188 | 5.0 | % | ||||||||||||||||||||||||
| Securities sold under repurchase agreements | 266,527 | 26,771 | 10.0 | % | 256,025 | 16,865 | 6.6 | % | 204,358 | 17,539 | 8.6 | % | ||||||||||||||||||||||||
| Interbank market debt and Institutional market debt | 183,981 | 25,099 | 13.6 | % | 174,834 | 16,216 | 9.3 | % | 154,852 | 13,440 | 8.7 | % | ||||||||||||||||||||||||
| Interbank market debt | 113,522 | 14,404 | 12.7 | % | 104,002 | 6,245 | 6.0 | % | 94,555 | 5,747 | 6.1 | % | ||||||||||||||||||||||||
| Institutional market debt | 70,459 | 10,695 | 15.2 | % | 70,832 | 9,971 | 14.1 | % | 60,297 | 7,693 | 12.8 | % | ||||||||||||||||||||||||
| Reserves for insurance and private pension and Liabilities for capitalization plans | 107,880 | 8,987 | 8.3 | % | 97,818 | 3,436 | 3.5 | % | 82,820 | 6,513 | 7.9 | % | ||||||||||||||||||||||||
| Other interest-bearing liabilities | 682 | 56 | 8.2 | % | 511 | 42 | 8.2 | % | 344 | 30 | 8.9 | % | ||||||||||||||||||||||||
| Non-interest bearing liabilities | 169,247 | 148,215 | 130,293 | |||||||||||||||||||||||||||||||||
| Non-interest bearing deposits | 43,840 | 36,726 | 30,324 | |||||||||||||||||||||||||||||||||
| Derivatives | 13,107 | 10,355 | 8,251 | |||||||||||||||||||||||||||||||||
| Other non-interest-bearing liabilities | 112,300 | 101,134 | 91,718 | |||||||||||||||||||||||||||||||||
| Total stockholders’ equity attributed to the owners of the parent company | 89,458 | 78,747 | 76,125 | |||||||||||||||||||||||||||||||||
| Non-controlling interests | 1,168 | 878 | 880 | |||||||||||||||||||||||||||||||||
| Total | 1,052,942 | 965,497 | 855,444 | |||||||||||||||||||||||||||||||||
| Annual Report2014 | A-138 |
ITEM 19. EXHIBITS
| Number | Description | |
| 1 | Bylaws of Itaú Unibanco Holding S.A. (unofficial English translation)(1). | |
| 2.(a) | Amended and Restated Deposit Agreement among the Registrant, The Bank of New York, as depositary, and the Holders from time to time of American Depositary Shares issued thereunder, including the form of American Depositary Receipts(2). | |
| 4.(a)1 | Share Purchase and Sale Agreement, dated November 4, 2002, among Fernão Carlos Botelho Bracher, Antonio Beltran Martinez and Banco Itaú S.A.(3). | |
| 4.(a)2 | Shareholders’ Agreement, dated as of January 27, 2009, between Itaúsa - Investimentos Itaú S.A. and the Moreira Salles family (unofficial English translation)(4). | |
| 6 | Statement explaining calculation of earnings per share(5). | |
| 8.1 | List of subsidiaries(6). | |
| 11.1 | Code of Ethics (unofficial English translation)(7). | |
| 12.1 | Chief Executive Officer Certification pursuant to Section 302 of the Sarbanes-Oxley Act of 2002(8). | |
| 12.2 | Chief Financial Officer Certification pursuant to Section 302 of the Sarbanes-Oxley Act of 2002(8). | |
| 13 | Chief Executive Officer and Chief Financial Officer Certification pursuant to 18 U.S.C. Section 1350 as Enacted Pursuant to Section 906 of the Sarbanes-Oxley Act of 2002(8). |
| (1) | Incorporated herein by reference to our Report on Form 6-K filed with the Commission on May 1, 2014 (Commission File No. 001-15276). |
| (2) | Incorporated herein by reference to the Registration Statement on Form F-6 filed with the Commission on October 16, 2013 (Commission File No. 333-191758). |
| (3) | Incorporated herein by reference to our Annual Report on Form 20-F filed with the Commission on June 30, 2003 (Commission File No. 001-15276). |
| (4) | Incorporated herein by reference to our Annual Report on Form 20-F/A filed with the Commission on May 17, 2010 (Commission File No. 001-15276). |
| (5) | Incorporated by reference herein to “Note 2.4 – Summary of main accounting policies, item x) Earnings per share” to Consolidated Financial Statements included in this Annual Report on Form 20-F. |
| (6) | Incorporated by reference herein to “Note 2.4 – Summary of main accounting policies, item a) Consolidation, 1. Subsidiaries” to Consolidated Financial Statements included in this Annual Report on Form 20-F. |
| (7) | Incorporated herein by reference to our Annual Report on Form 20-F filed with the Commission on April 29, 2013 (Commission File No. 001-15276). |
| (8) | Filed herewith. |
Pursuant to Instruction 2(b)(i) of Instructions as to Exhibits to Form 20-F, copies of instruments defining the rights of certain holders of long-term debt are not filed. We agree to furnish copies of such instruments to the Securities and Exchange Commission upon request.
| Form 20-F/A2014 | B-1 |
SIGNATURES
The registrant hereby certifies that it meets all of the requirements for filing on Form 20-F and that it has duly caused and authorized the undersigned to sign this Amendment No. 1 to the annual report on its behalf.
| ITAÚ UNIBANCO HOLDING S.A. | ||
| By: | /s/ Roberto Egydio Setubal | |
| Name: Roberto Egydio Setubal | ||
| Title: Chief Executive Officer | ||
| By: | /s/ Eduardo Mazzilli de Vassimon | |
| Name: Eduardo Mazzilli de Vassimon | ||
| Title: Chief Financial Officer | ||
| Dated: September 21, 2015 | ||
| Form 20-F/A2014 | B-2 |